UNITED STATES
SECURITIES AND EXCHANGE COMMISSION
WASHINGTON, D.C. 20549
FORM 10-K
(Mark One)
S ANNUAL REPORT PURSUANT TO SECTION 13 OR 15(d) OF THE
SECURITIES EXCHANGE ACT OF 1934
FOR THE FISCAL YEAR ENDED DECEMBER 31, 2005,
OR
£ TRANSITION REPORT PURSUANT TO SECTION 13 OR 15(d) OF THE
SECURITIES EXCHANGE ACT OF 1934
FOR THE TRANSITION PERIOD FROM TO .
Commission
File Number
| Registrants, State of Incorporation,
Address, and Telephone Number
| I.R.S. Employer
Identification No.
|
| | 001-09120 | | PUBLIC SERVICE ENTERPRISE GROUP INCORPORATED
(A New Jersey Corporation)
80 Park Plaza, P.O. Box 1171
Newark, New Jersey 07101-1171
973 430-7000
http://www.pseg.com | | 22-2625848 | |
| | 001-00973 | | PUBLIC SERVICE ELECTRIC AND GAS COMPANY
(A New Jersey Corporation)
80 Park Plaza, P.O. Box 570
Newark, New Jersey 07101-0570
973 430-7000
http://www.pseg.com | | 22-1212800 | |
| | 000-49614 | | PSEG POWER LLC
(A Delaware Limited Liability Company)
80 Park Plaza—T25
Newark, New Jersey 07102-4194
973 430-7000
http://www.pseg.com | | 22-3663480 | |
| | 000-32503 | | PSEG ENERGY HOLDINGS L.L.C.
(A New Jersey Limited Liability Company)
80 Park Plaza—T20
Newark, New Jersey 07102-4194
973 430-7000
http://www.pseg.com | | 42-1544079 | |
Securities registered pursuant to Section 12(b) of the Act:
Registrant
| | Title of Each Class
| | Name of Each Exchange
On Which Registered
|
Public Service Enterprise
Group Incorporated | | Common Stock without
par value | | New York Stock Exchange |
5.381% Preferred Trust Securities, $50 liquidation amount per Preferred Trust Security, issued by PSEG Funding Trust I (Registrant) and listed on the New York Stock Exchange.
Trust Originated Preferred Securities (Guaranteed Preferred Beneficial Interest in PSEG's Debentures), $25 par value at 8.75%, issued by PSEG Funding Trust II (Registrant) and listed on the New York Stock Exchange.
Registrant
| | Title of Each Class
| | Title of Each Class
| | Name of Each Exchange
On Which Registered
|
Public Service Electric and
Gas Company | | Cumulative Preferred Stock
$100 par value Series: | | First and Refunding
Mortgage Bonds: | | |
| | | | | | | Series | | Due | | |
| | | 4.08% | | 91⁄4% | | CC | | 2021 | | |
| | | 4.18% | | 63⁄4% | | UU | | 2006 | | |
| | | 4.30% | | 63⁄4% | | VV | | 2016 | | New York Stock Exchange |
| | | 5.05% | | 61⁄4% | | WW | | 2007 | | |
| | | 5.28% | | 63⁄8% | | YY | | 2023 | | |
| | | | | 8% | | | | 2037 | | |
| | | | | 5% | | | | 2037 | | |
(Cover continued on next page)
(Cover continued from previous page)
Securities registered pursuant to Section 12(g) of the Act:
Registrant
| | Title of Class
|
| Public Service Enterprise Group Incorporated | | Floating Rate Capital Securities (Guaranteed Preferred Beneficial Interest in PSEG's Debentures), $1,000 par value issued by Enterprise Capital Trust II (Registrant), LIBOR plus 1.22% |
| | | Floating Rate Notes, Series A |
| Public Service Electric and Gas Company | | 6.92% Cumulative Preferred Stock $100 par value
Medium-Term Notes, Series A
Medium-Term Notes, Series B
Medium-Term Notes, Series C
Medium-Term Notes, Series D |
| PSEG Power LLC | | Limited Liability Company Membership Interest |
| PSEG Energy Holdings L.L.C. | | Limited Liability Company Membership Interest |
Indicate by check mark whether each registrant is a well-known seasoned issuer, as defined in Rule 405 of the Securities Act.
| | Public Service Enterprise Group Incorporated | | Yes S | | No £ |
| | Public Service Electric and Gas Company | | Yes £ | | No S |
| | PSEG Power LLC | | Yes £ | | No S |
| | PSEG Energy Holdings L.L.C. | | Yes £ | | No S |
Indicate by check mark if each of the registrants is not required to file reports pursuant to Section 13 or 15(d) of the Securities Exchange Act of 1934. Yes £ No S
Indicate by check mark whether each of the registrants (1) has filed all reports required to be filed by Section 13 or 15(d) of the Securities Exchange Act of 1934 during the preceding 12 months (or for such shorter period that the registrants were required to file such reports) and (2) has been subject to such filing requirements for the past 90 days. Yes S No £
Indicate by check mark if disclosure of delinquent filers pursuant to Item 405 of Regulation S-K is not contained herein, and will not be contained, to the best of registrant's knowledge, in definitive proxy or information statements incorporated by reference in Part III of this Form 10-K or any amendment to this Form 10-K. S
Indicate by check mark whether each registrant is an accelerated filer (as defined in Rule 12b-2 of the Exchange Act).
| | Public Service Enterprise Group Incorporated | | Yes S | | No £ |
| | Public Service Electric and Gas Company | | Yes £ | | No S |
| | PSEG Power LLC | | Yes £ | | No S |
| | PSEG Energy Holdings L.L.C. | | Yes £ | | No S |
Indicate by check mark whether any of the registrants is a shell company (as defined in Rule 12b-2 of the Exchange Act). Yes £ No S
The aggregate market value of the Common Stock of Public Service Enterprise Group Incorporated held by non-affiliates as of June 30, 2005 was $14,247,381,923 based upon the New York Stock Exchange Composite Transaction closing price.
The number of shares outstanding of Public Service Enterprise Group Incorporated's sole class of Common Stock, as of the latest practicable date, was as follows:
Class
| | Outstanding at January 31, 2006
|
| Common Stock, without par value | | 251,168,819 |
As of January 31, 2006, Public Service Electric and Gas Company had issued and outstanding 132,450,344 shares of Common Stock, without nominal or par value, all of which were privately held, beneficially and of record by Public Service Enterprise Group Incorporated.
PSEG Power LLC and PSEG Energy Holdings L.L.C. are wholly owned subsidiaries of Public Service Enterprise Group Incorporated and meet the conditions set forth in General Instruction I(1)(a) and (b) of Form 10-K and are filing their respective Annual Reports on Form 10-K with the reduced disclosure format authorized by General Instruction I.
DOCUMENTS INCORPORATED BY REFERENCE—NONE
TABLE OF CONTENTS
i
Page
ii
FORWARD-LOOKING STATEMENTS
Certain of the matters discussed in this report constitute “forward-looking statements” within the meaning of the Private Securities Litigation Reform Act of 1995. Such forward-looking statements are subject to risks and uncertainties, which could cause actual results to differ materially from those anticipated. Such statements are based on management's beliefs as well as assumptions made by and information currently available to management. When used herein, the words “anticipate,” “intend,” “estimate,” “believe,” “expect,” “plan,” “hypothetical,” “potential,” “forecast,” “project,” variations of such words and similar expressions are intended to identify forward-looking statements. Public Service Enterprise Group Incorporated (PSEG), Public Service Electric and Gas Company (PSE&G), PSEG Power LLC (Power) and PSEG Energy Holdings L.L.C. (Energy Holdings) undertake no obligation to publicly update or revise any forward-looking statements, whether as a result of new information, future events or otherwise. The following review should not be construed as a complete list of factors that could effect forward-looking statements. In addition to any assumptions and other factors referred to specifically in connection with such forward-looking statements discussed above, factors that could cause actual results to differ materially from those contemplated in any forward-looking statements include, among others, the following:
| • | business conditions, financial market, credit rating, regulatory and other risks resulting from the pending merger with Exelon Corporation; |
| |
| • | regulatory issues that significantly impact operations; |
| |
| • | operating performance or cash flow from investments falling below projected levels; |
| |
| • | credit, commodity, interest rate, counterparty and other financial market risks; |
| |
| • | liquidity and the ability to access capital and maintain adequate credit ratings; |
| |
| • | adverse or unanticipated weather conditions that significantly impact costs and/or operations, including generation; |
| |
| • | changes in the electric industry, including changes to power pools; |
| |
| • | changes in demand resulting from changes in prices; |
| |
| • | changes in the number of market participants and the risk profiles of such participants; |
| |
| • | changes in technology that make generation, transmission and/or distribution assets less competitive; |
| |
| • | availability of power transmission facilities that impact the ability to deliver output to customers; |
| |
| • | growth in costs and expenses; |
| |
| • | environmental regulations that significantly impact operations; |
| |
| • | changes in rates of return on overall debt and equity markets that could adversely impact the value of pension and other postretirement benefits assets and liabilities and the Nuclear Decommissioning Trust Funds; |
| |
| • | ability to maintain satisfactory regulatory results; |
| |
| • | changes in political conditions, recession, acts of war or terrorism; |
| |
| • | continued availability of insurance coverage at commercially reasonable rates; |
| |
| • | involvement in lawsuits, including liability claims and commercial disputes; |
| |
| • | inability to attract and retain management and other key employees, particularly in view of the pending merger with Exelon Corporation; |
| |
| • | acquisitions, divestitures, mergers, restructurings or strategic initiatives that change PSEG's, PSE&G's, Power's and Energy Holdings' strategy or structure; |
| |
| • | business combinations among competitors and major customers; |
| |
| • | general economic conditions, including inflation or deflation; |
| |
| • | changes to accounting standards or accounting principles generally accepted in the U.S., which may require adjustments to financial statements; |
| |
| • | changes in tax laws and regulations; |
| |
| • | ability to recover investments or service debt as a result of any of the risks or uncertainties mentioned herein; |
iii
PSEG, PSE&G and Energy Holdings
| • | ability to obtain adequate and timely rate relief; |
PSEG, Power and Energy Holdings
| • | inability to effectively manage portfolios of electric generation assets, gas supply contracts and electric and gas supply obligations; |
| |
| • | energy transmission constraints or lack thereof; |
| |
| • | adverse changes in the market for energy, capacity, natural gas, emissions credits, congestion credits and other commodity prices, especially during significant price movements for natural gas and power; |
| |
| • | surplus of energy capacity and excess supply; |
| |
| • | substantial competition in the worldwide energy markets; |
| |
| • | margin posting requirements, especially during significant price movements for natural gas and power; |
| |
| • | availability of fuel and timely transportation at reasonable prices; |
| |
| • | effects on competitive position of actions involving competitors or major customers; |
| |
| • | changes in product or sourcing mix; |
| |
| • | delays, cost escalations or unsuccessful construction and development; |
PSEG and Power
| • | changes in regulation and safety and security measures at nuclear facilities; |
PSEG and Energy Holdings
| • | changes in foreign currency exchange rates; |
| |
| • | deterioration in the credit of lessees and their ability to adequately service lease rentals; |
| |
| • | ability to realize tax benefits; |
| |
| • | changes in political regimes in foreign countries; and |
| |
| • | international developments negatively impacting business. |
Consequently, all of the forward-looking statements made in this report are qualified by these cautionary statements and PSEG, PSE&G, Power and Energy Holdings cannot assure you that the results or developments anticipated by management will be realized, or even if realized, will have the expected consequences to, or effects on, PSEG, PSE&G, Power and Energy Holdings or their respective business prospects, financial condition or results of operations. Undue reliance should not be placed on these forward-looking statements in making any investment decision. Each of PSEG, PSE&G, Power and Energy Holdings expressly disclaims any obligation or undertaking to release publicly any updates or revisions to these forward-looking statements to reflect events or circumstances that occur or arise or are anticipated to occur or arise after the date hereof. In making any investment decision regarding PSEG's, PSE&G's, Power's and Energy Holdings' securities, PSEG, PSE&G, Power and Energy Holdings are not making, and you should not infer, any representation about the likely existence of any particular future set of facts or circumstances. The forward-looking statements contained in this report are intended to qualify for the safe harbor provisions of Section 27A of the Securities Act of 1933, as amended, and Section 21E of the Securities Exchange Act of 1934, as amended.
iv
WHERE TO FIND MORE INFORMATION
Public Service Enterprise Group Incorporated (PSEG), Public Service Electric and Gas Company (PSE&G), PSEG Power LLC (Power) and PSEG Energy Holdings L.L.C. (Energy Holdings) file annual, quarterly and special reports, proxy statements and other information with the Securities and Exchange Commission (SEC). You may read and copy any document that PSEG, PSE&G, Power and Energy Holdings file at the Public Reference Room of the SEC at 450 Fifth Street, N.W., Washington, D.C. 20549. Information on the operation of the Public Reference Room may be obtained by calling the SEC at 1-800-SEC-0330. You may also obtain PSEG's, PSE&G's, Power's and Energy Holdings' filings on the Internet at the SEC's website at www.sec.gov or at PSEG's website, www.pseg.com. PSEG's Common Stock is listed on the New York Stock Exchange under the ticker symbol “PEG.” You can obtain information about PSEG at the offices of the New York Stock Exchange, 20 Broad Street, New York, New York 10005.
PART I
This combined Annual Report on Form 10-K is separately filed by PSEG, PSE&G, Power and Energy Holdings. Information contained herein relating to any individual company is filed by such company on its own behalf. PSE&G, Power and Energy Holdings each makes representations only as to itself and its subsidiaries and makes no other representations whatsoever as to any other company.
ITEM 1. BUSINESS
GENERAL
PSEG, PSE&G, Power and Energy Holdings
PSEG was incorporated under the laws of the State of New Jersey in 1985 and has its principal executive offices located at 80 Park Plaza, Newark, New Jersey 07102. PSEG was an exempt public utility holding company under the Public Utility Holding Company Act of 1935 (PUHCA) prior to its repeal. The Energy Policy Act of 2005 (Energy Policy Act), among other things, repealed PUHCA as of February 8, 2006 and enacted the Public Utility Holding Company Act of 2005 (PUHCA 2005). PSEG is in the process of evaluating the compliance requirements under PUHCA 2005.
PSEG has four principal direct wholly owned subsidiaries: PSE&G, Power, Energy Holdings and PSEG Services Corporation (Services). The following organization chart shows PSEG and its principal subsidiaries, as well as the principal operating subsidiaries of Power: PSEG Fossil LLC (Fossil), PSEG Nuclear LLC (Nuclear) and PSEG Energy Resources & Trade LLC (ER&T); and of Energy Holdings: PSEG Global L.L.C. (Global) and PSEG Resources L.L.C. (Resources):
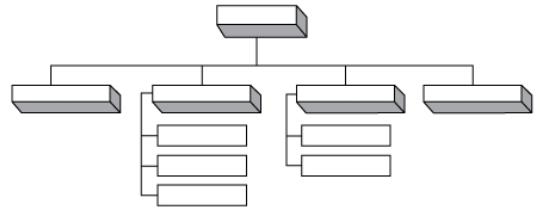
PSEG
PSE&G
Power
Energy Holdings
Services
Fossil
Nuclear
ER&T
Global
Resources
The regulatory structure that has historically governed the electric and gas utility industries in the United States (U.S.) has changed dramatically in recent years. Actions by state regulators and the Federal Energy Regulatory Commission (FERC) and the implementation of the National Energy Policy Act of 1992 have afforded power marketers, merchant generators, Exempt Wholesale Generators (EWGs) and utilities the opportunity to compete actively in wholesale energy markets and have allowed consumers the right to choose
1
their energy suppliers. The deregulation and restructuring of the nation's energy markets, the unbundling of energy and related services, the diverse strategies within the industry related to holding, building, buying or selling generation capacity and consolidation within the industry have had, and are likely to continue to have, a significant effect on PSEG and its subsidiaries, providing them with new opportunities and exposing them to new risks.
As energy markets have changed dramatically in recent years, PSEG and its subsidiaries have transitioned from a vertically-integrated utility to an energy company with a diversified business mix. PSEG realigned its organizational structure to address the competitive environment brought about by the deregulation of the electric generation industry and evolved from primarily being a state-regulated New Jersey utility to operating as a competitive energy company with operations primarily in the Northeastern U.S. and in other select markets. As the competitive portion of PSEG's business has grown, the resulting financial risks and rewards have become greater, causing financial requirements to change and increasing the volatility of earnings and cash flows.
PSEG seeks to reduce future volatility of earnings and cash flows principally by entering into longer-term contracts for material portions of its anticipated energy output. PSEG may also reduce exposure to its international businesses by seeking to opportunistically monetize investments of Energy Holdings that may no longer have a strategic fit. PSEG also expects a gradual decline in earnings from Resources' leveraged leasing business due to the maturation of its investment portfolio. For additional information, see Item 7. Management's Discussion and Analysis of Financial Condition and Results of Operations (MD&A)—Overview of 2005 and Future Outlook.
PENDING MERGER
PSEG, PSE&G, Power and Energy Holdings
As previously disclosed, on December 20, 2004, PSEG entered into an agreement and plan of merger (Merger Agreement) with Exelon Corporation (Exelon), a public utility holding company headquartered in Chicago, Illinois, whereby PSEG will be merged with and into Exelon (Merger). Under the Merger Agreement, each share of PSEG Common Stock will be converted into 1.225 shares of Exelon Common Stock.
The Merger Agreement has been unanimously approved by both companies' Boards of Directors. On July 19, 2005, shareholders of PSEG voted to approve the Merger and on July 22, 2005, shareholders of Exelon voted to approve the issuance of common shares to PSEG shareholders to effect the Merger.
Completion of the Merger is subject to approval by a number of governmental authorities, some of which have already been obtained. The authorities may impose conditions on completion of the Merger, require changes to the terms of the Merger or fail to approve the Merger. For additional information related to the Merger, see Item 3. Legal Proceedings, Item 7. MD&A—Pending Merger and Note 23. Pending Merger of the Notes to the Consolidated Financial Statements (Notes).
PSE&G
PSE&G is a New Jersey corporation, incorporated in 1924, and has principal executive offices at 80 Park Plaza, Newark, New Jersey 07102. PSE&G is an operating public utility company engaged principally in the transmission and distribution of electric energy and gas in New Jersey. PSE&G, pursuant to an order of the New Jersey Board of Public Utilities (BPU) issued under the provisions of the New Jersey Electric Discount and Energy Competition Act (EDECA), transferred all of its electric generation facilities, plant, equipment and wholesale power trading contracts to Power and its subsidiaries in August 2000 for approximately $2.8 billion. Also, pursuant to a BPU order, PSE&G transferred its gas supply business, including its inventories and supply contracts, to Power in May 2002 for approximately $183 million. PSE&G continues to own and operate its electric and gas transmission and distribution business. In addition, PSE&G owns PSE&G Transition Funding LLC (Transition Funding) and PSE&G Transition Funding II LLC (Transition Funding II), which are bankruptcy-remote entities that purchased the rights to receive certain non-bypassable amounts per Kilowatt-hour (kWh) of energy delivered to PSE&G customers and issued transition bonds secured by such property.
PSE&G provides electric and gas service in areas of New Jersey in which approximately 5.5 million people, about 70% of the state's population, reside. PSE&G's electric and gas service area is a corridor of
2
approximately 2,600 square miles running diagonally across New Jersey from Bergen County in the northeast to an area below the city of Camden in the southwest. The greater portion of this area is served with both electricity and gas, but some parts are served with electricity only and other parts with gas only. This heavily populated, commercialized and industrialized territory encompasses most of New Jersey's largest municipalities, including its six largest cities—Newark, Jersey City, Paterson, Elizabeth, Trenton and Camden—in addition to approximately 300 suburban and rural communities. This service territory contains a diversified mix of commerce and industry, including major facilities of many nationally prominent corporations. PSE&G's load requirements are split among residential, commercial and industrial customers, described below under customers. PSE&G believes that it has all the franchise rights (including consents) necessary for its electric and gas distribution operations in the territory it serves. Such franchise rights are not exclusive.
PSE&G distributes electric energy and gas to end-use customers within its designated service territory. All electric and gas customers in New Jersey have the ability to choose an electric energy and/or gas supplier. Pursuant to BPU requirements, PSE&G serves as the supplier of last resort for electric and gas customers within its service territory. PSE&G earns no margin on the commodity portion of its electric and gas sales. PSE&G earns margins through the transmission and distribution of electricity and gas. PSE&G's revenues for these services are based upon tariffs approved by the BPU and FERC. The demand for electric energy and gas by PSE&G's customers is affected by customer conservation, economic conditions, weather and other factors not within PSE&G's control.
Electric Supply
New Jersey's Electric Distribution Companies (EDCs), including PSE&G, provide two types of Basic Generation Service (BGS). BGS is the default electric supply service for customers who do not choose a third party to source their electric supply requirements. BGS-Fixed Price (FP) provides supply for smaller commercial and residential customers at seasonally-adjusted fixed prices. BGS-FP rates change annually on June 1, and are based on the average BGS price obtained at auctions in the current year and two prior years. BGS-Commercial and Industrial Energy Price (CIEP) provides supply for larger customers at hourly PJM Interconnection, L.L.C. (PJM) real-time market prices for a term of 12 months. BGS-FP and BGS-CIEP represent approximately 84% and 16%, respectively, of PSE&G's BGS-eligible load. Customers may obtain their electric supply through either the BGS default electric supply service or through competitive third-party electric suppliers.
New Jersey's EDCs jointly procure the supply to meet their BGS obligations through two concurrent auctions authorized by the BPU for New Jersey's total BGS requirement. Results of these auctions determine which energy suppliers are authorized to supply BGS to New Jersey's EDCs. Certain conditions are required to participate in these auctions. Energy suppliers must agree to execute the BGS Master Service Agreement, provide required security within three days of BPU certification of auction results and satisfy certain creditworthiness requirements.
PSE&G's total BGS-FP load is approximately 8,600 megawatts (MW). Approximately one-third of this total load is expected to be auctioned each year for a three-year term. The current pricing is as follows:
| | | | Term Ending
|
| | | | May 2006(a)
| | May 2007(b)
| | May 2008(a)
| | May 2009(c)
|
| | Term
| | 12 months
| | 34 months
| | 36 months
| | 36 months
|
| | Load (MW) | | | 2,900 | | | | 2,840 | | | | 2,840 | | | | 2,882 | |
| | $ per kWh | | $ | 0.05560 | | | $ | 0.05515 | | | $ | 0.06541 | | | $ | 0.10251 | |
| | | | | | | | | | | | | | | | | | |
| (a) | | Prices set in the February 2005 BGS auction. |
| (b) | | Prices set in the February 2004 BGS auction. |
| (c) | | Prices set in the February 2006 BGS auction, which becomes effective on June 1, 2006 when the agreements for the 12-month (May 2006) BGS-FP supply agreements expire. |
3
The February 2006 BGS-FP auction sought approximately one-third of PSE&G's BGS-FP eligible load (2,882 MW), since contracts for the other two-thirds were procured through the 2004 and 2005 auctions. The 2006 clearing price for PSE&G's BGS-FP load was 10.251 cents per kWh, an increase of approximately 57% over the 2005 auction price. The term of the supply period is from June 2006 through May 2009. Due to the stabilizing effect of the portfolio approach (blending this year's price with the prices set in the auctions in 2005 and 2004), residential customers' bills are expected to increase by approximately 14% beginning June 1, 2006.
The 2006 BGS-CIEP auction was not fully subscribed. Of the 1,830 MW offered, only 1,153 MW, approximately 63%, was filled by BGS-CIEP suppliers for the period June 2006 through May 2007. Since nearly 85% of BGS-CIEP load has migrated to third party suppliers on a spot market basis, PSE&G expects its required supply obligation to be approximately 110 MW of BGS-CIEP load, although it could vary if migration amounts change in response to changing market prices. PSE&G expects to be able to meet this requirement. PSE&G has filed a contingency plan, which was approved by the BPU, which covered instances where the auction volume for either BGS-FP or BGS-CIEP was reduced. The process calls for those reduced volumes to be served by the EDC from PJM administered markets with full cost recovery from customers. However, it is PSE&G's responsibility to carry out that obligation in a prudent manner to insure full cost recovery.
Gas Supply
PSE&G has a full requirements contract through 2007 with Power to meet the supply requirements of PSE&G's gas customers. Power charges PSE&G for gas commodity costs which PSE&G recovers from its customers. Any difference between rates charged by Power under the Basic Gas Supply Service (BGSS) contract and rates charged to PSE&G's customers are deferred and collected or refunded through adjustments in future rates.
Market Price Environment
There has been a significant increase in commodity prices, including fuel, emission allowances and electricity over the past year. For example, both natural gas and electric prices in PJM have more than doubled. Price increases of this magnitude are much greater than have been experienced in recent history and could continue to have considerable impacts.
For PSE&G, a rising commodity price environment results in higher delivered electric and gas rates for end use customers, and may result in decreased demand by end users of both electricity and gas, increased regulatory pressures and greater working capital requirements as the collection of higher commodity costs may be deferred under PSEG's regulated rate structure. For additional information see Item 7. MD&A.
Competitive Environment
The electric and gas transmission and distribution business has minimal risks from competitors. PSE&G's transmission and distribution business is minimally impacted when customers choose alternate electric or gas suppliers since PSE&G earns its return by providing transmission and distribution service, not by supplying the commodity.
Customers
As of December 31, 2005, PSE&G provided service to approximately 2.1 million electric customers and approximately 1.7 million gas customers, detailed below. In addition to its transmission and distribution business, PSE&G also offers appliance services and repairs to customers throughout its service territory.
| | | | % of Sales
|
| | Customer Type
| | Electric
| | Gas
|
| | Commercial | | | 54% | | | | 27% | |
| | Residential | | | 32% | | | | 55% | |
| | Industrial | | | 14% | | | | 18% | |
| | | | |
| | | |
| |
| | Total | | | 100% | | | | 100% | |
| | | | |
| | | |
| |
| | | | | | | | | | |
4
Employee Relations
As of December 31, 2005, PSE&G had 6,335 employees. PSE&G has six-year collective bargaining agreements, which were ratified in 2005, with four unions representing 5,043 employees. PSE&G believes that it maintains satisfactory relationships with its employees.
Power
Power is a Delaware limited liability company, formed in 1999, and has its principal executive offices at 80 Park Plaza, Newark, New Jersey 07102. Power is a multi-regional, wholesale energy supply company that integrates its generating asset operations with its wholesale energy, fuel supply, energy trading and marketing and risk management functions through three principal direct wholly owned subsidiaries: Nuclear, Fossil and ER&T.
As of December 31, 2005, Power's generation portfolio consisted of approximately 13,846 MW of installed capacity which is diversified by fuel source and market segment. For additional information, see Item 2. Properties.
As a merchant generator, Power's profit is derived from selling under contract or on the spot market a range of diverse products such as energy, capacity, emissions credits, congestion credits and a series of energy-related products used to optimize the operation of the energy grid, known as ancillary services.
Through its operating subsidiaries, Power competes as an independent wholesale electric generating company, primarily in the Northeast U.S. Most of Power's generating assets are strategically located within PJM, one of the nation's largest and most developed energy markets.
In addition to the electric generation business described above, Power's revenues include gas supply sales under the BGSS contract with PSE&G.
Nuclear
Nuclear has an ownership interest in five nuclear generating units: the Salem Nuclear Generating Station, Units 1 and 2 (Salem 1 and 2), each owned 57.41% by Nuclear and 42.59% by Exelon Generation Company LLC (Exelon Generation); the Hope Creek Nuclear Generating Station (Hope Creek), which is owned 100% by Nuclear; and, the Peach Bottom Atomic Power Station Units 2 and 3 (Peach Bottom 2 and 3), each of which is operated by Exelon Generation and owned 50% by Nuclear. For additional information, see Item 2. Properties—Power.
For a discussion of recent operational issues, see Regulatory Issues—Nuclear Regulatory Commission (NRC).
Nuclear unit capacity and availability factors for 2005 were as follows:
| | Unit
| | Capacity
Factor*
| | Availability
Factor
|
| | Salem Unit 1 | | | 93.0 | % | | | 92.5 | % |
| | Salem Unit 2 | | | 90.9 | % | | | 90.1 | % |
| | Hope Creek | | | 82.8 | % | | | 84.2 | % |
| | Peach Bottom Unit 2 | | | 98.7 | % | | | 97.8 | % |
| | Peach Bottom Unit 3 | | | 90.8 | % | | | 92.6 | % |
| | | | |
| | | |
| |
| | Total Power Ownership | | | 90.1 | % | | | 90.3 | % |
| | | | |
| | | |
| |
| | | | | | | | | | |
* Maximum Dependable Capacity (MDC) net.
Nuclear has several long-term purchase contracts with uranium suppliers, converters, enrichers and fabricators to meet the currently projected fuel requirements for the Salem and Hope Creek nuclear power plants. Nuclear has been advised by Exelon Generation that it has similar purchase contracts to satisfy the annual fuel requirements for Peach Bottom. For additional information, see Item 7. MD&A—Overview of 2005 and Future Outlook—Power and Note 12. Commitments and Contingent Liabilities of the Notes.
Concurrent with the Merger Agreement, Nuclear entered into an Operating Services Contract (OSC) with Exelon Generation, which commenced on January 17, 2005, relating to the operation of the Salem and Hope Creek nuclear generating stations. The OSC requires Exelon Generation to provide a chief nuclear
5
officer and other key personnel to oversee daily plant operations at the Hope Creek and Salem nuclear generating stations and to implement the Exelon operating model, which defines practices that Exelon has used to manage its own nuclear performance program. Nuclear continues as the license holder with exclusive legal authority to operate and maintain the plants, retains responsibility for management oversight and has full authority with respect to the marketing of its share of the output from the facilities. The OSC has a term of two years, subject to earlier termination in certain circumstances. In the event of termination, Exelon Generation will continue to provide services under the OSC for a transition period of at least 180 days and up to two years at the election of Nuclear. This period may be further extended by Nuclear for up to an additional twelve months if Nuclear determines that additional time is necessary to complete required activities during the transition period.
In May 2005, a scheduled refueling outage at Salem Unit 2 was completed ahead of schedule while meeting self-imposed nuclear safety targets. In November 2005, Salem Unit 1 returned to service, completing a scheduled refueling outage with a reactor head replacement in world record time. During 2005, Salem Unit 1 and Salem Unit 2 experienced their longest continuous on-line running days at nearly 100% capacity.
Fossil
Fossil has an ownership interest in 12 generating stations in New Jersey, one in New York, two in Connecticut, two in Pennsylvania and one in Indiana. For additional information, see Item 2. Properties—Power.
Since 1999, Fossil has added units to its fleet, including the Bergen 2 station in New Jersey, the Bridgeport Harbor and New Haven Harbor facilities in Connecticut, the Lawrenceburg station in Indiana and the Bethlehem Energy Center in New York, which was completed and placed in service on July 18, 2005, replacing the Albany Station. In addition, Fossil is currently in final stages of construction for its Linden, New Jersey plant, which is scheduled to be operational in the second quarter of 2006. During 2005, Fossil sold its Waterford, Ohio plant, which commenced commercial operation in August 2003. For additional information see Note 4. Discontinued Operations, Dispositions and Acquisitions of the Notes.
Fossil uses coal, natural gas and oil for electric generation. These fuels are purchased through various contracts and in the spot market and represent a significant portion of Power's working capital requirements. The majority of Power's fossil generating stations obtain their fuel supply from within the U.S. In order to minimize emissions levels, the Bridgeport generating facility uses a specific type of coal, which is obtained from Indonesia through a fixed-price supply contract that runs through 2008. If the supply of coal from Indonesia or equivalent coal from other sources was not available for the Connecticut facilities, additional material capital expenditures could be required to modify the existing plants to enable their continued operation. Power believes it has sufficient fuel supply, including transportation, for its facilities over the next several years. For additional information, see Item 7. MD&A—Overview of 2005 and Future Outlook—Power and Note 12. Commitments and Contingent Liabilities of the Notes.
ER&T
ER&T purchases the capacity and energy produced by each of the generation subsidiaries of Power. In conjunction with these purchases, ER&T uses commodity and financial instruments designed to cover estimated commitments for BGS and other bilateral contract agreements. ER&T also markets electricity, capacity, ancillary services and natural gas products on a wholesale basis. ER&T is a fully integrated wholesale energy marketing and trading organization that is active in the long-term and spot wholesale energy and energy-related markets. In anticipation of the proposed Merger with Exelon and a resulting reduction in personnel, ER&T has recently de-emphasized the proprietary trading component of its business to narrow its focus on its asset-based opportunities, including BGS and other load-related contracts, BGSS, capacity, emissions and congestion related products such as firm transmission rights (FTRs) and auction revenue rights.
Electric Supply
Power's generation capacity is sourced from a diverse mix of fuels comprised of approximately 45% gas, 25% nuclear, 17% coal, 12% oil and 1% pumped storage. Power's fuel diversity serves to mitigate risks associated with fuel price volatility and market demand cycles. The following table indicates the MWh output of Power's generating stations by fuel type in 2005, based on actual output of approximately 50,000 MWhs,
6
and its estimated MWh output by fuel type for 2006, based on anticipated output of approximately 52,000 MWhs.
Generation by Fuel Type
| | Actual
2005
| | Estimated
2006(A)
|
Nuclear: | | | | | | | | |
New Jersey facilities | | | 37 | % | | | 36 | % |
Pennsylvania facilities | | | 18 | % | | | 17 | % |
Fossil: | | | | | | | | |
Coal: | | | | | | | | |
New Jersey facilities | | | 13 | % | | | 13 | % |
Pennsylvania facilities | | | 12 | % | | | 12 | % |
Connecticut facilities | | | 6 | % | | | 5 | % |
Oil and Natural Gas: | | | | | | | | |
New Jersey facilities | | | 9 | % | | | 11 | % |
New York facilities | | | 2 | % | | | 4 | % |
Connecticut facilities | | | 2 | % | | | 2 | % |
Pumped Storage: | | | 1 | % | | | — | |
| | | |
| | | |
| |
Total | | | 100 | % | | | 100 | % |
| | | |
| | | |
| |
| | | | | | | | |
(A) No assurances can be given that actual 2006 output by source will match estimates.
For a discussion of Power's management and hedging strategy relating to its energy sales supply and fuel needs, see Market Price Environment and Item 7A. MD&A—Overview of 2005 and Future Outlook—Power.
Gas Supply
As described above, Power sells gas to PSE&G under the BGSS contract. Additionally, based upon availability, Power sells gas to others. About 42% of PSE&G's peak daily gas requirements are provided through firm transportation, which is available every day of the year. The remainder comes from field storage, liquefied natural gas, seasonal purchases, contract peaking supply, propane and refinery and landfill gas. Power purchases gas for its gas operations directly from natural gas producers and marketers. These supplies are transported to New Jersey by four interstate pipeline suppliers.
Power has approximately 1.16 billion cubic-feet-per-day of firm transportation capacity under contract to meet the primary needs of the gas consumers of PSE&G and the needs of its generation fleet. In addition, Power supplements that supply with a total storage capacity of 80 billion cubic feet that provides a maximum of 0.91 billion cubic feet-per-day of gas during the winter season.
Power expects to be able to meet the energy-related demands of its firm natural gas customers. However, the ability to maintain an adequate supply could be affected by several factors not within Power's control, including curtailments of natural gas by its suppliers, severe weather and the availability of feedstocks for the production of supplements to its natural gas supply. In addition, supply of all types of gas is affected by the nationwide availability of all sources of fuel for energy production.
Market Price Environment
There has been a significant increase in commodity prices, including fuel, emission allowances and electricity over the past year. For example, both natural gas and electric prices in PJM have more than doubled. Price increases of this magnitude are much greater than have been experienced in recent history and could continue to have considerable impacts.
System operators in the markets in which Power participates will generally dispatch the lowest cost units in the system first, with higher cost units dispatched as demand increases. As such, nuclear units, with their low variable cost operation, will generally be dispatched whenever they are available. Coal units generally follow next in the merit order of dispatch and gas and oil units generally follow to meet the total amount of demand. The price that all dispatched units receive is set by the last, or marginal unit that is dispatched.
7
This method of determining supply and pricing creates an environment where natural gas prices often have a major impact on the price that generators will receive for their output, especially in periods of relatively strong demand. As such, significant increases in the price of natural gas will often translate into significant increases in the price of electricity.
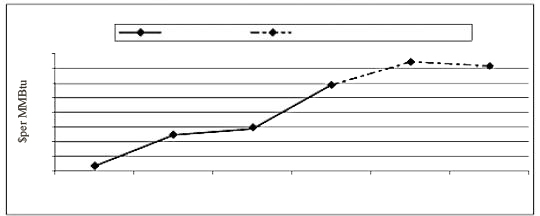
As a merchant generator, Power's profit is derived from selling under contract or on the spot market a range of diverse products such as energy, capacity, emissions credits, congestion credits and a series of energy-related products that the system operator uses to optimize the operation of the energy grid, known as ancillary services. Accordingly, commodity prices, such as electricity, gas, coal and emissions, as well as the availability of Power's diverse fleet of generation units to produce these products, when necessary, have a considerable effect on Power's profitability. Recently, the price of many of these products has increased dramatically. For example, the spot price of electricity at the quoted PJM West market has increased from $25 per MWh for 2002 to $60 per MWh in 2005. Similarly, the price of natural gas at the Henry Hub terminal has increased from an average of about $5 per one million British Thermal Units (MMBtu) for 2002 to 2004 to about $9 per MMBtu in 2005. The prices at which transactions are entered into for future delivery of these products, as evidenced through the market for forward contracts at points such as PJM West, have escalated as well. The historical spot prices and forward prices as of year-end 2005 are reflected in the graphs below:
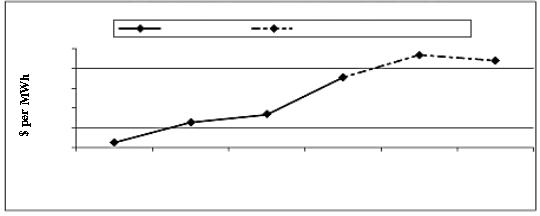
Historical and Forward PJM Western Hub RTC Prices
$75
$65
$55
$45
$35
$25
2002
2003
2004
2005
2006
2007
WH Historical Prices
(Source: PJM)
WH Forward Prices as of December 31, 2005
(Source: NYMEX)
Year
$11
$10
$9
$8
$7
$6
$5
$4
$3
2002
2003
2004
2005
2006
2007
Historical Gas Prices
(Source: Energy Information Administration)
Forward Gas Prices as of December 31, 2005
(Source: NYMEX)
Historical and Forward Henry Hub Gas Prices
Year
While these prices do not necessarily represent prices at which Power has contracted, they are representative of market prices at relatively liquid hubs, with nearer term forward pricing generally resulting from more liquid markets than pricing for later years. While they provide some perspective on past and future prices, the forward prices are highly volatile, and there is no assurance that such prices will remain in effect nor that Power will be able to contract its output at these forward prices.
8
Another of the products from which Power derives revenue is capacity. In PJM, New York and the New England Power Pool (NEPOOL), the market provides a payment for the capability to provide electricity, known as a capacity payment. This payment is reflective of the value to the grid for having the assurance of sufficient generating capacity to meet system reliability and energy requirements, and to encourage the future investment in adequate sources of new generation to meet system demand. A substantial increase in the construction of new capacity in each of these markets in recent years has created a surplus of capacity, depressing capacity prices. For example, capacity prices in PJM have recently averaged well below $10 per kW-year as compared to an average price of more than $25 per kW-yr during the period from 1999 to 2001.
While there is generally an abundance of capacity in the markets in which Power operates, there are certain areas in these markets where there are constraints in the transmission system, causing concerns for reliability and a more acute need for capacity. Some generators, including Power, recently announced the retirement of certain older generating facilities in these constrained areas due to insufficient energy and capacity revenues to support their continued operation. In separate instances, both PJM and NEPOOL have responded with fixed payments to the owners of these facilities to enable their continued availability. These Reliability-Must-Run (RMR) contracts for certain units provide their owners with fixed payments which, while not necessarily reflective of the full value of those units' contribution to reliability (e.g. they are cost-based), are nonetheless significant. Such payment structure by its nature acknowledges that these units provide a reliability service that is not compensated in the existing markets. It also suggests that fixed periodic payments, as would be provided in a capacity market, are an appropriate form of compensation for such units for this service. Power has received RMR payments in each of PJM and NEPOOL.
In addition, discussions are currently taking place that may result in changes in the nature of capacity payments on a prospective basis in each of PJM and NEPOOL. In PJM, a new capacity-pricing regime known as the Reliability Pricing Model (RPM), if approved, would provide generators with differentiated capacity payments based upon the location and operating characteristics of their respective facilities. Similarly, the Locational Installed Capacity (LICAP) proposal currently being discussed in NEPOOL provides for locational capacity payments. Both proposals are based in part on the premise that a more structured, forward-looking, transparent pricing scheme would give prospective investors in new generating facilities more clarity on the future value of capacity, sending a pricing signal to encourage expansion of capacity for future market demands. There is widespread debate in each of these areas, with many market participants having different views and divergent interests on the appropriate mechanisms to prospectively conduct market activities. Power supports capacity markets in general, and the recognition of locational capacity value, as the market value for capacity should reflect the fact that reliability, or supply adequacy, often manifests itself on a locational basis. Power believes that much of its nearly 14,000 MW of generating capacity may experience changes in value from aspects of market design currently being discussed. While Power believes there is potential additional revenue from these changes, it cannot predict the outcome of potential changes in either market.
For additional information on Power's collection of RMR payments in PJM and NEPOOL and the RPM and LICAP proposals, see Regulatory Issues—Federal Regulation.
Competitive Environment
Power's competitors include merchant generators with or without trading capabilities, including banks, funds, and other financial entities, utilities that have generating capability or have formed generation and/or trading affiliates, aggregators, wholesale power marketers and developers of transmission and Demand Side Management (DSM) projects and combinations thereof. These participants compete with Power and one another buying and selling in wholesale power pools, entering into bilateral contracts and/or selling to aggregated retail customers.
In the PJM market, the pricing of energy is based upon the locational marginal price (LMP) set through power providers' bids. Due to transmission constraints, the LMP may be higher in congested areas during peak demand periods reflecting the bid prices of the higher cost units that are dispatched to supply demand. This typically occurs in the eastern portion of PJM, where many of Power's plants are located, relative to the more liquid PJM West market location. Power also tends to contract a considerable amount of its production into this area, including its participation in the BGS auctions conducted in New Jersey. At various times, depending upon its production and its obligations, this price differential can serve to increase or decrease profitability.
9
The New England market has excess capacity and is also undergoing changes. The existence of reliability-based payments, coupled with the anticipated start of locational capacity markets in 2006, could enhance the value of Power's generation assets in Connecticut.
The Midwest has excess capacity due to recent additions, which will continue to negatively impact the expected returns of Power's Lawrenceburg facility. The drivers to reduce the excess capacity will be load growth, the retirement of certain inefficient plants, particularly older plants of competitors, and increased costs associated with higher levels of environmental compliance.
In addition, there has been a significant increase in commodity prices, including fuel and emission allowances, resulting in increased costs to produce electricity, which could potentially alter the dispatch order of units based upon fuel choice and efficiency.
For additional information regarding increased commodity prices and proposed changes to capacity markets, see Market Price Environment.
Power's businesses are also under competitive pressure due to technological advances in the power industry and increased efficiency in certain energy markets. It is possible that advances in technology, such as distributed generation, will reduce the cost of alternative methods of producing electricity to a level that is competitive with that of most central station electric production.
There is also a risk to Power if states should decide to turn away from competition and allow regulated utilities to continue to own or reacquire and operate generating stations in a regulated and potentially uneconomical manner. This has already occurred in certain states. The lack of consistent rules in markets outside of PJM can negatively impact the competitiveness of Power's plants. Also, regional inconsistencies in environmental regulations, particularly those related to emissions, have put some of Power's plants which are located in the Northeast, where rules are more stringent, at an economic disadvantage compared to its competitors in certain Midwest states.
Customers
As EWGs, Power's subsidiaries do not directly serve retail customers. Power uses its generation facilities primarily for the production of electricity for sale at the wholesale level. Power's customers consist mainly of wholesale buyers, primarily within PJM, but also in New York, Connecticut and the Midwest. Power is at times a direct or indirect supplier of New Jersey's EDCs, including PSE&G, depending on the positions it takes in the New Jersey BGS auction. In February 2006, the BPU approved the results of the most recent BGS auction for New Jersey customers, in which each bidder was limited to a third of each EDC's total load. Power was a successful bidder in the FP auction, which serves the state's residential and small industrial and commercial customers for a three-year period. In prior years, Power had also been a bidder in the CIEP auction, which serves large industrial and commercial customers at hourly PJM real-time market prices for a term of 12 months. Power has also extended into the New England Power Market by securing a three-year contract with a Connecticut utility expiring December 31, 2006. These contracts are full requirements contracts, where Power is responsible to serve a percentage of the full supply needs of the customer class being served, including energy, capacity, congestion and ancillary services. In addition, Power has four-year contracts with two Pennsylvania utilities expiring in 2008 and is considering pursuing similar opportunities in other states.
Power has also entered into a full requirements contract with PSE&G under which Power provides the gas supply services needed to meet PSE&G's BGSS and other contractual requirements through March 2007.
For the year ended December 31, 2005, approximately 34% of Power's revenue was comprised of billings to PSE&G for BGS and BGSS. See Note 21. Related-Party Transactions for additional information.
Employee Relations
As of December 31, 2005, Power had 2,590 employees, of which 1,414 employees (694 employees for Fossil and 720 employees for Nuclear) are union members. Power has six-year collective bargaining agreements with three union groups, which were ratified in February, July and August 2005, respectively. Power believes that it maintains satisfactory relationships with its employees.
10
Energy Holdings
Energy Holdings is a New Jersey limited liability company and is the successor to PSEG Energy Holdings Inc., which was incorporated in 1989. Energy Holdings' principal executive offices are located at 80 Park Plaza, Newark, New Jersey 07102. Energy Holdings has two principal direct wholly owned subsidiaries, which are also its segments: Global and Resources.
Energy Holdings pursued investment opportunities in the domestic and international energy markets, with Global focusing on the operating segments of the electric industries and Resources primarily making financial investments in these industries. Global and Resources have more than 70 financial and operating investments.
Energy Holdings' portfolio is diversified by number, type and geographic location of investments. As of December 31, 2005, its assets were comprised of the following types:
| | | | As of
December 31, 2005
|
| | Leveraged Leases (mainly energy-related) | | | 39 | % |
| | International Electric Distribution Facilities | | | 26 | % |
| | International Electric Generation Plants | | | 7 | % |
| | Domestic Electric Generation Plants | | | 12 | % |
| | Other(1) | | | 16 | % |
| | | | |
| |
| | Total | | | 100 | % |
| | | | |
| |
| | | | | | |
| (1) | | Primarily includes assets of Elektrocieplownia Chorzow Sp. Z o.o. (Elcho) and Elektrownia Skawina SA (Skawina), which are classified as Discontinued Operations. Also includes notes receivable from affiliates, and property, plant and equipment that are not related to specific electric distribution and generation plants and facilities. |
The characteristics of each of these investment types are described in more detail below.
Global
Global owns investments in power producers and distributors that own and operate electric generation and distribution facilities in selected domestic and international markets.
Global's assets include consolidated projects and those accounted for under the equity method. As of December 31, 2005, Global's share of project MW and number of customers by region are as follows:
| | | As of
December 31, 2005
|
| | | Assets
| | MW
| | Number of
Customers
|
| | | (Millions) | | | | | | | | |
Generation: | | | | | | | | | | | | |
North America | | $ | 882 | | | | 2,404 | | | | N/A | |
South America(1) | | | 329 | | | | 402 | | | | N/A | |
Other(2) | | | 123 | | | | 201 | | | | 47,000 | |
Distribution: | | | | | | | | | | | | |
South America | | | 1,838 | | | | N/A | | | | 2,978,000 | |
Other: | | | | | | | | | | | | |
Other(3) | | | 627 | | | | N/A | | | | N/A | |
| | | |
| | | |
| | | |
| |
Total | | $ | 3,799 | | | | 3,007 | | | | 3,025,000 | |
| | | |
| | | |
| | | |
| |
| | | | | | | | | | | | |
| (1) | | Includes 35 MW for a project in advanced development at Electroandes S.A. (Electroandes) in Peru. |
| (2) | | Excludes capacity related to investments in Elcho and Skawina, which were reclassified as Discontinued Operations in December 2005. For additional information relating to the sale, see Note 4. Discontinued Operations, Dispositions and Acquisitions of the Notes. |
| (3) | | Primarily includes assets of Elcho and Skawina, which are classified as Discontinued Operations, and deferred tax assets. |
11
Global's near-term emphasis is on maintaining adequate liquidity and improving profitability of currently held investments. Beginning in 2003, Global has been reviewing its portfolio for the purpose of opportunistically monetizing investments that no longer have a strategic fit. As part of this strategy, in May 2004, Global completed the sale of its majority interest in Carthage Power Company (CPC) in Rades, Tunisia. In December 2004, Global completed the sale of its 50% equity interest in Meiya Power Company Limited (MPC). Consistent with this strategy, Global entered into an agreement with CEZ a.s. on January 31, 2006 to sell its interests in Elcho and Skawina. For additional information relating to these dispositions, see Note 4. Discontinued Operations, Dispositions and Acquisitions of the Notes.
While Global still expects certain of its investments in South America to contribute significantly to its earnings in the future, adverse political and economic risks associated with this region could have a material adverse impact on such investments. To the extent practical, Global attempts to limit its financial exposure associated with each operating subsidiary to mitigate development risk, foreign currency exposure, interest rate risk and operating risk, including exposure to fuel costs, through financial and commodity contracts. For additional information related to these risks, see Item 7A. Qualitative and Quantitative Disclosures About Market Risk. In addition, project loan agreements are generally structured on a non-recourse basis. Further, Global generally structures non-recourse financings so that a default under one will have no effect on the loan agreements of other operating subsidiaries or on Energy Holdings' debt.
See Item 2. Properties—Energy Holdings for discussion of individual investments, including significant power purchase agreements (PPAs), fuel supply agreements, financing structures and other matters.
Resources
Resources invests in energy-related financial transactions and manages a diversified portfolio of assets, including leveraged leases, operating leases, leveraged buyout funds, limited partnerships and marketable securities. Established in 1985, Resources has a portfolio of approximately 50 separate investments. Based on current market conditions and Energy Holdings' intent to limit capital expenditures, it is unlikely that Resources will make significant additional investments in the near term.
Resources also owns and manages a DSM business. DSM revenues are earned principally from monthly payments received from utilities, which represent shared electricity savings from the installation of the energy efficient equipment.
The major components of Resources' investment portfolio as a percent of its total assets as of December 31, 2005 were:
| | | As of December 31, 2005
|
| | | Amount
| | % of
Resources'
Total Assets
|
| | | (Millions) | | | | |
Leveraged Leases | | | | | | | | |
Energy-Related | | | | | | | | |
Foreign | | $ | 1,017 | | | | 35 | % |
Domestic | | | 1,422 | | | | 50 | % |
Real Estate—Domestic | | | 193 | | | | 7 | % |
Commuter Railcars—Foreign | | | 88 | | | | 3 | % |
| | | |
| | | |
| |
Total Leveraged Leases | | | 2,720 | | | | 95 | % |
| | | |
| | | |
| |
| | | | | | | | |
Limited Partnerships | | | 15 | | | | 1 | % |
Other Investments(A) | | | 9 | | | | — | |
Owned Property | | | 116 | | | | 4 | % |
Current and Other Assets | | | 14 | | | | — | |
| | | |
| | | |
| |
Total Resources' Assets | | $ | 2,874 | | | | 100 | % |
| | | |
| | | |
| |
(A) Primarily includes investment in DSM business.
As of December 31, 2005, no single investment represented more than 9% of Resources' total assets.
Leveraged Lease Investments
Resources maintains a portfolio that is designed to provide a fixed rate of return. Income on leveraged leases is recognized by a method which produces a constant rate of return on the outstanding investment in the lease, net of the related deferred tax liability, in the years in which the net investment is positive. Any
12
gains or losses incurred as a result of a lease termination are recorded as Operating Revenues as these events occur in the ordinary course of business of managing the investment portfolio.
In a leveraged lease, the lessor acquires an asset by obtaining equity representing approximately 15% to 20% of the cost of the asset and incurring non-recourse lease debt for the balance. The lessor acquires economic and tax ownership of the asset and then leases it to the lessee for a period of time no greater than 80% of its remaining useful life. As the owner, the lessor is entitled to depreciate the asset under applicable federal and state tax guidelines. In addition, the lessor receives income from lease payments made by the lessee during the term of the lease and from tax benefits associated with interest and depreciation deductions with respect to the leased property. The ability of Resources to realize these tax benefits is dependent on operating gains generated by its affiliates and allocated pursuant to PSEG's consolidated tax sharing agreement. Lease rental payments are unconditional obligations of the lessee and are set at levels at least sufficient to service the non-recourse lease debt. The lessor is also entitled to any residual value associated with the leased asset at the end of the lease term. An evaluation of the after-tax cash flows to the lessor determines the return on the investment. Under accounting principles generally accepted in the U.S. (GAAP), the lease investment is recorded on a net basis and income is recognized as a constant return on the net unrecovered investment.
Resources has evaluated the lease investments it has made against specific risk factors. The assumed residual-value risk, if any, is analyzed and verified by third parties at the time an investment is made. Credit risk is assessed and, in some cases, mitigated or eliminated through various structuring techniques, such as defeasance mechanisms and letters of credit. Resources has not taken currency risk in its cross-border lease investments. Transactions have been structured with rental payments denominated and payable in U.S. Dollars. Resources, as a passive lessor or investor, has not taken operating risk with respect to the assets it owns, so leveraged leases have been structured with the lessee having an absolute obligation to make rental payments whether or not the related assets operate. The assets subject to lease are an integral element in Resources' overall security and collateral position. If the recorded amount of such assets were to be impaired, the rate of return on a particular transaction could be affected. The operating characteristics and the business environment in which the assets operate are, therefore, important and must be understood and periodically evaluated. For this reason, Resources will retain, as necessary, experts to conduct appraisals on the assets it owns and leases.
On December 28, 2005, Resources sold its interest in the Seminole Generation Station Unit 2 in Palatka, Florida. For additional information relating to this disposition, see Note 4. Discontinued Operations, Dispositions and Acquisitions of the Notes.
13
Resources' ten largest lease investments as of December 31, 2005 were as follows:
Investment
| | Description
| | Recorded
Investment Balances
as of
December 31, 2005
| | % of
Resources'
Total Assets
|
| | | | | (Millions) | | | | |
Reliant Energy MidAtlantic Power Holdings, LLC | | Three generating stations (Keystone, Conemaugh and Shawville) | | $ | 271 | | | | 9 | % |
Dynegy Holdings Inc | | Two electric generating stations (Danskammer and Roseton) | | | 224 | | | | 8 | % |
Midwest Generation (Guaranteed by Edison Mission Energy) | | Two electric generating stations (Powerton and Joliet) | | | 198 | | | | 7 | % |
ENECO | | Gas distribution network (Netherlands) | | | 161 | | | | 6 | % |
ESG | | Electric distribution system (Austria) | | | 135 | | | | 5 | % |
Merrill Creek | | Merrill Creek Reservoir Project | | | 133 | | | | 5 | % |
Grand Gulf | | Nuclear generating station (U.S.) | | | 129 | | | | 4 | % |
EZH | | Electric generating station (Netherlands) | | | 128 | | | | 4 | % |
Nuon | | Gas distribution network (Netherlands) | | | 105 | | | | 4 | % |
EDON | | Gas distribution network (Netherlands) | | | 99 | | | | 3 | % |
| | | | | |
| | | |
| |
| | | | $ | 1,583 | | | | 55 | % |
| | | | | |
| | | |
| |
For additional information on leases, including credit, tax and accounting risk related to certain lessees, see Item 7. MD&A—Results of Operations—Energy Holdings and Item 7A. Qualitative and Quantitative Disclosures About Market Risk—Credit Risk—Energy Holdings and Note 12. Commitments and Contingent Liabilities of the Notes.
As of December 31, 2005, Resources has a remaining net investment in four leased aircraft of approximately $32 million. On September 14, 2005, Delta Airlines (Delta) and Northwest Airlines (Northwest), the lessees for Resources' four remaining aircraft, filed for Chapter 11 bankruptcy protection. This had no material effect on Energy Holdings as it continues to believe that it will be able to recover the recorded amount of its investments in these aircraft as of December 31, 2005. In 2004 and 2005, Resources successfully restructured the leases and converted the Delta and Northwest leases from leveraged leases to operating leases. Energy Holdings expects to recover its investment through cash flows from the operating leases.
Other Subsidiaries
Enterprise Group Development Corporation (EGDC), a commercial real estate property management business, is conducting a controlled exit from its real estate business. Total assets of EGDC as of December 31, 2005 and 2004 were $71 million and $72 million, respectively, and include developed land in New Jersey, Maryland and Virginia and an 80% partnership interest in buildings and land in New Jersey.
Competitive Environment
Energy Holdings and its subsidiaries continue to experience substantial competition, both in the U.S. and in international markets. In the U.S., an overbuild in generation facilities has led to a large capacity surplus in several regions. This has resulted in reduced operating margins for both independent power producers and
14
utility generators where the marketplace has been evolving from a rate-regulated structure to a competitive environment. These matters in Texas showed improvement in 2005, evidenced by improved margins and increased utilization of Global's facilities.
With respect to Global's distribution businesses in Chile, Peru, Brazil and Oman these investments are rate-regulated and are exposed to minimal market risks from competitors. See Regulatory Issues—International Regulation for additional information.
Customers
Global has ownership interests in four distribution companies in South America which serve approximately three million customers and has developed or acquired interests in electric generation facilities which sell energy, capacity and ancillary services to numerous customers through PPAs, as well as into the wholesale market. For additional information, see Item 2. Properties—Energy Holdings.
Employee Relations
As of December 31, 2005, Energy Holdings had 61 employees. Energy Holdings believes that it maintains satisfactory relationships with its employees.
Services
Services is a New Jersey corporation with its principal executive offices at 80 Park Plaza, Newark, New Jersey 07102. Services provides management and administrative services to PSEG and its subsidiaries. These include accounting, legal, communications, federal affairs, human resources, information technology, treasury and financial, investor relations, stockholder services, real estate, insurance, risk management, tax, library, research and information services, security, corporate secretarial and certain planning, budgeting and forecasting services. Services charges PSEG and its subsidiaries for the cost of work performed and services provided pursuant to the terms and conditions of intercompany service agreements. As of December 31, 2005, Services had 1,039 employees, including 107 unionized employees. A new six-year collective bargaining agreement with the union group representing these employees was ratified in February 2005. Services believes that it maintains satisfactory relationships with its employees.
REGULATORY ISSUES
Federal Regulation
PUHCA
PSEG, PSE&G, Power and Energy Holdings
PSEG has claimed an exemption from regulation by the SEC as a registered holding company under PUHCA, except for Section 9(a)(2) thereof, which relates to the acquisition of 5% or more of the voting securities of an electric or gas utility company. Fossil, Nuclear, certain subsidiaries of Fossil and certain subsidiaries of Energy Holdings with domestic operations are EWGs. In addition, several of Energy Holdings' investments include foreign utility companies (FUCOs) under PUHCA and Qualifying Facilities (QFs) under the Public Utility Regulatory Policies Act of 1978 (PURPA). The Energy Policy Act, which became law on August 8, 2005, repealed PUHCA as of February 8, 2006 and established PUHCA 2005. Companies subject to the provisions of PUHCA 2005 must provide state regulators access to their books and records. PSEG, PSE&G, Power and Energy Holdings do not expect PUHCA 2005 to materially affect their respective businesses, prospects or properties. For additional information on the impact of PUHCA repeal, see State Regulation.
Environmental
PSEG, PSE&G, Power and Energy Holdings
PSEG and its subsidiaries are subject to the rules and regulations relating to environmental issues promulgated by the U.S. Environmental Protection Agency (EPA), the U.S. Department of Energy (DOE) and other regulators. For information on environmental regulation, see Environmental Matters.
15
FERC
PSEG, PSE&G, Power and Energy Holdings
FERC is an independent federal agency that regulates the transmission of electric energy and sale of electric energy at wholesale prices in interstate commerce pursuant to the Federal Power Act (FPA). FERC also regulates the interstate transportation of, as well as certain wholesale sales of, natural gas pursuant to the Natural Gas Act. Several PSEG subsidiaries including PSE&G, Fossil, Nuclear, ER&T and certain subsidiaries of Fossil and certain subsidiaries of Energy Holdings with domestic operations are public utilities subject to regulation by FERC. FERC's regulation of public utilities is comprehensive and governs such matters as rates, services, mergers, financings, affiliate transactions, market behaviors and reporting. FERC is also responsible under PURPA for administering PURPA's requirements for QFs.
Mandatory Reliability Standards
On September 27, 2005, PSEG joined ReliabilityFirst, a reliability organization that, as of January 1, 2006, consolidated three independent regional reliability councils that had promoted the reliability of the bulk power electric system throughout the Mid-Atlantic and portions of the Midwestern U.S.
The Energy Policy Act requires FERC to empower a single, national Electric Reliability Organization (ERO) to develop and enforce national and regional reliability standards for the U.S. bulk power system.
When FERC designates a single ERO, which is expected in the near future, PSEG may be subject to additional regulation by this entity or by FERC, which may now enforce reliability standards on its own initiative or by complaint. PSEG, PSE&G, Power and Energy Holdings do not expect any significant impacts resulting from additional regulation by the ERO or FERC on these issues since they are currently subject to, and comply with, certain reliability standards already in effect, however, no assurances can be given.
Market Power
Under FERC regulations, public utilities may sell power at cost-based rates or apply to FERC for authority to sell at market-based rates (MBR). PSE&G, Fossil, Nuclear, ER&T and certain subsidiaries of Fossil and Energy Holdings, have applied for and received MBR authority from FERC. Power is scheduled for its next triennial market power review in 2006.
In April 2004, FERC issued a final order revising its generation market power screen, which it uses to determine whether power sellers may have the ability to exercise market power. Upon application by a power seller, if FERC determines that a seller is not able to exercise market power under the screen, and the seller passes other tests, FERC's rules permit the seller to sell power at MBR. Failing FERC's revised screen will not conclusively determine whether an entity has market power and applicants failing the test will have the ability to demonstrate that they do not possess market power despite the screen failure. The screen includes two separate analyses: (1) an uncommitted pivotal supplier analysis and (2) a market share analysis that is to be prepared on a seasonal basis. FERC eliminated an exemption that previously existed for generators in Regional Transmission Organizations (RTOs) and Independent System Operators (ISOs), such as PJM and New York ISO (NYISO), and will require all entities that wish to sell at MBR to comply with the revised market power screen.
PSEG Lawrenceburg Energy Company LLC (Lawrenceburg), an indirect wholly owned subsidiary of Power, is authorized by FERC order to sell wholesale power at MBR. The order requires Lawrenceburg to file a revised market power analysis within 30 days of the closing of the pending merger with Exelon and to treat Exelon as an affiliate for purposes of Exelon's MBR codes of conduct, which are on file with FERC, to guard against cross-subsidization between business units.
Expanded Merger Review Authority
The Energy Policy Act expands FERC's authority to review mergers and acquisitions under the FPA. It extends the scope of FERC's authority to require prior FERC approval regarding transactions involving certain transfers of generation facilities, certain holding companies' transactions, and utility mergers and consolidations of any value. The Energy Policy Act requires that FERC, when reviewing proposed transactions, examine cross-subsidization and pledges or encumbrances of utility assets. This new authority does not apply to the pending Merger between PSEG and Exelon. PSEG, PSE&G, Power and Energy
16
Holdings are unable to predict the effect of this authority on any potential future transactions in which they may be involved.
PSEG, PSE&G and Power
Regional through and out rates (RTOR)
RTOR are separate transmission rates for transactions where electricity originated in one transmission control area transmitted to a point outside that control area. Both the Midwest Independent Transmission System Operator, Inc. (MISO) and PJM charged RTORs through December 1, 2004. FERC approved a new regional rate design, which became effective December 1, 2004 for the entire PJM/MISO region and approved the continuation of license plate rates and a transitional Seams Elimination Charge/Cost Adjustment/Assignment (SECA) methodology effective from December 1, 2004 through March 2006.
PSEG and its subsidiaries, along with other stakeholders, jointly (1) filed for rehearing of the November 18, 2004 order as it relates to the imposition of a SECA charge, (2) protested the SECA compliance filings and (3) protested and moved to reject the filing of American Electric Power, Commonwealth Edison Company and Dayton Power & Light Company (New PJM Companies) to collect certain lost revenues resulting from the elimination of RTORs between PJM transmission owners. This request for rehearing is currently pending. On November 30, 2004, FERC issued an order that allowed the New PJM Companies to make a filing with FERC to collect their lost revenues. The BPU has also authorized the pass-through of SECA charges to certain New Jersey ratepayers, so that PSE&G will be able to collect funds from these ratepayers and return them to certain BGS suppliers. As a BGS supplier, Power expects to receive funds from PSE&G to reimburse certain of its SECA expenses. On December 1, 2004, PSE&G began charging its BGS-FP customers for the increase in transmission charges. Consistent with the terms of the BGS-FP contracts, Power (and other BGS-FP suppliers) will not receive any revenue associated with a BGS-FP pass-through of the SECA charge until FERC's November 18, 2004 order is final and non-appealable. Pursuant to a reciprocity provision in its tariff, PJM and MISO began billing for the SECA in the May 2005 billing cycle. On February 10, 2005, FERC issued an order that accepted various SECA filings, established December 2004 as the effective date for the SECA rates, made them subject to refund and surcharge, and established hearing procedures to resolve the outstanding factual issues raised in the filings and the responsive pleadings. A trial-type hearing is now scheduled to commence on May 2, 2006, with an initial decision by August 11, 2006. Depending on the outcome of this proceeding, which cannot be predicted at this time, PSEG, PSE&G and/or Power's results of operations could be adversely affected.
PJM Reliability Pricing Model (RPM)
On August 31, 2005, PJM filed its RPM with FERC. The RPM constitutes a locational installed capacity market design for the PJM region, including a forward auction for installed capacity priced according to a downward-sloping demand curve and a transitional implementation of the market design. PJM requested that FERC issue an order on the proposal by January 1, 2006 in order to permit implementation of the RPM by June 1, 2006. Comments, interventions and protests of the filing made by other parties in October 2005. Numerous parties filed comments and protests. On November 8, 2005, PJM filed an extensive answer to comments and protests and asked for a determination by October 2006 so that implementation could commence in June 2007. While FERC has not responded to PJM's recommendations, it held a technical conference on February 3, 2006 to present opposing views regarding the RPM. Power supported the RPM at the conference. No conclusive determinations were made by FERC, and PSEG, PSE&G and Power are unable to predict the outcome of this proceeding.
PJM Long-Term Transmission Rate Design
On May 31, 2005, FERC issued an order addressing the recovery of costs for transmission upgrades designated through PJM's Regional Transmission Expansion Plan (RTEP) process. Among other matters, FERC's order responded to a proposal to continue PJM's current zonal rate design. FERC concluded that the existing rate design may not be just and reasonable and it established a hearing to examine the justness and reasonableness of continuing PJM's modified zonal rate design. Under the schedule for this proceeding, this hearing will commence in April 2006. The May 31, 2005 order also accepts the tariff sheets filed by certain PJM transmission owners to establish the general procedures for filing to recover the costs incurred under the RTEP process, subject to further compliance filings. In accordance with the schedule for this proceeding,
17
certain entities filed proposals with FERC on September 30, 2005 for alternative rate designs for the PJM region. PSE&G, as part of a coalition of potentially affected PJM transmission owners, filed answering testimony on November 22, 2005 that opposed both of these proposed rate designs. Rebuttal testimony was due on February 15, 2006. If FERC adopts one or a combination of these alternatives, PSEG's, PSE&G's or Power's results of operations could be negatively affected. PSEG, PSE&G and Power are unable to predict the outcome of this proceeding.
FERC Order No. 888
On September 16, 2005, FERC issued a Notice of Inquiry seeking comments on whether reforms are needed to the protections that FERC established in its Order No. 888 in order to prevent undue discrimination and preference in the provision of transmission service. FERC's Notice of Inquiry generally posed questions as to whether it should revise the pro forma Open Access Transmission Tariff. Order No. 888 established this tariff to govern the terms and conditions under which transmission owners must provide transmission service to all eligible customers. If FERC ultimately adopts structural remedies, such as further separating the ownership of generation and transmission, PSEG, PSE&G and Power's results of operations could be negatively affected.
PJM Stated Rate Filing
On July 1, 2005, PJM filed with FERC a proposal to change the rate design for its administrative cost recovery from a formula rate, which allocates PJM's administrative costs to its members on a yearly basis, to a stated rate of 39 cents per MW-hour. On August 31, 2005, FERC accepted these changes subject to the provision of further cost-of-service data by PJM within 60 days to demonstrate that its stated rate is a just and reasonable prediction of its costs for future years. PJM provided this cost-of-service data on November 30, 2005. Several parties, including PSE&G, Power, the BPU and the New Jersey RatePayer Advocate, submitted comments and protests regarding PJM's filing, which protested the filing and requested that FERC order an evidentiary hearing regarding the filing. Settlement discussions are currently ongoing. If FERC ultimately accepts PJM's stated rate proposal, PSEG, PSE&G and Power's results of operations could be affected. PSEG, PSE&G and Power are unable to predict the outcome of this proceeding.
PSEG and Power
LICAP Market Settlement in New England
On January 31, 2006, certain interested market participants in New England agreed to a settlement in principle of litigation regarding the design of the region's market for installed capacity, which would institute a transition period leading to the implementation of a new market design for capacity as early as 2010. Commencing in December 2006, all generators in New England would begin to receive fixed capacity payments that escalate gradually over the transition period. RMR contracts, such as Power's, would continue to be effective until the implementation of the new market design. The new market design would consist of a forward auction for installed capacity that is intended to recognize the locational value of generators on the system, and is expected to contain incentive mechanisms to encourage generator availability during generation shortages. If the settlement receives final approval from a majority of the settling parties, it is expected to be filed with FERC in early March. If the terms and conditions of the settlement in principle are ultimately approved by FERC, or if the settlement is not finalized and FERC adopts a different market design, the outcome could materially impact the pricing of installed capacity in the New England market. PSEG and Power are unable to predict the outcome of this proceeding.
Power
RMR Status
PJM
Although applicable tariff provisions differ from region to region, RMR tariff provisions provide compensation to a generation owner when a unit proposed for retirement must continue operating for reliability purposes. In September 2004, Power filed notice with PJM that it was considering the retirement of seven generating units in New Jersey, effective December 7, 2004, due to concerns about the economic
18
viability of the units under the then current market structure. The units that were being considered for retirement were Sewaren 1, 2, 3 and 4, Kearny 7 and 8 and Hudson 1. Kearny 7 and 8 were retired in 2005. In response to Power's filed notice, PJM identified certain system reliability concerns associated with the proposed retirements.
On February 24, 2005, Power requested that FERC approve such cost-of-service rate treatment for the Sewaren 1, 2, 3 and 4 and Hudson 1 units. On April 25, 2005, FERC issued an order accepting the February 24, 2005 filing, effective February 24, 2005, but establishing settlement procedures and a hearing on certain issues. Effective February 24, 2005, subject to refund and hearing, Power began to collect a monthly fixed payment of $3.3 million, net of operating margins at the units. On August 9, 2005, the parties reached a settlement in principle of the issues that FERC set for hearing. A detailed settlement was filed with FERC on September 23, 2005. The settlement permits Power to recover annual fixed costs of approximately $19 million and $14.5 million for the Sewaren and Hudson units, respectively, plus reimbursements of Power's expenditures in connection with certain construction at the units that are necessary to maintain reliability, offset by certain revenues earned in PJM's energy market. FERC accepted this settlement retroactive to February 24, 2005.
New England
In the New England electricity market, many owners of generation facilities have filed with FERC for RMR treatment under the NEPOOL Open Access Transmission Tariff. If FERC grants RMR status for a generation facility located in the New England market, the owner is entitled to receive cost-of-service treatment for its facility for the duration of an RMR contract that it enters into with ISO New England Inc. On November 17, 2004, PSEG Power Connecticut LLC (Power Connecticut), a wholly owned indirect subsidiary of Power, filed a request for RMR treatment for the New Haven Harbor generation station and Unit 2 at the Bridgeport Harbor generation station. Beginning on January 14, 2005, when FERC issued an order accepting this filing, subject to refund and hearing. Power Connecticut began collecting monthly fixed payments of approximately $1.6 million and $3.9 million for reliability services provided by the Bridgeport Harbor Station, Unit 2 and the New Haven Harbor Station, respectively, net of operating margins at the units. On June 17, 2005, Power Connecticut filed revised studies supporting monthly recovery of $1.3 million and $3.3 million for the Bridgeport Harbor and New Haven Harbor units, respectively.
On June 20, 2005, FERC issued an order on rehearing of its January 14, 2005 order and reversed its prior conclusion that Power Connecticut's November 17, 2004 filing would become effective only after a 60-day notice period. Instead, the rehearing order allowed the filing to become effective as of November 18, 2004, which permits Power Connecticut two additional months of RMR compensation. On November 28, 2005, FERC denied rehearing of its June 20, 2005 order.
While Power Connecticut was unable to settle the issues that FERC set for hearing, Power Connecticut believes that it has meritorious positions with respect to these issues; however, a final outcome of this process cannot be determined at this time. The hearing is currently scheduled to commence April 19, 2006. In addition, certain parties opposing the filing sought judicial review of FERC's orders in this proceeding on January 27, 2006. While Power Connecticut does not believe that such challenges are likely to be successful, it cannot predict a final outcome at this time.
PSE&G
Neptune Complaint Proceeding
On December 21, 2004, Neptune Regional Transmission System, LLC (Neptune) filed a complaint with FERC against PJM. Neptune is directly interconnected to the transmission system of FirstEnergy Corporation (FirstEnergy), but upgrades to the PSE&G transmission system will also be required to move power across the grid. In its complaint, Neptune alleges that PJM impermissibly conducted an interconnection re-study triggered by generator retirements in PJM, which had the effect of increasing Neptune's cost exposure for network upgrades. On February 10, 2005, FERC granted Neptune's complaint against PJM.
On June 24, 2005, in response to requests for rehearing and clarification, FERC issued an order denying rehearing and granting clarification of its February 10, 2005 order. FERC's June 24, 2005 order effectively approves Neptune's Interconnection Service Agreement with PJM, in which Neptune's cost responsibility is
19
set at the level of approximately $6 million. Costs arising as a result of generation retirements announced after Neptune received a System Impact Study from PJM, which costs total at least $20 million, may be allocated to PSE&G and FirstEnergy and/or to customers in these zones.
On August 15, 2005, PSE&G sought judicial review of FERC's orders in the U.S. Circuit Court of Appeals. Two additional petitioners also sought judicial review of these orders. PSE&G cannot at this time predict the outcome of these challenges.
NRC
PSEG and Power
Nuclear's operation of nuclear generating facilities is subject to continuous regulation by the NRC, a federal agency established to regulate nuclear activities to ensure protection of public health and safety, as well as the security and protection of the environment. Such regulation involves testing, evaluation and modification of all aspects of plant operation in light of NRC safety and environmental requirements. Continuous demonstrations to the NRC that plant operations meet requirements are also necessary. The NRC has the ultimate authority to determine whether any nuclear generating unit may operate. The current operating licenses of Power's nuclear facilities expire in the years shown below:
| | Facility
| | Year
|
| | Salem 1 | | | 2016 | |
| | Salem 2 | | | 2020 | |
| | Hope Creek | | | 2026 | |
| | Peach Bottom 2 | | | 2033 | |
| | Peach Bottom 3 | | | 2034 | |
| | | | | | |
Security
The NRC has issued orders to all nuclear power plants to implement compensatory security measures. Some of the requirements formalize a series of security measures that licensees had taken in response to advisories issued by the NRC in the aftermath of the September 11, 2001 terrorist attacks. Nuclear has evaluated these orders for the Salem, Peach Bottom and Hope Creek facilities. Security measures required to be in place by October 2004 have been completed at Salem, Hope Creek and Peach Bottom. Additional security upgrades were identified and have been implemented following an NRC Force-On-Force security exercise in January 2005. Power's share of the Security Project was approximately $7 million in 2004 and $30 million in 2005. A second Force-On-Force exercise was completed in July 2005. A follow-up letter from the NRC credited Salem/Hope Creek for demonstrating a sound protective strategy and indicated the NRC's interest in returning in 2006 to observe the site's annual Force-On-Force exercises.
Reactor Vessel Heads
In 2002, the NRC issued a bulletin requiring that all operators of pressurized water reactor (PWR) nuclear units submit certain information related to potential degradation of reactor vessel heads. In 2003, the NRC issued an order to all operators of PWR units concerning reactor vessel head inspections. The order confirms the previous bulletin's requirements and adds more intrusive and frequent future inspections, which apply to Salem 1 and 2. In September 2002, Nuclear provided the requested information for Salem to the NRC, and performed inspections in accordance with the NRC order for Salem 1 and 2 during 2004 and 2003, respectively. The reactor heads were determined to be satisfactory for continued safe operation. Nuclear replaced Salem 1 and 2 reactor heads in 2005 as a preventive measure, during scheduled refueling outages. Pursuant to an NRC directed order, the frequency of inspection on the new reactor heads is extended to three years.
Nuclear's Hope Creek unit and Peach Bottom 2 and 3 are unaffected by these bulletins as they are boiling water reactor nuclear units. Power cannot predict what other actions the NRC may take on this issue.
Nuclear Safety Issues
In January 2004, the NRC issued a letter requesting Power to conduct a review of its Salem and Hope Creek nuclear generation facilities to assess the workplace environment for raising and addressing safety
20
issues. Power responded to the letter in February 2004 and had independent assessments of the work environment at both facilities performed. The results of these assessments were provided to the NRC in May 2004. The assessments concluded that Salem and Hope Creek were safe for continued operations, but also identified issues that needed to be addressed.
At an NRC public meeting on June 16, 2004, Power outlined its action plan to address these issues, which focused on a safety-conscious work environment, the corrective action program and work management. A letter documenting these plans and commitments was sent to the NRC on June 25, 2004. On July 30, 2004, the NRC provided a letter to Power indicating that it had completed its review. The letter indicated that the NRC had not identified any safety violations and that it appeared that the PSEG action plan would address the key findings of both the NRC and Power assessments. On August 30, 2005, the NRC provided Power with its mid-cycle performance reviews of Salem and Hope Creek, which detailed the NRC's plan for enhanced oversight related to the work environment. The letter indicated the NRC plans to continue with this heightened oversight until Power has concluded that substantial, sustainable progress has been made, and the NRC has completed a review that confirms Power's conclusions. Under the NRC oversight program, among other things, Power provided the NRC with a report of its progress at public meetings in June and November 2005. The next public meeting is scheduled for the first half of 2006.
Recirculation Pump
In a letter to the NRC dated January 9, 2005, Power committed to install vibration-monitoring equipment on Hope Creek's “B” Reactor Recirculation Pump prior to the unit's return to service to address pump vibration concerns and replace the pump's shaft during the next refueling outage or any sooner outage of sufficient duration. This commitment was the subject of a January 11, 2005 Confirmatory Action Letter from the NRC. The shaft will be replaced at the next Hope Creek outage, scheduled for April 2006.
Other
PSE&G
Investment Tax Credits (ITC)
For a discussion of an Internal Revenue Service (IRS) proposal that could have a material impact on PSE&G's treatment of ITCs, see Note 12. Commitments and Contingent Liabilities of the Notes.
State Regulation
PSEG, PSE&G, Power and Energy Holdings
The BPU is the regulatory authority that oversees electric and natural gas distribution companies in New Jersey. PSE&G is subject to comprehensive regulation by the BPU including, among other matters, regulation of retail electric and gas distribution rates and service and the issuance and sale of securities. Power's partial ownership of generating facilities in Pennsylvania, as well as PSE&G's ownership of certain transmission facilities in Pennsylvania, are subject to regulation by the Pennsylvania Public Utility Commission (PAPUC), which oversees the electric and natural gas industries in Pennsylvania. PSE&G and Power are also subject to rules and regulations of the New Jersey Department of Environmental Protection (NJDEP) and the New Jersey Department of Transportation (NJDOT).
PSEG is not subject to direct regulation by the BPU, except, potentially, with respect to certain transfers of control and reporting requirements. Certain subsidiaries of PSEG and Power with operations in New Jersey may be subject to some regulation by the BPU, with respect to energy supply (BGS and BGSS), certain asset sales, transfers of control, reporting requirements and affiliate standards.
Various Power subsidiaries and Energy Holdings' subsidiaries are subject to some state regulation in other individual states where they operate facilities, including New York, Connecticut, Indiana, Texas, California, Hawaii and New Hampshire.
PUHCA Repeal
On August 1, 2005, the BPU initiated a proceeding to consider whether additional ratepayer protections were necessary in light of the repeal of PUHCA by the Energy Policy Act. In its order, the BPU requested
21
information from each New Jersey public utility regarding its financial and organizational structure and the BPU indicated that it was in the process of preparing a formal rulemaking recommendation to address these issues. On October 7, 2005, the BPU initiated an informal stakeholder process in this proceeding and requested comments from New Jersey's public utilities regarding the BPU's access to utility records, limits on utility diversification, restrictions on the transfer of capital by utilities to their corporate parents or affiliates, affiliate transactions and the prevention of cross-subsidization. PSE&G has provided the requested information and filed comments generally arguing that no additional regulatory protections are necessary.
On December 19, 2005, the BPU proposed a new regulation that would prevent a holding company that owns a New Jersey gas or electric utility from investing more than 25% of its combined assets in businesses unrelated to the utility industry. The proposed rule also would prevent holding companies primarily involved in non-utility businesses from purchasing New Jersey utilities unless they divest sufficient holdings to comply with the proposed rule. The BPU held a public hearing regarding the proposed rule on February 8, 2006. Comments on the proposed rule were due by February 17, 2006.
PSEG, PSE&G, Power and Energy Holdings are not able to predict the outcome of these proceedings at this time.
PSE&G
Electric Distribution Financial Review
Based on the Electric Base Rate Case approved in July 2003, PSE&G recorded a regulatory liability in the second quarter of 2003 by reducing its depreciation reserve for its electric distribution assets by $155 million and amortized this liability from August 1, 2003 through December 31, 2005. The $64 million annual amortization of this liability resulted in a reduction of Depreciation and Amortization expense. PSE&G filed for a $64 million (based on 2003 test year sales volumes) annual increase in electric distribution rates effective January 1, 2006, subject to BPU approval, including a review of PSE&G's earnings and other relevant financial information. Based on current sales volumes, the amount approximates $68 million.
The BPU issued an order on February 7, 2006 that and found that insufficient information had been provided to support the rate increase at this time. The order permits PSE&G to file, no later than June 15, 2006, actual data through March 31, 2006. The BPU will determine, based on the additional information, if the rate increase is warranted. The impact of not receiving this increase reduces PSE&G's earnings and cash flows by more than $5 million (pre-tax) per month.
BGSS Filings
On May 27, 2005, PSE&G filed its 2005/2006 BGSS commodity charge filing, requesting an increase in its BGSS commodity charge to its residential gas customers of approximately $162.7 million, excluding Sales and Use Taxes (SUT), in annual revenues effective October 1, 2005, or approximately 10.2% for the class average residential heating customer. PSE&G subsequently filed with the BPU requesting that the new rate become effective on September 1, 2005 rather than October 1, 2005. A provisional settlement was approved by the BPU on August 18, 2005. Under this settlement, PSE&G's filed BGSS rates became effective on September 1, 2005 on a provisional basis, subject to refund with interest. PSE&G's filing was transferred to the Office of Administrative Law (OAL) for a full review and an Initial Decision. On November 10, 2005, PSE&G filed a Motion for Emergent Relief due to the extreme increase in the price of natural gas since the original filing. The request was for an increase of $203.5 million (excluding SUT) or approximately 15.6% for the class average residential heating customer with an effective date of December 14, 2005. A provisional settlement was approved by the BPU on December 15, 2005 and the new rate went into effect immediately. A prehearing conference with the ALJ assigned to the case was held and a full review including additional discovery and a hearing, if necessary, must take place before both BGSS increases can be approved on a final basis.
Remediation Adjustment Clause (RAC) Filing
PSE&G has implemented a program to address potential environmental concerns regarding its former Manufactured Gas Plant (MGP) properties in cooperation with and under the supervision of NJDEP. On April 22, 2004, PSE&G filed its RAC-11 filing with the BPU to recover approximately $36 million of remediation program expenditures for the period from August 1, 2002 through July 31, 2003. Public hearings
22
were held in July 2004. On September 10, 2004, the ALJ issued an Initial Decision recommending approval of the settlement reached between all parties, allowing PSE&G to recover all requested costs. This resulted in PSE&G recovering an additional $0.4 million annually in remediation program expenditures. On October 5, 2004, the BPU issued a Final Decision and Order approving, in its entirety, the ALJ's Initial Decision recommending acceptance of the settlement.
On April 25, 2005, PSE&G filed its RAC-12 filing with the BPU to recover approximately $18 million of remediation program expenditures for the period from August 1, 2003 through July 31, 2004. On October 6, 2005, PSE&G signed a settlement agreement with the RPA and the BPU. The settlement agreement, which provides for PSE&G to recover substantially all of the $18 million requested, was approved October 13, 2005 by the ALJ. On December 5, 2005, the BPU issued a Decision and Order approving in its entirety the ALJ's Initial Decision recommending acceptance of the settlement.
Gas Base Rate Case
On September 30, 2005, PSE&G filed a petition with the BPU seeking an overall 3.78% increase in its gas base rates to cover the cost of gas delivery to be effective June 30, 2006. Approximately $55 million of the $133 million request is for an increase in book depreciation rates. The balance of the request will cover the return on increased plant investment, higher operating expenses and provide an 11% return on equity. PSE&G's current gas base rates have been in effect since January 2002.
PSE&G presented a detailed overview of the filing to the BPU and the RPA in October 2005 and subsequent to the presentation signed an agreement with the BPU Staff providing for transfer of the matter to OAL and agreeing to have the matter settled or ready for a BPU decision before September 28, 2006. The amount and timing of any rate relief cannot be predicted.
Cost Recovery Mechanism
EDECA required that the BPU provide electric and natural gas customers with the opportunity to choose a supplier for some or all electric or natural gas customer account services (CAS). In July 2004, PSE&G filed a petition with the BPU to implement the CAS Cost Recovery Mechanism for both its electric and gas operations to recover $4 million of CAS costs and accumulated interest resulting from implementing PSE&G's dual billing for its delivery costs and for the third-party suppliers' commodity charges as a result of customer migration from PSE&G. In September 2004, the case was transferred to the OAL as a contested case. A pre-hearing conference was held on December 20, 2005 at which time a schedule was established. Settlement discussions are being held between the parties.
Deferral Audit
The BPU Energy and Audit Division conducts audits of deferred balances. A draft Deferral Audit—Phase II report relating to the 12-month period ended December 31, 2003 was released by the consultant to the BPU in February 2005. The draft report addressed the Societal Benefits Clause (SBC), Market Transition Charge (MTC) and Non-Utility Generation (NUG) deferred balances.
While the consultant to the BPU found that the Phase II deferral balances complied in all material respects with the BPU orders regarding such deferrals, the consultant noted that the BPU Staff had raised certain questions with respect to the reconciliation method PSE&G employed in calculating the overrecovery of its MTC and other charges during the Phase I and Phase II four-year transition period. The amount in dispute is approximately $118 million. PSE&G and the BPU Staff are continuing discussions to resolve these issues and, if a resolution cannot be achieved, a BPU proceeding may be instituted to consider the issues raised. The BPU required PSE&G to produce discovery in the Deferral Audit related to the MTC issue for the RPA's review. It appears that there may be a full hearing on the MTC issue.
PSE&G believes the MTC methodology it used was fully litigated and resolved, without exception, by the BPU and other intervening parties in its previous electric base rate case. Further, PSE&G believes the deferral audit and deferral proceeding that were approved by the BPU in its order of April 22, 2004 are non-appealable. PSE&G cannot predict the impact of the outcome of any such proceeding.
23
Levelized Gas Adjustment Clause (LGAC)/BGSS Audit
The BPU's Division of Audit reviews gas costs of utilities in New Jersey on a regular basis. As part of its regular review in November 2004, the BPU commenced an audit of the gas supply costs incurred during the period October 1, 1999 through September 30, 2004. The field work for the audit has been completed. Company personnel met with the Audit Staff and provided some additional support. The outcome of the audit cannot be determined at this time.
New Jersey Clean Energy Program
The BPU has approved a funding requirement for each New Jersey utility applicable to Renewable Energy and Energy Efficiency programs for the years 2005 through 2008. The sum of PSE&G's electric and gas funding requirement for 2005 was $82 million and grows to $137 million in 2008 for a four-year total of $406 million. This liability has been recorded at a discounted present value with an offsetting regulatory asset. The BPU is seeking new program managers for the Energy Efficiency program currently being administered by the utilities. The transition from the utilities to the program managers is expected to take place in mid-2006.
Power
Connecticut Electric Authority (CEA)
Legislation proposed by the Attorney General of Connecticut has been recently introduced in the State Assembly to create a new public power authority to be known as the CEA. The CEA would have broad authority, including the power to procure, through open public auction, all of the electric power required by the state's electric utilities, to build or buy and operate generating, transmission and related facilities, to finance their construction or acquisition and to sell or resell electric power to the State's electric utilities for delivery to their “standard service” customers at cost. The enactment of a “windfall” profits tax of between 20% and 50% on a power generator's earnings in excess of 20% is also proposed for enactment. Revenues raised by such tax would be dedicated to financing the CEA and for rate relief. In addition, a separate bill has been introduced that would require the Connecticut Department of Public Utility Control to develop a plan by September 1, 2006 to commence a “contested case” proceeding to develop a plan for the withdrawal of all Connecticut electric distribution companies from participation in NEPOOL or the system of any electric system operator.
Neither PSEG nor Power is able to predict whether any of such proposals will be enacted into law or their impact, if any, or whether similar initiatives may be considered in other jurisdictions.
International Regulation
Energy Holdings
Global
Global's electric distribution facilities in South America and Oman are rate-regulated enterprises. Rates charged to customers are established by government authorities and are viewed by Global as currently sufficient to cover operating costs and provide a return on its investments. Global can give no assurances that future rates will be established at levels sufficient to cover such costs, provide a return on its investments or generate adequate cash flow to pay principal and interest on its debt or to enable it to comply with the terms of its debt agreements.
Brazil
Rio Grande Energia S.A. (RGE) is regulated by Agencia Nacional de Energia Eletrica (ANEEL), the national regulatory authority. ANEEL's functions include granting and supervising electric utility concessions, approving electricity tariffs, issuing regulations and monitoring distribution systems' performance. The rate-setting process for Brazilian distribution companies has two components: an annual adjustment for which RGE applies every April which is embedded in the concession contract and a rate case revision, which is repeated every fifth year and was last conducted in 2003.
24
RGE has contingent liabilities relating to past due taxes with the governing tax authority in Brazil and a tax assessment relating to a loan entered into by a former wholly owned subsidiary of RGE. For further information regarding these matters, see Note 12. Commitments and Contingent Liabilities of the Notes.
Chile
Distribution companies in Chile, including Chilquinta Energia S.A. (Chilquinta), Sociedad Austral de Electricidad S.A. (SAESA) and other members of the SAESA Group, are subject to rate regulation by the Comision Nacional de Energia (CNE), a national governmental regulatory authority. The Chilean regulatory framework has been in existence since 1982, with rates set every four years based on a model company for each typical concession area. The tariff which distribution companies charge to regulated customers consists of two components: the actual cost of energy purchased and an additional amount to compensate for the value added in distribution (DVA tariff). The DVA tariff considers allowed losses incurred in the distribution of electricity, administrative costs of providing service to customers, costs of maintaining and operating the distribution systems and an annual return on investment between 6% to 14% over inflation applied to the replacement cost of distribution assets. Changes in electricity distribution companies' cost of energy are passed through to customers, with no impact on the distributors' margins (equal to the DVA tariff). Therefore, distributors, including members of the SAESA Group and Chilquinta, should not be affected by changes in the generation sector which affect prices. The most recent tariff adjustments for members of the SAESA Group and Chilquinta occurred in 2004 and have been reviewed and approved by the CNE.
Peru
Distribution companies in Peru, including Luz del Sur (LDS), are subject to tariff regulation by the Organismo Supervisor de la Inversion en Energia, a national governmental regulatory authority. The Peruvian regulatory framework has been in existence since 1992, with tariffs set every four years based on a model company. The tariff which distribution companies charge to regulated customers consists of two components: the actual cost of energy purchased plus an additional amount to compensate for the DVA tariff. The DVA tariff considers allowed losses incurred in the distribution of electricity, administrative costs of providing service to customers, costs of maintaining and operating the distribution systems and an annual return on investment of 8% to 16% over inflation, based on the replacement cost of distribution assets. Changes in electricity distribution companies' cost of energy are passed through to customers, with no impact on the distributors' margins (equal to the DVA tariff). Therefore, distributors, including LDS, should not be affected by changes in the generation sector, which affect prices. The most recent tariff adjustments for LDS occurred in connection with the 2005 tariff-setting process. New tariffs were effective as of November 1, 2005.
Oman
Global, through Dhofar Power, has a 20-year concession agreement to own and operate a vertically operated utility that includes both the power plant and the local electric transmission and distribution systems. Gas for the power plant is supplied by the Government of Oman as a pass-through cost. Based on the original capital investment, the Government of Oman and Dhofar Power have an agreed tariff structure comprised of three components: generation allowances comprised of fixed capital cost allowances, fixed operating cost allowance, and variable operating allowances and fuel cost allowance; transmission and distribution system allowances comprised of transmission and distribution system allowances of the existing system and enhancements and extensions to the existing system, and the transmission and distribution system operating allowance; and the general allowances covering general and administrative cost allowance. Any transmission and distribution expansion projects must be approved by the Government of Oman. Upon approval, Dhofar Power would receive an additional capital investment and operation and maintenance allowance.
SEGMENT INFORMATION
Financial information with respect to the business segments of PSEG, PSE&G, Power and Energy Holdings is set forth in Note 18. Financial Information by Business Segment of the Notes.
25
ENVIRONMENTAL MATTERS
PSEG, PSE&G, Power and Energy Holdings
Federal, regional, state and local authorities regulate the environmental impacts of PSEG's operations within the U.S. Laws and regulations particular to the region, country or locality where PSEG's operations are located govern the environmental impacts associated with its foreign operations. For both domestic and foreign operations, areas of regulation may include air quality, water quality, site remediation, land use, waste disposal, aesthetics, impact on global climate and other matters.
To the extent that environmental requirements are more stringent and compliance more costly in certain states where PSEG operates compared to other states that are part of the same market, such rules may impact its ability to compete within that market. Due to evolving environmental regulations, it is difficult to project expected costs of compliance and its impact on competition. For additional information related to environmental matters, see Item 3. Legal Proceedings.
PSEG, Power and Energy Holdings
Air Pollution Control
The Federal Clean Air Act (CAA) and its implementing regulations require controls of emissions from sources of air pollution and also impose record keeping, reporting and permit requirements. Facilities in the U.S. that Power and Energy Holdings operate or in which they have an ownership interest are subject to these Federal requirements, as well as requirements established under state and local air pollution laws applicable where those facilities are located. Capital costs of complying with air pollution control requirements through 2010 are included in Power's estimate of construction expenditures in Item 7. MD&A—Capital Requirements.
Prevention of Significant Deterioration (PSD)/New Source Review (NSR)
The PSD/NSR regulations, promulgated under the Clean Air Act (CAA), require major sources of certain air pollutants to obtain permits, install pollution control technology and obtain offsets, in some circumstances, when those sources undergo a “major modification,” as defined in the regulations. The Federal government is seeking to order companies allegedly not in compliance with the PSD/NSR regulations to install the best available control technology at the affected plants and to pay monetary penalties of up to approximately $27,500 for each day of continued violation.
The EPA and the NJDEP issued a demand in March 2000 under the CAA requiring information to assess whether projects completed since 1978 at the Hudson and Mercer coal-burning units were implemented in accordance with applicable PSD/NSR regulations. Power completed its response to the requests for information and, in January 2002, reached an agreement with the NJDEP and the EPA to resolve allegations of noncompliance with PSD/NSR regulations. Under that agreement, over the course of 10 years, Power agreed to install advanced air pollution controls to reduce emissions of Sulfur Dioxide (SO2), Nitrogen Oxide (NOx), particulate matter and mercury from the coal-burning units at the Mercer and Hudson generating stations.
For additional discussion of PSD/NSR, see Note 12. Commitments and Contingent Liabilities of the Notes.
SO2 / NOx
To reduce emissions of SO2 for acid rain prevention, the CAA sets a cap on total SO2 emissions from affected units and allocates SO2 allowances (each allowance authorizes the emission of one ton of SO2) to those units. Generation units with emissions greater than their allocations can obtain allowances from sources that have excess allowances. At this time, Power does not expect to incur material expenditures to continue complying with the acid rain SO2 emissions program.
The EPA has issued regulations (commonly known as the NOx State Implementation Plan (SIP) Call) requiring 19 states in the eastern half of the U.S. and the District of Colombia to reduce and cap NOx emissions from power plant and industrial sources. The NOx reduction requirements are consistent with requirements already in place in New Jersey, New York, Connecticut and Pennsylvania, and therefore have not had an additional impact on the capacity available from Power's facilities in those states. Power has been
26
implementing measures to reduce NOx emissions at several of its units (including the installation of selective catalytic reduction systems at the Mercer Generating Station), which has reduced the impact of any further increases to the costs of allowances. A new facility that Power developed in Indiana became subject to rules that Indiana promulgated to comply with the NOx SIP Call. Because the rules in Indiana both set aside allowances for allocation to new sources, Power did not experience any material adverse effects from complying with this program in Indiana.
In 1997, the EPA adopted a new air quality standard for fine particulate matter and a revised air quality standard for ozone. In 2004, the EPA identified and designated areas of the U.S. that fail to meet the revised federal health standard for ozone or the new federal health standard for fine particulates. States are expected to develop regulatory measures necessary to achieve and maintain the health standards, which may require reductions in NOx and SO2 emissions. Additional NOx and SO2 reductions also may be required to satisfy requirements of an EPA rule protecting visibility in many of the nation's Class 1 (pristine) environmental areas. Most of Power's fossil facilities would be affected by this initiative.
In May 2005, the EPA published the final Clean Air Interstate Rule (CAIR) that identifies 28 states and the District of Columbia as contributing significantly to the levels of fine particulates and/or eight-hour ozone in downwind states. New Jersey, New York, Pennsylvania, Indiana, Texas and Connecticut are among the states the EPA lists in the CAIR. Based on state obligations to address interstate transport of pollutants under the CAA, the EPA is proposing a two-phased emission reduction program for NOx and SO2, with Phase 1 beginning in 2009 (NOx) and 2010 (SO2) and Phase 2 beginning in 2015. The EPA is recommending that the program be implemented through a cap-and-trade program, although states are not required to proceed in this manner. States need to submit plans to the EPA for complying with the rule by November 2006.
In December 2005, the EPA proposed new National Ambient Air Quality Standards for particulate matter.
Power is unable to determine whether any costs it may incur to comply with the above standards would be material.
Carbon Dioxide (CO2 ) Emissions
Countries participating in the Kyoto Protocol will be required to achieve material reductions of CO2 and certain other greenhouse gases between 2008 and 2012. Although the U.S. has not ratified the treaty, Global's assets in Italy will be affected by implementation of the Kyoto Protocol, as adopted through regulations by the European Union (EU). Global will more than meet the expected CO2 requirements and they are not anticipated to have a material effect on operations at Global's European assets in Italy.
In 2002, Power announced a voluntary agreement that called for a December 31, 2005 goal of reducing the annual average CO2 emission rate of its New Jersey fossil fuel-fired electric generating units by 15% below the 1990 average annual CO2 emission rate. Power is expected to exceed the target and will pay approximately $700,000 per the agreement pending emissions data verification. Fossil also made a $1.5 million payment to the NJDEP to assist in the development of landfill gas projects and had agreed to make a payment equal to $1 per ton of CO2 emitted greater than the 15% goal, up to $1.5 million, if that reduction was not achieved.
PSEG joined the EPA Climate Leaders Program in February 2002. On January 13, 2004, PSEG established a goal of reducing its CO2 emissions intensity by 18% per MWh generated (nuclear excluded) from 2000 levels by December 31, 2008. The goal would in part be met by re-powering the Bergen, Linden and Albany plants. PSEG has developed an emission inventory and inventory management plan, which was accepted by the EPA Climate Leaders Program. As of December 31, 2005, PSEG has met the 18% reduction commitment.
Several states, primarily in the Northeastern U.S., are developing state-specific or regional legislative initiatives to stimulate CO2 emission reductions in the electric power industry. For example, New York initiated the Regional Greenhouse Gas Initiative (RGGI) in April 2003. Currently, in the RGGI, seven Northeastern states have signed a memorandum of understanding (MOU) intended to cap and reduce CO2 emissions from the electric power sector in the RGGI region. A model rule is expected in March 2006 and states are expected to enact legislation and/or regulation representing, at least, the minimum requirements stipulated in the MOU. The NJDEP in 2005 finalized amendments to its regulations governing air pollution control that would designate CO2 as an air contaminant subject to regulation. The RGGI program is
27
scheduled to start in 2009. The outcome of this initiative cannot be determined at this time; however, adoption of stringent CO2 emission reduction requirements in the Northeast could materially impact Power's operation of its fossil fuel-fired electric generating units.
Other Air Pollutants
In March 2005, the EPA promulgated two rules: one revising its December 2000 determination that Hazardous Air Pollutants from coal-fired and oil-fired Electric Generating Units (EGUs) should be regulated under section 112 of the CAA and, on that basis, removing those units from the section 112(c) source category list (known as the delisting rule); the second establishing a New Source Performance Standard limit for nickel emissions from oil-fired EGUs, and a cap-and-trade program for mercury emissions from coal-fired EGUs, with a first phase cap of 38 tons per year (tpy) in 2010 and a second phase cap of 15 tpy in 2018 (the “cap-and-trade rule”). The EPA determined that it would not regulate other emissions from coal-fired and oil-fired EGUs.
A number of environmental and medical groups, the city of Baltimore, and a total of 16 states (all six New England states, New Jersey, California, Delaware, Illinois, New Mexico, New York, Minnesota, Pennsylvania, Michigan and Wisconsin) have sued the EPA challenging that the rules should be more restrictive. The environmental petitioners, but not the states, also sought a stay of the rules from both the agency and the court, but the request was denied. The outcome of these litigations cannot be determined at this time.
New Jersey and Connecticut have adopted standards for the reduction of emissions of mercury from coal-fired electric generating units. The Connecticut legislation requires coal-fired power plants in Connecticut to achieve either an emissions limit or a 90% mercury removal efficiency through technology installed to control mercury emissions effective in July 2008. The regulations in New Jersey require coal-fired electric generating units in New Jersey to meet certain emission limits or reduce emissions by 90% by December 15, 2007. Companies that are parties to multi-pollutant reduction agreements are permitted to postpone such reductions on half of their coal-fired electric generating capacity until December 15, 2012. Power has a multi-pollutant reduction agreement with the NJDEP as a result of a consent decree that resolved issues arising out of the PSD and NSR air pollution control programs at the Hudson, Mercer and Bergen facilities. Substantial uncertainty exists regarding the feasibility of achieving the reductions in mercury emissions required by the New Jersey regulations and Connecticut statute; however, the estimated costs of technology believed to be capable of meeting these emissions limits at Power's coal-fired unit in Connecticut by July 2008 and at its Mercer Station by December 15, 2007 are included in Power's capital expenditure forecast.
Water Pollution Control
The Federal Water Pollution Control Act (FWPCA) prohibits the discharge of pollutants to waters of the U.S. from point sources, except pursuant to a National Pollutant Discharge Elimination System (NPDES) permit issued by the EPA or by a state under a federally authorized state program. The FWPCA authorizes the imposition of technology-based and water quality-based effluent limits to regulate the discharge of pollutants into surface waters and ground waters. The EPA has delegated authority to a number of state agencies, including the NJDEP, to administer the NPDES program through state acts. The New Jersey Water Pollution Control Act (NJWPCA) authorizes the NJDEP to implement regulations and to administer the NPDES program with EPA oversight, and to issue and enforce New Jersey Pollutant Discharge Elimination System (NJPDES) permits. Power and Energy Holdings also have ownership interests in domestic facilities in other jurisdictions that have their own laws and implement regulations to control discharges to their surface waters and ground waters that directly govern Power's or Energy Holdings' facilities in these jurisdictions.
The EPA promulgated regulations under FWPCA Section 316(b), which requires that cooling water intake structures reflect the best technology available (BTA) for minimizing “adverse environmental impact.” Phase I of the rule covering new facilities became effective on January 17, 2002. None of the projects that Power currently has under construction or in development is subject to the Phase I rule. The Phase II rule covering large existing power plants became effective on September 7, 2004. The Phase II regulations provide the following five alternative methods by which a facility can demonstrate that it complies with the requirement for BTA for minimizing adverse environmental impacts associated with cooling water intake structures: (1) reduce flow commensurate with a closed-cycle system or reduce intake velocity; (2) meet
28
applicable performance standards for reduction of entrainment and impingement mortality through the use of the existing design, construction, operational or restoration measures; (3) meet applicable performance standards through a combination of existing and proposed design, construction, operational or restoration measures; (4) installation of a design and construction technology specified by the regulation or pre-approved by the agency; and (5) a site-specific determination that the cost to the facility to meet the performance standards is “significantly greater” than either (a) the costs that the EPA estimated for that type of facility or (b) the environmental benefits of complying with the performance standards. Although the rule applies to all of Power's electric generating units that use surface waters for once-through cooling purposes, the impact of the rule to Power and the rule's ability to withstand legal challenges cannot be determined at this time for all of Power's facilities. If application of the Phase II rules by the states requires the retrofitting of cooling water intake structures at Power's existing facilities, additional material capital expenditures could be required to modify the existing plants to enable their continued operations.
Several environmental groups, the Attorney Generals of six Northeastern states, the Utility Water Act Group and several of its members, including Power, are parties to litigation challenging the Phase II rule. The case will be heard in the U.S. Court of Appeals for the Second Circuit. The states and environmental groups have challenged the use of restoration and other measures to satisfy performance standards as well as a state's ability to make site-specific determinations based on cost tests. A decision issued in February 2004 by the Second Circuit in litigation challenging the Phase I rule (new facilities) struck down that rule's provision allowing for the use of restoration measures to satisfy the specified performance standards. An unfavorable decision in the Phase II litigation could have a material impact on Power's ability to renew its NJPDES permits at its larger once-through cooled plants without significant upgrades to their existing intake structures and cooling systems.
Power
Permit Renewals
For information on permit renewals for Salem, see Note 12, Commitments and Contingent Liabilities of the Notes.
| | Federal Comprehensive Environmental Response, Compensation and Liability Act of 1980 (CERCLA) and New Jersey Spill Compensation and Control Act (Spill Act) |
CERCLA and the Spill Act authorize Federal and state trustees for natural resources to assess damages against persons who have discharged a hazardous substance, causing an injury to natural resources. Pursuant to the Spill Act, the NJDEP requires persons conducting remediation to characterize injuries to natural resources and to address those injuries through restoration or damages. The NJDEP adopted regulations concerning site investigation and remediation that require an ecological evaluation of potential damages to natural resources in connection with an environmental investigation of contaminated sites. In 2003, the NJDEP issued a policy directive memorializing its efforts to recover natural resource damages and its intent to continue to pursue the recovery of natural resource damages. The NJDEP also issued guidance to assist parties in calculating their natural resource damage liability for settlement purposes, but has stated that those calculations are applicable only for those parties that volunteer to settle a claim for natural resource damages before a claim is asserted by the NJDEP. PSE&G and Power cannot assess the magnitude of the potential financial impact of this regulatory change. See Note 12. Commitments and Contingent Liabilities of the Notes for additional information.
Because of the nature of PSE&G's and Power's respective businesses, including the production and delivery of electricity, the distribution of gas and, formerly, the manufacture of gas, various by-products and substances are or were produced or handled that contain constituents classified by Federal and state authorities as hazardous. For discussions of these hazardous substance issues and a discussion of potential liability for remedial action regarding the Passaic River, see Note 12. Commitments and Contingent Liabilities of the Notes. For a discussion of remediation/clean-up actions involving PSE&G and Power, see Item 3. Legal Proceedings.
29
Uranium Enrichment Decontamination and Decommissioning Fund
In accordance with the Energy Policy Act, domestic entities that own nuclear generating stations are required to pay into a decontamination and decommissioning fund, based on their past purchases of U.S. government enrichment services. Since these amounts are being collected from PSE&G's customers over a period of 15 years, this obligation remained with PSE&G following the generation asset transfer to Power in 2000. PSE&G's obligation for the nuclear generating stations in which it had an interest was $75 million (adjusted for inflation). As of December 31, 2005, PSE&G had paid $70 million, resulting in a balance due of $6 million. As of December 31, 2005, Power also had a balance due of approximately $1 million, which related to interests in certain nuclear units it purchased. These amounts are payable to the DOE in annual installments through October 2006.
New Jersey Operating Permits
The New Jersey Administrative Code requires that certain sources of air emissions obtain operating permits issued by NJDEP. All of Power's generating facilities in New Jersey are required to have such operating permits. The costs of compliance associated with any new requirements that may be imposed by these permits in the future are not known at this time and are not included in capital expenditures, but may be material.
Nuclear Fuel Disposal
For a discussion of nuclear fuel disposal, see Note 12. Commitments and Contingent Liabilities of the Notes.
Low Level Radioactive Waste (LLRW)
As a by-product of their operations, nuclear generation units produce LLRW. Such wastes include paper, plastics, protective clothing, water purification materials and other materials. LLRW materials are accumulated on-site and disposed of at licensed permanent disposal facilities. New Jersey, Connecticut and South Carolina have formed the Atlantic Compact, which gives New Jersey nuclear generators, including Power, continued access to the Barnwell LLRW disposal facility which is owned by South Carolina. Power believes that the Atlantic Compact will provide for adequate LLRW disposal for Salem and Hope Creek through the end of their current licenses, although no assurances can be given. Both Power and Exelon have on-site LLRW storage facilities for Salem, Hope Creek and Peach Bottom, which have the capacity for at least five years of temporary storage for each facility.
PSE&G
MGP Remediation Program
For information regarding PSE&G's MGP Remediation Program, see Note 12. Commitments and Contingent Liabilities of the Notes.
ITEM 1A. RISK FACTORS
PSEG, PSE&G, Power and Energy Holdings
The following factors should be considered when reviewing the businesses of PSEG, PSE&G, Power and Energy Holdings. These factors could significantly impact the businesses and cause results to differ materially from those expressed in any statements made by, or on behalf of PSEG, PSE&G, Power or Energy Holdings herein. Some or all of these factors may apply to each of PSEG, PSE&G, Power, Energy Holdings and their respective subsidiaries.
Generation operating performance may fall below projected levels
Power and Energy Holdings
Operating generating stations below expected capacity levels, especially at low-cost nuclear and coal facilities, may result in lost revenues and increased expenses, including replacement power costs. Factors that
30
could cause generating station operations to fall below expected levels include, but are not limited to, the following:
| • | breakdown or failure of equipment, processes or management effectiveness; |
| |
| • | disruptions in the transmission of electricity; |
| |
| • | labor disputes; |
| |
| • | fuel supply interruptions or transportation constraints; |
| |
| • | limitations which may be imposed by environmental or other regulatory requirements; |
| |
| • | permit limitations; and |
| |
| • | operator error or catastrophic events such as fires, earthquakes, explosions, floods, acts of terrorism or other similar occurrences. |
The potential lost revenues and increased expenses could result in a case where sufficient cash may not be available to service debt. In addition, any prolonged operating performance issues could potentially result in an impairment of the value of the affected facility.
Failure to obtain adequate and timely rate relief could negatively impact results
PSE&G
As a public utility, PSE&G's rates are regulated. These rates are designed to allow PSE&G the opportunity to recover its operating expenses and earn a fair return on its rate base, which primarily consists of its property, plant and equipment. These rates include its electric and gas tariff rates that are subject to regulation by the BPU as well as its transmission rates that are subject to regulation by FERC. PSE&G's base rates are set by the BPU for electric distribution and gas distribution and are effective until the time a new rate case is brought to the BPU. These base rate cases generally take place when equity returns fall below reasonable levels. Some categories of costs, such as energy costs, are recovered through adjustment charges that are periodically reset to reflect actual costs. If these costs exceed the amount included in PSE&G's adjustment charges, there may be a negative impact on cash flows.
If PSE&G does not obtain adequate rate treatment on a timely basis in order to meet its operating expenses, there may be a negative impact on earnings and operating cash flows. PSE&G can give no assurances that tariff relief will be timely or sufficient for it to recover its costs and provide a sufficient return for its investors.
Energy Holdings
Global's distribution facilities are rate-regulated enterprises. Governmental authorities establish rates charged to customers. While these rates are designed to cover all operating costs and provide a return on investment, considerable uncertainties exist in certain countries due to economic, political and social concerns that could have an adverse impact.
Energy Holdings can give no assurances that rates will, in the future, be sufficient to cover Global's costs and provide a sufficient return on its investments. In addition, future rates may not be adequate to provide cash flow to pay principal and interest on the debt of Global's subsidiaries and affiliates or to enable its subsidiaries and affiliates to comply with the terms of debt agreements.
Inability to balance energy obligations, available supply and trading risks could negatively impact results
Power and Energy Holdings
The revenues generated by the operation of the generating stations are subject to market risks that are beyond each company's control. Generation output will either be used to satisfy wholesale contract requirements, other bilateral contracts or be sold into other competitive power markets. Participants in the competitive power markets are not guaranteed any specified rate of return on their capital investments through recovery of mandated rates payable by purchasers of electricity.
Generation revenues and results of operations are dependent upon prevailing market prices for energy, capacity, ancillary services and fuel supply in the markets served.
31
Power
Power's energy trading and marketing activities frequently involve the establishment of forward sale positions in the wholesale energy markets on long-term and short-term bases. To the extent that Power has produced or purchased energy in excess of its contracted obligations a reduction in market prices could reduce profitability.
Conversely, to the extent that Power has contracted obligations in excess of energy it has produced or purchased, an increase in market prices could reduce profitability.
If the strategy Power utilizes to hedge its exposures to these various risks is not effective, it could incur significant losses. Power's substantial market positions can also be adversely affected by the level of volatility in the energy markets that, in turn, depends on various factors, including weather in various geographical areas, short-term supply and demand imbalances and pricing differentials at various geographic locations, which cannot be predicted with any certainty.
Increases in market prices also affect Power's ability to hedge generation output and fuel requirements as the obligation to post margin increases with increasing prices and, resultingly, could require the maintenance of liquidity resources that would be prohibitively expensive.
Environmental regulations could limit operations
PSEG, PSE&G, Power and Energy Holdings
PSEG, PSE&G, Power and Energy Holdings are required to comply with numerous statutes, regulations and ordinances relating to the safety and health of employees and the public, the protection of the environment and land use. These statutes, regulations and ordinances are constantly changing. While management believes that PSEG, PSE&G, Power and Energy Holdings have obtained all material approvals currently required to own and operate their respective facilities and that approvals will be issued in a timely manner, significant additional costs could be incurred in order to comply with these requirements. In some cases, the cost of compliance could exceed the marginal value of the facility. Failure to comply with environmental statutes, regulations and ordinances could have a material effect on PSEG, PSE&G, Power and Energy Holdings, including potential civil or criminal liability, the imposition of clean-up liens or fines and expenditures of funds to bring facilities into compliance or possible impairment of the value of the affected facility.
PSEG, PSE&G, Power and Energy Holdings can give no assurance that they will be able to:
| • | obtain all required environmental approvals not yet received or that may be required in the future; |
| |
| • | obtain any necessary modifications to existing environmental approvals; |
| |
| • | maintain compliance with all applicable environmental laws, regulations and approvals; or |
| |
| • | recover any resulting costs through future sales. |
Delay in obtaining or failure to obtain and maintain in full force and effect any environmental approvals, or delay or failure to satisfy any applicable environmental regulatory requirements, could prevent construction of new facilities, operation of existing facilities or sale of energy from these facilities or could result in significant additional costs.
Power
Many of Power's generating facilities are located in the State of New Jersey where environmental programs are generally considered to be more stringent in comparison to similar programs in other states. As such, there may be instances where the facilities located in New Jersey are subject to more stringent and, therefore, more costly pollution control requirements than competitive facilities in other states.
Regulatory issues significantly impact operations
PSEG, PSE&G, Power and Energy Holdings
Federal, state and local authorities impose substantial regulation and permitting requirements on the electric power generation business. Power and Energy Holdings are required to comply with numerous laws and regulations and to obtain numerous governmental permits in order to operate generation stations. In
32
addition, PSE&G's and certain of Global's distribution facilities could be subject to financial penalties if reliability performance standards are not met.
PSEG, PSE&G, Power and Energy Holdings can give no assurance that existing regulations will not be revised or reinterpreted, that new laws and regulations will not be adopted or become applicable or that future changes in laws and regulations, including the possibility of reregulation in some deregulated markets, will not have a detrimental effect on their respective businesses.
Power and Energy Holdings
Power and Energy Holdings believe that they have obtained all material energy-related federal, state and local approvals currently required to operate their respective generation stations and sell energy output, including MBR authority from FERC. Although not currently required, additional regulatory approvals may be required in the future due to changes in laws and regulations or for other reasons. No assurance can be given that Power and Energy Holdings will be able to obtain any required regulatory approval in the future, or that they will be able to obtain any necessary extensions in receiving any required regulatory approvals.
Power is also subject to pervasive regulation by the NRC with respect to the operation of nuclear generation stations. This regulation involves testing, evaluation and modification of all aspects of plant operation in light of NRC safety, environmental and personnel management requirements. The NRC also requires continuous demonstrations that plant operations meet applicable requirements. The NRC has the ultimate authority to determine whether any nuclear generation unit may operate.
Any failure to obtain or comply with any required regulatory approvals could materially adversely affect Power's and Energy Holdings' ability to operate generation stations or sell electricity to third parties.
Availability of adequate power transmission facilities
PSEG, PSE&G, Power and Energy Holdings
The ability to sell and deliver electric energy products may be adversely impacted and the ability to generate revenues may be limited if:
| • | transmission is disrupted; |
| |
| • | transmission capacity is inadequate; or |
| |
| • | a region's power transmission infrastructure is inadequate. |
Inability to access sufficient capital in the amounts and at the times needed
PSEG, PSE&G, Power and Energy Holdings
Capital for projects and investments has been provided by internally-generated cash flow, equity issuances by PSEG and borrowings by PSEG, PSE&G, Power, Energy Holdings and their respective subsidiaries. Continued access to debt capital from outside sources is required in order to efficiently fund the cash flow needs of the businesses. The ability to arrange financing and the costs of capital depend on numerous factors including, among other things, general economic and market conditions, the availability of credit from banks and other financial institutions, investor confidence, the success of current projects and the quality of new projects.
The ability to access sufficient capital in the bank and debt capital markets is dependent upon current and future capital structure, performance, financial condition and the availability of capital at a reasonable economic cost. As a result, no assurance can be given that PSEG, PSE&G, Power or Energy Holdings will be successful in obtaining financing for projects and investments or funding the equity commitments required for such projects and investments in the future.
Counterparty credit risks or a deterioration of credit quality
PSEG, PSE&G, Power and Energy Holdings
As market prices for energy and fuel fluctuate, Power's forward energy sale and forward fuel purchase contracts could require substantial collateral requiring Power to source additional liquidity during periods when Power's ability to source such liquidity may be limited. Also, in connection with its energy trading
33
activities, Power must meet credit quality standards required by counterparties. Standard industry contracts generally require trading counterparties to maintain investment grade ratings. These same contracts provide reciprocal benefits to Power. If Power loses its investment grade credit rating, ER&T would have to provide additional collateral in the form of letters of credit or cash, which would significantly impact the energy trading business. This would increase Power's costs of doing business and limit its ability to successfully conduct energy trading operations.
Power sells generation output through the execution of bilateral contracts. These contracts are subject to credit risk, which relates to the ability of counterparties to meet their contractual payment obligations. Any failure to collect these payments from counterparties could have a material impact on PSEG's and Power's results of operations, cash flows and financial position. As market prices rise above contracted price levels, Power is required to post collateral with purchasers. Collateral posting requirements for BGS contracts in particular are one-sided. If market prices fall below BGS contracted price levels for a single contract, power purchasers are not required to post collateral with Power. However, such margin positions can be netted against margin due from Power in other BGS contracts with the same counterparty.
Substantial competition from well-capitalized participants in the worldwide energy markets
PSEG, PSE&G, Power and Energy Holdings
Restructuring of worldwide energy markets is creating opportunities for, and substantial competition from, well-capitalized entities that may adversely affect the ability of PSEG, PSE&G, Power and Energy Holdings to make investments on favorable terms and achieve growth objectives. Increased competition could contribute to a reduction in prices offered for power and could result in lower returns which may affect PSEG's, PSE&G's, Power's and Energy Holdings' ability to service their respective outstanding indebtedness, including short-term debt. Some of the competitors include:
| • | merchant generators; |
| |
| • | banks, funds and other financial entities; |
| |
| • | domestic and multi-national utility generators; |
| |
| • | energy marketers; |
| |
| • | fuel supply companies; and |
| |
| • | affiliates of other industrial companies. |
As a holding company, the ability to service debt could be limited
PSEG and Energy Holdings
PSEG and Energy Holdings are holding companies with no material assets other than the stock or membership interests of their subsidiaries and project affiliates. As such, PSEG and Energy Holdings depend on their respective subsidiaries' and project affiliates' cash flow and their respective access to capital in order to service their indebtedness. Each of PSEG's and Energy Holdings' respective subsidiaries and project affiliates are separate and distinct legal entities that have no obligation, contingent or otherwise, to pay any amounts when due on PSEG's or Energy Holdings' debt or to make any funds available to pay such amounts. As a result, PSEG's and Energy Holdings' debt will effectively be subordinated to all existing and future debt, trade creditors, and other liabilities of their respective subsidiaries and project affiliates and PSEG's and Energy Holdings' rights and hence the rights of their respective creditors to participate in any distribution of assets of any subsidiary or project affiliate upon its liquidation or reorganization or otherwise would be subject to the prior claims of that subsidiary's or project affiliate's creditors, except to the extent that PSEG's or Energy Holdings' claims as a creditor of such subsidiary or project affiliate may be recognized.
In addition, Energy Holdings' subsidiaries' project-related debt agreements generally restrict the subsidiaries' ability to pay dividends, make cash distributions or otherwise transfer funds. These restrictions may include achieving and maintaining financial performance or debt coverage ratios, absence of events of default, or priority in payment of other current or prospective obligations. These restrictions could further restrict Energy Holdings' ability to service its outstanding indebtedness.
34
Adverse international developments could negatively impact results
Energy Holdings
A component of PSEG's and Energy Holdings business strategy has been the development, acquisition and operation of projects outside the U.S. The economic and political conditions in certain countries where Global has interests present risks that may be different than those found in the U.S. which could affect the value of its investments cash flows from projects and make it more difficult to obtain non-recourse project refinancing on suitable terms or could impair Global's ability to enforce its rights under agreements relating to such projects. Such risks include:
| • | expropriation or nationalization of energy assets; |
| |
| • | renegotiation or abrogation of existing contracts; and |
| |
| • | changes in law or tax policy. |
Operations in foreign countries also present risks associated with currency exchange and convertibility, inflation and repatriation of earnings. In some countries, economic and monetary conditions and other factors could affect Global's ability to convert its cash distributions to U.S. Dollars or other freely convertible currencies, or to move funds offshore from these countries. Furthermore, the central bank of any of these countries may have the authority to suspend, restrict or otherwise impose conditions on foreign exchange transactions or to approve distributions to foreign investors.
Inability to realize tax benefits
Energy Holdings
Through its leveraged lease investments, Resources acquires an asset by obtaining equity representing approximately 15% to 20% of the cost of the asset and incurring non-recourse lease debt for the balance. As the owner, Resources is entitled to depreciate the asset under applicable federal and state tax guidelines and receives income from the tax benefits associated with interest and depreciation deductions with respect to the leased property. The ability of Resources to realize these tax benefits is dependent on operating income generated by its affiliates and allocated pursuant to PSEG's consolidated tax sharing agreement. A reduction of operating income could impair Resources' ability to receive such benefits, which would result in a reduction of earnings and cash flows. In addition, during 2005, the IRS proposed to disallow certain deductions associated with some of the leveraged leases which have been designated by the IRS as listed transactions. Any material disallowance of deductions could impact Energy Holdings' earnings and ability to service its outstanding indebtedness.
Failure to consummate the proposed Merger with Exelon
PSEG, PSE&G, Power and Energy Holdings
The proposed Merger with Exelon is subject to regulatory reviews not yet concluded, including the BPU and the U.S. Department of Justice (DOJ). The required regulatory approvals might not be received by June 20, 2006, the date set after which either PSEG or Exelon could terminate the Merger Agreement. Any regulatory approvals could contain one or more conditions which either PSEG or Exelon could determine constitute a “burdensome order” under the Merger Agreement giving each the right to terminate.
If the Merger is not closed, PSEG, PSE&G, Power and Energy Holdings could experience one or more of the following consequences:
| • | a credit rating downgrade by one or more of the credit rating agencies, resulting in higher financing costs and potentially limiting capital and credit market access; |
| |
| • | an inability to implement successful succession planning, attract and retain management and key employees and replace personnel lost to attrition pending regulatory approval of the Merger; and |
| |
| • | an inability to continue improved nuclear performance over a longer-term horizon. |
35
Decreases in the value of the pension and other postretirement assets could require additional funding
PSEG, PSE&G, Power and Energy Holdings
Adverse changes in the rates of return or performance of the investments in which the pension and other postretirement trust assets are held could lower the value of the funds and the trust assets. Such a decline in value could result in additional funding obligations to meet the applicable legal and regulatory requirements. To the extent that these additional funding obligations are significant, this could impact PSEG's, PSE&G's, Power's and Energy Holdings' ability to service debt.
Changes in technology may make power generation assets less competitive
Power and Energy Holdings
A key element of the business plan is that generating power at central power plants produces electricity at relatively low cost. There are alternative technologies to produce electricity that continue to attract capital for research and development, most notably fuel cells, microturbines, windmills and photovoltaic (solar) cells. It is possible that advances in technology will reduce the cost of alternative methods of producing electricity to a level that is competitive with that of most central station electric production. If this were to happen, Power's and Energy Holdings' market share could be eroded and the value of their respective power plants could be significantly impaired. Changes in technology could also alter the channels through which retail electric customers buy electricity, which could affect financial results.
Insurance coverages may not be sufficient
PSEG, PSE&G, Power and Energy Holdings
PSEG, PSE&G, Power and Energy Holdings have insurance for their respective facilities, including:
| • | all-risk property damage insurance; |
| |
| • | commercial general public liability insurance; |
| |
| • | boiler and machinery coverage; |
| |
| • | nuclear liability; and |
| |
| • | for nuclear generating units, replacement power and business interruption insurance in amounts and with deductibles that management considers appropriate. |
PSEG, PSE&G, Power and Energy Holdings can give no assurance that this insurance coverage will be available in the future on commercially reasonable terms or that the insurance proceeds received for any loss of or any damage to any of their respective facilities will be sufficient to fund future payments on debt. Additionally, some properties may not be insured in the event of an act of terrorism.
Recession, acts of war or terrorism
PSEG, PSE&G, Power and Energy Holdings
The consequences of a prolonged recession and adverse market conditions may include the continued uncertainty of energy prices and the capital and commodity markets. Management cannot predict the impact of any continued economic slowdown, reduced growth rate in energy usage or fluctuating energy prices; however, such impact could have a material adverse effect on PSEG's, PSE&G's, Power's and Energy Holdings' financial condition, results of operations and net cash flows.
Major industrial facilities, generation plants, fuel storage facilities and transmission and distribution facilities may be targets of terrorist activities that could result in disruption of PSE&G's, Power's or Energy Holdings' ability to produce or distribute some portion of their respective energy products. Any such disruption could result in a significant decrease in revenues and/or significant additional costs to repair, which could have a material adverse impact on the financial condition, results of operation and net cash flows of PSEG, PSE&G, Power and Energy Holdings.
36
ITEM 1B. UNRESOLVED STAFF COMMENTS
PSEG
None.
PSE&G, Power and Energy Holdings
Not Applicable.
37
ITEM 2. PROPERTIES
PSEG and Services
PSEG does not own any property. All property is owned by PSEG's subsidiaries.
Services leases a 25-story office tower for PSEG's corporate headquarters at 80 Park Plaza, Newark, New Jersey, together with an adjoining three-story building. In addition, Services owns the Maplewood Test Services Facility in Maplewood, New Jersey.
PSEG believes that it and its subsidiaries maintain adequate insurance coverage against loss or damage to plants and properties, subject to certain exceptions, to the extent such property is usually insured and insurance is available at a reasonable cost.
PSE&G
PSE&G's First and Refunding Mortgage (Mortgage), securing the bonds issued thereunder, constitutes a direct first mortgage lien on substantially all of PSE&G's property.
PSE&G's electric lines and gas mains are located over or under public highways, streets, alleys or lands, except where they are located over or under property owned by PSE&G or occupied by it under easements or other rights. These easements and other rights are deemed by PSE&G to be adequate for the purposes for which they are being used.
PSE&G believes that it maintains adequate insurance coverage against loss or damage to its principal properties, subject to certain exceptions, to the extent such property is usually insured and insurance is available at a reasonable cost.
Electric Transmission and Distribution Properties
As of December 31, 2005, PSE&G's transmission and distribution system included approximately 21,818 circuit miles, of which approximately 7,826 circuit miles were underground, and approximately 799,471 poles, of which approximately 537,632 poles were jointly-owned. Approximately 99% of this property is located in New Jersey.
In addition, as of December 31, 2005, PSE&G owned five electric distribution headquarters and four subheadquarters in four operating divisions, all located in New Jersey.
Gas Distribution Properties
As of December 31, 2005, the daily gas capacity of PSE&G's 100%-owned peaking facilities (the maximum daily gas delivery available during the three peak winter months) consisted of liquid petroleum air gas (LPG) and liquefied natural gas (LNG) and aggregated 2,973,000 therms (approximately 2,886,000 cubic feet on an equivalent basis of 1,030 Btu/cubic foot) as shown in the following table:
| | Plant
| | Location
| | Daily Capacity
(Therms)
|
| | Burlington LNG | | Burlington, NJ | | | 773,000 | |
| | Camden LPG | | Camden, NJ | | | 280,000 | |
| | Central LPG | | Edison Twp., NJ | | | 960,000 | |
| | Harrison LPG | | Harrison, NJ | | | 960,000 | |
| | | | | | |
| |
| | Total | | | | | 2,973,000 | |
| | | | | | |
| |
| | | | | | | | |
As of December 31, 2005, PSE&G owned and operated approximately 17,241 miles of gas mains, owned 12 gas distribution headquarters and three subheadquarters, all in two operating regions located in New Jersey and owned one meter shop in New Jersey serving all such areas. In addition, PSE&G operated 61 natural gas metering or regulating stations, all located in New Jersey, of which 28 were located on land owned by customers or natural gas pipeline suppliers and were operated under lease, easement or other similar arrangement. In some instances, the pipeline companies owned portions of the metering and regulating facilities.
38
Office Buildings and Facilities
PSE&G rents office space from Services as its headquarters in Newark, New Jersey. PSE&G also leases office space at various locations throughout New Jersey for district offices and offices for various corporate groups and services. PSE&G also owns various other sites for training, testing, parking, records storage, research, repair and maintenance, warehouse facilities and for other purposes related to its business.
In addition to the facilities discussed above, as of December 31, 2005, PSE&G owned 41 switching stations in New Jersey with an aggregate installed capacity of 21,728 megavolt-amperes and 244 substations with an aggregate installed capacity of 7,772 megavolt-amperes. In addition, four substations in New Jersey having an aggregate installed capacity of 109 megavolt-amperes were operated on leased property.
Power
Power rents office space from Services as its headquarters in Newark, New Jersey. Other leased properties include office, warehouse, classroom and storage space, primarily located in New Jersey. Power also owns the Central Maintenance Shop at Sewaren, New Jersey.
Power has a 57.41% ownership interest in approximately 13,000 acres in the Delaware River Estuary region to satisfy the condition of the NJPDES permit issued for Salem. Power also owns several other facilities, including the on-site Nuclear Administration and Processing Center buildings.
Power has a 13.91% ownership interest in the 650-acre Merrill Creek Reservoir in Warren County, New Jersey and approximately 2,158 acres of land surrounding the reservoir. The reservoir was constructed to store water for release to the Delaware River during periods of low flow. Merrill Creek is jointly-owned by seven companies that have generation facilities along the Delaware River or its tributaries and use the river water in their operations.
Power believes that it maintains adequate insurance coverage against loss or damage to its plants and properties, subject to certain exceptions, to the extent such property is usually insured and insurance is available at a reasonable cost. For a discussion of nuclear insurance, see Note 12. Commitments and Contingent Liabilities of the Notes.
39
As of December 31, 2005, Power's share of installed generating capacity was 13,846 MW, as shown in the following table:
OPERATING POWER PLANTS
Name
| | Location
| | Total
Capacity
(MW)
| | %
Owned
| | Owned
Capacity
(MW)
| | Principal
Fuels
Used
| | Mission
|
Steam: | | | | | | | | | | | | | | | | | | | | | | |
Hudson | | | NJ | | | | 991 | | | | 100% | | | | 991 | | | | Coal/Gas | | | Load Following |
Mercer | | | NJ | | | | 648 | | | | 100% | | | | 648 | | | | Coal/Gas | | | Load Following |
Sewaren | | | NJ | | | | 453 | | | | 100% | | | | 453 | | | | Gas/Oil | | | Load Following |
Linden(F) | | | NJ | | | | 430 | | | | 100% | | | | 430 | | | | Oil | | | Load Following |
Keystone(A)(B) | | | PA | | | | 1,700 | | | | 23% | | | | 388 | | | | Coal | | | Base Load |
Conemaugh(A)(B) | | | PA | | | | 1,700 | | | | 23% | | | | 382 | | | | Coal | | | Base Load |
Bridgeport Harbor | | | CT | | | | 503 | | | | 100% | | | | 503 | | | | Coal/Oil | | | Base Load |
New Haven Harbor | | | CT | | | | 448 | | | | 100% | | | | 448 | | | | Oil/Gas | | | Load Following |
| | | | | | | |
| | | | | | | |
| | | | | | | |
Total Steam | | | | | | | 6,873 | | | | | | | | 4,243 | | | | | | | |
| | | | | | | |
| | | | | | | |
| | | | | | | |
Nuclear: | | | | | | | | | | | | | | | | | | | | | | |
Hope Creek | | | NJ | | | | 1,059 | | | | 100% | | | | 1,059 | | | | Nuclear | | | Base Load |
Salem 1 & 2(A) | | | NJ | | | | 2,304 | | | | 57% | | | | 1,323 | | | | Nuclear | | | Base Load |
Peach Bottom 2 & 3(A)(C) | | | PA | | | | 2,224 | | | | 50% | | | | 1,112 | | | | Nuclear | | | Base Load |
| | | | | | | |
| | | | | | | |
| | | | | | | |
Total Nuclear | | | | | | | 5,587 | | | | | | | | 3,494 | | | | | | | |
| | | | | | | |
| | | | | | | |
| | | | | | | |
Combined Cycle: | | | | | | | | | | | | | | | | | | | | | | |
Bergen | | | NJ | | | | 1,221 | | | | 100% | | | | 1,221 | | | | Gas/Oil | | | Load Following |
Lawrenceburg | | | IN | | | | 1,096 | | | | 100% | | | | 1,096 | | | | Gas | | | Load Following |
Bethlehem | | | NY | | | | 750 | | | | 100% | | | | 750 | | | | Gas | | | Load Following |
| | | | | | | |
| | | | | | | |
| | | | | | | |
Total Combined Cycle | | | | | | | 3,067 | | | | | | | | 3,067 | | | | | | | |
| | | | | | | |
| | | | | | | |
| | | | | | | |
Combustion Turbine: | | | | | | | | | | | | | | | | | | | | | | |
Essex | | | NJ | | | | 617 | | | | 100% | | | | 617 | | | | Gas/Oil | | | Peaking |
Edison | | | NJ | | | | 504 | | | | 100% | | | | 504 | | | | Gas/Oil | | | Peaking |
Kearny | | | NJ | | | | 440 | | | | 100% | | | | 440 | | | | Gas/Oil | | | Peaking |
Burlington | | | NJ | | | | 557 | | | | 100% | | | | 557 | | | | Gas/Oil | | | Peaking |
Linden | | | NJ | | | | 324 | | | | 100% | | | | 324 | | | | Gas/Oil | | | Peaking |
Mercer | | | NJ | | | | 129 | | | | 100% | | | | 129 | | | | Oil | | | Peaking |
Sewaren | | | NJ | | | | 129 | | | | 100% | | | | 129 | | | | Oil | | | Peaking |
Bayonne | | | NJ | | | | 42 | | | | 100% | | | | 42 | | | | Oil | | | Peaking |
Bergen | | | NJ | | | | 21 | | | | 100% | | | | 21 | | | | Gas | | | Peaking |
National Park | | | NJ | | | | 21 | | | | 100% | | | | 21 | | | | Oil | | | Peaking |
Kearny | | | NJ | | | | 21 | | | | 100% | | | | 21 | | | | Gas | | | Peaking |
Salem(A) | | | NJ | | | | 38 | | | | 57% | | | | 22 | | | | Oil | | | Peaking |
Bridgeport Harbor | | | CT | | | | 10 | | | | 100% | | | | 10 | | | | Oil | | | Peaking |
| | | | | | | |
| | | | | | | |
| | | | | | | |
Total Combustion Turbine | | | | | | | 2,853 | | | | | | | | 2,837 | | | | | | | |
| | | | | | | |
| | | | | | | |
| | | | | | | |
Internal Combustion: | | | | | | | | | | | | | | | | | | | | | | |
Conemaugh(A)(B) | | | PA | | | | 11 | | | | 23% | | | | 2 | | | | Oil | | | Peaking |
Keystone(A)(B) | | | PA | | | | 11 | | | | 23% | | | | 3 | | | | Oil | | | Peaking |
| | | | | | | |
| | | | | | | |
| | | | | | | |
Total Internal Combustion | | | | | | | 22 | | | | | | | | 5 | | | | | | | |
| | | | | | | |
| | | | | | | |
| | | | | | | |
Pumped Storage: | | | | | | | | | | | | | | | | | | | | | | |
Yards Creek(A)(D)(E) | | | NJ | | | | 400 | | | | 50% | | | | 200 | | | | | | | Peaking |
| | | | | | | |
| | | | | | | |
| | | | | | | |
Total Operating Generation Plants | | | | | | | 18,802 | | | | | | | | 13,846 | | | | | | | |
| | | | | | | |
| | | | | | | |
| | | | | | | |
| | | | | | | | | | | | | | | | | | | | | | |
|
| (A) | | Power's share of jointly-owned facility. |
| (B) | | Operated by Reliant Energy. |
| (C) | | Operated by Exelon Generation. |
| (D) | | Operated by Jersey Central Power & Light Corporation. |
| (E) | | Excludes energy for pumping and synchronous condensers. |
| (F) | | This asset is scheduled for retirement within the next three years, partially dependent upon new generation going into service discussed below. |
40
As of December 31, 2005, Power had generating capacity in construction or advanced development, as shown in the following table:
POWER PLANTS IN CONSTRUCTION OR ADVANCED DEVELOPMENT
Name
| | Location
| | Total
Capacity
(MW)
| | %
Owned
| | Owned
Capacity
(MW)
| | Principal
Fuels
Used
| | Scheduled
In Service
Date
|
Combined Cycle: | | | | | | | | | | | | | | | | | | |
Linden | | | NJ | | | | 1,220 | | | 100% | | | 1,220 | | | Gas | | 2006 |
| | | | | | | |
| | | | | |
| | | | | |
Total Construction | | | | | | | 1,220 | | | | | | 1,220 | | | | | |
| | | | | | | |
| | | | | |
| | | | | |
Nuclear Uprates | | | NJ/PA | | | | 170 | | | Various | | | 147 | | | Nuclear | | 2006-2008 |
| | | | | | | |
| | | | | |
| | | | | |
Total Advanced Development | | | | | | | 170 | | | | | | 147 | | | | | |
| | | | | | | |
| | | | | |
| | | | | |
| | | | | | | | | | | | | | | | | | |
| Projected Capacity | | Total
Owned
Capacity
(MW)
|
Total Owned Operating Generation Plants | | | 13,846 | |
Under Construction | | | 1,220 | |
Advanced Development | | | 147 | |
Less: Planned Retirements | | | (430 | ) |
| | | |
| |
Projected Capacity | | | 14,783 | |
| | | |
| |
| | | | |
Energy Holdings
Energy Holdings rents office space from Services as its headquarters in Newark, New Jersey.
Energy Holdings believes that it maintains adequate insurance coverage for properties in which its subsidiaries have an equity interest, subject to certain exceptions, to the extent such property is usually insured and insurance is available at a reasonable cost.
41
Global has invested in the following generation facilities that were in operation as of December 31, 2005:
OPERATING POWER PLANTS
Name
| | Location
| | Total
Capacity
(MW)
| | %
Owned
| | Owned
Capacity
(MW)
| | Principal
Fuels
Used
|
United States | | | | | | | | | | | | | | | | |
Texas Independent Energy, L.P. (TIE) | | | | | | | | | | | | | | | | |
Guadalupe Power Partners, L.P. (Guadalupe) | | TX | | | 1,000 | | | | 100% | | | | 1,000 | | | Natural gas |
Odessa-Ector Power Partners, L.P. (Odessa) | | TX | | | 1,000 | | | | 100% | | | | 1,000 | | | Natural gas |
| | | | |
| | | | | | | |
| | | |
Total TIE | | | | | 2,000 | | | | | | | | 2,000 | | | |
Kalaeloa Partners L.P. (Kalaeloa) | | HI | | | 209 | | | | 50% | | | | 105 | | | Oil |
GWF Power Systems, L.P. (GWF) | | CA | | | 105 | | | | 50% | | | | 53 | | | Petroleum coke |
Hanford L.P. (Hanford) | | CA | | | 27 | | | | 50% | | | | 14 | | | Petroleum coke |
Thermal Energy Development Partnership L.P. (Tracy) | | CA | | | 21 | | | | 35% | | | | 7 | | | Biomass |
GWF Energy LLC (GWF Energy) | | | | | | | | | | | | | | | | |
Hanford—Peaker Plant | | CA | | | 95 | | | | 60% | | | | 57 | | | Natural gas |
Henrietta—Peaker Plant | | CA | | | 97 | | | | 60% | | | | 58 | | | Natural gas |
Tracy—Peaker Plant | | CA | | | 171 | | | | 60% | | | | 103 | | | Natural gas |
| | | | |
| | | | | | | |
| | | |
Total GWF Energy | | | | | 363 | | | | | | | | 218 | | | |
Bridgewater | | NH | | | 16 | | | | 40% | | | | 6 | | | Biomass |
Conemaugh | | PA | | | 15 | | | | 4% | | | | 1 | | | Hydro |
| | | | |
| | | | | | | |
| | | |
Total United States | | | | | 2,756 | | | | | | | | 2,404 | | | |
| | | | |
| | | | | | | |
| | | |
International (A) | | | | | | | | | | | | | | | | |
PPN Power Generating Company Limited (PPN) | | India | | | 330 | | | | 20% | | | | 66 | | | Naphtha/Natural gas |
Prisma | | | | | | | | | | | | | | | | |
Crotone | | Italy | | | 20 | | | | 25% | | | | 5 | | | Biomass |
Bando D'Argenta I | | Italy | | | 20 | | | | 50% | | | | 10 | | | Biomass |
Strongoli | | Italy | | | 40 | | | | 25% | | | | 10 | | | Biomass |
| | | | |
| | | | | | | |
| | | |
Total Prisma | | | | | 80 | | | | | | | | 25 | | | |
Electroandes | | Peru | | | 183 | | | | 100% | | | | 183 | | | Hydro |
Turboven | | | | | | | | | | | | | | | | |
Maracay | | Venezuela | | | 60 | | | | 50% | | | | 30 | | | Natural gas |
Cagua | | Venezuela | | | 60 | | | | 50% | | | | 30 | | | Natural gas |
| | | | |
| | | | | | | |
| | | |
Total Turboven | | | | | 120 | | | | | | | | 60 | | | |
Turbogeneradores de Maracay (TGM) | | Venezuela | | | 40 | | | | 9% | | | | 4 | | | Natural gas |
Dhofar Power Company S.A.O.C. (Dhofar Power) | | Oman | | | 240 | | | | 46% | | | | 110 | | | Natural gas |
SAESA Group | | Chile | | | 120 | | | | 100% | | | | 120 | | | Natural gas/
Oil/Hydro/Wind |
| | | | |
| | | | | | | |
| | | |
Total International | | | | | 1,113 | | | | | | | | 568 | | | |
| | | | |
| | | | | | | |
| | | |
Total Operating Power Plants | | | | | 3,869 | | | | | | | | 2,972 | | | |
| | | | |
| | | | | | | |
| | | |
| | | | | | | | | | | | | | | | |
|
| (A) | | In January 2006, Global entered into an agreement to sell its two power plants in Poland, Elcho and Skawina. Elcho's and Skawina's total capacity is 220 MW and 590 MW, respectively. Global's percentage ownership in Elcho and Skawina is 90% and 75%, respectively. The principal fuel used in both facilities is coal. For additional information relating to these dispositions, see Note 4. Discontinued Operations, Dispositions and Acquisitions of the Notes. |
As of December 31, 2005, Global had invested in the following generation facility that was in advanced development:
POWER PLANTS IN ADVANCED DEVELOPMENT
Name
| | Location
| | Total
Capacity
(MW)
| | %
Owned
| | Owned
Capacity
(MW)
| | Principal
Fuels Used
| | Scheduled
In
Service
Date
|
| | | | | | | | | | | | | | | | | | | | |
Electroandes | | Peru | | | 35 | | | | 100% | | | | 35 | | | Hydro | | | 2007 | |
| | | | |
| | | | | | | |
| | | | | | | |
Total Projected Capacity | | | | | 3,904 | | | | | | | | 3,007 | | | | | | | |
| | | | |
| | | | | | | |
| | | | | | | |
| | | | | | | | | | | | | | | | | | | | |
42
Domestic Generation In Operation
TIE
TIE owns and operates two electric generation facilities, one in Guadalupe County in south central Texas (Guadalupe) and one in Odessa in western Texas (Odessa). Approximately 50% of the total peak capacity of both Guadalupe and Odessa plants for 2006 have been sold via bilateral agreements and additional bilateral sales for peak and off-peak services will be signed as the year progresses. Any remaining uncommitted output is sold in the Texas spot market. Included in the sold capacity of Odessa above is a 350 MW five-year daily capacity call option that provides stable revenues and cash flows.
Kalaeloa
Global's 50% partner in Kalaeloa is a power fund managed by Harbert Power Corporation (Harbert). All of the electricity generated by the Kalaeloa power plant is sold to the Hawaiian Electric Company, Inc. (HECO) under a PPA expiring in May 2016. Under a steam purchase and sale agreement expiring in May 2016, the Kalaeloa power plant supplies steam to the adjacent Tesoro refinery. The primary fuel, low sulfur fuel oil, is provided from the adjacent Tesoro refinery under a long-term all requirements contract. The refinery is interconnected to the power plant by a pipeline and preconditions the fuel oil prior to delivery. Back-up fuel supply is provided by HECO.
The two combustion turbines of Kalaeloa were upgraded in 2004 resulting in both an increase in the net plant output by approximately 20 MW and an improvement in the efficiency of consuming fuel. As a result of the upgrades, Kalaeloa and HECO entered into two amendments to the PPA. The amendments were effective upon final approval from the Public Utility Commission of the State of Hawaii in September 2005. The amendments increased Kalaeloa's firm capacity and associated energy sales to HECO from 180 MW to 209 MW.
GWF and Hanford
Global and Harbert each own 50% of GWF. PPAs for the five GWF Bay Area plants' net output are in place with Pacific Gas and Electric Company (PG&E) ending in 2020 and 2021. GWF acquires the petroleum coke used to fuel its plants through contracts with two local oil refineries with price and minimum volumes negotiated annually. Three of the five GWF plants have been modified to burn a wider variety of petroleum coke products to mitigate fuel supply and pricing risk.
Global and Harbert each own 50% of Hanford. A PPA for the plant's net output is in place with PG&E ending in August 2011. Hanford acquires its petroleum coke through a contract with the new owner of a refinery that was previously scheduled to close but which was sold to the new owner in 2005.
Hanford, Henrietta and Tracy Peaker Plants
GWF Energy, which is 60% owned by Global and 40% owned by Harbinger GWF LLC (Harbinger), an affiliate of Harbert, owns and operates three peaker plants in California. Global owned approximately 75% of GWF Energy until February 2004 when it sold a 14.9% interest to Harbinger for approximately $14 million (approximate book value), pursuant to an arbitration panel's finding. The output of these plants is sold under a PPA with the California Department of Water Resources (DWR) with maturities in 2011 and 2012. DWR has the right to schedule energy and/or reserve capacity from each unit of the three plants for a maximum of 2,000 hours each year. Energy and capacity not scheduled by DWR is available for sale by GWF Energy. DWR supplies the natural gas when the units are scheduled for dispatch by DWR. GWF Energy obtains the natural gas used to fuel its plants for non-DWR sales from the spot market on a non-firm basis.
International Generation in Operation
India
PPN
Global owns a 20% interest in PPN located in Tamil Nadu, India. Global's partners include the Apollo Infrastructure Company Ltd., with a 46.9% interest, Marubeni Corporation, with a 26% interest, Housing Development Finance Corporation (HDFC) and HDFC Life Insurance Corporation, with a 5% and 2.1%
43
interest respectively. PPN has entered into a PPA for the sale of 100% of its output to the State Electricity Board of Tamil Nadu (TNEB) for 30 years, with an agreement to take-or-pay equal to a plant load factor of at least 68.5%. TNEB has not made full payment to PPN for the purchase of energy under the contract. For a discussion of the TNEB's failure to meet its obligations under this PPA, see Item 3. Legal Proceedings.
Peru
Electroandes
Global owns a 100% interest in Electroandes located in Peru. Electroandes' main assets include four hydroelectric facilities with a combined installed capacity of 183 MW and 437 miles of transmission lines located in the central Andean region east of Lima. In addition, Electroandes is in the process of developing a 35 MW expansion to an existing station. In 2005, 98% of Electroandes' revenues were obtained through various PPAs, denominated in U.S. Dollars, expiring through 2008.
Venezuela
Turboven
The facilities in Maracay and Cagua are owned and operated by Turboven, an entity which is jointly-owned by Global (50%) and Corporacion Industrial de Energia (CIE). PPAs expiring between 2006 and 2011 have been entered into for the sale of approximately 40% of the output of Maracay and Cagua to various industrial customers. The PPAs are structured to provide energy only with minimum take provisions. Fuel costs are passed through directly to customers and the energy tariffs are calculated in U.S. Dollars and paid in local currency.
TGM
Global has a 9% indirect interest in TGM through a partnership with CIE. TGM sells all of the energy produced under a PPA with Manufacturas del Papel (MANPA), a paper manufacturing concern located in Maracay. MANPA and CIE have common controlling shareholders.
Oman
Dhofar Power
In March 2001, Global, through Dhofar Power, signed a 20-year concession with the Government of Oman to privatize the electric system of the city of Salalah. Global owns 46% of Dhofar Power following the sale by Global in April 2005 of a 35% interest through a public offering on the Oman stock exchange as required under the concession agreement. The remainder of Dhofar Power's shares are owned by several major Omani investment groups (19%) and the public (35%) following the public offering. See Note 12. Commitments and Contingent Liabilities of the Notes for discussions regarding contractual disputes between Dhofar Power and the Government of Oman.
Electric Distribution Facilities
Global has invested in the following major distribution systems:
| | Name
| | Location
| | Number of
Customers
| | Global's
Ownership
Interest
|
| | RGE | | Brazil | | | 1,093,000 | | | | 32 | % |
| | Chilquinta | | Chile | | | 521,000 | | | | 50 | % |
| | SAESA Group | | Chile | | | 595,000 | | | | 100 | % |
| | LDS | | Peru | | | 769,000 | | | | 38 | % |
| | | | | | |
| | | | | |
| | Total | | | | | 2,978,000 | | | | | |
| | | | | | |
| | | | | |
| | | | | | | | | | | | |
As part of Dhofar Power's concession, Global also operates a distribution system serving approximately 47,000 customers in the southeast Dhofar region of Oman.
44
Brazil
RGE
Global owns a 32% equity interest in RGE. Global is the named operator for the system. A shareholders' agreement establishes corporate governance, voting rights and key financial provisions. Global has veto rights over certain actions, including approval of the annual budget and financing plan, appointment of executive officers, significant investments or acquisitions, sale or encumbrance of assets, establishment of guarantees, amendment of the by-laws of the company and dividend policies. Day-to-day operations are the responsibility of RGE's management, subject to shareholder oversight. The remaining ownership interest is held by Companhia Paulista de Forcae Luz (CPFL), an electric distribution company in which Global's original partners, VBC Energia S.A. (a Brazilian power company) and Previ (the pension fund of the Bank of Brazil), collectively, own a majority interest.
RGE operates under a territorial concession agreement ending in 2027. Under a new regulation passed in 2004, the concession is exclusive and only large consumers have the right to choose another provider of energy or to self-generate. Global does not believe this represents a material threat to the profitability of the distribution system in Brazil since the tariff structure provides the distribution system the opportunity to recover all costs associated with distribution service plus a return. In 2002, RGE secured its energy supply through a 12-year contract signed with Tractebel, a European generation company, which covers all of RGE's actual capacity not covered by other existing contracts. Of RGE's existing contracts, only one is denominated in U.S. Dollars. This contract represents 19% of RGE's current needs.
For additional information related to RGE, see Item 1. Business—Regulatory Issues and Item 3. Legal Proceedings.
Chile and Peru
Chilquinta and LDS
Global together with its partner, Sempra Energy (Sempra), own 99.99% of the shares of Chilquinta, an energy distribution company with numerous energy holdings, based in Valparaiso, Chile. Global's interest is 50% of this aggregate. Following the sale in 2004 of 12% of the shares of LDS to the public, Global and Sempra own 75.9% of LDS, an electric distribution company located in Lima, Peru. As part of the Chilquinta and LDS investments, Global and Sempra also own Tecnored and Tecsur, located in Chile and Peru, respectively. These companies provide procurement and contracting services to Chilquinta, LDS and others.
As equal partners, Global and Sempra share in the management of Chilquinta and LDS. However, Sempra has assumed lead operational responsibilities at Chilquinta, while Global has assumed lead operational responsibilities at LDS. The shareholders' agreement provides for important veto rights over major partnership decisions including dividend policy, budget approvals, management appointments and indebtedness.
Chilquinta operates under a non-exclusive perpetual franchise within Chile's Region V which is located just north and west of Santiago. Global believes that direct competition for distribution customers would be uneconomical for potential competitors. LDS operates under an exclusive, perpetual franchise in the southern portion of the city of Lima and in an area just south of the city along the coast serving a population of approximately 3.2 million. Both Chilquinta and LDS purchase energy for distribution from generators in their respective markets on a contract basis. For additional information related to Chilquinta and LDS, see Item 1. Business—Regulatory Issues.
SAESA Group
Global owns a 99.99% equity interest in SAESA, 98.99% of Empresa Electrica de la Frontera S.A. (Frontel) and 100% of PSEG Generacion y Energia Chile Limitada (Generacion), collectively known together with subsidiaries of SAESA as the SAESA Group. The SAESA Group consists of four distribution companies and one transmission company that provide electric service to 390 cities and towns over 900 miles in southern Chile and a generating company. The SAESA Group has 120 MW of installed generating capacity in operation (46 MW of natural gas-fired peaker capacity, 51 MW oil-fired, 21 MW hydro and two MW wind). The transmission company, Sistema de Transmision del Sur S.A. (STS), provides transmission
45
services to electric generation facilities that have PPAs with distributors in Regions VIII, IX and X and has installed transformation capacity of 939 megavolt-amperes.
The SAESA Group also owns a 50% interest in an Argentine distribution company, Empresa de Energia Rio Negro S.A. (EDERSA), which provides generation, transmission and distribution services to approximately 147,000 customers in the Province of Rio Negro, Argentina. The Chilean members of the SAESA Group are organized and administered according to a centralized administrative structure designed to maximize operational synergies. In Argentina, EDERSA has its own independent administrative structure. The SAESA Group is currently in the process of selling EDERSA and has entered into an agreement with the buyer. The sale process is pending Argentine governmental regulatory approval. For additional information related to the SAESA Group, see Item 1. Business—Regulatory Issues.
ITEM 3. LEGAL PROCEEDINGS
PSE&G
In November 2001, Consolidated Edison Company of New York, Inc. (Con Edison) filed a complaint against PSE&G with FERC asserting that PSE&G had breached agreements covering 1,000 MW of transmission. PSE&G denied the allegations set forth in the complaint. An Initial Decision issued by an ALJ in April 2002 upheld PSE&G's claim in part but also accepted Con Edison's contentions in part. In December 2002, FERC issued an order modifying the Initial Decision and remanding a number of issues to the ALJ for additional hearings, including issues related to the development of protocols to implement the findings of the order and regarding Phase II of the complaint. The ALJ issued an Initial Decision on the Phase II issues in June 2003 and in August 2004, FERC issued its decision on Phase II issues. While those decisions were largely favorable to PSE&G, PSE&G sought rehearing as to certain issues, as did Con Edison. Those rehearing applications are currently pending.
The August 2004 order required that PJM, NYISO, Con Edison and PSE&G meet for the purpose of developing operational protocols to implement FERC's directives. On February 18, 2005, NYISO, PJM and PSE&G submitted a joint compliance filing pursuant to FERC's August 2004 decision. FERC approved the joint proposals on May 18, 2005 and they took effect on July 1, 2005. In subsequent filings to FERC regarding the efficacy of these protocols, Con Edison continues to claim that the obligations under the agreements are not being met. In a December 30, 2005 filing with FERC, Con Edison claims to have incurred $57 million in damages, and has requested FERC to require refunds of this amount. To the extent that this claim is directed at PSE&G, PSE&G believes that the claim has no legal basis and that, in any event, PSE&G has meritorious defenses to the claim. The matter is currently pending before FERC, and PSEG and PSE&G are unable to predict the outcome of this proceeding.
Energy Holdings
Texas
In July 2003, Texas Commercial Energy LLC (TCE) filed suit against the three major electric utilities in Texas, certain wholesale power generators, their related affiliated retail electric providers and certain qualified scheduling entities, as well as the Electric Reliability Council of Texas (ERCOT), in its function as the ISO for the Texas energy market. The action filed in the U.S. District Court for the Southern District of Texas (District Court), Civil Action No. C-03-249, alleged price-fixing, predatory pricing and certain common law claims. Automated Power Exchange, Inc. (APX), a named defendant, acting as the qualified scheduling entity, submitted bids on behalf of Guadalupe Power Partners, LP (Guadalupe) and Odessa-Ector Power Partners, L.P. (Odessa), as well as several other generators in the ERCOT energy market. In this connection, APX has submitted a demand for indemnification from Guadalupe and Odessa. In February 2004, TCE amended its complaint and named TIE, Guadalupe, Odessa and others as additional defendants. In May 2004, the District Court granted the defendants' motion to dismiss the state and federal antitrust claims. On June 17, 2005, a two-judge panel of the Fifth Circuit Court of Appeals (Fifth Circuit) issued its decision affirming the District Court's dismissal of TCE's state and federal antitrust claims. TCE subsequently filed a Petition seeking a rehearing before the entire panel of the Fifth Circuit, which was denied. On October 14, 2005, TCE filed a Petition for Certification of this matter to the U.S. Supreme Court. The parties have since agreed to settle the case for an immaterial amount and the matter was subsequently dismissed with prejudice by the Supreme Court. TCE has since filed for bankruptcy, which could impact the final settlement.
46
On February 18, 2005, Utility Choice L.P. and Cirro Group Inc. filed suit against many of the same defendants in the TCE suit, including TIE, Guadalupe and Odessa, based on facts similar to those alleged in the TCE litigation. The new action, filed in the District Court also alleges price-fixing, predatory pricing and various other claims. The District Court issued a stay of action pending the outcome of the TCE appeal and the stay continued until the TCE request to the Fifth Circuit was determined. The District Court originally lifted the stay for the sole purpose of permitting motions to dismiss to be filed but later allowed the case to proceed to discovery. The case has been resolved by the parties for an immaterial amount and the matter has been voluntarily dismissed with prejudice.
India
Global has a 20% ownership interest in PPN, which sells its output under a long-term PPA with the TNEB. TNEB has not made full payment to PPN for the purchase of energy under the PPA. The project was not dispatched during the fourth quarter of 2005, primarily due to the high cost of naphtha fuel and resulting low ranking on the merit order dispatch list. The past due receivable as of December 31, 2005 was approximately $1 million, net of a $79 million reserve. Provided that TNEB continues to pay consistent with recent practices, PPN is not expected to have liquidity problems. Resolution of the past due receivables against which PPN has established reserves was expected to be achieved in 2005 by a joint working group including the Central Electric Authority (CEA), PPN and TNEB. However, in the latter part of 2005, the CEA reportedly stated that it had no jurisdiction in the matter and referred the parties to the Tamil Nadu Electric Regulatory Commission (TNERC). Neither PPN nor Global believe that TNERC has jurisdiction over Capital Cost Approval, a significant component of the receivables reserve. An adverse outcome concerning the disputed Capital Cost Approvals could result in impairment of this investment.
On March 26, 2004, Global and El Paso Energy Corporation (which sold its ownership interest in PPN in 2005) filed a notice of arbitration on behalf of PPN against TNEB under the arbitration clause of the PPA, asserting that they have the right as minority shareholders to protect the contractual rights of PPN where PPN has failed to exercise those rights itself. In response, PPN filed a petition for an anti-suit injunction against the arbitration. Global successfully defended against the petition in two lower courts. PPN has filed its final appeal in the Supreme Court of India (SLP Civil No. 23169). Hearings that began on January 24, 2005 have resulted in a stay of PSEG's continued actions in the arbitral court pending a decision by the Indian Supreme Court, which is expected in due course.
As of December 31, 2005, Global's total investment in PPN was approximately $33 million, a reduction of $5 million from the December 31, 2004 balance of $38 million due to dividends received from this investment.
Turkey
From about 1995 through 2001, Global and its partners expended approximately $12 million towards the construction of a lignite-fired thermal power plant in the Konya-Ilgin region of Turkey. In 2001, Turkey passed legislation and otherwise deprived Global of rights and fair and equitable treatment and expropriated Global's Concession contract for the power plant project without compensation, despite the Government's obligation to compensate Global for its costs under the existing contract and Turkish law. In 2002, Global initiated an arbitration under the U.S.-Turkey Bilateral Investment Treaty (BIT) before the International Centre for Settlement of International Disputes for Turkey's violation of its international rights under the BIT seeking return of sunk costs, lost profits, interest and attorney fees and costs for a total of $300 million. Written testimony has been submitted by both parties and hearings are scheduled for the first two weeks of April 2006 in Washington, D.C. A decision is expected later in 2006. While Global believes it has valid and sustainable claims against the Government of Turkey, which it will continue to vigorously assert, it is unable to predict the outcome of this matter. The recovery of costs in this matter could have a material positive impact on Energy Holdings' earnings and cash flows.
PSEG, PSE&G, Power and Energy Holdings
In addition to matters discussed above, see information on the following proceedings at the pages indicated for PSEG and each of PSE&G, Power and Energy Holdings as noted:
47
(1) | | Page 16. (Power) PSEG Lawrenceburg Energy Company and PSEG Waterford Energy respective filings of triennial market power reviews, Docket Nos. ER01-2460-002 and ER01-2482-002, August 2004. |
(2) | | Page 17. (PSEG, PSE&G and Power) FERC proceedings with MISO and PJM relating to RTOR and SECA methodology, Docket No. ER05-6-000 et al. |
(3) | | Page 17. (PSEG, PSE&G and Power) PJM Reliability Pricing Model filed with FERC on August 31, 2005, Docket Nos. ERO5-1410-000 and EL05-148-000. |
(4) | | Page 17. (PSEG, PSE&G and Power) FERC proceeding relating to PJM Long-Term Transmission Rate Design, Docket No. EL05-121-000. |
(5) | | Page 18. (PSEG, PSE&G and Power) Notice of Inquiry issued by FERC on September 16, 2005 to prevent undue discrimination and preference in the provisions of transmission service. Docket No. RM05-25-000. |
(6) | | Page 18. (PSEG, PSE&G and Power) FERC proceeding relating to PJM's stated rate proposal, Docket No. ER05-1181-000. |
(7) | | Page 18. (Power) PJM Interconnection L.L.C. filing with FERC on November 2, 2004, Docket No. EL03-236-003 to amend Tariff and Operating Agreement to request Reliability Must-Run (RMR) compensation. |
(8) | | Page 19. (Power) PSEG Power Connecticut's filing with FERC on November 17, 2004, Docket No. ER05-231-000, to request RMR compensation. |
(9) | | Page 19. (PSE&G) Neptune Regional Transmission System, LLC v. PJM Interconnection, L.L.C. complaint filed with FERC on December 21, 2004, Docket No. EL05-48-000, alleging PJM impermissibly conducted an interconnection re-study triggered by generator retirements in PJM, which had the effect of increasing Neptune's cost exposure for network upgrades from approximately $4 million to $26 million. |
(10) | | Page 21. (PSEG and PSE&G) BPU proceeding on August 1, 2005 relating to ratepayer protections due to repeal of PUHCA under the Energy Policy Act of 2005. Docket No. AX05070641. |
(11) | | Page 22. (PSE&G) BPU proceeding relating to Electric Base Rate Case financial review, Docket No. ER02050303. |
(12) | | Page 22. (PSE&G) PSE&G's BGSS Commodity filing with the BPU on May 28, 2004, Docket No. GR04050390. |
(13) | | Page 22. (PSE&G) Remediation Adjustment Clause filing with the BPU on April 22, 2004, Docket No. GR04040291. |
(14) | | Page 23. (PSE&G) Remediation Adjustment Clause filing with the BPU on April 25, 2005, Docket No. GR05040383. |
(15) | | Page 23. (PSE&G) PSE&G Petition for increase of gas base rates filed with BPU on September 30, 2005, Docket No. GR05100845. |
(16) | | Page 23. (PSE&G) Cost Recovery filing with the BPU on July 1, 2004, Docket No. EE04070718. |
(17) | | Page 23. (PSE&G) Deferral Proceeding filed with the BPU on August 28, 2002, Docket No. EX02060363, and Deferral Audit beginning on October 2, 2002 at the BPU, Docket No. EA02060366. |
(18) | | Page 24. (PSE&G) BPU's audit of gas supply costs. |
(19) | | Page 24. (PSE&G) BPU Order dated December 23, 2003, Docket No. EO02120955 relating to the New Jersey Interim Clean Energy Program. |
(20) | | Page 25. (Energy Holdings) DRF Porto Alegre RS claim for past due taxes at RGE, Case No. 2004-47. |
(21) | | Page 28. (Power) Power's Petition for Review filed in the United States Court of Appeals for the District of Columbia Circuit on July 30, 2004 challenging the final rule of the United States Environmental Protection Agency entitled "National Pollutant Discharge Elimination System—Final Regulations to Establish Requirements for Cooling Water Intake Structures at Phase II Existing Facilities,' now transferred to and venued in the United States Court of Appeals for the Second Circuit with Docket No. 04-6696-ag. |
(22) | | Page 157. (PSE&G) Investigation Directive of NJDEP dated September 19, 2003 and additional investigation Notice dated September 15, 2003 by the EPA regarding the Passaic River site. Docket No. EX93060255. |
48
(23) | | Page 158. (Power) PSE&G's MGP Remediation Program instituted by NJDEP's Coal Gasification Facility Sites letter dated March 25, 1988. |
(24) | | Page 162. (Power) Filing of Complaint by Nuclear against the DOE on September 26, 2001 in the U.S. Court of Federal Claims, Docket No. 01-0551C seeking damages caused by DOE's failure to take possession of spent nuclear fuel. The complaint was amended to include PSE&G as a prior owner in interest. |
(25) | | Page 166. (Energy Holdings) Peru's Internal Revenue Agency's (SUNAT) claim for past due taxes at LDS, Resolution No. 0150150000030, dated July 10, 2003. |
(26) | | Page 166. (Energy Holdings) Dhofar Power Company SAOC v. Ministry of Housing, Electricity and Water (Sultanate of Oman), ICC Reference EXP/233. |
PSE&G and Power
In addition, see the following environmental related matters involving governmental authorities. PSE&G and Power do not expect expenditures for any such site relating to the items listed below, individually or for all such current sites in the aggregate, to have a material effect on their respective financial condition, results of operations and net cash flows.
�� (1) Claim made in 1985 by the U.S. Department of the Interior under CERCLA with respect to the Pennsylvania Avenue and Fountain Avenue municipal landfills in Brooklyn, New York, for damages to natural resources. The U.S. Government alleges damages of approximately $200 million. To PSE&G's knowledge there has been no action on this matter since 1988.
(2) Duane Marine Salvage Corporation Superfund Site is in Perth Amboy, Middlesex County, New Jersey. The EPA had named PSE&G as one of several potentially responsible parties (PRPs) through a series of administrative orders between December 1984 and March 1985. Following work performed by the PRPs, the EPA declared on May 20, 1987 that all of its administrative orders had been satisfied. The NJDEP, however, named PSE&G as a PRP and issued its own directive dated October 21, 1987. Remediation is currently ongoing.
(3) Various Spill Act directives were issued by NJDEP to PRPs, including PSE&G with respect to the PJP Landfill in Jersey City, Hudson County, New Jersey, ordering payment of costs associated with operation and maintenance, interim remedial measures and a Remedial Investigation and Feasibility Study (RI/FS) in excess of $25 million. The directives also sought reimbursement of NJDEP's past and future oversight costs and the costs of any future remedial action.
(4) Claim by the EPA, Region III, under CERCLA with respect to a Cottman Avenue Superfund Site, a former non-ferrous scrap reclamation facility located in Philadelphia, Pennsylvania, owned and formerly operated by Metal Bank of America, Inc. PSE&G, other utilities and other companies are alleged to be liable for contamination at the site and PSE&G has been named as a PRP. A Final Remedial Design Report was submitted to the EPA in September of 2002. This document presents the design details that will implement the EPA's selected remediation remedy. The costs of remedy implementation are estimated to range from $14 million to $24 million. PSE&G's share of the remedy implementation costs are estimated between $4 million and $8 million. The remedy itself and responsibility for the costs of its implementation are the subject of litigation currently in the U.S. District Court for the Eastern District of Pennsylvania entitled United States of America, et. al., v. Union Corporation, et. al., Civil Action No. 80-1589.
(5) The Klockner Road site is located in Hamilton Township, Mercer County, New Jersey, and occupies approximately two acres on PSE&G's Trenton Switching Station property. PSE&G entered into a memorandum of agreement with the NJDEP for the Klockner Road site pursuant to which PSE&G conducted an RI/FS and remedial action at the site to address the presence of soil and groundwater contamination at the site.
(6) The NJDEP assumed control of a former petroleum products blending and mixing operation and waste oil recycling facility in Elizabeth, Union County, New Jersey (Borne Chemical Co. site) and issued various directives to a number of entities, including PSE&G, requiring performance of various remedial actions. PSE&G's nexus to the site is based upon the shipment of certain waste oils to the site for recycling. PSE&G and certain of the other entities named in NJDEP directives are members of a PRP group that have been working together to satisfy NJDEP requirements including: funding of the site security program; containerized waste removal; and a site remedial investigation program.
49
ITEM 4. SUBMISSION OF MATTERS TO A VOTE OF SECURITY HOLDERS
PSEG—None.
PSE&G—None.
Power—None.
Energy Holdings—None.
50
PART II
PSEG
PSEG's Common Stock is listed on the New York Stock Exchange, Inc. As of December 31, 2005, there were 100,679 holders of record.
The following table indicates the high and low sale prices for PSEG's Common Stock and dividends paid for the periods indicated:
| | Common Stock
| | High
| | Low
| | Dividend
Per Share
|
| | 2005: | | | | | | | | | | | | |
| | First Quarter | | $ | 56.23 | | | $ | 49.32 | | | $ | 0.56 | |
| | Second Quarter | | $ | 61.66 | | | $ | 52.00 | | | $ | 0.56 | |
| | Third Quarter | | $ | 68.47 | | | $ | 59.09 | | | $ | 0.56 | |
| | Fourth Quarter | | $ | 67.58 | | | $ | 56.05 | | | $ | 0.56 | |
| | 2004: | | | | | | | | | | | | |
| | First Quarter | | $ | 47.71 | | | $ | 42.85 | | | $ | 0.55 | |
| | Second Quarter | | $ | 47.70 | | | $ | 39.66 | | | $ | 0.55 | |
| | Third Quarter | | $ | 42.60 | | | $ | 38.10 | | | $ | 0.55 | |
| | Fourth Quarter | | $ | 52.64 | | | $ | 40.55 | | | $ | 0.55 | |
| | | | | | | | | | | | | | |
In January 2006, PSEG's Board of Directors approved a one-cent increase in its quarterly common stock dividend, from $0.56 to $0.57 per share, for the first quarter of 2006. This increase reflects an indicated annual dividend rate of $2.28 per share.
The Merger Agreement between PSEG and Exelon provides that, subject to applicable law and the fiduciary duties of its Board of Directors, Exelon will increase its quarterly dividend so that the first dividend paid after completion of the Merger is an amount equal to the dividend PSEG shareholders received in the quarter immediately prior to completion of the Merger based on the 1.225 exchange ratio used, up to a maximum of $0.47 per share of Exelon Common Stock. It is anticipated that the combined company will maintain Exelon's current dividend payout policy of 50% to 60% of earnings. For additional information concerning dividend payments, dividend history, policy and potential preferred voting rights, restrictions on payment and common stock repurchase programs, see Item 7. MD&A—Overview of 2005 and Future Outlook and Liquidity and Capital Resources and Note 9. Schedule of Consolidated Capital Stock and Other Securities of the Notes.
PSE&G
All of the common stock of PSE&G is owned by PSEG. For additional information regarding PSE&G's ability to continue to pay dividends, see Item 7. MD&A—Overview of 2005 and Future Outlook.
Power
All of Power's outstanding limited liability company membership interests are owned by PSEG. For additional information regarding Power's ability to pay dividends, see Item 7. MD&A—Overview of 2005 and Future Outlook.
Energy Holdings
All of Energy Holdings' outstanding limited liability company membership interests are owned by PSEG. For additional information regarding Energy Holdings' ability to pay dividends, see Item 7. MD&A—Overview of 2005 and Future Outlook.
51
ITEM 6. SELECTED FINANCIAL DATA
PSEG
The information presented below should be read in conjunction with the Management's Discussion and Analysis (MD&A) and the Consolidated Financial Statements and Notes to Consolidated Financial Statements (Notes).
| | | For the Years Ended December 31,
|
| | | 2005
| | 2004
| | 2003
| | 2002
| | 2001
|
| | | (Millions, where applicable) |
Operating Revenues | | $ | 12,430 | | | $ | 10,800 | | | $ | 11,006 | | | $ | 8,150 | | | $ | 6,863 | |
Income from Continuing Operations | | $ | 858 | | | $ | 770 | | | $ | 855 | | | $ | 403 | (A) | | $ | 766 | |
Net Income | | $ | 661 | | | $ | 726 | | | $ | 1,160 | | | $ | 235 | | | $ | 764 | |
Earnings per Share: | | | | | | | | | | | | | | | | | | | | |
Income from Continuing Operations: | | | | | | | | | | | | | | | | | | | | |
Basic | | $ | 3.57 | | | $ | 3.25 | | | $ | 3.75 | | | $ | 1.94 | (A) | | $ | 3.68 | |
Diluted | | $ | 3.51 | | | $ | 3.23 | | | $ | 3.74 | | | $ | 1.94 | (A) | | $ | 3.68 | |
Net Income: | | | | | | | | | | | | | | | | | | | | |
Basic | | $ | 2.75 | | | $ | 3.06 | | | $ | 5.08 | | | $ | 1.13 | | | $ | 3.67 | |
Diluted | | $ | 2.71 | | | $ | 3.05 | | | $ | 5.07 | | | $ | 1.13 | | | $ | 3.67 | |
Dividends Declared per Share | | $ | 2.24 | | | $ | 2.20 | | | $ | 2.16 | | | $ | 2.16 | | | $ | 2.16 | |
As of December 31: | | | | | | | | | | | | | | | | | | | | |
Total Assets | | $ | 29,815 | | | $ | 29,260 | | | $ | 28,132 | | | $ | 26,117 | | | $ | 25,549 | |
Long-Term Obligations(B) | | $ | 11,329 | | | $ | 12,663 | | | $ | 12,729 | | | $ | 10,889 | | | $ | 10,118 | |
| | | | | | | | | | | | | | | | | | | | |
| | | |
| (A) | | 2002 results include after-tax charges of $368 million, or $1.76 per share, related to losses from Energy Holdings' Argentine investments. |
| | | |
| (B) | | Includes capital lease obligations. |
PSE&G
The information presented below should be read in conjunction with the MD&A, the Consolidated Financial Statements and the Notes.
| | | For the Years Ended December 31,
|
| | | 2005
| | 2004
| | 2003
| | 2002
| | 2001
|
| | | (Millions) |
Operating Revenues | | $ | 7,728 | | | $ | 6,972 | | | $ | 6,740 | | | $ | 5,919 | | | $ | 6,091 | |
Income Before Extraordinary Item | | $ | 348 | | | $ | 346 | | | $ | 247 | | | $ | 205 | | | $ | 235 | |
Net Income | | $ | 348 | | | $ | 346 | | | $ | 229 | | | $ | 205 | | | $ | 235 | |
As of December 31: | | | | | | | | | | | | | | | | | | | | |
Total Assets | | $ | 14,291 | | | $ | 13,586 | | | $ | 13,177 | | | $ | 12,867 | | | $ | 13,299 | |
Long-Term Obligations(A) | | $ | 4,745 | | | $ | 4,877 | | | $ | 5,129 | | | $ | 5,050 | | | $ | 5,180 | |
| | | | | | | | | | | | | | | | | | | | |
| | | |
| (A) | | Includes capital lease obligations. |
Power
Omitted pursuant to conditions set forth in General Instruction I of Form 10-K.
Energy Holdings
Omitted pursuant to conditions set forth in General Instruction I of Form 10-K.
52
This combined MD&A is separately filed by Public Service Enterprise Group Incorporated (PSEG), Public Service Electric and Gas Company (PSE&G), PSEG Power LLC (Power) and PSEG Energy Holdings L.L.C. (Energy Holdings). Information contained herein relating to any individual company is filed by such company on its own behalf. PSE&G, Power and Energy Holdings each make representations only as to itself and make no other representations whatsoever as to any other company.
PENDING MERGER
PSEG, PSE&G, Power and Energy Holdings
On December 20, 2004, PSEG entered into an agreement and plan of merger (Merger Agreement) with Exelon Corporation (Exelon), a public utility holding company headquartered in Chicago, Illinois, whereby PSEG and its subsidiaries will be merged with and into Exelon (Merger). Under the Merger Agreement, each share of PSEG Common Stock will be converted into 1.225 shares of Exelon Common Stock.
The Merger Agreement has been unanimously approved by both companies' Boards of Directors. On July 19, 2005, shareholders of PSEG voted to approve the Merger, and on July 22, 2005, shareholders of Exelon voted to approve the issuance of common shares to PSEG shareholders to effect the Merger.
Completion of the Merger is subject to approval by a number of governmental authorities. As described below, PSEG and Exelon have obtained all regulatory approvals from the principal agencies involved except the Nuclear Regulatory Commission (NRC), U.S. Department of Justice (DOJ) and the New Jersey Board of Public Utilities (BPU).
On June 30, 2005, the Federal Energy Regulatory Commission (FERC) voted to approve the Merger. FERC determined that Exelon's and PSEG's proposed divestitures and other commitments in their original and supplemental filings with FERC, together with their answers to intervenors' questions, met the public interest standard of the Federal Power Act. Exelon and PSEG have committed to divest 4,000 megawatts (MW) of intermediate and peaking generation facilities located primarily in eastern PJM Interconnection, L.L.C. (PJM), and to “virtually divest” 2,600 MW of nuclear capacity by effectively transferring control of the output through sales to third parties. A number of parties filed requests for rehearing, which FERC denied on December 15, 2005. Several parties, including the BPU and the New Jersey RatePayer Advocate have filed notices to appeal FERC's Order.
During 2005, regulatory approvals or clearances related to the Merger were also obtained from the Connecticut Siting Council (CSC) regarding the transfer of PSEG Power Connecticut LLC's Certificate of Environmental Compatibility and Public Need to Exelon Generation Connecticut LLC, the New Jersey Department of Environmental Protection (NJDEP) under the Industrial Site Recovery Act, the New York Public Service Commission (NYPSC), FERC with respect to the transfer of the hydro license for Yards Creek Generating Station, the Indiana Utility Regulatory Commission, the Public Utility Commission of Texas and Brazil's Agencia Nacional de Energia Elétrica.
On January 27, 2006, the Pennsylvania Public Utility Commission (PAPUC) approved the Merger, principally adopting a settlement by PECO Energy Company (PECO), an Exelon public utility subsidiary serving areas in Southeastern Pennsylvania, and PSE&G with a number of the parties to the proceeding representing consumer, business, environmental and low income interests. Pursuant to the settlement, if the Merger is consummated, PECO will provide $120 million over four years in rate discounts for customers and cap its rates through the end of 2010. The settlement also provides substantial funding for alternative energy and environmental projects, economic development, and expanded outreach and assistance for low-income customers. PECO also made commitments for enhanced customer and service reliability and pledges for charitable donations and maintenance of its current headquarters at current staff levels in Philadelphia until the end of 2010.
On February 8, 2006, PUHCA was repealed, obviating approval by the SEC under that statute.
The NRC proceeding is essentially complete, and an order is pending.
PSEG and Exelon presently expect to complete their responses to the current information requests of the DOJ under the HSR Act in the first quarter of 2006. Once the DOJ has evaluated the information submitted by PSEG, Exelon and others, PSEG and Exelon expect to discuss any suggestions or remedies proposed by the DOJ.
53
In New Jersey, the BPU issued an order requiring Exelon and PSEG to prove that positive benefits flow to PSE&G's customers and the State as a result of the Merger, and that, at a minimum, there be no adverse impact to competition, employees or reliability due to the Merger. The procedural schedule for the BPU's regulatory approval process in New Jersey includes opportunities for settlement discussions with the consumer advocacy groups and other interested parties during the course of the proceedings.
In late November 2005, the BPU concluded five public hearings at which representatives from business, environmental coalitions, non-profit organizations and consumer groups offered opinions about the Merger. Representatives of the four unions representing workers at PSEG testified in support the Merger upon reaching an agreement with PSEG and Exelon that there will be no layoffs of union workers in New Jersey through the remaining five years of the unions' six-year contracts.
The hearings related to the BPU review of the Merger, commenced on January 4, 2006 and are currently ongoing at the New Jersey Office of Administrative Law. The schedule most recently approved by the Administrative Law Judge (ALJ) provides for the hearings to be completed around the end of March 2006, to enable the PJM Market Monitor the opportunity to complete his analysis of the adequacy of the proposal by PSEG and Exelon to mitigate market power of the new company through the sale of 4,000 MW of fossil generation and the virtual divestiture of 2,600 MW of nuclear. No assurances can be given that such analysis will be completed or, if completed, will be acceptable to either PSEG or Exelon. During the hearings, other parties have proposed additional divestiture and have opposed the use of virtual divestiture to address market power issues. During the hearings, PSEG and Exelon have also committed to provide rate credits to PSE&G's customers of $120 million over 3 or 4 years, to maintain PSE&G's capital expenditure program and to implement certain governance procedures. Settlement discussions began in December 2005 and are expected to resume after the hearings conclude. No assurances can be given as to whether any such discussions will result in settlements. No firm dates have been set for the ALJ's initial decision and final order from the BPU.
Commonwealth Edison Co. (ComEd), a wholly owned subsidiary of Exelon providing retail electric service in Illinois, is involved in regulatory proceedings in Illinois pertaining to the restructuring of the Illinois electric markets, which began in 1997. Since that time, the rates of ComEd have been reduced and capped, and ComEd transferred or sold its generation assets to third parties or to its affiliate, Exelon Generation LLC (Exelon Generation). Currently, the rate freeze for ComEd and contractual power supply obligations of Exelon Generation to ComEd expire December 31, 2006. In January 2006, the Illinois Commerce Commission (ICC) approved, with certain modifications, a proposal by ComEd to procure power commencing January 1, 2007 through an auction designed to reflect market rates. Various parties to the proceeding, including the Illinois Attorney General and the Citizens Utility Board have requested the ICC to reconsider its decision, and have indicated they will file appeals to the courts if the ICC ruling is not modified so as to disapprove the ComEd proposal. In addition, legislation has been introduced in the Illinois General Assembly to continue ComEd's rate freeze for an additional three years. ComEd has indicated that it believes that enactment of such legislation would violate Federal law and the U.S. Constitution. Nevertheless, ComEd has indicated that it cannot predict the outcome of these regulatory proceedings and legislative actions and that a rate freeze extension or other significant constraint on its ability to recover its power supply costs would have materially adverse financial and operating effects and would likely cause ComEd to resort to protection of the bankruptcy courts to continue as a going concern. The regulatory and political developments in Illinois could also have an effect on the timing or closing conditions of the Merger.
Exelon and PSEG presently expect to complete all of the regulatory reviews and close the Merger in the third quarter of 2006. Closing may occur earlier if a settlement is reached and accepted by the BPU. The Merger Agreement provides that if the Merger is not consummated by June 20, 2006, either party may terminate the Merger Agreement.
Although Exelon and PSEG believe that the expectations as to timing for the closing of the Merger described above are reasonable, no assurances can be given as to the timing of the receipt of any remaining regulatory approvals, that all required approvals will be received, or that conditions in future regulatory orders will be acceptable to the parties or not have materially adverse conditions. PSEG is committed to maintaining a viable stand-alone business strategy in the event the Merger does not close. Management believes PSEG will continue to operate successfully; however, inability to close the Merger could have an impact on PSEG's and Power's credit ratings and could impact the financial condition, results of operations and cash flows of PSEG, PSE&G, Power and Energy Holdings.
54
OVERVIEW OF 2005 AND FUTURE OUTLOOK
PSEG
PSEG's business consists of four reportable segments, which are PSE&G, Power and the two direct subsidiaries of Energy Holdings: PSEG Global L.L.C (Global) and PSEG Resources L.L.C. (Resources). The following is a discussion of the markets in which PSEG and its subsidiaries compete, the corporate strategy for the conduct of PSEG's businesses within these markets and significant events that have occurred during 2005 and expectations for 2006 and beyond.
PSEG develops a long-range growth target by building business plans and financial forecasts for each major business (PSE&G, Power, Global and Resources). These plans and forecasts incorporate detailed estimates of revenues, operating and maintenance expenses, capital expenditures, financing costs and other material factors for each business. Key factors that may influence the performance of each business, such as fuel costs and forward power prices, are also incorporated. Sensitivity analyses are performed on the key variables that drive the businesses' financial results in order to understand the impact of these assumptions on PSEG's projections. Once plans are in place, PSEG management monitors actual results and key variables and updates financial projections to reflect changes in the energy markets, the economy and regional and global conditions. PSEG management believes this monitoring and forecasting process enables it to alter operating and investment plans as conditions change.
For 2006, PSEG expects Income from Continuing Operations to range from $3.45 to $3.75 per share, excluding Merger-related costs. The increase as compared to 2005 earnings is primarily due to anticipated higher earnings at Power, offset by modest reductions at PSE&G and Energy Holdings. The projected increase at Power is due to anticipated higher margins through the expiration of existing contracts and the realization of current and anticipated higher market prices, partially offset by increases in depreciation and interest expense associated with the new Linden plant expected to be placed into service in mid-2006 and a full-year of operations for the Bethlehem Energy Center which commenced commercial operations in July 2005, increased Operation and Maintenance costs and lower earnings from the Nuclear Decommissioning Trust (NDT) Funds. The decrease at PSE&G is primarily due to the planning assumption of normal weather during 2006. The reduction at Energy Holdings is primarily due to the absence of the gain from the sale of Seminole Generation Station Unit 2 (Seminole). Also assumed in the earnings projections for 2006 are continued improved nuclear and fossil operations, a positive and timely outcome to the financial review by the BPU for PSE&G (discussed below) and continued strong contributions from Global's operations in Texas and South America. The earnings range for 2006 excludes the expected gain on the sale of Global's two generating facilities in Poland, Elektrocieplownia Chorzow Sp. Z o.o. (Elcho) and Elektrownia Skawina SA (Skawina), which will be reflected in Discontinued Operations, as well as any potential finance costs associated with use of the proceeds. The guidance range also does not contemplate the potential earnings fluctuations that could occur due to mark-to-market (MTM) accounting being applied to certain of Power's and Energy Holdings' operations pursuant to Statement of Financial Accounting Standards (SFAS) No. 133, “Accounting for Derivative Instruments and Hedging Activities”, as amended and interpreted (SFAS 133). See Note 11. Risk Management of the Notes for additional information.
In addition, PSEG anticipates earnings per share growth to be in excess of 10% per year for 2007 and 2008, which assumes continued improved operations at Power and reasonable outcomes in PSE&G's regulatory proceedings.
PSEG expects operating cash flows beyond 2005 to be sufficient to meet capital needs and dividend requirements and may employ any excess cash to reduce debt, invest in its businesses, increase dividends or, in the longer term, repurchase shares. On January 17, 2006, PSEG announced an increase in its quarterly dividend from $0.56 to $0.57 per share for the first quarter of 2006. This increase reflects an indicated annual dividend rate of $2.28 per share.
Several key factors that will drive PSEG's future success are energy, capacity and fuel prices, performance of Power's generating facilities, PSE&G's ability to maintain a reasonable rate of return under its regulated rate structure and the stability of international economies for Energy Holdings.
PSE&G
PSE&G operates as an electric and gas public utility in New Jersey under cost-based regulation by the BPU for its distribution operations and by FERC for its electric transmission and wholesale sales operations.
55
Consequently, the earnings of PSE&G are largely determined by the regulation of its rates by those agencies. In February 2006, the BPU approved the results of New Jersey's annual Basic Generation Service (BGS)-Fixed Price (FP) and BGS-Commercial and Industrial Energy Price (CIEP) auctions and PSE&G successfully secured contracts to provide the electricity requirements for the majority of its customers' needs.
On September 30, 2005, PSE&G filed a petition with the BPU seeking an overall 3.78% increase in its gas base rates to appropriately recover the cost of gas delivery and to be effective June 30, 2006. Approximately $55 million of the $133 million request is for an increase in book depreciation rates. The balance of the request will cover increased plant investment, higher operating expenses and provide an 11% return on equity. PSE&G's current gas base rates have been in effect since January 2002. The current schedule provides for a decision on the gas base rate case from the BPU in September 2006, with new rates effective October 1, 2006. PSE&G cannot predict the timing and amount of any rate relief.
On August 19, 2005, the BPU approved PSE&G's request for an increase in its Basic Gas Supply Service (BGSS) commodity charge to its residential gas customers of approximately $163 million (excluding sales and use taxes (SUT)) in annual revenues effective September 1, 2005 or approximately 10.2% for the class average residential heating customer. On December 15, 2005, the BPU approved PSE&G's request for an additional increase of approximately $204 million (excluding SUT) or approximately 15.6% for the class average residential heating customer which became effective immediately. The December 15, 2005 BGSS increase was intended to eliminate any large underrecovery and is expected to produce a zero deferred balance at September 30, 2006 based on the conditions at the time of the filing and is also intended to be in lieu of the 5% increases on December 1, 2005 and February 1, 2006.
In 2006, PSE&G expects Income from Continuing Operations to range from $315 million to $335 million, which is slightly lower than results for 2005, primarily due to the planning assumption of normal weather conditions for 2006.
Also included in PSE&G's projections is a positive and timely outcome, which cannot be assured, to the financial review at the BPU for approximately $64 million. As part of the settlement of PSE&G's electric base rate case in 2004, a $64 million annual depreciation credit was established. This credit expired on December 31, 2005. As part of the settlement, PSE&G was required to make a financial filing with the BPU in November 2005 to support a corresponding increase in rates to offset the loss of the depreciation credit. The BPU issued an order on February 7, 2006 and found that insufficient information had been provided to support the rate increase at the time. The order permits PSE&G to file, no later than June 15, 2006, actual data through March 31, 2006. The BPU will determine, based on the additional information, if the rate increase is warranted. The impact of not receiving this increase reduces PSE&G's earnings and cash flows by more than $5 million (pre-tax) per month. The timing and amount of an increase cannot be predicted with certainty.
The risks from this business generally relate to the treatment of the various rate and other issues by the state and federal regulatory agencies, specifically the BPU and FERC. In 2006 and beyond, PSE&G's success will depend, in part, on its ability to maintain a reasonable rate of return, including a reasonable outcome to its current Gas Base Rate Case and the ability to realize the approximate $64 million electric distribution rate increase per year beginning in 2006, continue cost containment initiatives, maintain system reliability and safety levels and continue to recover with an adequate return the regulatory assets it has deferred and the investments it plans to make in its electric and gas transmission and distribution system. Since PSE&G earns no margin on the commodity portion of its electric and gas sales through tariff agreements, there is no anticipated commodity price volatility for PSE&G.
Power
Power is an electric generation and wholesale energy marketing and trading company that is focused on a generation market extending from Maine to the Carolinas and the Atlantic Coast to Indiana. Power's principal operating subsidiaries, PSEG Fossil LLC (Fossil), PSEG Nuclear LLC (Nuclear) and PSEG Energy Resources & Trade LLC (ER&T) are regulated by FERC. Through its subsidiaries, Power seeks to balance its generating capacity, fuel requirements and supply obligations through integrated energy marketing and trading, enhance its ability to produce low-cost energy through efficient nuclear operations and pursue modest growth based on market conditions. Changes in the operation of Power's generating facilities, fuel and capacity prices, expected contract prices, capacity factors or other assumptions could materially affect its
56
ability to meet earnings targets and/or liquidity requirements. In addition to the electric generation business described above, Power's revenues include gas supply sales under the BGSS contract with PSE&G.
As a merchant generator, Power's profit is derived from selling under contract or on the spot market a range of diverse products such as energy, capacity, emissions credits, congestion credits, and a series of energy-related products that the system operator uses to optimize the operation of the energy grid, known as ancillary services. Accordingly, commodity prices, such as electricity, gas, coal and emissions, as well as the availability of Power's diverse fleet of generation units to produce these products, when necessary, have a considerable effect on Power's profitability. Recently, the price of many of these products has increased dramatically. These price increases have been accompanied by increases in volatility as well. The prices at which transactions are entered into for future delivery of these products, as evidenced through the market for forward contracts at points such as PJM West, have escalated but the volatility in the market will also increase the risk to Power's results as the market changes are likely to impact the value of the uncontracted portion of Power's portfolio.
Broad market price increases such as these are expected to have a positive effect on Power's results. Historically, Power's nuclear and coal-fired facilities have produced over 50% and 25% of Power's production, respectively. With the vast majority of its power sourced from lower-cost units, the rise in electric prices driven by dramatic increases in gas prices is anticipated to yield higher near-term margins for Power. In the near term, Power anticipates recognizing these higher margins, especially on the portion of its output that was more recently contracted or sold on the spot market. Over a longer-term horizon, if these higher prices are sustained at prices reflective of what the current forward markets indicate, it would yield a more attractive environment for Power to contract the sale of its anticipated output, allowing for potentially sustained higher profitability.
Power believes that recent events in PJM, New York and the New England Power Pool (NEPOOL) have created the potential for incremental value to be received from the capacity markets for its units. These include existing and anticipated Reliability-Must-Run (RMR) contracts to provide generation unit owners with fixed reliability payments to enable their continued availability and potential changes in the nature of capacity markets which would provide generators with differentiated capacity payments based upon the location and operating characteristics of their respective facilities.
During 2005, the rising commodity price environment resulted in increased liquidity requirements for Power's energy sales contracts entered into in the normal course of business. In response to such changes in the business environment, PSEG and Power obtained additional sources of liquidity. In addition, Accumulated Other Comprehensive Loss (OCL) increased as contracts that qualify for hedge accounting were marked to market.
Power seeks to mitigate volatility in its results by contracting in advance for a significant portion of its anticipated electric output and fuel needs. Power believes this contracting strategy increases stability of earnings and cash flow. By keeping some portion of its output uncontracted, Power is able to retain some exposure to market changes as well as provide some protection in the event of unexpected generation outages.
Power seeks to sell a portion of its anticipated nuclear and coal-fired generation over a multi-year forward horizon, normally over a period of approximately two to four years. In 2005, these units produced over 85% of Power's generation, and given their historic low operating cost, an even higher percentage of the company's margin. As of February 15, 2006, Power has contracted for over 95% of its anticipated 2006 nuclear and coal-fired generation, with 85% to 95% contracted for 2007 and 65% to 80% contracted for 2008, with a relatively small amount contracted beyond 2008.
Power has also entered into contracts for the future delivery of nuclear fuel and coal to support its contracted sales discussed above. As of February 15, 2006, Power had contracted for 100% of its anticipated nuclear fuel needs through 2008, and approximately 75% of its average anticipated coal needs, including transportation, through 2008. These estimates are subject to change based upon the level of operation, and in particular for coal, are subject to market demands and pricing.
By contrast, Power takes a more opportunistic approach in hedging its anticipated natural gas-fired generation. The generation from these units is less predictable, as these units are generally dispatched only when aggregate market demand has exceeded the supply provided by low-cost units. The natural gas-fired units generally provide a lower contribution to the margin of Power than either the nuclear or coal units.
57
Power will generally purchase natural gas as gas-fired generation is required to supply forward sale commitments.
In a changing market environment, this hedging strategy may cause Power's realized prices to be materially different than current market prices. At the present time, a significant portion of Power's existing contractual obligations, entered into during lower-priced periods, resulted in lower margins than would have been the case if no or little hedging activity had been conducted. Alternatively, in a falling price environment, this hedging strategy will tend to create margins in excess of those implied by the then current market.
Concurrent with the signing of the Merger Agreement, Power entered into an Operating Services Contract (OSC) with Exelon Generation. Under the terms of the OSC, since January 17, 2005, Exelon Generation has provided management personnel and its proprietary management systems under a fee arrangement to Power to operate the Salem and Hope Creek nuclear generating facilities. The OSC has a term of two years, subject to earlier termination in certain events upon prior notice, including any termination of the Merger Agreement. In the event of termination, Exelon Generation is required to continue to provide services under the OSC for a transition period of at least 180 days and up to two years at the election of Nuclear. This period may be further extended by Nuclear for up to an additional 12 months if Nuclear determines that additional time is necessary to complete required activities during the transition period.
On July 18, 2005, Power's new Bethlehem Energy Center (BEC), a 750 MW, natural gas -fired combined cycle power generation plant near Albany, New York, began commercial operations, replacing a 376 MW oil-fired facility at the same site.
On September 28, 2005, Power completed the sale of its electric generation facility located in Waterford, Ohio (Waterford) to a subsidiary of American Electric Power Company, Inc. The sale price for the facility and inventory was $220 million. The proceeds, together with anticipated reduction in tax liability, were approximately $320 million, which will be used to retire debt at Power. See Note 4. Discontinued Operations, Dispositions and Acquisitions of the Notes for further discussion.
In 2006, Power expects Income from Continuing Operations to range from $475 million to $525 million, reflecting continued improvements in the operating performance of its nuclear and fossil stations, strong energy markets and increased contracting opportunities. These increases will be partially offset by increases in depreciation and interest expense associated with the new Linden plant expected to be placed into service in mid-2006 and a full year for the Bethlehem Energy Center, increased Operation and Maintenance costs and lower earnings from the NDT Funds. The guidance range does not contemplate the potential earnings fluctuations that could occur due to MTM accounting being applied to Power's operations pursuant to SFAS 133. See Note 11. Risk Management of the Notes for additional information.
A key factor in Power's ability to achieve its objectives is its capability to operate its nuclear and fossil stations at sufficient capacity factors to limit the need to purchase higher-priced electricity to satisfy its obligations. Power's ability to benefit from any future increases in market prices will depend, to a large extent, on efficient power plant operations, especially for its low-cost nuclear and coal-fired facilities. While these increases may have a potentially significant, beneficial impact on margins, they could also raise any replacement power costs that Power may incur in the event of unanticipated outages, and could also further increase liquidity requirements as a result of contract obligations. For additional information on liquidity requirements, see Liquidity and Capital Resources. In addition, forward prices are constantly changing and therefore there is no assurance that Power will be able to contract its output at attractive prices.
Energy Holdings
Energy Holdings' operations are principally conducted through its subsidiaries Global, which has invested in international, rate-regulated distribution companies and domestic and international merchant generation companies, and Resources, which primarily invests in energy-related leveraged leases. Energy Holdings' earnings significantly exceeded its earnings guidance range in 2005 and previous years' results. The increase was driven by strong results in Global's generation projects in Texas and its South American distribution businesses and a gain on the sale of Resources' leveraged lease investment in Seminole. Also, Energy Holdings contributed over $400 million in cash distributions to PSEG while calling all $309 million of its 7.75% 2007 Senior Notes. In 2004, Energy Holdings contributed $475 million to PSEG and redeemed over $300 million of debt. Energy Holdings' strong cash flow in 2005 was largely due to dividends from its investments, the repatriation of approximately $240 million of cash from its foreign investments under the
58
American Jobs Creation Act of 2004 (Jobs Act), the collection of the note receivable from the 2004 sale of MPC and the sale of Resources' investment in Seminole.
For 2006, Energy Holdings expects Income from Continuing Operations to range from $155 million to $175 million. The expected 2006 range is less than the 2005 Income from Continuing Operations primarily due to a $43 million after-tax gain recognized in 2005 from the sale of Seminole. The earnings range for 2006 excludes the expected gain on the sale of Global's two generating facilities in Poland, Elcho and Skawina, which will be reflected in Discontinued Operations, as well as any potential finance costs associated with use of the proceeds. The guidance range also does not contemplate the potential earnings fluctuations that could occur due to MTM accounting being applied to Global's operations in Texas as the energy and gas contracts, which are backed by the physical capacity of the plant and sold in the normal course of business, must be marked to market pursuant to SFAS 133. See Note 11. Risk Management of the Notes for additional information related to this contract.
Global
Although Global continues to produce significant earnings and operating cash flow, the returns on several of the investments in its international portfolio have not been commensurate with the level of risk associated with international investments in developing energy markets. As a result, since 2003, Energy Holdings has refocused its strategy from one of growth to one that places emphasis on increasing the efficiency and returns of its existing assets.
Accordingly, Global continues to limit its capital spending, while focusing on operations and improved performance of existing businesses and is seeking to opportunistically monetize investments that may no longer have a strategic fit. On January 31, 2006, Energy Holdings entered into an agreement with CEZ a.s., the former Czech national utility company and the largest electric power company in central and eastern Europe, to sell Global's interest in two coal-fired plants in Poland, Elcho and Skawina. The sale is expected to close in the second quarter of 2006. Net proceeds from the sale are subject to various purchase price adjustments, foreign currency fluctuations and contingencies and are currently expected to be approximately $300 million after taxes and transaction costs, which is in excess of the book value of the facilities as of December 31, 2005. In April 2005, Global sold a 35% interest in Dhofar Power Company S.A.O.C. (Dhofar Power), reducing its ownership interest from 81% to 46%, through a public offering on the Omani stock exchange for net proceeds of approximately $25 million. The capital requirements of Global's consolidated subsidiaries are primarily financed from internally generated cash flow within the projects and from local sources on a basis that is non-recourse to Global or limited discretionary investments by Energy Holdings.
Under the provisions of the Jobs Act and the currently released IRS regulations, Global had a one-year window to repatriate earnings from its foreign investments and claim a special one-time 85% dividends received tax deduction on such distributions. In 2005, PSEG executed a total of three Domestic Reinvestment Plans under which approximately $242 million was repatriated, of which $177 million was eligible for the reduced tax rate pursuant to the Jobs Act. The tax expense associated with such repatriation totaled approximately $11 million. Other than amounts remitted under the Jobs Act, Global has made no change in its current intention to indefinitely reinvest accumulated earnings of its foreign subsidiaries.
Global's success will depend, in part, upon its ability to mitigate risks of its international strategy. The economic and political conditions in certain countries where Global has investments present risks that may be different or more significant than those found in the U.S. including: renegotiation or nullification of existing contracts, changes in law or tax policy, interruption of business, nationalization, expropriation, war and other factors. Operations in foreign countries also present risks associated with currency exchange and convertibility, inflation and repatriation of earnings. In some countries in which Global has interests, economic and monetary conditions and other factors could affect its ability to convert its cash distributions to U.S. Dollars or other freely convertible currencies. Furthermore, the central bank of any such country may have the authority to suspend, restrict or otherwise impose conditions on foreign exchange transactions or to limit distributions to foreign investors.
Resources
Resources primarily has invested in energy-related leveraged leases. Resources is focused on maintaining its current investment portfolio and does not expect to make any new investments. Resources' ability to realize tax benefits associated with its leveraged lease investments is dependent upon taxable income
59
generated by its affiliates. Resources' earnings and cash flows are expected to decrease in the future as the investment portfolio matures. Resources faces risks with regard to the creditworthiness of its counterparties, specifically certain lessees that collectively comprise a substantial portion of Resources' investment portfolio as discussed further below. Resources also faces risks related to potential changes in the current accounting and tax treatment of certain investments in leveraged leases. The manifestation of either of these risks could cause a materially adverse effect on Resources' strategy and its forecasted results of operations, financial position and net cash flows.
In January 2005, Resources and Global sold their interests in three Solar Electric Generating Systems (SEGS) projects for proceeds of approximately $7 million. Also in January 2005, Resources also received proceeds of approximately $17 million from the KKR Fund's sale of its investment in KinderCare Learning Centers, Inc.
In June 2005, Resources wrote off its entire investment of approximately $15 million, net of tax, in an aircraft lease to United Airlines (UAL) upon termination of the lease and repossession of the aircraft by the lenders in a bankruptcy proceeding with UAL.
In December 2005, Resources sold its interest in Seminole in Palatka, Florida, to Seminole Electric Cooperative Inc. for $286 million. Seminole is a 659 MW coal-fired facility. It is one of two units at the Seminole plant. The sale resulted in a $43 million after-tax gain. Net proceeds of $235 million together with other funds were used to redeem Energy Holdings' $309 million outstanding 7.75% Senior Notes due in 2007.
As of December 31, 2005, Resources has a remaining net investment in four leased aircraft of approximately $32 million. On September 14, 2005, Delta Airlines (Delta) and Northwest Airlines (Northwest), the lessees for Resources' four remaining aircraft, filed for Chapter 11 bankruptcy protection. This had no material effect on Energy Holdings as it continues to believe that it will be able to recover the recorded amount of its investments in these aircraft as of December 31, 2005. In 2004 and 2005, Resources successfully restructured the leases and converted the Delta and Northwest leases from leveraged leases to operating leases. Energy Holdings expects to recover its investment through cash flows from the operating leases.
During 2005, the IRS proposed to disallow certain deductions associated with some of the leveraged leases which have been designated by the IRS as listed transactions. In addition, a proposal by the Financial Accounting Standards Board (FASB) concerning leveraged leases would require a lessor to perform a recalculation of a leveraged lease when there is a change in the timing of the realization of tax benefits generated by the lease. If implemented in its present form, the impact of this proposal could be material. For additional information, see Note 12. Commitments and Contingent Liabilities of the Notes.
60
RESULTS OF OPERATIONS
PSEG, PSE&G, Power and Energy Holdings
Net Income for the year ended December 31, 2005 was $661 million or $2.71 per share of common stock, diluted, based on approximately 244 million average shares outstanding. Included in 2005 Net Income was a $178 million after-tax loss from the sale of Power's Waterford generation facility. See Note 4. Discontinued Operations, Acquisitions and Dispositions of the Notes. Net Income for the year ended December 31, 2004 was $726 million or $3.05 per share of common stock, diluted, based on approximately 238 million average shares outstanding. Net Income for the year ended December 31, 2003 was approximately $1.2 billion or $5.07 per share of common stock, diluted, based on approximately 229 million average shares outstanding. Included in 2003's Net Income was a $370 million after-tax Cumulative Effect of a Change in Accounting Principle related to the adoption in 2003 of SFAS No. 143, “Accounting for Asset Retirement Obligations” (SFAS 143). See Note 3. Asset Retirement Obligations of the Notes.
| | | | Earnings (Losses)
|
| | | | Years Ended December 31,
|
| | | | 2005
| | 2004
| | 2003
|
| | | | (Millions) |
| | PSE&G | | $ | 348 | | | $ | 346 | | | $ | 247 | |
| | Power | | | 406 | | | | 342 | | | | 483 | |
| | Energy Holdings: | | | | | | | | | | | | |
| | Global | | | 112 | | | | 93 | | | | 116 | |
| | Resources | | | 92 | | | | 68 | | | | 72 | |
| | Other(A) | | | (5 | ) | | | (10 | ) | | | (5 | ) |
| | | | |
| | | |
| | | |
| |
| | Total Energy Holdings | | | 199 | | | | 151 | | | | 183 | |
| | Other(B) | | | (95 | ) | | | (69 | ) | | | (58 | ) |
| | | | |
| | | |
| | | |
| |
| | PSEG Income from Continuing Operations | | | 858 | | | | 770 | | | | 855 | |
| | Loss from Discontinued Operations, including Gain (Loss) on Disposal(C) | | | (180 | ) | | | (44 | ) | | | (47 | ) |
| | Extraordinary Item(D) | | | — | | | | — | | | | (18 | ) |
| | Cumulative Effect of a Change in Accounting Principle(E) | | | (17 | ) | | | — | | | | 370 | |
| | | | |
| | | |
| | | |
| |
| | PSEG Net Income | | $ | 661 | | | $ | 726 | | | $ | 1,160 | |
| | | | |
| | | |
| | | |
| |
| | | | | | | | | | | | | | |
| | | | Contribution to Earnings
Per Share (Diluted)(F)
|
| | | | Years Ended December 31,
|
| | | | 2005
| | 2004
| | 2003
|
| | PSE&G | | $ | 1.42 | | | $ | 1.45 | | | $ | 1.08 | |
| | Power | | | 1.66 | | | | 1.44 | | | | 2.11 | |
| | Energy Holdings: | | | | | | | | | | | | |
| | Global | | | 0.46 | | | | 0.39 | | | | 0.51 | |
| | Resources | | | 0.38 | | | | 0.28 | | | | 0.32 | |
| | Other(A) | | | (0.02 | ) | | | (0.04 | ) | | | (0.02 | ) |
| | | | |
| | | |
| | | |
| |
| | Total Energy Holdings | | | 0.82 | | | | 0.63 | | | | 0.81 | |
| | Other(B) | | | (0.39 | ) | | | (0.29 | ) | | | (0.26 | ) |
| | | | |
| | | |
| | | |
| |
| | PSEG Income from Continuing Operations | | | 3.51 | | | | 3.23 | | | | 3.74 | |
| | Loss from Discontinued Operations, including Gain (Loss) on Disposal(C) | | | (0.73 | ) | | | (0.18 | ) | | | (0.21 | ) |
| | Extraordinary Item(D) | | | — | | | | — | | | | (0.08 | ) |
| | Cumulative Effect of a Change in Accounting Principle(E) | | | (0.07 | ) | | | — | | | | 1.62 | |
| | | | |
| | | |
| | | |
| |
| | PSEG Net Income | | $ | 2.71 | | | $ | 3.05 | | | $ | 5.07 | |
| | | | |
| | | |
| | | |
| |
| | | | | | | | | | | | | | |
61
| | | |
| (A) | | Other activities include non-segment amounts of Energy Holdings and its subsidiaries and intercompany eliminations. Non-segment amounts include interest on certain financing transactions and certain other administrative and general expenses at Energy Holdings. |
| | | |
| (B) | | Other activities include non-segment amounts of PSEG (as parent company) and intercompany eliminations. Specific amounts include after-tax Merger-related costs of approximately $32 million and $5 million in 2005 and 2004, respectively, preferred securities dividends/preference unit distributions for PSE&G and Energy Holdings, interest on certain financing transactions and certain administrative and general expenses at PSEG (as parent company). |
| | | |
| (C) | | Includes Discontinued Operations of Waterford, Skawina and Elcho in 2005, 2004 and 2003, Carthage Power Company (CPC) in 2004 and 2003 and Energy Technologies in 2003 as well as gains/losses on disposition of Waterford, CPC and Energy Technologies. See Note 4. Discontinued Operations, Dispositions and Acquisitions of the Notes. |
| | | |
| (D) | | Relates to a charge recorded in the second quarter of 2003 from PSE&G's Electric Base Rate Case. See Note 5. Regulatory Matters of the Notes. |
| | | |
| (E) | | Relates to the adoption of FASB Interpretation (FIN) No. 47, “Accounting for Conditional Asset Retirement Obligations.” in 2005 and SFAS 143 in 2003. See Note 2. Recent Accounting Standards and Note 3. Asset Retirement Obligations of the Notes. |
| | | |
| (F) | | Earnings Per Share of any segment dose not represent a direct legal interest in the assets and liabilities allocated to any one segment but rather represents a direct interest in PSEG's assets and liabilities as a whole. |
The $88 million, or $0.28 per share, increase in Income from Continuing Operations for the year ended December 31, 2005, as compared to the same period in 2004, was primarily due to higher earnings at Power. Power's increase reflected higher pricing and increased sales in the various power pools and new wholesale contracts and reduced Operation and Maintenance costs associated with the outage at Hope Creek in 2004. Marked improvement in Power's nuclear operations provided additional low-cost energy to satisfy Power's contractual obligations and to sell into the market at higher prices. The increases at Power were partially offset by interest and depreciation costs related to facilities in Albany, New York, which commenced operation in August 2005 and Lawrenceburg, Indiana, which commenced operation in June 2004. Energy Holdings also contributed to the increase with higher earnings due to improved operations at Texas Independent Energy, L.P. (TIE) and in South America and an after-tax gain of $43 million from the sale of Resources' leveraged lease investment in Seminole in December 2005. At PSE&G, higher margins, due to favorable weather conditions, and reduced interest expense were substantially offset by higher Operation and Maintenance costs. These increases were partially offset by after-tax Merger-related costs of approximately $32 million at PSEG, PSE&G and Power in 2005 and approximately $4 million at PSEG in 2004.
The $85 million, or $0.51 per share, decrease in Income from Continuing Operations for the year ended December 31, 2004, as compared to the same period in 2003, was primarily due to lower earnings at Power due to decreased load being served under the fixed-price BGS contracts, higher Operation and Maintenance costs primarily incurred for work performed during a longer-than-planned refueling outage at the Hope Creek nuclear unit, the loss of Market Transition Charge (MTC) revenues, which ceased effective August 1, 2003 at the end of the transition period and higher replacement power and congestion costs in 2004. Also contributing to the decrease were currency fluctuations at Global and lower earnings at Resources, primarily resulting from the termination of the Collins lease. These decreases were partially offset by improved earnings at PSE&G, primarily relating to increased electric base rates.
Changes in Net Income were also attributable to Loss from Discontinued Operations due to Power's sale of Waterford in 2005 and Energy Holdings' sale of its majority interests in Elcho and Skawina on January 31, 2006 and its sales of CPC in 2004 and Energy Technologies in 2003. Power reported Losses from Discontinued Operations of $198 million (including a loss of $178 million on disposal of Waterford), $34 million and $9 million in 2005, 2004 and 2003, respectively. Energy Holdings reported Income from Discontinued Operations of $18 million in 2005 and Losses from Discontinued Operations of $10 million in 2004 and $38 million in 2003.
62
PSEG
| | | For the
Years Ended
December 31,
| | 2005 vs 2004
| | 2004 vs 2003
|
| | | 2005
| | 2004
| | 2003
| | Increase
(Decrease)
| | %
| | Increase
(Decrease)
| | %
|
| | | | | | | (Millions) | | | | | | | | | | (Millions) | | | | |
Operating Revenues | | $ | 12,430 | | | $ | 10,800 | | | $ | 11,006 | | | $ | 1,630 | | | | 15 | | | $ | (206 | ) | | | (2 | ) |
Energy Costs | | $ | 7,273 | | | $ | 5,987 | | | $ | 6,335 | | | $ | 1,286 | | | | 21 | | | $ | (348 | ) | | | (5 | ) |
Operation and Maintenance | | $ | 2,314 | | | $ | 2,179 | | | $ | 2,064 | | | $ | 135 | | | | 6 | | | $ | 115 | | | | 6 | |
Depreciation and Amortization | | $ | 748 | | | $ | 693 | | | $ | 516 | | | $ | 55 | | | | 8 | | | $ | 177 | | | | 34 | |
Income from Equity Method Investments | | $ | 131 | | | $ | 126 | | | $ | 114 | | | $ | 5 | | | | 4 | | | $ | 12 | | | | 11 | |
Other Income | | $ | 221 | | | $ | 180 | | | $ | 184 | | | $ | 41 | | | | 23 | | | $ | (4 | ) | | $ | (2 | ) |
Other Deductions | | $ | (87 | ) | | $ | (69 | ) | | $ | (100 | ) | | $ | 18 | | | | 26 | | | $ | (31 | ) | | | (31 | ) |
Interest Expense | | $ | (816 | ) | | $ | (798 | ) | | $ | (825 | ) | | $ | 18 | | | | 2 | | | $ | (27 | ) | | | (3 | ) |
Income Tax Expense | | $ | (541 | ) | | $ | (467 | ) | | $ | (469 | ) | | $ | 74 | | | | 16 | | | $ | (2 | ) | | | — | |
Income (Loss) from Discontinued Operations, including Gain (Loss) on Disposal, net of tax | | $ | (180 | ) | | $ | (44 | ) | | $ | (47 | ) | | $ | 136 | | | | N/A | | | $ | (3 | ) | | | (6 | ) |
Extraordinary Item, net of tax | | $ | — | | | $ | — | | | $ | (18 | ) | | $ | — | | | | — | | | $ | (18 | ) | | | (100 | ) |
Cumulative Effect of a Change in Accounting Principle, net of tax | | $ | (17 | ) | | $ | — | | | $ | 370 | | | $ | 17 | | | | 100 | | | $ | (370 | ) | | | (100 | ) |
| | | | | | | | | | | | | | | | | | | | | | | | | | | | |
PSEG's results of operations are primarily comprised of the results of operations of its operating subsidiaries, PSE&G, Power and Energy Holdings, excluding changes related to intercompany transactions, which are eliminated in consolidation. It also includes certain financing costs at the parent company. For additional information on intercompany transactions, see Note 21. Related-Party Transactions of the Notes. For a discussion of the causes for the variances at PSEG in the table above, see the discussions for PSE&G, Power and Energy Holdings that follow.
PSE&G
| | | For the
Years Ended
December 31,
| | 2005 vs 2004
| | 2004 vs 2003
|
| | | 2005
| | 2004
| | 2003
| | Increase
(Decrease)
| | %
| | Increase
(Decrease)
| | %
|
| | | | | | | (Millions) | | | | | | | | | | (Millions) | | | | |
Operating Revenues | | $ | 7,728 | | | $ | 6,972 | | | $ | 6,740 | | | $ | 756 | | | | 11 | | | $ | 232 | | | | 3 | |
Energy Costs | | $ | 4,970 | | | $ | 4,284 | | | $ | 4,421 | | | $ | 686 | | | | 16 | | | $ | (137 | ) | | | (3 | ) |
Operation and Maintenance | | $ | 1,151 | | | $ | 1,083 | | | $ | 1,050 | | | $ | 68 | | | | 6 | | | $ | 33 | | | | 3 | |
Depreciation and Amortization | | $ | 553 | | | $ | 523 | | | $ | 372 | | | $ | 30 | | | | 6 | | | $ | 151 | | | | 41 | |
Other Income | | $ | 15 | | | $ | 12 | | | $ | 6 | | | $ | 3 | | | | 25 | | | $ | 6 | | | | 100 | |
Other Deductions | | $ | (3 | ) | | $ | (1 | ) | | $ | (1 | ) | | $ | 2 | | | | N/A | | | $ | — | | | | — | |
Interest Expense | | $ | (342 | ) | | $ | (362 | ) | | $ | (390 | ) | | $ | (20 | ) | | | (6 | ) | | $ | (28 | ) | | | (7 | ) |
Income Tax Expense | | $ | (235 | ) | | $ | (246 | ) | | $ | (129 | ) | | $ | (11 | ) | | | (4 | ) | | $ | 117 | | | | 91 | |
| | | | | | | | | | | | | | | | | | | | | | | | | | | | |
Operating Revenues
PSE&G has three sources of revenue: commodity revenues from the sales of energy to customers and in the PJM spot market; delivery revenues from the transmission and distribution of energy through its system; and other operating revenues from the provision of various services.
Operating Revenues increased $756 million for the year ended December 31, 2005, as compared to the same period in 2004, due to increases of $667 million in commodity revenues, $82 million in delivery revenues and $7 million in other operating revenues.
Operating Revenues increased $232 million for the year ended December 31, 2004, as compared to the same period in 2003, due to increases of $13 million in commodity revenues, $198 million in delivery revenues and $21 million in other operating revenues.
63
Commodity
PSE&G makes no margin on commodity sales as the costs are passed through to customers. The difference between costs and the amount paid by customers in revenues is deferred and collected from or returned to customers in future periods. Total commodity volumes and revenues are subject to market forces. Gas commodity prices fluctuate monthly for commercial and industrial customers and annually through the BGSS tariff for residential customers. In addition, for residential gas customers, PSE&G has the ability to adjust rates upward two additional times and downward at any time, if warranted, between annual BGSS proceedings.
Commodity revenues increased $667 million for the year ended December 31, 2005, as compared to the same period in 2004, due to increases of $305 million in electric commodity revenues, $235 million primarily due to higher BGS and Non-Utility Generation (NUG) prices and $70 million in higher volumes due to weather. Also contributing to the increase was $362 million in increased gas commodity revenues, $392 million primarily due to higher BGSS prices, offset by a $42 million decrease due to the expiration of the Third Party Shopping Incentive on July 1, 2005. There is a corresponding $42 million increase in delivery revenues, described below. Also contributing to the increase is $12 million in higher volumes, primarily due to increased cogeneration operations.
Commodity revenues increased $13 million for the year ended December 31, 2004, as compared to the same period in 2003. This was due to increases of $16 million in electric commodity revenues, $249 million from higher BGS prices offset by $233 million in lower volumes due to the migration of large customers to third-party suppliers. This was offset by $3 million in decreased gas commodity revenues, $249 million primarily due to higher BGSS prices, offset by $252 million in lower volumes, primarily due to decreased cogeneration operations.
Delivery
The $82 million increase in delivery revenues for the year ended December 31, 2005, as compared to the same period in 2004, was due to increases of $75 million in electric revenues and $7 million in gas revenues. The $75 million in electric revenues was primarily due to higher volumes of $68 million due to weather and $7 million due to increased distribution prices. The $7 million in increased gas revenues was due to the expiration of the Third Party Shopping Incentive Fund on July 1, 2005, resulting in an increase of $42 million in delivery revenues with a corresponding offset in commodity revenues, described above, and a $12 million increase in Societal Benefits Clause (SBC) revenues (offset in Operation and Maintenance Costs below). This was offset by $9 million in lower volume and demand revenues due to weather and $37 million due to the expiration of the Gas Cost Underrecovery Adjustment (GCUA) clause in January 2005.
The $198 million increase in delivery revenues for the year ended December 31, 2004, as compared to the same period in 2003, was due to increases of $222 million in electric revenues offset by decreases of $24 million in gas revenues. The $222 million in electric revenues was primarily due to $180 million in increased prices due to the effect of full-year base rate increases in August 2003 and other rate adjustments in January 2004 and increased volumes of $42 million. The $24 million in decreased gas revenues was primarily due to $18 million in lower volumes due to weather and $5 million due to lower prices.
Operating Expenses
Energy Costs
The $686 million increase for the year ended December 31, 2005, as compared to the same period in 2004, was comprised of increases of $319 million in electric costs and $367 million in gas costs. The increase in electric costs was caused by a $264 million or 8% increase due to higher prices for BGS and NUG purchases and a $67 million increase due to higher BGS volumes, partially offset by a decrease of $12 million due to lower NUG volumes. The increased gas costs were due to a $315 million or 17% increase in gas prices and an $89 million increase in sales volumes due primarily to higher sales to cogenerators. These were offset by a $37 million decrease due to the expiration of the GCUA clause in January 2005.
The $137 million decrease for the year ended December 31, 2004, as compared to the same period in 2003, was comprised of decreases of $96 million in electric costs and $41 million in gas costs. The electric decrease was caused by $262 million in lower BGS volumes due to customer migration to third-party suppliers offset by $166 million or 6% in higher prices for BGS and NUG purchases. The gas decrease was
64
caused by a $388 million or 20% decrease in sales volumes due primarily to lower sales to cogenerators offset by a $347 million or 26% increase in gas prices.
Operation and Maintenance
The $68 million increase for 2005, as compared to the same period in 2004, was due to increased SBC expenses of $27 million ($15 million electric, $12 million gas); $23 million in labor and fringe benefits; $6 million for increased injuries and damages reserves; $4 million for merger related expenses; $3 million for higher regulatory commission expenses; $2 million for higher bad debt expenses and $2 million for the purchase of Net Operating Losses. SBC costs are deferred when incurred and amortized to expense when recovered in revenues.
The $33 million increase for 2004, as compared to the same period in 2003, was due primarily to increased Demand Side Management (DSM) amortization of $20 million, increased consumer education expenses of $24 million, an $18 million reduction in real estate tax expense in 2003 and $10 million related to a regulatory asset reserve reversal in 2003. DSM costs are deferred when incurred and amortized to expense when recovered in revenues. Offsetting the increases were decreased labor and fringe benefits of $7 million, due to lower pension costs as a result of improved fund performance, a $22 million reduction in SBC expenses and $10 million in lower shared services costs due to reduced technology spending.
Depreciation and Amortization
The $30 million increase the year ended December 31, 2005, as compared to the same period in 2004, was due primarily to a $33 million increase in the amortization of securitized regulatory assets, a $4 million increase due to additional plant in service and a $4 million increase in the amortization of the Remediation Adjustment Clause (RAC). These were offset by an $8 million decrease in software amortization and a $3 million increase in excess depreciation reserve amortization.
The $151 million increase for the year ended December 31, 2004, as compared to the same period in 2003, was due primarily to a $132 million reduction in amortization of an excess electric distribution depreciation reserve regulatory liability, a $30 million increase in the amortization of various regulatory assets and a $10 million increase due to increased plant in service. These increases were offset by a $16 million decrease from the use of a lower book depreciation rate for electric distribution property, which took effect in August 2003 following the conclusion of the electric base rate case, and a $6 million decrease due to plant assets transferred to an affiliate in 2003.
Other Income
The $3 million increase for the year ended December 31, 2005, as compared to the same period in 2004, was due primarily to increases of $3 million due to the sale of land and $1 million of interest income offset by $1 million in lower realized gains on investments.
The $6 million increase for the year ended December 31, 2004, as compared to the same period in 2003, was due primarily to $11 million of equity return adjustments to regulatory assets in 2003, $4 million of interest income related to an affiliate loan and other Investment Income of $3 million offset by decreased gains on excess property sales of $12 million.
Interest Expense
The $20 million decrease for the year ended December 31, 2005, as compared to the same period in 2004, was primarily due to decreases of $22 million due to lower average interest rates and lower amounts of long-term debt outstanding, primarily offset by $5 million in higher short-term debt balances outstanding and higher interest rates.
The $28 million decrease for the year ended December 31, 2004, as compared to the same period in 2003, was due primarily to lower interest on long-term debt of $37 million as a result of lower interest rates and lower levels of long-term debt outstanding, partially offset by $11 million in increased interest on affiliated loans.
65
Income Taxes
The $11 million decrease for the year ended December 31, 2005, as compared to the same period in 2004, was primarily due to decreases of $4 million in prior period adjustments, $3 million in various flow-through benefits and $3 million in lower pre-tax income.
The $117 million increase for the year ended December 31, 2004, as compared to the same period in 2003, was primarily due to higher pre-tax income combined with lower tax benefits primarily attributable to the excess depreciation reserve adjustment in 2003.
Power
| | | For the
Years Ended
December 31,
| | 2005 vs 2004
| | 2004 vs 2003
|
| | | 2005
| | 2004
| | 2003
| | Increase
(Decrease)
| | %
| | Increase
(Decrease)
| | %
|
| | | | | | | (Millions) | | | | | | | | | | (Millions) | | | | |
Operating Revenues | | $ | 6,059 | | | $ | 5,168 | | | $ | 5,608 | | | $ | 891 | | | | 17 | | | $ | (440 | ) | | | (8 | ) |
Energy Costs | | $ | 4,286 | | | $ | 3,554 | | | $ | 3,750 | | | $ | 732 | | | | 21 | | | $ | (196 | ) | | | (5 | ) |
Operation and Maintenance | | $ | 949 | | | $ | 954 | | | $ | 911 | | | $ | (5 | ) | | | (1 | ) | | $ | 43 | | | | 5 | |
Depreciation and Amortization | | $ | 131 | | | $ | 108 | | | $ | 97 | | | $ | 23 | | | | 21 | | | $ | 11 | | | | 11 | |
Other Income | | $ | 186 | | | $ | 167 | | | $ | 150 | | | $ | 19 | | | | 11 | | | $ | 17 | | | | 11 | |
Other Deductions | | $ | (43 | ) | | $ | (55 | ) | | $ | (78 | ) | | $ | (12 | ) | | | (22 | ) | | $ | (23 | ) | | | (29 | ) |
Interest Expense | | $ | (131 | ) | | $ | (113 | ) | | $ | (107 | ) | | $ | 18 | | | | 16 | | | $ | 6 | | | | 6 | |
Income Tax Expense | | $ | (299 | ) | | $ | (209 | ) | | $ | (332 | ) | | $ | 90 | | | | 43 | | | $ | (123 | ) | | | (37 | ) |
Loss from Discontinued Operations, including Loss on Disposal, net of tax | | $ | (198 | ) | | $ | (34 | ) | | $ | (9 | ) | | $ | 164 | | | | N/A | | | $ | 25 | | | | N/A | |
Cumulative Effect of a Change in Accounting Principle, net of tax | | $ | (16 | ) | | $ | — | | | $ | 370 | | | $ | 16 | | | | 100 | | | $ | (370 | ) | | | (100 | ) |
| | | | | | | | | | | | | | | | | | | | | | | | | | | | |
Operating Revenues
Operating Revenues increased $891 million for the year ended December 31, 2005, as compared to the same period in 2004, due to increases of $573 million in generation revenues and $368 million in gas supply revenues partly offset by a decrease of $50 million in trading revenues.
Operating Revenues decreased by $440 million for the year ended December 31, 2004, as compared to the same period in 2003, due to decreases of $485 million in generation revenues and $6 million in trading revenues offset by an increase of $51 million in gas supply revenues.
Generation
Generation revenues increased $573 million for the year ended December 31, 2005, as compared to the same period in 2004, primarily due to higher revenues of approximately $256 million from higher pricing and increased sales in the various power pools supported by improved nuclear capacity, partially offset by reduced load being served under the fixed-priced BGS contracts. Also contributing to the increase were increases of approximately $103 million from new wholesale contracts, approximately $74 million from operations in New York, largely due to the commencement of BEC's operations in July 2005, partially offset by operations of the Albany Steam Station which was operational in 2004 and retired in February 2005, approximately $65 million from Reliability Must-Run (RMR) revenues which Power began receiving in 2005 for certain of its generating facilities and approximately $75 million from increased ancillary services and operating reserves.
Generation revenues decreased $485 million for the year ended December 31, 2004, as compared to the same period in 2003, primarily due to $1.1 billion in lower revenues due to decreased load being served under the fixed-priced BGS contracts, which was partially offset by $869 million of higher revenues from new contracts and higher sales into the various power pools. Additionally, the loss of MTC and NDT revenues, which amounted to $111 million and $17 million, respectively, comprised part of the decrease.
Also contributing to the decrease in 2004 from 2003 was the adoption of Emerging Issues Task Force (EITF) Issue No. 03-11, “Reporting Realized Gains and Losses on Derivative Instruments That Are Subject to FASB Statement No. 133, Accounting for Derivative Instruments and Hedging Activities,” and Not “Held
66
for Trading Purposes” as defined in EITF Issue No. 02-3, “Issues Involved in Accounting for Derivative Contracts Held for Trading Purposes and Contracts Involved in Energy Trading and Risk Management Activities” (EITF 03-11), which requires gains and losses (realized and unrealized) on all derivative instruments within the scope of SFAS 133 to be shown net when recognized in the Consolidated Statement of Operations, whether or not settled physically, if the derivative instruments are “held for trading purposes” as defined in EITF 02-3, which became effective on a prospective basis for transactions occurring after September 30, 2003. Since prior periods were not restated in 2004, the effect of adopting EITF 03-11 reduced Power's Operating Revenues by approximately $174 million, with an equal reduction in Energy Costs, as compared to the same period in 2003.
Gas Supply
Gas supply revenues increased $368 million for the year ended December 31, 2005, as compared to the same period in 2004, principally due to higher prices under the BGSS contract for gas and pipeline capacity partially offset by lower demand largely resulting from a warmer winter heating season in 2005.
Gas supply revenues increased by $51 million for the year ended December 31, 2004, as compared to the same period in 2003, primarily due to higher gas prices under the BGSS contract partially offset by decreased sales volumes mainly due to lower demand by PSE&G.
Trading
The $50 million decrease in trading revenues for the year ended December 31, 2005, as compared to the same period in 2004, resulted principally from reductions in realized gains related to emission credits.
The $6 million decrease in trading revenues for the year ended December 31, 2004, as compared to the same period in 2003, was primarily due to market conditions.
Operating Expenses
Energy Costs
Energy Costs represent the cost of generation, which includes fuel purchases for generation as well as purchased energy in the market, and gas purchases to meet Power's obligation under its BGSS contract with PSE&G.
Energy Costs increased approximately $732 million for the year ended December 31, 2005, as compared to the same period in 2004, primarily due to increased generation costs, reflecting higher fossil fuel prices and higher prices on increased volume of purchased power for new contracts and higher prices for gas purchased to satisfy Power's BGSS obligations.
Energy Costs decreased approximately $196 million for the year ended December 31, 2004, as compared to the same period in 2003, primarily due to a $213 million decrease in purchased power due to decreased load being served under the BGS contracts, which was offset by increased replacement power costs due to outages and higher purchased power for new contracts and a $12 million increase in gas supply costs due to higher gas prices. Also contributing to the decrease for the year was a reduction of approximately $174 million related to the adoption of EITF 03-11, as discussed above. Partially offsetting these decreases were higher fuel costs for generation of approximately $159 million, primarily related to higher gas prices and higher usage, including an increase of approximately $20 million related to the settlement for nuclear waste storage costs for Peach Bottom. For additional information regarding the settlement, see Note 12. Commitments and Contingent Liabilities—Nuclear Fuel Disposal of the Notes.
Operation and Maintenance
Operation and Maintenance expense decreased $5 million for the year ended December 31, 2005, as compared to the same period in 2004, primarily due to a decrease of $36 million in equipment repair costs related to outages at the nuclear facilities as well as $9 million of lower real estate taxes, $5 million of lower transmission fees in the power pools and an $8 million settlement of co-owner billings in 2004 related to Power's jointly-owned facilities. The decreases were substantially offset by an increase of $11 million in pension, postretirement and other employee benefits, a $16 million increase attributable to repairs for outages at the fossil generation plants, a $14 million restructuring charge recorded in 2005 related to
67
Nuclear's workforce realignment plan and a $12 million U.S. Department of Energy (DOE) settlement in 2004.
Operation and Maintenance expense increased $43 million for the year ended December 31, 2004, as compared to the same period in 2003, due to increased costs of $85 million related to the outages at Hope Creek, Salem and Mercer. This was offset by $12 million related to the settlement for nuclear waste storage costs for Peach Bottom and $10 million in lower real estate taxes and other items. Additional offsets include the absence of reorganization costs of $9 million and the lower write-down costs related to obsolete materials and supplies of $8 million. For additional information regarding the settlement, see Note 12. Commitments and Contingent Liabilities—Nuclear Fuel Disposal of the Notes.
Depreciation and Amortization
Depreciation and Amortization expense increased $23 million for the year ended December 31, 2005, as compared to the same period in 2004, primarily due to the BEC facility being placed into service in July 2005 and a higher depreciable asset base in 2005 at Nuclear. The increase is also due to the Lawrenceburg facility being placed into service in June 2004.
Depreciation and Amortization expense increased $11 million for the year ended December 31, 2004, as compared to the same period in 2003, primarily due to the Lawrenceburg facility.
Other Income
Other Income increased $19 million for the year ended December 31, 2005, as compared to the same period in 2004, primarily due to increased realized gains and income related to the NDT Funds and a $5 million gain from the sale in September 2005 of four gas turbine generators located in Burlington, New Jersey.
Other Income increased $17 million for the year ended December 31, 2004, as compared to the same period in 2003, due primarily to increased realized gains and income related to the NDT Funds.
Other Deductions
Other Deductions decreased $12 million for the year ended December 31, 2005, as compared to the same period in 2004, primarily due to decreased realized losses of $8 million related to the NDT Funds and a write-off of $5 million of unamortized issuance costs in the first quarter of 2004 related to the extinguishment of non-recourse financing of the Lawrenceburg facility.
Other Deductions decreased $23 million for the year ended December 31, 2004, as compared to the same period in 2003, primarily due to $28 million in lower realized losses and expenses related to the NDT Funds, partially offset by a $5 million write-off of unamortized issuance costs related to the extinguishment non-recourse financing of the Lawrenceburg facility.
Interest Expense
Interest Expense increased $18 million for the year ended December 31, 2005, as compared to the same period in 2004, due primarily to $23 million of lower capitalized interest costs in 2005 related to commencement of operations of the Lawrenceburg and BEC facilities in June 2004 and July 2005, respectively, partially offset by an overall decrease of $8 million due to the extinguishment of project debt and issuance of new long-term debt at more favorable pricing in March 2004.
Interest Expense increased $6 million for the year ended December 31, 2004, as compared to the same period in 2003, due primarily to $4 million related to an affiliate loan and additional interest on increased levels of long-term debt outstanding.
Income Taxes
Income taxes increased $90 million for the year ended December 31, 2005, as compared to the same period in 2004, primarily due to an increase of $63 million in taxes on pre-tax income, the recording in 2005 of $15 million of taxes for the NDT Funds and the reversal in 2004 of $16 million of contingency reserves and other prior period adjustments.
68
Income taxes decreased $123 million for the year ended December 31, 2004, as compared to the same period in 2003, due primarily to lower pre-tax income and the aforementioned $16 million reversal of contingency reserves and other prior period adjustments.
Loss from Discontinued Operations, including Loss on Disposal, net of tax
On May 27, 2005, Power reached an agreement to sell its Waterford generation facility for approximately $220 million and recognized an estimated loss on disposal of $177 million, net of tax, for the initial write-down of its carrying amount of Waterford to its fair value less cost to sell. On September 28, 2005, Power completed the sale of Waterford and recognized an additional loss of $1 million. The proceeds, together with anticipated reduction in tax liability, were approximately $320 million, which will be used to retire debt at Power. Power's Losses from Discontinued Operations of Waterford, not including the Loss of Disposal, were $20 million, $34 million and $9 million for the years ended December 31, 2005, 2004 and 2003, respectively. See Note 4. Discontinued Operations, Dispositions and Acquisitions of the Notes for additional information.
Cumulative Effect of a Change in Accounting Principle
For the year ended December 31, 2005, Power recorded an after-tax loss in the amount of $16 million due to the required recording of a liability for the fair value of asset-retirement costs primarily related to its generation plants under FIN 47 which was adopted in December, 2005. See Note 3. Asset Retirement Obligations of the Notes for additional information.
For the year ended December 31, 2003, Power recorded an after-tax benefit in the amount of $370 million due to the required remeasurement of Power's nuclear and fossil decommissioning obligations under SFAS 143, which was adopted on January 1, 2003. See Note 3. Asset Retirement Obligations of the Notes for additional information.
Energy Holdings
| | | For the
Years Ended
December 31,
| | 2005 vs 2004
| | 2004 vs 2003
|
| | | 2005
| | 2004
| | 2003
| | Increase
(Decrease)
| | %
| | Increase
(Decrease)
| | %
|
| | | | | | | (Millions) | | | | | | | | | | (Millions) | | | | |
Operating Revenues | | $ | 1,302 | | | $ | 836 | | | $ | 597 | | | $ | 466 | | | | 56 | | | $ | 239 | | | | 40 | |
Energy Costs | | $ | 675 | | | $ | 322 | | | $ | 103 | | | $ | 353 | | | | N/A | | | $ | 219 | | | | N/A | |
Operation and Maintenance | | $ | 215 | | | $ | 171 | | | $ | 124 | | | $ | 44 | | | | 26 | | | $ | 47 | | | | 38 | |
Depreciation and Amortization | | $ | 46 | | | $ | 44 | | | $ | 38 | | | $ | 2 | | | | 5 | | | $ | 6 | | | | 16 | |
Income from Equity Method Investments | | $ | 131 | | | $ | 126 | | | $ | 114 | | | $ | 5 | | | | 4 | | | $ | 12 | | | | 11 | |
Other Income | | $ | 10 | | | $ | 7 | | | $ | 26 | | | $ | 3 | | | | 43 | | | $ | (19 | ) | | | (73 | ) |
Other Deductions | | $ | (25 | ) | | $ | (10 | ) | | $ | (9 | ) | | $ | 15 | | | | N/A | | | $ | 1 | | | | 11 | |
Interest Expense | | $ | (213 | ) | | $ | (223 | ) | | $ | (214 | ) | | $ | (10 | ) | | | (4 | ) | | $ | 9 | | | | 4 | |
Income Tax Expense | | $ | (69 | ) | | $ | (46 | ) | | $ | (58 | ) | | $ | 23 | | | | 50 | | | $ | (12 | ) | | | (21 | ) |
Income (Loss) from Discontinued Operations, including Gain (Loss) on Disposal | | $ | 18 | | | $ | (10 | ) | | $ | (38 | ) | | $ | 28 | | | | N/A | | | $ | (28 | ) | | | (74 | ) |
| | | | | | | | | | | | | | | | | | | | | | | | | | | | |
The variances in Operating Revenues, Energy Costs, Operation and Maintenance, Depreciation and Amortization and Income from Equity Method Investments were primarily attributed to Global's acquisition of the remaining interests in TIE, thus consolidating the entity effective July 1, 2004, increased revenues at TIE in the second half of 2005 compared to same period in 2004 due to a stronger market and stronger spark spread (the difference between the market price of electricity and the cost of natural gas fuel) and Global's sale of a 35% interest in Dhofar Power Company S.A.O.C. (Dhofar Power) through a public offering on the Omani Stock Exchange in April 2005, reducing its ownership interest to 46% and thus accounting for the investment under the equity method of accounting following the sale. The variances are also related to favorable foreign currency exchange rates and higher energy sales volumes at Sociedad Austral de Electricidad S.A. (SAESA) and a change for GWF Energy LLC (GWF Energy), which owns three generation facilities in California, which was accounted for under the equity method of accounting in 2004, due to a change in ownership interest, as compared to the first nine months of 2003 when GWF Energy was
69
consolidated. For additional information, see Note 4. Discontinued Operations, Dispositions and Acquisitions of the Notes.
Operating Revenues
The increase of $466 million for the year ended December 31, 2005, as compared to the same period in 2004, was due to higher revenues at Global of $406 million, including a $279 million increase related to the consolidation of TIE commencing July 1, 2004 and $136 million due to higher revenues at TIE in the second half of 2005 and a $62 million increase related to SAESA due to higher energy sales volumes offset by a $43 million decrease related to the deconsolidation of Dhofar Power and the absence of a $35 million gain on the sale of MPC in 2004. Also contributing to the increase were higher revenues at Resources of $60 million primarily due to a $71 million pre-tax gain recognized in 2005 for the sale of its interest in Seminole offset by the absence of an $11 million pre-tax charge recorded due to the termination of the lease investment in the Collins generating facility in 2004.
The increase of $239 million for the year ended December 31, 2004, as compared to the same period in 2003, was due to higher revenues at Global of $290 million, including a $247 million increase related to the consolidation of TIE, a $35 million increase from SAESA, a $25 million increase from Dhofar Power and a $35 million gain on the sale of MPC, partially offset by a decrease of $53 million related to GWF Energy, which was not consolidated in 2004. Offsetting the increases at Global were lower revenues at Resources of $51 million, primarily due to a loss of $31 million related to the recalculation of certain leverage leases, a loss of $11 million due to the termination of the lease investment in the Collins generating facility and normal amortization of existing leases of $10 million offset by a realized gain of $2 million related to investments in leases, partnerships and securities. See Note 8. Long-Term Investments of the Notes for additional information.
Energy Costs
The increase of $353 million for the year ended December 31, 2005, as compared to the same period in 2004, was primarily due to a $219 million increase related to the consolidation of TIE commencing July 1, 2004, a $99 million increase in energy costs at TIE in the second half of 2005 and a $44 million increase related to SAESA due to significant increases in energy costs, offset by a $13 million decrease related to the deconsolidation of Dhofar Power.
The increase of $219 million for the year ended December 31, 2004, as compared to the same period in 2003, was primarily due to a $192 million increase related to the consolidation of TIE and increases of $22 million and $5 million from SAESA and Dhofar Power, respectively, offset by a decrease of $3 million from GWF Energy.
Operation and Maintenance
The increase of $44 million for the year ended December 31, 2005, as compared to the same period in 2004, was primarily due to a $41 million increase related to the consolidation of TIE commencing July 1, 2004 and a $14 million increase related to SAESA offset by a $6 million decrease related to the deconsolidation of Dhofar Power and a $7 million decrease in energy costs at TIE in the second half of 2005.
The increase of $47 million for the year ended December 31, 2004, as compared to the same period in 2003, was primarily due to a $30 million increase related to the consolidation of TIE and increases of $9 million and $2 million from SAESA and Dhofar Power, respectively, offset by a decrease of $8 million from GWF Energy. The increase is also due to higher operating expenses of $9 million at PSEG Energy Technologies Asset Management Company L.L.C. primarily due to higher legal expenses and final asset sale settlements and $5 million at Global primarily due to the 2003 reversal of contingencies related to the Argentine write-down.
Depreciation and Amortization
The increase of $2 million for the year ended December 31, 2005, as compared to the same period in 2004, was primarily due to an $8 million increase related to the consolidation of TIE commencing July 1, 2004 and a $2 million increase related to Resources due to the conversion of the Delta and Northwest leases from
70
leveraged lease to operating lease offset by a $9 million decrease related to the deconsolidation of Dhofar Power.
The increase of $6 million for the year ended December 31, 2004, as compared to the same period in 2003, was primarily due to a $9 million increase related to the consolidation of TIE and increases of $5 million and $2 million from Dhofar Power and SAESA, respectively, offset by a decrease of $11 million from GWF Energy.
Income from Equity Method Investments
The increase of $5 million for the year ended December 31, 2005, as compared to the same period in 2004, was primarily due to a $20 million increase due to stronger results in South America (RGE and Chilquinta) offset by an $11 million decrease related to the loss of earnings associated with the sale of Global's equity interest in MPC in December 2004 and a $3 million decrease related to Global's investment in Prisma.
The increase of $12 million for the year ended December 31, 2004, as compared to the same period in 2003, was primarily driven by an $8 million increase related to the sale of a portion of Global's investment in Luz del Sur (LDS), an $11 million increase related to MPC due to additional projects going into operation, and a $4 million increase related to GWF Energy, offset by an $11 million decrease related to the consolidation of TIE commencing July 1, 2004.
Other Income
The increase of $3 million for the year ended December 31, 2005, as compared to the same period in 2004, was primarily due to interest income from PSEG related to intercompany loans.
The decrease of $19 million for the year ended December 31, 2004, as compared to the same period in 2003, was primarily due to the absence in 2004 of foreign currency transaction gains of $15 million for RGE and SAESA that occurred in 2003.
Other Deductions
The $15 million increase for the year ended December 31, 2005, as compared to the same period in 2004, was primarily due to a loss on early extinguishment of debt of $7 million and foreign currency transaction losses of $9 million primarily on notes receivables from Prisma.
Interest Expense
The $10 million decrease for the year ended December 31, 2005, respectively, as compared to the same periods in 2004, was primarily due an $11 million decrease related to the deconsolidation of Dhofar Power and an $8 million decrease related to Resources due to a reduction in intercompany interest charges offset by a $9 million increase related to the consolidation of TIE commencing on July 1, 2004.
The increase of $9 million for the year ended December 31, 2004, as compared to the same period in 2003, was due to a $13 million increase related to the consolidation of TIE commencing on July 1, 2004, and an increase in non-recourse debt at the project level with higher interest rates, offset in part by the repayment of lower interest rate debt at Energy Holdings during 2003 and 2004.
Income Taxes
The $23 million increase for the year ended December 31, 2005, as compared to the same period in 2004, was primarily due to the recording of $11 million of U.S. tax associated with repatriation of funds under the American Jobs Creation Act of 2004, an increase in the mix of domestic earnings for Global due to improved results at TIE, taxes recognized of $28 million from the sale of Seminole, and additional benefits resulting from revisions to Resources' lease runs performed in the fourth quarter of 2005. For further information on lease runs, see below.
The decrease of $12 million for the year ended December 31, 2004, as compared to the same period in 2003, was primarily due to lower pre-tax income and the impact of changes in certain lease forecast assumptions. In the fourth quarter of 2004, Resources revised several of its lease runs and recorded additional benefits of state tax losses generated by certain of its leases. These additional benefits resulted from changes
71
in Resources' forecast of state taxable income and tax liability over the relevant lease terms. This forecast was embedded in the lease reruns and led to an income tax benefit of $43 million in 2004 to reflect the cumulative benefit of this adjustment. This benefit was largely offset by the tax impact associated with a $31 million decrease in leveraged lease revenue. Future earnings will also increase by a modest amount as a result of this forecasted benefit. If Resources affiliates' taxable earnings decreased significantly, resulting in the inability of Resources to record the benefits related to its taxable losses, it could lead to an adverse material impact to Resources' results of operations, financial position and cash flows. See Note 15. Income Taxes of the Notes for additional information.
Income (Loss) from Discontinued Operations, including Gain (Loss) on Disposal, net of tax
Elcho and Skawina
In January 2006, Energy Holdings entered into an agreement to sell its interest in two coal-fired plants in Poland, Elcho and Skawina. Income (Loss) from Discontinued Operations related to Elcho and Skawina for the years ended December 31, 2005, 2004 and 2003 was $18 million, $(15) million and $6 million, respectively. See Note 4. Discontinued Operations, Dispositions and Acquisitions of the Notes for additional information.
CPC
In May 2004, Global completed the sale of its interest in CPC for approximately $43 million in cash and recognized a gain on disposal of $5 million after-tax. Loss from Discontinued Operations for the year ended December 31, 2003 was $24 million including a $23 million estimated loss on disposal for the write-down of CPC to its fair value less cost to sell. See Note 4. Discontinued Operations, Dispositions and Acquisitions of the Notes for additional information.
Energy Technologies
In September 2003, Energy Holdings completed the sale of the remaining companies of Energy Technologies subsequent to recognizing a loss of $9 million, after-tax, in the first quarter of 2003. Loss from Discontinued Operations for year ended December 31, 2003 was $11 million. See Note 4. Discontinued Operations, Dispositions and Acquisitions of the Notes for additional information.
Other
To supplement the Consolidated Financial Statements presented in accordance with accounting principles generally accepted in the U.S. (GAAP), PSEG and Energy Holdings use the non-GAAP measure of Earnings Before Interest and Taxes (EBIT).
PSEG's and Energy Holdings' Management each reviews EBIT internally to evaluate performance and manage operations and believes that the inclusion of this non-GAAP financial measure provides consistent and comparable measures to help shareholders understand current and future operating results. PSEG and Energy Holdings urge shareholders to carefully review the GAAP financial information included as part of this Annual Report.
72
Global
The following table summarizes Global's Capital at Risk, net contributions to EBIT and Non-Recourse Interest in the following regions as of December 31, 2005 and 2004 and for the years ended December 31, 2005, 2004 and 2003.
| | | Total Capital at Risk(A)
| | | | | | | | | | | | | | | | | | | | | | | | |
| | | As of December 31,
| | EBIT(B)
| | Non-Recourse
Interest(C)
|
| | | 2005
| | 2004
| | 2005
| | 2004
| | 2003
| | 2005
| | 2004
| | 2003
|
| | | (Millions) |
Region: | | | | | | | | | | | | | | | | | | | | | | | | | | | | | | | | |
North America | | $ | 481 | | | $ | 427 | | | $ | 151 | | | $ | 98 | | | $ | 117 | | | $ | 22 | | | $ | 13 | | | $ | 2 | |
South America | | | 1,655 | | | | 1,581 | | | | 159 | | | | 135 | | | | 150 | | | | 29 | | | | 33 | | | | 27 | |
Europe(D) | | | 179 | | | | 209 | | | | (6 | ) | | | 6 | | | | 7 | | | | — | | | | — | | | | — | |
India and Oman | | | 61 | | | | 94 | | | | 12 | | | | 18 | | | | 9 | | | | 5 | | | | 15 | | | | 9 | |
Asia Pacific(E) | | | 6 | | | | 6 | | | | 5 | | | | 54 | | | | 8 | | | | — | | | | — | | | | — | |
Global G&A—Unallocated | | | — | | | | — | | | | (36 | ) | | | (31 | ) | | | (30 | ) | | | — | | | | — | | | | — | |
| | | |
| | | |
| | | |
| | | |
| | | |
| | | |
| | | |
| | | |
| |
Total | | $ | 2,382 | | | $ | 2,317 | | | $ | 285 | | | $ | 280 | | | $ | 261 | | | $ | 56 | | | $ | 61 | | | $ | 38 | |
| | | |
| | | |
| | | |
| | | |
| | | |
| | | |
| | | |
| | | |
| |
Total Global EBIT | | | | | | | | | | $ | 285 | | | $ | 280 | | | $ | 261 | | | | | | | | | | | | | |
Interest Expense | | | | | | | | | | | (138 | ) | | | (139 | ) | | | (115 | ) | | | | | | | | | | | | |
Income Taxes(E) | | | | | | | | | | | (34 | ) | | | (47 | ) | | | (22 | ) | | | | | | | | | | | | |
Minority Interests | | | | | | | | | | | (1 | ) | | | (2 | ) | | | (8 | ) | | | | | | | | | | | | |
| | | | | | | | | | | |
| | | |
| | | |
| | | | | | | | | | | | | |
Income from Continuing Operations | | | | | | | | | | $ | 112 | | | $ | 92 | | | $ | 116 | | | | | | | | | | | | | |
| | | | | | | | | | | |
| | | |
| | | |
| | | | | | | | | | | | | |
| | | | | | | | | | | | | | | | | | | | | | | | | | | | | | | | |
| | | |
| (A) | | Total Capital at Risk includes Global's gross investments less non-recourse debt. |
| | | |
| (B) | | For investments accounted for under the equity method of accounting, includes Global's share of net earnings, including Interest Expense and Income Taxes. |
| | | |
| (C) | | Non-Recourse Interest is Interest Expense on debt that is non-recourse to Global. |
| | | |
| (D) | | The Total Capital at Risk includes amounts relating to Elcho and Skawina as the sale has not been completed and therefore there is still Capital at Risk in Poland. EBIT and Non-Recourse Interest exclude amounts relating to Elcho and Skawina. EBIT was $56 million, $18 million and $15 million for the years ended December 31, 2005, 2004 and 2003, respectively. Non-Recourse Interest was $36 million, $33 million and $5 million for the years ended December 31, 2005, 2004 and 2003, respectively. See Note 4. Discontinued Operations, Dispositions and Acquisitions of the Notes. |
| | | |
| (E) | | The differences in EBIT for Asia Pacific and Income Taxes are primarily due to the sale of MPC, which closed on December 31, 2004, partially offset by higher taxes for repatriation. See Note 4. Discontinued Operations, Dispositions and Acquisitions of the Notes. |
LIQUIDITY AND CAPITAL RESOURCES
The following discussion of liquidity and capital resources is on a consolidated basis for PSEG, noting the uses and contributions of PSEG's three direct operating subsidiaries, PSE&G, Power and Energy Holdings.
Financing Methodology
PSEG, PSE&G, Power and Energy Holdings
Capital requirements for PSE&G, Power and Energy Holdings are met through liquidity provided by internally generated cash flow and external financings. PSEG expects to be able to fund existing commitments, reduce debt and meet dividend requirements using internally generated cash. PSEG, Power and Energy Holdings from time to time make equity contributions or otherwise provide credit support to their respective direct and indirect subsidiaries to provide for part of their capital and cash requirements,
73
generally relating to long-term investments. PSEG does not intend to contribute additional equity to Energy Holdings.
At times, PSEG utilizes intercompany dividends and intercompany loans (except however, that PSE&G may not, without prior BPU approval, make loans to its parent or its affiliates) to satisfy various subsidiary or parental needs and efficiently manage short-term cash. Any excess funds are invested in short-term liquid investments.
External funding to meet PSEG's, PSE&G's and Power's needs and a majority portion of the requirements of Energy Holdings consist of corporate finance transactions. The debt incurred is the direct obligation of those respective entities. Some of the proceeds of these debt transactions may be used by the respective obligor to make equity investments in its subsidiaries.
As discussed below, depending on the particular company, external financing may consist of public and private capital market debt and equity transactions, bank revolving credit and term loans, commercial paper and/or project financings. Some of these transactions involve special purpose entities (SPEs), formed in accordance with applicable tax and legal requirements in order to achieve specified financial advantages, such as favorable legal liability treatment. PSEG consolidates SPEs, as applicable, in accordance with FIN No. 46, “Consolidation of Variable Interest Entities (VIEs)” (FIN 46). See Note 2. Recent Accounting Standards of the Notes.
The availability and cost of external capital is affected by each entity's performance, as well as by the performance of their respective subsidiaries and affiliates. This could include the degree of structural separation between PSEG and its subsidiaries and the potential impact of affiliate ratings on consolidated and unconsolidated credit quality. Additionally, compliance with applicable financial covenants will depend upon future financial position, earnings and net cash flows, as to which no assurances can be given.
Over the next several years, PSEG, PSE&G, Power and Energy Holdings may be required to extinguish or refinance maturing debt and, to the extent there is not sufficient internally generated funds, may incur additional debt and/or provide equity to fund investment activities. Any inability to obtain required additional external capital or to extend or replace maturing debt and/or existing agreements at current levels and reasonable interest rates may adversely affect PSEG's, PSE&G's, Power's and Energy Holdings' respective financial condition, results of operations and net cash flows.
From time to time, PSEG, PSE&G, Power and Energy Holdings may repurchase portions of their respective debt securities using funds from operations, asset sales, commercial paper, debt issuances, equity issuances and other sources of funding and may make exchanges of new securities, including common stock, for outstanding securities. Such repurchases may be at variable prices below, at or above prevailing market prices and may be conducted by way of privately negotiated transactions, open-market purchases, tender or exchange offers or other means. PSEG, PSE&G, Power and Energy Holdings may utilize brokers or dealers or effect such repurchases directly. Any such repurchases may be commenced or discontinued at any time without notice.
It is expected that, pursuant to the Merger Agreement, PSEG will be consolidated into Exelon and Power into Exelon Generation and all debt outstanding at PSEG and Power will be assumed by the respective new entities. PSE&G and Energy Holdings expect their respective securities will continue to remain outstanding.
Energy Holdings
A portion of the financing for Global's investments is normally provided by non-recourse financing transactions. These consist of loans from banks and other lenders that are typically secured by project assets and cash flows. Non-recourse transactions generally impose no material obligation on the parent-level investor to repay any debt incurred by the project borrower. The consequences of permitting a project-level default include the potential for loss of any invested equity by the parent. However, in some cases, certain obligations relating to the investment being financed, including additional equity commitments, may be guaranteed by Global and/or Energy Holdings for their respective subsidiaries. PSEG does not provide guarantees or credit support to Energy Holdings or its subsidiaries.
74
Operating Cash Flows
PSEG
For the year ended December 31, 2005, PSEG's operating cash flow decreased by approximately $666 million from $1.6 billion to $940 million, as compared to the same period in 2004, primarily due to net decreases at Power for its working capital requirements, discussed below.
For the year ended December 31, 2004, PSEG's operating cash flow increased by approximately $112 million from $1.5 billion to $1.6 billion, as compared to the same period in 2003, due to net increases from its subsidiaries as discussed below.
PSE&G
PSE&G's operating cash flow decreased approximately $7 million from $696 million to $689 million for the year ended December 31, 2005, as compared to the same period in 2004. PSE&G's operating cash flow increased approximately $92 million from $604 million to $696 million for the year ended December 31, 2004, as compared to the same period in 2003 primarily due to higher Net Income related to the increase in electric base rates, additional regulatory recoveries and lower benefit plan contributions.
Power
Power's operating cash flow decreased approximately $371 million from $507 million to $136 million for the year ended December 31, 2005, as compared to the same period in 2004 primarily due to increased margin requirements and an increase in fuel inventory because of significantly increased commodity prices.
Power's operating cash flow decreased approximately $129 million from $636 million to $507 million for the year ended December 31, 2004, as compared to the same period in 2003 due to a decrease in Income from Continuing Operations of $166 million, primarily due to lower sales volumes and higher replacement power and maintenance costs combined with the loss of MTC revenues which ended August 1, 2003 offset by activity in the NDT Funds.
Energy Holdings
Energy Holdings' operating cash flow decreased approximately $160 million from $403 million to $243 million for the year ended December 31, 2005, as compared to the same period in 2004, due primarily to a decrease in Resources' cash flows, which was driven by the timing of receipt of tax benefits, and the monetization of the remaining receivables of PSEG Energy Technologies Asset Management Company LLC (PETAMC) in 2004.
Energy Holdings' operating cash flow increased approximately $114 million from $289 million to $403 million for the year ended December 31, 2004, as compared to the same period in 2003, due primarily to a tax payment made in 2003 related to two terminated leveraged lease transactions in 2002 and sales of certain investments in the KKR leveraged buyout fund in 2004.
PSEG, PSE&G, Power and Energy Holdings
For the year ended December 31, 2005, PSEG's cash from operations, excluding changes in working capital, was approximately $1.6 billion, which was generally consistent with the prior year. Higher commodity prices are expected to provide meaningful growth for Power, but result in increased working capital requirements in the form of cash collateral postings and fuel purchases. In the near term, these factors were the primary contributor to increased working capital requirements of more than $500 million at Power during 2005.
Despite the increased working capital requirements, total excess cash available to pay down recourse debt was approximately $150 million in 2005. Excess cash flow available to pay down recourse debt consists of PSEG's operating cash flows, less investing activities and net dividends and adjusted for items such as securitization financings, securitization bond principal repayments, offshore cash activity and the impact of consolidation accounting at Energy Holdings.
In 2005, excess cash available to pay down recourse debt was substantially supported by asset sales and lease terminations by Energy Holdings of approximately $400 million, repatriated pre-2005 offshore cash
75
balances of approximately $140 million, asset sales by Power of approximately $325 million and BGS securitization financing of $103 million. In the future, PSEG expects operating cash flows to be sufficient to fund the majority of capital requirements, dividend payments, reduce debt, and, long-term, repurchase common stock. PSEG expects that cash generation will increase substantially during the business plan cycle as Power's net cash flows are expected to increase materially.
Common Stock Dividends
Dividend payments on common stock for the year ended December 31, 2005 were $2.24 per share and totaled approximately $541 million. Dividend payments on common stock for the year ended December 31, 2004 were $2.20 per share and totaled approximately $522 million. Future dividends declared will be dependent upon PSEG's future earnings, cash flows, financial requirements, alternative investment opportunities and other factors. On January 17, 2006, PSEG announced an increase in its dividend from $0.56 to $0.57 per share for the first quarter of 2006. This quarterly increase reflects an indicated annual dividend rate of $2.28 per share.
Short-Term Liquidity
PSEG, PSE&G, Power and Energy Holdings
As of December 31, 2005, PSEG and its subsidiaries had a total of approximately $3.7 billion of committed credit facilities with approximately $2.5 billion of available liquidity under these facilities. In addition, PSEG and PSE&G have access to certain uncommitted credit facilities. Neither company had any loans outstanding under these uncommitted facilities as of December 31, 2005.
76
Each of the facilities is restricted to availability and use to the specific companies as listed below.
Company
| | Expiration
Date
| | Total
Facility
| | Primary
Purpose
| | Usage
as of
December 31, 2005
| | Available
Liquidity
as of
December 31, 2005
|
| | | (Millions) |
PSEG: | | | | | | | | | | | | | | | | |
4-year Credit Facility | | April 2008 | | $ | 450 | | | CP Support/
Funding/Letters
of Credit | | $ | — | | | $ | 450 | |
5-year Credit Facility | | May 2010 | | $ | 650 | | | CP Support/
Funding/Letters of Credit | | $ | — | | | $ | 650 | |
Bilateral Term Loan(D) | | May 2006 | | $ | 100 | | | Funding | | $ | 100 | | | $ | — | |
Uncommitted Bilateral Agreement | | N/A | | | N/A | | | Funding | | $ | — | | | | N/A | |
PSE&G: | | | | | | | | | | | | | | | | |
5-year Credit Facility | | June 2009 | | $ | 600 | | | CP Support/
Funding/Letters
of Credit | | $ | — | | | $ | 600 | |
Uncommitted Bilateral Agreement | | N/A | | | N/A | | | Funding | | $ | — | | | | N/A | |
PSEG and Power:(A) | | | | | | | | | | | | | | | | |
3-year Credit Facility | | April 2007 | | $ | 600 | | | CP Support/
Funding/Letters
of Credit | | $ | 262 | (B) | | $ | 338 | |
Bilateral Credit Facility (D) | | April 2006 | | $ | 100 | | | Funding/Letters
of Credit | | $ | 100 | (B) | | $ | — | |
Bilateral Credit Facility(D) | | June 2006 | | $ | 100 | | | Funding/Letters
of Credit | | $ | — | | | $ | 100 | |
Bilateral Credit Facility(D) | | June 2006 | | $ | 150 | | | Funding/Letters
of Credit | | $ | 150 | (B) | | $ | — | |
Bilateral Credit Facility(D) | | July 2006 | | $ | 150 | | | Funding/Letters
of Credit | | $ | — | | | $ | 150 | |
Bilateral Credit Facility(D) | | July 2006 | | $ | 100 | | | Funding/Letters
of Credit | | $ | 100 | (B) | | $ | — | |
Bilateral Credit Facility(D) | | Sept 2006 | | $ | 100 | | | Funding/Letters of Credit | | $ | 100 | (B) | | $ | — | |
Bilateral Credit Facility(D) | | Dec 2006 | | $ | 50 | | | Funding/Letters
of Credit | | $ | — | | | $ | 50 | |
Bilateral Credit Facility(D) | | Dec 2006 | | $ | 275 | | | Letters of
Credit | | $ | 200 | (B) | | $ | 75 | |
Power: | | | | | | | | | | | | | | | | |
Bilateral Credit Facility | | March 2010 | | $ | 100 | | | Funding/Letters
of Credit | | $ | 63 | (B) | | $ | 37 | |
Energy Holdings: | | | | | | | | | | | | | | | | |
5-year Credit Facility(C) | | June 2010 | | $ | 150 | | | Funding/Letters
of Credit | | $ | 58 | (B) | | $ | 92 | |
| | | | | | | | | | | | | | | | |
| | | |
| (A) | | PSEG/Power co-borrower facilities. |
| | | |
| (B) | | These amounts relate to letters of credit outstanding. |
| | | |
| (C) | | Energy Holdings/Global/Resources joint and several co-borrowed facility. |
| | | |
| (D) | | Established during the fourth quarter of 2005. |
77
PSEG and PSE&G
PSEG and PSE&G believe they have sufficient liquidity to fund their respective short-term cash needs.
Power
As of December 31, 2005, Power had borrowed $202 million from PSEG in the form of an intercompany loan.
During the year ended December 31, 2005, the increase in commodity prices reduced available liquidity as market prices exceeded the prices of Power's contracts. In the next few years this is expected to improve Power's earnings and cash flows as it enters into new contracts at these higher prices. However, Power was required to post additional margin for sales contracts entered into in the normal course of business. Should commodity prices continue to rise, additional margin calls may be necessary relative to existing power sales contracts. As these contract obligations are fulfilled, liquidity requirements are reduced. During the fourth quarter of 2005, PSEG and Power established an additional $1.125 billion in bilateral credit agreements with various maturities (see table above). With the addition of these committed credit facilities, Power believes that it has sufficient liquidity to fund its short-term cash needs.
In addition, ER&T maintains agreements that require Power, as its guarantor under performance guarantees, to satisfy certain creditworthiness standards. Many of these agreements allow the counterparty to demand that ER&T provide additional performance assurance, generally in the form of a letter of credit or cash, in the event of a downgrade of Power's credit rating to below investment grade. While Power believes that a downgrade to below investment grade is unlikely, management believes that Power could meet collateral requirements with current credit facilities, including the new credit agreements listed above, and its ability to access additional sources of liquidity through bank lending and/or capital market transactions. See Note 12. Commitments and Contingent Liabilities of the Notes for further information.
Energy Holdings
As of December 31, 2005, Energy Holdings had loaned $409 million of excess cash to PSEG. In addition, Energy Holdings and its subsidiaries had $68 million in cash. See Note 2. Recent Accounting Standards of the Notes regarding repatriation of certain portions of these funds in October and December 2005.
External Financings
PSEG
For the year ended December 31, 2005, PSEG issued approximately 1.2 million shares of its common stock under its Dividend Reinvestment Program and Employee Stock Purchase Plan for approximately $72 million.
On August 8, 2005, the 6.25% trust preferred securities that were issued in November 2002 in connection with PSEG's Participating Units (PEPS) were remarketed. The PEPS consisted of a forward purchase contract for PSEG Common Stock and a trust preferred security. The remarketing reset the coupon on the trust preferred security to 5.381%, which will mature in November 2007. On November 16, 2005, PEPS investors used the proceeds from the remarketing for settling the forward purchase contract. Upon settlement, PSEG received cash proceeds of approximately $460 million and issued approximately 11.4 million shares of common stock.
In September 2005, PSEG issued $375 million of floating rate senior unsecured debt due in 2008, callable at par after one-year. The proceeds were used to redeem PSEG's subordinated debt underlying $225 million of Enterprise Capital Trust I, 7.44% Series A and $150 million of Enterprise Capital Trust III, 7.25% Series C Preferred Securities in October 2005.
On December 30, 2005, PSEG called at par the subordinated debt underlying $150 million of Enterprise Capital Trust II, Floating Rate Securities, Series B to be redeemed on February 27, 2006 using short-term debt.
78
PSE&G
In September 2005, PSE&G Transition Funding II LLC (Transition Funding II) issued approximately $103 million of its Transition Bonds, Series 2005-1, in four classes. Proceeds were used to purchase from PSE&G the rights to collect a transition bond charge from electric customers pursuant to a BPU order. PSE&G used those proceeds to reduce short-term debt.
In July 2005, PSE&G issued $250 million of its 5.25% Secured Medium-Term Notes Series D due 2035. The proceeds were used to redeem $125 million of PSE&G's First and Refunding Mortgage Bonds, 9.125% Series BB due July 2005 and to reduce short-term debt.
For the year ended December 31, 2005, PSE&G Transition Funding LLC (Transition Funding) repaid approximately $146 million of its transition bonds.
Energy Holdings
During 2005, Energy Holdings made cash distributions to PSEG totaling $412 million, including a $100 million return of capital in February 2005, a $184 million preference unit redemption in May 2005, a $125 million dividend in December 2005 and $3 million of preference unit distributions. In December 2005, Energy Holdings called for redemption in January 2006, all of its $309 million outstanding 7.75% Senior Notes due 2007. The notes were redeemed in January 2006 at the make-whole price specified in the indenture utilizing proceeds from the sale of its interest in Seminole together with other funds.
Energy Holdings had non-recourse debt outstanding at TIE at December 31, 2005 of $202 million and $210 million related to Guadalupe and Odessa, respectively, each with an all-in interest rate of 6.31% through the first quarter of 2006.
In October 2004, the maturity of the Guadalupe debt was extended to December 31, 2009 and a similar extension was executed relative to the Odessa debt on February 17, 2006. Interest on each of the Guadalupe debt and the Odessa debt is based on a spread (currently 1.75%) above Libor. In April 2006, 80% of the scheduled outstanding principal of the Guadalupe debt will become subject to swaps that convert floating rate LIBOR to a weighted average fixed rate of 4.518%.
Debt Covenants
PSEG, PSE&G, Power and Energy Holdings
PSEG's, PSE&G's, Power's and Energy Holdings' respective credit agreements generally contain customary provisions under which the lenders could refuse to advance loans in the event of a material adverse change in the borrower's business or financial condition.
As explained in more detail below, these credit agreements may also contain maximum debt-to-equity ratios, minimum cash flow tests and other restrictive covenants and conditions to borrowing. Compliance with applicable financial covenants will depend upon the respective future financial position, level of earnings and cash flows of PSEG, PSE&G, Power and Energy Holdings, as to which no assurances can be given. The ratios presented below are for the benefit of the investors of the related securities to which the covenants apply. They are not intended as a financial performance or liquidity measure. The debt underlying the preferred securities of PSEG, which is presented in Long-Term Debt in accordance with FIN 46 is not included as debt when calculating these ratios, as provided for in the various credit agreements. As discussed previously, the rise in commodity prices has increased margin requirements and has resulted in increased OCL, which reduces total equity. This has resulted in increases to the debt to capitalization ratios at PSEG and Power.
PSEG
Financial covenants contained in PSEG's credit facilities include a ratio of debt (excluding non-recourse project financings, securitization debt and debt underlying preferred securities and including commercial paper and loans, certain letters of credit and similar instruments) to total capitalization (including preferred securities outstanding) covenant. This covenant requires that at the end of any quarterly financial period, such ratio not be more than 70.0%. As of December 31, 2005, PSEG's ratio of debt to capitalization (as defined above) was 59.9%.
79
PSE&G
Financial covenants contained in PSE&G's credit facilities include a ratio of long-term debt (excluding securitization debt and long-term debt maturing within one year) to total capitalization covenant. This covenant requires that at the end of any quarterly financial period, such ratio will not be more than 65.0%. As of December 31, 2005, PSE&G's ratio of long-term debt to total capitalization (as defined above) was 47.9%.
In addition, under its First and Refunding Mortgage (Mortgage), PSE&G may issue new First and Refunding Mortgage Bonds against previous additions and improvements, provided that its ratio of earnings to fixed charges calculated in accordance with its Mortgage is at least 2 to 1, and/or against retired Mortgage Bonds. As of December 31, 2005, PSE&G's Mortgage coverage ratio was 4.8 to 1 and the Mortgage would permit up to approximately $1.7 billion aggregate principal amount of new Mortgage Bonds to be issued against previous additions and improvements.
PSEG and Power
Financial covenants contained in the PSEG/Power joint and several credit facility include a ratio of debt to total capitalization for each specific borrower. This facility has a 70% debt to total capitalization covenant for PSEG (calculated as set forth above) and a 65% debt to total capitalization covenant for Power. The Power ratio is calculated as debt (including loans, certain letters of credit and similar instruments) to total capitalization, adjusted for the $986 million Basis Adjustment (see Consolidated Balance Sheets). This covenant requires that at the end of any quarterly financial period, such ratio will not exceed 65.0%. As of December 31, 2005, Power's ratio of debt to capitalization (as defined above) was 53.3%.
Energy Holdings
Energy Holdings entered into a $150 million five-year bank revolving credit agreement in June 2005 with a covenant requiring the ratio of Earnings Before Interest, Taxes, Depreciation and Amortization (EBITDA) to fixed charges to be greater than or equal to 1.75. This bank revolving credit agreement replaced a $200 million three-year bank revolving credit agreement that was entered into in October 2003. As of December 31, 2005, Energy Holdings' coverage of this covenant was 3.03. Additionally, Energy Holdings must maintain a ratio of net debt to EBITDA of less than 5.25. As of December 31, 2005, Energy Holdings' ratio under this covenant was 3.09. Energy Holdings is a co-borrower under this facility with Global and Resources, which are joint and several obligors. The terms of the agreement include a pledge of Energy Holdings' membership interest in Global, restrictions on the use of proceeds related to material sales of assets and the satisfaction of certain financial covenants. Net cash proceeds from asset sales in excess of 5% of total assets of Energy Holdings during any 12-month period must be used to repay any outstanding amounts under the credit agreement. Net cash proceeds from asset sales during any 12-month period in excess of 10% of total assets must be retained by Energy Holdings or used to repay the debt of Energy Holdings, Global or Resources.
Cross Default Provisions
PSEG, PSE&G, Power and Energy Holdings
The PSEG credit agreements contain default provisions under which a default by it, PSE&G or Power in an aggregate amount of $50 million or greater would result in the potential acceleration of payment under those agreements. PSEG has removed Energy Holdings from all cross default provisions.
PSEG's bank credit agreements and note purchase agreements (collectively, Credit Agreements) related to its private placement of debt contain cross default provisions under which certain payment defaults by PSE&G or Power, certain bankruptcy events relating to PSE&G or Power, the failure by PSE&G or Power to satisfy certain final judgments or the occurrence of certain events of default under the financing agreements of PSE&G or Power, would each constitute an event of default under the PSEG Credit Agreements. It is also an event of default under the PSEG Credit Agreements if PSE&G or Power ceases to be wholly-owned by PSEG.
80
PSE&G
PSE&G's Mortgage has no cross defaults. The PSE&G Medium-Term Note Indenture has a cross default to the PSE&G Mortgage. The credit agreements have cross defaults under which a default by PSE&G in the aggregate of $50 million or greater would result in an event of default and the potential acceleration of payment under the credit agreements.
Power
The Power Senior Debt Indenture contains a default provision under which a default by Power, Nuclear, Fossil or ER&T in an aggregate amount of $50 million or greater would result in an event of default and the potential acceleration of payment under the indenture. There are no cross defaults within Power's indenture from PSEG, Energy Holdings or PSE&G.
Energy Holdings
Energy Holdings' Credit Agreement and Senior Note Indenture contain default provisions under which a default by it, Resources or Global in an aggregate amount of $25 million or greater would result in an event of default and the potential acceleration of payment under that agreement or the Indenture.
Ratings Triggers
PSEG, PSE&G, Power and Energy Holdings
The debt indentures and credit agreements of PSEG, PSE&G, Power and Energy Holdings do not contain any material “ratings triggers” that would cause an acceleration of the required interest and principal payments in the event of a ratings downgrade. However, in the event of a downgrade, any one or more of the affected companies may be subject to increased interest costs on certain bank debt and certain collateral requirements.
PSE&G
In accordance with the BPU approved requirements under the BGS contracts that PSE&G enters into with suppliers, PSE&G is required to maintain an investment grade credit rating. If PSE&G were to lose its investment grade rating, PSE&G would be required to file with the BPU a plan to assure continued payment for the BGS requirements of its customers.
PSE&G is the servicer for the bonds issued by Transition Funding. If PSE&G were to lose its investment grade rating, PSE&G would be required to remit collected cash daily to the bond trustee. Currently, cash is remitted monthly.
Power
In connection with the management and optimization of Power's asset portfolio, ER&T maintains underlying agreements that require Power, as its guarantor under performance guarantees, to satisfy certain creditworthiness standards. In the event of a deterioration of Power's credit rating to below an investment grade rating, many of these agreements allow the counterparty to demand that ER&T provide performance assurance, generally in the form of a letter of credit or cash. As of December 31, 2005, if Power were to lose its investment grade rating and assuming all counterparties to agreements in which ER&T is “out-of-the-money” were contractually entitled to demand, and demanded, performance assurance, ER&T could be required to post collateral in an amount equal to approximately $916 million. Providing this credit support would increase Power's costs of doing business and could restrict the ability of ER&T to manage and optimize Power's asset portfolio. See Note 12. Commitments and Contingent Liabilities of the Notes.
Credit Ratings
PSEG, PSE&G, Power and Energy Holdings
The current ratings of securities of PSEG and its subsidiaries are shown below and reflect the respective views of the rating agencies. Any downward revision or withdrawal may adversely affect the market price of PSEG's, PSE&G's, Power's and Energy Holdings' securities and serve to materially increase those companies'
81
cost of capital and limit their access to capital. All ratings have a stable outlook unless otherwise noted. (N) denotes a negative outlook, (P) denotes a positive outlook and (WD) denotes a credit watch developing indicating that ratings could be raised or lowered. There is no assurance that the ratings will continue for any given period of time or that they will not be revised by the rating agencies, if, in their respective judgments, circumstances so warrant. Each rating given by an agency should be evaluated independently of the other agencies' ratings. The ratings should not be construed as an indication to buy, hold or sell any security.
| | | | Moody's(A)
| | S&P(B)
| | Fitch(C)
|
| | PSEG: | | | | | | |
| | Preferred Securities | | Baa3 | | BB+(WD) | | BBB–(P) |
| | Commercial Paper | | P2 | | A3(WD) | | F2 |
| | Senior Unsecured Debt | | Baa2 | | BBB–(WD) | | BBB(P) |
| | PSE&G: | | | | | | |
| | Mortgage Bonds | | A3 | | A–(WD) | | A |
| | Preferred Securities | | Baa3 | | BB+(WD) | | BBB+ |
| | Commercial Paper | | P2 | | A3(WD) | | F2 |
| | Power: | | | | | | |
| | Senior Notes | | Baa1 | | BBB(WD) | | BBB(P) |
| | Energy Holdings: | | | | | | |
| | Senior Notes | | Ba3(N) | | BB–(N) | | BB(N) |
| | | | | | | | |
| | | |
| (A) | | Moody's ratings range from Aaa (highest) to C (lowest) for long-term securities and P-1 (highest) to NP (lowest) for short-term securities. |
| | | |
| (B) | | S&P ratings range from AAA (highest) to D (lowest) for long-term securities and A-1 (highest) to D (lowest) for short-term securities. |
| | | |
| (C) | | Fitch ratings range from AAA (highest) to D (lowest) for long-term securities and F-1 (highest) to D (lowest) for short-term securities. |
On December 20, 2004, in conjunction with the announcement of the Merger Agreement between PSEG and Exelon, all of the rating agencies reviewed their ratings and took the following actions:
| • | Moody's affirmed the ratings for PSEG, Power and Energy Holdings. Moody's revised its outlook to stable from negative for PSEG and Power. The outlook for PSE&G remained stable and the outlook for Energy Holdings remained negative. |
| |
| • | S&P placed its BBB Corporate Credit Rating for PSEG, Power and PSE&G on Credit Watch with developing implications. S&P indicated that, if not for the Merger, the corporate credit ratings assigned to PSEG and its subsidiaries, other than Energy Holdings, would have been lowered to BBB–with a negative outlook. S&P lowered its outlook for Energy Holdings to negative. |
| |
| • | Fitch affirmed its ratings for PSEG, Power, PSE&G and Energy Holdings. Fitch revised the outlook for PSEG and Power to positive from stable. The outlook for PSE&G remained stable and Energy Holdings remained negative. |
OCL
PSEG, PSE&G, Power and Energy Holdings
For the year ended December 31, 2005, PSEG, Power and Energy Holdings had Other Comprehensive Loss/(Income) of $337 million, $438 million and $(99) million, respectively, due primarily to net unrealized losses on derivatives accounted for as hedges in accordance with SFAS 133, unrealized gains and losses in the NDT Funds at Power and foreign currency translation adjustments at Energy Holdings.
During the year ended December 31, 2005, Power's OCL has increased from $49 million to $487 million. The primary cause was an increase of approximately $410 million related to the change in market value, net of taxes, of energy and related contracts that qualify for hedge accounting that were entered into by Power in the normal course of business. During the year ended December 31, 2005, the increase in gas and electric prices has resulted in unrealized losses on many of those contracts, which are recorded in OCL as a reduction to equity.
82
CAPITAL REQUIREMENTS
PSEG, PSE&G, Power and Energy Holdings
It is expected that the majority of each subsidiary's capital requirements over the next five years will come from internally generated funds. Projected construction and investment expenditures, excluding nuclear fuel purchases, for PSEG's subsidiaries for the next five years are presented in the table below. These amounts are subject to change, based on various factors, including the possible change in strategy of the combined company following the Merger.
| | | 2006
| | 2007
| | 2008
| | 2009
| | 2010
|
| | | (Millions) |
PSE&G: | | | | | | | | | | | | | | | | | | | | |
Facility Support | | $ | 22 | | | $ | 17 | | | $ | 17 | | | $ | 11 | | | $ | 12 | |
Environmental/Regulatory | | | 46 | | | | 28 | | | | 25 | | | | 26 | | | | 26 | |
Facility Replacement | | | 197 | | | | 195 | | | | 207 | | | | 221 | | | | 203 | |
System Reinforcement | | | 165 | | | | 170 | | | | 146 | | | | 139 | | | | 145 | |
New Business | | | 156 | | | | 155 | | | | 161 | | | | 168 | | | | 172 | |
| | | |
| | | |
| | | |
| | | |
| | | |
| |
Total PSE&G | | | 586 | | | | 565 | | | | 556 | | | | 565 | | | | 558 | |
| | | |
| | | |
| | | |
| | | |
| | | |
| |
Power: | | | | | | | | | | | | | | | | | | | | |
Non-Recurring | | | 247 | | | | 283 | | | | 209 | | | | 147 | | | | 145 | |
Recurring | | | 109 | | | | 131 | | | | 72 | | | | 108 | | | | 113 | |
| | | |
| | | |
| | | |
| | | |
| | | |
| |
Total Power | | | 356 | | | | 414 | | | | 281 | | | | 255 | | | | 258 | |
Energy Holdings | | | 53 | | | | 28 | | | | 21 | | | | 19 | | | | 22 | |
Other | | | 21 | | | | 18 | | | | 14 | | | | 15 | | | | 16 | |
| | | |
| | | |
| | | |
| | | |
| | | |
| |
Total PSEG | | $ | 1,016 | | | $ | 1,025 | | | $ | 872 | | | $ | 854 | | | $ | 854 | |
| | | |
| | | |
| | | |
| | | |
| | | |
| |
| | | | | | | | | | | | | | | | | | | | |
PSE&G
In 2005, PSE&G made approximately $498 million of capital expenditures, primarily for reliability of transmission and distribution systems. The $498 million does not include approximately $30 million spent on cost of removal. PSE&G projections for future capital expenditures include additions to its transmission and distribution systems to meet expected growth and to manage reliability and cost of removal expenditures. The current projections do not include investments required as a result of PJM's approval of the Regional Transmission Expansion Plan (RTEP) in December 2005. As project scope and cost estimates develop, PSE&G will modify its current projections to include these required investments.
Power
In 2005, Power made approximately $401 million of capital expenditures (excluding $75 million for nuclear fuel), primarily related to the BEC, the Linden station in New Jersey and various other projects at Nuclear and Fossil. The projections above do not include the costs, if any, for pollution control modifications for the Hudson unit or cost associated with cooling towers for Salem, if required. See Note 12. Commitments and Contingent Liabilities for additional information relating to such costs.
Energy Holdings
In 2005, Energy Holdings incurred approximately $38 million of capital expenditures, primarily related to capital projects at SAESA, Skawina and Dhofar Power.
Energy Holdings' capital needs in 2006 will be limited to fulfilling existing contractual and potential contingent commitments. The balance of the forecasted expenditures relates to capital requirements of consolidated subsidiaries, which will primarily be financed from internally generated cash flow within the projects and from local sources on a non-recourse basis or limited discretionary investments by Energy Holdings. Such capital requirements include organic growth in SAESA's service territory, the Electroandes expansion project and other capital improvements at Global's consolidated subsidiaries. Construction on the Electroandes expansion project is expected to begin in the first half of 2006 with expected completion in 2007 at a total cost of $30 million. The project is expected to be financed by Electroandes with cash and non-recourse debt.
83
Disclosures about Long-Term Maturities, Contractual and Commercial Obligations and Certain Investments
The following table reflects PSEG's and its subsidiaries' contractual cash obligations and other commercial commitments in the respective periods in which they are due. In addition, the table summarizes anticipated recourse and non-recourse debt maturities for the years shown. The table below does not reflect debt maturities of Energy Holdings' non-consolidated investments. If those obligations were not able to be refinanced by the project, Energy Holdings may elect to make additional contributions in these investments. For additional information, see Note 10. Schedule of Consolidated Debt of the Notes.
Contractual Cash Obligations
| | Total
Amounts
Committed
| | Less
Than
1 year
| | 2–3
years
| | 4–5
years
| | Over
5 years
|
| | | (Millions) |
Short-Term Debt Maturities | | | | | | | | | | | | | | | | | | | | |
PSEG | | $ | 100 | | | $ | 100 | | | $ | — | | | $ | — | | | $ | — | |
PSE&G | | | — | | | | — | | | | — | | | | — | | | | — | |
Long-Term Debt Maturities | | | | | | | | | | | | | | | | | | | | |
Recourse Debt Maturities | | | | | | | | | | | | | | | | | | | | |
PSEG(A) | | | 1,581 | | | | 203 | | | | 947 | | | | 249 | | | | 182 | |
PSE&G | | | 3,188 | | | | 322 | | | | 363 | | | | 60 | | | | 2,443 | |
Transition Funding (PSE&G) | | | 1,939 | | | | 155 | | | | 330 | | | | 364 | | | | 1,090 | |
Transition Funding II (PSE&G) | | | 103 | | | | 8 | | | | 19 | | | | 21 | | | | 55 | |
Power | | | 3,317 | | | | 500 | | | | — | | | | 250 | | | | 2,567 | |
Energy Holdings | | | 1,752 | | | | 304 | (B) | | | 507 | | | | 400 | | | | 541 | |
Non-Recourse Project Financing | | | | | | | | | | | | | | | | | | | | |
Energy Holdings | | | 935 | | | | 44 | | | | 332 | | | | 251 | | | | 308 | |
Interest on Recourse Debt | | | | | | | | | | | | | | | | | | | | |
PSEG | | | 132 | | | | 42 | | | | 75 | | | | 15 | | | | — | |
PSE&G | | | 1,984 | | | | 160 | | | | 296 | | | | 270 | | | | 1,258 | |
Transition Funding (PSE&G) | | | 720 | | | | 124 | | | | 217 | | | | 174 | | | | 205 | |
Transition Funding II (PSE&G) | | | 26 | | | | 5 | | | | 8 | | | | 6 | | | | 7 | |
Power | | | 2,193 | | | | 209 | | | | 384 | | | | 370 | | | | 1,230 | |
Energy Holdings | | | 257 | | | | 55 | | | | 83 | | | | 54 | | | | 65 | |
Interest on Debt Supporting Trust Preferred Securities | | | | | | | | | | | | | | | | | | | | |
PSEG | | | 392 | | | | 52 | | | | 61 | | | | 20 | | | | 259 | |
Interest on Non-Recourse Project Financing | | | | | | | | | | | | | | | | | | | | |
Energy Holdings | | | 530 | | | | 137 | | | | 238 | | | | 132 | | | | 23 | |
Capital Lease Obligations | | | | | | | | | | | | | | | | | | | | |
PSEG | | | 72 | | | | 7 | | | | 14 | | | | 15 | | | | 36 | |
Power | | | 15 | | | | 1 | | | | 4 | | | | 2 | | | | 8 | |
Operating Leases | | | | | | | | | | | | | | | | | | | | |
PSE&G | | | 12 | | | | 4 | | | | 5 | | | | 2 | | | | 1 | |
Energy Holdings | | | 10 | | | | 3 | | | | 4 | | | | 2 | | | | 1 | |
Energy-Related Purchase Commitments | | | | | | | | | | | | | | | | | | | | |
Power | | | 2,445 | | | | 719 | | | | 980 | | | | 470 | | | | 276 | |
Energy Holdings | | | 163 | | | | 163 | | | | — | | | | — | | | | — | |
| | | |
| | | |
| | | |
| | | |
| | | |
| |
Total Contractual Cash Obligations | | $ | 21,866 | | | $ | 3,317 | | | $ | 4,867 | | | $ | 3,127 | | | $ | 10,555 | |
| | | |
| | | |
| | | |
| | | |
| | | |
| |
Standby Letters of Credit | | | | | | | | | | | | | | | | | | | | |
Power | | $ | 1,013 | | | $ | 1,013 | | | $ | — | | | $ | — | | | $ | — | |
Energy Holdings | | | 58 | | | | 22 | | | | 36 | | | | — | | | | — | |
Guarantees and Equity Commitments | | | | | | | | | | | | | | | | | | | | |
Energy Holdings | | | 75 | | | | 10 | | | | 20 | | | | 45 | | | | — | |
| | | |
| | | |
| | | |
| | | |
| | | |
| |
Total Commercial Commitments | | $ | 1,146 | | | $ | 1,045 | | | $ | 56 | | | $ | 45 | | | $ | — | |
| | | |
| | | |
| | | |
| | | |
| | | |
| |
| | | | | | | | | | | | | | | | | | | | |
| | | |
| (A) | | Includes debt supporting trust preferred securities of $814 million. |
| | | |
| (B) | | Represents 7.75% senior notes that were called in December 2005 and redeemed in January 2006. |
See Note 12. Commitments and Contingent Liabilities of the Notes for a discussion of contractual commitments for a variety of services for which annual amounts are not quantifiable.
84
OFF-BALANCE SHEET ARRANGEMENTS
Power
Power issues guarantees in conjunction with certain of its energy trading activities. See Note 12. Commitments and Contingent Liabilities of the Notes for further discussion.
PSEG and Energy Holdings
Global has certain investments that are accounted for under the equity method in accordance with GAAP. Accordingly, amounts recorded on the Consolidated Balance Sheets for such investments represent Global's equity investment, which is increased for Global's pro-rata share of earnings less any dividend distribution from such investments. The companies in which Global invests that are accounted for under the equity method have an aggregate $1.3 billion of debt on their combined, consolidated financial statements. PSEG's pro-rata share of such debt is $577 million. This debt is non-recourse to PSEG, Energy Holdings and Global. PSEG is generally not required to support the debt service obligations of these companies. However, default with respect to this non-recourse debt could result in a loss of invested equity.
Resources has investments in leveraged leases that are accounted for in accordance with SFAS No. 13, “Accounting for Leases.” Leveraged lease investments generally involve three parties: an owner/lessor, a creditor and a lessee. In a typical leveraged lease financing, the lessor purchases an asset to be leased. The purchase price is typically financed 80% with debt provided by the creditor and the balance comes from equity funds provided by the lessor. The creditor provides long-term financing to the transaction secured by the property subject to the lease. Such long-term financing is non-recourse to the lessor and is not presented on Energy Holdings' Consolidated Balance Sheets. In the event of default, the leased asset, and in some cases the lessee, secure the loan. As a lessor, Resources has ownership rights to the property and rents the property to the lessees for use in their business operation. As of December 31, 2005, Resources' equity investment in leased assets was approximately $987 million, net of deferred taxes of approximately $1.7 billion. For additional information, see Note 8. Long-Term Investments of the Notes.
In the event that collectibility of the minimum lease payments to be received by the lessor is no longer reasonably assured, the accounting treatment for some of the leases may change. In such cases, Resources may deem that a lessee has a high probability of defaulting on the lease obligation, and would reclassify the lease from a leveraged lease to an operating lease. Should Resources ever directly assume a debt obligation, the fair value of the underlying asset and the associated debt would be recorded on the Consolidated Balance Sheets instead of the net equity investment in the lease.
Energy Holdings has guaranteed certain obligations of its subsidiaries or affiliates related to certain projects. See Note 12. Commitments and Contingent Liabilities of the Notes for additional information.
CRITICAL ACCOUNTING ESTIMATES
PSEG, PSE&G, Power and Energy Holdings
Under GAAP, many accounting standards require the use of estimates, variable inputs and assumptions (collectively referred to as estimates) that are subjective in nature. Because of this, differences between the actual measure realized versus the estimate can have a material impact on results of operations, financial position and cash flows. The managements of PSEG, PSE&G, Power and Energy Holdings have each determined that the following estimates are considered critical to the application of rules that relate to their respective businesses.
Accounting for Pensions
PSEG, PSE&G, Power and Energy Holdings account for pensions under SFAS No. 87, “Employers' Accounting for Pensions” (SFAS 87). Pension costs under SFAS 87 are calculated using various economic and demographic assumptions. Economic assumptions include the discount rate and the long-term rate of return on trust assets. Demographic assumptions include projections of future mortality rates, pay increases and retirement patterns. In 2005, PSEG and its subsidiaries recorded pension expense of $109 million, compared to $102 million in 2004 and $147 million in 2003. Additionally, in 2005, PSEG and its respective subsidiaries contributed cash of approximately $155 million, compared to cash contributions of $96 million in 2004 and $211 million in 2003.
85
PSEG's discount rate assumption, which is determined annually, is based on the rates of return on high-quality fixed-income investments currently available and expected to be available during the period to maturity of the pension benefits. The discount rate used to calculate pension obligations is determined as of December 31 each year, PSEG's SFAS 87 measurement date. The discount rate used to determine year-end obligations is also used to develop the following year's net periodic pension cost. The discount rates used in PSEG's 2004 and 2005 net periodic pension costs were 6.25% and 6.00%, respectively. PSEG's 2006 net periodic pension cost was developed using a discount rate of 5.75%.
PSEG's expected rate of return on plan assets reflects current asset allocations, historical long-term investment performance and an estimate of future long-term returns by asset class using input from PSEG's actuary and investment advisors, as well as long-term inflation assumptions. For 2004 and 2005, PSEG assumed a rate of return of 8.75% on PSEG's pension plan assets. For 2006, PSEG will continue the rate of return assumption of 8.75%.
Based on the above assumptions, PSEG has estimated net period pension costs of approximately $93 million and contributions of up to approximately $100 million in 2006. As part of the business planning process, PSEG has modeled its future costs assuming an 8.75% rate of return and a 5.75% discount rate for 2007 and beyond. Actual future pension expense and funding levels will depend on future investment performance, changes in discount rates, market conditions, funding levels relative to PSEG's projected benefit obligation and accumulated benefit obligation (ABO) and various other factors related to the populations participating in PSEG's pension plans.
The following chart reflects the sensitivities associated with a change in certain actuarial assumptions. The effects of the assumption changes shown below solely reflect the impact of that specific assumption.
| | Actuarial Assumption
| | Current
| | Change/
(Decrease)
| | As of
December 31, 2005
Impact on
Pension Benefit
Obligation
| | Increase to
Pension Expense
in 2006
|
| | | | | | | | | | | | (Millions) |
| | Discount Rate | | | 5.75% | | | | (1% | ) | | $ | 560 | | | $ | 54 | |
| | Rate of Return on Plan Assets | | | 8.75% | | | | (1% | ) | | $ | — | | | $ | 31 | |
| | | | | | | | | | | | | | | | | | |
Accounting for Deferred Taxes
PSEG, PSE&G, Power and Energy Holdings provide for income taxes based on the liability method required by SFAS No. 109, “Accounting for Income Taxes” (SFAS 109). Under this method, deferred tax assets and liabilities are recognized for the future tax consequences attributable to differences between the financial statement carrying amounts of existing assets and liabilities and their respective tax basis, as well as net operating loss and credit carryforwards.
PSEG, PSE&G, Power and Energy Holdings evaluate the need for a valuation allowance against their respective deferred tax assets based on the likelihood of expected future taxable income. PSEG, PSE&G, Power and Energy Holdings do not believe a valuation allowance is necessary; however, if the expected level of future taxable income changes or certain tax planning strategies become unavailable, PSEG, PSE&G, Power and Energy Holdings would record a valuation allowance through income tax expense in the period the valuation allowance is deemed necessary. Resources' and Global's ability to realize their deferred tax assets are dependent on PSEG's subsidiaries' ability to generate ordinary income and capital gains.
Hedge and MTM Accounting
SFAS 133 requires an entity to recognize the fair value of derivative instruments held as assets or liabilities on the balance sheet. SFAS 133 applies to all derivative instruments held by PSEG, PSE&G, Power and Energy Holdings. The fair value of most derivative instruments is determined by reference to quoted market prices, listed contracts, or quotations from brokers. Some of these derivative contracts are long term and rely on forward price quotations over the entire duration of the derivative contracts.
In the absence of the pricing sources listed above, for a small number of contracts, PSEG and its subsidiary companies utilize mathematical models that rely on historical data to develop forward pricing information in the determination of fair value. Because the determination of fair value using such models is subject to significant assumptions and estimates, PSEG and its subsidiary companies developed reserve
86
policies that are consistently applied to model-generated results to determine reasonable estimates of value to record in the financial statements.
PSEG and its subsidiaries have entered into various derivative instruments in order to hedge exposure to commodity price risk, interest rate risk and foreign currency risk. Many such instruments have been designated as cash flow hedges. For a cash flow hedge, the change in the value of a derivative instrument is measured against the offsetting change in the value of the underlying contract or business condition the derivative instrument is intended to hedge. This is known as the measure of derivative effectiveness. In accordance with SFAS 133, the effective portion of the change in the fair value of a derivative instrument designated as a cash flow hedge is reported in OCL, net of tax, or as a Regulatory Asset (Liability). Amounts in OCL are ultimately recognized in earnings when the related hedged forecasted transaction occurs. During periods of extreme price volatility, there will be significant changes in the value recorded in OCL. The changes in the fair value of the ineffective portions of derivative instrument designated as cash flow hedges are recorded in earnings.
For Power and Holdings' wholesale energy businesses, many of the forward sale, forward purchase and other option contracts are derivative instruments that hedge commodity price risk, but for which the businesses are not able to apply the hedge accounting guidance in SFAS 133. The changes in value of such derivative contracts are marked to market through earnings as commodity prices fluctuate. As a result, the earnings of PSEG, Power and Holdings may experience significant fluctuations depending on the volatility of commodity prices.
For Power's energy trading activities, all changes in the fair value of energy trading derivative contracts are recorded in earnings.
For additional information regarding Derivative Financial Instruments, see Note 11. Risk Management.
PSE&G
Unbilled Revenues
Electric and gas revenues are recorded based on services rendered to customers during each accounting period. PSE&G records unbilled revenues for the estimated amount customers will be billed for services rendered from the time meters were last read to the end of the respective accounting period. Unbilled usage is calculated in two steps. The initial step is to apply a base usage per day to the number of unbilled days in the period. The second step estimates seasonal loads based upon the time of year and the variance of actual degree-days and temperature-humidity-index hours of the unbilled period from expected norms. The resulting usage is priced at current rate levels and recorded as revenue. A calculation of the associated energy cost for the unbilled usage is recorded as well. Each month the prior month's unbilled amounts are reversed and the current month's amounts are accrued. Using benchmarks other than those used in this calculation could have a material effect on the amounts accrued in a reporting period. The resulting revenue and expense reflect the service rendered in the calendar month.
PSE&G and Energy Holdings
SFAS No. 71, “Accounting for the Effects of Certain Types of Regulation” (SFAS 71)
PSE&G and certain of Global's investments prepare their respective Consolidated Financial Statements in accordance with the provisions of SFAS 71, which differs in certain respects from the application of GAAP by non-regulated businesses. In general, SFAS 71 recognizes that accounting for rate-regulated enterprises should reflect the economic effects of regulation. As a result, a regulated utility is required to defer the recognition of costs (a regulatory asset) or recognize obligations (a regulatory liability) if it is probable that, through the rate-making process, there will be a corresponding increase or decrease in future rates. Accordingly, PSE&G and Global have deferred certain costs, which will be amortized over various future periods. To the extent that collection of such costs or payment of liabilities is no longer probable as a result of changes in regulation and/or PSE&G's and Global's competitive position, the associated regulatory asset or liability is charged or credited to income. See Note 5. Regulatory Matters of the Notes for additional information related to these and other regulatory issues.
87
Power
NDT Funds
Power accounts for the assets in the NDT Funds under SFAS No. 115, “Accounting for Certain Investments in Debt and Equity Securities” (SFAS 115). The assets in the NDT Funds are classified as available-for-sale securities and are marked to market with unrealized gains and losses recorded in OCL. Realized gains, losses and dividend and interest income are recorded on Power's and PSEG's Statements of Operations under Other Income and Other Deductions. Unrealized losses that are deemed to be other than temporarily impaired, as defined under SFAS 115, and related interpretive guidance, are charged against earnings rather than OCL. Factors, such as the length of time and extent to which the fair value is below carrying value, the potential for impairments of securities when the issuer or industry is experiencing significant financial difficulties and Power's intent and ability to continue to hold securities, are used as indicators of the prospects of the securities to recover their value.
Power and Energy Holdings
Accounting for Goodwill
SFAS 142 requires an entity to evaluate its goodwill for impairment at least annually or when indications of impairment exist. An impairment may exist when the carrying amount of goodwill exceeds its implied fair value.
Accounting estimates related to goodwill fair value are highly susceptible to change from period to period because they require management to make cash flow assumptions about future sales, operating costs, economic conditions and discount rates over an indefinite life. The impact of recognizing an impairment could have a material impact on financial position and results of operations.
Power and Energy Holdings perform annual goodwill impairment tests and continuously monitor the business environment in which they operate for any impairment issues that may arise. As indicated above, certain assumptions are used to arrive at a fair value for goodwill testing. Such assumptions are consistently employed and include, but are not limited to, free cash flow projections, interest rates, tariff adjustments, economic conditions prevalent in the geographic regions in which Power and Energy Holdings do business, local spot market prices for energy, foreign exchange rates and the credit worthiness of customers. If an adverse event were to occur, such an event could materially change the assumptions used to value goodwill and could result in impairments of goodwill.
PSEG and Energy Holdings
Foreign Currency Translation
Energy Holdings' financial statements are prepared using the U.S. Dollar as the reporting currency. In accordance with SFAS No. 52 “Foreign Currency Translation,” for foreign operations whose functional currency is deemed to be the local (foreign) currency, asset and liability accounts are translated into U.S. Dollars at current exchange rates and revenues and expenses are translated at average exchange rates prevailing during the period. Translation gains and losses (net of applicable deferred taxes) are not included in determining Net Income but are reported in OCL. Gains and losses on transactions denominated in a currency other than the functional currency are included in the results of operations as incurred.
The determination of an entity's functional currency requires management's judgment. It is based on an assessment of the primary currency in which transactions in the local environment are conducted, and whether the local currency can be relied upon as a stable currency in which to conduct business. As economic and business conditions change, Energy Holdings is required to reassess the economic environment and determine the appropriate functional currency. The impact of foreign currency accounting could have a material adverse impact on Energy Holdings' financial condition, results of operation and net cash flows.
88
| ITEM 7A. | | QUALITATIVE AND QUANTITATIVE DISCLOSURES ABOUT MARKET RISK |
PSEG, PSE&G, Power and Energy Holdings
The market risk inherent in PSEG's, PSE&G's, Power's and Energy Holdings' market-risk sensitive instruments and positions is the potential loss arising from adverse changes in foreign currency exchange rates, commodity prices, equity security prices and interest rates as discussed in the Notes to Consolidated Financial Statements (Notes). It is the policy of each entity to use derivatives to manage risk consistent with its respective business plans and prudent practices. PSEG, PSE&G, Power and Energy Holdings have a Risk Management Committee (RMC) comprised of executive officers who utilize an independent risk oversight function to ensure compliance with corporate policies and prudent risk management practices.
Additionally, PSEG, PSE&G, Power and Energy Holdings are exposed to counterparty credit losses in the event of non-performance or non-payment. PSEG has a credit management process, which is used to assess, monitor and mitigate counterparty exposure for PSEG and its subsidiaries. In the event of non-performance or non-payment by a major counterparty, there may be a material adverse impact on PSEG and its subsidiaries' financial condition, results of operations or net cash flows.
Foreign Exchange Rate Risk
Energy Holdings
Global is exposed to foreign currency risk and other foreign operations risk that arise from investments in foreign subsidiaries and affiliates. A key component of this risk is that some of its foreign subsidiaries and affiliates utilize currencies other than the consolidated reporting currency, the U.S. Dollar. Additionally, certain of Global's foreign subsidiaries and affiliates have entered into monetary obligations and maintain receipts/receivables in U.S. Dollars or currencies other than their own functional currencies. Primarily, Global is exposed to changes in the U.S. Dollar to Brazilian Real, Euro, Peruvian Nuevo Sol and the Chilean Peso exchange rates. With respect to the foreign currency risk associated with the Brazilian Real, there has been significant devaluation since the initial acquisition of Global's investment in Rio Grande Energia S.A. (RGE), which has resulted in reduced U.S. Dollar earnings and cash flows relative to initial projections. However, there have been material improvements in a number of currencies during 2003, 2004, and 2005 against the U.S. Dollar, that have offset most of the loss incurred because of the devaluation of the Brazilian Real. Whenever possible, these subsidiaries and affiliates have attempted to limit potential foreign exchange exposure by entering into revenue contracts that adjust to changes in foreign exchange rates. Global also uses foreign currency forward, swap and option agreements, wherever possible, to manage risk related to certain foreign currency transactions.
As of December 31, 2005, the devaluation of the Brazilian Real had resulted in a cumulative $216 million loss of value which is recorded as a $191 million after-tax charge to OCL related to Global's equity method investments in RGE. An additional devaluation in the December 31, 2005 Brazilian Real to U.S. Dollar exchange rate of 10% would result in a $20 million change in the value of the investment in RGE and corresponding impact to OCL. If the December 31, 2005 Brazilian Real to U.S. Dollar exchange rate were to appreciate by 10%, it would result in a $24 million after-tax increase in the value of the investment in RGE.
Additionally, Global has approximately $60 million of Euro-denominated receivables related to Global's equity method investments in Prisma which is subject to fluctuations in the U.S. Dollar to Euro exchange rate. If the December 31, 2005 Euro to U.S. Dollar exchange rate were to increase by 10%, Global would record approximately $7 million of foreign currency transaction losses. If the December 31, 2005 Euro to U.S. Dollar exchange rate were to decrease by 10%, Global would record approximately $5 million of foreign currency transaction gains.
Global has various other foreign currency exposures related to translation adjustments. A devaluation of 10% in such foreign currencies would result in an aggregate after-tax charge to OCL of $86 million. As of December 31, 2005, Energy Holdings' net loss in OCL from currency fluctuations was approximately $20 million.
89
Commodity Contracts
PSEG and Power
The availability and price of energy commodities are subject to fluctuations from factors such as weather, environmental policies, changes in supply and demand, state and federal regulatory policies, market rules and other events. To reduce price risk caused by market fluctuations, Power enters into supply contracts and derivative contracts, including forwards, futures, swaps and options with approved counterparties. These contracts, in conjunction with demand obligations help reduce risk and optimize the value of owned electric generation capacity.
Normal Operations and Hedging Activities
Power enters into physical contracts, as well as financial contracts, including forwards, futures, swaps and options designed to reduce risk associated with volatile commodity prices. Commodity price risk is associated with market price movements resulting from market generation demand, changes in fuel costs and various other factors.
Under SFAS 133, changes in the fair value of qualifying cash flow hedge transactions are recorded in OCL, and gains and losses are recognized in earnings when the underlying transaction occurs. Changes in the fair value of derivative contracts that do not meet hedge criteria under SFAS 133 and the ineffective portion of hedge contracts are recognized in earnings currently. Additionally, changes in the fair value attributable to fair value hedges are similarly recognized in earnings.
Many non-trading contracts qualify for the normal purchases and normal sales exemption under SFAS 133 and are accounted for upon settlement.
Trading
Power maintains a strategy of entering into trading positions to optimize the value of its portfolio of generation assets, gas supply contracts and its electric and gas supply obligations. Power engages in physical and financial transactions in the electricity wholesale markets and executes an overall risk management strategy to mitigate the effects of adverse movements in the fuel and electricity markets. In addition, Power has non-asset based trading activities, which have significantly decreased. These contracts also involve financial transactions including swaps, options and futures. These activities are marked to market in accordance with SFAS 133 with gains and losses recognized in earnings.
Value-at-Risk (VaR) Models
Power
Power uses VaR models to assess the market risk of its commodity businesses. The portfolio VaR model for Power includes its owned generation and physical contracts, as well as fixed price sales requirements, load requirements and financial derivative instruments. VaR represents the potential gains or losses, under normal market conditions, for instruments or portfolios due to changes in market factors, for a specified time period and confidence level. Power estimates VaR across its commodity businesses.
Power manages its exposure at the portfolio level. Its portfolio consists of owned generation, load-serving contracts (both gas and electric), fuel supply contracts and energy derivatives designed to manage the risk around generation and load. While Power manages its risk at the portfolio level, it also monitors separately the risk of its trading activities and its hedges. Non-trading MTM VaR consists of MTM derivatives that are economic hedges, some of which qualify for hedge accounting. The MTM derivatives that are not hedges are included in the trading VaR.
The VaR models used by Power are variance/covariance models adjusted for the delta of positions with a 95% one-tailed confidence level and a one-day holding period for the MTM trading and non-trading activities and a 95% one-tailed confidence level with a one-week holding period for the portfolio VaR. The models assume no new positions throughout the holding periods, whereas Power actively manages its portfolio.
90
As of December 31, 2005 and December 31, 2004, trading VaR was approximately $1 million and $2 million, respectively.
| | For the Year Ended December 31, 2005
| | Trading VaR
| | Non-Trading
MTM VaR
|
| | | | (Millions) |
| | 95% Confidence Level, One-Day Holding Period, One-Tailed: | | | | | | | | |
| | Period End | | $ | 1 | | | $ | 50 | |
| | Average for the Period | | $ | — | | | $ | 58 | |
| | High | | $ | 1 | | | $ | 84 | |
| | Low | | $ | — | | | $ | 44 | |
| | 99% Confidence Level, One-Day Holding Period, Two-Tailed: | | | | | | | | |
| | Period End | | $ | 1 | | | $ | 78 | |
| | Average for the Period | | $ | 1 | | | $ | 91 | |
| | High | | $ | 2 | | | $ | 132 | |
| | Low | | $ | — | | | $ | 69 | |
| | | | | | | | | | |
Interest Rates
PSEG, PSE&G, Power and Energy Holdings
PSEG, PSE&G, Power and Energy Holdings are subject to the risk of fluctuating interest rates in the normal course of business. It is the policy of PSEG, PSE&G, Power and Energy Holdings to manage interest rate risk through the use of fixed and floating rate debt, interest rate swaps and interest rate lock agreements. PSEG, PSE&G, Power and Energy Holdings manage their respective interest rate exposures by maintaining a targeted ratio of fixed and floating rate debt. As of December 31, 2005, a hypothetical 10% change in market interest rates would result in a $2 million, $4 million, $3 million and $1 million change in annual interest costs related to debt at PSEG, PSE&G, Power and Energy Holdings, respectively. In addition, as of December 31, 2005, a hypothetical 10% change in market interest rates would result in a $6 million, $97 million, $114 million and $35 million change in the fair value of the debt of PSEG, PSE&G, Power and Energy Holdings, respectively.
Debt and Equity Securities
PSEG, PSE&G, Power and Energy Holdings
PSEG has approximately $3.1 billion invested in its pension plans. Although fluctuations in market prices of securities within this portfolio do not directly affect PSEG's earnings in the current period, changes in the value of these investments could affect PSEG's future contributions to these plans, its financial position if its ABO under its pension plans exceeds the fair value of its pension funds and future earnings as PSEG could be required to adjust pension expense and its assumed rate of return.
Power
Power's NDT Funds are comprised of both fixed income and equity securities totaling $1.1 billion as of December 31, 2005. The fair value of equity securities is determined independently each month by the Trustee. As of December 31, 2005, the portfolio was comprised of approximately $682 million of equity securities and approximately $451 million in fixed income securities. The fair market value of the assets in the NDT Funds will fluctuate primarily depending upon the performance of equity markets. As of December 31, 2005, a hypothetical 10% change in the equity market would impact the value of the equity securities in the NDT Funds by approximately $68 million.
Power uses duration to measure the interest rate sensitivity of the fixed income portfolio. Duration is a summary statistic of the effective average maturity of the fixed income portfolio. The benchmark for the fixed income component of the NDT Funds is the Lehman Brothers Aggregate Bond Index, which currently has a duration of 4.57 years and a yield of 5.08%. The portfolio's value will appreciate or depreciate by the duration with a 1% change in interest rates. As of December 31, 2005, a hypothetical 1% increase in interest rates would result in a decline in the market value for the fixed income portfolio of approximately $21 million.
91
Credit Risk
PSEG, PSE&G, Power and Energy Holdings
Credit risk relates to the risk of loss that PSEG, PSE&G, Power and Energy Holdings would incur as a result of non-performance by counterparties pursuant to the terms of their contractual obligations. PSEG, PSE&G, Power and Energy Holdings have established credit policies that they believe significantly minimize credit risk. These policies include an evaluation of potential counterparties' financial condition (including credit rating), collateral requirements under certain circumstances and the use of standardized agreements, which may allow for the netting of positive and negative exposures associated with a single counterparty.
PSE&G
BGS suppliers expose PSE&G to credit losses in the event of non-performance or non-payment upon a default of the BGS supplier. Credit requirements are governed under BPU approved BGS contracts.
Power
Counterparties expose Power's trading operation to credit losses in the event of non-performance or non-payment. Power has a credit management process, which is used to assess, monitor and mitigate counterparty exposure for Power and its subsidiaries. Power's counterparty credit limits are based on a scoring model that considers a variety of factors, including leverage, liquidity, profitability, credit ratings and risk management capabilities. Power's trading operations have entered into payment netting agreements or enabling agreements that allow for payment netting with the majority of its large counterparties, which reduce Power's exposure to counterparty risk by providing the offset of amounts payable to the counterparty against amounts receivable from the counterparty. In the event of non-performance or non-payment by a major counterparty, there may be a material adverse impact on Power's and its subsidiaries' financial condition, results of operations or net cash flows. As of December 31, 2005, over 90% of the credit exposure (MTM plus net receivables and payables, less cash collateral) for Power's trading operations was with investment grade counterparties. The majority of the credit exposure with non-investment grade counterparties was with certain companies that supply fuel (primarily coal) to Power. Therefore, this exposure relates to the risk of a counterparty performing under its obligations rather than payment risk. As of December 31, 2005, Power's trading operations had over 150 active counterparties.
In February 2006, the BPU approved the results of the BGS auctions for New Jersey customers. Power will continue to be a direct supplier of New Jersey EDCs. Power believes that its obligations under these contracts are reasonably balanced by its available supply.
Energy Holdings
Global
Global has credit risk with respect to its counterparties to power purchase agreements (PPAs) and other parties.
Resources
As of December 31, 2005, Resources has a remaining net investment in four leased aircraft of approximately $32 million. On September 14, 2005, Delta Airlines (Delta) and Northwest Airlines (Northwest), the lessees for Resources' four remaining aircraft, filed for Chapter 11 bankruptcy protection. This had no material effect on Energy Holdings as it continues to believe that it will be able to recover the recorded amount of its investments in these aircraft as of December 31, 2005. In 2004 and 2005, Resources successfully restructured the leases and converted the Delta and Northwest leases from leveraged leases to operating leases. Energy Holdings expects to recover its investment through cash flows from the operating leases.
Resources has credit risk related to its investments in leveraged leases, totaling $987 million, which is net of deferred taxes of $1.7 billion, as of December 31, 2005. These investments are largely concentrated in the energy industry. As of December 31, 2005, 67% of counterparties in the lease portfolio were rated investment grade by both S&P and Moody's.
92
Resources is the lessor of domestic generating facilities in several U.S. energy markets. As a result of rating agency actions due to concerns over forward energy prices, the credit of some of the lessees was downgraded. Specifically, the lessees in the following transactions were downgraded below investment grade during 2002 by these rating agencies. Resources' investment in such transactions was approximately $286 million, net of deferred taxes of $454 million as of December 31, 2005.
Resources is the lessor of a generation facility to Reliant Energy Mid Atlantic Power Holdings LLC (REMA), an indirect wholly owned subsidiary of Reliant Resources Incorporated (RRI). The leased assets are the Keystone, Conemaugh and Shawville generating facilities located in the PJM West market in Pennsylvania. REMA is capitalized with over $1 billion of equity from RRI and has no debt obligations senior to the lease obligations. REMA is rated B+ by S&P and B1 by Moody's. As the lessor/equity participant in the lease, Resources is protected with significant lease covenants that restrict the flow of dividends from REMA to its parent, and by over-collateralization of REMA with non-leased assets, transfer of which is restricted by the financing documents. Restrictive covenants include historical and forward cash flow coverage tests that prohibit discretionary capital expenditures and dividend payments to the parent/lessee if stated minimum coverages are not met and similar cash flow restrictions if ratings are not maintained at stated levels. The covenants are designed to maintain cash reserves in the transaction entity for the benefit of the non-recourse lenders and the lessor/equity participants in the event of a market downturn or degradation in operating performance of the leased assets. Resources' investment in the REMA transaction was $98 million, net of deferred taxes of $173 million as of December 31, 2005.
Resources is the lessor to the lease of the Powerton and Joliet power generating facilities operated by the lessee, Midwest Generation LLC (Midwest), an indirect subsidiary of Edison Mission Energy (EME). EME is the guarantor for the lease obligations. As of December 31, 2005, Resources' lease investment in the Powerton and Joliet facilities was $51 million, net of taxes of $147 million. EME's credit rating outlook is B with positive implications.
Resources is the lessor of the Danskammer generation facility in New York to Dynegy Danskammer LLC (Danskammer) and the Roseton generation facility to Dynegy Roseton LLC (Roseton). Both Danskammer and Roseton are indirect subsidiaries of Dynegy Holdings Inc. (DHI). The lease obligations are guaranteed by DHI which is currently rated B by S&P and Caa2 by Moody's. Resources' investment in Danskammer and Roseton was $112 million, net of deferred taxes of $112 million as of December 31, 2005.
Resources is a lessor in a lease to the Midland Cogeneration Venture, LP (MCV) of a 1,500 MW natural gas-fired cogeneration facility located in Midland, Michigan. The principal partners in the limited partnership, which leases the asset, are indirect subsidiaries of CMS Energy Corporation (CMS Energy) and El Paso Energy Corporation (El Paso). S&P's rating of the stand-alone credit quality of the facility is BB- reflecting both CMS Energy's and El Paso's credit deterioration, high fuel gas prices and a mismatch between coal-based energy rates and the price of natural gas fuel supply. To meet these challenges, MCV actively manages and hedges its fuel purchases and has accumulated substantial cash reserves for bondholder protection. Additionally, the partnership has negotiated and received the Michigan Public Service Commission's approval for an operating agreement with Consumers Power to allow the facility to dispatch in a more economic manner, mitigating the fuel risk. Resources closely monitors this credit situation. The facility has been in commercial operation since 1990, successfully paying down a significant portion of its debt to date. Resources' net investment in MCV was $25 million, net of deferred taxes of $22 million as of December 31, 2005.
In any lease transaction, in the event of a default, Energy Holdings would exercise its rights and attempt to seek recovery of its investment. The results of such efforts may not be known for a period of time. A bankruptcy of a lessee and failure to recover adequate value could lead to a foreclosure of the lease. Under a worst-case scenario, if a foreclosure were to occur, Resources would record a pre-tax write-off up to its gross investment, including deferred taxes, in these facilities. The investment balance increases as earnings are recognized and decreases as rental payments are received by the lessor. Also, in the event of a potential foreclosure, the net tax benefits generated by Resources' portfolio of investments could be materially reduced in the period in which gains associated with the potential forgiveness of debt at these projects occurs. The amount and timing of any potential reduction in net tax benefits is dependent upon a number of factors including, but not limited to, the time of a potential foreclosure, the amount of lease debt outstanding, any cash trapped at the projects and negotiations during such potential foreclosure process. The potential loss of earnings, impairment and/or tax payments could have a material impact to PSEG's and Energy Holdings' financial position, results of operations and net cash flows.
93
As of December 31, 2005, lease payments on these facilities were current and Resources determined that the collectibility of the minimum lease payments under its leveraged lease investments is still reasonably probable and therefore continues to account for these investments as leveraged leases.
Other Supplemental Information Regarding Market Risk
Power
The following table describes the drivers of Power's energy trading and marketing activities and Operating Revenues included in its Consolidated Statement of Operations for the year ended December 31, 2005. Normal operations and hedging activities represent the marketing of electricity available from Power's owned or contracted generation sold into the wholesale market. As the information in this table highlights, MTM activities represent a small portion of the total Operating Revenues for Power. Activities accounted for under the accrual method, including normal purchases and sales, account for the majority of the revenue. The MTM activities reported here are those relating to changes in fair value due to external movement in prices. For additional information, see Note 11. Risk Management of the Notes.
Operating Revenues
For the Year Ended December 31, 2005
| | | Normal
Operations and
Hedging(A)
| | Trading
| | Total
|
| | | (Millions) |
MTM Activities: | | | | | | | | | | | | |
Unrealized MTM Gains (Losses) | | | | | | | | | | | | |
Changes in Fair Value of Open Positions | | $ | 61 | | | $ | 3 | | | $ | 64 | |
Origination Unrealized Gain at Inception | | | — | | | | — | | | | — | |
Changes in Valuation Techniques and Assumptions | | | — | | | | — | | | | — | |
Realization at Settlement of Contracts | | | (75 | ) | | | (6 | ) | | | (81 | ) |
| | | |
| | | |
| | | |
| |
Total Change in Unrealized Fair Value | | | (14 | ) | | | (3 | ) | | | (17 | ) |
Realized Net Settlement of Transactions Subject to MTM | | | 75 | | | | 6 | | | | 81 | |
Broker Fees and Other Related Expenses | | | — | | | | (7 | ) | | | (7 | ) |
| | | |
| | | |
| | | |
| |
Net MTM Gains | | | 61 | | | | (4 | ) | | | 57 | |
Accrual Activities: | | | | | | | | | | | | |
Accrual Activities—Revenue, Including Hedge Reclassifications | | | 6,002 | | | | — | | | | 6,002 | |
| | | |
| | | |
| | | |
| |
Total Operating Revenues | | $ | 6,063 | | | $ | (4 | ) | | $ | 6,059 | |
| | | |
| | | |
| | | |
| |
| | | | | | | | | | | | |
| | | |
| (A) | | Includes derivative contracts that Power enters into to hedge anticipated exposures related to its owned and contracted generation supply, all asset backed transactions (ABT) and hedging activities, but excludes owned and contracted generation assets. |
The following table indicates Power's energy trading assets and liabilities, as well as Power's hedging activity related to ABTs and derivative instruments that qualify for hedge accounting under SFAS 133. This table presents amounts segregated by portfolio which are then netted for those counterparties with whom Power has the right to set off and therefore, are not necessarily indicative of amounts presented on the Consolidated Balance Sheets since balances with many counterparties are subject to offset and are shown net on the Consolidated Balance Sheets regardless of the portfolio in which they are included.
94
Energy Contract Net Assets/Liabilities
As of December 31, 2005
| | | Normal
Operations and
Hedging
| | Trading
| | Total
|
| | | (Millions) |
MTM Energy Assets | | | | | | | | | | | | |
Current Assets | | $ | 269 | | | $ | 149 | | | $ | 418 | |
Noncurrent Assets | | | 28 | | | | 13 | | | | 41 | |
| | | |
| | | |
| | | |
| |
Total MTM Energy Assets | | $ | 297 | | | $ | 162 | | | $ | 459 | |
| | | |
| | | |
| | | |
| |
MTM Energy Liabilities | | | | | | | | | | | | |
Current Liabilities | | $ | (502 | ) | | $ | (143 | ) | | $ | (645 | ) |
Noncurrent Liabilities | | | (598 | ) | | | (17 | ) | | | (615 | ) |
| | | |
| | | |
| | | |
| |
Total MTM Energy Liabilities | | $ | (1,100 | ) | | $ | (160 | ) | | $ | (1,260 | ) |
| | | |
| | | |
| | | |
| |
Total MTM Energy Contract Net (Liabilities) Assets | | $ | (803 | ) | | $ | 2 | | | $ | (801 | ) |
| | | |
| | | |
| | | |
| |
| | | | | | | | | | | | |
The following table presents the maturity of net fair value of MTM energy trading contracts.
Maturity of Net Fair Value of MTM Energy Trading Contracts
As of December 31, 2005
| | | Maturities within
|
| | | 2006
| | 2007
| | 2008-
2009
| | Total
|
| | | (Millions) |
Trading | | $ | 6 | | | $ | (6 | ) | | $ | 2 | | | $ | 2 | |
Normal Operations and Hedging | | | (232 | ) | | | (358 | ) | | | (213 | ) | | | (803 | ) |
| | | |
| | | |
| | | |
| | | |
| |
Total Net Unrealized Losses on MTM Contracts | | $ | (226 | ) | | $ | (364 | ) | | $ | (211 | ) | | $ | (801 | ) |
| | | |
| | | |
| | | |
| | | |
| |
| | | | | | | | | | | | | | | | |
Wherever possible, fair values for these contracts were obtained from quoted market sources. For contracts where no quoted market exists, modeling techniques were employed using assumptions reflective of current market rates, yield curves and forward prices as applicable to interpolate certain prices. The effect of using such modeling techniques is not material to Power's financial results.
PSEG, Power and Energy Holdings
The following table identifies losses on cash flow hedges that are currently in OCL, a separate component of equity. Power uses forward sale and purchase contracts, swaps and firm transmission rights contracts to hedge forecasted energy sales from its generation stations and its contracted supply obligations. Power also enters into swaps, options and futures transactions to hedge the price of fuel to meet its fuel purchase requirements for generation. PSEG, Power and Energy Holdings are subject to the risk of fluctuating interest rates in the normal course of business. PSEG's policy is to manage interest rate risk through the use of fixed rate debt, floating rate debt and interest rate derivatives. The table also provides an estimate of the losses, net of taxes, that are expected to be reclassified out of OCL and into earnings over the next twelve months.
Cash Flow Hedges Included in OCL
As of December 31, 2005
| | | | Accumulated
OCL
| | Portion Expected
to be Reclassified
in next 12 months
|
| | | | (Millions) |
| | Commodities | | $ | (558 | ) | | $ | (218 | ) |
| | Interest Rates | | | (68 | ) | | | (17 | ) |
| | Foreign Currency | | | — | | | | — | |
| | | | |
| | | |
| |
| | Net Cash Flow Hedge Loss Included in OCL | | $ | (626 | ) | | $ | (235 | ) |
| | | | |
| | | |
| |
| | | | | | | | | | |
95
Power
Credit Risk
The following table provides information on Power's credit exposure, net of collateral, as of December 31, 2005. Credit exposure is defined as any positive results of netting accounts receivable/accounts payable and the forward value on open positions. It further delineates that exposure by the credit rating of the counterparties and provides guidance on the concentration of credit risk to individual counterparties and an indication of the maturity of a company's credit risk by credit rating of the counterparties.
Schedule of Credit Risk Exposure on Energy Contracts Net Assets
As of December 31, 2005
Rating
| | Current
Exposure
| | Securities
Held
as Collateral
| | Net
Exposure
| | Number of
Counterparties
> 10%
| | Net Exposure of
Counterparties
> 10%
|
| | | (Millions) | | | | | | (Millions) |
Investment Grade—External Rating | | $ | 657 | | | $ | 88 | | | $ | 613 | | | | 1 | (A) | | $ | 430 | |
Non-Investment Grade—External Rating | | | 37 | | | | 47 | | | | 29 | | | | — | | | | — | |
Investment Grade—No External Rating | | | 10 | | | | 5 | | | | 10 | | | | — | | | | — | |
Non-Investment Grade—No External Rating | | | 40 | | | | — | | | | 40 | | | | — | | | | — | |
| | | |
| | | |
| | | |
| | | |
| | | |
| |
Total | | $ | 744 | | | $ | 140 | | | $ | 692 | | | | 1 | | | $ | 430 | |
| | | |
| | | |
| | | |
| | | |
| | | |
| |
| | | | | | | | | | | | | | | | | | | | |
| | | |
| (A) | | Counterparty is PSE&G. |
The net exposure listed above, in some cases, will not be the difference between the current exposure and the collateral held. A counterparty may have posted more collateral than the outstanding exposure, in which case there would not be exposure.
ITEM 8. FINANCIAL STATEMENTS AND SUPPLEMENTARY DATA
This combined Form 10-K is separately filed by Public Service Enterprise Group Incorporated (PSEG), Public Service Electric and Gas Company (PSE&G), PSEG Power LLC (Power) and PSEG Energy Holdings L.L.C. (Energy Holdings). Information contained herein relating to any individual company is filed by such company on its own behalf. PSE&G, Power and Energy Holdings each make representations only as to itself and makes no representations as to any other company.
96
REPORT OF INDEPENDENT REGISTERED PUBLIC ACCOUNTING FIRM
To the Stockholders and Board of Directors of
PUBLIC SERVICE ENTERPRISE GROUP INCORPORATED:
We have audited the accompanying consolidated balance sheets of Public Service Enterprise Group Incorporated and subsidiaries (the “Company”) as of December 31, 2005 and 2004, and the related consolidated statements of operations, common stockholders' equity and cash flows for each of the three years in the period ended December 31, 2005. Our audits also included the consolidated financial statement schedule listed in the Index at Item 15. These consolidated financial statements and the consolidated financial statement schedule are the responsibility of the Company's management. Our responsibility is to express an opinion on the consolidated financial statements and consolidated financial statement schedule based on our audits.
We conducted our audits in accordance with the standards of the Public Company Accounting Oversight Board (United States). Those standards require that we plan and perform the audit to obtain reasonable assurance about whether the financial statements are free of material misstatement. An audit includes examining, on a test basis, evidence supporting the amounts and disclosures in the financial statements. An audit also includes assessing the accounting principles used and significant estimates made by management, as well as evaluating the overall financial statement presentation. We believe that our audits provide a reasonable basis for our opinion.
In our opinion, such consolidated financial statements present fairly, in all material respects, the financial position of the Company as of December 31, 2005 and 2004, and the results of its operations and its cash flows for each of the three years in the period ended December 31, 2005, in conformity with accounting principles generally accepted in the United States of America. Also, in our opinion, such consolidated financial statement schedule, when considered in relation to the basic consolidated financial statements taken as a whole, presents fairly in all material respects, the information set forth therein.
As discussed in Note 3 to the consolidated financial statements, on January 1, 2003, the Company adopted Statement of Financial Accounting Standards No. 143, Accounting for Asset Retirement Obligations.
As discussed in Note 3 to the consolidated financial statements, on December 31, 2005, the Company adopted Financial Accounting Standards Board Interpretation No. 47, Accounting for Conditional Asset Retirement Obligations.
We have also audited, in accordance with the standards of the Public Company Accounting Oversight Board (United States), the effectiveness of the Company's internal control over financial reporting as of December 31, 2005, based on the criteria established in Internal Control—Integrated Framework issued by the Committee of Sponsoring Organizations of the Treadway Commission and our report dated February 27, 2006 expressed an unqualified opinion on management's assessment of the effectiveness of the Company's internal control over financial reporting and an unqualified opinion on the effectiveness of the Company's internal control over financial reporting.
DELOITTE & TOUCHE LLP
Parsippany, New Jersey
February 27, 2006
97
REPORT OF INDEPENDENT REGISTERED PUBLIC ACCOUNTING FIRM
To the Sole Stockholder and Board of Directors of
PUBLIC SERVICE ELECTRIC AND GAS COMPANY:
We have audited the accompanying consolidated balance sheets of Public Service Electric and Gas Company and subsidiaries (the “Company”) as of December 31, 2005 and 2004, and the related consolidated statements of operations, common stockholder's equity and cash flows for each of the three years in the period ended December 31, 2005. Our audits also included the consolidated financial statement schedule listed in the Index at Item 15. These consolidated financial statements and the consolidated financial statement schedule are the responsibility of the Company's management. Our responsibility is to express an opinion on the consolidated financial statements and consolidated financial statement schedule based on our audits.
We conducted our audits in accordance with the standards of the Public Company Accounting Oversight Board (United States). Those standards require that we plan and perform the audit to obtain reasonable assurance about whether the financial statements are free of material misstatement. The Company is not required to have, nor were we engaged to perform, an audit of its internal control over financial reporting. Our audits included consideration of internal control over financial reporting as a basis for designing audit procedures that are appropriate in the circumstances, but not for the purpose of expressing an opinion on the effectiveness of the Company's internal control over financial reporting. Accordingly, we express no such opinion. An audit also includes examining, on a test basis, evidence supporting the amounts and disclosures in the financial statements. An audit also includes assessing the accounting principles used and significant estimates made by management, as well as evaluating the overall financial statement presentation. We believe that our audits provide a reasonable basis for our opinion.
In our opinion, such consolidated financial statements present fairly, in all material respects, the financial position of the Company as of December 31, 2005 and 2004, and the results of its operations and its cash flows for each of the three years in the period ended December 31, 2005, in conformity with accounting principles generally accepted in the United States of America. Also, in our opinion, such consolidated financial statement schedule, when considered in relation to the basic consolidated financial statements taken as a whole, presents fairly in all material respects, the information set forth therein.
DELOITTE & TOUCHE LLP
Parsippany, New Jersey
February 27, 2006
98
REPORT OF INDEPENDENT REGISTERED PUBLIC ACCOUNTING FIRM
To the Sole Member and Board of Directors of
PSEG POWER LLC:
We have audited the accompanying consolidated balance sheets of PSEG Power LLC and subsidiaries (the “Company”) as of December 31, 2005 and 2004, and the related consolidated statements of operations, capitalization and member's equity and cash flows for each of the three years in the period ended December 31, 2005. Our audits also included the consolidated financial statement schedule listed in the Index at Item 15. These consolidated financial statements and the consolidated financial statement schedule are the responsibility of the Company's management. Our responsibility is to express an opinion on the consolidated financial statements and consolidated financial statement schedule based on our audits.
We conducted our audits in accordance with the standards of the Public Company Accounting Oversight Board (United States). Those standards require that we plan and perform the audit to obtain reasonable assurance about whether the financial statements are free of material misstatement. The Company is not required to have, nor were we engaged to perform, an audit of its internal control over financial reporting. Our audits included consideration of internal control over financial reporting as a basis for designing audit procedures that are appropriate in the circumstances, but not for the purpose of expressing an opinion on the effectiveness of the Company's internal control over financial reporting. Accordingly, we express no such opinion. An audit also includes examining, on a test basis, evidence supporting the amounts and disclosures in the financial statements. An audit also includes assessing the accounting principles used and significant estimates made by management, as well as evaluating the overall financial statement presentation. We believe that our audits provide a reasonable basis for our opinion.
In our opinion, such consolidated financial statements present fairly, in all material respects, the financial position of the Company as of December 31, 2005 and 2004, and the results of its operations and its cash flows for each of the three years in the period ended December 31, 2005, in conformity with accounting principles generally accepted in the United States of America. Also, in our opinion, such consolidated financial statement schedule, when considered in relation to the basic consolidated financial statements taken as a whole, presents fairly in all material respects, the information set forth therein.
As discussed in Note 3 to the consolidated financial statements, on January 1, 2003, the Company adopted Statement of Financial Accounting Standards No. 143, Accounting for Asset Retirement Obligations.
As discussed in Note 3 to the consolidated financial statements, on December 31, 2005, the Company adopted Financial Accounting Standards Board Interpretation No. 47, Accounting for Conditional Asset Retirement Obligations.
DELOITTE & TOUCHE LLP
Parsippany, New Jersey
February 27, 2006
99
REPORT OF INDEPENDENT REGISTERED PUBLIC ACCOUNTING FIRM
To the Sole Member and Board of Directors of
PSEG ENERGY HOLDINGS L.L.C.:
We have audited the accompanying consolidated balance sheets of PSEG Energy Holdings L.L.C. and subsidiaries (the “Company”) as of December 31, 2005 and 2004, and the related consolidated statements of operations, member's equity and cash flows for each of the three years in the period ended December 31, 2005. Our audits also included the consolidated financial statement schedule listed in the Index at Item 15. These consolidated financial statements and the consolidated financial statement schedule are the responsibility of the Company's management. Our responsibility is to express an opinion on the consolidated financial statements and consolidated financial statement schedule based on our audits.
We conducted our audits in accordance with the standards of the Public Company Accounting Oversight Board (United States). Those standards require that we plan and perform the audit to obtain reasonable assurance about whether the financial statements are free of material misstatement. The Company is not required to have, nor were we engaged to perform, an audit of its internal control over financial reporting. Our audits included consideration of internal control over financial reporting as a basis for designing audit procedures that are appropriate in the circumstances, but not for the purpose of expressing an opinion on the effectiveness of the Company's internal control over financial reporting. Accordingly, we express no such opinion. An audit also includes examining, on a test basis, evidence supporting the amounts and disclosures in the financial statements. An audit also includes assessing the accounting principles used and significant estimates made by management, as well as evaluating the overall financial statement presentation. We believe that our audits provide a reasonable basis for our opinion.
In our opinion, such consolidated financial statements present fairly, in all material respects, the financial position of the Company as of December 31, 2005 and 2004, and the results of its operations and its cash flows for each of the three years in the period ended December 31, 2005, in conformity with accounting principles generally accepted in the United States of America. Also, in our opinion, such consolidated financial statement schedule, when considered in relation to the basic consolidated financial statements taken as a whole, presents fairly in all material respects, the information set forth therein.
DELOITTE & TOUCHE LLP
Parsippany, New Jersey
February 27, 2006
100
PUBLIC SERVICE ENTERPRISE GROUP INCORPORATED
CONSOLIDATED STATEMENTS OF OPERATIONS
(Millions, except for share data)
| | | For The Years Ended December 31,
|
| | | 2005
| | 2004
| | 2003
|
OPERATING REVENUES | | $ | 12,430 | | | $ | 10,800 | | | $ | 11,006 | |
OPERATING EXPENSES | | | | | | | | | | | | |
Energy Costs | | | 7,273 | | | | 5,987 | | | | 6,335 | |
Operation and Maintenance | | | 2,314 | | | | 2,179 | | | | 2,064 | |
Depreciation and Amortization | | | 748 | | | | 693 | | | | 516 | |
Taxes Other Than Income Taxes | | | 141 | | | | 139 | | | | 136 | |
| | | |
| | | |
| | | |
| |
Total Operating Expenses | | | 10,476 | | | | 8,998 | | | | 9,051 | |
| | | |
| | | |
| | | |
| |
Income from Equity Method Investments | | | 131 | | | | 126 | | | | 114 | |
| | | |
| | | |
| | | |
| |
OPERATING INCOME | | | 2,085 | | | | 1,928 | | | | 2,069 | |
Other Income | | | 221 | | | | 180 | | | | 184 | |
Other Deductions | | | (87 | ) | | | (69 | ) | | | (100 | ) |
Interest Expense | | | (816 | ) | | | (798 | ) | | | (825 | ) |
Preferred Stock Dividends | | | (4 | ) | | | (4 | ) | | | (4 | ) |
| | | |
| | | |
| | | |
| |
INCOME FROM CONTINUING OPERATIONS
BEFORE INCOME TAXES | | | 1,399 | | | | 1,237 | | | | 1,324 | |
Income Tax Expense | | | (541 | ) | | | (467 | ) | | | (469 | ) |
| | | |
| | | |
| | | |
| |
INCOME FROM CONTINUING OPERATIONS | | | 858 | | | | 770 | | | | 855 | |
Income (Loss) from Discontinued Operations, including Gain/(Loss) on Disposal, net of tax benefit (expense) of $135, $26 and $13 for the years ended 2005, 2004 and 2003, respectively | | | (180 | ) | | | (44 | ) | | | (47 | ) |
| | | |
| | | |
| | | |
| |
INCOME BEFORE EXTRAORDINARY ITEM AND CUMULATIVE EFFECT OF A CHANGE IN ACCOUNTING PRINCIPLE | | | 678 | | | | 726 | | | | 808 | |
Extraordinary Item, net of tax benefit of $12 for 2003 | | | — | | | | — | | | | (18 | ) |
Cumulative Effect of a Change in Accounting Principle, net of tax benefit (expense) of $11 and ($255) in 2005 and 2003, respectively | | | (17 | ) | | | — | | | | 370 | |
| | | |
| | | |
| | | |
| |
NET INCOME | | $ | 661 | | | $ | 726 | | | $ | 1,160 | |
| | | |
| | | |
| | | |
| |
WEIGHTED AVERAGE COMMON SHARES
OUTSTANDING (THOUSANDS): | | | | | | | | | | | | |
BASIC | | | 240,297 | | | | 236,984 | | | | 228,222 | |
| | | |
| | | |
| | | |
| |
DILUTED | | | 244,406 | | | | 238,286 | | | | 228,824 | |
| | | |
| | | |
| | | |
| |
EARNINGS PER SHARE: | | | | | | | | | | | | |
BASIC | | | | | | | | | | | | |
INCOME FROM CONTINUING OPERATIONS | | $ | 3.57 | | | $ | 3.25 | | | $ | 3.75 | |
NET INCOME | | $ | 2.75 | | | $ | 3.06 | | | $ | 5.08 | |
| | | |
| | | |
| | | |
| |
DILUTED | | | | | | | | | | | | |
INCOME FROM CONTINUING OPERATIONS | | $ | 3.51 | | | $ | 3.23 | | | $ | 3.74 | |
NET INCOME | | $ | 2.71 | | | $ | 3.05 | | | $ | 5.07 | |
| | | |
| | | |
| | | |
| |
DIVIDENDS PAID PER SHARE OF COMMON STOCK | | $ | 2.24 | | | $ | 2.20 | | | $ | 2.16 | |
| | | |
| | | |
| | | |
| |
| | | | | | | | | | | | |
See Notes to Consolidated Financial Statements.
101
PUBLIC SERVICE ENTERPRISE GROUP INCORPORATED
CONSOLIDATED BALANCE SHEETS
(Millions)
| | | December 31,
|
| | | 2005
| | 2004
|
ASSETS | | | | | | | | |
CURRENT ASSETS | | | | | | | | |
Cash and Cash Equivalents | | $ | 288 | | | $ | 263 | |
Accounts Receivable, net of allowances of $44 and $26 in 2005 and 2004, respectively | | | 1,938 | | | | 1,590 | |
Unbilled Revenues | | | 394 | | | | 340 | |
Fuel | | | 812 | | | | 623 | |
Materials and Supplies, net | | | 277 | | | | 249 | |
Energy Trading Contracts | | | 327 | | | | 161 | |
Prepayments | | | 129 | | | | 121 | |
Restricted Funds | | | 76 | | | | 41 | |
Derivative Contracts | | | 50 | | | | 16 | |
Assets of Discontinued Operations | | | 498 | | | | 1,035 | |
Other | | | 41 | | | | 187 | |
| | | |
| | | |
| |
Total Current Assets | | | 4,830 | | | | 4,626 | |
| | | |
| | | |
| |
PROPERTY, PLANT AND EQUIPMENT | | | 18,896 | | | | 18,193 | |
Less: Accumulated Depreciation and Amortization | | | (5,560 | ) | | | (5,335 | ) |
| | | |
| | | |
| |
Net Property, Plant and Equipment | | | 13,336 | | | | 12,858 | |
| | | |
| | | |
| |
NONCURRENT ASSETS | | | | | | | | |
Regulatory Assets | | | 5,053 | | | | 5,127 | |
Long-Term Investments | | | 4,077 | | | | 4,181 | |
Nuclear Decommissioning Trust (NDT) Funds | | | 1,133 | | | | 1,086 | |
Other Special Funds | | | 559 | | | | 488 | |
Goodwill and Other Intangibles | | | 608 | | | | 622 | |
Energy Trading Contracts | | | 42 | | | | 30 | |
Derivative Contracts | | | — | | | | 8 | |
Other | | | 177 | | | | 234 | |
| | | |
| | | |
| |
Total Noncurrent Assets | | | 11,649 | | | | 11,776 | |
| | | |
| | | |
| |
TOTAL ASSETS | | $ | 29,815 | | | $ | 29,260 | |
| | | |
| | | |
| |
LIABILITIES AND CAPITALIZATION | | | | | | | | |
CURRENT LIABILITIES | | | | | | | | |
Long-Term Debt Due Within One Year | | $ | 1,536 | | | $ | 376 | |
Commercial Paper and Loans | | | 100 | | | | 638 | |
Accounts Payable | | | 1,154 | | | | 1,349 | |
Derivative Contracts | | | 425 | | | | 186 | |
Energy Trading Contracts | | | 200 | | | | 125 | |
Accrued Interest | | | 152 | | | | 155 | |
Accrued Taxes | | | 141 | | | | 54 | |
Clean Energy Program | | | 96 | | | | 82 | |
Liabilities of Discontinued Operations | | | 436 | | | | 463 | |
Other | | | 517 | | | | 461 | |
| | | |
| | | |
| |
Total Current Liabilities | | | 4,757 | | | | 3,889 | |
| | | |
| | | |
| |
NONCURRENT LIABILITIES | | | | | | | | |
Deferred Income Taxes and Investment Tax Credits (ITC) | | | 4,248 | | | | 4,357 | |
Regulatory Liabilities | | | 720 | | | | 545 | |
Asset Retirement Obligations | | | 585 | | | | 310 | |
Other Postretirement Benefit (OPEB) Costs | | | 597 | | | | 563 | |
Clean Energy Program | | | 233 | | | | 324 | |
Environmental Costs | | | 420 | | | | 366 | |
Derivative Contracts | | | 637 | | | | 180 | |
Energy Trading Contracts | | | 19 | | | | 23 | |
Other | | | 218 | | | | 266 | |
| | | |
| | | |
| |
Total Noncurrent Liabilities | | | 7,677 | | | | 6,934 | |
| | | |
| | | |
| |
COMMITMENTS AND CONTINGENT LIABILITIES (See Note 12) | | | | | | | | |
CAPITALIZATION | | | | | | | | |
LONG-TERM DEBT | | | | | | | | |
Long-Term Debt | | | 7,849 | | | | 8,414 | |
Securitization Debt | | | 1,879 | | | | 1,939 | |
Non-Recourse Debt | | | 891 | | | | 1,059 | |
Debt Supporting Trust Preferred Securities | | | 660 | | | | 1,201 | |
| | | |
| | | |
| |
Total Long-Term Debt | | | 11,279 | | | | 12,613 | |
| | | |
| | | |
| |
SUBSIDIARIES' PREFERRED SECURITIES | | | | | | | | |
Preferred Stock Without Mandatory Redemption, $100 par value, 7,500,000 authorized; issued and outstanding, 2005 and 2004—795,234 shares | | | 80 | | | | 80 | |
| | | |
| | | |
| |
COMMON STOCKHOLDERS' EQUITY | | | | | | | | |
Common Stock, no par, authorized 500,000,000 shares; issued; 2005—265,332,746 shares; 2004—264,128,807 shares | | | 4,618 | | | | 4,569 | |
Treasury Stock, at cost; 2005—14,169,560 shares; 2004—26,029,740 shares | | | (532 | ) | | | (978 | ) |
Retained Earnings | | | 2,545 | | | | 2,425 | |
Accumulated Other Comprehensive Loss | | | (609 | ) | | | (272 | ) |
| | | |
| | | |
| |
Total Common Stockholders' Equity | | | 6,022 | | | | 5,744 | |
| | | |
| | | |
| |
Total Capitalization | | | 17,381 | | | | 18,437 | |
| | | |
| | | |
| |
TOTAL LIABILITIES AND CAPITALIZATION | | $ | 29,815 | | | $ | 29,260 | |
| | | |
| | | |
| |
| | | | | | | | |
See Notes to Consolidated Financial Statements.
102
PUBLIC SERVICE ENTERPRISE GROUP INCORPORATED
CONSOLIDATED STATEMENTS OF CASH FLOWS
(Millions)
| | | For The Years Ended
December 31,
|
| | | 2005
| | 2004
| | 2003
|
CASH FLOWS FROM OPERATING ACTIVITIES | | | | | | | | | | | | |
Net Income | | $ | 661 | | | $ | 726 | | | $ | 1,160 | |
Adjustments to Reconcile Net Income to Net Cash Flows from | | | | | | | | | | | | |
Operating Activities: | | | | | | | | | | | | |
Extraordinary Item, net of tax benefit | | | — | | | | — | | | | 18 | |
(Gain) Loss on Disposition of Property, Plant and Equipment | | | (10 | ) | | | 1 | | | | — | |
Loss (Gain) on Disposal of Discontinued Operations, net of tax | | | 178 | | | | (3 | ) | | | 32 | |
Cumulative Effect of a Change in Accounting Principle, net of tax | | | 17 | | | | — | | | | (370 | ) |
Write-Down of Project Investments | | | 22 | | | | — | | | | — | |
Depreciation and Amortization | | | 765 | | | | 719 | | | | 526 | |
Amortization of Nuclear Fuel | | | 94 | | | | 80 | | | | 89 | |
Provision for Deferred Income Taxes (Other than Leases) and ITC | | | 224 | | | | 167 | | | | 365 | |
Non-Cash Employee Benefit Plan Costs | | | 235 | | | | 217 | | | | 253 | |
Leveraged Lease (Expense) Income, Adjusted for Rents Received and Deferred Taxes | | | (27 | ) | | | (92 | ) | | | 77 | |
Gain on Sale of Investments | | | (120 | ) | | | (79 | ) | | | (57 | ) |
Undistributed (Earnings) Losses from Affiliates | | | (46 | ) | | | (12 | ) | | | 40 | |
Foreign Currency Transaction (Gain) Loss | | | (3 | ) | | | 26 | | | | (16 | ) |
Unrealized Losses (Gains) on Energy Contracts and Other Derivatives | | | 24 | | | | (7 | ) | | | 34 | |
Over (Under) Recovery of Electric Energy Costs (BGS and NTC) and Gas Costs | | | 109 | | | | 80 | | | | (38 | ) |
(Under) Over Recovery of Societal Benefits Charge (SBC) | | | (120 | ) | | | (158 | ) | | | 4 | |
Net Realized Gains and Income from NDT Funds | | | (125 | ) | | | (105 | ) | | | (64 | ) |
Other Non-Cash Charges | | | 56 | | | | 49 | | | | 84 | |
Net Change in Certain Current Assets and Liabilities | | | (682 | ) | | | 25 | | | | (439 | ) |
Employee Benefit Plan Funding and Related Payments | | | (240 | ) | | | (174 | ) | | | (274 | ) |
Proceeds from the Withdrawal of Partnership Interests and Other Distributions | | | 64 | | | | 126 | | | | 66 | |
Other | | | (136 | ) | | | 20 | | | | 4 | |
| | | |
| | | |
| | | |
| |
Net Cash Provided By Operating Activities | | | 940 | | | | 1,606 | | | | 1,494 | |
| | | |
| | | |
| | | |
| |
CASH FLOWS FROM INVESTING ACTIVITIES | | | | | | | | | | | | |
Additions to Property, Plant and Equipment | | | (1,024 | ) | | | (1,247 | ) | | | (1,397 | ) |
Investments in Joint Ventures, Partnerships and Capital Leases | | | — | | | | (14 | ) | | | (37 | ) |
Proceeds from Sale of Property, Plant and Equipment | | | 229 | | | | 13 | | | | 20 | |
Proceeds from the Sale of Investments and Return of Capital from Partnerships | | | 315 | | | | 438 | | | | 30 | |
Proceeds from NDT Funds Sales | | | 3,223 | | | | 2,637 | | | | 1,229 | |
Investment in NDT Funds | | | (3,232 | ) | | | (2,647 | ) | | | (1,258 | ) |
Proceeds from Collection of Notes Receivable | | | 132 | | | | — | | | | — | |
Restricted Funds | | | (50 | ) | | | 54 | | | | (86 | ) |
NDT Funds Interest and Dividends | | | 35 | | | | 28 | | | | 26 | |
Other | | | 5 | | | | (18 | ) | | | (28 | ) |
| | | |
| | | |
| | | |
| |
Net Cash Used In Investing Activities | | | (367 | ) | | | (756 | ) | | | (1,501 | ) |
| | | |
| | | |
| | | |
| |
CASH FLOWS FROM FINANCING ACTIVITIES | | | | | | | | | | | | |
Net Change in Commercial Paper and Loans | | | (538 | ) | | | 339 | | | | (327 | ) |
Issuance of Long-Term Debt | | | 728 | | | | 1,429 | | | | 1,549 | |
Issuance of Non-Recourse Debt | | | 16 | | | | — | | | | 677 | |
Issuance of Common Stock | | | 533 | | | | 83 | | | | 441 | |
Redemptions of Long-Term Debt | | | (271 | ) | | | (2,232 | ) | | | (908 | ) |
Repayment of Non-Recourse Debt | | | (42 | ) | | | (77 | ) | | | (396 | ) |
Redemption of Trust Securities | | | (387 | ) | | | — | | | | (155 | ) |
Cash Dividends Paid on Common Stock | | | (541 | ) | | | (522 | ) | | | (493 | ) |
Contributions from Minority Shareholders | | | (1 | ) | | | (1 | ) | | | (48 | ) |
Other | | | (47 | ) | | | (49 | ) | | | (38 | ) |
| | | |
| | | |
| | | |
| |
Net Cash (Used In) Provided By Financing Activities | | | (550 | ) | | | (1,030 | ) | | | 302 | |
| | | |
| | | |
| | | |
| |
Effect of Exchange Rate Change | | | 2 | | | | 1 | | | | 2 | |
| | | |
| | | |
| | | |
| |
Net Increase (Decrease) in Cash and Cash Equivalents | | | 25 | | | | (179 | ) | | | 297 | |
Cash and Cash Equivalents at Beginning of Period | | | 263 | | | | 442 | | | | 145 | |
| | | |
| | | |
| | | |
| |
Cash and Cash Equivalents at End of Period | | $ | 288 | | | $ | 263 | | | $ | 442 | |
| | | |
| | | |
| | | |
| |
Supplemental Disclosure of Cash Flow Information: | | | | | | | | | | | | |
Income Taxes Paid (Received) | | $ | 103 | | | $ | 104 | | | $ | (21 | ) |
Interest Paid, Net of Amounts Capitalized | | $ | 783 | | | $ | 851 | | | $ | 975 | |
| | | | | | | | | | | | |
See Notes to Consolidated Financial Statements.
103
PUBLIC SERVICE ENTERPRISE GROUP INCORPORATED
CONSOLIDATED STATEMENTS OF COMMON STOCKHOLDERS' EQUITY
(Millions)
| | | Common Stock
| | Treasury
Stock
| | | | | | | | | | | | |
| | | Shs.
| | Amount
| | Shs.
| | Amount
| | Retained
Earnings
| | Accumulated
Other
Comprehensive
Loss
| | Total
|
Balance as of January 1, 2003 | | | 251 | | | $ | 4,051 | | | | (26 | ) | | $ | (981 | ) | | $ | 1,554 | | | $ | (733 | ) | | $ | 3,891 | |
| | | |
| | | |
| | | |
| | | |
| | | |
| | | |
| | | |
| |
Net Income | | | — | | | | — | | | | — | | | | — | | | | 1,160 | | | | — | | | | 1,160 | |
Other Comprehensive Income (Loss), net of tax: | | | | | | | | | | | | | | | | | | | | | | | | | | | | |
Currency Translation Adjustment, net of tax $4 | | | — | | | | — | | | | — | | | | — | | | | — | | | | 164 | | | | 164 | |
Available for Sale Securities, net of tax $81 | | | — | | | | — | | | | — | | | | — | | | | — | | | | 118 | | | | 118 | |
Change in Fair Value of Derivative Instruments, net of tax $(32) | | | — | | | | — | | | | — | | | | — | | | | — | | | | (57 | ) | | | (57 | ) |
Reclassification Adjustments for Net Amounts included in Net Income, net of tax | | | — | | | | — | | | | — | | | | — | | | | — | | | | 35 | | | | 35 | |
Settlement Adjustments Related to Projects Under Construction | | | — | | | | — | | | | — | | | | — | | | | — | | | | (11 | ) | | | (11 | ) |
Minimum Pension Liability, net of tax $200 | | | — | | | | — | | | | — | | | | — | | | | — | | | | 289 | | | | 289 | |
Change in Fair Value of Equity Investments | | | — | | | | — | | | | — | | | | — | | | | — | | | | 3 | | | | 3 | |
| | | | | | | | | | | | | | | | | | | | | | | | | | | |
| |
Other Comprehensive Income | | | | | | | | | | | | | | | | | | | | | | | | | | | 541 | |
| | | | | | | | | | | | | | | | | | | | | | | | | | | |
| |
Comprehensive Income | | | | | | | | | | | | | | | | | | | | | | | | | | | 1,701 | |
Cash Dividends on Common Stock | | | — | | | | — | | | | — | | | | — | | | | (493 | ) | | | — | | | | (493 | ) |
Issuance of Common Stock | | | 11 | | | | 452 | | | | — | | | | — | | | | — | | | | — | | | | 452 | |
Issuance Costs and Other | | | — | | | | (13 | ) | | | — | | | | — | | | | — | | | | — | | | | (13 | ) |
| | | |
| | | |
| | | |
| | | |
| | | |
| | | |
| | | |
| |
Balance as of December 31, 2003 | | | 262 | | | $ | 4,490 | | | | (26 | ) | | $ | (981 | ) | | $ | 2,221 | | | $ | (192 | ) | | $ | 5,538 | |
| | | |
| | | |
| | | |
| | | |
| | | |
| | | |
| | | |
| |
Net Income | | | — | | | | — | | | | — | | | | — | | | | 726 | | | | — | | | | 726 | |
Other Comprehensive Income (Loss), net of tax: | | | | | | | | | | | | | | | | | | | | | | | | | | | | |
Currency Translation Adjustment, net of tax $19 | | | — | | | | — | | | | — | | | | — | | | | — | | | | 64 | | | | 64 | |
Available for Sale Securities, net of tax $29 | | | — | | | | — | | | | — | | | | — | | | | — | | | | (16 | ) | | | (16 | ) |
Change in Fair Value of Derivative Instruments, net of tax $(115) | | | — | | | | — | | | | — | | | | — | | | | — | | | | (167 | ) | | | (167 | ) |
Reclassification Adjustments for Net Amounts included in Net Income, net of tax | | | — | | | | — | | | | — | | | | — | | | | — | | | | 46 | | | | 46 | |
Other | | | — | | | | — | | | | — | | | | — | | | | — | | | | (3 | ) | | | (3 | ) |
Minimum Pension Liability, net of tax $(3) | | | — | | | | — | | | | — | | | | — | | | | — | | | | (6 | ) | | | (6 | ) |
Change in Fair Value of Equity Investments | | | — | | | | — | | | | — | | | | — | | | | — | | | | 2 | | | | 2 | |
| | | | | | | | | | | | | | | | | | | | | | | | | | | |
| |
Other Comprehensive Loss | | | | | | | | | | | | | | | | | | | | | | | | | | | (80 | ) |
| | | | | | | | | | | | | | | | | | | | | | | | | | | |
| |
Comprehensive Income | | | | | | | | | | | | | | | | | | | | | | | | | | | 646 | |
Cash Dividends on Common Stock | | | — | | | | — | | | | — | | | | — | | | | (522 | ) | | | — | | | | (522 | ) |
Issuance of Common Stock | | | 2 | | | | 83 | | | | — | | | | — | | | | — | | | | — | | | | 83 | |
Issuance Costs and Other | | | — | | | | (4 | ) | | | — | | | | 3 | | | | — | | | | — | | | | (1 | ) |
| | | |
| | | |
| | | |
| | | |
| | | |
| | | |
| | | |
| |
Balance as of December 31, 2004 | | | 264 | | | $ | 4,569 | | | | (26 | ) | | $ | (978 | ) | | $ | 2,425 | | | $ | (272 | ) | | $ | 5,744 | |
| | | |
| | | |
| | | |
| | | |
| | | |
| | | |
| | | |
| |
Net Income | | | — | | | | — | | | | — | | | | — | | | | 661 | | | | — | | | | 661 | |
Other Comprehensive Income (Loss), net of tax: | | | | | | | | | | | | | | | | | | | | | | | | | | | | |
Currency Translation Adjustment, net of tax | | | — | | | | — | | | | — | | | | — | | | | — | | | | 84 | | | | 84 | |
Available for Sale Securities, net of tax $33 | | | — | | | | — | | | | — | | | | — | | | | — | | | | (30 | ) | | | (30 | ) |
Change in Fair Value of Derivative Instruments, net of tax $407 | | | — | | | | — | | | | — | | | | — | | | | — | | | | (573 | ) | | | (573 | ) |
Reclassification Adjustments for Net Amounts included in Net Income, net of tax | | | — | | | | — | | | | — | | | | — | | | | — | | | | 182 | | | | 182 | |
Settlement Adjustments Related to Projects Under Construction | | | — | | | | — | | | | — | | | | — | | | | — | | | | (2 | ) | | | (2 | ) |
Minimum Pension Liability, net of tax | | | — | | | | — | | | | — | | | | — | | | | — | | | | 2 | | | | 2 | |
| | | | | | | | | | | | | | | | | | | | | | | | | | | |
| |
Other Comprehensive Loss | | | | | | | | | | | | | | | | | | | | | | | | | | | (337 | ) |
| | | | | | | | | | | | | | | | | | | | | | | | | | | |
| |
Comprehensive Income | | | | | | | | | | | | | | | | | | | | | | | | | | | 324 | |
Cash Dividends on Common Stock | | | — | | | | — | | | | — | | | | — | | | | (541 | ) | | | — | | | | (541 | ) |
Issuance of Common Stock | | | 1 | | | | 104 | | | | 12 | | | | 429 | | | | — | | | | — | | | | 533 | |
Issuance Costs and Other | | | — | | | | (55 | ) | | | — | | | | 17 | | | | — | | | | — | | | | (38 | ) |
| | | |
| | | |
| | | |
| | | |
| | | |
| | | |
| | | |
| |
Balance as of December 31, 2005 | | | 265 | | | $ | 4,618 | | | | (14 | ) | | $ | (532 | ) | | $ | 2,545 | | | $ | (609 | ) | | $ | 6,022 | |
| | | |
| | | |
| | | |
| | | |
| | | |
| | | |
| | | |
| |
| | | | | | | | | | | | | | | | | | | | | | | | | | | | |
See Notes to Consolidated Financial Statements.
104
PUBLIC SERVICE ELECTRIC AND GAS COMPANY
CONSOLIDATED STATEMENTS OF OPERATIONS
(Millions)
| | | For The Years Ended December 31,
|
| | | 2005
| | 2004
| | 2003
|
OPERATING REVENUES | | $ | 7,728 | | | $ | 6,972 | | | $ | 6,740 | |
OPERATING EXPENSES | | | | | | | | | | | | |
Energy Costs | | | 4,970 | | | | 4,284 | | | | 4,421 | |
Operation and Maintenance | | | 1,151 | | | | 1,083 | | | | 1,050 | |
Depreciation and Amortization | | | 553 | | | | 523 | | | | 372 | |
Taxes Other Than Income Taxes | | | 141 | | | | 139 | | | | 136 | |
| | | |
| | | |
| | | |
| |
Total Operating Expenses | | | 6,815 | | | | 6,029 | | | | 5,979 | |
| | | |
| | | |
| | | |
| |
OPERATING INCOME | | | 913 | | | | 943 | | | | 761 | |
Other Income | | | 15 | | | | 12 | | | | 6 | |
Other Deductions | | | (3 | ) | | | (1 | ) | | | (1 | ) |
Interest Expense | | | (342 | ) | | | (362 | ) | | | (390 | ) |
| | | |
| | | |
| | | |
| |
INCOME BEFORE INCOME TAXES | | | 583 | | | | 592 | | | | 376 | |
Income Tax Expense | | | (235 | ) | | | (246 | ) | | | (129 | ) |
| | | |
| | | |
| | | |
| |
INCOME BEFORE EXTRAORDINARY ITEM | | | 348 | | | | 346 | | | | 247 | |
Extraordinary Item, net of tax benefit of $12 for 2003 | | | — | | | | — | | | | (18 | ) |
| | | |
| | | |
| | | |
| |
NET INCOME | | | 348 | | | | 346 | | | | 229 | |
Preferred Stock Dividends | | | (4 | ) | | | (4 | ) | | | (4 | ) |
| | | |
| | | |
| | | |
| |
EARNINGS AVAILABLE TO PUBLIC SERVICE
ENTERPRISE GROUP INCORPORATED | | $ | 344 | | | $ | 342 | | | $ | 225 | |
| | | |
| | | |
| | | |
| |
| | | | | | | | | | | | |
See disclosures regarding Public Service Electric and Gas Company included in the
Notes to Consolidated Financial Statements.
105
PUBLIC SERVICE ELECTRIC AND GAS COMPANY
CONSOLIDATED BALANCE SHEETS
(Millions)
| | | December 31,
|
| | | 2005
| | 2004
|
| | | | | | | | |
ASSETS | | | | | | | | |
CURRENT ASSETS | | | | | | | | |
Cash and Cash Equivalents | | $ | 159 | | | $ | 6 | |
Accounts Receivable, net of allowances of $41 in 2005 and $34 in 2004 | | | 959 | | | | 745 | |
Unbilled Revenues | | | 394 | | | | 340 | |
Materials and Supplies | | | 49 | | | | 45 | |
Prepayments | | | 49 | | | | 61 | |
Restricted Funds | | | 14 | | | | 5 | |
Other | | | 32 | | | | 19 | |
| | | |
| | | |
| |
Total Current Assets | | | 1,656 | | | | 1,221 | |
| | | |
| | | |
| |
PROPERTY, PLANT AND EQUIPMENT | | | 10,636 | | | | 10,159 | |
Less: Accumulated Depreciation and Amortization | | | (3,627 | ) | | | (3,471 | ) |
| | | |
| | | |
| |
Net Property, Plant and Equipment | | | 7,009 | | | | 6,688 | |
| | | |
| | | |
| |
NONCURRENT ASSETS | | | | | | | | |
Regulatory Assets | | | 5,053 | | | | 5,127 | |
Long-Term Investments | | | 144 | | | | 138 | |
Other Special Funds | | | 315 | | | | 278 | |
Other | | | 114 | | | | 134 | |
| | | |
| | | |
| |
Total Noncurrent Assets | | | 5,626 | | | | 5,677 | |
| | | |
| | | |
| |
TOTAL ASSETS | | $ | 14,291 | | | $ | 13,586 | |
| | | |
| | | |
| |
LIABILITIES AND CAPITALIZATION | | | | | | | | |
CURRENT LIABILITIES | | | | | | | | |
Long-Term Debt Due Within One Year | | $ | 485 | | | $ | 271 | |
Commercial Paper and Loans | | | — | | | | 105 | |
Accounts Payable | | | 286 | | | | 250 | |
Accounts Payable—Affiliated Companies, net | | | 388 | | | | 404 | |
Accrued Interest | | | 59 | | | | 59 | |
Clean Energy Program | | | 96 | | | | 82 | |
Derivative Contracts | | | 6 | | | | 15 | |
Other | | | 373 | | | | 296 | |
| | | |
| | | |
| |
Total Current Liabilities | | | 1,693 | | | | 1,482 | |
| | | |
| | | |
| |
NONCURRENT LIABILITIES | | | | | | | | |
Deferred Income Taxes and ITC | | | 2,608 | | | | 2,653 | |
Other Postretirement Benefit (OPEB) Costs | | | 561 | | | | 534 | |
Regulatory Liabilities | | | 720 | | | | 545 | |
Clean Energy Program | | | 233 | | | | 324 | |
Environmental Costs | | | 365 | | | | 309 | |
Asset Retirement Obligations | | | 210 | | | | — | |
Derivative Contracts | | | 6 | | | | 19 | |
Other | | | 27 | | | | 63 | |
| | | |
| | | |
| |
Total Noncurrent Liabilities | | | 4,730 | | | | 4,447 | |
| | | |
| | | |
| |
COMMITMENTS AND CONTINGENT LIABILITIES (See Note 12) | | | | | | | | |
CAPITALIZATION | | | | | | | | |
LONG-TERM DEBT | | | | | | | | |
Long-Term Debt | | | 2,866 | | | | 2,938 | |
Securitization Debt | | | 1,879 | | | | 1,939 | |
| | | |
| | | |
| |
Total Long-Term Debt | | | 4,745 | | | | 4,877 | |
| | | |
| | | |
| |
PREFERRED SECURITIES | | | | | | | | |
Preferred Stock Without Mandatory Redemption, $100 par value, 7,500,000 authorized; issued and outstanding, 2005 and 2004—795,234 shares | | | 80 | | | | 80 | |
| | | |
| | | |
| |
COMMON STOCKHOLDER'S EQUITY | | | | | | | | |
Common Stock; 150,000,000 shares authorized, 132,450,344 shares issued and outstanding | | | 892 | | | | 892 | |
Contributed Capital | | | 170 | | | | 170 | |
Basis Adjustment | | | 986 | | | | 986 | |
Retained Earnings | | | 1,000 | | | | 656 | |
Accumulated Other Comprehensive Loss | | | (5 | ) | | | (4 | ) |
| | | |
| | | |
| |
Total Common Stockholder's Equity | | | 3,043 | | | | 2,700 | |
| | | |
| | | |
| |
Total Capitalization | | | 7,868 | | | | 7,657 | |
| | | |
| | | |
| |
TOTAL LIABILITIES AND CAPITALIZATION | | $ | 14,291 | | | $ | 13,586 | |
| | | |
| | | |
| |
| | | | | | | | |
See disclosures regarding Public Service Electric and Gas Company included in the
Notes to Consolidated Financial Statements.
106
PUBLIC SERVICE ELECTRIC AND GAS COMPANY
CONSOLIDATED STATEMENTS OF CASH FLOWS
(Millions)
| | | For the Years Ended
December 31,
|
| | | 2005
| | 2004
| | 2003
|
CASH FLOWS FROM OPERATING ACTIVITIES | | | | | | | | | | | | |
Net Income | | $ | 348 | | | $ | 346 | | | $ | 229 | |
Adjustments to Reconcile Net Income to Net Cash Flows from Operating Activities: | | | | | | | | | | | | |
Extraordinary Item, net of tax benefit | | | — | | | | — | | | | 18 | |
Depreciation and Amortization | | | 553 | | | | 523 | | | | 372 | |
Provision for Deferred Income Taxes and ITC | | | (52 | ) | | | (80 | ) | | | 130 | |
Non-Cash Employee Benefit Plan Costs | | | 166 | | | | 155 | | | | 179 | |
Non-Cash Interest Expense | | | 16 | | | | 24 | | | | 50 | |
Employee Benefit Plan Funding and Related Payments | | | (154 | ) | | | (115 | ) | | | (177 | ) |
Over (Under) Recovery of Electric Energy Costs (BGS and NTC) | | | 117 | | | | 10 | | | | (139 | ) |
(Under) Over Recovery of Gas Costs | | | (8 | ) | | | 70 | | | | 101 | |
(Under) Over Recovery of SBC | | | (120 | ) | | | (158 | ) | | | 4 | |
Other Non-Cash Charges (Credits) | | | 4 | | | | 3 | | | | (8 | ) |
Gain on Sale of Property, Plant and Equipment | | | (3 | ) | | | — | | | | (12 | ) |
Net Changes in Certain Current Assets and Liabilities: | | | | | | | | | | | | |
Accounts Receivable and Unbilled Revenues | | | (268 | ) | | | (20 | ) | | | (21 | ) |
Materials and Supplies | | | (4 | ) | | | 5 | | | | (5 | ) |
Prepayments | | | 12 | | | | (17 | ) | | | (19 | ) |
Accrued Taxes | | | — | | | | 18 | | | | 2 | |
Accrued Interest | | | — | | | | (12 | ) | | | 2 | |
Accounts Payable | | | 36 | | | | (36 | ) | | | (50 | ) |
Accounts Receivable/Payable—Affiliated Companies, net | | | 79 | | | | 20 | | | | (5 | ) |
Other Current Assets and Liabilities | | | 77 | | | | 58 | | | | (7 | ) |
Other | | | (110 | ) | | | (98 | ) | | | (40 | ) |
| | | |
| | | |
| | | |
| |
Net Cash Provided By Operating Activities | | | 689 | | | | 696 | | | | 604 | |
| | | |
| | | |
| | | |
| |
CASH FLOWS FROM INVESTING ACTIVITIES | | | | | | | | | | | | |
Additions to Property, Plant and Equipment | | | (498 | ) | | | (420 | ) | | | (406 | ) |
Proceeds from the Sale of Property, Plant and Equipment—Affiliate | | | — | | | | — | | | | 53 | |
Proceeds from the Sale of Property, Plant and Equipment | | | 3 | | | | 13 | | | | 13 | |
Restricted Funds | | | (11 | ) | | | (4 | ) | | | (4 | ) |
Return of Capital from Capital Trust | | | — | | | | — | | | | 5 | |
| | | |
| | | |
| | | |
| |
Net Cash Used In Investing Activities | | | (506 | ) | | | (411 | ) | | | (339 | ) |
| | | |
| | | |
| | | |
| |
CASH FLOWS FROM FINANCING ACTIVITIES | | | | | | | | | | | | |
Net Change in Short-Term Debt | | | (105 | ) | | | 105 | | | | (224 | ) |
Issuance of Long-Term Debt | | | 250 | | | | 710 | | | | 909 | |
Issuance of Securitization Debt | | | 103 | | | | — | | | | — | |
Deferred Issuance Costs | | | (3 | ) | | | (9 | ) | | | (10 | ) |
Redemption of Long-Term Debt | | | (125 | ) | | | (984 | ) | | | (514 | ) |
Redemption of Securitization Debt | | | (146 | ) | | | (137 | ) | | | (129 | ) |
Redemption of Debt Underlying Preferred Trust Securities | | | — | | | | — | | | | (155 | ) |
Contributed Capital | | | — | | | | — | | | | 170 | |
Common Stock Dividends | | | — | | | | (100 | ) | | | (200 | ) |
Preferred Stock Dividends | | | (4 | ) | | | (4 | ) | | | (4 | ) |
Other | | | — | | | | — | | | | (3 | ) |
| | | |
| | | |
| | | |
| |
Net Cash Used In Financing Activities | | | (30 | ) | | | (419 | ) | | | (160 | ) |
| | | |
| | | |
| | | |
| |
Net Increase (Decrease) In Cash and Cash Equivalents | | | 153 | | | | (134 | ) | | | 105 | |
Cash and Cash Equivalents at Beginning of Period | | | 6 | | | | 140 | | | | 35 | |
| | | |
| | | |
| | | |
| |
Cash and Cash Equivalents at End of Period | | $ | 159 | | | $ | 6 | | | $ | 140 | |
| | | |
| | | |
| | | |
| |
Supplemental Disclosure of Cash Flow Information: | | | | | | | | | | | | |
Income Taxes Paid | | $ | 313 | | | $ | 355 | | | $ | 16 | |
Interest Paid, Net of Amounts Capitalized | | $ | 347 | | | $ | 347 | | | $ | 371 | |
| | | | | | | | | | | | |
See disclosures regarding Public Service Electric and Gas Company included in the
Notes to Consolidated Financial Statements.
107
PUBLIC SERVICE ELECTRIC AND GAS COMPANY
CONSOLIDATED STATEMENTS OF COMMON STOCKHOLDER'S EQUITY
(Millions)
| | | Common
Stock
| | Contributed
Capital from
PSEG
| | Basis
Adjustment
| | Retained
Earnings
| | Accumulated
Other
Comprehensive
Loss
| | Total
|
Balance as of January 1, 2003 | | $ | 892 | | | $ | — | | | $ | 986 | | | $ | 389 | | | $ | (172 | ) | | $ | 2,095 | |
| | | |
| | | |
| | | |
| | | |
| | | |
| | | |
| |
Net Income | | | — | | | | — | | | | — | | | | 229 | | | | — | | | | 229 | |
Other Comprehensive Income, net of tax: | | | | | | | | | | | | | | | | | | | | | | | | |
Minimum Pension Liability, net of tax $117 | | | — | | | | — | | | | — | | | | — | | | | 170 | | | | 170 | |
| | | | | | | | | | | | | | | | | | | | | | | |
| |
Comprehensive Income | | | | | | | | | | | | | | | | | | | | | | | 399 | |
| | | | | | | | | | | | | | | | | | | | | | | |
| |
Cash Dividends on Common Stock | | | — | | | | — | | | | — | | | | (200 | ) | | | — | | | | (200 | ) |
Cash Dividends on Preferred Stock | | | — | | | | — | | | | — | | | | (4 | ) | | | — | | | | (4 | ) |
Contributed Capital | | | — | | | | 170 | | | | — | | | | — | | | | — | | | | 170 | |
| | | |
| | | |
| | | |
| | | |
| | | |
| | | |
| |
Balance as of December 31, 2003 | | $ | 892 | | | $ | 170 | | | $ | 986 | | | $ | 414 | | | $ | (2 | ) | | $ | 2,460 | |
| | | |
| | | |
| | | |
| | | |
| | | |
| | | |
| |
Net Income | | | — | | | | — | | | | — | | | | 346 | | | | — | | | | 346 | |
Other Comprehensive Loss, net of tax: | | | | | | | | | | | | | | | | | | | | | | | | |
Minimum Pension Liability, net of tax $(1) | | | — | | | | — | | | | — | | | | — | | | | (2 | ) | | | (2 | ) |
| | | | | | | | | | | | | | | | | | | | | | | |
| |
Comprehensive Income | | | | | | | | | | | | | | | | | | | | | | | 344 | |
| | | | | | | | | | | | | | | | | | | | | | | |
| |
Cash Dividends on Common Stock | | | — | | | | — | | | | — | | | | (100 | ) | | | — | | | | (100 | ) |
Cash Dividends on Preferred Stock | | | — | | | | — | | | | — | | | | (4 | ) | | | — | | | | (4 | ) |
| | | |
| | | |
| | | |
| | | |
| | | |
| | | |
| |
Balance as of December 31, 2004 | | $ | 892 | | | $ | 170 | | | $ | 986 | | | $ | 656 | | | $ | (4 | ) | | $ | 2,700 | |
| | | |
| | | |
| | | |
| | | |
| | | |
| | | |
| |
Net Income | | | — | | | | — | | | | — | | | | 348 | | | | — | | | | 348 | |
Other Comprehensive Loss, net of tax: | | | | | | | | | | | | | | | | | | | | | | | | |
Minimum Pension Liability, net of tax | | | — | | | | — | | | | — | | | | — | | | | (1 | ) | | | (1 | ) |
| | | | | | | | | | | | | | | | | | | | | | | |
| |
Comprehensive Income | | | | | | | | | | | | | | | | | | | | | | | 347 | |
| | | | | | | | | | | | | | | | | | | | | | | |
| |
Cash Dividends on Common Stock | | | — | | | | — | | | | — | | | | — | | | | — | | | | — | |
Cash Dividends on Preferred Stock | | | — | | | | — | | | | — | | | | (4 | ) | | | — | | | | (4 | ) |
| | | |
| | | |
| | | |
| | | |
| | | |
| | | |
| |
Balance as of December 31, 2005 | | $ | 892 | | | $ | 170 | | | $ | 986 | | | $ | 1,000 | | | $ | (5 | ) | | $ | 3,043 | |
| | | |
| | | |
| | | |
| | | |
| | | |
| | | |
| |
| | | | | | | | | | | | | | | | | | | | | | | | |
See disclosures regarding Public Service Electric and Gas Company included in the
Notes to Consolidated Financial Statements.
108
PSEG POWER LLC
CONSOLIDATED STATEMENTS OF OPERATIONS
(Millions)
| | | For The Years Ended
December 31,
|
| | | 2005
| | 2004
| | 2003
|
OPERATING REVENUES | | $ | 6,059 | | | $ | 5,168 | | | $ | 5,608 | |
OPERATING EXPENSES | | | | | | | | | | | | |
Energy Costs | | | 4,286 | | | | 3,554 | | | | 3,750 | |
Operation and Maintenance | | | 949 | | | | 954 | | | | 911 | |
Depreciation and Amortization | | | 131 | | | | 108 | | | | 97 | |
| | | |
| | | |
| | | |
| |
Total Operating Expenses | | | 5,366 | | | | 4,616 | | | | 4,758 | |
| | | |
| | | |
| | | |
| |
OPERATING INCOME | | | 693 | | | | 552 | | | | 850 | |
Other Income | | | 186 | | | | 167 | | | | 150 | |
Other Deductions | | | (43 | ) | | | (55 | ) | | | (78 | ) |
Interest Expense | | | (131 | ) | | | (113 | ) | | | (107 | ) |
| | | |
| | | |
| | | |
| |
INCOME FROM CONTINUING OPERATIONS BEFORE INCOME TAXES | | | 705 | | | | 551 | | | | 815 | |
Income Tax Expense | | | (299 | ) | | | (209 | ) | | | (332 | ) |
| | | |
| | | |
| | | |
| |
INCOME FROM CONTINUING OPERATIONS | | | 406 | | | | 342 | | | | 483 | |
Loss from Discontinued Operations, net of tax benefit of $14, $23 and $6 for the years ended 2005, 2004 and 2003, respectively | | | (20 | ) | | | (34 | ) | | | (9 | ) |
Loss on Disposal of Discontinued Operations, net of tax benefit of $123 for the year ended 2005 | | | (178 | ) | | | — | | | | — | |
| | | |
| | | |
| | | |
| |
INCOME BEFORE CUMULATIVE EFFECT OF A CHANGE IN ACCOUNTING PRINCIPLE | | | 208 | | | | 308 | | | | 474 | |
Cumulative Effect of a Change in Accounting Principle, net of tax benefit (expense) of $11 and ($255) in 2005 and 2003, respectively | | | (16 | ) | | | — | | | | 370 | |
| | | |
| | | |
| | | |
| |
EARNINGS AVAILABLE TO PUBLIC SERVICE ENTERPRISE GROUP INCORPORATED | | $ | 192 | | | $ | 308 | | | $ | 844 | |
| | | |
| | | |
| | | |
| |
| | | | | | | | | | | | |
See disclosures regarding PSEG Power LLC included in the
Notes to Consolidated Financial Statements.
109
PSEG POWER LLC
CONSOLIDATED BALANCE SHEETS
(Millions)
| | | December 31,
|
| | | 2005
| | 2004
|
ASSETS | | | | | | | | |
CURRENT ASSETS | | | | | | | | |
Cash and Cash Equivalents | | $ | 8 | | | $ | 10 | |
Accounts Receivable | | | 862 | | | | 740 | |
Accounts Receivable—Affiliated Companies, net | | | 288 | | | | 324 | |
Fuel | | | 812 | | | | 621 | |
Materials and Supplies | | | 201 | | | | 175 | |
Energy Trading Contracts | | | 327 | | | | 161 | |
Derivative Contracts | | | 50 | | | | 14 | |
Assets of Discontinued Operations | | | — | | | | 511 | |
Other | | | 27 | | | | 47 | |
| | | |
| | | |
| |
Total Current Assets | | | 2,575 | | | | 2,603 | |
| | | |
| | | |
| |
PROPERTY, PLANT AND EQUIPMENT | | | 6,457 | | | | 6,073 | |
Less: Accumulated Depreciation and Amortization | | | (1,577 | ) | | | (1,482 | ) |
| | | |
| | | |
| |
Net Property, Plant and Equipment | | | 4,880 | | | | 4,591 | |
| | | |
| | | |
| |
NONCURRENT ASSETS | | | | | | | | |
Deferred Income Taxes and Investment Tax Credits (ITC) | | | 70 | | | | — | |
Nuclear Decommissioning Trust (NDT) Funds | | | 1,133 | | | | 1,086 | |
Goodwill and Other Intangibles | | | 63 | | | | 107 | |
Other Special Funds | | | 143 | | | | 121 | |
Energy Trading Contracts | | | 42 | | | | 30 | |
Derivative Contracts | | | — | | | | 8 | |
Other | | | 39 | | | | 61 | |
| | | |
| | | |
| |
Total Noncurrent Assets | | | 1,490 | | | | 1,413 | |
| | | |
| | | |
| |
TOTAL ASSETS | | $ | 8,945 | | | $ | 8,607 | |
| | | |
| | | |
| |
LIABILITIES AND MEMBER'S EQUITY | | | | | | | | |
CURRENT LIABILITIES | | | | | | | | |
Long-Term Debt Due Within One Year | | $ | 500 | | | $ | — | |
Accounts Payable | | | 745 | | | | 992 | |
Notes Payable-Affiliated Company | | | 202 | | | | 98 | |
Energy Trading Contracts | | | 200 | | | | 125 | |
Derivative Contracts | | | 403 | | | | 151 | |
Accrued Interest | | | 41 | | | | 42 | |
Other | | | 86 | | | | 113 | |
| | | |
| | | |
| |
Total Current Liabilities | | | 2,177 | | | | 1,521 | |
| | | |
| | | |
| |
NONCURRENT LIABILITIES | | | | | | | | |
Deferred Income Taxes and Investment Tax Credits (ITC) | | | — | | | | 96 | |
Asset Retirement Obligations | | | 373 | | | | 310 | |
Energy Trading Contracts | | | 19 | | | | 23 | |
Derivative Contracts | | | 597 | | | | 119 | |
Other | | | 125 | | | | 139 | |
| | | |
| | | |
| |
Total Noncurrent Liabilities | | | 1,114 | | | | 687 | |
| | | |
| | | |
| |
COMMITMENTS AND CONTINGENT LIABILITIES (See Note 12) | | | | | | | | |
LONG-TERM DEBT | | | | | | | | |
Total Long-Term Debt | | | 2,817 | | | | 3,316 | |
| | | |
| | | |
| |
MEMBER'S EQUITY | | | | | | | | |
Contributed Capital | | | 2,000 | | | | 2,000 | |
Basis Adjustment | | | (986 | ) | | | (986 | ) |
Retained Earnings | | | 2,310 | | | | 2,118 | |
Accumulated Other Comprehensive Loss | | | (487 | ) | | | (49 | ) |
| | | |
| | | |
| |
Total Member's Equity | | | 2,837 | | | | 3,083 | |
| | | |
| | | |
| |
TOTAL LIABILITIES AND MEMBER'S EQUITY | | $ | 8,945 | | | $ | 8,607 | |
| | | |
| | | |
| |
| | | | | | | | |
See disclosures regarding PSEG Power LLC included in the
Notes to Consolidated Financial Statements.
110
PSEG POWER LLC
CONSOLIDATED STATEMENTS OF CASH FLOWS
(Millions)
| | | For The Years Ended
December 31,
|
| | | 2005
| | 2004
| | 2003
|
CASH FLOWS FROM OPERATING ACTIVITIES | | | | | | | | | | | | |
Net Income | | $ | 192 | | | $ | 308 | | | $ | 844 | |
Adjustments to Reconcile Net Income to Net Cash Flows from Operating Activities: | | | | | | | | | | | | |
Loss on Disposal of Discontinued operations, net of tax | | | 178 | | | | — | | | | — | |
Cumulative Effect of a Change in Accounting Principle | | | 16 | | | | — | | | | (370 | ) |
(Gain) Loss on Disposition of Property, Plant and Equipment | | | (5 | ) | | | 1 | | | | — | |
Depreciation and Amortization | | | 136 | | | | 121 | | | | 102 | |
Amortization of Nuclear Fuel | | | 94 | | | | 80 | | | | 89 | |
Interest Accretion on Asset Retirement Obligations | | | 28 | | | | 26 | | | | 24 | |
Provision for Deferred Income Taxes and ITC | | | 276 | | | | 163 | | | | 151 | |
Unrealized Losses (Gains) on Energy Contracts and Other Derivatives | | | 17 | | | | (7 | ) | | | 33 | |
Non-Cash Employee Benefit Plan Costs | | | 46 | | | | 40 | | | | 54 | |
Net Realized Gains and Income from NDT Funds | | | (125 | ) | | | (105 | ) | | | (64 | ) |
Net Change in Certain Current Assets and Liabilities: | | | | | | | | | | | | |
Fuel, Materials and Supplies | | | (214 | ) | | | (121 | ) | | | (125 | ) |
Accounts Receivable | | | (122 | ) | | | (123 | ) | | | (78 | ) |
Accounts Payable | | | (247 | ) | | | 206 | | | | 96 | |
Accounts Receivable/Payable—Affiliated Companies, net | | | (91 | ) | | | (71 | ) | | | (52 | ) |
Other Current Assets and Liabilities | | | (27 | ) | | | (67 | ) | | | 4 | |
Employee Benefit Plan Funding and Related Payments | | | (58 | ) | | | (39 | ) | | | (70 | ) |
Other | | | 42 | | | | 95 | | | | (2 | ) |
| | | |
| | | |
| | | |
| |
Net Cash Provided By Operating Activities | | | 136 | | | | 507 | | | | 636 | |
| | | |
| | | |
| | | |
| |
CASH FLOWS FROM INVESTING ACTIVITIES | | | | | | | | | | | | |
Additions to Property, Plant and Equipment | | | (476 | ) | | | (725 | ) | | | (699 | ) |
Sales of Property, Plant and Equipment | | | 226 | | | | — | | | | — | |
Proceeds from NDT Funds Sales | | | 3,223 | | | | 2,637 | | | | 1,229 | |
NDT Funds Interest and Dividends | | | 35 | | | | 28 | | | | 26 | |
Investment in NDT Funds | | | (3,232 | ) | | | (2,647 | ) | | | (1,258 | ) |
Notes Receivable—Affiliated Company, net | | | — | | | | 77 | | | | (77 | ) |
Change in Restricted Cash | | | — | | | | 39 | | | | (39 | ) |
Other | | | (18 | ) | | | (19 | ) | | | (26 | ) |
| | | |
| | | |
| | | |
| |
Net Cash Used In Investing Activities | | | (242 | ) | | | (610 | ) | | | (844 | ) |
| | | |
| | | |
| | | |
| |
CASH FLOWS FROM FINANCING ACTIVITIES | | | | | | | | | | | | |
Issuance of Recourse Long-Term Debt | | | — | | | | 500 | | | | 300 | |
Redemption of Non-Recourse Long-Term Debt | | | — | | | | (800 | ) | | | — | |
Proceeds from Contributed Capital | | | — | | | | 300 | | | | 150 | |
Notes Payable—Affiliated Company, net | | | 104 | | | | 98 | | | | (239 | ) |
Other | | | — | | | | (12 | ) | | | (2 | ) |
| | | |
| | | |
| | | |
| |
Net Cash Provided By Financing Activities | | | 104 | | | | 86 | | | | 209 | |
| | | |
| | | |
| | | |
| |
Net (Decrease) Increase in Cash and Cash Equivalents | | | (2 | ) | | | (17 | ) | | | 1 | |
Cash and Cash Equivalents at Beginning of Period | | | 10 | | | | 27 | | | | 26 | |
| | | |
| | | |
| | | |
| |
Cash and Cash Equivalents at End of Period | | $ | 8 | | | $ | 10 | | | $ | 27 | |
| | | |
| | | |
| | | |
| |
Supplemental Disclosure of Cash Flow Information: | | | | | | | | | | | | |
Income Taxes (Received) Paid | | $ | (23 | ) | | $ | 12 | | | $ | 99 | |
Interest Paid, Net of Amounts Capitalized | | $ | 132 | | | $ | 233 | | | $ | 217 | |
| | | | | | | | | | | | |
See disclosures regarding PSEG Power LLC included in the
Notes to Condensed Consolidated Financial Statements.
111
PSEG POWER LLC
CONSOLIDATED STATEMENTS OF CAPITALIZATION AND MEMBER'S EQUITY
(Millions)
| | | Contributed
Capital
| | Basis
Adjustment
| | Retained
Earnings
| | Accumulated
Other
Comprehensive
Income (Loss)
| | Total
Member's
Equity
|
Balance as of January 1, 2003 | | $ | 1,550 | | | $ | (986 | ) | | $ | 966 | | | $ | (85 | ) | | $ | 1,445 | |
| | | |
| | | |
| | | |
| | | |
| | | |
| |
Net Income | | | — | | | | — | | | | 844 | | | | — | | | | 844 | |
Other Comprehensive Income (Loss), net of tax: | | | | | | | | | | | | | | | | | | | | |
Available for Sale Securities, net of tax $81 | | | — | | | | — | | | | — | | | | 118 | | | | 118 | |
Change in Fair Value of Derivative Instruments, net of tax $(21) | | | — | | | | — | | | | — | | | | (40 | ) | | | (40 | ) |
Reclassification Adjustments for Net Amount included in Net Income, net of tax | | | — | | | | — | | | | — | | | | 14 | | | | 14 | |
Pension Adjustments, net of tax $58 | | | — | | | | — | | | | — | | | | 83 | | | | 83 | |
| | | | | | | | | | | | | | | | | | | |
| |
Other Comprehensive Income | | | | | | | | | | | | | | | | | | | 175 | |
| | | | | | | | | | | | | | | | | | | |
| |
Comprehensive Income | | | | | | | | | | | | | | | | | | | 1,019 | |
Contributed Capital | | | 150 | | | | — | | | | — | | | | — | | | | 150 | |
| | | |
| | | |
| | | |
| | | |
| | | |
| |
Balance as of December 31, 2003 | | $ | 1,700 | | | $ | (986 | ) | | $ | 1,810 | | | $ | 90 | | | $ | 2,614 | |
| | | |
| | | |
| | | |
| | | |
| | | |
| |
Net Income | | | — | | | | — | | | | 308 | | | | — | | | | 308 | |
Other Comprehensive Income (Loss), net of tax: | | | | | | | | | | | | | | | | | | | | |
Available for Sale Securities, net of tax $29 | | | — | | | | — | | | | — | | | | (16 | ) | | | (16 | ) |
Change in Fair Value of Derivative Instruments, net of tax $(115) | | | — | | | | — | | | | — | | | | (166 | ) | | | (166 | ) |
Reclassification Adjustments for Net Amount included in Net Income, net of tax | | | — | | | | — | | | | — | | | | 43 | | | | 43 | |
| | | | | | | | | | | | | | | | | | | |
| |
Other Comprehensive Loss | | | | | | | | | | | | | | | | | | | (139 | ) |
| | | | | | | | | | | | | | | | | | | |
| |
Comprehensive Income | | | | | | | | | | | | | | | | | | | 169 | |
Contributed Capital | | | 300 | | | | — | | | | — | | | | — | | | | 300 | |
| | | |
| | | |
| | | |
| | | |
| | | |
| |
Balance as of December 31, 2004 | | $ | 2,000 | | | $ | (986 | ) | | $ | 2,118 | | | $ | (49 | ) | | $ | 3,083 | |
| | | |
| | | |
| | | |
| | | |
| | | |
| |
Net Income | | | — | | | | — | | | | 192 | | | | — | | | | 192 | |
Other Comprehensive Income (Loss), net of tax: | | | | | | | | | | | | | | | | | | | | |
Available for Sale Securities, net of tax $33 | | | — | | | | — | | | | — | | | | (30 | ) | | | (30 | ) |
Minimum Pension Liability, net of tax | | | — | | | | — | | | | — | | | | 1 | | | | 1 | |
Change in Fair Value of Derivative Instruments, net of tax $407 | | | — | | | | — | | | | — | | | | (589 | ) | | | (589 | ) |
Reclassification Adjustments for Net Amount included in Net Income, net of tax | | | — | | | | — | | | | — | | | | 180 | | | | 180 | |
| | | | | | | | | | | | | | | | | | | |
| |
Other Comprehensive Loss | | | | | | | | | | | | | | | | | | | (438 | ) |
| | | | | | | | | | | | | | | | | | | |
| |
Comprehensive Loss | | | | | | | | | | | | | | | | | | | (246 | ) |
Contributed Capital | | | — | | | | — | | | | — | | | | — | | | | — | |
| | | |
| | | |
| | | |
| | | |
| | | |
| |
Balance as of December 31, 2005 | | $ | 2,000 | | | $ | (986 | ) | | $ | 2,310 | | | $ | (487 | ) | | $ | 2,837 | |
| | | |
| | | |
| | | |
| | | |
| | | |
| |
| | | | | | | | | | | | | | | | | | | | |
See disclosures regarding PSEG Power LLC included in the
Notes to Consolidated Financial Statements.
112
PSEG ENERGY HOLDINGS L.L.C.
CONSOLIDATED STATEMENTS OF OPERATIONS
(Millions)
| | | For The Years Ended
December 31,
|
| | | 2005
| | 2004
| | 2003
|
OPERATING REVENUES | | | | | | | | | | | | |
Electric Generation and Distribution Revenues | | $ | 1,005 | | | $ | 558 | | | $ | 303 | |
Income from Leveraged and Operating Leases | | | 175 | | | | 165 | | | | 217 | |
Other | | | 122 | | | | 113 | | | | 77 | |
| | | |
| | | |
| | | |
| |
Total Operating Revenues | | | 1,302 | | | | 836 | | | | 597 | |
| | | |
| | | |
| | | |
| |
OPERATING EXPENSES | | | | | | | | | | | | |
Energy Costs | | | 675 | | | | 322 | | | | 103 | |
Operation and Maintenance | | | 215 | | | | 171 | | | | 124 | |
Depreciation and Amortization | | | 46 | | | | 44 | | | | 38 | |
| | | |
| | | |
| | | |
| |
Total Operating Expenses | | | 936 | | | | 537 | | | | 265 | |
| | | |
| | | |
| | | |
| |
Income from Equity Method Investments | | | 131 | | | | 126 | | | | 114 | |
| | | |
| | | |
| | | |
| |
OPERATING INCOME | | | 497 | | | | 425 | | | | 446 | |
Other Income | | | 10 | | | | 7 | | | | 26 | |
Other Deductions | | | (25 | ) | | | (10 | ) | | | (9 | ) |
Interest Expense | | | (213 | ) | | | (223 | ) | | | (214 | ) |
| | | |
| | | |
| | | |
| |
INCOME FROM CONTINUING OPERATIONS BEFORE
INCOME TAXES AND MINORITY INTEREST | | | 269 | | | | 199 | | | | 249 | |
Income Tax Expense | | | (69 | ) | | | (46 | ) | | | (58 | ) |
Minority Interests in Earnings of Subsidiaries | | | (1 | ) | | | (2 | ) | | | (8 | ) |
| | | |
| | | |
| | | |
| |
INCOME FROM CONTINUING OPERATIONS | | | 199 | | | | 151 | | | | 183 | |
Income (Loss) from Discontinued Operations, including Loss on Disposal, net of tax (expense) benefit of ($2), $3 and $7 for the years ended
2005, 2004 and 2003, respectively | | | 18 | | | | (10 | ) | | | (38 | ) |
| | | |
| | | |
| | | |
| |
NET INCOME | | | 217 | | | | 141 | | | | 145 | |
Preference Units Distributions | | | (3 | ) | | | (16 | ) | | | (23 | ) |
| | | |
| | | |
| | | |
| |
EARNINGS AVAILABLE TO PUBLIC SERVICE
ENTERPRISE GROUP INCORPORATED | | $ | 214 | | | $ | 125 | | | $ | 122 | |
| | | |
| | | |
| | | |
| |
| | | | | | | | | | | | |
See disclosures regarding PSEG Energy Holdings L.L.C. included in the
Notes to Consolidated Financial Statements.
113
PSEG ENERGY HOLDINGS L.L.C.
CONSOLIDATED BALANCE SHEETS
(Millions)
| | | December 31,
|
| | | 2005
| | 2004
|
ASSETS | | | | | | | | |
CURRENT ASSETS | | | | | | | | |
Cash and Cash Equivalents | | $ | 68 | | | $ | 183 | |
Accounts Receivable: | | | | | | | | |
Trade—net of allowances of $2 and $1 in 2005 and 2004,
respectively | | | 103 | | | | 87 | |
Other Accounts Receivable | | | 14 | | | | 16 | |
Affiliated Companies | | | — | | | | 19 | |
Notes Receivable: | | | | | | | | |
Affiliated Companies | | | 409 | | | | 115 | |
Other | | | 5 | | | | 138 | |
Inventory | | | 27 | | | | 31 | |
Restricted Funds | | | 62 | | | | 36 | |
Assets of Discontinued Operations | | | 498 | | | | 524 | |
Other | | | 7 | | | | 6 | |
| | | |
| | | |
| |
Total Current Assets | | | 1,193 | | | | 1,155 | |
| | | |
| | | |
| |
PROPERTY, PLANT AND EQUIPMENT | | | 1,560 | | | | 1,658 | |
Less: Accumulated Depreciation and Amortization | | | (237 | ) | | | (207 | ) |
| | | |
| | | |
| |
Net Property, Plant and Equipment | | | 1,323 | | | | 1,451 | |
| | | |
| | | |
| |
NONCURRENT ASSETS | | | | | | | | |
Leveraged Leases, net | | | 2,720 | | | | 2,851 | |
Corporate Joint Ventures | | | 976 | | | | 894 | |
Partnership Interests | | | 204 | | | | 219 | |
Goodwill and Other Intangibles | | | 540 | | | | 509 | |
Derivative Contracts | | | 3 | | | | — | |
Other | | | 98 | | | | 133 | |
| | | |
| | | |
| |
Total Noncurrent Assets | | | 4,541 | | | | 4,606 | |
| | | |
| | | |
| |
TOTAL ASSETS | | $ | 7,057 | | | $ | 7,212 | |
| | | |
| | | |
| |
LIABILITIES AND MEMBER'S EQUITY | | | | | | | | |
CURRENT LIABILITIES | | | | | | | | |
Long-Term Debt Due Within One Year | | $ | 348 | | | $ | 56 | |
Accounts Payable: | | | | | | | | |
Trade | | | 50 | | | | 46 | |
Affiliated Companies | | | 13 | | | | 2 | |
Derivative Contracts | | | 13 | | | | 16 | |
Accrued Interest | | | 42 | | | | 44 | |
Liabilities of Discontinued Operations | | | 436 | | | | 463 | |
Other | | | 83 | | | | 56 | |
| | | |
| | | |
| |
Total Current Liabilities | | | 985 | | | | 683 | |
| | | |
| | | |
| |
NONCURRENT LIABILITIES | | | | | | | | |
Deferred Income Taxes and Investment and Energy Tax Credits | | | 1,705 | | | | 1,595 | |
Derivative Contracts | | | 27 | | | | 31 | |
Other | | | 66 | | | | 51 | |
| | | |
| | | |
| |
Total Noncurrent Liabilities | | | 1,798 | | | | 1,677 | |
| | | |
| | | |
| |
COMMITMENTS AND CONTINGENT LIABILITIES (See Note 12) | | | | | | | | |
MINORITY INTERESTS | | | 15 | | | | 21 | |
| | | |
| | | |
| |
LONG-TERM DEBT | | | | | | | | |
Non-Recourse Debt | | | 891 | | | | 1,059 | |
Senior Notes | | | 1,448 | | | | 1,756 | |
| | | |
| | | |
| |
Total Long-Term Debt | | | 2,339 | | | | 2,815 | |
| | | |
| | | |
| |
MEMBER'S EQUITY | | | | | | | | |
Ordinary Unit | | | 1,713 | | | | 1,813 | |
Preference Units | | | — | | | | 184 | |
Retained Earnings | | | 317 | | | | 228 | |
Accumulated Other Comprehensive Loss | | | (110 | ) | | | (209 | ) |
| | | |
| | | |
| |
Total Member's Equity | | | 1,920 | | | | 2,016 | |
| | | |
| | | |
| |
TOTAL LIABILITIES AND MEMBER'S EQUITY | | $ | 7,057 | | | $ | 7,212 | |
| | | |
| | | |
| |
| | | | | | | | |
See disclosures regarding PSEG Energy Holdings L.L.C. included in the
Notes to Consolidated Financial Statements.
114
PSEG ENERGY HOLDINGS L.L.C.
CONSOLIDATED STATEMENTS OF CASH FLOWS
(Millions)
| | | For The Years Ended
December 31,
|
| | | 2005
| | 2004
| | 2003
|
CASH FLOWS FROM OPERATING ACTIVITIES | | | | | | | | | | | | |
Net Income | | $ | 217 | | | $ | 141 | | | $ | 145 | |
Adjustments to Reconcile Net Income to Net Cash Flows from Operating Activities: | | | | | | | | | | | | |
(Gain) Loss on Disposal of Discontinued Operations, net of tax | | | — | | | | (3 | ) | | | 32 | |
Depreciation and Amortization | | | 58 | | | | 57 | | | | 43 | |
Demand Side Management Amortization | | | 7 | | | | 8 | | | | 8 | |
Investment Write-off | | | 22 | | | | — | | | | — | |
Deferred Income Taxes (Other than Leases) | | | — | | | | 83 | | | | 81 | |
Leveraged Lease (Income) Expense, Adjusted for Rents Received and Deferred Income Taxes | | | (27 | ) | | | (92 | ) | | | 77 | |
Undistributed (Earnings) Losses from Affiliates | | | (46 | ) | | | (12 | ) | | | 40 | |
Gain on Sale of Investments | | | (122 | ) | | | (79 | ) | | | (45 | ) |
Unrealized Loss on Investments | | | 7 | | | | — | | | | 1 | |
Foreign Currency Transaction (Gain) Loss | | | (3 | ) | | | 26 | | | | (16 | ) |
Change in Fair Value of Derivative Financial Instruments | | | 3 | | | | 3 | | | | 5 | |
Other Non-Cash Charges | | | 8 | | | | 4 | | | | 14 | |
Net Changes in Certain Current Assets and Liabilities: | | | | | | | | | | | | |
Accounts Receivable | | | (7 | ) | | | 189 | | | | (24 | ) |
Inventory | | | 2 | | | | (9 | ) | | | (12 | ) |
Accounts Payable | | | 19 | | | | (44 | ) | | | (124 | ) |
Other Current Assets and Liabilities | | | 43 | | | | 2 | | | | (30 | ) |
Proceeds from Withdrawal of Partnership Interests and Other Distributions | | | 64 | | | | 126 | | | | 66 | |
Other | | | (2 | ) | | | 3 | | | | 28 | |
| | | |
| | | |
| | | |
| |
Net Cash Provided By Operating Activities | | | 243 | | | | 403 | | | | 289 | |
| | | |
| | | |
| | | |
| |
CASH FLOWS FROM INVESTING ACTIVITIES | | | | | | | | | | | | |
Additions to Property, Plant and Equipment | | | (38 | ) | | | (86 | ) | | | (271 | ) |
Investments in Joint Ventures, Partnerships, and Leveraged Lease Agreements | | | — | | | | (14 | ) | | | (37 | ) |
Proceeds from the Sale of Investments and Return of Capital from Partnerships | | | 28 | | | | 191 | | | | 19 | |
Proceeds from Termination of Leveraged Leases | | | 287 | | | | 247 | | | | 11 | |
Notes Receivable—Affiliated Company, net | | | (294 | ) | | | 185 | | | | (238 | ) |
Restricted Funds | | | (39 | ) | | | 19 | | | | (43 | ) |
Proceeds from Collection of Notes Receivable | | | 132 | | | | — | | | | — | |
Other | | | 9 | | | | 4 | | | | (7 | ) |
| | | |
| | | |
| | | |
| |
Net Cash Provided By (Used In) Investing Activities | | | 85 | | | | 546 | | | | (566 | ) |
| | | |
| | | |
| | | |
| |
CASH FLOWS FROM FINANCING ACTIVITIES | | | | | | | | | | | | |
Proceeds from Senior Notes | | | — | | | | — | | | | 340 | |
Proceeds from Non-Recourse Long-Term Debt | | | 16 | | | | 19 | | | | 677 | |
Repayment of Senior Notes | | | — | | | | (311 | ) | | | (13 | ) |
Repayment of Non-Recourse Long-Term Debt | | | (42 | ) | | | (77 | ) | | | (396 | ) |
Repayment of Medium-Term Notes | | | — | | | | — | | | | (252 | ) |
Return of Contributed Capital | | | (100 | ) | | | (75 | ) | | | — | |
Redemptions of Preference Units | | | (184 | ) | | | (325 | ) | | | — | |
Ordinary Unit Distributions | | | (125 | ) | | | (75 | ) | | | — | |
Cash Distributions Paid on Preference Units | | | (3 | ) | | | (16 | ) | | | (23 | ) |
Payments to Minority Shareholders | | | (1 | ) | | | (1 | ) | | | (48 | ) |
Other | | | (6 | ) | | | — | | | | 1 | |
| | | |
| | | |
| | | |
| |
Net Cash (Used In) Provided By Financing Activities | | | (445 | ) | | | (861 | ) | | | 286 | |
| | | |
| | | |
| | | |
| |
Effect of Exchange Rate Change | | | 2 | | | | 1 | | | | 2 | |
| | | |
| | | |
| | | |
| |
Net (Decrease) Increase In Cash and Cash Equivalents | | | (115 | ) | | | 89 | | | | 11 | |
Cash and Cash Equivalents at Beginning of Period | | | 183 | | | | 94 | | | | 83 | |
| | | |
| | | |
| | | |
| |
Cash and Cash Equivalents at End of Period | | $ | 68 | | | $ | 183 | | | $ | 94 | |
| | | |
| | | |
| | | |
| |
Supplemental Disclosure of Cash Flow Information: | | | | | | | | | | | | |
Income Taxes Received | | $ | (82 | ) | | $ | (197 | ) | | $ | (154 | ) |
Interest Paid, Net of Amounts Capitalized | | $ | 199 | | | $ | 247 | | | $ | 166 | |
| | | | | | | | | | | | |
See disclosures regarding PSEG Energy Holdings L.L.C. included in the
Notes to Consolidated Financial Statements.
115
PSEG ENERGY HOLDINGS L.L.C.
CONSOLIDATED STATEMENTS OF MEMBER'S EQUITY
(Millions)
| | | Ordinary
Unit
| | Preference
Units
| | Retained
Earnings
| | Other
Comprehensive
Income (Loss)
| | Total Member's/
Stockholder's
Equity
|
Balance as of January 1, 2003 | | $ | 1,888 | | | $ | 509 | | | $ | 56 | | | $ | (430 | ) | | $ | 2,023 | |
| | | |
| | | |
| | | |
| | | |
| | | |
| |
Net Income | | | — | | | | — | | | | 145 | | | | — | | | | 145 | |
Other Comprehensive Income (Loss), net of tax: | | | | | | | | | | | | | | | | | | | | |
Currency Translation Adjustment, net of tax $4 | | | | | | | — | | | | — | | | | 164 | | | | 164 | |
Current Period Declines in Fair Value of Derivative Instruments, net of tax $(11) | | | — | | | | — | | | | — | | | | (22 | ) | | | (22 | ) |
Reclassification Adjustments for Net Amounts Included in Net Income, net of tax | | | — | | | | — | | | | — | | | | 23 | | | | 23 | |
Settlement Adjustments related to projects under construction | | | — | | | | — | | | | — | | | | (11 | ) | | | (11 | ) |
Minimum Pension Liability Adjustment | | | — | | | | — | | | | — | | | | 5 | | | | 5 | |
| | | | | | | | | | | | | | | | | | |
| |
Other Comprehensive Income | | | — | | | | — | | | | — | | | | — | | | | 159 | |
| | | | | | | | | | | | | | | | | | |
| |
Comprehensive Income | | | | | | | | | | | | | | | | | | | 304 | |
Preference Units/Preferred Stock Dividends | | | — | | | | — | | | | (23 | ) | | | — | | | | (23 | ) |
| | | �� |
| | | |
| | | |
| | | |
| | | |
| |
Balance as of December 31, 2003 | | $ | 1,888 | | | $ | 509 | | | $ | 178 | | | $ | (271 | ) | | $ | 2,304 | |
| | | |
| | | |
| | | |
| | | |
| | | |
| |
Net Income | | | — | | | | — | | | | 141 | | | | — | | | | 141 | |
Other Comprehensive Income (Loss), net of tax: | | | | | | | | | | | | | | | | | | | | |
Currency Translation Adjustment, net of tax $8 | | | — | | | | — | | | | — | | | | 64 | | | | 64 | |
Current Period Declines in Fair Value of Derivative Instruments, net of tax $(1) | | | — | | | | — | | | | — | | | | (2 | ) | | | (2 | ) |
Reclassification Adjustments for Net Amounts Included in Net Income, net of tax | | | — | | | | — | | | | — | | | | 3 | | | | 3 | |
Settlement Adjustments related to projects under construction | | | — | | | | — | | | | — | | | | (3 | ) | | | (3 | ) |
Minimum Pension Liability Adjustment | | | — | | | | — | | | | — | | | | — | | | | — | |
| | | | | | | | | | | | | | | | | | |
| |
Other Comprehensive Income | | | — | | | | — | | | | — | | | | — | | | | 62 | |
| | | | | | | | | | | | | | | | | | |
| |
Comprehensive Income | | | — | | | | — | | | | — | | | | | | | | 203 | |
Ordinary Unit Distributions | | | — | | | | — | | | | (75 | ) | | | | | | | (75 | ) |
Return of Contributed Capital | | | (75 | ) | | | — | | | | — | | | | | | | | (75 | ) |
Preference Units Redemption | | | — | | | | (325 | ) | | | — | | | | | | | | (325 | ) |
Preference Units Distribution | | | — | | | | — | | | | (16 | ) | | | — | | | | (16 | ) |
| | | |
| | | |
| | | |
| | | |
| | | |
| |
Balance as of December 31, 2004 | | $ | 1,813 | | | $ | 184 | | | $ | 228 | | | $ | (209 | ) | | $ | 2,016 | |
| | | |
| | | |
| | | |
| | | |
| | | |
| |
Net Income | | | — | | | | — | | | | 217 | | | | — | | | | 217 | |
Other Comprehensive Income (Loss), net of tax: | | | | | | | | | | | | | | | | | | | | |
Currency Translation Adjustment, net of tax $8 | | | — | | | | — | | | | — | | | | 84 | | | | 84 | |
Current Period Declines in Fair Value of Derivative Instruments, net of tax $(1) | | | — | | | | — | | | | — | | | | 16 | | | | 16 | |
Reclassification Adjustments for Net Amounts Included in Net Income, net of tax | | | — | | | | — | | | | — | | | | 1 | | | | 1 | |
Settlement Adjustments related to projects under construction | | | — | | | | — | | | | — | | | | (2 | ) | | | (2 | ) |
Minimum Pension Liability Adjustment | | | — | | | | — | | | | — | | | | — | | | | — | |
| | | | | | | | | | | | | | | | | | |
| |
Other Comprehensive Income | | | — | | | | — | | | | — | | | | — | | | | 99 | |
| | | | | | | | | | | | | | | | | | |
| |
Comprehensive Income | | | — | | | | — | | | | | | | | | | | | 316 | |
Ordinary Unit Distributions | | | — | | | | — | | | | (125 | ) | | | | | | | (125 | ) |
Return of Contributed Capital | | | (100 | ) | | | — | | | | — | | | | | | | | (100 | ) |
Preference Units Redemption | | | — | | | | (184 | ) | | | — | | | | | | | | (184 | ) |
Preference Units Distribution | | | — | | | | — | | | | (3 | ) | | | — | | | | (3 | ) |
| | | |
| | | |
| | | |
| | | |
| | | |
| |
Balance as of December 31, 2005 | | $ | 1,713 | | | $ | — | | | $ | 317 | | | $ | (110 | ) | | $ | 1,920 | |
| | | |
| | | |
| | | |
| | | |
| | | |
| |
| | | | | | | | | | | | | | | | | | | | |
See disclosures regarding PSEG Energy Holdings LLC included in the
Notes to Consolidated Financial Statements.
116
NOTES TO CONSOLIDATED FINANCIAL STATEMENTS
Note 1. Organization and Summary of Significant Accounting Policies
Organization
Public Service Enterprise Group Incorporated (PSEG)
PSEG has four principal direct wholly owned subsidiaries: Public Service Electric and Gas Company (PSE&G), PSEG Power LLC (Power), PSEG Energy Holdings L.L.C. (Energy Holdings) and PSEG Services Corporation (Services).
As previously disclosed, on December 20, 2004, PSEG entered into an agreement and plan of merger (Merger Agreement) with Exelon Corporation (Exelon), a public utility holding company headquartered in Chicago, Illinois, whereby PSEG will be merged with and into Exelon (Merger). Under the Merger Agreement, each share of PSEG Common Stock will be converted into 1.225 shares of Exelon Common Stock.
The Merger Agreement has been unanimously approved by both companies' Boards of Directors. On July 19, 2005, shareholders of PSEG voted to approve the Merger and on July 22, 2005, shareholders of Exelon voted to approve the issuance of common shares to PSEG shareholders to effect the Merger.
Completion of the Merger is subject to approval by a number of governmental authorities, some of which have already been obtained. For additional information, see Note 23. Pending Merger.
PSE&G
PSE&G is an operating public utility engaged principally in the transmission of electric energy and distribution of electric energy and natural gas in certain areas of New Jersey. PSE&G is subject to regulation by the New Jersey Board of Public Utilities (BPU) and the Federal Energy Regulatory Commission (FERC).
PSE&G also owns PSE&G Transition Funding LLC (Transition Funding) and PSE&G Transition Funding II LLC (Transition Funding II), bankruptcy-remote entities that purchased certain transition property from PSE&G and issued transition bonds secured by such property. The transition property consists principally of the right to receive electricity consumption-based per kilowatt-hour (kWh) charges from PSE&G electric distribution customers, which represents the irrevocable right to receive amounts sufficient to recover certain of PSE&G's transition costs related to deregulation, as approved by the BPU.
Power
Power is a multi-regional, wholesale energy supply company that integrates its generating asset operations and gas supply commitments with its wholesale energy, fuel supply, energy trading and marketing and risk management function through three principal direct wholly owned subsidiaries: PSEG Nuclear LLC (Nuclear), PSEG Fossil LLC (Fossil) and PSEG Energy Resources & Trade LLC (ER&T). Nuclear and Fossil own and operate generation and generation-related facilities. ER&T is responsible for the day-to-day management of Power's portfolio. Fossil, Nuclear and ER&T are subject to regulation by FERC and Nuclear is also subject to regulation by the Nuclear Regulatory Commission (NRC).
Energy Holdings
Energy Holdings has two principal direct wholly owned subsidiaries: PSEG Global L.L.C. (Global), which owns and operates international and domestic projects engaged in the generation and distribution of energy, including power production facilities and electric distribution companies and PSEG Resources L.L.C. (Resources), which has invested primarily in energy-related leveraged leases. Energy Holdings also owns Enterprise Group Development Corporation (EGDC), a commercial real estate property management business.
Services
Services provides management and administrative services to PSEG and its subsidiaries. These include accounting, legal, communications, human resources, information technology, treasury and financial services, investor relations, stockholder services, real estate, environmental, health and safety, insurance, risk
117
NOTES TO CONSOLIDATED FINANCIAL STATEMENTS
management, tax, library, records and information services, security, corporate secretarial and certain planning, budgeting and forecasting services. Services charges PSEG and its subsidiaries for the cost of work performed and services provided pursuant to the terms and conditions of intercompany service agreements.
Summary of Significant Accounting Policies
Principles of Consolidation
PSEG, PSE&G, Power and Energy Holdings
PSEG's, PSE&G's, Power's and Energy Holdings' consolidated financial statements include their respective accounts and consolidate those entities in which they have a controlling interest or are the primary beneficiary, except for certain of PSEG's capital trusts which were deconsolidated in accordance with Financial Accounting Standards Board (FASB) Interpretation No. (FIN) 46 (revised December 2003), “Consolidation of Variable Interest Entities (VIE)” (FIN 46). Entities over which PSEG, PSE&G, Power and Energy Holdings exhibit significant influence, but do not have a controlling interest and/or are not the primary beneficiary are accounted for under the equity method of accounting. For investments in which significant influence does not exist and the investor is not the primary beneficiary, the cost method of accounting is applied. All significant intercompany accounts and transactions are eliminated in consolidation.
PSE&G and Power
PSE&G and Power each have undivided interests in certain jointly-owned facilities and each is responsible for paying their respective ownership share of additional construction costs, fuel inventory purchases and operating expenses. All revenues and expenses related to these facilities are consolidated at their respective pro-rata ownership share in the appropriate revenue and expense categories on the Consolidated Statements of Operations. For additional information regarding these jointly-owned facilities, see Note 19. Property, Plant and Equipment and Jointly-Owned Facilities.
Accounting for the Effects of Regulation
PSE&G and Energy Holdings
PSE&G and certain of Global's investments prepare their respective financial statements in accordance with the provisions of Statement of Financial Accounting Standards (SFAS) No. 71, “Accounting for the Effects of Certain Types of Regulation” (SFAS 71). In general, SFAS 71 recognizes that accounting for rate-regulated enterprises should reflect the economic effects of regulation. As a result, a regulated utility is required to defer the recognition of costs (a regulatory asset) or record the recognition of obligations (a regulatory liability) if it is probable that, through the rate-making process, there will be a corresponding increase or decrease in future rates. Accordingly, PSE&G and certain of Global's businesses have deferred certain costs and recoveries, which are being amortized over various future periods. To the extent that collection of any such costs or payment of liabilities is no longer probable as a result of changes in regulation and/or PSE&G's and Global's competitive positions, the associated regulatory asset or liability is charged or credited to income. Management believes that PSE&G's and certain of Global's transmission and distribution businesses continue to meet the requirements for application of SFAS 71. For additional information, see Note 5. Regulatory Matters.
Derivative Financial Instruments
PSEG, PSE&G, Power and Energy Holdings
PSEG, PSE&G, Power and Energy Holdings use derivative financial instruments to manage risk from changes in interest rates, congestion credits, emission credits, commodity prices and foreign currency exchange rates, pursuant to their business plans and prudent practices.
PSEG, PSE&G, Power and Energy Holdings recognize derivative instruments on the balance sheet at their fair value. Changes in the fair value of a derivative that is highly effective as, and that is designated and qualifies as, a fair value hedge (including foreign currency fair value hedges), along with changes of the fair
118
NOTES TO CONSOLIDATED FINANCIAL STATEMENTS
value of the hedged asset or liability that are attributable to the hedged risk, are recorded in current-period earnings. Changes in the fair value of a derivative that is highly effective as, and that is designated and qualifies as, a cash flow hedge (including foreign currency cash flow hedges) are recorded in Accumulated Other Comprehensive Loss (OCL) until earnings are affected by the variability of cash flows of the hedged transaction. Any hedge ineffectiveness is included in current-period earnings. In certain circumstances, PSEG, PSE&G, Power and/or Energy Holdings enter into derivative contracts that do not qualify as hedges or choose not to designate them as normal purchases or sales or as fair value or cash flow hedges; in such cases, changes in fair value are recorded in current-period earnings.
Many non-trading contracts qualify for the normal purchases and normal sales exemption under Statement of Financial Accounting Standards (SFAS) No. 133, “Accounting for Derivative Instruments and Hedging Activities,” as amended and interpreted (SFAS 133) and are accounted for upon settlement.
For additional information regarding derivative financial instruments, see Note 11. Risk Management.
Revenue Recognition
PSE&G
PSE&G's Operating Revenues are recorded based on services rendered to customers during each accounting period. PSE&G records unbilled revenues for the estimated amount customers will be billed for services rendered from the time meters were last read to the end of the respective accounting period. The unbilled revenue is estimated each month based on usage per day, the number of unbilled days in the period, estimated seasonal loads based upon the time of year and the variance of actual degree-days and temperature-humidity-index hours of the unbilled period from expected norms.
Power
The majority of Power's revenues relate to bilateral contracts, which are accounted for on the accrual basis as the energy is delivered. Power's revenue also includes changes in value of nontrading energy derivative contracts that are not designated as normal purchases or sales or as hedges of other positions. Power records margins from energy trading on a net basis pursuant to accounting principles generally accepted in the U.S. (GAAP). See Note 11. Risk Management for further discussion.
Energy Holdings
Global records revenues from its investments in generation and distribution facilities based on services rendered to customers during each accounting period. Certain of Global's investments are majority owned, controlled and consolidated by Global. Revenues from these projects are included in Operating Revenues. Other investments are less than majority owned and are accounted for under the equity or cost methods as appropriate. Income from these investments is recorded as a component of Operating Income. Gains or losses incurred as a result of exiting one of these businesses are typically recorded as a component of Operating Income.
The majority of Resources' revenues relates to its investments in leveraged leases and are accounted for under SFAS No. 13, “Accounting for Leases” (SFAS 13). Income on leveraged leases is recognized by a method which produces a constant rate of return on the outstanding net investment in the lease, net of the related deferred tax liability, in the years in which the net investment is positive. Any gains or losses incurred as a result of a lease termination are recorded as revenues as these events occur in the ordinary course of business of managing the investment portfolio. See Note 8. Long-Term Investments for further discussion.
Depreciation and Amortization
PSE&G
PSE&G calculates depreciation under the straight-line method based on estimated average remaining lives of the several classes of depreciable property. These estimates are reviewed on a periodic basis and necessary adjustments are made as approved by the BPU. The depreciation rate stated as a percentage of original cost of depreciable property was 3.00% for 2005, 3.07% for 2004 and 3.30% for 2003.
119
NOTES TO CONSOLIDATED FINANCIAL STATEMENTS
Power
Power calculates depreciation on generation-related assets under the straight-line method based on the assets' estimated useful lives which are determined based on planned operations. The estimated useful lives are from three years to 20 years for general plant assets. The estimated useful lives are 30 years to 55 years for fossil production assets, 49 years to 56 years for nuclear generation assets and 45 years for pumped storage facilities.
Energy Holdings
Energy Holdings calculates depreciation on property, plant and equipment under the straight-line method with estimated useful lives ranging from three years to 40 years.
Taxes Other Than Income Taxes
PSE&G
Excise taxes, transitional energy facilities assessment (TEFA) and gross receipts tax (GRT) collected from PSE&G's customers are presented on the financial statements on a gross basis. As a result of New Jersey energy tax reform, effective January 1, 1998, TEFA and GRT are the residual of the prior excise tax, the New Jersey gross receipts and franchise taxes. For the years ended December 31, 2005, 2004 and 2003, combined TEFA and GRT of approximately $155 million, $153 million and $152 million, respectively, are reflected in Operating Revenues and $141 million, $139 million and $136 million, respectively, are included in Taxes Other Than Income Taxes on the Consolidated Statements of Operations.
| | Allowance for Funds Used During Construction (AFUDC) and Interest Capitalized During Construction (IDC) |
PSE&G
AFUDC represents the cost of debt and equity funds used to finance the construction of new utility assets under the guidance of SFAS 71. The amount of AFUDC capitalized is reported in the Consolidated Statements of Operations as a reduction of interest charges. PSE&G's average rate used for calculating AFUDC in 2005, 2004 and 2003 was 3.17%, 1.33% and 3.43%, respectively. For the years ended December 31, 2005, 2004 and 2003, PSE&G's AFUDC amounted to $1.2 million, $0.1 million and $0.3 million, respectively.
Power and Energy Holdings
IDC represents the cost of debt used to finance construction at Power and Energy Holdings. The amount of IDC capitalized is reported in the Consolidated Statements of Operations as a reduction of interest charges and is included in Property, Plant and Equipment on the Consolidated Balance Sheets. Power's average rate used for calculating IDC in 2005, 2004 and 2003 was 6.74%, 6.81% and 7.07%, respectively. For the years ended December 31, 2005, 2004 and 2003, Power's IDC amounted to $95 million, $111 million and $107 million, respectively. Energy Holdings' average rate used for calculating IDC in 2005, 2004 and 2003 was 7.81%, 8.37% and 8.70%, respectively. For the years ended December 31, 2005, 2004 and 2003, Energy Holdings' IDC amounted to $3 million, $4 million and $12 million, respectively.
Income Taxes
PSEG, PSE&G, Power and Energy Holdings
PSEG and its subsidiaries file a consolidated Federal income tax return and income taxes are allocated to PSEG's subsidiaries based on the taxable income or loss of each subsidiary. Investment tax credits were deferred in prior years and are being amortized over the useful lives of the related property.
120
NOTES TO CONSOLIDATED FINANCIAL STATEMENTS
Foreign Currency Translation/Transactions
Energy Holdings
A business's functional currency is the currency of the primary economic environment in which the business operates and is generally the currency in which the business generates and expends cash. In accordance with SFAS No. 52, “Foreign Currency Translation,” the assets and liabilities of foreign operations of Energy Holdings, with a functional currency other than the U.S. Dollar, are translated into U.S. Dollars at the current exchange rates in effect at the end of the reporting period. The translation differences that result from this process, and gains and losses on intercompany foreign currency transactions, which are long-term in nature and that Energy Holdings does not intend to settle in the foreseeable future, are shown in OCL as a separate component of member's equity. U.S. deferred taxes are not provided on translation gains and losses where Energy Holdings expects earnings of a foreign operation to be permanently reinvested. The revenue and expense accounts of such foreign operations are translated into U.S. Dollars at the average exchange rates that prevail during the period.
Gains and losses that arise from exchange rate fluctuations on monetary assets and monetary liabilities denominated in a currency other than the functional currency are included in Other Income or Other Deductions. Gains and losses relating to derivatives designated as hedges of the foreign currency exposure of a net investment in foreign operations are reported in Currency Translation Adjustment, a separate component of OCL.
The determination of an entity's functional currency requires management's judgment. It is based on an assessment of the primary currency in which transactions in the local environment are conducted, and whether the local currency can be relied upon as a stable currency in which to conduct business. As economic and business conditions change, Energy Holdings is required to reassess the economic environment and determine the appropriate functional currency. The impact of foreign currency accounting could have a material effect on Energy Holdings' financial statements.
Cash and Cash Equivalents
PSEG, PSE&G, Power and Energy Holdings
Cash and cash equivalents consist primarily of working funds and highly liquid marketable securities (commercial paper and money market funds) with an original maturity of three months or less.
Materials and Supplies and Fuel
PSE&G
PSE&G's materials and supplies are carried at average cost consistent with the rate-making process.
Power and Energy Holdings
Materials and supplies and fuel for Power and Energy Holdings are valued at the lower of average cost or market.
Property, Plant and Equipment
PSE&G
PSE&G's additions and replacements to property, plant and equipment that are either retirement units or property record units are capitalized at original cost. The cost of maintenance, repair and replacement of minor items of property is charged to appropriate expense accounts as incurred. At the time units of depreciable property are retired or otherwise disposed of, the original cost, adjusted for net salvage value, is charged to accumulated depreciation.
121
NOTES TO CONSOLIDATED FINANCIAL STATEMENTS
Power and Energy Holdings
Power and Energy Holdings only capitalize costs which increase the capacity or extend the life of an existing asset, represent a newly acquired or constructed asset or represent the replacement of a retired asset. The cost of maintenance, repair and replacement of minor items of property is charged to appropriate expense accounts as incurred. Environmental costs are capitalized if the costs mitigate or prevent future environmental contamination or if the costs improve existing assets' environmental safety or efficiency. All other environmental expenditures are expensed as incurred. Certain subsidiaries of Energy Holdings that are in the distribution business capitalize all incremental costs associated with construction activities. These construction costs meet the capitalization criteria described above.
Other Special Funds
PSEG, PSE&G, Power and Energy Holdings
Other Special Funds represents amounts deposited to fund the qualified pension plans and to fund a Rabbi Trust which was established to meet the obligations related to three non-qualified pension plans and a deferred compensation plan.
Nuclear Decommissioning Trust (NDT) Funds
Power
As required under SFAS No. 115, “Accounting for Certain Investments in Debt and Equity Securities” (SFAS 115), realized gains and losses on securities in the NDT Funds are recorded in earnings and unrealized gains and losses on such securities are recorded as a component of OCL. See Note 3. Asset Retirement Obligations for a discussion of SFAS No. 143, “Accounting for Asset Retirement Obligations” (SFAS 143) and the impact of its adoption on the nuclear decommissioning liability and associated asset retirement costs related to the NDT Funds.
Investments in Corporate Joint Ventures and Partnerships
Energy Holdings
Generally, Global's interests in active joint ventures and partnerships are accounted for under the equity method of accounting where their respective ownership interests are 50% or less, it is not the primary beneficiary, as defined under FIN 46, and significant influence over joint venture or partnership operating and management decisions exists. For investments in which significant influence does not exist and Global is not the primary beneficiary, the cost method of accounting is applied.
Deferred Project Costs and Development Costs
Power
Power capitalizes all incremental and direct external and direct internal costs related to project development once a project reaches certain milestones. On Power's Consolidated Balance Sheets, deferred project costs are recorded in Construction Work in Progress. These costs are amortized on a straight-line basis over the lives of the related project assets. Such amortization commences upon the date of commercial operation. Development costs related to unsuccessful projects are charged to expense.
Stock Compensation
PSEG
PSEG applied Accounting Principles Board (APB) Opinion No. 25, “Accounting for Stock Issued to Employees” (APB 25), and related interpretations in accounting for stock-based compensation plans. Accordingly, no compensation cost has been recognized for fixed stock option grants since the exercise price of the stock options equaled the market price of the underlying stock on the date of grant. Had compensation costs for stock option grants been determined based on the fair value at the grant dates for awards under
122
NOTES TO CONSOLIDATED FINANCIAL STATEMENTS
these plans in accordance with SFAS No. 123, “Accounting for Stock-Based Compensation” (SFAS 123), there would have been an additional charge to Net Income of approximately $3 million, $5 million and $8 million in 2005, 2004 and 2003, respectively, with a $(0.02), $(0.02) and $(0.04) impact on diluted earnings per share in 2005, 2004 and 2003, respectively.
The following table illustrates the effect on Net Income and Earnings Per Share if PSEG had applied the fair value recognition provisions of SFAS 123 to stock-based employee compensation:
| | | | Years Ended
December 31,
|
| | | | 2005
| | 2004
| | 2003
|
| | | | (Millions, except
share data) |
| | Net Income, as reported | | $ | 661 | | | $ | 726 | | | $ | 1,160 | |
| | Add: Total stock-based compensation expensed during the period, net of tax | | | 5 | | | | 2 | | | | — | |
| | Deduct: Total stock-based employee compensation expense determined under fair value based method for all awards, net of related tax effects | | | (8 | ) | | | (7 | ) | | | (8 | ) |
| | | | |
| | | |
| | | |
| |
| | Pro forma Net Income | | $ | 658 | | | $ | 721 | | | $ | 1,152 | |
| | | | |
| | | |
| | | |
| |
| | Earnings per share: | | | | | | | | | | | | |
| | Basic—as reported | | $ | 2.75 | | | $ | 3.06 | | | $ | 5.08 | |
| | Basic—pro forma | | $ | 2.74 | | | $ | 3.04 | | | $ | 5.05 | |
| | Diluted—as reported | | $ | 2.71 | | | $ | 3.05 | | | $ | 5.07 | |
| | Diluted—pro forma | | $ | 2.69 | | | $ | 3.03 | | | $ | 5.03 | |
| | | | | | | | | | | | | | |
See Note 2. Recent Accounting Standards and Note 6. Earnings Per Share for further information.
Basis Adjustment
PSE&G and Power
PSE&G and Power have recorded a Basis Adjustment on their Consolidated Balance Sheets related to the generation assets that were transferred from PSE&G to Power in August 2000 at the price specified by the BPU. Because the transfer was between affiliates, PSE&G and Power, the transaction was recorded at the net book value of the assets and liabilities rather than the transfer price. The difference between the total transfer price and the net book value of the generation-related assets and liabilities, approximately $986 million, net of tax, was recorded as a Basis Adjustment on PSE&G's and Power's Consolidated Balance Sheets. The $986 million is a reduction of Power's Member's Equity and an addition to PSE&G's Common Stockholder's Equity. These amounts are eliminated on PSEG's consolidated financial statements.
Use of Estimates
PSEG, PSE&G, Power and Energy Holdings
The process of preparing financial statements in conformity with GAAP requires the use of estimates and assumptions regarding certain types of assets, liabilities, revenues and expenses. Such estimates primarily relate to unsettled transactions and events as of the date of the financial statements. Accordingly, upon settlement, actual results may materially differ from estimated amounts.
Reclassifications
PSEG, PSE&G, Power and Energy Holdings
Certain reclassifications of amounts reported in prior periods have been made to conform with the current presentation.
123
NOTES TO CONSOLIDATED FINANCIAL STATEMENTS
Note 2. Recent Accounting Standards
The following accounting standards were issued, but have not yet been adopted by PSEG as of December 31, 2005.
SFAS No. 123R, “Share-Based Payment, revised 2004” (SFAS 123R)
PSEG
In December 2004, the FASB issued SFAS 123R, which revises SFAS 123 and supersedes APB 25 and its related implementation guidance. SFAS 123R focuses primarily on accounting for share-based payments to employees in exchange for services, and it requires entities to recognize compensation expense for these payments. The cost for equity-based awards is expensed based on their grant date fair value, and liability awards are expensed based on their fair value, which is remeasured each reporting period. The pro forma disclosure previously permitted under SFAS 123 no longer will be an alternative to financial statement recognition.
PSEG currently has retirement eligible employees with outstanding share-based payment awards. Compensation cost related to those awards is currently recognized over the stated vesting period or until actual retirement occurs. After the adoption of SFAS 123R, if awards vest upon retirement, PSEG will be required to recognize compensation cost for new awards over the requisite service period, from the date of grant through the earlier of the vesting date or the retirement eligibility date. As a result, new or modified awards granted to retirement eligible employees will be expensed on the grant date if the plan provides vesting upon retirement.
SFAS 123R is effective for the first annual reporting period beginning after June 15, 2005, and the Company will adopt it prospectively on January 1, 2006. For PSEG the primary change in accounting under SFAS 123R is the requirement to recognize compensation cost for the unused portion of stock option awards which was not expensed under APB 25. In addition, any newly issued stock option awards will be expensed. Adoption of SFAS 123R will not have a material effect on PSEG's financial statements.
SFAS No. 151, “Inventory Costs” (SFAS 151)
PSEG, PSE&G, Power and Energy Holdings
In November 2004, the FASB issued SFAS 151 which clarifies the accounting for abnormal amounts of idle facility expense, freight, handling costs and wasted material. This statement requires that abnormal amounts of idle facility expense, freight, handling costs and spoilage be recognized as current-period charges. In addition, this statement requires that allocation of fixed production overheads to the costs of conversion be based on the normal capacity of the production facilities. SFAS 151 is effective for inventory costs incurred during fiscal years beginning after June 15, 2005. PSEG, PSE&G, Power and Energy Holdings do not believe the adoption of SFAS 151 will have a material effect on their respective financial statements.
SFAS No. 154, “Accounting Changes and Error Corrections” (SFAS 154)
PSEG, PSE&G, Power and Energy Holdings
In May 2005, the FASB issued SFAS 154, which replaces APB No. 20, “Accounting Changes” (APB 20), and SFAS No. 3, “Reporting Accounting Changes in Interim Financial Statements.” SFAS 154 eliminates the APB 20 requirement to include the cumulative effect of changes in accounting principle in the income statement in the period of change. To enhance comparability of prior period financial statements, SFAS 154 requires retrospective application to prior periods' financial statements of voluntary changes in accounting principles unless it is impracticable to determine either the period-specific effects or the cumulative effect of the change. SFAS 154 also requires that a change in depreciation, amortization or depletion method for long-lived non-financial assets be accounted for as a change in accounting estimate effected by a change in accounting principle. APB 20 previously required that such a change be reported as a change in accounting principle. SFAS 154 is effective for accounting changes and corrections of errors made in fiscal years beginning after December 15, 2005.
124
NOTES TO CONSOLIDATED FINANCIAL STATEMENTS
FASB Staff Position (FSP) 115-1 and 124-1, “The Meaning of Other-Than Temporary Impairment and its Application to Certain Investments” (FSP 115-1 and 124-1)
PSEG, PSE&G, Power and Energy Holdings
This FSP addresses the determination as to when an investment is considered impaired, whether that impairment is other than temporary, and the measurement of the impairment loss. It also requires certain disclosures about unrealized losses that have not been recognized as other-than-temporary impairments. This guidance applies to equity securities that have a readily determinable fair value and all debt securities. It does not apply to investments accounted for under the equity method. An investment is impaired if its fair value is less than its cost, as assessed at the individual security level. When an investment is impaired, the investor is required to evaluate whether the impairment is other-than-temporary. If other-than-temporary, the unrealized loss must be recognized. For all investments in an unrealized loss position for which other-than-temporary impairments have not been recognized, the investor should disclose by category of investment the amount of unrealized losses and the fair value of investments with unrealized losses and related narrative disclosures. FSP 115-1 and 124-1 is effective for reporting periods beginning after December 15, 2005. The adoption of this FSP is not expected to have a material effect on PSEG's, PSE&G's, Power's or Energy Holdings' respective financial statements.
Emerging Issues Task Force (EITF) Issue No. 04-13, “Accounting for Purchases and Sales of Inventory with the Same Counterparty” (EITF 04-13)
PSEG, PSE&G, Power and Energy Holdings
EITF 04-13 concludes that inventory purchases and sales transactions with the same counterparty that are entered into in contemplation of one another should be combined and treated as nonmonetary exchanges involving inventory. The consensus includes indicators that should be considered in determining whether transactions were entered into in contemplation of one another. The EITF also concludes that exchanges of finished goods for raw materials or work-in-process within the same line of business should be recognized at fair value if the transaction has commercial substance and fair value is determinable within reasonable limits. All other inventory exchanges should be recognized at carrying value. The provisions of EITF 04-13 are effective for new inventory arrangements entered into, or modifications or renewals of existing inventory arrangements occurring in financial periods beginning after March 15, 2006. PSEG, PSE&G, Power and Energy Holdings do not believe that adoption of EITF 04-13 will have a material effect on their respective financial statements.
The following accounting standard has been proposed by the FASB.
PSEG and Energy Holdings
In July 2005, the FASB issued proposed guidance concerning the accounting for uncertain tax positions and the accounting for the timing of cash flows relating to income taxes generated by leveraged lease transactions.
The proposal concerning uncertain tax positions would require that an uncertain tax position meet a probable recognition threshold based on the merits of the position in order for the benefit to be recognized in the financial statements. The proposal also addresses the accrual of interest and penalties related to tax uncertainties and the classification of liabilities on the balance sheet. If implemented in its present form, the impact of this proposal on PSEG and Energy Holdings could be material.
The proposal concerning leveraged leases would require a lessor to perform a recalculation of a leveraged lease when there is a change in the timing of the realization of tax benefits generated by the lease. It would also require a lessor to re-evaluate classification as a leveraged lease when a recalculation of the lease is performed. If implemented in its present form, the impact of this proposal on PSEG and Energy Holdings could be material.
125
NOTES TO CONSOLIDATED FINANCIAL STATEMENTS
The following new accounting standards were adopted by PSEG during the years ended December 31, 2005 and 2004.
FIN 47, “Accounting for Conditional Asset Retirement Obligations” (FIN 47)
PSEG, PSE&G, Power and Energy Holdings
In March 2005, the FASB issued FIN 47 to clarify the term “conditional asset retirement obligation” as used in SFAS 143. Conditional asset retirement obligation refers to a legal obligation to perform an asset retirement activity in which the timing and/or method of settlement are conditional on a future event that may or may not be within the control of the entity. The obligation to perform the asset retirement activity is unconditional even though uncertainty exists about the timing and/or method of settlement.
Accordingly, an entity is required to recognize a liability for the fair value of a conditional asset retirement obligation if the fair value of the liability can be reasonably estimated. The fair value of a liability for the conditional asset retirement obligation should be recognized when incurred, which is generally, upon acquisition, construction, development and/or through the normal operation of the asset. An asset retirement cost should be capitalized concurrently by increasing the carrying amount of the related asset by the same amount as the liability. A company shall subsequently allocate the asset retirement cost to expense over its useful life. In periods subsequent to the initial measurement, a company is required to recognize changes in the liability resulting from the passage of time (accretion) or due to revisions to either the timing or the amount of the originally estimated cash flows. Changes in the liability due to accretion are charged to Operation and Maintenance expense on the Consolidated Statements of Operations, whereas changes due to the timing or amount of cash flows are adjustments to the carrying amount of the related asset. PSEG, PSE&G, Power and Energy Holdings completed their respective reviews under FIN 47 on December 31, 2005 and identified and recorded certain conditional asset retirement obligations. For additional information see Note 3. Asset Retirement Obligations.
SFAS No. 153, “Exchanges of Nonmonetary Assets, an amendment of APB Opinion No. 29” (SFAS 153)
PSEG, PSE&G, Power and Energy Holdings
In December 2004, the FASB issued SFAS 153, which addresses the measurement of exchanges of nonmonetary assets and redefines the scope of transactions that should be measured based on the fair value of the assets exchanged. SFAS 153 amends APB Opinion No. 29 by eliminating the exception from fair value measurement for nonmonetary exchanges of similar productive assets and requires that an exchange of nonmonetary assets be accounted for at fair value if the exchange has commercial substance and fair value is determinable within reasonable limits. The Statement specifies that a nonmonetary exchange has commercial substance if the future cash flows of the entity are expected to change significantly as a result of the exchange. SFAS 153 was effective for nonmonetary asset exchanges occurring after July 1, 2005. The adoption of SFAS 153 did not have a material effect on the financial statements of PSEG, PSE&G, Power and Energy Holdings.
FSP No. 109-1, “Application of FASB Statement No. 109, “Accounting for Income Taxes”, to the Tax Deduction
on Qualified Production Activities Provided by the American Jobs Creation Act of 2004” (FSP 109-1)
PSEG, Power and Energy Holdings
In December 2004, the FASB issued FSP 109-1, which was effective upon issuance, to provide guidance on the application of SFAS No. 109, “Accounting for Income Taxes” (SFAS 109), to the provision within the American Jobs Creation Act of 2004 (Jobs Act) that provides a tax deduction on qualified production activities. The Jobs Act includes a tax deduction of up to 9% (when fully phased-in) of the lesser of (a) “qualified production activities income,” as defined in the Jobs Act, or (b) taxable income (after the deduction for the utilization of any net operating loss carryforwards). The tax deduction is limited to 50% of W-2 wages paid by the taxpayer. FSP 109-1 clarifies that the manufacturer's deduction provided for under the Jobs Act should be accounted for as a special deduction in accordance with SFAS 109 and not as a tax rate reduction. PSEG, Power and Energy Holdings do not believe that the manufacturer's deduction or the application of FSP 109-1 will have a material effect on their respective financial statements.
126
NOTES TO CONSOLIDATED FINANCIAL STATEMENTS
FSP No. 109-2, “Accounting and Disclosure Guidance for the Foreign Earnings Repatriation Provision within the American Jobs Creation Act of 2004” (FSP 109-2)
PSEG and Energy Holdings
In December 2004, the FASB issued FSP 109-2, which was effective upon issuance, to provide guidance on the application of the provision in the Jobs Act that allows a special one-time dividends received deduction on the repatriation of certain foreign earnings to a U.S. taxpayer, provided certain criteria are met. The Jobs Act provides a one-year window to repatriate earnings from foreign investments and claim a special 85% dividends received tax deduction on such distributions.
PSEG approved a total of three Domestic Reinvestment Plans, which provided for the repatriation of approximately $242 million through December 2005, of which approximately $177 million was eligible for the reduced tax rate pursuant to the Jobs Act. The tax expense associated with such repatriation totaled approximately $11 million and was recorded in 2005. Other than amounts discussed above, Global has made no change in its current intention to indefinitely reinvest accumulated earnings of its foreign subsidiaries.
FASB Staff Position 106-2, “Accounting and Disclosure Requirements Related to the Medicare Prescription Drug, Improvement and Modernization Act of 2003” (FSP 106-2)
PSEG, PSE&G, Power and Energy Holdings
In May 2004, the FASB staff issued FSP 106-2, which provides guidance on the accounting for the effects of the Medicare Prescription Drug, Improvement and Modernization Act of 2003 (Medicare Drug Act) for employers who sponsor postretirement health care plans that provide prescription drug benefits. FSP 106-2 also requires those employers to provide certain disclosures regarding the effect of the federal subsidy provided by the Medicare Drug Act. The Medicare Drug Act generally permits plan sponsors that provide retiree prescription drug benefits that are “actuarially equivalent” to the benefits of Medicare Part D to be eligible for a non-taxable federal subsidy. FSP 106-2 was effective for periods beginning after June 15, 2004. PSEG selected the prospective method of adoption of FSP 106-2. Upon adoption of FSP 106-2, the subsidy reduced the accumulated postretirement benefit obligation by $45 million from $929 million to $884 million on July 1, 2004. The Medicare Prescription Drug benefit reduced PSEG's other postretirement benefits (OPEB) expense by approximately $16 million in 2005 and $3 million in the last six months of 2004, a portion of which was capitalized.
EITF Issue No. 03-11, “Reporting Realized Gains and Losses on Derivative Instruments That Are Subject to FASB Statement No. 133, Accounting for Derivative Instruments and Hedging Activities, and Not Held for Trading Purposes as Defined in EITF Issue No. 02-3, Issues Involved in Accounting for Derivative Contracts Held for Trading Purposes and Contracts Involved in Energy Trading and Risk Management Activities“ (EITF 03-11)
PSEG and Power
The EITF has previously discussed the income statement presentation of gains and losses on contracts held for trading purposes in EITF Issue No. 02-3, “Issues Involved in Accounting for Derivative Contracts Held for Trading Purposes and Contracts Involved in Energy Trading and Risk Management Activities” (EITF 02-3). The EITF reached a consensus that gains and losses (realized and unrealized) on all derivative instruments within the scope of SFAS 133 should be shown net when recognized in the Consolidated Statement of Operations, whether or not settled physically, if the derivative instruments are “held for trading purposes” as defined in EITF 02-3. EITF 03-11 contemplates whether realized gains and losses should be shown gross or net in the Consolidated Statement of Operations for contracts that are not held for trading purposes, but are derivatives subject to SFAS 133. On July 31, 2003, the EITF indicated that the determination of whether realized gains and losses on physically settled derivative contracts not “held for trading purposes” should be reported on a gross or net basis is a matter of judgment. The EITF indicated that companies may base their judgment on existing authoritative guidance in gross/net presentation, such as EITF Issue No. 99-19, “Reporting Revenue Gross as a Principal Versus Net as an Agent” (EITF 99-19). These rules, which are effective for transactions occurring after September 30, 2003, required PSEG and
127
NOTES TO CONSOLIDATED FINANCIAL STATEMENTS
Power to reduce revenues and costs by approximately $90 million, $228 million and $5 million for the years ended December 31, 2005, 2004 and 2003, respectively.
Note 3. Asset Retirement Obligations
PSEG, PSE&G, Power and Energy Holdings
Effective January 1, 2003, PSEG, PSE&G, Power and Energy Holdings each adopted SFAS 143, which requires a company to initially recognize the fair value of a liability for an asset retirement obligation (ARO) in the period in which it is incurred. As a result of adopting SFAS 143, PSEG recorded a benefit for a Cumulative Effect of a Change in Accounting Principle of $370 million, after-tax, in the first quarter of 2003, all of which related to Power, as discussed below.
On December 31, 2005, PSEG, PSE&G, Power and Energy Holdings completed their analyses under FIN 47, which was issued in March 2005 to clarify certain guidance set forth in SFAS 143, and quantified conditional AROs identified that were previously not estimable. As a result of adopting FIN 47, PSEG recorded an additional ARO liability of approximately $246 million, including $210 million at PSE&G and $35 million at Power. PSEG also recorded a charge for a Cumulative Effect of a Change in Accounting Principle of $(17) million, after-tax, $(16) million of which relates to Power, with the remainder at Energy Holdings and Services.
The following table reflects pro forma results excluding the Cumulative Effect of a Change in Accounting Principle recorded upon the adoption of SFAS 143 and FIN 47 in 2003 and 2005, respectively, and including accretion and depreciation expense relating to the additional AROs identified under FIN 47, as if it had always been in effect.
| | | | Years Ended
December 31,
|
| | | | 2005
| | 2004
| | 2003
|
| | | | (Millions, except per
share data) |
| | PSEG | | | | | | | | | | | | |
| | Net Income—as reported | | $ | 661 | | | $ | 726 | | | $ | 1,160 | |
| | Net Income—pro forma | | $ | 677 | | | $ | 725 | | | $ | 789 | |
| | Earnings per share: | | | | | | | | | | | | |
| | Basic—as reported | | $ | 2.75 | | | $ | 3.06 | | | $ | 5.08 | |
| | Basic—pro forma | | $ | 2.81 | | | $ | 3.06 | | | $ | 3.46 | |
| | Diluted—as reported | | $ | 2.71 | | | $ | 3.05 | | | $ | 5.07 | |
| | Diluted—pro forma | | $ | 2.77 | | | $ | 3.04 | | | $ | 3.45 | |
| | Power | | | | | | | | | | | | |
| | Net Income—as reported | | $ | 192 | | | $ | 308 | | | $ | 844 | |
| | Net Income—pro forma | | $ | 207 | | | $ | 307 | | | $ | 473 | |
| | | | | | | | | | | | | | |
The pro forma amounts of the liabilities for PSEG's, PSE&G's and Power's asset retirement obligations for the period ended December 31, 2004, as well as the actual amounts of the liabilities recorded on PSEG's, PSE&G's and Power's Consolidated Balance Sheets as of December 31, 2005 are highlighted in the following table. These amounts were calculated using current information, current assumptions and current interest rates.
128
NOTES TO CONSOLIDATED FINANCIAL STATEMENTS
| | | | As of
December 31,
|
| | | | 2005
| | 2004
|
| | | | (Millions) |
| | PSEG | | | | | | | | |
| | Beginning of Period ARO Liability | | $ | 543 | | | $ | 508 | |
| | Accretion Expense | | | 42 | | | | 35 | |
| | | | |
| | | |
| |
| | End of Period ARO Liability | | $ | 585 | | | $ | 543 | |
| | | | |
| | | |
| |
| | PSE&G | | | | | | | | |
| | Beginning of Period ARO Liability | | $ | 198 | | | | 191 | |
| | Accretion Expense (A) | | | 12 | | | | 7 | |
| | | | |
| | | |
| |
| | End of Period ARO Liability | | $ | 210 | | | $ | 198 | |
| | | | |
| | | |
| |
| | Power | | | | | | | | |
| | Beginning of Period ARO Liability | | $ | 343 | | | | 315 | |
| | Accretion Expense | | | 30 | | | | 28 | |
| | | | |
| | | |
| |
| | End of Period ARO Liability | | $ | 373 | | | $ | 343 | |
| | | | |
| | | |
| |
| | | |
| (A) | | Accretion expense is not reflected on PSE&G's Consolidated Statements of Operations as it is deferred and recovered in rate base. |
PSEG
In addition to amounts recorded at PSE&G, Power and Energy Holdings, discussed below, Services recorded a conditional ARO under FIN 47 of less than $1 million related to its obligation to restore a leased office space to rentable condition upon lease termination. Concurrently, an asset was recorded for less than $1 million, representing the fair value of the ARO at the date the legal obligation was incurred.
PSE&G
PSE&G recorded a conditional ARO of $210 million, for legal obligations identified under FIN 47 related to the removal of asbestos and underground storage tanks at certain industrial establishments, removal of wood poles, leases and licenses, and the requirement to seal natural gas pipelines at all sources of gas when the pipelines are no longer in service. Concurrently, an asset was recorded of approximately $155 million, representing the fair value of the ARO at the date the legal obligation was incurred. PSE&G also recorded a $55 million Regulatory Asset for amounts to be collected in future rates.
Power
Power determined that its obligations under SFAS 143 were primarily related to the decommissioning of its nuclear power plants. Power's recorded liability for decommissioning as of December 31, 2002 was approximately $766 million, which was equivalent to the balance of its NDT Funds. As of January 1, 2003, this liability was recalculated to be approximately $261 million under SFAS 143. Concurrently, an asset was recorded of approximately $50 million, representing the fair value of the ARO at the date the legal obligation was incurred. This asset and liability were calculated using a probability-weighted average of multiple scenarios. The scenarios were each based on estimated cash flows, which were discounted using Power's risk-adjusted interest rate at the required effective date of the standard and considering the expected time period of the cash outflows. The scenarios included estimates for inflation, contingencies and assumptions related to the timing of decommissioning costs, using the current license lives for each unit, as well as early shutdown and license extensions scenarios.
Power also had $131 million of cost of removal liabilities recorded on its Consolidated Balance Sheet, as of December 31, 2002, which did not meet the requirements of an ARO and were therefore reversed and included in the Cumulative Effect of a Change in Accounting Principle recorded in the first quarter of 2003.
129
NOTES TO CONSOLIDATED FINANCIAL STATEMENTS
Of the $370 million, after-tax, Cumulative Effect of a Change in Accounting Principle recorded in 2003, $292 million (after-tax) related to decommissioning at Nuclear and $78 million (after-tax) related to the cost of removal liabilities for the fossil units that were reversed.
The $(16) million, after-tax, recorded on December 31, 2005 under FIN 47 primarily related to Power's fossil generation units, including liabilities for the removal of asbestos, stored hazardous liquid material and underground storage tanks from industrial power sites, restoration of leased office space to rentable condition upon lease termination, permits and authorizations, the restoration of an area occupied by a reservoir when the reservoir is no longer needed, the demolition of certain plants and the restoration of the sites at which they reside when the plants are no longer in service. Concurrently, an asset was recorded of approximately $10 million, representing the fair value of the ARO at the date the legal obligation was incurred.
Energy Holdings
Energy Holdings identified and recorded a legal obligation of less than $1 million under FIN 47 for Electroandes S.A.'s (Electroandes) water and infrastructure easement rights recognition agreement that expires in December 2006.
Note 4. Discontinued Operations, Dispositions and Acquisitions
Discontinued Operations
Power
Waterford Generation Facility (Waterford)
On May 27, 2005, Power entered into an agreement to sell its electric generation facility located in Waterford, Ohio to a subsidiary of American Electric Power Company, Inc. Since commencing construction of the project, the dramatic increase in natural gas prices relative to the price increase of coal and the failure to receive capacity compensation for the facility caused Power to consider alternatives for the project. After reviewing the alternatives in conjunction with other strategic and financial considerations, Power concluded that the value to be received from the sale of Waterford represented a means to accelerate the realization of the plant's value. The sale price for the facility and inventory was $220 million.
During 2005, Power recognized a loss on disposal of $178 million, net of tax. Power completed the sale of Waterford on September 28, 2005. The proceeds of the sale, together with an anticipated reduction in tax liability, were approximately $320 million, which will be used to retire debt at Power.
Waterford's operating results for the years ended December 31, 2005, 2004 and 2003 are summarized below:
| | | | Years Ended
December 31,
|
| | | | 2005
| | 2004
| | 2003
|
| | | | (Millions) |
| | Operating Revenues | | $ | 18 | | | $ | 4 | | | $ | 4 | |
| | Loss Before Income Taxes | | $ | (34 | ) | | $ | (57 | ) | | $ | (15 | ) |
| | Net Loss | | $ | (20 | ) | | $ | (34 | ) | | $ | (9 | ) |
| | | | | | | | | | | | | | |
The carrying amounts of the assets of Waterford as of December 31, 2004 are summarized in the following table:
| | | | As of
December 31,
2004
|
| | | | (Millions) |
| | Current Assets | | $ | 4 | |
| | Noncurrent Assets | | | 507 | |
| | | | |
| |
| | Total Assets of Discontinued Operations | | $ | 511 | |
| | | | |
| |
| | | | | | |
130
NOTES TO CONSOLIDATED FINANCIAL STATEMENTS
Energy Holdings
Elektrocieplownia Chorzow Elcho Sp. Z o.o. (Elcho) and Elektrownia Skawina SA (Skawina)
On January 31, 2006, Energy Holdings entered into an agreement with CEZ a.s. to sell its interest in two coal-fired plants in Poland, Elcho and Skawina, consistent with its strategy of monetizing assets on an opportunistic basis. The sale, which is expected to yield cash proceeds of approximately $300 million after taxes and transaction costs, is expected to close in the second quarter of 2006. The agreement is subject to customary conditions, including government and lender consents. The 2005 results for Global's assets in Poland have been reclassified to Discontinued Operations to reflect Energy Holdings' intention to sell these facilities. Comparable 2004 and 2003 results have also been reclassified to reflect this change.
Elcho's and Skawina's operating results for the years ended December 31, 2005, 2004 and 2003 are summarized below:
| | | | Years Ended
December 31,
|
| | | | Elcho
| | Skawina
|
| | | | 2005
| | 2004
| | 2003
| | 2005
| | 2004
| | 2003
|
| | | | (Millions) |
| | Operating Revenues | | $ | 106 | | | $ | 94 | | | $ | 32 | | | $ | 125 | | | $ | 98 | | | $ | 95 | |
| | Income (Loss) Before Income Taxes | | $ | 17 | | | $ | (19 | ) | | $ | — | | | $ | 3 | | | $ | 8 | | | $ | 6 | |
| | Net Income (Loss) | | $ | 16 | | | $ | (20 | ) | | $ | — | | | $ | 2 | | | $ | 5 | | | $ | 6 | |
| | | | | | | | | | | | | | | | | | | | | | | | | | |
The carrying amounts of the assets of Elcho and Skawina as of December 31, 2005 and 2004 are summarized in the following table:
| | | | As of
December 31,
2005
| | As of
December 31,
2004
|
| | | | Elcho
| | Skawina
| | Elcho
| | Skawina
|
| | | | (Millions) |
| | Current Assets | | $ | 41 | | | $ | 27 | | | $ | 47 | | | $ | 26 | |
| | Noncurrent Assets | | | 319 | | | | 111 | | | | 335 | | | | 116 | |
| | | | |
| | | |
| | | |
| | | |
| |
| | Total Assets of Discontinued Operations | | $ | 360 | | | $ | 138 | | | $ | 382 | | | $ | 142 | |
| | Current Liabilities | | $ | 27 | | | $ | 24 | | | $ | 44 | | | $ | 21 | |
| | Noncurrent Liabilities | | | 336 | | | | 49 | | | | 353 | | | | 45 | |
| | | | |
| | | |
| | | |
| | | |
| |
| | Total Liabilities of Discontinued Operations | | $ | 363 | | | $ | 73 | | | $ | 397 | | | $ | 66 | |
| | | | |
| | | |
| | | |
| | | |
| |
| | | | | | | | | | | | | | | | | | |
Elcho's and Skawina's current and noncurrent non-recourse debt amounted to $287 million and $26 million as of December 31, 2005, respectively and $305 million and $17 million as of December 31, 2004, respectively.
Carthage Power Company (CPC)
In December 2003, Global entered into a definitive purchase and sale agreement related to the sale of its majority interest in CPC, which owns and operates a power plant located in Rades, Tunisia. In December 2003, Global also recognized an estimated loss on disposal of $23 million for the initial write-down of its carrying amount of CPC to its fair value less cost to sell. During the first quarter of 2004, Energy Holdings re-evaluated the carrying value of CPC's assets and liabilities and determined that an additional write-down to fair value of $2 million was required, which offset CPC's Net Income for the quarter ended March 31, 2004. In May 2004, Global completed the sale of CPC for approximately $43 million in cash and recognized a gain on disposal of $5 million.
The operating results of CPC for the years ended December 31, 2004 and 2003 are summarized below:
131
NOTES TO CONSOLIDATED FINANCIAL STATEMENTS
| | | | Years Ended
December 31,
|
| | | | 2004
| | 2003
|
| | | | (Millions) |
| | Operating Revenues | | $ | 38 | | | $ | 95 | |
| | Pre-Tax Income (Loss) | | $ | 2 | | | $ | (8 | ) |
| | Net Income (Loss) | | $ | 2 | | | $ | (1 | ) |
| | | | | | | | | | |
Energy Technologies
In June 2002, Energy Holdings adopted a plan to sell Energy Technologies, its heating, ventilating and air conditioning (HVAC)/mechanical operating companies. The HVAC/mechanical operating companies met the criteria for classification as components of Discontinued Operations. Energy Holdings reduced the carrying value of the Energy Technologies' assets and liabilities to their fair value less costs to sell, and recorded a loss on disposal for the year ended December 31, 2002 of $20 million, net of $11 million tax benefit. During the first quarter of 2003, Energy Holdings re-evaluated the carrying value of Energy Technologies' assets and liabilities and determined that an additional write-down to fair value of $9 million, net of a $3 million tax benefit, was required. The sale of the HVAC/mechanical operating companies and Energy Technologies was complete as of September 30, 2003.
The revenues and results of operations of Energy Technologies for the period ended December 31, 2003 are displayed below:
| | | | Year Ended
December 31, 2003
|
| | | | (Millions) |
| | Operating Revenues | | $ | 68 | |
| | Pre-Tax Loss | | $ | (18 | ) |
| | Net Loss | | $ | (11 | ) |
| | | | | | |
Dispositions
Energy Holdings
Solar Electric Generating Systems (SEGS) Projects
In January 2005, Resources and Global sold their minority limited partner interests in three SEGS projects for proceeds of approximately $7 million resulting in an after-tax gain of $4 million.
Global
Dhofar Power Company S.A.O.C. (Dhofar Power)
In April 2005, Global sold a 35% interest in Dhofar Power through a public offering on the Omani stock exchange as required under the Concession Agreement, reducing Global's ownership in Dhofar Power from 81% to 46%. Net proceeds from the sale approximated $25 million, resulting in an after tax gain of approximately $1 million. As a result, Global's investment in Dhofar Power has been accounted for under the equity method following the sale.
Meiya Power Company Limited (MPC)
In December 2004, Global closed on the sale of its 50% equity interest in MPC to BTU Power Company for approximately $236 million, of which $100 million was paid in cash. The balance of approximately $136 million was provided in the form of a secured promissory note due on March 31, 2005, which was later amended to extend the maturity date to April 2005 and increase the amount due. The sale resulted in an after-tax gain of approximately $2 million, which was recorded in the fourth quarter of 2004. Global received payments of $38 million and $99 million in January 2005 and April 2005, respectively, representing the full payment of the outstanding receivable.
132
NOTES TO CONSOLIDATED FINANCIAL STATEMENTS
Luz del Sur S.A.A. (LDS)
In April 2004, Global sold a portion of its indirect ownership in LDS in the Lima stock exchange, reducing its ownership from 44% to 38% and received gross proceeds of approximately $31 million. Global realized an after-tax gain of approximately $5 million in the second quarter of 2004 related to the LDS sale which is recorded in Income from Equity Method Investments on the Consolidated Statements of Operations.
GWF Energy LLC (GWF Energy)
Prior to the fourth quarter of 2002, GWF Energy was accounted for under the equity method of accounting. Pursuant to the operating agreement, a member is required to have at least 75% interest to have control. During the fourth quarter of 2002, Global increased its member interest in GWF Energy to 76%, therefore acquiring control pursuant to the operating agreement. Due to this change, Global's investment in GWF Energy was consolidated on the Consolidated Financial Statements as of December 31, 2002 and for the three months ended December 31, 2002 and for each quarterly period thereafter through September 30, 2003. Global's investment in GWF Energy decreased to 74.9% during the fourth quarter of 2003 and accordingly, GWF Energy was deconsolidated and recorded under the equity method of accounting as of December 31, 2003. In February 2004, Harbinger GWF LLC (Harbinger) repurchased a 14.9% ownership interest from Global for approximately $14 million, resulting in a 60% ownership interest in GWF Energy as of December 31, 2004.
Resources
On December 28, 2005, Resources sold its interest in the Seminole Generation Station Unit 2 (Seminole) in Palatka, Florida, to Seminole Electric Cooperative Inc. for $286 million. Seminole is a 659 MW coal-fired facility. It is one of two units at the Seminole plant. The sale resulted in a $43 million after-tax gain. Net proceeds of $235 million, together with other funds, were used to redeem Holdings' $309 million outstanding 7.75% Senior Notes due in 2007.
Resources was the equity investor in a Boeing B767 leased to United Airlines (UAL). In December 2002, UAL filed for Chapter 11 bankruptcy protection. On June 13, 2005, Resources received a notice from the Trustee under the UAL lease that the lenders had terminated the lease and repossessed the aircraft. Upon receipt of this notice, Resources recorded a $15 million charge, after-tax, in June 2005 to eliminate its carrying value of this investment since management believes that there will be insufficient proceeds to recover any of the recorded amount of the investment due to the termination.
In January 2005, a KKR Fund, in which Resources had invested, sold its investment in KinderCare Learning Centers, Inc. and Resources received proceeds of approximately $17 million resulting in an after-tax gain of approximately $1 million.
In March 2004, Resources entered into an agreement with Midwest Generation LLC, an indirect subsidiary of Edison Mission Energy, to terminate its lease investment in the Collins generating facility in Illinois. In March 2004, Resources recorded a $17 million pre-tax charge to reduce its carrying value of the Collins lease. In April 2004, Resources closed on the termination of the lease agreement and received gross proceeds of approximately $184 million. The actual loss on the termination of the lease was $11 million, after-tax. As a result of the sale, Resources paid approximately $100 million in taxes.
In January 2004, Resources terminated two lease transactions with Qantas Airways and China Eastern Airlines Co., Ltd resulting from the lessees exercising their respective purchase options. Resources received aggregate gross cash proceeds of approximately $45 million and recorded an after-tax gain of $4 million. As a result of the sale, Resources paid approximately $36 million in taxes.
In November 2003, Resources sold its interest in Chelsea Historic Properties. Resources received net cash proceeds of $9 million and recorded an after-tax gain of approximately $4 million. As a result of the sale of this lease, Resources paid income taxes of approximately $3 million.
133
NOTES TO CONSOLIDATED FINANCIAL STATEMENTS
Acquisitions
Energy Holdings
Texas Independent Energy, L.P. (TIE)
In 2004, Global acquired all of TECO Energy, Inc.'s 50% equity interest in TIE for less than $1 million. With this purchase, Global owns 100% of TIE and consolidated this investment beginning in the third quarter of 2004.
The unaudited pro forma consolidated results of operations of Energy Holdings for 2004 and 2003 have been prepared as if the acquisition of TIE had occurred on January 1, 2003:
| | | | Actual
| | Pro Forma
|
| | | | For the
Year Ended December 31,
| | For the
Years Ended
December 31,
|
| | | | 2005
| | 2004
| | 2003
|
| | | | (Millions) | | (Millions) |
| | Operating Revenues | | $ | 1,302 | | | $ | 1,287 | | | $ | 1,178 | |
| | Income Before Discontinued Operations and Cumulative Effect of a Change in Accounting Principle | | $ | 199 | | | $ | 137 | | | $ | 177 | |
| | Net Income | | $ | 217 | | | $ | 142 | | | $ | 133 | |
| | | | | | | | | | | | | | |
The pro forma information is presented for informational purposes only and is not necessarily indicative of the results of operations that actually would have been achieved had the acquisition been consummated as of that time, nor is it intended to be a projection of future results.
Note 5. Regulatory Matters
Regulatory Assets and Liabilities
PSE&G
PSE&G prepares its financial statements in accordance with the provisions of SFAS 71. A regulated utility is required to defer the recognition of costs (a regulatory asset) or the recognition of obligations (a regulatory liability) if it is probable that, through the rate-making process, there will be a corresponding increase or decrease in future rates. Accordingly, PSE&G has deferred certain costs, which will be amortized over various future periods. These costs are deferred based on rate orders issued by the BPU or FERC or PSE&G's experience with prior rate cases. As of December 31, 2005 and 2004, approximately 89% and 91%, respectively, of PSE&G's regulatory assets were deferred based on written rate orders. Regulatory assets recorded on a basis other than by an issued rate order have less certainty of recovery since they can be disallowed in the future by regulatory authorities. PSE&G believes that all of its regulatory assets are probable of recovery. To the extent that collection of any regulatory assets or payments of regulatory liabilities is no longer probable, the amounts would be charged or credited to income.
134
NOTES TO CONSOLIDATED FINANCIAL STATEMENTS
PSE&G had the following regulatory assets and liabilities on the Consolidated Balance Sheets:
| | | As of
December 31,
| | |
| | | 2005
| | 2004
| | Recovery/Refund Period
|
| | | (Millions) | | |
Regulatory Assets | | | | | | | | | | |
Securitized Stranded Costs | | $ | 3,333 | | | $ | 3,427 | | | Through December 2015(1)(2) |
Deferred Income Taxes | | | 398 | | | | 366 | | | Various |
OPEB-Related Costs | | | 135 | | | | 154 | | | Through December 2012(2) |
Societal Benefits Charges (SBC) | | | 476 | | | | 430 | | | To be determined (1)(2) |
Manufactured Gas Plant (MGP) Remediation Costs | | | 409 | | | | 356 | | | Various(2) |
Unamortized Loss on Reacquired Debt | | | 91 | | | | 97 | | | Over remaining debt life(1) |
Non-Utility Transition Charge (NTC) | | | — | | | | 102 | | | Through December 2005(1)(2) |
Unrealized Losses on Interest Rate Swap | | | 11 | | | | 34 | | | Through December 2015(2) |
Repair Allowance | | | 69 | | | | 76 | | | Through August 2013(1)(2) |
Decontamination and Decommissioning Costs | | | 6 | | | | 11 | | | Through December 2007(2) |
Asbestos Abatement Costs | | | 10 | | | | 11 | | | Through 2020(2) |
Plant and Regulatory Study Costs | | | 19 | | | | 21 | | | Through December 2021(2) |
Regulatory Restructuring Costs | | | 35 | | | | 38 | | | Through August 2013(1)(2) |
Conditional Asset Retirement Obligation | | | 55 | | | | — | | | Various |
Other | | | 6 | | | | 4 | | | Various |
| | | |
| | | |
| | | |
Total Regulatory Assets | | $ | 5,053 | | | $ | 5,127 | | | |
| | | |
| | | |
| | | |
Regulatory Liabilities | | | | | | | | | | |
Cost of Removal | | $ | 345 | | | $ | 418 | | | Various |
Excess Depreciation Reserve | | | — | | | | 60 | | | Through December 2005(2) |
Overrecovered Gas Costs | | | 9 | | | | 17 | | | Through September 2006(1)(2) |
NTC | | | 174 | | | | — | | | To be determined(1)(2) |
Residential Gas Hedge | | | 152 | | | | 25 | | | Various(1) |
Other | | | 40 | | | | 25 | | | Various(1) |
| | | |
| | | |
| | | |
Total Regulatory Liabilities | | $ | 720 | | | $ | 545 | | | |
| | | |
| | | |
| | | |
| | | | | | | | | | |
| | | |
| (1) | | Recovered/Refunded with interest. |
| | | |
| (2) | | Recoverable/Refundable per specific rate order. |
All regulatory assets and liabilities are excluded from PSE&G's rate base unless otherwise noted. The descriptions below define certain regulatory items.
Securitized Stranded Costs: This reflects deferred costs, which are being recovered through the securitization transition charge authorized by the BPU. Funds collected through the securitization transition charge are remitted to Transition Funding and Transition Funding II and are used for interest and principal payments on the transition bonds and related costs and taxes.
Deferred Income Taxes: This amount represents the portion of deferred income taxes that will be recovered through future rates, based upon established regulatory practices, which permit the recovery of current taxes. Accordingly, this regulatory asset is offset by a deferred tax liability and is expected to be recovered, without interest, over the period the underlying book-tax timing differences reverse and become current taxes.
OPEB-Related Costs: Includes costs associated with the adoption of SFAS No. 106 “Employers' Accounting for Benefits Other Than Pensions” which were deferred in accordance with EITF Issue No. 92-12, “Accounting for OPEB Costs by Rate Regulated Enterprises.”
SBC: The SBC, as authorized by the BPU and the New Jersey Electric Discount and Energy Competition Act (EDECA), includes costs related to PSE&G's electric and gas business as follows: 1) the universal service fund; 2) Demand Side Management (DSM) programs; 3) social programs which include bad debt expense;
135
NOTES TO CONSOLIDATED FINANCIAL STATEMENTS
4) consumer education; 5) the New Jersey Clean Energy Program costs payable in 2006 through 2008, recorded at discounted present value; and 6) the Remediation Adjustment Clause for incurred MGP remediation expenditures. All components except for Clean Energy accrue interest.
MGP Remediation Costs: Represents the low end of the range for the remaining environmental investigation and remediation program costs that are probable of recovery in future rates.
Unamortized Loss on Reacquired Debt: Represents losses on reacquired long-term debt, which are recovered through rates over the remaining life of the debt or the life of the refinanced debt.
NTC: This clause was established by the EDECA to account for above market costs related to Non-Utility Generation (NUG) contracts, as approved by the BPU. Costs or benefits associated with the restructuring of these contracts are deferred. This clause also includes Basic Generation Service (BGS) costs in excess of current rates, as approved by the BPU.
Unrealized Losses on Interest Rate Swap: This represents the costs related to Transition Funding's interest rate swap that are being recovered without interest over the life of Transition Funding's transition bonds. This asset is offset by a derivative liability on the balance sheet.
Repair Allowance: This represents tax, interest and carrying charges relating to disallowed tax deductions for repair allowance as authorized by the BPU with recovery over 10 years effective August 1, 2003.
Decontamination and Decommissioning Costs: These costs are related to PSE&G's portion of the obligation for nuclear decontamination and decommissioning costs of U.S. Department of Energy nuclear sites prior to the generation asset transfer to Power in 2000.
Asbestos Abatement Costs: Represents costs incurred to remove and dispose of asbestos insulation at PSE&G's fossil generating stations. Per a BPU order dated December 9, 1992, these costs are treated as Cost of Removal for ratemaking purposes.
Plant and Regulatory Study Costs: These are costs incurred by PSE&G and required by the BPU which are related to current and future operations, including safety, planning, management and construction.
Regulatory Restructuring Costs: These are costs related to the restructuring of the energy industry in New Jersey through EDECA and include such items as the system design work necessary to transition PSE&G to a transmission and distribution only company, as well as costs incurred to transfer and establish the generation function as a separate corporate entity with recovery over 10 years beginning August 1, 2003.
Conditional Asset Retirement Obligation: These costs represent the differences between rate regulated cost of removal accounting and asset retirement accounting under GAAP. These costs will be recovered in future rates.
Other Regulatory Assets: This includes deferred consolidated billing start-up and deferred Energy Information Control Network program costs.
Cost of Removal: PSE&G accrues and collects for Cost of Removal in rates. Pursuant to the adoption of SFAS 143, the liability for Cost of Removal was reclassified as a regulatory liability. This liability is reduced as removal costs are incurred. Cost of removal is a reduction to the rate base.
Excess Depreciation Reserve: As required by the BPU in 1999, PSE&G reduced its depreciation reserve for its electric distribution assets and recorded such amount as a regulatory liability. The original liability was fully amortized in July 2003. In June 2003, PSE&G recorded an additional $155 million liability as a result of the BPU order in PSE&G's Electric Base Rate Case. This $155 million was being amortized from August 1, 2003 through December 31, 2005. As of December 31, 2005, approximately $10 million of outstanding reserve was reclassed to NTC.
Overrecovered Gas Costs: Represents PSE&G's gas costs in excess of the amount included in rates and probable of refund in the future.
Residential Gas Hedge: This represents the fair value of gas contracts needed to fulfill expected residential gas customer requirements.
Other Regulatory Liabilities: This includes the following: 1) a retail adder included in the BGS charges beginning on August 1, 2003. The BPU will determine the disposition of this amount in a future proceeding; 2) Gas Margin Adjustment Cost to be returned to customers in the future; and 3) amounts collected from customers in order for Transition Funding to obtain a AAA rating on its transition bonds.
136
NOTES TO CONSOLIDATED FINANCIAL STATEMENTS
Extraordinary Item
PSE&G
In May 2002, PSE&G filed an Electric Base Rate Case with the BPU requesting an annual $250 million increase for its electric distribution business. In July 2003, PSE&G received an oral decision from the BPU approving a proposed settlement with certain modifications. The related Final Order was received on April 22, 2004. As a result of the oral decision and subsequent summary written order, in the second quarter of 2003, PSE&G recorded certain adjustments in connection with the resolution of various issues relating to the Final Order PSE&G received from the BPU in 1999 relating to PSE&G's rate unbundling, stranded costs and restructuring proceedings. These amounts included a $30 million pre-tax refund to customers related to revenues previously collected in rates for nuclear decommissioning. Because this amount reflected the final accounting for PSEG's generation-related business pursuant to the four-year transition plan mandated by the Final Order, the adjustment was recorded as an $18 million, after-tax, Extraordinary Item as required under APB Opinion No. 30, “Reporting the Results of Operations—Reporting the Effects of Disposal of a Segment of a Business, and Extraordinary, Unusual and Infrequently Occurring Events and Transactions” (APB 30) and SFAS No. 101, “Regulated Enterprises—Accounting for the Discontinuation of Application of FASB Statement No. 71.”
Note 6. Earnings Per Share (EPS)
PSEG
Diluted EPS is calculated by dividing Net Income by the weighted average number of shares of common stock outstanding, including shares issuable upon exercise of stock options outstanding under PSEG's stock option plans, upon payment of performance units and upon conversion of Participating Units. The following table shows the effect of these stock options, performance units and Participating Units on the weighted average number of shares outstanding used in calculating diluted EPS:
| | | Years Ended December 31,
|
| | | 2005
| | 2004
| | 2003
|
| | | Basic
| | Diluted
| | Basic
| | Diluted
| | Basic
| | Diluted
|
EPS Numerator: | | | | | | | | | | | | | | | | | | | | | | | | |
Earnings (Millions) | | | | | | | | | | | | | | | | | | | | | | | | |
Continuing Operations | | $ | 858 | | | $ | 858 | | | $ | 770 | | | $ | 770 | | | $ | 855 | | | $ | 855 | |
Discontinued Operations | | | (180 | ) | | | (180 | ) | | | (44 | ) | | | (44 | ) | | | (47 | ) | | | (47 | ) |
Extraordinary Item | | | — | | | | — | | | | — | | | | — | | | | (18 | ) | | | (18 | ) |
Cumulative Effect of a Change in Accounting Principle | | | (17 | ) | | | (17 | ) | | | — | | | | — | | | | 370 | | | | 370 | |
| | | |
| | | |
| | | |
| | | |
| | | |
| | | |
| |
Net Income | | $ | 661 | | | $ | 661 | | | $ | 726 | | | $ | 726 | | | $ | 1,160 | | | $ | 1,160 | |
| | | |
| | | |
| | | |
| | | |
| | | |
| | | |
| |
EPS Denominator (Thousands): | | | | | | | | | | | | | | | | | | | | | | | | |
Weighted Average Common Shares Outstanding | | | 240,297 | | | | 240,297 | | | | 236,984 | | | | 236,984 | | | | 228,222 | | | | 228,222 | |
Effect of Stock Options | | | — | | | | 971 | | | | — | | | | 464 | | | | — | | | | 602 | |
Effect of Stock Performance Units | | | — | | | | 87 | | | | — | | | | 36 | | | | — | | | | — | |
Effect of Participating Units | | | — | | | | 3,051 | | | | — | | | | 802 | | | | — | | | | — | |
| | | |
| | | |
| | | |
| | | |
| | | |
| | | |
| |
Total Shares | | | 240,297 | | | | 244,406 | | | | 236,984 | | | | 238,286 | | | | 228,222 | | | | 228,824 | |
| | | |
| | | |
| | | |
| | | |
| | | |
| | | |
| |
EPS: | | | | | | | | | | | | | | | | | | | | | | | | |
Continuing Operations | | $ | 3.57 | | | $ | 3.51 | | | $ | 3.25 | | | $ | 3.23 | | | | 3.75 | | | $ | 3.74 | |
Discontinued Operations | | | (0.75 | ) | | | (0.73 | ) | | | (0.19 | ) | | | (0.18 | ) | | | (0.21 | ) | | | (0.21 | ) |
Extraordinary Item | | | — | | | | — | | | | — | | | | — | | | | (0.08 | ) | | | (0.08 | ) |
Cumulative Effect of a Change in Accounting Principle | | | (0.07 | ) | | | (0.07 | ) | | | — | | | | — | | | | 1.62 | | | | 1.62 | |
| | | |
| | | |
| | | |
| | | |
| | | |
| | | |
| |
Net Income | | $ | 2.75 | | | $ | 2.71 | | | $ | 3.06 | | | $ | 3.05 | | | $ | 5.08 | | | $ | 5.07 | |
| | | |
| | | |
| | | |
| | | |
| | | |
| | | |
| |
| | | | | | | | | | | | | | | | | | | | | | | | |
137
NOTES TO CONSOLIDATED FINANCIAL STATEMENTS
There were approximately 2.9 million and 5.3 million stock options excluded from the weighted average common shares calculation used for diluted EPS due to their antidilutive effect for the years ended December 31, 2004 and 2003, respectively. There were approximately 9.2 million Participating Units excluded from the weighted average common shares calculation used for diluted EPS due to their antidilutive effect for the year ended December 31, 2003. No stock options or Participating Units had an antidilutive effect for the year ended December 31, 2005.
Dividend payments on common stock for the year ended December 31, 2005 were $2.24 per share and totaled approximately $541 million. Dividend payments on common stock for the year ended December 31, 2004 were $2.20 per share and totaled approximately $522 million. Dividend payments on common stock for the year ended December 31, 2003 were $2.16 per share and totaled approximately $493 million.
Note 7. Goodwill and Other Intangibles
PSEG, Power and Energy Holdings
PSEG, Power and Energy Holdings conducted an annual review for goodwill impairment as of November 30, 2005 and concluded that goodwill was not impaired. There were no events that occurred subsequent to November 30, 2005 that required a further review of goodwill for impairment.
Power and Energy Holdings
As of December 31, 2005 and 2004, Power's and Energy Holdings' goodwill and pro-rata share of goodwill in equity method investments were as follows:
| | | | As of December 31,
|
| | | | 2005
| | 2004
|
| | | | (Millions) |
| | Consolidated Investments | | | | | | | | |
| | Energy Holdings—Global(A) | | | | | | | | |
| | Sociedad Austral de Electricidad S.A. (SAESA)(B) | | $ | 405 | | | $ | 373 | |
| | Electroandes | | | 133 | | | | 133 | |
| | | | |
| | | |
| |
| | Total Energy Holdings—Global | | | 538 | | | | 506 | |
| | Power—Bethlehem Energy Center | | | 16 | | | | 16 | |
| | | | |
| | | |
| |
| | Total PSEG Consolidated Goodwill | | | 554 | | | | 522 | |
| | | | |
| | | |
| |
| | Pro-Rata Share of Equity Method Investments | | | | | | | | |
| | Energy Holdings—Global | | | | | | | | |
| | Rio Grande Energia S.A. (RGE)(B) | | | 92 | | | | 81 | |
| | Chilquinta Energia S.A. (Chilquinta)(B) | | | 200 | | | | 178 | |
| | LDS | | | 55 | | | | 55 | |
| | Kalaeloa Partners L.P. (Kalaeloa) | | | 25 | | | | 25 | |
| | | | |
| | | |
| |
| | Pro-Rata Share of Equity Investment Goodwill | | | 372 | | | | 339 | |
| | | | |
| | | |
| |
| | Total PSEG Goodwill | | $ | 926 | | | $ | 861 | |
| | | | |
| | | |
| |
| | | | | | | | | | |
| | | |
| (A) | | Excludes goodwill of $8 million for the years ended December 31, 2005 and 2004 related to Global's investment in Elcho, which was reclassified as Discontinued Operations in December 2005. For additional information relating to the sale see Note 4. Discontinued Operations, Dispositions and Acquisitions. |
| | | |
| (B) | | Changes relate to changes in foreign exchange rates. |
PSEG, PSE&G, Power and Energy Holdings
In addition to goodwill, as of December 31, 2005 and 2004, PSEG, PSE&G, Power, Energy Holdings and Services had the following recorded intangible assets:
138
NOTES TO CONSOLIDATED FINANCIAL STATEMENTS
| | | PSE&G
| | Power
| | Energy
Holdings
| | Services
| | Consolidated
Total
|
| | | (Millions) |
As of December 31, 2005: | | | | | | | | | | | | | | | | | | | | |
Defined Benefit Pension Plan(A) | | $ | 2 | | | $ | 2 | | | $ | 2 | | | $ | 3 | | | $ | 9 | |
Emissions Allowances(B) | | | — | | | | 37 | | | | — | | | | — | | | | 37 | |
Transmission Credits(C) | | | — | | | | 8 | | | | — | | | | — | | | | 8 | |
| | | |
| | | |
| | | |
| | | |
| | | |
| |
Total Intangibles | | $ | 2 | | | $ | 47 | | | $ | 2 | | | $ | 3 | | | $ | 54 | |
| | | |
| | | |
| | | |
| | | |
| | | |
| |
As of December 31, 2004: | | | | | | | | | | | | | | | | | | | | |
Defined Benefit Pension Plan(A) | | $ | 2 | | | $ | 3 | | | $ | 3 | | | $ | 4 | | | $ | 12 | |
Emissions Allowances(B) | | | — | | | | 40 | | | | — | | | | — | | | | 40 | |
Various Access Rights(A) | | | — | | | | 40 | | | | — | | | | — | | | | 40 | |
Transmission Credits(C) | | | — | | | | 8 | | | | — | | | | — | | | | 8 | |
| | | |
| | | |
| | | |
| | | |
| | | |
| |
Total Intangibles | | $ | 2 | | | $ | 91 | | | $ | 3 | | | $ | 4 | | | $ | 100 | |
| | | |
| | | |
| | | |
| | | |
| | | |
| |
| | | | | | | | | | | | | | | | | | | | |
| | | |
| (A) | | Not subject to amortization. |
| | | |
| (B) | | Expensed when used or sold amounting to approximately $5 million, $7 million and $17 million for the years ended December 31, 2005, 2004 and 2003, respectively. |
| | | |
| (C) | | Amortized on a straight-line basis. |
Note 8. Long-Term Investments
PSEG, PSE&G, Power and Energy Holdings
PSEG, PSE&G, Power and Energy Holdings had the following Long-Term Investments as of December 31, 2005 and 2004:
| | | | As of December 31,
|
| | | | 2005
| | 2004
|
| | | | (Millions) |
| | Energy Holdings: | | | | | | | | |
| | Leveraged Leases | | $ | 2,720 | | | $ | 2,851 | |
| | Partnerships: | | | | | | | | |
| | General Partnerships | | | 15 | | | | 13 | |
| | Limited Partnerships | | | 189 | | | | 206 | |
| | | | |
| | | |
| |
| | Total Partnerships | | | 204 | | | | 219 | |
| | | | |
| | | |
| |
| | Corporate Joint Ventures | | | 976 | | | | 894 | |
| | Securities | | | — | | | | 3 | |
| | Other Investments(A) | | | 8 | | | | 15 | |
| | | | |
| | | |
| |
| | Total Long-Term Investments of Energy Holdings | | | 3,908 | | | | 3,982 | |
| | PSE&G(B) | | | 144 | | | | 138 | |
| | Power(C) | | | 5 | | | | 11 | |
| | Other Investments(D) | | | 20 | | | | 50 | |
| | | | |
| | | |
| |
| | Total Long-Term Investments | | $ | 4,077 | | | $ | 4,181 | |
| | | | |
| | | |
| |
| | | | | | | | | | |
| | | |
| (A) | | Primarily relates to DSM investments at Resources. |
| | | |
| (B) | | Primarily relates to life insurance and supplemental benefits of $136 million and $130 million as of December 31, 2005 and 2004, respectively. |
| | | |
| (C) | | Amounts represent sulfur dioxide (SO2) and nitrogen oxide (NOx) emission allowances held for trading purposes. |
| | | |
| (D) | | Amounts represent investments at PSEG (parent company), primarily related to investments in its Capital Trusts. |
139
NOTES TO CONSOLIDATED FINANCIAL STATEMENTS
Energy Holdings
Leveraged Leases
Energy Holdings' net investment, through Resources, in leveraged leases was comprised of the following elements:
| | | | As of December 31,
|
| | | | 2005
| | 2004
|
| | | | (Millions) |
| | Lease rents receivable (net of non-recourse debt) | | $ | 2,967 | | | $ | 3,094 | |
| | Estimated residual value of leased assets | | | 1,021 | | | | 1,278 | |
| | | | |
| | | |
| |
| | | | | 3,988 | | | | 4,372 | |
| | Unearned and deferred income | | | (1,268 | ) | | | (1,521 | ) |
| | | | |
| | | |
| |
| | Total investments in leveraged leases | | | 2,720 | | | | 2,851 | |
| | Deferred tax liabilities | | | (1,733 | ) | | | (1,623 | ) |
| | | | |
| | | |
| |
| | Net investment in leveraged leases | | $ | 987 | | | $ | 1,228 | |
| | | | |
| | | |
| |
| | | | | | | | | | |
Resources' pre-tax income and income tax effects related to investments in leveraged leases were as follows:
| | | | Years Ended
December 31,
|
| | | | 2005
| | 2004
| | 2003
|
| | | | (Millions) |
| | Pre-tax income of leveraged leases | | $ | 161 | | | $ | 153 | | | $ | 206 | |
| | | | |
| | | |
| | | |
| |
| | Income tax effect on pre-tax income of leveraged leases | | $ | 64 | | | $ | 12 | | | $ | 74 | |
| | Amortization of investment tax credits of leveraged leases | | $ | (1 | ) | | $ | (1 | ) | | $ | (1 | ) |
| | | | | | | | | | | | | | |
The $52 million increase in income tax effect on pre-tax income of leveraged leases in 2005 as compared to 2004, was primarily due to the sale of Resources' interest in Seminole in 2005 and additional benefits resulting from revisions to the revenue and tax calculations of certain of Resources' leveraged lease investments performed in the fourth quarter of 2005 resulting from changes in certain lease forecast assumptions pertaining to state income taxes. A change in a key assumption which effects the estimated total net income over the life of a leveraged lease requires a recalculation of the leveraged lease, from inception, using the revised information. Any change in the net investment in the leveraged leases is recognized as a gain or loss in the year the assumption is changed. For additional information regarding the sale of Seminole, see Note 4. Discontinued Operations, Dispositions and Acquisitions.
Of the $53 million decrease in pre-tax leveraged lease income in 2004 as compared to 2003, $31 million was due to a recalculation of the revenue and tax impacts of Resources' leveraged lease investments due to a change in the forecasted utilization of state tax benefits as described above. The remaining $22 million decrease in pre-tax leveraged lease income was primarily due to a realized loss and a reduction in leveraged lease income related to the termination of the Collins lease with Midwest Generation LLC in April 2004.
Partnership Investments and Corporate Joint Ventures
Energy Holdings' partnership investments of $204 million and $219 million as of December 31, 2005 and 2004, respectively, and corporate joint ventures of approximately $976 and $894 million as of December 31, 2005 and 2004, respectively, are those of Resources, Global and EGDC. The majority of these investments are accounted for under the equity method of accounting.
Resources also has limited partnership investments in a leveraged buyout fund and a collateralized bond obligation structure. Resources' total investment in limited partnerships was $15 million and $41 million as of December 31, 2005 and 2004, respectively.
The leveraged buyout fund mentioned above held one publicly-traded security as of December 31, 2005 which was valued at approximately $5 million.
140
NOTES TO CONSOLIDATED FINANCIAL STATEMENTS
Investments in and Advances to Affiliates
Investments in net assets of affiliated companies accounted for under the equity method of accounting by Global amounted to $1 billion as of December 31, 2005 and 2004. During the three years ended December 31, 2005, 2004 and 2003, the amount of dividends from these investments was $70 million, $89 million and $130 million, respectively. Global's share of income and cash flow distribution percentages ranged from 25% to 60% as of December 31, 2005. Interest is earned on loans made to various projects. Such loans earn interest that ranged from 6% to 12% during 2005.
As of December 31, 2005, Global's recorded investment in equity method subsidiaries was approximately $1 billion as compared to approximately $913 million of underlying equity in net assets of such investments. The difference primarily relates to an approximate $160 million investment in a foreign subsidiary which is classified as an equity investment on Global's financial statements and recorded as a loan on the equity method subsidiary. Investment classification is appropriate due to its long-term investment nature. The difference is also related to a $60 million Euro-denominated receivable from a foreign subsidiary included in Global's investment in equity method subsidiaries.
Global had the following equity method investments as of December 31, 2005:
| | Name
| | Location
| | %
Owned
|
| | Kalaeloa | | | HI | | | | 50 | % |
| | GWF | | | | | | | | |
| | Bay Area I | | | CA | | | | 50 | % |
| | Bay Area II | | | CA | | | | 50 | % |
| | Bay Area III | | | CA | | | | 50 | % |
| | Bay Area IV | | | CA | | | | 50 | % |
| | Bay Area V | | | CA | | | | 50 | % |
| | Hanford L.P. | | | CA | | | | 50 | % |
| | GWF Energy | | | | | | | | |
| | Hanford-Peaker Plant | | | CA | | | | 60 | % |
| | Henrietta-Peaker Plant | | | CA | | | | 60 | % |
| | Tracy-Peaker Plant | | | CA | | | | 60 | % |
| | Bridgewater | | | NH | | | | 40 | % |
| | Prisma 2000 S.p.A. (Prisma) | | | | | | | | |
| | Crotone | | | Italy | | | | 25 | % |
| | Bando D'Argenta I | | | Italy | | | | 50 | % |
| | Strongoli | | | Italy | | | | 25 | % |
| | Turboven | | | | | | | | |
| | Maracay | | | Venezuela | | | | 50 | % |
| | Cagua | | | Venezuela | | | | 50 | % |
| | RGE | | | Brazil | | | | 32 | % |
| | Chilquinta | | | Chile | | | | 50 | % |
| | LDS | | | Peru | | | | 38 | % |
| | Dhofar Power | | | Oman | | | | 46 | % |
| | | | | | | | | | |
141
NOTES TO CONSOLIDATED FINANCIAL STATEMENTS
Summarized results of operations and financial position of affiliates in which Global applied the equity method of accounting are presented below:
| | | Foreign
| | Domestic
| | Total
|
| | | (Millions) |
December 31, 2005 | | | | | | | | | | | | |
Statement of Operations Information | | | | | | | | | | | | |
Revenue | | $ | 1,521 | | | $ | 367 | | | $ | 1,888 | |
Gross Profit | | $ | 513 | | | $ | 133 | | | $ | 646 | |
Minority Interest | | $ | 14 | | | $ | — | | | $ | 14 | |
Net Income | | $ | 170 | | | $ | 78 | | | $ | 248 | |
Balance Sheet Information | | | | | | | | | | | | |
Assets: | | | | | | | | | | | | |
Current Assets | | $ | 533 | | | $ | 102 | | | $ | 635 | |
Property, Plant and Equipment | | | 1,904 | | | | 591 | | | | 2,495 | |
Goodwill | | | 785 | | | | 50 | | | | 835 | |
Other Noncurrent Assets | | | 359 | | | | 32 | | | | 391 | |
| | | |
| | | |
| | | |
| |
Total Assets | | $ | 3,581 | | | $ | 775 | | | $ | 4,356 | |
| | | |
| | | |
| | | |
| |
Liabilities: | | | | | | | | | | | | |
Current Liabilities | | $ | 498 | | | $ | 62 | | | $ | 560 | |
Debt* | | | 1,069 | | | | 245 | | | | 1,314 | |
Other Noncurrent Liabilities | | | 322 | | | | 51 | | | | 373 | |
Minority Interest | | | 60 | | | | — | | | | 60 | |
| | | |
| | | |
| | | |
| |
Total Liabilities | | | 1,949 | | | | 358 | | | | 2,307 | |
Equity | | | 1,632 | | | | 417 | | | | 2,049 | |
| | | |
| | | |
| | | |
| |
Total Liabilities and Equity | | $ | 3,581 | | | $ | 775 | | | $ | 4,356 | |
| | | |
| | | |
| | | |
| |
December 31, 2004 | | | | | | | | | | | | |
Statement of Operations Information | | | | | | | | | | | | |
Revenue | | $ | 1,397 | | | $ | 537 | | | $ | 1,934 | |
Gross Profit | | $ | 510 | | | $ | 130 | | | $ | 640 | |
Minority Interest | | $ | 7 | | | $ | — | | | $ | 7 | |
Net Income | | $ | 148 | | | $ | 46 | | | $ | 194 | |
Balance Sheet Information | | | | | | | | | | | | |
Assets: | | | | | | | | | | | | |
Current Assets | | $ | 419 | | | $ | 89 | | | $ | 508 | |
Property, Plant and Equipment | | | 1,612 | | | | 627 | | | | 2,239 | |
Goodwill | | | 716 | | | | 50 | | | | 766 | |
Other Noncurrent Assets | | | 240 | | | | 34 | | | | 274 | |
| | | |
| | | |
| | | |
| |
Total Assets | | $ | 2,987 | | | $ | 800 | | | $ | 3,787 | |
| | | |
| | | |
| | | |
| |
Liabilities: | | | | | | | | | | | | |
Current Liabilities | | $ | 374 | | | $ | 78 | | | $ | 452 | |
Debt* | | | 1,024 | | | | 293 | | | | 1,317 | |
Other Noncurrent Liabilities | | | . 188 | | | | 43 | | | | 231 | |
Minority Interest | | | 65 | | | | — | | | | 65 | |
| | | |
| | | |
| | | |
| |
Total Liabilities | | | 1,651 | | | | 414 | | | | 2,065 | |
Equity | | | 1,336 | | | | 386 | | | | 1,722 | |
| | | |
| | | |
| | | |
| |
Total Liabilities and Equity | | $ | 2,987 | | | $ | 800 | | | $ | 3,787 | |
| | | |
| | | |
| | | |
| |
December 31, 2003 | | | | | | | | | | | | |
Statement of Operations Information | | | | | | | | | | | | |
Revenue | | $ | 1,042 | | | $ | 747 | | | $ | 1,789 | |
Gross Profit | | $ | 415 | | | $ | 231 | | | $ | 646 | |
Minority Interest | | $ | (5 | ) | | $ | — | | | $ | (5 | ) |
Net Income | | $ | 138 | | | $ | 67 | | | $ | 205 | |
| | | | | | | | | | | | |
* Debt is non-recourse to PSEG, Energy Holdings and Global.
142
NOTES TO CONSOLIDATED FINANCIAL STATEMENTS
The differences in the results of operations and the financial position as of and for the year ended December 31, 2005, as compared to the same period in 2004, were due to: (1) the acquisition of all of TECO's interests in TIE, bringing Global's ownership interest to 100% and therefore consolidating the entity as of July 1, 2004; (2) the sale of Global's 50% equity interest in MPC in December 2004; (3) the change in accounting for Global's investment in PPN Power Generating Company Limited (PPN) from the equity method of accounting to the cost method in June 2004; and (4) Global's sale of a 35% interest in Dhofar Power through a public offering on the Omani Stock Exchange in April 2005, reducing its ownership interest to 46% and thus accounting for the investment under the equity method of accounting following the sale. See Note 4. Discontinued Operations, Dispositions and Acquisitions.
Global also has investments in certain companies in which it does not have the ability to exercise significant influence. Such investments are accounted for under the cost method. As of December 31, 2005 and 2004, the carrying value of these investments aggregated $39 million and $46 million, respectively. The decrease in 2005 as compared to 2004 was primarily due to dividends received from Global's investment in PPN which reduced Global's book investment in PPN.
Note 9. Schedule of Consolidated Capital Stock and Other Securities
PSEG and PSE&G
| | | | | | | | | | | Book Value
As of
December 31,
|
| | | Outstanding
Shares
As of
December 31,
2005
| | Current
Redemption
Price
Per Share
| | 2005
| | 2004
|
| | | | | | | | | | | (Millions) |
| | | | | | | | | | | | | | | | |
PSEG Common Stock (no par value)(A)(B) | | | | | | | | | | | | | | | | |
Authorized 500,000,000 shares; (outstanding as of
December 31, 2004, 238,099,067 shares) | | | 251,163,186 | | | | | | | $ | 4,086 | | | $ | 3,591 | |
| | | | | | | | | | |
| | | |
| |
PSE&G Cumulative Preferred Stock(C) without
Mandatory Redemption(D) $100 par value series | | | | | | | | | | | | | | | | |
4.08% | | | 146,221 | | | $ | 103.00 | | | $ | 15 | | | $ | 15 | |
4.18% | | | 116,958 | | | $ | 103.00 | | | | 12 | | | | 12 | |
4.30% | | | 149,478 | | | $ | 102.75 | | | | 15 | | | | 15 | |
5.05% | | | 104,002 | | | $ | 103.00 | | | | 10 | | | | 10 | |
5.28% | | | 117,864 | | | $ | 103.00 | | | | 12 | | | | 12 | |
6.92% | | | 160,711 | | | | — | | | | 16 | | | | 16 | |
| | |
| | | | | | | |
| | | |
| |
Total Preferred Stock without Mandatory Redemption | | | 795,234 | | | | | | | $ | 80 | | | $ | 80 | |
| | |
| | | | | | | |
| | | |
| |
| | | | | | | | | | | | | | | | |
| | | |
| (A) | | On November 16, 2005, PSEG issued approximately 11.4 million shares of its common stock for proceeds of approximately $460 million under the stock purchase obligation provision of the Participating Units issued by PSEG Funding Trust I in September, 2002. See Note 10. Schedule of Consolidated Debt. |
| | | |
| (B) | | In October 2003, PSEG issued approximately 8.8 million shares of its common stock for $356 million. For the years ended December 31, 2005, 2004 and 2003, PSEG issued approximately 1.2 million, 1.9 million and 2.1 million shares, respectively, for approximately $72 million, $83 million and $85 million, respectively, under the Dividend Reinvestment and Stock Purchase Plan (DRASPP) and the Employee Stock Purchase Plan (ESPP). Total authorized and unissued shares of common stock available for issuance through PSEG's DRASPP, ESPP and various employee benefit plans amounted to approximately 5.0 million shares as of December 31, 2005. |
| | | |
| (C) | | As of December 31, 2005, there was an aggregate of approximately 6.7 million shares of $100 par value and 10 million shares of $25 par value Cumulative Preferred Stock, which were authorized and unissued and which, upon issuance, may or may not provide for mandatory sinking fund redemption. If dividends upon any shares of Preferred Stock are in arrears for four consecutive quarters, holders receive voting rights for the election of a majority of PSE&G's Board of Directors and continue until all accumulated and unpaid dividends thereon have been paid, whereupon all such voting rights cease. There are no arrearages in cumulative preferred stock and hence currently no voting rights for preferred shares. No |
143
NOTES TO CONSOLIDATED FINANCIAL STATEMENTS
| | | preferred stock agreement contains any liquidation preferences in excess of par values or any “deemed” liquidation events. |
| | | |
| (D) | | As of December 31, 2005 and 2004, the annual dividend requirement and the embedded dividend rate for PSE&G's Preferred Stock without mandatory redemption was approximately $4 million and 5.03%, respectively, for each year. |
Fair Value of Preferred Securities
The estimated fair value of PSE&G's Cumulative Preferred Stock was $68 million and $73 million as of December 31, 2005 and 2004, respectively. The estimated fair value was determined using market quotations.
Note 10. Schedule of Consolidated Debt
Long-Term Debt
| | | | | As of December 31,
|
| | | Maturity
| | 2005
| | 2004
|
| | | | | (Millions) |
PSEG | | | | | | | | | | |
Senior Note—6.89% | | 2005–2009 | | $ | 196 | | | $ | 245 | |
Senior Note—Libor +.375%(D) | | 2008 | | | 375 | | | | — | |
Senior Note—4.66% | | 2009 | | | 200 | | | | 200 | |
Debt Supporting Trust Preferred Securities(A) | | 2007–2047 | | | 814 | | | | 1,201 | |
Other(B) | | | | | (4 | ) | | | 8 | |
| | | | |
| | | |
| |
Principal Amount Outstanding | | | | | 1,581 | | | | 1,654 | |
Amounts Due Within One Year(C) | | | | | (203 | ) | | | (49 | ) |
| | | | |
| | | |
| |
Total Long-Term Debt of PSEG (Parent) | | | | $ | 1,378 | | | $ | 1,605 | |
| | | | |
| | | |
| |
PSE&G | | | | | | | | | | |
First and Refunding Mortgage Bonds: | | | | | | | | | | |
9.125%(F) | | 2005 | | $ | — | | | $ | 125 | |
6.75% | | 2006 | | | 147 | | | | 147 | |
LIBOR plus 0.125%(H) | | 2006 | | | 175 | | | | 175 | |
6.25% | | 2007 | | | 113 | | | | 113 | |
6.75% | | 2016 | | | 171 | | | | 171 | |
6.45% | | 2019 | | | 5 | | | | 5 | |
9.25% | | 2021 | | | 134 | | | | 134 | |
6.38% | | 2023 | | | 157 | | | | 157 | |
5.20% | | 2025 | | | 23 | | | | 23 | |
3.25% Auction Rate(I) | | 2028 | | | 64 | | | | 64 | |
3.15% Auction Rate(I) | | 2029 | | | 93 | | | | 93 | |
3.10% Auction Rate(I) | | 2030 | | | 88 | | | | 88 | |
3.15% Auction Rate(I) | | 2031 | | | 104 | | | | 104 | |
5.45% | | 2032 | | | 50 | | | | 50 | |
6.40% | | 2032 | | | 100 | | | | 100 | |
3.25% Auction Rate(I) | | 2033 | | | 50 | | | | 50 | |
3.10% Auction Rate(I) | | 2033 | | | 50 | | | | 50 | |
3.20% Auction Rate(I) | | 2033 | | | 45 | | | | 45 | |
8.00% | | 2037 | | | 7 | | | | 7 | |
5.00% | | 2037 | | | 8 | | | | 8 | |
| | | | | | | | | | |
144
NOTES TO CONSOLIDATED FINANCIAL STATEMENTS
| | | | | As of December 31,
|
| | | Maturity
| | 2005
| | 2004
|
| | | | | (Millions) |
Medium-Term Notes: | | | | | | | | | | |
4.00% | | 2008 | | | 250 | | | | 250 | |
8.16% | | 2009 | | | 16 | | | | 16 | |
8.10% | | 2009 | | | 44 | | | | 44 | |
5.125% | | 2012 | | | 300 | | | | 300 | |
5.00% | | 2013 | | | 150 | | | | 150 | |
5.375% | | 2013 | | | 300 | | | | 300 | |
5.00% | | 2014 | | | 250 | | | | 250 | |
7.04% | | 2020 | | | 9 | | | | 9 | |
7.18% | | 2023 | | | 5 | | | | 5 | |
7.15% | | 2023 | | | 34 | | | | 34 | |
5.25%(F) | �� | 2035 | | | 250 | | | | — | |
| | | | |
| | | |
| |
Principal Amount Outstanding | | | | | 3,192 | | | | 3,067 | |
Amounts Due Within One Year(C) | | | | | (322 | ) | | | (125 | ) |
Net Unamortized Discount | | | | | (4 | ) | | | (4 | ) |
| | | | |
| | | |
| |
Total Long-Term Debt of PSE&G (Parent) | | | | $ | 2,866 | | | $ | 2,938 | |
| | | | |
| | | |
| |
Transition Funding (PSE&G) | | | | | | | | | | |
Securitization Bonds: | | | | | | | | | | |
5.74%(G) | | 2007 | | $ | — | | | $ | 34 | |
5.98%(G) | | 2008 | | | 71 | | | | 183 | |
6.29% | | 2011 | | | 496 | | | | 496 | |
6.45% | | 2013 | | | 328 | | | | 328 | |
6.61% | | 2015 | | | 454 | | | | 454 | |
6.75% | | 2016 | | | 220 | | | | 220 | |
6.89% | | 2017 | | | 370 | | | | 370 | |
| | | | |
| | | |
| |
Principal Amount Outstanding | | | | | 1,939 | | | | 2,085 | |
Amounts Due Within One Year(C) | | | | | (155 | ) | | | (146 | ) |
| | | | |
| | | |
| |
Total Securitization Debt of Transition Funding | | | | $ | 1,784 | | | $ | 1,939 | |
| | | | |
| | | |
| |
Transition Funding II (PSE&G) | | | | | | | | | | |
Securitization Bonds(E): | | | | | | | | | | |
4.18% | | 2006–2008 | | $ | 25 | | | $ | — | |
4.34% | | 2008–2012 | | | 35 | | | | — | |
4.49% | | 2013 | | | 20 | | | | — | |
4.57% | | 2015 | | | 23 | | | | — | |
| | | | |
| | | |
| |
Principal Amount Outstanding | | | | | 103 | | | | — | |
Amounts Due Within One Year(C) | | | | | (8 | ) | | | — | |
| | | | |
| | | |
| |
Total Securitization Debt of Transition Funding II | | | | $ | 95 | | | $ | — | |
| | | | |
| | | |
| |
Total Long-Term Debt of PSE&G | | | | $ | 4,745 | | | $ | 4,877 | |
| | | | |
| | | |
| |
| | | | | | | | | | |
145
NOTES TO CONSOLIDATED FINANCIAL STATEMENTS
| | | | | As of December 31,
|
| | | Maturity
| | 2005
| | 2004
|
| | | | | (Millions) |
Power | | | | | | | | | | |
Senior Notes: | | | | | | | | | | |
6.875% | | 2006 | | $ | 500 | | | $ | 500 | |
3.75% | | 2009 | | | 250 | | | | 250 | |
7.75% | | 2011 | | | 800 | | | | 800 | |
6.95% | | 2012 | | | 600 | | | | 600 | |
5.00% | | 2014 | | | 250 | | | | 250 | |
5.50% | | 2015 | | | 300 | | | | 300 | |
8.625% | | 2031 | | | 500 | | | | 500 | |
| | | | |
| | | |
| |
Total Senior Notes | | | | $ | 3,200 | | | $ | 3,200 | |
Pollution Control Notes: | | | | | | | | | | |
5.00% | | 2012 | | $ | 66 | | | $ | 66 | |
5.50% | | 2020 | | | 14 | | | | 14 | |
5.85% | | 2027 | | | 19 | | | | 19 | |
5.75% | | 2031 | | | 25 | | | | 25 | |
| | | | |
| | | |
| |
Total Pollution Control Notes | | | | $ | 124 | | | $ | 124 | |
Amounts Due Within One Year(C) | | | | | (500 | ) | | | — | |
Net Unamortized Discount | | | | | (7 | ) | | | (8 | ) |
| | | | |
| | | |
| |
Total Long-Term Debt of Power | | | | $ | 2,817 | | | $ | 3,316 | |
| | | | |
| | | |
| |
Energy Holdings (Parent) | | | | | | | | | | |
Senior Notes: | | | | | | | | | | |
7.75% | | 2007 | | $ | 309 | | | $ | 309 | |
8.625% | | 2008 | | | 507 | | | | 507 | |
10.00% | | 2009 | | | 400 | | | | 400 | |
8.50% | | 2011 | | | 544 | | | | 544 | |
| | | | |
| | | |
| |
Principal Amount Outstanding | | | | | 1,760 | | | | 1,760 | |
Amounts Due Within One Year(C)(M) | | | | | (304 | ) | | | — | |
Net Unamortized Discount and Senior Note Rate Swap | | | | | (8 | ) | | | (4 | ) |
| | | | |
| | | |
| |
Total Long-Term Debt of Energy Holdings (Parent) | | | | $ | 1,448 | | | $ | 1,756 | |
| | | | |
| | | |
| |
Global (Energy Holdings) | | | | | | | | | | |
Non-Recourse Debt: | | | | | | | | | | |
Dhofar Power–6.27%(J) | | 2004–2018 | | $ | — | | | $ | 195 | |
SAESA–4.191% | | 2004–2029 | | | 192 | | | | 167 | |
TIE (Odessa)–Libor +1.75%(K) | | 2004–2007 | | | 210 | | | | 227 | |
TIE (Guadalupe)–Libor +1.75%–2.00%(L) | | 2004–2009 | | | 202 | | | | 207 | |
Electroandes–5.880%–6.438% | | 2005–2016 | | | 102 | | | | 103 | |
Chilquinta–5.58%–6.62% | | 2008–2011 | | | 162 | | | | 162 | |
| | | | |
| | | |
| |
Principal Amount Outstanding | | | | | 868 | | | | 1,061 | |
Amounts Due Within One Year(C) | | | | | (36 | ) | | | (52 | ) |
| | | | |
| | | |
| |
Total Long-Term Debt of Global | | | | $ | 832 | | | $ | 1,009 | |
| | | | |
| | | |
| |
Resources (Energy Holdings) | | | | | | | | | | |
8.00%–9.30%–Non-Recourse Bank Loan(N) | | 2004–2020 | | $ | 46 | | | $ | 31 | |
Amounts Due Within One Year(C) | | | | | (6 | ) | | | (2 | ) |
| | | | |
| | | |
| |
Total Long-Term Debt of Resources | | | | $ | 40 | | | $ | 29 | |
| | | | |
| | | |
| |
EGDC (Energy Holdings) | | | | | | | | | | |
8.27%–Non-Recourse Mortgage | | 2004–2013 | | $ | 21 | | | $ | 23 | |
Amounts Due Within One Year(C) | | | | | (2 | ) | | | (2 | ) |
| | | | |
| | | |
| |
Total Long-Term Debt of EGDC | | | | $ | 19 | | | $ | 21 | |
| | | | |
| | | |
| |
Total Long-Term Debt of Energy Holdings | | | | $ | 2,339 | | | $ | 2,815 | |
| | | | |
| | | |
| |
Total PSEG Consolidated Long-Term Debt | | | | $ | 11,279 | | | $ | 12,613 | |
| | | | |
| | | |
| |
146
NOTES TO CONSOLIDATED FINANCIAL STATEMENTS
| | | |
| (A) | | As of each of the years ended December 31, 2005 and 2004, the annual dividend requirement of PSEG's Trust Preferred Securities (Guaranteed Preferred Beneficial Interest in PSEG's Subordinated Debentures), including those issued in connection with the Participating Units, and their embedded costs was approximately $96 million.
Enterprise Capital Trust I, Enterprise Capital Trust II, Enterprise Capital Trust III, Enterprise Capital Trust IV and PSEG Funding Trust II were formed and are controlled by PSEG for the purpose of issuing Quarterly Trust Preferred Securities (Quarterly Guaranteed Preferred Beneficial Interest in PSEG's Subordinated Debentures). The proceeds were loaned to PSEG and are evidenced by Deferrable Interest Subordinated Debentures. If and for as long as payments on the Deferrable Interest Subordinated Debentures have been deferred, or PSEG had defaulted on the indentures related thereto or its guarantees thereof, PSEG may not pay any dividends on its common and preferred stock. The Subordinated Debentures support the following Preferred Securities issued by the trusts: |
| | | As of
December 31,
|
| | | 2005
| | 2004
|
| | | (Millions) |
PSEG | | | | | | | | |
PSEG Quarterly Guaranteed Preferred Beneficial Interest in PSEG's Subordinated Debentures | | | | | | | | |
7.44% | | $ | — | | | $ | 225 | |
Floating Rate | | | 150 | | | | 150 | |
7.25% | | | — | | | | 150 | |
8.75% | | | 180 | | | | 180 | |
PSEG Participating Units | | | 460 | | | | 460 | |
| | | |
| | | |
| |
Total | | $ | 790 | | | $ | 1,165 | |
| | | |
| | | |
| |
| | | | | | | | |
| | PSEG recorded interest expense of $50 million, $56 million and $56 million for the years ended December 31, 2005, 2004 and 2003, respectively. |
| | In October 2005, PSEG redeemed $387 million of its Subordinated Debentures underlying $225 million of Enterprise Capital Trust I, 7.44% Series A Preferred Securities and $150 million of Enterprise Capital Trust III, 7.25% Securities C Preferred Securities and its common equity investments in the trusts. |
| | On August 8, 2005, the trust preferred securities issued in September 2002 in connection with PSEG Funding Trust I's 9.2 million Participating Units were remarketed and the coupon rate was reset from 6.25% to 5.381%. Each unit consisted of a trust preferred security and a stock forward purchase contract obligating the purchasers to buy shares of PSEG Common Stock. On November 16, 2005, upon settlement of the forward purchase contract, PSEG received cash proceeds of approximately $460 million and issued approximately 11.4 million shares of common stock. See Note 9. Schedule of Consolidated Capital Stock and Other Securities. |
| | | |
| (B) | | Represents fair value of interest rate swaps. |
| | | |
| (C) | | The aggregate principal amounts of maturities for each of the five years following December 31, 2005 are as follows: |
| | | | | | | PSE&G
| | | | | | Energy Holdings
| | | | |
Year
| | PSEG
| | PSE&G
| | Transition
Funding
| | Transition
Funding II
| | Power
| | Energy
Holdings
| | Global
| | Resources
| | EGDC
| | Total
|
| | | (Millions) |
2006 | | $ | 203 | | | $ | 322 | | | $ | 155 | | | $ | 8 | | | $ | 500 | | | $ | 304 | | | $ | 36 | | | $ | 6 | | | $ | 2 | | | $ | 1,536 | |
2007 | | | 523 | | | | 113 | | | | 161 | | | | 9 | | | | — | | | | — | | | | 222 | | | | 11 | | | | 2 | | | | 1,041 | |
2008 | | | 424 | | | | 250 | | | | 169 | | | | 10 | | | | — | | | | 507 | | | | 92 | | | | 3 | | | | 2 | | | | 1,457 | |
2009 | | | 249 | | | | 60 | | | | 178 | | | | 10 | | | | 250 | | | | 400 | | | | 193 | | | | 4 | | | | 3 | | | | 1,347 | |
2010 | | | — | | | | — | | | | 186 | | | | 11 | | | | — | | | | — | | | | 28 | | | | 20 | | | | 3 | | | | 248 | |
| | | |
| | | |
| | | |
| | | |
| | | |
| | | |
| | | |
| | | |
| | | |
| | | |
| |
| | $ | 1,399 | | | $ | 745 | | | $ | 849 | | | $ | 48 | | | $ | 750 | | | $ | 1,211 | | | $ | 571 | | | $ | 44 | | | $ | 12 | | | $ | 5,629 | |
| | | |
| | | |
| | | |
| | | |
| | | |
| | | |
| | | |
| | | |
| | | |
| | | |
| |
| | | | | | | | | | | | | | | | | | | | | | | | | | | | | | | | | | | | | | | | |
| | | |
| (D) | | In September 2005, PSEG issued $375 million of floating rate senior unsecured debt due in 2008, callable at par after one-year. The rate set for the March 2006 interest payment is 4.875%. |
147
NOTES TO CONSOLIDATED FINANCIAL STATEMENTS
| | | |
| (E) | | In September 2005, Transition Funding II issued approximately $103 million of its Transition Bonds Series 2005-1, in four classes. Proceeds were used to purchase from PSE&G the rights to collect a transition bond charge from electric customers pursuant to a BPU order. PSE&G used those proceeds to reduce short-term debt. |
| | | |
| (F) | | In July 2005, PSE&G issued $250 million of its 5.25% Secured Medium-Term Notes Series D due 2035. The proceeds were used to redeem $125 million of PSE&G's First and Refunding Mortgage Bonds, 9.125% Series BB due July 2005 and to reduce short-term debt. |
| | | |
| (G) | | In 2005, Transition Funding repaid approximately $146 million of its transition bonds. |
| �� | | |
| (H) | | The rate set for the March 2006 interest payment is 4.62875%. |
| | | |
| (I) | | Auction rates are variable. Reflects rates as of December 31, 2005. |
| | | |
| (J) | | In April 2005, Global sold 35% of its interest in Dhofar Power through a public offering on the Omani Stock Exchange, reducing its ownership interest to 46%. Following the sale, Global accounted for its investment in Dhofar Power under the equity method of accounting and, therefore, Dhofar Power's debt is no longer consolidated. |
| | | |
| (K) | | Interest rate floats below a Libor cap of 6.25% plus a spread. The principal amount subject to the cap at December 31, 2005 was $109 million. As of December 31, 2005, the all-in rate was 6.31%. The maturity was extended to December 2009 in the amount of $234 million (including power sales agreement letter of credit facility of $28 million). |
| | | |
| (L) | | As of December 31, 2005, the interest rate was 6.31%. On April 27, 2006, 80% of the scheduled outstanding principal will become subject to interest swaps that convert floating rate Libor to a weighted average rate of 4.518%. |
| | | |
| (M) | | In December 2005, Energy Holdings issued an irrevocable call of its 7.75% Senior Notes due 2007 for redemption on January 30, 2006. |
| | | |
| (N) | | In December 2005, Resources restructured its gross investment in two leased aircraft of Northwest Airlines, which had declared bankruptcy in September 2005. The restructuring resulted in changing from accounting for the leases as leveraged lease investments to operating leases in accordance with SFAS No. 13. As a result, approximately $15 million of debt associated with the aircraft is included on the Consolidated Balance Sheet as of December 31, 2005. |
148
NOTES TO CONSOLIDATED FINANCIAL STATEMENTS
Short-Term Liquidity
PSEG, PSE&G, Power and Energy Holdings
As of December 31, 2005, PSEG and its subsidiaries had a total of approximately $3.7 billion of committed credit facilities with approximately $2.5 billion of available liquidity under these facilities. In addition, PSEG and PSE&G have access to certain uncommitted credit facilities. Neither company had any loans outstanding under these uncommitted facilities as of December 31, 2005. Each of the facilities is restricted to availability and use to the specific companies as listed below.
Company
| | Expiration Date
| | Total
Facility
| | Primary Purpose
| | Usage as of
December 31,
2005
| | Available
Liquidity as of
December 31,
2005
|
| | | | | (Millions) | | | | | | | | | | |
PSEG: | | | | | | | | | | | | | | | | |
4-year Credit Facility | | April 2008 | | $ | 450 | | | CP Support/
Funding/
Letters of Credit | | $ | — | | | $ | 450 | |
5-year Credit Facility | | May 2010 | | $ | 650 | | | CP Support/
Funding/
Letters of Credit | | $ | — | | | $ | 650 | |
Bilateral Term Loan(D) | | May 2006 | | $ | 100 | | | Funding | | $ | 100 | | | $ | — | |
Uncommitted Bilateral Agreement | | N/A | | | N/A | | | Funding | | $ | — | | | | N/A | |
PSE&G: | | | | | | | | | | | | | | | | |
5-year Credit Facility | | June 2009 | | $ | 600 | | | CP Support/
Funding/
Letters of Credit | | $ | — | | | $ | 600 | |
Uncommitted Bilateral Agreement | | N/A | | | N/A | | | Funding | | $ | — | | | | N/A | |
PSEG and Power:(A) | | | | | | | | | | | | | | | | |
3-year Credit Facility | | April 2007 | | $ | 600 | | | CP Support/
Funding/
Letters of Credit | | $ | 262 | (B) | | $ | 338 | |
Bilateral Credit Facility(D) | | April 2006 | | $ | 100 | | | Funding/
Letters of Credit | | $ | 100 | (B) | | $ | — | |
Bilateral Credit Facility(D) | | June 2006 | | $ | 100 | | | Funding/
Letters of Credit | | $ | — | | | $ | 100 | |
Bilateral Credit Facility(D) | | June 2006 | | $ | 150 | | | Funding/
Letters of Credit | | $ | 150 | (B) | | $ | — | |
Bilateral Credit Facility(D) | | July 2006 | | $ | 150 | | | Funding/
Letters of Credit | | $ | — | | | $ | 150 | |
Bilateral Credit Facility(D) | | July 2006 | | $ | 100 | | | Funding/
Letters of Credit | | $ | 100 | (B) | | $ | — | |
Bilateral Credit Facility(D) | | September 2006 | | $ | 100 | | | Funding/
Letters of Credit | | $ | 100 | (B) | | $ | — | |
Bilateral Credit Facility(D) | | December 2006 | | $ | 50 | | | Funding/
Letters of Credit | | $ | — | | | $ | 50 | |
Bilateral Credit Facility(D) | | December 2006 | | $ | 275 | | | Letters of Credit | | $ | 200 | (B) | | $ | 75 | |
Power: | | | | | | | | | | | | | | | | |
Bilateral Credit Facility | | March 2010 | | $ | 100 | | | Funding/
Letters of Credit | | $ | 63 | (B) | | $ | 37 | |
Energy Holdings: | | | | | | | | | | | | | | | | |
5-year Credit Facility(C) | | June 2010 | | $ | 150 | | | Funding/
Letters of Credit | | $ | 58 | (B) | | $ | 92 | |
| | | | | | | | | | | | | | | | |
| | | |
| (A) | | PSEG/Power co-borrower facilities. |
| | | |
| (B) | | These amounts relate to letters of credit outstanding. |
| | | |
| (C) | | Energy Holdings/Global/Resources joint and several co-borrowed facility. |
| | | |
| (D) | | Established during the fourth quarter of 2005. |
Energy Holdings
As of December 31, 2005, Energy Holdings had loaned $409 million of excess cash to PSEG. For information regarding affiliate borrowings, see Note 21. Related-Party Transactions.
149
NOTES TO CONSOLIDATED FINANCIAL STATEMENTS
Fair Value of Debt
The estimated fair values were determined using the market quotations or values of instruments with similar terms, credit ratings, remaining maturities and redemptions as of December 31, 2005 and 2004, respectively.
| | | December 31, 2005
| | December 31, 2004
|
| | | Carrying
Amount
| | Fair
Value
| | Carrying
Amount
| | Fair
Value
|
| | | (Millions) |
Long-Term Debt: | | | | | | | | | | | | | | | | |
PSEG | | $ | 1,581 | | | $ | 1,573 | | | $ | 1,654 | | | $ | 1,817 | |
PSE&G | | | 3,188 | | | | 3,283 | | | | 3,063 | | | | 3,209 | |
Transition Funding (PSE&G) | | | 1,939 | | | | 2,086 | | | | 2,085 | | | | 2,272 | |
Transition Funding II (PSE&G) | | | 103 | | | | 101 | | | | — | | | | — | |
Power | | | 3,317 | | | | 3,609 | | | | 3,316 | | | | 3,714 | |
Energy Holdings | | | 2,687 | | | | 2,877 | | | | 2,871 | | | | 3,067 | |
| | | |
| | | |
| | | |
| | | |
| |
| | $ | 12,815 | | | $ | 13,529 | | | $ | 12,989 | | | $ | 14,079 | |
| | | |
| | | |
| | | |
| | | |
| |
| | | | | | | | | | | | | | | | |
Because their maturities are less than one year, fair values approximate carrying amounts for cash and cash equivalents, short-term debt and accounts payable. For additional information related to interest rate derivatives, see Note 11. Risk Management.
Note 11. Risk Management
PSEG, PSE&G, Power and Energy Holdings
The operations of PSEG, PSE&G, Power and Energy Holdings are exposed to market risks from changes in commodity prices, foreign currency exchange rates, interest rates and equity prices that could affect their results of operations and financial conditions. PSEG, PSE&G, Power and Energy Holdings manage exposure to these market risks through their regular operating and financing activities and, when deemed appropriate, hedge these risks through the use of derivative financial instruments. PSEG, PSE&G, Power and Energy Holdings use the term “hedge” to mean a strategy designed to manage risks of volatility in prices or rate movements on certain assets, liabilities or anticipated transactions and by creating a relationship in which gains or losses on derivative instruments are expected to counterbalance the gains or losses on the assets, liabilities or anticipated transactions exposed to such market risks. Each of PSEG, PSE&G, Power and Energy Holdings uses derivative instruments as risk management tools consistent with its respective business plan and prudent business practices.
Derivative Instruments and Hedging Activities
Energy Trading Contracts
Power
Power actively trades energy and energy-related products, including electricity, natural gas, electric capacity, firm transmission rights (FTRs), coal, oil and emission allowances in the spot, forward and futures markets, primarily in PJM Interconnection, L.L.C (PJM), but also in the surrounding region, which extends from Maine to the Carolinas and the Atlantic Coast to Indiana, and natural gas in the producing region.
Power maintains a strategy of entering into positions to optimize the value of its portfolio and reduce earnings volatility of generation assets, gas supply contracts and its electric and gas supply obligations. Power engages in physical and financial transactions in the electricity wholesale markets and executes an overall risk management strategy seeking to mitigate the effects of adverse movements in the fuel and electricity markets. These contracts also involve financial transactions including swaps, options and futures. There have been significant increases in commodity prices over the last year. The resultant changes in market values for energy and related contracts that qualify for hedge accounting have resulted in significant increases to OCL. For additional information, see Note 12. Commitments and Contingent Liabilities.
150
NOTES TO CONSOLIDATED FINANCIAL STATEMENTS
Power marks its derivative energy trading contracts to market in accordance with SFAS 133, with changes in fair value charged to the Consolidated Statements of Operations. Wherever possible, fair values for these contracts are obtained from quoted market sources. For contracts where no quoted market exists, modeling techniques are employed using assumptions reflective of current market rates, yield curves and forward prices, as applicable, to interpolate certain prices. The effect of using such modeling techniques is not material to Power's financial results.
Power routinely enters into exchange-traded futures and options transactions for electricity and natural gas as part of its operations. Generally, exchange-traded futures contracts require a deposit of margin cash, the amount of which is subject to change based on market movement and in accordance with exchange rules. As of December 31, 2005, Power had deposited margin of approximately $176 million related to such transactions.
Commodity Contracts
Power
The availability and price of energy commodities are subject to fluctuations from factors such as weather, environmental policies, changes in supply and demand, state and federal regulatory policies, market conditions, transmission availability and other events. Power manages its risk of fluctuations of energy price and availability through derivative instruments, such as forward purchase or sale contracts, swaps, options, futures and FTRs.
Cash Flow Hedges
Power uses forward sale and purchase contracts, swaps and FTR contracts to hedge forecasted energy sales from its generation stations and to hedge related load obligations. Power also enters into swaps and futures transactions to hedge the price of fuel to meet its fuel purchase requirements. These derivative transactions are designated and effective as cash flow hedges under SFAS 133. As of December 31, 2005, the fair value of these hedges was $(951) million. These hedges, along with realized gains on hedges of $11 million retained in OCL, result in a $(558) million after-tax impact on OCL. As of December 31, 2004, the fair value of these hedges was $(248) million, $(145) million after-tax. During the next 12 months, $218 million (after-tax) of net unrealized and realized losses on these commodity derivatives is expected to be reclassified to earnings. Approximately $212 million of after-tax unrealized losses on these commodity derivatives in OCL is expected to be reclassified to earnings for the year ending December 31, 2007. Ineffectiveness associated with these hedges, as defined in SFAS 133, was immaterial. The expiration date of the longest dated cash flow hedge is in 2008.
Other Derivatives
Power also enters into certain other contracts that are derivatives, but do not qualify for hedge accounting under SFAS 133. Most of these contracts are used for fuel purchases for generation requirements and for electricity purchases for contractual sales obligations. Therefore, the changes in fair market value of these derivative contracts are recorded in Energy Costs or Operating Revenues, as appropriate, on the Consolidated Statements of Operations. The net fair value of these instruments as of December 31, 2005 was not material. The net fair value of these instruments as of December 31, 2004 was $14 million.
Energy Holdings
Other Derivatives
TIE, an indirect, wholly owned subsidiary of Energy Holdings and Global, enters into electricity forward and capacity sale contracts to sell up to 1,500 MW of its 2,000 MW capacity for portions of the current calendar year, with the balance sold into the daily spot market. TIE also enters into gas purchase contracts to specifically match the generation requirements to support the electricity forward sales contracts. Although these contracts fix the amount of revenue, fuel costs and cash flows, and thereby provide financial stability to TIE, these contracts are, based on their terms, derivatives that do not meet the specific accounting criteria in
151
NOTES TO CONSOLIDATED FINANCIAL STATEMENTS
SFAS 133 to qualify for the normal purchases and normal sales exception, or to be designated as a hedge for accounting purposes. As a result, these contracts must be recorded at fair value, and could lead to significant volatility in reported revenue and net income in the future. All of the contracts outstanding at December 31, 2005, with one exception, are for terms of no more than one year in duration. Therefore, impacts of fair value adjustments for those contracts will cause volatility in reported revenue and net income from quarter to quarter as unrealized gains and losses are recorded, with the cumulative amount of earnings unaffected over the life of the contracts, typically a one year period. However, one contract, a 350 MW fixed-price, covered capacity daily call option that TIE sold, has a five year duration and could therefore lead to more significant earnings volatility over the life of the contract, due to the long-term nature of the contract and the uncertain market conditions for capacity prices over the contract term. As of December 31, 2005, the contract is recorded at fair value using a model that uses observable market data over the near term and extrapolates the results over the balance of the contract with appropriate model reserves to address the uncertain market conditions and liquidity reserves to address the increasing illiquidity of the market over the later years of the contract. The net fair value of the open positions was approximately $(7) million and $(3) million as of December 31, 2005 and December 31, 2004, respectively. See Note 20. Selected Quarterly Data for additional information.
Interest Rates
PSEG, PSE&G, Power and Energy Holdings
PSEG, PSE&G, Power and Energy Holdings are subject to the risk of fluctuating interest rates in the normal course of business. PSEG's policy is to manage interest rate risk through the use of fixed and floating rate debt and interest rate derivatives.
Fair Value Hedges
PSEG and Power
In March 2004, Power issued $250 million of 3.75% Senior Notes due April 2009. PSEG used an interest rate swap to convert Power's fixed-rate debt into variable-rate debt. The interest rate swap is designated and effective as a fair value hedge. The fair value changes of the interest rate swap are fully offset by the fair value changes in the underlying debt. As of December 31, 2005 and December 31, 2004, the fair value of the hedge was $(10) million and $(3) million, respectively.
Energy Holdings
In April 2003, Energy Holdings issued $350 million of 7.75% Senior Notes due in 2007. Energy Holdings used interest rate swaps to convert $200 million of this fixed-rate debt into variable-rate debt. The interest rate swaps were designated and effective as fair value hedges. The fair value changes of these interest rate swaps were fully offset by the fair value changes in the underlying debt. In December 2005, the Senior Notes were called for redemption and the interest rate swaps were terminated at a cost of $6 million.
Cash Flow Hedges
PSEG, PSE&G and Energy Holdings
PSEG, PSE&G and Energy Holdings use interest rate swaps and other interest rate derivatives to manage their exposures to the variability of cash flows, primarily related to variable-rate debt instruments. The interest rate derivatives used are designated and effective as cash flow hedges. Except for PSE&G's cash flow hedges, the fair value changes of these derivatives are initially recorded in OCL. As of December 31, 2005, the fair value of these cash flow hedges was $(17) million, including $(11) million and $(6) million at PSE&G and Energy Holdings, respectively. As of December 31, 2004, the fair value of these cash flow hedges was $(67) million, including $(11) million, $(34) million and $(22) million at PSEG, PSE&G and Energy Holdings, respectively. The $(11) million and $(34) million at PSE&G as of December 31, 2005 and December 31, 2004, respectively, is not included in OCL, as it is deferred as a Regulatory Asset and is expected to be recovered from PSE&G's customers. During the next 12 months, $17 million of unrealized
152
NOTES TO CONSOLIDATED FINANCIAL STATEMENTS
losses (net of taxes) on interest rate derivatives in OCL is expected to be reclassified to earnings, including $(1) million and $(16) million at PSEG and Energy Holdings, respectively. As of December 31, 2005, hedge ineffectiveness associated with these hedges was immaterial. The amounts above do not include the fair value of approximately $(60) million and $(78) million as of December 31, 2005 and 2004, respectively, for the cash flow hedges at Elcho, which have been reclassed into Discontinued Operations.
Other Derivatives
Energy Holdings
Energy Holdings has cross currency interest rate swaps whose changes in fair value were recorded in Income from Equity Method Investments on the Consolidated Statements of Operations. The fair value of these swaps was approximately $(2) million and $(4) million as of December 31, 2005 and December 31, 2004, respectively.
Foreign Currencies
Energy Holdings
Global is exposed to foreign currency risk and other foreign operations risk that arise from investments in foreign subsidiaries and affiliates. A key component of its risks is that some of its foreign subsidiaries and affiliates have functional currencies other than the consolidated reporting currency, the U.S. Dollar. Additionally, Global and certain of its foreign subsidiaries and affiliates have entered into monetary obligations and maintain receipts/receivables in U.S. Dollars or currencies other than their own functional currencies. Global, a U.S. Dollar functional currency entity, is primarily exposed to changes in the Brazilian Real, the Euro, the Peruvian Nuevo Sol and the Chilean Peso. Changes in valuation of these currencies can impact the value of Global's investments. Global has attempted to limit potential foreign exchange exposure by entering into revenue contracts that adjust for changes in foreign exchange rates. Global also uses foreign currency forward, swap and option agreements to manage risk related to certain foreign currency fluctuations.
For the year ended December 31, 2005, the Chilean Peso, Brazilian Real and the Peruvian Nuevo Sol appreciated significantly relative to the U.S. Dollar, increasing Energy Holdings' Member's Equity by approximately $96 million and largely offsetting prior years' reductions in equity. As a result, the net cumulative foreign currency devaluations had reduced the total amount of Energy Holdings' Member's Equity by $20 million as of December 31, 2005.
In November and December 2005, Energy Holdings purchased foreign currency options in order to hedge the majority of its 2006 expected earnings denominated in Brazilian Real, Chilean Pesos and Peruvian Nuevo Soles. These options are not considered hedges for accounting purposes under SFAS 133 and, as a result, changes in their fair value are recorded directly to earnings. The fair value of these swaps was approximately $2 million as of December 31, 2005. Due to the rise in local currency value relative to the U.S. Dollar, which increases the value of the foreign investments' earnings in U.S Dollar terms, these options did not have value at December 31, 2004. On January 31, 2006, in connection with the sale of Elcho and Skawina, Energy Holdings purchased an option to sell Euros and receive U.S. Dollars at a rate of 1.17 Euros to the Dollar. This nine month option will protect more than 90% of the expected sale proceeds from a devaluation of the Euro prior to the closing of the deal.
Hedges of Net Investments in Foreign Operations
Energy Holdings
In March 2004 and April 2004, Energy Holdings entered into four cross currency interest rate swap agreements. The swaps are designed to hedge the net investment in a foreign subsidiary associated with the exposure in the U.S. Dollar to Chilean Peso exchange rate. The fair value of the cross currency swaps was $(33) million and $(21) million as of December 31, 2005 and December 31, 2004, respectively. The change in fair value is recorded in Cumulative Translation Adjustment within OCL. As a result, Energy Holdings' Member's Equity was reduced by $24 million as of December 31, 2005.
153
NOTES TO CONSOLIDATED FINANCIAL STATEMENTS
Note 12. Commitments and Contingent Liabilities
Nuclear Insurance Coverages and Assessments
Power
Power is a member of an industry mutual insurance company, Nuclear Electric Insurance Limited (NEIL), which provides the primary property and decontamination liability insurance at Salem Nuclear Generating Station (Salem), Hope Creek Nuclear Generating Station (Hope Creek) and Peach Bottom Atomic Power Station (Peach Bottom). NEIL also provides excess property insurance through its decontamination liability, decommissioning liability and excess property policy and replacement power coverage through its accidental outage policy. NEIL policies may make retrospective premium assessments in case of adverse loss experience. Power's maximum potential liabilities under these assessments are included in the table and notes below. Certain provisions in the NEIL policies provide that the insurer may suspend coverage with respect to all nuclear units on a site without notice if the NRC suspends or revokes the operating license for any unit on that site, issues a shutdown order with respect to such unit or issues a confirmatory order keeping such unit down.
The American Nuclear Insurers (ANI) and NEIL policies both include coverage for claims arising out of acts of terrorism. Both ANI and NEIL make a distinction between certified and non-certified acts of terrorism, as defined under the Terrorism Risk Insurance Act (TRIA), and thus their policies respond accordingly. For non-certified acts of terrorism, ANI policies are subject to an industry aggregate limit of $300 million, subject to reinstatement at ANI discretion. Similarly, NEIL policies are subject to an industry aggregate limit of $3.2 billion plus any amounts available through reinsurance or indemnity for non-certified acts of terrorism. For certified acts, Power's nuclear liability ANI and nuclear property NEIL policies will respond similarly to other covered events.
The Price-Anderson Act sets the “limit of liability” for claims that could arise from an incident involving any licensed nuclear facility in the U.S. The “limit of liability” is based on the number of licensed nuclear reactors and is adjusted at least every five years based on the Consumer Price Index. The current “limit of liability” is $10.8 billion. All utilities owning a nuclear reactor, including Power, have provided for this exposure through a combination of private insurance and mandatory participation in a financial protection pool as established by the Price-Anderson Act. Under the Price-Anderson Act, each party with an ownership interest in a nuclear reactor can be assessed its share of $101 million per reactor per incident, payable at $15 million per reactor per incident per year. If the damages exceed the “limit of liability,” the President is to submit to Congress a plan for providing additional compensation to the injured parties. Congress could impose further revenue-raising measures on the nuclear industry to pay claims. Power's maximum aggregate assessment per incident is $317 million (based on Power's ownership interests in Hope Creek, Peach Bottom and Salem) and its maximum aggregate annual assessment per incident is $48 million. This does not include the $11 million that could be assessed under the nuclear worker policies. Further, a decision by the U.S. Supreme Court, not involving Power, has held that the Price-Anderson Act did not preclude awards based on state law claims for punitive damages.
154
NOTES TO CONSOLIDATED FINANCIAL STATEMENTS
Power's insurance coverages and maximum retrospective assessments for its nuclear operations are as follows:
| | | Total Site
Coverage
| | Retrospective
Assessments
|
| | | (Millions) |
Type and Source of Coverages | | | | | | | | |
Public and Nuclear Worker Liability (Primary Layer): | | | | | | | | |
ANI | | $ | 300.0 | (A) | | $ | 10.7 | |
Nuclear Liability (Excess Layer): | | | | | | | | |
Price-Anderson Act | | | 10,461.0 | (B) | | | 316.7 | |
| | | |
| | | |
| |
Nuclear Liability Total | | $ | 10,761.0 | (C) | | $ | 327.4 | |
| | | |
| | | |
| |
Property Damage (Primary Layer): | | | | | | | | |
NEIL | | | | | | | | |
Primary (Salem/Hope Creek/Peach Bottom) | | $ | 500.0 | | | $ | 20.1 | |
Property Damage (Excess Layers): | | | | | | | | |
NEIL II (Salem/Hope Creek/Peach Bottom) | | | 600.0 | | | | 7.7 | |
NEIL Blanket Excess (Salem/Hope Creek/Peach Bottom) | | | 1,000.0 | (D) | | | 6.8 | |
| | | |
| | | |
| |
Property Damage Total (Per Site) | | $ | 2,100.0 | | | $ | 34.6 | |
| | | |
| | | |
| |
Accidental Outage: | | | | | | | | |
NEIL I (Peach Bottom) | | $ | 245.0 | (E) | | $ | 9.8 | |
NEIL I (Salem) | | | 281.4 | (E) | | | 10.6 | |
NEIL I (Hope Creek) | | | 490.0 | (E) | | | 8.8 | |
| | | |
| | | |
| |
Replacement Power Total | | $ | 1,016.4 | | | $ | 29.2 | |
| | | |
| | | |
| |
| | | | | | | | |
| | | |
| (A) | | The primary limit for Public Liability is a per site aggregate limit with no potential for assessment. The Nuclear Worker Liability represents the potential liability from workers claiming exposure to the hazard of nuclear radiation. This coverage is subject to an industry aggregate limit that is subject to reinstatement at ANI discretion and has an assessment potential under former canceled policies. |
| | | |
| (B) | | Retrospective premium program under the Price-Anderson Act liability provisions of the Atomic Energy Act of 1954, as amended. Power is subject to retrospective assessment with respect to loss from an incident at any licensed nuclear reactor in the U.S. that produces greater than 100 megawatts (MW) of electrical power. This retrospective assessment can be adjusted for inflation every five years. The last adjustment was effective as of August 20, 2003. This retrospective program is in excess of the Public and Nuclear Worker Liability primary layers. |
| | | |
| (C) | | Limit of liability under the Price-Anderson Act for each nuclear incident. |
| | | |
| (D) | | For property limits in excess of $1.1 billion, Power participates in a Blanket Limit policy where the $1.0 billion limit is shared by Power with Amergen Energy Company, LLC and Exelon Generation Company, LLC (Exelon Generation) among the Braidwood, Byron, Clinton, Dresden, La Salle, Limerick, Oyster Creek, Quad Cities, TMI-1 facilities owned by Amergen and Exelon and the Peach Bottom, Salem and Hope Creek facilities. This limit is not subject to reinstatement in the event of a loss. Participation in this program materially reduces Power's premium and the associated potential assessment. |
| | | |
| (E) | | Peach Bottom has an aggregate indemnity limit based on a weekly indemnity of $2.3 million for 52 weeks followed by 80% of the weekly indemnity for 68 weeks. Salem has an aggregate indemnity limit based on a weekly indemnity of $2.5 million for 52 weeks followed by 80% of the weekly indemnity for 75 weeks. Hope Creek has an aggregate indemnity limit based on a weekly indemnity of $4.5 million for 52 weeks followed by 80% of the weekly indemnity for 71 weeks. |
155
NOTES TO CONSOLIDATED FINANCIAL STATEMENTS
Guaranteed Obligations
Power
Power has unconditionally guaranteed payments by its subsidiary, ER&T, in certain commodity-related transactions in the ordinary course of business. These payment guarantees were provided to counterparties in order to obtain credit under physical and financial agreements for gas, pipeline capacity, transportation, oil, electricity and related commodities and services. These Power payment guarantees support the current exposure, interest and other costs on sums due and payable by ER&T under these agreements. Guarantees offered for trading and marketing cover lines of credit between entities and are often reciprocal in nature. The exposure between counterparties can move in either direction. The face value of the guarantees outstanding as of December 31, 2005 and December 31, 2004 was approximately $1.6 billion. In order for Power to incur a liability for the face value of the outstanding guarantees, ER&T would have to fully utilize the credit granted to it by every counterparty to whom Power has provided a guarantee and all of ER&T's contracts would have to be “out-of-the-money” (if the contracts are terminated, Power would owe money to the counterparties). The probability of all contracts at ER&T being simultaneously “out-of-the-money” is highly unlikely. For this reason, the current exposure at any point in time is a more meaningful representation of the potential liability to Power under these guarantees. The current exposure consists of the net of accounts receivable and accounts payable and the forward value on open positions, less any margins posted. The current exposure from such liabilities was $549 million and $507 million as of December 31, 2005 and December 31, 2004, respectively.
Power is subject to collateral calls related to commodity contracts that are bilateral and is subject to certain creditworthiness standards as guarantor under performance guarantees for ER&T's agreements. There has been a significant increase in commodity prices, including fuel, emission allowances and electric. Over the last year, both natural gas prices and electric prices in PJM have more than doubled. These price increases can have an impact on contract terms and conditions, as margin calls on contracts entered into in the normal course of business will increase with price increases. As of December 31, 2005, Power had paid cash margin of approximately $203 million and received cash margin of approximately $53 million. In addition, as of December 31, 2005, letters of credit issued by Power were outstanding in the amount of approximately $1 billion (including $355 million issued to PSE&G) to satisfy trading collateral obligations and support various contractual and environmental obligations. Assuming no changes in energy prices and positions, Power's collateral requirements can be expected to decline over time as its contracts expire.
In the event of a deterioration of Power's credit rating to below investment grade, many of these agreements allow the counterparty to demand that ER&T provide further performance assurance, generally in the form of a letter of credit or cash. As of December 31, 2005, if Power were to lose its investment grade rating and, assuming all counterparties to which ER&T is “out-of-the-money” were contractually entitled to demand, and demanded, performance assurance, ER&T could be required to post additional collateral in an amount equal to approximately $916 million. PSEG and Power entered into additional credit agreements in the fourth quarter of 2005, increasing available liquidity by $1.1 billion. Power believes that it has sufficient access to liquidity to post such collateral, if necessary.
Due to the significant decline in commodity prices since year end, both amounts of collateral posting requirements and additional collateral required in the event of a downgrade in Power's credit rating below investment grade were reduced by approximately 50%.
Energy Holdings
Energy Holdings and/or Global have guaranteed certain obligations of their subsidiaries or affiliates, including the successful completion, performance or other obligations related to certain projects.
156
NOTES TO CONSOLIDATED FINANCIAL STATEMENTS
The contingent obligations as of December 31, 2005 and December 31, 2004 are as follows:
| | | | | | | | | As of
|
Subsidiaries/Affiliates
| | Location
| | Description
| | Expiration
Date
| | December 31,
2005
| | December 31,
2004
|
| | | | | | | | | (Millions) |
Skawina(a) | | Poland | | Equity commitment | | August 2007 | | $ | 9 | | | $ | 26 | |
PSEG Global Funding II LLC | | Delaware | | Contingent guarantee
related to debt service
obligations associated
with Chilquinta | | April 2011 | | | 25 | | | | 25 | |
Elcho(a) | | Poland | | Contingent guarantee
related to debt service
obligations | | October 2009 | | | 32 | | | | — | |
Prisma 2000 S.p.A. (Prisma) | | Italy | | Leasing agreement
guarantee | | N/A | | | 20 | | | | 35 | |
PSEG Energy Technologies Asset
Management Company LLC | | New Jersey | | Performance
guarantees | | N/A | | | 6 | | | | 13 | |
Other | | Various | | Various | | N/A | | | 46 | | | | 39 | |
| | | | | | | | | |
| | | |
| |
Total Contingent Obligations | | | | | | | | $ | 138 | | | $ | 138 | |
| | | | | | | | | | | | | | |
| | | | | | | | | |
| | | |
| |
| | | |
| (a) | | Expected to be sold in 2006. For further information, see Note 4. Discontinued Operations. |
In September 2003, Energy Holdings completed the sale of PSEG Energy Technologies Inc. (Energy Technologies) and nearly all of its assets. However, Energy Holdings retained certain outstanding construction and warranty obligations related to ongoing construction projects previously performed by Energy Technologies. These construction obligations have performance bonds issued by insurance companies for which exposure is adequately supported by the outstanding letters of credit shown in the table above for PSEG Energy Technologies Asset Management Company LLC. As of December 31, 2005, there were $29 million of such bonds outstanding, which are related to uncompleted construction projects. These performance bonds are not included in the $138 million of guaranteed obligations above.
In addition to the amounts discussed above, certain subsidiaries of Energy Holdings also have contingent obligations related to their respective projects, which are non-recourse to Energy Holdings or Global.
Environmental Matters
PSEG, PSE&G and Power
Hazardous Substances
The New Jersey Department of Environmental Protection (NJDEP) adopted regulations concerning site investigation and remediation that require an ecological evaluation of potential damages to natural resources in connection with an environmental investigation of contaminated sites. These regulations may substantially increase the costs of environmental investigations and necessary remediation, particularly at sites situated on surface water bodies. PSE&G, Power and respective predecessor companies own or owned and/or operate or operated certain facilities situated on surface water bodies, certain of which are currently the subject of remedial activities. The financial impact of these regulations is not currently estimable. However, neither PSE&G nor Power anticipates that compliance with these regulations will have a material adverse effect on their respective financial positions, results of operations or net cash flows.
The U.S. Environmental Protection Agency (EPA) has determined that a six-mile stretch of the Passaic River in the area of Newark, New Jersey is a “facility” within the meaning of that term under the Federal Comprehensive Environmental Response, Compensation and Liability Act of 1980 (CERCLA). PSE&G and certain of its predecessors conducted industrial operations at properties adjacent to the Passaic River facility. The operations included one operating electric generating station (Essex Site), one former generating station and four former MGPs. PSE&G's costs to clean up former MGPs are recoverable from utility customers through the SBC. PSE&G has sold the site of the former generating station and obtained releases and indemnities for liabilities arising out of the site in connection with the sale. The Essex Site was transferred to
157
NOTES TO CONSOLIDATED FINANCIAL STATEMENTS
Power in August 2000. Power assumed any environmental liabilities of PSE&G associated with the electric generating stations that PSE&G transferred to it, including the Essex Site.
In 2003, the EPA notified 41 potentially responsible parties (PRPs), including PSE&G and Power, that it was expanding its assessment of the Passaic River Study Area to the entire 17-mile tidal reach of the lower Passaic River. The EPA further indicated, with respect to PSE&G, that it believed that hazardous substances had been released from the Essex Site and a former MGP located in Harrison, New Jersey (Harrison Site), which also includes facilities for PSE&G's ongoing gas operations. The EPA estimated that its study would require five to eight years to complete and would cost approximately $20 million, of which it would seek to recover $10 million from the PRPs, including PSE&G and Power. Power is evaluating recoverability of any disbursed amounts from its insurance carriers.
Also, in 2003, PSEG, PSE&G and 56 other PRPs received a Directive and Notice to Insurers from the NJDEP that directed the PRPs to arrange for a natural resource damage assessment and interim compensatory restoration of natural resource injuries along the lower Passaic River and its tributaries pursuant to the New Jersey Spill Compensation and Control Act. The NJDEP alleged in the Directive that it had determined that hazardous substances had been discharged from the Essex Site and the Harrison Site. The NJDEP announced that it had estimated the cost of interim natural resource injury restoration activities along the lower Passaic River to approximate $950 million.
PSE&G and Power have indicated to both the EPA and NJDEP that they are willing to work with the agencies in an effort to resolve their respective claims and, along with approximately 43 other PRPs, have executed an agreement with the EPA that provides for sharing the costs of the study between the government organizations and the PRPs. PSEG, PSE&G and Power cannot predict what further actions, if any, or the costs or the timing thereof, that may be required with respect to the Passaic River or natural resource damages. However, such costs could be material. PSE&G anticipates spending $44 million in 2006, $45 million in 2007 and an average of $36 million per year through 2016.
PSE&G
MGP Remediation Program
PSE&G is currently working with the NJDEP under a program to assess, investigate and remediate environmental conditions at PSE&G's former MGP sites (Remediation Program). To date, 38 sites have been identified as sites requiring some level of remedial action. In addition, the NJDEP has announced initiatives to accelerate the investigation and subsequent remediation of the riverbeds underlying surface water bodies that have been impacted by hazardous substances from adjoining sites. Specifically, in 2005 the NJDEP initiated a program on the Delaware River aimed at identifying the ten most significant sites for cleanup. One of the sites identified is a former MGP facility located in Camden. The Remediation Program is periodically reviewed, and the estimated costs are revised by PSE&G based on regulatory requirements, experience with the program and available remediation technologies. In 2005, costs for the MGP Remediation Program were approximately $45 million. Since the inception of the Remediation Program in 1988 through December 31, 2005, PSE&G had expenditures of approximately $342 million.
During the fourth quarter of 2005, PSE&G refined the detailed site estimates. The cost of remediating all sites to completion, as well as the anticipated costs to address MGP-related material discovered in two rivers adjacent to former MGP sites, could range between $751 million and $796 million. No amount within the range was considered to be most likely. Therefore, $409 million was accrued at December 31, 2005, which represents the difference between the low end of the total program cost estimate of $751 million and the total incurred costs through December 31, 2005 of $342 million. Of this amount, approximately $44 million was recorded in Other Current Liabilities and $365 million was reflected in Other Noncurrent Liabilities. The costs associated with the MGP Remediation Program have historically been recovered through the SBC charges to PSE&G ratepayers. As such, a $409 million Regulatory Asset was recorded.
New Jersey Clean Energy Program
The BPU has approved a funding requirement for each New Jersey utility applicable to its Renewable Energy and Energy Efficiency programs for the years 2005 to 2008. The liability for the funding requirement
158
NOTES TO CONSOLIDATED FINANCIAL STATEMENTS
has been recorded at the discounted present value. The costs associated with this program will be recovered from PSE&G ratepayers over the four years and therefore a Regulatory Asset was also recorded. The current and noncurrent liability for the funding requirement as of December 31, 2005 and December 31, 2004 was $329 million and $406 million, respectively.
Power
Prevention of Significant Deterioration (PSD)/New Source Review (NSR)
The PSD/NSR regulations, promulgated under the Clean Air Act (CAA), require major sources of certain air pollutants to obtain permits, install pollution control technology and obtain offsets, in some circumstances, when those sources undergo a “major modification,” as defined in the regulations. The Federal government is seeking to order companies allegedly not in compliance with the PSD/NSR regulations to install the best available control technology at the affected plants and to pay monetary penalties of up to approximately $27,500 for each day of continued violation.
The EPA and the NJDEP issued a demand in March 2000 under the CAA requiring information to assess whether projects completed since 1978 at the Hudson and Mercer coal-burning units were implemented in accordance with applicable PSD/NSR regulations. Power completed its response to the requests for information and, in January 2002, reached an agreement with the NJDEP and the EPA to resolve allegations of noncompliance with PSD/NSR regulations. Under that agreement, over the course of 10 years, Power agreed to install advanced air pollution controls to reduce emissions of Sulfur Dioxide (SO2), Nitrogen Oxide (NOx), particulate matter and mercury from the coal-burning units at the Mercer and Hudson generating stations. The estimated cost of the program as of December 31, 2005 includes approximately $110 million for installation of selective catalytic reduction systems (SCRs) at Mercer, of which $106 million has been spent, as well as approximately $350 million to $450 million at Hudson and $150 million to $250 million for other pollution control equipment at Mercer to be installed by December 31, 2012. Power also paid a $1.4 million civil penalty and has agreed to spend up to $6 million on supplemental environmental projects. The agreement resolving the NSR allegations concerning the Hudson and Mercer coal-fired units also resolved a dispute over Bergen 2 regarding the applicability of PSD requirements and allowed construction of the unit to be completed and operations to commence.
Power has notified the EPA and the NJDEP that it is evaluating the continued operation of the Hudson coal unit in light of changes in the energy and capacity markets, increases in the cost of pollution control equipment and other necessary modifications to the unit. Power will be unable to complete the installation of the pollution control equipment by the December 31, 2006 deadline. Power believes that system reliability concerns that PJM previously identified in the area and its discussions with the EPA and the NJDEP may result in the unit continuing to operate after December 31, 2006. Power cannot accurately determine all costs, including any penalties, that may be associated with the continued operation of the Hudson unit beyond December 31, 2006, but such costs could be material. The costs associated with the pollution control modifications for the Hudson unit have not been included in Power's capital expenditure projections.
New Jersey Industrial Site Recovery Act (ISRA)
Potential environmental liabilities related to subsurface contamination at certain generating stations have been identified. In the second quarter of 1999, in anticipation of the transfer of PSE&G's generation-related assets to Power, a study was conducted pursuant to ISRA, which applies to the sale of certain assets. Power had a $51 million liability as of December 31, 2005 and December 31, 2004 related to these obligations, which is included in Other Noncurrent Liabilities on Power's Consolidated Balance Sheets and Environmental Costs on PSEG's Consolidated Balance Sheets.
Permit Renewals
In June 2001, the NJDEP issued a renewed New Jersey Pollutant Discharge Elimination System (NJPDES) permit for Salem, expiring in July 2006, allowing for the continued operation of Salem with its existing cooling water system. A renewal application prepared in accordance with the new Phase II 316(b) rule was filed with the NJDEP that allows the station to continue operating under its existing NJPDES permit
159
NOTES TO CONSOLIDATED FINANCIAL STATEMENTS
until a new permit is issued. Power's application to renew Salem's NJPDES permit demonstrates that the station meets the Phase II 316(b) rule's performance standards for reduction of impingement and entrainment through the station's existing cooling water intake technology and operations plus implemented restoration measures. The application further demonstrates that the station meets the Phase II 316(b) rule's site-specific determination standards without the benefits of restoration. If NJDEP were to require the installation of structures at the Salem facility to reduce cooling water intake flow commensurate with closed cycle cooling as a result of an unfavorable decision in the Phase II litigation (discussed above) or otherwise, Power's application estimates that the costs associated with cooling towers for Salem are approximately $1 billion, of which Power's share would be approximately $575 million. These costs are not included in Power's currently forecasted capital expenditures.
New Generation and Development
Power
In July 2005, Power completed construction of the Bethlehem Energy Center near Albany, New York. Total costs for this project were approximately $603 million, including IDC of $70 million. The plant was put into commercial operation on July 18, 2005.
Power is constructing a natural gas-fired generation plant in Linden, New Jersey. Power anticipates that construction will be completed in the second quarter of 2006. Total costs are estimated at approximately $1 billion with expenditures through December 31, 2005 of approximately $1 billion (including IDC of $197 million).
Power also has contracts with outside parties to purchase upgraded turbines for Salem Units 1 and 2 and to purchase upgraded turbines and complete a power uprate for Hope Creek to modestly increase its generating capacity. Salem Unit 2 completed Phase I of its turbine replacement in 2003 and gained 24 MW. Phase II of the replacement is currently scheduled for 2008 concurrent with steam generator replacement and is anticipated to increase capacity by 26 MW. Salem Unit 1 completed its turbine replacement in 2004 and gained 63 MW. Hope Creek completed Phase I of its turbine replacement in January 2005 and gained 15 MW. Phase II is expected to be completed in 2007 along with the thermal power uprate and is expected to add approximately 120 MW. Power's expenditures to date approximate $205 million (including IDC of $17 million) with an aggregate estimated share of total costs for these projects of $247 million (including IDC of $27 million). Timing, costs and results of these projects are dependent on timely completion of work, timely approval from the NRC and various other factors.
Completion of the projects discussed above within the estimated time frames and cost estimates cannot be assured. Construction delays, cost increases and various other factors could result in changes in the operational dates or ultimate costs to complete.
Power entered into a long-term contractual services agreement with a vendor in September 2003 to provide the outage and service needs for certain of Power's generating units at market rates. The contract covers approximately 25 years and could result in annual payments ranging from approximately $10 million to $50 million for services, parts and materials rendered.
Energy Holdings
Electroandes
There is a 35 MW expansion project on an existing hydro station under development at Electroandes, a generating facility in Peru. Construction on this project is expected to begin in the first half of 2006 with expected completion in 2007 at a total cost of $30 million. The project is expected to be financed by Electroandes with cash and non-recourse debt.
160
NOTES TO CONSOLIDATED FINANCIAL STATEMENTS
BGS and Basic Gas Supply Service (BGSS)
Power
Power seeks to mitigate volatility in its results by contracting in advance for its anticipated electric output as well as its anticipated fuel needs.
Power seeks to sell a portion of its anticipated low-cost nuclear and coal-fired generation over a multi-year forward horizon, normally over a period of approximately two to four years. As of February 15, 2006, Power has contracted for over 95% of its anticipated 2006 nuclear and coal-fired generation, with 85% to 95% contracted for 2007 and 65% to 80% contracted for 2008, with a modest amount contracted beyond 2008.
Power takes a more opportunistic approach in hedging its anticipated natural gas-fired generation. Natural gas prices are more highly correlated with electric prices (particularly during periods of relatively higher demand), providing to some degree a natural hedge.
As part of its objective, Power has entered into contracts to directly supply PSE&G and other New Jersey Electric Distribution Companies (EDCs) with a portion of their respective BGS requirements through the New Jersey BGS auction process. In addition to the BGS-related contracts, Power has entered into firm supply contracts with EDCs in Pennsylvania and Connecticut, as well as other firm sales and trading positions and commitments.
PSE&G and Power
PSE&G is required to obtain all electric supply requirements for customers that do not purchase electric supply from third-party suppliers through the annual New Jersey BGS auctions. The BGS auction process is a statewide process in which all of the New Jersey EDCs participate. The BGS auctions are “declining clock” auctions, where the EDCs accept offers for the amount of electric supply bidders are willing to offer with higher prices at the beginning of the auction. The auction proceeds when the amount of supply bid exceeds what is needed. The offer price is subsequently lowered and the process continues in a series of steps. When the amount of supply bid by the prospective suppliers matches an EDC's electric supply needs, the auction ends. The BPU renders a decision on the auction results within two business days.
PSE&G enters into the Supplier Master Agreement (SMA) with the winners of these BGS auctions within three business days of the BPU's approval. PSE&G has entered into contracts with Power, as well as with other winning BGS suppliers, to purchase BGS for PSE&G's anticipated load requirements. The winners of the auction are responsible for fulfilling all the requirements of a PJM Load Serving Entity (LSE) including capacity, energy, ancillary services, transmission and any other services required by PJM. BGS suppliers assume any migration risk and must satisfy New Jersey's renewable portfolio standards.
Through the BGS auctions, PSE&G has contracted for its anticipated BGS-Fixed Price load, as follows:
| | | | Term Ending
|
| | | | May 2006(a)
| | May 2007(b)
| | May 2008(a)
| | May 2009(c)
|
| | Term
| | 12 months
| | 34 months
| | 36 months
| | 36 months
|
| | Load (MW) | | | 2,900 | | | | 2,840 | | | | 2,840 | | | | 2,882 | |
| | $ per kWh | | $ | 0.05560 | | | $ | 0.05515 | | | $ | 0.06541 | | | $ | 0.10251 | |
| | | | | | | | | | | | | | | | | | |
| (a) | | Prices set in the February 2005 BGS auction. |
| (b) | | Prices set in the February 2004 BGS auction. |
| (c) | | Prices set in the February 2006 BGS auction, which becomes effective on June 1, 2006 when the agreements for the 12-month (May 2006) BGS-FP supply agreements expire. |
| | |
PSE&G entered into full requirement contract through 2007 with Power to meet the supply requirements of PSE&G's gas customers. The BPU permits recovery of the cost of gas hedging up to 115 billion cubic feet or approximately 80% of PSE&G's residential gas supply annually through the BGSS tariff. For the current 2005/06 winter season, Power has hedged approximately 75% of the 115 billion cubic feet allowed at an average price of $8.08 per decatherm (dth). Together with its current volumes in inventory as of December 31, 2005, Power has secured the majority of the anticipated residential volume for the 2005/06
161
NOTES TO CONSOLIDATED FINANCIAL STATEMENTS
winter season at prices that are lower than current market. Approximately 30% of the allowed residential gas volume has been hedged for the 2006 summer season at an average price of $8.43 per dth.
Minimum Fuel Purchase Requirements
Power
Power purchases coal and oil for certain of its fossil generation stations through various long-term commitments. The total minimum purchase requirements included in these commitments amount to approximately $867 million through 2012.
Power has various multi-year requirements-based purchase commitments that average approximately $89 million per year to meet Salem's and Hope Creek's nuclear fuel needs, of which Power's share is approximately $64 million per year through 2010. Power has been advised by Exelon Generation, the co-owner and operator of Peach Bottom, that it has similar purchase contracts to satisfy the fuel requirements for Peach Bottom through 2010, of which Power's share is approximately $27 million per year.
In addition to its fuel requirements, Power has entered into various multi-year contracts for firm transportation and storage capacity for natural gas, primarily to meet its gas supply obligations to PSE&G. As of December 31, 2005, the total minimum requirements under these contracts were approximately $1 billion through 2016.
These purchase obligations are in keeping with Power's strategy to enter into contracts for its fuel supply in comparable volumes to its sales contracts.
Energy Holdings
TIE's Guadalupe and Odessa plants have entered into gas supply agreements for their anticipated fuel requirements to satisfy obligations under their forward energy sales contracts. As of December 31, 2005, the Guadalupe and Odessa plants, which total approximately 2,000 MW of capacity, had forward energy sale contracts in place for approximately 50% of their expected output for 2006 and the sale of approximately 18% of their aggregate capacity for 2007 through 2010. TIE had fuel purchase commitments totaling $163 million to fully support such contracts.
Operating Services Contract (OSC)
Power
Nuclear has entered into an OSC with Exelon Generation, which commenced on January 17, 2005, relating to the operation of the Hope Creek and Salem nuclear generating stations. The OSC requires Exelon Generation to provide a chief nuclear officer and other key personnel to oversee daily plant operations at the Hope Creek and Salem nuclear generating stations and to implement the Exelon operating model, which defines practices that Exelon has used to manage its own nuclear performance program. Nuclear continues as the license holder with exclusive legal authority to operate and maintain the plants, retains responsibility for management oversight and has full authority with respect to the marketing of its share of the output from the facilities. Exelon Generation is entitled to receive reimbursement of its costs in discharging its obligations, an annual operating services fee and incentive fees up to $12 million annually based on attainment of goals relating to safety, capacity factor and operation and maintenance expenses. The OSC has a term of two years, subject to earlier termination in certain circumstances. In the event of termination, Exelon Generation will continue to provide services under the OSC for a transition period of at least 180 days and up to two years at the election of Nuclear. This period may be further extended by Nuclear for up to an additional twelve months if Nuclear determines that additional time is necessary to complete required activities during the transition period.
Nuclear Fuel Disposal
Power
Under the Nuclear Waste Policy Act of 1982, as amended (NWPA), the Federal government has entered into contracts with the operators of nuclear power plants for transportation and ultimate disposal of spent nuclear fuel. To pay for this service, nuclear plant owners are required to contribute to a Nuclear Waste Fund at a rate of one mil ($0.001) per kWh of nuclear generation, subject to such escalation as may be required to assure full cost recovery by the Federal government. Under the NWPA, the U.S. Department of Energy
162
NOTES TO CONSOLIDATED FINANCIAL STATEMENTS
(DOE) was required to begin taking possession of the spent nuclear fuel by no later than 1998. The DOE has announced that it does not expect a facility for such purpose to be available earlier than 2010.
Pursuant to NRC rules, spent nuclear fuel generated in any reactor can be stored in reactor facility storage pools or in independent spent fuel storage installations located at reactors or away-from-reactor sites for at least 30 years beyond the licensed life for reactor operation (which may include the term of a revised or renewed license). Adequate spent fuel storage capacity is estimated to be available through 2011 for Salem 1, 2015 for Salem 2 and 2007 for Hope Creek. Power has commenced construction of an on-site storage facility that will satisfy the spent fuel storage needs of both Salem and Hope Creek through the end of their current respective license lives. Exelon Generation has advised Power that it has a licensed and operational on-site storage facility at Peach Bottom that will satisfy Peach Bottom's spent fuel storage requirements until at least 2014.
Exelon Generation had previously advised Power that it had signed an agreement with the DOE, applicable to Peach Bottom, under which Exelon Generation would be reimbursed for costs incurred resulting from the DOE's delay in accepting spent nuclear fuel for permanent storage. Under this agreement, Power's portion of Peach Bottom's Nuclear Waste Fund fees was reduced by approximately $18 million through August 31, 2002, at which point credits were fully utilized and covered the cost of Exelon Generation's on-site storage facility. In September 2002, the U.S. Court of Appeals for the Eleventh Circuit issued an opinion upholding a petition seeking to set aside the receipt of these credits by Exelon Generation. On August 14, 2003, Exelon Generation received a letter from the DOE demanding repayment of previously received credits from the Nuclear Waste Fund. The letter also demanded a total of approximately $1.5 million of accrued interest. In August 2004, Exelon Generation advised Nuclear that it reached a settlement with the U.S. Department of Justice, under which Exelon Generation would be reimbursed for costs associated with the storage of spent nuclear fuel at the Peach Bottom facility, a portion of which would be paid to Nuclear as a co-owner of Peach Bottom. Future costs incurred resulting from DOE delays in accepting spent fuel will be reimbursed annually until the DOE fulfills its obligation to accept spent nuclear fuel. In addition, Exelon Generation and Nuclear are required to reimburse the DOE for the previously received credits from the Nuclear Waste Fund, plus lost earnings. Under this settlement, Power received approximately $27 million for its share of previously incurred storage costs for Peach Bottom, $22 million of which was used for the required reimbursement to the Nuclear Waste Fund. As a result of this settlement, Power reversed approximately $12 million of previously capitalized plant-related costs and recognized an increase of $7 million to Operating Expenses in the third quarter of 2004. Exelon Generation paid Power approximately $5.4 million for its portion of the spent fuel storage costs reimbursed by DOE in 2005 for costs incurred between October 1, 2003 and June 30, 2005.
In September 2001, Power filed a complaint in the U.S. Court of Federal Claims seeking damages caused by the DOE not taking possession of spent nuclear fuel in 1998. On October 14, 2004, an order to show cause was issued regarding whether the U.S. Court of Federal Claims has jurisdiction over the matter. Power responded to this order in November 2004. On January 31, 2005, the Judge dismissed the breach-of-contract claims of Power and three other utilities. Power moved for reconsideration in the U.S. Court of Federal Claims and jointly petitioned for permission to appeal the January 31, 2005 order to the U.S. Court of Appeals for the Federal Circuit. No assurances can be given as to any damage recovery or the ultimate availability of a disposal facility.
Spent Fuel Pool
Power
The spent fuel pool at each Salem unit has an installed leakage collection system. This normal leakage path was found to be obstructed. Power developed a solution to maintain the design function of the leakage collection system and is investigating the extent of any structural degradation caused by the leakage. The investigation is scheduled to be completed by the end of the first quarter 2006. Preliminary test results to date indicate that the degradation rate is decreasing over time and that the available margin in the Fuel Handling Building (FHB) structure at the projected end of plant life is expected to be positive with no repairs anticipated. The NRC issued Information Notice 2004-05 in March 2004 concerning this emerging industry issue and Power cannot predict what further actions the NRC may take on this matter.
Elevated concentrations of tritium in the shallow groundwater near Salem Unit 1 were detected in early 2003. This information was reported to the NJDEP and the NRC, as required. Power conducted a
163
NOTES TO CONSOLIDATED FINANCIAL STATEMENTS
comprehensive investigation in accordance with NJDEP site remediation regulations to determine the source and extent of the tritium in the groundwater. Power is conducting remedial actions to address the contamination in accordance with a remedial action workplan approved by the NJDEP in November 2004. The remedial actions are expected to be ongoing for several years. The costs necessary to address this groundwater contamination issue are not expected to be material.
Other
PSEG and PSE&G
Investment Tax Credits (ITC)
As of June 1999, the Internal Revenue Service (IRS) had issued several private letter rulings that concluded that the refunding of excess deferred tax and ITC balances to utility customers was permitted only over the related assets' regulatory lives, which were terminated upon New Jersey's electric industry deregulation. Based on this fact, PSEG and PSE&G reversed the deferred tax and ITC liability relating to PSE&G's generation assets that were transferred to Power and recorded a $235 million reduction of the extraordinary charge in 1999 due to the restructuring of the utility industry in New Jersey. PSE&G was directed by the BPU to seek a ruling from the IRS to determine if the ITC included in the impairment write-down of generation assets could be credited to customers without violating the tax normalization rules of the Internal Revenue Code. PSE&G filed a private letter ruling request with the IRS in 2002, which is still pending.
In 2003, the Treasury proposed regulations for comment that, if adopted, would allow utilities to elect retroactive application over periods equivalent to the ones in place prior to deregulation. On December 21, 2005, the Treasury proposed new regulations for comment addressing the normalization of ITC. These new regulations replace the regulations originally issued in 2003. The new proposed regulations, if finalized, would not permit retroactive application. Accordingly, the IRS's conclusions in the above referenced private letter rulings would continue to control for all industry deregulations prior to December 21, 2005.
The BPU has initiated generic proceedings on the ITC issue and has requested all utilities to submit comments on the issue by February 21, 2006 with reply comments to be submitted by March 7, 2006. These comments are being solicited even though the IRS has issued new regulations for comment and public hearing. PSE&G filed a letter response on February 15, 2006 requesting the BPU to take no further action until the IRS issues its final rule or PSE&G receives its private letter ruling. While PSE&G cannot predict the outcome of this matter, a requirement to refund such amounts to customers would have a material adverse impact on PSEG's and PSE&G's financial condition, results of operations and net cash flows.
BPU Deferral Audit
The BPU Energy and Audit Division conducts audits of deferred balances. A draft Deferral Audit—Phase II report relating to the 12-month period ended July 31, 2003 was released by the consultant to the BPU in April 2005. The draft report addresses the SBC, Market Transition Charge (MTC) and NUG deferred balances. The BPU released the report on May 13, 2005.
While the consultant to the BPU found that the Phase II deferral balances complied in all material respects with the BPU Orders regarding such deferrals, the consultant noted that the BPU Staff had raised certain questions with respect to the reconciliation method PSE&G employed in calculating the overrecovery of its MTC and other charges during the Phase I and Phase II four-year transition period. The amount in dispute is approximately $118 million. PSE&G and the BPU Staff are continuing discussions to resolve these questions and, if a resolution cannot be achieved, a BPU proceeding may be instituted to consider the issues raised. While PSE&G believes the MTC methodology it used was fully litigated and resolved, without exception, by the BPU and other intervening parties in its previous electric base rate case, deferral audit and deferral proceeding that were approved by the BPU in its order on April 22, 2004, and that such order is non-appealable, PSE&G cannot predict the impact of the outcome of any such proceeding.
PSEG and Energy Holdings
Leveraged Lease Investments
From 1996 through 2002, PSEG, through its indirect wholly owned subsidiary, Resources, entered into a number of leveraged lease transactions in the ordinary course of business. Certain of those transactions that were previously entered into are similar to a type that the IRS subsequently announced its intention to
164
NOTES TO CONSOLIDATED FINANCIAL STATEMENTS
challenge, and PSEG understands that similar transactions entered into by other companies have been the subject of review and challenge by the IRS. As of December 31, 2005 and December 31, 2004, Resources' total gross investment in such transactions was approximately $1.4 billion and $1.3 billion, respectively. The IRS is presently reviewing the tax returns of PSEG and its subsidiaries for tax years 1997 through 2000, years when Resources entered into some of these transactions.
On September 27, 2005, the IRS proposed to disallow PSEG's deductions associated with certain of these leveraged leases which have been designated by the IRS as listed transactions. Other lease transactions within the audit period are still under the IRS's review. The IRS may propose additional disallowances in the future. If deductions associated with these lease transactions entered into by PSEG are successfully challenged by the IRS, it could have a material adverse impact on PSEG's and Energy Holdings' financial position, results of operations and net cash flows and could impact future returns on these transactions. PSEG believes that its tax position related to these transactions is proper based on applicable statutes, regulations and case law and believes that it should prevail with respect to any IRS challenge, although no assurances can be given.
If the tax benefits associated with the above referenced lease transactions were completely disallowed by the IRS, approximately $660 million of PSEG's deferred tax liabilities that have been recorded under leveraged lease accounting through December 31, 2005 could become currently payable. In addition, interest expense of approximately $86 million, after-tax, and penalties could be assessed. Management assessed the probability of various outcomes to this matter and recorded appropriate reserves in accordance with SFAS No. 5 “Accounting for Contingencies.” Energy Holdings believes that such an outcome is unlikely, in the event that such a payment is required, Energy Holdings believes that, assuming certain asset monetizations of its investment portfolio, it has the financial capacity to meet this potential obligation.
The FASB is currently considering a modification to GAAP for leveraged leases. Under present GAAP, a tax settlement with the IRS that results in a change in the timing of tax liabilities would not require an accounting repricing of the lease investment. As such, income from the lease would continue to accrue at the original economic yield computed for the lease and there would be no write-down of the lease investment. See Note 2. Recent Accounting Standards for additional information.
Power
Restructuring Charge
In June 2005, Power implemented a plan, approved by management, to reduce its Nuclear workforce by approximately 200 positions. The plan includes voluntary and involuntary separations offered to both represented and non-represented employees. The major cost associated with the restructuring relates to payments to the employees who are terminated. Power's $14 million share of the estimated total cost was recorded in 2005, approximately $5 million of which had been paid as of December 31, 2005.
Energy Holdings
RGE
The governing tax authority in Brazil has claimed past due taxes from RGE plus penalties and interest for the periods 1998 to 2004 primarily related to claims that certain deductions were improper, certain changes in average depreciation rates made by RGE were not allowable and that the goodwill tax amortization period used by RGE for several years resulted in higher than allowed tax deductions. Global's share of the maximum claim amount related to these tax issues is approximately $27 million. RGE believes it has valid legal defenses to these claims. The court of first instance has ruled against RGE and RGE has appealed the lower court ruling. Although RGE believes its defenses to these claims are valid and will continue to vigorously contest this matter, no assurances can be given regarding the outcome.
Between 1998 and September 2005, Sul Geradora Participacoes Ltda. (SGP) was a wholly owned subsidiary of RGE. Following new regulations issued by the national regulatory authority, 33.34% of SGP was sold to an indirect subsidiary of Global and the remainder was sold to a subsidiary of the majority owner of RGE in September 2005. In 2004, the Brazilian tax authority filed a tax assessment against SGP relating to a loan entered into between SGP and BankBoston N.A. denying the characterization of the loan as a withholding-free transaction for 2000, 2001 and 2002. The original amount of the assessment is $15 million, including tax, penalty and interest. Global's indirect share of the claim, through its approximate 33% indirect ownership of SGP, is approximately $5 million. SGP believes it has valid defenses to these claims and has filed an appeal of the assessment, although no assurances can be given regarding the outcome.
165
NOTES TO CONSOLIDATED FINANCIAL STATEMENTS
LDS
The Superintendencia Nacional de Administracion Tributaria (SUNAT), the governing tax authority in Peru, has claimed past due taxes for the periods between 1996-1998 and 1999-2001, plus penalties and interest, resulting from LDS's interpretation of tax law that permitted restatement of assets to fair market value for tax purposes resulting in higher tax deductions for depreciation. LDS did not accept the SUNAT valuation and appealed. The Fiscal Court notified LDS on January 4, 2005 that a proper decision could not be based on the existing SUNAT studies and ordered another valuation study to be performed by Consejo Nacional de Tasaciones (CONATA), a Government Agency in Peru. CONATA completed the valuation of LDS assets in April 2005 and concluded that the asset value of LDS is higher than those originally used by LDS for its tax deductions for depreciation.
In September 2005, the SUNAT accepted the Fiscal Court's decision which validated the methodology used by LDS in revaluating its assets to market value in accordance with the then prevailing law. LDS has received a final assessment for the years 1996-1999 which will result in a refund. Since the Fiscal Court determined in its written decision the base amounts to be used for the asset revaluation, these amounts are valid for the remaining years in dispute by the SUNAT (2000 and 2001), thus limiting any additional tax exposure related to this issue.
Electroandes
In July 2005, Electroandes received a notice from SUNAT claiming past due taxes for 2002 totaling approximately $2 million related to certain interest deductions. Electroandes has taken similar interest deductions subsequent to 2002. The total cumulative estimated potential amount for past due taxes, including associated interest and penalties is approximately $6 million through December 31, 2005. Electroandes believes it has valid legal defenses to these claims, and has filed for an appeal with SUNAT to which it has not yet received a response, however no assurances can be given regarding the outcome of this matter.
Dhofar Power
Since commencing operations in Oman in May 2003, Dhofar Power has experienced a number of service interruptions, including four service interruptions in the first half of 2004, which resulted from a combination of force majeure events and breaches of general warranties of the contractors that installed equipment at Dhofar Power. Dhofar Power and the Government of Oman have been in a dispute regarding the applicability and extent of any penalties under Dhofar Power's Concession Agreement arising from these service interruptions. On July 14, 2005, the expert engaged by the parties recommended no penalties be assessed for the 2003 service interruptions and agreed with Dhofar Power's interpretation of the Concession Agreement with respect to the criteria to be utilized in assessing penalties. The Government of Oman has exercised its right to appeal the expert's determination to a full arbitration panel. Dhofar Power believes this matter will be favorably resolved in 2006, although no assurances can be given.
Dhofar Power and the Government of Oman are also in disagreement on the basis of the calculation of certain monthly allowances to be paid to compensate Dhofar Power for the capital investment costs associated with the enhancements and extensions of the transmission and distribution system in Salalah. On August 24, 2005, the expert engaged by the parties found in favor of Dhofar Power with respect to the criteria to be used in determining the monthly allowances. The Government has failed to properly exercise its right to appeal the expert's determination to a full arbitration panel but has not yet agreed to pay the sums awarded by the expert. Dhofar Power will seek to enforce the expert's determination that it is entitled to approximately $1 million annually for 15 years retroactive to December 2003 and believes that this matter will be favorably resolved in 2006, although no assurances can be given.
Minimum Lease Payments
PSEG, PSE&G and Energy Holdings
PSE&G and Energy Holdings lease administrative office space under various operating leases. For the years ended December 31, 2005, 2004 and 2003, PSEG's lease expenses were approximately $10 million per
166
NOTES TO CONSOLIDATED FINANCIAL STATEMENTS
year, primarily related to Energy Holdings. Total future minimum lease payments as of December 31, 2005 are:
| | | | 2006
| | 2007
| | 2008
| | 2009
| | 2010
| | After
2011
| | Total
|
| | | | (Millions) |
| | PSE&G | | $ | 4 | | | $ | 3 | | | $ | 2 | | | $ | 1 | | | $ | 1 | | | $ | 1 | | | $ | 12 | |
| | Energy Holdings | | | 3 | | | | 2 | | | | 2 | | | | 1 | | | | 1 | | | | 1 | | | | 10 | |
| | | | |
| | | |
| | | |
| | | |
| | | |
| | | |
| | | |
| |
| | Total PSEG | | $ | 7 | | | $ | 5 | | | $ | 4 | | | $ | 2 | | | $ | 2 | | | $ | 2 | | | $ | 22 | |
| | | | |
| | | |
| | | |
| | | |
| | | |
| | | |
| | | |
| |
| | | | | | | | | | | | | | | | | | | | | | | | | | | | | | |
PSE&G and Power
Power and Services have entered into capital leases for administrative office space. The total future minimum payments and present value of these capital leases as of December 31, 2005 are:
| | | | Services
| | Power
|
| | | | (Millions) |
| | 2006 | | $ | 7 | | | $ | 1 | |
| | 2007 | | | 7 | | | | 2 | |
| | 2008 | | | 7 | | | | 2 | |
| | 2009 | | | 7 | | | | 1 | |
| | 2010 | | | 8 | | | | 1 | |
| | Thereafter | | | 36 | | | | 8 | |
| | | | |
| | | |
| |
| | Total Minimum Lease Payments | | $ | 72 | | | $ | 15 | |
| | Less: Imputed Interest | | | (32 | ) | | | (4 | ) |
| | | | |
| | | |
| |
| | Present Value of Net Minimum Lease Payments | | $ | 40 | | | $ | 11 | |
| | | | |
| | | |
| |
| | | | | | | | | | |
Note 13. Nuclear Decommissioning
Power
In accordance with NRC regulations, entities owning an interest in nuclear generating facilities are required to determine the costs and funding methods necessary to decommission such facilities upon termination of operation. As a general practice, each nuclear owner places funds in independent external trust accounts it maintains to provide for decommissioning.
Power maintains the external master nuclear decommissioning trust previously established by PSE&G. This trust contains two separate funds: a qualified fund and a non-qualified fund. Section 468A of the Internal Revenue Code limits the amount of money that can be contributed into a “qualified” fund. In the most recent study of the total cost of decommissioning, Power's share related to its five nuclear units was estimated at approximately $2.1 billion, including contingencies.
Power's policy is that, except for investments tied to market indexes or other non-nuclear sector common trust funds or mutual funds (e.g., an S&P 500 mutual fund), assets of the trust shall not be invested in the securities or other obligations of PSEG or its affiliates, or its successors or assigns; and assets shall not be invested in securities of any entity owning one or more nuclear power plants.
Effective January 1, 2003, Power began accounting for the assets in the NDT Funds under SFAS 115. Power classifies investments in the NDT Funds as available-for-sale under SFAS 115. The following tables show the fair values and gross unrealized gains and losses for the securities held in the NDT Funds.
167
NOTES TO CONSOLIDATED FINANCIAL STATEMENTS
| | | As of December 31, 2005
|
| | | Cost
| | Gross
Unrealized
Gains
| | Gross
Unrealized
Losses
| | Estimated
Fair
Value
|
| | | (Millions) |
Equity Securities | | $ | 534 | | | $ | 161 | | | $ | (13 | ) | | $ | 682 | |
Debt Securities | | | | | | | | | | | | | | | | |
Government Obligations | | | 212 | | | | 3 | | | | (3 | ) | | | 212 | |
Other Debt Securities | | | 206 | | | | 3 | | | | (3 | ) | | | 206 | |
| | | |
| | | |
| | | |
| | | |
| |
Total Debt Securities | | | 418 | | | | 6 | | | | (6 | ) | | | 418 | |
| | | |
| | | |
| | | |
| | | |
| |
Other Securities | | | 33 | | | | 4 | | | | (4 | ) | | | 33 | |
| | | |
| | | |
| | | |
| | | |
| |
Total Available-for-Sale Securities | | $ | 985 | | | $ | 171 | | | $ | (23 | ) | | $ | 1,133 | |
| | | |
| | | |
| | | |
| | | |
| |
| | | | | | | | | | | | | | | | |
| | | As of December 31, 2004
|
| | | Cost
| | Gross
Unrealized
Gains
| | Gross
Unrealized
Losses
| | Estimated
Fair
Value
|
| | | (Millions) |
Equity Securities | | $ | 488 | | | $ | 200 | | | $ | (8 | ) | | $ | 680 | |
Debt Securities | | | | | | | | | | | | | | | | |
Government Obligations | | | 166 | | | | 4 | | | | (1 | ) | | | 169 | |
Other Debt Securities | | | 172 | | | | 8 | | | | (2 | ) | | | 178 | |
| | | |
| | | |
| | | |
| | | |
| |
Total Debt Securities | | | 338 | | | | 12 | | | | (3 | ) | | | 347 | |
| | | |
| | | |
| | | |
| | | |
| |
Other Securities | | | 59 | | | | 1 | | | | (1 | ) | | | 59 | |
| | | |
| | | |
| | | |
| | | |
| |
Total Available-for-Sale Securities | | $ | 885 | | | $ | 213 | | | $ | (12 | ) | | $ | 1,086 | |
| | | |
| | | |
| | | |
| | | |
| �� |
| | | | | | | | | | | | | | | | |
| | | | Years Ended December 31,
|
| | | | 2005
| | 2004
| | 2003
|
| | | | (Millions) |
| | Proceeds from Sales | | $ | 3,223 | | | $ | 2,637 | | | $ | 1,229 | |
| | Gross Realized Gains | | $ | 132 | | | $ | 126 | | | $ | 115 | |
| | Gross Realized Losses | | $ | 36 | | | $ | 43 | | | $ | 64 | |
| | | | | | | | | | | | | | |
Net realized gains of $96 million were recognized in Other Income and Other Deductions on Power's Consolidated Statement of Operations for the year ended December 31, 2005. Net unrealized gains of $72 million (after-tax) were recognized in OCL on Power's Consolidated Balance Sheet as of December 31, 2005. Of the $23 million of the gross 2005 unrealized losses, $22 million has been in an unrealized loss position for less than twelve months. The available-for-sale debt securities held as of December 31, 2005, had the following maturities: $20 million less than one year, $69 million one to five years, $98 million five to 10 years, $65 million 10 to 15 years, $11 million 15 to 20 years, and $155 million over 20 years. The cost of these securities was determined on the basis of specific identification.
The fair value of securities in an unrealized loss position as of December 31, 2005 was approximately $388 million. The unrealized losses were primarily caused by interest rate movements and fluctuations in the market. Based on Power's evaluations and its ability and intent to hold such investments for a reasonable period of time sufficient for a projected recovery of fair value, Power does not consider these investments to be other-than-temporarily impaired as of December 31, 2005.
168
NOTES TO CONSOLIDATED FINANCIAL STATEMENTS
Note 14. Other Income and Deductions
Other Income
| | | PSE&G
| | Power
| | Energy
Holdings
| | Other(A)
| | Consolidate
Total
|
| | | (Millions) |
For the Year Ended December 31, 2005: | | | | | | | | | | | | | | | | | | | | |
Interest Income | | $ | 11 | | | $ | 10 | | | $ | — | | | $ | 1 | | | $ | 22 | |
Gain on Disposition of Property | | | 3 | | | | 5 | | | | 2 | | | | — | | | | 10 | |
Gain on Investments | | | — | | | | — | | | | — | | | | 8 | | | | 8 | |
NDT Fund Realized Gains | | | — | | | | 132 | | | | — | | | | — | | | | 132 | |
NDT Interest and Dividend Income | | | — | | | | 35 | | | | — | | | | — | | | | 35 | |
Foreign Currency Gains | | | — | | | | — | | | | 2 | | | | — | | | | 2 | |
Other | | | 1 | | | | 4 | | | | 6 | | | | 1 | | | | 12 | |
| | | |
| | | |
| | | |
| | | |
| | | |
| |
Total Other Income | | $ | 15 | | | $ | 186 | | | $ | 10 | | | $ | 10 | | | $ | 221 | |
| | | |
| | | |
| | | |
| | | |
| | | |
| |
For the Year Ended December 31, 2004: | | | | | | | | | | | | | | | | | | | | |
Interest Income | | $ | 10 | | | $ | 10 | | | $ | — | | | $ | — | | | $ | 20 | |
NDT Fund Realized Gains | | | — | | | | 126 | | | | — | | | | — | | | | 126 | |
NDT Interest and Dividend Income | | | — | | | | 28 | | | | — | | | | — | | | | 28 | |
Foreign Currency Gains | | | — | | | | — | | | | 4 | | | | — | | | | 4 | |
Other | | | 2 | | | | 3 | | | | 3 | | | | (6 | ) | | | 2 | |
| | | |
| | | |
| | | |
| | | |
| | | |
| |
Total Other Income | | $ | 12 | | | $ | 167 | | | $ | 7 | | | $ | (6 | ) | | $ | 180 | |
| | | |
| | | |
| | | |
| | | |
| | | |
| |
For the Year Ended December 31, 2003: | | | | | | | | | | | | | | | | | | | | |
Interest Income | | $ | (7 | ) | | $ | 8 | | | $ | — | | | $ | 2 | | | $ | 3 | |
Gain on Disposition of Property | | | 12 | | | | — | | | | — | | | | — | | | | 12 | |
NDT Fund Realized Gains | | | — | | | | 115 | | | | — | | | | — | | | | 115 | |
NDT Interest and Dividend Income | | | — | | | | 26 | | | | — | | | | — | | | | 26 | |
Foreign Currency Gains | | | — | | | | — | | | | 19 | | | | — | | | | 19 | |
Change in Derivative Fair Value | | | — | | | | — | | | | 1 | | | | — | | | | 1 | |
Other | | | 1 | | | | 1 | | | | 6 | | | | — | | | | 8 | |
| | | |
| | | |
| | | |
| | | |
| | | |
| |
Total Other Income | | $ | 6 | | | $ | 150 | | | $ | 26 | | | $ | 2 | | | $ | 184 | |
| | | |
| | | |
| | | |
| | | |
| | | |
| |
| | | | | | | | | | | | | | | | | | | | |
169
NOTES TO CONSOLIDATED FINANCIAL STATEMENTS
Other Deductions
| | | PSE&G
| | Power
| | Energy
Holdings
| | Other(A)
| | Consolidated
Total
|
| | | (Millions) |
For the Year Ended December 31, 2005: | | | | | | | | | | | | | | | | | | | | |
Donations | | $ | 2 | | | $ | — | | | $ | — | | | $ | 13 | | | $ | 15 | |
NDT Fund Realized Losses and Expenses | | | — | | | | 42 | | | | — | | | | — | | | | 42 | |
Loss on Early Retirement of Debt | | | — | | | | — | | | | 10 | | | | — | | | | 10 | |
Foreign Currency Losses | | | — | | | | — | | | | 10 | | | | — | | | | 10 | |
Minority Interest | | | — | | | | — | | | | — | | | | 1 | | | | 1 | |
Change in Derivative Fair Value | | | — | | | | — | | | | 3 | | | | — | | | | 3 | |
Other | | | 1 | | | | 1 | | | | 2 | | | | 2 | | | | 6 | |
| | | |
| | | |
| | | |
| | | |
| | | |
| |
Total Other Deductions | | $ | 3 | | | $ | 43 | | | $ | 25 | | | $ | 16 | | | $ | 87 | |
| | | |
| | | |
| | | |
| | | |
| | | |
| |
For the Year Ended December 31, 2004: | | | | | | | | | | | | | | | | | | | | |
Donations | | $ | 1 | | | $ | — | | | $ | — | | | $ | — | | | $ | 1 | |
NDT Fund Realized Losses and Expenses | | | — | | | | 49 | | | | — | | | | — | | | | 49 | |
Loss on Disposition of Property | | | — | | | | 1 | | | | — | | | | — | | | | 1 | |
Loss on Early Retirement of Debt | | | — | | | | — | | | | 3 | | | | — | | | | 3 | |
Foreign Currency Losses | | | — | | | | — | | | | 3 | | | | — | | | | 3 | |
Minority Interest | | | — | | | | — | | | | — | | | | 2 | | | | 2 | |
Change in Derivative Fair Value | | | — | | | | — | | | | 2 | | | | — | | | | 2 | |
Other | | | — | | | | 5 | | | | 2 | | | | 1 | | | | 8 | |
| | | |
| | | |
| | | |
| | | |
| | | |
| |
Total Other Deductions | | $ | 1 | | | $ | 55 | | | $ | 10 | | | $ | 3 | | | $ | 69 | |
| | | |
| | | |
| | | |
| | | |
| | | |
| |
For the Year Ended December 31, 2003: | | | | | | | | | | | | | | | | | | | | |
Donations | | $ | 1 | | | $ | — | | | $ | — | | | $ | 4 | | | $ | 5 | |
NDT Fund Realized Losses and Expenses | | | — | | | | 77 | | | | — | | | | — | | | | 77 | |
Foreign Currency Losses | | | — | | | | — | | | | 1 | | | | — | | | | 1 | |
Minority Interest | | | — | | | | — | | | | — | | | | 8 | | | | 8 | |
Change in Derivative Fair Value | | | — | | | | — | | | | 6 | | | | — | | | | 6 | |
Other | | | — | | | | 1 | | | | 2 | | | | — | | | | 3 | |
| | | |
| | | |
| | | |
| | | |
| | | |
| |
Total Other Deductions | | $ | 1 | | | $ | 78 | | | $ | 9 | | | $ | 12 | | | $ | 100 | |
| | | |
| | | |
| | | |
| | | |
| | | |
| |
| | | | | | | | | | | | | | | | | | | | |
| | | |
| (A) | | Other primarily consists of activity at PSEG (parent company), Services and intercompany eliminations. |
170
NOTES TO CONSOLIDATED FINANCIAL STATEMENTS
Note 15. Income Taxes
A reconciliation of reported income tax expense with the amount computed by multiplying pre-tax income by the statutory Federal income tax rate of 35% is as follows:
| | | PSE&G
| | Power
| | Energy
Holdings
| | Other
| | Consolidated
Total
|
| | | (Millions) |
2005 | | | | | | | | | | | | | | | | | | | | |
Net Income (Loss)/Earnings Available to PSEG | | $ | 344 | | | $ | 192 | | | $ | 214 | | | $ | (89 | ) | | $ | 661 | |
Gain/(Loss) from Discontinued Operations, (Including Gain/(Loss) on Disposal net of tax benefit—$135) | | | — | | | | (198 | ) | | | 18 | | | | — | | | | (180 | ) |
Cumulative Effect of a Change in Accounting Principle, net of tax benefit—$11 | | | — | | | | (16 | ) | | | — | | | | (1 | ) | | | (17 | ) |
Minority Interest in Earnings of Subsidiaries | | | — | | | | — | | | | (1 | ) | | | — | | | | (1 | ) |
| | | |
| | | |
| | | |
| | | |
| | | |
| |
Income (Loss) From Continuing Operations, less Preferred Dividends | | | 344 | | | | 406 | | | | 197 | | | | (88 | ) | | | 859 | |
Preferred Dividends (net) | | | (4 | ) | | | — | | | | (3 | ) | | | 3 | | | | (4 | ) |
| | | |
| | | |
| | | |
| | | |
| | | |
| |
Income (Loss) from Continuing Operations Excluding Minority Interest and Preferred Dividends | | $ | 348 | | | $ | 406 | | | $ | 200 | | | $ | (91 | ) | | $ | 863 | |
| | | |
| | | |
| | | |
| | | |
| | | |
| |
Income Taxes: | | | | | | | | | | | | | | | | | | | | |
Federal—Current | | $ | 239 | | | $ | 97 | | | $ | (64 | ) | | $ | (49 | ) | | $ | 223 | |
Deferred | | | (58 | ) | | | 140 | | | | 149 | | | | (8 | ) | | | 223 | |
ITC | | | (3 | ) | | | — | | | | (1 | ) | | | — | | | | (4 | ) |
| | | |
| | | |
| | | |
| | | |
| | | |
| |
Total Federal | | | 178 | | | | 237 | | | | 84 | | | | (57 | ) | | | 442 | |
| | | |
| | | |
| | | |
| | | |
| | | |
| |
State—Current | | | 49 | | | | 38 | | | | 14 | | | | (1 | ) | | | 100 | |
Deferred | | | 8 | | | | 24 | | | | (41 | ) | | | (4 | ) | | | (13 | ) |
| | | |
| | | |
| | | |
| | | |
| | | |
| |
Total State | | | 57 | | | | 62 | | | | (27 | ) | | | (5 | ) | | | 87 | |
| | | |
| | | |
| | | |
| | | |
| | | |
| |
Foreign—Deferred | | | — | | | | — | | | | 12 | | | | — | | | | 12 | |
| | | |
| | | |
| | | |
| | | |
| | | |
| |
Total Foreign | | | — | | | | — | | | | 12 | | | | — | | | | 12 | |
| | | |
| | | |
| | | |
| | | |
| | | |
| |
Total | | | 235 | | | | 299 | | | | 69 | | | | (62 | ) | | | 541 | |
| | | |
| | | |
| | | |
| | | |
| | | |
| |
Pre-tax Income | | $ | 583 | | | $ | 705 | | | $ | 269 | | | $ | (153 | ) | | $ | 1,404 | |
| | | |
| | | |
| | | |
| | | |
| | | |
| |
Tax Computed at the Statutory Rate | | $ | 204 | | | $ | 247 | | | $ | 94 | | | $ | (54 | ) | | $ | 491 | |
Increase (Decrease) Attributable to Flow-Through of Certain Tax Adjustments: | | | | | | | | | | | | | | | | | | | | |
Repatriation | | | — | | | | — | | | | 11 | | | | — | | | | 11 | |
Plant-Related Items | | | 3 | | | | — | | | | — | | | | — | | | | 3 | |
Amortization of Investment Tax Credits | | | (3 | ) | | | — | | | | (1 | ) | | | — | | | | (4 | ) |
Tax Reserves | | | — | | | | — | | | | 6 | | | | — | | | | 6 | |
Nuclear Decommissioning Trust | | | — | | | | 15 | | | | — | | | | — | | | | 15 | |
Lease Rate Differential | | | — | | | | — | | | | 2 | | | | — | | | | 2 | |
Tax Effects Attributable to Foreign Operations | | | — | | | | — | | | | (33 | ) | | | — | | | | (33 | ) |
Other | | | (6 | ) | | | (3 | ) | | | 2 | | | | (4 | ) | | | (11 | ) |
State Income Tax (net of Federal Income Tax) | | | 37 | | | | 40 | | | | (12 | ) | | | (4 | ) | | | 61 | |
| | | |
| | | |
| | | |
| | | |
| | | |
| |
Subtotal | | | 31 | | | | 52 | | | | (25 | ) | | | (8 | ) | | | 50 | |
| | | |
| | | |
| | | |
| | | |
| | | |
| |
Total Income Tax Provisions | | $ | 235 | | | $ | 299 | | | $ | 69 | | | $ | (62 | ) | | $ | 541 | |
| | | |
| | | |
| | | |
| | | |
| | | |
| |
Effective Income Tax Rate | | | 40.3 | % | | | 42.4 | % | | | 25.7 | % | | | 40.5 | % | | | 38.5 | % |
| | | | | | | | | | | | | | | | | | | | |
171
NOTES TO CONSOLIDATED FINANCIAL STATEMENTS
| | | PSE&G
| | Power
| | Energy
Holdings
| | Other
| | Consolidated
Total
|
| | | (Millions) |
2004 | | | | | | | | | | | | | | | | | | | | |
Net Income (Loss)/Earnings Available to PSEG | | $ | 342 | | | $ | 308 | | | $ | 125 | | | $ | (49 | ) | | $ | 726 | |
Loss from Discontinued Operations, (Including Loss on Disposal, net of tax benefit—$26) | | | — | | | | (34 | ) | | | (10 | ) | | | — | | | | (44 | ) |
Minority Interest in Earnings of Subsidiaries | | | — | | | | — | | | | (2 | ) | | | — | | | | (2 | ) |
| | | |
| | | |
| | | |
| | | |
| | | |
| |
Income (Loss) from Continuing Operations, less Preferred Dividends | | | 342 | | | | 342 | | | | 137 | | | | (49 | ) | | | 772 | |
Preferred Dividends (net) | | | (4 | ) | | | — | | | | (16 | ) | | | 16 | | | | (4 | ) |
| | | |
| | | |
| | | |
| | | |
| | | |
| |
Income (Loss) from Continuing Operations excluding Minority Interest and Preferred Dividends | | $ | 346 | | | $ | 342 | | | $ | 153 | | | $ | (65 | ) | | $ | 776 | |
| | | |
| | | |
| | | |
| | | |
| | | |
| |
Income Taxes: | | | | | | | | | | | | | | | | | | | | |
Federal—Current | | $ | 255 | | | $ | 27 | | | $ | (91 | ) | | $ | (35 | ) | | $ | 156 | |
Deferred | | | (67 | ) | | | 136 | | | | 164 | | | | 3 | | | | 236 | |
ITC | | | (3 | ) | | | — | | | | (1 | ) | | | — | | | | (4 | ) |
| | | |
| | | |
| | | |
| | | |
| | | |
| |
Total Federal | | | 185 | | | | 163 | | | | 72 | | | | (32 | ) | | | 388 | |
| | | |
| | | |
| | | |
| | | |
| | | |
| |
State—Current | | | 72 | | | | 19 | | | | 4 | | | | — | | | | 95 | |
Deferred | | | (11 | ) | | | 27 | | | | (40 | ) | | | (2 | ) | | | (26 | ) |
| | | |
| | | |
| | | |
| | | |
| | | |
| |
Total State | | | 61 | | | | 46 | | | | (36 | ) | | | (2 | ) | | | 69 | |
| | | |
| | | |
| | | |
| | | |
| | | |
| |
Foreign—Deferred | | | — | | | | — | | | | 10 | | | | — | | | | 10 | |
| | | |
| | | |
| | | |
| | | |
| | | |
| |
Total Foreign | | | — | | | | — | | | | 10 | | | | — | | | | 10 | |
| | | |
| | | |
| | | |
| | | |
| | | |
| |
Total | | | 246 | | | | 209 | | | | 46 | | | | (34 | ) | | | 467 | |
| | | |
| | | |
| | | |
| | | |
| | | |
| |
Pre-tax Income | | $ | 592 | | | $ | 551 | | | $ | 199 | | | $ | (99 | ) | | $ | 1,243 | |
| | | |
| | | |
| | | |
| | | |
| | | |
| |
Tax Computed at the Statutory Rate | | $ | 207 | | | $ | 193 | | | $ | 70 | | | $ | (35 | ) | | $ | 435 | |
Increase (Decrease) Attributable to Flow-Through of Certain Tax Adjustments: | | | | | | | | | | | | | | | | | | | | |
Plant-Related Items | | | 5 | | | | — | | | | — | | | | — | | | | 5 | |
Amortization of Investment Tax Credits | | | (3 | ) | | | — | | | | (1 | ) | | | — | | | | (4 | ) |
Tax Reserves | | | — | | | | (18 | ) | | | 17 | | | | — | | | | (1 | ) |
Other | | | (3 | ) | | | 4 | | | | (8 | ) | | | 2 | | | | (5 | ) |
Lease Rate Differential | | | — | | | | — | | | | (8 | ) | | | — | | | | (8 | ) |
State Income Tax (net of Federal Income Tax) | | | 40 | | | | 30 | | | | (24 | ) | | | (1 | ) | | | 45 | |
| | | |
| | | |
| | | |
| | | |
| | | |
| |
Subtotal | | | 39 | | | | 16 | | | | (24 | ) | | | 1 | | | | 32 | |
| | | |
| | | |
| | | |
| | | |
| | | |
| |
Total Income Tax Provisions | | $ | 246 | | | $ | 209 | | | $ | 46 | | | $ | (34 | ) | | $ | 467 | |
| | | |
| | | |
| | | |
| | | |
| | | |
| |
Effective Income Tax Rate | | | 41.6 | % | | | 37.9 | % | | | 23.1 | % | | | 34.3 | % | | | 37.6 | % |
| | | | | | | | | | | | | | | | | | | | |
172
NOTES TO CONSOLIDATED FINANCIAL STATEMENTS
| | | PSE&G
| | Power
| | Energy
Holdings
| | Other
| | Consolidated
Total
|
| | | (Millions) |
2003 | | | | | | | | | | | | | | | | | | | | |
Net Income (Loss)/ Earnings Available to PSEG | | $ | 225 | | | $ | 844 | | | $ | 122 | | | $ | (31 | ) | | $ | 1,160 | |
Extraordinary Item, net of tax benefit | | | (18 | ) | | | — | | | | — | | | | — | | | | (18 | ) |
Loss from Discontinued Operations, (Including Loss on Disposal, net of tax benefit—$13) | | | — | | | | (9 | ) | | | (38 | ) | | | — | | | | (47 | ) |
Cumulative Effect of a Change in Accounting Principle, (net of tax expense—$255) | | | — | | | | 370 | | | | — | | | | — | | | | 370 | |
Minority Interest in Earnings of Subsidiaries | | | — | | | | — | | | | (8 | ) | | | — | | | | (8 | ) |
| | | |
| | | |
| | | |
| | | |
| | | |
| |
Income (Loss) from Continuing Operations, less Preferred Dividends | | | 243 | | | | 483 | | | | 168 | | | | (31 | ) | | | 863 | |
Preferred Dividends (net) | | | (4 | ) | | | — | | | | (23 | ) | | | 23 | | | | (4 | ) |
| | | |
| | | |
| | | |
| | | |
| | | |
| |
Income (Loss) from Continuing Operations excluding Minority Interest and Preferred Dividends | | $ | 247 | | | $ | 483 | | | $ | 191 | | | $ | (54 | ) | | $ | 867 | |
| | | |
| | | |
| | | |
| | | |
| | | |
| |
Income Taxes: | | | | | | | | | | | | | | | | | | | | |
Federal—Current | | $ | 1 | | | $ | 140 | | | $ | (298 | ) | | $ | (43 | ) | | $ | (200 | ) |
Deferred | | | 91 | | | | 121 | | | | 331 | | | | 5 | | | | 548 | |
ITC | | | (2 | ) | | | — | | | | (1 | ) | | | — | | | | (3 | ) |
| | | |
| | | |
| | | |
| | | |
| | | |
| |
Total Federal | | | 90 | | | | 261 | | | | 32 | | | | (38 | ) | | | 345 | |
| | | |
| | | |
| | | |
| | | |
| | | |
| |
State—Current | | | (2 | ) | | | 41 | | | | (57 | ) | | | (10 | ) | | | (28 | ) |
Deferred | | | 41 | | | | 30 | | | | 70 | | | | (2 | ) | | | 139 | |
| | | |
| | | |
| | | |
| | | |
| | | |
| |
Total State | | | 39 | | | | 71 | | | | 13 | | | | (12 | ) | | | 111 | |
| | | |
| | | |
| | | |
| | | |
| | | |
| |
Foreign—Deferred | | | — | | | | — | | | | 13 | | | | — | | | | 13 | |
| | | |
| | | |
| | | |
| | | |
| | | |
| |
Total Foreign | | | — | | | | — | | | | 13 | | | | — | | | | 13 | |
| | | |
| | | |
| | | |
| | | |
| | | |
| |
Total | | | 129 | | | | 332 | | | | 58 | | | | (50 | ) | | | 469 | |
| | | |
| | | |
| | | |
| | | |
| | | |
| |
Pre-tax Income | | $ | 376 | | | $ | 815 | | | $ | 249 | | | $ | (104 | ) | | $ | 1,336 | |
| | | |
| | | |
| | | |
| | | |
| | | |
| |
Tax Computed at the Statutory Rate | | $ | 132 | | | $ | 285 | | | $ | 87 | | | $ | (36 | ) | | $ | 468 | |
Increase (Decrease) Attributable to Flow-Through of Certain Tax Adjustments: | | | | | | | | | | | | | | | | | | | | |
Plant-Related Items | | | (18 | ) | | | — | | | | — | | | | — | | | | (18 | ) |
Amortization of Investment Tax Credits | | | (2 | ) | | | — | | | | (1 | ) | | | — | | | | (3 | ) |
Other | | | (9 | ) | | | — | | | | 4 | | | | (7 | ) | | | (12 | ) |
Tax Effects Attributable to Foreign Operations | | | — | | | | — | | | | (40 | ) | | | — | | | | (40 | ) |
State Income Tax (net of Federal Income Tax) | | | 26 | | | | 47 | | | | 8 | | | | (7 | ) | | | 74 | |
| | | |
| | | |
| | | |
| | | |
| | | |
| |
Subtotal | | | (3 | ) | | | 47 | | | | (29 | ) | | | (14 | ) | | | 1 | |
| | | |
| | | |
| | | |
| | | |
| | | |
| |
Total Income Tax Provisions | | $ | 129 | | | $ | 332 | | | $ | 58 | | | $ | (50 | ) | | $ | 469 | |
| | | |
| | | |
| | | |
| | | |
| | | |
| |
Effective Income Tax Rate | | | 34.3 | % | | | 40.7 | % | | | 23.3 | % | | | 48.1 | % | | | 35.1 | % |
| | | | | | | | | | | | | | | | | | | | |
173
NOTES TO CONSOLIDATED FINANCIAL STATEMENTS
PSEG, PSE&G, Power and Energy Holdings
Each of PSEG, PSE&G, Power and Energy Holdings provide deferred taxes at the enacted statutory tax rate for all temporary differences between the financial statement carrying amounts and the tax bases of existing assets and liabilities irrespective of the treatment for rate-making purposes. Management believes that it is probable that the accumulated tax benefits that previously have been treated as a flow-through item to PSE&G customers will be recovered from PSE&G's customers in the future. Accordingly, an offsetting regulatory asset was established. As of December 31, 2005, PSE&G had a regulatory asset of $398 million representing the tax costs expected to be recovered through rates based upon established regulatory practices which permit recovery of current taxes payable. This amount was determined using the enacted Federal income tax rate of 35% and State income tax rate of 9%.
Energy Holdings' effective tax rate differs from the statutory Federal income tax rate of 35% primarily due to the imposition of state taxes and the fact that Global accounts for many of its investments using the equity method of accounting. In addition, as allowed under APB Opinion No. 23, “Accounting for Income Taxes—Special Areas” and SFAS 109, Management has maintained a permanent reinvestment strategy as it relates to Global's international investments. If Management were to change that strategy, a deferred tax expense and deferred tax liability would need to be recorded to reflect the expected taxes that would need to be paid on Global's offshore earnings. As of December 31, 2005, undistributed foreign earnings were approximately $220 million. The determination of the amount of unrecognized U.S. Federal deferred income tax liability for undistributed earnings is not practicable.
The Jobs Act, as discussed further in Note 2. Recent Accounting Standards, provides a one-year window to repatriate earnings from foreign investments and claim a special 85% dividends received tax deduction on such distributions. PSEG approved a total of three Domestic Reinvestment Plans, which provided for the repatriation of approximately $242 million through December 2005, of which approximately $177 million was eligible for the reduced tax rate pursuant to the Jobs Act. The tax expense associated with such repatriation totaled approximately $11 million and was recorded in 2005. Other than amounts discussed above, Global has made no change in its current intention to indefinitely reinvest accumulated earnings of its foreign subsidiaries.
As of December 31, 2005, there is a capital loss carryforward of $48 million which will expire by 2007 unless utilized by PSEG. Since PSEG expects to fully realize this amount, no valuation allowance is necessary.
174
NOTES TO CONSOLIDATED FINANCIAL STATEMENTS
The following is an analysis of deferred income taxes:
| | | PSE&G
| | Power
| | Energy
Holdings
| | Other
| | Consolidated
|
| | | 2005
| | 2004
| | 2005
| | 2004
| | 2005
| | 2004
| | 2005
| | 2004
| | 2005
| | 2004
|
| | | (Millions) |
Deferred Income Taxes | | | | | | | | | | | | | | | | | | | | | | | | | | | | | | | | | | | | | | | | |
Assets: | | | | | | | | | | | | | | | | | | | | | | | | | | | | | | | | | | | | | | | | |
Current (net) | | $ | 31 | | | $ | 19 | | | $ | — | | | $ | — | | | $ | — | | | $ | — | | | $ | — | | | $ | — | | | $ | 31 | | | $ | 19 | |
| | | |
| | | |
| | | |
| | | |
| | | |
| | | |
| | | |
| | | |
| | | |
| | | |
| |
Noncurrent: | | | | | | | | | | | | | | | | | | | | | | | | | | | | | | | | | | | | | | | | |
Unrecovered Investment Tax Credits | | | 16 | | | | 18 | | | | — | | | | — | | | | — | | | | — | | | | — | | | | — | | | | 16 | | | | 18 | |
OCL | | | 3 | | | | 2 | | | | 383 | | | | 103 | | | | 17 | | | | 19 | | | | 5 | | | | 10 | | | | 408 | | | | 134 | |
Cumulative Effect of a Change in Cumulative Accounting Principle | | | — | | | | — | | | | 11 | | | | — | | | | — | | | | — | | | | — | | | | — | | | | 11 | | | | — | |
New Jersey Corporate Business Tax | | | 158 | | | | 182 | | | | 67 | | | | 75 | | | | (12 | ) | | | (42 | ) | | | — | | | | — | | | | 213 | | | | 215 | |
OPEB | | | 145 | | | | 129 | | | | — | | | | — | | | | — | | | | — | | | | — | | | | (2 | ) | | | 145 | | | | 127 | |
Cost of Removal | | | — | | | | — | | | | 51 | | | | 51 | | | | — | | | | — | | | | — | | | | — | | | | 51 | | | | 51 | |
Conservation Costs | | | — | | | | 30 | | | | — | | | | — | | | | — | | | | — | | | | — | | | | — | | | | — | | | | 30 | |
Investment Related Adjustment | | | — | | | | — | | | | — | | | | — | | | | 22 | | | | 32 | | | | — | | | | — | | | | 22 | | | | 32 | |
Development Fees | | | — | | | | — | | | | — | | | | — | | | | 18 | | | | 17 | | | | — | | | | — | | | | 18 | | | | 17 | |
Foreign Currency Translation | | | — | | | | — | | | | — | | | | — | | | | 30 | | | | 31 | | | | — | | | | — | | | | 30 | | | | 31 | |
Contractual Liabilities and Environmental Costs | | | — | | | | — | | | | 35 | | | | 35 | | | | — | | | | — | | | | — | | | | — | | | | 35 | | | | 35 | |
MTC | | | 11 | | | | 11 | | | | — | | | | — | | | | — | | | | — | | | | — | | | | — | | | | 11 | | | | 11 | |
Other | | | — | | | | — | | | | — | | | | — | | | | — | | | | 12 | | | | 8 | | | | 4 | | | | 8 | | | | 16 | |
| | | |
| | | |
| | | |
| | | |
| | | |
| | | |
| | | |
| | | |
| | | |
| | | |
| |
Total Noncurrent | | | 333 | | | | 372 | | | | 547 | | | | 264 | | | | 75 | | | | 69 | | | | 13 | | | | 12 | | | | 968 | | | | 717 | |
| | | |
| | | |
| | | |
| | | |
| | | |
| | | |
| | | |
| | | |
| | | |
| | | |
| |
Total Assets | | | 364 | | | | 391 | | | | 547 | | | | 264 | | | | 75 | | | | 69 | | | | 13 | | | | 12 | | | | 999 | | | | 736 | |
| | | |
| | | |
| | | |
| | | |
| | | |
| | | |
| | | |
| | | |
| | | |
| | | |
| |
Liabilities: | | | | | | | | | | | | | | | | | | | | | | | | | | | | | | | | | | | | | | | | |
Noncurrent: | | | | | | | | | | | | | | | | | | | | | | | | | | | | | | | | | | | | | | | | |
Plant-Related Items | | | 1,371 | | | | 1,382 | | | | 46 | | | | (80 | ) | | | — | | | | — | | | | — | | | | 2 | | | | 1,417 | | | | 1,304 | |
Nuclear Decommissioning | | | — | | | | — | | | | 79 | | | | 74 | | | | — | | | | — | | | | — | | | | — | | | | 79 | | | | 74 | |
Securitization | | | 1,218 | | | | 1,323 | | | | — | | | | — | | | | — | | | | — | | | | — | | | | — | | | | 1,218 | | | | 1,323 | |
Leasing Activities | | | — | | | | — | | | | — | | | | — | | | | 1,678 | | | | 1,564 | | | | — | | | | — | | | | 1,678 | | | | 1,564 | |
Partnership Activities | | | — | | | | — | | | | — | | | | — | | | | 35 | | | | 48 | | | | — | | | | — | | | | 35 | | | | 48 | |
Repair Allowance Deferred Carrying Charge | | | 24 | | | | — | | | | — | | | | — | | | | — | | | | — | | | | — | | | | — | | | | 24 | | | | — | |
Conservation Costs | | | 8 | | | | — | | | | — | | | | — | | | | — | | | | — | | | | — | | | | — | | | | 8 | | | | — | |
Energy Clause Recoveries | | | 24 | | | | 33 | | | | — | | | | — | | | | — | | | | — | | | | — | | | | — | | | | 24 | | | | 33 | |
Pension Costs | | | 86 | | | | 77 | | | | 27 | | | | 19 | | | | — | | | | — | | | | 18 | | | | 23 | | | | 131 | | | | 119 | |
SFAS 143 | | | — | | | | — | | | | 325 | | | | 325 | | | | — | | | | — | | | | — | | | | — | | | | 325 | | | | 325 | |
Taxes Recoverable Through Future Rates (net) | | | 163 | | | | 155 | | | | — | | | | — | | | | — | | | | — | | | | — | | | | — | | | | 163 | | | | 155 | |
Income from Foreign Operations | | | — | | | | — | | | | — | | | | — | | | | 49 | | | | 46 | | | | — | | | | — | | | | 49 | | | | 46 | |
Other | | | — | | | | 5 | | | | (6 | ) | | | 16 | | | | 12 | | | | — | | | | — | | | | — | | | | 6 | | | | 21 | |
| | | |
| | | |
| | | |
| | | |
| | | |
| | | |
| | | |
| | | |
| | | |
| | | |
| |
Total Noncurrent | | | 2,894 | | | | 2,975 | | | | 471 | | | | 354 | | | | 1,774 | | | | 1,658 | | | | 18 | | | | 25 | | | | 5,157 | | | | 5,012 | |
| | | |
| | | |
| | | |
| | | |
| | | |
| | | |
| | | |
| | | |
| | | |
| | | |
| |
Total Liabilities | | | 2,894 | | | | 2,975 | | | | 471 | | | | 354 | | | | 1,774 | | | | 1,658 | | | | 18 | | | | 25 | | | | 5,157 | | | | 5,012 | |
| | | |
| | | |
| | | |
| | | |
| | | |
| | | |
| | | |
| | | |
| | | |
| | | |
| |
Summary—Accumulated Deferred | | | | | | | | | | | | | | | | | | | | | | | | | | | | | | | | | | | | | | | | |
Income Taxes: | | | | | | | | | | | | | | | | | | | | | | | | | | | | | | | | | | | | | | | | |
Net Current Assets | | | 31 | | | | 19 | | | | — | | | | — | | | | — | | | | — | | | | — | | | | — | | | | 31 | | | | 19 | |
Net Noncurrent Liability (Asset) | | | 2,561 | | | | 2,603 | | | | (76 | ) | | | 90 | | | | 1,699 | | | | 1,589 | | | | 5 | | | | 13 | | | | 4,189 | | | | 4,295 | |
| | | |
| | | |
| | | |
| | | |
| | | |
| | | |
| | | |
| | | |
| | | |
| | | |
| |
Total | | $ | 2,530 | | | $ | 2,584 | | | $ | (76 | ) | | $ | 90 | | | $ | 1,699 | | | $ | 1,589 | | | $ | 5 | | | $ | 13 | | | $ | 4,158 | | | $ | 4,276 | |
| | | |
| | | |
| | | |
| | | |
| | | |
| | | |
| | | |
| | | |
| | | |
| | | |
| |
ITC | | | 47 | | | | 50 | | | | 6 | | | | 6 | | | | 6 | | | | 6 | | | | — | | | | — | | | | 59 | | | | 62 | |
Current Portion of SFAS 109 Transferred | | | 31 | | | | 19 | | | | — | | | | — | | | | — | | | | — | | | | — | | | | — | | | | 31 | | | | 19 | |
| | | |
| | | |
| | | |
| | | |
| | | |
| | | |
| | | |
| | | |
| | | |
| | | |
| |
Total Deferred Income Taxes and ITC | | $ | 2,608 | | | $ | 2,653 | | | $ | (70 | ) | | $ | 96 | | | $ | 1,705 | | | $ | 1,595 | | | $ | 5 | | | $ | 13 | | | $ | 4,248 | | | $ | 4,357 | |
| | | |
| | | |
| | | |
| | | |
| | | |
| | | |
| | | |
| | | |
| | | |
| | | |
| |
| | | | | | | | | | | | | | | | | | | | | | | | | | | | | | | | | | | | | | | | |
175
NOTES TO CONSOLIDATED FINANCIAL STATEMENTS
Note 16. Pension, OPEB and Savings Plans
PSEG
PSEG sponsors several qualified and nonqualified pension plans and other postretirement benefit plans covering PSEG's, and its participating affiliates, current and former employees who meet certain eligibility criteria.
Plan Assets
The following table provides the percentage of fair value of total plan assets for each major category of plan assets held as of the measurement date, December 31.
| | | | As of December 31,
|
| | Investments
| | 2005
| | 2004
|
| | Equity Securities | | | 61% | | | | 64% | |
| | Fixed Income Securities | | | 31% | | | | 28% | |
| | Real Estate Assets | | | 6% | | | | 5% | |
| | Other Investments | | | 2% | | | | 3% | |
| | | | |
| | | |
| |
| | Total Percentage | | | 100% | | | | 100% | |
| | | | |
| | | |
| |
| | | | | | | | | | |
PSEG utilizes an independent pension consultant to forecast returns, risk, and correlation of all asset classes in order to develop an optimal portfolio, which is designed to produce the maximum return opportunity per unit of risk. In 2002, PSEG completed its latest asset/liability study. The results from the study indicated that, in order to achieve the optimal risk/return portfolio, target allocations of 62% equity securities, 30% fixed income securities, 5% real estate investments, and 3% for other investments should be maintained. Derivative financial instruments are used by the plans' investment managers primarily to rebalance the fixed income/equity allocation of the portfolio and hedge the currency risk component of the foreign investments.
The expected long-term rate of return on plan assets was 8.75% as of December 31, 2005. For 2006, the expected long-term rate of return on plan assets will remain at 8.75%. This expected return was determined based on the study discussed above and considered the plans' historical annualized rate of return since inception of the plans, which was an annualized return of 10.2%.
Plan Contributions
PSEG anticipates contributing approximately $100 million into its qualified pension plans and $14 million into its postretirement healthcare plan for calendar year 2006.
Medicare Prescription Drug, Improvement, and Modernization Act of 2003 (the Medicare Act)
For information relating to the accounting impacts of the Medicare Act, see Note 2. Recent Accounting Standards.
Accumulated Benefit Obligations
The accumulated benefit obligations of all of PSEG's defined benefit pension plans as of December 31, 2005 and 2004 were $3.2 billion and $3.0 billion, respectively.
176
NOTES TO CONSOLIDATED FINANCIAL STATEMENTS
The following table provides a reconciliation of the changes in the fair value of plan assets during each of the two years in the period ended December 31, 2005 and a reconciliation of the funded status at the end of both years.
| | | Pension Benefits
| | Other Benefits
|
| | | 2005
| | 2004
| | 2005
| | 2004
|
| | | (Millions) |
Change in Benefit Obligation: | | | | | | | | | | | | | | | | |
Projected Benefit Obligation at Beginning of Year | | $ | 3,553 | | | $ | 3,235 | | | $ | 987 | | | $ | 916 | |
Service Cost | | | 90 | | | | 82 | | | | 18 | | | | 22 | |
Interest Cost | | | 206 | | | | 197 | | | | 62 | | | | 55 | |
Actuarial Loss | | | 100 | | | | 216 | | | | 67 | | | | 47 | |
Benefits Paid | | | (196 | ) | | | (178 | ) | | | (60 | ) | | | (52 | ) |
Plan Amendments | | | 6 | | | | — | | | | 145 | | | | — | |
| | | |
| | | |
| | | |
| | | |
| |
Projected Benefit Obligation at End of Year | | | 3,759 | | | | 3,552 | | | | 1,219 | | | | 988 | |
| | | |
| | | |
| | | |
| | | |
| |
Change in Plan Assets: | | | | | | | | | | | | | | | | |
Fair Value of Assets at Beginning of Year | | | 2,920 | | | | 2,696 | | | | 101 | | | | 77 | |
Actual Return on Plan Assets | | | 222 | | | | 306 | | | | 8 | | | | 10 | |
Employer Contributions | | | 159 | | | | 96 | | | | 74 | | | | 66 | |
Benefits Paid | | | (196 | ) | | | (178 | ) | | | (60 | ) | | | (52 | ) |
| | | |
| | | |
| | | |
| | | |
| |
Fair Value of Assets at End of Year | | | 3,105 | | | | 2,920 | | | | 123 | | | | 101 | |
| | | |
| | | |
| | | |
| | | |
| |
Reconciliation of Funded Status: | | | | | | | | | | | | | | | | |
Funded Status | | | (654 | ) | | | (632 | ) | | | (1,096 | ) | | | (887 | ) |
Unrecognized Net | | | | | | | | | | | | | | | | |
Transition Obligation | | | — | | | | — | | | | 167 | | | | 194 | |
Prior Service Cost | | | 61 | | | | 71 | | | | 135 | | | | — | |
Loss | | | 975 | | | | 894 | | | | 197 | | | | 131 | |
| | | |
| | | |
| | | |
| | | |
| |
Net Amount Recognized | | $ | 382 | | | $ | 333 | | | $ | (597 | ) | | $ | (562 | ) |
| | | |
| | | |
| | | |
| | | |
| |
Amounts Recognized in Statement of Financial Position: | | | | | | | | | | | | | | | | |
Prepaid Benefit Cost | | $ | 447 | | | $ | 383 | | | $ | — | | | $ | — | |
Accrued Cost | | | (90 | ) | | | (82 | ) | | | (597 | ) | | | (562 | ) |
Intangible Asset | | | 7 | | | | 11 | | | | N/A | | | | N/A | |
Accumulated Other Comprehensive Loss (pre-tax) | | | 18 | | | | 21 | | | | N/A | | | | N/A | |
| | | |
| | | |
| | | |
| | | |
| |
Net Amount Recognized | | $ | 382 | | | $ | 333 | | | $ | (597 | ) | | $ | (562 | ) |
| | | |
| | | |
| | | |
| | | |
| |
Separate Disclosure for Pension Plans With an Accumulated Benefit Obligation in Excess of Plan Assets: | | | | | | | | | | | | | | | | |
Projected Benefit Obligation at End of Year | | $ | 127 | | | $ | 91 | | | | | | | | | |
Accumulated Benefit Obligation at End of Year | | $ | 99 | | | $ | 81 | | | | | | | | | |
Fair Value of Assets at End of Year | | $ | 13 | | | $ | — | | | | | | | | | |
| | | | | | | | | | | | | | | | |
177
NOTES TO CONSOLIDATED FINANCIAL STATEMENTS
The pension benefits table above provides information relating to the funded status of all qualified and nonqualified pension plans and other postretirement benefit plans on an aggregate basis. The nonqualified pension plans are partially funded with Rabbi Trusts. In accordance with SFAS 87, the plan assets in the table above do not include the assets held in the Rabbi Trusts. The fair value of these assets are included on the Consolidated Balance Sheets. For additional information, see Rabbi Trusts, below.
| | | Pension Benefits
| | Other Benefits
|
| | | 2005
| | 2004
| | 2003
| | 2005
| | 2004
| | 2003
|
| | | (Millions) |
Components of Net Periodic Benefit Cost: | | | | | | | | | | | | | | | | | | | | | | | | |
Service Cost | | $ | 90 | | | $ | 82 | | | $ | 74 | | | $ | 18 | | | $ | 22 | | | $ | 21 | |
Interest Cost | | | 206 | | | | 197 | | | | 195 | | | | 62 | | | | 55 | | | | 51 | |
Expected Return on Plan Assets | | | (249 | ) | | | (231 | ) | | | (193 | ) | | | (9 | ) | | | (7 | ) | | | (5 | ) |
Amortization of Net | | | | | | | | | | | | | | | | | | | | | | | | |
Transition Obligation | | | — | | | | — | | | | 5 | | | | 27 | | | | 27 | | | | 27 | |
Prior Service Cost | | | 16 | | | | 16 | | | | 17 | | | | 9 | | | | — | | | | — | |
Loss/(Gain) | | | 46 | | | | 38 | | | | 49 | | | | 2 | | | | — | | | | (3 | ) |
| | | |
| | | |
| | | |
| | | |
| | | |
| | | |
| |
Net Periodic Benefit Cost | | $ | 109 | | | $ | 102 | | | $ | 147 | | | $ | 109 | | | $ | 97 | | | $ | 91 | |
| | | |
| | | |
| | | |
| | | |
| | | |
| | | |
| |
Components of Total Benefit Expense: | | | | | | | | | | | | | | | | | | | | | | | | |
Net Periodic Benefit Cost | | $ | 109 | | | $ | 102 | | | $ | 147 | | | $ | 109 | | | $ | 97 | | | $ | 91 | |
Effect of Regulatory Asset | | | — | | | | — | | | | — | | | | 19 | | | | 19 | | | | 19 | |
| | | |
| | | |
| | | |
| | | |
| | | |
| | | |
| |
Total Benefit Expense Including Effect of Regulatory Asset | | $ | 109 | | | $ | 102 | | | $ | 147 | | | $ | 128 | | | $ | 116 | | | $ | 110 | |
| | | |
| | | |
| | | |
| | | |
| | | |
| | | |
| |
Weighted-Average Assumptions Used to Determine Net Periodic Benefit Cost for Years Ended December 31: | | | | | | | | | | | | | | | | | | | | | | | | |
Discount Rate | | | 6.00 | % | | | 6.25 | % | | | 6.75 | % | | | 6.00 | % | | | 6.25 | % | | | 6.75 | % |
Expected Return on Plan Assets | | | 8.75 | % | | | 8.75 | % | | | 9.00 | % | | | 8.75 | % | | | 8.75 | % | | | 9.00 | % |
Rate of Compensation Increase | | | 4.69 | % | | | 4.69 | % | | | 4.69 | % | | | 4.69 | % | | | 4.69 | % | | | 4.69 | % |
Weighted-Average Assumptions Used to Determine Benefit Obligations as of December 31: | | | | | | | | | | | | | | | | | | | | | | | | |
Discount Rate | | | 5.75 | % | | | 6.00 | % | | | 6.25 | % | | | 5.75 | % | | | 6.00 | % | | | 6.25 | % |
Rate of Compensation Increase | | | 4.69 | % | | | 4.69 | % | | | 4.69 | % | | | 4.69 | % | | | 4.69 | % | | | 4.69 | % |
Rate of Increase in Health Benefit Costs | | | | | | | | | | | | | | | | | | | | | | | | |
Administrative Expense | | | | | | | | | | | | | | | 5.00 | % | | | 5.00 | % | | | 5.00 | % |
Dental Costs | | | | | | | | | | | | | | | 6.00 | % | | | 6.00 | % | | | 6.00 | % |
Pre-65 Medical Costs | | | | | | | | | | | | | | | | | | | | | | | | |
Immediate Rate | | | | | | | | | | | | | | | 9.50 | % | | | 10.00 | % | | | 9.00 | % |
Ultimate Rate | | | | | | | | | | | | | | | 5.00 | % | | | 5.00 | % | | | 6.00 | % |
Year Ultimate Rate Reached | | | | | | | | | | | | | | | 2011 | | | | 2010 | | | | 2009 | |
Post-65 Medical Costs | | | | | | | | | | | | | | | | | | | | | | | | |
Immediate Rate | | | | | | | | | | | | | | | 10.50 | % | | | 11.00 | % | | | 7.00 | % |
Ultimate Rate | | | | | | | | | | | | | | | 5.00 | % | | | 5.00 | % | | | 6.00 | % |
Year Ultimate Rate Reached | | | | | | | | | | | | | | | 2012 | | | | 2011 | | | | 2005 | |
Effect of a Change in the Assumed Rate of Increase in Health Benefit Costs: | | | | | | | | | | | | | | | | | | | | | | | | |
Effect of a 1% Increase On | | | | | | | | | | | | | | | | | | | | | | | | |
Total of Service Cost and Interest Cost | | | | | | | | | | | | | | $ | 11 | | | $ | 4 | | | $ | 4 | |
Postretirement Benefit Obligation | | | | | | | | | | | | | | $ | 132 | | | $ | 57 | | | $ | 51 | |
Effect of a 1% Decrease On | | | | | | | | | | | | | | | | | | | | | | | | |
Total of Service Cost and Interest Cost | | | | | | | | | | | | | | $ | (9 | ) | | $ | (3 | ) | | $ | (5 | ) |
Postretirement Benefit Obligation | | | | | | | | | | | | | | $ | (109 | ) | | $ | (50 | ) | | $ | (59 | ) |
| | | | | | | | | | | | | | | | | | | | | | | | |
178
NOTES TO CONSOLIDATED FINANCIAL STATEMENTS
Cash Flows
Estimated Future Benefit Payments (Reflecting Expected Future Service)
The following pension benefit and postretirement benefit payments, which reflect expected future service, are expected to be paid. Postretirement benefit payments are shown net of the federal subsidy expected for prescription drugs under the Medicare Act.
| | Year
| | Pension
Benefits
| | Other
Benefits
| | Medicare
Subsidy
| | Net
Other
Benefits
|
| | | | (Millions) |
| | 2006 | | $ | 189 | | | $ | 69 | | | $ | (4 | ) | | $ | 65 | |
| | 2007 | | | 192 | | | | 71 | | | | (4 | ) | | | 67 | |
| | 2008 | | | 196 | | | | 73 | | | | (4 | ) | | | 69 | |
| | 2009 | | | 201 | | | | 76 | | | | (5 | ) | | | 71 | |
| | 2010 | | | 207 | | | | 78 | | | | (5 | ) | | | 73 | |
| | 2011–2015 | | | 1,159 | | | | 397 | | | | (30 | ) | | | 367 | |
| | | | |
| | | |
| | | |
| | | |
| |
| | Total | | $ | 2,144 | | | $ | 764 | | | $ | (52 | ) | | $ | 712 | |
| | | | |
| | | |
| | | |
| | | |
| |
| | | | | | | | | | | | | | | | | | |
Rabbi Trusts
PSEG maintains certain unfunded, nonqualified benefit plans for which certain assets have been set aside in grantor trusts commonly known as “Rabbi Trusts” to provide supplemental retirement and deferred compensation benefits to certain of its and its subsidiaries' key employees and directors.
Effective January 1, 2003, PSEG began accounting for the assets in the Rabbi Trusts under SFAS 115. PSEG classifies investments in the Rabbi Trusts as available-for-sale under SFAS 115. The following tables show the fair values, gross unrealized gains and losses and amortized cost bases for the securities held in the Rabbi Trusts.
| | | As of December 31, 2005
|
| | | Cost
| | Gross
Unrealized
Gains
| | Gross
Unrealized
Losses
| | Estimated
Fair Value
|
| | | (Millions) |
Equity Securities | | $ | 11 | | | $ | 1 | | | $ | — | | | $ | 12 | |
Debt Securities | | | | | | | | | | | | | | | | |
Government Obligations | | | 68 | | | | — | | | | 1 | | | | 67 | |
Other Debt Securities | | | 29 | | | | — | | | | 1 | | | | 28 | |
| | | |
| | | |
| | | |
| | | |
| |
Total Debt Securities | | | 97 | | | | — | | | | 2 | | | | 95 | |
| | | |
| | | |
| | | |
| | | |
| |
Other Securities | | | 12 | | | | — | | | | — | | | | 12 | |
| | | |
| | | |
| | | |
| | | |
| |
Total Available-for-Sale Securities | | $ | 120 | | | $ | 1 | | | $ | 2 | | | $ | 119 | |
| | | |
| | | |
| | | |
| | | |
| |
| | | | | | | | | | | | | | | | |
| | | As of December 31, 2004
|
| | | Cost
| | Gross
Unrealized
Gains
| | Gross
Unrealized
Losses
| | Estimated
Fair Value
|
| | | (Millions) |
Equity Securities | | $ | 11 | | | $ | 1 | | | $ | — | | | $ | 12 | |
Debt Securities | | | | | | | | | | | | | | | | |
Government Obligations | | | 57 | | | | — | | | | — | | | | 57 | |
Other Debt Securities | | | 26 | | | | — | | | | — | | | | 26 | |
| | | |
| | | |
| | | |
| | | |
| |
Total Debt Securities | | | 83 | | | | — | | | | — | | | | 83 | |
| | | |
| | | |
| | | |
| | | |
| |
Other Securities | | | 11 | | | | — | | | | — | | | | 11 | |
| | | |
| | | |
| | | |
| | | |
| |
Total Available-for-Sale Securities | | $ | 105 | | | $ | 1 | | | $ | — | | | $ | 106 | |
| | | |
| | | |
| | | |
| | | |
| |
| | | | | | | | | | | | | | | | |
179
NOTES TO CONSOLIDATED FINANCIAL STATEMENTS
| | | | Years Ended
December 31,
|
| | | | 2005
| | 2004
| | 2003
|
| | | | (Millions) |
| | Proceeds from Sales | | $ | 100 | | | $ | 95 | | | $ | 15 | |
| | Gross Realized Gains | | $ | — | | | $ | 3 | | | $ | — | |
| | Gross Realized Losses | | $ | (1 | ) | | $ | 1 | | | $ | — | |
| | | | | | | | | | | | | | |
Net realized losses of $1 million were recognized in Other Deductions on PSEG's Consolidated Statement of Operations for the year ended December 31, 2005. The available-for-sale debt securities held as of December 31, 2005, had the following maturities: $3 million less than one year, $29 million one to five years, $21 million five to 10 years, $7 million 10 to 15 years, $5 million 15 to 20 years, and $30 million over 20 years. The cost of these securities was determined on the basis of specific identification.
The estimated fair value of the Rabbi Trusts related to PSEG, PSE&G, Power and Energy Holdings are detailed as follows:
| | | | As of
December 31,
|
| | | | 2005
| | 2004
|
| | | | (Millions) |
| | PSE&G | | $ | 50 | | | $ | 49 | |
| | Power | | | 26 | | | | 20 | |
| | Energy Holdings | | | 10 | | | | 9 | |
| | Services | | | 33 | | | | 28 | |
| | | | |
| | | |
| |
| | Total | | $ | 119 | | | $ | 106 | |
| | | | |
| | | |
| |
| | | | | | | | | | |
401(k) Plans
PSEG sponsors two 401(k) plans, which are Employee Retirement Income Security Act (ERISA) defined contribution plans. Eligible represented employees of PSE&G, Power and Services participate in the PSEG Employee Savings Plan (Savings Plan), while eligible non-represented employees of PSE&G, Power, Energy Holdings and Services participate in the PSEG Thrift and Tax-Deferred Savings Plan (Thrift Plan). Eligible employees may contribute up to 50% of their compensation to these plans. Employee contributions up to 7% for Savings Plan participants and up to 8% for Thrift Plan participants are matched with Employer contributions of cash equal to 50% of such employee contributions. The amount paid for Employer matching contributions to the plans for PSEG, PSE&G, Power and Energy Holdings are detailed as follows:
| | | | Thrift Plan and
Savings Plan
|
| | | | Years Ended
December 31,
|
| | | | 2005
| | 2004
| | 2003
|
| | | | (Millions) |
| | PSE&G | | $ | 15 | | | $ | 15 | | | $ | 13 | |
| | Power | | | 9 | | | | 8 | | | | 9 | |
| | Energy Holdings | | | — | | | | 1 | | | | 1 | |
| | Services | | | 4 | | | | 3 | | | | 2 | |
| | | | |
| | | |
| | | |
| |
| | Total Employer Matching Contributions | | $ | 28 | | | $ | 27 | | | $ | 25 | |
| | | | |
| | | |
| | | |
| |
| | | | | | | | | | | | | | |
180
NOTES TO CONSOLIDATED FINANCIAL STATEMENTS
PSEG, PSE&G, Power and Energy Holdings
Eligible employees of PSE&G, Power, Energy Holdings and Services participate in non-contributory pension and OPEB plans sponsored by PSEG and administered by Services. In addition, represented and nonrepresented employees are eligible for participation in PSEG's two defined contribution plans described above. Pension costs and OPEB costs for PSEG, PSE&G, Power and Energy Holdings are detailed as follows:
| | | | Pension Benefits
| | Other Benefits
|
| | | | Years Ended
December 31,
| | Years Ended
December 31,
|
| | | | 2005
| | 2004
| | 2003
| | 2005
| | 2004
| | 2003
|
| | | | (Millions) |
| | PSE&G | | $ | 55 | | | $ | 52 | | | $ | 79 | | | $ | 112 | | | $ | 104 | | | $ | 100 | |
| | Power | | | 33 | | | | 31 | | | | 46 | | | | 12 | | | | 9 | | | | 8 | |
| | Energy Holdings | | | 2 | | | | 2 | | | | 4 | | | | — | | | | — | | | | — | |
| | Services | | | 19 | | | | 17 | | | | 18 | | | | 4 | | | | 3 | | | | 2 | |
| | | | |
| | | |
| | | |
| | | |
| | | |
| | | |
| |
| | Total Benefit Expense | | $ | 109 | | | $ | 102 | | | $ | 147 | | | $ | 128 | | | $ | 116 | | | $ | 110 | |
| | | | |
| | | |
| | | |
| | | |
| | | |
| | | |
| |
Note 17. Stock Options and Employee Stock Purchase Plan
PSEG
Stock Options
As approved at the Annual Meeting of Stockholders in 2004, PSEG's 2004 Long-Term Incentive Plan (2004 LTIP) replaced prior Long-Term Incentive Plans (the 1989 LTIP and 2001 LTIP). The 2004 LTIP is a broad-based equity compensation program that provides for grants of various long-term incentive compensation awards, such as qualified and non-qualified stock options, stock appreciation rights, performance shares and restricted stock. Under the 2004 LTIP, non-qualified options to acquire shares of PSEG Common Stock may be granted to officers and other key employees of PSEG, PSE&G, Power, Energy Holdings, Services and their respective subsidiaries selected by the Organization and Compensation Committee of PSEG's Board of Directors, the plan's administrative committee (Committee).
Payment by option holders upon exercise of an option may be made in cash or, with the consent of the Committee, by delivering previously acquired shares of PSEG Common Stock. Options are exercisable over a period of time designated by the Committee (but not prior to one year or longer than 10 years from the date of grant) and are subject to such other terms and conditions as the Committee determines. Vesting schedules may be accelerated upon the occurrence of certain events, such as a change-in-control. Options may not be transferred during the lifetime of a holder.
The LTIP currently provides for the issuance of equity awards with respect to approximately 13.0 million shares of common stock. As of December 31, 2005, there were 11.8 million shares available for future awards under the 2004 LTIP.
PSEG purchases shares on the open market to meet the exercise of stock options. The difference between the cost of the shares (generally purchased on the date of exercise) and the exercise price of the options has been reflected in Stockholders' Equity, except where otherwise discussed.
181
NOTES TO CONSOLIDATED FINANCIAL STATEMENTS
Changes in common shares under option for the three fiscal years in the period ended December 31, 2005 are summarized as follows:
| | | | 2005
| | 2004
| | 2003
|
| | | | Options
| | Weighted
Average
Exercise
Price
| | Options
| | Weighted
Average
Exercise
Price
| | Options
| | Weighted
Average
Exercise
Price
|
| | Beginning of Year | | | 7,690,902 | | | $ | 39.97 | | | | 8,734,931 | | | $ | 39.37 | | | | 9,192,631 | | | $ | 39.32 | |
| | Granted | | | — | | | | — | | | | 863,700 | | | | 43.87 | | | | 706,300 | | | | 37.35 | |
| | Exercised | | | (3,707,347 | ) | | | 38.78 | | | | (1,539,966 | ) | | | 38.49 | | | | (541,767 | ) | | | 32.76 | |
| | Canceled | | | (2,000 | ) | | | 46.06 | | | | (367,763 | ) | | | 41.26 | | | | (622,233 | ) | | | 42.01 | |
| | | | |
| | | |
| | | |
| | | |
| | | |
| | | |
| |
| | End of Year | | | 3,981,555 | | | $ | 41.07 | | | | 7,690,902 | | | $ | 39.97 | | | | 8,734,931 | | | $ | 39.37 | |
| | | | |
| | | |
| | | |
| | | |
| | | |
| | | |
| |
| | Exercisable at End of Year | | | 3,171,589 | | | $ | 40.82 | | | | 5,612,528 | | | $ | 40.05 | | | | 5,822,196 | | | $ | 40.44 | |
| | | | |
| | | |
| | | |
| | | |
| | | |
| | | |
| |
| | Weighted average fair value of options granted during the year | | | | | | $ | — | | | | | | | $ | 6.58 | | | | | | | $ | 5.73 | |
| | | | | | | | |
| | | | | | | |
| | | | | | | |
| |
| | | | | | | | | | | | | | | | | | | | | | | | | | |
The following table provides information about options outstanding as of December 31, 2005:
| | | | | | | Options Outstanding
| | Options Exercisable
|
| | Range of
Exercise Prices
| | | Outstanding at
December 31,
2005
| | Weighted
Average
Remaining
Contractual
Life
| | Weighted
Average
Exercise
Price
| | Exercisable at
December 31,
2005
| | Weighted
Average
Exercise
Price
|
| | | $30.03—$35.03 | | | | | 911,782 | | | | 6.2 | | | | 32.32 | | | | 809,972 | | | | 32.07 | |
| | | $35.04—$40.03 | | | | | 157,000 | | | | 3.0 | | | | 39.31 | | | | 157,000 | | | | 39.31 | |
| | | $40.04—$45.04 | | | | | 1,515,780 | | | | 6.8 | | | | 41.91 | | | | 987,589 | | | | 41.79 | |
| | | $45.05—$50.05 | | | | | 1,396,993 | | | | 5.6 | | | | 46.07 | | | | 1,117,028 | | | | 46.04 | |
| | | | | | | |
| | | |
| | | |
| | | |
| | | |
| |
| | | $30.03—$50.05 | | | | | 3,981,555 | | | | 6.1 | | | $ | 41.07 | | | | 3,071,589 | | | $ | 40.65 | |
| | | | | | | |
| | | |
| | | |
| | | |
| | | |
| |
| | | | | | | | | | | | | | | | | | | | | | | | | |
The fair value of each option grant is estimated on the date of grant using the Black-Scholes option-pricing model. There were no options granted during 2005. The following weighted average assumptions were used for grants in 2004 and 2003, respectively: expected volatility of 26.74% and 29.68%, risk-free interest rates of 3.09% and 2.86%, expected lives of 4.0 years and 4.4 years. There was a weighted average dividend yield of 5.00% in 2004 and 5.82% in 2003.
Stock Compensation
Executive Officers
In June 1998, the Committee granted 150,000 shares of restricted Common Stock to a key executive. An additional 60,000 shares of restricted stock was granted to this executive in November 2001. These shares are subject to restrictions on transfer and subject to risk of forfeiture until earned by continued employment. The shares vest on a staggered schedule beginning on March 31, 2002 and become fully vested on March 31, 2007. As the shares vest, the earned compensation is recorded as compensation expense in the Consolidated Statements of Operations. The unearned compensation related to this restricted stock grant as of December 31, 2005 was less than $1 million and is included in Stockholders' Equity on the Consolidated Balance Sheets.
In 2005 and 2004, 447,700 and 94,400 shares, respectively, of restricted PSEG Common Stock were granted under the 2004 LTIP to certain key executives. These shares are subject to restrictions on transfer and subject to risk of forfeiture until vested by continued employment. The shares vest on a staggered schedule through December 20, 2008. The unearned compensation related to these restricted stock grants as of December 31, 2005 was approximately $22 million and is included in Common Stockholders' Equity on the Consolidated Balance Sheets. PSEG recorded compensation expense for restricted stock of approximately $7 million and $3 million for the years ended December 31, 2005 and 2004, respectively.
182
NOTES TO CONSOLIDATED FINANCIAL STATEMENTS
Also in 2004, 94,400 performance units were granted to certain key executives, which provide for payment in shares of PSEG Common Stock based on achievement of certain financial goals over the 2004 through 2006 three-year period. The payout varies from 0% to 200% of performance units depending on the Company's performance compared to the performance of other companies in the Dow Jones Utilities Index. The performance units are credited with dividend equivalents in an amount equal to dividends paid on PSEG Common Stock up until January 1, 2007. As of December 31, 2005, approximately 89,997 performance units were outstanding. PSEG recorded approximately $3 million of compensation expense related to performance units in 2005.
Outside Directors
During 2005, each director who was not an officer of PSEG or its subsidiaries and affiliates was paid an annual retainer of $50,000. Pursuant to the Compensation Plan for Outside Directors, a certain percentage, currently 50%, of the annual retainer is paid in PSEG Common Stock. In January 2003, PSEG amended the Compensation Plan for Outside Directors to provide for 100,000 shares of Common Stock to be used for awards to directors of PSEG who are not employees of PSEG or its subsidiaries.
PSEG also maintains a Stock Plan for Outside Directors pursuant to which directors of PSEG who are not employees of PSEG or its subsidiaries receive a restricted stock award, currently 1,000 shares per year, for each year of service as a director. The restrictions on the stock granted under the Stock Plan for Outside Directors provide that the shares are subject to forfeiture if the director leaves service at any time prior to the Annual Meeting of Stockholders following his or her 70th birthday. This restriction would be deemed to have been satisfied if the director's service were terminated after a “change in control” as defined in the Plan or if the director were to die in office. PSEG also has the ability to waive this restriction for good cause shown. Restricted stock may not be sold or otherwise transferred prior to the lapse of the restrictions. Dividends on shares held subject to restrictions are paid directly to the director who has the right to vote the shares. The fair value of these shares is recorded as compensation expense in the Consolidated Statements of Operations. Compensation expense for the Stock Plan for Outside Directors was less than $1 million for each of years ended December 31 2005, 2004 and 2003.
Employee Stock Purchase Plan
PSEG maintains an employee stock purchase plan for all eligible employees of PSEG, PSE&G, Power, Energy Holdings and Services. Under the plan, shares of PSEG Common Stock may be purchased at 95% of the fair market value through payroll deductions. Employees may purchase shares having a value not exceeding 10% of their base pay. During 2005, 2004 and 2003, employees purchased 73,062, 99,176 and 102,532 shares at an average price of $59.28, $43.62 and $40.00 per share, respectively. As of December 31, 2005, 1,889,080 shares were available for future issuance under this plan.
Note 18. Financial Information by Business Segment
Basis of Organization
PSEG, PSE&G, Power and Energy Holdings
The reportable segments were determined by management in accordance with SFAS No. 131, “Disclosures About Segments of an Enterprise and Related Information” (SFAS 131). These segments were determined based on how management measures performance based on segment Net Income, as illustrated in the following table, and how it allocates resources to each business.
PSE&G
PSE&G earns revenue from its tariffs, under which it provides electric transmission and electric and gas distribution services to residential, commercial and industrial customers in New Jersey. The rates charged for electric transmission are regulated by FERC while the rates charged for electric and gas distribution are
183
NOTES TO CONSOLIDATED FINANCIAL STATEMENTS
regulated by the BPU. Revenues are also earned from several other activities such as sundry sales, the appliance service business, wholesale transmission services and other miscellaneous services.
Power
Power earns revenues by selling energy, capacity and ancillary services on a wholesale basis under contract to power marketers and to load serving entities and by bidding energy, capacity and ancillary services into the markets for these products. Power also enters into trading contracts for energy, capacity, firm transmission rights, gas, emission allowances and other energy-related contracts to optimize the value of its portfolio of generating assets and its electric and gas supply obligations.
Energy Holdings
Global
Global earns revenues from its investment in and operation of projects in the generation and distribution of energy, both domestically and internationally. Global has ownership interests in four distribution companies and has developed or acquired interests in electric generation facilities which sell energy, capacity and ancillary services to numerous customers. The generation plants sell power under long-term agreements as well as on a merchant basis while the distribution companies are rate-regulated enterprises. Revenues include revenues of consolidated investments. Gains and losses on sales of investments are typically recognized in revenues.
Resources
Resources earns revenues from its passive investments in leveraged leases, limited partnerships, leveraged buyout funds and marketable securities. Approximately 89% of Resources' investments are in energy industry-related leveraged leases. DSM investments were transferred to Resources on December 31, 2002 and earn revenues primarily from monthly payments from utilities, representing shared electricity savings from the installation of energy efficient equipment. Resources operates both domestically and internationally; however, revenues from all international investments are denominated in U.S. Dollars. Gains and losses on sales of investments are typically recognized in revenues.
Other
Energy Holdings' other activities include amounts applicable to Energy Holdings (parent company). The net losses primarily relate to financing and certain administrative and general costs at the Energy Holdings parent corporation.
Other
PSEG's other activities include amounts applicable to PSEG (parent corporation), and intercompany eliminations, primarily relating to intercompany transactions between Power and PSE&G. No gains or losses are recorded on any intercompany transactions; rather, all intercompany transactions are at cost or, in the case of the BGS and BGSS contracts between Power and PSE&G, at rates prescribed by the BPU. For a further discussion of the intercompany transactions between Power and PSE&G, see Note 21. Related-Party Transactions. The net losses primarily relate to financing and certain administrative and general costs at the PSEG parent corporation.
184
NOTES TO CONSOLIDATED FINANCIAL STATEMENTS
Information related to the segments of PSEG and its subsidiaries is detailed below:
| | | | | | | | | | | Energy Holdings
| | | | | | | | |
| | | PSE&G
| | Power
| | Resources
| | Global
| | Other
| | Other
| | Consolidated
Total
|
| | | (Millions) |
For the Year Ended December 31, 2005: | | | | | | | | | | | | | | | | | | | | | | | | | | | | |
Total Operating Revenues | | $ | 7,728 | | | $ | 6,059 | | | $ | 247 | | | $ | 1,045 | | | $ | 10 | | | $ | (2,659 | ) | | $ | 12,430 | |
Depreciation and Amortization | | | 553 | | | | 131 | | | | 7 | | | | 39 | | | | — | | | | 18 | | | | 748 | |
Income (Loss) from Equity Method Investments | | | — | | | | — | | | | (1 | ) | | | 132 | | | | — | | | | — | | | | 131 | |
Operating Income (Loss) | | | 913 | | | | 693 | | | | 208 | | | | 300 | | | | (11 | ) | | | (18 | ) | | | 2,085 | |
Interest Income | | | 11 | | | | 10 | | | | — | | | | — | | | | — | | | | 1 | | | | 22 | |
Net Interest Charges | | | 342 | | | | 131 | | | | 73 | | | | 138 | | | | 2 | | | | 130 | | | | 816 | |
Income (Loss) Before Income Taxes | | | 583 | | | | 705 | | | | 130 | | | | 147 | | | | (8 | ) | | | (158 | ) | | | 1,399 | |
Income Taxes | | | 235 | | | | 299 | | | | 38 | | | | 34 | | | | (3 | ) | | | (62 | ) | | | 541 | |
Income (Loss) From Continuing Operations | | | 348 | | | | 406 | | | | 92 | | | | 112 | | | | (5 | ) | | | (95 | ) | | | 858 | |
(Loss)/Income from Discontinued Operations, net of tax (including Loss on Disposal) | | | — | | | | (198 | ) | | | — | | | | 18 | | | | — | | | | — | | | | (180 | ) |
Cumulative Effect of a Change in Accounting Principle, net of tax | | | — | | | | (16 | ) | | | — | | | | — | | | | — | | | | (1 | ) | | | (17 | ) |
Net Income (Loss) | | | 348 | | | | 192 | | | | 92 | | | | 130 | | | | (5 | ) | | | (96 | ) | | | 661 | |
Segment Earnings (Loss) | | | 344 | | | | 192 | | | | 92 | | | | 127 | | | | (5 | ) | | | (89 | ) | | | 661 | |
Gross Additions to Long-Lived Assets | | $ | 498 | | | $ | 476 | | | $ | 3 | | | $ | 34 | | | $ | 1 | | | $ | 12 | | | $ | 1,024 | |
As of December 31, 2005: | | | | | | | | | | | | | | | | | | | | | | | | | | | | |
Total Assets | | $ | 14,291 | | | $ | 8,945 | | | $ | 2,874 | | | $ | 3,799 | | | $ | 384 | | | $ | (478 | ) | | $ | 29,815 | |
Investments in Equity Method Subsidiaries | | $ | — | | | $ | — | | | $ | 15 | | | $ | 1,128 | | | $ | — | | | $ | — | | | $ | 1,143 | |
For the Year Ended December 31, 2004: | | | | | | | | | | | | | | | | | | | | | | | | | | | | |
Total Operating Revenues | | $ | 6,972 | | | $ | 5,168 | | | $ | 187 | | | $ | 639 | | | $ | 10 | | | $ | (2,176 | ) | | $ | 10,800 | |
Depreciation and Amortization | | | 523 | | | | 108 | | | | 5 | | | | 39 | | | | — | | | | 18 | | | | 693 | |
Income from Equity Method Investments | | | — | | | | — | | | | 1 | | | | 125 | | | | — | | | | — | | | | 126 | |
Operating Income (Loss) | | | 943 | | | | 552 | | | | 154 | | | | 284 | | | | (13 | ) | | | 8 | | | | 1,928 | |
Interest Income | | | 10 | | | | 10 | | | | — | | | | — | | | | — | | | | — | | | | 20 | |
Net Interest Charges | | | 362 | | | | 113 | | | | 81 | | | | 138 | | | | 4 | | | | 100 | | | | 798 | |
Income (Loss) Before Income Taxes | | | 592 | | | | 551 | | | | 71 | | | | 141 | | | | (13 | ) | | | (105 | ) | | | 1,237 | |
Income Taxes | | | 246 | | | | 209 | | | | 4 | | | | 47 | | | | (5 | ) | | | (34 | ) | | | 467 | |
Income (Loss) From Continuing Operations | | | 346 | | | | 342 | | | | 68 | | | | 93 | | | | (10 | ) | | | (69 | ) | | | 770 | |
Loss from Discontinued Operations, net of tax | | | — | | | | (34 | ) | | | — | | | | (10 | ) | | | — | | | | — | | | | (44 | ) |
Net Income (Loss) | | | 346 | | | | 308 | | | | 68 | | | | 83 | | | | (10 | ) | | | (69 | ) | | | 726 | |
Segment Earnings (Loss) | | | 342 | | | | 308 | | | | 65 | | | | 69 | | | | (9 | ) | | | (49 | ) | | | 726 | |
Gross Additions to Long-Lived Assets | | $ | 420 | | | $ | 725 | | | $ | 11 | | | $ | 89 | | | $ | — | | | $ | 16 | | | $ | 1,261 | |
As of December 31, 2004: | | | | | | | | | | | | | | | | | | | | | | | | | | | | |
Total Assets | | $ | 13,586 | | | $ | 8,607 | | | $ | 2,999 | | | $ | 4,144 | | | $ | 69 | | | $ | (145 | ) | | $ | 29,260 | |
Investments in Equity Method Subsidiaries | | $ | — | | | $ | — | | | $ | 41 | | | $ | 1,027 | | | $ | — | | | $ | — | | | $ | 1,068 | |
For the Year Ended December 31, 2003: | | | | | | | | | | | | | | | | | | | | | | | | | | | | |
Total Operating Revenues | | $ | 6,740 | | | $ | 5,608 | | | $ | 238 | | | $ | 348 | | | $ | 11 | | | $ | (1,939 | ) | | $ | 11,006 | |
Depreciation and Amortization | | | 372 | | | | 97 | | | | 5 | | | | 33 | | | | — | | | | 9 | | | | 516 | |
Income from Equity Method Investments | | | — | | | | — | | | | 1 | | | | 113 | | | | — | | | | — | | | | 114 | |
Operating Income (Loss) | | | 761 | | | | 850 | | | | 206 | | | | 245 | | | | (5 | ) | | | 12 | | | | 2,069 | |
Interest Income | | | (7 | ) | | | 8 | | | | — | | | | — | | | | — | | | | 2 | | | | 3 | |
Net Interest Charges | | | 390 | | | | 107 | | | | 96 | | | | 115 | | | | 3 | | | | 114 | | | | 825 | |
Income (Loss) Before Income Taxes | | | 376 | | | | 815 | | | | 109 | | | | 146 | | | | (6 | ) | | | (116 | ) | | | 1,324 | |
Income Taxes | | | 129 | | | | 332 | | | | 37 | | | | 22 | | | | (1 | ) | | | (50 | ) | | | 469 | |
Income (Loss) From Continuing Operations | | | 247 | | | | 483 | | | | 72 | | | | 116 | | | | (5 | ) | | | (58 | ) | | | 855 | |
Loss from Discontinued Operations, net of tax | | | — | | | | (9 | ) | | | — | | | | (18 | ) | | | (20 | ) | | | — | | | | (47 | ) |
Extraordinary Item, net of tax | | | (18 | ) | | | — | | | | — | | | | — | | | | — | | | | — | | | | (18 | ) |
Cumulative Effect of a Change in Accounting Principle, net of tax | | | — | | | | 370 | | | | — | | | | — | | | | — | | | | — | | | | 370 | |
Net Income (Loss) | | | 229 | | | | 844 | | | | 72 | | | | 98 | | | | (25 | ) | | | (58 | ) | | | 1,160 | |
Segment Earnings (Loss) | | | 225 | | | | 844 | | | | 66 | | | | 81 | | | | (25 | ) | | | (31 | ) | | | 1,160 | |
Gross Additions to Long-Lived Assets | | $ | 406 | | | $ | 699 | | | $ | 1 | | | $ | 306 | | | $ | 1 | | | $ | 21 | | | $ | 1,434 | |
185
NOTES TO CONSOLIDATED FINANCIAL STATEMENTS
Geographic information for PSEG is disclosed below. The foreign assets and operations noted below relate solely to Energy Holdings.
| | | Revenues
| | Assets(A)
|
| | | December 31,
| | December 31,
|
| | | 2005
| | 2004
| | 2003
| | 2005
| | 2004
|
| | | (Millions) |
United States | | $ | 11,913 | | | $ | 10,338 | | | $ | 10,582 | | | $ | 25,510 | | | $ | 24,966 | |
Foreign Countries | | | 517 | | | | 462 | | | | 424 | | | | 4,305 | | | | 4,294 | |
| | | |
| | | |
| | | |
| | | |
| | | |
| |
Total | | $ | 12,430 | | | $ | 10,800 | | | $ | 11,006 | | | $ | 29,815 | | | $ | 29,260 | |
| | | | | | | | | | | | | | | | | | | | |
| | | |
| | | |
| | | |
| | | |
| | | |
| |
Identifiable assets in foreign countries include: | | | | | | | | |
Chile | | $ | 1,463 | | | $ | 1,279 | |
Netherlands | | | 1,174 | | | | 1,113 | |
Poland | | | 500 | | | | 524 | |
Peru | | | 440 | | | | 449 | |
Austria | | | 178 | | | | 165 | |
Oman | | | 18 | | | | 269 | |
Brazil | | | 223 | | | | 178 | |
Other | | | 309 | | | | 317 | |
| | | |
| | | |
| |
Total | | $ | 4,305 | | | $ | 4,294 | |
| | | |
| | | |
| |
| | | |
| (A) | | Total assets are net of foreign currency translation adjustment of $(44) million (after-tax) as of December 31, 2005 and $(129) million (after-tax) as of December 31, 2004. |
As of December 31, 2005, Global and Resources had approximately $2.8 billion and $1.5 billion, respectively, of international assets. As of December 31, 2005, foreign assets represented 14% and 61% of PSEG's and Energy Holdings' consolidated assets, respectively, and the revenues related to those foreign assets contributed 4% and 40% to PSEG's and Energy Holdings' consolidated revenues, respectively, for the year ended December 31, 2005.
On January 31, 2006, Global entered into an agreement for the sale of its indirect interests in its two electric generating facilities in Poland, Elcho and Skawina, to CEZ a.s., the former Czech national utility company and the largest electric power company in central and eastern Europe. Elcho is a 220 MW coal-fired plant in which Global has an approximate 89% economic interest. Skawina is a 590 MW coal- and biomass-fired plant that is approximately 75% owned by Global. Each plant supplies electricity and heat to areas in southern Poland. The 2005 results for Global's assets in Poland have been reclassified to Discontinued Operations to reflect the Company's intention to sell its facilities. For additional information, see Note 4. Discontinued Operations, Dispositions and Acquisitions.
186
NOTES TO CONSOLIDATED FINANCIAL STATEMENTS
Note 19. Property, Plant and Equipment and Jointly-Owned Facilities
Information related to Property, Plant and Equipment as of December 31, 2005 and 2004 is detailed below:
| | | | PSE&G
| | Power
| | Energy
Holdings
| | Other
| | PSEG
Consolidated
|
| | | | (Millions) |
| | 2005 | | | | | | | | | | | | | | | | | | | | |
| | Generation: | | | | | | | | | | | | | | | | | | | | |
| | Fossil Production | | $ | — | | | $ | 3,957 | | | $ | 750 | | | $ | — | | | $ | 4,707 | |
| | Nuclear Production | | | — | | | | 606 | | | | — | | | | — | | | | 606 | |
| | Nuclear Fuel in Service | | | — | | | | 490 | | | | — | | | | — | | | | 490 | |
| | Construction Work in Progress | | | — | | | | 1,343 | | | | 1 | | | | — | | | | 1,344 | |
| | | | |
| | | |
| | | |
| | | |
| | | |
| |
| | Total Generation | | | — | | | | 6,396 | | | | 751 | | | | — | | | | 7,147 | |
| | | | |
| | | |
| | | |
| | | |
| | | |
| |
| | Transmission and Distribution: | | | | | | | | | | | | | | | | | | | | |
| | Electric Transmission | | | 1,358 | | | | — | | | | — | | | | — | | | | 1,358 | |
| | Electric Distribution | | | 5,088 | | | | — | | | | 561 | | | | — | | | | 5,649 | |
| | Gas Transmission | | | 75 | | | | — | | | | — | | | | — | | | | 75 | |
| | Gas Distribution | | | 3,843 | | | | — | | | | — | | | | — | | | | 3,843 | |
| | Construction Work in Progress | | | 58 | | | | — | | | | 26 | | | | — | | | | 84 | |
| | Plant Held for Future Use | | | 24 | | | | — | | | | — | | | | — | | | | 24 | |
| | Other | | | 59 | | | | — | | | | — | | | | — | | | | 59 | |
| | | | |
| | | |
| | | |
| | | |
| | | |
| |
| | Total Transmission and Distribution | | | 10,505 | | | | — | | | | 587 | | | | — | | | | 11,092 | |
| | | | |
| | | |
| | | |
| | | |
| | | |
| |
| | Other | | | 131 | | | | 61 | | | | 222 | | | | 243 | | | | 657 | |
| | | | |
| | | |
| | | |
| | | |
| | | |
| |
| | Total | | $ | 10,636 | | | $ | 6,457 | | | $ | 1,560 | | | $ | 243 | | | $ | 18,896 | |
| | | | |
| | | |
| | | |
| | | |
| | | |
| |
| | 2004 | | | | | | | | | | | | | | | | | | | | |
| | Generation: | | | | | | | | | | | | | | | | | | | | |
| | Fossil Production | | $ | — | | | $ | 3,324 | | | $ | 940 | | | $ | — | | | $ | 4,264 | |
| | Nuclear Production | | | — | | | | 399 | | | | — | | | | — | | | | 399 | |
| | Nuclear Fuel in Service | | | — | | | | 500 | | | | — | | | | — | | | | 500 | |
| | Construction Work in Progress | | | — | | | | 1,787 | | | | 44 | | | | — | | | | 1,831 | |
| | | | |
| | | |
| | | |
| | | |
| | | |
| |
| | Total Generation | | | — | | | | 6,010 | | | | 984 | | | | — | | | | 6,994 | |
| | | | |
| | | |
| | | |
| | | |
| | | |
| |
| | Transmission and Distribution: | | | | | | | | | | | | | | | | | | | | |
| | Electric Transmission | | | 1,299 | | | | — | | | | — | | | | — | | | | 1,299 | |
| | Electric Distribution | | | 4,840 | | | | — | | | | 464 | | | | — | | | | 5,304 | |
| | Gas Transmission | | | 74 | | | | — | | | | — | | | | — | | | | 74 | |
| | Gas Distribution | | | 3,592 | | | | — | | | | — | | | | — | | | | 3,592 | |
| | Construction Work in Progress | | | 20 | | | | — | | | | 39 | | | | — | | | | 59 | |
| | Plant Held for Future Use | | | 21 | | | | — | | | | — | | | | — | | | | 21 | |
| | Other | | | 68 | | | | — | | | | — | | | | — | | | | 68 | |
| | | | |
| | | |
| | | |
| | | |
| | | |
| |
| | Total Transmission and Distribution | | | 9,914 | | | | — | | | | 503 | | | | — | | | | 10,417 | |
| | | | |
| | | |
| | | |
| | | |
| | | |
| |
| | Other | | | 245 | | | | 63 | | | | 171 | | | | 303 | | | | 782 | |
| | | | |
| | | |
| | | |
| | | |
| | | |
| |
| | Total | | $ | 10,159 | | | $ | 6,073 | | | $ | 1,658 | | | $ | 303 | | | $ | 18,193 | |
| | | | | | | | | | | | | | | | | | | | | | |
| | | | |
| | | |
| | | |
| | | |
| | | |
| |
PSE&G and Power
PSE&G and Power have ownership interests in and are responsible for providing their share of the necessary financing for the following jointly-owned facilities. All amounts reflect the share of PSE&G's and Power's jointly-owned projects and the corresponding direct expenses are included in the Consolidated Statements of Operations as operating expenses.
187
NOTES TO CONSOLIDATED FINANCIAL STATEMENTS
| | | Ownership
Interest
| | Plant
| | Accumulated
Depreciation
|
| | | | | | | (Millions) |
December 31, 2005 | | | | | | | | | | | | |
Power: | | | | | | | | | | | | |
Coal Generating | | | | | | | | | | | | |
Conemaugh | | | 22.50 | % | | $ | 212 | | | $ | 97 | |
Keystone | | | 22.84 | % | | $ | 173 | | | $ | 76 | |
Nuclear Generating | | | | | | | | | | | | |
Peach Bottom | | | 50.00 | % | | $ | 268 | | | $ | 121 | |
Salem | | | 57.41 | % | | $ | 507 | | | $ | 174 | |
Nuclear Support Facilities | | | Various | | | $ | 120 | | | $ | 24 | |
Pumped Storage Facilities | | | | | | | | | | | | |
Yards Creek | | | 50.00 | % | | $ | 28 | | | $ | 20 | |
Merrill Creek Reservoir | | | 13.91 | % | | $ | 1 | | | $ | — | |
PSE&G: | | | | | | | | | | | | |
Transmission Facilities | | | Various | | | $ | 114 | | | $ | 52 | |
Linden Synthetic Natural Gas (SNG) Plant | | | 90.00 | % | | $ | 5 | | | $ | 6 | |
December 31, 2004 | | | | | | | | | | | | |
Power: | | | | | | | | | | | | |
Coal Generating | | | | | | | | | | | | |
Conemaugh | | | 22.50 | % | | $ | 208 | | | $ | 90 | |
Keystone | | | 22.84 | % | | $ | 170 | | | $ | 69 | |
Nuclear Generating | | | | | | | | | | | | |
Peach Bottom | | | 50.00 | % | | $ | 248 | | | $ | 113 | |
Salem | | | 57.41 | % | | $ | 482 | | | $ | 192 | |
Nuclear Support Facilities | | | Various | | | $ | 65 | | | $ | 19 | |
Pumped Storage Facilities | | | | | | | | | | | | |
Yards Creek | | | 50.00 | % | | $ | 28 | | | $ | 18 | |
Merrill Creek Reservoir | | | 13.91 | % | | $ | 1 | | | $ | — | |
PSE&G: | | | | | | | | | | | | |
Transmission Facilities | | | Various | | | $ | 113 | | | $ | 49 | |
Linden SNG Plant | | | 90.00 | % | | $ | 5 | | | $ | 5 | |
| | | | | | | | | | | | |
Power
Power holds undivided ownership interests in the jointly-owned facilities above, excluding related nuclear fuel and inventories. Power is entitled to shares of the generating capability and output of each unit equal to its respective ownership interests. Power also pays its ownership share of additional construction costs, fuel inventory purchases and operating expenses. Power's share of expenses for the jointly-owned facilities is included in the appropriate expense category.
Power's subsidiary, Nuclear, co-owns Salem and Peach Bottom with Exelon Generation. Nuclear is the owner-operator of Salem and Exelon Generation is the operator of Peach Bottom. A committee appointed by the co-owners reviews/approves major planning, financing and budgetary (capital and operating) decisions. Operating decisions within the above guidelines are made by the owner-operator.
Reliant Energy, Inc. (formally Reliant Resources) is a co-owner and the operator for Keystone Generating Station and Conemaugh Generating Station. A committee appointed by all co-owners makes all planning, financing and budgetary (capital and operating) decisions. Operating decisions within the above guidelines are made by Reliant Energy, Inc.
Power is a co-owner in the Yards Creek Pumped Storage Generation Facility. First Energy Corporation is also a co-owner and the operator of this facility. First Energy submits separate capital and Operations and Maintenance budgets, subject to the approval of Power.
188
NOTES TO CONSOLIDATED FINANCIAL STATEMENTS
Power is a minority owner in the Merrill Creek Reservoir and Environmental Preserve in Warren County, NJ. Merrill Creek Reservoir is the owner-operator of this facility. The operator submits separate capital and Operations and Maintenance budgets, subject to the approval of the non-operating owners.
All owners receive revenues, Operations and Maintenance and capital allocations based on their ownership percentages. Each owner is responsible for any financing with respect to its pro rata share of capital expenditures.
Note 20. Selected Quarterly Data (Unaudited)
PSEG, PSE&G, Power and Energy Holdings
The information shown below, in the opinion of PSEG, PSE&G, Power and Energy Holdings, includes all adjustments, consisting only of normal recurring accruals, necessary to fairly present such amounts.
| | | Calendar Quarter Ended
|
| | | March 31,
| | June 30,
| | September 30,
| | December 31,
|
| | | 2005
| | 2004
| | 2005
| | 2004
| | 2005
| | 2004
| | 2005
| | 2004
|
| | | (Millions, where applicable) |
PSEG Consolidated: | | | | | | | | | | | | | | | | | | | | | | | | | | | | | | | | |
Operating Revenues | | $ | 3,243 | | | $ | 3,177 | | | $ | 2,384 | | | $ | 2,241 | | | $ | 3,331 | | | $ | 2,708 | | | $ | 3,472 | | | $ | 2,674 | |
Operating Income | | | 629 | | | | 657 | | | | 336 | | | | 329 | | | | 598 | | | | 609 | | | | 522 | | | | 333 | |
Income from Continuing Operations | | | 280 | | | | 278 | | | | 91 | | | | 129 | | | | 267 | | | | 257 | | | | 220 | | | | 106 | |
Income/(Loss) from Discontinued Operations,
including Loss on Disposal, net of tax | | | 5 | | | | (7 | ) | | | (173 | ) | | | (5 | ) | | | (14 | ) | | | (13 | ) | | | 2 | | | | (19 | ) |
Cumulative Effect of a Change in Accounting
Principle | | | — | | | | — | | | | — | | | | — | | | | — | | | | — | | | | (17 | ) | | | — | |
Net Income (Loss) | | | 285 | | | | 271 | | | | (82 | ) | | | 124 | | | | 253 | | | | 244 | | | | 205 | | | | 87 | |
Earnings Per Share: | | | | | | | | | | | | | | | | | | | | | | | | | | | | | | | | |
Basic: | | | | | | | | | | | | | | | | | | | | | | | | | | | | | | | | |
Income from Continuing Operations | | | 1.18 | | | | 1.18 | | | | 0.38 | | | | 0.54 | | | | 1.12 | | | | 1.08 | | | | 0.90 | | | | 0.44 | |
Net Income | | | 1.20 | | | | 1.15 | | | | (0.34 | ) | | | 0.52 | | | | 1.06 | | | | 1.03 | | | | 0.84 | | | | 0.37 | |
Diluted: | | | | | | | | | | | | | | | | | | | | | | | | | | | | | | | | |
Income from Continuing Operations | | | 1.16 | | | | 1.16 | | | | 0.37 | | | | 0.54 | | | | 1.09 | | | | 1.08 | | | | 0.89 | | | | 0.44 | |
Net Income | | | 1.18 | | | | 1.14 | | | | (0.34 | ) | | | 0.52 | | | | 1.03 | | | | 1.03 | | | | 0.83 | | | | 0.36 | |
Weighted Average Common Shares Outstanding: | | | | | | | | | | | | | | | | | | | | | | | | | | | | | | | | |
Basic | | | 238 | | | | 236 | | | | 239 | | | | 237 | | | | 239 | | | | 237 | | | | 245 | | | | 238 | |
Diluted | | | 242 | | | | 239 | | | | 243 | | | | 238 | | | | 244 | | | | 238 | | | | 248 | | | | 239 | |
| | | | | | | | | | | | | | | | | | | | | | | | | | | | | | | | |
| | | Calendar Quarter Ended
|
| | | March 31,
| | June 30,
| | September 30,
| | December 31,
|
| | | 2005
| | 2004
| | 2005
| | 2004
| | 2005
| | 2004
| | 2005
| | 2004
|
| | | (Millions) |
PSE&G: | | | | | | | | | | | | | | | | | | | | | | | | | | | | | | | | |
Operating Revenues | | $ | 2,184 | | | $ | 2,182 | | | $ | 1,441 | | | $ | 1,418 | | | $ | 1,934 | | | $ | 1,636 | | | $ | 2,169 | | | $ | 1,736 | |
Operating Income | | | 287 | | | | 313 | | | | 164 | | | | 182 | | | | 273 | | | | 245 | | | | 189 | | | | 203 | |
Income from Continuing Operations | | | 118 | | | | 125 | | | | 49 | | | | 63 | | | | 115 | | | | 93 | | | | 66 | | | | 65 | |
Net Income | | | 118 | | | | 125 | | | | 49 | | | | 63 | | | | 115 | | | | 93 | | | | 66 | | | | 65 | |
Earnings Available to PSEG | | | 117 | | | | 124 | | | | 48 | | | | 62 | | | | 114 | | | | 92 | | | | 65 | | | | 64 | |
| | | | | | | | | | | | | | | | | | | | | | | | | | | | | | | | |
| | | Calendar Quarter Ended
|
| | | March 31,
| | June 30,
| | September 30,
| | December 31,
|
| | | 2005
| | 2004
| | 2005
| | 2004
| | 2005
| | 2004
| | 2005
| | 2004
|
| | | (Millions) |
Power: | | | | | | | | | | | | | | | | | | | | | | | | | | | | | | | | |
Operating Revenues | | $ | 1,730 | | | $ | 1,698 | | | $ | 1,060 | | | $ | 990 | | | $ | 1,444 | | | $ | 1,130 | | | $ | 1,825 | | | $ | 1,350 | |
Operating Income | | | 203 | | | | 217 | | | | 105 | | | | 53 | | | | 204 | | | | 254 | | | | 181 | | | | 28 | |
Income from Continuing Operations | | | 115 | | | | 120 | | | | 56 | | | | 60 | | | | 132 | | | | 139 | | | | 103 | | | | 23 | |
Loss from Discontinued Operations, including Loss on Disposal, net of tax | | | (7 | ) | | | (11 | ) | | | (183 | ) | | | (8 | ) | | | (7 | ) | | | (8 | ) | | | (1 | ) | | | (7 | ) |
Cumulative Effect of a Change in Accounting
Principle | | | — | | | | — | | | | — | | | | — | | | | — | | | | — | | | | (16 | ) | | | — | |
Net Income (Loss) | | | 108 | | | | 109 | | | | (127 | ) | | | 52 | | | | 125 | | | | 131 | | | | 86 | | | | 16 | |
| | | | | | | | | | | | | | | | | | | | | | | | | | | | | | | | |
189
NOTES TO CONSOLIDATED FINANCIAL STATEMENTS
| | | Calendar Quarter Ended
|
| | | March 31,
| | June 30,
| | September 30,
| | December 31,
|
| | | 2005
| | 2004
| | 2005
| | 2004
| | 2005
| | 2004
| | 2005
| | 2004
|
| | | (Millions) |
Energy Holdings: | | | | | | | | | | | | | | | | | | | | | | | | | | | | | | | | |
Operating Revenues | | $ | 313 | | | $ | 162 | | | $ | 269 | | | $ | 133 | | | $ | 335 | | | $ | 270 | | | $ | 385 | | | $ | 271 | |
Operating Income | | | 141 | | | | 120 | | | | 74 | | | | 90 | | | | 127 | | | | 109 | | | | 155 | | | | 106 | |
Income Before Discontinued Operations
and Cumulative Effect of a Change in
Accounting Principle | | | 67 | | | | 44 | | | | 12 | | | | 23 | | | | 46 | | | | 41 | | | | 74 | | | | 43 | |
Income/(Loss) on Disposal of Discontinued Operations, including Loss from Discontinued Operations, net of tax benefit | | | 12 | | | | 4 | | | | 10 | | | | 3 | | | | (7 | ) | | | (5 | ) | | | 3 | | | | (12 | ) |
Net Income | | | 79 | | | | 48 | | | | 22 | | | | 26 | | | | 39 | | | | 36 | | | | 77 | | | | 31 | |
Earnings Available to PSEG | | | 77 | | | | 43 | | | | 21 | | | | 21 | | | | 39 | | | | 33 | | | | 77 | | | | 28 | |
| | | | | | | | | | | | | | | | | | | | | | | | | | | | | | | | |
As discussed previously, TIE, an indirect, wholly owned subsidiary of Energy Holdings and Global, enters into electricity forward and capacity sale contracts for portions of its capacity with the balance sold into the daily spot market. TIE also enters into gas purchase contracts to specifically match the generation requirements to support the electricity forward sales contracts. Although these contracts fix the amount of revenue, fuel costs and cash flows, and thereby provide financial stability to TIE, these contracts are, based on their terms, derivatives that do not meet the specific accounting criteria in SFAS 133 to qualify for the normal purchases and normal sales exception, or to be designated as a hedge for accounting purposes. As a result, these contracts must be recorded at fair value, and could lead to significant volatility in reported revenue and net income in the future. All of the contracts outstanding at December 31, 2005, with one exception, are for terms of no more than one year in duration. Therefore, impacts of fair value adjustments for those contracts will cause volatility in reported revenue and net income from quarter to quarter as unrealized gains and losses are recorded, with the cumulative amount of earnings unaffected over the life of the contracts, typically a one year period.
Prior to December 31, 2005, many of these contracts were accounted for under the normal purchase and normal sales exception of SFAS 133; therefore, revenues and costs were recorded as energy was delivered and gas was used in generation, rather than marking these contracts to fair value. Upon additional review of the settlement provisions of these contracts against the criteria of SFAS 133, management has determined that the contracts should have been recorded at fair value from the date of their inception with unrealized gains and losses recorded in earnings. Energy Holdings has reviewed the impact of those contracts, had they been recorded at fair value in prior periods, and determined the impact was not material for the years ended December 31, 2005, 2004 and 2003, as well as for each of the quarterly periods for the years ended December 31, 2005 and 2004. Had such contracts been recorded at fair value in each respective period the after-tax impact would have been $(5) million, $4 million and $1 million for the years ended December 31, 2005, 2004 and 2003, respectively; $(9) million, $(7) million, and $11 million for the quarters ended March 31, 2005, June 30, 2005, and December 31, 2005, respectively; and $(2) million, $1 million, $3 million and $2 million for the quarters ended March 31, 2004, June 30, 2004, September 30, 2004 and December 31, 2004 respectively. All of these contracts were appropriately recorded at fair value as of December 31, 2005.
Note 21. Related-Party Transactions
The majority of the following discussion relates to intercompany transactions, which are eliminated during the PSEG consolidation process in accordance with GAAP.
BGSS and BGS Contracts
PSE&G and Power
PSE&G has entered into a requirements contract with Power under which Power provides the gas supply services needed to meet PSE&G's BGSS and other contractual requirements through March 2007.
Power has also entered into contracts to supply energy, capacity and ancillary services to PSE&G through the BGS auction process.
190
NOTES TO CONSOLIDATED FINANCIAL STATEMENTS
The amounts which Power charged to PSE&G for BGS and BGSS are presented below:
| | | | Billings for the Years
Ended December 31,
|
| | | | 2005
| | 2004
| | 2003
|
| | | | (Millions) |
| | BGS | | $ | 497 | | | $ | 359 | | | $ | 30 | |
| | BGSS | | $ | 2,127 | | | $ | 1,784 | | | $ | 1,785 | |
| | | | | | | | | | | | | | |
As of December 31, 2005 and 2004, Power had receivables from PSE&G of approximately $454 million and $357 million, respectively, primarily related to the BGS and BGSS contracts. These transactions were properly recognized on each company's stand-alone financial statements. For the year ended December 31, 2003, Power also billed PSE&G approximately $111 million for Market Transition Charges that were collected through the end of the transition period on July 31, 2003.
In addition, as of December 31, 2005 and December 31, 2004, PSE&G had a receivable from Power of approximately $152 million and $25 million, respectively, related to gas supply hedges Power entered into for BGSS. For additional information, see Note 12. Commitments and Contingent Liabilities.
Services
PSE&G, Power and Energy Holdings
Services provides and bills administrative services to PSE&G, Power and Energy Holdings. In addition, PSE&G, Power and Energy Holdings have other payables to Services, including amounts related to certain common costs, such as pension and OPEB costs, which Services pays on behalf of each of the operating companies. The billings for administrative services and payables are presented below:
| | | | Administrative Services
billed for the Years
Ended December 31,
| | Payable to
Services as of
December 31,
|
| | | | 2005
| | 2004
| | 2003
| | 2005
| | 2004
|
| | | | (Millions) |
| | PSE&G | | $ | 209 | | | $ | 208 | | | $ | 201 | | | $ | 34 | | | $ | 38 | |
| | Power | | $ | 154 | | | $ | 150 | | | $ | 124 | | | $ | 21 | | | $ | 23 | |
| | Energy Holdings | | $ | 19 | | | $ | 18 | | | $ | 16 | | | $ | 2 | | | $ | 2 | |
| | | | | | | | | | | | | | | | | | | | | | |
These transactions were properly recognized on each company's stand-alone financial statements and were eliminated when preparing PSEG's Consolidated Financial Statements. PSEG, PSE&G, Power and Energy Holdings believe that the costs of services provided by Services approximate market value for such services.
Tax Sharing Agreement
PSEG, PSE&G, Power and Energy Holdings
PSEG files a consolidated Federal income tax return with its affiliated companies. A tax allocation agreement exists between PSEG and each of its affiliated companies. The general operation of these agreements is that the subsidiary company will compute its taxable income on a stand-alone basis. If the result is a net tax liability, such amount shall be paid to PSEG. If there are net operating losses and/or tax credits, the subsidiary shall receive payment for the tax savings from PSEG to the extent that PSEG is able to utilize those benefits.
191
NOTES TO CONSOLIDATED FINANCIAL STATEMENTS
PSE&G, Power and Energy Holdings had (payables to) receivables from PSEG related to taxes as follows:
| | | | (Payable to)
Receivable from
PSEG as of
December 31,
|
| | | | 2005
| | 2004
|
| | | | (Millions) |
| | PSE&G | | $ | (59 | ) | | $ | (45 | ) |
| | Power | | $ | 4 | | | $ | 9 | |
| | Energy Holdings | | $ | (12 | ) | | $ | 19 | |
| | | | | | | | | | |
Affiliate Loans and Advances
PSEG and Power
As of December 31, 2005 and December 31, 2004, Power had a demand note payable to PSEG of approximately $202 million and $98 million, respectively, for short-term funding needs. Interest Income and Interest Expense relating to these short term funding activities was immaterial.
PSEG and Energy Holdings
As of December 31, 2005 and 2004, Energy Holdings had a demand note receivable due from PSEG of $409 million and $115 million, respectively, reflecting the investment of its excess cash with PSEG. Interest Income related to these borrowings for the years ended December 31, 2005 and 2004 was $4 million and $2 million, respectively.
PSE&G and Services
As of December 31, 2005 and 2004, PSE&G had advanced working capital to Services of approximately $33 million. The amount is included in Other Noncurrent Assets on PSE&G's Consolidated Balance Sheets.
Power and Services
As of December 31, 2005 and 2004, Power had advanced working capital to Services of approximately $17 million. The amount is included in Other Noncurrent Assets on Power's Consolidated Balance Sheets.
Changes in Capitalization
PSE&G
PSE&G paid a common stock dividend of approximately $100 million and $200 million to PSEG in 2004 and 2003, respectively.
Power
PSEG contributed capital of approximately $300 million and $150 million to Power during 2004 and 2003, respectively.
Energy Holdings
During 2005 and 2004, Energy Holdings made cash distributions to PSEG totaling $412 million and $491 million, respectively, in the form of preference unit redemptions, preference unit distributions, ordinary unit distributions and return of capital contributed.
192
NOTES TO CONSOLIDATED FINANCIAL STATEMENTS
Energy Holdings
Operation and Maintenance and Development Fees
Global provides operating, maintenance and other services to and receives management and guaranty fees from various joint ventures and partnerships in which it is an investor. Fees related to the development and construction of certain projects are deferred and recognized when earned. Income from these services of $3 million, $7 million and $6 million was included in Operating Revenues in the Consolidated Statements of Operations for the years ended December 31, 2005, 2004, and 2003, respectively.
Other
PSEG and PSE&G
As of December 31, 2005 and 2004, PSE&G had receivables from PSEG of approximately $6 million and $14 million, respectively, related to amounts that PSEG had collected on PSE&G's behalf.
PSEG and Power
As of December 31, 2005 and 2004, Power had receivables from PSEG of approximately $2 million and $4 million, respectively, related to amounts that PSEG had collected on Power's behalf.
Global
As of December 31, 2005 and 2004, Global had loans of approximately $60 million and $68 million, respectively, due from Prisma, a joint venture that is 50%-owned by Global and operates several biomass generation plants in Italy. The decrease in the loan balances, which are denominated in Euros, was due to the strengthening of the U.S. dollar relative to the Euro during 2005 and was recorded as a foreign currency loss in Other Deductions. Included in the loan balances as of December 31, 2005 and 2004 was $24 million of accrued interest. These loans are guaranteed by an affiliate of Global's partner. Due to insufficient funds at the project level, total payments of $12 million due to Global on June 30, 2005, September 30, 2005 and December 31, 2005 were not made. In August 2005, Global began seeking to enforce its rights under the guarantee by filing a legal action. In January 2006, Global and its partner entered into an agreement under which Global agreed to forgive the guarantee of the project's loans and convert a portion of the loans into an equity interest. Global expects to close on the agreement later in the first quarter. As a result, Global expects to increase its ownership percentage in Prisma to 85% and obtain voting control of the project through proportionate representation on Prisma's Board of Directors. Once the transaction is completed, Global will begin consolidating Prisma beginning in the first quarter of 2006.
193
NOTES TO CONSOLIDATED FINANCIAL STATEMENTS
Note 22. Guarantees of Debt
Each series of Power's Senior Notes and Pollution Control Notes is fully and unconditionally and jointly and severally guaranteed by Fossil, Nuclear and ER&T. The following table presents condensed financial information for the guarantor subsidiaries as well as Power's non-guarantor subsidiaries as of December 31, 2005 and 2004 and for the years ended December 31, 2005, 2004 and 2003:
| | | Power
| | Guarantor
Subsidiaries
| | Other
Subsidiaries
| | Consolidating
Adjustments
| | Total
|
| | | (Millions) |
| For the Year Ended December 31, 2005: | | | | | | | | | | | | | | | | | | | | |
Revenues | | $ | — | | | $ | 6,986 | | | $ | 138 | | | $ | (1,065 | ) | | $ | 6,059 | |
Operating Expenses | | | — | | | | 6,308 | | | | 122 | | | | (1,064 | ) | | | 5,366 | |
| | | |
| | | |
| | | |
| | | |
| | | |
| |
Operating Income | | | — | | | | 678 | | | | 16 | | | | (1 | ) | | | 693 | |
Equity Earnings (Losses) of Subsidiaries | | | 218 | | | | (213 | ) | | | — | | | | (5 | ) | | | — | |
Other Income | | | 138 | | | | 185 | | | | 2 | | | | (139 | ) | | | 186 | |
Other Deductions | | | — | | | | (42 | ) | | | (1 | ) | | | — | | | | (43 | ) |
Interest Expense | | | (142 | ) | | | (84 | ) | | | (46 | ) | | | 141 | | | | (131 | ) |
Income Taxes | | | (22 | ) | | | (293 | ) | | | 16 | | | | — | | | | (299 | ) |
Loss on Discontinued Operations, Including Loss on Disposal, net of tax benefit | | | — | | | | — | | | | (198 | ) | | | — | | | | (198 | ) |
Cumulative Effect of a Change in Accounting Principle, net of tax | | | — | | | | (15 | ) | | | (1 | ) | | | — | | | | (16 | ) |
| | | |
| | | |
| | | |
| | | |
| | | |
| |
Net Income (Loss) | | $ | 192 | | | $ | 216 | | | $ | (212 | ) | | $ | (4 | ) | | $ | 192 | |
| | | |
| | | |
| | | |
| | | |
| | | |
| |
As of December 31, 2005: | | | | | | | | | | | | | | | | | | | | |
Current Assets | | $ | 2,584 | | | $ | 2,616 | | | $ | 251 | | | $ | (2,876 | ) | | $ | 2,575 | |
Property, Plant and Equipment, net | | | 143 | | | | 3,271 | | | | 1,466 | | | | — | | | | 4,880 | |
Investment in Subsidiaries | | | 3,507 | | | | 453 | | | | — | | | | (3,960 | ) | | | — | |
Noncurrent Assets | | | 179 | | | | 1,609 | | | | 17 | | | | (315 | ) | | | 1,490 | |
| | | |
| | | |
| | | |
| | | |
| | | |
| |
Total Assets | | $ | 6,413 | | | $ | 7,949 | | | $ | 1,734 | | | $ | (7,151 | ) | | $ | 8,945 | |
| | | |
| | | |
| | | |
| | | |
| | | |
| |
Current Liabilities | | $ | 695 | | | $ | 3,213 | | | $ | 1,146 | | | $ | (2,877 | ) | | $ | 2,177 | |
Noncurrent Liabilities | | | 63 | | | | 1,268 | | | | 96 | | | | (313 | ) | | | 1,114 | |
Long-Term Debt | | | 2,817 | | | | — | | | | — | | | | — | | | | 2,817 | |
Member's Equity | | | 2,838 | | | | 3,468 | | | | 492 | | | | (3,961 | ) | | | 2,837 | |
| | | |
| | | |
| | | |
| | | |
| | | |
| |
Total Liabilities and Member's Equity | | $ | 6,413 | | | $ | 7,949 | | | $ | 1,734 | | | $ | (7,151 | ) | | $ | 8,945 | |
| | | |
| | | |
| | | |
| | | |
| | | |
| |
For the Year Ended December 31, 2005: | | | | | | | | | | | | | | | | | | | | |
Net Cash (Used In) Provided By Operating Activities | | $ | (943 | ) | | $ | (209 | ) | | $ | 1,052 | | | $ | 236 | | | $ | 136 | |
Net Cash (Used In) Provided By Investing Activities | | $ | (157 | ) | | $ | (28 | ) | | $ | 35 | | | $ | (92 | ) | | $ | (242 | ) |
Net Cash Provided By (Used In) Financing Activities | | $ | 1,100 | | | $ | 234 | | | $ | (1,087 | ) | | $ | (143 | ) | | $ | 104 | |
For the Year Ended December 31, 2004: | | | | | | | | | | | | | | | | | | | | |
Revenues | | $ | — | | | $ | 6,139 | | | $ | 122 | | | $ | (1,093 | ) | | $ | 5,168 | |
Operating Expenses | | | — | | | | 5,605 | | | | 104 | | | | (1,093 | ) | | | 4,616 | |
| | | |
| | | |
| | | |
| | | |
| | | |
| |
Operating Income | | | — | | | | 534 | | | | 18 | | | | — | | | | 552 | |
Equity Earnings (Losses) of Subsidiaries | | | 295 | | | | (54 | ) | | | — | | | | (241 | ) | | | — | |
Other Income | | | 101 | | | | 161 | | | | 1 | | | | (96 | ) | | | 167 | |
Other Deductions | | | — | | | | (49 | ) | | | (5 | ) | | | (1 | ) | | | (55 | ) |
Interest Expense | | | (118 | ) | | | (57 | ) | | | (35 | ) | | | 97 | | | | (113 | ) |
Income Taxes | | | 30 | | | | (239 | ) | | | (1 | ) | | | 1 | | | | (209 | ) |
Loss on Discontinued Operations | | | — | | | | (1 | ) | | | (33 | ) | | | — | | | | (34 | ) |
| | | |
| | | |
| | | |
| | | |
| | | |
| |
Net Income (Loss) | | $ | 308 | | | $ | 295 | | | $ | (55 | ) | | $ | (240 | ) | | $ | 308 | |
| | | |
| | | |
| | | |
| | | |
| | | |
| |
As of December 31, 2004: | | | | | | | | | | | | | | | | | | | | |
Current Assets | | $ | 1,445 | | | $ | 2,058 | | | $ | 578 | | | $ | (1,478 | ) | | $ | 2,603 | |
Property, Plant and Equipment, net | | | 107 | | | | 3,021 | | | | 1,463 | | | | — | | | | 4,591 | |
Investment in Subsidiaries | | | 3,725 | | | | 646 | | | | — | | | | (4,371 | ) | | | — | |
Noncurrent Assets | | | 1,291 | | | | 1,286 | | | | 56 | | | | (1,220 | ) | | | 1,413 | |
| | | |
| | | |
| | | |
| | | |
| | | |
| |
Total Assets | | $ | 6,568 | | | $ | 7,011 | | | $ | 2,097 | | | $ | (7,069 | ) | | $ | 8,607 | |
| | | |
| | | |
| | | |
| | | |
| | | |
| |
Current Liabilities | | $ | 117 | | | $ | 2,701 | | | $ | 269 | | | $ | (1,566 | ) | | $ | 1,521 | |
Noncurrent Liabilities | | | 51 | | | | 720 | | | | 36 | | | | (120 | ) | | | 687 | |
Note Payable—Affiliated Company | | | — | | | | — | | | | 300 | | | | (300 | ) | | | — | |
Long-Term Debt | | | 3,316 | | | | — | | | | 800 | | | | (800 | ) | | | 3,316 | |
Member's Equity | | | 3,084 | | | | 3,590 | | | | 692 | | | | (4,283 | ) | | | 3,083 | |
| | | |
| | | |
| | | |
| | | |
| | | |
| |
Total Liabilities and Member's Equity | | $ | 6,568 | | | $ | 7,011 | | | $ | 2,097 | | | $ | (7,069 | ) | | $ | 8,607 | |
| | | |
| | | |
| | | |
| | | |
| | | |
| |
194
NOTES TO CONSOLIDATED FINANCIAL STATEMENTS
| | | Power
| | Guarantor
Subsidiaries
| | Other
Subsidiaries
| | Consolidating
Adjustments
| | Total
|
| | | (Millions) |
| For the Year Ended December 31, 2004: | | | | | | | | | | | | | | | | | | | | |
Net Cash Provided By Operating Activities | | $ | 121 | | | $ | (34 | ) | | $ | 96 | | | $ | 324 | | | $ | 507 | |
Net Cash (Used In) Provided By Investing Activities | | $ | (121 | ) | | $ | (83 | ) | | $ | (176 | ) | | $ | (230 | ) | | $ | (610 | ) |
Net Cash (Used In) Provided By Financing Activities | | $ | — | | | $ | (199 | ) | | $ | 80 | | | $ | 205 | | | $ | 86 | |
For the Year Ended December 31, 2003: | | | | | | | | | | | | | | | | | | | | |
Revenues | | $ | — | | | $ | 6,416 | | | $ | 133 | | | $ | (941 | ) | | $ | 5,608 | |
Operating Expenses | | | — | | | | 5,608 | | | | 91 | | | | (941 | ) | | | 4,758 | |
| | | |
| | | |
| | | |
| | | |
| | | |
| |
Operating Income | | | — | | | | 808 | | | | 42 | | | | — | | | | 850 | |
Equity Earnings in Subsidiaries | | | 928 | | | | 17 | | | | — | | | | (945 | ) | | | — | |
Other Income | | | 15 | | | | 155 | | | | 116 | | | | (136 | ) | | | 150 | |
Other Deductions | | | — | | | | (77 | ) | | | — | | | | (1 | ) | | | (78 | ) |
Interest Expense | | | (160 | ) | | | (81 | ) | | | (4 | ) | | | 138 | | | | (107 | ) |
Income Taxes | | | 61 | | | | (330 | ) | | | (64 | ) | | | 1 | | | | (332 | ) |
Loss on Discontinued Operations | | | — | | | | — | | | | (9 | ) | | | — | | | | (9 | ) |
Cumulative Effect of a Change in Accounting Principle, net of tax | | | — | | | | 366 | | | | 4 | | | | — | | | | 370 | |
| | | |
| | | |
| | | |
| | | |
| | | |
| |
Net Income (Loss) | | $ | 844 | | | $ | 858 | | | $ | 85 | | | $ | (943 | ) | | $ | 844 | |
| | | |
| | | |
| | | |
| | | |
| | | |
| |
For the Year Ended December 31, 2003: | | | | | | | | | | | | | | | | | | | | |
Net Cash Provided By (Used In) Operating Activities | | $ | 2,179 | | | $ | 659 | | | $ | (680 | ) | | $ | (1,522 | ) | | $ | 636 | |
Net Cash (Used In) Provided By Investing Activities | | $ | (1,994 | ) | | $ | (1,232 | ) | | $ | 256 | | | $ | 2,176 | | | $ | (844 | ) |
Net Cash (Used In) Provided By Financing Activities | | $ | (185 | ) | | $ | 924 | | | $ | 424 | | | $ | (954 | ) | | $ | 209 | |
| | | | | | | | | | | | | | | | | | | | |
Note 23. Pending Merger
PSEG, PSE&G, Power and Energy Holdings
On December 20, 2004, PSEG entered into Merger Agreement with Exelon Exelon, a public utility holding company headquartered in Chicago, Illinois, whereby PSEG and its subsidiaries will be merged with and into Exelon (Merger). Under the Merger Agreement, each share of PSEG Common Stock will be converted into 1.225 shares of Exelon Common Stock.
The Merger Agreement has been unanimously approved by both companies' Boards of Directors. On July 19, 2005, shareholders of PSEG voted to approve the Merger, and on July 22, 2005, shareholders of Exelon voted to approve the issuance of common shares to PSEG shareholders to effect the Merger.
The Merger Agreement provides that if the Merger is not consummated by June 20, 2006, either party may terminate the Merger Agreement.
Severance Plan
The Severance Plan provides change in control severance benefits to certain elected officers of PSEG whose employment is terminated without “cause” or who resign their employment for “good reason” within two years after a change in control, which would include the consummation of the Merger. Under the Severance Plan, the majority of the participants, if they are terminated without “cause” or resign his or her employment for “good reason” within two years after a change in control, will receive (1) a pro rata bonus based on the participant's target annual incentive compensation, (2) two times the sum of the participant's salary and target incentive bonus, (3) accelerated vesting of equity-based awards, (4) a lump sum payment equal to the actuarial equivalent of the participant's benefits under all of PSEG's retirement plans in which the participant participates calculated as though the participant remained employed for two years beyond the date his or her employment terminates less the actuarial equivalent of such benefits on the date his or her employment terminates, (5) two years continued welfare benefits (the first 18 months of which will be provided through PSEG-paid COBRA continuation coverage), (6) one year of PSEG-paid outplacement services and (7) vesting of any compensation previously deferred. Under the Severance Plan, four participants will receive the same benefits as the other participants, except that the applicable multiplier for salary and target incentive bonus, retirement plan accruals and continuation of welfare benefits is three years instead of two.
195
NOTES TO CONSOLIDATED FINANCIAL STATEMENTS
Retention Program
The Retention Program, effective as of December 20, 2004, provides for payments to be made to certain key employees of PSEG who remain employed from the date of execution of the Merger Agreement through the date that is 90 days after the consummation of the Merger. The amount of a participant's retention payment may not be less than 40% or more than 150% of the participant's annual base salary. Retention payments under the Retention Program may not exceed $10 million in the aggregate.
PSEG paid the first installment, equal to half of a participant's total retention payment in December, 2005, the first anniversary of the date of execution of the Merger Agreement. PSEG will pay the participants' remaining retention payments within 90 days after the consummation of the Merger. No participant whose employment terminates for any reason other than involuntary termination without “cause” will receive any subsequent installment of the retention payment. A participant whose employment is terminated without “cause” on or prior to the consummation of the Merger will be treated as if he or she remained employed through the date that is 90 days after the consummation of the Merger for all purposes under the Retention Program.
196
ITEM 9. CHANGES IN AND DISAGREEMENTS WITH ACCOUNTANTS ON
ACCOUNTING AND FINANCIAL DISCLOSURE
PSEG, PSE&G, Power and Energy Holdings
None.
ITEM 9A. CONTROLS AND PROCEDURES
Disclosure Controls and Procedures
PSEG, PSE&G, Power and Energy Holdings
PSEG, PSE&G, Power and Energy Holdings have established and maintain disclosure controls and procedures which are designed to provide reasonable assurance that material information relating to each company, including their respective consolidated subsidiaries, is made known to the Chief Executive Officer and Chief Financial Officer of each company by others within those entities. PSEG, PSE&G, Power and Energy Holdings have established a disclosure committee which is made up of several key management employees and which reports directly to the Chief Financial Officer and Chief Executive Officer of each respective company. The committee monitors and evaluates the effectiveness of these disclosure controls and procedures. The Chief Financial Officer and Chief Executive Officer of each company have evaluated the effectiveness of the disclosure controls and procedures as of December 31, 2005 and, based on this evaluation, have concluded that the disclosure controls and procedures were effective in providing reasonable assurance during the period covered in these annual reports.
Internal Controls
PSEG, PSE&G, Power and Energy Holdings
PSEG has conducted an assessment of its internal control over financial reporting as of December 31, 2005 as required by Section 404 of the Sarbanes-Oxley Act. Management's report on PSEG's internal control over financial reporting is included on page 198. The Independent Registered Public Accounting Firm's report with respect to management's assessment of the effectiveness of internal control over financial reporting and the effectiveness of PSEG's internal control over financial reporting is included on pages 199 to 200. Management has concluded that internal control over financial reporting is effective as of December 31, 2005.
During the fourth quarter of 2005, PSEG, PSE&G, Power and Energy Holdings continued to make enhancements to internal controls to enable PSEG to maintain the effectiveness of its internal control over financial reporting as of December 31, 2005. These enhancements included significant changes to internal controls, including enhanced policies and procedures relative to the accounting and recording of wholesale energy transactions. It should be noted that the design of any system of controls is based, in part, on certain assumptions about the likelihood of future events, and provides reasonable assurance that the internal control system will succeed in achieving its stated objectives.
ITEM 9B. OTHER INFORMATION
PSEG, PSE&G, Power and Energy Holdings
None.
197
MANAGEMENT REPORT ON INTERNAL CONTROL OVER FINANCIAL REPORTING
Management of Public Service Enterprise Group (PSEG) is responsible for establishing and maintaining effective internal control over financial reporting and for the assessment of the effectiveness of internal control over financial reporting. As defined by the SEC in Rules 13a-15(f) and 15d-15(f) under the Securities Exchange Act of 1934, internal control over financial reporting is a process designed by, or under the supervision of, the company's principal executive and principal financial officers, or persons performing similar functions, and implemented by the company's management and other personnel, with oversight by the Audit Committee of the Board of Directors to provide reasonable assurance regarding the reliability of financial reporting and the preparation of financial statements for external purposes in accordance with accounting principles generally accepted in the United States of America (generally accepted accounting principles).
PSEG's internal control over financial reporting includes those policies and procedures that (1) pertain to the maintenance of records that, in reasonable detail, accurately and fairly reflect the transactions and dispositions of PSEG's assets; (2) provide reasonable assurance that transactions are recorded as necessary to permit preparation of financial statements in accordance with generally accepted accounting principles, and that receipts and expenditures of PSEG are being made only in accordance with authorizations of PSEG's management and directors; and (3) provide reasonable assurance regarding prevention or timely detection of unauthorized acquisition, use or disposition of PSEG's assets that could have a material effect on the financial statements.
In connection with the preparation of PSEG's annual financial statements, management of PSEG has undertaken an assessment, which includes the design and operational effectiveness of PSEG's internal control over financial reporting using the framework promulgated by the Committee of Sponsoring Organizations of the Treadway Commission, commonly referred to as “COSO”. The COSO framework is based upon five integrated components of control: control environment, risk assessment, control activities, information and communications and ongoing monitoring.
Because of its inherent limitations, internal control over financial reporting may not prevent or detect misstatements. Also, projection of any evaluation of effectiveness to future periods is subject to the risk that controls may become inadequate because of changes in conditions, or that the degree of compliance with the policies or procedures may deteriorate.
Based on the assessment performed, management has concluded that PSEG's internal control over financial reporting is effective and provides reasonable assurance regarding the reliability of PSEG's financial reporting and the preparation of its financial statements as of December 31, 2005 in accordance with generally accepted accounting principles. Further, management has not identified any material weaknesses in internal control over financial reporting as of December 31, 2005.
PSEG's external auditors, Deloitte & Touche LLP, have audited PSEG's financial statements for the year ended December 31, 2005 included in this annual report on Form 10-K and, as part of that audit, have issued a report on management's assessment of internal control over financial reporting, a copy of which is included in this annual report on Form 10-K.
/s/ E. JAMES FERLAND
Chief Executive Officer | | |
/s/ THOMAS M. O'FLYNN
Chief Financial Officer | | |
February 27, 2006
198
REPORT OF INDEPENDENT REGISTERED PUBLIC ACCOUNTING FIRM
To the Stockholders and Board of Directors of
PUBLIC SERVICE ENTERPRISE GROUP INCORPORATED:
We have audited management's assessment, included in the accompanying Management Report on Internal Control Over Financial Reporting, that Public Service Enterprise Group Incorporated and subsidiaries (the “Company”) maintained effective internal control over financial reporting as of December 31, 2005, based on the criteria established in “Internal Control—Integrated Framework” issued by the Committee of Sponsoring Organizations of the Treadway Commission. The Company's management is responsible for maintaining effective internal control over financial reporting and for its assessment of the effectiveness of internal control over financial reporting. Our responsibility is to express an opinion on management's assessment and an opinion on the effectiveness of the Company's internal control over financial reporting based on our audit.
We conducted our audit in accordance with the standards of the Public Company Accounting Oversight Board (United States). Those standards require that we plan and perform the audit to obtain reasonable assurance about whether effective internal control over financial reporting was maintained in all material respects. Our audit included obtaining an understanding of internal control over financial reporting, evaluating management's assessment, testing and evaluating the design and operating effectiveness of internal control, and performing such other procedures as we considered necessary in the circumstances. We believe that our audit provides a reasonable basis for our opinions.
A company's internal control over financial reporting is a process designed by, or under the supervision of, the company's principal executive and principal financial officers, or persons performing similar functions, and effected by the company's board of directors, management, and other personnel to provide reasonable assurance regarding the reliability of financial reporting and the preparation of financial statements for external purposes in accordance with generally accepted accounting principles. A company's internal control over financial reporting includes those policies and procedures that (1) pertain to the maintenance of records that, in reasonable detail, accurately and fairly reflect the transactions and dispositions of the assets of the company; (2) provide reasonable assurance that transactions are recorded as necessary to permit preparation of financial statements in accordance with generally accepted accounting principles, and that receipts and expenditures of the company are being made only in accordance with authorizations of management and directors of the company; and (3) provide reasonable assurance regarding prevention or timely detection of unauthorized acquisition, use, or disposition of the company's assets that could have a material effect on the financial statements.
Because of the inherent limitations of internal control over financial reporting, including the possibility of collusion or improper management override of controls, material misstatements due to error or fraud may not be prevented or detected on a timely basis. Also, projections of any evaluation of the effectiveness of the internal control over financial reporting to future periods are subject to the risk that the controls may become inadequate because of changes in conditions, or that the degree of compliance with the policies or procedures may deteriorate.
In our opinion, management's assessment that the Company maintained effective internal control over financial reporting as of December 31, 2005, is fairly stated, in all material respects, based on the criteria established in “Internal Control—Integrated Framework” issued by the Committee of Sponsoring Organizations of the Treadway Commission. Also in our opinion, the Company maintained, in all material respects, effective internal control over financial reporting as of December 31, 2005, based on the criteria established in “Internal Control—Integrated Framework” issued by the Committee of Sponsoring Organizations of the Treadway Commission.
199
We have also audited, in accordance with the standards of the Public Company Accounting Oversight Board (United States), the consolidated financial statements and financial statement schedule as of and for the year ended December 31, 2005 of the Company, and our report dated February 27, 2006 expressed an unqualified opinion on those consolidated financial statements and consolidated financial statement schedule, and included explanatory paragraphs regarding the adoption of Statement of Financial Accounting Standards No. 143, “Accounting for Asset Retirement Obligations” and Financial Accounting Standards Board Interpretation No. 47, “Accounting for Conditional Asset Retirement Obligations.”
DELOITTE & TOUCHE LLP
Parsippany, New Jersey
February 27, 2006
200
PART III
ITEM 10. DIRECTORS AND EXECUTIVE OFFICERS OF THE REGISTRANTS
Executive Officers
PSEG, PSE&G, Power and Energy Holdings
The Executive Officers of each of PSEG, PSE&G, Power and Energy Holdings, respectively, are set forth below, as indicated for each individual.
Name
| | Age as of
December 31,
2005
| | Office
| | Effective Date
First Elected to
Present Position
|
| E. James Ferland(1)(2)(3)(4) | | | 63 | | | Chairman of the Board, President and Chief Executive Officer (PSEG) | | July 1986 to present |
| | | | | | | Chairman of the Board and Chief Executive Officer (PSE&G) | | July 1986 to present |
| | | | | | | Chairman of the Board and Chief Executive Officer (Energy Holdings) | | June 1989 to present |
| | | | | | | Chairman of the Board and Chief Executive Officer (Power) | | June 1999 to present |
| | | | | | | Chairman of the Board and Chief Executive Officer (Services) | | November 1999 to present |
| Thomas M. O'Flynn(1)(3)(4) | | | 45 | | | Executive Vice President and Chief Financial Officer (PSEG) | | July 2001 to present |
| | | | | | | Executive Vice President—Finance (Services) | | July 2001 to present |
| | | | | | | Executive Vice President and Chief Financial Officer (Energy Holdings) | | August 2002 to present |
| | | | | | | Executive Vice President and Chief Financial Officer (Power) | | February 2002 to present |
| | | | | | | Managing Director—Global Power and Utility Investment Banking Division Group (Morgan Stanley) | | December 1997 to May 2001 |
| Robert J. Dougherty, Jr.(1)(4) | | | 54 | | | President and Chief Operating Officer (Energy Holdings) | | January 1997 to present |
| | | | | | | Vice President (PSEG) | | March 1995 to present |
| | | | | | | President (Global) | | August 2003 to present |
| Ralph Izzo(1)(2) | | | 48 | | | President and Chief Operating Officer (PSE&G) | | October 2003 to present |
| | | | | | | Vice President—Utility Operations (PSE&G) | | June 2002 to October 2003 |
| | | | | | | Vice President—Special Projects (Services) | | September 2001 to June 2002 |
| | | | | | | Vice President—Appliance Service (PSE&G) | | April 2000 to September 2001 |
| | | | | | | Vice President—Corporate Planning (PSEG) | | March 1998 to April 2000 |
| R. Edwin Selover(1)(2) | | | 60 | | | Senior Vice President and General Counsel (PSEG) | | April 2002 to present |
| | | | | | | Vice President and General Counsel (PSEG) | | April 1988 to April 2002 |
| | | | | | | Senior Vice President and General Counsel (PSE&G) | | January 1988 to present |
| | | | | | | Senior Vice President and General Counsel (Services) | | November 1999 to present |
| Patricia A. Rado(1)(2)(3)(4) | | | 63 | | | Vice President and Controller (PSEG) | | April 1993 to present |
| | | | | | | Vice President and Controller (PSE&G) | | April 1993 to present |
| | | | | | | Vice President and Controller (Power) Controller (Energy Holdings) | | June 1999 to present |
| | | | | | | Vice President and Controller (Services) | | November 1999 to present |
201
Name
| | Age as of
December 31,
2005
| | Office
| | Effective Date
First Elected to
Present Position
|
| Robert E. Busch(1)(2) | | | 59 | | | President & Chief Operating Officer (Services) | | April 2001 to present |
| | | | | | | Senior Vice President-Finance and Chief Financial Officer (Services) | | November 1999 to April 2001 |
| | | | | | | Senior Vice President and Chief Financial Officer (PSE&G) | | June 1998 to present |
| Harold W. Borden Jr.(3) | | | 61 | | | Vice President and General Counsel (Power) | | June 1999 to present |
| | | | | | | Vice President—Law (PSE&G) | | April 1995 to July 1999 |
| Morton A. Plawner(3) | | | 58 | | | Treasurer (PSEG) | | April 1998 to present |
| | | | | | | Vice President and Treasurer (PSE&G) | | April 1998 to present |
| | | | | | | Vice President and Treasurer (Power) | | June 1999 to present |
| Frank Cassidy(1)(3) | | | 59 | | | President and Chief Operating Officer (Power) | | June 1999 to present |
| | | | | | | President (Energy Technologies) | | November 1996 to June 1999 |
| Steven R. Teitelman(3) | | | 59 | | | President (ER&T) | | June 1999 to present |
| | | | | | | Vice President—Energy Resources and Trading (PSE&G) | | August 1997 to August 2002 |
| Michael J. Thomson(3) | | | 47 | | | President (Fossil) | | August 2003 to present |
| | | | | | | President (Global) | | January 1997 to July 2003 |
| Eileen A. Moran(4) | | | 51 | | | President (Resources) | | May 1990 to present |
| | | | | | | President (EGDC) | | January 1997 to present |
| Miriam E. Gilligan(4) | | | 54 | | | Vice President—Finance and Treasurer (Energy Holdings) | | December 2001 to present |
| | | | | | | Vice President (Services) | | December 2001 to present |
| | | | | | | Treasurer (Energy Holdings) | | 1997 to December 2001 |
|
| (1) | | Executive Officer of PSEG |
| (2) | | Executive Officer of PSE&G |
| (3) | | Executive Officer of Power |
| (4) | | Executive Officer of Energy Holdings |
Directors
PSEG
The PSEG board of directors is divided into three classes of as nearly equal numbers of directors as possible. As a result of this classification of directors, one class of directors is elected each year for a three-year term. Directors whose terms expire are eligible for renomination and will be considered by the PSEG corporate governance committee in accordance with its policies, which are described below under “Corporate Governance—Committees of the Board,” and subject to the retirement policy for directors mentioned below. The terms of directors in class II expire in 2006, in class I in 2007 and in class III in 2008.
There is shown as to each director, the period of service as a director of PSEG, age as of December 31, 2005, present committee memberships, business experience during at least the last five years and other present directorships. Beneficial ownership of PSEG Common Stock is shown under “Item 12—Security Ownership of Certain Beneficial Owners and Management and Related Stockholder Matters.” During 2005, each director attended more than 81% of the aggregate number of board meetings and committee meetings on which he or she served. Each director attended the 2005 Annual Meeting of Shareholders.
CAROLINE DORSA (class I) has been a director since February 2003. Age 46. Member of Audit Committee, Corporate Governance Committee and Finance Committee. Director of PSE&G. Has been Vice President and Treasurer of Merck & Co., Inc., Whitehouse Station, New Jersey (discovers, develops, manufactures and markets human and animal health products) since December 1996. Was Treasurer from January 1994 to November 1996 and Executive Director of the U. S. Human Health Marketing subsidiary of Merck & Co., Inc. from June 1992 to January 1994.
ERNEST H. DREW (class II) has been a director since January 1993. Age 68. Chair of Corporate Governance Committee and member of Executive Committee, Nuclear Committee and Organization and Compensation Committee. Until retirement, was Chief Executive Officer of Industries and Technology Group—Westinghouse Electric Corporation, from July 1997 to December 1997. Was a Member, Board of
202
Management, Hoechst AG, Frankfurt, Germany (manufactures pharmaceuticals, chemicals, fibers, film, specialties and advanced materials) from January 1995 to June 1997. Was Chairman of the Board and Chief Executive Officer of Hoechst Celanese Corporation, Somerville, New Jersey from May 1994 until January 1995, and President and Chief Executive Officer from January 1988 until May 1994. Director of Thomas & Betts Corporation, Ashland Inc. and UQM Technologies, Inc.
E. JAMES FERLAND (class I) has been a director since July 1986. Age 63. Chair of Executive Committee. Has been Chairman of the Board, President and Chief Executive Officer of PSEG and Chairman of the Board and Chief Executive Officer of PSE&G since July 1986, Chairman of the Board and Chief Executive Officer of Energy Holdings since June 1989, Chairman of the Board and Chief Executive Officer of Power since June 1999 and Chairman of the Board and Chief Executive Officer of PSEG Services since November 1999.
ALBERT R. GAMPER, JR. (class I) has been a director since December 2000. Age 63. Chair of Audit Committee and member of Executive Committee, Finance Committee and Nuclear Committee. Director of PSE&G. Until retirement, was Chairman of the Board of The CIT Group, Inc. of Livingston, New Jersey (a commercial finance company) from July 2004 until December 2004. Was Chairman of the Board and Chief Executive Officer of The CIT Group, Inc. from September 2003 to July 2004. Was Chairman of the Board, President and Chief Executive Officer of The CIT Group, Inc. from June 2002 to September 2003. Was President and Chief Executive Officer of The CIT Group, Inc. from February 2002 to June 2002. Was President and Chief Executive Officer of Tyco Capital Corporation from June 2001 to February 2002. Was Chairman of the Board, President and Chief Executive Officer of The CIT Group, Inc. from January 2000 to June 2001, and President and Chief Executive Officer of The CIT Group, Inc. from December 1989 to December 1999.
CONRAD K. HARPER (class III) has been a director since May 1997. Age 65. Chair of Finance Committee and member of Nuclear Committee and Organization and Compensation Committee. Director of PSE&G. Of Counsel to the law firm of Simpson Thacher & Bartlett LLP, New York, New York since January 2003. Was a partner from October 1996 to December 2002 and from October 1974 to May 1993. Was Legal Adviser, United States Department of State from May 1993 to June 1996. Director of New York Life Insurance Company.
WILLIAM V. HICKEY (class II) has been a director since October 2001. Age 61. Member of Audit Committee, Finance Committee and Organization and Compensation Committee. Has been President and Chief Executive Officer of Sealed Air Corporation, Saddle Brook, New Jersey (manufactures food and specialty protective packaging materials and systems), since March 2000. Was President and Chief Operating Officer from December 1996 to February 2000 and, prior to that, Executive Vice President from 1994 to December 1996. Director of Sealed Air Corporation and Sensient Technologies Corporation.
SHIRLEY ANN JACKSON (class III) has been a director since June 2001. Age 59. Chair of Organization and Compensation Committee and member of Audit Committee and Finance Committee. Has been President of Rensselaer Polytechnic Institute since July 1999. Was previously a director of PSEG from 1987 to 1995. Was Chair, United States Nuclear Regulatory Commission, from July 1995 to July 1999. Was Professor of Theoretical Physics, Rutgers University and a consultant in semiconductor theory to AT&T Bell Laboratories from 1991 to 1995. Director of FedEx Corporation, IBM Corporation, Marathon Oil Corporation, Medtronic, Inc., United States Steel Corporation and the New York Stock Exchange, Inc.
THOMAS A. RENYI (class III) has been a director since February 2003. Age 59. Member of Audit Committee, Corporate Governance Committee, Finance Committee and Organization and Compensation Committee. Has been Chairman of the Board and Chief Executive Officer of The Bank of New York Company, Inc., New York, New York and The Bank of New York, New York, New York (provider of banking and other financial services to corporations and individuals) since February 1998. Was President and Chief Executive Officer of The Bank of New York Company, Inc. from July 1997 to January 1998 and President of The Bank of New York from March 1992 to June 1997. Was President and Chief Executive Officer of The Bank of New York from January 1996 to January 1998 and President and Chief Operating Officer from December 1994 to December 1995. Director of The Bank of New York Company, Inc. and The Bank of New York.
RICHARD J. SWIFT (class II) has been a director since December 1994. Age 61. Chair of Nuclear Committee and member of Audit Committee and Corporate Governance Committee. Has been Chairman of the Financial Accounting Standards Advisory Council since January 2002. Was Chairman of the Board,
203
President and Chief Executive Officer of Foster Wheeler Ltd., Clinton, New Jersey (provides design, engineering, construction, manufacturing, management, plant operations and environmental services) from April 1994 until October 2001. Was President and Chief Operating Officer of Foster Wheeler Ltd. from December 1992 to April 1994. Director of Hubbell Incorporated, Ingersoll-Rand Limited and Kaman Corporation.
PSE&G
CAROLINE DORSA has been a director of PSE&G since February 2003. For additional information see PSEG—Directors, above.
E. JAMES FERLAND has been a director of PSE&G since July 1986. For additional information, see Executive Officers table, above.
ALBERT R. GAMPER, JR. has been a director of PSE&G since December 2000. For additional information see PSEG—Directors, above.
CONRAD K. HARPER has been a director of PSE&G since May 1997. For additional information see PSEG, above.
Power
ROBERT E. BUSCH has been a director of Power since December 2000. For additional information, see Executive Officers table above.
FRANK CASSIDY has been a director of Power since June 1999. For additional information, see Executive Officers table above.
ROBERT J. DOUGHERTY, JR. has been a director of Power since June 1999. For additional information, see Executive Officers table above.
E. JAMES FERLAND has been a director of Power since June 1999. For additional information, see Executive Officers table above.
THOMAS M. O'FLYNN has been a director of Power since July 2001. For additional information, see Executive Officers table above.
R. EDWIN SELOVER has been a director of Power since July 1999. For additional information, see Executive Officers table above.
Energy Holdings
ROBERT E. BUSCH has been a director of Energy Holdings since December 2000. For additional information, see Executive Officers table above.
FRANK CASSIDY has been a director of Energy Holdings since January 2000. For additional information, see Executive Officers table above.
ROBERT J. DOUGHERTY, JR. has been a director of Energy Holdings since January 2000. For additional information, see Executive Officers table above.
E. JAMES FERLAND has been a director of Energy Holdings since June 1989. For additional information, see Executive Officers table above.
THOMAS M. O'FLYNN has been a Director of Energy Holdings since July 2001. For additional information, see Executive Officers table above.
R. EDWIN SELOVER has been a Director of Energy Holdings since January 2000. For additional information, see Executive Officers table above.
Corporate Governance
PSEG
Management of PSEG is under the general direction of the PSEG board of directors. The PSEG board of directors has adopted and operates under the PSEG corporate governance principles which reflect PSEG's current governance practices in accordance with applicable statutory and regulatory requirements, including
204
those of the SEC and the New York Stock Exchange, Inc. (“NYSE”). The PSEG corporate governance principles are posted on PSEG's website, www.pseg.com/investor/governance. A copy is available upon request made to PSEG.
Under the PSEG corporate governance principles and the requirements of the NYSE, the PSEG board of directors must consist of a majority of independent directors. The PSEG board of directors has established standards for director independence, which are set forth in the PSEG corporate governance principles. These standards require that to be independent, a director may not be an employee and no member of the director's immediate family may be an executive officer of PSEG or its subsidiaries, or any company where any executive of PSEG or its subsidiaries serves on the compensation committee, or that makes payments to or receives payments from PSEG or its subsidiaries in any year more than the greater of $1 million or 2% of such company's consolidated gross revenue, nor may any of them receive more than $50,000 in direct compensation (other than fees and compensation provided to directors generally) or be affiliated or employed by PSEG's independent auditor. In addition, to be independent, a director may not be an executive officer of a charity if contributions by PSEG and its subsidiaries exceed the greater of $1 million or 2% of the charity's consolidated gross revenue. These limitations apply for three years after the end of the applicable affiliation or arrangement. As determined by the PSEG board of directors, all of the current directors, with the exception of E. James Ferland, the Chairman of the Board, President and Chief Executive Officer, are independent under the PSEG corporate governance principles and the requirements of the NYSE. This determination was based upon a review of the questionnaires submitted by each of the PSEG directors, relevant business records of PSEG, publicly available information and the applicable SEC and NYSE requirements.
PSEG has adopted a code of ethics titled PSEG Standards of Integrity applicable to it and all its subsidiaries. The PSEG Standards of Integrity are an integral part of PSEG's business conduct compliance program and embody the commitment of PSEG and its subsidiary companies to conduct operations in accordance with the highest legal and ethical standards. The PSEG Standards of Integrity apply to all PSEG directors, employees, contractors and consultants, worldwide. Each is responsible for understanding and complying with the PSEG Standards of Integrity. The PSEG Standards of Integrity are posted on PSEG's website, www.pseg.com/investor/governance. A copy is available upon request made to PSEG.
The PSEG board of directors has had for a number of years an audit committee, a corporate governance committee and an organization and compensation committee, each consisting solely of independent directors. As discussed more fully below, each of these committees has a charter that defines its roles and responsibilities. The charters are posted on PSEG's website, www.pseg.com/investor/governance. A copy is available upon request made to PSEG.
The PSEG board of directors holds regular monthly meetings, except in February, May and August, and meets on other occasions when circumstances require. The PSEG board of directors met nine times in 2005, and, on average, the meetings lasted approximately three hours. Directors spend additional time preparing for board of directors and committee meetings they attend and they are called upon for counsel between meetings. In addition, during 2005, Caroline Dorsa, E. James Ferland, Albert R. Gamper, Jr. and Conrad K. Harper served on the board of directors of PSE&G. Mr. Ferland also served on the boards of directors of Energy Holdings, Power and Services. The PSE&G board of directors met seven times in 2005. Committee membership and membership on the PSE&G board of directors is shown in the biographies above.
The PSEG corporate governance principles adopted by the PSEG board of directors provide that the PSEG board of directors will meet periodically on a regular basis at least twice each year in executive session without management in attendance. In such cases, the PSEG board of directors designates a non-management director to chair the meeting who is the independent Committee Chair most closely associated with the business at hand. During 2005, four executive sessions were held with only independent directors present. In addition, the PSEG audit committee, corporate governance committee and organization and compensation committee each meet periodically with only independent directors present.
Under the PSEG corporate governance principles, each director is expected to attend all PSEG board of directors meetings and all meetings of committees of which such director is a member, as well as the Annual Meeting of Shareholders. Meeting materials are provided to PSEG board of directors and committee members prior to meetings, and members are expected to review such materials prior to each meeting.
Under the retirement policy for directors, directors who have never been employees of the PSEG group of companies and directors who are former chief executive officers of PSEG may not serve as directors
205
beyond the Annual Meeting of Shareholders following their 70th birthday. Directors who are former employees, other than chief executive officers, may not serve as directors beyond the Annual Meeting of Shareholders following termination of active employment with the PSEG group of companies. In addition, directors must submit a letter of resignation upon a change in primary employment.
As set forth in the PSEG corporate governance principles, shareholders and other interested parties may communicate directly with the PSEG board of directors, including the independent directors of PSEG, by writing to Edward J. Biggins, Jr., Secretary, at Public Service Enterprise Group Incorporated, 80 Park Plaza, T4B, P.O. Box 1171, Newark, New Jersey 07101-1171, and indicating who should receive the communication. Unless the context otherwise requires, the Corporate Secretary will provide the communication to the independent Chair of the Board Committee most closely associated with the nature of the request.
Committees of the Board
PSEG
The committees of the PSEG board of directors and their principal functions are as follows:
Audit Committee
Assists the PSEG board of directors in fulfilling its responsibility for oversight of the integrity of PSEG's financial statements, and the quality and integrity of the accounting, auditing and financial reporting practices of PSEG, with open and free access to all information of PSEG and its subsidiaries. Solely responsible for the appointment, termination, compensation and oversight of the work of the independent auditor. The independent auditor reports directly to the PSEG audit committee. Reviews independence of independent auditor, the services provided by them, their fees and peer review reports of their performance. Pre-approves the services provided and fees paid to the independent auditor for all services provided to PSEG and its subsidiaries. Reviews with the independent auditor, management and PSEG's internal auditors the annual audited and quarterly financial statements and evaluates the acceptability and quality of such financial statements and PSEG's accounting, reporting and auditing practices. Generally discusses earnings press releases, financial information and earnings guidance provided to analysts and rating agencies as well as policies with respect to risk assessment and risk management. Recommends to the PSEG board of directors the inclusion of the audited financial statements in PSEG's Annual Report on Form 10-K. Resolves any disagreements which may arise between management and the independent auditor regarding financial reporting.
Annually reviews and assesses the PSEG audit committee charter. Provides oversight of the internal audit and environmental, health and safety audit functions of PSEG. Reviews annual audit reports of both independent and internal auditors, as well as environmental health and safety auditors. Reviews planned scope of future audits. Ascertains implementation of auditors' recommendations. Reviews internal auditing procedures and internal accounting controls. Reviews adequacy and implementation of policies and practices relating to accounting, financial reporting, internal auditing, operating controls, business conduct compliance program (including environmental health and safety compliance) and business ethics. Meets privately with representatives of the independent auditor, internal auditors and environmental auditors. Reviews the status of pending material litigation, and legal and business conduct compliance. Reviews compliance with legal and regulatory requirements.
The PSEG audit committee is comprised of three or more independent directors, as defined by the PSEG board of directors, who are generally knowledgeable in financial matters, including at least one member with accounting or financial management expertise. In addition to meeting the requirements for being an independent director, members may receive no direct or indirect compensation from PSEG or its subsidiaries, other than as a director or committee member, and may not be affiliated with PSEG or its subsidiaries, in accordance with applicable legal requirements.
The PSEG board of directors determines annually, and upon a change in audit committee composition, the independence, financial literacy and financial expertise of the PSEG audit committee members and makes written affirmation to the NYSE in accordance with its rules. In accordance with the rules of the SEC and the NYSE, PSEG maintains an audit committee consisting solely of directors who are independent of management. Also, in accordance with the NYSE rules, the PSEG board of directors has determined that all members of the PSEG audit committee are financially literate and, in addition, that each member of the
206
PSEG audit committee possesses financial expertise, as defined in the NYSE rules. The PSEG board of directors further has determined that each of Albert R. Gamper, Jr., Caroline Dorsa, William V. Hickey, Shirley Ann Jackson, Thomas A. Renyi and Richard J. Swift, the members of the PSEG audit committee, is an “audit committee financial expert” as defined under the Sarbanes-Oxley Act of 2002 and the rules of the SEC.
PSEG and the PSEG board of directors believe that the current composition of the PSEG audit committee provides that committee with the requisite expertise and experience to recommend to the PSEG board of directors the inclusion of PSEG's financial statements in the Annual Report on Form 10-K. The PSEG board of directors will consider this matter annually as a part of its ongoing governance review. The PSEG audit committee will also continue its assessment and enhancement of governance practices, including assurance that there exist adequate independent procedures for receipt and treatment of complaints regarding accounting, internal controls or auditing matters.
The PSEG audit committee meets at least four times per year, and in executive session without management present at least three times per year. The PSEG audit committee held ten meetings in 2005. The PSEG audit committee report appears below. The PSEG audit committee charter is posted on PSEG's website, www.pseg.com/investor/governance. A copy is available upon request made to PSEG.
Corporate Governance Committee
Monitors the composition of the PSEG board of directors to assure a reasonable balance of professional interests, business experience, financial expertise and independence. Considers qualifications of PSEG board of directors members and evaluates prospective nominees identified by the PSEG corporate governance committee or by other PSEG board of directors members, management, shareholders or other sources. The PSEG corporate governance committee retains for a fee third-party executive search firms to assist it in identifying and recruiting potential nominees for consideration for election to the PSEG board of directors. Recommends to the PSEG board of directors membership changes and nominees to maintain requisite balance. Also considers the amount of time that a person will likely have to devote to his or her duties as a director, including non-PSEG responsibilities as an executive officer, board member or trustee of businesses and charitable institutions, and the contribution by directors to the ongoing business of PSEG. Further evaluates the continuity current directors bring to service on the PSEG board of directors versus the benefit from new ideas and perspectives that new members bring to the PSEG board of directors. The PSEG corporate governance committee does not believe it is appropriate to set limits on outside board memberships or the length of a director's term, but monitors the above factors to attempt to assure that the PSEG board of directors contains an effective mix of people to best further PSEG's long-term business interests. The PSEG corporate governance committee utilizes the same criteria to evaluate all potential nominees, including those recommended by shareholders or from other sources.
Periodically evaluates performance of the PSEG board of directors and its committees, including a review of the size, structure and composition of the PSEG board of directors and its committees and their governance practices and makes recommendations to the PSEG board of directors. Makes recommendations to the PSEG board of directors to improve effectiveness of the PSEG board of directors and its committees. Recommends to the PSEG board of directors the chairs and members of several committees of the PSEG board of directors.
Membership consists of three or more independent directors. Meetings are held at least two times per year, and in executive session without management present at least once per year. The PSEG corporate governance committee met four times in 2005. The PSEG corporate governance committee charter is posted on PSEG's website, www.pseg.com/investor/governance. A copy is available upon request made to PSEG.
The PSEG corporate governance committee will consider shareholders' recommendations for nominees for election to the PSEG board of directors. Such recommendations must be submitted in writing to Edward J. Biggins, Jr., Secretary, Public Service Enterprise Group Incorporated, 80 Park Plaza, T4B, P.O. Box 1171, Newark, New Jersey 07101-1171. Nominations must be accompanied by the written consent of any such person to serve if nominated and elected and by biographical material to permit evaluation of the individual recommended. In addition, the By-Laws of PSEG require that shareholder nominations must be submitted at least 90 days in advance of an Annual Meeting of Shareholders.
The PSEG corporate governance committee seeks candidates for the PSEG board of directors with an attained position of leadership in their field of endeavor, breadth of experience and sound business judgment.
207
It is the policy of the PSEG board of directors that a person who is not an employee of PSEG shall not be recommended initially to the shareholders for election as a director unless it appears that, consistent with the retirement policy for directors referred to above, such person would be available to serve as a director for at least five years.
Executive Committee
Except as otherwise provided by law, the PSEG executive committee has and may exercise all the authority of the PSEG board of directors when the PSEG board of directors is not in session. Membership consists of the Chairman of the PSEG board of directors and at least one independent director. This PSEG executive committee meets only if it is impracticable to convene the full PSEG board of directors. It did not meet during 2005.
Finance Committee
Considers financial policies, or changes therein, before presentation to the PSEG board of directors. Periodically reviews and makes recommendation to the PSEG board of directors regarding PSEG's financial planning and significant financial decisions. Makes recommendations to the PSEG board of directors regarding the issuance and sale of securities and project investment and cash investment guidelines. Oversees the investment of the trust funds of the pension plans and nuclear decommissioning trust fund of PSEG and its subsidiaries. Consists of three or more members, the majority of whom are independent directors. Meets at least three times per year. The PSEG finance committee held four meetings in 2005.
Nuclear Committee
Provides an independent basis for evaluating the safety and effectiveness of PSEG's nuclear operations. Specific attention is provided to evaluation of overall management attention to nuclear safety, regulatory issues, other evaluations of nuclear operations and to improvement in operations. Consists of three or more independent directors and meets at least three times per year. The PSEG nuclear committee held three meetings in 2005.
Organization and Compensation Committee
Reviews, approves and modifies, as necessary, PSEG's executive compensation policy. Studies and makes recommendations to the PSEG board of directors concerning corporate organization in general and compensation for directors and certain executives. Administers the compensation program for executive officers and key employees. Makes comparative studies and reports to the PSEG board of directors with respect to compensation for directors who are not officers. Reviews and makes recommendations to the PSEG board of directors with respect to certain incentive compensation programs for officers and other key employees and certain benefit plans for directors and officers. Reviews and approves corporate goals and objectives relevant to Chief Executive Officer compensation, evaluates the Chief Executive Officer's performance in light of those goals and objectives and, with the independent board members, determines and approves the Chief Executive Officer's compensation level based on this evaluation. Administers certain benefit plans for directors and officers. Annually reviews management succession and development plans and performance reviews for the Chief Executive Officer and certain other key members of management. Retains independent compensation consultants to assist it in designing compensation programs that are consistent with comparable industry practices.
Consists of three or more independent directors who meet at least two times per year and in executive session at least two times per year, without management present. The PSEG organization and compensation committee held seven meetings in 2005. The PSEG organization and compensation committee report on executive compensation appears below. The PSEG organization and compensation committee charter is posted on PSEG's website, www.pseg.com/investor/governance. A copy is available upon request made to PSEG.
208
Code of Ethics
PSEG, PSE&G, Power and Energy Holdings
PSEG has adopted a code of ethics entitled Standards of Integrity (Standards) applicable to it and its subsidiaries, including PSE&G, Power and Energy Holdings. The Standards are an integral part of PSEG's business conduct compliance program and embody the commitment of PSEG and its subsidiary companies to conduct operations in accordance with the highest legal and ethical standards. The Standards apply to all PSEG directors, employees (including PSEG's, PSE&G's, Power's and Energy Holdings' respective principal executive officer, principal financial officer, principal accounting officer or Controller and persons performing similar functions), contractors and consultants, worldwide. Each is responsible for understanding and complying with the Standards.
The Standards establish a set of common expectations for behavior that each employee must adhere to in dealings with investors, customers, fellow employees, competitors, vendors, government officials, the media and all others who may associate their words and actions with PSEG. They have been developed to provide reasonable assurance that, in conducting PSEG's business, employees behave ethically and in accordance with the law and do not take advantage of investors, regulators or customers through manipulation, abuse of confidential information or misrepresentation of material facts.
Any amendment (other than technical, administrative or non-substantive) to or a waiver from the Standards that applies to any director or PSEG's, PSE&G's, Power's or Energy Holdings' principal executive officer, principal financial officer, principal accounting officer or Controller, or persons performing similar functions and that relates to any element enumerated by the SEC, will be posted on PSEG's website, www.pseg.com/investor/governance.
ITEM 11. EXECUTIVE COMPENSATION
PSEG
The following table sets forth compensation paid or awarded to the Chief Executive Officer (CEO) and the four most highly compensated executive officers of PSEG as of December 31, 2005 for all services rendered to PSEG and its subsidiaries and affiliates during each year indicated.
Summary Compensation Table
| | | | | | | Annual Compensation
Awards
| | Long-Term
Compensation
Awards
| | | | |
Name and Principal Position
| | Year(1)
| | Salary ($)
| | Bonus/Annual
Incentive
Award ($)(2)
| | Restricted
Stock
($)(3)(4)
| | Options
(#)(6)
| | All Other
Compensation
($)(7)
|
E. James Ferland
Chairman of the Board and Chief Executive Officer of PSEG | | | 2005
2004
2003 | | | | 1,075,965
1,081,138
1,006,227 | | | | 1,332,700
753,200
1,440,000 | | | | 6,645,900
949,050
0 | (5) | | | 0
135,000
0 | | | | 51,813
6,152
6,002 | |
Robert J. Dougherty, Jr.
President and Chief Operating Officer of Energy Holdings | | | 2005
2004
2003 | | | | 582,814
584,539
547,945 | | | | 480,900
342,400
460,400 | | | | 1,453,795
235,125
0 | (5) | | | 0
33,000
0 | | | | 5,252
6,002
5,001 | |
Thomas M. O'Flynn
Executive Vice President and Chief Financial Officer of PSEG | | | 2005
2004
2003 | | | | 533,002
532,809
488,170 | | | | 395,800
316,100
441,000 | | | | 1,453,795
235,125
0 | (5) | | | 0
33,000
0 | | | | 10,955
8,202
8,005 | |
Ralph Izzo
President and Chief Operating Officer of PSE&G(8) | | | 2005
2004
2003 | | | | 498,133
465,562
304,051 | | | | 366,300
350,500
282,800 | | | | 1,648,585
235,125
0 | (5) | | | 0
33,000
250,000 | | | | 14,937
8,204
8,003 | |
Frank Cassidy
President and Chief Operating Officer of Power | | | 2005
2004
2003 | | | | 523,039
488,170
468,243 | | | | 356,000
131,300
306,100 | | | | 1,453,795
235,125
0 | (5) | | | 0
33,000
0 | | | | 8,652
5,127
5,002 | |
| | | | | | | | | | | | | | | | | | | | | | | | |
|
| (1) | | Payments in 2005 and 2003 were for 26 biweekly pay periods; payment in 2004 was for 27 biweekly pay periods. |
| (2) | | Amounts awarded were earned under the Restated and Amended Management Incentive Compensation Plan and determined and paid in the following year. |
209
| (3) | | Value as of original award date, based on the respective closing prices on the NYSE of $51.56 on January 18, 2005, of $65.89 on December 20, 2005 and of $42.75 on May 3, 2004, with one-third of each of the 2005 share awards vesting, respectively, on each January 18 and December 20 of the succeeding three years and with one-third of the share award in 2004 vesting on December 31 of that year and the succeeding two years. Dividends on the shares awarded are paid in cash from the date of the award. The fair market value of the PSEG Common Stock at the time of vesting on December 31, 2005 and 2004 was $64.97 and $52.31, respectively. |
| (4) | | At December 31, 2005 each of the following individuals named had (i) unvested shares of restricted stock and (ii) unvested performance units denominated in shares of stock and payable in cash or stock at the discretion of the Organization and Compensation Committee, subject to achievement of performance goals for a three-year period ending December 31, 2006 (value represents number of shares/units multiplied by the closing price of the NYSE of $64.97). |
| | | | Unvested Restricted
Stock
| | Unvested Performance
Units
|
| | Name
| | #
| | $
| | #
| | $
|
| | E. James Ferland | | | 100,734 | | | | 6,544,688 | | | | 23,899 | | | | 1,552,718 | |
| | Robert J. Dougherty, Jr | | | 22,334 | | | | 1,451,040 | | | | 5,921 | | | | 384,687 | |
| | Thomas M. O'Flynn | | | 22,334 | | | | 1,451,040 | | | | 5,921 | | | | 384,687 | |
| | Ralph Izzo | | | 25,001 | | | | 1,624,315 | | | | 5,921 | | | | 384,687 | |
| | Frank Cassidy | | | 22,334 | | | | 1,451,040 | | | | 5,921 | | | | 384,687 | |
| | | | | | | | | | | | | | | | | | |
|
| (5) | | Reflects awards for two years' compensation. The general practice of the Organization and Compensation Committee has been to grant equity awards at the end of a calendar year in connection with establishing key employee compensation for the following calendar year. However, no awards were made in December 2003, pending stockholder consideration of the approval of the 2004 Long-Term Incentive Plan (2004 LTIP) at the 2004 Annual Meeting. Following receipt of such approval, the Committee granted restricted stock awards in May 2004. No awards under the 2004 LTIP were made in December 2004 due to the ongoing Merger negotiations. Following announcement of the planned Merger, the Committee granted restricted stock awards in January 2005 in connection with compensation for 2005. The restricted stock awards granted by the Committee in December 2005 were in connection with compensation for 2006. All were in keeping with the general practices noted above. |
| (6) | | All grants of options to purchase shares of PSEG Common Stock were non-qualified options. |
| (7) | | Amounts for 2004 and 2003 solely represent employer contributions to the PSEG Thrift and Tax Deferred Savings Plan. Amounts for 2005 include employer contributions to the PSEG Thrift and Tax-Deferred Savings Plan and interest on compensation deferred under PSEG's Deferred Compensation Plan in excess of 120% of the applicable federal long-term rate as prescribed under Section 1274(d) of the Internal Revenue Code as follows: |
| | | | Ferland
($)
| | Dougherty
($)
| | O'Flynn
($)
| | Izzo
($)
| | Cassidy
($)
|
| | Employer Thrift Plan Contributions | | | 6,301 | | | | 5,252 | | | | 8,405 | | | | 8,402 | | | | 8,305 | |
| | Interest on Deferred Compensation | | | 45,512 | | | | 0 | | | | 2,550 | | | | 6,535 | | | | 347 | |
| | | | |
| | | |
| | | |
| | | |
| | | |
| |
| | Total | | | 51,813 | | | | 5,252 | | | | 10,955 | | | | 14,937 | | | | 8,652 | |
| | | | |
| | | |
| | | |
| | | |
| | | |
| |
| | | | | | | | | | | | | | | | | | | | | | |
| (8) | | Mr. Izzo was elected to his current position effective October 18, 2003. |
210
Option Grants in Last Fiscal Year (2005)
| | | Option Grants in Last Fiscal Year
| | | | |
Name
| | Number of
Securities
Underlying
Options
Granted
| | % of Total
Options
Granted to
Employees in
Fiscal Year
| | Exercise or
Base Price
($/Sh)
| | Expiration
Date
| | Grant Date
Present Value
($)
|
E. James Ferland | | | 0 | | | | N/A | | | | N/A | | | | N/A | | | | N/A | |
Robert J. Dougherty, Jr. | | | 0 | | | | N/A | | | | N/A | | | | N/A | | | | N/A | |
Thomas M. O'Flynn | | | 0 | | | | N/A | | | | N/A | | | | N/A | | | | N/A | |
Ralph Izzo | | | 0 | | | | N/A | | | | N/A | | | | N/A | | | | N/A | |
Frank Cassidy | | | 0 | | | | N/A | | | | N/A | | | | N/A | | | | N/A | |
| | | | | | | | | | | | | | | | | | | | |
Aggregated Option Exercises in Last Fiscal Year (2005) and
Fiscal Year End Option Values (12/31/05)
| | | | | | | | | | | Number of Unexercised
Options at
Fiscal Year-End(#)
| | Value of Unexercised
In-the-Money Options
At Fiscal Year-End($)
|
Name
| | Shares
Acquired
on Exercise
(#)(1)
| | Value
Realized
($)
| | Exercisable
(#)
| | Unexercisable
(#)
| | Exercisable
($)(2)
| | Unexercisable
($)(2)
|
E. James Ferland | | | 334,000 | | | | 10,362,467 | | | | 1,176,000 | | | | 90,000 | | | | 29,725,721 | | | | 1,999,800 | |
Robert J. Dougherty, Jr. | | | 500,000 | | | | 9,784,883 | | | | 196,000 | | | | 22,000 | | | | 4,445,274 | | | | 488,840 | |
Thomas M. O'Flynn | | | 186,667 | | | | 4,258,865 | | | | 334,333 | | | | 72,000 | | | | 7,203,509 | | | | 1,448,840 | |
Ralph Izzo | | | 156,333 | | | | 3,310,888 | | | | 72,667 | | | | 172,000 | | | | 1,845,731 | | | | 4,118,840 | |
Frank Cassidy | | | 450,000 | | | | 9,927,048 | | | | 321,000 | | | | 22,000 | | | | 7,058,712 | | | | 488,840 | |
| | | | | | | | | | | | | | | | | | | | | | | | |
|
| (1) | | Reflects options exercised through December 31, 2005. |
| (2) | | Represents difference at December 31, 2005 between market price of PSEG Common Stock ($64.97) and the respective exercise prices of the options. Such amounts may not necessarily be realized. Actual values which may be realized, if any, upon any exercise of such options will be based on the market price of PSEG Common Stock at the time of any such exercise and thus are dependent upon future performance of PSEG Common Stock. |
Employment Contracts and Arrangements
PSEG entered into an employment agreement dated as of June 16, 1998 and amended as of November 20, 2001 with Mr. Ferland (together, the “Original Ferland Employment Agreement”), and further as amended on December 20, 2004 (the “Second Amendment”) covering his employment as Chief Executive Officer through March 31, 2007. The Original Ferland Employment Agreement provides that Mr. Ferland will be renominated for election as a director during his employment under the Original Ferland Employment Agreement. The Original Ferland Employment Agreement also provides that Mr. Ferland's base salary, target annual incentive bonus and long-term incentive bonus will be determined based on compensation practices for CEOs of similar companies and that his annual salary will not be reduced during its term. The Original Ferland Employment Agreement also provided for an award to him of 150,000 shares of restricted PSEG Common Stock as of June 16, 1998 and 60,000 shares of restricted PSEG Common Stock as of November 20, 2001, with 60,000 shares vesting in 2002; 20,000 shares vesting in 2003; 30,000 shares vesting in 2004; 40,000 shares vesting in 2005; 30,000 shares vesting in 2006; and 30,000 shares vesting in 2007. The Original Ferland Employment Agreement provides for the granting of 22 years of pension credit for Mr. Ferland's prior experience, which was awarded at the time of his initial employment.
The Second Amendment provides that, as of completion of the proposed Merger of PSEG and Exelon, Mr. Ferland will serve as the Chairman of the Exelon board of directors. Mr. Ferland will not have any executive duties after completion of the Merger. Mr. Ferland's term of employment continues through March 31, 2007, at which time he has agreed to retire. During this continued term of employment, Mr. Ferland's annual salary, target annual incentive bonus and target long-term incentive bonus will be set by the Exelon board of directors, but will not be less than the amounts paid to him or the targets set for him immediately prior to completion of the Merger. Under the Second Amendment, Mr. Ferland waived his right to resign his employment for “good reason” as a result of the Merger because: (1) of the changes to his title,
211
authority, duties, responsibilities and reporting lines; (2) he is not appointed to the position of Chief Executive Officer of Exelon; and (3) another individual is appointed to the position of Chief Executive Officer of Exelon. Further, under the Second Amendment, Mr. Ferland acknowledged that the changes in his title, authority, duties, responsibilities and reporting lines do not constitute a termination of his employment without “cause.” As a result, Mr. Ferland will not be entitled to any severance payment as a result of consummation of the Merger with Exelon. Otherwise, the provisions of the Original Ferland Employment Agreement, as amended, providing for severance payments on the termination of his employment without “cause” or on the resignation of his employment for “good reason,” remain in effect.
Under the Second Amendment, when Mr. Ferland retires at the end of his term of employment on March 31, 2007, he will be fully vested in any outstanding shares of restricted stock and any other equity awards he received as a long-term incentive award, and he will be paid any previously deferred compensation. He will not receive any special severance payments on retirement.
The Second Amendment only becomes effective if the Merger is completed.
PSEG entered into an employment agreement dated as of April 18, 2001 and amended as of December 21, 2001 with Mr. O'Flynn (the “O'Flynn Employment Agreement”) covering his employment as Executive Vice President and Chief Financial Officer through July 1, 2006. The O'Flynn Employment Agreement provides that Mr. O'Flynn's base salary, target annual incentive bonus and long-term incentive bonus will be determined based on compensation practices of similar companies and that his annual salary will not be reduced during its term. The O'Flynn Employment Agreement also provided for an award to him of 100,000 shares of restricted PSEG Common Stock and all of which have fully vested. The O'Flynn Employment Agreement awarded Mr. O'Flynn 250,000 options of PSEG Common Stock, all of which are fully vested and expire on July 1, 2011. The O'Flynn Employment Agreement also awarded 50,000 options, all of which have fully vested. The O'Flynn Employment Agreement provides for the granting, upon the completion of five years of service with PSEG, of 15 years of pension credit for Mr. O'Flynn's prior experience.
PSEG entered into an employment agreement with Mr. Izzo dated October 18, 2003, covering his employment as President and Chief Operating Officer of PSE&G through October 18, 2008. The agreement provides that his base salary, target annual incentive bonus and long-term incentive bonus will be determined based on compensation practices of similar companies and that annual salary will not be reduced during its term, and awarded him 250,000 options of PSEG Common Stock, 50,000 of which vest on October 18 from 2004 through 2008, and expire on October 18, 2013, provided he has remained continuously employed by PSEG through each such vesting date.
Each of the agreements discussed above further provides that if the individual is terminated without “cause” or resigns for “good reason” (as those terms are defined in each agreement) during the term of such agreement, the respective entire restricted stock award and/or entire option award becomes vested, the individual will be paid a benefit of two times base salary and target bonus, and his welfare benefits will be continued for two years unless he is sooner employed. In the event such a termination occurs after a “change in control” (also as defined in each agreement), the payment to the individual becomes three times the sum of salary and target bonus, continuation of welfare benefits for three years unless sooner reemployed, payment of the net present value of providing three years additional service under PSEG's retirement plans and a gross-up for excise taxes due under the Internal Revenue Code on any termination payments. Each of the agreements provides that the individual is prohibited for one year (two years for Mr. Ferland) from competing with and for two years from recruiting employees from, PSEG or its subsidiaries or affiliates, after termination of employment. Violation of these provisions requires a forfeiture of the respective restricted stock and option grants and certain benefits.
Under the Merger Agreement, PSEG has reserved the right to renew Mr. Izzo's agreement for a term not to exceed two years following the closing of the Merger.
Upon the expiration of their previous employment agreements in 2005, Messrs. Cassidy and Dougherty were made participants in the Key Executive Severance Plan. For additional information, see Note 23. Pending Merger of the Notes.
Compensation Committee Interlocks and Insider Participation
During 2005, each of the following individuals served as a member of the PSEG organization and compensation committee: Shirley Ann Jackson, Chair, Ernest H. Drew, Conrad K. Harper, William V. Hickey
212
and Thomas A. Renyi. During 2005, no member of the PSEG organization and compensation committee was an officer or employee or a former officer or employee of any PSEG company. No officer of PSEG served on the compensation committee of any of the companies for which any of these individuals served as an officer.
Compensation of Directors and Certain Business Relationships
During 2005, each director who was not an officer of PSEG or its subsidiaries and affiliates was paid an annual retainer of $50,000 and a fee of $1,500 for attendance at any PSEG board of directors or committee meeting, inspection trip, conference or other similar activity relating to PSEG or PSE&G. Pursuant to the Compensation Plan for Outside Directors, a certain percentage, currently fifty percent, of the annual retainer is paid in shares of PSEG Common Stock. No additional retainer is paid for service as a director of PSE&G. Each Committee Chair received an additional annual retainer of $5,000, except for the Chair of the PSEG audit committee, who received $10,000. In addition, each member of the PSEG audit committee received an additional annual retainer of $5,000.
PSEG also maintains a Stock Plan for Outside Directors pursuant to which directors who are not employees of PSEG or its subsidiaries and affiliates receive shares of restricted stock for each year of service as a director. For 2005, this amount was 1,000 shares of PSEG Common Stock. Such shares held by each non-employee director are included in the table below under “Item 12—Security Ownership of Certain Beneficial Owners and Management and Related Stockholder Matters.”
The restrictions on the shares of PSEG Common Stock granted under the Stock Plan for Outside Directors provide that the shares are subject to forfeiture if the director leaves service at any time prior to the Annual Meeting of Shareholders following his or her 70th birthday. This restriction would be deemed to have been satisfied if the director's service were terminated after a “change in control” as defined in the plan or if the director were to die in office. PSEG also has the ability to waive these restrictions for good cause shown. Restricted stock may not be sold or otherwise transferred prior to the lapse of the restrictions.
Dividends on shares of PSEG Common Stock held subject to restrictions are paid directly to the director and the director has the right to vote the shares of PSEG Common Stock.
Compensation Pursuant to Pension Plans
The table below illustrates annual retirement benefits for executive officers expressed in terms of single life annuities based on the average final compensation and service shown and retirement at age 65. A person's annual retirement benefit is based upon a percentage that is equal to years of credited service plus 30, but not more than 75%, times average final compensation at the earlier of retirement, attainment of age 65 or death. These amounts are reduced by Social Security benefits and certain retirement benefits from other employers. Pensions in the form of joint and survivor annuities are also available.
| | | | Length of Service
|
| | Average Final
Compensation
| | 30 Years
| | 35 Years
| | 40 Years
| | 45 Years
|
| | $ 600,000 | | $ | 360,000 | | | $ | 390,000 | | | $ | 420,000 | | | $ | 450,000 | |
| | 700,000 | | | 420,000 | | | | 455,000 | | | | 490,000 | | | | 525,000 | |
| | 800,000 | | | 480,000 | | | | 520,000 | | | | 560,000 | | | | 600,000 | |
| | 900,000 | | | 540,000 | | | | 585,000 | | | | 630,000 | | | | 675,000 | |
| | 1,000,000 | | | 600,000 | | | | 650,000 | | | | 700,000 | | | | 750,000 | |
| | 1,100,000 | | | 660,000 | | | | 715,000 | | | | 770,000 | | | | 825,000 | |
| | 1,200,000 | | | 720,000 | | | | 780,000 | | | | 840,000 | | | | 900,000 | |
| | 1,300,000 | | | 780,000 | | | | 845,000 | | | | 910,000 | | | | 975,000 | |
| | 1,400,000 | | | 840,000 | | | | 910,000 | | | | 980,000 | | | | 1,050,000 | |
| | 1,500,000 | | | 900,000 | | | | 975,000 | | | | 1,050,000 | | | | 1,125,000 | |
| | | | | | | | | | | | | | | | | | |
Average final compensation, for purposes of retirement benefits of executive officers, is generally equivalent to the average of the aggregate of the salary and bonus amounts reported in the Summary Compensation Table above under “Annual Compensation” for the five years preceding retirement, not to exceed 150% of the average annual salary for such five year period. Messrs. Ferland, Dougherty, O'Flynn, Cassidy and Izzo will have accrued approximately 48, 48, 44, 48 and 36 years of credited service, respectively, as of age 65.
213
Organization and Compensation Committee Report on Executive Compensation
The compensation program for executive officers of PSEG and its subsidiaries is administered by the PSEG organization and compensation committee of the PSEG board of directors. The PSEG organization and compensation committee operates under a written charter adopted by the PSEG board of directors, a copy of which is posted on PSEG's website, www.pseg.com/investor/governance. During 2005, the committee consisted solely of independent directors. Compensation plans developed by the committee are approved by the full PSEG board of directors. Administration of the plans is the responsibility of the PSEG organization and compensation committee.
The committee's philosophy on executive compensation is to base compensation on the value and level of performance of the executive and to link compensation to shareholder value. To achieve this result, the committee has developed and administers several pay delivery systems designed to focus executive efforts on improving corporate performance. These systems include base salary, an annual incentive compensation plan and a long-term incentive compensation plan. Over the past several years, the committee has shifted the relationship of these elements to place a higher portion on long-term compensation to increase the linkage of executive compensation with long-term shareholder value. The 2004 Long-Term Incentive Plan permits the use of several long-term incentive compensation components, such as performance shares, restricted stock and stock options. In 2005, the Committee decided to grant all long-term compensation in the form of restricted stock. In light of the pending Merger with Exelon Corporation, stock options and performance shares were not awarded. Also included as compensation are a deferred compensation plan, employer contributions to a 401(k) plan and an employee stock purchase plan. Changes in the law governing deferred compensation did not impact the Committee's compensation decisions in 2005.
Base salary levels are reviewed annually using compensation data compiled by outside compensation experts for similar positions and comparable companies. The utilities surveyed include some of, but are not limited to, those included in the Dow Jones Utilities Index. Most of the general industry companies surveyed are included in the S&P 500 Composite Stock Price Index. Each of these indices is shown in the Performance Graph below. For PSE&G positions, market data is reviewed for large electric and gas utilities, as well as for general industry. For PSEG Power, data for energy services and relevant general industry is utilized, while for PSEG Energy Holdings and PSEG Services positions, relevant general industry data is taken into consideration. Individual performance of the executive with respect to corporate performance criteria is determined and taken into account when setting salaries against the competitive market data. Such corporate performance criteria include attainment of business unit plans and financial targets, as well as individual measures for each executive officer related to such person's area of responsibility. In addition, factors such as leadership ability, managerial skills and other personal aptitudes and attributes are considered. Base salaries for satisfactory performance are targeted at the median of the competitive market. Generally, for 2005, base salaries were increased from 2004 levels to reflect general market adjustments for comparable positions.
For fiscal year 2005, the base salary of E. James Ferland, Chairman of the Board, President and Chief Executive Officer, based on overall performance and consideration of market data, was set at a rate which was approximately the median of comparable size energy companies. Since the incentive compensation plans discussed below have been based in part upon a percentage of salary, these elements of Mr. Ferland's compensation may be affected by increases in salary. In determining base salary for Mr. Ferland, individual performance in relation to corporate performance factors such as achievement of business plans, including progress on completion of the Merger, financial results, safety, human resources management, nuclear operations and civic leadership are considered.
The Restated and Amended Management Incentive Compensation Plan is designed to motivate and reward executives for both achievement of individual goals and overall company results and operates as an incentive compensation pool plan pursuant to which an award fund is established by the committee each year. The maximum award fund in any year is 2.5% of PSEG's net income. Mr. Ferland's maximum award cannot exceed 10% of the award fund and the maximum award for other participants cannot exceed 90% of the award fund divided by the number of participants, other than Mr. Ferland, for that plan year. The committee has the authority to reduce the award of any participant below the maximum award otherwise payable based upon criteria it deems appropriate. When considering whether to reduce the award of any executive officer below the maximum allowed under the plan for 2005, the committee considered a combination of corporate results, business factors and individual results including financial and business performance, business strategy and planning, including Merger and business integration, customer operations, corporate governance,
214
including Sarbanes-Oxley compliance, health and safety, management of corporate support services, cost savings and legal and environmental performance.
Annual awards are determined within 120 days after the end of the fiscal year. Awards for 2005 performance, including Mr. Ferland's, were determined in January 2006. The committee determined to reduce Mr. Ferland's and the other executive officers' awards below the maximum allowed based on its evaluation of the factors enumerated above.
The 2004 Long-Term Incentive Plan is designed to provide a direct linkage between the executive's interests and increases in shareholder value by encouraging certain executives of PSEG and its subsidiaries to increase their ownership of PSEG Common Stock through a variety of components, including the grant of stock options, restricted stock and performance units.
Grant levels are determined by the committee based upon several factors including the participant's ability to contribute to the overall success of PSEG and its subsidiaries and competitive market data. The level of grants is reviewed annually by the committee. The committee does not consider prior awards when determining grants.
In 2005 Mr. Ferland was granted 115,000 shares of restricted stock, reflecting awards for two years' compensation. The general practice of the Committee has been to grant equity awards at the end of a calendar year in connection with establishing key employee compensation for the following calendar year. No awards under the 2004 LTIP were made in December 2004 due to the ongoing merger negotiations. Following announcement of the planned merger, the Committee granted restricted stock awards in January 2005, including 65,000 to Mr. Ferland, in connection with compensation for 2005. The Committee granted restricted stock awards in December 2005, including 50,000 to Mr. Ferland, in connection with compensation for 2006. Both grants were below the median of the comparative market data.
Mr. Ferland has been awarded 210,000 shares of restricted PSEG Common Stock under the Original Ferland Employment Agreement, which shares vest in stages annually through 2007. The award was designed to align his interests with an increase in shareholder value and to incent him to remain with PSEG as Chief Executive Officer through March 31, 2007.
Section 162(m) of the Internal Revenue Code generally denies a deduction for United States federal income tax purposes for compensation in excess of $1 million for named executive officers, except for compensation pursuant to shareholder-approved performance-based plans. Shareholder approval of the 2004 Long-Term Incentive Plan was received at the 2004 Annual Meeting of Shareholders. Shareholder approval of the 2001 Long-Term Incentive Plan and the Restated and Amended Management Incentive Compensation Plan was received at the 2002 Annual Meeting of Shareholders. As a result, performance-based compensation under these plans is not now subject to the limitation on deductions contained in Section 162(m) of the Internal Revenue Code. In 2005, for purposes of Section 162(m) of the Internal Revenue Code, Messrs. Ferland, Dougherty, O'Flynn, Izzo and Cassidy had compensation subject to the limits of Section 162(m) of the Internal Revenue Code, comprised primarily of base salary and the value realized from the exercise of certain prior stock option awards. The committee and PSEG will continue to evaluate executive compensation in light of Section 162(m) of the Internal Revenue Code.
Members of the PSEG Organization and Compensation Committee:
Shirley Ann Jackson, Chair
Ernest H. Drew
Conrad K. Harper
William V. Hickey
Thomas A. Renyi
February 21, 2006
215
Audit Committee Report
The PSEG audit committee of the PSEG board of directors is composed solely of independent directors. It operates under a written charter adopted by the PSEG board of directors which is posted on PSEG's website, www.pseg.com/investor/governance. It is annually reviewed and assessed for adequacy by the PSEG audit committee.
Management is responsible for PSEG's financial statements and internal controls. The independent Registered Public Accountant of PSEG, Deloitte & Touche LLP, reports directly to the PSEG audit committee and is responsible for performing an independent audit of PSEG's annual consolidated financial statements in accordance with the standards of Public Company Accounting Oversight Board (U.S.) and on management's assessment of internal controls and for issuing reports thereon. The committee's overall responsibility is to assist the PSEG board of directors in overseeing the quality and integrity of the accounting, auditing and financial reporting practices.
In performance of its responsibilities, the committee has met and held discussions with management, the internal auditors and the independent auditor. The committee periodically meets privately with the internal auditors and with the independent auditor, and also meets in executive session with only Committee members present.
Management has represented to the committee that PSEG's consolidated financial statements were prepared in accordance with generally accepted accounting principles and the committee has reviewed and discussed the consolidated audited financial statements with management, the internal auditors and the independent auditor. The committee discussed with the independent auditor the matters required to be discussed by Statement on Auditing Standards No. 61 (Communication with Audit Committees) and other requirements, including the following:
| • | methods used to account for significant transactions; |
| |
| • | the effect of significant accounting policies in emerging areas; |
| |
| • | the process used by management in formulating accounting estimates and the basis for the auditors' conclusions regarding the reasonableness of these estimates; |
| |
| • | any disagreements with management over the application of accounting principles, the basis for management's accounting estimates and the disclosures in the financial statements; and |
| |
| • | critical accounting policies. |
The independent auditor also provided to the committee the written disclosures required by Independence Standards Board Standard No. 1 (Independence Discussions with Audit Committees). The committee discussed with the independent auditor the firm's independence with respect to PSEG and its management and discussed the internal controls and an assessment of the audits of Deloitte & Touche LLP by the Public Company Accounting Oversight Board. The committee has also reviewed the requirements of the Sarbanes-Oxley Act of 2002 with respect to auditor independence and has defined the amount and scope of services that may be performed by Deloitte & Touche LLP consistent with maintaining that firm's independence. The PSEG audit committee requires that all services of Deloitte & Touche LLP be pre-approved by the audit committee or the audit committee chair. The committee has considered whether the independent auditor's provision of non-audit services to PSEG and the audit and non-audit fees paid to the independent auditor, are compatible with maintaining the independent auditor's independence. On the basis of its review, the committee determined that the independent auditor has the requisite independence.
Based on the committee's discussions with management, the internal auditors and the independent auditor, the committee's review of the audited financial statements, the representations of management regarding the audited financial statements and the report of the independent auditor to the committee, the committee recommended to the PSEG board of directors that the audited financial statements be included in PSEG's Annual Report on Form 10-K for the fiscal year ended December 31, 2005, for filing with the SEC.
Members of the Audit Committee:
Albert R. Gamper, Jr., Chair
Shirley Ann Jackson
Caroline Dorsa
Thomas A. Renyi
William V. Hickey
Richard J. Swift
February 22, 2006
216
PSE&G
Information regarding the compensation of the CEO and the four most highly compensated executive officers of PSE&G as of December 31, 2005 is set forth below. Amounts shown were paid or awarded for all services rendered to PSEG and its subsidiaries and affiliates including PSE&G.
Summary Compensation Table
| | | | | | | | | | | | | | | Long-Term
Compensation
| | | | |
| | | | | | | Annual Compensation
Awards
| | Awards
| | | | |
Name and Principal Position
| | Year(1)
| | Salary ($)
| | Bonus/Annual
Incentive
Award ($)(2)
| | Restricted
Stock
($)(3)(4)
| | Options
(#)(6)
| | All Other
Compensation
($)(7)
|
E. James Ferland
Chairman of the Board and Chief Executive Officer | | | 2005
2004
2003 | | | | 1,075,965
1,081,138
1,006,227 | | | | 1,332,700
753,200
1,440,000 | | | | 6,645,900
949,050
0 | (5) | | | 0
135,000
0 | | | | 51,813
6,152
6,002 | |
Ralph Izzo(8)
President and Chief Operating Officer | | | 2005
2004
2003 | | | | 498,133
465,562
304,051 | | | | 366,300
350,500
282,800 | | | | 1,453,795
235,125
0 | (5) | | | 0
33,000
250,000 | | | | 14,937
8,204
8,003 | |
R. Edwin Selover
Senior Vice President and General Counsel | | | 2005
2004
2003 | | | | 458,282
439,698
403,487 | | | | 276,900
211,200
287,000 | | | | 976,549
141,075
0 | (5) | | | 0
22,000
0 | | | | 19,379
8,202
8,004 | |
Robert E. Busch
Senior Vice President and Chief Financial Officer | | | 2005
2004
2003 | | | | 393,524
398,315
370,610 | | | | 243,300
195,200
279,000 | | | | 788,629
128,250
0 | (5) | | | 0
20,000
0 | | | | 8,402
8,206
8,003 | |
Patricia A. Rado
Vice President and Controller | | | 2005
2004
2003 | | | | 273,973
256,577
227,148 | | | | 119,900
113,400
102,400 | | | | 337,739
53,437
0 | (5) | | | 0
7,600
0 | | | | 12,985
8,394
5,509 | |
| | | | | | | | | | | | | | | | | | | | | | | | |
|
| (1) | | Payments in 2005 and 2003 were for 26 biweekly pay periods; payment in 2004 was for 27 biweekly pay periods. |
| (2) | | Amounts awarded were earned under the Restated and Amended Management Incentive Compensation Plan and determined and paid in the following year. |
| (3) | | Value as of original award date, based on the respective closing prices on the NYSE of $51.56 on January 18, 2005, of $65.89 on December 20, 2005 and of $42.75 on May 3, 2004, with one-third of each of the share awards in 2005 each year vesting, respectively, on each January 18 and December 20 of the succeeding three years and with one-third of the share award in 2004 vesting on December 31 of that year and the succeeding two years. Dividends on the shares awarded are paid in cash from the date of the award. The fair market value of the PSEG Common Stock at the time of vesting on December 31, 2005 and 2004 was $64.97 and $52.31, respectively. |
| (4) | | At December 31, 2005 each of the following individuals named had (i) unvested shares of restricted stock and (ii) unvested performance units denominated in shares of stock and payable in cash or stock at the discretion of the Organization and Compensation Committee, subject to achievement of performance goals for a three-year period ending December 31, 2006 (value represents number of shares/units multiplied by the closing price of the NYSE of $64.97). |
| | | | Unvested Restricted Stock
| | Unvested Performance Units
|
| | Name
| | #
| | $
| | #
| | $
|
| | E. James Ferland | | | 100,734 | | | | 6,544,688 | | | | 23,899 | | | | 1,552,718 | |
| | Ralph Izzo | | | 25,001 | | | | 1,624,315 | | | | 5,921 | | | | 384,687 | |
| | R. Edwin Selover | | | 14,867 | | | | 965,909 | | | | 3,533 | | | | 229,539 | |
| | Robert E. Busch | | | 12,100 | | | | 786,137 | | | | 3,230 | | | | 209,853 | |
| | Patricia A. Rado | | | 5,184 | | | | 336,804 | | | | 1,346 | | | | 87,450 | |
| | | | | | | | | | | | | | | | | | |
217
| (5) | | Reflects awards for two years' compensation. The general practice of the Organization and Compensation Committee has been to grant equity awards at the end of a calendar year in connection with establishing key employee compensation for the following calendar year. However, no awards were made in December 2003, pending stockholder consideration of the approval of the 2004 Long-Term Incentive Plan (2004 LTIP) at the 2004 Annual Meeting. Following receipt of such approval, the Committee granted restricted stock awards in May 2004. No awards under the 2004 LTIP were made in December 2004 due to the ongoing Merger negotiations. Following announcement of the planned Merger, the Committee granted restricted stock awards in January 2005 in connection with compensation for 2005. The restricted stock awards granted by the Committee in December 2005 were in connection with compensation for 2006. All were in keeping with the general practices noted above. |
| (6) | | All grants of options to purchase shares of PSEG Common Stock were non-qualified options. |
| (7) | | Amounts for 2004 and 2003 solely represent employer contributions to the PSEG Thrift and Tax Deferred Savings Plan. Amounts for 2005 include employer contributions to the PSEG Thrift and Tax-Deferred Savings Plan and interest on compensation deferred under PSEG's Deferred Compensation Plan in excess of 120% of the applicable federal long-term rate as prescribed under Section 1274(d) of the Internal Revenue Code as follows: |
| | | | Ferland
($)
| | Izzo
($)
| | Selover
($)
| | Busch
($)
| | Rado
($)
|
| | Employer Contributions | | | 6,301 | | | | 8,402 | | | | 8,406 | | | | 8,402 | | | | 7,969 | |
| | Interest of Deferred Compensation | | | 45,512 | | | | 6,535 | | | | 10,973 | | | | 0 | | | | 5,016 | |
| | | | |
| | | |
| | | |
| | | |
| | | |
| |
| | Total | | | 51,813 | | | | 14,937 | | | | 19,379 | | | | 8,402 | | | | 12,985 | |
| | | | |
| | | |
| | | |
| | | |
| | | |
| |
| | | | | | | | | | | | | | | | | | | | | | |
| (8) | | Mr. Izzo was elected to his present position effective October 18, 2003. |
Option Grants in Last Fiscal Year (2005)
| | | Option Grants in Last Fiscal Year
| | | | |
Name
| | Number of
Securities
Underlying
Options
Granted
| | % of Total
Options
Granted to
Employees in
Fiscal Year
| | Exercise or
Base Price
($/Sh)
| | Expiration
Date
| | Grant Date
Present Value
($)
|
E. James Ferland | | | 0 | | | | N/A | | | | N/A | | | | N/A | | | | N/A | |
Ralph Izzo | | | 0 | | | | N/A | | | | N/A | | | | N/A | | | | N/A | |
R. Edwin Selover | | | 0 | | | | N/A | | | | N/A | | | | N/A | | | | N/A | |
Robert E. Busch | | | 0 | | | | N/A | | | | N/A | | | | N/A | | | | N/A | |
Patricia A. Rado | | | 0 | | | | N/A | | | | N/A | | | | N/A | | | | N/A | |
| | | | | | | | | | | | | | | | | | | | |
Aggregated Option Exercises in Last Fiscal Year (2005) and
Fiscal Year End Option Values (12/31/05)
| | | | | | | | | | | Number of Unexercised
Options at
FY-End(#)(1)
| | Value of Unexercised
In-the-Money Options
At FY-End($)(3)
|
Name
| | Shares
Acquired
on Exercise
(#)(1)
| | Value
Realized
($)(2)
| | Exercisable
(#)
| | Unexercisable
(#)
| | Exercisable
($)(3)
| | Unexercisable
($)(3)
|
E. James Ferland | | | 334,000 | | | | 10,362,467 | | | | 1,176,000 | | | | 90,000 | | | | 29,725,721 | | | | 1,999,800 | |
Ralph Izzo | | | 156,333 | | | | 3,310,088 | | | | 72,667 | | | | 172,000 | | | | 1,845,731 | | | | 4,118,840 | |
R. Edwin Selover | | | 257,334 | | | | 6,230,556 | | | | 0 | | | | 14,666 | | | | 0 | | | | 325,879 | |
Robert E. Busch | | | 205,000 | | | | 3,586,959 | | | | 171,667 | | | | 63,333 | | | | 3,537,711 | | | | 1,233,259 | |
Patricia A. Rado | | | 8,333 | | | | 245,129 | | | | 50,867 | | | | 5,066 | | | | 1,224,157 | | | | 112,567 | |
| | | | | | | | | | | | | | | | | | | | | | | | |
|
| (1) | | Reflects any options exercised through December 31, 2005. |
| (2) | | Represents difference between exercise price and market price of PSEG Common Stock on date of exercise. |
218
| (3) | | Represents difference at December 31, 2005 between market price of PSEG Common Stock ($65.89) and the respective exercise prices of the options. Such amounts may not necessarily be realized. Actual values which may be realized, if any, upon any exercise of such options will be based on the market price of PSEG Common Stock at the time of any such exercise and thus are dependent upon future performance of PSEG Common Stock. |
Employment Contracts and Arrangements
Upon the expiration of his employment agreements in 2005, Mr. Busch was made a participant in the Key Executive Severance Plan. For additional information, see Note 23. Pending Merger of the Notes.
See PSEG above for additional information about employment agreements with Messrs. Ferland and Izzo.
Compensation Committee Interlocks and Insider Participation
PSE&G does not have a compensation committee. Decisions regarding compensation of PSE&G's executive officers are made by the Organization and Compensation Committee of PSEG. Hence, during 2005 the PSE&G Board of Directors did not have, and no officer, employee or former officer of PSE&G participated in any deliberations of such Board, concerning executive officer compensation.
Compensation of Directors and Certain Business Relationships
See PSEG above.
Compensation Pursuant to Pension Plans
The table below illustrates annual retirement benefits for executive officers expressed in terms of single life annuities based on the average final compensation and service shown and retirement at age 65. A person's annual retirement benefit is based upon a percentage that is equal to years of credited service plus 30, but not more than 75%, times average final compensation at the earlier of retirement, attainment of age 65 or death. These amounts are reduced by Social Security benefits and certain retirement benefits from other employers. Pensions in the form of joint and survivor annuities are also available.
| | | | Length of Service
|
| | Average Final
Compensation
| | 30 Years
| | 35 Years
| | 40 Years
| | 45 Years
|
| | $ 300,000 | | $ | 180,000 | | | $ | 195,000 | | | $ | 210,000 | | | $ | 225,000 | |
| | 400,000 | | | 240,000 | | | | 260,000 | | | | 280,000 | | | | 300,000 | |
| | 500,000 | | | 300,000 | | | | 325,000 | | | | 350,000 | | | | 375,000 | |
| | 600,000 | | | 360,000 | | | | 390,000 | | | | 420,000 | | | | 450,000 | |
| | 700,000 | | | 420,000 | | | | 455,000 | | | | 490,000 | | | | 525,000 | |
| | 800,000 | | | 480,000 | | | | 520,000 | | | | 560,000 | | | | 600,000 | |
| | 900,000 | | | 540,000 | | | | 585,000 | | | | 630,000 | | | | 675,000 | |
| | 1,000,000 | | | 600,000 | | | | 650,000 | | | | 700,000 | | | | 750,000 | |
| | 1,100,000 | | | 660,000 | | | | 715,000 | | | | 770,000 | | | | 825,000 | |
| | 1,200,000 | | | 720,000 | | | | 780,000 | | | | 840,000 | | | | 900,000 | |
| | 1,300,000 | | | 780,000 | | | | 845,000 | | | | 910,000 | | | | 975,000 | |
| | 1,400,000 | | | 840,000 | | | | 910,000 | | | | 980,000 | | | | 1,050,000 | |
| | 1,500,000 | | | 900,000 | | | | 975,000 | | | | 1,050,000 | | | | 1,125,000 | |
| | | | | | | | | | | | | | | | | | |
Average final compensation, for purposes of retirement benefits of executive officers, is generally equivalent to the average of the aggregate of the salary and bonus amounts reported in the Summary Compensation Table above under "Annual Compensation' for the five years preceding retirement, not to exceed 150% of the average annual salary for such five year period. Messrs. Ferland, Selover, Busch, Izzo and Mrs. Rado will have accrued approximately 48, 43, 34, 36, and 29 years of credited service, respectively, as of age 65.
219
Power
Omitted pursuant to conditions set forth in General Instruction I of Form 10-K.
Energy Holdings
Omitted pursuant to conditions set forth in General Instruction I of Form 10-K.
ITEM 12. SECURITY OWNERSHIP OF CERTAIN BENEFICIAL OWNERS AND
MANAGEMENT AND RELATED STOCKHOLDER MATTERS
PSEG
The following table indicates the securities authorized for issuance under equity compensation plans as of December 31, 2005:
Plan Category
| | Number of Securities
to be Issued Upon
Exercise of
Outstanding Options,
Warrants and Rights
(#)
| | Weighted-Average
Exercise Price of
Outstanding Options,
Warrants and Rights
($)
| | Number of Securities
Remaining Available
for Future Issuance
Under Equity
Compensation Plans
(#)
|
Equity compensation plans approved by security holders | | | 2,902,888 | | | | 40.82 | | | | 12,483,313 | |
Equity compensation plans not approved by security holders | | | 1,078,667 | | | | 41.74 | | | | 1,889,080 | (A) |
| | | |
| | | |
| | | |
| |
Total | | | 3,981,555 | | | | 41.07 | | | | 14,372,393 | |
| | | |
| | | |
| | | |
| |
| | | | | | | | | | | | |
(A) Shares issuable under the PSEG Employee Stock Purchase Plan.
For additional discussion of specific plans concerning equity-based compensation, see Note 17. Stock Options and Employee Stock Purchase Plan of the Notes and Item 11. Executive Compensation for PSEG and PSE&G, above.
The following table sets forth, as of February 15, 2006, beneficial ownership of PSEG common stock, including options, by the directors and executive officers named in the table appearing under “—Executive Compensation.” None of these amounts exceeds 1% of the Common Stock outstanding, except for the amount for all directors and executive officers as a group, which constitutes approximately 1.2%.
| | Name
| | Amount and
Nature of
Beneficial Ownership
|
| | Frank Cassidy | | | 281,812 | (1) |
| | Caroline Dorsa | | | 5,306 | (2) |
| | Robert J. Dougherty, Jr. | | | 175,705 | (3) |
| | Ernest H. Drew | | | 13,849 | (4) |
| | E. James Ferland | | | 1,584,902 | (5) |
| | Albert R. Gamper, Jr. | | | 7,609 | (6) |
| | Conrad K. Harper | | | 9,343 | (7) |
| | William V. Hickey | | | 6,594 | (8) |
| | Ralph Izzo | | | 308,144 | (9) |
| | Shirley Ann Jackson | | | 5,684 | (10) |
| | Thomas M. O'Flynn | | | 417,950 | (11) |
| | Thomas A. Renyi | | | 4,806 | (12) |
| | Richard J. Swift | | | 12,614 | (13) |
| | All directors and executive officers as a group (16 persons) | | | 3,114,546 | (14) |
| | | | | | |
| | | |
| (1) | | Includes the equivalent of 2,101 shares held under the Thrift Plan. Includes 22,334 shares of restricted stock awarded pursuant to the 2004 LTIP. Includes options to purchase 243,000 shares, 232,000 shares of which are currently exercisable. |
220
| | | |
| (2) | | Includes 3,400 shares of restricted stock awarded pursuant to the Stock Plan for Outside Directors. Includes 500 shares jointly owned with her husband. |
| | | |
| (3) | | Includes the equivalent of 1,164 shares held under the Thrift Plan. Includes 22,334 shares of restricted stock awarded pursuant to the 2004 LTIP. Includes options to purchase 118,000 shares, 107,000 shares of which are currently exercisable. Includes 6,849 shares jointly owned with his wife. |
| | | |
| (4) | | Includes 6,800 shares of restricted stock awarded pursuant to the Stock Plan for Outside Directors. |
| | | |
| (5) | | Includes the equivalent of 15,984 shares held under the Thrift Plan. Includes 100,734 shares of restricted stock awarded pursuant to the 2004 LTIP. Includes options to purchase 1,166,000 shares, 1,121,000 shares of which are currently exercisable. Includes 210,000 shares held in a trust. |
| | | |
| (6) | | Includes 3,800 shares of restricted stock awarded pursuant to the Stock Plan for Outside Directors. |
| | | |
| (7) | | Includes 5,600 shares of restricted stock awarded pursuant to the Stock Plan for Outside Directors. |
| | | |
| (8) | | Includes 3,800 shares of restricted stock awarded pursuant to the Stock Plan for Outside Directors. |
| | | |
| (9) | | Includes the equivalent of 334 shares held under the Thrift Plan. Includes 25,001 shares of restricted stock awarded pursuant to the 2004 LTIP. Includes options to purchase 244,667 shares, 83,667 shares of which are currently exercisable. |
| | | |
| (10) | | Includes 3800 shares of restricted stock awarded pursuant to the Stock Plan for Outside Directors. |
| | | |
| (11) | | Includes the equivalent of 15 shares held under the Thrift Plan. Includes 22,334 shares of restricted stock awarded pursuant to the 2004 LTIP. Includes options to purchase 338,000 shares, 327,000 shares of which are currently exercisable. Includes 45,000 shares held in a trust. |
| | | |
| (12) | | Includes 3,400 shares of restricted stock awarded pursuant to the Stock Plan for Outside Directors. |
| | | |
| (13) | | Includes 6,200 shares of restricted stock awarded pursuant to the Stock Plan for Outside Directors. |
| | | |
| (14) | | Includes the equivalent of 19,805 shares held under the Thrift Plan. Includes options to purchase 2,327,933 shares, 2,072,400 shares of which are currently exercisable. Includes 224,888 shares of restricted stock. Includes 269,143 shares held in trusts. |
Certain Beneficial Owners
The following table sets forth beneficial ownership by any person or group known to PSEG, as of February 15, 2006, to be the beneficial owner of more than five percent of PSEG Common Stock. According to the Schedules 13G filed by these owners with the SEC, these securities were acquired in the ordinary course of business and were not acquired for the purpose of and do not have the effect of changing or influencing the control of PSEG and were not acquired in connection with or as a participant in any transaction having such purpose or effect.
Name and Address
| | Amount and
Nature of
Beneficial
Ownership
| | Percent
|
Capital Research and Management Company
333 South Hope Street
Los Angeles, CA 90071 | | | 22,896,300 | (1) | | | 9.6 | %(1) |
(1) As reported on Schedule 13G/A filed February 10, 2006.
Section 16(a) Beneficial Ownership Reporting Compliance
During 2005, no director or executive officer of PSEG was late in filing a Form 3, 4 or 5 in accordance with the requirements of Section 16(a) of the Securities Exchange Act of 1934, as amended, with regard to transactions involving PSEG Common Stock.
221
Performance Graph
The graph below shows a comparison of the five-year cumulative return assuming $100 invested on December 31, 2000 in PSEG Common Stock, the S&P Composite Stock Price Index, the Dow Jones Utilities Index and the S&P Electric Utilities Index.
5-Year Cumulative Total Comparative Returns—as of December 31, 2005
| | | 2000
| | 2001
| | 2002
| | 2003
| | 2004
| | 2005
|
PSEG | | | 100.00 | | | | 91.10 | | | | 73.48 | | | | 105.65 | | | | 131.10 | | | | 170.67 | |
S&P 500 | | | 100.00 | | | | 88.17 | | | | 68.73 | | | | 88.41 | | | | 97.99 | | | | 102.80 | |
DJ Utilities | | | 100.00 | | | | 73.87 | | | | 56.64 | | | | 73.11 | | | | 95.08 | | | | 118.81 | |
S&P Electrics | | | 100.00 | | | | 83.31 | | | | 70.74 | | | | 87.61 | | | | 110.74 | | | | 130.16 | |
| | | | | | | | | | | | | | | | | | | | | | | | |
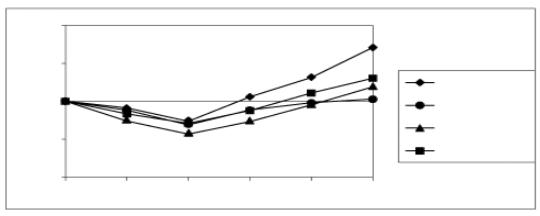
150.00
200.00
100.00
50.00
0.00
2000
2001
2002
2003
2004
2005
PSEG
S&P 500
DJ Utilities
S&P Electrics
PSE&G
All of PSE&G's 132,450,344 outstanding shares of Common Stock are owned beneficially and of record by PSE&G's parent, PSEG, 80 Park Plaza, P.O. Box 1171, Newark, New Jersey.
The following table sets forth beneficial ownership of PSEG Common Stock, including options, by the directors and executive officers named below as of February 15, 2006. None of these amounts exceed 1% of the PSEG Common Stock outstanding at such date. No director or executive officer owns any of PSE&G's Preferred Stock of any class.
Name
| | Amount and
Nature of
Beneficial Ownership
|
Robert E. Busch | | | 180,945 | (1) |
Caroline Dorsa | | | 5,306 | (2) |
E. James Ferland | | | 1,584,902 | (3) |
Albert R. Gamper, Jr | | | 7,609 | (4) |
Conrad K. Harper | | | 9,343 | (5) |
Ralph Izzo | | | 308,144 | (6) |
Patricia A. Rado | | | 65,551 | (7) |
R. Edwin Selover | | | 33,732 | (8) |
All directors and executive officers as a group (8 persons) | | | 2,195,532 | (9) |
| | | | |
| | | |
| (1) | | Includes the equivalent of 195 shares held under the Thrift Plan. Includes options to purchase 155,000 shares, 148,333 shares of which are currently exercisable. Includes 14,600 shares of restricted stock. |
| | | |
| (2) | | Includes 3,400 shares of restricted stock awarded pursuant to the Stock Plan for Outside Directors. Includes 500 shares held jointly with spouse. |
222
| | | |
| (3) | | Includes the equivalent of 15,984 shares held under the PSEG Thrift and Tax-Deferred Savings Plan (Thrift Plan). Includes options to purchase 1,166,000 shares, 1,121,000 shares of which are currently exercisable. Includes 100,734 shares of restricted stock. Includes 210,000 shares held in a trust. |
| | | |
| (4) | | Includes 3,800 shares of restricted stock awarded pursuant to the Stock Plan for Outside Directors. |
| | | |
| (5) | | Includes 5,600 shares of restricted stock awarded pursuant to the Stock Plan for Outside Directors. |
| | | |
| (6) | | Includes the equivalent of 334 shares held under the Thrift Plan. Includes 25,001 shares of restricted stock awarded pursuant to the 2004 LTIP. Includes options to purchase 244,667 shares, 83,667 shares of which are currently exercisable. |
| | | |
| (7) | | Includes options to purchase 55,933 shares, 53,400 shares of which are currently exercisable. Includes 5,184 shares of restricted stock. |
| | | |
| (8) | | Includes the equivalent of 12 shares held under the Thrift Plan. Includes options to purchase 7,333 shares, none of which are currently exercisable. Includes 14,867 shares of restricted stock. |
| | | |
| (9) | | Includes the equivalent of 16,525 shares held under the Thrift Plan. Includes options to purchase 1,628,933 shares, 1,406,400 shares of which are currently exercisable. Includes 173,186 shares of restricted stock. Includes 248,143 shares held in trusts. |
Power
Omitted pursuant to conditions set forth in General Instruction I of Form 10-K.
Energy Holdings
Omitted pursuant to conditions set forth in General Instruction I of Form 10-K.
ITEM 13. CERTAIN RELATIONSHIPS AND RELATED TRANSACTIONS
PSEG
None.
PSE&G
None.
Power
Omitted pursuant to conditions set forth in General Instruction I of Form 10-K.
Energy Holdings
Omitted pursuant to conditions set forth in General Instruction I of Form 10-K.
ITEM 14. PRINCIPAL ACCOUNTING FEES AND SERVICES
The appointment, termination, compensation and oversight of the work of the Independent Registered Public Accountants, Deloitte & Touche LLP, is the direct responsibility of the PSEG audit committee of the PSEG board of directors, which reviews their independence, the services provided and their fees, as well as peer review reports of their performance. All fees paid to Deloitte & Touche LLP, the member firms of Deloitte Touche Tohmatsu and their respective affiliates (collectively, Deloitte & Touche) for all services, audit and non-audit, provided to PSEG and its subsidiaries are pre-approved by the audit committee or its chair.
Audit Fees
The aggregate fees billed to PSEG and its subsidiaries by Deloitte & Touche for audit services rendered for the years ended December 31, 2005 and 2004 totaled $8,039,094 and $7,686,120, respectively. The fees were incurred for audits of the annual consolidated financial statements of PSEG and its subsidiaries,
223
including the Annual Report on Form l0-K of PSEG and its subsidiaries, reviews of financial statements included in Quarterly Reports on Form 10-Q of PSEG and its subsidiaries and for services rendered in connection with certain financing transactions and fees for accounting consultations related to the application of new accounting standards and rules.
Audit Related Fees
The aggregate fees billed to PSEG and its subsidiaries by Deloitte & Touche for audit related services rendered for the years ended December 31, 2005 and 2004 totaled $781,415 and $1,083,200, respectively, primarily related to audits of PSEG's employee benefit plans, performing certain attest services and, in 2004, due diligence related to the proposed merger with Exelon.
Tax Fees
The aggregate fees billed to PSEG and its subsidiaries by Deloitte &Touche for tax compliance, tax planning and tax advice for the years ended December 31, 2005 and 2004 totaled $61,388 and $888,178, respectively.
All Other Fees
The aggregate fees billed to PSEG and its subsidiaries by Deloitte & Touche for services other than the services described above totaled $150,860 for the year ended December 31, 2005, primarily for merger-related consultations and training sessions and $23,500 for the year ended December 31, 2004, primarily for assistance in certain litigation.
PART IV
ITEM 15. EXHIBITS AND FINANCIAL STATEMENT SCHEDULES
| (A) | | The following Financial Statements are filed as a part of this report: |
| | | a. | | Public Service Enterprise Group Incorporated's Consolidated Balance Sheets as of December 31, 2005 and 2004 and the related Consolidated Statements of Operations, Cash Flows and Common Stockholders' Equity for the three years ended December 31, 2005 on pages 102, 101, 103 and 104, respectively. |
| | | b. | | Public Service Electric and Gas Company's Consolidated Balance Sheets as of December 31, 2005 and 2004 and the related Consolidated Statements of Operations, Cash Flows and Common Stockholder's Equity for the three years ended December 31, 2005 on pages 106, 105, 107 and 108, respectively. |
| | | c. | | PSEG Power LLC Consolidated Balance Sheets as of December 31, 2005 and 2004 and the related Consolidated Statements of Operations, Cash Flows and Capitalization and Member's Equity for the three years ended December 31, 2005 on pages 110, 109, 111 and 112, respectively. |
| | | d. | | PSEG Energy Holdings L.L.C. Consolidated Balance Sheets as of December 31, 2005 and 2004 and the related Consolidated Statements of Operations, Cash Flows and Member's/Common Stockholder's Equity for the three years ended December 31, 2005 on pages 114, 113, 115 and 116, respectively. |
| (B) | | The following documents are filed as a part of this report: |
| | | a. | | PSEG Financial Statement Schedules: |
| | | | | Schedule II—Valuation and Qualifying Accounts for each of the three years in the period ended December 31, 2005 (page 235). |
| | | b. | | PSE&G Financial Statement Schedules: |
| | | | | Schedule II—Valuation and Qualifying Accounts for each of the three years in the period ended December 31, 2005 (page 236). |
224
| | | c. | | Power's Financial Statement Schedules: |
| | | | | Schedule II—Valuation and Qualifying Accounts for each of the three years in the period ended December 31, 2005 (page 236). |
| | | d. | | Energy Holdings' Financial Statement Schedules: |
| | | | | Schedule II—Valuation and Qualifying Accounts for each of the three years in the period ended December 31, 2005 (page 237). |
| Schedules other than those listed above are omitted for the reason that they are not required or are not applicable, or the required information is shown in the consolidated financial statements or notes thereto. |
| (C) | | The following documents are filed as part of this report: |
LIST OF EXHIBITS:
| a. | | | PSEG: |
| 3a | | | Certificate of Incorporation Public Service Enterprise Group Incorporated1 |
| 3b | | | By-Laws of Public Service Enterprise Group Incorporated as in effect May 16, 20052 |
| 3c | | | Certificate of Amendment of Certificate of Incorporation of Public Service Enterprise Group Incorporated, effective April 23, 19873 |
| 3d | | | Amended and Restated Trust Agreement for Enterprise Capital Trust I4 |
| 3e | | | Amended and Restated Trust Agreement for Enterprise Capital Trust II5 |
| 3f | | | Amended and Restated Trust Agreement for Enterprise Capital Trust III6 |
| 3g | | | Amended and Restated Trust Agreement for PSEG Funding Trust I7 |
| 3h | | | Amendment No. 1 to Amended and Restated Trust Agreement for PSEG Funding Trust I8 |
| 3i | | | Amended and Restated Trust Agreement for PSEG Funding Trust II9 |
| 4a | (1) | | Indenture between Public Service Enterprise Group Incorporated and First Union National Bank (now, Wachovia Bank, National Association), as Trustee, dated January 1, 1998 providing for Deferrable Interest Subordinated Debentures in Series (relating to Quarterly Preferred Securities)10 |
| 4a | (2) | | First Supplemental Indenture to Indenture dated as of January 1, 1998 between Public Service Enterprise Group Incorporated and First Union National Bank (now, Wachovia Bank, National Association), as Trustee, dated June 1, 1998 providing for the issuance of Floating Rate Deferrable Interest Subordinated Debentures, Series B (relating to Trust Preferred Securities)11 |
| 4a | (3) | | Second Supplemental Indenture to Indenture dated as of January 1, 1998 between Public Service Enterprise Group Incorporated and First Union National Bank (now, Wachovia Bank, National Association), as Trustee, dated July 1, 1998 providing for the issuance of Deferrable Interest Subordinated Debentures, Series C (relating to Trust Preferred Securities)12 |
| 4b | | | Indenture dated as of November 1, 1998 between Public Service Enterprise Group Incorporated and First Union National Bank (now, Wachovia Bank, National Association) providing for the issuance of Senior Debt Securities13 |
| 4c | | | First Supplemental Indenture to Indenture dated as of November 1, 1998 between Public Service Enterprise Group Incorporated and Wachovia Bank, National Association, as Trustee, dated September 10, 2002 providing for the issuance of Senior Deferrable Notes (Senior Debt Securities)14 |
| 4d | | | Second Supplemental Indenture to Indenture dated as of November 1, 1998 between Public Service Enterprise Group Incorporated and Wachovia Bank, National Association, as Trustee, dated July 27, 200515 |
| 4e | | | Indenture dated as of December 17, 2002 between Public Service Enterprise Group Incorporated and Wachovia Bank, National Association providing for the issuance of Debentures in Series including 8.75% Deferrable Interest Junior Subordinated Debentures, Series D16 |
| 9 | | | Inapplicable |
225
| 10a | (1) | | Deferred Compensation Plan for Directors |
| 10a | (2) | | Deferred Compensation Plan for Certain Employees |
| 10a | (3) | | Amended and Restated Limited Supplemental Benefits Plan for Certain Employees |
| 10a | (4) | | Mid Career Hire Supplemental Retirement Income Plan |
| 10a | (5) | | Retirement Income Reinstatement Plan for Non-Represented Employees |
| 10a | (6) | | 1989 Long-Term Incentive Plan, as amended17 |
| 10a | (7) | | 2001 Long-Term Incentive Plan18 |
| 10a | (8) | | Restated and Amended Management Incentive Compensation Plan19 |
| 10a | (9) | | Employment Agreement with E. James Ferland dated June 16, 199820 |
| 10a | (10) | | Amendment to Employment Agreement with E. James Ferland dated November 20, 200121 |
| 10a | (11) | | Second Amendment to Employment Agreement with E. James Ferland dated December 20, 200422 |
| 10a | (12) | | Employment Agreement with Thomas M. O'Flynn dated April 18, 200123 |
| 10a | (13) | | Amendment to Employment Agreement with Thomas M. O'Flynn dated December 21, 200124 |
| 10a | (14) | | Key Executive Severance Plan |
| 10a | (15) | | Employment Agreement with Ralph Izzo dated October 18, 200326 |
| 10a | (16) | | Stock Plan for Outside Directors, as amended27 |
| 10a | (17) | | Employment Agreement with Robert E. Busch dated April 24, 200128 |
| 10a | (18) | | Employee Stock Purchase Plan29 |
| 10a | (19) | | Compensation Plan for Outside Directors30 |
| 10a | (20) | | 2004 Long-Term Incentive Plan31 |
| 10a | (21) | | Retention Program for Key Employees32 |
| 10b | (1) | | Agreement and Plan of Merger33 |
| 10b | (2) | | Operating Services Contract34 |
| 11 | | | Inapplicable |
| 12 | | | Computation of Ratios of Earnings to Fixed Charges |
| 13 | | | Inapplicable |
| 14 | | | Code of Ethics84 |
| 16 | | | Inapplicable |
| 18 | | | Inapplicable |
| 21 | | | Subsidiaries of the Registrant |
| 22 | | | Inapplicable |
| 23 | | | Consent of Independent Registered Public Accounting Firm |
| 24 | | | Inapplicable |
| 31a | | | Certification by E. James Ferland, pursuant to Rules 13a-14 and 15d-14 of the 1934 Securities Exchange Act |
| 31b | | | Certification by Thomas M. O'Flynn pursuant to Rules 13a-14 and 15d-14 of the 1934 Securities Exchange Act |
| 32a | | | Certification by E. James Ferland, pursuant to Section 1350 of Chapter 63 of Title 18 of the United States Code |
| 32b | | | Certification by Thomas M. O'Flynn, pursuant to Section 1350 of Chapter 63 of Title 18 of the United States Code |
| b. | | | PSE&G: |
| 3a | (1) | | Restated Certificate of Incorporation of PSE&G35 |
226
| 3a | (2) | | Certificate of Amendment of Certificate of Restated Certificate of Incorporation of PSE&G filed February 18, 1987 with the State of New Jersey adopting limitations of liability provisions in accordance with an amendment to New Jersey Business Corporation Act36 |
| 3a | (3) | | Certificate of Amendment of Restated Certificate of Incorporation of PSE&G filed June 17, 1992 with the State of New Jersey, establishing the 7.44% Cumulative Preferred Stock ($100 Par) as a series of Preferred Stock37 |
| 3a | (4) | | Certificate of Amendment of Restated Certificate of Incorporation of PSE&G filed March 11, 1993 with the State of New Jersey, establishing the 5.97% Cumulative Preferred Stock ($100 Par) as a series of Preferred Stock38 |
| 3a | (5) | | Certificate of Amendment of Restated Certificate of Incorporation of PSE&G filed January 27, 1995 with the State of New Jersey, establishing the 6.92% Cumulative Preferred Stock ($100 Par) and the 6.75% Cumulative Preferred Stock—$25 Par as series of Preferred Stock39 |
| 3b | (1) | | By-Laws of PSE&G40 |
| 4a | (1) | | Indenture between PSE&G and Fidelity Union Trust Company (now, Wachovia Bank, National Association), as Trustee, dated August 1, 1924, securing First and Refunding Mortgage Bond41 |
| | | | Indentures between PSE&G and First Fidelity Bank, National Association (now, Wachovia Bank, National Association), as Trustee, supplemental to Exhibit 4a(1), dated as follows: |
| 4a | (2) | | April 1, 192742 |
| 4a | (3) | | June 1, 193743 |
| 4a | (4) | | July 1, 193744 |
| 4a | (5) | | December 19, 193945 |
| 4a | (6) | | March 1, 194246 |
| 4a | (7) | | June 1, 1991 (No. 1)47 |
| 4a | (8) | | July 1, 199348 |
| 4a | (9) | | September 1, 199349 |
| 4a | (10) | | February 1, 199450 |
| 4a | (11) | | March 1, 1994 (No. 2)51 |
| 4a | (12) | | May 1, 199452 |
| 4a | (13) | | October 1, 1994 (No. 2)53 |
| 4a | (14) | | January 1, 1996 (No. 1)54 |
| 4a | (15) | | January 1, 1996 (No. 2)55 |
| 4a | (16) | | May 1, 199856 |
| 4a | (17) | | September 1, 200257 |
| 4a | (18) | | August 1, 200358 |
| 4a | (19) | | December 1, 2003 (No. 1)59 |
| 4a | (20) | | December 1, 2003 (No. 2)60 |
| 4a | (21) | | December 1, 2003 (No. 3)61 |
| 4a | (22) | | December 1, 2003 (No. 4)62 |
| 4a | (23) | | June 1, 200463 |
| 4a | (24) | | August 1, 2004 (No. 1)64 |
| 4a | (25) | | August 1, 2004 (No. 2)65 |
| 4a | (26) | | August 1, 2004 (No. 3)66 |
| 4a | (27) | | August 1, 2004 (No. 4)67 |
| 4b | | | Indenture of Trust between PSE&G and Chase Manhattan Bank (National Association) (now, JP Morgan Chase Bank, NA), as Trustee, providing for Secured Medium-Term Notes dated July 1, 199368 |
227
| 4c | | | Indenture dated as of December 1, 2000 between Public Service Electric and Gas Company and First Union National Bank (now, Wachovia Bank, National Association), as Trustee, providing for Senior Debt Securities69 |
| 10a | (1) | | Deferred Compensation Plan for Directors |
| 10a | (2) | | Deferred Compensation Plan for Certain Employees |
| 10a | (3) | | Amended and Restated Limited Supplemental Benefits Plan for Certain Employees |
| 10a | (4) | | Mid Career Hire Supplemental Retirement Income Plan |
| 10a | (5) | | Retirement Income Reinstatement Plan for Non-Represented Employees |
| 10a | (6) | | 1989 Long-Term Incentive Plan, as amended17 |
| 10a | (7) | | 2001 Long-Term Incentive Plan18 |
| 10a | (8) | | Restated and Amended Management Incentive Compensation Plan19 |
| 10a | (9) | | Employment Agreement with E. James Ferland, dated June 16, 199820 |
| 10a | (10) | | Amendment to Employment Agreement with E. James Ferland dated November 20, 200121 |
| 10a | (11) | | Second Amendment to Employment Agreement with E. James Ferland dated December 20, 200422 |
| 10a | (12) | | Key Executive Severance Plan |
| 10a | (13) | | Employment Agreement with Ralph Izzo dated October 18, 200326 |
| 10a | (14) | | Employment Agreement with Robert E. Busch dated April 24, 200128 |
| 10a | (15) | | Employee Stock Purchase Plan29 |
| 10a | (16) | | Stock Plan for Outside Directors, as amended27 |
| 10a | (17) | | Compensation Plan for Outside Directors30 |
| 10a | (18) | | 2004 Long-Term Incentive Plan31 |
| 10a | (19) | | Retention Program for Key Employees32 |
| 11 | | | Inapplicable |
| 12a | | | Computation of Ratios of Earnings to Fixed Charges |
| 12b | | | Computation of Ratios of Earnings to Fixed Charges Plus Preferred Stock Dividend Requirements |
| 13 | | | Inapplicable |
| 14 | | | Code of Ethics84 |
| 16 | | | Inapplicable |
| 18 | | | Inapplicable |
| 19 | | | Inapplicable |
| 21a | | | Inapplicable |
| 23a | | | Consent of Independent Registered Public Accounting Firm |
| 24 | | | Inapplicable |
| 31c | | | Certification by E. James Ferland, pursuant to Rules 13a-14 and 15d-14 of the 1934 Securities Exchange Act |
| 31d | | | Certification by Robert E. Busch pursuant to Rules 13a-14 and 15d-14 of the 1934 Securities Exchange Act |
| 32c | | | Certification by E. James Ferland, pursuant to Section 1350 of Chapter 63 of Title 18 of the United States Code |
| 32d | | | Certification by Robert E. Busch, pursuant to Section 1350 of Chapter 63 of Title 18 of the United States Code |
| c. | | | Power: |
| 3a | | | Certificate of Formation of PSEG Power LLC70 |
| 3b | | | PSEG Power LLC Limited Liability Company Agreement71 |
228
| 3c | | | Trust Agreement for PSEG Power Capital Trust I72 |
| 3d | | | Trust Agreement for PSEG Power Capital Trust II73 |
| 3e | | | Trust Agreement for PSEG Power Capital Trust III74 |
| 3f | | | Trust Agreement for PSEG Power Capital Trust IV75 |
| 3g | | | Trust Agreement for PSEG Power Capital Trust V76 |
| 4a | | | Indenture dated April 16, 2001 between and among PSEG Power, PESG Fossil, PSEG Nuclear, PSEG Energy Resources & Trade and The Bank of New York and form of Subsidiary Guaranty included therein77 |
| 4b | | | First Supplemental Indenture, supplemental to Exhibit 4a, dated as of March 13, 200278 |
| 10a | (1) | | Deferred Compensation Plan for Certain Employees |
| 10a | (2) | | Amended and Restated Limited Supplemental Benefits Plan for Certain Employees |
| 10a | (3) | | Mid Career Hire Supplemental Retirement Income Plan |
| 10a | (4) | | Retirement Income Reinstatement Plan for Non-Represented Employees |
| 10a | (5) | | 1989 Long-Term Incentive Plan, as amended17 |
| 10a | (6) | | 2001 Long-Term Incentive Plan18 |
| 10a | (7) | | Restated and Amended Management Incentive Compensation Plan19 |
| 10a | (8) | | Employment Agreement with E. James Ferland, dated June 16, 199820 |
| 10a | (9) | | Amendment to Employment Agreement with E. James Ferland dated November 20, 200121 |
| 10a | (10) | | Second Amendment to Employment Agreement with E. James Ferland dated December 20, 200422 |
| 10a | (11) | | Employment Agreement with Thomas M. O'Flynn dated April 18, 200123 |
| 10a | (12) | | Amendment to Employment Agreement with Thomas M. O'Flynn dated December 21, 200124 |
| 10a | (13) | | Key Executive Severance Plan |
| 10a | (14) | | Employee Stock Purchase Plan29 |
| 10a | (15) | | 2004 Long-Term Incentive Plan31 |
| 10a | (16) | | Retention Program for Key Employees32 |
| 10b | (1) | | Operating Services Contract34 |
| 11 | | | Inapplicable |
| 12c | | | Computation of Ratio of Earnings to Fixed Charges |
| 13 | | | Inapplicable |
| 14 | | | Code of Ethics84 |
| 16 | | | Inapplicable |
| 18 | | | Inapplicable |
| 19 | | | Inapplicable |
| 23 | | | Consent of Independent Registered Public Accounting Firm |
| 24 | | | Inapplicable |
| 31e | | | Certification by E. James Ferland, pursuant to Rules 13a-14 and 15d-14 of the 1934 Securities Exchange Act |
| 31f | | | Certification by Thomas M. O'Flynn pursuant to Rules 13a-14 and 15d-14 of the 1934 Securities Exchange Act |
| 32e | | | Certification by E. James Ferland, pursuant to Section 1350 of Chapter 63 of Title 18 of the United States Code |
| 32f | | | Certification by Thomas M. O'Flynn, pursuant to Section 1350 of Chapter 63 of Title 18 of the United States Code |
| d. | | | Energy Holdings: |
229
| 3a | | | Certificate of Formation of PSEG Energy Holdings L.L.C.79 |
| 3b | | | Certificate of Amendment to Certificate of Formation of PSEG Energy Holdings L.L.C.80 |
| 3c | | | Limited Liability Company Agreement of PSEG Energy Holdings L.L.C.81 |
| 4a | | | Indenture dated October 8, 1999 between Energy Holdings and First Union National Bank (now Wachovia Bank, National Association)82 |
| 4b | | | First Supplemental Indenture to Exhibit 4a between Energy Holdings and Wachovia Bank, National Association dated September 30, 200283 |
| 10a | (1) | | Deferred Compensation Plan for Certain Employees |
| 10a | (2) | | Amended and Restated Limited Supplemental Benefits Plan for Certain Employees |
| 10a | (3) | | Mid Career Hire Supplemental Retirement Income Plan |
| 10a | (4) | | Retirement Income Reinstatement Plan for Non-Represented Employees |
| 10a | (5) | | 1989 Long-Term Incentive Plan, as amended17 |
| 10a | (6) | | 2001 Long-Term Incentive Plan18 |
| 10a | (7) | | Restated and Amended Management Incentive Compensation Plan19 |
| 10a | (8) | | Employment Agreement with E. James Ferland, dated June 16, 199820 |
| 10a | (9) | | Amendment to Employment Agreement with E. James Ferland dated November 20, 200121 |
| 10a | (10) | | Second Amendment to Employment Agreement with E. James Ferland dated December 20, 200422 |
| 10a | (11) | | Employment Agreement with Thomas M. O'Flynn dated April 18, 200123 |
| 10a | (12) | | Amendment to Employment Agreement with Thomas M. O'Flynn dated December 21, 200124 |
| 10a | (13) | | Employee Stock Purchase Plan29 |
| 10a | (14) | | 2004 Long-Term Incentive Plan31 |
| 10a | (15) | | Key Executive Severance Plan |
| 10a | (16) | | Retention Program for Key Employees32 |
| 11 | | | Inapplicable |
| 12d | | | Computation of Ratios of Earnings to Fixed Charges |
| 13 | | | Inapplicable |
| 14 | | | Code of Ethics84 |
| 16 | | | Inapplicable |
| 19 | | | Inapplicable |
| 24 | | | Inapplicable |
| 31g | | | Certification by E. James Ferland, pursuant to Rules 13a-14 and 15d-14 of the 1934 Securities Exchange Act |
| 31h | | | Certification by Thomas M. O'Flynn pursuant to Rules 13a-14 and 15d-14 of the 1934 Securities Exchange Act |
| 32g | | | Certification by E. James Ferland, pursuant to Section 1350 of Chapter 63 of Title 18 of the United States Code |
| 32h | | | Certification by Thomas M. O'Flynn, pursuant to Section 1350 of Chapter 63 of Title 18 of the United States Code |
| (1) | | Filed as Exhibit 3(a) to Registration Statement on Form S-4, No. 33-2935 and incorporated herein by this reference. |
| (2) | | Filed as Exhibit 3(ii) with Current Report on Form 8-K, No. 001-09120 filed on May 20, 2005 and incorporated herein by this reference. |
| (3) | | Filed as Exhibit 3(c) with Annual Report on Form 10-K for the year ended December 31, 1987, File No. 001-09120 on April 11, 1988 and incorporated herein by this reference. |
230
| (4) | | Filed as Exhibit 3(d) with Annual Report on Form 10-K for the year ended December 31, 2002, File No. 001-09120 on February 26, 2003 and incorporated herein by this reference. |
| (5) | | Filed as Exhibit 3 with Quarterly Report on Form 10-Q for the Quarter ended June 30, 1998, File No. 001-09120 on August 14, 1998 and incorporated herein by this reference. |
| (6) | | Filed as Exhibit 3(f) with Annual Report on Form 10-K for the year ended December 31, 2002, File No. 001-09120 on February 26, 2003 and incorporated herein by this reference. |
| (7) | | Filed as Exhibit 4.3 with Current Report on Form 8-K, File No. 001-09120 on September 9, 2002 and incorporated herein by this reference. |
| (8) | | Filed as Exhibit 4.2 with Current Report on Form 8-K, File No. 001-09120 on July 29, 2005 and incorporated herein by this reference. |
| (9) | | Filed as Exhibit 3(h) with Annual Report on Form 10-K for the year ended December 31, 2002, File No. 001-09120 on February 26, 2003 and incorporated herein by this reference. |
| (10) | | Filed as Exhibit 4(f) with Quarterly Report on Form 10-Q for the Quarter ended March 31, 1998, File No. 001-09120 on May 13, 1998 and incorporated herein by this reference. |
| (11) | | Filed as Exhibit 4(a) with Current Report on Form 8-K, File No. 001-09120 on August 14, 1998 and incorporated herein by this reference. |
| (12) | | Filed as Exhibit 4(b) with Current Report on Form 8-K, File No. 001-09120 on August 14, 1998 and incorporated herein by this reference. |
| (13) | | Filed as Exhibit 4(f) with Annual Report on Form 10-K for the year ended December 31, 1998, File No. 001-09120 on February 22, 1999 and incorporated herein by this reference. |
| (14) | | Filed as Exhibit 4(c) with Annual Report on Form 10-K for the year ended December 31, 2002, File No. 001-09120 on February 26, 2003 and incorporated herein by this reference. |
| (15) | | Filed as Exhibit 4.1 with Current Report on Form 8-K, File No. 001-09120 on July 29, 2005 and incorporated herein by this reference. |
| (16) | | Filed as Exhibit 4(d) with Annual Report on Form 10-K for the year ended December 31, 2002, File No. 001-09120 on February 26, 2003 and incorporated herein by this reference. |
| (17) | | Filed as Exhibit 10 with Quarterly Report on Form 10-Q for the Quarter ended September 30, 2002, File No. 001-09120, on November 2, 2002 and incorporated herein by this reference. |
| (18) | | Filed as Exhibit 10a(7) with Annual Report on Form 10-K for the year ended December 31, 2000, File No. 001-09120, on March 6, 2001 and incorporated herein by this reference. |
| (19) | | Filed as Exhibit 10a(8) with Annual Report on Form 10-K for the year ended December 31, 2000, File No. 001-09120, on March 6, 2001 and incorporated herein by this reference. |
| (20) | | Filed as Exhibit 10 with Quarterly Report on Form 10-Q for the Quarter ended June 30, 1998, File No. 001-09120, on August 14, 1998 and incorporated herein by this reference. |
| (21) | | Filed as Exhibit 10a(10) with Annual Report on Form 10-K for the year ended December 31, 2001, File No. 001-09120, on March 1, 2002 and incorporated herein by this reference. |
| (22) | | Filed as Exhibit 10.1 with Current Report on Form 8-K, File No. 001-09120, on December 20, 2004 and incorporated herein by this reference. |
| (23) | | Filed as Exhibit 10a(24) with Quarterly Report on Form 10-Q for the Quarter ended June 30, 2001, File No. 001-09120, on August 9, 2001 and incorporated herein by this reference. |
| (24) | | Filed as Exhibit 10a(12) with Annual Report on Form 10-K for the year ended December 31, 2001, File No. 001-09120, on March 1, 2002 and incorporated herein by this reference. |
| (25) | | Filed as Exhibit 10a(14) with Annual Report on Form 10-K for the year ended December 31, 1993, File No. 001-09120, on February 26, 1994 and incorporated herein by this reference. |
| (26) | | Filed as Exhibit 10 with Quarterly Report on Form 10-Q for the Quarter ended September 30, 2003, File No. 001-09120, on October 30, 2003 and incorporated herein by this reference. |
| (27) | | Filed as Exhibit 10a(17) with Annual Report on Form 10-K for the year ended December 31, 2002, File No. 001-09120, on February 26, 2003 and incorporated herein by this reference. |
231
| (28) | | Filed as Exhibit 10a(23) with Quarterly Report on Form 10-Q for the Quarter ended June 30, 2001, File No. 001-09120, on August 9, 2001 and incorporated herein by this reference. |
| (29) | | Filed with Registration Statement on Form S-8, File No. 333-106330 filed on June 20, 2003 and incorporated herein by this reference. |
| (30) | | Filed as Exhibit 10a(20) with Annual Report on Form 10-K for the year ended December 31, 2002, File No. 001-09120, on February 26, 2003 and incorporated herein by this reference. |
| (31) | | Filed as Exhibit 10a(21) with Annual Report on Form 10-K for the Year ended December 31, 2003, File No. 001-09120, on February 25, 2004 and incorporated herein by this reference. |
| (32) | | Filed as Exhibit 10.3 with Current Report on Form 8-K, File No. 001-009120, on December 20, 2004 and incorporated herein by this reference. |
| (33) | | Filed as Exhibit 2.1 with Current Report on Form 8-K, File No. 001-009120, on December 20, 2004 and incorporated herein by this reference. |
| (34) | | Filed as Exhibit 99.2 with Current Report on Form 8-K, File No. 001-009120, on December 20, 2004 and incorporated herein by this reference. |
| (35) | | Filed as Exhibit 3(a) with Quarterly Report on Form 10-Q for the Quarter ended June 30, 1986, File No. 001-00973, on August 28, 1986 and incorporated herein by this reference. |
| (36) | | Filed as Exhibit 3a(2) with Annual Report on Form 10-K for the year ended December 31, 1987, File No. 001-00973, on March 28, 1988 and incorporated herein by this reference. |
| (37) | | Filed as Exhibit 3a(3) on Form 8-A, File No. 001-00973, on February 4, 1994 and incorporated herein by this reference. |
| (38) | | Filed as Exhibit 3a(4) on Form 8-A, File No. 001-00973, on February 4, 1994 and incorporated herein by this reference. |
| (39) | | Filed as Exhibit 3a(5) on Form 8-A, File No. 001-00973, on February 4, 1994 and incorporated herein by this reference. |
| (40) | | Filed as Exhibit 3b(1) with Quarterly Report on Form 10-Q for the Quarter ended June 30, 2000, No. 001-00973 filed on August 8, 2000 and incorporated herein by this reference. |
| (41) | | Filed as Exhibit 4b(1) with Annual Report on Form 10-K for the Year ended December 31, 1980, File No. 001-00973 on February 18, 1981 and incorporated herein by this reference. |
| (42) | | Filed as Exhibit 4b(2) with Annual Report on Form 10-K for the Year ended December 31, 1980, File No. 001-00973 on February 18, 1981 and incorporated herein by this reference. |
| (43) | | Filed as Exhibit 4b(3) with Annual Report on Form 10-K for the Year ended December 31, 1980, File No. 001-00973 on February 18, 1981 and incorporated herein by this reference. |
| (44) | | Filed as Exhibit 4b(4) with Annual Report on Form 10-K for the Year ended December 31, 1980, File No. 001-00973 on February 18, 1981 and incorporated herein by this reference. |
| (45) | | Filed as Exhibit 4b(5) with Annual Report on Form 10-K for the Year ended December 31, 1980, File No. 001-00973 on February 18, 1981 and incorporated herein by this reference. |
| (46) | | Filed as Exhibit 4b(6) with Annual Report on Form 10-K for the Year ended December 31, 1980, File No. 001-00973 on February 18, 1981 and incorporated herein by this reference. |
| (47) | | Filed as Exhibit 4(i) on Form 8-A, File No. 001-00973 on July 1, 1991 and incorporated herein by this reference. |
| (48) | | Filed as Exhibit 4(ii) on Form 8-A, File No. 001-00973 on May 25, 1993 and incorporated herein by this reference. |
| (49) | | Filed as Exhibit 4(i) with Current Report on Form 8-K, File No. 001-00973 on December 1, 1993 and incorporated herein by this reference. |
| (50) | | Filed as Exhibit 4 with Current Report on Form 8-K, File No. 001-00973 on December 1, 1993 and incorporated herein by this reference. |
| (51) | | Filed as Exhibit 4 on Form 8-A, File No. 001-00973 on February 3, 1994 and incorporated herein by this reference. |
232
| (52) | | Filed as Exhibit 4(i) on Form 8-A, File No. 001-00973 on March 15, 1994 and incorporated herein by this reference. |
| (53) | | Filed as Exhibit 4a(91) with Quarterly Report on Form 10-Q for the Quarter ended September 30, 1994, File No. 001-00973, on November 8, 1994 and incorporated herein by this reference. |
| (54) | | Filed as Exhibit 4a(2) on Form 8-A, File No. 001-00973 on January 26, 1996 and incorporated herein by this reference. |
| (55) | | Filed as Exhibit 4a(3) on Form 8-A, File No. 001-00973 on January 26, 1996 and incorporated herein by this reference. |
| (56) | | Filed as Exhibit 4 on Form 8-A, File No. 001-00973 on May 15, 1998 and incorporated herein by this reference. |
| (57) | | Filed as Exhibit 4a(97) with Annual Report on Form 10-K for the Year ended December 31, 2002, File No. 001-00973 on February 25, 2003 and incorporated herein by this reference. |
| (58) | | Filed as Exhibit 4a(98) with Annual Report on Form 10-K for the Year ended December 31, 2003, File No. 001-00973 on February 25, 2004 and incorporated herein by this reference. |
| (59) | | Filed as Exhibit 4a(99) with Annual Report on Form 10-K for the Year ended December 31, 2003, File No. 001-00973 on February 25, 2004 and incorporated herein by this reference. |
| (60) | | Filed as Exhibit 4a(25) with Annual Report on Form 10-K for the Year ended December 31, 2004, File No. 001-00973 on March 1, 2005 and incorporated herein by this reference. |
| (61) | | Filed as Exhibit 4a(26) with Annual Report on Form 10-K for the Year ended December 31, 2004, File No. 001-00973 on March 1, 2005 and incorporated herein by this reference. |
| (62) | | Filed as Exhibit 4a(27) with Annual Report on Form 10-K for the Year ended December 31, 2004, File No. 001-00973 on March 1, 2005 and incorporated herein by this reference. |
| (63) | | Filed as Exhibit 4a(28) with Annual Report on Form 10-K for the Year ended December 31, 2004, File No. 001-00973 on March 1, 2005 and incorporated herein by this reference. |
| (64) | | Filed as Exhibit 4a(100) with Annual Report on Form 10-K for the Year ended December 31, 2003, File No. 001-00973 on February 25, 2004 and incorporated herein by this reference. |
| (65) | | Filed as Exhibit 4a(101) with Annual Report on Form 10-K for the Year ended December 31, 2003, File No. 001-00973 on February 25, 2004 and incorporated herein by this reference. |
| (66) | | Filed as Exhibit 4a(102) with Annual Report on Form 10-K for the Year ended December 31, 2003, File No. 001-00973 on February 25, 2004 and incorporated herein by this reference. |
| (67) | | Filed as Exhibit 4 with Quarterly Report on Form 10-Q for the Quarter ended June 30, 2004, File No. 001-00973 on August 3, 2004 and incorporated herein by this reference. |
| (68) | | Filed as Exhibit 4 with Current Report on Form 8-K, File No. 001-00973 on December 1, 1993 and incorporated herein by this reference. |
| (69) | | Filed as Exhibit 4.6 to Registration Statement on Form S-3, No. 333-76020 filed on December 27, 2001 and incorporated herein by this reference. |
| (70) | | Filed as Exhibit 3.1 to Registration Statement on Form S-4, No. 333-69228 filed on October 5, 2001 and incorporated herein by this reference. |
| (71) | | Filed as Exhibit 3.2 to Registration Statement on Form S-4, No. 333-69228 filed on October 5, 2001 and incorporated herein by this reference. |
| (72) | | Filed as Exhibit 3.6 to Registration Statement on Form S-3, No. 333-105704 filed on May 30, 2003 and incorporated herein by this reference. |
| (73) | | Filed as Exhibit 3.7 to Registration Statement on Form S-3, No. 333-105704 filed on May 30, 2003 and incorporated herein by this reference. |
| (74) | | Filed as Exhibit 3.8 to Registration Statement on Form S-3, No. 333-105704 filed on May 30, 2003 and incorporated herein by this reference. |
| (75) | | Filed as Exhibit 3.9 to Registration Statement on Form S-3, No. 333-105704 filed on May 30, 2003 and incorporated herein by this reference. |
233
| (76) | | Filed as Exhibit 3.10 to Registration Statement on Form S-3, No. 333-105704 filed on May 30, 2003 and incorporated herein by this reference. |
| (77) | | Filed as Exhibit 4.1 to Registration Statement on Form S-4, No. 333-69228 filed on October 5, 2001 and incorporated herein by this reference. |
| (78) | | Filed as Exhibit 4.7 with Quarterly Report on Form 10-Q for the Quarter ended March 31, 2002, File No. 001-49614, on May 15, 2002 and incorporated herein by this reference. |
| (79) | | Filed as Exhibit 3 with Current Report on Form 8-K, File No. 000-32503 on October 4, 2002 and incorporated herein by this reference. |
| (80) | | Filed as Exhibit 3.1 with Current Report on Form 8-K, File No. 000-32503 on October 4, 2002 and incorporated herein by this reference. |
| (81) | | Filed as Exhibit 3.2 with Current Report on Form 8-K, File No. 000-32503 on October 4, 2002 and incorporated herein by this reference. |
| (82) | | Filed as Exhibit 4.1 to Registration Statement on Form S-4, No. 333-95697 filed on January 28, 2000 and incorporated herein by this reference. |
| (83) | | Filed as Exhibit 4 with Current Report on Form 8-K, File No. 000-32503 on October 4, 2002 and incorporated herein by this reference. |
| (84) | | Filed as Exhibit 14 with Annual Report on Form 10-K for the year ended December 31, 2004, File Nos. 001-09120, 001-00973, 001-49614 and 000-32503, and incorporated herein by reference. |
234
SCHEDULE II
PUBLIC SERVICE ENTERPRISE GROUP INCORPORATED
Schedule II—Valuation and Qualifying Accounts
Years Ended December 31, 2005—December 31, 2003
Column A
| | Column B
| | Column C
| | Column D
| | Column E
|
| | | | | | | Additions
| | | | | | | | |
Description
| | Balance at
Beginning
of Period
| | Charged to
cost and
expenses
| | Charged to
other
accounts–
describe
| | Deductions–
describe
| | Balance at
End of
Period
|
| | | (Millions) |
2005: | | | | | | | | | | | | | | | | | | | | |
Allowance for Doubtful Accounts | | $ | 34 | | | $ | 64 | | | $ | — | | | $ | 57 | (A)(K) | | $ | 41 | |
Materials and Supplies Valuation Reserve | | | 9 | | | | — | | | | — | | | | 3 | (B) | | | 6 | |
Other Reserves | | | 2 | | | | 1 | (D) | | | — | | | | — | | | | 3 | |
Other Valuation Allowances | | | 8 | | | | — | | | | — | | | | — | | | | 8 | |
2004: | | | | | | | | | | | | | | | | | | | | |
Allowance for Doubtful Accounts | | $ | 40 | | | $ | 47 | | | $ | — | | | $ | 53 | (A)(J) | | $ | 34 | |
Materials and Supplies Valuation Reserve | | | 15 | | | | — | | | | — | | | | 6 | (B) | | | 9 | |
Other Reserves | | | 4 | | | | — | | | | — | | | | 2 | (B) | | | 2 | |
Other Valuation Allowances | | | 18 | | | | 17 | (L) | | | — | | | | 27 | (F)(L) | | | 8 | |
2003: | | | | | | | | | | | | | | | | | | | | |
Allowance for Doubtful Accounts | | $ | 47 | | | $ | 52 | | | $ | — | | | $ | 59 | (A)(E) | | $ | 40 | |
Materials and Supplies Valuation Reserve | | | 5 | | | | 11 | (I) | | | — | | | | 1 | (B) | | | 15 | |
Other Reserves | | | 12 | | | | 7 | (D) | | | 2 | (G) | | | 17 | (K) | | | 4 | |
Other Valuation Allowances | | | 21 | | | | 8 | | | | — | | | | 11 | (E)(F) | | | 18 | |
| | | | | | | | | | | | | | | | | | | | |
| | | |
| (A) | | Accounts Receivable/Investments written off. |
| | | |
| (B) | | Reduced reserve to appropriate level and to remove obsolete inventory. |
| | | |
| (C) | | Acquired two Connecticut electric generating stations. |
| | | |
| (D) | | Includes various liquidity, credit and bad debt reserves. |
| | | |
| (E) | | Valuation allowances consolidated in connection with the acquisition of Sociedad Austral de Electricidad S.A. (SAESA). |
| | | |
| (F) | | Recorded in connection with the sales of certain properties held by Enterprise Group Development Corporation (EGDC), $10 million and $1 million in 2004 and 2003, respectively. |
| | | |
| (G) | | Includes fuel reserve related to Connecticut acquisition. |
| | | |
| (H) | | Reclassified to Discontinued Operations. |
| | | |
| (I) | | Increased reserve due to obsolescence, excess and damaged items. |
| | | |
| (J) | | Valuation allowances reversed in connection with PSEG Energy Technologies Asset Management Company LLC (PETAMC) Accounts Receivable settlement. |
| | | |
| (K) | | Includes amounts related to Enron settlement. |
| | | |
| (L) | | Recorded in 2004 to reduce the carrying value of the Collins Lease by $17 million. |
235
PUBLIC SERVICE ELECTRIC AND GAS COMPANY
Schedule II—Valuation and Qualifying Accounts
Years Ended December 31, 2005—December 31, 2003
Column A
| | Column B
| | Column C
| | Column D
| | Column E
|
| | | | | | | Additions
| | | | | | | | |
Description
| | Balance at
Beginning
of Period
| | Charged to
cost and
expenses
| | Charged to
other
accounts–
describe
| | Deductions–
describe
| | Balance at
End of
Period
|
| | | (Millions) |
2005: | | | | | | | | | | | | | | | | | | | | |
Allowance for Doubtful Accounts | | $ | 34 | | | $ | 64 | | | $ | — | | | $ | 57 | (A) | | $ | 41 | |
2004: | | | | | | | | | | | | | | | | | | | | |
Allowance for Doubtful Accounts | | $ | 34 | | | $ | 47 | | | $ | — | | | $ | 47 | (A) | | $ | 34 | |
2003: | | | | | | | | | | | | | | | | | | | | |
Allowance for Doubtful Accounts | | $ | 32 | | | $ | 46 | | | $ | — | | | $ | 44 | (A) | | $ | 34 | |
| | | | | | | | | | | | | | | | | | | | |
| | | |
| (A) | | Accounts Receivable/Investments written off. |
PSEG POWER LLC
Schedule II—Valuation and Qualifying Accounts
Years Ended December 31, 2005—December 31, 2003
Column A
| | Column B
| | Column C
| | Column D
| | Column E
|
| | | | | | | Additions
| | | | | | | | |
Description
| | Balance at
Beginning
of Period
| | Charged to
cost and
expenses
| | Charged to
other
accounts–
describe
| | Deductions–
describe
| | Balance at
End of
Period
|
| | | (Millions) |
2005: | | | | | | | | | | | | | | | | | | | | |
Materials and Supplies Valuation Reserve | | $ | 9 | | | $ | — | | | $ | — | | | $ | 3 | (A) | | $ | 6 | |
Other Reserves | | | 2 | | | | 1 | (B) | | | — | | | | — | | | | 3 | |
2004: | | | | | | | | | | | | | | | | | | | | |
Materials and Supplies Valuation Reserve | | $ | 15 | | | $ | — | | | $ | — | | | $ | 6 | (A) | | $ | 9 | |
Other Reserves | | | 4 | | | | — | | | | — | | | | 2 | (A) | | | 2 | |
2003: | | | | | | | | | | | | | | | | | | | | |
Materials and Supplies Valuation Reserve | | $ | 5 | | | $ | 11 | (D) | | $ | — | | | $ | 1 | (A) | | $ | 15 | |
Other Reserves | | | 12 | | | | 7 | (B)(E) | | | 2 | (C) | | | 17 | (E) | | | 4 | |
| | | | | | | | | | | | | | | | | | | | |
| | | |
| (A) | | Reduced reserve to appropriate level and removed obsolete inventory. |
| | | |
| (B) | | Includes various liquidity, credit and bad debt reserves. |
| | | |
| (C) | | Includes fuel reserve related to Connecticut acquisition. |
| | | |
| (D) | | Increased reserve due to obsolescence, excess and damaged items. |
| | | |
| (E) | | Includes amounts related to Enron settlement. |
236
PSEG ENERGY HOLDINGS L.L.C.
Schedule II—Valuation and Qualifying Accounts
Years Ended December 31, 2005—December 31, 2003
Column A
| | Column B
| | Column C
| | Column D
| | Column E
|
| | | | | | | Additions
| | | | | | | | |
Description
| | Balance at
Beginning
of Period
| | Charged to
cost and
expenses
| | Charged to
other
accounts–
describe
| | Deductions–
describe
| | Balance at
End of
Period
|
| | | (Millions) |
2005: | | | | | | | | | | | | | | | | | | | | |
Allowance for Doubtful Accounts | | $ | — | | | $ | — | | | $ | — | | | $ | — | | | $ | — | |
Other Valuation Allowances | | | 8 | | | | — | | | | — | | | | — | | | | 8 | |
2004: | | | | | | | | | | | | | | | | | | | | |
Allowance for Doubtful Accounts | | $ | 6 | | | $ | — | | | $ | — | | | $ | 6 | (E) | | $ | — | |
Other Valuation Allowances | | | 18 | | | | 17 | (F) | | | — | | | | 27 | (B)(F) | | | 8 | |
2003: | | | | | | | | | | | | | | | | | | | | |
Allowance for Doubtful Accounts | | $ | 15 | | | $ | 6 | | | $ | — | | | $ | 15 | (A) | | $ | 6 | |
Other Valuation Allowances | | | 21 | | | | 8 | | | | — | | | | 11 | (A)(B) | | | 18 | |
| | | | | | | | | | | | | | | | | | | | |
| | | |
| (A) | | Valuation allowances consolidated in connection with the acquisition of SAESA. |
| | | |
| (B) | | Recorded in connection with the sales of certain properties held by EGDC, $10 million and $1 million in 2004 and 2003, respectively. |
| | | |
| (C) | | Reserve established for Accounts Receivable in Argentina. |
| | | |
| (D) | | Reclassified to Discontinued Operations. |
| | | |
| (E) | | Valuation allowances reversed in connection with PETAMC Accounts Receivable settlement. |
| | | |
| (F) | | Recorded in 2004 to reduce the carrying value of the Collins Lease by $17 million. |
237
SIGNATURES
Pursuant to the requirements of Section 13 or 15(d) of the Securities Exchange Act of 1934, the registrant has duly caused this report to be signed on its behalf by the undersigned, thereunto duly authorized. The signature of the undersigned company shall be deemed to relate only to matters having reference to such company and any subsidiaries thereof.
| | | PUBLIC SERVICE ENTERPRISE GROUP INCORPORATED |
| | | |
| | | By /s/ E. JAMES FERLAND
E. James Ferland
Chairman of the Board, President and
Chief Executive Officer |
Date: February 27, 2006
Pursuant to the requirements of the Securities Exchange Act of 1934, this report has been signed below by the following persons on behalf of the registrant and in the capacities and on the dates indicated. The signatures of the undersigned shall be deemed to relate only to matters having reference to such company and any subsidiaries thereof.
Signature
| | Title
| | Date
|
/s/ E. JAMES FERLAND
E. James Ferland | | Chairman of the Board,
President and Chief Executive Officer and
Director (Principal Executive Officer) | | February 27, 2006 |
/s/ THOMAS M. O'FLYNN
Thomas M. O'Flynn | | Executive Vice President and Chief
Financial Officer (Principal Financial
Officer) | | February 27, 2006 |
/s/ PATRICIA A. RADO
Patricia A. Rado | | Vice President and Controller
(Principal Accounting Officer) | | February 27, 2006 |
/s/ CAROLINE DORSA
Caroline Dorsa | | Director | | February 27, 2006 |
/s/ ERNEST H. DREW
Ernest H. Drew | | Director | | February 27, 2006 |
Albert R. Gamper, Jr. | | Director | | |
/s/ CONRAD K. HARPER
Conrad K. Harper | | Director | | February 27, 2006 | /s/ WILLIAM V. HICKEY
William V. Hickey | | Director | | February 27, 2006 |
/s/ SHIRLEY ANN JACKSON
Shirley Ann Jackson | | Director | | February 27, 2006 |
/s/ THOMAS A. RENYI
Thomas A. Renyi | | Director | | February 27, 2006 |
/s/ RICHARD J. SWIFT
Richard J. Swift | | Director | | February 27, 2006 |
238
SIGNATURES
Pursuant to the requirements of Section 13 or 15(d) of the Securities Exchange Act of 1934, the registrant has duly caused this report to be signed on its behalf by the undersigned, thereunto duly authorized. The signature of the undersigned shall be deemed to relate only to matters having reference to such company and any subsidiaries thereof.
| | | PUBLIC SERVICE ELECTRIC AND GAS COMPANY |
| | | |
| | | By /s/ RALPH IZZO
Ralph Izzo
President and
Chief Operating Officer |
Date: February 27, 2006
Pursuant to the requirements of the Securities Exchange Act of 1934, this report has been signed below by the following persons on behalf of the registrant and in the capacities and on the dates indicated. The signatures of the undersigned company shall be deemed to relate only to matters having reference to such company and any subsidiaries thereof.
Signature
| | Title
| | Date
|
/s/ E. JAMES FERLAND
E. James Ferland | | Chairman of the Board and Chief
Executive Officer and Director
(Principal Executive Officer) | | February 27, 2006 |
/s/ ROBERT E. BUSCH
Robert E. Busch | | Senior Vice President—Finance and
Chief Financial Officer
(Principal Financial Officer) | | February 27, 2006 |
/s/ PATRICIA A. RADO
Patricia A. Rado | | Vice President and Controller
(Principal Accounting Officer)
| | February 27, 2006 |
/s/ CAROLINE DORSA
Caroline Dorsa | | Director | | February 27, 2006 |
Albert R. Gamper, Jr. | | Director | | |
/s/ CONRAD K. HARPER
Conrad K. Harper | | Director | | February 27, 2006 |
239
SIGNATURES
Pursuant to the requirements of Section 13 or 15(d) of the Securities Exchange Act of 1934, the registrant has duly caused this report to be signed on its behalf by the undersigned, thereunto duly authorized. The signature of the undersigned company shall be deemed to relate only to matters having reference to such company and any subsidiaries thereof.
| | | PSEG POWER LLC |
| | | |
| | | By /s/ FRANK CASSIDY
Frank Cassidy
President and
Chief Operating Officer |
Date: February 27, 2006
Pursuant to the requirements of the Securities Exchange Act of 1934, this report has been signed below by the following persons on behalf of the registrant and in the capacities and on the dates indicated. The signatures of the undersigned company shall be deemed to relate only to matters having reference to such company and any subsidiaries thereof.
Signature
| | Title
| | Date
|
/s/ E. JAMES FERLAND
E. James Ferland | | Chairman of the Board and Chief
Executive Officer and Director
(Principal Executive Officer) | | February 27, 2006 |
/s/ THOMAS M. O'FLYNN
Thomas M. O'Flynn | | Executive Vice President and Chief
Financial Officer and Director
(Principal Financial Officer) | | February 27, 2006 |
/s/ PATRICIA A. RADO
Patricia A. Rado | | Vice President and Controller
(Principal Accounting Officer) | | February 27, 2006 |
/s/ ROBERT E. BUSCH
Robert E. Busch | | Director | | February 27, 2006 |
/s/ FRANK CASSIDY
Frank Cassidy | | Director | | February 27, 2006 |
/s/ ROBERT J. DOUGHERTY, JR.
Robert J. Dougherty, Jr. | | Director | | February 27, 2006 |
/s/ R. EDWIN SELOVER
R. Edwin Selover | | Director | | February 27, 2006 |
240
SIGNATURES
Pursuant to the requirements of Section 13 or 15(d) of the Securities Exchange Act of 1934, the registrant has duly caused this report to be signed on its behalf by the undersigned, thereunto duly authorized. The signature of the undersigned company shall be deemed to relate only to matters having reference to such company and any subsidiaries thereof.
| | | PSEG ENERGY HOLDINGS LLC |
| | | |
| | | By /s/ ROBERT J. DOUGHERTY, JR.
Robert J. Dougherty, Jr.
President and
Chief Operating Officer |
Date: February 27, 2006
Pursuant to the requirements of the Securities Exchange Act of 1934, this report has been signed below by the following persons on behalf of the registrant and in the capacities and on the dates indicated. The signatures of the undersigned shall be deemed to relate only to matters having reference to such company and any subsidiaries thereof.
Signature
| | Title
| | Date
|
/s/ E. JAMES FERLAND
E. James Ferland | | Chairman of the Board and
Chief Executive Officer and Manager
(Principal Executive Officer)
| | February 27, 2006 |
/s/ THOMAS M. O'FLYNN
Thomas M. O'Flynn | | Executive Vice President and
Chief Financial Officer and Manager
(Principal Financial Officer) | | February 27, 2006 |
/s/ PATRICIA A. RADO
Patricia A. Rado | | Controller
(Principal Accounting Officer) | | February 27, 2006 |
/s/ ROBERT E. BUSCH
Robert E. Busch | | Manager | | February 27, 2006 |
/s/ FRANK CASSIDY
Frank Cassidy | | Manager | | February 27, 2006 |
/s/ ROBERT J. DOUGHERTY, JR.
Robert J. Dougherty, Jr. | | Manager | | February 27, 2006 |
/s/ R. EDWIN SELOVER
R. Edwin Selover | | Manager | | February 27, 2006 |
241
The following documents are filed as a part of this report:
a. | PSEG: |
| | 10a(1) Deferred Compensation Plan for Directors |
| | 10a(2) Deferred Compensation Plan for Certain Employees |
| | 10a(3) Amended and Restated Limited Supplemental Benefits Plan for Certain Employees |
| | 10a(4) Mid Career Hire Supplemental Retirement Income Plan |
| | 10a(5) Retirement Income Reinstatement Plan for Non-Represented Employees |
| | 10a(14) Key Executive Severance Plan |
| Exhibit 12: Computation of Ratios of Earnings to Fixed Charges |
| Exhibit 21: Subsidiaries of the Registrant |
| Exhibit 23: Consent of Independent Registered Public Accounting Firm |
| Exhibit 31a: Certification by E. James Ferland Pursuant to Rules 13a-14 and 15d-14 of the Securities Exchange Act of 1934 |
| Exhibit 31b: Certification by Thomas M. O'Flynn Pursuant to Rules 13a-14 and 15d-14 of the Securities Exchange Act of 1934 |
| Exhibit 32a: Certification by E. James Ferland Pursuant to Section 1350 of Chapter 63 of Title 18 of the United States Code |
| Exhibit 32b: Certification by Thomas M. O'Flynn Pursuant to Section 1350 of Chapter 63 of Title 18 of the United States Code |
b. | PSE&G: |
| | 10a(1) Deferred Compensation Plan for Directors |
| | 10a(2) Deferred Compensation Plan for Certain Employees |
| | 10a(3) Amended and Restated Limited Supplemental Benefits Plan for Certain Employees |
| | 10a(4) Mid Career Hire Supplemental Retirement Income Plan |
| | 10a(5) Retirement Income Reinstatement Plan for Non-Represented Employees |
| | 10a(12) Key Executive Severance Plan |
| Indentures between PSE&G and First Fidelity Bank, National Association (now, Wachovia Bank National Association), as Trustee, supplemental to Indenture date August 1, 1924, dates as follows: |
| Exhibit 12a: Computation of Ratios of Earnings to Fixed Charges |
| Exhibit 12b: Computation of Ratios of Earnings to Fixed Charges Plus Preferred Stock Dividend Requirements |
| Exhibit 21a: Subsidiaries of Registrant |
| Exhibit 23a: Consent of Independent Registered Public Accounting Firm |
| Exhibit 31c: Certification by E. James Ferland Pursuant to Rules 13a-14 and 15d-14 of the Securities Exchange Act of 1934 |
| Exhibit 31d: Certification by Robert E. Busch Pursuant to Rules 13a-14 and 15d-14 of the Securities Exchange Act of 1934 |
| Exhibit 32c: Certification by E. James Ferland Pursuant to Section 1350 of Chapter 63 of Title 18 of the United States Code |
| Exhibit 32d: Certification by Robert E. Busch Pursuant to Section 1350 of Chapter 63 of Title 18 of the United States Code |
c. | Power: |
| | 10a(1) Deferred Compensation Plan for Certain Employees |
| | 10a(2) Amended and Restated Limited Supplemental Benefits Plan for Certain Employees |
| | 10a(3) Mid Career Hire Supplemental Retirement Income Plan |
| | 10a(4) Retirement Income Reinstatement Plan for Non-Represented Employees |
| | 10a(13) Key Executive Severance Plan |
| Exhibit 12c: Computation of Ratios of Earnings to Fixed Charges |
| Exhibit 23b: Consent of Independent Registered Public Accounting Firm |
| Exhibit 31e: Certification by E. James Ferland Pursuant to Rules 13a-14 and 15d-14 of the Securities Exchange Act of 1934 |
| Exhibit 31f: Certification by Thomas M. O'Flynn Pursuant to Rules 13a-14 and 15d-14 of the Securities Exchange Act of 1934 |
242
| Exhibit 32e: Certification by E. James Ferland Pursuant to Section 1350 of Chapter 63 of Title 18 of the United States Code |
| Exhibit 32f: Certification by Thomas M. O'Flynn Pursuant to Section 1350 of Chapter 63 of Title 18 of the United States Code |
d. | Energy Holdings: |
| | 10a(1) Deferred Compensation Plan for Certain Employees |
| | 10a(2) Amended and Restated Limited Supplemental Benefits Plan for Certain Employees |
| | 10a(3) Mid Career Hire Supplemental Retirement Income Plan |
| | 10a(4) Retirement Income Reinstatement Plan for Non-Represented Employees |
| | 10a(15) Key Executive Severance Plan |
| Exhibit 12d: Computation of Ratios of Earnings to Fixed Charges |
| Exhibit 31g: Certification by E. James Ferland Pursuant to Rules 13a-14 and 15d-14 of the Securities Exchange Act of 1934 |
| Exhibit 31h: Certification by Thomas M. O'Flynn Pursuant to Rules 13a-14 and 15d-14 of the Securities Exchange Act of 1934 |
| Exhibit 32g: Certification by E. James Ferland Pursuant to Section 1350 of Chapter 63 of Title 18 of the United States Code |
| Exhibit 32h: Certification by Thomas M. O'Flynn Pursuant to Section 1350 of Chapter 63 of Title 18 of the United States Code |
243
[THIS PAGE INTENTIONALLY LEFT BLANK]
[THIS PAGE INTENTIONALLY LEFT BLANK]
[THIS PAGE INTENTIONALLY LEFT BLANK]