                                          Filed pursuant to Rule 433
                                          Registration Statement No. 333-137902
                                          Dated March 20, 2009

                           Private Wealth Management
                                 Deutsch Bank

                    Deutsche Bank Commodity Harvest Indices

                                   March 2009

The instruments described in this presentation are hybrid instruments under the
                        Commodity Exchange Act ("CEA").
 As such, the instruments are not contracts of sale of a commodity for future
    delivery (or options on such contracts) and are not subject to the CEA.

                               [GRAPHIC OMITTED]
|  |
Private Wealth Management

Risks

Commodities are speculative and highly volatile. The risk of loss in trading
commodities can be substantial. Commodity prices may be subject to substantial
and unpredictable fluctuations over short periods of time and may be affected
by, among other things, a wide variety of regulatory, monetary and/or economic
developments and policies. Prospective investors must independently assess the
appropriateness of an investment in commodities in light of their own financial
situation and investment objectives.


The price of an instrument and the commodities which comprise the index may be
affected by numerous market factors, including events in the market for
commodities, the equity markets, the bond market and the foreign exchange
market, fluctuations in interest rates, and world economic, political and
regulatory events. A rise in the value of one commodity may be offset by a fall
in the value of one or more of the other commodities comprising the index.

Commodity prices can be highly volatile and may impact negatively the value of
an instrument. Volatility around the time of maturity could have a significant
impact on the overall performance of an investment.

The value of any instrument linked to the index described herein will depend
on, among other things, fluctuations in interest rates, the value of the
commodities underlying the index, the time remaining to the maturity date, and
associated options markets and hedging costs of the issuer. The value of any
instrument may start to decline significantly if the value of the index at a
given time is below the level of the index on the issue date of the instrument.
Price movements may also be caused by changes in the credit spread of the
issuer.

The receipt by the investor of monies owed under instruments linked to the
index described herein is subject to and dependent on the issuer's abilities to
pay such monies. Consequently, investors are subject to a counterparty risk and
are susceptible to risks relating to the creditworthiness of the issuer.

                                    page 2
|  |
Private Wealth Management

Risks

Investing in instruments linked to the index involves certain risks. Inherent
in the index is the risk that the forward curves for the underlying futures
contracts will unexpectedly move from a contangoed curve and remain as either a
less contangoed curve or a backwardated curve after long positions have been
taken in such futures contracts. This switch would result in negative carry at
a time when the optimum yield methodology has presumed that the underlying
futures contract would result in positive carry. Further, because the index is
composed of long and short positions, there is a risk that these positions
could cancel each other out if the long "booster" position were identical to
the short position in the GSCI Light Energy Index. This would occur if the
optimum yield methodology selects the same futures contract for an underlying
commodity as the fixed roll methodology used by the GSCI Light Energy Index
which would result in flat returns for the index for that respective component.

The DB Commodity Harvest 3.5 TV Index attempts to achieve a realized volatility
of 3.5%. Adjustments are made to the participation in the DB Commodity Harvest
Index based on realized volatility of the DB Commodity Harvest Index. The
realized volatility of the DB Commodity Harvest Index may differ --- perhaps
significantly --- from its historical realized volatility. It is also possible
that the DB Commodity Harvest 3.5 TV Index will achieve realized volatility
that differs --- possibly significantly --- from the target volatility of 3.5%.

                                    page 3
|  |
Private Wealth Management

Contents

DB Commodity Harvest Index

o    Executive Summary

o    Sources of Return in Commodities / Commodity Index

o    Concept and Construction

o    Performance and Descriptive Statistics

DB Commodity Harvest 3.5 TV "Target Volatility" Index

o    Executive Summary

o    Risk Control by Targeting Volatility

o    Exhibit I - Weights and Contracts

                                    page 4
|  |
                           Private Wealth Management
                                 Deutsch Bank

                          DB Commodity Harvest Index
|  |
Private Wealth Management
Executive Summary
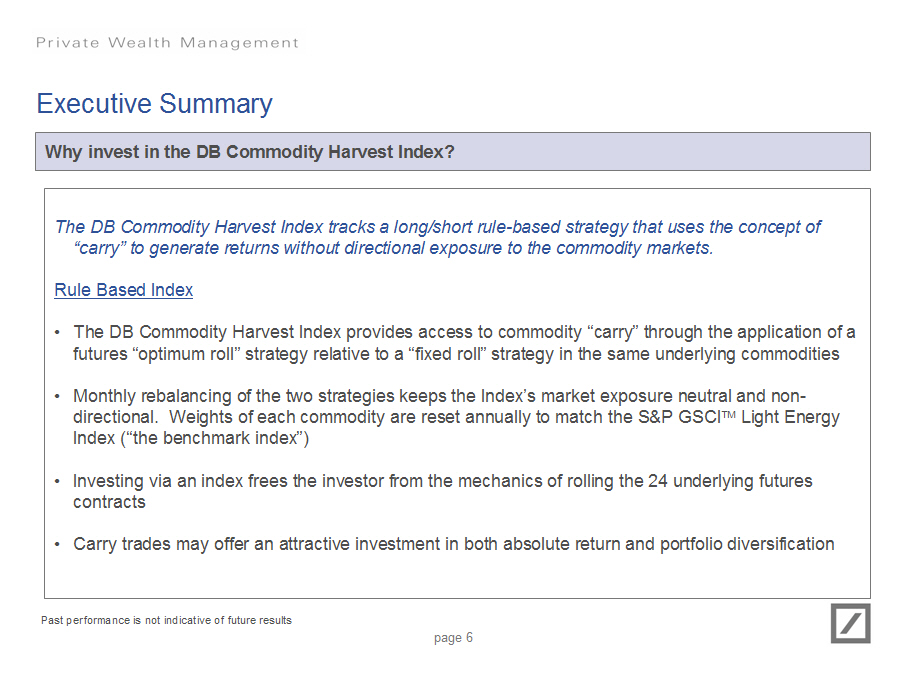
Why invest in the DB Commodity Harvest Index?
The DB Commodity Harvest Index tracks a long/short rule-based strategy that
uses the concept of "carry" to generate returns without directional exposure to
the commodity markets.
Rule Based Index
o The DB Commodity Harvest Index provides access to commodity "carry"
through the application of a futures "optimum roll" strategy relative to a
"fixed roll" strategy in the same underlying commodities
o Monthly rebalancing of the two strategies keeps the Index's market
exposure neutral and non- directional. Weights of each commodity are reset
annually to match the S&P GSCITM Light Energy Index ("the benchmark
index")
o Investing via an index frees the investor from the mechanics of rolling
the 24 underlying futures contracts
o Carry trades may offer an attractive investment in both absolute return
and portfolio diversification
Past performance is not indicative of future results
page 6
|  |
Private Wealth Management
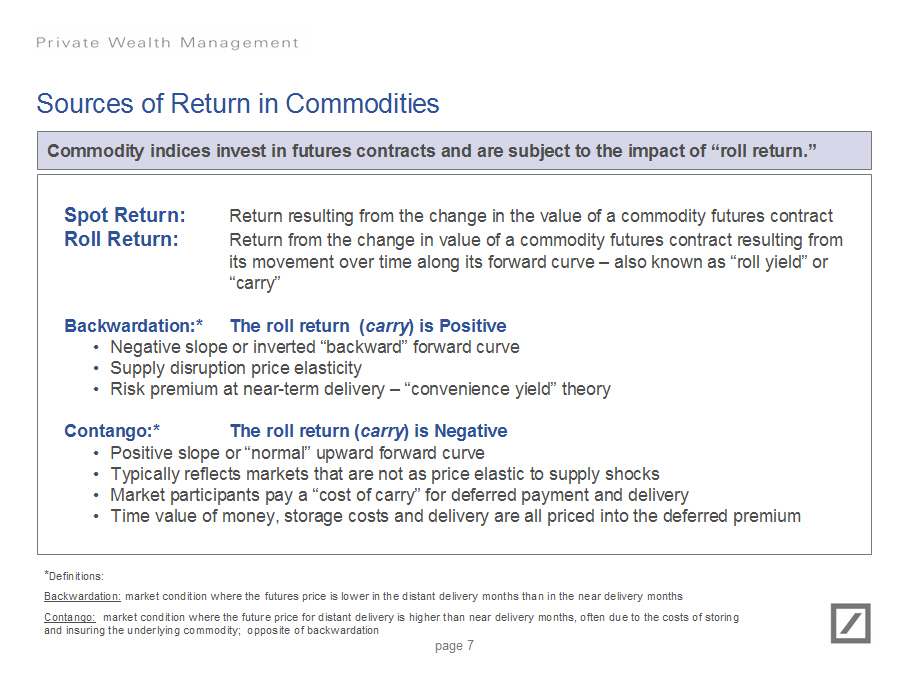
Sources of Return in Commodities
Commodity indices invest in futures contracts and are subject to the impact of
"roll return."
Spot Return: Return resulting from the change in the value of a commodity
futures contract
Roll Return: Return from the change in value of a commodity futures contract
resulting from its movement over time along its forward curve -
also known as "roll yield" or "carry"
Backwardation:* The roll return (carry) is Positive
o Negative slope or inverted "backward" forward curve
o Supply disruption price elasticity
o Risk premium at near-term delivery - "convenience yield" theory
Contango:* The roll return (carry) is Negative
o Positive slope or "normal" upward forward curve
o Typically reflects markets that are not as price elastic to supply shocks
o Market participants pay a "cost of carry" for deferred payment and
delivery
o Time value of money, storage costs and delivery are all priced into the
deferred premium
*Definitions:
Backwardation: market condition where the futures price is lower in the distant
delivery months than in the near delivery months
Contango: market condition where the future price for distant delivery is
higher than near delivery months, often due to the costs of storing and
insuring the underlying commodity; opposite of backwardation
page 7
|  |
Private Wealth Management
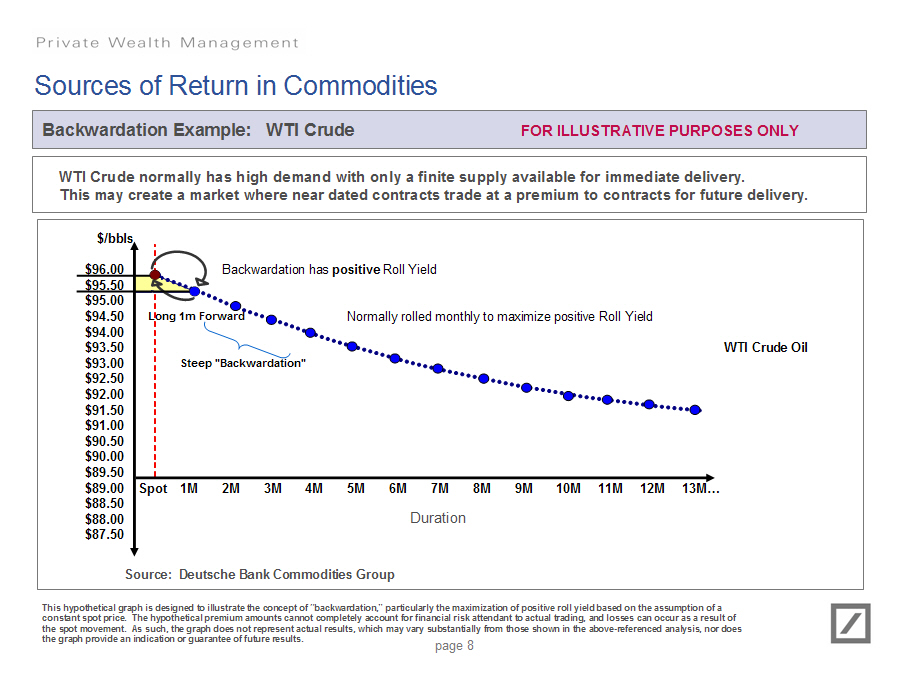
Sources of Return in Commodities
Backwardation Example: WTI Crude FOR ILLUSTRATIVE PURPOSES ONLY
WTI Crude normally has high demand with only a finite supply available for
immediate delivery. This may create a market where near dated contracts trade
at a premium to contracts for future delivery.
[GRAPHIC OMITTED]
This hypothetical graph is designed to illustrate the concept of
"backwardation," particularly the maximization of positive roll yield based on
the assumption of a constant spot price. The hypothetical premium amounts
cannot completely account for financial risk attendant to actual trading, and
losses can occur as a result of the spot movement. As such, the graph does not
represent actual results, which may vary substantially from those shown in the
above-referenced analysis, nor does the graph provide an indication or
guarantee of future results.
page 8
|  |
Private Wealth Management

Sources of Return in Commodities

Contango Example:   Gold                        FOR ILLUSTRATIVE PURPOSES ONLY

Gold normally has insurance and storage costs associated with future delivery.
This may create a market where future dated contracts trade at a premium to
contracts for immediate delivery.

[GRAPHIC OMITTED]

Source: Deutsche Bank Commodities Group

This hypothetical graph is designed to illustrate the concept of "contango,"
particularly the maximization of negative roll yield based on the assumption of
a constant spot price. The hypothetical premium amounts cannot completely
account for financial risk attendant to actual trading, and losses can occur as
a result of the spot movement. As such, the graph does not represent actual
results, which may vary substantially from those shown in the above-referenced
analysis, nor does the graph provide an indication or guarantee of future
results.

                                    page 9
|  |
Private Wealth Management
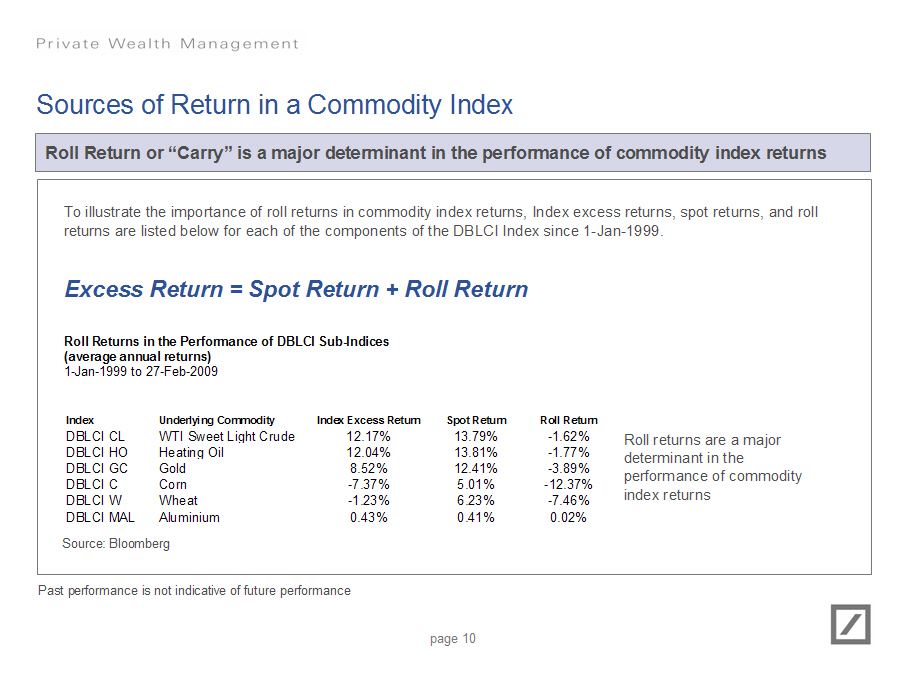
Sources of Return in a Commodity Index
Roll Return or "Carry" is a major determinant in the performance of commodity
index returns
To illustrate the importance of roll returns in commodity index returns, Index
excess returns, spot returns, and roll returns are listed below for each of the
components of the DBLCI Index since 1-Jan-1999.
Excess Return = Spot Return + Roll Return
Roll Returns in the Performance of DBLCI Sub-Indices
(average annual returns)
1-Jan-1999 to 27-Feb-2009
Index Underlying Commodity Index Excess Return Spot Return Roll Return
DBLCI CL WTI Sweet Light Crude 12.17% 13.79% -1.62% Roll returns are a major
DBLCI HO Heating Oil 12.04% 13.81% -1.77% determinant in the
DBLCI GC Gold 8.52% 12.41% -3.89% performance of commodity
DBLCI C Corn -7.37% 5.01% -12.37% index returns
DBLCI W Wheat -1.23% 6.23% -7.46%
DBLCI MAL Aluminium 0.43% 0.41% 0.02%
Source: Bloomberg
Past performance is not indicative of future performance
page 10
|  |
Private Wealth Management
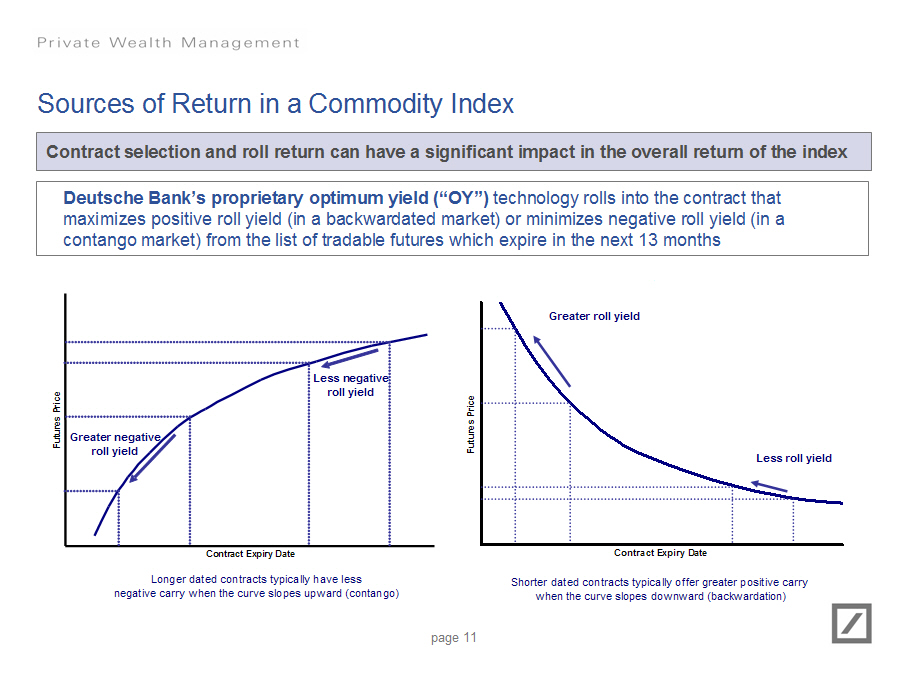
Sources of Return in a Commodity Index
Contract selection and roll return can have a significant impact in the overall
return of the index
Deutsche Bank's proprietary optimum yield ("OY") technology rolls into the
contract that maximizes positive roll yield (in a backwardated market) or
minimizes negative roll yield (in a contango market) from the list of tradable
futures which expire in the next 13 months
[GRAPHIC OMITTED] [GRAPHIC OMITTED]
Longer dated contracts typically have Shorter dated contracts typically
less negative carry when the curve offer greater positive carry when
slopes upward (contango) the curve slopes downward
(backwardation)
page 11
|  |
Private Wealth Management
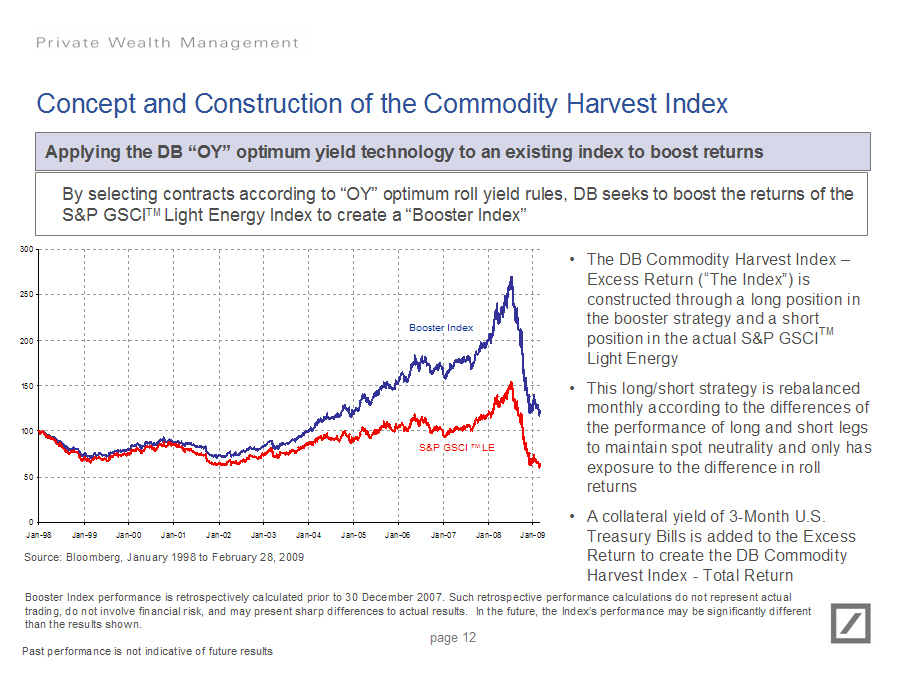
Concept and Construction of the Commodity Harvest Index
Applying the DB "OY" optimum yield technology to an existing index to boost
returns
By selecting contracts according to "OY" optimum roll yield rules, DB seeks to
boost the returns of the S&P GSCITM Light Energy Index to create a "Booster
Index"
[GRAPHIC OMITTED]
o The DB Commodity Harvest Index - Excess Return ("The Index") is
constructed through a long position in the booster strategy and a shortTM
position in the actual S&P GSCI Light Energy
o This long/short strategy is rebalanced monthly according to the
differences of the performance of long and short legs to maintain spot
neutrality and only has exposure to the difference in roll returns
o A collateral yield of 3-Month U.S. Treasury Bills is added to the Excess
Return to create the DB Commodity Harvest Index - Total Return
Source: Bloomberg, January 1998 to February 28, 2009
Booster Index performance is retrospectively calculated prior to 30 December
2007. Such trading, do not involve financial risk, and may present sharp
differences to actual results. than the results shown.
Past performance is not indicative of future results
page 12
|  |
Private Wealth Management

Concept and Construction of the Commodity Harvest Index

Performance of the DB Commodity Harvest Index TR

The DB Commodity Harvest Index rebalances mechanically in order to extract
alpha and reduce spot market risk.

[GRAPHIC OMITTED]

o    The Index is rebalanced every month to reduce spot price exposure created
     by performance differences between long and short legs.

o    Additional reweighting occurs annually to match the annual reweighting of
     the S&P GSCITM Light Energy

o    The Index is diversified among 24 underlying commodities

     (see Exhibit I for weightings)

Source: Bloomberg, Jan 1998 to     February 28, 2009

Booster Index performance is retrospectively calculated prior to 30 December
2007. Such retrospective performance calculations do not represent actual
trading, do not involve financial risk, and may present sharp differences to
actual results. In the future, the Index's performance may be significantly
different than the results shown.

                                    page 13

Past performance is not indicative of future results
|  |
Past performance is not indicative of future results
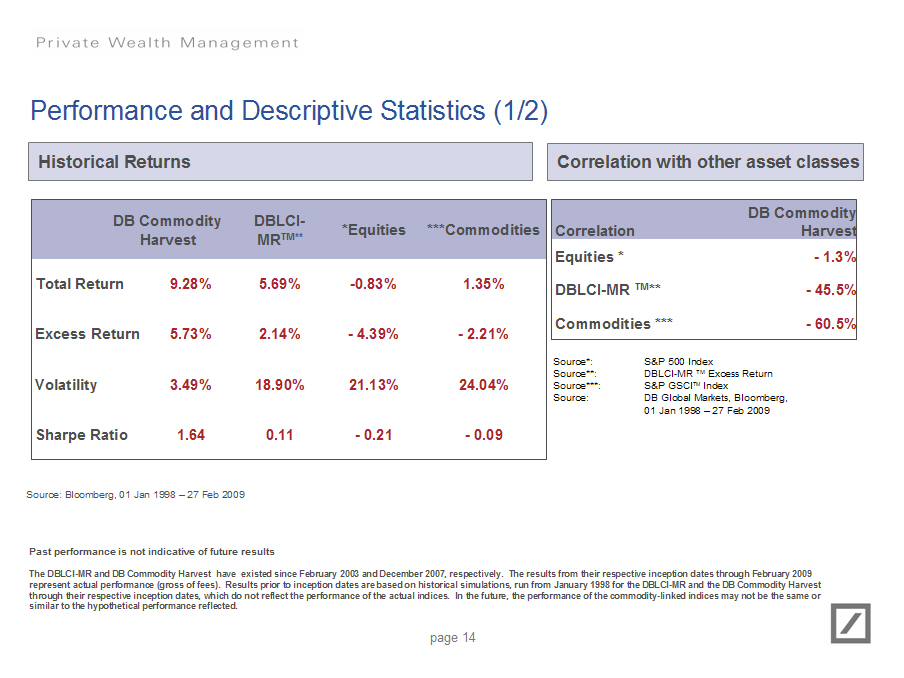
Performance and Descriptive Statistics (1/2)
Historical Returns
- --------------------------------------------------------------------
DB Commodity DBLCI- *Equities ***Commodities
Harvest MR TM**
Total Return 9.28% 5.69% -0.83% 1.35%
Excess Return 5.73% 2.14% -4.39% -2.21%
Volatility 3.49% 18.90% 21.13% 24.04%
Sharpe Ratio 1.64 0.11 - 0.21 -0.09
- --------------------------------------------------------------------
Source: Bloomberg, 01 Jan 1998 - 27 Feb 2009
Correlation with other asset classes
- -------------------------------
DB Commodity
Correlation Harvest
Equities * - 1.3%
DBLCI-MR TM** - 45.5%
Commodities *** - 60.5%
- -------------------------------
Source*: S&P 500 Index
Source**: DBLCI-MR TM Excess Return
Source***: S&P GSCITM Index
Source: DB Global Markets, Bloomberg,
01 Jan 1998 - 27 Feb 2009
Past performance is not indicative of future results
The DBLCI-MR and DB Commodity Harvest have existed since February 2003 and
December 2007, respectively. The results from their respective inception dates
through February 2009 represent actual performance (gross of fees). Results
prior to inception dates are based on historical simulations, run from January
1998 for the DBLCI-MR and the DB Commodity Harvest through their respective
inception dates, which do not reflect the performance of the actual indices. In
the future, the performance of the commodity-linked indices may not be the same
or similar to the hypothetical performance reflected.
page 14
|  |
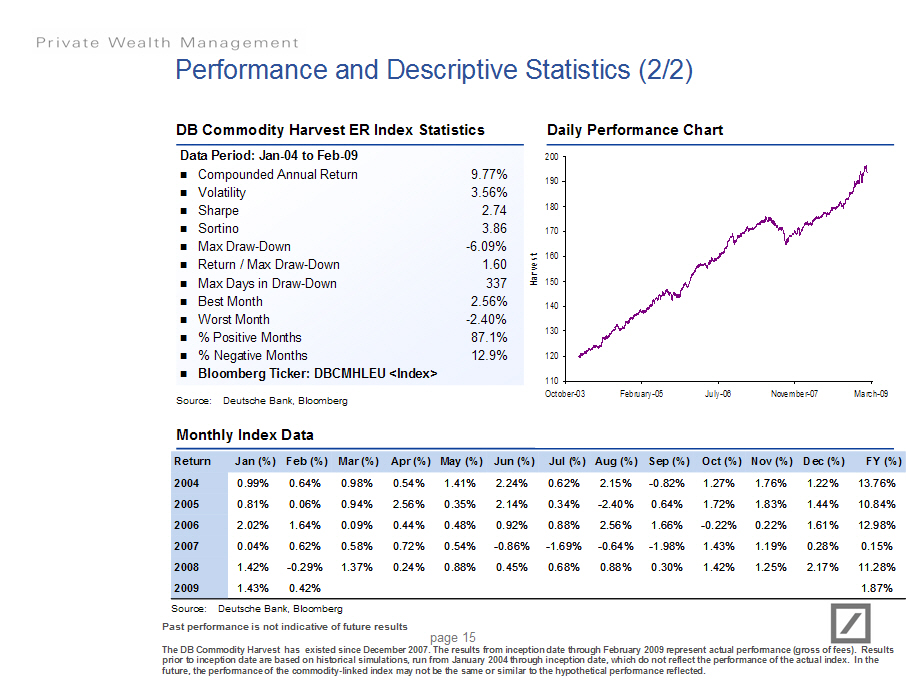
Performance and Descriptive Statistics (2/2)

DB Commodity Harvest ER Index Statistics
Data Period: Jan-04 to Feb-09
    Compounded Annual Return                               9.77%
    Volatility                                             3.56%
    Sharpe                                                  2.74
    Sortino                                                 3.86
    Max Draw-Down                                         -6.09%
    Return / Max Draw-Down                                  1.60
    Max Days in Draw-Down                                    337
    Best Month                                             2.56%
    Worst Month                                           -2.40%
    % Positive Months                                      87.1%
    % Negative Months                                      12.9%
    Bloomberg Ticker: DBCMHLEU (Index)
Source: Deutsche Bank, Bloomberg

Daily Performance Chart

[GRAPHIC OMITTED]

Monthly Index Data
Return        Jan (%)Feb (%)      Mar (%)    Apr (%)   May (%)  Jun (%)  Jul (%)
2004            0.99%  0.64%        0.98%     0.54%     1.41%    2.24%   0.62%
2005            0.81%  0.06%        0.94%     2.56%     0.35%    2.14%   0.34%
2006            2.02%  1.64%        0.09%     0.44%     0.48%    0.92%   0.88%
2007            0.04%  0.62%        0.58%     0.72%     0.54%   -0.86%  -1.69%
2008            1.42% -0.29%        1.37%     0.24%     0.88%    0.45%   0.68%
2009            1.43%  0.42%
- --------------------------------------------------------------------------------

Aug (%)   Sep (%)   Oct (%)    Nov (%)  Dec (%)    FY (%)
  2.15%    -0.82%    1.27%     1.76%     1.22%      13.76%
 -2.40%     0.64%    1.72%     1.83%     1.44%      10.84%
  2.56%     1.66%   -0.22%     0.22%     1.61%      12.98%
 -0.64%    -1.98%    1.43%     1.19%     0.28%       0.15%
  0.88%     0.30%    1.42%     1.25%     2.17%      11.28%
                                                     1.87%
- ------------------------------------------------------------
Source: Deutsche Bank, Bloomberg

Past performance is not indicative of future results

The DB Commodity Harvest has existed since December 2007. The results from
inception date through February 2009 represent actual performance (gross of
fees). Results prior to inception date are based on historical simulations, run
from January 2004 through inception date, which do not reflect the performance
of the actual index. In the future, the performance of the commodity-linked
index may not be the same or similar to the hypothetical performance reflected.

                                     page 15
|  |
                       DB Commodity Harvest 3.5 TV Index

                                    page 16
|  |
Executive Summary

Why invest in the DB Commodity Harvest 3.5 TV Index?

The  DB Commodity Harvest Index seeks to generate alpha through a long/short
     index strategy. However, there are no controls for volatility. The DB
     Commodity Harvest 3.5 TV Index is an allocation strategy based on the DB
     Commodity Harvest Index that aims at maintaining a target volatility of
     3.5%

Rules-Based Index

o     The DB Commodity Harvest 3.5 TV Index dynamically controls the exposure to
      the DB Commodity Harvest Excess Return Index ("the Underlying Index") in
      order to target realized volatility of close to 3.5%

o     Rebalancing occurs monthly, at which time the participation of the DB
      Commodity Harvest 3.5 TV Index in the Underlying Index is reset to the
      ratio of Target Volatility / Realized Volatility

o     Participation in the Underlying Index increases when the realized
      volatility of the Underlying Index has gone down and vice-versa

o     Volatility targeting can reduce the cost of options when there is a large
      divergence between realized (historical) and implied (expected)
      volatility, as reflected by the option price

 Past performance is not indicative of future results

                                    page 17
|  |
Index Construction (Harvest 3.5 TV Index)

Applying volatility targeting to potentially control risk

Monthly rebalancing

Calculated on 3rd last business day of the month, effective on the last business
day

Step I

Monitor Realized Volatility (Based on Last 90 Days Returns)

Step II

Calculate Index Participation Participation = Target Volatility / Realized
Volatility, subject to a maximum participation of 300%

Step III

Harvest 3.5 TV Index Return = Participation x Underlying Index
return

Numerical
Example:
Volatility Target =
3.5%

         90 Day Realized                         Underlying   Vol Target
Month         Volatility   Participation (%)   Index Return       Return
          (Annualized %)                                (%)          (%)
12                  3.50              100.00          +5.00        +5.00
13                 10.50               33.33          -1.00        -0.33
14                  2.50              140.00          +3.00        +4.20
15                  2.00              175.00          -2.00        -3.50
16                  1.50              233.33          +5.00       +11.66
17                  3.00              116.67          +1.00        +1.16
18                  3.50              100.00         +10.00       +10.00
- -------------------------  ------------------  -------------  ----------

                                    page 18
|  |
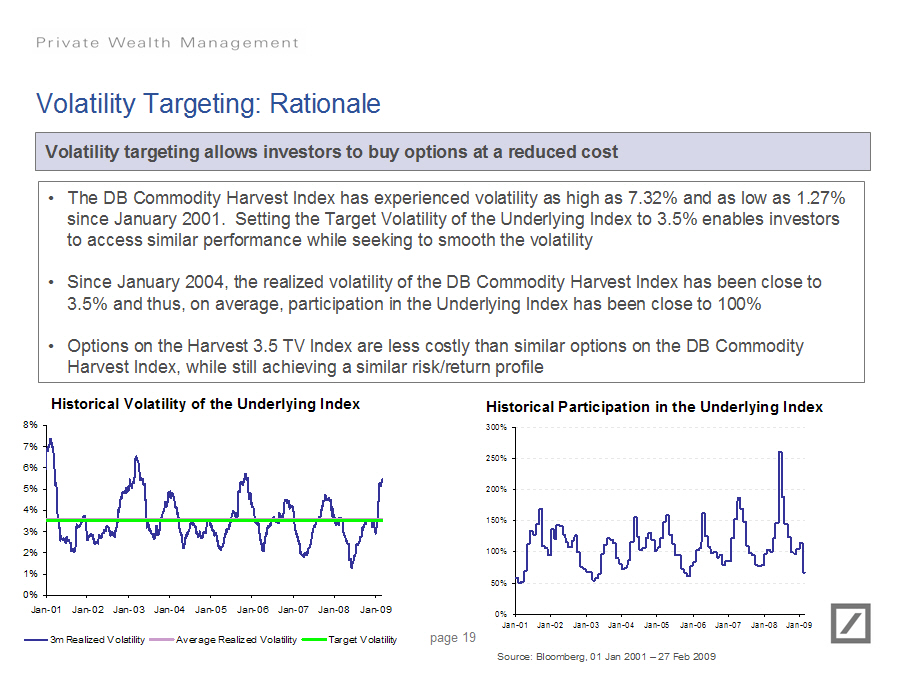
Volatility Targeting: Rationale

Volatility targeting allows investors to buy options at a reduced cost


o    The DB Commodity Harvest Index has experienced volatility as high as 7.32%
     and as low as 1.27% since January 2001. Setting the Target Volatility of
     the Underlying Index to 3.5% enables investors to access similar
     performance while seeking to smooth the volatility

o    Since January 2004, the realized volatility of the DB Commodity Harvest
     Index has been close to 3.5% and thus, on average, participation in the
     Underlying Index has been close to 100%

o    Options on the Harvest 3.5 TV Index are less costly than similar options on
     the DB Commodity Harvest Index, while still achieving a similar risk/return
     profile

Historical Volatility of the Underlying Index
[GRAPHIC OMITTED]

3m Realized Volatility   Average Realized Volatility     Target Volatility


Historical Participation in the Underlying Index
[GRAPHIC OMITTED]

Source: Bloomberg, 01 Jan 2001 - 27 Feb 2009

                                    page 19
|  |
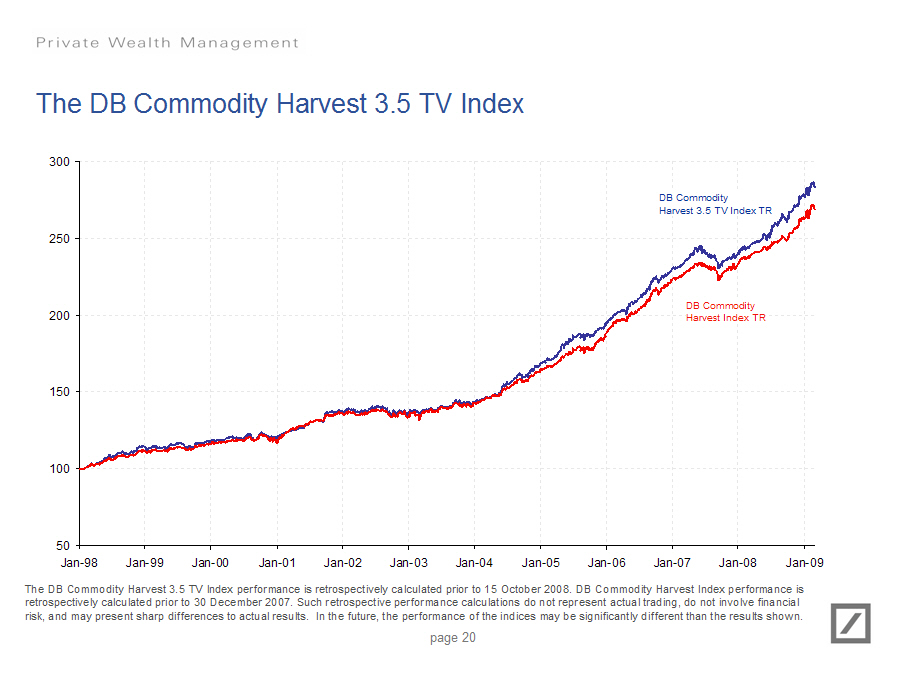
The DB Commodity Harvest 3.5 TV Index

[GRAPHIC OMITTED]

The DB Commodity Harvest 3.5 TV Index performance is retrospectively calculated
prior to 15 October 2008. DB Commodity Harvest Index performance is
retrospectively calculated prior to 30 December 2007. Such retrospective
performance calculations do not represent actual trading, do not involve
financial risk, and may present sharp differences to actual results. In the
future, the performance of the indices may be significantly different than the
results shown.
                                    page 20
|  |
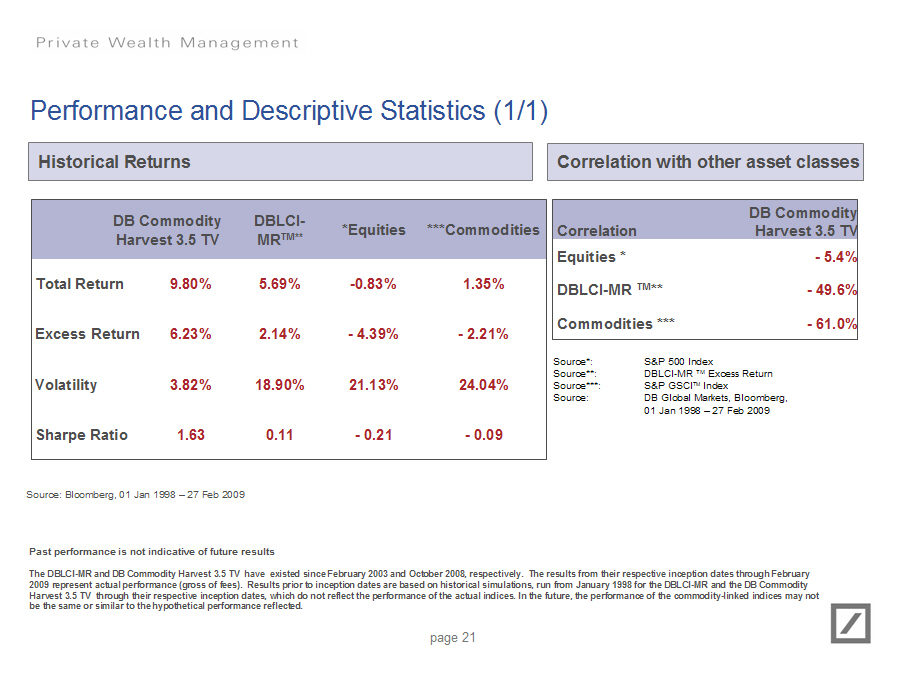
Performance and Descriptive Statistics (1/1)


Historical Returns
 ------------------------------------------------------------------
                 DB Commodity    DBLCI-  *Equities   ***Commodities
               Harvest 3.5 TV   MRTM**
 Total Return           9.80%     5.69%   -0.83%          1.35%
 Excess Return          6.23%     2.14%   -4.39%         -2.21%
 Volatility             3.82%    18.90%   21.13%         24.04%
 Sharpe Ratio            1.63     0.11    -0.21          -0.09
 ------------------------------------------------------------------
Source: Bloomberg, 01 Jan 1998 - 27 Feb 2009


Correlation with other asset classes
- ------------------------------------------------------------
                                               DB Commodity
Correlation                                  Harvest 3.5 TV
Equities *                                           - 5.4%
DBLCI-MR TM**                                       - 49.6%
Commodities ***                                     - 61.0%
- ------------------------------------------------------------

Source*:          S&P 500 Index
Source**:         DBLCI-MR TM Excess Return
Source***:        S&P GSCITM Index
Source:           DB Global Markets, Bloomberg,
                  01 Jan 1998 - 27 Feb 2009

Past performance is not indicative of future results

The DBLCI-MR and DB Commodity Harvest 3.5 TV have existed since February 2003
and October 2008, respectively. The results from their respective inception
dates through February 2009 represent actual performance (gross of fees).
Results prior to inception dates are based on historical simulations, run from
January 1998 for the DBLCI-MR and the DB Commodity Harvest 3.5 TV through their
respective inception dates, which do not reflect the performance of the actual
indices. In the future, the performance of the commodity-linked indices may not
be the same or similar to the hypothetical performance reflected.

                                    page 21
|  |
Performance and Descriptive Statistics (2/2)

db Commodity Harvest - 3.5 ER Index Statistics

Data Period: Jan-04 to Feb-09

o Compounded Annual Return                10.75%
o Volatility                               3.92%
o Sharpe                                    2.74
o Sortino                                   4.00
o Max Draw-Down                           -7.18%
o Return / Max Draw-Down                    1.50
o Max Days in Draw-Down                      415
o Best Month                               3.90%
o Worst Month                             -2.22%
o % Positive Months                        87.1%
o % Negative Months                        12.9%
o Bloomberg Ticker: DBCMHVEC (Index)

Daily Performance Chart

[GRAPHIC OMITTED]


Monthly Index Data

Return Jan (%)    Feb (%)  Mar (%)  Apr (%)  May (%)  Jun (%)   Jul (%)   Aug (%)
2004     0.81%    0.49%      0.77%   0.55%     2.15%    3.14%     0.62%    2.27%
2005     0.89%    0.06%      1.25%   3.90%     0.49%    2.48%     0.17%   -2.22%
2006     1.54%    1.46%      0.16%   0.88%     0.67%    1.01%     0.91%    2.48%
2007     0.06%    0.73%      0.78%   1.26%     0.95%   -1.38%    -2.06%   -0.63%
2008     1.34%    -0.30%     1.31%   0.27%     1.38%    1.06%     1.45%    1.39%
2009     1.37%    0.39%
- ---------------------------------------------------------------------------------

 Sep (%)   Oct (%)   Nov (%)  Dec (%)    FY (%)
 -1.00%      1.59%    2.12%     1.30%    15.78%
  0.87%      1.15%    1.21%     1.12%    11.82%
  1.66%     -0.42%    0.18%     1.33%    12.50%
 -2.07%      1.21%    0.90%     0.41%     0.06%
  0.38%      1.68%    1.27%     2.12%    14.16%
                                          1.77%


Source: Deutsche Bank, Bloomberg

Past performance is not indicative of future results

The db Commodity Harvest - 3.5 has existed since October 2008. The results from
inception date through February 2009 represent actual performance (gross of
fees). Results prior to inception date are based on historical simulations, run
from January 2004 through inception date, which do not reflect the performance
of the actual index. In the future, the performance of the commodity-linked
index may not be the same or similar to the hypothetical performance reflected.

                                     page 22
| 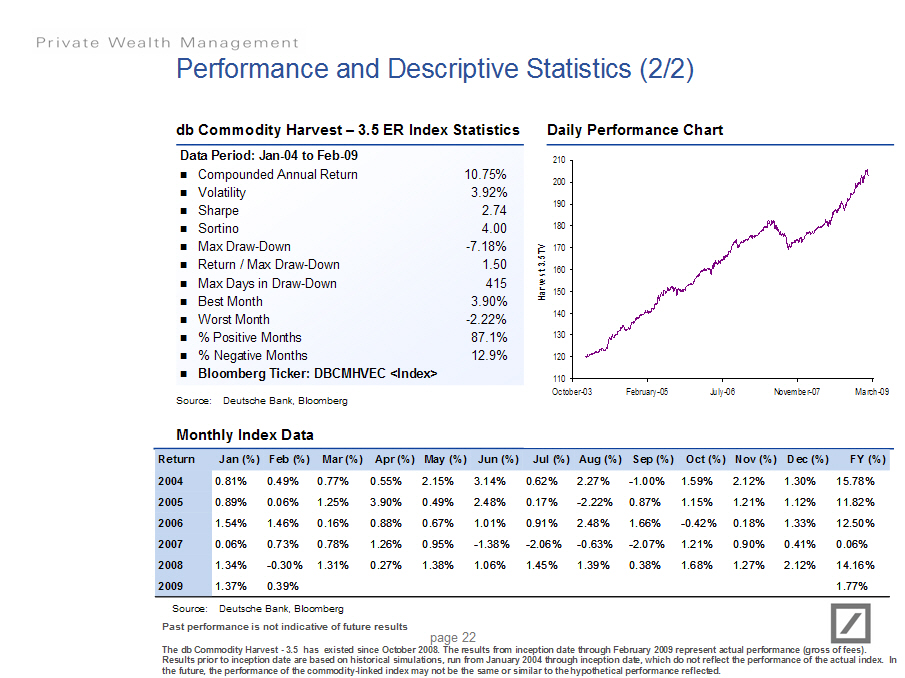 |
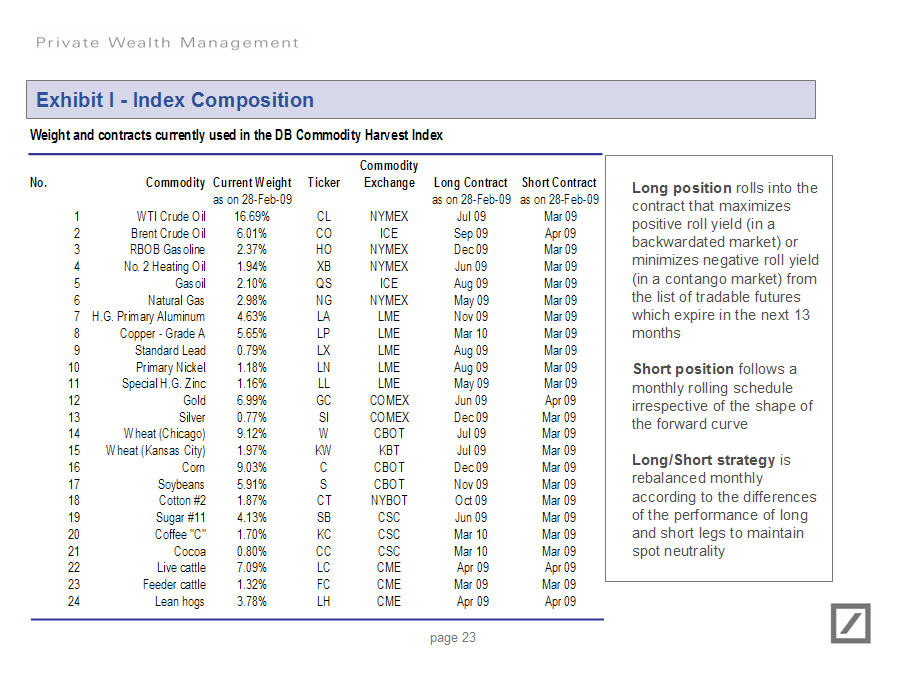
Exhibit I - Index Composition

Weight and contracts currently used in the DB Commodity Harvest Index

- -------------------------------------------------------------------------------------------------------
                                                        Commodity
No.             Commodity Current Weight     Ticker     Exchange      Long Contract   Short Contract
                          as on 28-Feb-09                            as on 28-Feb-09  as on 28-Feb-09
 1           WTI Crude Oil     16.69%          CL         NYMEX          Jul 09           Mar 09
 2         Brent Crude Oil      6.01%          CO          ICE           Sep 09           Apr 09
 3           RBOB Gasoline      2.37%          HO         NYMEX          Dec 09           Mar 09
 4       No. 2 Heating Oil      1.94%          XB         NYMEX          Jun 09           Mar 09
 5                  Gasoil      2.10%          QS          ICE           Aug 09           Mar 09
 6             Natural Gas      2.98%          NG         NYMEX          May 09           Mar 09
 7   H.G. Primary Aluminum      4.63%          LA          LME           Nov 09           Mar 09
 8        Copper - Grade A      5.65%          LP          LME           Mar 10           Mar 09
 9           Standard Lead      0.79%          LX          LME           Aug 09           Mar 09
10          Primary Nickel      1.18%          LN          LME           Aug 09           Mar 09
11       Special H.G. Zinc      1.16%          LL          LME           May 09           Mar 09
12                    Gold      6.99%          GC         COMEX          Jun 09           Apr 09
13                  Silver      0.77%          SI         COMEX          Dec 09           Mar 09
14         Wheat (Chicago)      9.12%          W          CBOT           Jul 09           Mar 09
15     Wheat (Kansas City)      1.97%          KW          KBT           Jul 09           Mar 09
16                    Corn      9.03%          C          CBOT           Dec 09           Mar 09
17                Soybeans      5.91%          S          CBOT           Nov 09           Mar 09
18               Cotton #2      1.87%          CT         NYBOT          Oct 09           Mar 09
19               Sugar #11      4.13%          SB          CSC           Jun 09           Mar 09
20              Coffee "C"      1.70%          KC          CSC           Mar 10           Mar 09
21                   Cocoa      0.80%          CC          CSC           Mar 10           Mar 09
22             Live cattle      7.09%          LC          CME           Apr 09           Apr 09
23           Feeder cattle      1.32%          FC          CME           Mar 09           Mar 09
24               Lean hogs      3.78%          LH          CME           Apr 09           Apr 09
- -------------------------------------------------------------------------------------------------------

Long position rolls into the contract that maximizes positive roll yield (in a
backwardated market) or minimizes negative roll yield (in a contango market)
from the list of tradable futures which expire in the next 13 months

Short position follows a monthly rolling schedule irrespective of the shape of
the forward curve

Long/Short strategy is rebalanced monthly according to the differences of the
performance of long and short legs to maintain spot neutrality

                                    page 23
|  |
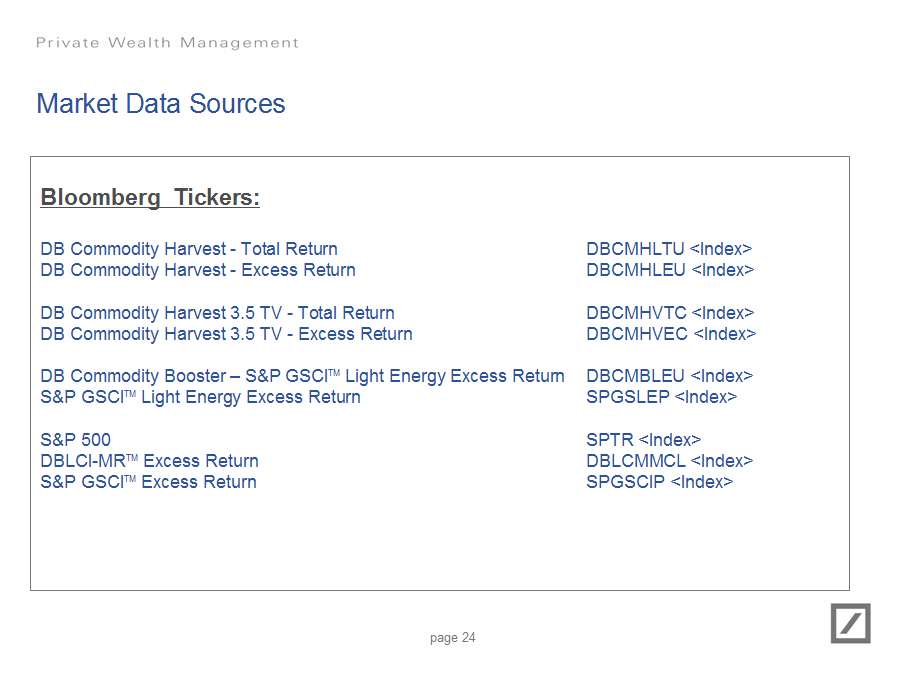
Market Data Sources

Bloomberg  Tickers:

DB Commodity Harvest - Total Return                             DBCMHLTU (Index)
DB Commodity Harvest - Excess Return                            DBCMHLEU (Index)

DB Commodity Harvest 3.5 TV - Total Return                      DBCMHVTC (Index)
DB Commodity Harvest 3.5 TV - Excess Return                     DBCMHVEC (Index)

DB Commodity Booster - S&P GSCITM Light Energy Excess Return    DBCMBLEU (Index)
S&P GSCITM Light Energy Excess Return                           SPGSLEP (Index)

S&P 500                                                         SPTR (Index)
DBLCI-MRTM Excess Return                                        DBLCMMCL (Index)
S&P GSCITM Excess Return                                        SPGSCIP (Index)

                                    page 24
|  |
Important Notes

The analysis set forth herein is based on information we believe to be reliable,
including internal models, certain assumptions (all of which are subject to
change without notice) and available market data, which may be internally
generated.

"Deutsche Bank" means Deutsche Bank AG and its affiliated companies, as the
context requires. Deutsche Bank Private Wealth Management refers to Deutsche
Bank's wealth management activities for high net worth clients around the world.

Investors should consider an investment linked to the indices described herein
only after careful consideration and consultation with their legal, tax,
accounting and other advisers as to the suitability of the investments in light
of their own particular financial, tax and other circumstances, and the
information set out in this document and the other documents we provide to you.

Deutsche Bank AG has filed a registration statement (including a prospectus)
with the Securities and Exchange Commission, or SEC, for offerings to which
these materials relate. Before you invest, you should read the prospectus in
that registration statement and the other documents relating to such offering
that Deutsche Bank AG has filed with the SEC for more complete information about
Deutsche Bank AG and such offering. You may obtain these documents without cost
by visiting EDGAR on the SEC Web site at www.sec.gov. Alternatively, Deutsche
Bank AG, any agent or any dealer participating in such offering will arrange to
send you the prospectus, prospectus supplement and other documents relating to
the offering if you so request by calling toll-free 1-800-311-4409.

Your return on an investment linked to the indices described herein will be
dependent on the performance of the indices during the term of the instrument.
The composite is subject to change and there is no assurance that the
commodities which comprise an index will have positive performance, and past
performance of any of the commodities which comprise an index is not a
guarantee, nor necessarily indicative, of their future performance.

Deutsche Bank AG, including its subsidiaries and affiliates, does not provide
legal, tax or accounting advice. This communication was prepared solely in
connection with the promotion or marketing, to the extent permitted by
applicable law, of the matter addressed herein, and was not intended or written
to be used, and cannot be used or relied upon, by any taxpayer for purposes of
avoiding any U.S. federal tax penalties. The recipient of this communication
should seek advice from an independent tax advisor regarding any tax matters
addressed herein based on its particular circumstances.

                                    page 25
|  |
S&P GSCI Disclaimer

These materials are not sponsored, endorsed, sold or promoted by Standard &
Poor's, a division of The McGraw-Hill Companies, Inc. ("S&P"). Standard & Poor's
does not make any representation or warranty, express or implied, to the owners
of any instrument linked to the indices described herein or any member of the
public regarding the advisability of investing in securities generally or in any
instrument linked to the indices described herein or the ability of S&P GSCI
Index to track general commodity market performance. S&P's only relationship to
Deutsche Bank AG is the licensing of certain trademarks and trade names of S&P
and of S&P GSCI Index, which indices are determined, composed and calculated by
S&P without regard to Deutsche Bank AG or any instrument linked to the indices
described herein. S&P has no obligation to take the needs of Deutsche Bank AG or
the owners of any instrument linked to the indices described herein into
consideration in determining, composing or calculating S&P GSCI Index. S&P is
not responsible for and has not participated in the determination of the timing
of, prices at, or quantities of any instrument linked to the indices described
herein to be issued or in the determination or calculation of the equation by
which the S&P GSCI Index are to be converted into cash. S&P has no obligation or
liability in connection with the administration, marketing or trading of any
instrument linked to the indices described herein.

S&P DOES NOT GUARANTEE THE ACCURACY AND/OR THE COMPLETENESS OF S&P GSCI INDEX OR
ANY DATA INCLUDED THEREIN AND S&P SHALL HAVE NO LIABILITY FOR ANY ERRORS,
OMISSIONS, OR INTERRUPTIONS THEREIN. S&P MAKES NO WARRANTY, EXPRESS OR IMPLIED,
AS TO RESULTS TO BE OBTAINED BY DEUTSCHE BANK AG, OWNERS OF ANY INSTRUMENT
LINKED TO THE INDICES DESCRIBED HEREIN OR ANY OTHER PERSON OR ENTITY FROM THE
USE OF S&P GSCI INDEX OR ANY DATA INCLUDED THEREIN. S&P MAKES NO EXPRESS OR
IMPLIED WARRANTIES, AND EXPRESSLY DISCLAIMS ALL WARRANTIES OF MERCHANTABILITY OR
FITNESS FOR A PARTICULAR PURPOSE OR USE WITH RESPECT TO THE S&P INDICES OR ANY
DATA INCLUDED THEREIN. WITHOUT LIMITING ANY OF THE FOREGOING, IN NO EVENT SHALL
S&P HAVE ANY LIABILITY FOR ANY SPECIAL, PUNITIVE, INDIRECT, OR CONSEQUENTIAL
DAMAGES (INCLUDING LOST PROFITS), EVEN IF NOTIFIED OF THE POSSIBILITY OF SUCH
DAMAGES.

S&P GSCI Index is a trademark of The McGraw-Hill Companies, Inc. and has been
licensed for use by Deutsche Bank AG.

                                    page 26
|  |