UNITED STATES
SECURITIES AND EXCHANGE COMMISSION
SECURITIES AND EXCHANGE COMMISSION
Washington, D.C. 20549
Form 6-K
REPORT OF FOREIGN PRIVATE ISSUER PURSUANT TO RULE 13a-16 OR 15d-16
UNDER THE SECURITIES EXCHANGE ACT OF 1934
UNDER THE SECURITIES EXCHANGE ACT OF 1934
November 2, 2017
Commission File Number 001-15244
CREDIT SUISSE GROUP AG
(Translation of registrant’s name into English)
Paradeplatz 8, CH 8001 Zurich, Switzerland
(Address of principal executive office)
(Address of principal executive office)
Commission File Number 001-33434
CREDIT SUISSE AG
(Translation of registrant’s name into English)
Paradeplatz 8, CH 8001 Zurich, Switzerland
(Address of principal executive office)
(Address of principal executive office)
Indicate by check mark whether the registrant files or will file annual reports under cover of Form 20-F or
Form 40-F.
Form 40-F.
Form 20-F  Form 40-F
Form 40-F Indicate by check mark if the registrant is submitting the Form 6-K in paper as permitted by Regulation S-T Rule 101(b)(1):
Note: Regulation S-T Rule 101(b)(1) only permits the submission in paper of a Form 6-K if submitted solely to provide an attached annual report to security holders.
Indicate by check mark if the registrant is submitting the Form 6-K in paper as permitted by Regulation S-T Rule 101(b)(7):
Note: Regulation S-T Rule 101(b)(7) only permits the submission in paper of a Form 6-K if submitted to furnish a report or other document that the registrant foreign private issuer must furnish and make public under the laws of the jurisdiction in which the registrant is incorporated, domiciled or legally organized (the registrant’s “home country”), or under the rules of the home country exchange on which the registrant’s securities are traded, as long as the report or other document is not a press release, is not required to be and has not been distributed to the registrant’s security holders, and, if discussing a material event, has already been the subject of a Form 6-K submission or other Commission filing on EDGAR.
This report includes the media release and the slides for the presentation to investors in connection with the 3Q17 results.
CREDIT SUISSE GROUP AG Paradeplatz 8 P.O. Box CH-8070 Zurich Switzerland Telephone +41 844 33 88 44 Fax +41 44 333 88 77 media.relations@credit-suisse.com |
November 2, 2017
Media Release
Credit Suisse Group announces 3Q17 results
Group delivers 3Q17 reported pre-tax income of CHF 400 million, up 80% year on year; adjusted* pre-tax income of CHF 620 million, up 90% year on year
Net income attributable to shareholders of CHF 244 million in 3Q17, up from CHF 41 million in 3Q16
Core adjusted* net revenues in 3Q17 up 0.2% year on year; adjusted* total operating expenses down 5% and adjusted* pre-tax income up 30% year on year
Group adjusted* net revenues in 3Q17 down 2% year on year, driven by USD 95 million decrease in SRU adjusted* net revenues; Group total adjusted* operating expenses down 7% year on year
Growth across Wealth Management with 3Q17 NNA1 totaling CHF 10.4 billion, up 8% year on year; 9M17 NNA1 of CHF 33.2 billion, up 11% year on year; assets under management1 up 12% year on year to a record CHF 751 billion
SUB, IWM and APAC WM&C combined 3Q17 adjusted* net revenues2 of CHF 3.1 billion, up 9% year on year; adjusted* pre-tax income2 of CHF 1 billion in 3Q17, up 30% year on year, profiting from positive operating leverage in seasonally slower quarter
GM delivers resilient performance despite seasonal impacts in 3Q17; Equities3 net revenues up 5% and Fixed Income3 net revenues down 8% year on year
In 9M17, IBCM achieved strong progress year on year and increased share of wallet4 across all key products
9M17 cumulative cost savings5 of CHF 1 billion, with approximately CHF 400 million generated in 3Q17; confident in ending 2017 below our CHF 18.5 billion cost target
Further progress in SRU6 wind-down in 3Q17 with adjusted* total operating costs down 35%, leverage exposure down 43% and RWA7 down 53% year on year (down 10%, 10% and 13%, respectively, quarter on quarter)
On a look-through basis, achieved organic capital generation of approximately CHF 400 million in 3Q17, resulting in CET1 ratio of 13.2% (13.4%8 excluding operational risk RWA add-on announced at our 2Q17 results). Look-through CET1 capital increased to CHF 34.9 billion
1
Group highlights
• Adjusted* net revenues of CHF 5 billion in 3Q17, down 2% year on year (9M17: CHF 15.7 billion, up 6% year on year)
• Adjusted* total operating expenses of CHF 4.4 billion5 in 3Q17, down 9% year on year (9M17: CHF 13.4 billion5, down 7% year on year)
• Reported pre-tax income of CHF 400 million in 3Q17, up 80% year on year (9M17: CHF 1.7 billion)
• Adjusted* pre-tax income of CHF 620 million in 3Q17, up 90% year on year (9M17: CHF 2.2 billion)
• Net income attributable to shareholders of CHF 244 million in 3Q17, up from CHF 41 million in 3Q16
Tidjane Thiam, Chief Executive Officer of Credit Suisse, stated: “Our 3Q17 results demonstrate the progress we are making in creating positive operating leverage with Group adjusted* pre-tax income up 90% year on year and driving significantly higher profitability across the Group.
While the outlook for global economic growth has continued to improve, uncertain geopolitical developments, central bank policies and the magnitude and timing of reforms in the US, as well as historically low levels of volatility, have impacted client activity levels, which remained muted. In addition, activity levels in the third quarter of 2016 were unusually strong due to the combination of the effects of Brexit and the US elections.
Our third quarter revenue performance was resilient, with Core adjusted* net revenues from our operating businesses up 0.2%, costs9 down 5% and adjusted* pre-tax income up 30%, all on a year-on-year basis. Group adjusted* net revenues were 2% lower year on year, impacted by USD 95 million of lower revenues from the SRU as we accelerate the wind-down of our non-core division. In a tough quarter, we have maintained our strong operating leverage, with Group adjusted* pre-tax income up 90% year on year. At 9M17, Group adjusted* net revenues are up 6%, and Group adjusted* total operating expenses are down 6% year on year.
In a challenging context, our wealth management connected activities10 had a very strong quarter alongside resilient performance in GM and IBCM. These results further emphasize the value of our diversified franchise.
In our wealth management related businesses10, we have achieved a step change in profitability with adjusted* net revenue2 growth of 9% year on year and adjusted* pre-tax income2 of CHF 1 billion, up 30% year on year, illustrating the power of positive operating leverage in wealth management. Our emerging markets focused businesses of APAC and IWM delivered an exceptionally strong quarter with combined asset inflows of CHF 9.4 billion11. Adjusted* pre-tax income for APAC WM&C and IWM at the nine-month stage is at or above the full year 2016 result for both divisions. Assets under management1 grew 12% year on year to a record CHF 751 billion. We generated CHF 10.4 billion of net asset inflows1 during 3Q17 and over CHF 33 billion in 9M17, representing an annualized growth rate of 7%, notwithstanding our higher asset base. In Switzerland, we recorded our seventh consecutive quarter of year-on-year profitable12 growth and generated positive net asset inflows in Private Clients. Across SUB, IWM and APAC, we are delivering on our strategy with a balanced approach to wealth management between mature and emerging markets, while growing recurring commissions and fees.
Our GM and IBCM franchises both held up well in a seasonally tougher quarter and delivered resilient results.
We have maintained our relentless focus on costs, with approximately CHF 400 million of additional savings in 3Q17 and CHF 1 billion in 9M17. We are confident in ending 2017 below our CHF 18.5 billion cost target.
We maintained our strong capital position with a look-through CET1 ratio of 13.2% while absorbing 26 bps from an operational risk RWA add-on, primarily in respect of our RMBS settlements. Importantly, in the seventh quarter of our restructuring, we were able to generate capital organically, accreting approximately CHF 400 million on a look-through basis and ending the quarter with CHF 34.9 billion of look-through CET1 capital.
2
As we move through the final quarter of the year, our teams remain focused on serving our clients and on the continued disciplined execution of our strategy. Despite the anticipated seasonal impact on our market-sensitive activities, we are seeing the benefits of a number of key decisions we have taken to capture the wealth management opportunity. We believe client demand for the solutions we provide across wealth management and investment banking will remain strong going forward.”
Outlook
We expect global economic growth to remain strong overall in the fourth quarter, which could be a significant tailwind for our activities in spite of continuing geopolitical uncertainty. We expect to see a continued strong performance in our wealth management businesses, albeit with seasonally lower NNA inflows. Our deal pipeline remains strong with a substantial backlog of transactions to be completed in the fourth quarter, subject to constructive markets. Within our most market dependent businesses, trading conditions in October have remained broadly similar to those in the third quarter, with continued low levels of volatility but improved activity levels. After seven quarters of our three-year plan, we remain firmly focused on delivering against our objectives for both business growth and efficiency improvement in order to create value for our clients and shareholders.
Divisional summaries
• Swiss Universal Bank (SUB) delivered its seventh consecutive quarter of year-on-year profitable12 growth in 3Q17. Adjusted* pre-tax income totaled CHF 448 million for the quarter and reached CHF 1.4 billion for 9M17. Private Clients delivered improved operating leverage, resulting in 3Q17 adjusted* pre-tax income of CHF 217 million, up 11% year on year. This performance was primarily driven by higher client activity, which resulted in 13% growth in transaction-based revenues year on year. On an adjusted* basis, net revenues grew 3% year on year to CHF 727 million in 3Q17. Assets under management totaled CHF 206 billion, an increase of 7% year on year, and net new assets were resilient at CHF 1 billion. During the quarter, SUB successfully launched the expanded offering of ‘Viva Kids’. Performance in Corporate & Institutional Clients was impacted by a decrease in recurring revenues due to lower discretionary mandate fees and the impact of selected EAM exits, as well as a reduction in trading services revenues compared to 3Q16. We nevertheless maintained our leading market share in the area of investment banking in Switzerland with a no. 1 position in DCM13 and top three positions in M&A14 and ECM15.
• International Wealth Management (IWM) continued to consistently execute its strategy and achieved a step change in profitability. Adjusted* pre-tax income rose 59% year on year to CHF 382 million in 3Q17 and reached CHF 1.1 billion in 9M17 – up 34% from 9M16 and already in line with the full-year 2016 level. Improved operating leverage was driven by revenue growth across all major revenue categories, coupled with continued cost control. The adjusted* return on regulatory capital was 29% in 3Q17. Net new assets totaled CHF 4.7 billion for the quarter and CHF 31.8 billion for 9M17, up more than 25% compared to 9M16. In Private Banking, we saw a sharp improvement in profitability, with 3Q17 adjusted* pre-tax income growing 43% year on year to CHF 272 million. This results from a 10% increase in net revenues, driven by continued growth across all regions, combined with strict cost discipline. Net interest income rose 13%, driven by higher average loan and deposit volumes at increased margins. It is a key objective of our Wealth Management strategy to grow recurring commissions and fees. Recurring commissions and fees grew strongly year on year, also demonstrating solid client demand for our ‘House View’-linked solutions. Transaction- and performance-based revenues improved due to higher levels of client activity. This positive evolution was partly offset by lower revenues from trading services. Private Banking net new assets totaled CHF 3.6 billion in 3Q17 (9M17: CHF 12.9 billion), resulting in an annualized growth rate of 4% (9M17: 5%) as we generated solid asset inflows from Europe and emerging markets. Asset Management more than doubled its adjusted* pre-tax income to CHF 110 million in 3Q17 compared to 3Q16, supported by a 28% rise in management fees. Following the transition of the Asset Management business over the last two years towards a model focused on recurring management
3
fees, we have seen improved efficiency as well as higher revenues from specific growth initiatives and better collaboration with our Private Banking activities. This was enhanced by clear tailwinds as 2017 has seen higher asset prices.
• Asia Pacific (APAC) delivered its strongest third-quarter performance since 2014 with adjusted* pre-tax income of CHF 228 million, up 30% year on year. Adjusted* return on regulatory capital for 3Q17 was 18% and adjusted* total operating expenses decreased 7% year on year, primarily due to a 20% cost reduction in our Markets business compared to 3Q16. Wealth Management & Connected (WM&C) delivered strong results, with record 9M17 adjusted* pre-tax income of CHF 581 million, exceeding the total WM&C adjusted* pre-tax income for 2016. Net new assets for 9M17 rose to CHF 15.6 billion, also exceeding the full-year 2016 level. Adjusted* pre-tax income for 3Q17 grew 75% year on year to CHF 178 million with an adjusted* return on regulatory capital of 25%, driven by higher revenue productivity with a strong contribution from strategic hires and better RM and banker productivity. Advisory, underwriting and financing revenues rose 10% year on year, led by strong debt capital markets and client activities in Greater China. Private Banking revenues rose 16% compared to 3Q16, reflecting record transaction-based revenues and recurring commissions and fees since the beginning of 2014. Higher levels of divisional collaboration and broader activities with clients led to record assets under management of CHF 190 billion, with particularly robust levels of asset referrals from ultra-high-net-worth entrepreneurs. Our advisory and underwriting businesses retained a top three ranking4 in 9M17 in terms of share of wallet for Asia Pacific ex-Japan and onshore China. Our Markets business generated adjusted* pre-tax income of USD 52 million. 3Q17 net revenues grew 19% sequentially to USD 354 million, driven primarily by stronger trading performance and increased client activity in equity derivatives, partly offset by lower revenues from emerging markets rates products. Revenues have been resilient over the last three quarters during a period of repositioning for the business. We continued to make good progress in reducing operating expenses and are on track to meet our cost target of USD 1.2 billion by end-2018. We were recently recognized by Asia Risk as ‘Quant House of the Year’16 for our continued strength in structured products, innovation and risk management. We confirm the target we announced at our 1Q17 results presentation of an adjusted* return on regulatory capital of 10-15% by 2018 for APAC Markets.
• Investment Banking & Capital Markets (IBCM) achieved a strong performance across all key products in 9M17 and continued to deliver against its strategy in the traditionally slower third quarter, with increased share of wallet4 in advisory, equity underwriting and Leveraged Finance. We achieved top five rankings17 in M&A, Leveraged Finance and ECM, including a number one position in IPOs in 3Q17. Net revenues were stable compared to 3Q16, as lower performance in debt and equity underwriting was partly offset by revenue growth in advisory, which rose 13% year on year and 10% sequentially, outperforming the Street in both regions17. Adjusted* pre-tax income reached USD 54 million for the quarter and totaled USD 297 million in 9M17, up 92% compared to 9M16. In 9M17, performance was driven by a 28% rise in equity underwriting revenues and a 10% increase in debt underwriting revenues year on year. Adjusted* total operating expenses decreased 6% in 3Q17 compared to 3Q16, reflecting continued cost discipline. 3Q17 net revenues in global advisory and underwriting18 totaled USD 950 million and reached USD 3.1 billion in 9M17, up 14% year on year, driven primarily by higher revenues in debt and equity underwriting.
• Global Markets (GM) delivered a resilient performance with adjusted* pre-tax income of USD 101 million and net revenues of USD 1.3 billion in 3Q17 amid difficult operating conditions. The 6% decline in net revenues compared to 3Q16 reflected positive momentum in Equities3, which grew 5% year on year, and continued outperformance in our Securitized Products franchise, offset by a slowdown in credit trading and issuance activity. Overall, Fixed Income3 net revenues were down 8% compared to the strong prior-year period. We continued to make progress in reducing costs, which declined 4% on an adjusted* basis compared to 3Q16. 9M17 profitability increased substantially year on year, with adjusted* pre-tax income of USD 739 million, driven by improved operating leverage and reflecting the consistent execution of our strategy. 9M17 net revenues of USD 4.5 billion increased 4% year on year, highlighting the strength of our client franchise and our sustained leading market share4 across our trading and underwriting businesses. In addition, we launched a partnership with IWM and SUB to improve the diversity and depth of our product offering for institutional and wealth
4
management clients. Adjusted* total operating expenses in 9M17 declined 8% year on year, demonstrating our strong cost discipline. We believe we are on track to achieve our 2018 target cost base of below USD 4.8 billion. We continue to take a disciplined approach to investing in our franchise and increasing cross-divisional collaboration. We believe we are well positioned to achieve our 2018 net revenue ambition of over USD 6 billion.
5
Information for investors and media
Adam Gishen, Investor Relations, Credit Suisse
Tel: +41 44 333 71 49
email: investor.relations@credit-suisse.com
Tel: +41 44 333 71 49
email: investor.relations@credit-suisse.com
Amy Rajendran, Media Relations, Credit Suisse
Tel: +41 844 33 88 44
email: media.relations@credit-suisse.com
Tel: +41 844 33 88 44
email: media.relations@credit-suisse.com
The complete 3Q17 Financial Report and Results Presentation Slides are available for download from 07:00 CET today at: https://www.credit-suisse.com/results.
Presentation of 3Q17 results – Thursday, November 2, 2017
| Event | Analyst Call | Media Conference | |||
| Time | 08:15 Zurich 07:15 London 03:15 New York | 10:00 Zurich 09:00 London 05:00 New York | |||
| Speakers | Tidjane Thiam, Chief Executive Officer David Mathers, Chief Financial Officer | Tidjane Thiam, Chief Executive Officer David Mathers, Chief Financial Officer | |||
| Language | The presentation will be held in English. | The presentation will be held in English. Simultaneous interpreting in German will be available. | |||
| Access via Telephone | +41 44 580 40 01 (Switzerland) +44 1452 565 510 (Europe) +1 866 389 9771 (US) Reference: Credit Suisse Analysts and Investors call or meeting ID: 98976094 Please dial in 10 minutes before the start of the presentation. | +41 44 580 40 01 (Switzerland) +44 1452 565 510 (Europe) +1 866 389 9771 (US) Reference: Credit Suisse Group quarterly results Please dial in 10 minutes before the start of the presentation. | |||
| Q&A Session | Opportunity to ask questions via the telephone conference. | Following the presentation, you will have the opportunity to ask the speakers questions. | |||
| Playback | Replay available approximately one hour after the event: +41 44 580 34 56 (Switzerland) +44 1452 550 000 (Europe) +1 866 247 4222 (US) Conference ID: 98976094# | Replay available approximately two hours after the event: +41 44 580 34 56 (Switzerland) +44 1452 550 000 (Europe) +1 866 247 4222 (US) Conference ID English: 97550321# Conference ID German: 97582659# |
6
The results of Credit Suisse Group comprise the results of our six reporting segments, including the Strategic Resolution Unit, and the Corporate Center. Core results exclude revenues and expenses from our Strategic Resolution Unit.
As we move ahead with the implementation of our strategy, it is important to measure the progress achieved by our underlying business performance in a consistent manner. To achieve this, we will focus our analyses on adjusted results.
Adjusted results referred to in this Media Release are non-GAAP financial measures that exclude goodwill impairment and certain other revenues and expenses included in our reported results. Management believes that adjusted results provide a useful presentation of our operating results for the purposes of assessing our Group and divisional performance consistently over time, on a basis that excludes items that management does not consider representative of our underlying performance. We will report quarterly on the same adjusted* basis for the Group, Core and divisional results until end-2018 to allow investors to monitor our progress in implementing our strategy, given the material restructuring charges we are likely to incur and other items which are not reflective of our underlying performance but are to be borne in the interim period. Tables in the Appendix of this Media Release provide the detailed reconciliation between reported and adjusted results for the Group, Core businesses and the individual divisions.
Footnotes
* Adjusted results are non-GAAP financial measures. For a reconciliation of the adjusted results to the most directly comparable US GAAP measures, see the Appendix of this Media Release.
1 Combined figures and comparative descriptions for Wealth Management NNA and assets under management are derived from the respective NNA and assets under management for SUB PC, IWM PB and APAC PB within WM&C.
2 Combined figures and comparative descriptions are derived measuring the combined respective adjusted* net revenues and adjusted* pre-tax income for SUB, IWM and APAC WM&C.
3 Includes sales and trading and underwriting, based on USD figures.
4 Source: Dealogic as of September 30, 2017.
5 Measured at constant FX rates.
6 All based on USD figures.
7 Excluding operational risk RWA.
8 Excludes impact of FINMA-imposed operational risk RWA add-on of CHF 5.2 billion, primarily in respect of our RMBS settlements, which was effective beginning in 3Q17.
9 Referring to adjusted* total operating expenses.
10 Referring to SUB, IWM and APAC WM&C.
11 Figures listed are derived by combining the respective NNA for APAC PB within WM&C and IWM PB. For the avoidance of doubt, these same amounts are used in the calculation of the combined Wealth Management NNA totaling CHF 10.4 billion.
12 Referring to SUB adjusted* pre-tax income.
13 Source: IFR as of September 27, 2017.
14 Source: Thomson Securities, SDC Platinum, Credit Suisse as of September 27, 2017.
15 Source: Dealogic as of September 27, 2017.
16 Source: Asia Risk as of September 26, 2017.
17 Source: Dealogic for the period ending September 30, 2017; includes Americas and EMEA only.
18 Gross global revenues from advisory, debt and equity underwriting generated across all divisions before cross-divisional revenue sharing agreements.
Abbreviations
APAC – Asia Pacific; APAC WM&C – Asia Pacific Wealth Management & Connected; bps – basis points; CET1 – Common Equity Tier 1; DCM – Debt Capital Markets; EAM – External Asset Managers; ECM – Equity Capital Markets; EMEA – Europe, the Middle East and Africa; GAAP – Generally Accepted Accounting Principles; GM – Global Markets; IBCM – Investment Banking & Capital Markets; IPO – Initial Public Offering; IWM – International Wealth Management; NNA – Net New Assets; M&A – Mergers and Acquisitions; PB – Private Banking; PC – Private Clients; RM – Relationship Manager; RMBS – Residential Mortgage Backed Securities; RWA – Risk Weighted Assets; SRU – Strategic Resolution Unit; SUB – Swiss Universal Bank
Important information
This Media Release contains select information from the full 3Q17 Financial Report and 3Q17 Results Presentation Slides that Credit Suisse believes is of particular interest to media professionals. The complete 3Q17 Financial Report and 3Q17 Results Presentation Slides, which have been distributed simultaneously, contain more comprehensive information about our results and operations for the reporting quarter, as well as important information about our reporting methodology and some of the terms used in these documents. The complete 3Q17 Financial Report and Results Presentation Slides are not incorporated by reference into this Media Release.
Information referenced in this Media Release, whether via website links or otherwise, is not incorporated into this Media Release.
7
Our cost savings program is measured on the basis of adjusted* operating expenses at constant FX rates. “Adjusted operating expenses at constant FX rates” and “adjusted non-compensation operating expenses at constant FX rates” include adjustments as made in all our disclosures for restructuring expenses, major litigation expenses and a goodwill impairment taken in 4Q15 as well as adjustments for certain accounting changes (which had not been in place at the launch of the cost savings program), debit valuation adjustments (DVA) related volatility and for FX, applying the following main currency exchange rates for 1Q15: USD/CHF 0.9465, EUR/CHF 1.0482, GBP/CHF 1.4296, 2Q15: USD/CHF 0.9383, EUR/CHF 1.0418, GBP/CHF 1.4497, 3Q15: USD/CHF 0.9684, EUR/CHF 1.0787, GBP/CHF 1.4891, 4Q15: USD/CHF 1.0010, EUR/CHF 1.0851, GBP/CHF 1.5123, 1Q16: USD/CHF 0.9928, EUR/CHF 1.0941, GBP/CHF 1.4060, 2Q16: USD/CHF 0.9756, EUR/CHF 1.0956, GBP/CHF 1.3845, 3Q16: USD/CHF 0.9728, EUR/CHF 1.0882, GBP/CHF 1.2764, 4Q16: USD/CHF 1.0101, EUR/CHF 1.0798, GBP/CHF 1.2451, 1Q17: USD/CHF 0.9963, EUR/CHF 1.0670, GBP/CHF 1.2464, 2Q17: USD/CHF 0.9736, EUR/CHF 1.0881, GBP/CHF 1.2603, 3Q17: USD/CHF 0.9645, EUR/CHF 1.1413, GBP/CHF 1.2695.
These currency exchange rates are unweighted, i.e. a straight line average of monthly rates. We apply this calculation consistently for the periods under review. Adjusted non-compensation expenses are adjusted operating expenses excluding compensation and benefits. To calculate adjusted non-compensation expenses at constant FX rates, we subtract compensation and benefits (adjusted at constant FX rates in the manner described above) from adjusted operating expenses at constant FX rates.
Regulatory capital is calculated as the worst of 10% of RWA and 3.5% of leverage exposure. Return on regulatory capital is calculated using (adjusted) income after tax and assumes a tax rate of 30% and capital allocated based on the worst of 10% of average RWA and 3.5% of average leverage exposure. For the Markets business within the APAC division and for the Global Markets and Investment Banking & Capital Markets divisions, return on regulatory capital is based on US dollar denominated numbers. Adjusted return on regulatory capital is calculated using adjusted results, applying the same methodology to calculate return on regulatory capital.
We may not achieve all of the expected benefits of our strategic initiatives. Factors beyond our control, including but not limited to the market and economic conditions, changes in laws, rules or regulations and other challenges discussed in our public filings, could limit our ability to achieve some or all of the expected benefits of these initiatives.
In particular, the terms “Illustrative”, “Ambition”, “Outlook” and “Goal” are not intended to be viewed as targets or projections, nor are they considered to be Key Performance Indicators. All such illustrations, ambitions and goals are subject to a large number of inherent risks, assumptions and uncertainties, many of which are completely outside of our control. Accordingly, this information should not be relied on for any purpose. We do not intend to update these illustrations, ambitions or goals.
In preparing this media release, management has made estimates and assumptions that affect the numbers presented. Actual results may differ. Annualized numbers do not take account variations in operating results, seasonality and other factors and may not be indicative of actual, full-year results. Figures throughout this media release may also be subject to rounding adjustments.
As of January 1, 2013, Basel 3 was implemented in Switzerland along with the Swiss “Too Big to Fail” legislation and regulations thereunder (in each case, subject to certain phase-in periods). As of January 1, 2015, the Bank for International Settlements (BIS) leverage ratio framework, as issued by the Basel Committee on Banking Supervision (BCBS), was implemented in Switzerland by FINMA. Our related disclosures are in accordance with our interpretation of such requirements, including relevant assumptions. Changes in the interpretation of these requirements in Switzerland or in any of our assumptions or estimates could result in different numbers from those shown in this media release.
Unless otherwise noted, leverage exposure is based on the BIS leverage ratio framework and consists of period-end balance sheet assets and pre- scribed regulatory adjustments. Beginning in 2015, the Swiss leverage ratio is calculated as Swiss total capital, divided by period-end leverage expo- sure. The look-through BIS tier 1 leverage ratio and CET1 leverage ratio are calculated as look-through BIS tier 1 capital and CET1 capital, respectively, divided by end-period leverage exposure.
Mandates penetration means advisory and discretionary mandates in private banking businesses as a percentage of the related AuM, excluding those from the external asset manager business.
Margin calculations for APAC are aligned with the performance metrics of the Private Banking business and its related assets under management within the Wealth Management & Connected business in APAC. Assets under management and net new assets for APAC relate to the Private Banking business within the Wealth Management & Connected business.
Net margin is calculated by dividing income before taxes by average assets under management. Adjusted net margins is calculated using adjusted results, applying the same methodology to calculate net margin.
When we refer to operating divisions throughout this Media Release, we mean SUB, IWM, APAC, IBCM and GM.
Investors and others should note that we announce material information (including quarterly earnings releases and financial reports) to the investing public using press releases, SEC and Swiss ad hoc filings, our website and public conference calls and webcasts. We intend to also use our Twitter account @creditsuisse (https://twitter.com/creditsuisse) to excerpt key messages from our public disclosures, including earnings releases. We may retweet such messages through certain of our regional Twitter accounts, including @csschweiz (https://twitter.com/csschweiz) and @csapac (https://twitter.com/csapac). Investors and others should take care to consider such abbreviated messages in the context of the disclosures from which they are excerpted. The information we post on these Twitter accounts is not a part of this Media Release.
In various tables, use of “–” indicates not meaningful or not applicable.
8
| Key metrics | |||||||||||||||||
| in / end of | % change | in / end of | % change | ||||||||||||||
| 3Q17 | 2Q17 | 3Q16 | QoQ | YoY | 9M17 | 9M16 | YoY | ||||||||||
| Credit Suisse Group results (CHF million) | |||||||||||||||||
| Net revenues | 4,972 | 5,205 | 5,396 | (4) | (8) | 15,711 | 15,142 | 4 | |||||||||
| Provision for credit losses | 32 | 82 | 55 | (61) | (42) | 167 | 177 | (6) | |||||||||
| Total operating expenses | 4,540 | 4,541 | 5,119 | 0 | (11) | 13,892 | 15,028 | (8) | |||||||||
| Income/(loss) before taxes | 400 | 582 | 222 | (31) | 80 | 1,652 | (63) | – | |||||||||
| Net income/(loss) attributable to shareholders | 244 | 303 | 41 | (19) | 495 | 1,143 | (91) | – | |||||||||
| Assets under management and net new assets (CHF million) | |||||||||||||||||
| Assets under management | 1,344.8 | 1,307.3 | 1,254.2 | 2.9 | 7.2 | 1,344.8 | 1,254.2 | 7.2 | |||||||||
| Net new assets | (1.8) | 12.1 | 11.6 | – | – | 34.7 | 33.5 | 3.6 | |||||||||
| Basel III regulatory capital and leverage statistics | |||||||||||||||||
| CET1 ratio (%) | 14.0 | 14.2 | 14.1 | – | – | 14.0 | 14.1 | – | |||||||||
| Look-through CET1 ratio (%) | 13.2 | 13.3 | 12.0 | – | – | 13.2 | 12.0 | – | |||||||||
| Look-through CET1 leverage ratio (%) | 3.8 | 3.8 | 3.4 | – | – | 3.8 | 3.4 | – | |||||||||
| Look-through tier 1 leverage ratio (%) | 5.2 | 5.2 | 4.6 | – | – | 5.2 | 4.6 | – | |||||||||
A-1
| Credit Suisse and Core Results | |||||||||||||||||||
| Core Results | Strategic Resolution Unit | Credit Suisse | |||||||||||||||||
| in / end of | 3Q17 | 2Q17 | 3Q16 | 3Q17 | 2Q17 | 3Q16 | 3Q17 | 2Q17 | 3Q16 | ||||||||||
| Statements of operations (CHF million) | |||||||||||||||||||
| Net revenues | 5,227 | 5,479 | 5,561 | (255) | (274) | (165) | 4,972 | 5,205 | 5,396 | ||||||||||
| Provision for credit losses | 40 | 69 | 50 | (8) | 13 | 5 | 32 | 82 | 55 | ||||||||||
| Compensation and benefits | 2,366 | 2,448 | 2,540 | 85 | 94 | 134 | 2,451 | 2,542 | 2,674 | ||||||||||
| General and administrative expenses | 1,414 | 1,416 | 1,464 | 216 | 164 | 514 | 1,630 | 1,580 | 1,978 | ||||||||||
| Commission expenses | 338 | 343 | 309 | 9 | 7 | 13 | 347 | 350 | 322 | ||||||||||
| Restructuring expenses | 91 | 58 | 124 | 21 | 11 | 21 | 112 | 69 | 145 | ||||||||||
| Total other operating expenses | 1,843 | 1,817 | 1,897 | 246 | 182 | 548 | 2,089 | 1,999 | 2,445 | ||||||||||
| Total operating expenses | 4,209 | 4,265 | 4,437 | 331 | 276 | 682 | 4,540 | 4,541 | 5,119 | ||||||||||
| Income/(loss) before taxes | 978 | 1,145 | 1,074 | (578) | (563) | (852) | 400 | 582 | 222 | ||||||||||
| Statement of operations metrics (%) | |||||||||||||||||||
| Return on regulatory capital | 9.3 | 10.9 | 10.4 | – | – | – | 3.5 | 5.1 | 1.8 | ||||||||||
| Balance sheet statistics (CHF million) | |||||||||||||||||||
| Total assets | 739,281 | 728,984 | 729,130 | 49,409 | 54,427 | 77,581 | 788,690 | 783,411 | 806,711 | ||||||||||
| Risk-weighted assets 1 | 229,170 | 221,236 | 217,194 | 35,842 | 38,101 | 53,268 | 265,012 | 259,337 | 270,462 | ||||||||||
| Leverage exposure 1 | 843,582 | 834,583 | 833,736 | 65,385 | 71,611 | 115,008 | 908,967 | 906,194 | 948,744 | ||||||||||
| Core Results | Strategic Resolution Unit | Credit Suisse | |||||||||||
| in / end of | 9M17 | 9M16 | 9M17 | 9M16 | 9M17 | 9M16 | |||||||
| Statements of operations (CHF million) | |||||||||||||
| Net revenues | 16,446 | 16,211 | (735) | (1,069) | 15,711 | 15,142 | |||||||
| Provision for credit losses | 138 | 94 | 29 | 83 | 167 | 177 | |||||||
| Compensation and benefits | 7,384 | 7,384 | 267 | 506 | 7,651 | 7,890 | |||||||
| General and administrative expenses | 4,271 | 4,550 | 587 | 1,036 | 4,858 | 5,586 | |||||||
| Commission expenses | 1,042 | 1,011 | 23 | 50 | 1,065 | 1,061 | |||||||
| Restructuring expenses | 279 | 371 | 39 | 120 | 318 | 491 | |||||||
| Total other operating expenses | 5,592 | 5,932 | 649 | 1,206 | 6,241 | 7,138 | |||||||
| Total operating expenses | 12,976 | 13,316 | 916 | 1,712 | 13,892 | 15,028 | |||||||
| Income/(loss) before taxes | 3,332 | 2,801 | (1,680) | (2,864) | 1,652 | (63) | |||||||
| Statement of operations metrics (%) | |||||||||||||
| Return on regulatory capital | 10.5 | 9.1 | – | . | – | 4.8 | (0.2) | ||||||
1 Disclosed on a look-through basis. | |||||||||||||
A-2
Adjusted results are non-GAAP financial measures that exclude goodwill impairment and certain other revenues and expenses included in our reported results. Management believes that adjusted results provide a useful presentation of our operating results for purposes of assessing our Group and divisional performance over time, on a basis that excludes items that management does not consider representative of our underlying performance. Refer to ”Reconciliation of adjusted results” for a reconciliation to the most directly comparable US GAAP measures.
| Reconciliation of adjusted results | |||||||||||||||||||
| Core Results | Strategic Resolution Unit | Credit Suisse | |||||||||||||||||
| in | 3Q17 | 2Q17 | 3Q16 | 3Q17 | 2Q17 | 3Q16 | 3Q17 | 2Q17 | 3Q16 | ||||||||||
| Reconciliation of adjusted results (CHF million) | |||||||||||||||||||
| Net revenues | 5,227 | 5,479 | 5,561 | (255) | (274) | (165) | 4,972 | 5,205 | 5,396 | ||||||||||
| Real estate gains | 0 | 0 | (346) | 0 | 0 | 0 | 0 | 0 | (346) | ||||||||||
| Adjusted net revenues | 5,227 | 5,479 | 5,215 | (255) | (274) | (165) | 4,972 | 5,205 | 5,050 | ||||||||||
| Provision for credit losses | 40 | 69 | 50 | (8) | 13 | 5 | 32 | 82 | 55 | ||||||||||
| Total operating expenses | 4,209 | 4,265 | 4,437 | 331 | 276 | 682 | 4,540 | 4,541 | 5,119 | ||||||||||
| Restructuring expenses | (91) | (58) | (124) | (21) | (11) | (21) | (112) | (69) | (145) | ||||||||||
| Major litigation provisions | (20) | (12) | 12 | (88) | (21) | (318) | (108) | (33) | (306) | ||||||||||
| Adjusted total operating expenses | 4,098 | 4,195 | 4,325 | 222 | 244 | 343 | 4,320 | 4,439 | 4,668 | ||||||||||
| Income/(loss) before taxes | 978 | 1,145 | 1,074 | (578) | (563) | (852) | 400 | 582 | 222 | ||||||||||
| Total adjustments | 111 | 70 | (234) | 109 | 32 | 339 | 220 | 102 | 105 | ||||||||||
| Adjusted income/(loss) before taxes | 1,089 | 1,215 | 840 | (469) | (531) | (513) | 620 | 684 | 327 | ||||||||||
| Adjusted return on regulatory capital (%) | 10.4 | 11.5 | 8.1 | – | – | – | 5.5 | 5.9 | 2.7 | ||||||||||
| Core Results | Strategic Resolution Unit | Credit Suisse | |||||||||||
| in | 9M17 | 9M16 | 9M17 | 9M16 | 9M17 | 9M16 | |||||||
| Reconciliation of adjusted results (CHF million) | |||||||||||||
| Net revenues | 16,446 | 16,211 | (735) | (1,069) | 15,711 | 15,142 | |||||||
| Real estate gains | 0 | (346) | 0 | 0 | 0 | (346) | |||||||
| (Gains)/losses on business sales | 23 | 52 | (38) | 4 | (15) | 56 | |||||||
| Adjusted net revenues | 16,469 | 15,917 | (773) | (1,065) | 15,696 | 14,852 | |||||||
| Provision for credit losses | 138 | 94 | 29 | 83 | 167 | 177 | |||||||
| Total operating expenses | 12,976 | 13,316 | 916 | 1,712 | 13,892 | 15,028 | |||||||
| Restructuring expenses | (279) | (371) | (39) | (120) | (318) | (491) | |||||||
| Major litigation provisions | (59) | 12 | (179) | (318) | (238) | (306) | |||||||
| Adjusted total operating expenses | 12,638 | 12,957 | 698 | 1,274 | 13,336 | 14,231 | |||||||
| Income/(loss) before taxes | 3,332 | 2,801 | (1,680) | (2,864) | 1,652 | (63) | |||||||
| Total adjustments | 361 | 65 | 180 | 442 | 541 | 507 | |||||||
| Adjusted income/(loss) before taxes | 3,693 | 2,866 | (1,500) | (2,422) | 2,193 | 444 | |||||||
| Adjusted return on regulatory capital (%) | 11.7 | 9.3 | – | – | 6.3 | 1.2 | |||||||
| Adjusted return on regulatory capital is calculated using adjusted results, applying the same methodology used to calculate return on regulatory capital. | |||||||||||||
A-3
| Reconciliation of adjustment items | |||||||||
| Group | |||||||||
| in | 3Q17 | 3Q16 | 9M17 | 9M16 | |||||
| Adjusted results (CHF million) | |||||||||
| Total operating expenses | 4,540 | 5,119 | 13,892 | 15,028 | |||||
| Restructuring expenses | (112) | (145) | (318) | (491) | |||||
| Major litigation provisions | (108) | (306) | (238) | (306) | |||||
| Debit valuation adjustments (DVA) | (20) | 0 | (63) | 0 | |||||
| Certain accounting changes | (48) | 0 | (125) | 0 | |||||
| Adjusted total operating expenses | 4,252 | 4,668 | 13,148 | 14,231 | |||||
| FX adjustment | 106 | 121 | 277 | 223 | |||||
| Adjusted FX-neutral total operating expenses | 4,358 | 4,789 | 13,425 | 14,454 | |||||
| Reconciliation of adjusted results | |||||||||||
| SUB, IWM, and APAC WM&C | |||||||||||
| in | 3Q17 | 3Q16 | 9M17 | 9M16 | 9M15 | 1 | |||||
| Adjusted results (CHF million) | |||||||||||
| Net revenues | 3,129 | 3,229 | 9,521 | 9,103 | 8,596 | ||||||
| Real estate gains | 0 | (346) | 0 | (346) | (23) | ||||||
| Adjusted net revenues | 3,129 | 2,883 | 9,521 | 8,757 | 8,573 | ||||||
| Provision for credit losses | 22 | 64 | 81 | 77 | 139 | ||||||
| Total operating expenses | 2,153 | 2,067 | 6,527 | 6,266 | 6,193 | ||||||
| Restructuring expenses | (34) | (41) | (131) | (110) | 0 | ||||||
| Major litigation provisions | (20) | 19 | (59) | 19 | (40) | ||||||
| Adjusted total operating expenses | 2,099 | 2,045 | 6,337 | 6,175 | 6,153 | ||||||
| Income before taxes | 954 | 1,098 | 2,913 | 2,760 | 2,264 | ||||||
| Total adjustments | 54 | (324) | 190 | (255) | 17 | ||||||
| Adjusted income before taxes | 1,008 | 774 | 3,103 | 2,505 | 2,281 | ||||||
1 Excludes net revenues and total operating expenses for Swisscard of CHF 148 million and CHF 123 million, respectively. | |||||||||||
A-4
| Swiss Universal Bank | |||||||||||||||||
| in / end of | % change | in / end of % change | |||||||||||||||
| 3Q17 | 2Q17 | 3Q16 | QoQ | YoY | 9M17 | 9M16 | YoY | ||||||||||
| Results (CHF million) | |||||||||||||||||
| Net revenues | 1,319 | 1,405 | 1,667 | (6) | (21) | 4,078 | 4,360 | (6) | |||||||||
| of which Private Clients | 727 | 733 | 1,053 | (1) | (31) | 2,171 | 2,509 | (13) | |||||||||
| of which Corporate & Institutional Clients | 592 | 672 | 614 | (12) | (4) | 1,907 | 1,851 | 3 | |||||||||
| Provision for credit losses | 14 | 36 | 30 | (61) | (53) | 60 | 45 | 33 | |||||||||
| Total operating expenses | 879 | 867 | 879 | 1 | 0 | 2,686 | 2,672 | 1 | |||||||||
| Income before taxes | 426 | 502 | 758 | (15) | (44) | 1,332 | 1,643 | (19) | |||||||||
| of which Private Clients | 206 | 222 | 526 | (7) | (61) | 589 | 922 | (36) | |||||||||
| of which Corporate & Institutional Clients | 220 | 280 | 232 | (21) | (5) | 743 | 721 | 3 | |||||||||
| Metrics (%) | |||||||||||||||||
| Return on regulatory capital | 13.2 | 15.5 | 24.7 | – | – | 13.8 | 18.0 | – | |||||||||
| Cost/income ratio | 66.6 | 61.7 | 52.7 | – | – | 65.9 | 61.3 | – | |||||||||
| Private Clients | |||||||||||||||||
| Assets under management (CHF billion) | 206.1 | 201.5 | 192.6 | 2.3 | 7.0 | 206.1 | 192.6 | 7.0 | |||||||||
| Net new assets (CHF billion) | 1.0 | 1.7 | 0.9 | – | – | 4.7 | 1.9 | – | |||||||||
| Gross margin (annualized) (bp) | 142 | 146 | 220 | – | – | 145 | 177 | – | |||||||||
| Net margin (annualized) (bp) | 40 | 44 | 110 | – | – | 39 | 65 | – | |||||||||
| Corporate & Institutional Clients | |||||||||||||||||
| Assets under management (CHF billion) | 346.7 | 352.5 | 336.5 | (1.6) | 3.0 | 346.7 | 336.5 | 3.0 | |||||||||
| Net new assets (CHF billion) | (13.7) | 0.0 | (1.9) | – | – | (13.7) | 1.7 | – | |||||||||
A-5
| Reconciliation of adjusted results | |||||||||||||||||||
| Private Clients | Corporate & Institutional Clients | Swiss Universal Bank | |||||||||||||||||
| in | 3Q17 | 2Q17 | 3Q16 | 3Q17 | 2Q17 | 3Q16 | 3Q17 | 2Q17 | 3Q16 | ||||||||||
| Adjusted results (CHF million) | |||||||||||||||||||
| Net revenues | 727 | 733 | 1,053 | 592 | 672 | 614 | 1,319 | 1,405 | 1,667 | ||||||||||
| Real estate gains | 0 | 0 | (346) | 0 | 0 | 0 | 0 | 0 | (346) | ||||||||||
| Adjusted net revenues | 727 | 733 | 707 | 592 | 672 | 614 | 1,319 | 1,405 | 1,321 | ||||||||||
| Provision for credit losses | 9 | 11 | 12 | 5 | 25 | 18 | 14 | 36 | 30 | ||||||||||
| Total operating expenses | 512 | 500 | 515 | 367 | 367 | 364 | 879 | 867 | 879 | ||||||||||
| Restructuring expenses | (9) | 2 | (16) | (4) | 2 | (3) | (13) | 4 | (19) | ||||||||||
| Major litigation provisions | (2) | (2) | 0 | (7) | (4) | 0 | (9) | (6) | 0 | ||||||||||
| Adjusted total operating expenses | 501 | 500 | 499 | 356 | 365 | 361 | 857 | 865 | 860 | ||||||||||
| Income before taxes | 206 | 222 | 526 | 220 | 280 | 232 | 426 | 502 | 758 | ||||||||||
| Total adjustments | 11 | 0 | (330) | 11 | 2 | 3 | 22 | 2 | (327) | ||||||||||
| Adjusted income before taxes | 217 | 222 | 196 | 231 | 282 | 235 | 448 | 504 | 431 | ||||||||||
| Adjusted return on regulatory capital (%) | – | – | – | – | – | – | 13.9 | 15.6 | 14.0 | ||||||||||
Private Clients | Corporate & Institutional Clients | Swiss Universal Bank | |||||||||||
| in | 9M17 | 9M16 | 9M17 | 9M16 | 9M17 | 9M16 | |||||||
| Adjusted results (CHF million) | |||||||||||||
| Net revenues | 2,171 | 2,509 | 1,907 | 1,851 | 4,078 | 4,360 | |||||||
| Real estate gains | 0 | (346) | 0 | 0 | 0 | (346) | |||||||
| Adjusted net revenues | 2,171 | 2,163 | 1,907 | 1,851 | 4,078 | 4,014 | |||||||
| Provision for credit losses | 32 | 29 | 28 | 16 | 60 | 45 | |||||||
| Total operating expenses | 1,550 | 1,558 | 1,136 | 1,114 | 2,686 | 2,672 | |||||||
| Restructuring expenses | (54) | (54) | (7) | (9) | (61) | (63) | |||||||
| Major litigation provisions | (4) | 0 | (38) | 0 | (42) | 0 | |||||||
| Adjusted total operating expenses | 1,492 | 1,504 | 1,091 | 1,105 | 2,583 | 2,609 | |||||||
| Income before taxes | 589 | 922 | 743 | 721 | 1,332 | 1,643 | |||||||
| Total adjustments | 58 | (292) | 45 | 9 | 103 | (283) | |||||||
| Adjusted income before taxes | 647 | 630 | 788 | 730 | 1,435 | 1,360 | |||||||
| Adjusted return on regulatory capital (%) | – | – | – | – | 14.9 | 14.9 | |||||||
A-6
| International Wealth Management | |||||||||||||||||
| in / end of | % change | in / end of | % change | ||||||||||||||
| 3Q17 | 2Q17 | 3Q16 | QoQ | YoY | 9M17 | 9M16 | YoY | ||||||||||
| Results (CHF million) | |||||||||||||||||
| Net revenues | 1,262 | 1,264 | 1,081 | 0 | 17 | 3,747 | 3,399 | 10 | |||||||||
| of which Private Banking | 870 | 927 | 789 | (6) | 10 | 2,680 | 2,453 | 9 | |||||||||
| of which Asset Management | 392 | 337 | 292 | 16 | 34 | 1,067 | 946 | 13 | |||||||||
| Provision for credit losses | 3 | 8 | 0 | (63) | – | 13 | 14 | (7) | |||||||||
| Total operating expenses | 904 | 891 | 836 | 1 | 8 | 2,723 | 2,595 | 5 | |||||||||
| Income before taxes | 355 | 365 | 245 | (3) | 45 | 1,011 | 790 | 28 | |||||||||
| of which Private Banking | 252 | 297 | 196 | (15) | 29 | 788 | 613 | 29 | |||||||||
| of which Asset Management | 103 | 68 | 49 | 51 | 110 | 223 | 177 | 26 | |||||||||
| Metrics (%) | |||||||||||||||||
| Return on regulatory capital | 26.9 | 28.3 | 20.5 | – | – | 26.1 | 22.2 | – | |||||||||
| Cost/income ratio | 71.6 | 70.5 | 77.3 | – | – | 72.7 | 76.3 | – | |||||||||
| Private Banking | |||||||||||||||||
| Assets under management (CHF billion) | 355.3 | 336.4 | 311.4 | 5.6 | 14.1 | 355.3 | 311.4 | 14.1 | |||||||||
| Net new assets (CHF billion) | 3.6 | 4.6 | 4.4 | – | – | 12.9 | 15.2 | – | |||||||||
| Gross margin (annualized) (bp) | 101 | 110 | 104 | – | – | 106 | 111 | – | |||||||||
| Net margin (annualized) (bp) | 29 | 35 | 26 | – | – | 31 | 28 | – | |||||||||
| Asset Management | |||||||||||||||||
| Assets under management (CHF billion) | 376.3 | 366.0 | 324.3 | 2.8 | 16.0 | 376.3 | 324.3 | 16.0 | |||||||||
| Net new assets (CHF billion) | 1.1 | 2.8 | 5.0 | – | – | 18.9 | 10.0 | – | |||||||||
A-7
| Reconciliation of adjusted results | |||||||||||||||||||
| Private Banking | Asset Management | International Wealth Management | |||||||||||||||||
| in | 3Q17 | 2Q17 | 3Q16 | 3Q17 | 2Q17 | 3Q16 | 3Q17 | 2Q17 | 3Q16 | ||||||||||
| Adjusted results (CHF million) | |||||||||||||||||||
| Net revenues | 870 | 927 | 789 | 392 | 337 | 292 | 1,262 | 1,264 | 1,081 | ||||||||||
| Provision for credit losses | 3 | 8 | 0 | 0 | 0 | 0 | 3 | 8 | 0 | ||||||||||
| Total operating expenses | 615 | 622 | 593 | 289 | 269 | 243 | 904 | 891 | 836 | ||||||||||
| Restructuring expenses | (9) | (4) | (13) | (7) | (3) | (2) | (16) | (7) | (15) | ||||||||||
| Major litigation provisions | (11) | (6) | 19 | 0 | 0 | 0 | (11) | (6) | 19 | ||||||||||
| Adjusted total operating expenses | 595 | 612 | 599 | 282 | 266 | 241 | 877 | 878 | 840 | ||||||||||
| Income before taxes | 252 | 297 | 196 | 103 | 68 | 49 | 355 | 365 | 245 | ||||||||||
| Total adjustments | 20 | 10 | (6) | 7 | 3 | 2 | 27 | 13 | (4) | ||||||||||
| Adjusted income before taxes | 272 | 307 | 190 | 110 | 71 | 51 | 382 | 378 | 241 | ||||||||||
| Adjusted return on regulatory capital (%) | – | – | – | – | – | – | 28.9 | 29.3 | 20.1 | ||||||||||
| Private Banking | Asset Management | International Wealth Management | |||||||||||
| in | 9M17 | 9M16 | 9M17 | 9M16 | 9M17 | 9M16 | |||||||
| Adjusted results (CHF million) | |||||||||||||
| Net revenues | 2,680 | 2,453 | 1,067 | 946 | 3,747 | 3,399 | |||||||
| Provision for credit losses | 13 | 14 | 0 | 0 | 13 | 14 | |||||||
| Total operating expenses | 1,879 | 1,826 | 844 | 769 | 2,723 | 2,595 | |||||||
| Restructuring expenses | (36) | (36) | (23) | (2) | (59) | (38) | |||||||
| Major litigation provisions | (17) | 19 | 0 | 0 | (17) | 19 | |||||||
| Adjusted total operating expenses | 1,826 | 1,809 | 821 | 767 | 2,647 | 2,576 | |||||||
| Income before taxes | 788 | 613 | 223 | 177 | 1,011 | 790 | |||||||
| Total adjustments | 53 | 17 | 23 | 2 | 76 | 19 | |||||||
| Adjusted income before taxes | 841 | 630 | 246 | 179 | 1,087 | 809 | |||||||
| Adjusted return on regulatory capital (%) | – | – | – | – | 28.0 | 22.7 | |||||||
A-8
| Asia Pacific | |||||||||||||||||
| in / end of | % change | in / end of | % change | ||||||||||||||
| 3Q17 | 2Q17 | 3Q16 | QoQ | YoY | 9M17 | 9M16 | YoY | ||||||||||
| Results (CHF million) | |||||||||||||||||
| Net revenues | 890 | 848 | 917 | 5 | (3) | 2,619 | 2,735 | (4) | |||||||||
| of which Wealth Management & Connected | 548 | 559 | 481 | (2) | 14 | 1,696 | 1,344 | 26 | |||||||||
| of which Markets | 342 | 289 | 436 | 18 | (22) | 923 | 1,391 | (34) | |||||||||
| Provision for credit losses | 5 | (1) | 34 | – | (85) | 8 | 15 | (47) | |||||||||
| Total operating expenses | 667 | 661 | 731 | 1 | (9) | 2,058 | 2,098 | (2) | |||||||||
| Income before taxes | 218 | 188 | 152 | 16 | 43 | 553 | 622 | (11) | |||||||||
| of which Wealth Management & Connected | 173 | 196 | 95 | (12) | 82 | 570 | 327 | 74 | |||||||||
| of which Markets | 45 | (8) | 57 | – | (21) | (17) | 295 | – | |||||||||
| Metrics (%) | |||||||||||||||||
| Return on regulatory capital | 16.8 | 14.4 | 11.3 | – | – | 13.9 | 15.9 | – | |||||||||
| Cost/income ratio | 74.9 | 77.9 | 79.7 | – | – | 78.6 | 76.7 | – | |||||||||
| Wealth Management & Connected – Private Banking | |||||||||||||||||
| Assets under management (CHF billion) | 190.0 | 177.8 | 168.0 | 6.9 | 13.1 | 190.0 | 168.0 | 13.1 | |||||||||
| Net new assets (CHF billion) | 5.8 | 4.5 | 4.3 | – | – | 15.6 | 12.9 | – | |||||||||
| Gross margin (annualized) (bp) | 87 | 91 | 84 | – | – | 91 | 86 | – | |||||||||
| Net margin (annualized) (bp) | 30 | 33 | 14 | – | – | 32 | 23 | – | |||||||||
A-9
| Reconciliation of adjusted results | |||||||||||||||||||
| Wealth Management & Connected | Markets | Asia Pacific | |||||||||||||||||
| in | 3Q17 | 2Q17 | 3Q16 | 3Q17 | 2Q17 | 3Q16 | 3Q17 | 2Q17 | 3Q16 | ||||||||||
| Adjusted results (CHF million) | |||||||||||||||||||
| Net revenues | 548 | 559 | 481 | 342 | 289 | 436 | 890 | 848 | 917 | ||||||||||
| Provision for credit losses | 5 | (1) | 34 | 0 | 0 | 0 | 5 | (1) | 34 | ||||||||||
| Total operating expenses | 370 | 364 | 352 | 297 | 297 | 379 | 667 | 661 | 731 | ||||||||||
| Restructuring expenses | (5) | (2) | (7) | (5) | (9) | (16) | (10) | (11) | (23) | ||||||||||
| Adjusted total operating expenses | 365 | 362 | 345 | 292 | 288 | 363 | 657 | 650 | 708 | ||||||||||
| Income/(loss) before taxes | 173 | 196 | 95 | 45 | (8) | 57 | 218 | 188 | 152 | ||||||||||
| Total adjustments | 5 | 2 | 7 | 5 | 9 | 16 | 10 | 11 | 23 | ||||||||||
| Adjusted income before taxes | 178 | 198 | 102 | 50 | 1 | 73 | 228 | 199 | 175 | ||||||||||
| Adjusted return on regulatory capital (%) | – | – | – | – | – | – | 17.6 | 15.3 | 12.9 | ||||||||||
| Wealth Management & Connected | Markets | Asia Pacific | |||||||||||
| in | 9M17 | 9M16 | 9M17 | 9M16 | 9M17 | 9M16 | |||||||
| Adjusted results (CHF million) | |||||||||||||
| Net revenues | 1,696 | 1,344 | 923 | 1,391 | 2,619 | 2,735 | |||||||
| Provision for credit losses | 8 | 18 | 0 | (3) | 8 | 15 | |||||||
| Total operating expenses | 1,118 | 999 | 940 | 1,099 | 2,058 | 2,098 | |||||||
| Restructuring expenses | (11) | (9) | (29) | (25) | (40) | (34) | |||||||
| Adjusted total operating expenses | 1,107 | 990 | 911 | 1,074 | 2,018 | 2,064 | |||||||
| Income/(loss) before taxes | 570 | 327 | (17) | 295 | 553 | 622 | |||||||
| Total adjustments | 11 | 9 | 29 | 25 | 40 | 34 | |||||||
| Adjusted income before taxes | 581 | 336 | 12 | 320 | 593 | 656 | |||||||
| Adjusted return on regulatory capital (%) | – | – | – | – | 15.0 | 16.7 | |||||||
| APAC Markets | |||||
| in | 3Q17 | 2Q17 | |||
| Adjusted results (USD million) | |||||
| Net revenues | 354 | 298 | |||
| Total operating expenses | 308 | 305 | |||
| Restructuring expenses | (6) | (8) | |||
| Adjusted total operating expenses | 302 | 297 | |||
| Income before taxes | 46 | (7) | |||
| Total adjustments | 6 | 8 | |||
| Adjusted income before taxes | 52 | 1 | |||
A-10
| Global Markets | |||||||||||||||||
| in / end of | % change | in / end of | % change | ||||||||||||||
| 3Q17 | 2Q17 | 3Q16 | QoQ | YoY | 9M17 | 9M16 | YoY | ||||||||||
| Results (CHF million) | |||||||||||||||||
| Net revenues | 1,262 | 1,517 | 1,357 | (17) | (7) | 4,388 | 4,232 | 4 | |||||||||
| Provision for credit losses | 6 | 12 | (5) | (50) | – | 23 | 1 | – | |||||||||
| Total operating expenses | 1,185 | 1,248 | 1,275 | (5) | (7) | 3,720 | 4,188 | (11) | |||||||||
| Income before taxes | 71 | 257 | 87 | (72) | (18) | 645 | 43 | – | |||||||||
| Metrics (%) | |||||||||||||||||
| Return on regulatory capital | 2.0 | 7.4 | 2.5 | – | – | 6.1 | 0.4 | – | |||||||||
| Cost/income ratio | 93.9 | 82.3 | 94.0 | – | – | 84.8 | 99.0 | – | |||||||||
| Reconciliation of adjusted results | |||||||||||
| Global Markets | |||||||||||
| in | 3Q17 | 2Q17 | 3Q16 | 9M17 | 9M16 | ||||||
| Adjusted results (CHF million) | |||||||||||
| Net revenues | 1,262 | 1,517 | 1,357 | 4,388 | 4,232 | ||||||
| Provision for credit losses | 6 | 12 | (5) | 23 | 1 | ||||||
| Total operating expenses | 1,185 | 1,248 | 1,275 | 3,720 | 4,188 | ||||||
| Restructuring expenses | (27) | (32) | (52) | (79) | (202) | ||||||
| Major litigation provisions | 0 | 0 | (7) | 0 | (7) | ||||||
| Adjusted total operating expenses | 1,158 | 1,216 | 1,216 | 3,641 | 3,979 | ||||||
| Income before taxes | 71 | 257 | 87 | 645 | 43 | ||||||
| Total adjustments | 27 | 32 | 59 | 79 | 209 | ||||||
| Adjusted income before taxes | 98 | 289 | 146 | 724 | 252 | ||||||
| Adjusted return on regulatory capital (%) | 2.8 | 8.3 | 4.1 | 6.9 | 2.4 | ||||||
| Global Markets | |||||||||
| in | 3Q17 | 3Q16 | 9M17 | 9M16 | |||||
| Adjusted results (USD million) | |||||||||
| Net revenues | 1,308 | 1,396 | 4,483 | 4,319 | |||||
| Provision for credit losses | 7 | (6) | 24 | (1) | |||||
| Total operating expenses | 1,228 | 1,310 | 3,801 | 4,272 | |||||
| Restructuring expenses | (28) | (52) | (81) | (206) | |||||
| Major litigation provisions | 0 | (7) | 0 | (7) | |||||
| Adjusted total operating expenses | 1,200 | 1,251 | 3,720 | 4,059 | |||||
| Income before taxes | 73 | 92 | 658 | 48 | |||||
| Total adjustments | 28 | 59 | 81 | 213 | |||||
| Adjusted income before taxes | 101 | 151 | 739 | 261 | |||||
A-11
| Investment Banking & Capital Markets | |||||||||||||||||
| in / end of | % change | in / end of | % change | ||||||||||||||
| 3Q17 | 2Q17 | 3Q16 | QoQ | YoY | 9M17 | 9M16 | YoY | ||||||||||
| Results (CHF million) | |||||||||||||||||
| Net revenues | 457 | 511 | 467 | (11) | (2) | 1,574 | 1,398 | 13 | |||||||||
| Provision for credit losses | 12 | 13 | (9) | (8) | – | 31 | 20 | 55 | |||||||||
| Total operating expenses | 410 | 420 | 437 | (2) | (6) | 1,281 | 1,266 | 1 | |||||||||
| Income before taxes | 35 | 78 | 39 | (55) | (10) | 262 | 112 | 134 | |||||||||
| Metrics (%) | |||||||||||||||||
| Return on regulatory capital | 5.2 | 12.0 | 6.1 | – | – | 13.2 | 6.4 | – | |||||||||
| Cost/income ratio | 89.7 | 82.2 | 93.6 | – | – | 81.4 | 90.6 | – | |||||||||
| Reconciliation of adjusted results | |||||||||||
| Investment Banking & Capital Markets | |||||||||||
| in | 3Q17 | 2Q17 | 3Q16 | 9M17 | 9M16 | ||||||
| Adjusted results (CHF million) | |||||||||||
| Net revenues | 457 | 511 | 467 | 1,574 | 1,398 | ||||||
| Provision for credit losses | 12 | 13 | (9) | 31 | 20 | ||||||
| Total operating expenses | 410 | 420 | 437 | 1,281 | 1,266 | ||||||
| Restructuring expenses | (16) | (10) | (15) | (28) | (34) | ||||||
| Adjusted total operating expenses | 394 | 410 | 422 | 1,253 | 1,232 | ||||||
| Income before taxes | 35 | 78 | 39 | 262 | 112 | ||||||
| Total adjustments | 16 | 10 | 15 | 28 | 34 | ||||||
| Adjusted income before taxes | 51 | 88 | 54 | 290 | 146 | ||||||
| Adjusted return on regulatory capital (%) | 7.6 | 13.5 | 8.6 | 14.6 | 8.3 | ||||||
| Investment Banking & Capital Markets | |||||||||
| in | 3Q17 | 3Q16 | 9M17 | 9M16 | |||||
| Adjusted results (USD million) | |||||||||
| Net revenues | 474 | 479 | 1,609 | 1,432 | |||||
| Provision for credit losses | 12 | (9) | 32 | 21 | |||||
| Total operating expenses | 425 | 449 | 1,309 | 1,291 | |||||
| Restructuring expenses | (17) | (16) | (29) | (35) | |||||
| Adjusted total operating expenses | 408 | 433 | 1,280 | 1,256 | |||||
| Income before taxes | 37 | 39 | 268 | 120 | |||||
| Total adjustments | 17 | 16 | 29 | 35 | |||||
| Adjusted income before taxes | 54 | 55 | 297 | 155 | |||||
| Global advisory and underwriting revenues | |||||||||||||||||
| in | % change | in | % change | ||||||||||||||
| 3Q17 | 2Q17 | 3Q16 | QoQ | YoY | 9M17 | 9M16 | YoY | ||||||||||
| Global advisory and underwriting revenues (USD million) | |||||||||||||||||
| Global advisory and underwriting revenues | 950 | 1,016 | 945 | (6) | 1 | 3,099 | 2,729 | 14 | |||||||||
| of which advisory and other fees | 237 | 192 | 209 | 23 | 13 | 707 | 736 | (4) | |||||||||
| of which debt underwriting | 544 | 582 | 552 | (7) | (1) | 1,773 | 1,469 | 21 | |||||||||
| of which equity underwriting | 169 | 242 | 184 | (30) | (8) | 619 | 524 | 18 | |||||||||
A-12
Cautionary statement regarding forward-looking information
This media release contains statements that constitute forward-looking statements. In addition, in the future we, and others on our behalf, may make statements that constitute forward-looking statements. Such forward-looking statements may include, without limitation, statements relating to the following:
– our plans, objectives or goals;
– our future economic performance or prospects;
– the potential effect on our future performance of certain contingencies; and
– assumptions underlying any such statements.
Words such as “believes,” “anticipates,” “expects,” “intends” and “plans” and similar expressions are intended to identify forward-looking statements but are not the exclusive means of identifying such statements. We do not intend to update these forward-looking statements except as may be required by applicable securities laws.
By their very nature, forward-looking statements involve inherent risks and uncertainties, both general and specific, and risks exist that predictions, forecasts, projections and other outcomes described or implied in forward-looking statements will not be achieved. We caution you that a number of important factors could cause results to differ materially from the plans, objectives, expectations, estimates and intentions expressed in such forward-looking statements. These factors include:
– the ability to maintain sufficient liquidity and access capital markets;
– market volatility and interest rate fluctuations and developments affecting interest rate levels;
– the strength of the global economy in general and the strength of the economies of the countries in which we conduct our operations, in particular the risk of continued slow economic recovery or downturn in the US or other developed countries or in emerging markets in 2017 and beyond;
– the direct and indirect impacts of deterioration or slow recovery in residential and commercial real estate markets;
– adverse rating actions by credit rating agencies in respect of us, sovereign issuers, structured credit products or other credit-related exposures;
– the ability to achieve our strategic objectives, including cost efficiency, net new asset, pre-tax income/(loss), capital ratios and return on regulatory capital, leverage exposure threshold, risk-weighted assets threshold and other targets and ambitions;
– the ability of counterparties to meet their obligations to us;
– the effects of, and changes in, fiscal, monetary, exchange rate, trade and tax policies, as well as currency fluctuations;
– political and social developments, including war, civil unrest or terrorist activity;
– the possibility of foreign exchange controls, expropriation, nationalization or confiscation of assets in countries in which we conduct our operations;
– operational factors such as systems failure, human error, or the failure to implement procedures properly;
– the risk of cyberattacks on our business or operations;
– actions taken by regulators with respect to our business and practices and possible resulting changes to our business organization, practices and policies in countries in which we conduct our operations;
– the effects of changes in laws, regulations or accounting policies or practices in countries in which we conduct our operations;
– the potential effects of proposed changes in our legal entity structure;
– competition or changes in our competitive position in geographic and business areas in which we conduct our operations;
– the ability to retain and recruit qualified personnel;
– the ability to maintain our reputation and promote our brand;
– the ability to increase market share and control expenses;
– technological changes;
– the timely development and acceptance of our new products and services and the perceived overall value of these products and services by users;
– acquisitions, including the ability to integrate acquired businesses successfully, and divestitures, including the ability to sell non-core assets;
– the adverse resolution of litigation, regulatory proceedings and other contingencies; and
– other unforeseen or unexpected events and our success at managing these and the risks involved in the foregoing.
We caution you that the foregoing list of important factors is not exclusive. When evaluating forward-looking statements, you should carefully consider the foregoing factors and other uncertainties and events, including the information set forth in “Risk factors” in I – Information on the company in our Annual Report 2016.
A-13
Third Quarter 2017 Results Presentation to Investors and Analysts November 2, 2017
Disclaimer Cautionary statement regarding forward-looking statements This presentation contains forward-looking statements that involve inherent risks and uncertainties, and we might not be able to achieve the predictions, forecasts, projections and other outcomes we describe or imply in forward-looking statements. A number of important factors could cause results to differ materially from the plans, objectives, expectations, estimates and intentions we express in these forward-looking statements, including those we identify in "Risk factors” in our Annual Report on Form 20-F for the fiscal year ended December 31, 2016 and in the “Cautionary statement regarding forward-looking information" in our 3Q17 Financial Report filed with the US Securities and Exchange Commission, and in other public filings and press releases. We do not intend to update these forward-looking statements except as may be required by applicable law. In particular, the terms “Illustrative”, “Ambition”, “Outlook” and “Goal” are not intended to be viewed as targets or projections, nor are they considered to be Key Performance Indicators. All such illustrations, ambitions and goals are subject to a large number of inherent risks, assumptions and uncertainties, many of which are completely outside of our control. Accordingly, this information should not be relied on for any purpose. We do not intend to update these illustrations, ambitions or goals.We may not achieve the benefits of our strategic initiativesWe may not achieve all of the expected benefits of our strategic initiatives. Factors beyond our control, including but not limited to the market and economic conditions, changes in laws, rules or regulations and other challenges discussed in our public filings, could limit our ability to achieve some or all of the expected benefits of these initiatives.Estimates and assumptionsIn preparing this presentation, management has made estimates and assumptions that affect the numbers presented. Actual results may differ. Annualized numbers do not take account of variations in operating results, seasonality and other factors and may not be indicative of actual, full-year results. Figures throughout this presentation may also be subject to rounding adjustments.Statement regarding non-GAAP financial measuresThis presentation also contains non-GAAP financial measures, including adjusted results. Information needed to reconcile such non-GAAP financial measures to the most directly comparable measures under US GAAP can be found in this presentation in the Appendix, which is available on our website at www.credit-suisse.com.Statement regarding capital, liquidity and leverageAs of January 1, 2013, Basel III was implemented in Switzerland along with the Swiss “Too Big to Fail” legislation and regulations thereunder (in each case, subject to certain phase-in periods). As of January 1, 2015, the Bank for International Settlements (BIS) leverage ratio framework, as issued by the Basel Committee on Banking Supervision (BCBS), was implemented in Switzerland by FINMA. Our related disclosures are in accordance with our interpretation of such requirements, including relevant assumptions. Changes in the interpretation of these requirements in Switzerland or in any of our assumptions or estimates could result in different numbers from those shown in this presentation. Capital and ratio numbers for periods prior to 2013 are based on estimates, which are calculated as if the Basel III framework had been in place in Switzerland during such periods. Unless otherwise noted, leverage exposure is based on the BIS leverage ratio framework and consists of period-end balance sheet assets and prescribed regulatory adjustments. Beginning in 2015, the Swiss leverage ratio is calculated as Swiss total capital, divided by period-end leverage exposure. The look-through BIS tier 1 leverage ratio and CET1 leverage ratio are calculated as look-through BIS tier 1 capital and CET1 capital, respectively, divided by end-period leverage exposure.

3Q17 Earnings ReviewTidjane Thiam, Chief Executive OfficerDavid Mathers, Chief Financial Officer
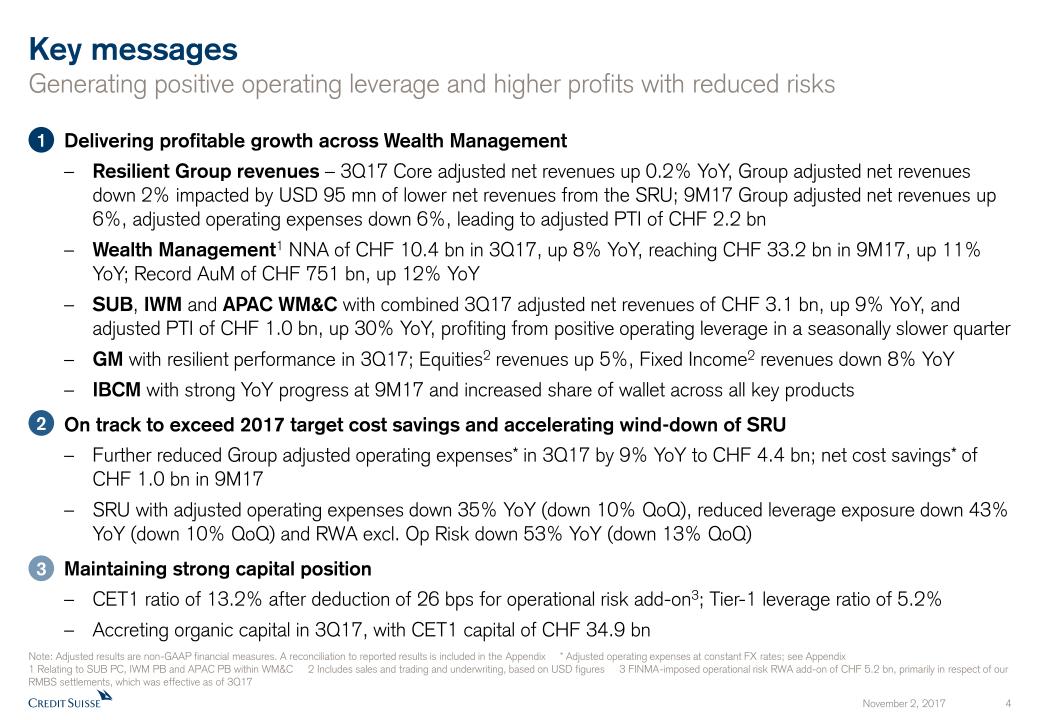
Delivering profitable growth across Wealth ManagementResilient Group revenues – 3Q17 Core adjusted net revenues up 0.2% YoY, Group adjusted net revenues down 2% impacted by USD 95 mn of lower net revenues from the SRU; 9M17 Group adjusted net revenues up 6%, adjusted operating expenses down 6%, leading to adjusted PTI of CHF 2.2 bnWealth Management1 NNA of CHF 10.4 bn in 3Q17, up 8% YoY, reaching CHF 33.2 bn in 9M17, up 11% YoY; Record AuM of CHF 751 bn, up 12% YoYSUB, IWM and APAC WM&C with combined 3Q17 adjusted net revenues of CHF 3.1 bn, up 9% YoY, and adjusted PTI of CHF 1.0 bn, up 30% YoY, profiting from positive operating leverage in a seasonally slower quarterGM with resilient performance in 3Q17; Equities2 revenues up 5%, Fixed Income2 revenues down 8% YoYIBCM with strong YoY progress at 9M17 and increased share of wallet across all key productsOn track to exceed 2017 target cost savings and accelerating wind-down of SRUFurther reduced Group adjusted operating expenses* in 3Q17 by 9% YoY to CHF 4.4 bn; net cost savings* of CHF 1.0 bn in 9M17SRU with adjusted operating expenses down 35% YoY (down 10% QoQ), reduced leverage exposure down 43% YoY (down 10% QoQ) and RWA excl. Op Risk down 53% YoY (down 13% QoQ)Maintaining strong capital positionCET1 ratio of 13.2% after deduction of 26 bps for operational risk add-on3; Tier-1 leverage ratio of 5.2%Accreting organic capital in 3Q17, with CET1 capital of CHF 34.9 bn Key messagesGenerating positive operating leverage and higher profits with reduced risks 1 2 3 Note: Adjusted results are non-GAAP financial measures. A reconciliation to reported results is included in the Appendix * Adjusted operating expenses at constant FX rates; see Appendix1 Relating to SUB PC, IWM PB and APAC PB within WM&C 2 Includes sales and trading and underwriting, based on USD figures 3 FINMA-imposed operational risk RWA add-on of CHF 5.2 bn, primarily in respect of our RMBS settlements, which was effective as of 3Q17
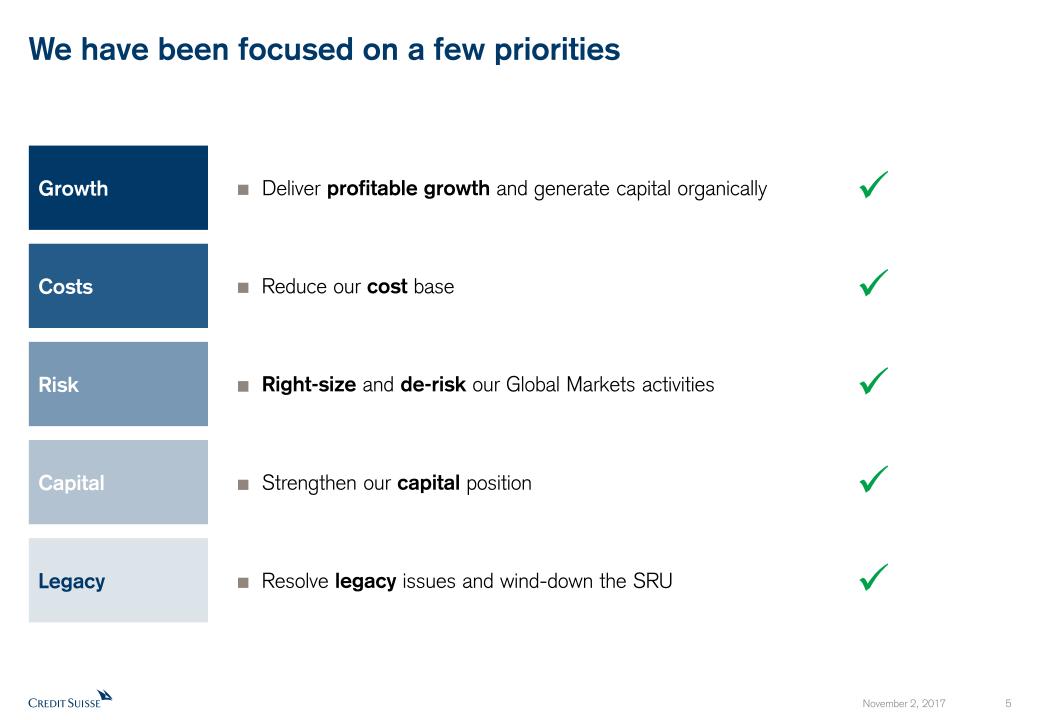
We have been focused on a few priorities Risk Costs Capital Reduce our cost base Right-size and de-risk our Global Markets activities Strengthen our capital position Legacy Resolve legacy issues and wind-down the SRU Growth Deliver profitable growth and generate capital organically
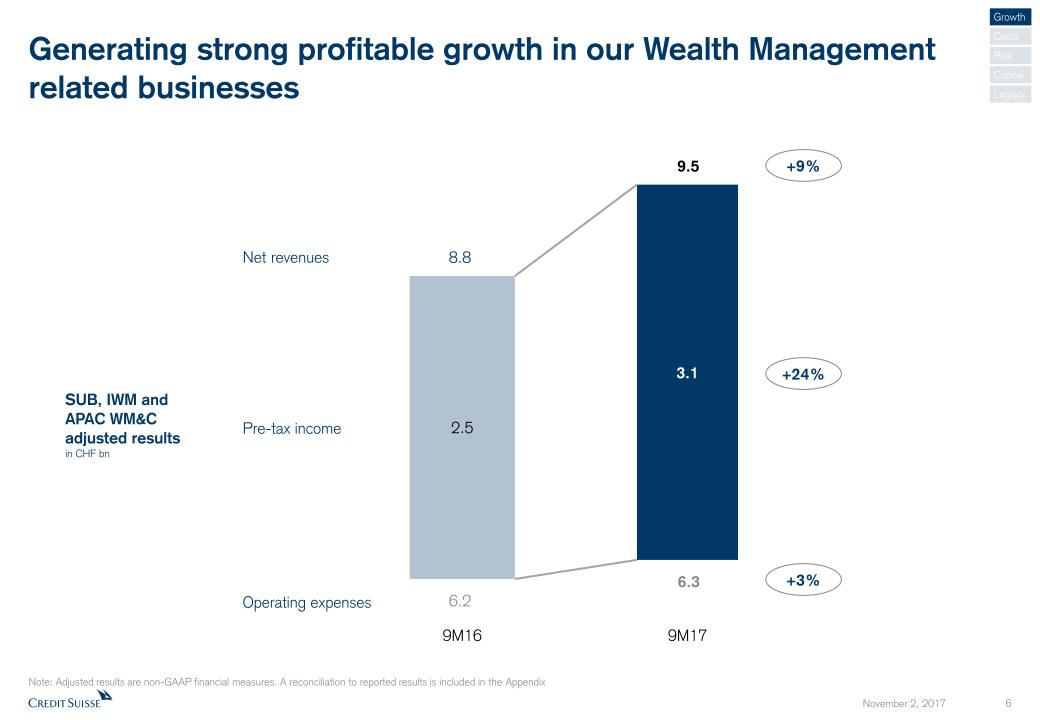
2.5 3.1 Generating strong profitable growth in our Wealth Management related businesses Note: Adjusted results are non-GAAP financial measures. A reconciliation to reported results is included in the Appendix SUB, IWM andAPAC WM&Cadjusted resultsin CHF bn 9M16 Net revenues Operating expenses Pre-tax income 9M17 Growth Costs Risk Legacy Capital 9.5 +3% +24% +9%
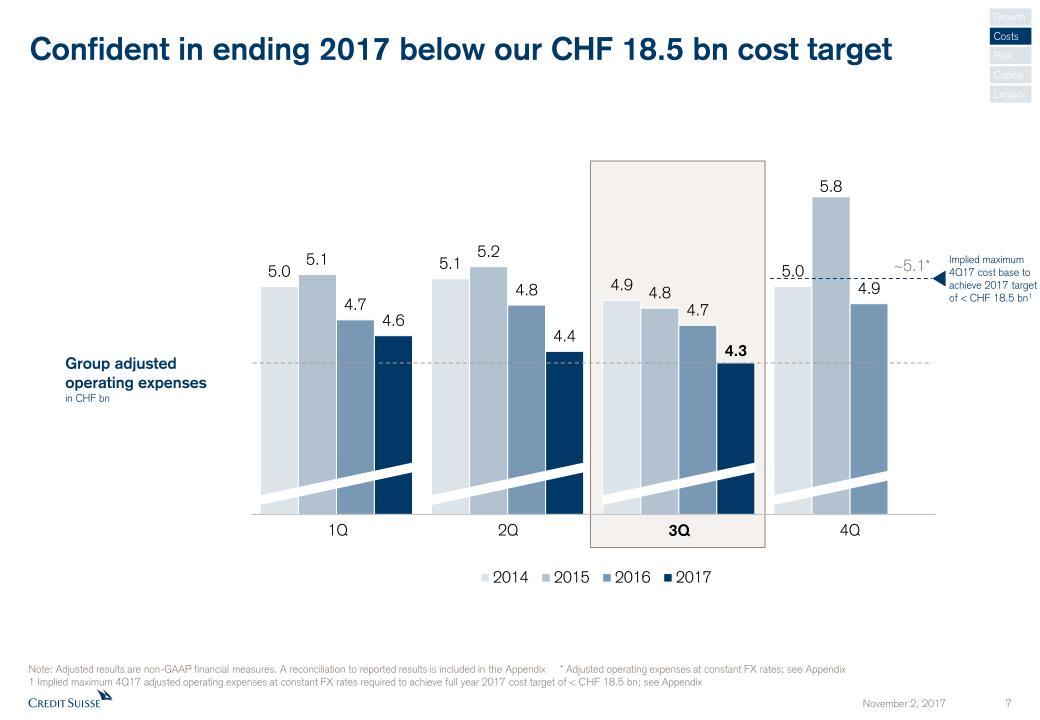
Confident in ending 2017 below our CHF 18.5 bn cost target Note: Adjusted results are non-GAAP financial measures. A reconciliation to reported results is included in the Appendix * Adjusted operating expenses at constant FX rates; see Appendix1 Implied maximum 4Q17 adjusted operating expenses at constant FX rates required to achieve full year 2017 cost target of < CHF 18.5 bn; see Appendix Group adjustedoperating expensesin CHF bn 1Q 2Q 3Q 4Q Implied maximum 4Q17 cost base to achieve 2017 target of < CHF 18.5 bn1 ~5.1* Growth Costs Risk Legacy Capital
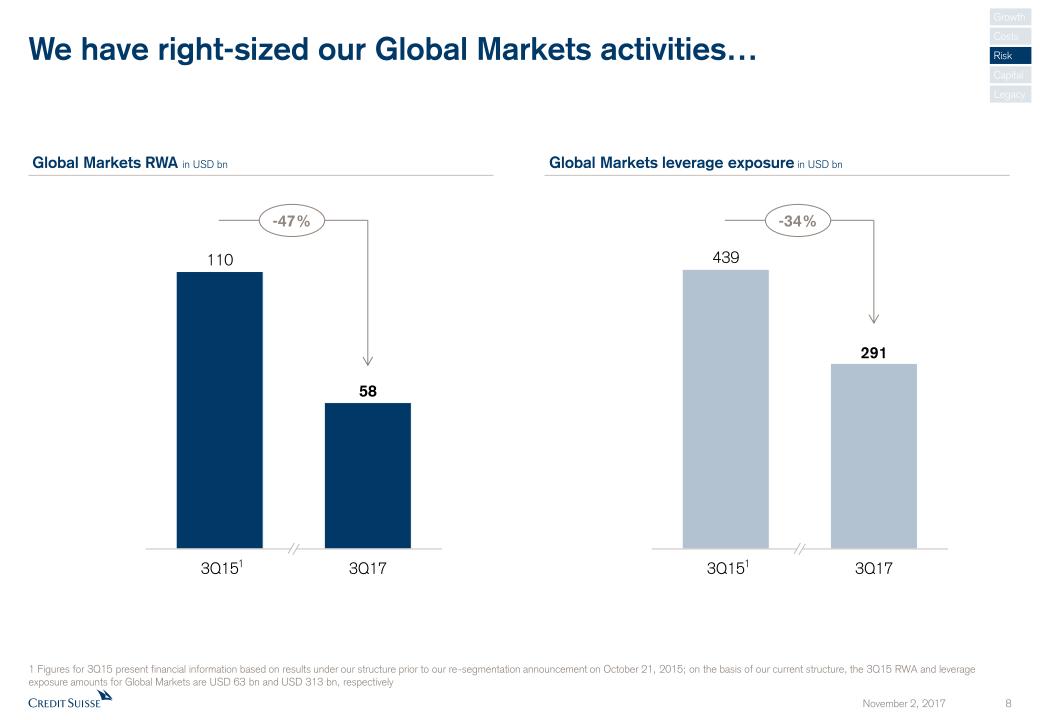
We have right-sized our Global Markets activities… Global Markets leverage exposure in USD bn 1 Figures for 3Q15 present financial information based on results under our structure prior to our re-segmentation announcement on October 21, 2015; on the basis of our current structure, the 3Q15 RWA and leverage exposure amounts for Global Markets are USD 63 bn and USD 313 bn, respectively ��Global Markets RWA in USD bn -47% 1 Growth Costs Risk Legacy Capital -34% 1
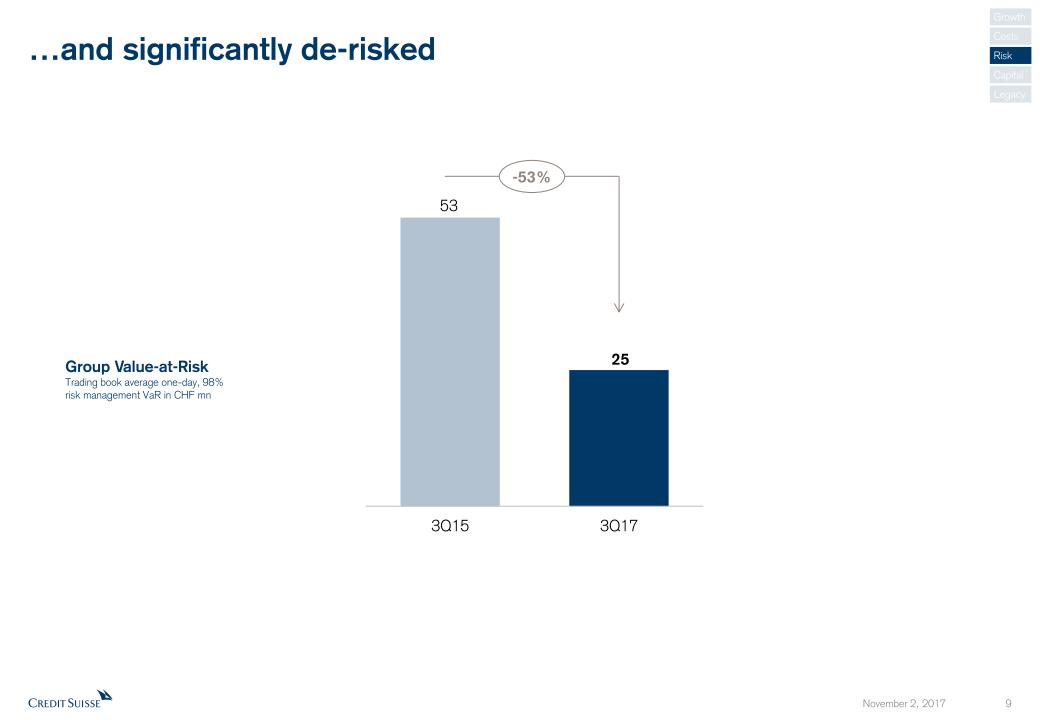
…and significantly de-risked -53% Growth Costs Risk Legacy Capital Group Value-at-RiskTrading book average one-day, 98%risk management VaR in CHF mn
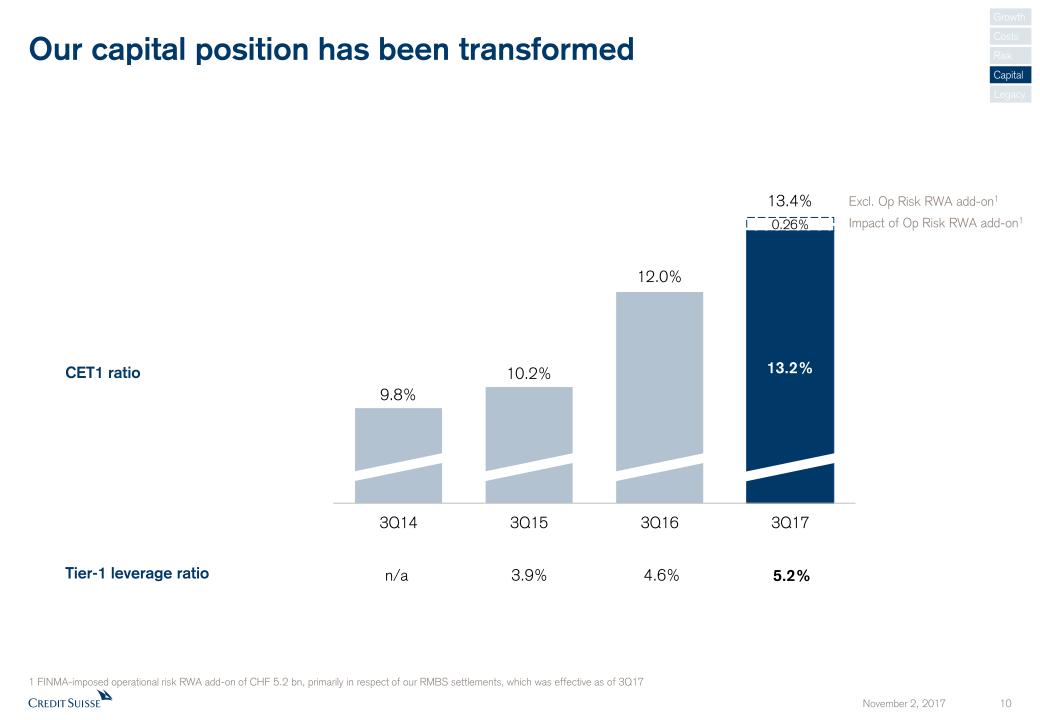
Our capital position has been transformed CET1 ratio 3.9% Tier-1 leverage ratio 4.6% 5.2% n/a 13.4% Impact of Op Risk RWA add-on1 Excl. Op Risk RWA add-on1 1 FINMA-imposed operational risk RWA add-on of CHF 5.2 bn, primarily in respect of our RMBS settlements, which was effective as of 3Q17 Growth Costs Risk Legacy Capital
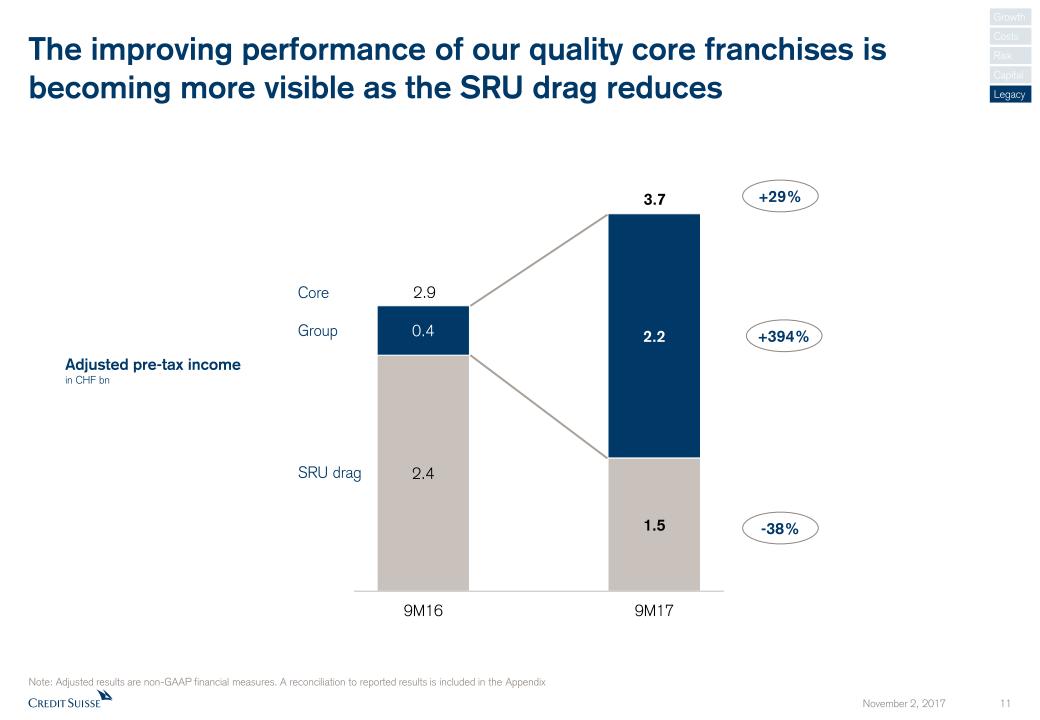
The improving performance of our quality core franchises is becoming more visible as the SRU drag reduces Note: Adjusted results are non-GAAP financial measures. A reconciliation to reported results is included in the Appendix Adjusted pre-tax incomein CHF bn Core SRU drag Group +29% -38% 3.7 2.9 +394% Growth Costs Risk Legacy Capital
Delivering profitable growth across Wealth ManagementWealth Management highlightsDivisional updates: SUB, IWM, APAC, GM and IBCMOn track to exceed 2017 target cost savings and accelerating wind-down of SRUCost savingsSRU wind-downMaintaining strong capital position Update on 3Q17 operating performance 1 2 3
Our approach to Wealth Management Allocating more capital to Wealth ManagementFocusing on UHNWI and entrepreneursBalanced approach between Mature and Emerging MarketsOffering an integrated approach, combining wealth and asset management and investmentbanking – highly valued by our clientsDeveloping advisory and investment solutions for our clients – growing our base of recurring feesFocusing on strong controls to generate quality and compliant growth
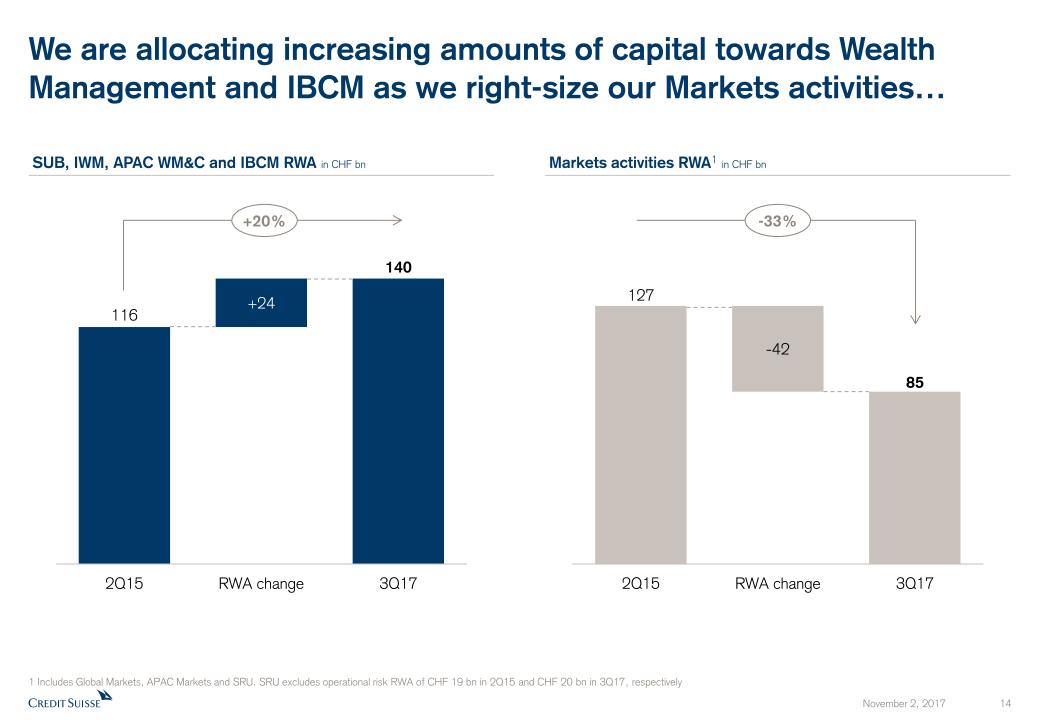
We are allocating increasing amounts of capital towards Wealth Management and IBCM as we right-size our Markets activities… 1 Includes Global Markets, APAC Markets and SRU. SRU excludes operational risk RWA of CHF 19 bn in 2Q15 and CHF 20 bn in 3Q17, respectively SUB, IWM, APAC WM&C and IBCM RWA in CHF bn Markets activities RWA1 in CHF bn -33% +20%
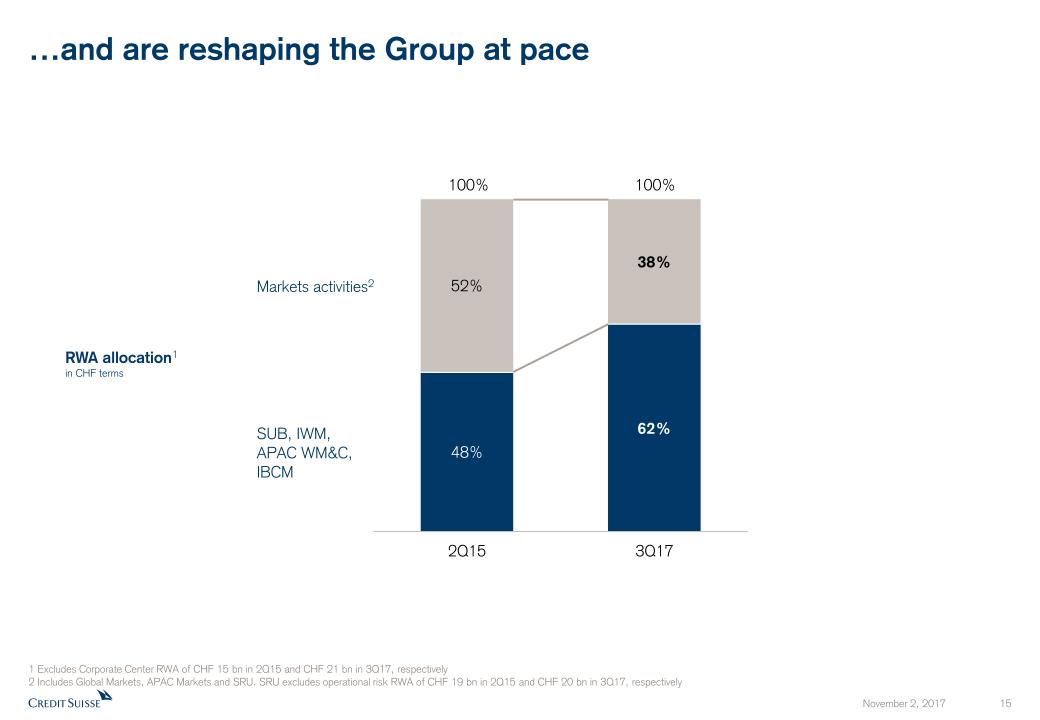
…and are reshaping the Group at pace 1 Excludes Corporate Center RWA of CHF 15 bn in 2Q15 and CHF 21 bn in 3Q17, respectively 2 Includes Global Markets, APAC Markets and SRU. SRU excludes operational risk RWA of CHF 19 bn in 2Q15 and CHF 20 bn in 3Q17, respectively SUB, IWM, APAC WM&C, IBCM Markets activities2 RWA allocation1in CHF terms 100% 100%
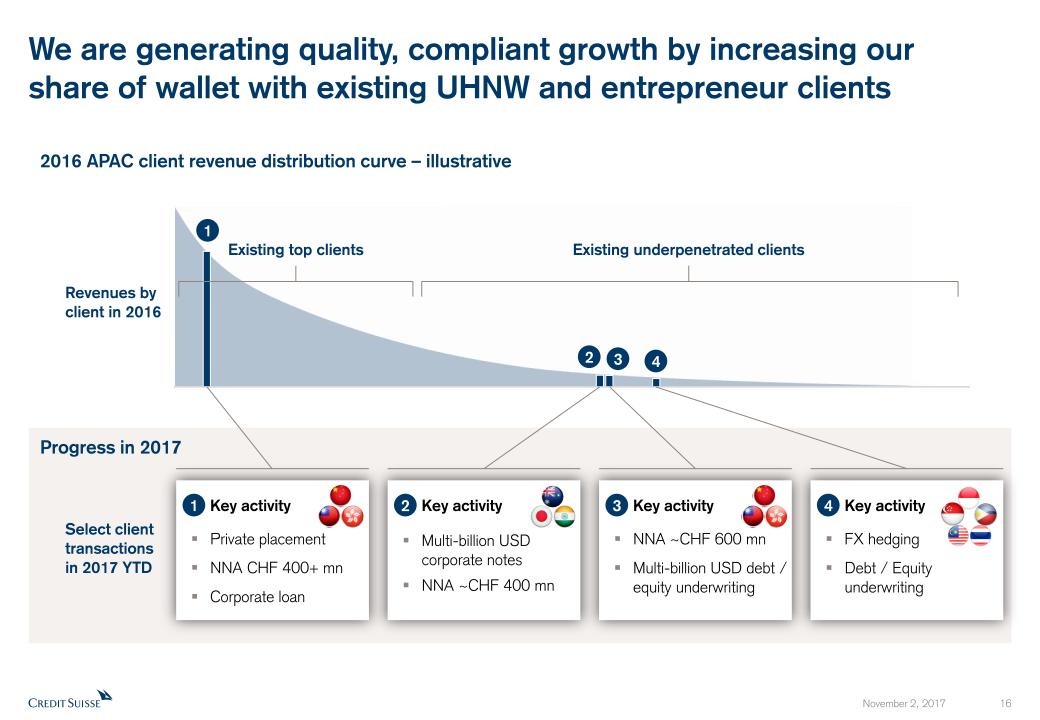
Progress in 2017 2016 APAC client revenue distribution curve – illustrative 2 3 4 Revenues by client in 2016 Select client transactionsin 2017 YTD Key activityMulti-billion USD corporate notesNNA ~CHF 400 mn We are generating quality, compliant growth by increasing ourshare of wallet with existing UHNW and entrepreneur clients Existing underpenetrated clients Existing top clients Key activityFX hedgingDebt / Equity underwriting Key activityNNA ~CHF 600 mnMulti-billion USD debt / equity underwriting 1 Key activityPrivate placementNNA CHF 400+ mnCorporate loan 1 2 3 4
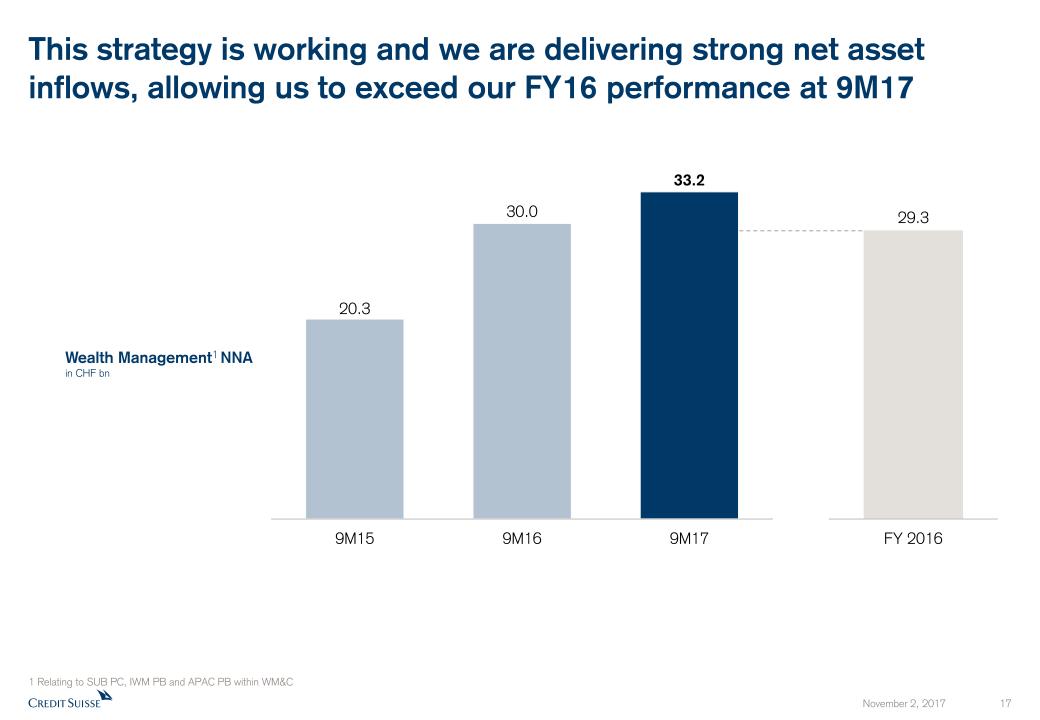
This strategy is working and we are delivering strong net asset inflows, allowing us to exceed our FY16 performance at 9M17 Wealth Management1 NNAin CHF bn 1 Relating to SUB PC, IWM PB and APAC PB within WM&C
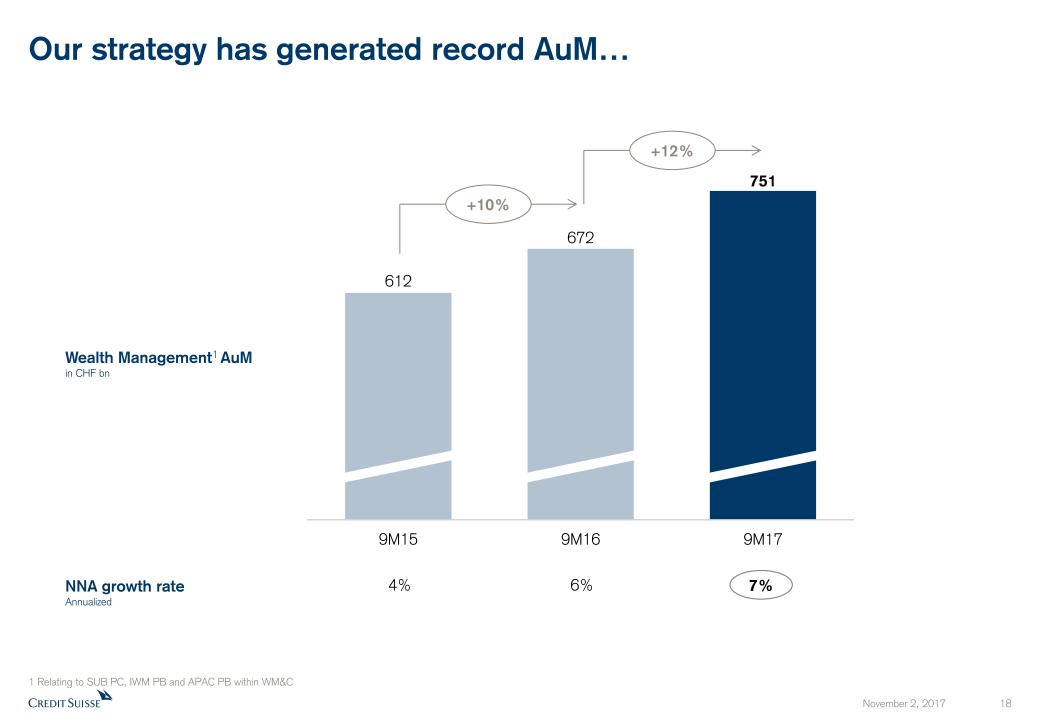
Our strategy has generated record AuM… 1 Relating to SUB PC, IWM PB and APAC PB within WM&C Wealth Management1 AuMin CHF bn NNA growth rateAnnualized 4% 7% 6% +12% +10%
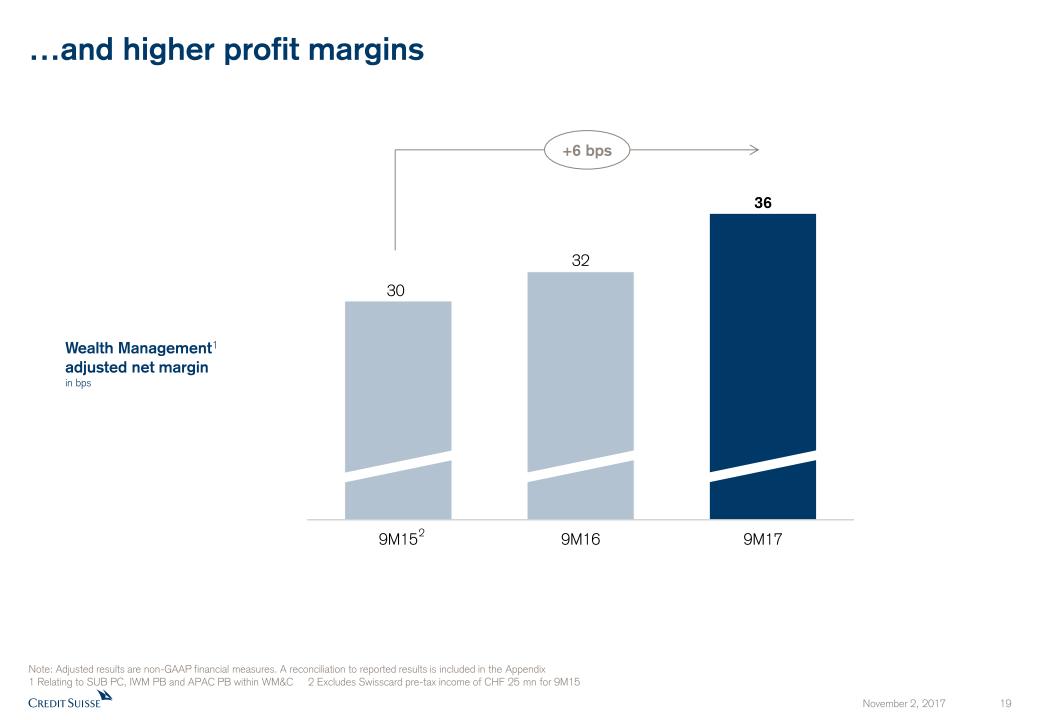
…and higher profit margins Note: Adjusted results are non-GAAP financial measures. A reconciliation to reported results is included in the Appendix1 Relating to SUB PC, IWM PB and APAC PB within WM&C 2 Excludes Swisscard pre-tax income of CHF 25 mn for 9M15 Wealth Management1adjusted net marginin bps +6 bps 2
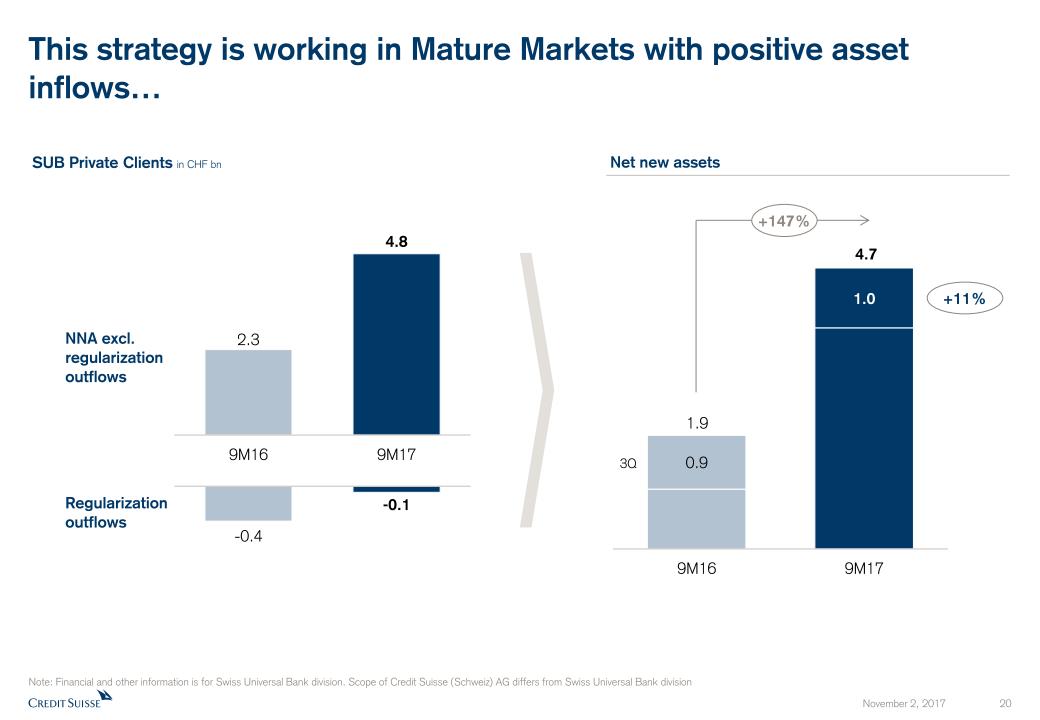
Net new assets Note: Financial and other information is for Swiss Universal Bank division. Scope of Credit Suisse (Schweiz) AG differs from Swiss Universal Bank division NNA excl. regularization outflows Regularization outflows +147% 1.9 4.7 3Q SUB Private Clients in CHF bn +11% This strategy is working in Mature Markets with positive asset inflows…
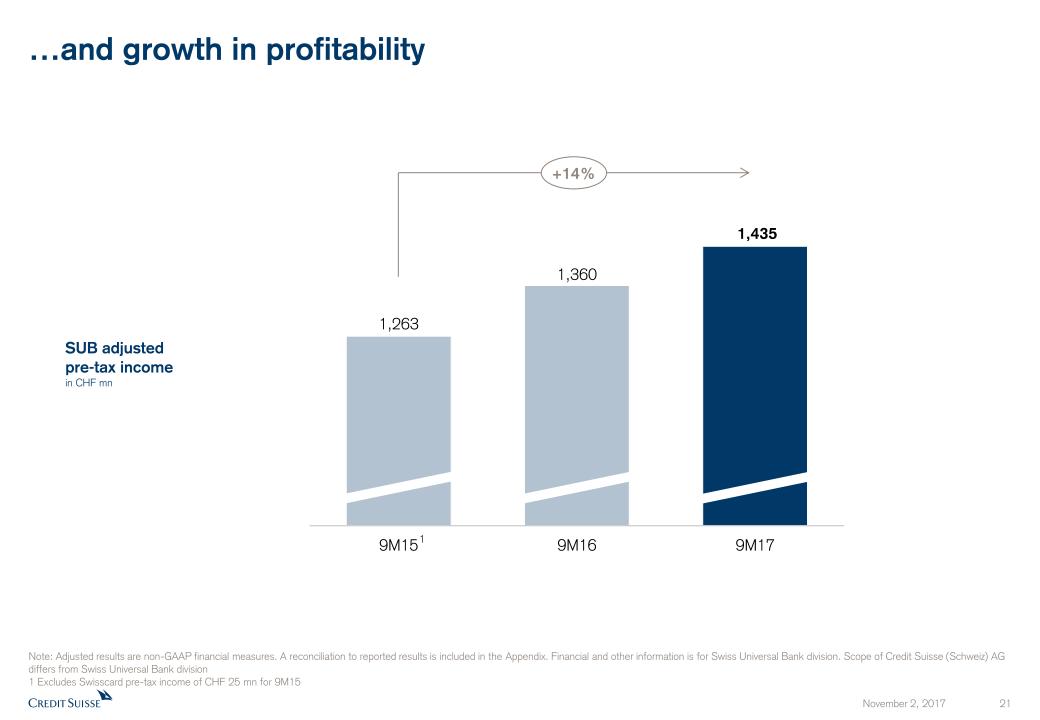
…and growth in profitability +14% SUB adjustedpre-tax incomein CHF mn Note: Adjusted results are non-GAAP financial measures. A reconciliation to reported results is included in the Appendix. Financial and other information is for Swiss Universal Bank division. Scope of Credit Suisse (Schweiz) AG differs from Swiss Universal Bank division1 Excludes Swisscard pre-tax income of CHF 25 mn for 9M15 1
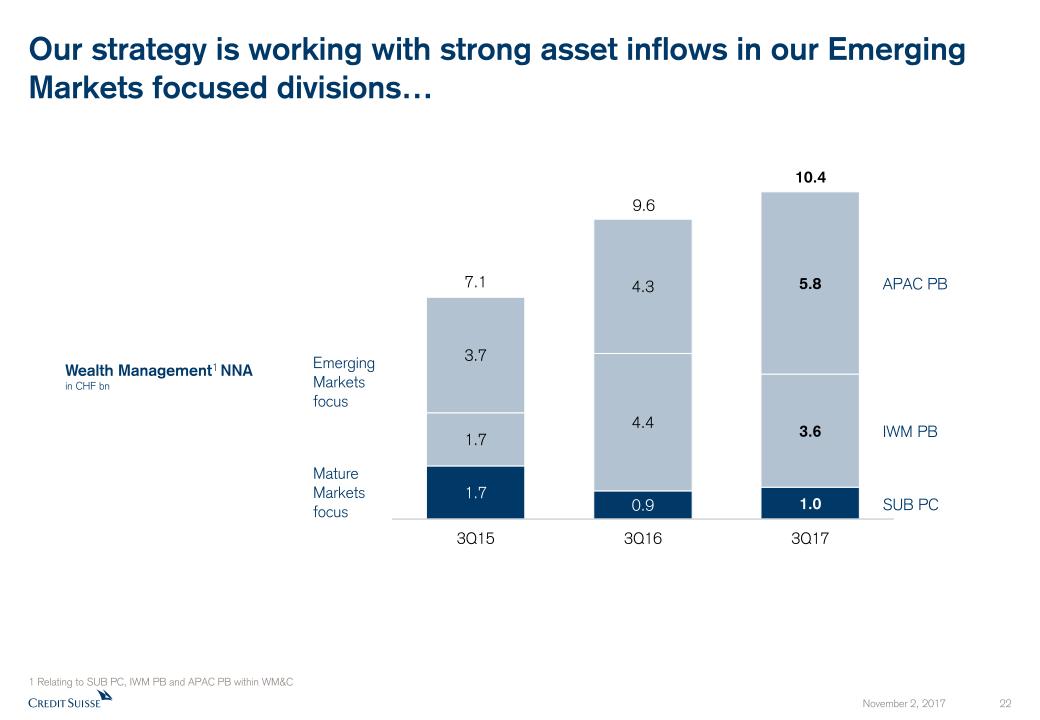
Our strategy is working with strong asset inflows in our Emerging Markets focused divisions… Wealth Management1 NNAin CHF bn 1 Relating to SUB PC, IWM PB and APAC PB within WM&C 10.4 SUB PC IWM PB APAC PB 9.6 7.1 Mature Markets focus Emerging Markets focus
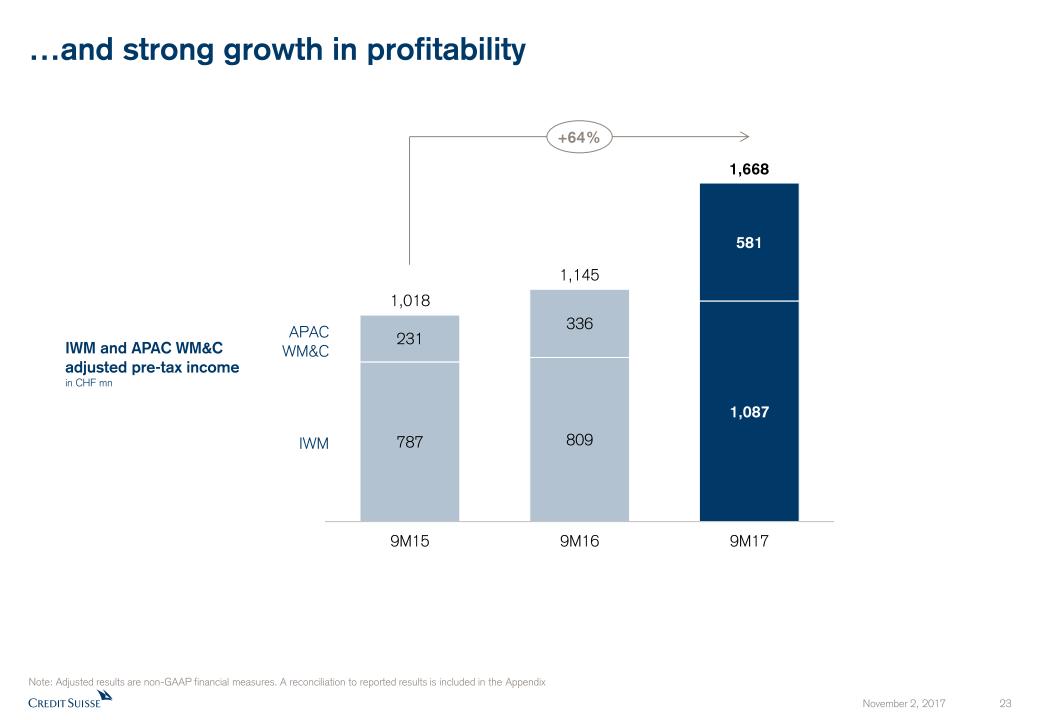
…and strong growth in profitability IWM and APAC WM&C adjusted pre-tax incomein CHF mn 1,668 APAC WM&C IWM 1,018 1,145 Note: Adjusted results are non-GAAP financial measures. A reconciliation to reported results is included in the Appendix +64%

IWM is delivering strong revenue growth, driven by higher recurring income… 1 Includes other revenues of CHF (5) mn in 9M16 and CHF 1 mn in 9M17, respectively 3,3991 3,7471 +10% IWM net revenuesin CHF mn +7% +11% +12% Recurring commissions & fees Net interestincome Transaction- and performance-based
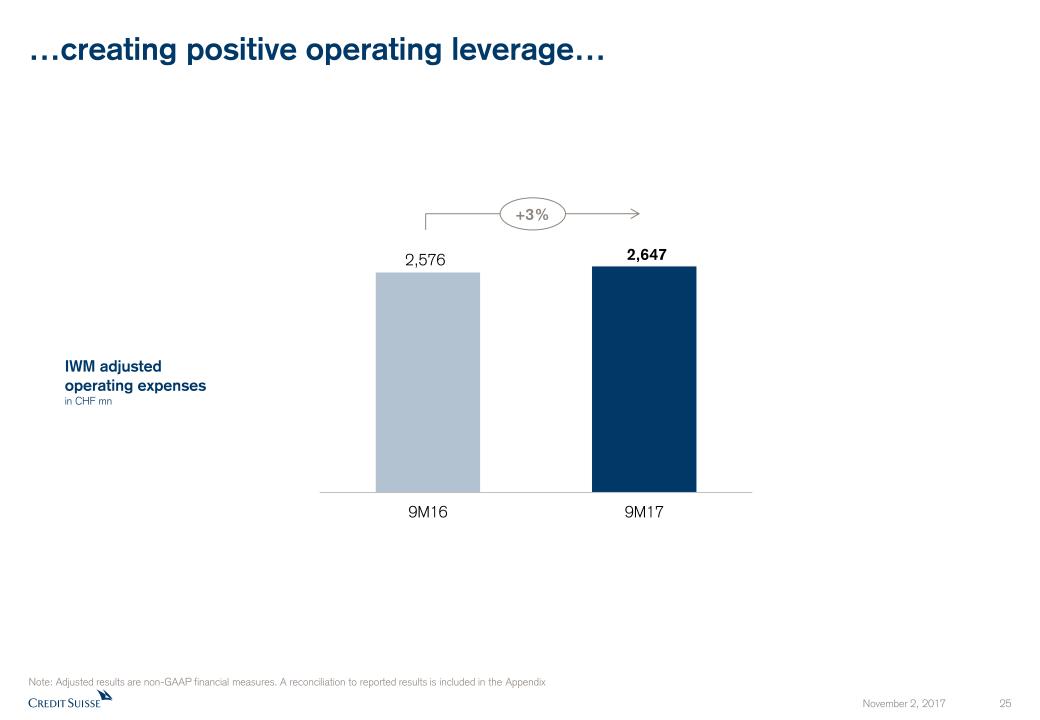
…creating positive operating leverage… Note: Adjusted results are non-GAAP financial measures. A reconciliation to reported results is included in the Appendix IWM adjustedoperating expensesin CHF mn +3%
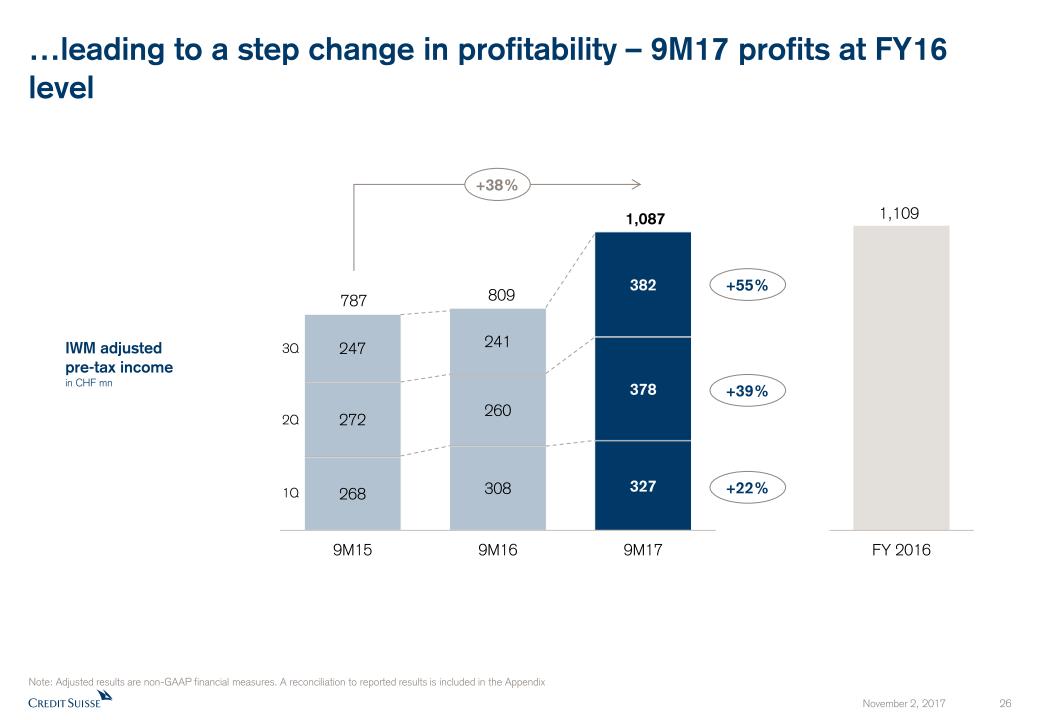
…leading to a step change in profitability – 9M17 profits at FY16 level 1,087 809 1Q 2Q 3Q 787 IWM adjustedpre-tax incomein CHF mn Note: Adjusted results are non-GAAP financial measures. A reconciliation to reported results is included in the Appendix +55% +22% +39% +38% 1,109
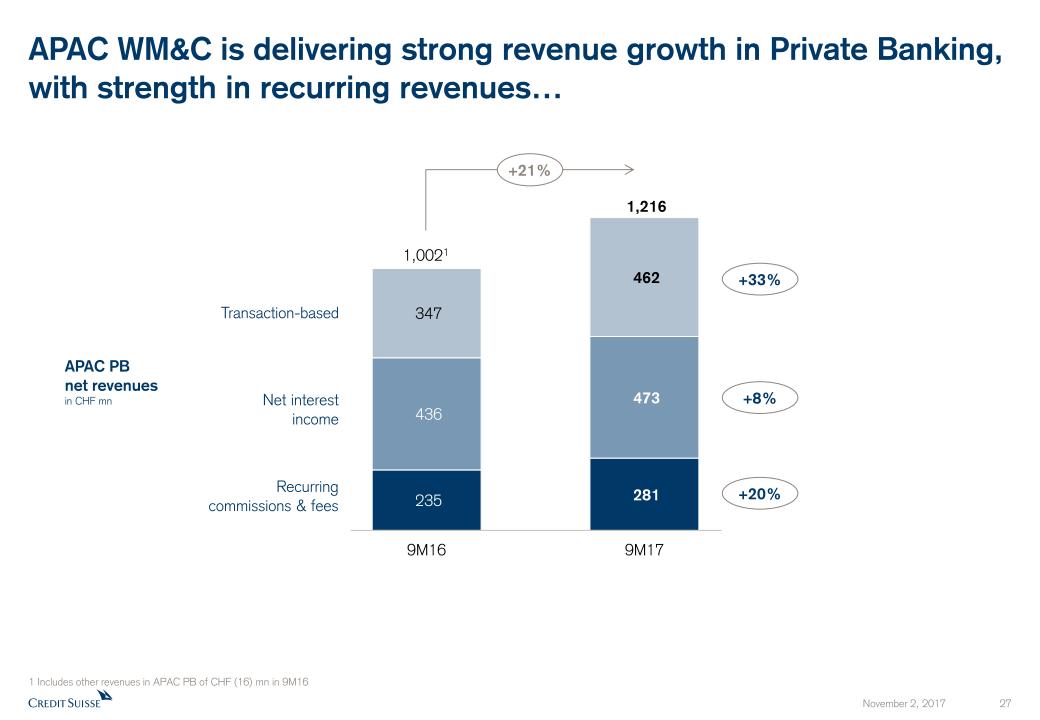
APAC WM&C is delivering strong revenue growth in Private Banking, with strength in recurring revenues… 1 Includes other revenues in APAC PB of CHF (16) mn in 9M16 1,0021 1,216 +21% Recurringcommissions & fees APAC PBnet revenuesin CHF mn Net interest income Transaction-based +33% +20% +8%
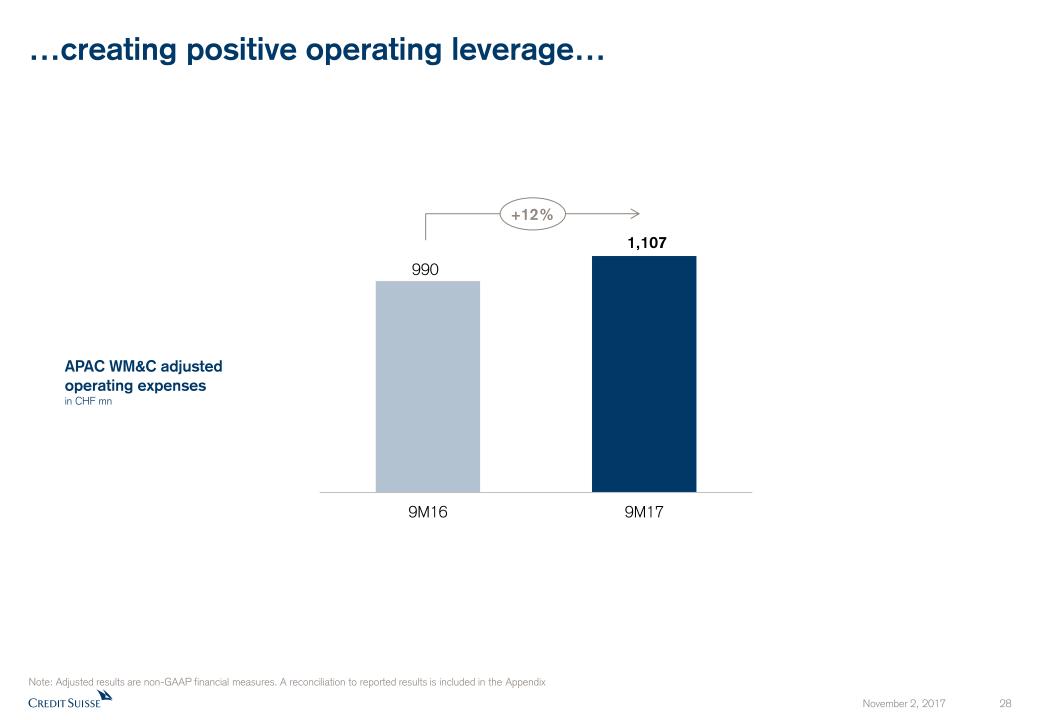
…creating positive operating leverage… Note: Adjusted results are non-GAAP financial measures. A reconciliation to reported results is included in the Appendix APAC WM&C adjustedoperating expensesin CHF mn +12%
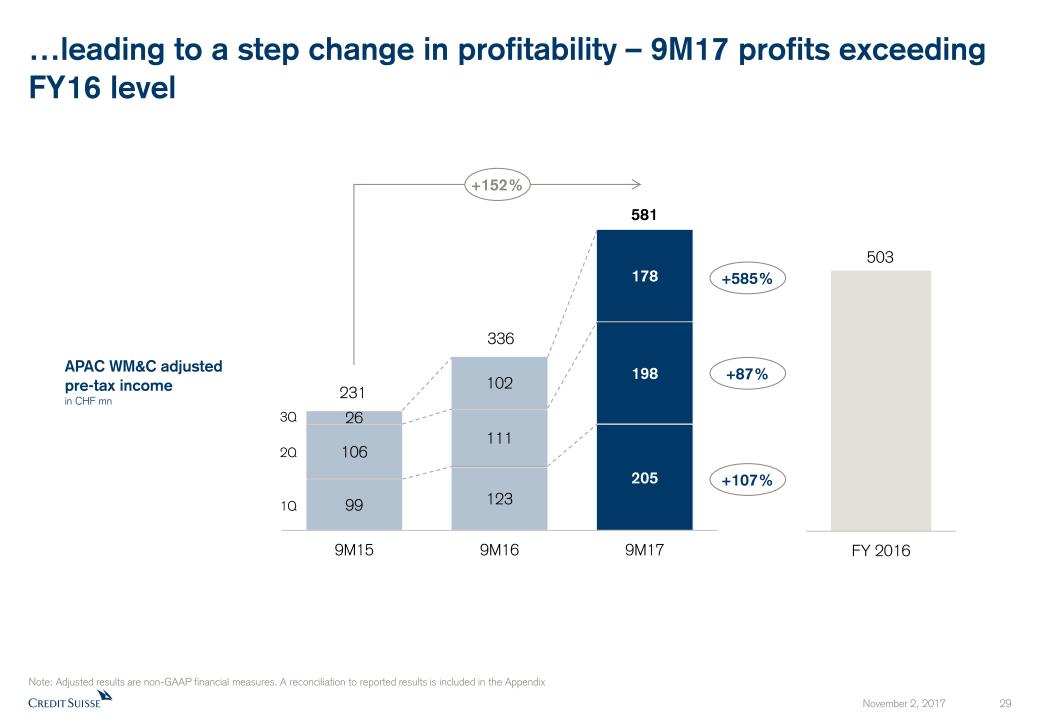
…leading to a step change in profitability – 9M17 profits exceeding FY16 level Note: Adjusted results are non-GAAP financial measures. A reconciliation to reported results is included in the Appendix APAC WM&C adjustedpre-tax incomein CHF mn 581 336 1Q 2Q 3Q 231 +585% +107% +87% 503 +152%
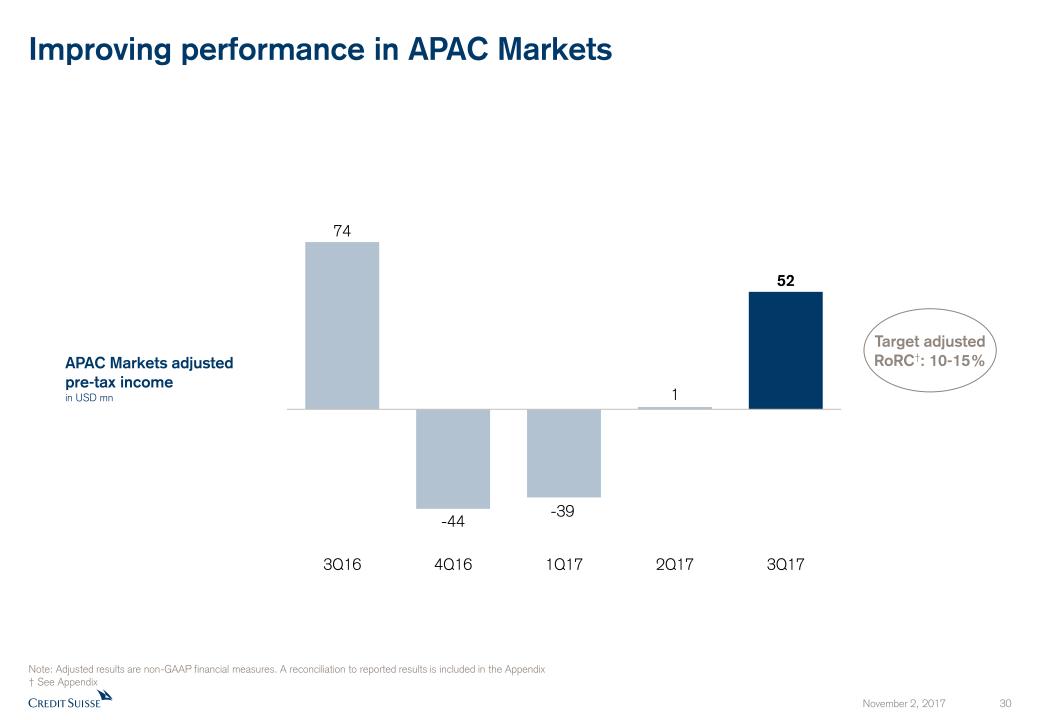
Improving performance in APAC Markets APAC Markets adjusted pre-tax income in USD mn Note: Adjusted results are non-GAAP financial measures. A reconciliation to reported results is included in the Appendix† See Appendix Target adjusted RoRC†: 10-15%
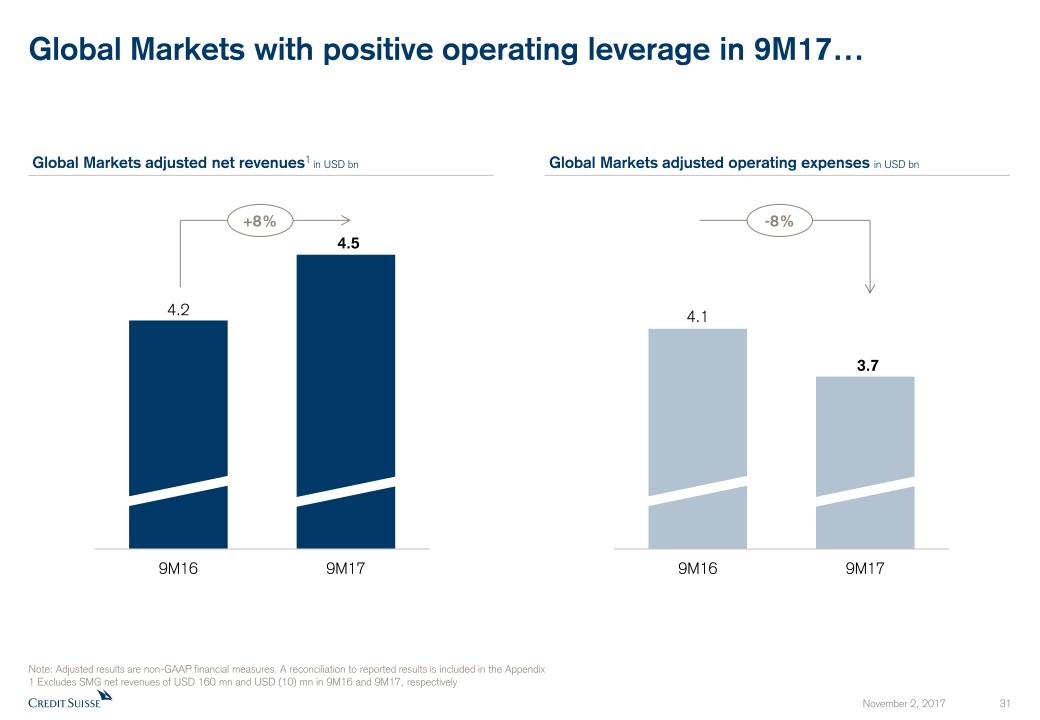
Global Markets with positive operating leverage in 9M17… Global Markets adjusted operating expenses in USD bn Global Markets adjusted net revenues1 in USD bn +8% -8% Note: Adjusted results are non-GAAP financial measures. A reconciliation to reported results is included in the Appendix1 Excludes SMG net revenues of USD 160 mn and USD (10) mn in 9M16 and 9M17, respectively
…with 3Q17 performance impacted by seasonality, resilient performance in Fixed Income and rebound in Equities Performance impacted by seasonality and low volatility environmentEquities1 revenues increased 5%, Fixed Income1 revenues down 8% YoYContinued cost discipline, on track for full-year 2018 operating cost base of < USD 4.8 bnOn track to achieve full-year 2018 net revenues of > USD 6.0 bn 1 Includes sales and trading and underwriting, based on USD figures
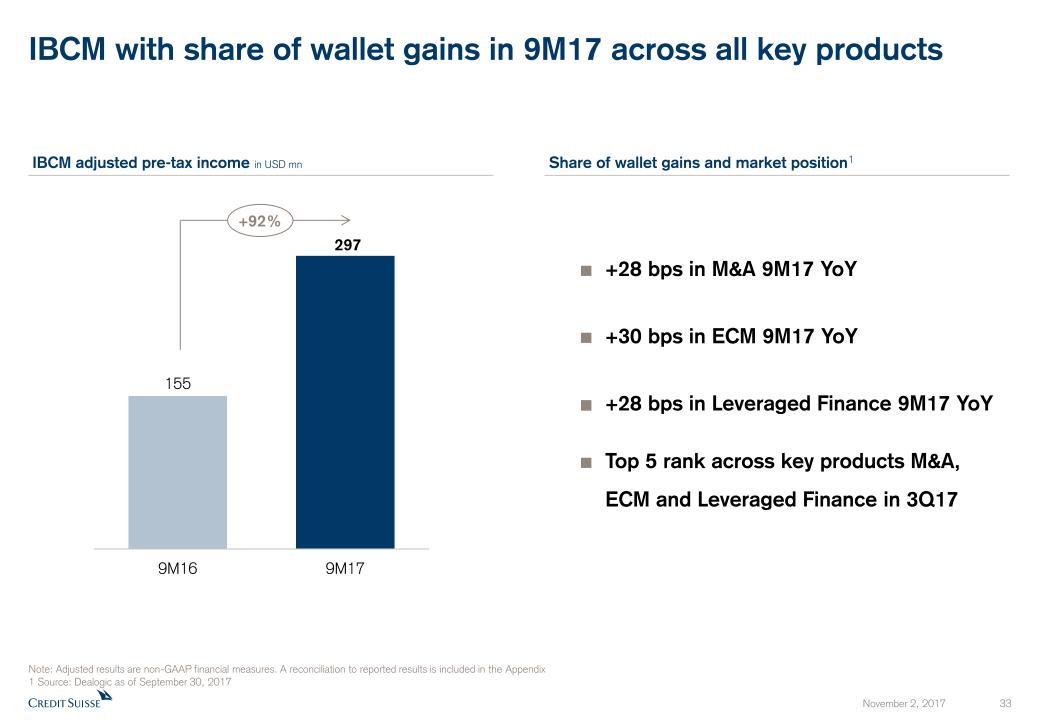
Share of wallet gains and market position1 IBCM adjusted pre-tax income in USD mn Note: Adjusted results are non-GAAP financial measures. A reconciliation to reported results is included in the Appendix1 Source: Dealogic as of September 30, 2017 IBCM with share of wallet gains in 9M17 across all key products +28 bps in M&A 9M17 YoY+30 bps in ECM 9M17 YoY+28 bps in Leveraged Finance 9M17 YoYTop 5 rank across key products M&A, ECM and Leveraged Finance in 3Q17 +92%
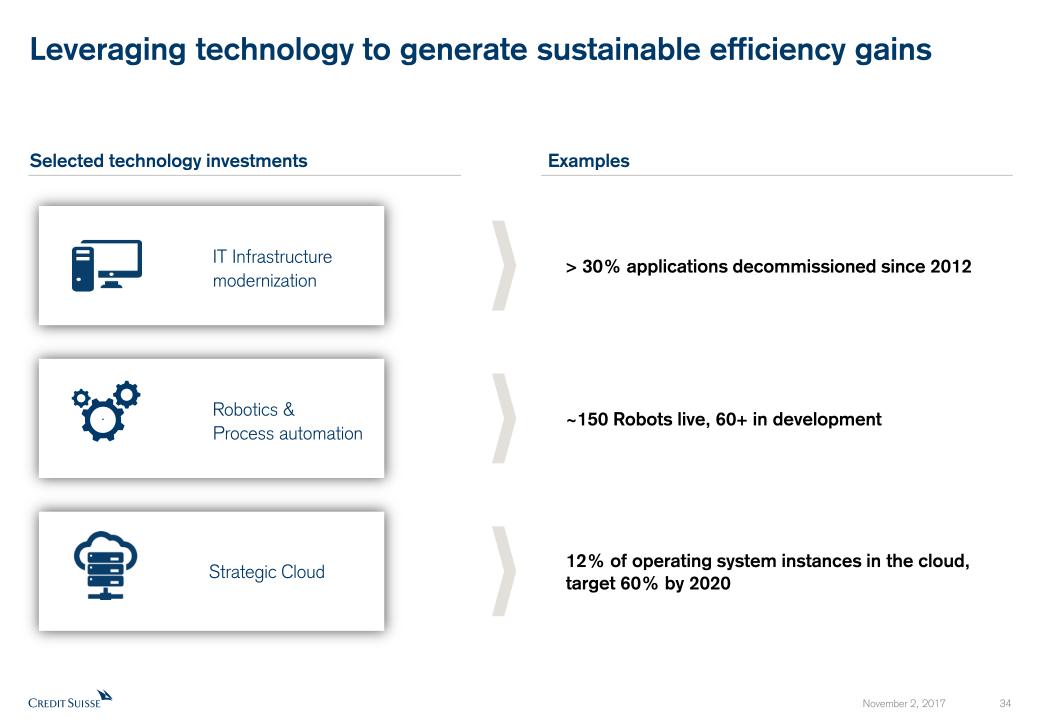
Strategic Cloud Robotics & Process automation IT Infrastructure modernization Leveraging technology to generate sustainable efficiency gains > 30% applications decommissioned since 2012 Examples 12% of operating system instances in the cloud, target 60% by 2020 Selected technology investments ~150 Robots live, 60+ in development
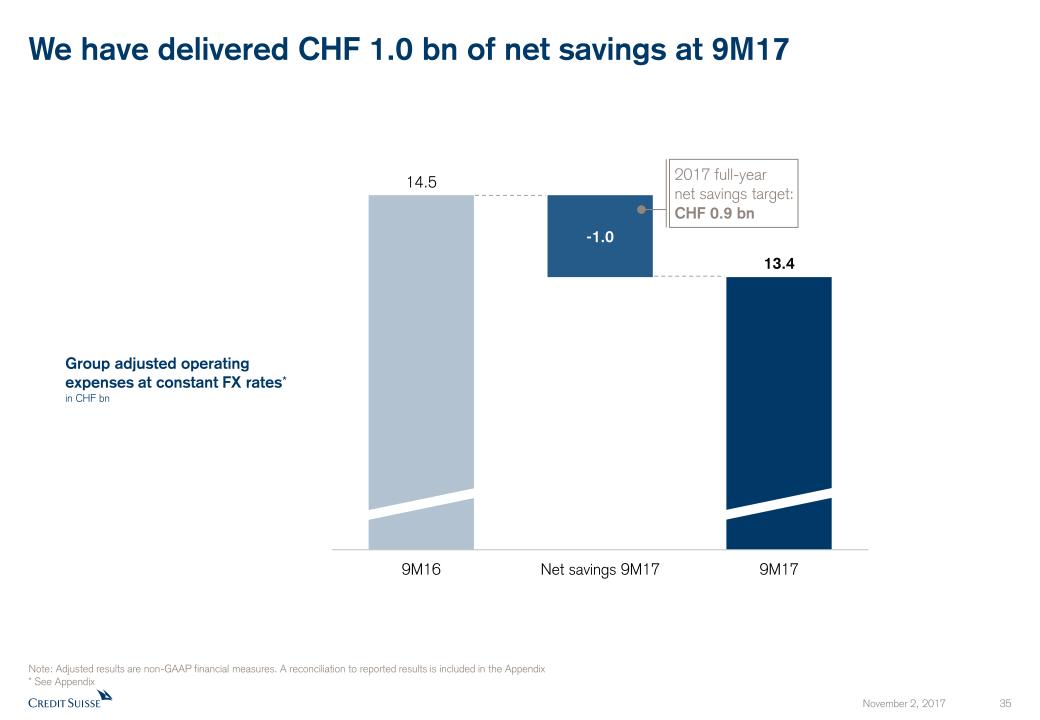
Group adjusted operating expenses at constant FX rates*in CHF bn Note: Adjusted results are non-GAAP financial measures. A reconciliation to reported results is included in the Appendix* See Appendix We have delivered CHF 1.0 bn of net savings at 9M17 2017 full-yearnet savings target:CHF 0.9 bn
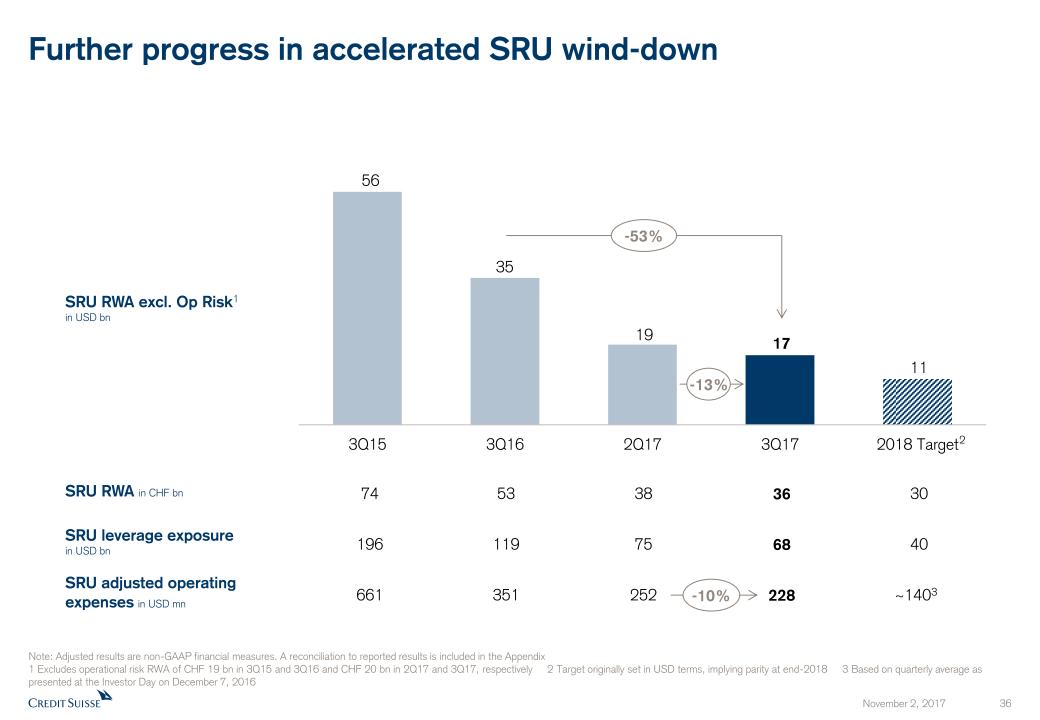
SRU RWA excl. Op Risk1in USD bn Further progress in accelerated SRU wind-down Note: Adjusted results are non-GAAP financial measures. A reconciliation to reported results is included in the Appendix1 Excludes operational risk RWA of CHF 19 bn in 3Q15 and 3Q16 and CHF 20 bn in 2Q17 and 3Q17, respectively 2 Target originally set in USD terms, implying parity at end-2018 3 Based on quarterly average as presented at the Investor Day on December 7, 2016 -53% SRU leverage exposurein USD bn 68 40 SRU adjusted operating expenses in USD mn 228 ~1403 75 SRU RWA in CHF bn 36 38 30 252 196 74 661 119 53 351 2 -13% -10%
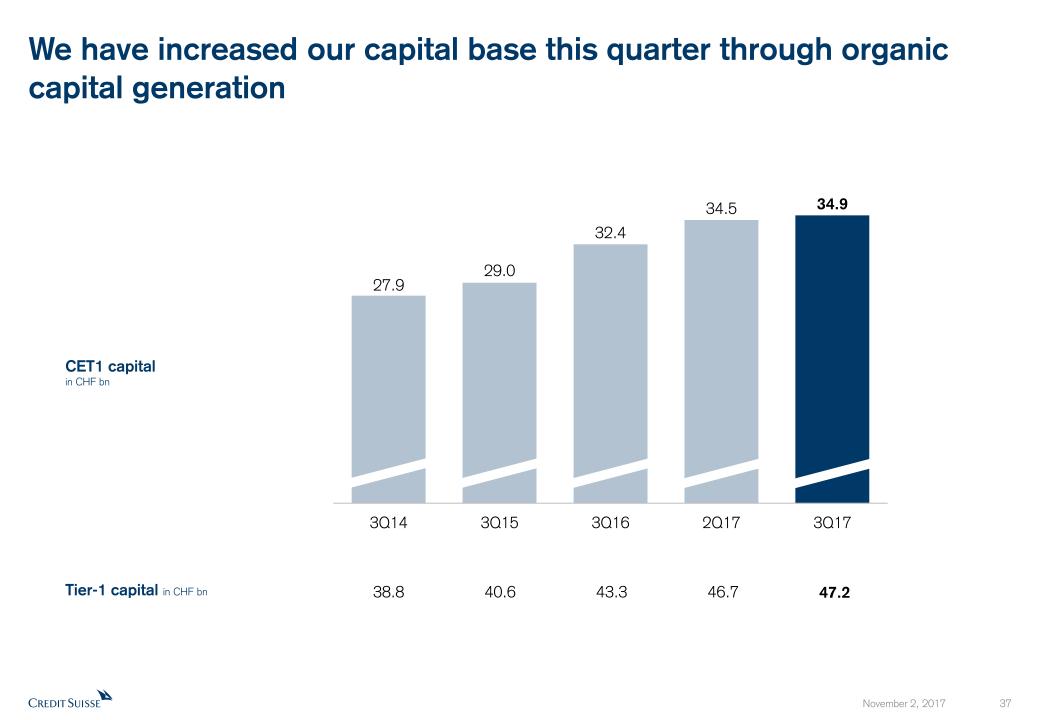
We have increased our capital base this quarter through organic capital generation CET1 capital in CHF bn 40.6 Tier-1 capital in CHF bn 43.3 47.2 38.8 46.7
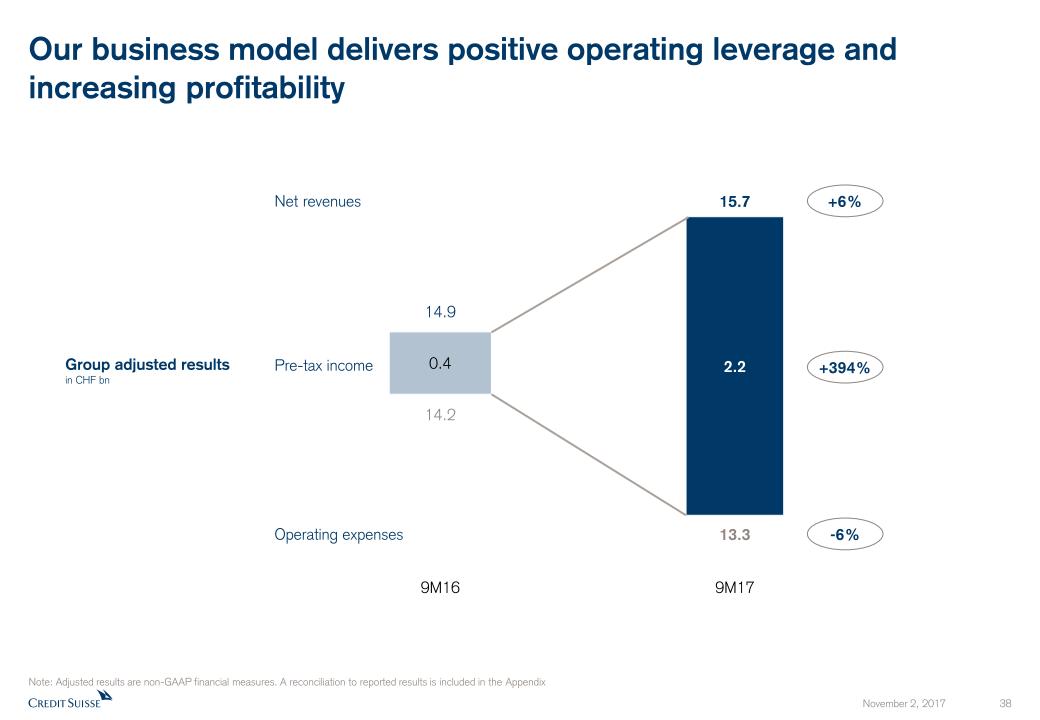
2.2 0.4 Our business model delivers positive operating leverage and increasing profitability Note: Adjusted results are non-GAAP financial measures. A reconciliation to reported results is included in the Appendix Net revenues Operating expenses Pre-tax income Group adjusted resultsin CHF bn 15.7 14.9 14.2 13.3 9M16 9M17 -6% +394% +6%
Summary Delivering profitable growth across Wealth ManagementOn track to exceed 2017 target cost savings and accelerating wind-down of SRUMaintaining strong capital position
Detailed Financials November 02, 2017
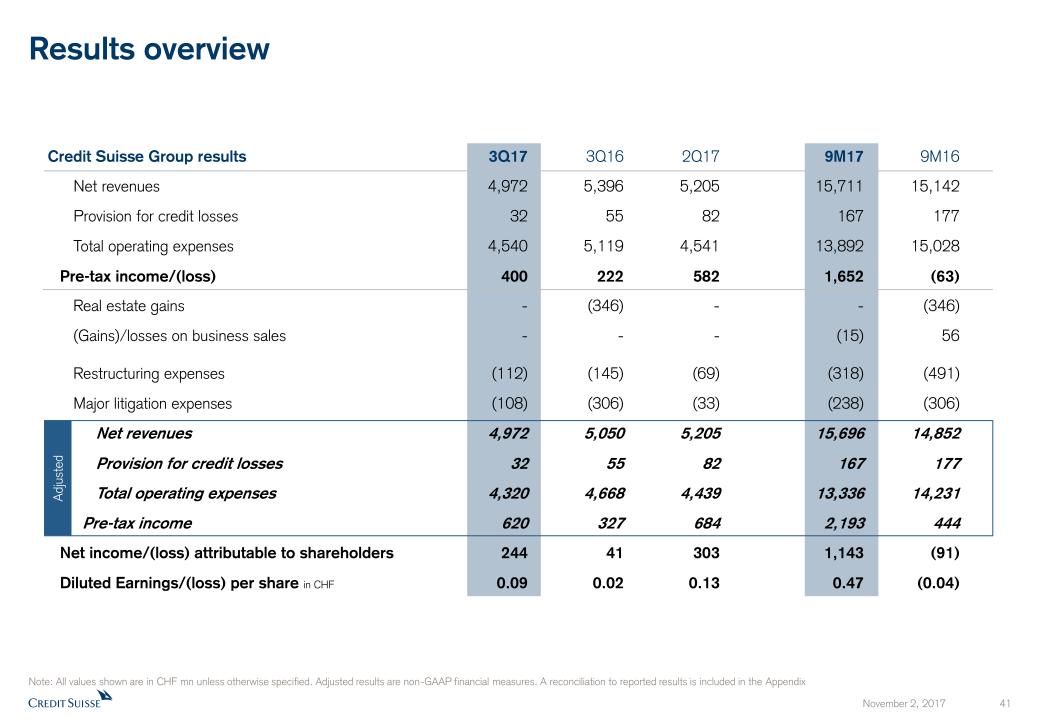
Results overview Adjusted Credit Suisse Group results 3Q17 3Q16 2Q17 9M17 9M16 Net revenues 4,972 5,396 5,205 15,711 15,142 Provision for credit losses 32 55 82 167 177 Total operating expenses 4,540 5,119 4,541 13,892 15,028Pre-tax income/(loss) 400 222 582 1,652 (63) Real estate gains - (346) - - (346) (Gains)/losses on business sales - - - (15) 56 Restructuring expenses (112) (145) (69) (318) (491) Major litigation expenses (108) (306) (33) (238) (306) Net revenues 4,972 5,050 5,205 15,696 14,852 Provision for credit losses 32 55 82 167 177 Total operating expenses 4,320 4,668 4,439 13,336 14,231 Pre-tax income 620 327 684 2,193 444Net income/(loss) attributable to shareholders 244 41 303 1,143 (91)Diluted Earnings/(loss) per share in CHF 0.09 0.02 0.13 0.47 (0.04) Note: All values shown are in CHF mn unless otherwise specified. Adjusted results are non-GAAP financial measures. A reconciliation to reported results is included in the Appendix
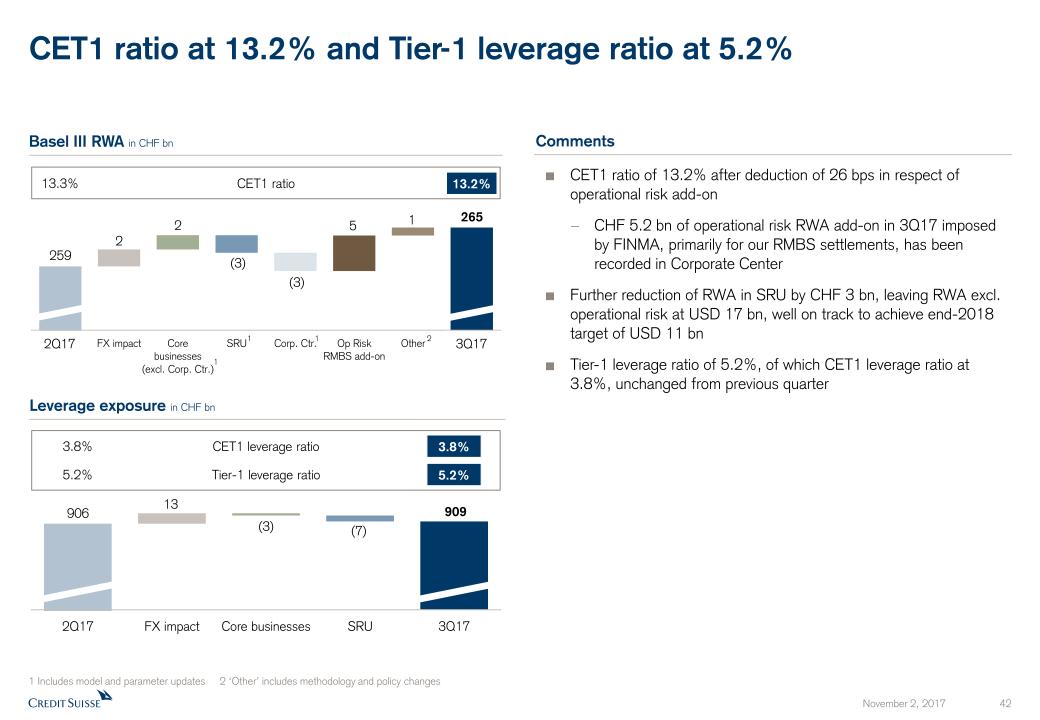
CET1 ratio at 13.2% and Tier-1 leverage ratio at 5.2% 1 Includes model and parameter updates 2 ‘Other’ includes methodology and policy changes Basel III RWA in CHF bn Comments Leverage exposure in CHF bn 13.2% CET1 ratio 3.8% 3.8% CET1 leverage ratio 5.2% 5.2% Tier-1 leverage ratio 1 1 CET1 ratio of 13.2% after deduction of 26 bps in respect of operational risk add-onCHF 5.2 bn of operational risk RWA add-on in 3Q17 imposed by FINMA, primarily for our RMBS settlements, has been recorded in Corporate CenterFurther reduction of RWA in SRU by CHF 3 bn, leaving RWA excl. operational risk at USD 17 bn, well on track to achieve end-2018 target of USD 11 bnTier-1 leverage ratio of 5.2%, of which CET1 leverage ratio at 3.8%, unchanged from previous quarter 2Q17 3Q17 2 1 13.3%

Achieved 9M17 net savings of CHF 1.0 bn;well on track to beat targeted reduction in cost base Note: Adjusted results are non-GAAP financial measures. A reconciliation to reported results is included in the Appendix* Adjusted operating expenses at constant FX rates; see Appendix Adjusted operating expenses at constant FX rates* in CHF bn Key messages Continued progress in cost reduction; 9M17 net savings mainly driven by decreased professional services costs and execution of workforce strategy9M17 net savings of CHF 1.0 bn with incremental 3Q17 savings of CHF 0.4 bn; ahead of schedule to deliver on the full year 2017 cost base target of < CHF 18.5 bn and net savings of > CHF 900 mn, notwithstanding headwinds in expected increase in regulatory-related expensesCommitted to delivering on our end-2018 target with adjusted cost base of < CHF 17.0 bn 21.2 19.4 (1.0) <17.0 <18.5 1H17: 0.63Q17: 0.4 (7)% 9M17 vs. 9M16
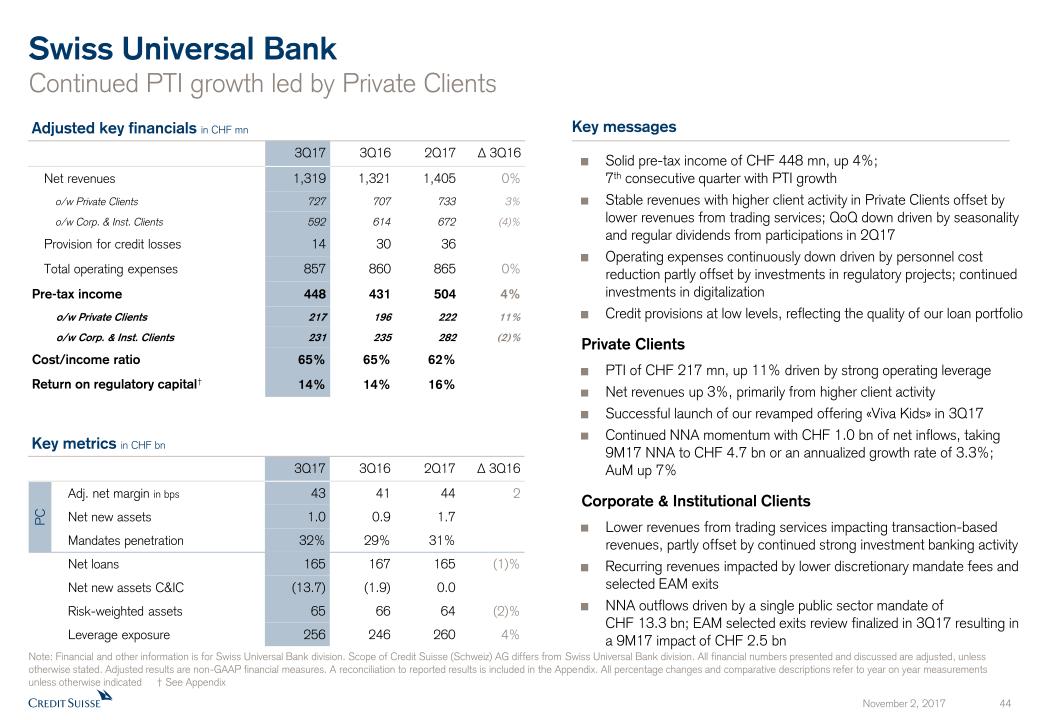
Swiss Universal Bank Continued PTI growth led by Private Clients Key messages PC Key metrics in CHF bn Adjusted key financials in CHF mn 3Q17 3Q16 2Q17 Δ 3Q16 Adj. net margin in bps 43 41 44 2 Net new assets 1.0 0.9 1.7 Mandates penetration 32% 29% 31% Net loans 165 167 165 (1)% Net new assets C&IC (13.7) (1.9) 0.0 Risk-weighted assets 65 66 64 (2)% Leverage exposure 256 246 260 4% 3Q17 3Q16 2Q17 Δ 3Q16 Net revenues 1,319 1,321 1,405 0% o/w Private Clients 727 707 733 3% o/w Corp. & Inst. Clients 592 614 672 (4)% Provision for credit losses 14 30 36 Total operating expenses 857 860 865 0% Pre-tax income 448 431 504 4% o/w Private Clients 217 196 222 11% o/w Corp. & Inst. Clients 231 235 282 (2)% Cost/income ratio 65% 65% 62% Return on regulatory capital† 14% 14% 16% Note: Financial and other information is for Swiss Universal Bank division. Scope of Credit Suisse (Schweiz) AG differs from Swiss Universal Bank division. All financial numbers presented and discussed are adjusted, unless otherwise stated. Adjusted results are non-GAAP financial measures. A reconciliation to reported results is included in the Appendix. All percentage changes and comparative descriptions refer to year on year measurements unless otherwise indicated † See Appendix Solid pre-tax income of CHF 448 mn, up 4%; 7th consecutive quarter with PTI growthStable revenues with higher client activity in Private Clients offset by lower revenues from trading services; QoQ down driven by seasonality and regular dividends from participations in 2Q17Operating expenses continuously down driven by personnel cost reduction partly offset by investments in regulatory projects; continued investments in digitalizationCredit provisions at low levels, reflecting the quality of our loan portfolioPrivate ClientsPTI of CHF 217 mn, up 11% driven by strong operating leverageNet revenues up 3%, primarily from higher client activitySuccessful launch of our revamped offering «Viva Kids» in 3Q17 Continued NNA momentum with CHF 1.0 bn of net inflows, taking 9M17 NNA to CHF 4.7 bn or an annualized growth rate of 3.3%; AuM up 7%Corporate & Institutional ClientsLower revenues from trading services impacting transaction-based revenues, partly offset by continued strong investment banking activityRecurring revenues impacted by lower discretionary mandate fees and selected EAM exitsNNA outflows driven by a single public sector mandate of CHF 13.3 bn; EAM selected exits review finalized in 3Q17 resulting in a 9M17 impact of CHF 2.5 bn
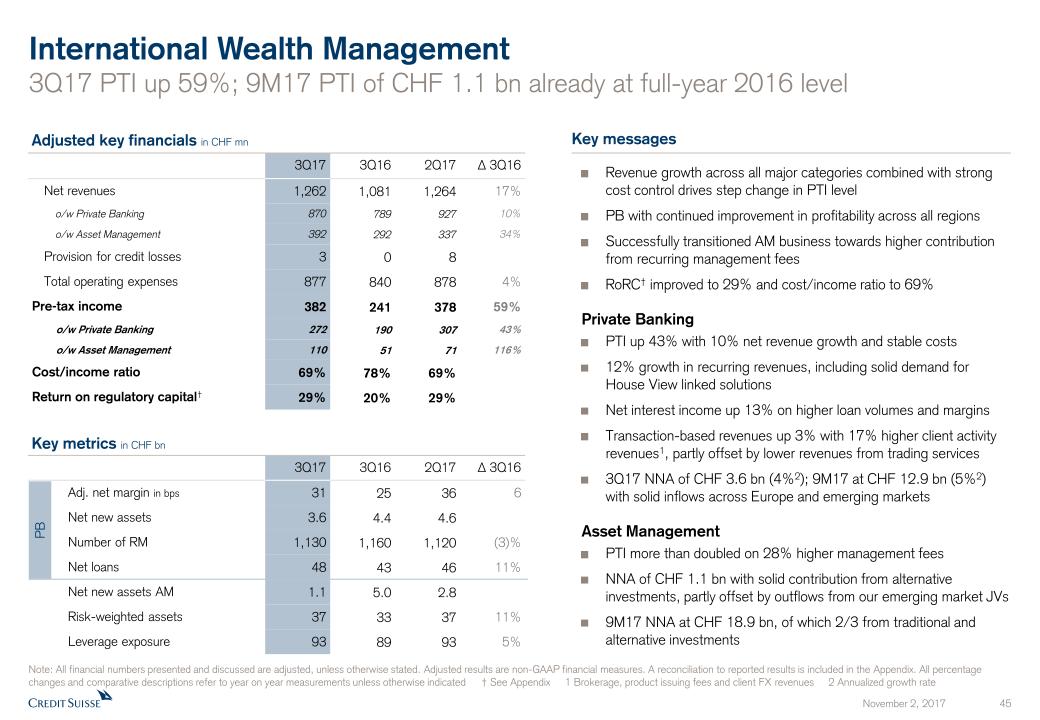
Adjusted key financials in CHF mn 3Q17 3Q16 2Q17 Δ 3Q16 Net revenues 1,262 1,081 1,264 17% o/w Private Banking 870 789 927 10% o/w Asset Management 392 292 337 34% Provision for credit losses 3 0 8 Total operating expenses 877 840 878 4% Pre-tax income 382 241 378 59% o/w Private Banking 272 190 307 43% o/w Asset Management 110 51 71 116% Cost/income ratio 69% 78% 69% Return on regulatory capital† 29% 20% 29% PB 3Q17 3Q16 2Q17 Δ 3Q16 Adj. net margin in bps 31 25 36 6 Net new assets 3.6 4.4 4.6 Number of RM 1,130 1,160 1,120 (3)% Net loans 48 43 46 11% Net new assets AM 1.1 5.0 2.8 Risk-weighted assets 37 33 37 11% Leverage exposure 93 89 93 5% Key messages Key metrics in CHF bn Note: All financial numbers presented and discussed are adjusted, unless otherwise stated. Adjusted results are non-GAAP financial measures. A reconciliation to reported results is included in the Appendix. All percentage changes and comparative descriptions refer to year on year measurements unless otherwise indicated † See Appendix 1 Brokerage, product issuing fees and client FX revenues 2 Annualized growth rate International Wealth Management3Q17 PTI up 59%; 9M17 PTI of CHF 1.1 bn already at full-year 2016 level Revenue growth across all major categories combined with strong cost control drives step change in PTI levelPB with continued improvement in profitability across all regionsSuccessfully transitioned AM business towards higher contribution from recurring management feesRoRC† improved to 29% and cost/income ratio to 69%Private BankingPTI up 43% with 10% net revenue growth and stable costs12% growth in recurring revenues, including solid demand for House View linked solutionsNet interest income up 13% on higher loan volumes and marginsTransaction-based revenues up 3% with 17% higher client activity revenues1, partly offset by lower revenues from trading services3Q17 NNA of CHF 3.6 bn (4%2); 9M17 at CHF 12.9 bn (5%2) with solid inflows across Europe and emerging marketsAsset ManagementPTI more than doubled on 28% higher management feesNNA of CHF 1.1 bn with solid contribution from alternative investments, partly offset by outflows from our emerging market JVs9M17 NNA at CHF 18.9 bn, of which 2/3 from traditional and alternative investments
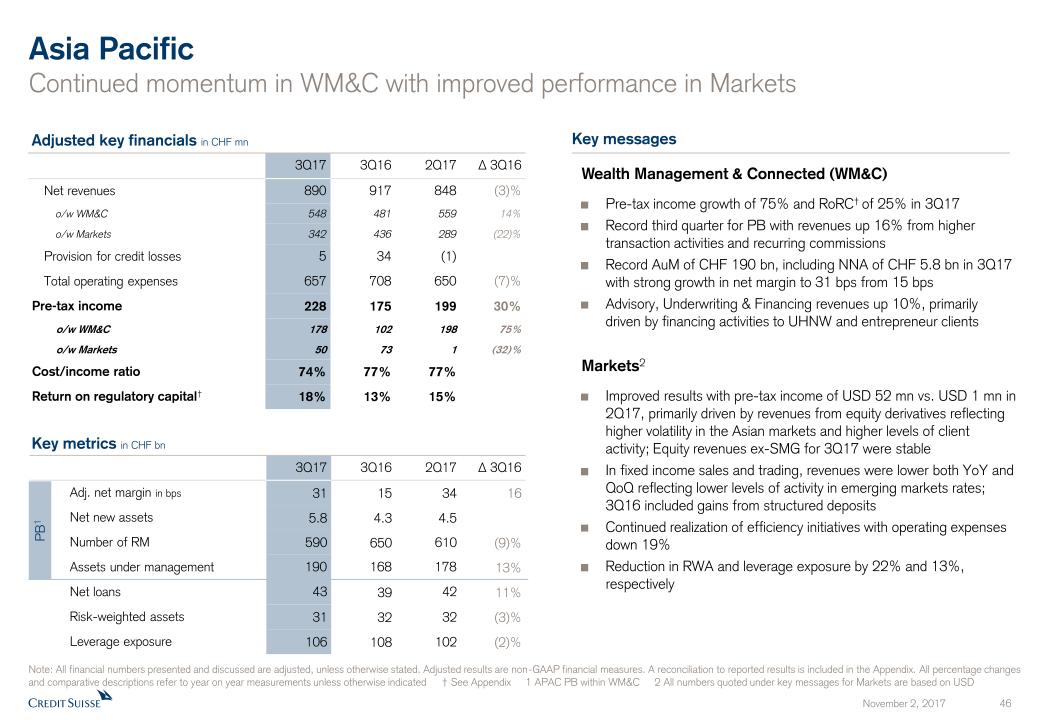
Adjusted key financials in CHF mn Asia PacificContinued momentum in WM&C with improved performance in Markets Key messages 3Q17 3Q16 2Q17 Δ 3Q16 Net revenues 890 917 848 (3)% o/w WM&C 548 481 559 14% o/w Markets 342 436 289 (22)% Provision for credit losses 5 34 (1) Total operating expenses 657 708 650 (7)% Pre-tax income 228 175 199 30% o/w WM&C 178 102 198 75% o/w Markets 50 73 1 (32)% Cost/income ratio 74% 77% 77% Return on regulatory capital† 18% 13% 15% PB1 3Q17 3Q16 2Q17 Δ 3Q16 Adj. net margin in bps 31 15 34 16 Net new assets 5.8 4.3 4.5 Number of RM 590 650 610 (9)% Assets under management 190 168 178 13% Net loans 43 39 42 11% Risk-weighted assets 31 32 32 (3)% Leverage exposure 106 108 102 (2)% Key metrics in CHF bn Note: All financial numbers presented and discussed are adjusted, unless otherwise stated. Adjusted results are non-GAAP financial measures. A reconciliation to reported results is included in the Appendix. All percentage changes and comparative descriptions refer to year on year measurements unless otherwise indicated † See Appendix 1 APAC PB within WM&C 2 All numbers quoted under key messages for Markets are based on USD Wealth Management & Connected (WM&C)Pre-tax income growth of 75% and RoRC† of 25% in 3Q17Record third quarter for PB with revenues up 16% from higher transaction activities and recurring commissionsRecord AuM of CHF 190 bn, including NNA of CHF 5.8 bn in 3Q17 with strong growth in net margin to 31 bps from 15 bpsAdvisory, Underwriting & Financing revenues up 10%, primarily driven by financing activities to UHNW and entrepreneur clientsMarkets2Improved results with pre-tax income of USD 52 mn vs. USD 1 mn in 2Q17, primarily driven by revenues from equity derivatives reflecting higher volatility in the Asian markets and higher levels of client activity; Equity revenues ex-SMG for 3Q17 were stableIn fixed income sales and trading, revenues were lower both YoY and QoQ reflecting lower levels of activity in emerging markets rates; 3Q16 included gains from structured depositsContinued realization of efficiency initiatives with operating expenses down 19%Reduction in RWA and leverage exposure by 22% and 13%, respectively
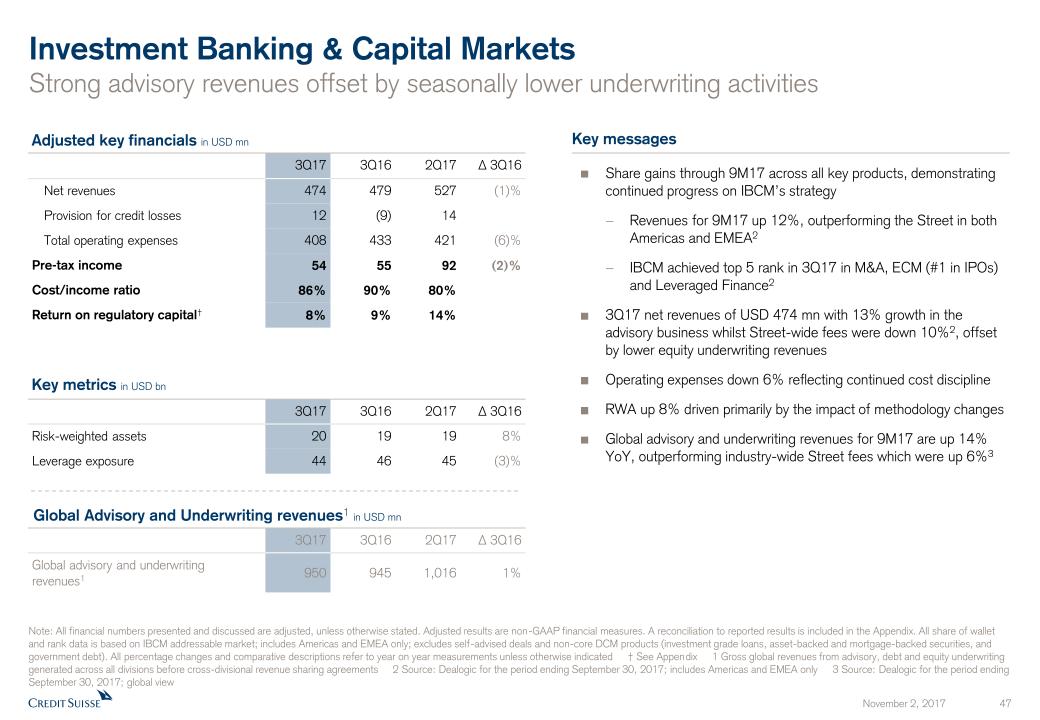
Key messages Investment Banking & Capital MarketsStrong advisory revenues offset by seasonally lower underwriting activities Note: All financial numbers presented and discussed are adjusted, unless otherwise stated. Adjusted results are non-GAAP financial measures. A reconciliation to reported results is included in the Appendix. All share of walletand rank data is based on IBCM addressable market; includes Americas and EMEA only; excludes self-advised deals and non-core DCM products (investment grade loans, asset-backed and mortgage-backed securities, andgovernment debt). All percentage changes and comparative descriptions refer to year on year measurements unless otherwise indicated † See Appendix 1 Gross global revenues from advisory, debt and equity underwriting generated across all divisions before cross-divisional revenue sharing agreements 2 Source: Dealogic for the period ending September 30, 2017; includes Americas and EMEA only 3 Source: Dealogic for the period ending September 30, 2017; global view 3Q17 3Q16 2Q17 Δ 3Q16 Risk-weighted assets 20 19 19 8% Leverage exposure 44 46 45 (3)% Adjusted key financials in USD mn 3Q17 3Q16 2Q17 Δ 3Q16 Net revenues 474 479 527 (1)% Provision for credit losses 12 (9) 14 Total operating expenses 408 433 421 (6)% Pre-tax income 54 55 92 (2)% Cost/income ratio 86% 90% 80% Return on regulatory capital† 8% 9% 14% Key metrics in USD bn 3Q17 3Q16 2Q17 Δ 3Q16 Global advisory and underwriting revenues1 950 945 1,016 1% Global Advisory and Underwriting revenues1 in USD mn Share gains through 9M17 across all key products, demonstrating continued progress on IBCM’s strategyRevenues for 9M17 up 12%, outperforming the Street in both Americas and EMEA2IBCM achieved top 5 rank in 3Q17 in M&A, ECM (#1 in IPOs) and Leveraged Finance23Q17 net revenues of USD 474 mn with 13% growth in the advisory business whilst Street-wide fees were down 10%2, offset by lower equity underwriting revenuesOperating expenses down 6% reflecting continued cost disciplineRWA up 8% driven primarily by the impact of methodology changes Global advisory and underwriting revenues for 9M17 are up 14% YoY, outperforming industry-wide Street fees which were up 6%3
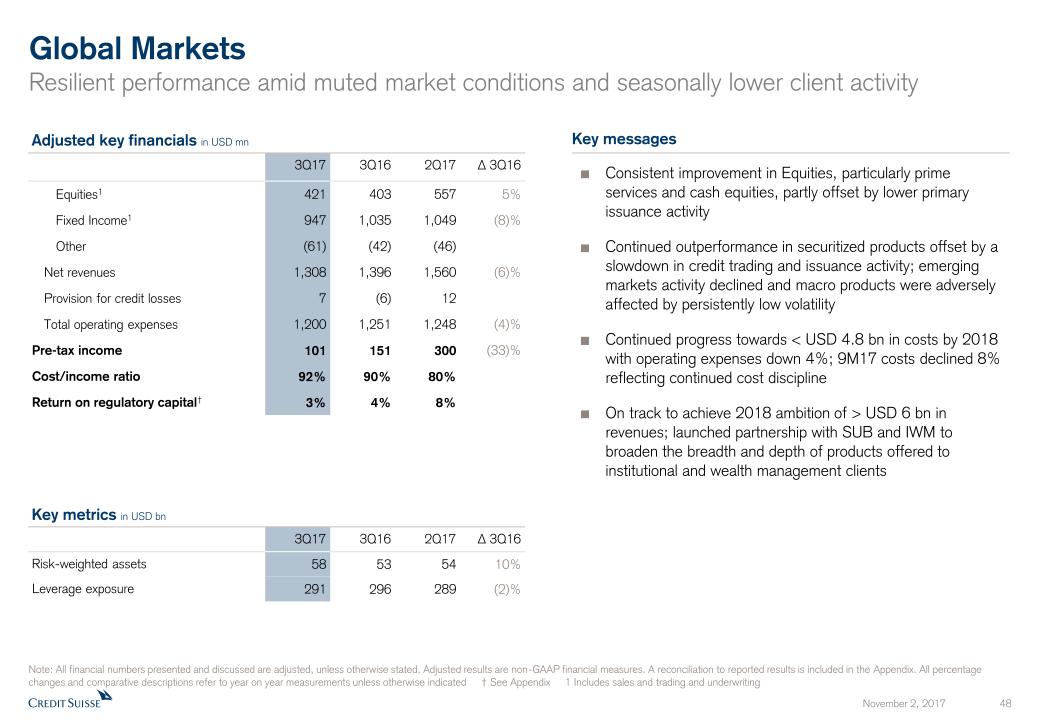
Key messages Global MarketsResilient performance amid muted market conditions and seasonally lower client activity 3Q17 3Q16 2Q17 Δ 3Q16 Risk-weighted assets 58 53 54 10% Leverage exposure 291 296 289 (2)% Key metrics in USD bn Note: All financial numbers presented and discussed are adjusted, unless otherwise stated. Adjusted results are non-GAAP financial measures. A reconciliation to reported results is included in the Appendix. All percentage changes and comparative descriptions refer to year on year measurements unless otherwise indicated † See Appendix 1 Includes sales and trading and underwriting Adjusted key financials in USD mn 3Q17 3Q16 2Q17 Δ 3Q16 Equities1 421 403 557 5% Fixed Income1 947 1,035 1,049 (8)% Other (61) (42) (46) Net revenues 1,308 1,396 1,560 (6)% Provision for credit losses 7 (6) 12 Total operating expenses 1,200 1,251 1,248 (4)% Pre-tax income 101 151 300 (33)% Cost/income ratio 92% 90% 80% Return on regulatory capital† 3% 4% 8% Consistent improvement in Equities, particularly prime services and cash equities, partly offset by lower primary issuance activityContinued outperformance in securitized products offset by a slowdown in credit trading and issuance activity; emerging markets activity declined and macro products were adversely affected by persistently low volatilityContinued progress towards < USD 4.8 bn in costs by 2018 with operating expenses down 4%; 9M17 costs declined 8% reflecting continued cost disciplineOn track to achieve 2018 ambition of > USD 6 bn in revenues; launched partnership with SUB and IWM to broaden the breadth and depth of products offered to institutional and wealth management clients

Key messages Strategic Resolution UnitFurther significant progress in reducing RWA, leverage exposure and operating expenses Adjusted Key financials in USD mn 3Q17 3Q16 2Q17 Δ 3Q16 Net revenues (265) (170) (280) 56% Provision for credit losses (9) 6 14 Total operating expenses 228 351 252 (35)% Pre-tax loss (484) (527) (546) Real estate gains - - - (Gain) / loss on business sales - - - Restructuring expenses 21 23 12 Major litigation expenses 94 324 20 Pre-tax loss reported (599) (874) (578) 3Q17 3Q16 2Q17 Δ 3Q16 Risk-weighted assets in CHF bn 36 53 38 (33)% RWA excl. operational risk in USD bn 17 35 19 (53)% Leverage exposure in USD bn 68 119 75 (43)% Key metrics Note: Adjusted results are non-GAAP financial measures. A reconciliation to reported results is included in the Appendix. All percentage changes and comparative descriptions refer to year on year measurements unless otherwise indicated Adjusted net revenue loss of USD 265 mn compares to a loss of USD 170 mn in 3Q16, and USD 280 mn in 2Q17Lower fee-based revenues as a result of businesses exits, partly offset by lower funding costsExit costs of USD 72 mn in the quarter; life-time cost of 1.2% of RWA remain in line with long-term guidance of less than 3%Adjusted operating expenses lower by USD 24 mn vs. 2Q17RWA excluding operational risk and leverage exposure lower by USD 3 bn (13%) and USD 7 bn (10%), respectively in 3Q17Sale of limited partnership fund interests, representing bulk of remaining illiquid asset management exposuresInterest rate and FX derivatives exposures reduced by 16% through unwinds, novations and compressionsLoans and financing exposure reduced by 14%, notably from sales and restructurings of emerging markets positions

Summary Delivering profitable growth across Wealth ManagementOn track to exceed 2017 target cost savings and accelerating wind-down of SRUMaintaining strong capital position
Appendix November 02, 2017
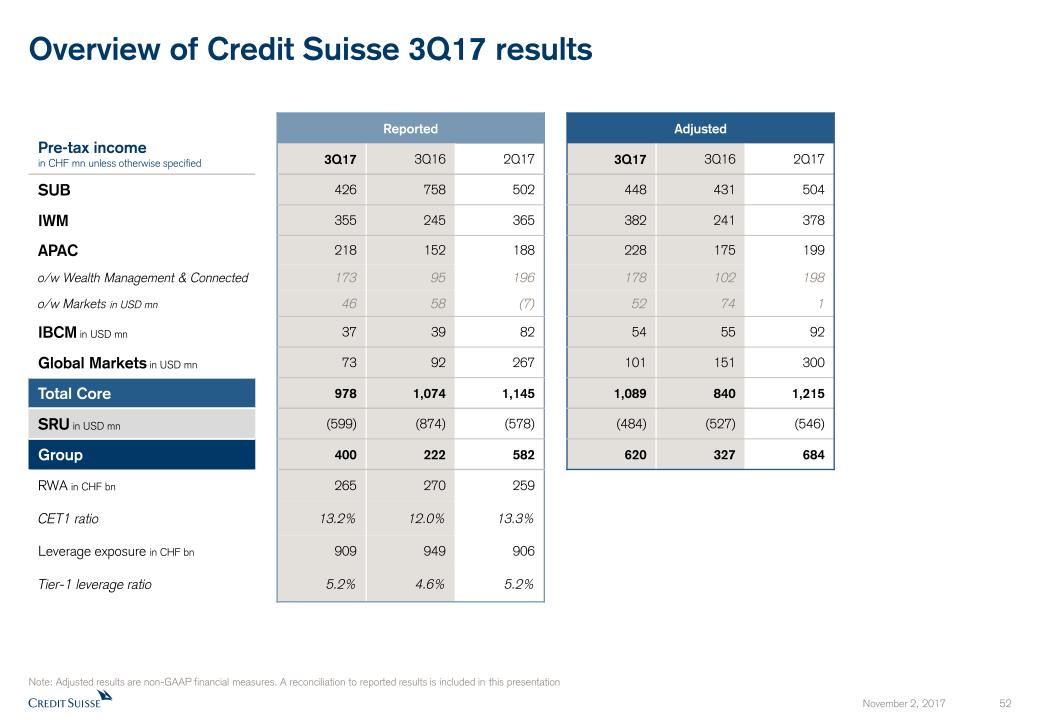
Note: Adjusted results are non-GAAP financial measures. A reconciliation to reported results is included in this presentation Overview of Credit Suisse 3Q17 results Pre-tax incomein CHF mn unless otherwise specified Reported Adjusted 3Q17 3Q16 2Q17 3Q17 3Q16 2Q17 SUB 426 758 502 448 431 504 IWM 355 245 365 382 241 378 APAC 218 152 188 228 175 199 o/w Wealth Management & Connected 173 95 196 178 102 198 o/w Markets in USD mn 46 58 (7) 52 74 1 IBCM in USD mn 37 39 82 54 55 92 Global Markets in USD mn 73 92 267 101 151 300 Total Core 978 1,074 1,145 1,089 840 1,215 SRU in USD mn (599) (874) (578) (484) (527) (546) Group 400 222 582 620 327 684 RWA in CHF bn 265 270 259 CET1 ratio 13.2% 12.0% 13.3% Leverage exposure in CHF bn 909 949 906 Tier-1 leverage ratio 5.2% 4.6% 5.2%
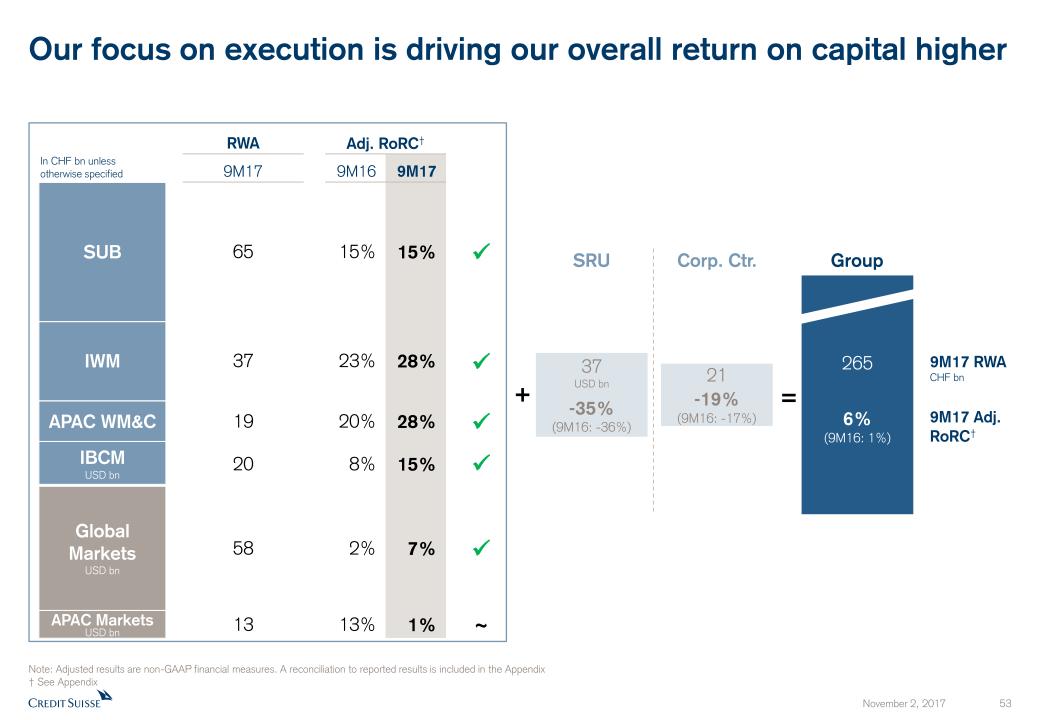
Our focus on execution is driving our overall return on capital higher 2656%(9M16: 1%) = + 9M17 RWACHF bn 9M17 Adj.RoRC† Group SRU Corp. Ctr. Adj. RoRC† RWA 15% 28% 28% 15% 7% 1% 37USD bn-35%(9M16: -36%) 21-19%(9M16: -17%) Note: Adjusted results are non-GAAP financial measures. A reconciliation to reported results is included in the Appendix† See Appendix In CHF bn unlessotherwise specified 9M17 9M16 15% 23% 20% 8% 2% 13% 9M17 ~ 65 37 19 20 58 SUB IWM APAC WM&C IBCMUSD bn GlobalMarketsUSD bn APAC MarketsUSD bn 13
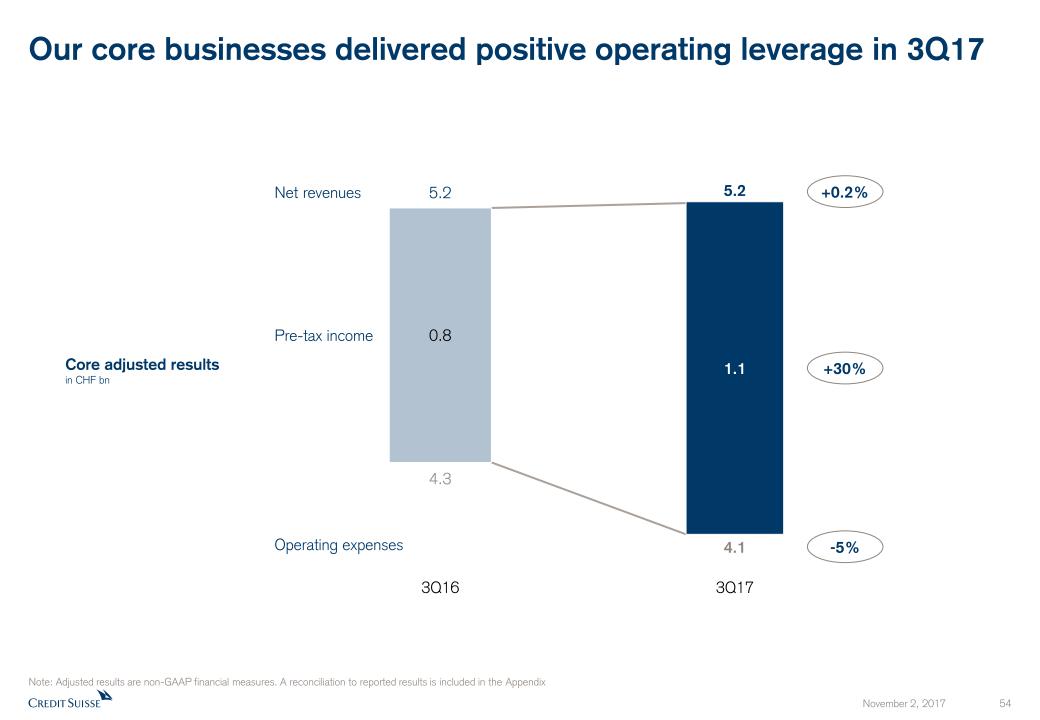
Our core businesses delivered positive operating leverage in 3Q17 Note: Adjusted results are non-GAAP financial measures. A reconciliation to reported results is included in the Appendix Net revenues Operating expenses Pre-tax income Core adjusted resultsin CHF bn 5.2 5.2 4.3 4.1 3Q16 3Q17 -5% +30% +0.2% 1.1 0.8

Our core businesses delivered positive operating leverage in 9M17 Note: Adjusted results are non-GAAP financial measures. A reconciliation to reported results is included in the Appendix Net revenues Operating expenses Pre-tax income Core adjusted resultsin CHF bn 16.5 15.9 13.0 12.6 9M16 9M17 -2% +29% +3% 3.7 2.9
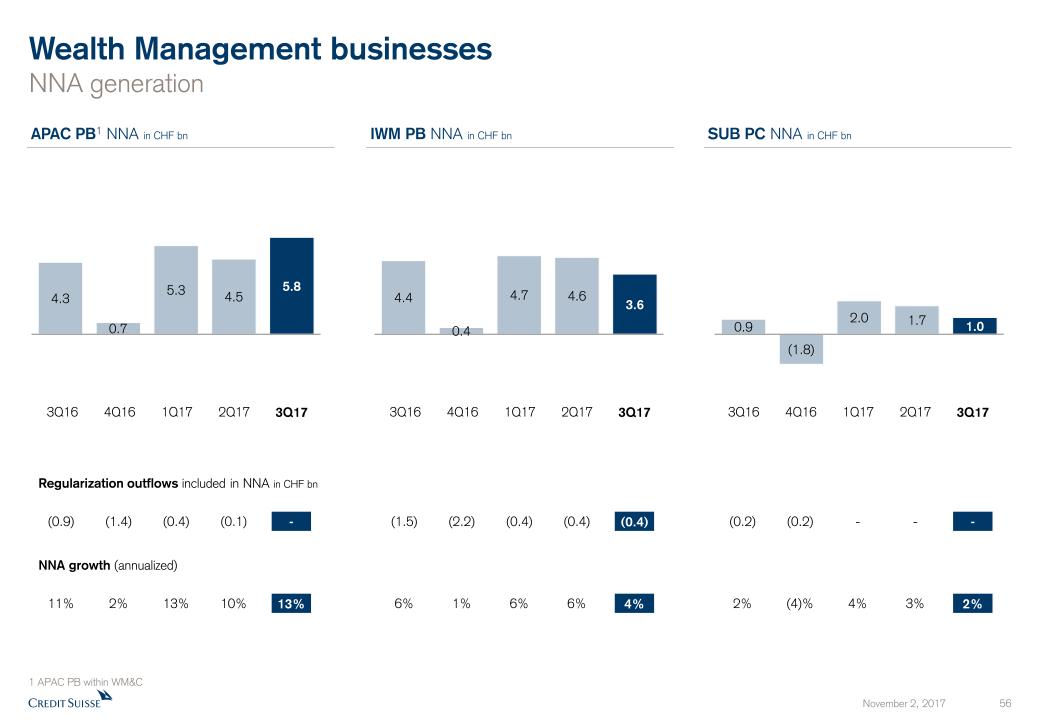
Wealth Management businessesNNA generation NNA growth (annualized) IWM PB NNA in CHF bn Regularization outflows included in NNA in CHF bn SUB PC NNA in CHF bn 3Q16 3Q17 11% 13% 2% 13% 10% 4Q16 1Q17 2Q17 APAC PB1 NNA in CHF bn (0.9) - (1.4) (0.4) (0.1) 6% 4% 1% 6% 6% (1.5) (0.4) (2.2) (0.4) (0.4) 2% 2% (4)% 4% 3% (0.2) - (0.2) - - 1 APAC PB within WM&C 3Q16 3Q17 4Q16 1Q17 2Q17 3Q16 3Q17 4Q16 1Q17 2Q17
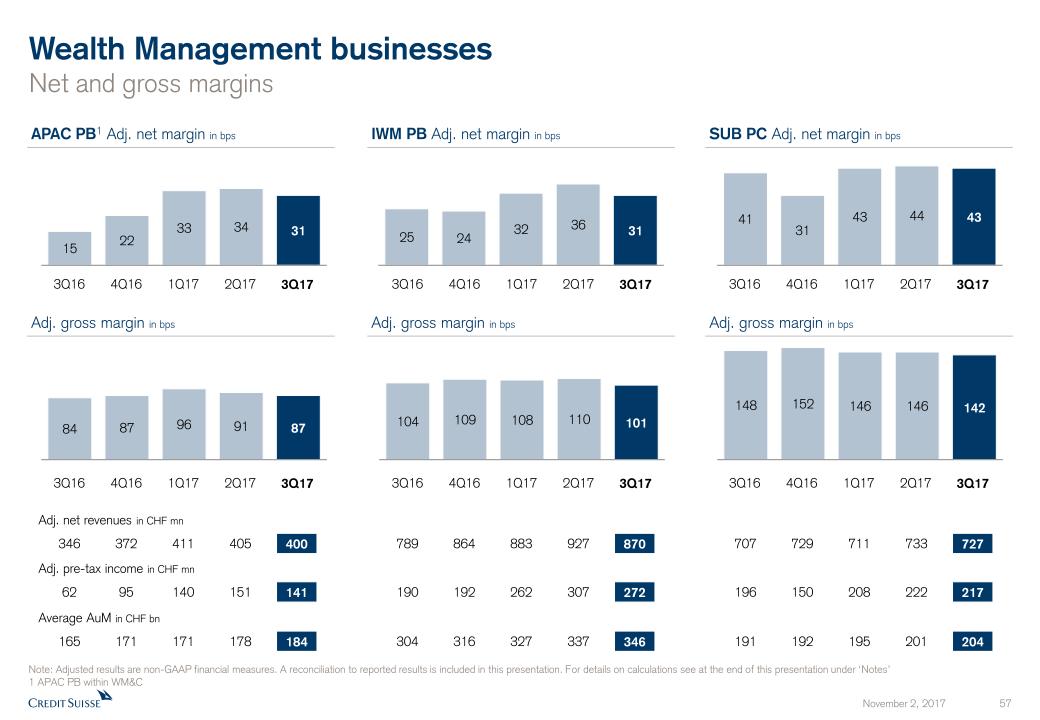
Wealth Management businessesNet and gross margins SUB PC Adj. net margin in bps Adj. gross margin in bps IWM PB Adj. net margin in bps Adj. gross margin in bps APAC PB1 Adj. net margin in bps 165 184 178 3Q16 3Q17 1Q17 Adj. gross margin in bps Average AuM in CHF bn 62 141 151 Adj. pre-tax income in CHF mn 346 400 405 Adj. net revenues in CHF mn 4Q16 2Q17 171 95 372 171 140 411 304 346 337 190 272 307 789 870 927 316 192 864 327 262 883 191 204 201 196 217 222 707 727 733 192 150 729 195 208 711 Note: Adjusted results are non-GAAP financial measures. A reconciliation to reported results is included in this presentation. For details on calculations see at the end of this presentation under ‘Notes’1 APAC PB within WM&C 3Q16 3Q17 1Q17 4Q16 2Q17 3Q16 3Q17 1Q17 4Q16 2Q17 3Q16 3Q17 1Q17 4Q16 2Q17 3Q16 3Q17 1Q17 4Q16 2Q17 3Q16 3Q17 1Q17 4Q16 2Q17
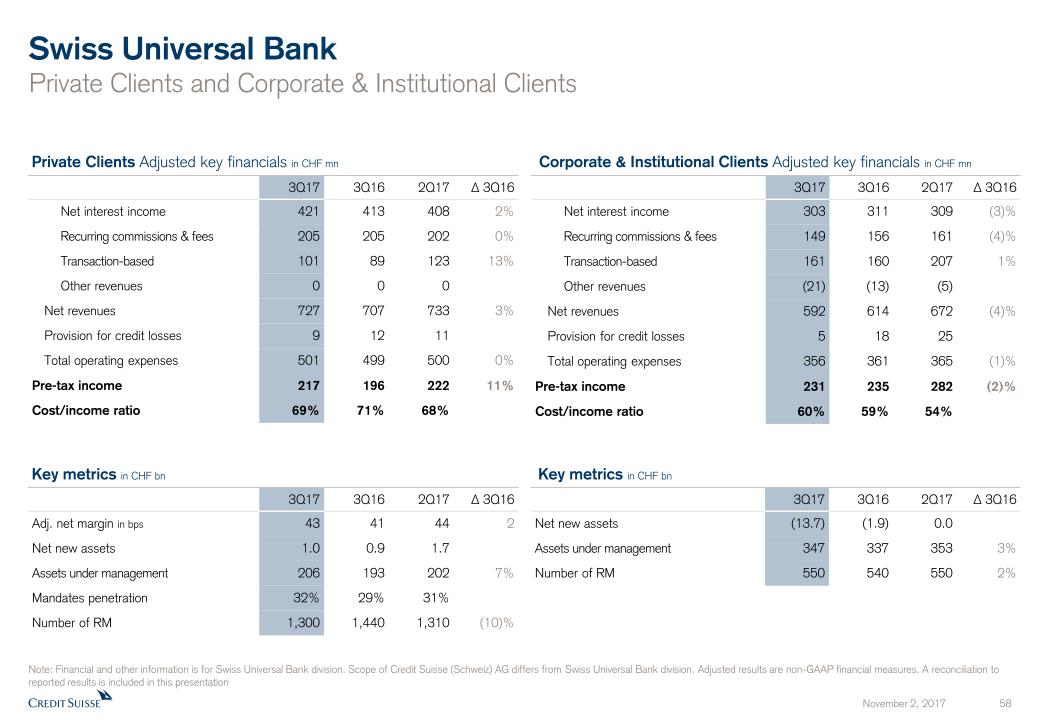
Swiss Universal BankPrivate Clients and Corporate & Institutional Clients Note: Financial and other information is for Swiss Universal Bank division. Scope of Credit Suisse (Schweiz) AG differs from Swiss Universal Bank division. Adjusted results are non-GAAP financial measures. A reconciliation to reported results is included in this presentation Private Clients Adjusted key financials in CHF mn Corporate & Institutional Clients Adjusted key financials in CHF mn Key metrics in CHF bn Key metrics in CHF bn 3Q17 3Q16 2Q17 Δ 3Q16 Net interest income 303 311 309 (3)% Recurring commissions & fees 149 156 161 (4)% Transaction-based 161 160 207 1% Other revenues (21) (13) (5) Net revenues 592 614 672 (4)% Provision for credit losses 5 18 25 Total operating expenses 356 361 365 (1)% Pre-tax income 231 235 282 (2)% Cost/income ratio 60% 59% 54% 3Q17 3Q16 2Q17 Δ 3Q16 Adj. net margin in bps 43 41 44 2 Net new assets 1.0 0.9 1.7 Assets under management 206 193 202 7% Mandates penetration 32% 29% 31% Number of RM 1,300 1,440 1,310 (10)% 3Q17 3Q16 2Q17 Δ 3Q16 Net new assets (13.7) (1.9) 0.0 Assets under management 347 337 353 3% Number of RM 550 540 550 2% 3Q17 3Q16 2Q17 Δ 3Q16 Net interest income 421 413 408 2% Recurring commissions & fees 205 205 202 0% Transaction-based 101 89 123 13% Other revenues 0 0 0 Net revenues 727 707 733 3% Provision for credit losses 9 12 11 Total operating expenses 501 499 500 0% Pre-tax income 217 196 222 11% Cost/income ratio 69% 71% 68%
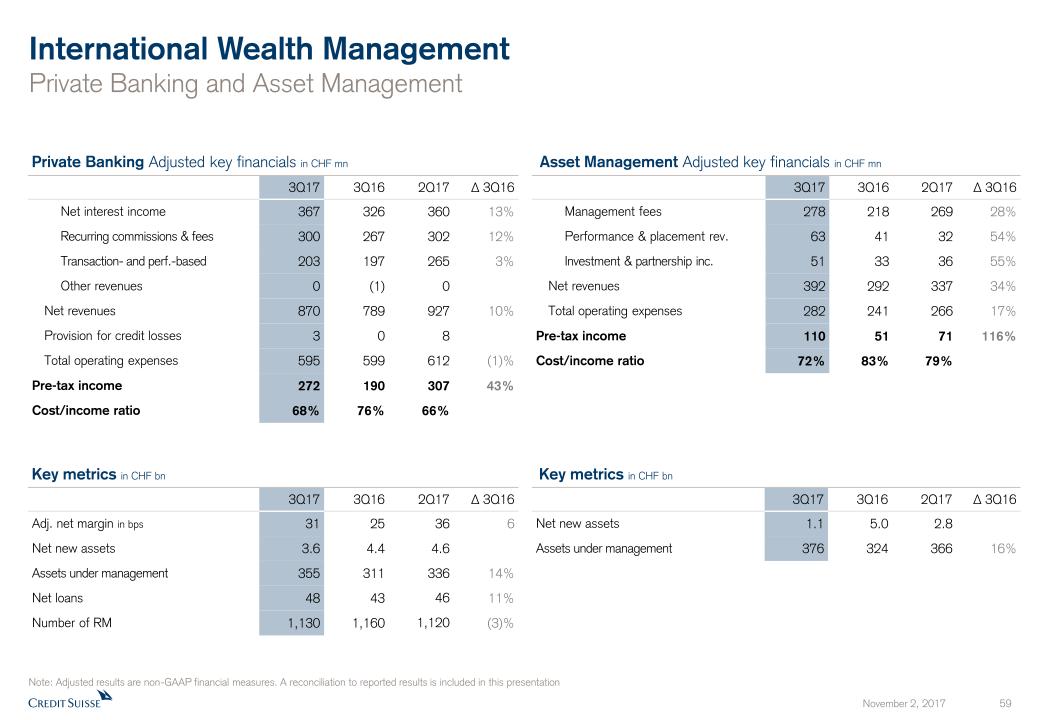
International Wealth ManagementPrivate Banking and Asset Management Note: Adjusted results are non-GAAP financial measures. A reconciliation to reported results is included in this presentation Private Banking Adjusted key financials in CHF mn Asset Management Adjusted key financials in CHF mn Key metrics in CHF bn Key metrics in CHF bn 3Q17 3Q16 2Q17 Δ 3Q16 Net interest income 367 326 360 13% Recurring commissions & fees 300 267 302 12% Transaction- and perf.-based 203 197 265 3% Other revenues 0 (1) 0 Net revenues 870 789 927 10% Provision for credit losses 3 0 8 Total operating expenses 595 599 612 (1)% Pre-tax income 272 190 307 43% Cost/income ratio 68% 76% 66% 3Q17 3Q16 2Q17 Δ 3Q16 Adj. net margin in bps 31 25 36 6 Net new assets 3.6 4.4 4.6 Assets under management 355 311 336 14% Net loans 48 43 46 11% Number of RM 1,130 1,160 1,120 (3)% 3Q17 3Q16 2Q17 Δ 3Q16 Management fees 278 218 269 28% Performance & placement rev. 63 41 32 54% Investment & partnership inc. 51 33 36 55% Net revenues 392 292 337 34% Total operating expenses 282 241 266 17% Pre-tax income 110 51 71 116% Cost/income ratio 72% 83% 79% 3Q17 3Q16 2Q17 Δ 3Q16 Net new assets 1.1 5.0 2.8 Assets under management 376 324 366 16%
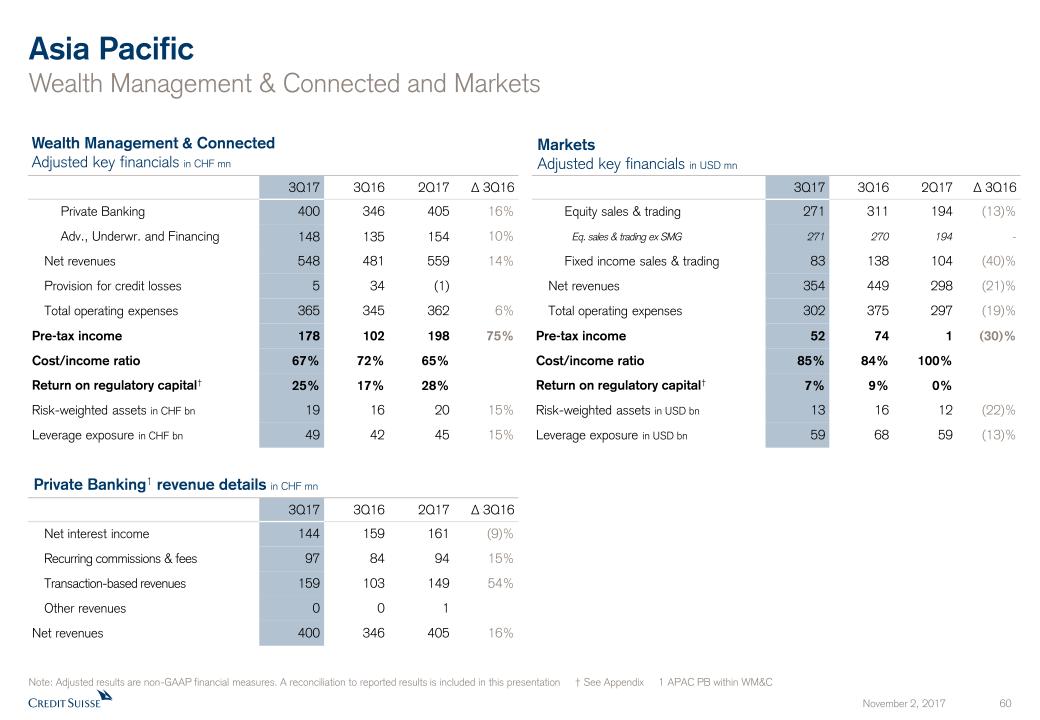
Asia PacificWealth Management & Connected and Markets Note: Adjusted results are non-GAAP financial measures. A reconciliation to reported results is included in this presentation † See Appendix 1 APAC PB within WM&C Wealth Management & ConnectedAdjusted key financials in CHF mn Markets Adjusted key financials in USD mn 3Q17 3Q16 2Q17 Δ 3Q16 Private Banking 400 346 405 16% Adv., Underwr. and Financing 148 135 154 10% Net revenues 548 481 559 14% Provision for credit losses 5 34 (1) Total operating expenses 365 345 362 6% Pre-tax income 178 102 198 75% Cost/income ratio 67% 72% 65% Return on regulatory capital† 25% 17% 28% Risk-weighted assets in CHF bn 19 16 20 15% Leverage exposure in CHF bn 49 42 45 15% 3Q17 3Q16 2Q17 Δ 3Q16 Equity sales & trading 271 311 194 (13)% Eq. sales & trading ex SMG 271 270 194 - Fixed income sales & trading 83 138 104 (40)% Net revenues 354 449 298 (21)% Total operating expenses 302 375 297 (19)% Pre-tax income 52 74 1 (30)% Cost/income ratio 85% 84% 100% Return on regulatory capital† 7% 9% 0% Risk-weighted assets in USD bn 13 16 12 (22)% Leverage exposure in USD bn 59 68 59 (13)% Private Banking1 revenue details in CHF mn 3Q17 3Q16 2Q17 Δ 3Q16 Net interest income 144 159 161 (9)% Recurring commissions & fees 97 84 94 15% Transaction-based revenues 159 103 149 54% Other revenues 0 0 1 Net revenues 400 346 405 16%
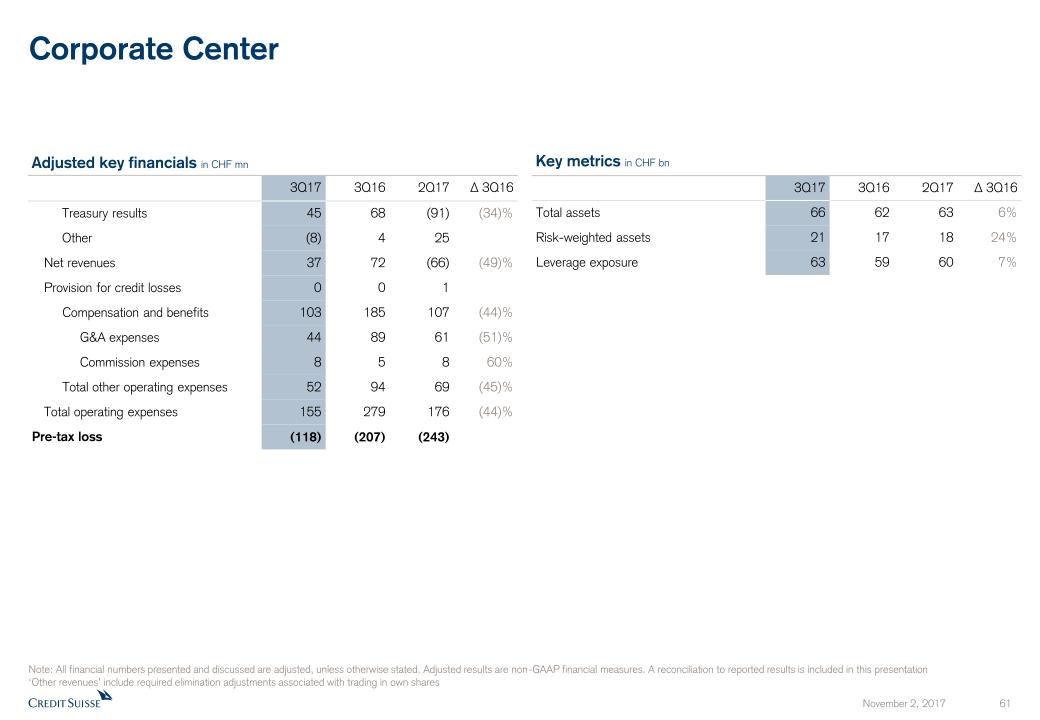
Corporate Center Note: All financial numbers presented and discussed are adjusted, unless otherwise stated. Adjusted results are non-GAAP financial measures. A reconciliation to reported results is included in this presentation‘Other revenues’ include required elimination adjustments associated with trading in own shares 3Q17 3Q16 2Q17 Δ 3Q16 Total assets 66 62 63 6% Risk-weighted assets 21 17 18 24% Leverage exposure 63 59 60 7% Adjusted key financials in CHF mn 3Q17 3Q16 2Q17 Δ 3Q16 Treasury results 45 68 (91) (34)% Other (8) 4 25 Net revenues 37 72 (66) (49)% Provision for credit losses 0 0 1 Compensation and benefits 103 185 107 (44)% G&A expenses 44 89 61 (51)% Commission expenses 8 5 8 60% Total other operating expenses 52 94 69 (45)% Total operating expenses 155 279 176 (44)% Pre-tax loss (118) (207) (243) Key metrics in CHF bn
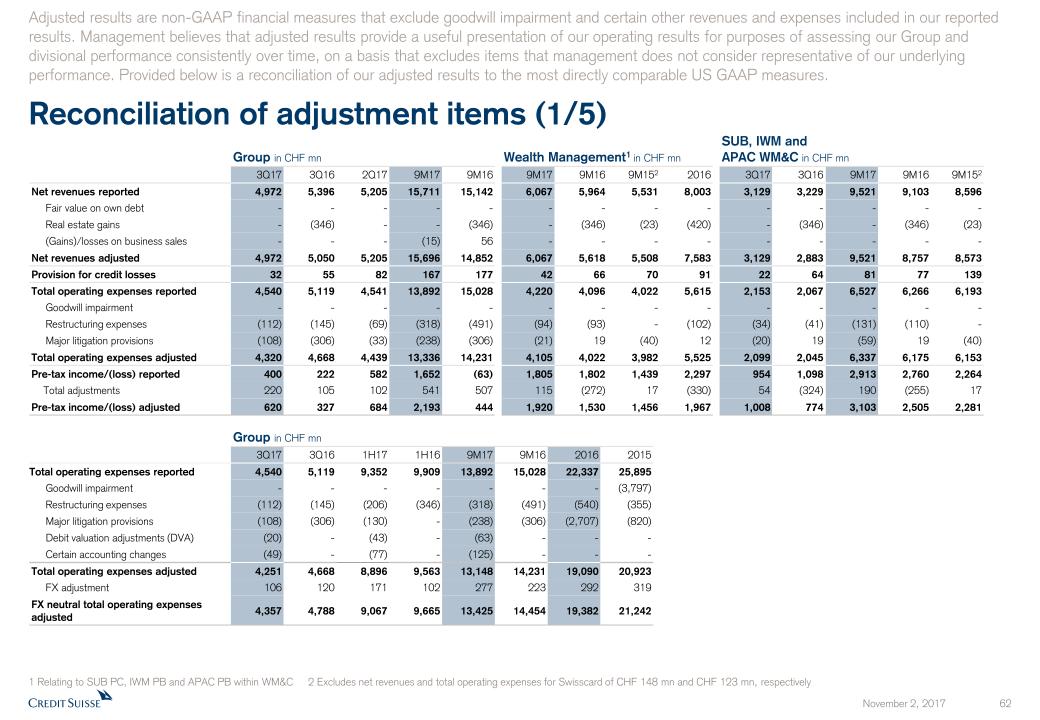
Reconciliation of adjustment items (1/5) Adjusted results are non-GAAP financial measures that exclude goodwill impairment and certain other revenues and expenses included in our reported results. Management believes that adjusted results provide a useful presentation of our operating results for purposes of assessing our Group and divisional performance consistently over time, on a basis that excludes items that management does not consider representative of our underlying performance. Provided below is a reconciliation of our adjusted results to the most directly comparable US GAAP measures. 1 Relating to SUB PC, IWM PB and APAC PB within WM&C 2 Excludes net revenues and total operating expenses for Swisscard of CHF 148 mn and CHF 123 mn, respectively Group in CHF mn 3Q17 3Q16 1H17 1H16 9M17 9M16 2016 2015 Total operating expenses reported 4,540 5,119 9,352 9,909 13,892 15,028 22,337 25,895 Goodwill impairment - - - - - - - (3,797) Restructuring expenses (112) (145) (206) (346) (318) (491) (540) (355) Major litigation provisions (108) (306) (130) - (238) (306) (2,707) (820) Debit valuation adjustments (DVA) (20) - (43) - (63) - - - Certain accounting changes (49) - (77) - (125) - - - Total operating expenses adjusted 4,251 4,668 8,896 9,563 13,148 14,231 19,090 20,923 FX adjustment 106 120 171 102 277 223 292 319 FX neutral total operating expenses adjusted 4,357 4,788 9,067 9,665 13,425 14,454 19,382 21,242 Group in CHF mn Wealth Management1 in CHF mn SUB, IWM andAPAC WM&C in CHF mn 3Q17 3Q16 2Q17 9M17 9M16 9M17 9M16 9M152 2016 3Q17 3Q16 9M17 9M16 9M152 Net revenues reported 4,972 5,396 5,205 15,711 15,142 6,067 5,964 5,531 8,003 3,129 3,229 9,521 9,103 8,596 Fair value on own debt - - - - - - - - - - - - - - Real estate gains - (346) - - (346) - (346) (23) (420) - (346) - (346) (23) (Gains)/losses on business sales - - - (15) 56 - - - - - - - - - Net revenues adjusted 4,972 5,050 5,205 15,696 14,852 6,067 5,618 5,508 7,583 3,129 2,883 9,521 8,757 8,573 Provision for credit losses 32 55 82 167 177 42 66 70 91 22 64 81 77 139 Total operating expenses reported 4,540 5,119 4,541 13,892 15,028 4,220 4,096 4,022 5,615 2,153 2,067 6,527 6,266 6,193 Goodwill impairment - - - - - - - - - - - - - - Restructuring expenses (112) (145) (69) (318) (491) (94) (93) - (102) (34) (41) (131) (110) - Major litigation provisions (108) (306) (33) (238) (306) (21) 19 (40) 12 (20) 19 (59) 19 (40) Total operating expenses adjusted 4,320 4,668 4,439 13,336 14,231 4,105 4,022 3,982 5,525 2,099 2,045 6,337 6,175 6,153 Pre-tax income/(loss) reported 400 222 582 1,652 (63) 1,805 1,802 1,439 2,297 954 1,098 2,913 2,760 2,264 Total adjustments 220 105 102 541 507 115 (272) 17 (330) 54 (324) 190 (255) 17 Pre-tax income/(loss) adjusted 620 327 684 2,193 444 1,920 1,530 1,456 1,967 1,008 774 3,103 2,505 2,281
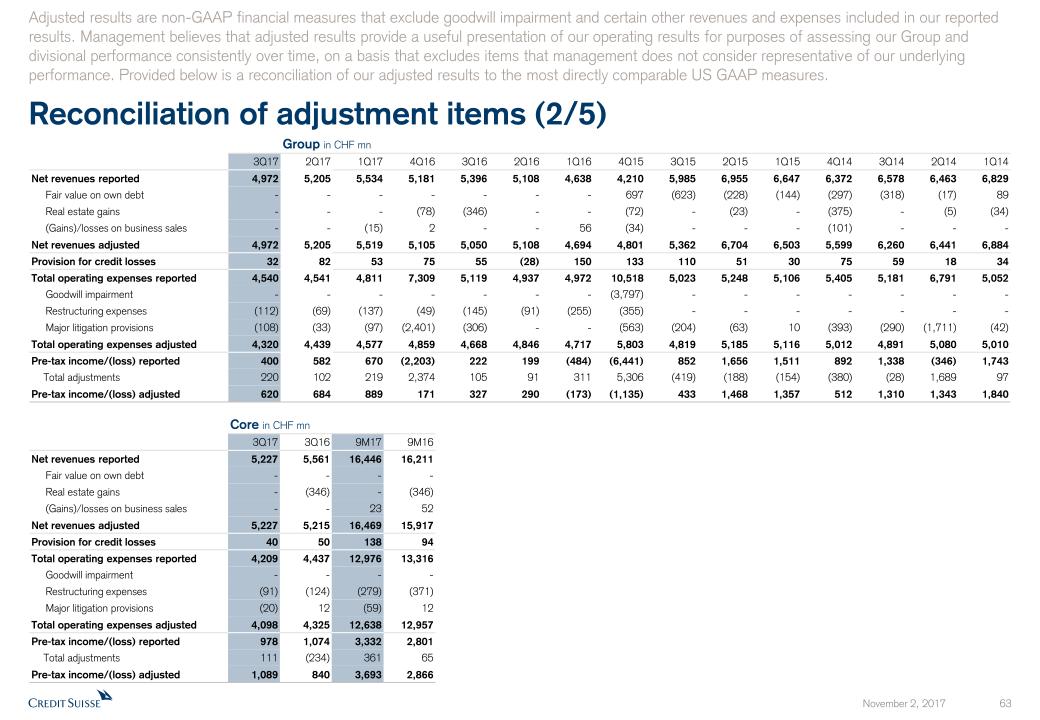
Reconciliation of adjustment items (2/5) Adjusted results are non-GAAP financial measures that exclude goodwill impairment and certain other revenues and expenses included in our reported results. Management believes that adjusted results provide a useful presentation of our operating results for purposes of assessing our Group and divisional performance consistently over time, on a basis that excludes items that management does not consider representative of our underlying performance. Provided below is a reconciliation of our adjusted results to the most directly comparable US GAAP measures. Group in CHF mn 3Q17 2Q17 1Q17 4Q16 3Q16 2Q16 1Q16 4Q15 3Q15 2Q15 1Q15 4Q14 3Q14 2Q14 1Q14 Net revenues reported 4,972 5,205 5,534 5,181 5,396 5,108 4,638 4,210 5,985 6,955 6,647 6,372 6,578 6,463 6,829 Fair value on own debt - - - - - - - 697 (623) (228) (144) (297) (318) (17) 89 Real estate gains - - - (78) (346) - - (72) - (23) - (375) - (5) (34) (Gains)/losses on business sales - - (15) 2 - - 56 (34) - - - (101) - - - Net revenues adjusted 4,972 5,205 5,519 5,105 5,050 5,108 4,694 4,801 5,362 6,704 6,503 5,599 6,260 6,441 6,884 Provision for credit losses 32 82 53 75 55 (28) 150 133 110 51 30 75 59 18 34 Total operating expenses reported 4,540 4,541 4,811 7,309 5,119 4,937 4,972 10,518 5,023 5,248 5,106 5,405 5,181 6,791 5,052 Goodwill impairment - - - - - - - (3,797) - - - - - - - Restructuring expenses (112) (69) (137) (49) (145) (91) (255) (355) - - - - - - - Major litigation provisions (108) (33) (97) (2,401) (306) - - (563) (204) (63) 10 (393) (290) (1,711) (42) Total operating expenses adjusted 4,320 4,439 4,577 4,859 4,668 4,846 4,717 5,803 4,819 5,185 5,116 5,012 4,891 5,080 5,010 Pre-tax income/(loss) reported 400 582 670 (2,203) 222 199 (484) (6,441) 852 1,656 1,511 892 1,338 (346) 1,743 Total adjustments 220 102 219 2,374 105 91 311 5,306 (419) (188) (154) (380) (28) 1,689 97 Pre-tax income/(loss) adjusted 620 684 889 171 327 290 (173) (1,135) 433 1,468 1,357 512 1,310 1,343 1,840 Core in CHF mn 3Q17 3Q16 9M17 9M16 Net revenues reported 5,227 5,561 16,446 16,211 Fair value on own debt - - - - Real estate gains - (346) - (346) (Gains)/losses on business sales - - 23 52 Net revenues adjusted 5,227 5,215 16,469 15,917 Provision for credit losses 40 50 138 94 Total operating expenses reported 4,209 4,437 12,976 13,316 Goodwill impairment - - - - Restructuring expenses (91) (124) (279) (371) Major litigation provisions (20) 12 (59) 12 Total operating expenses adjusted 4,098 4,325 12,638 12,957 Pre-tax income/(loss) reported 978 1,074 3,332 2,801 Total adjustments 111 (234) 361 65 Pre-tax income/(loss) adjusted 1,089 840 3,693 2,866
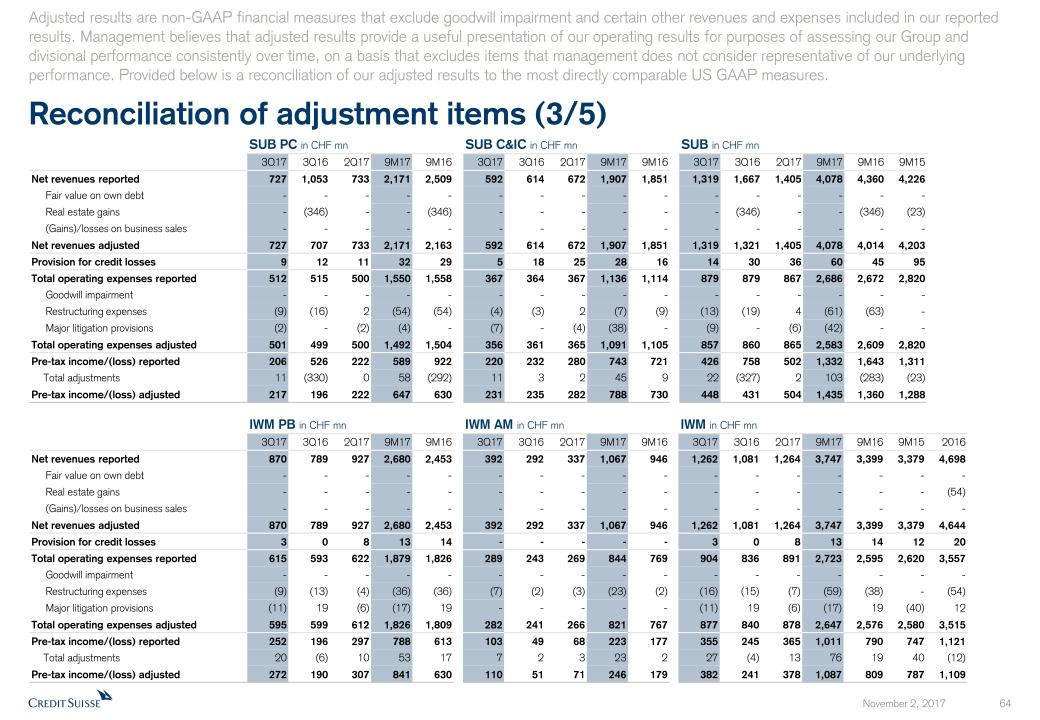
Reconciliation of adjustment items (3/5) Adjusted results are non-GAAP financial measures that exclude goodwill impairment and certain other revenues and expenses included in our reported results. Management believes that adjusted results provide a useful presentation of our operating results for purposes of assessing our Group and divisional performance consistently over time, on a basis that excludes items that management does not consider representative of our underlying performance. Provided below is a reconciliation of our adjusted results to the most directly comparable US GAAP measures. SUB PC in CHF mn SUB C&IC in CHF mn SUB in CHF mn 3Q17 3Q16 2Q17 9M17 9M16 3Q17 3Q16 2Q17 9M17 9M16 3Q17 3Q16 2Q17 9M17 9M16 9M15 Net revenues reported 727 1,053 733 2,171 2,509 592 614 672 1,907 1,851 1,319 1,667 1,405 4,078 4,360 4,226 Fair value on own debt - - - - - - - - - - - - - - - - Real estate gains - (346) - - (346) - - - - - - (346) - - (346) (23) (Gains)/losses on business sales - - - - - - - - - - - - - - - - Net revenues adjusted 727 707 733 2,171 2,163 592 614 672 1,907 1,851 1,319 1,321 1,405 4,078 4,014 4,203 Provision for credit losses 9 12 11 32 29 5 18 25 28 16 14 30 36 60 45 95 Total operating expenses reported 512 515 500 1,550 1,558 367 364 367 1,136 1,114 879 879 867 2,686 2,672 2,820 Goodwill impairment - - - - - - - - - - - - - - - - Restructuring expenses (9) (16) 2 (54) (54) (4) (3) 2 (7) (9) (13) (19) 4 (61) (63) - Major litigation provisions (2) - (2) (4) - (7) - (4) (38) - (9) - (6) (42) - - Total operating expenses adjusted 501 499 500 1,492 1,504 356 361 365 1,091 1,105 857 860 865 2,583 2,609 2,820 Pre-tax income/(loss) reported 206 526 222 589 922 220 232 280 743 721 426 758 502 1,332 1,643 1,311 Total adjustments 11 (330) 0 58 (292) 11 3 2 45 9 22 (327) 2 103 (283) (23) Pre-tax income/(loss) adjusted 217 196 222 647 630 231 235 282 788 730 448 431 504 1,435 1,360 1,288 IWM PB in CHF mn IWM AM in CHF mn IWM in CHF mn 3Q17 3Q16 2Q17 9M17 9M16 3Q17 3Q16 2Q17 9M17 9M16 3Q17 3Q16 2Q17 9M17 9M16 9M15 2016 Net revenues reported 870 789 927 2,680 2,453 392 292 337 1,067 946 1,262 1,081 1,264 3,747 3,399 3,379 4,698 Fair value on own debt - - - - - - - - - - - - - - - - - Real estate gains - - - - - - - - - - - - - - - - (54) (Gains)/losses on business sales - - - - - - - - - - - - - - - - - Net revenues adjusted 870 789 927 2,680 2,453 392 292 337 1,067 946 1,262 1,081 1,264 3,747 3,399 3,379 4,644 Provision for credit losses 3 0 8 13 14 - - - - - 3 0 8 13 14 12 20 Total operating expenses reported 615 593 622 1,879 1,826 289 243 269 844 769 904 836 891 2,723 2,595 2,620 3,557 Goodwill impairment - - - - - - - - - - - - - - - - - Restructuring expenses (9) (13) (4) (36) (36) (7) (2) (3) (23) (2) (16) (15) (7) (59) (38) - (54) Major litigation provisions (11) 19 (6) (17) 19 - - - - - (11) 19 (6) (17) 19 (40) 12 Total operating expenses adjusted 595 599 612 1,826 1,809 282 241 266 821 767 877 840 878 2,647 2,576 2,580 3,515 Pre-tax income/(loss) reported 252 196 297 788 613 103 49 68 223 177 355 245 365 1,011 790 747 1,121 Total adjustments 20 (6) 10 53 17 7 2 3 23 2 27 (4) 13 76 19 40 (12) Pre-tax income/(loss) adjusted 272 190 307 841 630 110 51 71 246 179 382 241 378 1,087 809 787 1,109
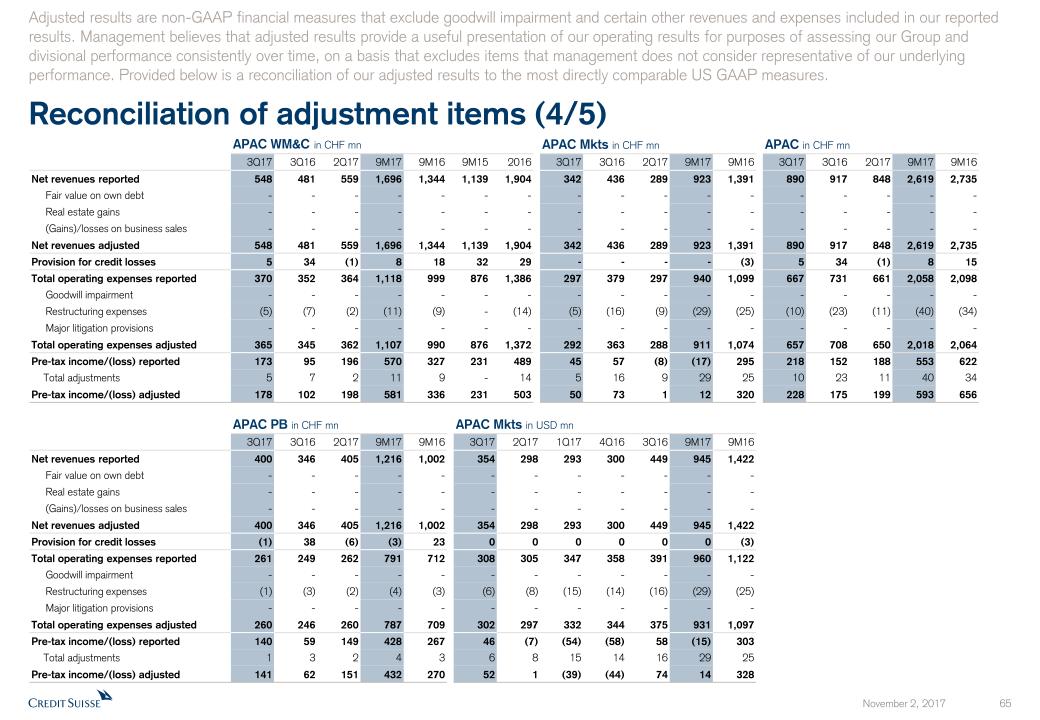
Reconciliation of adjustment items (4/5) Adjusted results are non-GAAP financial measures that exclude goodwill impairment and certain other revenues and expenses included in our reported results. Management believes that adjusted results provide a useful presentation of our operating results for purposes of assessing our Group and divisional performance consistently over time, on a basis that excludes items that management does not consider representative of our underlying performance. Provided below is a reconciliation of our adjusted results to the most directly comparable US GAAP measures. APAC PB in CHF mn APAC Mkts in USD mn 3Q17 3Q16 2Q17 9M17 9M16 3Q17 2Q17 1Q17 4Q16 3Q16 9M17 9M16 Net revenues reported 400 346 405 1,216 1,002 354 298 293 300 449 945 1,422 Fair value on own debt - - - - - - - - - - - - Real estate gains - - - - - - - - - - - - (Gains)/losses on business sales - - - - - - - - - - - - Net revenues adjusted 400 346 405 1,216 1,002 354 298 293 300 449 945 1,422 Provision for credit losses (1) 38 (6) (3) 23 0 0 0 0 0 0 (3) Total operating expenses reported 261 249 262 791 712 308 305 347 358 391 960 1,122 Goodwill impairment - - - - - - - - - - - - Restructuring expenses (1) (3) (2) (4) (3) (6) (8) (15) (14) (16) (29) (25) Major litigation provisions - - - - - - - - - - - - Total operating expenses adjusted 260 246 260 787 709 302 297 332 344 375 931 1,097 Pre-tax income/(loss) reported 140 59 149 428 267 46 (7) (54) (58) 58 (15) 303 Total adjustments 1 3 2 4 3 6 8 15 14 16 29 25 Pre-tax income/(loss) adjusted 141 62 151 432 270 52 1 (39) (44) 74 14 328 APAC WM&C in CHF mn APAC Mkts in CHF mn APAC in CHF mn 3Q17 3Q16 2Q17 9M17 9M16 9M15 2016 3Q17 3Q16 2Q17 9M17 9M16 3Q17 3Q16 2Q17 9M17 9M16 Net revenues reported 548 481 559 1,696 1,344 1,139 1,904 342 436 289 923 1,391 890 917 848 2,619 2,735 Fair value on own debt - - - - - - - - - - - - - - - - - Real estate gains - - - - - - - - - - - - - - - - - (Gains)/losses on business sales - - - - - - - - - - - - - - - - - Net revenues adjusted 548 481 559 1,696 1,344 1,139 1,904 342 436 289 923 1,391 890 917 848 2,619 2,735 Provision for credit losses 5 34 (1) 8 18 32 29 - - - - (3) 5 34 (1) 8 15 Total operating expenses reported 370 352 364 1,118 999 876 1,386 297 379 297 940 1,099 667 731 661 2,058 2,098 Goodwill impairment - - - - - - - - - - - - - - - - - Restructuring expenses (5) (7) (2) (11) (9) - (14) (5) (16) (9) (29) (25) (10) (23) (11) (40) (34) Major litigation provisions - - - - - - - - - - - - - - - - - Total operating expenses adjusted 365 345 362 1,107 990 876 1,372 292 363 288 911 1,074 657 708 650 2,018 2,064 Pre-tax income/(loss) reported 173 95 196 570 327 231 489 45 57 (8) (17) 295 218 152 188 553 622 Total adjustments 5 7 2 11 9 - 14 5 16 9 29 25 10 23 11 40 34 Pre-tax income/(loss) adjusted 178 102 198 581 336 231 503 50 73 1 12 320 228 175 199 593 656
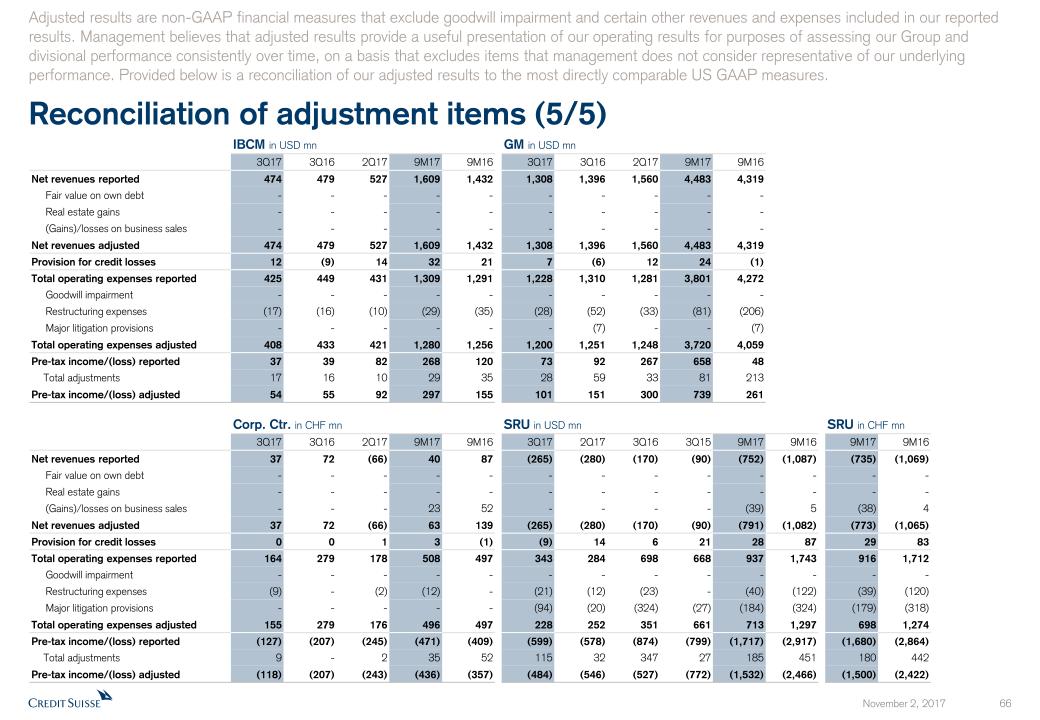
Reconciliation of adjustment items (5/5) Adjusted results are non-GAAP financial measures that exclude goodwill impairment and certain other revenues and expenses included in our reported results. Management believes that adjusted results provide a useful presentation of our operating results for purposes of assessing our Group and divisional performance consistently over time, on a basis that excludes items that management does not consider representative of our underlying performance. Provided below is a reconciliation of our adjusted results to the most directly comparable US GAAP measures. IBCM in USD mn GM in USD mn 3Q17 3Q16 2Q17 9M17 9M16 3Q17 3Q16 2Q17 9M17 9M16 Net revenues reported 474 479 527 1,609 1,432 1,308 1,396 1,560 4,483 4,319 Fair value on own debt - - - - - - - - - - Real estate gains - - - - - - - - - - (Gains)/losses on business sales - - - - - - - - - - Net revenues adjusted 474 479 527 1,609 1,432 1,308 1,396 1,560 4,483 4,319 Provision for credit losses 12 (9) 14 32 21 7 (6) 12 24 (1) Total operating expenses reported 425 449 431 1,309 1,291 1,228 1,310 1,281 3,801 4,272 Goodwill impairment - - - - - - - - - - Restructuring expenses (17) (16) (10) (29) (35) (28) (52) (33) (81) (206) Major litigation provisions - - - - - - (7) - - (7) Total operating expenses adjusted 408 433 421 1,280 1,256 1,200 1,251 1,248 3,720 4,059 Pre-tax income/(loss) reported 37 39 82 268 120 73 92 267 658 48 Total adjustments 17 16 10 29 35 28 59 33 81 213 Pre-tax income/(loss) adjusted 54 55 92 297 155 101 151 300 739 261 Corp. Ctr. in CHF mn SRU in USD mn SRU in CHF mn 3Q17 3Q16 2Q17 9M17 9M16 3Q17 2Q17 3Q16 3Q15 9M17 9M16 9M17 9M16 Net revenues reported 37 72 (66) 40 87 (265) (280) (170) (90) (752) (1,087) (735) (1,069) Fair value on own debt - - - - - - - - - - - - - Real estate gains - - - - - - - - - - - - - (Gains)/losses on business sales - - - 23 52 - - - - (39) 5 (38) 4 Net revenues adjusted 37 72 (66) 63 139 (265) (280) (170) (90) (791) (1,082) (773) (1,065) Provision for credit losses 0 0 1 3 (1) (9) 14 6 21 28 87 29 83 Total operating expenses reported 164 279 178 508 497 343 284 698 668 937 1,743 916 1,712 Goodwill impairment - - - - - - - - - - - - - Restructuring expenses (9) - (2) (12) - (21) (12) (23) - (40) (122) (39) (120) Major litigation provisions - - - - - (94) (20) (324) (27) (184) (324) (179) (318) Total operating expenses adjusted 155 279 176 496 497 228 252 351 661 713 1,297 698 1,274 Pre-tax income/(loss) reported (127) (207) (245) (471) (409) (599) (578) (874) (799) (1,717) (2,917) (1,680) (2,864) Total adjustments 9 - 2 35 52 115 32 347 27 185 451 180 442 Pre-tax income/(loss) adjusted (118) (207) (243) (436) (357) (484) (546) (527) (772) (1,532) (2,466) (1,500) (2,422)
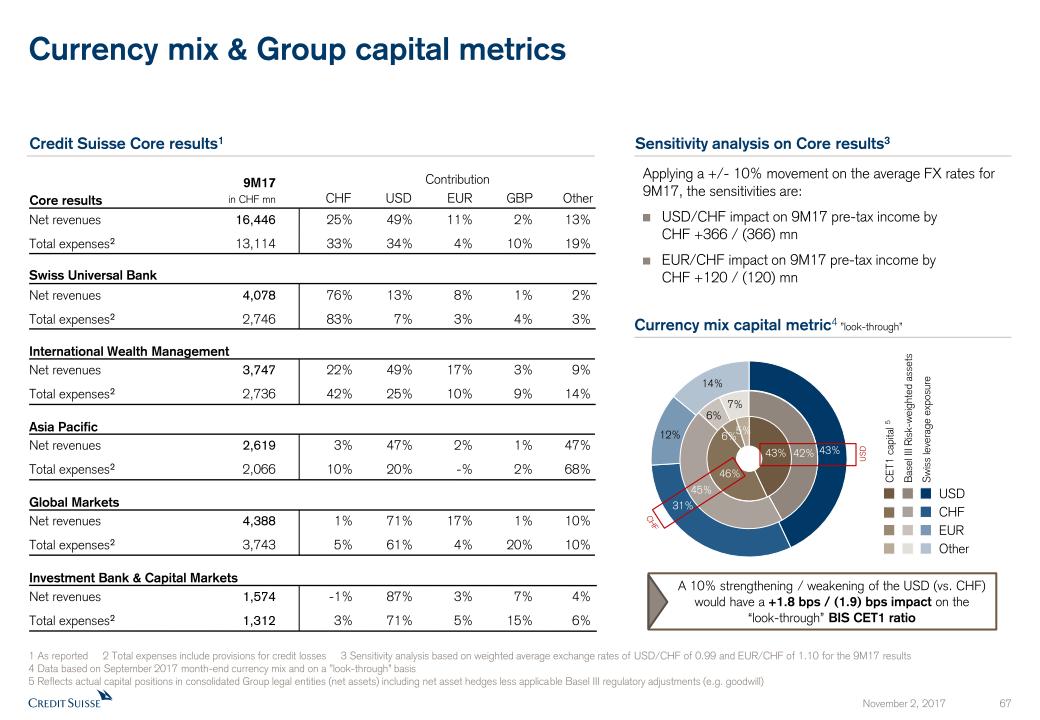
Currency mix & Group capital metrics Contribution Swiss Universal Bank International Wealth Management Asia Pacific Global Markets Investment Bank & Capital Markets Credit Suisse Core results1 Core results 9M17in CHF mn CHF USD EUR GBP Other Applying a +/- 10% movement on the average FX rates for 9M17, the sensitivities are:USD/CHF impact on 9M17 pre-tax income by CHF +366 / (366) mnEUR/CHF impact on 9M17 pre-tax income by CHF +120 / (120) mn Sensitivity analysis on Core results3 Net revenues 16,446 25% 49% 11% 2% 13%Total expenses2 13,114 33% 34% 4% 10% 19% Net revenues 4,078 76% 13% 8% 1% 2%Total expenses2 2,746 83% 7% 3% 4% 3% Net revenues 3,747 22% 49% 17% 3% 9%Total expenses2 2,736 42% 25% 10% 9% 14% Net revenues 2,619 3% 47% 2% 1% 47%Total expenses2 2,066 10% 20% -% 2% 68% Net revenues 4,388 1% 71% 17% 1% 10%Total expenses2 3,743 5% 61% 4% 20% 10% Net revenues 1,574 -1% 87% 3% 7% 4%Total expenses2 1,312 3% 71% 5% 15% 6% Currency mix capital metric4 ”look-through” A 10% strengthening / weakening of the USD (vs. CHF) would have a +1.8 bps / (1.9) bps impact on the“look-through” BIS CET1 ratio Basel III Risk-weighted assets Swiss leverage exposure CHF EUR Other USD USD CET1 capital 5 1 As reported 2 Total expenses include provisions for credit losses 3 Sensitivity analysis based on weighted average exchange rates of USD/CHF of 0.99 and EUR/CHF of 1.10 for the 9M17 results 4 Data based on September 2017 month-end currency mix and on a ”look-through” basis 5 Reflects actual capital positions in consolidated Group legal entities (net assets) including net asset hedges less applicable Basel III regulatory adjustments (e.g. goodwill) CHF
Notes Throughout the presentation rounding differences may occurUnless otherwise noted, all CET1 ratio, Tier-1 leverage ratio, risk-weighted assets and leverage exposure figures shown in this presentation are as of the end of the respective period and on a “look-through” basisGross and net margins are shown in basis pointsGross margin = adj. net revenues annualized / average AuM; net margin = adj. pre-tax income annualized / average AuMMandates penetration reflects advisory and discretionary mandates as percentage of total AuM General notes Adj. = Adjusted; AM = Asset Management; APAC = Asia Pacific; AuM = Assets under Management; BIS = Bank for International Settlements; bps = basis points; CET1 = Common Equity Tier 1; C&IC = Corporate & Institutional Clients; Corp. Ctr. = Corporate Center; DCM = Debt Capital Markets; EAM = External Asset Manager; ECM = Equity Capital Markets; EMEA = Europe, Middle East & Africa; FINMA = Swiss Financial Market Supervisory Authority; FX = Foreign Exchange; GM = Global Markets; IBCM = Investment Banking & Capital Markets; IWM = International Wealth Management; IPO = Initial Public Offering; JV = Joint Venture; M&A = Mergers & Acquisitions; Mkts = Markets; NNA = Net new assets; Op Risk = Operational Risk; PB = Private Banking; PC = Private Clients; perf. = performance; PTI = Pre-tax income; QoQ = Quarter-on-quarter; RM = Relationship Manager(s); RMBS = Residential Mortgage Backed Securities; RoRC = Return on Regulatory Capital; RWA = Risk-weighted assets; SMG = Systematic Market-Making Group; SRU = Strategic Resolution Unit; SUB = Swiss Universal Bank; UHNW(I) = Ultra High Net Worth Individuals; VaR = Value-at-Risk; WM&C = Wealth Management & Connected; YoY = Year on year; YTD = Year to Date Abbreviations Specific notes * “Adjusted operating expenses at constant FX rates” and “adjusted non-compensation operating expenses at constant FX rates” include adjustments as made in all our disclosures for restructuring expenses, major litigation expenses and a goodwill impairment taken in 4Q15 as well as adjustments for certain accounting changes (which had not been in place at the launch of the cost savings program), debit valuation adjustments (DVA) related volatility and for FX, applying the following main currency exchange rates for1Q15: USD/CHF 0.9465, EUR/CHF 1.0482, GBP/CHF 1.4296, 2Q15: USD/CHF 0.9383, EUR/CHF 1.0418, GBP/CHF 1.4497,3Q15: USD/CHF 0.9684, EUR/CHF 1.0787, GBP/CHF 1.4891, 4Q15: USD/CHF 1.0010, EUR/CHF 1.0851, GBP/CHF 1.5123,1Q16: USD/CHF 0.9928, EUR/CHF 1.0941, GBP/CHF 1.4060, 2Q16: USD/CHF 0.9756, EUR/CHF 1.0956, GBP/CHF 1.3845,3Q16: USD/CHF 0.9728, EUR/CHF 1.0882, GBP/CHF 1.2764, 4Q16: USD/CHF 1.0101, EUR/CHF 1.0798, GBP/CHF 1.2451,1Q17: USD/CHF 0.9963, EUR/CHF 1.0670, GBP/CHF 1.2464, 2Q17: USD/CHF 0.9736, EUR/CHF 1.0881, GBP/CHF 1.2603,3Q17: USD/CHF 0.9645, EUR/CHF 1.1413, GBP/CHF 1.2695.These currency exchange rates are unweighted, i.e. a straight line average of monthly rates. We apply this calculation consistently for the periods under review. Adjusted non-compensation expenses are adjusted operating expenses excluding compensation and benefits. To calculate adjusted non-compensation expenses at constant FX rates, we subtract compensation and benefits (adjusted at constant FX rates in the manner described above) from adjusted operating expenses at constant FX rates.† Regulatory capital is calculated as the worst of 10% of RWA and 3.5% of leverage exposure. Return on regulatory capital is calculated using (adjusted) income after tax and assumes a tax rate of 30% and capital allocated based on the worst of 10% of average RWA and 3.5% of average leverage exposure. For the Markets business within the APAC division and for the Global Markets and Investment Banking & Capital Markets divisions, return on regulatory capital is based on US dollar denominated numbers. Adjusted return on regulatory capital is calculated using adjusted results, applying the same methodology to calculate return on regulatory capital.

Pursuant to the requirements of the Securities Exchange Act of 1934, the registrant has duly caused this report to be signed on its behalf by the undersigned, thereunto duly authorized.
CREDIT SUISSE GROUP AG and CREDIT SUISSE AG
(Registrants)
Date: November 2, 2017
By:
/s/ Tidjane Thiam
Tidjane Thiam
Chief Executive Officer
By:
/s/ David R. Mathers
David R. Mathers
Chief Financial Officer