UNITED STATES
SECURITIES AND EXCHANGE COMMISSION
Washington, D.C. 20549
______________
Form 6-K/A
______________
REPORT OF FOREIGN PRIVATE ISSUER PURSUANT TO RULE 13a-16 OR 15d-16
UNDER THE SECURITIES EXCHANGE ACT OF 1934
December 31, 2018
Commission File Number 001-15244
CREDIT SUISSE GROUP AG
(Translation of registrant’s name into English)
Paradeplatz 8, 8001 Zurich, Switzerland
(Address of principal executive office)
______________
Commission File Number 001-33434
CREDIT SUISSE AG
(Translation of registrant’s name into English)
Paradeplatz 8, 8001 Zurich, Switzerland
(Address of principal executive office)
______________
Indicate by check mark whether the registrant files or will file annual reports under cover of Form 20-F or Form 40-F.
| Form 20-F ☒ | Form 40-F ☐ |
Indicate by check mark if the registrant is submitting the Form 6-K in paper as permitted by Regulation S-T Rule 101(b)(1):
Note: Regulation S-T Rule 101(b)(1) only permits the submission in paper of a Form 6-K if submitted solely to provide an attached annual report to security holders.
Indicate by check mark if the registrant is submitting the Form 6-K in paper as permitted by Regulation S-T Rule 101(b)(7):
Note: Regulation S-T Rule 101(b)(7) only permits the submission in paper of a Form 6-K if submitted to furnish a report or other document that the registrant foreign private issuer must furnish and make public under the laws of the jurisdiction in which the registrant is incorporated, domiciled or legally organized (the registrant’s “home country”), or under the rules of the home country exchange on which the registrant’s securities are traded, as long as the report or other document is not a press release, is not required to be and has not been distributed to the registrant’s security holders, and, if discussing a material event, has already been the subject of a Form 6-K submission or other Commission filing on EDGAR.
This report on Form 6-K/A is a resubmission of the Investor Day materials furnished on December 12, 2018 (accession number 0001370368-18-000055) with Appendix tables repeated behind one of the sets of slides and to correct two typographical errors.
CREDIT SUISSE GROUP AG Paradeplatz 8 P.O. Box CH-8070 Zurich Switzerland Telephone +41 844 33 88 44 Fax +41 44 333 88 77 media.relations@credit-suisse.com |
Media release
Investor Day 2018
Credit Suisse continues to deliver on its strategy and to generate profitable growth
- On track to successfully complete three-year restructuring
- Confirms RoTE targets for 2019 and 2020
- For 2019, Board of Directors approves buyback of Credit Suisse Group AG ordinary shares of up to CHF 1.5 billion; anticipates buyback of at least CHF 1 billion, subject to market and economic conditions
- For 2020, we expect a similar share buyback programme
- Plans to increase ordinary dividend by at least 5% per annum from 2019 onwards
Zurich, December 12, 2018 – We will today update investors and analysts on the progress we have made as we near the completion of our three-year restructuring programme. We will highlight how we intend to continue to increase our returns beyond 2018, having successfully executed a deep and necessary restructuring.
Driving profitable, compliant growth and increasing returns
As our restructuring draws to a close, we have delivered on the strategic objectives we set ourselves three years ago. We have achieved profitable growth in our Wealth Management-related businesses1, significantly reduced our adjusted* operating cost base, beyond our target and sustainably lowered our break-even point. We have also right-sized and de-risked our Global Markets activities while maintaining delivery of high quality products and services to clients from that part of the business.
The adjusted* profits from our Core businesses2, are expected to be more than 20% higher in 2018 than they were in 2015, with a significantly reduced level of risk3, down 41% in 9M18 compared to 2015.
We have transformed and significantly strengthened our capital position and reallocated more capital to areas and regions of growth, such as our Wealth Management-related and Investment Banking & Capital Markets (IBCM) businesses. This has led to a significant shift in our business mix, while reducing overall capital consumption.
The successful implementation of our Wealth Management strategy has allowed us to continuously grow Wealth Management-related revenues since the third quarter of 2015. We have delivered CHF 1.4 billion of revenue growth across our three Wealth Management-related divisions, where revenue grew at a CAGR, over the period, of 16% for APAC Wealth Management & Connected (APAC WM&C), 6% for International Wealth Management (IWM) and 1% for our Swiss Universal Bank (SUB). IBCM has also delivered revenue growth (7% CAGR in US dollars), outpacing peers since 20154.
We have focused on growing the quality of our Wealth Management-related revenues by increasing our stable, more resilient net interest income and recurring revenue stream. Since 4Q15, we have consistently driven adjusted* returns on regulatory capital higher across these businesses.
| Media Release | |
December 12, 2018 Page 2/11 |
At the same time we have transformed our cost base, allowing greater operational leverage across our key businesses. We will today confirm that for 2018, we expect the adjusted* operating cost base to be CHF16.9 billion, below our CHF 17 billion target, and that we expect to deliver CHF 4.3 billion in net savings since the end of 2015, surpassing the cumulative more than CHF 4.2 billion target we set three years ago.
We have also dealt effectively with our key legacy issues through the Strategic Resolution Unit (SRU), which we set up three years ago and which we today confirm will be closed on schedule at the end of the year.
We have made great strides in strengthening our risks, compliance framework and controls to ensure that the bank can focus on supporting and delivering high quality business worldwide. In parallel, we have driven improvements in our culture which have contributed to achieving the sustainable, compliant and profitable growth we have seen since 2016.
Our strategy to be a leading wealth manager with strong investment banking capabilities has proven to be the right one, as, since adopting the strategy in 2015, global wealth has continued to grow5, and global sales and trading revenue pools have continued to decline6. Following a balanced approach between mature and emerging markets in Wealth Management, focusing on Ultra-High Net Worth (UHNW) and entrepreneur clients, and serving both their private wealth and business financial needs with an integrated model, has driven significant revenue growth.
Longer term macro trends and current market environment
We are now well positioned to take advantage of a number of macro trends which we believe will remain supportive over the long term. We believe that global wealth will continue to grow, with UHNW and HNW being the most attractive segments in wealth management, particularly where entrepreneurs require an integrated approach, leveraging our full suite of investment banking solutions to meet their private wealth and business needs. Both emerging and mature markets have attractive growth dynamics, while industry-wide trading revenue pools continue to decline.
Given the current challenging market environment, we will also specifically address, today, how our businesses are positioned to withstand economic and other headwinds. We will use part of the Investor Day to highlight our resilience in a number of key areas, notably the impact of markets on our Assets under Management, Global Markets’ credit exposure, Global Markets’ revenue prospects, and credit risk in our loan book, as well as the strengthening of our compliance and risk frameworks.
| Media Release | |
December 12, 2018 Page 3/11 |
Delivering value to our shareholders post-restructuring
The actions we have taken and the progress we have made over the last three years position us well to continue to profitably grow our Wealth Management-related businesses, driving Group returns and shareholder value higher, while strengthening our resilience in a challenging market environment.
Group Return on Tangible Equity target 10-11% in 2019 11-12% in 2020 12%+ beyond 2020 | Share buyback programme Up to CHF 1.5bn approved with at least CHF 1bn expected in 2019; expecting a similar programme in 2020 |
- Intention to distribute at least 50% of net income for 2019 and 2020
- For 2019, the Board of Directors of Credit Suisse Group AG has approved a buyback of Credit Suisse Group AG ordinary shares of up to CHF 1.5 billion
- We anticipate a share buyback of at least CHF 1 billion in 2019, subject to market and economic conditions
- For 2020, we expect a similar share buyback programme7, subject to approval by the Board of Directors
- In addition, we expect to generate a sustainable ordinary dividend for shareholders, and to increase the ordinary dividend by at least 5% per annum; the Board of Directors will propose to shareholders at the Annual General Meeting on April 26, 2019 the amount of the dividend per share for distribution for the financial year 2018
Tidjane Thiam, CEO of Credit Suisse Group AG, said:
“The actions taken during the restructuring mean that the bank is now more resilient in the face of market turbulence. Those actions included dealing with legacy issues, reallocating capital towards our more stable, capital efficient and profitable Wealth Management businesses, and away from our more volatile Markets activities. In parallel, we have strengthened the bank’s capital position, reduced our risks, and invested in strengthening our regulatory and compliance functions.
Throughout the restructuring we have been able to generate both significant revenue growth and significant cost savings, achieving positive operating leverage. We expect our adjusted* profits for our Core businesses this year to be more than 20% above our 2015 profits, with 41% less risk3. We are confident that going forward, growth in Wealth Management, primarily through more stable revenue sources of net interest income and recurring fees, will allow us to continue to drive Group returns higher.
As a result of known actions that are under our control, we expect to achieve at least a 10% RoTE in 2019.
| Media Release | |
December 12, 2018 Page 4/11 |
We expect that in 2019 our shareholders will start to see the benefits of the restructuring through the return of capital announced today and growing tangible book value per share.”
Full year 2018 estimates
The following is a list of performance indicators and our estimates for year-end 2018:
- Reported pre-tax income between CHF 3.2 – 3.4 billion
- Adjusted* operating cost base of CHF 16.9 billion; CHF 4.3 billion in net savings since the end of 2015
- Strategic Resolution Unit achieved capital targets ahead of plan; since 3Q15, we expect to have:
- Released USD 5.8 billion of allocated capital8
- Reduced leverage exposure by 84%
- Reduced RWA (excluding operational risk9) by 86%
- SRU to be closed at end-2018; adjusted* pre-tax loss of SRU approximately USD 1.3 billion
- APAC Markets net revenues approximately 8-10% lower than prior year
- Return on tangible equity expected to be approximately 6%
Outlook
At our third quarter results on November 1, we said that despite continued geopolitical tensions surrounding global trade and the potential impact of central bank monetary policy changes, we believe the outlook for global economic growth over the long term remains positive, albeit at a lower level. We believe we are well positioned to continue to capitalize in the long term on the opportunities created by the growth in global wealth.
Persistent challenging market conditions have not changed our positive long-term outlook; however we are mindful of the short term headwinds. Many of the actions that we have taken over the past three years - dealing with our legacy issues, lowering our break-even point, strengthening our capital position and significantly reducing our risk - were aimed at increasing our resilience in adverse conditions. Therefore, as we move into 2019, despite global geopolitical and macro-economic uncertainties, we believe we remain well positioned.
Ends
Contact
Adam Gishen, Investor Relations
Tel: +41 44 333 71 49
investor.relations@credit-suisse.com
James Quinn, Corporate Communications
Tel : +41 844 33 88 44
media.relations@credit-suisse.com
The Investor Day media release and all presentation slides will be available to download from 07:00 CET at: https://www.credit-suisse.com/investorday.
| Media Release | |
December 12, 2018 Page 5/11 |
Note: As indicated, many of our references to estimates, ambitions, objectives and targets for revenues, operating expenses, operating cost base, pre-tax income and return on regulatory capital are on an adjusted* basis. These adjusted* numbers, return on tangible equity and tangible book value per share are non-GAAP financial measures. A reconciliation of the estimates, ambitions, objectives and targets to the nearest GAAP measures is unavailable without unreasonable efforts. Adjusted* results exclude goodwill impairment, major litigation charges, real estate gains and other revenue and expense items included in our reported results, which are unavailable on a prospective basis. Tangible equity excludes goodwill and other intangible assets from shareholders’ equity, all of which are unavailable on a prospective basis. Tangible book value per share excludes the impact of any dividends paid during the performance period, share buybacks, own credit movements, foreign exchange rate movements and pension-related impacts, all of which are unavailable on a prospective basis.
Webcast details
| Date | Wednesday, December 12, 2018 |
| Time | 08:30 GMT / 09:30 CET |
| Webcast | Audio webcast online at: https://www.credit-suisse.com/investorday |
| Telephone | Switzerland: +41 445 807 121 Europe: +44 2071 928 522 US: +1 917 677 75 38 Conference passcode: 1504800 # |
| Note | Due to the large volume of callers expected we strongly recommend that you dial in approximately 20 minutes before the start of the presentation. Please enter the Direct Event Passcode when prompted. You will be joined automatically to the conference. Due to regional restrictions some participants may receive operator assistance when joining this conference call and will not be automatically connected. |
| Documents | All documentation will be available on https://www.credit-suisse.com/investorday |
| Playbacks | A replay of the telephone conference will be available approximately four hours after the event. |
| Media Release | |
December 12, 2018 Page 6/11 |
The results of Credit Suisse Group comprise the results of our six reporting segments, including the Strategic Resolution Unit, and the Corporate Center. Core results exclude revenues and expenses from our Strategic Resolution Unit.
As we move ahead with the implementation of our strategy, it is important to measure the progress achieved by our underlying business performance in a consistent manner. To achieve this, we will focus our analyses on adjusted results.
Adjusted results referred to in this Media Release are non-GAAP financial measures that exclude goodwill impairment and certain other revenues and expenses included in our reported results. Management believes that adjusted results provide a useful presentation of our operating results for the purposes of assessing our Group and divisional performance consistently over time, on a basis that excludes items that management does not consider representative of our underlying performance. We will report quarterly on the same adjusted* basis for the Group, Core and divisional results until end-2018 to allow investors to monitor our progress in implementing our strategy, given the material restructuring charges we are likely to incur and other items which are not reflective of our underlying performance but are to be borne in the interim period.
Abbreviations
APAC – Asia Pacific; CEO – Chief Executive Officer; CET1 – Common Equity Tier 1; ECM – Equity Capital Markets; EMEA – Europe, the Middle East and Africa; GM – Global Markets; IBCM – Investment Banking & Capital Markets; ITS – International Trading Services; IWM – International Wealth Management; M&A – Mergers and Acquisitions; RWA – Risk Weighted Assets; SRU – Strategic Resolution Unit; SUB – Swiss Universal Bank; UHNWI – Ultra-High-Net-Worth Individual; WM&C – Wealth Management & Connected
Footnotes
1 This includes wealth management activities across Swiss Universal Bank (SUB), International Wealth Management (IWM) and APAC Wealth Management & Connected (APAC WM&C)
2 This includes our five operating divisions and the Corporate Center
3 9M18 Trading book average one-day, 98% risk management VaR in CHF compared to 2015
4 Source: Peer financial reports and filings. Underwriting and advisory revenue growth since 2015 based on LTM 9M18 reported revenues compared to FY15
5 Source: McKinsey Wealth Pools 2018. Excludes life and pension assets
6 Source: Coalition as of November 14, 2018; Total Industry Revenue Pools according to Credit Suisse’s Global Markets taxonomy
7 Subject to market and economic conditions; the level of the share buyback for 2020 will be set in light of our capital plans and subject to prevailing market conditions but is expected to be in line with our intention to distribute at least 50% of net income
8 Allocated capital calculated as 3.5% of leverage exposure
9 Excludes Operational Risk RWA of USD 20 billion in each of 3Q15, 3Q16 and 3Q17 and USD 11 billion in 3Q18
| Media Release | |
December 12, 2018 Page 7/11 |
Important information about this Media Release
Information referenced in this Media Release, whether via website links or otherwise, is not incorporated into this Media Release.
Our cost savings programme, until the end of 2018, is measured using an adjusted operating cost base at constant 2015 FX rates. “Adjusted operating cost base at constant FX rates” includes adjustments as made in all our disclosures for restructuring expenses, major litigation expenses, expenses related to business sales and a goodwill impairment taken in 4Q15 as well as adjustments for debit valuation adjustments (DVA) related volatility, FX and for certain accounting changes (which had not been in place at the launch of the cost savings programme). Adjustments for certain accounting changes have been restated to reflect grossed up expenses in the Corporate Center and, starting in 1Q18, also include adjustments for changes from ASU 2014-09 “Revenue from Contracts with Customers”, which is described further in our 1Q18, 2Q18 and 3Q18 Financial Reports. Adjustments for FX apply unweighted currency exchange rates, i.e., a straight line average of monthly rates, consistently for the periods under review. Starting from 1Q19, we intend to express our operating cost base at constant 2018 FX rates and to adjust for significant litigation costs, expenses related to business and real estate sales, as well as DVA related volatility, but not for restructuring expenses and certain accounting changes. Adjustments for FX will continue to apply unweighted currency exchange rates.
Regulatory capital is calculated as the worst of 10% of RWA and 3.5% of leverage exposure. Return on regulatory capital is calculated using (adjusted) income / (loss) after tax and assumes a tax rate of 30% and capital allocated based on the worst of 10% of average RWA and 3.5% of average leverage exposure. For the Markets business within the APAC division and for the Global Markets and Investment Banking & Capital Markets divisions, return on regulatory capital is based on US dollar denominated numbers. Adjusted return on regulatory capital is calculated using adjusted results, applying the same methodology to calculate return on regulatory capital.
Return on tangible equity attributable to shareholders, a non-GAAP financial measure, is based on tangible equity attributable to shareholders, which is calculated by deducting goodwill and other intangible assets from total equity attributable to shareholders as presented in our balance sheet. Management believes that the return on tangible equity attributable to shareholders is meaningful as it allows consistent measurement of the performance of businesses without regard to whether the businesses were acquired.
Tangible book value per share, a non-GAAP financial measure, excludes the impact of any dividends paid during the performance period, share buybacks, own credit movements, foreign exchange rate movements and pension-related impacts.
We may not achieve all of the expected benefits of our strategic initiatives. Factors beyond our control, including but not limited to the market and economic conditions, changes in laws, rules or regulations and other challenges discussed in our public filings, could limit our ability to achieve some or all of the expected benefits of these initiatives.
In particular, the terms “Estimate”, “Illustrative”, “Ambition”, “Objective”, “Outlook” and “Goal” are not intended to be viewed as targets or projections, nor are they considered to be Key Performance Indicators. All such estimates, illustrations, ambitions, objectives, outlooks and goals are subject to a large number of inherent risks, assumptions and uncertainties, many of which are completely outside of our control. These risks, assumptions and uncertainties include, but are not limited to, general market conditions, market volatility, interest rate volatility and levels, global and regional economic
| Media Release | |
December 12, 2018 Page 8/11 |
conditions, political uncertainty, changes in tax policies, regulatory changes, changes in levels of client activity as a result of any of the foregoing and other factors. Accordingly, this information should not be relied on for any purpose. We do not intend to update these estimates, illustrations, ambitions, objectives, outlooks or goals.
In preparing this media release, management has made estimates and assumptions that affect the numbers presented. Actual results may differ. Annualized numbers do not take into account variations in operating results, seasonality and other factors and may not be indicative of actual, full-year results. Figures throughout this media release may also be subject to rounding adjustments. All opinions and views constitute judgments as of the date of writing without regard to the date on which the reader may receive or access the information. This information is subject to change at any time without notice and we do not intend to update this information.
As of January 1, 2013, Basel III was implemented in Switzerland along with the Swiss “Too Big to Fail” legislation and regulations thereunder (in each case, subject to certain phase-in periods). As of January 1, 2015, the Bank for International Settlements (BIS) leverage ratio framework, as issued by the Basel Committee on Banking Supervision (BCBS), was implemented in Switzerland by the Swiss Financial Market Supervisory Authority FINMA (FINMA). Our related disclosures are in accordance with our interpretation of such requirements, including relevant assumptions. Changes in the interpretation of these requirements in Switzerland or in any of our assumptions or estimates could result in different numbers from those shown in this media release.
Unless otherwise noted, leverage exposure is based on the BIS leverage ratio framework and consists of period-end balance sheet assets and prescribed regulatory adjustments. The look-through tier 1 leverage ratio and CET1 leverage ratio are calculated as look-through BIS tier 1 capital and CET1 capital, respectively, divided by period end leverage exposure. Swiss leverage ratios are measured on the same period-end basis as the leverage exposure for the BIS leverage ratio.
Margin calculations for APAC are aligned with the performance metrics of the Private Banking business and its related assets under management within the WM&C business in APAC. Assets under management and net new assets for APAC relate to the Private Banking business within the Wealth Management & Connected business.
Gross margin is calculated by dividing net revenues by average assets under management. Net margin is calculated by dividing income before taxes by average assets under management. Adjusted margins are calculated using adjusted results, applying the same methodology to calculate gross and net margin.
Mandate penetration reflects advisory and discretionary mandates volumes as a percentage of assets under management, excluding those from the external asset manager business.
References to Wealth Management mean SUB PC, IWM PB and APAC PB within WM&C or their combined results. References to Wealth Management-related mean SUB, IWM and APAC WM&C or their combined results.
References to global advisory and underwriting include global revenues from advisory, debt and equity underwriting generated across all divisions before cross-divisional revenue sharing agreements.
Generic references to profit and costs in this media release refer to pre-tax income and operating expenses, respectively.
| Media Release | |
December 12, 2018 Page 9/11 |
Investors and others should note that we announce material information (including quarterly earnings releases and financial reports) to the investing public using press releases, SEC and Swiss ad hoc filings, our website and public conference calls and webcasts. We intend to also use our Twitter account @creditsuisse (https://twitter.com/creditsuisse) to excerpt key messages from our public disclosures, including earnings releases. We may retweet such messages through certain of our regional Twitter accounts, including @csschweiz (https://twitter.com/csschweiz) and @csapac (https://twitter.com/csapac). Investors and others should take care to consider such abbreviated messages in the context of the disclosures from which they are excerpted. The information we post on these Twitter accounts is not a part of this Media Release.
In various tables, use of “–” indicates not meaningful or not applicable.
| Media Release | |
December 12, 2018 Page 10/11 |
Cautionary statement regarding forward-looking information
This document contains statements that constitute forward-looking statements. In addition, in the future we, and others on our behalf, may make statements that constitute forward-looking statements. Such forward-looking statements may include, without limitation, statements relating to the following:
- our plans, objectives, ambitions, targets or goals;
- our future economic performance or prospects;
- the potential effect on our future performance of certain contingencies; and
- assumptions underlying any such statements.
Words such as “believes,” “anticipates,” “expects,” “intends” and “plans” and similar expressions are intended to identify forward-looking statements but are not the exclusive means of identifying such statements. We do not intend to update these forward-looking statements.
By their very nature, forward-looking statements involve inherent risks and uncertainties, both general and specific, and risks exist that predictions, forecasts, projections and other outcomes described or implied in forward-looking statements will not be achieved. We caution you that a number of important factors could cause results to differ materially from the plans, objectives, ambitions, targets, expectations, estimates and intentions expressed in such forward-looking statements. These factors include:
- the ability to maintain sufficient liquidity and access capital markets;
- market volatility and interest rate fluctuations and developments affecting interest rate levels;
- the strength of the global economy in general and the strength of the economies of the countries in which we conduct our operations, in particular the risk of continued slow economic recovery or downturn in the US or other developed countries or in emerging markets in 2018 and beyond;
- the direct and indirect impacts of deterioration or slow recovery in residential and commercial real estate markets;
- adverse rating actions by credit rating agencies in respect of us, sovereign issuers, structured credit products or other credit-related exposures;
- the ability to achieve our strategic goals, including those related to cost efficiency, income/(loss) before taxes, capital ratios and return on regulatory capital, leverage exposure threshold, risk-weighted assets threshold, return on tangible equity and other targets, objectives and ambitions;
- the ability of counterparties to meet their obligations to us;
- the effects of, and changes in, fiscal, monetary, exchange rate, trade and tax policies, as well as currency fluctuations;
- political and social developments, including war, civil unrest or terrorist activity;
- the possibility of foreign exchange controls, expropriation, nationalization or confiscation of assets in countries in which we conduct our operations;
- operational factors such as systems failure, human error, or the failure to implement procedures properly;
- the risk of cyber attacks on our business or operations;
- actions taken by regulators with respect to our business and practices and possible resulting changes to our business organization, practices and policies in countries in which we conduct our operations;
- the effects of changes in laws, regulations or accounting or tax standards, policies or practices in countries in which we conduct our operations;
- the potential effects of proposed changes in our legal entity structure;
- competition or changes in our competitive position in geographic and business areas in which we conduct our operations;
| Media Release | |
December 12, 2018 Page 11/11 |
- the ability to retain and recruit qualified personnel;
- the ability to maintain our reputation and promote our brand;
- the ability to increase market share and control expenses;
- technological changes;
- the timely development and acceptance of our new products and services and the perceived overall value of these products and services by users;
- acquisitions, including the ability to integrate acquired businesses successfully, and divestitures, including the ability to sell non-core assets;
- the adverse resolution of litigation, regulatory proceedings and other contingencies; and
- other unforeseen or unexpected events and our success at managing these and the risks involved in the foregoing.
We caution you that the foregoing list of important factors is not exclusive. When evaluating forward-looking statements, you should carefully consider the foregoing factors and other uncertainties and events, including the information set forth in “Risk factors” in I – Information on the company in our Annual Report 2017.

Tidjane Thiam, Chief Executive OfficerDecember 12, 2018 Credit Suisse Investor Day 2018

Disclaimer 2 December 12, 2018 This material does not purport to contain all of the information that you may wish to consider. This material is not to be relied upon as such or used in substitution for the exercise of independent judgment.Cautionary statement regarding forward-looking statementsThis presentation contains forward-looking statements that involve inherent risks and uncertainties, and we might not be able to achieve the predictions, forecasts, projections and other outcomes we describe or imply in forward-looking statements. A number of important factors could cause results to differ materially from the plans, objectives, expectations, estimates and intentions we express in these forward-looking statements, including those we identify in "Risk factors” in our Annual Report on Form 20-F for the fiscal year ended December 31, 2017 and in the “Cautionary statement regarding forward-looking information" in our media release relating to Investor Day, published on December 12, 2018 and filed with the US Securities and Exchange Commission, and in other public filings and press releases. We do not intend to update these forward-looking statements. In particular, the terms “Estimate”, “Illustrative”, “Ambition”, “Objective”, “Outlook” and “Goal” are not intended to be viewed as targets or projections, nor are they considered to be Key Performance Indicators. All such estimates, illustrations, ambitions, objectives, outlooks and goals are subject to a large number of inherent risks, assumptions and uncertainties, many of which are completely outside of our control. These risks, assumptions and uncertainties include, but are not limited to, general market conditions, market volatility, interest rate volatility and levels, global and regional economic conditions, political uncertainty, changes in tax policies, regulatory changes, changes in levels of client activity as a result of any of the foregoing and other factors. Accordingly, this information should not be relied on for any purpose. We do not intend to update these estimates, illustrations, ambitions, objectives, outlooks or goals. We may not achieve the benefits of our strategic initiativesWe may not achieve all of the expected benefits of our strategic initiatives. Factors beyond our control, including but not limited to the market and economic conditions, changes in laws, rules or regulations and other challenges discussed in our public filings, could limit our ability to achieve some or all of the expected benefits of these initiatives. Estimates and assumptionsIn preparing this presentation, management has made estimates and assumptions that affect the numbers presented. Actual results may differ. Annualized numbers do not take account of variations in operating results, seasonality and other factors and may not be indicative of actual, full-year results. Figures throughout this presentation may also be subject to rounding adjustments. All opinions and views constitute judgments as of the date of writing without regard to the date on which the reader may receive or access the information. This information is subject to change at any time without notice and we do not intend to update this information. Statement regarding non-GAAP financial measuresThis presentation also contains non-GAAP financial measures, including adjusted results. Information needed to reconcile such non-GAAP financial measures to the most directly comparable measures under US GAAP can be found in this presentation in the Appendix, which is available on our website at www.credit-suisse.com. Many of our references to estimates, ambitions, objectives and targets for revenues, operating expenses, operating cost base, pre-tax income and return on regulatory capital are on an adjusted basis as well. These adjusted numbers, return on tangible equity and tangible book value per share are non-GAAP financial measures. A reconciliation of the estimates, ambitions, objectives and targets to the nearest GAAP measure is unavailable without unreasonable efforts. Adjusted results exclude goodwill impairment, major litigation charges, real estate gains and other revenue and expense items included in our reported results, which are unavailable on a prospective basis. Tangible equity excludes goodwill and other intangible assets from shareholders’ equity, all of which are unavailable on a prospective basis. Tangible book value per share excludes the impact of any dividends paid during the performance period, share buybacks, own credit movements, foreign exchange rate movements and pension-related impacts, all of which are unavailable on a prospective basis.Statement regarding capital, liquidity and leverageAs of January 1, 2013, Basel III was implemented in Switzerland along with the Swiss “Too Big to Fail” legislation and regulations thereunder (in each case, subject to certain phase-in periods). As of January 1, 2015, the Bank for International Settlements (BIS) leverage ratio framework, as issued by the Basel Committee on Banking Supervision (BCBS), was implemented in Switzerland by FINMA. Our related disclosures are in accordance with our interpretation of such requirements, including relevant assumptions. Changes in the interpretation of these requirements in Switzerland or in any of our assumptions or estimates could result in different numbers from those shown in this presentation. Unless otherwise noted, leverage exposure is based on the BIS leverage ratio framework and consists of period-end balance sheet assets and prescribed regulatory adjustments. The look-through tier 1 leverage ratio and CET1 leverage ratio are calculated as look-through BIS tier 1 capital and CET1 capital, respectively, divided by period-end leverage exposure. Swiss leverage ratios are measured on the same period-end basis as the leverage exposure for the BIS leverage ratio.SourcesCertain material in this presentation has been prepared by Credit Suisse on the basis of publicly available information, internally developed data and other third-party sources believed to be reliable. Credit Suisse has not sought to independently verify information obtained from public and third-party sources and makes no representations or warranties as to accuracy, completeness or reliability of such information.
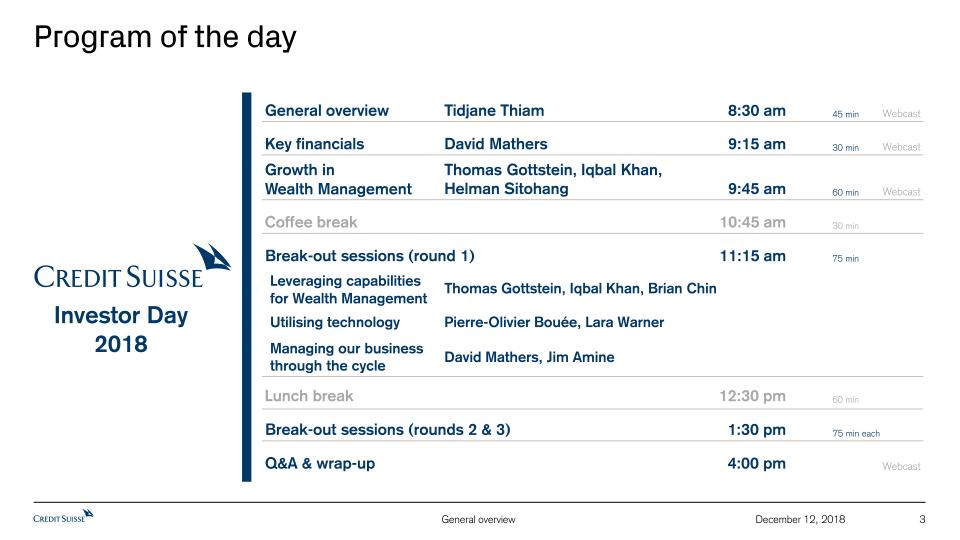
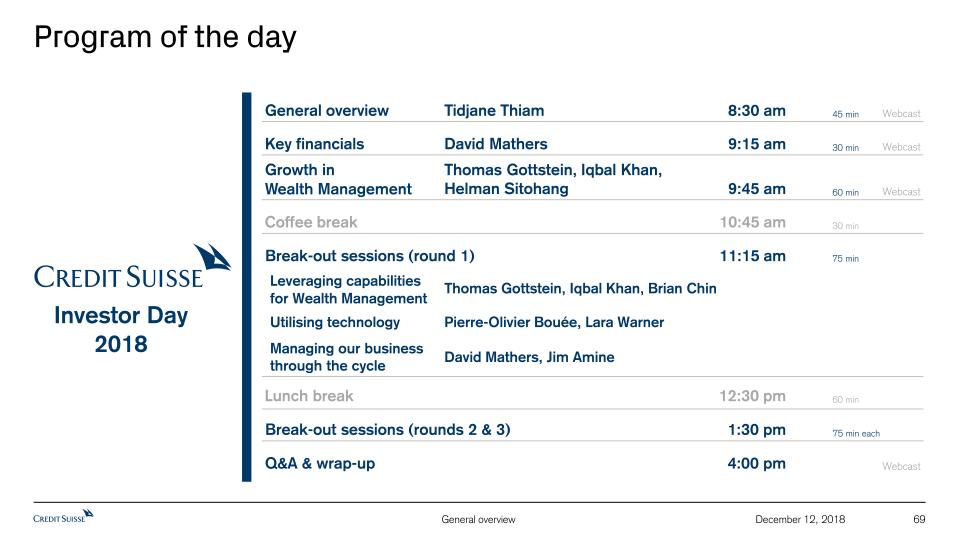
3 December 12, 2018 Program of the day Investor Day 2018 General overview Webcast 8:30 am 45 min Tidjane Thiam Coffee break 10:45 am 30 min Lunch break 12:30 pm 60 min Growth in Wealth Management Webcast 9:45 am 60 min Thomas Gottstein, Iqbal Khan,Helman Sitohang Break-out sessions (rounds 2 & 3) 1:30 pm Leveraging capabilities for Wealth Management Thomas Gottstein, Iqbal Khan, Brian Chin David Mathers, Jim Amine Managing our business through the cycle Pierre-Olivier Bouée, Lara Warner Utilising technology Key financials Webcast 9:15 am 30 min David Mathers Q&A & wrap-up Webcast 4:00 pm Break-out sessions (round 1) 11:15 am 75 min 75 min each
The macro trends 2 Sustainable and profitable growth 1 Agenda 4 December 12, 2018 2018 and beyond 3
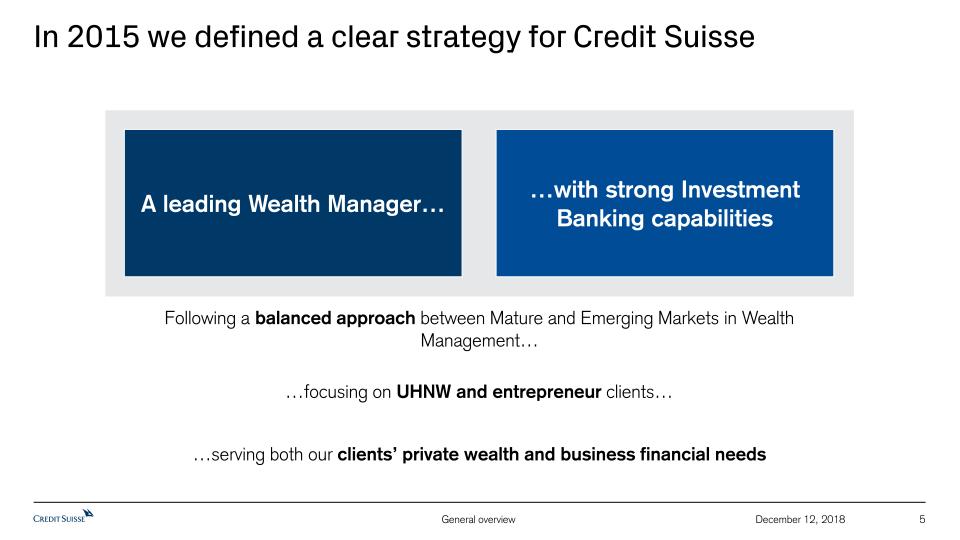
5 December 12, 2018 In 2015 we defined a clear strategy for Credit Suisse A leading Wealth Manager… Following a balanced approach between Mature and Emerging Markets in Wealth Management… …with strong Investment Banking capabilities …focusing on UHNW and entrepreneur clients… …serving both our clients’ private wealth and business financial needs

6 December 12, 2018 Global wealth has nearly doubled over the last 10 years Personal financial assetsof the wealthy (USD >1 mn)1in USD tn +6% CAGR2017-2022E CAGR+6% CAGR+6% 1 Source: McKinsey Wealth Pools 2018. Excludes life and pension assets
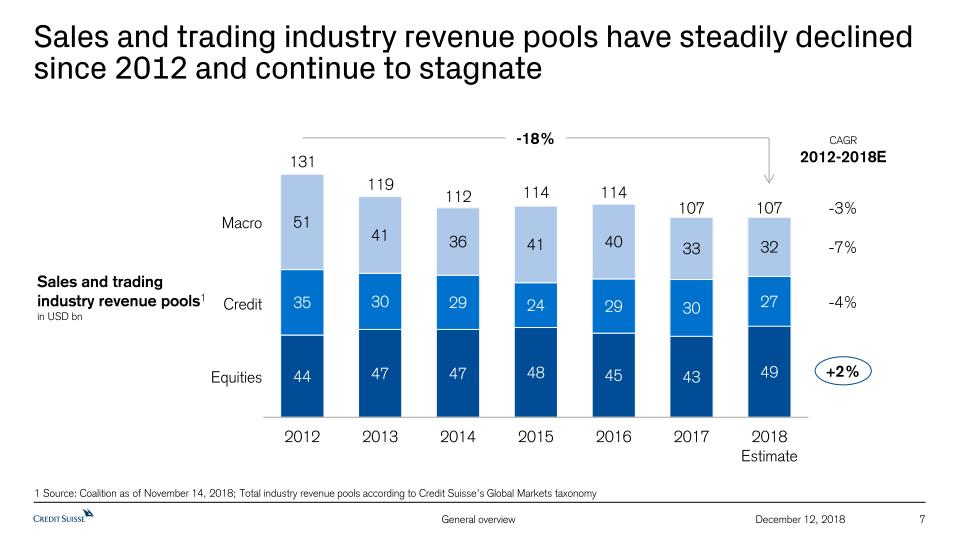
7 December 12, 2018 Sales and trading industry revenue pools have steadily declined since 2012 and continue to stagnate Sales and trading industry revenue pools1in USD bn 1 Source: Coalition as of November 14, 2018; Total industry revenue pools according to Credit Suisse’s Global Markets taxonomy -18% -4% -7% -3% Macro Credit Equities 131 119 112 114 114 107 107 +2% CAGR2012-2018E
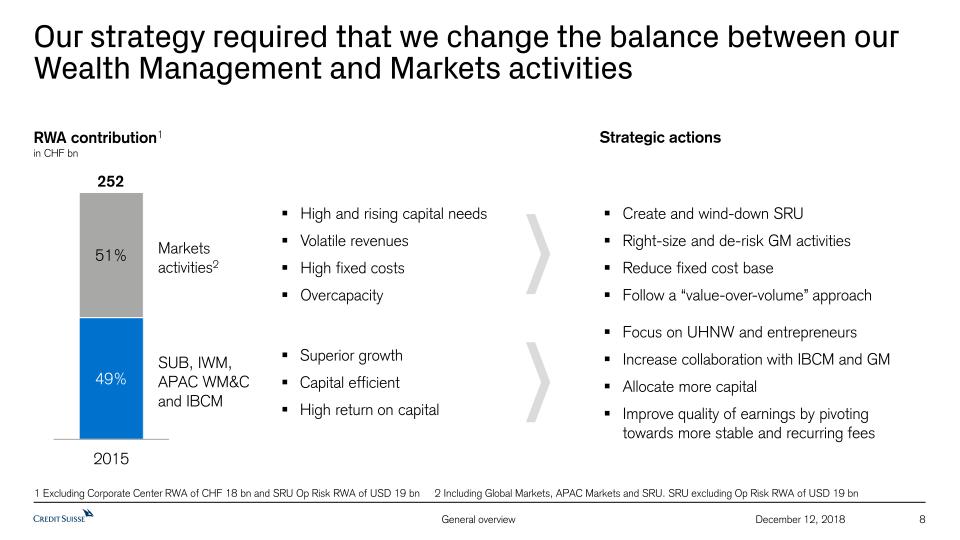
8 December 12, 2018 Our strategy required that we change the balance between our Wealth Management and Markets activities 252 1 Excluding Corporate Center RWA of CHF 18 bn and SRU Op Risk RWA of USD 19 bn 2 Including Global Markets, APAC Markets and SRU. SRU excluding Op Risk RWA of USD 19 bn RWA contribution1in CHF bn Strategic actions SUB, IWM, APAC WM&C and IBCM Superior growthCapital efficientHigh return on capital Focus on UHNW and entrepreneursIncrease collaboration with IBCM and GMAllocate more capitalImprove quality of earnings by pivotingtowards more stable and recurring fees Marketsactivities2 High and rising capital needsVolatile revenuesHigh fixed costsOvercapacity Create and wind-down SRURight-size and de-risk GM activitiesReduce fixed cost baseFollow a “value-over-volume” approach
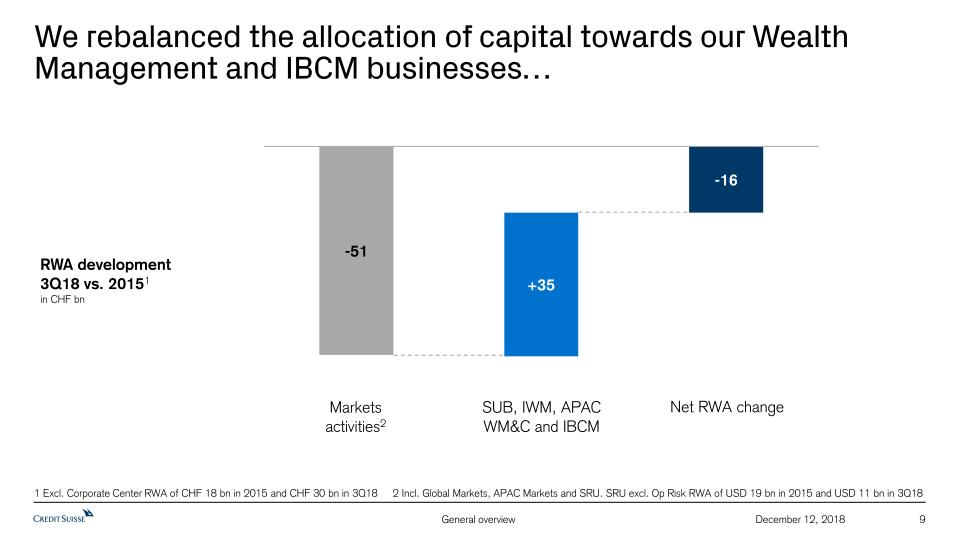
We rebalanced the allocation of capital towards our Wealth Management and IBCM businesses… 9 December 12, 2018 RWA development3Q18 vs. 20151in CHF bn 1 Excl. Corporate Center RWA of CHF 18 bn in 2015 and CHF 30 bn in 3Q18 2 Incl. Global Markets, APAC Markets and SRU. SRU excl. Op Risk RWA of USD 19 bn in 2015 and USD 11 bn in 3Q18 SUB, IWM, APAC WM&C and IBCM Marketsactivities2 Net RWA change
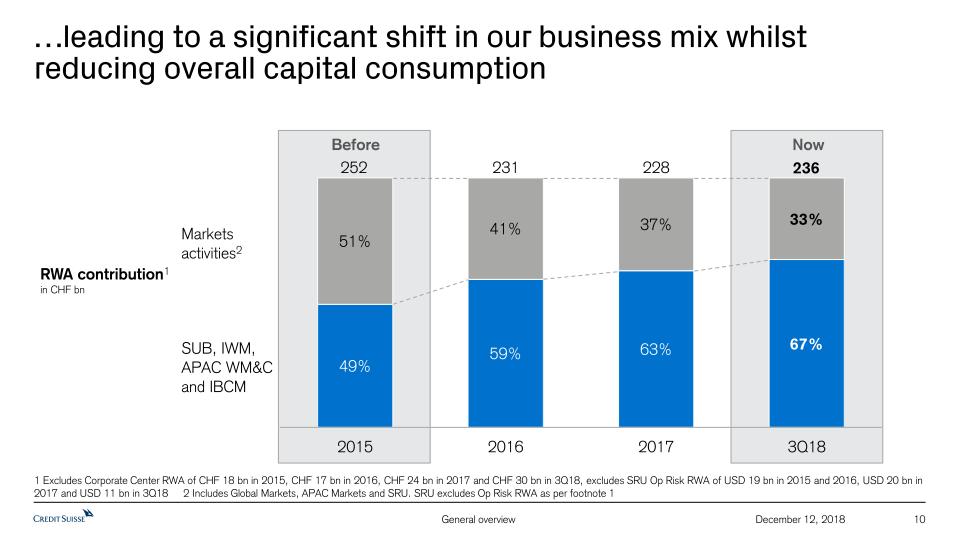
…leading to a significant shift in our business mix whilst reducing overall capital consumption 10 December 12, 2018 RWA contribution1in CHF bn SUB, IWM,APAC WM&Cand IBCM Marketsactivities2 252 228 231 236 Before Now 1 Excludes Corporate Center RWA of CHF 18 bn in 2015, CHF 17 bn in 2016, CHF 24 bn in 2017 and CHF 30 bn in 3Q18, excludes SRU Op Risk RWA of USD 19 bn in 2015 and 2016, USD 20 bn in 2017 and USD 11 bn in 3Q18 2 Includes Global Markets, APAC Markets and SRU. SRU excludes Op Risk RWA as per footnote 1
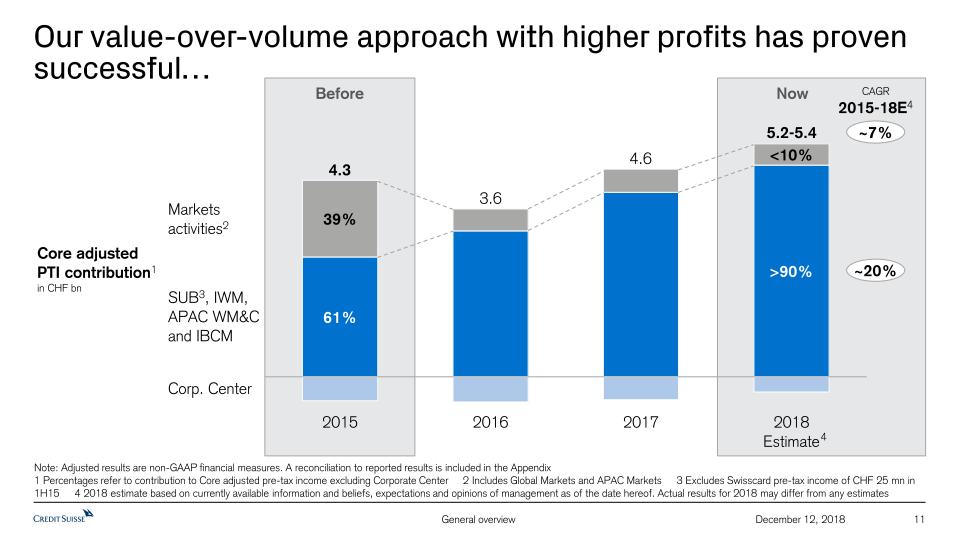
Our value-over-volume approach with higher profits has proven successful… Note: Adjusted results are non-GAAP financial measures. A reconciliation to reported results is included in the Appendix1 Percentages refer to contribution to Core adjusted pre-tax income excluding Corporate Center 2 Includes Global Markets and APAC Markets 3 Excludes Swisscard pre-tax income of CHF 25 mn in 1H15 4 2018 estimate based on currently available information and beliefs, expectations and opinions of management as of the date hereof. Actual results for 2018 may differ from any estimates 11 December 12, 2018 4.3 5.2-5.4 4.6 3.6 SUB3, IWM,APAC WM&Cand IBCM Marketsactivities2 Before Now Corp. Center 4 Core adjustedPTI contribution1in CHF bn CAGR2015-18E4 ~7% ~20%
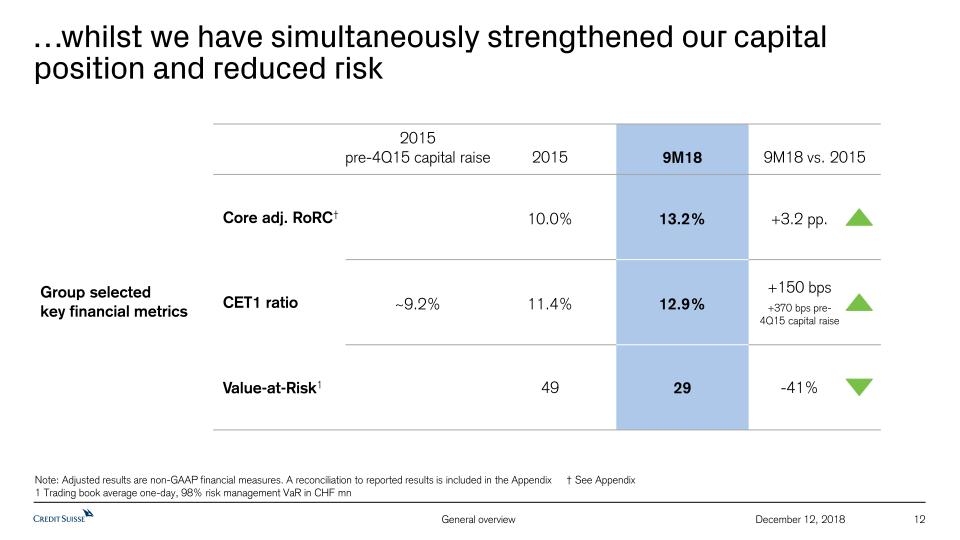
12 December 12, 2018 …whilst we have simultaneously strengthened our capital position and reduced risk Note: Adjusted results are non-GAAP financial measures. A reconciliation to reported results is included in the Appendix † See Appendix1 Trading book average one-day, 98% risk management VaR in CHF mn 2015 9M18 vs. 2015 10.0% +3.2 pp. 11.4% +150 bps+370 bps pre-4Q15 capital raise 49 -41% 9M18 13.2% 12.9% 29 Core adj. RoRC† CET1 ratio Value-at-Risk1 2015pre-4Q15 capital raise ~9.2% Group selectedkey financial metrics
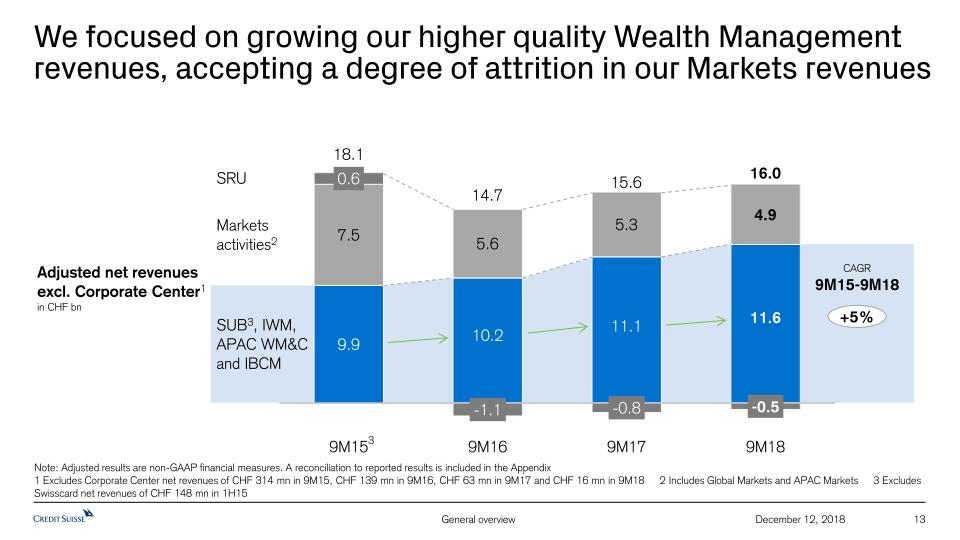
13 December 12, 2018 We focused on growing our higher quality Wealth Management revenues, accepting a degree of attrition in our Markets revenues Note: Adjusted results are non-GAAP financial measures. A reconciliation to reported results is included in the Appendix1 Excludes Corporate Center net revenues of CHF 314 mn in 9M15, CHF 139 mn in 9M16, CHF 63 mn in 9M17 and CHF 16 mn in 9M18 2 Includes Global Markets and APAC Markets 3 Excludes Swisscard net revenues of CHF 148 mn in 1H15 Adjusted net revenues excl. Corporate Center1in CHF bn 14.7 18.1 15.6 16.0 3 14.7 18.1 15.6 16.0 3 Marketsactivities2 SRU +5% 14.7 18.1 15.6 16.0 3 CAGR9M18 vs. 9M15 SUB3, IWM, APAC WM&C and IBCM 14.7 18.1 15.6 16.0 3 SUB3, IWM, APAC WM&C and IBCM Marketsactivities2 SRU +5% CAGR9M15-9M18
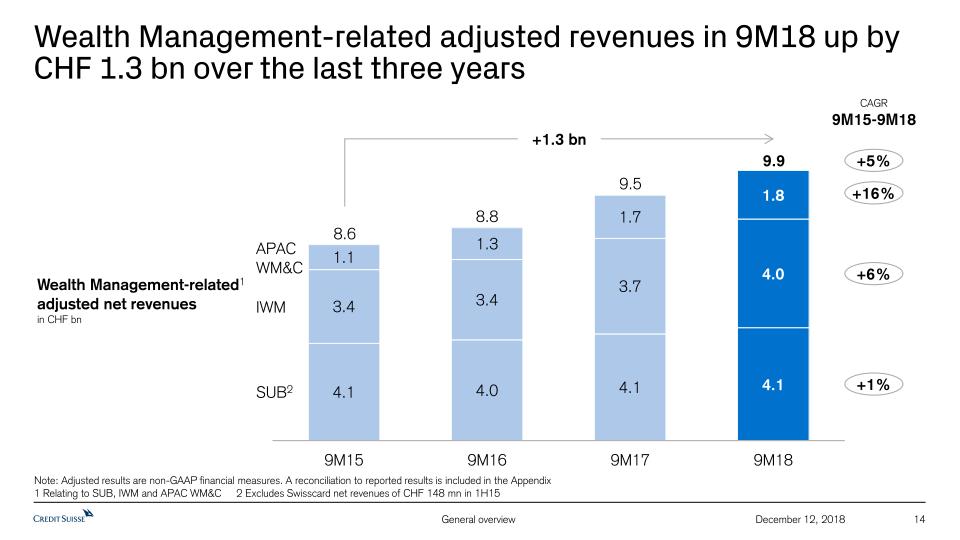
Wealth Management-related adjusted revenues in 9M18 up by CHF 1.3 bn over the last three years SUB2 IWM APAC WM&C CAGR9M15-9M18 +1% +6% Wealth Management-related1adjusted net revenuesin CHF bn Note: Adjusted results are non-GAAP financial measures. A reconciliation to reported results is included in the Appendix1 Relating to SUB, IWM and APAC WM&C 2 Excludes Swisscard net revenues of CHF 148 mn in 1H15 +1.3 bn 9.9 9.5 8.6 8.8 +5% +16% 14 December 12, 2018
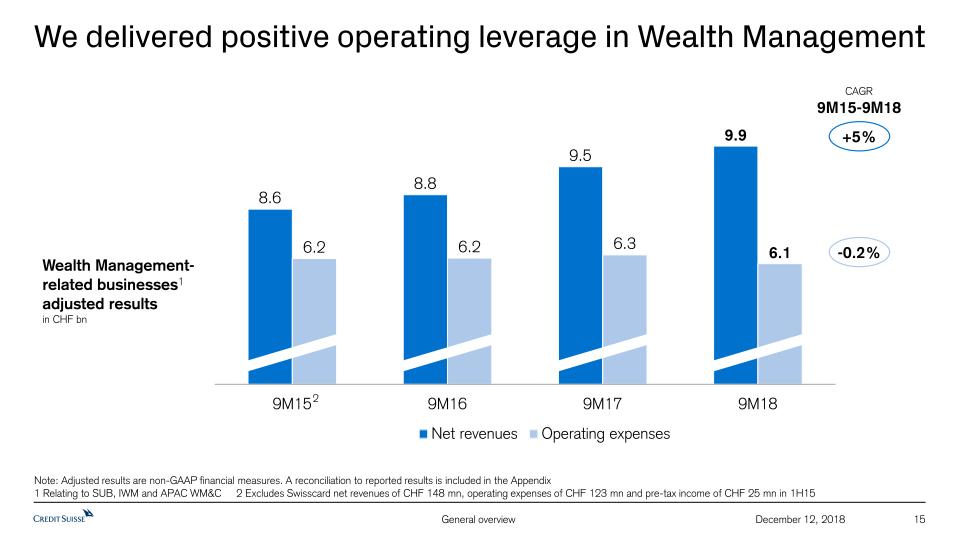
15 December 12, 2018 Note: Adjusted results are non-GAAP financial measures. A reconciliation to reported results is included in the Appendix1 Relating to SUB, IWM and APAC WM&C 2 Excludes Swisscard net revenues of CHF 148 mn, operating expenses of CHF 123 mn and pre-tax income of CHF 25 mn in 1H15 Wealth Management-related businesses1 adjusted resultsin CHF bn +5% CAGR9M15-9M18 -0.2% We delivered positive operating leverage in Wealth Management 2
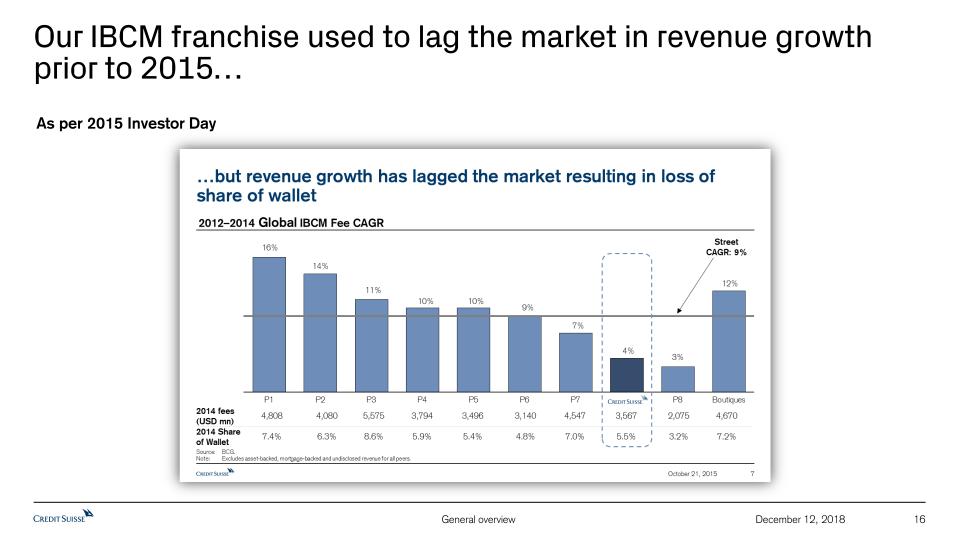
16 December 12, 2018 Our IBCM franchise used to lag the market in revenue growth prior to 2015… As per 2015 Investor Day
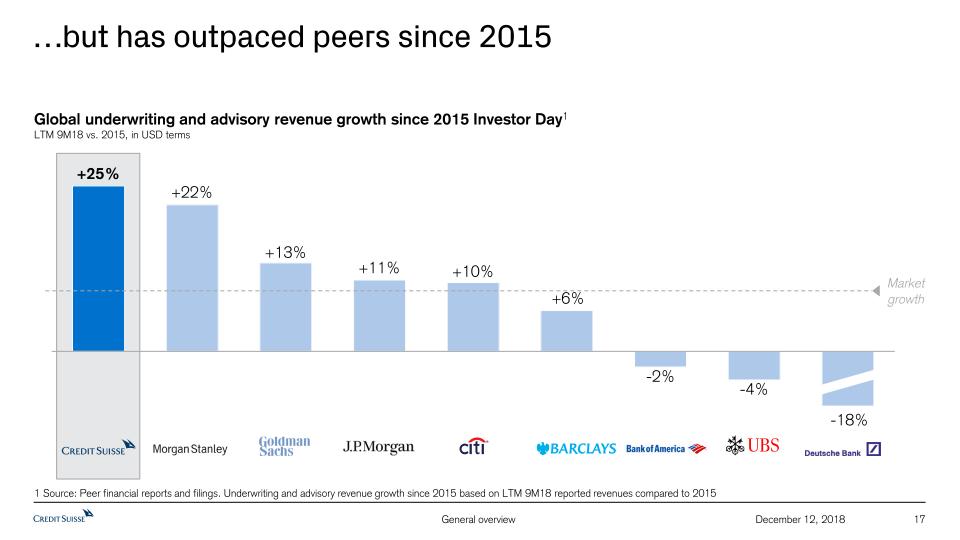
17 December 12, 2018 …but has outpaced peers since 2015 Market growth -18% 1 Source: Peer financial reports and filings. Underwriting and advisory revenue growth since 2015 based on LTM 9M18 reported revenues compared to 2015 Global underwriting and advisory revenue growth since 2015 Investor Day1LTM 9M18 vs. 2015, in USD terms
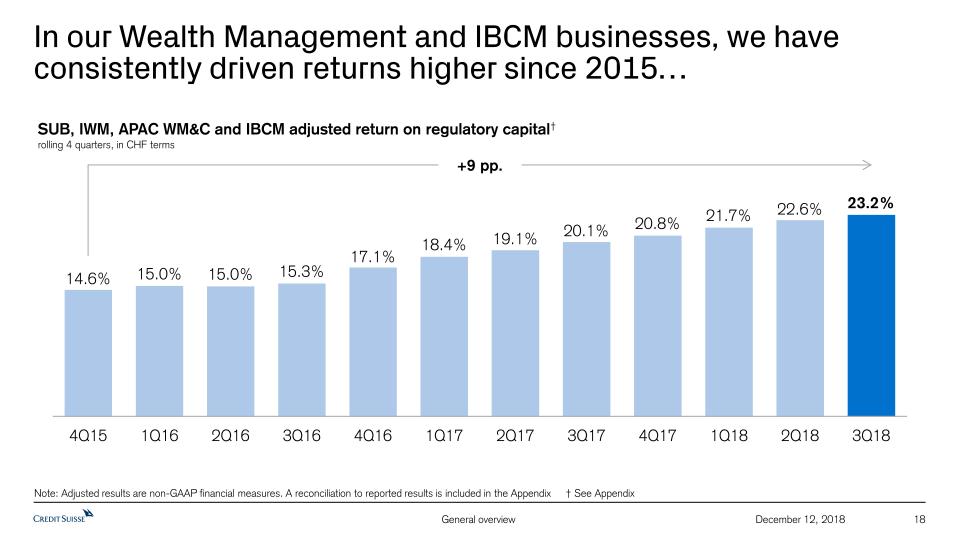
18 December 12, 2018 In our Wealth Management and IBCM businesses, we have consistently driven returns higher since 2015… +9 pp. Note: Adjusted results are non-GAAP financial measures. A reconciliation to reported results is included in the Appendix † See Appendix SUB, IWM, APAC WM&C and IBCM adjusted return on regulatory capital†rolling 4 quarters, in CHF terms
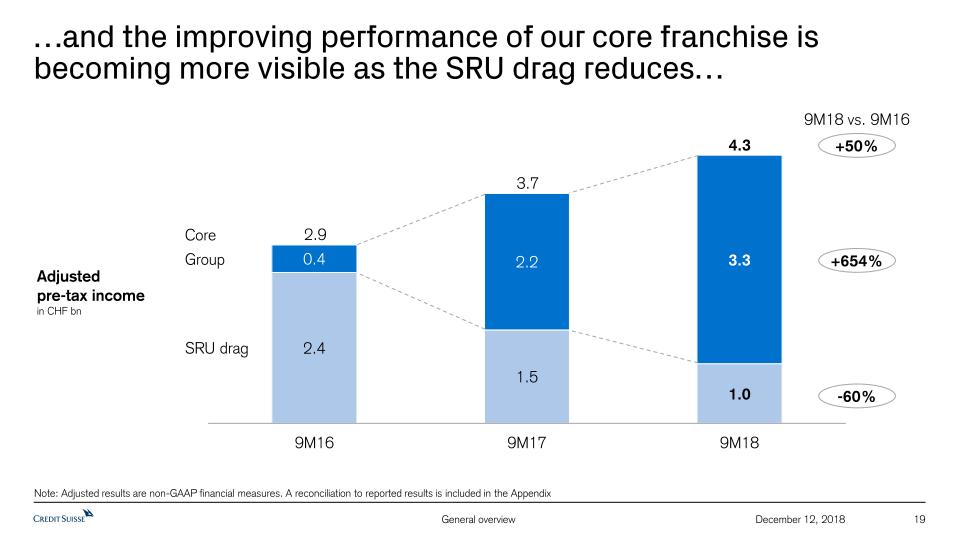
19 December 12, 2018 …and the improving performance of our core franchise is becoming more visible as the SRU drag reduces… Note: Adjusted results are non-GAAP financial measures. A reconciliation to reported results is included in the Appendix 2.9 3.7 4.3 9M18 vs. 9M16 +50% +654% -60% Core SRU drag Group Adjustedpre-tax incomein CHF bn
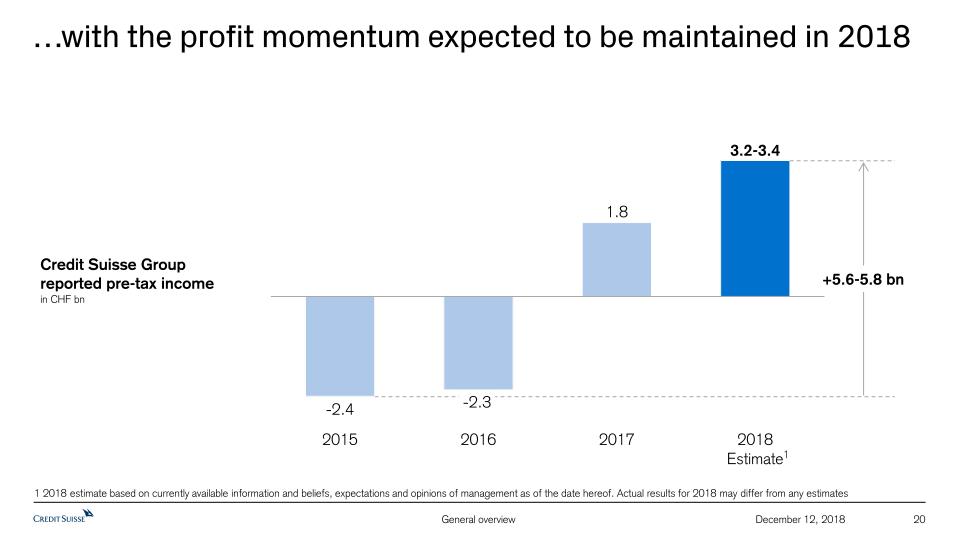
…with the profit momentum expected to be maintained in 2018 20 December 12, 2018 Credit Suisse Groupreported pre-tax incomein CHF bn 1 2018 estimate based on currently available information and beliefs, expectations and opinions of management as of the date hereof. Actual results for 2018 may differ from any estimates 1 +5.6-5.8 bn
The macro trends 2 Sustainable and profitable growth 1 Agenda 21 December 12, 2018 2018 and beyond 3
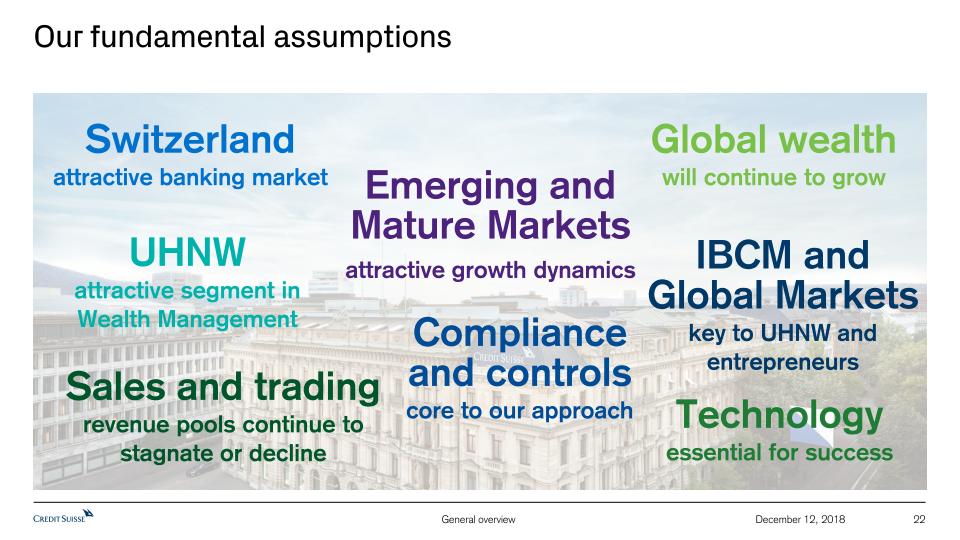
22 December 12, 2018 Our fundamental assumptions Switzerlandattractive banking market Global wealthwill continue to grow Sales and trading revenue pools continue to stagnate or decline IBCM and Global Marketskey to UHNW and entrepreneurs UHNWattractive segment inWealth Management Technologyessential for success Emerging and Mature Marketsattractive growth dynamics Compliance and controlscore to our approach
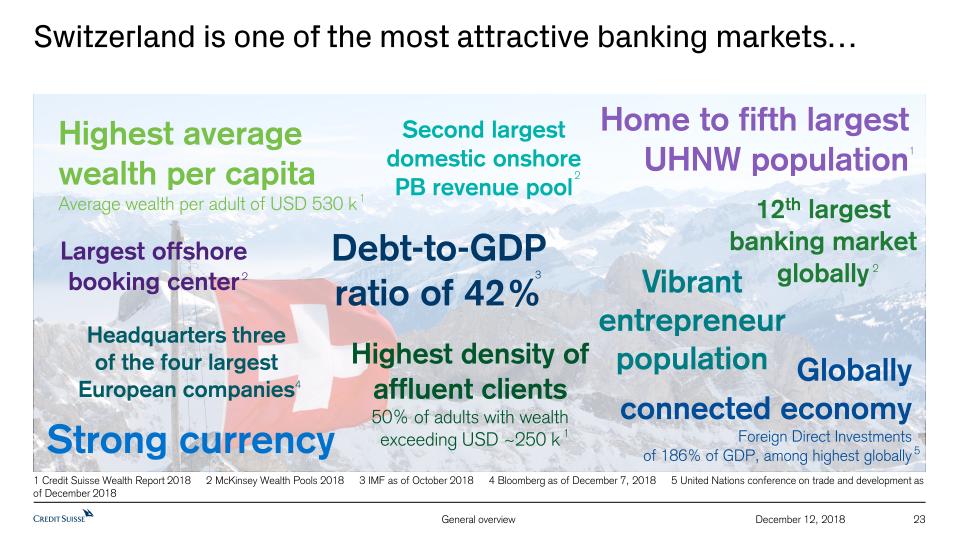
1 Credit Suisse Wealth Report 2018 2 McKinsey Wealth Pools 2018 3 IMF as of October 2018 4 Bloomberg as of December 7, 2018 5 United Nations conference on trade and development as of December 2018 23 December 12, 2018 Switzerland is one of the most attractive banking markets… Strong currency Highest averagewealth per capitaAverage wealth per adult of USD 530 k Highest density of affluent clients50% of adults with wealthexceeding USD ~250 k Second largest domestic onshore PB revenue pool 12th largest banking market globally Debt-to-GDP ratio of 42% Headquarters threeof the four largest European companies Largest offshore booking center 1 1 2 2 2 3 4 Vibrant entrepreneur population Globally connected economyForeign Direct Investmentsof 186% of GDP, among highest globally Home to fifth largest UHNW population 1 5
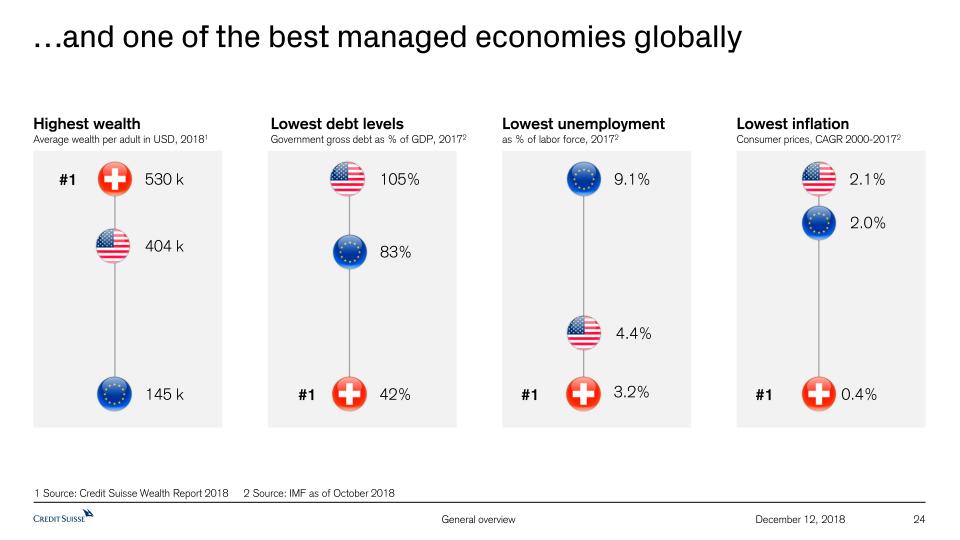
24 December 12, 2018 …and one of the best managed economies globally Highest wealthAverage wealth per adult in USD, 20181 Lowest debt levelsGovernment gross debt as % of GDP, 20172 Lowest unemploymentas % of labor force, 20172 Lowest inflationConsumer prices, CAGR 2000-20172 1 Source: Credit Suisse Wealth Report 2018 2 Source: IMF as of October 2018 530 k 404 k 145 k 83% 4.4% 0.4% 2.1% 2.0% #1 42% 105% 9.1% 3.2% #1 #1 #1
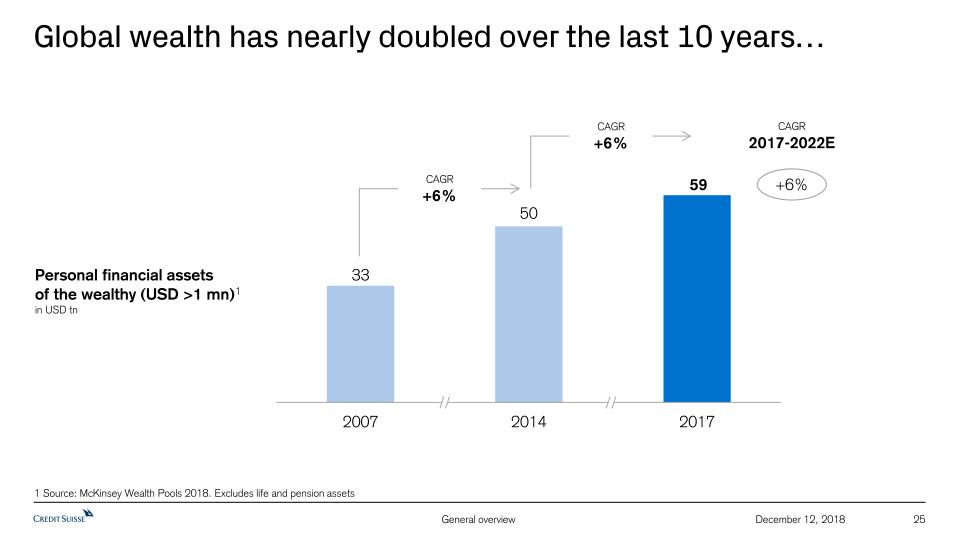
25 December 12, 2018 Global wealth has nearly doubled over the last 10 years… Personal financial assetsof the wealthy (USD >1 mn)1in USD tn +6% CAGR2017-2022E CAGR+6% CAGR+6% 1 Source: McKinsey Wealth Pools 2018. Excludes life and pension assets
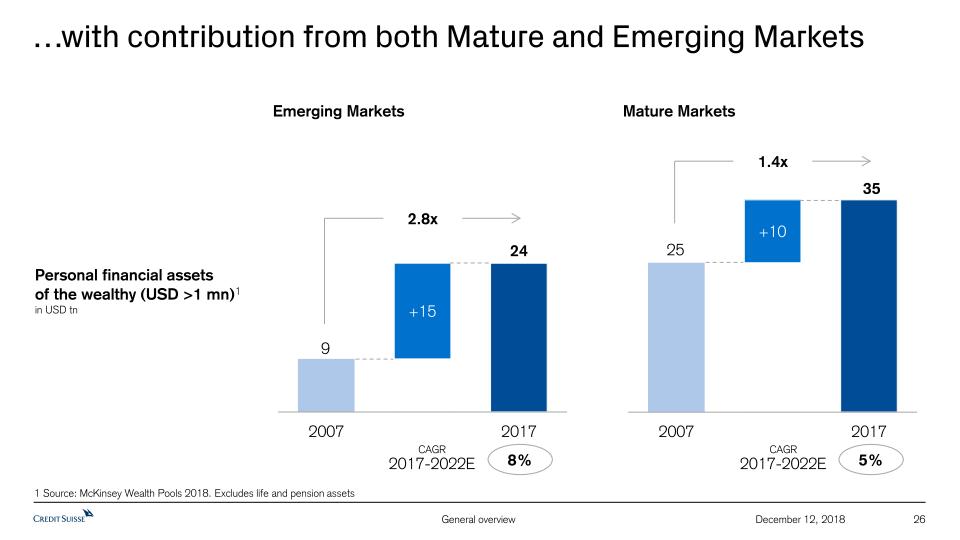
26 December 12, 2018 …with contribution from both Mature and Emerging Markets 1.4x Mature Markets Emerging Markets 2.8x 8% CAGR2017-2022E 5% CAGR2017-2022E Personal financial assetsof the wealthy (USD >1 mn)1in USD tn 1 Source: McKinsey Wealth Pools 2018. Excludes life and pension assets
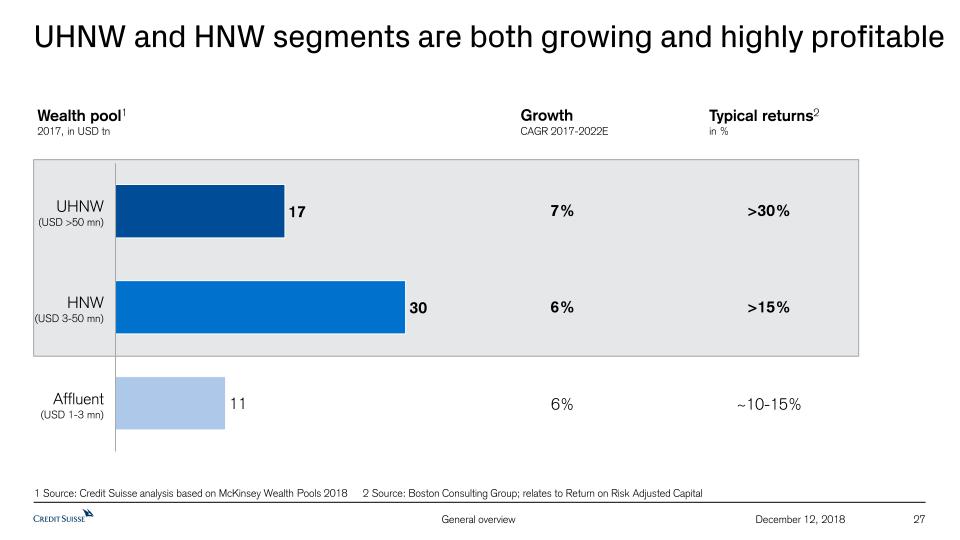
27 December 12, 2018 UHNW and HNW segments are both growing and highly profitable ~10-15% >15% Wealth pool12017, in USD tn Typical returns2 in % >30% GrowthCAGR 2017-2022E 6% 6% 7% 1 Source: Credit Suisse analysis based on McKinsey Wealth Pools 2018 2 Source: Boston Consulting Group; relates to Return on Risk Adjusted Capital UHNW(USD >50 mn) HNW(USD 3-50 mn) Affluent(USD 1-3 mn)
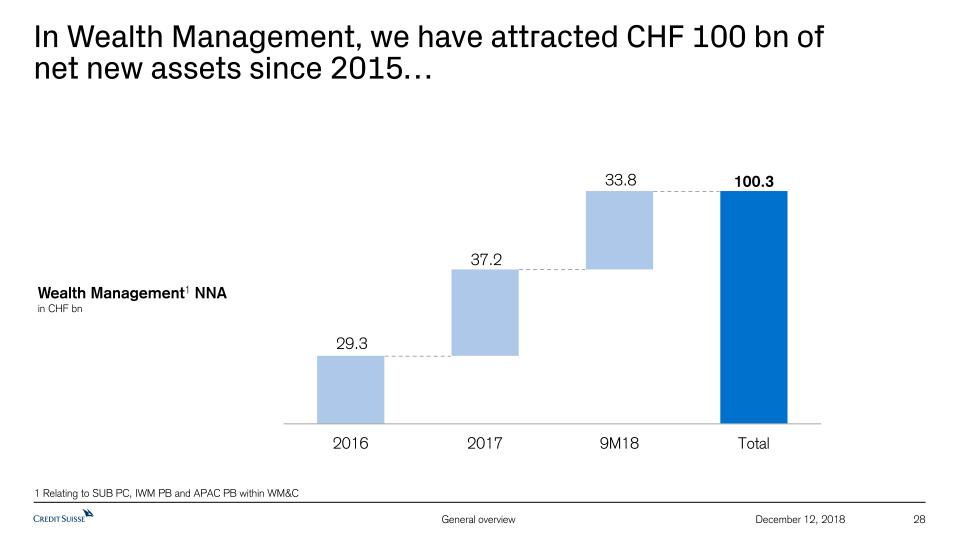
28 December 12, 2018 In Wealth Management, we have attracted CHF 100 bn of net new assets since 2015… Wealth Management1 NNAin CHF bn 1 Relating to SUB PC, IWM PB and APAC PB within WM&C
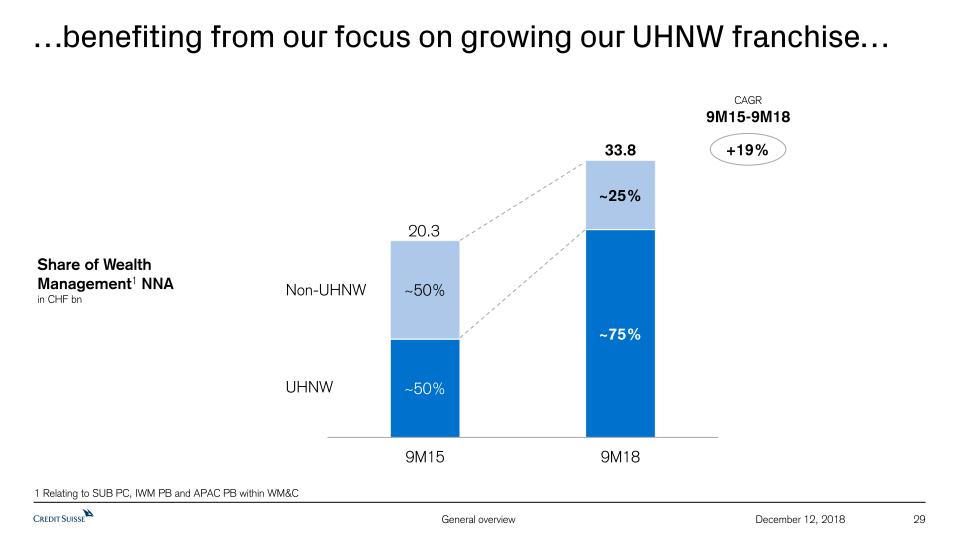
…benefiting from our focus on growing our UHNW franchise… 29 Share of Wealth Management1 NNAin CHF bn 1 Relating to SUB PC, IWM PB and APAC PB within WM&C December 12, 2018 UHNW Non-UHNW 20.3 33.8 +19% CAGR9M15-9M18
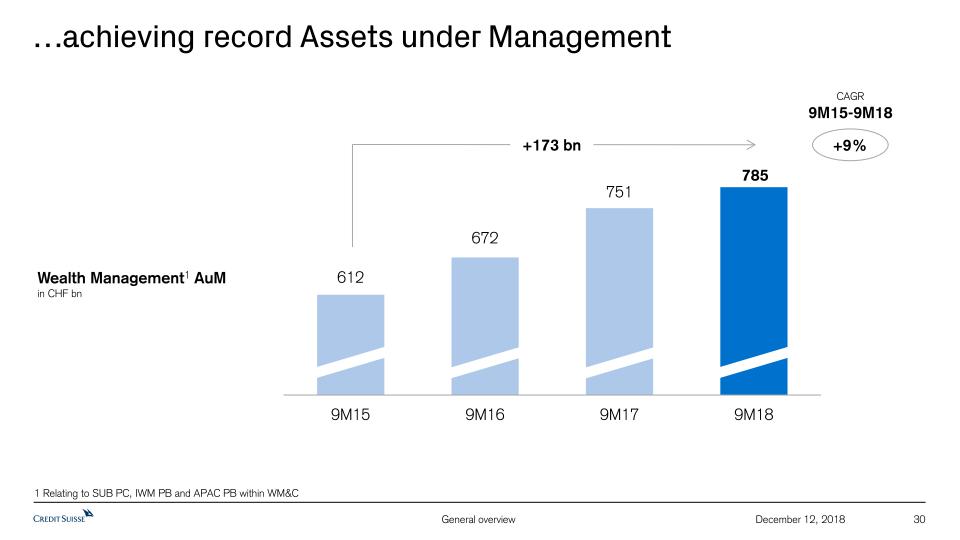
30 December 12, 2018 …achieving record Assets under Management +173 bn 1 Relating to SUB PC, IWM PB and APAC PB within WM&C Wealth Management1 AuMin CHF bn +9% CAGR9M15-9M18
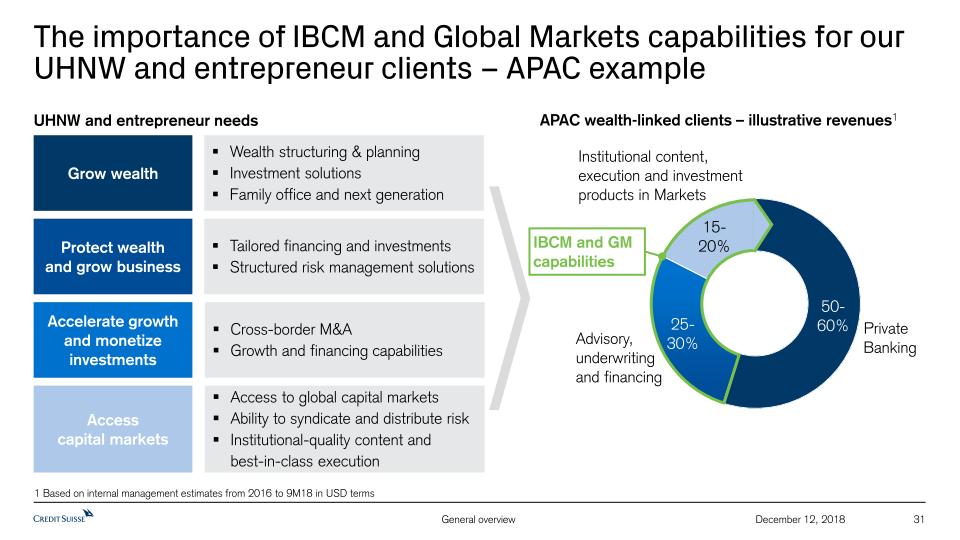
31 December 12, 2018 The importance of IBCM and Global Markets capabilities for ourUHNW and entrepreneur clients – APAC example UHNW and entrepreneur needs Protect wealthand grow business Accelerate growth and monetize investments Access capital markets Tailored financing and investmentsStructured risk management solutions Access to global capital marketsAbility to syndicate and distribute riskInstitutional-quality content andbest-in-class execution Cross-border M&AGrowth and financing capabilities Grow wealth Wealth structuring & planningInvestment solutionsFamily office and next generation APAC wealth-linked clients – illustrative revenues1 PrivateBanking Advisory, underwriting and financing Institutional content, execution and investment products in Markets 1 Based on internal management estimates from 2016 to 9M18 in USD terms IBCM and GM capabilities

32 December 12, 2018 Sales and trading industry revenue pools have steadily declined since 2012 and continue to stagnate Sales and trading industry revenue pools1in USD bn 1 Source: Coalition as of November 14, 2018; Total industry revenue pools according to Credit Suisse’s Global Markets taxonomy -18% -4% -7% -3% Macro Credit Equities 131 119 112 114 114 107 107 +2% CAGR2012-2018E
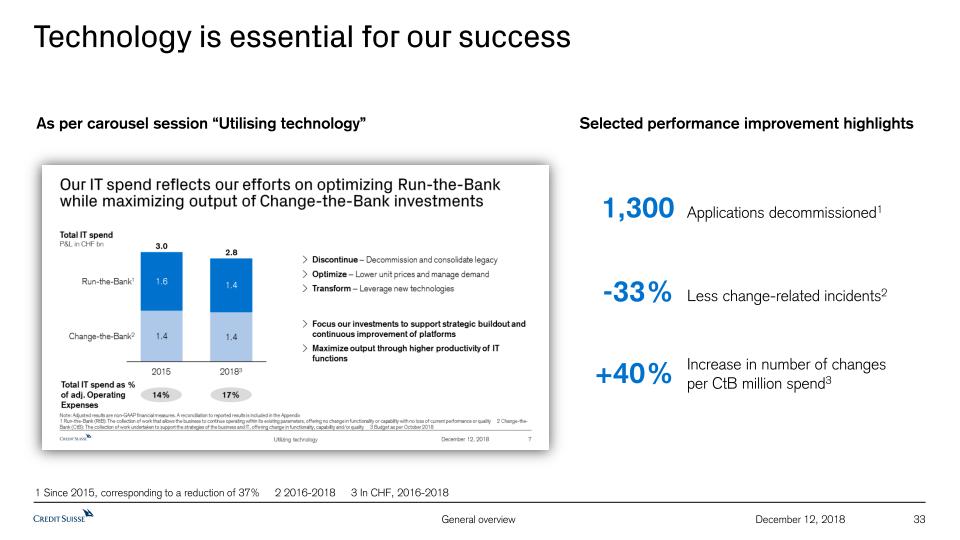
33 December 12, 2018 Technology is essential for our success As per carousel session “Utilising technology” Selected performance improvement highlights 1,300 -33% +40% Applications decommissioned1 Less change-related incidents2 Increase in number of changes per CtB million spend3 1 Since 2015, corresponding to a reduction of 37% 2 2016-2018 3 In CHF, 2016-2018
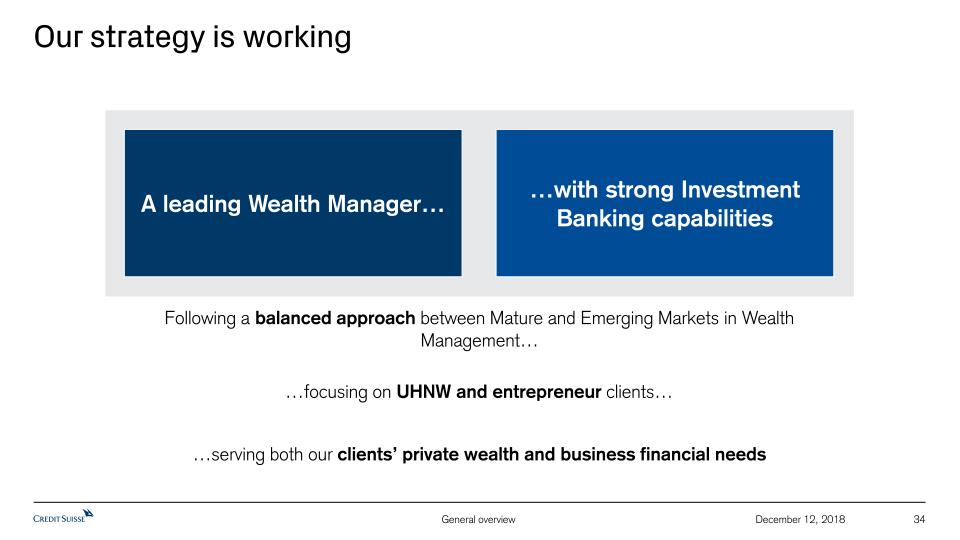
34 December 12, 2018 Our strategy is working A leading Wealth Manager… Following a balanced approach between Mature and Emerging Markets in Wealth Management… …with strong Investment Banking capabilities …focusing on UHNW and entrepreneur clients… …serving both our clients’ private wealth and business financial needs
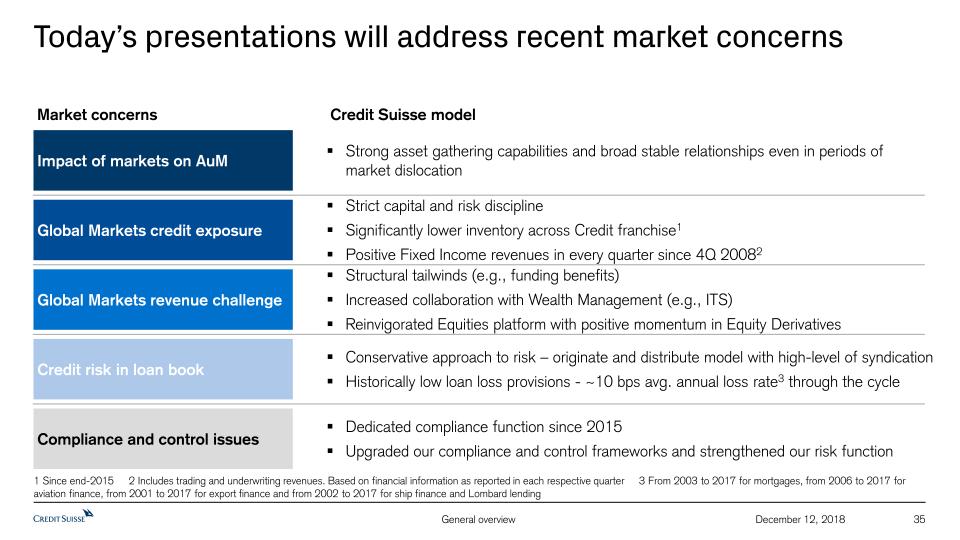
35 December 12, 2018 Today’s presentations will address recent market concerns Strong asset gathering capabilities and broad stable relationships even in periods of market dislocation Global Markets credit exposure Impact of markets on AuM Global Markets revenue challenge Credit risk in loan book Strict capital and risk disciplineSignificantly lower inventory across Credit franchise1Positive Fixed Income revenues in every quarter since 4Q 20082 Structural tailwinds (e.g., funding benefits)Increased collaboration with Wealth Management (e.g., ITS)Reinvigorated Equities platform with positive momentum in Equity Derivatives Conservative approach to risk – originate and distribute model with high-level of syndicationHistorically low loan loss provisions - ~10 bps avg. annual loss rate3 through the cycle Market concerns Credit Suisse model 1 Since end-2015 2 Includes trading and underwriting revenues. Based on financial information as reported in each respective quarter 3 From 2003 to 2017 for mortgages, from 2006 to 2017 for aviation finance, from 2001 to 2017 for export finance and from 2002 to 2017 for ship finance and Lombard lending Compliance and control issues Dedicated compliance function since 2015Upgraded our compliance and control frameworks and strengthened our risk function
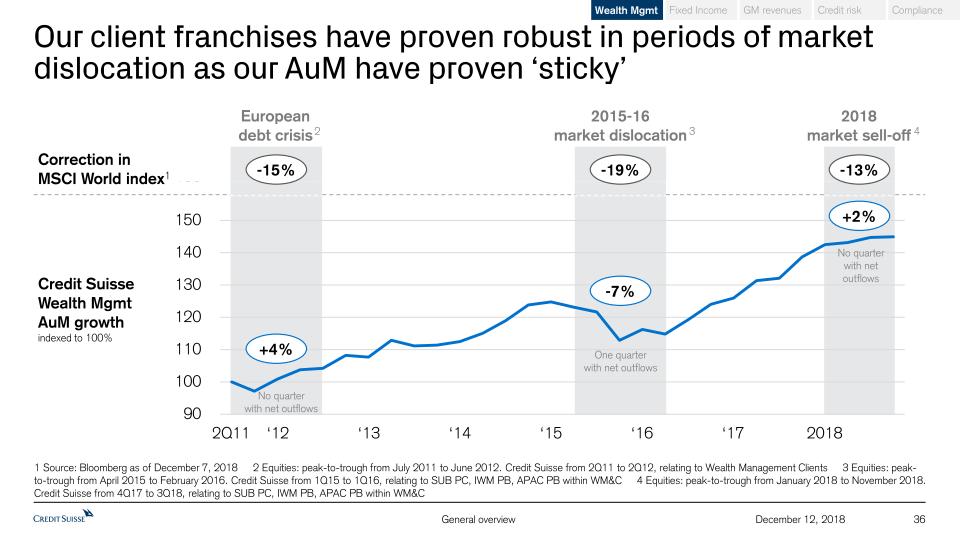
36 December 12, 2018 Our client franchises have proven robust in periods of market dislocation as our AuM have proven ‘sticky’ 1 Source: Bloomberg as of December 7, 2018 2 Equities: peak-to-trough from July 2011 to June 2012. Credit Suisse from 2Q11 to 2Q12, relating to Wealth Management Clients 3 Equities: peak-to-trough from April 2015 to February 2016. Credit Suisse from 1Q15 to 1Q16, relating to SUB PC, IWM PB, APAC PB within WM&C 4 Equities: peak-to-trough from January 2018 to November 2018. Credit Suisse from 4Q17 to 3Q18, relating to SUB PC, IWM PB, APAC PB within WM&C European debt crisis 2015-16market dislocation 2 3 ‘16 ‘17 2Q11 2018 ‘15 ‘14 ‘13 ‘12 2018market sell-off 4 +4% No quarter with net outflows Credit SuisseWealth Mgmt AuM growthindexed to 100% +2% One quarter with net outflows No quarter with netoutflows -7% -15% Correction inMSCI World index1 -13% -19% Fixed Income Credit risk GM revenues Compliance Wealth Mgmt
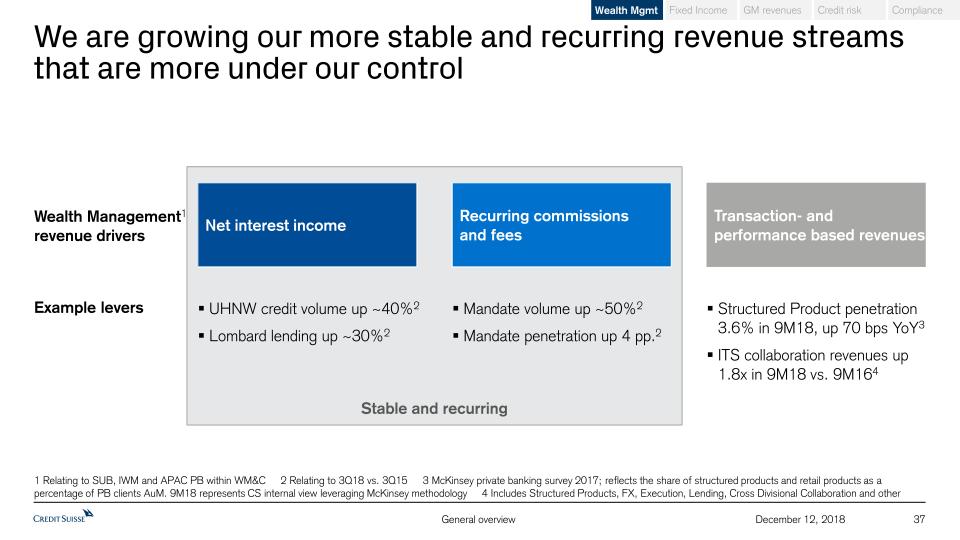
1 Relating to SUB, IWM and APAC PB within WM&C 2 Relating to 3Q18 vs. 3Q15 3 McKinsey private banking survey 2017; reflects the share of structured products and retail products as a percentage of PB clients AuM. 9M18 represents CS internal view leveraging McKinsey methodology 4 Includes Structured Products, FX, Execution, Lending, Cross Divisional Collaboration and other Stable and recurring 37 December 12, 2018 We are growing our more stable and recurring revenue streams that are more under our control Wealth Management1revenue drivers Net interest income Recurring commissionsand fees Transaction- and performance based revenues Mandate volume up ~50%2Mandate penetration up 4 pp.2 UHNW credit volume up ~40%2Lombard lending up ~30%2 Structured Product penetration 3.6% in 9M18, up 70 bps YoY3ITS collaboration revenues up 1.8x in 9M18 vs. 9M164 Example levers Fixed Income Credit risk GM revenues Compliance Wealth Mgmt
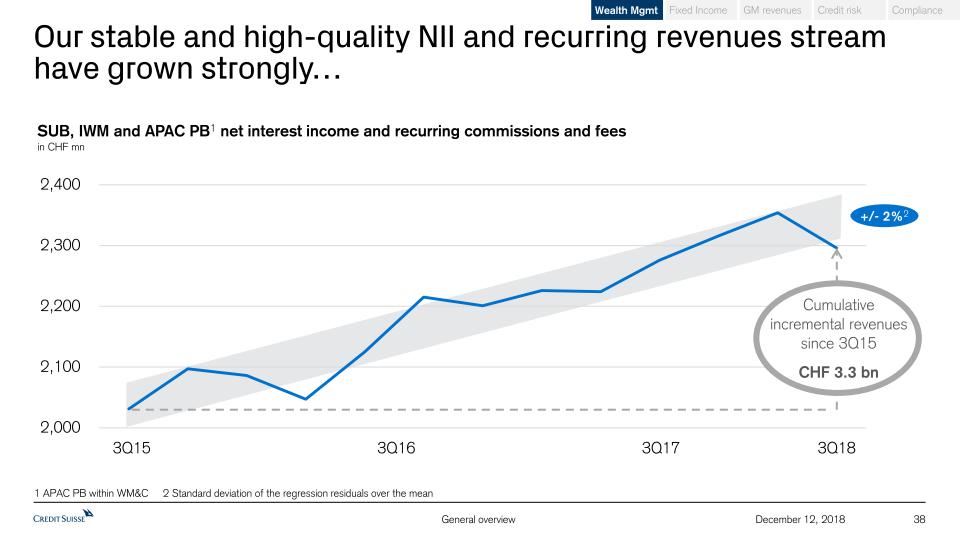
38 December 12, 2018 Our stable and high-quality NII and recurring revenues stream have grown strongly… SUB, IWM and APAC PB1 net interest income and recurring commissions and feesin CHF mn +/- 2%2 3Q16 3Q17 3Q15 3Q18 Cumulative incremental revenues since 3Q15CHF 3.3 bn 1 APAC PB within WM&C 2 Standard deviation of the regression residuals over the mean Fixed Income Credit risk GM revenues Compliance Wealth Mgmt
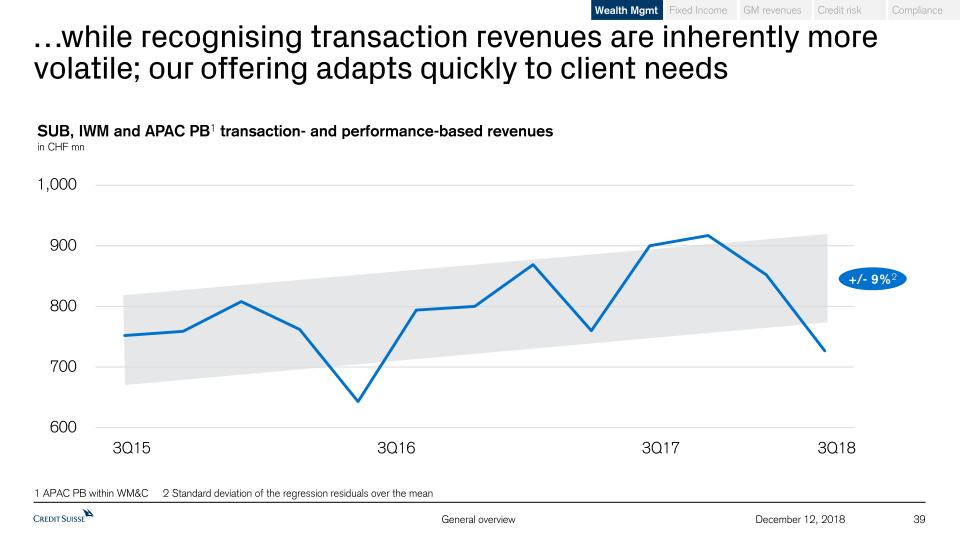
39 December 12, 2018 …while recognising transaction revenues are inherently more volatile; our offering adapts quickly to client needs +/- 9%2 1,000 SUB, IWM and APAC PB1 transaction- and performance-based revenues in CHF mn 1 APAC PB within WM&C 2 Standard deviation of the regression residuals over the mean 3Q16 3Q17 3Q15 3Q18 Fixed Income Credit risk GM revenues Compliance Wealth Mgmt
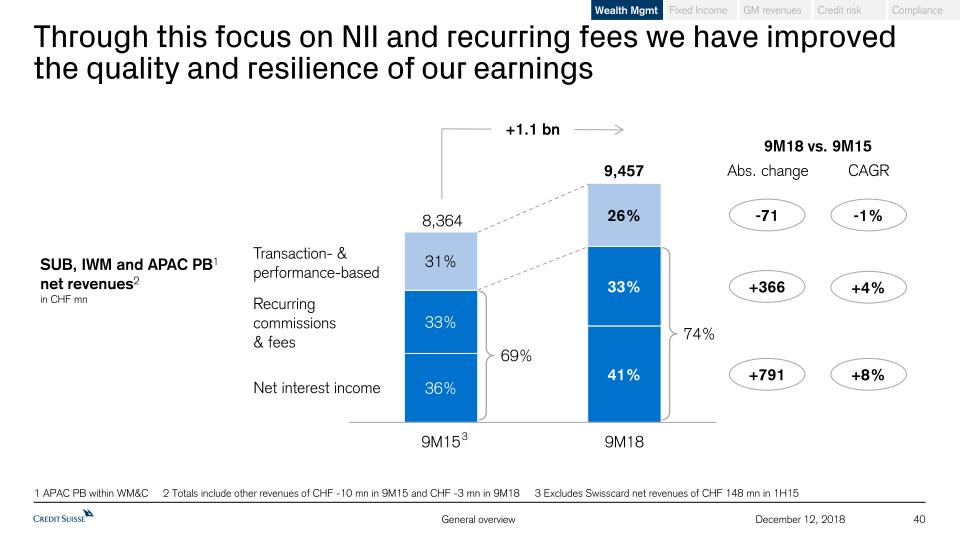
40 December 12, 2018 Net interest income Recurring commissions& fees Transaction- & performance-based 1 APAC PB within WM&C 2 Totals include other revenues of CHF -10 mn in 9M15 and CHF -3 mn in 9M18 3 Excludes Swisscard net revenues of CHF 148 mn in 1H15 +1.1 bn 8,364 SUB, IWM and APAC PB1net revenues2in CHF mn 9,457 69% 74% +366 +791 -71 Abs. change 3 Through this focus on NII and recurring fees we have improved the quality and resilience of our earnings 9M18 vs. 9M15 CAGR +4% +8% -1% Fixed Income Credit risk GM revenues Compliance Wealth Mgmt
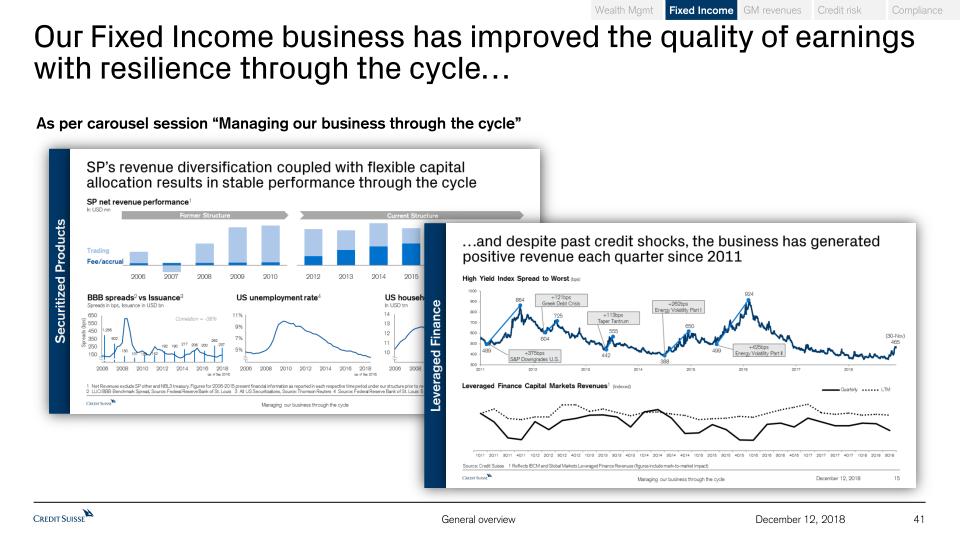
41 December 12, 2018 Our Fixed Income business has improved the quality of earnings with resilience through the cycle… As per carousel session “Managing our business through the cycle” Fixed Income Credit risk GM revenues Compliance Wealth Mgmt Securitized Products Leveraged Finance
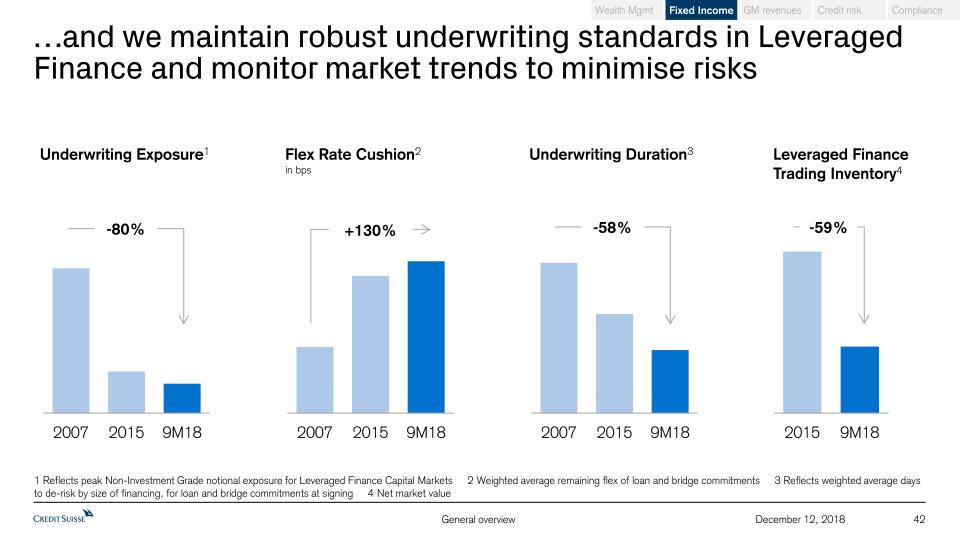
42 December 12, 2018 …and we maintain robust underwriting standards in Leveraged Finance and monitor market trends to minimise risks Fixed Income Credit risk GM revenues Compliance Wealth Mgmt 1 Reflects peak Non-Investment Grade notional exposure for Leveraged Finance Capital Markets 2 Weighted average remaining flex of loan and bridge commitments 3 Reflects weighted average days to de-risk by size of financing, for loan and bridge commitments at signing 4 Net market value Flex Rate Cushion2in bps Underwriting Duration3 Underwriting Exposure1 -80% +130% -58% Leveraged Finance Trading Inventory4 -59%
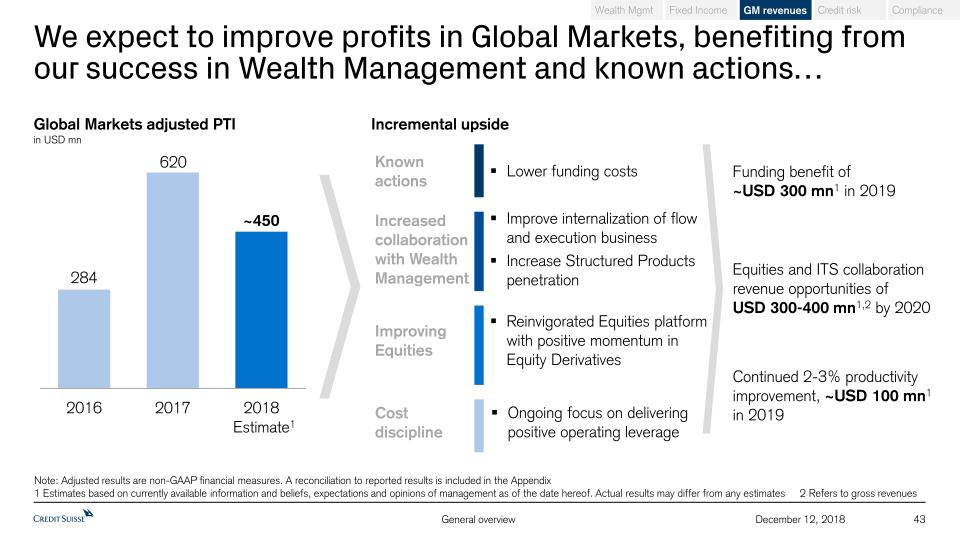
43 December 12, 2018 We expect to improve profits in Global Markets, benefiting fromour success in Wealth Management and known actions… Note: Adjusted results are non-GAAP financial measures. A reconciliation to reported results is included in the Appendix1 Estimates based on currently available information and beliefs, expectations and opinions of management as of the date hereof. Actual results may differ from any estimates 2 Refers to gross revenues Global Markets adjusted PTIin USD mn 1 Funding benefit of ~USD 300 mn1 in 2019 Equities and ITS collaboration revenue opportunities ofUSD 300-400 mn1,2 by 2020 Knownactions Increased collaborationwith Wealth Management Improving Equities Lower funding costs Improve internalization of flow and execution businessIncrease Structured Products penetration Reinvigorated Equities platform with positive momentum in Equity Derivatives Incremental upside Cost discipline Ongoing focus on delivering positive operating leverage Continued 2-3% productivity improvement, ~USD 100 mn1 in 2019 Fixed Income Credit risk GM revenues Compliance Wealth Mgmt
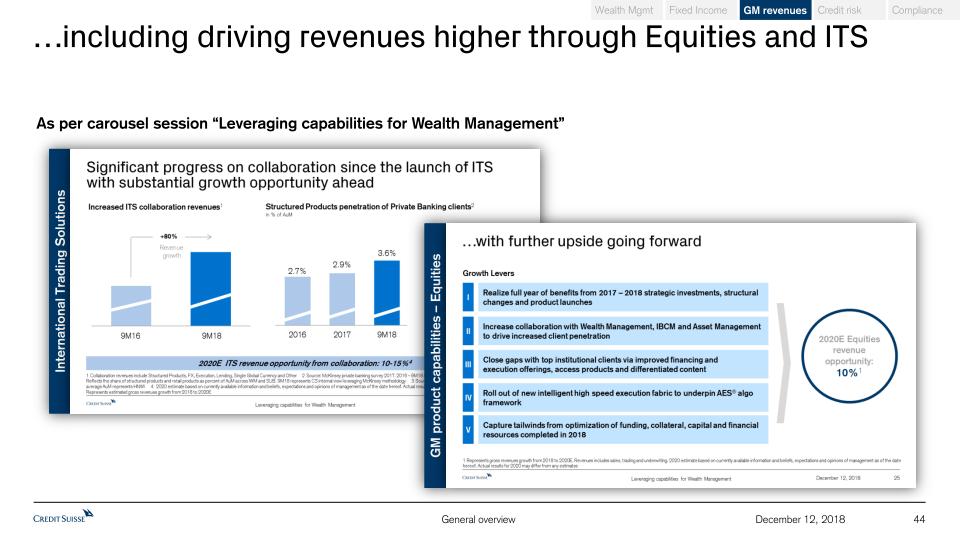
International Trading Solutions 44 December 12, 2018 …including driving revenues higher through Equities and ITS Fixed Income Credit risk GM revenues Compliance Wealth Mgmt As per carousel session “Leveraging capabilities for Wealth Management” GM product capabilities – Equities
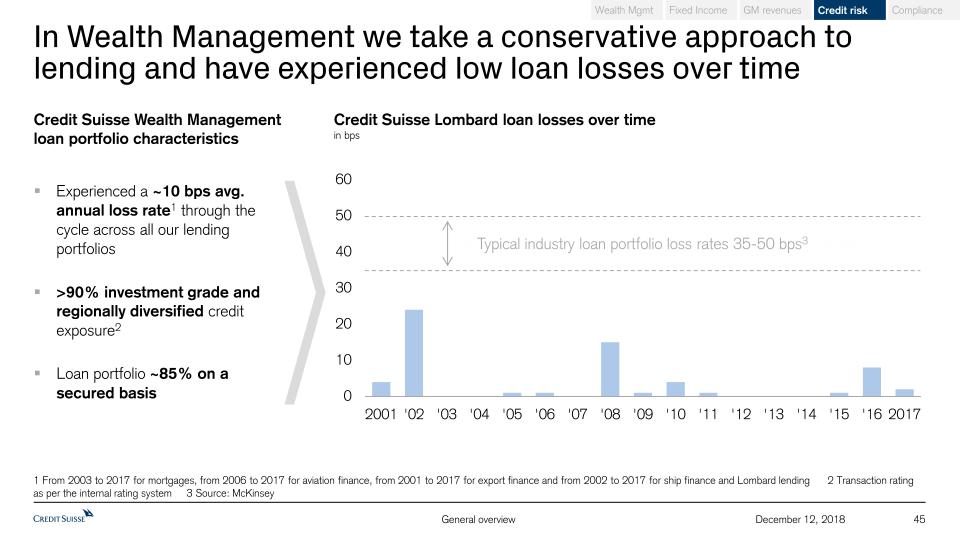
45 December 12, 2018 In Wealth Management we take a conservative approach to lending and have experienced low loan losses over time Credit Suisse Lombard loan losses over timein bps 1 From 2003 to 2017 for mortgages, from 2006 to 2017 for aviation finance, from 2001 to 2017 for export finance and from 2002 to 2017 for ship finance and Lombard lending 2 Transaction rating as per the internal rating system 3 Source: McKinsey Experienced a ~10 bps avg. annual loss rate1 through the cycle across all our lending portfolios>90% investment grade and regionally diversified credit exposure2Loan portfolio ~85% on a secured basis Credit Suisse Wealth Managementloan portfolio characteristics Fixed Income Credit risk GM revenues Compliance Wealth Mgmt Industry average loan portfolio loss provisions 35-50 bps3 Typical industry loan portfolio loss rates 35-50 bps3

2016 2017 2018 We have invested significantly to upgrade our Compliance and Control frameworks Headcount increased by 42% Invested in Compliancetalent and stature Multiple legacy reviews of over 30,000 clients finalized for financial crime & tax Completed significant legacy reviews of high risk clients Over 10,000 control issues and improvements closed across all Bank-wide risks Enhanced controls to achieve & exceed industry standards From 0% strategic investments up to 47% From 12 legacy platforms down to 1 strategic platform Shifted investments in technology to enable industry -leading tools & capabilities Single Client View covering 99% of Wealth Management clients Trader Holistic Surveillance covering all traders globally RM Holistic Surveillance covering ~80% of RMs Rolled out industry-leading tools bank-wide CCRO costs reduced by 12% Delivered positive jaws 46 December 12, 2018 Client Holistic Surveillance pilot in CH Fixed Income Credit risk GM revenues Compliance Wealth Mgmt
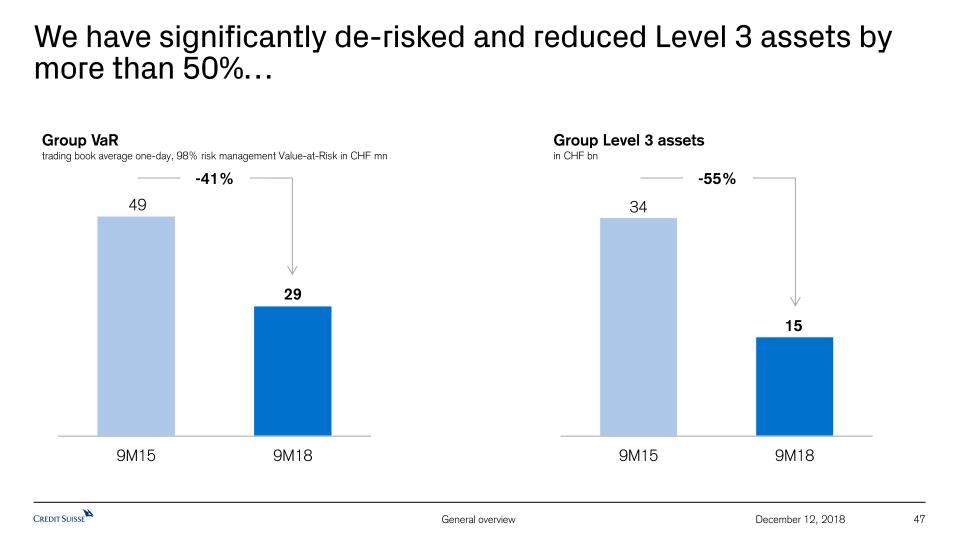
47 December 12, 2018 We have significantly de-risked and reduced Level 3 assets by more than 50%… Group VaRtrading book average one-day, 98% risk management Value-at-Risk in CHF mn -41% Group Level 3 assetsin CHF bn -55%

…increased our resilience through the cycle by lowering our breakeven point… 48 December 12, 2018 Adjusted operating cost base at constant FX rates*in CHF bn Note: Adjusted results are non-GAAP financial measures. A reconciliation to reported results is included in the Appendix * See Appendix1 2018 estimate based on currently available information and beliefs, expectations and opinions of management as of the date hereof. Actual results for 2018 may differ from any estimates 2 As presented at the Investor Day on December 7, 2016 1 1 2

49 December 12, 2018 …and substantially strengthened our capital base CET1 capitalin CHF bn +22%
The macro trends 2 Sustainable and profitable growth 1 Agenda 50 December 12, 2018 2018 and beyond 3
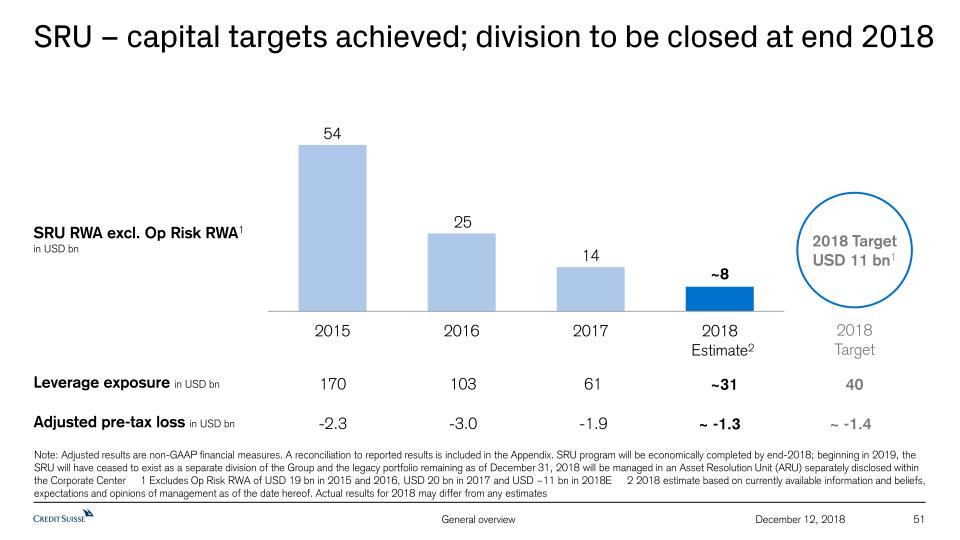
51 December 12, 2018 SRU – capital targets achieved; division to be closed at end 2018 SRU RWA excl. Op Risk RWA1in USD bn -2.3 -1.9 -3.0 ~ -1.3 Adjusted pre-tax loss in USD bn 2 Note: Adjusted results are non-GAAP financial measures. A reconciliation to reported results is included in the Appendix. SRU program will be economically completed by end-2018; beginning in 2019, the SRU will have ceased to exist as a separate division of the Group and the legacy portfolio remaining as of December 31, 2018 will be managed in an Asset Resolution Unit (ARU) separately disclosed within the Corporate Center 1 Excludes Op Risk RWA of USD 19 bn in 2015 and 2016, USD 20 bn in 2017 and USD ~11 bn in 2018E 2 2018 estimate based on currently available information and beliefs, expectations and opinions of management as of the date hereof. Actual results for 2018 may differ from any estimates 170 61 103 ~31 Leverage exposure in USD bn 2018 TargetUSD 11 bn1 ~ -1.4 40 2018Target
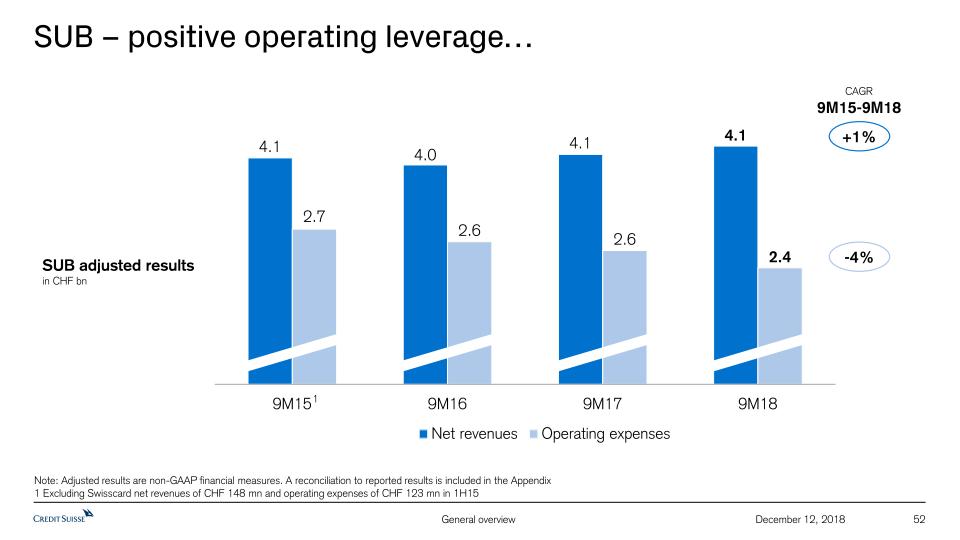
52 December 12, 2018 SUB – positive operating leverage… SUB adjusted results in CHF bn -4% +1% CAGR9M15-9M18 Note: Adjusted results are non-GAAP financial measures. A reconciliation to reported results is included in the Appendix1 Excluding Swisscard net revenues of CHF 148 mn and operating expenses of CHF 123 mn in 1H15 1
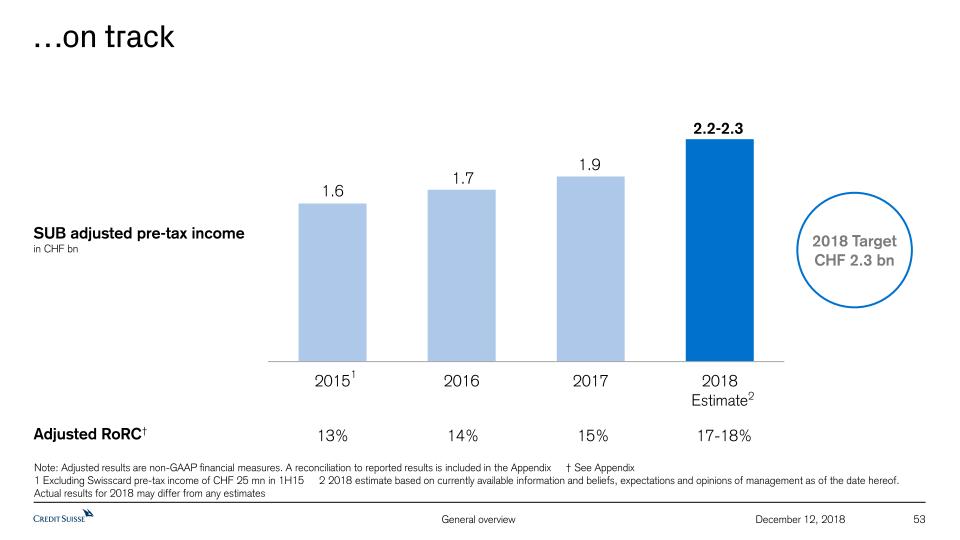
53 December 12, 2018 …on track SUB adjusted pre-tax incomein CHF bn Adjusted RoRC† 13% 15% 14% 17-18% Note: Adjusted results are non-GAAP financial measures. A reconciliation to reported results is included in the Appendix † See Appendix1 Excluding Swisscard pre-tax income of CHF 25 mn in 1H15 2 2018 estimate based on currently available information and beliefs, expectations and opinions of management as of the date hereof. Actual results for 2018 may differ from any estimates 2018 TargetCHF 2.3 bn 2 1
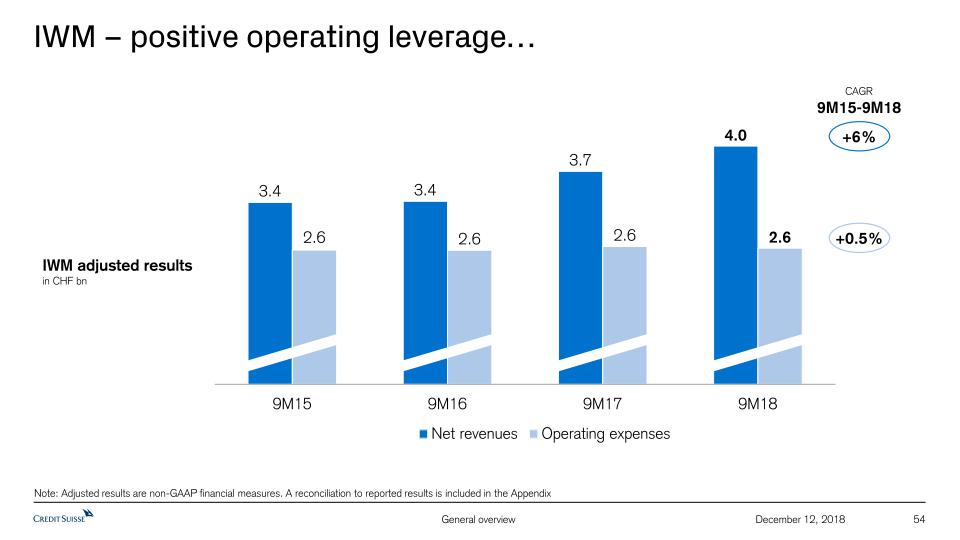
54 December 12, 2018 IWM – positive operating leverage… Note: Adjusted results are non-GAAP financial measures. A reconciliation to reported results is included in the Appendix IWM adjusted results in CHF bn +6% CAGR9M15-9M18 +0.5%
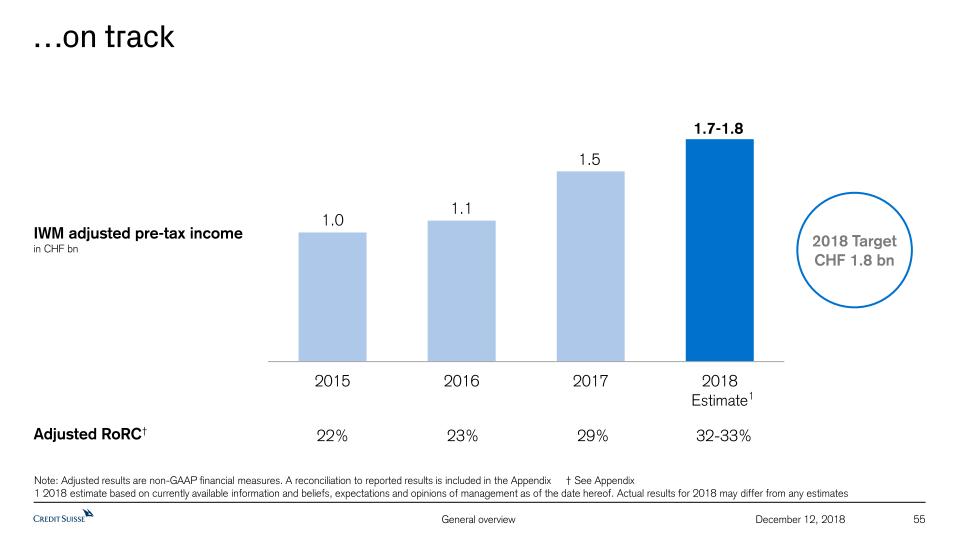
55 December 12, 2018 …on track IWM adjusted pre-tax incomein CHF bn 22% 29% 23% 32-33% Adjusted RoRC† Note: Adjusted results are non-GAAP financial measures. A reconciliation to reported results is included in the Appendix † See Appendix1 2018 estimate based on currently available information and beliefs, expectations and opinions of management as of the date hereof. Actual results for 2018 may differ from any estimates 1 2018 TargetCHF 1.8 bn
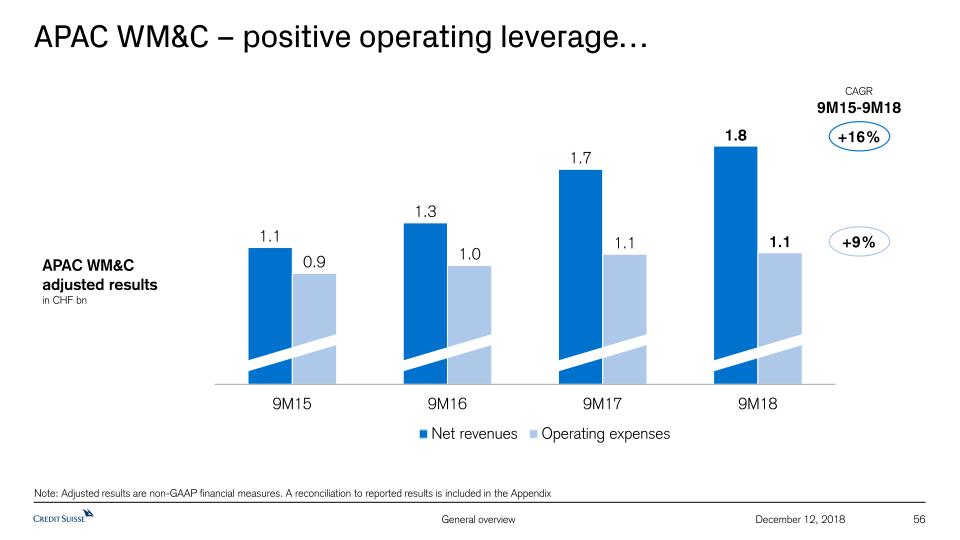
56 December 12, 2018 APAC WM&C – positive operating leverage… Note: Adjusted results are non-GAAP financial measures. A reconciliation to reported results is included in the Appendix APAC WM&Cadjusted results in CHF bn +9% CAGR9M15-9M18 +16%
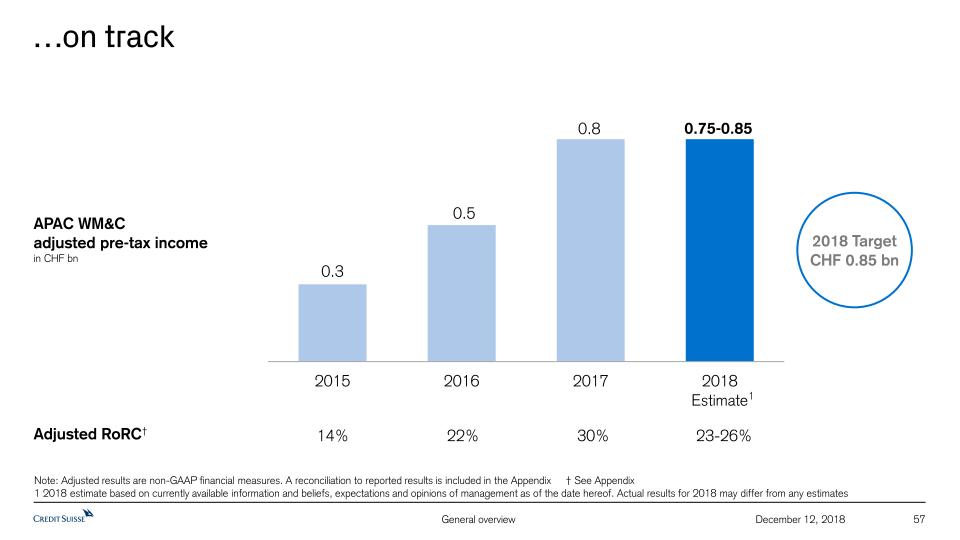
57 December 12, 2018 …on track APAC WM&Cadjusted pre-tax incomein CHF bn 14% 30% 22% 23-26% Adjusted RoRC† Note: Adjusted results are non-GAAP financial measures. A reconciliation to reported results is included in the Appendix † See Appendix1 2018 estimate based on currently available information and beliefs, expectations and opinions of management as of the date hereof. Actual results for 2018 may differ from any estimates 1 2018 TargetCHF 0.85 bn
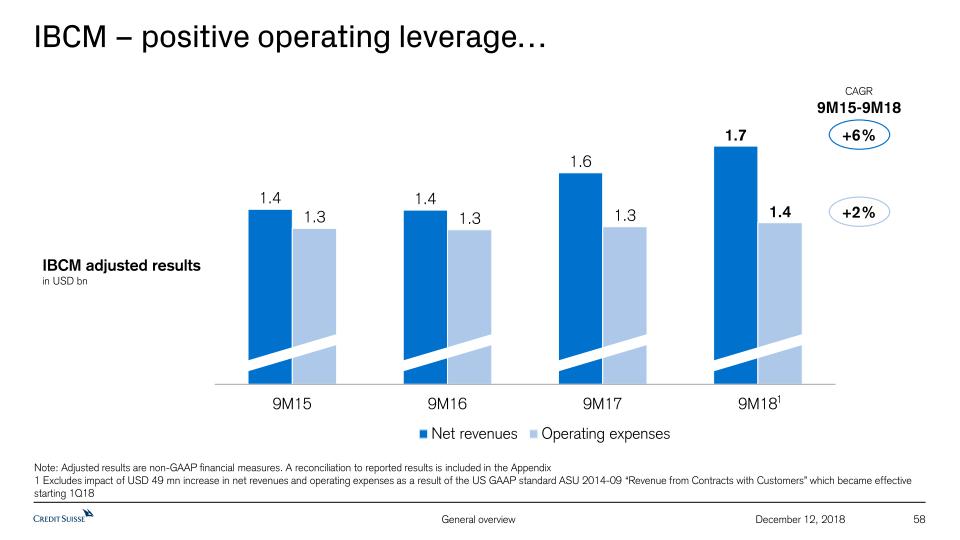
58 December 12, 2018 IBCM – positive operating leverage… Note: Adjusted results are non-GAAP financial measures. A reconciliation to reported results is included in the Appendix1 Excludes impact of USD 49 mn increase in net revenues and operating expenses as a result of the US GAAP standard ASU 2014-09 “Revenue from Contracts with Customers” which became effective starting 1Q18 IBCM adjusted results in USD bn +2% +6% CAGR9M15-9M18 1
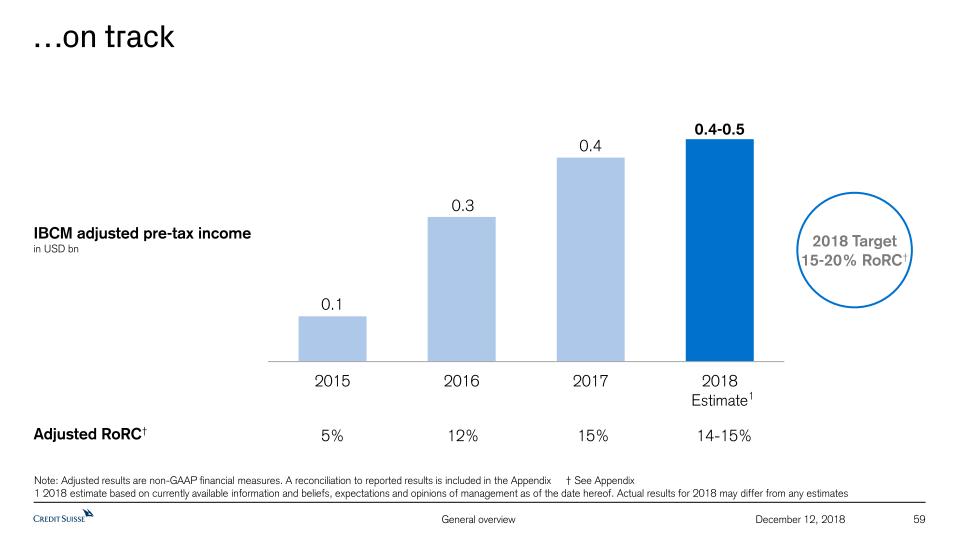
59 December 12, 2018 …on track IBCM adjusted pre-tax incomein USD bn 5% 15% 12% 14-15% Adjusted RoRC† Note: Adjusted results are non-GAAP financial measures. A reconciliation to reported results is included in the Appendix † See Appendix1 2018 estimate based on currently available information and beliefs, expectations and opinions of management as of the date hereof. Actual results for 2018 may differ from any estimates 1 2018 Target15-20% RoRC†
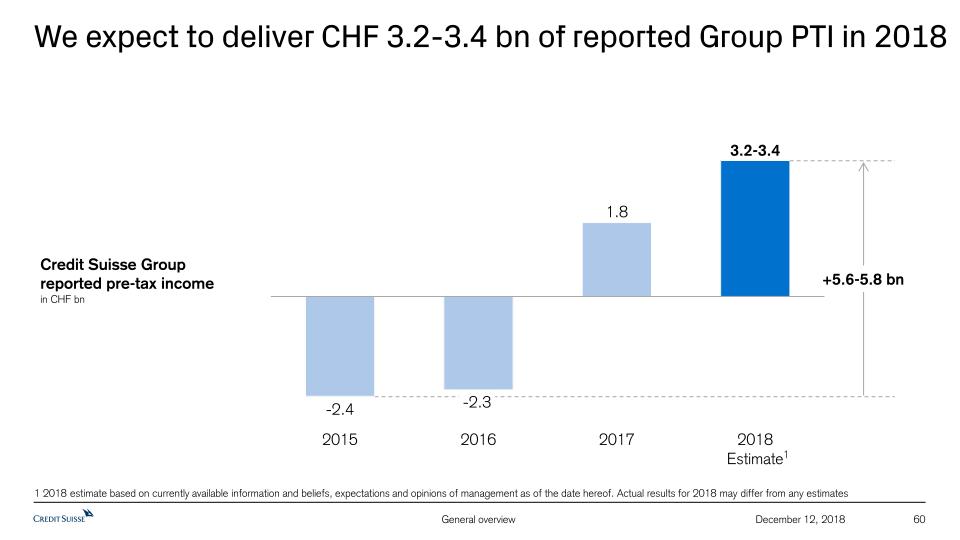
We expect to deliver CHF 3.2-3.4 bn of reported Group PTI in 2018 60 December 12, 2018 1 2018 estimate based on currently available information and beliefs, expectations and opinions of management as of the date hereof. Actual results for 2018 may differ from any estimates Credit Suisse Groupreported pre-tax incomein CHF bn 1 +5.6-5.8 bn

61 December 12, 2018 Our engagement scores have improved during our restructuring “I am proud to work at Credit Suisse” 1 Credit Suisse results based on the 2018 internal Conduct and Ethics Pulse Survey 2 Source: AON (independent provider of human resources solutions) as of 2018 “I would recommend Credit Suisse to family and friends as a place to work” “I feel motivated to go above and beyond at work” 85%Industry average2 77%Industry average2 72%Industry average2
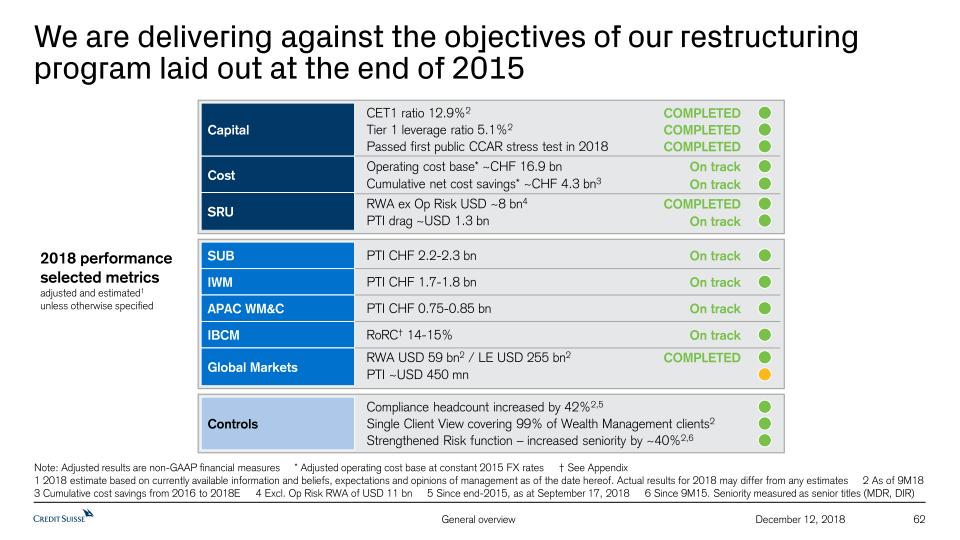
We are delivering against the objectives of our restructuring program laid out at the end of 2015 62 December 12, 2018 2018 performanceselected metricsadjusted and estimated1unless otherwise specified Note: Adjusted results are non-GAAP financial measures * Adjusted operating cost base at constant 2015 FX rates † See Appendix 1 2018 estimate based on currently available information and beliefs, expectations and opinions of management as of the date hereof. Actual results for 2018 may differ from any estimates 2 As of 9M183 Cumulative cost savings from 2016 to 2018E 4 Excl. Op Risk RWA of USD 11 bn 5 Since end-2015, as at September 17, 2018 6 Since 9M15. Seniority measured as senior titles (MDR, DIR) PTI CHF 2.2-2.3 bn SUB PTI CHF 1.7-1.8 bn IWM PTI CHF 0.75-0.85 bn APAC WM&C RoRC† 14-15% IBCM PTI ~USD 450 mn RWA USD 59 bn2 / LE USD 255 bn2 Global Markets COMPLETED Compliance headcount increased by 42%2,5 Single Client View covering 99% of Wealth Management clients2 Controls Strengthened Risk function – increased seniority by ~40%2,6 Operating cost base* ~CHF 16.9 bn Cost Capital Tier 1 leverage ratio 5.1%2 COMPLETED Passed first public CCAR stress test in 2018 COMPLETED SRU RWA ex Op Risk USD ~8 bn4 COMPLETED On track PTI drag ~USD 1.3 bn CET1 ratio 12.9%2 COMPLETED Cumulative net cost savings* ~CHF 4.3 bn3 On track On track On track On track On track On track

63 December 12, 2018 We are well positioned to drive shareholder value beyond 2018 Wealth Management-focused strategy supported by strong secular trend in global wealth with growth above GDPDistinctive global client franchise with differentiated approach catering to UHNW and entrepreneursUnlocking full earnings potential with restructuring completed and benefiting from meaningful tailwindsResilience to withstand adverse impact of periods with market volatility
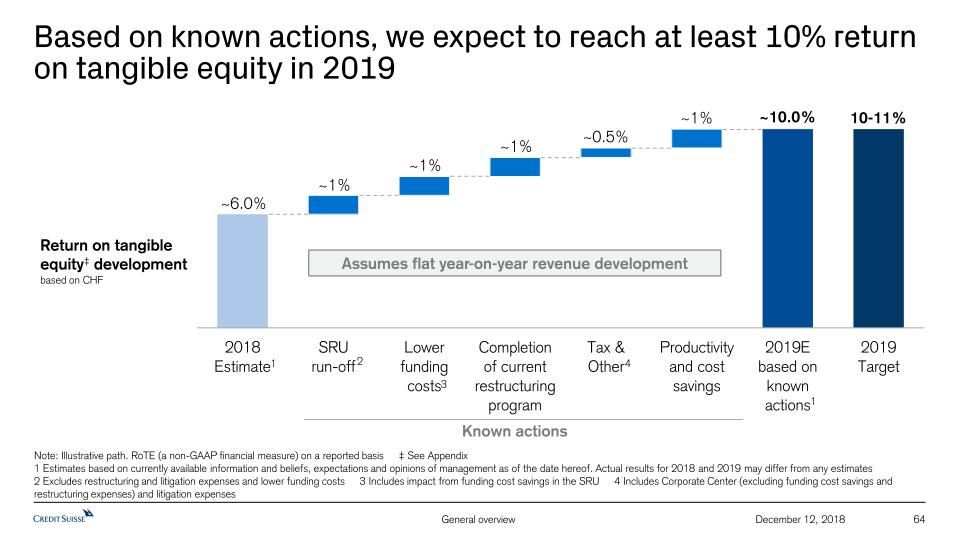
64 December 12, 2018 3 4 2 1 Note: Illustrative path. RoTE (a non-GAAP financial measure) on a reported basis ‡ See Appendix1 Estimates based on currently available information and beliefs, expectations and opinions of management as of the date hereof. Actual results for 2018 and 2019 may differ from any estimates2 Excludes restructuring and litigation expenses and lower funding costs 3 Includes impact from funding cost savings in the SRU 4 Includes Corporate Center (excluding funding cost savings and restructuring expenses) and litigation expenses Return on tangible equity‡ development based on CHF 1 Known actions Assumes flat year-on-year revenue development Based on known actions, we expect to reach at least 10% return on tangible equity in 2019
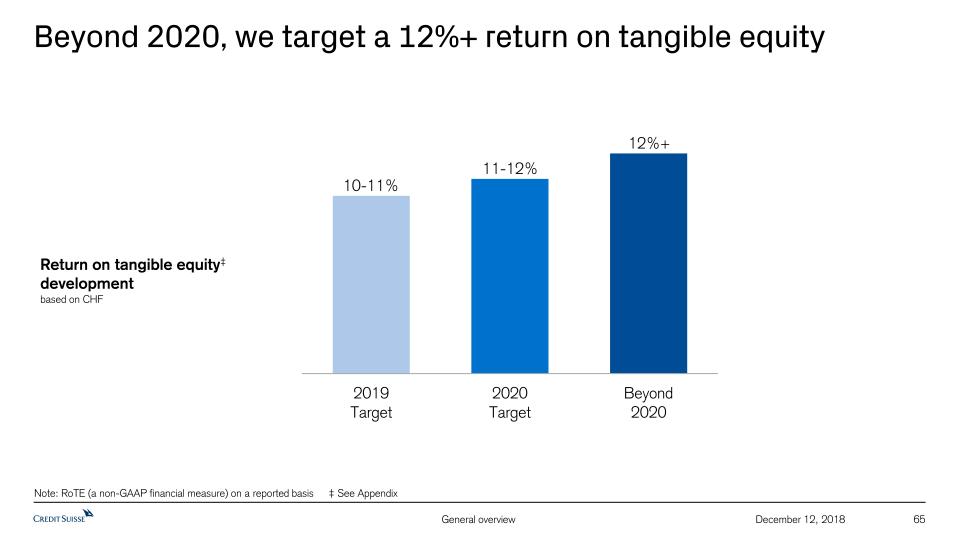
65 December 12, 2018 Beyond 2020, we target a 12%+ return on tangible equity Return on tangible equity‡ development based on CHF Note: RoTE (a non-GAAP financial measure) on a reported basis ‡ See Appendix 10-11% 11-12% 12%+
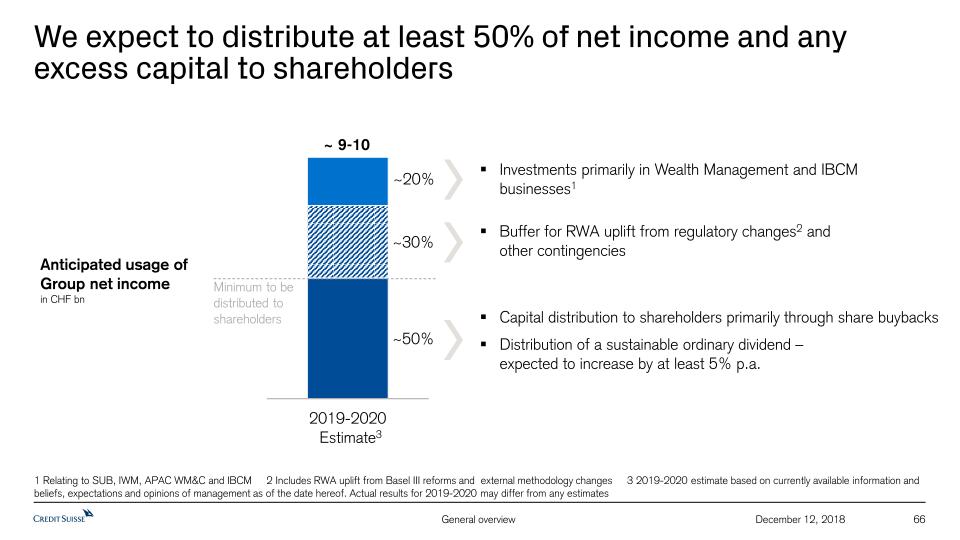
66 December 12, 2018 We expect to distribute at least 50% of net income and any excess capital to shareholders Investments primarily in Wealth Management and IBCM businesses1 1 Relating to SUB, IWM, APAC WM&C and IBCM 2 Includes RWA uplift from Basel III reforms and external methodology changes 3 2019-2020 estimate based on currently available information and beliefs, expectations and opinions of management as of the date hereof. Actual results for 2019-2020 may differ from any estimates Buffer for RWA uplift from regulatory changes2 and other contingencies Capital distribution to shareholders primarily through share buybacksDistribution of a sustainable ordinary dividend – expected to increase by at least 5% p.a. Minimum to be distributed to shareholders ~ 9-10 3 Anticipated usage of Group net incomein CHF bn

67 December 12, 2018 Returning capital to our shareholders and announcing a share buyback program Our Board of Directors has approved a share buyback program of up to CHF 1.5 bnWe expect to buy back at least CHF 1.0 bn1 2019 2020 Dividend We expect a similar share buyback program as in 20192 We expect to distribute a sustainable ordinary dividend in 2019 and 2020This is expected to increase by at least 5% p.a. 1 Subject to market and economic conditions 2 The level of the share buyback for 2020 will be set in light of our capital plans and subject to prevailing market conditions but is expected to be in line with our intention to distribute at least 50% of net income

68 December 12, 2018 Delivering value to our shareholders 10-11% in 201911-12% in 202012%+ beyond 2020 Group RoTE‡ target Share buyback programup to CHF 1.5 bn approved withat least CHF 1.0 bn expected in 20191and expecting a similar program in 20202 Note: RoTE (a non-GAAP financial measure) on a reported basis ‡ See Appendix1 Subject to market and economic conditions 2 The level of the share buyback for 2020 will be set in light of our capital plans and subject to prevailing market conditions but is expected to be in line with our intention to distribute at least 50% of net income
69 December 12, 2018 Program of the day Investor Day 2018 General overview Webcast 8:30 am 45 min Tidjane Thiam Coffee break 10:45 am 30 min Lunch break 12:30 pm 60 min Growth in Wealth Management Webcast 9:45 am 60 min Thomas Gottstein, Iqbal Khan,Helman Sitohang Break-out sessions (rounds 2 & 3) 1:30 pm Leveraging capabilities for Wealth Management Thomas Gottstein, Iqbal Khan, Brian Chin David Mathers, Jim Amine Managing our business through the cycle Pierre-Olivier Bouée, Lara Warner Utilising technology Key financials Webcast 9:15 am 30 min David Mathers Q&A & wrap-up Webcast 4:00 pm Break-out sessions (round 1) 11:15 am 75 min 75 min each
Appendix 70 December 12, 2018
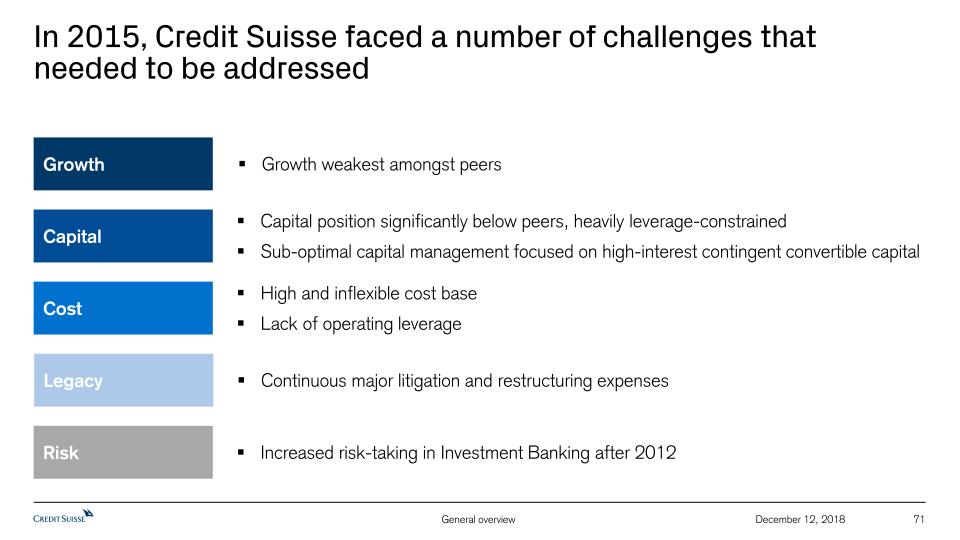
71 December 12, 2018 In 2015, Credit Suisse faced a number of challenges that needed to be addressed Capital position significantly below peers, heavily leverage-constrainedSub-optimal capital management focused on high-interest contingent convertible capital High and inflexible cost baseLack of operating leverage Continuous major litigation and restructuring expenses Cost Capital Legacy Increased risk-taking in Investment Banking after 2012 Risk Growth Growth weakest amongst peers
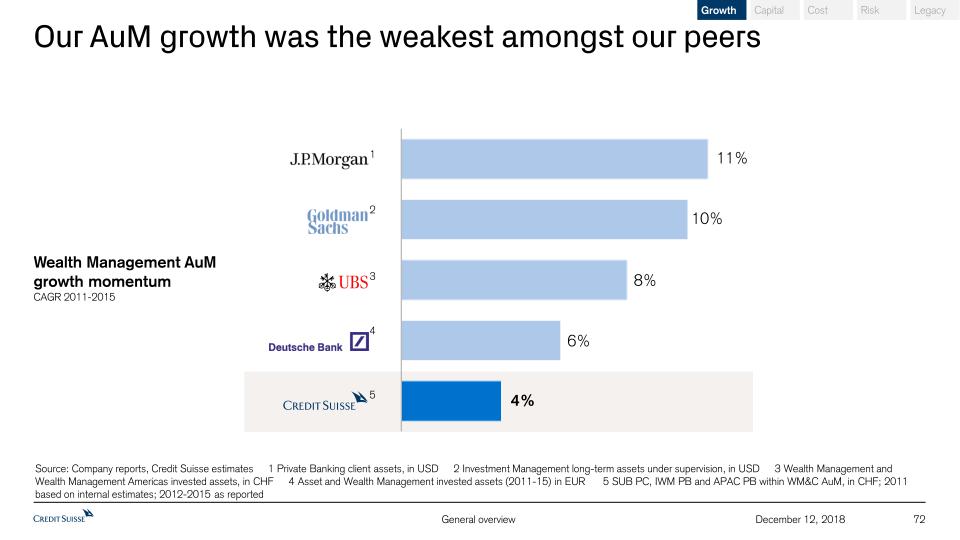
72 December 12, 2018 Our AuM growth was the weakest amongst our peers Source: Company reports, Credit Suisse estimates 1 Private Banking client assets, in USD 2 Investment Management long-term assets under supervision, in USD 3 Wealth Management and Wealth Management Americas invested assets, in CHF 4 Asset and Wealth Management invested assets (2011-15) in EUR 5 SUB PC, IWM PB and APAC PB within WM&C AuM, in CHF; 2011 based on internal estimates; 2012-2015 as reported Wealth Management AuMgrowth momentumCAGR 2011-2015 1 2 4 3 5 Capital Risk Cost Legacy Growth
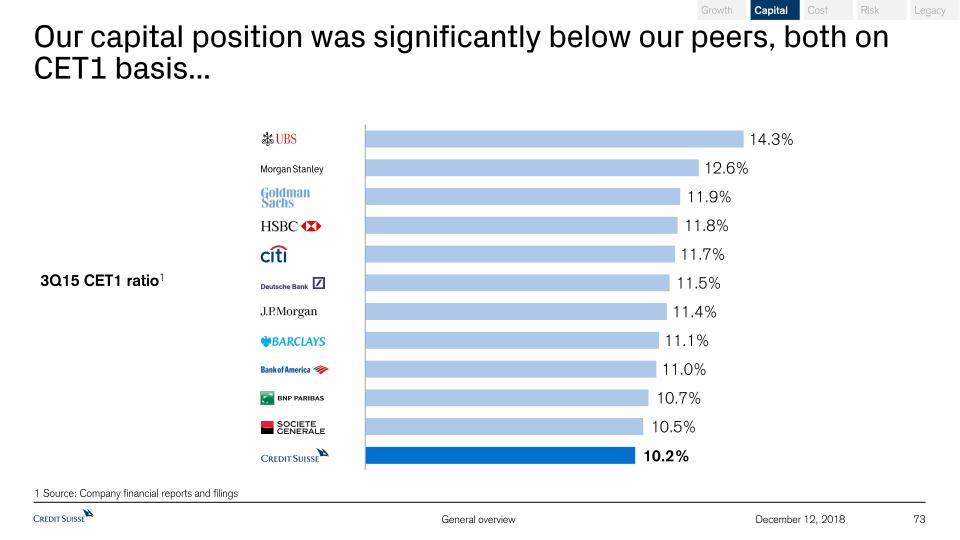
Our capital position was significantly below our peers, both on CET1 basis... 73 December 12, 2018 3Q15 CET1 ratio1 1 Source: Company financial reports and filings Capital Risk Cost Legacy Growth
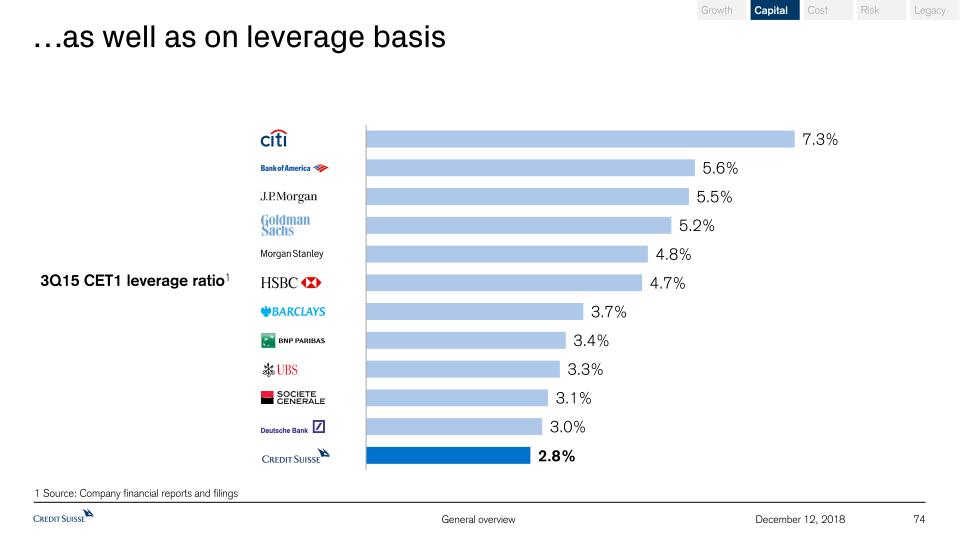
…as well as on leverage basis 74 December 12, 2018 3Q15 CET1 leverage ratio1 1 Source: Company financial reports and filings Capital Risk Cost Legacy Growth
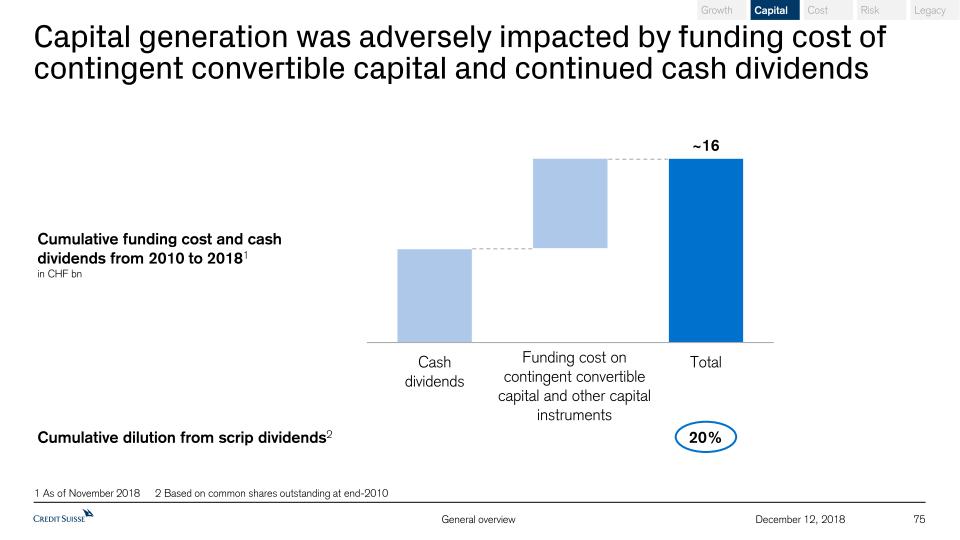
Capital generation was adversely impacted by funding cost of contingent convertible capital and continued cash dividends 75 December 12, 2018 Capital�� Risk Cost Legacy Growth Cumulative funding cost and cash dividends from 2010 to 20181in CHF bn Funding cost on contingent convertible capital and other capital instruments 20% 1 As of November 2018 2 Based on common shares outstanding at end-2010 ~16 Cumulative dilution from scrip dividends2

Our cost base was high and inflexible… 76 December 12, 2018 Group reportedoperating expensesin CHF bn 1 Figures for 2010 to 2014 present financial information based on results under our structure prior to our re-segmentation announcement on October 21, 2015 2 Goodwill impairment of CHF 3.8 bn in 4Q15 As per 2015 Investor Day1 Excl. goodwill impairment2 Capital Risk Cost Legacy Growth
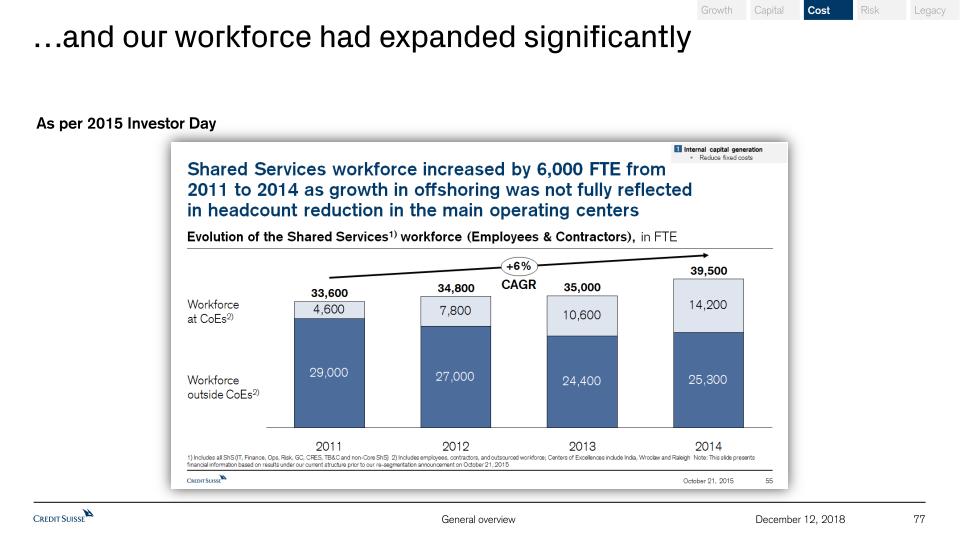
…and our workforce had expanded significantly 77 December 12, 2018 As per 2015 Investor Day Capital Risk Cost Legacy Growth
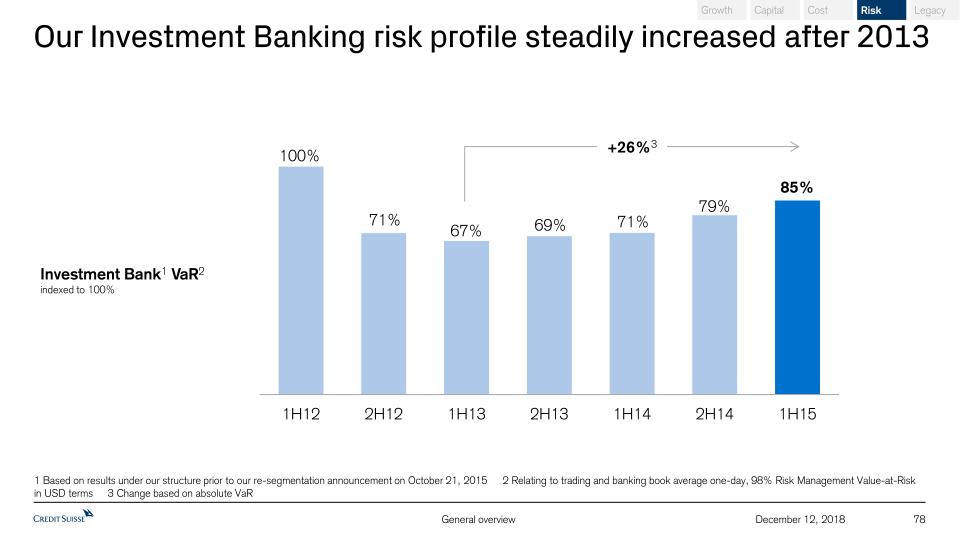
78 December 12, 2018 Our Investment Banking risk profile steadily increased after 2013 Investment Bank1 VaR2indexed to 100% +26%3 1 Based on results under our structure prior to our re-segmentation announcement on October 21, 2015 2 Relating to trading and banking book average one-day, 98% Risk Management Value-at-Risk in USD terms 3 Change based on absolute VaR Capital Risk Cost Legacy Growth
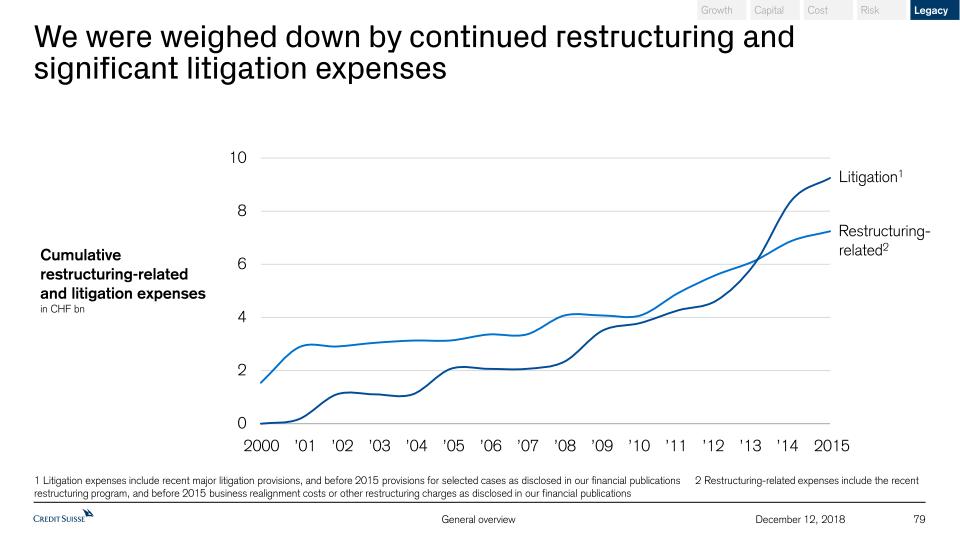
79 December 12, 2018 We were weighed down by continued restructuring and significant litigation expenses Cumulative restructuring-relatedand litigation expensesin CHF bn ’01 ’02 ’06 ’05 ’03 ’04 ’08 ’07 ’10 ’09 ’11 ’12 2015 ’13 ’14 2000 Litigation1 Restructuring-related2 Capital Risk Cost Legacy Growth 1 Litigation expenses include recent major litigation provisions, and before 2015 provisions for selected cases as disclosed in our financial publications 2 Restructuring-related expenses include the recent restructuring program, and before 2015 business realignment costs or other restructuring charges as disclosed in our financial publications
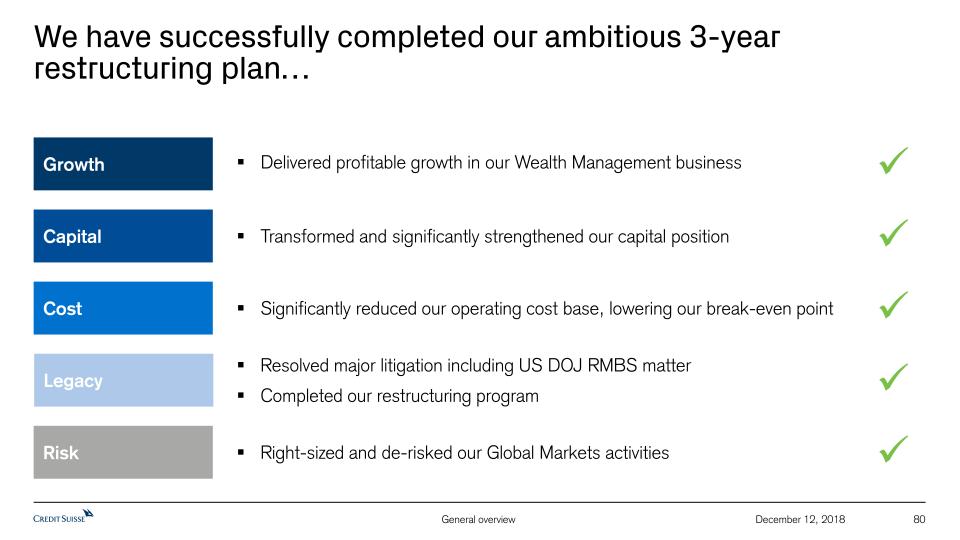
80 December 12, 2018 We have successfully completed our ambitious 3-year restructuring plan… Transformed and significantly strengthened our capital position Significantly reduced our operating cost base, lowering our break-even point Right-sized and de-risked our Global Markets activities Resolved major litigation including US DOJ RMBS matterCompleted our restructuring program Cost Capital Legacy Risk Growth Delivered profitable growth in our Wealth Management business
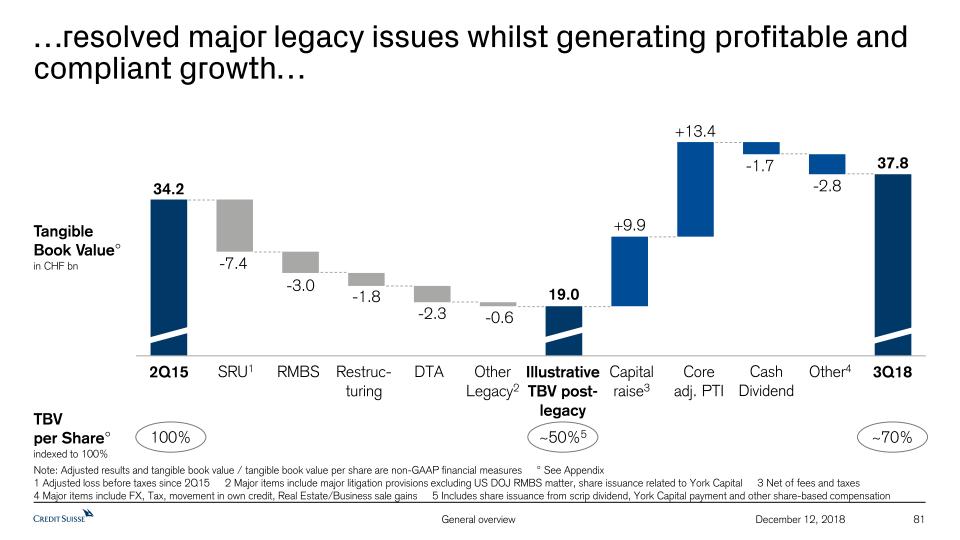
81 December 12, 2018 …resolved major legacy issues whilst generating profitable and compliant growth… TangibleBook Value° in CHF bn Note: Adjusted results and tangible book value / tangible book value per share are non-GAAP financial measures ° See Appendix1 Adjusted loss before taxes since 2Q15 2 Major items include major litigation provisions excluding US DOJ RMBS matter, share issuance related to York Capital 3 Net of fees and taxes 4 Major items include FX, Tax, movement in own credit, Real Estate/Business sale gains 5 Includes share issuance from scrip dividend, York Capital payment and other share-based compensation Other4 Cash Dividend 3Q18 2Q15 RMBS SRU1 Capital raise3 DTA Restruc-turing Core adj. PTI Other Legacy2 Illustrative TBV post-legacy TBVper Share°indexed to 100% ~70% ~50%5 100%
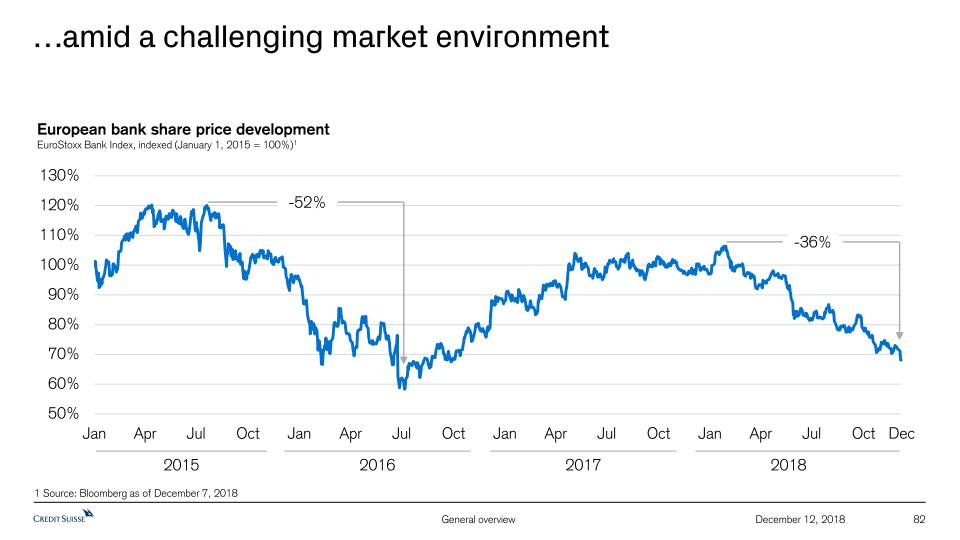
82 December 12, 2018 European bank share price developmentEuroStoxx Bank Index, indexed (January 1, 2015 = 100%)1 2015 2018 1 Source: Bloomberg as of December 7, 2018 2016 2017 -52% -36% …amid a challenging market environment Dec

83 December 12, 2018 Reconciliation between adjusted operating cost base at constant 2015 FX rates and reported operating expenses Group in CHF mn 9M18 9M17 2017 2016 2015 Total operating expenses reported 13,156 13,892 18,897 22,337 25,895 Goodwill impairment - - - - -3,797 Restructuring expenses -490 -318 -455 -540 -355 Major litigation provisions -162 -238 -493 -2,707 -820 Expenses related to business sales -3 - -8 - - Total operating expenses adjusted 12,501 13,336 17,941 19,090 20,923 FX adjustment 256 277 326 291 310 Debit valuation adjustments (DVA) 14 -63 -83 - - Certain accounting changes -183 -169 -234 -70 -58 Total operating cost base adjusted at constant FX 12,588 13,381 17,950 19,311 21,175 Adjusted results are non-GAAP financial measures that exclude goodwill impairment and certain other revenues and expenses included in our reported results. Management believes that adjusted results provide a useful presentation of our operating results for purposes of assessing our Group and divisional performance consistently over time, on a basis that excludes items that management does not consider representative of our underlying performance. Provided below is a reconciliation of our adjusted results to the most directly comparable US GAAP measures.

84 December 12, 2018 Reconciliation of adjustment items (1/11) Adjusted results are non-GAAP financial measures that exclude goodwill impairment and certain other revenues and expenses included in our reported results. Management believes that adjusted results provide a useful presentation of our operating results for purposes of assessing our Group and divisional performance consistently over time, on a basis that excludes items that management does not consider representative of our underlying performance. Provided below is a reconciliation of our adjusted results to the most directly comparable US GAAP measures. 1 Excludes net revenues and total operating expenses for Swisscard of CHF 148 mn and CHF 123 mn, respectively Group in CHF mn 9M18 9M17 9M16 9M15 Net revenues reported 16,119 15,711 15,142 19,587 FVoD - - - -995 Real estate gains -16 - -346 -23 Gains (-)/losses on business sales -68 -15 56 - Net revenues adjusted 16,035 15,696 14,852 18,569 Provision for credit losses 186 167 177 191 Total operating expenses reported 13,156 13,892 15,028 15,377 Goodwill impairment - - - - Restructuring expenses -490 -318 -491 - Major litigation provisions -162 -238 -306 -257 Expenses related to business sales -3 - - - Total operating expenses adjusted 12,501 13,336 14,231 15,120 Pre-tax income/loss (-) reported 2,777 1,652 -63 4,019 Total adjustments 571 541 507 -761 Pre-tax income/loss (-) adjusted 3,348 2,193 444 3,258 Group excl. Corp. Ctr. in CHF mn 9M18 9M17 9M16 9M151 16,103 15,671 15,055 18,130 - - - - -16 - -346 -23 -68 -38 4 - 16,019 15,633 14,713 18,107 Corp. Ctr. in CHF mn 9M18 9M17 9M16 9M15 2017 2016 2015 16 40 87 1,309 85 71 561 - - - -995 - - -298 - - - - - - - - 23 52 - 23 52 - 16 63 139 314 108 123 263 - 3 -1 1 - -1 -1 290 508 497 555 821 759 862 - - - - - - - -1 -12 - - -14 -7 - - - - - -127 - - - - - - - - - 289 496 497 555 680 752 862 -274 -471 -409 753 -736 -687 -300 1 35 52 -995 164 59 -298 -273 -436 -357 -242 -572 -628 -598

85 December 12, 2018 Reconciliation of adjustment items (2/11) Adjusted results are non-GAAP financial measures that exclude goodwill impairment and certain other revenues and expenses included in our reported results. Management believes that adjusted results provide a useful presentation of our operating results for purposes of assessing our Group and divisional performance consistently over time, on a basis that excludes items that management does not consider representative of our underlying performance. Provided below is a reconciliation of our adjusted results to the most directly comparable US GAAP measures. 1 Excludes net revenues and total operating expenses for Swisscard of CHF 148 mn and CHF 123 mn, respectively Core in CHF mn 9M18 9M17 9M16 2017 2016 20151 Net revenues reported 16,652 16,446 16,211 21,786 21,594 23,138 FVoD - - - - - -298 Real estate gains -15 - -346 - -420 -95 Gains (-)/losses on business sales -68 23 52 51 52 -34 Net revenues adjusted 16,569 16,469 15,917 21,837 21,226 22,711 Provision for credit losses 184 138 94 178 141 187 Total operating expenses reported 12,607 12,976 13,316 17,680 17,960 22,746 Goodwill impairment - - - - - -3,797 Restructuring expenses -438 -279 -371 -398 -419 -199 Major litigation provisions -90 -59 12 -224 -14 -530 Expenses related to business sales - - - -8 - - Total operating expenses adjusted 12,079 12,638 12,957 17,050 17,527 18,220 Pre-tax income/loss (-) reported 3,861 3,332 2801 3,928 3,493 205 Total adjustments 445 361 65 681 65 4,099 Pre-tax income/loss (-) adjusted 4,306 3,693 2,866 4,609 3,558 4,304 SRU in CHF mn 9M18 9M17 9M16 9M15 -533 -735 -1,069 637 - - - - -1 - - - - -38 4 - -534 -773 -1,065 637 2 29 83 37 549 916 1,712 1,930 - - - - -52 -39 -120 - -72 -179 -318 -36 -3 - - - 422 698 1,274 1,894 -1,084 -1,680 -2,864 -1,330 126 180 442 36 -958 -1,500 -2,422 -1,294
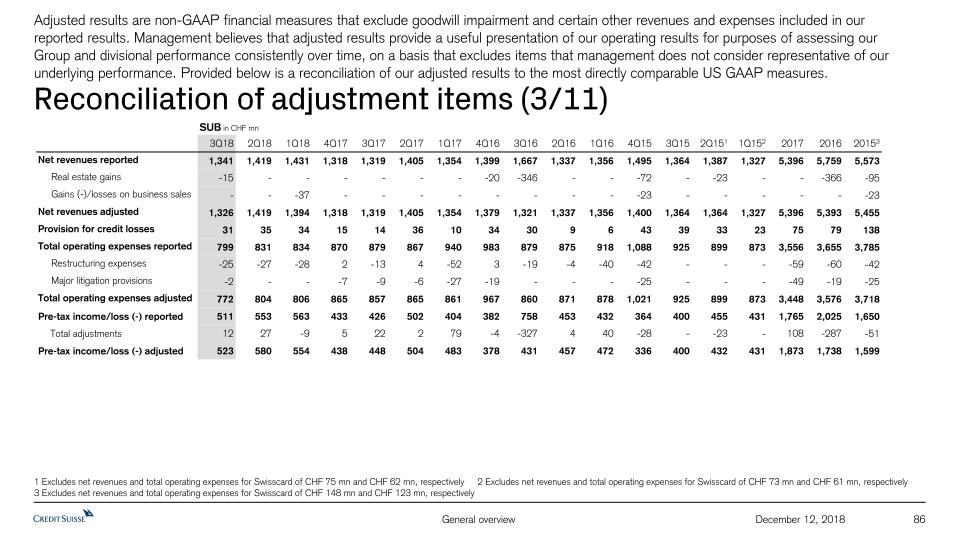
86 December 12, 2018 Reconciliation of adjustment items (3/11) Adjusted results are non-GAAP financial measures that exclude goodwill impairment and certain other revenues and expenses included in our reported results. Management believes that adjusted results provide a useful presentation of our operating results for purposes of assessing our Group and divisional performance consistently over time, on a basis that excludes items that management does not consider representative of our underlying performance. Provided below is a reconciliation of our adjusted results to the most directly comparable US GAAP measures. 1 Excludes net revenues and total operating expenses for Swisscard of CHF 75 mn and CHF 62 mn, respectively 2 Excludes net revenues and total operating expenses for Swisscard of CHF 73 mn and CHF 61 mn, respectively 3 Excludes net revenues and total operating expenses for Swisscard of CHF 148 mn and CHF 123 mn, respectively SUB in CHF mn 3Q18 2Q18 1Q18 4Q17 3Q17 2Q17 1Q17 4Q16 3Q16 2Q16 1Q16 4Q15 3Q15 2Q151 1Q152 2017 2016 ��20153 Net revenues reported 1,341 1,419 1,431 1,318 1,319 1,405 1,354 1,399 1,667 1,337 1,356 1,495 1,364 1,387 1,327 5,396 5,759 5,573 Real estate gains -15 - - - - - - -20 -346 - - -72 - -23 - - -366 -95 Gains (-)/losses on business sales - - -37 - - - - - - - - -23 - - - - - -23 Net revenues adjusted 1,326 1,419 1,394 1,318 1,319 1,405 1,354 1,379 1,321 1,337 1,356 1,400 1,364 1,364 1,327 5,396 5,393 5,455 Provision for credit losses 31 35 34 15 14 36 10 34 30 9 6 43 39 33 23 75 79 138 Total operating expenses reported 799 831 834 870 879 867 940 983 879 875 918 1,088 925 899 873 3,556 3,655 3,785 Restructuring expenses -25 -27 -28 2 -13 4 -52 3 -19 -4 -40 -42 - - - -59 -60 -42 Major litigation provisions -2 - - -7 -9 -6 -27 -19 - - - -25 - - - -49 -19 -25 Total operating expenses adjusted 772 804 806 865 857 865 861 967 860 871 878 1,021 925 899 873 3,448 3,576 3,718 Pre-tax income/loss (-) reported 511 553 563 433 426 502 404 382 758 453 432 364 400 455 431 1,765 2,025 1,650 Total adjustments 12 27 -9 5 22 2 79 -4 -327 4 40 -28 - -23 - 108 -287 -51 Pre-tax income/loss (-) adjusted 523 580 554 438 448 504 483 378 431 457 472 336 400 432 431 1,873 1,738 1,599
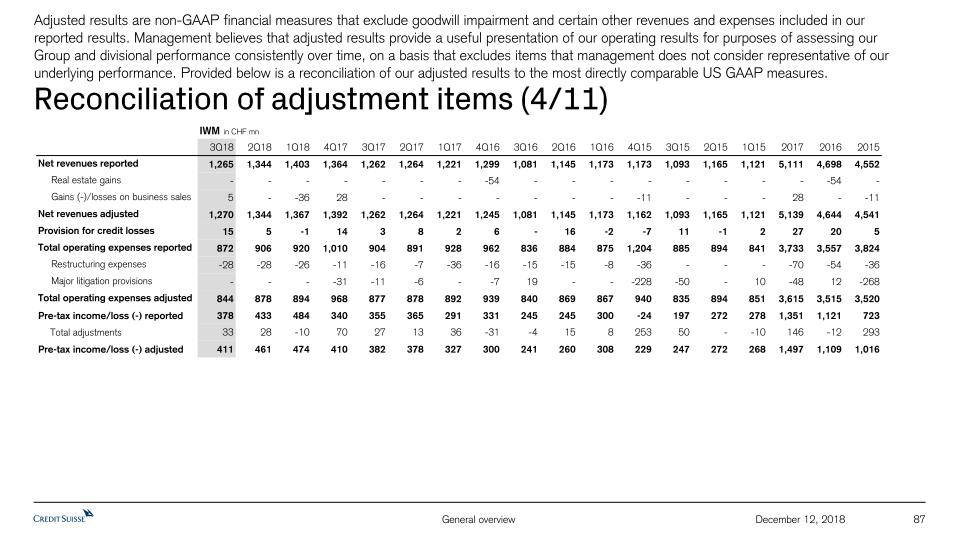
87 December 12, 2018 Reconciliation of adjustment items (4/11) Adjusted results are non-GAAP financial measures that exclude goodwill impairment and certain other revenues and expenses included in our reported results. Management believes that adjusted results provide a useful presentation of our operating results for purposes of assessing our Group and divisional performance consistently over time, on a basis that excludes items that management does not consider representative of our underlying performance. Provided below is a reconciliation of our adjusted results to the most directly comparable US GAAP measures. IWM in CHF mn 3Q18 2Q18 1Q18 4Q17 3Q17 2Q17 1Q17 4Q16 3Q16 2Q16 1Q16 4Q15 3Q15 2Q15 1Q15 2017 2016 2015 Net revenues reported 1,265 1,344 1,403 1,364 1,262 1,264 1,221 1,299 1,081 1,145 1,173 1,173 1,093 1,165 1,121 5,111 4,698 4,552 Real estate gains - - - - - - - -54 - - - - - - - - -54 - Gains (-)/losses on business sales 5 - -36 28 - - - - - - - -11 - - - 28 - -11 Net revenues adjusted 1,270 1,344 1,367 1,392 1,262 1,264 1,221 1,245 1,081 1,145 1,173 1,162 1,093 1,165 1,121 5,139 4,644 4,541 Provision for credit losses 15 5 -1 14 3 8 2 6 - 16 -2 -7 11 -1 2 27 20 5 Total operating expenses reported 872 906 920 1,010 904 891 928 962 836 884 875 1,204 885 894 841 3,733 3,557 3,824 Restructuring expenses -28 -28 -26 -11 -16 -7 -36 -16 -15 -15 -8 -36 - - - -70 -54 -36 Major litigation provisions - - - -31 -11 -6 - -7 19 - - -228 -50 - 10 -48 12 -268 Total operating expenses adjusted 844 878 894 968 877 878 892 939 840 869 867 940 835 894 851 3,615 3,515 3,520 Pre-tax income/loss (-) reported 378 433 484 340 355 365 291 331 245 245 300 -24 197 272 278 1,351 1,121 723 Total adjustments 33 28 -10 70 27 13 36 -31 -4 15 8 253 50 - -10 146 -12 293 Pre-tax income/loss (-) adjusted 411 461 474 410 382 378 327 300 241 260 308 229 247 272 268 1,497 1,109 1,016
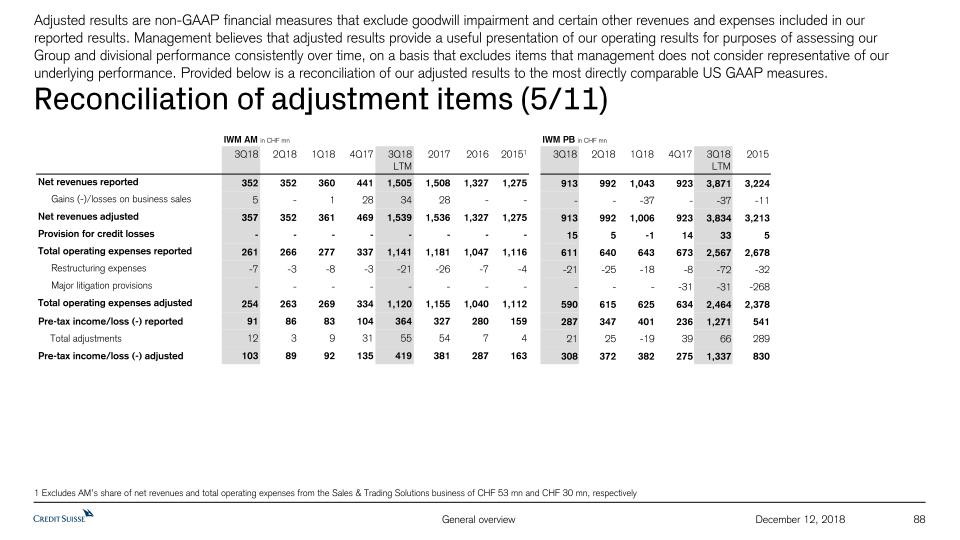
88 December 12, 2018 Reconciliation of adjustment items (5/11) Adjusted results are non-GAAP financial measures that exclude goodwill impairment and certain other revenues and expenses included in our reported results. Management believes that adjusted results provide a useful presentation of our operating results for purposes of assessing our Group and divisional performance consistently over time, on a basis that excludes items that management does not consider representative of our underlying performance. Provided below is a reconciliation of our adjusted results to the most directly comparable US GAAP measures. IWM AM in CHF mn 3Q18 2Q18 1Q18 4Q17 3Q18 LTM 2017 2016 20151 Net revenues reported 352 352 360 441 1,505 1,508 1,327 1,275 Gains (-)/losses on business sales 5 - 1 28 34 28 - - Net revenues adjusted 357 352 361 469 1,539 1,536 1,327 1,275 Provision for credit losses - - - - - - - - Total operating expenses reported 261 266 277 337 1,141 1,181 1,047 1,116 Restructuring expenses -7 -3 -8 -3 -21 -26 -7 -4 Major litigation provisions - - - - - - - - Total operating expenses adjusted 254 263 269 334 1,120 1,155 1,040 1,112 Pre-tax income/loss (-) reported 91 86 83 104 364 327 280 159 Total adjustments 12 3 9 31 55 54 7 4 Pre-tax income/loss (-) adjusted 103 89 92 135 419 381 287 163 1 Excludes AM’s share of net revenues and total operating expenses from the Sales & Trading Solutions business of CHF 53 mn and CHF 30 mn, respectively IWM PB in CHF mn 3Q18 2Q18 1Q18 4Q17 3Q18 LTM 2015 913 992 1,043 923 3,871 3,224 - - -37 - -37 -11 913 992 1,006 923 3,834 3,213 15 5 -1 14 33 5 611 640 643 673 2,567 2,678 -21 -25 -18 -8 -72 -32 - - - -31 -31 -268 590 615 625 634 2,464 2,378 287 347 401 236 1,271 541 21 25 -19 39 66 289 308 372 382 275 1,337 830
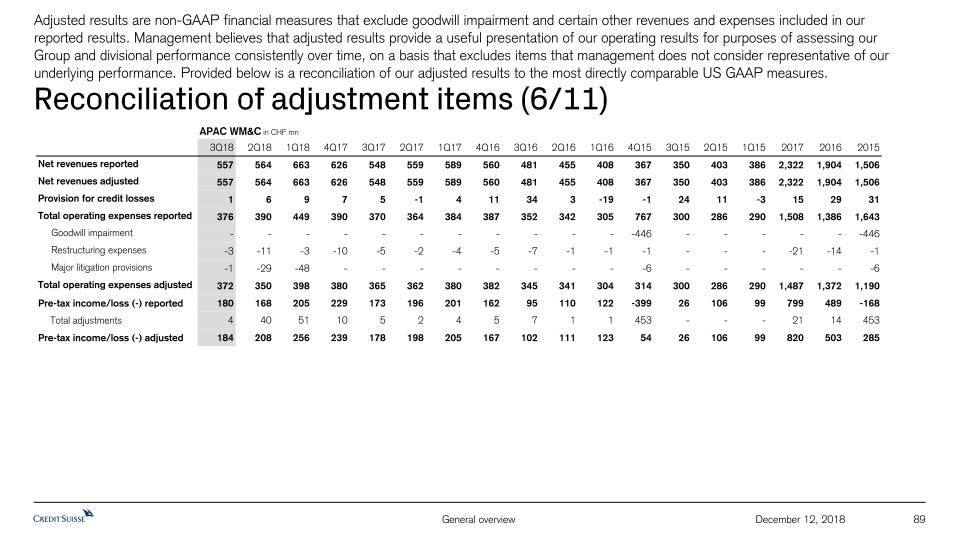
89 December 12, 2018 Reconciliation of adjustment items (6/11) Adjusted results are non-GAAP financial measures that exclude goodwill impairment and certain other revenues and expenses included in our reported results. Management believes that adjusted results provide a useful presentation of our operating results for purposes of assessing our Group and divisional performance consistently over time, on a basis that excludes items that management does not consider representative of our underlying performance. Provided below is a reconciliation of our adjusted results to the most directly comparable US GAAP measures. APAC WM&C in CHF mn 3Q18 2Q18 1Q18 4Q17 3Q17 2Q17 1Q17 4Q16 3Q16 2Q16 1Q16 4Q15 3Q15 2Q15 1Q15 2017 2016 2015 Net revenues reported 557 564 663 626 548 559 589 560 481 455 408 367 350 403 386 2,322 1,904 1,506 Net revenues adjusted 557 564 663 626 548 559 589 560 481 455 408 367 350 403 386 2,322 1,904 1,506 Provision for credit losses 1 6 9 7 5 -1 4 11 34 3 -19 -1 24 11 -3 15 29 31 Total operating expenses reported 376 390 449 390 370 364 384 387 352 342 305 767 300 286 290 1,508 1,386 1,643 Goodwill impairment - - - - - - - - - - - -446 - - - - - -446 Restructuring expenses -3 -11 -3 -10 -5 -2 -4 -5 -7 -1 -1 -1 - - - -21 -14 -1 Major litigation provisions -1 -29 -48 - - - - - - - - -6 - - - - - -6 Total operating expenses adjusted 372 350 398 380 365 362 380 382 345 341 304 314 300 286 290 1,487 1,372 1,190 Pre-tax income/loss (-) reported 180 168 205 229 173 196 201 162 95 110 122 -399 26 106 99 799 489 -168 Total adjustments 4 40 51 10 5 2 4 5 7 1 1 453 - - - 21 14 453 Pre-tax income/loss (-) adjusted 184 208 256 239 178 198 205 167 102 111 123 54 26 106 99 820 503 285

90 December 12, 2018 Reconciliation of adjustment items (7/11) Adjusted results are non-GAAP financial measures that exclude goodwill impairment and certain other revenues and expenses included in our reported results. Management believes that adjusted results provide a useful presentation of our operating results for purposes of assessing our Group and divisional performance consistently over time, on a basis that excludes items that management does not consider representative of our underlying performance. Provided below is a reconciliation of our adjusted results to the most directly comparable US GAAP measures. IBCM in CHF mn 3Q18 2Q18 1Q18 4Q17 3Q17 2Q17 1Q17 4Q16 3Q16 2Q16 1Q16 4Q15 3Q15 2Q15 1Q15 2017 2016 2015 Net revenues reported 530 644 528 565 457 511 606 574 467 543 388 420 400 568 399 2,139 1,972 1,787 Net revenues adjusted 530 644 528 565 457 511 606 574 467 543 388 420 400 568 399 2,139 1,972 1,787 Provision for credit losses 3 15 1 -1 12 13 6 - -9 - 29 - - - - 30 20 - Total operating expenses reported 457 519 468 459 410 420 451 425 437 408 421 897 335 423 446 1,740 1,691 2,101 Goodwill impairment - - - - - - - - - - - -380 - - - - - -380 Restructuring expenses -17 -31 -30 -14 -16 -10 -2 6 -15 8 -27 -22 - - - -42 -28 -22 Total operating expenses adjusted 440 488 438 445 394 410 449 431 422 416 394 495 335 423 446 1,698 1,663 1,699 Pre-tax income/loss (-) reported 70 110 59 107 35 78 149 149 39 135 -62 -477 65 145 -47 369 261 -314 Total adjustments 17 31 30 14 16 10 2 -6 15 -8 27 402 - - - 42 28 402 Pre-tax income/loss (-) adjusted 87 141 89 121 51 88 151 143 54 127 -35 -75 65 145 -47 411 289 88

91 December 12, 2018 Reconciliation of adjustment items (8/11) Adjusted results are non-GAAP financial measures that exclude goodwill impairment and certain other revenues and expenses included in our reported results. Management believes that adjusted results provide a useful presentation of our operating results for purposes of assessing our Group and divisional performance consistently over time, on a basis that excludes items that management does not consider representative of our underlying performance. Provided below is a reconciliation of our adjusted results to the most directly comparable US GAAP measures. 1 Excludes net revenues and total operating expenses for Swisscard of CHF 75 mn and CHF 62 mn, respectively 2 Excludes net revenues and total operating expenses for Swisscard of CHF 73 mn and CHF 61 mn, respectively 3 Excludes net revenues and total operating expenses for Swisscard of CHF 148 mn and CHF 123 mn, respectively SUB, IWM, APAC WM&C and IBCM in CHF mn 3Q18 2Q18 1Q18 4Q17 3Q17 2Q17 1Q17 4Q16 3Q16 2Q16 1Q16 4Q15 3Q15 2Q151 1Q152 2017 2016 20153 Net revenues reported 3,693 3,971 4,025 3,873 3,586 3,739 3,770 3,832 3,696 3,480 3,325 3,455 3,207 3,523 3,233 14,968 14,333 13,418 Real estate gains -15 - - - - - - -74 -346 - - -72 - -23 - - -420 -95 Gains (-)/losses on business sales 5 - -73 28 - - - - - - - -34 - - - 28 - -34 Net revenues adjusted 3,683 3,971 3,952 3,901 3,586 3,739 3,770 3,758 3,350 3,480 3,325 3,349 3,207 3,500 3,233 14,996 13,913 13,289 Provision for credit losses 50 61 43 35 34 56 22 51 55 28 14 35 74 43 22 147 148 174 Total operating expenses reported 2,504 2,646 2,671 2,729 2,563 2,542 2,703 2,757 2,504 2,509 2,519 3,956 2,445 2,502 2,450 10,537 10,289 11,353 Goodwill impairment - - - - - - - - - - - -826 - - - - - -826 Restructuring expenses -73 -97 -87 -33 -50 -15 -94 ��-12 -56 -12 -76 -101 - - - -192 -156 -101 Major litigation provisions -3 -29 -48 -38 -20 -12 -27 -26 19 - - -259 -50 - 10 -97 -7 -299 Total operating expenses adjusted 2,428 2,520 2,536 2,658 2,493 2,515 2,582 2,719 2,467 2,497 2,443 2,770 2,395 2,502 2,460 10,248 10,126 10,127 Pre-tax income/loss (-) reported 1,139 1,264 1,311 1,109 989 1,141 1,045 1,024 1,137 943 792 -536 688 978 761 4,284 3,896 1,891 Total adjustments 66 126 62 99 70 27 121 -36 -309 12 76 1,080 50 -23 -10 317 -257 1,097 Pre-tax income/loss (-) adjusted 1,205 1,390 1,373 1,208 1,059 1,168 1,166 988 828 955 868 544 738 955 751 4,601 3,639 2,988 SUB, IWM, APAC WM&C and IBCM in CHF mn 9M18 9M17 9M16 9M153 Net revenues reported 11,689 11,095 10,501 9,963 Real estate gains -15 - -346 -23 Gains (-)/losses on business sales -68 - - - Net revenues adjusted 11,606 11,095 10,155 9,940
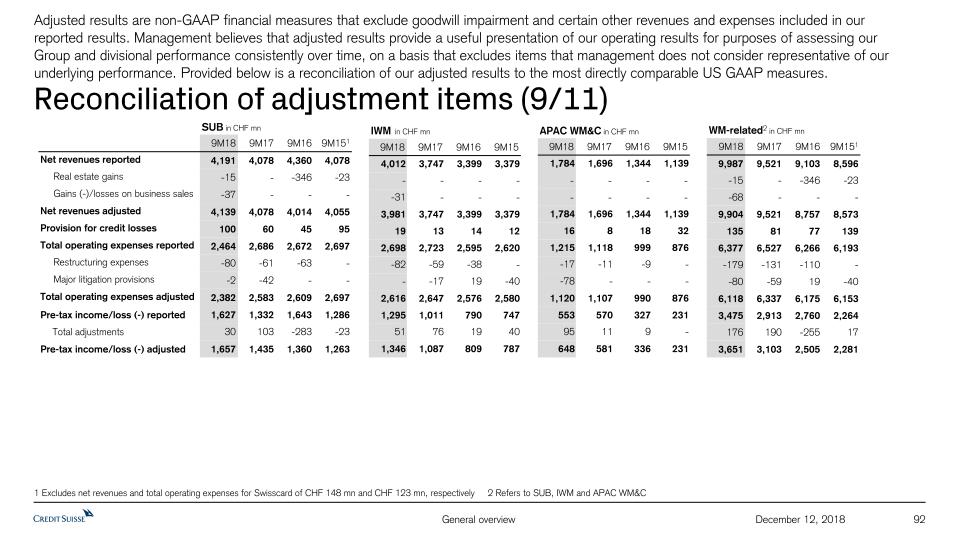
92 December 12, 2018 Reconciliation of adjustment items (9/11) Adjusted results are non-GAAP financial measures that exclude goodwill impairment and certain other revenues and expenses included in our reported results. Management believes that adjusted results provide a useful presentation of our operating results for purposes of assessing our Group and divisional performance consistently over time, on a basis that excludes items that management does not consider representative of our underlying performance. Provided below is a reconciliation of our adjusted results to the most directly comparable US GAAP measures. WM-related2 in CHF mn 9M18 9M17 9M16 9M151 9,987 9,521 9,103 8,596 -15 - -346 -23 -68 - - - 9,904 9,521 8,757 8,573 135 81 77 139 6,377 6,527 6,266 6,193 -179 -131 -110 - -80 -59 19 -40 6,118 6,337 6,175 6,153 3,475 2,913 2,760 2,264 176 190 -255 17 3,651 3,103 2,505 2,281 1 Excludes net revenues and total operating expenses for Swisscard of CHF 148 mn and CHF 123 mn, respectively 2 Refers to SUB, IWM and APAC WM&C SUB in CHF mn 9M18 9M17 9M16 9M151 Net revenues reported 4,191 4,078 4,360 4,078 Real estate gains -15 - -346 -23 Gains (-)/losses on business sales -37 - - - Net revenues adjusted 4,139 4,078 4,014 4,055 Provision for credit losses 100 60 45 95 Total operating expenses reported 2,464 2,686 2,672 2,697 Restructuring expenses -80 -61 -63 - Major litigation provisions -2 -42 - - Total operating expenses adjusted 2,382 2,583 2,609 2,697 Pre-tax income/loss (-) reported 1,627 1,332 1,643 1,286 Total adjustments 30 103 -283 -23 Pre-tax income/loss (-) adjusted 1,657 1,435 1,360 1,263 IWM in CHF mn 9M18 9M17 9M16 9M15 4,012 3,747 3,399 3,379 - - - - -31 - - - 3,981 3,747 3,399 3,379 19 13 14 12 2,698 2,723 2,595 2,620 -82 -59 -38 - - -17 19 -40 2,616 2,647 2,576 2,580 1,295 1,011 790 747 51 76 19 40 1,346 1,087 809 787 APAC WM&C in CHF mn 9M18 9M17 9M16 9M15 1,784 1,696 1,344 1,139 - - - - - - - - 1,784 1,696 1,344 1,139 16 8 18 32 1,215 1,118 999 876 -17 -11 -9 - -78 - - - 1,120 1,107 990 876 553 570 327 231 95 11 9 - 648 581 336 231
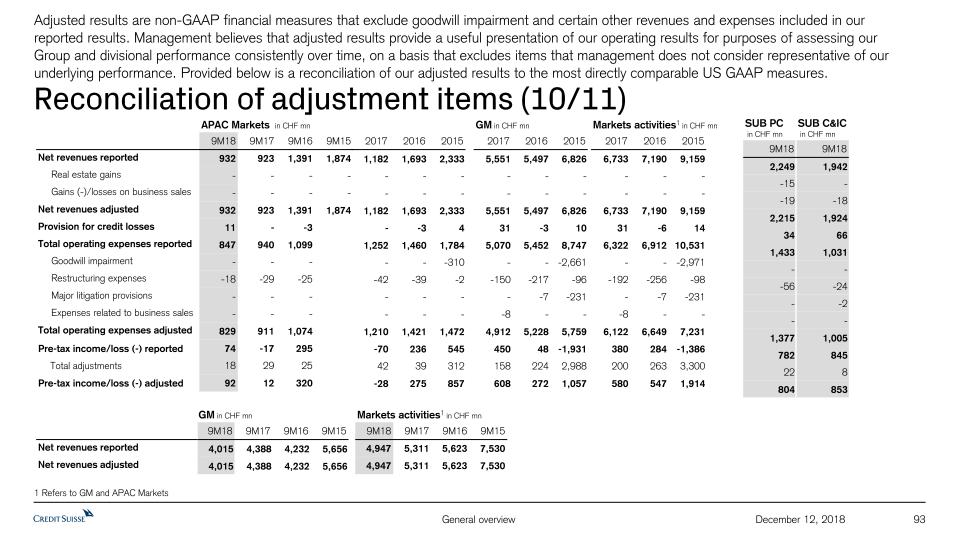
93 December 12, 2018 Reconciliation of adjustment items (10/11) Adjusted results are non-GAAP financial measures that exclude goodwill impairment and certain other revenues and expenses included in our reported results. Management believes that adjusted results provide a useful presentation of our operating results for purposes of assessing our Group and divisional performance consistently over time, on a basis that excludes items that management does not consider representative of our underlying performance. Provided below is a reconciliation of our adjusted results to the most directly comparable US GAAP measures. 2017 2016 2015 1,182 1,693 2,333 - - - - - - 1,182 1,693 2,333 - -3 4 1,252 1,460 1,784 - - -310 -42 -39 -2 - - - - - - 1,210 1,421 1,472 -70 236 545 42 39 312 -28 275 857 GM in CHF mn 9M18 9M17 9M16 9M15 4,015 4,388 4,232 5,656 4,015 4,388 4,232 5,656 APAC Markets in CHF mn 9M18 9M17 9M16 9M15 Net revenues reported 932 923 1,391 1,874 Real estate gains - - - - Gains (-)/losses on business sales - - - - Net revenues adjusted 932 923 1,391 1,874 Provision for credit losses 11 - -3 Total operating expenses reported 847 940 1,099 Goodwill impairment - - - Restructuring expenses -18 -29 -25 Major litigation provisions - - - Expenses related to business sales - - - Total operating expenses adjusted 829 911 1,074 Pre-tax income/loss (-) reported 74 -17 295 Total adjustments 18 29 25 Pre-tax income/loss (-) adjusted 92 12 320 GM in CHF mn 2017 2016 2015 5,551 5,497 6,826 - - - - - - 5,551 5,497 6,826 31 -3 10 5,070 5,452 8,747 - - -2,661 -150 -217 -96 - -7 -231 -8 - - 4,912 5,228 5,759 450 48 -1,931 158 224 2,988 608 272 1,057 1 Refers to GM and APAC Markets Markets activities1 in CHF mn 9M18 9M17 9M16 9M15 4,947 5,311 5,623 7,530 4,947 5,311 5,623 7,530 Net revenues reported Net revenues adjusted Markets activities1 in CHF mn 2017 2016 2015 6,733 7,190 9,159 - - - - - - 6,733 7,190 9,159 31 -6 14 6,322 6,912 10,531 - - -2,971 -192 -256 -98 - -7 -231 -8 - - 6,122 6,649 7,231 380 284 -1,386 200 263 3,300 580 547 1,914 SUB PC in CHF mn SUB C&IC in CHF mn 9M18 9M18 2,249 1,942 -15 - -19 -18 2,215 1,924 34 66 1,433 1,031 - - -56 -24 - -2 - - 1,377 1,005 782 845 22 8 804 853

94 December 12, 2018 Reconciliation of adjustment items (11/11) Adjusted results are non-GAAP financial measures that exclude goodwill impairment and certain other revenues and expenses included in our reported results. Management believes that adjusted results provide a useful presentation of our operating results for purposes of assessing our Group and divisional performance consistently over time, on a basis that excludes items that management does not consider representative of our underlying performance. Provided below is a reconciliation of our adjusted results to the most directly comparable US GAAP measures. SRU in USD mn 2017 2016 2015 -905 -1,285 557 - -4 - -39 6 - -944 -1,283 557 31 115 138 1,243 4,353 3,130 - - - -59 -123 -158 -275 -2,646 -295 - - - 909 1,584 2,677 -2,179 -5,753 -2,711 295 2,771 453 -1,884 -2,982 -2,258 IBCM in USD mn 9M18 9M17 9M16 9M15 2017 2016 2015 Net revenues reported 1,752 1,609 1,432 1,439 2,182 2,001 1,857 Net revenues adjusted 1,752 1,609 1,432 1,439 2,182 2,001 1,857 Provision for credit losses 19 32 21 - 31 20 - Total operating expenses reported 1,489 1,309 1,291 1,268 1,775 1,713 2,170 Goodwill impairment - - - - - - -384 Restructuring expenses -81 -29 -35 - -43 -29 -22 Total operating expenses adjusted 1,408 1,280 1,256 1,268 1,732 1,684 1,764 Pre-tax income/loss (-) reported 244 268 120 171 376 268 -313 Total adjustments 81 29 35 - 43 29 406 Pre-tax income/loss (-) adjusted 325 297 155 171 419 297 93 GM in USD mn 2017 2016 Net revenues reported 5,662 5,575 Real estate gains - - Gains (-)/losses on business sales - - Net revenues adjusted 5,662 5,575 Provision for credit losses 32 -4 Total operating expenses reported 5,172 5,522 Goodwill impairment - - Restructuring expenses -154 -220 Major litigation provisions - -7 Expenses related to business sales -8 - Total operating expenses adjusted 5,010 5,295 Pre-tax income/loss (-) reported 458 57 Total adjustments 162 227 Pre-tax income/loss (-) adjusted 620 284

Notes (1/2) 95 December 12, 2018 For reconciliation of adjusted to reported results, refer to the Appendix of this Investor Day 2018 presentationThroughout the presentation rounding differences may occurUnless otherwise noted, all CET1 ratio, Tier 1 leverage ratio, risk-weighted assets and leverage exposure figures shown in this presentation are as of the end of the respective period and on a “look-through” basisGross and net margins are shown in basis pointsGross margin = (adj.) net revenues annualized / average AuM; net margin = (adj.) pre-tax income annualized / average AuMMandate penetration reflects advisory and discretionary mandate volumes as a percentage of AuM, excluding those from the external asset manager business General notes Specific notes * Our cost savings program, until the end of 2018, is measured using an adjusted operating cost base at constant 2015 FX rates. “Adjusted operating cost base at constant FX rates” includes adjustments as made in all our disclosures for restructuring expenses, major litigation provisions, expenses related to business sales and a goodwill impairment taken in 4Q15 as well as adjustments for debit valuation adjustments (DVA) related volatility, FX and for certain accounting changes (which had not been in place at the launch of the cost savings program). Adjustments for certain accounting changes have been restated to reflect grossed up expenses in the Corporate Center and, starting in 1Q18, also include adjustments for changes from ASU 2014-09 “Revenue from Contracts with Customers”, which is described further in our 1Q18, 2Q18 and 3Q18 financial reports. Adjustments for FX apply unweighted currency exchange rates, i.e., a straight line average of monthly rates, consistently for the periods under review. Starting from 1Q19, we intend to express our operating cost base at constant 2018 FX rates and to adjust for significant litigation costs, expenses related to business and real estate sales as well as DVA related volatility, but not for restructuring expenses and certain accounting changes. Adjustments for FX will continue to apply unweighted currency exchange rates.† Regulatory capital is calculated as the worst of 10% of RWA and 3.5% of leverage exposure. Return on regulatory capital is calculated using (adjusted) income / (loss) after tax and assumes a tax rate of 30% and capital allocated based on the worst of 10% of average RWA and 3.5% of average leverage exposure. For the Markets business within the APAC division and for the Global Markets and Investment Banking & Capital Markets divisions, return on regulatory capital is based on US dollar denominated numbers. Adjusted return on regulatory capital is calculated using adjusted results, applying the same methodology to calculate return on regulatory capital. ‡ Return on tangible equity is based on tangible equity attributable to shareholders, a non-GAAP financial measure, which is calculated by deducting goodwill and other intangible assets from total equity attributable to shareholders as presented in our balance sheet. Management believes that the return on tangible equity attributable to shareholders is meaningful as it allows consistent measurement of the performance of businesses without regard to whether the businesses were acquired.° Tangible book value is a non-GAAP financial measure and is equal to tangible equity attributable to shareholders. Tangible book value per share is a non-GAAP financial measure, which is calculated by dividing tangible equity attributable to shareholders, a non-GAAP financial measure, by total number of shares outstanding. Tangible equity attributable to shareholders, a non-GAAP financial measure, is calculated by deducting goodwill and other intangible assets from total equity attributable to shareholders as presented in our balance sheet. Management believes that tangible book value per share is meaningful as it allows consistent measurement of the performance of businesses without regard to whether the businesses were acquired. For end-3Q18, tangible equity excluded goodwill of CHF 4,736 mn and other intangible assets of CHF 214 mn from total shareholders’ equity of CHF 42,734 mn as presented in our balance sheet. For end-2017, tangible equity excluded goodwill of CHF 4,742 mn and other intangible assets of CHF 223 mn from total shareholders' equity of CHF 41,902 mn as presented in our balance sheet. For end-2Q15, tangible equity excluded goodwill of CHF 8,238 mn and other intangible assets of CHF 205 mn from total shareholders' equity of CHF 42,642 mn as presented in our balance sheet. Shares outstanding were 2,552.4 mn at end-3Q18, 2,550.3 mn at end-2017 and 1,632.4 mn at end-2Q15.

Notes (2/2) 96 December 12, 2018 Abbreviations Adj. = Adjusted; AI = Artificial Intelligence; AM = Asset Management; AML = Anti-Money Laundering; APAC = Asia Pacific; ARU = Asset Resolution Unit;AT1 = Additional Tier 1; AuM = Assets under Management; BCBS = Basel Committee on Banking Supervision; BEAT = Base Erosion and Anti-Abuse Tax; BIS = Bank for International Settlements; bps = basis points; CAGR = Compound Annual Growth Rate; CBG = Corporate Bank Group; CCAR = Comprehensive Capital Adequacy Review; CCRO = Chief Compliance and Regulatory Affairs Officer; CDX HY = High-yield credit default swap index; CET1 = Common Equity Tier 1; CIC = Corporate & Institutional Clients; CIF = Customer/Client Information File; CIO = Chief Investment Officer; Corp. Ctr. = Corporate Center; CtB = Change the Bank; CVA = Credit Valuation Adjustment; DCM = Debt Capital Markets; DoJ = Department of Justice; DTA = Deferred Tax Assets; DVA = Debit Valuation Adjustments; EAM = External Asset Manager; EBITDA = Earnings Before Interest Taxes Depreciation and Amortization; ECM = Equity Capital Markets; EM = Emerging Markets; EMEA = Europe, Middle East & Africa; EQ = Equities; ERP = Enterprise Resource Planning; Est. = Estimate; EU = European Union; FICC = Fixed Income, Currencies & Commodities; FINMA = Swiss Financial Market Supervisory Authority FINMA; FLP = Fund Linked Products; FRTB = Fundamental Review of the Trading Book; FTE = Full-time employee; FX = Foreign Exchange; GDP = Gross Domestic Product; GM = Global Markets; G10 = Group of Ten; HKEX = Hong Kong Exchange; IBCM = Investment Banking & Capital Markets; IBD = Investment Banking Department; IC = Investment Consultant; ICBC = Industrial and Commercial Bank of China; ICBCCS = ICBC Credit Suisse Asset Management Co. Ltd; IG = Investment Grade; IMF = International Monetary Fund; IMM = Internal Model Method; IP = Investor Products; IPO = Initial Public Offering; IPRE= Interest Producing Real Estate; IRB = Internal Ratings Based; IS&P = Investment Solutions and Products; IT = Information Technology; ITS = International Trading Solutions; IWM = International Wealth Management; JV = Joint Venture; LBO = Leveraged Buyout; LE = Leverage Exposure; LSC = Large Swiss Corporates; LTM = Last Twelve Months; M&A = Mergers & Acquisitions; MD(R) = Managing Director; Mgmt. = Management; MI = Management Information; MifiD II = Markets in Financial Instruments Directive II; Mkts = Markets; NNA = Net new assets; OCC = Office of the Comptroller of the Currency; Op Risk = Operational Risk; PB = Private Banking; PB&WM = Private Banking & Wealth Management; PC = Private Clients; PEP = Politically Exposed Person; pp = percentage points; PTI = Pre-tax income; PWMC = Private & Wealth Management Clients; RM = Relationship Manager(s); RMBS = Residential Mortgage Backed Securities; RoRC = Return on Regulatory Capital; RoTE = Return on Tangible Equity; RPA = Robotic Process Automation; RtB = Run the Bank; RWA = Risk-weighted assets; SA-CCR = Standardized Approach to Counterparty Credit Risk; SME = Small and Medium-Sized Enterprises; SMG = Systematic Market-Making Group; SoW = Share of Wallet; SRU = Strategic Resolution Unit; SUB = Swiss Universal Bank; TBTF = Too Big To Fail; TBV(PS) = Tangible Book Value (per Share); (U)HNW(I) = (Ultra) High Net Worth (Individuals); US GAAP = United States Generally Accepted Accounting Principles; U/W = Underwriting; VaR = Value-at-Risk; VIX = Volatility Index; WM = Wealth Management; WM&C = Wealth Management & Connected; YoY = Year over year; YTD = Year to Date

David Mathers, Chief Financial OfficerDecember 12, 2018 Credit Suisse Investor Day 2018Key financials
Disclaimer 2 December 12, 2018 This material does not purport to contain all of the information that you may wish to consider. This material is not to be relied upon as such or used in substitution for the exercise of independent judgment.Cautionary statement regarding forward-looking statementsThis presentation contains forward-looking statements that involve inherent risks and uncertainties, and we might not be able to achieve the predictions, forecasts, projections and other outcomes we describe or imply in forward-looking statements. A number of important factors could cause results to differ materially from the plans, objectives, expectations, estimates and intentions we express in these forward-looking statements, including those we identify in "Risk factors” in our Annual Report on Form 20-F for the fiscal year ended December 31, 2017 and in the “Cautionary statement regarding forward-looking information" in our media release relating to Investor Day, published on December 12, 2018 and filed with the US Securities and Exchange Commission, and in other public filings and press releases. We do not intend to update these forward-looking statements. In particular, the terms “Estimate”, “Illustrative”, “Ambition”, “Objective”, “Outlook” and “Goal” are not intended to be viewed as targets or projections, nor are they considered to be Key Performance Indicators. All such estimates, illustrations, ambitions, objectives, outlooks and goals are subject to a large number of inherent risks, assumptions and uncertainties, many of which are completely outside of our control. These risks, assumptions and uncertainties include, but are not limited to, general market conditions, market volatility, interest rate volatility and levels, global and regional economic conditions, political uncertainty, changes in tax policies, regulatory changes, changes in levels of client activity as a result of any of the foregoing and other factors. Accordingly, this information should not be relied on for any purpose. We do not intend to update these estimates, illustrations, ambitions, objectives, outlooks or goals. We may not achieve the benefits of our strategic initiativesWe may not achieve all of the expected benefits of our strategic initiatives. Factors beyond our control, including but not limited to the market and economic conditions, changes in laws, rules or regulations and other challenges discussed in our public filings, could limit our ability to achieve some or all of the expected benefits of these initiatives. Estimates and assumptionsIn preparing this presentation, management has made estimates and assumptions that affect the numbers presented. Actual results may differ. Annualized numbers do not take account of variations in operating results, seasonality and other factors and may not be indicative of actual, full-year results. Figures throughout this presentation may also be subject to rounding adjustments. All opinions and views constitute judgments as of the date of writing without regard to the date on which the reader may receive or access the information. This information is subject to change at any time without notice and we do not intend to update this information. Statement regarding non-GAAP financial measuresThis presentation also contains non-GAAP financial measures, including adjusted results. Information needed to reconcile such non-GAAP financial measures to the most directly comparable measures under US GAAP can be found in this presentation in the Appendix, which is available on our website at www.credit-suisse.com. Many of our references to estimates, ambitions, objectives and targets for revenues, operating expenses, operating cost base, pre-tax income and return on regulatory capital are on an adjusted basis as well. These adjusted numbers, return on tangible equity and tangible book value per share are non-GAAP financial measures. A reconciliation of the estimates, ambitions, objectives and targets to the nearest GAAP measure is unavailable without unreasonable efforts. Adjusted results exclude goodwill impairment, major litigation charges, real estate gains and other revenue and expense items included in our reported results, which are unavailable on a prospective basis. Tangible equity excludes goodwill and other intangible assets from shareholders’ equity, all of which are unavailable on a prospective basis. Tangible book value per share excludes the impact of any dividends paid during the performance period, share buybacks, own credit movements, foreign exchange rate movements and pension-related impacts, all of which are unavailable on a prospective basis.Statement regarding capital, liquidity and leverageAs of January 1, 2013, Basel III was implemented in Switzerland along with the Swiss “Too Big to Fail” legislation and regulations thereunder (in each case, subject to certain phase-in periods). As of January 1, 2015, the Bank for International Settlements (BIS) leverage ratio framework, as issued by the Basel Committee on Banking Supervision (BCBS), was implemented in Switzerland by FINMA. Our related disclosures are in accordance with our interpretation of such requirements, including relevant assumptions. Changes in the interpretation of these requirements in Switzerland or in any of our assumptions or estimates could result in different numbers from those shown in this presentation. Unless otherwise noted, leverage exposure is based on the BIS leverage ratio framework and consists of period-end balance sheet assets and prescribed regulatory adjustments. The look-through tier 1 leverage ratio and CET1 leverage ratio are calculated as look-through BIS tier 1 capital and CET1 capital, respectively, divided by period-end leverage exposure. Swiss leverage ratios are measured on the same period-end basis as the leverage exposure for the BIS leverage ratio.SourcesCertain material in this presentation has been prepared by Credit Suisse on the basis of publicly available information, internally developed data and other third-party sources believed to be reliable. Credit Suisse has not sought to independently verify information obtained from public and third-party sources and makes no representations or warranties as to accuracy, completeness or reliability of such information.
Financial goals 2019-2021 2 Completing the 2015-2018 restructuring program 1 Update on Financials 3 December 12, 2018 Costs Funding SRU Costs Regulatory changes to capital RoTE Capital generation & distribution
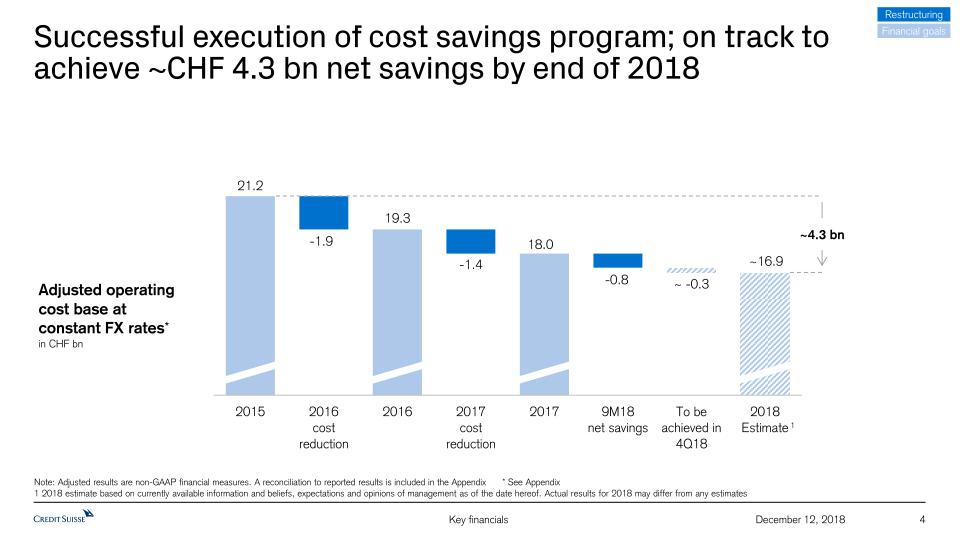
4 December 12, 2018 Successful execution of cost savings program; on track to achieve ~CHF 4.3 bn net savings by end of 2018 Adjusted operating cost base at constant FX rates*in CHF bn ~4.3 bn Note: Adjusted results are non-GAAP financial measures. A reconciliation to reported results is included in the Appendix * See Appendix1 2018 estimate based on currently available information and beliefs, expectations and opinions of management as of the date hereof. Actual results for 2018 may differ from any estimates Restructuring Financial goals 1
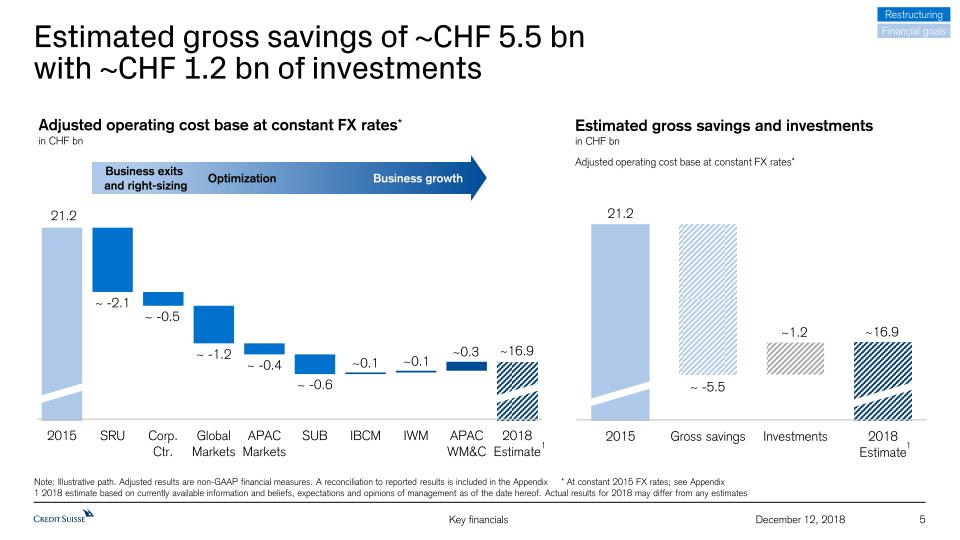
5 December 12, 2018 Estimated gross savings of ~CHF 5.5 bnwith ~CHF 1.2 bn of investments Restructuring Financial goals Business exits and right-sizing Optimization Business growth Adjusted operating cost base at constant FX rates*in CHF bn Estimated gross savings and investmentsin CHF bn 1 Note: Illustrative path. Adjusted results are non-GAAP financial measures. A reconciliation to reported results is included in the Appendix * At constant 2015 FX rates; see Appendix1 2018 estimate based on currently available information and beliefs, expectations and opinions of management as of the date hereof. Actual results for 2018 may differ from any estimates Adjusted operating cost base at constant FX rates* 1
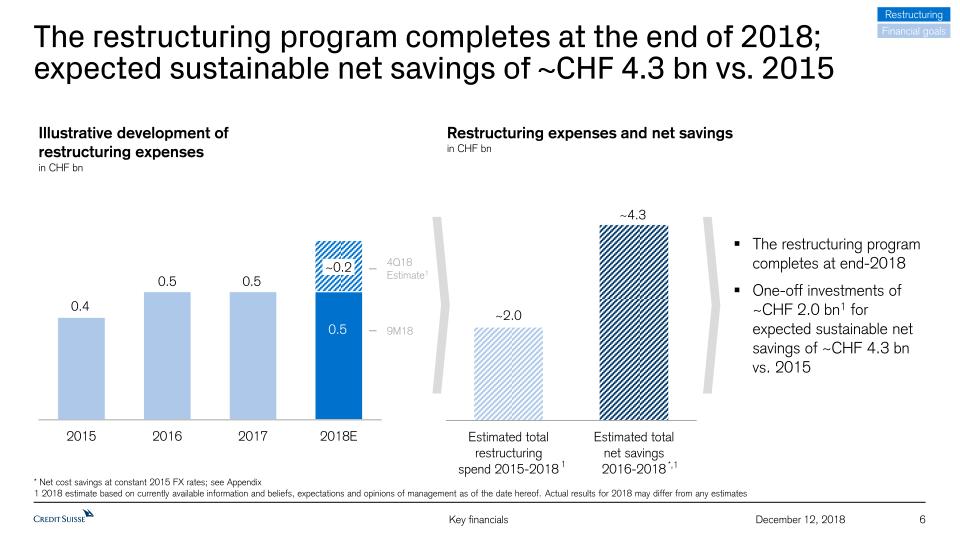
6 December 12, 2018 Illustrative development of restructuring expensesin CHF bn Restructuring expenses and net savingsin CHF bn 9M18 4Q18Estimate1 * Net cost savings at constant 2015 FX rates; see Appendix1 2018 estimate based on currently available information and beliefs, expectations and opinions of management as of the date hereof. Actual results for 2018 may differ from any estimates Restructuring Financial goals The restructuring program completes at end-2018One-off investments of ~CHF 2.0 bn1 for expected sustainable net savings of ~CHF 4.3 bn vs. 2015 The restructuring program completes at the end of 2018; expected sustainable net savings of ~CHF 4.3 bn vs. 2015 1 *,1 ~0.2
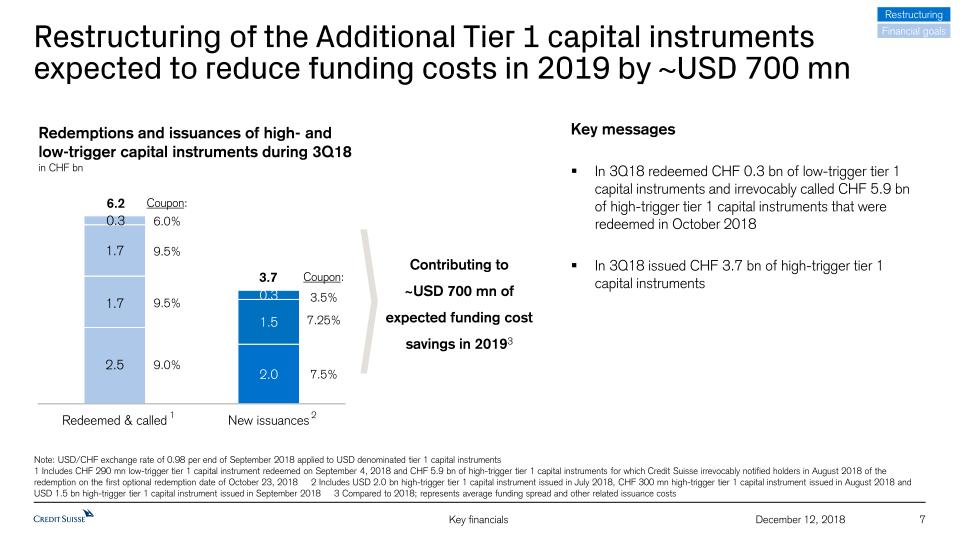
7 December 12, 2018 Restructuring of the Additional Tier 1 capital instrumentsexpected to reduce funding costs in 2019 by ~USD 700 mn Redemptions and issuances of high- andlow-trigger capital instruments during 3Q18in CHF bn Note: USD/CHF exchange rate of 0.98 per end of September 2018 applied to USD denominated tier 1 capital instruments1 Includes CHF 290 mn low-trigger tier 1 capital instrument redeemed on September 4, 2018 and CHF 5.9 bn of high-trigger tier 1 capital instruments for which Credit Suisse irrevocably notified holders in August 2018 of the redemption on the first optional redemption date of October 23, 2018 2 Includes USD 2.0 bn high-trigger tier 1 capital instrument issued in July 2018, CHF 300 mn high-trigger tier 1 capital instrument issued in August 2018 and USD 1.5 bn high-trigger tier 1 capital instrument issued in September 2018 3 Compared to 2018; represents average funding spread and other related issuance costs 2 6.2 3.7 9.5% 9.0% 3.5% 7.25% 7.5% 9.5% 6.0% Coupon: Coupon: Contributing to ~USD 700 mn of expected funding cost savings in 20193 1 Key messagesIn 3Q18 redeemed CHF 0.3 bn of low-trigger tier 1 capital instruments and irrevocably called CHF 5.9 bn of high-trigger tier 1 capital instruments that were redeemed in October 2018In 3Q18 issued CHF 3.7 bn of high-trigger tier 1 capital instruments Restructuring Financial goals

8 December 12, 2018 In the SRU we achieved our capital targets ahead of plan; estimated release of ~USD 5.8 bn of allocated capital since 3Q15 RWA excl. operational risk1 in USD bn ~ -86% Leverage exposure in USD bn Allocated capital2 in USD bn ~ -5.8 bn Restructuring Financial goals Note: SRU program will be economically completed by end-2018; beginning in 2019, the SRU will have ceased to exist as a separate division of the Group and the legacy portfolio remaining as of December 31, 2018 will be managed in an Asset Resolution Unit (ARU) separately disclosed within the Corporate Center 1 Excludes Op Risk RWA of USD 20 bn in each of 3Q15, 3Q16 and 3Q17 and USD 11 bn in 3Q18 2 Allocated capital calculated as 3.5% of leverage exposure 3 2018 estimate based on currently available information and beliefs, expectations and opinions of management as of the date hereof. Actual results for 2018 may differ from any estimates 3 ~ -84% 3 3
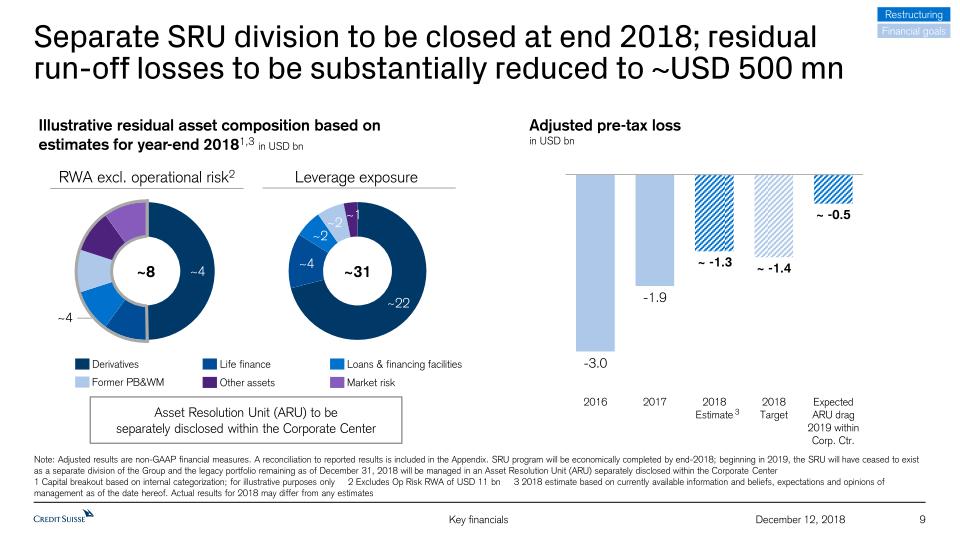
9 December 12, 2018 Separate SRU division to be closed at end 2018; residualrun-off losses to be substantially reduced to ~USD 500 mn Note: Adjusted results are non-GAAP financial measures. A reconciliation to reported results is included in the Appendix. SRU program will be economically completed by end-2018; beginning in 2019, the SRU will have ceased to exist as a separate division of the Group and the legacy portfolio remaining as of December 31, 2018 will be managed in an Asset Resolution Unit (ARU) separately disclosed within the Corporate Center1 Capital breakout based on internal categorization; for illustrative purposes only 2 Excludes Op Risk RWA of USD 11 bn 3 2018 estimate based on currently available information and beliefs, expectations and opinions of management as of the date hereof. Actual results for 2018 may differ from any estimates Illustrative residual asset composition based on estimates for year-end 20181,3 in USD bn Adjusted pre-tax lossin USD bn ~8 Asset Resolution Unit (ARU) to beseparately disclosed within the Corporate Center Restructuring Financial goals ~31 RWA excl. operational risk2 Leverage exposure Derivatives Life finance Loans & financing facilities Former PB&WM Other assets Market risk ~4 3
Financial goals 2019-2021 2 Completing the 2015-2018 restructuring program 1 Update on Financials 10 December 12, 2018 Costs Funding SRU Costs Regulatory changes to capital RoTE Capital generation & distribution
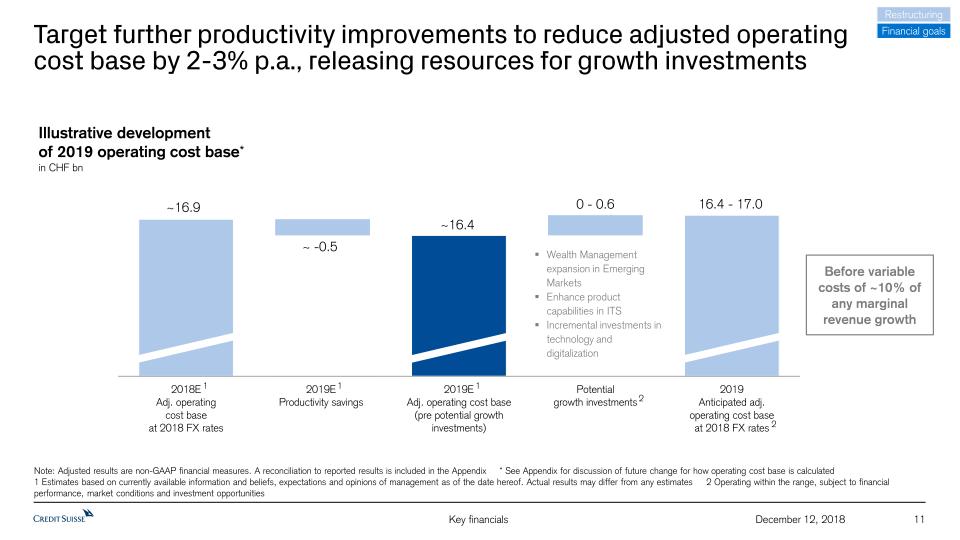
11 December 12, 2018 Target further productivity improvements to reduce adjusted operating cost base by 2-3% p.a., releasing resources for growth investments Restructuring Financial goals Note: Adjusted results are non-GAAP financial measures. A reconciliation to reported results is included in the Appendix * See Appendix for discussion of future change for how operating cost base is calculated1 2018 estimate based on currently available information and beliefs, expectations and opinions of management as of the date hereof. Actual results for 2018 may differ from any estimates 2 Operating within the range, subject to financial performance, market conditions and investment opportunities Illustrative developmentof 2019 operating cost base*in CHF bn 2 Before variable costs of ~10% of any marginal revenue growth 2 Wealth Management expansion in Emerging MarketsEnhance product capabilities in ITSIncremental investments in technology and digitalization 1 1 1
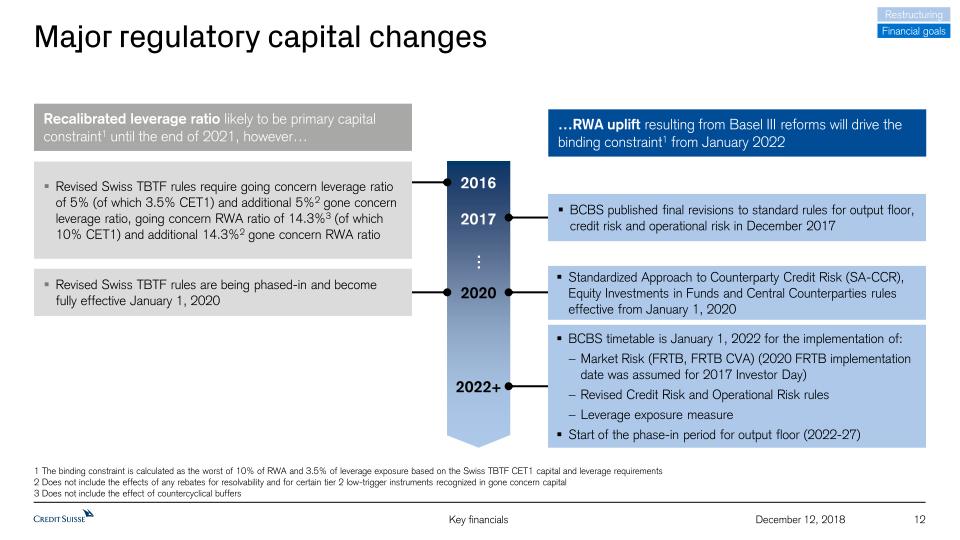
Major regulatory capital changes 12 December 12, 2018 1 The binding constraint is calculated as the worst of 10% of RWA and 3.5% of leverage exposure based on the Swiss TBTF CET1 capital and leverage requirements2 Does not include the effects of any rebates for resolvability and for certain tier 2 low-trigger instruments recognized in gone concern capital3 Does not include the effect of countercyclical buffers Restructuring Financial goals Recalibrated leverage ratio likely to be primary capital constraint1 until the end of 2021, however… 2017 2020 2022+ 2016 … Revised Swiss TBTF rules are being phased-in and become fully effective January 1, 2020 Revised Swiss TBTF rules require going concern leverage ratio of 5% (of which 3.5% CET1) and additional 5%2 gone concern leverage ratio, going concern RWA ratio of 14.3%3 (of which 10% CET1) and additional 14.3%2 gone concern RWA ratio …RWA uplift resulting from Basel III reforms will drive the binding constraint1 from January 2022 Standardized Approach to Counterparty Credit Risk (SA-CCR), Equity Investments in Funds and Central Counterparties rules effective from January 1, 2020 BCBS published final revisions to standard rules for output floor, credit risk and operational risk in December 2017 BCBS timetable is January 1, 2022 for the implementation of:Market Risk (FRTB, FRTB CVA) (2020 FRTB implementation date was assumed for 2017 Investor Day)Revised Credit Risk and Operational Risk rulesLeverage exposure measureStart of the phase-in period for output floor (2022-27)
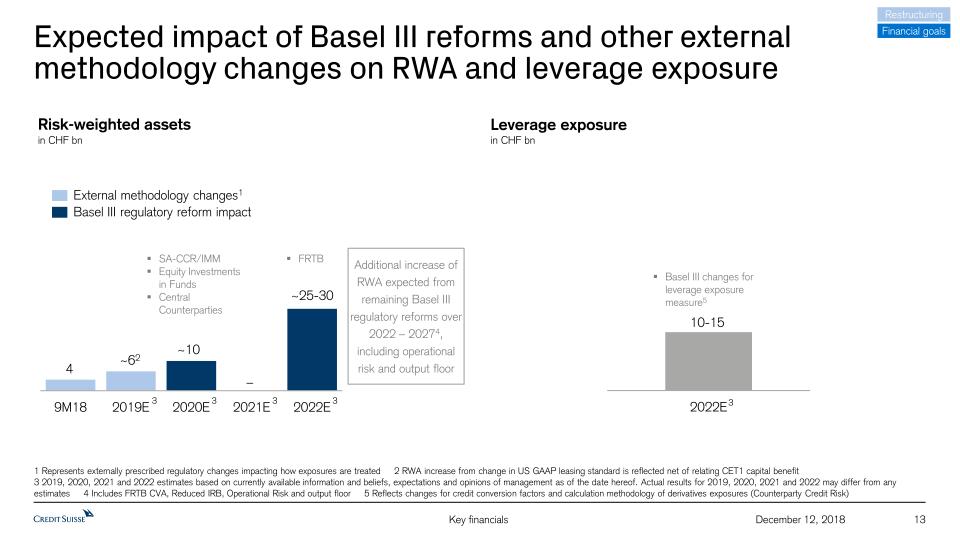
Expected impact of Basel III reforms and other externalmethodology changes on RWA and leverage exposure 13 December 12, 2018 Restructuring Financial goals Risk-weighted assetsin CHF bn Leverage exposurein CHF bn External methodology changes1 Basel III regulatory reform impact Basel III changes for leverage exposure measure5 1 Represents externally prescribed regulatory changes impacting how exposures are treated 2 RWA increase from change in US GAAP leasing standard is reflected net of relating CET1 capital benefit 3 2019, 2020, 2021 and 2022 estimates based on currently available information and beliefs, expectations and opinions of management as of the date hereof. Actual results for 2019, 2020, 2021 and 2022 may differ from any estimates 4 Includes FRTB CVA, Reduced IRB, Operational Risk and output floor 5 Reflects changes for credit conversion factors and calculation methodology of derivatives exposures (Counterparty Credit Risk) Additional increase of RWA expected from remaining Basel III regulatory reforms over 2022 – 20274, including operational risk and output floor 10-15 SA-CCR/IMMEquity Investments in FundsCentral Counterparties FRTB 3 3 3 3 3 –
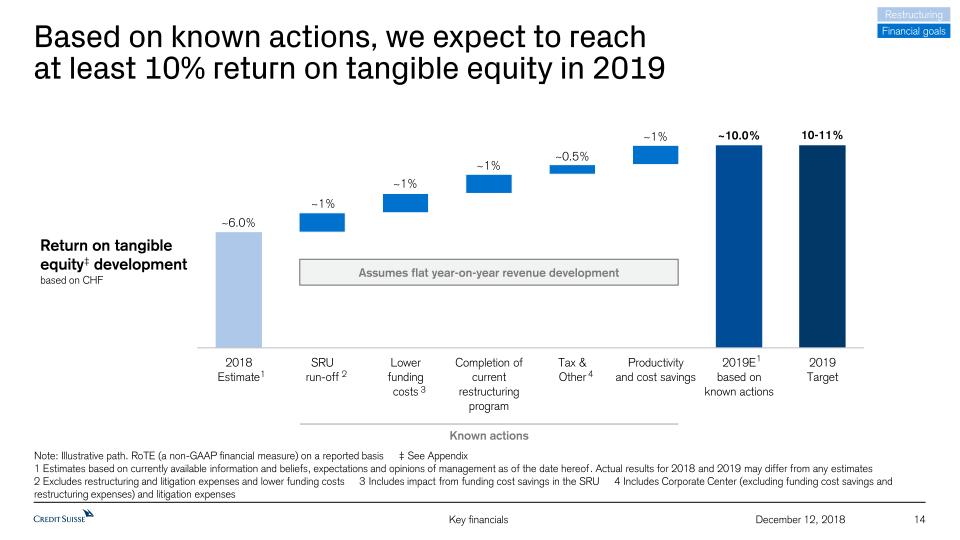
14 December 12, 2018 Based on known actions, we expect to reachat least 10% return on tangible equity in 2019 3 4 2 1 Note: Illustrative path. RoTE (a non-GAAP financial measure) on a reported basis ‡ See Appendix1 Estimates based on currently available information and beliefs, expectations and opinions of management as of the date hereof. Actual results for 2018 and 2019 may differ from any estimates2 Excludes restructuring and litigation expenses and lower funding costs 3 Includes impact from funding cost savings in the SRU 4 Includes Corporate Center (excluding funding cost savings and restructuring expenses) and litigation expenses Return on tangible equity‡ development based on CHF 1 Known actions Restructuring Financial goals Assumes flat year-on-year revenue development
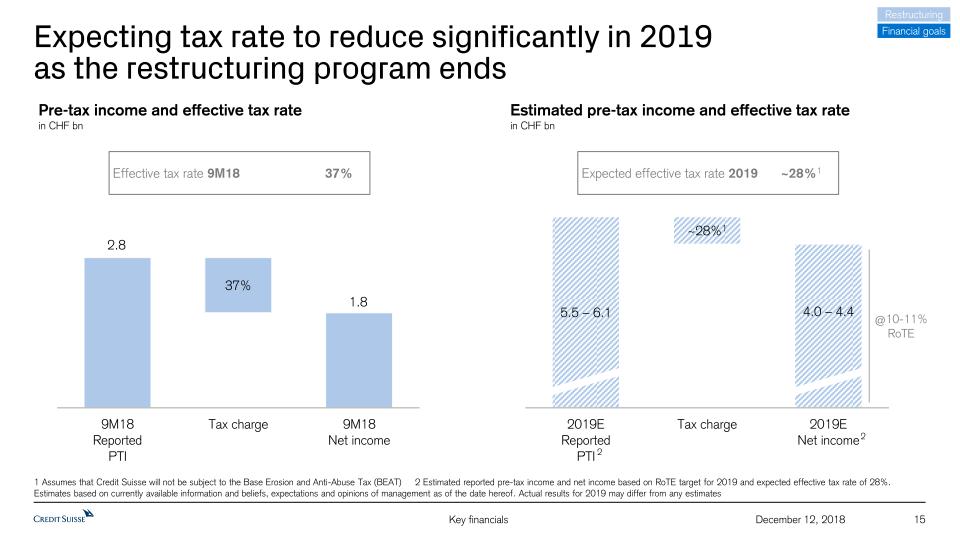
15 December 12, 2018 Expecting tax rate to reduce significantly in 2019as the restructuring program ends Restructuring Financial goals Pre-tax income and effective tax ratein CHF bn Expected effective tax rate 2019 ~28%1 Effective tax rate 9M18 37% 1 Assumes that Credit Suisse will not be subject to the Base Erosion and Anti-Abuse Tax (BEAT) 2 Estimated reported pre-tax income and net income based on RoTE target for 2019 and expected effective tax rate of 28%. Estimates based on currently available information and beliefs, expectations and opinions of management as of the date hereof. Actual results for 2019 may differ from any estimates 2 2 Estimated pre-tax income and effective tax ratein CHF bn @10-11% RoTE
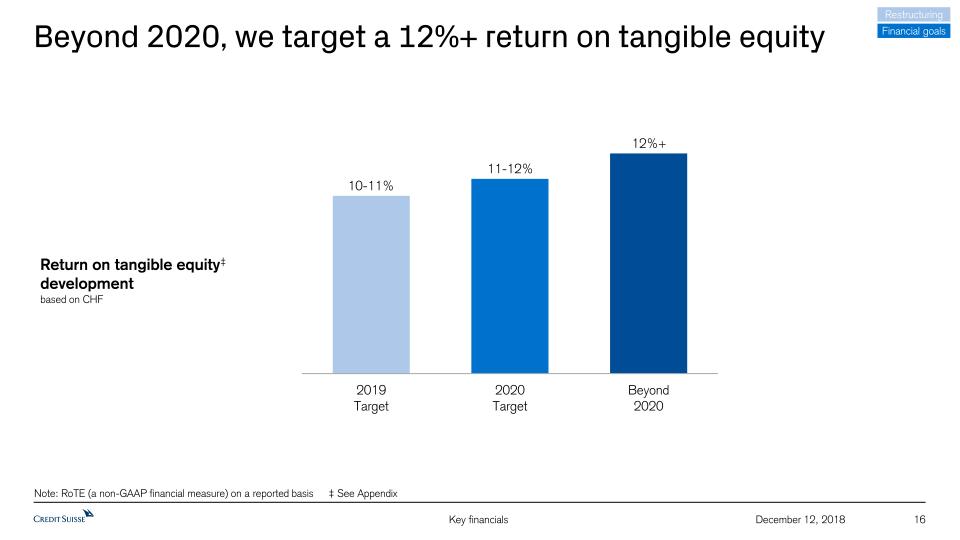
16 December 12, 2018 Beyond 2020, we target a 12%+ return on tangible equity Return on tangible equity‡ development based on CHF Note: RoTE (a non-GAAP financial measure) on a reported basis ‡ See Appendix 10-11% 11-12% 12%+ Restructuring Financial goals
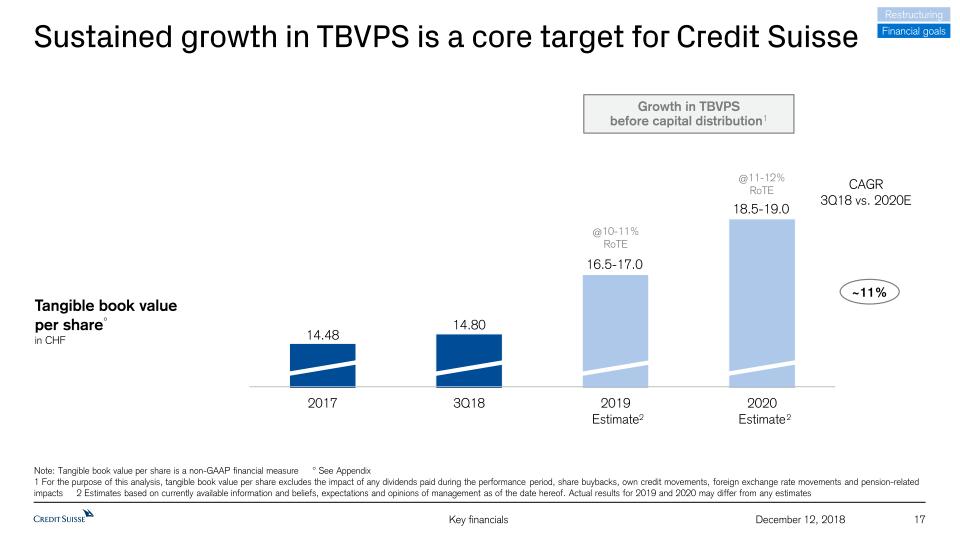
17 December 12, 2018 Sustained growth in TBVPS is a core target for Credit Suisse Note: Tangible book value per share is a non-GAAP financial measure ° See Appendix1 For the purpose of this analysis, tangible book value per share excludes the impact of any dividends paid during the performance period, share buybacks, own credit movements, foreign exchange rate movements and pension-related impacts 2 Estimates based on currently available information and beliefs, expectations and opinions of management as of the date hereof. Actual results for 2019 and 2020 may differ from any estimates Tangible book valueper share°in CHF CAGR3Q18 vs. 2020E ~11% @10-11%RoTE @11-12%RoTE Growth in TBVPSbefore capital distribution1 Financial goals Restructuring 2 2
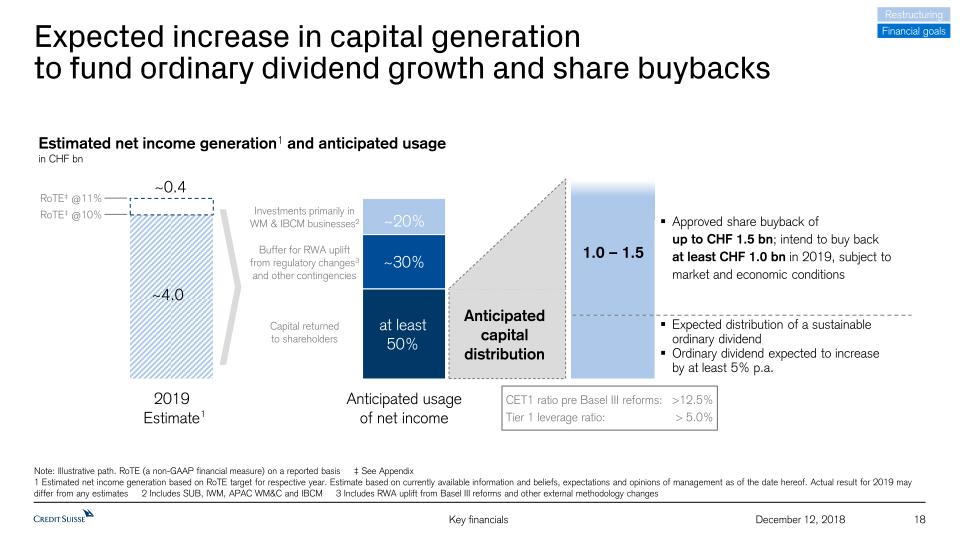
18 December 12, 2018 Financial goals Restructuring Expected increase in capital generationto fund ordinary dividend growth and share buybacks Note: Illustrative path. RoTE (a non-GAAP financial measure) on a reported basis ‡ See Appendix1 Estimated net income generation based on RoTE target for respective year. Estimate based on currently available information and beliefs, expectations and opinions of management as of the date hereof. Actual result for 2019 may differ from any estimates 2 Includes SUB, IWM, APAC WM&C and IBCM 3 Includes RWA uplift from Basel III reforms and other external methodology changes Estimated net income generation1 and anticipated usagein CHF bn RoTE‡ @11% RoTE‡ @10% ~4.0 ~20% Expected distribution of a sustainable ordinary dividendOrdinary dividend expected to increaseby at least 5% p.a. Approved share buyback of up to CHF 1.5 bn; intend to buy back at least CHF 1.0 bn in 2019, subject to market and economic conditions Anticipated capital distribution Investments primarily in WM & IBCM businesses2 Buffer for RWA uplift from regulatory changes3 and other contingencies CET1 ratio pre Basel III reforms: >12.5%Tier 1 leverage ratio: > 5.0% at least50% 1.0 – 1.5 1 Capital returnedto shareholders

Appendix 19 December 12, 2018
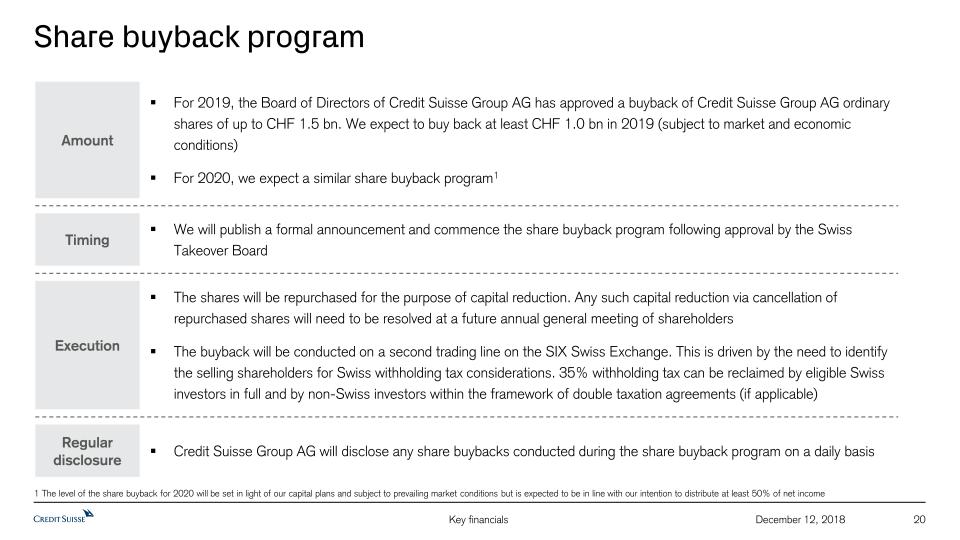
20 December 12, 2018 Share buyback program For 2019, the Board of Directors of Credit Suisse Group AG has approved a buyback of Credit Suisse Group AG ordinary shares of up to CHF 1.5 bn. We expect to buy back at least CHF 1.0 bn in 2019 (subject to market and economic conditions) For 2020, we expect a similar share buyback program1 Amount Timing Execution We will publish a formal announcement and commence the share buyback program following approval by the Swiss Takeover Board The shares will be repurchased for the purpose of capital reduction. Any such capital reduction via cancellation of repurchased shares will need to be resolved at a future annual general meeting of shareholdersThe buyback will be conducted on a second trading line on the SIX Swiss Exchange. This is driven by the need to identify the selling shareholders for Swiss withholding tax considerations. 35% withholding tax can be reclaimed by eligible Swiss investors in full and by non-Swiss investors within the framework of double taxation agreements (if applicable) Credit Suisse Group AG will disclose any share buybacks conducted during the share buyback program on a daily basis Regular disclosure 1 The level of the share buyback for 2020 will be set in light of our capital plans and subject to prevailing market conditions but is expected to be in line with our intention to distribute at least 50% of net income
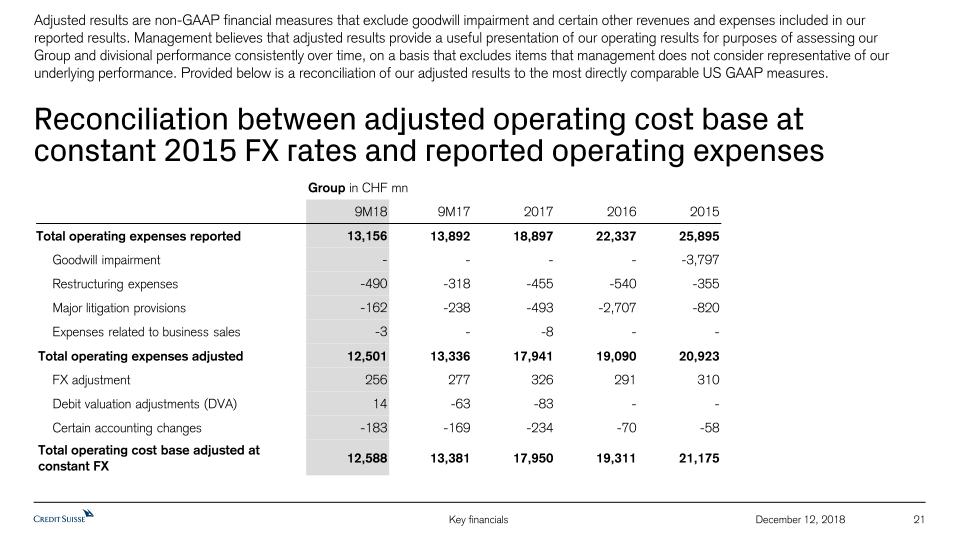
21 December 12, 2018 Reconciliation between adjusted operating cost base at constant 2015 FX rates and reported operating expenses Group in CHF mn 9M18 9M17 2017 2016 2015 Total operating expenses reported 13,156 13,892 18,897 22,337 25,895 Goodwill impairment - - - - -3,797 Restructuring expenses -490 -318 -455 -540 -355 Major litigation provisions -162 -238 -493 -2,707 -820 Expenses related to business sales -3 - -8 - - Total operating expenses adjusted 12,501 13,336 17,941 19,090 20,923 FX adjustment 256 277 326 291 310 Debit valuation adjustments (DVA) 14 -63 -83 - - Certain accounting changes -183 -169 -234 -70 -58 Total operating cost base adjusted at constant FX 12,588 13,381 17,950 19,311 21,175 Adjusted results are non-GAAP financial measures that exclude goodwill impairment and certain other revenues and expenses included in our reported results. Management believes that adjusted results provide a useful presentation of our operating results for purposes of assessing our Group and divisional performance consistently over time, on a basis that excludes items that management does not consider representative of our underlying performance. Provided below is a reconciliation of our adjusted results to the most directly comparable US GAAP measures.
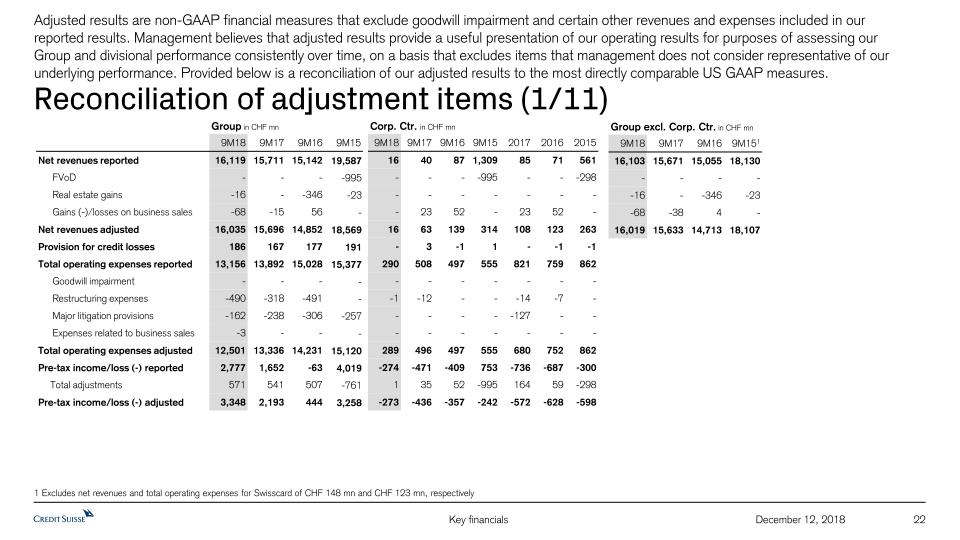
22 December 12, 2018 Reconciliation of adjustment items (1/11) Adjusted results are non-GAAP financial measures that exclude goodwill impairment and certain other revenues and expenses included in our reported results. Management believes that adjusted results provide a useful presentation of our operating results for purposes of assessing our Group and divisional performance consistently over time, on a basis that excludes items that management does not consider representative of our underlying performance. Provided below is a reconciliation of our adjusted results to the most directly comparable US GAAP measures. 1 Excludes net revenues and total operating expenses for Swisscard of CHF 148 mn and CHF 123 mn, respectively Group in CHF mn 9M18 9M17 9M16 9M15 Net revenues reported 16,119 15,711 15,142 19,587 FVoD - - - -995 Real estate gains -16 - -346 -23 Gains (-)/losses on business sales -68 -15 56 - Net revenues adjusted 16,035 15,696 14,852 18,569 Provision for credit losses 186 167 177 191 Total operating expenses reported 13,156 13,892 15,028 15,377 Goodwill impairment - - - - Restructuring expenses -490 -318 -491 - Major litigation provisions -162 -238 -306 -257 Expenses related to business sales -3 - - - Total operating expenses adjusted 12,501 13,336 14,231 15,120 Pre-tax income/loss (-) reported 2,777 1,652 -63 4,019 Total adjustments 571 541 507 -761 Pre-tax income/loss (-) adjusted 3,348 2,193 444 3,258 Group excl. Corp. Ctr. in CHF mn 9M18 9M17 9M16 9M151 16,103 15,671 15,055 18,130 - - - - -16 - -346 -23 -68 -38 4 - 16,019 15,633 14,713 18,107 Corp. Ctr. in CHF mn 9M18 9M17 9M16 9M15 2017 2016 2015 16 40 87 1,309 85 71 561 - - - -995 - - -298 - - - - - - - - 23 52 - 23 52 - 16 63 139 314 108 123 263 - 3 -1 1 - -1 -1 290 508 497 555 821 759 862 - - - - - - - -1 -12 - - -14 -7 - - - - - -127 - - - - - - - - - 289 496 497 555 680 752 862 -274 -471 -409 753 -736 -687 -300 1 35 52 -995 164 59 -298 -273 -436 -357 -242 -572 -628 -598
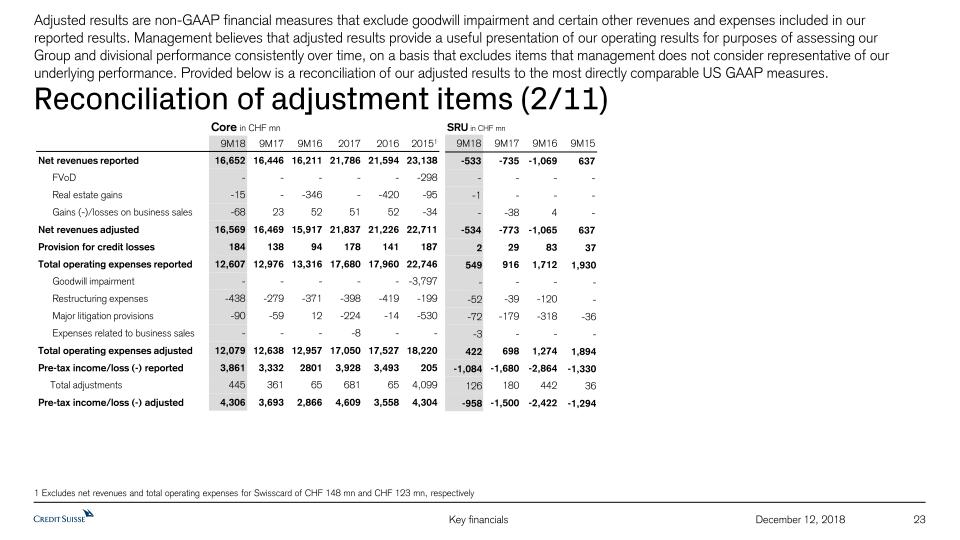
23 December 12, 2018 Reconciliation of adjustment items (2/11) Adjusted results are non-GAAP financial measures that exclude goodwill impairment and certain other revenues and expenses included in our reported results. Management believes that adjusted results provide a useful presentation of our operating results for purposes of assessing our Group and divisional performance consistently over time, on a basis that excludes items that management does not consider representative of our underlying performance. Provided below is a reconciliation of our adjusted results to the most directly comparable US GAAP measures. 1 Excludes net revenues and total operating expenses for Swisscard of CHF 148 mn and CHF 123 mn, respectively Core in CHF mn 9M18 9M17 9M16 2017 2016 20151 Net revenues reported 16,652 16,446 16,211 21,786 21,594 23,138 FVoD - - - - - -298 Real estate gains -15 - -346 - -420 -95 Gains (-)/losses on business sales -68 23 52 51 52 -34 Net revenues adjusted 16,569 16,469 15,917 21,837 21,226 22,711 Provision for credit losses 184 138 94 178 141 187 Total operating expenses reported 12,607 12,976 13,316 17,680 17,960 22,746 Goodwill impairment - - - - - -3,797 Restructuring expenses -438 -279 -371 -398 -419 -199 Major litigation provisions -90 -59 12 -224 -14 -530 Expenses related to business sales - - - -8 - - Total operating expenses adjusted 12,079 12,638 12,957 17,050 17,527 18,220 Pre-tax income/loss (-) reported 3,861 3,332 2801 3,928 3,493 205 Total adjustments 445 361 65 681 65 4,099 Pre-tax income/loss (-) adjusted 4,306 3,693 2,866 4,609 3,558 4,304 SRU in CHF mn 9M18 9M17 9M16 9M15 -533 -735 -1,069 637 - - - - -1 - - - - -38 4 - -534 -773 -1,065 637 2 29 83 37 549 916 1,712 1,930 - - - - -52 -39 -120 - -72 -179 -318 -36 -3 - - - 422 698 1,274 1,894 -1,084 -1,680 -2,864 -1,330 126 180 442 36 -958 -1,500 -2,422 -1,294

24 December 12, 2018 Reconciliation of adjustment items (3/11) Adjusted results are non-GAAP financial measures that exclude goodwill impairment and certain other revenues and expenses included in our reported results. Management believes that adjusted results provide a useful presentation of our operating results for purposes of assessing our Group and divisional performance consistently over time, on a basis that excludes items that management does not consider representative of our underlying performance. Provided below is a reconciliation of our adjusted results to the most directly comparable US GAAP measures. 1 Excludes net revenues and total operating expenses for Swisscard of CHF 75 mn and CHF 62 mn, respectively 2 Excludes net revenues and total operating expenses for Swisscard of CHF 73 mn and CHF 61 mn, respectively 3 Excludes net revenues and total operating expenses for Swisscard of CHF 148 mn and CHF 123 mn, respectively SUB in CHF mn 3Q18 2Q18 1Q18 4Q17 3Q17 2Q17 1Q17 4Q16 3Q16 2Q16 1Q16 4Q15 3Q15 2Q151 1Q152 2017 2016 20153 Net revenues reported 1,341 1,419 1,431 1,318 1,319 1,405 1,354 1,399 1,667 1,337 1,356 1,495 1,364 1,387 1,327 5,396 5,759 5,573 Real estate gains -15 - - - - - - -20 -346 - - -72 - -23 - - -366 -95 Gains (-)/losses on business sales - - -37 - - - - - - - - -23 - - - - - -23 Net revenues adjusted 1,326 1,419 1,394 1,318 1,319 1,405 1,354 1,379 1,321 1,337 1,356 1,400 1,364 1,364 1,327 5,396 5,393 5,455 Provision for credit losses 31 35 34 15 14 36 10 34 30 9 6 43 39 33 23 75 79 138 Total operating expenses reported 799 831 834 870 879 867 940 983 879 875 918 1,088 925 899 873 3,556 3,655 3,785 Restructuring expenses -25 -27 -28 2 -13 4 -52 3 -19 -4 -40 -42 - - - -59 -60 -42 Major litigation provisions -2 - - -7 -9 -6 -27 -19 - - - -25 - - - -49 -19 -25 Total operating expenses adjusted 772 804 806 865 857 865 861 967 860 871 878 1,021 925 899 873 3,448 3,576 3,718 Pre-tax income/loss (-) reported 511 553 563 433 426 502 404 382 758 453 432 364 400 455 431 1,765 2,025 1,650 Total adjustments 12 27 -9 5 22 2 79 -4 -327 4 40 -28 - -23 - 108 -287 -51 Pre-tax income/loss (-) adjusted 523 580 554 438 448 504 483 378 431 457 472 336 400 432 431 1,873 1,738 1,599

25 December 12, 2018 Reconciliation of adjustment items (4/11) Adjusted results are non-GAAP financial measures that exclude goodwill impairment and certain other revenues and expenses included in our reported results. Management believes that adjusted results provide a useful presentation of our operating results for purposes of assessing our Group and divisional performance consistently over time, on a basis that excludes items that management does not consider representative of our underlying performance. Provided below is a reconciliation of our adjusted results to the most directly comparable US GAAP measures. IWM in CHF mn 3Q18 2Q18 1Q18 4Q17 3Q17 2Q17 1Q17 4Q16 3Q16 2Q16 1Q16 4Q15 3Q15 2Q15 1Q15 2017 2016 2015 Net revenues reported 1,265 1,344 1,403 1,364 1,262 1,264 1,221 1,299 1,081 1,145 1,173 1,173 1,093 1,165 1,121 5,111 4,698 4,552 Real estate gains - - - - - - - -54 - - - - - - - - -54 - Gains (-)/losses on business sales 5 - -36 28 - - - - - - - -11 - - - 28 - -11 Net revenues adjusted 1,270 1,344 1,367 1,392 1,262 1,264 1,221 1,245 1,081 1,145 1,173 1,162 1,093 1,165 1,121 5,139 4,644 4,541 Provision for credit losses 15 5 -1 14 3 8 2 6 - 16 -2 -7 11 -1 2 27 20 5 Total operating expenses reported 872 906 920 1,010 904 891 928 962 836 884 875 1,204 885 894 841 3,733 3,557 3,824 Restructuring expenses -28 -28 -26 -11 -16 -7 -36 -16 -15 -15 -8 -36 - - - -70 -54 -36 Major litigation provisions - - - -31 -11 -6 ��- -7 19 - - -228 -50 - 10 -48 12 -268 Total operating expenses adjusted 844 878 894 968 877 878 892 939 840 869 867 940 835 894 851 3,615 3,515 3,520 Pre-tax income/loss (-) reported 378 433 484 340 355 365 291 331 245 245 300 -24 197 272 278 1,351 1,121 723 Total adjustments 33 28 -10 70 27 13 36 -31 -4 15 8 253 50 - -10 146 -12 293 Pre-tax income/loss (-) adjusted 411 461 474 410 382 378 327 300 241 260 308 229 247 272 268 1,497 1,109 1,016

26 December 12, 2018 Reconciliation of adjustment items (5/11) Adjusted results are non-GAAP financial measures that exclude goodwill impairment and certain other revenues and expenses included in our reported results. Management believes that adjusted results provide a useful presentation of our operating results for purposes of assessing our Group and divisional performance consistently over time, on a basis that excludes items that management does not consider representative of our underlying performance. Provided below is a reconciliation of our adjusted results to the most directly comparable US GAAP measures. IWM AM in CHF mn 3Q18 2Q18 1Q18 4Q17 3Q18 LTM 2017 2016 20151 Net revenues reported 352 352 360 441 1,505 1,508 1,327 1,275 Gains (-)/losses on business sales 5 - 1 28 34 28 - - Net revenues adjusted 357 352 361 469 1,539 1,536 1,327 1,275 Provision for credit losses - - - - - - - - Total operating expenses reported 261 266 277 337 1,141 1,181 1,047 1,116 Restructuring expenses -7 -3 -8 -3 -21 -26 -7 -4 Major litigation provisions - - - - - - - - Total operating expenses adjusted 254 263 269 334 1,120 1,155 1,040 1,112 Pre-tax income/loss (-) reported 91 86 83 104 364 327 280 159 Total adjustments 12 3 9 31 55 54 7 4 Pre-tax income/loss (-) adjusted 103 89 92 135 419 381 287 163 1 Excludes AM’s share of net revenues and total operating expenses from the Sales & Trading Solutions business of CHF 53 mn and CHF 30 mn, respectively IWM PB in CHF mn 3Q18 2Q18 1Q18 4Q17 3Q18 LTM 2015 913 992 1,043 923 3,871 3,224 - - -37 - -37 -11 913 992 1,006 923 3,834 3,213 15 5 -1 14 33 5 611 640 643 673 2,567 2,678 -21 -25 -18 -8 -72 -32 - - - -31 -31 -268 590 615 625 634 2,464 2,378 287 347 401 236 1,271 541 21 25 -19 39 66 289 308 372 382 275 1,337 830

27 December 12, 2018 Reconciliation of adjustment items (6/11) Adjusted results are non-GAAP financial measures that exclude goodwill impairment and certain other revenues and expenses included in our reported results. Management believes that adjusted results provide a useful presentation of our operating results for purposes of assessing our Group and divisional performance consistently over time, on a basis that excludes items that management does not consider representative of our underlying performance. Provided below is a reconciliation of our adjusted results to the most directly comparable US GAAP measures. APAC WM&C in CHF mn 3Q18 2Q18 1Q18 4Q17 3Q17 2Q17 1Q17 4Q16 3Q16 2Q16 1Q16 4Q15 3Q15 2Q15 1Q15 2017 2016 2015 Net revenues reported 557 564 663 626 548 559 589 560 481 455 408 367 350 403 386 2,322 1,904 1,506 Net revenues adjusted 557 564 663 626 548 559 589 560 481 455 408 367 350 403 386 2,322 1,904 1,506 Provision for credit losses 1 6 9 7 5 -1 4 11 34 3 -19 -1 24 11 -3 15 29 31 Total operating expenses reported 376 390 449 390 370 364 384 387 352 342 305 767 300 286 290 1,508 1,386 1,643 Goodwill impairment - - - - - - - - - - - -446 - - - - - -446 Restructuring expenses -3 -11 -3 -10 -5 -2 -4 -5 -7 -1 -1 -1 - - - -21 -14 -1 Major litigation provisions -1 -29 -48 - - - - - - - - -6 - - - - - -6 Total operating expenses adjusted 372 350 398 380 365 362 380 382 345 341 304 314 300 286 290 1,487 1,372 1,190 Pre-tax income/loss (-) reported 180 168 205 229 173 196 201 162 95 110 122 -399 26 106 99 799 489 -168 Total adjustments 4 40 51 10 5 2 4 5 7 1 1 453 - - - 21 14 453 Pre-tax income/loss (-) adjusted 184 208 256 239 178 198 205 167 102 111 123 54 26 106 99 820 503 285
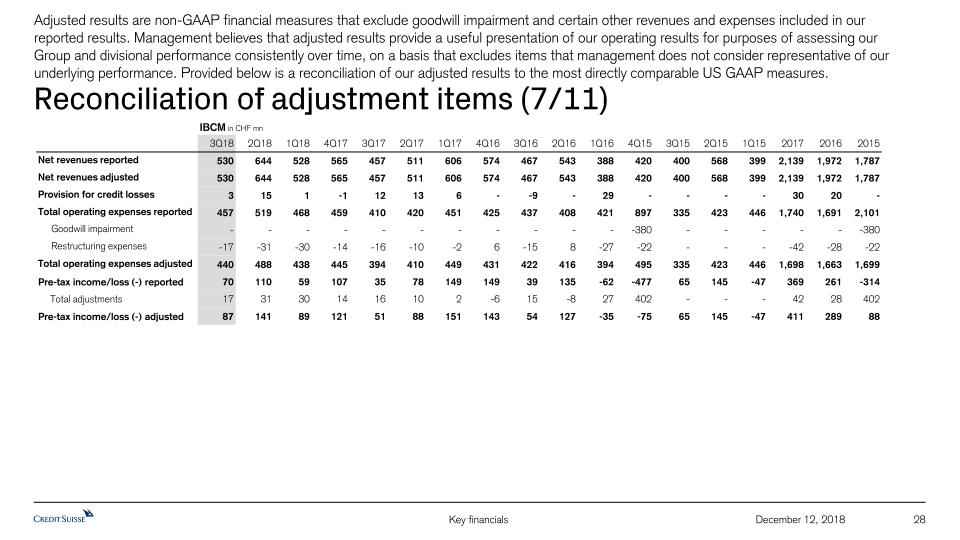
28 December 12, 2018 Reconciliation of adjustment items (7/11) Adjusted results are non-GAAP financial measures that exclude goodwill impairment and certain other revenues and expenses included in our reported results. Management believes that adjusted results provide a useful presentation of our operating results for purposes of assessing our Group and divisional performance consistently over time, on a basis that excludes items that management does not consider representative of our underlying performance. Provided below is a reconciliation of our adjusted results to the most directly comparable US GAAP measures. IBCM in CHF mn 3Q18 2Q18 1Q18 4Q17 3Q17 2Q17 1Q17 4Q16 3Q16 2Q16 1Q16 4Q15 3Q15 2Q15 1Q15 2017 2016 2015 Net revenues reported 530 644 528 565 457 511 606 574 467 543 388 420 400 568 399 2,139 1,972 1,787 Net revenues adjusted 530 644 528 565 457 511 606 574 467 543 388 420 400 568 399 2,139 1,972 1,787 Provision for credit losses 3 15 1 -1 12 13 6 - -9 - 29 - - - - 30 20 - Total operating expenses reported 457 519 468 459 410 420 451 425 437 408 421 897 335 423 446 1,740 1,691 2,101 Goodwill impairment - - - - - - - - - - - -380 - - - - - -380 Restructuring expenses -17 -31 -30 -14 -16 -10 -2 6 -15 8 -27 -22 - - - -42 -28 -22 Total operating expenses adjusted 440 488 438 445 394 410 449 431 422 416 394 495 335 423 446 1,698 1,663 1,699 Pre-tax income/loss (-) reported 70 110 59 107 35 78 149 149 39 135 -62 -477 65 145 -47 369 261 -314 Total adjustments 17 31 30 14 16 10 2 -6 15 -8 27 402 - - - 42 28 402 Pre-tax income/loss (-) adjusted 87 141 89 121 51 88 151 143 54 127 -35 -75 65 145 -47 411 289 88
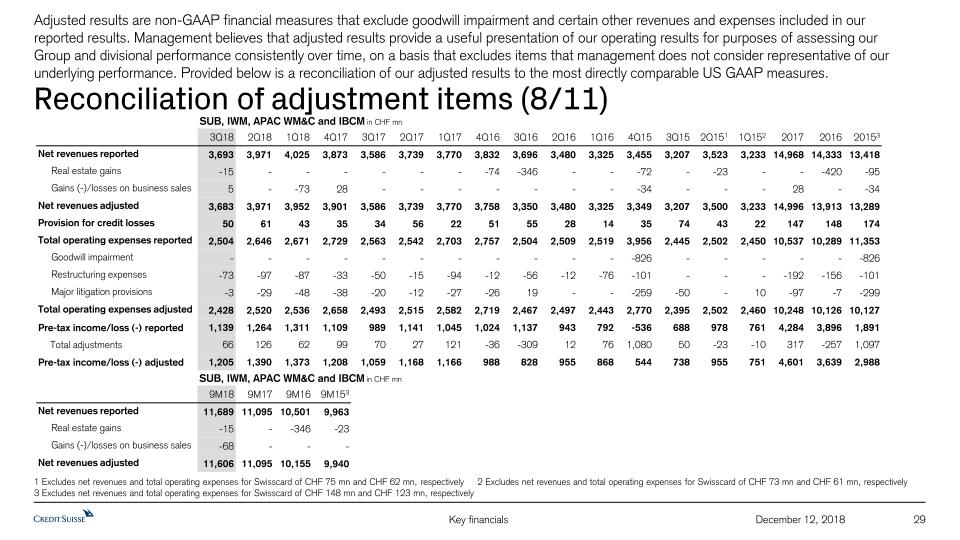
29 December 12, 2018 Reconciliation of adjustment items (8/11) Adjusted results are non-GAAP financial measures that exclude goodwill impairment and certain other revenues and expenses included in our reported results. Management believes that adjusted results provide a useful presentation of our operating results for purposes of assessing our Group and divisional performance consistently over time, on a basis that excludes items that management does not consider representative of our underlying performance. Provided below is a reconciliation of our adjusted results to the most directly comparable US GAAP measures. 1 Excludes net revenues and total operating expenses for Swisscard of CHF 75 mn and CHF 62 mn, respectively 2 Excludes net revenues and total operating expenses for Swisscard of CHF 73 mn and CHF 61 mn, respectively 3 Excludes net revenues and total operating expenses for Swisscard of CHF 148 mn and CHF 123 mn, respectively SUB, IWM, APAC WM&C and IBCM in CHF mn 3Q18 2Q18 1Q18 4Q17 3Q17 2Q17 1Q17 4Q16 3Q16 2Q16 1Q16 4Q15 3Q15 2Q151 1Q152 2017 2016 20153 Net revenues reported 3,693 3,971 4,025 3,873 3,586 3,739 3,770 3,832 3,696 3,480 3,325 3,455 3,207 3,523 3,233 14,968 14,333 13,418 Real estate gains -15 - - - - - - -74 -346 - - -72 - -23 - - -420 -95 Gains (-)/losses on business sales 5 - -73 28 - - - - - - - -34 - - - 28 - -34 Net revenues adjusted 3,683 3,971 3,952 3,901 3,586 3,739 3,770 3,758 3,350 3,480 3,325 3,349 3,207 3,500 3,233 14,996 13,913 13,289 Provision for credit losses 50 61 43 35 34 56 22 51 55 28 14 35 74 43 22 147 148 174 Total operating expenses reported 2,504 2,646 2,671 2,729 2,563 2,542 2,703 2,757 2,504 2,509 2,519 3,956 2,445 2,502 2,450 10,537 10,289 11,353 Goodwill impairment - - - - - - - - - - - -826 - - - - - -826 Restructuring expenses -73 -97 -87 -33 -50 -15 -94 -12 -56 -12 -76 -101 - - - -192 -156 -101 Major litigation provisions -3 -29 -48 -38 -20 -12 -27 -26 19 - - -259 -50 - 10 -97 -7 -299 Total operating expenses adjusted 2,428 2,520 2,536 2,658 2,493 2,515 2,582 2,719 2,467 2,497 2,443 2,770 2,395 2,502 2,460 10,248 10,126 10,127 Pre-tax income/loss (-) reported 1,139 1,264 1,311 1,109 989 1,141 1,045 1,024 1,137 943 792 -536 688 978 761 4,284 3,896 1,891 Total adjustments 66 126 62 99 70 27 121 -36 -309 12 76 1,080 50 -23 -10 317 -257 1,097 Pre-tax income/loss (-) adjusted 1,205 1,390 1,373 1,208 1,059 1,168 1,166 988 828 955 868 544 738 955 751 4,601 3,639 2,988 SUB, IWM, APAC WM&C and IBCM in CHF mn 9M18 9M17 9M16 9M153 Net revenues reported 11,689 11,095 10,501 9,963 Real estate gains -15 - -346 -23 Gains (-)/losses on business sales -68 - - - Net revenues adjusted 11,606 11,095 10,155 9,940
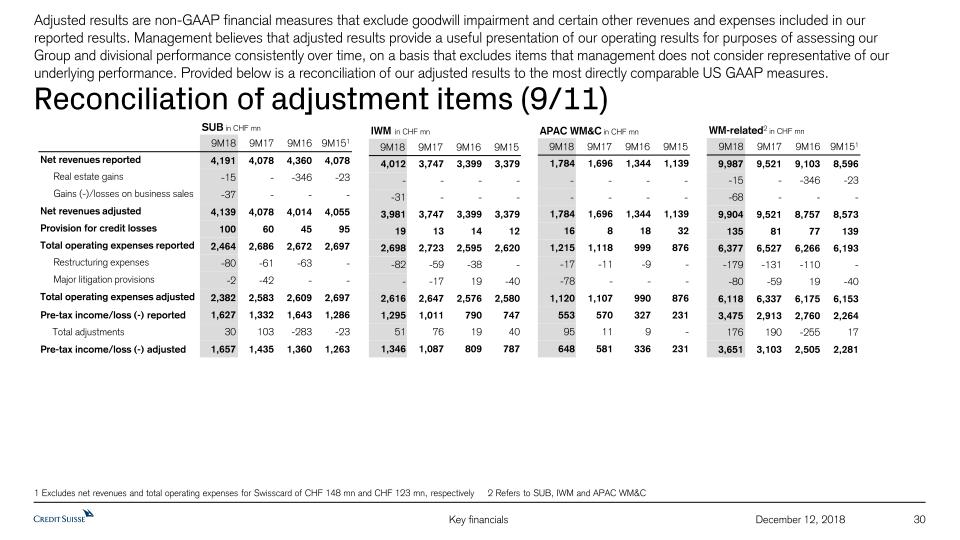
30 December 12, 2018 Reconciliation of adjustment items (9/11) Adjusted results are non-GAAP financial measures that exclude goodwill impairment and certain other revenues and expenses included in our reported results. Management believes that adjusted results provide a useful presentation of our operating results for purposes of assessing our Group and divisional performance consistently over time, on a basis that excludes items that management does not consider representative of our underlying performance. Provided below is a reconciliation of our adjusted results to the most directly comparable US GAAP measures. WM-related2 in CHF mn 9M18 9M17 9M16 9M151 9,987 9,521 9,103 8,596 -15 - -346 -23 -68 - - - 9,904 9,521 8,757 8,573 135 81 77 139 6,377 6,527 6,266 6,193 -179 -131 -110 - -80 -59 19 -40 6,118 6,337 6,175 6,153 3,475 2,913 2,760 2,264 176 190 -255 17 3,651 3,103 2,505 2,281 1 Excludes net revenues and total operating expenses for Swisscard of CHF 148 mn and CHF 123 mn, respectively 2 Refers to SUB, IWM and APAC WM&C SUB in CHF mn 9M18 9M17 9M16 9M151 Net revenues reported 4,191 4,078 4,360 4,078 Real estate gains -15 - -346 -23 Gains (-)/losses on business sales -37 - - - Net revenues adjusted 4,139 4,078 4,014 4,055 Provision for credit losses 100 60 45 95 Total operating expenses reported 2,464 2,686 2,672 2,697 Restructuring expenses -80 -61 -63 - Major litigation provisions -2 -42 - - Total operating expenses adjusted 2,382 2,583 2,609 2,697 Pre-tax income/loss (-) reported 1,627 1,332 1,643 1,286 Total adjustments 30 103 -283 -23 Pre-tax income/loss (-) adjusted 1,657 1,435 1,360 1,263 IWM in CHF mn 9M18 9M17 9M16 9M15 4,012 3,747 3,399 3,379 - - - - -31 - - - 3,981 3,747 3,399 3,379 19 13 14 12 2,698 2,723 2,595 2,620 -82 -59 -38 - - -17 19 -40 2,616 2,647 2,576 2,580 1,295 1,011 790 747 51 76 19 40 1,346 1,087 809 787 APAC WM&C in CHF mn 9M18 9M17 9M16 9M15 1,784 1,696 1,344 1,139 - - - - - - - - 1,784 1,696 1,344 1,139 16 8 18 32 1,215 1,118 999 876 -17 -11 -9 - -78 - - - 1,120 1,107 990 876 553 570 327 231 95 11 9 - 648 581 336 231
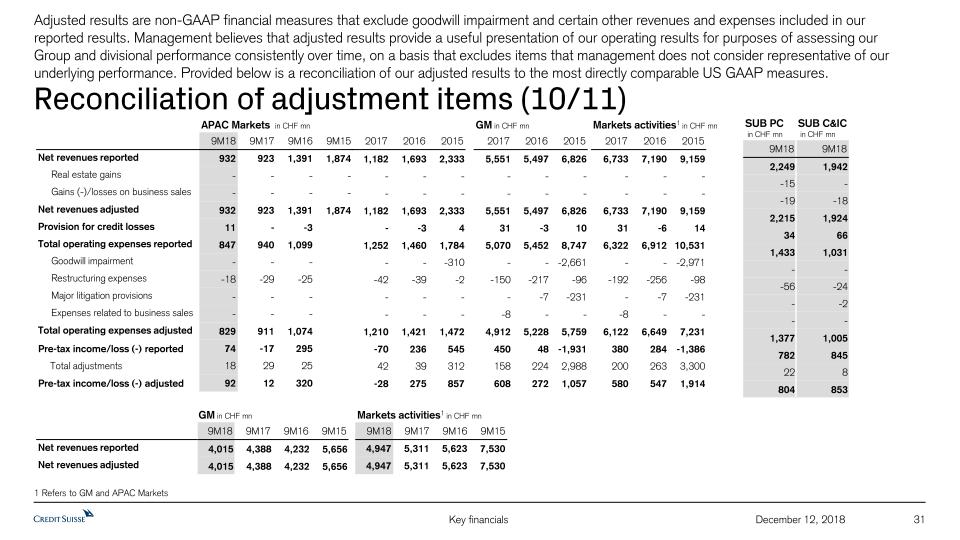
31 December 12, 2018 Reconciliation of adjustment items (10/11) Adjusted results are non-GAAP financial measures that exclude goodwill impairment and certain other revenues and expenses included in our reported results. Management believes that adjusted results provide a useful presentation of our operating results for purposes of assessing our Group and divisional performance consistently over time, on a basis that excludes items that management does not consider representative of our underlying performance. Provided below is a reconciliation of our adjusted results to the most directly comparable US GAAP measures. 2017 2016 2015 1,182 1,693 2,333 - - - - - - 1,182 1,693 2,333 - -3 4 1,252 1,460 1,784 - - -310 -42 -39 -2 - - - - - - 1,210 1,421 1,472 -70 236 545 42 39 312 -28 275 857 GM in CHF mn 9M18 9M17 9M16 9M15 4,015 4,388 4,232 5,656 4,015 4,388 4,232 5,656 APAC Markets in CHF mn 9M18 9M17 9M16 9M15 Net revenues reported 932 923 1,391 1,874 Real estate gains - - - - Gains (-)/losses on business sales - - - - Net revenues adjusted 932 923 1,391 1,874 Provision for credit losses 11 - -3 Total operating expenses reported 847 940 1,099 Goodwill impairment - - - Restructuring expenses -18 -29 -25 Major litigation provisions - - - Expenses related to business sales - - - Total operating expenses adjusted 829 911 1,074 Pre-tax income/loss (-) reported 74 -17 295 Total adjustments 18 29 25 Pre-tax income/loss (-) adjusted 92 12 320 GM in CHF mn 2017 2016 2015 5,551 5,497 6,826 - - - - - - 5,551 5,497 6,826 31 -3 10 5,070 5,452 8,747 - - -2,661 -150 -217 -96 - -7 -231 -8 - - 4,912 5,228 5,759 450 48 -1,931 158 224 2,988 608 272 1,057 1 Refers to GM and APAC Markets Markets activities1 in CHF mn 9M18 9M17 9M16 9M15 4,947 5,311 5,623 7,530 4,947 5,311 5,623 7,530 Net revenues reported Net revenues adjusted Markets activities1 in CHF mn 2017 2016 2015 6,733 7,190 9,159 - - - - - - 6,733 7,190 9,159 31 -6 14 6,322 6,912 10,531 - - -2,971 -192 -256 -98 - -7 -231 -8 - - 6,122 6,649 7,231 380 284 -1,386 200 263 3,300 580 547 1,914 SUB PC in CHF mn SUB C&IC in CHF mn 9M18 9M18 2,249 1,942 -15 - -19 -18 2,215 1,924 34 66 1,433 1,031 - - -56 -24 - -2 - - 1,377 1,005 782 845 22 8 804 853
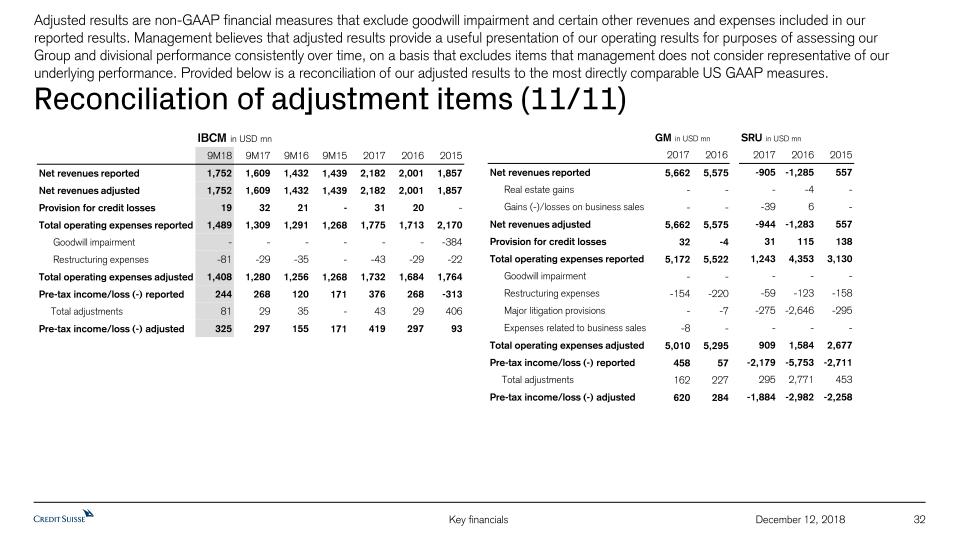
32 December 12, 2018 Reconciliation of adjustment items (11/11) Adjusted results are non-GAAP financial measures that exclude goodwill impairment and certain other revenues and expenses included in our reported results. Management believes that adjusted results provide a useful presentation of our operating results for purposes of assessing our Group and divisional performance consistently over time, on a basis that excludes items that management does not consider representative of our underlying performance. Provided below is a reconciliation of our adjusted results to the most directly comparable US GAAP measures. SRU in USD mn 2017 2016 2015 -905 -1,285 557 - -4 - -39 6 - -944 -1,283 557 31 115 138 1,243 4,353 3,130 - - - -59 -123 -158 -275 -2,646 -295 - - - 909 1,584 2,677 -2,179 -5,753 -2,711 295 2,771 453 -1,884 -2,982 -2,258 IBCM in USD mn 9M18 9M17 9M16 9M15 2017 2016 2015 Net revenues reported 1,752 1,609 1,432 1,439 2,182 2,001 1,857 Net revenues adjusted 1,752 1,609 1,432 1,439 2,182 2,001 1,857 Provision for credit losses 19 32 21 - 31 20 - Total operating expenses reported 1,489 1,309 1,291 1,268 1,775 1,713 2,170 Goodwill impairment - - - - - - -384 Restructuring expenses -81 -29 -35 - -43 -29 -22 Total operating expenses adjusted 1,408 1,280 1,256 1,268 1,732 1,684 1,764 Pre-tax income/loss (-) reported 244 268 120 171 376 268 -313 Total adjustments 81 29 35 - 43 29 406 Pre-tax income/loss (-) adjusted 325 297 155 171 419 297 93 GM in USD mn 2017 2016 Net revenues reported 5,662 5,575 Real estate gains - - Gains (-)/losses on business sales - - Net revenues adjusted 5,662 5,575 Provision for credit losses 32 -4 Total operating expenses reported 5,172 5,522 Goodwill impairment - - Restructuring expenses -154 -220 Major litigation provisions - -7 Expenses related to business sales -8 - Total operating expenses adjusted 5,010 5,295 Pre-tax income/loss (-) reported 458 57 Total adjustments 162 227 Pre-tax income/loss (-) adjusted 620 284
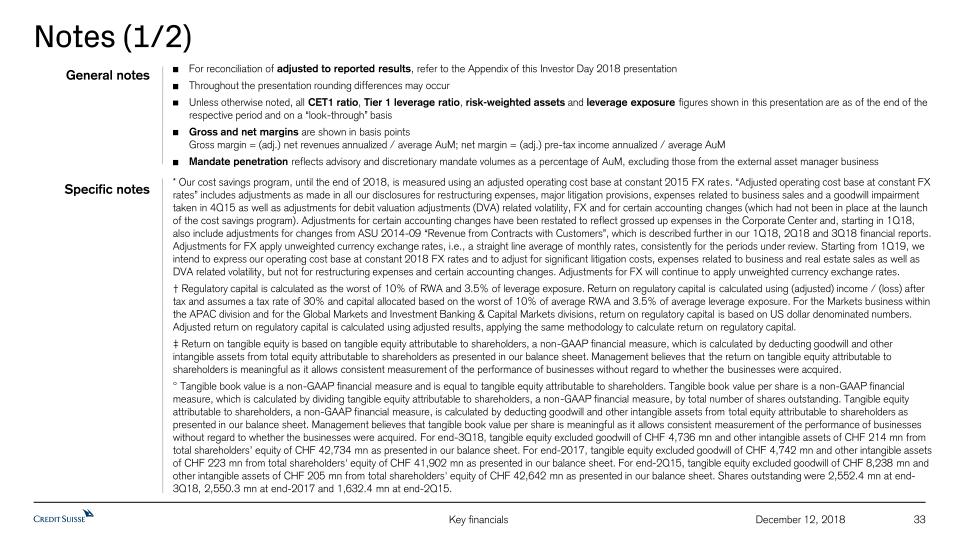
Notes (1/2) 33 December 12, 2018 For reconciliation of adjusted to reported results, refer to the Appendix of this Investor Day 2018 presentationThroughout the presentation rounding differences may occurUnless otherwise noted, all CET1 ratio, Tier 1 leverage ratio, risk-weighted assets and leverage exposure figures shown in this presentation are as of the end of the respective period and on a “look-through” basisGross and net margins are shown in basis pointsGross margin = (adj.) net revenues annualized / average AuM; net margin = (adj.) pre-tax income annualized / average AuMMandate penetration reflects advisory and discretionary mandate volumes as a percentage of AuM, excluding those from the external asset manager business General notes Specific notes * Our cost savings program, until the end of 2018, is measured using an adjusted operating cost base at constant 2015 FX rates. “Adjusted operating cost base at constant FX rates” includes adjustments as made in all our disclosures for restructuring expenses, major litigation provisions, expenses related to business sales and a goodwill impairment taken in 4Q15 as well as adjustments for debit valuation adjustments (DVA) related volatility, FX and for certain accounting changes (which had not been in place at the launch of the cost savings program). Adjustments for certain accounting changes have been restated to reflect grossed up expenses in the Corporate Center and, starting in 1Q18, also include adjustments for changes from ASU 2014-09 “Revenue from Contracts with Customers”, which is described further in our 1Q18, 2Q18 and 3Q18 financial reports. Adjustments for FX apply unweighted currency exchange rates, i.e., a straight line average of monthly rates, consistently for the periods under review. Starting from 1Q19, we intend to express our operating cost base at constant 2018 FX rates and to adjust for significant litigation costs, expenses related to business and real estate sales as well as DVA related volatility, but not for restructuring expenses and certain accounting changes. Adjustments for FX will continue to apply unweighted currency exchange rates.† Regulatory capital is calculated as the worst of 10% of RWA and 3.5% of leverage exposure. Return on regulatory capital is calculated using (adjusted) income / (loss) after tax and assumes a tax rate of 30% and capital allocated based on the worst of 10% of average RWA and 3.5% of average leverage exposure. For the Markets business within the APAC division and for the Global Markets and Investment Banking & Capital Markets divisions, return on regulatory capital is based on US dollar denominated numbers. Adjusted return on regulatory capital is calculated using adjusted results, applying the same methodology to calculate return on regulatory capital. ‡ Return on tangible equity is based on tangible equity attributable to shareholders, a non-GAAP financial measure, which is calculated by deducting goodwill and other intangible assets from total equity attributable to shareholders as presented in our balance sheet. Management believes that the return on tangible equity attributable to shareholders is meaningful as it allows consistent measurement of the performance of businesses without regard to whether the businesses were acquired.° Tangible book value is a non-GAAP financial measure and is equal to tangible equity attributable to shareholders. Tangible book value per share is a non-GAAP financial measure, which is calculated by dividing tangible equity attributable to shareholders, a non-GAAP financial measure, by total number of shares outstanding. Tangible equity attributable to shareholders, a non-GAAP financial measure, is calculated by deducting goodwill and other intangible assets from total equity attributable to shareholders as presented in our balance sheet. Management believes that tangible book value per share is meaningful as it allows consistent measurement of the performance of businesses without regard to whether the businesses were acquired. For end-3Q18, tangible equity excluded goodwill of CHF 4,736 mn and other intangible assets of CHF 214 mn from total shareholders’ equity of CHF 42,734 mn as presented in our balance sheet. For end-2017, tangible equity excluded goodwill of CHF 4,742 mn and other intangible assets of CHF 223 mn from total shareholders' equity of CHF 41,902 mn as presented in our balance sheet. For end-2Q15, tangible equity excluded goodwill of CHF 8,238 mn and other intangible assets of CHF 205 mn from total shareholders' equity of CHF 42,642 mn as presented in our balance sheet. Shares outstanding were 2,552.4 mn at end-3Q18, 2,550.3 mn at end-2017 and 1,632.4 mn at end-2Q15.

Notes (2/2) 34 December 12, 2018 Abbreviations Adj. = Adjusted; AI = Artificial Intelligence; AM = Asset Management; AML = Anti-Money Laundering; APAC = Asia Pacific; ARU = Asset Resolution Unit;AT1 = Additional Tier 1; AuM = Assets under Management; BCBS = Basel Committee on Banking Supervision; BEAT = Base Erosion and Anti-Abuse Tax; BIS = Bank for International Settlements; bps = basis points; CAGR = Compound Annual Growth Rate; CBG = Corporate Bank Group; CCAR = Comprehensive Capital Adequacy Review; CCRO = Chief Compliance and Regulatory Affairs Officer; CDX HY = High-yield credit default swap index; CET1 = Common Equity Tier 1; CIC = Corporate & Institutional Clients; CIF = Customer/Client Information File; CIO = Chief Investment Officer; Corp. Ctr. = Corporate Center; CtB = Change the Bank; CVA = Credit Valuation Adjustment; DCM = Debt Capital Markets; DoJ = Department of Justice; DTA = Deferred Tax Assets; DVA = Debit Valuation Adjustments; EAM = External Asset Manager; EBITDA = Earnings Before Interest Taxes Depreciation and Amortization; ECM = Equity Capital Markets; EM = Emerging Markets; EMEA = Europe, Middle East & Africa; EQ = Equities; ERP = Enterprise Resource Planning; Est. = Estimate; EU = European Union; FICC = Fixed Income, Currencies & Commodities; FINMA = Swiss Financial Market Supervisory Authority FINMA; FLP = Fund Linked Products; FRTB = Fundamental Review of the Trading Book; FTE = Full-time employee; FX = Foreign Exchange; GDP = Gross Domestic Product; GM = Global Markets; G10 = Group of Ten; HKEX = Hong Kong Exchange; IBCM = Investment Banking & Capital Markets; IBD = Investment Banking Department; IC = Investment Consultant; ICBC = Industrial and Commercial Bank of China; ICBCCS = ICBC Credit Suisse Asset Management Co. Ltd; IG = Investment Grade; IMF = International Monetary Fund; IMM = Internal Model Method; IP = Investor Products; IPO = Initial Public Offering; IPRE= Interest Producing Real Estate; IRB = Internal Ratings Based; IS&P = Investment Solutions and Products; IT = Information Technology; ITS = International Trading Solutions; IWM = International Wealth Management; JV = Joint Venture; LBO = Leveraged Buyout; LE = Leverage Exposure; LSC = Large Swiss Corporates; LTM = Last Twelve Months; M&A = Mergers & Acquisitions; MD(R) = Managing Director; Mgmt. = Management; MI = Management Information; MifiD II = Markets in Financial Instruments Directive II; Mkts = Markets; NNA = Net new assets; OCC = Office of the Comptroller of the Currency; Op Risk = Operational Risk; PB = Private Banking; PB&WM = Private Banking & Wealth Management; PC = Private Clients; PEP = Politically Exposed Person; pp = percentage points; PTI = Pre-tax income; PWMC = Private & Wealth Management Clients; RM = Relationship Manager(s); RMBS = Residential Mortgage Backed Securities; RoRC = Return on Regulatory Capital; RoTE = Return on Tangible Equity; RPA = Robotic Process Automation; RtB = Run the Bank; RWA = Risk-weighted assets; SA-CCR = Standardized Approach to Counterparty Credit Risk; SME = Small and Medium-Sized Enterprises; SMG = Systematic Market-Making Group; SoW = Share of Wallet; SRU = Strategic Resolution Unit; SUB = Swiss Universal Bank; TBTF = Too Big To Fail; TBV(PS) = Tangible Book Value (per Share); (U)HNW(I) = (Ultra) High Net Worth (Individuals); US GAAP = United States Generally Accepted Accounting Principles; U/W = Underwriting; VaR = Value-at-Risk; VIX = Volatility Index; WM = Wealth Management; WM&C = Wealth Management & Connected; YoY = Year over year; YTD = Year to Date

Thomas Gottstein CEO Swiss Universal BankIqbal Khan CEO International Wealth ManagementHelman Sitohang CEO Asia PacificDecember 12, 2018 Credit Suisse Investor Day 2018Growth in Wealth Management
Disclaimer 2 December 12, 2018 This material does not purport to contain all of the information that you may wish to consider. This material is not to be relied upon as such or used in substitution for the exercise of independent judgment.Cautionary statement regarding forward-looking statementsThis presentation contains forward-looking statements that involve inherent risks and uncertainties, and we might not be able to achieve the predictions, forecasts, projections and other outcomes we describe or imply in forward-looking statements. A number of important factors could cause results to differ materially from the plans, objectives, expectations, estimates and intentions we express in these forward-looking statements, including those we identify in "Risk factors” in our Annual Report on Form 20-F for the fiscal year ended December 31, 2017 and in the “Cautionary statement regarding forward-looking information" in our media release relating to Investor Day, published on December 12, 2018 and filed with the US Securities and Exchange Commission, and in other public filings and press releases. We do not intend to update these forward-looking statements. In particular, the terms “Estimate”, “Illustrative”, “Ambition”, “Objective”, “Outlook” and “Goal” are not intended to be viewed as targets or projections, nor are they considered to be Key Performance Indicators. All such estimates, illustrations, ambitions, objectives, outlooks and goals are subject to a large number of inherent risks, assumptions and uncertainties, many of which are completely outside of our control. These risks, assumptions and uncertainties include, but are not limited to, general market conditions, market volatility, interest rate volatility and levels, global and regional economic conditions, political uncertainty, changes in tax policies, regulatory changes, changes in levels of client activity as a result of any of the foregoing and other factors. Accordingly, this information should not be relied on for any purpose. We do not intend to update these estimates, illustrations, ambitions, objectives, outlooks or goals. We may not achieve the benefits of our strategic initiativesWe may not achieve all of the expected benefits of our strategic initiatives. Factors beyond our control, including but not limited to the market and economic conditions, changes in laws, rules or regulations and other challenges discussed in our public filings, could limit our ability to achieve some or all of the expected benefits of these initiatives. Estimates and assumptionsIn preparing this presentation, management has made estimates and assumptions that affect the numbers presented. Actual results may differ. Annualized numbers do not take account of variations in operating results, seasonality and other factors and may not be indicative of actual, full-year results. Figures throughout this presentation may also be subject to rounding adjustments. All opinions and views constitute judgments as of the date of writing without regard to the date on which the reader may receive or access the information. This information is subject to change at any time without notice and we do not intend to update this information. Statement regarding non-GAAP financial measuresThis presentation also contains non-GAAP financial measures, including adjusted results. Information needed to reconcile such non-GAAP financial measures to the most directly comparable measures under US GAAP can be found in the Appendix of the CEO and CFO Investor Day presentations, published on December 12, 2018. All Investor Day presentations are available on our website at www.credit-suisse.com.Many of our references to estimates, ambitions, objectives and targets for revenues, operating expenses, operating cost base, pre-tax income and return on regulatory capital are on an adjusted basis as well. These adjusted numbers, return on tangible equity and tangible book value per share are non-GAAP financial measures. A reconciliation of the estimates, ambitions, objectives and targets to the nearest GAAP measure is unavailable without unreasonable efforts. Adjusted results exclude goodwill impairment, major litigation charges, real estate gains and other revenue and expense items included in our reported results, which are unavailable on a prospective basis. Tangible equity excludes goodwill and other intangible assets from shareholders’ equity, all of which are unavailable on a prospective basis. Tangible book value per share excludes the impact of any dividends paid during the performance period, share buybacks, own credit movements, foreign exchange rate movements and pension-related impacts, all of which are unavailable on a prospective basis.Statement regarding capital, liquidity and leverageAs of January 1, 2013, Basel III was implemented in Switzerland along with the Swiss “Too Big to Fail” legislation and regulations thereunder (in each case, subject to certain phase-in periods). As of January 1, 2015, the Bank for International Settlements (BIS) leverage ratio framework, as issued by the Basel Committee on Banking Supervision (BCBS), was implemented in Switzerland by FINMA. Our related disclosures are in accordance with our interpretation of such requirements, including relevant assumptions. Changes in the interpretation of these requirements in Switzerland or in any of our assumptions or estimates could result in different numbers from those shown in this presentation. Unless otherwise noted, leverage exposure is based on the BIS leverage ratio framework and consists of period-end balance sheet assets and prescribed regulatory adjustments. The look-through tier 1 leverage ratio and CET1 leverage ratio are calculated as look-through BIS tier 1 capital and CET1 capital, respectively, divided by period-end leverage exposure. Swiss leverage ratios are measured on the same period-end basis as the leverage exposure for the BIS leverage ratio.SourcesCertain material in this presentation has been prepared by Credit Suisse on the basis of publicly available information, internally developed data and other third-party sources believed to be reliable. Credit Suisse has not sought to independently verify information obtained from public and third-party sources and makes no representations or warranties as to accuracy, completeness or reliability of such information.
Thomas Gottstein, CEO Swiss Universal BankDecember 12, 2018 Credit Suisse Investor Day 2018Swiss Universal Bank

4 December 12, 2018 Key messages Keypriorities Progress since2015 Wayforward Further strengthen our leading position as a universal bank in SwitzerlandBuild on our unique offering as The Bank for EntrepreneursContinue to transform our business through digitalizationImprove client satisfaction and client retentionEnhance our offering for the Next Generation across client segments 11 consecutive quarters of YoY adjusted PTI growth with acceleration in 2018Step change in profitability and cost efficiencySignificant growth in client business volumes across private, corporate and institutional clients Grow from a position of strength in our Bank for Entrepreneurs and corporate franchiseDrive further growth in U/HNW and Entrepreneurs & Executives (E&E) through our integrated offeringFurther invest in platform technology for institutional clients (pension funds, financial institutions and external asset managers)Continue to drive positive operating leverage through digital transformation Note: Adjusted results are non-GAAP financial measures. A reconciliation to reported results is included in the Appendix Swiss Universal Bank

5 December 12, 2018 Switzerland – a strong and resilient economy… Swiss economy expected to maintain its steady growth… GDP (in USD k) per capita2 1 Source: Credit Suisse Global Wealth Databook 2018 (USD/CHF exchange rate of 0.98 applied) 2 Source: International Monetary Fund as of December 7, 2018 (USD/CHF exchange rate of 0.98 applied) 3 Source: State Secretariat for Economic Affairs as of October, 2018 4 Measured by 2017 government gross debt as % of GDP based on data from IMF 5 Source: World Talent Ranking 2018 (Institute for Management Development)6 Source: Global Innovation Index 2018 (Cornell University, INSEAD and WIPO, 2018) …with a stable unemployment rate at low levels…3 Population1 8.5 mnTotal wealth1 CHF 3.5 tnGDP per capita2 CHF 78 k ...and supported by leading indicators Fiscal discipline4 World talent pool5 Innovation6 42% 64% 88% 97% #1 #2 #3 #4 #1 #2 #3 #4 Swiss Universal Bank
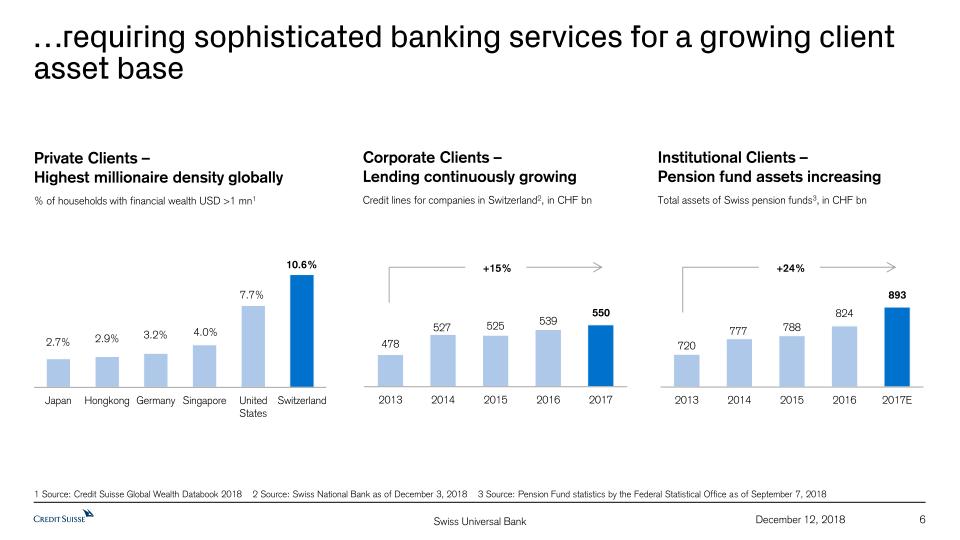
6 December 12, 2018 …requiring sophisticated banking services for a growing client asset base 1 Source: Credit Suisse Global Wealth Databook 2018 2 Source: Swiss National Bank as of December 3, 2018 3 Source: Pension Fund statistics by the Federal Statistical Office as of September 7, 2018 Corporate Clients –Lending continuously growingCredit lines for companies in Switzerland2, in CHF bn Institutional Clients –Pension fund assets increasingTotal assets of Swiss pension funds3, in CHF bn +15% +24% Private Clients – Highest millionaire density globally % of households with financial wealth USD >1 mn1 Swiss Universal Bank
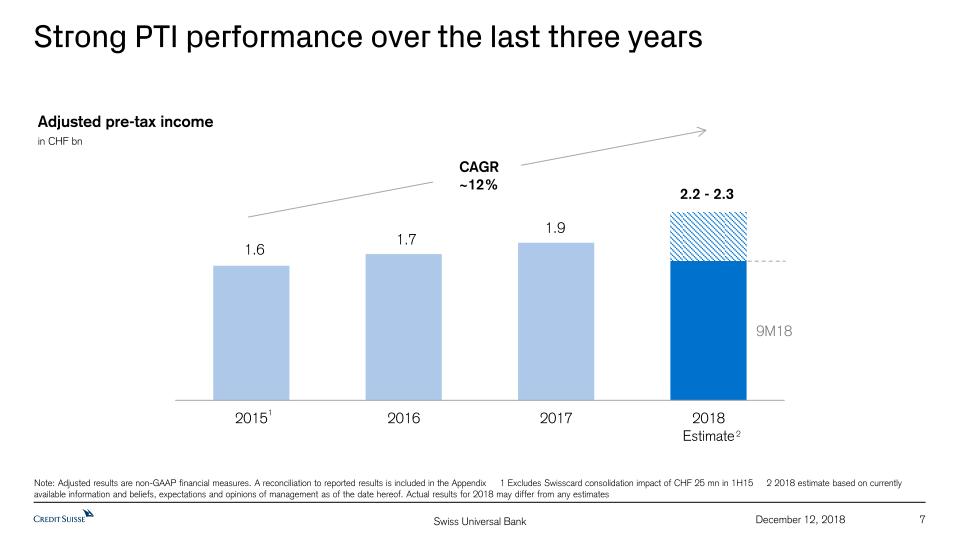
7 December 12, 2018 Strong PTI performance over the last three years Adjusted pre-tax incomein CHF bn Note: Adjusted results are non-GAAP financial measures. A reconciliation to reported results is included in the Appendix 1 Excludes Swisscard consolidation impact of CHF 25 mn in 1H15 2 2018 estimate based on currently available information and beliefs, expectations and opinions of management as of the date hereof. Actual results for 2018 may differ from any estimates CAGR ~12% 9M18 1 2 Swiss Universal Bank
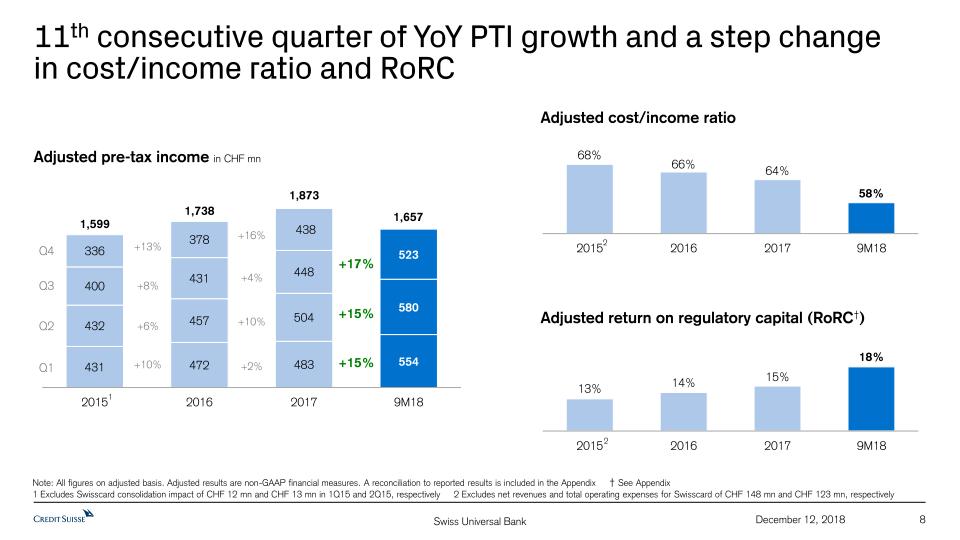
8 December 12, 2018 11th consecutive quarter of YoY PTI growth and a step change in cost/income ratio and RoRC +16% +4% +10% +2% +10% +6% +8% +13% Adjusted pre-tax income in CHF mn Adjusted cost/income ratio Adjusted return on regulatory capital (RoRC†) Q4 Q3 Q2 Q1 Note: All figures on adjusted basis. Adjusted results are non-GAAP financial measures. A reconciliation to reported results is included in the Appendix † See Appendix 1 Excludes Swisscard consolidation impact of CHF 12 mn and CHF 13 mn in 1Q15 and 2Q15, respectively 2 Excludes net revenues and total operating expenses for Swisscard of CHF 148 mn and CHF 123 mn, respectively 1,657 +15% +15% +17% 2 2 1 Swiss Universal Bank
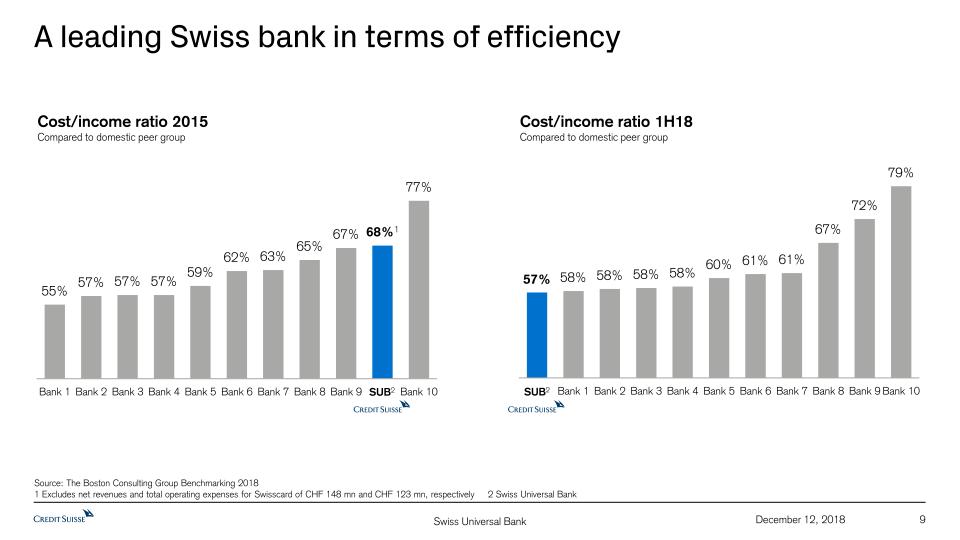
9 December 12, 2018 A leading Swiss bank in terms of efficiency Source: The Boston Consulting Group Benchmarking 20181 Excludes net revenues and total operating expenses for Swisscard of CHF 148 mn and CHF 123 mn, respectively 2 Swiss Universal Bank Cost/income ratio 1H18Compared to domestic peer group Cost/income ratio 2015Compared to domestic peer group SUB2 SUB2 Swiss Universal Bank

10 December 12, 2018 Outgrowing the market in client business volume, driving recurring revenue growth Private Clients business volume in CHF bn Corporate & Institutional Clients business volume in CHF bn AuM AuC1 Net loans ~ +16% ~ +10% 1 Includes commercial assets and transactional accounts Strong AuM/AuC growth driven by positive NNA and market performanceNNA, especially in our U/HNW and E&E franchises, offer opportunity for diversification of client assets and early involvement of Next GenerationModerate loan growth across mortgage and lombard (including single-stock) Strong AuM growth momentum from large institutional clients, driven by positive NNA and by market performance Global connectivity with AM, IBCM and ITS as a key differentiator across our franchiseContinued risk discipline, especially in IPRE, and innovative balance sheet velocity measures resulting in stable loan volumes +97bn / +12% Swiss Universal Bank
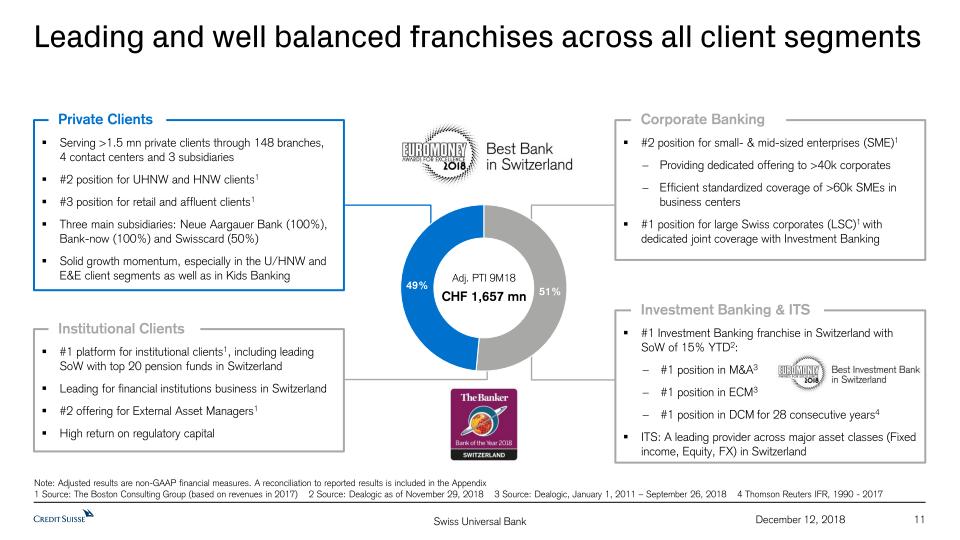
11 December 12, 2018 Leading and well balanced franchises across all client segments Adj. PTI 9M18CHF 1,657 mn #2 position for small- & mid-sized enterprises (SME)1Providing dedicated offering to >40k corporatesEfficient standardized coverage of >60k SMEs in business centers#1 position for large Swiss corporates (LSC)1 with dedicated joint coverage with Investment Banking Corporate Banking Serving >1.5 mn private clients through 148 branches, 4 contact centers and 3 subsidiaries#2 position for UHNW and HNW clients1#3 position for retail and affluent clients1Three main subsidiaries: Neue Aargauer Bank (100%), Bank-now (100%) and Swisscard (50%)Solid growth momentum, especially in the U/HNW and E&E client segments as well as in Kids Banking Private Clients #1 platform for institutional clients1, including leading SoW with top 20 pension funds in SwitzerlandLeading for financial institutions business in Switzerland#2 offering for External Asset Managers1High return on regulatory capital Institutional Clients #1 Investment Banking franchise in Switzerland with SoW of 15% YTD2:#1 position in M&A3#1 position in ECM3#1 position in DCM for 28 consecutive years4ITS: A leading provider across major asset classes (Fixed income, Equity, FX) in Switzerland Investment Banking & ITS Note: Adjusted results are non-GAAP financial measures. A reconciliation to reported results is included in the Appendix 1 Source: The Boston Consulting Group (based on revenues in 2017) 2 Source: Dealogic as of November 29, 2018 3 Source: Dealogic, January 1, 2011 – September 26, 2018 4 Thomson Reuters IFR, 1990 - 2017 Swiss Universal Bank
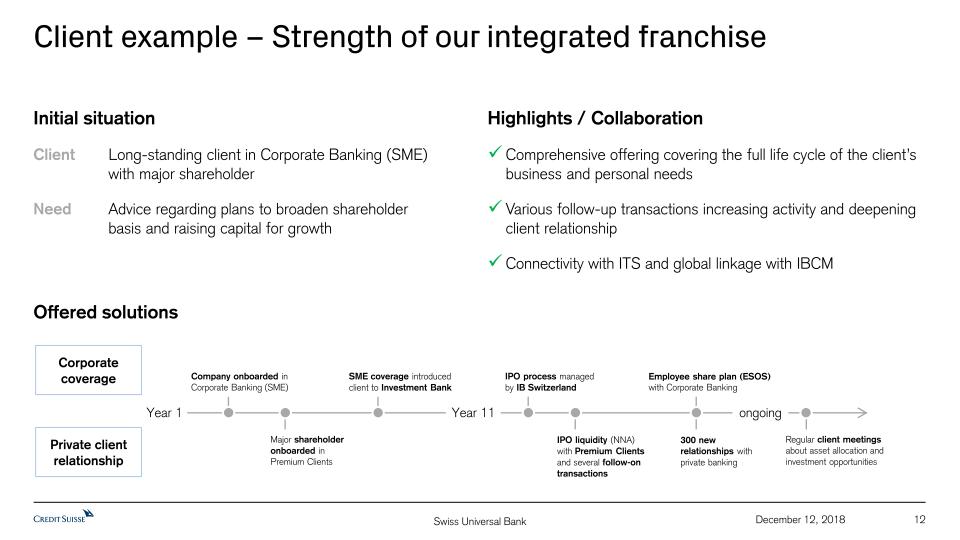
12 December 12, 2018 Client example – Strength of our integrated franchise Private client relationship Initial situationClient Long-standing client in Corporate Banking (SME) with major shareholderNeed Advice regarding plans to broaden shareholder basis and raising capital for growth Year 1 Corporate coverage IPO process managed by IB Switzerland Employee share plan (ESOS) with Corporate Banking Company onboarded in Corporate Banking (SME) SME coverage introduced client to Investment Bank IPO liquidity (NNA) with Premium Clients and several follow-on transactions Major shareholder onboarded in Premium Clients Regular client meetingsabout asset allocation and investment opportunities Offered solutions Highlights / CollaborationComprehensive offering covering the full life cycle of the client’s business and personal needs Various follow-up transactions increasing activity and deepening client relationshipConnectivity with ITS and global linkage with IBCM ongoing 300 new relationships with private banking Year 11 Swiss Universal Bank
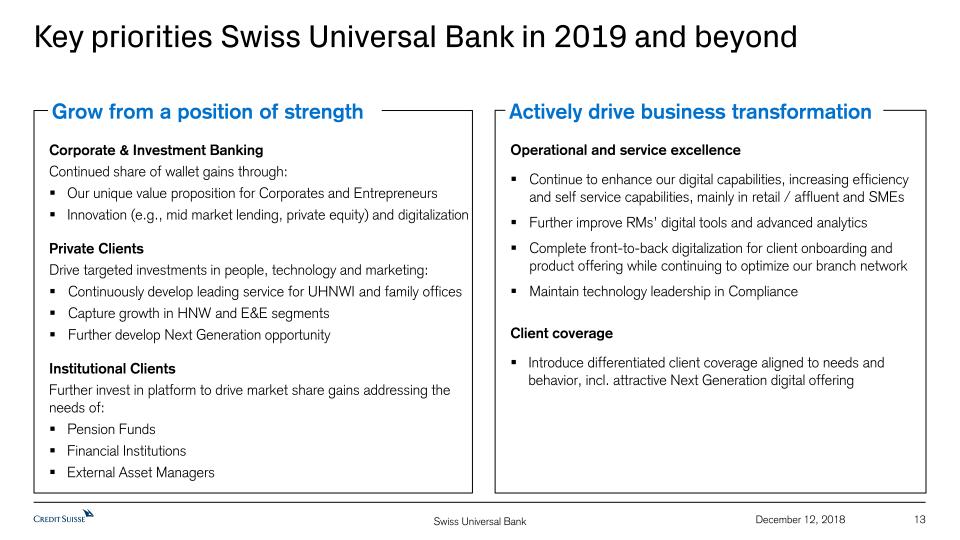
13 December 12, 2018 Key priorities Swiss Universal Bank in 2019 and beyond Corporate & Investment BankingContinued share of wallet gains through:Our unique value proposition for Corporates and EntrepreneursInnovation (e.g., mid market lending, private equity) and digitalizationPrivate ClientsDrive targeted investments in people, technology and marketing: Continuously develop leading service for UHNWI and family officesCapture growth in HNW and E&E segmentsFurther develop Next Generation opportunityInstitutional ClientsFurther invest in platform to drive market share gains addressing the needs of: Pension FundsFinancial InstitutionsExternal Asset Managers Grow from a position of strength Operational and service excellenceContinue to enhance our digital capabilities, increasing efficiency and self service capabilities, mainly in retail / affluent and SMEsFurther improve RMs’ digital tools and advanced analytics Complete front-to-back digitalization for client onboarding and product offering while continuing to optimize our branch networkMaintain technology leadership in Compliance Client coverageIntroduce differentiated client coverage aligned to needs and behavior, incl. attractive Next Generation digital offering Actively drive business transformation Swiss Universal Bank
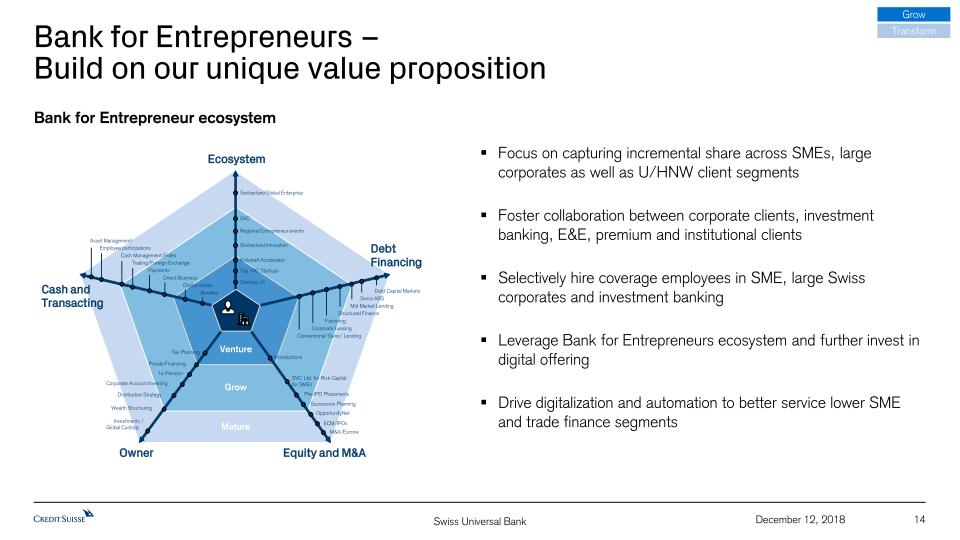
14 December 12, 2018 Bank for Entrepreneurs – Build on our unique value proposition Bank for Entrepreneur ecosystem Focus on capturing incremental share across SMEs, large corporates as well as U/HNW client segmentsFoster collaboration between corporate clients, investment banking, E&E, premium and institutional clientsSelectively hire coverage employees in SME, large Swiss corporates and investment bankingLeverage Bank for Entrepreneurs ecosystem and further invest in digital offeringDrive digitalization and automation to better service lower SME and trade finance segments Ecosystem Grow Transform Startups.ch Top 100 Startups SVC Bundles Trading/Foreign Exchange Direct Business Employee participations Asset Management 1e Pension SVC Ltd. for Risk Capital for SMEs Pre-IPO Placements ECM/IPOs Introductions M&A/Escrow OpportunityNet Tax Planning Corporate Account Investing Digital shares Wealth Structuring Distribution Strategy Regional Entrepreneur events Mature Grow Venture Investments / Global Custody Switzerland Innovation Debt Capital Markets Mid Market Lending Conventional ‘Swiss’ Lending Swiss ABS Structured Finance Corporate Leasing Private Financing Kickstart Accelerator Factoring Payments Succession Planning Switzerland Global Enterprise Cash Management/Fides Equity and M&A Owner Cash and Transacting Debt Financing Swiss Universal Bank
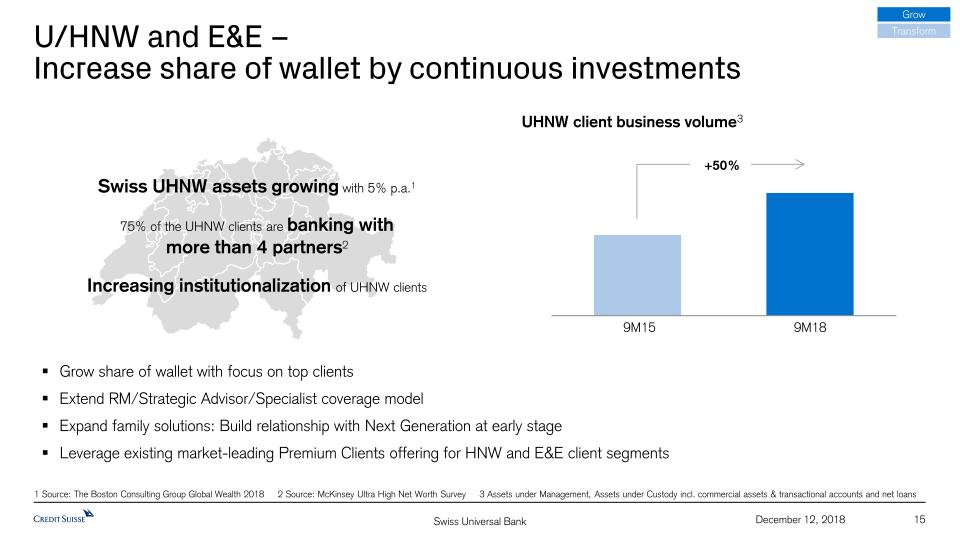
15 December 12, 2018 U/HNW and E&E –Increase share of wallet by continuous investments Grow share of wallet with focus on top clientsExtend RM/Strategic Advisor/Specialist coverage modelExpand family solutions: Build relationship with Next Generation at early stageLeverage existing market-leading Premium Clients offering for HNW and E&E client segments UHNW client business volume3 9M15 9M18 1 Source: The Boston Consulting Group Global Wealth 2018 2 Source: McKinsey Ultra High Net Worth Survey 3 Assets under Management, Assets under Custody incl. commercial assets & transactional accounts and net loans Swiss UHNW assets growing with 5% p.a.1 75% of the UHNW clients are banking with more than 4 partners2Increasing institutionalization of UHNW clients +50% Grow Transform Swiss Universal Bank

16 December 12, 2018 Institutional Clients –Continue to grow market share Gain market share with clear focus on large and mid-sized clientsStrengthen client coverage to grow and serve largest, most sophisticated clientsInvest in IT platform to ensure competitive offering, customized connectivity and digital processes/interfacesStrengthen collaboration and enable growth across Asset Management, ITS and IBCM SolutionsFull offering incl. AM, GM and technology PlatformOffering delivery, client connectivity, process efficiency CoverageLeading RM/specialist base to advise largest sophisticated clients Institutional Market(Pension Funds, Financial Institutions and External Asset Managers) Leading market positionin all businesses Structural market growth2-4% growth p.a. from asset cycle and Swiss financial center1 Top client focus in consolidating marketHave edge with largest/complex clients in rapidly consolidating market Concentrated competition Grow Transform High Touch / High Tech Service Model Growth opportunities 1 Macroeconomic Forecast (MEF) provided by Credit Suisse Economic Research Swiss Universal Bank
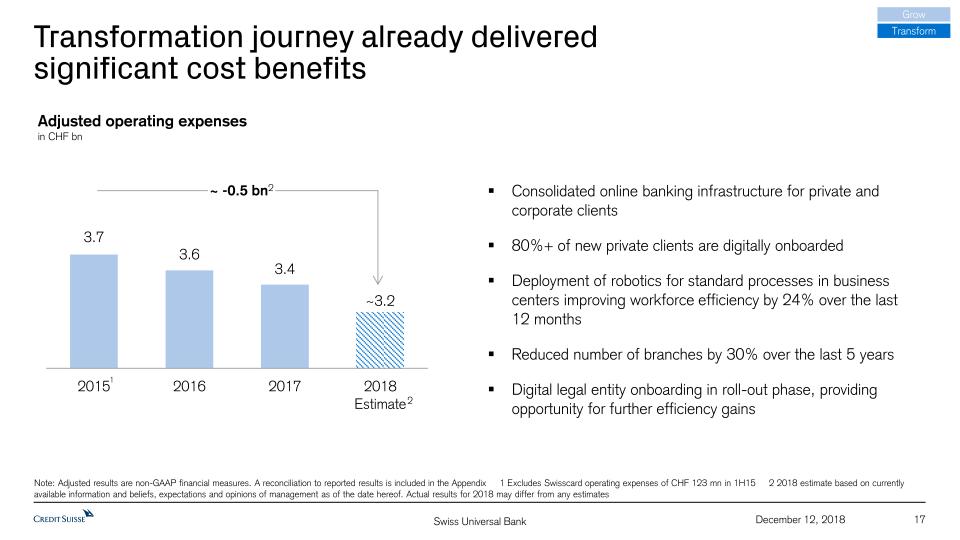
17 December 12, 2018 Transformation journey already delivered significant cost benefits Adjusted operating expensesin CHF bn Consolidated online banking infrastructure for private and corporate clients80%+ of new private clients are digitally onboarded Deployment of robotics for standard processes in business centers improving workforce efficiency by 24% over the last 12 monthsReduced number of branches by 30% over the last 5 yearsDigital legal entity onboarding in roll-out phase, providing opportunity for further efficiency gains Note: Adjusted results are non-GAAP financial measures. A reconciliation to reported results is included in the Appendix 1 Excludes Swisscard operating expenses of CHF 123 mn in 1H15 2 2018 estimate based on currently available information and beliefs, expectations and opinions of management as of the date hereof. Actual results for 2018 may differ from any estimates Grow Transform ~ -0.5 bn2 2 1 Swiss Universal Bank
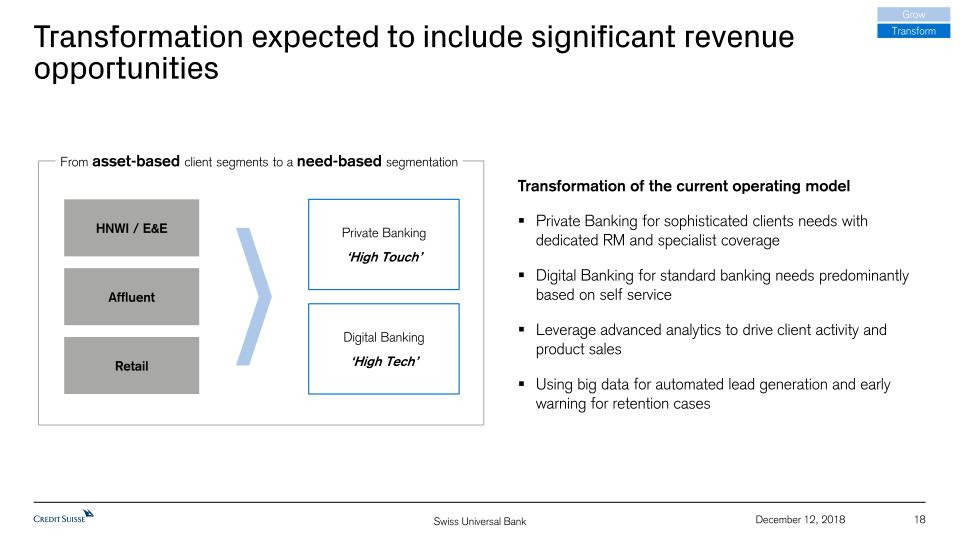
18 December 12, 2018 Transformation expected to include significant revenue opportunities Transformation of the current operating modelPrivate Banking for sophisticated clients needs with dedicated RM and specialist coverageDigital Banking for standard banking needs predominantly based on self serviceLeverage advanced analytics to drive client activity and product salesUsing big data for automated lead generation and early warning for retention cases Grow Transform From asset-based client segments to a need-based segmentation Retail HNWI / E&E Affluent Private Banking‘High Touch’ Digital Banking‘High Tech’ Swiss Universal Bank
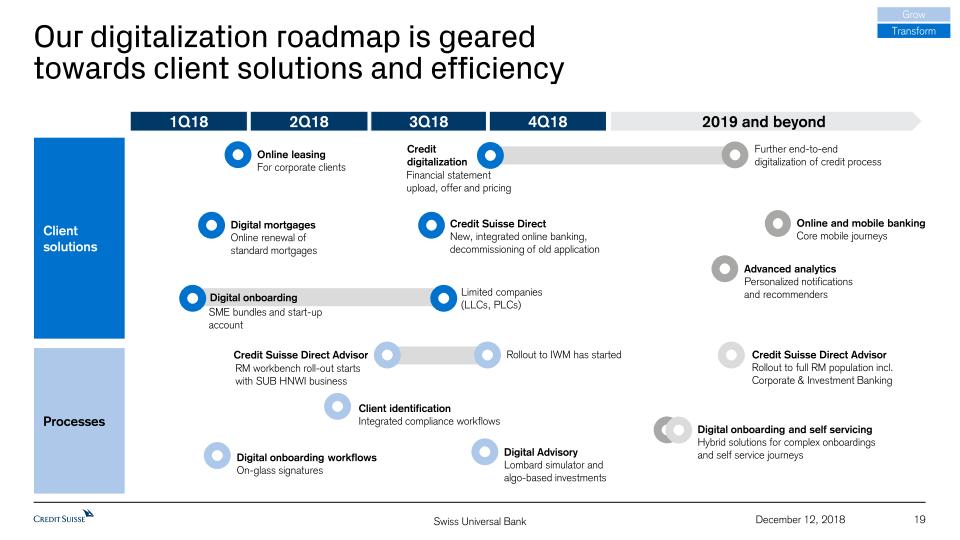
19 December 12, 2018 Our digitalization roadmap is geared towards client solutions and efficiency 2019 and beyond 1Q18 2Q18 3Q18 4Q18 Processes Client solutions SME bundles and start-up account Credit Suisse Direct Advisor Digital AdvisoryLombard simulator and algo-based investments Limited companies (LLCs, PLCs) Rollout to IWM has started Client identificationIntegrated compliance workflows Digital onboarding workflowsOn-glass signatures Digital onboarding and self servicingHybrid solutions for complex onboardings and self service journeys Credit Suisse Direct AdvisorRollout to full RM population incl. Corporate & Investment Banking Credit Suisse DirectNew, integrated online banking, decommissioning of old application Online leasingFor corporate clients Financial statement upload, offer and pricing Digital mortgagesOnline renewal of standard mortgages Online and mobile bankingCore mobile journeys Advanced analyticsPersonalized notifications and recommenders Further end-to-end digitalization of credit process Credit digitalization Digital onboarding RM workbench roll-out starts with SUB HNWI business Grow Transform Swiss Universal Bank
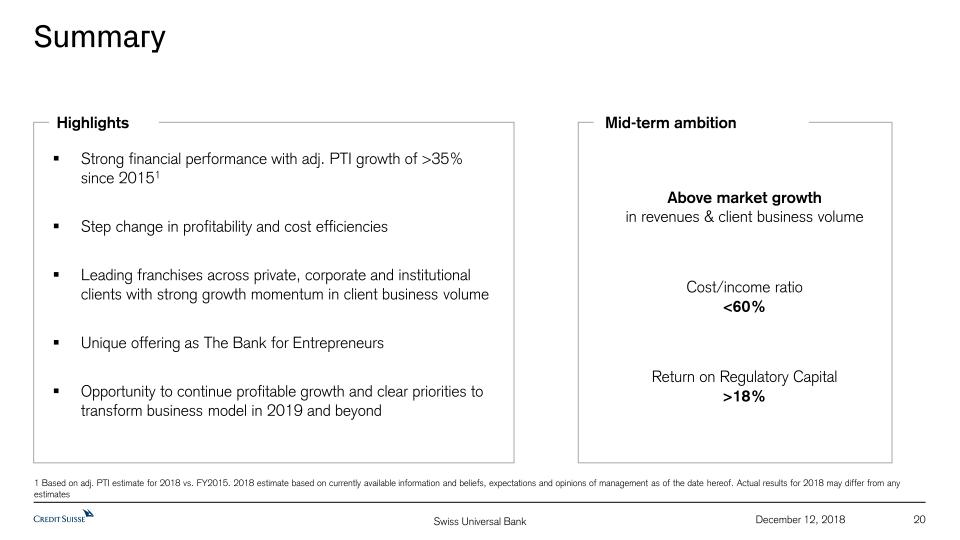
20 December 12, 2018 Summary Strong financial performance with adj. PTI growth of >35%since 20151Step change in profitability and cost efficienciesLeading franchises across private, corporate and institutional clients with strong growth momentum in client business volumeUnique offering as The Bank for EntrepreneursOpportunity to continue profitable growth and clear priorities to transform business model in 2019 and beyond 1 Based on adj. PTI estimate for 2018 vs. FY2015. 2018 estimate based on currently available information and beliefs, expectations and opinions of management as of the date hereof. Actual results for 2018 may differ from any estimates Highlights Above market growthin revenues & client business volumeCost/income ratio<60%Return on Regulatory Capital>18% Mid-term ambition Swiss Universal Bank

Iqbal Khan, CEO International Wealth ManagementDecember 12, 2018 Credit Suisse Investor Day 2018International Wealth Management
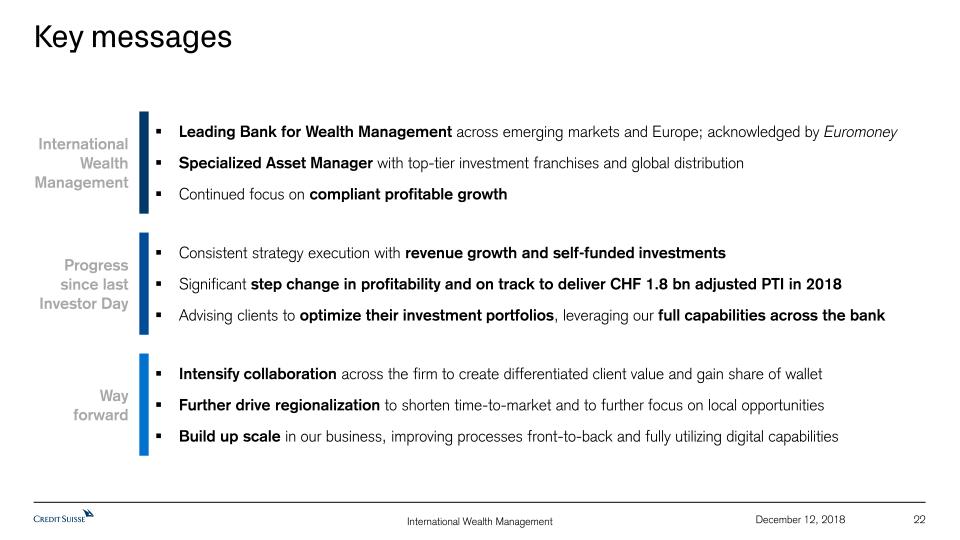
22 December 12, 2018 Key messages International Wealth Management Progress since lastInvestor Day Wayforward Leading Bank for Wealth Management across emerging markets and Europe; acknowledged by EuromoneySpecialized Asset Manager with top-tier investment franchises and global distributionContinued focus on compliant profitable growth Consistent strategy execution with revenue growth and self-funded investmentsSignificant step change in profitability and on track to deliver CHF 1.8 bn adjusted PTI in 2018Advising clients to optimize their investment portfolios, leveraging our full capabilities across the bank Intensify collaboration across the firm to create differentiated client value and gain share of walletFurther drive regionalization to shorten time-to-market and to further focus on local opportunitiesBuild up scale in our business, improving processes front-to-back and fully utilizing digital capabilities International Wealth Management
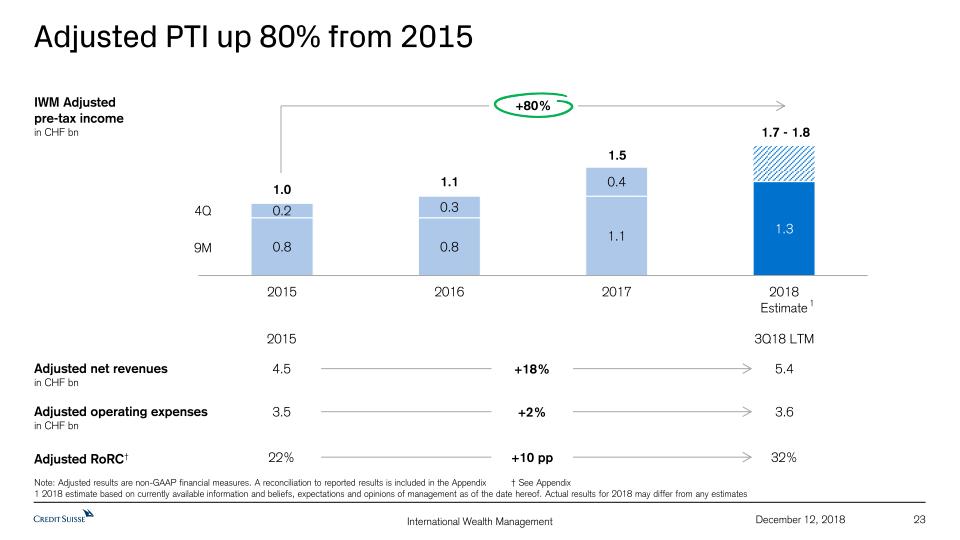
23 December 12, 2018 Adjusted PTI up 80% from 2015 Note: Adjusted results are non-GAAP financial measures. A reconciliation to reported results is included in the Appendix † See Appendix1 2018 estimate based on currently available information and beliefs, expectations and opinions of management as of the date hereof. Actual results for 2018 may differ from any estimates 1.0 1.1 1.5 1.7 - 1.8 IWM Adjustedpre-tax incomein CHF bn 9M 4Q Adjusted net revenuesin CHF bn Adjusted operating expensesin CHF bn Adjusted RoRC† 4.5 5.4 3.5 3.6 22% 32% 2015 3Q18 LTM +80% +18% +2% +10 pp 1 International Wealth Management
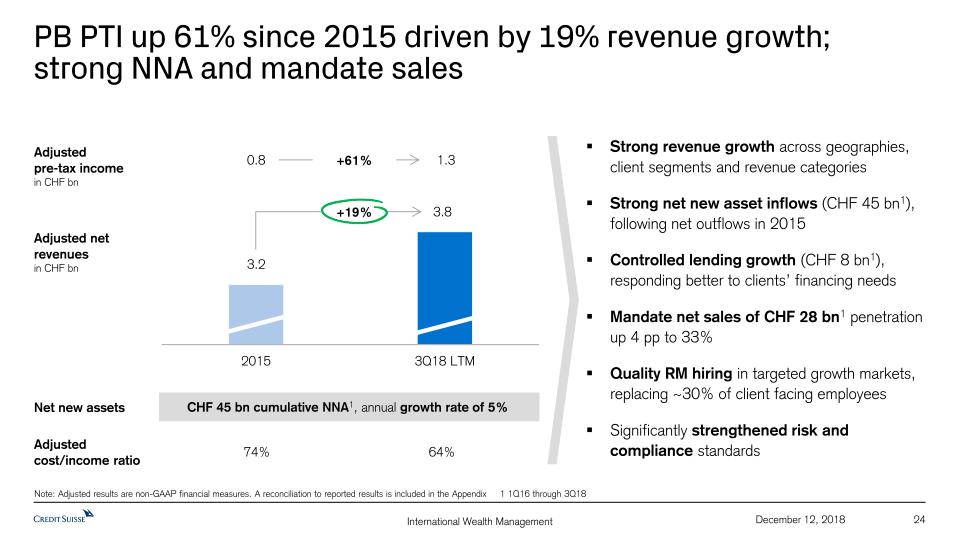
24 December 12, 2018 PB PTI up 61% since 2015 driven by 19% revenue growth; strong NNA and mandate sales Adjusted net revenuesin CHF bn Note: Adjusted results are non-GAAP financial measures. A reconciliation to reported results is included in the Appendix 1 1Q16 through 3Q18 3.2 3.8 Strong revenue growth across geographies, client segments and revenue categoriesStrong net new asset inflows (CHF 45 bn1), following net outflows in 2015Controlled lending growth (CHF 8 bn1), responding better to clients’ financing needsMandate net sales of CHF 28 bn1 penetration up 4 pp to 33%Quality RM hiring in targeted growth markets, replacing ~30% of client facing employeesSignificantly strengthened risk andcompliance standards 0.8 1.3 +19% +61% Adjustedpre-tax incomein CHF bn Adjusted cost/income ratio 74% 64% Net new assets CHF 45 bn cumulative NNA1, annual growth rate of 5% International Wealth Management
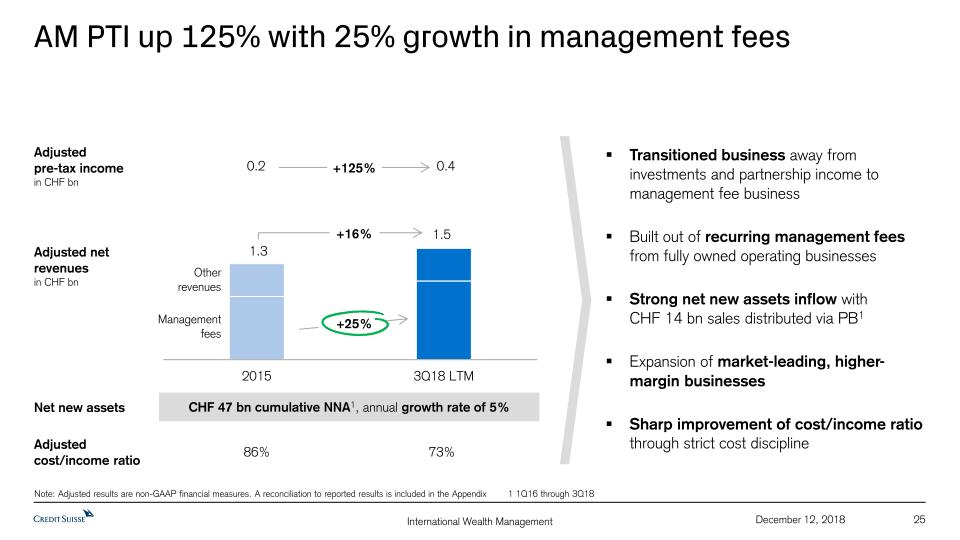
25 December 12, 2018 AM PTI up 125% with 25% growth in management fees Adjusted net revenuesin CHF bn Net new assets CHF 47 bn cumulative NNA1, annual growth rate of 5% Note: Adjusted results are non-GAAP financial measures. A reconciliation to reported results is included in the Appendix 1 1Q16 through 3Q18 Adjustedpre-tax incomein CHF bn 0.2 0.4 Management fees Otherrevenues 1.3 1.5 +16% +25% +125% Transitioned business away from investments and partnership income to management fee businessBuilt out of recurring management fees from fully owned operating businessesStrong net new assets inflow with CHF 14 bn sales distributed via PB1Expansion of market-leading, higher-margin businessesSharp improvement of cost/income ratio through strict cost discipline Adjusted cost/income ratio 86% 73% International Wealth Management
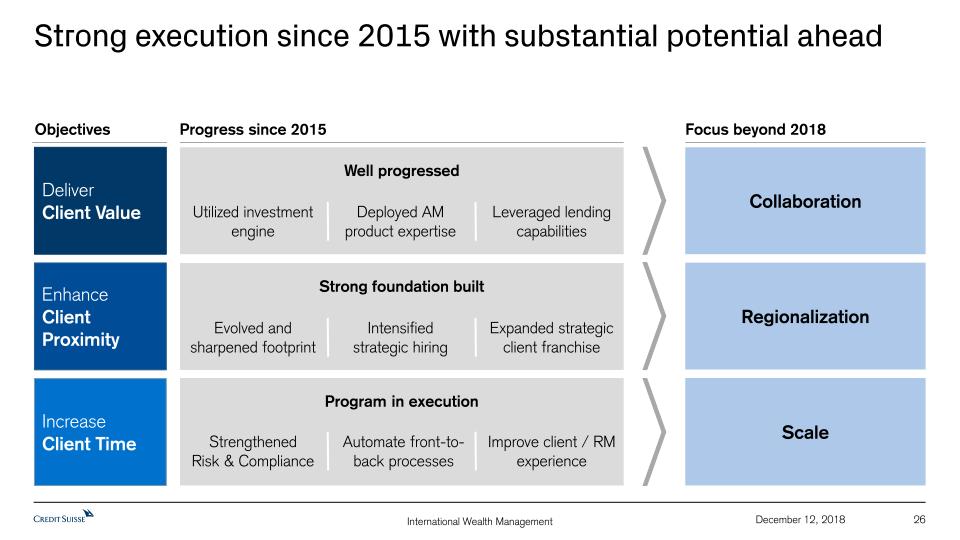
26 December 12, 2018 Strong execution since 2015 with substantial potential ahead DeliverClient Value EnhanceClient Proximity IncreaseClient Time Objectives Focus beyond 2018 Well progressed Program in execution Collaboration Strong foundation built Regionalization Scale Progress since 2015 Leveraged lending capabilities Deployed AMproduct expertise Utilized investment engine Expanded strategic client franchise Intensifiedstrategic hiring Evolved and sharpened footprint Automate front-to-back processes Improve client / RM experience StrengthenedRisk & Compliance International Wealth Management
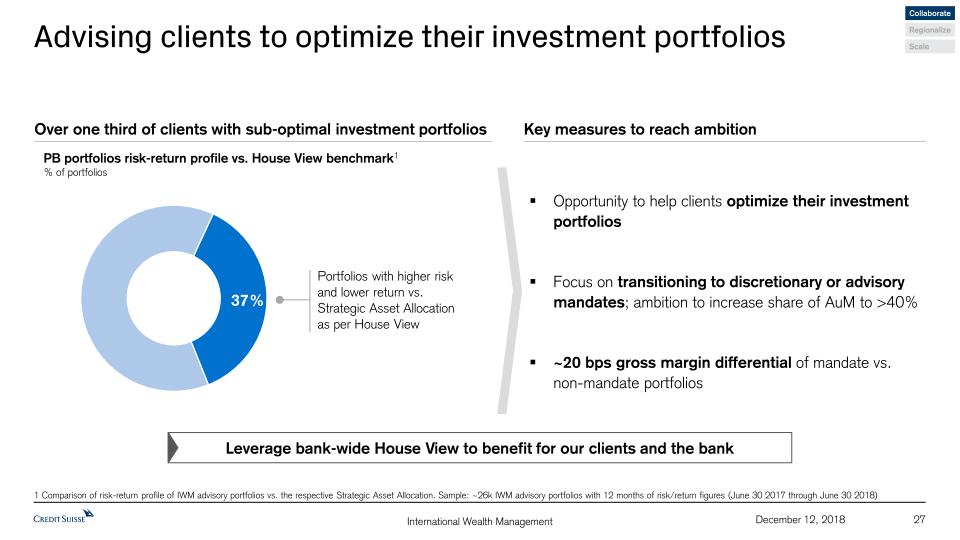
27 December 12, 2018 Advising clients to optimize their investment portfolios Over one third of clients with sub-optimal investment portfolios Key measures to reach ambition Opportunity to help clients optimize their investment portfoliosFocus on transitioning to discretionary or advisory mandates; ambition to increase share of AuM to >40%~20 bps gross margin differential of mandate vs.non-mandate portfolios 1 Comparison of risk-return profile of IWM advisory portfolios vs. the respective Strategic Asset Allocation. Sample: ~26k IWM advisory portfolios with 12 months of risk/return figures (June 30 2017 through June 30 2018) PB portfolios risk-return profile vs. House View benchmark1 % of portfolios Collaborate Regionalize Scale Leverage bank-wide House View to benefit for our clients and the bank Portfolios with higher risk and lower return vs. Strategic Asset Allocation as per House View 37% International Wealth Management
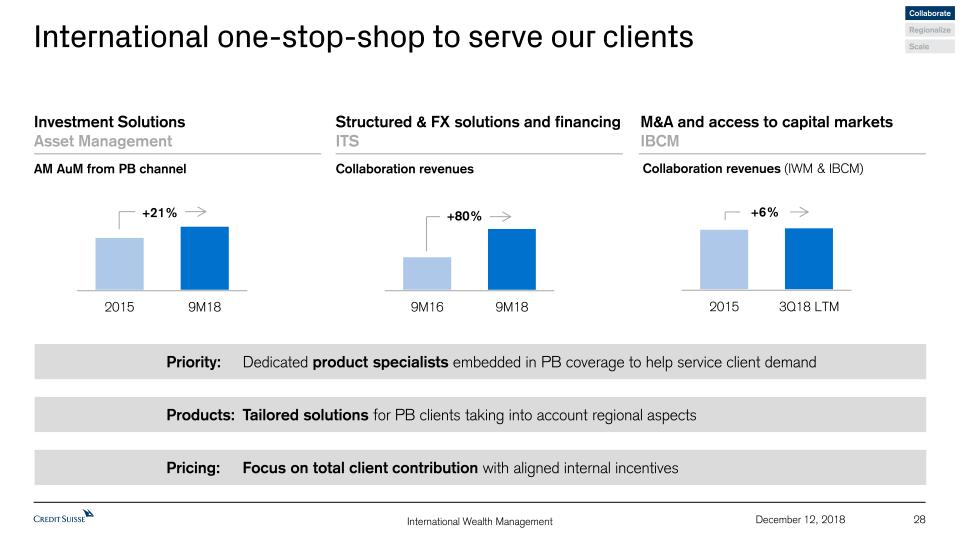
28 December 12, 2018 Investment SolutionsAsset Management 64 53 AM AuM from PB channel Structured & FX solutions and financingITS Collaboration revenues Collaborate Regionalize Scale M&A and access to capital marketsIBCM Collaboration revenues (IWM & IBCM) 72 68 International one-stop-shop to serve our clients Priority: Dedicated product specialists embedded in PB coverage to help service client demand Products: Tailored solutions for PB clients taking into account regional aspects Pricing: Focus on total client contribution with aligned internal incentives +80% +21% +6% International Wealth Management
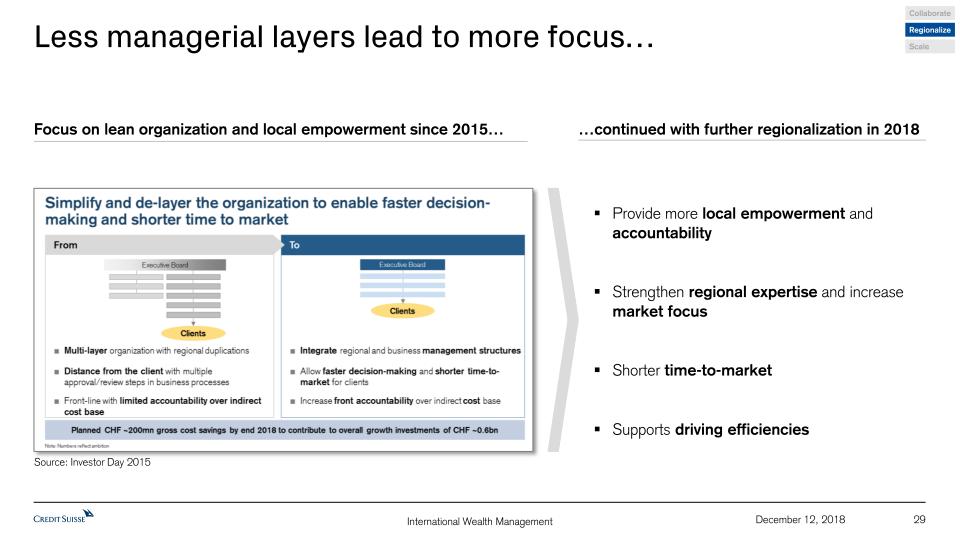
29 December 12, 2018 Less managerial layers lead to more focus… Focus on lean organization and local empowerment since 2015… …continued with further regionalization in 2018 Provide more local empowerment and accountabilityStrengthen regional expertise and increase market focusShorter time-to-marketSupports driving efficiencies Source: Investor Day 2015 Collaborate Regionalize Scale International Wealth Management
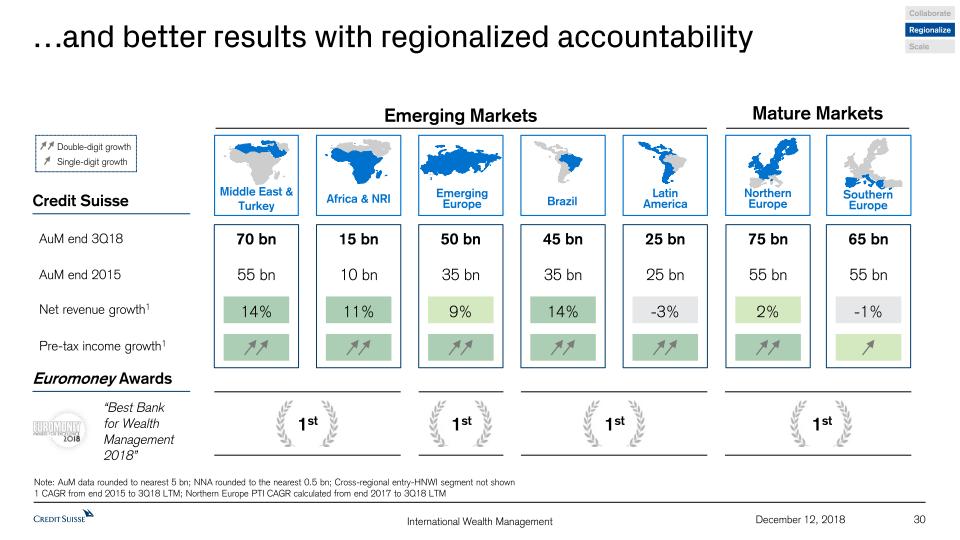
30 December 12, 2018 …and better results with regionalized accountability Note: AuM data rounded to nearest 5 bn; NNA rounded to the nearest 0.5 bn; Cross-regional entry-HNWI segment not shown 1 CAGR from end 2015 to 3Q18 LTM; Northern Europe PTI CAGR calculated from end 2017 to 3Q18 LTM Collaborate Regionalize Scale Credit Suisse AuM end 3Q18 AuM end 2015 Net revenue growth1 Pre-tax income growth1 Euromoney Awards “Best Bank for Wealth Management 2018” Double-digit growth Single-digit growth Emerging Markets Mature Markets 1st 1st 15 bn 10 bn Africa & NRI 11% 70 bn 55 bn Middle East & Turkey 14% 25 bn 25 bn Latin America -3% 45 bn 35 bn Brazil 14% 50 bn 35 bn Emerging Europe 9% 75 bn 55 bn 2% 65 bn 55 bn -1% 1st 1st Northern Europe SouthernEurope International Wealth Management
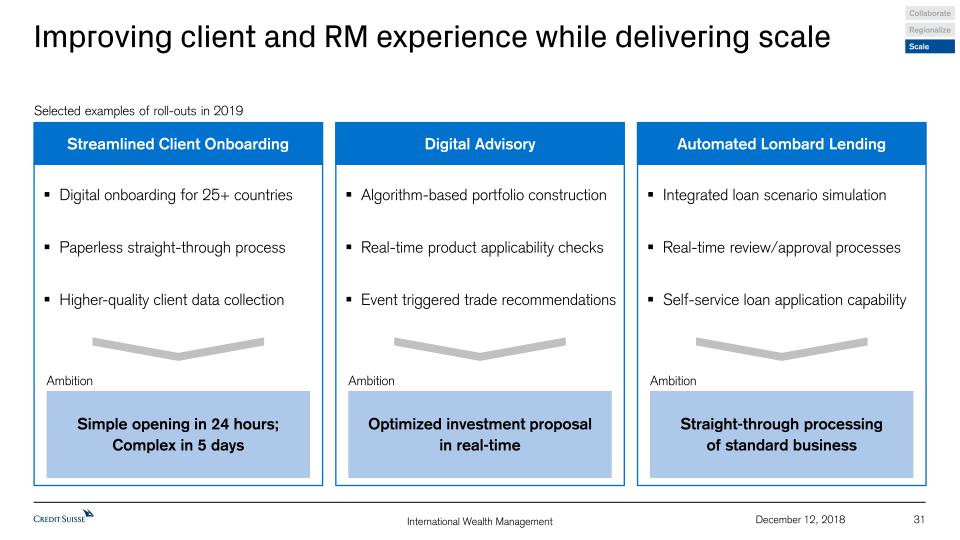
31 December 12, 2018 Improving client and RM experience while delivering scale Collaborate Regionalize Scale Streamlined Client Onboarding Digital Advisory Automated Lombard Lending Selected examples of roll-outs in 2019 Digital onboarding for 25+ countriesPaperless straight-through processHigher-quality client data collection Algorithm-based portfolio constructionReal-time product applicability checksEvent triggered trade recommendations Integrated loan scenario simulationReal-time review/approval processesSelf-service loan application capability Ambition Ambition Ambition Simple opening in 24 hours;Complex in 5 days Straight-through processing of standard business Optimized investment proposalin real-time International Wealth Management
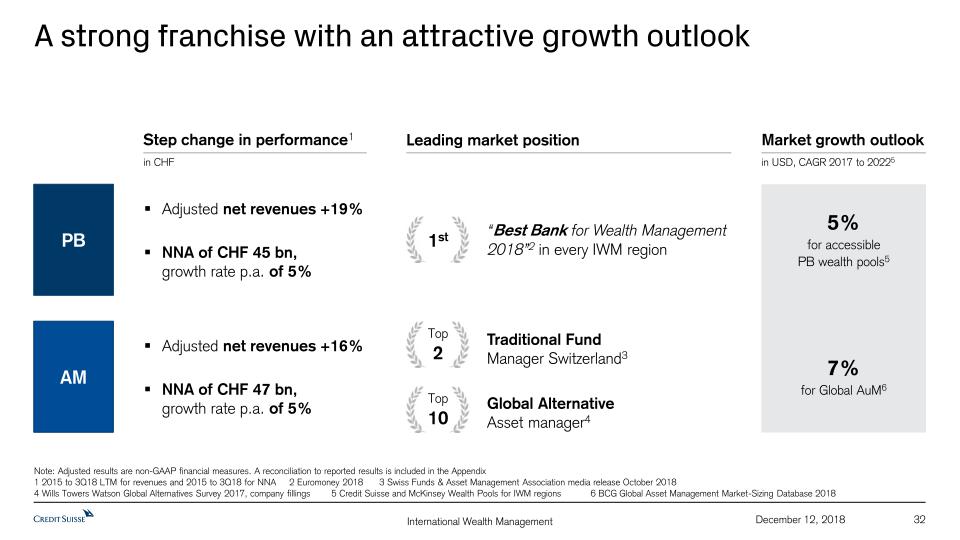
32 December 12, 2018 A strong franchise with an attractive growth outlook Note: Adjusted results are non-GAAP financial measures. A reconciliation to reported results is included in the Appendix 1 2015 to 3Q18 LTM for revenues and 2015 to 3Q18 for NNA 2 Euromoney 2018 3 Swiss Funds & Asset Management Association media release October 2018 4 Wills Towers Watson Global Alternatives Survey 2017, company fillings 5 Credit Suisse and McKinsey Wealth Pools for IWM regions 6 BCG Global Asset Management Market-Sizing Database 2018 Leading market position “Best Bank for Wealth Management 2018”2 in every IWM region 1st Traditional FundManager Switzerland3 Global AlternativeAsset manager4 Top10 Top2 Step change in performance1 Adjusted net revenues +19%NNA of CHF 45 bn,growth rate p.a. of 5% Adjusted net revenues +16%NNA of CHF 47 bn,growth rate p.a. of 5% Market growth outlook in USD, CAGR 2017 to 20225 5%for accessible PB wealth pools5 7%for Global AuM6 PB AM in CHF International Wealth Management

Appendix 33 December 12, 2018 International Wealth Management
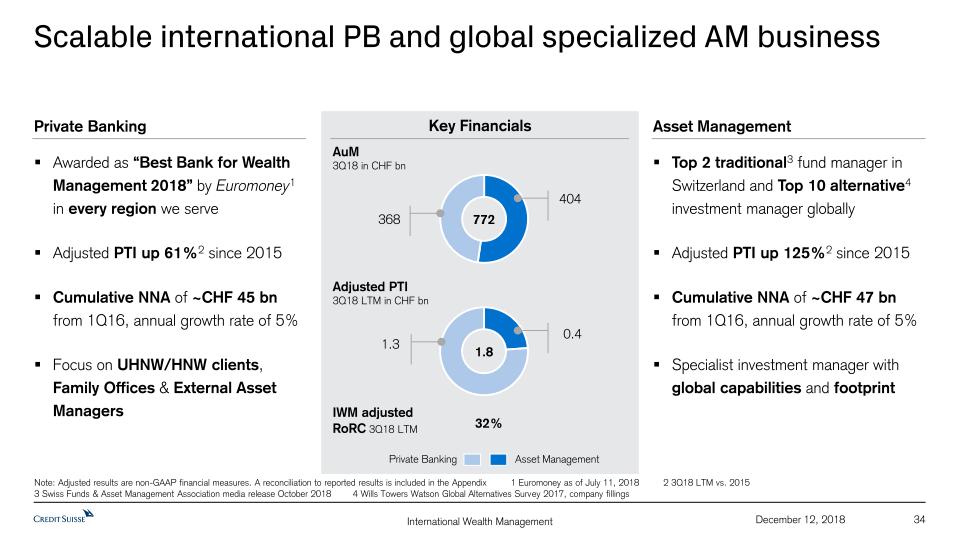
34 December 12, 2018 Private Banking Asset Management Awarded as “Best Bank for Wealth Management 2018” by Euromoney1 in every region we serveAdjusted PTI up 61%2 since 2015Cumulative NNA of ~CHF 45 bn from 1Q16, annual growth rate of 5%Focus on UHNW/HNW clients, Family Offices & External Asset Managers Top 2 traditional3 fund manager in Switzerland and Top 10 alternative4 investment manager globallyAdjusted PTI up 125%2 since 2015Cumulative NNA of ~CHF 47 bn from 1Q16, annual growth rate of 5%Specialist investment manager with global capabilities and footprint 772 368 404 Private Banking Asset Management Key Financials Note: Adjusted results are non-GAAP financial measures. A reconciliation to reported results is included in the Appendix 1 Euromoney as of July 11, 2018 2 3Q18 LTM vs. 2015 3 Swiss Funds & Asset Management Association media release October 2018 4 Wills Towers Watson Global Alternatives Survey 2017, company fillings Scalable international PB and global specialized AM business AuM3Q18 in CHF bn Adjusted PTI3Q18 LTM in CHF bn 1.8 1.3 0.4 IWM adjusted RoRC 3Q18 LTM 32% International Wealth Management
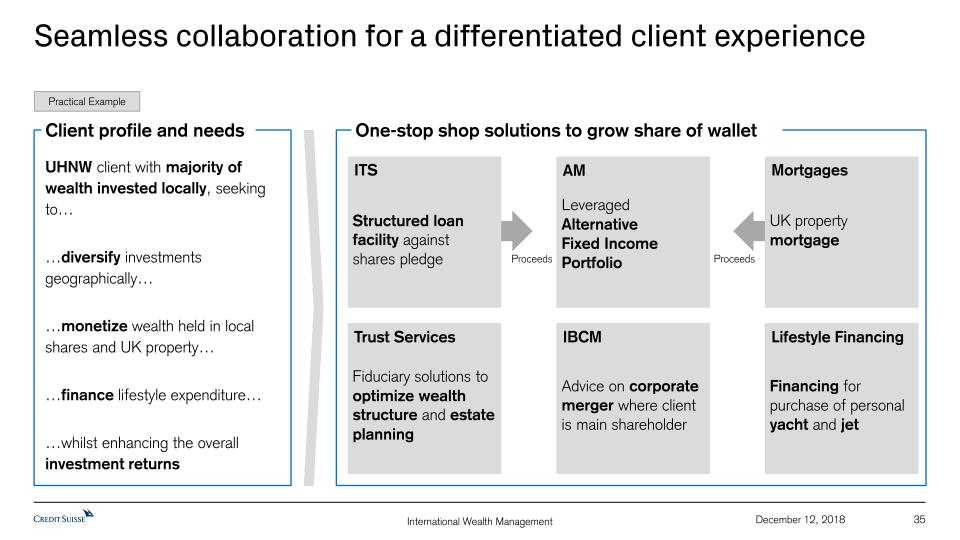
35 December 12, 2018 Seamless collaboration for a differentiated client experience One-stop shop solutions to grow share of wallet Client profile and needs UHNW client with majority of wealth invested locally, seeking to……diversify investments geographically……monetize wealth held in local shares and UK property……finance lifestyle expenditure……whilst enhancing the overall investment returns Practical Example ITS Structured loan facility against shares pledge Mortgages UK property mortgage AM Leveraged AlternativeFixed Income Portfolio Trust Services Fiduciary solutions to optimize wealth structure and estate planning IBCM Advice on corporate merger where client is main shareholder Lifestyle Financing Financing for purchase of personal yacht and jet Proceeds Proceeds International Wealth Management
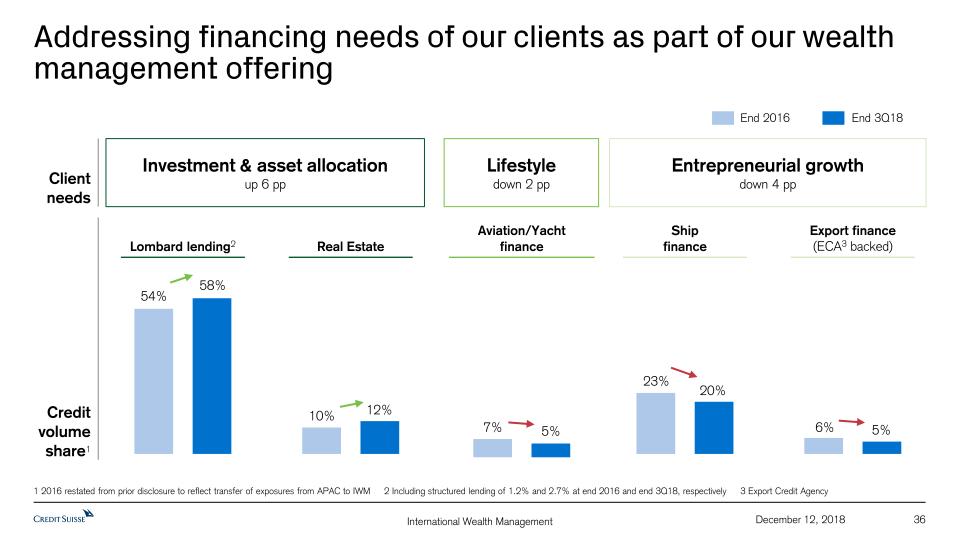
Addressing financing needs of our clients as part of our wealth management offering Entrepreneurial growthdown 4 pp Investment & asset allocationup 6 pp Lifestyledown 2 pp Lombard lending2 Real Estate Aviation/Yachtfinance Shipfinance Export finance(ECA3 backed) Client needs 54% 58% 10% 12% 7% 5% 23% 20% 6% 5% Credit volume share1 End 2016 End 3Q18 1 2016 restated from prior disclosure to reflect transfer of exposures from APAC to IWM 2 Including structured lending of 1.2% and 2.7% at end 2016 and end 3Q18, respectively 3 Export Credit Agency December 12, 2018 36 International Wealth Management

Helman Sitohang, CEO Asia PacificDecember 12, 2018 Credit Suisse Investor Day 2018Asia Pacific
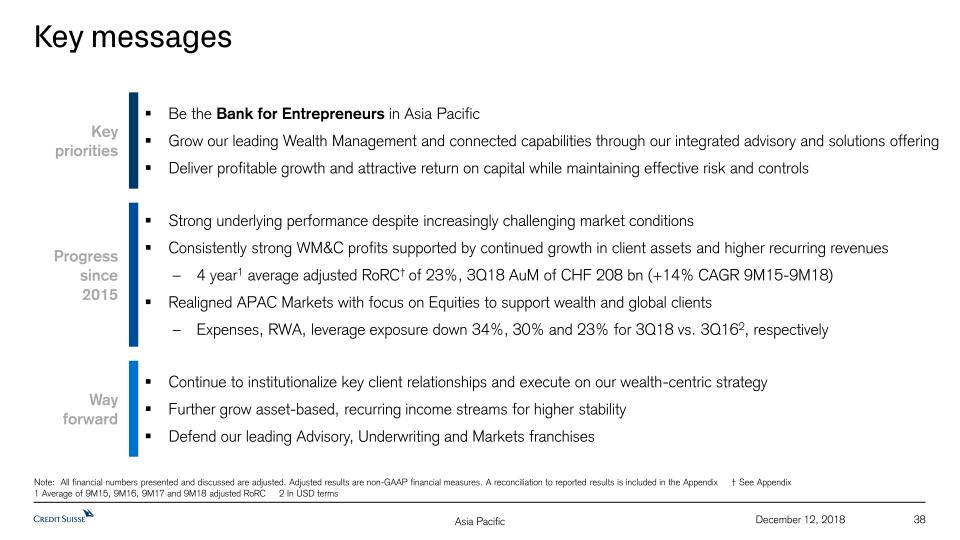
38 December 12, 2018 Key messages Keypriorities Progress since2015 Wayforward Be the Bank for Entrepreneurs in Asia Pacific Grow our leading Wealth Management and connected capabilities through our integrated advisory and solutions offeringDeliver profitable growth and attractive return on capital while maintaining effective risk and controls Strong underlying performance despite increasingly challenging market conditionsConsistently strong WM&C profits supported by continued growth in client assets and higher recurring revenues4 year1 average adjusted RoRC† of 23%, 3Q18 AuM of CHF 208 bn (+14% CAGR 9M15-9M18)Realigned APAC Markets with focus on Equities to support wealth and global clientsExpenses, RWA, leverage exposure down 34%, 30% and 23% for 3Q18 vs. 3Q162, respectively Continue to institutionalize key client relationships and execute on our wealth-centric strategyFurther grow asset-based, recurring income streams for higher stabilityDefend our leading Advisory, Underwriting and Markets franchises Note: All financial numbers presented and discussed are adjusted. Adjusted results are non-GAAP financial measures. A reconciliation to reported results is included in the Appendix † See Appendix 1 Average of 9M15, 9M16, 9M17 and 9M18 adjusted RoRC 2 In USD terms Asia Pacific
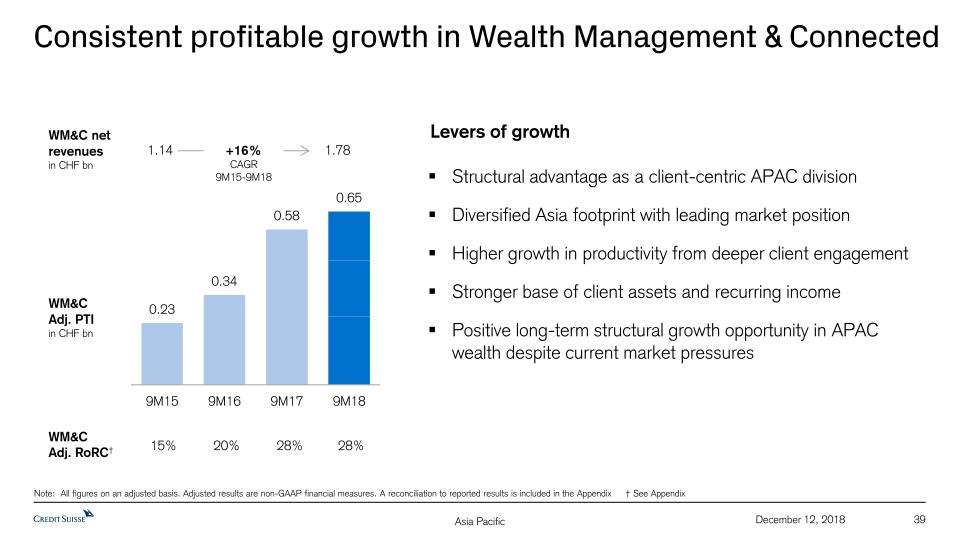
39 December 12, 2018 Consistent profitable growth in Wealth Management & Connected Levers of growth WM&CAdj. PTI in CHF bn WM&C net revenuesin CHF bn 1.14 1.78 +16% CAGR9M15-9M18 Note: All figures on an adjusted basis. Adjusted results are non-GAAP financial measures. A reconciliation to reported results is included in the Appendix † See Appendix WM&C Adj. RoRC† 20% 28% Structural advantage as a client-centric APAC divisionDiversified Asia footprint with leading market positionHigher growth in productivity from deeper client engagementStronger base of client assets and recurring incomePositive long-term structural growth opportunity in APAC wealth despite current market pressures 15% 28% Asia Pacific

The unique APAC setup supports our successful wealth strategy 40 December 12, 2018 Gearing to APAC wealth clients Joint coverage of key UHNW clients and entrepreneurs across departmentsOne-stop-shop for financing needs with unified platform front-to-backSingle Markets platform delivering institutional quality advice and execution, with global connectivityFirst line of defense supported by comprehensive structuring, risk management and syndication platform Wealth and corporate advisory Private Banking M&A / capital markets Financing Solutions & Research Integrated Asia Division Business model geared towards Asia clients Institutional sales, distribution & execution Asia Pacific
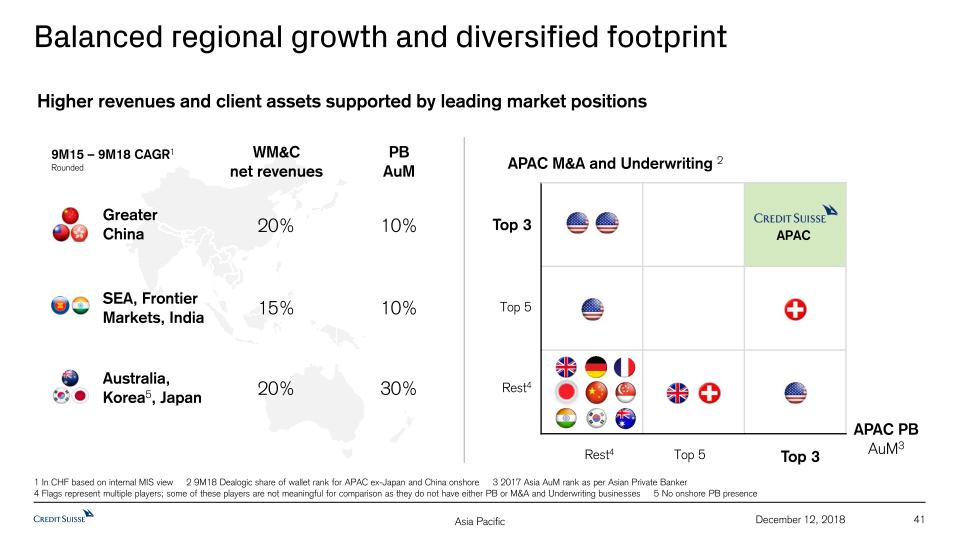
41 December 12, 2018 Balanced regional growth and diversified footprint APAC M&A and Underwriting 2 APAC PB AuM3 Top 3 Top 5 Rest4 Rest4 Top 5 Top 3 APAC WM&Cnet revenues PB AuM Greater China SEA, Frontier Markets, India Australia, Korea5, Japan 20% 10% 15% 10% 20% 30% Broad growth with target APAC wealth clients... 9M15 – 9M18 CAGR1Rounded Higher revenues and client assets supported by leading market positions 1 In CHF based on internal MIS view 2 9M18 Dealogic share of wallet rank for APAC ex-Japan and China onshore 3 2017 Asia AuM rank as per Asian Private Banker 4 Flags represent multiple players; some of these players are not meaningful for comparison as they do not have either PB or M&A and Underwriting businesses 5 No onshore PB presence Asia Pacific
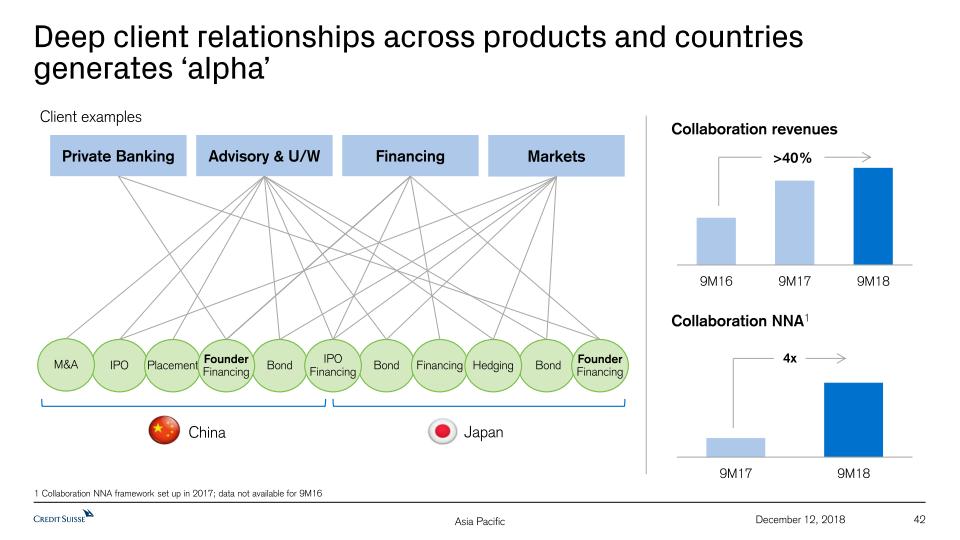
Deep client relationships across products and countriesgenerates ‘alpha’ Client examples 42 December 12, 2018 Private Banking Advisory & U/W Markets Financing China Japan IPO Bond M&A Placement Bond Bond FounderFinancing Financing Hedging IPOFinancing FounderFinancing 4x Collaboration NNA1 >40% Collaboration revenues 1 Collaboration NNA framework set up in 2017; data not available for 9M16 Asia Pacific
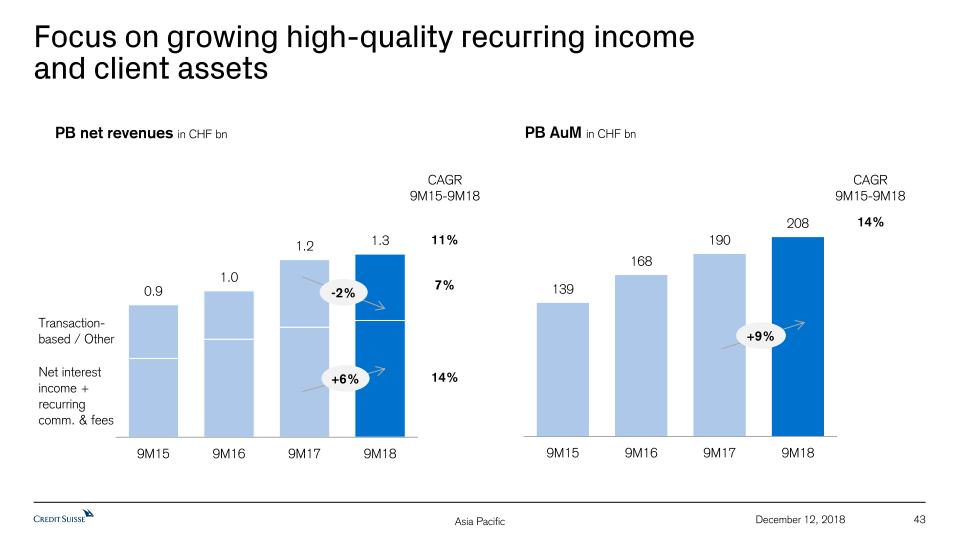
43 December 12, 2018 Focus on growing high-quality recurring income and client assets PB AuM in CHF bn PB net revenues in CHF bn Transaction-based / Other Net interest income + recurring comm. & fees +6% -2% +9% CAGR 9M15-9M18 14% CAGR 9M15-9M18 11% 14% 7% Asia Pacific
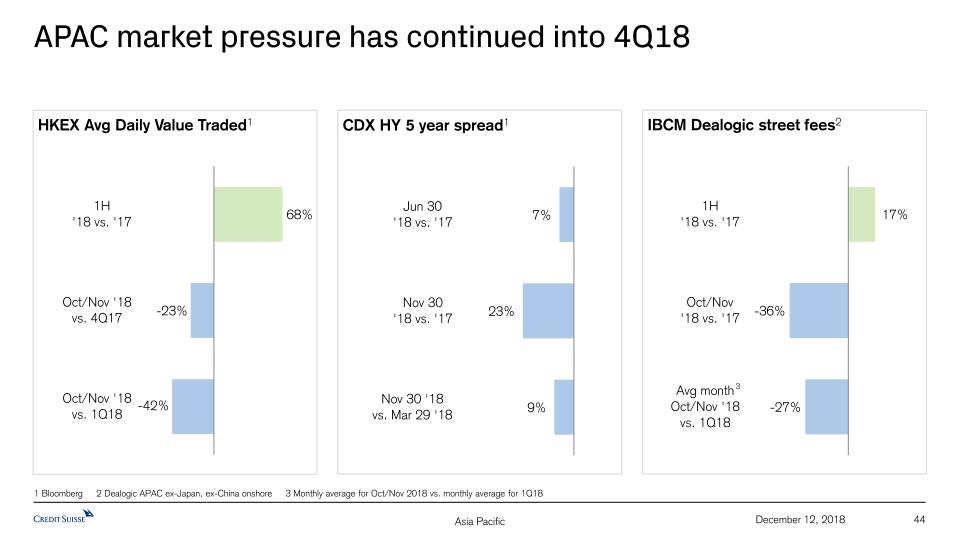
44 APAC market pressure has continued into 4Q18 CDX HY 5 year spread1 HKEX Avg Daily Value Traded1 IBCM Dealogic street fees2 December 12, 2018 1 Bloomberg 2 Dealogic APAC ex-Japan, ex-China onshore 3 Monthly average for Oct/Nov 2018 vs. monthly average for 1Q18 3 Asia Pacific
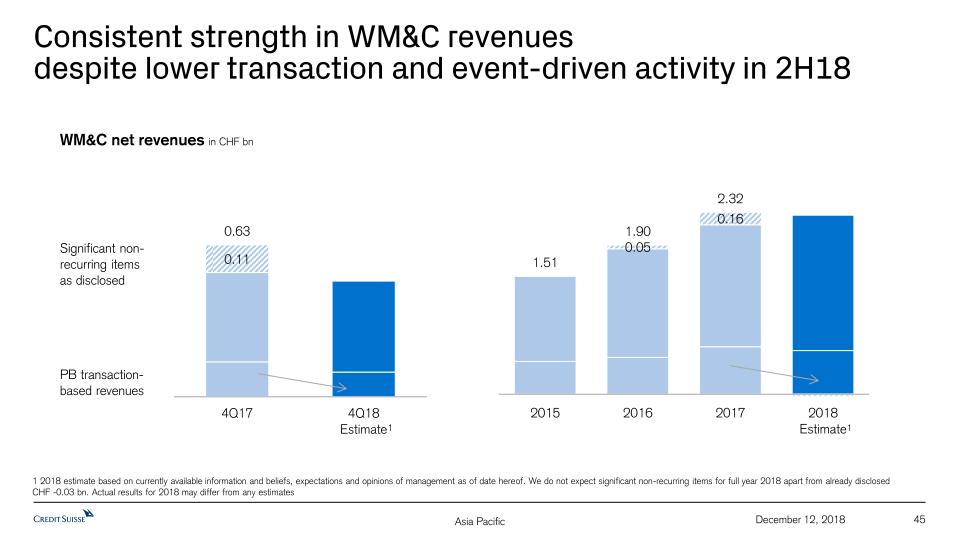
45 December 12, 2018 Consistent strength in WM&C revenues despite lower transaction and event-driven activity in 2H18 Significant non-recurring items as disclosed WM&C net revenues in CHF bn 1 2018 estimate based on currently available information and beliefs, expectations and opinions of management as of date hereof. We do not expect significant non-recurring items for full year 2018 apart from already disclosed CHF -0.03 bn. Actual results for 2018 may differ from any estimates PB transaction-based revenues 1 1 Asia Pacific
APAC Markets focus on Equities to support our wealth activities 1 2018 estimate based on currently available information and beliefs, expectations and opinions of management as of date hereof. Actual results for 2018 may differ from any estimates 46 December 12, 2018 74% of APAC Markets revenues from Equities for 9M18Top CS clients franchises in Cash, Equity Derivatives that also support U/HNW clientsClient risk appetite and transactions down significantly in 4Q18Full year 2018 net revenues for APAC Markets expected to be 8 to 10% lower than in prior year1 Asia Pacific
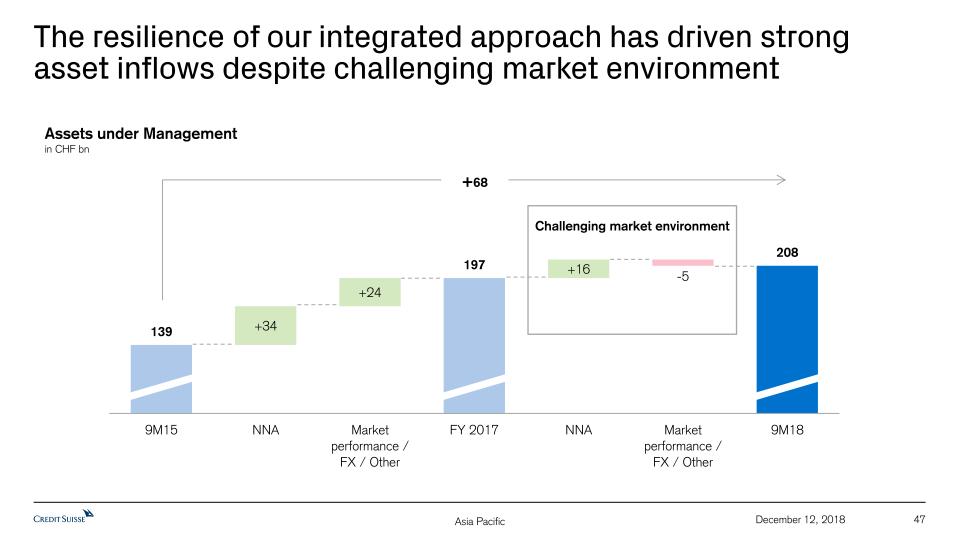
47 December 12, 2018 The resilience of our integrated approach has driven strong asset inflows despite challenging market environment +68 Assets under Managementin CHF bn Challenging market environment Asia Pacific
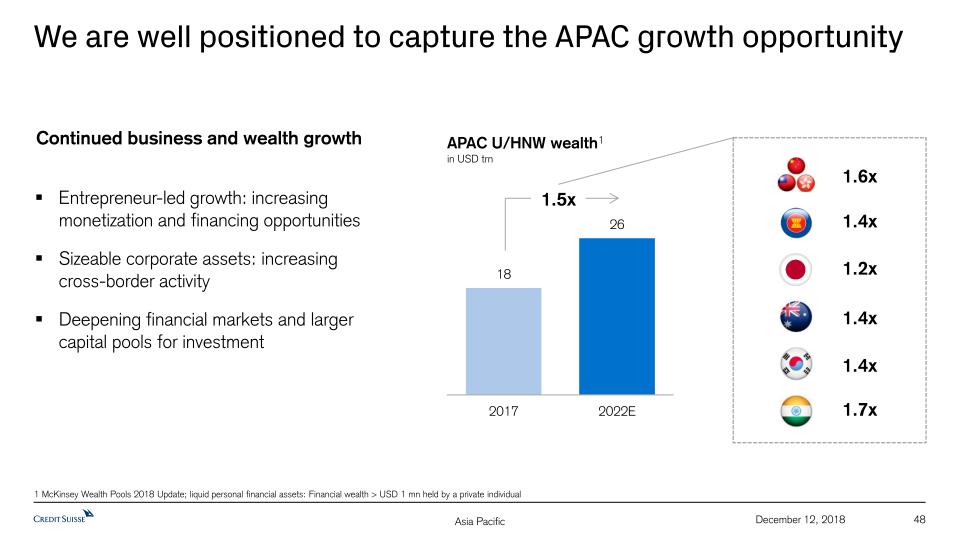
We are well positioned to capture the APAC growth opportunity 48 December 12, 2018 1 McKinsey Wealth Pools 2018 Update; liquid personal financial assets: Financial wealth > USD 1 mn held by a private individual Entrepreneur-led growth: increasing monetization and financing opportunitiesSizeable corporate assets: increasing cross-border activityDeepening financial markets and larger capital pools for investment APAC U/HNW wealth1 in USD trn 1.5x 1.6x 1.4x 1.2x 1.4x 1.4x 1.7x Continued business and wealth growth Asia Pacific
49 December 12, 2018 Looking ahead Continue to broaden key client relationshipsGrow revenues with focus on recurring incomeExecute with discipline and prudent risk management We remain focused on capturing the growth opportunitiesthrough our wealth-centric strategy Asia Pacific

Appendix 50 December 12, 2018
Notes (1/2) 51 December 12, 2018 For reconciliation of adjusted to reported results, refer to the Appendix of the CEO and CFO Investor Day presentations, published on December 12, 2018Throughout the presentation rounding differences may occurUnless otherwise noted, all CET1 ratio, Tier 1 leverage ratio, risk-weighted assets and leverage exposure figures shown in this presentation are as of the end of the respective period and on a “look-through” basisGross and net margins are shown in basis pointsGross margin = (adj.) net revenues annualized / average AuM; net margin = (adj.) pre-tax income annualized / average AuMMandate penetration reflects advisory and discretionary mandate volumes as a percentage of AuM, excluding those from the external asset manager business General notes Specific notes * Our cost savings program, until the end of 2018, is measured using an adjusted operating cost base at constant 2015 FX rates. “Adjusted operating cost base at constant FX rates” includes adjustments as made in all our disclosures for restructuring expenses, major litigation provisions, expenses related to business sales and a goodwill impairment taken in 4Q15 as well as adjustments for debit valuation adjustments (DVA) related volatility, FX and for certain accounting changes (which had not been in place at the launch of the cost savings program). Adjustments for certain accounting changes have been restated to reflect grossed up expenses in the Corporate Center and, starting in 1Q18, also include adjustments for changes from ASU 2014-09 “Revenue from Contracts with Customers”, which is described further in our 1Q18, 2Q18 and 3Q18 financial reports. Adjustments for FX apply unweighted currency exchange rates, i.e., a straight line average of monthly rates, consistently for the periods under review. Starting from 1Q19, we intend to express our operating cost base at constant 2018 FX rates and to adjust for significant litigation costs, expenses related to business and real estate sales as well as DVA related volatility, but not for restructuring expenses and certain accounting changes. Adjustments for FX will continue to apply unweighted currency exchange rates.† Regulatory capital is calculated as the worst of 10% of RWA and 3.5% of leverage exposure. Return on regulatory capital is calculated using (adjusted) income / (loss) after tax and assumes a tax rate of 30% and capital allocated based on the worst of 10% of average RWA and 3.5% of average leverage exposure. For the Markets business within the APAC division and for the Global Markets and Investment Banking & Capital Markets divisions, return on regulatory capital is based on US dollar denominated numbers. Adjusted return on regulatory capital is calculated using adjusted results, applying the same methodology to calculate return on regulatory capital. ‡ Return on tangible equity is based on tangible equity attributable to shareholders, a non-GAAP financial measure, which is calculated by deducting goodwill and other intangible assets from total equity attributable to shareholders as presented in our balance sheet. Management believes that the return on tangible equity attributable to shareholders is meaningful as it allows consistent measurement of the performance of businesses without regard to whether the businesses were acquired.° Tangible book value is a non-GAAP financial measure and is equal to tangible equity attributable to shareholders. Tangible book value per share is a non-GAAP financial measure, which is calculated by dividing tangible equity attributable to shareholders, a non-GAAP financial measure, by total number of shares outstanding. Tangible equity attributable to shareholders, a non-GAAP financial measure, is calculated by deducting goodwill and other intangible assets from total equity attributable to shareholders as presented in our balance sheet. Management believes that tangible book value per share is meaningful as it allows consistent measurement of the performance of businesses without regard to whether the businesses were acquired. For end-3Q18, tangible equity excluded goodwill of CHF 4,736 mn and other intangible assets of CHF 214 mn from total shareholders’ equity of CHF 42,734 mn as presented in our balance sheet. For end-2017, tangible equity excluded goodwill of CHF 4,742 mn and other intangible assets of CHF 223 mn from total shareholders' equity of CHF 41,902 mn as presented in our balance sheet. For end-2Q15, tangible equity excluded goodwill of CHF 8,238 mn and other intangible assets of CHF 205 mn from total shareholders' equity of CHF 42,642 mn as presented in our balance sheet. Shares outstanding were 2,552.4 mn at end-3Q18, 2,550.3 mn at end-2017 and 1,632.4 mn at end-2Q15.
Notes (2/2) 52 December 12, 2018 Abbreviations Adj. = Adjusted; AI = Artificial Intelligence; AM = Asset Management; AML = Anti-Money Laundering; APAC = Asia Pacific; ARU = Asset Resolution Unit;AT1 = Additional Tier 1; AuM = Assets under Management; BCBS = Basel Committee on Banking Supervision; BEAT = Base Erosion and Anti-Abuse Tax; BIS = Bank for International Settlements; bps = basis points; CAGR = Compound Annual Growth Rate; CBG = Corporate Bank Group; CCAR = Comprehensive Capital Adequacy Review; CCRO = Chief Compliance and Regulatory Affairs Officer; CDX HY = High-yield credit default swap index; CET1 = Common Equity Tier 1; CIC = Corporate & Institutional Clients; CIF = Customer/Client Information File; CIO = Chief Investment Officer; Corp. Ctr. = Corporate Center; CtB = Change the Bank; CVA = Credit Valuation Adjustment; DCM = Debt Capital Markets; DoJ = Department of Justice; DTA = Deferred Tax Assets; DVA = Debit Valuation Adjustments; EAM = External Asset Manager; EBITDA = Earnings Before Interest Taxes Depreciation and Amortization; ECM = Equity Capital Markets; EM = Emerging Markets; EMEA = Europe, Middle East & Africa; EQ = Equities; ERP = Enterprise Resource Planning; Est. = Estimate; EU = European Union; FICC = Fixed Income, Currencies & Commodities; FINMA = Swiss Financial Market Supervisory Authority FINMA; FLP = Fund Linked Products; FRTB = Fundamental Review of the Trading Book; FTE = Full-time employee; FX = Foreign Exchange; GDP = Gross Domestic Product; GM = Global Markets; G10 = Group of Ten; HKEX = Hong Kong Exchange; IBCM = Investment Banking & Capital Markets; IBD = Investment Banking Department; IC = Investment Consultant; ICBC = Industrial and Commercial Bank of China; ICBCCS = ICBC Credit Suisse Asset Management Co. Ltd; IG = Investment Grade; IMF = International Monetary Fund; IMM = Internal Model Method; IP = Investor Products; IPO = Initial Public Offering; IPRE= Interest Producing Real Estate; IRB = Internal Ratings Based; IS&P = Investment Solutions and Products; IT = Information Technology; ITS = International Trading Solutions; IWM = International Wealth Management; JV = Joint Venture; LBO = Leveraged Buyout; LE = Leverage Exposure; LSC = Large Swiss Corporates; LTM = Last Twelve Months; M&A = Mergers & Acquisitions; MD(R) = Managing Director; Mgmt. = Management; MI = Management Information; MifiD II = Markets in Financial Instruments Directive II; Mkts = Markets; NNA = Net new assets; OCC = Office of the Comptroller of the Currency; Op Risk = Operational Risk; PB = Private Banking; PB&WM = Private Banking & Wealth Management; PC = Private Clients; PEP = Politically Exposed Person; pp = percentage points; PTI = Pre-tax income; PWMC = Private & Wealth Management Clients; RM = Relationship Manager(s); RMBS = Residential Mortgage Backed Securities; RoRC = Return on Regulatory Capital; RoTE = Return on Tangible Equity; RPA = Robotic Process Automation; RtB = Run the Bank; RWA = Risk-weighted assets; SA-CCR = Standardized Approach to Counterparty Credit Risk; SME = Small and Medium-Sized Enterprises; SMG = Systematic Market-Making Group; SoW = Share of Wallet; SRU = Strategic Resolution Unit; SUB = Swiss Universal Bank; TBTF = Too Big To Fail; TBV(PS) = Tangible Book Value (per Share); (U)HNW(I) = (Ultra) High Net Worth (Individuals); US GAAP = United States Generally Accepted Accounting Principles; U/W = Underwriting; VaR = Value-at-Risk; VIX = Volatility Index; WM = Wealth Management; WM&C = Wealth Management & Connected; YoY = Year over year; YTD = Year to Date

December 12, 2018 Credit Suisse Investor Day 2018Leveraging capabilities for Wealth Management

Disclaimer 2 December 12, 2018 This material does not purport to contain all of the information that you may wish to consider. This material is not to be relied upon as such or used in substitution for the exercise of independent judgment.Cautionary statement regarding forward-looking statementsThis presentation contains forward-looking statements that involve inherent risks and uncertainties, and we might not be able to achieve the predictions, forecasts, projections and other outcomes we describe or imply in forward-looking statements. A number of important factors could cause results to differ materially from the plans, objectives, expectations, estimates and intentions we express in these forward-looking statements, including those we identify in "Risk factors” in our Annual Report on Form 20-F for the fiscal year ended December 31, 2017 and in the “Cautionary statement regarding forward-looking information" in our media release relating to Investor Day, published on December 12, 2018 and filed with the US Securities and Exchange Commission, and in other public filings and press releases. We do not intend to update these forward-looking statements. In particular, the terms “Estimate”, “Illustrative”, “Ambition”, “Objective”, “Outlook” and “Goal” are not intended to be viewed as targets or projections, nor are they considered to be Key Performance Indicators. All such estimates, illustrations, ambitions, objectives, outlooks and goals are subject to a large number of inherent risks, assumptions and uncertainties, many of which are completely outside of our control. These risks, assumptions and uncertainties include, but are not limited to, general market conditions, market volatility, interest rate volatility and levels, global and regional economic conditions, political uncertainty, changes in tax policies, regulatory changes, changes in levels of client activity as a result of any of the foregoing and other factors. Accordingly, this information should not be relied on for any purpose. We do not intend to update these estimates, illustrations, ambitions, objectives, outlooks or goals. We may not achieve the benefits of our strategic initiativesWe may not achieve all of the expected benefits of our strategic initiatives. Factors beyond our control, including but not limited to the market and economic conditions, changes in laws, rules or regulations and other challenges discussed in our public filings, could limit our ability to achieve some or all of the expected benefits of these initiatives. Estimates and assumptionsIn preparing this presentation, management has made estimates and assumptions that affect the numbers presented. Actual results may differ. Annualized numbers do not take account of variations in operating results, seasonality and other factors and may not be indicative of actual, full-year results. Figures throughout this presentation may also be subject to rounding adjustments. All opinions and views constitute judgments as of the date of writing without regard to the date on which the reader may receive or access the information. This information is subject to change at any time without notice and we do not intend to update this information. Statement regarding non-GAAP financial measuresThis presentation also contains non-GAAP financial measures, including adjusted results. Information needed to reconcile such non-GAAP financial measures to the most directly comparable measures under US GAAP can be found in the Appendix of the CEO and CFO Investor Day presentations, published on December 12, 2018. All Investor Day presentations are available on our website at www.credit-suisse.com.Many of our references to estimates, ambitions, objectives and targets for revenues, operating expenses, operating cost base, pre-tax income and return on regulatory capital are on an adjusted basis as well. These adjusted numbers, return on tangible equity and tangible book value per share are non-GAAP financial measures. A reconciliation of the estimates, ambitions, objectives and targets to the nearest GAAP measure is unavailable without unreasonable efforts. Adjusted results exclude goodwill impairment, major litigation charges, real estate gains and other revenue and expense items included in our reported results, which are unavailable on a prospective basis. Tangible equity excludes goodwill and other intangible assets from shareholders’ equity, all of which are unavailable on a prospective basis. Tangible book value per share excludes the impact of any dividends paid during the performance period, share buybacks, own credit movements, foreign exchange rate movements and pension-related impacts, all of which are unavailable on a prospective basis.Statement regarding capital, liquidity and leverageAs of January 1, 2013, Basel III was implemented in Switzerland along with the Swiss “Too Big to Fail” legislation and regulations thereunder (in each case, subject to certain phase-in periods). As of January 1, 2015, the Bank for International Settlements (BIS) leverage ratio framework, as issued by the Basel Committee on Banking Supervision (BCBS), was implemented in Switzerland by FINMA. Our related disclosures are in accordance with our interpretation of such requirements, including relevant assumptions. Changes in the interpretation of these requirements in Switzerland or in any of our assumptions or estimates could result in different numbers from those shown in this presentation. Unless otherwise noted, leverage exposure is based on the BIS leverage ratio framework and consists of period-end balance sheet assets and prescribed regulatory adjustments. The look-through tier 1 leverage ratio and CET1 leverage ratio are calculated as look-through BIS tier 1 capital and CET1 capital, respectively, divided by period-end leverage exposure. Swiss leverage ratios are measured on the same period-end basis as the leverage exposure for the BIS leverage ratio.SourcesCertain material in this presentation has been prepared by Credit Suisse on the basis of publicly available information, internally developed data and other third-party sources believed to be reliable. Credit Suisse has not sought to independently verify information obtained from public and third-party sources and makes no representations or warranties as to accuracy, completeness or reliability of such information.
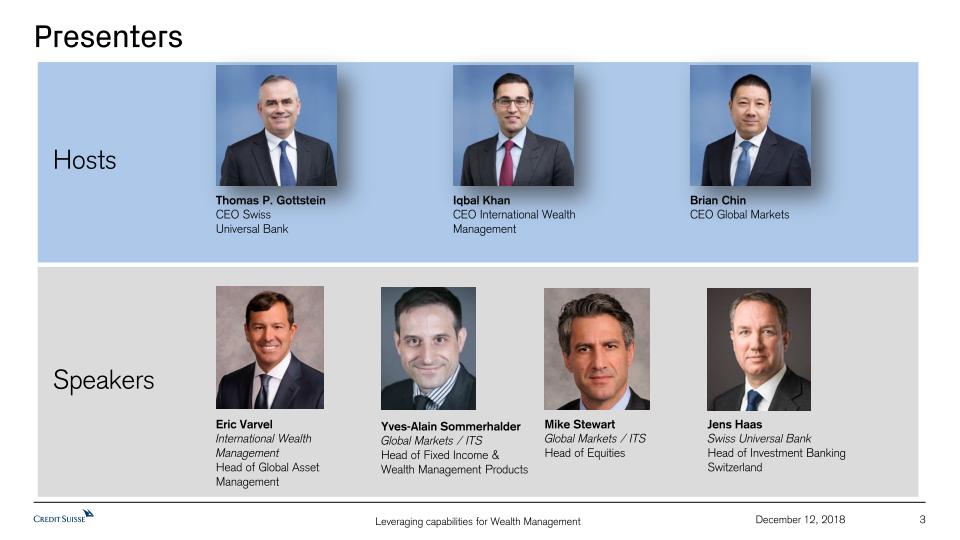
Presenters 3 December 12, 2018 Hosts Speakers Thomas P. GottsteinCEO Swiss Universal Bank Brian ChinCEO Global Markets Iqbal KhanCEO International Wealth Management Eric VarvelInternational Wealth ManagementHead of Global Asset Management Mike StewartGlobal Markets / ITSHead of Equities Yves-Alain SommerhalderGlobal Markets / ITSHead of Fixed Income & Wealth Management Products Jens HaasSwiss Universal BankHead of Investment Banking Switzerland
Eric Varvel, Head of Global Asset ManagementDecember 12, 2018 Leveraging capabilities for Wealth ManagementAsset Management
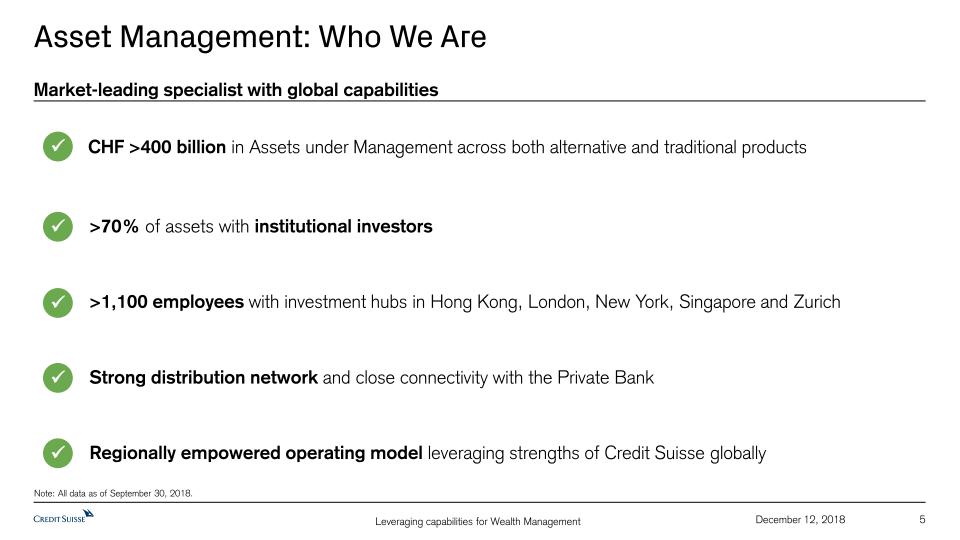
5 Asset Management: Who We Are Market-leading specialist with global capabilities CHF >400 billion in Assets under Management across both alternative and traditional products >70% of assets with institutional investors >1,100 employees with investment hubs in Hong Kong, London, New York, Singapore and Zurich Strong distribution network and close connectivity with the Private Bank Regionally empowered operating model leveraging strengths of Credit Suisse globally December 12, 2018 Note: All data as of September 30, 2018.
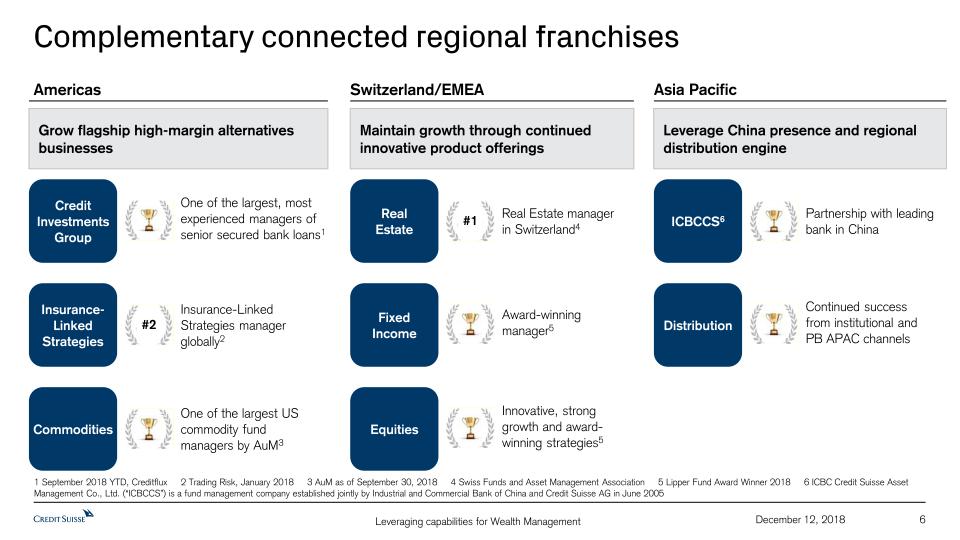
6 Americas December 12, 2018 Switzerland/EMEA Asia Pacific Complementary connected regional franchises One of the largest US commodity fund managers by AuM3 Commodities Innovative, strong growth and award-winning strategies5 Equities Insurance-Linked Strategies manager globally2 Insurance-Linked Strategies #2 One of the largest, most experienced managers of senior secured bank loans1 Credit Investments Group Real Estate managerin Switzerland4 Real Estate #1 Partnership with leading bank in China ICBCCS6 Award-winning manager5 Fixed Income Continued success from institutional and PB APAC channels Distribution Grow flagship high-margin alternatives businesses Maintain growth through continued innovative product offerings Leverage China presence and regional distribution engine 1 September 2018 YTD, Creditflux 2 Trading Risk, January 2018 3 AuM as of September 30, 2018 4 Swiss Funds and Asset Management Association 5 Lipper Fund Award Winner 2018 6 ICBC Credit Suisse Asset Management Co., Ltd. (“ICBCCS”) is a fund management company established jointly by Industrial and Commercial Bank of China and Credit Suisse AG in June 2005
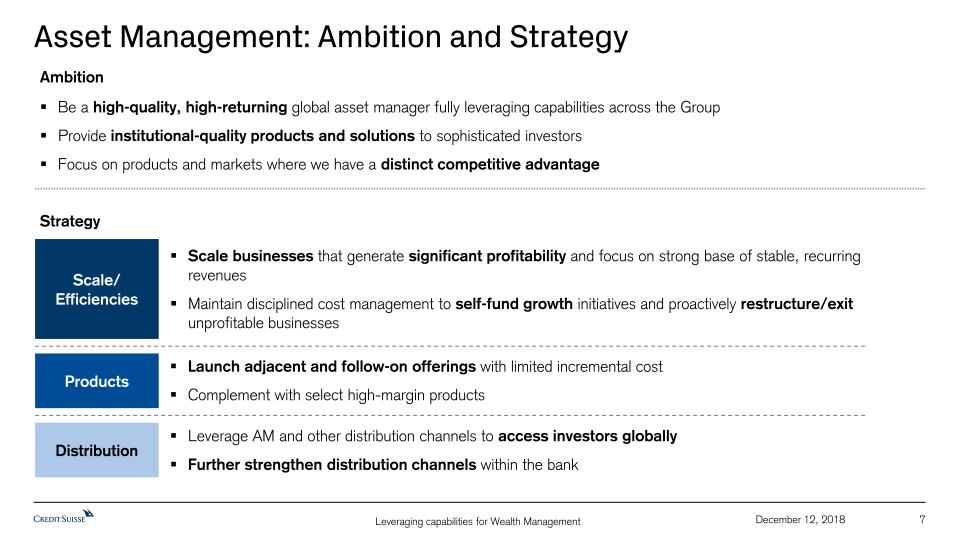
7 Asset Management: Ambition and Strategy Be a high-quality, high-returning global asset manager fully leveraging capabilities across the GroupProvide institutional-quality products and solutions to sophisticated investorsFocus on products and markets where we have a distinct competitive advantage Scale businesses that generate significant profitability and focus on strong base of stable, recurring revenuesMaintain disciplined cost management to self-fund growth initiatives and proactively restructure/exit unprofitable businesses Launch adjacent and follow-on offerings with limited incremental costComplement with select high-margin products Leverage AM and other distribution channels to access investors globallyFurther strengthen distribution channels within the bank December 12, 2018 Strategy Ambition Scale/Efficiencies Products Distribution
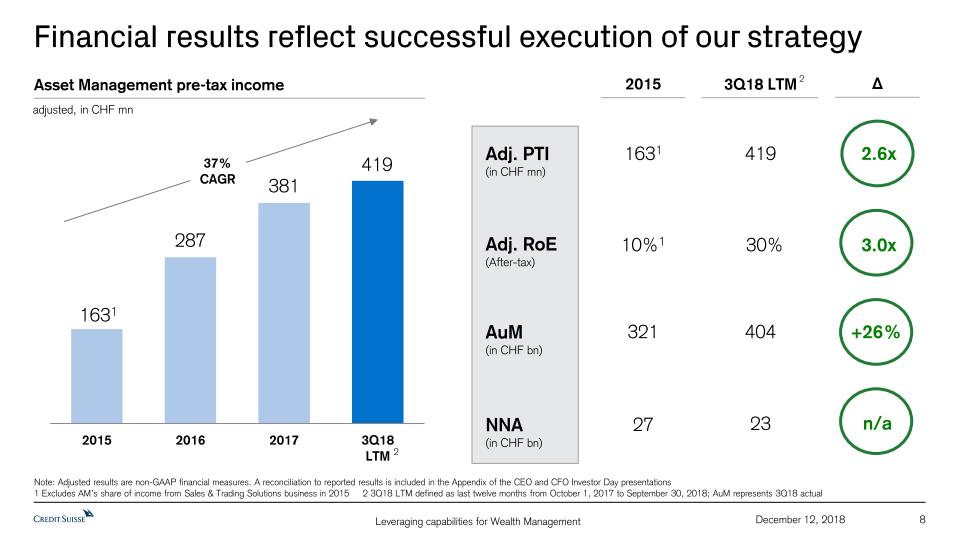
Financial results reflect successful execution of our strategy 37% CAGR 2015 3Q18 LTM ∆ 1631 419 10%1 30% 321 404 23 Asset Management pre-tax income Adj. PTI (in CHF mn) Adj. RoE(After-tax) AuM (in CHF bn) adjusted, in CHF mn NNA(in CHF bn) 2.6x 3.0x +26% n/a 27 8 December 12, 2018 419 Note: Adjusted results are non-GAAP financial measures. A reconciliation to reported results is included in the Appendix of the CEO and CFO Investor Day presentations1 Excludes AM’s share of income from Sales & Trading Solutions business in 2015 2 3Q18 LTM defined as last twelve months from October 1, 2017 to September 30, 2018; AuM represents 3Q18 actual 1631 2 2

Strategic priorities drive resilience and value creation 9 December 12, 2018 Drive scaled market-leading, higher-margin businesses 1 Strengthen partnership with PB 2 Continue to enhance quality of earnings 3 Efficient utilization of resources 4
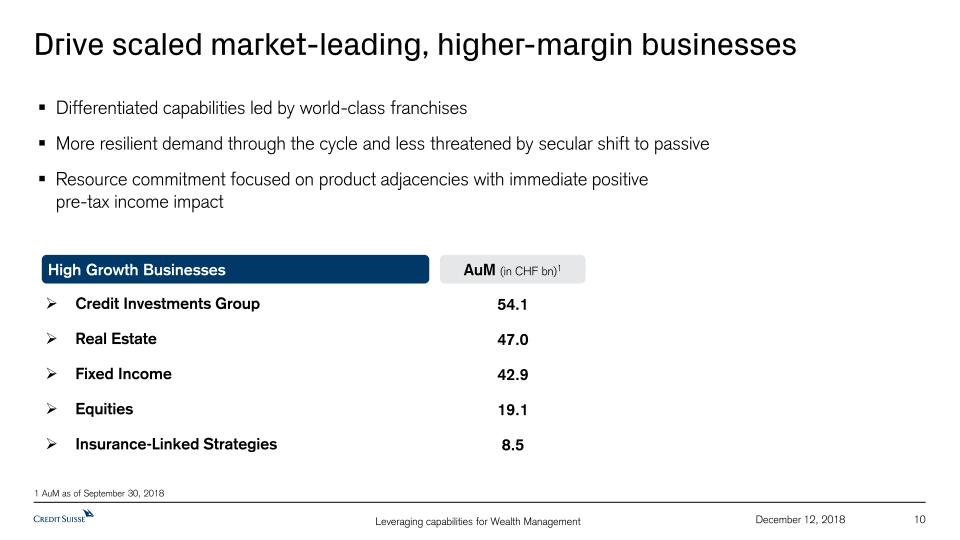
Drive scaled market-leading, higher-margin businesses High Growth Businesses AuM (in CHF bn)1 Real Estate 47.0 Insurance-Linked Strategies 8.5 Fixed Income 42.9 Credit Investments Group 54.1 Differentiated capabilities led by world-class franchisesMore resilient demand through the cycle and less threatened by secular shift to passive Resource commitment focused on product adjacencies with immediate positive pre-tax income impact Equities 19.1 10 December 12, 2018 1 AuM as of September 30, 2018

Strengthen partnership with PB Asset Management Net New Assets from Private Bank Channels Thematic Equity Funds1 Successful fund launches focused on key themes and trendsRobotics: CHF 2.8 bn AuMDigital Health: CHF 1.7 bn AuMSecurity: CHF 1.4 bn AuM 1 AuM as of September 30, 2018 December 12, 2018 11 Collaboration Initiatives Continue to expand Product Specialist team servicing our Wealth Management businessesSignificantly enhance distribution through APAC Private Banking Increase share of UHNW wallet by leveraging differentiated array of institutional-quality asset management products Cumulative NNA Growth Total 2015 to 2017 NNA of ~CHF 14 bn
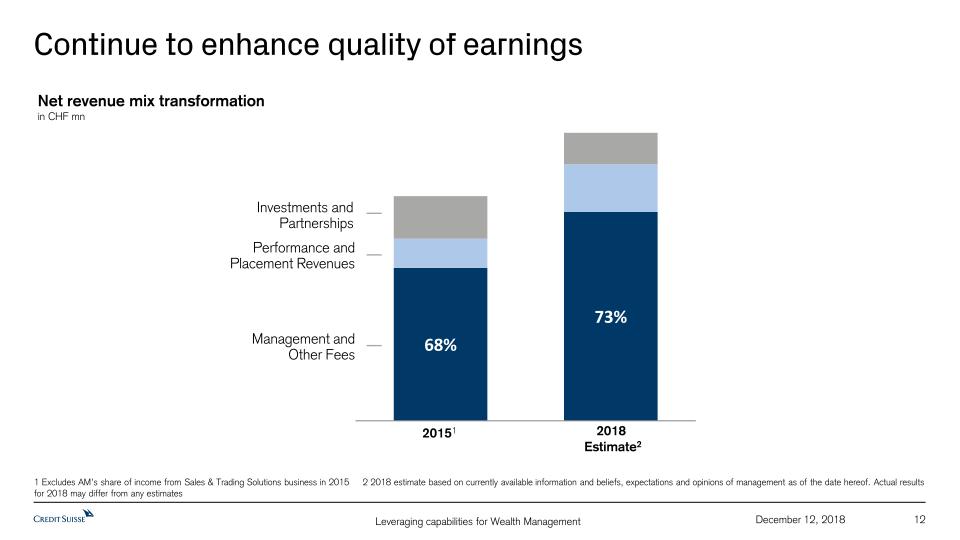
Continue to enhance quality of earnings Management and Other Fees Investments and Partnerships Performance and Placement Revenues 12 Net revenue mix transformationin CHF mn December 12, 2018 20151 2018 Estimate2 1 Excludes AM’s share of income from Sales & Trading Solutions business in 2015 2 2018 estimate based on currently available information and beliefs, expectations and opinions of management as of the date hereof. Actual results for 2018 may differ from any estimates
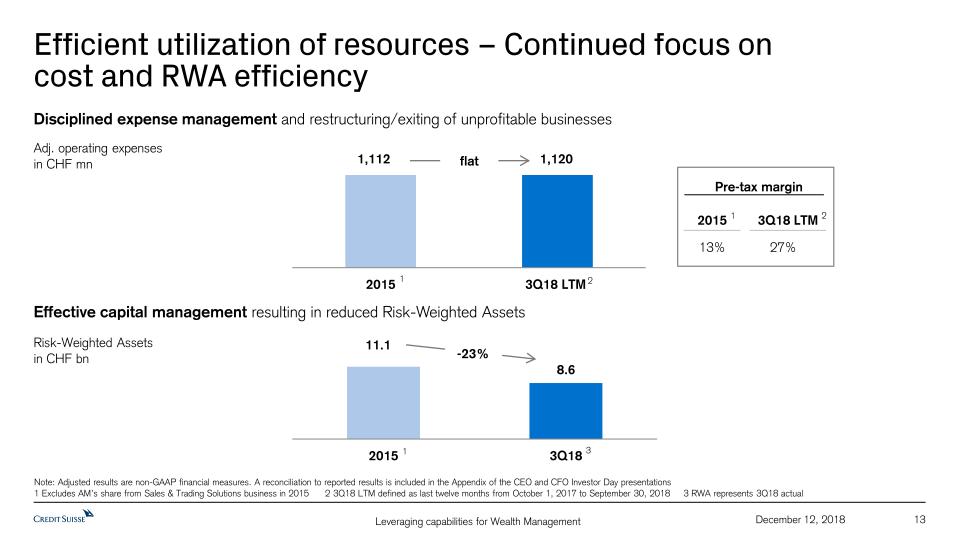
Efficient utilization of resources – Continued focus oncost and RWA efficiency Disciplined expense management and restructuring/exiting of unprofitable businesses Effective capital management resulting in reduced Risk-Weighted Assets Adj. operating expenses in CHF mn Risk-Weighted Assetsin CHF bn -23% 1,112 1,120 flat 13 December 12, 2018 2015 13% Pre-tax margin Note: Adjusted results are non-GAAP financial measures. A reconciliation to reported results is included in the Appendix of the CEO and CFO Investor Day presentations 1 Excludes AM’s share from Sales & Trading Solutions business in 2015 2 3Q18 LTM defined as last twelve months from October 1, 2017 to September 30, 2018 3 RWA represents 3Q18 actual 11.1 3Q18 LTM 27% 1 1 3 2 2 1
Yves-Alain Sommerhalder, Head of Fixed Income & Wealth Management ProductsDecember 12, 2018 Leveraging capabilities for Wealth ManagementInternational Trading Solutions
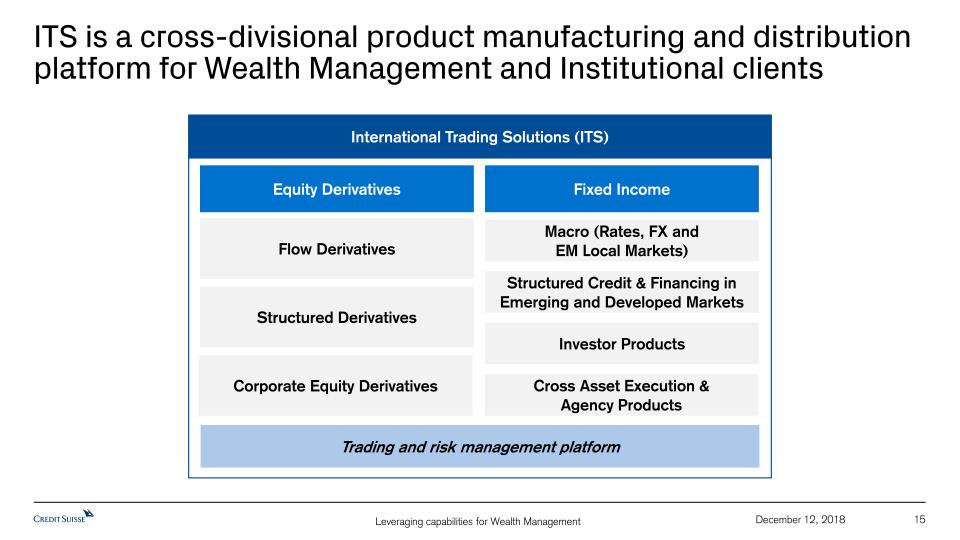
ITS is a cross-divisional product manufacturing and distribution platform for Wealth Management and Institutional clients ��15 December 12, 2018 International Trading Solutions (ITS) Equity Derivatives Fixed Income Trading and risk management platform Flow Derivatives Structured Derivatives Corporate Equity Derivatives Macro (Rates, FX and EM Local Markets) Structured Credit & Financing in Emerging and Developed Markets Investor Products Cross Asset Execution & Agency Products

16 ITS is the result of a 15+ year evolution across Credit SuissePrivate Banking and Investment Banking Private Banking Investment Banking / Global Markets International Trading Solutions (ITS) Single Integrated Platform for WM and institutional clients Phase 2: 2016 Phase 3: 2017 Phase 1: Pre-2016 2003 Advisory Partners Integrated Corporate Finance, Trust and Funds services 2006 Solution Partners Created single advisory, financing & structured investment offering Combined FX & EM Markets across GM and STS STS 2.0 Sales & Trading Services (STS) Built Swiss trading business2013 Equities & Fixed Income Departments Derivative and Financing solutions embedded within each product area across Fixed Income and Equities GM Solutions Created a single cross-asset structured lending and derivative offering for institutional clients December 12, 2018
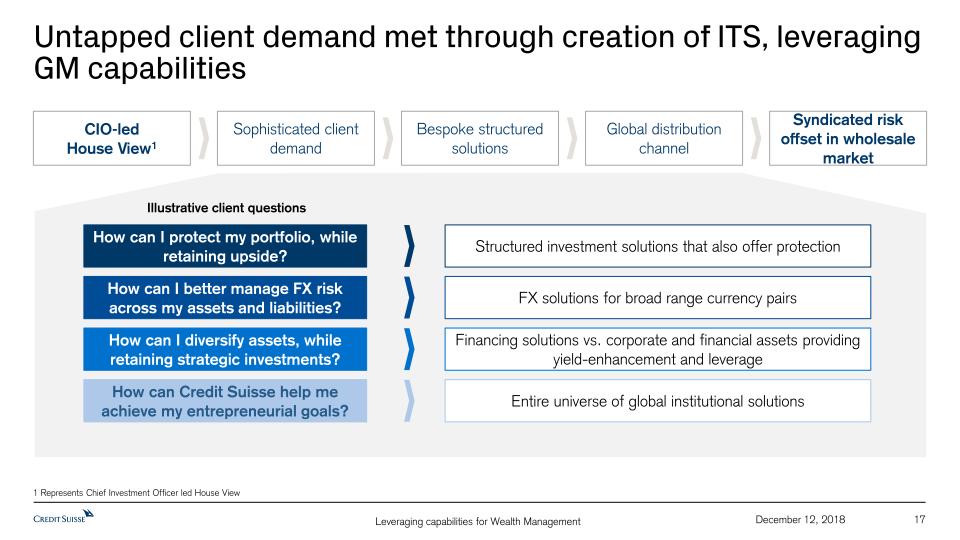
17 Untapped client demand met through creation of ITS, leveraging GM capabilities CIO-ledHouse View1 Sophisticated client demand Bespoke structured solutions Global distribution channel Syndicated risk offset in wholesale market How can I protect my portfolio, while retaining upside? Structured investment solutions that also offer protection How can I better manage FX risk across my assets and liabilities? FX solutions for broad range currency pairs How can I diversify assets, while retaining strategic investments? Financing solutions vs. corporate and financial assets providing yield-enhancement and leverage How can Credit Suisse help me achieve my entrepreneurial goals? Entire universe of global institutional solutions Illustrative client questions December 12, 2018 1 Represents Chief Investment Officer led House View
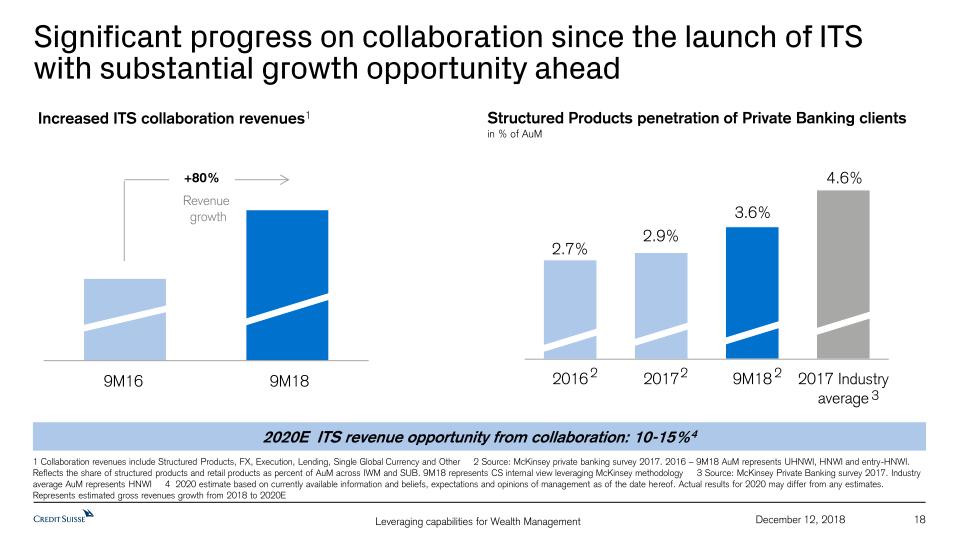
18 December 12, 2018 Significant progress on collaboration since the launch of ITS with substantial growth opportunity ahead Increased ITS collaboration revenues1 1 Collaboration revenues include Structured Products, FX, Execution, Lending, Single Global Currency and Other 2 Source: McKinsey private banking survey 2017. 2016 – 9M18 AuM represents UHNWI, HNWI and entry-HNWI. Reflects the share of structured products and retail products as percent of AuM across IWM and SUB. 9M18 represents CS internal view leveraging McKinsey methodology 3 Source: McKinsey Private Banking survey 2017. Industry average AuM represents HNWI 4 2020 estimate based on currently available information and beliefs, expectations and opinions of management as of the date hereof. Actual results for 2020 may differ from any estimates. Represents estimated gross revenues growth from 2018 to 2020E 9M16 9M18 +80% Revenue growth Structured Products penetration of Private Banking clients in % of AuM 3 2020E ITS revenue opportunity from collaboration: 10-15%4 2 2 2
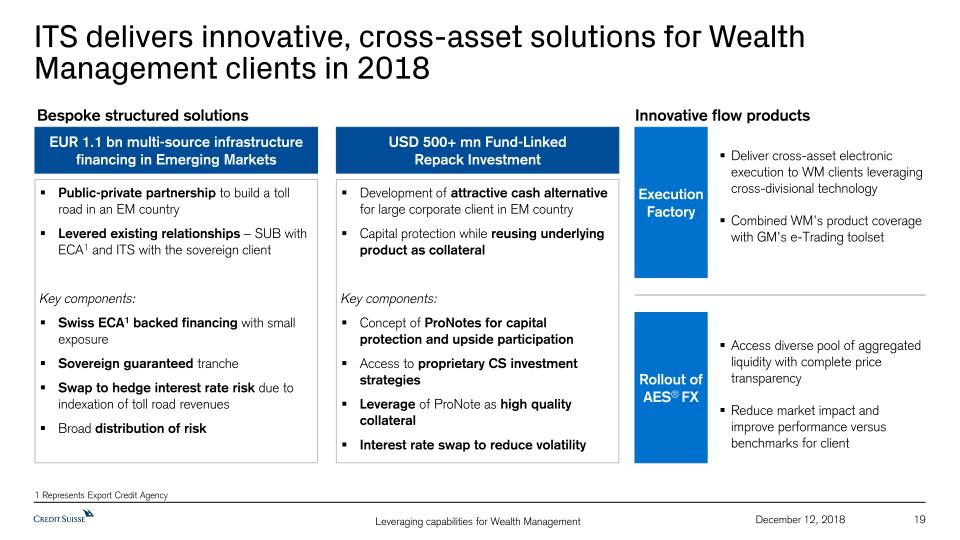
19 December 12, 2018 ITS delivers innovative, cross-asset solutions for Wealth Management clients in 2018 EUR 1.1 bn multi-source infrastructure financing in Emerging Markets Public-private partnership to build a toll road in an EM countryLevered existing relationships – SUB with ECA1 and ITS with the sovereign clientKey components:Swiss ECA1 backed financing with small exposureSovereign guaranteed trancheSwap to hedge interest rate risk due to indexation of toll road revenuesBroad distribution of risk Development of attractive cash alternative for large corporate client in EM country Capital protection while reusing underlying product as collateral Key components:Concept of ProNotes for capital protection and upside participationAccess to proprietary CS investment strategiesLeverage of ProNote as high quality collateralInterest rate swap to reduce volatility USD 500+ mn Fund-Linked Repack Investment Deliver cross-asset electronic execution to WM clients leveraging cross-divisional technologyCombined WM’s product coverage with GM’s e-Trading toolset Execution Factory Rollout of AES® FX Access diverse pool of aggregated liquidity with complete price transparencyReduce market impact and improve performance versus benchmarks for client Bespoke structured solutions Innovative flow products 1 Represents Export Credit Agency
Mike Stewart, Head of EquitiesDecember 12, 2018 Leveraging capabilities for Wealth ManagementGlobal Markets product capabilities - Equities
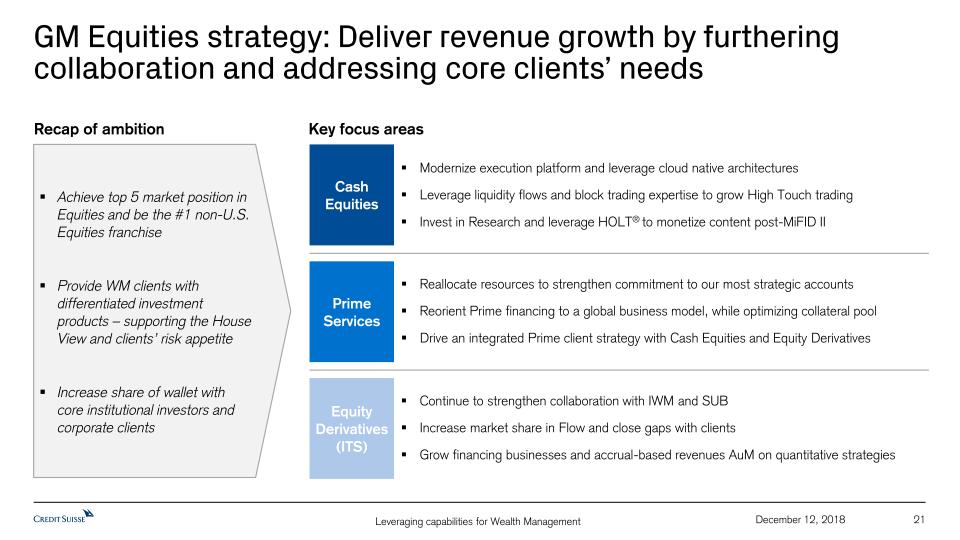
Achieve top 5 market position in Equities and be the #1 non-U.S. Equities franchiseProvide WM clients with differentiated investment products – supporting the House View and clients’ risk appetiteIncrease share of wallet with core institutional investors and corporate clients GM Equities strategy: Deliver revenue growth by furthering collaboration and addressing core clients’ needs Key focus areas Cash Equities Prime Services Equity Derivatives(ITS) Modernize execution platform and leverage cloud native architecturesLeverage liquidity flows and block trading expertise to grow High Touch tradingInvest in Research and leverage HOLT® to monetize content post-MiFID II Reallocate resources to strengthen commitment to our most strategic accountsReorient Prime financing to a global business model, while optimizing collateral pool Drive an integrated Prime client strategy with Cash Equities and Equity Derivatives Continue to strengthen collaboration with IWM and SUB Increase market share in Flow and close gaps with clientsGrow financing businesses and accrual-based revenues AuM on quantitative strategies 21 December 12, 2018 Recap of ambition
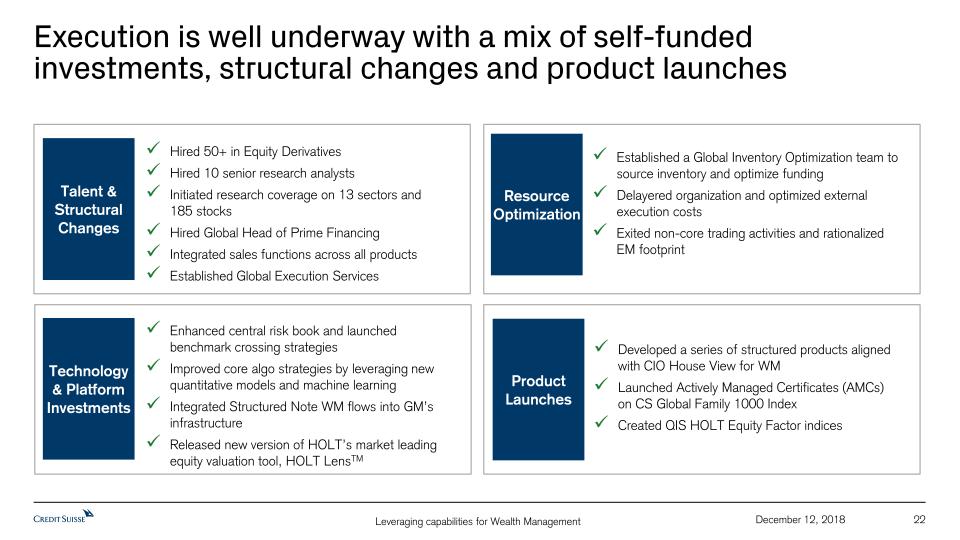
22 Execution is well underway with a mix of self-funded investments, structural changes and product launches December 12, 2018 Hired 50+ in Equity DerivativesHired 10 senior research analystsInitiated research coverage on 13 sectors and 185 stocksHired Global Head of Prime FinancingIntegrated sales functions across all productsEstablished Global Execution Services Enhanced central risk book and launched benchmark crossing strategies Improved core algo strategies by leveraging new quantitative models and machine learningIntegrated Structured Note WM flows into GM’s infrastructureReleased new version of HOLT’s market leading equity valuation tool, HOLT LensTM Talent & Structural Changes Technology & Platform Investments Established a Global Inventory Optimization team to source inventory and optimize funding Delayered organization and optimized external execution costs Exited non-core trading activities and rationalized EM footprint Resource Optimization Developed a series of structured products aligned with CIO House View for WMLaunched Actively Managed Certificates (AMCs) on CS Global Family 1000 IndexCreated QIS HOLT Equity Factor indices Product Launches
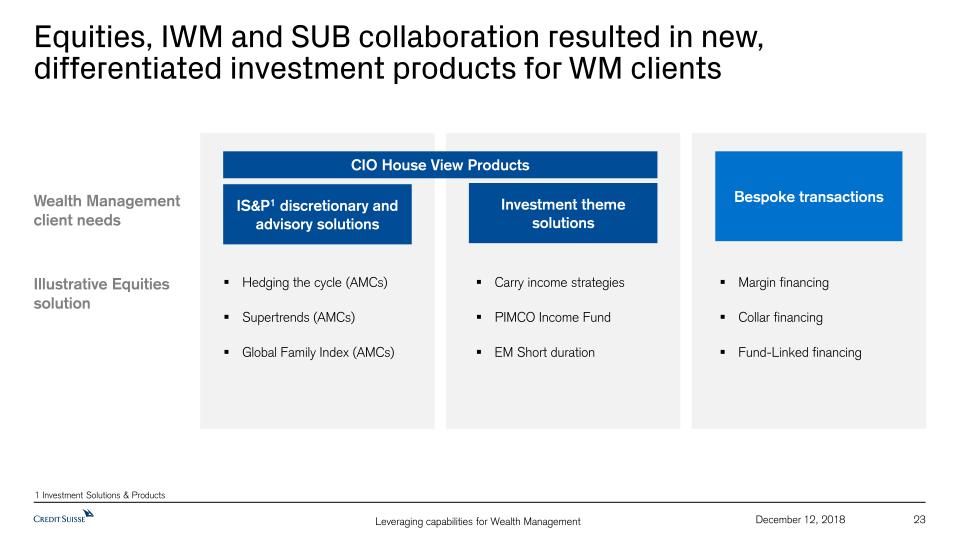
23 December 12, 2018 Equities, IWM and SUB collaboration resulted in new, differentiated investment products for WM clients IS&P1 discretionary and advisory solutions Investment theme solutions Bespoke transactions Hedging the cycle (AMCs)Supertrends (AMCs)Global Family Index (AMCs) Carry income strategiesPIMCO Income FundEM Short duration Margin financingCollar financingFund-Linked financing Illustrative Equities solution Wealth Management client needs CIO House View Products 1 Investment Solutions & Products

24 December 12, 2018 The strategy is working… Improved profitability… …enabled WM products… 9M17 9M18 +6% GM Equities net revenues1 GM Equities operating expense1 9M17 9M18 9M17 9M18 ~35% Industry2 CS Structured notes into WM3 9M18 YoY Derivatives growth …while maintaining franchise strength 26% ~90% 1 Includes sales and trading and underwriting. Excludes impact of business rationalizations in 9M18 2 Industry growth based on Coalition report, November 2018 3 Represents notional value for IWM and SUB 4 Source: EuroHedge as of May 2018. Based on total AuM 5 Source: Absolute Returns as of June 2018. Based on total AuM 6 Source: Third Party competitive analysis #1 #4 #5 #5 European Prime Brokerage4 US Prime Brokerage5 US Cash Equities6 (1H18) Pan-Europe Cash / ETFs6 (1H18) Named 2018 Americas Derivatives House of the Year Named 2018 Best House in theAmericas / USA for Structured Products -8% Gained 4 positions in the 2018 All America Research team survey
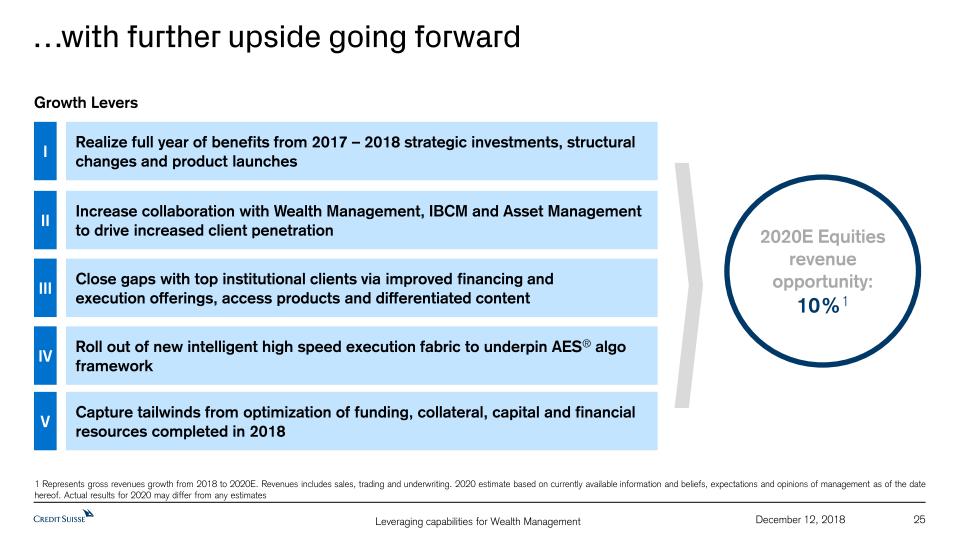
25 …with further upside going forward Growth Levers II III IV I V Increase collaboration with Wealth Management, IBCM and Asset Management to drive increased client penetration Close gaps with top institutional clients via improved financing and execution offerings, access products and differentiated content Roll out of new intelligent high speed execution fabric to underpin AES® algo framework Realize full year of benefits from 2017 – 2018 strategic investments, structural changes and product launches Capture tailwinds from optimization of funding, collateral, capital and financial resources completed in 2018 December 12, 2018 2020E Equities revenueopportunity: 10%1 1 Represents gross revenues growth from 2018 to 2020E. Revenues includes sales, trading and underwriting. 2020 estimate based on currently available information and beliefs, expectations and opinions of management as of the date hereof. Actual results for 2020 may differ from any estimates
Jens Haas, Head of Investment Banking SwitzerlandDecember 12, 2018 Leveraging capabilities for Wealth ManagementInvestment Banking capabilities
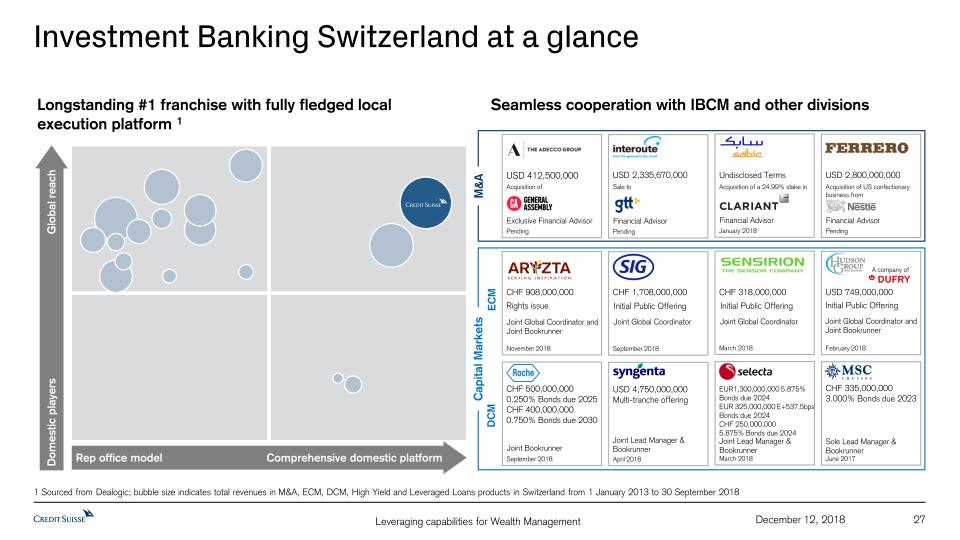
27 December 12, 2018 Investment Banking Switzerland at a glance Domestic players Global reach Rep office model Comprehensive domestic platform 1 Sourced from Dealogic; bubble size indicates total revenues in M&A, ECM, DCM, High Yield and Leveraged Loans products in Switzerland from 1 January 2013 to 30 September 2018 Longstanding #1 franchise with fully fledged local execution platform 1 Seamless cooperation with IBCM and other divisions M&A Capital Markets Acquisition of Exclusive Financial Advisor USD 412,500,000 Pending Sale to Financial Advisor USD 2,335,670,000 Pending Acquisition of US confectionary business from Financial Advisor USD 2,800,000,000 Pending Acquisition of a 24.99% stake in Financial Advisor Undisclosed Terms January 2018 Rights issue Joint Global Coordinator and Joint Bookrunner CHF 908,000,000 November 2018 CHF 1,708,000,000 September 2018 USD 749,000,000 February 2018 CHF 318,000,000 March 2018 Joint Global Coordinator Initial Public Offering Joint Global Coordinator Initial Public Offering Joint Global Coordinator and Joint Bookrunner Initial Public Offering Joint Bookrunner CHF 500,000,0000.250% Bonds due 2025CHF 400,000,0000.750% Bonds due 2030 September 2018 EUR1,300,000,000 5.875% Bonds due 2024EUR 325,000,000 E+537.5bps Bonds due 2024CHF 250,000,0005.875% Bonds due 2024 March 2018 Joint Lead Manager & Bookrunner USD 4,750,000,000Multi-tranche offering April 2018 Joint Lead Manager & Bookrunner June 2017 ECM DCM CHF 335,000,0003.000% Bonds due 2023 Sole Lead Manager & Bookrunner A company of
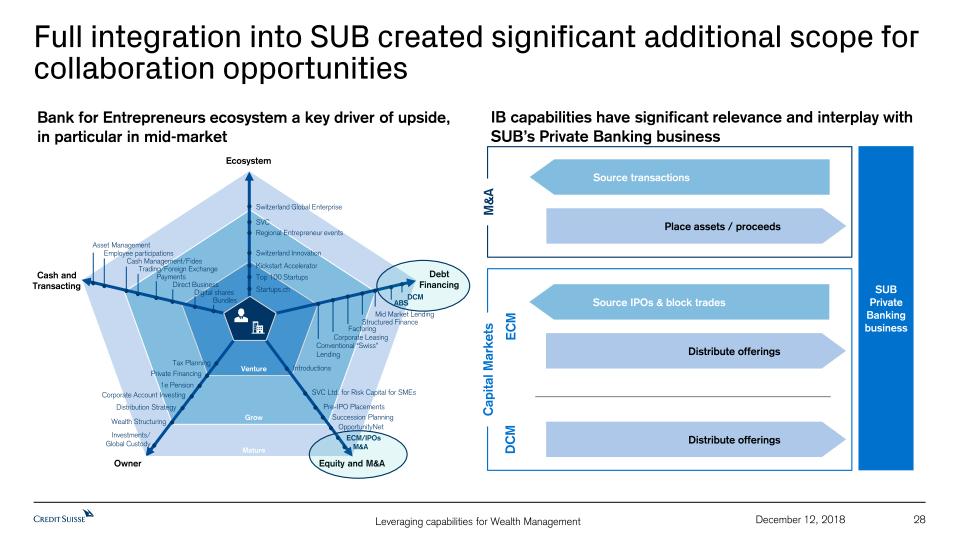
Debt Financing 28 December 12, 2018 Full integration into SUB created significant additional scope for collaboration opportunities Bank for Entrepreneurs ecosystem a key driver of upside, in particular in mid-market IB capabilities have significant relevance and interplay with SUB’s Private Banking business Source transactions Place assets / proceeds Source IPOs & block trades Distribute offerings Distribute offerings Startups.ch Top 100 Startups SVC Cash and Transacting Equity and M&A Bundles Trading/Foreign Exchange Direct Business Employee participations Asset Management 1e Pension SVC Ltd. for Risk Capital for SMEs Pre-IPO Placements ECM/IPOs Introductions M&A OpportunityNet Tax Planning Corporate Account Investing Digital shares Wealth Structuring Distribution Strategy Regional Entrepreneur events Mature Grow Venture Investments/Global Custody Switzerland Innovation DCM Mid Market Lending Conventional “Swiss” Lending ABS Structured Finance Corporate Leasing Private Financing Kickstart Accelerator Factoring Payments Succession Planning Ecosystem Switzerland Global Enterprise Cash Management/Fides Owner M&A Capital Markets ECM DCM SUB Private Banking business
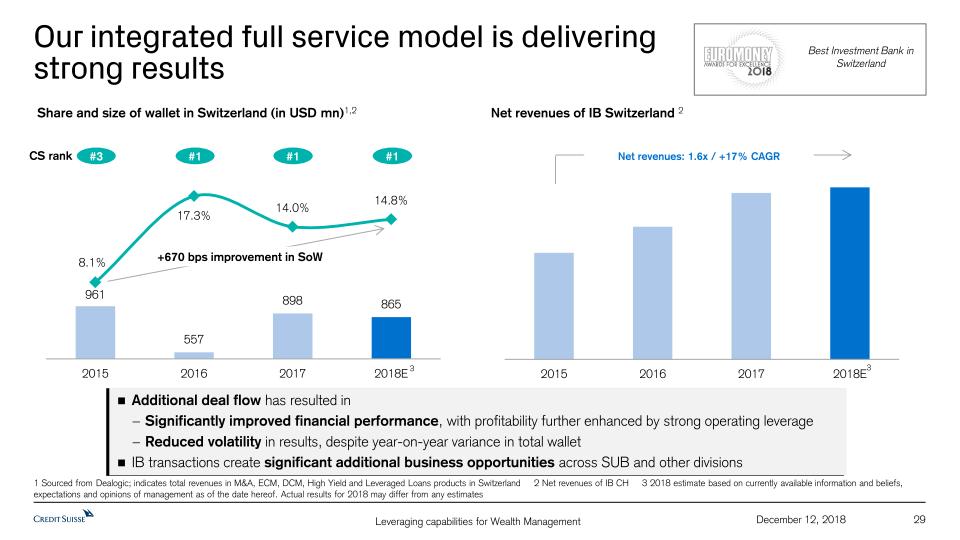
Our integrated full service model is deliveringstrong results Share and size of wallet in Switzerland (in USD mn)1,2 Net revenues of IB Switzerland 2 1 Sourced from Dealogic; indicates total revenues in M&A, ECM, DCM, High Yield and Leveraged Loans products in Switzerland 2 Net revenues of IB CH 3 2018 estimate based on currently available information and beliefs, expectations and opinions of management as of the date hereof. Actual results for 2018 may differ from any estimates #3 CS rank #1 #1 #1 Best Investment Bank in Switzerland +670 bps improvement in SoW Additional deal flow has resulted inSignificantly improved financial performance, with profitability further enhanced by strong operating leverageReduced volatility in results, despite year-on-year variance in total walletIB transactions create significant additional business opportunities across SUB and other divisions 29 December 12, 2018 Net revenues: 1.6x / +17% CAGR 3 3

Private client relationship Case studies (1/2)Successful IPO leading to repeat business The opportunityClient Swiss-rooted global market leader, initially under family ownershipNeed Transactional advice for succession planning and raising capital for growth Year 1 Year 3 Corporate & Investment Banking IPO process lead-managed by IB IB acting as exclusive financial advisor in sale of companyProvided acquisition financing and subsequent refinancing Significant Credit Suisse Private Banking demand for IPO Offered solutions Credit Suisse solutionsSuccession planning for initial family owners by way of trade saleProceeds largely placed with private bankingAcquisition financing and refinancing for new ownerCapital market exit for new owner (IPO and follow-on offerings)Ongoing support of company’s growth ambitions through debt capital market financing Year 4 December 12, 2018 30 Year 5 IB acted as lead bookrunner on several ABBs, enabling a full exit Significant participation by Credit Suisse Private Banking in follow-on placings IB acting as lead bookrunner on inaugural bond issuance Large portion of proceeds from sale placed with Credit Suisse Private Banking
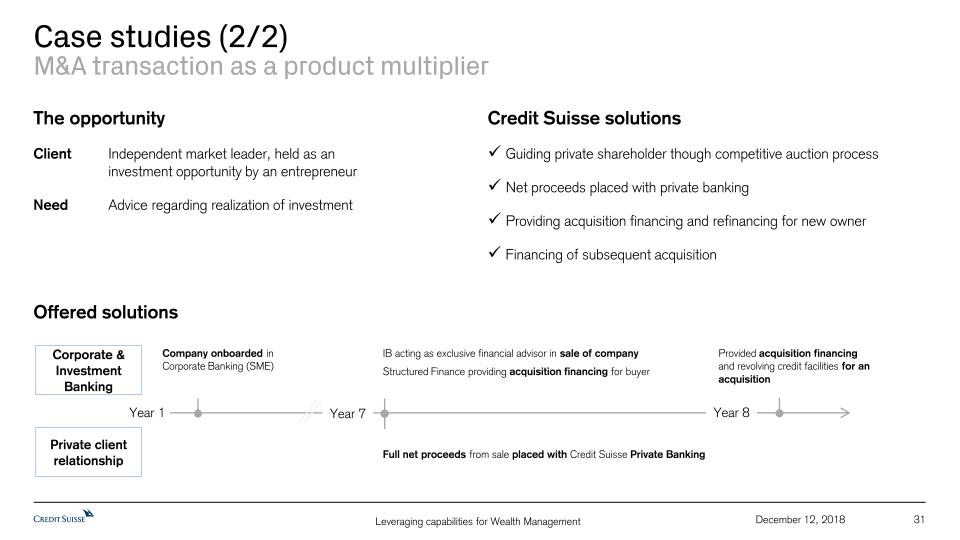
Private client relationship Case studies (2/2)M&A transaction as a product multiplier The opportunityClient Independent market leader, held as an investment opportunity by an entrepreneur Need Advice regarding realization of investment Year 1 Corporate & Investment Banking Offered solutions Credit Suisse solutionsGuiding private shareholder though competitive auction processNet proceeds placed with private bankingProviding acquisition financing and refinancing for new ownerFinancing of subsequent acquisition Year 8 December 12, 2018 31 IB acting as exclusive financial advisor in sale of companyStructured Finance providing acquisition financing for buyer Full net proceeds from sale placed with Credit Suisse Private Banking Provided acquisition financing and revolving credit facilities for an acquisition Year 7 Company onboarded in Corporate Banking (SME)

Appendix 32 December 12, 2018
Notes (1/2) 33 December 12, 2018 For reconciliation of adjusted to reported results, refer to the Appendix of the CEO and CFO Investor Day presentations, published on December 12, 2018Throughout the presentation rounding differences may occurUnless otherwise noted, all CET1 ratio, Tier 1 leverage ratio, risk-weighted assets and leverage exposure figures shown in this presentation are as of the end of the respective period and on a “look-through” basisGross and net margins are shown in basis pointsGross margin = (adj.) net revenues annualized / average AuM; net margin = (adj.) pre-tax income annualized / average AuMMandate penetration reflects advisory and discretionary mandate volumes as a percentage of AuM, excluding those from the external asset manager business General notes Specific notes * Our cost savings program, until the end of 2018, is measured using an adjusted operating cost base at constant 2015 FX rates. “Adjusted operating cost base at constant FX rates” includes adjustments as made in all our disclosures for restructuring expenses, major litigation provisions, expenses related to business sales and a goodwill impairment taken in 4Q15 as well as adjustments for debit valuation adjustments (DVA) related volatility, FX and for certain accounting changes (which had not been in place at the launch of the cost savings program). Adjustments for certain accounting changes have been restated to reflect grossed up expenses in the Corporate Center and, starting in 1Q18, also include adjustments for changes from ASU 2014-09 “Revenue from Contracts with Customers”, which is described further in our 1Q18, 2Q18 and 3Q18 financial reports. Adjustments for FX apply unweighted currency exchange rates, i.e., a straight line average of monthly rates, consistently for the periods under review. Starting from 1Q19, we intend to express our operating cost base at constant 2018 FX rates and to adjust for significant litigation costs, expenses related to business and real estate sales as well as DVA related volatility, but not for restructuring expenses and certain accounting changes. Adjustments for FX will continue to apply unweighted currency exchange rates.† Regulatory capital is calculated as the worst of 10% of RWA and 3.5% of leverage exposure. Return on regulatory capital is calculated using (adjusted) income / (loss) after tax and assumes a tax rate of 30% and capital allocated based on the worst of 10% of average RWA and 3.5% of average leverage exposure. For the Markets business within the APAC division and for the Global Markets and Investment Banking & Capital Markets divisions, return on regulatory capital is based on US dollar denominated numbers. Adjusted return on regulatory capital is calculated using adjusted results, applying the same methodology to calculate return on regulatory capital. ‡ Return on tangible equity is based on tangible equity attributable to shareholders, a non-GAAP financial measure, which is calculated by deducting goodwill and other intangible assets from total equity attributable to shareholders as presented in our balance sheet. Management believes that the return on tangible equity attributable to shareholders is meaningful as it allows consistent measurement of the performance of businesses without regard to whether the businesses were acquired.° Tangible book value is a non-GAAP financial measure and is equal to tangible equity attributable to shareholders. Tangible book value per share is a non-GAAP financial measure, which is calculated by dividing tangible equity attributable to shareholders, a non-GAAP financial measure, by total number of shares outstanding. Tangible equity attributable to shareholders, a non-GAAP financial measure, is calculated by deducting goodwill and other intangible assets from total equity attributable to shareholders as presented in our balance sheet. Management believes that tangible book value per share is meaningful as it allows consistent measurement of the performance of businesses without regard to whether the businesses were acquired. For end-3Q18, tangible equity excluded goodwill of CHF 4,736 mn and other intangible assets of CHF 214 mn from total shareholders’ equity of CHF 42,734 mn as presented in our balance sheet. For end-2017, tangible equity excluded goodwill of CHF 4,742 mn and other intangible assets of CHF 223 mn from total shareholders' equity of CHF 41,902 mn as presented in our balance sheet. For end-2Q15, tangible equity excluded goodwill of CHF 8,238 mn and other intangible assets of CHF 205 mn from total shareholders' equity of CHF 42,642 mn as presented in our balance sheet. Shares outstanding were 2,552.4 mn at end-3Q18, 2,550.3 mn at end-2017 and 1,632.4 mn at end-2Q15.
34 December 12, 2018 Notes (2/2) Abbreviations Adj. = Adjusted; AI = Artificial Intelligence; AM = Asset Management; AML = Anti-Money Laundering; APAC = Asia Pacific; ARU = Asset Resolution Unit;AT1 = Additional Tier 1; AuM = Assets under Management; BCBS = Basel Committee on Banking Supervision; BEAT = Base Erosion and Anti-Abuse Tax; BIS = Bank for International Settlements; bps = basis points; CAGR = Compound Annual Growth Rate; CBG = Corporate Bank Group; CCAR = Comprehensive Capital Adequacy Review; CCRO = Chief Compliance and Regulatory Affairs Officer; CDX HY = High-yield credit default swap index; CET1 = Common Equity Tier 1; CIC = Corporate & Institutional Clients; CIF = Customer/Client Information File; CIO = Chief Investment Officer; Corp. Ctr. = Corporate Center; CtB = Change the Bank; CVA = Credit Valuation Adjustment; DCM = Debt Capital Markets; DoJ = Department of Justice; DTA = Deferred Tax Assets; DVA = Debit Valuation Adjustments; EAM = External Asset Manager; EBITDA = Earnings Before Interest Taxes Depreciation and Amortization; ECM = Equity Capital Markets; EM = Emerging Markets; EMEA = Europe, Middle East & Africa; EQ = Equities; ERP = Enterprise Resource Planning; Est. = Estimate; EU = European Union; FICC = Fixed Income, Currencies & Commodities; FINMA = Swiss Financial Market Supervisory Authority FINMA; FLP = Fund Linked Products; FRTB = Fundamental Review of the Trading Book; FTE = Full-time employee; FX = Foreign Exchange; GDP = Gross Domestic Product; GM = Global Markets; G10 = Group of Ten; HKEX = Hong Kong Exchange; IBCM = Investment Banking & Capital Markets; IBD = Investment Banking Department; IC = Investment Consultant; ICBC = Industrial and Commercial Bank of China; ICBCCS = ICBC Credit Suisse Asset Management Co. Ltd; IG = Investment Grade; IMF = International Monetary Fund; IMM = Internal Model Method; IP = Investor Products; IPO = Initial Public Offering; IPRE= Interest Producing Real Estate; IRB = Internal Ratings Based; IS&P = Investment Solutions and Products; IT = Information Technology; ITS = International Trading Solutions; IWM = International Wealth Management; JV = Joint Venture; LBO = Leveraged Buyout; LE = Leverage Exposure; LSC = Large Swiss Corporates; LTM = Last Twelve Months; M&A = Mergers & Acquisitions; MD(R) = Managing Director; Mgmt. = Management; MI = Management Information; MifiD II = Markets in Financial Instruments Directive II; Mkts = Markets; NNA = Net new assets; OCC = Office of the Comptroller of the Currency; Op Risk = Operational Risk; PB = Private Banking; PB&WM = Private Banking & Wealth Management; PC = Private Clients; PEP = Politically Exposed Person; pp = percentage points; PTI = Pre-tax income; PWMC = Private & Wealth Management Clients; RM = Relationship Manager(s); RMBS = Residential Mortgage Backed Securities; RoRC = Return on Regulatory Capital; RoTE = Return on Tangible Equity; RPA = Robotic Process Automation; RtB = Run the Bank; RWA = Risk-weighted assets; SA-CCR = Standardized Approach to Counterparty Credit Risk; SME = Small and Medium-Sized Enterprises; SMG = Systematic Market-Making Group; SoW = Share of Wallet; SRU = Strategic Resolution Unit; SUB = Swiss Universal Bank; TBTF = Too Big To Fail; TBV(PS) = Tangible Book Value (per Share); (U)HNW(I) = (Ultra) High Net Worth (Individuals); US GAAP = United States Generally Accepted Accounting Principles; U/W = Underwriting; VaR = Value-at-Risk; VIX = Volatility Index; WM = Wealth Management; WM&C = Wealth Management & Connected; YoY = Year over year; YTD = Year to Date

December 12, 2018 Credit Suisse Investor Day 2018Utilizing technology
Disclaimer 2 December 12, 2018 This material does not purport to contain all of the information that you may wish to consider. This material is not to be relied upon as such or used in substitution for the exercise of independent judgment.Cautionary statement regarding forward-looking statementsThis presentation contains forward-looking statements that involve inherent risks and uncertainties, and we might not be able to achieve the predictions, forecasts, projections and other outcomes we describe or imply in forward-looking statements. A number of important factors could cause results to differ materially from the plans, objectives, expectations, estimates and intentions we express in these forward-looking statements, including those we identify in "Risk factors” in our Annual Report on Form 20-F for the fiscal year ended December 31, 2017 and in the “Cautionary statement regarding forward-looking information" in our media release relating to Investor Day, published on December 12, 2018 and filed with the US Securities and Exchange Commission, and in other public filings and press releases. We do not intend to update these forward-looking statements. In particular, the terms “Estimate”, “Illustrative”, “Ambition”, “Objective”, “Outlook” and “Goal” are not intended to be viewed as targets or projections, nor are they considered to be Key Performance Indicators. All such estimates, illustrations, ambitions, objectives, outlooks and goals are subject to a large number of inherent risks, assumptions and uncertainties, many of which are completely outside of our control. These risks, assumptions and uncertainties include, but are not limited to, general market conditions, market volatility, interest rate volatility and levels, global and regional economic conditions, political uncertainty, changes in tax policies, regulatory changes, changes in levels of client activity as a result of any of the foregoing and other factors. Accordingly, this information should not be relied on for any purpose. We do not intend to update these estimates, illustrations, ambitions, objectives, outlooks or goals. We may not achieve the benefits of our strategic initiativesWe may not achieve all of the expected benefits of our strategic initiatives. Factors beyond our control, including but not limited to the market and economic conditions, changes in laws, rules or regulations and other challenges discussed in our public filings, could limit our ability to achieve some or all of the expected benefits of these initiatives. Estimates and assumptionsIn preparing this presentation, management has made estimates and assumptions that affect the numbers presented. Actual results may differ. Annualized numbers do not take account of variations in operating results, seasonality and other factors and may not be indicative of actual, full-year results. Figures throughout this presentation may also be subject to rounding adjustments. All opinions and views constitute judgments as of the date of writing without regard to the date on which the reader may receive or access the information. This information is subject to change at any time without notice and we do not intend to update this information. Statement regarding non-GAAP financial measuresThis presentation also contains non-GAAP financial measures, including adjusted results. Information needed to reconcile such non-GAAP financial measures to the most directly comparable measures under US GAAP can be found in the Appendix of the CEO and CFO Investor Day presentations, published on December 12, 2018. All Investor Day presentations are available on our website at www.credit-suisse.com.Many of our references to estimates, ambitions, objectives and targets for revenues, operating expenses, operating cost base, pre-tax income and return on regulatory capital are on an adjusted basis as well. These adjusted numbers, return on tangible equity and tangible book value per share are non-GAAP financial measures. A reconciliation of the estimates, ambitions, objectives and targets to the nearest GAAP measure is unavailable without unreasonable efforts. Adjusted results exclude goodwill impairment, major litigation charges, real estate gains and other revenue and expense items included in our reported results, which are unavailable on a prospective basis. Tangible equity excludes goodwill and other intangible assets from shareholders’ equity, all of which are unavailable on a prospective basis. Tangible book value per share excludes the impact of any dividends paid during the performance period, share buybacks, own credit movements, foreign exchange rate movements and pension-related impacts, all of which are unavailable on a prospective basis.Statement regarding capital, liquidity and leverageAs of January 1, 2013, Basel III was implemented in Switzerland along with the Swiss “Too Big to Fail” legislation and regulations thereunder (in each case, subject to certain phase-in periods). As of January 1, 2015, the Bank for International Settlements (BIS) leverage ratio framework, as issued by the Basel Committee on Banking Supervision (BCBS), was implemented in Switzerland by FINMA. Our related disclosures are in accordance with our interpretation of such requirements, including relevant assumptions. Changes in the interpretation of these requirements in Switzerland or in any of our assumptions or estimates could result in different numbers from those shown in this presentation. Unless otherwise noted, leverage exposure is based on the BIS leverage ratio framework and consists of period-end balance sheet assets and prescribed regulatory adjustments. The look-through tier 1 leverage ratio and CET1 leverage ratio are calculated as look-through BIS tier 1 capital and CET1 capital, respectively, divided by period-end leverage exposure. Swiss leverage ratios are measured on the same period-end basis as the leverage exposure for the BIS leverage ratio.SourcesCertain material in this presentation has been prepared by Credit Suisse on the basis of publicly available information, internally developed data and other third-party sources believed to be reliable. Credit Suisse has not sought to independently verify information obtained from public and third-party sources and makes no representations or warranties as to accuracy, completeness or reliability of such information.
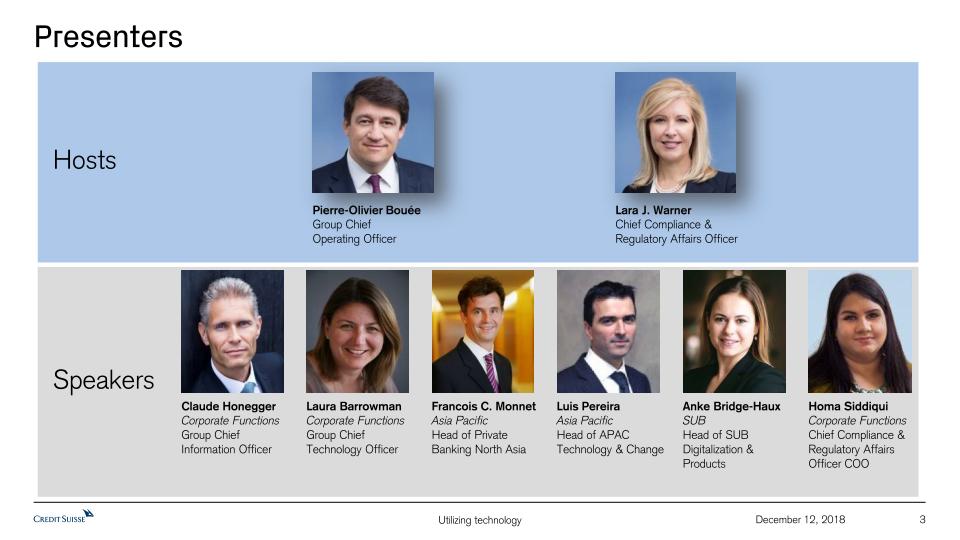
Presenters 3 December 12, 2018 Hosts Speakers Francois C. MonnetAsia PacificHead of Private Banking North Asia Anke Bridge-HauxSUBHead of SUB Digitalization & Products Laura BarrowmanCorporate FunctionsGroup Chief Technology Officer Homa SiddiquiCorporate FunctionsChief Compliance & Regulatory Affairs Officer COO Pierre-Olivier BouéeGroup Chief Operating Officer Lara J. WarnerChief Compliance & Regulatory Affairs Officer Luis PereiraAsia PacificHead of APAC Technology & Change Claude HoneggerCorporate FunctionsGroup ChiefInformation Officer

Pierre-Olivier Bouée, Group Chief Operating OfficerClaude Honegger, Group Chief Information OfficerLaura Barrowman, Group Chief Technology OfficerDecember 12, 2018 Utilizing technology
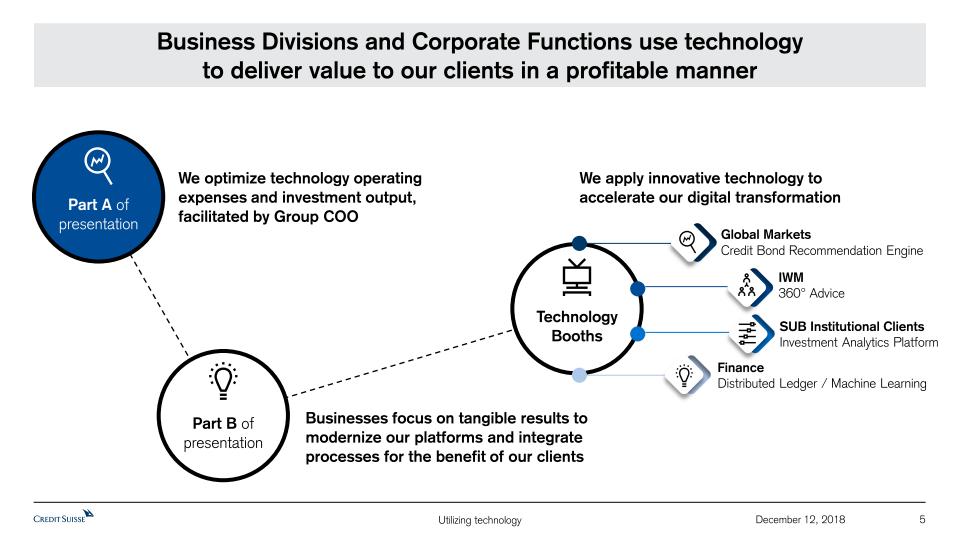
5 December 12, 2018 Technology Booths Part A of presentation Part B of presentation Business Divisions and Corporate Functions use technologyto deliver value to our clients in a profitable manner We optimize technology operating expenses and investment output, facilitated by Group COO Businesses focus on tangible results to modernize our platforms and integrate processes for the benefit of our clients We apply innovative technology to accelerate our digital transformation Global Markets Credit Bond Recommendation Engine IWM360° Advice SUB Institutional ClientsInvestment Analytics Platform FinanceDistributed Ledger / Machine Learning
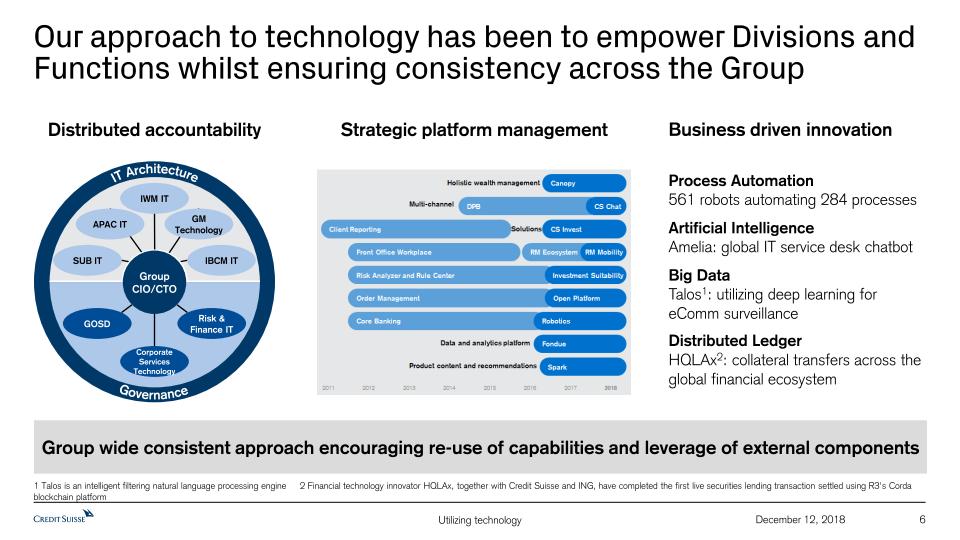
Group wide consistent approach encouraging re-use of capabilities and leverage of external components 6 December 12, 2018 Our approach to technology has been to empower Divisions and Functions whilst ensuring consistency across the Group Distributed accountability Business driven innovation Strategic platform management IWM IT SUB IT IBCM IT Corporate Services Technology GOSD Risk & Finance IT Group CIO/CTO IT Architecture Governance APAC IT GM Technology Artificial IntelligenceAmelia: global IT service desk chatbot Big DataTalos1: utilizing deep learning for eComm surveillance Distributed LedgerHQLAx2: collateral transfers across the global financial ecosystem Process Automation561 robots automating 284 processes 1 Talos is an intelligent filtering natural language processing engine 2 Financial technology innovator HQLAx, together with Credit Suisse and ING, have completed the first live securities lending transaction settled using R3's Corda blockchain platform
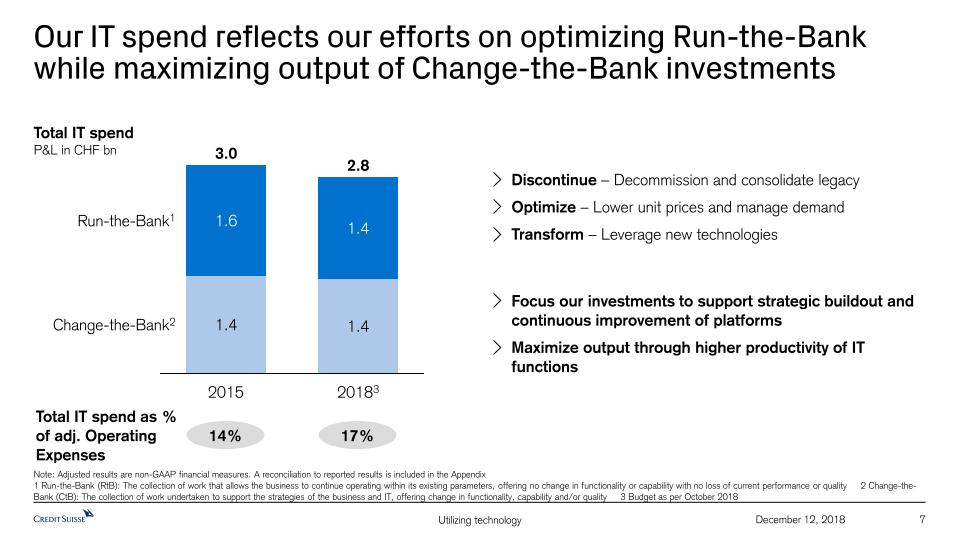
7 December 12, 2018 Our IT spend reflects our efforts on optimizing Run-the-Bank while maximizing output of Change-the-Bank investments Change-the-Bank2 Run-the-Bank1 20183 2.8 1.4 1.4 2015 3.0 1.4 1.6 Total IT spendP&L in CHF bn Total IT spend as % of adj. Operating Expenses 14% 17% Note: Adjusted results are non-GAAP financial measures. A reconciliation to reported results is included in the Appendix1 Run-the-Bank (RtB): The collection of work that allows the business to continue operating within its existing parameters, offering no change in functionality or capability with no loss of current performance or quality 2 Change-the-Bank (CtB): The collection of work undertaken to support the strategies of the business and IT, offering change in functionality, capability and/or quality 3 Budget as per October 2018 Discontinue – Decommission and consolidate legacyOptimize – Lower unit prices and manage demandTransform – Leverage new technologies Focus our investments to support strategic buildout and continuous improvement of platformsMaximize output through higher productivity of IT functions
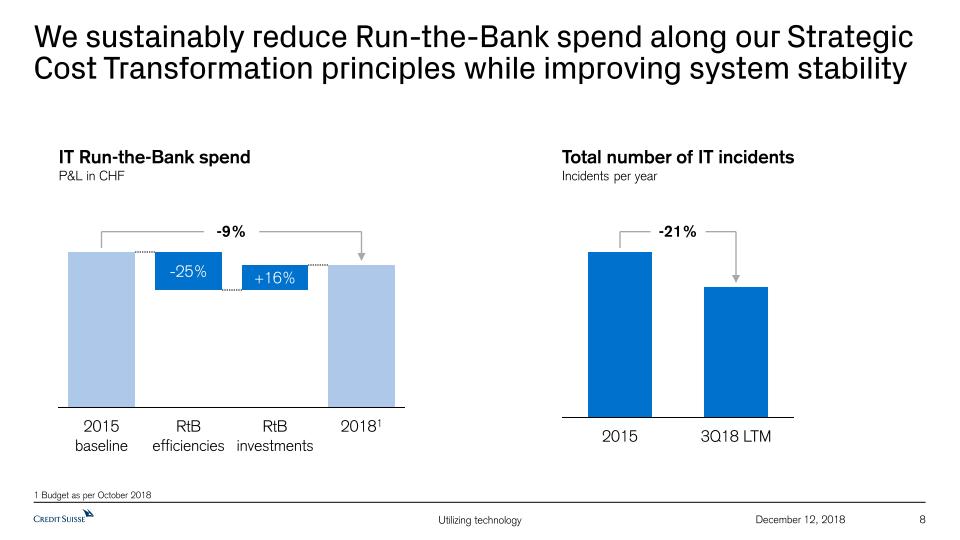
8 December 12, 2018 We sustainably reduce Run-the-Bank spend along our Strategic Cost Transformation principles while improving system stability IT Run-the-Bank spend P&L in CHF +16% RtBefficiencies -25% 2015baseline -9% 20181 RtBinvestments -21% 3Q18 LTM 2015 Total number of IT incidentsIncidents per year 1 Budget as per October 2018
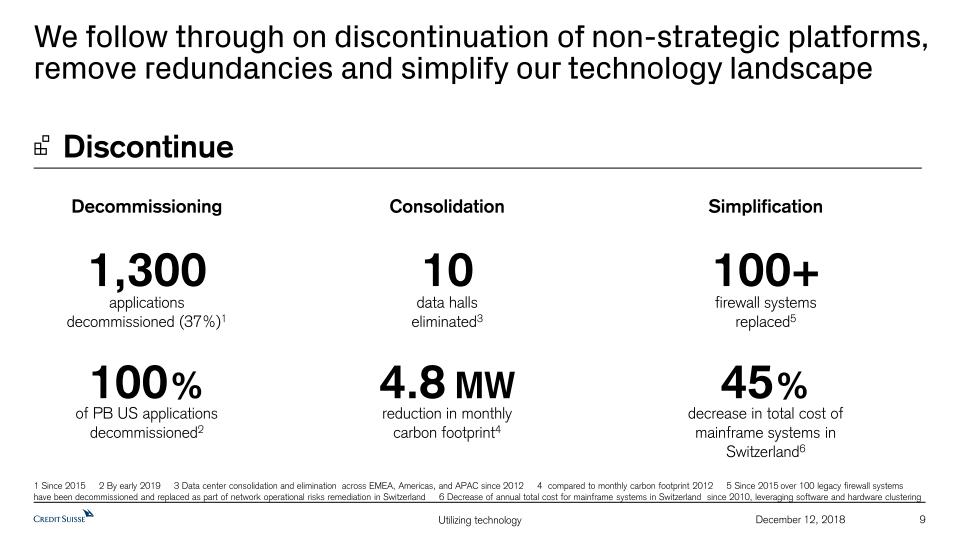
9 December 12, 2018 We follow through on discontinuation of non-strategic platforms, remove redundancies and simplify our technology landscape Discontinue Decommissioning Consolidation Simplification applications decommissioned (37%)1 1,300 100+ firewall systems replaced5 data halls eliminated3 10 of PB US applications decommissioned2 100% 45% decrease in total cost of mainframe systems in Switzerland6 4.8 MW reduction in monthly carbon footprint4 1 Since 2015 2 By early 2019 3 Data center consolidation and elimination across EMEA, Americas, and APAC since 2012 4 compared to monthly carbon footprint 2012 5 Since 2015 over 100 legacy firewall systems have been decommissioned and replaced as part of network operational risks remediation in Switzerland 6 Decrease of annual total cost for mainframe systems in Switzerland since 2010, leveraging software and hardware clustering
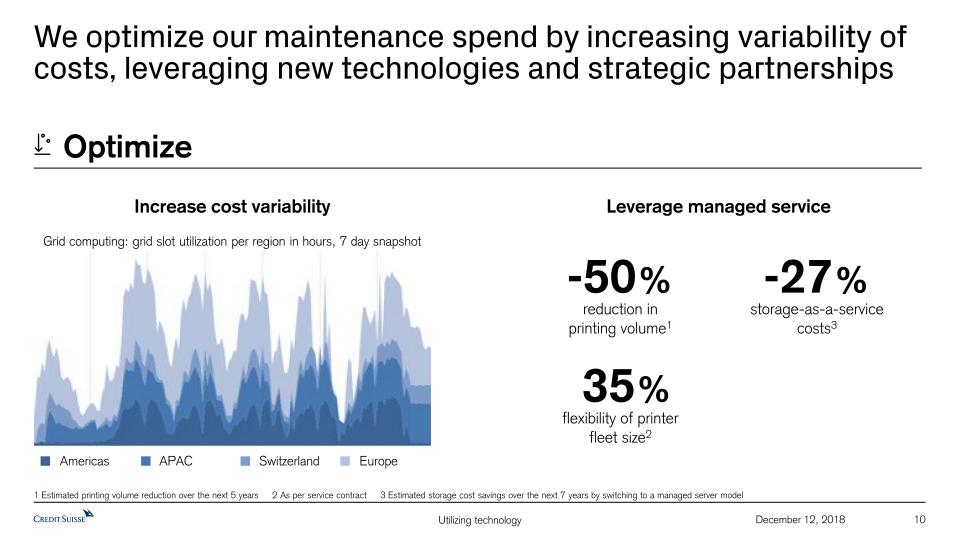
10 December 12, 2018 We optimize our maintenance spend by increasing variability of costs, leveraging new technologies and strategic partnerships Optimize Leverage managed service Increase cost variabilityGrid computing: grid slot utilization per region in hours, 7 day snapshot 1 Estimated printing volume reduction over the next 5 years 2 As per service contract 3 Estimated storage cost savings over the next 7 years by switching to a managed server model Americas APAC Switzerland Europe reduction in printing volume1 -50% storage-as-a-service costs3 -27% flexibility of printer fleet size2 35%
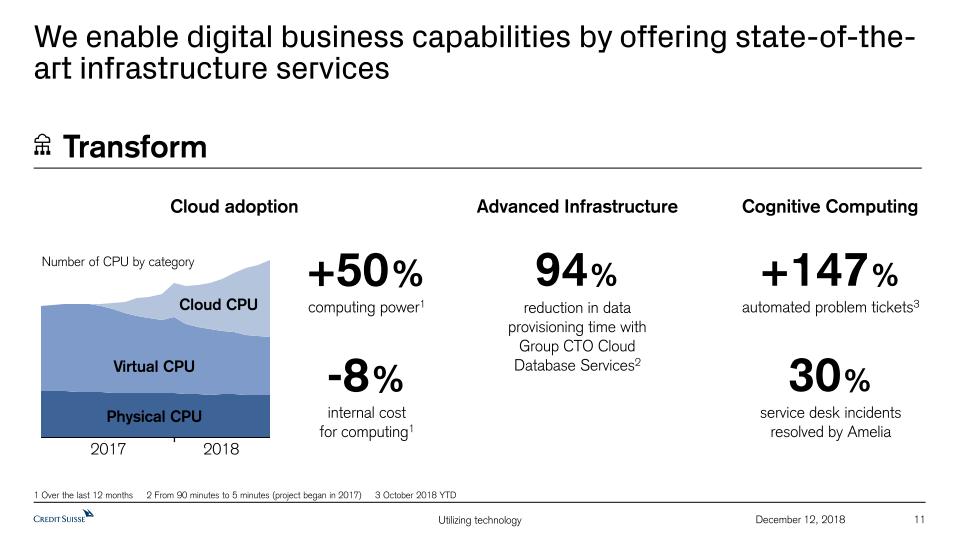
11 December 12, 2018 We enable digital business capabilities by offering state-of-the-art infrastructure services Advanced Infrastructure Cognitive Computing Cloud adoption reduction in data provisioning time with Group CTO Cloud Database Services2 94% Number of CPU by category Physical CPU Virtual CPU Cloud CPU Transform 2017 2018 automated problem tickets3 +147% service desk incidents resolved by Amelia 30% 1 Over the last 12 months 2 From 90 minutes to 5 minutes (project began in 2017) 3 October 2018 YTD computing power1 +50% internal cost for computing1 -8%
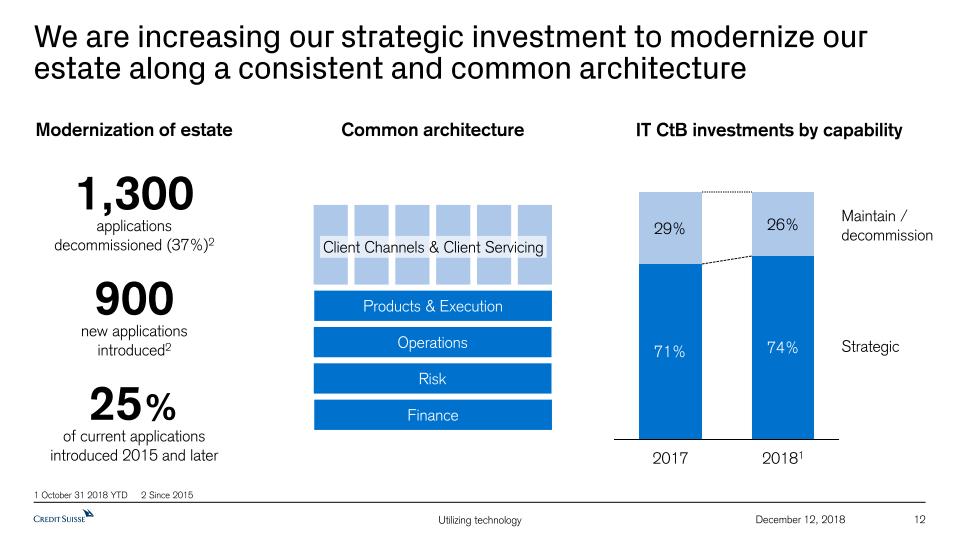
12 December 12, 2018 We are increasing our strategic investment to modernize our estate along a consistent and common architecture Finance Risk Operations Products & Execution Client Channels & Client Servicing Common architecture Modernization of estate applications decommissioned (37%)2 1,300 new applications introduced2 900 of current applications introduced 2015 and later 25% Strategic 20181 2017 IT CtB investments by capability Maintain / decommission 1 October 31 2018 YTD 2 Since 2015
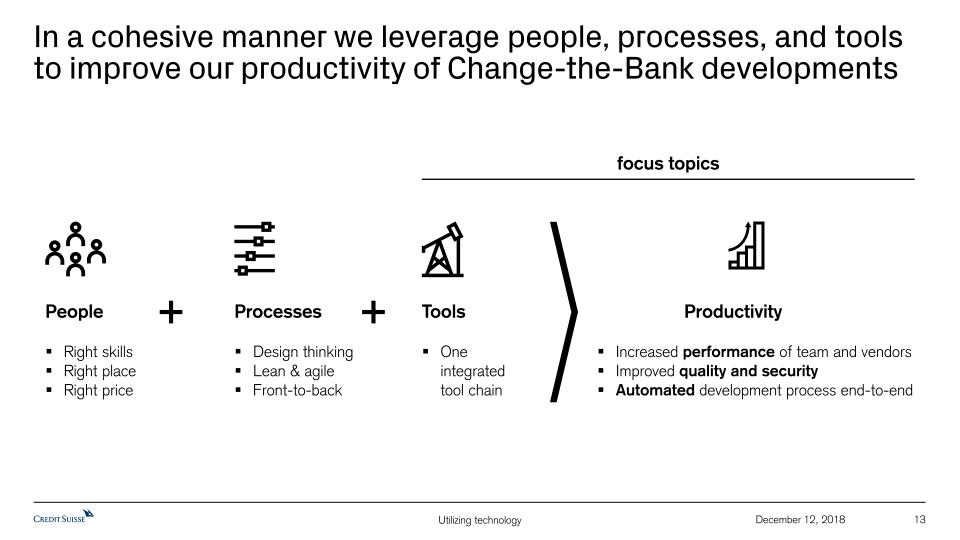
focus topics 13 December 12, 2018 In a cohesive manner we leverage people, processes, and tools to improve our productivity of Change-the-Bank developments People Right skillsRight placeRight price Processes Design thinkingLean & agileFront-to-back Tools One integrated tool chain Increased performance of team and vendorsImproved quality and securityAutomated development process end-to-end Productivity

14 December 12, 2018 One single integrated developer tool chain, Odyssey, is used across all IT areas and technology estate Plan Code Build Test Release Crucible FishEye Strela Artifactory Jenkins SonarQube Lifecycle Transporter Jira Leverage and integrate state of the art components, recently added Git1, Bitbucket1 and flexible quality gates1Continuous integration and automation of development process end-to-end with 98% adoption rateInstalled telemetry to provide transparency on performance, quality, security, and level of automation Odyssey (simplified view) Subversion 1 Software development tools integrated into Odyssey tool chain
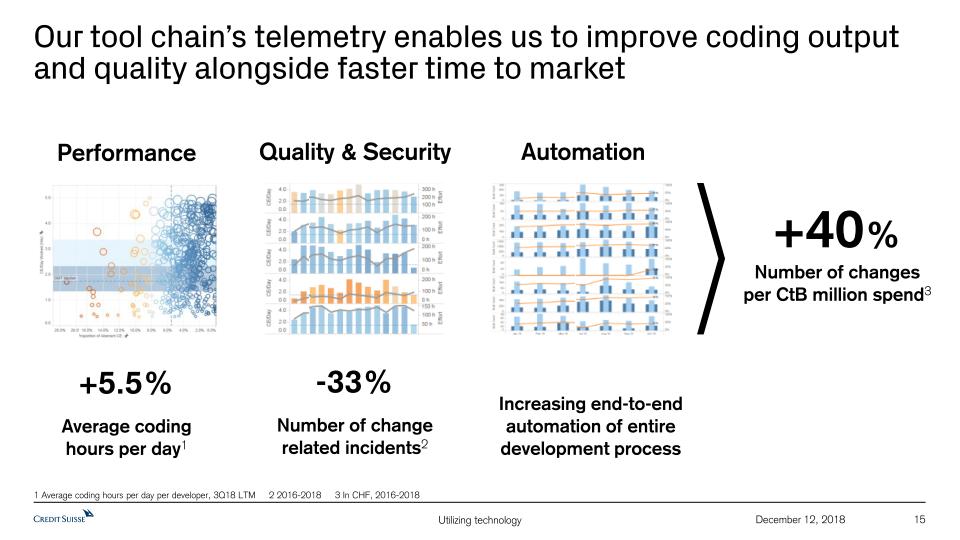
15 December 12, 2018 Our tool chain’s telemetry enables us to improve coding output and quality alongside faster time to market Quality & Security Automation Number of change related incidents2 -33% Performance Average coding hours per day1 +5.5% 1 Average coding hours per day per developer, 3Q18 LTM 2 2016-2018 3 In CHF, 2016-2018 Increasing end-to-end automation of entire development process Number of changes per CtB million spend3 +40%
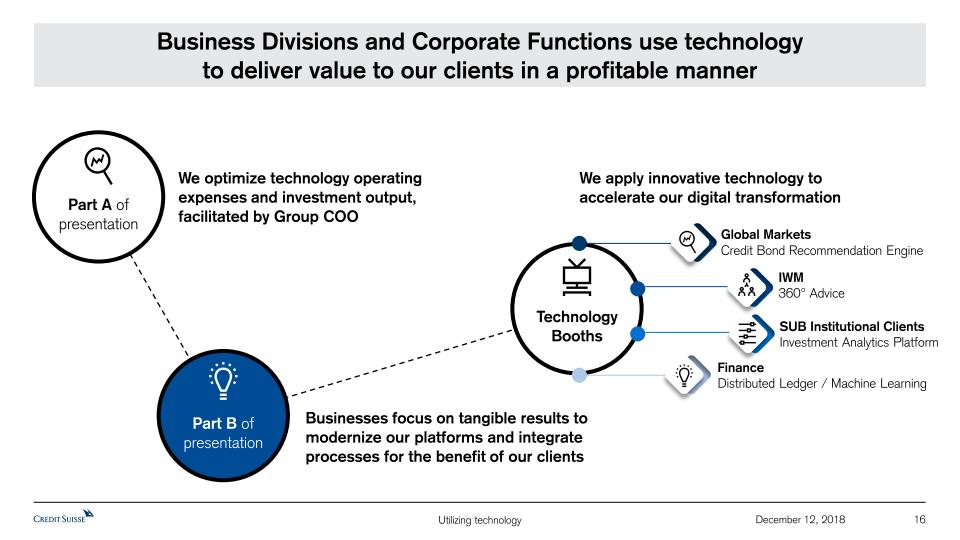
16 December 12, 2018 Technology Booths Part A of presentation Part B of presentation Business Divisions and Corporate Functions use technologyto deliver value to our clients in a profitable manner Global Markets Credit Bond Recommendation Engine IWM360° Advice SUB Institutional ClientsInvestment Analytics Platform FinanceDistributed Ledger / Machine Learning We optimize technology operating expenses and investment output, facilitated by Group COO Businesses focus on tangible results to modernize our platforms and integrate processes for the benefit of our clients We apply innovative technology to accelerate our digital transformation
Francois Clovis Monnet, Head of Private Banking North AsiaLuis Pereira, Head of APAC Technology & ChangeDecember 12, 2018 Utilizing technologyDriving growth through RM productivity and client interaction
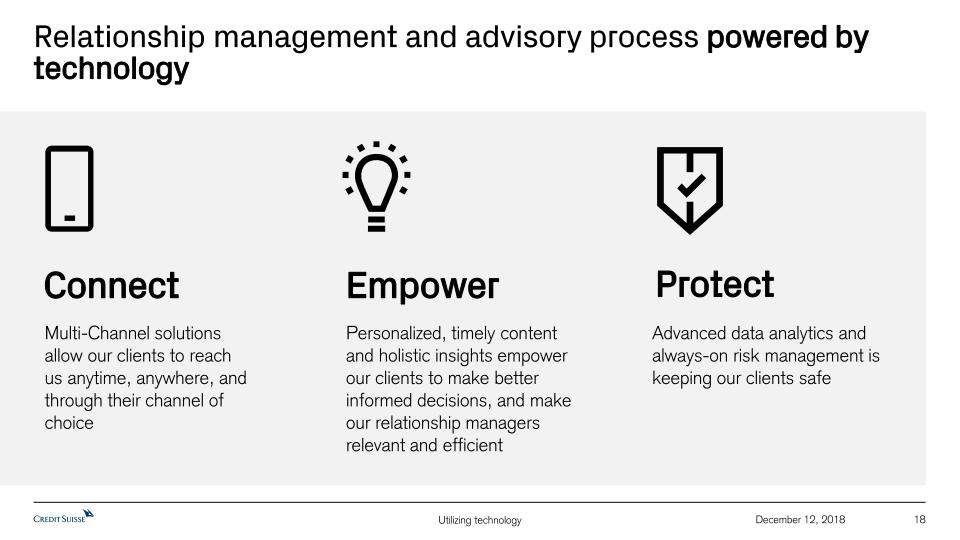
18 December 12, 2018 Relationship management and advisory process powered by technology Connect Multi-Channel solutions allow our clients to reach us anytime, anywhere, and through their channel of choice Empower Personalized, timely content and holistic insights empower our clients to make better informed decisions, and make our relationship managers relevant and efficient Protect Advanced data analytics and always-on risk management is keeping our clients safe
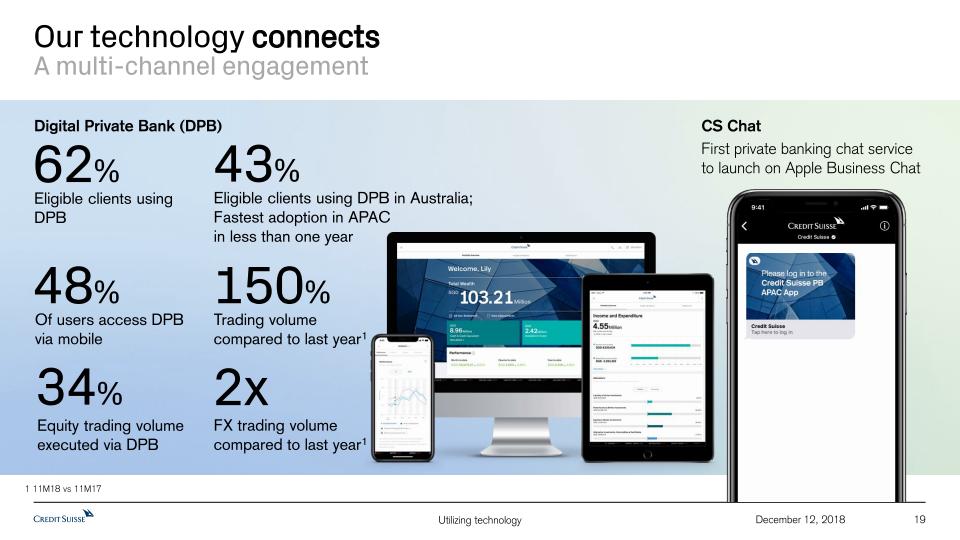
Our technology connectsA multi-channel engagement Digital Private Bank (DPB) 62% Eligible clients using DPB 48% Of users access DPB via mobile 34% Equity trading volume executed via DPB 150% Trading volume compared to last year1 43% Eligible clients using DPB in Australia; Fastest adoption in APAC in less than one year 2x FX trading volume compared to last year1 CS Chat First private banking chat service to launch on Apple Business Chat December 12, 2018 19 1 11M18 vs 11M17
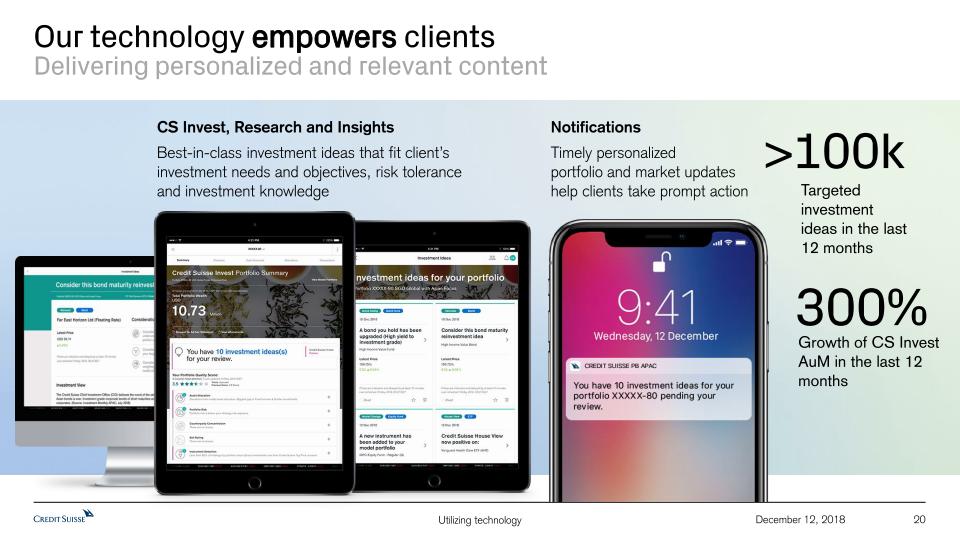
20 December 12, 2018 Our technology empowers clientsDelivering personalized and relevant content Notifications Timely personalized portfolio and market updates help clients take prompt action CS Invest, Research and Insights Best-in-class investment ideas that fit client’s investment needs and objectives, risk tolerance and investment knowledge >100k Targeted investment ideas in the last 12 months 300% Growth of CS Invest AuM in the last 12 months
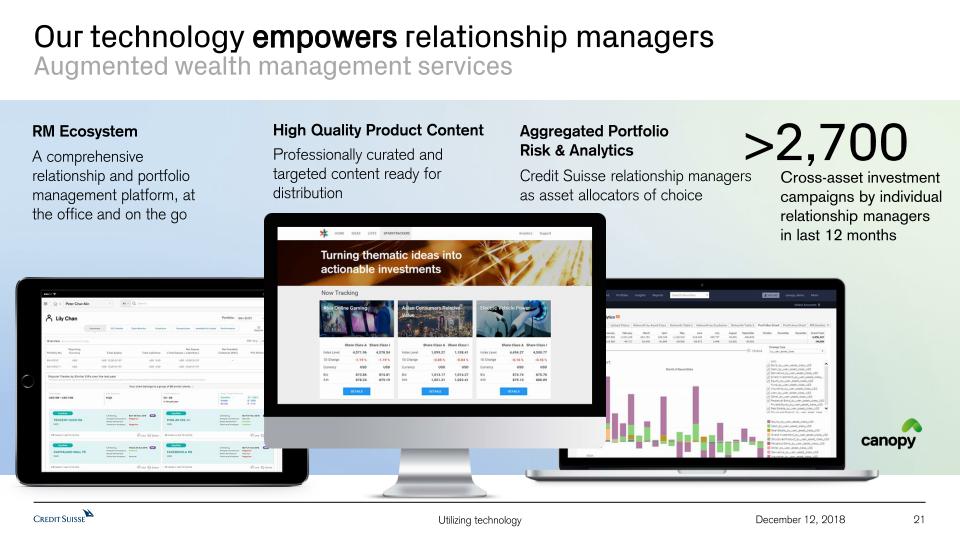
21 December 12, 2018 Our technology empowers relationship managersAugmented wealth management services RM Ecosystem A comprehensive relationship and portfolio management platform, at the office and on the go High Quality Product Content Professionally curated and targeted content ready for distribution Aggregated Portfolio Risk & AnalyticsCredit Suisse relationship managers as asset allocators of choice >2,700 Cross-asset investment campaigns by individual relationship managers in last 12 months

22 December 12, 2018 Our technology protects Advanced risk monitoring Risk Analyzer Comprehensive portfolio health-check and risk simulations Portfolio Monitoring Advanced analytics with performance and risk attributions Investment Suitability Systematic measures to guide our clients and keep them safe Investment suitability validations a month 14mn 900k Positions 37k Portfolios

23 December 12, 2018 How we did itOur technology delivery model has been transformed Design thinking Close collaboration between technology and the business, focusing on delivering superior client experiences Open WMC platformA component and API based architecture, leveraging institutional capabilities for content, data and risk management Agile methodologyStrategic talent acquisition, small self-managed teams and strong DevOps practices
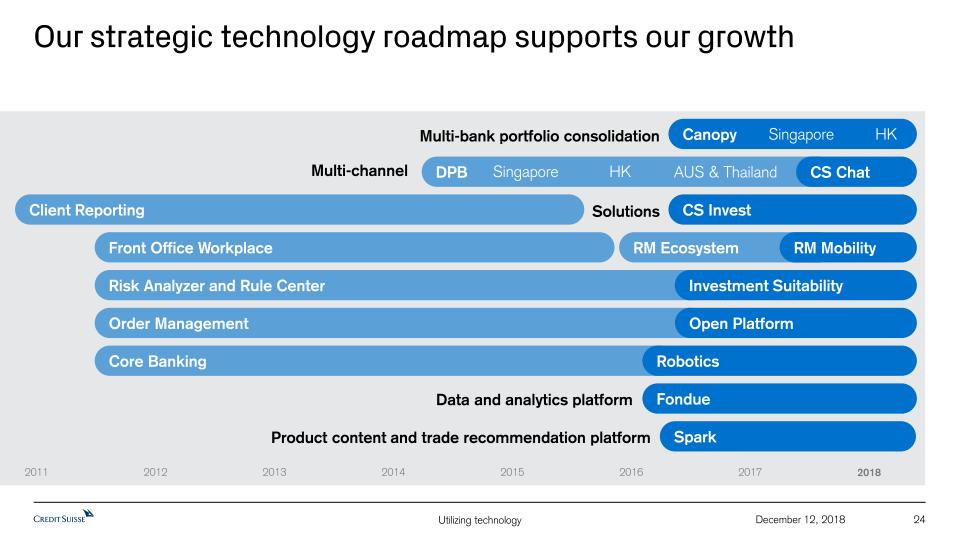
24 December 12, 2018 2011 2018 2012 2013 2014 2015 2016 2017 Client Reporting DPB CS Invest Canopy CS Chat Front Office Workplace Order Management RM Ecosystem RM Mobility Core Banking Robotics Fondue Spark Risk Analyzer and Rule Center Investment Suitability Multi-bank portfolio consolidation Multi-channel Solutions Open Platform Singapore HK AUS & Thailand Singapore HK Data and analytics platform Product content and trade recommendation platform Our strategic technology roadmap supports our growth
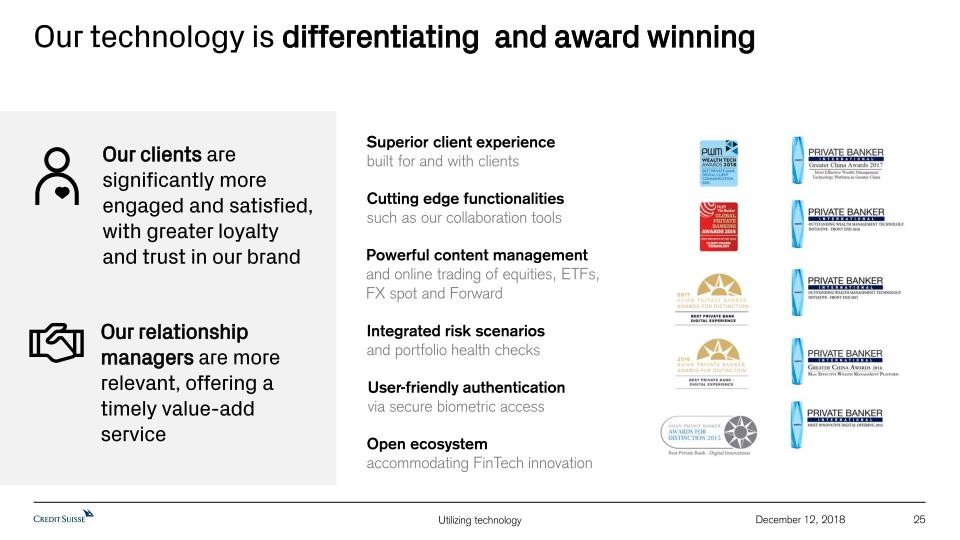
25 December 12, 2018 Our technology is differentiating and award winning Superior client experiencebuilt for and with clients Cutting edge functionalitiessuch as our collaboration tools Powerful content managementand online trading of equities, ETFs, FX spot and Forward Integrated risk scenariosand portfolio health checks User-friendly authenticationvia secure biometric access Open ecosystemaccommodating FinTech innovation Our clients are significantly more engaged and satisfied, with greater loyalty and trust in our brand Our relationship managers are more relevant, offering a timely value-add service

Anke Bridge-Haux, Head of SUB Digitalization & ProductsDecember 12, 2018 Utilizing technologyOffering seamless and integrated client experience
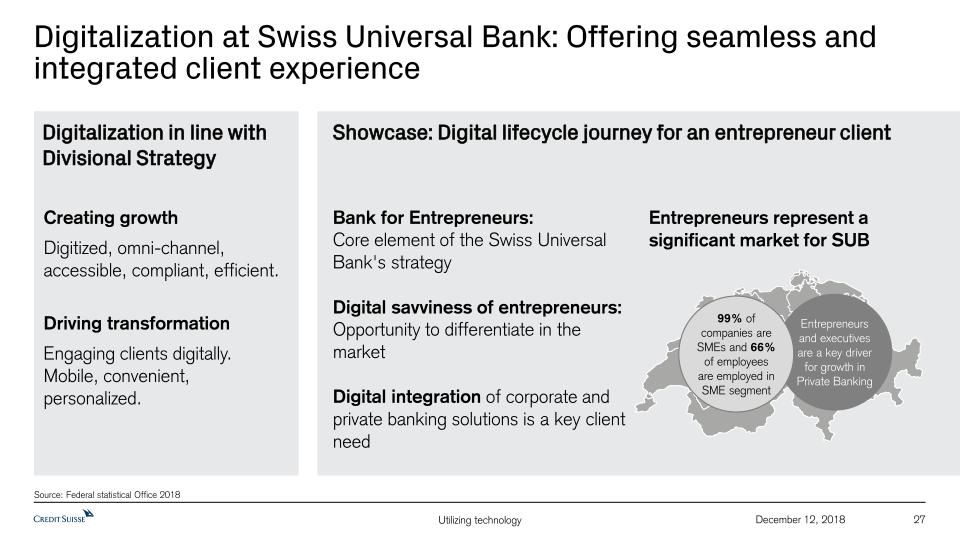
Digitalization at Swiss Universal Bank: Offering seamless and integrated client experience December 12, 2018 27 Source: Federal statistical Office 2018 Showcase: Digital lifecycle journey for an entrepreneur client Digitalization in line with Divisional Strategy Creating growthDigitized, omni-channel, accessible, compliant, efficient.Driving transformationEngaging clients digitally. Mobile, convenient, personalized. Bank for Entrepreneurs: Core element of the Swiss Universal Bank's strategyDigital savviness of entrepreneurs: Opportunity to differentiate in the marketDigital integration of corporate and private banking solutions is a key client need Entrepreneurs represent a significant market for SUB Entrepreneurs and executives are a key driver for growth in Private Banking 99% of companies are SMEs and 66% of employees are employed in SME segment
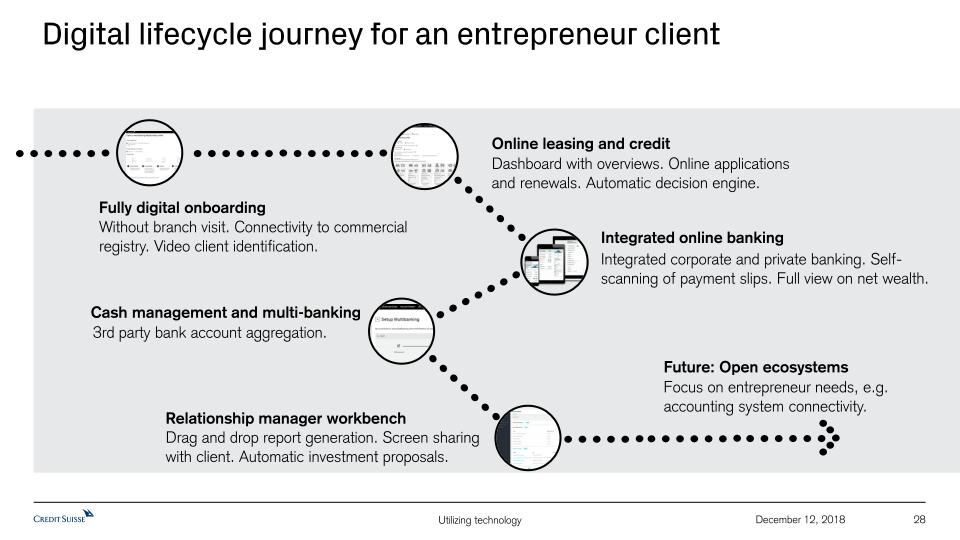
3rd party bank account aggregation. Dashboard with overviews. Online applications and renewals. Automatic decision engine. Integrated online banking Integrated corporate and private banking. Self-scanning of payment slips. Full view on net wealth. Online leasing and credit Cash management and multi-banking Drag and drop report generation. Screen sharing with client. Automatic investment proposals. Relationship manager workbench Focus on entrepreneur needs, e.g. accounting system connectivity. Future: Open ecosystems Digital lifecycle journey for an entrepreneur client December 12, 2018 28 Fully digital onboarding Without branch visit. Connectivity to commercial registry. Video client identification.
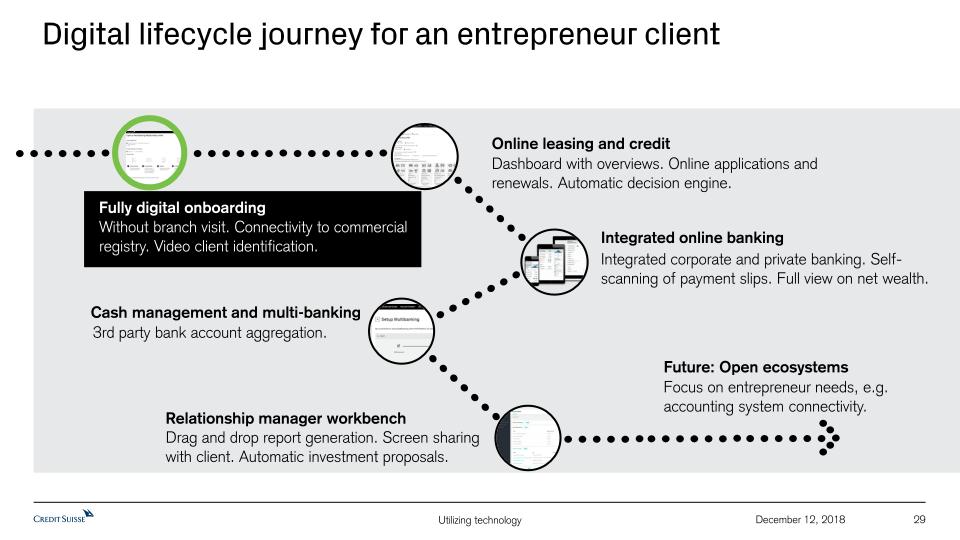
3rd party bank account aggregation. Dashboard with overviews. Online applications and renewals. Automatic decision engine. Integrated online banking Online leasing and credit Cash management and multi-banking Drag and drop report generation. Screen sharing with client. Automatic investment proposals. Relationship manager workbench Future: Open ecosystems Digital lifecycle journey for an entrepreneur client December 12, 2018 29 Fully digital onboarding Without branch visit. Connectivity to commercial registry. Video client identification. Integrated corporate and private banking. Self-scanning of payment slips. Full view on net wealth. Focus on entrepreneur needs, e.g. accounting system connectivity.

30 December 12, 2018 Fully digital onboarding
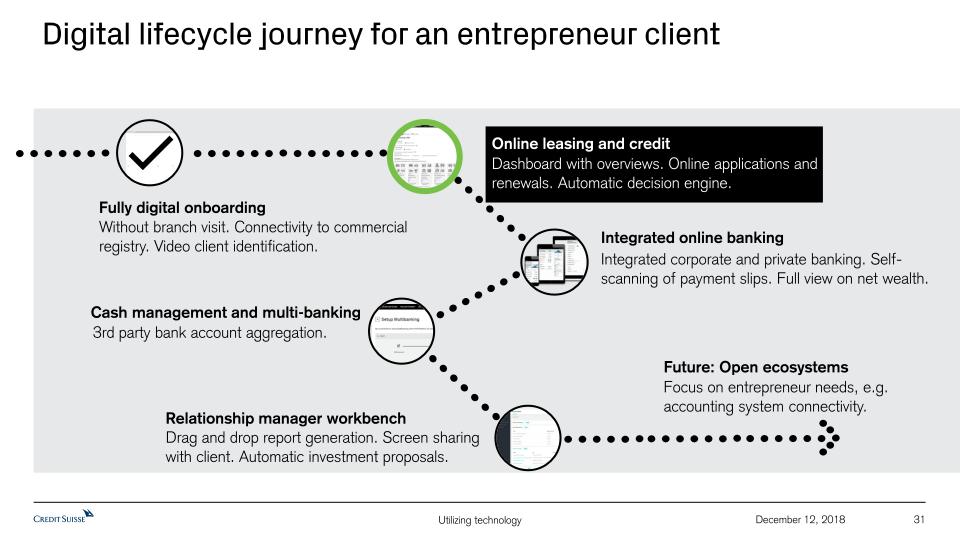
3rd party bank account aggregation. Dashboard with overviews. Online applications and renewals. Automatic decision engine. Integrated online banking Online leasing and credit Cash management and multi-banking Drag and drop report generation. Screen sharing with client. Automatic investment proposals. Relationship manager workbench Future: Open ecosystems Digital lifecycle journey for an entrepreneur client December 12, 2018 31 Fully digital onboarding Without branch visit. Connectivity to commercial registry. Video client identification. Integrated corporate and private banking. Self-scanning of payment slips. Full view on net wealth. Focus on entrepreneur needs, e.g. accounting system connectivity.

32 December 12, 2018 Online leasing and credit
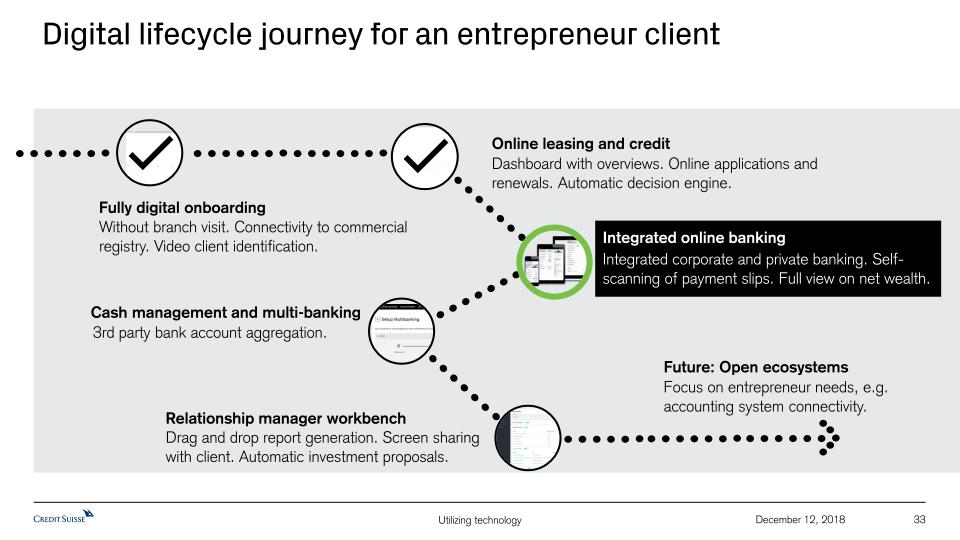
3rd party bank account aggregation. Dashboard with overviews. Online applications and renewals. Automatic decision engine. Integrated online banking Integrated corporate and private banking. Self-scanning of payment slips. Full view on net wealth. Online leasing and credit Cash management and multi-banking Drag and drop report generation. Screen sharing with client. Automatic investment proposals. Relationship manager workbench Future: Open ecosystems Digital lifecycle journey for an entrepreneur client December 12, 2018 33 Fully digital onboarding Without branch visit. Connectivity to commercial registry. Video client identification. Focus on entrepreneur needs, e.g. accounting system connectivity.
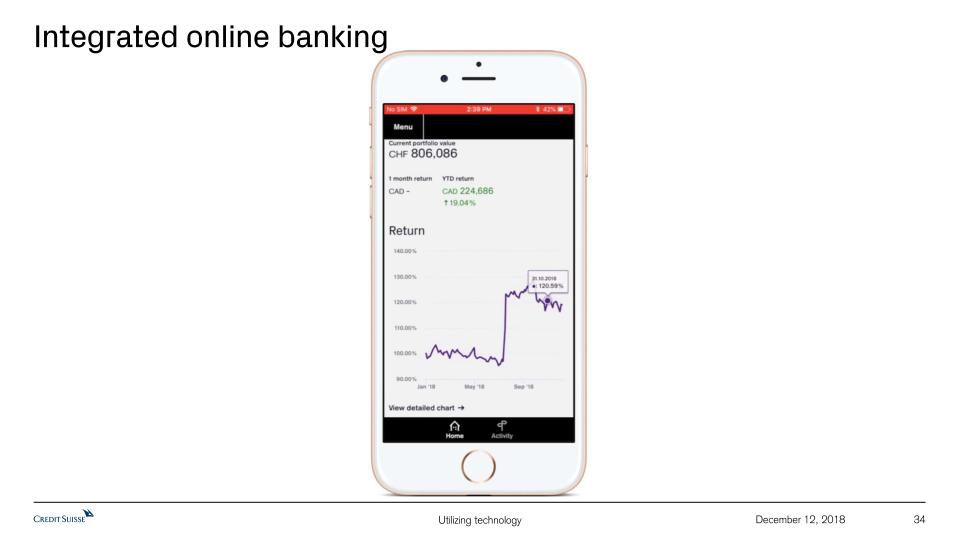
34 December 12, 2018 Integrated online banking

3rd party bank account aggregation. Dashboard with overviews. Online applications and renewals. Automatic decision engine. Integrated online banking Online leasing and credit Cash management and multi-banking Drag and drop report generation. Screen sharing with client. Automatic investment proposals. Relationship manager workbench Future: Open ecosystems Digital lifecycle journey for an entrepreneur client December 12, 2018 35 Fully digital onboarding Without branch visit. Connectivity to commercial registry. Video client identification. Integrated corporate and private banking. Self-scanning of payment slips. Full view on net wealth. Focus on entrepreneur needs, e.g. accounting system connectivity.
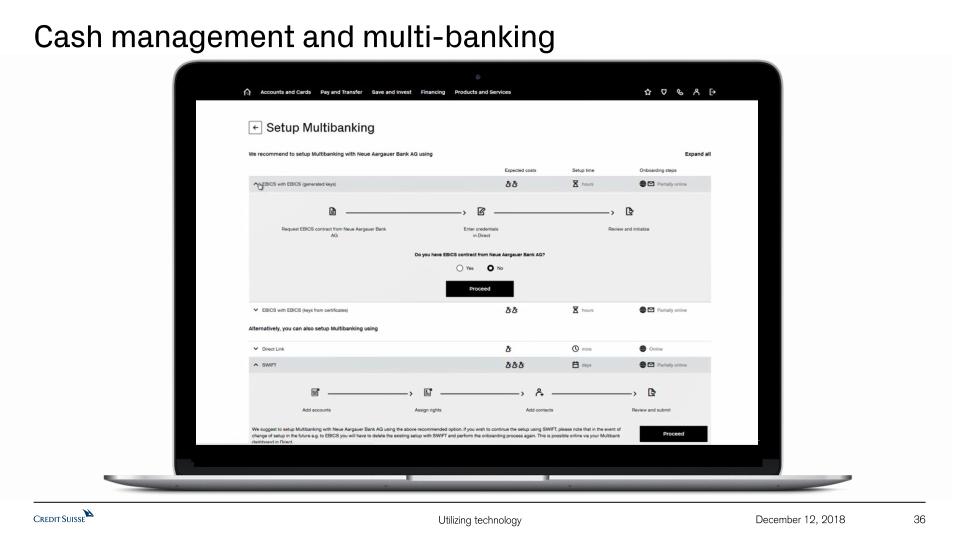
36 December 12, 2018 Cash management and multi-banking
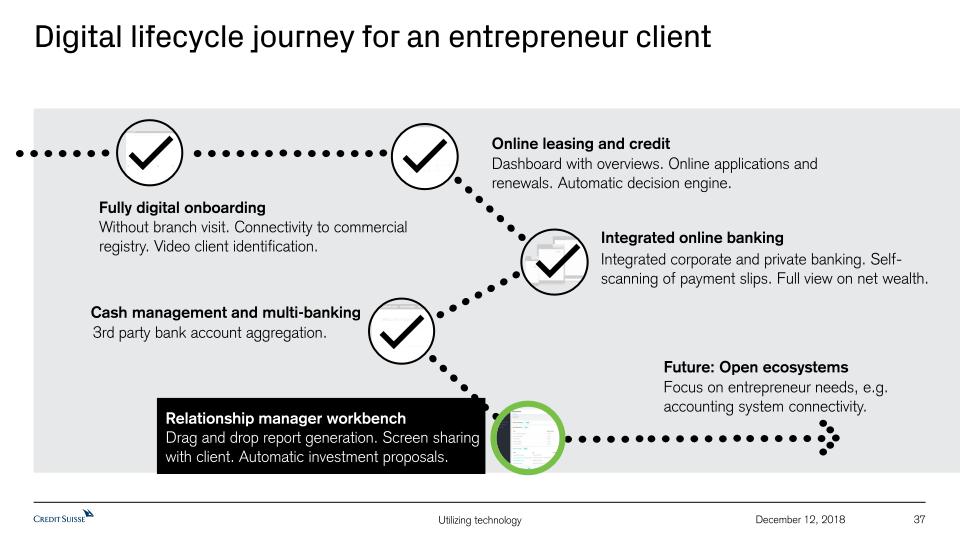
3rd party bank account aggregation. Dashboard with overviews. Online applications and renewals. Automatic decision engine. Integrated online banking Online leasing and credit Cash management and multi-banking Drag and drop report generation. Screen sharing with client. Automatic investment proposals. Relationship manager workbench Future: Open ecosystems Digital lifecycle journey for an entrepreneur client December 12, 2018 37 Fully digital onboarding Without branch visit. Connectivity to commercial registry. Video client identification. Integrated corporate and private banking. Self-scanning of payment slips. Full view on net wealth. Focus on entrepreneur needs, e.g. accounting system connectivity.
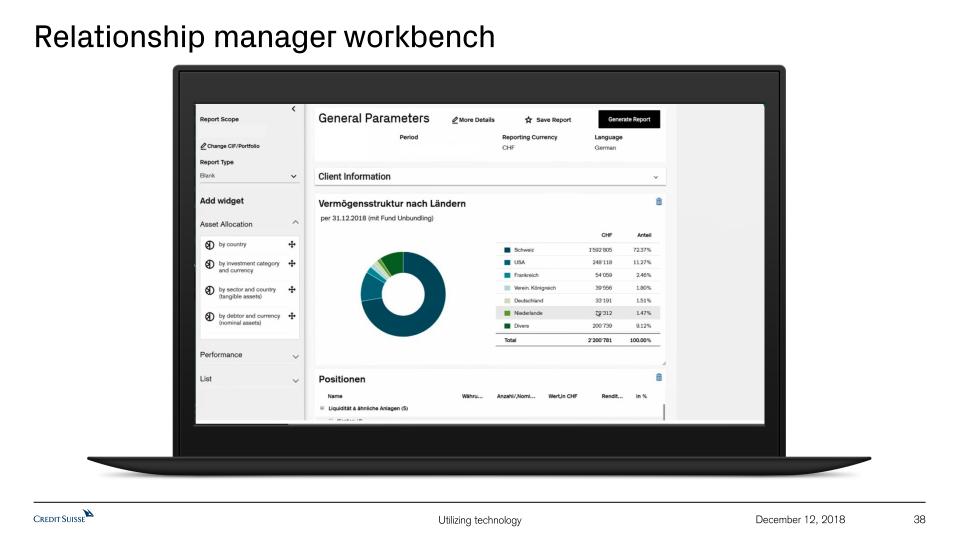
38 December 12, 2018 Relationship manager workbench
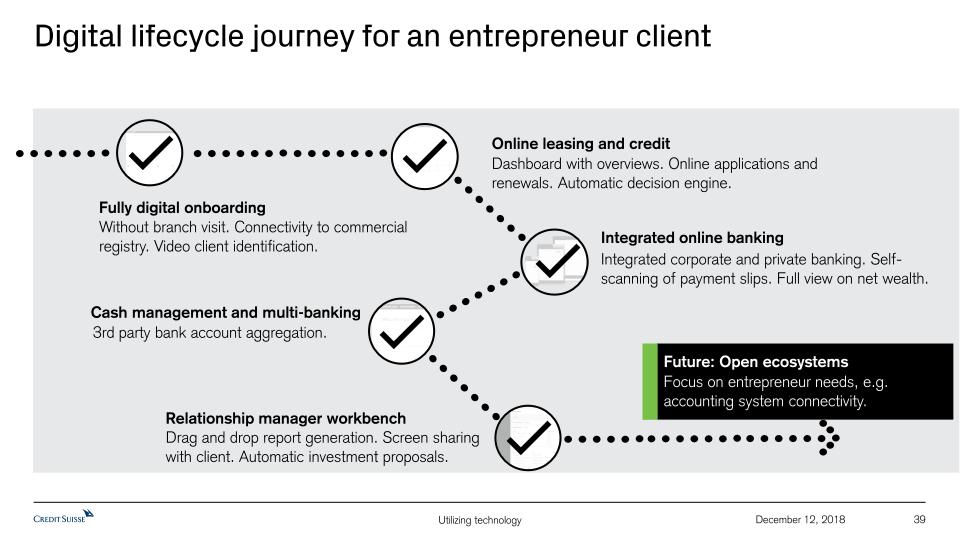
3rd party bank account aggregation. Dashboard with overviews. Online applications and renewals. Automatic decision engine. Integrated online banking Online leasing and credit Cash management and multi-banking Drag and drop report generation. Screen sharing with client. Automatic investment proposals. Relationship manager workbench Focus on entrepreneur needs, e.g. accounting system connectivity. Future: Open ecosystems Digital lifecycle journey for an entrepreneur client December 12, 2018 39 Fully digital onboarding Without branch visit. Connectivity to commercial registry. Video client identification. Integrated corporate and private banking. Self-scanning of payment slips. Full view on net wealth.
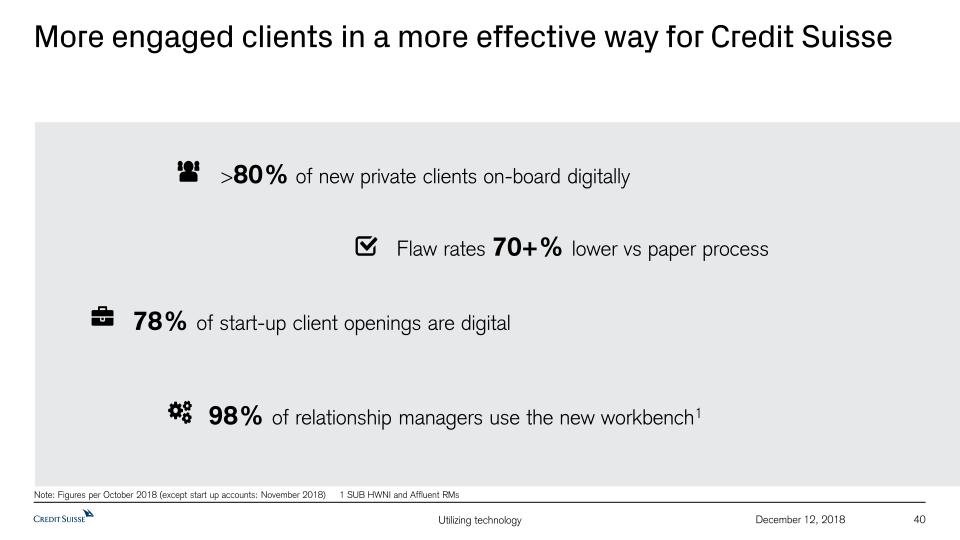
40 December 12, 2018 More engaged clients in a more effective way for Credit Suisse 78% of start-up client openings are digital Note: Figures per October 2018 (except start up accounts: November 2018) 1 SUB HWNI and Affluent RMs >80% of new private clients on-board digitally Flaw rates 70+% lower vs paper process 98% of relationship managers use the new workbench1

Lara Warner, Chief Compliance & Regulatory OfficerHoma Siddiqui, Chief Compliance & Regulatory Officer COODecember 12, 2018 Utilizing technologyModern Compliance risk management capabilities
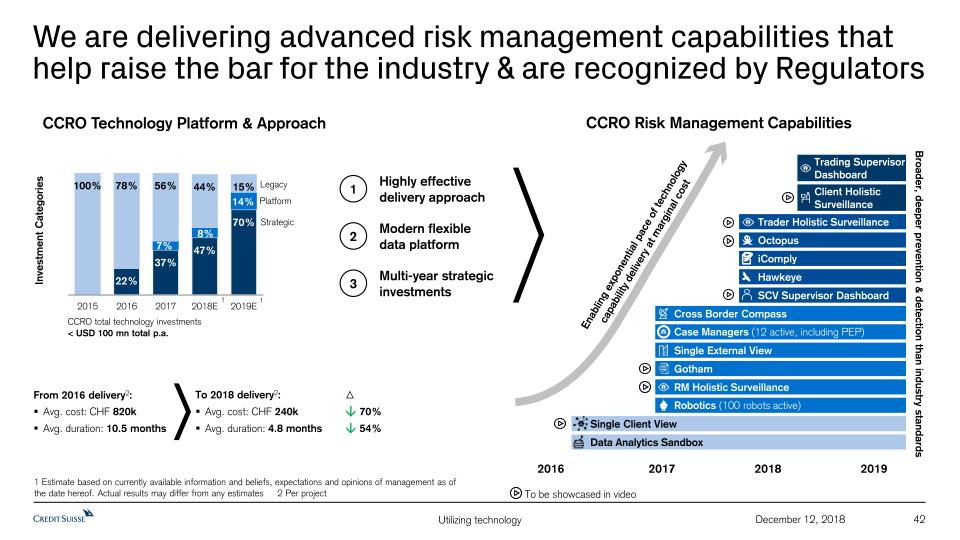
We are delivering advanced risk management capabilities that help raise the bar for the industry & are recognized by Regulators 42 1 Estimate based on currently available information and beliefs, expectations and opinions of management as of the date hereof. Actual results for may differ from any estimates 2 Per project December 12, 2018 Enabling exponential pace of technology capability delivery at marginal cost CCRO Risk Management Capabilities 2017 2016 2018 2019 Broader, deeper prevention & detection than industry standards To be showcased in video CCRO Technology Platform & Approach Legacy Platform Strategic Investment Categories CCRO total technology investments < USD 100 mn total p.a. 1 1 1 Highly effective delivery approach 2 Modern flexible data platform 3 Multi-year strategic investments From 2016 delivery2:Avg. cost: CHF 820kAvg. duration: 10.5 months To 2018 delivery2: Avg. cost: CHF 240k 70%Avg. duration: 4.8 months 54% Hawkeye Octopus iComply Trader Holistic Surveillance SCV Supervisor Dashboard Robotics (100 robots active) Cross Border Compass Case Managers (12 active, including PEP) RM Holistic Surveillance Single External View Gotham Data Analytics Sandbox Single Client View Trading Supervisor Dashboard Client Holistic Surveillance
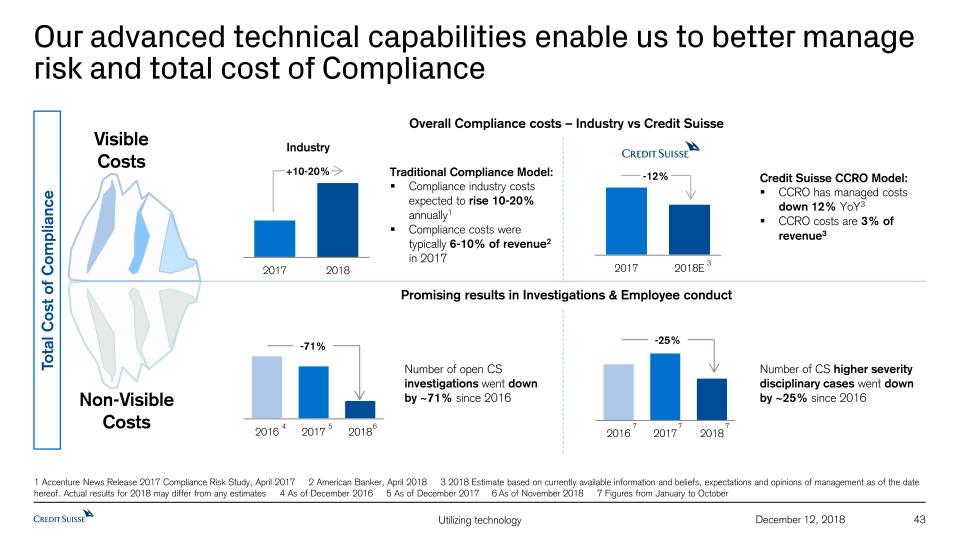
43 Our advanced technical capabilities enable us to better manage risk and total cost of Compliance Total Cost of Compliance 1 Accenture News Release 2017 Compliance Risk Study, April 2017 2 American Banker, April 2018 3 2018 Estimate based on currently available information and beliefs, expectations and opinions of management as of the date hereof. Actual results for 2018 may differ from any estimates 4 As of December 2016 5 As of December 2017 6 As of November 2018 7 Figures from January to October December 12, 2018 Non-VisibleCosts Promising results in Investigations & Employee conduct Number of open CS investigations went down by ~71% since 2016 Number of CS higher severity disciplinary cases went down by ~25% since 2016 -71% 4 5 6 -25% 7 7 7 Traditional Compliance Model:Compliance industry costs expected to rise 10-20% annually1Compliance costs were typically 6-10% of revenue2 in 2017 Overall Compliance costs – Industry vs Credit Suisse +10-20% Industry -12% Credit Suisse CCRO Model:CCRO has managed costs down 12% YoY3CCRO costs are 3% of revenue3 VisibleCosts 3
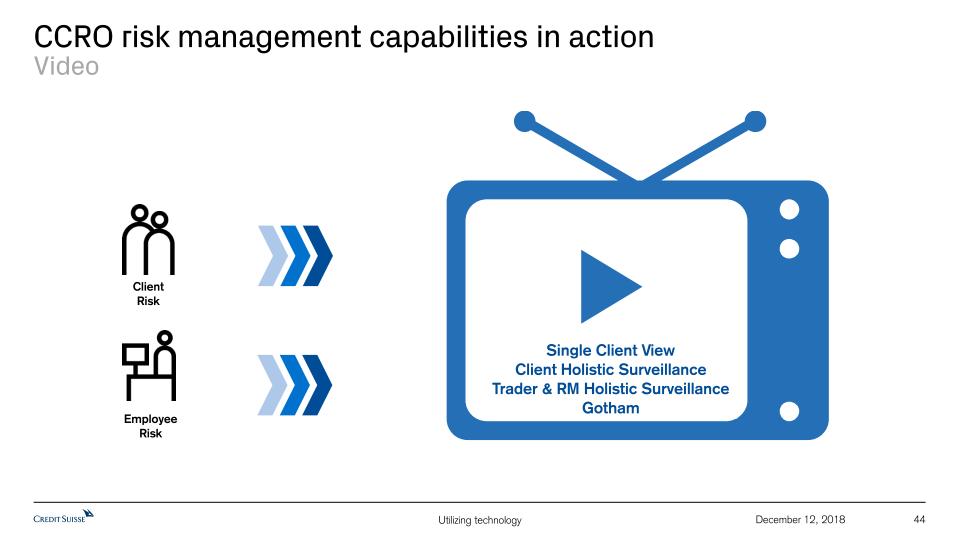
CCRO risk management capabilities in actionVideo Client Risk Employee Risk Single Client ViewClient Holistic SurveillanceTrader & RM Holistic SurveillanceGotham 44 December 12, 2018
45 December 12, 2018 Key issues the industry faces in respect of money laundering on a global scale Risk of systematic and undetected money launderingSystemic weaknesses in systems and controls alongside other factors such as employee misconductFailure to detect and report suspicious transactionsFailure to detect rogue employee behaviorsFailure to adapt and learn lessons from past incidents, including taking an industry-wide view A traditional, industry standard approach towards prevention and detection leads to repeat issues, sanctions, reputational risk and loss of shareholder and public confidence within the industry as a wholeWhilst it is not possible to guarantee that all illicit activity will always be detected, industry leading capabilities including data analytics, technology and enhanced investigation techniques lead to proactive prevention and detection alongside continuous Compliance improvement ? ? ? ? ?
46 December 12, 2018 Traditional methods/capabilities provide limited ability to prevent and detect AML risk Traditional anti-money laundering surveillances are usually rules or scenario-based Across the industry, ability to systematically identify suspicious/complex behavior is limited Manual monitoring conducted by human beings is prone to gaps and potential failure Employee behaviors also need to be effectively monitored to detect and prevent internal threats Third parties who may not be visible to us can also create further risk Client relationships can range in terms of complexity ? Many parties, accounts and jurisdictions can be involved Isolated account/sub-account view versus holistic client overview increases complexity of risk management A B C Manual approach to onboarding, KYC, account lifecycle management leads to risk of knowledge gaps ? ? ? ? ?
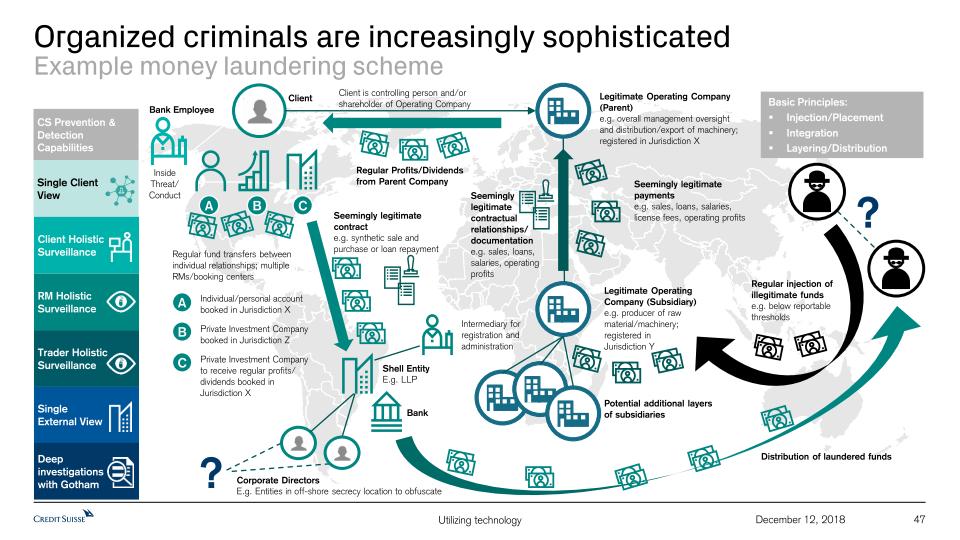
Legitimate Operating Company (Parent)e.g. overall management oversight and distribution/export of machinery; registered in Jurisdiction X Legitimate Operating Company (Subsidiary) e.g. producer of raw material/machinery; registered in Jurisdiction Y Client is controlling person and/or shareholder of Operating Company Potential additional layers of subsidiaries Client Individual/personal account booked in Jurisdiction XPrivate Investment Company booked in Jurisdiction ZPrivate Investment Company to receive regular profits/ dividends booked in Jurisdiction X A B C A B C Organized criminals are increasingly sophisticatedExample money laundering scheme 47 December 12, 2018 Regular fund transfers between individual relationships; multiple RMs/booking centers ? Seemingly legitimate contractual relationships/documentatione.g. sales, loans, salaries, operating profits Seemingly legitimate paymentse.g. sales, loans, salaries, license fees, operating profits Regular Profits/Dividends from Parent Company Shell EntityE.g. LLP Corporate DirectorsE.g. Entities in off-shore secrecy location to obfuscate Intermediary for registration and administration Bank Seemingly legitimate contracte.g. synthetic sale and purchase or loan repayment Distribution of laundered funds CS Prevention & Detection Capabilities Single Client View Single External View Client Holistic Surveillance Deep investigationswith Gotham Trader Holistic Surveillance RM Holistic Surveillance Inside Threat/Conduct Bank Employee Regular injection of illegitimate fundse.g. below reportable thresholds ? Basic Principles:Injection/PlacementIntegration Layering/Distribution
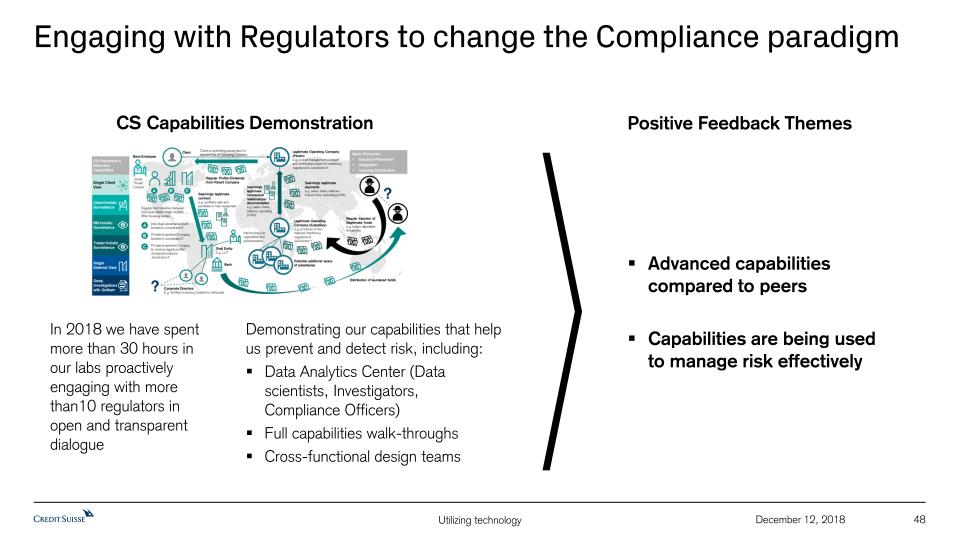
Engaging with Regulators to change the Compliance paradigm 48 December 12, 2018 Positive Feedback Themes Advanced capabilities compared to peersCapabilities are being used to manage risk effectively CS Capabilities Demonstration In 2018 we have spent more than 30 hours in our labs proactively engaging with more than10 regulators in open and transparent dialogue Demonstrating our capabilities that help us prevent and detect risk, including:Data Analytics Center (Data scientists, Investigators,Compliance Officers)Full capabilities walk-throughsCross-functional design teams
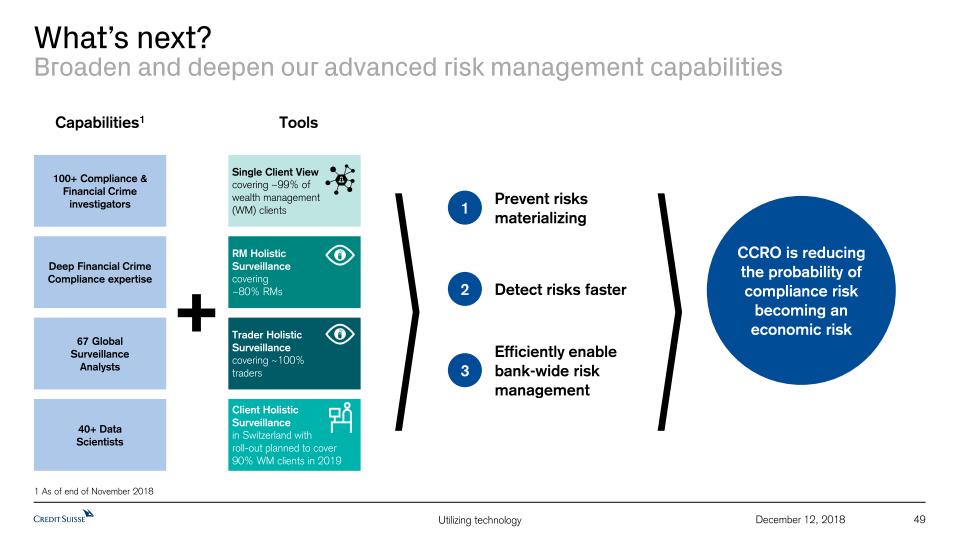
49 What’s next?Broaden and deepen our advanced risk management capabilities December 12, 2018 Prevent risks materializing 1 Detect risks faster 2 Efficiently enable bank-wide risk management 3 67 GlobalSurveillanceAnalysts Capabilities1 Tools Deep Financial Crime Compliance expertise 100+ Compliance &Financial Crime investigators 40+ DataScientists Single Client Viewcovering ~99% ofwealth management(WM) clients Client Holistic Surveillance in Switzerland withroll-out planned to cover 90% WM clients in 2019 Trader Holistic Surveillancecovering ~100%traders RM HolisticSurveillance covering~80% RMs CCRO is reducing the probability of compliance risk becoming an economic risk 1 As of end of November 2018
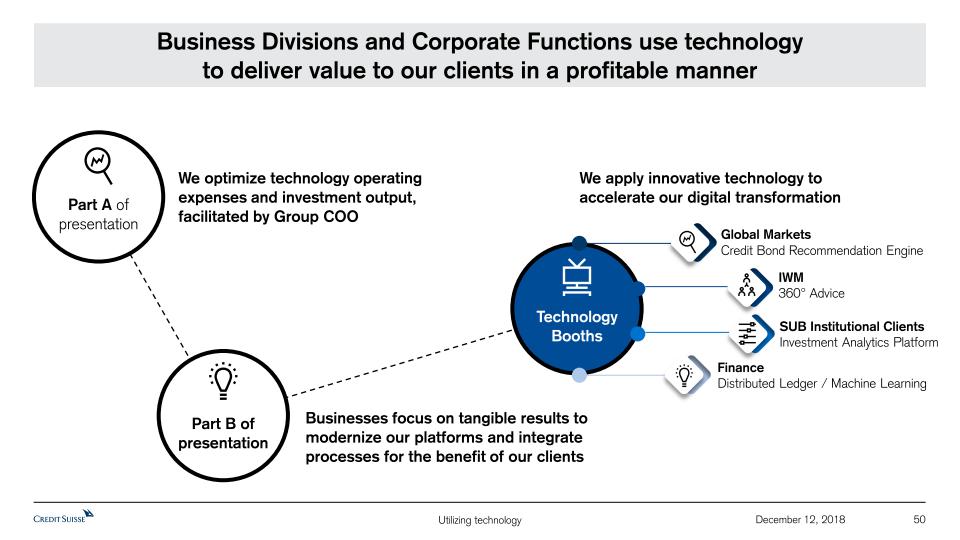
50 December 12, 2018 Technology Booths Part A of presentation Part B of presentation Business Divisions and Corporate Functions use technologyto deliver value to our clients in a profitable manner Global Markets Credit Bond Recommendation Engine IWM360° Advice SUB Institutional ClientsInvestment Analytics Platform FinanceDistributed Ledger / Machine Learning We optimize technology operating expenses and investment output, facilitated by Group COO Businesses focus on tangible results to modernize our platforms and integrate processes for the benefit of our clients We apply innovative technology to accelerate our digital transformation

Appendix 51 December 12, 2018
Notes (1/2) 52 December 12, 2018 For reconciliation of adjusted to reported results, refer to the Appendix of the CEO and CFO Investor Day presentations, published on December 12, 2018Throughout the presentation rounding differences may occurUnless otherwise noted, all CET1 ratio, Tier 1 leverage ratio, risk-weighted assets and leverage exposure figures shown in this presentation are as of the end of the respective period and on a “look-through” basisGross and net margins are shown in basis pointsGross margin = (adj.) net revenues annualized / average AuM; net margin = (adj.) pre-tax income annualized / average AuMMandate penetration reflects advisory and discretionary mandate volumes as a percentage of AuM, excluding those from the external asset manager business General notes Specific notes * Our cost savings program, until the end of 2018, is measured using an adjusted operating cost base at constant 2015 FX rates. “Adjusted operating cost base at constant FX rates” includes adjustments as made in all our disclosures for restructuring expenses, major litigation provisions, expenses related to business sales and a goodwill impairment taken in 4Q15 as well as adjustments for debit valuation adjustments (DVA) related volatility, FX and for certain accounting changes (which had not been in place at the launch of the cost savings program). Adjustments for certain accounting changes have been restated to reflect grossed up expenses in the Corporate Center and, starting in 1Q18, also include adjustments for changes from ASU 2014-09 “Revenue from Contracts with Customers”, which is described further in our 1Q18, 2Q18 and 3Q18 financial reports. Adjustments for FX apply unweighted currency exchange rates, i.e., a straight line average of monthly rates, consistently for the periods under review. Starting from 1Q19, we intend to express our operating cost base at constant 2018 FX rates and to adjust for significant litigation costs, expenses related to business and real estate sales as well as DVA related volatility, but not for restructuring expenses and certain accounting changes. Adjustments for FX will continue to apply unweighted currency exchange rates.† Regulatory capital is calculated as the worst of 10% of RWA and 3.5% of leverage exposure. Return on regulatory capital is calculated using (adjusted) income / (loss) after tax and assumes a tax rate of 30% and capital allocated based on the worst of 10% of average RWA and 3.5% of average leverage exposure. For the Markets business within the APAC division and for the Global Markets and Investment Banking & Capital Markets divisions, return on regulatory capital is based on US dollar denominated numbers. Adjusted return on regulatory capital is calculated using adjusted results, applying the same methodology to calculate return on regulatory capital. ‡ Return on tangible equity is based on tangible equity attributable to shareholders, a non-GAAP financial measure, which is calculated by deducting goodwill and other intangible assets from total equity attributable to shareholders as presented in our balance sheet. Management believes that the return on tangible equity attributable to shareholders is meaningful as it allows consistent measurement of the performance of businesses without regard to whether the businesses were acquired.° Tangible book value is a non-GAAP financial measure and is equal to tangible equity attributable to shareholders. Tangible book value per share is a non-GAAP financial measure, which is calculated by dividing tangible equity attributable to shareholders, a non-GAAP financial measure, by total number of shares outstanding. Tangible equity attributable to shareholders, a non-GAAP financial measure, is calculated by deducting goodwill and other intangible assets from total equity attributable to shareholders as presented in our balance sheet. Management believes that tangible book value per share is meaningful as it allows consistent measurement of the performance of businesses without regard to whether the businesses were acquired. For end-3Q18, tangible equity excluded goodwill of CHF 4,736 mn and other intangible assets of CHF 214 mn from total shareholders’ equity of CHF 42,734 mn as presented in our balance sheet. For end-2017, tangible equity excluded goodwill of CHF 4,742 mn and other intangible assets of CHF 223 mn from total shareholders' equity of CHF 41,902 mn as presented in our balance sheet. For end-2Q15, tangible equity excluded goodwill of CHF 8,238 mn and other intangible assets of CHF 205 mn from total shareholders' equity of CHF 42,642 mn as presented in our balance sheet. Shares outstanding were 2,552.4 mn at end-3Q18, 2,550.3 mn at end-2017 and 1,632.4 mn at end-2Q15.
53 December 12, 2018 Notes (2/2) Abbreviations Adj. = Adjusted; AI = Artificial Intelligence; AM = Asset Management; AML = Anti-Money Laundering; APAC = Asia Pacific; ARU = Asset Resolution Unit;AT1 = Additional Tier 1; AuM = Assets under Management; BCBS = Basel Committee on Banking Supervision; BEAT = Base Erosion and Anti-Abuse Tax; BIS = Bank for International Settlements; bps = basis points; CAGR = Compound Annual Growth Rate; CBG = Corporate Bank Group; CCAR = Comprehensive Capital Adequacy Review; CCRO = Chief Compliance and Regulatory Affairs Officer; CDX HY = High-yield credit default swap index; CET1 = Common Equity Tier 1; CIC = Corporate & Institutional Clients; CIF = Customer/Client Information File; CIO = Chief Investment Officer; Corp. Ctr. = Corporate Center; CtB = Change the Bank; CVA = Credit Valuation Adjustment; DCM = Debt Capital Markets; DoJ = Department of Justice; DTA = Deferred Tax Assets; DVA = Debit Valuation Adjustments; EAM = External Asset Manager; EBITDA = Earnings Before Interest Taxes Depreciation and Amortization; ECM = Equity Capital Markets; EM = Emerging Markets; EMEA = Europe, Middle East & Africa; EQ = Equities; ERP = Enterprise Resource Planning; Est. = Estimate; EU = European Union; FICC = Fixed Income, Currencies & Commodities; FINMA = Swiss Financial Market Supervisory Authority FINMA; FLP = Fund Linked Products; FRTB = Fundamental Review of the Trading Book; FTE = Full-time employee; FX = Foreign Exchange; GDP = Gross Domestic Product; GM = Global Markets; G10 = Group of Ten; HKEX = Hong Kong Exchange; IBCM = Investment Banking & Capital Markets; IBD = Investment Banking Department; IC = Investment Consultant; ICBC = Industrial and Commercial Bank of China; ICBCCS = ICBC Credit Suisse Asset Management Co. Ltd; IG = Investment Grade; IMF = International Monetary Fund; IMM = Internal Model Method; IP = Investor Products; IPO = Initial Public Offering; IPRE= Interest Producing Real Estate; IRB = Internal Ratings Based; IS&P = Investment Solutions and Products; IT = Information Technology; ITS = International Trading Solutions; IWM = International Wealth Management; JV = Joint Venture; LBO = Leveraged Buyout; LE = Leverage Exposure; LSC = Large Swiss Corporates; LTM = Last Twelve Months; M&A = Mergers & Acquisitions; MD(R) = Managing Director; Mgmt. = Management; MI = Management Information; MifiD II = Markets in Financial Instruments Directive II; Mkts = Markets; NNA = Net new assets; OCC = Office of the Comptroller of the Currency; Op Risk = Operational Risk; PB = Private Banking; PB&WM = Private Banking & Wealth Management; PC = Private Clients; PEP = Politically Exposed Person; pp = percentage points; PTI = Pre-tax income; PWMC = Private & Wealth Management Clients; RM = Relationship Manager(s); RMBS = Residential Mortgage Backed Securities; RoRC = Return on Regulatory Capital; RoTE = Return on Tangible Equity; RPA = Robotic Process Automation; RtB = Run the Bank; RWA = Risk-weighted assets; SA-CCR = Standardized Approach to Counterparty Credit Risk; SME = Small and Medium-Sized Enterprises; SMG = Systematic Market-Making Group; SoW = Share of Wallet; SRU = Strategic Resolution Unit; SUB = Swiss Universal Bank; TBTF = Too Big To Fail; TBV(PS) = Tangible Book Value (per Share); (U)HNW(I) = (Ultra) High Net Worth (Individuals); US GAAP = United States Generally Accepted Accounting Principles; U/W = Underwriting; VaR = Value-at-Risk; VIX = Volatility Index; WM = Wealth Management; WM&C = Wealth Management & Connected; YoY = Year over year; YTD = Year to Date

December 12, 2018 Credit Suisse Investor Day 2018Managing our business through the cycle
Disclaimer 2 December 12, 2018 This material does not purport to contain all of the information that you may wish to consider. This material is not to be relied upon as such or used in substitution for the exercise of independent judgment.Cautionary statement regarding forward-looking statementsThis presentation contains forward-looking statements that involve inherent risks and uncertainties, and we might not be able to achieve the predictions, forecasts, projections and other outcomes we describe or imply in forward-looking statements. A number of important factors could cause results to differ materially from the plans, objectives, expectations, estimates and intentions we express in these forward-looking statements, including those we identify in "Risk factors” in our Annual Report on Form 20-F for the fiscal year ended December 31, 2017 and in the “Cautionary statement regarding forward-looking information" in our media release relating to Investor Day, published on December 12, 2018 and filed with the US Securities and Exchange Commission, and in other public filings and press releases. We do not intend to update these forward-looking statements. In particular, the terms “Estimate”, “Illustrative”, “Ambition”, “Objective”, “Outlook” and “Goal” are not intended to be viewed as targets or projections, nor are they considered to be Key Performance Indicators. All such estimates, illustrations, ambitions, objectives, outlooks and goals are subject to a large number of inherent risks, assumptions and uncertainties, many of which are completely outside of our control. These risks, assumptions and uncertainties include, but are not limited to, general market conditions, market volatility, interest rate volatility and levels, global and regional economic conditions, political uncertainty, changes in tax policies, regulatory changes, changes in levels of client activity as a result of any of the foregoing and other factors. Accordingly, this information should not be relied on for any purpose. We do not intend to update these estimates, illustrations, ambitions, objectives, outlooks or goals. We may not achieve the benefits of our strategic initiativesWe may not achieve all of the expected benefits of our strategic initiatives. Factors beyond our control, including but not limited to the market and economic conditions, changes in laws, rules or regulations and other challenges discussed in our public filings, could limit our ability to achieve some or all of the expected benefits of these initiatives. Estimates and assumptionsIn preparing this presentation, management has made estimates and assumptions that affect the numbers presented. Actual results may differ. Annualized numbers do not take account of variations in operating results, seasonality and other factors and may not be indicative of actual, full-year results. Figures throughout this presentation may also be subject to rounding adjustments. All opinions and views constitute judgments as of the date of writing without regard to the date on which the reader may receive or access the information. This information is subject to change at any time without notice and we do not intend to update this information. Statement regarding non-GAAP financial measuresThis presentation also contains non-GAAP financial measures, including adjusted results. Information needed to reconcile such non-GAAP financial measures to the most directly comparable measures under US GAAP can be found in the Appendix of the CEO and CFO Investor Day presentations, published on December 12, 2018. All Investor Day presentations are available on our website at www.credit-suisse.com.Many of our references to estimates, ambitions, objectives and targets for revenues, operating expenses, operating cost base, pre-tax income and return on regulatory capital are on an adjusted basis as well. These adjusted numbers, return on tangible equity and tangible book value per share are non-GAAP financial measures. A reconciliation of the estimates, ambitions, objectives and targets to the nearest GAAP measure is unavailable without unreasonable efforts. Adjusted results exclude goodwill impairment, major litigation charges, real estate gains and other revenue and expense items included in our reported results, which are unavailable on a prospective basis. Tangible equity excludes goodwill and other intangible assets from shareholders’ equity, all of which are unavailable on a prospective basis. Tangible book value per share excludes the impact of any dividends paid during the performance period, share buybacks, own credit movements, foreign exchange rate movements and pension-related impacts, all of which are unavailable on a prospective basis.Statement regarding capital, liquidity and leverageAs of January 1, 2013, Basel III was implemented in Switzerland along with the Swiss “Too Big to Fail” legislation and regulations thereunder (in each case, subject to certain phase-in periods). As of January 1, 2015, the Bank for International Settlements (BIS) leverage ratio framework, as issued by the Basel Committee on Banking Supervision (BCBS), was implemented in Switzerland by FINMA. Our related disclosures are in accordance with our interpretation of such requirements, including relevant assumptions. Changes in the interpretation of these requirements in Switzerland or in any of our assumptions or estimates could result in different numbers from those shown in this presentation. Unless otherwise noted, leverage exposure is based on the BIS leverage ratio framework and consists of period-end balance sheet assets and prescribed regulatory adjustments. The look-through tier 1 leverage ratio and CET1 leverage ratio are calculated as look-through BIS tier 1 capital and CET1 capital, respectively, divided by period-end leverage exposure. Swiss leverage ratios are measured on the same period-end basis as the leverage exposure for the BIS leverage ratio.SourcesCertain material in this presentation has been prepared by Credit Suisse on the basis of publicly available information, internally developed data and other third-party sources believed to be reliable. Credit Suisse has not sought to independently verify information obtained from public and third-party sources and makes no representations or warranties as to accuracy, completeness or reliability of such information.

Presenters 3 December 12, 2018 Hosts Speakers David MillerGlobal MarketsGlobal Head ofCredit Products Timothy JoyceIBCMGlobal Head of Portfolio Management forCorporate Bank Jay KimGlobal MarketsGlobal Head of Securitized Products David MathersChief Financial Officer James AmineCEO Investment Banking & Capital Markets Carsten StoehrAsia PacificHead of APACFinancing Group &CEO Greater China Malcolm PriceIBCMGlobal HeadFinancial Sponsors
Jay Kim, Global Head of Securitized ProductsDecember 12, 2018 Managing our business through the cycleSecuritized Products
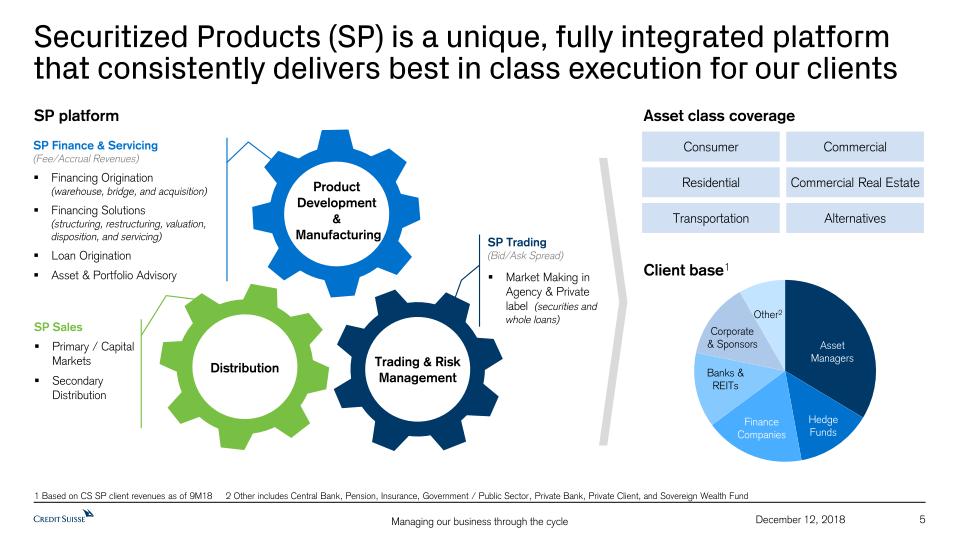
5 December 12, 2018 Securitized Products (SP) is a unique, fully integrated platform that consistently delivers best in class execution for our clients 1 Based on CS SP client revenues as of 9M18 2 Other includes Central Bank, Pension, Insurance, Government / Public Sector, Private Bank, Private Client, and Sovereign Wealth Fund Client base1 Asset class coverage Consumer Commercial Residential Commercial Real Estate Transportation Alternatives SP platform Asset Managers Hedge Funds Finance Companies Banks & REITs Corporate & Sponsors Other2 Product Development & Manufacturing Trading & Risk Management Distribution SP Finance & Servicing(Fee/Accrual Revenues)Financing Origination (warehouse, bridge, and acquisition)Financing Solutions (structuring, restructuring, valuation, disposition, and servicing)Loan OriginationAsset & Portfolio Advisory SP SalesPrimary / Capital MarketsSecondary Distribution SP Trading(Bid/Ask Spread)Market Making in Agency & Private label (securities and whole loans)
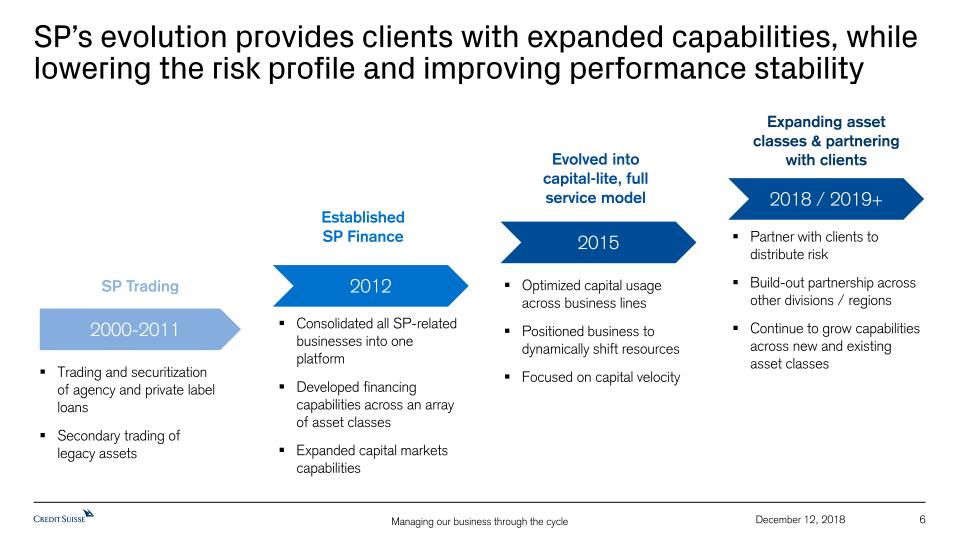
6 December 12, 2018 SP’s evolution provides clients with expanded capabilities, while lowering the risk profile and improving performance stability 2000-2011 2012 2015 2018 / 2019+ Evolved into capital-lite, full service model Established SP Finance Expanding asset classes & partnering with clients SP Trading Trading and securitization of agency and private label loans Secondary trading of legacy assets Consolidated all SP-related businesses into one platformDeveloped financing capabilities across an array of asset classesExpanded capital markets capabilities Optimized capital usage across business linesPositioned business to dynamically shift resourcesFocused on capital velocity Partner with clients to distribute riskBuild-out partnership across other divisions / regionsContinue to grow capabilities across new and existing asset classes

7 December 12, 2018 SP’s revenue diversification coupled with flexible capital allocation results in stable performance through the cycle SP net revenue performance1In USD mn Trading Fee/accrual 2008 2009 2010 2012 2013 2014 2015 2016 2017 LTM(as of Sep 2018) 2007 2006 Former Structure Current Structure US household debt5In USD trn BBB spreads2 vs Issuance3Spreads in bps, Issuance in USD bn 1 Net Revenues exclude SP other and NBL3 treasury. Figures for 2006-2015 present financial information as reported in each respective time period under our structure prior to re-segmentation announcement on Oct 21, 2015 2 LUCI BBB Benchmark Spread, Source: Federal Reserve Bank of St. Louis 3 All US Securitizations, Source: Thomson Reuters 4 Source: Federal Reserve Bank of St. Louis 5 Source: New York Fed Consumer Credit Panel/Equifax 3Q18 Total: USD 13.5 trn Correlation = -38% Spreads (bps) (as of Sep 2018) (as of Sep 2018) US unemployment rate4 (as of Sep 2018) 5% 7% 9% 11%
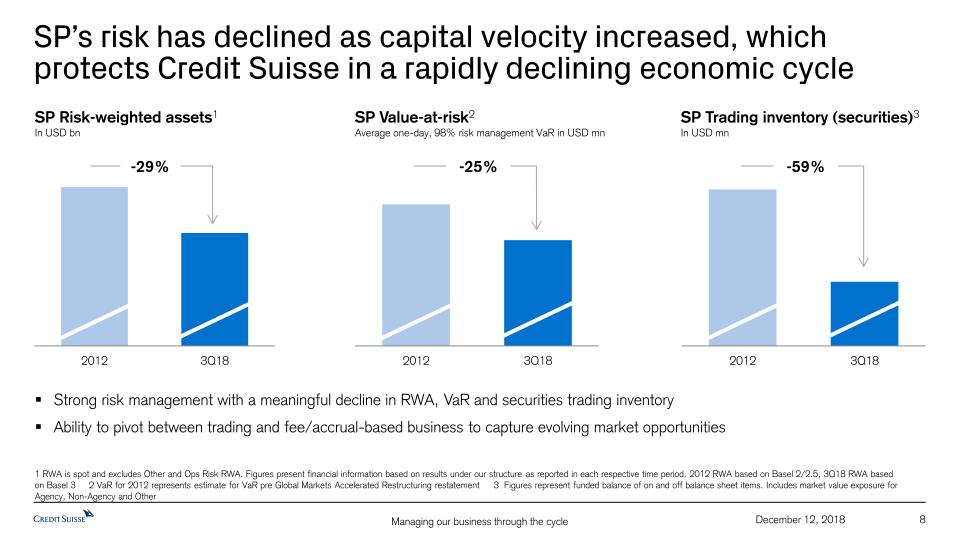
8 December 12, 2018 SP’s risk has declined as capital velocity increased, which protects Credit Suisse in a rapidly declining economic cycle SP Risk-weighted assets1In USD bn 1 RWA is spot and excludes Other and Ops Risk RWA. Figures present financial information based on results under our structure as reported in each respective time period. 2012 RWA based on Basel 2/2.5, 3Q18 RWA basedon Basel 3 2 VaR for 2012 represents estimate for VaR pre Global Markets Accelerated Restructuring restatement 3 Figures represent funded balance of on and off balance sheet items. Includes market value exposure for Agency, Non-Agency and Other -29% SP Value-at-risk2Average one-day, 98% risk management VaR in USD mn -25% Strong risk management with a meaningful decline in RWA, VaR and securities trading inventoryAbility to pivot between trading and fee/accrual-based business to capture evolving market opportunities SP Trading inventory (securities)3In USD mn -59%
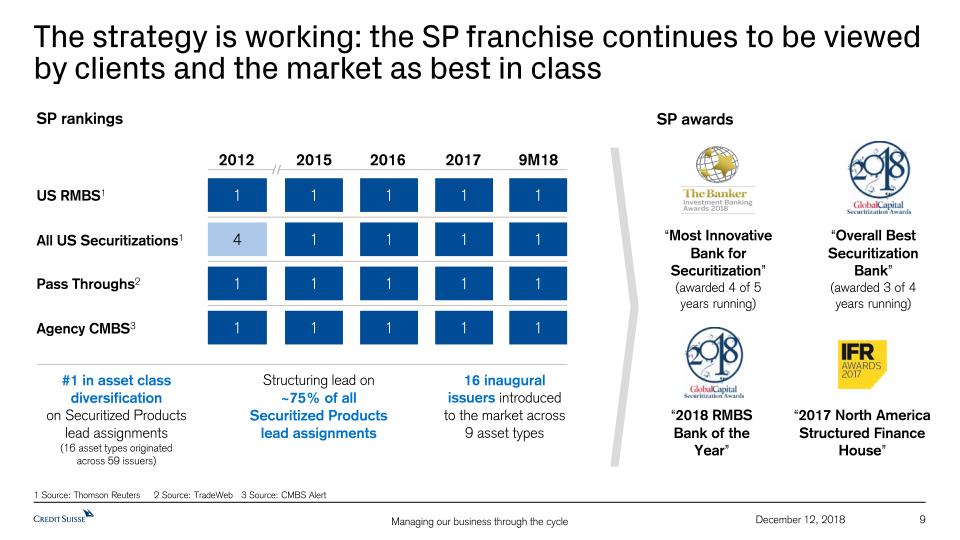
9 December 12, 2018 The strategy is working: the SP franchise continues to be viewed by clients and the market as best in class 1 1 1 1 US RMBS1 All US Securitizations1 2012 2015 2016 9M18 “Most Innovative Bank for Securitization”(awarded 4 of 5 years running) “Overall Best Securitization Bank” (awarded 3 of 4 years running) 1 2017 SP rankings “2018 RMBS Bank of the Year” Pass Throughs2 1 1 1 4 1 1 1 1 1 1 Agency CMBS3 1 1 1 1 1 “2017 North America Structured Finance House” Structuring lead on ~75% of all Securitized Products lead assignments 16 inaugural issuers introduced to the market across 9 asset types #1 in asset class diversification on Securitized Products lead assignments (16 asset types originated across 59 issuers) SP awards 1 Source: Thomson Reuters 2 Source: TradeWeb 3 Source: CMBS Alert
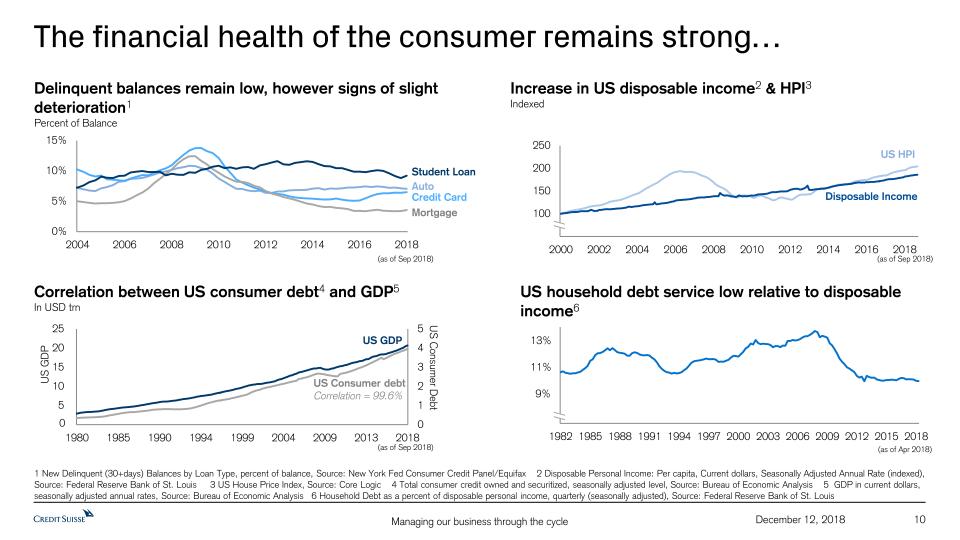
10 December 12, 2018 The financial health of the consumer remains strong… 1 New Delinquent (30+days) Balances by Loan Type, percent of balance, Source: New York Fed Consumer Credit Panel/Equifax 2 Disposable Personal Income: Per capita, Current dollars, Seasonally Adjusted Annual Rate (indexed), Source: Federal Reserve Bank of St. Louis 3 US House Price Index, Source: Core Logic 4 Total consumer credit owned and securitized, seasonally adjusted level, Source: Bureau of Economic Analysis 5 GDP in current dollars, seasonally adjusted annual rates, Source: Bureau of Economic Analysis 6 Household Debt as a percent of disposable personal income, quarterly (seasonally adjusted), Source: Federal Reserve Bank of St. Louis US household debt service low relative to disposable income6 Correlation between US consumer debt4 and GDP5In USD trn Increase in US disposable income2 & HPI3Indexed Delinquent balances remain low, however signs of slight deterioration1Percent of Balance 13% 11% 9% (as of Sep 2018) (as of Apr 2018) US HPI Disposable Income Student Loan Auto Credit Card Mortgage (as of Sep 2018) (as of Sep 2018) Correlation = 99.6% US Consumer debt US GDP US Consumer Debt US GDP 0
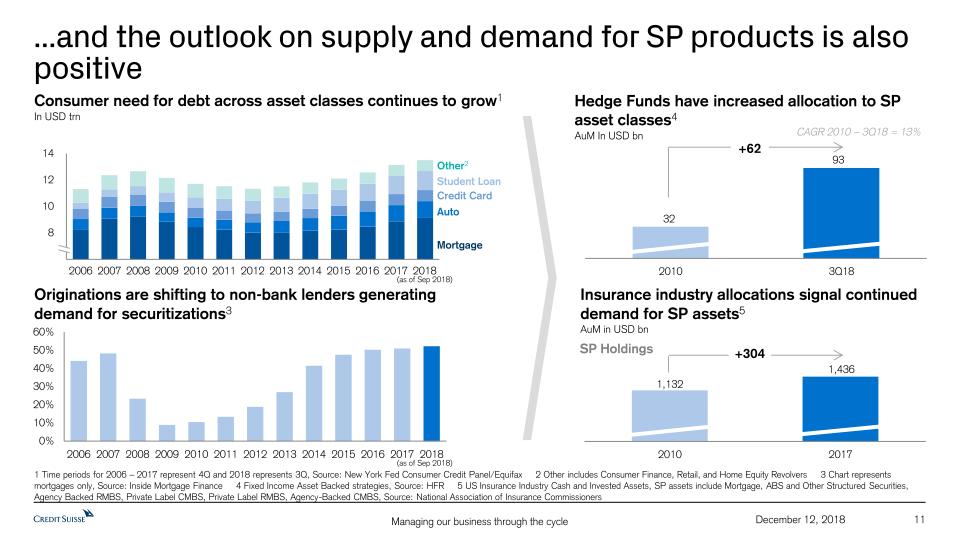
11 December 12, 2018 ...and the outlook on supply and demand for SP products is also positive 1 Time periods for 2006 – 2017 represent 4Q and 2018 represents 3Q, Source: New York Fed Consumer Credit Panel/Equifax 2 Other includes Consumer Finance, Retail, and Home Equity Revolvers 3 Chart represents mortgages only, Source: Inside Mortgage Finance 4 Fixed Income Asset Backed strategies, Source: HFR 5 US Insurance Industry Cash and Invested Assets, SP assets include Mortgage, ABS and Other Structured Securities, Agency Backed RMBS, Private Label CMBS, Private Label RMBS, Agency-Backed CMBS, Source: National Association of Insurance Commissioners Insurance industry allocations signal continued demand for SP assets5AuM in USD bn Hedge Funds have increased allocation to SP asset classes4AuM In USD bn SP Holdings (as of Sep 2018) Consumer need for debt across asset classes continues to grow1In USD trn Auto Credit Card Other2 2006 2007 2008 2009 2010 2011 2012 2013 2014 2015 2016 2017 2018 Mortgage Originations are shifting to non-bank lenders generating demand for securitizations3 Student Loan +62 (as of Sep 2018) CAGR 2010 – 3Q18 = 13% +304

David Miller, Global Head of Credit ProductsMalcolm Price, Global Head Financial SponsorsDecember 12, 2018 Managing our business through the cycleLeveraged Finance
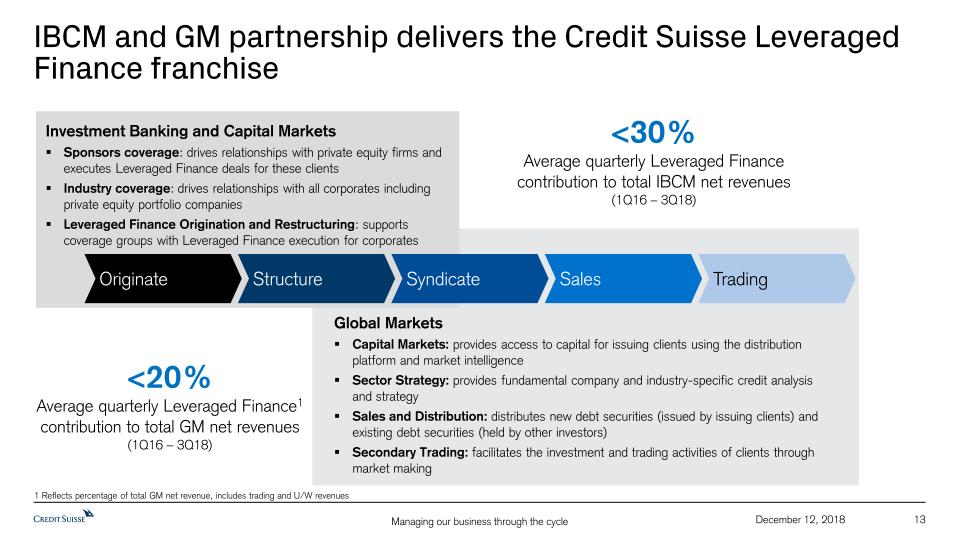
13 December 12, 2018 IBCM and GM partnership delivers the Credit Suisse Leveraged Finance franchise Global MarketsCapital Markets: provides access to capital for issuing clients using the distribution platform and market intelligenceSector Strategy: provides fundamental company and industry-specific credit analysis and strategySales and Distribution: distributes new debt securities (issued by issuing clients) and existing debt securities (held by other investors)Secondary Trading: facilitates the investment and trading activities of clients through market making Investment Banking and Capital MarketsSponsors coverage: drives relationships with private equity firms and executes Leveraged Finance deals for these clients Industry coverage: drives relationships with all corporates including private equity portfolio companiesLeveraged Finance Origination and Restructuring: supports coverage groups with Leveraged Finance execution for corporates Syndicate Sales Originate Structure Trading <30% Average quarterly Leveraged Finance contribution to total IBCM net revenues (1Q16 – 3Q18) <20%Average quarterly Leveraged Finance1 contribution to total GM net revenues (1Q16 – 3Q18) 1 Reflects percentage of total GM net revenue, includes trading and U/W revenues
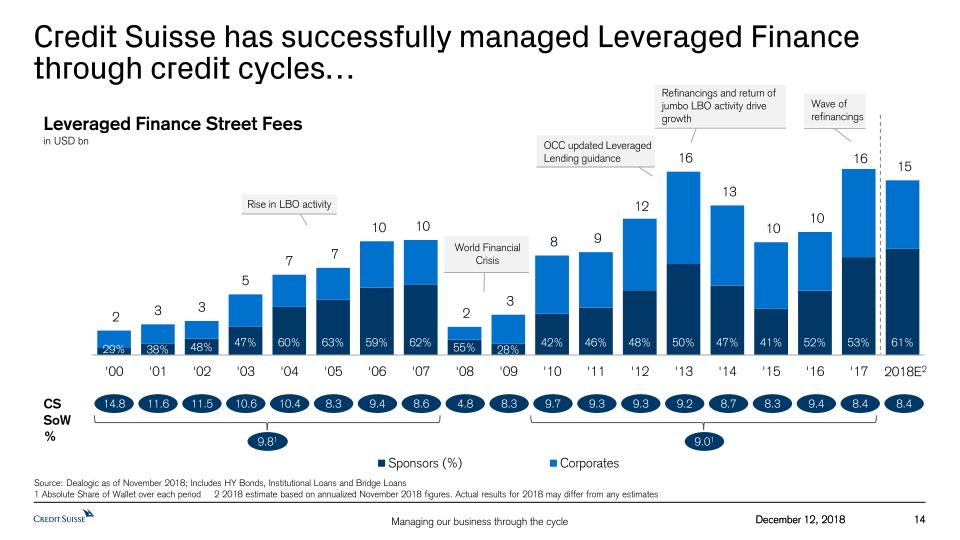
14 December 12, 2018 Credit Suisse has successfully managed Leveraged Finance through credit cycles… 14 December 12, 2018 CSSoW % 14.8 11.6 11.5 10.6 10.4 8.3 9.4 8.6 4.8 8.3 9.7 9.3 9.3 9.2 8.7 8.3 9.4 8.4 8.4 Source: Dealogic as of November 2018; Includes HY Bonds, Institutional Loans and Bridge Loans 1 Absolute Share of Wallet over each period 2 2018 estimate based on annualized November 2018 figures. Actual results for 2018 may differ from any estimates World Financial Crisis Rise in LBO activity Refinancings and return of jumbo LBO activity drive growth Wave of refinancings OCC updated Leveraged Lending guidance 2018E2 9.81 9.01 Leveraged Finance Street Feesin USD bn
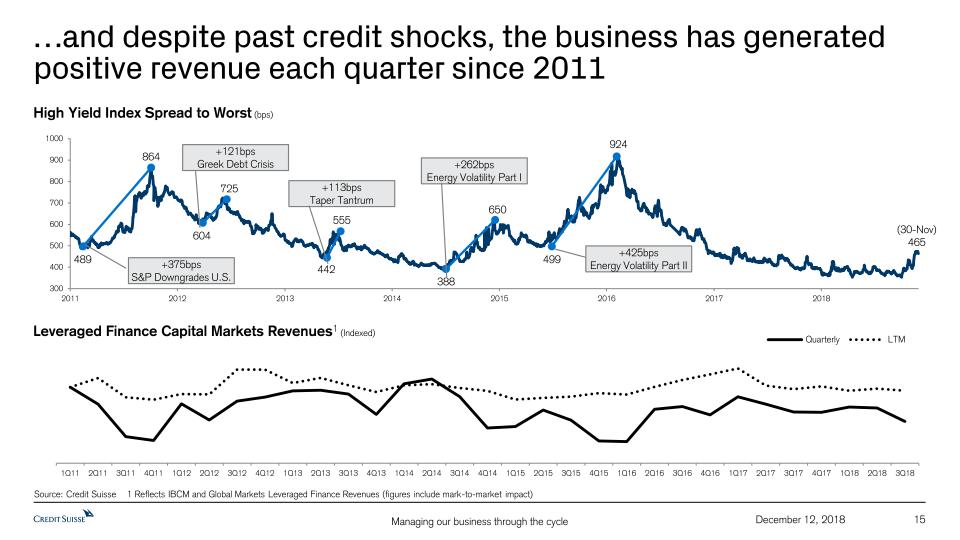
15 December 12, 2018 …and despite past credit shocks, the business has generated positive revenue each quarter since 2011 High Yield Index Spread to Worst (bps) Leveraged Finance Capital Markets Revenues1 (Indexed) 489 864 604 725 442 555 388 650 499 924 (30-Nov)465 +375bpsS&P Downgrades U.S. +121bpsGreek Debt Crisis +113bpsTaper Tantrum +262bpsEnergy Volatility Part I +425bpsEnergy Volatility Part II Source: Credit Suisse 1 Reflects IBCM and Global Markets Leveraged Finance Revenues (figures include mark-to-market impact)
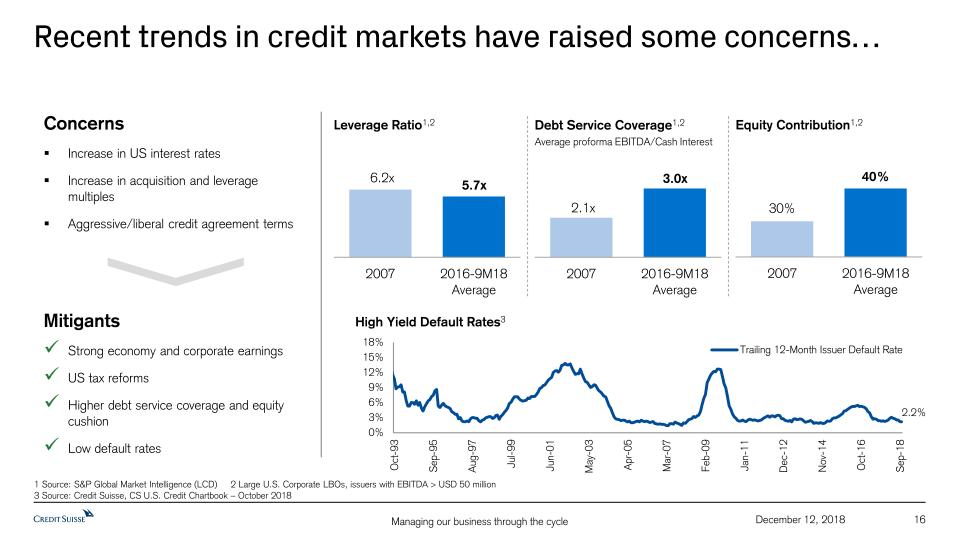
16 December 12, 2018 Recent trends in credit markets have raised some concerns… ConcernsIncrease in US interest ratesIncrease in acquisition and leverage multiplesAggressive/liberal credit agreement terms Debt Service Coverage1,2Average proforma EBITDA/Cash Interest 1 Source: S&P Global Market Intelligence (LCD) 2 Large U.S. Corporate LBOs, issuers with EBITDA > USD 50 million3 Source: Credit Suisse, CS U.S. Credit Chartbook – October 2018 MitigantsStrong economy and corporate earningsUS tax reformsHigher debt service coverage and equity cushionLow default rates High Yield Default Rates3 Leverage Ratio1,2 Equity Contribution1,2
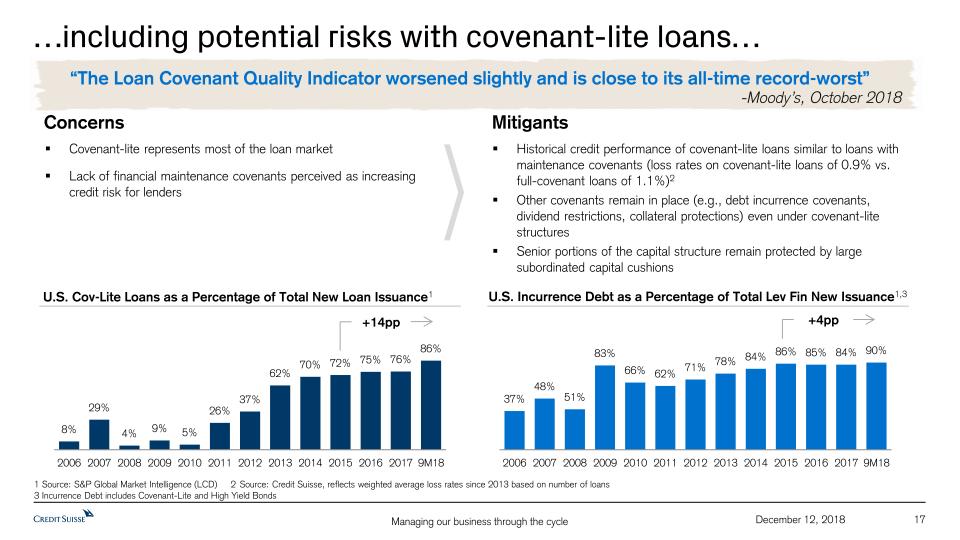
17 December 12, 2018 …including potential risks with covenant-lite loans… “The Loan Covenant Quality Indicator worsened slightly and is close to its all-time record-worst”-Moody’s, October 2018 U.S. Cov-Lite Loans as a Percentage of Total New Loan Issuance1 U.S. Incurrence Debt as a Percentage of Total Lev Fin New Issuance1,3 Concerns Mitigants Covenant-lite represents most of the loan marketLack of financial maintenance covenants perceived as increasing credit risk for lenders Historical credit performance of covenant-lite loans similar to loans with maintenance covenants (loss rates on covenant-lite loans of 0.9% vs. full-covenant loans of 1.1%)2 Other covenants remain in place (e.g., debt incurrence covenants, dividend restrictions, collateral protections) even under covenant-lite structuresSenior portions of the capital structure remain protected by large subordinated capital cushions 1 Source: S&P Global Market Intelligence (LCD) 22Source: Credit Suisse, reflects weighted average loss rates since 2013 based on number of loans 3 Incurrence Debt includes Covenant-Lite and High Yield Bonds +14pp +4pp
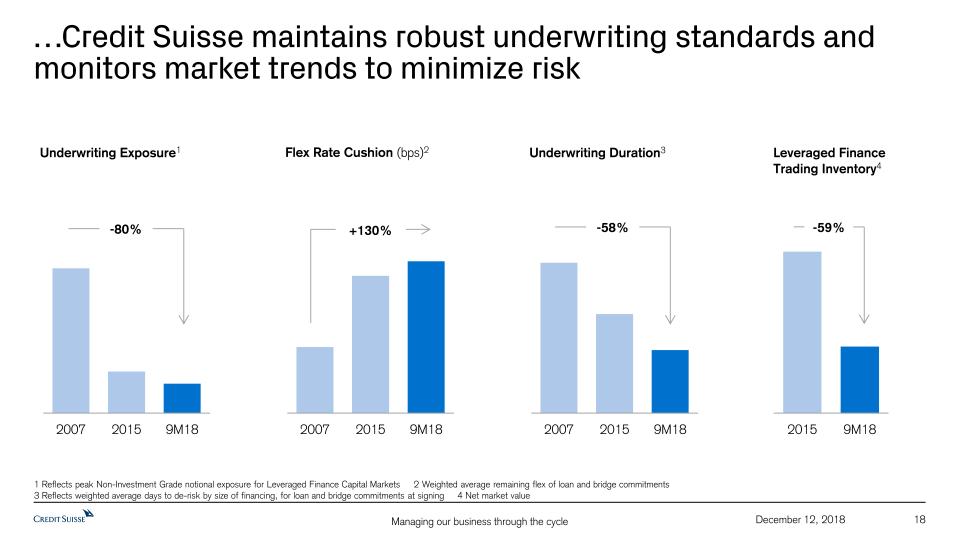
18 December 12, 2018 …Credit Suisse maintains robust underwriting standards and monitors market trends to minimize risk 1 Reflects peak Non-Investment Grade notional exposure for Leveraged Finance Capital Markets 2 Weighted average remaining flex of loan and bridge commitments3 Reflects weighted average days to de-risk by size of financing, for loan and bridge commitments at signing 4 Net market value Flex Rate Cushion (bps)2 Underwriting Duration3 Underwriting Exposure1 -80% +130% -58% Leveraged Finance Trading Inventory4 -59%

Fundamentals of the largest Single B M&A financing deals have significantly improved post-crisis 19 December 12, 2018 Top Deals 2006 – 2008 Company Total Debt in USD bn Net Leverage Multiple Equity Cushion TXU Corp 40.0 7.9x 18.8% HCA Inc 27.9 6.3x 15.9% Alltel Holdings Corp 24.0 7.7x 15.5% First Data Corp 22.2 8.4x 24.8% Clear Channel 20.8 8.4x 14.4% Top Deals 2016 – 9M18 Company Total Debt in USD bn Net Leverage Multiple Equity Cushion Refinitiv 13.5 5.2x 32.5% Akzo Nobel Chemicals 7.6 5.7x 34.2% Avantor 7.3 7.0x 41.0% Envision Healthcare 7.2 6.9x 31.5% BMC Software 6.2 6.5x 27.7% 27.0 Top 5 average Source: S&P Global Market Intelligence (LCD), Dealogic, Public OMs (Use of Proceeds & Source of Funds)1 Weighted average based on total debt ~7.7x1 ~17.9%1 8.4 Top 5 average ~6.1x1 ~33.4%1
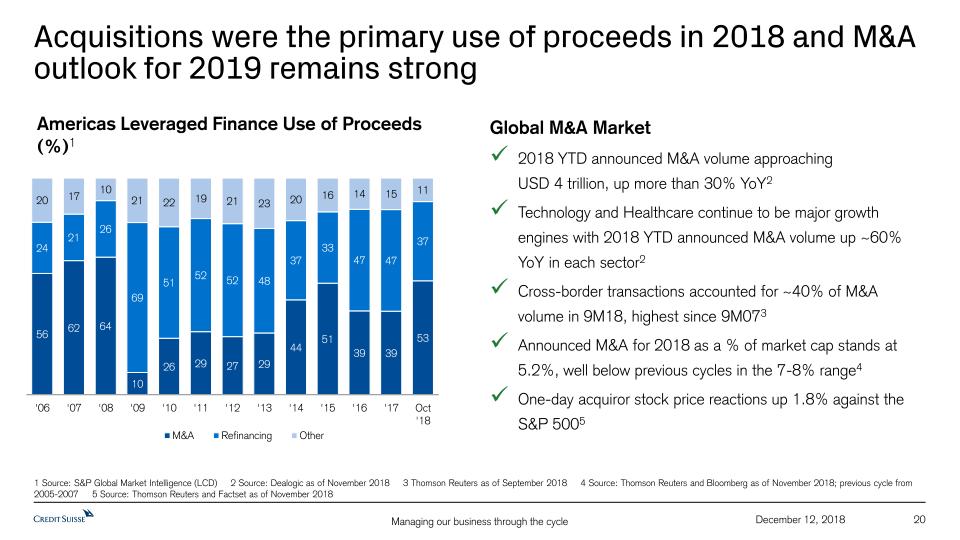
20 December 12, 2018 Acquisitions were the primary use of proceeds in 2018 and M&A outlook for 2019 remains strong 1 Source: S&P Global Market Intelligence (LCD) 2 Source: Dealogic as of November 2018 3 Thomson Reuters as of September 2018 4 Source: Thomson Reuters and Bloomberg as of November 2018; previous cycle from 2005-2007 5 Source: Thomson Reuters and Factset as of November 2018 Americas Leveraged Finance Use of Proceeds (%)1 Global M&A Market2018 YTD announced M&A volume approaching USD 4 trillion, up more than 30% YoY2Technology and Healthcare continue to be major growth engines with 2018 YTD announced M&A volume up ~60% YoY in each sector2Cross-border transactions accounted for ~40% of M&A volume in 9M18, highest since 9M073 Announced M&A for 2018 as a % of market cap stands at 5.2%, well below previous cycles in the 7-8% range4One-day acquiror stock price reactions up 1.8% against the S&P 5005
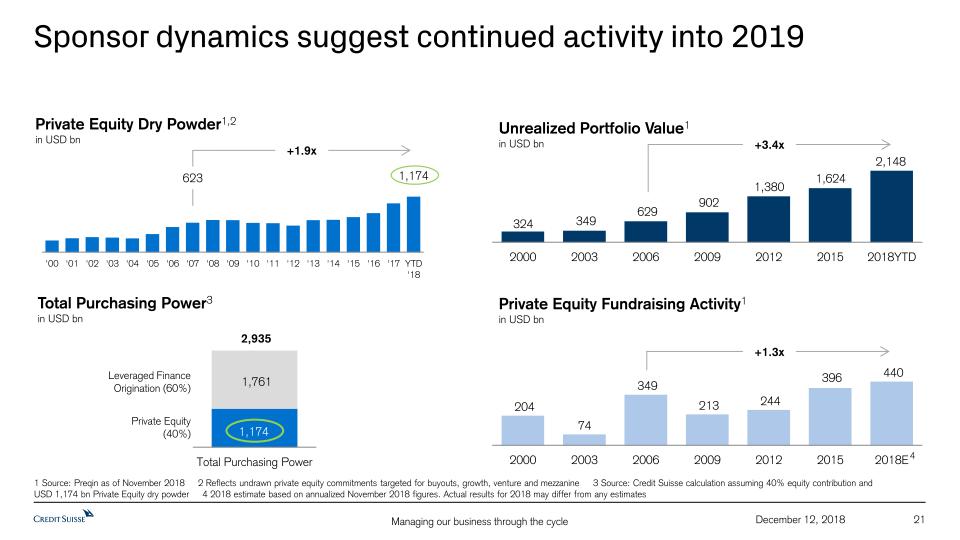
21 December 12, 2018 Sponsor dynamics suggest continued activity into 2019 Unrealized Portfolio Value1 in USD bn Private Equity Fundraising Activity1 in USD bn Private Equity Dry Powder1,2 in USD bn 1,174 +1.9x 623 Total Purchasing Power3 in USD bn +3.4x Leveraged Finance Origination (60%) Private Equity (40%) 2,935 +1.3x 4 1 Source: Preqin as of November 2018 2 Reflects undrawn private equity commitments targeted for buyouts, growth, venture and mezzanine 3 Source: Credit Suisse calculation assuming 40% equity contribution andUSD 1,174 bn Private Equity dry powder 4 2018 estimate based on annualized November 2018 figures. Actual results for 2018 may differ from any estimates 1,174 1,761
Timothy Joyce, Global Head of Portfolio Management for Corporate BankDecember 12, 2018 Managing our business through the cycleCorporate Bank
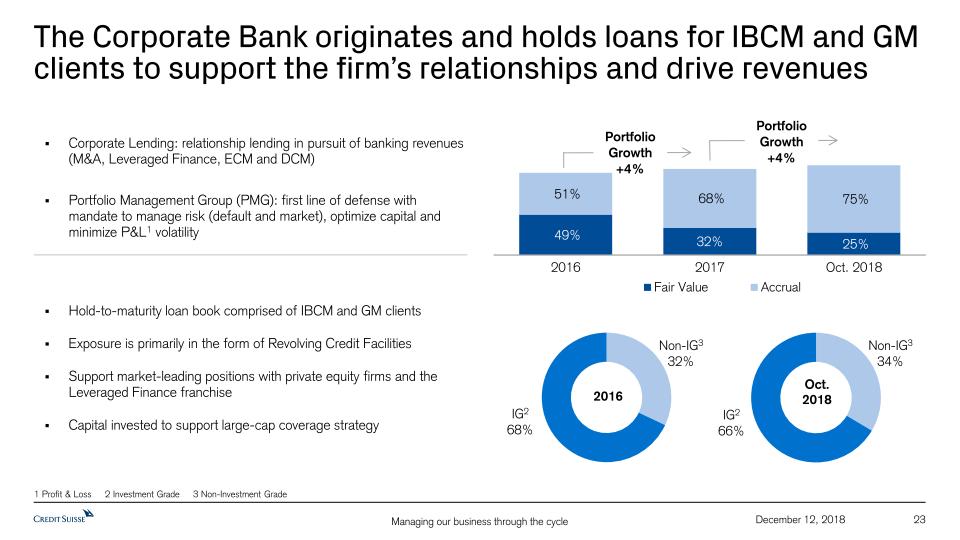
23 December 12, 2018 The Corporate Bank originates and holds loans for IBCM and GM clients to support the firm’s relationships and drive revenues Hold-to-maturity loan book comprised of IBCM and GM clients Exposure is primarily in the form of Revolving Credit FacilitiesSupport market-leading positions with private equity firms and the Leveraged Finance franchiseCapital invested to support large-cap coverage strategy Corporate Lending: relationship lending in pursuit of banking revenues (M&A, Leveraged Finance, ECM and DCM)Portfolio Management Group (PMG): first line of defense with mandate to manage risk (default and market), optimize capital and minimize P&L1 volatility Portfolio Growth +4% Portfolio Growth +4% 2016 Oct. 2018 1 Profit & Loss 2 Investment Grade 3 Non-Investment Grade Non-IG332% Non-IG334%
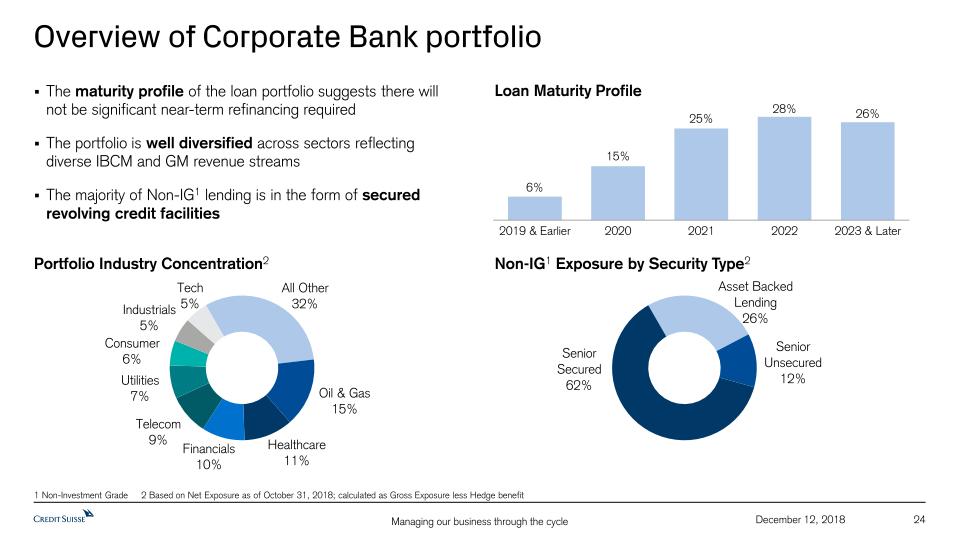
24 December 12, 2018 Overview of Corporate Bank portfolio The maturity profile of the loan portfolio suggests there will not be significant near-term refinancing requiredThe portfolio is well diversified across sectors reflecting diverse IBCM and GM revenue streamsThe majority of Non-IG1 lending is in the form of secured revolving credit facilities Loan Maturity Profile Non-IG1 Exposure by Security Type2 Portfolio Industry Concentration2 1 Non-Investment Grade 2 Based on Net Exposure as of October 31, 2018; calculated as Gross Exposure less Hedge benefit
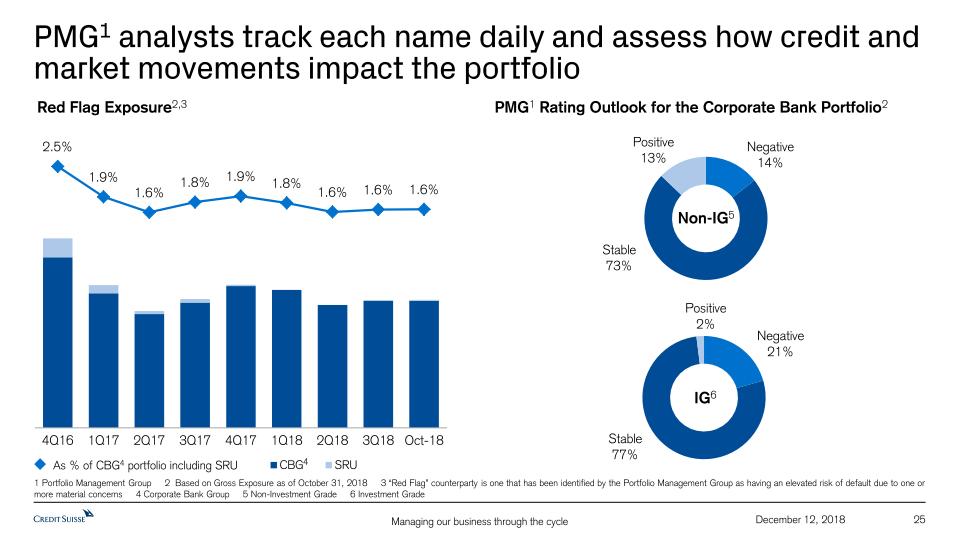
25 December 12, 2018 PMG1 analysts track each name daily and assess how credit and market movements impact the portfolio As % of CBG4 portfolio including SRU Non-IG5 IG6 PMG1 Rating Outlook for the Corporate Bank Portfolio2 Red Flag Exposure2,3 1 Portfolio Management Group 2 Based on Gross Exposure as of October 31, 2018 3 “Red Flag” counterparty is one that has been identified by the Portfolio Management Group as having an elevated risk of default due to one or more material concerns 4 Corporate Bank Group 5 Non-Investment Grade 6 Investment Grade 4

Carsten Stoehr, Head of APAC Financing Group & CEO Greater ChinaDecember 12, 2018 Managing our business through the cycleIntegrated APAC client lending
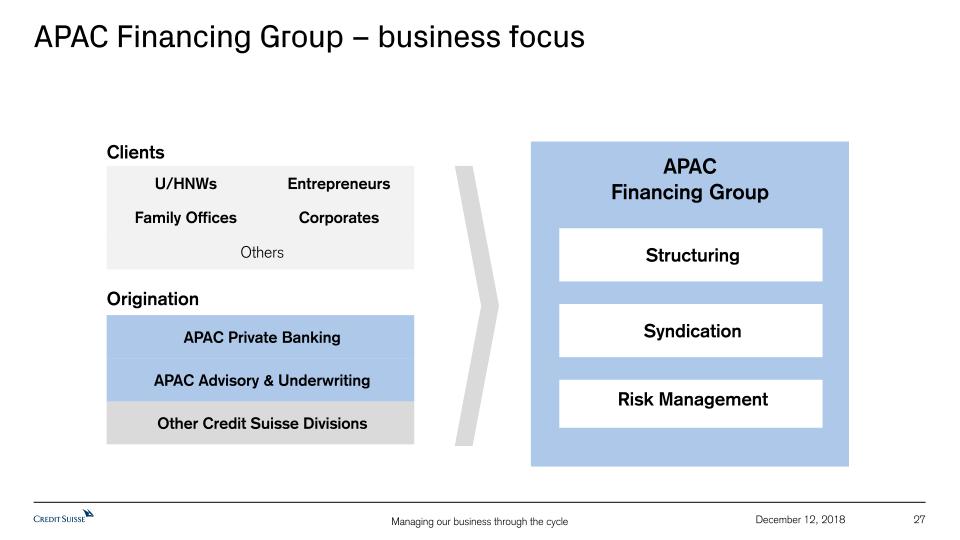
27 December 12, 2018 APAC Financing Group – business focus U/HNWsFamily Offices Clients APAC Private Banking Origination Other Credit Suisse Divisions APACFinancing Group Structuring Syndication Risk Management APAC Advisory & Underwriting EntrepreneursCorporates Others
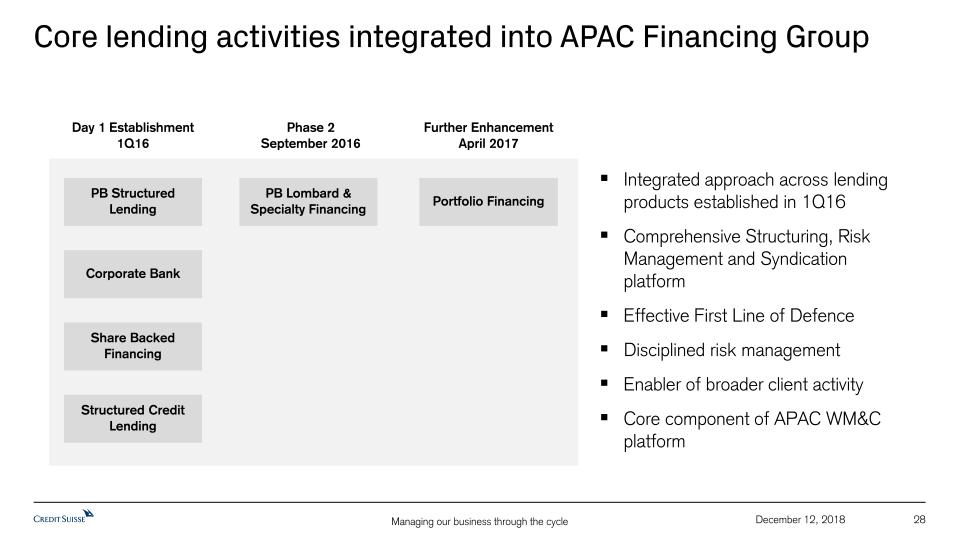
28 December 12, 2018 Core lending activities integrated into APAC Financing Group Day 1 Establishment1Q16 Phase 2 September 2016 Further EnhancementApril 2017 PB Structured Lending PB Lombard & Specialty Financing Corporate Bank Share Backed Financing Portfolio Financing Structured Credit Lending Integrated approach across lending products established in 1Q16Comprehensive Structuring, Risk Management and Syndication platformEffective First Line of DefenceDisciplined risk managementEnabler of broader client activityCore component of APAC WM&C platform
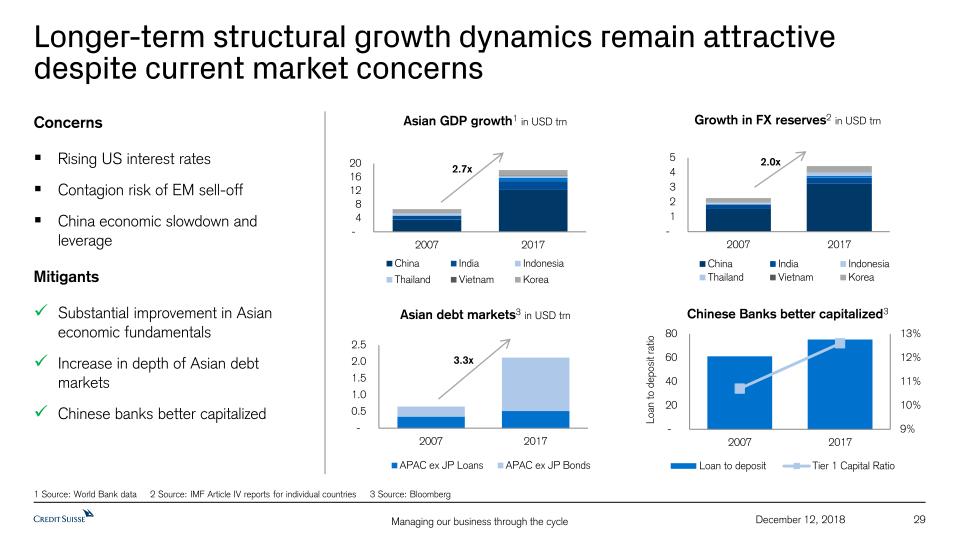
29 December 12, 2018 Longer-term structural growth dynamics remain attractive despite current market concerns ConcernsRising US interest ratesContagion risk of EM sell-offChina economic slowdown and leverage MitigantsSubstantial improvement in Asian economic fundamentalsIncrease in depth of Asian debt marketsChinese banks better capitalized Asian GDP growth1 in USD trn 2.7x 2.0x Growth in FX reserves2 in USD trn Asian debt markets3 in USD trn 3.3x 1 Source: World Bank data 2 Source: IMF Article IV reports for individual countries 3 Source: Bloomberg Chinese Banks better capitalized3
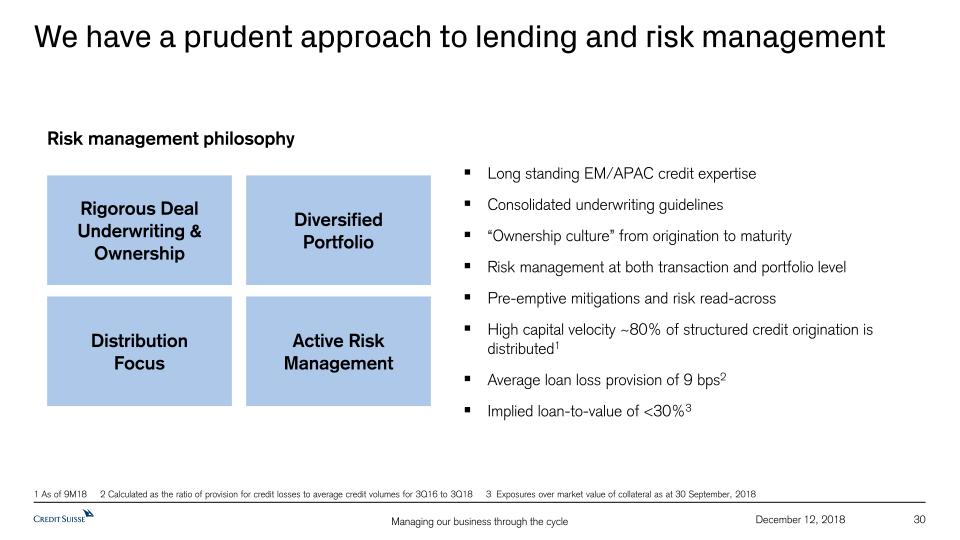
30 December 12, 2018 We have a prudent approach to lending and risk management Long standing EM/APAC credit expertiseConsolidated underwriting guidelines“Ownership culture” from origination to maturityRisk management at both transaction and portfolio levelPre-emptive mitigations and risk read-acrossHigh capital velocity ~80% of structured credit origination is distributed1Average loan loss provision of 9 bps2Implied loan-to-value of <30%3 Rigorous Deal Underwriting & Ownership Risk management philosophy DistributionFocus Diversified Portfolio Active Risk Management 1 As of 9M18 2 Calculated as the ratio of provision for credit losses to average credit volumes for 3Q16 to 3Q18 3 Exposures over market value of collateral as at 30 September, 2018
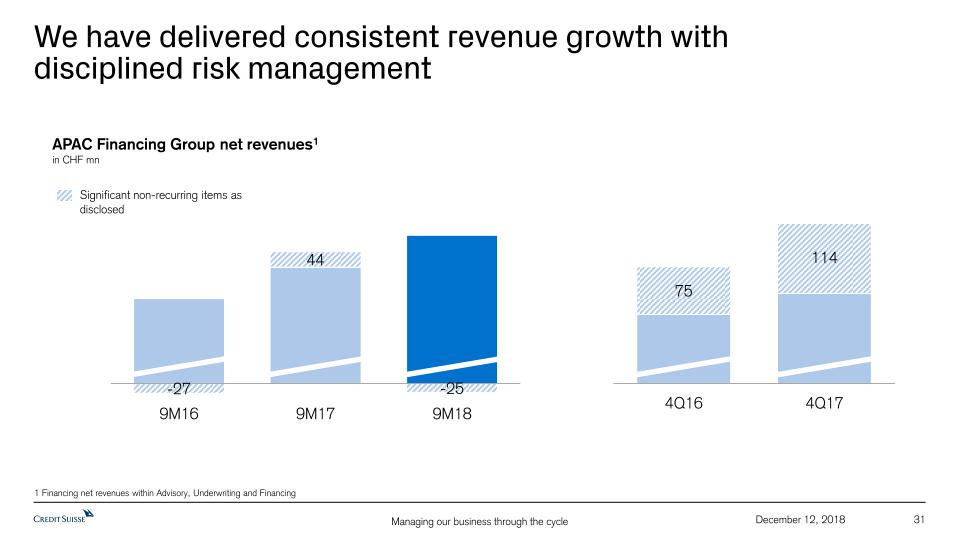
31 December 12, 2018 We have delivered consistent revenue growth withdisciplined risk management APAC Financing Group net revenues1in CHF mn Significant non-recurring items as disclosed 1 Financing net revenues within Advisory, Underwriting and Financing c
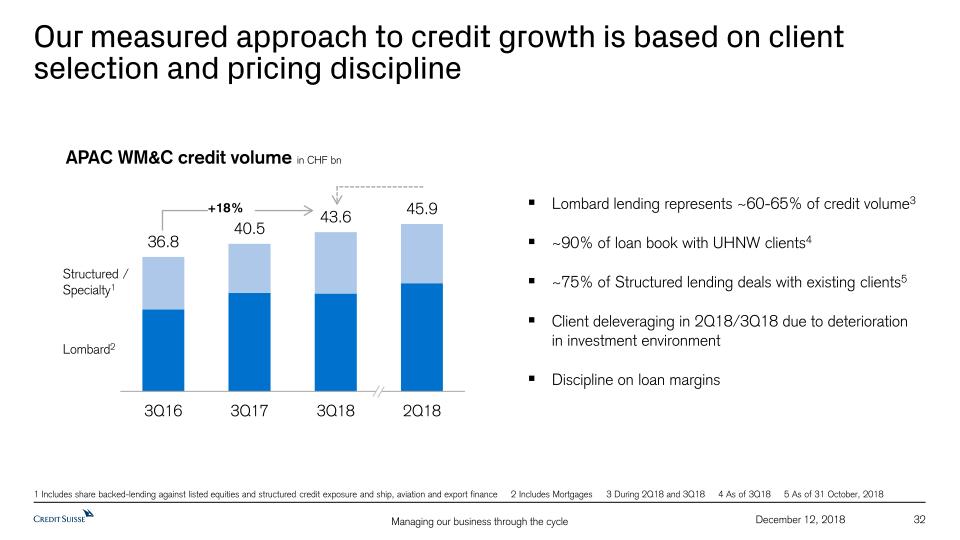
32 December 12, 2018 Our measured approach to credit growth is based on client selection and pricing discipline Lombard lending represents ~60-65% of credit volume3~90% of loan book with UHNW clients4~75% of Structured lending deals with existing clients5Client deleveraging in 2Q18/3Q18 due to deterioration in investment environmentDiscipline on loan margins APAC WM&C credit volume in CHF bn 1 Includes share backed-lending against listed equities and structured credit exposure and ship, aviation and export finance 2 Includes Mortgages 3 During 2Q18 and 3Q18 4 As of 3Q18 5 As of 31 October, 2018 Lombard2 Structured / Specialty1 +18%
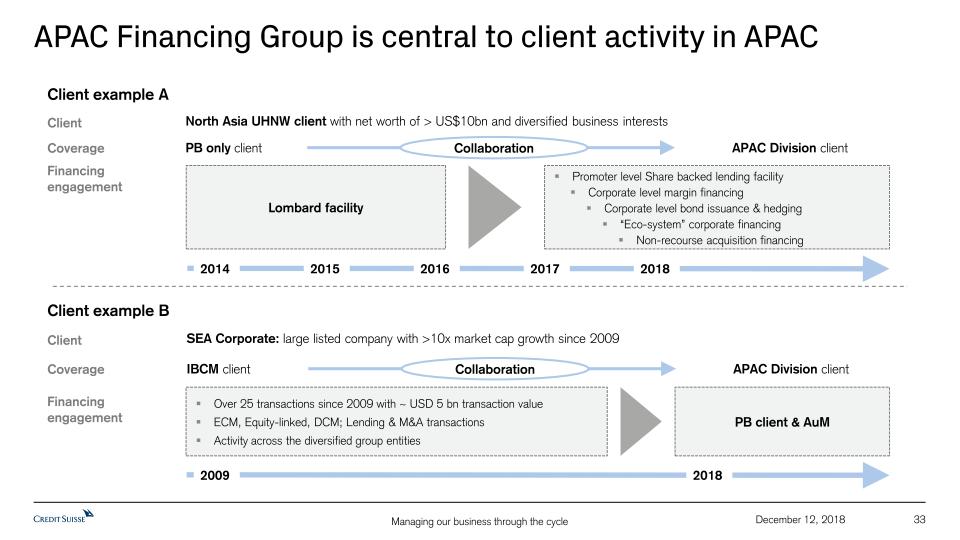
33 December 12, 2018 APAC Financing Group is central to client activity in APAC Lombard facility Client example A North Asia UHNW client with net worth of > US$10bn and diversified business interests Financing engagement 2014 2017 2015 2016 Promoter level Share backed lending facility Client Coverage PB only client APAC Division client Collaboration 2018 Corporate level margin financing Corporate level bond issuance & hedging “Eco-system” corporate financing Non-recourse acquisition financing Client example B SEA Corporate: large listed company with >10x market cap growth since 2009 Financing engagement 2009 Client Coverage IBCM client APAC Division client Collaboration 2018 Over 25 transactions since 2009 with ~ USD 5 bn transaction valueECM, Equity-linked, DCM; Lending & M&A transactionsActivity across the diversified group entities PB client & AuM
Appendix 34 December 12, 2018
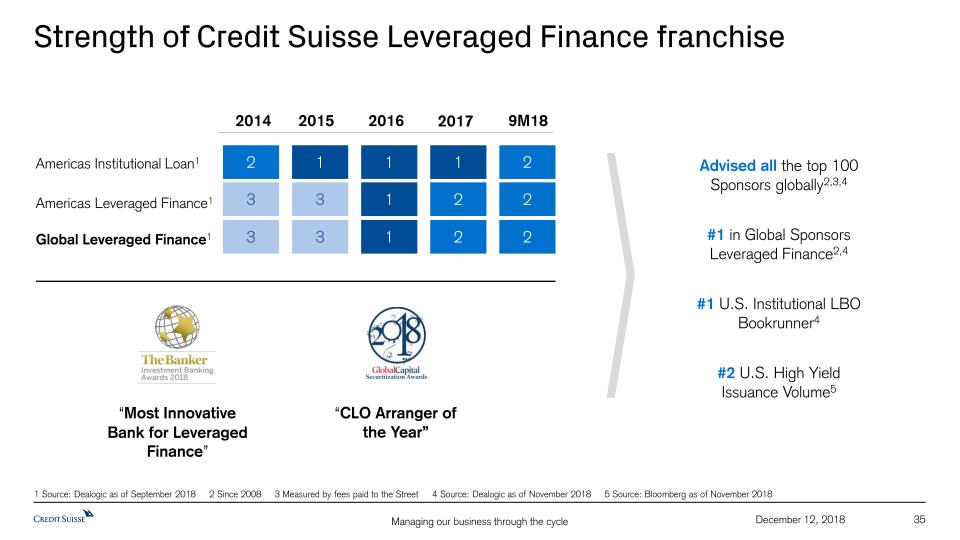
35 December 12, 2018 Strength of Credit Suisse Leveraged Finance franchise 1 1 2 2 1 2 3 3 Americas Institutional Loan1 Americas Leveraged Finance1 Global Leveraged Finance1 2014 2015 2016 9M18 1 2 3 3 1 2 2017 2 “CLO Arranger of the Year” “Most Innovative Bank for Leveraged Finance” #1 in Global Sponsors Leveraged Finance2,4 Advised all the top 100 Sponsors globally2,3,4 #1 U.S. Institutional LBO Bookrunner4 #2 U.S. High Yield Issuance Volume5 1 Source: Dealogic as of September 2018 2 Since 2008 3 Measured by fees paid to the Street 4 Source: Dealogic as of November 2018 5 Source: Bloomberg as of November 2018

Notes (1/2) 36 December 12, 2018 For reconciliation of adjusted to reported results, refer to the Appendix of the CEO and CFO Investor Day presentations, published on December 12, 2018Throughout the presentation rounding differences may occurUnless otherwise noted, all CET1 ratio, Tier 1 leverage ratio, risk-weighted assets and leverage exposure figures shown in this presentation are as of the end of the respective period and on a “look-through” basisGross and net margins are shown in basis pointsGross margin = (adj.) net revenues annualized / average AuM; net margin = (adj.) pre-tax income annualized / average AuMMandate penetration reflects advisory and discretionary mandate volumes as a percentage of AuM, excluding those from the external asset manager business General notes Specific notes * Our cost savings program, until the end of 2018, is measured using an adjusted operating cost base at constant 2015 FX rates. “Adjusted operating cost base at constant FX rates” includes adjustments as made in all our disclosures for restructuring expenses, major litigation provisions, expenses related to business sales and a goodwill impairment taken in 4Q15 as well as adjustments for debit valuation adjustments (DVA) related volatility, FX and for certain accounting changes (which had not been in place at the launch of the cost savings program). Adjustments for certain accounting changes have been restated to reflect grossed up expenses in the Corporate Center and, starting in 1Q18, also include adjustments for changes from ASU 2014-09 “Revenue from Contracts with Customers”, which is described further in our 1Q18, 2Q18 and 3Q18 financial reports. Adjustments for FX apply unweighted currency exchange rates, i.e., a straight line average of monthly rates, consistently for the periods under review. Starting from 1Q19, we intend to express our operating cost base at constant 2018 FX rates and to adjust for significant litigation costs, expenses related to business and real estate sales as well as DVA related volatility, but not for restructuring expenses and certain accounting changes. Adjustments for FX will continue to apply unweighted currency exchange rates.† Regulatory capital is calculated as the worst of 10% of RWA and 3.5% of leverage exposure. Return on regulatory capital is calculated using (adjusted) income / (loss) after tax and assumes a tax rate of 30% and capital allocated based on the worst of 10% of average RWA and 3.5% of average leverage exposure. For the Markets business within the APAC division and for the Global Markets and Investment Banking & Capital Markets divisions, return on regulatory capital is based on US dollar denominated numbers. Adjusted return on regulatory capital is calculated using adjusted results, applying the same methodology to calculate return on regulatory capital. ‡ Return on tangible equity is based on tangible equity attributable to shareholders, a non-GAAP financial measure, which is calculated by deducting goodwill and other intangible assets from total equity attributable to shareholders as presented in our balance sheet. Management believes that the return on tangible equity attributable to shareholders is meaningful as it allows consistent measurement of the performance of businesses without regard to whether the businesses were acquired.° Tangible book value is a non-GAAP financial measure and is equal to tangible equity attributable to shareholders. Tangible book value per share is a non-GAAP financial measure, which is calculated by dividing tangible equity attributable to shareholders, a non-GAAP financial measure, by total number of shares outstanding. Tangible equity attributable to shareholders, a non-GAAP financial measure, is calculated by deducting goodwill and other intangible assets from total equity attributable to shareholders as presented in our balance sheet. Management believes that tangible book value per share is meaningful as it allows consistent measurement of the performance of businesses without regard to whether the businesses were acquired. For end-3Q18, tangible equity excluded goodwill of CHF 4,736 mn and other intangible assets of CHF 214 mn from total shareholders’ equity of CHF 42,734 mn as presented in our balance sheet. For end-2017, tangible equity excluded goodwill of CHF 4,742 mn and other intangible assets of CHF 223 mn from total shareholders' equity of CHF 41,902 mn as presented in our balance sheet. For end-2Q15, tangible equity excluded goodwill of CHF 8,238 mn and other intangible assets of CHF 205 mn from total shareholders' equity of CHF 42,642 mn as presented in our balance sheet. Shares outstanding were 2,552.4 mn at end-3Q18, 2,550.3 mn at end-2017 and 1,632.4 mn at end-2Q15.

37 December 12, 2018 Abbreviations Adj. = Adjusted; AI = Artificial Intelligence; AM = Asset Management; AML = Anti-Money Laundering; APAC = Asia Pacific; ARU = Asset Resolution Unit;AT1 = Additional Tier 1; AuM = Assets under Management; BCBS = Basel Committee on Banking Supervision; BEAT = Base Erosion and Anti-Abuse Tax; BIS = Bank for International Settlements; bps = basis points; CAGR = Compound Annual Growth Rate; CBG = Corporate Bank Group; CCAR = Comprehensive Capital Adequacy Review; CCRO = Chief Compliance and Regulatory Affairs Officer; CDX HY = High-yield credit default swap index; CET1 = Common Equity Tier 1; CIC = Corporate & Institutional Clients; CIF = Customer/Client Information File; CIO = Chief Investment Officer; Corp. Ctr. = Corporate Center; CtB = Change the Bank; CVA = Credit Valuation Adjustment; DCM = Debt Capital Markets; DoJ = Department of Justice; DTA = Deferred Tax Assets; DVA = Debit Valuation Adjustments; EAM = External Asset Manager; EBITDA = Earnings Before Interest Taxes Depreciation and Amortization; ECM = Equity Capital Markets; EM = Emerging Markets; EMEA = Europe, Middle East & Africa; EQ = Equities; ERP = Enterprise Resource Planning; Est. = Estimate; EU = European Union; FICC = Fixed Income, Currencies & Commodities; FINMA = Swiss Financial Market Supervisory Authority FINMA; FLP = Fund Linked Products; FRTB = Fundamental Review of the Trading Book; FTE = Full-time employee; FX = Foreign Exchange; GDP = Gross Domestic Product; GM = Global Markets; G10 = Group of Ten; HKEX = Hong Kong Exchange; IBCM = Investment Banking & Capital Markets; IBD = Investment Banking Department; IC = Investment Consultant; ICBC = Industrial and Commercial Bank of China; ICBCCS = ICBC Credit Suisse Asset Management Co. Ltd; IG = Investment Grade; IMF = International Monetary Fund; IMM = Internal Model Method; IP = Investor Products; IPO = Initial Public Offering; IPRE= Interest Producing Real Estate; IRB = Internal Ratings Based; IS&P = Investment Solutions and Products; IT = Information Technology; ITS = International Trading Solutions; IWM = International Wealth Management; JV = Joint Venture; LBO = Leveraged Buyout; LE = Leverage Exposure; LSC = Large Swiss Corporates; LTM = Last Twelve Months; M&A = Mergers & Acquisitions; MD(R) = Managing Director; Mgmt. = Management; MI = Management Information; MifiD II = Markets in Financial Instruments Directive II; Mkts = Markets; NNA = Net new assets; OCC = Office of the Comptroller of the Currency; Op Risk = Operational Risk; PB = Private Banking; PB&WM = Private Banking & Wealth Management; PC = Private Clients; PEP = Politically Exposed Person; pp = percentage points; PTI = Pre-tax income; PWMC = Private & Wealth Management Clients; RM = Relationship Manager(s); RMBS = Residential Mortgage Backed Securities; RoRC = Return on Regulatory Capital; RoTE = Return on Tangible Equity; RPA = Robotic Process Automation; RtB = Run the Bank; RWA = Risk-weighted assets; SA-CCR = Standardized Approach to Counterparty Credit Risk; SME = Small and Medium-Sized Enterprises; SMG = Systematic Market-Making Group; SoW = Share of Wallet; SRU = Strategic Resolution Unit; SUB = Swiss Universal Bank; TBTF = Too Big To Fail; TBV(PS) = Tangible Book Value (per Share); (U)HNW(I) = (Ultra) High Net Worth (Individuals); US GAAP = United States Generally Accepted Accounting Principles; U/W = Underwriting; VaR = Value-at-Risk; VIX = Volatility Index; WM = Wealth Management; WM&C = Wealth Management & Connected; YoY = Year over year; YTD = Year to Date Notes (2/2)
SIGNATURES
Pursuant to the requirements of the Securities Exchange Act of 1934, the registrants have duly caused this report to be signed on their behalf by the undersigned, thereunto duly authorized.
| CREDIT SUISSE GROUP AG and CREDIT SUISSE AG | ||
| (Registrants) | ||
| By: | /s/ Heidi Schmid Obrist | |
| Heidi Schmid Obrist | ||
| Director | ||
| /s/ Federica Pisacane Rohde | ||
| Federica Pisacane Rohde | ||
| Date: December 31, 2018 | Vice President |