UNITED STATES
SECURITIES AND EXCHANGE COMMISSION
SECURITIES AND EXCHANGE COMMISSION
Washington, D.C. 20549
Form 6-K
REPORT OF FOREIGN PRIVATE ISSUER PURSUANT TO RULE 13a-16 OR 15d-16
UNDER THE SECURITIES EXCHANGE ACT OF 1934
UNDER THE SECURITIES EXCHANGE ACT OF 1934
February 14, 2019
Commission File Number 001-15244
CREDIT SUISSE GROUP AG
(Translation of registrant’s name into English)
Paradeplatz 8, CH 8001 Zurich, Switzerland
(Address of principal executive office)
(Address of principal executive office)
Commission File Number 001-33434
CREDIT SUISSE AG
(Translation of registrant’s name into English)
Paradeplatz 8, CH 8001 Zurich, Switzerland
(Address of principal executive office)
(Address of principal executive office)
Indicate by check mark whether the registrant files or will file annual reports under cover of Form 20-F or
Form 40-F.
Form 40-F.
Form 20-F  Form 40-F
Form 40-F Indicate by check mark if the registrant is submitting the Form 6-K in paper as permitted by Regulation S-T Rule 101(b)(1):
Note: Regulation S-T Rule 101(b)(1) only permits the submission in paper of a Form 6-K if submitted solely to provide an attached annual report to security holders.
Indicate by check mark if the registrant is submitting the Form 6-K in paper as permitted by Regulation S-T Rule 101(b)(7):
Note: Regulation S-T Rule 101(b)(7) only permits the submission in paper of a Form 6-K if submitted to furnish a report or other document that the registrant foreign private issuer must furnish and make public under the laws of the jurisdiction in which the registrant is incorporated, domiciled or legally organized (the registrant’s “home country”), or under the rules of the home country exchange on which the registrant’s securities are traded, as long as the report or other document is not a press release, is not required to be and has not been distributed to the registrant’s security holders, and, if discussing a material event, has already been the subject of a Form 6-K submission or other Commission filing on EDGAR.
This report includes the media release and the slides for the presentation to investors in connection with the 4Q18 and full year 2018 results.
Media Release Zurich, 14 February, 2019 |  |
Full year and fourth quarter 2018 financial results
Completes three year restructuring and achieves first annual post-tax profit since 2014 of CHF 2.1 billion
Full year 2018 highlights:
| ■ | Group annual reported pre-tax income of CHF 3.4 billion, up 90% against 2017 reported pre-tax income of CHF 1.8 billion |
| ■ | Adjusted* pre-tax income of CHF 4.2 billion, 52% higher than 2017 |
| ■ | Net income attributable to shareholders of CHF 2.1 billion for 2018, delivering first annual post-tax profit since 2014; achieving diluted earnings of CHF 0.78 per share |
| ■ | Adjusted* operating cost base of CHF 16.5 billion for 2018, beating the target of CHF 17 billion by end-2018; cumulative net cost savings of CHF 4.6 billion since end-2015, exceeding target of greater than CHF 4.2 billion by 11% |
| ■ | Strong annual inflows with CHF 34.4 billion of Wealth Management Net New Assets (NNA) in 2018, the result of inflows in each quarter; total NNA of CHF 56.5 billion, up 49% against 2017 |
| ■ | Strategic Resolution Unit (SRU) successfully closed, outperforming end-state targets; adjusted* annual pre-tax loss of USD 1.3 billion compared to USD 3.0 billion in 2016; projected to fall to an adjusted* pre-tax loss of approximately USD 0.5 billion in 2019 |
| ■ | Strong capital position; CET1 ratio of 12.6%; look-through Tier 1 leverage ratio of 5.2%, up from 5.1% at end-3Q18 |
| ■ | Share buyback announced in December 2018 and up to CHF 1.5 billion in 2019 approved, with at least CHF 1.0 billion expected, subject to market and economic conditions; 13.9 million shares, worth CHF 170 million, repurchased in January 2019 |
Page 1
Media Release Zurich, 14 February, 2019 | |
Fourth quarter 2018 highlights:
| ■ | Highest fourth quarter adjusted* pre-tax income since 2013; adjusted* pre-tax income of CHF 846 million, 49% higher than the fourth quarter of 2017; reported pre-tax income of CHF 628 million, a more than four-fold increase year on year |
| ■ | Eleventh consecutive profitable quarter, and ninth consecutive quarter of year on year profit increase, both on an adjusted* basis |
| ■ | Lowest quarterly adjusted* operating expenses in last five years, at CHF 3.9 billion |
| ■ | Total Wealth Management NNA of CHF 600 million in the quarter, comprising CHF 1.2 billion of NNA in APAC Private Banking in spite of material deleveraging, CHF 0.5 billion in IWM Private Banking, and an outflow of CHF 1.1 billion in SUB Private Clients reflecting seasonal patterns |
| ■ | Total Wealth Management-related NNA of CHF 3.4 billion for the quarter; total Assets under Management (AuM) of CHF 1.35 trillion at the end of the quarter |
| ■ | Net income attributable to shareholders of CHF 292 million for the quarter, reflecting substantially greater tax charge as a result of a higher effective tax rate and CHF 65 million for the impact from US Base Erosion and Anti-Abuse Tax (BEAT), leading to an effective tax rate for 2018 of 40% |
Key metrics
In CHF millions
| 2018 | 2017 | 4Q18 | 4Q17 | |
| Net revenues | 20,920 | 20,900 | 4,801 | 5,189 |
Of which Wealth Management-related | 13,268 | 12,829 | 3,281 | 3,308 |
| Of which IBCM | 2,177 | 2,139 | 475 | 565 |
| Of which Markets activities | 6,083 | 6,733 | 1,136 | 1,422 |
| Total operating expenses | 17,270 | 18,897 | 4,114 | 5,005 |
| Pre-tax income | 3,405 | 1,793 | 628 | 141 |
| Adjusted* net revenues | 20,821 | 20,913 | 4,786 | 5,217 |
| Adjusted* total operating expenses | 16,382 | 17,941 | 3,881 | 4,605 |
| Adjusted* pre-tax income | 4,194 | 2,762 | 846 | 569 |
| Net income attributable to shareholders | 2,057 | -983 | 292 | -2,126 |
Page 2
Media Release Zurich, 14 February, 2019 | |
Tidjane Thiam, Chief Executive Officer of Credit Suisse, commented:
“We have achieved Group reported pre-tax income of CHF 3.4 billion, 90% higher than in 2017. Net income attributable to shareholders reached CHF 2.1 billion. This is our first annual post-tax profit since 2014 and it was only achieved thanks to the support of our clients, investors and other key stakeholders and the hard work of our teams.
“Our restructuring, initiated in the fourth quarter of 2015, three years ago, was aimed at making the bank more resilient in challenging times by reducing risks, cutting costs and strengthening our capital base. We also wanted to grow our Wealth Management-related revenues and our relatively stable streams of income: we wanted to go back to profitable, compliant, quality growth. We wanted to right-size our more market dependent activities and deal resolutely with our largest legacy issues. These objectives have broadly been achieved and our performance in the final quarter of 2018, our best fourth quarter since 2013, illustrates how much the bank has changed since 2015.
“We saw during the fourth quarter the continued benefits of positive operating leverage in challenging market conditions as well as the benefits of our de-risking efforts as we recorded no material losses in our credit activities, in spite of large increases in spreads. We delivered a profit in one of our most challenging fourth quarters in years, with an adjusted* pre-tax income of CHF 846 million, up 49% year on year. The fourth quarter of 2018 was our ninth consecutive quarter of year on year profit growth and our eleventh consecutive profitable quarter, both on adjusted* basis. Our focus on risk and control helped ensure we remained resilient when navigating headwinds.
“The share buyback programme, which we announced at our 2018 Investor Day, began in January. We see the buyback – of up to CHF 1.5 billion in 2019, with at least CHF 1 billion expected – as a further signal that we have returned the bank to a solid footing.
“With lower costs, lower risks and more capital than at the start of our restructuring in 2015, we believe that the bank is now well positioned to withstand challenging market conditions when they arise, to capitalise on positive trends in the world economy and to grow revenue and profits, by meeting our clients’ needs.”
Outlook
In the fourth quarter of 2018, we experienced widespread volatility and lower activity levels across the market. This has improved so far this year, with signs of normalisation in the first six weeks of 2019, leading to a less negative trading environment than in the fourth quarter but still weaker than in the first quarter of 2018.
With the growth of our Wealth Management-related activities, our revenues increasingly come from more stable, more recurring and less market dependent sources and our Assets under Management have proven resilient. We have seen a recovery in Assets under Management during the month of January, and are now back to November levels, erasing the sharp falls experienced during the December dislocation.
In markets, the year began with a pronounced recovery in equity and debt markets from a very challenging December. Corporate earnings for the fourth quarter have been largely positive and commentary from the US Federal Reserve has been more cautious regarding future rate increases, underpinning a significant improvement in the credit markets. However, concerns over a US government shutdown, the US-China trade dispute and Brexit remain. This has resulted in a very slow
Page 3
Media Release Zurich, 14 February, 2019 | |
start to the year in terms of Street fees across debt and equity products. There is a significant degree of uncertainty on the evolution during the rest of the first quarter and of the year.
The uncertain political climate in a number of major world economies and the resultant potential disruptions to world trade are clear concerns. With our lower cost base, the reduction of our risk profile, our flexible and diversified model and the benefits flowing from the closure of our Strategic Resolution Unit, we expect to remain resilient in the face of downside risks, and believe we are well positioned to take advantage of any potential upside.
Our strategy of focusing on our unique wealth management franchise with strong investment banking capabilities, low risk and a strong balance sheet is working, and should allow us to continue to support our clients and create growing value for our shareholders.
Page 4
Media Release Zurich, 14 February, 2019 | |
Changes to the Board of Directors
The Board of Directors of Credit Suisse Group AG is proposing Christian Gellerstad and Shan Li for election as new non-executive members of the Board of Directors at the Annual General Meeting on April 26, 2019.
Andreas Koopmann will not stand for re-election at the Annual General Meeting and Alexandre Zeller will step down from the Board of Directors with effect from February 28, 2019. All other members of the Board of Directors will stand for re-election for a further term of office of one year.
Regarding the nominations of Christian Gellerstad and Shan Li, Urs Rohner, Chairman of the Board of Directors of Credit Suisse Group, commented: “Christian Gellerstad, former CEO of Pictet Wealth Management, is a recognised professional with over twenty years of experience and has an excellent international knowledge of running a private banking business in mature as well as developing markets. He has extensive expertise in various leadership functions at Pictet in Switzerland and internationally. Shan Li, Chief Executive Officer of Silk Road Finance Corporation Limited, Hong Kong, has an excellent track record in the financial services industry, particularly in our important Chinese market. Shan Li started his career at Credit Suisse First Boston and for over two decades, held several executive management level positions including Chief International Business Advisor of the China Development Bank, Vice Chairman of UBS Investment Bank Asia, Chief Executive Officer of Bank of China International Holdings, and Chief China Economist at Goldman Sachs. Christian Gellerstad and Shan Li will ideally complement the strengths of the Board of Directors with their great expertise and long experience in their respective fields.”
Regarding the end of Andreas Koopmann's and Alexandre Zeller's tenure as members of the Board of Directors, Urs Rohner stated: “After 10 years on the Board of Directors of Credit Suisse Group and a total of more than two decades in various board and advisory functions at diverse Group entities, Andreas Koopmann will not stand for re-election at the Annual General Meeting. Following Alexandre Zeller's notification that he will join Lombard Odier as Managing Partner, the Board of Directors accepted his resignation from his functions at Credit Suisse Group AG and Credit Suisse (Schweiz) AG, with effect from February 28, 2019, to avoid conflicts of interest. We are very grateful to Andreas Koopmann and Alexandre Zeller for their important contributions to the Group, in particular during the recent restructuring of our bank. It has been a privilege for me and my colleagues to work with them on the Board and the various Committees. I wish both Andreas Koopmann and Alexandre Zeller all the best in their future endeavours."
Dividend
The Board of Directors will propose to shareholders at the Annual General Meeting on April 26, 2019 a distribution of CHF 0.2625 per share out of capital contribution reserves for the financial year 2018. This is in line with our intention to increase the ordinary dividend by at least 5% per annum. The distribution will be free of Swiss withholding tax and will not be subject to income tax for Swiss resident individuals holding the shares as a private investment. The distribution will be payable in cash.
Page 5
Media Release Zurich, 14 February, 2019 | |
Full year overview
At the end of 2018, Credit Suisse completed its three-year restructuring programme. When we announced the programme in October 2015, we had three main objectives. Firstly, there were some urgent matters to be addressed, namely our capital position, absolute level of risk, and our fixed cost base. Secondly, we defined a strategy for sustainable, compliant and profitable growth. Thirdly, our goal was to significantly upgrade our risk and compliance controls and improve our culture.
We have significantly strengthened our capital position since the end of 2015, we have lowered our operating cost base and exceeded our ambitious adjusted* operating cost base target of less than CHF 17 billion, and we have closed the SRU and significantly derisked our Global Markets business.
The continued growth of our Wealth Management-related businesses remained a key focus during 2018, attracting CHF 34.4 billion of Wealth Management NNA last year and delivering net inflows in each quarter. In our Wealth Management franchises, annualised NNA growth was 9% in Private Banking within APAC Wealth Management & Connected, 4% in Private Banking within International Wealth Management and 1% in Private Clients within Swiss Universal Bank. Across the Group, we attracted total NNA of CHF 56.5 billion, up 49% year on year.
Our focus on reducing costs in order to strengthen our ability to withstand a drop in revenues in a volatile industry continued in 2018, with an adjusted* operating cost base, at constant 2015 foreign exchange (FX) rates, of CHF 16.5 billion, compared to CHF 21.2 billion in 2015, a reduction of 22%, and well ahead of our target of less than CHF 17 billion by the end of 2018.
At the same time as growing our revenues and reducing our costs, we have reduced the overall level of risk. The SRU, which was closed on schedule at the end of the year, recorded an adjusted* pre-tax loss of USD 1.3 billion in 2018, down from USD 3.0 billion in 2016. Its residual portfolio, which was transferred to the Asset Resolution Unit, and will be separately disclosed within the Corporate Center as of January 1, 2019, is expected to have a pre-tax profit drag of approximately USD 0.5 billion in 2019.
At a Group-wide level, we exceeded our targets for our CET1 and leverage ratios and our US intermediate holding company completed its first public CCAR stress test in 2018, with the Board of Governors of the Federal Reserve System not objecting to its 2018 capital plan. Given the uncertain macro-economic environment over the last three years, these achievements underscore both the balance and resilience of our new operating model.
During 2018, we continued to deliver successfully on our objectives, against a backdrop of mixed market conditions. In the first half of 2018, markets were favourable and we experienced strong client activity levels. In the second half of the year, we faced more challenging market conditions and a significant drop in client activity resulting from a combination of factors, including increasing trade tensions, rising US interest rates and a rise in geopolitical uncertainty.
Despite this turbulence, we have reported full year pre-tax income of CHF 3.4 billion, up 90% from the previous year. This performance demonstrates the earnings power of the bank now that we have completed the restructuring programme and established Credit Suisse as a leading wealth manager with strong investment banking capabilities. We are well positioned to take advantage of a number of macro trends that we believe will remain supportive over the long term.
Page 6
Media Release Zurich, 14 February, 2019 | |
Detailed divisional summaries
Swiss Universal Bank (SUB) had a strong FY18 with adjusted* pre-tax income up 18% at CHF 2.2 billion and an increase of 38%1 since the communication of our strategy at the end of 2015. Adjusted* pre-tax income totaled CHF 548 million for the quarter, up 25%, reflecting strong operating leverage. Adjusted* net revenues rose 2%, to CHF 5.5 billion in 2018, mainly due to higher recurring commissions and fees and higher net interest income. Adjusted* operating expenses decreased by 8%, with continued headcount reductions and further efficiency gains from digitalisation and automatisation. Digital onboarding of our clients, the automatisation for standard processes or our online mortgage renewal and our online leasing tool are some examples of our growing digital capabilities. We had strong NNA of CHF 11.6 billion in FY18, with contributions from both segments of the business, reflecting the strength of our franchise.
Private Clients reported adjusted* pre-tax income of CHF 282 million in 4Q18, contributing to FY18 adjusted* pre-tax income of CHF 1.1 billion, up 26%. This increase was primarily driven by solid net interest income and rigorous cost discipline, resulting in continued positive operating leverage. AuM were CHF 198 billion, down 5%, mainly driven by unfavourable market movements. However this was partially offset by NNA of CHF 3.0 billion in FY18, representing contributions from across the business.
In Corporate & Institutional Clients, adjusted* pre-tax income for FY18 rose 10% to CHF 1.1 billion, also supported by the strong NNA momentum in our pension business. For 4Q18, adjusted* pre-tax income was up 18% at CHF 266 million with net revenues up 7% at CHF 633 million. This was mainly driven by resilient net interest income and strong performance in our Swiss investment banking business. Adjusted* total operating expenses were CHF 337 million in 4Q18, down 7%, and were CHF 1.3 billion in FY18, down 8%, benefitting from continued digitalisation efforts.
International Wealth Management (IWM) had a successful year with adjusted* pre-tax income up 21%, reaching our target of CHF 1.8 billion. Continued adjusted* revenue growth for FY18 of 4%, to CHF 5.4 billion, and an adjusted* total operating expense reduction of 3% were the drivers of this step change in profitability. Adjusted* pre-tax income for 4Q18 was CHF 464 million, up 13% compared to 4Q17, as we kept adjusted* net revenues stable in a more challenging environment and reduced adjusted* total operating expenses by 7%. Adjusted* return on regulatory capital reached 33% both in 4Q18 and FY18, while the adjusted* cost/income ratio improved to 65% for the quarter and 66% for the year.
In Private Banking, adjusted* pre-tax income was up 24% at CHF 1.4 billion for FY18 driven by 7% revenue growth, with higher revenues across all major categories, as well as stable adjusted* total operating expenses. Adjusted* pre-tax income for the quarter was CHF 321 million, up 17% from 4Q17, with higher net interest income offsetting lower brokerage and product issuing fees. Our FY18
adjusted* net margin was 38 basis points, up 6 basis points year on year. NNA in FY18 totaled CHF 14.2 billion, representing a growth rate of 4%, with solid inflows, especially from emerging markets.
In Asset Management, adjusted* pre-tax income in FY18 grew by 12% to CHF 427 million, mostly reflecting lower adjusted* total operating expenses that were down 7% year on year. Adjusted* net revenues for FY18 were down 2% year on year, as continued growth in management fees, of 9%, at resilient margins, was offset by lower performance fees and investment-related gains, with a market correction across asset classes in the fourth quarter. NNA for the year stood at CHF 22.2 billion,
Page 7
Media Release Zurich, 14 February, 2019 | |
representing a growth rate of 6% with broadly distributed contributions from traditional and alternative investments.
Asia Pacific (APAC) generated adjusted* pre-tax income of CHF 804 million in FY18, slightly higher than the prior year, and delivered adjusted* return on regulatory capital of 15%. Our performance in 2018 reflects the resilience of our wealth management strategy and our leading business franchises within APAC, despite significant dislocation across Asian markets, particularly in the second half of the year. Adjusted* pre-tax income for 4Q18 was CHF 64 million, compared to CHF 199 million in 4Q17.
APAC Wealth Management & Connected (WM&C) reported adjusted* pre-tax income of CHF 797 million in FY18, down 3%, and maintained stable revenues in challenging market conditions. Private Banking achieved higher recurring commissions and fees for FY18, largely offsetting lower transaction-based revenues. It ended the year with AuM of CHF 202 billion and NNA of CHF 17.2 billion, with net new assets offsetting negative market movements. Advisory, underwriting, and financing revenues for FY18 were down 5% year on year, mainly driven by lower financing revenues, while fees from M&A transactions and equity underwriting revenues were higher. APAC advisory and underwriting maintained its top 3 ranking2 in terms of share of wallet.
APAC Markets reported adjusted* pre-tax income of USD 10 million in FY18, an improvement from the adjusted* pre-tax loss of USD 26 million in FY17, despite more challenging market conditions in 2018, particularly in the second half. Performance was supported by continued cost discipline, with adjusted* operating expenses down 10%, while revenues for FY18 were USD 1.1 billion, down 6%, which is in line with the guidance we provided at our 2018 Investor Day of 8% to 10% lower than FY17.
Investment Banking and Capital Markets (IBCM) delivered year on year growth in adjusted* pre-tax income and net revenues in FY18, despite a market slowdown in 4Q18. Total global advisory and underwriting revenues3 for FY18 were USD 4.0 billion, down 2% year on year, but outperforming the Street4 in a challenging market environment.
Adjusted* pre-tax income rose 5% to USD 439 million in FY18, including 4Q18 adjusted* pre-tax income of USD 114 million. Additionally, our adjusted* return on regulatory capital was 13.6% for FY18 and our leverage exposure was down 9% at USD 41 billion. Net revenues in FY18 rose 2% year on year, driven by strong performance in advisory but partially offset by lower financing activity, in line with the Street5. Our continued focus on cost discipline led to our adjusted* operating expenses remaining broadly flat with a 2% increase year on year.
Advisory revenues were up 23%, at USD 970 million, for FY18, outperforming the Street5, with 4Q18 being the strongest quarter since 2012. This was mainly driven by higher revenues from completed M&A transactions as well as higher levels of client activity, particularly in the Americas.
Debt underwriting revenues were down 9%, at USD 960 million, for FY18, in line with the Street5. Debt underwriting’s performance was driven by lower leveraged finance and debt capital market revenues but was partially offset by strong performance in the derivatives financing business. However, we still maintained our leading position in leveraged finance5.
Equity underwriting revenues were down 18%, at USD 323 million, for FY18, underperforming the Street5 due to lower client activity and a loss on a block trade in 4Q18.
Page 8
Media Release Zurich, 14 February, 2019 | |
In 2018, Global Markets (GM) demonstrated strict resource and risk discipline in a challenging operating environment characterised by high levels of volatility and widening credit spreads, particularly in the second half of the year. Adjusted* total operating expenses of USD 4.7 billion decreased by 7% compared to FY17, below our 2018 goal of USD 4.8 billion. In addition, GM maintained its dynamic approach to capital management as leverage exposure decreased by 14% or USD 41 billion. GM recorded an adjusted* pre-tax income of USD 425 million with an adjusted* return on regulatory capital of 3.1% in 2018. In that context, net revenues decreased 10% compared to FY17, reflecting lower results in our fixed income businesses partially offset by strength in our International Trading Solutions (ITS) franchise. In the fourth quarter, GM recorded an adjusted* pre-tax loss of USD 117 million.
Equities revenues of USD 2.0 billion were stable compared to FY17, as continued momentum in equity derivatives was offset mainly by lower cash equities revenues. During the year we continued to invest in equities, particularly in equity derivatives, driving increased collaboration with IWM through the ITS franchise as we continued serving our wealth management clients.
Fixed Income revenues of USD 3.6 billion were down 9%, compared to a strong comparable period in 2017, reflecting reduced client activity across our credit franchise due to challenging operating conditions, particularly in the last quarter. Despite this decline, the Fixed Income franchise remained resilient as we maintained our leading market share in our asset finance and leveraged finance underwriting franchises6.
Page 9
Media Release Zurich, 14 February, 2019 | |
Credit Suisse and sustainable finance
2018 was the first full year of operation for our Impact Advisory & Finance (IAF) department, which aims to facilitate projects and initiatives for clients that have a positive economic and social impact while generating a financial return. IAF is generating significant momentum across both wealth management and corporate and investment banking. IAF is also playing a part in codifying this relatively new but rapidly growing sector, including consulting with the International Finance Corporation to launch the Principles for Impact Management at the International Monetary Fund meeting in October and becoming a founding member of Bloomberg’s US Alliance for Sustainable Finance in December.
Highlights for the fourth quarter include a landmark of surpassing USD 1 billion of sustainable investments under management in the APAC region, the successful seeding of PG Impact Investments Fund I, which raised USD 210 million to help underserved people globally, and acting for the Israeli aMoon 2 Life Sciences Venture Fund, which to date has raised over CHF 600 million to invest in accelerating cures for life-threatening diseases. In addition, we are seeing significant client appetite for our launch of the RobecoSAM SMART Mobility Fund, which is investing in the electric vehicles value chain.
In November, APAC executed a USD 440 million ESG mandate for a regional institutional client, just one example of how we help clients to align their new or existing mandates with their sustainability objectives. Our international green bond franchise continues to thrive, with underwriting increasing five-fold in 20187.
2018 marked the ten-year anniversary of the bank’s Global Initiatives in Financial Inclusion and Financial Education, the two central themes of Corporate Citizenship funding and employee engagement, with a focus on sector development and innovation. Highlights included three Sustainable Development Goals-focused industry thought leadership events and highly visible internal and external communication measures.
Through Sustainability Affairs, the bank convened three industry roundtables on environmental and social risk management and disclosure of climate-related financial risks, and supported the publication of an investor climate guide. Moreover, the bank updated its Statement on Sustainability and participated in consultations with policymakers on emerging sustainable finance regulation and continued to engage with investors and civil society representatives on topical issues.
Page 10
Media Release Zurich, 14 February, 2019 | |
Biographies of the proposed new non-executive Board members
Christian Gellerstad is a recognised wealth management professional with over 20 years of experience in the Swiss private banking industry. He looks back on a long and successful career at the Pictet Group, at which he most recently held the position of CEO, Pictet Wealth Management from 2007 to 2018. He was also an Executive Committee Member of Banque Pictet & Cie, Geneva, between 2013 and 2018, and an Equity Partner at the Pictet Group from 2006 until 2018. Christian Gellerstad served as CEO and Managing Director of Banque Pictet & Cie (Europe) in Luxembourg between 2000 and 2007 and prior to that, as Deputy CEO and Senior Vice President of Pictet Bank & Trust in the Bahamas from 1996 to 2000. Christian Gellerstad began his career at Pictet in 1994 as a Financial Analyst and Portfolio Manager in Geneva. Prior to joining the Pictet Group, he worked as an Emerging Markets Trader at Cargill International. Christian Gellerstad currently serves as a non-executive Board Member of Banque Pictet & Cie SA, Geneva, Banque Pictet & Cie (Europe) SA, Luxembourg, and Bank Pictet & Cie (Asia) Ltd., Singapore and as the non-executive Chairman of Pictet Bank & Trust Ltd. Subject to his election as a Board Member at Credit Suisse Group, Christian Gellerstad plans to step down from his directorships at Pictet. Furthermore, he is an independent director of the family-owned industrial companies FAVI SA (since 2015) and AFICA SA (since 2013), both based in France. Christian Gellerstad holds a Masters of Business Administration and Economics from the University of St. Gallen, Switzerland, and is a Certified International Investment Analyst and Certified Portfolio Manager and Financial Analyst. Christian Gellerstad is a Swiss and Swedish citizen and resides in Switzerland.
Shan Li is an economist and investment expert, who has held executive management level positions in international financial institutions in the US, Europe and Asia over the past two decades. He began his career as an Associate in foreign exchange trading with Credit Suisse First Boston in New York and then worked as an International Economist and Executive Director at Goldman Sachs in New York, Hong Kong, and London between 1993 and 1998. Following that, Shan Li moved to the China Development Bank in Beijing, where he served as the Deputy Head of the Investment Bank Preparation Leading Group from 1998 to 1999. Between 1999 and 2001, he held the position of Head of China Investment Banking at Lehman Brothers in Hong Kong and following that, he served for four years as the CEO of Bank of China International Holdings. In 2005, Shan Li founded San Shan Capital Partners, a private investment firm based in Hong Kong, at which he continues to serve as the Founding Partner. Between 2010 and 2011, Shan Li held the position of Vice Chairman of UBS Asia Investment Bank and from 2013 to 2015, he returned to the China Development Bank in Beijing as the Chief International Business Advisor. Since 2015, Shan Li is the CEO of the Silk Road Finance Corporation. He furthermore serves as Chairman and CEO of Chinastone Capital Management, an investment firm based in Shanghai, a position he’s held since 2010. Shan Li holds a Bachelor of Science in Management Information Systems from Tsinghua University (Beijing), a Master’s degree in Economics from the University of California, Davis, and a PhD in Economics from the Massachusetts Institute of Technology (Cambridge). Shan Li is a Chinese citizen and permanent resident of Hong Kong.
Page 11
Media Release Zurich, 14 February, 2019 | |
Contact details
Adam Gishen, Investor Relations, Credit Suisse Tel: +41 44 333 71 49 Email: investor.relations@credit-suisse.com |
James Quinn, Corporate Communications, Credit Suisse Tel: +41 844 33 88 44 E-mail: media.relations@credit-suisse.com |
The Earnings Release, Presentation Slides and Time Series spreadsheets for the full year 2018 and fourth quarter 2018 are available to download from 7:00 CET today at: https://www.credit-suisse.com/results Credit Suisse’s annual report is expected to be published on March 22, 2019. Note: Our estimates, ambitions, objectives and targets often include metrics that are non-GAAP financial measures and are unaudited. A reconciliation of the estimates, ambitions, objectives and targets to the nearest GAAP measures is unavailable without unreasonable efforts. Adjusted* results exclude goodwill impairment, major litigation charges, real estate gains and other revenue and expense items included in our reported results, all of which are unavailable on a prospective basis. Such estimates, ambitions, objectives and targets are calculated in a manner that is consistent with the accounting policies applied by us in preparing our financial statements. |
Page 12
Media Release Zurich, 14 February, 2019 | |
Presentation of FY18/4Q18 results – Thursday, February 14, 2019
| Event | Analyst Call | Media Call |
| Time | 08:15 Zurich 07:15 London 02:15 New York | 10:15 Zurich 09:15 London 04:15 New York |
| Speakers | Tidjane Thiam, Chief Executive Officer David Mathers, Chief Financial Officer Adam Gishen, Group Head of Investor Relations and Corporate Communications | Tidjane Thiam, Chief Executive Officer David Mathers, Chief Financial Officer Adam Gishen, Group Head of Investor Relations and Corporate Communications |
| Language | English | English with simultaneous German translation |
| Access | Switzerland: +41 44 580 48 73 Europe: +44 207 192 8007 US: +1 866 597 37 99 Reference: Credit Suisse Analysts and Investors call Conference ID: 3993575 Please dial in 15 minutes before the start of the call | Switzerland: +41 44 580 48 73 Europe: +44 207 192 8007 US: +1 866 597 37 99 Reference: Credit Suisse Media Call Conference ID English: 5436429 Conference ID German: 3673987 Please dial in 10 minutes before the start of the call |
| Q&A Session | Following the presentation, you will have the opportunity to ask the speakers questions | Following the presentation, you will have the opportunity to ask the speakers questions |
| Playback | Replay available approximately one hour after the event Switzerland: +41 44 580 40 26 Europe: +44 3333 00 97 85 US: +1 917 677 75 32 Conference ID: 3993575 | Replay available approximately one hour after the event Switzerland: +41 44 580 40 26 Europe: +44 3333 00 97 85 US: +1 917 677 75 32 Conference ID English: 5436429 Conference ID German: 3673987 |
Until the end of 2018, the results of Credit Suisse Group comprised the results of our six reporting segments, including the Strategic Resolution Unit, and the Corporate Center. Core results excluded revenues and expenses from our Strategic Resolution Unit.
During the implementation of our strategy, it was important to measure the progress achieved by our underlying business performance in a consistent manner. To achieve this, we focused our analyses on adjusted results.
Adjusted results referred to in this Media Release are non-GAAP financial measures that exclude goodwill impairment and certain other revenues and expenses included in our reported results. Management believes that adjusted results provide a useful presentation of our operating results for the purposes of assessing our Group and divisional performance consistently over time, on a basis that excludes items that management does not consider representative of our underlying performance.
Page 13
Media Release Zurich, 14 February, 2019 | |
We reported quarterly on the same adjusted* basis for the Group, Core and divisional results until end-2018 to allow investors to monitor our progress in implementing our strategy, given the material restructuring charges we incurred and other items which were not reflective of our underlying performance but were to be borne during the three-year restructuring programme. Tables in the Appendix of this Media Release provide the detailed reconciliation between reported and adjusted results for the Group, Core businesses and the individual divisions.
Footnotes
1 2015 comparable figure of CHF 1,599 million (excludes Swisscard pre-tax income of CHF 25 million)
2 Source: Dealogic data (APAC excluding Japan and excluding onshore China) for the period ending December 31, 2018
3 Gross global revenues from advisory, debt and equity underwriting generated across all divisions before cross divisional revenue sharing agreements
4 Source: Dealogic data (Global) for the period ending December 31, 2018
5 Source: Dealogic data (Americas and EMEA) for the period ending December 31, 2018
6 Source: Dealogic data (Americas and EMEA) for the period ending December 31, 2018 and Thomson Reuters for the period ending December 31, 2018
7 Source: Bloomberg as of January 1, 2019; in 2018, Credit Suisse underwrote approximately USD 6.1 billion of green financing compared to 2017, when Credit Suisse underwrote approximately USD 1.2 billion
Abbreviations
APAC – Asia Pacific; ASU – Accounting Standards Update; AuM – assets under management; BCBS – Basel Committee on Banking Supervision; BEAT – Base Erosion and Anti-Abuse Tax; BIS – Bank of International Settlements; CCAR – Comprehensive Capital Analysis and Review; CHF – Swiss francs; CET1 – common equity tier 1; DVA - Debit valuation adjustments; EMEA – Europe, Middle East and Africa; ESG – environmental, social and governance; FINMA – Swiss Financial Market Supervisory Authority; FX – foreign exchange; GM – Global Markets; HNW – high-net-worth; IAF – Impact Advisory and Finance department; IBCM – Investment Banking & Capital Markets; ITS – International Trading Solutions; IWM – International Wealth Management; M&A – mergers and acquisitions; NNA – net new assets; PB – Private Banking; PC – Private Clients; RWA – risk-weighted assets; SEC – Securities and Exchange Commission; SRU – Strategic Resolution Unit; SUB – Swiss Universal Bank; USD – US dollar; GAAP – Generally accepted accounting principles; WM&C – Wealth Management & Connected
Important information
This Media Release contains select information from the full 4Q18 Earnings Release and 4Q18 Results Presentation slides that Credit Suisse believes is of particular interest to media professionals. The complete 4Q18 Earnings Release and 4Q18 Results Presentation slides, which have been distributed simultaneously, contain more comprehensive information about our results and operations for the reporting quarter, as well as important information about our reporting methodology and some of the terms used in these documents. The complete 4Q18 Earnings Release and 4Q18 Results Presentation slides are not incorporated by reference into this Media Release.
Credit Suisse has not finalised its 2018 Annual Report and Credit Suisse’s independent registered public accounting firm has not completed its audit of the consolidated financial statements for the period. Accordingly, the financial information contained in this Media Release is subject to completion of year-end procedures, which may result in changes to that information.
Information referenced in this Media Release, whether via website links or otherwise, is not incorporated into this Media Release.
Our cost savings programme, until the end of 2018, is measured using an adjusted operating cost base at constant 2015 FX rates. “Adjusted operating cost base at constant FX rates” includes adjustments as made in all our disclosures for restructuring expenses, major litigation expenses, expenses related to business sales and a goodwill impairment taken in 4Q15 as well as adjustments for debit valuation adjustments (DVA) related volatility, FX and for certain accounting changes (which had not been in place at the launch of the cost savings programme). Adjustments for certain accounting changes have been restated to reflect grossed up expenses in the Corporate Center and, starting in 1Q18, also include adjustments for changes from ASU 2014-09 “Revenue from Contracts with Customers”, which is described further in our 1Q18, 2Q18 and 3Q18 Financial Reports. Adjustments for FX apply unweighted currency exchange rates, i.e., a straight line average of monthly rates, consistently for the periods under review. Starting from 1Q19, we intend to express our operating cost base at constant 2018 FX rates and to adjust for significant litigation costs, expenses related to business and real estate sales, as well as DVA related volatility, but not for restructuring expenses and certain accounting changes. Adjustments for FX will continue to apply unweighted currency exchange rates.
Regulatory capital is calculated as the worst of 10% of RWA and 3.5% of leverage exposure. Return on regulatory capital is calculated using (adjusted) income / (loss) after tax and assumes a tax rate of 30% and capital allocated based on the worst of 10% of average RWA and 3.5% of average leverage exposure. For the Markets business within the APAC division and for the Global Markets and Investment Banking & Capital Markets divisions, return on regulatory capital is based on US dollar denominated numbers. Adjusted return on regulatory capital is calculated using adjusted results, applying the same methodology to calculate return on regulatory capital.
We may not achieve all of the expected benefits of our strategic initiatives. Factors beyond our control, including but not limited to the market and economic conditions, changes in laws, rules or regulations and other challenges discussed in our public filings, could limit our ability to achieve some or all of the expected benefits of these initiatives.
Page 14
Media Release Zurich, 14 February, 2019 | |
In particular, the terms “Estimate”, “Illustrative”, “Ambition”, “Objective”, “Outlook” and “Goal” are not intended to be viewed as targets or projections, nor are they considered to be Key Performance Indicators. All such estimates, illustrations, ambitions, objectives, outlooks and goals are subject to a large number of inherent risks, assumptions and uncertainties, many of which are completely outside of our control. These risks, assumptions and uncertainties include, but are not limited to, general market conditions, market volatility, interest rate volatility and levels, global and regional economic conditions, political uncertainty, changes in tax policies, regulatory changes, changes in levels of client activity as a result of any of the foregoing and other factors. Accordingly, this information should not be relied on for any purpose. We do not intend to update these estimates, illustrations, ambitions, objectives, outlooks or goals.
In preparing this media release, management has made estimates and assumptions that affect the numbers presented. Actual results may differ. Annualised numbers do not take into account variations in operating results, seasonality and other factors and may not be indicative of actual, full-year results. Figures throughout this media release may also be subject to rounding adjustments. All opinions and views constitute judgments as of the date of writing without regard to the date on which the reader may receive or access the information. This information is subject to change at any time without notice and we do not intend to update this information.
This document contains certain unaudited interim financial information for the first quarter of 2019. This information has been derived from management accounts, is preliminary in nature, does not reflect the complete results of the first quarter of 2019 and is subject to change, including as a result of any normal quarterly adjustments in relation to the financial statements for the first quarter of 2019. This information has not been subject to any review by our independent registered public accounting firm. There can be no assurance that the final results for these periods will not differ from these preliminary results, and any such differences could be material. Quarterly financial results for the first quarter of 2019 will be included in our 1Q19 Financial Report. These interim results of operations are not necessarily indicative of the results to be achieved for the remainder of 1Q19 or the full first quarter of 2019.
As of January 1, 2013, Basel III was implemented in Switzerland along with the Swiss “Too Big to Fail” legislation and regulations thereunder (in each case, subject to certain phase-in periods). As of January 1, 2015, the Bank for International Settlements (BIS) leverage ratio framework, as issued by the Basel Committee on Banking Supervision (BCBS), was implemented in Switzerland by the Swiss Financial Market Supervisory Authority FINMA (FINMA). Our related disclosures are in accordance with our interpretation of such requirements, including relevant assumptions. Changes in the interpretation of these requirements in Switzerland or in any of our assumptions or estimates could result in different numbers from those shown in this media release.
Unless otherwise noted, leverage exposure is based on the BIS leverage ratio framework and consists of period-end balance sheet assets and prescribed regulatory adjustments. The look-through tier 1 leverage ratio and CET1 leverage ratio are calculated as look-through BIS tier 1 capital and CET1 capital, respectively, divided by period end leverage exposure. Swiss leverage ratios are measured on the same period-end basis as the leverage exposure for the BIS leverage ratio.
Gross margin is calculated by dividing net revenues by average assets under management. Net margin is calculated by dividing income before taxes by average assets under management. Adjusted margins are calculated using adjusted results, applying the same methodology used to calculate gross and net margin.
References to Wealth Management mean SUB PC, IWM PB and APAC PB within WM&C or their combined results. References to Wealth Management-related mean SUB, IWM and APAC WM&C or their combined results. References to Markets mean Global Markets and APAC Markets or their combined results.
References to global advisory and underwriting include global revenues from advisory, debt and equity underwriting generated across all divisions before cross-divisional revenue sharing agreements.
Generic references to profit and costs in this media release refer to pre-tax income and operating expenses, respectively.
Investors and others should note that we announce material information (including quarterly earnings releases and financial reports) to the investing public using press releases, SEC and Swiss ad hoc filings, our website and public conference calls and webcasts. We intend to also use our Twitter account @creditsuisse (https://twitter.com/creditsuisse) to excerpt key messages from our public disclosures, including earnings releases. We may retweet such messages through certain of our regional Twitter accounts, including @csschweiz (https://twitter.com/csschweiz) and @csapac (https://twitter.com/csapac). Investors and others should take care to consider such abbreviated messages in the context of the disclosures from which they are excerpted. The information we post on these Twitter accounts is not a part of this Media Release.
In various tables, use of “–” indicates not meaningful or not applicable.
Page 15
| Key metrics | |||||||||||||||||
| in / end of | % change | in / end of | % change | ||||||||||||||
| 4Q18 | 3Q18 | 4Q17 | QoQ | YoY | 2018 | 2017 | YoY | ||||||||||
| Credit Suisse Group results (CHF million) | |||||||||||||||||
| Net revenues | 4,801 | 4,888 | 5,189 | (2) | (7) | 20,920 | 20,900 | 0 | |||||||||
| Provision for credit losses | 59 | 65 | 43 | (9) | 37 | 245 | 210 | 17 | |||||||||
| Total operating expenses | 4,114 | 4,152 | 5,005 | (1) | (18) | 17,270 | 18,897 | (9) | |||||||||
| Income before taxes | 628 | 671 | 141 | (6) | 345 | 3,405 | 1,793 | 90 | |||||||||
| Net income/(loss) attributable to shareholders | 292 | 424 | (2,126) | (31) | – | 2,057 | (983) | – | |||||||||
| Assets under management and net new assets (CHF million) | |||||||||||||||||
| Assets under management | 1,347.3 | 1,404.7 | 1,376.1 | (4.1) | (2.1) | 1,347.3 | 1,376.1 | (2.1) | |||||||||
| Net new assets | 0.5 | 15.7 | 3.1 | (96.8) | (83.9) | 56.5 | 37.8 | 49.5 | |||||||||
| Basel III regulatory capital and leverage statistics | |||||||||||||||||
| CET1 ratio (%) | 12.6 | 12.9 | 13.5 | – | – | 12.6 | 13.5 | – | |||||||||
| Look-through CET1 ratio (%) | 12.6 | 12.9 | 12.8 | – | – | 12.6 | 12.8 | – | |||||||||
| Look-through CET1 leverage ratio (%) | 4.1 | 4.0 | 3.8 | – | – | 4.1 | 3.8 | – | |||||||||
| Look-through tier 1 leverage ratio (%) | 5.2 | 5.1 | 5.2 | – | – | 5.2 | 5.2 | – | |||||||||
A-1
| Credit Suisse and Core Results | |||||||||||||||||||
| Core Results | Strategic Resolution Unit | Credit Suisse | |||||||||||||||||
| in / end of | 4Q18 | 3Q18 | 4Q17 | 4Q18 | 3Q18 | 4Q17 | 4Q18 | 3Q18 | 4Q17 | ||||||||||
| Statements of operations (CHF million) | |||||||||||||||||||
| Net revenues | 4,976 | 5,042 | 5,340 | (175) | (154) | (151) | 4,801 | 4,888 | 5,189 | ||||||||||
| Provision for credit losses | 60 | 62 | 40 | (1) | 3 | 3 | 59 | 65 | 43 | ||||||||||
| Compensation and benefits | 2,084 | 2,333 | 2,503 | 57 | 61 | 65 | 2,141 | 2,394 | 2,568 | ||||||||||
| General and administrative expenses | 1,442 | 1,243 | 1,726 | 94 | 58 | 209 | 1,536 | 1,301 | 1,935 | ||||||||||
| Commission expenses | 298 | 283 | 356 | 3 | 3 | 9 | 301 | 286 | 365 | ||||||||||
| Restructuring expenses | 167 | 143 | 119 | (31) | 28 | 18 | 136 | 171 | 137 | ||||||||||
| Total other operating expenses | 1,907 | 1,669 | 2,201 | 66 | 89 | 236 | 1,973 | 1,758 | 2,437 | ||||||||||
| Total operating expenses | 3,991 | 4,002 | 4,704 | 123 | 150 | 301 | 4,114 | 4,152 | 5,005 | ||||||||||
| Income/(loss) before taxes | 925 | 978 | 596 | (297) | (307) | (455) | 628 | 671 | 141 | ||||||||||
| Statement of operations metrics (%) | |||||||||||||||||||
| Return on regulatory capital | 8.7 | 9.0 | 5.6 | – | – | – | 5.7 | 6.0 | 1.2 | ||||||||||
| Balance sheet statistics (CHF million) | |||||||||||||||||||
| Total assets | 748,042 | 745,486 | 750,660 | 20,874 | 23,058 | 45,629 | 768,916 | 768,544 | 796,289 | ||||||||||
| Risk-weighted assets 1 | 266,656 | 257,310 | 238,067 | 17,926 | 19,297 | 33,613 | 284,582 | 276,607 | 271,680 | ||||||||||
| Leverage exposure 1 | 851,807 | 852,092 | 856,591 | 29,579 | 32,860 | 59,934 | 881,386 | 884,952 | 916,525 | ||||||||||
| Credit Suisse and Core Results | |||||||||||||
| Core Results | Strategic Resolution Unit | Credit Suisse | |||||||||||
| in / end of | 2018 | 2017 | 2018 | 2017 | 2018 | 2017 | |||||||
| Statements of operations (CHF million) | |||||||||||||
| Net revenues | 21,628 | 21,786 | (708) | (886) | 20,920 | 20,900 | |||||||
| Provision for credit losses | 244 | 178 | 1 | 32 | 245 | 210 | |||||||
| Compensation and benefits | 9,366 | 10,035 | 254 | 332 | 9,620 | 10,367 | |||||||
| General and administrative expenses | 5,380 | 5,849 | 385 | 796 | 5,765 | 6,645 | |||||||
| Commission expenses | 1,247 | 1,398 | 12 | 32 | 1,259 | 1,430 | |||||||
| Restructuring expenses | 605 | 398 | 21 | 57 | 626 | 455 | |||||||
| Total other operating expenses | 7,232 | 7,645 | 418 | 885 | 7,650 | 8,530 | |||||||
| Total operating expenses | 16,598 | 17,680 | 672 | 1,217 | 17,270 | 18,897 | |||||||
| Income/(loss) before taxes | 4,786 | 3,928 | (1,381) | (2,135) | 3,405 | 1,793 | |||||||
| Statement of operations metrics (%) | |||||||||||||
| Return on regulatory capital | 11.1 | 9.3 | – | – | 7.5 | 3.9 | |||||||
1 Disclosed on a look-through basis. | |||||||||||||
A-2
Adjusted results referred to in this media release are non-GAAP financial measures that exclude goodwill impairment and certain other revenues and expenses included in our reported results. Management believes that adjusted results provide a useful presentation of our operating results for purposes of assessing our Group and divisional performance over time, on a basis that excludes items that management does not consider representative of our underlying performance. Provided below is a reconciliation of our adjusted results to the most directly comparable US GAAP measures.
| Reconciliation of adjusted results | |||||||||||||||||||
| Core Results | Strategic Resolution Unit | Credit Suisse | |||||||||||||||||
| in | 4Q18 | 3Q18 | 4Q17 | 4Q18 | 3Q18 | 4Q17 | 4Q18 | 3Q18 | 4Q17 | ||||||||||
| Reconciliation of adjusted results (CHF million) | |||||||||||||||||||
| Net revenues | 4,976 | 5,042 | 5,340 | (175) | (154) | (151) | 4,801 | 4,888 | 5,189 | ||||||||||
| Real estate gains | (12) | (15) | 0 | 0 | 0 | 0 | (12) | (15) | 0 | ||||||||||
| (Gains)/losses on business sales | (3) | 5 | 28 | 0 | 0 | 0 | (3) | 5 | 28 | ||||||||||
| Adjusted net revenues | 4,961 | 5,032 | 5,368 | (175) | (154) | (151) | 4,786 | 4,878 | 5,217 | ||||||||||
| Provision for credit losses | 60 | 62 | 40 | (1) | 3 | 3 | 59 | 65 | 43 | ||||||||||
| Total operating expenses | 3,991 | 4,002 | 4,704 | 123 | 150 | 301 | 4,114 | 4,152 | 5,005 | ||||||||||
| Restructuring expenses | (167) | (143) | (119) | 31 | (28) | (18) | (136) | (171) | (137) | ||||||||||
| Major litigation provisions | (4) | (13) | (165) | (45) | (9) | (90) | (49) | (22) | (255) | ||||||||||
| Expenses related to business sales | (47) | 0 | (8) | (1) | (2) | 0 | (48) | (2) | (8) | ||||||||||
| Adjusted total operating expenses | 3,773 | 3,846 | 4,412 | 108 | 111 | 193 | 3,881 | 3,957 | 4,605 | ||||||||||
| Income/(loss) before taxes | 925 | 978 | 596 | (297) | (307) | (455) | 628 | 671 | 141 | ||||||||||
| Total adjustments | 203 | 146 | 320 | 15 | 39 | 108 | 218 | 185 | 428 | ||||||||||
| Adjusted income/(loss) before taxes | 1,128 | 1,124 | 916 | (282) | (268) | (347) | 846 | 856 | 569 | ||||||||||
| Adjusted return on regulatory capital (%) | 10.6 | 10.4 | 8.6 | – | – | – | 7.7 | 7.6 | 5.0 | ||||||||||
| Core Results | Strategic Resolution Unit | Credit Suisse | |||||||||||
| in | 2018 | 2017 | 2018 | 2017 | 2018 | 2017 | |||||||
| Reconciliation of adjusted results (CHF million) | |||||||||||||
| Net revenues | 21,628 | 21,786 | (708) | (886) | 20,920 | 20,900 | |||||||
| Real estate gains | (27) | 0 | (1) | 0 | (28) | 0 | |||||||
| (Gains)/losses on business sales | (71) | 51 | 0 | (38) | (71) | 13 | |||||||
| Adjusted net revenues | 21,530 | 21,837 | (709) | (924) | 20,821 | 20,913 | |||||||
| Provision for credit losses | 244 | 178 | 1 | 32 | 245 | 210 | |||||||
| Total operating expenses | 16,598 | 17,680 | 672 | 1,217 | 17,270 | 18,897 | |||||||
| Restructuring expenses | (605) | (398) | (21) | (57) | (626) | (455) | |||||||
| Major litigation provisions | (94) | (224) | (117) | (269) | (211) | (493) | |||||||
| Expenses related to business sales | (47) | (8) | (4) | 0 | (51) | (8) | |||||||
| Adjusted total operating expenses | 15,852 | 17,050 | 530 | 891 | 16,382 | 17,941 | |||||||
| Income/(loss) before taxes | 4,786 | 3,928 | (1,381) | (2,135) | 3,405 | 1,793 | |||||||
| Total adjustments | 648 | 681 | 141 | 288 | 789 | 969 | |||||||
| Adjusted income/(loss) before taxes | 5,434 | 4,609 | (1,240) | (1,847) | 4,194 | 2,762 | |||||||
| Adjusted return on regulatory capital (%) | 12.5 | 10.9 | – | – | 9.2 | 6.0 | |||||||
A-3
| Reconciliation of adjusted results | |||||||||||||||||||||
| Credit Suisse | |||||||||||||||||||||
| in | 2Q18 | 1Q18 | 4Q17 | 3Q17 | 2Q17 | 1Q17 | 4Q16 | 3Q16 | 2Q16 | 1Q16 | |||||||||||
| Reconciliation of adjusted results (CHF million, except where indicated) | |||||||||||||||||||||
| Net revenues | 5,595 | 5,636 | 5,189 | 4,972 | 5,205 | 5,534 | 5,181 | 5,396 | 5,108 | 4,638 | |||||||||||
| Real estate gains | 0 | (1) | 0 | 0 | 0 | 0 | (78) | (346) | 0 | 0 | |||||||||||
| (Gains)/losses on business sales | 0 | (73) | 28 | 0 | 0 | (15) | 2 | 0 | 0 | 56 | |||||||||||
| Adjusted net revenues | 5,595 | 5,562 | 5,217 | 4,972 | 5,205 | 5,519 | 5,105 | 5,050 | 5,108 | 4,694 | |||||||||||
| Provision for credit losses | 73 | 48 | 43 | 32 | 82 | 53 | 75 | 55 | (28) | 150 | |||||||||||
| Total operating expenses | 4,470 | 4,534 | 5,005 | 4,540 | 4,541 | 4,811 | 7,309 | 5,119 | 4,937 | 4,972 | |||||||||||
| Restructuring expenses | (175) | (144) | (137) | (112) | (69) | (137) | (49) | (145) | (91) | (255) | |||||||||||
| Major litigation provisions | (55) | (85) | (255) | (108) | (33) | (97) | (2,401) | (306) | 0 | 0 | |||||||||||
| Expenses related to business sales | (1) | 0 | (8) | 0 | 0 | 0 | 0 | 0 | 0 | 0 | |||||||||||
| Adjusted total operating expenses | 4,239 | 4,305 | 4,605 | 4,320 | 4,439 | 4,577 | 4,859 | 4,668 | 4,846 | 4,717 | |||||||||||
| Income/(loss) before taxes | 1,052 | 1,054 | 141 | 400 | 582 | 670 | (2,203) | 222 | 199 | (484) | |||||||||||
| Total adjustments | 231 | 155 | 428 | 220 | 102 | 219 | 2,374 | 105 | 91 | 311 | |||||||||||
| Adjusted income/(loss) before taxes | 1,283 | 1,209 | 569 | 620 | 684 | 889 | 171 | 327 | 290 | (173) | |||||||||||
| Reconciliation of adjusted results (continued) | |||||||||||||||||
| Credit Suisse | |||||||||||||||||
| in | 4Q15 | 3Q15 | 2Q15 | 1Q15 | 4Q14 | 3Q14 | 2Q14 | 1Q14 | |||||||||
| Reconciliation of adjusted results (CHF million, except where indicated) | |||||||||||||||||
| Net revenues | 4,210 | 5,985 | 6,955 | 6,647 | 6,372 | 6,578 | 6,463 | 6,829 | |||||||||
| Fair value on own debt | 697 | (623) | (228) | (144) | (297) | (318) | (17) | 89 | |||||||||
| Real estate gains | (72) | 0 | (23) | 0 | (375) | 0 | (5) | (34) | |||||||||
| (Gains)/losses on business sales | (34) | 0 | 0 | 0 | (101) | 0 | 0 | 0 | |||||||||
| Adjusted net revenues | 4,801 | 5,362 | 6,704 | 6,503 | 5,599 | 6,260 | 6,441 | 6,884 | |||||||||
| Provision for credit losses | 133 | 110 | 51 | 30 | 75 | 59 | 18 | 34 | |||||||||
| Total operating expenses | 10,518 | 5,023 | 5,248 | 5,106 | 5,405 | 5,181 | 6,791 | 5,052 | |||||||||
| Goodwill impairment | (3,797) | 0 | 0 | 0 | 0 | 0 | 0 | 0 | |||||||||
| Restructuring expenses | (355) | – | – | – | – | – | – | – | |||||||||
| Major litigation provisions | (563) | (204) | (63) | 10 | (393) | (290) | (1,711) | (42) | |||||||||
| Adjusted total operating expenses | 5,803 | 4,819 | 5,185 | 5,116 | 5,012 | 4,891 | 5,080 | 5,010 | |||||||||
| Income/(loss) before taxes | (6,441) | 852 | 1,656 | 1,511 | 892 | 1,338 | (346) | 1,743 | |||||||||
| Total adjustments | 5,306 | (419) | (188) | (154) | (380) | (28) | 1,689 | 97 | |||||||||
| Adjusted income/(loss) before taxes | (1,135) | 433 | 1,468 | 1,357 | 512 | 1,310 | 1,343 | 1,840 | |||||||||
A-4
| Reconciliation of adjusted results | |||||||||
| SUB, IWM and APAC WM&C | |||||||||
| in | 2018 | 2017 | 2016 | 2015 | 1 | ||||
| Adjusted results (CHF million) | |||||||||
| Net revenues | 13,268 | 12,829 | 12,361 | 11,631 | |||||
| Real estate gains | (23) | 0 | (420) | (95) | |||||
| (Gains)/losses on business sales | (92) | 28 | 0 | (34) | |||||
| Adjusted net revenues | 13,153 | 12,857 | 11,941 | 11,502 | |||||
| Provision for credit losses | 186 | 117 | 128 | 174 | |||||
| Total operating expenses | 8,528 | 8,797 | 8,598 | 9,252 | |||||
| Goodwill impairment | 0 | 0 | 0 | (446) | |||||
| Restructuring expenses | (243) | (150) | (128) | (79) | |||||
| Major litigation provisions | (83) | (97) | (7) | (299) | |||||
| Expenses related to business sales | (47) | 0 | 0 | 0 | |||||
| Adjusted total operating expenses | 8,155 | 8,550 | 8,463 | 8,428 | |||||
| Income before taxes | 4,554 | 3,915 | 3,635 | 2,205 | |||||
| Total adjustments | 258 | 275 | (285) | 695 | |||||
| Adjusted income before taxes | 4,812 | 4,190 | 3,350 | 2,900 | |||||
1 Excludes net revenues and total operating expenses for Swisscard of CHF 148 million and CHF 123 million, respectively. | |||||||||
| Reconciliation of adjustment items | |||||||||
| Group | |||||||||
| in | 2018 | 2017 | 2016 | 2015 | |||||
| Adjusted results (CHF million) | |||||||||
| Total operating expenses | 17,270 | 18,897 | 22,337 | 25,895 | |||||
| Goodwill impairment | 0 | 0 | 0 | (3,797) | |||||
| Restructuring expenses | (626) | (455) | (540) | (355) | |||||
| Major litigation provisions | (211) | (493) | (2,707) | (820) | |||||
| Expenses related to business sales | (51) | (8) | 0 | 0 | |||||
| Debit valuation adjustments (DVA) | 46 | (83) | 0 | 0 | |||||
| Certain accounting changes | (228) | (234) | (70) | (58) | |||||
| Adjusted operating cost base | 16,200 | 17,624 | 19,020 | 20,865 | |||||
| FX adjustment | 334 | 326 | 291 | 310 | |||||
| Adjusted FX-neutral operating cost base | 16,534 | 17,950 | 19,311 | 21,175 | |||||
A-5
| Swiss Universal Bank | |||||||||||||||||
| in / end of | % change | in / end of % change | |||||||||||||||
| 4Q18 | 3Q18 | 4Q17 | QoQ | YoY | 2018 | 2017 | YoY | ||||||||||
| Results (CHF million) | |||||||||||||||||
| Net revenues | 1,373 | 1,341 | 1,318 | 2 | 4 | 5,564 | 5,396 | 3 | |||||||||
| of which Private Clients | 740 | 730 | 726 | 1 | 2 | 2,989 | 2,897 | 3 | |||||||||
| of which Corporate & Institutional Clients | 633 | 611 | 592 | 4 | 7 | 2,575 | 2,499 | 3 | |||||||||
| Provision for credit losses | 26 | 31 | 15 | (16) | 73 | 126 | 75 | 68 | |||||||||
| Total operating expenses | 816 | 799 | 870 | 2 | (6) | 3,280 | 3,556 | (8) | |||||||||
| Income before taxes | 531 | 511 | 433 | 4 | 23 | 2,158 | 1,765 | 22 | |||||||||
| of which Private Clients | 278 | 249 | 212 | 12 | 31 | 1,060 | 801 | 32 | |||||||||
| of which Corporate & Institutional Clients | 253 | 262 | 221 | (3) | 14 | 1,098 | 964 | 14 | |||||||||
| Metrics (%) | |||||||||||||||||
| Return on regulatory capital | 16.7 | 16.2 | 13.5 | – | – | 17.1 | 13.7 | – | |||||||||
| Cost/income ratio | 59.4 | 59.6 | 66.0 | – | – | 59.0 | 65.9 | – | |||||||||
| Private Clients | |||||||||||||||||
| Assets under management (CHF billion) | 198.0 | 209.3 | 208.3 | (5.4) | (4.9) | 198.0 | 208.3 | (4.9) | |||||||||
| Net new assets (CHF billion) | (1.1) | 0.9 | 0.0 | – | – | 3.0 | 4.7 | – | |||||||||
| Gross margin (annualized) (bp) | 144 | 139 | 140 | – | – | 144 | 143 | – | |||||||||
| Net margin (annualized) (bp) | 54 | 48 | 41 | – | – | 51 | 40 | – | |||||||||
| Corporate & Institutional Clients | |||||||||||||||||
| Assets under management (CHF billion) | 348.7 | 360.2 | 354.7 | (3.2) | (1.7) | 348.7 | 354.7 | (1.7) | |||||||||
| Net new assets (CHF billion) | 2.1 | 1.8 | (0.2) | – | – | 8.6 | (13.9) | – | |||||||||
A-6
| Reconciliation of adjusted results | |||||||||||||||||||
| Private Clients | Corporate & Institutional Clients | Swiss Universal Bank | |||||||||||||||||
| in | 4Q18 | 3Q18 | 4Q17 | 4Q18 | 3Q18 | 4Q17 | 4Q18 | 3Q18 | 4Q17 | ||||||||||
| Adjusted results (CHF million) | |||||||||||||||||||
| Net revenues | 740 | 730 | 726 | 633 | 611 | 592 | 1,373 | 1,341 | 1,318 | ||||||||||
| Real estate gains | (6) | (15) | 0 | 0 | 0 | 0 | (6) | (15) | 0 | ||||||||||
| Adjusted net revenues | 734 | 715 | 726 | 633 | 611 | 592 | 1,367 | 1,326 | 1,318 | ||||||||||
| Provision for credit losses | (4) | 13 | 10 | 30 | 18 | 5 | 26 | 31 | 15 | ||||||||||
| Total operating expenses | 466 | 468 | 504 | 350 | 331 | 366 | 816 | 799 | 870 | ||||||||||
| Restructuring expenses | (10) | (17) | 1 | (11) | (8) | 1 | (21) | (25) | 2 | ||||||||||
| Major litigation provisions | 0 | 0 | (2) | (2) | (2) | (5) | (2) | (2) | (7) | ||||||||||
| Adjusted total operating expenses | 456 | 451 | 503 | 337 | 321 | 362 | 793 | 772 | 865 | ||||||||||
| Income before taxes | 278 | 249 | 212 | 253 | 262 | 221 | 531 | 511 | 433 | ||||||||||
| Total adjustments | 4 | 2 | 1 | 13 | 10 | 4 | 17 | 12 | 5 | ||||||||||
| Adjusted income before taxes | 282 | 251 | 213 | 266 | 272 | 225 | 548 | 523 | 438 | ||||||||||
| Adjusted return on regulatory capital (%) | – | – | – | – | – | – | 17.2 | 16.6 | 13.7 | ||||||||||
Private Clients | Corporate & Institutional Clients | Swiss Universal Bank | |||||||||||||
| in | 2018 | 2017 | 2018 | 2017 | 2018 | 2017 | 2015 | 1 | |||||||
| Adjusted results (CHF million) | |||||||||||||||
| Net revenues | 2,989 | 2,897 | 2,575 | 2,499 | 5,564 | 5,396 | 5,573 | ||||||||
| Real estate gains | (21) | 0 | 0 | 0 | (21) | 0 | (95) | ||||||||
| Gains on business sales | (19) | 0 | (18) | 0 | (37) | 0 | (23) | ||||||||
| Adjusted net revenues | 2,949 | 2,897 | 2,557 | 2,499 | 5,506 | 5,396 | 5,455 | ||||||||
| Provision for credit losses | 30 | 42 | 96 | 33 | 126 | 75 | 138 | ||||||||
| Total operating expenses | 1,899 | 2,054 | 1,381 | 1,502 | 3,280 | 3,556 | 3,785 | ||||||||
| Restructuring expenses | (66) | (53) | (35) | (6) | (101) | (59) | (42) | ||||||||
| Major litigation provisions | 0 | (6) | (4) | (43) | (4) | (49) | (25) | ||||||||
| Adjusted total operating expenses | 1,833 | 1,995 | 1,342 | 1,453 | 3,175 | 3,448 | 3,718 | ||||||||
| Income before taxes | 1,060 | 801 | 1,098 | 964 | 2,158 | 1,765 | 1,650 | ||||||||
| Total adjustments | 26 | 59 | 21 | 49 | 47 | 108 | (51) | ||||||||
| Adjusted income before taxes | 1,086 | 860 | 1,119 | 1,013 | 2,205 | 1,873 | 1,599 | ||||||||
| Adjusted return on regulatory capital (%) | – | – | – | – | 17.4 | 14.6 | 13.2 | ||||||||
1 Excludes net revenues and total operating expenses for Swisscard of CHF 148 million and CHF 123 million, respectively. | |||||||||||||||
A-7
| International Wealth Management | |||||||||||||||||
| in / end of | % change | in / end of | % change | ||||||||||||||
| 4Q18 | 3Q18 | 4Q17 | QoQ | YoY | 2018 | 2017 | YoY | ||||||||||
| Results (CHF million) | |||||||||||||||||
| Net revenues | 1,402 | 1,265 | 1,364 | 11 | 3 | 5,414 | 5,111 | 6 | |||||||||
| of which Private Banking | 942 | 913 | 923 | 3 | 2 | 3,890 | 3,603 | 8 | |||||||||
| of which Asset Management | 460 | 352 | 441 | 31 | 4 | 1,524 | 1,508 | 1 | |||||||||
| Provision for credit losses | 16 | 15 | 14 | 7 | 14 | 35 | 27 | 30 | |||||||||
| Total operating expenses | 976 | 872 | 1,010 | 12 | (3) | 3,674 | 3,733 | (2) | |||||||||
| Income before taxes | 410 | 378 | 340 | 8 | 21 | 1,705 | 1,351 | 26 | |||||||||
| of which Private Banking | 298 | 287 | 236 | 4 | 26 | 1,333 | 1,024 | 30 | |||||||||
| of which Asset Management | 112 | 91 | 104 | 23 | 8 | 372 | 327 | 14 | |||||||||
| Metrics (%) | |||||||||||||||||
| Return on regulatory capital | 28.9 | 27.1 | 25.2 | – | – | 30.7 | 25.8 | – | |||||||||
| Cost/income ratio | 69.6 | 68.9 | 74.0 | – | – | 67.9 | 73.0 | – | |||||||||
| Private Banking | |||||||||||||||||
| Assets under management (CHF billion) | 357.5 | 368.4 | 366.9 | (3.0) | (2.6) | 357.5 | 366.9 | (2.6) | |||||||||
| Net new assets (CHF billion) | 0.5 | 3.0 | 2.7 | – | – | 14.2 | 15.6 | – | |||||||||
| Gross margin (annualized) (bp) | 103 | 99 | 101 | – | – | 106 | 105 | – | |||||||||
| Net margin (annualized) (bp) | 33 | 31 | 26 | – | – | 36 | 30 | – | |||||||||
| Asset Management | |||||||||||||||||
| Assets under management (CHF billion) | 388.7 | 403.7 | 385.6 | (3.7) | 0.8 | 388.7 | 385.6 | 0.8 | |||||||||
| Net new assets (CHF billion) | 0.7 | 4.5 | 1.4 | – | – | 22.2 | 20.3 | – | |||||||||
A-8
| Reconciliation of adjusted results | |||||||||||||||||||
| Private Banking | Asset Management | International Wealth Management | |||||||||||||||||
| in | 4Q18 | 3Q18 | 4Q17 | 4Q18 | 3Q18 | 4Q17 | 4Q18 | 3Q18 | 4Q17 | ||||||||||
| Adjusted results (CHF million) | |||||||||||||||||||
| Net revenues | 942 | 913 | 923 | 460 | 352 | 441 | 1,402 | 1,265 | 1,364 | ||||||||||
| Real estate gains | (2) | 0 | 0 | 0 | 0 | 0 | (2) | 0 | 0 | ||||||||||
| (Gains)/losses on business sales | 0 | 0 | 0 | (24) | 5 | 28 | (24) | 5 | 28 | ||||||||||
| Adjusted net revenues | 940 | 913 | 923 | 436 | 357 | 469 | 1,376 | 1,270 | 1,392 | ||||||||||
| Provision for credit losses | 16 | 15 | 14 | 0 | 0 | 0 | 16 | 15 | 14 | ||||||||||
| Total operating expenses | 628 | 611 | 673 | 348 | 261 | 337 | 976 | 872 | 1,010 | ||||||||||
| Restructuring expenses | (25) | (21) | (8) | (8) | (7) | (3) | (33) | (28) | (11) | ||||||||||
| Major litigation provisions | 0 | 0 | (31) | 0 | 0 | 0 | 0 | 0 | (31) | ||||||||||
| Expenses related to business sales | 0 | 0 | 0 | (47) | 0 | 0 | (47) | 0 | 0 | ||||||||||
| Adjusted total operating expenses | 603 | 590 | 634 | 293 | 254 | 334 | 896 | 844 | 968 | ||||||||||
| Income before taxes | 298 | 287 | 236 | 112 | 91 | 104 | 410 | 378 | 340 | ||||||||||
| Total adjustments | 23 | 21 | 39 | 31 | 12 | 31 | 54 | 33 | 70 | ||||||||||
| Adjusted income before taxes | 321 | 308 | 275 | 143 | 103 | 135 | 464 | 411 | 410 | ||||||||||
| Adjusted return on regulatory capital (%) | – | – | – | – | – | – | 32.7 | 29.4 | 30.5 | ||||||||||
| Private Banking | Asset Management | International Wealth Management | |||||||||||
| in | 2018 | 2017 | 2018 | 2017 | 2018 | 2017 | |||||||
| Adjusted results (CHF million) | |||||||||||||
| Net revenues | 3,890 | 3,603 | 1,524 | 1,508 | 5,414 | 5,111 | |||||||
| Real estate gains | (2) | 0 | 0 | 0 | (2) | 0 | |||||||
| (Gains)/losses on business sales | (37) | 0 | (18) | 28 | (55) | 28 | |||||||
| Adjusted net revenues | 3,851 | 3,603 | 1,506 | 1,536 | 5,357 | 5,139 | |||||||
| Provision for credit losses | 35 | 27 | 0 | 0 | 35 | 27 | |||||||
| Total operating expenses | 2,522 | 2,552 | 1,152 | 1,181 | 3,674 | 3,733 | |||||||
| Restructuring expenses | (89) | (44) | (26) | (26) | (115) | (70) | |||||||
| Major litigation provisions | 0 | (48) | 0 | 0 | 0 | (48) | |||||||
| Expenses related to business sales | 0 | 0 | (47) | 0 | (47) | 0 | |||||||
| Adjusted total operating expenses | 2,433 | 2,460 | 1,079 | 1,155 | 3,512 | 3,615 | |||||||
| Income before taxes | 1,333 | 1,024 | 372 | 327 | 1,705 | 1,351 | |||||||
| Total adjustments | 50 | 92 | 55 | 54 | 105 | 146 | |||||||
| Adjusted income before taxes | 1,383 | 1,116 | 427 | 381 | 1,810 | 1,497 | |||||||
| Adjusted return on regulatory capital (%) | – | – | – | – | 32.6 | 28.6 | |||||||
A-9
| Asia Pacific | |||||||||||||||||
| in / end of | % change | in / end of | % change | ||||||||||||||
| 4Q18 | 3Q18 | 4Q17 | QoQ | YoY | 2018 | 2017 | YoY | ||||||||||
| Results (CHF million) | |||||||||||||||||
| Net revenues | 677 | 811 | 885 | (17) | (24) | 3,393 | 3,504 | (3) | |||||||||
| of which Wealth Management & Connected | 506 | 557 | 626 | (9) | (19) | 2,290 | 2,322 | (1) | |||||||||
| of which Markets | 171 | 254 | 259 | (33) | (34) | 1,103 | 1,182 | (7) | |||||||||
| Provision for credit losses | 8 | 10 | 7 | (20) | 14 | 35 | 15 | 133 | |||||||||
| Total operating expenses | 632 | 625 | 702 | 1 | (10) | 2,694 | 2,760 | (2) | |||||||||
| Income before taxes | 37 | 176 | 176 | (79) | (79) | 664 | 729 | (9) | |||||||||
| of which Wealth Management & Connected | 138 | 180 | 229 | (23) | (40) | 691 | 799 | (14) | |||||||||
| of which Markets | (101) | (4) | (53) | – | 91 | (27) | (70) | (61) | |||||||||
| Metrics (%) | |||||||||||||||||
| Return on regulatory capital | 2.7 | 12.5 | 13.3 | – | – | 12.0 | 13.8 | – | |||||||||
| Cost/income ratio | 93.4 | 77.1 | 79.3 | – | – | 79.4 | 78.8 | – | |||||||||
| Wealth Management & Connected – Private Banking | |||||||||||||||||
| Assets under management (CHF billion) | 201.7 | 207.5 | 196.8 | (2.8) | 2.5 | 201.7 | 196.8 | 2.5 | |||||||||
| Net new assets (CHF billion) | 1.2 | 6.4 | 1.3 | – | – | 17.2 | 16.9 | – | |||||||||
| Gross margin (annualized) (bp) | 70 | 76 | 80 | – | – | 79 | 88 | – | |||||||||
| Net margin (annualized) (bp) | 19 | 26 | 23 | – | – | 27 | 30 | – | |||||||||
A-10
| Reconciliation of adjusted results | |||||||||||||||||||
| Wealth Management & Connected | Markets | Asia Pacific | |||||||||||||||||
| in | 4Q18 | 3Q18 | 4Q17 | 4Q18 | 3Q18 | 4Q17 | 4Q18 | 3Q18 | 4Q17 | ||||||||||
| Adjusted results (CHF million) | |||||||||||||||||||
| Net revenues | 506 | 557 | 626 | 171 | 254 | 259 | 677 | 811 | 885 | ||||||||||
| Provision for credit losses | 9 | 1 | 7 | (1) | 9 | 0 | 8 | 10 | 7 | ||||||||||
| Total operating expenses | 359 | 376 | 390 | 273 | 249 | 312 | 632 | 625 | 702 | ||||||||||
| Restructuring expenses | (10) | (3) | (10) | (16) | (6) | (13) | (26) | (9) | (23) | ||||||||||
| Major litigation provisions | (1) | (1) | 0 | 0 | 0 | 0 | (1) | (1) | 0 | ||||||||||
| Adjusted total operating expenses | 348 | 372 | 380 | 257 | 243 | 299 | 605 | 615 | 679 | ||||||||||
| Income/(loss) before taxes | 138 | 180 | 229 | (101) | (4) | (53) | 37 | 176 | 176 | ||||||||||
| Total adjustments | 11 | 4 | 10 | 16 | 6 | 13 | 27 | 10 | 23 | ||||||||||
| Adjusted income/(loss) before taxes | 149 | 184 | 239 | (85) | 2 | (40) | 64 | 186 | 199 | ||||||||||
| Adjusted return on regulatory capital (%) | – | – | – | – | – | – | 4.7 | 13.2 | 15.0 | ||||||||||
| Wealth Management & Connected | Markets | Asia Pacific | |||||||||||
| in | 2018 | 2017 | 2018 | 2017 | 2018 | 2017 | |||||||
| Adjusted results (CHF million) | |||||||||||||
| Net revenues | 2,290 | 2,322 | 1,103 | 1,182 | 3,393 | 3,504 | |||||||
| Provision for credit losses | 25 | 15 | 10 | 0 | 35 | 15 | |||||||
| Total operating expenses | 1,574 | 1,508 | 1,120 | 1,252 | 2,694 | 2,760 | |||||||
| Restructuring expenses | (27) | (21) | (34) | (42) | (61) | (63) | |||||||
| Major litigation provisions | (79) | 0 | 0 | 0 | (79) | 0 | |||||||
| Adjusted total operating expenses | 1,468 | 1,487 | 1,086 | 1,210 | 2,554 | 2,697 | |||||||
| Income/(loss) before taxes | 691 | 799 | (27) | (70) | 664 | 729 | |||||||
| Total adjustments | 106 | 21 | 34 | 42 | 140 | 63 | |||||||
| Adjusted income/(loss) before taxes | 797 | 820 | 7 | (28) | 804 | 792 | |||||||
| Adjusted return on regulatory capital (%) | – | – | – | – | 14.5 | 15.0 | |||||||
| APAC Markets | |||||||||
| in | 4Q18 | 4Q17 | 2018 | 2017 | |||||
| Adjusted results (USD million) | |||||||||
| Net revenues | 173 | 264 | 1,134 | 1,209 | |||||
| Total operating expenses | 275 | 317 | 1,147 | 1,277 | |||||
| Restructuring expenses | (16) | (13) | (34) | (42) | |||||
| Adjusted total operating expenses | 259 | 304 | 1,113 | 1,235 | |||||
| Income before taxes | (101) | (53) | (24) | (68) | |||||
| Total adjustments | 16 | 13 | 34 | 42 | |||||
| Adjusted income before taxes | (85) | (40) | 10 | (26) | |||||
A-11
| Global Markets | |||||||||||||||||
| in / end of | % change | in / end of | % change | ||||||||||||||
| 4Q18 | 3Q18 | 4Q17 | QoQ | YoY | 2018 | 2017 | YoY | ||||||||||
| Results (CHF million) | |||||||||||||||||
| Net revenues | 965 | 1,043 | 1,163 | (7) | (17) | 4,980 | 5,551 | (10) | |||||||||
| Provision for credit losses | 5 | 3 | 8 | 67 | (38) | 24 | 31 | (23) | |||||||||
| Total operating expenses | 1,153 | 1,136 | 1,350 | 1 | (15) | 4,802 | 5,070 | (5) | |||||||||
| Income/(loss) before taxes | (193) | (96) | (195) | 101 | (1) | 154 | 450 | (66) | |||||||||
| Metrics (%) | |||||||||||||||||
| Return on regulatory capital | (6.2) | (3.0) | (5.5) | – | – | 1.2 | 3.2 | – | |||||||||
| Cost/income ratio | 119.5 | 108.9 | 116.1 | – | – | 96.4 | 91.3 | – | |||||||||
| Reconciliation of adjusted results | |||||||||||
| Global Markets | |||||||||||
| in | 4Q18 | 3Q18 | 4Q17 | 2018 | 2017 | ||||||
| Adjusted results (CHF million) | |||||||||||
| Net revenues | 965 | 1,043 | 1,163 | 4,980 | 5,551 | ||||||
| Provision for credit losses | 5 | 3 | 8 | 24 | 31 | ||||||
| Total operating expenses | 1,153 | 1,136 | 1,350 | 4,802 | 5,070 | ||||||
| Restructuring expenses | (80) | (64) | (71) | (242) | (150) | ||||||
| Major litigation provisions | 0 | (10) | 0 | (10) | 0 | ||||||
| Expenses related to business sales | 0 | 0 | (8) | 0 | (8) | ||||||
| Adjusted total operating expenses | 1,073 | 1,062 | 1,271 | 4,550 | 4,912 | ||||||
| Income/(loss) before taxes | (193) | (96) | (195) | 154 | 450 | ||||||
| Total adjustments | 80 | 74 | 79 | 252 | 158 | ||||||
| Adjusted income/(loss) before taxes | (113) | (22) | (116) | 406 | 608 | ||||||
| Adjusted return on regulatory capital (%) | (3.7) | (0.7) | (3.3) | 3.1 | 4.3 | ||||||
| Global Markets | |||||||||
| in | 4Q18 | 4Q17 | 2018 | 2017 | |||||
| Adjusted results (USD million) | |||||||||
| Net revenues | 966 | 1,179 | 5,115 | 5,662 | |||||
| Provision for credit losses | 4 | 8 | 24 | 32 | |||||
| Total operating expenses | 1,158 | 1,371 | 4,922 | 5,172 | |||||
| Restructuring expenses | (79) | (73) | (246) | (154) | |||||
| Major litigation provisions | 0 | 0 | (10) | 0 | |||||
| Expenses related to business sales | 0 | (8) | 0 | (8) | |||||
| Adjusted total operating expenses | 1,079 | 1,290 | 4,666 | 5,010 | |||||
| Income before taxes | (196) | (200) | 169 | 458 | |||||
| Total adjustments | 79 | 81 | 256 | 162 | |||||
| Adjusted income before taxes | (117) | (119) | 425 | 620 | |||||
A-12
| Investment Banking & Capital Markets | |||||||||||||||||
| in / end of | % change | in / end of | % change | ||||||||||||||
| 4Q18 | 3Q18 | 4Q17 | QoQ | YoY | 2018 | 2017 | YoY | ||||||||||
| Results (CHF million) | |||||||||||||||||
| Net revenues | 475 | 530 | 565 | (10) | (16) | 2,177 | 2,139 | 2 | |||||||||
| Provision for credit losses | 5 | 3 | (1) | 67 | – | 24 | 30 | (20) | |||||||||
| Total operating expenses | 365 | 457 | 459 | (20) | (20) | 1,809 | 1,740 | 4 | |||||||||
| Income before taxes | 105 | 70 | 107 | 50 | (2) | 344 | 369 | (7) | |||||||||
| Metrics (%) | |||||||||||||||||
| Return on regulatory capital | 12.4 | 8.9 | 15.0 | – | – | 10.9 | 13.7 | – | |||||||||
| Cost/income ratio | 76.8 | 86.2 | 81.2 | – | – | 83.1 | 81.3 | – | |||||||||
| Reconciliation of adjusted results | |||||||||||
| Investment Banking & Capital Markets | |||||||||||
| in | 4Q18 | 3Q18 | 4Q17 | 2018 | 2017 | ||||||
| Adjusted results (CHF million) | |||||||||||
| Net revenues | 475 | 530 | 565 | 2,177 | 2,139 | ||||||
| Provision for credit losses | 5 | 3 | (1) | 24 | 30 | ||||||
| Total operating expenses | 365 | 457 | 459 | 1,809 | 1,740 | ||||||
| Restructuring expenses | (6) | (17) | (14) | (84) | (42) | ||||||
| Major litigation provisions | (1) | 0 | 0 | (1) | 0 | ||||||
| Adjusted total operating expenses | 358 | 440 | 445 | 1,724 | 1,698 | ||||||
| Income before taxes | 105 | 70 | 107 | 344 | 369 | ||||||
| Total adjustments | 7 | 17 | 14 | 85 | 42 | ||||||
| Adjusted income before taxes | 112 | 87 | 121 | 429 | 411 | ||||||
| Adjusted return on regulatory capital (%) | 13.3 | 11.0 | 16.9 | 13.6 | 15.2 | ||||||
| Investment Banking & Capital Markets | |||||||||
| in | 4Q18 | 4Q17 | 2018 | 2017 | |||||
| Adjusted results (USD million) | |||||||||
| Net revenues | 476 | 573 | 2,228 | 2,182 | |||||
| Provision for credit losses | 5 | (1) | 24 | 31 | |||||
| Total operating expenses | 365 | 466 | 1,854 | 1,775 | |||||
| Restructuring expenses | (6) | (14) | (87) | (43) | |||||
| Major litigation provisions | (2) | 0 | (2) | 0 | |||||
| Adjusted total operating expenses | 357 | 452 | 1,765 | 1,732 | |||||
| Income before taxes | 106 | 108 | 350 | 376 | |||||
| Total adjustments | 8 | 14 | 89 | 43 | |||||
| Adjusted income before taxes | 114 | 122 | 439 | 419 | |||||
| Global advisory and underwriting revenues | |||||||||||||||||
| in | % change | in | % change | ||||||||||||||
| 4Q18 | 3Q18 | 4Q17 | QoQ | YoY | 2018 | 2017 | YoY | ||||||||||
| Global advisory and underwriting revenues (USD million) | |||||||||||||||||
| Global advisory and underwriting revenues | 761 | 1,020 | 1,034 | (25) | (26) | 4,043 | 4,133 | (2) | |||||||||
| of which advisory and other fees | 308 | 291 | 228 | 6 | 35 | 1,163 | 935 | 24 | |||||||||
| of which debt underwriting | 368 | 498 | 519 | (26) | (29) | 2,050 | 2,292 | (11) | |||||||||
| of which equity underwriting | 85 | 231 | 287 | (63) | (70) | 830 | 906 | (8) | |||||||||
A-13
| Strategic Resolution Unit | |||||||||||||||||
| in / end of | % change | in / end of | % change | ||||||||||||||
| 4Q18 | 3Q18 | 4Q17 | QoQ | YoY | 2018 | 2017 | YoY | ||||||||||
| Results (CHF million) | |||||||||||||||||
| Net revenues | (175) | (154) | (151) | 14 | 16 | (708) | (886) | (20) | |||||||||
| Provision for credit losses | (1) | 3 | 3 | – | – | 1 | 32 | (97) | |||||||||
| Total operating expenses | 123 | 150 | 301 | (18) | (59) | 672 | 1,217 | (45) | |||||||||
| Income/(loss) before taxes | (297) | (307) | (455) | (3) | (35) | (1,381) | (2,135) | (35) | |||||||||
| Reconciliation of adjusted results | |||||||||||
| Strategic Resolution Unit | |||||||||||
| in | 4Q18 | 3Q18 | 4Q17 | 2018 | 2017 | ||||||
| Adjusted results (CHF million) | |||||||||||
| Net revenues | (175) | (154) | (151) | (708) | (886) | ||||||
| Real estate gains | 0 | 0 | 0 | (1) | 0 | ||||||
| (Gains)/losses on business sales | 0 | 0 | 0 | 0 | (38) | ||||||
| Adjusted net revenues | (175) | (154) | (151) | (709) | (924) | ||||||
| Provision for credit losses | (1) | 3 | 3 | 1 | 32 | ||||||
| Total operating expenses | 123 | 150 | 301 | 672 | 1,217 | ||||||
| Restructuring expenses | 31 | (28) | (18) | (21) | (57) | ||||||
| Major litigation provisions | (45) | (9) | (90) | (117) | (269) | ||||||
| Expenses related to business sales | (1) | (2) | 0 | (4) | 0 | ||||||
| Adjusted total operating expenses | 108 | 111 | 193 | 530 | 891 | ||||||
| Income/(loss) before taxes | (297) | (307) | (455) | (1,381) | (2,135) | ||||||
| Total adjustments | 15 | 39 | 108 | 141 | 288 | ||||||
| Adjusted income/(loss) before taxes | (282) | (268) | (347) | (1,240) | (1,847) | ||||||
| Strategic Resolution Unit | |||||||
| in | 2018 | 2017 | 2016 | ||||
| Adjusted results (USD million) | |||||||
| Net revenues | (725) | (905) | (1,285) | ||||
| Real estate gains | (1) | 0 | (4) | ||||
| (Gains)/losses on business sales | 0 | (39) | 6 | ||||
| Adjusted net revenues | (726) | (944) | (1,283) | ||||
| Provision for credit losses | 1 | 31 | 115 | ||||
| Total operating expenses | 690 | 1,243 | 4,353 | ||||
| Restructuring expenses | (21) | (59) | (123) | ||||
| Major litigation provisions | (120) | (275) | (2,646) | ||||
| Expenses related to business sales | (5) | 0 | 0 | ||||
| Adjusted total operating expenses | 544 | 909 | 1,584 | ||||
| Income before taxes | (1,416) | (2,179) | (5,753) | ||||
| Total adjustments | 145 | 295 | 2,771 | ||||
| Adjusted income before taxes | (1,271) | (1,884) | (2,982) | ||||
A-14
Cautionary statement regarding forward-looking information
This document contains statements that constitute forward-looking statements. In addition, in the future we, and others on our behalf, may make statements that constitute forward-looking statements. Such forward-looking statements may include, without limitation, statements relating to the following:
– our plans, objectives, ambitions, targets or goals;
– our future economic performance or prospects;
– the potential effect on our future performance of certain contingencies; and
– assumptions underlying any such statements.
Words such as “believes,” “anticipates,” “expects,” “intends” and “plans” and similar expressions are intended to identify forward-looking statements but are not the exclusive means of identifying such statements. We do not intend to update these forward-looking statements.
By their very nature, forward-looking statements involve inherent risks and uncertainties, both general and specific, and risks exist that predictions, forecasts, projections and other outcomes described or implied in forward-looking statements will not be achieved. We caution you that a number of important factors could cause results to differ materially from the plans, objectives, ambitions, targets, expectations, estimates and intentions expressed in such forward-looking statements. These factors include:
– the ability to maintain sufficient liquidity and access capital markets;
– market volatility and interest rate fluctuations and developments affecting interest rate levels;
– the strength of the global economy in general and the strength of the economies of the countries in which we conduct our operations, in particular the risk of continued slow economic recovery or downturn in the US or other developed countries or in emerging markets in 2019 and beyond;
– the direct and indirect impacts of deterioration or slow recovery in residential and commercial real estate markets;
– adverse rating actions by credit rating agencies in respect of us, sovereign issuers, structured credit products or other credit-related exposures;
– the ability to achieve our strategic goals, including those related to cost efficiency, income/(loss) before taxes, capital ratios and return on regulatory capital, leverage exposure threshold, risk-weighted assets threshold, return on tangible equity and other targets, objectives and ambitions;
– the ability of counterparties to meet their obligations to us;
– the effects of, and changes in, fiscal, monetary, exchange rate, trade and tax policies, as well as currency fluctuations;
– political and social developments, including war, civil unrest or terrorist activity;
– the possibility of foreign exchange controls, expropriation, nationalization or confiscation of assets in countries in which we conduct our operations;
– operational factors such as systems failure, human error, or the failure to implement procedures properly;
– the risk of cyber attacks on our business or operations;
– actions taken by regulators with respect to our business and practices and possible resulting changes to our business organization, practices and policies in countries in which we conduct our operations;
– the effects of changes in laws, regulations or accounting or tax standards, policies or practices in countries in which we conduct our operations;
– the potential effects of proposed changes in our legal entity structure;
– competition or changes in our competitive position in geographic and business areas in which we conduct our operations;
– the ability to retain and recruit qualified personnel;
– the ability to maintain our reputation and promote our brand;
– the ability to increase market share and control expenses;
– technological changes;
– the timely development and acceptance of our new products and services and the perceived overall value of these products and services by users;
– acquisitions, including the ability to integrate acquired businesses successfully, and divestitures, including the ability to sell non-core assets;
– the adverse resolution of litigation, regulatory proceedings and other contingencies; and
– other unforeseen or unexpected events and our success at managing these and the risks involved in the foregoing.
We caution you that the foregoing list of important factors is not exclusive. When evaluating forward-looking statements, you should carefully consider the foregoing factors and other uncertainties and events, including the information set forth in “Risk factors” in I – Information on the company in our Annual Report 2017.
A-15

Tidjane Thiam, Chief Executive OfficerDavid Mathers, Chief Financial OfficerFebruary 14, 2019 Credit SuisseFourth Quarter and Full Year 2018 Results
Disclaimer This material does not purport to contain all of the information that you may wish to consider. This material is not to be relied upon as such or used in substitution for the exercise of independent judgment.Cautionary statement regarding forward-looking statements This presentation contains forward-looking statements that involve inherent risks and uncertainties, and we might not be able to achieve the predictions, forecasts, projections and other outcomes we describe or imply in forward-looking statements. A number of important factors could cause results to differ materially from the plans, objectives, expectations, estimates and intentions we express in these forward-looking statements, including those we identify in "Risk factors” in our Annual Report on Form 20-F for the fiscal year ended December 31, 2017 and in the “Cautionary statement regarding forward-looking information" in our 4Q18 Earnings Release, published on February 14, 2019 and filed with the US Securities and Exchange Commission, and in other public filings and press releases. We do not intend to update these forward-looking statements. In particular, the terms “Estimate”, “Illustrative”, “Ambition”, “Objective”, “Outlook” and “Goal” are not intended to be viewed as targets or projections, nor are they considered to be Key Performance Indicators. All such estimates, illustrations, ambitions, objectives, outlooks and goals are subject to a large number of inherent risks, assumptions and uncertainties, many of which are completely outside of our control. These risks, assumptions and uncertainties include, but are not limited to, general market conditions, market volatility, interest rate volatility and levels, global and regional economic conditions, political uncertainty, changes in tax policies, regulatory changes, changes in levels of client activity as a result of any of the foregoing and other factors. Accordingly, this information should not be relied on for any purpose. We do not intend to update these estimates, illustrations, ambitions, objectives, outlooks or goals. We may not achieve the benefits of our strategic initiativesWe may not achieve all of the expected benefits of our strategic initiatives. Factors beyond our control, including but not limited to the market and economic conditions, changes in laws, rules or regulations and other challenges discussed in our public filings, could limit our ability to achieve some or all of the expected benefits of these initiatives. Estimates and assumptionsIn preparing this presentation, management has made estimates and assumptions that affect the numbers presented. Actual results may differ. Annualized numbers do not take account of variations in operating results, seasonality and other factors and may not be indicative of actual, full-year results. Figures throughout this presentation may also be subject to rounding adjustments. All opinions and views constitute judgments as of the date of writing without regard to the date on which the reader may receive or access the information. This information is subject to change at any time without notice and we do not intend to update this information.Statement regarding non-GAAP financial measuresThis presentation also contains non-GAAP financial measures, including adjusted results. Information needed to reconcile such non-GAAP financial measures to the most directly comparable measures under US GAAP can be found in this presentation in the Appendix, which is available on our website at www.credit-suisse.com.Our estimates, ambitions, objectives and targets often include metrics that are non-GAAP financial measures and are unaudited. A reconciliation of the estimates, ambitions, objectives and targets to the nearest GAAP measures is unavailable without unreasonable efforts. Adjusted results exclude goodwill impairment, major litigation charges, real estate gains and other revenue and expense items included in our reported results, all of which are unavailable on a prospective basis. Return on Tangible Equity is based on tangible shareholders' equity, a non-GAAP financial measure, which is calculated by deducting goodwill and other intangible assets from total shareholders' equity as presented in our balance sheet, both of which are unavailable on a prospective basis. Such estimates, ambitions, objectives and targets are calculated in a manner that is consistent with the accounting policies applied by us in preparing our financial statements.Statement regarding capital, liquidity and leverageAs of January 1, 2013, Basel III was implemented in Switzerland along with the Swiss “Too Big to Fail” legislation and regulations thereunder (in each case, subject to certain phase-in periods). As of January 1, 2015, the Bank for International Settlements (BIS) leverage ratio framework, as issued by the Basel Committee on Banking Supervision (BCBS), was implemented in Switzerland by FINMA. Our related disclosures are in accordance with our interpretation of such requirements, including relevant assumptions. Changes in the interpretation of these requirements in Switzerland or in any of our assumptions or estimates could result in different numbers from those shown in this presentation. Unless otherwise noted, leverage exposure is based on the BIS leverage ratio framework and consists of period-end balance sheet assets and prescribed regulatory adjustments. The look-through tier 1 leverage ratio and CET1 leverage ratio are calculated as look-through BIS tier 1 capital and CET1 capital, respectively, divided by period-end leverage exposure. Swiss leverage ratios are measured on the same period-end basis as the leverage exposure for the BIS leverage ratio.SourcesCertain material in this presentation has been prepared by Credit Suisse on the basis of publicly available information, internally developed data and other third-party sources believed to be reliable. Credit Suisse has not sought to independently verify information obtained from public and third-party sources and makes no representations or warranties as to accuracy, completeness or reliability of such information. 2 February 14, 2019
Earnings Review 3 February 14, 2019
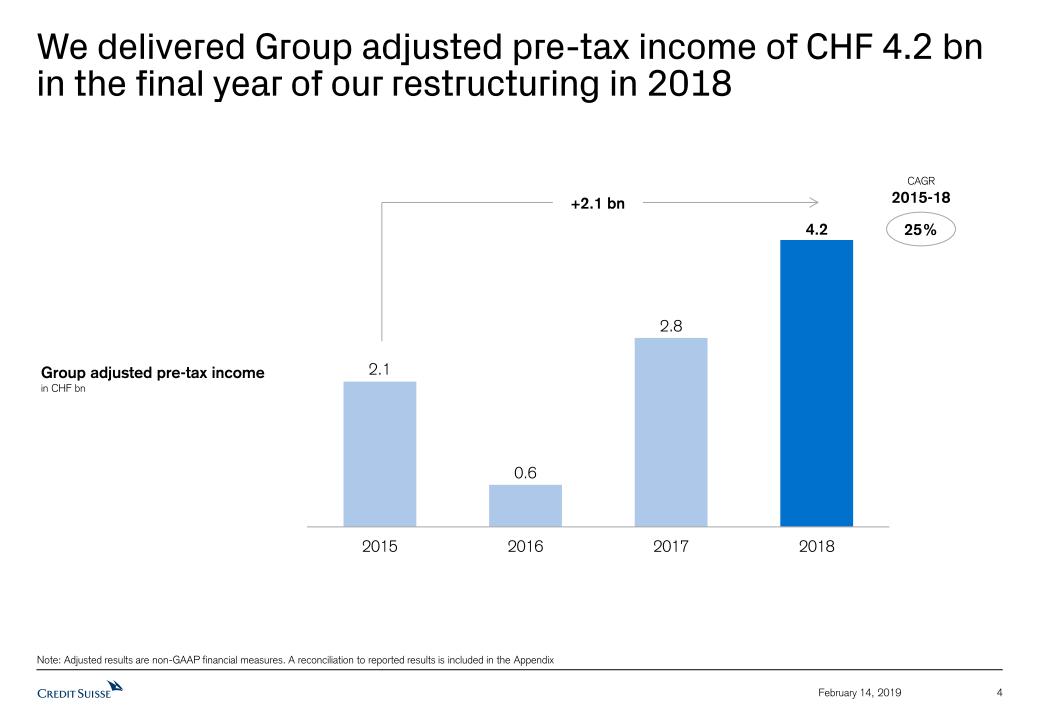
We delivered Group adjusted pre-tax income of CHF 4.2 bn in the final year of our restructuring in 2018 4 February 14, 2019 +2.1 bn Group adjusted pre-tax incomein CHF bn Note: Adjusted results are non-GAAP financial measures. A reconciliation to reported results is included in the Appendix 25% CAGR2015-18
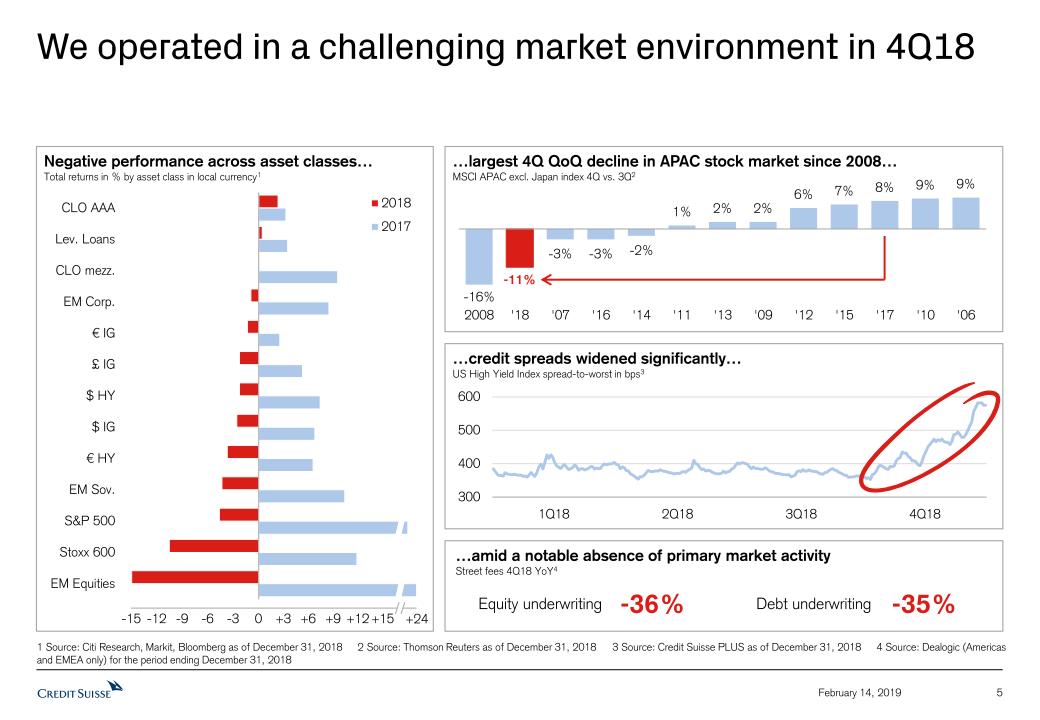
We operated in a challenging market environment in 4Q18 5 February 14, 2019 1 Source: Citi Research, Markit, Bloomberg as of December 31, 2018 2 Source: Thomson Reuters as of December 31, 2018 3 Source: Credit Suisse PLUS as of December 31, 2018 4 Source: Dealogic (Americas and EMEA only) for the period ending December 31, 2018 …amid a notable absence of primary market activityStreet fees 4Q18 YoY4 Equity underwriting -36% Debt underwriting -35% Negative performance across asset classes…Total returns in % by asset class in local currency1 -15 -12 -9 -6 -3 0 +3 +24 +6 +9 +12 +15 …credit spreads widened significantly…US High Yield Index spread-to-worst in bps3 1Q18 2Q18 3Q18 4Q18 …largest 4Q QoQ decline in APAC stock market since 2008…MSCI APAC excl. Japan index 4Q vs. 3Q2
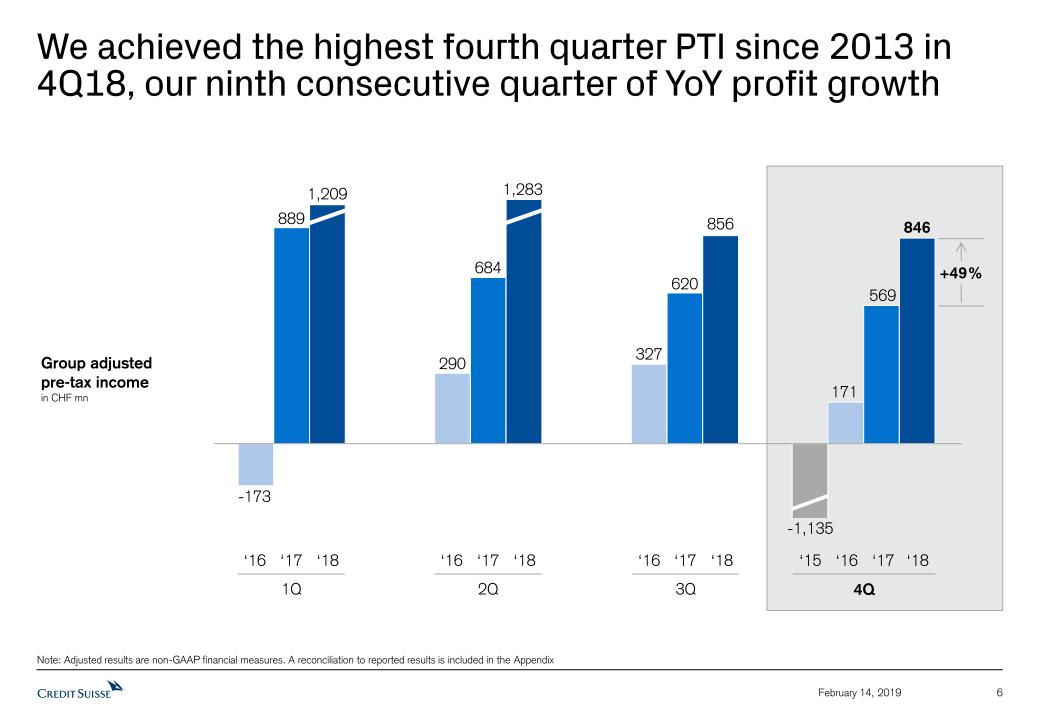
We achieved the highest fourth quarter PTI since 2013 in 4Q18, our ninth consecutive quarter of YoY profit growth 6 February 14, 2019 1Q Note: Adjusted results are non-GAAP financial measures. A reconciliation to reported results is included in the Appendix -1,135 ‘16 ‘17 ‘18 3Q ‘16 ‘17 4Q ‘15 ‘16 ‘17 2Q ‘16 ‘17 ‘18 +49% ‘18 ‘18 Group adjustedpre-tax incomein CHF mn
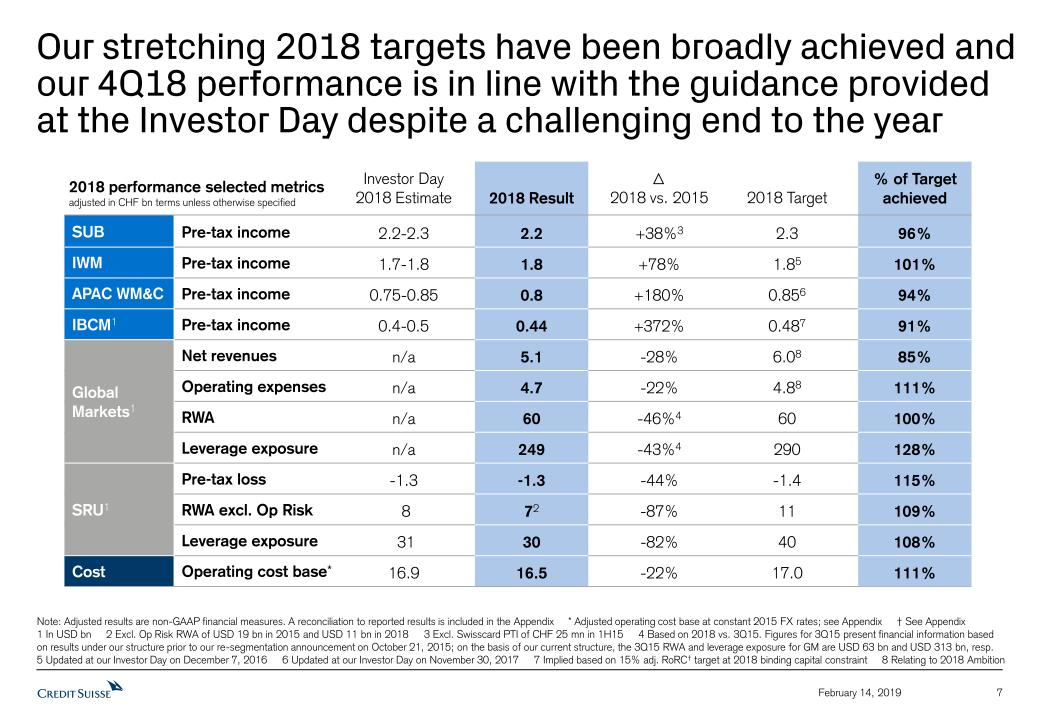
Our stretching 2018 targets have been broadly achieved and our 4Q18 performance is in line with the guidance provided at the Investor Day despite a challenging end to the year 7 February 14, 2019 Note: Adjusted results are non-GAAP financial measures. A reconciliation to reported results is included in the Appendix * Adjusted operating cost base at constant 2015 FX rates; see Appendix † See Appendix1 In USD bn 2 Excl. Op Risk RWA of USD 19 bn in 2015 and USD 11 bn in 2018 3 Excl. Swisscard PTI of CHF 25 mn in 1H15 4 Based on 2018 vs. 3Q15. Figures for 3Q15 present financial information basedon results under our structure prior to our re-segmentation announcement on October 21, 2015; on the basis of our current structure, the 3Q15 RWA and leverage exposure for GM are USD 63 bn and USD 313 bn, resp. 5 Updated at our Investor Day on December 7, 2016 6 Updated at our Investor Day on November 30, 2017 7 Implied based on 15% adj. RoRC† target at 2018 binding capital constraint 8 Relating to 2018 Ambition 2018 Target 2.3 1.85 0.856 0.487 6.08 17.0 -1.4 4.88 60 290 11 40 Investor Day2018 Estimate 2.2-2.3 1.7-1.8 0.75-0.85 0.4-0.5 n/a 16.9 -1.3 n/a n/a n/a 8 31 2018 Result 2.2 1.8 0.8 0.44 5.1 16.5 -1.3 4.7 60 249 72 30 2018 vs. 2015 +38%3 +78% +180% +372% -28% -22% -44% -22% -46%4 -43%4 -87% -82% 2018 performance selected metricsadjusted in CHF bn terms unless otherwise specified Pre-tax income Pre-tax income Pre-tax income Pre-tax income Net revenues Operating cost base* Pre-tax loss Operating expenses RWA Leverage exposure RWA excl. Op Risk Leverage exposure SRU1 GlobalMarkets1 SUB IWM APAC WM&C IBCM1 Cost % of Target achieved 96% 101% 94% 91% 85% 111% 115% 111% 100% 128% 109% 108%
Highlights of 2018 8 February 14, 2019 Strong revenue growth in Wealth Management1, outperforming key peers and the wider market in 20182Continued growth in stable and high-quality revenues with share of NII and recurring fees ~75% of PB1 revenuesLeveraging our Investment Banking capabilities for our UHNW client franchiseCreating positive operating leverage – delivered cumulative net cost savings* of CHF 4.6 bn3Completed SRU wind-downStrong capital position, started 2019 share buyback program4Navigated through severe market dislocation in 4Q18, with no material lossesResilient performance in APAC WM&C with particular strength in our APAC Financing GroupProgress towards our 10% RoTE‡ target Note: Adjusted results are non-GAAP financial measures. RoTE (a non-GAAP financial measure) on a reported basis * Measured using adjusted operating cost base at constant 2015 FX rates; see Appendix ‡ See Appendix 1 Relating to SUB PC, IWM PB and APAC PB within WM&C 2 Source: Company public filings and Credit Suisse internal estimates based on McKinsey Wealth Pools 2017 3 From 2016 to 2018 4 Detailed information on the share buyback program, including the buyback notice, available at https://www.credit-suisse.com/corporate/en/investor-relations/corporate-and-share-information/share-information/share-capital-and-statistics.html
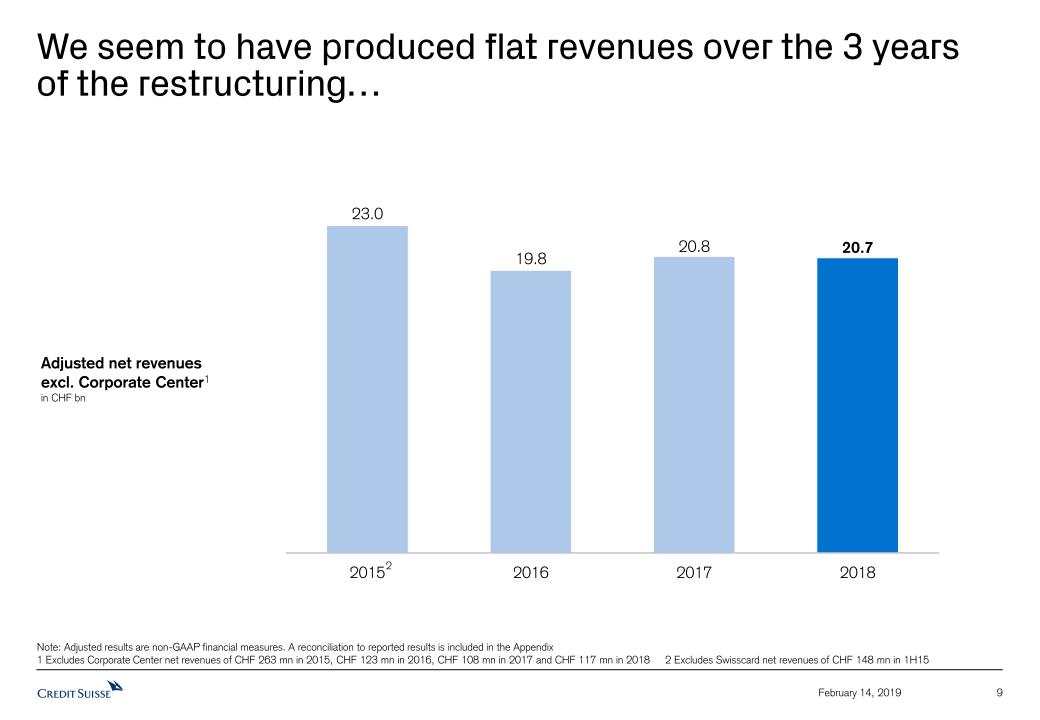
We seem to have produced flat revenues over the 3 years of the restructuring… 9 February 14, 2019 Adjusted net revenuesexcl. Corporate Center1in CHF bn Note: Adjusted results are non-GAAP financial measures. A reconciliation to reported results is included in the Appendix1 Excludes Corporate Center net revenues of CHF 263 mn in 2015, CHF 123 mn in 2016, CHF 108 mn in 2017 and CHF 117 mn in 2018 2 Excludes Swisscard net revenues of CHF 148 mn in 1H15 2

…we focused on growing higher quality Wealth Management revenues, accepting some attrition in our Markets revenues… 10 February 14, 2019 Note: Adjusted results are non-GAAP financial measures. A reconciliation to reported results is included in the Appendix1 Excludes Corporate Center net revenues of CHF 263 mn in 2015, CHF 123 mn in 2016, CHF 108 mn in 2017 and CHF 117 mn in 2018 2 Includes Global Markets and APAC Markets 3 Relating to SUB, IWM and APAC WM&C 4 Excludes Swisscard net revenues of CHF 148 mn in 1H15 WealthManagement-related3 Marketsactivities2 20.7 23.0 20.8 19.8 SRU 4 IBCM CAGR2015-18 5% Adj. net revenuesexcl. Corp. Center1in CHF bn
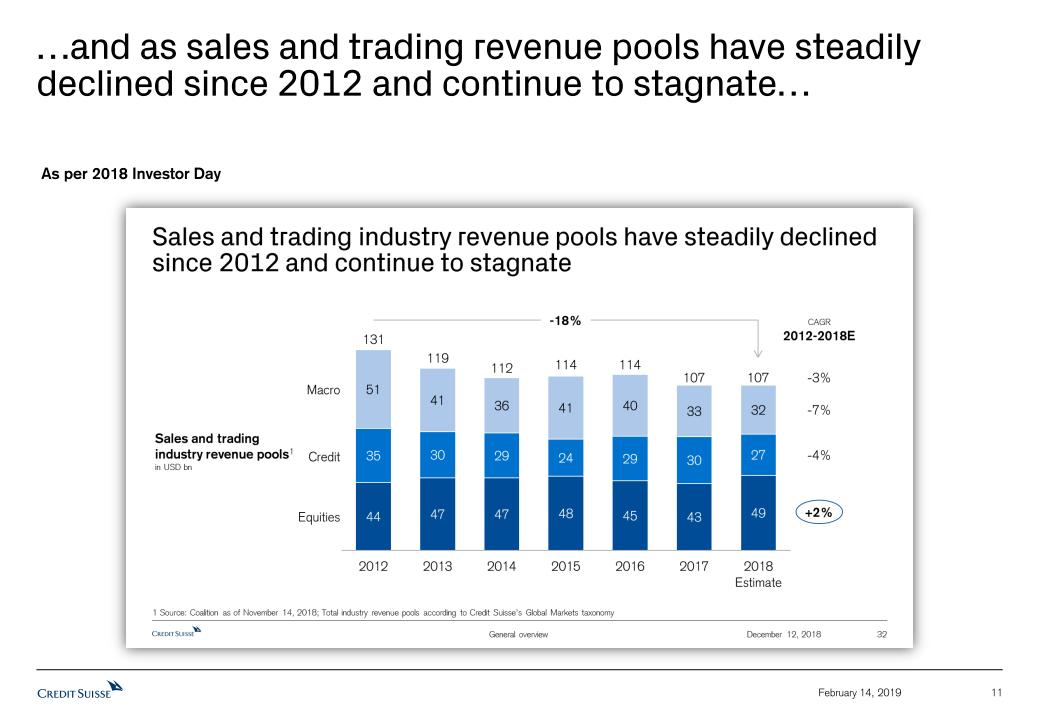
11 February 14, 2019 …and as sales and trading revenue pools have steadily declined since 2012 and continue to stagnate… As per 2018 Investor Day
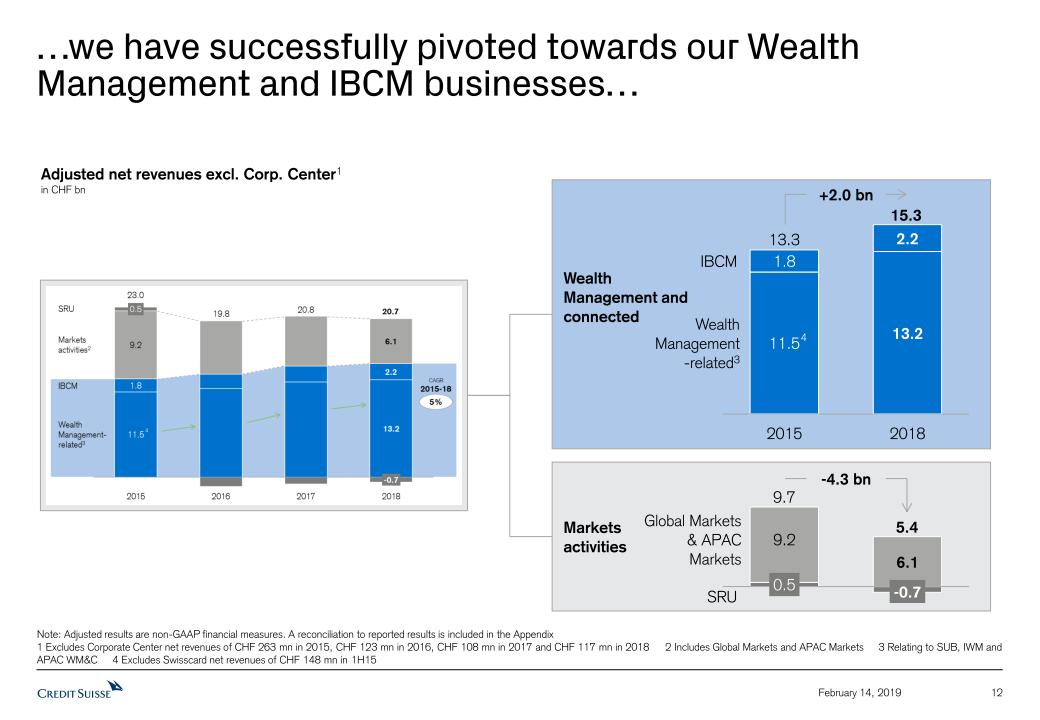
…we have successfully pivoted towards our Wealth Management and IBCM businesses… 12 February 14, 2019 Note: Adjusted results are non-GAAP financial measures. A reconciliation to reported results is included in the Appendix1 Excludes Corporate Center net revenues of CHF 263 mn in 2015, CHF 123 mn in 2016, CHF 108 mn in 2017 and CHF 117 mn in 2018 2 Includes Global Markets and APAC Markets 3 Relating to SUB, IWM and APAC WM&C 4 Excludes Swisscard net revenues of CHF 148 mn in 1H15 Adjusted net revenues excl. Corp. Center1in CHF bn Global Markets& APACMarkets SRU 9.7 5.4 Markets activities -4.3 bn Wealth Management-related3 IBCM 13.3 15.3 WealthManagement and connected 4 +2.0 bn
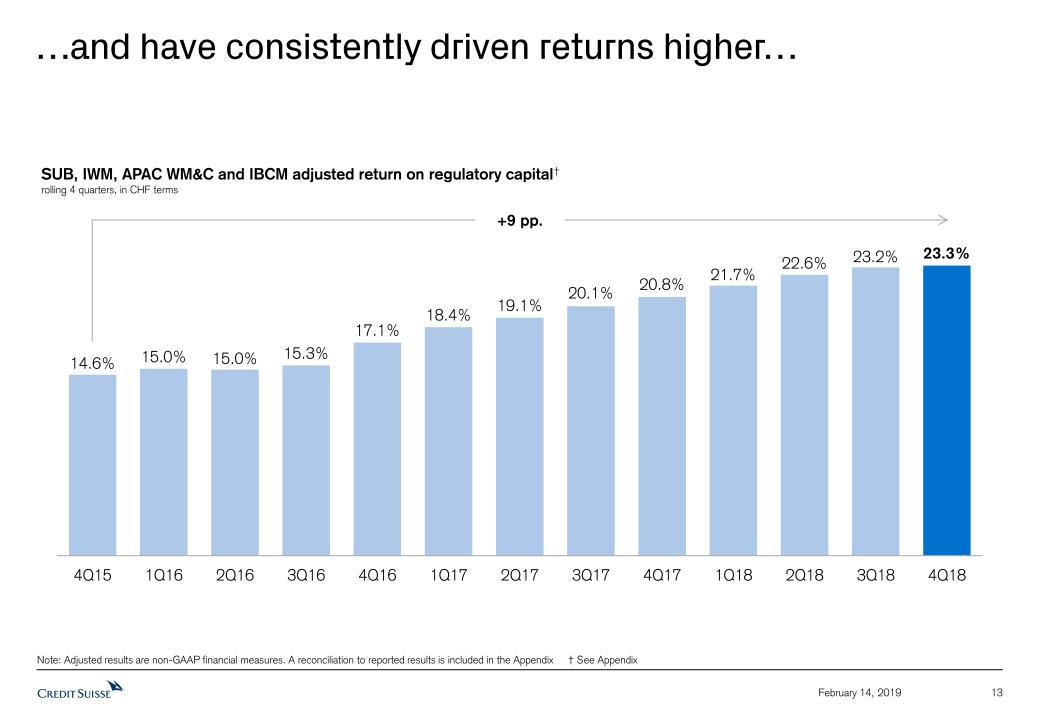
13 February 14, 2019 …and have consistently driven returns higher… +9 pp. Note: Adjusted results are non-GAAP financial measures. A reconciliation to reported results is included in the Appendix † See Appendix SUB, IWM, APAC WM&C and IBCM adjusted return on regulatory capital†rolling 4 quarters, in CHF terms
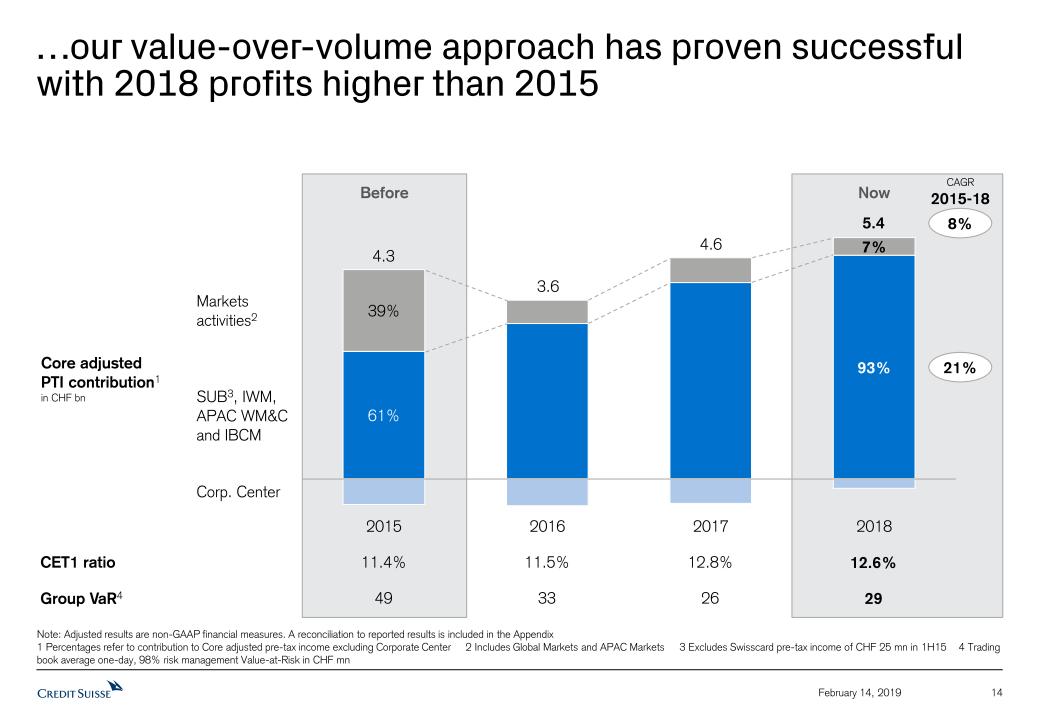
Now Before …our value-over-volume approach has proven successful with 2018 profits higher than 2015 14 February 14, 2019 Note: Adjusted results are non-GAAP financial measures. A reconciliation to reported results is included in the Appendix1 Percentages refer to contribution to Core adjusted pre-tax income excluding Corporate Center 2 Includes Global Markets and APAC Markets 3 Excludes Swisscard pre-tax income of CHF 25 mn in 1H15 4 Trading book average one-day, 98% risk management Value-at-Risk in CHF mn SUB3, IWM,APAC WM&Cand IBCM Marketsactivities2 Corp. Center CAGR2015-18 8% 21% Core adjustedPTI contribution1in CHF bn 5.4 4.3 4.6 3.6 CET1 ratio 11.4% 12.8% 11.5% Group VaR4 49 26 33 12.6% 29
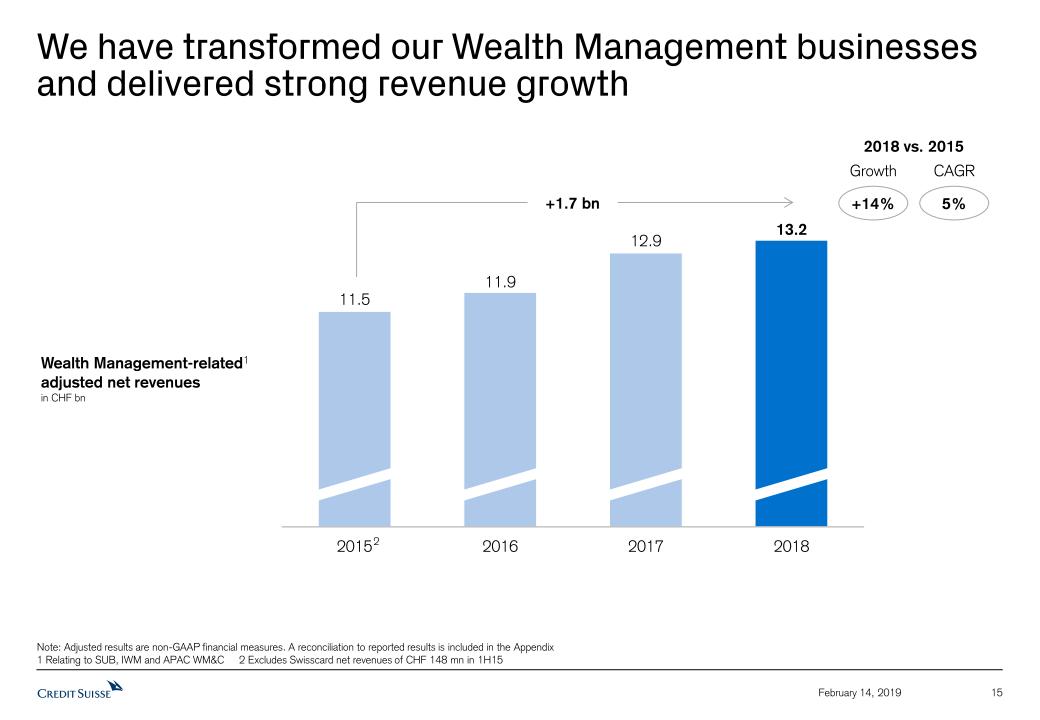
We have transformed our Wealth Management businesses and delivered strong revenue growth 15 February 14, 2019 +1.7 bn Wealth Management-related1 adjusted net revenuesin CHF bn Note: Adjusted results are non-GAAP financial measures. A reconciliation to reported results is included in the Appendix1 Relating to SUB, IWM and APAC WM&C 2 Excludes Swisscard net revenues of CHF 148 mn in 1H15 5% Growth 2018 vs. 2015 CAGR +14% 2
We are set-up to drive continued Wealth Management growth 16 February 14, 2019 Capture growingglobal wealth Follow balanced approach to wealth managementFocus on highest growth and most profitable UHNW and Entrepreneur segmentsSet-up regionalized structure with proximity to clients Increase share of wallet Leverage new sourcesof growth Bespoke financing transactions Best-in-class global execution through International Trading SolutionsAddress client demand for structured product solutionsInstitutional quality investment solutions to drive mandate penetrationUtilize state-of-the-art digital capabilities to increase client-time of relationship managers Benefit from investments in growth marketsFully leverage potential and further investments in new senior hires across all divisionsProactive management of wealth transfer across generations
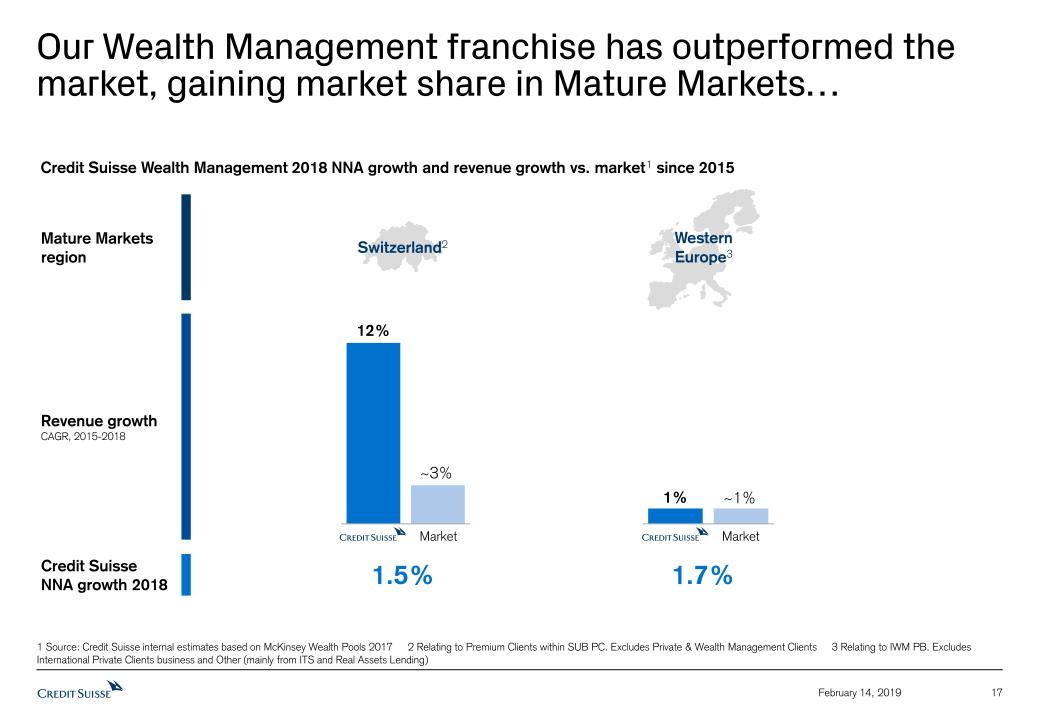
Our Wealth Management franchise has outperformed the market, gaining market share in Mature Markets… 17 February 14, 2019 Credit Suisse Wealth Management 2018 NNA growth and revenue growth vs. market1 since 2015 1 Source: Credit Suisse internal estimates based on McKinsey Wealth Pools 2017 2 Relating to Premium Clients within SUB PC. Excludes Private & Wealth Management Clients 3 Relating to IWM PB. Excludes International Private Clients business and Other (mainly from ITS and Real Assets Lending) Western Europe3 1.5% Switzerland2 1.7% Mature Markets region Revenue growthCAGR, 2015-2018 Credit Suisse NNA growth 2018 Market Market
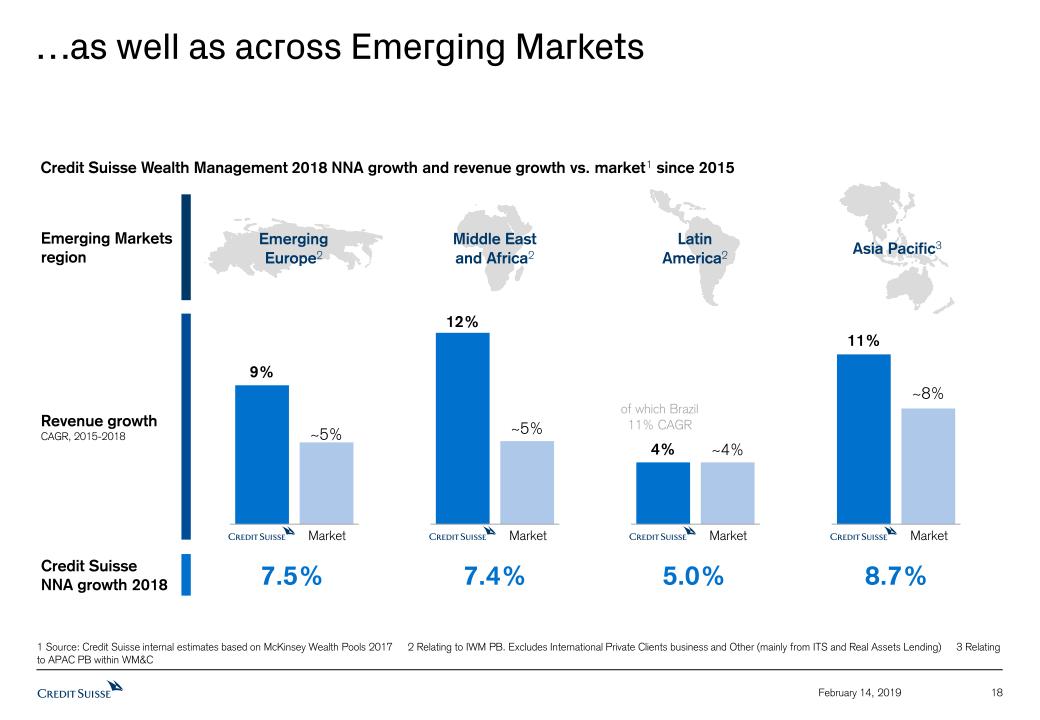
…as well as across Emerging Markets 18 February 14, 2019 1 Source: Credit Suisse internal estimates based on McKinsey Wealth Pools 2017 2 Relating to IWM PB. Excludes International Private Clients business and Other (mainly from ITS and Real Assets Lending) 3 Relating to APAC PB within WM&C Revenue growthCAGR, 2015-2018 Asia Pacific3 Latin America2 Middle East and Africa2 Emerging Europe2 of which Brazil 11% CAGR 7.5% 7.4% 5.0% 8.7% Credit SuisseNNA growth 2018 Emerging Markets region Credit Suisse Wealth Management 2018 NNA growth and revenue growth vs. market1 since 2015 Market Market Market Market
We have grown our stable and recurring revenue streams by CHF 1.4 bn since 2015 19 February 14, 2019 Stable andrecurring4 Marketdependent3 +1.3 bn 11.3 12.6 70% 74% 5 CAGR2015 vs. 2018 6% -0.3% SUB, IWM and APAC PB1net revenues2in CHF bn 1 APAC PB within WM&C 2 Totals include other revenues of CHF 73 mn in 2015 and CHF -9 mn in 2018 3 Includes transaction- & performance-based revenues 4 Includes recurring commissions & fees and net interest income 5 Excludes Swisscard net revenues of CHF 148 mn in 1H15 +1.4 bn
Wealth Management1 AuMin CHF bn Our asset gathering capabilities have allowed us to mitigate the impact of weak markets in 4Q18… 20 February 14, 2019 2 1 Relating to SUB PC, IWM PB and APAC PB within WM&C 2 Including other effects of CHF -4 bn of whichCHF -32 bnin 4Q18 -2%
…as we have generated positive NNA in every quarter of 2018, including during a challenging 4Q18 21 February 14, 2019 1 Relating to SUB PC, IWM PB and APAC PB within WM&C 2 APAC PB within WM&C 2 NNA growth rateannualized 1% 4% 9% 4% Wealth Management1 NNAin CHF bn
We have made continued progress to deepen collaboration between IB and WM despite challenging market conditions 22 February 14, 2019 1 Source: McKinsey private banking survey 2017. AuM represents UHNW, HNW and entry-HNW. Reflects the share of structured products and retail products as percent of AuM across IWM and SUB 2 Credit Suisse internal view leveraging McKinsey methodology. AuM represents UHNW, HNW and entry-HNW. Reflects the share of structured products and retail products as percent of AuM across IWM and SUB 3 Source: McKinsey private banking survey 2017. Industry represents HNW 4 Includes Structured Products, FX, Execution, Lending, Single Global Currency and Other. Refers to gross revenues Structured Products penetration of Private Banking clientsin % of AuM 1.4x +21% 1 1 2 ITS collaboration revenues42018 vs. 2017 in USD terms 3
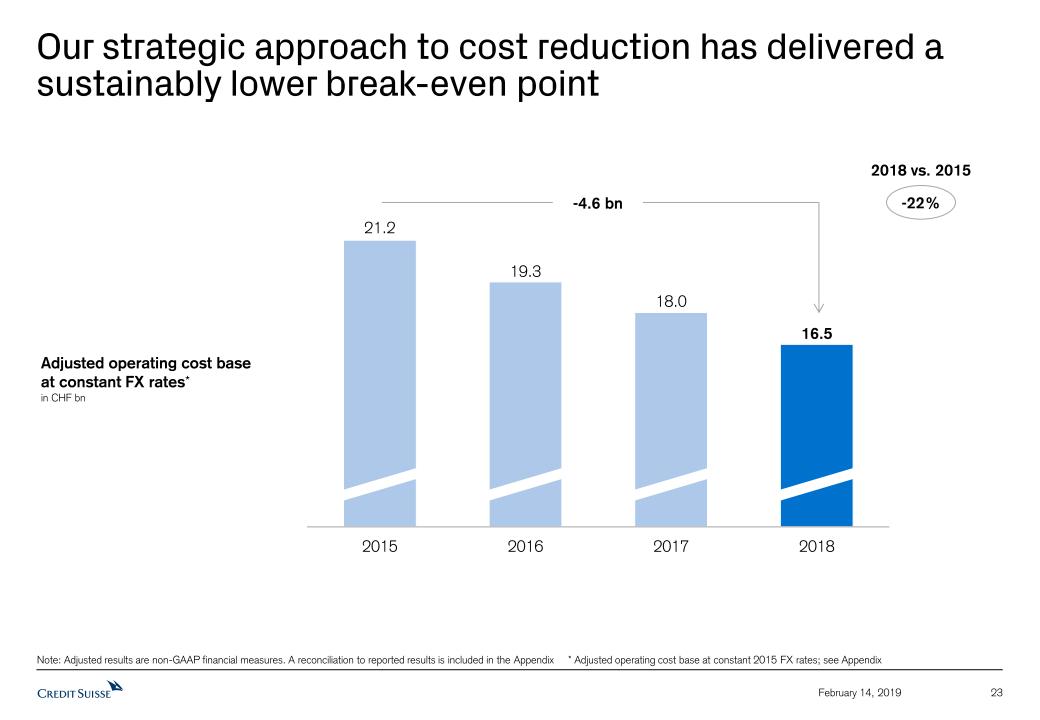
Our strategic approach to cost reduction has delivered a sustainably lower break-even point 23 February 14, 2019 -4.6 bn Adjusted operating cost baseat constant FX rates*in CHF bn Note: Adjusted results are non-GAAP financial measures. A reconciliation to reported results is included in the Appendix * Adjusted operating cost base at constant 2015 FX rates; see Appendix -22% 2018 vs. 2015
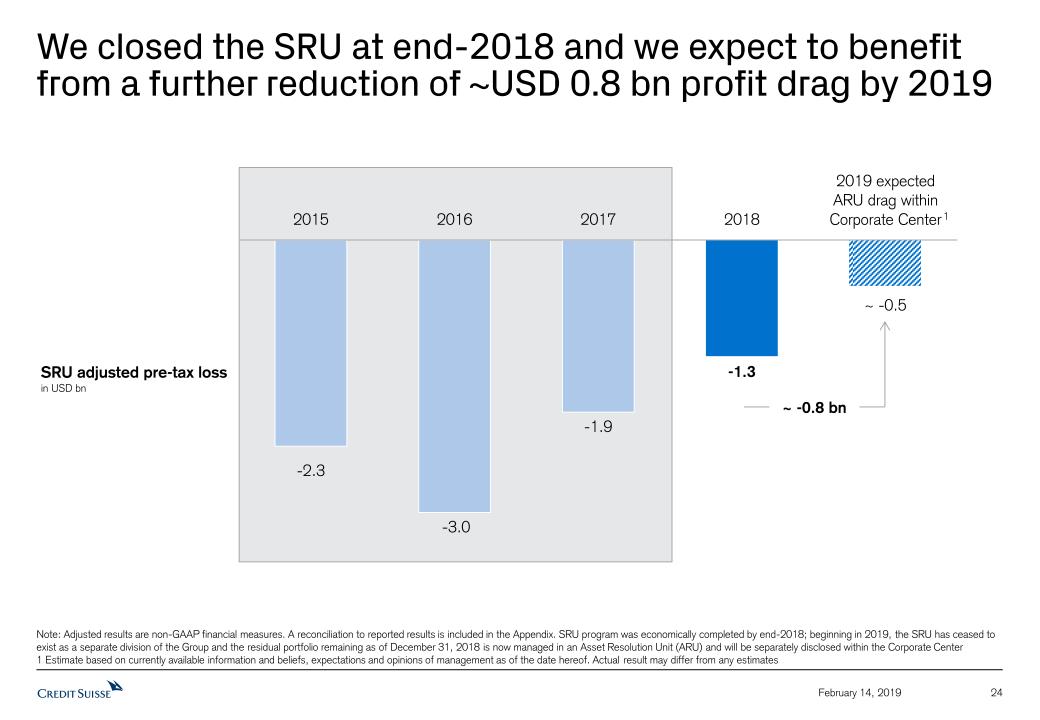
We closed the SRU at end-2018 and we expect to benefit from a further reduction of ~USD 0.8 bn profit drag by 2019 24 February 14, 2019 Note: Adjusted results are non-GAAP financial measures. A reconciliation to reported results is included in the Appendix. SRU program was economically completed by end-2018; beginning in 2019, the SRU has ceased to exist as a separate division of the Group and the residual portfolio remaining as of December 31, 2018 is now managed in an Asset Resolution Unit (ARU) and will be separately disclosed within the Corporate Center1 Estimate based on currently available information and beliefs, expectations and opinions of management as of the date hereof. Actual result may differ from any estimates SRU adjusted pre-tax lossin USD bn ~ -0.8 bn 1
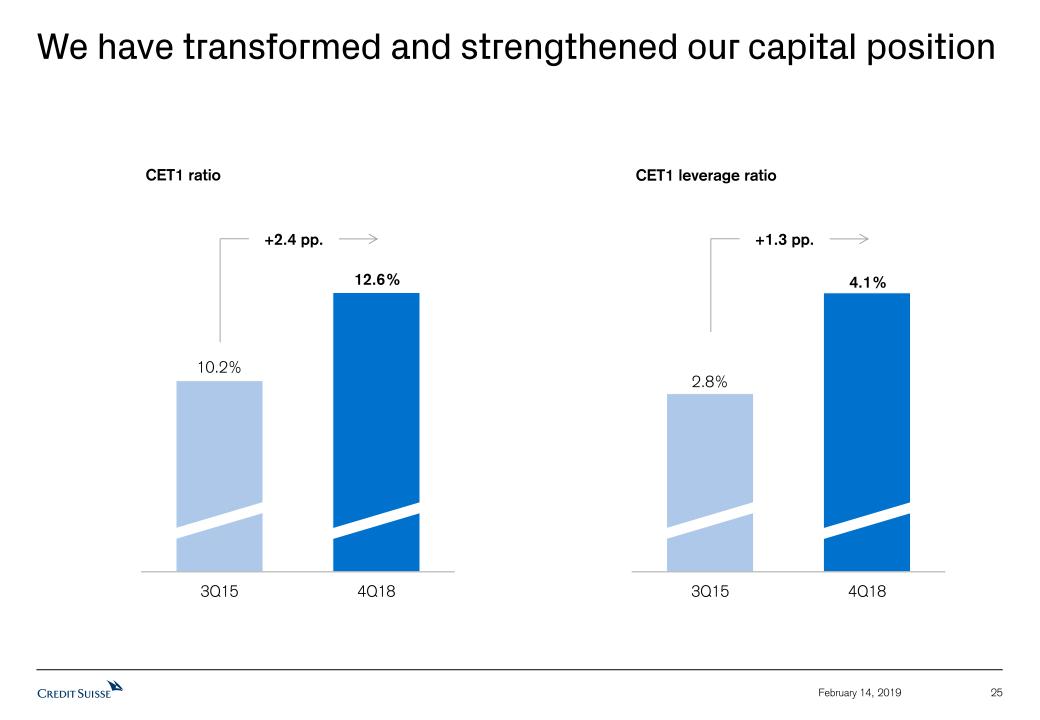
We have transformed and strengthened our capital position 25 February 14, 2019 +2.4 pp. CET1 ratio CET1 leverage ratio +1.3 pp.
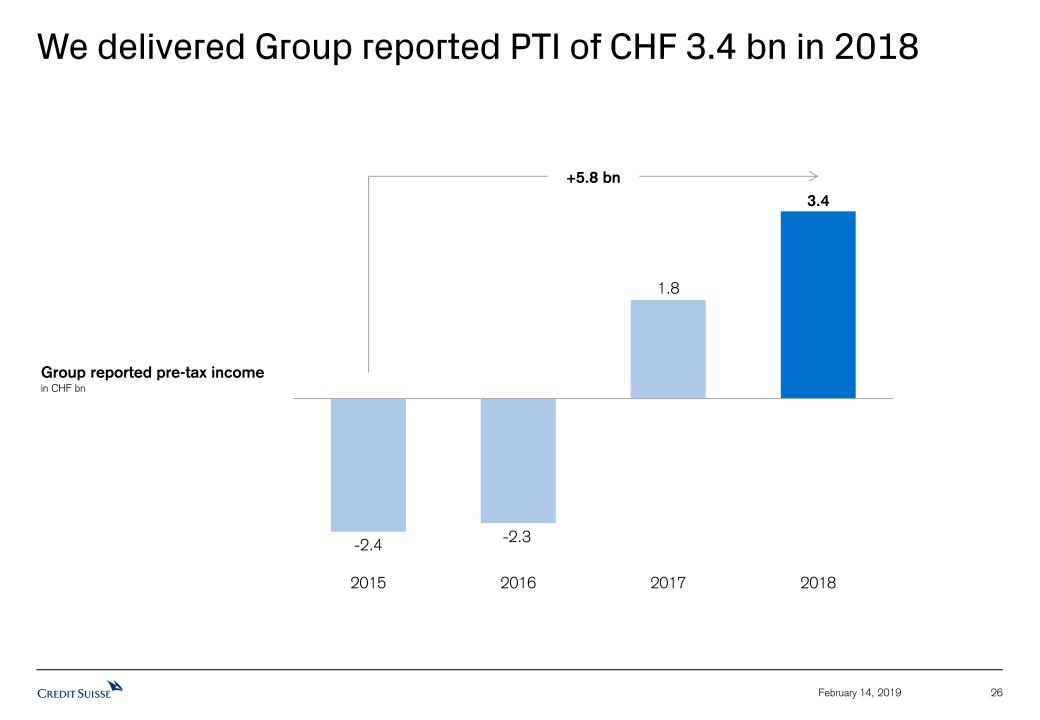
We delivered Group reported PTI of CHF 3.4 bn in 2018 26 February 14, 2019 Group reported pre-tax incomein CHF bn +5.8 bn
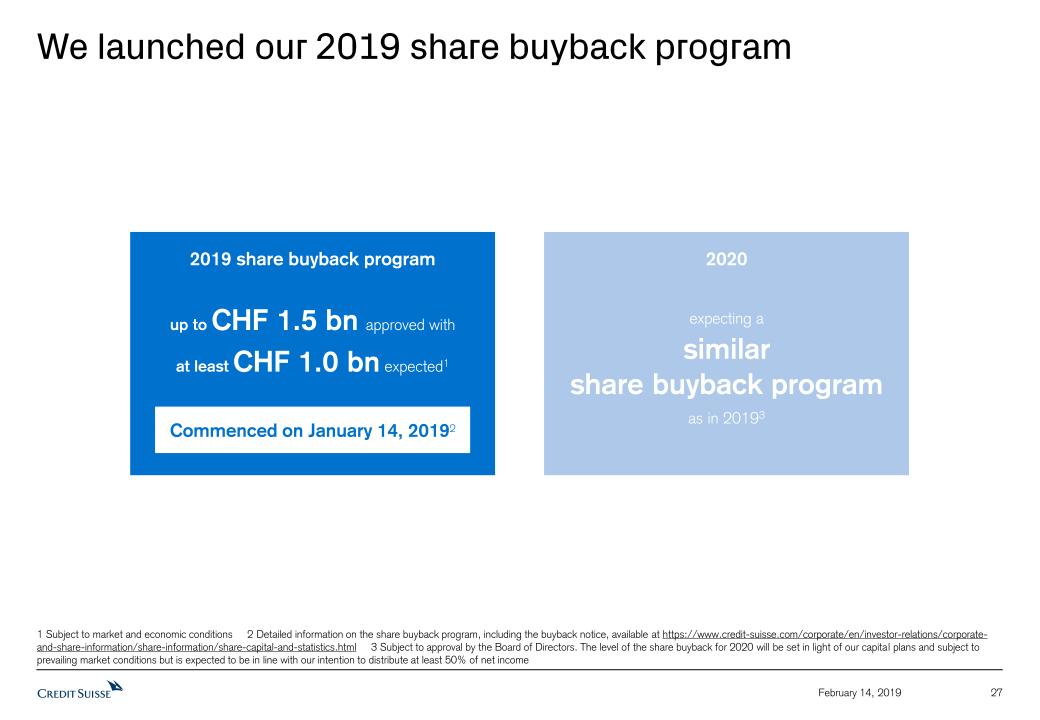
We launched our 2019 share buyback program 27 February 14, 2019 1 Subject to market and economic conditions 2 Detailed information on the share buyback program, including the buyback notice, available at https://www.credit-suisse.com/corporate/en/investor-relations/corporate-and-share-information/share-information/share-capital-and-statistics.html 3 Subject to approval by the Board of Directors. The level of the share buyback for 2020 will be set in light of our capital plans and subject to prevailing market conditions but is expected to be in line with our intention to distribute at least 50% of net income 2020expecting a similarshare buyback programas in 20193 2019 share buyback programup to CHF 1.5 bn approved withat least CHF 1.0 bn expected1 Commenced on January 14, 20192
Summary 28 February 14, 2019 Resilient operating model with continued positive operating leverage amid challenging market conditionsSignificantly improved Group performance in 2018 with reported PTI of CHF 3.4 bnCompleted 3-year restructuring programWell positioned to drive returns higher and deliver growing shareholder value

Detailed Financials 29 February 14, 2019
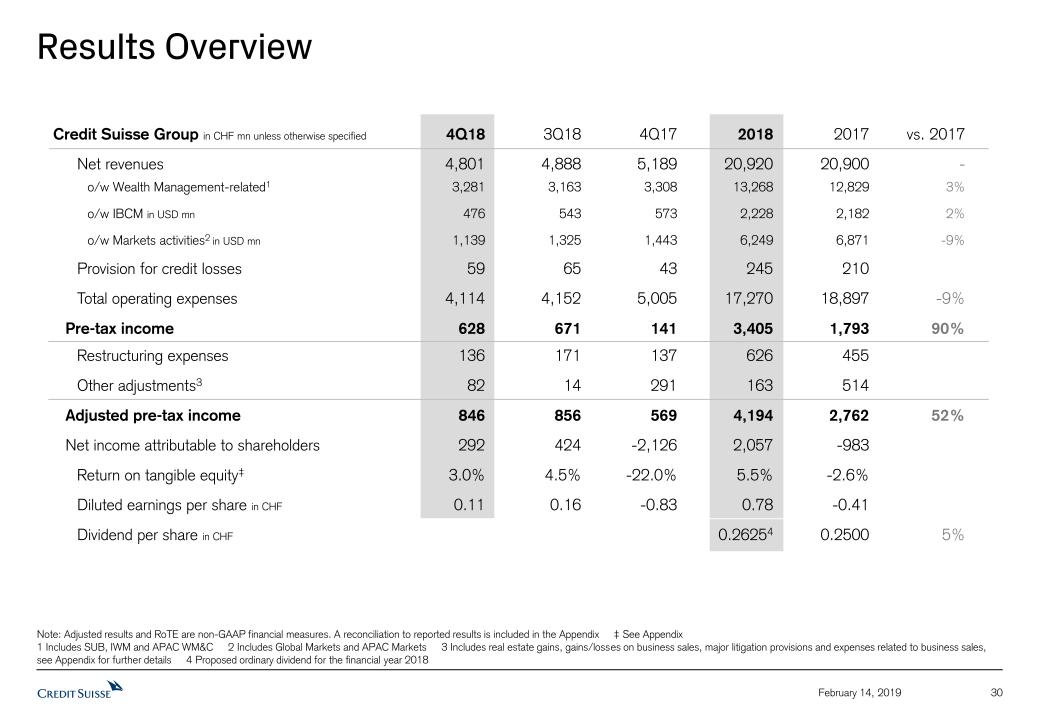
Results Overview Note: Adjusted results and RoTE are non-GAAP financial measures. A reconciliation to reported results is included in the Appendix ‡ See Appendix1 Includes SUB, IWM and APAC WM&C 2 Includes Global Markets and APAC Markets 3 Includes real estate gains, gains/losses on business sales, major litigation provisions and expenses related to business sales, see Appendix for further details 4 Proposed ordinary dividend for the financial year 2018 30 February 14, 2019 Credit Suisse Group in CHF mn unless otherwise specified 4Q18 3Q18 4Q17 2018 2017 vs. 2017Net revenues 4,801 4,888 5,189 20,920 20,900 - o/w Wealth Management-related1 3,281 3,163 3,308 13,268 12,829 3% o/w IBCM in USD mn 476 543 573 2,228 2,182 2% o/w Markets activities2 in USD mn 1,139 1,325 1,443 6,249 6,871 -9%Provision for credit losses 59 65 43 245 210Total operating expenses 4,114 4,152 5,005 17,270 18,897 -9%Pre-tax income 628 671 141 3,405 1,793 90%Restructuring expenses 136 171 137 626 455Other adjustments3 82 14 291 163 514Adjusted pre-tax income 846 856 569 4,194 2,762 52%Net income attributable to shareholders 292 424 -2,126 2,057 -983 Return on tangible equity‡ 3.0% 4.5% -22.0% 5.5% -2.6%Diluted earnings per share in CHF 0.11 0.16 -0.83 0.78 -0.41 Dividend per share in CHF 0.26254 0.2500 5%
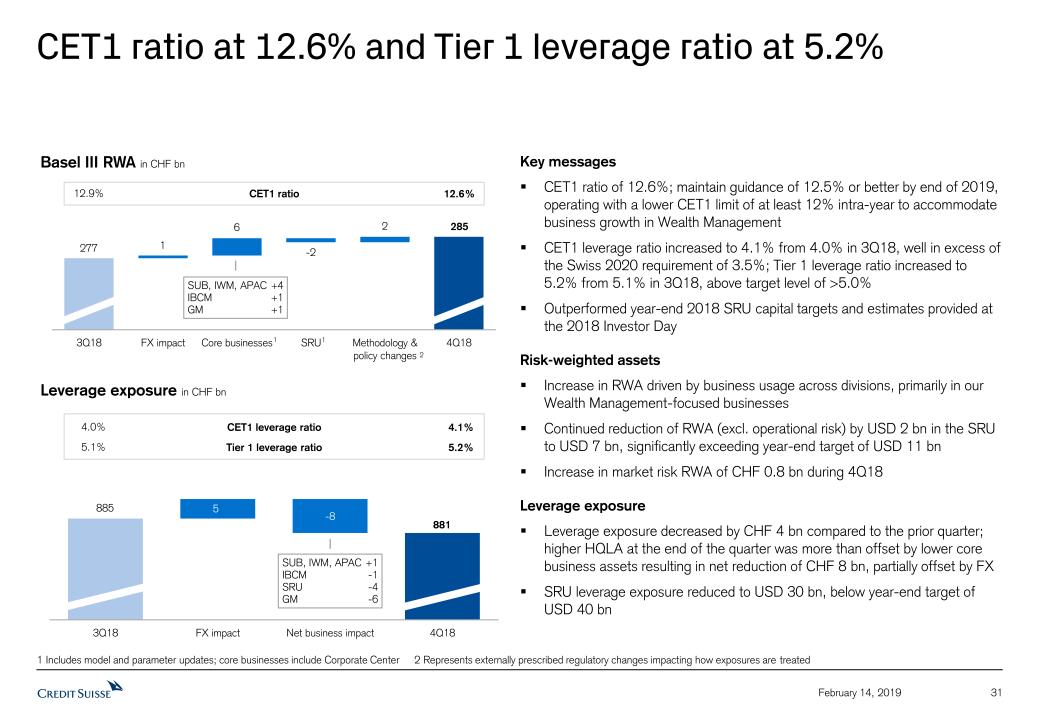
CET1 ratio at 12.6% and Tier 1 leverage ratio at 5.2% 31 February 14, 2019 SUB, IWM, APAC +1IBCM -1SRU -4GM -6 1 Includes model and parameter updates; core businesses include Corporate Center 2 Represents externally prescribed regulatory changes impacting how exposures are treated Basel III RWA in CHF bn 277 1 6 -2 2 285 Leverage exposure in CHF bn 885 5 -8 881 1 1 2 12.9% 12.6% CET1 ratio 4.0% 4.1% CET1 leverage ratio 5.1% 5.2% Tier 1 leverage ratio Key messagesCET1 ratio of 12.6%; maintain guidance of 12.5% or better by end of 2019, operating with a lower CET1 limit of at least 12% intra-year to accommodate business growth in Wealth ManagementCET1 leverage ratio increased to 4.1% from 4.0% in 3Q18, well in excess of the Swiss 2020 requirement of 3.5%; Tier 1 leverage ratio increased to 5.2% from 5.1% in 3Q18, above target level of >5.0%Outperformed year-end 2018 SRU capital targets and estimates provided at the 2018 Investor DayRisk-weighted assetsIncrease in RWA driven by business usage across divisions, primarily in our Wealth Management-focused businessesContinued reduction of RWA (excl. operational risk) by USD 2 bn in the SRU to USD 7 bn, significantly exceeding year-end target of USD 11 bnIncrease in market risk RWA of CHF 0.8 bn during 4Q18Leverage exposureLeverage exposure decreased by CHF 4 bn compared to the prior quarter; higher HQLA at the end of the quarter was more than offset by lower core business assets resulting in net reduction of CHF 8 bn, partially offset by FXSRU leverage exposure reduced to USD 30 bn, below year-end target of USD 40 bn SUB, IWM, APAC +4IBCM +1GM +1
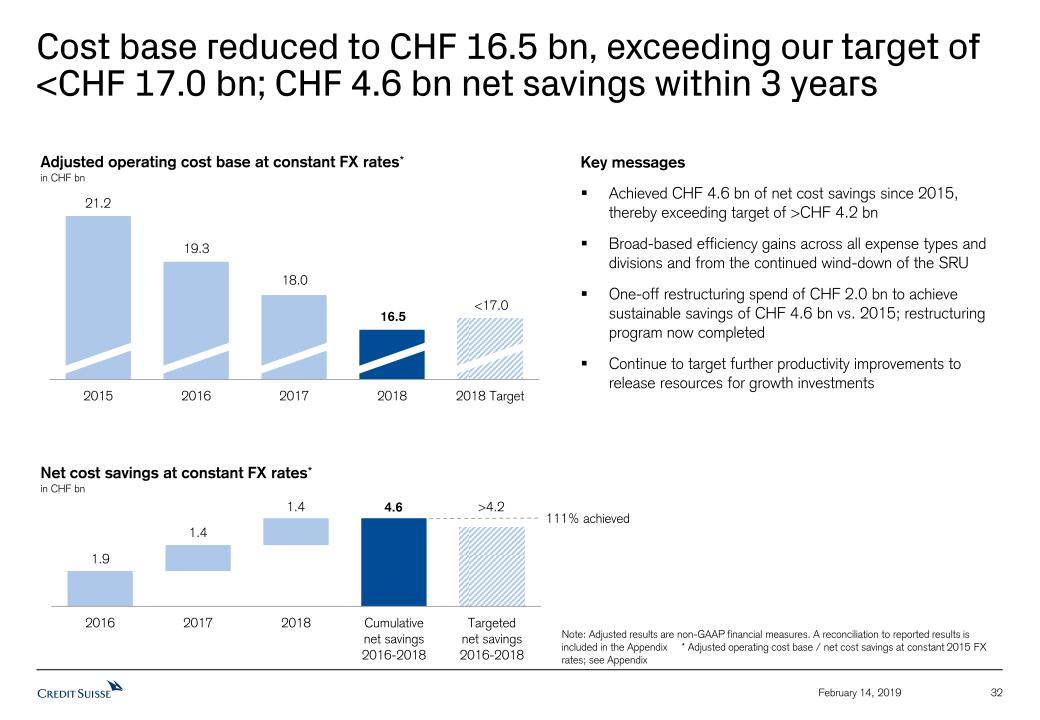
Cost base reduced to CHF 16.5 bn, exceeding our target of <CHF 17.0 bn; CHF 4.6 bn net savings within 3 years Note: Adjusted results are non-GAAP financial measures. A reconciliation to reported results is included in the Appendix * Adjusted operating cost base / net cost savings at constant 2015 FX rates; see Appendix Key messagesAchieved CHF 4.6 bn of net cost savings since 2015, thereby exceeding target of >CHF 4.2 bnBroad-based efficiency gains across all expense types and divisions and from the continued wind-down of the SRUOne-off restructuring spend of CHF 2.0 bn to achieve sustainable savings of CHF 4.6 bn vs. 2015; restructuring program now completedContinue to target further productivity improvements to release resources for growth investments Adjusted operating cost base at constant FX rates*in CHF bn 21.2 19.3 18.0 <17.0 1.9 1.4 >4.2 111% achieved Net cost savings at constant FX rates*in CHF bn 32 February 14, 2019 16.5 1.4 4.6
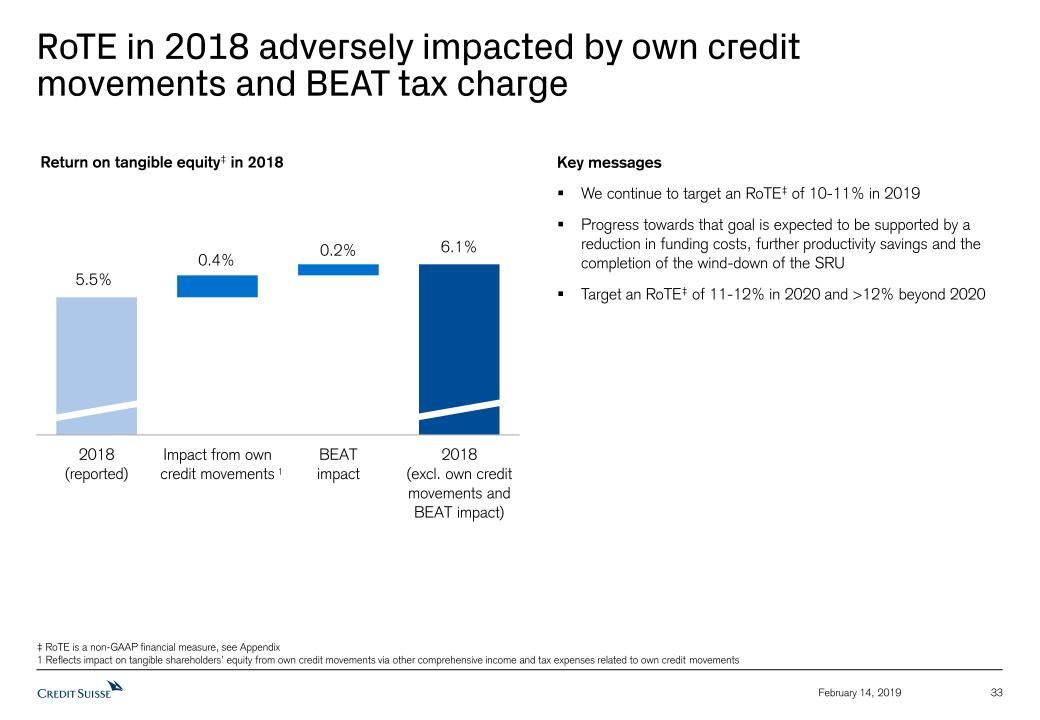
33 February 14, 2019 RoTE in 2018 adversely impacted by own creditmovements and BEAT tax charge 1 Return on tangible equity‡ in 2018 ‡ RoTE is a non-GAAP financial measure, see Appendix1 Reflects impact on tangible shareholders’ equity from own credit movements via other comprehensive income and tax expenses related to own credit movements Key messagesWe continue to target an RoTE‡ of 10-11% in 2019Progress towards that goal is expected to be supported by a reduction in funding costs, further productivity savings and the completion of the wind-down of the SRUTarget an RoTE‡ of 11-12% in 2020 and >12% beyond 2020
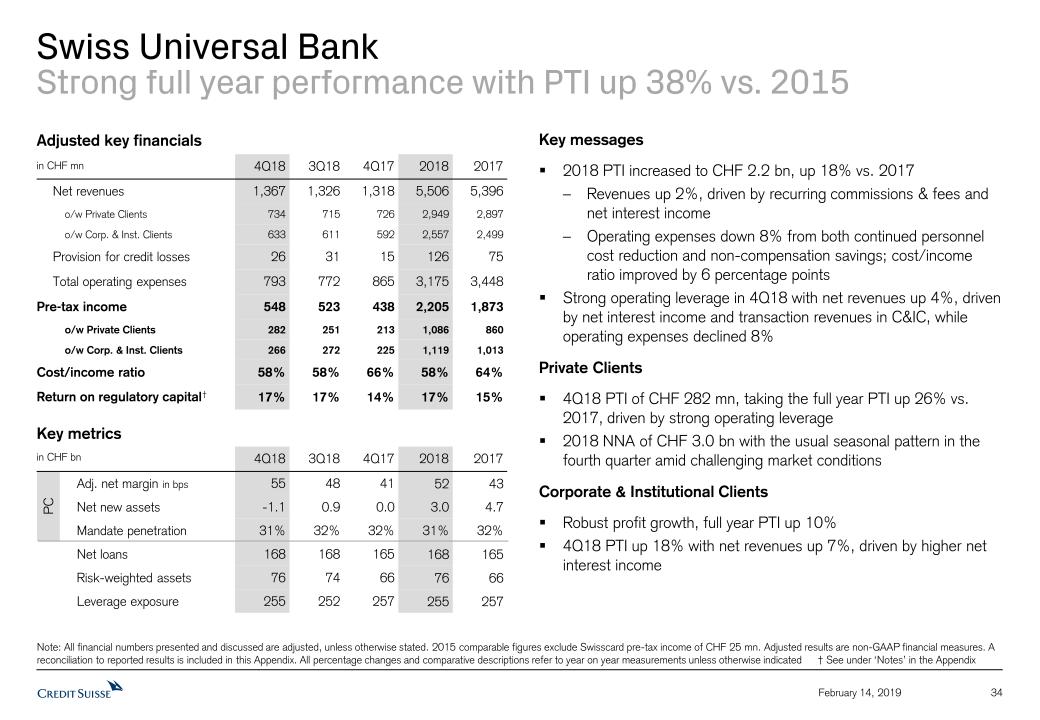
Swiss Universal Bank Strong full year performance with PTI up 38% vs. 2015 Note: All financial numbers presented and discussed are adjusted, unless otherwise stated. 2015 comparable figures exclude Swisscard pre-tax income of CHF 25 mn. Adjusted results are non-GAAP financial measures. A reconciliation to reported results is included in this Appendix. All percentage changes and comparative descriptions refer to year on year measurements unless otherwise indicated † See under ‘Notes’ in the Appendix PC Key metrics in CHF bn 4Q18 3Q18 4Q17 2018 2017 Adj. net margin in bps 55 48 41 52 43 Net new assets -1.1 0.9 0.0 3.0 4.7 Mandate penetration 31% 32% 32% 31% 32% Net loans 168 168 165 168 165 Risk-weighted assets 76 74 66 76 66 Leverage exposure 255 252 257 255 257 Adjusted key financials in CHF mn 4Q18 3Q18 4Q17 2018 2017 Net revenues 1,367 1,326 1,318 5,506 5,396 o/w Private Clients 734 715 726 2,949 2,897 o/w Corp. & Inst. Clients 633 611 592 2,557 2,499 Provision for credit losses 26 31 15 126 75 Total operating expenses 793 772 865 3,175 3,448 Pre-tax income 548 523 438 2,205 1,873 o/w Private Clients 282 251 213 1,086 860 o/w Corp. & Inst. Clients 266 272 225 1,119 1,013 Cost/income ratio 58% 58% 66% 58% 64% Return on regulatory capital† 17% 17% 14% 17% 15% Key messages2018 PTI increased to CHF 2.2 bn, up 18% vs. 2017Revenues up 2%, driven by recurring commissions & fees and net interest incomeOperating expenses down 8% from both continued personnel cost reduction and non-compensation savings; cost/income ratio improved by 6 percentage points Strong operating leverage in 4Q18 with net revenues up 4%, driven by net interest income and transaction revenues in C&IC, while operating expenses declined 8%Private Clients4Q18 PTI of CHF 282 mn, taking the full year PTI up 26% vs. 2017, driven by strong operating leverage2018 NNA of CHF 3.0 bn with the usual seasonal pattern in the fourth quarter amid challenging market conditionsCorporate & Institutional ClientsRobust profit growth, full year PTI up 10% 4Q18 PTI up 18% with net revenues up 7%, driven by higher net interest income 34 February 14, 2019
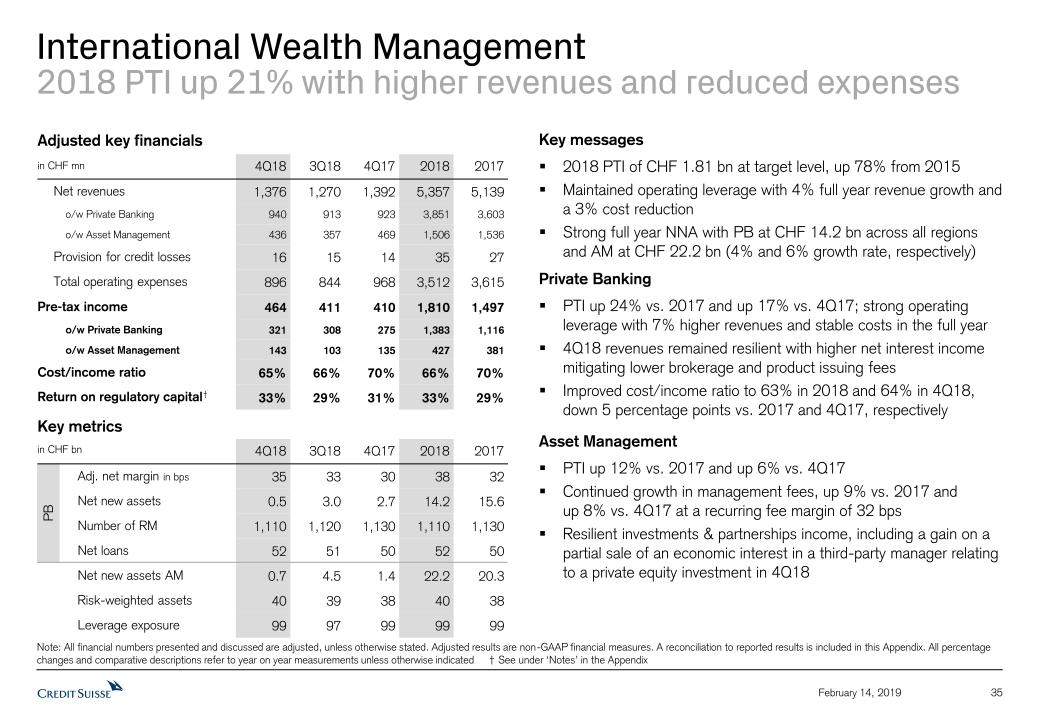
International Wealth Management2018 PTI up 21% with higher revenues and reduced expenses Note: All financial numbers presented and discussed are adjusted, unless otherwise stated. Adjusted results are non-GAAP financial measures. A reconciliation to reported results is included in this Appendix. All percentage changes and comparative descriptions refer to year on year measurements unless otherwise indicated † See under ‘Notes’ in the Appendix PB Adjusted key financials in CHF mn 4Q18 3Q18 4Q17 2018 2017 Net revenues 1,376 1,270 1,392 5,357 5,139 o/w Private Banking 940 913 923 3,851 3,603 o/w Asset Management 436 357 469 1,506 1,536 Provision for credit losses 16 15 14 35 27 Total operating expenses 896 844 968 3,512 3,615 Pre-tax income 464 411 410 1,810 1,497 o/w Private Banking 321 308 275 1,383 1,116 o/w Asset Management 143 103 135 427 381 Cost/income ratio 65% 66% 70% 66% 70% Return on regulatory capital† 33% 29% 31% 33% 29% Key metrics in CHF bn 4Q18 3Q18 4Q17 2018 2017 Adj. net margin in bps 35 33 30 38 32 Net new assets 0.5 3.0 2.7 14.2 15.6 Number of RM 1,110 1,120 1,130 1,110 1,130 Net loans 52 51 50 52 50 Net new assets AM 0.7 4.5 1.4 22.2 20.3 Risk-weighted assets 40 39 38 40 38 Leverage exposure 99 97 99 99 99 Key messages2018 PTI of CHF 1.81 bn at target level, up 78% from 2015Maintained operating leverage with 4% full year revenue growth and a 3% cost reduction Strong full year NNA with PB at CHF 14.2 bn across all regions and AM at CHF 22.2 bn (4% and 6% growth rate, respectively)Private BankingPTI up 24% vs. 2017 and up 17% vs. 4Q17; strong operating leverage with 7% higher revenues and stable costs in the full year4Q18 revenues remained resilient with higher net interest income mitigating lower brokerage and product issuing feesImproved cost/income ratio to 63% in 2018 and 64% in 4Q18, down 5 percentage points vs. 2017 and 4Q17, respectivelyAsset ManagementPTI up 12% vs. 2017 and up 6% vs. 4Q17Continued growth in management fees, up 9% vs. 2017 andup 8% vs. 4Q17 at a recurring fee margin of 32 bpsResilient investments & partnerships income, including a gain on a partial sale of an economic interest in a third-party manager relating to a private equity investment in 4Q18 35 February 14, 2019
Asia PacificStable PTI performance in severely challenging markets Note: All financial numbers presented and discussed are adjusted, unless otherwise stated. Adjusted results are non-GAAP financial measures. A reconciliation to reported results is included in this Appendix. All percentage changes and comparative descriptions refer to year on year measurements unless otherwise indicated † See under ‘Notes’ in the Appendix 1 APAC PB within WM&C 2 Dealogic (APAC excl. Japan and China onshore) for the period ending December 31, 2018 3 All references under key messages for Markets are based on USD PB1 Adjusted key financials in CHF mn 4Q18 3Q18 4Q17 2018 2017 Net revenues 677 811 885 3,393 3,504 o/w WM&C 506 557 626 2,290 2,322 o/w Markets 171 254 259 1,103 1,182 Provision for credit losses 8 10 7 35 15 Total operating expenses 605 615 679 2,554 2,697 Pre-tax income 64 186 199 804 792 o/w WM&C 149 184 239 797 820 o/w Markets -85 2 -40 7 -28 Cost/income ratio 89% 76% 77% 75% 77% Return on regulatory capital† 5% 13% 15% 15% 15% Key metrics in CHF bn 4Q18 3Q18 4Q17 2018 2017 Adj. net margin in bps 21 27 24 28 30 Net new assets 1.2 6.4 1.3 17.2 16.9 Number of RM 580 600 590 580 590 Assets under management 202 208 197 202 197 Net loans 44 42 43 44 43 Risk-weighted assets 37 34 31 37 31 Leverage exposure 106 108 106 106 106 36 February 14, 2019 Key messagesStable 2018 WM&C revenues reflecting resilience of our diversified business model during extremely weak Asian markets in 2H18Markets with break-even PTI for the year; lower revenues as a result of significant market dislocation offset by reduced expensesRedeployed capital from Markets to WM&CWealth Management & Connected (WM&C)2018 PTI of CHF 797 mn in a challenging environment; top 3 rank in advisory & underwriting with increased share of wallet in the year2For the year, PB achieved growth in recurring commissions & fees offsetting lower transaction revenues NNA of CHF 17.2 bn at a growth rate of 9% for the year, despite significant deleveraging across the region, in particular in 2H18; AuM exceed CHF 200 bn despite unfavorable market movementsContinued cost discipline leading to stable full year expensesMarkets3Full year revenues declined 6% reflecting weak markets, particularly in 4Q18, countered by a 10% expense reductionEquities sales and trading revenues declined reflecting lower client activity in a difficult trading environment in 2H18Fixed income sales and trading revenues declined mainly from rates products, partially offset by growth in FX, structured products and credit
Investment Banking & Capital Markets Growth in full year profit despite challenging 4Q Note: All financial numbers presented and discussed are adjusted, unless otherwise stated. Adjusted results are non-GAAP financial measures. A reconciliation to reported results is included in this Appendix. All percentage changes and comparative descriptions refer to year on year measurements unless otherwise indicated † See under ‘Notes’ in the Appendix 1 Gross global revenues from advisory, debt and equity underwriting generated across all divisions before cross-divisional revenue sharing agreements 2 Dealogic for the period ending December 31, 2018 Key metrics in USD bn 4Q18 3Q18 4Q17 2018 2017 Risk-weighted assets 25 23 21 25 21 Leverage exposure 41 42 45 41 45 Adjusted key financials in USD mn 4Q18 3Q18 4Q17 2018 2017 Net revenues 476 543 573 2,228 2,182 Provision for credit losses 5 3 -1 24 31 Total operating expenses 357 450 452 1,765 1,732 Pre-tax income 114 90 122 439 419 Cost/income ratio 75% 83% 79% 79% 79% Return on regulatory capital† 13% 11% 17% 14% 15% Global advisory and underwriting revenues1 in USD mn 4Q18 3Q18 4Q17 2018 2017 Global advisory and underwriting revenues 761 1,020 1,034 4,043 4,133 Key messagesDelivered full year PTI growth despite slowdown in activity in 4Q Continued focus on cost discipline and resource management Full year 2018 / 4Q18 performance2018 net revenues up 2%, outperforming the Street2, driven by strong performance in advisory, partially offset by lower financing activity across the Street2018 PTI up 5% driving RoRC† of 14%4Q18 operating expenses down 21% driven by continued cost disciplineRWA up 19% driven by growth in the underwriting portfolio and the Corporate Bank, the reallocation of operational risk RWA in 1Q18 and increases from methodology changes 37 February 14, 2019
Global MarketsStrong cost and risk discipline amid difficult market conditions Note: All financial numbers presented and discussed are adjusted, unless otherwise stated. Adjusted results are non-GAAP financial measures. A reconciliation to reported results is included in this Appendix. All percentage changes and comparative descriptions refer to year on year measurements unless otherwise indicated † See under ‘Notes’ in the Appendix 1 Includes sales and trading and underwriting 2 Dealogic (Americas and EMEA only) for the period ending December 31, 2018 for leveraged finance underwriting and Thomson Reuters for the period ending December 31, 2018 for asset finance Key metrics in USD bn 4Q18 3Q18 4Q17 2018 2017 Risk-weighted assets 60 59 60 60 60 Leverage exposure 249 255 290 249 290 Adjusted key financials in USD mn 4Q18 3Q18 4Q17 2018 2017 Equities1 386 426 453 1,970 1,982 Fixed Income1 686 755 802 3,580 3,920 Other -106 -115 -76 -435 -240 Net revenues 966 1,066 1,179 5,115 5,662 Provision for credit losses 4 3 8 24 32 Total operating expenses 1,079 1,084 1,290 4,666 5,010 Pre-tax income/loss (-) -117 -21 -119 425 620 Cost/income ratio 112% 102% 109% 91% 88% Return on regulatory capital† n/m n/m n/m 3% 4% Key messagesDisciplined resource management resulting in significantly reduced cost base and capital usageInvestments in Equities franchise and increased collaboration driving strength in ITSResilient credit performance and sustained market shares2 despite adverse operating conditions, particularly in 4Q18Full year 2018 / 4Q18 performance2018 expenses of USD 4.7 bn decreased by USD 344 mn or 7%; exceeded 2018 expense ambition of USD 4.8 bnSignificant decline in leverage exposure of USD 41 bn or 14%2018 Equities revenues stable, as continued momentum in equity derivatives was offset by lower cash equities revenues2018 Fixed income revenues down 9% vs. a strong 2017, reflecting reduced client activity, particularly in 4Q18 38 February 14, 2019
Outperformed end-state targets in the SRUResidual portfolio moved into ARU from the beginning of 2019 RWA excl. operational risk1 in USD bn -87% Leverage exposure in USD bn -82% Adjusted pre-tax loss in USD bn 39 February 14, 2019 Asset Resolution Unit (ARU) to be separately disclosed within the Corporate Center -57% Note: Adjusted results are non-GAAP financial measures. A reconciliation to reported results is included in the Appendix. SRU program economically completed by end-2018 1 Excludes Op Risk RWA of USD 19 bn in 2015 and 2016, USD 20 bn in 2017 and USD 11 bn in 2018

Summary 40 February 14, 2019

Summary 41 February 14, 2019 Resilient operating model with continued positive operating leverage amid challenging market conditionsSignificantly improved Group performance in 2018 with reported PTI of CHF 3.4 bnCompleted 3-year restructuring programWell positioned to drive returns higher and deliver growing shareholder value
Appendix 42 February 14, 2019
Overview of Credit Suisse 4Q18 results 43 February 14, 2019 Note: Adjusted results are non-GAAP financial measures. A reconciliation to reported results is included in this Appendix4Q18 average USD/CHF = 1.00; 3Q18 average USD/CHF = 0.98; 4Q17 average USD/CHF = 0.99; 2018 average USD/CHF = 0.98; 2017 average USD/CHF = 0.98 Pre-tax income Reported Adjusted in CHF mn unless otherwise specified 4Q18 3Q18 4Q17 2018 2017 4Q18 3Q18 4Q17 2018 2017 SUB 531 511 433 2,158 1,765 548 523 438 2,205 1,873 IWM 410 378 340 1,705 1,351 464 411 410 1,810 1,497 APAC 37 176 176 664 729 64 186 199 804 792 IBCM in USD mn 106 72 108 350 376 114 90 122 439 419 Global Markets in USD mn -196 -97 -200 169 458 -117 -21 -119 425 620 Corporate Center 35 -61 -265 -239 -736 53 -61 -136 -220 -572 Total Core 925 978 596 4,786 3,928 1,128 1,124 916 5,434 4,609 SRU in USD mn -297 -314 -462 -1,416 -2,179 -282 -275 -352 -1,271 -1,884 Group 628 671 141 3,405 1,793 846 856 569 4,194 2,762 RWA in CHF bn 285 277 272 CET1 ratio 12.6% 12.9% 12.8% Leverage exposure in CHF bn 881 885 917 Tier 1 leverage ratio 5.2% 5.1% 5.2%
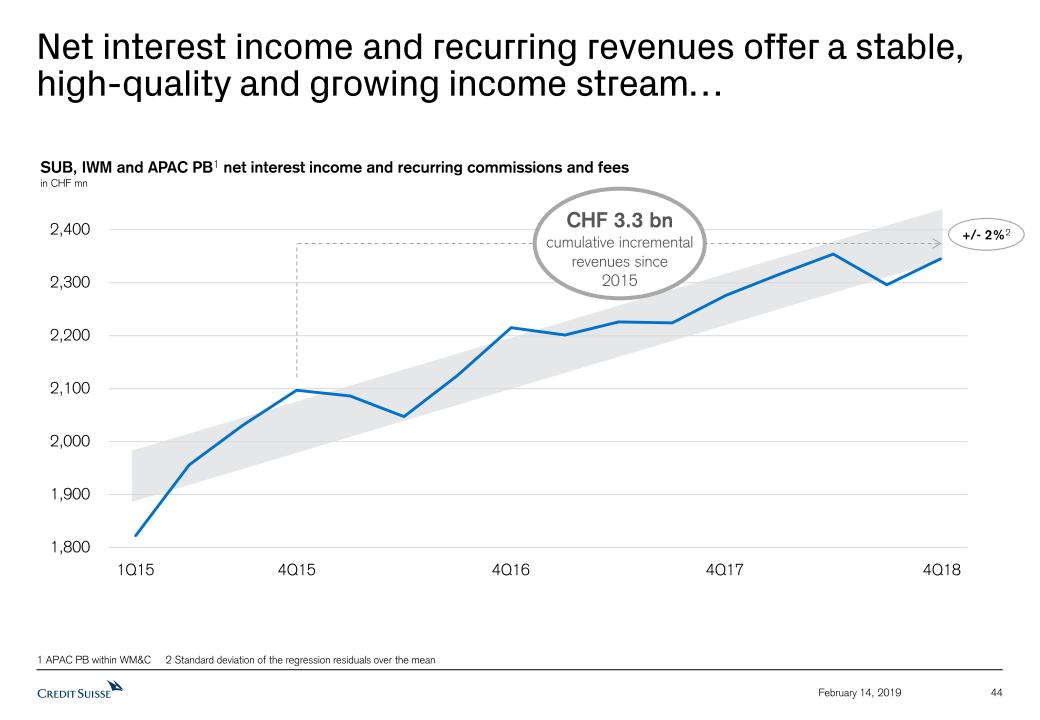
Net interest income and recurring revenues offer a stable, high-quality and growing income stream… 44 February 14, 2019 4Q16 4Q17 1Q15 4Q18 4Q15 +/- 2%2 CHF 3.3 bncumulative incremental revenues since2015 SUB, IWM and APAC PB1 net interest income and recurring commissions and feesin CHF mn 1 APAC PB within WM&C 2 Standard deviation of the regression residuals over the mean
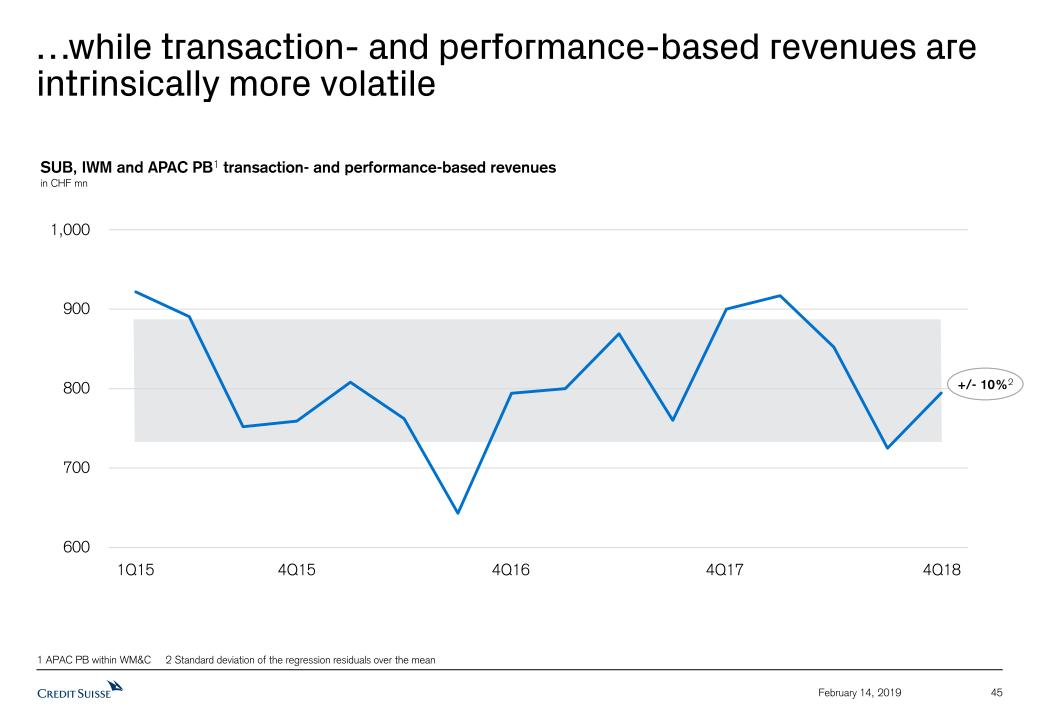
…while transaction- and performance-based revenues are intrinsically more volatile 45 February 14, 2019 1,000 4Q16 4Q17 1Q15 4Q18 4Q15 SUB, IWM and APAC PB1 transaction- and performance-based revenuesin CHF mn 1 APAC PB within WM&C 2 Standard deviation of the regression residuals over the mean +/- 10%2
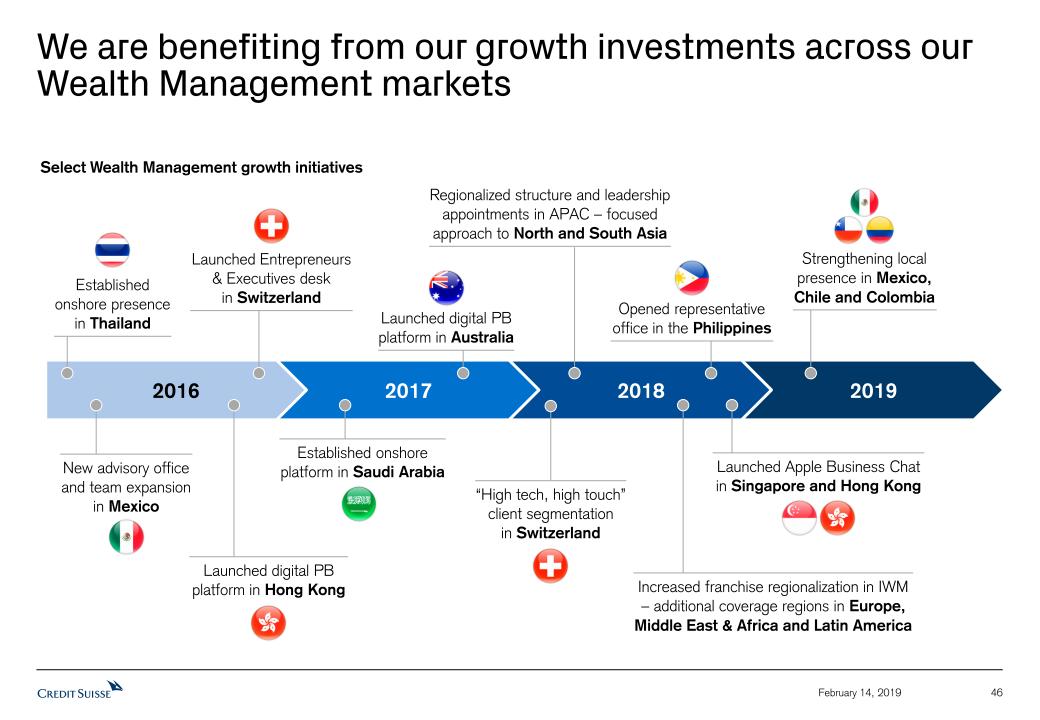
We are benefiting from our growth investments across our Wealth Management markets 46 February 14, 2019 Select Wealth Management growth initiatives 2016 2017 2018 2019 Establishedonshore presencein Thailand Launched Entrepreneurs & Executives deskin Switzerland Regionalized structure and leadership appointments in APAC – focused approach to North and South Asia Launched digital PB platform in Hong Kong Increased franchise regionalization in IWM – additional coverage regions in Europe, Middle East & Africa and Latin America Opened representative office in the Philippines Established onshore platform in Saudi Arabia New advisory office and team expansion in Mexico Strengthening local presence in Mexico, Chile and Colombia Launched Apple Business Chat in Singapore and Hong Kong Launched digital PB platform in Australia “High tech, high touch” client segmentationin Switzerland
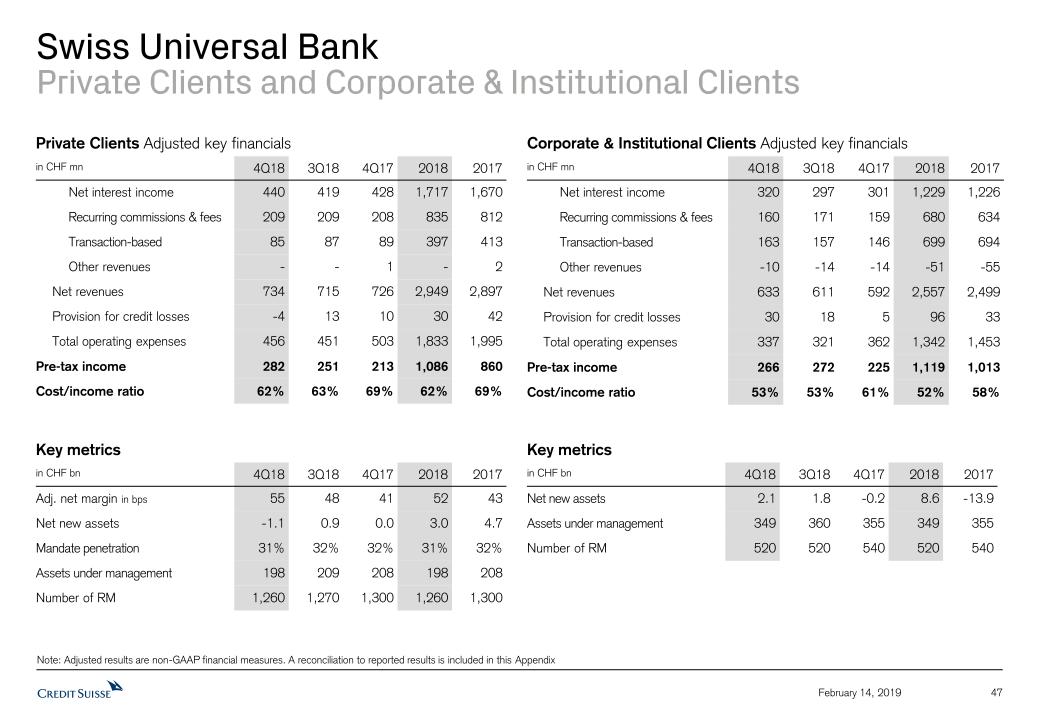
Swiss Universal BankPrivate Clients and Corporate & Institutional Clients Note: Adjusted results are non-GAAP financial measures. A reconciliation to reported results is included in this Appendix Corporate & Institutional Clients Adjusted key financials in CHF mn 4Q18 3Q18 4Q17 2018 2017 Net interest income 320 297 301 1,229 1,226 Recurring commissions & fees 160 171 159 680 634 Transaction-based 163 157 146 699 694 Other revenues -10 -14 -14 -51 -55 Net revenues 633 611 592 2,557 2,499 Provision for credit losses 30 18 5 96 33 Total operating expenses 337 321 362 1,342 1,453 Pre-tax income 266 272 225 1,119 1,013 Cost/income ratio 53% 53% 61% 52% 58% Key metrics in CHF bn 4Q18 3Q18 4Q17 2018 2017 Adj. net margin in bps 55 48 41 52 43 Net new assets -1.1 0.9 0.0 3.0 4.7 Mandate penetration 31% 32% 32% 31% 32% Assets under management 198 209 208 198 208 Number of RM 1,260 1,270 1,300 1,260 1,300 Key metrics in CHF bn 4Q18 3Q18 4Q17 2018 2017 Net new assets 2.1 1.8 -0.2 8.6 -13.9 Assets under management 349 360 355 349 355 Number of RM 520 520 540 520 540 Private Clients Adjusted key financials in CHF mn 4Q18 3Q18 4Q17 2018 2017 Net interest income 440 419 428 1,717 1,670 Recurring commissions & fees 209 209 208 835 812 Transaction-based 85 87 89 397 413 Other revenues - - 1 - 2 Net revenues 734 715 726 2,949 2,897 Provision for credit losses -4 13 10 30 42 Total operating expenses 456 451 503 1,833 1,995 Pre-tax income 282 251 213 1,086 860 Cost/income ratio 62% 63% 69% 62% 69% 47 February 14, 2019

International Wealth ManagementPrivate Banking and Asset Management Note: Adjusted results are non-GAAP financial measures. A reconciliation to reported results is included in this Appendix 48 February 14, 2019 Private Banking Adjusted key financials in CHF mn 4Q18 3Q18 4Q17 2018 2017 Net interest income 404 382 380 1,568 1,449 Recurring commissions & fees 305 302 308 1,227 1,200 Transaction- and perf.-based 229 229 235 1,054 953 Other revenues 2 - - 2 1 Net revenues 940 913 923 3,851 3,603 Provision for credit losses 16 15 14 35 27 Total operating expenses 603 590 634 2,433 2,460 Pre-tax income 321 308 275 1,383 1,116 Cost/income ratio 64% 65% 69% 63% 68% Key metrics in CHF bn 4Q18 3Q18 4Q17 2018 2017 Adj. net margin in bps 35 33 30 38 32 Net new assets 0.5 3.0 2.7 14.2 15.6 Assets under management 358 368 367 358 367 Mandate penetration 32% 33% 31% 32% 31% Net loans 52 51 50 52 50 Number of RM 1,110 1,120 1,130 1,110 1,130 Asset Management Adjusted key financials in CHF mn 4Q18 3Q18 4Q17 2018 2017 Management fees 283 279 263 1,107 1,011 Performance & placement rev. 72 32 159 169 293 Investment & partnership inc. 81 46 47 230 232 Net revenues 436 357 469 1,506 1,536 Total operating expenses 293 254 334 1,079 1,155 Pre-tax income 143 103 135 427 381 Cost/income ratio 67% 71% 71% 72% 75% Key metrics in CHF bn 4Q18 3Q18 4Q17 2018 2017 Net new assets 0.7 4.5 1.4 22.2 20.3 Assets under management 389 404 386 389 386
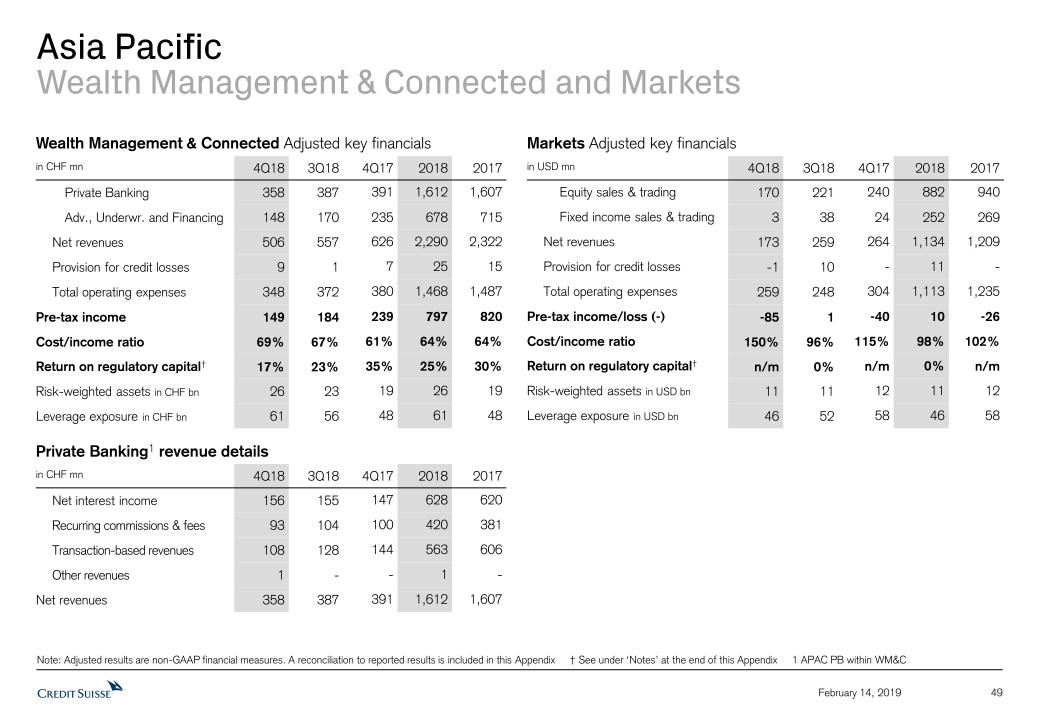
Asia PacificWealth Management & Connected and Markets Note: Adjusted results are non-GAAP financial measures. A reconciliation to reported results is included in this Appendix † See under ‘Notes’ at the end of this Appendix 1 APAC PB within WM&C Wealth Management & Connected Adjusted key financials in CHF mn 4Q18 3Q18 4Q17 2018 2017 Private Banking 358 387 391 1,612 1,607 Adv., Underwr. and Financing 148 170 235 678 715 Net revenues 506 557 626 2,290 2,322 Provision for credit losses 9 1 7 25 15 Total operating expenses 348 372 380 1,468 1,487 Pre-tax income 149 184 239 797 820 Cost/income ratio 69% 67% 61% 64% 64% Return on regulatory capital† 17% 23% 35% 25% 30% Risk-weighted assets in CHF bn 26 23 19 26 19 Leverage exposure in CHF bn 61 56 48 61 48 Markets Adjusted key financials in USD mn 4Q18 3Q18 4Q17 2018 2017 Equity sales & trading 170 221 240 882 940 Fixed income sales & trading 3 38 24 252 269 Net revenues 173 259 264 1,134 1,209 Provision for credit losses -1 10 - 11 - Total operating expenses 259 248 304 1,113 1,235 Pre-tax income/loss (-) -85 1 -40 10 -26 Cost/income ratio 150% 96% 115% 98% 102% Return on regulatory capital† n/m 0% n/m 0% n/m Risk-weighted assets in USD bn 11 11 12 11 12 Leverage exposure in USD bn 46 52 58 46 58 Private Banking1 revenue details in CHF mn 4Q18 3Q18 4Q17 2018 2017 Net interest income 156 155 147 628 620 Recurring commissions & fees 93 104 100 420 381 Transaction-based revenues 108 128 144 563 606 Other revenues 1 - - 1 - Net revenues 358 387 391 1,612 1,607 49 February 14, 2019
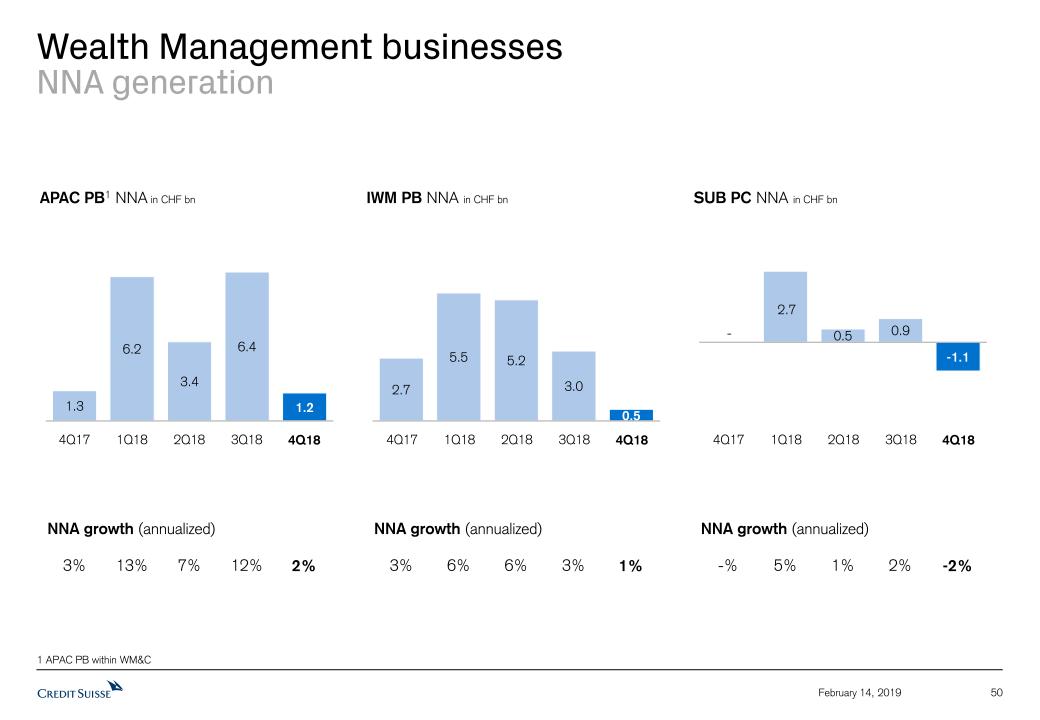
Wealth Management businessesNNA generation IWM PB NNA in CHF bn NNA growth (annualized) 3% 1% 6% 3% 6% SUB PC NNA in CHF bn NNA growth (annualized) -% -2% 5% 2% 1% 1 APAC PB within WM&C 4Q17 4Q18 1Q18 2Q18 3Q18 4Q17 4Q18 1Q18 2Q18 3Q18 NNA growth (annualized) 4Q17 3% 2% 13% 12% APAC PB1 NNA in CHF bn 4Q18 1Q18 2Q18 3Q18 7% 50 February 14, 2019
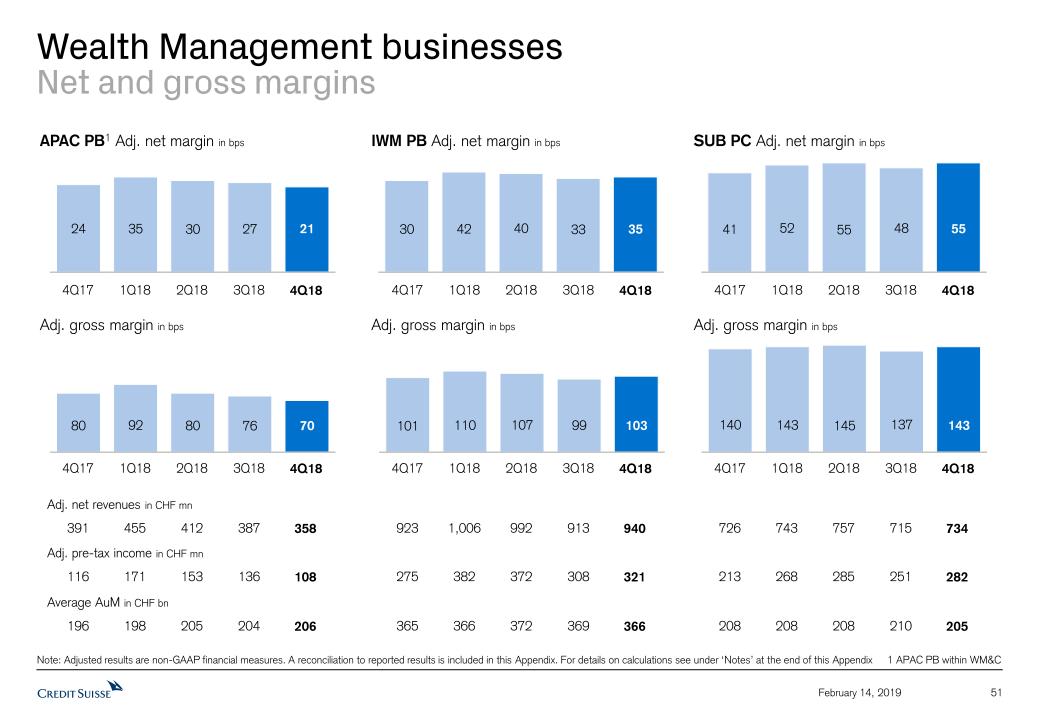
Wealth Management businessesNet and gross margins Note: Adjusted results are non-GAAP financial measures. A reconciliation to reported results is included in this Appendix. For details on calculations see under ‘Notes’ at the end of this Appendix 1 APAC PB within WM&C IWM PB Adj. net margin in bps Adj. gross margin in bps SUB PC Adj. net margin in bps Adj. gross margin in bps 365 366 369 366 372 208 205 210 208 208 275 321 308 382 372 213 282 251 268 285 923 940 913 1,006 992 726 734 715 743 757 4Q17 4Q18 2Q18 1Q18 3Q18 4Q17 4Q18 2Q18 1Q18 3Q18 4Q17 4Q18 2Q18 1Q18 3Q18 4Q17 4Q18 2Q18 1Q18 3Q18 APAC PB1 Adj. net margin in bps 4Q17 4Q18 2Q18 Adj. gross margin in bps 1Q18 3Q18 196 206 204 Average AuM in CHF bn 198 205 116 108 136 Adj. pre-tax income in CHF mn 171 153 391 358 387 Adj. net revenues in CHF mn 455 412 4Q17 4Q18 2Q18 1Q18 3Q18 51 February 14, 2019
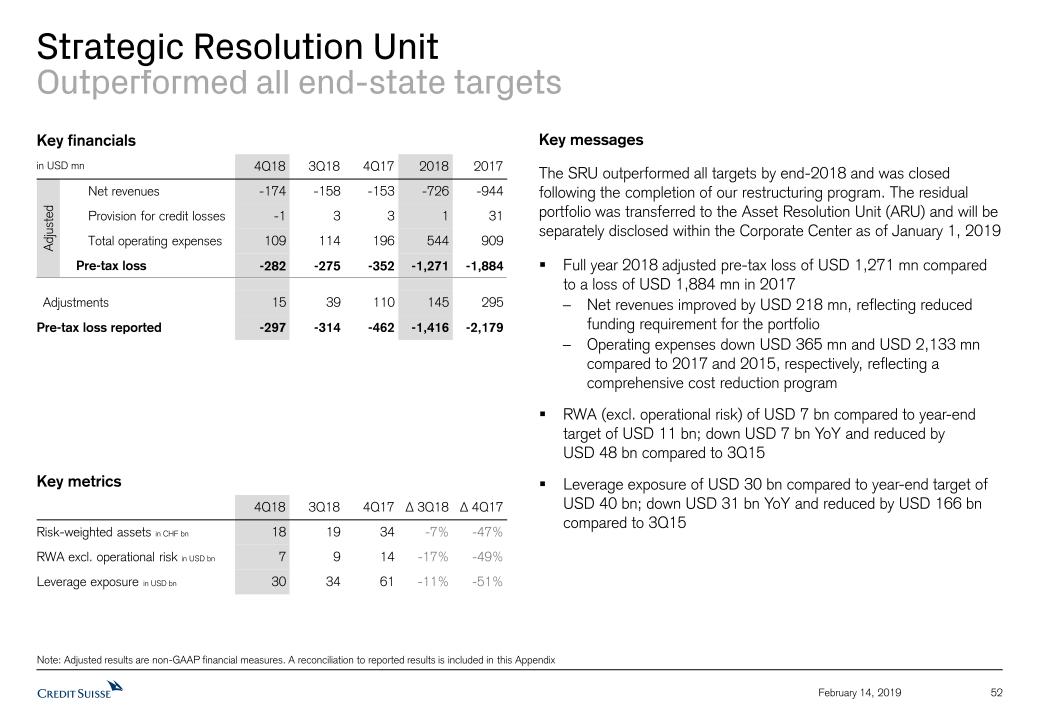
Adjusted Strategic Resolution UnitOutperformed all end-state targets Note: Adjusted results are non-GAAP financial measures. A reconciliation to reported results is included in this Appendix Key financials in USD mn 4Q18 3Q18 4Q17 2018 2017 Net revenues -174 -158 -153 -726 -944 Provision for credit losses -1 3 3 1 31 Total operating expenses 109 114 196 544 909 Pre-tax loss -282 -275 -352 -1,271 -1,884 Adjustments 15 39 110 145 295 Pre-tax loss reported -297 -314 -462 -1,416 -2,179 Key metrics 4Q18 3Q18 4Q17 Δ 3Q18 Δ 4Q17 Risk-weighted assets in CHF bn 18 19 34 -7% -47% RWA excl. operational risk in USD bn 7 9 14 -17% -49% Leverage exposure in USD bn 30 34 61 -11% -51% Key messagesThe SRU outperformed all targets by end-2018 and was closed following the completion of our restructuring program. The residual portfolio was transferred to the Asset Resolution Unit (ARU) and will be separately disclosed within the Corporate Center as of January 1, 2019Full year 2018 adjusted pre-tax loss of USD 1,271 mn compared to a loss of USD 1,884 mn in 2017Net revenues improved by USD 218 mn, reflecting reduced funding requirement for the portfolioOperating expenses down USD 365 mn and USD 2,133 mn compared to 2017 and 2015, respectively, reflecting a comprehensive cost reduction programRWA (excl. operational risk) of USD 7 bn compared to year-end target of USD 11 bn; down USD 7 bn YoY and reduced byUSD 48 bn compared to 3Q15Leverage exposure of USD 30 bn compared to year-end target of USD 40 bn; down USD 31 bn YoY and reduced by USD 166 bn compared to 3Q15 52 February 14, 2019
Corporate Center 53 February 14, 2019 Note: All financial numbers presented and discussed are adjusted, unless otherwise stated. Adjusted results are non-GAAP financial measures. A reconciliation to reported results is included in this Appendix. ‘Other revenues’ include required elimination adjustments associated with trading in own shares and treasury commissions charged to divisions Key metrics in CHF bn 4Q18 3Q18 4Q17 2018 2017 Total assets 104 103 68 104 68 Risk-weighted assets 30 30 24 30 24 Leverage exposure 105 105 67 105 67 Adjusted key financials in CHF mn 4Q18 3Q18 4Q17 2018 2017 Treasury results 132 -5 72 13 56 Other -31 57 -27 104 52 Net revenues 101 52 45 117 108 Provision for credit losses - - -3 - - Compensation and benefits -64 63 81 128 398 G&A expenses 107 46 95 160 237 Commission expenses 5 4 8 49 45 Total other operating expenses 112 50 103 209 282 Total operating expenses 48 113 184 337 680 Pre-tax income / loss (-) 53 -61 -136 -220 -572
54 Tangible shareholders’ equity benefitted from widening credit spreads Tangible shareholders’ equity‡in CHF bn Key messagesYear-end tangible shareholders’ equity increased by CHF 1.2 bn from 3Q18, mainly driven by the widening of credit spreads across currencies and tenorsCHF 1.3 bn positive impact from the fair valuation of own debtLast quarter’s adverse FX impact of CHF -0.5 bn from 2Q18 only partially reversed by CHF 0.1 bnNet income attributable to shareholders contributes CHF 0.3 bn to the increase in tangible shareholders’ equityOther movements of CHF -0.5 bn include the annual re-measurement of pension plans Note: Tangible shareholders' equity is a non-GAAP financial measure ‡ See under ‘Notes’ at the end of this Appendix February 14, 2019
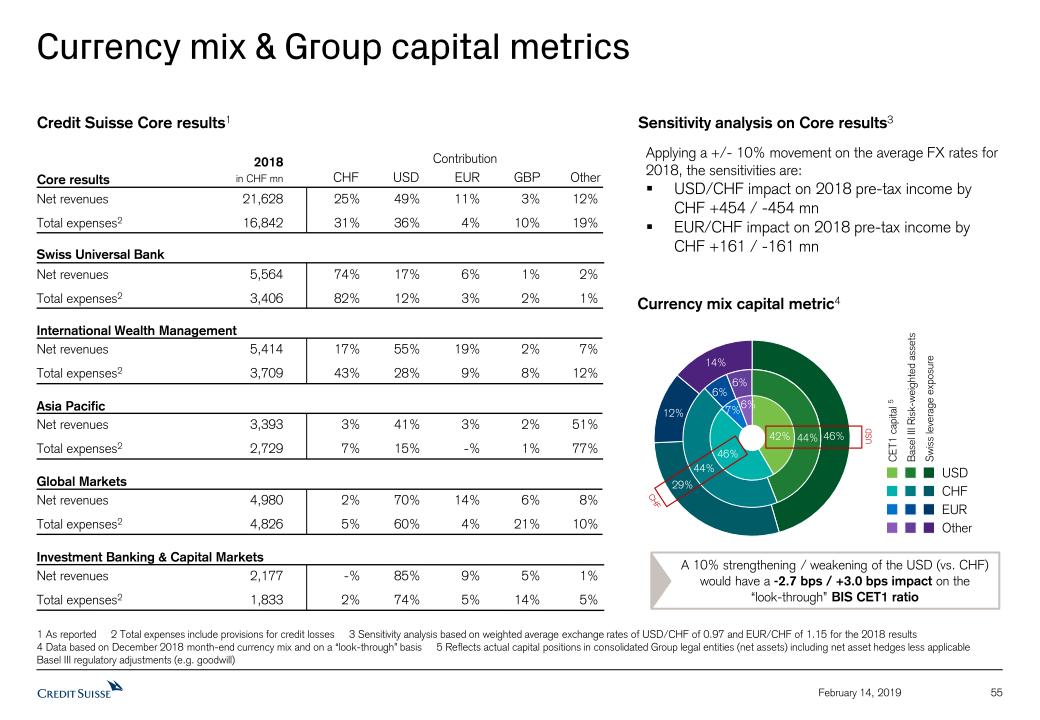
Currency mix & Group capital metrics 55 February 14, 2019 1 As reported 2 Total expenses include provisions for credit losses 3 Sensitivity analysis based on weighted average exchange rates of USD/CHF of 0.97 and EUR/CHF of 1.15 for the 2018 results 4 Data based on December 2018 month-end currency mix and on a “look-through” basis 5 Reflects actual capital positions in consolidated Group legal entities (net assets) including net asset hedges less applicable Basel III regulatory adjustments (e.g. goodwill) Credit Suisse Core results1 2018in CHF mn Applying a +/- 10% movement on the average FX rates for 2018, the sensitivities are:USD/CHF impact on 2018 pre-tax income by CHF +454 / -454 mnEUR/CHF impact on 2018 pre-tax income by CHF +161 / -161 mn Sensitivity analysis on Core results3 Contribution Swiss Universal Bank International Wealth Management Asia Pacific Global Markets Investment Banking & Capital Markets Core results CHF USD EUR GBP Other Net revenues 21,628 25% 49% 11% 3% 12%Total expenses2 16,842 31% 36% 4% 10% 19% Net revenues 5,564 74% 17% 6% 1% 2%Total expenses2 3,406 82% 12% 3% 2% 1% Net revenues 5,414 17% 55% 19% 2% 7%Total expenses2 3,709 43% 28% 9% 8% 12% Net revenues 3,393 3% 41% 3% 2% 51%Total expenses2 2,729 7% 15% -% 1% 77% Net revenues 4,980 2% 70% 14% 6% 8%Total expenses2 4,826 5% 60% 4% 21% 10% Net revenues 2,177 -% 85% 9% 5% 1%Total expenses2 1,833 2% 74% 5% 14% 5% Currency mix capital metric4 A 10% strengthening / weakening of the USD (vs. CHF) would have a -2.7 bps / +3.0 bps impact on the“look-through” BIS CET1 ratio Basel III Risk-weighted assets Swiss leverage exposure CHF EUR Other USD USD CET1 capital 5 CHF
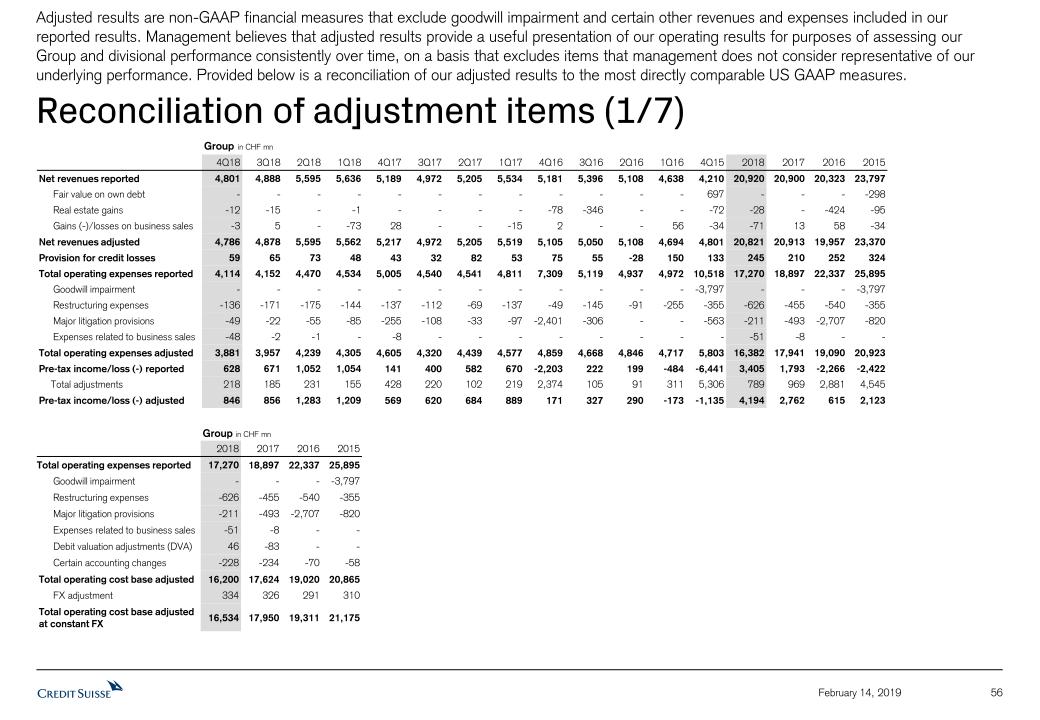
56 February 14, 2019 Reconciliation of adjustment items (1/7) Adjusted results are non-GAAP financial measures that exclude goodwill impairment and certain other revenues and expenses included in our reported results. Management believes that adjusted results provide a useful presentation of our operating results for purposes of assessing our Group and divisional performance consistently over time, on a basis that excludes items that management does not consider representative of our underlying performance. Provided below is a reconciliation of our adjusted results to the most directly comparable US GAAP measures. Group in CHF mn 4Q18 3Q18 2Q18 1Q18 4Q17 3Q17 2Q17 1Q17 4Q16 3Q16 2Q16 1Q16 4Q15 2018 2017 2016 2015 Net revenues reported 4,801 4,888 5,595 5,636 5,189 4,972 5,205 5,534 5,181 5,396 5,108 4,638 4,210 20,920 20,900 20,323 23,797 Fair value on own debt - - - - - - - - - - - - 697 - - - -298 Real estate gains -12 -15 - -1 - - - - -78 -346 - - -72 -28 - -424 -95 Gains (-)/losses on business sales -3 5 - -73 28 - - -15 2 - - 56 -34 -71 13 58 -34 Net revenues adjusted 4,786 4,878 5,595 5,562 5,217 4,972 5,205 5,519 5,105 5,050 5,108 4,694 4,801 20,821 20,913 19,957 23,370 Provision for credit losses 59 65 73 48 43 32 82 53 75 55 -28 150 133 245 210 252 324 Total operating expenses reported 4,114 4,152 4,470 4,534 5,005 4,540 4,541 4,811 7,309 5,119 4,937 4,972 10,518 17,270 18,897 22,337 25,895 Goodwill impairment - - - - - - - - - - - - -3,797 - - - -3,797 Restructuring expenses -136 -171 -175 -144 -137 -112 -69 -137 -49 -145 -91 -255 -355 -626 -455 -540 -355 Major litigation provisions -49 -22 -55 -85 -255 -108 -33 -97 -2,401 -306 - - -563 -211 -493 -2,707 -820 Expenses related to business sales -48 -2 -1 - -8 - - - - - - - - -51 -8 - - Total operating expenses adjusted 3,881 3,957 4,239 4,305 4,605 4,320 4,439 4,577 4,859 4,668 4,846 4,717 5,803 16,382 17,941 19,090 20,923 Pre-tax income/loss (-) reported 628 671 1,052 1,054 141 400 582 670 -2,203 222 199 -484 -6,441 3,405 1,793 -2,266 -2,422 Total adjustments 218 185 231 155 428 220 102 219 2,374 105 91 311 5,306 789 969 2,881 4,545 Pre-tax income/loss (-) adjusted 846 856 1,283 1,209 569 620 684 889 171 327 290 -173 -1,135 4,194 2,762 615 2,123 Group in CHF mn 2018 2017 2016 2015 Total operating expenses reported 17,270 18,897 22,337 25,895 Goodwill impairment - - - -3,797 Restructuring expenses -626 -455 -540 -355 Major litigation provisions -211 -493 -2,707 -820 Expenses related to business sales -51 -8 - - Debit valuation adjustments (DVA) 46 -83 - - Certain accounting changes -228 -234 -70 -58 Total operating cost base adjusted 16,200 17,624 19,020 20,865 FX adjustment 334 326 291 310 Total operating cost base adjusted at constant FX 16,534 17,950 19,311 21,175
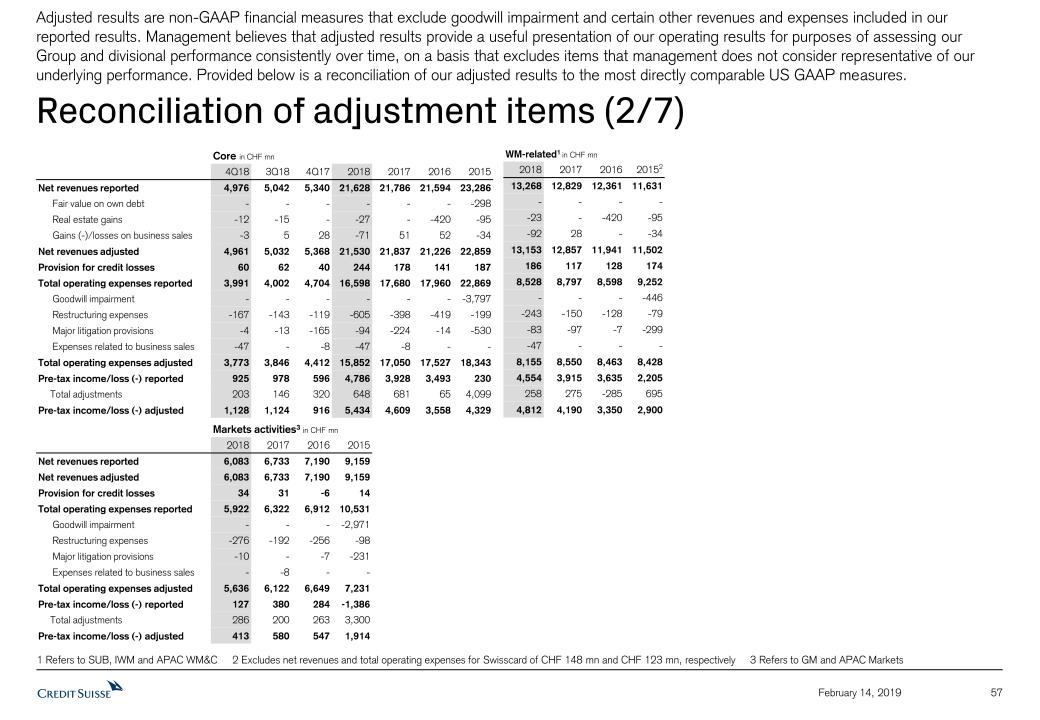
57 February 14, 2019 Reconciliation of adjustment items (2/7) Adjusted results are non-GAAP financial measures that exclude goodwill impairment and certain other revenues and expenses included in our reported results. Management believes that adjusted results provide a useful presentation of our operating results for purposes of assessing our Group and divisional performance consistently over time, on a basis that excludes items that management does not consider representative of our underlying performance. Provided below is a reconciliation of our adjusted results to the most directly comparable US GAAP measures. 1 Refers to SUB, IWM and APAC WM&C 2 Excludes net revenues and total operating expenses for Swisscard of CHF 148 mn and CHF 123 mn, respectively 3 Refers to GM and APAC Markets Core in CHF mn 4Q18 3Q18 4Q17 2018 2017 2016 2015 Net revenues reported 4,976 5,042 5,340 21,628 21,786 21,594 23,286 Fair value on own debt - - - - - - -298 Real estate gains -12 -15 - -27 - -420 -95 Gains (-)/losses on business sales -3 5 28 -71 51 52 -34 Net revenues adjusted 4,961 5,032 5,368 21,530 21,837 21,226 22,859 Provision for credit losses 60 62 40 244 178 141 187 Total operating expenses reported 3,991 4,002 4,704 16,598 17,680 17,960 22,869 Goodwill impairment - - - - - - -3,797 Restructuring expenses -167 -143 -119 -605 -398 -419 -199 Major litigation provisions -4 -13 -165 -94 -224 -14 -530 Expenses related to business sales -47 - -8 -47 -8 - - Total operating expenses adjusted 3,773 3,846 4,412 15,852 17,050 17,527 18,343 Pre-tax income/loss (-) reported 925 978 596 4,786 3,928 3,493 230 Total adjustments 203 146 320 648 681 65 4,099 Pre-tax income/loss (-) adjusted 1,128 1,124 916 5,434 4,609 3,558 4,329 WM-related1 in CHF mn 2018 2017 2016 20152 13,268 12,829 12,361 11,631 - - - - -23 - -420 -95 -92 ��28 - -34 13,153 12,857 11,941 11,502 186 117 128 174 8,528 8,797 8,598 9,252 - - - -446 -243 -150 -128 -79 -83 -97 -7 -299 -47 - - - 8,155 8,550 8,463 8,428 4,554 3,915 3,635 2,205 258 275 -285 695 4,812 4,190 3,350 2,900 Markets activities3 in CHF mn 2018 2017 2016 2015 Net revenues reported 6,083 6,733 7,190 9,159 Net revenues adjusted 6,083 6,733 7,190 9,159 Provision for credit losses 34 31 -6 14 Total operating expenses reported 5,922 6,322 6,912 10,531 Goodwill impairment - - - -2,971 Restructuring expenses -276 -192 -256 -98 Major litigation provisions -10 - -7 -231 Expenses related to business sales - -8 - - Total operating expenses adjusted 5,636 6,122 6,649 7,231 Pre-tax income/loss (-) reported 127 380 284 -1,386 Total adjustments 286 200 263 3,300 Pre-tax income/loss (-) adjusted 413 580 547 1,914
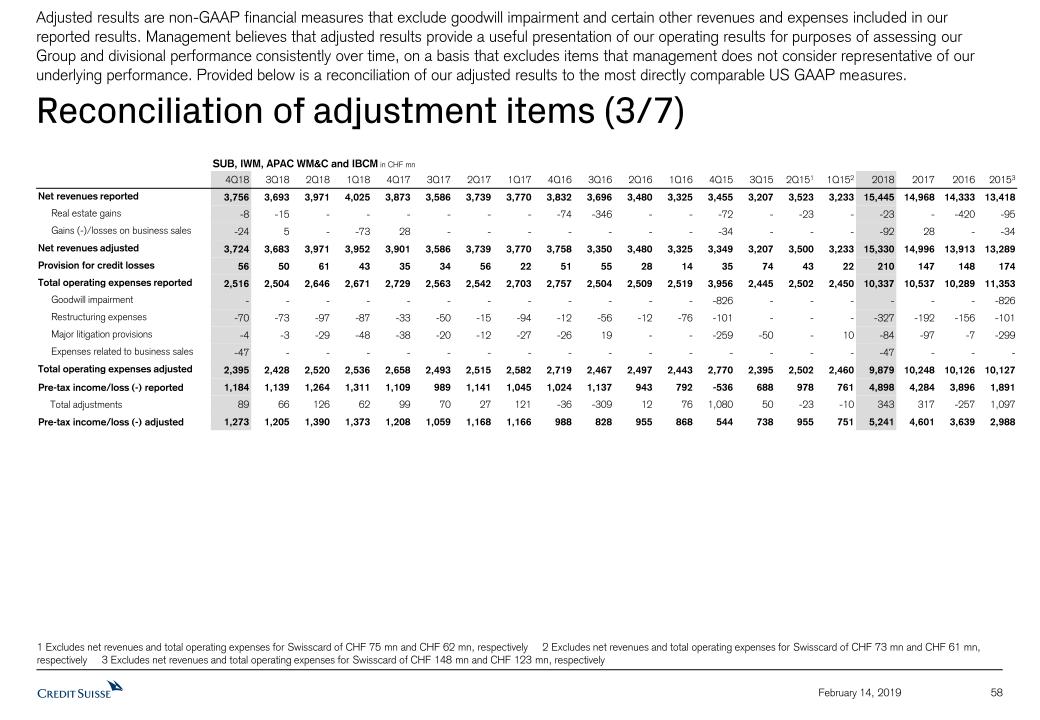
58 February 14, 2019 Reconciliation of adjustment items (3/7) Adjusted results are non-GAAP financial measures that exclude goodwill impairment and certain other revenues and expenses included in our reported results. Management believes that adjusted results provide a useful presentation of our operating results for purposes of assessing our Group and divisional performance consistently over time, on a basis that excludes items that management does not consider representative of our underlying performance. Provided below is a reconciliation of our adjusted results to the most directly comparable US GAAP measures. 1 Excludes net revenues and total operating expenses for Swisscard of CHF 75 mn and CHF 62 mn, respectively 2 Excludes net revenues and total operating expenses for Swisscard of CHF 73 mn and CHF 61 mn, respectively 3 Excludes net revenues and total operating expenses for Swisscard of CHF 148 mn and CHF 123 mn, respectively SUB, IWM, APAC WM&C and IBCM in CHF mn 4Q18 3Q18 2Q18 1Q18 4Q17 3Q17 2Q17 1Q17 4Q16 3Q16 2Q16 1Q16 4Q15 3Q15 2Q151 1Q152 2018 2017 2016 20153 Net revenues reported 3,756 3,693 3,971 4,025 3,873 3,586 3,739 3,770 3,832 3,696 3,480 3,325 3,455 3,207 3,523 3,233 15,445 14,968 14,333 13,418 Real estate gains -8 -15 - - - - - - -74 -346 - - -72 - -23 - -23 - -420 -95 Gains (-)/losses on business sales -24 5 - -73 28 - - - - - - - -34 - - - -92 28 - -34 Net revenues adjusted 3,724 3,683 3,971 3,952 3,901 3,586 3,739 3,770 3,758 3,350 3,480 3,325 3,349 3,207 3,500 3,233 15,330 14,996 13,913 13,289 Provision for credit losses 56 50 61 43 35 34 56 22 51 55 28 14 35 74 43 22 210 147 148 174 Total operating expenses reported 2,516 2,504 2,646 2,671 2,729 2,563 2,542 2,703 2,757 2,504 2,509 2,519 3,956 2,445 2,502 2,450 10,337 10,537 10,289 11,353 Goodwill impairment - - - - - - - - - - - - -826 - - - - - - -826 Restructuring expenses -70 -73 -97 -87 -33 -50 -15 -94 -12 -56 -12 -76 -101 - - - -327 -192 -156 -101 Major litigation provisions -4 -3 -29 -48 -38 -20 -12 -27 -26 19 - - -259 -50 - 10 -84 -97 -7 -299 Expenses related to business sales -47 - - - - - - - - - - - - - - - -47 - - - Total operating expenses adjusted 2,395 2,428 2,520 2,536 2,658 2,493 2,515 2,582 2,719 2,467 2,497 2,443 2,770 2,395 2,502 2,460 9,879 10,248 10,126 10,127 Pre-tax income/loss (-) reported 1,184 1,139 1,264 1,311 1,109 989 1,141 1,045 1,024 1,137 943 792 -536 688 978 761 4,898 4,284 3,896 1,891 Total adjustments 89 66 126 62 99 70 27 121 -36 -309 12 76 1,080 50 -23 -10 343 317 -257 1,097 Pre-tax income/loss (-) adjusted 1,273 1,205 1,390 1,373 1,208 1,059 1,168 1,166 988 828 955 868 544 738 955 751 5,241 4,601 3,639 2,988
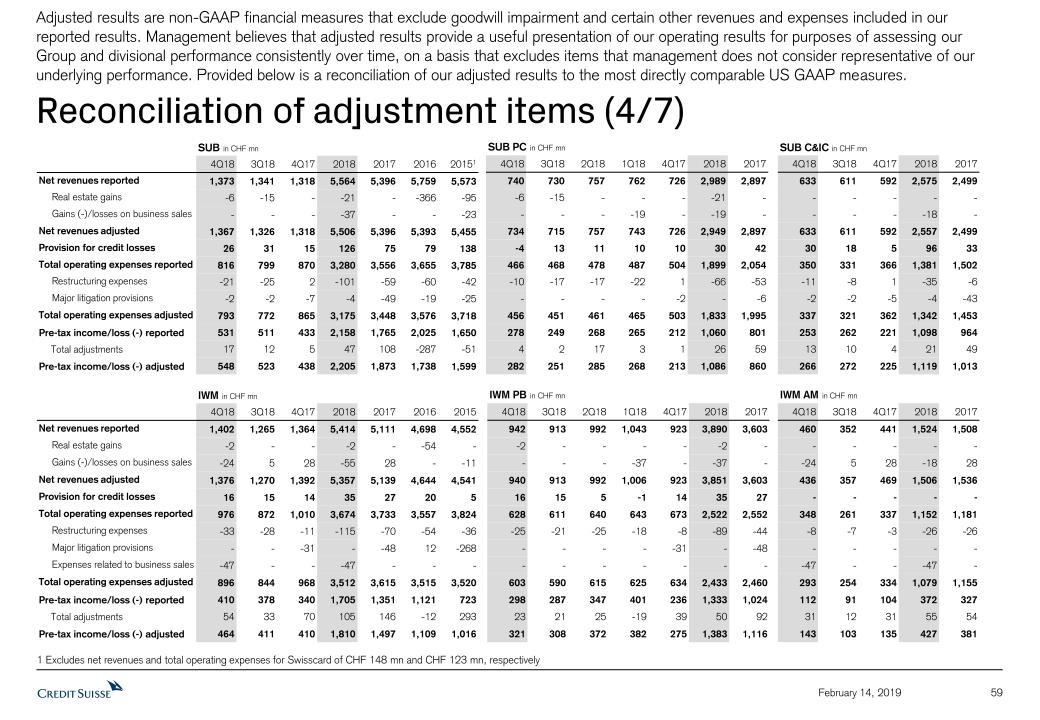
59 February 14, 2019 Reconciliation of adjustment items (4/7) Adjusted results are non-GAAP financial measures that exclude goodwill impairment and certain other revenues and expenses included in our reported results. Management believes that adjusted results provide a useful presentation of our operating results for purposes of assessing our Group and divisional performance consistently over time, on a basis that excludes items that management does not consider representative of our underlying performance. Provided below is a reconciliation of our adjusted results to the most directly comparable US GAAP measures. 1 Excludes net revenues and total operating expenses for Swisscard of CHF 148 mn and CHF 123 mn, respectively SUB PC in CHF mn SUB C&IC in CHF mn 4Q18 3Q18 2Q18 1Q18 4Q17 2018 2017 4Q18 3Q18 4Q17 2018 2017 740 730 757 762 726 2,989 2,897 633 611 592 2,575 2,499 -6 -15 - - - -21 - - - - - - - - - -19 - -19 - - - - -18 - 734 715 757 743 726 2,949 2,897 633 611 592 2,557 2,499 -4 13 11 10 10 30 42 30 18 5 96 33 466 468 478 487 504 1,899 2,054 350 331 366 1,381 1,502 -10 -17 -17 -22 1 -66 -53 -11 -8 1 -35 -6 - - - - -2 - -6 -2 -2 -5 -4 -43 456 451 461 465 503 1,833 1,995 337 321 362 1,342 1,453 278 249 268 265 212 1,060 801 253 262 221 1,098 964 4 2 17 3 1 26 59 13 10 4 21 49 282 251 285 268 213 1,086 860 266 272 225 1,119 1,013 SUB in CHF mn 4Q18 3Q18 4Q17 2018 2017 2016 20151 Net revenues reported 1,373 1,341 1,318 5,564 5,396 5,759 5,573 Real estate gains -6 -15 - -21 - -366 -95 Gains (-)/losses on business sales - - - -37 - - -23 Net revenues adjusted 1,367 1,326 1,318 5,506 5,396 5,393 5,455 Provision for credit losses 26 31 15 126 75 79 138 Total operating expenses reported 816 799 870 3,280 3,556 3,655 3,785 Restructuring expenses -21 -25 2 -101 -59 -60 -42 Major litigation provisions -2 -2 -7 -4 -49 -19 -25 Total operating expenses adjusted 793 772 865 3,175 3,448 3,576 3,718 Pre-tax income/loss (-) reported 531 511 433 2,158 1,765 2,025 1,650 Total adjustments 17 12 5 47 108 -287 -51 Pre-tax income/loss (-) adjusted 548 523 438 2,205 1,873 1,738 1,599 IWM in CHF mn 4Q18 3Q18 4Q17 2018 2017 2016 2015 Net revenues reported 1,402 1,265 1,364 5,414 5,111 4,698 4,552 Real estate gains -2 - - -2 - -54 - Gains (-)/losses on business sales -24 5 28 -55 28 - -11 Net revenues adjusted 1,376 1,270 1,392 5,357 5,139 4,644 4,541 Provision for credit losses 16 15 14 35 27 20 5 Total operating expenses reported 976 872 1,010 3,674 3,733 3,557 3,824 Restructuring expenses -33 -28 -11 -115 -70 -54 -36 Major litigation provisions - - -31 - -48 12 -268 Expenses related to business sales -47 - - -47 - - - Total operating expenses adjusted 896 844 968 3,512 3,615 3,515 3,520 Pre-tax income/loss (-) reported 410 378 340 1,705 1,351 1,121 723 Total adjustments 54 33 70 105 146 -12 293 Pre-tax income/loss (-) adjusted 464 411 410 1,810 1,497 1,109 1,016 IWM PB in CHF mn IWM AM in CHF mn 4Q18 3Q18 2Q18 1Q18 4Q17 2018 2017 4Q18 3Q18 4Q17 2018 2017 942 913 992 1,043 923 3,890 3,603 460 352 441 1,524 1,508 -2 - - - - -2 - - - - - - - - - -37 - -37 - -24 5 28 -18 28 940 913 992 1,006 923 3,851 3,603 436 357 469 1,506 1,536 16 15 5 -1 14 35 27 - - - - - 628 611 640 643 673 2,522 2,552 348 261 337 1,152 1,181 -25 -21 -25 -18 -8 -89 -44 -8 -7 -3 -26 -26 - - - - -31 - -48 - - - - - - - - - - - - -47 - - -47 - 603 590 615 625 634 2,433 2,460 293 254 334 1,079 1,155 298 287 347 401 236 1,333 1,024 112 91 104 372 327 23 21 25 -19 39 50 92 31 12 31 55 54 321 308 372 382 275 1,383 1,116 143 103 135 427 381
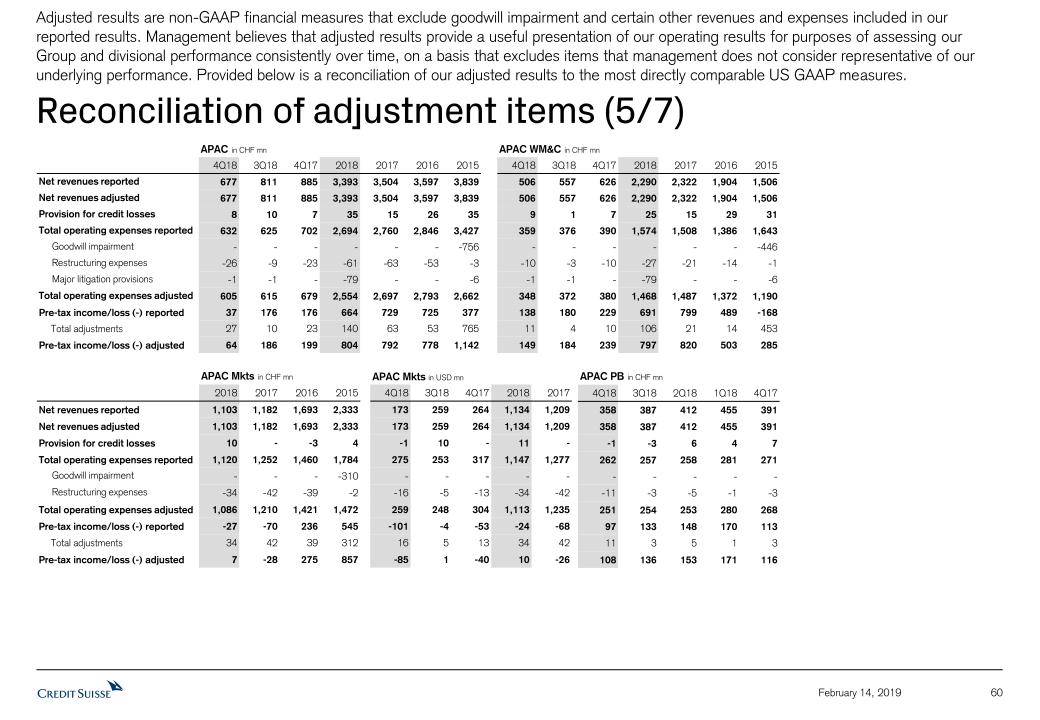
60 February 14, 2019 Reconciliation of adjustment items (5/7) Adjusted results are non-GAAP financial measures that exclude goodwill impairment and certain other revenues and expenses included in our reported results. Management believes that adjusted results provide a useful presentation of our operating results for purposes of assessing our Group and divisional performance consistently over time, on a basis that excludes items that management does not consider representative of our underlying performance. Provided below is a reconciliation of our adjusted results to the most directly comparable US GAAP measures. APAC Mkts in CHF mn APAC Mkts in USD mn 2018 2017 2016 2015 4Q18 3Q18 4Q17 2018 2017 Net revenues reported 1,103 1,182 1,693 2,333 173 259 264 1,134 1,209 Net revenues adjusted 1,103 1,182 1,693 2,333 173 259 264 1,134 1,209 Provision for credit losses 10 - -3 4 -1 10 - 11 - Total operating expenses reported 1,120 1,252 1,460 1,784 275 253 317 1,147 1,277 Goodwill impairment - - - -310 - - - - - Restructuring expenses -34 -42 -39 -2 -16 -5 -13 -34 -42 Total operating expenses adjusted 1,086 1,210 1,421 1,472 259 248 304 1,113 1,235 Pre-tax income/loss (-) reported -27 -70 236 545 -101 -4 -53 -24 -68 Total adjustments 34 42 39 312 16 5 13 34 42 Pre-tax income/loss (-) adjusted 7 -28 275 857 -85 1 -40 10 -26 APAC in CHF mn 4Q18 3Q18 4Q17 2018 2017 2016 2015 Net revenues reported 677 811 885 3,393 3,504 3,597 3,839 Net revenues adjusted 677 811 885 3,393 3,504 3,597 3,839 Provision for credit losses 8 10 7 35 15 26 35 Total operating expenses reported 632 625 702 2,694 2,760 2,846 3,427 Goodwill impairment - - - - - - -756 Restructuring expenses -26 -9 -23 -61 -63 -53 -3 Major litigation provisions -1 -1 - -79 - - -6 Total operating expenses adjusted 605 615 679 2,554 2,697 2,793 2,662 Pre-tax income/loss (-) reported 37 176 176 664 729 725 377 Total adjustments 27 10 23 140 63 53 765 Pre-tax income/loss (-) adjusted 64 186 199 804 792 778 1,142 APAC WM&C in CHF mn 4Q18 3Q18 4Q17 2018 2017 2016 2015 506 557 626 2,290 2,322 1,904 1,506 506 557 626 2,290 2,322 1,904 1,506 9 1 7 25 15 29 31 359 376 390 1,574 1,508 1,386 1,643 - - - - - - -446 -10 -3 -10 -27 -21 -14 -1 -1 -1 - -79 - - -6 348 372 380 1,468 1,487 1,372 1,190 138 180 229 691 799 489 -168 11 4 10 106 21 14 453 149 184 239 797 820 503 285 APAC PB in CHF mn 4Q18 3Q18 2Q18 1Q18 4Q17 358 387 412 455 391 358 387 412 455 391 -1 -3 6 4 7 262 257 258 281 271 - - - - - -11 -3 -5 -1 -3 251 254 253 280 268 97 133 148 170 113 11 3 5 1 3 108 136 153 171 116
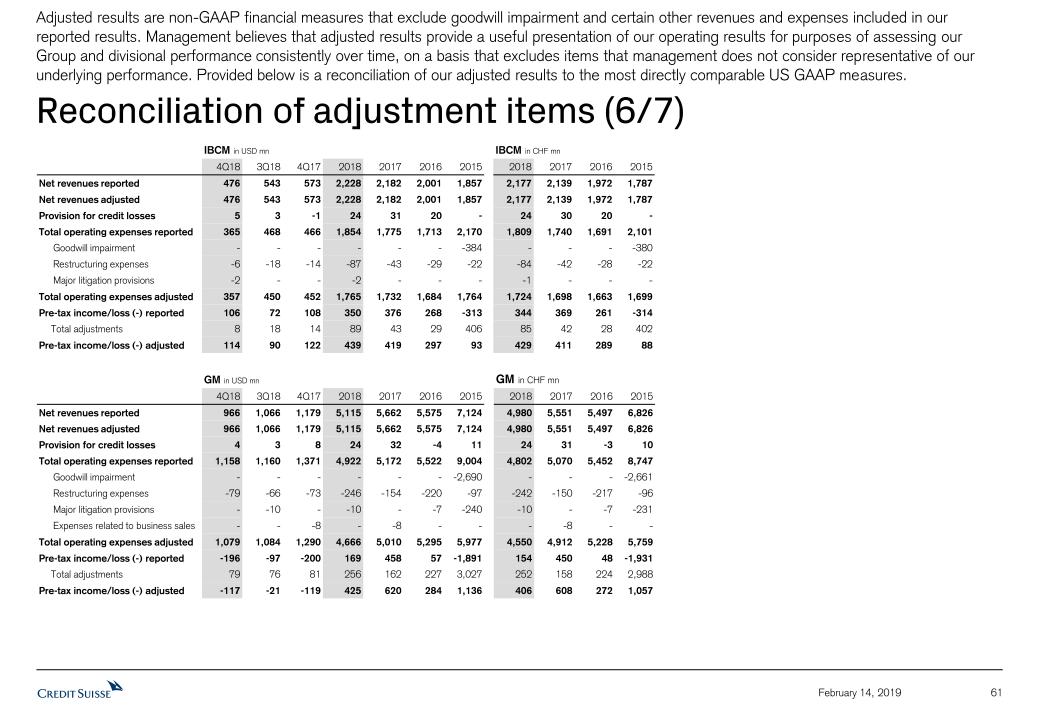
61 February 14, 2019 Reconciliation of adjustment items (6/7) Adjusted results are non-GAAP financial measures that exclude goodwill impairment and certain other revenues and expenses included in our reported results. Management believes that adjusted results provide a useful presentation of our operating results for purposes of assessing our Group and divisional performance consistently over time, on a basis that excludes items that management does not consider representative of our underlying performance. Provided below is a reconciliation of our adjusted results to the most directly comparable US GAAP measures. IBCM in USD mn IBCM in CHF mn 4Q18 3Q18 4Q17 2018 2017 2016 2015 2018 2017 2016 2015 Net revenues reported 476 543 573 2,228 2,182 2,001 1,857 2,177 2,139 1,972 1,787 Net revenues adjusted 476 543 573 2,228 2,182 2,001 1,857 2,177 2,139 1,972 1,787 Provision for credit losses 5 3 -1 24 31 20 - 24 30 20 - Total operating expenses reported 365 468 466 1,854 1,775 1,713 2,170 1,809 1,740 1,691 2,101 Goodwill impairment - - - - - - -384 - - - -380 Restructuring expenses -6 -18 -14 -87 -43 -29 -22 -84 -42 -28 -22 Major litigation provisions -2 - - -2 - - - -1 - - - Total operating expenses adjusted 357 450 452 1,765 1,732 1,684 1,764 1,724 1,698 1,663 1,699 Pre-tax income/loss (-) reported 106 72 108 350 376 268 -313 344 369 261 -314 Total adjustments 8 18 14 89 43 29 406 85 42 28 402 Pre-tax income/loss (-) adjusted 114 90 122 439 419 297 93 429 411 289 88 GM in USD mn GM in CHF mn 4Q18 3Q18 4Q17 2018 2017 2016 2015 2018 2017 2016 2015 Net revenues reported 966 1,066 1,179 5,115 5,662 5,575 7,124 4,980 5,551 5,497 6,826 Net revenues adjusted 966 1,066 1,179 5,115 5,662 5,575 7,124 4,980 5,551 5,497 6,826 Provision for credit losses 4 3 8 24 32 -4 11 24 31 -3 10 Total operating expenses reported 1,158 1,160 1,371 4,922 5,172 5,522 9,004 4,802 5,070 5,452 8,747 Goodwill impairment - - - - - - -2,690 - - - -2,661 Restructuring expenses -79 -66 -73 -246 -154 -220 -97 -242 -150 -217 -96 Major litigation provisions - -10 - -10 - -7 -240 -10 - -7 -231 Expenses related to business sales - - -8 - -8 - - - -8 - - Total operating expenses adjusted 1,079 1,084 1,290 4,666 5,010 5,295 5,977 4,550 4,912 5,228 5,759 Pre-tax income/loss (-) reported -196 -97 -200 169 458 57 -1,891 154 450 48 -1,931 Total adjustments 79 76 81 256 162 227 3,027 252 158 224 2,988 Pre-tax income/loss (-) adjusted -117 -21 -119 425 620 284 1,136 406 608 272 1,057
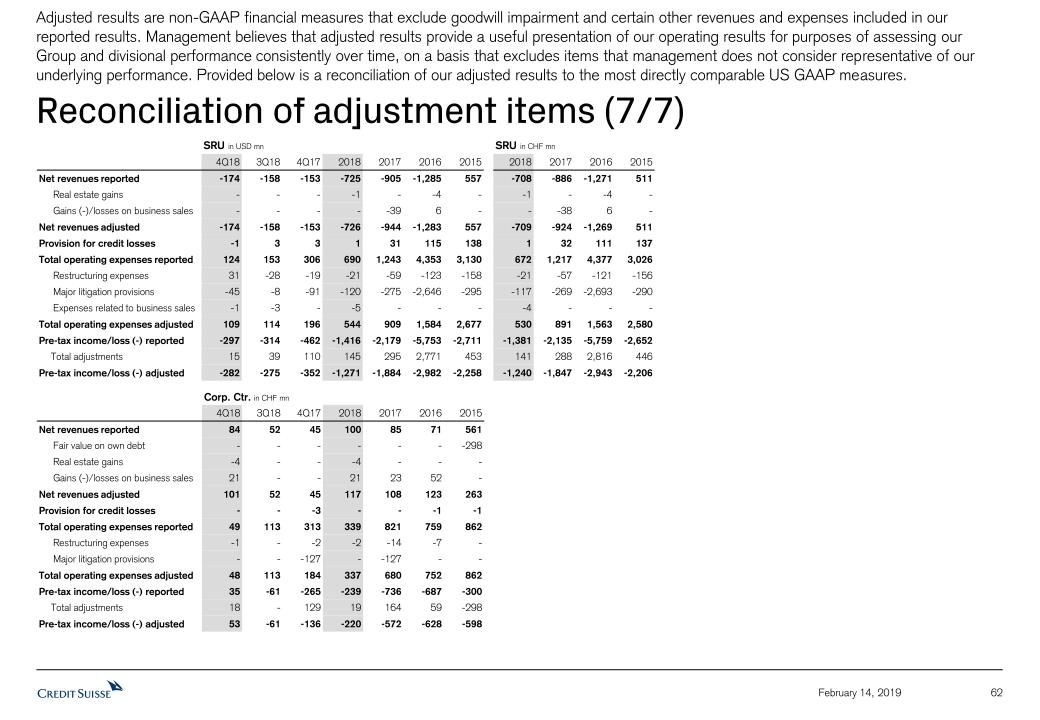
62 February 14, 2019 Reconciliation of adjustment items (7/7) Adjusted results are non-GAAP financial measures that exclude goodwill impairment and certain other revenues and expenses included in our reported results. Management believes that adjusted results provide a useful presentation of our operating results for purposes of assessing our Group and divisional performance consistently over time, on a basis that excludes items that management does not consider representative of our underlying performance. Provided below is a reconciliation of our adjusted results to the most directly comparable US GAAP measures. Corp. Ctr. in CHF mn 4Q18 3Q18 4Q17 2018 2017 2016 2015 Net revenues reported 84 52 45 100 85 71 561 Fair value on own debt - - - - - - -298 Real estate gains -4 - - -4 - - - Gains (-)/losses on business sales 21 - - 21 23 52 - Net revenues adjusted 101 52 45 117 108 123 263 Provision for credit losses - - -3 - - -1 -1 Total operating expenses reported 49 113 313 339 821 759 862 Restructuring expenses -1 - -2 -2 -14 -7 - Major litigation provisions - - -127 - -127 - - Total operating expenses adjusted 48 113 184 337 680 752 862 Pre-tax income/loss (-) reported 35 -61 -265 -239 -736 -687 -300 Total adjustments 18 - 129 19 164 59 -298 Pre-tax income/loss (-) adjusted 53 -61 -136 -220 -572 -628 -598 SRU in USD mn SRU in CHF mn 4Q18 3Q18 4Q17 2018 2017 2016 2015 2018 2017 2016 2015 Net revenues reported -174 -158 -153 -725 -905 -1,285 557 -708 -886 -1,271 511 Real estate gains - - - -1 - -4 - -1 - -4 - Gains (-)/losses on business sales - - - - -39 6 - - -38 6 - Net revenues adjusted -174 -158 -153 -726 -944 -1,283 557 -709 -924 -1,269 511 Provision for credit losses -1 3 3 1 31 115 138 1 32 111 137 Total operating expenses reported 124 153 306 690 1,243 4,353 3,130 672 1,217 4,377 3,026 Restructuring expenses 31 -28 -19 -21 -59 -123 -158 -21 -57 -121 -156 Major litigation provisions -45 -8 -91 -120 -275 -2,646 -295 -117 -269 -2,693 -290 Expenses related to business sales -1 -3 - -5 - - - -4 - - - Total operating expenses adjusted 109 114 196 544 909 1,584 2,677 530 891 1,563 2,580 Pre-tax income/loss (-) reported -297 -314 -462 -1,416 -2,179 -5,753 -2,711 -1,381 -2,135 -5,759 -2,652 Total adjustments 15 39 110 145 295 2,771 453 141 288 2,816 446 Pre-tax income/loss (-) adjusted -282 -275 -352 -1,271 -1,884 -2,982 -2,258 -1,240 -1,847 -2,943 -2,206
Notes Throughout the presentation rounding differences may occurUnless otherwise noted, all CET1 ratio, Tier 1 leverage ratio, risk-weighted assets and leverage exposure figures shown in this presentation are as of the end of the respective period and on a “look-through” basisGross and net margins are shown in basis pointsGross margin = (adj.) net revenues annualized / average AuM; net margin = (adj.) pre-tax income annualized / average AuMMandate penetration reflects advisory and discretionary mandate volumes as a percentage of AuM, excluding those from the external asset manager business General notes Specific notes * Our cost savings program, until the end of 2018, is measured using an adjusted operating cost base at constant 2015 FX rates. “Adjusted operating cost base at constant FX rates” includes adjustments as made in all our disclosures for restructuring expenses, major litigation provisions, expenses related to business sales and a goodwill impairment taken in 4Q15 as well as adjustments for debit valuation adjustments (DVA) related volatility, FX and for certain accounting changes (which had not been in place at the launch of the cost savings program). Adjustments for certain accounting changes have been restated to reflect grossed up expenses in the Corporate Center and, starting in 1Q18, also include adjustments for changes from ASU 2014-09 “Revenue from Contracts with Customers”, which is described further in our 1Q18, 2Q18 and 3Q18 financial reports. Adjustments for FX apply unweighted currency exchange rates, i.e., a straight line average of monthly rates, consistently for the periods under review. Starting from 1Q19, we intend to express our operating cost base at constant 2018 FX rates and to adjust for significant litigation costs, expenses related to business and real estate sales as well as DVA related volatility, but not for restructuring expenses and certain accounting changes. Adjustments for FX will continue to apply unweighted currency exchange rates.† Regulatory capital is calculated as the worst of 10% of RWA and 3.5% of leverage exposure. Return on regulatory capital is calculated using (adjusted) income / (loss) after tax and assumes a tax rate of 30% and capital allocated based on the worst of 10% of average RWA and 3.5% of average leverage exposure. For the Markets business within the APAC division and for the Global Markets and Investment Banking & Capital Markets divisions, return on regulatory capital is based on US dollar denominated numbers. Adjusted return on regulatory capital is calculated using adjusted results, applying the same methodology to calculate return on regulatory capital.‡ Return on tangible equity is based on tangible equity attributable to shareholders, a non-GAAP financial measure, which is calculated by deducting goodwill and other intangible assets from total equity attributable to shareholders as presented in our balance sheet. Management believes that the return on tangible equity attributable to shareholders is meaningful as it allows consistent measurement of the performance of businesses without regard to whether the businesses were acquired. For end-4Q17, tangible equity excluded goodwill of CHF 4,742 mn and other intangible assets of CHF 223 mn from total shareholders’ equity of CHF 41,902 mn as presented in our balance sheet. For end-3Q18, tangible equity excluded goodwill of CHF 4,736 mn and other intangible assets of CHF 214 mn from total shareholders’ equity of CHF 42,734 mn as presented in our balance sheet. For end-4Q18, tangible equity excluded goodwill of CHF 4,766 mn and other intangible assets of CHF 219 mn from total shareholders’ equity of CHF 43,955 mn as presented in our balance sheet. 63 February 14, 2019 Abbreviations Adj. = Adjusted; Adv. = Advisory; AM = Asset Management; APAC = Asia Pacific; ARU = Asset Resolution Unit; attr. = attributable; AuM = Assets under Management; BCBS = Basel Committee on Banking Supervision; BEAT = Base Erosion and Anti-Abuse Tax; BIS = Bank for International Settlements; bps = basis points; CAGR = Compound Annual Growth Rate; CET1 = Common Equity Tier 1; C&IC = Corporate & Institutional Clients; CLO = Collateralized Loan Obligation; Corp. = Corporate(s); Corp. Ctr. = Corporate Center; DVA = Debit Valuation Adjustments; e.g. = for example; EM = Emerging Markets; EMEA = Europe, Middle East & Africa; excl. = excluding; FINMA = Swiss Financial Market Supervisory Authority; FX = Foreign Exchange; G&A = General & Administrative; GAAP = Generally Accepted Accounting Principles; GM = Global Markets; HQLA = High Quality Liquid Assets; HY = High Yield; IB = Investment Banking; IBCM = Investment Banking & Capital Markets; IG = Investment Grade; inc. = income; Inst. = Institutional; ITS = International Trading Solutions; IWM = International Wealth Management; Lev. = Leveraged; mezz. = mezzanine; Mkts = Markets; NII = Net Interest Income; n/m = not meaningful; NNA = Net New Assets; Op Risk = Operational Risk; PB = Private Banking; PC = Private Clients; perf. = performance; pp. = percentage points; PTI = Pre-tax income; QoQ = Quarter on Quarter; rev. = revenues; RM = Relationship Manager(s); RoRC = Return on Regulatory Capital; RoTE = Return on Tangible Equity; RWA = Risk-weighted assets; Sov. = Sovereign; SRU = Strategic Resolution Unit; SUB = Swiss Universal Bank; (U)HNW = (Ultra) High Net Worth; Underwr. = Underwriting; VaR = Value-at-Risk WM = Wealth Management; WM&C = Wealth Management & Connected; YoY = Year on year

Pursuant to the requirements of the Securities Exchange Act of 1934, the registrants have duly caused this report to be signed on their behalf by the undersigned, thereunto duly authorized.
CREDIT SUISSE GROUP AG and CREDIT SUISSE AG
(Registrants)
Date: February 14, 2019
By:
/s/ Tidjane Thiam
Tidjane Thiam
Chief Executive Officer
By:
/s/ David R. Mathers
David R. Mathers
Chief Financial Officer