| Key metrics | |||||||||||
| in / end of | % change | ||||||||||
| 1Q21 | 4Q20 | 1Q20 | QoQ | YoY | |||||||
| Credit Suisse (CHF million) | |||||||||||
| Net revenues | 7,574 | 5,221 | 5,776 | 45 | 31 | ||||||
| Provision for credit losses | 4,394 | 138 | 568 | – | – | ||||||
| Total operating expenses | 3,937 | 5,171 | 4,007 | (24) | (2) | ||||||
| Income/(loss) before taxes | (757) | (88) | 1,201 | – | – | ||||||
| Net income/(loss) attributable to shareholders | (252) | (353) | 1,314 | (29) | – | ||||||
| Cost/income ratio (%) | 52.0 | 99.0 | 69.4 | – | – | ||||||
| Effective tax rate (%) | 69.5 | – | (9.2) | – | – | ||||||
| Basic earnings/(loss) per share (CHF) | (0.10) | (0.15) | 0.53 | (33) | – | ||||||
| Diluted earnings/(loss) per share (CHF) | (0.10) | (0.15) | 0.52 | (33) | – | ||||||
| Return on equity (%) | (2.3) | (3.2) | 11.7 | – | – | ||||||
| Return on tangible equity (%) | (2.6) | (3.5) | 13.1 | – | – | ||||||
| Assets under management and net new assets (CHF billion) | |||||||||||
| Assets under management | 1,596.0 | 1,511.9 | 1,370.5 | 5.6 | 16.5 | ||||||
| Net new assets | 28.4 | 8.4 | 5.8 | 238.1 | 389.7 | ||||||
| Balance sheet statistics (CHF million) | |||||||||||
| Total assets | 851,395 | 805,822 | 832,166 | 6 | 2 | ||||||
| Net loans | 304,188 | 291,908 | 302,674 | 4 | 1 | ||||||
| Total shareholders' equity | 44,590 | 42,677 | 48,675 | 4 | (8) | ||||||
| Tangible shareholders' equity | 39,707 | 38,014 | 43,792 | 4 | (9) | ||||||
| Basel III regulatory capital and leverage statistics (%) | |||||||||||
| CET1 ratio | 12.2 | 12.9 | 12.1 | – | – | ||||||
| CET1 leverage ratio | 3.8 | 4.4 | 4.2 | – | – | ||||||
| Tier 1 leverage ratio | 5.5 | 6.4 | 5.8 | – | – | ||||||
| Share information | |||||||||||
| Shares outstanding (million) | 2,364.0 | 2,406.1 | 2,399.0 | (2) | (1) | ||||||
| of which common shares issued | 2,447.7 | 2,447.7 | 2,556.0 | 0 | (4) | ||||||
| of which treasury shares | (83.7) | (41.6) | (157.0) | 101 | (47) | ||||||
| Book value per share (CHF) | 18.86 | 17.74 | 20.29 | 6 | (7) | ||||||
| Tangible book value per share (CHF) | 16.80 | 15.80 | 18.25 | 6 | (8) | ||||||
| Market capitalization (CHF million) | 24,009 | 27,904 | 19,582 | (14) | 23 | ||||||
| Number of employees (full-time equivalents) | |||||||||||
| Number of employees | 49,090 | 48,770 | 48,500 | 1 | 1 | ||||||
| See relevant tables for additional information on these metrics. | |||||||||||
2
In 1Q21, we recorded a net loss attributable to shareholders of CHF 252 million. Return on equity and return on tangible equity were (2.3)% and (2.6)%, respectively. As of the end of 1Q21, our CET1 ratio was 12.2%.
| Results | |||||||||||
| in / end of | % change | ||||||||||
| 1Q21 | 4Q20 | 1Q20 | QoQ | YoY | |||||||
| Statements of operations (CHF million) | |||||||||||
| Net interest income | 1,654 | 1,448 | 1,534 | 14 | 8 | ||||||
| Commissions and fees | 3,737 | 3,191 | 2,927 | 17 | 28 | ||||||
| Trading revenues 1 | 1,811 | 484 | 927 | 274 | 95 | ||||||
| Other revenues | 372 | 98 | 388 | 280 | (4) | ||||||
| Net revenues | 7,574 | 5,221 | 5,776 | 45 | 31 | ||||||
| Provision for credit losses | 4,394 | 138 | 568 | – | – | ||||||
| Compensation and benefits | 2,207 | 2,539 | 2,316 | (13) | (5) | ||||||
| General and administrative expenses | 1,376 | 2,279 | 1,346 | (40) | 2 | ||||||
| Commission expenses | 329 | 303 | 345 | 9 | (5) | ||||||
| Restructuring expenses | 25 | 50 | – | (50) | – | ||||||
| Total other operating expenses | 1,730 | 2,632 | 1,691 | (34) | 2 | ||||||
| Total operating expenses | 3,937 | 5,171 | 4,007 | (24) | (2) | ||||||
| Income/(loss) before taxes | (757) | (88) | 1,201 | – | – | ||||||
| Income tax expense/(benefit) | (526) | 262 | (110) | – | 378 | ||||||
| Net income/(loss) | (231) | (350) | 1,311 | (34) | – | ||||||
| Net income/(loss) attributable to noncontrolling interests | 21 | 3 | (3) | – | – | ||||||
| Net income/(loss) attributable to shareholders | (252) | (353) | 1,314 | (29) | – | ||||||
| Statement of operations metrics (%) | |||||||||||
| Return on regulatory capital | (7.6) | (0.9) | 11.9 | – | – | ||||||
| Cost/income ratio | 52.0 | 99.0 | 69.4 | – | – | ||||||
| Effective tax rate | 69.5 | – | (9.2) | – | – | ||||||
| Earnings per share (CHF) | |||||||||||
| Basic earnings/(loss) per share | (0.10) | (0.15) | 0.53 | (33) | – | ||||||
| Diluted earnings/(loss) per share | (0.10) | (0.15) | 0.52 | (33) | – | ||||||
| Return on equity (%, annualized) | |||||||||||
| Return on equity | (2.3) | (3.2) | 11.7 | – | – | ||||||
| Return on tangible equity 2 | (2.6) | (3.5) | 13.1 | – | – | ||||||
| Book value per share (CHF) | |||||||||||
| Book value per share | 18.86 | 17.74 | 20.29 | 6 | (7) | ||||||
| Tangible book value per share 2 | 16.80 | 15.80 | 18.25 | 6 | (8) | ||||||
| Balance sheet statistics (CHF million) | |||||||||||
| Total assets | 851,395 | 805,822 | 832,166 | 6 | 2 | ||||||
| Risk-weighted assets | 302,869 | 275,084 | 300,580 | 10 | 1 | ||||||
| Leverage exposure | 967,798 | 799,853 | 869,706 | 21 | 11 | ||||||
| Number of employees (full-time equivalents) | |||||||||||
| Number of employees | 49,090 | 48,770 | 48,500 | 1 | 1 | ||||||
1 Represent revenues on a product basis which are not representative of business results within our business segments as segment results utilize financial instruments across various product types. | |||||||||||
2 Based on tangible shareholders' equity, a non-GAAP financial measure, which is calculated by deducting goodwill and other intangible assets from total shareholders' equity as presented in our balance sheet. Management believes that these metrics are meaningful as they are measures used and relied upon by industry analysts and investors to assess valuations and capital adequacy. | |||||||||||
3
1Q21 results
In 1Q21, Credit Suisse reported a net loss attributable to shareholders of CHF 252 million compared to net income attributable to shareholders of CHF 1,314 million in 1Q20 and a net loss attributable to shareholders of CHF 353 million in 4Q20. In 1Q21, Credit Suisse reported a loss before taxes of CHF 757 million, compared to income before taxes of CHF 1,201 million in 1Q20 and a loss before taxes of CHF 88 million in 4Q20.
The 1Q21 results included provision for credit losses of CHF 4,394 million, driven by an individual charge of CHF 4,430 million. This charge was in respect of the failure by a US-based hedge fund to meet its margin commitments on March 26, 2021 relating to the return of margin advances made to the fund, and is reflected in the Investment Bank.
> Refer to “US-based hedge fund matter” in Other information for further information.
Net revenues
In 1Q21, we reported net revenues of CHF 7,574 million, which increased 31% compared to 1Q20, primarily reflecting higher net revenues in the Investment Bank, Asia Pacific and the Corporate Center, partially offset by lower net revenues in International Wealth Management. The increase in the Investment Bank reflected broad-based growth across products and regions. The increase in Asia Pacific was mainly driven by higher transaction-based revenues and an Allfunds Group equity investment revaluation gain compared to a lower gain in 1Q20 related to the completed transfer of the InvestLab fund platform to Allfunds Group, which were both reflected in other revenues, partially offset by lower net interest income. The decrease in International Wealth Management was mainly driven by lower net interest income and lower other revenues. 1Q21 included revenues of CHF 149 million in the Corporate Center.
Compared to 4Q20, net revenues increased 45%, primarily reflecting higher net revenues in the Investment Bank, International Wealth Management and Asia Pacific. The increase in the Investment Bank reflected higher revenues across all businesses and a seasonal increase in client activity. The increase in International Wealth Management was mainly driven by higher other revenues due to an impairment loss of CHF 414 million from York Capital Management (York) in 4Q20. The increase in Asia Pacific was primarily driven by higher transaction-based revenues, higher net interest income and higher recurring commissions and fees.
Provision for credit losses
In 1Q21, provision for credit losses of CHF 4,394 million primarily related to net provisions of CHF 4,350 million in the Investment Bank, including the charge of CHF 4,430 million in respect of the failure by a US-based hedge fund to meet its margin commitments.
Litigation
On April 19, 2021, Credit Suisse entered into a settlement with U.S. Bank as trustee in two legacy legal actions in New York state court relating to residential mortgage-backed securities from 2006 for the aggregate amount of USD 500 million on claims of over USD 1.3 billion. Credit Suisse is fully reserved, and the settlements will have no impact on Credit Suisse’s financial results for 2Q21. The settlement remains subject to approval through a separate court proceeding to be brought by the trustee. In 1Q21, the Group recorded net litigation provisions of CHF 57 million.
The Group’s estimate of the aggregate range of reasonably possible losses that are not covered by existing provisions for certain proceedings for which the Group believes an estimate is possible was zero to CHF 1.0 billion as of the end of 1Q21.
Total operating expenses
Compared to 1Q20, total operating expenses of CHF 3,937 million decreased 2%, primarily reflecting a 5% decrease in compensation and benefits, mainly relating to lower discretionary compensation expenses. This decrease was partially offset by a 2% increase in general and administrative expenses, mainly
4
driven by higher occupancy expenses and higher IT, machinery and equipment, partially offset by lower travel and entertainment expenses, and restructuring expenses of CHF 25 million.
Compared to 4Q20, total operating expenses decreased 24%, primarily reflecting a 40% decrease in general and administrative expenses, mainly driven by lower legacy litigation provisions relating to mortgage-related matters, and a 13% decrease in compensation and benefits, mainly relating to lower discretionary compensation expenses.
Income tax
In 1Q21, the income tax benefit of CHF 526 million, resulting in an effective tax rate of 69.5% for the quarter, mainly reflected the estimated effective tax rate for the full year, as applied to the 1Q21 results. The effective tax rate is expected to remain at significantly elevated levels for the remainder of the year, potentially as high as the level for 1Q21. This primarily reflects the loss related to the US-based hedge fund matter, for which only a partial tax benefit could be recognized, and the application of a valuation allowance for the remainder of the loss. Other key drivers of the full year estimated effective tax rate were the impact of the geographical mix of results, the non-deductible funding costs and an additional valuation allowance in one of the Group’s operating entities in Switzerland. Overall, net deferred tax assets increased CHF 270 million to CHF 3,407 million during 1Q21, primarily driven by the impact of the partial tax benefit of the US-based hedge fund matter, for which the Group recognized a deferred tax asset on temporary differences, and foreign exchange impacts, partially offset by the impact of earnings during the quarter.
Regulatory capital
As of the end of 1Q21, our Bank for International Settlements (BIS) common equity tier 1 (CET1) ratio was 12.2% and our risk-weighted assets (RWA) were CHF 302.9 billion.
As of the end of March 2021, the Swiss Financial Market Supervisory Authority FINMA (FINMA) imposed a temporary add-on to our risk weighted assets relating to credit risk in the Investment Bank of USD 6.1 billion (CHF 5.8 billion) in relation to our exposure in the US-based hedge fund matter (described below). We expect this add-on to be reduced to zero by the end of 2Q21.
We have agreed with FINMA to apply a Pillar 2 capital add-on of CHF 1.9 billion (USD 2.0 billion) relating to the supply chain finance funds matter (described below).
> Refer to “Additional financial metrics” for further information on regulatory capital.
5
| Results overview | |||||||||||||
in / end of | Swiss Universal Bank | International Wealth Management | Asia Pacific | Investment Bank | Corporate Center | Credit Suisse | |||||||
| 1Q21 (CHF million) | |||||||||||||
| Net revenues | 1,449 | 1,373 | 1,060 | 3,543 | 149 | 7,574 | |||||||
| Provision for credit losses | 26 | 0 | 27 | 4,350 | (9) | 4,394 | |||||||
| Compensation and benefits | 472 | 522 | 314 | 860 | 39 | 2,207 | |||||||
| Total other operating expenses | 286 | 328 | 195 | 800 | 121 | 1,730 | |||||||
| of which general and administrative expenses | 227 | 262 | 153 | 629 | 105 | 1,376 | |||||||
| of which restructuring expenses | 9 | 1 | 1 | 17 | (3) | 25 | |||||||
| Total operating expenses | 758 | 850 | 509 | 1,660 | 160 | 3,937 | |||||||
| Income/(loss) before taxes | 665 | 523 | 524 | (2,467) | (2) | (757) | |||||||
| Return on regulatory capital (%) | 21.2 | 38.6 | 56.3 | (69.2) | – | (7.6) | |||||||
| Cost/income ratio (%) | 52.3 | 61.9 | 48.0 | 46.9 | – | 52.0 | |||||||
| Total assets | 269,089 | 94,241 | 74,878 | 292,843 | 120,344 | 851,395 | |||||||
| Goodwill | 595 | 1,431 | 1,063 | 5,434 | 0 | 8,523 | |||||||
| Risk-weighted assets | 84,974 | 45,024 | 30,049 | 92,974 | 49,848 | 302,869 | |||||||
| Leverage exposure | 305,034 | 108,851 | 83,160 | 348,982 | 121,771 | 967,798 | |||||||
| 4Q20 (CHF million) | |||||||||||||
| Net revenues | 1,393 | 952 | 784 | 2,109 | (17) | 5,221 | |||||||
| Provision for credit losses | 66 | 25 | 6 | 38 | 3 | 138 | |||||||
| Compensation and benefits | 499 | 551 | 341 | 1,008 | 140 | 2,539 | |||||||
| Total other operating expenses | 341 | 388 | 200 | 773 | 930 | 2,632 | |||||||
| of which general and administrative expenses | 286 | 300 | 162 | 623 | 908 | 2,279 | |||||||
| of which restructuring expenses | 3 | 26 | 2 | 14 | 5 | 50 | |||||||
| Total operating expenses | 840 | 939 | 541 | 1,781 | 1,070 | 5,171 | |||||||
| Income/(loss) before taxes | 487 | (12) | 237 | 290 | (1,090) | (88) | |||||||
| Return on regulatory capital (%) | 15.8 | (0.9) | 27.0 | 8.8 | – | (0.9) | |||||||
| Cost/income ratio (%) | 60.3 | 98.6 | 69.0 | 84.4 | – | 99.0 | |||||||
| Total assets | 261,465 | 95,206 | 67,356 | 270,488 | 111,307 | 805,822 | |||||||
| Goodwill | 575 | 1,352 | 1,021 | 1,478 | 0 | 4,426 | |||||||
| Risk-weighted assets | 81,288 | 43,000 | 26,589 | 77,872 | 46,335 | 275,084 | |||||||
| Leverage exposure | 295,507 | 104,014 | 74,307 | 319,339 | 6,686 | 799,853 | |||||||
| 1Q20 (CHF million) | |||||||||||||
| Net revenues | 1,454 | 1,477 | 835 | 2,080 | (70) | 5,776 | |||||||
| Provision for credit losses | 124 | 39 | 99 | 304 | 2 | 568 | |||||||
| Compensation and benefits | 500 | 593 | 320 | 955 | (52) | 2,316 | |||||||
| Total other operating expenses | 299 | 336 | 198 | 738 | 120 | 1,691 | |||||||
| of which general and administrative expenses | 243 | 277 | 154 | 577 | 95 | 1,346 | |||||||
| Total operating expenses | 799 | 929 | 518 | 1,693 | 68 | 4,007 | |||||||
| Income/(loss) before taxes | 531 | 509 | 218 | 83 | (140) | 1,201 | |||||||
| Return on regulatory capital (%) | 17.5 | 38.7 | 21.7 | 2.3 | – | 11.9 | |||||||
| Cost/income ratio (%) | 55.0 | 62.9 | 62.0 | 81.4 | – | 69.4 | |||||||
| Total assets | 255,472 | 90,874 | 74,453 | 293,836 | 117,531 | 832,166 | |||||||
| Goodwill | 602 | 1,462 | 980 | 1,560 | 0 | 4,604 | |||||||
| Risk-weighted assets | 83,044 | 44,928 | 31,803 | 97,255 | 43,550 | 300,580 | |||||||
| Leverage exposure | 289,862 | 99,194 | 81,685 | 362,870 | 36,095 | 869,706 | |||||||
6
| Net revenues by region | |||||||||||
| in | % change | ||||||||||
| 1Q21 | 4Q20 | 1Q20 | QoQ | YoY | |||||||
| Net revenues (CHF million) | |||||||||||
| Switzerland | 1,667 | 1,682 | 1,805 | (1) | (8) | ||||||
| EMEA | 1,372 | 1,057 | 1,363 | 30 | 1 | ||||||
| Americas | 2,904 | 1,462 | 1,550 | 99 | 87 | ||||||
| Asia Pacific | 1,482 | 1,037 | 1,128 | 43 | 31 | ||||||
| Corporate Center | 149 | (17) | (70) | – | – | ||||||
| Net revenues | 7,574 | 5,221 | 5,776 | 45 | 31 | ||||||
| A significant portion of our business requires inter-regional coordination in order to facilitate the needs of our clients. The methodology for allocating our results by region is dependent on management judgment. For the wealth management business, results are allocated based on the management reporting structure of our relationship manager organization. For the investment banking business, trading results are allocated based on where the risk is primarily managed, while also reflecting certain revenue transfers to regions where the relevant sales teams and clients are domiciled. | |||||||||||
Reconciliation of adjustment items
Results excluding certain items included in our reported results are non-GAAP financial measures. Management believes that such results provide a useful presentation of our operating results for purposes of assessing our Group and divisional performance consistently over time, on a basis that excludes items that management does not consider representative of our underlying performance. Provided below is a reconciliation of our adjusted results, our adjusted results excluding significant items and our adjusted results excluding significant items and the US-based hedge fund matter to the most directly comparable US GAAP measures. The Group announced a new restructuring plan beginning in 3Q20 and the related restructuring charges are excluded in the presentation of these metrics.
in | Swiss Universal Bank | International Wealth Management | Asia Pacific | Investment Bank | Corporate Center | Credit Suisse | |||||||
| 1Q21 (CHF million) | |||||||||||||
| Net revenues | 1,449 | 1,373 | 1,060 | 3,543 | 149 | 7,574 | |||||||
| Significant items | |||||||||||||
| Gain on equity investment in Allfunds Group | (43) | (58) | (43) | 0 | 0 | (144) | |||||||
| Adjusted net revenues excluding significant items | 1,406 | 1,315 | 1,017 | 3,543 | 149 | 7,430 | |||||||
| Provision for credit losses | 26 | 0 | 27 | 4,350 | (9) | 4,394 | |||||||
| US-based hedge fund matter | 0 | 0 | 0 | (4,430) | 0 | (4,430) | |||||||
| Provision for credit losses excluding the US-based hedge fund matter | 26 | 0 | 27 | (80) | (9) | (36) | |||||||
| Total operating expenses | 758 | 850 | 509 | 1,660 | 160 | 3,937 | |||||||
| Restructuring expenses | (9) | (1) | (1) | (17) | 3 | (25) | |||||||
| Major litigation provisions | 0 | 11 | 0 | 0 | (15) | (4) | |||||||
| Expenses related to real estate disposals 1 | 0 | (6) | 0 | (32) | 0 | (38) | |||||||
| Adjusted total operating expenses | 749 | 854 | 508 | 1,611 | 148 | 3,870 | |||||||
| Income/(loss) before taxes | 665 | 523 | 524 | (2,467) | (2) | (757) | |||||||
| Adjusted income/(loss) before taxes | 674 | 519 | 525 | (2,418) | 10 | (690) | |||||||
| Adjusted income/(loss) before taxes excluding significant items | 631 | 461 | 482 | (2,418) | 10 | (834) | |||||||
| Adjusted income/(loss) before taxes excluding significant items and the US-based hedge fund matter | 631 | 461 | 482 | 2,012 | 10 | 3,596 | |||||||
| Adjusted return on regulatory capital (%) | 21.5 | 38.3 | 56.4 | (67.8) | – | (6.9) | |||||||
| Adjusted return on regulatory capital excluding significant items (%) | 20.1 | 34.0 | 51.7 | (67.8) | – | (8.4) | |||||||
| Adjusted return on regulatory capital excluding significant items and the US-based hedge fund matter (%) | 20.1 | 34.0 | 51.7 | 59.5 | – | 36.1 | |||||||
1 Relates to the termination of real estate contracts initiated before the completion of the previous three-year restructuring program at the end of 2018. | |||||||||||||
7
| Reconciliation of adjustment items (continued) | |||||||||||||
in | Swiss Universal Bank | International Wealth Management | Asia Pacific | Investment Bank | Corporate Center | Credit Suisse | |||||||
| 4Q20 (CHF million) | |||||||||||||
| Net revenues | 1,393 | 952 | 784 | 2,109 | (17) | 5,221 | |||||||
| Real estate gains | (15) | 0 | 0 | 0 | 0 | (15) | |||||||
| Adjusted net revenues | 1,378 | 952 | 784 | 2,109 | (17) | 5,206 | |||||||
| Significant items | |||||||||||||
| Gain on equity investment in Allfunds Group | (38) | (51) | (38) | 0 | 0 | (127) | |||||||
| Gain on equity investment in SIX Group AG | (97) | (61) | 0 | 0 | 0 | (158) | |||||||
| Impairment on York Capital Management | 0 | 414 | 0 | 0 | 0 | 414 | |||||||
| Adjusted net revenues excluding significant items | 1,243 | 1,254 | 746 | 2,109 | (17) | 5,335 | |||||||
| Provision for credit losses | 66 | 25 | 6 | 38 | 3 | 138 | |||||||
| Total operating expenses | 840 | 939 | 541 | 1,781 | 1,070 | 5,171 | |||||||
| Restructuring expenses | (3) | (26) | (2) | (14) | (5) | (50) | |||||||
| Major litigation provisions | (44) | (1) | 0 | 0 | (712) | (757) | |||||||
| Expenses related to real estate disposals 1 | (3) | (4) | 0 | (21) | 0 | (28) | |||||||
| Adjusted total operating expenses | 790 | 908 | 539 | 1,746 | 353 | 4,336 | |||||||
| Income/(loss) before taxes | 487 | (12) | 237 | 290 | (1,090) | (88) | |||||||
| Adjusted income/(loss) before taxes | 522 | 19 | 239 | 325 | (373) | 732 | |||||||
| Adjusted income/(loss) before taxes excluding significant items | 387 | 321 | 201 | 325 | (373) | 861 | |||||||
| Adjusted return on regulatory capital (%) | 17.0 | 1.4 | 27.2 | 9.9 | – | 7.8 | |||||||
| Adjusted return on regulatory capital excluding significant items (%) | 12.6 | 23.9 | 22.8 | 9.9 | – | 9.1 | |||||||
| 1Q20 (CHF million) | |||||||||||||
| Net revenues | 1,454 | 1,477 | 835 | 2,080 | (70) | 5,776 | |||||||
| Significant items | |||||||||||||
| Gain related to InvestLab transfer | (25) | (218) | (25) | 0 | 0 | (268) | |||||||
| Adjusted net revenues excluding significant items | 1,429 | 1,259 | 810 | 2,080 | (70) | 5,508 | |||||||
| Provision for credit losses | 124 | 39 | 99 | 304 | 2 | 568 | |||||||
| Total operating expenses | 799 | 929 | 518 | 1,693 | 68 | 4,007 | |||||||
| Major litigation provisions | (1) | 0 | 0 | 0 | (17) | (18) | |||||||
| Expenses related to real estate disposals 1 | 0 | 1 | 0 | 4 | 0 | 5 | |||||||
| Adjusted total operating expenses | 798 | 930 | 518 | 1,697 | 51 | 3,994 | |||||||
| Income/(loss) before taxes | 531 | 509 | 218 | 83 | (140) | 1,201 | |||||||
| Adjusted income/(loss) before taxes | 532 | 508 | 218 | 79 | (123) | 1,214 | |||||||
| Adjusted income/(loss) before taxes excluding significant items | 507 | 290 | 193 | 79 | (123) | 946 | |||||||
| Adjusted return on regulatory capital (%) | 17.5 | 38.6 | 21.7 | 2.2 | – | 12.0 | |||||||
| Adjusted return on regulatory capital excluding significant items (%) | 16.7 | 22.0 | 19.2 | 2.2 | – | 9.3 | |||||||
1 Relates to the termination of real estate contracts initiated before the completion of the previous three-year restructuring program at the end of 2018. | |||||||||||||
8
| Employees and other headcount | |||||||
| end of | 1Q21 | 4Q20 | 1Q20 | ||||
| Employees (full-time equivalents) | |||||||
| Swiss Universal Bank | 13,220 | 13,220 | 13,260 | ||||
| International Wealth Management | 10,120 | 9,850 | 9,970 | ||||
| Asia Pacific | 6,950 | 6,890 | 6,970 | ||||
| Investment Bank | 17,750 | 17,560 | 17,100 | ||||
| Corporate Center | 1,050 | 1,250 | 1,200 | ||||
| Total employees | 49,090 | 48,770 | 48,500 | ||||
| Other headcount | |||||||
| Outsourced roles, contractors and consultants 1 | 13,670 | 13,210 | 12,790 | ||||
| Total employees and other headcount | 62,760 | 61,980 | 61,290 | ||||
| Based on full-time equivalents. | |||||||
1 Excludes the headcount of certain managed service resources which are related to fixed fee projects. | |||||||
There were 49,090 Group employees as of the end of 1Q21, stable compared to 4Q20, reflecting increases in International Wealth Management, the Investment Bank and Asia Pacific, offset by a decrease in the Corporate Center. The number of outsourced roles, contractors and consultants increased by 460 compared to 4Q20.
US-based hedge fund matter
As reported on April 6, 2021, we have incurred a provision for credit losses of CHF 4,430 million in 1Q21 in respect of the failure by a US-based hedge fund to meet its margin commitments. On March 26, 2021, certain Group subsidiaries were notified by the fund that it would be unable to return margin advances previously extended and recognized as collateral receivable by the Group. Following the failure of the fund, we initiated the process of exiting the fund positions. To date, we estimate that we have exited 97% of the related positions. We have also incurred additional losses in 2Q21 of approximately CHF 0.6 billion as a result of market movements during the process of closing out these positions. The Board of Directors has also initiated an externally-led investigation of this matter, which will be supervised by a special committee of the Board of Directors.
Following the US-based hedge fund matter, we have reviewed exposures across the prime services business. The related risk and control governance is being strengthened and will be further enhanced after rigorous first and second line risk management assessments. We expect that our prime brokerage and prime financing businesses will be resized with a primary focus on continuing to serve our most important franchise clients. By the end of 2021, we also expect to reduce leverage exposure in the Investment Bank by at least USD 35 billion and to align risk-weighted assets in the Investment Bank to no more than end-2020 levels.
> Refer to “Significant negative consequences of the supply chain finance funds and US-based hedge fund matters” in Risk factor for further information on risks that may arise in relation to this matter.
Supply chain finance funds matter
As previously reported, on March 1, 2021, the boards of four supply chain finance funds managed by certain Group subsidiaries (collectively, the SCFFs) decided to suspend redemptions and subscriptions of those funds to protect the interests of the funds’ investors. On March 4, 2021, the boards decided to terminate the SCFFs and to proceed to their liquidation. Credit Suisse Asset Management (Schweiz) AG (CSAM) acts as the portfolio manager of the SCFFs. Redemptions and subscriptions of certain other funds managed by CSAM or CSAM subsidiaries that invest in part in the SCFFs were also suspended.
The assets held by the SCFFs largely consist of notes backed by existing and future receivables. These notes were originated and structured by Greensill Capital (UK) Limited or one of its affiliates (Greensill Capital). Greensill Capital filed for insolvency in the UK on March 8, 2021, and the portfolio manager is working closely with the administrators of Greensill Capital, Grant Thornton, and with other parties to facilitate the liquidation of the SCFFs.
The last published net asset value of the SCFFs in late February was approximately USD 10 billion in the aggregate. To date, total cash collected in the supply chain finance funds, including the cash position in the funds at the time of suspension, amounts to USD 5.4 billion, and redemption payments totaling USD 4.8 billion have been made to their investors in two cash distributions. The portfolio manager continues to work to liquidate the remaining assets of the SCFFs, including by engaging directly with potentially delinquent obligors and other creditors as appropriate. However, there remains considerable uncertainty regarding the valuation of a significant part of the remaining assets, including the fact that certain of the notes underlying the funds were not paid when they fell due and the portfolio manager has been informed that further notes will not be paid when they fall due in the future. It therefore can be assumed that the investors of the SCFFs will suffer a loss. CSAM will take all necessary steps to collect outstanding amounts from debtors and insurers, but can give no assurance as to the final amount that may be recovered for the SCFFs under such notes. The amount of loss of the investors therefore is currently unknown. Based on currently available information, losses for the investors can be expected to occur predominantly in positions that, prior to March 31, 2021, had a net asset value of approximately USD 2.3 billion in the aggregate. These positions relate primarily to three groups of companies: “GFG Alliance,” Katerra and Bluestone.
Group subsidiaries also have collateralized bridge lending and other direct and indirect exposures to Greensill Capital, including exposures relating to certain fund-linked products. With regard to the outstanding collateralized bridge loan of USD 140 million, USD 50 million was recently repaid by the administrators of Greensill Capital, reducing the outstanding amount of the loan to USD 90 million, which we have marked down by USD 30 million in 1Q21. We will take all commercially reasonable steps to collect the outstanding
9
amount, but can give no assurance as to the final amount that may be recovered.
We continue to analyze these matters, including with the assistance of external counsel and other experts. The Board of Directors has also initiated an externally-led investigation of these matters, which will be supervised by a special committee of the Board of Directors.
> Refer to “Significant negative consequences of the supply chain finance funds and US-based hedge fund matters” in Risk factor for further information on risks that may arise in relation to this matter.
Changes to the Executive Board
Effective April 1, 2021, the Board appointed Ulrich Körner as CEO of Asset Management and a member of the Group Executive Board. From that date, the Asset Management business will be separated from the International Wealth Management division and managed as a new separate division of the Group.
On April 6, 2021, the Board announced that following the significant US-based hedge fund matter, Brian Chin, CEO of the Investment Bank, will be stepping down from his role on the Executive Board, effective April 30, 2021. Lara Warner, former Chief Risk and Compliance Officer, stepped down from her role on the Executive Board on April 6, 2021. Both of them will leave Credit Suisse.
Effective May 1, 2021, Christian Meissner, currently co-head of IWM Investment Banking Advisory and vice-chairman of Investment Banking, has been appointed CEO of the Investment Bank and a member of the Executive Board. Effective April 6, 2021, Joachim Oechslin, former senior advisor and chief of staff to the CEO, was appointed interim Chief Risk Officer and a member of the Executive Board on an interim basis, and Thomas Grotzer, former General Counsel and Member of the executive board of Credit Suisse (Schweiz) AG, was appointed interim Global Head of Compliance.
Changes to the Board of Directors
At the 2021 Annual General Meeting (AGM), Urs Rohner, the current Chairman of the Board of Directors (Board), will have served on the Board for the maximum standard term limit of 12 years and will therefore not stand for re-election at the AGM on April 30, 2021. The Board is proposing António Horta-Osório as the new Chairman of the Board and successor to Urs Rohner for election at the 2021 AGM.
Amendments to AGM Proposals
On April 6, the Board announced adjusted proposals for the 2021 AGM of Shareholders as well as an update to the 2020 Compensation Report.
Withdrawal of proposals on variable compensation of the Executive Board and update to the Compensation Report
The Board updated the Compensation Report following its decision to withdraw its proposals regarding the variable compensation for the Executive Board, comprising the 2020 short-term incentive compensation (STI), which was based on 2020 performance, and the 2021 long-term incentive opportunities (LTI), for which payout would have been determined based on prospective performance over the three-year period 2021–2023. In addition, the Chairman of the Board proposed to waive his chair fee of CHF 1.5 million, which would have been awarded to him at the end of the 2020 AGM to 2021 AGM period. The Board has agreed to and approved his proposal. The Board recommends that the 2020 Compensation Report, as updated, be accepted by the shareholders in a consultative vote.
Discharge of the members of the Board of Directors and the Executive Board
The Board has further withdrawn its proposal for the discharge of the members of the Board and the Executive Board. The Board believes it is in the best interest of our shareholders to consider this proposal once the internal investigations into the recent developments have been completed and the outcome communicated.
Update to the dividend proposal
In the original 2021 AGM proposal, the Board proposed a cash distribution of CHF 0.2926 per share for the financial year 2020. Following recent developments related to the US-based hedge fund matter, the Board has amended its dividend proposal for the financial year 2020, proposing to distribute an ordinary total dividend of CHF 0.10 gross per share, half from retained earnings and half out of the capital contribution reserves.
Suspension of the share buyback program
Following the completion of share buybacks in April 2021 with 25.1 million repurchased shares, we have suspended our previously announced share buyback program. Subject to 2021 financial performance, the Board of Directors would intend to restore the dividend in 2021 before any resumption of share buybacks.
Mandatory Convertible Notes Offering
On April 22, 2021, the Group announced that it placed two series of mandatory convertible notes (MCNs), Series A MCNs and Series B MCNs, which will be convertible into 100 million shares and 103 million shares of Credit Suisse Group AG, respectively (together, the MCN Offering). The offering is expected to close on or around May 12, 2021.
The MCNs’ conversion ratio will be their CHF-denominated principal amount divided by their conversion price, which will be set at an at-the-market 5% discount to the average of the volume-weighted average price of Credit Suisse Group AG’s shares on April 22, 2021 and April 23, 2021.
While, as discussed elsewhere in this earnings release, our capital position remained solid with a CET1 ratio of 12.2% and a CET1 leverage ratio of 3.8% as of the end of 1Q21, our intention is to strengthen our capital position and achieve a CET1 ratio of approximately 13% and a minimum CET1 leverage ratio of 4%. With the MCN Offering, we estimate an uplift of approximately
10
55 to 60 basis points to the CET1 ratio and approximately 16 to 18 basis points to the CET1 leverage ratio.
The shares of Credit Suisse Group AG underlying the Series A MCNs will be issued from Credit Suisse Group AG’s current conditional capital. The shares of Credit Suisse Group AG underlying the Series B MCNs will be issued from Credit Suisse Group AG’s current authorized capital. As the full amount of the current authorized capital is expected to be utilized for such issuance, the Board has decided to withdraw, at the AGM 2021, its proposal for a moderate increase and the extension of the authorized capital.
COVID-19 pandemic
The COVID-19 pandemic continued to affect the economic environment. Equity and credit markets performed well on the increased prospect that 2021 would bring a strong economic recovery due to significant fiscal supports, accommodative monetary policies, accelerating vaccination programs and the easing of economic and social activity lockdowns. However, progress on vaccination programs was uneven, with the EU and most emerging market countries lagging far behind the US and the UK in executing their programs. A rise in COVID-19 infections in a number of EU countries in late March also led to the re-imposition of lockdowns or their extension into 2Q21. We continue to closely monitor the COVID-19 pandemic and its effects on our operations and businesses.
> Refer to “COVID-19 pandemic and related regulatory measures” in II – Operating and financial review – Credit Suisse and “Key risk developments” in III – Treasury, Risk, Balance Sheet and Off-balance sheet – Risk management in the Credit Suisse Annual Report 2020 for a discussion of other developments pertaining to COVID-19, including regulatory developments, and further information.
Significant negative consequences of the supply chain finance funds and US-based hedge fund matters
As previously reported, Credit Suisse has incurred a material provision for credit losses in respect of the US-based hedge fund matter, and, as discussed above, is expected to incur an additional loss in relation to this matter in 2Q21. Credit Suisse has also previously reported that it is reasonably possible that it will incur a loss in respect of the SCFF matter, though it is not yet possible to estimate the size of such a reasonably possible loss. However, the ultimate cost of resolving the SCFF matter may be material to our operating results. In addition, we may suffer reputational harm as a result of these matters that might cause loss of assets under management, as well as adversely affect our ability to attract and retain customers, clients, investors and employees and conduct business transactions with our counterparties.
A number of regulatory and other investigations and actions have been initiated or are being considered in respect of each of these matters, including enforcement actions by FINMA. FINMA has also imposed certain measures, including those previously reported, as well as certain risk-reducing measures and capital surcharges discussed elsewhere in this report. Third parties appointed by FINMA will conduct investigations into these matters. The Luxembourg CSSF has also announced its intention to review the SCFF matter through a statutory auditor. Furthermore, certain investors have already threatened litigation in respect of these matters. An investor has also brought a lawsuit claiming violations of the US federal securities laws based on these matters. As both of these matters develop, we may become subject to additional litigation, disputes or other actions.
The Board of Directors has launched investigations into both of these matters, which will not only focus on the direct issues arising from each of them, but also reflect on the broader consequences and lessons learned. As previously announced, we have undertaken senior management changes within the Investment Bank division and within the Risk and Compliance organization in response to these matters. In addition, effective April 1, 2021, we have established Asset Management as a separate division.
The combined effect of these two matters, including the material loss incurred in respect of the US-based hedge fund matter, may have other material adverse consequences for us, including negative effects on our business and operating results from actions that we may be required or decide to take in response to these matters. Such actions include our decision to reduce our dividend proposal, suspend our share buyback program, resize our prime brokerage and prime financing businesses, reduce leverage exposure in the Investment Bank by at least USD 35 billion and realign RWA in the Investment Bank to not exceed end-2020 levels. In addition, we have been required by FINMA to take certain capital and related actions, including a temporary add-on to RWA in relation to our exposure in the US-based hedge fund matter and a Pillar 2 capital add-on relating to the SCFF matter. There could also be additional capital and related actions, including an add-on to RWA relating to operational risk and a Pillar 2 capital add-on relating to counterparty credit risk. There can be no assurance that measures instituted to manage related risks will be effective in all instances.
Several of the processes discussed above are still ongoing, including the external and Board-led investigations, the process of seeking to recover amounts in respect of the SCFF matter, our review of our businesses and potential personnel and organizational changes in response to these matters. There can be no assurance that any additional losses, damages, costs and expenses, as well as any further regulatory and other investigations and actions or any downgrade of our credit ratings, will not be material to us, including from any impact on our business, financial condition, results of operations, prospects, liquidity or capital position.
11
In 1Q21, we reported income before taxes of CHF 665 million and net revenues of CHF 1,449 million. Income before taxes increased 25% and 37% compared to 1Q20 and 4Q20, respectively.
1Q21 results
In 1Q21, income before taxes of CHF 665 million increased 25% compared to 1Q20. Net revenues of CHF 1,449 million were stable, with lower transaction-based revenues and lower net interest income, offset by higher other revenues and higher recurring commissions and fees. Other revenues in 1Q21 included an Allfunds Group equity investment revaluation gain of CHF 43 million, while other revenues in 1Q20 included a gain related to the completed transfer of the InvestLab fund platform to Allfunds Group of CHF 25 million, both reflected in Corporate & Institutional Clients. Provision for credit losses was CHF 26 million compared to CHF 124 million in 1Q20. Total operating expenses of CHF 758 million decreased 5%, driven by lower compensation and benefits and lower general and administrative expenses, partially offset by restructuring expenses of CHF 9 million in 1Q21.
Compared to 4Q20, income before taxes increased 37%. Net revenues increased 4%, driven by higher transaction-based revenues, higher recurring commissions and fees and higher net interest income, partially offset by lower other revenues. Other revenues in 1Q21 included the Allfunds Group equity investment revaluation gain, while other revenues in 4Q20 included a SIX Group AG (SIX) equity investment revaluation gain of CHF 97 million, reflected in Private Clients and Corporate & Institutional Clients, an Allfunds Group equity investment revaluation gain of CHF 38 million in Corporate & Institutional Clients and gains on the sale of real estate of CHF 15 million in Private Clients. Provision for credit losses was CHF 26 million compared to CHF 66 million in 4Q20. Total operating expenses decreased 10%, mainly driven by lower general and administrative expenses, reflecting decreased litigation provisions, and lower compensation and benefits.
We continue to closely monitor the COVID-19 pandemic and its effects on our operations and businesses.
> Refer to “COVID-19 pandemic” in Credit Suisse – Other information for further information.
Capital and leverage metrics
As of the end of 1Q21, we reported RWA of CHF 85.0 billion, CHF 3.7 billion higher compared to the end of 4Q20, mainly related to the foreign exchange impact and movements in risk levels, primarily in credit risk, reflecting business growth. Leverage exposure of CHF 305.0 billion was CHF 9.5 billion higher compared to the end of 4Q20, mainly driven by business growth and the foreign exchange impact.
| Divisional results | |||||||||||
| in / end of | % change | ||||||||||
| 1Q21 | 4Q20 | 1Q20 | QoQ | YoY | |||||||
| Statements of operations (CHF million) | |||||||||||
| Net revenues | 1,449 | 1,393 | 1,454 | 4 | 0 | ||||||
| Provision for credit losses | 26 | 66 | 124 | (61) | (79) | ||||||
| Compensation and benefits | 472 | 499 | 500 | (5) | (6) | ||||||
| General and administrative expenses | 227 | 286 | 243 | (21) | (7) | ||||||
| Commission expenses | 50 | 52 | 56 | (4) | (11) | ||||||
| Restructuring expenses | 9 | 3 | – | 200 | – | ||||||
| Total other operating expenses | 286 | 341 | 299 | (16) | (4) | ||||||
| Total operating expenses | 758 | 840 | 799 | (10) | (5) | ||||||
| Income before taxes | 665 | 487 | 531 | 37 | 25 | ||||||
| Statement of operations metrics (%) | |||||||||||
| Return on regulatory capital | 21.2 | 15.8 | 17.5 | – | – | ||||||
| Cost/income ratio | 52.3 | 60.3 | 55.0 | – | – | ||||||
| Number of employees and relationship managers | |||||||||||
| Number of employees (full-time equivalents) | 13,220 | 13,220 | 13,260 | 0 | 0 | ||||||
| Number of relationship managers | 1,760 | 1,770 | 1,810 | (1) | (3) | ||||||
12
| Divisional results (continued) | |||||||||||
| in / end of | % change | ||||||||||
| 1Q21 | 4Q20 | 1Q20 | QoQ | YoY | |||||||
| Net revenue detail (CHF million) | |||||||||||
| Private Clients | 737 | 750 | 769 | (2) | (4) | ||||||
| Corporate & Institutional Clients | 712 | 643 | 685 | 11 | 4 | ||||||
| Net revenues | 1,449 | 1,393 | 1,454 | 4 | 0 | ||||||
| Net revenue detail (CHF million) | |||||||||||
| Net interest income | 683 | 658 | 694 | 4 | (2) | ||||||
| Recurring commissions and fees | 381 | 352 | 374 | 8 | 2 | ||||||
| Transaction-based revenues | 357 | 244 | 374 | 46 | (5) | ||||||
| Other revenues | 28 | 139 | 12 | (80) | 133 | ||||||
| Net revenues | 1,449 | 1,393 | 1,454 | 4 | 0 | ||||||
| Balance sheet statistics (CHF million) | |||||||||||
| Total assets | 269,089 | 261,465 | 255,472 | 3 | 5 | ||||||
| Net loans | 180,307 | 176,332 | 174,160 | 2 | 4 | ||||||
| of which Private Clients | 113,100 | 118,223 | 117,000 | (4) | (3) | ||||||
| Risk-weighted assets | 84,974 | 81,288 | 83,044 | 5 | 2 | ||||||
| Leverage exposure | 305,034 | 295,507 | 289,862 | 3 | 5 | ||||||
| Net interest income includes a term spread credit on stable deposit funding and a term spread charge on loans. Recurring commissions and fees includes investment product management, discretionary mandate and other asset management-related fees, fees for general banking products and services and revenues from wealth structuring solutions. Transaction-based revenues arise primarily from brokerage fees, fees from foreign exchange client transactions, trading and sales income, equity participations income and other transaction-based income. Other revenues include fair value gains/(losses) on synthetic securitized loan portfolios and other gains and losses. | |||||||||||
| Reconciliation of adjustment items | |||||||||||||||||||
| Private Clients | Corporate & Institutional Clients | Swiss Universal Bank | |||||||||||||||||
| in | 1Q21 | 4Q20 | 1Q20 | 1Q21 | 4Q20 | 1Q20 | 1Q21 | 4Q20 | 1Q20 | ||||||||||
| Adjusted results excluding significant items (CHF million) | |||||||||||||||||||
| Net revenues | 737 | 750 | 769 | 712 | 643 | 685 | 1,449 | 1,393 | 1,454 | ||||||||||
| Real estate (gains)/losses | 0 | (15) | 0 | 0 | 0 | 0 | 0 | (15) | 0 | ||||||||||
| Adjusted net revenues | 737 | 735 | 769 | 712 | 643 | 685 | 1,449 | 1,378 | 1,454 | ||||||||||
| Significant items | |||||||||||||||||||
| Gain related to InvestLab transfer | 0 | 0 | 0 | 0 | 0 | (25) | 0 | 0 | (25) | ||||||||||
| Gain on equity investment in Allfunds Group | 0 | 0 | 0 | (43) | (38) | 0 | (43) | (38) | 0 | ||||||||||
| Gain on equity investment in SIX Group AG | 0 | (47) | 0 | 0 | (50) | 0 | 0 | (97) | 0 | ||||||||||
| Adjusted net revenues excluding significant items | 737 | 688 | 769 | 669 | 555 | 660 | 1,406 | 1,243 | 1,429 | ||||||||||
| Provision for credit losses | 5 | 17 | 12 | 21 | 49 | 112 | 26 | 66 | 124 | ||||||||||
| Total operating expenses | 451 | 476 | 478 | 307 | 364 | 321 | 758 | 840 | 799 | ||||||||||
| Restructuring expenses | (5) | 1 | – | (4) | (4) | – | (9) | (3) | – | ||||||||||
| Major litigation provisions | 0 | 0 | 0 | 0 | (44) | (1) | 0 | (44) | (1) | ||||||||||
| Expenses related to real estate disposals | 0 | (3) | 0 | 0 | 0 | 0 | 0 | (3) | 0 | ||||||||||
| Adjusted total operating expenses | 446 | 474 | 478 | 303 | 316 | 320 | 749 | 790 | 798 | ||||||||||
| Income before taxes | 281 | 257 | 279 | 384 | 230 | 252 | 665 | 487 | 531 | ||||||||||
| Adjusted income before taxes | 286 | 244 | 279 | 388 | 278 | 253 | 674 | 522 | 532 | ||||||||||
| Adjusted income before taxes excluding significant items | 286 | 197 | 279 | 345 | 190 | 228 | 631 | 387 | 507 | ||||||||||
| Adjusted return on regulatory capital (%) | – | – | – | – | – | – | 21.5 | 17.0 | 17.5 | ||||||||||
| Adjusted return on regulatory capital excluding significant items (%) | – | – | – | – | – | – | 20.1 | 12.6 | 16.7 | ||||||||||
| Adjusted results, adjusted results excluding significant items and adjusted results excluding significant items and the US-based hedge fund matter are non-GAAP financial measures. Refer to “Reconciliation of adjustment items” in Credit Suisse for further information. | |||||||||||||||||||
13
Private Clients
In 1Q21, income before taxes of CHF 281 million was stable compared to 1Q20, with lower total operating expenses and lower provision for credit losses, offset by lower net revenues. Compared to 4Q20, income before taxes increased 9%, reflecting lower total operating expenses and lower provision for credit losses, partially offset by lower net revenues.
Net revenues
Compared to 1Q20, net revenues of CHF 737 million decreased 4%, mainly driven by lower transaction-based revenues and lower net interest income. Transaction-based revenues of CHF 137 million decreased 10%, driven by lower client activity and lower corporate advisory fees. Net interest income of CHF 404 million decreased 3%, with lower deposit margins on slightly lower average deposit volumes and lower loan margins on slightly lower average loan volumes, partially offset by higher treasury revenues. Recurring commissions and fees of CHF 199 million decreased 2%, primarily reflecting lower revenues from our investment in Swisscard and lower banking services fees.
Compared to 4Q20, net revenues decreased 2%, mainly driven by lower other revenues, partially offset by higher transaction-based revenues. Other revenues in 4Q20 included a SIX equity investment revaluation gain of CHF 47 million and the gains on the sale of real estate of CHF 15 million. Transaction-based revenues increased 43%, mainly due to higher revenues from Global Trading Solutions (GTS) and higher client activity. Recurring commissions and fees increased 3%, driven by higher investment advisory fees, higher discretionary mandate management fees, increased security account and custody services fees and higher investment product management fees. Net interest income was stable, with higher treasury revenues, offset by higher loan margins on lower average loan volumes and lower deposit margins on lower average deposit volumes.
Provision for credit losses
The Private Clients loan portfolio is substantially comprised of residential mortgages in Switzerland and loans collateralized by securities and, to a lesser extent, consumer finance loans.
In 1Q21, Private Clients recorded provision for credit losses of CHF 5 million compared to provision for credit losses of CHF 12 million in 1Q20 and CHF 17 million in 4Q20. The provisions were primarily related to our consumer finance business.
Total operating expenses
Compared to 1Q20, total operating expenses of CHF 451 million decreased 6%, driven by lower compensation and benefits and lower general and administrative expenses, partially offset by restructuring expenses of CHF 5 million in 1Q21. Compensation and benefits of CHF 279 million decreased 5%, primarily driven by lower pension expenses, lower salary expenses and lower social security expenses, partially offset by higher allocated corporate function costs. General and administrative expenses of CHF 149 million decreased 7%, mainly reflecting lower allocated corporate function costs, lower advertising and marketing expenses and lower occupancy expenses.
Compared to 4Q20, total operating expenses decreased 5%, reflecting lower compensation and benefits and lower general and administrative expenses, partially offset by higher restructuring expenses. Compensation and benefits decreased 6%, driven by lower discretionary compensation expenses. General and administrative expenses decreased 3%, driven by lower professional services fees and lower advertising and marketing expenses, partially offset by higher occupancy expenses.
Margins
Our gross margin was 142 basis points in 1Q21, a decrease of four basis points compared to 1Q20, primarily reflecting lower transaction-based revenues and lower net interest income on stable average assets under management. Compared to 4Q20, our gross margin was four basis points lower, mainly driven by lower other revenues on stable average assets under management, partially offset by higher transaction-based revenues.
> Refer to “Assets under management” for further information.
Our net margin was 54 basis points in 1Q21, an increase of one basis point compared to 1Q20, reflecting lower total operating expenses and lower provision for credit losses on stable average assets under management, partially offset by lower net revenues. Compared to 4Q20, our net margin was four basis points higher, reflecting lower total operating expenses and lower provision for credit losses, partially offset by lower net revenues on stable average assets under management.
14
| Results - Private Clients | |||||||||||
| in / end of | % change | ||||||||||
| 1Q21 | 4Q20 | 1Q20 | QoQ | YoY | |||||||
| Statements of operations (CHF million) | |||||||||||
| Net revenues | 737 | 750 | 769 | (2) | (4) | ||||||
| Provision for credit losses | 5 | 17 | 12 | (71) | (58) | ||||||
| Compensation and benefits | 279 | 298 | 294 | (6) | (5) | ||||||
| General and administrative expenses | 149 | 154 | 160 | (3) | (7) | ||||||
| Commission expenses | 18 | 25 | 24 | (28) | (25) | ||||||
| Restructuring expenses | 5 | (1) | – | – | – | ||||||
| Total other operating expenses | 172 | 178 | 184 | (3) | (7) | ||||||
| Total operating expenses | 451 | 476 | 478 | (5) | (6) | ||||||
| Income before taxes | 281 | 257 | 279 | 9 | 1 | ||||||
| Statement of operations metrics (%) | |||||||||||
| Cost/income ratio | 61.2 | 63.5 | 62.2 | – | – | ||||||
| Net revenue detail (CHF million) | |||||||||||
| Net interest income | 404 | 403 | 415 | 0 | (3) | ||||||
| Recurring commissions and fees | 199 | 193 | 204 | 3 | (2) | ||||||
| Transaction-based revenues | 137 | 96 | 152 | 43 | (10) | ||||||
| Other revenues | (3) | 58 | (2) | – | 50 | ||||||
| Net revenues | 737 | 750 | 769 | (2) | (4) | ||||||
| Margins on assets under management (annualized) (bp) | |||||||||||
| Gross margin 1 | 142 | 146 | 146 | – | – | ||||||
| Net margin 2 | 54 | 50 | 53 | – | – | ||||||
| Number of relationship managers | |||||||||||
| Number of relationship managers | 1,250 | 1,290 | 1,320 | (3) | (5) | ||||||
1 Net revenues divided by average assets under management. | |||||||||||
2 Income before taxes divided by average assets under management. | |||||||||||
As of the end of 1Q21, assets under management of CHF 213.1 billion were CHF 4.5 billion higher compared to the end of 4Q20, driven by favorable market movements, favorable foreign exchange-related movements and net new assets, partially offset by structural effects. Net new assets of CHF 2.2 billion reflected positive contributions from all businesses. Structural effects included the transfer of assets under management of CHF 4.0 billion to Corporate & Institutional Clients related to the integration of Neue Aargauer Bank (NAB).
15
| Assets under management – Private Clients | |||||||||||
| in / end of | % change | ||||||||||
| 1Q21 | 4Q20 | 1Q20 | QoQ | YoY | |||||||
| Assets under management (CHF billion) | |||||||||||
| Assets under management | 213.1 | 208.6 | 194.8 | 2.2 | 9.4 | ||||||
| Average assets under management | 207.8 | 205.5 | 210.7 | 1.1 | (1.4) | ||||||
| Assets under management by currency (CHF billion) | |||||||||||
| USD | 36.5 | 34.8 | 34.1 | 4.9 | 7.0 | ||||||
| EUR | 20.3 | 19.3 | 17.1 | 5.2 | 18.7 | ||||||
| CHF | 147.0 | 145.7 | 136.5 | 0.9 | 7.7 | ||||||
| Other | 9.3 | 8.8 | 7.1 | 5.7 | 31.0 | ||||||
| Assets under management | 213.1 | 208.6 | 194.8 | 2.2 | 9.4 | ||||||
| Growth in assets under management (CHF billion) | |||||||||||
| Net new assets | 2.2 | (2.1) | (4.2) | – | – | ||||||
| Other effects | 2.3 | 5.7 | (18.6) | – | – | ||||||
| of which market movements | 3.7 | 7.7 | (17.2) | – | – | ||||||
| of which foreign exchange | 3.3 | (1.5) | (1.2) | – | – | ||||||
| of which other | (4.7) | 1 | (0.5) | (0.2) | – | – | |||||
| Growth in assets under management | 4.5 | 3.6 | (22.8) | – | – | ||||||
| Growth in assets under management (annualized) (%) | |||||||||||
| Net new assets | 4.2 | (4.1) | (7.7) | – | – | ||||||
| Other effects | 4.4 | 11.1 | (34.2) | – | – | ||||||
| Growth in assets under management (annualized) | 8.6 | 7.0 | (41.9) | – | – | ||||||
| Growth in assets under management (rolling four-quarter average) (%) | |||||||||||
| Net new assets | 0.3 | (2.7) | (1.9) | – | – | ||||||
| Other effects | 9.1 | (1.4) | (5.6) | – | – | ||||||
| Growth in assets under management (rolling four-quarter average) | 9.4 | (4.1) | (7.5) | – | – | ||||||
1 Includes the transfer of assets under management of CHF 4.0 billion to Corporate & Institutional Clients related to the integration of NAB. | |||||||||||
Corporate & Institutional Clients
In 1Q21, income before taxes of CHF 384 million increased 52% compared to 1Q20, mainly driven by lower provision for credit losses and higher net revenues. Compared to 4Q20, income before taxes increased 67%, reflecting higher net revenues, lower total operating expenses and lower provision for credit losses.
Net revenues
Compared to 1Q20, net revenues of CHF 712 million increased 4%, mainly driven by higher other revenues and higher recurring commissions and fees. Other revenues in 1Q21 included the Allfunds Group equity investment revaluation gain of CHF 43 million, while other revenues in 1Q20 included the gain related to the completed transfer of the InvestLab fund platform of CHF 25 million. Recurring commissions and fees of CHF 182 million increased 7%, including higher fees from lending activities, higher banking services fees and higher investment product management fees. Net interest income of CHF 279 million was stable, with lower loan margins on higher average loan volumes, offset by lower deposit margins on higher average deposit volumes. Transaction-based revenues of CHF 220 million were stable, with lower revenues from our Swiss investment banking business, offset by higher fees from foreign exchange client business.
16
| Results – Corporate & Institutional Clients | |||||||||||
| in / end of | % change | ||||||||||
| 1Q21 | 4Q20 | 1Q20 | QoQ | YoY | |||||||
| Statements of operations (CHF million) | |||||||||||
| Net revenues | 712 | 643 | 685 | 11 | 4 | ||||||
| Provision for credit losses | 21 | 49 | 112 | (57) | (81) | ||||||
| Compensation and benefits | 193 | 201 | 206 | (4) | (6) | ||||||
| General and administrative expenses | 78 | 132 | 83 | (41) | (6) | ||||||
| Commission expenses | 32 | 27 | 32 | 19 | 0 | ||||||
| Restructuring expenses | 4 | 4 | – | 0 | – | ||||||
| Total other operating expenses | 114 | 163 | 115 | (30) | (1) | ||||||
| Total operating expenses | 307 | 364 | 321 | (16) | (4) | ||||||
| Income before taxes | 384 | 230 | 252 | 67 | 52 | ||||||
| Statement of operations metrics (%) | |||||||||||
| Cost/income ratio | 43.1 | 56.6 | 46.9 | – | – | ||||||
| Net revenue detail (CHF million) | |||||||||||
| Net interest income | 279 | 255 | 279 | 9 | 0 | ||||||
| Recurring commissions and fees | 182 | 159 | 170 | 14 | 7 | ||||||
| Transaction-based revenues | 220 | 148 | 222 | 49 | (1) | ||||||
| Other revenues | 31 | 81 | 14 | (62) | 121 | ||||||
| Net revenues | 712 | 643 | 685 | 11 | 4 | ||||||
| Number of relationship managers | |||||||||||
| Number of relationship managers | 510 | 480 | 490 | 6 | 4 | ||||||
Compared to 4Q20, net revenues increased 11%, reflecting higher transaction-based revenues, higher net interest income and higher recurring commissions and fees, partially offset by lower other revenues. Transaction-based revenues increased 49%, primarily driven by significantly higher revenues from GTS. Net interest income increased 9%, reflecting lower loan margins on higher average loan volumes, partially offset by lower treasury revenues and lower deposit margins on higher average deposit volumes. Recurring commissions and fees increased 14%, mainly reflecting higher fees from lending activities, higher banking services fees and higher security account and custody services fees. Other revenues in 1Q21 included the Allfunds Group equity investment revaluation gain, while other revenues in 4Q20 included a SIX equity investment revaluation gain of CHF 50 million and the Allfunds Group equity investment revaluation gain of CHF 38 million.
Provision for credit losses
The Corporate & Institutional Clients loan portfolio has relatively low concentrations and is mainly secured by real estate, securities and other financial collateral.
In 1Q21, Corporate & Institutional Clients recorded provision for credit losses of CHF 21 million compared to CHF 112 million in 1Q20 and CHF 49 million in 4Q20. The provision for credit losses in 1Q21 mainly reflected several individual cases across various industries.
Total operating expenses
Compared to 1Q20, total operating expenses of CHF 307 million decreased 4%, mainly driven by lower compensation and benefits and lower general and administrative expenses, partially offset by restructuring expenses of CHF 4 million in 1Q21. Compensation and benefits of CHF 193 million decreased 6%, driven by lower allocated corporate function costs and lower discretionary compensation expenses. General and administrative expenses of CHF 78 million decreased 6%, primarily reflecting lower litigation provisions, lower travel and entertainment expenses and lower professional services fees.
Compared to 4Q20, total operating expenses decreased 16%, mainly driven by lower general and administrative expenses. General and administrative expenses decreased 41%, primarily reflecting litigation provisions of CHF 44 million in 4Q20. Compensation and benefits decreased 4%, primarily driven by lower discretionary compensation expenses.
As of the end of 1Q21, assets under management of CHF 487.0 billion were CHF 24.4 billion higher compared to the end of 4Q20, driven by favorable market movements, favorable foreign exchange-related movements, structural effects and net new assets. Structural effects included the transfer of assets under management of CHF 4.0 billion from Private Clients related to the integration of NAB. Net new assets of CHF 3.9 billion mainly reflected inflows from our pension business.
17
In 1Q21, we reported income before taxes of CHF 523 million and net revenues of CHF 1,373 million. Income before taxes increased 3% compared to 1Q20 and increased significantly compared to 4Q20.
1Q21 results
In 1Q21, income before taxes of CHF 523 million increased 3% compared to 1Q20. Net revenues of CHF 1,373 million decreased 7%, mainly driven by lower net interest income and lower other revenues. Other revenues in 1Q21 included an Allfunds Group equity investment revaluation gain of CHF 58 million reflected in Private Banking, while other revenues in 1Q20 included a gain related to the completed transfer of the InvestLab fund platform of CHF 218 million reflected in Asset Management and Private Banking. Provision for credit losses was CHF 0 million compared to CHF 39 million in 1Q20. Total operating expenses of CHF 850 million decreased 9%, driven by lower compensation and benefits and lower general and administrative expenses.
Compared to 4Q20, income before taxes increased significantly as 4Q20 included an impairment loss of CHF 414 million from York reflected in Asset Management. Net revenues increased 44%, mainly driven by higher other revenues due to the impairment loss of CHF 414 million from York. Other revenues in 1Q21 included the Allfunds Group equity investment revaluation gain reflected in Private Banking, while other revenues in 4Q20 included the impairment loss from York reflected in Asset Management as well as a SIX equity investment revaluation gain of CHF 61 million and an Allfunds Group equity investment revaluation gain of CHF 51 million, both reflected in Private Banking. Provision for credit losses was CHF 0 million compared to CHF 25 million in 4Q20. Total operating expenses decreased 9%, reflecting lower general and administrative expenses, lower compensation and benefits and lower restructuring expenses.
We continue to closely monitor the COVID-19 pandemic and its effects on our operations and businesses.
> Refer to “COVID-19 pandemic” in Credit Suisse – Other information for further information.
Capital and leverage metrics
As of the end of 1Q21, we reported RWA of CHF 45.0 billion, an increase of CHF 2.0 billion compared to the end of 4Q20, mainly related to the foreign exchange impact, partially offset by movements in risk levels, primarily in credit risk. Leverage exposure of CHF 108.9 billion was CHF 4.8 billion higher compared to the end of 4Q20, mainly driven by the foreign exchange impact.
| Divisional results | |||||||||||
| in / end of | % change | ||||||||||
| 1Q21 | 4Q20 | 1Q20 | QoQ | YoY | |||||||
| Statements of operations (CHF million) | |||||||||||
| Net revenues | 1,373 | 952 | 1,477 | 44 | (7) | ||||||
| Provision for credit losses | 0 | 25 | 39 | (100) | (100) | ||||||
| Compensation and benefits | 522 | 551 | 593 | (5) | (12) | ||||||
| General and administrative expenses | 262 | 300 | 277 | (13) | (5) | ||||||
| Commission expenses | 65 | 62 | 59 | 5 | 10 | ||||||
| Restructuring expenses | 1 | 26 | – | (96) | – | ||||||
| Total other operating expenses | 328 | 388 | 336 | (15) | (2) | ||||||
| Total operating expenses | 850 | 939 | 929 | (9) | (9) | ||||||
| Income/(loss) before taxes | 523 | (12) | 509 | – | 3 | ||||||
| Statement of operations metrics (%) | |||||||||||
| Return on regulatory capital | 38.6 | (0.9) | 38.7 | – | – | ||||||
| Cost/income ratio | 61.9 | 98.6 | 62.9 | – | – | ||||||
| Number of employees (full-time equivalents) | |||||||||||
| Number of employees | 10,120 | 9,850 | 9,970 | 3 | 2 | ||||||
18
| Divisional results (continued) | |||||||||||
| in / end of | % change | ||||||||||
| 1Q21 | 4Q20 | 1Q20 | QoQ | YoY | |||||||
| Net revenue detail (CHF million) | |||||||||||
| Private Banking | 987 | 974 | 1,032 | 1 | (4) | ||||||
| Asset Management | 386 | (22) | 445 | – | (13) | ||||||
| Net revenues | 1,373 | 952 | 1,477 | 44 | (7) | ||||||
| Net revenue detail (CHF million) | |||||||||||
| Net interest income | 285 | 304 | 346 | (6) | (18) | ||||||
| Recurring commissions and fees | 561 | 557 | 545 | 1 | 3 | ||||||
| Transaction- and performance-based revenues | 448 | 433 | 458 | 3 | (2) | ||||||
| Other revenues | 79 | (342) | 128 | – | (38) | ||||||
| Net revenues | 1,373 | 952 | 1,477 | 44 | (7) | ||||||
| Balance sheet statistics (CHF million) | |||||||||||
| Total assets | 94,241 | 95,206 | 90,874 | (1) | 4 | ||||||
| Net loans | 55,605 | 52,189 | 50,412 | 7 | 10 | ||||||
| of which Private Banking | 55,584 | 52,175 | 50,390 | 7 | 10 | ||||||
| Risk-weighted assets | 45,024 | 43,000 | 44,928 | 5 | 0 | ||||||
| Leverage exposure | 108,851 | 104,014 | 99,194 | 5 | 10 | ||||||
| Reconciliation of adjustment items | |||||||||||||||||||
| Private Banking | Asset Management | International Wealth Management | |||||||||||||||||
| in | 1Q21 | 4Q20 | 1Q20 | 1Q21 | 4Q20 | 1Q20 | 1Q21 | 4Q20 | 1Q20 | ||||||||||
| Adjusted results excluding significant items (CHF million) | |||||||||||||||||||
| Net revenues | 987 | 974 | 1,032 | 386 | (22) | 445 | 1,373 | 952 | 1,477 | ||||||||||
| Significant items | |||||||||||||||||||
| Gain related to InvestLab transfer | 0 | 0 | (15) | 0 | 0 | (203) | 0 | 0 | (218) | ||||||||||
| Gain on equity investment in Allfunds Group | (58) | (51) | 0 | 0 | 0 | 0 | (58) | (51) | 0 | ||||||||||
| Gain on equity investment in SIX Group AG | 0 | (61) | 0 | 0 | 0 | 0 | 0 | (61) | 0 | ||||||||||
| Impairment on York Capital Management | 0 | 0 | 0 | 0 | 414 | 0 | 0 | 414 | 0 | ||||||||||
| Adjusted net revenues excluding significant items | 929 | 862 | 1,017 | 386 | 392 | 242 | 1,315 | 1,254 | 1,259 | ||||||||||
| Provision for credit losses | 0 | 31 | 39 | 0 | (6) | 0 | 0 | 25 | 39 | ||||||||||
| Total operating expenses | 579 | 650 | 648 | 271 | 289 | 281 | 850 | 939 | 929 | ||||||||||
| Restructuring expenses | 0 | (21) | – | (1) | (5) | – | (1) | (26) | – | ||||||||||
| Major litigation provisions | 11 | (1) | 0 | 0 | 0 | 0 | 11 | (1) | 0 | ||||||||||
| Expenses related to real estate disposals | (5) | (3) | 1 | (1) | (1) | 0 | (6) | (4) | 1 | ||||||||||
| Adjusted total operating expenses | 585 | 625 | 649 | 269 | 283 | 281 | 854 | 908 | 930 | ||||||||||
| Income/(loss) before taxes | 408 | 293 | 345 | 115 | (305) | 164 | 523 | (12) | 509 | ||||||||||
| Adjusted income/(loss) before taxes | 402 | 318 | 344 | 117 | (299) | 164 | 519 | 19 | 508 | ||||||||||
| Adjusted income/(loss) before taxes excluding significant items | 344 | 206 | 329 | 117 | 115 | (39) | 461 | 321 | 290 | ||||||||||
| Adjusted return on regulatory capital (%) | – | – | – | – | – | – | 38.3 | 1.4 | 38.6 | ||||||||||
| Adjusted return on regulatory capital excluding significant items (%) | – | – | – | – | – | – | 34.0 | 23.9 | 22.0 | ||||||||||
| Adjusted results, adjusted results excluding significant items and adjusted results excluding significant items and the US-based hedge fund matter are non-GAAP financial measures. Refer to “Reconciliation of adjustment items” in Credit Suisse for further information. | |||||||||||||||||||
19
Private Banking
In 1Q21, income before taxes of CHF 408 million increased 18% compared to 1Q20, reflecting lower total operating expenses and lower provision for credit losses, partially offset by lower net revenues. Compared to 4Q20, income before taxes increased 39%, mainly driven by lower total operating expenses and lower provision for credit losses.
Net revenues
Compared to 1Q20, net revenues of CHF 987 million decreased 4%, reflecting lower net interest income and lower transaction- and performance-based revenues, partially offset by higher other revenues. Net interest income of CHF 285 million decreased 18%, mainly reflecting lower deposit margins on higher average deposit volumes. Transaction- and performance-based revenues of CHF 351 million decreased 8%, mainly driven by lower client activity, including lower structured product issuances, partially offset by higher revenues from GTS. Other revenues in 1Q21 included the Allfunds Group equity investment revaluation gain of CHF 58 million while other revenues in 1Q20 included a gain related to the completed transfer of the InvestLab fund platform of CHF 15 million. Recurring commissions and fees of CHF 296 million were stable, with higher fees from lending activities, offset by lower banking services fees and lower discretionary mandate management fees.
Compared to 4Q20, net revenues were stable, with higher transaction- and performance-based revenues, offset by lower other revenues and lower net interest income. Transaction- and performance-based revenues increased 34%, driven by significantly higher revenues from GTS and higher client activity, partially offset by lower performance fees. Other revenues in 1Q21 included the Allfunds Group equity investment revaluation gain, while other revenues in 4Q20 included the SIX equity investment revaluation gain of CHF 61 million and the Allfunds Group equity investment revaluation gain of CHF 51 million. Net interest income decreased 6%, reflecting lower deposit margins on slightly higher average deposit volumes and lower treasury revenues. Recurring commissions and fees were stable, with lower fees from lending activities, offset by higher discretionary mandate management fees and higher security account and custody services fees.
Provision for credit losses
The Private Banking loan portfolio primarily comprises lombard loans, mainly backed by listed securities, ship finance and real estate mortgages.
In 1Q21, provision for credit losses was CHF 0 million, compared to provision for credit losses of CHF 39 million in 1Q20 and CHF 31 million in 4Q20. Provision for credit losses in 1Q21 included provisions for two cases, offset by a release of current expected credit loss (CECL) provisions of CHF 5 million. Provision for credit losses in 1Q20 included the impact from the expected deterioration of macroeconomic factors across multiple industries under the new CECL methodology, and provision for credit losses in 4Q20 was primarily related to the application of the CECL methodology and two individual cases.
Total operating expenses
Compared to 1Q20, total operating expenses of CHF 579 million decreased 11%, primarily driven by lower compensation and benefits. Compensation and benefits of CHF 365 million decreased 15%, mainly driven by lower discretionary compensation expenses, lower allocated corporate function costs and lower social security and pension expenses. General and administrative expenses of CHF 176 million decreased 4%, primarily reflecting a release of litigation provisions in 1Q21 compared to an increase in litigation provisions in 1Q20 and lower travel and entertainment expenses, partially offset by higher allocated corporate function costs and higher professional services fees.
Compared to 4Q20, total operating expenses decreased 11%, mainly reflecting lower compensation and benefits, lower restructuring expenses and lower general and administrative expenses. Compensation and benefits decreased 8%, primarily reflecting lower discretionary compensation expenses, lower deferred compensation expenses from prior-year awards and lower allocated corporate function costs, partially offset by higher social security and pension expenses and higher salary expenses. In 1Q21, no restructuring expenses were recorded compared to restructuring expenses of CHF 21 million in 4Q20. General and administrative expenses decreased 10%, mainly reflecting the release of litigation provisions in 1Q21 and lower professional services fees, partially offset by higher allocated corporate function costs.
Margins
Our gross margin was 105 basis points in 1Q21, a decrease of ten basis points compared to 1Q20, driven by lower net interest income, a 4.7% increase in average assets under management and lower transaction- and performance-based revenues, partially offset by higher other revenues. Compared to 4Q20, our gross margin was four basis points lower, mainly reflecting lower other revenues, a 5.2% increase in average assets under management and lower net interest income, partially offset by higher transaction- and performance-based revenues.
> Refer to “Assets under management” for further information.
Our net margin was 44 basis points in 1Q21, an increase of five basis points compared to 1Q20, mainly reflecting lower total operating expenses and lower provision for credit losses, partially offset by lower net revenues and the higher average assets under management. Our net margin was eleven basis points higher compared to 4Q20, mainly reflecting lower total operating expenses and lower provision for credit losses, partially offset by the higher average assets under management.
20
| Results – Private Banking | |||||||||||
| in / end of | % change | ||||||||||
| 1Q21 | 4Q20 | 1Q20 | QoQ | YoY | |||||||
| Statements of operations (CHF million) | |||||||||||
| Net revenues | 987 | 974 | 1,032 | 1 | (4) | ||||||
| Provision for credit losses | 0 | 31 | 39 | (100) | (100) | ||||||
| Compensation and benefits | 365 | 397 | 427 | (8) | (15) | ||||||
| General and administrative expenses | 176 | 195 | 183 | (10) | (4) | ||||||
| Commission expenses | 38 | 37 | 38 | 3 | 0 | ||||||
| Restructuring expenses | 0 | 21 | – | (100) | – | ||||||
| Total other operating expenses | 214 | 253 | 221 | (15) | (3) | ||||||
| Total operating expenses | 579 | 650 | 648 | (11) | (11) | ||||||
| Income before taxes | 408 | 293 | 345 | 39 | 18 | ||||||
| Statement of operations metrics (%) | |||||||||||
| Cost/income ratio | 58.7 | 66.7 | 62.8 | – | – | ||||||
| Net revenue detail (CHF million) | |||||||||||
| Net interest income | 285 | 304 | 346 | (6) | (18) | ||||||
| Recurring commissions and fees | 296 | 297 | 294 | 0 | 1 | ||||||
| Transaction- and performance-based revenues | 351 | 261 | 381 | 34 | (8) | ||||||
| Other revenues | 55 | 112 | 11 | (51) | 400 | ||||||
| Net revenues | 987 | 974 | 1,032 | 1 | (4) | ||||||
| Margins on assets under management (annualized) (bp) | |||||||||||
| Gross margin 1 | 105 | 109 | 115 | – | – | ||||||
| Net margin 2 | 44 | 33 | 39 | – | – | ||||||
| Number of relationship managers | |||||||||||
| Number of relationship managers | 1,140 | 1,140 | 1,160 | 0 | (2) | ||||||
| Net interest income includes a term spread credit on stable deposit funding and a term spread charge on loans. Recurring commissions and fees includes investment product management, discretionary mandate and other asset management-related fees, fees for general banking products and services and revenues from wealth structuring solutions. Transaction- and performance-based revenues arise primarily from brokerage and product issuing fees, fees from foreign exchange client transactions, trading and sales income, equity participations income and other transaction- and performance-based income. | |||||||||||
1 Net revenues divided by average assets under management. | |||||||||||
2 Income before taxes divided by average assets under management. | |||||||||||
As of the end of 1Q21, assets under management of CHF 386.2 billion were CHF 20.8 billion higher compared to the end of 4Q20, mainly driven by favorable foreign exchange-related movements and net new assets, partially offset by structural effects. Net new assets of CHF 7.2 billion reflected inflows from both emerging markets and Western Europe. Structural effects included CHF 2.4 billion related to the reclassification to assets under custody for our clients’ assets that were impacted by the suspension and ongoing liquidation of the supply chain finance funds.
21
| Assets under management – Private Banking | |||||||||||
| in / end of | % change | ||||||||||
| 1Q21 | 4Q20 | 1Q20 | QoQ | YoY | |||||||
| Assets under management (CHF billion) | |||||||||||
| Assets under management | 386.2 | 365.4 | 327.7 | 5.7 | 17.9 | ||||||
| Average assets under management | 374.9 | 356.4 | 358.1 | 5.2 | 4.7 | ||||||
| Assets under management by currency (CHF billion) | |||||||||||
| USD | 191.4 | 180.5 | 165.0 | 6.0 | 16.0 | ||||||
| EUR | 114.4 | 110.4 | 91.1 | 3.6 | 25.6 | ||||||
| CHF | 18.0 | 17.9 | 17.3 | 0.6 | 4.0 | ||||||
| Other | 62.4 | 56.6 | 54.3 | 10.2 | 14.9 | ||||||
| Assets under management | 386.2 | 365.4 | 327.7 | 5.7 | 17.9 | ||||||
| Growth in assets under management (CHF billion) | |||||||||||
| Net new assets | 7.2 | 4.3 | 3.7 | – | – | ||||||
| Other effects | 13.6 | 9.1 | (46.0) | – | – | ||||||
| of which market movements | 0.4 | 16.6 | (32.1) | – | – | ||||||
| of which foreign exchange | 16.2 | (6.7) | (13.9) | – | – | ||||||
| of which other | (3.0) | 1 | (0.8) | 0.0 | – | – | |||||
| Growth in assets under management | 20.8 | 13.4 | (42.3) | – | – | ||||||
| Growth in assets under management (annualized) (%) | |||||||||||
| Net new assets | 7.9 | 4.9 | 4.0 | – | – | ||||||
| Other effects | 14.9 | 10.3 | (49.7) | – | – | ||||||
| Growth in assets under management (annualized) | 22.8 | 15.2 | (45.7) | – | – | ||||||
| Growth in assets under management (rolling four-quarter average) (%) | |||||||||||
| Net new assets | 6.2 | 4.5 | 3.8 | – | – | ||||||
| Other effects | 11.7 | (5.7) | (11.9) | – | – | ||||||
| Growth in assets under management (rolling four-quarter average) | 17.9 | (1.2) | (8.1) | – | – | ||||||
1 Includes CHF 2.4 billion relating to the reclassification to assets under custody for our clients' assets that were impacted by the suspension and ongoing liquidation of the supply chain finance funds. | |||||||||||
Asset Management
Income before taxes of CHF 115 million decreased 30% compared to 1Q20, mainly driven by lower net revenues. Compared to 4Q20, income before taxes increased significantly as 4Q20 included the impairment of CHF 414 million from York.
Net revenues
Compared to 1Q20, net revenues of CHF 386 million decreased 13%, mainly driven by lower investment and partnership income, partially offset by higher performance and placement revenues and higher management fees. Investment and partnership income of CHF 29 million decreased significantly, reflecting a gain related to the completed transfer of the InvestLab fund platform of CHF 203 million in 1Q20. Performance and placement revenues of CHF 73 million increased significantly, primarily related to investment-related gains in 1Q21 compared to losses in 1Q20. Management fees of CHF 284 million increased 6%, mainly from higher average assets under management. Revenues in 1Q20 included unrealized losses of CHF 101 million across performance and placement revenues and investment and partnership income related to losses on seed money investments in our funds.
Compared to 4Q20, net revenues increased significantly, mainly driven by the impairment loss from York reflected in investment and partnership income in 4Q20. Performance and placement revenues decreased 37%, primarily driven by lower placement fees and the year-end performance fees in 4Q20, partially offset by higher investment-related gains. Management fees increased 6%, mainly reflecting higher average assets under management.
22
| Results – Asset Management | |||||||||||
| in / end of | % change | ||||||||||
| 1Q21 | 4Q20 | 1Q20 | QoQ | YoY | |||||||
| Statements of operations (CHF million) | |||||||||||
| Net revenues | 386 | (22) | 445 | – | (13) | ||||||
| Provision for credit losses | 0 | (6) | 0 | 100 | – | ||||||
| Compensation and benefits | 157 | 154 | 166 | 2 | (5) | ||||||
| General and administrative expenses | 86 | 105 | 94 | (18) | (9) | ||||||
| Commission expenses | 27 | 25 | 21 | 8 | 29 | ||||||
| Restructuring expenses | 1 | 5 | – | (80) | – | ||||||
| Total other operating expenses | 114 | 135 | 115 | (16) | (1) | ||||||
| Total operating expenses | 271 | 289 | 281 | (6) | (4) | ||||||
| Income/(loss) before taxes | 115 | (305) | 164 | – | (30) | ||||||
| Statement of operations metrics (%) | |||||||||||
| Cost/income ratio | 70.2 | – | 63.1 | – | – | ||||||
| Net revenue detail (CHF million) | |||||||||||
| Management fees | 284 | 269 | 269 | 6 | 6 | ||||||
| Performance and placement revenues | 73 | 115 | (33) | (37) | – | ||||||
| Investment and partnership income | 29 | (406) | 209 | – | (86) | ||||||
| Net revenues | 386 | (22) | 445 | – | (13) | ||||||
| of which recurring commissions and fees | 265 | 260 | 251 | 2 | 6 | ||||||
| of which transaction- and performance-based revenues | 97 | 172 | 77 | (44) | 26 | ||||||
| of which other revenues | 24 | (454) | 117 | – | (79) | ||||||
| Management fees include fees on assets under management, asset administration revenues and transaction fees related to the acquisition and disposal of investments in the funds being managed. Performance revenues relate to the performance or return of the funds being managed and includes investment-related gains and losses from proprietary funds. Placement revenues arise from our third-party private equity fundraising activities and secondary private equity market advisory services. Investment and partnership income includes equity participation income from seed capital returns and from minority investments in third-party asset managers, income from strategic partnerships and distribution agreements, and other revenues. | |||||||||||
Total operating expenses
Compared to 1Q20, total operating expenses of CHF 271 million decreased 4%, reflecting lower compensation and benefits and lower general and administrative expenses. Compensation and benefits of CHF 157 million decreased 5%, driven by lower discretionary compensation expenses, partially offset by higher salary expenses, mainly related to the sale of a private equity investment of a fund. General and administrative expenses of CHF 86 million decreased 9%, mainly driven by lower professional services fees.
Compared to 4Q20, total operating expenses decreased 6%, mainly reflecting lower general and administrative expenses, partially offset by higher compensation and benefits. General and administrative expenses decreased 18%, mainly driven by lower professional services fees. Compensation and benefits increased 2%, reflecting higher discretionary compensation expenses as 4Q20 included a release of discretionary compensation expenses and higher salary expenses, mainly related to the sale of a private equity investment of a fund, partially offset by lower allocated corporate function costs. 1Q21 included restructuring expenses of CHF 1 million compared to CHF 5 million in 4Q20.
As of the end of 1Q21, assets under management of CHF 458.0 billion were CHF 17.7 billion higher compared to the end of 4Q20, reflecting favorable foreign exchange-related movements, net new assets and favorable market movements, partially offset by structural effects. Net new assets of CHF 10.3 billion reflected inflows from traditional investments, emerging market joint ventures and alternative investments. Structural effects included CHF 7.9 billion related to the exit of our supply chain finance funds business.
23
| Assets under management – Asset Management | |||||||||||
| in / end of | % change | ||||||||||
| 1Q21 | 4Q20 | 1Q20 | QoQ | YoY | |||||||
| Assets under management (CHF billion) | |||||||||||
| Traditional investments | 291.7 | 285.8 | 241.7 | 2.1 | 20.7 | ||||||
| Alternative investments | 116.7 | 109.5 | 125.6 | 6.6 | (7.1) | ||||||
| Investments and partnerships | 49.6 | 45.0 | 42.3 | 10.2 | 17.3 | ||||||
| Assets under management | 458.0 | 440.3 | 409.6 | 4.0 | 11.8 | ||||||
| Average assets under management | 450.5 | 440.2 | 432.5 | 2.3 | 4.2 | ||||||
| Assets under management by currency (CHF billion) | |||||||||||
| USD | 126.7 | 120.8 | 113.7 | 4.9 | 11.4 | ||||||
| EUR | 57.3 | 57.5 | 48.6 | (0.3) | 17.9 | ||||||
| CHF | 219.9 | 213.5 | 203.7 | 3.0 | 8.0 | ||||||
| Other | 54.1 | 48.5 | 43.6 | 11.5 | 24.1 | ||||||
| Assets under management | 458.0 | 440.3 | 409.6 | 4.0 | 11.8 | ||||||
| Growth in assets under management (CHF billion) | |||||||||||
| Net new assets 1 | 10.3 | 6.3 | 0.1 | – | – | ||||||
| Other effects | 7.4 | (4.5) | (28.4) | – | – | ||||||
| of which market movements | 5.5 | 18.6 | (24.0) | – | – | ||||||
| of which foreign exchange | 12.2 | (5.3) | (4.4) | – | – | ||||||
| of which other | (10.3) | 2 | (17.8) | 3 | 0.0 | – | – | ||||
| Growth in assets under management | 17.7 | 1.8 | (28.3) | – | – | ||||||
| Growth in assets under management (annualized) (%) | |||||||||||
| Net new assets | 9.4 | 5.7 | 0.1 | – | – | ||||||
| Other effects | 6.7 | (4.1) | (26.0) | – | – | ||||||
| Growth in assets under management | 16.1 | 1.6 | (25.9) | – | – | ||||||
| Growth in assets under management (rolling four-quarter average) (%) | |||||||||||
| Net new assets | 6.3 | 3.5 | 5.5 | – | – | ||||||
| Other effects | 5.5 | (3.0) | (4.2) | – | – | ||||||
| Growth in assets under management (rolling four-quarter average) | 11.8 | 0.5 | 1.3 | – | – | ||||||
1 Includes outflows for private equity assets reflecting realizations at cost and unfunded commitments on which a fee is no longer earned. | |||||||||||
2 Includes CHF 7.9 billion relating to the exit of our supply chain finance funds business. | |||||||||||
3 Includes CHF 14.8 billion relating to the sale of Wincasa AG in 2012 following the conclusion in 4Q20 of a transition period regarding the related assets under management. | |||||||||||
24
In 1Q21, we reported income before taxes of CHF 524 million and net revenues of CHF 1,060 million. Income before taxes increased 140% compared to 1Q20 and increased 121% compared to 4Q20.
1Q21 results
In 1Q21, income before taxes of CHF 524 million increased 140% compared to 1Q20. Net revenues of CHF 1,060 million increased 27%, mainly driven by higher transaction-based revenues and an Allfunds Group equity investment revaluation gain of CHF 43 million compared to a gain of CHF 25 million related to the completed transfer of the InvestLab fund platform to Allfunds Group in 1Q20 reflected in other revenues, partially offset by lower net interest income. Provision for credit losses was CHF 27 million in 1Q21 compared to CHF 99 million in 1Q20. Total operating expenses of CHF 509 million decreased 2%, mainly due to lower compensation and benefits. Compared to 1Q20, our results were impacted by the weakening of the average rate of the US dollar against the Swiss franc, which adversely impacted revenues, but favorably impacted expenses.
Compared to 4Q20, income before taxes increased 121%. Net revenues increased 35%, primarily driven by higher transaction-based revenues, higher net interest income and higher recurring commissions and fees. Provision for credit losses was CHF 27 million compared to CHF 6 million in 4Q20. Total operating expenses decreased 6%, mainly due to lower compensation and benefits. Compared to 4Q20, our results were impacted by the strengthening of the average rate of the US dollar against the Swiss franc, which favorably impacted revenues, but adversely impacted expenses.
We continue to closely monitor the COVID-19 pandemic and its effects on our operations and businesses.
> Refer to “COVID-19 pandemic” in Credit Suisse – Other information for further information.
Capital and leverage metrics
As of the end of 1Q21, we reported RWA of CHF 30.0 billion, CHF 3.5 billion higher compared to the end of 4Q20, mainly reflecting the foreign exchange impact and movements in risk levels, primarily in credit risk, reflecting business growth. Leverage exposure of CHF 83.2 billion was CHF 8.9 billion higher compared to the end of 4Q20, mainly driven by the foreign exchange impact and business growth.
| Divisional results | |||||||||||
| in / end of | % change | ||||||||||
| 1Q21 | 4Q20 | 1Q20 | QoQ | YoY | |||||||
| Statements of operations (CHF million) | |||||||||||
| Net revenues | 1,060 | 784 | 835 | 35 | 27 | ||||||
| Provision for credit losses | 27 | 6 | 99 | 350 | (73) | ||||||
| Compensation and benefits | 314 | 341 | 320 | (8) | (2) | ||||||
| General and administrative expenses | 153 | 162 | 154 | (6) | (1) | ||||||
| Commission expenses | 41 | 36 | 44 | 14 | (7) | ||||||
| Restructuring expenses | 1 | 2 | – | (50) | – | ||||||
| Total other operating expenses | 195 | 200 | 198 | (3) | (2) | ||||||
| Total operating expenses | 509 | 541 | 518 | (6) | (2) | ||||||
| Income before taxes | 524 | 237 | 218 | 121 | 140 | ||||||
| Statement of operations metrics (%) | |||||||||||
| Return on regulatory capital | 56.3 | 27.0 | 21.7 | – | – | ||||||
| Cost/income ratio | 48.0 | 69.0 | 62.0 | – | – | ||||||
| Number of employees (full-time equivalents) | |||||||||||
| Number of employees | 6,950 | 6,890 | 6,970 | 1 | 0 | ||||||
25
| Divisional results (continued) | |||||||||||
| in / end of | % change | ||||||||||
| 1Q21 | 4Q20 | 1Q20 | QoQ | YoY | |||||||
| Net revenue detail (CHF million) | |||||||||||
| Net interest income | 260 | 241 | 312 | 8 | (17) | ||||||
| Recurring commissions and fees | 99 | 89 | 94 | 11 | 5 | ||||||
| Transaction-based revenues | 658 | 415 | 403 | 59 | 63 | ||||||
| Other revenues | 43 | 39 | 26 | 10 | 65 | ||||||
| Net revenues | 1,060 | 784 | 835 | 35 | 27 | ||||||
| Balance sheet statistics (CHF million) | |||||||||||
| Total assets | 74,878 | 67,356 | 74,453 | 11 | 1 | ||||||
| Net loans | 43,671 | 38,625 | 42,226 | 13 | 3 | ||||||
| Risk-weighted assets | 30,049 | 26,589 | 31,803 | 13 | (6) | ||||||
| Leverage exposure | 83,160 | 74,307 | 81,685 | 12 | 2 | ||||||
| Margins on assets under management (annualized) (bp) | |||||||||||
| Gross margin 1 | 184 | 141 | 156 | – | – | ||||||
| Net margin 2 | 91 | 43 | 41 | – | – | ||||||
| Number of relationship managers | |||||||||||
| Number of relationship managers | 630 | 600 | 620 | 5 | 2 | ||||||
| Net interest income includes a term spread credit on stable deposit funding and a term spread charge on loans. Recurring commissions and fees includes investment product management, discretionary mandate and other asset management-related fees, fees for general banking products and services and revenues from wealth structuring solutions. Transaction-based revenues arise primarily from brokerage and product issuing fees, fees from foreign exchange client transactions, trading and sales income including revenues from GTS, financing, underwriting and advisory fees, equity participations income and other transaction-based income. Financing revenues include unrealized mark-to-market movements on our fair valued portfolio. | |||||||||||
1 Net revenues divided by average assets under management. | |||||||||||
2 Income before taxes divided by average assets under management. | |||||||||||
| Reconciliation of adjustment items | |||||||
| Asia Pacific | |||||||
| in | 1Q21 | 4Q20 | 1Q20 | ||||
| Adjusted results excluding significant items (CHF million) | |||||||
| Net revenues | 1,060 | 784 | 835 | ||||
| Significant items | |||||||
| Gain related to InvestLab transfer | 0 | 0 | (25) | ||||
| Gain on equity investment in Allfunds Group | (43) | (38) | 0 | ||||
| Adjusted net revenues excluding significant items | 1,017 | 746 | 810 | ||||
| Provision for credit losses | 27 | 6 | 99 | ||||
| Total operating expenses | 509 | 541 | 518 | ||||
| Restructuring expenses | (1) | (2) | – | ||||
| Adjusted total operating expenses | 508 | 539 | 518 | ||||
| Income before taxes | 524 | 237 | 218 | ||||
| Adjusted income before taxes | 525 | 239 | 218 | ||||
| Adjusted income before taxes excluding significant items | 482 | 201 | 193 | ||||
| Adjusted return on regulatory capital (%) | 56.4 | 27.2 | 21.7 | ||||
| Adjusted return on regulatory capital excluding significant items (%) | 51.7 | 22.8 | 19.2 | ||||
| Adjusted results, adjusted results excluding significant items and adjusted results excluding significant items and the US-based hedge fund matter are non-GAAP financial measures. Refer to “Reconciliation of adjustment items” in Credit Suisse for further information. | |||||||
26
In 1Q21, income before taxes of CHF 524 million increased 140% compared to 1Q20, mainly reflecting higher net revenues and lower provision for credit losses. Compared to 4Q20, income before taxes increased 121%, reflecting higher net revenues and lower total operating expenses, partially offset by higher provision for credit losses.
Net revenues
Compared to 1Q20, net revenues of CHF 1,060 million increased 27%, mainly due to higher transaction-based revenues and the Allfunds Group equity investment revaluation gain of CHF 43 million compared to a gain of CHF 25 million related to the completed transfer of the InvestLab fund platform to Allfunds Group in 1Q20 reflected in other revenues, partially offset by lower net interest income. Transaction-based revenues increased 63% to CHF 658 million, primarily reflecting higher financing revenues, higher brokerage and product issuing fees, higher equity underwriting revenues, higher revenues from completed mergers and acquisitions (M&A) transactions and higher revenues from GTS. Financing revenues in 1Q21 mainly reflected lower unrealized mark-to-market losses, net of hedges, of CHF 5 million on our fair valued portfolio compared to mark-to-market losses, net of hedges, of CHF 175 million in 1Q20. Recurring commissions and fees increased 5% to CHF 99 million, mainly reflecting higher investment product management, discretionary mandates management and investment advisory fees, partially offset by lower banking services fees. Net interest income decreased 17% to CHF 260 million, mainly reflecting lower loan margins on lower average loan volumes and significantly lower deposit margins on higher average deposit volumes, partially offset by higher treasury revenues.
Compared to 4Q20, net revenues increased 35%, mainly due to higher transaction-based revenues, higher net interest income and higher recurring commissions and fees. Transaction-based revenues increased 59%, primarily reflecting higher revenues from GTS, higher client activity and higher revenues from completed M&A transactions, partially offset by lower financing revenues. Financing revenues in 1Q21 reflected the unrealized mark-to-market losses, net of hedges, on our fair valued portfolio compared to unrealized mark-to-market gains, net of hedges, of CHF 46 million in 4Q20. Net interest income increased 8%, mainly reflecting slightly lower loan margins on higher average loan volumes. Recurring commissions and fees increased 11%, mainly reflecting higher discretionary mandates management, security account and custody services and investment advisory fees. Other revenues in 1Q21 included an Allfunds Group equity investment revaluation of CHF 43 million compared to CHF 38 million in 4Q20.
Provision for credit losses
The loan portfolio primarily comprises lombard loans, which are mainly backed by listed securities, share-backed loans and secured and unsecured loans to corporates.
In 1Q21, we recorded provision for credit losses of CHF 27 million, compared to provision for credit losses of CHF 99 million in 1Q20 and CHF 6 million in 4Q20. The provision for credit losses in 1Q21 was primarily driven by an increase in CECL provisions and two individual cases.
Total operating expenses
Total operating expenses of CHF 509 million decreased 2% compared to 1Q20, primarily reflecting lower compensation and benefits and lower commission expenses. Compensation and benefits decreased 2% to CHF 314 million, reflecting lower deferred compensation expenses from prior-year awards, lower discretionary compensation expenses and lower employee benefits, partially offset by higher salary expenses. General and administrative expenses of CHF 153 million were stable, primarily due to higher IT machinery and equipment costs and higher advertising and marketing costs, offset by lower allocated corporate function costs and lower travel and entertainment expenses.
Compared to 4Q20, total operating expenses decreased 6%, primarily reflecting lower compensation and benefits and lower general and administrative expenses, partially offset by higher commission expenses. Compensation and benefits decreased 8%, mainly reflecting lower discretionary compensation expenses, partially offset by higher salary expenses. General and administrative expenses decreased 6%, mainly due to lower allocated corporate function costs.
Margins
Our gross margin was 184 basis points in 1Q21, 28 basis points higher compared to 1Q20, primarily due to higher transaction-based revenues, partially offset by a 8.0% increase in average assets under management and lower net interest income. Compared to 4Q20, our gross margin was 43 basis points higher, mainly reflecting higher transaction-based revenues, partially offset by a 4.1% increase in average assets under management.
> Refer to “Assets under management” for further information.
Our net margin was 91 basis points in 1Q21, 50 basis points higher compared to 1Q20, mainly reflecting higher net revenues and lower provision for credit losses, partially offset by the increase in average assets under management. Compared to 4Q20, our net margin was 48 basis points higher, mainly reflecting higher net revenues and lower total operating expenses.
As of the end of 1Q21, assets under management of CHF 241.9 billion were CHF 20.6 billion higher compared to the end of 4Q20, mainly reflecting favorable foreign exchange-related movements, net new assets and favorable market movements. Net new assets of CHF 5.0 billion primarily reflected inflows from Greater China.
27
| Assets under management | |||||||||||
| in / end of | % change | ||||||||||
| 1Q21 | 4Q20 | 1Q20 | QoQ | YoY | |||||||
| Assets under management (CHF billion) | |||||||||||
| Assets under management | 241.9 | 221.3 | 197.0 | 9.3 | 22.8 | ||||||
| Average assets under management | 231.0 | 221.8 | 213.8 | 4.1 | 8.0 | ||||||
| Assets under management by currency (CHF billion) | |||||||||||
| USD | 132.2 | 122.5 | 113.6 | 7.9 | 16.4 | ||||||
| EUR | 6.1 | 6.0 | 5.5 | 1.7 | 10.9 | ||||||
| CHF | 1.7 | 1.7 | 1.5 | 0.0 | 13.3 | ||||||
| Other | 101.9 | 91.1 | 76.4 | 11.9 | 33.4 | ||||||
| Assets under management | 241.9 | 221.3 | 197.0 | 9.3 | 22.8 | ||||||
| Growth in assets under management (CHF billion) | |||||||||||
| Net new assets | 5.0 | (1.1) | 3.0 | – | – | ||||||
| Other effects | 15.6 | 3.9 | (26.0) | – | – | ||||||
| of which market movements | 3.5 | 10.9 | (20.8) | – | – | ||||||
| of which foreign exchange | 13.2 | (6.9) | (5.2) | – | – | ||||||
| of which other | (1.1) | (0.1) | 0.0 | – | – | ||||||
| Growth in assets under management | 20.6 | 2.8 | (23.0) | – | – | ||||||
| Growth in assets under management (annualized) (%) | |||||||||||
| Net new assets | 9.0 | (2.0) | 5.5 | – | – | ||||||
| Other effects | 28.2 | 7.1 | (47.3) | – | – | ||||||
| Growth in assets under management (annualized) | 37.2 | 5.1 | (41.8) | – | – | ||||||
| Growth in assets under management (rolling four-quarter average) (%) | |||||||||||
| Net new assets | 5.4 | 3.9 | 3.7 | – | – | ||||||
| Other effects | 17.4 | (3.3) | (11.9) | – | – | ||||||
| Growth in assets under management (rolling four-quarter average) | 22.8 | 0.6 | (8.2) | – | – | ||||||
28
In 1Q21, we reported a loss before taxes of CHF 2,467 million, primarily due to a charge related to the failure of a US-based hedge fund. Net revenues of CHF 3,543 million increased 70% compared to 1Q20, reflecting more favorable market conditions and market share gains.
1Q21 results
In 1Q21, we reported a loss before taxes of CHF 2,467 million compared to income before taxes of CHF 83 million in 1Q20, driven by a charge of CHF 4,430 million in respect of the failure by a US-based hedge fund to meet its margin commitments. Net revenues of CHF 3,543 million increased 70%, reflecting broad-based growth across products and regions. We recorded provision for credit losses of CHF 4,350 million in 1Q21 compared to CHF 304 million in 1Q20, driven by the charge of CHF 4,430 million in respect of the failure by a US-based hedge fund to meet its margin commitments. Total operating expenses of CHF 1,660 million decreased 2% compared to 1Q20, as lower compensation and benefits were partially offset by higher general and administrative expenses.
Compared to 4Q20, net revenues increased 68%, reflecting higher revenues across all businesses and a seasonal increase in client activity. We recorded provision for credit losses of CHF 4,350 million in 1Q21 compared to CHF 38 million in 4Q20, driven by the charge of CHF 4,430 million in respect of the failure by a US-based hedge fund to meet its margin commitments. Total operating expenses decreased 7%, reflecting lower compensation and benefits, partially offset by higher commission expenses.
As previously disclosed, we have incurred a charge of CHF 4,430 million in 1Q21 in respect of the failure by a US-based hedge fund to meet its margin commitments on March 26, 2021. In light of this event, we are reviewing exposures across the entire prime services business and are planning to significantly re-size the prime brokerage and prime financing businesses with a primary focus on continuing to serve our most important franchise clients.
> Refer to “US-based hedge fund matter” in Credit Suisse – Other information for further information.
We continue to closely monitor the COVID-19 pandemic and its effects on our operations and businesses.
> Refer to “COVID-19 pandemic” in Credit Suisse – Other information for further information.
Capital and leverage metrics
As of the end of 1Q21, RWA were USD 99 billion, an increase of USD 10.4 billion compared to the end of 4Q20, mainly related to movements in risk levels, primarily in credit risk, reflecting increased business activity and market volatility. In addition, FINMA imposed a temporary add-on of USD 6.1 billion to our credit risk RWA in relation to our exposure in the US-based hedge fund matter included in movements in risk levels. Leverage exposure was USD 371 billion, an increase of USD 8.2 billion compared to the end of 4Q20, due to increased business activity and settlement fails.
| Divisional results | |||||||||||
| in / end of | % change | ||||||||||
| 1Q21 | 4Q20 | 1Q20 | QoQ | YoY | |||||||
| Statements of operations (CHF million) | |||||||||||
| Net revenues | 3,543 | 2,109 | 2,080 | 68 | 70 | ||||||
| Provision for credit losses | 4,350 | 38 | 304 | – | – | ||||||
| Compensation and benefits | 860 | 1,008 | 955 | (15) | (10) | ||||||
| General and administrative expenses | 629 | 623 | 577 | 1 | 9 | ||||||
| Commission expenses | 154 | 136 | 161 | 13 | (4) | ||||||
| Restructuring expenses | 17 | 14 | – | 21 | – | ||||||
| Total other operating expenses | 800 | 773 | 738 | 3 | 8 | ||||||
| Total operating expenses | 1,660 | 1,781 | 1,693 | (7) | (2) | ||||||
| Income/(loss) before taxes | (2,467) | 290 | 83 | – | – | ||||||
| Statement of operations metrics (%) | |||||||||||
| Return on regulatory capital | (69.2) | 8.8 | 2.3 | – | – | ||||||
| Cost/income ratio | 46.9 | 84.4 | 81.4 | – | – | ||||||
| Number of employees (full-time equivalents) | |||||||||||
| Number of employees | 17,750 | 17,560 | 17,100 | 1 | 4 | ||||||
29
| Divisional results (continued) | |||||||||||
| in / end of | % change | ||||||||||
| 1Q21 | 4Q20 | 1Q20 | QoQ | YoY | |||||||
| Net revenue detail (CHF million) | |||||||||||
| Fixed income sales and trading | 1,429 | 713 | 1,178 | 100 | 21 | ||||||
| Equity sales and trading | 897 | 498 | 777 | 80 | 15 | ||||||
| Capital markets | 1,088 | 760 | 61 | 43 | – | ||||||
| Advisory and other fees | 195 | 179 | 139 | 9 | 40 | ||||||
| Other revenues 1 | (66) | (41) | (75) | 61 | (12) | ||||||
| Net revenues | 3,543 | 2,109 | 2,080 | 68 | 70 | ||||||
| Balance sheet statistics (CHF million) | |||||||||||
| Total assets | 292,843 | 270,488 | 293,836 | 8 | 0 | ||||||
| Net loans | 23,219 | 23,359 | 34,450 | (1) | (33) | ||||||
| Risk-weighted assets | 92,974 | 77,872 | 97,255 | 19 | (4) | ||||||
| Risk-weighted assets (USD) | 98,800 | 88,423 | 100,904 | 12 | (2) | ||||||
| Leverage exposure | 348,982 | 319,339 | 362,870 | 9 | (4) | ||||||
| Leverage exposure (USD) | 370,853 | 362,607 | 376,490 | 2 | (1) | ||||||
1 Other revenues include treasury funding costs and changes in the carrying value of certain investments. | |||||||||||
| Reconciliation of adjustment items | |||||||
| Investment Bank | |||||||
| in | 1Q21 | 4Q20 | 1Q20 | ||||
| Adjusted results excluding the US-based hedge fund matter (CHF million) | |||||||
| Net revenues | 3,543 | 2,109 | 2,080 | ||||
| Provision for credit losses | 4,350 | 38 | 304 | ||||
| US-based hedge fund matter | (4,430) | 0 | 0 | ||||
| Provision for credit losses excluding the US-based hedge fund matter | (80) | 38 | 304 | ||||
| Total operating expenses | 1,660 | 1,781 | 1,693 | ||||
| Restructuring expenses | (17) | (14) | – | ||||
| Expenses related to real estate disposals | (32) | (21) | 4 | ||||
| Adjusted total operating expenses | 1,611 | 1,746 | 1,697 | ||||
| Income/(loss) before taxes | (2,467) | 290 | 83 | ||||
| Adjusted income/(loss) before taxes | (2,418) | 325 | 79 | ||||
| Adjusted income/(loss) before taxes excluding the US-based hedge fund matter | 2,012 | 325 | 79 | ||||
| Adjusted return on regulatory capital (%) | (67.8) | 9.9 | 2.2 | ||||
| Adjusted return on regulatory capital excluding the US-based hedge fund matter (%) | 59.5 | 9.9 | 2.2 | ||||
| Adjusted results, adjusted results excluding significant items and adjusted results excluding significant items and the US-based hedge fund matter are non-GAAP financial measures. Refer to “Reconciliation of adjustment items” in Credit Suisse for further information. | |||||||
| Global capital markets and advisory fees | |||||||||||
| in | % change | ||||||||||
| 1Q21 | 4Q20 | 1Q20 | QoQ | YoY | |||||||
| Global capital markets and advisory fees (USD million) | |||||||||||
| Debt capital markets | 463 | 365 | 338 | 27 | 37 | ||||||
| Equity capital markets | 590 | 421 | 106 | 40 | 457 | ||||||
| Total capital markets | 1,053 | 786 | 444 | 34 | 137 | ||||||
| Advisory and other fees | 262 | 243 | 184 | 8 | 42 | ||||||
| Global capital markets and advisory fees | 1,315 | 1,029 | 628 | 28 | 109 | ||||||
| The Group’s global capital markets and advisory business operates across the Investment Bank, Asia Pacific and Swiss Universal Bank. In order to reflect the global performance and capabilities of this business and for enhanced comparability versus its peers, the table above aggregates total capital markets and advisory fees for the Group into a single metric in US dollar terms. | |||||||||||
30
Fixed income sales and trading
In 1Q21, fixed income revenues of CHF 1,429 million increased 21% compared to 1Q20, reflecting significantly higher securitized products and emerging markets revenues, partially offset by lower macro and global credit products revenues. Market conditions were characterized by continued demand for yield products amid a low interest rate environment. Securitized products revenues increased significantly, driven by broad based growth across non-agency and agency trading and higher asset finance client activity. Emerging markets revenues increased, driven by higher trading in Asia and increased financing activity in Latin America. This was partially offset by lower macro products revenues compared to a strong prior year, driven by lower revenues in our rates and foreign exchange businesses. In addition, global credit products revenues decreased compared to a strong prior year, mainly reflecting lower investment grade trading revenues, partially offset by higher leveraged finance trading activity.
Compared to 4Q20, revenues increased 100%, reflecting a seasonal increase in client activity. Securitized products revenues increased, driven by significantly higher non-agency and agency trading activity and higher asset finance revenues. Macro revenues increased, driven by higher client activity in our rates and foreign exchange businesses. Global credit products revenues increased, reflecting higher leveraged finance and investment grade trading activity due to favorable market conditions including tightened US high yield credit spreads and increased issuance activity. In addition, emerging markets revenues increased, reflecting higher client activity in trading and structured credit, particularly in Asia, partially offset by reduced financing activity.
Equity sales and trading
In 1Q21, equity sales and trading revenues of CHF 897 million increased 15% compared to 1Q20, reflecting higher equity derivatives and cash equities trading activity, partially offset by lower prime services revenues. Equity derivatives revenues increased, driven by significantly higher structured equity derivatives trading activity, reflecting higher volumes, particularly in Asia. In addition, cash equities revenues increased, due to higher secondary trading volumes with particular strength in Asia. This was partially offset by reduced prime services revenues, reflecting lower listed derivatives and reduced client financing, particularly in Asia, partially offset by prime brokerage activity.
Compared to 4Q20, revenues increased 80%, reflecting higher equity derivatives, prime services and cash equities revenues driven by a seasonal increase in client activity. Equity derivatives revenues increased, driven by higher client activity across most products with particular strength in structured equity derivatives. Prime services revenues increased, primarily due to higher client financing activity. In addition, cash equities revenues increased, driven by higher secondary trading volumes in Asia and the US.
Capital markets
In 1Q21, capital markets revenues of CHF 1,088 million increased significantly compared to 1Q20, reflecting strong client activity across debt and equity capital markets, driven by increased issuance activity. Debt capital markets revenues increased significantly compared to a subdued prior year, which included unrealized mark-to-market losses of CHF 284 in our leveraged finance business; this increase reflected higher leveraged finance and investment grade issuance activity due to favorable market conditions, including a continued low interest rate environment. In addition, equity capital markets revenues increased significantly, driven by higher initial public offering (IPO) and follow-on issuance activity.
Compared to 4Q20, revenues increased 43%, driven by higher client activity across debt and equity capital markets. Debt capital markets increased, primarily due to higher leveraged finance and investment grade issuance activity. Equity capital markets revenues increased, driven by higher IPO issuance activity.
Advisory and other fees
In 1Q21, advisory revenues of CHF 195 million increased 40% compared to 1Q20, driven by higher revenues from completed M&A transactions.
Compared to 4Q20, revenues increased 9%, driven by higher revenues from completed M&A transactions.
Provision for credit losses
In 1Q21, we recorded provision for credit losses of CHF 4,350 million, compared to provision for credit losses of CHF 304 million in 1Q20 and provision for credit losses of CHF 38 million in 4Q20. The provision for credit losses in 1Q21 was driven by a charge of CHF 4,430 million, or USD 4,707 million, in respect of the failure by a US-based hedge fund to meet its margin commitments.
Total operating expenses
In 1Q21, total operating expenses of CHF 1,660 million decreased 2% compared to 1Q20, as lower compensation and benefits were partially offset by higher general and administrative expenses. Compensation and benefits of CHF 860 million decreased 10%, primarily due to decreased discretionary compensation expenses. General and administrative expenses of CHF 629 million increased 9%, driven by higher revenue-related costs from capital markets transactions and increased expenses related to real estate disposals, partially offset by lower travel and entertainment costs. In 1Q21, we incurred restructuring expenses of CHF 17 million.
Compared to 4Q20, total operating expenses decreased 7%, reflecting lower compensation and benefits, partially offset by higher commission expenses. Compensation and benefits decreased 15%, reflecting reduced discretionary compensation expenses. General and administrative expenses were stable, as lower UK bank levy expenses were offset by higher allocated corporate function costs and increased expenses related to real estate disposals.
31
In 1Q21, we reported a loss before taxes of CHF 2 million compared to losses of CHF 140 million in 1Q20 and CHF 1,090 million in 4Q20.
Corporate Center includes parent company operations such as Group financing, expenses for projects sponsored by the Group, including costs associated with the evolution of our legal entity structure to meet developing and future regulatory requirements, and certain other expenses and revenues that have not been allocated to the segments. Corporate Center further includes consolidation and elimination adjustments required to eliminate intercompany revenues and expenses.
Treasury results include the impact of volatility in the valuations of certain central funding transactions such as structured notes issuances and swap transactions. Treasury results also include additional interest charges from transfer pricing to align funding costs to assets held in the Corporate Center and legacy funding costs.
The Asset Resolution Unit is separately presented within our Corporate Center disclosures, including related asset funding costs. Certain activities not linked to the underlying portfolio, such as legacy funding costs, legacy litigation provisions, a specific client compliance function and noncontrolling interests without significant economic interest are recorded in the Corporate Center and are not reflected in the Asset Resolution Unit.
Other revenues primarily include required elimination adjustments associated with trading in own shares, treasury commissions charged to divisions, the cost of certain hedging transactions executed in connection with the Group’s RWA and valuation hedging impacts from long-dated legacy deferred compensation and retirement programs mainly relating to former employees.
Compensation and benefits include fair value adjustments on certain deferred compensation plans not allocated to the segments and fair value adjustments on certain other long-dated legacy deferred compensation and retirement programs mainly relating to former employees.
| Corporate Center results | |||||||||||
| in / end of | % change | ||||||||||
| 1Q21 | 4Q20 | 1Q20 | QoQ | YoY | |||||||
| Statements of operations (CHF million) | |||||||||||
| Treasury results | 104 | (32) | (43) | – | – | ||||||
| Asset Resolution Unit | (33) | (50) | (57) | (34) | (42) | ||||||
| Other | 78 | 65 | 30 | 20 | 160 | ||||||
| Net revenues | 149 | (17) | (70) | – | – | ||||||
| Provision for credit losses | (9) | 3 | 2 | – | – | ||||||
| Compensation and benefits | 39 | 140 | (52) | (72) | – | ||||||
| General and administrative expenses | 105 | 908 | 95 | (88) | 11 | ||||||
| Commission expenses | 19 | 17 | 25 | 12 | (24) | ||||||
| Restructuring expenses | (3) | 5 | – | – | – | ||||||
| Total other operating expenses | 121 | 930 | 120 | (87) | 1 | ||||||
| Total operating expenses | 160 | 1,070 | 68 | (85) | 135 | ||||||
| Income/(loss) before taxes | (2) | (1,090) | (140) | (100) | (99) | ||||||
| of which Asset Resolution Unit | (68) | (100) | (94) | (32) | (28) | ||||||
| Balance sheet statistics (CHF million) | |||||||||||
| Total assets | 120,344 | 111,307 | 117,531 | 8 | 2 | ||||||
| Risk-weighted assets | 49,848 | 46,335 | 43,550 | 8 | 14 | ||||||
| Leverage exposure | 121,771 | 6,686 | 36,095 | – | 237 | ||||||
| As of the end of 4Q20 leverage exposure excludes CHF 110,677 million of central bank reserves, after adjusting for the dividend paid in 2020. | |||||||||||
32
| Reconciliation of adjustment items | |||||||
| Corporate Center | |||||||
| in | 1Q21 | 4Q20 | 1Q20 | ||||
| Adjusted results (CHF million) | |||||||
| Net revenues | 149 | (17) | (70) | ||||
| Provision for credit losses | (9) | 3 | 2 | ||||
| Total operating expenses | 160 | 1,070 | 68 | ||||
| Restructuring expenses | 3 | (5) | – | ||||
| Major litigation provisions | (15) | (712) | (17) | ||||
| Adjusted total operating expenses | 148 | 353 | 51 | ||||
| Income/(loss) before taxes | (2) | (1,090) | (140) | ||||
| Adjusted income/(loss) before taxes | 10 | (373) | (123) | ||||
| Adjusted results, adjusted results excluding significant items and adjusted results excluding significant items and the US-based hedge fund matter are non-GAAP financial measures. Refer to “Reconciliation of adjustment items” in Credit Suisse for further information. | |||||||
1Q21 results
In 1Q21, we reported a loss before taxes of CHF 2 million compared to losses of CHF 140 million in 1Q20 and CHF 1,090 million in 4Q20. Net revenues of CHF 149 million in 1Q21 were primarily driven by positive treasury results, partially offset by negative net revenues related to the Asset Resolution Unit. Total operating expenses of CHF 160 million increased 135% compared to 1Q20, mainly reflecting higher compensation and benefits. Compared to 4Q20, total operating expenses decreased 85%, mainly driven by lower general and administrative expenses, primarily reflecting increased legacy litigation provisions of CHF 737 million in 4Q20, mainly in connection with mortgage-related matters, and lower compensation and benefits.
Capital and leverage metrics
As of the end of 1Q21, we reported RWA of CHF 49.8 billion, an increase of CHF 3.5 billion compared to the end of 4Q20, primarily driven by the foreign exchange impact. Leverage exposure was CHF 121.8 billion as of the end of 1Q21, an increase of CHF 115.1 billion compared to the end of 4Q20, primarily reflecting the expiration on January 1, 2021 of the temporary exclusion of central bank reserves from leverage exposure as permitted by FINMA in 2020.
Net revenues
In 1Q21, we reported net revenues of CHF 149 million compared to negative net revenues of CHF 70 million in 1Q20 and CHF 17 million in 4Q20.
Positive treasury results of CHF 104 million in 1Q21 primarily reflected gains of CHF 70 million with respect to structured notes volatility and gains of CHF 52 million relating to hedging volatility, partially offset by negative revenues of CHF 11 million relating to funding activities, excluding Asset Resolution Unit-related asset funding costs. In 1Q20, negative treasury results of CHF 43 million reflected losses of CHF 279 million with respect to structured notes volatility, primarily relating to own credit spread movements, mainly in March, amid continued market volatility surrounding COVID-19 and central bank stimulus announcements, and negative revenues of CHF 22 million relating to funding activities, excluding Asset Resolution Unit-related asset funding costs. Negative revenues and losses in 1Q20 were partially offset by gains of CHF 179 million on fair-valued money market instruments and gains of CHF 94 million relating to fair value option volatility on own debt. In 4Q20, negative treasury results of CHF 32 million primarily reflected negative revenues of CHF 41 million relating to funding activities, excluding Asset Resolution Unit-related asset funding costs, losses of CHF 7 million on fair-valued money market instruments and losses of CHF 7 million relating to hedging volatility. Negative revenues and losses in 4Q20 were partially offset by gains of CHF 22 million with respect to structured notes volatility.
In the Asset Resolution Unit, we reported negative net revenues of CHF 33 million in 1Q21 compared to CHF 57 million in 1Q20 and CHF 50 million in 4Q20. Compared to 1Q20 and 4Q20, the improvement was mainly driven by revenues from portfolio assets.
In 1Q21, other revenues of CHF 78 million increased CHF 48 million compared to 1Q20, mainly reflecting the positive valuation impact from long-dated legacy deferred compensation and retirement programs, partially offset by lower elimination of losses from trading in own shares. Compared to 4Q20, other revenues increased CHF 13 million, mainly reflecting the elimination of losses from trading in own shares compared to the elimination of gains in 4Q20, partially offset by the negative valuation impact from long-dated legacy deferred compensation and retirement programs.
Provision for credit losses
In 1Q21, we recorded a release of provision for credit losses of CHF 9 million compared to provision for credit losses of CHF 2 million in 1Q20 and CHF 3 million in 4Q20.
33
Total operating expenses
Total operating expenses of CHF 160 million increased CHF 92 million compared to 1Q20, mainly reflecting an increase in compensation and benefits. Compensation and benefits increased CHF 91 million, mainly driven by higher deferred compensation expenses from prior-year awards and higher expenses for long-dated legacy deferred compensation and retirement programs, partially offset by lower discretionary compensation expenses. General and administrative expenses increased CHF 10 million, primarily reflecting higher discretionary compensation expenses and higher expenses related to legacy litigation provisions, partially offset by the impact of corporate function allocations.
Compared to 4Q20, total operating expenses decreased CHF 910 million, mainly reflecting decreases in general and administrative expenses and compensation and benefits. General and administrative expenses decreased CHF 803 million, primarily reflecting the increased legacy litigation provisions of CHF 737 million in 4Q20. Compensation and benefits decreased CHF 101 million, primarily reflecting lower discretionary compensation expenses, lower deferred compensation expenses from prior-year awards and lower expenses for long-dated legacy deferred compensation and retirement programs, partially offset by the impact of corporate function allocations.
| Expense allocation to divisions | |||||||||||
| in | % change | ||||||||||
| 1Q21 | 4Q20 | 1Q20 | QoQ | YoY | |||||||
| Expense allocation to divisions (CHF million) | |||||||||||
| Compensation and benefits | 751 | 911 | 693 | (18) | 8 | ||||||
| General and administrative expenses | 590 | 1,347 | 540 | (56) | 9 | ||||||
| Commission expenses | 19 | 17 | 25 | 12 | (24) | ||||||
| Restructuring expenses | 15 | 21 | – | (29) | – | ||||||
| Total other operating expenses | 624 | 1,385 | 565 | (55) | 10 | ||||||
| Total operating expenses before allocation to divisions | 1,375 | 2,296 | 1,258 | (40) | 9 | ||||||
| Net allocation to divisions | 1,215 | 1,226 | 1,190 | (1) | 2 | ||||||
| of which Swiss Universal Bank | 252 | 259 | 261 | (3) | (3) | ||||||
| of which International Wealth Management | 243 | 250 | 241 | (3) | 1 | ||||||
| of which Asia Pacific | 166 | 166 | 170 | 0 | (2) | ||||||
| of which Investment Bank | 554 | 551 | 518 | 1 | 7 | ||||||
| Total operating expenses | 160 | 1,070 | 68 | (85) | 135 | ||||||
| Corporate services and business support, including in finance, operations, human resources, legal, compliance, risk management and IT, are provided by corporate functions, and the related costs are allocated to the segments and the Corporate Center based on their requirements and other relevant measures. | |||||||||||
| Asset Resolution Unit | |||||||||||
| in / end of | % change | ||||||||||
| 1Q21 | 4Q20 | 1Q20 | QoQ | YoY | |||||||
| Statements of operations (CHF million) | |||||||||||
| Revenues from portfolio assets | 14 | (1) | (6) | – | – | ||||||
| Asset funding costs | (47) | (49) | (51) | (4) | (8) | ||||||
| Net revenues | (33) | (50) | (57) | (34) | (42) | ||||||
| Provision for credit losses | (1) | 0 | 0 | – | – | ||||||
| Compensation and benefits | 19 | 24 | 24 | (21) | (21) | ||||||
| General and administrative expenses | 15 | 25 | 12 | (40) | 25 | ||||||
| Commission expenses | 2 | 1 | 1 | 100 | 100 | ||||||
| Total other operating expenses | 17 | 26 | 13 | (35) | 31 | ||||||
| Total operating expenses | 36 | 50 | 37 | (28) | (3) | ||||||
| Income/(loss) before taxes | (68) | (100) | (94) | (32) | (28) | ||||||
| Balance sheet statistics (CHF million) | |||||||||||
| Total assets | 12,080 | 12,560 | 14,320 | (4) | (16) | ||||||
| Risk-weighted assets (USD) 1 | 8,502 | 9,930 | 9,313 | (14) | (9) | ||||||
| Leverage exposure (USD) | 18,452 | 20,532 | 21,744 | (10) | (15) | ||||||
1 Risk-weighted assets excluding operational risk were USD 7,523 million, USD 8,963 million and USD 7,640 million as of the end of 1Q21, 4Q20 and 1Q20, respectively. | |||||||||||
34
As of the end of 1Q21 assets under management were CHF 1,596.0 billion, 5.6% higher compared to the end of 4Q20 with net new assets of CHF 28.4 billion in 1Q21.
| Assets under management and net new assets | |||||||||||
| end of | % change | ||||||||||
| 1Q21 | 4Q20 | 1Q20 | QoQ | YoY | |||||||
| Assets under management (CHF billion) | |||||||||||
| Swiss Universal Bank - Private Clients | 213.1 | 208.6 | 194.8 | 2.2 | 9.4 | ||||||
| Swiss Universal Bank - Corporate & Institutional Clients | 487.0 | 462.6 | 405.3 | 5.3 | 20.2 | ||||||
| International Wealth Management - Private Banking | 386.2 | 365.4 | 327.7 | 5.7 | 17.9 | ||||||
| International Wealth Management - Asset Management | 458.0 | 440.3 | 409.6 | 4.0 | 11.8 | ||||||
| Asia Pacific | 241.9 | 221.3 | 197.0 | 9.3 | 22.8 | ||||||
| Assets managed across businesses 1 | (190.2) | (186.3) | (163.9) | 2.1 | 16.0 | ||||||
| Assets under management | 1,596.0 | 1,511.9 | 1,370.5 | 5.6 | 16.5 | ||||||
| of which discretionary assets | 506.5 | 483.0 | 450.1 | 4.9 | 12.5 | ||||||
| of which advisory assets | 1,089.5 | 1,028.9 | 920.4 | 5.9 | 18.4 | ||||||
| in | 1Q21 | 4Q20 | 1Q20 | ||||
| Net new assets (CHF billion) | |||||||
| Swiss Universal Bank – Private Clients | 2.2 | (2.1) | (4.2) | ||||
| Swiss Universal Bank – Corporate & Institutional Clients | 3.9 | 3.8 | 4.8 | ||||
| International Wealth Managment – Private Banking | 7.2 | 4.3 | 3.7 | ||||
| International Wealth Managment – Asset Management 2 | 10.3 | 6.3 | 0.1 | ||||
| Asia Pacific | 5.0 | (1.1) | 3.0 | ||||
| Assets managed across businesses 1 | (0.2) | (2.8) | (1.6) | ||||
| Net new assets | 28.4 | 8.4 | 5.8 | ||||
1 Represents assets managed by Asset Management within International Wealth Management for the other businesses. | |||||||
2 Includes outflows for private equity assets reflecting realizations at cost and unfunded commitments on which a fee is no longer earned. | |||||||
1Q21 results
As of the end of 1Q21, assets under management of CHF 1,596.0 billion increased CHF 84.1 billion compared to the end of 4Q20. The increase was driven by favorable foreign exchange-related movements, net new assets of CHF 28.4 billion and by favorable market movements, partially offset by structural effects. Structural effects included CHF 11.2 billion related to the exit of our supply chain finance funds business in Asset Management of CHF 7.9 billion and CHF 3.3 billion related to the reclassification to assets under custody for our clients’ assets that were impacted by the suspension and ongoing liquidation of these funds.
Net new assets of CHF 28.4 billion in 1Q21 mainly reflected inflows across the following businesses. Net new assets of CHF 10.3 billion in the Asset Management business of International Wealth Management reflected inflows from traditional investments, emerging market joint ventures and alternative investments. Net new assets of CHF 7.2 billion in the Private Banking business of International Wealth Management reflected inflows from both emerging markets and Western Europe. Net new assets of CHF 5.0 billion in Asia Pacific primarily reflected inflows from Greater China. Net new assets of CHF 3.9 billion in the Corporate & Institutional Clients business of Swiss Universal Bank mainly reflected inflows from the pension business. Net new asset of CHF 2.2 billion in the Private Clients business of Swiss Universal Bank reflected positive contributions from all businesses.
> Refer to “Swiss Universal Bank”, “International Wealth Management” and “Asia Pacific” for further information.
> Refer to “Note 39 – Assets under management” in VI – Consolidated financial statements – Credit Suisse Group in the Credit Suisse Annual Report 2020 for further information.
35
Balance sheet
As of the end of 1Q21, total assets of CHF 851.4 billion increased 6% compared to 4Q20, reflecting a positive foreign exchange translation impact and higher operating activities. Excluding the foreign exchange translation impact, total assets increased CHF 11.3 billion.
Total shareholders’ equity
Credit Suisse’s total shareholders’ equity was CHF 44.6 billion as of the end of 1Q21 compared to CHF 42.7 billion as of the end of 4Q20. Total shareholders’ equity was positively impacted by foreign exchange-related movements on cumulative translation adjustments, gains on fair value elected liabilities relating to credit risk and an increase in the share-based compensation obligation, partially offset by transactions relating to the settlement of share-based compensation awards, the re-purchase of shares under the share buyback program and a net loss attributable to shareholders.
Liquidity coverage ratio
Our average liquidity coverage ratio was 205% as of the end of 1Q21, an increase compared to the end of 4Q20. The ratio reflects a conservative liquidity position, including ensuring that the Group’s branches and subsidiaries meet applicable local liquidity requirements and taking a prudent approach to liquidity management during the COVID-19 pandemic.
Capital metrics
The CET1 ratio was 12.2% as of the end of 1Q21 compared to 12.9% as of the end of 4Q20. Credit Suisse’s tier 1 ratio was 17.6% as of the end of 1Q21 compared to 18.6% as of the end of 4Q20. The total capital ratio was 18.0% as of the end of 1Q21 compared to 19.0% as of the end of 4Q20.
CET1 capital was CHF 37.0 billion as of the end of 1Q21, a 5% increase compared to CHF 35.4 billion as of the end of 4Q20, mainly reflecting a positive foreign exchange impact and the reversal of a dividend accrual, partially offset by the repurchase of shares under the share buyback program and the net loss attributable to shareholders equity. Total eligible capital was CHF 54.4 billion as of the end of 1Q21, a 4% increase compared to CHF 52.2 billion as of the end of 4Q20, mainly reflecting higher CET1 capital.
RWA was CHF 302.9 billion as of the end of 1Q21, a 10% increase compared to CHF 275.1 billion as of the end of 4Q20. The increase in RWA was mainly related to the foreign exchange impact and movements in risk levels, primarily reflecting business growth. In addition, FINMA imposed a temporary add-on of CHF 5.8 billion (USD 6.1 billion) to our credit risk RWA in relation to our exposure in the US-based hedge fund matter, which was included in movements in risk levels in the Investment Bank.
As a consequence of the provisions for mortgage-related matters recorded in 4Q20 and the settlement with MBIA Insurance Corp, additional RWA relating to operational risk of CHF 6.5 billion are expected to be recognized in 2Q21.
Leverage metrics
The BIS tier 1 leverage ratio was 5.5% as of the end of 1Q21, with a BIS CET1 component of 3.8%.
The leverage exposure was CHF 967.8 billion as of the end of 1Q21, a 21% increase compared to CHF 799.9 billion as of the end of 4Q20. The increase in leverage exposure was mainly due to the expiration on January 1, 2021 of the temporary exclusion of central bank reserves from leverage exposure as permitted by FINMA in response to the COVID-19 pandemic. The movement in leverage exposure was also partially impacted by an increase in the consolidated balance sheet due to the positive foreign exchange impact and higher operating activities. For 4Q20, the leverage exposure excluded CHF 110.7 billion of cash held at central banks, after adjusting for the dividend paid in 2020.
| BIS capital and leverage metrics | |||||
| end of | 1Q21 | 4Q20 | |||
| Capital metrics | |||||
| Risk-weighted assets (CHF billion) | 302.9 | 275.1 | |||
| CET1 ratio (%) | 12.2 | 12.9 | |||
| Tier 1 ratio (%) | 17.6 | 18.6 | |||
| Total capital ratio (%) | 18.0 | 19.0 | |||
| Leverage metrics | |||||
| Leverage exposure (CHF billion) | 967.8 | 799.9 | |||
| CET1 leverage ratio (%) | 3.8 | 4.4 | |||
| Tier 1 leverage ratio (%) | 5.5 | 6.4 | |||
| Refer to the Appendix for additional information on BIS and Swiss capital and leverage metrics. | |||||
36
The Group has not finalized its 1Q21 Financial Report and the Group’s independent registered public accounting firm has not completed its review of the condensed consolidated financial statements (unaudited) for the period. Accordingly, the financial information contained in this Earnings Release is subject to completion of quarter-end procedures, which may result in changes to that information. Certain reclassifications have been made to prior periods to conform to the current presentation.
For purposes of this Earnings Release, unless the context otherwise requires, the terms “Credit Suisse”, “the Group”, “we”, “us” and “our” mean Credit Suisse Group AG and its consolidated subsidiaries. The business of Credit Suisse AG, the direct bank subsidiary of the Group, is substantially similar to the Group, and these terms are used to refer to both when the subject is the same or substantially similar. The term “the Bank” is used when referring to Credit Suisse AG and its consolidated subsidiaries.
Information referenced in this Earnings Release, whether via website links or otherwise, is not incorporated into this Earnings Release.
Credit Suisse is subject to the Basel III framework, as implemented in Switzerland, as well as Swiss legislation and regulations for systemically important banks (Swiss Requirements) (in each case, subject to certain phase-in periods), which include capital, liquidity, leverage and large exposure requirements and rules for emergency plans designed to maintain systemically relevant functions in the event of threatened insolvency. Credit Suisse adopted the BIS leverage ratio framework, as issued by the Basel Committee on Banking Supervision and implemented in Switzerland by FINMA.
References to phase-in and look-through included herein refer to Basel III requirements and Swiss Requirements. Phase-in reflects that for the years 2013 – 2022, there is a phase-out of certain capital instruments. Look-through assumes the full phase-out of certain capital instruments.
Unless otherwise noted, leverage exposure is based on the BIS leverage ratio framework and consists of period-end balance sheet assets and prescribed regulatory adjustments. The tier 1 leverage ratio and CET1 leverage ratio are calculated as BIS tier 1 capital and CET1 capital, respectively, divided by period-end leverage exposure. Swiss leverage ratios are measured on the same period-end basis as the leverage exposure for the BIS leverage ratio.
Prior to 3Q20, regulatory capital was calculated as the worst of 10% of RWA and 3.5% of leverage exposure and return on regulatory capital (a non-GAAP financial measure) was calculated using income/(loss) after tax and assumed a tax rate of 30%. In 3Q20, we updated our calculation approach, following which regulatory capital is calculated as the average of 10% of RWA and 3.5% of leverage exposure and return on regulatory capital, a non-GAAP financial measure, is calculated using income/(loss) after tax and assumes a tax rate of 30% for periods prior to 2020 and 25% from 2020 onwards. For periods in 2020, for purposes of calculating Group return on regulatory capital, leverage exposure excludes cash held at central banks, after adjusting for the dividend paid in 2020. For the Investment Bank division, return on regulatory capital is based on US dollar denominated numbers. Adjusted return on regulatory capital is calculated using adjusted results, applying the same methodology used to calculate return on regulatory capital.
We may not achieve all of the expected benefits of our strategic initiatives. Factors beyond our control, including but not limited to the market and economic conditions (including macroeconomic and other challenges and uncertainties, for example, resulting from the COVID-19 pandemic), changes in laws, rules or regulations and other challenges discussed in our public filings, could limit our ability to achieve some or all of the expected benefits of these initiatives.
The Group’s estimate of the aggregate range of reasonably possible losses that are not covered by existing provisions which is discussed above relates only to those proceedings for which the Group believes an estimate is possible and which are discussed in the litigation note to the Consolidated Financial Statements in the Group’s Annual Report on Form 20-F and updated in its quarterly reports (including the Group’s 1Q21 Financial Report that is scheduled to be released on May 6, 2021). It is inherently difficult to determine whether a loss is probable or even reasonably possible or to estimate the amount of any loss or loss range for many of the Group’s legal proceedings. The Group’s aggregate litigation provisions include estimates of losses, additional losses or ranges of loss for proceedings for which such losses are probable and can be reasonably estimated. The Group does not believe that it can estimate an aggregate range of reasonably possible losses for certain of its proceedings because of their complexity, the novelty of some of the claims, the early stage of the proceedings, the limited amount of discovery that has occurred and/or other factors. For additional details, see the litigation note to the Consolidated Financial Statements in the Group’s Annual Report on Form 20-F and in each of its quarterly Financial Reports.
Investors and others should note that we announce important company information (including quarterly earnings releases and financial reports as well as our annual sustainability report) to the investing public using press releases, SEC and Swiss ad hoc filings, our website and public conference calls and webcasts. We also routinely use our Twitter account @creditsuisse (https://twitter.com/creditsuisse), our LinkedIn account (https://www.linkedin.com/company/credit-suisse/), our Instagram accounts (https://www.instagram.com/creditsuisse_careers/ and https://www.instagram.com/creditsuisse_ch/), our Facebook account (https://www.facebook.com/creditsuisse/) and other social media channels as additional means to disclose public information, including to excerpt key messages from our public disclosures, including earnings releases. We may share or retweet such messages through certain of our regional accounts, including through Twitter at @csschweiz (https://twitter.com/csschweiz) and @csapac (https://twitter.com/csapac). Investors and others should take care to consider such abbreviated messages in the context of the disclosures from which they are excerpted. The information we post on these social media accounts is not a part of this Earnings Release.
Credit Suisse Group AG shares are listed on the SIX stock exchange under the ticker symbol CSGN and – in the form of American Depositary Shares, as evidenced by American Depositary Receipts – on the New York Stock Exchange under the ticker symbol CS.
In various tables, use of “–” indicates not meaningful or not applicable.
These materials are not an offer to sell securities or the solicitation of any offer to buy securities, nor shall there be any offer of securities, in any jurisdiction in which such offer or sale would be unlawful.
These materials are not an offer of securities for sale in the United States or to U.S. persons (“U.S. persons”) as defined in Regulation S under the U.S. Securities Act of 1933, as amended (the “U.S. Securities Act”). The mandatory convertible notes described in these materials and the shares of Credit Suisse Group AG issuable on their conversion have not been and will not be registered under the U.S. Securities Act and may not be offered or sold in the United States or to, or for the account or benefit of, U.S. persons, absent registration or an applicable exemption from registration under the U.S. Securities Act.
37
| BIS capital metrics – Group | |||||||
| % change | |||||||
| end of | 1Q21 | 4Q20 | QoQ | ||||
| Capital and risk-weighted assets (CHF million) | |||||||
| CET1 capital | 36,964 | 35,361 | 5 | ||||
| Tier 1 capital | 53,411 | 51,202 | 4 | ||||
| Total eligible capital | 54,429 | 52,163 | 4 | ||||
| Risk-weighted assets | 302,869 | 275,084 | 10 | ||||
| Capital ratios (%) | |||||||
| CET1 ratio | 12.2 | 12.9 | – | ||||
| Tier 1 ratio | 17.6 | 18.6 | – | ||||
| Total capital ratio | 18.0 | 19.0 | – | ||||
| Eligible capital – Group | |||||||
| % change | |||||||
| end of | 1Q21 | 4Q20 | QoQ | ||||
| Eligible capital (CHF million) | |||||||
| Total shareholders' equity | 44,590 | 42,677 | 4 | ||||
| Adjustments | |||||||
| Regulatory adjustments 1 | 332 | (342) | – | ||||
| Goodwill 2 | (4,898) | (4,681) | 5 | ||||
| Other intangible assets 2 | (272) | (271) | 0 | ||||
| Deferred tax assets that rely on future profitability | (1,011) | (1,070) | (6) | ||||
| Shortfall of provisions to expected losses | (192) | (176) | 9 | ||||
| (Gains)/losses due to changes in own credit on fair-valued liabilities | 2,040 | 2,466 | (17) | ||||
| Defined benefit pension assets 2 | (2,405) | (2,249) | 7 | ||||
| Investments in own shares | (603) | (397) | 52 | ||||
| Other adjustments 3 | (617) | (596) | 4 | ||||
| Total adjustments | (7,626) | (7,316) | 4 | ||||
| CET1 capital | 36,964 | 35,361 | 5 | ||||
| High-trigger capital instruments (7% trigger) | 11,778 | 11,410 | 3 | ||||
| Low-trigger capital instruments (5.125% trigger) | 4,669 | 4,431 | 5 | ||||
| Additional tier 1 capital | 16,447 | 15,841 | 4 | ||||
| Tier 1 capital | 53,411 | 51,202 | 4 | ||||
| Tier 2 low-trigger capital instruments (5% trigger) | 1,018 | 961 | 6 | ||||
| Tier 2 capital 4 | 1,018 | 961 | 6 | ||||
| Total eligible capital 4 | 54,429 | 52,163 | 4 | ||||
1 Includes certain adjustments, such as a cumulative dividend accrual. | |||||||
2 Net of deferred tax liability. | |||||||
3 Includes reversals of cash flow hedge reserves and, in 4Q20, of unrealized gains on certain investments that are not eligible for CET1 recognition. | |||||||
4 Amounts are shown on a look-through basis. Certain tier 2 instruments are subject to phase out through 2022. As of 1Q21 and 4Q20, total eligible capital was CHF 54,686 million and CHF 52,437 million, including CHF 258 million and CHF 273 million of such instruments and the total capital ratio was 18.1% and 19.1%, respectively. | |||||||
38
| 1Q21 Capital movement – Group | |||
| CET1 capital (CHF million) | |||
| Balance at beginning of period | 35,361 | ||
| Net loss attributable to shareholders | (252) | ||
| Foreign exchange impact 1 | 1,772 | ||
| Repurchase of shares under the share buyback program | (285) | ||
| Other 2 | 368 | ||
| Balance at end of period | 36,964 | ||
| Additional tier 1 capital (CHF million) | |||
| Balance at beginning of period | 15,841 | ||
| Foreign exchange impact | 966 | ||
| Other 3 | (360) | ||
| Balance at end of period | 16,447 | ||
| Tier 2 capital (CHF million) | |||
| Balance at beginning of period | 961 | ||
| Foreign exchange impact | 66 | ||
| Other | (9) | ||
| Balance at end of period | 1,018 | ||
| Eligible capital (CHF million) | |||
| Balance at end of period | 54,429 | ||
1 Includes US GAAP cumulative translation adjustments and the foreign exchange impact on regulatory CET1 adjustments. | |||
2 Includes the reversal of unrealized gains on certain investments that are not eligible for CET1 recognition, a regulatory adjustment of defined benefit pension plan assets, a dividend accrual and the net effect of share-based compensation. | |||
3 Primarily reflects valuation impacts. | |||
| Risk-weighted assets – Group | |||||||||||||
end of | Swiss Universal Bank | International Wealth Management | Asia Pacific | Investment Bank | Corporate Center | Group | |||||||
| 1Q21 (CHF million) | |||||||||||||
| Credit risk | 71,895 | 30,930 | 22,620 | 65,102 | 26,877 | 217,424 | |||||||
| Market risk | 1,968 | 2,056 | 2,219 | 13,095 | 2,596 | 21,934 | |||||||
| Operational risk | 11,111 | 12,038 | 5,210 | 14,777 | 20,375 | 63,511 | |||||||
| Risk-weighted assets | 84,974 | 45,024 | 30,049 | 92,974 | 49,848 | 302,869 | |||||||
| 4Q20 (CHF million) | |||||||||||||
| Credit risk | 69,428 | 29,920 | 20,133 | 53,475 | 25,156 | 198,112 | |||||||
| Market risk | 1,598 | 1,962 | 1,645 | 10,749 | 2,363 | 18,317 | |||||||
| Operational risk | 10,262 | 11,118 | 4,811 | 13,648 | 18,816 | 58,655 | |||||||
| Risk-weighted assets | 81,288 | 43,000 | 26,589 | 77,872 | 46,335 | 275,084 | |||||||
39
| Risk-weighted asset movement by risk type – Group | |||||||||||||
1Q21 | Swiss Universal Bank | International Wealth Management | Asia Pacific | Investment Bank | Corporate Center | Total | |||||||
| Credit risk (CHF million) | |||||||||||||
| Balance at beginning of period | 69,428 | 29,920 | 20,133 | 53,475 | 25,156 | 198,112 | |||||||
| Foreign exchange impact | 1,079 | 1,498 | 1,298 | 3,647 | 1,373 | 8,895 | |||||||
| Movements in risk levels | 1,270 | (578) | 1,250 | 9,437 | 101 | 11,480 | |||||||
| Model and parameter updates – internal 1 | 118 | 90 | (61) | (1,457) | 247 | (1,063) | |||||||
| Balance at end of period | 71,895 | 30,930 | 22,620 | 65,102 | 26,877 | 217,424 | |||||||
| Market risk (CHF million) | |||||||||||||
| Balance at beginning of period | 1,598 | 1,962 | 1,645 | 10,749 | 2,363 | 18,317 | |||||||
| Foreign exchange impact | 119 | 134 | 129 | 874 | 169 | 1,425 | |||||||
| Movements in risk levels | 256 | (51) | 452 | 1,617 | 103 | 2,377 | |||||||
| Model and parameter updates – internal 1 | (5) | 11 | (7) | (145) | (39) | (185) | |||||||
| Balance at end of period | 1,968 | 2,056 | 2,219 | 13,095 | 2,596 | 21,934 | |||||||
| Operational risk (CHF million) | |||||||||||||
| Balance at beginning of period | 10,262 | 11,118 | 4,811 | 13,648 | 18,816 | 58,655 | |||||||
| Foreign exchange impact | 711 | 771 | 334 | 945 | 1,304 | 4,065 | |||||||
| Model and parameter updates – internal 1 | 138 | 149 | 65 | 184 | 255 | 791 | |||||||
| Balance at end of period | 11,111 | 12,038 | 5,210 | 14,777 | 20,375 | 63,511 | |||||||
| Total (CHF million) | |||||||||||||
| Balance at beginning of period | 81,288 | 43,000 | 26,589 | 77,872 | 46,335 | 275,084 | |||||||
| Foreign exchange impact | 1,909 | 2,403 | 1,761 | 5,467 | 2,846 | 14,386 | |||||||
| Movements in risk levels | 1,526 | (629) | 1,702 | 11,054 | 204 | 13,857 | |||||||
| Model and parameter updates – internal 1 | 251 | 250 | (3) | (1,419) | 463 | (458) | |||||||
| Balance at end of period | 84,974 | 45,024 | 30,049 | 92,974 | 49,848 | 302,869 | |||||||
1 Represents movements arising from internally driven updates to models and recalibrations of model parameters specific only to Credit Suisse. | |||||||||||||
| BIS leverage metrics – Group | |||||||
| % change | |||||||
| end of | 1Q21 | 4Q20 | QoQ | ||||
| Capital and leverage exposure (CHF million) | |||||||
| CET1 capital | 36,964 | 35,361 | 5 | ||||
| Tier 1 capital | 53,411 | 51,202 | 4 | ||||
| Leverage exposure | 967,798 | 799,853 | 1 | 21 | |||
| Leverage ratios (%) | |||||||
| CET1 leverage ratio | 3.8 | 4.4 | – | ||||
| Tier 1 leverage ratio | 5.5 | 6.4 | – | ||||
1 Leverage exposure excluded CHF 110,677 million of cash held at central banks, after adjusting for the dividend paid in 2020. | |||||||
40
| Swiss capital metrics – Group | |||||||
| % change | |||||||
| end of | 1Q21 | 4Q20 | QoQ | ||||
| Swiss capital and risk-weighted assets (CHF million) | |||||||
| Swiss CET1 capital | 36,959 | 35,351 | 5 | ||||
| Going concern capital | 53,406 | 51,192 | 4 | ||||
| Gone concern capital | 52,187 | 41,852 | 25 | ||||
| Total loss-absorbing capacity (TLAC) | 105,593 | 93,044 | 13 | ||||
| Swiss risk-weighted assets | 303,380 | 275,576 | 10 | ||||
| Swiss capital ratios (%) | |||||||
| Swiss CET1 ratio | 12.2 | 12.8 | – | ||||
| Going concern capital ratio | 17.6 | 18.6 | – | ||||
| Gone concern capital ratio | 17.2 | 15.2 | – | ||||
| TLAC ratio | 34.8 | 33.8 | – | ||||
| Swiss capital and risk-weighted assets – Group | |||||||
| % change | |||||||
| end of | 1Q21 | 4Q20 | QoQ | ||||
| Swiss capital (CHF million) | |||||||
| CET1 capital – BIS | 36,964 | 35,361 | 5 | ||||
| Swiss regulatory adjustments 1 | (5) | (10) | (50) | ||||
| Swiss CET1 capital | 36,959 | 35,351 | 5 | ||||
| Additional tier 1 high-trigger capital instruments | 11,778 | 11,410 | 3 | ||||
| Grandfathered additional tier 1 low-trigger capital instruments | 4,669 | 4,431 | 5 | ||||
| Swiss additional tier 1 capital | 16,447 | 15,841 | 4 | ||||
| Going concern capital | 53,406 | 51,192 | 4 | ||||
| Bail-in debt instruments | 49,644 | 39,450 | 26 | ||||
| Tier 2 low-trigger capital instruments | 1,018 | 961 | 6 | ||||
| Tier 2 amortization component | 1,525 | 1,441 | 6 | ||||
| Gone concern capital 2 | 52,187 | 41,852 | 25 | ||||
| Total loss-absorbing capacity | 105,593 | 93,044 | 13 | ||||
| Risk-weighted assets (CHF million) | |||||||
| Risk-weighted assets – BIS | 302,869 | 275,084 | 10 | ||||
| Swiss regulatory adjustments 3 | 511 | 492 | 4 | ||||
| Swiss risk-weighted assets | 303,380 | 275,576 | 10 | ||||
1 Includes adjustments for certain unrealized gains outside the trading book. | |||||||
2 Amounts are shown on a look-through basis. Certain tier 2 instruments and their related tier 2 amortization components are subject to phase out through 2022. As of 1Q21 and 4Q20, gone concern capital was CHF 52,456 million and CHF 42,198 million, including CHF 269 million and CHF 346 million, respectively, of such instruments. | |||||||
3 Primarily includes differences in the credit risk multiplier. | |||||||
41
| Swiss leverage metrics – Group | |||||||
| % change | |||||||
| end of | 1Q21 | 4Q20 | QoQ | ||||
| Swiss capital and leverage exposure (CHF million) | |||||||
| Swiss CET1 capital | 36,959 | 35,351 | 5 | ||||
| Going concern capital | 53,406 | 51,192 | 4 | ||||
| Gone concern capital | 52,187 | 41,852 | 25 | ||||
| Total loss-absorbing capacity | 105,593 | 93,044 | 13 | ||||
| Leverage exposure | 967,798 | 799,853 | 21 | ||||
| Swiss leverage ratios (%) | |||||||
| Swiss CET1 leverage ratio | 3.8 | 4.4 | – | ||||
| Going concern leverage ratio | 5.5 | 6.4 | – | ||||
| Gone concern leverage ratio | 5.4 | 5.2 | 1 | – | |||
| TLAC leverage ratio | 10.9 | 11.6 | – | ||||
| Rounding differences may occur. | |||||||
1 The gone concern ratio would have been 4.6%, if calculated using a leverage exposure of CHF 910,530 million, without the temporary exclusion of cash held at central banks, after adjusting for the dividend paid in 2020, of CHF 110,677 million. | |||||||
Risk management value-at-risk (VaR)
Risk management VaR measures the Group’s traded market risk exposure, which generally includes trading book positions, banking book positions held at fair value and foreign exchange and commodity risk from banking book positions.
in / end of | Interest rate | Credit spread | Foreign exchange | Commodity | Equity | Diversi- fication benefit | 1 | Total | |||||||
| CHF million | |||||||||||||||
| 1Q21 | |||||||||||||||
| Average | 14 | 71 | 33 | 2 | 31 | (91) | 60 | ||||||||
| Minimum | 12 | 65 | 26 | 2 | 24 | – | 2 | 53 | |||||||
| Maximum | 15 | 76 | 37 | 4 | 36 | – | 2 | 70 | |||||||
| End of period | 13 | 76 | 36 | 3 | 35 | (97) | 66 | ||||||||
| 4Q20 | |||||||||||||||
| Average | 15 | 73 | 33 | 2 | 29 | (92) | 60 | ||||||||
| Minimum | 13 | 69 | 29 | 2 | 21 | – | 2 | 51 | |||||||
| Maximum | 18 | 80 | 38 | 3 | 32 | – | 2 | 66 | |||||||
| End of period | 13 | 70 | 36 | 2 | 32 | (93) | 60 | ||||||||
| USD million | |||||||||||||||
| 1Q21 | |||||||||||||||
| Average | 15 | 78 | 37 | 3 | 35 | (101) | 67 | ||||||||
| Minimum | 13 | 73 | 29 | 2 | 27 | – | 2 | 60 | |||||||
| Maximum | 17 | 83 | 41 | 5 | 39 | – | 2 | 74 | |||||||
| End of period | 14 | 81 | 38 | 3 | 37 | (103) | 70 | ||||||||
| 4Q20 | |||||||||||||||
| Average | 17 | 81 | 37 | 2 | 32 | (102) | 67 | ||||||||
| Minimum | 14 | 76 | 32 | 2 | 23 | – | 2 | 56 | |||||||
| Maximum | 19 | 87 | 43 | 3 | 36 | – | 2 | 72 | |||||||
| End of period | 14 | 79 | 41 | 2 | 36 | (104) | 68 | ||||||||
| Excludes risks associated with counterparty and own credit exposures. Risk management VaR measures traded market risk and generally includes the trading book positions, banking book positions held at fair value and foreign exchange and commodity risk from banking book positions. | |||||||||||||||
1 Diversification benefit represents the reduction in risk that occurs when combining different, not perfectly correlated risk types in the same portfolio and is measured as the difference between the sum of the individual risk types and the risk calculated on the combined portfolio. | |||||||||||||||
2 As the maximum and minimum occur on different days for different risk types, it is not meaningful to calculate a portfolio diversification benefit. | |||||||||||||||
42
| in | 1Q21 | 4Q20 | 1Q20 | ||||
| Consolidated statements of operations (CHF million) | |||||||
| Interest and dividend income | 3,055 | 2,790 | 4,295 | ||||
| Interest expense | (1,401) | (1,342) | (2,761) | ||||
| Net interest income | 1,654 | 1,448 | 1,534 | ||||
| Commissions and fees | 3,737 | 3,191 | 2,927 | ||||
| Trading revenues | 1,811 | 484 | 927 | ||||
| Other revenues | 372 | 98 | 388 | ||||
| Net revenues | 7,574 | 5,221 | 5,776 | ||||
| Provision for credit losses | 4,394 | 138 | 568 | ||||
| Compensation and benefits | 2,207 | 2,539 | 2,316 | ||||
| General and administrative expenses | 1,376 | 2,279 | 1,346 | ||||
| Commission expenses | 329 | 303 | 345 | ||||
| Restructuring expenses | 25 | 50 | – | ||||
| Total other operating expenses | 1,730 | 2,632 | 1,691 | ||||
| Total operating expenses | 3,937 | 5,171 | 4,007 | ||||
| Income/(loss) before taxes | (757) | (88) | 1,201 | ||||
| Income tax expense/(benefit) | (526) | 262 | (110) | ||||
| Net income/(loss) | (231) | (350) | 1,311 | ||||
| Net income/(loss) attributable to noncontrolling interests | 21 | 3 | (3) | ||||
| Net income/(loss) attributable to shareholders | (252) | (353) | 1,314 | ||||
| Earnings/(loss) per share (CHF) | |||||||
| Basic earnings/(loss) per share | (0.10) | (0.15) | 0.53 | ||||
| Diluted earnings/(loss) per share | (0.10) | (0.15) | 0.52 | ||||
43
| end of | 1Q21 | 4Q20 | |||
| Assets (CHF million) | |||||
| Cash and due from banks | 133,285 | 139,112 | |||
| Interest-bearing deposits with banks | 1,447 | 1,298 | |||
| Central bank funds sold, securities purchased under resale agreements and securities borrowing transactions | 91,121 | 79,133 | |||
| Securities received as collateral, at fair value | 56,494 | 50,773 | |||
| Trading assets, at fair value | 157,139 | 157,338 | |||
| Investment securities | 614 | 607 | |||
| Other investments | 5,640 | 5,412 | |||
| Net loans | 304,188 | 291,908 | |||
| Goodwill | 4,644 | 4,426 | |||
| Other intangible assets | 239 | 237 | |||
| Brokerage receivables | 47,682 | 35,941 | |||
| Other assets | 48,902 | 39,637 | |||
| Total assets | 851,395 | 805,822 | |||
| Liabilities and equity (CHF million) | |||||
| Due to banks | 19,422 | 16,423 | |||
| Customer deposits | 406,069 | 390,921 | |||
| Central bank funds purchased, securities sold under repurchase agreements and securities lending transactions | 22,853 | 23,851 | |||
| Obligation to return securities received as collateral, at fair value | 56,494 | 50,773 | |||
| Trading liabilities, at fair value | 47,740 | 45,871 | |||
| Short-term borrowings | 24,887 | 20,868 | |||
| Long-term debt | 170,453 | 161,087 | |||
| Brokerage payables | 26,890 | 21,653 | |||
| Other liabilities | 31,703 | 31,434 | |||
| Total liabilities | 806,511 | 762,881 | |||
| Common shares | 98 | 98 | |||
| Additional paid-in capital | 33,523 | 33,323 | |||
| Retained earnings | 32,582 | 32,834 | |||
| Treasury shares, at cost | (946) | (428) | |||
| Accumulated other comprehensive income/(loss) | (20,667) | (23,150) | |||
| Total shareholders' equity | 44,590 | 42,677 | |||
| Noncontrolling interests | 294 | 264 | |||
| Total equity | 44,884 | 42,941 | |||
| Total liabilities and equity | 851,395 | 805,822 | |||
44
| Attributable to shareholders | |||||||||||||||||
Common shares | Additional paid-in capital | Retained earnings | Treasury shares, at cost | AOCI | Total share- holders' equity | Non- controlling interests | Total equity | ||||||||||
| 1Q21 (CHF million) | |||||||||||||||||
| Balance at beginning of period | 98 | 33,323 | 32,834 | (428) | (23,150) | 42,677 | 264 | 42,941 | |||||||||
| Purchase of subsidiary shares from non- controlling interests, not changing ownership 1, 2 | – | – | – | – | – | – | (7) | (7) | |||||||||
| Sale of subsidiary shares to noncontrolling interests, not changing ownership 2 | – | – | – | – | – | – | 5 | 5 | |||||||||
| Net income/(loss) | – | – | (252) | – | – | (252) | 21 | (231) | |||||||||
| Total other comprehensive income/(loss), net of tax | – | – | – | – | 2,483 | 2,483 | 11 | 2,494 | |||||||||
| Sale of treasury shares | – | (4) | – | 6,770 | – | 6,766 | – | 6,766 | |||||||||
| Repurchase of treasury shares | – | – | – | (7,335) | – | (7,335) | – | (7,335) | |||||||||
| Share-based compensation, net of tax | – | 204 | – | 47 | – | 251 | – | 251 | |||||||||
| Balance at end of period | 98 | 33,523 | 32,582 | (946) | (20,667) | 44,590 | 294 | 44,884 | |||||||||
1 Distributions to owners in funds include the return of original capital invested and any related dividends. | |||||||||||||||||
2 Transactions with and without ownership changes related to fund activity are all displayed under "not changing ownership". | |||||||||||||||||
| in | 1Q21 | 4Q20 | 1Q20 | ||||
| Net income/(loss) attributable to shareholders (CHF million) | |||||||
| Net income/(loss) attributable to shareholders for basic earnings per share | (252) | (353) | 1,314 | ||||
| Net income/(loss) attributable to shareholders for diluted earnings per share | (252) | (353) | 1,314 | ||||
| Weighted-average shares outstanding (million) | |||||||
| For basic earnings per share available for common shares | 2,446.6 | 2,433.4 | 2,465.9 | ||||
| Dilutive share options and warrants | 0.0 | 0.0 | 1.6 | ||||
| Dilutive share awards | 0.0 | 0.0 | 60.1 | ||||
| For diluted earnings per share available for common shares 1 | 2,446.6 | 2 | 2,433.4 | 2 | 2,527.6 | ||
| Earnings/(loss) per share available for common shares (CHF) | |||||||
| Basic earnings/(loss) per share available for common shares | (0.10) | (0.15) | 0.53 | ||||
| Diluted earnings/(loss) per share available for common shares | (0.10) | (0.15) | 0.52 | ||||
1 Weighted-average potential common shares relating to instruments that were not dilutive for the respective periods (and therefore not included in the diluted earnings per share calculation above) but could potentially dilute earnings per share in the future were 6.5 million, 7.8 million and 4.2 million for 1Q21, 4Q20 and 1Q20, respectively. | |||||||
2 Due to the net losses in 1Q21 and 4Q20, 0.4 million and 1.3 million, respectively, of weighted-average share options and warrants outstanding and 92.0 million and 101.0 million, respectively, of weighted-average share awards outstanding were excluded from the diluted earnings per share calculation, as the effect would be antidilutive. | |||||||
| in | 1Q21 | 4Q20 | |||
| Restructuring expenses by type (CHF million) | |||||
| Compensation and benefits-related expenses | 11 | 32 | |||
| of which severance expenses | 7 | 23 | |||
| of which accelerated deferred compensation | 4 | 9 | |||
| General and administrative-related expenses | 14 | 18 | |||
| of which pension expenses | (7) | 6 | |||
| Total restructuring expenses | 25 | 50 | |||
45
Return on regulatory capital
Credit Suisse measures firm-wide returns against total shareholders’ equity and tangible shareholders’ equity, a non-GAAP financial measure also known as tangible book value. In addition, it also measures the efficiency of the firm and its divisions with regard to the usage of capital as determined by the minimum requirements set by regulators. Prior to 3Q20, regulatory capital was calculated as the worst of 10% of RWA and 3.5% of leverage exposure and return on regulatory capital, a non-GAAP financial measure, was calculated using income/(loss) after tax and assumed a tax rate of 30%. In 3Q20, we updated our calculation approach, following which regulatory capital is calculated as the average of 10% of RWA and 3.5% of leverage exposure and return on regulatory capital, a non-GAAP financial measure, is calculated using income/(loss) after tax and assumes a tax rate of 30% for periods prior to 2020 and 25% from 2020 onward. For periods in 2020, for purposes of calculating Group return on regulatory capital, leverage exposure excludes cash held at central banks, after adjusting for the dividend paid in 2020. For the Investment Bank, return on regulatory capital is based on US dollar denominated numbers. Adjusted return on regulatory capital is calculated using adjusted results, applying the same methodology used to calculate return on regulatory capital.
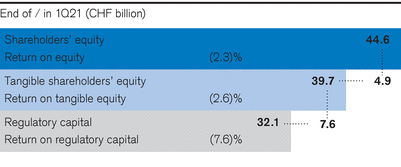
46
This document contains statements that constitute forward-looking statements. In addition, in the future we, and others on our behalf, may make statements that constitute forward-looking statements. Such forward-looking statements may include, without limitation, statements relating to the following:
■ our plans, targets or goals;
■ our future economic performance or prospects;
■ the potential effect on our future performance of certain contingencies; and
■ assumptions underlying any such statements.
Words such as “believes,” “anticipates,” “expects,” “intends” and “plans” and similar expressions are intended to identify forward-looking statements but are not the exclusive means of identifying such statements. We do not intend to update these forward-looking statements.
By their very nature, forward-looking statements involve inherent risks and uncertainties, both general and specific, and risks exist that predictions, forecasts, projections and other outcomes described or implied in forward-looking statements will not be achieved. We caution you that a number of important factors could cause results to differ materially from the plans, targets, goals, expectations, estimates and intentions expressed in such forward-looking statements and that the COVID-19 pandemic creates significantly greater uncertainty about forward-looking statements in addition to the factors that generally affect our business. These factors include:
■ the ability to maintain sufficient liquidity and access capital markets;
■ market volatility and interest rate fluctuations and developments affecting interest rate levels, including the persistence of a low or negative interest rate environment;
■ the strength of the global economy in general and the strength of the economies of the countries in which we conduct our operations, in particular the risk of negative impacts of COVID-19 on the global economy and financial markets and the risk of continued slow economic recovery or downturn in the EU, the US or other developed countries or in emerging markets in 2021 and beyond;
■ the emergence of widespread health emergencies, infectious diseases or pandemics, such as COVID-19, and the actions that may be taken by governmental authorities to contain the outbreak or to counter its impact;
■ potential risks and uncertainties relating to the severity of impacts from COVID-19 and the duration of the pandemic, including potential material adverse effects on our business, financial condition and results of operations;
■ the direct and indirect impacts of deterioration or slow recovery in residential and commercial real estate markets;
■ adverse rating actions by credit rating agencies in respect of us, sovereign issuers, structured credit products or other credit-related exposures;
■ the ability to achieve our strategic goals, including those related to our targets, ambitions and financial goals;
■ the ability of counterparties to meet their obligations to us and the adequacy of our allowance for credit losses;
■ the effects of, and changes in, fiscal, monetary, exchange rate, trade and tax policies;
■ the effects of currency fluctuations, including the related impact on our business, financial condition and results of operations due to moves in foreign exchange rates;
■ political, social and environmental developments, including war, civil unrest or terrorist activity and climate change;
■ the ability to appropriately address social, environmental and sustainability concerns that may arise from our business activities;
■ the effects of, and the uncertainty arising from, the UK’s withdrawal from the EU;
■ the possibility of foreign exchange controls, expropriation, nationalization or confiscation of assets in countries in which we conduct our operations;
■ operational factors such as systems failure, human error, or the failure to implement procedures properly;
■ the risk of cyber attacks, information or security breaches or technology failures on our reputation, business or operations, the risk of which is increased while large portions of our employees work remotely;
■ the adverse resolution of litigation, regulatory proceedings and other contingencies;
■ actions taken by regulators with respect to our business and practices and possible resulting changes to our business organization, practices and policies in countries in which we conduct our operations;
■ the effects of changes in laws, regulations or accounting or tax standards, policies or practices in countries in which we conduct our operations;
■ the expected discontinuation of LIBOR and other interbank offered rates and the transition to alternative reference rates;
■ the potential effects of changes in our legal entity structure;
■ competition or changes in our competitive position in geographic and business areas in which we conduct our operations;
■ the ability to retain and recruit qualified personnel;
■ the ability to maintain our reputation and promote our brand;
■ the ability to increase market share and control expenses;
■ technological changes instituted by us, our counterparties or competitors;
■ the timely development and acceptance of our new products and services and the perceived overall value of these products and services by users;
■ acquisitions, including the ability to integrate acquired businesses successfully, and divestitures, including the ability to sell non-core assets; and
■ other unforeseen or unexpected events and our success at managing these and the risks involved in the foregoing.
We caution you that the foregoing list of important factors is not exclusive. When evaluating forward-looking statements, you should carefully consider the foregoing factors and other uncertainties and events, including the information set forth in “Risk factors” in I – Information on the company in our Annual Report 2020 and in “Risk factor” in Credit Suisse.
47