UNITED STATES SECURITIES AND EXCHANGE COMMISSION
Washington, D.C. 20549
Form 6-K
REPORT OF FOREIGN PRIVATE ISSUER PURSUANT TO RULE 13a-16 OR 15d-16 UNDER THE SECURITIES EXCHANGE ACT OF 1934
July 27, 2022
Commission File Number 001-15244
Credit Suisse Group AG
(Translation of registrant’s name into English)
Paradeplatz 8, 8001 Zurich, Switzerland
(Address of principal executive office)
Commission File Number 001-33434
Credit Suisse AG
(Translation of registrant’s name into English)
Paradeplatz 8, 8001 Zurich, Switzerland
(Address of principal executive office)
Indicate by check mark whether the registrant files or will file annual reports under cover of Form 20-F or Form 40-F.
Form 20-F  Form 40-F
Form 40-F Indicate by check mark if the registrant is submitting the Form 6-K in paper as permitted by Regulation S-T Rule 101(b)(1):
Note: Regulation S-T Rule 101(b)(1) only permits the submission in paper of a Form 6-K if submitted solely to provide an attached annual report to security holders.
Indicate by check mark if the registrant is submitting the Form 6-K in paper as permitted by Regulation S-T Rule 101(b)(7):
Note: Regulation S-T Rule 101(b)(7) only permits the submission in paper of a Form 6-K if submitted to furnish a report or other document that the registrant foreign private issuer must furnish and make public under the laws of the jurisdiction in which the registrant is incorporated, domiciled or legally organized (the registrant’s “home country”), or under the rules of the home country exchange on which the registrant’s securities are traded, as long as the report or other document is not a press release, is not required to be and has not been distributed to the registrant’s security holders, and, if discussing a material event, has already been the subject of a Form 6-K submission or other Commission filing on EDGAR.
This report includes the media release and the slides for the presentation to investors in connection with the 2Q22 results.
Media Release Zurich, July 27, 2022 |
Ad hoc announcement pursuant to Art. 53 LR
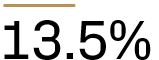
Credit Suisse reports net revenues of CHF 3.6 bn and pre-tax loss of CHF 1.2 bn along with a CET1 ratio of 13.5% in 2Q22
“Our results for the second quarter of 2022 are disappointing, especially in the Investment Bank, and were also impacted by higher litigation provisions and other adjusting items. The bank’s performance was significantly affected by a number of external factors, including geopolitical, macroeconomic and market headwinds. These challenging circumstances led to results which overshadow the strength of our leading client franchises in all four divisions of the bank. The urgency for decisive action is clear and a comprehensive review to strengthen our pivot to the Wealth Management, Swiss Bank and Asset Management businesses, supported by a fundamental transformation of our Investment Bank, is underway. Further, we have now launched a broader cost efficiency and digital transformation program to reduce our absolute cost base to less than CHF 15.5 bn in the medium term. Today marks a leadership change for Credit Suisse. It has been an absolute privilege and honor to serve Credit Suisse over these past 23 years. It has been my passion since day one to deliver best-in-class service to our clients. As a leader, since joining the Executive Board in 2015, I was focused on delivering results and embracing our values, including partnership, accountability and integrity.” Thomas Gottstein, Chief Executive Officer of Credit Suisse Group AG Please refer to the additional media release published on July 27, 2022, concerning the management change and comprehensive strategic review. |
Credit Suisse Group results for 2Q22
Reported (CHF mn) | 2Q22 | 1Q22 | 2Q21 | Δ1Q22 | Δ2Q21 | 1H22 | 1H21 | Δ1H21 |
| Net revenues | 3,645 | 4,412 | 5,103 | (17)% | (29)% | 8,057 | 12,677 | (36)% |
| Provision for credit losses | 64 | (110) | (25) | - | - | (46) | 4,369 | - |
| Total operating expenses | 4,754 | 4,950 | 4,315 | (4)% | 10% | 9,704 | 8,252 | 18% |
| Pre-tax income/(loss) | (1,173) | (428) | 813 | - | - | (1,601) | 56 | - |
| Effective tax rate | (36)% | 35% | 70% | - | - | (17)% | 71% | - |
| Net income/(loss) attributable to shareholders | (1,593) | (273) | 253 | - | - | (1,866) | 1 | - |
| Return on tangible equity | (15.0)% | (2.6)% | 2.6% | - | - | (8.9)% | 0.0% | - |
| Cost/income ratio | 130% | 112% | 85% | - | - | 120% | 65% | - |
| Net New Assets (NNA) in CHF bn | (7.7) | 7.9 | (4.7) | - | - | 0.2 | 23.7 | - |
| Assets under Management (AuM) in CHF bn | 1,454 | 1,555 | 1,632 | - | - | 1,454 | 1,632 | - |
Adjusted* (CHF mn) | 2Q22 | 1Q22 | 2Q21 | Δ1Q22 | Δ2Q21 | 1H22 | 1H21 | Δ1H21 |
| Net revenues | 3,820 | 4,582 | 5,226 | (17)% | (27)% | 8,402 | 12,656 | (34)% |
| Provision for credit losses | 64 | 45 | (95) | - | - | 109 | (131) | - |
| Total operating expenses | 4,198 | 4,237 | 4,008 | (1)% | 5% | 8,435 | 7,878 | 7% |
| Pre-tax income/(loss) | (442) | 300 | 1,313 | - | - | (142) | 4,909 | - |
Capital ratios for 2Q22
 |  |  |
| CET1 ratio vs. 13.7% in 2Q21 | CET1 leverage ratio vs. 4.2% in 2Q21 | Tier 1 leverage ratio vs. 6.0% in 2Q21 |
Media Release Zurich, July 27, 2022 |
Summary of 2Q22 performance
As stated in our Trading Update on June 8, 2022, the second quarter was marked by challenging economic and market conditions. The combination of the current geopolitical situation following Russia’s invasion of Ukraine and significant monetary tightening by major central banks in response to the substantial increase in inflation have resulted in continued heightened market volatility, weak customer flows and ongoing client deleveraging. Our performance in the Investment Bank (IB) was impacted by significantly lower capital markets issuance activity as well as reduced client activity, partly offset by stronger M&A advisory revenues. The IB’s franchise positioning was not geared towards benefiting from the volatile market conditions and our areas of strength, such as capital markets, were significantly impacted. Our performance in Wealth Management (WM) was strained due to lower client activity, volumes and recurring revenues. However, WM and Swiss Bank (SB) benefited from the improved rates environment leading to higher net interest income. In 2Q22 we saw net revenues decrease by 29% year on year, driven by a decline in IB net revenues, down 43%, on a USD basis; a decline in WM net revenues, down 34%; as well as a decline in Asset Management (AM) net revenues, down 25%. We had a net revenue increase in SB, up 3% year on year. Reported net revenues included a valuation loss of CHF 168 mn from our equity investment in Allfunds Group. We had adjusted* net revenues of CHF 3.8 bn, down 27% year on year; these include mark-to-market losses of USD 245 mn in | Leveraged Finance within the IB as a result of less favorable market conditions. Reported operating expenses of CHF 4.8 bn were up 10% year on year and included major litigation provisions of CHF 434 mn, primarily relating to developments in a number of previously disclosed legal matters, including a matter concerning compliance with records preservation requirements relating to business communications sent over unapproved electronic messaging channels. Our adjusted* operating expenses of CHF 4.2 bn were up 5%, primarily driven by incremental investment spend. We reported a pre-tax loss of CHF 1.2 bn compared to a pre-tax income of CHF 813 mn in 2Q21. Our adjusted* pre-tax loss for 2Q22 was CHF 442 mn, down significantly compared to 2Q21. We reported a net loss attributable to shareholders of CHF 1.6 bn, compared to net income attributable to shareholders of CHF 253 mn in 2Q21. We had Group net asset outflows of CHF 7.7 bn in 2Q22, compared to net asset outflows of CHF 4.7 bn in 2Q21. Our global wealth management, which includes our WM division and Private Banking Switzerland, had moderate net asset outflows for 2Q22 of CHF 1.8 bn; this was driven primarily by net asset outflows in EMEA and Switzerland partially offset by net inflows across Asia Pacific and Americas. Group AuM for 2Q22, stood at CHF 1.5 trn, down from CHF 1.6 trn at the end of 1Q22. We maintained a resilient capital base with our CET1 capital ratio at 13.5% as of the end of 2Q22, in line with our guidance. Our CET1 leverage ratio, and our Tier 1 leverage ratio remained flat at 4.3% and 6.1%, respectively, as of the end of 2Q22. |
Summary of 1H22 performance
For the first half of 2022 we saw net revenues decrease by 36% year on year, driven by a decline in IB net revenues, down 48%, on a USD basis, and a decline in WM net revenues, down 39%. We also saw a decline in AM net revenues, down 18% year on year, whereas net revenues in SB were up 5% for 1H22. Our reported net revenues of CHF 8.1 bn included real estate gains of CHF 177 mn, partially offset by a valuation loss of CHF 521 mn related to our equity investment in Allfunds Group. We had adjusted* net revenues of CHF 8.4 bn, down 34% year on year. The bank’s performance was impacted by the ongoing macro-economic and geopolitical challenges and market headwinds. | We had reported operating expenses of CHF 9.7 bn, up 18% year on year, primarily driven by litigation provisions of CHF 1.1 bn. Our adjusted* operating expenses were CHF 8.4 bn, up 7%, driven by increased incremental investment spend of CHF 331 mn relating to our Group strategy, as well as increased remediation spend in Risk, Compliance and Infrastructure. We reported a pre-tax loss of CHF 1.6 bn for 1H22, compared to a pre-tax income of CHF 56 mn for the same period in 2021. Our adjusted* pre-tax loss for the first half of 2022 was CHF 142 mn, which compares to an exceptionally strong adjusted* pre-tax income of CHF 4.9 bn in the first half of 2021. Our Group NNA for 1H22 was CHF 0.2 bn, compared to CHF 23.7 bn for the same period in 2021. |
Media Release Zurich, July 27, 2022 |
Net revenues for 2Q22 and 2Q21 by region
| Switzerland | 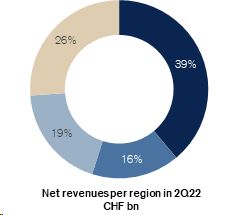 | Switzerland | 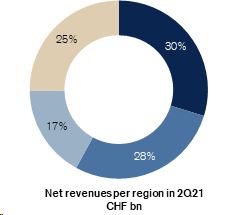 | |||
| EMEA | EMEA | |||||
| Asia Pacific | Asia Pacific | |||||
| Americas | Americas | |||||
| Outlook |
Our financial results for 1H22 have been significantly affected by the challenging economic and market environment, as well as legacy litigation provisions and losses resulting from the fall in the market value of our investment in Allfunds. The combination of the geopolitical situation following Russia’s invasion of Ukraine and significant monetary tightening by major central banks in response to inflation concerns have continued to result in heightened volatility and client risk aversion so far this year. The Swiss Bank continues to deliver a resilient performance and Wealth Management is benefiting from higher interest rates. In our Investment Bank, Equity Derivatives delivered its best second quarter results in recent history1, advisory revenues increased and our Securitized Products business delivered a resilient performance, given the more difficult environment. However, the current market environment has had an adverse impact on client activity across both Wealth Management and the Investment Bank. The Investment Bank has been particularly adversely affected by the industry-wide reduction in capital market volumes and by the widening in credit spreads, which have resulted in mark-to-market losses of USD 245 mn in 2Q22 in our Leveraged Finance portfolio, primarily in unfunded loans. Furthermore, the Investment Bank has relatively limited exposure to business areas, such as interest rate trading, which have benefited from the current monetary environment. We would expect these market conditions to continue for the coming months. In the Investment Bank, while we have a robust pipeline of transactions, these may prove difficult to execute in the current market environment. Trading so far in 3Q22 has been marked by a continued weakness in client activity, exacerbating normal seasonal declines, and we would expect this division to report a further loss this quarter. However, we would expect our Swiss Bank to continue to deliver a resilient performance, notwithstanding the decision by the SNB to increase CHF interest rates. Furthermore, while client activity remains subdued in our Wealth Management businesses and recurring revenues are expected to continue to reflect lower market levels, this division is already benefiting from higher interest rates, particularly related to our USD exposures. We would also expect an improvement in our Asset Management results in the second half of the year. In this environment, expense discipline is of particular importance and, as has been announced separately, the Board of Directors and the Executive Board, have now launched a broader cost efficiency and digital transformation program to reduce our absolute cost base to less than CHF 15.5 bn in the medium-term. Credit Suisse will provide further details on the progress of the strategic review, including specific performance goals, with its third quarter 2022 results. With regard to our capital position, we would expect to operate with a CET1 ratio of between 13% and 14% for the balance of 2022 supported by continued discipline around capital usage. |
Media Release Zurich, July 27, 2022 |
Selected Group strategy execution measures and progress
As stated at our Investor Deep Dive in June, we remain firmly focused on the execution of our strategic plan throughout 2022 and on reinforcing our risk culture – crucially, while staying close to our clients. Addressing our cost base remains a priority. We have announced a broader cost efficiency and digital transformation program to reduce our absolute cost base to less than CHF 15.5 bn in the medium-term. The digital transformation program includes measures such as the simplification of front to back processes, reduction in manual data handling and duplication as well as increase the use of scalable cloud-based infrastructure. The new absolute cost base ambition is net of investment spend that we continue to allocate to our core businesses. Credit Suisse will provide further details on the progress of the strategic review, including specific performance goals, with its third quarter 2022 results. | Over the course of 2Q22 we have achieved the following relating to our Group strategy: • Achieved USD 3.3 bn of our ambition to release more than USD 3 bn of allocated capital in the IB by year end 2022 ahead of schedule • Achieved a 7% year on year reduction in our Group credit portfolio, including 15% reduction in our non-investment grade portfolio, an 18% reduction in our Emerging Markets portfolio as well as a more than 70% reduction to our Russia net credit exposure since the end of 2021 • Took CHF 0.4 bn in major litigation provisions in 2Q22; proactive approach to resolving legal cases • Credit Suisse has further announced that a comprehensive review to strengthen its pivot to Wealth Management, Swiss Bank and Asset Management, supported by a transformation of the Investment Bank, is underway |
Media Release Zurich, July 27, 2022 |
Divisional summaries
Wealth Management (WM) | |
 Adjusted* pre-tax income QoQ in CHF million | 2Q22 On an adjusted* basis, WM’s pre-tax income fell to CHF 114 mn, down from CHF 432 mn or 74% year on year due to reduced client activity, lower volumes impacting revenues and higher costs. Adjusted* pre-tax income was adversely impacted by certain asset impairments and non-operational charges, including CHF 17 mn relating to certain third-party assets, mark-to-market losses in APAC Financing of CHF 21 mn, CHF 24 mn relating to the Supply Chain Finance Fund (SCFF) fee waiver program and, impacting expenses, a CHF 38 mn write-off of certain IT-related assets. The reported pre-tax loss for the quarter of CHF 96 mn, mainly reflects a valuation loss on the equity investment in Allfunds Group of CHF 168 mn. WM had reported net revenues of CHF 1.3 bn, down 34% year on year. Adjusted* net revenues of CHF 1.4 bn were down 7% due to lower recurring commission and fees, down 14%, reflecting lower AuM at broadly stable margins, as well as lower transaction- and performance-based revenues, down 11%, due to more cautious client sentiment adversely impacting brokerage and structured product fees. These were slightly offset by higher net interest income, up 4%, primarily driven by higher deposit income reflecting higher interest rates, especially in USD. WM had higher adjusted* operating expenses, up 18%, reflecting an impairment of CHF 38 mn related to certain IT assets, higher Group-wide technology, risk, and compliance investments as well as investments in business growth including China. WM had net asset outflows of CHF 1.4 bn in 2Q22 mainly driven by outflows from EMEA and Switzerland, including client deleveraging, partially offset by inflows from Asia Pacific and Americas. WM recorded AuM of CHF 662 bn, compared to CHF 769 bn in 2Q21 and CHF 707 bn in 1Q22, mainly reflecting unfavorable markets movements and structural effects. Additionally, WM had client business volume of CHF 974 bn, down 16% year on year, and down 6% quarter on quarter, due to the challenging market environment. 1H22 On an adjusted* basis, WM’s pre-tax income fell to CHF 326 mn, down 74% year on year. Adjusted* pre-tax income included negative impacts of CHF 50 mn relating to the SCFF fee waiver program. WM had lower adjusted* net revenues, down 15%, as well as higher adjusted* operating expenses, up 17%. WM had reported net revenues of CHF 2.4 bn, down 39% year on year. The decline in reported net revenues was driven by a valuation loss of CHF 521 mn on the equity investment in Allfunds Group, compared to a valuation gain of CHF 461 mn in the first half of 2021. Adjusted* net revenues of CHF 3.0 bn were down 15% year on year, due to lower transaction- and performance-based revenues, down 28%, mainly from lower brokerage and product issuing fees and lower Global Trading Solutions (GTS) revenues; lower recurring commission and fees, down 10%, reflecting lower AuM as well as lower net interest income, down 2%. WM had NNA of CHF 3.4 bn for the half year at annualized growth rate of 1%. |
Media Release Zurich, July 27, 2022 |
| Investment Bank (IB) | |
 Adjusted* pre-tax income/loss QoQ in USD million | 2Q22 On an adjusted* basis the IB posted a significant pre-tax loss of USD 860 mn, down from a pre-tax income of USD 663 mn in 2Q21, reflecting extremely challenging market conditions, particularly in capital markets. The reported pre-tax loss was USD 1.2 bn. The division’s reported net revenues were USD 1.2 bn for 2Q22, down 43% year on year due to a strong comparable in 2Q21; on an adjusted* basis, net revenues were down 55% year on year. Total reported operating expenses were up 12% and included USD 200 mn of major litigation provisions, mainly in connection with a previously disclosed matter concerning compliance with records preservation requirements relating to business communications sent over unapproved electronic messaging channels, as well as restructuring costs of USD 63 mn. Adjusted* operating expenses were flat year on year, as reduced revenue-related costs were offset by higher Group-wide technology, risk and compliance costs. Capital markets revenues decreased 96% year on year, impacted by substantially lower ECM and Leveraged Finance market activity and including mark-to-market losses in Leveraged Finance of USD 245 mn. We saw an increase in Advisory revenues, up 37%, from significant deal closings. Revenues in our Fixed Income Sales & Trading business were down 32%, reflecting lower Emerging Markets trading and financing activity as well as lower securitized products and global credit products revenues. On an adjusted* basis, Equity Sales & Trading revenues declined by 33%2 mainly driven by the exit of Prime Services3 that has been largely completed in the quarter. GTS revenues increased year on year due to strong equity derivatives and macro trading activity driven by increased market volatility, partially offset by lower activity in Emerging Markets trading and financing. We reduced allocated capital by USD 0.8 bn in 2Q22, releasing USD 3.3 bn in aggregate since the end of 2020, achieving ahead of schedule our ambition of more than USD 3 bn capital release by year end 2022. 1H22 On an adjusted* basis the IB recorded a pre-tax loss of USD 915 mn compared to a pre-tax income of USD 3.0 bn in the first half of 2021. This is largely due to significantly lower client activity, particularly in capital markets, compared to a strong first half of 2021, amid challenging markets as well as the cumulative impact of our reduced risk appetite and exit of Prime Services4. The division’s reported net revenues were USD 3.2 bn, down 48% year on year, largely driven by significantly lower Capital Markets revenues and lower Fixed Income and Equity Sales & Trading revenues. We had slightly higher Advisory revenues, up 4% year on year. Total reported operating expenses were up 9% year on year; on an adjusted* basis they were up 3%, largely driven by increased Group-wide technology, risk and compliance costs partially offset by lower commissions and revenue-related expenses. |
Media Release Zurich, July 27, 2022 |
Swiss Bank (SB) | |
 Adjusted* pre-tax income QoQ in CHF million | 2Q22 SB had good revenues in 2Q22 with increases across all major revenue segments. Provision for credit losses continued at a low level. SB had an adjusted* pre-tax income of CHF 402 mn, down 10% year on year, with higher revenues outweighed by provision for credit losses and higher operating expenses. Adjusted* operating expenses were up 6%, from increased cash accruals for compensation due to normalized deferral levels, Group-wide technology, risk and compliance costs as well as targeted advertising and marketing campaigns. SB’s reported net revenues were CHF 1.1 bn, up 3% year on year; adjusted* net revenues were also up 3%. Net interest income increased by 3% year on year driven by higher deposit income; recurring commissions and fees were up 3% mainly driven by improved performance in our investment in Swisscard; and transaction-based revenues were up 2%, due to higher revenues from foreign exchange (FX) transactions. SB had net asset outflows of CHF 1.6 bn driven primarily by outflows of CHF 1.2 bn by our institutional clients. The division’s AuM as of the end of 2Q22 was CHF 545 bn, down from CHF 588 bn at the end of 2Q21 and compared to CHF 583 bn at the end of 1Q22 primarily due to declining markets. SB had client business volume of CHF 826 bn in 2Q22, down 6% year on year. 1H22 SB had an adjusted* pre-tax income of CHF 787 mn for the first half of 2022, down 9% year on year mainly driven by higher adjusted* operating expenses, up 5% due to higher Group-wide technology, risk and compliance costs as well as increased cash accruals for compensation due to normalized deferral levels. SB’s reported net revenues were CHF 2.2 bn for the first half of 2022, up 5% year on year, these included real estate gains of CHF 97 mn. Adjusted* net revenues were stable, up 1%, driven by higher recurring commission and fees, up 5%, with stable net interest income and stable transaction-based revenues, down 1%. SB had NNA of CHF 4.4 bn for the first half of 2022, driven by our institutional clients. |
Media Release Zurich, July 27, 2022 |
Asset Management (AM) | |
 Adjusted* pre-tax income QoQ in CHF million | 2Q22 AM had an adjusted* pre-tax income of CHF 31 mn for 2Q22, down 75% year on year, driven by lower adjusted* net revenue, down 25%, partially offset by slightly lower adjusted* operating expenses, down 5%. Lower pre-tax income reflects declining market levels, reduced client risk appetite and declining activity levels. Adjusted* operating expenses were down due to the release of certain expense provisions related to the SCFF matter, partially offset by higher Group-wide technology, risk and compliance costs as well as higher deferred compensation expenses. AM’s reported net revenues were down 25% year on year at CHF 311 mn. The decrease in revenues was mainly due to lower performance, transaction and placement revenues, down 94% year on year, reflecting investment related losses, declining performance fees and reduced placement fees. Net revenues also reflected reduced recurring management fees, down 9%, resulting from lower average AuM and increased investor bias towards passive products. Finally, investment and partnership income was also down 9% year on year primarily due to lower equity participation income, partially offset by increased investment related gains related to a single investment. AM had net asset outflows of CHF 6.1 bn for the quarter across both traditional and alternative investments, partly offset by inflows from investments and partnerships. AM had AuM of CHF 427 bn at the end of 2Q22, down 9% year on year or CHF 44 bn, of which CHF 41 bn is due to market and FX-related movements. 1H22 AM had adjusted* pre-tax income of CHF 82 mn for the first half of 2022, down 68% year on year due to lower adjusted* net revenues, down 18%, coupled with higher adjusted* operating expenses, up 4%. AM’s reported net revenues were down 18% year on year at CHF 672 mn. The decrease in revenues were driven by lower performance, transaction and placement revenues, down 70%, primarily due to investment related losses, reduced performance fees and declining placement fees, as well as lower recurring management fees, down 6%. These declines were partially offset by higher investment & partnership revenues, up 11% year on year. AM had net asset outflows of CHF 6.7 bn in the first half of 2022, down compared to NNA of CHF 11.6 bn in the same period in 2021. |
Media Release Zurich, July 27, 2022 |
Progress on our sustainability ambitions and strategy
Credit Suisse continued to focus on its sustainability strategy, driving activity across divisions and functions in 2Q22. The bank continues to emphasize the importance of sustainability as a core element of its value proposition for its clients, shareholders, employees and society. Summary of recent sustainability-related activity: • 2Q22 Sustainable AuM of CHF 134 bn5, up from CHF 133 bn in 2Q21, resulting in a penetration of 9.2% of total AuM as of June 30, 2022 • Number of Wealth Management ESG funds6 at 162 as of the end of 2Q22 compared to 138 at the end of 2Q21 • Hosted the 9th annual Credit Suisse Conservation Finance conference on May 12, 2022, focusing on the ‘Super Year for Nature’, highlighting the importance of nature and conservation finance in 2022 • Hosted the 6th annual Global Women’s Financial Forum on June 28-29, 2022, with a diverse line up of thought leaders covering critical topics such as geopolitics or sustainability across industries | • Published the Credit Suisse Nuclear Energy Report 2022 on July 14, 2022, which considers the efficiency and environmental merits, challenges, and political discord around nuclear technology |
Media Release Zurich, July 27, 2022 |
Contact details
Kinner Lakhani, Investor Relations, Credit Suisse
Tel: +41 44 333 71 49
Email: investor.relations@credit-suisse.com
Dominik von Arx, Corporate Communications, Credit Suisse
Tel: +41 844 33 88 44
Email: media.relations@credit-suisse.com
The Earnings Release and Presentation for 2Q22 and 1H22 are available to download from 06:45 CEST today at:
www.credit-suisse.com/results
Presentation of 2Q22 results
Wednesday, July 27, 2022
| Event | Analyst Call | Media Call |
| Time | 08:15 CEST (Zurich) 07:15 BST (London) 02:15 EDT (New York) | 10:30 CEST (Zurich) 09:30 BST (London) 04:30 EDT (New York) |
| Language | English | English |
| Access | Switzerland +41 (0) 58 310 51 26 UK +44 (0) 121 281 8012 USA +1 631 232 7997 Reference: Credit Suisse Analysts and Investors Call Conference ID: 20220428 Please dial in 10 minutes before the start of the call. When dialing in please enter the Passcode/Conference ID and leave your first, last name and company name after the tone. You will be joined automatically to the conference. Webcast link here. | Switzerland +41 (0) 58 310 51 26 UK +44 (0) 121 281 8012 USA +1 631 232 7997 Reference: Credit Suisse Media Call Conference ID: 20220429 Please dial in 10 minutes before the start of the call. When dialing in please enter the Passcode/Conference ID and leave your first, last name and company name after the tone. You will be joined automatically to the conference. Webcast link here. |
| Q&A Session | Following the presentation, you will have the opportunity to ask the speakers questions | Following the presentation, you will have the opportunity to ask the speakers questions |
| Playback | Replay available at the webcast link. | Replay available at the webcast link. |
Media Release Zurich, July 27, 2022 |
Abbreviations AM – Asset Management; APAC – Asia Pacific; AuM – assets under management; bn – billion; CET1 – common equity tier 1; CHF – Swiss francs; ECM – Equity Capital Markets; EMEA – Europe, Middle East and Africa; ESG – Environmental, Social and Governance; FINMA – Swiss Financial Market Supervisory Authority FINMA; FX – Foreign Exchange; GAAP – Generally accepted accounting principles; GTS – Global Trading Solutions; IB – Investment Bank; IT – Information Technology; mn – million; M&A – Mergers & Acquisitions; NNA – net new assets; QoQ – Quarter on Quarter; RWA – risk weighted assets; SB – Swiss Bank; SCFF – Supply Chain Finance Funds; SEC – US Securities and Exchange Commission; trn – trillion; (U)HNW – (Ultra) high-net-worth; UK – United Kingdom; US – United States; USD – US dollar; WM – Wealth Management Important information This document contains select information from the full 2Q22 Earnings Release and 2Q22 Results Presentation slides that Credit Suisse believes is of particular interest to media professionals. The complete 2Q22 Earnings Release and 2Q22 Results Presentation slides, which have been distributed simultaneously, contain more comprehensive information about our results and operations for the reporting quarter, as well as important information about our reporting methodology and some of the terms used in these documents. The complete 2Q22 Earnings Release and 2Q22 Results Presentation slides are not incorporated by reference into this document. Credit Suisse has not finalized its 2Q22 Financial Report and Credit Suisse’s independent registered public accounting firm has not completed its review of the condensed consolidated financial statements (unaudited) for the period. Accordingly, the financial information contained in this document is subject to completion of quarter-end procedures, which may result in changes to that information. This document contains certain unaudited interim financial information for the third quarter of 2022. This information has been derived from management accounts, is preliminary in nature, does not reflect the complete results of the third quarter of 2022 and is subject to change, including as a result of any normal quarterly adjustments in relation to the financial statements for the third quarter of 2022. This information has not been subject to any review by our independent registered public accounting firm. There can be no assurance that the final results for these periods will not differ from these preliminary results, and any such differences could be material. Quarterly financial results for the third quarter of 2022 will be included in our 3Q22 Financial Report. These interim results of operations are not necessarily indicative of the results to be achieved for the remainder of or the full third quarter of 2022. Our ambition to release over USD 3 billion of capital from the Investment Bank over 2021-2022 and our ambition to invest approximately CHF 3 billion of capital in Wealth Management over 2021-2024 is based on an average of 13.5% risk-weighted assets and 4.25% leverage exposure. Our absolute cost base ambition is measured using adjusted operating expenses at constant 2021 FX rates. We may not achieve all of the expected benefits of our strategic initiatives. Factors beyond our control, including but not limited to the market and economic conditions (including macroeconomic and other challenges and uncertainties, for example, resulting from Russia’s invasion of Ukraine), changes in laws, rules or regulations and other challenges discussed in our public filings, could limit our ability to achieve some or all of the expected benefits of these initiatives. In particular, the terms “Estimate”, “Illustrative”, “Ambition”, “Objective”, “Outlook”, “Goal”, “Commitment” and “Aspiration” are not intended to be viewed as targets or projections, nor are they considered to be Key Performance Indicators. All such estimates, illustrations, ambitions, objectives, outlooks, goals, commitments and aspirations are subject to a large number of inherent risks, assumptions and uncertainties, many of which are completely outside of our control. These risks, assumptions and uncertainties include, but are not limited to, general market conditions, market volatility, increased inflation, interest rate volatility and levels, global and regional economic conditions, challenges and uncertainties resulting from Russia’s invasion of Ukraine, political uncertainty, changes in tax policies, scientific or technological developments, evolving sustainability strategies, changes in the nature or scope of our operations, changes in carbon markets, regulatory changes, changes in levels of client activity as a result of any of the foregoing and other factors. Accordingly, these | statements, which speak only as of the date made, are not guarantees of future performance and should not be relied on for any purpose. We do not intend to update these estimates, illustrations, ambitions, objectives, outlooks, goals, commitments, aspirations or any other forward-looking statements. For these reasons, we caution you not to place undue reliance upon any forward-looking statements. In preparing this document, management has made estimates and assumptions that affect the numbers presented. Actual results may differ. Annualized numbers do not take into account variations in operating results, seasonality and other factors and may not be indicative of actual, full-year results. Figures throughout this document may also be subject to rounding adjustments. All opinions and views constitute good faith judgments as of the date of writing without regard to the date on which the reader may receive or access the information. This information is subject to change at any time without notice and we do not intend to update this information. Our estimates, ambitions, objectives and targets often include metrics that are non-GAAP financial measures and are unaudited. A reconciliation of the estimates, ambitions, objectives and targets to the nearest GAAP measures is unavailable without unreasonable efforts. Adjusted results exclude goodwill impairment, major litigation provisions, real estate gains and other revenue and expense items included in our reported results, all of which are unavailable on a prospective basis. Such estimates, ambitions, objectives and targets are calculated in a manner that is consistent with the accounting policies applied by us in preparing our financial statements. Return on tangible equity, a non-GAAP financial measure, is calculated as annualized net income attributable to shareholders divided by average tangible shareholders’ equity. Tangible shareholders’ equity, a non-GAAP financial measure, is calculated by deducting goodwill and other intangible assets from total shareholders’ equity as presented in our balance sheet. Management believes that return on tangible equity is meaningful as it is a measure used and relied upon by industry analysts and investors to assess valuations and capital adequacy. Adjusted return on tangible equity excluding certain items included in our reported results is calculated using results excluding such items, applying the same methodology. For end 2Q22, tangible shareholders’ equity excluded goodwill of CHF 2,974 million and other intangible assets of CHF 340 million from total shareholders’ equity of CHF 45,842 million as presented in our balance sheet. For end 1Q22, tangible shareholders’ equity excluded goodwill of CHF 2,931 million and other intangible assets of CHF 307 million from total shareholders’ equity of CHF 44,442 million as presented in our balance sheet. For end 2Q21, tangible shareholders’ equity excluded goodwill of CHF 4,588 million and other intangible assets of CHF 245 million from total shareholders’ equity of CHF 43,580 million as presented in our balance sheet. Regulatory capital is calculated as the average of 13.5% of RWA and 4.25% of leverage exposure and return on regulatory capital, a non-GAAP financial measure, is calculated using income/(loss) after tax and assumes a tax rate of 30% for periods prior to 2020 and 25% from 2020 onward. For the Investment Bank division, return on regulatory capital is based on US dollar denominated numbers. Adjusted return on regulatory capital excluding certain items included in our reported results is calculated using results excluding such items, applying the same methodology. The Group’s economic profit is a non-GAAP financial measure, calculated using income/(loss) before tax applying a 25% tax rate less a capital charge. The capital charge is calculated based on the sum of (i) a cost of capital applied to the average regulatory capital of each of the four divisions; and (ii) a 10% cost of capital applied to the residual of the Group’s average tangible equity less the sum of the regulatory capital of the four divisions. The applied cost of capital for the divisions is 8% for Wealth Management, the Swiss Bank and Asset Management and 12% for the Investment Bank. Adjusted economic profit excluding certain items included in our reported results is calculated using results excluding such items, applying the same methodology. Credit Suisse is subject to the Basel framework, as implemented in Switzerland, as well as Swiss legislation and regulations for systemically important banks, which include capital, liquidity, leverage and large exposure requirements and rules for emergency plans designed to maintain systemically relevant functions in the event of threatened insolvency. Credit Suisse has adopted the Bank for International Settlements (BIS) leverage ratio framework, as issued by the Basel Committee on Banking Supervision (BCBS) and implemented in Switzerland by the Swiss Financial Market Supervisory Authority FINMA (FINMA). |
Media Release Zurich, July 27, 2022 |
Unless otherwise noted, all CET1 ratio, CET1 leverage ratio, Tier-1 leverage ratio, risk-weighted assets and leverage exposure figures in this document are as of the end of the respective period. Unless otherwise noted, leverage exposure is based on the BIS leverage ratio framework and consists of period-end balance sheet assets and prescribed regulatory adjustments. The tier 1 leverage ratio and CET1 leverage ratio are calculated as BIS tier 1 capital and CET1 capital, respectively, divided by period end leverage exposure. Client business volume includes assets under management, custody assets (including assets under custody and commercial assets) and net loans. Investors and others should note that we announce important company information (including quarterly earnings releases and financial reports as well as our annual sustainability report) to the investing public using press releases, SEC and Swiss ad hoc filings, our website and public conference calls and webcasts. We also routinely use our Twitter account @creditsuisse (https://twitter.com/creditsuisse), our LinkedIn account (https://www.linkedin.com/company/credit-suisse/), our Instagram accounts (https://www.instagram.com/creditsuisse_careers/ and https://www.instagram.com/creditsuisse_ch/), our Facebook account (https://www.facebook.com/creditsuisse/) and other social media channels as | additional means to disclose public information, including to excerpt key messages from our public disclosures. We may share or retweet such messages through certain of our regional accounts, including through Twitter at @csschweiz (https://twitter.com/csschweiz) and @csapac (https://twitter.com/csapac). Investors and others should take care to consider such abbreviated messages in the context of the disclosures from which they are excerpted. The information we post on these social media accounts is not a part of this document. Information referenced in this document, whether via website links or otherwise, is not incorporated into this document. Certain material in this document has been prepared by Credit Suisse on the basis of publicly available information, internally developed data and other third-party sources believed to be reliable. Credit Suisse has not sought to independently verify information obtained from public and third-party sources and makes no representations or warranties as to accuracy, completeness, reasonableness or reliability of such information. In various tables, use of “–” indicates not meaningful or not applicable. The English language version of this document is the controlling version. |
* Refers to results excluding certain items included in our reported results. These are non-GAAP financial measures. For a reconciliation to the most directly comparable US GAAP measures, see the Appendix of this Media Release 1 Best 2Q result for Equity Derivatives since 2Q16 2 Excludes Archegos loss of USD 542 mn from Equity Sales & Trading revenues in 2Q21 3 With the exception of Index Access and APAC Delta One 4 With the exception of Index Access and APAC Delta One | 5 Refers to Credit Suisse’s assets managed according to the Credit Suisse Sustainable Investment Framework (Sustainable AuM). This includes only AuM balances from managed solutions that to date have been mapped to a sustainability rating of 2 and higher, based on the Framework scale (0-5). The movement vs. 2Q21 reflects a combination of onboarding of new sustainable funds, net sales and further product classifications, partially offset by market and FX movements 6 Includes funds of our Wealth Management Lead Offering that as of June 30, 2022 have been mapped to a sustainability rating of 2 and higher, based on our internal Sustainable Investment Framework scale (0-5) |
| Appendix |
| Key metrics | |||||||||||||||||
| in / end of | % change | in / end of | % change | ||||||||||||||
| 2Q22 | 1Q22 | 2Q21 | QoQ | YoY | 6M22 | 6M21 | YoY | ||||||||||
| Credit Suisse Group results (CHF million) | |||||||||||||||||
| Net revenues | 3,645 | 4,412 | 5,103 | (17) | (29) | 8,057 | 12,677 | (36) | |||||||||
| Provision for credit losses | 64 | (110) | (25) | – | – | (46) | 4,369 | – | |||||||||
| Compensation and benefits | 2,392 | 2,458 | 2,356 | (3) | 2 | 4,850 | 4,563 | 6 | |||||||||
| General and administrative expenses | 2,005 | 2,148 | 1,589 | (7) | 26 | 4,153 | 2,965 | 40 | |||||||||
| Commission expenses | 254 | 298 | 325 | (15) | (22) | 552 | 654 | (16) | |||||||||
| Restructuring expenses | 80 | 46 | 45 | 74 | 78 | 126 | 70 | 80 | |||||||||
| Total other operating expenses | 2,362 | 2,492 | 1,959 | (5) | 21 | 4,854 | 3,689 | 32 | |||||||||
| Total operating expenses | 4,754 | 4,950 | 4,315 | (4) | 10 | 9,704 | 8,252 | 18 | |||||||||
| Income/(loss) before taxes | (1,173) | (428) | 813 | 174 | – | (1,601) | 56 | – | |||||||||
| Net income/(loss) attributable to shareholders | (1,593) | (273) | 253 | 484 | – | (1,866) | 1 | – | |||||||||
| Balance sheet statistics (CHF million) | |||||||||||||||||
| Total assets | 727,365 | 739,554 | 810,952 | (2) | (10) | 727,365 | 810,952 | (10) | |||||||||
| Risk-weighted assets | 274,442 | 273,043 | 283,611 | 1 | (3) | 274,442 | 283,611 | (3) | |||||||||
| Leverage exposure | 862,737 | 878,023 | 931,041 | (2) | (7) | 862,737 | 931,041 | (7) | |||||||||
| Assets under management and net new assets (CHF billion) | |||||||||||||||||
| Assets under management | 1,453.9 | 1,554.9 | 1,632.0 | (6.5) | (10.9) | 1,453.9 | 1,632.0 | (10.9) | |||||||||
| Net new assets | (7.7) | 7.9 | (4.7) | – | 63.8 | 0.2 | 23.7 | (99.2) | |||||||||
| Basel III regulatory capital and leverage statistics (%) | |||||||||||||||||
| CET1 ratio | 13.5 | 13.8 | 13.7 | – | – | 13.5 | 13.7 | – | |||||||||
| CET1 leverage ratio | 4.3 | 4.3 | 4.2 | – | – | 4.3 | 4.2 | – | |||||||||
| Tier 1 leverage ratio | 6.1 | 6.1 | 5.9 | – | – | 6.1 | 5.9 | – | |||||||||
Page A-1
| Appendix |
Results excluding certain items included in our reported results are non-GAAP financial measures. Following the reorganization implemented at the beginning of 2022, we have amended the presentation of our adjusted results. Management believes that such results provide a useful presentation of our operating results for purposes of assessing our Group and divisional performance consistently over time, on a basis that excludes items that management does not consider representative of our underlying performance. Provided below is a reconciliation to the most directly comparable US GAAP measures.
| Reconciliation of adjustment items | |||||||||||
| Group | |||||||||||
| in | 2Q22 | 1Q22 | 2Q21 | 6M22 | 6M21 | ||||||
| Results (CHF million) | |||||||||||
| Net revenues | 3,645 | 4,412 | 5,103 | 8,057 | 12,677 | ||||||
| Real estate (gains)/losses | (13) | (164) | (4) | (177) | (4) | ||||||
| (Gains)/losses on business sales | 1 | 3 | 0 | 4 | 0 | ||||||
| Major litigation recovery | 0 | 0 | (49) | 0 | (49) | ||||||
| (Gain)/loss on equity investment in Allfunds Group | 168 | 353 | (317) | 521 | (461) | ||||||
| (Gain)/loss on equity investment in SIX Group AG | 19 | (5) | 0 | 14 | 0 | ||||||
| Archegos | 0 | (17) | 493 | (17) | 493 | ||||||
| Adjusted net revenues | 3,820 | 4,582 | 5,226 | 8,402 | 12,656 | ||||||
| Provision for credit losses | 64 | (110) | (25) | (46) | 4,369 | ||||||
| Archegos | 0 | 155 | (70) | 155 | (4,500) | ||||||
| Adjusted provision for credit losses | 64 | 45 | (95) | 109 | (131) | ||||||
| Total operating expenses | 4,754 | 4,950 | 4,315 | 9,704 | 8,252 | ||||||
| Goodwill impairment | (23) | 0 | 0 | (23) | 0 | ||||||
| Restructuring expenses | (80) | (46) | (45) | (126) | (70) | ||||||
| Major litigation provisions | (434) | (653) | (208) | (1,087) | (212) | ||||||
| Expenses related to real estate disposals | (6) | (3) | (4) | (9) | (42) | ||||||
| Expenses related to equity investment in Allfunds Group | 0 | 0 | (19) | 0 | (19) | ||||||
| Archegos | (13) | (11) | (31) | (24) | (31) | ||||||
| Adjusted total operating expenses | 4,198 | 4,237 | 4,008 | 8,435 | 7,878 | ||||||
| Income/(loss) before taxes | (1,173) | (428) | 813 | (1,601) | 56 | ||||||
| Adjusted income/(loss) before taxes | (442) | 300 | 1,313 | (142) | 4,909 | ||||||
| Adjusted economic profit | (1,383) | (786) | (52) | (2,169) | 1,674 | ||||||
| Adjusted return on tangible equity (%) | (8.1) | 4.3 | 6.6 | (2.0) | 20.0 | ||||||
Page A-2
| Appendix |
| Wealth Management | |||||||||||||||||
| in / end of | % change | in / end of | % change | ||||||||||||||
| 2Q22 | 1Q22 | 2Q21 | QoQ | YoY | 6M22 | 6M21 | YoY | ||||||||||
| Results (CHF million) | |||||||||||||||||
| Net revenues | 1,266 | 1,177 | 1,913 | 8 | (34) | 2,443 | 3,998 | (39) | |||||||||
| Provision for credit losses | (11) | 24 | (24) | – | (54) | 13 | (11) | – | |||||||||
| Total operating expenses | 1,373 | 1,510 | 1,167 | (9) | 18 | 2,883 | 2,261 | 28 | |||||||||
| Income/(loss) before taxes | (96) | (357) | 770 | (73) | – | (453) | 1,748 | – | |||||||||
| Metrics | |||||||||||||||||
| Economic profit (CHF million) | (254) | (448) | 383 | (43) | – | (702) | 927 | – | |||||||||
| Cost/income ratio (%) | 108.5 | 128.3 | 61.0 | – | – | 118.0 | 56.6 | – | |||||||||
| Assets under management (CHF billion) | 661.5 | 707.0 | 769.4 | (6.4) | (14.0) | 661.5 | 769.4 | (14.0) | |||||||||
| Net new assets (CHF billion) | (1.4) | 4.8 | (6.5) | – | – | 3.4 | 8.0 | – | |||||||||
| Gross margin (annualized) (bp) | 73 | 65 | 101 | – | – | 69 | 108 | – | |||||||||
| Net margin (annualized) (bp) | (6) | (20) | 41 | – | – | (13) | 47 | – | |||||||||
| Reconciliation of adjustment items | |||||||||||
| Wealth Management | |||||||||||
| in | 2Q22 | 1Q22 | 2Q21 | 6M22 | 6M21 | ||||||
| Results (CHF million) | |||||||||||
| Net revenues | 1,266 | 1,177 | 1,913 | 2,443 | 3,998 | ||||||
| Real estate (gains)/losses | 0 | (25) | 1 | 0 | (25) | 0 | |||||
| (Gains)/losses on business sales | 1 | 3 | 0 | 4 | 0 | ||||||
| Major litigation recovery | 0 | 0 | (49) | 0 | (49) | ||||||
| (Gain)/loss on equity investment in Allfunds Group | 168 | 353 | (317) | 521 | (461) | ||||||
| (Gain)/loss on equity investment in SIX Group AG | 9 | (2) | 0 | 7 | 0 | ||||||
| Adjusted net revenues | 1,444 | 1,506 | 1,547 | 2,950 | 3,488 | ||||||
| Provision for credit losses | (11) | 24 | (24) | 13 | (11) | ||||||
| Total operating expenses | 1,373 | 1,510 | 1,167 | 2,883 | 2,261 | ||||||
| Restructuring expenses | (15) | (10) | (9) | (25) | (12) | ||||||
| Major litigation provisions | (16) | (230) | 0 | (246) | 11 | ||||||
| Expenses related to real estate disposals | (1) | 0 | 0 | (1) | (4) | ||||||
| Expenses related to equity investment in Allfunds Group | 0 | 0 | (19) | 0 | (19) | ||||||
| Adjusted total operating expenses | 1,341 | 1,270 | 1,139 | 2,611 | 2,237 | ||||||
| Income/(loss) before taxes | (96) | (357) | 770 | (453) | 1,748 | ||||||
| Adjusted income before taxes | 114 | 212 | 432 | 326 | 1,262 | ||||||
| Adjusted economic profit | (97) | (21) | 130 | (118) | 563 | ||||||
| Adjusted return on regulatory capital (%) | 3.8 | 7.1 | 13.4 | 5.4 | 19.9 | ||||||
1 Of which CHF 20 million is reflected in other revenues and CHF 5 million is reflected in transaction- and performance-based revenues. | |||||||||||
Page A-3
| Appendix |
| Investment Bank | |||||||||||||||||
| in / end of | % change | in / end of | % change | ||||||||||||||
| 2Q22 | 1Q22 | 2Q21 | QoQ | YoY | 6M22 | 6M21 | YoY | ||||||||||
| Results (CHF million) | |||||||||||||||||
| Net revenues | 1,109 | 1,938 | 1,844 | (43) | (40) | 3,047 | 5,728 | (47) | |||||||||
| Provision for credit losses | 55 | (156) | 19 | – | 189 | (101) | 4,384 | – | |||||||||
| Total operating expenses | 2,170 | 1,970 | 1,841 | 10 | 18 | 4,140 | 3,670 | 13 | |||||||||
| Income/(loss) before taxes | (1,116) | 124 | (16) | – | – | (992) | (2,326) | (57) | |||||||||
| Metrics | |||||||||||||||||
| Economic profit (CHF million) | (1,220) | (297) | (467) | 311 | 161 | (1,517) | (2,661) | (43) | |||||||||
| Cost/income ratio (%) | 195.7 | 101.7 | 99.8 | – | – | 135.9 | 64.1 | – | |||||||||
| Results (USD million) | |||||||||||||||||
| Net revenues | 1,150 | 2,096 | 2,017 | (45) | (43) | 3,246 | 6,280 | (48) | |||||||||
| Provision for credit losses | 57 | (169) | 21 | – | 171 | (112) | 4,656 | – | |||||||||
| Total operating expenses | 2,258 | 2,131 | 2,018 | 6 | 12 | 4,389 | 4,033 | 9 | |||||||||
| Income/(loss) before taxes | (1,165) | 134 | (22) | – | – | (1,031) | (2,409) | (57) | |||||||||
| Net revenue detail | |||||||||||
| in / end of | 2Q22 | 1Q22 | 2Q21 | 6M22 | 6M21 | ||||||
| Net revenue detail (USD million) | |||||||||||
| Fixed income sales and trading | 622 | 802 | 916 | 1,424 | 2,532 | ||||||
| Equity sales and trading | 342 | 545 | (33) | 887 | 997 | ||||||
| Capital markets | 38 | 466 | 1,000 | 504 | 2,361 | ||||||
| Advisory and other fees | 190 | 221 | 139 | 411 | 396 | ||||||
| Other revenues | (42) | 62 | (5) | 20 | (6) | ||||||
| Net revenues | 1,150 | 2,096 | 2,017 | 3,246 | 6,280 | ||||||
Page A-4
| Appendix |
| Reconciliation of adjustment items | |||||||||||
| Investment Bank | |||||||||||
| in | 2Q22 | 1Q22 | 2Q21 | 6M22 | 6M21 | ||||||
| Results (CHF million) | |||||||||||
| Net revenues | 1,109 | 1,938 | 1,844 | 3,047 | 5,728 | ||||||
| Real estate (gains)/losses | 0 | (53) | 0 | (53) | 0 | ||||||
| Archegos | 0 | (17) | 493 | (17) | 493 | ||||||
| Adjusted net revenues | 1,109 | 1,868 | 2,337 | 2,977 | 6,221 | ||||||
| Provision for credit losses | 55 | (156) | 19 | (101) | 4,384 | ||||||
| Archegos | 0 | 155 | (70) | 155 | (4,500) | ||||||
| Adjusted provision for credit losses | 55 | (1) | (51) | 54 | (116) | ||||||
| Total operating expenses | 2,170 | 1,970 | 1,841 | 4,140 | 3,670 | ||||||
| Goodwill impairment | (23) | 0 | 0 | (23) | 0 | ||||||
| Restructuring expenses | (60) | (36) | (29) | (96) | (46) | ||||||
| Major litigation provisions | (191) | 0 | 0 | (191) | 0 | ||||||
| Expenses related to real estate disposals | (5) | (3) | 0 | (8) | (33) | ||||||
| Archegos | (13) | (11) | (31) | (24) | (31) | ||||||
| Adjusted total operating expenses | 1,878 | 1,920 | 1,781 | 3,798 | 3,560 | ||||||
| Income/(loss) before taxes | (1,116) | 124 | (16) | (992) | (2,326) | ||||||
| Adjusted income/(loss) before taxes | (824) | (51) | 607 | (875) | 2,777 | ||||||
| Adjusted economic profit | (1,001) | (428) | 1 | (1,429) | 1,166 | ||||||
| Adjusted return on regulatory capital (%) | (19.0) | (1.2) | 12.3 | (9.9) | 27.9 | ||||||
| Reconciliation of adjustment items | |||||||||||
| Investment Bank | |||||||||||
| in | 2Q22 | 1Q22 | 2Q21 | 6M22 | 6M21 | ||||||
| Results (USD million) | |||||||||||
| Net revenues | 1,150 | 2,096 | 2,017 | 3,246 | 6,280 | ||||||
| Real estate (gains)/losses | 0 | (57) | 0 | (57) | 0 | ||||||
| Archegos | 0 | (19) | 542 | (19) | 542 | ||||||
| Adjusted net revenues | 1,150 | 2,020 | 2,559 | 3,170 | 6,822 | ||||||
| Provision for credit losses | 57 | (169) | 21 | (112) | 4,656 | ||||||
| Archegos | 0 | 167 | (77) | 167 | (4,784) | ||||||
| Adjusted provision for credit losses | 57 | (2) | (56) | 55 | (128) | ||||||
| Total operating expenses | 2,258 | 2,131 | 2,018 | 4,389 | 4,033 | ||||||
| Goodwill impairment | (24) | – | – | (24) | – | ||||||
| Restructuring expenses | (63) | (39) | (32) | (102) | (51) | ||||||
| Major litigation provisions | (200) | 0 | 0 | (200) | 0 | ||||||
| Expenses related to real estate disposals | (4) | (3) | 0 | (7) | (35) | ||||||
| Archegos | (14) | (12) | (34) | (26) | (34) | ||||||
| Adjusted total operating expenses | 1,953 | 2,077 | 1,952 | 4,030 | 3,913 | ||||||
| Income/(loss) before taxes | (1,165) | 134 | (22) | (1,031) | (2,409) | ||||||
| Adjusted income/(loss) before taxes | (860) | (55) | 663 | (915) | 3,037 | ||||||
| Adjusted economic profit | (1,053) | (466) | 11 | (1,519) | 1,285 | ||||||
| Adjusted return on regulatory capital (%) | (19.0) | (1.2) | 12.3 | (9.9) | 27.9 | ||||||
Page A-5
| Appendix |
| Swiss Bank | |||||||||||||||||
| in / end of | % change | in / end of | % change | ||||||||||||||
| 2Q22 | 1Q22 | 2Q21 | QoQ | YoY | 6M22 | 6M21 | YoY | ||||||||||
| Results (CHF million) | |||||||||||||||||
| Net revenues | 1,050 | 1,109 | 1,023 | (5) | 3 | 2,159 | 2,054 | 5 | |||||||||
| Provision for credit losses | 18 | 23 | (21) | (22) | – | 41 | 5 | – | |||||||||
| Total operating expenses | 630 | 615 | 599 | 2 | 5 | 1,245 | 1,192 | 4 | |||||||||
| Income before taxes | 402 | 471 | 445 | (15) | (10) | 873 | 857 | 2 | |||||||||
| Metrics | |||||||||||||||||
| Economic profit (CHF million) | 101 | 154 | 129 | (34) | (22) | 255 | 234 | 9 | |||||||||
| Cost/income ratio (%) | 60.0 | 55.5 | 58.6 | – | – | 57.7 | 58.0 | – | |||||||||
| Assets under management (CHF billion) | 544.5 | 582.5 | 588.2 | (6.5) | (7.4) | 544.5 | 588.2 | (7.4) | |||||||||
| Net new assets (CHF billion) | (1.6) | 6.0 | 0.7 | – | – | 4.4 | 4.5 | – | |||||||||
| Gross margin (annualized) (bp) | 74 | 75 | 71 | – | – | 75 | 72 | – | |||||||||
| Net margin (annualized) (bp) | 28 | 32 | 31 | – | – | 30 | 30 | – | |||||||||
| Reconciliation of adjustment items | |||||||||||
| Swiss Bank | |||||||||||
| in | 2Q22 | 1Q22 | 2Q21 | 6M22 | 6M21 | ||||||
| Results (CHF million) | |||||||||||
| Net revenues | 1,050 | 1,109 | 1,023 | 2,159 | 2,054 | ||||||
| Real estate (gains)/losses | (13) | (84) | (4) | (97) | (4) | ||||||
| (Gain)/loss on equity investment in SIX Group AG | 10 | (3) | 0 | 7 | 0 | ||||||
| Adjusted net revenues | 1,047 | 1,022 | 1,019 | 2,069 | 2,050 | ||||||
| Provision for credit losses | 18 | 23 | (21) | 41 | 5 | ||||||
| Total operating expenses | 630 | 615 | 599 | 1,245 | 1,192 | ||||||
| Restructuring expenses | (3) | (1) | (3) | (4) | (10) | ||||||
| Expenses related to real estate disposals | – | – | (4) | – | (4) | ||||||
| Adjusted total operating expenses | 627 | 614 | 592 | 1,241 | 1,178 | ||||||
| Income before taxes | 402 | 471 | 445 | 873 | 857 | ||||||
| Adjusted income before taxes | 402 | 385 | 448 | 787 | 867 | ||||||
| Adjusted economic profit | 101 | 90 | 130 | 191 | 241 | ||||||
| Adjusted return on regulatory capital (%) | 12.0 | 11.6 | 13.1 | 11.8 | 12.8 | ||||||
Page A-6
| Appendix |
| Asset Management | |||||||||||||||||
| in / end of | % change | in / end of | % change | ||||||||||||||
| 2Q22 | 1Q22 | 2Q21 | QoQ | YoY | 6M22 | 6M21 | YoY | ||||||||||
| Results (CHF million) | |||||||||||||||||
| Net revenues | 311 | 361 | 417 | (14) | (25) | 672 | 817 | (18) | |||||||||
| Provision for credit losses | 2 | 0 | 1 | – | 100 | 2 | 1 | 100 | |||||||||
| Total operating expenses | 279 | 308 | 296 | (9) | (6) | 587 | 565 | 4 | |||||||||
| Income before taxes | 30 | 53 | 120 | (43) | (75) | 83 | 251 | (67) | |||||||||
| Metrics | |||||||||||||||||
| Economic profit (CHF million) | 9 | 28 | 74 | (68) | (88) | 37 | 158 | (77) | |||||||||
| Cost/income ratio (%) | 89.7 | 85.3 | 71.0 | – | – | 87.4 | 69.2 | – | |||||||||
| Reconciliation of adjustment items | |||||||||||
| Asset Management | |||||||||||
| in | 2Q22 | 1Q22 | 2Q21 | 6M22 | 6M21 | ||||||
| Results (CHF million) | |||||||||||
| Net revenues | 311 | 361 | 417 | 672 | 817 | ||||||
| Real estate (gains)/losses | 0 | (2) | 0 | (2) | 0 | ||||||
| Adjusted net revenues | 311 | 359 | 417 | 670 | 817 | ||||||
| Provision for credit losses | 2 | 0 | 1 | 2 | 1 | ||||||
| Total operating expenses | 279 | 308 | 296 | 587 | 565 | ||||||
| Restructuring expenses | (1) | 0 | (2) | (1) | (3) | ||||||
| Expenses related to real estate disposals | 0 | 0 | 0 | 0 | (1) | ||||||
| Adjusted total operating expenses | 278 | 308 | 294 | 586 | 561 | ||||||
| Income before taxes | 30 | 53 | 120 | 83 | 251 | ||||||
| Adjusted income before taxes | 31 | 51 | 122 | 82 | 255 | ||||||
| Adjusted economic profit | 10 | 27 | 76 | 37 | 162 | ||||||
| Adjusted return on regulatory capital (%) | 14.6 | 25.3 | 49.1 | 19.8 | 52.1 | ||||||
Page A-7
| Appendix |
Cautionary statement regarding forward-looking information
This document contains statements that constitute forward-looking statements. In addition, in the future we, and others on our behalf, may make statements that constitute forward-looking statements. Such forward-looking statements may include, without limitation, statements relating to the following:
■ our plans, targets or goals;
■ our future economic performance or prospects;
■ the potential effect on our future performance of certain contingencies; and
■ assumptions underlying any such statements.
Words such as “believes,” “anticipates,” “expects,” “intends” and “plans” and similar expressions are intended to identify forward-looking statements but are not the exclusive means of identifying such statements. We do not intend to update these forward-looking statements.
By their very nature, forward-looking statements involve inherent risks and uncertainties, both general and specific, and risks exist that predictions, forecasts, projections and other outcomes described or implied in forward-looking statements will not be achieved. We caution you that a number of important factors could cause results to differ materially from the plans, targets, goals, expectations, estimates and intentions expressed in such forward-looking statements. These factors include, but are not limited to:
■ the ability to maintain sufficient liquidity and access capital markets;
■ market volatility, increases in inflation and interest rate fluctuations or developments affecting interest rate levels;
■ the ongoing significant negative consequences, including reputational harm, of the Archegos and supply chain finance funds matters, as well as other recent events, and our ability to successfully resolve these matters;
■ our ability to improve our risk management procedures and policies and hedging strategies;
■ the strength of the global economy in general and the strength of the economies of the countries in which we conduct our operations, in particular, but not limited to, the risk of negative impacts of COVID-19 on the global economy and financial markets, Russia’s invasion of Ukraine, the resulting sanctions from the US, EU, UK, Switzerland and other countries and the risk of continued slow economic recovery or downturn in the EU, the US or other developed countries or in emerging markets in 2022 and beyond;
■ the emergence of widespread health emergencies, infectious diseases or pandemics, such as COVID-19, and the actions that may be taken by governmental authorities to contain the outbreak or to counter its impact;
■ potential risks and uncertainties relating to the severity of impacts from COVID-19 and the duration of the pandemic, including potential material adverse effects on our business, financial condition and results of operations;
■ the direct and indirect impacts of deterioration or slow recovery in residential and commercial real estate markets;
■ adverse rating actions by credit rating agencies in respect of us, sovereign issuers, structured credit products or other credit-related exposures;
■ the ability to achieve our strategic initiatives, including those related to our targets, ambitions and goals, such as our financial ambitions as well as various goals and commitments to incorporate certain environmental, social and governance considerations into our business strategy, products, services and risk management processes;
■ the ability of counterparties to meet their obligations to us and the adequacy of our allowance for credit losses;
■ the effects of, and changes in, fiscal, monetary, exchange rate, trade and tax policies;
■ the effects of currency fluctuations, including the related impact on our business, financial condition and results of operations due to moves in foreign exchange rates;
■ geopolitical and diplomatic tensions, instabilities and conflicts, including war, civil unrest, terrorist activity, sanctions or other geopolitical events or escalations of hostilities, such as Russia’s invasion of Ukraine;
■ political, social and environmental developments, including climate change;
■ the ability to appropriately address social, environmental and sustainability concerns that may arise from our business activities;
■ the effects of, and the uncertainty arising from, the UK’s withdrawal from the EU;
■ the possibility of foreign exchange controls, expropriation, nationalization or confiscation of assets in countries in which we conduct our operations;
■ operational factors such as systems failure, human error, or the failure to implement procedures properly;
■ the risk of cyber attacks, information or security breaches or technology failures on our reputation, business or operations, the risk of which is increased while large portions of our employees work remotely;
■ the adverse resolution of litigation, regulatory proceedings and other contingencies;
■ actions taken by regulators with respect to our business and practices and possible resulting changes to our business organization, practices and policies in countries in which we conduct our operations;
■ the effects of changes in laws, regulations or accounting or tax standards, policies or practices in countries in which we conduct our operations;
■ the discontinuation of LIBOR and other interbank offered rates and the transition to alternative reference rates;
■ the potential effects of changes in our legal entity structure;
■ competition or changes in our competitive position in geographic and business areas in which we conduct our operations;
■ the ability to retain and recruit qualified personnel;
■ the ability to protect our reputation and promote our brand;
■ the ability to increase market share and control expenses;
■ technological changes instituted by us, our counterparties or competitors;
■ the timely development and acceptance of our new products and services and the perceived overall value of these products and services by users;
■ acquisitions, including the ability to integrate acquired businesses successfully, and divestitures, including the ability to sell non-core assets; and
■ other unforeseen or unexpected events and our success at managing these and the risks involved in the foregoing.
We caution you that the foregoing list of important factors is not exclusive. When evaluating forward-looking statements, you should carefully consider the foregoing factors and other uncertainties and events, including the information set forth in “Risk factors” in I – Information on the company in our Annual Report 2021.
Page A-8

2Q22 Results Analyst and Investor Call Thomas Gottstein Chief Executive OfficerDavid Mathers Chief Financial OfficerJuly 27, 2022
Disclaimer (1/2) 2 Credit Suisse has not finalized its 2Q22 Financial Report and Credit Suisse’s independent registered public accounting firm has not completed its review of the condensed consolidated financial statements (unaudited) for the period. Accordingly, the financial information contained in this document is subject to completion of quarter-end procedures, which may result in changes to that information.This material does not purport to contain all of the information that you may wish to consider. This material is not to be relied upon as such or used in substitution for the exercise of independent judgment. Please also refer to our 2Q22 Earnings Release for additional information.Cautionary statement regarding forward-looking statements This document contains forward-looking statements that involve inherent risks and uncertainties, and we might not be able to achieve the predictions, forecasts, projections and other outcomes we describe or imply in forward-looking statements. A number of important factors could cause results to differ materially from the plans, targets, goals, expectations, estimates and intentions we express in these forward-looking statements, including those we identify in "Risk factors” in our Annual Report on Form 20-F for the fiscal year ended December 31, 2021 and in the “Cautionary statement regarding forward-looking information" in our 2Q22 Earnings Release published on July 27, 2022 and submitted to the US Securities and Exchange Commission, and in other public filings and press releases. We do not intend to update these forward-looking statements. In particular, the terms “Estimate”, “Illustrative”, “Ambition”, “Objective”, “Outlook”, “Goal”, “Commitment” and “Aspiration” are not intended to be viewed as targets or projections, nor are they considered to be Key Performance Indicators. All such estimates, illustrations, ambitions, objectives, outlooks, goals, commitments and aspirations are subject to a large number of inherent risks, assumptions and uncertainties, many of which are completely outside of our control. These risks, assumptions and uncertainties include, but are not limited to, general market conditions, market volatility, increased inflation, interest rate volatility and levels, global and regional economic conditions, challenges and uncertainties resulting from Russia’s invasion of Ukraine, political uncertainty, changes in tax policies, scientific or technological developments, evolving sustainability strategies, changes in the nature or scope of our operations, changes in carbon markets, regulatory changes, changes in levels of client activity as a result of any of the foregoing and other factors. Accordingly, these statements, which speak only as of the date made, are not guarantees of future performance and should not be relied on for any purpose. We do not intend to update these estimates, illustrations, ambitions, objectives, outlooks, goals, commitments, aspirations or any other forward-looking statements. For these reasons, we caution you not to place undue reliance upon any forward-looking statements. We may not achieve the benefits of our strategic initiativesWe may not achieve all of the expected benefits of our strategic initiatives. Factors beyond our control, including but not limited to the market and economic conditions (including macroeconomic and other challenges and uncertainties, for example, resulting from Russia’s invasion of Ukraine), changes in laws, rules or regulations and other challenges discussed in our public filings, could limit our ability to achieve some or all of the expected benefits of these initiatives. Estimates and assumptionsIn preparing this document, management has made estimates and assumptions that affect the numbers presented. Actual results may differ. Annualized numbers do not take into account variations in operating results, seasonality and other factors and may not be indicative of actual, full-year results. Figures throughout this document may also be subject to rounding adjustments. All opinions and views constitute good faith judgments as of the date of writing without regard to the date on which the reader may receive or access the information. This information is subject to change at any time without notice and we do not intend to update this information.Statement regarding non-GAAP financial measuresThis document contains non-GAAP financial measures, including results excluding certain items included in our reported resultsas well as return on regulatory capital and return on tangible equity (which is based on tangible shareholders’ equity). Further details and information needed to reconcile such non-GAAP financial measures to the most directly comparable measures under US GAAP can be found in the Appendix as well as in the 2Q22 Earnings Release, which is available on our website at www.credit-suisse.com. Our estimates, ambitions, objectives, aspirations and targets often include metrics that are non-GAAP financial measures and are unaudited. A reconciliation of the estimates, ambitions, objectives, aspirations and targets to the nearest GAAP measures is unavailable without unreasonable efforts. Results excluding certain items included in our reported results do not include items such as goodwill impairment, major litigation provisions, real estate gains, impacts from foreign exchange and other revenue and expense items included in our reported results, all of which are unavailable on a prospective basis. Such estimates, ambitions, objectives and targets are calculated in a manner that is consistent with the accounting policies applied by us in preparing our financial statements.
Disclaimer (2/2) 3 Statement regarding capital, liquidity and leverageCredit Suisse is subject to the Basel framework, as implemented in Switzerland, as well as Swiss legislation and regulations for systemically important banks, which include capital, liquidity, leverage and large exposure requirements and rules for emergency plans designed to maintain systemically relevant functions in the event of threatened insolvency. Credit Suisse has adopted the Bank for International Settlements (BIS) leverage ratio framework, as issued by the Basel Committee on Banking Supervision (BCBS) and implemented in Switzerland by the Swiss Financial Market Supervisory Authority FINMA.Unless otherwise noted, leverage exposure is based on the BIS leverage ratio framework and consists of period-end balance sheet assets and prescribed regulatory adjustments. The tier 1 leverage ratio and CET1 leverage ratio are calculated as BIS tier 1 capital and CET1 capital, respectively, divided by period-end leverage exposure.SourcesCertain material in this document has been prepared by Credit Suisse on the basis of publicly available information, internally developed data and other third-party sources believed to be reliable. Credit Suisse has not sought to independently verify information obtained from public and third-party sources and makes no representations or warranties as to accuracy, completeness, reasonableness or reliability of such information.
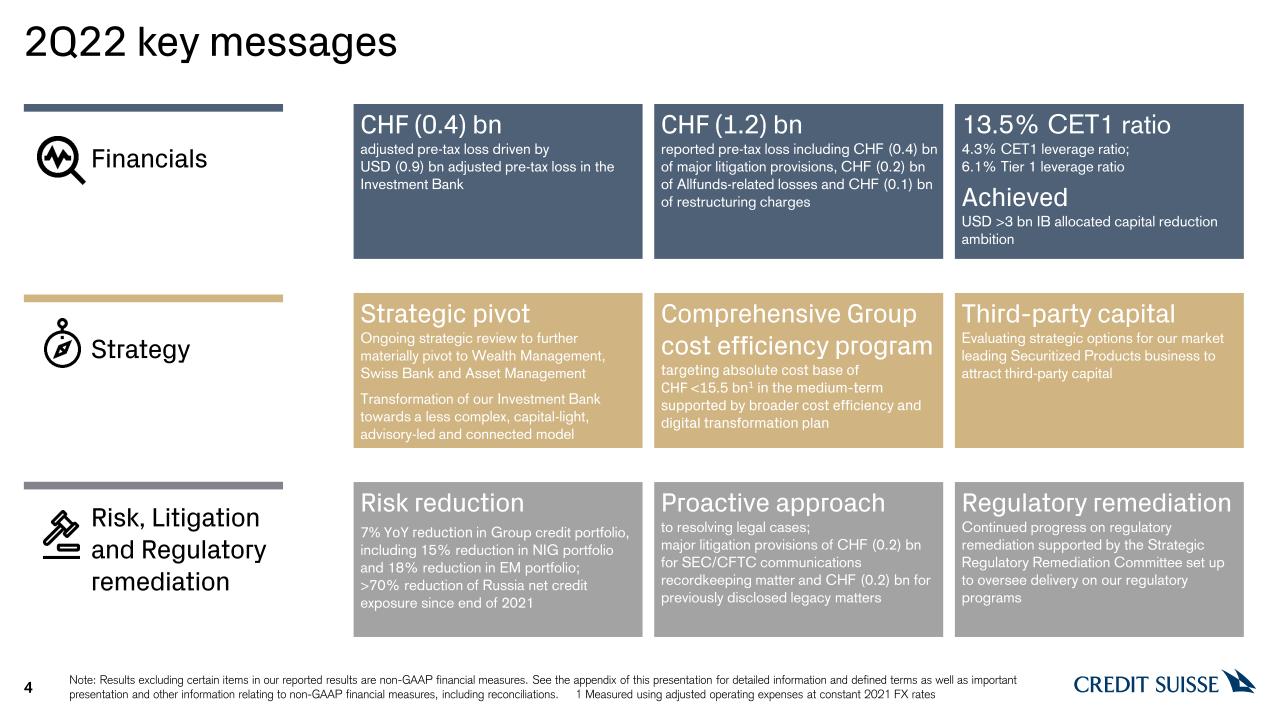
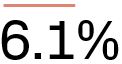
2Q22 key messages 4 CHF (1.2) bn reported pre-tax loss including CHF (0.4) bn of major litigation provisions, CHF (0.2) bn of Allfunds-related losses and CHF (0.1) bn of restructuring charges CHF (0.4) bnadjusted pre-tax loss driven by USD (0.9) bn adjusted pre-tax loss in the Investment Bank 13.5% CET1 ratio4.3% CET1 leverage ratio;6.1% Tier 1 leverage ratioAchievedUSD >3 bn IB allocated capital reduction ambition Comprehensive Group cost efficiency programtargeting absolute cost base of CHF <15.5 bn1 in the medium-term supported by broader cost efficiency and digital transformation plan Third-party capitalEvaluating strategic options for our market leading Securitized Products business to attract third-party capital Risk reduction7% YoY reduction in Group credit portfolio, including 15% reduction in NIG portfolio and 18% reduction in EM portfolio; >70% reduction of Russia net credit exposure since end of 2021 Proactive approach to resolving legal cases;major litigation provisions of CHF (0.2) bn for SEC/CFTC communications recordkeeping matter and CHF (0.2) bn for previously disclosed legacy matters Regulatory remediationContinued progress on regulatory remediation supported by the Strategic Regulatory Remediation Committee set up to oversee delivery on our regulatory programs Strategic pivotOngoing strategic review to further materially pivot to Wealth Management, Swiss Bank and Asset ManagementTransformation of our Investment Bank towards a less complex, capital-light, advisory-led and connected model Note: Results excluding certain items in our reported results are non-GAAP financial measures. See the appendix of this presentation for detailed information and defined terms as well as important presentation and other information relating to non-GAAP financial measures, including reconciliations. 1 Measured using adjusted operating expenses at constant 2021 FX rates Strategy Risk, Litigation and Regulatory remediation Financials
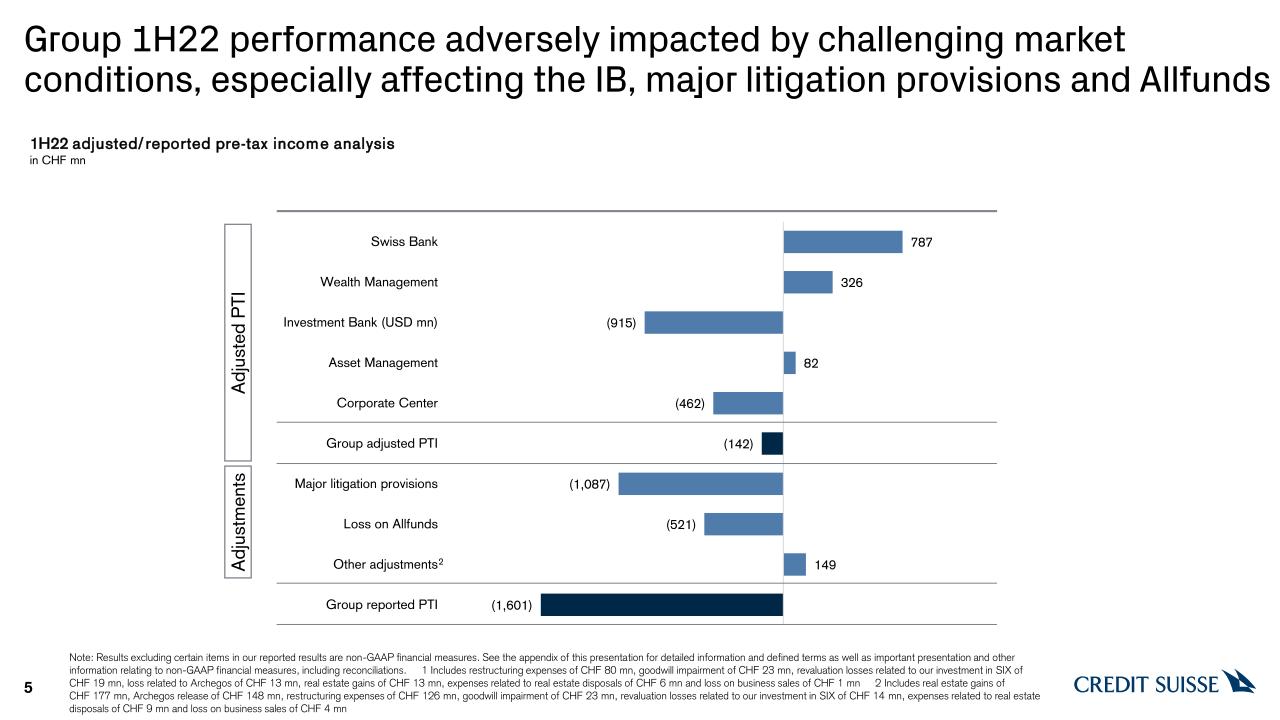
Group 1H22 performance adversely impacted by challenging market conditions, especially affecting the IB, major litigation provisions and Allfunds 5 1H22 adjusted/reported pre-tax income analysisin CHF mn Note: Results excluding certain items in our reported results are non-GAAP financial measures. See the appendix of this presentation for detailed information and defined terms as well as important presentation and other information relating to non-GAAP financial measures, including reconciliations. 1 Includes restructuring expenses of CHF 80 mn, goodwill impairment of CHF 23 mn, revaluation losses related to our investment in SIX of CHF 19 mn, loss related to Archegos of CHF 13 mn, real estate gains of CHF 13 mn, expenses related to real estate disposals of CHF 6 mn and loss on business sales of CHF 1 mn 2 Includes real estate gains of CHF 177 mn, Archegos release of CHF 148 mn, restructuring expenses of CHF 126 mn, goodwill impairment of CHF 23 mn, revaluation losses related to our investment in SIX of CHF 14 mn, expenses related to real estate disposals of CHF 9 mn and loss on business sales of CHF 4 mn Adjusted PTI Adjustments 2

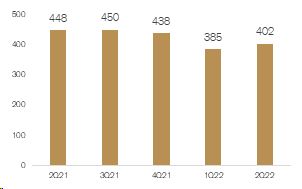
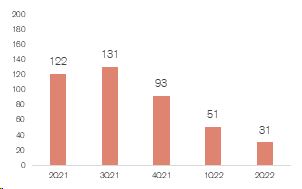
Significant markets impact on our Investment Bank and Wealth Management while Swiss Bank remained resilient 6 Adjusted PTI 2Q22 commentary WMin CHF mn IBin USD mn SBin CHF mn AMin CHF mn CCin CHF mn Improving NII from higher rates offset by lower recurring fees and transaction-based revenuesContinued investments in relationship managers, Group-wide technology, risk and compliance and in business growth including China resulting in 18% higher operating expensesNet inflows in APAC and Americas offset by outflows in EMEA and Switzerland; 1H22 NNA of CHF 3.4 bn (including CHF 1.9 bn of Russia-related outflows) o/w Russia (99)o/w AFG1 (34)o/w SCFF fee waiver (27) o/w Russia (101) Capital Markets revenues impacted by substantially lower ECM, Leveraged Finance market activity and Leveraged Finance mark-to-market losses Higher Advisory revenues and strong Equity Derivatives and Macro trading Net revenues up 3% across all major revenue lines, offset by normalized provisions for credit losses and higher operating expenses from increased deferred compensation, investments and marketing expenses; RoRC† at 12% PTI adversely impacted by a challenging market environment, partially offset by lower operating expenses reflecting the release of certain expense provisions related to the SCFF matterNet asset outflows across both traditional and alternative investments, partially offset by inflows from investments and partnerships Pre-tax losses decreased mostly due to lower operating expenses, notwithstanding volatile interest rate environment 2Q21 1Q22 2Q22 o/w Asset impairments (55)2o/w SCFF fee waiver (24)o/w AFG1 (21) o/w LevFin MtM (245) Note: Results excluding certain items in our reported results are non-GAAP financial measures. See the appendix of this presentation for detailed information and defined terms as well as important presentation and other information relating to non-GAAP financial measures, including reconciliations. 1 Includes MtM losses in APAC Financing 2 Includes CHF (38) mn write-off of certainIT-related assets and CHF (17) mn impairments relating to certain third-party assets

IB Deep Dive: performance impacted by our franchise positioning 7 Note: Results excluding certain items in our reported results are non-GAAP financial measures. See the appendix of this presentation for detailed information and defined terms as well as important presentation and other information relating to non-GAAP financial measures, including reconciliations. 1 Dealogic 1H22 2 Thomson Reuters 2017-21 3 Thomson Reuters 1H22 4 Coalition Greenwich Competitor Analytics, FY21 5 Based on Third Party Competitive Analysis as of 1Q22 6 Including ECM, Leverage Finance, DCM revenue pools from Dealogic 7 Reflecting 2Q22 YoY performance of fee pool 8 Annualized figures based on YTD data as of 30th June 2022 9 Bloomberg 10 Dealogic (Global) as of 1H22 11 Since 2Q16 Investment banking products Macro Equities Market activity Credit Suisse IB weighting IBCM Credit Our competitive strength #1 in US Securitizations2#1 in US RMBS3 Top 5 ranked4 Structured Equity Derivatives#6 rank in Cash Equities5 Tailored solutions including eFX platform Top 5 Global LevFin1Top 6 Global ECM1 Market drivers Capital market6 revenue poolsin USD bn 8 Credit spreadsin bps9 Equity market volatility9 Rates and FX volatility9 Our 2Q22 performance Lower Securitized Products vs. a strong prior yearRobust SP Financing pipeline Best 2Q Equity Derivatives results in recent history11Adjusted revenues impacted by Prime exit Strong Macro performance offset by lower EM trading Advisory fees +37% vs. Street (28)%Involved in 5 of the top 6 IBCM fee events10ECM down in line with StreetLFCM MtM of USD (245) mn ECM ~(80)%7Lev Fin ~(70)%7 Market performance
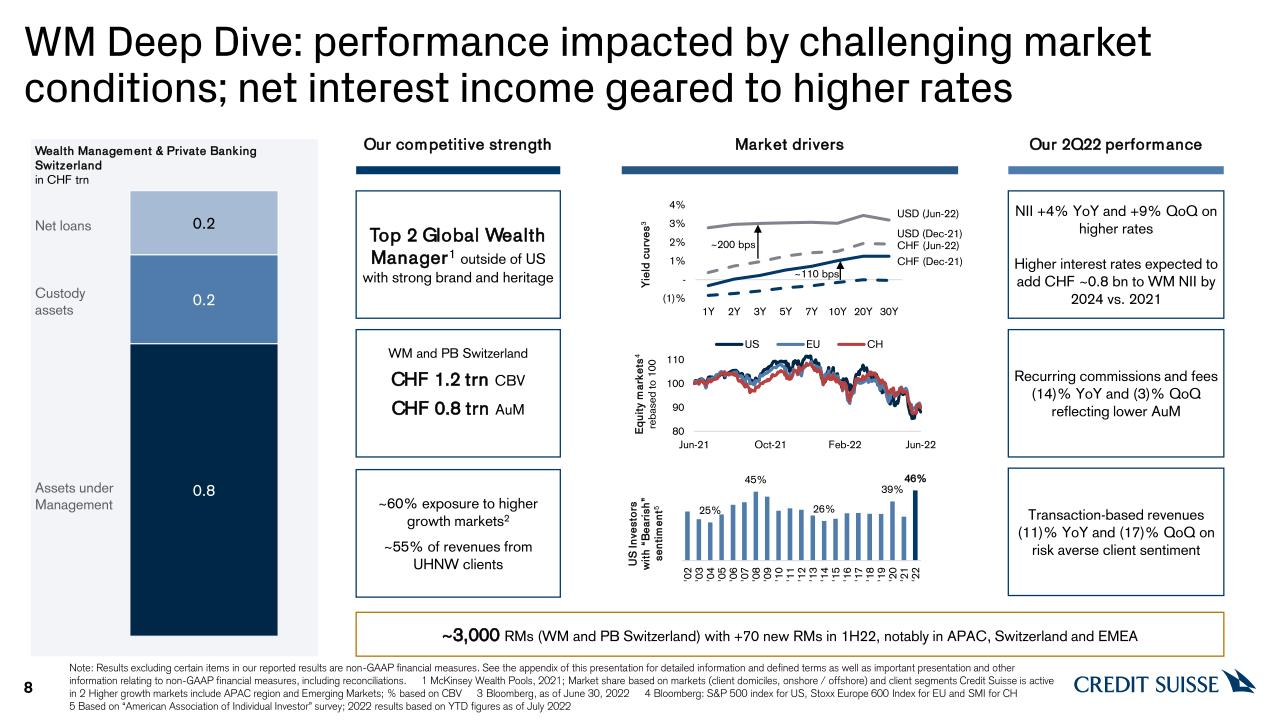
WM Deep Dive: performance impacted by challenging market conditions; net interest income geared to higher rates 8 Note: Results excluding certain items in our reported results are non-GAAP financial measures. See the appendix of this presentation for detailed information and defined terms as well as important presentation and other information relating to non-GAAP financial measures, including reconciliations. 1 McKinsey Wealth Pools, 2021; Market share based on markets (client domiciles, onshore / offshore) and client segments Credit Suisse is active in 2 Higher growth markets include APAC region and Emerging Markets; % based on CBV 3 Bloomberg, as of June 30, 2022 4 Bloomberg: S&P 500 index for US, Stoxx Europe 600 Index for EU and SMI for CH 5 Based on “American Association of Individual Investor” survey; 2022 results based on YTD figures as of July 2022 Our competitive strength WM and PB Switzerland CHF 1.2 trn CBVCHF 0.8 trn AuM ~60% exposure to higher growth markets2~55% of revenues from UHNW clients ~3,000 RMs (WM and PB Switzerland) with +70 new RMs in 1H22, notably in APAC, Switzerland and EMEA Top 2 Global Wealth Manager1 outside of US with strong brand and heritage Market drivers Yield curves3 Equity markets4rebased to 100 US Investors with “Bearish” sentiment5 Our 2Q22 performance Recurring commissions and fees (14)% YoY and (3)% QoQ reflecting lower AuM Transaction-based revenues (11)% YoY and (17)% QoQ on risk averse client sentiment NII +4% YoY and +9% QoQ on higher ratesHigher interest rates expected to add CHF ~0.8 bn to WM NII by 2024 vs. 2021 Assets under Management Net loans Custody assets USD (Jun-22) USD (Dec-21) CHF (Jun-22) CHF (Dec-21) ~200 bps ~110 bps Wealth Management & Private Banking Switzerlandin CHF trn
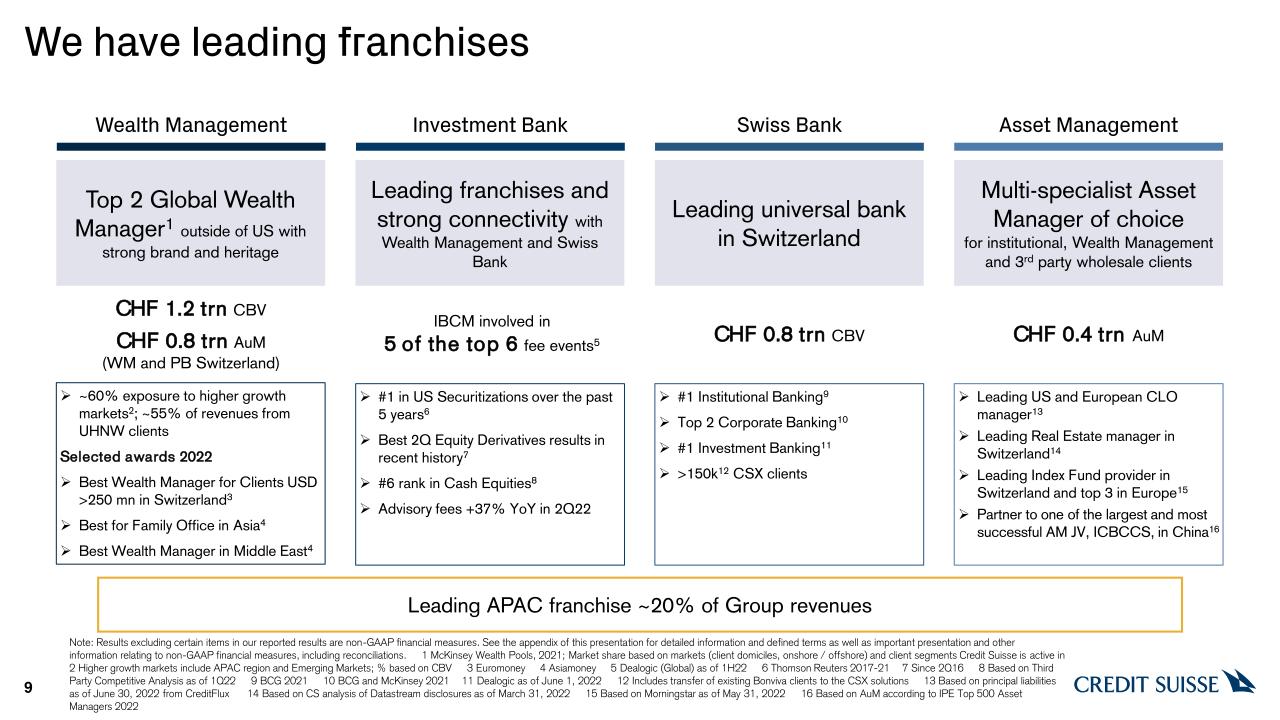
We have leading franchises 9 Wealth Management Leading APAC franchise ~20% of Group revenues ~60% exposure to higher growth markets2; ~55% of revenues from UHNW clientsSelected awards 2022Best Wealth Manager for Clients USD >250 mn in Switzerland3Best for Family Office in Asia4Best Wealth Manager in Middle East4 #1 in US Securitizations over the past 5 years6Best 2Q Equity Derivatives results in recent history7#6 rank in Cash Equities8Advisory fees +37% YoY in 2Q22 Investment Bank Top 2 Global Wealth Manager1 outside of US with strong brand and heritage Leading franchises and strong connectivity with Wealth Management and Swiss Bank #1 Institutional Banking9Top 2 Corporate Banking10#1 Investment Banking11>150k12 CSX clients Swiss Bank Leading universal bank in Switzerland Leading US and European CLO manager13Leading Real Estate manager in Switzerland14Leading Index Fund provider in Switzerland and top 3 in Europe15Partner to one of the largest and most successful AM JV, ICBCCS, in China16 Asset Management Multi-specialist Asset Manager of choicefor institutional, Wealth Management and 3rd party wholesale clients Note: Results excluding certain items in our reported results are non-GAAP financial measures. See the appendix of this presentation for detailed information and defined terms as well as important presentation and other information relating to non-GAAP financial measures, including reconciliations. 1 McKinsey Wealth Pools, 2021; Market share based on markets (client domiciles, onshore / offshore) and client segments Credit Suisse is active in2 Higher growth markets include APAC region and Emerging Markets; % based on CBV 3 Euromoney 4 Asiamoney 5 Dealogic (Global) as of 1H22 6 Thomson Reuters 2017-21 7 Since 2Q16 8 Based on Third Party Competitive Analysis as of 1Q22 9 BCG 2021 10 BCG and McKinsey 2021 11 Dealogic as of June 1, 2022 12 Includes transfer of existing Bonviva clients to the CSX solutions 13 Based on principal liabilities as of June 30, 2022 from CreditFlux 14 Based on CS analysis of Datastream disclosures as of March 31, 2022 15 Based on Morningstar as of May 31, 2022 16 Based on AuM according to IPE Top 500 Asset Managers 2022 CHF 1.2 trn CBVCHF 0.8 trn AuM(WM and PB Switzerland) IBCM involved in5 of the top 6 fee events5 CHF 0.8 trn CBV CHF 0.4 trn AuM
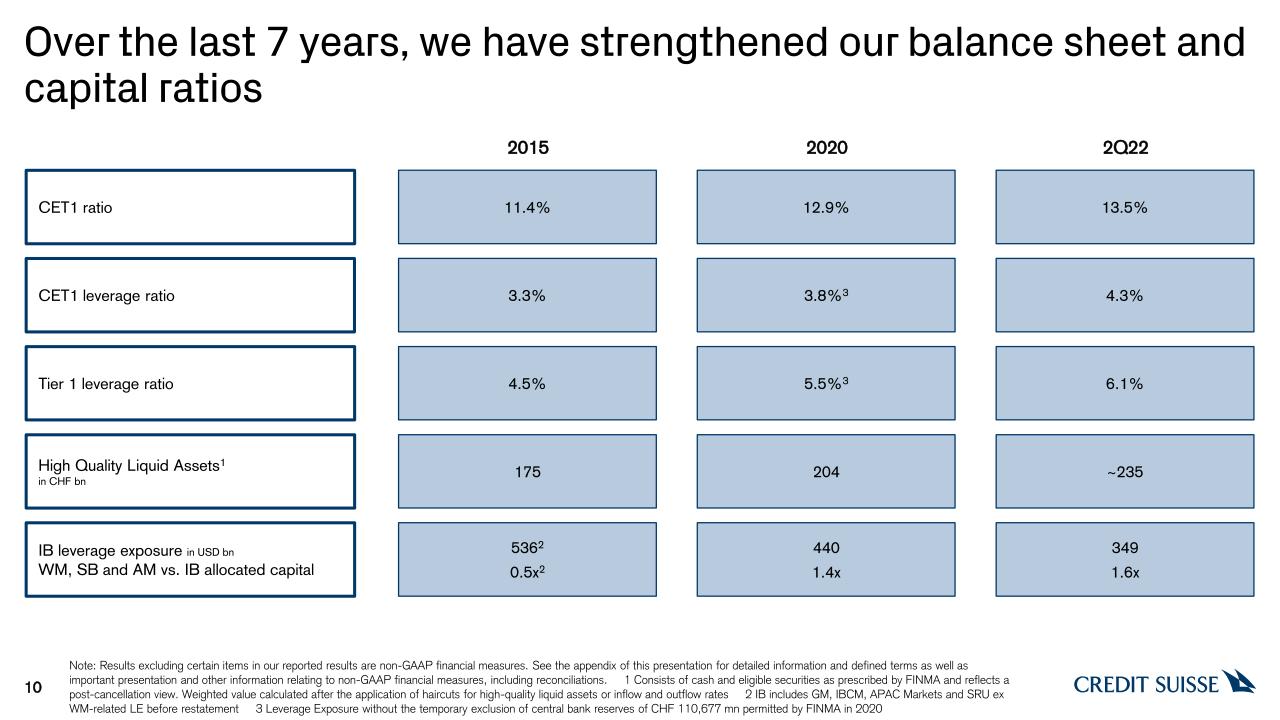
Over the last 7 years, we have strengthened our balance sheet and capital ratios 2015 2020 ~235 High Quality Liquid Assets1in CHF bn 6.1% Tier 1 leverage ratio 3491.6x IB leverage exposure in USD bnWM, SB and AM vs. IB allocated capital 4.3% CET1 leverage ratio CET1 ratio 13.5% 175 4.5% 53620.5x2 3.3% 11.4% 204 5.5%3 4401.4x 3.8%3 12.9% 2Q22 10 Note: Results excluding certain items in our reported results are non-GAAP financial measures. See the appendix of this presentation for detailed information and defined terms as well as important presentation and other information relating to non-GAAP financial measures, including reconciliations. 1 Consists of cash and eligible securities as prescribed by FINMA and reflects a post-cancellation view. Weighted value calculated after the application of haircuts for high-quality liquid assets or inflow and outflow rates 2 IB includes GM, IBCM, APAC Markets and SRU ex WM-related LE before restatement 3 Leverage Exposure without the temporary exclusion of central bank reserves of CHF 110,677 mn permitted by FINMA in 2020

11 Digital Transformation expected to drive fundamental change across the Group and lead to sustainable cost savings Our Ambition Our Approach The Benefits Digital transformation to position the bank for long-term growth and support cost efficiency program Group-wide digital vision presented by Joanne Hannaford on June 28th, 2022 Investor Deep DiveRobust, scalable and automated processes with a strong control focusEnterprise services that drive client value and reduce duplicative applications over timeDigital, cloud-based business platforms enabling front-to-back capabilities and differentiated productsEnterprise-scale, foundational technology capabilities to drive productivityStreamlined delivery via agile working practices Digital transformation to support fundamental change and Group cost efficiency programBenefits beyond cost-savings include:Superior client experienceRevenue growthLower operational riskImproved employee experience Note: Results excluding certain items in our reported results are non-GAAP financial measures. See the appendix of this presentation for detailed information and defined terms as well as important presentation and other information relating to non-GAAP financial measures, including reconciliations. 1 Measured using adjusted operating expenses at constant 2021 FX rates
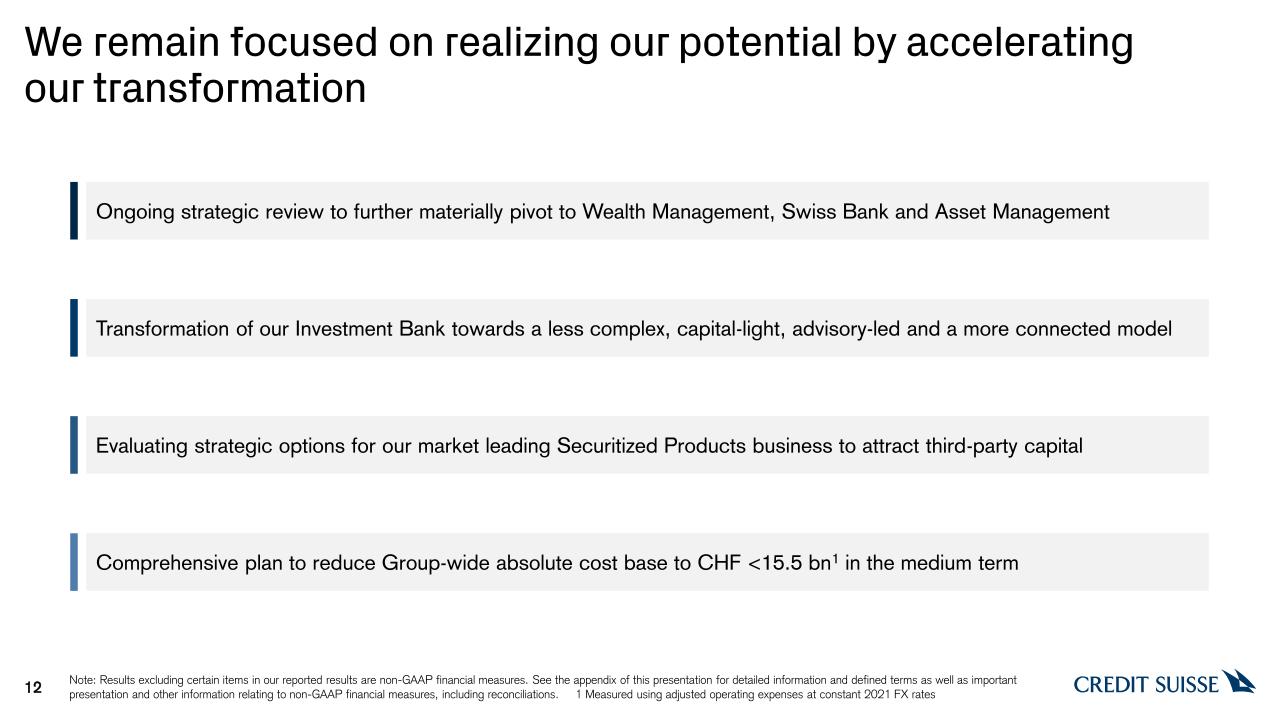
We remain focused on realizing our potential by accelerating our transformation 12 Comprehensive plan to reduce Group-wide absolute cost base to CHF <15.5 bn1 in the medium term Ongoing strategic review to further materially pivot to Wealth Management, Swiss Bank and Asset Management Evaluating strategic options for our market leading Securitized Products business to attract third-party capital Transformation of our Investment Bank towards a less complex, capital-light, advisory-led and a more connected model Note: Results excluding certain items in our reported results are non-GAAP financial measures. See the appendix of this presentation for detailed information and defined terms as well as important presentation and other information relating to non-GAAP financial measures, including reconciliations. 1 Measured using adjusted operating expenses at constant 2021 FX rates

Detailed Financials
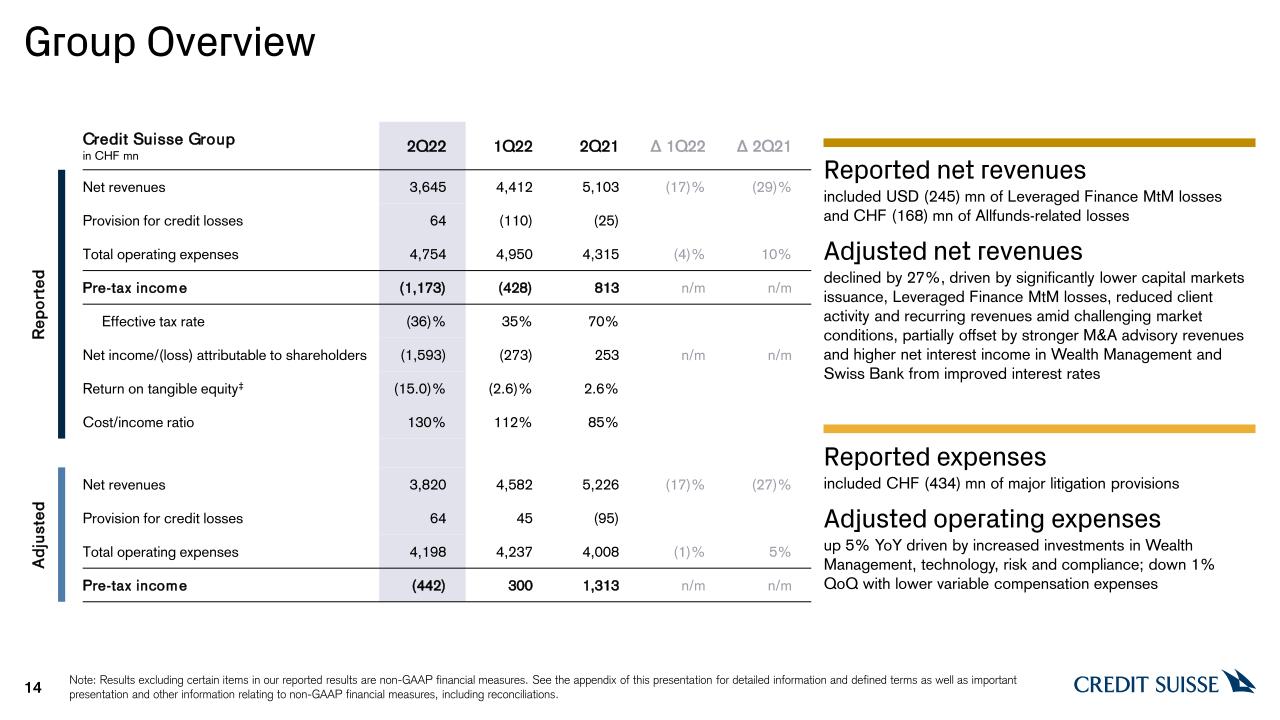
Group Overview 14 Reported net revenuesincluded USD (245) mn of Leveraged Finance MtM losses and CHF (168) mn of Allfunds-related losses Adjusted net revenuesdeclined by 27%, driven by significantly lower capital markets issuance, Leveraged Finance MtM losses, reduced client activity and recurring revenues amid challenging market conditions, partially offset by stronger M&A advisory revenues and higher net interest income in Wealth Management and Swiss Bank from improved interest rates Credit Suisse Group in CHF mn 2Q22 1Q22 2Q21 Δ 1Q22 Δ 2Q21 Reported Net revenues 3,645 4,412 5,103 (17)% (29)% Provision for credit losses 64 (110) (25) Total operating expenses 4,754 4,950 4,315 (4)% 10% Pre-tax income (1,173) (428) 813 n/m n/m Effective tax rate (36)% 35% 70% Net income/(loss) attributable to shareholders (1,593) (273) 253 n/m n/m Return on tangible equity‡ (15.0)% (2.6)% 2.6% Cost/income ratio 130% 112% 85% Adjusted Net revenues 3,820 4,582 5,226 (17)% (27)% Provision for credit losses 64 45 (95) Total operating expenses 4,198 4,237 4,008 (1)% 5% Pre-tax income (442) 300 1,313 n/m n/m Reported expensesincluded CHF (434) mn of major litigation provisions Adjusted operating expensesup 5% YoY driven by increased investments in Wealth Management, technology, risk and compliance; down 1% QoQ with lower variable compensation expenses Note: Results excluding certain items in our reported results are non-GAAP financial measures. See the appendix of this presentation for detailed information and defined terms as well as important presentation and other information relating to non-GAAP financial measures, including reconciliations.
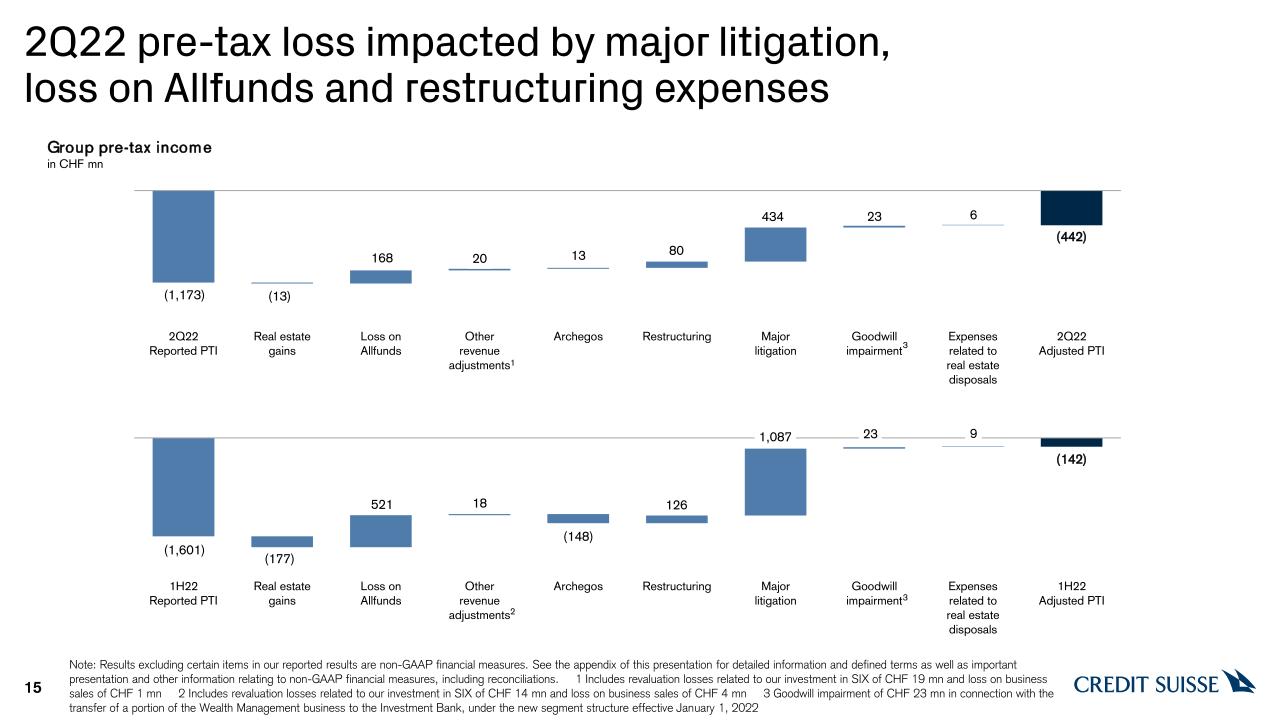
2Q22 pre-tax loss impacted by major litigation, loss on Allfunds and restructuring expenses 15 Note: Results excluding certain items in our reported results are non-GAAP financial measures. See the appendix of this presentation for detailed information and defined terms as well as important presentation and other information relating to non-GAAP financial measures, including reconciliations. 1 Includes revaluation losses related to our investment in SIX of CHF 19 mn and loss on business sales of CHF 1 mn 2 Includes revaluation losses related to our investment in SIX of CHF 14 mn and loss on business sales of CHF 4 mn 3 Goodwill impairment of CHF 23 mn in connection with the transfer of a portion of the Wealth Management business to the Investment Bank, under the new segment structure effective January 1, 2022 Group pre-tax incomein CHF mn 1 2 3 3

Aiming to reduce Group-wide absolute cost base to CHF <15.5 bn1 in the medium term 16 Group adjusted operating expensesat constant 2021 FX rates, in CHF bn 1Q22 2Q22 16.8 Accelerating digital transformationincluding the simplification of front-to-back processes, reducing manual data handling and duplication, and increasing the use of scalable cloud-based infrastructure. These initiatives as well as our broader cost efficiency program are expected to lead to a reduction of the absolute cost base to CHF <15.5 bn1 in the medium-term. Further detail, including incremental restructuring costs, will be provided at our 3Q22 results announcement 1H22 annualized expensesof CHF 16.8 bn1 in line with current guidance of CHF ~16.5-17.0 bn. These include CHF 331 mn of incremental investments relating to implementation of the Group’s strategy, including increased remediation spend in Risk, Compliance and infrastructure Note: Results excluding certain items in our reported results are non-GAAP financial measures. See the appendix of this presentation for detailed information and defined terms as well as important presentation and other information relating to non-GAAP financial measures, including reconciliations. 1 Measured using adjusted operating expenses at constant 2021 FX rates
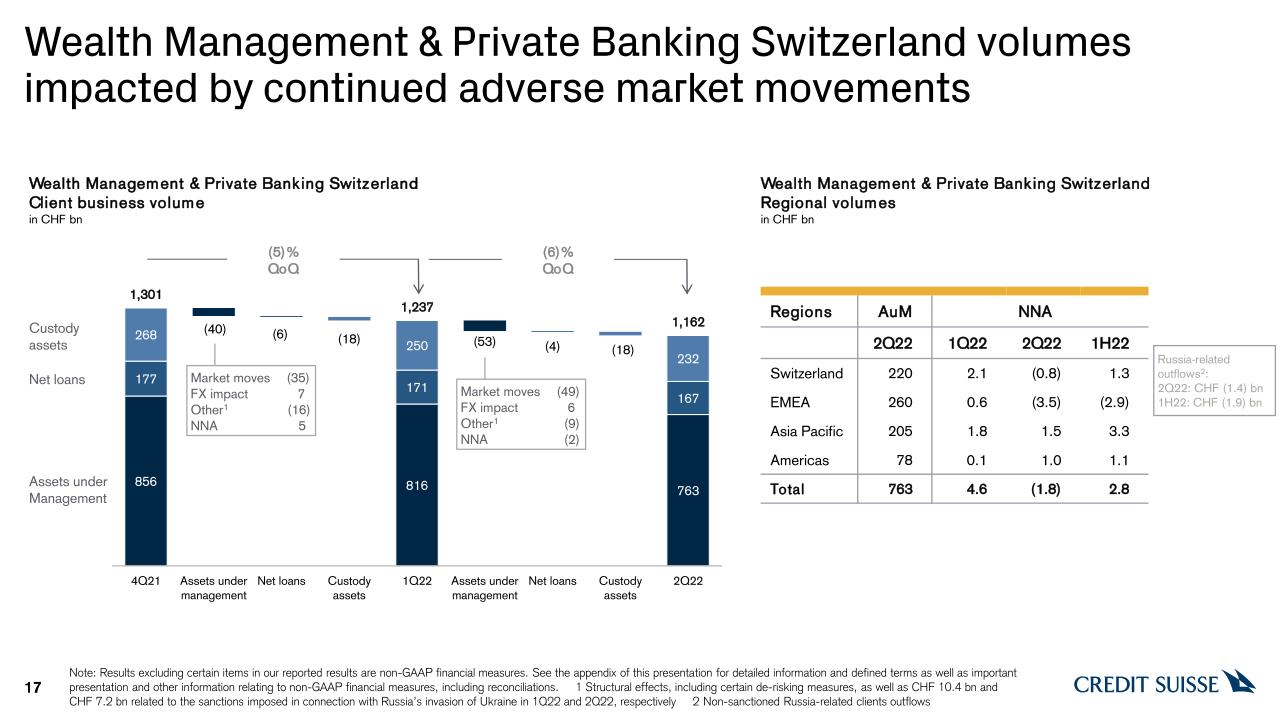
Wealth Management & Private Banking Switzerland volumes impacted by continued adverse market movements 17 Assets under Management Net loans Custody assets Regions AuM NNA 2Q22 1Q22 2Q22 1H22 Switzerland 220 2.1 (0.8) 1.3 EMEA 260 0.6 (3.5) (2.9) Asia Pacific 205 1.8 1.5 3.3 Americas 78 0.1 1.0 1.1 Total 763 4.6 (1.8) 2.8 Wealth Management & Private Banking SwitzerlandRegional volumesin CHF bn Wealth Management & Private Banking SwitzerlandClient business volumein CHF bn (6)%QoQ (5)%QoQ Market moves (49)FX impact 6Other1 (9)NNA (2) Market moves (35)FX impact 7Other1 (16)NNA 5 Note: Results excluding certain items in our reported results are non-GAAP financial measures. See the appendix of this presentation for detailed information and defined terms as well as important presentation and other information relating to non-GAAP financial measures, including reconciliations. 1 Structural effects, including certain de-risking measures, as well as CHF 10.4 bn and CHF 7.2 bn related to the sanctions imposed in connection with Russia’s invasion of Ukraine in 1Q22 and 2Q22, respectively 2 Non-sanctioned Russia-related clients outflows Russia-related outflows2:2Q22: CHF (1.4) bn1H22: CHF (1.9) bn

Higher USD and EUR interest rates expected to lead to additional CHF ~1 bn1 in Group net revenues by 2024 Sensitivity of Group revenues to interest rates Revenue impact from realization of forward rates3, in CHF bn 18 Yield curves2 have shifted higher We expect higher funding costs4in 2022 vs. 2021 of CHF ~0.2 bn CHF USD EUR USD (Jun-22) USD (Dec-21) CHF (Jun-22) CHF (Dec-21) Note: Results excluding certain items in our reported results are non-GAAP financial measures. See the appendix of this presentation for detailed information and defined terms as well as important presentation and other information relating to non-GAAP financial measures, including reconciliations. 1 Under U.S. GAAP these revenues will be reflected in Group net interest income and Group trading revenues 2 Bloomberg, as of June 30, 2022 3 From realization of CHF, USD and EUR forward rates; as of June 30, 2022 4 Includes Treasury-related cost of capital instruments, long-term funding and HQLA; includes FX impact ~200 bps ~150 bps ~80 bps ~110 bps
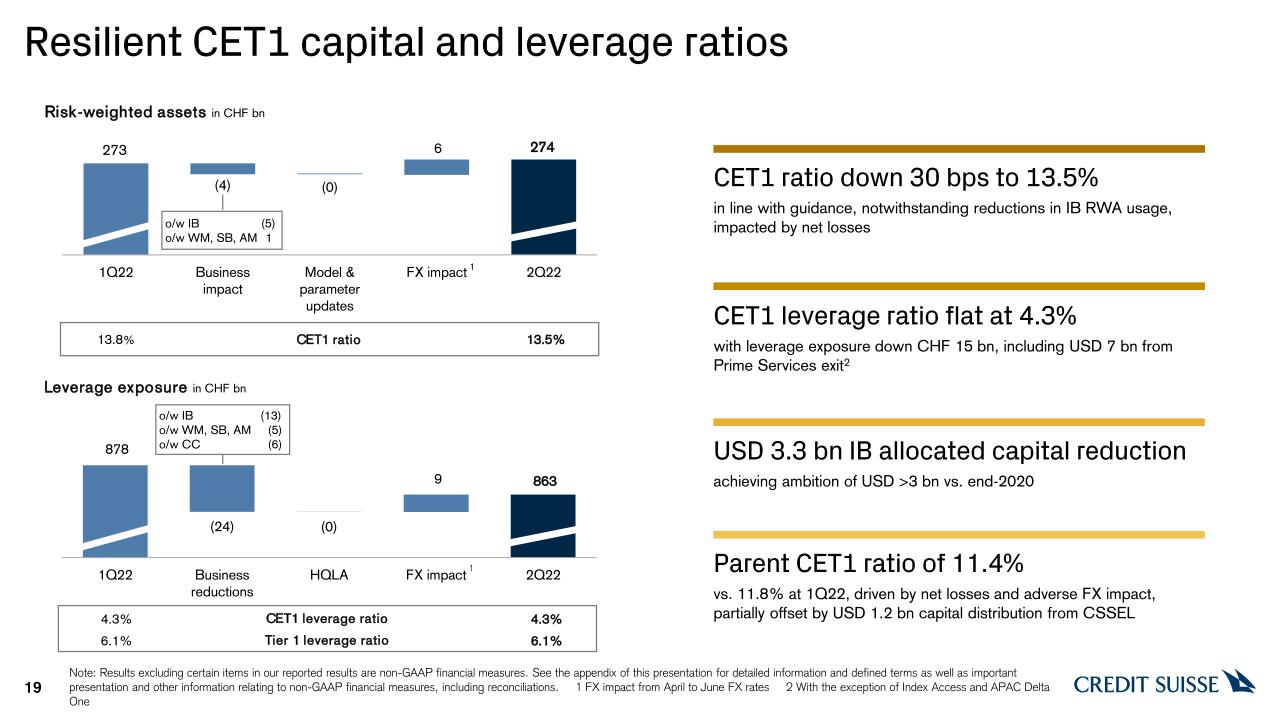
Resilient CET1 capital and leverage ratios 19 CET1 ratio down 30 bps to 13.5%in line with guidance, notwithstanding reductions in IB RWA usage, impacted by net losses CET1 leverage ratio flat at 4.3%with leverage exposure down CHF 15 bn, including USD 7 bn from Prime Services exit2 USD 3.3 bn IB allocated capital reductionachieving ambition of USD >3 bn vs. end-2020 13.5% CET1 ratio 13.8% Risk-weighted assets in CHF bn 1 Leverage exposure in CHF bn o/w IB (13) o/w WM, SB, AM (5) o/w CC (6) 1 4.3% CET1 leverage ratio 4.3% 6.1% Tier 1 leverage ratio 6.1% o/w IB (5) o/w WM, SB, AM 1. Parent CET1 ratio of 11.4%vs. 11.8% at 1Q22, driven by net losses and adverse FX impact, partially offset by USD 1.2 bn capital distribution from CSSEL Note: Results excluding certain items in our reported results are non-GAAP financial measures. See the appendix of this presentation for detailed information and defined terms as well as important presentation and other information relating to non-GAAP financial measures, including reconciliations. 1 FX impact from April to June FX rates 2 With the exception of Index Access and APAC Delta One
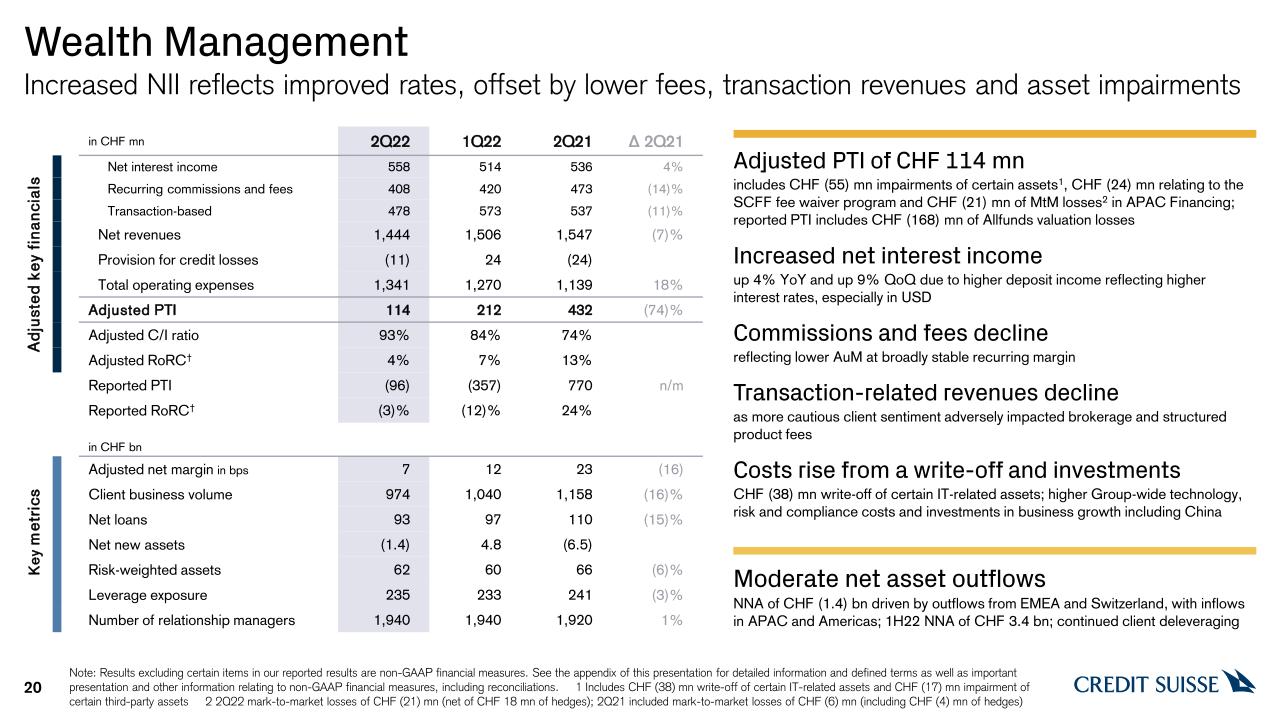
Wealth Management 20 Increased NII reflects improved rates, offset by lower fees, transaction revenues and asset impairments in CHF mn 2Q22 1Q22 2Q21 Δ 2Q21 Adjusted key financials Net interest income 558 514 536 4% Recurring commissions and fees 408 420 473 (14)% Transaction-based 478 573 537 (11)% Net revenues 1,444 1,506 1,547 (7)% Provision for credit losses (11) 24 (24) Total operating expenses 1,341 1,270 1,139 18% Adjusted PTI 114 212 432 (74)% Adjusted C/I ratio 93% 84% 74% Adjusted RoRC† 4% 7% 13% Reported PTI (96) (357) 770 n/m Reported RoRC† (3)% (12)% 24% in CHF bn Key metrics Adjusted net margin in bps 7 12 23 (16) Client business volume 974 1,040 1,158 (16)% Net loans 93 97 110 (15)% Net new assets (1.4) 4.8 (6.5) Risk-weighted assets 62 60 66 (6)% Leverage exposure 235 233 241 (3)% Number of relationship managers 1,940 1,940 1,920 1% Adjusted PTI of CHF 114 mnincludes CHF (55) mn impairments of certain assets1, CHF (24) mn relating to the SCFF fee waiver program and CHF (21) mn of MtM losses2 in APAC Financing; reported PTI includes CHF (168) mn of Allfunds valuation lossesIncreased net interest incomeup 4% YoY and up 9% QoQ due to higher deposit income reflecting higher interest rates, especially in USDCommissions and fees declinereflecting lower AuM at broadly stable recurring marginTransaction-related revenues declineas more cautious client sentiment adversely impacted brokerage and structured product feesCosts rise from a write-off and investmentsCHF (38) mn write-off of certain IT-related assets; higher Group-wide technology, risk and compliance costs and investments in business growth including China Moderate net asset outflowsNNA of CHF (1.4) bn driven by outflows from EMEA and Switzerland, with inflows in APAC and Americas; 1H22 NNA of CHF 3.4 bn; continued client deleveraging Note: Results excluding certain items in our reported results are non-GAAP financial measures. See the appendix of this presentation for detailed information and defined terms as well as important presentation and other information relating to non-GAAP financial measures, including reconciliations. 1 Includes CHF (38) mn write-off of certain IT-related assets and CHF (17) mn impairment of certain third-party assets 2 2Q22 mark-to-market losses of CHF (21) mn (net of CHF 18 mn of hedges); 2Q21 included mark-to-market losses of CHF (6) mn (including CHF (4) mn of hedges)
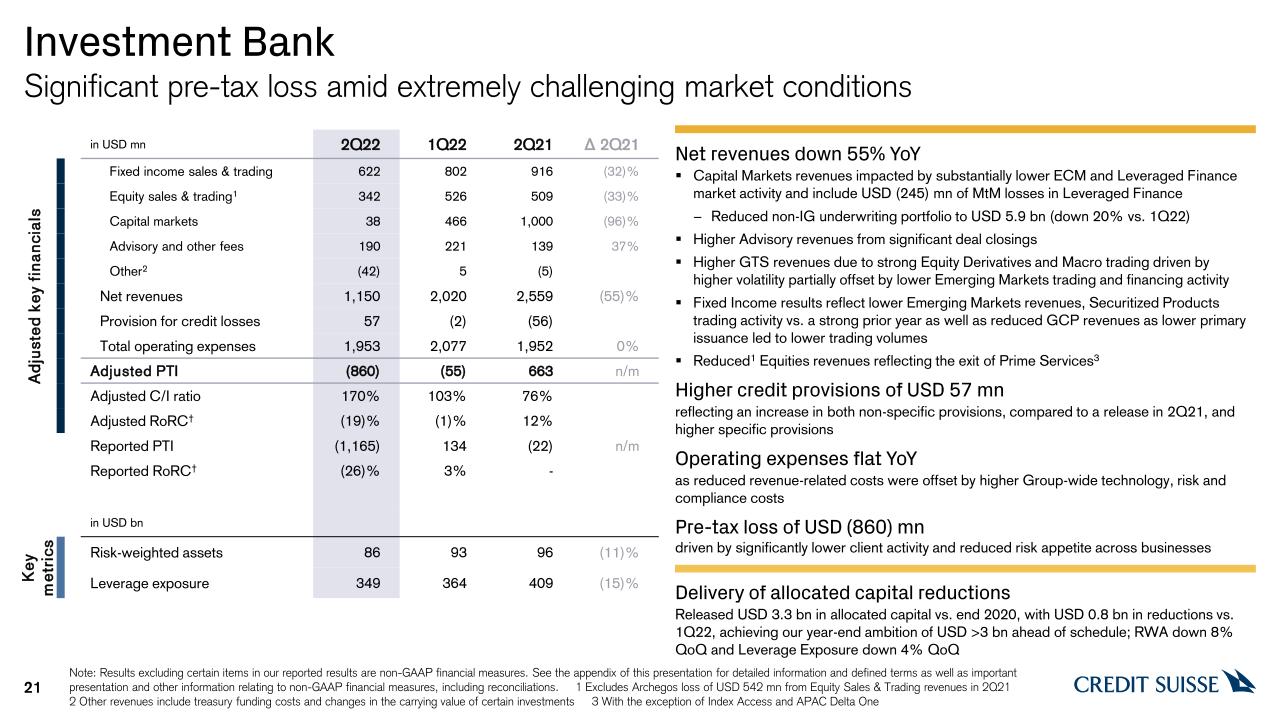
Investment Bank Note: Results excluding certain items in our reported results are non-GAAP financial measures. See the appendix of this presentation for detailed information and defined terms as well as important presentation and other information relating to non-GAAP financial measures, including reconciliations. 1 Excludes Archegos loss of USD 542 mn from Equity Sales & Trading revenues in 2Q21 2 Other revenues include treasury funding costs and changes in the carrying value of certain investments 3 With the exception of Index Access and APAC Delta One 21 Significant pre-tax loss amid extremely challenging market conditions in USD mn 2Q22 1Q22 2Q21 Δ 2Q21 Adjusted key financials Fixed income sales & trading 622 802 916 (32)% Equity sales & trading1 342 526 509 (33)% Capital markets 38 466 1,000 (96)% Advisory and other fees 190 221 139 37% Other2 (42) 5 (5) Net revenues 1,150 2,020 2,559 (55)% Provision for credit losses 57 (2) (56) Total operating expenses 1,953 2,077 1,952 0% Adjusted PTI (860) (55) 663 n/m Adjusted C/I ratio 170% 103% 76% Adjusted RoRC† (19)% (1)% 12% Reported PTI (1,165) 134 (22) n/m Reported RoRC† (26)% 3% - in USD bn Key metrics Risk-weighted assets 86 93 96 (11)% Leverage exposure 349 364 409 (15)% Net revenues down 55% YoYCapital Markets revenues impacted by substantially lower ECM and Leveraged Finance market activity and include USD (245) mn of MtM losses in Leveraged FinanceReduced non-IG underwriting portfolio to USD 5.9 bn (down 20% vs. 1Q22)Higher Advisory revenues from significant deal closingsHigher GTS revenues due to strong Equity Derivatives and Macro trading driven by higher volatility partially offset by lower Emerging Markets trading and financing activity Fixed Income results reflect lower Emerging Markets revenues, Securitized Products trading activity vs. a strong prior year as well as reduced GCP revenues as lower primary issuance led to lower trading volumesReduced1 Equities revenues reflecting the exit of Prime Services3Higher credit provisions of USD 57 mnreflecting an increase in both non-specific provisions, compared to a release in 2Q21, and higher specific provisionsOperating expenses flat YoYas reduced revenue-related costs were offset by higher Group-wide technology, risk and compliance costs Pre-tax loss of USD (860) mndriven by significantly lower client activity and reduced risk appetite across businesses Delivery of allocated capital reductionsReleased USD 3.3 bn in allocated capital vs. end 2020, with USD 0.8 bn in reductions vs. 1Q22, achieving our year-end ambition of USD >3 bn ahead of schedule; RWA down 8% QoQ and Leverage Exposure down 4% QoQ

Asset Management 22 PTI adversely affected by market sell off in CHF mn 2Q22 1Q22 2Q21 Δ 2Q21 Adjusted key financials Management fees 258 272 285 (9)% Perf., transaction & placement rev. 5 44 79 (94)% Investment and partnership income 48 43 53 (9)% Net revenues 311 359 417 (25)% Provision for credit losses 2 0 1 Total operating expenses 278 308 294 (5)% Adjusted PTI 31 51 122 (75)% Adjusted C/I ratio 89% 86% 71% Adjusted RoRC† 15% 25% 49% Reported PTI 30 53 120 (76)% Reported RoRC† 14% 26% 48% in CHF bn Key metrics Assets under management 427 462 471 (9)% Net new assets (6.1) (0.6) 1.3 Risk-weighted assets 9 8 10 (16)% Leverage exposure 3 3 3 (3)% Net revenues down 25%due to lower performance, transactions & placement revenues reflecting CHF (30) mn of investment-related losses, CHF (21) mn lower performance fees, CHF (16) mn lower placement fees and lower management fees (reflecting 9% drop in AuM)Operating expenses down 5%mainly reflecting release of certain expense provisions related to the SCFF matter, partially offset by higher Group-wide technology, risk and compliance costs and increased cash accruals for compensation due to normalized deferral levels Pre-tax income down 75%reflecting declining market levels, reduced client risk appetite and declining activity levels AuM down 9%or CHF (44) bn, of which CHF (41) bn is due to market and FX effectsNNA of CHF (6.1) bnwith outflows across both traditional investments and alternative investments, partially offset by inflows from investments and partnerships Note: Results excluding certain items in our reported results are non-GAAP financial measures. See the appendix of this presentation for detailed information and defined terms as well as important presentation and other information relating to non-GAAP financial measures, including reconciliations.
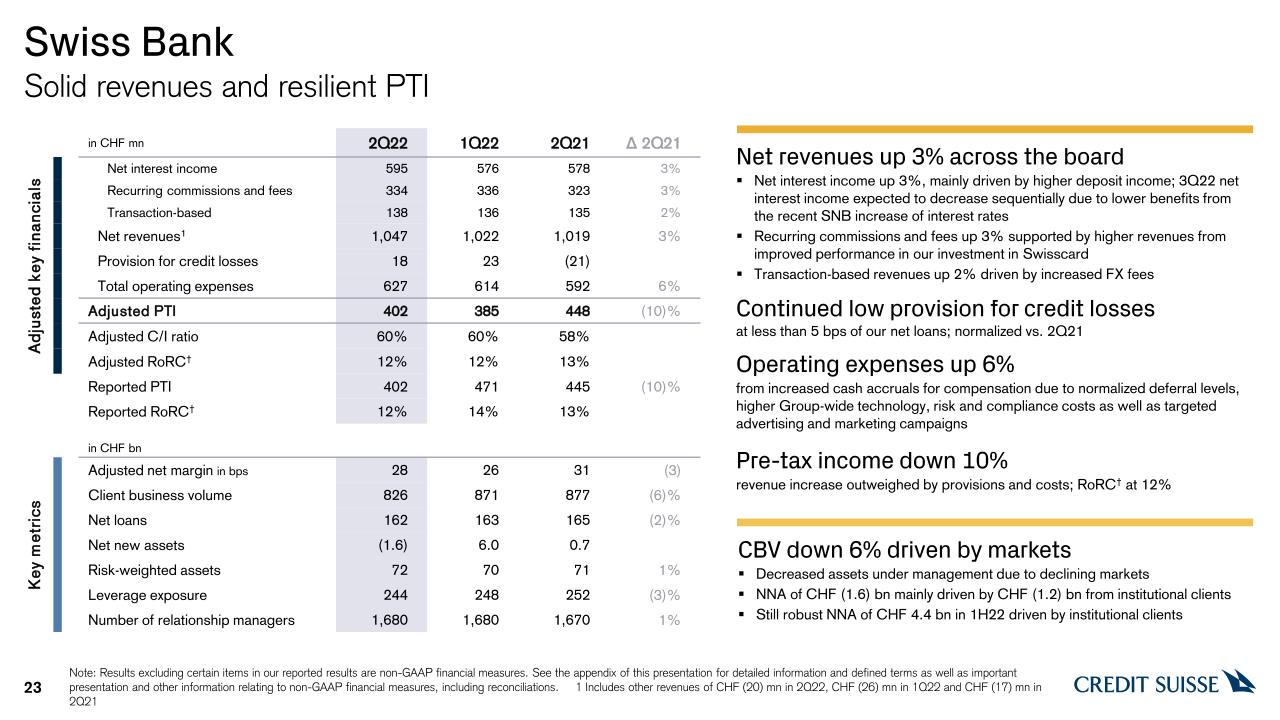
Swiss Bank 23 Solid revenues and resilient PTI in CHF mn 2Q22 1Q22 2Q21 Δ 2Q21 Adjusted key financials Net interest income 595 576 578 3% Recurring commissions and fees 334 336 323 3% Transaction-based 138 136 135 2% Net revenues1 1,047 1,022 1,019 3% Provision for credit losses 18 23 (21) Total operating expenses 627 614 592 6% Adjusted PTI 402 385 448 (10)% Adjusted C/I ratio 60% 60% 58% Adjusted RoRC† 12% 12% 13% Reported PTI 402 471 445 (10)% Reported RoRC† 12% 14% 13% in CHF bn Key metrics Adjusted net margin in bps 28 26 31 (3) Client business volume 826 871 877 (6)% Net loans 162 163 165 (2)% Net new assets (1.6) 6.0 0.7 Risk-weighted assets 72 70 71 1% Leverage exposure 244 248 252 (3)% Number of relationship managers 1,680 1,680 1,670 1% Net revenues up 3% across the boardNet interest income up 3%, mainly driven by higher deposit income; 3Q22 net interest income expected to decrease sequentially due to lower benefits from the recent SNB increase of interest ratesRecurring commissions and fees up 3% supported by higher revenues from improved performance in our investment in SwisscardTransaction-based revenues up 2% driven by increased FX feesContinued low provision for credit losses at less than 5 bps of our net loans; normalized vs. 2Q21Operating expenses up 6%from increased cash accruals for compensation due to normalized deferral levels, higher Group-wide technology, risk and compliance costs as well as targeted advertising and marketing campaignsPre-tax income down 10%revenue increase outweighed by provisions and costs; RoRC† at 12% CBV down 6% driven by marketsDecreased assets under management due to declining markets NNA of CHF (1.6) bn mainly driven by CHF (1.2) bn from institutional clientsStill robust NNA of CHF 4.4 bn in 1H22 driven by institutional clients Note: Results excluding certain items in our reported results are non-GAAP financial measures. See the appendix of this presentation for detailed information and defined terms as well as important presentation and other information relating to non-GAAP financial measures, including reconciliations. 1 Includes other revenues of CHF (20) mn in 2Q22, CHF (26) mn in 1Q22 and CHF (17) mn in 2Q21

Appendix

Net and gross margins 25 Adjusted gross margin in bps 2Q22 1Q22 3Q21 2Q21 4Q21 2Q22 1Q22 3Q21 2Q21 4Q21 754 432 Average AuM in CHF bn Adjusted pre-tax income in CHF mn Adjusted net revenues in CHF mn 1,547 1,567 1,345 138 384 759 755 1,444 114 694 1,506 212 724 Wealth Management 2Q22 1Q22 3Q21 2Q21 4Q21 579 448 1,019 1,049 1,039 438 450 592 593 1,047 402 569 1,022 385 588 Swiss Bank Adjusted net margin in bps 2Q22 1Q22 3Q21 2Q21 4Q21 Note: Results excluding certain items in our reported results are non-GAAP financial measures. See later in this Appendix for detailed information and defined terms as well as important presentation and other information relating to non-GAAP financial measures, including reconciliations.

Corporate Center 26 Corporate Center in CHF mn 2Q22 1Q22 2Q21 Δ 2Q21 Adjusted key financials Treasury results (155) (254) (116) n/m Asset Resolution unit 22 39 (43) n/m Other1 42 42 65 (35)% Net revenues (91) (173) (94) n/m Provision for credit losses - (1) - Total operating expenses 74 125 202 (63)% Adjusted PTI (165) (297) (296) n/m Reported PTI (393) (719) (506) n/m in CHF bn Key metrics Total assets 44 56 52 (15)% Risk-weighted assets 50 49 48 6% Leverage exposure 48 58 57 (16)% ARU within Corporate Center in CHF mn 2Q22 1Q22 2Q21 Δ 2Q21 Key financials Net revenues 22 39 (43) n/m Provision for credit losses - (1) - Total operating expenses 29 30 36 (19)% PTI (7) 10 (79) n/m in USD bn Key metrics Risk-weighted assets 6 7 8 (25)% Leverage exposure 15 16 19 (18)% Note: Results excluding certain items in our reported results are non-GAAP financial measures. See later in this Appendix for detailed information and defined terms as well as important presentation and other information relating to non-GAAP financial measures, including reconciliations. 1 Other revenues primarily include required elimination adjustments associated with trading in own shares, treasury commissions charged to divisions, the cost of certain hedging transactions executed in connection with the Group's RWAs and valuation hedging impacts from long-dated legacy deferred compensation and retirement programs mainly relating to former employees
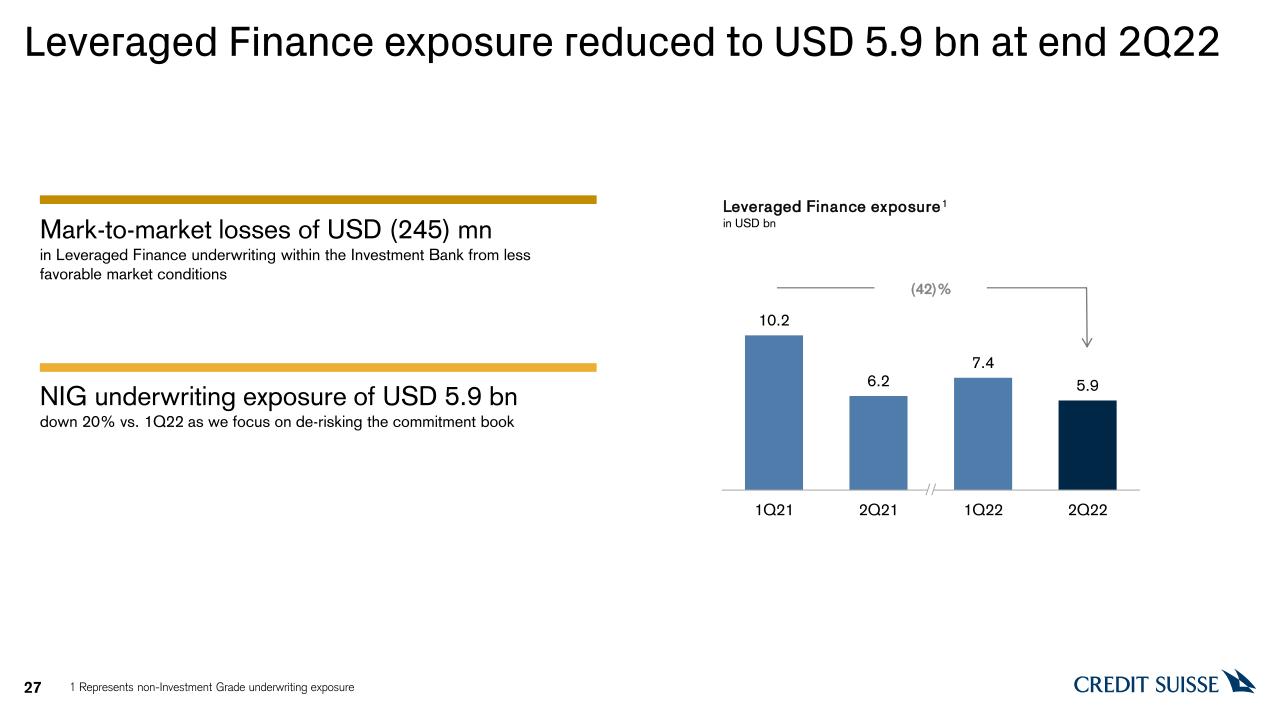
Leveraged Finance exposure reduced to USD 5.9 bn at end 2Q22 27 Mark-to-market losses of USD (245) mnin Leveraged Finance underwriting within the Investment Bank from less favorable market conditions Leveraged Finance exposure1in USD bn (42)% NIG underwriting exposure of USD 5.9 bndown 20% vs. 1Q22 as we focus on de-risking the commitment book 1 Represents non-Investment Grade underwriting exposure

Oil & Gas / Russia-related exposures 28 Oil & Gas exposure1in USD bn 4.2 Gross Net2 Gross Net2 Risk exposure 1,041 373 664 244 o/w Sovereigns 35 35 65 65 o/w Financial institutions 229 177 43 43 o/w Corporates 429 82 261 70 o/w Individuals 348 79 295 66 As at March 31, 2022 As at June 30, 2022 Russia credit exposure2in CHF mn 1 Oil & Gas net lending exposure in Corporate Bank 2 Exposure is net of specific allowances, specific provisions for credit losses and valuation adjustments

Credit Suisse We have a strong capital and liquidity position 29 2Q22 CET1 ratio – Peers1 2Q22 Tier 1 leverage ratio – Peers2 2Q22 Liquidity coverage ratio – Peers 2Q22 HQLA as % of total assets – Peers * * * * * * * * * * Credit Suisse Credit Suisse Credit Suisse * * * * * * * * * * Source: Company filings as of 1Q22 except for Credit Suisse, UBS and US banksNote: Peers include Bank of America, Barclays, BNP, Citigroup, Deutsche Bank, Goldman Sachs, HSBC, JP Morgan, Morgan Stanley, Société Générale and UBS *As of 1Q22 1 US peers reflect lower of standardized or advanced CET1 ratio 2 Supplementary Leverage Ratio for US peers * * * * * * * * * *
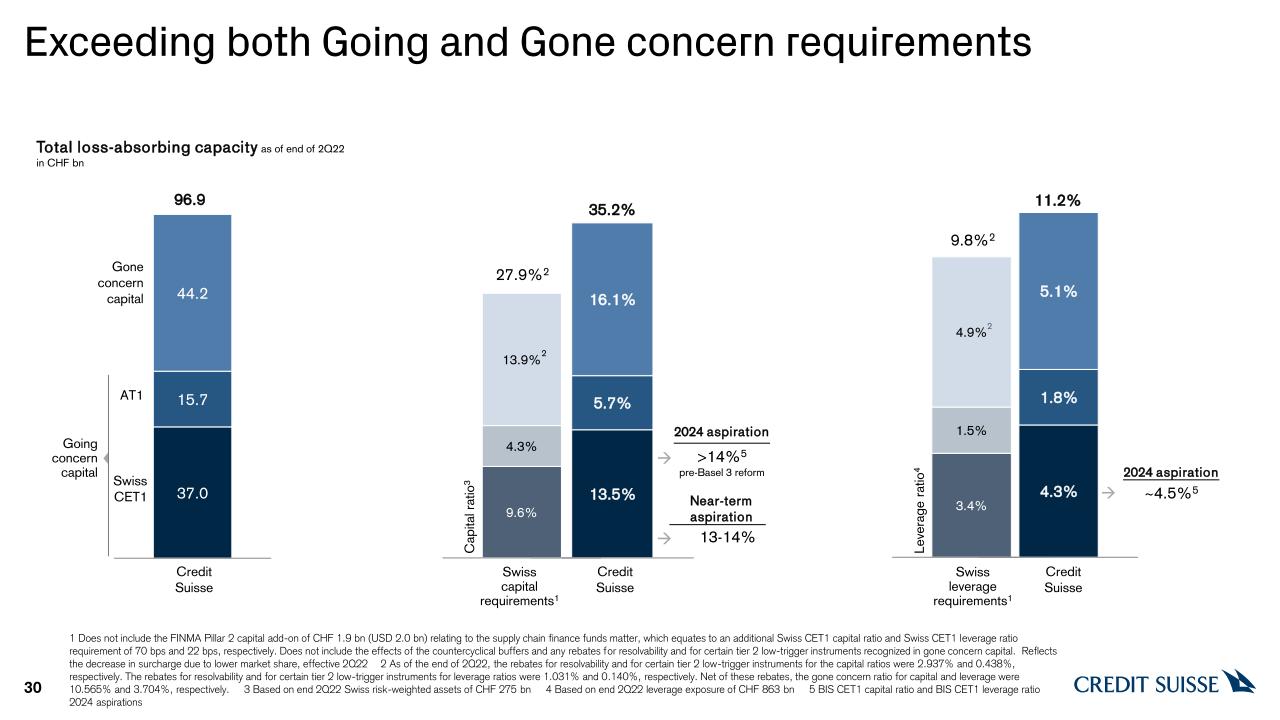
Exceeding both Going and Gone concern requirements 30 1 Does not include the FINMA Pillar 2 capital add-on of CHF 1.9 bn (USD 2.0 bn) relating to the supply chain finance funds matter, which equates to an additional Swiss CET1 capital ratio and Swiss CET1 leverage ratio requirement of 70 bps and 22 bps, respectively. Does not include the effects of the countercyclical buffers and any rebates for resolvability and for certain tier 2 low-trigger instruments recognized in gone concern capital. Reflects the decrease in surcharge due to lower market share, effective 2Q22 2 As of the end of 2Q22, the rebates for resolvability and for certain tier 2 low-trigger instruments for the capital ratios were 2.937% and 0.438%, respectively. The rebates for resolvability and for certain tier 2 low-trigger instruments for leverage ratios were 1.031% and 0.140%, respectively. Net of these rebates, the gone concern ratio for capital and leverage were 10.565% and 3.704%, respectively. 3 Based on end 2Q22 Swiss risk-weighted assets of CHF 275 bn 4 Based on end 2Q22 leverage exposure of CHF 863 bn 5 BIS CET1 capital ratio and BIS CET1 leverage ratio 2024 aspirations Total loss-absorbing capacity as of end of 2Q22 in CHF bn Swiss CET1 Gone concern capital AT1 Going concern capital Leverage ratio4 Capital ratio3 28.6%2 2 10.0%2 2 96.9 35.2% 11.2% Swiss capital requirements1 Swiss leverage requirements1 >14%5 pre-Basel 3 reform 2024 aspiration ~4.5%5 2024 aspiration 13-14% Near-term aspiration 27.9%2 9.8%2 Credit Suisse Credit Suisse Credit Suisse

Currency mix & Group capital metrics 31 Adjusted Credit Suisse Group results Applying a +/- 10% movement on the average FX rates for 2Q22 LTM, the sensitivities are:USD/CHF impact on 2Q22 LTM pre-tax income by CHF +220 / (220) mnEUR/CHF impact on 1Q22 LTM pre-tax income by CHF +104 / (104) mn Sensitivity analysis on Group results2 2Q22 LTMin CHF mn Contribution Wealth Management Investment Bank Swiss Bank Asset Management Group CHF USD EUR GBP Other Currency mix capital metric3 A 10% strengthening / weakening of the USD (vs. CHF) would have a +4.1 bps / (4.7) bps impact on the BIS CET1 ratio Basel III Risk-weighted assets Swiss leverage exposure CHF EUR Other USD USD CET1 capital 4 CHF Net revenues 18,290 31% 43% 11% 4% 11%Total expenses1 16,742 31% 34% 6% 10% 19% Net revenues 5,862 15% 49% 16% 4% 16%Total expenses1 5,014 32% 21% 10% 7% 30% Net revenues 7,134 5% 64% 11% 6% 14%Total expenses1 7,569 6% 53% 5% 15% 21% Net revenues 4,157 91% 2% 5% 1% 2%Total expenses1 2,482 91% 2% 2% 1% 4% Net revenues 1,474 49% 38% 9% 1% 3%Total expenses1 1,168 43% 37% 7% 8% 5% 1 Total expenses include provisions for credit losses 2 Sensitivity analysis based on adjusted numbers and on weighted average exchange rates of USD/CHF of 0.92 and EUR/CHF of 1.04 for 2Q22 LTM results 3 Data based on June 2022 month-end currency mix 4 Reflects actual capital positions in consolidated Group legal entities (net assets) including net asset hedges less applicable Basel III regulatory adjustments (e.g. goodwill)

32 Results excluding certain items included in our reported results are non-GAAP financial measures. Following the reorganization implemented at the beginning of 2022, we have amended the presentation of our adjusted results. Management believes that such results provide a useful presentation of our operating results for purposes of assessing our Group and divisional performance consistently over time, on a basis that excludes items that management does not consider representative of our underlying performance. Provided below is a reconciliation of our adjusted results to the most directly comparable US GAAP measures. Reconciliation of adjustment items (1/3) Group in CHF mn 2Q22 1Q22 4Q21 3Q21 2Q21 Net revenues 3,645 4,412 4,582 5,437 5,103 Real estate (gains)/losses (13) (164) (224) (4) (4) (Gains)/losses on business sales 1 3 (13) 42 - Major litigation recovery - - - - (49) Valuation adjustment related to major litigation - - - 69 - (Gain)/loss on equity investment in Allfunds Group 168 353 (31) (130) (317) (Gain)/loss on equity investment in SIX Group AG 19 (5) 70 - - Impairment on York Capital Management - - - 113 - Archegos - (17) - (23) 493 Adjusted net revenues 3,820 4,582 4,384 5,504 5,226 Provision for credit losses 64 (110) (20) (144) (25) Archegos - 155 5 188 (70) Adjusted provision for credit losses 64 45 (15) 44 (95) Total operating expenses 4,754 4,950 6,266 4,573 4,315 Goodwill impairment (23) - (1,623) - - Restructuring expenses (80) (46) (33) - (45) Major litigation provisions (434) (653) (514) (495) (208) Expenses related to real estate disposals (6) (3) (11) (3) (4) Expenses related to equity investmentin Allfunds Group - - - (1) (19) Archegos (13) (11) (14) 24 (31) Adjusted total operating expenses 4,198 4,237 4,071 4,098 4,008 Income/(loss) before taxes (1,173) (428) (1,664) 1,008 813 Adjusted income/(loss) before taxes (442) 300 328 1,362 1,313 Group operating expenses in CHF mn 2Q22 1Q22 Total reported operating expenses 4,754 4,950 Goodwill impairment (23) - Restructuring expenses (80) (46) Major litigation provisions (434) (653) Expenses related to real estate disposals (6) (3) Archegos (13) (11) Total adjusted operating expenses 4,198 4,237 FX impact 31 (10) Total adjusted operating expenses at FXC1 4,167 4,247 1 At constant 2021 FX rates Wealth Management in CHF mn 2Q22 1Q22 4Q21 3Q21 2Q21 Net revenues 1,266 1,177 1,377 1,656 1,913 Real estate (gains)/losses - (25) (19) - - (Gains)/losses on business sales 1 3 (17) 41 - Major litigation recovery - - - - (49) (Gain)/loss on equity investment in Allfunds Group 168 353 (31) (130) (317) (Gain)/loss on equity investment in SIX Group AG 9 (2) 35 - - Adjusted net revenues 1,444 1,506 1,345 1,567 1,547 Provision for credit losses (11) 24 (7) 18 (24) Total operating expenses 1,373 1,510 1,227 1,236 1,167 Restructuring expenses (15) (10) (7) - (9) Major litigation provisions (16) (230) (3) (70) - Expenses related to real estate disposals (1) - (3) - - Expenses related to equity investmentin Allfunds Group - - - (1) (19) Adjusted total operating expenses 1,341 1,270 1,214 1,165 1,139 Income/(loss) before taxes (96) (357) 157 402 770 Adjusted income/(loss) before taxes 114 212 138 384 432
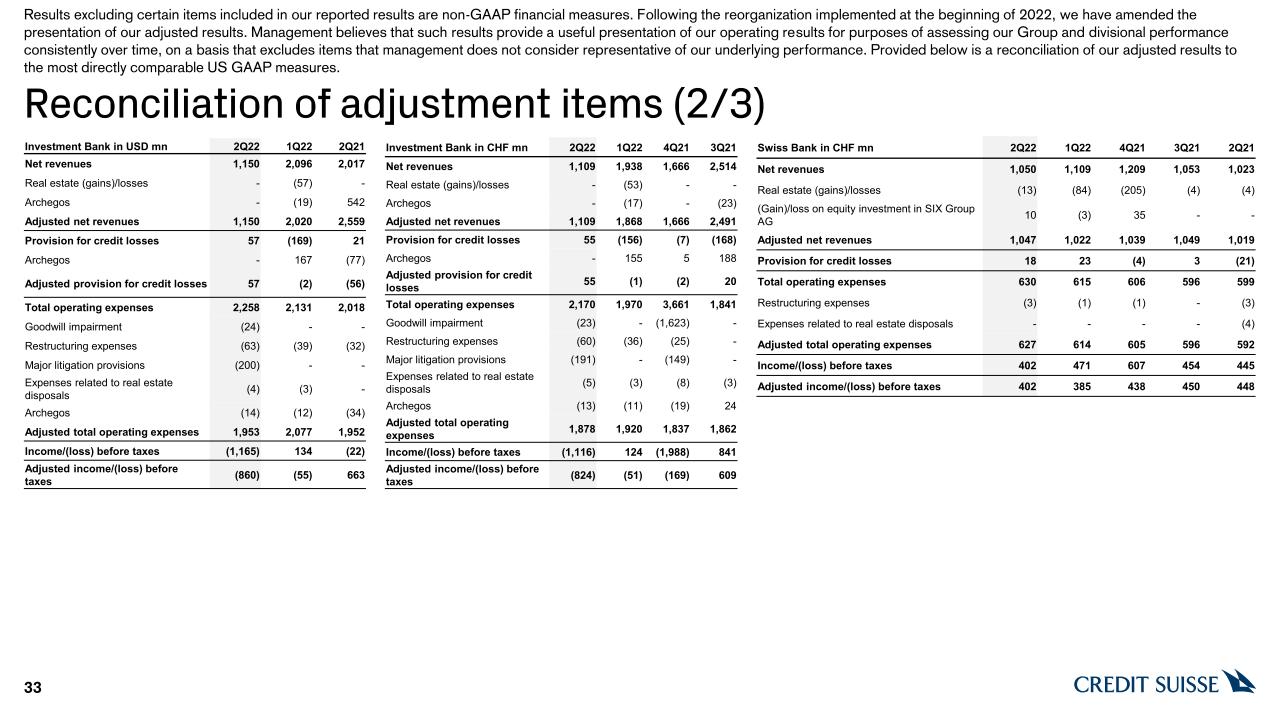
33 Results excluding certain items included in our reported results are non-GAAP financial measures. Following the reorganization implemented at the beginning of 2022, we have amended the presentation of our adjusted results. Management believes that such results provide a useful presentation of our operating results for purposes of assessing our Group and divisional performance consistently over time, on a basis that excludes items that management does not consider representative of our underlying performance. Provided below is a reconciliation of our adjusted results to the most directly comparable US GAAP measures. Reconciliation of adjustment items (2/3) Investment Bank in USD mn 2Q22 1Q22 2Q21 Net revenues 1,150 2,096 2,017 Real estate (gains)/losses - (57) - Archegos - (19) 542 Adjusted net revenues 1,150 2,020 2,559 Provision for credit losses 57 (169) 21 Archegos - 167 (77) Adjusted provision for credit losses 57 (2) (56) Total operating expenses 2,258 2,131 2,018 Goodwill impairment (24) - - Restructuring expenses (63) (39) (32) Major litigation provisions (200) - - Expenses related to real estate disposals (4) (3) - Archegos (14) (12) (34) Adjusted total operating expenses 1,953 2,077 1,952 Income/(loss) before taxes (1,165) 134 (22) Adjusted income/(loss) before taxes (860) (55) 663 Investment Bank in CHF mn 2Q22 1Q22 4Q21 3Q21 Net revenues 1,109 1,938 1,666 2,514 Real estate (gains)/losses - (53) - - Archegos - (17) - (23) Adjusted net revenues 1,109 1,868 1,666 2,491 Provision for credit losses 55 (156) (7) (168) Archegos - 155 5 188 Adjusted provision for credit losses 55 (1) (2) 20 Total operating expenses 2,170 1,970 3,661 1,841 Goodwill impairment (23) - (1,623) - Restructuring expenses (60) (36) (25) - Major litigation provisions (191) - (149) - Expenses related to real estate disposals (5) (3) (8) (3) Archegos (13) (11) (19) 24 Adjusted total operating expenses 1,878 1,920 1,837 1,862 Income/(loss) before taxes (1,116) 124 (1,988) 841 Adjusted income/(loss) before taxes (824) (51) (169) 609 Swiss Bank in CHF mn 2Q22 1Q22 4Q21 3Q21 2Q21 Net revenues 1,050 1,109 1,209 1,053 1,023 Real estate (gains)/losses (13) (84) (205) (4) (4) (Gain)/loss on equity investment in SIX Group AG 10 (3) 35 - - Adjusted net revenues 1,047 1,022 1,039 1,049 1,019 Provision for credit losses 18 23 (4) 3 (21) Total operating expenses 630 615 606 596 599 Restructuring expenses (3) (1) (1) - (3) Expenses related to real estate disposals - - - - (4) Adjusted total operating expenses 627 614 605 596 592 Income/(loss) before taxes 402 471 607 454 445 Adjusted income/(loss) before taxes 402 385 438 450 448
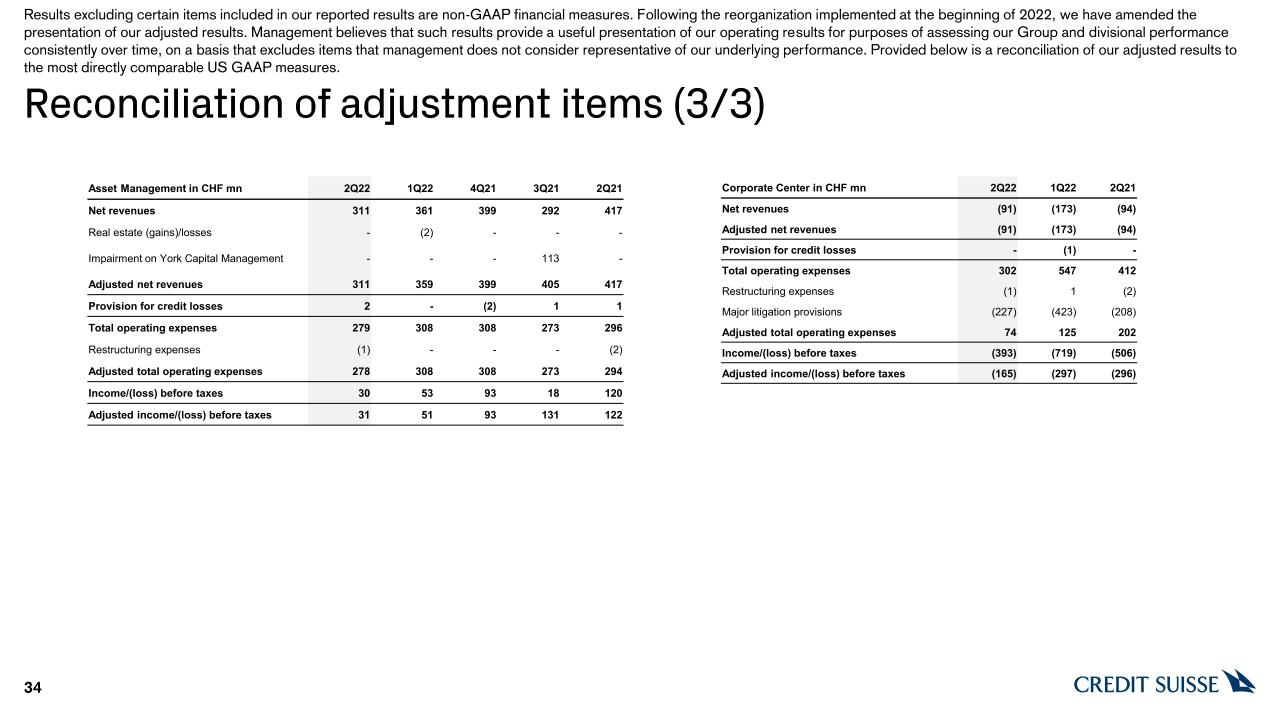
34 Results excluding certain items included in our reported results are non-GAAP financial measures. Following the reorganization implemented at the beginning of 2022, we have amended the presentation of our adjusted results. Management believes that such results provide a useful presentation of our operating results for purposes of assessing our Group and divisional performance consistently over time, on a basis that excludes items that management does not consider representative of our underlying performance. Provided below is a reconciliation of our adjusted results to the most directly comparable US GAAP measures. Reconciliation of adjustment items (3/3) Asset Management in CHF mn 2Q22 1Q22 4Q21 3Q21 2Q21 Net revenues 311 361 399 292 417 Real estate (gains)/losses - (2) - - - Impairment on York Capital Management - - - 113 - Adjusted net revenues 311 359 399 405 417 Provision for credit losses 2 - (2) 1 1 Total operating expenses 279 308 308 273 296 Restructuring expenses (1) - - - (2) Adjusted total operating expenses 278 308 308 273 294 Income/(loss) before taxes 30 53 93 18 120 Adjusted income/(loss) before taxes 31 51 93 131 122 Corporate Center in CHF mn 2Q22 1Q22 2Q21 Net revenues (91) (173) (94) Adjusted net revenues (91) (173) (94) Provision for credit losses - (1) - Total operating expenses 302 547 412 Restructuring expenses (1) 1 (2) Major litigation provisions (227) (423) (208) Adjusted total operating expenses 74 125 202 Income/(loss) before taxes (393) (719) (506) Adjusted income/(loss) before taxes (165) (297) (296)
Notes 35 General notesThroughout this presentation and the 2Q22 Results presentation rounding differences may occurUnless otherwise stated, all financial numbers presented and discussed are adjusted. Results excluding certain items included in our reported results are non-GAAP financial measures. All percentage changes and comparative descriptions refer to YoY measurements unless otherwise specifiedEstimates and assumptions are based on currently available information and beliefs, expectations and opinions of management and include all known facts and decisions as of July 27, 2022. Actual results may differOur absolute cost base ambition is measured using adjusted operating expenses at constant 2021 FX ratesUnless otherwise noted, all CET1 capital, CET1 ratio, CET1 leverage ratio, Tier 1 leverage ratio, risk-weighted assets and leverage exposure figures shown in these presentations are as of the end of the respective period and, for periods prior to 2019, on a “look-through” basisGross and net margins are shown in basis points; gross margin = net revenues annualized / average AuM; net margin = pre-tax income annualized / average AuM. Adjusted net margin excluding certain items included in our reported results is calculated using results excluding such items, applying the same methodologyMandates reflect advisory and discretionary mandate volumesMandate penetration reflects advisory and discretionary mandate volumes as a percentage of AuM, excluding those from the external asset manager businessParent means Credit Suisse AG on a standalone basis. All CET1 capital and CET1 ratio figures shown in these presentations for Parent are Swiss capital metricsClient Business Volume includes assets under management, custody assets and net loansCustody assets includes assets under custody and commercial assetsSpecific notes† Regulatory capital is calculated as the average of 13.5% of RWA and 4.25% of leverage exposure and return on regulatory capital, a non-GAAP financial measure, is calculated using income/(loss) after tax and assumes a tax rate of 25% from 2020 onward. For the Investment Bank, return on regulatory capital is based on US dollar denominated numbers. Return on regulatory capital excluding certain items included in our reported results is calculated using results excluding such items, applying the same methodology. Adjusted return on regulatory capital excluding certain items included in our reported results is calculated using results excluding such items, applying the same methodology.‡ Return on tangible equity, a non-GAAP financial measure, is calculated as annualized net income attributable to shareholders divided by average tangible shareholders’ equity. Tangible shareholders’ equity, a non-GAAP financial measure, is calculated by deducting goodwill and other intangible assets from total shareholders’ equity as presented in our balance sheet.For end-2Q21, tangible shareholders’ equity excluded goodwill of CHF 4,588 mn and other intangible assets of CHF 245 mn from total shareholders’ equity of CHF 43,580 mn as presented in our balance sheet.For end-1Q22, tangible shareholders’ equity excluded goodwill of CHF 2,931 mn and other intangible assets of CHF 307 mn from total shareholders’ equity of CHF 44,442 mn as presented in our balance sheet.For end-2Q22, tangible shareholders’ equity excluded goodwill of CHF 2,974 mn and other intangible assets of CHF 340 mn from total shareholders’ equity of CHF 45,842 mn as presented in our balance sheet.Our ambition to release USD >3 bn of capital from the Investment Bank over 2021-2022 and our ambition to invest CHF ~3 bn of capital in Wealth Management over 2021-2024 is based on an average of 13.5% risk-weighted assets and 4.25% leverage exposure.AbbreviationsAFG = APAC Financing Group; AM = Asset Management; APAC = Asia Pacific; ARU = Asset Resolution Unit; AuM = Assets under Management; BCG = Boston Consulting Group; BIS = Bank of International Settlements; bps = basis points; CBV = Client Business Volume; CC = Corporate Center; CET1 = Common Equity Tier 1; CFTC = Commodity Futures Trading Commission; CHF = Swiss Franc; CLO = Collateralized Loan Obligations; CSSEL = Credit Suisse Securities (Europe) Limited; CTOO = Chief Technology and Operations Officer; C/I = cost income ratio; DCM = Debt Capital Markets; ECM = Equity Capital Markets; EM = Emerging Markets; EMEA = Europe, Middle East and Africa; EUR = Euro; FINMA = Swiss Financial Market Supervisory Authority; FX = Foreign Exchange; GAAP = Generally Accepted Accounting Principles; GCP = Global Credit Products; GM = Global Markets; GTS = Global Trading Solutions; HY = High Yield; HQLA = High-quality Liquid Assets; IB = Investment Bank; IBCM = Investment Banking Capital Markets; IG = Investment Grade; ICBCCS = Industrial and Commercial Bank of China Credit Suisse; IT = Information Technology; JV = Joint Venture; LE = Leverage exposure; LFCM = Leveraged Finance Capital Markets; LevFin = Leveraged Finance; LTM = Last twelve months; M&A = Mergers & Acquisitions; MtM = Mark-to-market; NIG = Non-investment Grade; NII = Net interest income; NNA = Net New Assets; PB = Private Banking PCL = provision for credit losses; PTI = Pre-tax income; QoQ = Quarter on Quarter; rev. = revenues; rhs = right hand side; RM = Relationship Manager; RMBS = Residential Mortgage-backed Securities; RoRC = Return on Regulatory Capital; RWA = Risk-weighted assets; SB = Swiss Bank; SCFF = Supply Chain Finance Funds; SEC = Securities and Exchange Commission; SME = Small and Medium Enterprises; SMI = Swiss Market Index; SNB = Swiss National Bank; SP = Securitized Products; SRU = Strategic Resolution Unit; UHNW = Ultra High Net Worth; USD = United States Dollar; vs. = versus; WM = Wealth Management; YoY = Year on year; YTD = Year-to-Date

Footnotes are an integral part of this presentation. See slides • in the appendix of this presentation for detailed information, including important presentation and other information relating to non-GAAP financial measures, and defined terms. 36
Signatures
Pursuant to the requirements of the Securities Exchange Act of 1934, the registrants have duly caused this report to be signed on their behalf by the undersigned, thereunto duly authorized.
CREDIT SUISSE GROUP AG and CREDIT SUISSE AG
(Registrants)
Date: July 27, 2022
By:
/s/ Thomas Gottstein /s/ David R. Mathers
Thomas Gottstein David R. Mathers
Chief Executive Officer Chief Financial Officer