The Dutch market comprises five players and is highly penetrated, with two of the largest competitors holding a combined market share of approximately 70 per cent.
We shall continue to invest in the build-out of the Airwave network until its completion by the end of 2005. We shall also address the expanding range of opportunities for winning potential Airwave customers among the emergency services and public safety organisations at a time when there is heightened concern about national security and terrorist attacks.
Back to Contents
for RTE’s highly popular “You’re a Star” talent show, sponsored by O2 Ireland. Viewers cast their votes via premium text messaging using O2’s SMS Broker service, now called Mobile Marketing. On the final night of the show more than 850,000 SMS votes were cast using our Mobile Marketing service. O2 Ireland launched Ireland’s first public Wireless Local Area Network service, wireless zone, in early February 2003. wireless zone enables business people on the move to connect to the Internet at broadband speeds (25 – 30 times the speed of a dial-up modem) within 12 specific public locations, or ‘hotspots,’ nationwide. Representing a €1.9 million investment by O2 Ireland and using the inherent capability of the company’s core nationwide data network, wireless zone is available to both O2 and non-O2 customers.
Our distribution strategy continues to be a cornerstone of our success. In May 2002, we announced the formation of a new retail company, O2 Retail, and the consolidation and full integration of O2 Ireland’s four existing retail operations under the O2 Retail banner. This removed duplication of stores, reduced overhead costs and enabled us to bring a common, focused retail approach. We have continued to expand our network in a cost-efficient manner and in a way that is as unobtrusive as possible to local communities. We continued to upgrade a number of sites, which delivered improved network quality and capacity at a lower network cost. O2 Ireland is a company that is committed to investing in and playing a part in the development of local communities around the country. We are active in a wide range of activities that are integral to Irish life.
The number of competitors in the Irish mobile market is set to increase from January 2004 with the introduction of 3 (Hutchison Telecom). As part of the 3G licence process, O2 Ireland and Vodafone Ireland were awarded B licences while 3 was awarded the only A licence. The main differences in the licences are price and coverage and rollout requirements. The fee for the A licence is €50 million, while the fee for the B licence is €114 million. The B licence, while more expensive, carries less aggressive roll-out and coverage requirements. Meteor, the third 2G operator in the Irish market did not apply for a licence.
The focus for O2 Ireland over the coming year will be on further understanding the needs of our customers and satisfying those needs as efficiently as possible. ARPU in the Irish mobile phone market continues to be above the European average due to the high levels of both voice and non-voice usage. O2 Ireland will continue to look at ways of maximising value from existing voice services and a growing stream of value added, non-voice services. Any new investment in the existing 2G network will continue to be justified on a financial pay-back basis and where possible will be shared with the roll-out of our 3G network where our investment will be demand-driven.
Manx Telecom has been at the forefront of introducing new telecommunications technology and services. The Isle of Man has had the benefit of broadband ADSL services over fixed lines since March 2000, when Manx Telecom launched these services ahead of the UK. ADSL services are now available to around 80 per cent of the island’s population and the number of connections continues to rise steadily. In December 2001, Manx Telecom became the first operator in Europe to launch a fully operational 3G mobile network. Manx Telecom’s 3G network supports location-based services, video telephony, online gaming and video surveillance, as well as voice calls and high speed Internet access.
Manx Telecom’s 3G project has been a key demonstration of O2’s mobile data leadership and is providing an invaluable practical learning experience to other O2 businesses as they plan the implementation of 3G services in their own territories. In May 2002, we transported a 3G base station to Dublin to conduct a live demonstration in support of O2 Ireland’s successful bid for a 3G licence. Since its launch we have offered a 3G trial service to over 100 interested parties. We have also announced Europe’s first 3G tariffs and have tested a wide variety of applications across the new high-speed network. As one of a very small number of operators around the world who can demonstrate 3G, Manx Telecom has attracted over 1,200 visitors, including politicians and print and broadcast media from around the world, wishing to see the ground-breaking service at first hand. At the Manx
20
Back to Contents
International Rally in August 2002, 3G connectivity at each of the checkpoints around the course meant that driver information, times and results were for the first time simultaneously available all over the course via a web-based application. We are pleased that the mobile industry has recognised our achievements. We have won awards from Mobile News – Technology Innovation Award – and Tarifica Billing Magazine – Globe Award for Excellence in Mediation. In November 2002, Manx Telecom’s 3G services also gained Highly Commended at the eBTA Awards, hosted by Charteris and the Institute of Directors, in the category “Most Innovative Project”.
Manx Telecom is the only provider of mobile telephony in the Isle of Man.
Discussions are currently underway with the Isle of Man Government over the terms of the renewal of our licence ahead of the expiry date of the current licence in 2006. We have demonstrated our commitment to ensuring that we deliver the best possible service to our customers by achieving an overall satisfaction rating of over 98 per cent across the whole of the Manx Telecom portfolio. We have also invested £7.5 million during the year to upgrade and enhance the existing network and to deliver new services.
Between 2001 and 2003 O2 Online grew rapidly, underlining O2’s position as the clear UK market leader in mobile portal services. We doubled our online subscriber base to more than half a million customers, of which almost half are high-value contract customers. Customers for our premium rate services, such as ring tones and pre-paid alerts, have consistently recorded some of the highest ARPU levels within mmO2. The use of WAP services through our mobile portal demonstrated strong growth as customers embraced mobile Internet messaging, games, sport and news/information via their mobile handset. Our online portal, O2.co.uk, was named as “Best Site Makeover” by silicon.com.
O2 Online has had a key role in developing the interactive mobile services that are used increasingly to communicate media-related content in recent, innovative marketing campaigns. Interactive techniques include text voting, gaming quizzes, ringtones, icons and news alerts together with the facility to text comments to TV and radio programmes. During the year, in response to the increasing demand for these applications, O2 Online developed Mobile Interactive Services – a new capability that provides co-branded and own brand mobile text based services across the media, sport, consumer goods and finance sectors. We developed further our sponsorship agreements with Arsenal and the England rugby team to provide interactive services to fans. We also used our skills to run the official websites for high profile interactive television programmes including Channel 4’s Big Brother 3, the BBC’s Fame Academy and RTE’s You’re a Star. Big Brother 3 generated in excess of 10 million premium rate text messages during the nine week programme – making it the most successful premium rate mobile data event to date in Europe. Third party customers included Granada, for Popstars – the Rivals, ITV for I’m a Celebrity, Get Me Out of Here, Masterfoods, RAC and the Capital Radio Group.
Our principal competitors are the mobile internet portals of other network operators such as Vizzavi, Zed and Orange, fixed internet portals such as iTouch and Mviva. We believe that our strongest competition will be from other mobile portals.
In the coming year, O2 Online will continue to target high-value customers with competitive and appealing voice and mobile data services. We will be offering a specialist online business shop to enable business customers to take advantage of specialist/tailored online tariffs, online care and online billing. It is just one way in which we will seek to improve our customers’ interface with us, making it easier for them to access content and applications that will enhance their lives.
21
Back to Contents
Last year we continued to invest heavily in the roll-out of Airwave, our digital radio system for public safety and emergency organisations, delivering the service to our tenth police force. Over the next 12 months more than 20 further police forces, including the Metropolitan Police, are due to go live. We invested £163 million in our network development last year and capital spending in the 2004 financial year will also be significant. Under the terms of a £2.9 billion, 19-year contract with the Home Office, Airwave will be the sole supplier of core mobile radio services to all 53 police forces in England, Scotland and Wales. The Airwave network is currently used by forces in Lancashire, Greater Manchester, North Yorkshire, West Mercia, Northumbria, Suffolk, Leicestershire, Cambridgeshire, Derbyshire and Humberside.
Opportunities for Airwave are not restricted to police forces. Airwave is also currently used by the British Transport Police, the Lancashire Fire Brigade, the Shropshire Fire Brigade, Hereford and Worcester NHS Ambulance Trust and the Ministry of Defence police. The UK Government has recently invited tenders for the implementation of nationwide communications systems for the country’s Fire and Ambulance services. Airwave has submitted competitive bids for both procurements. Airwave is a sophisticated, fully encrypted digital radio system, which cannot be scanned or monitored by outsiders. Scheduled for completion by the end of 2005, the Airwave network will allow the police to communicate seamlessly and securely throughout England, Scotland and Wales. Airwave’s multi-functional handsets, combining a digital radio and mobile phone, will also in future operate as data terminals – enabling officers in the field to access local and national databases, such as the Police National Computer and driving licence information. As well as making a significant contribution to the fight against crime, the system promotes officer safety, partly because it has better radio coverage and call clarity, but also because of its emergency button feature, which enables officers to summon immediate assistance.
The Airwave network is based on the open European standard for digital TETRA. In addition to almost 100 per cent geographical coverage, capacity will be available on Airwave whenever and wherever a public safety user needs it – a vital feature in emergencies. Voice quality is very clear and there is a facility for encryption, which means that third parties cannot listen in, allowing the police, for example, to keep one step ahead of criminals. Airwave will also provide a common platform for public safety organisations, giving them true interoperability and comprehensive geographical coverage. Lack of communication at major emergencies and disasters has been highlighted as a significant factor in hampering the effective co-ordination of rescue efforts by the emergency services. With Airwave, police officers from different forces can talk to one another or to officers from other emergency services who can, in turn, communicate directly with one another.
What Airwave can do for the police: |
Officers in Lancashire and West Mercia using Airwave have caught burglars carrying analogue radio scanners. The criminals had been expecting to monitor the whereabouts of police officers but have been prevented from doing so by Airwave’s encryption. The call clarity provided by Airwave has also been an advantage to officers in Suffolk and North Yorkshire who were previously hampered by East Coast Interference, which sometimes put them in contact with Dutch taxi drivers and North Sea trawlers.
Michael Craik, Deputy Chief Constable Northumbria Police has this to say about Airwave:
“Feedback on the new features and functionality of the Airwave service from all the Area Commands where it is live has been extremely positive – the extra coverage and voice quality has received special mention from officers”.
What Airwave can do for Fire Brigades: |
The Airwave solution for Fire Brigades would be based on an existing and fully rolled-out network, providing exceptionally clear speech quality to control room staff and fire crews. We want to work actively with other market leaders to develop world-class voice and data solutions for the Fire Brigades, in line with their modernisation agendas. While network reliability is vital, O2 Airwave considers that the overall dependability of the end-to-end solution is paramount. An example of just such a solution is the interim five-year Airwave contract
22
Back to Contents
for the Shropshire Fire and Rescue Service. It includes the provision and management of Airwave voice facilities, a comprehensive mobile data solution together with mobile radio terminals.
Ian Kerr, Chief Fire Officer of Shropshire Fire and Rescue Service, says: “Following the Airwave trials with the police, we were keen to share the benefits of using the same technology. With improved access to risk data, Airwave will enhance the level of safety we can give our fire fighters”. And Lancashire Fire and Rescue Service (LFRS) says: “The Airwave service has provided LFRS with a wide area network that gives exceptional clarity of voice together with a technology that offers further development opportunities for LFRS”.
What Airwave can do for ambulance services: |
Airwave has shown itself in the field to be a secure and reliable mechanism for transmitting ambulance data. Patient data, including ElectroCardioGraph and vital signs, has been carried across the Airwave network. At the same time Airwave has enabled the intelligent mobilisation of ambulances, helping the service to meet targets for ambulance response times, supported by status messaging and vehicle tracking.
Airwave has also been chosen as an interim solution, pending the outcome of the national procurement, for Hereford and Worcester NHS Ambulance Trust. Brian Chambers, Director of Clinical Services, Hereford and Worcester NHS Ambulance Trust, says: “We are working in partnership with Airwave to provide reliable mobile data communications for the 21st century”.
Our commitment to almost 100 per cent national coverage for the emergency services means that the roll-out of our network will take us into areas that are challenging from a planning point of view. These include national parks, other areas of natural beauty as well as major cities. Airwave, although not an official signatory to the mobile phone industry’s Ten Commitments on mast siting, does apply those principles in its own consultation procedures with local communities over network development.
mmO2 is committed to delivering data leadership, and Products O2 develops the mobile data capability and services to help it achieve this goal.
The Company continues to demonstrate strong performance in this field – and exceeded its 2003 financial year target of 16 per cent of revenues from data, reaching 17.3 per cent across the Group.
mmO2 retained its position as the “home of text”, with another record breaking year. Group-wide, more than 8.5 billion text messages were sent by our customers, up 60 per cent on the previous year, and well over half of O2 customers now use text messaging. In the UK, O2 maintained its number one position, while both O2 Germany and O2 Ireland recorded strong growth in text messaging, with Ireland consistently achieving amongst the highest SMS usage levels in Europe.
Taking peer-to-peer text to the next stage, mmO2 is also leading the market in the provision of innovative premium text messaging services, including ring-tones, text alerts, votes, sports information and picture messaging. The Company has recorded strong usage of such services particularly in regard to its interactive partnerships with Arsenal Football Club and “reality TV” programme Big Brother in the UK.
Building on its success in text messaging and mobile Internet services, and its ability to attract and retain high-value customers, O2 has launched number of mobile data applications during the year that are proving appealing to high value-users:
| • | mmO2’s Java games service, the O2 Games Arcade, is proving highly popular amongst the high value “youth” target audience. The service is constantly made more appealing by the addition of new games – to date more than 60 have been added to the arcade. |
23
Back to Contents
| • | the Group launched its picture messaging service, O2 Media Messaging, in October 2002, enabling customers to send and receive multimedia messages – incorporating pictures, sound and text – using specially enabled handsets. mmO2 led the market towards “interconnect” between networks and was the first to announce such agreements in the UK and Germany – enabling customers to share multimedia messages with their friends, family and colleagues on other networks. mmO2 has seen encouraging usage of its picture messaging service since launch and expects this to grow further as penetration of suitable devices within the market increases. |
| | |
| • | O2 has recently announced trials of video and the world’s first “music over mobile” services using existing mobile data networks. Video services being trialled include the ability to create and send 10-second video clips, and to browse, select and download video clips including regularly updated news, sport, weather and entertainment. Once selected, the clip will be “streamed” or downloaded direct to the mobile handset. The O2 music service enables customers to select, retrieve and store the latest chart hits via their GPRS-enabled mobile handset onto a specially designed “digital music player” – and start listening in around 12 seconds. |
Continues to provide leading mobile data solutions for businesses. Uptake of the corporate e-mail on the move solution – BlackBerry™ – continues with more than 23,000 devices now sold across the Group. O2 achieved clear leadership in this market, accounting for more than 65 per cent of the total BlackBerry™ devices sold in Europe during the year. Enhancements over the last 12 months include voice capability, attachment opening, Lotus Notes capability and extensive international roaming. The Group has recently announced it is to trial a BlackBerry™ solution for the SME market.
The xda from O2 – the world’s first truly integrated colour PDA and GPRS mobile handset, combining touch screen PDA functionality with advanced mobile phone capability – was launched in May 2002. Sales continue to show steady growth – to date more than 55,000 devices have been sold in the UK, Germany, Ireland, the Netherlands and Asia Pacific. As well as winning excellent reviews, xda users are using its functionality to the full and are consistently amongst mmO2’s heaviest data users.
Driven by these developments, use of mmO2’s medium speed mobile data (GPRS) networks recorded significant growth to more than half a million active users across the Group.
Our focus for the year ahead is to leverage our leadership position in text messaging to deliver further growth in the uptake of mobile data services. We plan to stimulate sustained and active usage through the delivery of compelling services that are easy to use and appeal to our target audiences – within both the high-value consumer and business markets. We intend to drive penetration of data enabled devices across our territories and remain committed to achieving our stated target of 25 per cent of service revenues from data by the end of 2004.
We conduct most of our business in the United Kingdom, Germany, Ireland and the Isle of Man. We are therefore subject to national regulation in each of those countries as well as European Union-wide regulation. The following summary describes those regulations in force, which are material to our key business activities in the countries in which we principally operate. Due to the sale of O2 Netherlands, this summary does not describe regulation in the Netherlands.
European Union, or EU, legislation has a direct impact on how we are regulated in each of the countries in which we principally operate.
24
Back to Contents
A new regulatory framework |
On 14 February 2002, the European Communities adopted four Directives relating to electronic communications. These set out the new EU regulatory framework for electronic communications, which must be implemented in EU member states by 25 July 2003. The key features of the new regime are described below.
Removal of the requirement to hold a license |
Under the new framework, telecommunications operators will no longer require a licence to run their telecommunications network. The new regime envisages a system of general “authorisation” – a scheme of general conditions applying to all providers of electronic communications networks and services.
In addition operators will be obliged to comply with specific conditions, where they have significant market power or SMP in a particular market. SMP, for these purposes, has been aligned to the competition law concept of dominance, which essentially means an ability to act independently of customers, suppliers and competitors. Market shares above 40 per cent usually raise concerns as to dominance.
National regulators will decide whether operators have SMP in any relevant market (either alone or jointly) by means of a market review. The markets to be reviewed by national regulators in this way have already been identified in a European Commission Recommendation, although national regulators may add to these in certain circumstances. The three mobile markets, which have been identified by the European Commission, are: access and call origination on public mobile telephone networks, voice call termination on individual mobile networks and the wholesale national market for international roaming on public mobile networks.
Where an operator is found to have SMP on any market, the regulator must impose an SMP condition on it. The SMP condition may require the operator to comply with one or more of the following obligations: transparency; non-discrimination; accounting separation; access; and price control and cost accounting. In exceptional circumstances, a regulator may impose additional or alternative obligations, but these have to be approved by the European Commission.
As national regulators have not yet completed their market reviews, they have not yet decided whether we have SMP on any markets in any member states in which we operate and, if so, which SMP conditions should be imposed on us. The new regulatory framework and, in particular, the outcomes of the market reviews, and any designation of SMP, may materially affect the nature of regulation to which we are subject and may affect the services we offer or may wish to offer in the future.
Other regulation in the EU |
EU law restricts the collection, use and processing of personal data and guarantees individuals certain rights, including the right of access to personal data, the right to have inaccurate data rectified and a right of recourse in the event of unlawful processing. Individuals also have the right to withhold permission to use their data for direct marketing.
EU rules also regulate electronic commerce, or e-commerce, service providers and provide for harmonised rules on the conclusion of contracts by electronic means.
We are also subject to the general competition law of the EU and, in particular, Articles 81 and 82 of the EC Treaty, which prohibit anti-competitive agreements or concerted practices and the abuse of a dominant position respectively where there is an appreciable effect on EU member states.
EU competition law is enforced by the European Commission, which can impose fines of up to 10 per cent of a group’s worldwide annual turnover for breaches of Article 81 or 82. Companies which breach EU competition law may also be sued in national courts by third parties which suffer loss as a result of the breach. As of 1 May 2004, as part of EU Competition law procedural reform, there will be joint enforcement of the rules
25
Back to Contents
governing restrictive practices by the European Commission, the national competition authorities and the national courts.
The European Commission is currently conducting an inquiry into competition in the market for mobile roaming services in the European Economic Area, or the EEA. The investigation is continuing and no conclusions have yet been reached. If the European Commission finds that there have been infringements of Articles 81 and/or 82, it could fine infringing operators. Action could also ultimately be taken to force certain operators to reduce their wholesale and retail charges for roaming or to change the way in which such charges are set or regulated.
Infrastructure sharing and national roaming |
We have entered into 3G infrastructure-sharing and national roaming agreements with T-Mobile in the UK and Germany, to which Article 81 of the EC Treaty may apply. The agreements were formally notified to the European Commission for clearance or exemption. The European Commission approved the UK arrangements on 30 April 2003.
Regulation in the United Kingdom |
| |
Implementation of the EU regulatory framework |
The new EU regulatory framework for electronic communications is due to be implemented into UK law by the Communications Act (or alternatively by statutory instrument) by 25 July 2003. Under the Communications Act, responsibility for the regulation of electronic communications networks and services will lie with the Office of Communications (OFCOM), which will replace the Office of Telecommunications (OFTEL), the Radiocommunications Agency, the Independent Television Commission, the Broadcasting Standards Commission and the Radio Authority.
In preparation for implementation of the new regulatory framework, OFTEL is currently conducting market reviews of two of the three mobile markets identified in the Commission’s Recommendation (access and origination, and call termination). The consultation document for OFTEL’s access and origination market review was published on 11 April 2003, and proposes that mobile operators should not be designated as having SMP. If this position is confirmed, among other things, this would entail the lifting of the requirements to meet requests for interconnection and not to show undue preference or discrimination in the supply of wholesale services provided over public mobile networks (i.e. services sold and purchased by communications providers rather than end-users). On 15 May 2003 Oftel published its market review relating to mobile wholesale voice calls terminating on individual mobile networks. As a result of this, the Director General of Telecommunications has formed an initial view that each mobile network operator in the UK has significant market power in a separate market for voice call termination on its network and can be expected to have market power for at least the next three years. It is proposed by the Director that in addition to a one off 15 per cent cut to be implemented by 25 July 2003 by all four mobile operators (us, Vodafone, T-Mobile and Orange), we and Vodafone should be subject to further successive reductions in real terms which amount to an annual reduction of 15 per cent for each of the remaining three years to 31 March 2006 (16 per cent for T-Mobile and Orange). This broadly follows the recommendations of the Competition Commission. The Director is seeking comments by 24 July 2003. If these successive reductions are implemented, this will cause an additional reduction in the revenues we receive from termination charges over the coming years.
Telecommunications licenses |
When the new regulatory framework is implemented, the requirement to hold a licence to run a telecommunications network will be removed. Until that date, the running of a mobile telecommunications network will continue to require a licence under the Telecommunications Act 1984. We hold licences under that Act to operate a mobile telecommunications network, for the provision of radio paging services and for providing the Airwave service to emergency services.
26
Back to Contents
The operation of a mobile telecommunications network also requires a frequency licence under the Wireless Telegraphy Acts and this obligation will continue under the new EU regulatory framework. We have such licences for the frequencies necessary to run our GSM network and also hold one of five Wireless Telegraphy Acts licences for UMTS spectrum. Our licence for UMTS spectrum obliges us to roll-out our third generation network so that it covers 80 per cent of the UK population by 31 December 2007.
We also hold Wireless Telegraphy Acts licences in relation to our allocation of radio spectrum and the use of stations and equipment involved in the provision of our mobile telecommunications services, our paging services and our Airwave services.
We have reached agreement with Hutchison 3G to permit them to use our second generation network to originate and terminate calls to and from its subscribers whilst it builds its own UMTS network.
Network access and interconnection |
Under the current regulatory regime, we (and Vodafone) must provide interconnection on non-discriminatory and transparent terms. In the new regime all operators of a public electronic communications network (whether or not they have SMP) will have the right and the obligation to negotiate interconnection with each other. In addition, “access” obligations can be imposed on operators found to have SMP following a market review. The Communications Bill also provides for access related obligations to be imposed on non-SMP operators to secure “efficiency, sustainable competition and the greatest possible benefit to end-users”.
We have entered into an agreement with T-Mobile in relation to infrastructure sharing and seamless national roaming in the UK. This agreement is subject to competition rules and was formally notified to the European Commission for clearance or exemption. The European Commission approved the UK arrangements on 30 April 2003.
The Radiocommunications Agency is currently investigating GSM gateways (devices fitted to a phone network that monitor calls from fixed telephones to mobile phones which automatically select the cheapest tariff for the call). Third parties have complained that action should be taken to permit the use of these devices for business customers. The Radiocommunications Agency is expected to report on this issue later this year.
Planning, health, and environmental measures |
In May 2000, the Independent Expert Group on Mobile Phones, under the Chairmanship of Sir William Stewart, published its report, known as the Stewart Report, into mobile phones and health. In a document published by the Department of Health on the same day the Government accepted many of the recommendations of the Stewart Report. The Department of Health also published guidelines in December 2000 recommending that the widespread use of mobile phones by children under the age of 16 should be discouraged for non-essential calls. We, together with the other mobile operators in the United Kingdom, have committed ourselves to addressing these various community concerns and have given ten commitments to that end.
We are subject to data protection and privacy rules that limit the way in which we can process and use our customers’ personal data. In particular, we can only use this data for marketing purposes if we have the consent of our customer to do so.
We are subject to UK competition law which is set out in the Competition Act 1998. This mirrors the provisions of EU competition law, prohibiting anti-competitive agreements or concerted practices and the abuse of a dominant position in the UK.
27
Back to Contents
The Competition Act is enforced by the Director General of Fair Trading, and (where “commercial activities connected with telecommunications” are concerned) the Director General of Telecommunications. Once the Communications Act comes into force, the latter’s responsibility will pass to OFCOM.
As under EU law, companies which breach UK competition law can be fined. They can also be sued for damages by third parties who suffer loss as a result of the breach.
On 16 May 2003, the Director General of Telecommunications opened investigation into us, Vodafone, Orange and T-Mobile under the Competition Act 1998. The investigation focuses on whether the prices we charge certain retail business customers for calls to mobiles could be discriminatory, or represent a margin squeeze, when compared to the wholesale prices charged to other operators. If the Director General of Telecommunications ultimately finds against us then we could be required to alter our prices, could be fined, and could be liable to third parties for damages.
Interception of Communication |
The Regulation of Investigatory powers Act 2000 (RIPA) regulates the use of a range of investigatory powers by a variety of public authorities and updates the law on interception of communications. A Code of Practice has been issued by the Home Office, which provides guidance on the procedures that can be followed before interception of communications can take under the RIPA. However, on 11 March 2003 the Government published revised plans on how public bodies should access information records under the RIPA as well as how data should be retained by communications service providers under the Anti-Terrorism Crime and Security Act 2001. Among the proposals is a safeguard where access to certain types of information (such as itemised telephone call records) is granted only after prior approval by a judicial independent third party. Consultation is ongoing.
| |
Implementation of the EU regulatory framework |
Until the new framework has been implemented, the German Telecommunications Act will continue to govern the award of licences for the conduct of certain telecommunications activities and the allocation of frequencies. The German telecommunications regulator (RegTP), supported by other government bodies, has powers under the German Telecommunications Act to regulate these matters.
The German Ministry for Economy and Employment has published first drafts for a new Telecommunications Act to incorporate the new EU regulatory framework into German law, but the new Telecommunications Act is not expected to be in force before 1 January 2004.
RegTP has not yet commenced any market reviews under the new regulatory framework. It is expected that the market reviews will follow shortly after the new Telecommunications Act comes into force around 1 January 2004.
Telecommunications and frequency licenses |
We currently hold the necessary licences with nationwide coverage which, together with our frequency licences, authorise us to run mobile telecommunications operations in Germany. As in other EU member states, the requirement to hold a licence to run a telecommunications network will be removed on implementation of the new EU regulatory framework.
We were awarded one of four GSM licences in May 1997 by the Federal Ministry of Post and Telecommunications. Our GSM licence is valid until 31 December 2016. Under our GSM licence, frequencies will be allocated to us upon request up to a specified maximum amount.
We hold one of six licences awarded for use of UMTS spectrum. This licence is valid until 31 December 2020. RegTP may revoke our licences in certain circumstances, including breaches of the obligations in our licences or under the German Telecommunications Act.
28
Back to Contents
Our UMTS licence obliges us to roll-out our third generation network so that it covers at least 25 per cent of the population by the end of 2003 and 50 per cent of the population by the end of 2005.
The anti-trust authorities in Germany have indicated that national roaming agreements may infringe competition laws, but that in the case of O2 Germany’s agreement with T-Mobile, this is unlikely to be the case at least until 2004 as it considers O2 Germany to be a new entrant at least until this date.
On 5 June 2001, RegTP announced that it would interpret licence conditions to permit network co-operation and infrastructure sharing. The infrastructure we will be able to share in Germany includes radio base stations as well as antennas. Infrastructure sharing agreements remain subject to national or European competition rules.
We have entered into an agreement with T-Mobile in relation to 3G infrastructure sharing and national roaming in Germany. This is subject to competition rules and was formally notified to the European Commission for clearance or exemption. We expect a decision from the Commission in relation to this agreement later this year.
Network access and interconnection |
Under the existing regulatory regime, RegTP may determine the terms on which interconnection is provided if operators are unable to reach commercial agreement between themselves in a reasonable timeframe. None of the mobile network operators is yet obliged to grant another carrier interconnection to its network on non-discriminatory or cost-oriented terms.
We are not currently subject to price regulation and we will not be subject to price regulation under the new German Telecommunications Act or new EU regulatory framework unless we are designated as having SMP in any market.
Number portability and carrier selection |
Telecommunications carriers are obliged, by virtue of the German Telecommunications Act, to provide number portability.
Telecommunications carriers are also under an obligation under the German Telecommunications Act to offer carrier “preselection” which may be overridden by a carrier selection prefix each time a call is made, also referred to as call-by-call.
Other mobile telecommunications operators are required to allow service providers to market their GSM services. There is, however, no such requirement in our GSM licence. As a consequence, we market our own services exclusively. A claim has been filed against us with the civil courts by the service provider Debitel, stating that we have a statutory obligation under the Telecommunications Customer Protection Ordinance to permit service providers to market our GSM services. If Debitel succeeds in its claim before the civil courts, we will be obliged to grant them, and subsequently other service providers, the ability to market our services. Our UMTS licence obliges us to permit service providers to market our UMTS services once they become available.
We are subject to data protection regulations in Germany and we believe that we are in compliance with these regulations. We are currently dealing with the Federal Data Protection Office on certain matters that were raised by an audit.
Planning, health and environmental measures |
In order to address public concerns about any alleged health and environmental risks of increased electromagnetic emissions from our infrastructure, we have collaborated with the other mobile and UMTS operators in Germany in establishing an information sharing body. We, in common with other
29
Back to Contents
telecommunications infrastructure providers in Germany, rely on rights of way to allow us to install and maintain our infrastructure. The constitutionality of these rights of way is disputed. All holders of telecommunications licences have automatic rights of way over public land. In so far as private landowners are concerned, our rights of way are more limited.
We are subject to German competition law, which is set out in the act governing restraints of competition. This legislation is broadly similar to EU competition law and prohibits anti-competitive agreements and concerted practices and the abuse of a dominant position. Both RegTP and the Federal Cartel Office both regulate competition in Germany. The Federal Cartel Office has in the past refrained from initiating proceedings where RegTP is dealing with a case.
| |
Implementation of the EU regulatory framework |
The new EU regulatory framework will be implemented into Irish law by statutory instrument. The Department of Communications, Marine and Natural Resources have now completed a public consultation on the draft statutory instruments and the Department expect the adopted Regulations to be brought into force prior to 25 July 2003.
Until then, the operation of mobile telecommunications networks and the provision of mobile telephony services in Ireland continues to be regulated under the Postal and Telecommunications Services Act 1983 (as amended), or Irish Postal and Telecommunications Act, and the Wireless Telegraphy Act 1926 (as amended), or Irish Wireless Telegraphy Act.
On 1 December 2002, under the Communications Regulation Act 2002 (the Act), a new regulatory body was established for the regulation of the communications sector in Ireland. This new three-person regulatory body, known as the Commission for Communications Regulation (ComReg) replaces the Office of the Director of Telecommunications Regulation (ODTR).
In preparation for the implementation of the new EU regulatory framework, ComReg is currently collecting data to carry out market analysis of the communications sector including mobile operators. The data collection process concluded on 14 April 2003 and a consultation document outlining its findings will be issued in the next few months with a decision expected in September 2003.
Telecommunications Licences |
We have been granted licences necessary to provide mobile telecommunications services and systems in Ireland. The term of our current mobile telecommunications licences are 15 years from commencement, which for GSM 900 band is 16 May 1996, and in respect of services provided in the GSM 1800 band is 1 January 2000. As in other EU member states, the requirement to hold a licence to run a telecommunications network will be removed under the new EU regulatory framework.
In addition to mobile telecommunications licences, we hold Irish Wireless Telegraphy Act licences that permit us to use apparatus and radio spectrum in the operation of our mobile telecommunications networks. Our Irish Wireless Telegraphy Act licence is renewed annually.
We also hold from time to time a large number of radio link licences granted by the DTR which authorise the use of mobile telegraphy apparatus for the purpose of establishing radio links between transmission stations we operate. These radio link licences are renewed regularly.
On 2 October 2002, we were awarded a UMTS licence as a result of the comparative process (“beauty contest”) run by ComReg to award such licences. Our licence includes minimum requirements of 33 per cent demographic
30
<<Back to Contents
coverage to be fulfilled by the end of June 2006 and 53 per cent demographic coverage to be fulfilled by the end of June 2008. The total licence fee is €114 million phased over 15 years.
As a precondition to entering the UMTS licensing process, we have committed to the provision of national roaming facilities for five years on our network for new entrant UMTS licensees who meet minimum roll-out requirements. Pursuant to this obligation, we are in detailed discussions with Hutchison 3G (Ireland) Limited in respect of the potential implementation of 2G national roaming between our networks.
Network access and interconnection |
Under the existing regulatory regime, we and Vodafone have been designated as having SMP in the mobile telephony market and the national market for interconnection in Ireland. Accordingly, we are obliged to adhere to principles of non-discrimination and transparency in relation to interconnection offered to third parties and may not unreasonably refuse access to our network. These obligations will be reviewed on implementation of the new regulatory framework.
ComReg is currently consulting on the possible imposition of an accounting separation obligation on SMP mobile operators, namely O2 Ireland and Vodafone. A response on that consultation process was expected in January 2003 but has yet to be issued by ComReg.
The three mobile operators have agreed with ComReg to introduce full mobile number portability in July 2003.
In July 2000, the DTR published a paper entitled “The Regulatory Framework for Access in the Mobile Market”, or the Access Paper, which sets out views on the regulatory issues associated with indirect access provision. According to ComReg, mobile operators with SMP in the mobile market (currently Vodafone and us) are obliged to negotiate interconnection with “qualifying operators”. In addition, mobile operators that have been designated as having SMP in the national market for interconnection (currently Vodafone and us) must provide interconnection on a cost-oriented basis. ComReg has indicated that it may consider undertaking further consultation on carrier preselection for mobile networks.
We are subject to data protection regulations in Ireland. The EU Directive relating to data protection is expected to be transposed into EU law around October 2003. This will impose stricter conditions on the collection, use and processing of personal data by us. It will also impose notification obligations on us.
In addition to EU competition law, we are also subject to Irish competition law which is set out in the Competition Act 2002 (this Act replaces the previous Competition Acts of 1991 and 1996). This legislation is modelled on EU competition law. It prohibits anti-competitive agreements and arrangements and the abuse of a dominant position, which affect trade in any goods or services in Ireland or in a substantial part of Ireland.
Regulation in the Isle of Man |
The Isle of Man is a self-governing Crown Dependency with its own parliament and is not part of the United Kingdom or the EU. Accordingly, Manx legislation and regulations predominantly govern our operations in the Isle of Man.
Telecommunications Licences |
Our principal licence relating to our fixed network operations in the Isle of Man, or the Fixed Licence, was issued on 27 June 1986 and came into force on 1 January 1987. It continues in force until 31 December 2006. Our principal licence relating to our mobile network operations in the Isle of Man, or the Mobile Licence, was issued on 28 October 1994. The Mobile Licence expires on 31 December 2006. Our current GSM mobile network is
31
Back to Contents
operated under the Mobile Licence and the Isle of Man Communications Commission has consented to our proposed UMTS service also being operated pursuant to the Mobile Licence. In addition, we also benefit from certain other licences granted under applicable Manx legislation in relation to paging, satellite and internet services. We are subject to retail price restrictions and charge reviews by the Isle of Man Communications Commission under our licences. Our Fixed Licence also requires us to publish the terms and conditions on which offers of certain telecommunications services are made.
Mobile network services and spectrum allocation |
We have been granted Wireless Telegraphy Acts licences by the UK Radiocommunications Agency that permit us to establish and use stations and apparatus for mobile transmissions in the operation of our mobile networks. On 19 February 2001 the Radiocommunications Agency granted us a Schedule for Third Generation Mobile Services, renewed annually, and we will operate our proposed UMTS network pursuant to this Schedule and the 1994 Mobile Licence referred to above.
Independent review of telecommunications regulation |
The Isle of Man Communications Commission has commissioned a report from a firm of independent consultants on the future regulatory policy that should be adopted in the Isle of Man. The report, published on 12 July 2001, recommended that competition be gradually introduced in respect of certain services, that negotiations should commence with Manx Telecom for a new 15-year licence for the period after 2006 and that new legislation be introduced to strengthen the powers of the Communications Commission, to introduce an interconnection regime based on the EU model and to introduce a system of tariff controls. The Communications Commission has welcomed the recommendations of the report and begun negotiations with Manx Telecom regarding a new licence.
Key Markets and Employees |
Europe includes some of the most advanced markets for mobile services in the world. These markets are characterised by relatively high mobile penetration rates and revenues per customer and are amongst the leading markets for the emergence of mobile data services. These markets are also characterised by high population density and GDP per capita. Across Western Europe, the proportion of total voice traffic carried over mobile rather than fixed-line networks continues to increase. These markets are also seeing an increasing proportion of mobile revenues attributable to mobile data services and we expect this trend to continue.
Our mobile businesses cover two of the largest markets in Europe, with the UK and German markets giving us access to a total population of over 143 million people. All our markets have seen growth over the last few years in the number of mobile telephone users, in large part reflecting strong demand for competitively priced pre-pay offerings. Our markets are seeing the emergence of additional wholesale opportunities for network operators. Through wholesale agreements, network operators are able to sell capacity and services on a large scale to other service providers and mobile virtual network operators.
Historically, the number of customer connections to mobile telephone networks in the markets where we are present has been greater during the second half of the financial year than during the first half, primarily due to increased sales during the Christmas period. See “Operating and Financial Review and Prospects – Factors Affecting Our Business”.
32
Back to Contents
The table below presents selected data regarding the principal countries in Europe in which our businesses operate. Due to the sale of O2 Netherlands, this table does not present data for that business.
| | | | | Mobile1
customers’ | | mmO2 | |
| | | | | penetration | | customers | |
| | | | | at 31 March | | at 31 March | |
Country | | Population1 | | 2003 | | 2003 | |
| |
|
| |
|
| |
|
| |
| | | (in millions) | | (%) | | (in 000’s) | |
| Germany | | | 83 | | | 69 | | | 4,812 | |
| United Kingdom | | | 60 | | | 85 | | | 12,050 | |
| Ireland | | | 4 | | | 81 | | | 1,255 | |
| | |
| |
| |
| |
Total | | | 147 | | | | | | 18,117 | |
| | |
| | | | |
| |
| 1 | Source: EMC Worldwide Cellular Database, May 2003. |
The Group had the equivalent of 12,476 full-time employees at 31 March 2003, as set forth by country in the table below:
Country | | Number of employees | |
| | |
|
| |
| United Kingdom | | | 6,759 | |
| Germany | | | 3,416 | |
| Netherlands | | | 710 | |
| Ireland | | | 1,317 | |
| Isle of Man | | | 274 | |
| | |
|
| |
Total | | | 12,476 | |
| | |
|
| |
For the year ended 31 March 2003, the aggregate number of temporary staff employed by our businesses was 2,420.
In the United Kingdom, a number of our employees are represented by two labour unions: Connect, which has representation rights in respect of management employees; and the Communications Workers Union, which has representation rights in respect of clerical, engineering and technical employees. Membership of these unions is individual and voluntary. In addition, a non-unionised employee representative body represents certain managers. Our other operating businesses also meet with their employee representative bodies, or works councils, regularly. We believe that our businesses have a good relationship with our employees and their representatives.
Approximately 67 per cent of our permanent employees are covered by collective bargaining agreements. These agreements are kept under review, with changes being made through discussion with the relevant representative body as required.
Network and service platform technology |
Last year we launched a major initiative to build a common infrastructure to support the development of services and applications across our networks. The deployment of a common network architecture will be essential to bring economies of scale, support pan-European services and enable tailoring for local market requirements. As part of this process we implemented common service enabling platforms across our four key businesses, which allow new applications to be swiftly rolled-out across these networks without requiring costly and time-consuming redevelopment.
The flexibility and functionality of our information systems will be critical to our strategy and to the successful operation of our businesses. We are currently reliant on a wide range of systems, partly as a result of the speed of growth in the mobile market, but also as a result of our acquisitions of retailers and service providers. In addition,
33
Back to Contents
our customer base has expanded rapidly. During the year O2 UK signed an agreement with IBM to deliver world-class customer service and business support capability for voice, text and mobile internet markets.
BT transferred to us its interest in certain software and other materials attracting copyright that were used exclusively in connection with our businesses and which those businesses originally funded. BT has transferred to us all of its rights in certain trademarks and domain names used exclusively in our UK businesses, except that BT has retained rights in trademarks and domain names previously used in our business which comprise names and logos that relate to the BT Group, such as “BT” and BT’s full-piper and half-piper logos. BT has retained ownership of all other intellectual property rights used in our UK businesses which have not been transferred to us and which are not already owned by us.
We have a limited non-exclusive royalty-free licence from BT, for the operation of our worldwide businesses, to continue to use any and all patents, copyright, unregistered design rights, database rights and know-how. In May 2002, we introduced a single new customer brand, O2. We have actively taken steps to protect the new brand, including the acquisition of core trademark registrations in O2 brand and related brand materials. In addition, we have other pending national and European Community trademark applications in ancillary classes.
We are aware that various third parties use O2 or similar brands in connection with other goods and services. We have entered into agreements with some such third parties, which permit the brands to co-exist. These agreements contain some restrictions on use of our brand, but we do not believe that these restrictions conflict with our business model or day-to-day activities. It is not our intention to trade under the O2 brand in the United States, where our securities trade under the mmO2 plc name. We have also acquired a range of domain names, including the core domains of mmo2.com, o2.co.uk, o2.ie, o2.nl and o2online.de.
We have applied for patent protection relating to technology used in our HomeZone service. The HomeZone service is one of our products marketed in Germany under the Genion name. A third party owns two patents which cover the technology used in the HomeZone service. To date, this third party has not sought to challenge our patent applications or prevent us from using the HomeZone technology. We believe that it is unlikely to take any such action in the future. However, if that third party sought successfully to do so, we might have to stop using the HomeZone technology.
We maintain the types and amounts of insurance customary in the industries and countries in which our Group operates, including coverage for employee-related accidents and injuries and property damage. We consider our insurance coverage and that of our operating businesses to be adequate both as to the nature of the risks covered and amounts insured for the business conducted by us.
34
Back to Contents
| | |
| C. | Organisational Structure |
Our principal operating subsidiary undertakings are detailed below, all of which are included in the Group financial statements.
Name | | Country of incorporation and operation | | Activity | | Portion of
ordinary
shares
held % |
| |
| |
| |
|
O2 Limited1 | | England and Wales | | Intermediate holding company | | 100 |
O2 (UK) Limited2 | | England and Wales | | Mobile cellular telephone system provider and operator | | 100 |
O2 Third Generation Limited3 | | England and Wales | | UMTS licence holder | | 100 |
O2 (Online) Limited4 | | England and Wales | | Mobile internet business | | 100 |
O2 Communications (Ireland) Limited5 | | Ireland | | Mobile cellular telephone system provider and operator | | 100 |
| Manx Telecom Limited | | Isle of Man | | Telecommunications services supplier | | 100 |
O2 (Netherlands) BV6 | | Netherlands | | Mobile cellular telephone system provider and operator | | 100 |
O2 (Germany) GmbH & Co. OHG7 | | Germany | | Mobile cellular telephone system provider and operator | | 100 |
Airwave mmO2 Limited | | England and Wales | | Digital radio service for public safety organisations | | 100 |
| | | | | | | |
| 1 | Cellnet Group Limited changed its name to BT Wireless Limited on 30 March 2001, and then to O2 Limited on 3 September 2001. |
| 2 | BT Cellnet Limited changed its name to O2 (UK) Limited on 19 April 2002. |
| 3 | BT3G Limited changed its name to O2 Third Generation Limited on 19 April 2002. |
| 4 | Genie Internet Limited changed its name to O2 (Online) Limited on 19 April 2002. |
| 5 | Esat Digifone Limited changed its name to Digifone mmO2 Limited on 12 September 2001, and then to O2 Communications (Ireland) Limited on 23 April 2002. |
| 6 | Telfort Mobiel BV changed its name to O2 (Netherlands) BV on 19 April 2002. On 3 June 2003 O2 Netherlands was sold to Greenfield Capital Partners. |
| 7 | Viag Interkom GmbH & Co. changed its name to O2 (Germany) GmbH & Co. OHG on 19 April 2002. |
The shares in O2 Limited are held directly by mmO2 plc. The shares of the other operating companies are held by O2 Limited or its wholly owned subsidiaries. The accounting reference date of all the subsidiary undertakings is 31 March. The Group also owns a 40 per cent stake in an associate, The Link Stores Limited, which is a telecommunications equipment retailer.
| D. | Property, Plant and Equipment |
Details of our tangible fixed assets can be found in note 11 of our financial statements, included in Item 18.
We lease, own and have other legal and/or beneficial interests in sites in the United Kingdom, Germany, Ireland and the Isle of Man. Our properties consist primarily of buildings with integrated technical facilities, such as switching devices, transmission towers and antennae and, to a lesser extent, administrative buildings and call centres.
As of 31 March 2003, we also leased, owned and had other legal and/or beneficial interests in sites in the Netherlands. On 3 June 2003 we sold our business in the Netherlands and, as a result, no longer have any material property interests in the Netherlands.
35
Back to Contents
Our principal administrative buildings in the United Kingdom are mmO2’s registered office at Wellington Street, Slough, Berkshire SL1 1YP, England, and O2 UK’s registered office at 260 Bath Road, Slough, Berkshire, England, occupying approximately 9,012 square meters.
The remainder of the properties (excluding cell site or retail properties) that we own or lease in the United Kingdom account for approximately 62,000 square meters and are used as offices, call centres and for switching apparatus.
In the United Kingdom and Ireland there are agreements between us and the BT Group that provide for access to and use of office, cell site and technical equipment premises currently owned or leased by the BT Group, but occupied by us and our group companies. In addition in Ireland, the site sharing agreements between the BT Group and us provide for the BT Group to access and use technical equipment sites currently leased by us.
We lease all of our properties in Germany. Our principal administrative building in Germany is O2 Germany’s head office at Georg-Brauchle-Ring 23-25, Munich, occupying approximately 41,121 square meters. The properties that we lease in Germany account for a total of approximately 118,873 square meters, and primarily comprise office premises and call centres. We have sublease agreements with the BT Group, which account for approximately 33,189 square meters, or 30 per cent, of the property in Germany currently leased by us.
| ITEM 5 | OPERATING AND FINANCIAL REVIEW AND PROSPECTS |
This commentary discusses, and is based on, the audited consolidated financial statements of the Group prepared in accordance with UK Generally Accepted Accounting Principles (UK GAAP), included in Item 18. This commentary should be read in conjunction with these financial statements.
The financial information prepared under UK GAAP differs in certain respects from that prepared under US Generally Accepted Accounting Principles (US GAAP). Details of the main differences are provided and described in note 32 to the financial statements included in Item 18.
Definitions of the operating metrics (including ARPU, data as a percentage of service revenue, churn and SAC) used in this commentary can be found in “Key Information – Operating data” in Item 3.
The year ended 31 March 2003 is our first full year of trading as a separate group following our demerger from BT and the first full year in which we have had sole control over our business and strategy.
During the year, we provided voice and data mobile communications services and products in the United Kingdom, Germany, Ireland and the Netherlands through our wholly-owned mobile businesses, O2 UK, O2 Germany, O2 Ireland and O2 Netherlands, respectively, and through our mobile internet business, O2 Online. We also supplied fixed and mobile communications services in the Isle of Man through our wholly-owned subsidiary, Manx Telecom and we are developing a fully integrated national digital radio service for the police forces of the United Kingdom through our Airwave business.
On 14 April 2003, we announced that we had agreed the sale of O2 Netherlands to Greenfield Capital Partners, an independent private equity and corporate finance group. The transaction has received final competition clearance in the Netherlands and completed on 3 June 2003. The sale has resulted in a loss on disposal of approximately £1.4 billion. A provision for the loss on disposal has been recognised in the 2003 financial year.
We have also undertaken a detailed review of the carrying values of the fixed assets held by the other three continuing mobile telecommunications businesses in our Group (being O2 UK, O2 Germany and O2 Ireland). The review indicated that the carrying value of the fixed assets of these businesses were impaired. An exceptional charge of £8,300 million has been recognised in the profit and loss account in respect of these impairments.
36
Back to Contents
Historically, we were part of the BT group. Our business has been based predominantly in the United Kingdom, although we have had joint ventures or subsidiaries in Germany, Ireland and the Netherlands throughout our last three financial years. Since the end of the financial year ended 31 March 2000, we have significantly expanded our business in Germany, Ireland and the Netherlands. We completed the acquisition of the remaining shares in our German mobile joint venture, O2 Germany, on 20 February 2001 and the remaining interest in our Dutch mobile joint venture, O2 Netherlands, on 30 June 2000. We acquired a controlling interest in our Irish operation, O2 Ireland, on 30 March 2000 and purchased the remaining shares in O2 Ireland on 18 April 2001. We have also acquired UMTS licences in the United Kingdom, Germany, Ireland, the Netherlands and the Isle of Man.
On 19 November 2001, the Group was demerged from BT. Prior to this date, we were not constituted as a separate legal group of companies under a separate holding company within the existing BT group. However, our consolidated financial statements, contained elsewhere in this document have been prepared as though we had existed as a stand-alone group throughout the period prior to demerger. Whilst we believe that the financial information set out in our consolidated financial statements is an appropriate presentation, this financial information is not necessarily indicative of the financial results that might have occurred had we been an independently financed and managed public entity during the periods prior to demerger presented or of our financial results that may occur in any future period.
O2 UK, our largest and most established business, has steadily increased its underlying operating profit over the past three financial years. Despite O2 UK’s positive results, our Group has incurred consolidated operating losses over the same period. Our recent operating losses are largely the result of consolidating the results of O2 Germany and O2 Netherlands in our financial statements commencing with the 2001 financial year. We also record amortisation and impairment of telecommunications licences and goodwill arising from the acquisition of the stakes in our businesses.
As newer telecommunications businesses incurring significant start-up costs, O2 Germany and O2 Netherlands have historically been, and currently are, loss-making. We expect O2 Germany to continue to incur operating losses as it increases its customer base. The results of O2 Netherlands will be included within those of the Group until 3 June 2003, the date of completion of the sale of the business.
O2 Online is our online sales channel and the developer of the Group’s mobile data capability. It continues to invest in these areas and as a result has recorded an increased operating loss in the current financial year compared to the previous financial year.
Factors affecting our business |
During the three years ended 31 March 2003 our results of operations have been significantly affected by the acquisitions of our German and Dutch businesses. Certain other key factors affecting results of operations in the periods under review are discussed below.
The mobile telecommunications market |
The mobile telecommunications market has changed markedly in the past five years. Until recently, it was characterised by high customer growth rates in all the countries in which we operate. By 31 March 2003, penetration rates were approximately 85 per cent in the United Kingdom, 69 per cent in Germany and 81 per cent in Ireland. Our pro forma total number of registered customers increased from approximately 5.0 million at 31 March 1999 to approximately 16.5 million at 31 March 2001 assuming we owned our current businesses on 31 March 1999. From 31 March 2001, we revised the definition of how we measure our customer base, from including all our registered customers to only including those customers who have recently made or received a call. On the revised basis, our total active customer base has increased by 12 per cent from 15.52 million at 31 March 2001 to 17.46 million at 31 March 2002 and by a further 11 per cent to 19.37 million at 31 March 2003.
The high penetration rates in our markets has led to a shift in our approach to customers. We are now placing greater focus on customer retention, and on generating increased usage from existing customers. At the same time
37
Back to Contents
we are also focusing on acquiring higher spending contract customers. In general, we expect subscriber acquisition costs to decrease and subscriber retention costs to increase, although, reflecting our focus on higher value customers, subscriber acquisition costs for certain customers, in particular high valued post-pay customers, may increase.
Introduction of pre-pay products |
A significant portion of our growth in customers in recent years has resulted from the success of pre-pay mobile products. We introduced our pre-pay products across the Group during the period from July 1998 to August 1999, and now our pre-pay customers account for 66 per cent of our customers in the United Kingdom (down from 68 per cent in 2002), 45 per cent in Germany (down from 49 per cent in 2002), 71 per cent in Ireland (up from 70 per cent in 2002), and 75 per cent in the Netherlands. The overall fall in the proportion of customers using pre-pay services rather than post-pay services reflects the success of the Group in acquiring higher spending post-pay customers. Nonetheless, pre-pay services offer us several significant advantages, including lower SAC, higher average per minute charges, reduced credit risk and lower administrative costs. However, lower average outgoing usage minutes for pre-pay customers have resulted in lower ARPU.
As our ARPU from pre-pay customers is lower than for post-pay customers, to maintain profitability we give lower handset discounts to pre-pay customers, in line with the general industry practice. Our overall subscriber acquisition costs per new customer have decreased significantly as our pre-pay customer base has increased, although the Group’s success in attracting contract customers has impacted the continuing fall in SACs.
Historically, the number of customer connections to mobile telephone networks in the markets where we are present has been greater during the second half of the financial year than during the first half, primarily owing to increased sales during the Christmas period. Therefore, our revenues from equipment sales and connection charges, and the aggregate costs of customer equipment and dealer commissions and our other related costs of sales, have been greater during the second half of the financial year than during the first half. However, there is no assurance that this trend will continue and it is difficult to predict the seasonality of customer connections in the future.
Our businesses operate in highly regulated markets, and governmental regulation frequently limits the revenue we may receive from certain sources, particularly in the United Kingdom. In January 2003 the UK Competition Commission ruled that mobile network operators call termination charges should be cut substantially. This and the regulatory climate in the territories in which our other businesses operate is discussed in the Regulation section of our business review.
Critical accounting policies |
The Group’s consolidated financial statements are prepared in accordance with accounting principles that are generally accepted in the UK. As part of these reporting guidelines management are required to identify and disclose the accounting policies relating to all aspects of the results and financial position of the Group used in preparing the financial statements. The preparation of consolidated financial statements requires management to make estimates and judgements that affect the reported amounts of assets, liabilities, revenues and expenses, as well as the disclosure of certain contingent assets and liabilities. The accounting policies used in preparing the Group’s financial statements for the year ended 31 March 2003 are disclosed in note 1 of those financial statements.
The following accounting policies are considered to be critical to the understanding of the consolidated financial statements. These policies have the potential to have a significant impact on the Group’s financial statements, either because of the significance of the financial statement item to which they relate, or because they require a high degree of judgement and estimation owing to the uncertainty involved in measuring, at a specific point in time, events that are continuous in nature.
38
Back to Contents
Tangible and intangible fixed assets |
We estimate the useful lives of property, plant and equipment, goodwill and other intangible assets, in order to determine the amount of depreciation and amortisation to be charged in any reporting period. These useful lives are estimated at the time the asset is acquired, and are based on historical experience with similar assets, as well as taking into account future anticipated events affecting their life. Changes in technology or changes in the Group’s intended use of these assets may cause the estimated life or the value of these assets to change.
We perform a review of the estimated useful life, residual value and depreciation method for each category of tangible fixed assets, (being property, plant and equipment and assets in the course of construction), at the end of every reporting period. Our review of these assets may indicate that their lives need to be shortened, resulting in an increased depreciation charge in future periods. Alternatively, our review may indicate a decrease in the value of the asset, recognised by an impairment charge.
Under the principles of UK GAAP, we assess the carrying values of our intangible fixed assets (including goodwill) at the end of the first full financial year following acquisition and all our fixed assets (tangible, intangible and goodwill) in any accounting period if events, or changes in circumstances, indicate that the carrying values may not be recoverable. Factors we believe are important and may trigger an impairment review could include the following:
| • | a significant decline in a fixed asset’s market value; |
| | |
| • | a significant adverse change in the business or the market in which the fixed asset is involved; |
| | |
| • | a significant adverse change in the statutory or other regulatory environment; |
| | |
| • | significant underperformance relative to expected or forecast operating results. |
Under UK GAAP, when a triggering event has occurred, we perform an impairment review by comparing the carrying value of the income generating unit (IGU) with its recoverable amount. The recoverable amount is deemed to be the higher of the IGU’s value-in-use and its net realisable value. Unless an IGU is to be disposed of, the recoverable amount is deemed to be equal to its value-in-use, which is determined by calculating the net present value of the future estimated cash flows.
In calculating the net present value of an IGU, management are required to make estimates and assumptions which are fundamental to the present value of future cash flows. These include:
| • | the determination of the composition of the IGU; |
| | |
| • | the projected net cash flows of the IGU over the period of the review; |
| | |
| • | the determination of the terminal value cash flows, and the terminal value growth rate; and |
| | |
| • | the determination of the appropriate discount rate. |
In calculating the value-in-use we believe that there is significant uncertainty as to the present value of future cash flows. In assessing those future cash flows, we have made assumptions using the best estimates available at the time of performing the review. In order to estimate the net cash flows, assumptions about future revenues, the related cost of sales, and capital expenditure have been made. These forecasts are an integral part of approved internal business plans and include estimates and assumptions concerning the Group’s strategic plans for existing and new products; the active customer base growth and the related voice and data ARPUs; churn rates; subscriber acquisition and retention costs; and the timing of the construction of our UMTS networks.
The assumptions and estimates used in our models can vary significantly from period to period as a result of changes in the mobile telecommunications industry, including advances in technology; changes in the performance of our businesses as a result of competitive pressures or otherwise; potential difficulty in the implementation of the UMTS network; the competitive and regulatory landscape; the take-up and charge rate of data services; and the availability of functioning technological infrastructure to support the UMTS roll-out.
39
Back to Contents
As a result of our reviews in the year ended 31 March 2003, we recognised impairment charges totalling £8,300 million, in connection with the impairment of the intangible fixed assets of the Group. This included charges relating to the UMTS licence and goodwill in O2 UK and O2 Germany (totalling £2,300 million and £4,700 million respectively), and the impairment of goodwill relating to O2 Ireland of £1,300 million.
Under US GAAP, we recorded an impairment charge in the year ended 31 March 2003 against goodwill relating to O2 UK and O2 Ireland of £1,884 million. We did not record an impairment against telecommunication licences. The method of calculating and applying impairment charges differs significantly between UK GAAP and US GAAP. The difference in the impairment charges for our goodwill and telecommunication licences between UK and US GAAP is primarily as a result of the requirement under US GAAP to first test the carrying value of long-lived assets using undiscounted cash flows and secondarily the difference in methodology for calculating the impairment of goodwill. Further details are contained in note 32 to the financial statements in Item 18.
We only recognise transactions in turnover that are considered to be part of our principal ongoing operations. We recognise voice and data service revenue in the profit and loss account based on minutes of airtime processed over the Group’s networks. Turnover derived from connection fees and subscriptions is recognised evenly over the estimated customer relationship period, or the contracted period to which they relate. Income received from sales of pre-pay call cards is deferred until the customer has used the value in the card to pay for relevant calls. Revenues from handsets are recognised at the point of sale.
In connection with recording revenue, we maintain provisions for doubtful debts for estimated losses that result from the inability of a portion of our customers to make required payments. We base our provision on historical results and future expectations, the economic and competitive environment and other relevant factors, and review the provision regularly.
Capitalisation of interest |
Under UK GAAP, the Group does not capitalise interest in its financial statements. To comply with US GAAP, the estimated amount of interest incurred whilst constructing major capital projects is included in fixed assets and depreciated over the lives of the related assets. This includes capitalisation of interest incurred on funding the UMTS licences for the period up to the launch of the related services. The amount of interest capitalised is determined by reference to the average interest rates on outstanding borrowings and cannot exceed the annual interest expense charged. Further details are contained in note 32 to the financial statements in Item 18.
Basis of presentation of financial statements |
The consolidated financial statements have been prepared using merger accounting principles as if the businesses comprising the Group had been part of the Group for all periods presented, since they have been under common control throughout this period.
For the purpose of these financial statements, a portion of BT’s short- and long-term loans has been allocated to the Group for the periods up to 19 November 2001, the date of demerger from BT. The allocation has been determined by reference to the amount of loans and other borrowings raised by BT to fund certain significant acquisitions in the year ended 31 March 2001 of mobile businesses and assets, including UMTS licences. These allocated loans are interest bearing and further details are disclosed in note 1 to the financial statements in Item 18.
Businesses acquired from, or disposed to, third parties during the periods presented have been accounted for using acquisition accounting, from or to the date control passed.
The principal components of our Group in the periods under review have been as follows:
| • | O2 UK, our UK business, has been included throughout the periods covered by the consolidated financial statements; |
| | |
| • | O2 Germany, our mobile business in Germany, has been consolidated since we increased our interest to 100 per cent on 20 February 2001. Prior to this date, we owned a 45 per cent stake in the company from its |
40
Back to Contents
inception until 15 January 2001, when our interest increased to 55 per cent. In our consolidated financial statements we accounted for this interest under the equity method as a joint venture until 20 February 2001, when we obtained regulatory approval to acquire the remaining interest and control;
| • | O2 Netherlands, our mobile business in the Netherlands, has been consolidated since 30 June 2000, when we acquired the remaining 50 per cent interest in the company, and obtained full control. Prior to 30 June 2000, we held a 50 per cent joint venture interest in O2 Netherlands which has been accounted for in our consolidated financial statements under the equity method as a joint venture. On 3 June 2003, O2 Netherlands was sold to Greenfield Capital Partners. |
| | |
| • | O2 Ireland, our mobile business in Ireland, has been consolidated in our Group financial statements throughout the periods under review. Our interest in the issued voting share capital of O2 Ireland increased to 50.5 per cent on 30 March 2000 from the 1 per cent acquired in January 2000. We acquired the remaining 49.5 per cent interest in O2 Ireland on 18 April 2001; |
| | |
| • | various businesses and assets in the United Kingdom have been operated throughout the period of the consolidated financial statements as separate units within the BT Group, including the BT Mobile, BT Shops and Airwave businesses. The businesses and assets of all these operations were transferred to the Group prior to demerger. The assets and results of each of these operations have been included in the consolidated financial statements for all periods presented; |
| | |
| • | the O2 Online internet portal business was operated initially as a division of O2 UK. However, in 2001, the business and assets of O2 Online were transferred into a separate legal entity which was a wholly-owned subsidiary of O2 UK. In March 2003 the ownership of O2 Online was transferred from O2 UK to another Group company, O2 Networks Limited; and |
| | |
| • | Manx Telecom Limited, O2 Third Generation Limited and Cellular Radio Limited which have been included throughout the periods presented in the consolidated financial statements. |
| |
Financial performance measurement |
We define EBITDA as our earnings before interest, tax, depreciation, amortisation and exceptional items, excluding our share of operating profits and losses of our associates and joint ventures. We use EBITDA, a non GAAP financial measure, as one of the key performance indicators for evaluating the financial performance of our business units. We believe that EBITDA provides an important measure of the underlying operating performance of the Group because it excludes recurring non-cash items such as depreciation and amortisation. We believe that this measure is also used by readers of this annual report in order to assess our performance against other comparable companies. Other measures used include revenues, operating profit or loss, and capital expenditure.
We also believe that EBITDA is one of the key indicators of our borrowing potential as indicated by the financial covenants attaching to some of our credit facilities which require compliance with EBITDA targets and EBITDA-based ratios. Further details are provided in the sources of liquidity and capital resources section.
41
Back to Contents
Group operating loss is considered to be the UK GAAP financial measure closest to EBITDA. The reconciliation of EBITDA to Group operating loss for the loss for the periods under review is as follows:
| | | Year ended 31 March
| |
| | | 2003 | | 2002 | | 2001 | |
| | |
|
| |
|
| |
|
| |
| | | £m | | £m | | £m | |
EBITDA | | | 859 | | | 433 | | | 317 | |
| Depreciation before exceptional items | | | (932 | ) | | (747 | ) | | (362 | ) |
| Amortisation before exceptional items | | | (405 | ) | | (392 | ) | | (298 | ) |
| | |
|
| |
|
| |
|
| |
| Operating loss before exceptional items | | | (478 | ) | | (706 | ) | | (343 | ) |
| Exceptional items | | | (8,300 | ) | | (150 | ) | | (2,821 | ) |
| | |
|
| |
|
| |
|
| |
Group operating loss | | | (8,778 | ) | | (856 | ) | | (3,164 | ) |
| | |
|
| |
|
| |
|
| |
As EBITDA is not a measure of financial performance under UK GAAP, it may not be comparable to similarly titled measures of other companies because EBITDA is not uniformly defined. EBITDA should not be considered by investors as an alternative to Group operating loss or loss on ordinary activities before taxation as an indication of operating performance, or as an alternative to cash flow from operating activities as an indication of cash flows.
On 14 April 2003, the Group announced that it had agreed the sale of its wholly-owned Dutch subsidiary, O2 Netherlands, to Greenfield Capital Partners, an independent private equity and corporate finance group with existing interests in the fixed telecoms sector, for €25 million in cash. The sale took the form of the sale of all the issued shares of O2 Netherlands. Final competition clearance in the Netherlands has been received and the sale completed on 3 June 2003.
At the date of approval of the financial statements, 20 May 2003, the sale of O2 Netherlands had not received final clearance from the Dutch competition commission. In accordance with FRS 3 “Reporting financial performance”, the activities of O2 Netherlands are shown as discontinuing, as a component of continuing operations. The Group has made a provision for the loss on disposal of £1,364 million. This represents the impairment of the assets of O2 Netherlands, and goodwill relating to the original purchase of the stake in O2 Netherlands, down to their net realisable value. This is equal to the proceeds less the direct costs incurred in relation to the sale. The provision is charged in the profit and loss account below Group operating loss.
The summarised results of the Group, excluding O2 Netherlands, in the years under review are:
| | | Year ended 31 March
| |
| | | 2003 | | 2002 | | 2001 | |
| | |
|
| |
|
| |
|
| |
| | | £m | | £m | | £m | |
| Group turnover | | | 4,611 | | | 4,076 | | | 3,110 | |
| Cost of sales | | | (2,854 | ) | | (2,519 | ) | | (1,722 | ) |
| | |
|
| |
|
| |
|
| |
| Gross profit | | | 1,757 | | | 1,557 | | | 1,388 | |
| Administrative expenses before exceptional items | | | (2,149 | ) | | (2,141 | ) | | (1,620 | ) |
| | |
|
| |
|
| |
|
| |
| Group operating loss before exceptional items | | | (392 | ) | | (584 | ) | | (232 | ) |
| Exceptional items | | | (8,300 | ) | | (139 | ) | | (2,821 | ) |
| | |
|
| |
|
| |
|
| |
| Group operating loss | | | (8,692 | ) | | (723 | ) | | (3,053 | ) |
| | |
|
| |
|
| |
|
| |
| |
Introduction to results of operations |
The following is a brief description of the items comprised within turnover, cost of sales and administrative expenses within our results of operations.
42
Back to Contents
Our turnover from operations can be analysed into three areas: service, equipment and other revenue, with service revenue our principal source of income. These income streams are briefly described below:
| • | Service. Our principal source of income is derived from our customers’ use of our mobile networks. This includes both voice-related airtime and data services, such as SMS, WAP and GPRS. It also includes interconnection fees from other networks terminating calls on our customers’ mobile phones, and roaming fees from other network customers using our networks; |
| | |
| • | Equipment. Equipment revenue is derived from the sale of handsets and other accessories; and |
| | |
| • | Other. Other revenue primarily relates to revenue received from other mobile networks in situations when we are acting as a retailer or as a service provider. Other revenue also includes connection charges and revenue from other sources such as voice messaging and paging services. |
The principal items within cost of sales are:
| • | Service. Service cost of sales mainly comprises interconnection charges and operation and maintenance costs relating to our networks. These costs may be sub-divided into costs of a variable nature and costs which are more fixed in nature. Interconnection charges are the payments made by us to other fixed line or mobile network operators, both in the local country and roaming costs when our customers make calls or send SMS messages that are terminated on a competitor’s network. These costs are variable in nature, increasing as the usage of the network increases. Costs relating to the operation and maintenance of our networks mainly comprise core transmission costs, mast site leases, network equipment maintenance and depreciation charges related to our network assets. These costs are more fixed in nature, and depend on the size of the network, not the usage of the network. Service cost of sales will significantly increase once we commence providing services pursuant to our UMTS licences, because service cost of sales will include amortisation of our UMTS licence acquisition costs over the remaining life of these licences and depreciation of our UMTS networks once they are constructed; |
| | |
| • | Equipment. Equipment cost of sales includes the cost of purchasing handsets and other hardware items, such as SIM cards, from manufacturers; and |
| | |
| • | Other. Other cost of sales primarily relates to the cost of services from other mobile networks when we are acting as a retailer or service provider. Other cost of sales also includes the network cost of providing voice messaging and paging services. |
| |
Administrative expenses before exceptional items |
Principal administrative expenses are:
| • | Promotional and advertising. These costs primarily comprise bonuses and commissions to retailers, mainly for acquisition, but increasingly for retention, of customers. Promotional and advertising expenses also include expenditure on advertising, marketing and loyalty programmes; |
| | |
| • | Overhead. Overhead expenses include personnel costs relating to functions such as finance, planning, network, regulatory, legal, marketing and customer care. They also include property charges, facilities, training and information technology support; |
| | |
| • | Depreciation. This includes depreciation expenses not related to network assets; and |
| | |
| • | Amortisation. This comprises amortisation expenses on goodwill arising on the acquisition of businesses. |
Exceptional items are large non-recurring expenses and incomes that have been disclosed separately to avoid distortion of reported trading profit.
43
Back to Contents
mmO2 consolidated results of operations for the years ended 31 March 2003, 2002 and 2001 |
The following table presents certain financial data for our Group, including O2 Netherlands, for the years ended 31 March 2003, 2002 and 2001 extracted from our consolidated financial statements:
| | | Year ended 31 March
| |
| | | 2003 | | 2002 | | 2001 | |
| | |
|
| |
|
| |
|
| |
| | | £m | | £m | | £m | |
| Group turnover | | | 4,874 | | | 4,276 | | | 3,200 | |
| Cost of sales | | | (3,060 | ) | | (2,714 | ) | | (1,814 | ) |
| | |
|
| |
|
| |
|
| |
| Gross profit | | | 1,814 | | | 1,562 | | | 1,386 | |
| Administrative expenses before exceptional items | | | (2,292 | ) | | (2,268 | ) | | (1,729 | ) |
| Exceptional items | | | (8,300 | ) | | (150 | ) | | (2,821 | ) |
| | |
|
| |
|
| |
|
| |
| | | | | | | | | | | |
EBITDA1 before exceptional items | | | 859 | | | 433 | | | 317 | |
| | |
|
| |
|
| |
|
| |
| Group operating loss | | | (8,778 | ) | | (856 | ) | | (3,164 | ) |
| Group’s share of operating loss of joint ventures | | | — | | | — | | | (303 | ) |
| Group’s share of operating profit of associates | | | 5 | | | 8 | | | 17 | |
| | |
|
| |
|
| |
|
| |
| Total operating loss | | | (8,778 | ) | | (848 | ) | | (3,450 | ) |
| Provision for loss on sale of business | | | (1,364 | ) | | — | | | — | |
| Net interest payable and similar charges | | | (66 | ) | | (781 | ) | | (669 | ) |
| | |
|
| |
|
| |
|
| |
| Loss on ordinary activities before taxation | | | (10,203 | ) | | (1,629 | ) | | (4,119 | ) |
| Tax on loss on ordinary activities | | | 55 | | | 250 | | | 114 | |
| | |
|
| |
|
| |
|
| |
| Loss on ordinary activities after taxation | | | (10,148 | ) | | (1,379 | ) | | (4,005 | ) |
| Minority interests | | | — | | | — | | | (4 | ) |
| | |
|
| |
|
| |
|
| |
| Loss for the financial year | | | (10,148 | ) | | (1,379 | ) | | (4,009 | ) |
| | |
|
| |
|
| |
|
| |
| 1 | EBITDA is our earnings before interest, tax, depreciation, amortisation and exceptional items, excluding our share of operating profits and losses of our joint ventures and associates. The use of EBITDA as a financial performance measure is discussed in “Operating and Financial Review and Prospects – Financial performance measurement” in Item 5. |
44
Back to Contents
Year ended 31 March 2003 compared to year ended 31 March 2002 |
The following table shows contributions of our businesses to Group turnover:
| | | Year ended 31 March | | | | |
| | |
| | per cent | |
| | | 2003 | | 2002 | | variation | |
| | |
|
| |
|
| |
|
| |
| | | £m | | £m | | | |
O2 UK | | | 3,025 | | | 2,756 | | | 10 | |
O2 Germany | | | 1,060 | | | 875 | | | 21 | |
O2 Ireland | | | 442 | | | 395 | | | 12 | |
O2 Netherlands | | | 263 | | | 200 | | | 32 | |
O2 Online | | | 93 | | | 100 | | | (7 | ) |
| Other operations | | | 64 | | | 54 | | | 18 | |
| Intragroup eliminations | | | (73 | ) | | (104 | ) | | (31 | ) |
| | |
|
| |
|
| |
|
| |
Total | | | 4,874 | | | 4,276 | | | 14 | |
| | |
|
| |
|
| |
|
| |
Group turnover increased by 14 per cent from £4,276 million for the year ended 31 March 2002, to £4,874 million for the year ended 31 March 2003. All our mobile telecommunications businesses contributed to the rise in Group turnover. The principal reasons for this are the overall rise in subscriber numbers in the current year and the increased usage of the Group’s services by subscribers. These factors are considered in detail below in the review by business.
O2 UK’s overall turnover increased by nearly 10 per cent from £2,756 million for the year ended 31 March 2002 to £3,025 million for the year ended 31 March 2003. Turnover is largely comprised of service revenue, which increased by 13 per cent from £2,426 million for the year ended 31 March 2002 to £2,738 million for the year ended 31 March 2003.
Penetration within the UK mobile phone market is reaching saturation. This has driven our focus towards ensuring that we win and retain higher quality customers. We believe that the effects of this effort can be seen in the significant rise in service revenue.
O2 UK’s total active customer base increased from 11.1 million at 31 March 2002 to 12.1 million at 31 March 2003, an increase of 9 per cent, which includes a net increase in post-pay subscribers of over half a million customers. In addition to this, post-pay churn has continued the downward trend established last year.
The following table details O2 UK’s revenue split between service, equipment and other revenues:
| | | Year ended 31 March | | | | |
| | |
| | per cent | |
| | | 2003 | | 2002 | | variation | |
| | |
|
| |
|
| |
|
| |
| | | £m | | £m | | | |
| Service | | | 2,738 | | | 2,426 | | | 13 | |
| Equipment | | | 190 | | | 136 | | | 40 | |
| Other | | | 97 | | | 194 | | | (50 | ) |
| | |
|
| |
|
| |
|
| |
Total | | | 3,025 | | | 2,756 | | | 10 | |
| | |
|
| |
|
| |
|
| |
Service. Service revenue is the principal element of O2 UK’s turnover, comprising 91 per cent of total turnover for the year ended 31 March 2003. O2 UK’s service revenue increased by 13 per cent from £2,426 million for the year ended 31 March 2002 to £2,738 million for the year ended 31 March 2003. Of this, service revenue from post-pay customers is the principal source of income, with post-pay revenue accounting for over 67 per cent of the total. This represents an increase over the 65 per cent recorded for the year ended 31 March 2002.
45
Back to Contents
O2 UK’s revenue has grown as a result of a combination of an increase in the subscriber base, partly arising from better retention of existing users, and an increase in post-pay ARPU.
Post-pay subscribers’ gross additions for the year ended 31 March 2003 total 1.7 million, taking our total post-pay customer base to 4.1 million (representing 519,000 net additions for the year). The post-pay churn rate has continued the downward trend established in the 2002 financial year. Post-pay churn for the year ended 31 March 2003 was 28 per cent, a fall of 10 per cent from the churn of 31 per cent recorded for the year ended 31 March 2002.
These improvements have been driven by the success of the O2 brand, launched in May 2002, and new and innovative product offerings to customers in both voice and mobile data services. An example of these are the “bolt-ons”, our packages offering additional data and voice services to customers, which attract high-spending users and grow revenues from existing customers rather than incurring SACs.
Data revenues, as a proportion of total service revenues increased steadily through the year from 11.8 per cent for the year ended 31 March 2002 to 17.1 per cent for the year ended 31 March 2003. Data revenue as a proportion of total service revenue for the final quarter of the year ended 31 March 2003 was 19.1 per cent. Included within these statistics, the popularity of text messages continued to grow, with nearly 5.8 billion messages sent during the year ended 31 March 2003, compared with 3.4 billion during the year ended 31 March 2002.
Equipment and other revenues. Equipment revenues have increased 40 per cent in the 2003 financial year compared to the 2002 financial year. The principal reason for the rise is the increase in the gross post-pay additions of customers in the year ended 31 March 2003.
O2 UK’s other revenue in the 2002 financial year mainly comprised revenue from Lumina, a service provider acquired in the 2000 financial year, and sales of non-mobile products by the O2 retail shops. Lumina had a customer base which included both O2 UK and Vodafone customers. At the end of the 2002 financial year we sold the Vodafone customers and no longer derive revenue from them. The sales by the O2 shops have also fallen following the rationalisation of the retail chain in the first half of the 2003 calendar year. However, the sales per store of the remaining shops were more than double those of the previous year.
The current year is the second full year of ownership of O2 Germany. The total revenue of O2 Germany for the year ended 31 March 2003 was £1,060 million, an increase of 21 per cent over the year ended 31 March 2002 revenue of £875 million.
The following table details O2 Germany’s revenue split between service, equipment and other revenues:
| | | Year ended 31 March | | | | |
| | |
| | per cent
variation | |
| | | 2003 | | 2002 | | |
| | |
|
| |
|
| |
|
| |
| | | £m | | £m | | | | |
| Service | | | 944 | | | 696 | | | 36 | |
| Equipment | | | 94 | | | 127 | | | (26 | ) |
| Other | | | 22 | | | 52 | | | (58 | ) |
| | |
|
| |
|
| |
|
| |
Total | | | 1,060 | | | 875 | | | 21 | |
| | |
|
| |
|
| |
|
| |
Service O2 Germany’s service revenue for the year ended 31 March 2003 has increased by 36 per cent compared to the previous year.
This increase in revenues is principally the result of a significant increase in the subscriber base, which has risen from 3.9 million active subscribers at 31 March 2002, to 4.8 million active subscribers at 31 March 2003. Post-pay customer additions in the year ended 31 March 2002 were 651,000, representing 71 per cent of total net additions. The pre-pay customer base increased by 14 per cent from the 2002 financial year to the 2003 financial year, with pre-pay customers totalling 2.2 million at 31 March 2003.
46
Back to Contents
A large proportion of the post-pay additions during the year relate to customers who have subscribed to the Genion Home service, our location-based tariffing technology, which allows reduced call rates within the homezone. O2 Germany also offers an equivalent service to business customers. Both Genion Home and Business are part of our drive across the Group to attract high-value customers.
Post-pay ARPU has increased from £313 for the year ended 31 March 2002, to £341 for the year ended 31 March 2003. This rise is a function of the continuing drive to win higher spending customers. At 31 March 2003, over 30 per cent of the total customer base subscribed to the Genion service.
O2 Germany have continued to launch new data services during the 2003 financial year, following the launch of the first operational German GPRS network in January 2001. New services announced in the year include multimedia messaging and Java games. In addition, SMS messaging continues to gain in popularity. This has been reflected in the increase in the proportion of data revenues compared to total service revenues which have risen to 19.3 per cent during the year ended 31 March 2003. The proportion for the three months ended 31 March 2003 reached a record 21.0 per cent. The principal element of data revenue is generated by text messages; O2 Germany recorded 1,337 million text messages in the year ended 31 March 2003, an increase of 564 million messages over last year.
Equipment and other revenues. Both equipment and other revenues have fallen by 26 per cent and 56 per cent respectively compared to the prior year.
The fall in equipment revenues has been caused by a decline in the sales of devices to shops and third-party dealers in the 2002 financial year which have not been repeated in the 2003 financial year. Other revenues represent several other revenue streams. These include certain support contracts with BT Ignite following the demerger from BT which are reaching the end of their term.
Other mobile telecommunication businesses |
The Group had two other mobile telecommunication businesses in Europe during the year – O2 Ireland and O2 Netherlands.
O2 Ireland’s revenue has increased by 12 per cent from £395 million for the year ended 31 March 2002, to £442 million for the year ended 31 March 2003. This increase in revenue is a combination of an increase of 75,000 in the customer base and a 7 per cent rise in blended ARPU. Contract customer numbers increased from 356,000 at 31 March 2002 to 366,000 active subscribers at 31 March 2003 and the pre-pay customers bases increased from 824,000 at 31 March 2002 to 889,000 at 31 March 2003.
O2 Netherlands’ revenue has increased by 32 per cent from £200 million for the year ended 31 March 2002, to £263 million for the year ended 31 March 2003.
O2 Online acts as the online sales channel in the UK and Ireland and as the developer of all of the Group’s mobile data capability. O2 Online has increased revenues generated from outside the Group by 15 per cent from £33 million in the year ended 31 March 2002 to £38 million in the year ended 31 March 2003. External revenue includes sales of devices outside the Group’s territories, paid-for alerts and ring-tones and advertising. Approximately 60 per cent of revenues in the year ended 31 March 2003, down from 66 per cent in the year ended 31 March 2002, were generated internally with the Group. Internal revenue is generated mainly from connection fees and airtime voucher sales as well as the provision of WAP gateway and portal services to other Group companies.
Net operating expenses before exceptional items |
Net operating expenses before exceptional items may be analysed between cost of sales and administrative expenses. Net operating expenses increased by 7 per cent from £4,982 million for the year ended 31 March 2002 to £5,352 million for the 2003 financial year. This increase arises from an increase in the cost of sales in the current year reflecting the increase in turnover described earlier.
47
Back to Contents
An analysis of the net operating expenses before exceptional items for our operating companies for the periods indicated is provided in the table below:
| | | Year ended 31 March | | | | |
| | |
| | per cent
variation | |
| | | 2003 | | 2002 | | |
| | |
|
| |
|
| |
|
| |
| | | £m | | £m | | | | |
O2 UK | | | 2,691 | | | 2,458 | | | 9 | |
O2 Germany | | | 1,295 | | | 1,275 | | | 2 | |
| Other mobile telecommunication businesses | | | 705 | | | 655 | | | 8 | |
O2 Online | | | 216 | | | 194 | | | 11 | |
| Goodwill amortisation | | | 374 | | | 369 | | | 1 | |
| Other operations and central costs | | | 71 | | | 31 | | | 129 | |
| | |
|
| |
|
| |
|
| |
Total | | | 5,352 | | | 4,982 | | | 7 | |
| | |
|
| |
|
| |
|
| |
Group cost of sales increased by 13 per cent from £2,714 million for the year ended 31 March 2002, to £3,060 million for the year ended 31 March 2003. This increase in cost of sales in the 2003 financial year was commensurate with the increase in Group turnover of 14 per cent.
The gross margin percentage (gross profit divided by turnover) of our newer business in Germany is lower than those of our more established businesses in the UK and Ireland. This is because O2 Germany is in the process of building its customer base. Despite this, O2 Germany increased its gross margin by 16 percentage points to 28 per cent. However, the gross profit margin of the Group remained constant at 37 per cent as both O2 Online and Airwave contributed a higher cost of sales. This is due to the increase in activity at both operations.
Group administrative expenses before exceptional items |
Group administrative expenses before exceptional items have increased by 1 per cent from £2,268 million for the year ended 31 March 2002 to £2,292 million for the year ended 31 March 2003. Administrative expenses have not grown in line with the rise in revenues following the restructuring at the UK and German operations initiated in February 2002 which are realising cost savings.
Group administrative expenses before exceptional items, as a percentage of turnover, have decreased from 53 per cent in the 2002 financial year to 47 per cent in the year ended 31 March 2003.
O2 Germany has a higher ratio of administrative expenses as a percentage of turnover than those of our more established businesses, because it is still building its customer base. As the business of O2 Germany matures, we expect that the ratio will fall and for O2 Germany for the year ended 31 March 2003, it has fallen by 7 percentage points compared to the year ended 31 March 2002.
O2 UK’s net operating expenses before exceptional items have increased by 9 per cent, from £2,458 million for the year ended 31 March 2002 to £2,691 million for the year ended 31 March 2003. Net operating expenses as a percentage of turnover has remained constant at 89 per cent for the two financial years under review.
The variable element of O2 UK’s service cost of sales has increased in line with the network usage. Interconnection charges increased significantly during the financial year 2003, compared to the year ended 31 March 2002, reflecting the increased calls from O2 UK customers terminating on other networks, including other mobile networks whose termination charges are generally higher than charges levied by fixed-line network providers.
O2 UK’s depreciation charge has increased from £372 million in the year ended 31 March 2002 to £477 million in the year ended 31 March 2003, which reflects the continued investment in improving O2 UK’s network quality
48
Back to Contents
and the shortening of the useful economic life of certain network assets which are being swapped out of the network.
The advertising and marketing spend for the year ended 31 March 2003 has increased by 9 per cent on the 2002 financial year. This arises from an overall increase in subscriber acquisition costs resulting from the increased level of connections in the business in the 2003 financial year. The overall rise in SACs contrasts with a fall in both the pre-pay and post-pay average subscriber acquisition costs. Post-pay SACs have decreased from £180 to £177 per subscriber, and pre-pay SACs have decreased from £53 to £25 per subscriber.
Compared to the year ended 31 March 2002, O2 UK’s overheads have decreased by 4 per cent for the year ended 31 March 2003, which, despite the increased turnover and concentration on improving customer service, reflects the cost control measures during the year and the cost savings derived from restructuring of the business announced in February 2002.
O2 Germany’s net operating expenses before exceptional items increased from £1,275 million for the year ended 31 March 2002, to £1,295 million for the year ended 31 March 2003.
Net operating expenses as a percentage of turnover was 146 per cent for the 2002 financial year, and for the 2003 financial year has fallen to 122 per cent. This reflects the rapid growth in revenues at O2 Germany. For O2 Germany, we expect this ratio to be higher than the same ratio of our more established businesses, as the newer businesses are in the process of building up their customer bases.
The total depreciation charge (both network and non-network fixed assets) was £259 million for the year ended 31 March 2003, a 14 per cent increase over the charge for the year ended 31 March 2002 of £228 million. This represents the continuing investment by O2 Germany in their network.
Blended subscriber acquisition costs have increased by 13 per cent from £95 per subscriber for the year ended 31 March 2002 to £107 per subscriber for the year ended 31 March 2003. This reflects the very high level of contract customer connections in the year, with over 70 per cent of net additions being post-pay customers who traditionally have required a higher SAC to attract. Despite this, the SAC per customer for post-pay subscribers has remained almost constant year on year.
Other mobile telecommunication businesses |
Net operating expenses before exceptional items for our other mobile telecommunication businesses, O2 Netherlands and O2 Ireland, have increased by 8 per cent from £655 million for the year ended 31 March 2002, to £705 million for the year ended 31 March 2003.
The principal reason for the increase is the expansion of the businesses in the 2003 financial year; the total turnover of O2 Ireland and O2 Netherlands has grown by 18 per cent from the 2002 financial year to the 2003 financial year.
O2 Ireland’s net operating costs before exceptional items have increased by 6 per cent from £337 million in the year ended 31 March 2002 to £356 million in the year ended 31 March 2003, reflecting the effect of the 12 per cent increase in service revenue during the 2003 financial year compared to the 2002 financial year. The effect of the revenue increase was reduced as a result of the implementation of cost control measures.
O2 Online’s net operating expenses before exceptional items increased by 11 per cent from £194 million for the year ended 31 March 2002 to £216 million for the year ended 31 March 2003. This reflects the Group’s continued focus on developing mobile data capability. The ratio of net operating expenses to external turnover at O2 Online in 2003 has remained consistent with the ratio in 2002.
49
Back to Contents
The goodwill amortisation charge before the exceptional impairment charge, included in the Group’s results has increased marginally from £369 million in the year ended 31 March 2002 to £374 million in the year ended 31 March 2003. Goodwill relating to our overseas businesses is held as a foreign currency denominated asset. The fall of almost 4 per cent in the average Euro to Sterling exchange rate for the year between the 2002 financial year and 2003 financial year has increased the goodwill amortisation charge recognised in our reporting currency, Sterling.
In accordance with FRS 11 “Impairment of fixed assets and goodwill” we regularly monitor the carrying values of our fixed assets.
During the second half of the year ended 31 March 2003 certain events, including our strategic review of the Dutch market which led to the announcement of the disposal of O2 Netherlands, indicated that we should perform impairment reviews of its four principal operations; the mobile telecommunications operations in the UK, Germany, Ireland and the Netherlands.
In April 2003, we announced the sale of O2 Netherlands resulting in an accounting loss of approximately £1.4 billion, which provided an indication that the valuation of mobile businesses may be lower than previously estimated. Additionally, following the Competition Commission’s report on mobile termination charges, we announced that we were reviewing the launch dates of our 3G services and would adopt a more prudent timetable where local regulatory requirements permitted. This revision in the timetable, together with the current absence of evidence as to the present mass market appeal of 3G services and the limited availability of 2G/3G compatible handsets, has led us to review and revise the business plans of our mobile operations across our European footprint.
As a result of the above events, the carrying value of the fixed assets of each of our principal income generating units (IGUs), being O2 UK, O2 Germany, O2 Ireland and O2 Netherlands, were compared to their respective recoverable amounts.
The announced disposal of O2 Netherlands has led to the carrying value of the net assets of the Dutch IGU being written down to their recoverable amount, which in this case is the sale proceeds less direct costs of disposal. This has resulted in an exceptional impairment charge of £1,364 million being recognised in the profit and loss account below Group operating loss.
With respect to the IGUs that are held for continuing use within the Group (being O2 UK, O2 Germany and O2 Ireland), the carrying values of their fixed assets were compared to their value in use to the Group. The value in use of each IGU is calculated with reference to the net present value of its future cash flows derived from the assets, using cash flow projections for the period up to 31 March 2013. These projections cover a ten-year period, as we believe that throughout this ten-year period, the annual growth rate of the IGUs being assessed will differ from the average growth rates for the countries concerned. For the periods beyond 1 April 2013, the projections use a long-term growth rate assumed to be at or below the nominal GDP of the country concerned. The discount rates applied to the projections were based on the post-tax weighted average cost of capital for the Group. The effective pre-tax discount rate for each of our territories ranged between 10.4 per cent and 12.5 per cent.
The impairment review performed during the year ended 31 March 2003 revealed that the fixed assets of each of the IGUs held for continuing use within the Group were impaired, resulting in an exceptional impairment charge of £8,300 million included within operating expenses.
50
Back to Contents
The total exceptional impairment charges in the year ended 31 March 2003 are analysed below:
| | | Goodwill | | Licences,
other
intangible
assets and
investments | | Tangible
assets | | Total | |
| | |
|
| |
|
| |
|
| |
|
| |
| | | £m | | £m | | £m | | £m | |
Operating exceptional items: | | | | | | | | | | | | | |
O2 UK | | | 198 | | | 2,102 | | | — | | | 2,300 | |
O2 Germany | | | 903 | | | 3,797 | | | — | | | 4,700 | |
O2 Ireland | | | 1,300 | | | — | | | — | | | 1,300 | |
| | |
|
| |
|
| |
|
| |
|
| |
| | | | 2,401 | | | 5,899 | | | — | | | 8,300 | |
Non-operating exceptional items: | | | | | | | | | | | | | |
O2 Netherlands | | | 649 | | | 423 | | | 292 | | | 1,364 | |
| | |
|
| |
|
| |
|
| |
|
| |
| | | | 3,050 | | | 6,322 | | | 292 | | | 9,664 | |
| | |
|
| |
|
| |
|
| |
|
| |
The carrying value of the Group’s goodwill and licences after the impairment charges are £3,418 million and £4,164 million respectively.
The impairment charge relating to goodwill includes £47 million in respect of goodwill arising on acquisitions prior to 1 April 1998 which has been written off directly to reserves. This goodwill has been reinstated and written off through the profit and loss account.
In calculating the value in use there is considerable uncertainty as to the present value of the future cash flows. In assessing the future cash flows, assumptions have been made using the best estimates available at the time of performing the impairment review. These estimates include those used to reflect the growth rates up to 2013, the long-term growth rates beyond 2013, the discount rate, the competitive landscape, the take up and charge rate of data services and the availability of functioning technological infrastructure to support the 3G roll-out. The actual outcome is uncertain and these estimates may change over time as subsequent changes in the mobile telecommunications industry, including advances in technology, changes in the performance or our businesses as a result of competitive pressure or otherwise, or potential difficulty in the implementation of the UMTS network, may in the future shorten the estimated useful lives or result in a further write-down of these assets.
Exceptional items for the year ended 31 March 2002 amounted to £150 million. These related to the costs arising as a result of the demerger of the Group from BT in November 2001, and costs relating to the reorganisation of the Group subsequent to the demerger. We incurred exceptional costs of £27 million which were directly attributable to the demerger of the Group from BT. The remaining £123 million of exceptional items relate to the restructuring of our UK and German operations post demerger, of which £87 million was in respect of redundancy costs.
51
Back to Contents
EBITDA is our earnings before interest, tax, depreciation, amortisation and exceptional items, excluding our share of operating profits and losses of our joint ventures and associates.
The reconciliation of EBITDA to Group operating (loss)/profit, the closest UK GAAP financial measure, by business is as follows:
| | | Group operating
(loss)/profit | | Depreciation | | Amortisation | | Exceptional
items | | EBITDA | |
| | |
| |
| |
| |
| |
| |
| | | 2003 | | 2002 | | 2003 | | 2002 | | 2003 | | 2002 | | 2003 | | 2002 | | 2003 | | 2002 | |
| | |
|
| |
|
| |
|
| |
|
| |
|
| |
|
| |
|
| |
|
| |
|
| |
|
| |
| | | £m | | £m | | £m | | £m | | £m | | £m | | £m | | £m | | £m | | £m | |
O2 UK | | | (2,116 | ) | | 36 | | | 478 | | | 372 | | | 175 | | | 176 | | | 2,300 | | | 86 | | | 837 | | | 670 | |
O2 Germany | | | (4,979 | ) | | (472 | ) | | 259 | | | 228 | | | 47 | | | 49 | | | 4,700 | | | 29 | | | 27 | | | (166 | ) |
O2 Ireland | | | (1,331 | ) | | (57 | ) | | 67 | | | 61 | | | 121 | | | 118 | | | 1,300 | | | — | | | 157 | | | 122 | |
O2 Netherlands | | | (120 | ) | | (164 | ) | | 74 | | | 57 | | | 47 | | | 44 | | | — | | | 12 | | | 1 | | | (51 | ) |
O2 Online | | | (122 | ) | | (103 | ) | | 34 | | | 20 | | | 15 | | | 5 | | | — | | | 10 | | | (73 | ) | | (68 | ) |
| Other businesses | | | (110 | ) | | (96 | ) | | 20 | | | 9 | | | — | | | — | | | — | | | 13 | | | (90 | ) | | (74 | ) |
| | |
|
| |
|
| |
|
| |
|
| |
|
| |
|
| |
|
| |
|
| |
|
| |
|
| |
| | | | (8,778 | ) | | (856 | ) | | 932 | | | 747 | | | 405 | | | 392 | | | 8,300 | | | 150 | | | 859 | | | 433 | |
| | |
|
| |
|
| |
|
| |
|
| |
|
| |
|
| |
|
| |
|
| |
|
| |
|
| |
Our businesses with larger market shares in their countries of operation, O2 UK and O2 Ireland, have generated positive EBITDA over the last three financial years. O2 Germany, a newer business, historically made EBITDA losses until the 2003 financial year, during which O2 Germany achieved a positive EBITDA result for the first time. The following table shows the contributions of our businesses to Group EBITDA.
| | | Year ended 31 March | |
| | |
| |
| | | 2003 | | 2002 | |
| | |
|
| |
|
| |
| | | £m | | £m | |
O2 UK | | | 837 | | | 670 | |
O2 Germany | | | 27 | | | (166 | ) |
O2 Ireland | | | 157 | | | 122 | |
O2 Netherlands | | | 1 | | | (51 | ) |
O2 Online | | | (73 | ) | | (68 | ) |
| Other operations | | | (90 | ) | | (74 | ) |
| | |
|
| |
|
| |
Total | | | 859 | | | 433 | |
| | |
|
| |
|
| |
Group EBITDA increased by 98 per cent from £433 million for the year ended 31 March 2002 to £859 million for the year ended 31 March 2003. The increased EBITDA contribution has come from all four mobile telecommunication businesses in the Group.
The total operating loss of the Group increased significantly from a loss of £848 million for the year ended 31 March 2002 to a loss of £8,773 million for the year ended 31 March 2003. This includes the exceptional impairment charge of £8,300 referred to earlier. The total operating loss excluding exceptional items has reduced by 44 per cent from a loss of £848 million for the year ended 31 March 2002 to £473 million for the year ended 31 March 2003. This fall in total operating loss before exceptional items can be ascribed to both the increased revenues generated by all our businesses arising from the increased number of subscribers and the rise in ARPUs and to the cost reduction measures implemented in 2002 after demerger by O2 UK and O2 Germany.
Net interest payable principally relates to notional interest charged on the notional loans due to BT which were settled on demerger, and to the finance charges payable on external debt net of interest received on amounts invested. In the 2003 financial year, the principal elements of our interest charge were the interest on our
52
Back to Contents
revolving credit facility amounting to £12 million, and the interest accrued on our long-term bonds, which we issued in January 2002, of £63 million. In accordance with UK GAAP, we are amortising the issue costs of our bank facility and our bonds over the lives of the facilities (five and ten years respectively), through the interest line in the profit and loss account. Amortisation of these costs amounted to £3 million in the 2003 financial year. We also have interest payable in relation to the O2 UK loan notes and interest on our finance leases and other borrowings, and have received interest on our short-term investments. Prior to demerger, we were principally funded by BT in a combination of equity and notional loans. For the purpose of these financial statements, a portion of BT’s short- and long-term loans has been allocated to the Group for the periods up to 19 November 2001, the date of demerger from BT. Notional interest of £756 million for the year ended 31 March 2002 was charged on these BT loans. As part of the demerger transaction, a large portion of these loans were capitalised so that at 19 November 2001, the date we demerged from BT, we had net debt of £506 million. For the year ended 31 March 2002, the Group’s net interest charge, excluding the notional interest on the BT loans, was £25 million. In the 2002 financial year, the principal elements of our interest charge, excluding the BT loans, were the interest on our revolving credit facility amounting to £6 million, and the interest accrued on our long-term bonds, which we issued in January 2002, of £12 million. In accordance with UK GAAP, we are amortising the issue costs of our bank facility and our bonds over the lives of the facilities (five and ten years respectively) through the interest line in the profit and loss account. Amortisation of these costs amounted to £4 million in the 2002 financial year.
Tax on loss on ordinary activities |
The Group has a tax credit of £55 million for the year ended 31 March 2003 compared to a credit of £250 million for the year ended 31 March 2002. The decrease in the tax credit is principally as a result of the notional BT interest charge in 2002 on the allocated loans from BT existing pre-demerger. With the exception of Manx Telecom and O2 Ireland, we do not anticipate incurring a tax charge next year. We expect to pay tax on the profits of Manx Telecom and O2 Ireland earned in this period.
Year ended 31 March 2002 compared to year ended 31 March 2001 |
The following table shows the contributions of our businesses to Group turnover:
| | | Year ended 31 March | | | | |
| | |
| | per cent | |
| | | 2002 | | 2001 | | variation | |
| | |
|
| |
|
| |
|
| |
| | | £m | | £m | | | | |
O2 UK | | | 2,756 | | | 2,706 | | | 2 | |
O2 Germany1 | | | 875 | | | 65 | | | 1,246 | |
O2 Netherlands2 | | | 200 | | | 90 | | | 122 | |
O2 Ireland | | | 395 | | | 309 | | | 28 | |
O2 Online | | | 100 | | | 15 | | | 567 | |
| Other operations | | | 54 | | | 47 | | | 15 | |
| Intragroup eliminations | | | (104 | ) | | (32 | ) | | 225 | |
| | |
|
| |
|
| |
|
| |
Total | | | 4,276 | | | 3,200 | | | 34 | |
| | |
|
| |
|
| |
|
| |
| 1 | Included within our consolidated Group from 20 February 2001. |
| 2 | Included within our consolidated Group from 30 June 2000. |
Group turnover increased by 34 per cent from £3,200 million for the year ended 31 March 2001, to £4,276 million for the year ended 31 March 2002. This increase in revenues is principally owing to the inclusion within our consolidated Group of a full year of results from O2 Netherlands and O2 Germany which became fully owned subsidiaries in June 2000 and February 2001 respectively. In addition, the revenue of O2 Online has increased over six fold.
53
Back to Contents
O2 UK’s overall turnover increased by two per cent from £2,706 million for the year ended 31 March 2001 to £2,756 million for the year ended 31 March 2002. Turnover largely comprises of service revenue, which increased by ten per cent from £2,207 million for the year ended 31 March 2001 to £2,426 million for the year ended 31 March 2002.
During the year ended 31 March 2002, we have seen the expected slowdown in growth of the mobile phone market, as penetration levels approach 80 per cent. This has led to the smaller increase in overall revenues in the financial year ended 31 March 2002 compared to the 2001 financial year.
O2 UK’s total active customer base increased from 10.6 million at 31 March 2001 to 11.1 million at 31 March 2002, an increase of five per cent, which includes a net increase in post-pay subscribers of approximately 100,000 over the year. Post-pay churn has shown a significant decrease from 44 per cent for the year ended 31 March 2001 to 31 per cent for the current year.
The following table details O2 UK’s revenue split between service, equipment and other revenues:
| | | Year ended 31 March | | | | |
| | |
| | per cent | |
| | | 2002 | | 2001 | | variation | |
| | |
|
| |
|
| |
|
| |
| | | £m | | £m | | | | |
| Service | | | 2,426 | | | 2,207 | | | 10 | |
| Equipment | | | 136 | | | 222 | | | (39 | ) |
| Other | | | 194 | | | 277 | | | (30 | ) |
| | |
|
| |
|
| |
|
| |
Total | | | 2,756 | | | 2,706 | | | 2 | |
| | |
|
| |
|
| |
|
| |
Service. Service revenue is the principal element of O2 UK’s revenue, comprising 88 per cent of total turnover for the year ended 31 March 2002. O2 UK’s service revenue increased by ten per cent from £2,207 million for the year ended 31 March 2001 to £2,426 million for the year ended 31 March 2002. Of this, service revenue from post-pay customers is the principal source of income, with post-pay revenue accounting for over 65 per cent of the total.
O2 UK’s revenue has increased as a result of a combination of an increase in the subscriber base, an increase in the post-pay ARPU, and better retention of existing users.
Post-pay subscribers’ gross additions for the year ended 31 March 2002 total 1.3 million, taking our total post-pay customer base to 3.5 million (representing 87,000 net additions for the year). The post-pay churn rate has decreased significantly from 43.5 per cent as at 31 March 2001 to 31.0 per cent at 31 March 2002.
These improvements have been as a result of the operation focusing on business, professionals and young adult customers, which we believe represent the higher value segments of the market, both in pre-pay and post-pay. We are also concentrating on retaining our high-value customers through successful customer relationship management initiatives, such as our effective customer loyalty, retention and upgrade schemes, First and Select, which have assisted in reducing our contract churn.
Data revenues, as a proportion of total service revenues increased steadily through the year from less than ten per cent at 31 March 2001 to 11.8 per cent for the year ended 31 March 2002. Included within these statistics, the popularity of text messages continued to grow, with over 3.4 billion messages sent during the year ended 31 March 2002, compared with 1.6 billion the prior year.
Equipment and other revenue. Both equipment and other revenues have decreased compared to the prior year. Equipment revenues are generally decreasing as handset sale prices are reducing. In addition the higher proportion of new pre-pay customers over the year has decreased the overall equipment revenue as handset prices for pre-pay customers are lower than for post-pay.
54
Back to Contents
O2 UK’s other revenue in both the 2001 and 2002 financial years mainly comprised revenue from Lumina, a service provider acquired in the 2000 financial year, which had a customer base which included both O2 UK and Vodafone customers. As a result of this acquisition, O2 UK receives revenues from customers connected to the Vodafone network. We have been actively working to migrate these customers to our own network, and as a result the revenues generated from the Vodafone customers has decreased.
O2 Germany was consolidated from 20 February 2001 and contributed £65 million to Group turnover for the year ended 31 March 2001. During the year ended 31 March 2002, O2 Germany contributed £875 million to Group revenue.
The following table details O2 Germany’s contribution to Group revenue between service, equipment and other revenues:
| | | Year ended 31 March
| | Year ended
31 December | |
| | | 2002 | | 2001 | | 20001 | |
| | |
|
| |
|
| |
|
| |
| | | £m | | £m | | £m | |
| Service | | | 696 | | | 45 | | | 470 | |
| Equipment | | | 127 | | | 13 | | | 119 | |
| Other | | | 52 | | | 7 | | | 11 | |
| | |
|
| |
|
| |
|
| |
Total | | | 875 | | | 65 | | | 600 | |
| | |
|
| |
|
| |
|
| |
| 1 | The year ended 31 December 2000 comparatives, translated from the Euro at €1.6208/£1, are included for illustration purposes only. Audited results for the year ended 31 March 2001 are not available. |
Service. O2 Germany’s service revenue for the year ended 31 March 2002 has increased over 15 times on the revenue for the period from acquisition to 31 March 2001 as a result of consolidating a full year’s results for the first time, and by 48 per cent on the 12 month period ended 31 December 2000.
This increase in revenues, apart from the effect of consolidating for the first time, is principally as a result of the significant increase in the subscriber base, from 3.2 million active subscribers at 31 March 2001, to 3.9 million active subscribers at 31 March 2002. This increase in subscribers was substantially evenly divided between post-pay and pre-pay net additions, with post-pay accounting for 372,000, and pre-pay 352,000 net additions during the year ended 31 March 2002.
A large proportion of the post-pay additions during the year relate to customers who have subscribed to the Genion Home service, our location-based tariffing technology, which allows reduced call rates within the homezone. O2 Germany also offer an equivalent service to business customers. Both Genion Home and Business are part of our drive across the Group to attract high-value customers.
Post-pay ARPU has decreased from £358 for the 12 months ended 31 December 2000, to £313 for the year ended 31 March 2002. The fourth quarter ARPU to 31 March 2002 of £313 has shown an increase of two per cent over the third quarter ended 31 December 2001 ARPU of £306, as our drive to target the higher value customers started to have an effect.
In line with our Group-wide commitment to become a leader in data services, in January 2001 O2 Germany became the first operator in Germany to launch an operational GPRS network, and have introduced a number of data applications and hardware during the current year. This has been reflected in the increase in the proportion of data revenues which have risen to 14.5 per cent during the three months ended 31 March 2002, from 13.6 per cent for the quarter ended 30 June 2001. The principal element of data revenue is generated by text messages; O2 Germany recorded 958 million text messages in the year ended 31 March 2002.
Equipment and other revenues. Equipment revenue has increased approximately ten times to £127 million for the year ended 31 March 2002, and by seven per cent on the 12 month period ended 31 December 2000, which is
55
Back to Contents
principally a result of the increase in the subscriber base over the periods. Other revenue has increased seven times from £7 million in the year ended 31 March 2001 to £52 million in the year ended 31 March 2002.
Other mobile telecommunication businesses |
The revenue of our other mobile telecommunication businesses in Europe has increased by 49 per cent from £399 million in the year ended 31 March 2001 to £595 million in the year ended 31 March 2002.
O2 Ireland’s revenue has increased by 28 per cent from £309 million for the year ended 31 March 2001, to £395 million for the year ended 31 March 2002. This increase in revenue is a combination of the increase in the customer base, offset by slight fall in ARPU. Contract customer numbers increased from 332,000 at 31 March 2001 to 356,000 active subscribers at 31 March 2002 and the pre-pay customers increased from 641,000 at 31 March 2001 to 824,000 at 31 March 2002.
O2 Netherlands was acquired outright in June 2000, and so only contributed to the Group’s results for nine months of the year ended 31 March 2001. As a result the consolidated revenues of O2 Netherlands have increased by 122 per cent from £90 million in the year ended 31 March 2001 to £200 million in the current financial year. Revenue has also increased as a result of the combination of an increase in subscriber numbers together with an increase in blended ARPU for the year.
The customer base in O2 Netherlands has increased significantly by 58 per cent from a total active base of 793,000 at 31 March 2001 to 1,255,000 active subscribers at 31 March 2002. During the year, O2 Netherlands secured a mobile banking agreement with PostBank, in which new subscribers to O2 Netherlands received a free pre-pay phone. Some 475,000 PostBank account holders received the subsidised phone since the arrangement began. This has contributed to the pre-pay ARPU increasing from £80 for the year ended 31 March 2001 to £84 for the year ended 31 March 2002.
Post pay active subscribers have increased from 176,000 at 31 March 2001 to 233,000 at 31 March 2002, and post-pay ARPU has also increased from £469 to £492 over the same period. The level of contract churn has decreased from 32 per cent to 27 per cent.
O2 Online has shown continual growth in revenue since it was launched in 1997. Revenue has increased by over six times, from £15 million in the year ended 31 March 2001, to £100 million in the year ended 31 March 2002. Approximately two-thirds of the revenue in the 2002 financial year was intragroup, principally for provision of WAP gateway and portal services to other Group companies.
Net operating expenses before exceptional items |
Net operating expenses before exceptional items may be analysed between cost of sales and administrative expenses. Net operating expenses increased by 41 per cent from £3,543 million for the year ended 31 March 2001 to £4,982 million for the 2002 financial year, principally as a result of consolidating a full year’s results of O2 Germany and O2 Netherlands for the first time.
56
Back to Contents
An analysis of the net operating expenses before exceptional items, between the operating companies is provided in the table below:
| | | Year ended 31 March
| | per cent | |
| | | 2002 | | 2001 | | variation | |
| | |
|
| |
|
| |
|
| |
| | | £m | | £m | | | | |
O2 UK | | | 2,458 | | | 2,418 | | | 2 | |
O2 Germany1 | | | 1,275 | | | 103 | | | 1,138 | |
Other mobile telecommunication businesses2 | | | 655 | | | 488 | | | 34 | |
O2 Online | | | 194 | | | 163 | | | 19 | |
| Goodwill amortisation | | | 369 | | | 287 | | | 29 | |
| Other operations and central costs | | | 31 | | | 84 | | | (63 | ) |
| | |
|
| |
|
| |
|
| |
Total | | | 4,982 | | | 3,543 | | | 41 | |
| | |
|
| |
|
| |
|
| |
| | | | | | | | | | | |
| 1 | Included within our consolidated Group results from 20 February 2001. |
| 2 | Includes the operations of O2 Netherlands, from 30 June 2000, and O2 Ireland. |
Group cost of sales increased by 50 per cent from £1,814 million for the year ended 31 March 2001, to £2,714 million for the year ended 31 March 2002. The increase in cost of sales in the 2002 financial year was primarily the result of consolidating a full year’s result of O2 Germany and O2 Netherlands in our consolidated financial statements for the first time.
The gross margin percentages (gross profit divided by turnover) of our newer businesses in Germany and the Netherlands are lower than those of our more established businesses in Ireland and the UK. This is because the newer businesses are in the process of building their respective customer bases. This has had the effect of reducing the Group gross margin by six percentage points from 43 per cent in the 2001 financial year to 37 per cent in the 2002 financial year.
The increase in activity of O2 Online and Airwave has also contributed to the increase in the Group cost of sales.
Group administrative expenses before exceptional items |
Group administrative expenses before exceptional items have increased by 31 per cent from £1,729 million for the year ended 31 March 2001 to £2,268 million for the year ended 31 March 2002. The increase in administrative expenses in the 2002 financial year was primarily the result of consolidating a full year’s result of O2 Germany and O2 Netherlands in our consolidated financial statements for the first time.
Group administrative expenses before exceptional items as a percentage of turnover has decreased slightly from 54 per cent in the 2001 financial year to 53 per cent in the year ended 31 March 2002. Our newer businesses of O2 Germany and O2 Netherlands have higher ratios than the ratios of our more established businesses, because they are still building their respective customer bases. The negative impact of consolidating both O2 Germany and O2 Netherlands for a full year for the first time in the 2002 financial year has been mitigated by the cost reduction exercises across the Group.
O2 UK’s net operating expenses before exceptional items have increased by two per cent, from £2,418 million for the year ended 31 March 2001 to £2,458 million for the year ended 31 March 2002. Net operating expenses as a percentage of turnover has remained constant at 89 per cent for the two financial years under review.
The variable element of O2 UK’s service cost of sales has increased in line with the network usage. Interconnection charges increased significantly during the financial year 2002, compared to the year ended 31 March 2001, reflecting the increased calls from O2 UK customers terminating on other networks, including
57
Back to Contents
other mobile networks whose termination charges are generally higher than charges levied by fixed line network providers.
O2 UK’s depreciation charge has increased from £256 million in the year ended 31 March 2001 to £372 million in the year ended 31 March 2002, which reflects the increased investment in improving O2 UK’s network quality.
The advertising and marketing spend for the year ended 31 March 2002 has decreased by over 25 per cent on the 2001 financial year, principally as a result of lower subscriber acquisition costs which have decreased by 26 per cent over the same period. Both the pre-pay and post-pay average subscriber acquisition cost have decreased, with the post-pay SACs decreasing from £184 to £180 per subscriber, and the pre-pay decreasing from £63 to £53 per subscriber.
Compared to the year ended 31 March 2001, O2 UK’s overheads have decreased slightly by less than 1 per cent for the year ended 31 March 2002, which, despite the increased turnover and concentration on improving customer service, reflects the cost control measures implemented during the year.
O2 Germany’s net operating expenses before exceptional items increased significantly from £103 million for the period from acquisition to 31 March 2001, to £1,275 million for the year ended 31 March 2002, reflecting the consolidation of O2 Germany’s full year results into the Group’s results for the first time.
Net operating expenses as a percentage of turnover was 146 per cent for the 2002 financial year. For O2 Germany, and indeed our other newer mobile operation in Netherlands, we expect this ratio to be higher than the same ratio of our more established businesses, as the newer businesses are in the process of building up their customer bases.
The total depreciation charge (both network and non-network) was £228 million for the year ended 31 March 2002, which represented 21 per cent of the net book value of tangible fixed assets at 31 March 2002.
Subscriber acquisition costs have decreased by 33 per cent from £142 per subscriber over the year ended 31 December 2000 to £95 per subscriber for the year ended 31 March 2002, although the total subscriber acquisition costs have increased over the year.
Other mobile telecommunication businesses |
Net operating expenses before exceptional items for our other mobile telecommunication businesses, O2 Netherlands and O2 Ireland, has increased by 34 per cent from £488 million for the year ended 31 March 2001, to £655 million for the year ended 31 March 2002.
The principal reason for this increase is the inclusion of O2 Netherlands net operating expenses before exceptional items for the full year ended 31 March 2002 for the first time, which, compared to the 2001 financial year, has increased by 60 per cent.
In addition, net operating expenses before exceptional items have also increased in O2 Netherlands as a result of the increased usage of the network, in line with an increase in the customer base from 793,000 at 31 March 2001 to 1,255,000 at 31 March 2002. Additionally, O2 Netherlands recorded high subscriber acquisition costs, as a result of the PostBank arrangement, where customers were given a free mobile phone.
O2 Ireland’s net operating costs before exceptional items have increased by 17 per cent from £287 million in the year ended 31 March 2001 to £336 million in the year ended 31 March 2002, reflecting the effect of the 28 per cent increase in revenue during the 2002 financial year as compared to the 2001 financial year. The effect of the revenue increase was reduced as a result of the implementation of cost control measures.
O2 Online’s net operating expenses before exceptional items increased by 19 per cent from £163 million for the year ended 31 March 2001 to £194 million for the year ended 31 March 2002. The revenue of O2 Online has increased by greater than six fold over the same period, but as part of our Group-wide cost control measures we have significantly reduced the ratio of net operating expenses to turnover.
58
Back to Contents
The goodwill amortisation charge included in the Group’s results has increased by 29 per cent from £287 million in the year ended 31 March 2001 to £369 million for the year ended 31 March 2002. This increase is as a result of including a full year’s amortisation charge in respect of the goodwill on O2 Germany, O2 Netherlands and O2 Ireland for the first time in the 2002 financial year.
Exceptional items for the year ended 31 March 2002 have been discussed earlier.
Exceptional items for the year ended 31 March 2001 totalled £2,821 million. Of this total, £2,800 million represents a non-cash charge for the write-down of goodwill, reflecting impairment of the carrying value of O2 Germany. The remaining £21 million exceptional item was a write-off of information technology systems no longer required following the separation of the fixed and mobile businesses of O2 Germany.
EBITDA is our earnings before interest, tax, depreciation, amortisation and exceptional items, excluding our share of operating profits and losses of our joint ventures and associates.
Our more established business, O2 UK, has had positive EBITDA over the last three financial years. Similarly, O2 Ireland has had positive EBITDA since it has been included within our consolidated Group since 30 March 2000, the date of its acquisition. O2 Germany, O2 Netherlands and O2 Online, our newer businesses, have had negative EBITDA. The following table shows contributions of our businesses to Group EBITDA.
| | | Year ended 31 March
| |
| | | 2002 | | 2001 | |
| | |
|
| |
|
| |
| | | £m | | £m | |
O2 UK | | | 670 | | | 555 | |
O2 Germany1 | | | (166 | ) | | (15 | ) |
O2 Ireland | | | 122 | | | 68 | |
O2 Netherlands2 | | | (51 | ) | | (76 | ) |
O2 Online | | | (68 | ) | | (143 | ) |
| Other operations | | | (74 | ) | | (72 | ) |
| | |
|
| |
|
| |
Total | | | 433 | | | 317 | |
| | |
|
| |
|
| |
| | | | | | | | |
| 1 | Included within our consolidated Group from 20 February 2001. |
| 2 | Included within our consolidated Group from 30 June 2000. |
The reconciliation of EBITDA to Group operating profit/(loss), the closest UK GAAP financial measure, by business is as follows:
| | Group operating
profit/(loss)
| | Depreciation
| | Amortisation
| | Exceptional
items
| | EBITDA
| |
| | 2002 | | 2001 | | 2002 | | 2001 | | 2002 | | 2001 | | 2002 | | 2001 | | 2002 | | 2001 | |
| |
|
| |
|
| |
|
| |
|
| |
|
| |
|
| |
|
| |
|
| |
|
| |
|
| |
| | £m | | £m | | £m | | £m | | £m | | £m | | £m | | £m | | £m | | £m | |
O2 UK | | 36 | | | 125 | | | 372 | | | 256 | | | 176 | | | 174 | | | 86 | | | — | | | 670 | | | 555 | |
O2 Germany | | (472 | ) | | (2,874 | ) | | 228 | | | 23 | | | 49 | | | 15 | | | 29 | | | 2,821 | | | (166 | ) | | (15 | ) |
O2 Ireland | | 9 | | | (137 | ) | | 57 | | | 28 | | | 44 | | | 33 | | | 12 | | | — | | | 122 | | | 68 | |
O2 Netherlands | | (230 | ) | | (51 | ) | | 61 | | | 47 | | | 118 | | | 72 | | | — | | | — | | | (51 | ) | | (76 | ) |
O2 Online | | (103 | ) | | (148 | ) | | 20 | | | 4 | | | 5 | | | 1 | | | 10 | | | — | | | (68 | ) | | (143 | ) |
| Other businesses | | (96 | ) | | (79 | ) | | 9 | | | 4 | | | — | | | 3 | | | 13 | | | — | | | (74 | ) | | (72 | ) |
| |
|
| |
|
| |
|
| |
|
| |
|
| |
|
| |
|
| |
|
| |
|
| |
|
| |
| | | (856 | ) | | (3,164 | ) | | 747 | | | 362 | | | 392 | | | 298 | | | 150 | | | 2,821 | | | 433 | | | 317 | |
| |
|
| |
|
| |
|
| |
|
| |
|
| |
|
| |
|
| |
|
| |
|
| |
|
| |
59
Back to Contents
Group EBITDA increased by 37 per cent from £317 million for the year ended 31 March 2001 to £433 million for the year ended 31 March 2002. Group EBITDA increased for the year ended 31 March 2002 owing to increased EBITDA contributed by O2 UK and O2 Ireland, despite consolidating a full year of O2 Germany’s and O2 Netherlands’ losses for the first time. O2 Online showed a significant improvement of EBITDA in the 2002 financial year, whilst the negative EBITDA of the other operations, including the central costs remained significantly unchanged.
Group’s share of operating loss of joint ventures |
During the year ended 31 March 2001, the Group had interest in two joint ventures, O2 Germany and O2 Netherlands. The remaining interest in both these companies were purchased during the year, O2 Netherlands on 30 June 2000, and O2 Germany on 20 February 2001. The share of losses recognised in the Group consolidated results prior to these acquisition dates was £18 million and £285 million respectively.
The Group now wholly owns its mobile operations in the UK, Ireland, the Netherlands and Germany. The Group no longer has interests in any joint ventures.
The total operating loss of the Group decreased significantly from a loss of £3,450 million for the year ended 31 March 2001 to a loss of £848 million for the year ended 31 March 2002.
The operating loss in the 2001 financial year included the impairment charge of £2,800 million relating to the write-down of the goodwill arising on the acquisition of O2 Germany, and the £21 million write-off of O2 Germany IT assets. The operating loss before exceptional items was £629 million in the 2001 financial year.
The 2002 financial year’s operating loss before exceptional items was £698 million, which is an 11 per cent increase in the Group loss compared to the previous financial year, which is a result of consolidating a full year’s operating losses of O2 Germany and O2 Netherlands for the first time.
Net interest payable relates to the finance charges payable on external debt net of interest received on amounts invested. Prior to demerger, we were principally funded by BT and net interest payable in the years ended 31 March 2002 and 2001 relates to interest payable on the notional loans from BT and our other external loans net of interest received in respect of amounts invested. Net interest payable was £669 million in the year ended 31 March 2001 and £781 million in the year ended 31 March 2002. The majority of the interest payable in both years represents the notional interest charged on the loans from BT of £16.8 billion in the year ended 31 March 2001 and for the period from 1 April 2001 to 19 November 2001. This notional loan incurred interest at 7.2 per cent. in both periods.
Tax on loss on ordinary activities |
The Group has a tax credit of £250 million for the year ended 31 March 2002 and a tax credit of £114 million for the year ended 31 March 2001. The increase in the tax credit is principally a result of the notional BT interest charge. With the exception of Manx Telecom and O2 Ireland, we do not anticipate incurring a tax charge in the next few years. We expect to pay tax on the profits of Manx Telecom and O2 Ireland earned in this period.
60
Back to Contents
| B. | Liquidity and capital resources |
The following table sets forth our cash flows for the Group, including O2 Netherlands, for the years ended 31 March 2003, 2002 and 2001 extracted without adjustment from our consolidated financial statements.
| | | Year ended 31 March
| |
| | | 2003 | | 2002 | | 2001 | |
| | |
|
| |
|
| |
|
| |
| | | £m | | £m | | £m | |
| Net cash inflow from operating activities | | | 1,033 | | | 457 | | | 318 | |
| Returns on investments and servicing of finance | | | (63 | ) | | (9 | ) | | (11 | ) |
| Tax (paid)/recovered | | | (4 | ) | | (4 | ) | | 21 | |
| Net cash outflow for capital expenditure and financial investment | | | (868 | ) | | (1,231 | ) | | (5,234 | ) |
| Net cash outflow for acquisitions and disposals | | | — | | | (864 | ) | | (12,574 | ) |
| | |
|
| |
|
| |
|
| |
| Cash inflow/(outflow) before management of liquid resources and financing | | | 98 | | | (1,651 | ) | | (17,480 | ) |
| Management of liquid resources | | | (3 | ) | | (459 | ) | | — | |
| Net cash (outflow)/inflow from financing | | | (47 | ) | | 1,790 | | | 17,593 | |
| | |
|
| |
|
| |
|
| |
| Increase/(decrease) in cash in the year | | | 48 | | | (320 | ) | | 113 | |
| | |
|
| |
|
| |
|
| |
Our operating activities provided cash of £1,033 million, £457 million and £318 million during the three years ended 31 March 2003, 2002 and 2001 respectively. Our Group operating losses of £8,778 million, £856 million and £3,164 million in each of the years are offset by significant non-cash depreciation and amortisation charges totalling £9,637 million (including the operating exceptional charge of £8,300 million), £1,139 million and £3,481 million (including the exceptional £2,800 million impairment of O2 Germany’s goodwill) respectively.
Net cash outflows for servicing of finance have increased in the 2003 financial year compared to the previous two years as we were funded by interest free loans from BT prior to our demerger, although for the purposes of these financial statements we include a notional, non-cash interest charge for the period pre-demerger in our profit and loss account. In the year ended 31 March 2002 we incurred interest on external funding for four months after demerger whereas in the year ended 31 March 2003 we have incurred a full year’s charge. The servicing of finance cash outflow for the year ended 31 March 2003 consisted mainly of net interest payable of £66 million on our loans. This can be analysed as £13 million interest paid on our revolving credit facility (2002: £6 million) and interest paid on our long-term bonds of £64 million (2002: £8 million). Offset against this as part of the management of our liquid resources, we have invested surplus cash in various short-term investments, on which we have received approximately £14 million (2002: £5 million) in interest.
The total tax paid for the Group in the years ended 31 March 2003 and 2002 was a cash outflow of £4 million, compared to a cash inflow of £21 million in the 2001 financial year.
Cash outflow in respect of capital expenditure for the 2003 financial year was £868 million, which is significantly lower than our capital expenditure cash flow for the 2002 financial year. The reduction in capital expenditure at our main mobile telecommunications businesses compared to 2002 is due to more focused investment in improving 2G network quality and the delay in commencing the full roll-out of our planned 3G network. The capital expenditure in the year ended 31 March 2002 of £1,231 million related mainly to tangible fixed asset purchases across our footprint in respect of network expansion and improvement, and expenditure on the UMTS network in the UK. The capital expenditure in 2001 of £5,234 million mainly related to the purchase of our UK and Dutch UMTS licences.
61
Back to Contents
Across the Group, there are generally timing differences between the recognition of a new fixed asset in our financial statements, and the cash payment, because we are often able to secure delayed non-interest bearing payment terms with our capital suppliers. The following table presents the capital additions recognised for the Group, including O2 Netherlands, for the years ended 31 March 2003, 2002 and 2001:
| | | Year ended 31 March
| |
| | | 2003 | | 2002 | | 2001 | |
| | |
|
| |
|
| |
|
| |
| | | £m | | £m | | £m | |
O2 UK | | | 362 | | | 556 | | | 721 | |
O2 Germany1 | | | 141 | | | 250 | | | 56 | |
O2 Ireland | | | 59 | | | 85 | | | 127 | |
O2 Netherlands2 | | | 59 | | | 97 | | | 112 | |
O2 Online | | | 21 | | | 59 | | | 48 | |
| Airwave | | | 163 | | | 90 | | | 94 | |
| Other operations | | | 8 | | | 5 | | | 5 | |
| UMTS licences and other intangible assets | | | 131 | | | — | | | 4,307 | |
| | |
|
| |
|
| |
|
| |
Total | | | 944 | | | 1,142 | | | 5,440 | |
| | |
|
| |
|
| |
|
| |
| | | | | | | | | | | |
| 1 | Included within our consolidated Group results from 20 February 2001. |
| 2 | Included within our consolidated Group results from 30 June 2000. |
Total capital expenditure for the year ended 31 March 2003 has fallen by a further 17 per cent to £944 million from £1,142 million for the year ended 31 March 2002. In the 2003 financial year the Group purchased a UMTS licence in Ireland for £73 million. Airwave, our business developing a national digital radio service for the police, increased capital expenditure by 81 per cent from £90 million in the year ended 31 March 2002 to £163 million in the year ended 31 March 2003. This reflects the accelerating programme to roll-out the new Airwave network, resulting in ten police forces going “live” during the 2003 financial year.
Total capital expenditure for the year ended 31 March 2002 was £1,142 million, a significant decrease on the 2001 year expenditure of £5,440 million. The principal reason for this decrease is the purchase of the UMTS licences in the 2001 financial year. Tangible fixed asset capital expenditure has remained approximately constant, decreasing slightly from £1,133 million for the year ended 31 March 2001, to £1,121 million for the year ended 31 March 2002, despite including a full year of capital expenditure relating to O2 Germany and O2 Netherlands for the first time in 2002.
The capital expenditure for the year ended 31 March 2001 represented mainly the purchase by O2 Third Generation Limited of our UK UMTS licence, and O2 Netherlands’ purchase of our Dutch UMTS licence.
Over the five years to 31 March 2008 we expect to incur capital expenditure of approximately £5.5 billion, a material portion of which relates to the roll-out of our UMTS networks. We expect to fund our future capital spend from our bank facilities and long-term bonds described below, and from net cash flows from operations.
The Group will maintain tight control of its investment programme, and in particular will aim to match the timing and quantum of capital expenditure on our UMTS network roll-out with the emerging demand for mobile data services. The Group currently anticipates providing services on its UMTS network in the second half of 2004, or earlier where local regulatory conditions require us to do so. Capital expenditure in the 2004 financial year is expected to be higher than in 2003, mainly due to the commencement of the investment in 3G networks and higher investment in the Airwave network in the UK.
The Group did not incur any acquisitions expenditure during the year ended 31 March 2003. Cash outflow from acquisitions decreased significantly from £12,574 million in the year ended 31 March 2001 to £864 million in the year ended 31 March 2002. The cash outflow in the 2001 financial year related to the acquisition of the remaining 55 per cent interest in O2 Germany, the remaining 50 per cent interest in O2 Netherlands, and acquiring a
62
Back to Contents
50.5 per cent controlling interest in O2 Ireland. In April 2001, the Group acquired the remaining 49.5 per cent interest in O2 Ireland for a total consideration of £877 million including expenses of which £13 million was payable after 31 March 2002. Of this deferred consideration, £8 million remained payable after 31 March 2003.
During the year ended 31 March 2003, the Group incurred a cash outflow from financing of £47 million. This mainly represents the redemption of O2 UK loan notes during the first half of the 2003 financial year. During the year ended 31 March 2002, the Group’s cash inflow from financing was £1,790 million. This cash inflow may be analysed between cash inflow prior to our demerger from BT on 19 November 2001, and the financing cash inflow post demerger. Pre demerger, we received net funds from BT amounting to £847 million. In January 2002, we received £989 million in respect of our Euro medium-term bond issue. We repaid £74 million of our O2 UK loan notes. Our financing activities are further described below.
Sources of liquidity and capital resources |
Prior to demerger our principal sources of liquidity were funding from BT and cash from operating activities. Since demerger our principal sources of liquidity are cash from operating activities, bank financing and the bond financing described below.
Upon demerger from BT, we had net debt of £506 million, of which approximately £444 million, net of cash remaining in our Group, was owed to BT. This debt to BT was refinanced shortly after completion of the demerger out of the financing arrangements described below.
Total gross debt at 31 March 2003 amounted to £1,465 million (including the O2 UK hire purchase obligations (the QTE leases), the obligations of which are fully offset by cash deposits held in trust) and net debt was £549 million. Included in the total gross debt were €1,000 million and £375 million of eurobonds issued in January 2002 which have a five year and ten year term, respectively. Loan notes outstanding in aggregate amounted to £19 million, redeemable at any time at the option of the holder. As at 31 March 2002 we had net debt of £617 million and total gross debt of £1,496 million including the QTE leases.
As at 31 March 2003, bank facilities totalled £1,975 million. Tranche A of the syndicated facility totalled £1,725 million, maturing on 14 September 2006; Tranche B totalled £150 million, maturing on 17 September 2003 and the bilateral facility totalled £100 million, maturing on 19 December 2003. As at 31 March 2003, both the syndicated and bilateral facilities were un-drawn. As at 31 March 2002 we had outstanding a multi-currency revolving credit facility with a syndicate of banks totalling £2,475 million. During the period, £600 million of Tranche B of the facility was cancelled. In addition, a £100 million bilateral facility was arranged.
Interest on loans drawn under the bank facilities is calculated at a margin above LIBOR (or in the case of Euro advances, EURIBOR) from time to time. The margin varies according to the long-term credit rating assigned to mmO2 plc by major credit rating agencies but is subject to a maximum of 1.50 per cent. As at 31 March 2003 all bank facilities bear a margin of below 1 per cent.
Interest on the bonds is at a fixed rate at 6.375 per cent per annum and 7.625 per cent per annum on the Euro and the Sterling bond issues, respectively. Interest on the €1,000 million bond issue has been swapped to floating rate. Interest on €500 million is calculated at a margin above Sterling LIBOR, having been swapped from Euro into Sterling and interest on the other €500 million is calculated at a margin above EURIBOR.
63
Back to Contents
The Group’s contractual obligations, including commitments for future payments under hire purchase contracts, and long- and short-term debt arrangements are summarised in the table below. Details of these obligations are fully disclosed in notes 18, 19 and 20 of the financial statements in Item 18.
| | | Payments due by period | |
| | |
| |
| | | | | Less than | | 1 to 2 | | 2 to 5 | | After | |
Future commitments | | Total | | 1 year | | years | | years | | 5 years | |
| |
|
| |
|
| |
|
| |
|
| |
|
| |
| | | (£m) | | | | | | | | | | | | | |
| Long-term bonds | | | 1,015 | | | — | | | — | | | 644 | | | 371 | |
| Gross hire purchase obligations | | | 390 | | | 31 | | | 31 | | | 84 | | | 244 | |
| Loan notes | | | 19 | | | 19 | | | — | | | — | | | — | |
| Other loans and borrowings | | | 41 | | | 8 | | | 7 | | | 19 | | | 7 | |
| | |
|
| |
|
| |
|
| |
|
| |
|
| |
Total | | | 1,465 | | | 58 | | | 38 | | | 747 | | | 622 | |
| | |
|
| |
|
| |
|
| |
|
| |
|
| |
At 31 March 2003 we also have contracted capital commitments of £909 million (2002: £704 million).
Treasury management and policies |
Group Treasury (Treasury) operates as a centralised service for the Group. The role of Treasury is to identify, monitor and manage financial risk within the framework of Board approved policies and delegated authorities. Treasury is not permitted to add to the financial risks inherent in the business and may not undertake speculative activity.
The principal financial risks to the Group are identified below.
It is our current policy to fully fund our business plan by access to the debt capital markets and other sources of funding. Borrowing is centralised and there are no material facilities at the local operating businesses. The Group is committed to maintaining the key financial ratios as set out in the covenants relating to the multi-currency revolving credit facility, of Group EBITDA to interest and net debt to Group EBITDA. As at 31 March 2003, actual ratios were Group EBITDA to interest of 13.0 times and net debt of 0.6 times Group EBITDA. As at 31 March 2003, the Group’s projected funding requirements were fully funded through a combination of bonds issued under the Group’s bond financing programme (£375 million and €1,000 million) and committed bank facilities (£1,975 million). As at 31 March 2002, actual ratios were Group EBITDA to interest (excluding notional interest on allocated BT loans) of 17.3 times and net debt of 1.4 times Group EBITDA. The Group EBITDA to interest ratio has fallen in the 2003 financial year compared to the 2002 financial year. This reflects a full year’s interest charge in the 2003 financial year compared to the 2002 financial year in which in the period prior to demerger a substantial portion of Group funding was provided by BT on a non-interest bearing basis for the purposes of the calculation of these ratios.
Foreign exchange management |
The policy of the Group is to hedge (primarily by the use of foreign currency forward contracts) identified foreign exchange flows, although the current level of transaction risk exposure is low due to the fact that cash flows are primarily domestic in each Group company. The policy of the Group regarding foreign exchange translation risk is to manage material risk on the translation of future cash flows generated by overseas assets primarily by the use of natural offsets and the use of currency debt, cross-currency and foreign exchange swaps. Due to the variability of the cash flows in our overseas businesses, we expect to review our hedging strategy in the future. However, as at 31 March 2003, all net debt was denominated in Sterling after taking account of the effect of derivative instruments.
The debt level within the Group is a key determinant of the impact of interest rates. It is current policy to fix or protect expected interest flows where Group profits or key financial ratios would be materially at risk from
64
Back to Contents
interest rate movements. Treasury maintains the proportion of fixed rate debt within a Board approved range of 25 to 75 per cent by the issuance of fixed rate debt and the use of derivative instruments (primarily interest rate swaps). As at 31 March 2003, and after taking into account the effect of derivative instruments, 36 per cent (2002: 34 per cent) of gross borrowings (excluding the QTE lease which is fully defeased) were fixed for a period of at least three years (2002: three years). Based on the net debt as at 31 March 2003, a one per cent rise in market interest rates would have an adverse effect of approximately £7 million (2002: £2 million) on Group profit before taxation.
It is our current policy to mitigate credit risk to our financial counter-parties through the application of strict counter-party limits. Counter-party limits are based on credit ratings issued by the main credit rating agencies and outstanding transactions are weighted according to potential risk to the Group. Counter-party limits are reviewed on a regular basis by Treasury.
| C. | Research and development, patents and licences |
We have not engaged in any significant research and development activities during any of the last three financial years, although we have worked closely with BT Exact, suppliers and applications developers to create products suited to our markets.
In the three remaining markets in which the Group operates, competition to acquire and retain high-value customers is expected to remain robust. In addition, these markets are subject to general economic conditions and continuing regulatory risk.
The Group believes that its O2 brand, its strong position in mobile data services, and the operational momentum it has developed since the demerger in November 2001, will enable it to deliver sustained progress in all the markets it serves.
In the year to 31 March 2004, O2 UK continues to target service revenue growth of 10 per cent, driven by a combination of customer growth and higher ARPU. The increase in ARPU is expected to be driven primarily by higher revenues from mobile data services, with less growth coming from voice services.
In the year to 31 March 2004, O2 UK continues to target an EBITDA margin of 30 per cent for the full year, and O2 Germany is targeting a double-digit EBITDA margin.
The asset impairment charge and the growth and performance improvement delivered in the year ended 31 March 2003 should accelerate the Group’s progress towards delivery of positive earnings per share.
In the year to 31 March 2004, Group capital expenditure is expected to be higher than in the previous year, mainly due to the commencement of investment in 3G networks, and higher investment in the Airwave network in the UK.
Our consolidated financial statements are prepared up to the date of demerger from BT on a carve-out basis in accordance with UK GAAP, which differs in certain respects from US GAAP. A detailed description of the main differences between UK GAAP and US GAAP as they relate to us and a reconciliation to US GAAP of net loss and net assets is given in note 32 to the financial statements in Item 18.
Our net loss determined in accordance with US GAAP was £3,671 million, £1,463 million and £3,747 million for the years ended 31 March 2003, 2002 and 2001, respectively, compared with our net loss determined under UK GAAP of £10,148 million, £850 million and £3,533 million, respectively. The principal differences affecting the determination of net loss under US GAAP for the year ended 31 March 2003 are:
| • | adjustments in relation to capitalisation of interest, net of related depreciation of £(67) million (2002: £579 million, 2001: £344 million); |
65
Back to Contents
| | |
| • | adjustments for goodwill impairment of £482 million (2002: nil, 2001: nil); |
| | |
| • | adjustments for licence impairment of £5,899 million (2002: nil, 2001: nil); |
| | |
| • | adjustments for fixed asset impairment on discontinuing operations of £(25) million (2002: nil, 2001: nil); |
| | |
| • | adjustments for goodwill amortisation of £374 million (2002: £23 million, 2001: £19 million); |
| | |
| • | adjustments for mobile licences, software and other intangible assets of £(37) million (2002: £(217) million, 2001: £(98) million); |
| | |
| • | adjustments for derivative instrument valuation of £50 million (2002: £(19) million, 2000: nil); and |
| | |
| • | adjustments for deferred taxation on US GAAP differences of £(176) million (2002: £(240) milion, 2001: £134 million). |
| |
Recent accounting pronouncements |
The Group continues to apply the transitional disclosure arrangements set out in FRS 17 “Retirement benefits”. Mandatory implementation is not required by the Group until the year ended 31 March 2006. The transitional disclosures required are provided in note 8 to the financial statements in Item 18. The changes introduced by FRS 17 principally affect the way defined benefit pension schemes are accounted for. At each year-end the pension scheme assets should be measured at market value while pension scheme liabilities should be measured at a present value using a specified actuarial valuation method and discounted at a corporate bond rate. The resulting pension scheme surplus or deficit must be shown on the Group’s balance sheet, and could be volatile because of the dependence on market conditions at the balance sheet date.
In June 2001, the Financial Accounting Standards Board (FASB) issued SFAS No. 143, “Accounting for Obligations Associated with the Retirement of Long-Lived Assets”, which is effective for the Group from 1 April 2003. SFAS No. 143 requires, among other things, that the fair value of a liability for an asset retirement obligation be recognised in the period in which it is incurred, if a reasonable estimate of fair value can be made and the Group has a legal obligation to do so. A legal obligation can result from (i) a government action, such as a law or ordinance, (ii) an agreement between entities, such as a written or oral contract, or (iii) a promise conveyed to a third party that imposes a reasonable expectation of performance upon the promisor under the doctrine of promissory estoppel.
The associated asset retirement costs are capitalised as part of the carrying amount of the long-lived asset. The asset retirement cost is subsequently allocated to expense (as depreciation or impairment) over the useful life of the related long-lived asset. The liability is discounted and subsequently accreted using the credit-adjusted risk-free interest rate in effect when the liability was initially recognised. The accretion amounts must be recognised as an increase in the carrying amount of the liability and classified in the statement of income as other operating expense. The Group is currently assessing the impact of the adoption of this statement on its financial position, results of operations and cash flows.
In June 2002, the FASB issued SFAS No. 146, “Accounting for Costs Associated with Exit or Disposal Activities”. SFAS No. 146 requires that a liability for costs associated with an exit or disposal activity be recognised and measured initially at its fair value in the period in which the liability is incurred. Previously a liability for an exit cost was required to be recognised at the date of an entity’s commitment to an exit plan, however, this does not, by itself, create a present obligation to others that meets the definition of a liability. SFAS No. 146 will be effective for the Group for any exit or disposal activities that are initiated after 31 December 2002. The Group does not anticipate adoption of this statement having a significant impact on its financial position, results of operations and cash flows.
66
Back to Contents
In November 2002, the FASB issued FASB Interpretation 45 (FIN 45), “Guarantor’s Accounting and Disclosure Requirements for Guarantees, Including Indirect Guarantees of Indebtedness of Others”. FIN 45 requires that a liability (at fair value) be recorded in the guarantor’s balance sheet upon issuance of a guarantee. In addition, FIN 45 requires disclosures about the guarantees that an entity has issued, including a reconciliation of changes in the entity’s product warranty liabilities. The initial recognition and initial measurement provisions of FIN 45 are applicable on a prospective basis to guarantees issued or modified after 31 December 2002, irrespective of the guarantor’s fiscal year-end. The disclosure (but not the accounting) requirements of FIN 45 are effective for the Group’s 2003 financial statements.
In January 2003, the FASB issued FASB Interpretation 46 (FIN 46), “Consolidation of Variable Interest Entities, an Interpretation of ARB 51”. FIN 46 requires certain variable interest entities to be consolidated by the primary beneficiary of the entity if the equity investors in the entity do not have the characteristics of a controlling financial interest or do not have sufficient equity at risk for the entity to finance its activities without additional subordinated financial support from other parties. FIN 46 is effective immediately for all new variable interest entities created or acquired after 31 January 2003. For variable interest entities created or acquired prior to 1 February 2003, the provisions of FIN 46 must be applied for the first interim or annual period beginning after 15 June 2003. The disclosure (but not the accounting) requirements of FIN 46 are effective for the Group’s 2003 financial statements, regardless of the date on which the variable interest entity was created. Management is currently evaluating the impact of FIN 46 on the Group’s consolidated financial statements.
In November 2002, the Emerging Issues Task Force (EITF) reached a consensus on Issue 00-21 (EITF 00-21), “Revenue Arrangements with Multiple Deliverables”. EITF 00-21 addresses certain aspects of the accounting by a vendor for arrangements under which the vendor will perform multiple revenue generating activities. EITF 00-21 will be effective for interim periods beginning after 15 June 2003. The Group is currently evaluating the impact of adoption of EITF 00-21 on its financial position and results of operations in 2003.
67
Back to Contents
| ITEM 6 | DIRECTORS, SENIOR MANAGEMENT AND EMPLOYEES |
| | |
| A. | Directors and Senior Management |
David Varney (57) Chairman (2), (4), (5)
David Varney was appointed to the Board in August 2001 as full time Chairman. In April 2003, he became part time Chairman as envisaged at the time of the demerger from BT. He has extensive experience both in the UK and overseas markets gained during his four years as Chief Executive Officer of BG Group (formerly British Gas) from 1996 to 2000. Prior to joining BG Group, he held a variety of senior roles in Shell including the position of Managing Director of AB Svenska Shell in Sweden and Director of Shell International with responsibility for Shell’s Oil Products business in Europe. He is also Chairman of Business in the Community.
Peter Erskine (51) Chief Executive Officer (2), (3), (4)
Peter Erskine was appointed to the Board in August 2001. Mr Erskine is the Company’s Chief Executive Officer. He joined the Company from BT where, since March 1993, he held a number of senior positions including Director of BT Mobile, President and Chief Executive of Concert, and, from 1998, Managing Director of BT Cellnet. Prior to joining BT he was European Vice President of Sales and Customer Service for Mars and Senior Vice President Sales and Marketing for UNITEL.
David Finch (47) Chief Financial Officer (2), (3), (4)
David Finch was initially appointed to the Board in August 2001. Mr Finch is the Company’s Chief Financial Officer and has extensive experience in financial management having previously held senior finance positions at Exel, Novar (formerly Caradon) and Grand Metropolitan. In addition to Group Finance, he has direct responsibility for the Group Treasury and Investor Relations functions.
Rudolf Gröger (48) CEO O2 Germany (3)
Rudolf Gröger was appointed to the Board on 1 April 2003. Mr Gröger joined the Company in October 2001 as Chief Executive Officer of O2 Germany (previously called Viag Interkom). Prior to this, he was Managing Director of T-Systems International GmbH, a subsidiary of Deutsche Telekom, from 1999 to 2001. He played a key role in the acquisition of Debis Systemhaus GmbH and its integration into Deutsche Telekom. He has also worked for Siemens and was head of its German information and communication product operations.
David McGlade (42) CEO O2 UK (3)
David McGlade was appointed to the Board on 1 April 2003. Mr McGlade joined O2 UK (previously called BT Cellnet) in October 2000. Before being appointed as Managing Director of BT Cellnet, he was Chairman and Chief Executive Officer of PureMatrix, a mobile webnet software company based in Colorado. He was also President and Chief Executive Officer of Catch TV, President West Region of Sprint PCS where he launched the first Code Division Multiple Access network outside Asia and a Vice President of TCI.
Kent Thexton (40) Chief Data and Marketing Officer (3)
Kent Thexton was appointed to the Board on 1 April 2003. Mr Thexton joined O2 UK (previously called BT Cellnet) in 1998 as Marketing Director before becoming Managing Director of O2 Online (previously called Genie) in 2000. He was appointed Chief Data and Marketing Officer for the Company in July 2001. Before joining BT Cellnet, he spent eight years in the Canadian mobile industry, holding the position of Chief Operating Officer and Executive Vice President of Rogers Cantel (now Rogers Wireless). Prior to this, he held management positions at Northern Telecom and Bell Canada. He is also a non-executive Director of two private Canadian companies, Avista and Casero.
68
Back to Contents
Andrew Sukawaty (48) (5), (6)
Andrew Sukawaty was initially appointed to the Board in August 2001. Mr Sukawaty is the non-executive Deputy Chairman of the Company and senior independent Director. He is President and Chief Executive Officer of Cable Partners Europe LLC, which invests in and operates cable television services in Europe. He is also Chairman of Telenet. He has considerable experience in the mobile telephone industry and telecommunications industries in the United States and Europe having at different times in those periods held the offices of Chief Executive and President of Sprint PCS, Chief Executive Officer of NTL, Chief Operating Officer of Mercury One2One, where he launched the world’s first digital Personal Communications Services company, and he is a former Chairman of the Cellular Telephone and Internet Association (CTIA) in the United States.
David Arculus (56) (1), (5)
David Arculus was appointed to the Board on 1 April 2003. Mr Arculus is Chairman of Severn Trent and the Better Regulation Task Force and a non-executive Director of Barclays and Earls Court and Olympia Limited. Mr Arculus was previously Chairman of IPC Group Limited and, before that, Group Managing Director of EMAP.
David Chance (46) (1), (5)
David Chance was appointed to the Board on 21 January 2003. Mr Chance was Deputy Managing Director of BSkyB until June 1998 and is a non-executive Director of Granada, Modern Times Group and Sunderland AFC. He previously held senior marketing and business development roles at US telecoms companies, Scientific Atlanta and Grass Valley Group, and European satellite broadcaster, SES.
Stephen Hodge (61) (1), (6)
Stephen Hodge was initially appointed to the Board in October 2001. Mr Hodge was Director of Finance of the Royal Dutch/Shell Group, prior to his retirement in September 2001, where he had responsibility for all financial and investor relations issues for the Shell Group and its parent companies. He has extensive knowledge of the financial management of international companies, having worked throughout the world including Australia, the Netherlands, Venezuela and Argentina in a variety of financial positions. He is Chairman of Shell Pensions Trust Limited and a member of the Franchise Board of Lloyd’s of London.
Neelie Kroes (61) (1), (6)
Neelie Kroes was initially appointed to the Board in August 2001. Ms Kroes is a member of the Supervisory Boards of a number of Dutch enterprises including Cório, Lucent Technologies, Nederlandse Spoorwegen, New Skies Satellites and P&O Royal Nedlloyd. She is also a member of the Supervisory Boards of Volvo Group and Thales Group. She is a member of the Prologis Board. She is a former President of Nijenrode University in the Netherlands. Before this, she served as Adviser to the European Transport Commissioner and also served two periods, in the Netherlands, as Cabinet Minister of Transport, Public Works and Telecommunications and Secretary of State for Transport, Public Works and Telecommunications. She was also a member of the Dutch Parliament and a member of the Rotterdam Municipal Council.
Ian Meakins (46) (1), (6)
Ian Meakins was appointed to the Board in December 2001. Mr Meakins is currently President, European Major Markets and Global Supply of Diageo. He has held a number of senior marketing and operational directorships since joining United Distillers in 1992 from strategic management consultants, The Kalchas Group, where he was a founding partner. Prior to this, he worked at Bain & Company and Procter & Gamble.
Paul Myners (55) (5), (6)
Paul Myners was initially appointed to the Board in August 2001. Mr Myners is Chairman of Aspen Insurance and the Guardian Media Group and a non-executive Director of The Bank of New York and Marks and Spencer. He is a member of the Financial Reporting Council. He was Chairman of Gartmore Investment Management until November 2001 and has previously held directorships at National Westminster Bank, Coutts & Co., the
69
Back to Contents
Investment Management Regulatory Organisation, the Lloyd’s Market Board, Celltech Group, the Scottish National Trust, Powergen and Orange. He is a Trustee of both Tate and Glyndebourne.
Key to membership of Board Committees:
| | |
| (6) | Remuneration Committee |
All of the non-executive Directors are considered independent of the management of the Company.
Company Secretary and General Counsel |
Philip Bramwell (46)
Philip Bramwell joined the Company from BT, where he was employed since April 1998, initially as Legal Manager, Group Strategy and Development and then as Chief Counsel, Corporate Development. Before joining BT, he was a partner in DDV, a European specialist telecommunications consultancy firm. Prior to this, he held the position of Vice President and General Counsel at BellSouth with responsibility for the European operations of the Air Call and Dataserv groups and worked on cellular and mobile data licence bids and start-ups throughout Europe.
Executive Management Team |
mmO2’s Executive Committee comprises Messrs. Erskine (Chairman), Finch, Gröger, McGlade and Thexton and the following senior executives:
Danuta Gray (44) CEO O2 Ireland
Danuta Gray joined the Company from BT, where she was employed since 1984. Before transferring to her present role in July 2001, Ms Gray was Senior Vice President of BT Wireless’s businesses in Europe. Prior to this, she was a General Manager of BT Mobile, Leeds from 1994 to 1999, Sales Manager and Deputy General Manager of BT Global Communications from 1992 to 1994 and Account Director for BT Global Communications, Commercial Sector from 1990 to 1992. She also worked in various departments as a manager and consultant for BT.
Andrew Harley (42) Group HR Director
Andrew Harley joined the Company from BT, where he had worked since August 1980. Before being appointed as Senior Vice President, HR, BT Wireless in February 2001, Mr Harley was Senior Vice President, Human Resources, BTopenworld, BT’s fixed internet service provider, and before that he was Human Resources Director for BT Cellnet. Mr Harley was also Human Resources Director for Telenordia in Sweden.
Richard Poston (43) Director Corporate Communications
Richard Poston joined the Company in September 2001. Previously Mr Poston was the Director of Communications for TI Group from 1999 to 2001 and prior to this Director of Corporate Communications for Racal Electronics from 1994 to 1999. He held a number of corporate communications and public affairs roles in Racal Electronics. During this time, he was closely involved with the early growth of Vodafone leading to its demerger from Racal and the formation of Camelot Group, operator of the National Lottery, in which Racal was a major shareholder. He started his career in the Royal Navy where he served from 1978 to 1986.
70
Back to Contents
Sohail Qadri (42) Group Director Business Development & Strategy
Sohail Qadri joined O2 UK (previously called BT Cellnet) in 1993 as Director of Operations and Strategy. In 1997, Mr Qadri became Director of Mobility, Group Strategy and Development for BT before taking on his current role. Prior to joining BT Cellnet, he was a Principal Consultant at Coopers & Lybrand, now PricewaterhouseCoopers.
David Williams (45) Chief Technology Officer
David Williams joined the Company on 3 February 2003 and was appointed to the Executive Committee on this date. Mr Williams joined the Company from Cingular Wireless, where he was Vice President for Strategic Planning. Prior to the merger of SBC Wireless and BellSouth Cellular in the US to form Cingular, he ran all technological operations for SBC Wireless west region. He joined SBC Wireless following the acquisition of Pacific Bell Mobile Services by that company and was instrumental in integrating the two networks. After working for both Orange and Vodafone in the UK, he relocated to the US in 1996 to direct the build-out of one of the US’s first digital mobile networks for Pacific Bell.
Details of those companies and partnerships outside the mmO2 Group of which the directors, officers and members of the executive committee are or have been directors or partners at any time since 1 July 1998, are as follows:
| Name | Directorships and Partnerships |
| | |
| David Varney | Cable and Wireless Public Limited Company*, BG Group plc*, Transco plc*, Transco Holdings plc*, Oil Industries Club Limited (The)*, Business in the Community. |
| | |
| Peter Erskine | The Link Stores Limited*, Concert Communications Company*. |
| | |
| Rudolf Gröger | T-Systems International GmbH*, Debis Systemhaus GmbH*. |
| | |
| David McGlade | Catch TV Acquisition Corporation*, Pure Matrix Inc.*, The Link Stores Limited. |
| | |
| Kent Thexton | Solect Technology Ltd*, Avista, Casero. |
| | |
| Andrew Sukawaty1 | Cable Broadband Wireless Inc.*, My.Net International Ltd*., Nupremis Inc*, Post.com Limited*, Powerwave Technologies Inc, Telenet BidCo N.V., American PCS Communications LLC*, American PCS L.P.*, American Personal Communications Holdings Inc.*, APC PCS LLC*, APC Realty and Equipment Company LLC*, Cox Communications PCS L.P.*, Cox PCS Assets LLC*, Cox PCS License LLC*, NetTelco L.P.*, Pegaso Inc.*, Sprint Spectrum Holding Company L.P.*, WirelessCo L.P.*, Cable Partners Europe LLC. |
| | |
| David Arculus | Earls Court & Olympia Limited, Barclays plc, Severn Trent plc, Geest plc*, IPC Group Limited*, The Guiton Group Limited*. |
| | |
| David Chance | Freeview Plus (Newsinco.166), Granada plc, Intertrust Technologies Inc.*, Modern Times Group, Sunderland plc, British Sky Broadcasting Group plc*, RBM (Car Park) Limited*, Richmond Bridge Mansions Limited*. |
| | |
| Stephen Hodge | Shell Petroleum Company Limited*, Shell Pensions Trust Limited, Lloyd’s of London Franchise Board. |
| | |
| Neelie Kroes | NIB Capital N.V.*, Port Support International B.V.*, VIB*, Brambles Industries Ltd. (Australia)*, Royal Nedlloyd, Ballast Nedam, NCM Holding N.V.*, Prologis, Corio, Fondel Finance B.V., Lucent Technologies, New Skies |
71
Back to Contents
| | Satellites, P&O Nedlloyd, Volvo Group, Thales Group, Nederlandse Spoorwegen, Meyermonitor B.V. |
| | |
| Ian Meakins | United Distillers UK plc, Champagnes et Spiritueux Associes, Lothian Distillers Limited, Moet Hennessy Distribution, Neggma S.A., UDV (SJ) Limited, United Distillers Denmark A/S, Diageo Hellas S.A., Vedima International Getranke-Vertriebs GmbH, W&A Gilbey (South Africa) (Proprietary) Limited, London International Group plc*, UDV Portugal-Distribuidora de Bobidas, Lda*, United Distillers Companhia Velha, Limitada*, The North British Distillery Company Limited*. |
| | |
| Paul Myners2 | The European Private Equity Partnership*, Gartmore Distribution Trust plc*, Gartmore Capital Strategy Fund Limited*, Gartmore Capital Strategy Portfolio Limited*, Gartmore Fund Managers Limited*, Gartmore Investment Limited*, Gartmore Global Trust plc, Gartmore Investment Management plc*, McLean, Budden Limited*, Nippon Credit Gartmore Investment Management Limited*, Orange plc*, National Westminster Life Assurance Limited*, National Westminster Bank plc*, Gartmore Share Equity Trust P.L.C., Guardian Media Group plc, Marenwood Limited*, National Maritime Museum Cornwall Trust, PowerGen plc*, PowerGen UK plc*, Royal Academy Trust, GSET Dealing Ltd*, GMIT Subsidiary Ltd*, Guardian Newspapers Ltd, Nationwide Asset Management Holdings Limited*, Marks and Spencer Group plc, The Bank of New York, Nationwide UK Holding Company Limited*, Asset Management Holding plc*, Glyndebourne Arts Trust, Aspen Insurance Holdings Limited. |
| | |
| Philip Bramwell | New Cellular Holdings plc*, DDV Telecommunications Strategy NV*, BT Wireless Investments Ltd*. |
| | |
| Richard Poston | Racal Group Services Limited*, TI Corporate Services Limited*. |
| | |
| Sohail Qadri | Maxis Communications Berhad*, SFR S.A.*, Rogers Wireless Communications, Inc*. |
| | |
| * | Past directorships/partnerships |
| 1 | My.Net International Ltd is being wound up by way of a creditors’ voluntary liquidation. In May 2001, the date of the last assessment by the directors of My.Net International Ltd, the shortfall to creditors was estimated at £5 million. |
| 2 | Mr Myners, a director was a divisional director of British & Commonwealth Holdings PLC until his resignation on 12 March 1990. His resignation followed the disposal by the company of its subsidiary, Gartmore Investment Management Limited, of which Mr Myners was Chairman and Chief Executive. On 3 June 1990, the company was placed into administrationn. The circumstances leading up to that company being placed into administration were the subject of a report by the Department of Trade and Industry. Mr Myners was not the subject of criticism in this report. The administration is ongoing. At the date of this annual report, the amount of the shortfall to creditors is approximately £18 million. |
The discussion in this section forms a remuneration report that has been prepared by the Remuneration Committee (the Committee) and has been approved by the Board.
This remuneration report complies with the Directors’ Remuneration Report Regulations 2002 (the Regulations), which apply to the Company for the first time this year. This report sets out how the principles of the Combined Code (the UK guide for corporate governance for publicly listed companies in the UK) relating to executive Director remuneration are applied by the mmO2 Group.
72
Back to Contents
The Regulations require the Group’s auditors to report to shareholders on the auditable part of this remuneration report and to state whether, in their opinion, that part of this remuneration report has been properly prepared in accordance with the Companies Act 1985 (as amended by the Regulations). The auditable sections of the report include those relating to Directors’ remuneration and benefits, share incentive schemes and pension benefits.
A resolution will be put to shareholders at the Annual General Meeting on 30 July 2003 inviting them to consider and approve this remuneration report.
Membership and responsibilities of the Remuneration Committee
The Committee consists entirely of independent non-executive Directors who are independent of management and free from any business or other relationship which could materially interfere with the exercise of their judgement. No member of the Committee has any personal financial interest, other than as a shareholder, in the matters to be decided by the Committee.
During the year the Committee was chaired by Andrew Sukawaty, and its other members were Stephen Hodge, Neelie Kroes, Ian Meakins and Paul Myners. David Chance was invited to, and attended, Committee meetings during January, February and March 2003 following his appointment as a non-executive Director on 21 January 2003. The Chairman and Chief Executive Officer are invited to attend meetings of the Committee, save that they are absent when their own remuneration is under consideration. Biographies can be found in Item 6, “Directors, Senior Management and Employees – A. Directors and Senior Management”.
The Committee is responsible for determining policy on the remuneration and performance of executive Directors, the Company Secretary and General Counsel and members of the Executive Committee as described throughout this Item 6.B. It determines, within agreed terms of reference, specific remuneration packages for each of the executive Directors, the Company Secretary and General Counsel and members of the Executive Committee, including:
| | |
| • | any compensation payments; and |
| | |
| • | the operation of the mmO2 Executive Share Portfolio (the Portfolio). |
The Committee has responsibility for agreeing any awards or options granted under the Portfolio.
The Committee takes advice from both inside and outside the Group on a range of matters, including the scale and composition of the total remuneration package payable in comparable companies to people with similar qualifications, skills and experience.
The following people and organisations provided advice or services that materially assisted the Committee in its consideration of Directors’ remuneration matters during the year ended 31 March 2003:
| • | the Committee consulted the Chief Executive Officer on matters relating to the remuneration of the other executive Directors who report to him. The Chairman and Andrew Harley, Group HR Director, were consulted in relation to the remuneration of all executive Directors. |
| | |
| • | the Committee also had access to advice from independent executive remuneration consultants, New Bridge Street Consultants, on all aspects of executive remuneration. New Bridge Street Consultants were appointed by the Committee and provided no other services to the Company during the financial year. |
The committee met six times between 1 April 2002 and 31 March 2003.
73
Back to Contents
The Group has complied with the Combined Code’s provisions relating to Directors’ remuneration throughout the year ended 31 March 2003.
Remuneration policy
The Committee operates on the principle that executive Directors, the Company Secretary and General Counsel and members of the Executive Committee should be provided with appropriate incentives to encourage superior performance and should, in a fair and responsible manner, be rewarded for their contribution to the success of the Group.
mmO2 is committed to developing and maintaining appropriate remuneration strategies which attract, retain and motivate key people. The Company is committed to aligning the remuneration of senior executives across the whole business who may have different remuneration histories. In addition, the Committee considers it vital to align the interests of the leadership team with those of shareholders, and to link a significant proportion of the package to shareholder value.
The remuneration policy for the executive Directors, the Company Secretary and General Counsel and members of the Executive Committee is based on the following principles:
| • | base pay will generally be positioned at the median of the relevant market, but due consideration is given to executive wage levels in other companies and to general wage levels elsewhere in the Company; |
| | |
| • | emphasis will be placed on providing a total cash and total compensation package that has potential to be upper quartile for high performance; and |
| | |
| • | performance-related remuneration will seek to align the interests of executive Directors with those of the shareholders through the imposition of stretching business performance targets and share based long-term incentives. |
The policy has been designed to provide an appropriate balance between fixed remuneration and variable reward, which is linked to the performance of the Group and the individual. Presently, on the basis of achievement of “on-target” bonus and the annualised value of performance related long-term incentives, approximately 55 per cent of each executive Director’s total remuneration will be derived from the variable elements of reward (annual bonus and long-term incentives) with approximately 45 per cent being derived from the fixed elements (base salary, pensions and benefits in kind).
The Committee will review the total remuneration of the executive Directors annually to ensure adherence to the above.
This remuneration report sets out the Company’s policy on executive Directors’ remuneration for the year ending 31 March 2004 and, so far as practicable, for subsequent years. The inclusion in the report of the remuneration policy in respect of subsequent years is required by the Regulations. However, the Committee believes it is appropriate to operate a dynamic policy which evolves and adjusts in light of changing circumstances, both internally and in the wider market. In operating such a dynamic policy, the Committee has discretion in determining the actual levels of the variable elements of remuneration, such as annual bonus and long-term incentives. Accordingly, while the Committee is able to state its remuneration policy for the year ending 31 March 2004 with reasonable certainty, of necessity, it is likely to change over time. Any changes in policy for subsequent years will be described in future reports on Directors’ remuneration, which will continue to be subject to shareholder approval. All statements in this report in relation to remuneration policy for subsequent years should be read in light of this paragraph.
Elements of remuneration
Executive remuneration comprises: base salary, annual incentives (bonus), long-term incentives, pensions and benefits. The long-term incentive schemes and the bonus are performance-related, and the Committee regards them as key elements in the executive Directors’ remuneration package.
74
Back to Contents
Base salary
Base salaries for all executive Directors, the Company Secretary and General Counsel and other Executive Committee members are reviewed (but not necessarily increased) annually by the Committee. Salary increases are made when the Committee believes that this would result in a better reflection of past and future contribution, level of responsibility, competitiveness and criticality to the business. In considering base salaries the Committee makes reference to market information and data for comparable positions in comparable businesses.
As at 31 March 2003, David Varney (Chairman) received an annual salary of £500,000. The Committee had recommended an annual salary increase of 5 per cent to David Varney for the year ended 31 March 2003 which he waived. From 1 April 2003, however, in line with a reduction in time commitment, Mr Varney’s annual salary will be reduced to £350,000. As at 31 March 2003, the annual salaries payable to Peter Erskine, Chief Executive Officer, and David Finch, Chief Financial Officer, were £545,000 and £375,000 respectively. With effect from 1 June 2003 their annual salaries will be £620,000 and £400,000 respectively.
Rudolf Gröger (CEO O2 Germany), David McGlade (CEO O2 UK) and Kent Thexton (Chief Data and Marketing Officer) were appointed to the Board on 1 April 2003 with salaries of €550,000, £360,000 and £330,000 respectively.
Annual incentives
In respect of the year ended 31 March 2003, mmO2 operated an annual incentive scheme based on a balance of key performance indicators, including EBITDA, cash flow, revenue and customer satisfaction targets. Targets were determined at the start of the financial year and agreed by the Committee. The Committee has discretion, by exception, to adjust bonuses up or down where the incentive outcomes do not in its view fully reflect the performance of the relevant executive Director. The bonuses remain subject to the stated maximums for each executive Director.
Bonus as a percentage of salary payable for the year ended 31 March 2003 was for the Chief Executive Officer 65 per cent of salary for achieving on-target performance and a maximum of 100 per cent. For the Chief Financial Officer, the percentages were 50 per cent and 75 per cent respectively. Bonuses are not pensionable. David Varney does not participate in annual incentive arrangements.
In the year ended 31 March 2003, Peter Erskine earned an annual bonus of £387,000. David Finch earned an annual bonus of £206,250.
The annual incentive arrangements for the year ending 31 March 2004 will be based on a balance of key performance indicators, including EBITDA, cash flow, revenue and customer satisfaction targets. Targets were determined by the Committee at the start of the financial year.
For the year ending 31 March 2004, the percentage of salary payable to the Chief Executive Officer at on-target and maximum will remain unchanged at 65 per cent and 100 per cent respectively. The Chief Financial Officer’s bonus potential will also be 65 per cent at on-target and 100 per cent at maximum to reflect his performance and key contribution to the business.
The new executive Directors each have an on-target and maximum bonus potential of 80 per cent and 120 per cent of salary for the year ending 31 March 2004. These reflect the Company’s policy of driving and rewarding superior performance for these key contributors to business success.
Long-term incentives
The Portfolio is the primary vehicle for aligning the interests of key employees and executive Directors with those of shareholders. It comprises three elements:
75
Back to Contents
The Committee is responsible for the operation of the Portfolio. The Committee actively reviews the most appropriate elements of the Portfolio to use from time to time to incentivise participants. In the year ended 31 March 2003 only the share option element of the Portfolio was operated. It is the Committee’s intention that no executive Director or employee should participate in all three elements in the same year. Participation is solely at the discretion of the Committee, and all employees of the mmO2 Group, including executive Directors, are eligible to be invited to participate. The Committee determines the appropriate performance targets to be applied to awards and options and reviews the extent to which they have been met.
During the year ended 31 March 2003, the Committee undertook a comprehensive review of its long-term incentive policies in light of experience since the demerger from BT, developments in both market and best practice and the impending changes in the accounting treatment of share plans.
As a result the Committee has concluded that it will operate the Performance Share element of the Portfolio as the primary form of long-term incentive for the year ending 31 March 2004. This is to:
| • | provide the opportunity for a more robust performance condition, thereby more clearly aligning the interests of executives with those of shareholders; and |
| | |
| • | align more closely the benefits received by participants with the accounting charges likely to be incurred by the Company. |
Awards and options are not pensionable and may not be assigned or transferred except on a participant’s death, when they may be assigned to the participant’s personal representatives. The Committee will keep under review the issue of whether an ongoing personal shareholding requirement should be introduced for executive Directors and senior executives.
The Committee is satisfied that all the schemes described below constitute a well-considered overall plan for executive Directors’ long-term remuneration. These schemes are kept under regular review to take account of changing circumstances. Share incentive scheme payments are not taken into account for pension purposes.
Performance shares element
Under this element of the Portfolio shares will be awarded and will normally vest subject to the satisfaction of a predetermined and challenging performance condition, as well as continued employment with the Company. The performance condition will relate to the total shareholder return (TSR) performance of the Company when compared with the TSR performance of the constituent companies of the FTSE E300 Telecoms Service Index as at the date of award. TSR compares the net return to a mmO2 plc shareholder (share price growth and assumed reinvestment of any dividends) with that of a shareholder in each of the comparator companies. The FTSE E300 Telecoms Service Index represents the 22 largest European telecommunications companies with market capitalisation ranging between £1.9 billion and £84 billion. The Index includes three UK-based companies.
After reviewing the various types of performance measures in common usage, the Committee concluded that it wished to continue to operate TSR as the performance measure given that, in the view of the Committee, it is the most appropriate means of aligning the interests of executives with those of shareholders in the context of the Company’s current state of development. Several potential comparator groups were considered and the Committee concluded that comparison with the constituents of the E300 Telecoms Service Index provided the most clear measure for determining the success or otherwise of the management team at mmO2 against similar companies.
These shares will normally vest in full if the Company’s TSR performance places it at or above the upper quartile of the comparator group over a fixed three-year period. No vesting will occur if the Company’s TSR performance places it below the median of the comparator group. If the Company’s TSR performance places it at the median, 30 per cent will vest. If the Company’s TSR performance is between the median and upper quartile, the shares will vest on a straight-line basis. There will be no retesting opportunities.
76
Back to Contents
In addition awards will only vest to the extent that the Committee is satisfied that the Company’s TSR performance is a genuine reflection of the Company’s underlying financial performance over the period. In circumstances where the Committee makes adjustments on this basis it will explain its reasoning in the subsequent report on Directors’ remuneration.
The Company’s relative TSR performance will be periodically measured and reported to the Committee and participants. This measurement will be undertaken by an independent third party.
Share options element
Following the review of long-term incentives by the Committee, it is not proposed to make any regular option grants in the year ending 31 March 2004; however, the Committee reserves the ability to grant options in exceptional circumstances; for example, if required to secure an appointment.
Options granted in the year ended 31 March 2003 were granted on terms that they normally only become exercisable on the third anniversary of grant subject to a demanding performance condition being met. This relates to the TSR performance of the Company when compared with the TSR performance of the constituent companies in the FTSE 100 Index at the date of grant (the Comparator Group). The FTSE 100 was selected as the Comparator Group as this was considered an objective group from a shareholder perspective.
These options will only become exercisable in full if, at one of the test dates described below, the Company’s TSR performance places it at or above the upper quartile of the Comparator Group. No part of the option will become exercisable if the Company’s TSR performance places it below the median of the Comparator Group. If the Company’s TSR performance places it at the median, 50 per cent will become exercisable. If the Company’s TSR performance is between the median and upper quartile, the option will become exercisable on a straight-line basis.
This performance target will first be tested on the third anniversary of grant; if the target is not satisfied in full after this period, it can be retested on two subsequent occasions, on the fourth and fifth anniversaries of grant, extending the length of the performance period at each test. The proportion of options that can be exercised will increase if the Company’s TSR performance improves between the test dates.
For options granted in the year ended 31 March 2003, the first performance test is expected to be July 2005. TSR performance from 18 July 2002 (the start of the performance period) to 31 March 2003 places mmO2 at 2nd position within the Comparator Group. As noted above, these options will only become exercisable in full if the Company’s TSR performance meets the relevant target at one of the test dates described above.
Each of the executive Directors was made a grant of share options with an aggregate exercise price equal to three times salary in July 2002. Details of these grants can be found in Item 6. “Directors, Senior Management and Employees – B. Compensation – Directors’ Remuneration – Executive Share Options”.
Restricted shares element |
Awards under this plan will be solely at the discretion of the Committee. There are currently no intentions to make any awards under this plan in the forthcoming financial year; however, the Committee reserves the ability to grant awards in exceptional circumstances – for example, if required to secure an appointment.
77
Back to Contents
The performance graphs below illustrate the Company’s total shareholder performance over the period from 19 November 2001, when the Company was first listed following its demerger from BT, to 31 March 2003 compared to that of each of the FTSE 100 Index and the FTSE Technology, Media and Telecommunications (TMT) Index over the same period. These graphs have been prepared in accordance with the Regulations. The FTSE 100 Index was selected by the Committee because it is recognised as an externally valid and robust comparator group of UK-based companies of similar size to mmO2 in terms of market capitalisation. The FTSE TMT Index, which the Company outperformed, was chosen because it more closely compares the Company with its sector.
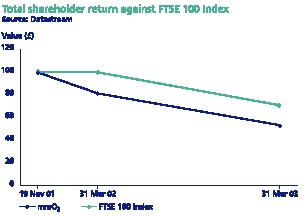

The graphs look at the value to 31 March 2003 of £100 invested in mmO2 on 19 November 2001 compared with the value of £100 invested in the FTSE 100 or FTSE TMT Indices respectively. The other points plotted are the values at the intermediate financial year-ends.
Former long-term incentives |
These are described on pages 86 and 87.
All-Employee share plans
The Committee believes that it is in the interests of all employees across the business to be given the opportunity to own mmO2 shares, and wishes to encourage this by taking advantage of favourable tax treatment where available for employee shareholdings.
Executive Directors are eligible to participate in the Company’s all-employee share schemes on the same terms as other employees. The schemes are:
| • | the mmO2 Sharesave Plan, under which the Directors can grant options to all employees across the business to acquire shares at an exercise price set at a discount of up to 20 per cent to the market value of a share at the time of invitation. This scheme operates within specific tax legislation in the UK (under which savings contributions towards the aggregate exercise cost of the option cannot exceed £250 per month) and exercise of these options is not subject to satisfaction of a performance target; |
| | |
| • | the mmO2 Share Ownership Plan, under which the Directors can award shares to UK employees on a variety of tax-favoured terms. This scheme operates within specific tax legislation, and there are no performance conditions attached to awards of shares. |
78
Back to Contents
There are pension arrangements in place in the main jurisdictions in which the mmO2 Group operates. Schemes vary in accordance with local market practices in each jurisdiction, and as such there are several arrangements in place for executive Directors, the Company Secretary and General Counsel and Executive Committee members, including 401k plans and final salary schemes.
Each of the executive Directors is entitled to final salary related pension benefits up to the statutory earnings cap. In addition, they are entitled to supplementary pension benefits in respect of earnings above the statutory earnings cap (comprising unfunded final salary related benefits in the case of Peter Erskine and funded defined contribution benefits in the case of David Finch). Peter Erskine’s pension arrangements provide for a total pension of two-thirds of final salary at age 60, inclusive of any retained benefits from his previous employment, and a widow’s pension of two-thirds of his pension. The majority of his pension is provided outside the mmO2 Pension Plan as an unfunded benefit promise from the Company. The increase in his accrued pension and transfer value at 31 March 2003 is partly as a result of the increase in pay at separation from BT which now fully impacts on his accrued pension.
David Finch’s pension arrangements provide for an annual accrual of 1/30th of the earnings cap subject to any restriction due to retained benefits. In addition, he is entitled to a supplementary defined contribution benefit, the level of which is determined on an annual basis. For the year ended 31 March 2003 this was equal to 32.5 per cent of base salary; 21 per cent paid to a Funded Unapproved Retirement Benefit Scheme (FURBS), and 11.5 per cent paid as a cash supplement. David Varney has no contractual entitlement to participation in pension arrangements.
The pension arrangements provide for life cover of four times salary.
The Committee, having considered the policy for executive Directors’ pension provision in light of the launch of the new mmO2 Pension Plan on 1 July 2002, made no changes to the existing provisions for either Peter Erskine or David Finch.
Details of pension arrangements within mmO2 are set out in note 8 to the financial statements, included in Item 18.
The main benefit provisions in the contracts of executive Directors are a company car or cash equivalent; healthcare for the executive and family; dental care for the executive and spouse and personal tax and financial planning costs reimbursed to a maximum of £5,000 per annum. Life cover of four times salary is provided for David Varney.
Contracts and notice periods |
It is the Committee’s general policy that executive Directors will have contracts and service agreements with the same provisions. Where this may not be possible initially, every effort will be made to revert to the Committee’s policy as soon as practicable.
Peter Erskine entered into a service agreement with mmO2 dated 14 September 2001 and effective from 24 October 2001. The notice period required by the Company to terminate this agreement is 12 months. The Company may in its discretion terminate without notice and make a payment in lieu of notice to Peter Erskine equal to the sum of 12 months’ pay, the value of employers’ pension contributions, benefits, and a bonus payment of not less than the previous year’s bonus. This may be paid in a lump sum or in monthly instalments until the end of the notice period or, if earlier, such time as Peter Erskine obtains qualifying alternative employment. This payment in lieu of notice provision does not prevent the Company from terminating in breach of contract, which may enable the Company to pay a reduced amount by requiring greater mitigation. On termination of Peter Erskine’s employment within 12 months of a change of control, mmO2 is obliged to make a liquidated damages payment equal to the base salary, the value of employer pension contributions and benefits for the notice period, plus additional payments generally equal to the annual bonus potential for that year, and in respect of the loss of rights under share incentive schemes.
79
Back to Contents
David Finch entered into a service agreement with mmO2 dated 14 September 2001 and effective from 19 November 2001. The notice period required by the Company to terminate this agreement is 12 months. The Company may in its discretion terminate this agreement without notice and make a payment in lieu of notice to David Finch equal to the sum of 12 months’ pay, the value of employers’ pension contributions, benefits and a bonus payment of not less than the previous year’s bonus. This may be paid in a lump sum or in monthly instalments until the end of the notice period or, if earlier, such time as David Finch obtains alternative employment. This payment in lieu of notice provision does not prevent the Company from terminating in breach of contract, which may enable the Company to pay a reduced amount by requiring greater mitigation. On termination of David Finch’s employment within 12 months of a change of control, mmO2 is obliged to make a liquidated damages payment equal to the base salary, the value of employer pension contributions and benefits for the notice period, plus additional payments generally equal to the annual bonus potential for that year, and in respect of the loss of rights under share incentive schemes.
With effect from 1 April 2003, David Varney serves as Chairman under a letter of appointment dated 31 March 2003. Mr Varney’s time commitment has been reduced to an average of between two and three days per week, and the annual salary payable to Mr Varney has been reduced to £350,000. The previous annual salary was £500,000 for full-time work. Mr Varney’s appointment will end no later than the date of the Company’s Annual General Meeting in 2004. The appointment may be terminated at any time prior to this date by either party giving three months’ notice.
Recent appointments to the Board |
In respect of the additional executive Director appointments to the Board which took effect on 1 April 2003 (Rudolf Gröger, David McGlade and Kent Thexton), full remuneration details including contracts and notice periods will be available in the remuneration report relating to the year ending 31 March 2004. Remuneration policy as set out above is reflected in the contracts and remuneration of these new Board members. However, in recognition of local market practice in Germany Mr Gröger’s contract is initially for a fixed term ending on 31 October 2005, but will convert to a one-year rolling contract after the end of this initial period. Additionally, in the event of termination of Mr Gröger’s employment within 12 months of a change of control of mmO2 or O2 Germany, the employer is obliged to make a cash payment equal to two times his base salary and bonus. The amount of bonus payable will be that expected for on-target performance. On-target bonus is equal to 80 per cent of base salary.
Remuneration of non-executive Directors |
The Company recognises that the demand for non-executive Directors reflects a market for such positions. In appointing non-executive Directors the Company has regard to the practice of other companies and the increasing time demands on non-executive Directors, which go well beyond attendance at relevant committee meetings.
The fees of non-executive Directors are determined by the Chairman and Chief Executive Officer who have access to independent advice. Up to 31 March 2003:
| (a) | the annual fee payable to the non-executive Directors (other than Andrew Sukawaty) was £30,000 (plus an additional fee of £3,000 per annum for membership of each Board Committee in excess of one Committee); and |
| | |
| (b) | the Deputy Chairman of the Company (Andrew Sukawaty) was entitled to a fee of £100,000 per annum. |
In the year ended 31 March 2003, the remuneration of non-executive Directors was reviewed in light of the Higgs Report on the “Role and Effectiveness of Non-Executive Directors”. It was agreed that with effect from 1 April 2003 the annual fee payable to the non-executive Directors (other than Andrew Sukawaty) will be £40,000, plus an additional fee of £5,000 for chairmanship of a committee, and an additional fee of £5,000 each for membership of the Audit and Remuneration Committees and £3,000 for membership of the Nomination Committee. The fee for the Deputy Chairman of the Company remains unchanged.
The level of fees for the non-executive Directors will be reviewed on an annual basis.
80
Back to Contents
During the year ended 31 March 2003 the Board approved a proposal for payment of non-executive Directors’ fees in shares. Under this arrangement each non-executive Director has agreed that a portion of their after-tax fee, equivalent to a minimum of 50 per cent and up to a maximum of 100 per cent, would be invested in shares (the Share Portion). Fees are paid quarterly in arrears and the shares are allotted on the same basis. The number of shares to be allotted in respect of each quarter is calculated by dividing the Share Portion for the quarter by the average middle market quotation on the three dealing days preceding the date of the quarterly allotment.
Each non-executive Director has entered into a letter of appointment with mmO2 which covers, amongst other items, their terms of appointment and a general statement of their role and duties. Non-executive Directors are appointed initially for three years. Towards the end of that period, the Board will consider whether to continue their appointment, which will then become terminable on 12 months’ notice from either the Company or the Director. The initial terms of three years began at demerger or 20 December 2001 in the case of Ian Meakins, and 21 January 2003 in the case of David Chance. (Since the adoption of this remuneration report, each of the non-executive Directors have agreed to enter into revised letters of appointment with mmO2 which cover, in greater detail, their terms of appointment and their role and duties and specify that their appointment will become terminable on one month’s notice by either the Company or the Director). The non-executive Directors do not participate in any of mmO2’s pension or incentive arrangements.
Policy on outside appointments |
It is the Company’s policy to support the undertaking of external directorships or similar roles by executive Directors, including the Chairman and senior managers where it is beneficial for both the individual concerned and the Company and where it does not detract from their responsibilities to the Company. Appointments relating to executive Directors and Executive Committee members require the prior approval of either the Chairman or the Board. Appointments relating to other senior managers require the prior approval of the Chairman.
81
Back to Contents
Directors’ remuneration (excluding pension arrangements) was as follows:
| | | Salary and fees | | Annual and
special bonuses | | Benefits
excluding pensions1 | | Gains from
long-term
incentive
plans2 | | Total | |
| | |
| |
| |
| |
| |
| |
| | | 2003 | | 2002 | | 2003 | | 2002 | | 2003 | | 2002 | | 2003 | | 2003 | | 2002 | |
| | |
|
| |
|
| |
|
| |
|
| |
|
| |
|
| |
|
| |
|
| |
|
| |
| | | £ | | £ | | £ | | £ | | £ | | £ | | £ | | £ | | £ | |
| David Varney | | | 500,000 | | | 393,056 | 3 | | — | | | 150,000 | | | 17,308 | | | 24,537 | | | — | | | 517,308 | | | 567,593 | |
Peter Erskine4 | | | 537,500 | | | 449,464 | | | 387,000 | | | 250,000 | | | 36,651 | | | 31,350 | | | 48,303 | 5 | | 1,009,454 | | | 730,814 | |
| David Finch | | | 370,833 | | | 235,215 | 6 | | 206,250 | | | 145,000 | | | 48,158 | | | 13,388 | | | 109,333 | 7 | | 734,574 | | | 393,603 | |
Andrew Sukawaty8 | | | 100,000 | | | 76,256 | 11 | | — | | | — | | | — | | | — | | | — | | | 100,000 | | | 76,256 | |
David Chance8 | | | 7,064 | 12 | | — | | | — | | | — | | | — | | | — | | | — | | | 7,064 | | | — | |
Stephen Hodge8 | | | 36,000 | | | 18,000 | 13 | | — | | | — | | | — | | | — | | | — | | | 36,000 | | | 18,000 | |
Neelie Kroes9 | | | 36,000 | | | 21,099 | 14 | | — | | | — | | | — | | | — | | | — | | | 36,000 | | | 21,099 | |
Ian Meakins8 | | | 36,000 | | | 10,184 | 15 | | — | | | — | | | — | | | — | | | — | | | 36,000 | | | 10,184 | |
Paul Myners10 | | | 36,000 | | | 21,099 | 14 | | — | | | — | | | — | | | — | | | — | | | 36,000 | | | 21,099 | |
| 1 | Benefits include car provision or cash allowance, healthcare, financial planning, dental care, home security and life cover. |
| 2 | There were no gains from long-term incentives in the year ended 31 March 2002. |
| 3 | From date of initial appointment 18 June 2001. Appointed to the Board 31 August 2001. |
| 4 | Highest paid Director. Appointed to the Board 31 August 2001. |
| 5 | Gain on vesting of 1997 Executive Share Award as described in Item 6. “Directors, Senior Management and Employees – B. Compensation – Former long-term incentives – BT Executive Share Plan”. |
| 6 | From date of initial appointment 1 August 2001. Initially appointed to the Board 31 August 2001. |
| 7 | Gain on vesting of Restricted Share Award as described in Item 6. “Directors, Senior Management and Employees – B. Compensation – Directors’ Remuneration – Restricted Shares”. |
| 8 | Elected to receive 50 per cent of their Directors’ fees after tax in shares. |
| 9 | Elected to receive 75 per cent of Directors’ fees after tax in shares. |
| 10 | Elected to receive 100 per cent of Directors’ fees after tax in shares. |
| 11 | Initially appointed as Deputy Chairman 31 August 2001. |
| 12 | Appointed 21 January 2003. |
| 13 | Initially appointed 1 October 2001. |
| 14 | Initially appointed 31 August 2001. |
| 15 | Appointed 20 December 2001. |
82
Back to Contents
| | | Total accrued
pension1
At 31 March
| | Transfer value
of accrued
benefit2,3
At 31 March
| | Increase in
accrued pension
during year
| | Increase in
accrued pension
during year
(including
inflation)
| | Transfer
value of real
increase in
accrued benefit
(less Directors’
contributions)2,3
| | Increase in
transfer
value less
Directors’
contri-
butions | | Directors’
contri-
butions | |
| | | 2003 | | 2002 | | 2003 | | 2002 | | 2003 | | 2002 | | 2003 | | 2002 | | 2003 | | 2002 | |
| | |
|
| |
|
| |
|
| |
|
| |
|
| |
|
| |
|
| |
|
| |
|
| |
|
| |
|
| |
|
| |
| | | £000 | | £000 | | £000 | | £000 | | £000 | | £000 | | £000 | | £000 | | £000 | | £000 | | £000 | | £000 | |
| Peter Erskine | | | | | | | | | | | | | | | | | | | | | | | | | | | | | | | | | | | | | |
mmO2 Pension Plan | | | 33 | | | 29 | | | 324 | | | 337 | | | 3 | | | 3 | | | 4 | | | 4 | | | 16 | | | 23 | | | (28 | ) | | 15 | |
| Unfunded Plan | | | 160 | | | 117 | | | 2,155 | | | 1,562 | | | 41 | | | 29 | | | 43 | | | 30 | | | 543 | | | 380 | | | 593 | | | 0 | |
| | |
|
| |
|
| |
|
| |
|
| |
|
| |
|
| |
|
| |
|
| |
|
| |
|
| |
|
| |
|
| |
| Total | | | 193 | | | 146 | | | 2,479 | | | 1,899 | | | 44 | | | 32 | | | 47 | | | 34 | | | 559 | | | 403 | | | 565 | | | 15 | |
| | |
|
| |
|
| |
|
| |
|
| |
|
| |
|
| |
|
| |
|
| |
|
| |
|
| |
|
| |
|
| |
| David Finch | | | 5 | | | 2 | | | 40 | | | 20 | | | 3 | | | 24 | | | 3 | | | 24 | | | 24 | | | 20 | | | 20 | | | 0 | |
| | |
|
| |
|
| |
|
| |
|
| |
|
| |
|
| |
|
| |
|
| |
|
| |
|
| |
|
| |
|
| |
| 1 | The accrued annual pension represents the maximum defined benefit liability for mmO2. The amounts will be reduced by any retained benefits from previous employment. |
| 2 | The transfer values have been calculated on the basis of actuarial advice. The transfer values of the Inland Revenue approved benefits have been calculated in accordance with Actuarial Guidance Note GN11 using the assumptions adopted by the mmO2 Pension Plan Actuary. The unapproved element of pension benefits has been valued using assumptions appropriate to the FRS 17 accounting standard, which are consistent with GN11 principles. |
| 3 | These figures represent liabilities of the Company and the mmO2 Pension Plan, not sums paid to the individual. |
Under arrangements to provide Mr Finch with supplementary pension benefits in respect of earnings above the statutory earnings cap, for the year ended 31 March 2003 the Company contributed £77,875 to a money purchase funded unapproved retirement benefits scheme (FURBS) in respect of Mr Finch (£43,167 for the year ended 31 March 2002). In addition, a cash supplement of £42,646 was paid to Mr Finch (£26,833 for the year ended 31 March 2002).
The closing market price of mmO2 shares at 31 March 2003 was 44.75p and the range from 1 April 2002 to that date was 37p to 68.25p.
Beneficial interests in ordinary shares |
The beneficial interests of the Directors and their immediate families in mmO2 ordinary shares of 0.1p each as at 31 March 2003 are set out in the table below.
| | | As at 31 March 2003 | | As at 1 April 2002 | |
| | |
|
| |
|
| |
| David Varney | | | 277,237 | 1,2,3 | | 274,019 | |
| Peter Erskine | | | 534,710 | 1,3 | | 405,444 | |
| David Finch | | | 608,964 | 1,3 | | 304,211 | |
Andrew Sukawaty4 | | | 45,738 | | | — | |
David Chance4,5 | | | — | | | — | |
Stephen Hodge4 | | | 74,159 | | | 60,000 | |
Neelie Kroes4 | | | 27,529 | | | — | |
Ian Meakins4 | | | 16,465 | | | — | |
Paul Myners4 | | | 228,320 | | | 200,000 | |
| | | | | | | | |
| 1 | Since 31 March 2003 David Varney, Peter Erskine and David Finch have each acquired 471 additional ordinary shares under the terms of the mmO2 Share Ownership Plan. There have been no other changes in the Directors’ beneficial and non-beneficial interests in share capital, including options to subscribe for shares, or in the debentures of the Company and its subsidiaries between 31 March 2003 and 13 May 2003. |
83
Back to Contents
| 2 | Includes 1,000 shares in the form of 100 mmO2 American Depositary Shares (ADSs) (1 ADS = 10 ordinary shares). |
| 3 | Includes shares held by the trustee in respect of the mmO2 Share Ownership Plan. |
| 4 | Additionally, shares will be allotted as a result of the reinvestment of fees for the quarter to 31 March 2003. These shares are expected to be allotted following the publication of this report. |
| 5 | Appointed 21 January 2003. |
The table below shows the options which were granted and/or remained outstanding under the share option element of the Portfolio held by Directors during the year ended 31 March 2003. Vesting is subject to the satisfaction of corporate performance criteria as detailed in Item 6. “Directors, Senior Management and Employees – B. Compensation – Share options element”. The table also shows options over BT shares held by David Varney prior to demerger. These were re-granted over mmO2 shares as indicated.
| | | | Plan | | | Grant date | | | Number at 1 April 2002 | | | Options Granted during the year ended 31 March 2003 | | | Exercised | | | Lapsed | | | Number at 31 March 20031 | | | Exercise price | | | Date exercisable | |
| | |
|
| |
|
| |
|
| |
|
| |
|
| |
|
| |
|
| |
|
| |
|
| |
| David Varney | | | mmO2 Legacy share option plan2 | | | 22 June 2001 | | | 491,272 | | | — | | | — | | | — | | | 491,272 | | | 101.7p | | | 2004-2011 | |
| | | | Executive share option plan | | | 23 November 2001 | | | 1,724,137 | | | — | | | — | | | — | | | 1,724,137 | | | 87p | | | 23 November 2004 –
23 November 2011 | |
| | | | Executive share option plan | | | 25 July 2002 | | | — | | | 3,260,869 | | | — | | | — | | | 3,260,869 | | | 46p | | | 25 July 2005 –
25 July 2012 | |
| | | | | | | | | | | | | | | | | | | | | | | | | | | | | |
| Peter Erskine | | | Executive share option plan | | | 23 November 2001 | | | 1,724,137 | | | — | | | — | | | — | | | 1,724,137 | | | 87p | | | 23 November 2004 –
23 November 2011 | |
| | | | | | | 25 July 2002 | | | — | | | 3,554,347 | | | — | | | — | | | 3,554,347 | | | 46p | | | 25 July 2005 –
25 July 2012 | |
| | | | | | | | | | | | | | | | | | | | | | | | | | | | | |
| David Finch | | | Executive share option plan | | | 23 November 2001 | | | 1,206,896 | | | — | | | — | | | — | | | 1,206,896 | | | 87p | | | 23 November 2004 –
23 November 2011 | |
| | | | �� | | | 25 July 2002 | | | — | | | 2,445,652 | | | — | | | — | | | 2,445,652 | | | 46p | | | 25 July 2005 –
25 July 2012 | |
| 1 | In the financial year ended 31 March 2003, options were granted for nil consideration under the share option element to 1,041 employees, based on their past and anticipated future contribution to the business. The maximum face value of shares granted under option was three times salary although most grants were at 30 per cent to 60 per cent of salary. The exercise price for such options is not set at a discount to the market value of shares under option at the time of grant. |
| 2 | As at 31 March 2003. The options were re-granted on 20 December 2001. |
No share options granted to Directors lapsed or were exercised during the year.
Unrealised gains on executive share options were nil as at 31 March 2003.
The table below shows the sharesave options over mmO2 ordinary shares held by Directors during the year ended 31 March 2003.
| | | | | Number at | | | | | | Number at | | | | | | |
| | | | | 1 April | | | | | | 31 March | | Exercise | | | | |
| | | Grant date | | 2002 | | Exercised | | Lapsed | | 2003 | | Price | | Date exercisable | |
| | |
| |
| |
| |
| |
| |
| |
|
| |
| David Varney | | | 21 December 2001 | | 12,978 | | — | | — | | 12,978 | | 73.2p | | | 14 February 2005-14 August 2005 | |
| Peter Erskine | | | 21 December 2001 | | 12,978 | | — | | — | | 12,978 | | 73.2p | | | 14 February 2005-14 August 2005 | |
| David Finch | | | 21 December 2001 | | 12,978 | | — | | — | | 12,978 | | 73.2p | | | 14 February 2005-14 August 2005 | |
84
Back to Contents
The table below shows the number of restricted shares awarded to executive Directors under the operation of the Portfolio.
| | | | | Number held | | | | | | Number held | | | | |
| | | | | at 1 April | | | | | | at 31 March | | | | |
| | | Grant date | | 20021 | | Vested | | Lapsed | | 2003 | | Vesting date | |
| | |
| |
|
| |
|
| |
|
| |
|
| |
|
| |
Peter Erskine2 | | 23/11/01 | | 575,815 | | — | | — | | 575,815 | | | 23/11/04 | |
David Finch3 | | 23/11/01 | | 604,606 | | 201,535 | | — | | 403,071 | | | 201,535 on 23/11/03 | |
| | | | | | | | | | | | | | | | | | | 201,536 on 23/11/04 | |
| | | | | | | | | | | | | | | | | | | | |
| 1 | Restricted share awards were granted to a small group of senior executives (including executive Directors) shortly after demerger. Most awards were granted on terms that they will normally only vest on the third anniversary of grant if the participant builds up a significant personal shareholding in the Company within 18 months of grant and retains this until the vesting date as well as remaining in employment with the mmO2 Group until this time. The awards vest on a pro rata basis if the participant builds up a lower personal investment. As at 31 March 2003 both Peter Erskine and David Finch had met their shareholding requirement, and are required to maintain that shareholding until the third anniversary of award in order for their restricted shares awards to vest in full. |
| 2 | Vesting is subject to the satisfaction of a personal shareholding requirement as set out in note 1. The personal shareholding requirement for Peter Erskine is equal to the number of shares under award. |
| 3 | Vesting is subject to the satisfaction of a personal shareholding requirement. The personal shareholding requirement for David Finch is equal to one-third of the shares under award. Under the terms of David Finch’s Restricted Share Plan award 201,535 shares vested on 22 November 2002. In relation to awards granted on 23 November 2001 which vested on 22 November 2002 the market value of a share on these two dates was 87 pence and 54.25 pence respectively. |
In addition, Peter Erskine has the following mmO2 shares under award from BT Legacy Share Awards, a description of which can be found below. Following demerger, these awards were adjusted to relate solely to mmO2 shares, and any performance measure has been translated into a measure of mmO2 performance from demerger to the end of the performance period.
| | | | | Number of | | | | | | Number of | | | | |
| | | | | mmO2 shares | | | | | | mmO2 shares | | | | |
| | | | | 1 April | | | | | | 31 March | | | | |
| | | Year of award | | 2002 | | Vested | | Lapsed | | 2003 | | Vesting date | |
| | |
|
| |
|
| |
|
| |
|
| |
|
| |
|
| |
| BT Executive Share Plan | | 19971 | | 256,137 | | 107,939 | | 148,198 | | — | | 2002 | |
| | | 19982 | | 154,057 | | — | | — | | 154,057 | | 2004 | |
| | | 19993 | | 144,198 | | — | | — | | 144,198 | | 2005 | |
| | | | | |
| | | | | | | |
| | | | |
| Total | | | | | 554,392 | | 107,939 | | 148,198 | | 298,255 | | | | |
| | | | | |
| | | | | | | |
| | | | |
| BT Incentive Share Plan | | 20004 | | 312,750 | | — | | — | | 312,750 | | 2003 | |
| | | | | |
| | | | | | | |
| | | | |
| Total | | | | | 312,750 | | | | | | | | 312,750 | | | | |
| | | | | |
| | | | | | | |
| | | | |
BT Deferred Bonus Plan5 | | 2001 | | 127,656 | | — | | — | | 127,656 | | 2004 | |
| | | | | |
| | | | | | | |
| | | | |
| Total | | | | | 127,656 | | | | | | | | 127,656 | | | | |
| | | | | |
| | | | | | | |
| | | | |
| 1 | As a result of the vesting of the 1997 BT Executive Share Plan award 107,939 mmO2 shares were transferred to Peter Erskine on 1 August 2002. The remaining shares under this award lapsed under the terms of the award. The market value of a share on 1 August 2002 was 44.75 pence. |
| 2 | The performance period for the 1998 BT Executive Share Plan ended on 31 March 2003. The performance condition was not met and as a result 154,057 shares will lapse following the year end. |
| 3 | The value of those shares which would transfer to the Director under the Executive Share Plan at the end of the five-year performance period providing the performance criteria has been satisfied in full and based on a share price of 44.75 pence as at 31 March 2003 would be £64,528. |
| 4 | The performance period for the 2000 BT Incentive Share Plan ended on 31 March 2003. The performance condition was not met and as a result 312,750 shares will lapse following the year end. |
| 5 | Vesting of shares awarded under the BT Deferred Bonus Plan is subject only to the continued employment of the Director with the Company. |
85
Back to Contents
At 31 March 2003, Peter Erskine had a non-beneficial interest in 5,853,475 mmO2 ordinary shares held in trust by Ilford Trustees (Jersey) Limited as trustee of the BT Deferred Bonus Plan, BT Incentive Share Plan, BT Retention Share Plan and BT Executive Share Plan.
At 31 March 2003, Peter Erskine and David Finch had a non-beneficial interest in 5,824,695 mmO2 ordinary shares and 81,573 mmO2 American Depositary Shares held in trust by Computershare Trustees (C.I.) Limited as trustee of the mmO2 Restricted Share Plan.
The aggregate remuneration of members of the Executive Committee and the Company Secretary and General Counsel, other than executive Directors, for services in all capacities during the 2003 financial year was £8.7 million. In addition, loans outstanding to senior officers of the Company as at 31 March 2003 were £150,000.
The members of the Executive Committee and the Company Secretary and General Counsel beneficially own less than 1 per cent of the Company’s outstanding ordinary shares.
Former long-term incentives
BT Legacy Share Awards
A number of key employees (including the Chief Executive Officer) of mmO2 were participants in BT share plans prior to demerger. The awards made under these plans have been adjusted so that they relate solely to mmO2 shares, and any performance measure has been translated into a measure of mmO2 performance from demerger to the end of the performance period. On vesting these awards will be satisfied in existing mmO2 shares held by an employee trust which has already been funded by BT.
No further awards will be made under these plans to mmO2 employees.
Details of Peter Erskine’s shares under award from these plans are set out above, and a short description of each is set out below.
BT Deferred Bonus Plan (BT DBP)
Awards of BT shares were made to executives based on their performance in the financial year preceding the relevant date of grant and vest after three years. Peter Erskine currently has 127,656 mmO2 shares under award which will vest in 2004.
BT Incentive Share Plan (BT ISP)
Participants are awarded shares which will normally vest at the end of a three-year period provided a predetermined TSR target is met. The performance period for the 2000 BT ISP award ended on 31 March 2003. The performance condition was not met and as a result 312,750 mmO2 shares held by Peter Erskine will lapse following the year end.
BT Executive Share Plan (BT ESP) |
Awards under the BT ESP normally vest at the end of five years provided a predetermined TSR target is met. Awards of shares were granted in each of the years from 1994 to 1999. Under the terms of the 1997 BT ESP award, 107,939 mmO2, shares vested to Peter Erskine in August 2002. The performance period for the 1998 BT ESP award ended on 31 March 2003. The performance condition was not met and as a result 154,057 mmO2 shares will lapse following the year end. Subject to performance 144,198 mmO2 shares will normally vest to Mr Eskine in 2005.
If mmO2’s performance in the year to 31 March 2003 were to continue at the same level, then none of the remaining awards under the BT ESP would vest, as the relevant performance targets would not be met.
86
Back to Contents
mmO2 Legacy Option Plan
Subsisting options over BT shares granted under BT executive share option plans have been replaced with options over mmO2, shares, granted under the mmO2 Legacy Option Plan, for those participants now employed by mmO2. The replacement options were granted on the same terms, and are exercisable between the same dates, as the options for which they were exchanged.
There are no performance conditions relating to the vesting of these options other than continued employment with the mmO2 Group. This reflects the terms of the underlying BT Option plan. The legacy options will be satisfied using new issue shares, and options granted under this plan do not count towards the dilution limits established for mmO2 share option plans.
David Varney has 491,272 shares under option under this plan, which are shown on page 84.
Cash-based incentives
Prior to demerger a variety of cash-based incentive plans operated in the mmO2 businesses in the UK, Germany, the Netherlands and Ireland and also within O2 Online. mmO2 has taken steps to terminate some plans early and does not intend to renew the others when they reach the end of their performance periods. Each of the incentive plans is briefly described below.
Under a plan introduced by O2 Germany in November 2000, eligible employees are entitled, no earlier than April 2004, to a payment based on the value of the goodwill of O2 Germany at that time. Payment is only made if O2 Germany achieves positive EBITDA in the financial year prior to payment.
Under a plan operated by O2 Netherlands, key employees and management are entitled to payments determined by reference to O2 Netherlands’ achievement of business targets. The final payment in respect of this plan will be made in the year to 31 March 2004 and is not affected by the disposal of O2 Netherlands. Following this all participation will cease and no further awards will be made.
Under a plan operated by O2 Ireland, key employees and management are entitled to cash payments by reference to the performance of O2 Ireland up to the date of payment. The final payment in respect of this plan will be made in the forthcoming financial year. Following this all participation will cease and no further awards will be made. A substantial part of the plan (also cash-based), related to the growth in value of O2 Ireland, has been replaced with grants and awards under the Portfolio.
A plan operated for O2 Online’s management team was terminated in July 2001 by reference to O2 Online’s achievement of pre-set performance conditions up to that date. The crystallised cash amounts were paid to participants in instalments between 30 November 2001 and 31 March 2003, subject to their continued employment up to the relevant date. No further payments will be made under this arrangement.
The Board continues to seek compliance with corporate governance best practice and supports high standards in corporate governance. The application, during the financial year, of the principles in Section 1 of the Combined Code are described in the appropriate sections of this statement and in the report on directors’ remuneration. The Directors consider that the Company has fully complied with the provisions set out in Section 1 of the Combined Code.
The Board
The Board comprises the Chairman, Chief Executive Officer, Chief Financial Officer, three further executive Directors, and seven independent non-executive Directors, one of whom, Andrew Sukawaty, the Deputy Chairman, is recognised as the senior independent Director to whom concerns can be conveyed independently of the Chairman.
The Board has regular scheduled meetings throughout the year together with an annual off-site conference to review and discuss corporate strategy. Additional meetings are held as necessary. During the financial year ended 31 March 2003, the Board met ten times. Whilst not actively involved in the day-to-day management of the
87
Back to Contents
Company, the non-executive Directors play an important role in bringing their independent judgement and considerable knowledge and experience to the Board’s deliberations. The Directors’ biographies appear in Item 6. “Directors, Senior Management and Employees – A. Directors and Senior Management”.
The Board is responsible for the overall Group strategy and competent management of the affairs of the Group. The Board has a formal schedule of matters specifically reserved to it for decision, including the approval of strategic plans and the annual operating plan, significant investments and capital projects, and treasury and risk management policies.
Guidelines are in place concerning the content, presentation and delivery of papers by management to Directors for each Board meeting, so that the Directors have enough information to be properly briefed. Where issues arise at Board meetings, the Chairman ensures that all Directors are properly briefed and, where necessary, appropriate further enquiries are made.
All Directors have access to the advice and services of the Company Secretary who is responsible to the Board for ensuring that Board procedures are followed and maintaining compliance with all applicable rules and regulations. The removal of the Company Secretary is a matter for the Board as a whole. There is an agreed procedure for Directors to take, if necessary, independent professional advice at the Company’s expense.
At the time of a Director’s appointment to the Board, an internal induction programme is provided on the Group’s strategic and business plans and developments to date. The content of this induction programme and, where appropriate, any additional training which may be required by the Director, is kept under review. Directors are also advised of their legal and other obligations as a Director of a listed company.
Non-executive Directors are appointed initially for three years. Towards the end of that period, the Board will consider whether to continue their appointment for a further three year period. Under the terms of the new letter referred to above such appointment can become terminable on one month’s notice from either the Company or the Director.
In accordance with the Combined Code and the Company’s Articles of Association, all Directors submit themselves for re-election at least every three years.
The Board has adopted appropriate governance policies dealing with the conduct of Board affairs and delegations, which are described below.
The Board has delegated authority to the following committees on specific matters. All of the committees have formal terms of reference. Minutes of meetings are formally recorded.
Chairman’s Committee. Chairman: David Varney
The Chairman’s Committee advises and assists the Chairman in the preparation for Board meetings. The Committee also acts on behalf of the Board between scheduled Board meetings, in exceptional circumstances, where it is not possible or practicable to convene a meeting of the Board. In addition to the Chairman, Peter Erskine and David Finch are members of the Committee.
Audit Committee. Chairman: Stephen Hodge
During the financial year, all the non-executive Directors were members of the Audit Committee. Since 1 April 2003, the Committee comprises Stephen Hodge, David Arculus, David Chance, Neelie Kroes and Ian Meakins. The Committee monitors the adequacy of the Group’s accounting policies and financial reporting; reviews the half-yearly and annual financial statements before they are presented to the Board; monitors internal financial and non-financial controls, including the system for maintaining these controls; maintains a liaison with the internal and external auditors, keeping under review the scope and results of the audit, its cost effectiveness and the independence and objectivity of the auditors and matters relating to the provision of, including the extent of, their
88
Back to Contents
non-audit services. The Committee focuses primarily on compliance with legal requirements, accounting standards and the rules of the UK Listing Authority and other regulators. The Committee also receives formal reports from the Head of Internal Audit who attends meetings.
The Committee meets four times a year, with part of each meeting currently being held between the Committee members and the external auditors in private. Since the year-end, the Board has adopted a formal policy governing the independence of the Company’s external auditors and defining those non-audit services that may be provided to the Group, including those which require the prior approval of the Audit Committee.
Finance Committee. Chairman: David Varney
The Finance Committee considers financing and investment decisions concerning the Group. The Committee normally meets four times a year. In addition to the Chairman, Peter Erskine and David Finch are members of the Committee.
Nomination Committee. Chairman: David Varney
During the financial year, all the non-executive Directors were members of the Nomination Committee. Since 1 April 2003, the Committee comprises David Varney, David Arculus, David Chance, Paul Myners and Andrew Sukawaty. The Committee is responsible for reviewing the structure, size and composition of the Board and for recommending candidates for the approval of the Board for Board membership.
Remuneration Committee. Chairman: Andrew Sukawaty
During the financial year, all the non-executive Directors were members of the Remuneration Committee. Since 1 April 2003, the Committee comprises Andrew Sukawaty, Stephen Hodge, Neelie Kroes, Ian Meakins and Paul Myners. The Committee is responsible for determining the framework and policy for the remuneration of the Chairman, all executive Directors, the Company Secretary and General Counsel and members of the Executive Committee and for determining, within agreed terms of reference, specific remuneration packages for each of these, including any pension rights, any compensation payments and the implementation of executive incentive schemes. The Committee will operate on the principle that members of the executive management should be provided with appropriate incentives to encourage superior performance and should, in a fair and responsible manner, be rewarded for their individual contributions to the success of the Group. The discussion pertaining to directors’ remuneration is found in Item 6. “Directors, Senior Management and Employees – B. Compensation”.
The Chief Executive Officer, Peter Erskine, together with the other executive Directors and his senior executive team, is responsible for the executive day-to-day running of the Company. He chairs the Executive Committee, which is responsible for the preparation and maintenance of strategic plans for the Group and for monitoring the performance of the Group as a whole.
During the financial year, a Disclosure Committee was established to consider the materiality of information and the respective disclosure obligations in releases made to regulatory bodies. This Committee assists the Chief Executive Officer and Chief Financial Officer to evaluate the effectiveness of the Group’s disclosure controls and procedures to ensure that material information relating to the Group is made known to them by others.
The Board will continue to keep its corporate governance aligned with best practice and intends to carry out a further review following the Financial Reporting Council announcement of its amendments to the Combined Code in response to Derek Higgs’ review of the role and effectiveness of non-executive directors and Sir Robert Smith’s report on the role of audit committees. The Group will continue to comply with New York Stock Exchange listing rules and the SEC rules implementing the Sarbanes-Oxley Act of 2002, where they apply to the Group as a foreign issuer.
The Board has overall responsibility for the Group’s systems of internal control and risk management and for reviewing the effectiveness of those systems. Such systems are designed to manage, rather than eliminate, the risk
89
Back to Contents
of failure to achieve business objectives; any system can provide only reasonable and not absolute assurance against material misstatement or loss.
The Board sets the policy on Internal Control and Risk Management that is implemented by management. This policy is in accordance with the Turnbull Guidance “Internal Control: Guidance for Directors on the Combined Code”.
Internal Control compliance, Risk Management and Internal Audit are the responsibility of separate functions within the Company but they operate holistically to deliver an effective internal control system.
The Group has a detailed ongoing risk management process for identifying, evaluating and managing the significant risks faced by the Company. This process has been reviewed and updated during the year.
Risk assessment and evaluation take place as an integral part of the Group’s annual strategic planning cycle and this includes the consideration of major business risks by senior management.
The risk management process comprises the following key elements:
| • | Group operating companies and key functions in the business carry out risk assessments, using workshop techniques, to determine the nature and extent of risks facing the Company; |
| | |
| • | the Executive Committee undertakes a formal Group-wide risk review every six months, which is reviewed by the Board. Risk management is a formal item at each Executive Committee meeting; |
| | |
| • | registers are produced which detail significant risks and indicate likelihood, impact, and the level of controls, together with mitigating actions; |
| | |
| • | the profile of the significant risks from the registers is summarised and tracked using a consolidated risk map; |
| | |
| • | senior management is accountable and responsible for managing risks within the Group, supported by dedicated risk managers. These risk managers assist in embedding risk management within the business culture, via risk forums, team meetings, training sessions and the Company’s intranet; |
| | |
| • | the Internal Audit function also promotes effective risk management in the business’ operations; and |
| | |
| • | a fast track process for identifying and responding to evolving risks and significant changes to existing risks so that they are reported to an appropriate level of management and corrective action is taken. |
The Audit Committee, on behalf of the Board, considers the effectiveness of the operation of internal control procedures in the Group during the financial year. The Audit Committee, which meets quarterly, reviews reports from the Executive Committee and from both the internal and external auditors, keeping under review the scope and results of the audit and the cost effectiveness, independence and objectivity of the auditors and reports its conclusions to the Board. The Audit Committee has carried out these actions during the year.
Senior management report each six months to the Chief Financial Officer on the operation of internal controls in their area of responsibility and report any significant control failings or weaknesses.
The Chief Executive Officer receives annual reports from senior executives responsible for major Group operations with their opinions on the effectiveness of the operation of internal controls during the financial year.
The Board has reviewed the nature, extent and changes to the significant risks to the business. The Group’s current key risks are summarised in “Item 3. Key Information – D. Risk Factors”.
The Internal Control and Risk Management policy has been reviewed during the year.
90
Back to Contents
The Group’s internal auditors carry out regular assessments of the quality of the Internal Control and Risk Management process as part of their cyclic risk based audit approach.
These processes have been in place for the whole of the financial year and have continued up to the date on which this document was approved.
Business ethics
To reinforce our commitment to achieve best practice in our standards of business ethics and corporate governance, mmO2 has introduced new guidelines on Business Principles covering the whole Group, which have been endorsed by the Chairman. This followed an extensive review process involving internal consultation and an external benchmarking exercise. A copy of the statement is available on the Company’s web site. These high-level principles are supported by a confidential helpline and e-mail facility, which are available to employees who have questions regarding the application of the principles. The Company also continues to require its business partners and suppliers to apply these principles when dealing with mmO2.
Investor relations
The Company is committed to ongoing development of open and effective communications with shareholders. The Chief Executive Officer and the Chief Financial Officer regularly meet with institutional shareholders and analysts and the Company’s Annual General Meeting is used as an opportunity to communicate with private investors and encourage their participation. All substantial issues, including the adoption of the annual report and financial statements, are proposed at the Annual General Meeting on separate resolutions. At the Annual General Meeting the number of proxy votes to be cast for or against each resolution, together with the number of proxy abstentions, are indicated after the vote has been dealt with on a show of hands. It is intended that the Chairmen of the Audit, Nomination and Remuneration Committees will be available to answer questions at the Annual General Meeting.
Going concern
The Directors have reviewed the Group’s liquid resources and borrowing facilities and the Group’s budget and cash flow forecast for the year to 31 March 2004 and outline projections for the subsequent year. On the basis of this review, the Directors are satisfied that the Group has adequate resources to continue in operational existence for the foreseeable future. For this reason, the Directors adopt the going-concern basis in the preparation of the financial statements.
91
Back to Contents
The following tables present information concerning employee numbers and costs.
| | | 2003 | | 2002 | | 2001 | |
| | |
|
| |
|
| |
|
| |
| | | No. | | No. | | No. | |
| Average number of full time employee equivalents (including Executive Directors) by class of business: | | | | | | | | | | |
| Mobile telecommunications | | | 11,643 | | | 13,999 | | | 13,731 | |
| Mobile internet services | | | 269 | | | 307 | | | 138 | |
| Other businesses | | | 866 | | | 810 | | | 474 | |
| | |
|
| |
|
| |
|
| |
Total employees | | | 12,778 | | | 15,116 | | | 14,343 | |
| | |
|
| |
|
| |
|
| |
| Average number of full time employee equivalents (including Executive Directors) by geographic area: | | | | | | | | | | |
| UK | | | 7,081 | | | 8,750 | | | 7,746 | |
| Germany | | | 3,527 | | | 4,084 | | | 4,046 | |
| Other | | | 2,170 | | | 2,282 | | | 2,551 | |
| | |
|
| |
|
| |
|
| |
Total employees | | | 12,778 | | | 15,116 | | | 14,343 | |
| | |
|
| |
|
| |
|
| |
The costs incurred in respect of these employees were:
| | | 2003 | | 2002 | | 2001 | |
| | |
|
| |
|
| |
|
| |
| | | £m | | £m | | £m | |
| Wages and salaries | | | 446 | | | 483 | | | 291 | |
| Social security costs | | | 47 | | | 59 | | | 26 | |
| Employee share ownership scheme | | | 4 | | | 2 | | | 2 | |
| Pension costs (note 8) | | | 24 | | | 26 | | | 23 | |
| | |
|
| |
|
| |
|
| |
Total staff costs | | | 521 | | | 570 | | | 342 | |
| | |
|
| |
|
| |
|
| |
At 31 March 2003, the Group employed 12,476 (2002: 14,300) full time employee equivalents.
In the United Kingdom, a number of our employees are represented by two labour unions: Connect, which has representation rights in respect of management employees and the Communications Workers Union, which has representation rights in respect of clerical, engineering and technical employees. Membership of these unions is individual and voluntary. In addition, certain managers are represented by a non-unionised employee representative body. Our other operating businesses also meet with their employee representative bodies, or works councils, regularly. We believe that our businesses have a good relationship with our employees and their representatives.
Approximately 67 per cent of our permanent employees are covered by collective bargaining agreements. These agreements are kept under review, with changes being made through discussion with the relevant representative body as required.
Under UK GAAP, the cost of shares expected to be awarded under each plan is amortised evenly over the period from the original date of grant of the particular award, to the time of vesting. Under US GAAP, the Group adopted the disclosure-only option in SFAS No. 123, “Accounting for Stock-Based Compensation”. Accordingly, the Group accounts for share options in accordance with APB Opinion No. 25, “Accounting for Stock Issued to Employees”, under which compensation expense is recognised to the extent that the fair market value of the shares optioned exceeds the option exercise price. Aggregate share compensation of £3 million (2002: £2 million) has been recognised under APB No. 25 in the year. A charge of £2 million was recognised under UK GAAP.
92
Back to Contents
Share Option and Purchase Schemes
The Group operates savings-related share option schemes for its employees and those of participating subsidiaries and further share option schemes (the mmO2 Share Option Plan and the mmO2 Legacy Option Plan) for selected Group employees.
Sharesave Scheme
The mmO2 Sharesave Plan is a savings-related share option scheme available to all employees. Share options are normally exercisable on completion of a three-year or five-year Save-As-You-Earn contract. Under this scheme, the option exercise price is set at a 20 per cent discount to the market price at the date of grant. Similar savings related schemes exist for Group employees based outside the UK.
mmO2 Share Option Plan
From 1 April 2002 to 31 March 2003, options were granted for nil consideration to 1,041 employees. All such options have an exercise price equal to the market value at grant date. These options were granted on the terms that they normally only become exercisable on the third anniversary of grant, subject to certain performance criteria. If these criteria are not met on the third anniversary of grant, the performance goals will be retested on the fourth and fifth anniversaries. Options under this scheme generally have a life of ten years.
mmO2 Legacy Option Plan
Subsisting options over BT shares granted under BT executive share option plans have been replaced with options over mmO2 shares, granted under the Legacy Option Plan, for those participants now employed by mmO2. The replacement options were granted on the same terms, and are exercisable between the same dates, as the options for which they were exchanged.
Options are normally exercisable up until the tenth anniversary of the date of the original grant. The exercise price of these options equalled the market value as at original grant date.
Options outstanding in relation to Group employees under these share option schemes as at 31 March 2003 together with their exercise prices and vesting periods, were as follows:
| | | | | Options outstanding over
ordinary shares | | Options exercisable over
ordinary shares | |
| | | | |
| |
| |
Range of exercise prices1 | | Number
outstanding | | Weighted-
average
remaining
contractual
life | | Weighted-
average
exercise
price | | Number
exercisable | | Weighted-
average
exercise
price | |
| |
|
| |
|
| |
|
| |
|
| |
|
| |
| | | m | | years | | £ | | m | | £ | |
| £0.44 | | | 37 | | | 3 | | | 0.44 | | | — | | | — | |
| £0.46 | | | 77 | | | 9 | | | 0.46 | | | — | | | — | |
| £0.48-0.69 | | | 13 | | | 9 | | | 0.65 | | | 3 | | | 0.69 | |
| £0.73-0.84 | | | 8 | | | 2 | | | 0.73 | | | 1 | | | 0.83 | |
| £0.87 | | | 46 | | | 9 | | | 0.87 | | | 3 | | | 0.87 | |
| £0.91-2.29 | | | 5 | | | 7 | | | 1.36 | | | 2 | | | 1.64 | |
| | |
|
| |
|
| |
|
| |
|
| |
|
| |
| | | | 186 | | | 8 | | | 0.60 | | | 9 | | | 1.02 | |
| | |
|
| |
|
| |
|
| |
|
| |
|
| |
| | | | | | | | | | | | | | | | | |
| 1 | Share options over American Depositary Shares (ADS) have exercise prices termed in US Dollars. For purposes of disclosure, these options’ exercise prices have been translated into Sterling at the year end exchange rate. As each ADS represents 10 ordinary shares, the number of options and exercise prices have been adjusted by this ratio to reflect the options on a like for like basis. |
93
Back to Contents
Options granted, exercised and lapsed in respect of Group employees under these share option schemes during the years ended 31 March 2003, 2002 and 2001 were as follows:
| | | Options over
ordinary shares | | Options over ADSs | |
| | |
| |
| |
| | | Ordinary shares1 | | ADSs2 | |
| | |
| |
| |
Range of exercise prices1 | | Savings-
related
share
options | | Other
share
options | | Weighted-
average
exercise
price | | Other
share
options | | Weighted-
average
exercise
price | |
| |
|
| |
|
| |
|
| |
|
| |
|
| |
| | | m | | m | | £ | | m | | £ | |
| Balance at 31 March 2000 | | | 55 | | | 2 | | | 1.05 | | | — | | | — | |
| Granted | | | 10 | | | 2 | | | 1.82 | | | — | | | — | |
| Exercised | | | (11 | ) | | (1 | ) | | 0.77 | | | — | | | — | |
| Lapsed | | | (4 | ) | | — | | | 1.50 | | | — | | | — | |
| | |
|
| |
|
| |
|
| |
|
| |
|
| |
| Balance at 31 March 2001 | | | 50 | | | 3 | | | 1.37 | | | — | | | — | |
| Lapsed on demerger | | | (50 | ) | | (3 | ) | | 1.37 | | | — | | | — | |
| | |
|
| |
|
| |
|
| |
|
| |
|
| |
| Balance on demerger | | | — | | | — | | | — | | | — | | | — | |
| Granted | | | 31 | | | 65 | | | 0.82 | | | 6 | | | 1.17 | |
| Lapsed | | | — | | | (2 | ) | | 0.84 | | | — | | | — | |
| | |
|
| |
|
| |
|
| |
|
| |
|
| |
| Balance at 31 March 2002 | | | 31 | | | 63 | | | 0.82 | | | 6 | | | 1.17 | |
| Granted | | | 37 | | | 81 | | | 0.45 | | | — | | | — | |
| Lapsed | | | (23 | ) | | (6 | ) | | (0.72 | ) | | (3 | ) | | 0.87 | |
| | |
|
| |
|
| |
|
| |
|
| |
|
| |
Balance at 31 March 2003 | | | 45 | | | 138 | | | 0.60 | | | 3 | | | 1.49 | |
| | |
|
| |
|
| |
|
| |
|
| |
|
| |
| | | | | | | | | | | | | | | | | |
| 1 | All options granted, exercised, lapsed and outstanding for periods prior to demerger have been adjusted to reflect the exchange ratio of 4.1266 shares of mmO2 per share of BT. |
| 2 | Share options over ADSs have exercise prices termed in US Dollars. For purposes of disclosure, these options’ exercise prices have been translated into Sterling at the year end exchange rate. As each ADS represents 10 ordinary shares, the number of options and exercise prices have been adjusted by this ratio to reflect the options on a like for like basis. |
mmO2 Restricted Share Plan
Restricted share awards have been granted to a small group of senior executives. Most of these awards were granted on terms that they will normally only vest on the third anniversary of grant if the participant builds up a pre-determined personal shareholding in the Group, and remains in employment with the Group. Shares required to satisfy these awards are held in trust during the restricted period. In accordance with APB No. 25, an expense has been recognised to the extent that executives have commenced building their personal shareholding. The weighted average grant date fair value of the 9.4 million shares granted under this plan in the year ended 31 March 2002 was £0.80. No shares were granted under this plan in the year ended 31 March 2003.
For disclosure purposes, the fair value of all share options granted is estimated using the Black-Scholes option-pricing model. The following weighted average assumptions were used for share options granted by the Group:
| | | 2003 | | 2002 | | 2001 | |
| | |
|
| |
|
| |
|
| |
| | | % | | % | | % | |
| Annual dividends | | | — | | | — | | | 2 | |
| Expected volatility | | | 27 | | | 55 | | | 40 | |
| Risk free interest rate | | | 4 | | | 5 | | | 7 | |
| | |
|
| |
|
| |
|
| |
The expected life applied in the model anticipated the life of options extending one month later than the first exercise date.
94
Back to Contents
Had compensation expense been determined on the basis of fair value pursuant to SFAS No. 123, net loss and net loss per share would have been as follows:
| | | 2003 | | 2002 | | 2001 | |
| | |
|
| |
|
| |
|
| |
| | | in £ millions, except per share
data which is stated in pence | |
Net loss | | | | | | | | | | |
| As reported | | | 3,671 | | | 1,463 | | | 3,747 | |
| | |
|
| |
|
| |
|
| |
| Pro forma | | | 3,676 | | | 1,463 | | | 3,750 | |
| | |
|
| |
|
| |
|
| |
Net loss per share | | | | | | | | | | |
| As reported | | | 42.3 | | | 16.9 | | | | |
| | |
| |
| | | | |
| Pro forma | | | 42.4 | | | 16.9 | | | | |
| | |
| |
| | | | |
The weighted average fair value of share options granted in the year ended 31 March 2003 was £nil (2002: £0.16) for options exercisable one year after the date of grant, £nil (2002: £0.22) for options exercisable two years after the date of grant, £0.13 (2002: £0.35, 2001: £0.80) for options exercisable three years after the date of grant and £0.23 (2002: £0.46, 2001: £1.03) for options exercisable five years after the date of grant.
BT Legacy Share Awards
A number of key employees of mmO2 were participants prior to demerger in BT share plans. The awards have been adjusted so that they relate solely to mmO2 plc shares, and any performance measure has been translated into a measure of the Group’s performance from demerger to the end of the performance period. On maturity these awards will be satisfied in existing mmO2 shares held by an employee trust which has already been funded by BT.
In accordance with the rules of these plans the awards were converted into awards over mmO2 plc shares on the basis of an adjustment factor of 4.1266.
Incentive Share Plan, (ISP) and Retention Share Plan, (RSP)
Participants are awarded shares which will normally vest at the end of a three-year period provided a pre-determined total shareholder return, (TSR), target is met.
Executive Share Plan, (ESP)
Participants are awarded shares which will normally vest at the end of five years provided a pre-determined TSR target is met.
Deferred Bonus Plan, (DBP)
Awards of shares were made to executives based on their performance in the preceding financial year and vest after three years. Under the DBP there are no associated performance goals.
Under the Separation Agreement between the Group and BT, it has been endorsed and agreed that all share awards required under the ISP, RSP, ESP and DBP will be honoured by BT and will be satisfied by issuance of existing mmO2 shares held by a BT trust which has already been funded by BT. Thus, the Group is not responsible for any of the options or shares under these schemes and will bear no compensation expense in association with them.
Further details on the above plans can be found by reference to Item 6. “Directors, Senior Management and Employees – B. Compensation”.
95
Back to Contents
| ITEM 7 | MAJOR SHAREHOLDERS AND RELATED PARTY TRANSACTIONS |
Share and ADR prices
At 30 June 2003, no person or company is known to hold more than three per cent of the Company’s ordinary shares except for those disclosed in the following table:
| Shareholder | | Number of mmO2 plc
ordinary shares | | Percentage of issued
ordinary share capital | |
| |
|
| |
|
| |
| The Capital Group Companies Inc. | | | 976,870,022 | | | 11.27 | |
| Legal & General Investment Management Limited | | | 301,362,565 | | | 3.48 | |
| | |
|
| |
|
| |
The Company is not directly or indirectly owned or controlled by any other company or any government.
| | | Pence per
ordinary share | | US$ per ADS | |
| | |
| |
| |
| | | High | | Low | | High | | Low | |
| | |
|
| |
|
| |
|
| |
|
| |
| | | pence | | pence | | $ | | $ | |
| January 2003 | | | 50.75 | | | 44.25 | | | 8.40 | | | 7.23 | |
| February 2003 | | | 50.00 | | | 45.50 | | | 8.01 | | | 7.11 | |
| March 2003 | | | 50.00 | | | 42.00 | | | 7.85 | | | 6.65 | |
| April 2003 | | | 57.75 | | | 45.75 | | | 9.24 | | | 7.15 | |
| May 2003 | | | 61.50 | | | 53.75 | | | 10.05 | | | 8.42 | |
| June 2003 | | | 64.50 | | | 56.25 | | | 10.50 | | | 9.23 | |
| | |
|
| |
|
| |
|
| |
|
| |
The prices are the highest and lowest closing middle market prices for mmO2 plc ordinary shares, as derived from the Daily Official List of the London Stock Exchange, and the highest and lowest sales prices of mmO2 plc ADSs, as reported on the New York Stock Exchange, for the months indicated.
Analysis of shareholdings
| | | | | | | Ordinary shares of 0.1p each
| |
Size of shareholding
at 31 March 2003 | | Number of
shareholders | | Percentage
of total | | Number of
shares held | | Percentage
of total | |
| |
|
| |
|
| |
|
| |
|
| |
| 1 – 500 | | | 881,078 | | | 53.92 | | | 228,968,612 | | | 2.64 | |
| 501 – 999 | | | 391,086 | | | 23.93 | | | 273,372,625 | | | 3.15 | |
| 1,000 – 9,999 | | | 355,708 | | | 21.77 | | | 718,091,666 | | | 8.28 | |
| 10,000 – 99,999 | | | 4,814 | | | 0.30 | | | 91,024,650 | | | 1.05 | |
| 100,000 – 999,999 | | | 838 | | | 0.05 | | | 326,499,980 | | | 3.77 | |
| 1,000,000 – 4,999,999 | | | 351 | | | 0.02 | | | 793,287,188 | | | 9.15 | |
| 5,000,000 and above | | | 198 | | | 0.01 | | | 6,238,936,906 | | | 71.96 | |
| | |
|
| |
|
| |
|
| |
|
| |
Total | | | 1,634,073 | | | 100.00 | | | 8,670,181,627 | | | 100.00 | |
| | |
|
| |
|
| |
|
| |
|
| |
At 31 March 2003, the number of holders of record of mmO2 plc ordinary shares in the USA was 3,427 with holdings of 2,213,767 ordinary shares, and the number of registered holders of ADSs was 1,972 with holdings of 12,970,703 ADSs, representing 129,707,030 ordinary shares. Because certain of these ordinary shares and ADSs were held by brokers or other nominees, the number of holders of record or registered holders in the USA is not representative of the number of beneficial holders or of the residence of beneficial holders.
96
Back to Contents
Interest of management in certain transactions
During and at the end of the 2003 financial year, none of the Company’s Directors had a significant interest in any material transaction in relation to the Group’s business.
| B. | Related Party Transactions |
None
| C. | Interests of Experts and Counsel |
Not applicable.
| ITEM 8 | FINANCIAL STATEMENTS |
| | |
| A. | Consolidated Financial Statements and Other Financial Information |
| |
Audited Consolidated Financial Statements |
Please refer to Item 18 “Financial Statements” for our audited consolidated financial statements.
The Group does not believe there are any pending legal proceedings which would have a material adverse effect on the financial position or results of operations of the Group.
The board of mmO2 currently expects that all available cash from operations will be used to finance the growth and development of the mmO2 businesses and to meet the mmO2 Group’s capital and other expenditure requirements. Therefore, the Company does not anticipate paying dividends in the foreseeable future.
The Directors do not recommend the payment of a dividend for the year ended 31 March 2003.
Except as disclosed in note 3 to the financial statements in Item 18 with respect to the completion of the sale of O2 Netherlands, there has been no significant change in our financial or trading position since 31 March, 2003, the date to which our audited consolidated financial statements were prepared.
| ITEM 9 | THE OFFER AND LISTING |
| | |
| A. | Offer and Listing Details |
Our American Depositary Shares, each representing ten ordinary shares of nominal value 0.1p each, have been listed and traded on the New York Stock Exchange since 19 November 2001 under the symbol “OOM”. Our shares have also been listed on the London Stock Exchange since 19 November 2001 under the symbol “OOM”. Prior to these listings, there was no public market for our equity securities.
The New York Stock Exchange and the London Stock Exchange are the principal trading markets for our ADSs and ordinary shares.
The high and low closing sale prices of the ordinary shares on the London Stock Exchange and of the ADSs on the New York Stock Exchange for each of the last 6 months can be found by reference to Item 7. “Major Shareholder and Related Party Transactions – A. Major Shareholders – Share and ADR prices”.
Not applicable.
97
Back to Contents
The ordinary shares of the Company were listed on the London Stock Exchange on 19 November 2001. On the same date ADSs were also listed on the New York Stock Exchange. The ratio of ADSs to ordinary shares is 1:10. The ADSs have been issued by JPMorgan Chase Bank as Depositary for the ADSs.
Not applicable.
Not applicable.
Not applicable.
Not applicable.
| B. | Memorandum and Articles of Association |
Incorporated by reference to our Registration Statement on Form 20-F filed with the Securities and Exchange Commission on 20 September 2001, and incorporated herein by reference except with respect to the following change to the Articles of Association:
On 20 December 2001, the one issued redeemable preference share of £50,000 was redeemed, following which, pursuant to a conditional special resolution passed on 11 September 2001, the authorised redeemable preference share capital was sub-divided into and redesignated as 50,000,000 ordinary shares with a face value of 0.1p each.
The following contracts, not being contracts entered into in the ordinary course of business, have been entered into by a member of our Group and either:
| • | have been entered into within the two years immediately preceding the date of this annual report and are material: or |
| | |
| • | contain any provision under which any member of our Group has any obligation or entitlement which is material at the date of this annual report: |
| | |
| (a) | the Demerger Agreement dated 18 September 2001 between mmO2 BT and BT Group plc. The Demerger Agreement sets out the obligations of the parties in implementing the steps to achieve the demerger transaction. Under the Demerger Agreement, mmO2 agreed to transfer BT Group Investments to BT Group plc. In exchange for such transfer, BT Group plc agreed to allot and issue BT Group plc ordinary shares to mmO2 shareholders in satisfaction of the dividend required to effect the last step of the demerger transaction and that each mmO2 shareholder at the demerger record time was entitled to receive one BT Group plc ordinary share for each mmO2 ordinary share then held. No party to this agreement has given any representation, warranty or indemnity to the others and no party has any right to rescind this agreement. |
| | |
| (b) | the Separation Agreement dated 18 September 2001 between mmO2, BT Group plc, O2, and BT, which was amended and restated on 31 October 2001. Under the Separation Agreement, prior to the demerger transaction becoming effective, BT agreed to convert into equity party of the intercompany debt owed by the mmO2 Group to the BT Group such that the net indebtedness (excluding trading balances) owed by the |
98
Back to Contents
| | mmO2 Group (including the BT Group) outstanding at the effective date of the demerger transaction was approximately £500 million. |
| | |
| | Following the demerger transaction, mmO2 and BT Group plc also agreed to allocate certain assets and liabilities and rights and obligations between their respective groups. mmO2 was to be responsible for insuring the ongoing activities of its business following the demerger transaction. |
| | |
| | The allocation of assets and liabilities in the Separation Agreement supplemented the asset and share transfer agreements entered into between members of our Group and the BT Group to effect the reorganisation. |
| | |
| (c) | the Tax Agreement dated 18 September 2001 between mmO2 and BT Group plc. The Tax Agreement contains provisions relating to, among other things, the allocation of tax liabilities between the mmO2 Group and the BT Group, the manner in which the groups will prepare and agree tax computations and returns, the basis on which certain claims and elections can be made (including the surrender of tax reliefs from one group to the other and the ability of the BT Group to “roll over” capital gains into assets owned by the mmO2 Group), the conduct of negotiations and disputes with the tax authorities, the exchange of information relating to their tax affairs and certain other administrative matters. |
| | |
| (d) | the Wireless Trading Agreement dated 14 September 2001 between O2 UK and BT. The Wireless Trading Agreement provides that BT will continue to promote exclusively our mobile telecommunications products and services to the business market in the United Kingdom. This agreement is for an initial term of three years and may be terminated by either party if the other does not meet certain performance targets. Either party may also terminate the agreement upon, among other things, material or persistent breach or insolvency proceedings. Either party may also terminate the agreement upon 12 months’ notice following a change of control of the other party. mmO2 UK will pay BT a percentage of the revenue it receives for sales to business customers introduced by BT. BT may also buy mobile network capacity from O2 UK at wholesale prices in order to provide communications solutions to its own business customers. BT has undertaken to ensure that a specified minimum level of revenue will be generated for O2 UK by sales through BT to business customers contracting directly with O2 UK through BT as an agent rather than through wholesale sales by O2 UK to BT. Subject to limited exceptions, BT has agreed not to solicit business customers who have contracts with O2 UK at the time the agreement was entered into. |
| | |
| (e) | the Sponsors’ Agreement dated 18 September 2001 between mmO2, BT, Merrill Lynch International, Morgan Stanley & Co. International Limited and Salomon Brothers International Limited, pursuant to which Merrill Lynch International, Morgan Stanley & Co. International Limited and Salomon Brothers International Limited agreed to act as joint sponsors for mmO2 in connection with its admission. Under this agreement, mmO2 has given certain customary representations, warranties and undertakings to the joint sponsors including as to the accuracy of the information contained in the UK Listing Particulars, as to other matters relating to the mmO2 Group and its businesses and in connection with its admission BT has given certain limited warranties in connection with the implementation of the reorganisation, the scheme of arrangement and the demerger transaction and certain other matters. |
| | |
| (f) | a syndicated credit facilities agreement (which became available for drawdown on the date of our demerger), dated 14 September 2001 (the “Facility Agreement”), between mmO2 and O2 as borrowers, certain financial institutions who have participated in the credit facility (the “Banks”). |
| | |
| | The Facility Agreement provides for the Banks to make available to mmO2 and O2 a five year committed £1,725 million multicurrency revolving credit facility (“Tranche A”) and provides a 364 day committed £1,750 million multi-currency revolving facility (“Tranche B”). |
| | |
| | Cash advances under Tranche A are for general corporate purposes of the mmO2 Group. £1,000 million of Tranche B was refinanced through €1,000 million and £375 million Eurobond issues launched in January 2002 and which have a five-year and ten-year term, respectively. Tranche B matured 14 September 2001 and |
99
Back to Contents
| | was replaced by a £300 million, 364 day syndicated committed multi-currency facility (the “Facility”). The Facility was reduced to £150 million on 31 December 2002. |
| | |
| | The facilities are guaranteed by mmO2 in respect of drawings of each additional borrower, and by such subsidiaries of mmO2 as are nominated by mmO2 and accede to the Facility Agreement as guarantors. |
| | |
| (g) | A €5,000 million Euro Medium Term Note Programme (the “Programme”), was established for the issue of Euro Medium Term Notes (the “Notes”). Notes issued will be constituted by a trust deed dated 18 December 2001 entered into between the Issuer and Bankers Trustee Company Limited. Under the Programme, the Issuer may issue Notes denominated in any currency under the terms and conditions as set out in an offering circular dated 18 December 2001 (the “Offering Circular”) up to €5,000 million (or its equivalent in other currencies) outstanding at any time. The €1,000 million and £375 million Eurobond issues were launched in January 2002 under the Programme. |
There are currently no exchange controls or other limitations in the UK affecting security holders.
The following discussion is a general summary of certain material UK tax and US federal income tax considerations under present law relevant to the purchase, ownership and disposition of our shares or American Depositary Shares (ADSs). It applies only if you are a US holder (as defined below), you hold our shares or ADSs as capital assets and you use the US dollar as your functional currency. It does not address the tax treatment of US holders subject to special rules, such as banks, securities dealers, traders in securities that elect to mark to market, insurance companies, tax-exempt entities, holders of ten per cent or more of our voting shares, persons holding our shares or ADSs as part of a hedge, straddle, conversion or constructive sale transaction and persons that are resident or ordinarily resident in the United Kingdom.
This summary does not consider your particular circumstances. It is not a substitute for tax advice. We urge you to consult your own tax advisers about the particular tax consequences to you in light of your particular circumstances of ownership of our shares or ADSs.
As used in this discussion, “US holder” means a beneficial owner of our shares or ADSs that is (i) a US citizen or individual resident, (ii) a corporation or certain other business entities organised under US law, (iii) a trust subject to the control of a US person and the primary supervision of a US court, or (iv) an estate the income of which is subject to US federal income tax regardless of its source.
No tax is required to be withheld at source from dividends paid on our shares or ADSs. See “– US Federal Income Taxation – Dividends”.
Except as discussed below, you will not be liable for tax on capital gains realised on your disposal of our shares or ADSs unless you are resident or ordinarily resident in the United Kingdom, or you carry on a trade, profession or vocation in the United Kingdom through a branch or agency in the UK for years in which your disposal occurs and our shares or ADSs are or have been used, held or acquired for the purposes of such trade (or profession or vocation), branch or agency.
If you are an individual who has been resident or ordinarily resident in the United Kingdom during the five years before you disposed of our shares or ADSs, you are likely to be liable for tax on capital gains if you return to the United Kingdom, subject to any available exemption or relief.
100
Back to Contents
Our ordinary shares will be assets situated, and our ADSs are likely to be assets situated, in the United Kingdom for the purposes of the UK inheritance tax. Subject to the discussion of the UK-US estate tax treaty in the next paragraph, UK inheritance tax may apply if you hold our shares or ADSs, and you gift them or die even if you are neither domiciled nor deemed to be domiciled in the United Kingdom. If you transfer our shares or ADSs at less than full market value, you may be treated as making a gift. Special rules apply to gifts if the donor retains some benefit, to close companies, and to trustees of settlements.
If your domicile is in the United States for purposes of the UK-US estate tax treaty and you are not a UK national, you will not be subject to UK inheritance tax if you die or gift our shares or ADSs unless our shares or ADSs are part of the business property of a UK permanent establishment or pertain to a UK fixed base of an individual used for the performance of independent personal services.
The UK-US estate tax treaty provides a credit mechanism if our shares or ADSs are subject to both UK inheritance tax and to the US federal estate or gift tax.
UK stamp duty and stamp duty reserve tax |
UK stamp duty and stamp duty reserve tax, or SDRT, are generally payable upon the issue and deposit of our shares with the depository or its nominee in exchange for our ADSs evidenced by ADRs. The current rate of stamp duty and SDRT imposed on these issues and transfers is 1.5 per cent applied, in each case, to the value of the consideration or, in some circumstances, to the value of our shares. The stamp duty or SDRT is payable by the depository. In accordance with the terms of the deposit agreement holders of our ADRs must reimburse the depository for the stamp duty or SDRT.
No such SDRT or stamp duty will however arise from the issuance and deposit of our shares pursuant to the scheme of arrangement.
No UK stamp duty will be payable on the transfer of our ADRs if the instrument of transfer is not executed in the United Kingdom and remains outside the United Kingdom. Transfer of our ADRs will not give rise to a liability for SDRT.
A transfer of our shares by the depository to an ADR holder where there is no change in beneficial ownership will result in UK stamp duty at the rate of £5 per transfer.
Transfers of our shares to persons other than the depository or its nominee will give rise to UK stamp duty or SDRT at the time of transfer or agreement to transfer, normally at the rate of 0.5 per cent (rounded up, in the case of stamp duty, to the nearest £5) of the amount payable for our shares. The purchaser usually pays SDRT or UK stamp duty. If our shares are later transferred to the depository, additional UK stamp duty or SDRT will normally be payable as described above.
US Federal Income Taxation |
If the obligations contemplated by the deposit agreement are performed in accordance with their terms, holders of our ADSs generally will be treated for US federal income tax purposes as the owners of our shares represented by those ADSs.
For US federal income tax purposes, the gross amount of any distribution (including any additional income arising from a foreign tax credit claim as described below) paid to a US holder of shares or ADSs will be treated as a dividend and taxed as ordinary income to such US holder on the date of receipt by the depositary (in the case of our ADSs) or the holder (in the case of our shares) to the extent paid out of our current or accumulated earnings and profits, as determined for US federal income tax purposes. Distributions in excess of our current and accumulated earnings and profits will be treated first as a tax-free return of capital to the extent of the US holder’s tax basis in the share or ADSs, and to the extent in excess of such tax basis, will be treated as a gain from a sale or exchange of such shares or ADSs. The dividends will not be eligible for the dividends-received deduction
101
Back to Contents
available to corporations. Dividends paid in pounds sterling will be includible in income in a US dollar amount based on the exchange rate in effect on the date received by the depository (in the case of our ADSs) or the holder (in the case of our shares) whether or not the payment is converted into US dollars at that time. Any gain or loss you recognize on a subsequent conversion of pounds sterling for a different amount generally will be US source ordinary income or loss.
If you hold our shares or ADSs and you are eligible for benefits under the United Kingdom-United States Income Tax Convention that was entered into force on 25 April 1980 (the 1980 Convention), you may be entitled to a foreign tax credit for UK withholding tax. The amount of the foreign tax credit equals the tax credit payment that you are entitled to receive from the UK Inland Revenue. At current rates, a dividend of £90 entitles an eligible US holder to a Treaty payment of £10 which is completely offset by a UK withholding tax of £10. Because the tax credit payment and the withholding tax offset each other, the UK Inland Revenue neither makes the payment nor collects the tax. The offsetting payments nevertheless have US tax significance. If you elect the benefits of the 1980 Convention, you must include the tax credit payment in your income and you can claim a foreign tax credit for the UK withholding tax (subject to otherwise applicable limitations on foreign tax credit claims). To make the election, you must file a completed US Internal Revenue Service Form 8833 with your US federal income tax return for the relevant year. The rules relating to the determination of the foreign tax credit are complex. You should consult your own tax advisor regarding the advisability of claiming the foreign tax credit, including the limitations associated therewith and any alternatives available to you.
US holders should be aware that a new United Kingdom – United States Income Tax Convention entered into force on 31 March 2003 (the New Convention) and generally will have effect in respect of dividends paid on or after 1 May 2003. Certain articles in the New Convention limit or restrict the ability of a US holder to claim benefits under the New Convention while similar provisions were not contained in the 1980 Convention. Under the New Convention there will be no hypothetical Treaty payment and no notional UK withholding tax applied to a dividend. Therefore, it will not generally be possible for US holders to claim a foreign tax credit in respect of any dividend paid by us on or after 1 May 2003. However, a US holder entitled to benefits under the 1980 Convention may elect to have the provisions of the 1980 Convention continue for an additional twelve months if the election to apply the 1980 Convention would result in greater benefits to the holder. If a US holder were to make an effective election, the discussion above with respect to dividends subject to the 1980 Convention would continue to apply to dividends paid by us prior to 1 May 2004. US holders should consult their own tax advisors to determine whether the US holder is eligible for benefits under the 1980 Convention and the New Convention, whether, and to what extent, a foreign tax credit will be available with respect to dividends received from us, and whether it may be advisable in light of the US holder’s particular circumstances to elect to have the provisions of the 1980 Convention continue in force until 1 May 2004.
You will recognize capital gain or loss on the sale or other disposition of our shares or ADSs in an amount equal to the difference between adjusted tax basis in the shares or ADSs and the amount realized from the sale or other disposition. Gain or loss upon the disposition of shares or ADSs generally will be US source gain or loss, and will be treated as long-term capital gain or loss if, at the time of the disposition, the holding period for the shares or ADSs exceeds one year. If you are an individual, any capital gains generally will be subject to US federal income tax at preferential rates if specified minimum holding periods are met. The deductibility of capital losses is subject to significant limitations.
The surrender of ADSs in exchange for shares pursuant to the Deposit Agreement governing the ADSs will not be a taxable event for US federal income tax purposes. Accordingly, you will not recognize any gain or loss upon such surrender.
A US holder that receives pounds sterling on the sale or other disposition of our shares will realize an amount equal to the US dollar value of the pounds sterling on the date of sale (or, in the case of cash basis or electing accrual basic taxpayers, the settlement date). A US holder will have a tax basis in the pounds sterling received
102
Back to Contents
equal to the US dollar amount realized. Any gain or loss realized on a subsequent conversion of the pounds sterling for a different amount generally will be US source ordinary income or loss.
Recent US Tax Law Changes Applicable to Individuals |
Recent US tax legislation generally has reduced the rates of tax payable by individuals (as well as certain trusts and estates) on many items of income. Under the Jobs and Growth Tax Relief Reconciliation Act of 2003 (the “2003 Act”), the marginal tax rates applicable to ordinary income generally have been lowered effective 1 January 2003. Furthermore, for capital assets held for over one year and sold or exchanged on or after 6 May 2003 but in taxable years beginning before 1 January 2009, the maximum rate of tax generally will be 15 per cent (rather than the higher rates of tax generally applicable to items of ordinary income). Finally, “qualified dividend income” received in taxable years beginning after 31 December 2002 and beginning before 1 January 2009, generally will be taxed at the rates applicable to these capital gains i.e., a maximum rate of 15 per cent) rather than the rates applicable to other items of ordinary income. For this purpose, “qualified dividend income” generally includes dividends paid on shares in US corporations as well as dividends paid on shares in certain non-US corporations if, among other things, (i) the shares of the non-US corporation (including ADRs backed by such shares) are readily tradable on an established securities market in the United States, or (ii) the non-US corporation is eligible with respect to substantially all of its income for the benefits of a comprehensive income tax treaty with the United States which contains an exchange of information program (qualifying treaties are to be identified by the Secretary of the US Treasury Department). We currently anticipate that dividends paid by us with respect to our shares or ADSs should constitute “qualified dividend income” for US federal income tax purposes and that US holders who are individuals should be entitled to the reduced rates of tax, as applicable. However, the precise extent to which dividends paid by non-US corporations will constitute “qualified dividend income” and the effect of such status on the ability of a taxpayer to utilize associated foreign tax credits is not entirely clear at present. It is anticipated that there will be administrative pronouncements concerning these provisions in the future. In the meantime, investors are urged to consult their own tax advisors regarding the impact on their particular situations of the provisions of the 2003 Act.
US Information reporting and backup withholding |
Dividend payments made to holders of shares or ADSs and proceeds from the sale, exchange or redemption of shares or ADSs may be subject to information reporting requirements and US federal backup withholding tax at a current rate of 28 per cent. Certain exempt persons (such as corporations) are not subject to these information reporting requirements. Backup withholding will not apply, however, to a holder who furnishes a correct taxpayer identification number or certificate of foreign status and makes any other required certification or who is otherwise exempt from the backup withholding. US persons who are required to establish their exempt status generally must furnish a completed Internal Revenue Service Form W-9 (Request for Taxpayer Identification Number and Certification). Non-US holders generally will not be subject to US information reporting or backup withholding. However, such holders may be required to provide certification of non-US status in connection with payments received in the United States or through certain US-related financial intermediaries.
Backup withholding is not an additional tax. Amounts withheld as backup withholding may be credited against a holder’s US federal income tax liability, and a holder may obtain a refund of any excess amounts withheld under the backup withholding rules by filing the appropriate claim for refund with the US Internal Revenue Service and furnishing any required information.
| F. | Dividends and Paying Agents |
Not applicable.
Not applicable.
103
Back to Contents
| | |
| | The documents that are exhibits to this annual report can be obtained from the Securities and Exchange Commission’s (“SEC”) public reference facilities at 450 Fifth Street, N.W., Washington DC 20549, USA, at prescribed rates. Additionally, copies of this material may also be obtained from the SEC’s Internet website at http://www.sec.gov. |
Not applicable.
| ITEM 11 | QUANTITATIVE AND QUALITATIVE DISCLOSURES ABOUT MARKET RISK |
| | We are exposed to interest rate risk and foreign exchange rate risk. See note 18 to our consolidated financial statements in Item 18, “Financial Statements”, for a description of how we manage these risks. |
| | |
| ITEM 12 | DESCRIPTION OF SECURITIES OTHER THAN EQUITY SECURITIES |
Not applicable.
Not applicable.
Not applicable.
| D. | American Depositary Shares |
Not applicable.
104
Back to Contents
PART II
| ITEM 13 | DEFAULTS, DIVIDEND ARREARAGES AND DELINQUENCIES |
Not applicable.
| ITEM 14 | MATERIAL MODIFICATIONS TO THE RIGHTS OF SECURITY HOLDERS AND USE OF PROCEEDS |
Not applicable.
| ITEM 15 | CONTROLS AND PROCEDURES |
| | Our chief executive office and chief financial officer, after evaluating the effectiveness of our disclosure controls and procedures (as defined in Exchange Acts Rule 13a-14(c)) within 90 days of the date of this report, have concluded that, as of such date, our disclosure controls and procedures were effective to ensure that material information relating to our company was made known to them by others within our company, particularly during the period in which this Form 20-F was being prepared. |
| | |
| | There were no significant changes in our internal controls or in other factors that could significantly affect these controls subsequent to the date our chief executive officer and chief financial officer completed their evaluation, nor were there any significant deficiencies or material weaknesses in our internal controls requiring corrective actions. |
Not applicable.
PART III
| ITEM 17 | FINANCIAL STATEMENTS |
Please see Item 18.
105
Back to Contents
mmO2 GROUP
| ITEM 18 | FINANCIAL STATEMENTS |
INDEX TO THE FINANCIAL STATEMENTS
Contents | | Page |
mmO2 GROUP |
| | |
| | |
| | |
| | |
| | |
| | |
| | |
| | |
| | | |
O2 (Germany) GmbH & Co. OHG. (formerly Viag Interkom GmbH & Co.) |
| | |
| | |
| | |
| | |
| | |
| | |
F-1
Back to Contents
mmO2 GROUP
REPORT OF THE INDEPENDENT ACCOUNTANTS
To the Board of Directors and Shareholders of mmO2 plc:
In our opinion, the accompanying consolidated balance sheets and the related consolidated profit and loss accounts, statements of total recognised gains and losses, reconciliations of movements in shareholders funds and cashflow statements present fairly, in all material respects, the financial position of mmO2 and its subsidiaries at 31 March 2003 and 31 March 2002, and the results of their operations and their cashflows for the three years in the period ended 31 March 2003, in conformity with accounting principles which, as described in Note 1, are generally accepted in the United Kingdom. These financial statements are the responsibility of the Company’s management; our responsibility is to express an opinion on these financial statements based on our audits. We conducted our audits of these statements in accordance with auditing standards generally accepted in the United States of America and in the United Kingdom, which require that we plan and perform the audit to obtain reasonable assurance about whether the financial statements are free of material misstatement. An audit includes examining, on a test basis, evidence supporting the amounts and disclosures in the financial statements, assessing the accounting principles used and significant estimates made by management, and evaluating the overall financial statement presentation. We believe that our audits provide a reasonable basis for our opinion.
As indicated in Note 1, mmO2 plc represents the mobile business which was demerged from British Telecommunications plc (“BT”) on 19 November 2001. The consolidated financial statements for the periods prior to the demerger have been prepared on a carve-out basis as described in Note 1. The balance sheets, profit and loss accounts and cash flow statements of mmO2 plc prepared on a carve-out basis differ from those presented in the mmO2 Annual Report and Financial Statements prepared for filing purposes in the United Kingdom (the “UK Statutory Accounts”). When preparing financial statements on a carve-out basis a portion of BT’s short- and long-term loans and other borrowings are allocated to mmO2 plc. The basis of preparation adopted for the UK Statutory Accounts shows the results and financial position of mmO2 plc with no push-down allocation of loans and other borrowings.
Accounting principles generally accepted in the United Kingdom vary in certain important respects from accounting principles generally accepted in the United States of America. The application of the latter would have affected the determination of consolidated net income for each of the three years in the period ended 31 March 2003 and the determination of consolidated shareholders’ equity at 31 March 2003 and 2002 to the extent summarised in Note 32 to the consolidated financial statements.
/s/ PricewaterhouseCoopers LLP
PricewaterhouseCoopers LLP
Chartered Accountants and Registered Auditors
London, England
20 May 2003
F-2
Back to Contents
mmO2 GROUP
CONSOLIDATED PROFIT AND LOSS ACCOUNT |
| |
| | | | | Year ended 31 March
| |
| | | Note | | 2003 | | 2002 | | 2001 | |
| | |
|
| |
|
| |
|
| |
|
| |
| | | | | £m | | £m | | £m | |
Turnover: Group and share of joint ventures and associates | | | 2 | | | 5,020 | | | 4,407 | | | 3,712 | |
| Group’s share of joint ventures’ turnover | | | | | | — | | | — | | | (337 | ) |
| Group’s share of associates’ turnover | | | | | | (146 | ) | | (131 | ) | | (175 | ) |
| | | | | |
| |
| |
| |
Group turnover | | | 2 | | | 4,874 | | | 4,276 | | | 3,200 | |
Net operating expenses (including exceptional items) | | | 3 | | | (13,652 | ) | | (5,132 | ) | | (6,364 | ) |
| | | | | |
| |
| |
| |
Group operating loss | | | 3,4 | | | (8,778 | ) | | (856 | ) | | (3,164 | ) |
| Group’s share of operating loss of joint ventures | | | | | | — | | | — | | | (303 | ) |
| Group’s share of operating profit of associates | | | | | | 5 | | | 8 | | | 17 | |
| | | | | |
| |
| |
| |
Total operating loss | | | | | | (8,773 | ) | | (848 | ) | | (3,450 | ) |
| Provision for loss on sale of business | | | 3,12 | | | (1,364 | ) | | — | | | — | |
| Net interest payable and similar charges | | | 9 | | | (66 | ) | | (781 | ) | | (669 | ) |
| | | | | |
| |
| |
| |
Loss on ordinary activities before taxation | | | | | | (10,203 | ) | | (1,629 | ) | | (4,119 | ) |
| Tax on loss on ordinary activities | | | 10 | | | 55 | | | 250 | | | 114 | |
| | | | | |
| |
| |
| |
Loss on ordinary activities after taxation | | | | | | (10,148 | ) | | (1,379 | ) | | (4,005 | ) |
| Minority interests | | | | | | — | | | — | | | (4 | ) |
| | | | | |
| |
| |
| |
Retained loss for the financial year | | | 24 | | | (10,148 | ) | | (1,379 | ) | | (4,009 | ) |
| | | | | |
| |
| |
| |
In all three years all profits and losses arise from continuing operations.
The accompanying notes on pages F-8 to F-67 are an integral part of these financial statements.
F-3
Back to Contents
mmO2 GROUP
CONSOLIDATED STATEMENT OF TOTAL RECOGNISED GAINS AND LOSSES |
| |
| | | | | Year ended 31 March
| |
| | | Note | | 2003 | | 2002 | | 2001 | |
| | |
|
| |
|
| |
|
| |
|
| |
| | | | | £m | | £m | | £m | |
Loss for the financial year | | | | | | (10,148 | ) | | (1,379 | ) | | (4,009 | ) |
Currency translation differences arising on foreign currency net investment in: | | | | | | | | | | | | | |
| Subsidiaries | | | 24 | | | 1,333 | | | 161 | | | (21 | ) |
| Joint ventures | | | | | | — | | | — | | | 10 | |
| | | | | |
| |
| |
| |
Total recognised losses relating to the year | | | | | | (8,815 | ) | | (1,218 | ) | | (4,020 | ) |
| | | | | |
| |
| |
| |
The accompanying notes on pages F-8 to F-67 are an integral part of these financial statements.
F-4
Back to Contents
mmO2 GROUP
CONSOLIDATED BALANCE SHEET
| | | | | As at 31 March
| |
| | | Note | | 2003 | | 2002 | |
| | |
|
| |
|
| |
|
| |
| | | | | £m | | £m | |
Fixed assets | | | | | | | | | | |
| Intangible assets | | | 13 | | | 7,582 | | | 15,992 | |
| Tangible assets | | | 14 | | | 3,875 | | | 4,094 | |
| Investments | | | 15 | | | 3 | | | 37 | |
| | | | | |
| |
| |
| | | | | | | 11,460 | | | 20,123 | |
| | | | | |
| |
| |
Current assets | | | | | | | | | | |
| Stocks | | | | | | 73 | | | 68 | |
| Debtors | | | 16 | | | 924 | | | 1,090 | |
| Investments | | | 17 | | | 848 | | | 859 | |
| Cash at bank and in hand | | | | | | 68 | | | 20 | |
| | | | | |
| |
| |
| | | | | | | 1,913 | | | 2,037 | |
Creditors: amounts falling due within one year | | | 18 | | | (1,572 | ) | | (1,521 | ) |
| | | | | |
| |
| |
Net current assets | | | | | | 341 | | | 516 | |
| | | | | |
| |
| |
Total assets less current liabilities | | | | | | 11,801 | | | 20,639 | |
| | | | | |
| |
| |
Creditors: amounts falling due after more than one year | | | 19 | | | (1,451 | ) | | (1,403 | ) |
Provisions for liabilities and charges | | | 22 | | | (284 | ) | | (402 | ) |
| | | | | |
| |
| |
Net assets | | | | | | 10,066 | | | 18,834 | |
| | | | | |
| |
| |
Capital and reserves | | | | | | | | | | |
| Called up share capital | | | 23 | | | 9 | | | 9 | |
| Other reserves | | | 24 | | | 12,087 | | | 22,656 | |
| Profit and loss account | | | 24 | | | (2,030 | ) | | (3,831 | ) |
| | | | | |
| |
| |
| | | | | | | 10,066 | | | 18,834 | |
| | | | | |
| |
| |
The Company balance sheet is shown in note 31.
These financial statements were approved by the Board of Directors on 20 May 2003 and were signed on its behalf by:
| P Erskine Chief Executive Officer | D Finch Chief Financial Officer |
The accompanying notes on pages F-8 to F-67 are an integral part of these financial statements.
F-5
Back to Contents
mmO2 GROUP
RECONCILIATION OF GROUP OPERATING LOSS TO OPERATING CASH FLOWS
| | | Year ended 31 March
| |
| | | 2003 | | 2002 | | 2001 | |
| | |
|
| |
|
| |
|
| |
| | | £m | | £m | | £m | |
| Group operating loss | | | (8,778 | ) | | (856 | ) | | (3,164 | ) |
| Depreciation and amortisation charges | | | 9,637 | | | 1,139 | | | 3,481 | |
| Loss on disposal of fixed assets | | | 8 | | | 9 | | | 4 | |
| (Increase)/decrease in stocks | | | (5 | ) | | 89 | | | (31 | ) |
| Decrease/(increase) in debtors | | | 166 | | | (38 | ) | | 151 | |
| Increase/(decrease) in creditors | | | 58 | | | 24 | | | (130 | ) |
| (Decrease)/increase in provisions | | | (53 | ) | | 90 | | | 7 | |
| | |
|
| |
|
| |
|
| |
Net cash inflow from operating activities | | | 1,033 | | | 457 | | | 318 | |
| | |
|
| |
|
| |
|
| |
CONSOLIDATED CASH FLOW STATEMENT
| | | | | Year ended 31 March
| |
| | | Note | | 2003 | | 2002 | | 2001 | |
| | |
|
| |
|
| |
|
| |
|
| |
| | | | | £m | | £m | | £m | |
Net cash inflow from operating activities | | | | | | 1,033 | | | 457 | | | 318 | |
| Returns on investments and servicing of finance | | | 25 | | | (63 | ) | | (9 | ) | | (11 | ) |
| Taxation | | | 25 | | | (4 | ) | | (4 | ) | | 21 | |
| Capital expenditure and financial investment | | | 25 | | | (868 | ) | | (1,231 | ) | | (5,234 | ) |
| Acquisitions and disposals | | | 25 | | | — | | | (864 | ) | | (12,574 | ) |
| | | | | |
| |
| |
| |
Cash inflow/(outflow) before management of liquid resources and financing | | | | | | 98 | | | (1,651 | ) | | (17,480 | ) |
| Management of liquid resources | | | 25 | | | (3 | ) | | (459 | ) | | — | |
| Financing | | | 25 | | | (47 | ) | | 1,790 | | | 17,953 | |
| | | | | |
| |
| |
| |
Increase/(decrease) in cash in the year | | | 26 | | | 48 | | | (320 | ) | | 113 | |
| | | | | |
| |
| |
| |
The accompanying notes on pages F-8 to F-67 are an integral part of these financial statements.
F-6
Back to Contents
mmO2 GROUP
CONSOLIDATED NET DEBT
| | | | | As at 31 March
| |
| | | Note | | 2003 | | 2002 | |
| | |
|
| |
|
| |
|
| |
| | | | | £m | | £m | |
| Cash at bank and in hand | | | | | | 68 | | | 20 | |
| Current asset investments | | | 17 | | | 848 | | | 859 | |
| | | | | |
| |
| |
| | | | | | | 916 | | | 879 | |
| Euro medium-term notes (net of issue costs) | | | 19 | | | (1,015 | ) | | (982 | ) |
| Loan notes | | | 18 | | | (19 | ) | | (58 | ) |
| Obligations under hire purchase contracts | | | 20 | | | (390 | ) | | (406 | ) |
| Other loans and borrowings | | | | | | (41 | ) | | (50 | ) |
| | | | | |
| |
| |
Net debt | | | | | | (549 | ) | | (617 | ) |
| | | | | |
| |
| |
The accompanying notes on pages F-8 to F-67 are an integral part of these financial statements.
F-7
Back to Contents
mmO2 GROUP
NOTES TO THE CONSOLIDATED FINANCIAL STATEMENTS
The financial statements are prepared under the historical cost convention and in accordance with applicable accounting standards in the United Kingdom (“UK GAAP”). A summary of the more important Group accounting policies is set out below, together with an explanation of the basis of preparation used in order to present a true and fair view. These differ in certain significant respects from accounting standards in the United States of America and a reconciliation to generally accepted accounting principles in the United States of America (“US GAAP”) is included in note 32 to the financial statements.
All principal subsidiary undertakings’ financial years are coterminous with those of mmO2 plc. O2 Germany has been accounted for as a subsidiary from February 2001. Prior to this date O2 Germany had an accounting reference date of 31 December. It has not been practicable for O2 Germany to prepare audited carve-out financial statements for the year ended 31 March 2000 and consequently, the results presented for the year ended 31 March 2001 include the Group’s share of O2 Germany’s turnover, net losses and net liabilities for the period from 1 January 2000 to 19 February 2001, together with consolidated financial results for the period from 20 February 2001 to 31 March 2001.
mmO2 plc was incorporated on 30 March 2001. On 19 November 2001, its ordinary shares were listed on the London Stock Exchange and the New York Stock Exchange. This was the culmination of a group reorganisation undertaken by British Telecommunications plc (“BT”) to demerge its wireless business.
The financial statements have been prepared as if the mmO2 Group had been demerged from BT prior to 1 April 2000. This presents information which more accurately reflects the ongoing operations of the Group. Accordingly the demerger and related transactions have been accounted for using carve-out accounting principles as applicable to group reorganisations up to the date of actual demerger. Whilst the financial information set out in the consolidated financial statements is an appropriate presentation, this financial information is not necessarily indicative of the financial results that might have occurred had mmO2 plc been an independently financed and managed public entity during the periods presented or of the financial results that may occur in any future period. During the year ended 30 March 2001 and the period from 1 April 2001 to 19 November 2001 included in these financial statements, the Group was not consituted as a discrete legal group of companies under a single holding company. The new Group holding company, mmO2 plc, to which the Group’s operations were transferred on demerger was established on 30 March 2001. For the period to demerger, these financial statements therefore reflect the combination of the consolidated financial statements of these operations which comprise the mmO2 Group following the demerger from BT. Included within the Group are the O2 UK group of companies in the United Kingdom, and the mobile operations of other companies in the Group owned prior to demerger either directly by BT or through its subsidiary companies, together with certain other business units within BT. Financial information in respect of companies or business units that have historically been integrated with other BT operations and that are now combined within the mmO2 Group, has been included in these financial statements on a carve-out basis.
Furthermore, for the purpose of these financial statements, a portion of BT’s short- and long-term loans has been allocated to the Group for the periods up to 19 November 2001, the date of demerger from BT. The allocation has been determined by reference to the amount of loans and other borrowings raised by BT to fund certain significant acquisitions in the year ended 31 March 2001, of mobile businesses and assets, including UMTS licences. This has resulted in £16.8 billion of intercompany loans due to BT at 31 March 2001, bearing interest at
F-8
Back to Contents
mmO2 GROUP
NOTES TO THE CONSOLIDATED FINANCIAL STATEMENTS
| 1. | Accounting policies (Continued) |
7.2 per cent., and £16.8 billion of intercompany loans from 1 April 2001 to 19 November 2001, bearing an average annual interest rate of 7.2 per cent. The analysis of these loans between long and short term creditors is consistent with the year end redemption profile of BT’s loans and other borrowings. The interest rates applied have been calculated with reference to the average annual composite interest cost of BT’s loans and other borrowings for each period. There are no hedging transactions associated with these intercompany loans. The interest expense allocated to the Group is not indicative of the interest expense that would have been incurred if the mmO2 Group had been a separate stand-alone group. As part of the demerger transaction, a large portion of these loans were capitalised so that at 19 November 2001, the date we demerged from BT, we had net debt of £506 million.
The financial statements include the results for mmO2 plc and its subsidiaries. All intercompany accounts and transactions have been eliminated.
The preparation of financial statements in conformity with generally accepted accounting principles requires management to make estimates and assumptions that affect the amounts reported in the consolidated financial statements and accompanying notes. Actual results could differ from those estimates. Estimates are used when accounting for certain items such as revenue recognition, provision for bad and doubtful debtors, depreciation and amortisation, valuation of inventory, pensions and other benefits, and asset impairment.
Group turnover, which excludes value added tax and other sales taxes, comprises the value of services provided and equipment sales.
Mobile telecommunications service turnover includes turnover earned for usage of the Group’s wireless network for voice and data transmission by O2 customers, connection charges, subscription fees and interconnect revenues. Post-pay customers are billed in arrears based on usage and turnover is recognised when the service is rendered. Turnover for pre-pay customers is recorded as deferred revenues prior to commencement of services and is recognised as the pre-pay services are rendered. Inbound roaming revenues, earned from other mobile operators whose customers roam onto the O2 network, and outbound roaming revenues, earned from certain customers roaming outside their domestic coverage area, are recognised based upon usage and are included in mobile service turnover. Turnover from subscription fees is recognised evenly throughout the periods to which they relate. Revenues from connection charges are deferred and recognised over the estimated customer relationship period and are included in other turnover.
Hardware turnover principally consists of revenues from the sale of wireless mobile devices. The revenue and related expenses associated with the sale of wireless handsets and accessories are recognised when the products are delivered and accepted by the customer.
Subscriber acquisition costs
Subscriber acquisition costs, which include the commission costs associated with acquiring new subscribers and other incremental costs of customer acquisition, are charged to the profit and loss account as incurred.
Research and development
Expenditure on research and development is written off in the year in which it is incurred.
Advertising
Advertising costs are included in administrative expenses and are expensed as incurred.
F-9
Back to Contents
mmO2 GROUP
NOTES TO THE CONSOLIDATED FINANCIAL STATEMENTS
| 1. | Accounting policies (Continued) |
Foreign currencies
Transactions denominated in foreign currencies are translated at the exchange rates ruling at the dates of the transactions, adjusted for the effects of any hedging arrangements except for material exceptional items which are translated at the rate ruling at the date of the transaction. Monetary assets and liabilities denominated in foreign currencies at the balance sheet date are retranslated at the rates ruling at that date.
The balance sheets of foreign subsidiaries are translated into sterling at the closing rates of exchange and the differences arising from the translation of the opening net investment in subsidiaries at the closing rate are taken direct to reserves and are reported in the statement of total recognised gains and losses. The profit and loss and cash flows for the year of foreign subsidiaries are translated at the average rates of exchange for the year.
All other exchange gains or losses are dealt with in the profit and loss account.
Goodwill
Goodwill, arising from the purchase of subsidiary undertakings and interests in associates and joint ventures, represents the excess of the fair value of the purchase consideration over the fair value of the net assets acquired.
For all acquisitions arising on or after 1 April 1998, the goodwill arising is capitalised as an intangible asset. The goodwill is amortised on a straight-line basis from the time of acquisition over a period estimated by the Directors to be its useful economic life. The economic life is normally between 10 and 20 years, subject to review if and when an event or change occurs which may affect the asset life. Where applicable, goodwill relating to overseas businesses is held as a foreign currency denominated asset.
For acquisitions made before the adoption of Financial Reporting Standard (“FRS”) 10 “Goodwill and Intangible Assets”, on 1 April 1998, the goodwill was written off directly to reserves. The goodwill written off directly to reserves will be charged to the profit and loss account on the subsequent disposal of the business to which it relates.
Other intangible fixed assets
Licence fees paid to governments, which permit telecommunication activities to be operated for defined periods, are capitalised at cost and are amortised from the later of the start of the licence period or launch of service, to the end of the licence period on a straight-line basis. Other licences are amortised over the period of the licence on a straight-line basis.
Tangible fixed assets
Tangible fixed assets are stated at historical cost less depreciation. The cost of tangible fixed assets includes directly attributable incremental costs incurred in their acquisition and installation.
Depreciation is provided on tangible fixed assets from the date they are brought into use, in equal instalments over their estimated useful lives, taking into account any residual values. The lives assigned to tangible fixed assets are:
| Freehold buildings | 40 years |
| Leasehold land and buildings | Unexpired portion of lease or 40 years,
whichever is the shorter |
| Network assets | 5 to 15 years |
| Plant and machinery | 2 to 5 years |
| Computers, software and office equipment | 2 to 6 years |
| Motor vehicles | 5 years |
No depreciation is provided on freehold land or assets in course of construction.
F-10
Back to Contents
mmO2 GROUP
NOTES TO THE CONSOLIDATED FINANCIAL STATEMENTS
| 1. | Accounting policies (Continued) |
Fixed asset investments
Investments in associates and joint ventures are included in the consolidated financial statements using the equity method of accounting. The profit and loss account includes the Group’s share of profits or losses of associates and joint ventures.
Other investments held as fixed assets comprise equity shareholdings and other interests and are stated at cost less provisions for impairment.
Own shares
The Group partially hedges its future obligations under certain share awards by holding its own shares in the mmO2 Employee Share Trust. The cost of shares expected to be awarded under each plan is amortised evenly over the period from the original date of grant of the particular award to the time of vesting.
Own shares are held at cost less amortisation charged to date.
Fixed asset impairment
Goodwill, other intangible assets and tangible assets are reviewed for impairment: (i) at the end of the first full financial year following acquisition; and (ii) in other periods if events or changes in circumstances indicate that the carrying values may not be recoverable. Such events may include continuing operating losses, technological obsolescence or significant adverse changes in the business or the market in which the fixed asset is used.
The impairment review is performed by comparing the carrying value of the asset, or group of assets, with their recoverable amount. For assets used in the continuing operations of the Group the recoverable amount is the assets’ value in use which is estimated by calculating the present value of it’s future cash flows. For assets to be disposed, the recoverable amount is the assets’ net realisable value. Impairment charges are recognised in the profit and loss account to the extent that the carrying value exceeds the recoverable amount in the period in which the impairment is identified.
Stocks
Stocks comprise mainly handsets and are stated at the lower of cost and net realisable value (which reflects the value to the business of the handset in the hands of the subscriber) on a first-in, first-out basis, after provisions for obsolescence.
Debtors
Debtors are stated at estimated net realisable value. Net realisable value is the invoiced amount less provisions for bad and doubtful debtors. Provisions are made specifically against debtors where there is evidence of a dispute or an inability to pay. An additional provision is made based on an analysis of balances by age, previous losses experienced and general economic conditions.
Provisions
Provisions are recognised by the Group when three criteria are met: (i) the Group has a constructive or legal obligation as a result of a past event; (ii) if it is probable that a transfer of economic benefits will be required to settle the obligation and (iii) a reliable estimate of the obligation can be made.
A provision is made for the present value of the cost of restoration of mast sites at the date of acquisition of the site in accordance with FRS 12 “Provisions, contingent liabilities and contingent assets”.
F-11
Back to Contents
mmO2 GROUP
NOTES TO THE CONSOLIDATED FINANCIAL STATEMENTS
| 1. | Accounting policies (Continued) |
Post retirement benefits
The Group participates in or operates a number of pension schemes as disclosed in note 8 to the financial statements.
All pension schemes are accounted for in accordance with the provisions of Statement of Standard Accounting Practice (SSAP) 24 “Accounting for pension costs”. The Group continues to apply the transitional disclosure requirements set out in FRS 17 “Retirement benefits” which are provided in note 8.
The Group participates in a number of multi-employer pension schemes providing benefits based on final pensionable salary, where the assets of the schemes are held separately from those of the participating employers. In its capacity as a participating employer, the Group is required to pay to the pension schemes a predetermined percentage of the pensionable payroll costs of those employees who are members of the scheme. These costs are charged to the profit and loss account in the period to which they relate.
The Group is also the principal employer for certain pension schemes. For these funded and unfunded defined benefit schemes, the expected costs of providing pensions and other post retirement benefits, as calculated periodically by professionally qualified actuaries, are charged to the profit and loss account so as to spread the cost over the service lives of employees in the schemes in such a way that the pension cost is a substantially level percentage of current and expected future pensionable payroll. For the funded schemes, the assets of the schemes are held separately from those of the principal employer. For the unfunded schemes, no contributions are made by either employees or the employer to a separate pension fund but a provision is recorded on the balance sheet to recognise the accrued liability of the Group to date.
The Group also supports a number of defined contribution pension schemes where the benefits are based on the level of contributions paid. Costs arising from these schemes are charged to the profit and loss account in the period to which they relate.
Deferred taxation
Deferred tax is provided in full on all timing differences which result in an obligation at the balance sheet date to pay more tax, or a right to pay less tax, at a future date, at rates expected to apply when they crystallise based on current tax rates and law. Timing differences arise from the inclusion of items of income and expenditure in taxation computations in periods different from those in which they are included in the financial statements. Deferred tax assets are recognised to the extent that it is regarded as more likely than not that they will be recovered. Deferred tax assets and liabilities are not discounted.
Financial instruments – Debt instruments
Debt instruments are stated at the amount of net proceeds received. Financing costs are amortised over the term of the debt to ensure a constant rate of charge.
Criteria to qualify for hedge accounting
The Group considers its derivative financial instruments to be hedges when certain criteria are met. For foreign currency derivatives, the instrument must be related to actual foreign currency assets or liabilities or a probable commitment and whose characteristics have been identified. It must involve the same currency or similar currencies as the hedged item and must also reduce the risk of foreign currency exchange movements on the Group’s operations. For interest rate derivatives, the instrument must be related to assets or liabilities or a probable commitment, such as a future bond issue, and must also change the interest rate or the nature of the interest rate by converting a fixed rate to a variable rate or vice versa.
F-12
Back to Contents
mmO2 GROUP
NOTES TO THE CONSOLIDATED FINANCIAL STATEMENTS
| 1. | Accounting policies (Continued) |
Accounting for derivative financial instruments
Interest differentials, under interest rate swap agreements used to vary the amounts and periods for which interest rates on borrowings are fixed, are recognised by adjustment of interest payable.
The forward exchange contracts used to change the currency mix of net debt are revalued to balance sheet rates with net unrealised gains and losses being shown as part of debtors or creditors. The difference between spot and forward rate for these contracts is recognised as part of net interest payable over the term of the contract.
The forward exchange contracts hedging transaction exposures are revalued at the prevailing forward rate on the balance sheet date with net unrealised gains and losses being shown as debtors and creditors.
Leases and hire purchase contracts
Rentals under operating leases are charged to the profit and loss account in equal annual amounts over the periods of the leases.
Assets held under finance leases and hire purchase contracts are capitalised at their fair value on the inception of the leases and depreciated over the shorter of the period of the lease and the estimated useful economic lives of the assets. The finance charges are allocated over the period of the lease in proportion to the capital amount outstanding and are charged to the profit and loss account.
The Group’s operations have been divided internally into three classes of business, in line with day-to-day managerial and budgetary control:
| 1) | the supply of mobile telecommunications services and products; |
| | |
| 2) | the provision of mobile internet services; and |
| | |
| 3) | other businesses, which comprises Airwave, a terrestrial trunked radio business, and Manx Telecom, the fixed and mobile telecommunications business in the Isle of Man. |
Mobile telecommunications services mainly derives its turnover from the calls made and received by its customers using mobile telephones, from subscription fees charged to its contract customers and from handset equipment sales. Mobile internet services generate revenues through advertising, provision of content and application and from e-commerce and m-commerce activities.
F-13
Back to Contents
mmO2 GROUP
NOTES TO THE CONSOLIDATED FINANCIAL STATEMENTS
| 2. | Segmental analysis (Continued) |
| | |
| | | Total
turnover | | Group
turnover | | Depreciation,
amortisation
and
impairment1 | | Operating
profit/(loss)
of associates
and joint
ventures | | Total
operating
profit/(loss) | |
| | |
|
| |
|
| |
|
| |
|
| |
|
| |
| | | £m | | £m | | £m | | £m | | £m | |
Year ended 31 March 2003 | | | | | | | | | | | | | | | | |
| Mobile telecommunications | | | | | | | | | | | | | | | | |
| UK | | | 3,171 | | | 3,025 | | | 2,953 | | | 5 | | | (2,111 | ) |
| Germany | | | 1,060 | | | 1,060 | | | 5,006 | | | — | | | (4,979 | ) |
| Other countries | | | 705 | | | 705 | | | 1,609 | 2 | | — | | | (1,451 | ) |
| | |
|
| |
|
| |
|
| |
|
| |
|
| |
Total mobile telecommunications | | | 4,936 | | | 4,790 | | | 9,568 | | | 5 | | | (8,541 | ) |
| Mobile internet services | | | | | | | | | | | | | | | | |
| UK | | | 93 | | | 93 | | | 49 | | | — | | | (122 | ) |
| Other businesses | | | | | | | | | | | | | | | | |
| UK | | | 64 | | | 64 | | | 19 | | | — | | | (23 | ) |
| Central overheads and adjustments | | | — | | | — | | | 1 | | | — | | | (87 | ) |
| Inter-segment eliminations | | | (73 | ) | | (73 | ) | | — | | | — | | | — | |
| | |
|
| |
|
| |
|
| |
|
| |
|
| |
Group total | | | 5,020 | | | 4,874 | | | 9,637 | | | 5 | | | (8,773 | ) |
| | |
|
| |
|
| |
|
| |
|
| |
|
| |
Year ended 31 March 2002 | | | | | | | | | | | | | | | | |
| Mobile telecommunications | | | | | | | | | | | | | | | | |
| UK | | | 2,887 | | | 2,756 | | | 548 | | | 8 | | | 44 | |
| Germany | | | 875 | | | 875 | | | 277 | | | — | | | (472 | ) |
| Other countries | | | 595 | | | 595 | | | 280 | | | — | | | (221 | ) |
| | |
|
| |
|
| |
|
| |
|
| |
|
| |
Total mobile telecommunications | | | 4,357 | | | 4,226 | | | 1,105 | | | 8 | | | (649 | ) |
| Mobile internet services | | | | | | | | | | | | | | | | |
| UK | | | 100 | | | 100 | | | 25 | | | — | | | (103 | ) |
| Other businesses | | | | | | | | | | | | | | | | |
| UK | | | 54 | | | 54 | | | 9 | | | — | | | (22 | ) |
| Central overheads and adjustments | | | — | | | — | | | — | | | — | | | (74 | ) |
| Inter-segment eliminations | | | (104 | ) | | (104 | ) | | — | | | — | | | — | |
| | |
|
| |
|
| |
|
| |
|
| |
|
| |
Group total | | | 4,407 | | | 4,276 | | | 1,139 | | | 8 | | | (848 | ) |
| | |
|
| |
|
| |
|
| |
|
| |
|
| |
F-14
Back to Contents
mmO2 GROUP
NOTES TO THE CONSOLIDATED FINANCIAL STATEMENTS
| 2. | Segmental analysis (Continued) |
| | |
| | | Total
turnover | | Group
turnover | | Depreciation,
amortisation
and
impairment | | Operating
profit/(loss)
of associates
and joint
ventures | | Total
operating
profit/(loss) | |
| | |
|
| |
|
| |
|
| |
|
| |
|
| |
| | | £m | | £m | | £m | | £m | | £m | |
Year ended 31 March 2001 | | | | | | | | | | | | | | | | |
| Mobile telecommunications | | | | | | | | | | | | | | | | |
| UK | | | 2,881 | | | 2,706 | | | 431 | | | 17 | | | 141 | |
| Germany | | | 390 | | | 65 | | | 2,858 | 3 | | (285 | ) | | (3,159 | ) |
| Other countries | | | 411 | | | 399 | | | 182 | | | (18 | ) | | (205 | ) |
| | |
|
| |
|
| |
|
| |
|
| |
|
| |
Total mobile telecommunications | | | 3,682 | | | 3,170 | | | 3,471 | | | (286 | ) | | (3,223 | ) |
| Mobile internet services | | | | | | | | | | | | | | | | |
| UK | | | 15 | | | 15 | | | 5 | | | — | | | (148 | ) |
| Other businesses | | | | | | | | | | | | | | | | |
| UK | | | 47 | | | 47 | | | 5 | | | — | | | (17 | ) |
| Central overheads and adjustments | | | (14 | ) | | (14 | ) | | — | | | — | | | (44 | ) |
| Inter-segment eliminations | | | (18 | ) | | (18 | ) | | — | | | — | | | (18 | ) |
| | |
|
| |
|
| |
|
| |
|
| |
|
| |
Group total | | | 3,712 | | | 3,200 | | | 3,481 | | | (286 | ) | | (3,450 | ) |
| | |
|
| |
|
| |
|
| |
|
| |
|
| |
| 1 | In the year ended 31 March 2003, the exceptional depreciation, amortisation and impairment charged to total operating profit of £8,300 million comprised a charge of £2,401 million in respect of impairment of goodwill and £5,899 million in respect of telecommunication licences and investments held in the Group’s businesses. Further details are disclosed in note 12. |
| 2 | Excludes non-operating exceptional impairment charge of £1,364 million relating to the sale of O2 Netherlands as disclosed in note 12. |
| 3 | Includes exceptional charges of £2,800 million in respect of impairment of goodwill and £21 million IT integration costs written off related to O2 Germany. |
Turnover is based on the country of invoice origination, which is not materially different to turnover by destination. Other countries include the Netherlands and Ireland. Central overheads and adjustments includes central costs, eliminations and other consolidation adjustments.
F-15
Back to Contents
mmO2 GROUP
NOTES TO THE CONSOLIDATED FINANCIAL STATEMENTS
| 2. | Segmental analysis (Continued) |
| | |
| | | | | | | Net operating | | Associates | |
| | | Capital | | Tangible | | assets/ | | and joint | |
| | | expenditure1 | | fixed assets | | (liabilities)2 | | ventures | |
| | |
|
| |
|
| |
|
| |
|
| |
| | | £m | | £m | | £m | | £m | |
Year ended and as at 31 March 2003 | | | | | | | | | | | | | |
| Mobile telecommunications | | | | | | | | | | | | | |
| UK | | | 362 | | | 2,111 | | | 6,226 | | | — | |
| Germany | | | 141 | | | 1,072 | | | 3,203 | | | — | |
| Other countries | | | 116 | | | 288 | | | 1,198 | | | — | |
| | |
|
| |
|
| |
|
| |
|
| |
| Total mobile telecommunications | | | 619 | | | 3,471 | | | 10,627 | | | — | |
| Mobile internet services | | | | | | | | | | | | | |
| UK | | | 17 | | | 48 | | | 20 | | | — | |
| Other businesses | | | | | | | | | | | | | |
| UK | | | 170 | | | 353 | | | 295 | | | — | |
| Corporate assets and adjustments | | | 1 | | | 3 | | | (109 | ) | | — | |
| | |
|
| |
|
| |
|
| |
|
| |
Group total | | | 807 | | | 3,875 | | | 10,833 | | | — | |
| | |
|
| |
|
| |
|
| |
|
| |
Year ended and as at 31 March 2002 | | | | | | | | | | | | | |
| Mobile telecommunications | | | | | | | | | | | | | |
| UK | | | 611 | | | 2,219 | | | 8,857 | | | 34 | |
| Germany | | | 248 | | | 1,065 | | | 7,183 | | | — | |
| Other countries | | | 180 | | | 540 | | | 3,567 | | | — | |
| | |
|
| |
|
| |
|
| |
|
| |
| Total mobile telecommunications | | | 1,039 | | | 3,824 | | | 19,607 | | | 34 | |
| Mobile internet services | | | | | | | | | | | | | |
| UK | | | 42 | | | 65 | | | 46 | | | — | |
| Other businesses | | | | | | | | | | | | | |
| UK | | | 95 | | | 202 | | | 161 | | | — | |
| Corporate assets and adjustments | | | — | | | 3 | | | (36 | ) | | — | |
| | |
|
| |
|
| |
|
| |
|
| |
Group total | | | 1,176 | | | 4,094 | | | 19,778 | | | 34 | |
| | |
|
| |
|
| |
|
| |
|
| |
Year ended and as at 31 March 2001 | | | | | | | | | | | | | |
| Mobile telecommunications | | | | | | | | | | | | | |
| UK | | | 720 | | | 2,012 | | | 9,114 | | | 33 | |
| Germany | | | 56 | | | 1,071 | | | 7,385 | | | — | |
| Other countries | | | 240 | | | 485 | | | 2,856 | | | — | |
| | |
|
| |
|
| |
|
| |
|
| |
| Total mobile telecommunications | | | 1,016 | | | 3,568 | | | 19,355 | | | 33 | |
| Mobile internet services | | | | | | | | | | | | | |
| UK | | | 48 | | | 44 | | | 12 | | | — | |
| Other businesses | | | | | | | | | | | | | |
| UK | | | 70 | | | 115 | | | 232 | | | — | |
| Corporate assets and adjustments | | | — | | | — | | | (92 | ) | | — | |
| | |
|
| |
|
| |
|
| |
|
| |
Group total | | | 1,134 | | | 3,727 | | | 19,691 | | | 33 | |
| | |
|
| |
|
| |
|
| |
|
| |
| 1 | Capital expenditure comprises tangible fixed asset additions. |
| 2 | Net operating assets comprise tangible and intangible fixed assets (including goodwill), stocks, debtors, creditors (excluding debt) falling due within and after one year and provisions (excluding deferred tax). |
F-16
Back to Contents
mmO2 GROUP
NOTES TO THE CONSOLIDATED FINANCIAL STATEMENTS
| 2. | Segmental analysis (Continued) |
The Group’s share of the turnover and operating losses of joint ventures included in the above geographical analysis is as follows:
| | | Year ended 31 March
| |
| | | 2003 | | 2002 | | 2001 | |
| | |
|
| |
|
| |
|
| |
| | | £m | | £m | | £m | |
| Share of turnover | | | | | | | | | | |
| Germany | | | — | | | — | | | 325 | |
| Other | | | — | | | — | | | 12 | |
| | |
|
| |
|
| |
|
| |
Total | | | — | | | — | | | 337 | |
| | |
|
| |
|
| |
|
| |
| Share of operating losses | | | | | | | | | | |
| Germany | | | — | | | — | | | (285 | ) |
| Other | | | — | | | — | | | (18 | ) |
| | |
|
| |
|
| |
|
| |
Total | | | — | | | — | | | (303 | ) |
| | |
|
| |
|
| |
|
| |
The Group’s share of turnover and operating losses of joint ventures for the year ended 31 March 2001 includes the results of O2 Germany for the 14 months ended 20 February 2001. For the three months ended 31 March 2000 the Group’s share of O2 Germany’s turnover and operating loss was £61 million and £39 million, respectively.
F-17
Back to Contents
mmO2 GROUP
NOTES TO THE CONSOLIDATED FINANCIAL STATEMENTS
| 2. | Segmental analysis (Continued) |
| | | Year ended 31 March
| |
| | | 2003 | | 2002 | | 2001 | |
| | |
|
| |
|
| |
|
| |
| | | £m | | £m | | £m | |
| Mobile telecommunications | | | | | | | | | | |
| Service turnover | | | | | | | | | | |
| UK | | | 2,738 | | | 2,426 | | | 2,207 | |
| Germany | | | 944 | | | 696 | | | 45 | |
| Other | | | 645 | | | 550 | | | 216 | |
| | |
|
| |
|
| |
|
| |
Total service turnover | | | 4,327 | | | 3,672 | | | 2,468 | |
| | |
|
| |
|
| |
|
| |
| Equipment turnover | | | | | | | | | | |
| UK | | | 190 | | | 136 | | | 222 | |
| Germany | | | 94 | | | 127 | | | 13 | |
| Other | | | 33 | | | 28 | | | 27 | |
| | |
|
| |
|
| |
|
| |
Total equipment turnover | | | 317 | | | 291 | | | 262 | |
| | |
|
| |
|
| |
|
| |
| Other turnover | | | | | | | | | | |
| UK | | | 97 | | | 194 | | | 277 | |
| Germany | | | 22 | | | 52 | | | 7 | |
| Other | | | 27 | | | 17 | | | 156 | |
| | |
|
| |
|
| |
|
| |
Total other turnover | | | 146 | | | 263 | | | 440 | |
| | |
|
| |
|
| |
|
| |
Total mobile telecommunications turnover | | | 4,790 | | | 4,226 | | | 3,170 | |
| | |
|
| |
|
| |
|
| |
| Mobile internet services | | | | | | | | | | |
| UK | | | 93 | | | 100 | | | 15 | |
| Other businesses | | | | | | | | | | |
| UK | | | 64 | | | 54 | | | 47 | |
| Less segmental eliminations | | | (73 | ) | | (104 | ) | | (32 | ) |
| | |
|
| |
|
| |
|
| |
Group turnover | | | 4,874 | | | 4,276 | | | 3,200 | |
| | |
|
| |
|
| |
|
| |
| | | 2003 | | 2002 | | 2001 | |
| | |
|
| |
|
| |
|
| |
| | | £m | | £m | | £m | |
| Group turnover | | | 4,874 | | | 4,276 | | | 3,200 | |
| Cost of sales | | | (3,060 | ) | | (2,714 | ) | | (1,814 | ) |
| | |
|
| |
|
| |
|
| |
| Gross profit | | | 1,814 | | | 1,562 | | | 1,386 | |
| Administrative expenses | | | (10,592 | ) | | (2,418 | ) | | (4,550 | ) |
| | | | | | | | | | | |
| Administrative expenses before exceptional items | | | (2,292 | ) | | (2,268 | ) | | (1,729 | ) |
| | |
| Exceptional items | | | (8,300 | ) | | (150 | ) | | (2,821 | ) |
| | |
|
| |
|
| |
|
| |
Group operating loss | | | (8,778 | ) | | (856 | ) | | (3,164 | ) |
| | |
|
| |
|
| |
|
| |
Net operating expenses comprise cost of sales and administrative expenses (including exceptional items) and total £13,652 million in 2003 (2002: £5,132 million, 2001: £6,364 million).
F-18
Back to Contents
mmO2 GROUP
NOTES TO THE CONSOLIDATED FINANCIAL STATEMENTS
| 3. | Net operating expenses (Continued) |
On 14 April 2003, the Group announced the sale of O2 Netherlands, its wholly owned Dutch subsidiary, to Greenfield Capital Partners, for a consideration of €25 million. At the date of approval of these financial statements, 20 May 2003, final competition clearance from the Dutch competition commission had not been received. The sale was completed on 3 June 2003. In accordance with FRS 3 “Reporting financial performance”, the results of O2 Netherlands for the three years ended 31 March 2001, 2002 and 2003 are classified as “discontinuing” as a component within continuing operations above and are analysed below:
| | | Year ended 31 March
| |
| | | 2003 | | 2002 | | 2001 | |
| | |
|
| |
|
| |
|
| |
| | | £m | | £m | | £m | |
| Turnover | | | 263 | | | 200 | | | 90 | |
| Cost of sales | | | (206 | ) | | (195 | ) | | (92 | ) |
| | |
|
| |
|
| |
|
| |
| Gross profit | | | 57 | | | 5 | | | (2 | ) |
| Administrative expenses | | | (143 | ) | | (138 | ) | | (109 | ) |
| | | | | | | | | | | |
| Administrative expenses before exceptional items | | | (143 | ) | | (126 | ) | | (109 | ) |
| | | | | | | | | | | |
| Exceptional items | | | — | | | (12 | ) | | — | |
| | |
|
| |
|
| |
|
| |
Operating loss | | | (86 | ) | | (133 | ) | | (111 | ) |
| | |
|
| |
|
| |
|
| |
The figures reported in 2001 as discontinuing operations represent the results of O2 Netherlands from 30 June 2001. This is the date from which O2 Netherlands has been accounted for as a wholly owned subsidiary of the Group.
Provision for the loss on disposal of O2 Netherlands of £1,364 million has been charged as an exceptional item below Group operating loss in accordance with FRS 3. The remaining carrying value of O2 Netherlands is equal to the sales proceeds of €25 million less direct costs relating to the sale. No provision has been made for operating losses that may be incurred by O2 Netherlands from 1 April 2003 to the date of completion of the disposal.
F-19
Back to Contents
mmO2 GROUP
NOTES TO THE CONSOLIDATED FINANCIAL STATEMENTS
Group operating loss is stated after charging/(crediting):
| | | Year ended 31 March
| |
| | | 2003 | | 2002 | | 2001 | |
| | |
|
| |
|
| |
|
| |
| | | £m | | £m | | £m | |
| Depreciation of tangible fixed assets: | | | | | | | | | | |
| Owned | | | 907 | | | 677 | | | 358 | |
| Held under hire purchase contracts | | | 25 | | | 70 | | | 4 | |
| Amortisation of intangible fixed assets (before impairment): | | | | | | | | | | |
| Goodwill | | | 374 | | | 369 | | | 287 | |
| Other | | | 31 | | | 23 | | | 11 | |
| Rentals under operating leases: | | | | | | | | | | |
| Hire of plant and machinery | | | 48 | | | 64 | | | 1 | |
| Other operating leases | | | 135 | | | 108 | | | 14 | |
| Advertising costs | | | 195 | | | 198 | | | 92 | |
| Staff costs (note 7) | | | 521 | | | 570 | | | 342 | |
| Own work capitalised | | | (62 | ) | | (121 | ) | | (63 | ) |
| Loss on disposal of fixed assets | | | 8 | | | 9 | | | 4 | |
| Research and development | | | 9 | | | 8 | | | 3 | |
| Exceptional items: | | | | | | | | | | |
| Impairment of intangible assets (note 12) | | | 8,300 | | | — | | | 2,800 | |
| Costs relating to demerger from BT | | | — | | | 27 | | | — | |
| Costs relating to business closure and reorganisation | | | — | | | 123 | | | — | |
Write-off of O2 Germany IT systems relating to integration | | | — | | | — | | | 21 | |
| | |
|
| |
|
| |
|
| |
Exceptional items shown above for the year ended 31 March 2003 relate to the impairment of fixed assets in the Group’s operating businesses in the UK, Germany and Ireland. Further details are provided in note 12. In the year ended 31 March 2002 the exceptional reorganisation costs related to the restructuring of the UK and German operations post demerger and include £87 million in respect of redundancy costs. The exceptional items charged in 2002 gave rise to a cash outflow of £27 million in that year. An impairment of goodwill relating to O2 Germany was recognised in 2001. The impairments recognised in 2003 and 2001 do not result in any cash flows.
F-20
Back to Contents
mmO2 GROUP
NOTES TO THE CONSOLIDATED FINANCIAL STATEMENTS
The aggregate fees paid to auditors during the year for audit and other services is analysed below:
| | | Year ended 31 March
| |
| | | 2003 | | 2002 | | 2001 | |
| | |
|
| |
|
| |
|
| |
| | | £000 | | £000 | | £000 | |
| Statutory audit fees: | | | | | | | | | | |
| UK | | | 500 | | | 500 | | | 600 | |
| Other countries | | | 500 | | | 400 | | | 600 | |
| | |
|
| |
|
| |
|
| |
| | | | 1,000 | | | 900 | | | 1,200 | |
| | |
|
| |
|
| |
|
| |
| Non-audit fees: | | | | | | | | | | |
| Accounting and assurance | | | 614 | | | 394 | | | 200 | |
| Merger and acquisition | | | 90 | | | — | | | — | |
| Tax advisory | | | 296 | | | 22 | | | — | |
| Systems implementation | | | 176 | | | — | | | — | |
| | |
|
| |
|
| |
|
| |
| | | | 1,176 | | | 416 | | | 200 | |
| | |
|
| |
|
| |
|
| |
The audit fees for the Company were £10,000 (2002: £10,000).
The emoluments of the Directors for the year ended 31 March 2003 and the benefits received under long-term incentive plans were, in summary, as follows:
| | | Year ended 31 March
| |
| | | 2003 | | 2002 | | 2001 | |
| | |
|
| |
|
| |
|
| |
| | | £000 | | £000 | | £000 | |
| Salaries | | | 1,408 | | | 1,078 | | | 390 | |
Performance related bonus(1) | | | 593 | | | 545 | | | 306 | |
Gains under long-term incentive plans(2)(3) | | | 158 | | | — | | | — | |
| Other benefits | | | 102 | | | 69 | | | 25 | |
| | |
|
| |
|
| |
|
| |
| | | | 2,261 | | | 1,692 | | | 721 | |
| Payments to non-executive Directors | | | 251 | | | 147 | | | — | |
| | |
|
| |
|
| |
|
| |
Total emoluments | | | 2,512 | | | 1,839 | | | 721 | |
| | |
|
| |
|
| |
|
| |
| | | | | | | | | | | |
| (1) | Includes £150,000 paid by BT in 2002 in respect of David Varney’s contribution to the successful demerger. |
| (2) | In addition to the emoluments disclosed above, in 2002 an additional £186,880 was paid as a result of the early vesting of the BT Cellnet long-term incentive plan as a result of the demerger. |
| (3) | In 2003, represents gains on vesting of 1997 Executive Share Award and vesting of Restricted Share Award. |
During the year, two Directors (2002: two) accrued retirement benefits under the Group’s UK defined benefit pension plan. In addition, contributions of £77,875 (2002: £43,167) in respect of one Director (2002: one) were paid to a defined contribution pension plan.
More detailed information concerning Directors’ remuneration, shareholdings, pension entitlement, share options and other long-term incentive plans is shown in the report on Directors’ remuneration in “Directors, Senior Management and Employees — B. Compensation — Directors’ Remuneration” in Item 6.
F-21
Back to Contents
mmO2 GROUP
NOTES TO THE CONSOLIDATED FINANCIAL STATEMENTS
| | | Year ended 31 March
| |
| | | 2003 | | 2002 | | 2001 | |
| | |
|
| |
|
| |
|
| |
| | | No. | | No. | | No. | |
| Average number of full time employee equivalents (including Executive Directors) by class of business: | | | | | | | | | | |
| Mobile telecommunications | | | 11,643 | | | 13,999 | | | 13,731 | |
| Mobile internet services | | | 269 | | | 307 | | | 138 | |
| Other businesses | | | 866 | | | 810 | | | 474 | |
| | |
|
| |
|
| |
|
| |
Total employees | | | 12,778 | | | 15,116 | | | 14,343 | |
| | |
|
| |
|
| |
|
| |
| Average number of full time employee equivalents (including Executive Directors) by geographic area: | | | | | | | | | | |
| UK | | | 7,081 | | | 8,750 | | | 7,746 | |
| Germany | | | 3,527 | | | 4,084 | | | 4,046 | |
| Other | | | 2,170 | | | 2,282 | | | 2,551 | |
| | |
|
| |
|
| |
|
| |
Total employees | | | 12,778 | | | 15,116 | | | 14,343 | |
| | |
|
| |
|
| |
|
| |
The costs incurred in respect of these employees were:
| | | Year ended 31 March
| |
| | | 2003 | | 2002 | | 2001 | |
| | |
|
| |
|
| |
|
| |
| | | £m | | £m | | £m | |
| Wages and salaries | | | 446 | | | 483 | | | 291 | |
| Social security costs | | | 47 | | | 59 | | | 26 | |
| Employee share ownership scheme | | | 4 | | | 2 | | | 2 | |
| Pension costs (note 8) | | | 24 | | | 26 | | | 23 | |
| | |
|
| |
|
| |
|
| |
Total staff costs | | | 521 | | | 570 | | | 342 | |
| | |
|
| |
|
| |
|
| |
At 31 March 2003, the Group employed 12,476 (2002: 14,300) full time employee equivalents.
The Group operates a number of employee incentive schemes including a sharesave plan, a share ownership plan and various executive and employee option schemes. Full details are disclosed in “Directors, Senior Management and Employees — E. Share Ownership — Share Options and Purchase Schemes” in Item 6.
| | | Year ended 31 March
| |
| | | 2003 | | 2002 | | 2001 | |
| | |
|
| |
|
| |
|
| |
| | | £m | | £m | | £m | |
mmO2 Pension Plan cost | | | 12 | | | — | | | — | |
| Contributions to the BT Pension Scheme | | | 4 | | | 20 | | | 20 | |
| Other defined benefit schemes | | | 4 | | | 4 | | | 2 | |
| Defined contribution schemes | | | 4 | | | 2 | | | 1 | |
| | |
|
| |
|
| |
|
| |
| | | | 24 | | | 26 | | | 23 | |
| | |
|
| |
|
| |
|
| |
F-22
Back to Contents
mmO2 GROUP
NOTES TO THE CONSOLIDATED FINANCIAL STATEMENTS
| 8. | Pension costs (Continued) |
The Group operates a number of pension schemes in its businesses. All the Group’s pension schemes are provided through either defined benefit or defined contribution arrangements. Defined benefit schemes generally provide pensions based on the employee’s length of service and their final pensionable salary. Defined contribution schemes offer employees individual funds which are converted into pension benefits on retirement. The majority of the schemes’ assets are held independently of the Group’s finances.
This plan is divided into defined benefit and defined contribution sections, as discussed below.
In the UK, until 30 June 2002, the Group was a participating employer in the BT Pension Scheme (BTPS), a funded defined benefit pension scheme which is the principal pension scheme of BT. The BTPS is closed to new members. Prior to the demerger from BT, certain employees of the Group were eligible to participate in this scheme. While participating the Group paid to the BTPS a predetermined percentage of the pensionable payroll costs of those Group employees who were members of the scheme. These costs have been charged in the period to which they relate.
A formal actuarial valuation of the BTPS was performed as at 31 December 1999. Another formal actuarial valuation is due at 31 December 2002. Details of the financial position of the BTPS and further information regarding the scheme are contained in the financial statements of BT Group plc.
On 1 July 2002 the mmO2 Pension Plan (mmO2 PP), a new pension plan (with defined benefit and defined contribution sections), was established for employees in the United Kingdom by the Group in accordance with the Separation Agreement relating to the demerger of the Group from BT. The defined contribution section is covered below. Any active member of the BTPS employed by the Group could join a defined benefit section of, and elect to transfer their past service liability from the BTPS to, the new plan. The vast majority of those eligible to transfer elected to do so. The benefits of all deferred and pensioner members at 30 June 2002 remain in the BTPS.
A share of the assets of the BTPS, determined on the basis of the past service liabilities of the members electing to transfer their benefits to the new plan, were transferred to the mmO2 PP on 17 March 2003.
From 1 July 2002, the Group has been the principal employer of the mmO2 PP. The pension costs have been assessed in accordance with the advice of a qualified actuary using the projected unit method. The defined benefits sections of the mmO2 PP are closed to new entrants and therefore the current service cost is likely to increase as the members approach retirement. The principal assumptions used to determine the pension cost for the period from 1 July 2002 are:
| | | mmO2 PP
% | |
| | |
|
| |
| Nominal rate of increase in salaries | | | 4.25% p.a. | |
| Nominal rate of increase of pensions in payment | | | 2.50% p.a. | |
| Investment return pre retirement | | | 6.50% p.a. | |
| Investment return post retirement | | | 6.00% p.a. | |
| Inflation assumption | | | 2.50% p.a. | |
| | |
|
| |
F-23
Back to Contents
mmO2 GROUP
NOTES TO THE CONSOLIDATED FINANCIAL STATEMENTS
| 8. | Pension costs (Continued) |
The first full actuarial valuation of the mmO2 PP will have an effective date of 30 June 2003. An initial report has been completed recommending an interim contribution rate and having an effective date of 1 July 2002. The employer contribution rate has been set at 11.6 per cent of pensionable salaries. This rate will be reviewed as part of the first full valuation. On the inception of the mmO2 PP at 1 July 2002 no assets or benefits had accrued to members in the new scheme. Following the confirmation of the members electing to transfer their liabilities from the BTPS, a funding level of 99 per cent as at 1 July 2002 was assessed. The transfer of assets to the mmO2 PP to cover the liabilities of the members electing to transfer was completed on 17 March 2003 and the actual funding level has declined from 99 per cent owing to the fall in the UK equity market over that period.
The difference between the assets and liabilities has been amortised over the expected future working life of the active membership using the straight line method and included in the cost.
Other defined benefit pension schemes |
The Group also operates funded defined benefit pension schemes in the Netherlands and in the Isle of Man. The combined cost under SSAP 24 charged in the year for these schemes was £3 million (2002: £2 million). At 31 March 2003, the Netherlands scheme had 693 active members (2002: 851 active members), and the Isle of Man scheme had 409 members of whom 264 were active (2002: 403 members of whom 274 were active). The Isle of Man scheme was closed to new entrants on 30 June 2002. A defined contribution scheme is available for new employees.
The sale of O2 Netherlands to Greenfield Capital Partners was announced on 14 April 2003. The assets and liabilities of the O2 Netherlands pension scheme are included in the disposal.
The aggregate market value of the assets of these schemes as at 31 March 2003 was £21 million (2002: £25 million).
The Group operates an unfunded defined benefit pension scheme in the UK. A provision, determined in accordance with SSAP 24, is recorded on the balance sheet to recognise the accrued liability to date for this scheme.
The provision recorded at 31 March 2003 for the unfunded scheme was £5 million (2002: £4 million). The cost charged for the scheme for the year was £1 million (2002: £1 million). At 31 March 2003, the scheme had 23 members, of whom 22 were active (2002: 24 members, all of whom were active).
In Germany the Group operates a number of defined benefit schemes. Until May 2001 the O2 Germany main scheme was unfunded. This scheme has been changed to a funded arrangement with payments being made to provide for previously unfunded liabilities over the period to the active members’ retirements. The vast majority of members of the O2 Germany main scheme are now accruing benefits under the defined contribution arrangement. The other defined benefit schemes are unfunded. A provision of £7 million (2002: £5 million) is recorded on the balance sheet to recognise the liabilities of the defined benefit schemes. At 31 March 2003 the German schemes had 3,742 members (2002: 4,294 members).
F-24
Back to Contents
mmO2 GROUP
NOTES TO THE CONSOLIDATED FINANCIAL STATEMENTS
| 8. | Pension costs (Continued) |
Defined contribution schemes |
The mmO2 PP has a defined contribution section. Prior to 1 July 2002, the Group participated in the BT Retirement Plan (BTRP), a defined contribution scheme established by BT with effect from 1 April 2001 for employees and certain employees of its subsidiaries who were not eligible to join the BTPS. Members of the BTRP could elect to transfer their funds under management into the new mmO2 Plan (defined contribution section) on its inception. These funds were transferred on 14 March 2003. The cost for the year to 31 March 2003 was £1 million.
The Group also operates defined contribution schemes in Ireland and Germany. The cost for the year to 31 March 2003 was £1 million in Ireland and £2 million in Germany.
The assets of the defined contribution arrangements are held separately from those of the Group in independently administered funds. There were no contributions outstanding or pre-paid at the year end.
In accordance with the transitional arrangements of FRS 17 “Retirement benefits”, certain information regarding the Group’s pension arrangements are disclosed below. No comparative information is presented at the end of last year in respect of the mmO2 PP as it was established during the current year, although information is provided at 1 July 2002, the date of inception of the Plan.
The initial actuarial valuation of the mmO2 PP (including the subsequent assessment of the assets and liabilities transferred from the BTPS) has been updated to 31 March 2003 by an independent qualified actuary in accordance with the transitional arrangements of FRS 17. In accordance with FRS 17, the defined benefit liabilities have been measured using the projected unit method. Plan assets are stated at their market value.
| | | 31 March
| | 1 July
| |
Main assumptions under FRS 17 | | 2003 | | 2002 | |
| | |
|
| |
|
| |
| | | mmO2 PP | | mmO2 PP | |
| | | | | | | | |
| Nominal rate of increase in salaries | | | 3.75 | % | | 4.20 | % |
| Nominal rate of increase of pensions in payment | | | | | | | |
| – Pension increases with inflation | | | 2.50 | % | | 2.70 | % |
| – Pension increases with inflation limited to 5% p.a. | | | 2.40 | % | | 2.70 | % |
| Discount rate | | | 5.80 | % | | 6.00 | % |
| Inflation assumption | | | 2.50 | % | | 2.70 | % |
| Expected long-term return for: | | | | | | | |
| – Equities | | | 7.50 | % | | 7.70 | % |
| – Other | | | 3.80 | % | | — | |
| | |
|
| |
|
| |
The assumptions, adopted for FRS 17 purposes, for the other defined benefit schemes around the Group are consistent with those used for the mmO2 PP.
F-25
Back to Contents
mmO2 GROUP
NOTES TO THE CONSOLIDATED FINANCIAL STATEMENTS
| 8. | Pension costs (Continued) |
The assets and liabilities of the defined benefit pension schemes are:
| | | | | 31 March | | | | 31 March | |
| | | 31 March | | 2003 | | 1 July | | 2002 | |
| | | 2003 | | other | | 2002 | | other | |
| | | mmO2 PP | | schemes | | mmO2 PP | | schemes | |
| | |
|
| |
|
| |
|
| |
|
| |
| | | £m | | £m | | £m | | £m | |
| Fair value of assets comprises: | | | | | | | | | | | | | |
| – Equities | | | 177 | | | 11 | | | 227 | | | 16 | |
| – Bonds | | | — | | | 10 | | | — | | | 6 | |
| – Other | | | 20 | | | — | | | — | | | 1 | |
| | |
|
| |
|
| |
|
| |
|
| |
| Fair value of assets | | | 197 | | | 21 | | | 227 | | | 23 | |
| Present value of liabilities | | | (268 | ) | | (39 | ) | | (259 | ) | | (36 | ) |
| | |
|
| |
|
| |
|
| |
|
| |
| Deficit | | | (71 | ) | | (18 | ) | | (32 | ) | | (13 | ) |
| Related deferred tax asset | | | 21 | | | 5 | | | 10 | | | 4 | |
| | |
|
| |
|
| |
|
| |
|
| |
| Net pension liability | | | (50 | ) | | (13 | ) | | (22 | ) | | (9 | ) |
| | |
|
| |
|
| |
|
| |
|
| |
The fair value of the assets of the mmO2 PP at 30 April 2003 were approximately £215 million.
Under FRS 17, the mmO2 PP would be represented on the balance sheet as a liability of £71 million (£50 million net of deferred tax).
The following table sets out the amounts which would be charged to the profit and loss account and statement of total recognised gains and losses in accordance with the requirements of FRS 17. For the mmO2 PP, the amount charged for the period from 1 April 2002 to 30 June 2002 is the contributions paid to the BTPS of £4 million and is in addition to charges shown below.
| | | Period from | | | | |
| | | 1 July 2002 to | | Year ended | |
| | | 31 March 2003 | | 31 March 2003 | |
| | | mmO2 PP | | other schemes | |
| | |
|
| |
|
| |
| | | £m | | £m | |
| Analysis of the amount charged to operating loss: | | | | | | | |
| Current service cost (employers’) | | | 14 | | | 3 | |
| Vested past service cost | | | — | | | (1 | ) |
| | |
|
| |
|
| |
| Total operating charge | | | 14 | | | 2 | |
| | |
|
| |
|
| |
| Analysis of the amount credited/(charged) to other finance income: | | | | | | | |
| Expected return on pension plan scheme assets | | | 14 | | | 1 | |
| Interest on pension plan liabilities | | | (12 | ) | | (2 | ) |
| | |
|
| |
|
| |
| Net return | | | 2 | | | (1 | ) |
| | |
|
| |
|
| |
| Analysis of the amount recognised in the statement of total recognised gains and losses: | | | | | | | |
Actual return less expected return on pension plan assets1 | | | (62 | ) | | (7 | ) |
| Experience gains and losses arising on plan liabilities | | | (4 | ) | | 2 | |
| Changes in assumptions underlying the present value of plan liabilities | | | 26 | | | — | |
| | |
|
| |
|
| |
| Actuarial loss recognised in the statement of total recognised gains and losses | | | (40 | ) | | (5 | ) |
| | |
|
| |
|
| |
| 1 Excluding the returns on assets of the Group’s defined contribution arrangements which do not impact on the balance sheet liability. |
F-26
Back to Contents
mmO2 GROUP
NOTES TO THE CONSOLIDATED FINANCIAL STATEMENTS
| 8. | Pension costs (Continued) |
| | |
| | | Period from | | | | |
| | | 1 July 2002 to | | Year ended | |
| | | 31 March 2003 | | 31 March 2003 | |
| | | mmO2 PP | | other schemes | |
| | |
|
| |
|
| |
| | | £m | | £m | |
Movement in deficit during the period/year | | | | | | | |
| Deficit at 1 July 2002/1 April 2002 | | | (32 | ) | | (13 | ) |
| Movement in period/year: | | | | | | | |
| Total current service cost | | | (21 | ) | | (4 | ) |
| Total contributions | | | 20 | | | 4 | |
| Vested past service costs | | | — | | | 1 | |
| Other finance income | | | 2 | | | (1 | ) |
| Actuarial loss recognised in the statement of total recognised gains and losses | | | (40 | ) | | (5 | ) |
| | |
|
| |
|
| |
| Deficit in plan at 31 March 2003 | | | (71 | ) | | (18 | ) |
| | |
|
| |
|
| |
History of experience gains and losses | | | | | | | |
| Difference between the expected and actual return on plan assets: | | | | | | | |
| Amount – loss | | | (62 | ) | | (7 | ) |
| Percentage of plan assets | | | (32 | )% | | (33 | )% |
| Experience gains and losses on plan liabilities: | | | | | | | |
| Amount – (loss)/gain | | | (4 | ) | | 2 | |
| Percentage of the present value of plan liabilities | | | (1 | )% | | 5 | % |
| Total amount recognised in statement of total recognised gains and losses: | | | | | | | |
| Amount – loss | | | (40 | ) | | (6 | ) |
| Percentage of the present value of plan liabilities | | | (15 | )% | | (15 | )% |
| | |
|
| |
|
| |
At 31 March 2002, the expected assets of the mmO2 PP were calculated assuming that all eligible employees elected to transfer their past service liabilities to the new plan. On this basis, the fair value of plan assets, as at 31 March 2002, would have been £299 million. Under FRS 17 the new plan was not expected to have either a significant surplus or a deficit.
The actual liabilities of the mmO2 PP at 1 July 2002 were £259 million. The reduction compared to the anticipated liabilities at 31 March 2002 has occurred as a result of a reduction in the number of employees eligible to transfer their benefits to the mmO2 PP following the restructuring programme in the UK announced by the Group in 2002. The past service liabilities of the members not eligible to transfer remain in the BTPS. The assets of the mmO2 PP at 1 July 2002 have also fallen compared with the indicative asset valuation disclosed at 31 March 2002. This is a combined result of the reduction in the numbers of employees transferring their benefits to the mmO2 PP and the fall in UK equity markets between 31 March and 1 July 2002.
F-27
Back to Contents
mmO2 GROUP
NOTES TO THE CONSOLIDATED FINANCIAL STATEMENTS
| 9. | Net interest payable and similar charges |
| | |
| | | 2003 | | 2002 | | 2001 | |
| | |
|
| |
|
| |
|
| |
| | | £m | | £m | | £m | |
Group | | | | | | | | | | |
| Interest receivable and similar income | | | 18 | | | 9 | | | 74 | |
| Net interest receivable on sale and leaseback transaction (note 20) | | | 1 | | | 2 | | | — | |
| Interest payable and similar charges: | | | | | | | | | | |
| Bank loans and overdrafts | | | (7 | ) | | (6 | ) | | (2 | ) |
| Amortisation of debt issue costs | | | (3 | ) | | (4 | ) | | — | |
| Debentures | | | (63 | ) | | (12 | ) | | — | |
| Other borrowings | | | (12 | ) | | (15 | ) | | (11 | ) |
| Loans from BT | | | — | | | (756 | ) | | (660 | ) |
| | |
|
| |
|
| |
|
| |
| Group net interest (payable)/receivable | | | (66 | ) | | (782 | ) | | (599 | ) |
| | |
|
| |
|
| |
|
| |
Share of joint ventures | | | | | | | | | | |
| Interest receivable and similar income | | | — | | | — | | | 2 | |
| Interest payable and similar charges | | | — | | | — | | | (72 | ) |
Share of associates | | | | | | | | | | |
| Interest receivable and similar income | | | — | | | 1 | | | — | |
| | |
|
| |
|
| |
|
| |
| Share of joint ventures and associates net interest receivable/(payable) | | | — | | | 1 | | | (70 | ) |
| | |
|
| |
|
| |
|
| |
| Net interest payable | | | (66 | ) | | (781 | ) | | (669 | ) |
| | |
|
| |
|
| |
|
| |
| | |
| 10. | Tax on loss on ordinary activities |
| | |
| | | 2003 | | 2002 | | 2001 | |
| | |
|
| |
|
| |
|
| |
| | | £m | | £m | | £m | |
Current tax | | | | | | | | | | |
| United Kingdom corporation tax at 30 per cent | | | — | | | (13 | ) | | — | |
| Tax on Group’s share of results of associates | | | 2 | | | 2 | | | 7 | |
| Adjustments in respect of prior periods | | | — | | | (2 | ) | | 1 | |
| Non United Kingdom tax | | | 8 | | | 2 | | | — | |
| | |
|
| |
|
| |
|
| |
Total current tax charge/(credit) | | | 10 | | | (11 | ) | | 8 | |
| | |
|
| |
|
| |
|
| |
Deferred tax (credit)/charge at 30 per cent | | | | | | | | | | |
| Origination and reversal of timing differences | | | (72 | ) | | (233 | ) | | (121 | ) |
| Adjustments in respect of prior periods | | | 7 | | | (6 | ) | | (1 | ) |
| | |
|
| |
|
| |
|
| |
Total deferred tax (credit)/charge | | | (65 | ) | | (239 | ) | | 122 | |
| | |
|
| |
|
| |
|
| |
Tax (credit)/charge on loss on ordinary activities | | | (55 | ) | | (250 | ) | | (114 | ) |
| | |
|
| |
|
| |
|
| |
In the year ended 31 March 2003, the loss on ordinary activities before taxation was £10,203 million (2002: £1,629 million, 2001: £4,119 million).
F-28
Back to Contents
mmO2 GROUP
NOTES TO THE CONSOLIDATED FINANCIAL STATEMENTS
| 10. | Tax on loss on ordinary activities (Continued) |
The tax assessed for the year varied from the amount computed by applying the corporation tax rate to loss on ordinary activities before taxation. The differences were attributable to the following factors:
| | | 2003 | | 2002 | | 2001 | |
| | |
|
| |
|
| |
|
| |
| | | £m | | £m | | £m | |
| UK corporation tax on loss at standard rate | | | (3,061 | ) | | (489 | ) | | (1,235 | ) |
| Non-deductible depreciation, amortisation and impairment | | | 2,387 | | | 124 | | | 929 | |
| Non-deductible non-UK losses | | | 23 | | | 44 | | | 178 | |
| UK and non-UK tax rate differences | | | (7 | ) | | (3 | ) | | (1 | ) |
| Capital allowances for period in excess/(deficit) of depreciation | | | 14 | | | (21 | ) | | (49 | ) |
| Losses carried forward | | | 657 | | | 260 | | | 185 | |
| Pre-demerger losses | | | — | | | 74 | | | — | |
| Other timing differences and adjustments | | | (3 | ) | | — | | | 1 | |
| | |
|
| |
|
| |
|
| |
Current tax charge/(credit) for year | | | 10 | | | (11 | ) | | 8 | |
| | |
|
| |
|
| |
|
| |
Factors that may affect future tax charges
The Group expects to be able to claim capital allowances in excess of depreciation in future years. The future tax charges will also continue to be affected by the fact that relief is not available for goodwill amortisation and by the inability to offset non-UK tax losses against taxable profits in the UK and other jurisdictions.
The deferred taxation (credit)/charge was mainly the result of the tax effect of timing differences as follows:
| | | 2003 | | 2002 | | 2001 | |
| | |
|
| |
|
| |
|
| |
| | | £m | | £m | | £m | |
| Excess capital allowances | | | 4 | | | 44 | | | 49 | |
| Other timing differences | | | (76 | ) | | (277 | ) | | (170 | ) |
| Adjustments in respect of prior periods | | | 7 | | | (6 | ) | | (1 | ) |
| | |
|
| |
|
| |
|
| |
Total deferred tax charge | | | (65 | ) | | (239 | ) | | (122 | ) |
| | |
|
| |
|
| |
|
| |
Basic and diluted loss per share has been calculated by dividing the loss for the financial year of £10,148 million (2002: £850 million, 2001: £3,533 million) by 8,670 million shares (2002: 8,670 million, 2001: 8,670 million), being the weighted average number of ordinary shares in issue during the year. For 2002 the number of ordinary shares is based on the weighted average number of shares in issue for the period from demerger to 31 March 2002. For 2001 the number of ordinary shares is based on the issued share capital of BT at the date of demerger and a one-for-one allotment at this date.
In accordance with FRS 11 “Impairment of fixed assets and goodwill” the Group regularly monitors the carrying values of its fixed assets.
During the second half of the year ended 31 March 2003 certain events, including the Group’s strategic review of the Dutch market which led to the announcement of the disposal of O2 Netherlands, indicated the Group should perform impairment reviews of its four principal operations; its mobile telecommunications operations in the UK, Germany, Ireland and the Netherlands.
F-29
Back to Contents
mmO2 GROUP
NOTES TO THE CONSOLIDATED FINANCIAL STATEMENTS
| 12. | Impairment review (Continued) |
In April 2003, the Group announced the sale of O2 Netherlands resulting in an accounting loss of approximately £1.4 billion, which provided an indication that the valuation of mobile businesses may be lower than previously estimated. Additionally, following the Competition Commission’s report on mobile termination charges, the Group announced that it was reviewing the launch dates of its 3G services and would adopt a more prudent timetable where local regulatory requirements permitted. The revision in this timetable, together with the current absence of evidence as to the present mass market appeal of 3G services and the limited availability of 2G/3G compatible handsets, has led management to review and revise the business plans of its mobile operations across its European footprint.
As a result of the above events, the carrying value of the fixed assets of each of the Group’s principal income generating units (IGUs), being O2 UK, O2 Germany, O2 Ireland and O2 Netherlands, were compared to their respective recoverable amounts.
The announced disposal of O2 Netherlands has led to the carrying value of the net assets of the Dutch IGU being written down to their recoverable amount, which in this case is the sale proceeds less direct costs of disposal. This has resulted in an exceptional impairment charge of £1,364 million being recognised in the profit and loss account below Group operating loss.
With respect to the IGUs that are held for continuing use within the Group (being O2 UK, O2 Germany and O2 Ireland), the carrying values of their fixed assets were compared to their value in use to the Group. The value in use of each IGU is calculated with reference to the net present value of its future cash flows derived from the assets, using cash flow projections for the period up to 31 March 2013. These projections cover a ten-year period, as management believes that throughout this ten-year period, the annual growth rate of the IGUs being assessed will differ from the average growth rates for the countries concerned. For the periods beyond 1 April 2013, the projections use a long-term growth rate assumed to be at or below the nominal GDP growth rate of the country concerned. The discount rates applied to the projections were based on the post-tax weighted average cost of capital for the Group. The effective pre-tax discount rate for each of our territories ranged between 10.4 per cent and 12.5 per cent.
The impairment review performed during the year ended 31 March 2003 revealed that the fixed assets of each of the IGUs held for continuing use within the Group were impaired, resulting in an exceptional impairment charge of £8,300 million included within operating expenses.
The total exceptional impairment charges are analysed below:
| | | | | Licences, | | | | | | | |
| | | | | other | | | | | | | |
| | | | | intangible | | | | | | | |
| | | | | assets and | | Tangible | | | | |
| | | Goodwill | | investments | | assets | | Total | |
| | |
|
| |
|
| |
|
| |
|
| |
| | | £m | | £m | | £m | | £m | |
Operating exceptional items: | | | | | | | | | | | | | |
O2 UK | | | 198 | | | 2,102 | | | — | | | 2,300 | |
O2 Germany | | | 903 | | | 3,797 | | | — | | | 4,700 | |
O2 Ireland | | | 1,300 | | | — | | | — | | | 1,300 | |
| | |
|
| |
|
| |
|
| |
|
| |
| | | | 2,401 | | | 5,899 | | | — | | | 8,300 | |
Non-operating exceptional items: | | | | | | | | | | | | | |
O2 Netherlands | | | 649 | | | 423 | | | 292 | | | 1,364 | |
| | |
|
| |
|
| |
|
| |
|
| |
| | | | 3,050 | | | 6,322 | | | 292 | | | 9,664 | |
| | |
|
| |
|
| |
|
| |
|
| |
F-30
Back to Contents
mmO2 GROUP
NOTES TO THE CONSOLIDATED FINANCIAL STATEMENTS
| 12. | Impairment review (Continued) |
The carrying value of the Group’s goodwill and licences after the impairment charges are £3,418 million and £4,164 million respectively.
The impairment charge relating to goodwill includes £47 million in respect of goodwill arising on acquisitions prior to 1 April 1998 which has been written off directly to reserves. This goodwill has been reinstated and written off through the profit and loss account.
In calculating the value in use there is considerable uncertainty as to the present value of the future cash flows. In assessing the future cash flows, assumptions have been made using the best estimates available at the time of performing the impairment review. These estimates include those used to reflect the growth rates up to 2013, the long-term growth rates beyond 2013, the discount rate, the competitive landscape, the take up and charge rate of data services and the availability of functioning technological infrastructure to support the 3G roll-out. The actual outcome is uncertain and these estimates may change over time as subsequent changes in the mobile telecommunications industry, including advances in technology, changes in the performance of our businesses as a result of competitive pressure or otherwise, or potential difficulty in the implementation of the UMTS network, may in the future shorten the estimated useful lives or result in a further write down of these assets.
Similar impairment reviews were performed during the years ended 31 March 2002 and 2001. The review in 2001 resulted in an exceptional charge to operating costs of £2,800 million in respect of O2 Germany, which was allocated to goodwill.
| | | Goodwill | | Licences
and other
intangible
assets | | Total | |
| | |
|
| |
|
| |
|
| |
| | | £m | | £m | | £m | |
Cost | | | | | | | | | | |
| At 1 April 2002 | | | 9,835 | | | 9,695 | | | 19,530 | |
| Additions | | | — | | | 137 | | | 137 | |
| Disposals | | | — | | | (4 | ) | | (4 | ) |
| Currency movements | | | 838 | | | 727 | | | 1,565 | |
| | |
|
| |
|
| |
|
| |
At 31 March 2003 | | | 10,673 | | | 10,555 | | | 21,228 | |
| | |
|
| |
|
| |
|
| |
Amortisation | | | | | | | | | | |
| At 1 April 2002 | | | 3,474 | | | 64 | | | 3,538 | |
| Charge for the year | | | 374 | | | 31 | | | 405 | |
| Impairment charge (note 12) | | | 3,003 | | | 6,288 | | | 9,291 | |
| Currency movements | | | 404 | | | 8 | | | 412 | |
| | |
|
| |
|
| |
|
| |
At 31 March 2003 | | | 7,255 | | | 6,391 | | | 13,646 | |
| | |
|
| |
|
| |
|
| |
Net book value | | | | | | | | | | |
At 31 March 2003 | | | 3,418 | | | 4,164 | | | 7,582 | |
| | |
|
| |
|
| |
|
| |
At 31 March 2002 | | | 6,361 | | | 9,631 | | | 15,992 | |
| | |
|
| |
|
| |
|
| |
F-31
Back to Contents
mmO2 GROUP
NOTES TO THE CONSOLIDATED FINANCIAL STATEMENTS
| | | Land and
buildings | | Plant and
equipment | | Assets in
course of
construction | | Total | |
| | |
|
| |
|
| |
|
| |
|
| |
| | | £m | | £m | | £m | | £m | |
Cost | | | | | | | | | | | | | |
| At 1 April 2002 | | | 222 | | | 5,429 | | | 569 | | | 6,220 | |
| Additions | | | 2 | | | 233 | | | 572 | | | 807 | |
| Transfers | | | 92 | | | 401 | | | (493 | ) | | — | |
| Disposals | | | (18 | ) | | (171 | ) | | — | | | (189 | ) |
| Currency movements | | | 27 | | | 353 | | | 10 | | | 390 | |
| | |
|
| |
|
| |
|
| |
|
| |
At 31 March 2003 | | | 325 | | | 6,245 | | | 658 | | | 7,228 | |
| | |
|
| |
|
| |
|
| |
|
| |
Depreciation | | | | | | | | | | | | | |
| At 1 April 2002 | | | 79 | | | 2,047 | | | — | | | 2,126 | |
| Charge for the year | | | 42 | | | 890 | | | — | | | 932 | |
| Impairment charge (note 12) | | | — | | | 274 | | | 18 | | | 292 | |
| Disposals | | | (12 | ) | | (169 | ) | | — | | | (181 | ) |
| Currency movements | | | 15 | | | 169 | | | — | | | 184 | |
| | |
|
| |
|
| |
|
| |
|
| |
At 31 March 2003 | | | 124 | | | 3,211 | | | 18 | | | 3,353 | |
| | |
|
| |
|
| |
|
| |
|
| |
Net book value | | | | | | | | | | | | | |
At 31 March 2003 | | | 201 | | | 3,034 | | | 640 | | | 3,875 | |
| | |
|
| |
|
| |
|
| |
|
| |
At 31 March 2002 | | | 143 | | | 3,382 | | | 569 | | | 4,094 | |
| | |
|
| |
|
| |
|
| |
|
| |
The net book value of land and buildings comprises:
| | | 2003 | | 2002 | |
| | |
|
| |
|
| |
| | | £m | | £m | |
| Freehold | | | 80 | | | 29 | |
| Long leases | | | 22 | | | 16 | |
| Short leases | | | 99 | | | 98 | |
| | |
|
| |
|
| |
| Net book value | | | 201 | | | 143 | |
| | |
|
| |
|
| |
| The net book value of assets held under hire purchase contracts comprises: | | | | | | | |
| Cost | | | 731 | | | 698 | |
| Accumulated depreciation | | | (347 | ) | | (314 | ) |
| | |
|
| |
|
| |
| Net book value | | | 384 | | | 384 | |
| | |
|
| |
|
| |
F-32
Back to Contents
mmO2 GROUP
NOTES TO THE CONSOLIDATED FINANCIAL STATEMENTS
| 15. | Fixed asset investments |
| | |
| Group | | Interests in
associates
and other
investments | | Own
shares | | Total | |
| |
|
| |
|
| |
|
| |
| | £m | | £m | | £m | |
Cost | | | | | | | | | | |
| At 1 April 2002 | | | 90 | | | 4 | | | 94 | |
| Additions | | | — | | | 2 | | | 2 | |
| Profit retained for the year | | | 3 | | | — | | | 3 | |
| | |
|
| |
|
| |
|
| |
At 31 March 2003 | | | 93 | | | 6 | | | 99 | |
| | |
|
| |
|
| |
|
| |
Provisions | | | | | | | | | | |
| At 1 April 2002 | | | 56 | | | 1 | | | 57 | |
| Charge for the year | | | 3 | | | 2 | | | 5 | |
| Impairment charge (note 12) | | | 34 | | | — | | | 34 | |
| | |
|
| |
|
| |
|
| |
At 31 March 2003 | | | 93 | | | 3 | | | 96 | |
| | |
|
| |
|
| |
|
| |
Net book value | | | | | | | | | | |
At 31 March 2003 | | | — | | | 3 | | | 3 | |
| | |
|
| |
|
| |
|
| |
At 31 March 2002 | | | 34 | | | 3 | | | 37 | |
| | |
|
| |
|
| |
|
| |
| | | | | | | | | | | |
| Parent company | | Shares in
subsidiary
undertakings | | Own shares | |
| |
|
| |
|
| |
| | | £m | | £m | |
Cost | | | | | | | |
| At 1 April 2002 | | | 18,498 | | | 4 | |
| Additions | | | — | | | 2 | |
| | |
|
| |
|
| |
At 31 March 2003 | | | 18,498 | | | 6 | |
| | |
|
| |
|
| |
Provisions | | | | | | | |
| At 1 April 2002 | | | — | | | 1 | |
| Charge for the year | | | — | | | 2 | |
| Impairment charge | | | 7,215 | | | — | |
| | |
|
| |
|
| |
At 31 March 2003 | | | 7,215 | | | 3 | |
| | |
|
| |
|
| |
Net book value | | | — | | | | |
At 31 March 2003 | | | 11,283 | | | 3 | |
| | |
|
| |
|
| |
At 31 March 2002 | | | 18,498 | | | 3 | |
| | |
|
| |
|
| |
The Directors consider that disclosing full particulars of all subsidiary undertakings would lead to a statement of excessive length. A list of principal subsidiary undertakings is given in note 30. A full list of subsidiary undertakings at 31 March 2003 will be annexed to the Company’s next Annual Return.
F-33
Back to Contents
mmO2 GROUP
NOTES TO THE CONSOLIDATED FINANCIAL STATEMENTS
| | | Group
| | Parent
company
| |
| | | 2003 | | 2002 | | 2003 | | 2002 | |
| | |
|
| |
|
| |
|
| |
|
| |
| | | £m | | £m | | £m | | £m | |
| Trade debtors | | | 594 | | | 584 | | | — | | | — | |
| Amounts due from Group undertakings | | | — | | | — | | | 440 | | | 705 | |
| Other debtors | | | 39 | | | 166 | | | 9 | | | 10 | |
| Prepayments | | | 204 | | | 237 | | | — | | | — | |
| Accrued income | | | 87 | | | 103 | | | — | | | — | |
| | |
|
| |
|
| |
|
| |
|
| |
| | | | 924 | | | 1,090 | | | 449 | | | 715 | |
| | |
|
| |
|
| |
|
| |
|
| |
Trade debtors are stated after deducting £128 million as at 31 March 2003 (2002: £105 million) for doubtful debts. The amount charged to the Group’s profit and loss account for doubtful debts for the year ended 31 March 2003 was £72 million (2002: £61 million).
T-Mobile Deutschland GmbH (T-Mobile) provides national roaming capacity to O2 Germany in areas where O2 Germany has not developed its own network. The cost of the contract is determined based on a fixed number of minutes available to O2 Germany. In February 2003 an extension to this agreement gave O2 Germany increased access to T-Mobile’s 3G network over a longer period. Amounts already paid for minutes which have not yet been used of £106 million (2002: £172 million) are included in prepayments at 31 March 2003. Outstanding contractual payments due to T-Mobile at 31 March 2003 are £151 million (2002: £nil million).
| 17. | Current asset investments |
| | |
| | | Group
| | Parent
company
| |
| | | 2003 | | 2002 | | 2003 | | 2002 | |
| | |
|
| |
|
| |
|
| |
|
| |
| | | £m | | £m | | £m | | £m | |
| Money market deposits | | | 414 | | | 131 | | | 414 | | | 131 | |
| Money market funds | | | 79 | | | 328 | | | 79 | | | 328 | |
| Other deposits | | | 354 | | | 384 | | | — | | | — | |
| Certificates of tax deposit | | | 1 | | | 16 | | | — | | | — | |
| | |
|
| |
|
| |
|
| |
|
| |
| | | | 848 | | | 859 | | | 493 | | | 459 | |
| | |
|
| |
|
| |
|
| |
|
| |
All current asset investments mature within one year, except for an amount of £323 million (2002: £384 million) included within other deposits, relating to the O2 UK hire purchase contracts as disclosed in note 20, which is receivable in more than one year.
F-34
Back to Contents
mmO2 GROUP
NOTES TO THE CONSOLIDATED FINANCIAL STATEMENTS
| 18. | Creditors: amounts falling due within one year |
| | |
| | | Group
| | Parent
company
| |
| | | 2003 | | 2002 | | 2003 | | 2002 | |
| | |
|
| |
|
| |
|
| |
|
| |
| | | £m | | £m | | £m | | £m | |
| Bank loans and overdrafts | | | — | | | — | | | — | | | 190 | |
| Other loans | | | 8 | | | 7 | | | — | | | — | |
| Loan notes (note 20) | | | 19 | | | 58 | | | — | | | — | |
| Obligations under hire purchase contracts (note 20) | | | 39 | | | 36 | | | — | | | — | |
| Trade creditors | | | 423 | | | 384 | | | — | | | — | |
| Corporation tax | | | 10 | | | 2 | | | — | | | — | |
| Other taxation and social security | | | 64 | | | 52 | | | — | | | — | |
| Other creditors | | | 28 | | | 163 | | | — | | | — | |
| Accrued expenses | | | 781 | | | 649 | | | 14 | | | 12 | |
| Deferred income | | | 200 | | | 170 | | | — | | | — | |
| | |
|
| |
|
| |
|
| |
|
| |
| | | | 1,572 | | | 1,521 | | | 14 | | | 202 | |
| | |
|
| |
|
| |
|
| |
|
| |
| | |
| 19. | Creditors: amounts falling due after more than one year |
| | |
| | | Group
| | Parent company
| |
| | | 2003 | | 2002 | | 2003 | | 2002 | |
| | |
|
| |
|
| |
|
| |
|
| |
| | | £m | | £m | | £m | | £m | |
| Debentures (note 20) | | | 1,015 | | | 982 | | | 1,015 | | | 982 | |
| Other loans | | | 33 | | | 43 | | | — | | | — | |
| Obligations under hire purchase contracts (note 20) | | | 351 | | | 370 | | | — | | | — | |
| Other creditors | | | 52 | | | 8 | | | — | | | — | |
| | |
|
| |
|
| |
|
| |
|
| |
| | | | 1,451 | | | 1,403 | | | 1,015 | | | 982 | |
| | |
|
| |
|
| |
|
| |
|
| |
| | |
| 20. | Debentures and other borrowings |
| | |
| | | Group
| | Parent company
| |
| | | 2003 | | 2002 | | 2003 | | 2002 | |
| | |
|
| |
|
| |
|
| |
|
| |
| | | £m | | £m | | £m | | £m | |
Analysis of loan repayments: | | | | | | | | | | | | | |
| Within one year or on demand | | | 27 | | | 65 | | | — | | | 190 | |
| Between one and two years | | | 7 | | | 7 | | | — | | | — | |
| Between two and five years | | | 663 | | | 632 | | | 643 | | | 610 | |
| After five years | | | 378 | | | 386 | | | 372 | | | 372 | |
| | |
|
| |
|
| |
|
| |
|
| |
| | | | 1,075 | | | 1,090 | | | 1,015 | | | 1,172 | |
| | |
|
| |
|
| |
|
| |
|
| |
F-35
Back to Contents
mmO2 GROUP
NOTES TO THE CONSOLIDATED FINANCIAL STATEMENTS
| 20. | Debentures and other borrowings (Continued) |
| |
Obligations under finance leases and hire purchase contracts |
| |
| | | Group | |
| | |
| |
| | | 2003 | | 2002 | |
| | |
|
| |
|
| |
| | | £m | | £m | |
| Within one year | | | 39 | | | 51 | |
| Between one and five years | | | 147 | | | 203 | |
| After five years | | | 348 | | | 335 | |
| | |
|
| |
|
| |
| | | | 534 | | | 589 | |
| Less: finance charges allocated to future periods | | | (144 | ) | | (183 | ) |
| | |
|
| |
|
| |
| | | | 390 | | | 406 | |
| | |
|
| |
|
| |
In January 2002 mmO2 plc issued two debentures in the form of a €1,000 million 6.375% fixed rate bond and a £375 million 7.625% fixed rate bond which have a five and ten-year term respectively.
Loan notes of £132 million were issued by O2 UK between March 1999 and April 2000 for the purchase of various businesses. At 31 March 2003 loan notes totalling £19 million (2002: £58 million) were outstanding and repayable on demand.
Obligations under hire purchase contracts are mainly in respect of leases of plant and equipment. On 30 March 2001 and 9 April 2001 hire purchase financing contracts were signed between O2 UK and a number of US leasing trusts. Under the contracts O2 UK sold and repurchased material portions of its GSM radio and switching equipment. O2 UK has deposited sufficient funds with a trust company to meet the future hire purchase obligations. The deposit account is included in current asset investments. The hire purchase agreement is for 16 years with an early buy out option after 12 years. In accordance with the Separation Agreement signed on demerger, BT continues to guarantee all future hire purchase obligations of the trust company. O2 UK has provided a counter indemnity to BT for this guarantee. mmO2 has put in place bank guarantees totalling £63 million to cover specific risks under this hire purchase transaction.
| 21. | Financial instruments and risk management |
Financial risks are identified and managed by a centralised Group treasury function. The Group’s treasury policy, including details of the nature, terms and credit risk associated with financial instruments with off-balance sheet risk are described in the Treasury Management and Policies section of the “Operating and Financial Review and Prospects – B. Liquidity and Capital Resources – Treasury Management and Policies” in Item 5.
Short-term debtors and creditors, where permitted by FRS 13 “Derivatives and Other Financial Instruments: Disclosures”, have been excluded from the following disclosures, which are after taking account of interest rate and currency swaps where applicable.
The Group holds or issues financial instruments mainly to finance its operations, for the temporary investment of short-term funds and to manage currency and interest rate risks arising from its operations. Further details on the financing of operations is contained in the Source of Liquidity and Capital Resources section in the operating and financial review and prospects.
The Group uses derivative financial instruments to manage its exposure to market risks such as changes in interest rates and foreign exchange rates. The objective is to match the profile and characteristics of Group funding (equity and debt) to that of the assets funded and to mitigate foreign exchange risk under the guidelines approved by the Board of Directors in the Treasury Policy document.
F-36
Back to Contents
mmO2 GROUP
NOTES TO THE CONSOLIDATED FINANCIAL STATEMENTS
| 21. | Financial instruments and risk management (Continued) |
| |
Fair value of financial instruments |
The Group held the following financial assets and financial liabilities at 31 March 2003. The book and fair values of the assets are presented below.
Fair value is the amount at which a financial instrument could be exchanged in an arm’s length transaction between informed and willing parties, other than a forced or liquidation sale and excludes accrued interest. Book values are stated before deducting any unamortised issue costs.
| | | Book value
2003 | | Fair value
2003 | | Book value
2002 | | Fair value
2002 | |
| | |
|
| |
|
| |
|
| |
|
| |
| | | £m | | £m | | £m | | £m | |
Liabilities | | | | | | | | | | | | | |
| Long-term borrowings | | | (1,065 | ) | | (1,105 | ) | | (987 | ) | | (951 | ) |
| Hire purchase contracts | | | (390 | ) | | (370 | ) | | (406 | ) | | (406 | ) |
| Loan notes | | | (19 | ) | | (19 | ) | | (58 | ) | | (58 | ) |
| Other loans and borrowings | | | (41 | ) | | (41 | ) | | (50 | ) | | (50 | ) |
| | |
|
| |
|
| |
|
| |
|
| |
| | | | (1,515 | ) | | (1,535 | ) | | (1,501 | ) | | (1,465 | ) |
| | |
|
| |
|
| |
|
| |
|
| |
Assets | | | | | | | | | | | | | |
| Hire purchase contracts | | | 354 | | | 392 | | | 384 | | | 384 | |
| Short-term deposits | | | 414 | | | 414 | | | 344 | | | 344 | |
| Money market funds | | | 79 | | | 79 | | | 131 | | | 131 | |
| Cash at bank and in hand | | | 68 | | | 68 | | | 20 | | | 20 | |
| | |
|
| |
|
| |
|
| |
|
| |
| | | | 915 | | | 953 | | | 879 | | | 879 | |
| | |
|
| |
|
| |
|
| |
|
| |
Derivative financial instruments held to manage the interest rate and currency profile of the Group | | | | | | | | | | | | | |
| Interest rate swaps | | | — | | | 15 | | | — | | | (9 | ) |
| Cross-currency swaps | | | 38 | | | 53 | | | (2 | ) | | (13 | ) |
| Forward foreign exchange contracts | | | 6 | | | 7 | | | — | | | 1 | |
| | |
|
| |
|
| |
|
| |
|
| |
| | | | 44 | | | 75 | | | (2 | ) | | (21 | ) |
| | |
|
| |
|
| |
|
| |
|
| |
| |
Summary of methods and assumptions |
For interest rate swaps, currency swaps and forward foreign exchange contracts, the fair value is based upon market price of comparable instruments where available and if not available by the discounting of future cash flows to net present values using appropriate interest and currency rates.
For short-term deposits and borrowings and cash at bank, the fair value of the short-term deposits, money market funds and cash at bank approximate to the book carrying value due to the short-term/on demand maturity of these instruments.
For long-term borrowings the fair value of the sterling and Euro denominated bonds have been estimated using quoted market prices.
For other borrowings the fair value of other short-term borrowings approximate to the carrying value due to the short-term/on demand maturity of these instruments.
F-37
Back to Contents
mmO2 GROUP
NOTES TO THE CONSOLIDATED FINANCIAL STATEMENTS
| 21. | Financial instruments and risk management (Continued) |
Under the Group’s accounting policy as detailed in note 1 to the financial statements, gains and losses on derivative instruments used for hedging are not recognised in the financial statements. The gains and losses are as follows:
| | | Gains | | Losses | | Total net
gains/(losses)
2003 | |
| | |
|
| |
|
| |
|
| |
| | | £m | | £m | | £m | |
| Unrecognised gains and losses at 1 April 2002 | | | 1 | | | (20 | ) | | (19 | ) |
| Gains and losses arising in previous years that were recognised in the year | | | — | | | — | | | — | |
| | |
|
| |
|
| |
|
| |
| Gains and losses arising in previous years that were not recognised in the year | | | 1 | | | (20 | ) | | (19 | ) |
| Gains and losses arising in the year that were not recognised in the year | | | 30 | | | 20 | | | 50 | |
| | |
|
| |
|
| |
|
| |
Unrecognised gains and losses on hedges at 31 March 2003 | | | 31 | | | — | | | 31 | |
| Of which: | | | | | | | | | | |
| Gains and losses expected to be recognised in 2003-04 | | | 7 | | | — | | | 7 | |
| Gains and losses expected to be recognised in 2004-05 or later | | | 24 | | | — | | | 24 | |
| | |
|
| |
|
| |
|
| |
The table below shows the extent to which Group companies have monetary assets and liabilities in currencies other than their local currencies.
| | | Net foreign currency monetary assets | |
| | |
| |
Functional currency of Group operations | | Sterling | | US dollars | | Euro | | Total | |
| |
|
| |
|
| |
|
| |
|
| |
| | | £m | | £m | | £m | | £m | |
| Sterling | | | — | | | 3 | | | 1 | | | 4 | |
| Other currencies | | | — | | | — | | | — | | | — | |
| | |
|
| |
|
| |
|
| |
|
| |
Total | | | — | | | 3 | | | 1 | | | 4 | |
| | |
|
| |
|
| |
|
| |
|
| |
| |
Foreign exchange transaction risk management |
Taking into account the effect of forward instruments, the Group’s identified exposure to foreign currency risk of expected future sales and expenditure is immaterial as at 31 March 2003.
Financial instruments held for trading purposes |
The Group does not trade in financial instruments.
Financial assets consist of sterling and euro denominated cash at bank, short-term money market deposits and investments in a AAA-rated money market fund. Money market deposits have a maturity profile between overnight and three months and earn interest at market rates. Investments in the money market fund can be called on either a same day or next day basis and yield income/interest on the basis of performance of the underlying assets measured against one-week and three-month LIBOR/EURIBOR benchmarks.
F-38
Back to Contents
mmO2 GROUP
NOTES TO THE CONSOLIDATED FINANCIAL STATEMENTS
| 21. | Financial instruments and risk management (Continued) |
| | |
| | | 2003 | | 2002 | |
| | |
| |
| |
| | | | | Hire | | Short-term | | | | | | | | Short-term | | | | |
| | | Cash at | | purchase | | deposits | | | | Cash at | | Hire | | deposits | | | | |
| | | bank and | | related | | and money | | | | bank and | | purchase | | and money | | | | |
| | | in hand | | assets | | market funds | | Total | | in hand | | related assets | | market funds | | Total | |
| | |
|
| |
|
| |
|
| |
|
| |
|
| |
|
| |
|
| |
|
| |
| | | £m | | £m | | £m | | £m | | £m | | £m | | £m | | £m | |
Currency: | | | | | | | | | | | | | | | | | | | | | | | | | |
| Sterling | | | 7 | | | — | | | 290 | | | 297 | | | (17 | ) | | — | | | 265 | | | 248 | |
| Euro | | | 58 | | | — | | | 137 | | | 195 | | | 34 | | | — | | | 210 | | | 244 | |
| Other | | | 3 | | | 354 | | | 66 | | | 423 | | | 3 | | | 384 | | | — | | | 387 | |
| | |
|
| |
|
| |
|
| |
|
| |
|
| |
|
| |
|
| |
|
| |
At 31 March 2003 | | | 68 | | | 354 | | | 493 | | | 915 | | | 20 | | | 384 | | | 475 | | | 879 | |
| | |
|
| |
|
| |
|
| |
|
| |
|
| |
|
| |
|
| |
|
| |
At 31 March 2003, the Group had no fixed rate financial assets.
| | | 2003 | |
| | |
| |
| | | | | Floating | | | | Fixed rate | | Fixed rate financial | |
| | | Fixed rate | | rate | | | | financial liabilities | | liabilities weighted | |
| | | financial | | financial | | | | weighted average | | average period for | |
| | | liabilities | | liabilities | | Total | | interest rate | | which rate is fixed | |
| | |
|
| |
|
| |
|
| |
|
| |
|
| |
| | | £m | | £m | | £m | | % | | (years) | |
Currency: | | | | | | | | | | | | | | | | |
| Sterling | | | 434 | | | 562 | | | 996 | | | 7.66 | % | | 8.2 | |
| Euro | | | — | | | 103 | | | 103 | | | — | | | — | |
| Other | | | 372 | | | — | | | 372 | | | 6.68 | % | | 6.3 | |
| | |
|
| |
|
| |
|
| |
|
| |
|
| |
At 31 March 2003 | | | 806 | | | 665 | | | 1,471 | | | 7.21 | % | | 7.3 | |
| | |
|
| |
|
| |
|
| |
|
| |
|
| |
| | | | | | | | | | | | | | | | | |
| | | 2002 | |
| | |
| |
| | | | | Floating | | | | Fixed rate | | Fixed rate financial | |
| | | Fixed rate | | rate | | | | financial liabilities | | liabilities weighted | |
| | | financial | | financial | | | | weighted average | | average period for | |
| | | liabilities | | liabilities | | Total | | interest rate | | which rate is fixed | |
| | |
|
| |
|
| |
|
| |
|
| |
|
| |
| | | £m | | £m | | £m | | % | | (years) | |
Currency: | | | | | | | | | | | | | | | | |
| Sterling | | | 373 | | | 414 | | | 787 | | | 7.625 | % | | 8.8 | |
| Euro | | | — | | | 303 | | | 303 | | | — | | | — | |
| Other | | | 406 | | | — | | | 406 | | | 6.68 | % | | 7.3 | |
| | |
|
| |
|
| |
|
| |
|
| |
|
| |
At 31 March 2002 | | | 779 | | | 717 | | | 1,496 | | | 7.13 | % | | 8.5 | |
| | |
|
| |
|
| |
|
| |
|
| |
|
| |
The effect of the Group’s interest rate swaps are to classify €500 million of Euro borrowings as floating rate in both years. The Group also has cross-currency and foreign exchange swaps, which classify €500 million and €350 million respectively of Euro borrowings as floating rate in sterling in both years. The impact of the cross-currency and foreign exchange swaps is to reduce the Euro borrowings and increase Sterling borrowings by £309 million (2002: £309 million) and £234 million respectively.
Floating rate financial liabilities bear interest at rates, based on relevant national LIBOR/EURIBOR equivalents, which are fixed in advance for periods of six months.
F-39
Back to Contents
mmO2 GROUP
NOTES TO THE CONSOLIDATED FINANCIAL STATEMENTS
| 21. | Financial instruments and risk management (Continued) |
The Group has the following undrawn committed floating rate borrowing facilities available at 31 March 2003 in respect of which all conditions precedent had been met at that date:
| | | Total | |
| | | 2003 | |
| | |
|
| |
| | | £m | |
| Expiring within one year | | | 250 | |
| Expiring in more than two years | | | 1,725 | |
| | |
|
| |
Total | | | 1,975 | |
| | |
|
| |
The facilities expiring within one year include the 364-day tranche of the Revolving Credit Facility (RCF) and a 364-day bilateral facility. The facility expiring in more than two years is the five-year tranche of the RCF, which matures in September 2006. All facilities incur commitment fees at market rates.
| 22. | Provisions for liabilities and charges |
| | |
| | | Deferred | | | | Other | | | | |
| | | taxation | | Restructuring | | provisions | | Total | |
| | |
|
| |
|
| |
|
| |
|
| |
| | | £m | | £m | | £m | | £m | |
| At 1 April 2002 | | | 286 | | | 81 | | | 35 | | | 402 | |
| (Credited)/charged against loss for the year | | | (65 | ) | | — | | | 24 | | | (41 | ) |
| Utilised in the year | | | — | | | (82 | ) | | — | | | (82 | ) |
| Currency movements | | | — | | | 1 | | | 4 | | | 5 | |
| | |
|
| |
|
| |
|
| |
|
| |
At 31 March 2003 | | | 221 | | | — | | | 63 | | | 284 | |
| | |
|
| |
|
| |
|
| |
|
| |
The elements of deferred taxation provided for in the financial statements, are as follows:
| | | 2003 | | 2002 | |
| | |
|
| |
|
| |
| | | £m | | £m | |
| Accelerated capital allowances | | | 362 | | | 358 | |
| Other | | | (11 | ) | | (20 | ) |
| Unrelieved tax losses carried forward | | | (130 | ) | | (52 | ) |
| | |
|
| |
|
| |
Total provision for deferred taxation | | | 221 | | | 286 | |
| | |
|
| |
|
| |
Other provisions as at 31 March 2003 include £25 million (2002: £20 million) in respect of mast site restoration costs and £12 million (2002: £9 million) in respect of pensions provisions. It also includes amounts provided for legal claims.
F-40
Back to Contents
mmO2 GROUP
NOTES TO THE CONSOLIDATED FINANCIAL STATEMENTS
| 23. | Called up share capital |
| | | Number of shares | | | £m | |
| | | | | | | | |
| | |
|
| |
|
| |
Authorised | | | | | | | |
| Ordinary shares of 0.1 pence each | | | 20,050,000,000 | | | 20 | |
| Deferred shares of £1 each | | | 40 | | | — | |
| | |
|
| |
|
| |
| | | | 20,050,000,040 | | | 20 | |
| | |
|
| |
|
| |
Called up, allotted and fully paid | | | | | | | |
| Ordinary shares of 0.1 pence each | | | 8,670,181,627 | | | 9 | |
| Deferred shares of £1 each | | | 40 | | | — | |
| | |
|
| |
|
| |
| | | | 8,670,181,667 | | | 9 | |
| | |
|
| |
|
| |
During the year, the Company issued 132,211 ordinary shares of 0.1 pence each for a total cash consideration of £65,081.
The Company has in issue 40 deferred shares of £1 each. The holders of the deferred shares have no right to attend or vote at any general meeting of the Company. The deferred shares do confer the right to receive a cumulative dividend of 1 per cent of the nominal value of the deferred shares each year. On a return of capital on the winding-up of the Company, the holders are entitled to receive any accumulated unpaid dividends and, subject to all other classes of shares being repaid, the amount paid up on the deferred shares. The deferred shares are classified as non-equity.
| 24. | Reconciliation of movements in shareholders’ funds |
| | |
| | | Called up
share capital | | Other
reserves | | Profit and
loss account | | Owners’ net
investment | | Total equity
shareholders’
funds | |
| | |
|
| |
|
| |
|
| |
|
| |
|
| |
| | | £m | | £m | | £m | | £m | | £m | |
Group | | | | | | | | | | | | | | | | |
At 1 April 2000 | | | — | | | — | | | — | | | 2,053 | | | 2,053 | |
| Retained loss for the year | | | — | | | — | | | — | | | (4,009 | ) | | (4,009 | ) |
| Currency translation differences | | | — | | | — | | | — | | | (11 | ) | | (11 | ) |
| Funding flows with BT | | | — | | | — | | | — | | | 4,419 | | | 4,419 | |
| | |
|
| |
|
| |
|
| |
|
| |
|
| |
At 31 March 2001 | | | — | | | — | | | — | | | 2,452 | | | 2,452 | |
| Funding flows with BT | | | — | | | — | | | (1,003 | ) | | 17,591 | | | 16,588 | |
| Transfer on demerger | | | 9 | | | 23,189 | | | (3,146 | ) | | (20,043 | ) | | 9 | |
| Retained loss for the period after demerger | | | — | | | — | | | (376 | ) | | — | | | (376 | ) |
| Transfer from profit and loss account | | | — | | | (533 | ) | | 533 | | | — | | | — | |
| Currency translation differences | | | — | | | — | | | 161 | | | — | | | 161 | |
| | |
|
| |
|
| |
|
| |
|
| |
|
| |
At 31 March 2002 | | | 9 | | | 22,656 | | | (3,831 | ) | | — | | | 18,834 | |
| Retained loss for the year | | | — | | | — | | | (10,148 | ) | | — | | | (10,148 | ) |
| Reinstatement of goodwill previously written off to reserves | | | — | | | — | | | 47 | | | — | | | 47 | |
| Transfer from profit and loss account | | | — | | | (10,569 | ) | | 10,569 | | | — | | | — | |
| Currency translation differences | | | — | | | — | | | 1,333 | | | — | | | 1,333 | |
| | |
|
| |
|
| |
|
| |
|
| |
|
| |
At 31 March 2003 | | | 9 | | | 12,087 | | | (2,030 | ) | | — | | | 10,066 | |
| | |
|
| |
|
| |
|
| |
|
| |
|
| |
F-41
Back to Contents
mmO2 GROUP
NOTES TO THE CONSOLIDATED FINANCIAL STATEMENTS
| 24. | Reconciliation of movements in shareholders’ funds (Continued) |
Other reserves arose on demerger. They relate to the difference between the carrying value of the Group held by BT prior to demerger (representing BT’s investments and funding in the Group) and amounts settled with BT on demerger to acquire the assets and liabilities of the Group.
Aggregate goodwill as at 31 March 2003 in respect of acquisitions completed prior to 1 April 1998 of £15 million (2002: £62 million) has been written off against reserves in accordance with the accounting policy existing prior to the adoption of FRS 10 “Goodwill and intangible assets”.
If the Group had fully adopted the provisions of FRS 17 “Retirement benefits” in the year ended 31 March 2003, the pension schemes deficit (net of deferred tax) of £63 million as disclosed in note 8 to the financial statements would have been recognised on the Group’s balance sheet. Instead the Group is providing the following analysis of reserves in accordance with the transitional disclosures required regarding the pension schemes:
| | | £m | |
| Profits and loss account excluding pension deficit | | | (2,030 | ) |
| Pension deficit (net of related deferred tax asset) | | | (63 | ) |
| | |
|
| |
| Profit and loss account including pension deficit | | | (2,093 | ) |
| | |
|
| |
| | | | | |
| | | Called up
share capital | | Other
reserves | | Profit and
loss account | | Total equity
shareholders’
funds | |
| | |
|
| |
|
| |
|
| |
|
| |
| | | £m | | £m | | £m | | £m | |
Company | | | | | | | | | | | | | |
| On incorporation | | | — | | | — | | | — | | | — | |
| Issue of shares | | | 9 | | | — | | | — | | | 9 | |
| Arising on demerger from BT | | | — | | | 18,488 | | | — | | | 18,488 | |
| Retained loss for the year | | | — | | | — | | | (6 | ) | | (6 | ) |
| | |
|
| |
|
| |
|
| |
|
| |
At 31 March 2002 | | | 9 | | | 18,488 | | | (6 | ) | | 18,491 | |
| Retained loss for the year | | | — | | | — | | | (7,291 | ) | | (7,291 | ) |
| Transfer from profit and loss account | | | — | | | (7,215 | ) | | 7,215 | | | — | |
| | |
|
| |
|
| |
|
| |
|
| |
At 31 March 2003 | | | 9 | | | 11,273 | | | (82 | ) | | 11,200 | |
| | |
|
| |
|
| |
|
| |
|
| |
The Company has taken advantage of s.230 of the Companies Act 1985 not to present the Company’s own profit and loss account. The loss attributable to shareholders of the Company for the year was £7,291 million (period from incorporation on 30 March 2001 to 31 March 2002: £6 million).
F-42
Back to Contents
mmO2 GROUP
NOTES TO THE CONSOLIDATED FINANCIAL STATEMENTS
| 25. | Analysis of cash flows for headings netted in the cash flow statement |
| | |
| | | 2003 | | 2002 | | 2001 | |
| | |
|
| |
|
| |
|
| |
| | | £m | | £m | | £m | |
Returns on investments and servicing of finance | | | | | | | | | | |
| Interest received | | | 18 | | | 31 | | | 2 | |
| Finance costs | | | — | | | (22 | ) | | — | |
| Interest paid | | | (81 | ) | | (18 | ) | | (13 | ) |
| | |
|
| |
|
| |
|
| |
| | | | (63 | ) | | (9 | ) | | (11 | ) |
| | |
|
| |
|
| |
|
| |
Taxation | | | | | | | | | | |
| UK corporation tax (paid)/recovered | | | (4 | ) | | (4 | ) | | 21 | |
| | |
|
| |
|
| |
|
| |
| | | | (4 | ) | | (4 | ) | | 21 | |
| | |
|
| |
|
| |
|
| |
Capital expenditure and financial investment | | | | | | | | | | |
| Purchase of tangible fixed assets | | | (779 | ) | | (1,240 | ) | | (990 | ) |
| Purchase of intangible fixed assets | | | (89 | ) | | (21 | ) | | (4,306 | ) |
| Sale of tangible fixed assets | | | — | | | 30 | | | 62 | |
| | |
|
| |
|
| |
|
| |
| | | �� | (868 | ) | | (1,231 | ) | | (5,234 | ) |
| | |
|
| |
|
| |
|
| |
Acquisitions and disposals | | | | | | | | | | |
| Purchase of subsidiary undertakings (2001: acquired net of £96 million cash) | | | — | | | (864 | ) | | (9,410 | ) |
| Investments in joint ventures and associated undertakings | | | — | | | — | | | (3,168 | ) |
| Disposal of associated undertaking | | | — | | | — | | | 4 | |
| | |
|
| |
|
| |
|
| |
| | | | — | | | (864 | ) | | (12,574 | ) |
| | |
|
| |
|
| |
|
| |
Management of liquid resources | | | | | | | | | | |
| Increase in money market deposits and funds | | | (3 | ) | | (459 | ) | | — | |
| | |
|
| |
|
| |
|
| |
| | | | (3 | ) | | (459 | ) | | — | |
| | |
|
| |
|
| |
|
| |
Financing | | | | | | | | | | |
| Net cash contributions from BT | | | — | | | 847 | | | 3,938 | |
| New loans from BT | | | — | | | — | | | 13,800 | |
| Debentures issued | | | — | | | 989 | | | — | |
| Other loans issued | | | — | | | 28 | | | — | |
| Loan repayments | | | (47 | ) | | (74 | ) | | (145 | ) |
| | |
|
| |
|
| |
|
| |
| | | | (47 | ) | | 1,790 | | | 17,593 | |
| | |
|
| |
|
| |
|
| |
Liquid resources comprise money market deposits and funds (note 17).
F-43
Back to Contents
mmO2 GROUP
NOTES TO THE CONSOLIDATED FINANCIAL STATEMENTS
| | | At
1 April
2002 | | Cash flow | | Other non-cash
changes and
exchange
movements | | At
31 March
2003 | |
| | |
|
| |
|
| |
|
| |
|
| |
| | | £m | | £m | | £m | | £m | |
| Cash at bank and in hand | | | 20 | | | 48 | | | — | | | 68 | |
| Current asset investments | | | 859 | | | 3 | | | (14 | ) | | 848 | |
| Debt due after one year | | | (1,025 | ) | | — | | | (23 | ) | | (1,048 | ) |
| Debt due within one year | | | (65 | ) | | 47 | | | (9 | ) | | (27 | ) |
| Finance leases | | | (406 | ) | | — | | | 16 | | | (390 | ) |
| | |
|
| |
|
| |
|
| |
|
| |
| | | | (617 | ) | | 98 | | | (30 | ) | | (549 | ) |
| | |
|
| |
|
| |
|
| |
|
| |
| |
Reconciliation of net cash flow to movements in net debt |
| |
| | | 2003 | | 2002 | | 2001 | |
| | |
|
| |
|
| |
|
| |
| | | £m | | £m | | £m | |
| Increase/(decrease) in cash in the period | | | 48 | | | (320 | ) | | 113 | |
| Management of liquid resources | | | 3 | | | 459 | | | — | |
| Cash outflow/(inflow) from decrease/(increase) in debt | | | 47 | | | (1,295 | ) | | (13,655 | ) |
| | |
|
| |
|
| |
|
| |
| Change in net debt resulting from cash flows | | | 98 | | | (1,156 | ) | | (13,542 | ) |
| Other non-cash movements | | | (30 | ) | | 17,133 | | | 1 | |
| Debt assumed on acquisitions | | | — | | | — | | | (33 | ) |
| | |
|
| |
|
| |
|
| |
| Decrease/(increase) in net debt in the year | | | 68 | | | 15,977 | | | (13,574 | ) |
| Net funds/(debt) at beginning of year | | | (617 | ) | | (16,594 | ) | | (3,020 | ) |
| | |
|
| |
|
| |
|
| |
Net (debt)/funds at end of year | | | (549 | ) | | (617 | ) | | (16,594 | ) |
| | |
|
| |
|
| |
|
| |
Other non-cash movements relate principally to the inception of new finance leases, interest accrued thereon and foreign exchange gains and losses arising in relation to items of net debt held in foreign currencies.
In February 2001, Telenor exercised a put option to sell its remaining 49.5 per cent interest in O2 Ireland to the Group and this transaction was completed in April 2001, following approval by the regulator.
The total consideration for this stake was £877 million including expenses resulting in additional goodwill of £884 million. The consideration includes £17 million payable to the former Managing Director for his 2 per cent stake in the non-voting shares of O2 Ireland, of which £8 million (2002: £13 million) is payable after the year end.
F-44
Back to Contents
mmO2 GROUP
NOTES TO THE CONSOLIDATED FINANCIAL STATEMENTS
| 28. | Financial commitments and contingent liabilities |
| |
Obligations under hire purchase contracts |
Future gross hire purchase payments payable by Group as at 31 March 2003 are as follows:
| | | £m | |
Payable in the year ending 31 March: | | | | |
| 2004 | | | 39 | |
| 2005 | | | 43 | |
| 2006 | | | 37 | |
| 2007 | | | 34 | |
| 2008 | | | 33 | |
| Thereafter | | | 348 | |
| | |
|
| |
Total future gross hire purchase payments | | | 534 | |
| | |
|
| |
Hire purchase commitments are mainly in respect of leases of plant and equipment. Full details of these leases are provided in note 20.
| | | 2003 | | 2002 | |
| | |
|
| |
|
| |
| | | £m | | £m | |
| Contracts placed for capital expenditure not provided in the accounts | | | 909 | | | 704 | |
| | |
|
| |
|
| |
| |
Operating lease commitments |
At 31 March 2003 the Group was committed to making the following payments during the next year in respect of operating leases:
| | | 2003
| | 2002
| |
| | | Land and
buildings | | Other | | Land and
buildings | | Other | |
| | |
|
| |
|
| |
|
| |
|
| |
| | | £m | | £m | | £m | | £m | |
Leases which expire: | | | | | | | | | | | | | |
| Within one year | | | 7 | | | 4 | | | 10 | | | 23 | |
| Between one and five years | | | 32 | | | 25 | | | 20 | | | 7 | |
| After five years | | | 127 | | | 7 | | | 73 | | | 34 | |
| | |
|
| |
|
| |
|
| |
|
| |
| | | | 166 | | | 36 | | | 103 | | | 64 | |
| | |
|
| |
|
| |
|
| |
|
| |
F-45
Back to Contents
mmO2 GROUP
NOTES TO THE CONSOLIDATED FINANCIAL STATEMENTS
| 28. | Financial commitments and contingent liabilities (Continued) |
Future minimum operating lease payments due by the Group as at 31 March 2003 are as follows:
| | | £m | |
Payable in the year ending 31 March: | | | | |
| 2004 | | | 202 | |
| 2005 | | | 193 | |
| 2006 | | | 198 | |
| 2007 | | | 162 | |
| 2008 | | | 154 | |
| Thereafter | | | 959 | |
| | |
|
| |
Total future minimum operating lease payments | | | 1,868 | |
| | |
|
| |
mmO2 plc has provided a guarantee of all liabilities of Airwave mmO2 Limited under its contracts with PITO (the Police Information Technology Organisation) and the police force customers.
There are no other contingent liabilities or guarantees other than those detailed in note 20 to the financial statements and those arising in the ordinary course of the Group’s business and on these no material losses are anticipated. The Group has insurance cover to certain limits for major risks on property and major claims in connection with legal liabilities arising in the course of its operations.
The Group does not believe there are any pending legal proceedings which would have a material adverse effect on the financial position or results of operations of the Group.
| 29. | Related party disclosures |
The Group demerged from BT in the year ended 31 March 2002. In accordance with FRS 8 “Related party disclosures”, BT is not a related party of the Group in the year ended 31 March 2003. Transactions and balances with BT in the year ended 31 March 2002 were:
| | | 2002 | |
| | |
|
| |
| | | £m | |
| Telecommunications services (net) | | | 172 | |
| Building rental | | | (50 | ) |
| Other | | | (75 | ) |
| | |
|
| |
Total net transactions (analysed below)1 | | | 47 | |
| | |
|
| |
| 1 | All transactions are at arm’s length rates. |
| | |
| | | 2002 | |
| | |
|
| |
| | | £m | |
Turnover | | | | |
| BT | | | 607 | |
Purchases | | | | |
| BT | | | (560 | ) |
| | |
|
| |
Total net transactions | | | 47 | |
| | |
|
| |
F-46
Back to Contents
mmO2 GROUP
NOTES TO THE CONSOLIDATED FINANCIAL STATEMENTS
| 29. | Related party disclosures (Continued) |
The Group had the following balances outstanding with BT as at 31 March 2002:
| | | 2002 | |
| | |
|
| |
| | | £m | |
| Trade debtors | | | 92 | |
| Trade creditors | | | (115 | ) |
| | |
|
| |
During the year the Group also undertook transactions with other related parties as follows:
| | | 2003 | | 2002 | |
| | |
|
| |
|
| |
| | | £m | | £m | |
Turnover | | | | | | | |
| The Link Stores Limited | | | 54 | | | 47 | |
Purchases | | | | | | | |
| The Link Stores Limited | | | (79 | ) | | (95 | ) |
| | |
|
| |
|
| |
Total net transactions | | | (25 | ) | | (48 | ) |
| | |
|
| |
|
| |
During the year ended 31 March 2001, the Group provided loans to its joint venture, O2 Germany, totalling £2,591 million. Following the acquisition of the remaining shareholding in O2 Germany in February 2001, there were no loans owed to the Group by joint ventures as at 31 March 2002 or 31 March 2003.
| 30. | Principal subsidiary undertakings and associates |
The principal operating subsidiary undertakings are detailed below, all of which are included in the Group financial statements.
Name | | | Country of incorporation and operation | | | Activity | | | Portion of ordinary shares held % | |
| |
|
| |
|
| |
|
| |
O2 Limited | | | England and Wales | | | Intermediate holding company | | | 100 | |
O2 (UK) Limited1 | | | England and Wales | | | Mobile cellular telephone system provider and operator | | | 100 | |
O2 Third Generation Limited2 | | | England and Wales | | | UMTS licence holder | | | 100 | |
O2 (Online) Limited3 | | | England and Wales | | | Mobile internet business | | | 100 | |
O2 Communications (Ireland) Limited4 | | | Ireland | | | Mobile cellular telephone system provider and operator | | | 100 | |
| Manx Telecom Limited | | | Isle of Man | | | Telecommunication services supplier | | | 100 | |
O2 (Netherlands) BV5 | | | Netherlands | | | Mobile cellular telephone system provider and operator | | | 100 | |
O2 (Germany) GmbH & Co. OHG6 | | | Germany | | | Mobile cellular telephone system provider and operator | | | 100 | |
Airwave mmO2 Limited | | | England and Wales | | | Digital radio service for public safety organisations | | | 100 | |
| 1 | BT Cellnet Limited changed its name to O2 (UK) Limited on 19 April 2002. |
| 2 | BT3G Limited changed its name to O2 Third Generation Limited on 19 April 2002. |
| 3 | Genie Internet Limited changed its name to O2 (Online) Limited on 19 April 2002. |
| 4 | Esat Digifone Limited changed its name to Digifone mmO2 Limited on 12 September 2001, and then to O2 Communications (Ireland) Limited on 23 April 2002. |
| 5 | Telfort Mobiel BV changed its name to O2 (Netherlands) BV on 19 April 2002. On 3 June 2003 O2 Netherlands was sold to Greenfield Capital Partners. |
| 6 | Viag Interkom GmbH & Co. changed its name to O2 (Germany) GmbH & Co. OHG on 19 April 2002. |
F-47
Back to Contents
mmO2 GROUP
NOTES TO THE CONSOLIDATED FINANCIAL STATEMENTS
| 30. | Principal subsidiary undertakings and associates (Continued) |
The shares in O2 Limited are held directly by mmO2 plc. The shares of the other operating companies are held by O2 Limited or its wholly owned subsidiaries. The accounting reference date of all the subsidiary undertakings is 31 March. The Group also owns a 40 per cent stake in an associate, The Link Stores Limited, a telecommunications equipment retailer which is incorporated and operates in England and Wales.
| 31. | Parent Company Balance Sheet of mmO2 plc at 31 March 2003 |
| | |
| | | Note | | 2003
£m | | 2002
£m | |
| | |
|
| |
|
| |
|
| |
Fixed assets | | | | | | | | | | |
| Investments in subsidiary undertakings | | | 15 | | | 11,283 | | | 18,498 | |
| Investment in own shares | | | 15 | | | 3 | | | 3 | |
| | | | | |
| |
| |
| | | | | | | 11,286 | | | 18,501 | |
Current assets | | | | | | | | | | |
| Debtors | | | 16 | | | 449 | | | 715 | |
| Investments | | | 17 | | | 493 | | | 459 | |
| Cash at bank and in hand | | | | | | 1 | | | — | |
| | | | | |
| |
| |
| | | | | | | 943 | | | 1,174 | |
Creditors: amounts falling due within one year | | | 18 | | | (14 | ) | | (202 | ) |
| | | | | |
| |
| |
Net current assets | | | | | | 929 | | | 972 | |
| | | | | |
| |
| |
Total assets less current liabilities | | | | | | 12,215 | | | 19,473 | |
| | | | | |
| |
| |
Creditors: amounts falling due after more than one year | | | 19 | | | (1,015 | ) | | (982 | ) |
| | | | | |
| |
| |
Net assets | | | | | | 11,200 | | | 18,491 | |
| | | | | |
| |
| |
Capital and reserves | | | | | | | | | | |
| Called up share capital | | | 23 | | | 9 | | | 9 | |
| Other reserves | | | 24 | | | 11,273 | | | 18,488 | |
| Profit and loss account | | | 24 | | | (82 | ) | | (6 | ) |
| | | | | |
| |
| |
Shareholders’ funds | | | | | | 11,200 | | | 18,491 | |
| | | | | |
| |
| |
These financial statements were approved by the Board of Directors on 20 May 2003 and were signed on its behalf by:
P Erskine Chief Executive Officer D Finch Chief Financial Officer
F-48
Back to Contents
mmO2 GROUP
NOTES TO THE CONSOLIDATED FINANCIAL STATEMENTS
| 32. | Reconciliation from UK GAAP to US GAAP and supplementary information |
| |
Reconciliation with US GAAP |
The Group’s financial statements are prepared in accordance with accounting principles generally accepted in the United Kingdom (UK GAAP), which differ in certain respects from generally accepted accounting principles in the United States of America (US GAAP).
| I. | Differences between accounting principles generally accepted in the United Kingdom and the United States of America |
The following are the main differences between UK GAAP and US GAAP which are relevant to the Group’s financial statements.
| (a) | Capitalisation of interest |
Under UK GAAP, the Group does not capitalise interest in its financial statements. To comply with US GAAP, the estimated amount of interest incurred whilst constructing major capital projects is included in fixed assets and depreciated over the lives of the related assets. This includes capitalisation of interest incurred on funding the UMTS licences for the period up to the launch of the related services. The amount of interest capitalised is determined by reference to the average interest rates on outstanding borrowings and cannot exceed the annual interest expense charged. As at 31 March 2003 under US GAAP, gross capitalised interest of £1,299 million (2002: £1,214 million) was subject to depreciation generally over periods of five to 20 years.
| (b) | Goodwill and intangible assets |
Under UK GAAP, in respect of acquisitions completed prior to 1 April 1998, the Group wrote off goodwill arising from the purchase of subsidiary undertakings, associates and joint ventures on acquisition against Owners’ net investment. The goodwill is reflected in the net income of the period of disposal, as part of the calculation of the gain or loss on divestment to the extent it has not already been recognised in the profit and loss account. Under US GAAP, such goodwill is held as an intangible asset in the balance sheet and was previously amortised over its useful life with only the unamortised portion being included in any gain or loss on divestment. Under UK GAAP, goodwill arising on acquisitions completed on or after 1 April 1998 is amortised over its useful life. In addition, under UK GAAP, contingent purchase consideration is generally included as part of the purchase cost at the date of acquisition. Under US GAAP, this cost is not recognised until the contingency is resolved or the amount is determinable beyond a reasonable doubt.
F-49
Back to Contents
mmO2 GROUP
NOTES TO THE CONSOLIDATED FINANCIAL STATEMENTS
| 32. | Reconciliation from UK GAAP to US GAAP and supplementary information (Continued) |
In June 2001, the FASB issued Statement of Financial Accounting Standard (SFAS) No. 142, “Goodwill and Other Intangible Assets.” The Group adopted SFAS No. 142 on 1 April 2002. SFAS No. 142 requires the cessation of amortisation of intangible fixed assets that have an indefinite useful life, including goodwill. Instead, such intangible fixed assets are reviewed for impairment annually, or sooner should a triggering event occur. Those intangible fixed assets that have definite useful lives continue to be amortised over their useful life, with impairment reviews being carried out when triggering events occur. Such definite lived intangible assets are tested for impairment in accordance with SFAS No. 144, “Accounting for the Impairment or Disposal of Long-Lived Assets”. In considering whether a triggering event has occurred under SFAS No. 142 and SFAS No. 144, the Group looks for the existence of facts and circumstances, either internal or external, which indicate that the carrying value of the asset may not be recovered.
Certain intangible fixed assets recognised under US GAAP purchase accounting requirements are subsumed within goodwill under UK GAAP. Under US GAAP, these separately identified intangible assets are valued and amortised over their useful lives. Under US GAAP, the Group separately identified intangible assets which arose on acquisition, other than goodwill, relating to customer bases, trademarks and tradenames, internally developed software, assembled workforce and licences. In accordance with the provisions of SFAS No. 142, the net balance of £53 million for assembled workforce was transferred to goodwill and will no longer be subject to amortisation.
As of 1 April 2002, the Group performed the transitional impairment test under SFAS No. 142 and compared the carrying value for each reporting unit to its fair value, which was determined based on discounted cash flows. Upon completion of the transitional impairment test, the Group determined that there was no transitional impairment as of 1 April 2002.
During the second half of the year ended 31 March 2003 certain trigger events indicated the Group should perform impairment reviews of its four principal reporting units; its mobile telecommunications operations in the UK, Germany, Ireland and the Netherlands in accordance with SFAS No. 142 and SFAS No. 144.
In April 2003, the Group announced the sale of O2 Netherlands resulting in an accounting loss of approximately £1.4 billion, which provided an indication that the valuation of mobile businesses may be lower than previously estimated. Additionally, following the Competition Commission’s report on mobile termination charges, the Group announced that it was reviewing the launch dates of its 3G services and would adopt a more prudent timetable where local regulatory requirements permitted. The revision in this timetable, together with the current absence of evidence as to the present mass market appeal of 3G services and the limited availability of 2G/3G compatible handsets, has led management to review and revise the business plans of its mobile operations across its European footprint.
As a result of the above events and in conjunction with the Group’s annual impairment review under SFAS 142, the carrying value of the fixed assets of O2 UK, O2 Germany and O2 Ireland and the goodwill that arose on their acquisition was reviewed. In evaluating whether any long-lived assets and intangibles were impaired, the undiscounted cash flows of O2 UK, O2 Germany and O2 Ireland were compared to their carrying values. To test the carrying value of goodwill, the fair value of each reporting unit, based on the present value of future cash flows, was compared to the carrying value of the reporting units’ assets and liabilities. Where the carrying value of the reporting unit exceeded the fair value, the fair value of all assets and liabilities of the reporting unit, including any unrecognised intangible assets, was estimated in order to determine the implied value of goodwill.
F-50
Back to Contents
mmO2 GROUP
NOTES TO THE CONSOLIDATED FINANCIAL STATEMENTS
| 32. | Reconciliation from UK GAAP to US GAAP and supplementary information (Continued) |
Based on our analyses under US GAAP, the Group recorded charges of £409 million and £1,475 million to reduce the carrying value of the goodwill that arose on the acquisitions of O2 UK and O2 Ireland respectively.
Under UK GAAP the Group recorded an impairment of £8,300 million of the intangible assets relating to O2 UK, O2 Germany and O2 Ireland, of which £2,401 million related to the impairment of goodwill and £5,899 million related to the impairment of long-lived assets. The difference in the impairment charges is primarily as a result of the requirement under US GAAP to first test the carrying value of long-lived assets using undiscounted cash flows and secondarily the difference in methodology for calculating the impairment of goodwill.
As a result of the announced disposal of O2 Netherlands, the carrying values of the net assets of O2 Netherlands have been written down to their net realisable amount, being the sale proceeds less direct costs of disposal. This has resulted in an impairment charge of £1,424 million being recognised in the profit and loss account of which £684 million related to goodwill and £740 million related to long-lived assets.
The difference between the impairment charge recorded for US GAAP and UK GAAP in respect of O2 Netherlands is due to the different carrying values of the net assets.
The changes in the carrying amount of goodwill for the segments and in total for the year ended 31 March 2003 are as follows:
| | | Mobile telecommunications
| | Other | | | | |
| | | UK £m | | Germany £m | | Other £m | | businesses £m | | Total £m | |
| | |
|
| |
|
| |
|
| |
|
| |
|
| |
| Balance at 31 March 2002 | | | 2,820 | | | 605 | | | 2,397 | | | 5 | | | 5,827 | |
| Impairment charges | | | (409 | ) | | — | | | (2,159 | ) | | — | | | (2,568 | ) |
| Foreign exchange and other movements | | | — | | | 126 | | | 310 | | | — | | | 436 | |
| | |
|
| |
|
| |
|
| |
|
| |
|
| |
Balance at 31 March 2003 | | | 2,411 | | | 731 | | | 548 | | | 5 | | | 3,695 | |
| | |
|
| |
|
| |
|
| |
|
| |
|
| |
The following table represents the components of amortisable intangible assets for US GAAP purposes as of 31 March 2003:
| | | Gross carrying
amount | | Accumulated
amortisation
2003 | | Gross carrying
amount | | Accumulated
amortisation
2002 | |
| | | £m | | £m | | £m | | £m | |
| | |
|
| |
|
| |
|
| |
|
| |
| Licences | | | 10,489 | | | 423 | | | 9,690 | | | — | |
| Other intangible assets | | | 519 | | | 302 | | | 522 | | | 235 | |
| | |
|
| |
|
| |
|
| |
|
| |
| | | | 11,008 | | | 723 | | | 10,212 | | | 235 | |
| | |
|
| |
|
| |
|
| |
|
| |
F-51
Back to Contents
mmO2 GROUP
NOTES TO THE CONSOLIDATED FINANCIAL STATEMENTS
| 32. | Reconciliation from UK GAAP to US GAAP and supplementary information (Continued) |
The following table presents current and expected amortisation expense for other identifiable intangible assets for the current year and the subsequent five years.
| | | Amount | |
| | | £m | |
| | |
|
| |
| Aggregate amortisation expense for the year ended 31 March: | | | | |
| 2003 | | | 37 | |
| | |
|
| |
| Expected amortisation expense for the year ending 31 March: | | | | |
| 2004 | | | 165 | |
| 2005 | | | 579 | |
| 2006 | | | 579 | |
| 2007 | | | 579 | |
| 2008 | | | 579 | |
| | |
|
| |
The above table represents the Group’s estimate regarding future amortisation of amortisable intangible assets recorded on the balance sheet as at 31 March 2003. Due to the effects of foreign exchange, any future investments or capital expenditure on intangible assets, and the date on which the assets are likely to be put into service, it is likely that the actual charge will be different.
As at 31 March 2003, the gross carrying value of goodwill before impairment and amortisation under US GAAP was £10,257 million (2002: £9,412 million).
In 2001, O2 Germany wrote off certain software related to the integration of the fixed and mobile business units that were abandoned as a result of the split of the mobile and fixed line businesses of Viag Interkom. Under US GAAP, the software abandonment is treated as a purchase price allocation adjustment for the portion acquired on 20 February 2001. The portion owned by the Group prior to the February acquisition is expensed at the acquisition date. Under UK GAAP, the entire amount of software is written off subsequent to the purchase after BT has attained full control of the entity and commenced the reorganisation of Viag Interkom. The adjustment presented reverses the expense recorded under UK GAAP related to the purchase price adjustment. The corresponding effect on shareholders’ funds of the software write-off increases the recognised goodwill.
Share options have been granted under the mmO2 Sharesave Plan at a 20 per cent discount to the market price of the date of grant. Under UK GAAP, the share issues are recorded at their discounted price when the options are exercised. Under US GAAP, a plan is considered compensatory when the discount to market price is in excess of 15 per cent. Compensation cost is recognised for the difference between the exercise price of the share options granted and the quoted market price of the shares at the measurement date (the grant date in this case) and accrued over the vesting period of the options.
Additionally, certain shares have been awarded to a small group of executives under the mmO2 Restricted Share Plan on the basis that they will only vest if participants build up a pre-determined personal shareholding in the Group. Under US GAAP an expense is only recognised where it can be reasonably assured that the executive will build up the required personal shareholding and such an expense is recognised over the vesting period.
F-52
Back to Contents
mmO2 GROUP
NOTES TO THE CONSOLIDATED FINANCIAL STATEMENTS
| 32. | Reconciliation from UK GAAP to US GAAP and supplementary information (Continued) |
The Group’s potentially dilutive share options are anti-dilutive and therefore, in accordance with US GAAP, are not included in the computation of weighted average shares used in computing the diluted loss per share.
| (e) | Investments accounted for under the equity method |
| | |
| 1) | Additional US GAAP adjustments to equity method investments |
Under UK GAAP, certain joint ventures and associates have been accounted for using the equity method of accounting. For the purposes of this reconciliation, adjustments have been made to restate net loss and shareholders’ funds of these associates to US GAAP. The only material reconciling item is capitalised interest, which reduced US GAAP net loss by £nil for the year ended 31 March 2003 (2002: £nil, 2001: £66 million). This adjustment is reflected in the capitalised interest reconciling line item.
| 2) | Change in the reporting period of a subsidiary |
Under UK GAAP, the additional reporting period, or lag time, resulting from a parent changing a subsidiary’s year end is included in the income statement. Under US GAAP, the results from this period are treated as a direct adjustment to retained earnings. The amount included in the US GAAP reconciliation of net loss relates to the O2 Germany equity loss pick-up for the three-month period 1 January 2000 through 31 March 2000 included in the UK GAAP profit and loss account for the year ended 31 March 2001.
| (f) | Other employee compensation expense |
Under UK GAAP certain amounts paid and payable to former owners of purchased companies who are also employees are included as part of the acquisition cost of these companies. Under US GAAP, where payment of those amounts is based on achievement of certain performance goals, they qualify as employee compensation expense and are recognised in the financial statements when the performance goals are met.
The Group recognised a restructuring charge related to employee termination benefits and real estate closures. This plan called for the reduction of over 1,900 positions in the technical, retail and administrative departments of O2 UK and O2 Germany. Under US GAAP, site closure costs can only be recognised for the period post cessation of operations at that site, whereas under UK GAAP the provision may be recognised at the time of managements’ commitment, communication and reasonable estimate of the associated cost. As of 31 March 2002, approximately 650 employees had been terminated, with all other terminations and associated closures occurring in the year ended 31 March 2003.
In the year ended 31 March 2003, mmO2 Employee Share Trust purchased 2 million shares on the stock market for £1 million (year ended 31 March 2002, 6 million shares for £4 million). Under UK GAAP these shares have been classified as a fixed asset investment and a charge of £2 million (2002: £1 million) has been recognised for stock compensation. Under US GAAP such shares are classified as treasury stock and are included as a deduction in shareholders’ funds. This treasury stock has been accounted for under the cost method.
| (i) | Derivative financial instruments |
Under UK GAAP certain derivative financial instruments qualify for hedge accounting which do not qualify for hedge accounting under US GAAP. The financial instruments, under US GAAP, are carried at market value with valuation adjustments recorded in the profit and loss account.
F-53
Back to Contents
mmO2 GROUP
NOTES TO THE CONSOLIDATED FINANCIAL STATEMENTS
| 32. | Reconciliation from UK GAAP to US GAAP and supplementary information (Continued) |
| | |
| (j) | Deferred tax effect of US GAAP adjustments |
As at 31 March 2003, the adjustment of £(278) million (2002: £(102) million) reconciling shareholders’ funds under UK GAAP to the amount under US GAAP included the tax effect of US GAAP adjustments. This comprises an adjustment to increase non-current assets by £742 million (2002: £74 million increase) and increase long-term liabilities by £1,020 million (2002: £176 million increase).
| (k) | Long-term licence creditors |
In the year ended 31 March 2003, O2 Ireland purchased a UMTS ‘B’ licence. The total licence fee is €114 million phased over 15 years. Under US GAAP the asset cost has been recorded at the discounted present value of the phased payments and a corresponding creditor established. Over the 15 year period the creditor will be accreted in order to recognise the full €114 million due. Under UK GAAP the asset and creditor have been recognised at their undiscounted value.
Due to the different methods of calculating pension liabilities, the pension scheme deficit calculated under UK GAAP using FRS 17 differs from the calculation under SFAS No. 87 “Employers accounting for pensions”.
In 2003, a minimum liability relating to certain pension plans has been recognised in other comprehensive income under US GAAP, whereas this balance is not provided for under UK GAAP, but included as a disclosure item only.
The Group carries a significant portion of its net assets in Euros. The foreign exchange adjustment reflects the retranslation of US GAAP adjustments which are Euro denominated.
F-54
Back to Contents
mmO2 GROUP
NOTES TO THE CONSOLIDATED FINANCIAL STATEMENTS
| 32. | Reconciliation from UK GAAP to US GAAP and supplementary information (Continued) |
| | |
| II. | Net loss and owners’ net investment reconciliation |
The following statements summarise the material estimated adjustments, which reconcile net loss and owners’ net investment/shareholders’ funds from that reported under UK GAAP to that which would have been reported had US GAAP been applied.
| | | Note | | 2003 | | 2002 | | 2001 | |
| | |
|
| |
|
| |
|
| |
|
|
|
| | | | | £m | | £m | | £m | |
Net loss | | | | | | | | | | | | | |
| Net loss under UK GAAP | | | | | | (10,148 | ) | | (1,379 | ) | | (4,009 | ) |
| Adjustment for: | | | | | | | | | | | | | |
| Capitalisation of interest, net of related depreciation | | | (a) | | | (67 | ) | | 579 | | | 344 | |
| Goodwill impairment | | | (b) | | | 482 | | | — | | | — | |
| Licence impairment | | | (b) | | | 5,899 | | | — | | | — | |
| Fixed asset impairment on discontinuing operations | | | (b) | | | (25 | ) | | — | | | — | |
| Goodwill amortisation | | | (b) | | | 374 | | | 23 | | | 19 | |
| Mobile licences, software and other intangible assets | | | (b) | | | (37 | ) | | (217 | ) | | (98 | ) |
| Software impairment | | | (c) | | | — | | | — | | | 12 | |
| Employee share plans | | | (d) | | | (1 | ) | | (1 | ) | | (8 | ) |
| Equity investments: adjustment for change in reporting period | | | (e) | | | — | | | — | | | 51 | |
| Other employee compensation expense | | | (f) | | | — | | | (3 | ) | | (8 | ) |
| Restructuring costs | | | (g) | | | (21 | ) | | 21 | | | — | |
| Fair value of derivatives | | | (i) | | | 50 | | | (19 | ) | | — | |
| Deferred taxation on US GAAP differences | | | (j) | | | (176 | ) | | (467 | ) | | (50 | ) |
| Long-term licence creditors | | | (k) | | | (1 | ) | | — | | | — | |
| | | | | |
| |
| |
| |
| Net loss as adjusted for US GAAP | | | | | | (3,671 | ) | | (1,463 | ) | | (3,747 | ) |
| | | | | |
| |
| |
| |
| Basic and diluted net loss per share, as adjusted for US GAAP (pence) | | | | | | (42.3 | ) | | (16.9 | ) | | | |
F-55
Back to Contents
mmO2 GROUP
NOTES TO THE CONSOLIDATED FINANCIAL STATEMENTS
| 32. | Reconciliation from UK GAAP to US GAAP and supplementary information (Continued) |
| | |
| | | Note | | 2003 | | 2002 | |
| | |
|
| |
|
| |
|
| |
| | | | | £m | | £m | |
Shareholders’ funds | | | | | | | | | | |
| Net assets under UK GAAP | | | | | | 10,066 | | | 18,834 | |
| Adjustment for: | | | | | | | | | | |
| Capitalisation of interest, net of related depreciation | | | (a) | | | 912 | | | 979 | |
| Goodwill impairment | | | (b) | | | 435 | | | — | |
| Licence impairment | | | (b) | | | 5,899 | | | — | |
| Fixed asset impairment on discontinuing operations | | | (b) | | | (25 | ) | | — | |
| Purchase business combinations and amortisation of intangible assets | | | (b) | | | 69 | | | (268 | ) |
| Employee share plans | | | (d) | | | (4 | ) | | (3 | ) |
| Other employee compensation expense | | | (f) | | | (11 | ) | | (11 | ) |
| Restructuring costs | | | (g) | | | — | | | 21 | |
| Treasury stock | | | (h) | | | (3 | ) | | (3 | ) |
| Fair value of derivatives | | | (i) | | | 31 | | | (19 | ) |
| Deferred taxation on US GAAP differences | | | (j) | | | (278 | ) | | (102 | ) |
| Long-term licence creditors | | | (k) | | | (1 | ) | | | |
| Pension liability | | | (l) | | | (38 | ) | | — | |
| Foreign exchange | | | (m) | | | (7 | ) | | — | |
| | | | | |
| |
| |
| Net assets as adjusted for US GAAP | | | | | | 17,045 | | | 19,428 | |
| | | | | |
| |
| |
Had the cessation of goodwill amortisation requirement of SFAS No. 142 been applied in prior periods, results of operations would have been as follows:
| | | 2002
£m | | 2001
£m | |
| | |
|
| |
|
| |
| Net loss as reported under US GAAP | | | (1,463 | ) | | (3,747 | ) |
| Add back: Goodwill amortisation | | | 346 | | | 268 | |
| | |
|
| |
|
| |
| Adjusted net loss | | | (1,117 | ) | | (3,479 | ) |
| | |
|
| |
|
| |
| Basic and diluted net loss per share as reported under US GAAP (pence) | | | (16.9 | ) | | | |
| Add back: Goodwill amortisation (pence) | | | 4.0 | | | | |
| | |
| | | | |
| Basic and diluted adjusted net loss per share (pence) | | | (12.9 | ) | | | |
| | |
| | | | |
F-56
Back to Contents
mmO2 GROUP
NOTES TO THE CONSOLIDATED FINANCIAL STATEMENTS
| 32. | Reconciliation from UK GAAP to US GAAP and supplementary information (Continued) |
The net loss under UK GAAP has been prepared for statutory reporting purposes using accounting policies which differ in certain respects to those used in the Listing Particulars, Form 20-F/A and Form 20-F. The impact of the different accounting policies is set out below:
| | | 2003 | | 2002 | | 2001 | |
| | |
|
| |
|
| |
|
| |
| | | £m | | £m | | £m | |
| | | | | | | | | | | |
| Net loss on Form 20-F basis | | | (10,148 | ) | | (1,379 | ) | | (4,009 | ) |
| Notional loans due to BT | | | — | | | 756 | | | 660 | |
| Deferred taxation on US GAAP differences | | | — | | | (227 | ) | | (184 | ) |
| | |
|
| |
|
| |
|
| |
| Net loss under UK GAAP for UK statutory reporting purposes | | | (10,148 | ) | | (850 | ) | | (3,533 | ) |
| | |
|
| |
|
| |
|
| |
The above adjustments have no impact on the net loss as adjusted for US GAAP.
III. Accounting for stock options |
Under UK GAAP, the cost of shares expected to be awarded under each plan is amortised evenly over the period from the original date of grant of the particular award, to the time of vesting. Under US GAAP, the Group adopted the disclosure-only option in SFAS No. 123, “Accounting for Stock-Based Compensation”. Accordingly, the Group accounts for share options in accordance with APB Opinion No. 25, “Accounting for Stock Issued to Employees”, under which compensation expense is recognised to the extent that the fair market value of the shares optioned exceeds the option exercise price. Aggregate share compensation of £3 million (2002: £2 million) has been recognised under APB No. 25 in the year. A charge of £2 million was recognised under UK GAAP.
Share option and purchase schemes |
The Group operates savings-related share option schemes for its employees and those of participating subsidiaries and further share option schemes (the mmO2 Share Option Plan and the mmO2 Legacy Option Plan) for selected Group employees.
The mmO2 Sharesave Plan is a savings-related share option scheme available to all employees. Share options are normally exercisable on completion of a three-year or five-year Save-As-You-Earn contract. Under this scheme, the option exercise price is set at a 20 per cent discount to the market price at the date of grant. Similar savings related schemes exist for Group employees based outside the UK.
From 1 April 2002 to 31 March 2003, options were granted for nil consideration to 1,041 employees. All such options have an exercise price equal to the market value at grant date. These options were granted on the terms that they normally only become exercisable on the third anniversary of grant, subject to certain performance criteria. If these criteria are not met on the third anniversary of grant, the performance goals will be retested on the fourth and fifth anniversaries. Options under this scheme generally have a life of ten years.
F-57
Back to Contents
mmO2 GROUP
NOTES TO THE CONSOLIDATED FINANCIAL STATEMENTS
| 32. | Reconciliation from UK GAAP to US GAAP and supplementary information (Continued) |
Subsisting options over BT shares granted under BT executive share option plans have been replaced with options over mmO2 shares, granted under the Legacy Option Plan, for those participants now employed by mmO2. The replacement options were granted on the same terms, and are exercisable between the same dates, as the options for which they were exchanged.
Options are normally exercisable up until the tenth anniversary of the date of the original grant. The exercise price of these options equalled the market value as at original grant date.
Options outstanding in relation to Group employees under these share option schemes as at 31 March 2003 together with their exercise prices and vesting periods, were as follows:
| | | | | Options outstanding over
ordinary shares
| | Options exercisable over
ordinary shares
| |
Range of exercise prices1 | | Number
outstanding | | Weighted-
average
remaining
contrac- tual
life | | Weigthted
average
exercise
price | | Number
exercisable | | Weighted-
average
exercise
price | |
| | |
|
| |
|
| |
|
| |
|
| |
|
| |
| | | (m) | | (years) | | (£) | | (m) | | (£) | |
| £0.44 | | | 37 | | | 3 | | | 0.44 | | | — | | | — | |
| £0.46 | | | 77 | | | 9 | | | 0.46 | | | — | | | — | |
| £0.48-0.69 | | | 13 | | | 9 | | | 0.65 | | | 3 | | | 0.69 | |
| £0.73-0.84 | | | 8 | | | 2 | | | 0.73 | | | 1 | | | 0.83 | |
| £0.87 | | | 46 | | | 9 | | | 0.87 | | | 3 | | | 0.87 | |
| £0.91-2.29 | | | 5 | | | 7 | | | 1.36 | | | 2 | | | 1.64 | |
| | |
|
| |
|
| |
|
| |
|
| |
|
| |
| | | | 186 | | | 8 | | | 0.60 | | | 9 | | | 1.02 | |
| | |
|
| |
|
| |
|
| |
|
| |
|
| |
| 1 | Share options over American Depositary Shares (ADS) have exercise prices termed in US Dollars. For purposes of disclosure, these options’ exercise prices have been translated into Sterling at the year end exchange rate. As each ADS represents 10 ordinary shares, the number of options and exercise prices have been adjusted by this ratio to reflect the options on a like for like basis. |
F-58
Back to Contents
mmO2 GROUP
NOTES TO THE CONSOLIDATED FINANCIAL STATEMENTS
| 32. | Reconciliation from UK GAAP to US GAAP and supplementary information (Continued) |
Options granted, exercised and lapsed in respect of Group employees under these share option schemes during the years ended 31 March 2003, 2002 and 2001 were as follows:
| | | Options over ordinary shares
| | Options over ADSs
| |
| | | Ordinary shares1
| | ADSs2
| |
Range of exercise prices1 | | Savings-
related
share
options | | Other
share
options | | Weighted-
average
exercise
price | | Other
share
options | | Weighted-
average
exercise
price | |
| | |
|
| |
|
| |
|
| |
|
| |
|
| |
| | | (m) | | (m) | | (£) | | (m) | | (£) | |
| Balance at 31 March 2000 | | | 55 | | | 2 | | | 1.05 | | | — | | | — | |
| Granted | | | 10 | | | 2 | | | 1.82 | | | — | | | — | |
| Exercised | | | (11 | ) | | (1 | ) | | 0.77 | | | — | | | — | |
| Lapsed | | | (4 | ) | | — | | | 1.50 | | | — | | | — | |
| | |
|
| |
|
| |
|
| |
|
| |
|
| |
| Balance at 31 March 2001 | | | 50 | | | 3 | | | 1.37 | | | — | | | — | |
| Lapsed on demerger | | | (50 | ) | | (3 | ) | | 1.37 | | | — | | | — | |
| | |
|
| |
|
| |
|
| |
|
| |
|
| |
| Balance on demerger | | | — | | | — | | | — | | | — | | | — | |
| Granted | | | 31 | | | 65 | | | 0.82 | | | 6 | | | 1.17 | |
| Lapsed | | | — | | | (2 | ) | | 0.84 | | | — | | | — | |
| | |
|
| |
|
| |
|
| |
|
| |
|
| |
| Balance at 31 March 2002 | | | 31 | | | 63 | | | 0.82 | | | 6 | | | 1.17 | |
| Granted | | | 37 | | | 81 | | | 0.45 | | | — | | | — | |
| Lapsed | | | (23 | ) | | (6 | ) | | (0.72 | ) | | (3 | ) | | 0.87 | |
| | |
|
| |
|
| |
|
| |
|
| |
|
| |
Balance at 31 March 2003 | | | 45 | | | 138 | | | 0.60 | | | 3 | | | 1.49 | |
| | |
|
| |
|
| |
|
| |
|
| |
|
| |
| 1 | All options granted, exercised, lapsed and outstanding for periods prior to demerger have been adjusted to reflect the exchange ratio of 4.1266 shares of mmO2 per share of BT. |
| 2 | Share options over ADSs have exercise prices termed in US Dollars. For purposes of disclosure, these options’ exercise prices have been translated into Sterling at the year end exchange rate. As each ADS represents 10 ordinary shares, the number of options and exercise prices have been adjusted by this ratio to reflect the options on a like for like basis. |
| |
mmO2 Restricted Share Plan |
Restricted share awards have been granted to a small group of senior executives. Most of these awards were granted on terms that they will normally only vest on the third anniversary of grant if the participant builds up a pre-determined personal shareholding in the Group, and remains in employment with the Group. Shares required to satisfy these awards are held in trust during the restricted period. In accordance with APB No. 25, an expense has been recognised to the extent that executives have commenced building their personal shareholding. The weighted average grant date fair value of the 9.4 million shares granted under this plan in the year ended 31 March 2002 was £0.80. No shares were granted under this plan in the year ended 31 March 2003.
F-59
Back to Contents
mmO2 GROUP
NOTES TO THE CONSOLIDATED FINANCIAL STATEMENTS
| 32. | Reconciliation from UK GAAP to US GAAP and supplementary information (Continued) |
For disclosure purposes, the fair value of all share options granted is estimated using the Black-Scholes option-pricing model. The following weighted average assumptions were used for share options granted by the Group:
| | | 2003 | | 2002 | | 2001 | |
| | | |
| |
|
| |
|
| |
| | | % | | % | | % | |
| Annual dividends | | | – | | | – | | | 2 | |
| Expected volatility | | | 27 | | | 55 | | | 40 | |
| Risk free interest rate | | | 4 | | | 5 | | | 7 | |
The expected life applied in the model anticipated the life of options extending one month later than the first exercise date.
Had compensation expense been determined on the basis of fair value pursuant to SFAS No. 123, net loss and net loss per share would have been as follows:
| | | 2003 | | 2002 | | 2001 | |
| | |
|
| |
|
| |
|
| |
| | | (in £ millions, except per share
data which is stated in pence) | |
Net loss | | | | | | | | | | |
| As reported | | | 3,671 | | | 1,463 | | | 3,747 | |
| | |
|
| |
|
| |
|
| |
Pro forma | | | 3,676 | | | 1,463 | | | 3,750 | |
| | |
|
| |
|
| |
|
| |
Net loss per share | | | | | | | | | | |
| As reported | | | 42.3 | | | 16.9 | | | | |
| | |
| |
| | | | |
Pro forma | | | 42.4 | | | 16.9 | | | | |
| | |
| |
| | | | |
The weighted average fair value of share options granted in the year ended 31 March 2003 was £nil (2002: £0.16) for options exercisable one year after the date of grant, £nil (2002: £0.22) for options exercisable two years after the date of grant, £0.13 (2002: £0.35, 2001: £0.80) for options exercisable three years after the date of grant and £0.23 (2002: £0.46, 2001: £1.03) for options exercisable five years after the date of grant.
A number of key employees of mmO2 were participants prior to demerger in BT share plans. The awards have been adjusted so that they relate solely to mmO2 plc shares, and any performance measure has been translated into a measure of the Group’s performance from demerger to the end of the performance period. On maturity these awards will be satisfied in existing mmO2 shares held by an employee trust which has already been funded by BT.
In accordance with the rules of these plans the awards were converted into awards over mmO2 plc shares on the basis of an adjustment factor of 4.1266.
Incentive Share Plan, (ISP) and Retention Share Plan, (RSP) |
Participants are awarded shares which will normally vest at the end of a three-year period provided a pre-determined total shareholder return, (TSR), target is met.
Executive Share Plan, (ESP) |
Participants are awarded shares which will normally vest at the end of five years provided a pre-determined TSR target is met.
F-60
Back to Contents
mmO2 GROUP
NOTES TO THE CONSOLIDATED FINANCIAL STATEMENTS
| 32. | Reconciliation from UK GAAP to US GAAP and supplementary information (Continued) |
| |
Deferred Bonus Plan, (DBP) |
Awards of shares were made to executives based on their performance in the preceding financial year and vest after three years. Under the DBP there are no associated performance goals.
Under the Separation Agreement between the Group and BT, it has been endorsed and agreed that all share awards required under the ISP, RSP, ESP and DBP will be honoured by BT and will be satisfied by issuance of existing mmO2 shares held by a BT trust which has already been funded by BT. Thus, the Group is not responsible for any of the options or shares under these schemes and will bear no compensation expense in association with them.
| IV. | Group cash flow statements |
Under UK GAAP, the Group cash flow statement is presented in accordance with FRS 1 “Cash flow statements”. The statements prepared under FRS 1 present substantially the same information as that required under SFAS No. 95 “Statement of Cash Flows”.
Under SFAS No. 95, cash and cash equivalents include cash and short-term investments with original maturities of three months or less. Under FRS 1, cash comprises cash in hand and at bank and overnight deposits, net of bank overdrafts.
Under FRS 1, cash flows are presented for operating activities, returns on investments and servicing of finance, taxation, capital expenditure and financial investments, acquisitions and disposals, dividends paid to the Company’s shareholders, management of liquid resources and financing. SFAS No. 95 requires a classification of cash flows as resulting from operating, investing and financing activities.
Cash flows under FRS 1 in respect of interest received, interest paid and taxation would be included within operating activities under SFAS No. 95. Cash flows from purchases, sales and maturities of trading securities, while not separately identified under UK GAAP, would be included within operating activities under US GAAP.
The following statements summarise the combined cash flow statements as if they had been presented in accordance with US GAAP, and include the adjustments that reconcile cash and cash equivalents under US GAAP to cash at bank and in hand reported under UK GAAP.
| | | 2003 | | 2002 | | 2001 | |
| | |
|
| |
|
| |
|
| |
| | | £m | | £m | | £m | |
| Net cash provided by operating activities | | | 966 | | | 444 | | | 328 | |
| Net cash used in investing activities | | | (868 | ) | | (2,095 | ) | | (17,808 | ) |
| Net cash provided by financing activities | | | (47 | ) | | 1,790 | | | 17,593 | |
| | |
|
| |
|
| |
|
| |
| Net increase in cash and cash equivalents | | | 51 | | | 139 | | | 113 | |
| Exchange movement on cash and cash equivalents | | | 31 | | | — | | | — | |
| Cash and cash equivalents under US GAAP at the beginning of the year | | | 479 | | | 340 | | | 227 | |
| | |
|
| |
|
| |
|
| |
| Cash and cash equivalents under US GAAP at the end of the year | | | 561 | | | 479 | | | 340 | |
| Short-term investments | | | (493 | ) | | (459 | ) | | — | |
| Bank overdrafts | | | — | | | — | | | 49 | |
| | |
|
| |
|
| |
|
| |
| Cash at bank and in hand under UK GAAP at the end of the year | | | 68 | | | 20 | | | 389 | |
| | |
|
| |
|
| |
|
| |
F-61
Back to Contents
mmO2 GROUP
NOTES TO THE CONSOLIDATED FINANCIAL STATEMENTS
| 32. | Reconciliation from UK GAAP to US GAAP and supplementary information (Continued) |
Information in respect of the net periodic benefit cost and related obligation determined in accordance with SFAS No. 87 and SFAS No. 132 is given below. A description of the pension arrangements of the Group is given in note 8 to the financial statements. The assumptions used to determine the net periodic benefit cost and the year-end benefit obligation or the mmO2 Pension Plan (mmO2 PP) are shown below. The assumptions used for the other defined benefit schemes around the Group are consistent with those used for the mmO2 PP.
| | | Cost for period from
1 July 2002 to
31 March 2003 | | Year-end
benefit obligation | |
| | |
|
| |
|
| |
| | | % | | % | |
| Assumptions | | | | | | | |
| Discount rate | | | 6.0 | | | 5.8 | |
| Long-term rate of return on plan assets | | | 7.7 | | | 7.1 | |
| Increase in compensation levels | | | 4.2 | | | 3.7 | |
| Inflation rate | | | 2.7 | | | 2.5 | |
| Increase in payment of pensions | | | | | | | |
| – pension increases in line with inflation | | | 2.7 | | | 2.5 | |
| – pension increases limited to 5% p.a. | | | 2.7 | | | 2.4 | |
| |
Components of net benefit expenses |
No comparatives for the year ended 31 March 2002 are presented as in that period most pension obligations were provided for in the BT Pension Scheme (BTPS). Under UK GAAP and US GAAP multi-employer accounting was applied to the Group’s participation in the BTPS. This applied until the inception of the mmO2 PP on 1 July 2002 for which the Group is the principal employer. The cost for the period from 1 April 2002 to 30 June 2002 equals the contributions paid to the BTPS of £4 million and is in addition to the costs shown below. For the Group’s other arrangements, the difference between UK GAAP and US GAAP is not significant.
F-62
Back to Contents
mmO2 GROUP
NOTES TO THE CONSOLIDATED FINANCIAL STATEMENTS
| 32. | Reconciliation from UK GAAP to US GAAP and supplementary information (Continued) |
| |
Supplementary information for United States investors |
The net benefit expense for the year ended 31 March 2003 for the Group’s defined benefit pension schemes in aggregate may be analysed as follows:
| | | 2003 | |
| | |
|
| |
| | | £m | |
| Service cost | | | (17 | ) |
| Interest cost on benefit obligation | | | (13 | ) |
| Expected return on plan assets | | | 15 | |
| Net amortisation and deferral – recognised losses | | | (1 | ) |
| | |
|
| |
| Net periodic benefit cost | | | (16 | ) |
| Defined contribution cost | | | (4 | ) |
| | |
|
| |
| Net benefit expense | | | (20 | ) |
| | |
|
| |
The funded status of the Group’s pension schemes at 31 March 2003 was:
| | | 2003 | |
| | |
|
| |
| | | £m | |
| Benefit obligation at end of year | | | (310 | ) |
| Fair value of plan assets | | | 218 | |
| | |
|
| |
| Plan assets below benefit obligation | | | (92 | ) |
| Unrecognised net loss | | | 82 | |
| | |
|
| |
| Net amount recognised | | | (10 | ) |
| | |
|
| |
| Comprising: | | | | |
| Benefit provision (including additional minimum liability) | | | (48 | ) |
| Amount recognised through accumulated other comprehensive income | | | 38 | |
| | |
|
| |
| Net amount recognised | | | (10 | ) |
| | |
|
| |
| | | | | |
| | | 2003 | |
| | |
|
| |
| | | £m | |
| Change in additional minimum liability before tax: | | | | |
| Accrued pension benefit expense | | | 38 | |
| | |
|
| |
| Other comprehensive income before tax | | | 38 | |
| | |
|
| |
F-63
Back to Contents
mmO2 GROUP
NOTES TO THE CONSOLIDATED FINANCIAL STATEMENTS
| 32. | Reconciliation from UK GAAP to US GAAP and supplementary information (Continued) |
The change in the benefit obligation and the plan assets of the Group’s pension schemes in the year ended 31 March 2003 may be analysed as follows:
| | | 2003
£m | |
| | | |
| | |
|
| |
| Benefit obligation at start of year | | | (298 | ) |
| Service cost | | | (17 | ) |
| Interest cost | | | (13 | ) |
| Contributions by plan participants | | | (8 | ) |
| Actuarial gains | | | 26 | |
| | |
|
| |
| Benefit obligation at end of year | | | (310 | ) |
| | |
|
| |
| | | | | |
| Fair value of plan assets at start of year | | | 250 | |
| Actual return on plan assets | | | (56 | ) |
| Contributions by plan participants | | | 8 | |
| Contributions by employer | | | 16 | |
| | |
|
| |
| Fair value of plan assets at end of year | | | 218 | |
| | |
|
| |
The elements of deferred taxation to be considered for US GAAP purposes are as follows:
| | | As at 31 March | |
| | | 2003 | | 2002 | |
| | |
|
| |
|
| |
| | | £m | | £m | |
| Bad debt provision | | | 11 | | | 8 | |
| Other general provision | | | — | | | 7 | |
| | |
|
| |
|
| |
Deferred current tax assets | | | 11 | | | 15 | |
| | |
|
| |
|
| |
| Tax losses carried forward | | | 1,712 | | | 893 | |
| Other | | | 38 | | | 8 | |
| | |
|
| |
|
| |
Deferred non-current tax asset | | | 1,750 | | | 901 | |
| Allowance | | | (878 | ) | | (631 | ) |
| | |
|
| |
|
| |
Total deferred non-current tax asset after allowance | | | 872 | | | 270 | |
| Capitalised interest | | | (312 | ) | | (385 | ) |
| Intangible assets | | | (708 | ) | | (16 | ) |
| Accelerated capital allowance | | | (362 | ) | | (359 | ) |
| | |
|
| |
|
| |
Total deferred tax liabilities | | | (1,382 | ) | | (760 | ) |
| | |
|
| |
|
| |
Net deferred non-current liabilities (net of deferred tax assets) | | | (499 | ) | | (475 | ) |
| | |
|
| |
|
| |
F-64
Back to Contents
mmO2 GROUP
NOTES TO THE CONSOLIDATED FINANCIAL STATEMENTS
| 32. | Reconciliation from UK GAAP to US GAAP and supplementary information (Continued) |
The table below represents the deferred tax for loss carry forwards and expiry dates as at 31 March 2003:
| | | O2 | | O2 | | O2 | | O2 | | | |
| | | UK | | Germany | | Nether- lands | | Ireland | | Total | |
| | |
|
| |
|
| |
|
| |
|
| |
|
| |
| | | £m | | £m | | £m | | £m | | £m | |
| Total (no expiration) | | | 708 | | | 920 | | | 84 | | | — | | | 1,712 | |
| | |
|
| |
|
| |
|
| |
|
| |
|
| |
The Group provides a valuation allowance against its net deferred tax assets on a country by country basis if, based on available objective evidence, it is probable that they will not be fully realised.
VII. Additional US GAAP disclosures |
Under UK GAAP, the Group accounts for joint venture investments using the gross equity method of accounting. The profit and loss account includes the Group’s share of the operating profit and loss, interest income or expense and attributable taxation of those companies. The balance sheet shows the Group’s share of the gross assets and liabilities of those companies and attributed goodwill. Under US GAAP, these investments would be accounted for using the net equity method. The profit and loss account would include on one line an item with the Group’s share of the loss before tax of £nil (2002: £nil, 2001: £374 million). The balance sheet would show on one line an item with the Group’s share of the net assets of those companies.
Under UK GAAP exceptional costs totalling £8,300 have been recognised (2002: £150 million; 2001: £2,821 million). Under US GAAP these would not be considered exceptional items and would be classified within net operating expenses.
(c) Use of estimates in preparation of financial statements |
The preparation of financial statements in conformity with accounting principles generally accepted in the United Kingdom and the United States of America requires management to make estimates and assumptions that affect the reported amounts of assets and liabilities and disclosure of contingent assets and liabilities to the date of the financial statements and the reported amounts of revenue and expenses during the period. Actual results could differ from those estimates.
(d) Recent US GAAP Accounting Pronouncements |
In June 2001, the Financial Accounting Standards Board (FASB) issued SFAS No. 143, “Accounting for Obligations Associated with the Retirement of Long-Lived Assets”, which is effective for the Group from 1 April 2003. SFAS No. 143 requires, among other things, that the fair value of a liability for an asset retirement obligation be recognised in the period in which it is incurred, if a reasonable estimate of fair value can be made and the Group has a legal obligation to do so. A legal obligation can result from (i) a government action, such as a law or ordinance, (ii) an agreement between entities, such as a written or oral contract, or (iii) a promise conveyed to a third party that imposes a reasonable expectation of performance upon the promisor under the doctrine of promissory estoppel.
F-65
Back to Contents
mmO2 GROUP
NOTES TO THE CONSOLIDATED FINANCIAL STATEMENTS
| 32. | Reconciliation from UK GAAP to US GAAP and supplementary information (Continued) |
The associated asset retirement costs are capitalised as part of the carrying amount of the long-lived asset. The asset retirement cost is subsequently allocated to expense (as depreciation or impairment) over the useful life of the related long-lived asset. The liability is discounted and subsequently accreted using the credit-adjusted risk-free interest rate in effect when the liability was initially recognised. The accretion amounts must be recognised as an increase in the carrying amount of the liability and classified in the statement of income as other operating expense. The Group is currently assessing the impact of the adoption of this statement on its financial position, results of operations and cash flows.
In June 2002, the FASB issued SFAS No. 146, “Accounting for Costs Associated with Exit or Disposal Activities”. SFAS No. 146 requires that a liability for costs associated with an exit or disposal activity be recognised and measured initially at its fair value in the period in which the liability is incurred. Previously a liability for an exit cost was required to be recognised at the date of an entity’s commitment to an exit plan, however, this does not, by itself, create a present obligation to others that meets the definition of a liability. SFAS No. 146 will be effective for the Group for any exit or disposal activities that are initiated after 31 December 2002. The Group does not anticipate adoption of this statement having a significant impact on its financial position, results of operations and cash flows.
In November 2002, the FASB issued FASB Interpretation 45 (FIN 45), “Guarantor’s Accounting and Disclosure Requirements for Guarantees, Including Indirect Guarantees of Indebtedness of Others.” FIN 45 requires that a liability (at fair value) be recorded in the guarantor’s balance sheet upon issuance of a guarantee. In addition, FIN 45 requires disclosures about the guarantees that an entity has issued, including a reconciliation of changes in the entity’s product warranty liabilities. The initial recognition and initial measurement provisions of FIN 45 are applicable on a prospective basis to guarantees issued or modified after 31 December 2002, irrespective of the guarantor’s fiscal year-end. The disclosure (but not the accounting) requirements of FIN 45 are effective for the Group’s 2003 financial statements.
In January 2003, the FASB issued FASB Interpretation 46 (FIN 46), “Consolidation of Variable Interest Entities, an Interpretation of ARB 51.” FIN 46 requires certain variable interest entities to be consolidated by the primary beneficiary of the entity if the equity investors in the entity do not have the characteristics of a controlling financial interest or do not have sufficient equity at risk for the entity to finance its activities without additional subordinated financial support from other parties. FIN 46 is effective immediately for all new variable interest entities created or acquired after 31 January 2003. For variable interest entities created or acquired prior to 1 February 2003, the provisions of FIN 46 must be applied for the first interim or annual period beginning after 15 June 2003. The disclosure (but not the accounting) requirements of FIN 46 are effective for the Group’s 2003 financial statements, regardless of the date on which the variable interest entity was created. Management is currently evaluating the impact of FIN 46 on the Group’s consolidated financial statements.
In November 2002, the Emerging Issues Task Force (EITF) reached a consensus on Issue 00-21 (EITF 00-21), “Revenue Arrangements with Multiple Deliverables”. EITF 00-21 addresses certain aspects of the accounting by a vendor for arrangements under which the vendor will perform multiple revenue generating activities. EITF 00-21 will be effective for interim periods beginning after 15 June 2003. The Group is currently evaluating the impact of adoption of EITF 00-21 on its financial position and results of operations in 2003.
F-66
Back to Contents
mmO2 GROUP
NOTES TO THE CONSOLIDATED FINANCIAL STATEMENTS
| 32. | Reconciliation from UK GAAP to US GAAP and supplementary information (Continued) |
| | |
| (e) | Recent UK accounting standards |
The Group continues to apply the transitional disclosure arrangements set out in FRS 17 “Retirement benefits”. Mandatory implementation is not required by the Group until the year ended 31 March 2006. The transitional disclosures required are provided in note 8 to the financial statements. The changes introduced by FRS 17 principally affect the way defined benefit pension schemes are accounted for. At each year-end the pension scheme assets should be measured at market value while pension scheme liabilities should be measured at a present value using a specified actuarial valuation method and discounted at a corporate bond rate. The resulting pension scheme surplus or deficit must be shown on the Group’s balance sheet, and could be volatile because of the dependence on market conditions at the balance sheet date.
F-67
Back to Contents
O2 GERMANY
(formerly VIAG INTERKOM)
REPORT OF THE INDEPENDENT ACCOUNTANTS |
To the Board of Directors and Owner of VIAG Interkom:
In our opinion, the accompanying combined balance sheets and the related combined profit and loss accounts and combined cash flow statements, present fairly, in all material respects, the financial position of Viag Interkom as at 31 December 1999 and 2000, and the results of its operations and its cash flows for each of the three years in the period ended 31 December 2000, in conformity with accounting principles which, as described in Note 1, are generally accepted in the United Kingdom. These financial statements are the responsibility of the management of Viag Interkom GmbH & Co.; our responsibility is to express an opinion on these financial statements based on our audits. We conducted our audits of these statements in accordance with auditing standards generally accepted in the United States of America, which require that we plan and perform the audit to obtain reasonable assurance about whether the financial statements are free of material misstatement. An audit includes examining, on a test basis, evidence supporting the amounts and disclosures in the financial statements, assessing the accounting principles used and significant estimates made by management, and evaluating the overall financial statement presentation. We believe that our audits provide a reasonable basis for our opinion.
As indicated in Note 1, Viag Interkom represents the mobile business which has been carved out of the overall Viag Interkom GmbH & Co. business and include all or a portion of Viag Interkom GmbH & Co., Viag Interkom Management GmbH, Interkom Shop GmbH, Viag Europlattform AG and Interkom Gesellschaft für internationale Kommunikation in der Datenverarbeitung GmbH. The financial position, results of operations and cash flows of Viag Interkom could differ from those that would have resulted had Viag Interkom operated as a separate, stand alone group.
Accounting principles generally accepted in the United Kingdom vary in certain significant respects from accounting principles generally accepted in the United States of America. The application of the latter would have affected the determination of net income expressed in Euros for each of the two years in the period ended 31 December 2000 and the determination of Owners’ net investment and combined financial position also expressed in Euros as at 31 December 1999 and 2000 to the extent summarized in Note 22 to the combined financial statements.
Munich, Germany
14 September 2001
PwC Deutsche Revision
Aktiengesellschaft
Wirtschaftsprüfungsgesellschaft
| (Gesswein) | (ppa. Rekitt) |
| | |
| Wirtschaftsprüfer | Wirtschaftsprüfer |
F-68
Back to Contents
O2 GERMANY
(formerly VIAG INTERKOM)
COMBINED PROFIT AND LOSS ACCOUNTS |
| |
| | | | | Year ended 31 December
| |
| | | Notes | | 1998 | | 1999 | | 2000 | |
| | |
|
| |
|
| |
|
| |
|
| |
| | | | | €’000 | | €’000 | | €’000 | |
Turnover | | | 2 | | | 4,303 | | | 373,471 | | | 959,806 | |
| Cost of sales | | | | | | (72,558 | ) | | (564,530 | ) | | (1,026,040 | ) |
| | | | | |
| |
| |
| |
Gross loss | | | | | | (68,255 | ) | | (191,059 | ) | | (66,234 | ) |
| | | | | | | | | | | | | | |
| Sales and marketing expenses | | | | | | (27,298 | ) | | (105,646 | ) | | (221,548 | ) |
| Administrative expenses | | | | | | (240,850 | ) | | (435,940 | ) | | (609,270 | ) |
| | | | | |
| |
| |
| |
Operating loss | | | 3 | | | (336,403 | ) | | (732,645 | ) | | (897,052 | ) |
| | | | | | | | | | | | | | |
| Interest receivable and similar income | | | 4 | | | 3,213 | | | 5,840 | | | 8,407 | |
| Interest payable and similar charges | | | 5 | | | (67 | ) | | (603 | ) | | (166,430 | ) |
| | | | | |
| |
| |
| |
Loss on ordinary activities before taxation | | | | | | (333,257 | ) | | (727,408 | ) | | (1,055,075 | ) |
| Taxation on loss on ordinary activities | | | 6 | | | — | | | — | | | — | |
| | | | | |
| |
| |
| |
Loss for the financial year | | | 15 | | | (333,257 | ) | | (727,408 | ) | | (1,055,075 | ) |
| | | | | |
| |
| |
| |
Turnover and operating loss derive entirely from continuing activities. Other than the loss for the financial year, there have been no other recognized gains or losses during the years 1998, 1999 and 2000. The profit and loss accounts have been prepared on the historical cost basis. Accordingly, neither combined statements of comprehensive income nor reconciliations of movement in Owners’ net investment are shown.
The accompanying notes on pages F-72 to F-90 are an integral part of the combined financial statements
F-69
Back to Contents
O2 GERMANY
(formerly VIAG INTERKOM)
| | | | | As at 31 December
| |
| | | Note | | 1999 | | 2000 | |
| | |
|
| |
|
| |
|
| |
| | | | | €’000 | | €’000 | |
Fixed assets | | | | | | | | | | |
| Intangible assets | | | 8 | | | 18,762 | | | 8,475,541 | |
| Tangible assets | | | 9 | | | 1,262,389 | | | 1,757,898 | |
| | | | | |
| |
| |
Total fixed assets | | | | | | 1,281,151 | | | 10,233,439 | |
| | | | | |
| |
| |
Current assets | | | | | | | | | | |
| Stocks | | | 10 | | | 39,538 | | | 103,336 | |
| Debtors | | | 11 | | | 393,781 | | | 525,487 | |
| Cash at bank and in hand | | | | | | 53,858 | | | 204,407 | |
| | | | | |
| |
| |
Total current assets | | | | | | 487,177 | | | 833,230 | |
| | | | | |
| |
| |
Creditors: amounts falling due within one year | | | | | | | | | | |
| Loans and other borrowings | | | 12 | | | — | | | (9,032,461 | ) |
| Other creditors | | | 13 | | | (466,321 | ) | | (427,653 | ) |
| | | | | |
| |
| |
Net current assets/(liabilities) | | | | | | 20,856 | | | (8,626,884 | ) |
| | | | | |
| |
| |
Total assets less current liabilities | | | | | | 1,302,007 | | | 1,606,555 | |
| | | | | | | | | | | |
| Provisions for liabilities and charges | | | 14 | | | (17,591 | ) | | (22,497 | ) |
| | | | | |
| |
| |
Net assets | | | | | | 1,284,416 | | | 1,584,058 | |
| | | | | |
| |
| |
| | | | | | | | | | | |
Owners’ net investment | | | 15 | | | 1,284,416 | | | 1,584,058 | |
| | | | | |
| |
| |
The accompanying notes on pages F-72 to F-90 are an integral part of the combined financial statements
F-70
Back to Contents
O2 GERMANY
(formerly VIAG INTERKOM)
COMBINED CASH FLOW STATEMENTS |
| |
| | | | | Year ended 31 December
| |
| | | Notes | | 1998 | | 1999 | | 2000 | |
| | |
|
| |
|
| |
|
| |
|
| |
| | | | | €’000 | | €’000 | | €’000 | |
| | | | | | | | | | | | | | |
Net cash outflow from operating activities | | | 16 | | | (174,318 | ) | | (740,020 | ) | | (855,596 | ) |
| | | | | |
| |
| |
| |
Returns on investments and servicing of finance | | | | | | | | | | | | | |
| Interest received | | | | | | 3,213 | | | 5,840 | | | 8,407 | |
| Interest paid, including finance costs | | | | | | (67 | ) | | (603 | ) | | (1,527 | ) |
| | | | | |
| |
| |
| |
Net cash inflow from returns on investments and servicing of finance | | | | | | 3,146 | | | 5,237 | | | 6,880 | |
| | | | | |
| |
| |
| |
Capital expenditure and financial investments | | | | | | | | | | | | | |
| Purchase of intangible fixed assets | | | | | | (895 | ) | | (11,746 | ) | | (8,458,082 | ) |
| Purchase of tangible fixed assets | | | | | | (674,369 | ) | | (598,808 | ) | | (767,842 | ) |
| Disposal of tangible fixed assets | | | | | | 2,015 | | | — | | | 2,914 | |
| | | | | |
| |
| |
| |
Net cash outflow for capital expenditure and financial investment | | | | | | (673,249 | ) | | (610,554 | ) | | (9,223,010 | ) |
| | | | | |
| |
| |
| |
Cash outflow before management of liquid resources and financing | | | | | | (844,421 | ) | | (1,345,337 | ) | | (10,071,726 | ) |
| | | | | |
| |
| |
| |
Financing | | | | | | | | | | | | | |
| Increase in Owners’ net investment | | | 15 | | | 826,794 | | | 1,391,557 | | | 1,354,717 | |
| Increase in short-term borrowings from Owners | | | | | | — | | | — | | | 8,867,558 | |
| | | | | |
| |
| |
| |
Net cash inflow from financing | | | | | | 826,794 | | | 1,391,557 | | | 10,222,275 | |
| | | | | |
| |
| |
| |
(Decrease)/increase in cash and cash equivalents | | | | | | (17,627 | ) | | 46,220 | | | 150,549 | |
| | | | | |
| |
| |
| |
| | | | | | | | | | | | | | |
| Cash and cash equivalents as at beginning of period | | | | | | 25,265 | | | 7,638 | | | 53,858 | |
| (Decrease)/increase in cash and cash equivalents | | | | | | (17,627 | ) | | 46,220 | | | 150,549 | |
| | | | | |
| |
| |
| |
Cash and cash equivalents as at end of period | | | | | | 7,638 | | | 53,858 | | | 204,407 | |
| | | | | |
| |
| |
| |
Reconciliation of net cash flow to movements in net debt
| | | | | | Year ended 31 December
| |
| | | | | | 1998 | | 1999 | | 2000 | |
| | | | | |
| |
| |
| |
| | | | | | €’000 | | €’000 | | €’000 | |
| | | | | | | | | | | | | | |
| (Decrease)/increase in cash in the year | | | | | | (17,627 | ) | | 46,220 | | | 150,549 | |
| Cash inflow from increase in debt | | | | | | — | | | — | | | (8,867,558 | ) |
| | | | | |
| |
| |
| |
| (Increase)/decrease in net debt resulting from cash flows | | | | | | (17,627 | ) | | 46,220 | | | (8,717,009 | ) |
| Other non-cash movements | | | | | | — | | | — | | | (164,903 | ) |
| | | | | |
| |
| |
| |
(Increase)/decrease in net debt in the year | | | | | | (17,627 | ) | | 46,220 | | | (8,881,912 | ) |
| Net debt as at 1 January | | | | | | 25,265 | | | 7,638 | | | 53,858 | |
| | | | | |
| |
| |
| |
Net funds/(debt) as at 31 December | | | 17 | | | 7,638 | | | 53,858 | | | (8,828,054 | ) |
| | | | | |
| |
| |
| |
The accompanying notes on pages F-72 to F-90 are an integral part of the combined financial statements
F-71
Back to Contents
O2 GERMANY
(formerly VIAG INTERKOM)
NOTES TO THE COMBINED FINANCIAL STATEMENTS
| 1. | Basis of preparation, combination and accounting policies |
Description of Business and Ownership
Viag Interkom GmbH & Co. (“Viag”), an integrated fixed and mobile telecommunications company headquartered in Munich, was launched in May 1995 as a joint venture between British Telecommunications plc (“BT”) and Viag AG, with BT holding a 50 per cent stake. BT’s stake was reduced to 45 per cent when Telenor AS acquired a 10 per cent stake in April 1997. In January 2001, BT increased its stake to 55 per cent and on 20 February 2001 BT acquired 100 per cent of the business. On 28 February 2001 the business, assets and liabilities of Viag’s fixed-line business were sold to a new company, BT Ignite GmbH & Co. OHG (“Ignite”), set up for the purpose. The remaining assets and liabilities of Viag consist entirely of the assets and liabilities of the mobile business and its subsidiary undertakings (together “Viag Interkom”).
The business of Viag Interkom comprises the operation of a mobile telecommunications network in Germany, offering mobile services to the consumer and business markets.
In May 1997 Viag entered one of the largest mobile telecommunication markets in Europe with the acquisition of the fourth German GSM license, followed by the launch of the GSM network in October 1998. In August 2000, a UMTS license was acquired from the German state at auction at a cost of DEM16.5 billion (€8.4 billion). Since January 2001 Viag Interkom has also offered mobile data services via GPRS (2.5 G).
The future performance of Viag Interkom will be significantly influenced by the growth of the UMTS market in Germany. Viag Interkom has incurred substantial operating losses since inception and has had negative cash flow from operations. Under the UMTS license acquired in 2000, Viag Interkom is required to develop a third generation mobile network in Germany which will require substantial future investments. Historically, Viag Interkom has relied upon support from its partners to provide funding for operations and will continue to rely upon funding from the mmO2 Group in the future. As described above, on 20 February 2001, Viag Interkom became a wholly-owned subsidiary of BT.
Basis of preparation and presentation
These combined financial statements represent the carve-out of the mobile operations of Viag and its subsidiary undertakings and include all or a portion of Viag Interkom GmbH & Co., Viag Interkom Management GmbH, Interkom Shop GmbH, Viag Europlattform AG and Interkom Gesellschaft für Internationale Kommunikation in der Datenverarbeitung GmbH.
The financial statements have been prepared in Deutschemarks and converted to Euros using the fixed exchange rate of DEM 1.9558 to EUR1.
Basis of carve-out
Viag Interkom, until the separation referred to above, was a fully integrated business unit of Viag. The combined financial statements reflect the results, financial position and cash flows of Viag Interkom as if it was a separate entity for all periods presented.
The combined financial statements reflect the assets, liabilities, operating results and cash flows of Viag Interkom and has been prepared from the accounting records of Viag. The combined financial information includes balances which were directly attributable to the Viag Interkom business or which were apportioned based on allocations deemed reasonable by management, to present the results of operations, financial position and cash flows of Viag Interkom on a stand-alone basis.
F-72
Back to Contents
O2 GERMANY
(formerly VIAG INTERKOM)
NOTES TO THE COMBINED FINANCIAL STATEMENTS (Continued)
| | |
| 1. | Basis of preparation, combination and accounting policies (Continued) |
The principal allocation methodologies are described below.
Viag Interkom had not in the past formed a separate legal group or been structured with a holding company as a separate legal entity. The investment by the Viag Owners attributable to Viag Interkom has been shown on the balance sheet as the Owners’ net investment. Viag Interkom had not been charged with any financing costs in respect of amounts included in the Owners’ net investment during the period covered by this report.
Viag Interkom had no separate share capital and reserves for the periods covered by these financial statements. All funding of the Viag Interkom operations during the period of the combined financial statements has been financed by Owners’ loans or Owners’ net investment. Trading and short-term asset management balances with Ignite are included within debtors and creditors as appropriate.
As an integrated business unit of Viag, Viag Interkom has not prepared separate financial statements in accordance with UK GAAP in the normal course of its operations. These combined financial statements were prepared in accordance with UK GAAP for the purposes of the mmO2 Group demerger. Changes in Owners’ net investment represent transfers to or from the Owners, after giving effect to the losses attributable to the Owners during the period and are assumed to be settled in cash.
As Viag Interkom was not a separate legal entity its results in the period under review have not been the subject of separate taxation returns during the period under review. For the purpose of this report, the tax charge has been calculated at the applicable municipal corporate tax rate for the years concerned.
Turnover and direct product cost of sales were allocated to Viag Interkom by direct attribution through the use of product codes. Mobile network costs, primarily depreciation and maintenance costs, were allocated to Viag Interkom by direct attribution according to the same allocation as for network assets. Network costs for the use of the fixed network were charged to Viag Interkom based upon actual usage at an average annual price. The price was calculated based upon market rates charged by Ignite to third parties during each period adjusted by an appropriate discount rate. The discount used is consistent with a rate that would have been applied had Viag Interkom been an autonomous related party.
Depreciation and amortization expense were allocated based on the allocation of the intangible and tangible fixed assets. However, costs have been reduced by an assumed charge to Ignite, based on usage, for the use of shared assets. The charge was based on the depreciation of the fixed assets concerned and thus no profit was achieved in total. The usage of the common assets by Ignite, and thus the charge to Ignite, was estimated based on the ratio of average headcount during each of the periods as this ratio is considered by management to be representative of the attributable costs of the respective operations.
Direct costs and product specific overhead costs were allocated by direct attribution through the use of cost centre information, which identified Viag Interkom activities. Non product specific overhead costs, primarily general administrative overhead including the accounting department and senior management were allocated based upon the ratio of average headcount during each of the periods. This ratio is considered by management to be a reasonable basis for determining the attributable costs of the respective operations.
F-73
Back to Contents
O2 GERMANY
(formerly VIAG INTERKOM)
NOTES TO THE COMBINED FINANCIAL STATEMENTS (Continued)
| | |
| 1. | Basis of preparation, combination and accounting policies (Continued) |
The pension cost attributable to Viag Interkom has been based on the pension charge incurred by individual operations in respect of specific pension plans of which employees of Viag Interkom are members. For the purposes of presentation of the Viag Interkom financial statements, Viag Interkom’s participation in the Viag pension plans has been treated as if the members were continuing participants within the current Viag scheme. The charges included in the financial statements reflect the pension arrangements of Viag.
All interest income and interest expense was allocated to Viag Interkom since all cash and loans have been allocated to Viag Interkom.
The allocation of intangible and tangible fixed assets corresponds to the actual asset separation agreed as at February 28, 2001 rolled back through the historical periods.
Network assets and other technical equipment have been allocated to Viag Interkom based on the identification of the mobile network platforms and associated asset components. The fixed network platforms, transmission network, fixed network accommodation sites and the corresponding business customer sales branches were excluded from the Viag Interkom network assets. Shared fixed assets (software and other equipment) have been allocated entirely by direct attribution based upon the nature of each asset.
Stocks, debtors and prepaid expenses have been allocated to Viag Interkom based upon direct identification.
Creditors have been allocated to Viag Interkom according to management’s best estimate based upon an analysis of the creditors. Any remaining balance was allocated based upon the ratio of fixed asset capital expenditure as this ratio is considered by management to be a reasonable representation of the overall purchasing activity of Viag Interkom.
Employee related accrued liabilities and provisions were allocated to Viag Interkom based upon the average headcount ratio during each of the periods.
Use of estimates
The preparation of the carve-out financial statements requires management to make estimates and assumptions that affect the reported amounts of assets and liabilities and disclosure of contingent assets and liabilities at the date of the financial statements and the reported amounts of income and expenditure during the reported periods. Actual results may differ from those estimates.
The financial statements herein may not necessarily reflect the financial position, results of operations, and cash flows of Viag Interkom in the future or what they would have been had Viag Interkom been a separate, stand-alone entity during the periods presented.
F-74
Back to Contents
O2 GERMANY
(formerly VIAG INTERKOM)
NOTES TO THE COMBINED FINANCIAL STATEMENTS (Continued)
| | |
| 1. | Basis of preparation, combination and accounting policies (Continued) |
Accounting policies
The financial statements are prepared under the historical cost convention and in accordance with the applicable accounting standards in the United Kingdom. A summary of the principal accounting policies, which have been applied consistently in all the periods presented, are set out below:
Turnover
Turnover from services, which excludes value added tax, is recognized in the profit and loss account based on charges for minutes of airtime including SMS, monthly fees and international roaming as well as minor income from internet-portal related activities. Turnover from connection charges and activation fees is deferred and recognized over the customer relationship period. Turnover from subscription fees is recognized evenly throughout the periods to which they relate. Turnover from the sales of handsets and other hardware is recognized at the point of sale. Pre- paid call card sales are deferred until the customer uses the stored value in the card to pay for relevant calls.
Cost of sales
Cost of sales comprises network costs, including national roaming charges, costs of interconnecting to other networks and international roaming, costs for content provisioning, hardware cost of sales, bad debts, customer management costs and outsourcing of billing.
Selling and administrative expenses
All marketing costs, commissions paid to distributors and customer retention costs are classified as selling and marketing expenses. All other operating costs, including non-network depreciation and central overheads, are classified as administrative expenses.
All selling and administrative expenses, including advertising and promotional costs, are charged to the profit and loss account as incurred.
Subscriber acquisition costs
Subscriber acquisition costs (“SACs”) which include the commission costs associated with acquiring new customers, are charged to the profit and loss account as incurred.
Research and development
Expenditure on research and development is expensed as incurred.
Interest
Interest payable, including that related to financing the construction of tangible fixed assets, is expensed as incurred.
Taxation
The charge for taxation is based on the profit for the year and takes into account deferred taxation. Provision is made for deferred taxation in respect of all timing differences that have originated but not reversed by the balance sheet date. Deferred tax assets are recognized only to the extent that it is regarded as more than likely they will be recovered. Viag Interkom has not pursued the policy of discounting deferred tax balances.
F-75
Back to Contents
O2 GERMANY
(formerly VIAG INTERKOM)
NOTES TO THE COMBINED FINANCIAL STATEMENTS (Continued)
| | |
| 1. | Basis of preparation, combination and accounting policies (Continued) |
Foreign currencies
Transactions in foreign currencies are recorded at the exchange rates ruling on the dates of those transactions. Monetary assets and liabilities denominated in foreign currencies are translated at the rate of exchange ruling at the balance sheet date.
Basis of combination
The combined financial statements incorporate the financial statements of Viag Interkom and its subsidiaries. All intercompany transactions and balances have been eliminated. The accounts include the results of subsidiaries acquired during the year, where significant, from the relevant date of acquisition. They also include the results of subsidiaries disposed of during the year up to the relevant date of disposal.
Intangible assets
Goodwill, arising from the acquisition of subsidiary undertakings and interests in associates, represents the excess of the fair value of the purchase consideration over the fair value of the net assets acquired. The goodwill is amortized over a 20 year period.
License fees paid to the government and associated bid costs, which permit telecommunication activities to be operated for defined periods, are capitalized at cost and amortized from the later of the start of the license period or launch of service to the end of the license period on a straight line basis.
Tangible fixed assets
Tangible fixed assets are stated at historical cost, less accumulated depreciation. Cost in the case of network services includes planning and construction costs, site installation and equipment upgrade costs.
Depreciation is provided on tangible fixed assets on a straight-line basis from the time they are available for use, so as to write off their costs over their estimated useful lives taking into account any expected residual values. No depreciation is provided on freehold land or assets in the course of construction.
| Principal useful lives used are: |
| | |
| Technical equipment | 8 years |
| Leasehold land and buildings | Shorter of the expected useful life or the term of the lease |
| Plant and machinery | 5 years |
| Computers and office equipment | 2 to 5 years |
Leasehold improvements are depreciated on a straight line basis over the shorter of the expected useful life or the term of the lease.
Asset impairment
Intangible and tangible fixed assets are tested for impairment if and when an event that might affect asset values has occurred. Such events or changes in circumstances may include continuing operating losses, technological obsolescence or significant adverse changes in the business or the market. An impairment loss is recognized to the extent that the carrying amount cannot be recovered either by selling the asset or by the discounted future earnings from operating the asset.
F-76
Back to Contents
O2 GERMANY
(formerly VIAG INTERKOM)
NOTES TO THE COMBINED FINANCIAL STATEMENTS (Continued)
| | |
| 1. | Basis of preparation, combination and accounting policies (Continued) |
Leased assets
Viag Interkom has not entered into any finance lease arrangements.
Annual rentals from operating leases are charged to the profit and loss account on a straight line basis over the lease term.
Stocks
Stocks consist mainly of handsets and are stated at the lower of cost or estimated net realizable value (which reflects the value to the business of the handset in the hands of the subscriber) on a first in, first out basis, after provision for obsolescence.
Pension costs
Employees of Viag Interkom participate in the Viag Interkom GmbH & Co. pension scheme, a salary dependent unfunded pension scheme. The pension liability is provided for by Viag Interkom in its balance sheet. No contributions are made by either employees or Viag Interkom to a separate pension fund.
Pension benefits are based upon the pension commitment (Pensionplan) of Viag Interkom GmbH & Co. dated 15 August 1998.
Pension costs for inclusion in the profit and loss account are calculated under the UK Statement of Standard Accounting Practice No. 24 (“SSAP 24”) and under the US Statement of Financial Accounting Standards No. 87 (“SFAS 87”). Actuarial valuations of the scheme are carried out on an annual basis in order to calculate the pension cost to be charged in the profit and loss account.
Site restoration costs
To the extent that the costs for the restoration of sites are expected to materialize, a provision is created in full, on a discounted basis, and recognized over the estimated average remaining lease period to which the provision relates.
The directors consider that Viag Interkom has only one business segment, namely that of providing a mobile communications network and related services. Viag Interkom’s operations are based entirely in Germany.
Operating loss is stated after charging:
| | | Year ended 31 December
| |
| | | 1998 | | 1999 | | 2000 | |
| | |
|
| |
|
| |
|
| |
| | | €’000 | | €’000 | | €’000 | |
| Hire of plant and equipment | | | 2,421 | | | 2,792 | | | 1,356 | |
| Operating lease rentals in respect of land and buildings | | | 9,865 | | | 15,186 | | | 38,072 | |
| Operating lease rentals in respect of motor vehicles and plant and equipment | | | 1,255 | | | 2,168 | | | 2,949 | |
| Depreciation of owned tangible fixed assets | | | 41,850 | | | 155,936 | | | 265,553 | |
| Amortization of intangible assets | | | 426 | | | 966 | | | 1,303 | |
| (Profit)/loss on disposal of fixed assets | | | (119 | ) | | 1 | | | 3,866 | |
| Year 2000 expenses | | | — | | | 828 | | | — | |
| Euro conversion expenses | | | — | | | — | | | 731 | |
F-77
Back to Contents
O2 GERMANY
(formerly VIAG INTERKOM)
NOTES TO THE COMBINED FINANCIAL STATEMENTS (Continued)
| | |
| 4. | Interest receivable and similar income |
| | |
| | | Year ended 31 December
| |
| | | 1998 | | 1999 | | 2000 | |
| | |
|
| |
|
| |
|
| |
| | | €’000 | | €’000 | | €’000 | |
| Interest from related parties | | | 393 | | | 3,614 | | | 1,599 | |
| Bank interest receivable | | | 2,820 | | | 1,803 | | | 4,505 | |
| Other interest receivable | | | — | | | 423 | | | 2,303 | |
| | |
|
| |
|
| |
|
| |
| | | | 3,213 | | | 5,840 | | | 8,407 | |
| | |
|
| |
|
| |
|
| |
| | |
| 5. | Interest payable and similar charges |
| | |
| | | Year ended 31 December
| |
| | | 1998 | | 1999 | | 2000 | |
| | |
|
| |
|
| |
|
| |
| | | €’000 | | €’000 | | €’000 | |
| Interest payable to owners | | | 16 | | | — | | | 164,903 | |
| Bank interest payable | | | 11 | | | 9 | | | 102 | |
| Other interest payable | | | 40 | | | 594 | | | 1,425 | |
| | |
|
| |
|
| |
|
| |
| | | | 67 | | | 603 | | | 166,430 | |
| | |
|
| |
|
| |
|
| |
| | |
| 6. | Taxation on loss on ordinary activities |
No corporate tax charges have been incurred because of net losses arising in each period.
The average monthly number of employees employed by Viag Interkom is set out below. The majority are employed by Viag although the employment costs of staff seconded from BT have been charged directly to Viag Interkom and are included below. The aggregate employee costs were as follows:
| | | Year ended 31 December
| |
| | | 1998 | | 1999 | | 2000 | |
| | |
|
| |
|
| |
|
| |
| | | €’000 | | €’000 | | €’000 | |
| | | | | | | | | | | |
| Wages and salaries | | | 72,369 | | | 120,596 | | | 159,413 | |
| Social security costs | | | 11,370 | | | 18,524 | | | 25,480 | |
| Pension costs | | | 1,606 | | | 2,011 | | | 1,154 | |
| | |
|
| |
|
| |
|
| |
| | | | 85,345 | | | 141,131 | | | 186,047 | |
| | |
|
| |
|
| |
|
| |
F-78
Back to Contents
O2 GERMANY
(formerly VIAG INTERKOM)
NOTES TO THE COMBINED FINANCIAL STATEMENTS (Continued)
| | |
| 7. | Employee information (Continued) |
The average number of employees during the year was made up as follows:
| | | Year ended 31 December
| |
| | | 1998 | | 1999 | | 2000 | |
| | |
|
| |
|
| |
|
| |
| | | No. | | No. | | No. | |
| | | | | | | | | | | |
| Technology | | | 745 | | | 883 | | | 958 | |
| Customer operations | | | 347 | | | 919 | | | 1,760 | |
| Administration | | | 269 | | | 435 | | | 461 | |
| | |
|
| |
|
| |
|
| |
| | | | 1,361 | | | 2,237 | | | 3,179 | |
| BT secondees, charged to Viag Interkom | | | 124 | | | 125 | | | 137 | |
| | |
|
| |
|
| |
|
| |
| | | | 1,485 | | | 2,362 | | | 3,316 | |
| | |
|
| |
|
| |
|
| |
Pensions
The pension costs for the periods were based on valuations carried out by professional qualified independent actuaries. The pension liability as at 31 December for each year was based on the valuation undertaken for Viag Interkom GmbH & Co. The costs and liabilities subsequently attributed to the Viag Interkom business were based on the employees remaining within the Viag Interkom business.
The main assumptions in the past valuations were:
| | | | | | | | | | | |
| | | Year ended 31 December
| |
| | | 1998 | | 1999 | | 2000 | |
| | |
|
| |
|
| |
|
| |
| | | | | | | | | | | |
| Discount rate | | | 6.0% | | | 6.25% | | | 6.25% | |
| Salary increase | | | 2.5% | | | 2.75% | | | 2.75% | |
| Pension increase | | | 1.00% | | | 1.25% | | | 1.25% | |
| | | | | | | | | | | |
Details of the pension provisions are provided in note 14.
F-79
Back to Contents
O2 GERMANY
(formerly VIAG INTERKOM)
NOTES TO THE COMBINED FINANCIAL STATEMENTS (Continued)
| | | Licenses | | Goodwill | | Total | |
| | |
|
| |
|
| |
|
| |
| | | €’000 | | €’000 | | €’000 | |
Cost | | | | | | | | | | |
As at 1 January 1999 | | | 8,523 | | | — | | | 8,523 | |
| Additions | | | 11,746 | | | — | | | 11,746 | |
| | |
|
| |
|
| |
|
| |
As at 31 December 1999 | | | 20,269 | | | — | | | 20,269 | |
| Additions | | | 8,450,311 | | | 7,771 | | | 8,458,082 | |
| | |
|
| |
|
| |
|
| |
As at 31 December 2000 | | | 8,470,580 | | | 7,771 | | | 8,478,351 | |
| | |
|
| |
|
| |
|
| |
| | | | | | | | | | | |
Amortization | | | | | | | | | | |
As at 1 January 1999 | | | 541 | | | — | | | 541 | |
| Charge for the year | | | 966 | | | — | | | 966 | |
| | |
|
| |
|
| |
|
| |
As at 31 December 1999 | | | 1,507 | | | — | | | 1,507 | |
| Charge for the year | | | 1,149 | | | 154 | | | 1,303 | |
| | |
|
| |
|
| |
|
| |
As at 31 December 2000 | | | 2,656 | | | 154 | | | 2,810 | |
| | |
|
| |
|
| |
|
| |
| | | | | | | | | | | |
Net book value as at 31 December 1999 | | | 18,762 | | | — | | | 18,762 | |
| | |
|
| |
|
| |
|
| |
Net book value as at 31 December 2000 | | | 8,467,924 | | | 7,617 | | | 8,475,541 | |
| | |
|
| |
|
| |
|
| |
In 1998, Viag acquired GSM license for the commencement of the mobile business. This license is being amortized over a 20-year period. In 2000, Viag acquired one of six German UMTS licenses which will be amortized over its remaining 20-year term from the date of the launch of 3G services.
F-80
Back to Contents
O2 GERMANY
(formerly VIAG INTERKOM)
NOTES TO THE COMBINED FINANCIAL STATEMENTS (Continued)
| | | Leasehold
buildings | | Technical
equipment | | Other
equipment | | Assets under
construction | | Total | |
| | |
|
| |
|
| |
|
| |
|
| |
|
| |
| | | €’000 | | €’000 | | €’000 | | €’000 | | €’000 | |
Cost | | | | | | | | | | | | | | | | |
As at 1 January 1999 | | | 7,660 | | | 587,625 | | | 97,206 | | | 180,956 | | | 873,447 | |
| Additions | | | 2,741 | | | 428,439 | | | 32,284 | | | 135,344 | | | 598,808 | |
| Transfers | | | 1,165 | | | 131,872 | | | 2,908 | | | (135,945 | ) | | — | |
| Disposals | | | — | | | (221 | ) | | (3,710 | ) | | — | | | (3,931 | ) |
| | |
|
| |
|
| |
|
| |
|
| |
|
| |
As at 31 December 1999 | | | 11,566 | | | 1,147,715 | | | 128,688 | | | 180,355 | | | 1,468,324 | |
| Additions | | | 34,551 | | | 587,544 | | | 62,674 | | | 83,073 | | | 767,842 | |
| Transfers | | | 2,754 | | | 77,527 | | | 8,330 | | | (88,611 | ) | | — | |
| Disposals | | | (1,369 | ) | | (1,379 | ) | | (11,503 | ) | | — | | | (14,251 | ) |
| | |
|
| |
|
| |
|
| |
|
| |
|
| |
As at 31 December 2000 | | | 47,502 | | | 1,811,407 | | | 188,189 | | | 174,817 | | | 2,221,915 | |
| | |
|
| |
|
| |
|
| |
|
| |
|
| |
Depreciation | | | | | | | | | | | | | | | | |
As at 1 January 1999 | | | 1,312 | | | 33,869 | | | 18,749 | | | — | | | 53,930 | |
| Charge for the year | | | 2,152 | | | 115,668 | | | 38,116 | | | — | | | 155,936 | |
| Disposals | | | — | | | (89 | ) | | (3,842 | ) | | — | | | (3,931 | ) |
| | |
|
| |
|
| |
|
| |
|
| |
|
| |
As at 31 December 1999 | | | 3,464 | | | 149,448 | | | 53,023 | | | — | | | 205,935 | |
| Charge for the year | | | 4,133 | | | 225,393 | | | 36,027 | | | — | | | 265,553 | |
| Disposals | | | (713 | ) | | (303 | ) | | (6,455 | ) | | — | | | (7,471 | ) |
| | |
|
| |
|
| |
|
| |
|
| |
|
| |
As at 31 December 2000 | | | 6,884 | | | 374,538 | | | 82,595 | | | — | | | 464,017 | |
| | |
|
| |
|
| |
|
| |
|
| |
|
| |
| | | | | | | | | | | | | | | | | |
Net book value at 31 December 1999 | | | 8,102 | | | 998,267 | | | 75,665 | | | 180,355 | | | 1,262,389 | |
| | |
|
| |
|
| |
|
| |
|
| |
|
| |
Net book value at 31 December 2000 | | | 40,618 | | | 1,436,869 | | | 105,594 | | | 174,817 | | | 1,757,898 | |
| | |
|
| |
|
| |
|
| |
|
| |
|
| |
F-81
Back to Contents
O2 GERMANY
(formerly VIAG INTERKOM)
NOTES TO THE COMBINED FINANCIAL STATEMENTS (Continued)
| | | As at 31 December
| |
| | | 1999 | | 2000 | |
| | |
|
| |
|
| |
| | | €’000 | | €’000 | |
| Spare parts | | | 3,538 | | | 5,493 | |
| Goods for resale | | | 36,000 | | | 97,843 | |
| | |
|
| |
|
| |
| | | | 39,538 | | | 103,336 | |
| | |
|
| |
|
| |
| | |
| 11. | Debtors: amounts falling due within one year |
| | |
| | | As at 31 December
| |
| | | 1999 | | 2000 | |
| | |
|
| |
|
| |
| | | €’000 | | €’000 | |
| Trade debtors | | | 185,643 | | | 206,560 | |
| Less: Provision for doubtful debts | | | (18,912 | ) | | (15,105 | ) |
| | |
|
| |
|
| |
| | | | 166,731 | | | 191,455 | |
| Payments on account (see below) | | | 200,838 | | | 254,763 | |
| Prepayments | | | 2,222 | | | 36,127 | |
| Other debtors | | | 23,990 | | | 43,142 | |
| | |
|
| |
|
| |
| | | | 393,781 | | | 525,487 | |
| | |
|
| |
|
| |
Payments on account relate to a national roaming agreement entered into with DeTeMobil Deutsche Telekom MobilNet GmbH (“T-Mobil”) on 11 May 1999 and revised on 18 May 2000, under which T-Mobil provides national roaming capacity to Viag Interkom in areas where Viag Interkom has not developed its own network. The cost of the contract is determined based on a fixed number of minutes available to Viag Interkom, for which payment is made by instalments. The price for future minutes is renegotiable at the point at which all minutes have been used by Viag Interkom. The payments on account represent amounts paid in advance for certain of the contractual minutes.
Outstanding contractual payments due to T-Mobil at 31 December 2000 are €154 million (1999: €297 million; 1988: nil).
F-82
Back to Contents
O2 GERMANY
(formerly VIAG INTERKOM)
NOTES TO THE COMBINED FINANCIAL STATEMENTS (Continued)
| | |
| 12. | Loans and borrowings: amounts falling due within one year |
| | |
| | | As at 31 December
| |
| | | 1999 | | 2000 | |
| | |
|
| |
|
| |
| | | €’000 | | €’000 | |
| | | | | | | | |
UMTS loans | | | | | | | |
| BT | | | — | | | 3,800,254 | |
| E.ON | | | — | | | 3,800,254 | |
| Telenor | | | — | | | 844,500 | |
| | | | | | | | |
Other loans | | | | | | | |
| BT | | | — | | | 183,820 | |
| E.ON | | | — | | | 195,324 | |
| Telenor | | | — | | | 43,406 | |
| | | | | | | | |
Interest expenses | | | | | | | |
| BT | | | — | | | 74,625 | |
| E.ON | | | — | | | 74,604 | |
| Telenor | | | — | | | 15,674 | |
| | |
|
| |
|
| |
| | | | — | | | 9,032,461 | |
| | |
|
| |
|
| |
Loans due to the Owners
BT, E.ON and Telenor AS each granted Viag Interkom interest bearing loans, which terminated on 31 May 2001. The interest rates varied between 5.39 per cent and 5.72 per cent. As part of the consideration for the acquisition of Telenor AS and E.ON’s shareholdings in Viag by BT on 15 January 2001 and 20 February 2001, respectively, the liabilities were assumed by a subsidiary of BT. As part of the transfer of Viag’s fixed line business to Ignite a proportion of the debt was repaid in February 2001.
| 13. | Other creditors: amounts falling due within one year |
| | |
| | | As at 31 December
| |
| | | 1999 | | 2000 | |
| | |
|
| |
|
| |
| | | €’000 | | €’000 | |
| | | | | | | | |
| Trade creditors | | | 340,806 | | | 221,652 | |
| | | | | | | | |
| Accruals | | | 116,332 | | | 161,528 | |
| Deferred income | | | 2,430 | | | 29,318 | |
| Other creditors | | | 6,753 | | | 15,155 | |
| | |
|
| |
|
| |
| | | | 466,321 | | | 427,653 | |
| | |
|
| |
|
| |
Accruals represent amounts owed for goods received but not invoiced and for staff costs.
F-83
Back to Contents
O2 GERMANY
(formerly VIAG INTERKOM)
NOTES TO THE COMBINED FINANCIAL STATEMENTS (Continued)
| | |
| 14. | Provisions for liabilities and charges |
| | |
| | | Pension
provision | | Provision
for site
restoration | | Total | |
| | |
|
| |
|
| |
|
| |
| | | €’000 | | €’000 | | €’000 | |
| | | | | | | | | | | |
As at 1 January 1998 | | | 1,095 | | | — | | | 1,095 | |
| Increase for year | | | 1,606 | | | 7,189 | | | 8,795 | |
| | |
|
| |
|
| |
|
| |
As at 31 December 1998 | | | 2,701 | | | 7,189 | | | 9,890 | |
| Increase for year | | | 2,011 | | | 5,690 | | | 7,701 | |
| | |
|
| |
|
| |
|
| |
As at 31 December 1999 | | | 4,712 | | | 12,879 | | | 17,591 | |
| Increase for year | | | 1,154 | | | 3,752 | | | 4,906 | |
| | |
|
| |
|
| |
|
| |
As at 31 December 2000 | | | 5,866 | | | 16,631 | | | 22,497 | |
| | |
|
| |
|
| |
|
| |
Losses are set out in note 15 and are indicative of the losses incurred by Viag Interkom although not the actual tax losses available for offset. No deferred tax assets have been recognized since, on the basis of available evidence, it is more likely than not that taxable profits will not be available for offset in the foreseeable future.
| 15. | Owners’ net investment |
| | |
| | | As at 31 December
| |
| | | 1998 | | 1999 | | 2000 | |
| | |
|
| |
|
| |
|
| |
| | | €’000 | | €’000 | | €’000 | |
| | | | | | | | | | | |
| Opening Owners’ net investment | | | 126,730 | | | 620,267 | | | 1,284,416 | |
| Net investment for the year | | | 826,794 | | | 1,391,557 | | | 1,354,717 | |
| | | | | | | | | | | |
| Loss for the financial year | | | (333,257 | ) | | (727,408 | ) | | (1,055,075 | ) |
| | |
|
| |
|
| |
|
| |
| Closing Owners’ net investment | | | 620,267 | | | 1,284,416 | | | 1,584,058 | |
| | |
|
| |
|
| |
|
| |
| | |
| 16. | Reconciliation of operating loss to operating cash flows |
| | |
| | | Year ended 31 December
| |
| | | 1998 | | 1999 | | 2000 | |
| | |
|
| |
|
| |
|
| |
| | | €’000 | | €’000 | | €’000 | |
| | | | | | | | | | | |
Operating loss | | | (336,403 | ) | | (732,645 | ) | | (897,052 | ) |
| Depreciation | | | 41,850 | | | 155,936 | | | 265,553 | |
| Amortization | | | 426 | | | 966 | | | 1,303 | |
| (Profit)/loss on disposal of fixed assets | | | (119 | ) | | 1 | | | 3,866 | |
| Increase in stocks | | | (8,908 | ) | | (30,630 | ) | | (63,798 | ) |
| Increase in debtors | | | (13,115 | ) | | (353,117 | ) | | (131,706 | ) |
| Increase/(decrease) in creditors | | | 133,155 | | | 211,769 | | | (38,668 | ) |
| Increase in provisions | | | 8,796 | | | 7,700 | | | 4,906 | |
| | |
|
| |
|
| |
|
| |
Net cash outflow from operating activities | | | (174,318 | ) | | (740,020 | ) | | (855,596 | ) |
| | |
|
| |
|
| |
|
| |
F-84
Back to Contents
O2 GERMANY
(formerly VIAG INTERKOM)
NOTES TO THE COMBINED FINANCIAL STATEMENTS (Continued)
| | | As at 31 December
| |
| | | 1998 | | 1999 | | 2000 | |
| | |
|
| |
|
| |
|
| |
| | | €’000 | | €’000 | | €’000 | |
| | | | | | | | | | | |
| Cash in hand and at bank | | | 7,638 | | | 53,858 | | | 204,407 | |
| Debt due after one year | | | — | | | — | | | (9,032,461 | ) |
| | |
|
| |
|
| |
|
| |
Net funds/(debt) | | | 7,638 | | | 53,858 | | | (8,828,054 | ) |
| | |
|
| |
|
| |
|
| |
| | |
| 18. | Financial instruments and risk management |
Viag Interkom’s funding has been provided through equity contributions and short term loans from its Owners.
Viag Interkom purchases financial instruments in order to finance its operations and to manage the interest rate and currency risk that arise from those operations and from its finance resources.
The main risks arising from Viag Interkom’s financial instruments are interest rate risk, liquidity risk and foreign currency risk.
Interest rate risk
Viag Interkom finances its operations through short term loans from its Owners based on floating interest rates.
Liquidity risk
Viag Interkom has relied and continues to rely on funding from its shareholders for investment and operational requirements.
Foreign currency risk
During the reporting period Viag Interkom activities have primarily been conducted in DEM and Euro. In general, it is Viag Interkom’s policy to hedge other foreign currency exposure through forward contracts. In the three years ending 31 December 2000 the level of foreign exchange hedging by Viag Interkom is not significant.
Viag Interkom held the following cash at bank and in hand:
| | | As at 31 December
| |
| | | 1998 | | 1999 | | 2000 | |
| | |
|
| |
|
| |
|
| |
| | | €’000 | | €’000 | | €’000 | |
| | | | | | | | | | | |
| German Deutschmark | | | 4,618 | | | 36,884 | | | 185,165 | |
| UK Sterling | | | 152 | | | 4,289 | | | 5,457 | |
| US Dollars | | | 2,868 | | | 12,685 | | | 13,785 | |
| | |
|
| |
|
| |
|
| |
| | | | 7,638 | | | 53,858 | | | 204,407 | |
| | |
|
| |
|
| |
|
| |
| | | As at 31 December
| |
| | | 1998 | | 1999 | | 2000 | |
| | |
|
| |
|
| |
|
| |
| | | €’000 | | €’000 | | €’000 | |
| Capital expenditure contracted for, but not provided in the accounts | | | 225,000 | | | 383,000 | | | 470,000 | |
| | |
|
| |
|
| |
|
| |
F-85
Back to Contents
O2 GERMANY
(formerly VIAG INTERKOM)
NOTES TO THE COMBINED FINANCIAL STATEMENTS (Continued)
| | |
| 19. | Financial commitments (Continued) |
Lease commitments
Viag Interkom had annual commitments under operating leases as follows:
| | | As at 31 December
| |
| | | 1998 | | 1999 | | 2000 | |
| | |
|
| |
|
| |
|
| |
| | | €’000 | | €’000 | | €’000 | |
Land and buildings | | | | | | | | | | |
| Expiring within one year | | | — | | | — | | | — | |
| Expiring between two to five years inclusive | | | — | | | — | | | — | |
| Expiring thereafter | | | 24,747 | | | 62,178 | | | 87,635 | |
| | |
|
| |
|
| |
|
| |
| | | | 24,747 | | | 62,178 | | | 87,635 | |
| | |
|
| |
|
| |
|
| |
Motor vehicles and plant and equipment | | | | | | | | | | |
| Expiring within one year | | | — | | | — | | | — | |
| Expiring between two to five years inclusive | | | 982 | | | 2,454 | | | 2,876 | |
| | |
|
| |
|
| |
|
| |
| | | | 982 | | | 2,454 | | | 2,876 | |
| | |
|
| |
|
| |
|
| |
| | | | 25,729 | | | 64,632 | | | 90,511 | |
| | |
|
| |
|
| |
|
| |
| | |
| 20. | Contingent liabilities |
Debitel, a German service provider, filed an action in the courts of Munich against Viag Interkom, claiming that there is a statutory obligation upon Viag Interkom to allow service providers the ability to market its services. The court’s decision is still pending. However, a preliminary finding requires Viag Interkom and Debitel to attempt to negotiate a contractual settlement. If Viag Interkom and Debitel are unable to reach a negotiated settlement, then further legal proceedings are possible. If Debitel succeeds in its claim, Viag Interkom will be obliged to grant them and subsequently other service providers, the ability to market its services. In this event, Viag Interkom would be obliged to service additional customers which would lead to additional revenue for Viag Interkom, but potentially at relatively low margin. Debitel may also be entitled to damages, however, management believe that it is unlikely that material damages will arise in respect of this claim. Certain other telecommunications operators in Germany are required to allow service providers to market their GSM services. There is, however, no such clause in Viag Interkom’s GSM license. A final judgement on this action is not expected before the end of 2001.
At the date the carve-out financial statements for the three years ended 31 December 2000 were signed, the directors of Viag Interkom were not aware of any other contingent liabilities.
| 21. | Related party transactions |
Viag Interkom has entered into significant related party transactions during the period in respect of financing arrangements. These are summarized in note 12.
Under the ownership of Viag the mobile and fixed line operations were not treated as separate entities and therefore no formal charges were made between the two for services provided. Following the separation of the businesses future transactions will be charged based on trade agreements outlining the use of the Ignite transmission network by Viag Interkom and the provision of mobile technology for certain Ignite products. Based on the network records maintained by Viag the market values of transactions between Viag Interkom and Ignite for the years ended 31 December 1998, 1999 and 2000 were as follows:
F-86
Back to Contents
O2 GERMANY
(formerly VIAG INTERKOM)
NOTES TO THE COMBINED FINANCIAL STATEMENTS (Continued)
| | |
| 21. | Related party transactions (Continued) |
| | |
| | | Year ended 31 December
| |
| | | 1998 | | 1999 | | 2000 | |
| | |
|
| |
|
| |
|
| |
| | | €’000 | | €’000 | | €’000 | |
| Housing | | | 6,793 | | | 12,118 | | | 16,220 | |
| Network Capacity National Carrier Line | | | 4,721 | | | 26,134 | | | 38,725 | |
| Network Capacity DTAG | | | 639 | | | 639 | | | 1,278 | |
| Network Capacity Increase Access | | | 5,630 | | | 14,444 | | | 15,143 | |
| | |
|
| |
|
| |
|
| |
| Total | | | 17,783 | | | 53,335 | | | 71,366 | |
| | |
|
| |
|
| |
|
| |
Following the separation of the mobile and fixed line businesses on 28 February 2001, Viag Interkom will charge Ignite on a monthly basis for shared services including office space and the use of the Corporate Communications Centre.
| 22. | Reconciliation to United States generally accepted accounting principles (US GAAP) |
Viag Interkom’s financial statements are prepared in accordance with accounting principles generally accepted in the United Kingdom (“UK GAAP”), which differ in certain respects from accounting principles generally accepted in the United States of America (“US GAAP”).
| I. | Differences between accounting principles generally accepted in the United Kingdom and United States |
The following are the primary differences between UK GAAP and US GAAP which are relevant to Viag Interkom’s financial statements.
| (a) | Capitalization of interest |
Under UK GAAP, Viag Interkom does not capitalize interest in its financial statements. Under US GAAP the estimated amount of interest incurred while constructing major capital projects is included in fixed assets and depreciated over the lives of the related assets. This includes capitalization of interest incurred on funding the UMTS license for the period up to the launch of the related services.
The net deferred tax liability arising from the US GAAP reconciling items has not been recorded, as it is offset by deferred tax assets resulting from Viag Interkom’s share of Viag’s tax losses. There is a valuation allowance against the remainder of those tax losses.
| II. | Reconciliation of net loss |
The following statements summarize the significant estimated adjustments, which reconcile net loss and Owners’ net investment from that reported under UK GAAP to that which would have been reported had US GAAP been applied. There is no net tax effect from the US GAAP adjustments due to a full valuation allowance.
F-87
Back to Contents
O2 GERMANY
(formerly VIAG INTERKOM)
NOTES TO THE COMBINED FINANCIAL STATEMENTS (Continued)
| | |
| 22. | Reconciliation to United States generally accepted accounting principles (Continued) |
| | |
| | | Year ended 31 December
| |
| | | 1999 | | 2000 | |
| | |
|
| |
|
| |
| | | €’000 | | €’000 | |
| Net loss under UK GAAP | | | (727,408 | ) | | (1,055,075 | ) |
| US GAAP adjustment: | | | | | | | |
| Capitalization of interest, net of related depreciation | | | — | | | 161,609 | |
| | |
|
| |
|
| |
| Net loss as adjusted for US GAAP | | | (727,408 | ) | | (893,466 | ) |
| | |
|
| |
|
| |
| III. | Reconciliation of Owners’ net investment |
| | | Year ended 31 December
| |
| | | 1999 | | 2000 | |
| | |
|
| |
|
| |
| | | €’000 | | €’000 | |
| Owners’ net investment under UK GAAP | | | 1,284,416 | | | 1,584,058 | |
| US GAAP adjustment: | | | | | | | |
| Capitalization of interest, net of related depreciation | | | — | | | 161,609 | |
| | |
|
| |
|
| |
| Owners’ net investment as adjusted for US GAAP | | | 1,284,416 | | | 1,745,667 | |
| | |
|
| |
|
| |
| IV. | Combined cash flow statements |
Under UK GAAP, the combined cash flow statements are presented in accordance with UK Financial Reporting Standard No. 1 (“FRS 1”). The statements prepared under FRS 1 present substantially the same information as that required under SFAS No. 95.
Under SFAS No. 95 cash and cash equivalents include cash and short-term investments with original maturities of three months or less. Under FRS 1, cash comprises cash in hand and at bank and overnight deposits, net of bank overdrafts.
Under FRS 1 cash flows are presented for: operating activities, returns on investments and servicing of finance, taxation, capital expenditure and financial investments, acquisitions and disposals, dividends paid to the company’s shareholders, management of liquid resources and financing. SFAS No. 95 requires a classification of cash flows as resulting from operating, investing and financing activities.
Cash flows under FRS 1 in respect of interest received, interest paid (net of that capitalized under US GAAP) and taxation would be included within operating activities under SFAS No. 95. Cash flows from purchases, sales and maturities of trading securities, while not separately identified under UK GAAP, would be included within operating activities under US GAAP. Capitalized interest, while not recognized under UK GAAP, would be included in investing activities under US GAAP. Dividends paid would be included within financing activities under US GAAP.
F-88
Back to Contents
O2 GERMANY
(formerly VIAG INTERKOM)
NOTES TO THE COMBINED FINANCIAL STATEMENTS (Continued)
| | |
| 22. | Reconciliation to United States generally accepted accounting principles (Continued) |
The following statements summarize the combined cash flow statements as if they had been presented in accordance with US GAAP, and include the adjustments which reconcile cash and cash equivalents under US GAAP to cash at bank and in hand reported under UK GAAP.
| | | Year ended 31 December
| |
| | | 1999 | | 2000 | |
| | |
|
| |
|
| |
| | | €’000 | | €’000 | |
| | | | | | | | |
| Net cash used in operating activities | | | (734,783 | ) | | (848,716 | ) |
| Net cash used in investing activities | | | (610,554 | ) | | (9,223,010 | ) |
| Net cash provided by financing activities | | | 1,391,557 | | | 10,222,275 | |
| | |
|
| |
|
| |
| Net increase in cash and cash equivalents | | | 46,220 | | | 150,549 | |
| Cash and cash equivalents under US GAAP at beginning of year | | | 7,638 | | | 53,858 | |
| | |
|
| |
|
| |
| Cash and cash equivalents under US GAAP at end of year | | | 53,858 | | | 204,407 | |
| Short-term investments with original maturities of less than three months | | | — | | | — | |
| | |
|
| |
|
| |
| Cash at bank and in hand under UK GAAP at end of year | | | 53,858 | | | 204,407 | |
| | |
|
| |
|
| |
F-89
Back to Contents
O2 GERMANY
(formerly VIAG INTERKOM)
NOTES TO THE COMBINED FINANCIAL STATEMENTS (Continued)
| | |
| 23. | Subsidiary undertakings and associates |
Principal operating subsidiary undertakings and associates at each balance sheet date, all of which were unlisted, were as follows:
| | |
| | Viag Interkom interest
| | | |
| | | Activity | | 1998 | | 1999 | | 2000 | | Country of operations | |
| | | | | % | | % | | % | | | | |
| Interkom Gesellschaft für Internationale Kommunikation in der Datenverarbeitung GmbH | | | Dormant Company | | | 100 | | | 100 | | | — | | | Germany | |
| Viag Interkom Management GmbH | | | Management Company | | | — | | | 100 | | | — | | | Germany | |
| Bertelsmann Game Channel GmbH & Co. KG | | | Internet games | | | — | | | 50 | | | — | | | Germany | |
| Bertelsmann Interactive GmbH | | | Internet games | | | — | | | 50 | | | — | | | Germany | |
| Viag Europlattform AG | | | Piloting of UMTS services | | | — | | | — | | | 100 | | | Liechtenstein | |
| Interkom Shop GmbH | | | Retailer | | | — | | | — | | | 100 | | | Germany | |
The results and operations of certain of the above investments did not have a significant impact on the results and assets and liabilities of Viag Interkom and therefore have not been consolidated in the three years to 31 December 2000.
| 24. | Post Balance sheet Events |
On 15 January 2001, BT acquired the 10 per cent Shareholding in Viag held by Telenor AS. On 20 February 2001 BT acquired E.ON’s remaining 45 per cent shareholding in Viag. As part of the consideration for the acquisition of the additional shareholdings the loans provided by Telenor AS and Viag were repaid by BT and the liability was assumed by BT Interkom GmbH.
F-90
Back to Contents
Exhibit Number | | Description of Exhibits |
| |
|
| 1.1 | | Memorandum and Articles of Association of mmO2 plc.* |
| 2.1 | | Deposit Agreement among the mmO2 plc, Morgan Guaranty Trust Company of New York, as depositary, and Holders of American Depositary Receipts.** |
| 3.1 | | Not Applicable. |
| 4.1 | | Demerger Agreement between British Telecommunications plc, mmO2 plc and BT Group plc.** |
| 4.2 | | Separation Agreement between BT Group plc, British Telecommunications plc, mmO2 plc and O2 Limited.** |
| 4.3 | | Tax Agreement between BT Group plc and mmO2 plc.** |
| 4.4 | | Wireless Trading Agreement between British Telecommunications plc and BT Cellnet Limited.** |
| 4.5 | | Sponsors’ Agreement between mmO2 plc, British Telecommunications plc, Merrill Lynch International, Morgan Stanley & Co. International Limited and Salomon Brothers International Limited.** |
| 4.6 | | £3,500,000,000 Multicurrency Trading Revolving Facility between mmO2, as parent, mmO2 and O2 Limited, as original borrowers, Barclays Capital, Deutsche Bank AG London, HSBC Investment Bank plc, J.P. Morgan plc, Salomon Brothers International Limited and The Royal Bank of Scotland plc, as lead arrangers, certain financial institutions, as the original banks, The Royal Bank of Scotland plc, as agent, and the Royal Bank of Scotland plc, as the issuing bank.** |
| 4.7 | | Amended and Restated Separation Agreement between BT Group plc, mmO2 plc and O2 Limited.*** |
| 4.8 | | Programme Agreement in relation to the €5,000,000,000 Euro Medium Term Note Programme between mmO2, Bankers Trustee Company Limited as Trustee, Deutsche Bank AG London as arranger, Barclays Bank PLC, HSBC Bank plc, Salomon Brothers International Limited, Deutsche Bank AG London, J.P. Morgan Securities Ltd and The Royal Bank of Scotland plc, as dealers.**** |
| 4.9 | | Trust Deed relating to €5,000,000,000 Euro Medium Term Note Programme between mmO2 and Bankers Trustee Company Limited, as Trustee.**** |
| | BT Executive Share Plan |
| | BT Incentive Share Plan |
| | BT Deferred Bonus Plan |
| | mmO2 Legacy Option Plan |
| | mmO2 Executive Share Option Plan |
| | mmO2 Restricted Share Plan |
| | Directors’ Service Contracts |
| 5.1 | | Not Applicable. |
| 6.1 | | Not Applicable. |
| 7.1 | | Not Applicable. |
| 8.1 | | See Item 4.C, “Information on the Company – Organisational Structure.” |
| 9.1 | | Not Applicable. |
| | Joint Certification of Peter Erskine, Chief Executive Officer and David Finch,
Chief Financial Officer, pursuant to 18 U.S.C. Section 1350, as adopted pursuant to Section 906 of the Sarbanes-Oxley Act of 2002. |
I
Back to Contents
| * | Previously included in mmO2’s registration statement on Form 20-F, as filed with the Securities and Exchange Commission on 20 September 2001, and incorporated herein by reference except with respect to the following change to the Articles of Association: |
| | |
| | On 20 December 2001, the one issued redeemable preference share of £50,000 was redeemed, following which, pursuant to a conditional special resolution passed on 11 September 2001, the authorised redeemable preference share capital was sub-divided into and redesignated as 50,000,000 ordinary shares with a face value of 0.1p each. |
| | |
| ** | Previously included in mmO2’s registration statement on Form 20-F, as filed with the Securities and Exchange Commission on 20 September 2001, and incorporated herein by reference. |
| | |
| *** | Previously included in mmO2’s registration statement on Form 20F/A, as filed with the Securities and Exchange Commission on 31 October 2001, and incorporated herein by reference. |
| | |
| **** | Previously included in mmO2’s annual report on Form 20F, as filed with the Securities and Exchange Commission on 12 July, 2002, and incorporated herein by reference. |
II
Back to Contents
GLOSSARY OF TERMS
Terms Used | US Equivalent or Brief Description |
|
|
| Articles of Association | Bylaws |
| Associates | Equity investments |
| Balance sheet | Statement of financial position |
| Called-up share capital | Ordinary shares, issued and fully paid |
| Capital allowances | Tax depreciation allowances |
| Creditors | Payables |
| Debtors | Receivables |
| Finance lease | Capital lease |
| Financial year | Fiscal year |
| Freehold | Ownership with absolute rights |
| Interest payable | Interest expense |
| Interest receivable | Interest income |
| Joint venture | Equity investment |
| Nominal value | Par value |
| Ordinary shares | Common stock |
| Overdraft | A line of credit, contractually repayable on demand unless a fixed-term has been agreed, established through a customer’s current account |
| Preference shares | Preferred stock |
| Profit & loss account | Income statement |
| Profit & loss account reserve | Retained earnings |
| Provisions | Reserves |
| Share capital | Ordinary shares or common stock issued and fully paid |
| Shareholders’ funds | Stockholders’ equity |
| Stock | Inventories |
| Tangible fixed assets | Property, plant and equipment |
| Turnover | Revenue |
III
Back to Contents
DEFINITIONS
The following definitions apply throughout this document unless the context requires otherwise:
| “Airwave” | | Airwave mmO2 Limited, a company incorporated in England and Wales with a registered number 3985643. |
| “analogue” | | The first generation of mobile telecommunications technology in which radio signals are modulated proportionally by the strength and frequency of audio sounds. |
| “ARPU” | | Average Revenue Per User. |
| “BT” | | British Telecommunications public limited company, a company incorporated in England and Wales with registered number 1800000. |
| “BT Group” | | BT Group plc and its subsidiary undertakings from time to time. |
| “BT Group Investments” | | BT Group Investments Limited, a company incorporated in England and Wales with registered number 4278695. |
| “BT Group plc” | | BT Group plc, a company incorporated in England and Wales with registered number 4190816. |
| “GPRS” | | General Packet Radio Service. A technology, sometimes referred to as 2.5G, that allows customers to remain connected to the network between calls for the receipt and transmission of data. |
| “GSM” | | The Global System for Mobile communications. Originally defined as a pan-European standard for digital cellular telephone networks to support roaming, it is now one of the world’s main digital mobile standards. |
| “Manx Telecom” | | Manx Telecom Limited, a company incorporated in the Isle of Man with registered number 28059. |
“mmO2” or the “Company” | | mmO2 plc, a company incorporated in England and Wales with registered number 4190833. |
“mmO2 Group” or “Group” | | mmO2 plc and its subsidiary undertakings from time to time. |
“mmO2 Ordinary Shares” or “ordinary shares” | | Ordinary shares of 0.1 pence each in the capital of mmO2. |
| “MMS” | | Multimedia Messaging Services. |
“O2” | | O2 Limited, formerly BT Wireless Limited, formerly Cellnet Group Limited, a company incorporated in England and Wales with registered number 2604354 together, where the context requires, with its subsidiary and associated undertakings. |
“O2 Germany” | | O2 (Germany) GmbH & Co.OHG, formerly VIAG Interkom GmbH & Co. OHG, a company incorporated in Germany. |
“O2 Ireland” | | O2 Communications (Ireland) Limited, formerly Digifone mmO2 Limited, formerly Esat Digifone Limited, a company incorporated in Ireland, together where the context requires with its subsidiary and associated undertakings. |
IV
Back to Contents
“O2 Netherlands” | | O2 (Netherlands) B.V., formerly Telfort Mobiel BV, a company incorporated in the Netherlands. |
“O2 Online” | | O2 (Online) Limited, formerly Genie Internet Limited, a company incorporated in England and Wales with registered number 01906156 together, where the context requires, with its subsidiary and associated undertakings. |
“O2 UK” | | O2 (UK) Limited, formerly BT Cellnet Limited, a company incorporated in England and Wales with registered number 1743099 together, where the context requires, with its subsidiary and associated undertakings. |
| “PDA” | | Personal Digital Assistant. |
| “SAC” | | Subscriber Acquisition Cost. |
| “SMS” | | a service sometimes known as text messaging, which enables mobile telephone users to send and receive written messages on their handsets. |
| “TETRA” | | Terrestrial Trunked Radio. Radio technology used in networks that require a high level of security and availability. |
| “UMTS” | | Universal Mobile Telecommunications System. An international standard of third generation, or 3G, mobile telecommunications. |
| “WAP” | | Wireless Application Protocol. A global, open standard for accessing online services through mobile devices. |
| “we” or “us” | | mmO2 and/or, if the context so requires, one or more members of the mmO2 Group. |
V
Back to Contents
SIGNATURES
The registrant hereby certifies that it meets all of the requirements for filing on Form 20-F and that it has duly caused and authorised the undersigned to sign this annual report on its behalf.
mmO2 plc
| | By: /s/ David Finch
——————————
Name: David Finch
Title: Chief Financial Officer |
Date: 7 July 2003
VI
Back to Contents
CERTIFICATIONS
I, Peter Eskine, certify that:
| 1. | I have reviewed this annual report on Form 20-F of mm02 plc; |
| | |
| 2. | Based on my knowledge, this annual report does not contain any untrue statement of a material fact or omit to state a material fact necessary to make the statements made, in light of the circumstances under which such statements were made, not misleading with respect to the period covered by this annual report; |
| | |
| 3. | Based on my knowledge, the financial statements, and other financial information included in this annual report, fairly present in all material respects the financial condition, results of operations and cash flows of the registrant as of, and for, the periods presented in this annual report; |
| | |
| 4. | The registrant’s other certifying officers and I are responsible for establishing and maintaining disclosure controls and procedures (as defined in Exchange Act Rules 13a-14 and 15d-14) for the registrant and have: |
| | | |
| | a) | designed such disclosure controls and procedures to ensure that material information relating to the registrant, including its consolidated subsidiaries, is made known to us by others within those entities, particularly during the period in which this annual report is being prepared; |
| | | |
| | b) | evaluated the effectiveness of the registrant’s disclosure controls and procedures as of a date within 90 days prior to the filing date of this annual report (the “Evaluation Date”); and |
| | | |
| | c) | presented in this annual report our conclusions about the effectiveness of the disclosure controls and procedures based on our evaluation as of the Evaluation Date; |
| | |
| 5. | The registrant’s other certifying officers and I have disclosed, based on our most recent evaluation, to the registrant’s auditors and the audit committee of registrant’s board of directors (or persons performing the equivalent function): |
| | | |
| | a) | all significant deficiencies in the design or operation of internal controls which could adversely affect the registrant’s ability to record, process, summarize and report financial data and have identified for the registrant’s auditors any material weaknesses in internal controls; and |
| | | |
| | b) | any fraud, whether or not material, that involves management or other employees who have a significant role in the registrant’s internal controls; and |
| | |
| 6. | The registrant’s other certifying officers and I have indicated in this annual report whether or not there were significant changes in internal controls or in other factors that could significantly affect internal controls subsequent to the date of our most recent evaluation, including any corrective actions with regard to significant deficiencies and material weaknesses. |
| | |
| | By: /s/ Peter Erskine
——————————
Name: Peter Erskine
Title: Chief Executive Officer |
VII
Back to Contents
CERTIFICATIONS
| | I, David Finch, certify that: |
| | |
| 1. | I have reviewed this annual report on Form 20-F of mm02 plc; |
| | |
| 2. | Based on my knowledge, this annual report does not contain any untrue statement of a material fact or omit to state a material fact necessary to make the statements made, in light of the circumstances under which such statements were made, not misleading with respect to the period covered by this annual report; |
| | |
| 3. | Based on my knowledge, the financial statements, and other financial information included in this annual report, fairly present in all material respects the financial condition, results of operations and cash flows of the registrant as of, and for, the periods presented in this annual report; |
| | |
| 4. | The registrant’s other certifying officers and I are responsible for establishing and maintaining disclosure controls and procedures (as defined in Exchange Act Rules 13a-14 and 15d-14) for the registrant and have: |
| | | |
| | a) | designed such disclosure controls and procedures to ensure that material information relating to the registrant, including its consolidated subsidiaries, is made known to us by others within those entities, particularly during the period in which this annual report is being prepared; |
| | | |
| | b) | evaluated the effectiveness of the registrant’s disclosure controls and procedures as of a date within 90 days prior to the filing date of this annual report (the “Evaluation Date”); and |
| | | |
| | c) | presented in this annual report our conclusions about the effectiveness of the disclosure controls and procedures based on our evaluation as of the Evaluation Date; |
| | |
| 5. | The registrant’s other certifying officers and I have disclosed, based on our most recent evaluation, to the registrant’s auditors and the audit committee of registrant’s board of directors (or persons performing the equivalent function): |
| | | |
| | a) | all significant deficiencies in the design or operation of internal controls which could adversely affect the registrant’s ability to record, process, summarize and report financial data and have identified for the registrant’s auditors any material weaknesses in internal controls; and |
| | | |
| | b) | any fraud, whether or not material, that involves management or other employees who have a significant role in the registrant’s internal controls; and |
| | |
| 6. | The registrant’s other certifying officers and I have indicated in this annual report whether or not there were significant changes in internal controls or in other factors that could significantly affect internal controls subsequent to the date of our most recent evaluation, including any corrective actions with regard to significant deficiencies and material weaknesses. |
| | |
| | By: /s/ David Finch
——————————
Name: David Finch
Title: Chief Financial Officer |
VIII