In 1987, our business in the Isle of Man, Manx Telecom, was awarded a 20-year licence to operate the Isle of Man telecommunications network. The licence originally covered fixed line telephony, but was expanded in 1994 to include GSM mobile services and in 1999 to include UMTS services. Manx Telecom launched Europe’s first UMTS network in December 2001. On 1 January 2004, Manx Telecom was awarded a licence extension for 15 years.
Back to Contents
We are a leading provider of mobile communications services in Europe, with wholly owned businesses in the United Kingdom, Germany, Ireland and the Isle of Man.
Together these target a total population of 148 million people. For the first time our total subscriber base broke through 20 million during the year and we now provide international mobile roaming to 150 countries worldwide.
The businesses in the UK and Ireland are both established and profitable, with a track record of revenue and customer growth and a strong presence in high-value markets, such as business and mobile data services.
O2 Germany is now the fastest growing operator in Germany. Its 6 million customers account for the highest ARPU ratio of any German operator.
O2 Airwave, which is supplying a network of secure communications to the police forces and other Public Safety Users in England, Scotland and Wales, has continued to develop rapidly.
Manx Telecom is unique within the Group, providing mobile, fixed line and internet services in the Isle of Man. It was also the pioneer of UMTS networks, the platform on which we, in measured stages, will supply services Europe-wide.
At the heart of our improved performance is GPRS. This achieved market maturity and rapid growth during the year.
GPRS provides “always on” connectivity for office services, media/picture messaging, e-mail, e-commerce, banking, online billing, entertainment, mobile internet and other data services. Fuelled by the launch of affordable colour screen handsets and new multimedia applications, the number of customers using GPRS more than tripled in the year and applications and services were taken up enthusiastically across all territories.
The trend enabled us to launch Europe’s first mobile music service, allowing customers to download a choice of over 40,000 tracks to their mobile phones. Video streaming was also launched, bringing Rugby World Cup highlights and other sports to mobile handsets operating on our network.
Only a few years ago, all our revenues came from traditional voice telephony. Today our customers spend more than £1 billion a year on other services, including text messaging, e-mail, games and internet surfing.
Such innovations are essential for achieving our strategic goal of growing our revenues from more sophisticated data services. Nevertheless, we continue to benefit from simple text messaging, with our networks carrying over 11 billion texts during the financial year to 31 March 2004. We also saw the rapid growth in participation TV programmes. The final of Pop Idol 2, a TV programme, for example, attracted 1.4 million text votes in the first hour.
GPRS technology, however, is a transitional stage in the gradual roll-out of UMTS networks. Over time, these are expected to bring significant benefits to customers, such as high-resolution video, higher speed multimedia services and other enhancements.
We have secured licences to operate UMTS services in the UK, Germany, Ireland and the Isle of Man. We believe it is imperative that these roll out progressively, and only when we can offer customers a genuinely dynamic service and a range of affordable handsets with adequate battery life to support such services. As a result we do not expect to see a mass market take-up of UMTS until late 2005.
Our products and services |
In line with our strategy, our internet portal is designed to attract high-value customers, reduce churn and generate revenues by providing high-quality content and closer relationships with customers. We are pleased with
12
Back to Contents
the success of this service, which has recorded a 27 per cent increase in online subscribers in the financial year to 31 March 2004, of which around half were post-pay customers.
We are committed to increasing the value of our offering to business. Our corporate handheld e-mail device, BlackBerry™, is central to this. Since launch, more than 55,000 devices have been sold to over 2,000 organisations.
Following the success of our Xda device, this year’s launch of our own-brand X1 picture phone and Xda II second-generation pocket PC highlighted our ability to offer innovative products to our customers.
Designed to make the mobile phone more intuitive and easier to use, O2 Active, which is discussed in greater detail later in this review, has been an instant success. An award-winning, data services menu, it quickly became the UK’s most widely used mobile portal.
In October 2003, our German, UK and Irish operations became founder members of the Starmap Mobile Alliance, a group of independent mobile phone operators who are joining forces in readiness for the international roll-out of UMTS services. Starmap aims to provide a “home-away- from-home” experience by introducing seamless roaming and multimedia connectivity to more than 46 million customers in 10 European countries. The “home-away-from-home” concept aims to provide customers with a service while travelling that is as close as possible to that they receive at home. It will enable members to be quick to market across borders with new products and services, and will increase their inbound roaming revenues.
Our primary goal is to create shareholder value by becoming the fastest growing major European mobile operator in revenue and profitability. We have a number of specific growth opportunities including market share growth in Germany, improving our customer mix in the UK and Ireland, O2 Airwave moving into full operations, and maximising the potential of key partnerships such as Tesco Mobile.
We will build on the momentum created by our successful brand, ensuring that whenever customers come into contact with us the expectations created by the brand are met. This requires us to understand clearly different types of customer, to deliver a range of targeted service packages, to develop efficient CRM systems and to transform our retail presence. In this way, we aim to become an integral part of customers’ lives and improve our ability to attract and retain higher-value customers.
We have already established a strong position in mobile data. To maintain this strength, we will continue to make these services more accessible and user-friendly for customers and to deliver compelling content, services and devices. We will continue to work with third parties to achieve this.
As a group, we are smaller than some of our international competitors and we will leverage this relatively small scale to our advantage. We have recently reorganised our operations to improve the speed and quality of execution while also developing and communicating a “local touch” in each market. We continue to focus on our European footprint of wholly owned businesses.
Our results this year illustrate the value of this targeted approach. We are experiencing greater customer loyalty and a richer mix of customers with more emphasis on post-pay packages, together with higher average returns, which results in greater revenues across the Group.
13
Back to Contents
The following table represents the turnover for each of our continuing operating businesses for the three financial years ended 31 March:
| | | 2004 | | 2003 | | 2002 | |
| | |
| |
| |
| |
Continuing operations | | £m | | £m | | £m | |
| | | | | | | |
O2 UK | | 3,451 | | 3,025 | | 2,756 | |
O2 Germany | | 1,508 | | 1,060 | | 875 | |
O2 Ireland | | 529 | | 442 | | 395 | |
O2 Airwave | | 89 | | 16 | | 11 | |
| Manx Telecom | | 50 | | 48 | | 43 | |
O2 Online | | 140 | | 93 | | 100 | |
| | |
| |
| |
| |
Total | | 5,646 | | 4,611 | | 4,076 | |
| | |
| |
| |
| |
O2 UK continued to build momentum during the financial year to 31 March 2004. Financial performance ahead of our key financial targets was matched by strong operating performance. Strong growth in customer numbers and ARPU was accompanied by significant improvements in network and service quality, innovative new propositions for our customers and the development of an increasingly “iconic” and distinctive O2 brand.
Total customer numbers grew by 1.2 million to 13.3 million. Encouragingly, higher spending post-pay customers accounted for over 40 per cent of customer growth.
The quality of our customer base continued to improve, with higher ARPU for both post-pay and pre-pay customers. Post-pay ARPU for the financial year to 31 March 2004 was £525, a 4.4 per cent increase over the previous financial year, while pre-pay ARPU was £141, a 16.5 per cent rise over the previous financial year. On a blended basis ARPU was £272 for the financial year to 31 March 2004, an increase of 10.1 per cent over the previous financial year.
These increases in ARPU reflect our success in attracting large numbers of new customers from our target high-value consumer and business segments, as well as success in driving greater revenue from existing users. As a result, our net service revenue grew by 16.3 per cent year on year.
To attract high-value customers, we rolled out a number of ground breaking new services and introduced simpler new tariff packages. For example, O2 Bolt Ons – which allow users to “bolt” additional bundles of attractively priced voice, text and other services on to their existing price plan – continued to drive higher usage and differentiate the O2 brand in a crowded market. In September 2003, we launched O2 Home, which uses location-based technology to allow customers to make cheaper mobile calls from their home for a fixed monthly premium.
Developing and growing the market for non-voice, or data services, also remained an area of major focus for the financial year to 31 March 2004, and will continue to be so going forward. Increased take-up of services that go beyond simple voice and text will be the key to growing ARPU in a maturing market where new customer additions will decelerate. During the year, revenue from non-voice services accounted for over 20 per cent of total O2 UK revenue, the highest proportion among any UK mobile operator. By the end of the year, nearly 9 per cent of this revenue came from data services other than text messaging.
For the mass consumer market we introduced O2 Active, the mobile portal, in June 2003, a simple-to-use colour menu that enables customers to access a range of multimedia services such as video downloads, news, games, picture messaging, ringtones, images and chat. As at 31 March 2004, across the Group, there were more than 2.7 million O2 Active customers measured as the number of unique visitors during the previous 90 days.
14
Back to Contents
A number of innovative O2 sourced and branded devices also helped us drive growing service usage. The O2 Xda (versions I and II), a wireless personal digital assistant enabling web browsing, LAN/WAN access, video, e-mail and a range of office applications, was widely recognised as the best device of its kind and helped attract some of the highest value users in the market. At the other end of the spectrum, the X1, our unique handset with a range of multimedia functions, succeeded in stimulating greater non-voice use amongst pre-pay users because of its very attractive price. We also pioneered music over mobile with the launch of the O2 Digital Music Player, Europe’s first “over the air” music download service.
All of these services were promoted through a growing network of O2 UK retail stores. Store numbers increased by 41 to reach 235 by 31 March 2004 and retail store sales rose by 25 per cent. Online sales also grew strongly. Our internet portal, www.o2.co.uk, signed up its one-millionth customer in October 2003, making it the most successful service of its kind in Europe.
In the business market, the financial year to 31 March 2004 saw a sharp increase in competition as other mobile operators put far heavier emphasis in this area than in previous years. To combat this change, we restructured our sales operations, improved the quality and focus of our sales force and introduced new pricing and service propositions for our customers.
Our Best for Business campaign – a series of initiatives including new tariffs, improved service quality, enhanced account management, and a multiple award-winning “2 Minute Challenge” advertising campaign – played a large part in a continued sustained recovery in our position in the UK business market. Our momentum increased during the year with customer connections and ARPU both showing steady growth as the year ended. Good demand for specialist devices such as BlackBerry™, a wireless e-mail device that utilises our GPRS data network, and the Xda also contributed to this resurgence.
Operationally, our strategy to improve overall service quality focused on two main areas: improving our network performance and increasing our customer service capabilities. Both are aligned to our continuing strategy of differentiating by delivering a better overall customer experience.
Our focus on the network led to a 25 per cent overall increase in performance and quality year-on-year, as measured through indicators such as minutes per drop, being the number of minutes between dropped voice calls. This significant improvement brought independent recognition of O2 UK from the industry regulator Oftel for showing the best ever published national call success rates by any UK operator. This was achieved despite lower capital expenditure on the 2G network than in previous years. Improved network and service quality were among a number of factors contributing to a year-on-year reduction in churn amongst our post-pay customers. Pre-pay churn increased slightly, in line with industry trends.
In terms of improving customer service, we continued to make significant investment in Companion, a single billing and CRM system that will be a key operational foundation for our future.
Companion will enable us increasingly to predict and meet customer needs by better aligning our billing, care and relationship management activities to their behaviour. A large number of existing customers have already been transferred from old billing and CRM systems to Companion and this process will continue during the year.
Through these and other initiatives, O2 UK’s customer satisfaction, measured using our quarterly survey, improved during the year. Through Companion and other programmes we will continue to put substantial investment into improving customer satisfaction in the forthcoming financial year and beyond.
We continued to differentiate ourselves from our competitors through the increasingly strong appeal and distinctiveness of the O2 brand. Brand awareness continued to climb last year, assisted by O2 UK’s sponsorships of the World Cup-winning England rugby team, 2003 FA Cup winners and new Premiership champions, Arsenal, the Big Brother TV show and Capital Radio’s drive-time, as well as the strong appeal of our market propositions. Spontaneous brand awareness for O2 in the UK is currently 64 per cent – an all time high – versus 53 per cent a year earlier. In less than two years, O2 UK has already achieved the brand awareness figures previously achieved by its predecessor, BT Cellnet.
15
Back to Contents
Our performance was achieved against the backdrop of stiff and increasing competition. This came from traditional competitors such as Vodafone, Orange and T-Mobile, plus the rise of several newer entrants whose presence was particularly felt during the second half of the year. 3, a new third generation mobile network operator owned by Hutchison Whampoa, launched in March 2003 and, after a slow start, has built strong momentum. BT Group also re-entered the mass consumer market as a “virtual” operator (a network reseller) in autumn 2003. We also formed Tesco Mobile, a 50:50 joint venture between O2 UK and Tesco plc, to address sections of the family market that we do not currently target with the O2 brand. Tesco Mobile launched in October 2003 and, by May 2004, had reached 250,000 customers, many of them new to the UK mobile market. We expect competition to intensify again during the financial year to 31 March 2005, and this will coincide with slowing overall growth in new customers as the UK market matures.
We will continue our focus on improving profitability by growing our base of high-value customers and improving business efficiency. To achieve this, we remain committed to delivering the best possible experience for our customers through, amongst other things, continued improvements in service quality, launch of innovative new services, improvements in customer service and CRM, and continued development of the O2 brand.
Some of these new services will be made possible by UMTS mobile technology. Investment made in our UMTS network during the financial year to 31 March 2004 will accelerate in the financial year to 31 March 2005 as we move towards the commercial launch of our initial UMTS services in autumn 2004. However, we expect that UMTS will have a more substantial impact on the UK market after 2004.
Overall, we expect that competition in the UK mobile market will continue to intensify over the next 12 months. As such, we expect customer and revenue growth to slow in the financial year to 31 March 2005. This is why we remain focused on driving increased usage of new non-voice services to help deliver higher ARPU. We remain confident that the momentum we have established and the actions we are currently taking to continue strengthening our business will ideally position us to emerge from a challenging market in good health.
O2 Germany reduced its operating losses, underlining its high degree of operational efficiency and strict cost management together with its ability to generate strong top line growth, fuelled by high value customers.
Further important programmes were initiated to streamline operations, for example integrated customer care, and to increase customer loyalty. In October 2003, O2 Germany launched an online loyalty programme aimed at driving ARPU up and churn down. Customers collecting bonus points are able to choose between different rewards. The loyalty programme is simple to understand and also brings the customer closer to O2 Germany’s product range. An “Active Lifecycle Management Pre-paid and Post-paid” programme to increase customer retention and profitability was also introduced. With service differentiation and new, extended sales channels, customer retention has been given a high priority. Integrated marketing is an additional component of the CRM concept. Having identified gaps in our distribution network we successfully increased the number of our direct outlets to 470 shops by 31 March 2004 which included partnerships with other retailers, including shop-in-shops. Our online shop has become one of our strongest direct sales channels with particular appeal to mobile data customers.
Genion, a key driver of gross additions, underlines our strategic focus on more profitable customers, generating higher ARPU and a considerably lower churn rate than other mobile products. Customers attracted from other operators usually generate a higher ARPU because they change their patterns of usage with Genion. Thanks to its advanced technology, Genion offers innovative services in combination with reduced tariffs in a geographical area chosen by the customer, usually near the home or workplace. This is a unique service in the German market. We will be continuing to promote Genion employing an evolutionary marketing approach to widen the potential market and to address sub-segments with dedicated campaigns and special tariff offers.
16
Back to Contents
In our target business market we made good progress, winning major new customers, forging new partnerships with sales channels and software suppliers, and introducing innovative new tariff packages and services specially tailored for the business customer. We acquired a number of household name customers, including Kraft Foods, Xerox, Campbells, Bayer, Blohm+Voss and Deutsche Assekuranz Pool GmbH. We also expanded our indirect sales model – the “pure business centre” – which is targeted at small and medium sized enterprises. We intend to have between 10 and 15 key partners who will, in turn, manage a further 60 to 100 sales partners. Some 20 co-operation agreements have been signed with companies including Siemens SBS, UNISYS, Tobit Software, Nextira One and Software AG. With these partners we are able to offer our business customers mobile solutions in such areas as field service control and mobile data security, using our Xda II and the BlackBerry™, among other platforms. In January 2004 we launched customised business packages – Pro Office, Pro Company and Pro Connect – for small businesses and the self-employed. We introduced a new simple, transparent and flexible tariff scheme for medium to large companies. As an example of our focus on the customer, we were first to the German business market with an application that allows quick access to company data using UMTS. O2 Germany customers can now use either UMTS, GPRS or WLAN for mobile data applications with the aid of new connectivity software that automatically connects customers to the network best suited to their needs.
Our growth in revenues from mobile data products continued last year, reinforced by further progress in the wholesale market. Data revenues at O2 Germany have shown a strong increase accompanied by superior data ARPU compared with our competitors. SMS services are still the main driver of growth in data revenues, but non-SMS data services are also showing significant growth. About 20 per cent of our customer base is now using non-SMS data services. In June 2003, the O2 Active mobile portal was launched. O2 Active is the first full colour mobile portal to adapt automatically to the user’s behaviour. It has enjoyed an excellent reception in the marketplace and from external commentators. In September 2003, we launched mobile data packs, comprising e-mail & surf pack and an e-mail pack. This is a differentiating factor for O2 Germany compared to our competition (which followed suit), a good example of O2 Germanys innovative marketing initiatives. It has been well received in the marketplace because mobile data packs are easy to use and offer transparent pricing. Multicard, a service enabling customers to combine between three and six SIM cards under one number, was launched in October 2003. It shows a high level of technical functionality, in particular enabling customers to surf the internet and make phone calls at the same time which is unique in the German market. Our hardware strategy also showed successes. MMS handsets with integrated cameras, which show an MMS-ARPU-share about three times higher than for handsets with click-on cameras, have become increasingly important. In November 2003, we launched the X1, the first O2 branded phone.
As a complementary product, we have developed WLAN services. From October 2003, O2 Germany post-pay customers have been able to tap into the service without prior registration. Pre-pay customers can access the WLAN service by using vouchers or a credit card. O2 Germany currently has 450 hotspots, making it one of the leading WLAN providers in Germany. Our partnerships with GlobalAirnet AG, Swisscom Eurospot, ISIS Multimedia Net and NetCheckIn are driving the rapid expansion of our WLAN hotspots. Our partners deal with WLAN technology while O2 Germany takes care of marketing and billing.
The German mobile phone market grew at a faster rate last year as penetration of active customers rose to 76 per cent in March 2004 compared with 69 per cent in March 2003. During the financial year to 31 March 2004, the total number of connections grew by 6 million to 66 million. The attractiveness of the German market is underlined by its strong growth, even though the market is close to saturation. The availability of mobile data services and increasingly attractive handsets were an important driver of market growth. Market conditions remained competitive as operators sought growth through highly subsidised handset offers and attractive tariffs, including flat rates and large volume bundles. There are currently four mobile network operators in Germany – T-Mobile, Vodafone, E-Plus and O2 Germany.
17
Back to Contents
Last year we concentrated on reductions in operating costs and improvements in our core processes, together with a number of major new product launches and the launch of our customer Loyalty Programme. Corporate customers are increasingly recognising the value of our specially tailored products. In the coming year, O2 Germany will continue to develop and enhance data products such as a surf@home (a mobile Internet enhancement for our Genion product based on UMTS) and to exploit synergies within the Starmap Mobile Alliance. The next phase of O2 Active will provide customers with an integrated experience and offer an advanced online portal with personalised content for the next generation of handsets. We will also be developing an attractive and comprehensive UMTS service in line with availability of appropriate handsets and customer demand. We will maintain an ongoing focus on market segmentation and continue to adjust our marketing activities and organisation accordingly. Our target remains to continue to grow our market share in Germany focusing on high-value customers through top line growth and operational efficiency.
O2 Ireland management maintained a focus last year on providing customers with the best possible service experience, and was recognised in a number of industry awards and commendations. In April 2003, O2 Ireland was awarded Telecoms Company of the Year at the ICT Expo Awards. Our portal website (www.o2.ie) won Ireland’s leading technology award, the Golden Spider Award, for the third year running. O2 Ireland was also short-listed by the Irish Independent among the top 50 companies to work for in Ireland.
In the past year, the O2 Ireland management team has continued to improve business performance, gain market share and build the reputation of the O2 brand and the business. Through improved operational efficiencies, quality of service and innovation, we have retained our existing customers and won new subscribers. During the past 12 months, the strength of the O2 brand has continued to grow and deliver maximum value to the business. Awareness of the brand was helped by sponsorships and associations with the Irish Rugby Football Union, the Smurfit European Open, golfer Padraig Harrington and O2 in the Park – a family musical event in Phoenix Park, Dublin.
O2 Ireland also maintained a strong performance in its quarterly customer satisfaction survey over the past year as customers scored O2 Ireland highly in both network quality and billing services. The increase in customer satisfaction on these two counts stemmed from continued investment in the O2 Ireland network together with intensive efforts to make bills easier to understand and to ensure that they get to customers on time.
O2 Ireland continues to invest in technology and improvements in the efficiency of our operations, ensuring that our people can deliver a better service to our customers. In the past year, with this aim in view, we have concentrated on customer care, IT and network technology. The new products and services that we launched last year have reinforced our strategy, which is to offer value for money, simple tariffs and services that are easy to use. In this way we retain and attract high value customers. We introduced new tariffs in 2003 for pre-pay and post-pay customers, leading to a strong increase in our customer base.
In September 2003, we introduced All Ireland, a new tariff for customers moving between the Republic of Ireland and Northern Ireland that abolishes roaming charges between the two jurisdictions. We also brought an innovative new cost-saving service to market: Group Worker enables companies to separate the mobile calls of their employees into personal and work-related calls, thereby reducing the overall cost of mobile communications to the company.
Full Mobile Number Portability came into effect in July 2003. This was a highly complex programme, successfully implemented by a large team from across our business and one which won us customers from other operators.
18
Back to Contents
Maintaining the highest quality network in order to maximise customer satisfaction remains central to our business. We always seek to build our network in a cost efficient and environmentally friendly way and we therefore continued, where possible, to share existing sites of other mobile operators and utilities providers.
We have adopted the same policy in building our UMTS network. On 14 January 2004, the Commission for Communications Regulation (ComReg) formally confirmed that O2 Ireland had reached its UMTS performance targets in relation to network coverage, quality of service and site sharing. We began limited trials of our UMTS service in January and plan to bring UMTS services to the market in late 2004.
We have built our networks in a way that is designed to be as unobtrusive as possible to local communities. We have put community relations at the heart of everything we do and we continue to play a highly visible role in many parts of Irish life from sports to entertainment to the arts.
As part of our strategy to provide wireless broadband services to the regions, O2 Ireland became the only Irish mobile operator to receive government funding to install wi-fi hotspots in selected locations in western Ireland. We also rolled out our own wi-fi hotspots nationwide in hotels, airports, bus and train stations and business centres. Currently we have over 20 hotspots in operation around the country and we are in discussion with other operators to seek agreement over roaming services.
Mobile data usage continued to improve owing to the success of products such as the BlackBerry™, the Xda combined phone and personal computer, and games. Growth in text messaging continued with usage up by 20.2 per cent. We had a particularly strong Christmas in 2003, with sales of camera phones and new customer acquisitions exceeding our targets. In the corporate market, we gained a number of important new customers including Campbell Soups, APC and Atlantic Industries.
The Irish market continues to be a highly challenging one for the mobile industry with penetration levels of mobile phones in the population now standing at 88%. O2 Ireland holds the second biggest share of the market at 40%. 3 (Hutchison Telecom) entered the market in January 2004 and has begun to roll out its UMTS network. Meanwhile two fixed line operators, Esat BT and Eircom, have both indicated that they intend to re-enter the mobile market.
The focus for O2 Ireland over the coming year will be to concentrate on providing the best possible customer experience with the aim of acquiring and keeping high value customers and offering them compelling products and services. We will continue to grow basic services by increasing market share. Non-voice revenues will become increasingly important. We saw a noticeable increase in the number of camera phones and other data devices sold towards the end of last year, which will lead to more and more revenues coming from non-voice services. While non-voice revenue will become an increasingly important part of our revenue stream, we will continue to maximise revenue from existing voice services. We have met the regulatory requirements for UMTS network roll-out and we would hope to provide commercial UMTS services to the mass market in late 2004, dependent on the availability of handsets at a price and in a form that is attractive to our customers. While we expect competitiveness in the market place to increase, we are well placed to grow the business profitably with ongoing reviews to maximise shareholder value.
During the financial year to 31 March 2004, O2 Airwave accelerated the roll-out of its network and established itself as our fourth substantial business. We delivered our service to a further 25 police forces during the year, including the Metropolitan Police, taking the total of forces so far supplied to 35 with over 50,000 officers using the service. We won new customers from other Public Safety Users and launched new products and services, securing additional business. We expect to complete the roll-out of the Airwave network by the end of calendar 2005 when a further 16 forces will start using the service. The faster pace of roll-out led to a more than five-fold
19
Back to Contents
increase in revenues, which, coupled with tight cost controls, produced a five-fold increase in our revenues. We invested £243 million in building our network during the financial year to 31 March 2004. We will continue to invest a significant amount during the financial year to 31 March 2005, after which our capital expenditure will decline as we complete the build of our network. Under the terms of a £2.9 billion, 19-year contract with the Home Office, O2 Airwave will be the sole supplier of core mobile radio services to all 51 police forces in England, Scotland and Wales, with the three national forces also using the service.
Opportunities for Airwave are not restricted to police forces. Airwave is currently used by the Ministry of Defence Police, the UK Atomic Energy Authority Constabulary, the Land Army, two Fire and Rescue Services and an Ambulance Trust. The Royal Navy is also contracted to use Airwave in the future. We are licensed by the DTI to offer our service to about 100 other defined Public Safety Users in the UK. In an important opportunity, O2 Airwave is short-listed for a contract to provide the communications network for the Ambulance Service nationwide. We have also been short-listed to supply the Fire Service nationwide. During the year, O2 Airwave won new customers among other Public Safety Users who value Airwave’s ability to allow emergency services to communicate with each other. O2 Airwave is working with the Highways Agency to put Airwave into 400 vehicles that patrol motorways and A-roads, dealing with traffic incidents and managing the road network nationwide. HM Prison Service has chosen O2 Airwave to provide communications in the transport of prisoners. Two of our first customers for Airwave Direct, a fully-managed radio communications service enabling smaller public safety bodies to subscribe directly to the Airwave network, have been Norfolk County Council and Darlington Borough Council. Norfolk is using Airwave to improve communications within its emergency planning team and to allow the team to communicate directly with the police when necessary. For similar reasons, Darlington has equipped its community wardens with Airwave making communication easier among wardens and with the police.
Airwave’s capabilities go beyond voice transmission: they enable the secure communication of vital data across the network. Airwave allows police officers to gain access to the Police National Computer (PNC) and Scottish Criminal Records Office to carry out vehicle and personal checks directly from their Airwave handsets. Rapid access to national records not only increases the efficiency of police officers; it also reduces the workload of command and control centres. North Yorkshire and Suffolk Police Forces are using Airwave’s Automatic Vehicle Location Service to track the precise deployment and status of their fleets of vehicles, about 700 vehicles in total. Kent and Lancashire constabularies have undertaken trials of our Mobile Application Gateway (MAG). The Kent Police Force used MAG to give officers access to the PNC and to its local HQ while Lancashire Police Forces accessed the PNC together with databases for firearms, arrest warrants and “missing from home” cases. Among non-police customers, Hereford & Worcester Ambulance Trust is the first NHS organisation to use a patient telemetry service over the Airwave network. Patients’ vital data can be monitored by ambulance crews and transmitted over the Airwave network directly to hospital Accident & Emergency units, enabling life-saving treatment to begin at the scene of an incident. Shropshire Fire & Rescue has also enjoyed improved safety for its fire fighters, faster response times and better risk management by using voice and data communication over the Airwave network.
Airwave is a sophisticated, fully encrypted digital radio system, which cannot be scanned or monitored by outsiders. On completion in 2005, the Airwave network will allow the police to communicate seamlessly and securely throughout England, Scotland and Wales. Airwave’s multi- functional handsets, combining a digital radio and mobile phone, also operate as data terminals – enabling officers in the field to access local and national databases. As well as making a significant contribution to the fight against crime, the system promotes the safety of officers, partly because it has better radio coverage and call clarity but also because of its emergency button feature, which enables officers to summon immediate assistance. The Airwave network is based on the open European standard for TETRA. In addition to almost 100 per cent geographical coverage, capacity will be available on Airwave whenever and wherever a Public Safety User needs it – a vital feature in emergencies. Voice quality is very clear and all communications are encrypted, which means that third parties cannot listen in, allowing the police, for example, to keep one step ahead of the criminals. Airwave will also provide a common platform for Public Safety Users, giving them true interoperability and comprehensive geographical coverage.
20
Back to Contents
Lack of communications at major emergencies and disasters has been highlighted as a significant factor in hampering the effective coordination of rescue efforts by the emergency services. Using Airwave, police officers from different forces can talk to one another or to officers from other emergency services, whatever their location, who can in turn communicate directly with one another.
We will continue to invest a significant amount during the financial year to 31 March 2005, after which our capital expenditure will decline as we complete the build of our network. O2 Airwave has improved its revenues five-fold for the financial year to 31 March 2004 and network completion will assist in even greater revenue performance. In the meantime, O2 Airwave will seek to build on its success in exploiting the expanding range of opportunities for winning potential customers among the emergency services and Public Safety Users.
Manx Telecom has been operating on the Isle of Man since 1987 and has provided a programme of investment to establish a world-class telecommunications infrastructure there, at the forefront of introducing new technology and services. We were the first telecommunications operator in Europe to switch on a live UMTS network, which we did in December 2001. Our experience has provided the Group with valuable feedback prior to its launch of UMTS services in Germany, Ireland and the UK.
On 1 January 2004 Manx Telecom was awarded a licence extension by the Isle of Man Government for 15 years. The licence renewal has reduced Manx Telecom’s annual payment to the government to a level which covers the cost of telecommunications regulation. The savings resulting from this are being passed on to customers through a range of tariff reductions and increased discounts which will help to make our pricing very competitive.
In May 2003, Manx Telecom launched its GPRS service, Manx Pronto Connect, with Island-wide coverage, followed in July 2003 by picture messaging. We also launched a wholesale SMS service which has increased the volume of text messages generated. The average number of SMS (texts) sent per month was around three million.
Capital spending during the year was £9 million compared with £7 million in the previous financial year. In December 2003, Manx Telecom completed a programme of work that saw all its telephone exchanges ADSL-enabled, in order to provide broadband services to local customers. This means that around 98 per cent of households and businesses on the island can now access broadband Internet. This initiative, in conjunction with the launch of our competitively-priced Wires-Only ADSL service in September 2003, has seen the take-up of broadband accelerate on the island. In the past five years, Manx Telecom has invested around £50 million in the Isle of Man’s telecommunications infrastructure.
This year we continued to build on our customer service reputation with figures from event-driven surveys showing that 87 per cent of customers are very satisfied with the service they have received.
Manx Telecom is the only provider of mobile and fixed line telephony on the island.
Our newly awarded, 15-year, licence will give us the platform to continue to offer telecommunications services of the highest quality and best possible value to the population of the Isle of Man. We will remain at the forefront of new technological developments in telecoms on the island and actively support the government’s strategy to attract new inward investment to the Isle of Man. We look forward with optimism to the future.
We conduct most of our business in the United Kingdom, Germany, Ireland and the Isle of Man. We are therefore subject to national regulation in each of those countries as well as European Union-wide regulation.
21
Back to Contents
The EU has adopted a new regulatory framework for the electronic communications sector (the New EU Framework) which replaces much of the previous EU regulatory regime. Member States were required to implement the New EU Framework into national law by 24 July 2003, although some have not yet completed implementation.
The New EU Framework comprises four principal Directives which are intended to converge and harmonise electronic communication regulation throughout the European Community. Amongst other things, the Directives set out policy objectives and regulatory principles that National Regulatory Authorities (NRAs) must follow: they provide for a new authorisation system for companies which provide electronic communications networks and services, contain measures to ensure the universal provision of basic services to consumers, and set out the terms on which providers may access each other’s networks and services.
Importantly, the New EU Framework also harmonises the rules for deciding when regulation may be imposed on electronic communications providers. In particular, it provides that electronic communications providers can usually only be subject to specific regulation in markets in which they have “significant market power” (SMP). SMP, for these purposes, has been aligned to the competition law concept of dominance, which essentially means an ability to act independently of customers, suppliers and competitors.
The European Commission (Commission) has identified in a Recommendation (published in February 2003) a list of markets which may be such as to justify the application of specific regulation (the Recommendation). The Recommendation includes the following mobile markets: (i) access and call origination on public mobile telephone networks; (ii) voice call termination on individual mobile networks; and (iii) wholesale national market for international roaming on public mobile networks. The commission had stated that it would review the Recommendation by 30 June 2004, but on 16 June 2004 announced that it had re-scheduled this review for the end of 2005.
NRAs must conduct market reviews in order to determine whether any companies have SMP in any of the markets identified in the Recommendation. NRAs may also, with the Commission’s consent, review markets that are not listed in the Recommendation. Where a company is found to have SMP in any market, the regulator must impose one or more of the following SMP conditions on it: transparency; non-discrimination; accounting separation; access; price control and cost accounting. In exceptional circumstances, a regulator may impose additional or alternative obligations, but these have to be approved by the Commission. If a company is found not to have SMP in a market, then SMP conditions cannot be imposed on it, and existing regulation must be removed.
Regulation in the United Kingdom |
| |
Implementation of the New EU Framework |
The New EU Framework was implemented in the UK by the Communications Act 2003 (Communications Act) on 25 July 2003. Under the Communications Act, responsibility for the regulation of electronic communications networks and services lies with the Office of Communications (Ofcom), which replaced the Office of Telecommunications (Oftel), the Radiocommunications Agency, the Independent Television Commission, the Broadcasting Standards Commission and the Radio Authority. Transitional arrangements were put in place whereby Ofcom’s functions in relation to telecommunications were carried out by the Director General of Telecommunications (DGT) between 25 July 2003 and 29 December 2003. Ofcom is carrying out a Strategic Review of telecommunications. This will provide us with the opportunity to inform and constructively engage with Ofcom in the shaping of future UK industry regulations.
In the UK, the DGT concluded that no mobile network operator (either individually or jointly) had SMP in the market for access and call origination on public mobile telephone networks. This meant that various regulatory obligations (such as requirements to meet requests for interconnection and not to show undue preference or discrimination in the supply of wholesale services provided over public mobile networks) which had previously been imposed on us and Vodafone were lifted.
22
Back to Contents
On 1 June 2004 Ofcom completed its review of voice call termination on individual mobile networks. Ofcom has decided that our call termination charges should be reduced from an average of 8.03 pence per minute to an average of 5.63 pence per minute for the period from 1 September 2004 to 31 March 2005; and that they should remain at 5.63 pence per minute in the financial year to 31 March 2006.
Under the previous regulatory regime, O2 UK and Vodafone were subject to an obligation in our licences to negotiate a national roaming agreement with the new entrant mobile network operator, 3. In accordance with this obligation, we entered into an agreement with 3 to permit it to use our second generation network to originate and terminate calls to and from its subscribers while it builds its own UMTS network.
The New EU Framework was implemented into German law via a new Telecommunications Act (Telekommunikationsgesetz) on 26 June 2004. The German telecommunications regulator RegTP has already started its market reviews (of the markets listed in the Commissions Recommendation) and is expected to consult on its preliminary conclusions on market definitions and proposed remedies shortly. O2 Germany fulfilled its obligation, under German UMTS licence requirements, to reach 25 per cent population coverage with its UMTS network. Mobilcom handed back its UMTS licence to RegTP in December 2003.
The New EU Framework was implemented into Irish law on 25 July 2003. On 1 December 2002, under the Communications Regulation Act 2002, a new regulatory body was established for the regulation of the communications sector in Ireland. This new three-person regulatory body, known as the Commission for Communications Regulation (ComReg), replaces the Office of the Director of Telecommunications Regulation.
Under the old framework, O2 Ireland and Vodafone were designated as having SMP in the mobile telephony market and the national market for interconnection in Ireland. Our SMP conditions under the old framework remain in place until ComReg has completed its market reviews.
ComReg is currently reviewing responses to its consultation document on the wholesale mobile access and call origination market. ComReg’s preliminary conclusion in the consultation document was that O2 Ireland and Vodafone are jointly dominant and should be designated with SMP in this market. If this conclusion is confirmed, ComReg proposes to impose on us SMP conditions requiring us to enter into commercial negotiations for the purpose of providing wholesale national roaming access to qualifying non-SMP operators. It may also impose on us certain transparency, non-discrimination, accounting separation and cost accounting obligations. ComReg’s conclusions on its market analysis and proposed SMP designations are expected to be issued in July/August 2004.
In July 2003, O2 Ireland agreed with ComReg to reduce mobile termination rates by Retail Price Index minus 8 per cent per annum for the period 31 August 2003 to 31 August 2005.
On 8 June 2004 ComReg published a consultation paper on the regulation of our call termination charges from September 2005. The consultation paper concludes that mobile termination charges should be cost oriented and proposes a number of ways of achieving this.
Regulation in the Isle of Man |
The Isle of Man is a self-governing Crown Dependency with its own parliament and is not part of the United Kingdom or the EU. Accordingly, Manx legislation and regulations predominantly govern our operations in the Isle of Man.
On 1 January 2004 our new licence extension, awarded by the Isle of Man Government for 15 years, came into force.
23
Back to Contents
We are subject to the general competition law of the EU and, in particular, Articles 81 and 82 of the EC Treaty (Article 81 and Article 82), which prohibit anti-competitive agreements or concerted practices and the abuse of a dominant position respectively where there is an effect on trade between EU Member States.
EU competition law is enforced by the Commission and, since 1 May 2004, has also been enforced by national competition authorities and national courts. Companies which breach EU competition law can be subjected to fines of up to 10 per cent of their group’s worldwide annual turnover. They may also be sued in national courts by third parties which suffer loss as a result of the breach.
We are also subject to the national competition law of the countries in which we operate. In the UK, Germany and Ireland, national competition law broadly mirrors the provisions of EU competition law, prohibiting anti-competitive agreements or concerted practices and the abuse of a dominant position.
International roaming charges |
The Commission is currently investigating whether mobile operators have infringed Article 81 and/or Article 82 in markets for international mobile roaming services in the European Economic Area. The investigation is continuing and no conclusions have yet been reached.
Infrastructure sharing and national roaming |
We have entered into UMTS infrastructure-sharing and national roaming agreements with T-Mobile in the UK and Germany. The agreements were formally notified to the Commission for negative clearance or exemption under Article 81. The Commission formally cleared the UK arrangement by Decision of 30 April 2003, and the German arrangement by Decision of 16 July 2003.
The Commission took the view that the infrastructure sharing aspects of the agreements did not restrict competition. National roaming, on the other hand, was considered restrictive of competition, but was granted exemption from Article 81 for certain specified time periods. We lodged an appeal of the German decision with the European Court of First Instance on 25 September 2003.
We also have a 2G national roaming agreement with T-Mobile in Germany. The German competition authority indicated in August 1999 that national roaming agreements may infringe competition laws but that, in the case of our agreement with T-Mobile, this was unlikely to be the case at that time. However, it reserved the right to review this position.
Europe includes some of the most advanced markets for mobile services in the world. These markets are characterised by relatively high mobile penetration rates and revenues per customer and are amongst the leading markets for the emergence of mobile data services. These markets are also characterised by high population density and GDP per capita. Across Western Europe, the proportion of total voice traffic carried over mobile rather than fixed-line networks continues to increase. These markets are also seeing an increasing proportion of mobile revenues attributable to mobile data services and we expect this trend to continue.
Our mobile businesses cover two of the largest markets in Europe, with the UK and German markets giving us access to a total population of over 144 million people. All our markets have seen growth over the last few years in the number of mobile telephone users, in large part reflecting strong demand for competitively priced pre-pay offerings. Our markets are seeing the emergence of additional wholesale opportunities for network operators. Through wholesale agreements, network operators are able to sell capacity and services on a large scale to other service providers and mobile virtual network operators.
Historically, the number of customer connections to mobile telephone networks in the markets where we are present has been greater during the second half of the financial year than during the first half, primarily due to
24
Back to Contents
increased sales during the Christmas period. See “Operating and financial review and prospects – Factors affecting our business”, Item 5.
The table below presents selected data regarding the principal countries in Europe in which our businesses operate. Due to the sale of O2 Netherlands, this table does not present data for that business.
| | | Population1 | | Active mobile1
customers’
penetration
at 31 March
2004 | | mmO2
customers
at 31 March
2004 | |
| | |
| |
| |
| |
Country | | (in millions) | | (%) | | (in 000’s) | |
| | | | | | | |
| Germany | | 84 | | 76 | | 5,982 | |
| United Kingdom | | 60 | | 91 | | 13,264 | |
| Ireland | | 4 | | 88 | | 1,391 | |
| | |
| | | |
| |
Total | | 148 | | | | 20,637 | |
| | |
| | | |
| |
| | | | | | |
| 1 | Source: EMC Worldwide Cellular Database, May 2004. |
The Group had the equivalent of 12,905 employees at 31 March 2004, as set forth by country in the table below:
Country | | Number of employees | |
| |
| |
| United Kingdom | | 7,576 | |
| Germany | | 3,517 | |
| Ireland | | 1,534 | |
| Isle of Man | | 278 | |
| | |
| |
Total | | 12,905 | |
| | |
| |
For the year ended 31 March 2004, the aggregate number of temporary staff employed by our businesses was 2,124.
In the United Kingdom, a number of our employees are represented by two recognised unions: Connect, which has representation rights in respect of junior management employees, and the Communications Workers Union, which has representation rights in respect of clerical, engineering and technical employees. Membership of these unions is individual and voluntary. In addition, a non-unionised employee representative body represents certain managers. Our other operating businesses also meet with their employee representative bodies, or works councils, regularly. We believe that our businesses have a good relationship with our employees and their representatives.
Network and service platform technology |
As a result of the initiative to move forward with a common infrastructure which supports the development of services and applications across the Group, a Nortel GPRS core network has been installed and is now operational in the UK, Germany and Ireland. Common UMTS core (Nortel) and radio (Nortel and Nokia) has also been installed over the last year in these operating businesses. Adopting this approach has brought economies of scale to the costs of infrastructure roll-out across the Group and supports a pan-European approach to services while enabling tailoring for local market requirements.
The information technology deployed in the Group is critical to the efficient and effective operation of the businesses. The focus for each business has been to:
| • | maintain a firm level of cost control, whilst supporting overall business growth; |
| | |
| • | ensure investment is maintained in the most strategic systems; and |
25
Back to Contents
| • | work together to leverage cross-Group benefits. |
Following a successful Group-wide initiative to reduce costs in line with our peers, a variety of initiatives have been pursued. These include renegotiating and consolidating supplier contracts, tightly managing contract renewal and deploying new equipment to reduce maintenance costs.
This cost control has allowed a shift in investment to strategic projects, for example to enhance content billing, to consolidate multiple legacy billing systems, to address new market segments and to enhance significantly the CRM capability in each of our businesses.
The IT community from each of the operating businesses has worked together where benefits have been clearly identified. This has enabled us to deploy common infrastructure, use common products and re-use custom developments. There has also been a joint approach to our key suppliers, providing benefits to both sides and enabling the introduction of framework contracts across the Group.
Looking ahead, our businesses have major IT projects to underpin the business strategy. These include projects to further enhance CRM, ensure a consistently high quality end-to-end customer experience and support key business programmes. Within the IT units there are initiatives to increase responsiveness to change, ensure the long term value of our systems through adherence to architectural policies and to work with our partners in the Starmap Alliance.
We have actively taken steps to protect our brand, including the acquisition of core trademark registrations for the O2 brand and related brand materials. In addition, we have other pending national and European Community trademark applications in ancillary classes.
We are aware that various third parties use O2 or similar brands in connection with other goods and services. We have entered into agreements with some such third parties, which permit the brands to co-exist. These agreements contain some restrictions on use of our brand, but we do not believe that these restrictions conflict with our business model or day-to-day activities. It is not our intention to trade under the O2 brand in the United States, where our securities trade under the mmO2 plc name.
Meanwhile we have just been granted a European Patent relating to technology used in our HomeZone service. The HomeZone service is one of our products marketed in Germany. A third party owns two patents which cover the technology used in the HomeZone service. To date, this third party has not sought to challenge our patent applications or prevent us from using the HomeZone technology. We believe that it is unlikely to take any such action in the future. However, if that third party sought successfully to do so, we might have to stop using the HomeZone technology or find an alternative solution with the third party or use an alternative technology which serves the HomeZone functionality.
We maintain and keep under continuous review the types and amounts of insurance which are appropriate according to industry best practice in the industries and countries in which the Group operates. We consider our insurance programme and that of our operating businesses to be adequate in support of the business activities carried out both with respect of the types of the risks covered and the amount insured.
26
Back to Contents
| C. | Organisational Structure |
The principal operating subsidiary undertakings are detailed below, all of which are included in the Group financial statements.
Name | | | Country of incorporation and operation | | | Activity | | | Portion of ordinary shares held
% | |
| |
|
| |
|
| |
|
| |
O2 Limited | | | England and Wales | | | Intermediate holding company | | | 100 | |
O2 (UK) Limited | | | England and Wales | | | Mobile cellular telephone system provider and operator | | | 100 | |
O2 (Germany) GmbH & Co. OHG | | | Germany | | | Mobile cellular telephone system provider and operator | | | 100 | |
O2 Communications (Ireland) Limited | | | Ireland | | | Mobile cellular telephone system provider and operator | | | 100 | |
Airwave mmO2 Limited | | | England and Wales | | | Digital radio service for public safety organisations | | | 100 | |
O2 (Online) Limited | | | England and Wales | | | Mobile internet business | | | 100 | |
| Manx Telecom Limited | | | Isle of Man | | | Telecommunication services supplier | | | 100 | |
The shares in O2 Limited are held directly by mmO2 plc. The shares of the other operating companies are held by O2 Limited or its wholly owned subsidiaries. The accounting reference date of all subsidiary undertakings is 31 March.
The Group also owns a 50 per cent stake in a joint venture, Tesco Mobile Limited, and a 40 per cent stake in an associate, The Link Stores Limited. Tesco Mobile Limited supplies mobile electronic communications and related services to consumers and is incorporated in England and Wales and operates throughout the United Kingdom. The accounting reference date of Tesco Mobile Limited is 28 February. The Link Stores Limited is a telecommunications equipment retailer which is incorporated and operates in England and Wales.
During the year the Group sold its entire interest in O2 Netherlands as disclosed in note 21 to the financial statements in Item 18.
| D. | Property, Plant and Equipment |
Details of our tangible fixed assets can be found in note 9 of our financial statements, included in Item 18.
We lease, own and have other legal and/or beneficial interests in sites in the United Kingdom, Germany, Ireland and the Isle of Man. Our properties consist primarily of buildings with integrated technical facilities, such as switching devices, transmission towers and antennae and, to a lesser extent, administrative buildings and call centres.
Our principal administrative buildings in the United Kingdom are mmO2’s registered office at Wellington Street, Slough, Berkshire SL1 1YP, England, and O2 UK’s registered office at 260 Bath Road, Slough, Berkshire, England, occupying approximately 9,012 square meters.
The remainder of the properties (excluding cell site or retail properties) that we own or lease in the United Kingdom account for approximately 62,000 square meters and are used as offices, call centres and for switching apparatus.
In the United Kingdom and Ireland there are agreements between us and the BT Group that provide for access to and use of office, cell site and technical equipment premises currently owned or leased by the BT Group, but occupied by us and our group companies. In addition in Ireland, the site sharing agreements between the BT Group and us provide for the BT Group to access and use technical equipment sites currently leased by us.
27
Back to Contents
We lease all of our properties in Germany. Our principal administrative building in Germany is O2 Germany’s head office at Georg-Brauchle-Ring 23-25, Munich, occupying approximately 41,121 square meters. The properties that we lease in Germany account for a total of approximately 118,873 square meters, and primarily comprise office premises and call centres. We have sublease agreements with the BT Group, which account for approximately 33,189 square meters, or 30 per cent, of the property in Germany currently leased by us.
| ITEM 5 | OPERATING AND FINANCIAL REVIEW AND PROSPECTS |
This commentary discusses, and is based on, the audited consolidated financial statements of the Group prepared in accordance with UK Generally Accepted Accounting Principles (UK GAAP), included in Item 18. This commentary should be read in conjunction with those financial statements.
The financial information prepared under UK GAAP differs in certain respects from that prepared under US Generally Accepted Accounting Principles (US GAAP). Details of the main differences are provided and described in note 31 to the financial statements included in Item 18.
Definitions of the operating metrics (including ARPU, data as a percentage of service revenue, churn and SAC) used in this commentary can be found in “Key Information – Operating data” in Item 3.
The year ended 31 March 2004 is our second full year of trading as a separate group following our demerger from BT and the second full year in which we have had sole control over our businesses and strategy.
We provided voice and data mobile communications services and products throughout the year in the United Kingdom, Germany and Ireland through our wholly-owned mobile businesses, O2 UK, O2 Germany and O2 Ireland, respectively, and through our mobile internet business, O2 Online. We also supplied fixed and mobile communications services in the Isle of Man through our wholly-owned subsidiary, Manx Telecom, and we continue to develop a fully integrated national digital radio service for the police forces of England, Scotland and Wales through our O2 Airwave business.
On 14 April 2003, we announced that we had agreed the sale of O2 Netherlands to Greenfield Capital Partners, an independent private equity and corporate finance group. The sale completed on 3 June 2003 and resulted in a loss on disposal of £1.4 billion. A provision for the loss on disposal was recognised in the 2003 financial year.
In early October, the Group commenced the transfer of the O2 Online, Products O2 and certain other central functions to the operating businesses, aiming to simplify lines of management, reduce costs, and improve speed of execution.
The Group also passed an important milestone in the year ended 31 March 2004 in making its first ever retained profit of £166 million.
Foreign currency translation |
We publish our Group financial statements in pounds sterling (£). Our subsidiaries in Germany and Ireland report their results and financial position in Euros (€). Consequently, fluctuations in the value of the pound sterling against the Euro affect the amount at which these items are reported in our Group financial statements, even if their value has not changed in their original currency.
We were part of BT until our demerger on 19 November 2001. Prior to this date, we were not constituted as a separate legal group of companies under a separate holding company within the existing BT Group. However our consolidated financial statements, contained in Item 18, have been prepared as though we had existed as a stand-alone group throughout the period prior to demerger. Whilst we believe that the financial information set out in our consolidated financial statements is an appropriate presentation, this financial information is not necessarily indicative of the financial results that might have occurred had we been an independently financed and managed
28
Back to Contents
public entity during the periods prior to demerger presented or of our financial results that may occur in any future period.
Further details on the development of our key businesses are contained in our business description in Item 4.
Factors affecting our business |
Certain key factors affecting our results of operations in the three years ended 31 March 2004 are discussed below.
The mobile telecommunications market |
The Western European mobile telecommunications market has high penetration rates. The rapid growth in customer numbers experienced in the late 1990s has declined as penetration rates have reached in excess of 75 per cent in each of the territories across our footprint. Accordingly, we focus on customer retention, and on generating increased usage from existing customers through both voice services and data applications. At the same time we are also focusing on acquiring higher spending contract customers. In general, we expect subscriber acquisition costs (SACs) to decrease and subscriber retention costs to increase, although, reflecting our focus on higher value customers, SACs for certain customers, in particular high value post-pay customers, may increase.
Pre-pay customers pay in advance for their usage, and comprise the majority of our customer base across the Group. Our pre-pay customers account for 65 per cent of our customers in the United Kingdom (down from 66 per cent in 2003), 42 per cent in Germany (down from 45 per cent in 2003) and 73 per cent in Ireland (up from 71 per cent in 2003).
The overall decrease in the proportion of customers using pre-pay services rather than post-pay services reflects the success of the Group in acquiring higher spending post-pay customers. Nonetheless, pre-pay services offer us several significant advantages, including lower SAC, higher average per minute charges, reduced credit risk and lower administrative costs. However, lower average outgoing usage minutes for pre-pay customers results in lower ARPU. As our ARPU from pre-pay customers is lower than for post-pay customers, to maintain profitability we give lower handset discounts to pre-pay customers, in line with the general industry practice.
Historically, the number of new customer connections to mobile telephone networks in the markets where we are present has been greater during the second half of the financial year than during the first half, primarily owing to increased sales during the Christmas period. Therefore, our revenues from equipment sales and connection charges, and the aggregate costs of customer equipment and dealer commissions and our other related costs of sales, have been greater during the second half of the financial year than during the first half. However, this trend may not continue and it is difficult to predict the seasonality of customer connections in the future.
Our businesses operate in highly regulated markets and governmental regulation frequently limits the revenue we may receive from certain sources. The regulatory climate in the territories in which our businesses operate is discussed in the regulation section of Item 4 “Information on the Company”.
Critical accounting policies |
The Group’s consolidated financial statements are prepared in accordance with accounting principles that are generally accepted in the UK. As part of these reporting guidelines management are required to identify and disclose the accounting policies relating to all aspects of the results and financial position of the Group used in preparing the financial statements. The preparation of consolidated financial statements requires the management to make estimates and judgements that affect the reported amounts of assets, liabilities, revenues and expenses, as well as the disclosure of certain contingent assets and liabilities. The accounting policies used in preparing the Group’s financial statements for the year ended 31 March 2004 are disclosed in note 1 of those financial statements in Item 18.
29
Back to Contents
Full details of the US GAAP accounting policies which differ to those under UK GAAP are provided in Note 31 to our financial statements in Item 18.
The following accounting policies are considered to be critical to the understanding of the consolidated financial statements. These policies have the potential to have a significant impact on the Group’s financial statements, either because of the significance of the financial statement item to which they relate, or because they require a high degree of judgement and estimation owing to the uncertainty involved in measuring, at a specific point in time, events that are continuous in nature.
| |
Tangible and intangible fixed assets |
We estimate the useful lives of property, plant and equipment, goodwill and other intangible assets in order to determine the amount of depreciation and amortisation to be charged in any reporting period. These useful lives are estimated at the time the asset is acquired, and are based on historical experience with similar assets, as well as taking into account future anticipated events affecting their life. Changes in technology or changes in the Group’s intended use of these assets may cause the estimated life or the value of these assets to change.
We perform a review of the estimated useful life, residual value and depreciation method for each category of tangible fixed assets, (being property, plant and equipment and assets in the course of construction), at the end of every reporting period. Our review of these assets may indicate that their lives need to be lengthened or shortened, resulting in a decreased or increased depreciation charge respectively in future periods. Alternatively, our review may indicate a decrease in the value of the asset, recognised by an impairment charge.
In accordance with UK GAAP, we assess the carrying values of our intangible fixed assets (including goodwill) at the end of the first full financial year following acquisition and all our fixed assets (tangible, intangible and goodwill) in any accounting period if events, or changes in circumstances, indicate that the carrying values may not be recoverable. Factors we believe are important and may trigger an impairment review could include the following:
| • | a significant decline in a fixed asset’s market value; |
| | |
| • | a significant adverse change in the business or the market in which the fixed asset is involved; |
| | |
| • | a significant adverse change in the statutory or other regulatory environment; or |
| | |
| • | significant underperformance relative to expected or forecast operating results. |
Under UK GAAP, when a triggering event has occurred, we perform an impairment review by comparing the carrying value of the income generating unit (IGU) with its recoverable amount. The recoverable amount is deemed to be the higher of the IGU’s value-in-use and its net realisable value. Unless an IGU is to be disposed of, the recoverable amount is deemed to be equal to its value-in-use, which is determined by calculating the net present value of the future estimated cash flows.
We have not identified any events requiring an impairment review to be undertaken in the current year.
In turnover we only recognise transactions that are considered to be part of our principal ongoing operations. In particular:
| • | voice and data service revenue is recognised in the profit and loss account based on minutes of airtime processed over the Group’s networks; |
| | |
| • | turnover derived from connection fees and subscriptions is recognised evenly over the estimated customer relationship period, or the contracted period to which they relate; |
30
Back to Contents
| • | income received from sales of pre-pay call cards is deferred until the customer has used the value in the card to pay for relevant calls; and |
| | |
| • | revenues from handsets are recognised at the point of sale. |
The Group recognises revenue on a gross basis where its role is that of principal in a transaction. The gross basis represents the gross value of the billing to the customer after trade discounts, with any related costs being charged to operating expenses. Where the Group acts as agent in a transaction, the net revenue earned is recognised as turnover.
In connection with recording revenue, we maintain provisions for doubtful debts for estimated losses that result from the inability of a portion of our customers to make required payments. We base our provision on historical results and future expectations, the economic and competitive environment and other relevant factors, and review the provision regularly.
Mast site restoration provisions |
We have certain legal obligations relating to the restoration of leased property at the end of the lease term to its original condition. This obligation relates principally to mast sites. We provide for expected costs of restoring those sites on which we believe that we will have a material liability. The provision is based on assumptions covering the lease term, the characteristics of the site, the expected cost of restoring the site and the period of time before the obligation is expected to be incurred. There is inherent uncertainty given the long period over which certain leases run and actual restoration costs may differ to those estimated.
| |
Goodwill and other intangible and tangible assets |
The Group adopted SFAS No. 142 on 1 April 2002. SFAS No. 142 required the cessation of amortisation of intangible fixed assets that have an indefinite useful life, including goodwill. Instead, such intangible fixed assets are reviewed for impairment annually, or sooner should a triggering event occur. From 1 April 2002 the Group ceased to amortise its goodwill balances and conducts annual impairment reviews of its goodwill balances.
To test the carrying value of goodwill, the fair value of each reporting unit (RU), based on the present value of future cash flows, is compared to the carrying value of the RUs assets and liabilities. Where the carrying value of the RU exceeded the fair value, the fair value of all assets and liabilities of the RU, including any unrecognised intangible assets, was estimated in order to determine the implied value of goodwill. The value in use of each RU was calculated with reference to the net present value of its future cash flows derived from the assets, using cash flow projections.
In calculating the net present value of a RU, management are required to make estimates and assumptions which are fundamental to the present value of future cash flows. These include:
| • | the determination of the composition of the RU; |
| | |
| • | the projected net cash flows of the RU over the period of the review; |
| | |
| • | the determination of the terminal value cash flows, and the terminal value growth rate; and |
| | |
| • | the determination of the appropriate discount rate. |
In calculating the value in use there is considerable uncertainty as to the present value of the future cash flows. In assessing the future cash flows, assumptions have been made using the best estimates available at the time of performing the impairment review. In order to estimate the net cash flows, assumptions about future revenues, the related cost of sales, and capital expenditure have been made. These forecasts are an integral part of approved internal business plans and include estimates and assumptions concerning the Group’s strategic plans for existing and new products; the active customer base growth and the related voice and data ARPUs; churn rates; subscriber acquisition and retention costs; and the timing of the construction of our UMTS networks.
31
Back to Contents
The assumptions and estimates used in our models can vary significantly from period to period as a result of changes in the mobile telecommunications industry, including advances in technology; changes in the performance of our businesses as a result of competitive pressures or otherwise; potential difficulty in the implementation of the UMTS network; the competitive and regulatory landscape; the take-up and charge rate of data services; and the availability of functioning technological infrastructure to support the UMTS roll-out.
Those intangible and tangible fixed assets that have definite useful lives continue to be amortised over their useful life, with impairment reviews being carried out when triggering events occur. Such definite lived intangible assets are tested for impairment in accordance with SFAS No. 144, “Accounting for the Impairment or Disposal of Long-Lived Assets”. In considering whether a triggering event has occurred under SFAS No. 142 and SFAS No. 144, the Group looks for the existence of facts and circumstances, either internal or external, which indicate that the carrying value of the asset may not be recovered.
Certain intangible fixed assets recognised under the US GAAP purchase accounting rules are subsumed within goodwill under UK GAAP. Under US GAAP, these separately identified intangible assets are valued and amortised over their useful lives. These include customer bases and internally developed software. Determining the life of an intangible asset, including assessing whether that life is indefinite, involves a degree of management judgement.
Capitalisation of interest |
Under UK GAAP, the Group does not capitalise interest in its financial statements. To comply with US GAAP, the estimated amount of interest incurred whilst constructing major capital projects is included in fixed assets and depreciated over the lives of the related assets. This includes capitalisation of interest incurred on funding the UMTS licences for the period up to the launch of the related services.
Basis of presentation of financial statements |
Our consolidated financial statements have been prepared using merger accounting principles as if the businesses comprising the Group had been part of the Group for all periods presented, since they have been under common control throughout this period.
For the purpose of these financial statements, a portion of BT’s short- and long-term loans has been allocated to the Group for the periods up to 19 November 2001, the date of demerger from BT. The allocation has been determined by reference to the amount of loans and other borrowings raised by BT to fund certain significant acquisitions in the year ended 31 March 2001 of mobile businesses and assets, including UMTS licences. These allocated loans are interest bearing and further details are disclosed in note 1 to the financial statements in Item 18.
The principal components of our Group in the periods under review are as follows:
| • | O2 UK, O2 Germany and Manx Telecom, which have been included throughout the periods covered by the consolidated financial statements; |
| | |
| • | O2 Netherlands has been included up to 3 June 2003, the date at which our disposal of this business completed and control passed to the purchaser; |
| | |
| • | O2 Ireland has been consolidated in our Group financial statements throughout the periods under review. The remaining 49.5 per cent interest which BT did not already own in O2 Ireland was acquired on 18 April 2001; |
| | |
| • | the assets and results of our O2 Airwave business have been included in the consolidated financial statements for all periods presented although it operated as a separate unit within the BT group until the business was transferred to the Group prior to demerger; and |
| | |
| • | the O2 Online internet portal business was operated as a division of O2 UK until 2001, when the business and assets of O2 Online were transferred into a separate legal entity which was a wholly-owned subsidiary of O2 UK. On 1 April 2004, the main business of O2 Online was subsumed back into O2 UK. |
32
Back to Contents
Financial performance measurement |
We define EBITDA as our earnings before interest, tax, depreciation, amortisation and exceptional items, excluding our share of operating profits and losses of our joint ventures and associates. We use EBITDA, a non-GAAP financial measure, as one of the key performance indicators for evaluating the financial performance of our business units. We believe that EBITDA provides an important measure of the underlying operating performance of our Group because it excludes recurring non-cash items such as depreciation and amortisation. We believe that this measure is also used by readers of this Annual Report in order to assess our performance against other comparable companies. Other measures used include revenues, operating profit or loss and capital expenditure.
We also believe that EBITDA is one of the key indicators of our borrowing potential as indicated by the financial covenants attaching to some of our credit facilities which require compliance with EBITDA targets and EBITDA-based ratios. Further details are provided in Item 5.B “Liquidity and capital resources – Treasury management and policies”.
As EBITDA is not a measure of financial performance under UK GAAP, it may not be comparable to similarly titled measures of other companies because EBITDA is not uniformly defined. EBITDA should not be considered by investors as an alternative to Group operating profit or loss or profit or loss on ordinary activities before taxation as an indication of operating performance, or as an alternative to cash flow from operating activities as an indication of cash flows.
33
Back to Contents
Group operating profit/(loss) is considered to be the UK GAAP financial measure most directly comparable to EBITDA. The reconciliation of EBITDA to Group operating profit/(loss) for the three years ended 31 March 2004 is as follows:
| | | 2004 | | 2003 | | 2002 | |
| | |
|
| |
|
| |
|
| |
| | | £m | | £m | | £m | |
EBITDA | | | 1,367 | | | 859 | | | 433 | |
Depreciation before exceptional items1 | | | (926 | ) | | (932 | ) | | (747 | ) |
| Goodwill amortisation before exceptional items | | | (201 | ) | | (374 | ) | | (369 | ) |
| Other amortisation | | | (7 | ) | | (31 | ) | | (23 | ) |
| | |
|
| |
|
| |
|
| |
| Operating profit/(loss) before exceptional items | | | 233 | | | (478 | ) | | (706 | ) |
| Exceptional items | | | (75 | ) | | (8,300 | ) | | (150 | ) |
| | |
|
| |
|
| |
|
| |
Group operating profit/(loss) | | | 158 | | | (8,778 | ) | | (856 | ) |
| | |
|
| |
|
| |
|
| |
| | | | | | | | | | | |
| 1 | Excludes depreciation of £2 million charged as an exceptional item in 2004 as part of the restructuring discussed under “Exceptional items” below. |
On 14 April 2003, the Group announced that it had agreed the sale of its wholly-owned Dutch subsidiary, O2 Netherlands, to Greenfield Capital Partners, an independent private equity and corporate finance group with existing interests in the fixed telecoms sector, for €25 million in cash. The sale completed on 3 June 2003 and took the form of the sale of all the issued shares of O2 Netherlands.
In the year ended 31 March 2003 the Group recognised a non- operating provision for the loss on disposal of O2 Netherlands of £1,364 million. This represented the impairment of the assets of O2 Netherlands, and goodwill relating to the original purchase of the stake in O2 Netherlands, down to their net recoverable amount which in this case was the sale proceeds less the estimated direct costs of disposal. The total loss on sale arising on completion was £1,369 million which, after utilisation of the provision recognised in 2003, resulted in a non-operating exceptional loss of £5 million in the year.
In accordance with FRS 3 “Reporting financial performance”, the results of O2 Netherlands for the three years ended 31 March 2004 have been classified as discontinued.
The summarised results of the Group, excluding O2 Netherlands, for the three years ended 31 March 2004 are:
| | | 2004 | | 2003 | | 2002 | |
| | |
|
| |
|
| |
|
| |
| | | £m | | £m | | £m | |
| Group turnover | | | 5,646 | | | 4,611 | | | 4,076 | |
| Cost of sales | | | (3,291 | ) | | (2,854 | ) | | (2,519 | ) |
| | |
|
| |
|
| |
|
| |
| Gross profit | | | 2,355 | | | 1,757 | | | 1,557 | |
| Administrative expenses before exceptional items | | | (2,121 | ) | | (2,115 | ) | | (2,111 | ) |
| | |
|
| |
|
| |
|
| |
| Group operating profit/(loss) before exceptional items | | | 234 | | | (358 | ) | | (554 | ) |
| Exceptional items | | | (75 | ) | | (8,300 | ) | | (138 | ) |
| | |
|
| |
|
| |
|
| |
| Group operating profit/(loss) | | | 159 | | | (8,658 | ) | | (692 | ) |
| | |
|
| |
|
| |
|
| |
34
Back to Contents
Introduction to results of operations |
The main components of turnover, cost of sales and administrative expenses, which form our results of operations, are described below.
Our turnover from operations can be analysed into three areas: service, equipment and other revenue, with service revenue our principal source of income. These income streams are briefly described below:
| • | service revenue is derived from our customers’ use of our mobile networks. This includes both voice-related airtime and data services, such as SMS and GPRS. It also includes interconnection fees from other networks terminating calls on our customers’ mobile phones, and roaming fees from other network customers using our networks; |
| | |
| • | equipment revenue is derived from the sale of handsets and other accessories; and |
| | |
| • | other revenue includes sales we recognise when acting as a service provider for non-O2 customers, national roaming and wholesale contracts revenue. It also includes connection charges and revenue from other sources such as voice messaging and paging services. |
The principal items within cost of sales are:
| • | service cost of sales mainly comprises interconnection charges and operation and maintenance costs relating to our networks. Interconnection charges are payments made by us to other fixed line or mobile network operators domestically and abroad when our customers use voice or data services which terminate on other networks. These costs are variable in nature, increasing as the usage of the network increases. Costs relating to the operation and maintenance of our networks mainly comprise core transmission costs, mast site leases, network equipment maintenance and depreciation charges related to our network assets. These costs are more fixed in nature, and depend on the size of the network, not the usage of the network. We expect service cost of sales to increase as we depreciate our UMTS networks once they are constructed and operational; |
| | |
| • | equipment cost of sales includes the cost of purchasing handsets and other hardware items, such as SIM cards, from manufacturers; and |
| | |
| • | other cost of sales includes costs associated with the provision of roaming and wholesale contracts and the network cost of providing voice messaging and paging services. |
| |
Administrative expenses before exceptional items |
Principal administrative expenses are:
| • | promotional and advertising expenses primarily comprising bonuses and commissions to retailers, for the acquisition and retention of customers. They also include expenditure on advertising, marketing and loyalty programmes; |
| | |
| • | overhead expenses including personnel costs relating to functions such as finance, planning, network, regulatory, legal, marketing and customer care. They also include property charges, facilities, training and information technology support; |
| | |
| • | depreciation charges on non-network assets; and |
| | |
| • | amortisation charges on goodwill arising on the acquisition of businesses and on our UMTS telecommunications licences from the date of market launch of UMTS services. |
Exceptional items are large non-recurring incomes or expenses that have been disclosed separately to avoid distortion of reported trading profit.
35
Back to Contents
mmO2 consolidated results of operations for the years ended 31 March 2004, 2003 and 2002 |
The following table presents certain financial data for our Group, including O2 Netherlands, for the years ended 31 March 2004, 2003 and 2002 extracted from our consolidated financial statements:
| | | 2004 | | 2003 | | 2002 | |
| | |
|
| |
|
| |
|
| |
| | | £m | | £m | | £m | |
| Group turnover | | | 5,694 | | | 4,874 | | | 4,276 | |
| Cost of sales | | | (3,314 | ) | | (3,060 | ) | | (2,714 | ) |
| | |
|
| |
|
| |
|
| |
| Gross profit | | | 2,380 | | | 1,814 | | | 1,562 | |
| Administrative expenses before exceptional items | | | (2,147 | ) | | (2,292 | ) | | (2,268 | ) |
| Exceptional items | | | (75 | ) | | (8,300 | ) | | (150 | ) |
| | | | | | | | | | | |
EBITDA1 before exceptional items | | | 1,367 | | | 859 | | | 433 | |
| Group operating profit/(loss) | | | 158 | | | (8,778 | ) | | (856 | ) |
| Group’s share of operating result of joint ventures and associates | | | — | | | 5 | | | 8 | |
| | |
|
| |
|
| |
|
| |
| Total operating profit/(loss) | | | 158 | | | (8,773 | ) | | (848 | ) |
| Total loss on sale of business | | | (5 | ) | | (1,364 | ) | | — | |
| Net interest payable and similar charges | | | (58 | ) | | (66 | ) | | (781 | ) |
| | |
|
| |
|
| |
|
| |
| Profit/(loss) on ordinary activities before taxation | | | 95 | | | (10,203 | ) | | (1,629 | ) |
| Taxation | | | 71 | | | 55 | | | 250 | |
| | |
|
| |
|
| |
|
| |
| Retained profit/(loss) for the year | | | 166 | | | (10,148 | ) | | (1,379 | ) |
| | |
|
| |
|
| |
|
| |
| 1 | EBITDA is our earnings before interest, tax, depreciation, amortisation and exceptional items, excluding our share of operating profits and losses of our joint ventures and associates. The use of EBITDA as a financial performance measure is discussed in “Operating and Financial Performance Measurement” in Item 5. |
| |
Year ended 31 March 2004 compared to the year ended 31 March 2003 |
The following table shows contributions of our businesses to Group turnover:
| | | Year ended 31 March
| | per cent | |
| | | 2004 | | 2003 | | variation | |
| | |
| |
| |
| |
| | | £m | | £m | | | | |
Continuing operations | | | | | | | | | | |
O2 UK | | | 3,451 | | | 3,025 | | | 14 | |
O2 Germany | | | 1,508 | | | 1,060 | | | 42 | |
O2 Ireland | | | 529 | | | 442 | | | 20 | |
O2 Online | | | 140 | | | 93 | | | 51 | |
| Other operations | | | 139 | | | 64 | | | 117 | |
| Intragroup eliminations | | | (121 | ) | | (73 | ) | | 66 | |
| | |
|
| |
|
| |
|
| |
| | | | 5,646 | | | 4,611 | | | 22 | |
Discontinued operations | | | | | | | | | | |
O2 Netherlands | | | 48 | | | 263 | | | (82 | ) |
| | |
|
| |
|
| |
|
| |
Total | | | 5,694 | | | 4,874 | | | 17 | |
| | |
|
| |
|
| |
|
| |
Group turnover from continuing operations increased by 22 per cent from £4,611 million for the year ended 31 March 2003 to £5,646 million for the year ended 31 March 2004. All our businesses contributed to the rise in Group turnover. The principal reasons for the increases in our mobile telecommunications businesses were the overall rise in subscriber numbers in the current year and the increased usage of the Group’s services by
36
Back to Contents
subscribers. The rise in turnover of our other operations is due mainly to our Airwave business which contributed £73 million of the increase.
The strengthening of the Euro during 2004 has also improved the growth. Translating the results of our overseas business at the exchange rates prevailing in the prior year would reduce the reported growth in turnover by £153 million.
A description of the significant new products and services offered by the Group during the year, and the development of the O2 brand, are given in our business description in Item 4.
O2 UK’s overall turnover increased by 14 per cent from £3,025 million for the year ended 31 March 2003 to £3,451 million for the year ended 31 March 2004. O2 UK’s total active customer base increased from 12.1 million at 31 March 2003 to 13.3 million at 31 March 2004, an increase of 10 per cent. This includes a net increase in post-pay subscribers of over half a million customers.
The following table provides an analysis of O2 UK’s turnover:
| | | Year ended 31 March
| | per cent | |
| | | 2004 | | 2003 | | variation | |
| | |
| |
| |
| |
| | | £m | | £m | | | | |
| Service | | | 3,183 | | | 2,738 | | | 16 | |
| Equipment | | | 194 | | | 190 | | | 2 | |
| Other | | | 74 | | | 97 | | | (24 | ) |
| | |
|
| |
|
| |
|
| |
Total | | | 3,451 | | | 3,025 | | | 14 | |
| | |
|
| |
|
| |
|
| |
Service Service revenue is the principal element of O2 UK’s turnover, comprising 92 per cent of total turnover for the year ended 31 March 2004. O2 UK’s service revenue increased by 16 per cent from £2,738 million for the year ended 31 March 2003 to £3,183 million for the year ended 31 March 2004. Of this, service revenue from post-pay customers remains the principal source of income, accounting for over 65 per cent of the total. This represents a decrease from the 67 per cent recorded for the year ended 31 March 2003 and is a function of the strong growth in pre-pay ARPU in the year ended 31 March 2004.
O2 UK’s revenue has grown as a result of a combination of an increase in the subscriber base, partly arising from improving levels of retention of existing post-pay users, and an increase in post-pay ARPU.
Post-pay subscriber gross additions for the year ended 31 March 2004 total 1.7 million, taking our total post-pay customer base to 4.6 million (representing 516,000 net additions for the year). Post-pay churn for the year ended 31 March 2004 was 26 per cent, a fall of 2 percentage points from the churn of 28 per cent recorded for the year ended 31 March 2003. This reflects our efforts to attract higher-spending customers through innovative products and services as well as targeted and successful campaigns in the business market. We have also increased our use of ARPU-share incentive arrangements with independent distributors to increase revenue and reduce churn.
ARPU for both post-pay and pre-pay customers has grown strongly in the year. Post-pay ARPU has increased from £503 for the year ended 31 March 2003 to £525 for the year ended 31 March 2004. Pre-pay ARPU has increased from £121 for the year ended 31 March 2003 to £141 for the year ended 31 March 2004.
Data revenues, as a proportion of total service revenues, increased steadily through the year from 17.1 per cent for the year ended 31 March 2003 to 20.4 per cent for the year ended 31 March 2004. Data revenue as a proportion of total service revenue for the final quarter of the year ended 31 March 2004 was 22.3 per cent. Included within these statistics, the popularity of text messages continued to grow, with in excess of 8.0 billion messages sent during the year ended 31 March 2004, compared with 5.8 billion during the year ended 31 March 2003.
Equipment revenues Equipment revenues have increased by only 2 per cent in the 2004 financial year compared to the 2003 financial year. Although the level of gross additions to our subscriber base has remained level in 2004
37
Back to Contents
compared to 2003, handset prices have generally decreased year on year, the effect of which has been offset by the sales mix.
Other revenues Other revenues have fallen by 24 per cent from 2003 to 2004 reflecting a reduction in service provider and non-mobile retail revenues, which is partially offset by increased revenue from national roaming and wholesale contracts.
O2 Germany’s overall turnover increased by 42 per cent from £1,060 million for the year ended 31 March 2003 to £1,508 million for the year ended 31 March 2004. O2 Germany’s total active customer base increased by 24 per cent from 4.8 million at 31 March 2003 to slightly less than 6.0 million at 31 March 2004. The following table provides an analysis of O2 Germany’s turnover:
| | | Year ended 31 March
| | per cent | |
| | | 2004 | | 2003 | | variation | |
| | |
| |
| |
| |
| | | £m | | £m | | | | |
| Service | | | 1,347 | | | 944 | | | 43 | |
| Equipment and other | | | 161 | | | 116 | | | 39 | |
| | |
|
| |
|
| |
|
| |
Total | | | 1,508 | | | 1,060 | | | 42 | |
| | |
|
| |
|
| |
|
| |
Service Service revenue is the principal element of O2 Germany’s turnover, comprising 89 per cent of total turnover for the year ended 31 March 2004. O2 Germany’s service revenue increased by 43 per cent from £944 million for the year ended 31 March 2003 to £1,347 million for the year ended 31 March 2004. Of this, service revenue from post-pay customers is the principal source of income, with post-pay revenue accounting for 84 per cent of the total.
This increase in service revenue is principally the result of a significant increase in the active subscriber base described above. In particular, the post-pay customer additions in the year ended 31 March 2004 were 836,000, representing 71 per cent of total net additions. The pre-pay customer base increased by 15 per cent from the 2003 financial year to the 2004 financial year, with pre-pay customers totalling 2.5 million at 31 March 2004. A further contributory factor in the growth in service revenue is the effect of foreign exchange. Translating O2 Germany’s service revenue in 2004 at the exchange rates prevailing in the prior year would reduce the reported growth in turnover by £101 million.
A large proportion of the post-pay additions during the year relate to customers who have subscribed to the Genion “HomeZone” service, our location-based tariffing technology, which allows reduced call rates within a small geographical area, usually at home. O2 Germany also offers an equivalent service to business customers. Both Genion Home and Business are part of our drive across the Group to attract high-value customers. At 31 March 2004, over 42 per cent of the total customer base subscribed to the Genion service compared with 30 per cent at 31 March 2003.
Post-pay ARPU has increased from £341 for the year ended 31 March 2003 to £375 for the year ended 31 March 2004. This rise is a function of the continuing drive to win higher spending customers.
O2 Germany have continued to offer advanced data services during the 2004 financial year. This has been reflected in the increase in the proportion of data revenues compared to total service revenues which have risen to 19.5 per cent during the year ended 31 March 2004. The proportion for the three months ended 31 March 2004 reached 20.7 per cent. The principal element of data revenue is generated by text messages and O2 Germany recorded in excess of 1.8 billion text messages in the year ended 31 March 2004, an increase of 466 million messages over last year.
Equipment revenues Equipment revenues have risen by 56 per cent to £147 million compared to the prior year. This is principally owing to the increase of almost 500,000 gross additions in the 2004 year compared to the 2003 year.
38
Back to Contents
O2 Ireland’s revenue has increased by 20 per cent from £442 million for the year ended 31 March 2003 to £529 million for the year ended 31 March 2004. This increase in revenue is a combination of an increase of 136,000 in the customer base and an 11 per cent rise in blended ARPU. Post-pay customer numbers increased from 366,000 at 31 March 2003 to 381,000 active subscribers at 31 March 2004 and the pre-pay customer base increased from 889,000 at 31 March 2003 to 1,010,000 at 31 March 2004.
A further contributory factor in the growth in revenue is the effect of foreign exchange. Translating O2 Ireland’s revenue in 2004 at the exchange rates prevailing in the prior year would reduce the reported growth in turnover by £40 million.
Within other operations, revenue at our Airwave business has increased by over 450 per cent from £16 million for the year ended 31 March 2003 to £89 million for the year ended 31 March 2004. The roll-out of the secure digital communication network for the police forces of England, Scotland and Wales continued during the year and by 31 March 2004 had achieved live status in 35 of the country’s 51 forces.
During the year O2 Online acted as the online sales channel for O2 UK and as the developer of the Group’s mobile data capability. Subsequent to the year end, the operations of O2 Online and Products O2 have been transferred to O2 UK as part of the reorganisation undertaken in the year ended 31 March 2004.
O2 Online generated internal revenue mainly from connection fees, airtime voucher sales and the provision of WAP gateway and portal services to other Group companies. External revenues include sales of devices outside the Group’s territories, paid-for alerts and ring-tones and advertising.
In the current year, gross connections through the Online channel doubled compared to the 2003 year to over 1.0 million.
Net operating expenses before exceptional items |
Net operating expenses before exceptional items comprises cost of sales and administrative expenses. Net operating expenses from continuing operations (excluding O2 Netherlands) increased by 8 per cent from £4,969 million for the 2003 financial year to £5,412 million for the 2004 financial year. This reflects the increase in the cost of sales arising from the growth in turnover described earlier. Translating the net operating expenses of our overseas businesses at the exchange rates prevailing in the prior year would reduce these costs by £147 million.
Group cost of sales from continuing operations increased by 15 per cent from £2,854 million for the year ended 31 March 2003 to £3,291 million for the year ended 31 March 2004. The increase in cost of sales for the 2004 financial year is commensurate with the increase in Group turnover of 22 per cent, partly offset by the improvement in gross margin percentage in our businesses. The gross profit margin of the Group, excluding O2 Netherlands, increased by four percentage points to 42 per cent.
The gross margin percentage (gross profit divided by turnover) of our newer business in Germany is lower than those of our more established businesses in the UK and Ireland. O2 Germany is in the process of building its customer base and, as revenues grow, additional contribution is made towards the fixed element of cost of sales, which increases the margin. As a consequence, in the year ended 31 March 2004, O2 Germany increased its gross margin by 10 percentage points to 38 per cent. As our O2 Airwave business matures, we expect the gross margin to improve similarly.
Group administrative expenses before exceptional items |
Group administrative expenses before exceptional items from continuing operations, which exclude O2 Netherlands, have increased from £2,115 million for the year ended 31 March 2003 to £2,121 million for the year ended 31 March 2004. Given the growth in subscribers and revenues in 2004, the static level of administrative
39
Back to Contents
expenses before exceptional items reflects the benefit of a full year of cost savings following the restructuring undertaken by the Group in the 2002 and 2003 financial years, and certain savings already realised from the reorganisation started in 2004. Translating the administrative expenses of our overseas business at the exchange rates prevailing in the prior year would reduce them by £62 million from the £2,121 million reported.
Group administrative expenses before exceptional items from continuing operations, as a percentage of turnover, have decreased from 46 per cent in the 2003 financial year to 38 per cent in the 2004 financial year.
An analysis of the net operating expenses before exceptional items, between the operating companies is provided in the table below:
| | | Year ended 31 March
| | per cent | |
| | | 2004 | | 2003 | | variation | |
| | |
| |
| |
| |
| | | £m | | £m | | | | |
O2 UK | | | 2,899 | | | 2,691 | | | 8 | |
O2 Germany | | | 1,579 | | | 1,295 | | | 22 | |
O2 Ireland | | | 389 | | | 356 | | | 9 | |
O2 Online | | | 224 | | | 216 | | | 4 | |
| Goodwill amortisation | | | 201 | | | 340 | | | (41 | ) |
| Other operations and central costs | | | 120 | | | 71 | | | 69 | |
| | |
|
| |
|
| |
|
| |
Total | | | 5,412 | | | 4,969 | | | 9 | |
| | |
|
| |
|
| |
|
| |
O2 UK’s net operating expenses before exceptional items have increased by 8 per cent, from £2,691 million for the year ended 31 March 2003, to £2,899 million for the year ended 31 March 2004.
The variable element of O2 UK’s service cost of sales has increased in line with the network usage. Interconnection charges increased significantly during the financial year 2004, compared to the year ended 31 March 2003, reflecting increased calls from O2 UK customers terminating on other networks including other mobile networks whose termination charges are generally higher than charges levied by fixed-line network providers.
O2 UK’s depreciation charge has increased from £477 million in the year ended 31 March 2003 to £488 million in the year ended 31 March 2004, an increase of 2 per cent.
The advertising and marketing spend for the year ended 31 March 2004 has remained static year on year reflecting the focused nature of the spend in this area. Within this, subscriber acquisition costs have fallen as the unit cost of connections has declined despite an increase in the volume of gross subscribed additions. Post-pay SACs have decreased from £177 to £160 per subscriber and pre-pay SACs have decreased from £25 to £16 per subscriber.
Compared to the year ended 31 March 2003, O2 UK’s overheads have increased by 8 per cent for the year ended 31 March 2004, which, despite the increased turnover and concentration on improving customer service, reflects the cost control measures during the year and the cost savings which continue to be derived from the restructuring of the business announced in February 2002.
O2 Germany’s net operating expenses before exceptional items increased from £1,295 million for the year ended 31 March 2003 to £1,579 million for the year ended 31 March 2004.
T-Mobile Deutschland GmbH (T-Mobile) provides national roaming capacity to O2 Germany in areas where O2 Germany has not developed its own network. The cost of the contract is determined based on a fixed number of minutes available to O2 Germany. In February 2003 an extension to this agreement gave O2 Germany access to
40
Back to Contents
T-Mobile’s 3G network over a longer period. The access provides us with an effective route to provide UMTS services to our customers in Germany.
Net operating expenses as a percentage of turnover was 122 per cent for the 2003 financial year and for the 2004 financial year has fallen to 105 per cent. This reflects the rapid growth in revenues at O2 Germany. For O2 Germany, we expect this ratio to be higher than the same ratio of our more established businesses, as it is a newer business and is in the process of building up its customer base.
The total depreciation charge (for both network and non-network fixed assets) was £295 million for the year ended 31 March 2004, a 14 per cent increase over the charge for the year ended 31 March 2003 of £259 million. This reflects the continuing investment by O2 Germany in their network.
Blended subscriber acquisition costs have increased by 11 per cent from £107 per subscriber for the year ended 31 March 2003 to £119 per subscriber for the year ended 31 March 2004. The euro-denominated SAC has remained static for both pre-pay and post-pay connections from 2003 to 2004. The increase in blended SAC is mainly attributable to the strengthening of the euro against the pound sterling from 2003 to 2004 which increases the SAC when translated into pounds sterling for reporting purposes.
Net operating expenses before exceptional items for O2 Ireland have increased by 9 per cent from £356 million for the year ended 31 March 2003 to £389 million for the year ended 31 March 2004.
The principal reason for the increase is the expansion of the business in the 2004 financial year as the total turnover of O2 Ireland has grown by 20 per cent from the 2003 financial year to the 2004 financial year. The effect of the revenue increase was reduced as a result of the continuing cost control measures.
O2 Online’s net operating expenses before exceptional items increased by 4 per cent from £216 million for the year ended 31 March 2003 to £224 million for the year ended 31 March 2004. This reflects the Group’s continued focus on developing mobile data capability while at the same time minimising expenditure prior to the transfer of the trade to O2 UK immediately after the 2004 year end.
Within other operations and central costs, the net operating expenses of our Airwave business have increased by £68 million from 2003 to 2004 as the business has expanded.
The Group’s goodwill amortisation charge relating to continuing operations before the exceptional impairment charge recognised in the 2003 financial year decreased from £340 million in the 2003 financial year to £201 million in the 2004 financial year. This is due to the impairment charge recognised in 2003 which reduced the ongoing annual amortisation charge.
In the year ended 31 March 2004, we incurred an exceptional operating charge of £75 million in respect of the restructuring of central functions and the resultant rationalisation of our property portfolio. This arose on the transfer of O2 Online, Products O2 and certain other central functions to our operating businesses in the UK, Germany and Ireland and includes provisions relating to redundancies and the termination of property leases. The objectives of the reorganisation were to simplify the lines of management, reduce costs and improve speed of execution.
The charge gave rise to a cash outflow of £17 million in the year ended 31 March 2004 and a provision of £54 million remains at the year end in respect of these costs.
41
Back to Contents
We have also recognised a non-operating exceptional charge of £5 million in the 2004 year relating to the completion of the sale of O2 Netherlands. We incurred a total loss of £1,369 million in respect of this disposal compared to a provision for loss on disposal of £1,364 million at 31 March 2003.
In 2003, we recognised an exceptional non-cash charge relating to the impairment of fixed assets in our continuing businesses (being our UK, German and Irish businesses) of £8,300 million.
Full details of the impairment charges and provision recognised in the year ended 31 March 2003 are contained later in this Item 5.A under “Year ended 31 March 2003 compared to the year ended 31 March 2002”.
EBITDA is our earnings before interest, tax, depreciation, amortisation and exceptional items, excluding our share of operating profits and losses of our joint ventures and associates. Our businesses with larger market shares in their countries of operation, O2 UK and O2 Ireland, have generated positive EBITDA over the last three financial years. O2 Germany, a newer business, has historically made negative EBITDA, until the 2003 financial year, during which O2 Germany achieved a positive EBITDA result for the first time and in the 2004 financial year has achieved an EBITDA margin (being the ratio of EBITDA to turnover) of 15 per cent.
The reconciliation of EBITDA to Group operating profit/(loss), the most directly comparable UK GAAP financial measure, by business is as follows:
| | | Group operating
profit/(loss)
| | Depreciation
| | Amortisation
| | Exceptional
items
| | EBITDA
| |
| | | 2004 | | 2003 | | 2004 | | 2003 | | 2004 | | 2003 | | 2004 | | 2003 | | 2004 | | 2003 | |
| | |
|
| |
|
| |
|
| |
|
| |
|
| |
|
| |
|
| |
|
| |
|
| |
|
| |
| | | £m | | £m | | £m | | £m | | £m | | £m | | £m | | £m | | £m | | £m | |
Continuing operations | | | | | | | | | | | | | | | | | | | | | | | | | | | | | | | |
O2 UK | | | 346 | | | (2,116 | ) | | 488 | | | 478 | | | 150 | | | 175 | | | 57 | | | 2,300 | | | 1,041 | | | 837 | |
O2 Germany | | | (72 | ) | | (4,979 | ) | | 295 | | | 259 | | | — | | | 47 | | | 2 | | | 4,700 | | | 225 | | | 27 | |
O2 Ireland | | | 87 | | | (1,331 | ) | | 67 | | | 67 | | | 53 | | | 121 | | | 1 | | | 1,300 | | | 208 | | | 157 | |
O2 Online | | | (93 | ) | | (122 | ) | | 36 | | | 34 | | | 4 | | | 15 | | | 10 | | | — | | | (43 | ) | | (73 | ) |
| Other businesses | | | (109 | ) | | (110 | ) | | 39 | | | 20 | | | 1 | | | — | | | 5 | | | — | | | (64 | ) | | (90 | ) |
| | |
|
| |
|
| |
|
| |
|
| |
|
| |
|
| |
|
| |
|
| |
|
| |
|
| |
| | | | 159 | | | (8,658 | ) | | 925 | | | 858 | | | 208 | | | 358 | | | 75 | | | 8,300 | | | 1,367 | | | 858 | |
Discontinued operations | | | | | | | | | | | | | | | | | | | | | | | | | | | | | | | |
O2 Netherlands | | | (1 | ) | | (120 | ) | | 1 | | | 74 | | | — | | | 47 | | | — | | | — | | | — | | | 1 | |
| | |
|
| |
|
| |
|
| |
|
| |
|
| |
|
| |
|
| |
|
| |
|
| |
|
| |
| | | | 158 | | | (8,778 | ) | | 926 | | | 932 | | | 208 | | | 405 | | | 75 | | | 8,300 | | | 1,367 | | | 859 | |
| | |
|
| |
|
| |
|
| |
|
| |
|
| |
|
| |
|
| |
|
| |
|
| |
|
| |
42
Back to Contents
The following table shows contributions of our businesses to Group EBITDA:
| | | Year ended 31 March
| |
| | | 2004 | | 2003 | |
| | |
|
| |
|
| |
| | | £m | | £m | |
Continuing operations | | | | | | | |
O2 UK | | | 1,041 | | | 837 | |
O2 Germany | | | 225 | | | 27 | |
O2 Ireland | | | 208 | | | 157 | |
O2 Online | | | (43 | ) | | (73 | ) |
| Other operations | | | (64 | ) | | (90 | ) |
| | |
|
| |
|
| |
| | | | 1,367 | | | 858 | |
Discontinued operations | | | | | | | |
O2 Netherlands | | | — | | | 1 | |
| | |
|
| |
|
| |
Total | | | 1,367 | | | 859 | |
| | |
|
| |
|
| |
Group EBITDA from continuing operations has increased by 59 per cent from £858 million for the year ended 31 March 2003 to £1,367 million for the year ended 31 March 2004. The increased EBITDA contribution has come from all the trading operations of the Group.
Total operating profit/(loss) |
We have recorded our first ever total operating profit in the year ended 31 March 2004, of £158 million. This compares with a total operating loss of the Group for the year ended 31 March 2003 of £8,773 million which included the exceptional impairment charge of £8,300 million referred to above. Excluding exceptional items, the total operating loss recorded in 2003 of £473 million reversed to a profit of £233 million in 2004. This can be ascribed to both increased revenues generated by all our businesses arising from the increased number of subscribers and the rise in ARPUs and to the continuing cost control exhibited by our businesses.
Net interest payable relates to the finance charges payable on external debt, net of interest received on amounts invested. In the 2004 financial year we incurred an interest charge totalling £58 million, a decrease of 12 per cent over the 2003 financial year reflecting the decrease in net debt over that period. In the 2004 financial year, the principal elements of our interest charge were the interest on our revolving credit facility amounting to £8 million (2003: £12 million) and the interest accrued, of £62 million (2003: £63 million) on our long-term bonds, which we issued in January 2002. In accordance with UK GAAP, we are amortising the issue costs of our bank facility and our bonds over the lives of the facilities (five and ten years respectively), through the interest line in the profit and loss account. Amortisation of these costs amounted to £4 million in the 2004 financial year (2003: £3 million). We also incur interest charges on the O2 UK loan notes and on our finance leases and other borrowings, and have received interest on our short-term investments. See Item 5.B “Liquidity and capital resources”.
Tax on profit on ordinary activities |
We have recognised a tax credit of £71 million for the year ended 31 March 2004 compared to a credit of £55 million for the year ended 31 March 2003. The increase in the tax credit is principally as a result of the improved financial performance of the Group for the 2004 financial year and the related recognition of certain losses as deferred tax assets. However, overall the Group continues to have a net deferred tax liability.
43
Back to Contents
Year ended 31 March 2003 compared to year ended 31 March 2002 |
The following table shows contributions of our businesses to Group turnover:
| | | Year ended 31 March
| | per cent | |
| | | 2003 | | 2002 | | variation | |
| | |
| |
| |
| |
| | | £m | | £m | | | | |
O2 UK | | | 3,025 | | | 2,756 | | | 10 | |
O2 Germany | | | 1,060 | | | 875 | | | 21 | |
O2 Ireland | | | 442 | | | 395 | | | 12 | |
O2 Netherlands | | | 263 | | | 200 | | | 32 | |
O2 Online | | | 93 | | | 100 | | | (7 | ) |
| Other operations | | | 64 | | | 54 | | | 18 | |
| Intragroup eliminations | | | (73 | ) | | (104 | ) | | (31 | ) |
| | |
|
| |
|
| |
|
| |
Total | | | 4,874 | | | 4,276 | | | 14 | |
| | |
|
| |
|
| |
|
| |
Group turnover increased by 14 per cent from £4,276 million for the year ended 31 March 2002, to £4,874 million for the year ended 31 March 2003. All our mobile telecommunications businesses contributed to the rise in Group turnover. The principal reasons for this were the overall rise in subscriber numbers in the current year and the increased usage of the Group’s services by subscribers. These factors are considered in detail in our business description in Item 4.
O2 UK’s overall turnover increased by nearly 10 per cent from £2,756 million for the year ended 31 March 2002 to £3,025 million for the year ended 31 March 2003. Turnover is largely comprised of service revenue, which increased by 13 per cent from £2,426 million for the year ended 31 March 2002 to £2,738 million for the year ended 31 March 2003.
O2 UK’s total active customer base increased from 11.1 million at 31 March 2002 to 12.1 million at 31 March 2003, an increase of 9 per cent, which includes a net increase in post-pay subscribers of over half a million customers. In addition to this, post-pay churn has continued the downward trend established in the year ended 31 March 2002.
The following table shows a breakdown of O2 UK’s turnover:
| | | Year ended 31 March
| | per cent | |
| | | 2003 | | 2002 | | variation | |
| | |
| |
| |
| |
| | | £m | | £m | | | | |
| Service | | | 2,738 | | | 2,426 | | | 13 | |
| Equipment | | | 190 | | | 136 | | | 40 | |
| Other | | | 97 | | | 194 | | | (50 | ) |
| | |
|
| |
|
| |
|
| |
Total | | | 3,025 | | | 2,756 | | | 10 | |
| | |
|
| |
|
| |
|
| |
Service Service revenue is the principal element of O2 UK’s turnover, comprising 91 per cent of total turnover for the year ended 31 March 2003. O2 UK’s service revenue increased by 13 per cent from £2,426 million for the year ended 31 March 2002 to £2,738 million for the year ended 31 March 2003. Of this, service revenue from post-pay customers is the principal source of income, accounting for over 67 per cent of the total. This represents an increase over the 65 per cent recorded for the year ended 31 March 2002.
O2 UK’s revenue has grown as a result of a combination of an increase in the subscriber base, partly arising from better retention of existing users, and an increase in post-pay ARPU.
44
Back to Contents
Post-pay subscribers’ gross additions for the year ended 31 March 2003 total 1.7 million, taking our total post-pay customer base to 4.1 million (representing 519,000 net additions for the year). The post-pay churn rate has continued the downward trend established in the 2002 financial year. Post-pay churn for the year ended 31 March 2003 was 28 per cent, a fall of 10 per cent from the churn of 31 per cent recorded for the year ended 31 March 2002.
These improvements were driven by the success of the O2 brand, launched in May 2002, and new and innovative product offerings to customers in both voice and mobile data services. An example of these are the “bolt-ons”, our packages offering additional data and voice services to customers, which attracted high-spending users and grew revenues from existing customers rather than incurring SACs.
Data revenues, as a proportion of total service revenues increased steadily through the year from 11.8 per cent for the year ended 31 March 2002 to 17.1 per cent for the year ended 31 March 2003. Data revenue as a proportion of total service revenue for the final quarter of the year ended 31 March 2003 was 19.1 per cent. Included within these statistics, the popularity of text messages continued to grow, with nearly 5.8 billion messages sent during the year ended 31 March 2003, compared with 3.4 billion during the year ended 31 March 2002.
Equipment and other revenues Equipment revenues have increased 40 per cent in the 2003 financial year compared to the 2002 financial year. The principal reason for the rise is the increase in the gross post-pay additions of customers in the year ended 31 March 2003.
O2 UK’s other revenue in the 2002 financial year mainly comprised revenue from Lumina, a service provider acquired in the 2000 financial year, and sales of non-mobile products by the O2 retail shops. Lumina had a customer base which included both O2 UK and Vodafone customers. At the end of the 2002 financial year we sold the Vodafone customers and no longer derive revenue from them. The sales by the O2 shops have also fallen following the rationalisation of the retail chain in the first half of the 2003 calendar year. However, the sales per store of the remaining shops were more than double those of the previous year.
The year ended 31 March 2003 was the second full year of ownership of O2 Germany. The total revenue of O2 Germany for the year ended 31 March 2003 was £1,060 million, an increase of 21 per cent over the year ended 31 March 2002 revenue of £875 million.
The following table details O2 Germany’s revenue split between service and other revenues:
| | | Year ended 31 March
| | per cent | |
| | | 2003 | | 2002 | | variation | |
| | |
| |
| |
| |
| | | £m | | £m | | | | |
| Service | | | 944 | | | 696 | | | 36 | |
| Equipment | | | 94 | | | 127 | | | (26 | ) |
| Other | | | 22 | | | 52 | | | (58 | ) |
| | |
|
| |
|
| |
|
| |
Total | | | 1,060 | | | 875 | | | 21 | |
| | |
|
| |
|
| |
|
| |
Service O2 Germany’s service revenue for the year ended 31 March 2003 increased by 36 per cent compared to the previous year.
This increase in revenues was principally the result of a significant increase in the subscriber base, which rose from 3.9 million active subscribers at 31 March 2002, to 4.8 million active subscribers at 31 March 2003. Post-pay customer additions in the year ended 31 March 2002 were 651,000, representing 71 per cent of total net additions. The pre-pay customer base increased by 14 per cent from the 2002 financial year to the 2003 financial year, with pre-pay customers totalling 2.2 million at 31 March 2003.
A large proportion of the post-pay additions during the year related to customers who subscribed to the Genion HomeZone service, our location-based tariffing technology, which allows reduced call rates within the home
45
Back to Contents
zone. O2 Germany also offers an equivalent service to business customers. Both Genion Home and Business are part of our drive across the Group to attract high-value customers.
Post-pay ARPU has increased from £313 for the year ended 31 March 2002, to £341 for the year ended 31 March 2003. This rise is a function of the continuing drive to win higher spending customers. At 31 March 2003, over 30 per cent of the total customer base subscribed to the Genion service.
O2 Germany continued to launch new data services during the 2003 financial year, following the launch of the first operational German GPRS network in January 2001. New services announced in the year ended 31 March 2003 included multimedia messaging and Java games. In addition, SMS messaging continued to gain in popularity. This was reflected in the increase in the proportion of data revenues compared to total service revenues which have risen to 19.3 per cent during the year ended 31 March 2003. The proportion for the three months ended 31 March 2003 reached a record 21.0 per cent. The principal element of data revenue was generated by text messages; O2 Germany recorded 1,337 million text messages in the year ended 31 March 2003, an increase of 564 million messages over last year.
Equipment and other revenues Both equipment and other revenues fell by 26 per cent and 56 per cent respectively compared to the prior year.
The fall in equipment revenues was caused by a decline in the sales of devices to shops and third-party dealers in the 2002 financial year which have not been repeated in the 2003 financial year. Other revenues represented several other revenue streams. These include certain support contracts with BT Ignite following the demerger from BT which were reaching the end of their term.
Other mobile telecommunication businesses |
The Group had two other mobile telecommunication businesses in Europe during the year ended 31 March 2003 – O2 Ireland and O2 Netherlands.
O2 Ireland’s revenue increased by 12 per cent from £395 million for the year ended 31 March 2002, to £442 million for the year ended 31 March 2003. This increase in revenue was a combination of an increase of 75,000 in the customer base and a 7 per cent rise in blended ARPU. Contract customer numbers increased from 356,000 at 31 March 2002 to 366,000 active subscribers at 31 March 2003 and the pre-pay customers bases increased from 824,000 at 31 March 2002 to 889,000 at 31 March 2003.
O2 Netherlands’ revenue increased by 32 per cent from £200 million for the year ended 31 March 2002, to £263 million for the year ended 31 March 2003.
O2 Online acts as the online sales channel in the UK and Ireland and as the developer of all of the Group’s mobile data capability. O2 Online increased external revenues by 15 per cent from £33 million in the year ended 31 March 2002 to £38 million in the year ended 31 March 2003. Approximately 60 per cent of revenues in the year ended 31 March 2003, down from 66 per cent in the year ended 31 March 2002, were generated internally. Internal revenue is generated mainly from connection fees and airtime voucher sales as well as the provision of WAP gateway and portal services to other Group companies.
Net operating expenses before exceptional items |
Net operating expenses before exceptional items comprises cost of sales and administrative expenses. Net operating expenses increased by 7 per cent from £4,982 million for the year ended 31 March 2002 to £5,352 million for the 2003 financial year. This increase arose from an increase in the cost of sales in the current year reflecting the increase in turnover described earlier.
Group cost of sales increased by 13 per cent from £2,714 million for the year ended 31 March 2002, to £3,060 million for the year ended 31 March 2003. This increase in cost of sales in the 2003 financial year was commensurate with the increase in Group turnover of 14 per cent.
46
Back to Contents
The gross margin percentage (gross profit divided by turnover) of our newer business in Germany was lower than those of our more established businesses in the UK and Ireland. This is because O2 Germany is in the process of building its customer base. Despite this, O2 Germany increased its gross margin by 16 percentage points to 28 per cent. However, the gross profit margin of the Group remained constant at 37 per cent as both O2 Online and O2 Airwave contributed a higher cost of sales. This was due to the increase in activity at both operations.
Group administrative expenses before exceptional items |
Group administrative expenses before exceptional items increased by 1 per cent from £2,268 million for the year ended 31 March 2002 to £2,292 million for the year ended 31 March 2003. Administrative expenses did not grow in line with the rise in revenues following the restructuring at the UK and German operations initiated in February 2002 which have realised cost savings.
Group administrative expenses before exceptional items, as a percentage of turnover, decreased from 53 per cent in the 2002 financial year to 47 per cent in the year ended 31 March 2003.
O2 Germany had a higher ratio of administrative expenses as a percentage of turnover than those of our more established businesses, because it is still building its customer base. As the business of O2 Germany matures, we expect that the ratio will fall and for O2 Germany for the year ended 31 March 2003, it has fallen by 7 percentage points compared to the year ended 31 March 2002.
An analysis of the net operating expenses before exceptional items, between the operating companies is provided in the table below:
| | | Year ended 31 March
| | per cent | |
| | | 2003 | | 2002 | | variation | |
| | |
| |
| |
| |
| | | £m | | £m | | | | |
O2 UK | | | 2,691 | | | 2,458 | | | 9 | |
O2 Germany | | | 1,295 | | | 1,275 | | | 2 | |
| Other mobile telecommunication businesses | | | 705 | | | 655 | | | 8 | |
O2 Online | | | 216 | | | 194 | | | 11 | |
| Goodwill amortisation | | | 374 | | | 369 | | | 1 | |
| Other operations and central costs | | | 71 | | | 31 | | | 129 | |
| | |
|
| |
|
| |
|
| |
Total | | | 5,352 | | | 4,982 | | | 7 | |
| | |
|
| |
|
| |
|
| |
O2 UK’s net operating expenses before exceptional items increased by 9 per cent, from £2,458 million for the year ended 31 March 2002 to £2,691 million for the year ended 31 March 2003. Net operating expenses as a percentage of turnover remained constant at 89 per cent for the two financial years under review.
The variable element of O2 UK’s service cost of sales increased in line with the network usage. Interconnection charges increased significantly during the financial year 2003, compared to the year ended 31 March 2002, reflecting increased calls from O2 UK customers terminating on other networks, including other mobile networks whose termination charges were generally higher than charges levied by fixed-line network providers.
O2 UK’s depreciation charge increased from £372 million in the year ended 31 March 2002 to £477 million in the year ended 31 March 2003, which reflects the continued investment in improving O2 UK’s network quality and the shortening of the useful economic life of certain network assets which were being swapped out of the network.
The advertising and marketing spend for the year ended 31 March 2003 increased by 9 per cent on the 2002 financial year. This arose from an overall increase in subscriber acquisition costs resulting from the increased level of connections in the business in the 2003 financial year. The overall rise in SACs contrasts with a decrease in both the pre-pay and post-pay average subscriber acquisition costs. Post-pay SACs decreased from £180 to £177 per subscriber, and prepay SACs decreased from £53 to £25 per subscriber.
47
Back to Contents
Compared to the year ended 31 March 2002, O2 UK’s overheads decreased by 4 per cent for the year ended 31 March 2003, which, despite the increased turnover and concentration on improving customer service, reflected the cost control measures during the year and the cost savings derived from the restructuring of the business announced in February 2002.
O2 Germany’s net operating expenses before exceptional items increased from £1,275 million for the year ended 31 March 2002, to £1,295 million for the year ended 31 March 2003.
Net operating expenses as a percentage of turnover was 146 per cent for the 2002 financial year and for the 2003 financial year decreased to 122 per cent. This reflected the rapid growth in revenues at O2 Germany.
The total depreciation charge (both network and non-network fixed assets) was £259 million for the year ended 31 March 2003, a 14 per cent increase over the charge for the year ended 31 March 2002 of £228 million. This represented the continuing investment by O2 Germany in their network.
Blended subscriber acquisition costs increased by 13 per cent from £95 per subscriber for the year ended 31 March 2002 to £107 per subscriber for the year ended 31 March 2003. This reflected the very high level of contract customer connections in the year, with over 70 per cent of net additions being post-pay customers who traditionally have required a higher SAC to attract. Despite this, the SAC per customer for post-pay subscribers remained almost constant year on year.
Other mobile telecommunication businesses |
Net operating expenses before exceptional items for our other mobile telecommunication businesses, O2 Netherlands and O2 Ireland, increased by 8 per cent from £655 million for the year ended 31 March 2002, to £705 million for the year ended 31 March 2003.
The principal reason for the increase was the expansion of the businesses in the 2003 financial year; the total turnover of O2 Ireland and O2 Netherlands grew by 18 per cent from the 2002 financial year to the 2003 financial year.
O2 Ireland’s net operating costs before exceptional items have increased by 6 per cent from £337 million in the year ended 31 March 2002 to £356 million in the year ended 31 March 2003, reflecting the effect of the 12 per cent increase in service revenue during the 2003 financial year compared to the 2002 financial year. The effect of the revenue increase was reduced as a result of the implementation of cost control measures.
O2 Online’s net operating expenses before exceptional items increased by 11 per cent from £194 million for the year ended 31 March 2002 to £216 million for the year ended 31 March 2003. This reflected the Group’s continued focus on developing mobile data capability. The ratio of net operating expenses to external turnover at O2 Online in 2003 remained similar to the ratio in 2002.
The goodwill amortisation charge before the exceptional impairment charge, included in the Group’s results increased marginally from £369 million in the year ended 31 March 2002 to £374 million in the year ended 31 March 2003. Goodwill relating to our overseas businesses was held as a foreign currency denominated asset. The fall of almost 4 per cent in the average Euro to Sterling exchange rate for the year between the 2002 financial year and 2003 financial year increased the goodwill amortisation charge recognised in our reporting currency, Sterling.
In accordance with FRS 11 “Impairment of fixed assets and goodwill” we regularly monitor the carrying values of our fixed assets.
48
Back to Contents
During the second half of the year ended 31 March 2003 certain events, including our strategic review of the Dutch market which led to the announcement of the disposal of O2 Netherlands, indicated that we should perform impairment reviews of our four principal operations; the mobile telecommunications operations in the UK, Germany, Ireland and the Netherlands.
In April 2003, we announced the sale of O2 Netherlands resulting in an accounting loss of approximately £1.4 billion, which provided an indication that the valuation of mobile businesses might be lower than previously estimated. Additionally, following the Competition Commission’s report on mobile termination charges, we announced that we were reviewing the launch dates of our 3G services and would adopt a more prudent timetable where local regulatory requirements permitted. This revision in the timetable, together with the current absence of evidence as to the present mass market appeal of 3G services and the limited availability of 2G/3G compatible handsets, led us to review and revise the business plans of our mobile operations across our European footprint.
As a result of the above events, the carrying value of the fixed assets of each of our principal income generating units (IGUs), being O2 UK, O2 Germany, O2 Ireland and O2 Netherlands, were compared to their respective recoverable amounts.
The announced disposal of O2 Netherlands led to the carrying value of the net assets of the Dutch IGU being written down to their recoverable amount, which in this case was the sale proceeds less direct costs of disposal. This resulted in an exceptional impairment charge of £1,364 million being recognised in the profit and loss account below Group operating loss.
With respect to the IGUs that are held for continuing use within the Group (being O2 UK, O2 Germany and O2 Ireland), the carrying values of their fixed assets were compared to their value in use to the Group. The value in use of each IGU was calculated with reference to the net present value of its future cash flows derived from the assets, using cash flow projections for the period up to 31 March 2013. These projections cover a ten-year period, as we believe that throughout this ten-year period, the annual growth rate of the IGUs being assessed will differ from the average growth rates for the countries concerned. For the periods beyond 1 April 2013, the projections use a long-term growth rate assumed to be at or below the nominal GDP of the country concerned. The discount rates applied to the projections were based on the post-tax weighted average cost of capital for the Group. The effective pre-tax discount rate for each of our territories ranged between 10.4 per cent and 12.5 per cent.
The impairment review performed during the year ended 31 March 2003 revealed that the fixed assets of each of the IGUs held for continuing use within the Group were impaired, resulting in an exceptional impairment charge of £8,300 million included within operating expenses.
49
Back to Contents
The total exceptional impairment charges in the year ended 31 March 2003 are analysed below:
| | | | | Licences, | | | | | | | |
| | | | | other | | | | | | | |
| | | | | intangible | | | | | | | |
| | | | | assets and | | Tangible | | | | |
| | | Goodwill | | investments | | assets | | Total | |
| | |
|
| |
|
| |
|
| |
|
| |
| | | £m | | £m | | £m | | £m | |
Operating exceptional items: | | | | | | | | | | | | | |
O2 UK | | | 198 | | | 2,102 | | | — | | | 2,300 | |
O2 Germany | | | 903 | | | 3,797 | | | — | | | 4,700 | |
O2 Ireland | | | 1,300 | | | — | | | — | | | 1,300 | |
| | |
|
| |
|
| |
|
| |
|
| |
| | | | 2,401 | | | 5,899 | | | — | | | 8,300 | |
Non-operating exceptional items: | | | | | | | | | | | | | |
O2 Netherlands | | | 649 | | | 423 | | | 292 | | | 1,364 | |
| | |
|
| |
|
| |
|
| |
|
| |
| | | | 3,050 | | | 6,322 | | | 292 | | | 9,664 | |
| | |
|
| |
|
| |
|
| |
|
| |
The carrying value of the Group’s goodwill and licences after the impairment charges were £3,418 million and £4,164 million respectively.
The impairment charge relating to goodwill includes £47 million in respect of goodwill arising on acquisitions prior to 1 April 1998 which has been written off directly to reserves. This goodwill has been reinstated and written off through the profit and loss account.
In calculating the value in use there is considerable uncertainty as to the present value of the future cash flows. In assessing the future cash flows, assumptions have been made using the best estimates available at the time of performing the impairment review. These estimates include those used to reflect the growth rates up to 2013, the long-term growth rates beyond 2013, the discount rate, the competitive landscape, the take up and charge rate of data services and the availability of functioning technological infrastructure to support the 3G roll-out. The actual outcome is uncertain and these estimates may change over time as subsequent changes in the mobile telecommunications industry, including advances in technology, changes in the performance of our businesses as a result of competitive pressure or otherwise, or potential difficulty in the implementation of the UMTS network, may in the future shorten the estimated useful lives or result in a further write-down of these assets.
Exceptional items for the year ended 31 March 2002 amounted to £150 million. These related to the costs arising as a result of the demerger of the Group from BT in November 2001, and costs relating to the reorganisation of the Group subsequent to the demerger. We incurred exceptional costs of £27 million which were directly attributable to the demerger of the Group from BT. The remaining £123 million of exceptional items relate to the restructuring of our UK and German operations post demerger, of which £87 million was in respect of redundancy costs.
50
Back to Contents
The reconciliation of EBITDA to Group operating (loss)/profit, the most directly comparable UK GAAP financial measure, by business is as follows:
| | | Group operating
(loss)/profit
| | Depreciation
| | Amortisation
| | Exceptional
items
| | EBITDA
| |
| | | 2003 | | 2002 | | 2003 | | 2002 | | 2003 | | 2002 | | 2003 | | 2002 | | 2003 | | 2002 | |
| | |
| |
| |
| |
| |
| |
| |
| |
| |
| |
| |
| | | £m | | £m | | £m | | £m | | £m | | £m | | £m | | £m | | £m | | £m | |
O2 UK | | (2,116 | ) | 36 | | 478 | | 372 | | 175 | | 176 | | 2,300 | | 86 | | 837 | | 670 | |
O2 Germany | | (4,979 | ) | (472 | ) | 259 | | 228 | | 47 | | 49 | | 4,700 | | 29 | | 27 | | (166 | ) |
O2 Ireland | | (1,331 | ) | (57 | ) | 67 | | 61 | | 121 | | 118 | | 1,300 | | — | | 157 | | 122 | |
O2 Netherlands | | (120 | ) | (164 | ) | 74 | | 57 | | 47 | | 44 | | — | | 12 | | 1 | | (51 | ) |
O2 Online | | (122 | ) | (103 | ) | 34 | | 20 | | 15 | | 5 | | — | | 10 | | (73 | ) | (68 | ) |
| Other businesses | | (110 | ) | (96 | ) | 20 | | 9 | | — | | — | | — | | 13 | | (90 | ) | (74 | ) |
| | |
| |
| |
| |
| |
| |
| |
| |
| |
| |
| |
| | | (8,778 | ) | (856 | ) | 932 | | 747 | | 405 | | 392 | | 8,300 | | 150 | | 859 | | 433 | |
| | |
| |
| |
| |
| |
| |
| |
| |
| |
| |
| |
EBITDA is our earnings before interest, tax, depreciation, amortisation and exceptional items, excluding our share of operating profits and losses of our joint ventures and associates.
Our businesses with larger market shares in their countries of operation, O2 UK and O2 Ireland, have generated positive EBITDA over the last three financial years. O2 Germany, a newer business, has historically made EBITDA losses until the 2003 financial year, during which O2 Germany has achieved a positive EBITDA result for the first time. The following table shows contributions of our businesses to Group EBITDA.
| | | Year ended 31 March
| |
| | | 2003 | | 2002 | |
| | |
|
| |
|
| |
| | | £m | | £m | |
O2 UK | | | 837 | | | 670 | |
O2 Germany | | | 27 | | | (166 | ) |
O2 Ireland | | | 157 | | | 122 | |
O2 Netherlands | | | 1 | | | (51 | ) |
O2 Online | | | (73 | ) | | (68 | ) |
| Other operations | | | (90 | ) | | (74 | ) |
| | |
|
| |
|
| |
Total | | | 859 | | | 433 | |
| | |
|
| |
|
| |
Group EBITDA increased by 98 per cent from £433 million for the year ended 31 March 2002 to £859 million for the year ended 31 March 2003. The increased EBITDA contribution came from all four mobile telecommunication businesses in the Group.
The total operating loss of the Group increased significantly from a loss of £848 million for the year ended 31 March 2002 to a loss of £8,773 million for the year ended 31 March 2003. This included the exceptional impairment charge of £8,300 referred to earlier. The total operating loss excluding exceptional items decreased by 44 per cent from a loss of £848 million for the year ended 31 March 2002 to £473 million for the year ended 31 March 2003. This fall in total operating loss before exceptional items can be ascribed to both the increased revenues generated by all our businesses arising from the increased number of subscribers and the rise in ARPUs and to the cost reduction measures implemented in 2002 after demerger by O2 UK and O2 Germany.
Net interest payable principally relates to notional interest charged on the notional loans due to BT which were settled on demerger, and to the finance charges payable on external debt net of interest received on amounts invested. In the 2003 financial year, the principal elements of our interest charge were the interest on our
51
Back to Contents
revolving credit facility amounting to £12 million, and the interest accrued on our long-term bonds, which we issued in January 2002, of £63 million. In accordance with UK GAAP, we are amortising the issue costs of our bank facility and our bonds over the lives of the facilities (five and ten years respectively), through the interest line in the profit and loss account. Amortisation of these costs amounted to £3 million in the 2003 financial year. We also have interest payable in relation to the O2 UK loan notes and interest on our finance leases and other borrowings, and have received interest on our short-term investments. Prior to demerger, we were principally funded by BT in a combination of equity and notional loans. For the purpose of these financial statements, a portion of BT’s short- and long-term loans has been allocated to the Group for the periods up to 19 November 2001, the date of demerger from BT. Notional interest of £756 million for the year ended 31 March 2002 was charged on these BT loans. As part of the demerger transaction, a large portion of these loans were capitalised so that at 19 November 2001, the date we demerged from BT, we had net debt of £506 million. For the year ended 31 March 2002, the Group’s net interest charge, excluding the notional interest on the BT loans, was £25 million. In the 2002 financial year, the principal elements of our interest charge, excluding the BT loans, were the interest on our revolving credit facility amounting to £6 million, and the interest accrued on our long-term bonds, which we issued in January 2002, of £12 million. In accordance with UK GAAP, we are amortising the issue costs of our bank facility and our bonds over the lives of the facilities (five and ten years respectively) through the interest line in the profit and loss account. Amortisation of these costs amounted to £4 million in the 2002 financial year.
Tax on loss on ordinary activities |
The Group had a tax credit of £55 million for the year ended 31 March 2003 compared to a credit of £250 million for the year ended 31 March 2002. The decrease in the tax credit is principally as a result of the notional BT interest charge in 2002 on the allocated loans from BT existing pre-demerger. With the exception of Manx Telecom and O2 Ireland, we do not anticipate incurring a tax charge next year. We expect to pay tax on the profits of Manx Telecom and O2 Ireland earned in this period.
| B. | Liquidity and capital resources |
The following table sets forth our cash flows for the years ended 31 March 2004, 2003 and 2002 extracted without adjustment from our consolidated financial statements.
| | | 2004 | | 2003 | | 2002 | |
| | |
|
| |
|
| |
|
| |
| | | £m | | £m | | £m | |
| Net cash inflow from operating activities | | | 1,391 | | | 1,033 | | | 457 | |
| Returns on investments and servicing of finance | | | (62 | ) | | (63 | ) | | (9 | ) |
| Tax paid | | | (13 | ) | | (4 | ) | | (4 | ) |
| Net cash outflow from capital expenditure and financial investment | | | (1,114 | ) | | (868 | ) | | (1,231 | ) |
| Acquisitions and disposals | | | (6 | ) | | — | | | (864 | ) |
| | |
|
| |
|
| |
|
| |
| Cash inflow/(outflow) before management of liquid resources and financing | | | 196 | | | 98 | | | (1,651 | ) |
| Management of liquid resources | | | (191 | ) | | (3 | ) | | (459 | ) |
| Net cash (outflow)/inflow from financing | | | (50 | ) | | (47 | ) | | 1,790 | |
| | |
|
| |
|
| |
|
| |
| (Decrease)/increase in cash in the year | | | (45 | ) | | 48 | | | (320 | ) |
| | |
|
| |
|
| |
|
| |
| |
Net cash inflow from operating activities |
Our operating activities provided cash of £1,391 million, £1,033 million and £457 million during the three years ended 31 March 2004, 2003 and 2002 respectively. Our Group operating profit of £158 million, loss of £8,778 million and loss of £856 million in each of the years were offset by significant non-cash depreciation and amortisation charges totalling £1,136 million, £9,637 million (including in 2004 exceptional depreciation of £2 million and in 2003 the exceptional impairment charge of £8,300 million) and £1,139 million respectively.
Returns on investment and servicing of finance |
Net cash outflows for servicing of finance in the 2004 and 2003 financial years have increased compared to the 2002 financial year as prior to our demerger in November 2001 we were funded by interest free loans from BT. In
52
<<<Back to Contents
the year ended 31 March 2002 we incurred interest on external funding for four months after demerger whereas in the years ended 31 March 2003 and 31 March 2004 we incurred a full year’s charge. The servicing of finance cash outflow for the year ended 31 March 2004 consisted mainly of net interest payable of £62 million (2003: £66 million) on our loans. This can be analysed as £6 million interest paid on our revolving credit facility (2003: £13 million, 2002: £6 million) and interest paid on our long-term bonds of £62 million (2003: £64 million, 2002: £8 million). Offset against this as part of the management of our liquid resources, we have invested surplus cash in various short-term investments, on which we have received approximately £16 million (2003: £14 million, 2002: £5 million) in interest.
The total tax paid for the Group in the years ended 31 March 2004 was £13 million, an increase over 2003 and 2002 during which the Group paid £4 million each year.
Net cash outflow from capital expenditure and financial investment |
Cash outflow in respect of capital expenditure for the 2004 financial year was £1,114 million, an increase of 28 per cent over the equivalent outflow of £868 million for the 2003 financial year. The increase at O2 UK and O2 Germany is a consequence of the ongoing spend on rolling out our planned UMTS networks, which accounted for 35 per cent of capital expenditure at O2 Germany in the year ended 31 March 2004. Around 25 per cent of capital expenditure by O2 UK in the 2004 financial year related to investment in new customer care systems.
Our Airwave business also increased capital expenditure in the current year as the roll-out of its new secure network has accelerated.
Capital expenditure in the year ended 31 March 2002 of £1,231 million related mainly to tangible fixed asset purchases across our footprint in respect of network expansion and improvement.
Across the Group, there are generally timing differences between the recognition of a new fixed asset in our financial statements, and the cash payment, because we are often able to secure delayed non-interest bearing payment terms with our capital suppliers. The following table presents the capital additions recognised for each of the years in the three-year period ended 31 March 2004:
| | | 2004 | | 2003 | | 2002 | |
| | |
|
| |
|
| |
|
| |
| | | £m | | £m | | £m | |
Continuing operations | | | | | | | | | | |
O2 UK | | | 502 | | | 362 | | | 556 | |
O2 Germany | | | 308 | | | 141 | | | 250 | |
O2 Ireland | | | 52 | | | 59 | | | 85 | |
O2 Online | | | 14 | | | 21 | | | 59 | |
O2 Airwave | | | 243 | | | 163 | | | 90 | |
| Other operations | | | 11 | | | 8 | | | 5 | |
| UMTS licences and other intangible assets | | | 83 | | | 131 | | | — | |
| | |
|
| |
|
| |
|
| |
| | | | 1,213 | | | 885 | | | 1,045 | |
Discontinued operations | | | | | | | | | | |
O2 Netherlands | | | 5 | | | 59 | | | 97 | |
| | |
|
| |
|
| |
|
| |
Total | | | 1,218 | | | 944 | | | 1,142 | |
| | |
|
| |
|
| |
|
| |
Total capital expenditure by continuing operations, excluding O2 Netherlands, for the year ended 31 March 2004 has increased by 37 per cent to £1,213 million from £885 million for the year ended 31 March 2003. Capital expenditure also included the second payment in respect of the network sharing agreement in Germany, of £83 million. In the 2003 financial year the Group purchased a UMTS licence in Ireland for £73 million.
We expect to incur significant capital expenditure in the medium term a material portion of which relates to the roll-out of our UMTS networks. We expect to fund our future capital spend from our bank facilities and long-
53
Back to Contents
term bonds described below, and from net cash flows from operations. The Group will maintain tight control of its investment programme, and in particular will aim to match the timing and quantum of capital expenditure on our UMTS network roll-out with the emerging demand for mobile data services.
Acquisitions and disposals |
During the year ended 31 March 2004, we sold O2 Netherlands for €25 million. The sale proceeds, net of cash disposed with O2Netherlands, were £7 million. In 2004 we also invested a combination of loan notes and partly-paid equity totalling £6 million in Tesco Mobile Limited, our joint venture with Tesco plc. Cash outflow from acquisitions in the year ended 31 March 2002 was £864 million which related to the acquisition in April 2001 of the remaining 49.5 per cent interest in O2 Ireland, including deferred payments owing, for a total consideration of £877 million. All deferred consideration had been paid by 31 March 2004.
During the year ended 31 March 2004, we incurred a cash outflow from financing of £50 million. This was principally in relation to loan repayments of £53 million. We also issued shares vesting under various option and award schemes which realised a cash inflow of £3 million. The cash outflow in the year ended 31 March 2003 was £47 million being mainly the redemption of O2 UK loan notes during the first half of the 2003 financial year. During the year ended 31 March 2002, our cash inflow from financing was £1,790 million. This cash inflow comprises cash inflow prior to our demerger from BT on 19 November 2001, and financing cash inflow post demerger. Pre demerger, we received net funds from BT amounting to £847 million. In January 2002, we received £989 million in respect of our Euro medium-term bond issue. We repaid £74 million of our O2 UK loan notes. Our financing activities are described further below.
Sources of liquidity and capital resources |
Prior to demerger our principal sources of liquidity were funding from BT and cash from operating activities. Since demerger our principal sources of liquidity are cash from operating activities, bank financing and bond financing described below.
Upon demerger from BT, we had net debt of £506 million, of which approximately £444 million, net of cash remaining in our Group, was owed to BT. This debt to BT was refinanced shortly after completion of the demerger out of the financing arrangements described below.
Total gross debt at 31 March 2004 amounted to £1,382 million (2003: £1,465 million, 2002: £1,496 million), including the O2 UK hire purchase obligations (the QTE leases), the obligations of which are fully offset by cash deposits held in trust. Net debt was £366 million (2003: £549 million, 2002: £617 million). Included in the total gross debt are €1,000 million and £375 million of eurobonds issued in January 2002 which have a five year and ten year term, respectively. Loan notes outstanding in aggregate amounted to £8 million (2003: £19 million), redeemable at any time at the option of the holder.
As at 31 March 2004, bank facilities totalled £1,825 million. These comprise a syndicated facility totalling £1,725 million and a bilateral facility totalling £100 million, both with a final maturity date of 14 September 2006. During the year, £150 million of the syndicated facility was cancelled. As at 31 March 2004, both the syndicated and bilateral facilities were un-drawn.
Interest on loans drawn under the bank facilities is calculated at a margin above LIBOR (or in the case of Euro advances, EURIBOR) from time to time. The margin varies according to the long-term credit rating assigned to mmO2 plc by major credit rating agencies but is subject to a maximum of 1.50 per cent. As at 31 March 2004 all bank facilities bear a margin of below 1 per cent.
Interest on our eurobonds is at a fixed rate at 6.375 per cent per annum and 7.625 per cent per annum on the Euro and the Sterling bond issues, respectively. Interest on the €1,000 million bond issue has been swapped to floating rate. Interest on €500 million is calculated at a margin above Sterling LIBOR, having been swapped from Euro into Sterling and interest on the other €500 million is calculated at a margin above EURIBOR.
54
Back to Contents
Treasury management and policies |
Group Treasury (Treasury) operates as a centralised service for the Group. The role of Treasury is to identify, monitor and manage financial risk within the framework of Board approved policies and delegated authorities. Treasury is not permitted to add to the financial risks inherent in the business and may not undertake speculative activity.
The principal financial risks of the Group are identified below.
It is our current policy to fully fund our business plan by access to the debt capital markets and other sources of funding. Borrowing is centralised and there are no material local facilities. The Group is committed to maintaining the key financial ratios as set out in the covenants relating to the multi-currency revolving credit facility, of Group EBITDA to interest and net debt to Group EBITDA. As at 31 March 2004, we were in compliance with these financial covenants. Our actual ratios were Group EBITDA to interest of 23.6 times (2003: 13.0 times, 2002: 17.3 times) and net debt of 0.3 times Group EBITDA (2003: 0.6 times, 2002: 1.4 times). As at 31 March 2004, the Group’s projected funding requirements were fully funded through a combination of bonds issued under the Group’s bond financing programme (£375 million and €1,000 million) and committed bank facilities (£1,825 million).
Foreign exchange management |
The policy of the Group is to hedge (primarily by the use of foreign currency forward contracts) identified foreign exchange flows, although the current level of transaction risk exposure is low due to the fact that cash flows are primarily domestic in each Group company. The policy of the Group regarding foreign exchange translation risk is to manage material risk on the translation of foreign currency assets and liabilities into pounds sterling primarily through natural offsets and the use of currency debt, cross-currency and foreign exchange swaps. At 31 March 2004, the majority of net debt was denominated in pounds sterling after taking account of the effect of derivative instruments. In line with the development of positive cash flows in our oveseas businesses and as visibility of the future financial profile of our Group becomes clearer, we anticipate increasing the level of hedging of our overseas assets through the redenomination of existing debt and the use of cross-currency and foreign exchange swaps.
The debt level within the Group is a key determinant of the impact of interest rates. It is current policy to fix or protect expected interest flows where Group profits or key financial ratios would be materially at risk from interest rate movements. Treasury maintains the proportion of fixed rate debt within a Board approved range of 25 to 75 per cent by the issuance of fixed rate debt and the use of derivative instruments (primarily interest rate swaps). As at 31 March 2004, and after taking into account the effect of derivative instruments, 39 per cent (2003: 36 per cent, 2002: 34 per cent) of gross borrowings (excluding the QTE lease which is fully defeased) were fixed for a period of at least three years (2003: three years, 2002: three years). Based on the net debt as at 31 March 2004, a one per cent rise in market interest rates would increase debt costs which would be broadly offset by investment deposit returns. The effect on the Group’s profit before tax would therefore be insignificant (2003: adverse effect £7 million, 2002: adverse effect £2 million).
It is our current policy to mitigate credit risk to our financial counter-parties through the application of strict counter-party limits. Counter-party limits are based on credit ratings issued by the main credit rating agencies and outstanding transactions are weighted according to potential risk to the Group. Counter-party limits are reviewed on a regular basis by Treasury.
| C. | Research and development, patents and licences |
We have not engaged in any significant research and development activities during any of the last three financial years.
55
Back to Contents
At O2 UK, in a highly competitive market, we expect service revenue growth of between 5 and 8 per cent, reflecting the continuing momentum generated by the strong customer growth in the year ended 31 March 2004, partially offset by the substantial cut in termination revenue expected to be incurred.
The EBITDA margin, reported on the same basis as the 2004 year, is expected to remain stable. The margin actually reported for the 2005 year will reflect the transfer to O2 UK of a substantial part of the O2 Online and Products O2 functions, partially offset by the efficiencies achieved as a result of the restructuring programme completed in the second half of the 2004 year.
At O2 Germany, we expect to deliver further strong service revenue growth, and achieve an EBITDA margin for the full year to 31 March 2005 rising to the high teens per cent, and reflecting further rapid growth of the customer base, UMTS network running costs, and the continuing cost of national roaming.
We expect the Group to incur capital expenditure slightly higher than in the 2004 year. An increase in UMTS investment in the UK is expected to be partially offset by reduced UMTS capital expenditure in Germany. O2 Airwave capital expenditure is expected to be similar to that incurred in the 2004 year.
We expect to launch competitive commercial services on our UMTS platform later in 2004, having achieved the level of UMTS network coverage and quality required across all our markets, to enable delivery of a superior customer service experience. We do not expect UMTS services to become a mass market, generating material revenue, until late 2005.
At the time of the demerger we expected that all available cash from operations would be used to finance the development and growth of the operating businesses and to meet capital and other expenditure requirements. We did not anticipate paying dividends in the foreseeable future. Having reported, for the first time, positive earnings per share and positive cash flow for the full year, and as visibility of the future financial profile of the Group becomes clearer, it is now appropriate to review the distribution policy established at the time of demerger. This review will be undertaken during the first half of the financial year to 31 March 2005, and we will aim to update the distribution policy at the time of our Interim Results announcement, scheduled for November 2004.
| E. | Off balance sheet arrangements |
We do not participate in, or secure financing for, any unconsolidated special purpose entities.
| F. | Tabular Disclosure of Contractual Obligations |
The Group’s contractual obligations, including commitments for future payments under hire purchase contracts, and long- and short-term debt arrangements are summarised in the table below. Details of these obligations are fully disclosed in notes 13, 14, 15 and 22 of the Group’s financial statements in Item 18.
| | | Payments due by period | |
| | |
| |
| | | | | Less than | | 1 to 3 | | 3 to 5 | | After | |
Future commitments | | Total | | 1 year | | years | | years | | 5 years | |
| |
|
| |
|
| |
|
| |
|
| |
|
| |
| | | £m | | £m | | £m | | £m | | £m | |
| Debentures | | | 1,012 | | | — | | | — | | | 639 | | | 373 | |
| Gross obligations under finance leases and hire purchase contracts | | | 325 | | | 39 | | | 59 | | | 58 | | | 169 | |
| Loan notes | | | 8 | | | 8 | | | — | | | — | | | — | |
| Other loans and borrowings | | | 37 | | | 6 | | | 14 | | | 17 | | | — | |
| Other creditors | | | 47 | | | — | | | 3 | | | 5 | | | 39 | |
| Operating lease commitments not provided in the accounts | | | 1,847 | | | 194 | | | 185 | | | 487 | | | 981 | |
| Other commitments not provided in the accounts | | | 466 | | | 381 | | | 28 | | | 57 | | | — | |
| | |
|
| |
|
| |
|
| |
|
| |
|
| |
Total | | | 3,742 | | | 628 | | | 289 | | | 1,263 | | | 1,562 | |
| | |
|
| |
|
| |
|
| |
|
| |
|
| |
56
Back to Contents
Our consolidated financial statements are prepared up to the date of demerger from BT on a carve-out basis in accordance with UK GAAP, which differs in certain respects from US GAAP. A detailed description of the principal differences between UK GAAP and US GAAP as they relate to us and a reconciliation to US GAAP of net profit/(loss) and shareholders’ funds is given in Note 31 to the financial statements in Item 18.
Our results determined in accordance with US GAAP for the three years ended 31 March 2004 were 2004, a net profit of £180 million, 2003, a net loss of £3,671 million and 2002, a net loss of £1,463 million compared with our result determined under UK GAAP of a net profit of £166 million, a net loss of £10,148 million and a net loss of £1,379 million, respectively. The principal differences affecting the determination of net profit under US GAAP for the year ended 31 March 2004 are:
| • | adjustments in relation to capitalisation of interest, net of related depreciation of £(77) million (2003: £(67) million, 2002: £579 million); |
| | |
| • | adjustments for goodwill amortisation of £201 million (2003: £374 million, 2002: £23 million); |
| | |
| • | adjustments for software and other intangible asset amortisation of £(37) million (2003: £(37) million, 2002: £(217) million); |
| | |
| • | recognition of compensation expense in respect of employee share plans of £(26) million (2003: £(1) million, 2002: £(1) million); |
| | |
| • | adjustments for restructuring costs of £19 million (2003: £(21) million, 2002: £21 million); |
| | |
| • | adjustments for the fair value of derivative financial instruments of £5 million (2003: £50 million, 2002: £(19) million); |
| | |
| • | recognition of losses on disposal of O2 Netherlands of £(6) million (2003: nil, 2002: nil); |
| | |
| • | adjustments in relation to the adoption of SFAS No. 143 (“Accounting for Asset Retirement Obligations”) in the current year of £(4) million (2003: nil, 2002: nil); |
| | |
| • | accumulative adjustments in relation to the adoption of SFAS No. 143 of £(4) million (2003: nil, 2002: nil); and |
| | |
| • | adjustments for deferred taxation on US GAAP differences of £(56) million (2003: £(176) million, 2002: £(467) million). |
| |
Recent UK accounting pronouncements |
| |
Amendment to FRS 5 “Reporting the substance of transactions” – revenue recognition |
The amendment takes the form of an additional application note to FRS 5, being “Application Note G”. This codifies the basic principles of revenue recognition and provides specific guidance in five areas. Of particular importance to our Group is the guidance on presentation of turnover as agent or principal. We recognise revenue on a gross basis where our role is that of principal. The gross basis represents the value of the billing to the customer after trade discounts, with any related costs being charged to operating expenses. Where we act as agent in a transaction, we recognise the net revenue earned as turnover.
We continue to apply the transitional disclosure arrangements set out in FRS 17 “Retirement benefits”. Mandatory implementation is not required until the year ended 31 March 2006 by which time we expect to have adopted International Accounting Standards. The transitional disclosures required are provided in note 29 to the financial statements in Item 18. The changes introduced by FRS 17 principally affect the way defined benefit pension schemes are accounted for. At each year-end the pension scheme assets should be measured at market value while pension scheme liabilities should be measured at a present value using a specified actuarial valuation method and discounted at a corporate bond rate. The resulting pension scheme surplus or deficit must be shown
57
Back to Contents
on the Group’s balance sheet, and could be volatile because of the dependence on market conditions at the balance sheet date.
Recent US accounting pronouncements |
In January 2003, the Financial Accounting Standards Board (FASB) issued FASB Interpretation No. 46 (FIN 46), “Consolidation of Variable Interest Entities, an interpretation of ARB No. 51”. FIN 46 was subsequently revised with the release of FIN 46R in December 2003. FIN 46R requires the Group to review the entity’s in which it holds an interest to determine whether the entity has sufficient equity to conduct its activities and to ensure that its equity holders have decision-making authority and exposure to the entity’s expected residual returns or losses. When any of these characteristics are lacking, the party exposed to a majority of the entity’s expected losses or residual returns, if any, is considered the primary beneficiary and would be required to consolidate. Consolidation is possible under FIN 46R regardless of whether the company holds equity or carries voting rights in the entity. Where consolidation is not required FIN 46R imposes an obligation to disclose significant interests held in variable interest entities.
FIN 46R is effective immediately for variable interests held in variable entities created after 31 January 2003. FIN 46R is effective 1 April 2004 for entitles considered special purpose entities (SPEs) and for all non-SPEs as of the first US GAAP balance sheet presented thereafter. The adoption of the standard for entities created after 31 January 2003 did not have an impact on the Group’s results of operations, financial condition, or cash flows. Management is currently evaluating the effect that the adoption of FIN 46R for entities created prior to 1 February 2003 will have on its results of operations and financial condition.
In November 2002, the Emerging Issues Task Force (EITF) reached consensus on EITF No. 00-21, Accounting for Revenue Arrangements with Multiple Deliverables. This consensus requires that revenue arrangements with multiple deliverables be divided into separate units of accounting if the deliverables in the arrangement meet specific criteria. In addition, arrangement consideration must be allocated among the separate units of accounting based on their relative fair values, with certain limitations. The Group adopted this statement on 1 October 2003 and is applying it on a prospective basis. The initial adoption of this statement did not have a material impact on the results of operations, financial position, or cash flows of the Group.
International accounting standards |
The Council of the European Union announced in June 2002 that listed companies in Europe would be required to adopt International Financial Reporting Standards (IFRS) for accounting periods beginning on or after 1 January 2005. The adoption of IFRS will apply to our Group for the first time for the half year ending 30 September 2005 and the year ending 31 March 2006.
We have established a project team to manage the conversion from UK GAAP to IFRS. The scope of the project includes:
| • | an initial assessment of the impact on the Group’s reported financial results and position of the change to IFRS; |
| | |
| • | continued assessment of the impact of future developments in International Accounting Standards; |
| | |
| • | identification of changes required to the Group’s existing financial systems and procedures; |
| | |
| • | appropriate training of all necessary staff; and |
| | |
| • | an internal and external communication strategy of areas of significant change. |
We expect the adoption of IFRS by the Group for our year ending 31 March 2006 to result in significant changes in the accounting, presentation and disclosure of certain items in our financial statements. We expect to publish details of the differences, and a reconciliation between our existing UK GAAP results and net assets and those under IFRS in due course.
58
Back to Contents
| ITEM 6 | DIRECTORS, SENIOR MANAGEMENT AND EMPLOYEES |
| | |
| A. | Directors and Senior Management |
David Varney (58) Chairman (2), (4)
David Varney was appointed to the Board in 2001 as full-time Chairman. In April 2003, he became part-time Chairman as envisaged at the time of the demerger from BT. He has extensive experience both in the UK and overseas markets gained during his four years as Chief Executive Officer of BG Group (formerly British Gas) from 1996 to 2000. Prior to joining BG Group, he held a variety of senior roles in Shell including the position of Managing Director of AB Svenska Shell in Sweden and Director of Shell International with responsibility for Shell’s Oil Products business in Europe. He is also Chairman of Business in the Community and President of the Council for the Institute of Employment Studies. He will be retiring from the Board at the conclusion of the Company’s Annual General Meeting being held on 28 July 2004.
Peter Erskine (52) Chief Executive Officer (2), (3)
Peter Erskine was appointed to the Board in 2001 as the Company’s Chief Executive Officer. He joined the Company from BT where, since March 1993, he held a number of senior positions including Director of BT Mobile, President and Chief Executive of Concert, and, from 1998, Managing Director of BT Cellnet. Prior to joining BT he was European Vice President of Sales and Customer Service for Mars and Senior Vice President Sales and Marketing for UNITEL. Mr Erskine was appointed to the Advisory Board of the University of Reading Business School in July 2003.
David Finch (48) Chief Financial Officer (2), (3)
David Finch was appointed to the Board in 2001. Mr Finch is the Company’s Chief Financial Officer and has extensive experience in financial management having previously held senior finance positions at Exel, Novar (formerly Caradon) and Grand Metropolitan. In addition to Group Finance, he has direct responsibility for the Group Treasury and Investor Relations functions.
Rudolf Gröger (49) CEO O2 Germany (3)
Rudolf Gröger was appointed to the Board on 1 April 2003. He joined the Company in October 2001 as Chief Executive Officer of O2 Germany. Prior to this, he was Managing Director of T-Systems International GmbH, a subsidiary of Deutsche Telekom, from 1999 to 2001. He played a key role in the acquisition of Debis Systemhaus GmbH and its integration into Deutsche Telekom. He has also worked for Siemens and was head of its German information and communication product operations.
David McGlade (43) CEO O2 UK (3)
David McGlade was appointed to the Board on 1 April 2003. Mr McGlade joined O2 UK (previously called BT Cellnet) in October 2000. Before being appointed as Managing Director of BT Cellnet, he was Chairman and Chief Executive Officer of PureMatrix, a mobile webnet software company based in Colorado, and remains a non-executive Director of this company. He was also President and Chief Executive Officer of Catch TV, President West Region of Sprint PCS where he launched the first CDMA network outside Asia and a Vice President of TCI. Mr McGlade is also a board member of the GSM Association and Tesco Mobile.
| |
Andrew Sukawaty (49) (4), (5) |
Andrew Sukawaty was appointed to the Board in 2001. Mr Sukawaty is the non-executive Deputy Chairman of the Company and senior independent Director. He is Chairman and Chief Executive Officer of Inmarsat Group. He is President of Cable Partners Europe LLC, which invests in and operates cable television services in Europe. He is also Chairman of Telenet and Deputy Chairman of Xyratex Group Limited. He has considerable experience
59
Back to Contents
in the mobile telephone industry and telecommunications industries in the United States and Europe having at different times in those periods held the offices of Chief Executive and President of Sprint PCS, Chief Executive Officer of NTL and Chief Operating Officer of Mercury One2One, where he launched the world’s first digital Personal Communications Services company. He has also been a former Chairman of the Cellular Telephone and Internet Association (CTIA) in the United States.
David Arculus (58) (1), (4)
David Arculus was appointed to the Board on 1 April 2003. Mr Arculus is Chairman of Severn Trent, a position which he will relinquish by the end of 2004, and the Better Regulation Task Force and a non-executive Director of Barclays. Mr Arculus was previously Chairman of IPC Group Limited and, before that, Group Managing Director of EMAP. Mr Arculus will become Chairman on 28 July 2004 at the conclusion of the Company’s 2004 Annual General Meeting.
David Chance (47) (1), (4)
David Chance was appointed to the Board in 2003. Mr Chance was Deputy Managing Director of BSkyB until June 1998 and is Chairman of Modern Times Group and Top Up TV Limited, and is a non-executive Director of ITV and Sunderland AFC. He previously held senior marketing and business development roles at US telecoms companies, Scientific Atlanta and Grass Valley Group, and European satellite broadcaster, SES.
Stephen Hodge (62) (1), (5)
Stephen Hodge was appointed to the Board in 2001. Mr Hodge was Director of Finance of the Royal Dutch/Shell Group, prior to his retirement in September 2001, where he had responsibility for all financial and investor relations issues for the Shell Group and its parent companies. He has extensive knowledge of the financial management of international companies, having worked throughout the world including Australia, the Netherlands, Venezuela and Argentina in a variety of financial positions. He is Chairman of Shell Pensions Trust Limited and a member of the Franchise Board of Lloyd’s of London.
Neelie Kroes (62) (1), (5)
Neelie Kroes was appointed to the Board in 2001. Ms Kroes is a member of the Supervisory Boards of a number of Dutch enterprises including Cório, Lucent Technologies, Nederlandse Spoorwagen, New Skies Satellites and Royal P&O Nedlloyd. She is also a member of the Supervisory Boards of Volvo Group, Thales Group and Prologis. She is a former President of Nijenrode University in the Netherlands. Before this, she served as Adviser to the European Transport Commissioner and also served in the Netherlands, as Cabinet Minister of Transport, Public Works and Telecommunications and Secretary of State for Transport, Public Works and Telecommunications. She was also a member of the Dutch Parliament and a member of the Rotterdam Municipal Council.
Ian Meakins (47) (1), (5)
Ian Meakins was appointed to the Board in 2001. Mr Meakins is currently President, European Major Markets and Global Supply of Diageo. He has held a number of senior marketing and operational directorships since joining United Distillers in 1992 from strategic management consultants, The Kalchas Group, where he was a founding partner. Prior to this, he worked at Bain & Company and Procter & Gamble.
Paul Myners (56) (4), (5)
Paul Myners was appointed to the Board in 2001. Mr Myners is Chairman of Guardian Media Group, Aspen Insurance Holdings and Tate Trustees and a non-executive Director of The Bank of New York and Marks & Spencer, where he became interim Chairman in May 2004. He was Chairman of Gartmore Investment Management until November 2001 and has previously held directorships at National Westminster Bank, Coutts & Co., the Investment Management Regulatory Organisation, the Lloyd’s Market Board, Celltech Group, the Scottish National Trust, Powergen and Orange.
60
Back to Contents
Company Secretary and General Counsel |
Philip Bramwell (47)
Philip Bramwell joined the Company from BT, where he was employed since 1998, initially as Legal Manager, Group Strategy and Development and then as Chief Counsel, Corporate Development. Before joining BT, he was a partner in DDV, a European specialist telecommunications consultancy firm. Prior to this, he held the position of Vice President and General Counsel at BellSouth Europe and Secretary and Legal Advisor at SmithKline Beecham Pharmaceuticals international division. He was called to the Bar in 1983.
Key to membership of Board Committees: |
| | |
| (4) | Nomination and Governance Committee |
| | |
| (5) | Remuneration Committee |
All of the non-executive Directors are considered independent of the management of the Company.
Executive management team |
mmO2’s Executive Committee comprises Messrs. Erskine (Chairman), Finch, Gröger, and McGlade and the following senior executives (including Kent Thexton up to 31 March 2004):
Danuta Gray (45) CEO O2 Ireland
Danuta Gray joined the Company from BT, where she was employed since 1984. Before transferring to her present role in July 2001, Ms Gray was Senior Vice President of BT Wireless’s businesses in Europe. Prior to this, she was a General Manager of BT Mobile, Leeds from 1994 to 1999, Sales Manager and Deputy General Manager of BT Global Communications from 1992 to 1994 and Account Director for BT Global Communications, Commercial Sector from 1990 to 1992. She also worked in various departments as a manager and consultant for BT. She is a board member of Business in the Community in Ireland.
Andrew Harley (43) Group HR Director
Andrew Harley joined the Company from BT, where he had worked since 1980. Before being appointed as Senior Vice President, HR, BT Wireless in February 2001, Mr Harley was Senior Vice President, Human Resources, BTopenworld, BT’s fixed internet service provider, and before that he was Human Resources Director for BT Cellnet. Mr Harley was also Human Resources Director for Telenordia in Sweden.
Richard Poston (44) Director Corporate Affairs
Richard Poston joined the Company in 2001. Previously Mr Poston was the Director of Communications for TI Group from 1999 to 2001 and, prior to this, Director of Corporate Communications for Racal Electronics from 1994 to 1999. He held a number of corporate communications and public affairs roles in Racal Electronics. During this time, he was closely involved with the early growth of Vodafone leading to its demerger from Racal and the formation of Camelot Group, operator of the National Lottery, in which Racal was a major shareholder. He started his career in the Royal Navy where he served from 1978 to 1986.
Sohail Qadri (43) Group Director Strategy & Performance Management
Sohail Qadri joined the Company from BT where he had worked since 1993 initially as Director of Operations and Strategy for BT Cellnet, from 1997 as Director of Mobility, Group Strategy and Development, and from 2000, as President, Strategy & Business Development of BT Wireless. Before joining BT, he was a Principal Consultant at Coopers & Lybrand, now PricewaterhouseCoopers.
61
Back to Contents
Kent Thexton (41) Chief Data and Marketing Officer
Kent Thexton joined the Company from BT where he had worked since 1998 as Marketing Director of BT Cellnet before becoming Managing Director of O2 Online (previously called Genie) in 2000. He was appointed Chief Data and Marketing Officer for the Company in July 2001. Before joining BT Cellnet, he spent eight years in the Canadian mobile industry, holding the position of Chief Operating Officer and Executive Vice President of Rogers Cantel (now Rogers Wireless). Prior to this he held management positions at Northern Telecom and Bell Canada. He is also a non-executive Director of two private Canadian companies, Audience View and Casero. Mr Thexton, who was appointed to the Board on 1 April 2003, resigned as a Director of the Company on 4 February 2004 but remained on the Executive Committee until 31 March 2004, when he left the Company.
David Williams (46) Chief Technology Officer
David Williams joined the Company in 2003 from Cingular Wireless, where he was Vice President for Strategic Planning. Prior to the merger of SBC Wireless and BellSouth Cellular in the US to form Cingular, he ran all technological operations for SBC Wireless west region. He joined SBC Wireless following the acquisition of Pacific Bell Mobile Services by that company and was instrumental in integrating the two networks. After working for both Orange and Vodafone in the UK, he relocated to the US in 1996 to direct the build-out of one of the US’s first digital mobile networks for Pacific Bell.
The discussion in this section comprises the report on directors’ remuneration for the year ended 31 March 2004 that has been prepared by the Remuneration Committee (the Committee) and has been approved by the Board. A resolution will be put to shareholders at the Annual General Meeting (the AGM) on 28 July 2004 inviting them to consider and vote on this report.
The mmO2 Group operates in a highly competitive environment, which experiences continual, rapid transformation. The Committee believes that the remuneration strategy must fully support the Group’s paramount aim of delivering sustainable shareholder value and that performance measures should be closely linked to the key performance drivers.
During the year ended 31 March 2004, the Committee undertook a comprehensive review of the long-term incentives portfolio in light of the key concerns and challenges currently faced by the Group.
Following this review, the Committee is proposing to introduce a Deferred Equity Incentive Plan which will be based on the achievement of excellent year-on-year progress against both strategic and tactical objectives with a strong and robust link to sustainable value creation. The plan will only deliver the maximum level of reward if that balanced annual performance is then combined with three further years of shareholder returns that place the Group in the top 20 per cent of European telecoms companies.
The Committee believes that the long-term success of the Group is built on a foundation of strong, regularly measured performance. This year we have reviewed performance measurement under the annual bonus process to ensure that it is both quantifiable and independently verified, and that the measures themselves contribute to the long-term strength of the business.
The Committee actively seeks dialogue with our shareholders and takes independent advice to ensure that we deliver a remuneration strategy that aligns the interests of shareholders with our executives, and engages senior management to drive the long-term success of the Group. The Committee is confident that the policies detailed in this report will support achieving these objectives.
The Remuneration Committee |
The Committee is responsible for determining policy on the remuneration and performance of executive Directors, the Company Secretary and General Counsel, and members of the Executive Committee as set out in
62
Back to Contents
Item 6A. It determines, within agreed terms of reference, specific remuneration packages for each of the above, including:
| | |
| • | any compensation payments; and |
| | |
| • | the operation of the mmO2 Executive Share Portfolio (the Portfolio), which will include the Deferred Equity Incentive Plan described below, if approved by shareholders. |
The Committee consists entirely of independent non-executive Directors. No member of the Committee has any personal financial interest, other than as a shareholder, in the matters to be decided by the Committee.
During the year, the Committee was chaired by Andrew Sukawaty, and its other members were Stephen Hodge, Neelie Kroes, Ian Meakins and Paul Myners. David Varney, Chairman, and Peter Erskine, Chief Executive Officer, are invited to attend meetings of the Committee, except when their own remuneration is discussed.
The Committee met eight times between 1 April 2003 and 31 March 2004.
The Committee takes advice from both inside and outside the Group on a range of remuneration matters, to ensure that it is able to exercise informed judgment in determining a remuneration policy that supports the business, is market competitive and represents good practice.
The following people and organisations provided advice or services that materially assisted the Committee in its consideration of Directors’ remuneration matters during the year ended 31 March 2004:
| • | the Committee consulted Peter Erskine on matters relating to the remuneration of the other executive Directors who report to him. David Varney and Andrew Harley, Group HR Director, were consulted in relation to the remuneration of all executive Directors. |
| | |
| • | the Committee appointed independent executive remuneration consultants, New Bridge Street Consultants and Deloitte & Touche, to provide advice on executive remuneration. Deloitte & Touche also provided the Group with audit services in relation to the mmO2 pension plan, and specialist corporation tax, VAT and expatriate services during the financial year. |
The Committee believes that executive remuneration at mmO2 should provide appropriate incentives to encourage superior performance, and should, in a fair and responsible manner, reward executives for their contribution to the success of the Group.
The Committee believes that executive remuneration policy should be flexible to support the changing objectives of the business, and recognises the particularly important role that performance-related incentives play in driving and rewarding superior performance from our executives.
The overriding objective of the remuneration policy is to motivate and retain the high calibre of executives required to build the success of the Group. In addition, the Committee considers it vital to align the interests of the leadership team with those of shareholders, by linking a significant proportion of the package to the creation of shareholder value.
63
Back to Contents
The remuneration policy for executives is based on the following principles:
| • | the Committee sets base salaries based on each executive’s contribution and criticality to the business. Decisions are made with reference to the median of the relevant market, executive wage levels in other companies and to general wage levels elsewhere in the Group; |
| | |
| • | emphasis is placed on providing a total cash and total compensation package that has potential to be upper quartile for high performance; and, |
| | |
| • | performance-related remuneration aligns the interests of executive Directors with those of the shareholders through the imposition of stretching business performance targets and share-based long-term incentives. |
The policy has been designed to provide an appropriate balance between fixed remuneration and performance-related elements of reward. Presently, on the basis of achievement of “on-target” bonus and long-term incentives, the balance between fixed (base salary and benefits) and variable (annual bonus and long-term incentives) pay is approximately 46:54.
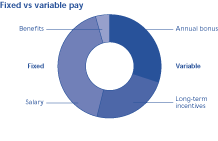
The Committee reviews the total remuneration of the executive Directors annually, to ensure that the balance between fixed and variable remuneration remains appropriate.
This report sets out the Company’s policy on executive Directors’ remuneration for the year ending 31 March 2005 and, as far as possible, for subsequent years. The Committee believes it is important to operate a dynamic policy which evolves and adjusts in light of changing circumstances. Accordingly, while the Committee is able to state its remuneration policy for the year ending 31 March 2005, it is likely to change over time. Any changes in policy for subsequent years will be described in future reports on directors’ remuneration.
Base salaries are reviewed (but not necessarily increased) annually by the Committee. Salary increases are made when the Committee believes that this would result in a better reflection of past and future contribution, level of responsibility, competitiveness and criticality to the business.
As at 31 March 2004, David Varney, Chairman, received an annual fee of £350,000.
As at 31 March 2004, the annual salaries payable to Peter Erskine, Chief Executive Officer, David Finch, Chief Financial Officer, Rudolf Gröger, Chief Executive Officer O2 Germany, and David McGlade, Chief Executive Officer O2 UK, were £620,000, £400,000, €600,000 and £385,000 respectively. With effect from 1 June 2004 their annual salaries will be £675,000, £430,000, €650,000 and £420,000 respectively.
64
Back to Contents
All executives, with the exception of David Varney, participate in the annual incentive plan.
For the year ended 31 March 2004, the bonus payable to Peter Erskine and David Finch was 65 per cent of salary for on-target performance, and 100 per cent of salary for maximum performance. The other executive Directors each have an on-target and maximum bonus potential of 80 per cent and 120 per cent of salary. Bonuses are not pensionable.
Details of the actual annual bonus payable in respect of the year ended 31 March 2004 can be found later in this section.
The annual incentive arrangements for the past year and for the year ending 31 March 2005 are based on a balance of key performance indicators, including EBITDA, EBIT, cash flow, net service revenue, data ARPU and customer satisfaction targets. The Committee considers these measures to be the key drivers of shareholder value. The percentage of salary payable to all executive Directors at on-target and maximum will remain unchanged for 2004/05.
The Committee believes that long-term incentives should form a key part of the executive remuneration package, and that executives should look to the performance-related elements of the package to achieve superior reward. The Committee believes it is important to adapt the incentive arrangements offered in future years to support the Group’s strategic objectives. This is achieved through a flexible portfolio of long-term incentives, which the Committee actively reviews to ensure that incentives remain appropriate to the needs of the business.
The Portfolio is the primary vehicle for aligning the interests of key employees and executive Directors with those of shareholders. It comprises three elements:
All employees of the mmO2 Group, including executive Directors, are eligible to be invited to participate in long-term incentives, at the discretion of the Committee. The Committee determines the appropriate performance targets, and reviews the extent to which they have been met. Awards and options are not pensionable.
The Portfolio provides a range of plans that can be tailored to meet the needs of the Group. Other than in exceptional circumstances, executives will only be made an award under one plan in any year. In the year ended 31 March 2004, only the performance share element of the Portfolio was operated.
Performance under the long-term incentives is, and will continue to be, measured by Total Shareholder Return (TSR), as the Committee believes that is the most appropriate means of aligning the interests of executives with those of shareholders. TSR compares the net return of an mmO2 plc shareholder (share price growth and assumed reinvestment of any dividends) with that of a shareholder in each of a group of comparator companies.
As a result of this year’s review of the long-term incentives, the Committee has recommended the implementation of a new executive share plan, the Deferred Equity Incentive Plan (the DEIP). It is envisaged that the DEIP will form part of the Portfolio, and, subject to shareholder approval being obtained at the AGM in July 2004, will be the primary form of long-term incentive for the executive Directors, the Company Secretary and General Counsel, and Executive Committee members for the year ending 31 March 2005.
A summary of the DEIP is set out below. Further details of the DEIP can be found in the Notice of Annual General Meeting.
65
Back to Contents
If shareholder approval is not obtained, the Committee will operate the Performance Share Plan for this group on a similar basis to last year. Further details of the Performance Share Plan are set out below.
mmO2 Executive Share Portfolio – Summary of Plans |
| |
Deferred Executive Incentive Plan (DEIP) |
Under the DEIP, participants will receive a Deferred Award and a Performance Uplift.
| | |
| • | In 2004/05 the Deferred Award will be shares equal in value to one half of the annual bonus paid in respect of 2003/04 performance, and will generally vest after three years, subject to continued employment. |
| | |
| • | The maximum Performance Uplift is two times the Deferred Award, and vesting of these shares is subject to the long-term performance of the Company. |
| | |
| • | Vesting of the Performance Uplift is subject to the Company’s relative TSR performance against a comparator group over a fixed three-year period as set out below: |
| | |
mmO2 TSR ranking | | % Performance Uplift vests | |
| |
| |
| Below median | | | 0 | % |
| Median | | | 30 | % |
| Upper quintile (top 20%) | | | 100 | % |
| | |
| | (Vesting on a straight line basis between median and maximum performance) |
| | |
| • | The comparator group for the year to 31 March 2005 will be the constituents of the FTSE E300 Telecoms Service Index at the time the Performance Uplift is awarded. |
| | |
| • | The Performance Uplift will only vest to the extent that the Committee is satisfied that the Company’s TSR performance is a genuine reflection of the Company’s underlying financial performance over the period. There are no retesting opportunities. |
The Committee operated the Performance Share Plan as the primary form of long-term incentive for senior management in the year ended 31 March 2004.
Subject to the DEIP obtaining shareholder approval, awards of Performance Shares will not be made to DEIP participants in the year ending March 2005.
Performance Shares will continue to be used as the primary long-term incentive for senior management below the DEIP participation level.
| | |
| • | During 2003/04, each of the executive Directors was made an award of Performance Shares equal to 120 per cent of salary. Details of these awards can be found later in this section. |
| | |
| • | Vesting is subject to the Company’s relative TSR performance against a comparator group over a fixed three-year period as set out below: |
| | |
mmO2 TSR ranking | | % Performance Shares vest | |
| |
| |
| Below median | | | 0 | % |
| Median | | | 30 | % |
| Upper quartile (top 25%) | | | 100 | % |
66
Back to Contents
| | (Vesting on a straight line basis between median and maximum performance) |
| | |
| • | The comparator group consists of the constituents of the FTSE E300 Telecoms Service Index at the time the award is made. |
| | |
| • | Awards will only vest to the extent that the Committee is satisfied that the Company’s TSR performance is a genuine reflection of the Company’s underlying financial performance over the period. There are no retesting opportunities. |
| | |
| • | No options were granted and no options were exercised by executive Directors during the year ended 31 March 2004. |
| | |
| • | Following the review of long-term incentives by the Committee, it is not proposed to make any option grants to executive Directors in the year ending 31 March 2005, save for in exceptional circumstances; for example, if required to secure an appointment. |
| | |
| • | Apart from the proposed grant of a restricted share award to the new Chairman (see below), there is currently no intention to make any awards to executive Directors under this plan in the 2004/05 financial year. However, the Committee reserves the ability to grant awards in exceptional circumstances; for example, if required to secure an appointment. |
| | |
| • | No restricted shares were awarded in the year ended 31 March 2004. |
| |
All-employee share schemes |
The Committee believes that it is in the interests of all employees across the business to be given the opportunity to own mmO2 shares, and wishes to encourage this by taking advantage of favourable tax treatment where available for employee shareholdings.
Executive Directors are eligible to participate in the Group’s all-employee share schemes on the same terms as other eligible employees. There are no performance conditions attached to these schemes and both operate within specific tax legislation:
| • | the mmO2 Sharesave Plan, under which the Directors can grant options to all employees across the business to acquire shares at an exercise price set at a discount of up to 20 per cent to the market value of a share at the time of invitation. |
| | |
| • | the mmO2 Share Ownership Plan, under which the Directors can award shares to UK employees on a variety of tax-favoured terms. |
Details of Directors’ sharesave interests can be found later in this section. Details of their holdings under the mmO2 Share Ownership Plan are included in their beneficial interests shown later in this section.
Former long-term incentives |
Outstanding awards under former long-term incentive arrangements are described later in this section.
There are pension arrangements in place in the main jurisdictions in which the mmO2 Group operates. Schemes vary in accordance with local market practices in each jurisdiction, and as such there are several arrangements in place for executive Directors, the Company Secretary and General Counsel, and Executive Committee members. David Varney does not participate in any mmO2 plc pension arrangements.
Peter Erskine and David Finch are entitled to final salary-related pension benefits up to the statutory earnings cap. In addition, they are entitled to supplementary pension benefits in respect of earnings above the statutory earnings cap (comprising unfunded final salary related benefits in the case of Peter Erskine and funded defined
67
Back to Contents
contribution benefits in the case of David Finch). Peter Erskine’s pension arrangements provide for a total pension of two-thirds of final salary at age 60, inclusive of any retained benefits from his previous employment, and a widow’s pension of two-thirds of his pension. The majority of his pension is provided outside the mmO2 Pension Plan as an unfunded benefit promise from the Company.
David Finch’s pension arrangements provide for an annual accrual of 1/30 of the earnings cap subject to any restriction due to retained benefits. In addition, he is entitled to a supplementary defined contribution benefit, the level of which is determined on an annual basis. For the year ended 31 March 2004 this was equal to 32.5 per cent of base salary; 21 per cent paid to a Funded Unapproved Retirement Benefit Scheme (FURBS), and 11.5 per cent paid as a cash supplement.
Rudolf Gröger’s pension arrangements provide for a pension at age 60 of 20 per cent of salary after the first three years of service and an annual pension accrual of 1.5 per cent of salary thereafter. The benefit is provided by the Company as an unfunded pension promise. David McGlade receives a cash allowance of 20 per cent of basic salary in lieu of pension benefits. This cash allowance will increase to 30 per cent of basic salary with effect from 1 June 2004.
The pension arrangements provide for life cover of four times salary. This is arranged separately for David Varney.
Details of pension arrangements within mmO2 are set out in note 29 to the Financial Statements in Item 18.
The main benefit provisions in the contracts of executive Directors are a company car or cash equivalent; healthcare for the executive and family; dental care for the executive and spouse, and personal tax and financial planning costs reimbursed to a specified maximum. David Varney, Peter Erskine and Rudolf Gröger have the use of a driver.
Contracts and notice periods |
It is the Committee’s general policy that executive Directors will have contracts and service agreements with similar provisions. Where this may not be possible initially, every effort will be made to bring the agreements in line with the Committee’s policy as soon as practicable.
David Varney serves as Chairman under a letter of appointment dated 31 March 2003.
The service contracts and notice periods for the executive Directors are set out below:
Director | | | Effective date of service agreement | | | Notice period | |
| |
|
| |
|
| |
| P Erskine | | | 24 October 2001 | | | 12 months | |
| D Finch | | | 19 November 2001 | | | 12 months | |
| D McGlade | | | 1 April 2003 | | | 12 months | |
| R Gröger | | | 1 April 2003 | | | Fixed term ending 31 October 2005* | |
| * | In recognition of local market practice in Germany, Rudolf Gröger’s contract is initially for a fixed term ending on 31 October 2005, but will convert to a one-year rolling contract in line with the other executive Directors after the end of this initial period. |
The Company may in its discretion terminate without notice and make a payment in lieu of notice equal to the sum of 12 months’ pay including the value of employers’ pension contributions, benefits, and a bonus payment of not less than the previous year’s bonus. This payment in lieu of notice provision does not prevent the Company from terminating in breach of contract, which may enable the Company to pay a reduced amount by requiring greater mitigation.
On termination of employment within 12 months of a change of control, mmO2 is obliged to make a liquidated damages payment equal to the base salary, the value of employer pension contributions and benefits for the notice period, plus additional payments generally equal to the annual bonus potential for that year, and in respect of the loss of rights under share incentive schemes.
68
Back to Contents
In the event of termination of Rudolf Gröger’s employment within 12 months of a change of control of mmO2 or its German business, the employer is obliged to make a cash payment equal to two times his base salary and bonus. The amount of bonus payable will be that expected for on- target performance.
As previously reported, David Varney retires as Chairman at the conclusion of this year’s AGM on 28 July 2004. No compensation for loss of office will be paid to Mr Varney on his retirement. He was not awarded any further share options or share awards following the announcement in April 2003 of his intention to step down, however, the share options granted to him in 2001 and 2002 will continue for one year after he leaves, but will only be exercisable subject to the TSR performance of mmO2 where applicable.
David Arculus, who currently serves as a non-executive Director of the Company, has agreed to serve as Chairman with effect from the conclusion of the AGM under an agreement dated 4 May 2004. His time commitment is anticipated to be an average of two days per week. David Arculus will be entitled to an annual fee of £325,000 as Chairman, of which £25,000 will, at his request, be paid into his personal pension arrangements. The notice period required by the Company to terminate this agreement is 12 months. David Arculus has agreed to invest 15 per cent of his after-tax fee in the Company’s shares, to be retained until his retirement as Chairman. On a change of control, in the event that his agreement is terminated, he will be entitled to 12 months’ pay in lieu of notice. This can be subject to mitigation in the event that he finds a comparable alternative role.
In addition to the above, the Company is proposing to make a one-time award of restricted shares with a market value on grant of £300,000 shortly after David Arculus takes over the duties of Chairman. The vesting of the award is subject to two conditions:
| • | Within 12 months of grant, he must build up a personal investment in mmO2 shares equivalent in number to those granted to him; and |
| | |
| • | a corporate performance condition of the Company’s relative TSR performance against the comparator group (FTSE E300 Telecoms) over a fixed three-year period from the date of award. Thirty per cent of the award will vest if the Company is ranked at the median, 100 per cent will vest if the Company is ranked in the upper quartile. Vesting between these points will occur on a straight-line basis. |
On a change of control, the award will normally roll over into an equivalent award of shares in the acquiring company and will continue to be subject to the TSR performance condition and the personal investment requirement. However, if it is impracticable for the award to be rolled over, or if the Chairman’s appointment is terminated in connection with the change of control, the award will normally vest based on the TSR performance achieved by that date but will be reduced by reference to the time elapsed since the grant date, and further reduced to the extent that the personal investment requirement has not been met.
Rudolf Gröger, David McGlade and Kent Thexton were appointed to the Board on 1 April 2003.
Having overseen the restructuring of O2 Online, Products O2 and Group central functions initiated in October 2003, Kent Thexton resigned from the Board on 4 February 2004 and left employment on 31 March 2004. He entered into a consultancy arrangement with the Company for 16 months from 1 April 2004. Further details of Mr Thexton’s arrangements following cessation of employment are provided in a footnote to the Directors’ remuneration table later on in this section.
Policy on outside appointments |
It is the Group’s policy to support executive Directors and senior managers taking external directorships or similar roles where it is beneficial for both the individual concerned and the Group and does not detract from their responsibilities to the Group. The number of such appointments must not exceed two, only one of which may be with a FTSE 100 company. Appointments relating to executive Directors and Executive Committee members
69
Back to Contents
require the prior approval of the Board. Appointments relating to other senior executives require the prior approval of the Chairman. The Company permits the executive Director or senior executive concerned to retain any fees earned from such a position provided they are at a reasonable level. Peter Erskine is a member of the University of Reading Business School Advisory Board, Kent Thexton is a director of Canadian-based Casero and Audience View and David McGlade is a non-executive Director of a US-based company called PureMatrix. None of the executive Directors receive fees in respect of these external directorships.
The performance graph below illustrates the Company’s TSR performance over the period from 19 November 2001 (when the Company was first listed following its demerger from BT) to 31 March 2004, compared to the FTSE 100 Index and the FTSE E300 Telecoms Service Index over the same period. The FTSE 100 Index was selected by the Committee because it is recognised as an externally valid and robust comparator group of UK-based companies of similar size to mmO2 in terms of market capitalisation. The FTSE E300 Telecoms Service Index was chosen because it more closely compares the Company with its sector.
The graph shows the growth in value from 19 November 2001 to 31 March 2004 of £100 invested in mmO2 compared with the value of £100 invested in the FTSE 100 or FTSE E300 Telecoms Indices.
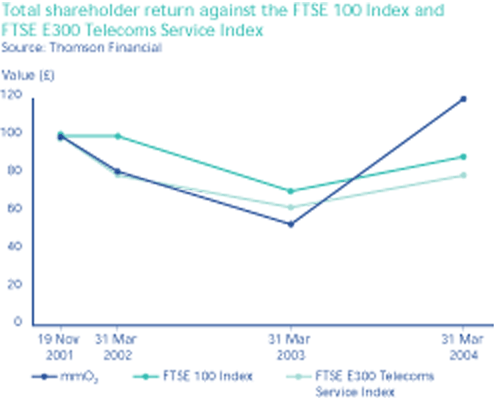
Remuneration of non-executive Directors |
In appointing non-executive Directors, the Group has regard to the practice of other companies and the increasing demands on non-executive Directors beyond attendance at relevant committee and Board meetings.
The fees of non-executive Directors are determined by the Chairman and executive Directors who have access to independent advice. In the year to 31 March 2004:
| (a) | the annual fee payable to the non-executive Directors (other than Andrew Sukawaty) was £40,000 plus an additional fee of £5,000 per annum for chairmanship of a Committee and an additional fee of £5,000 for membership of the Audit and Remuneration Committees and £3,000 for membership of the Nomination and Governance Committee; and |
| | |
| (b) | the Deputy Chairman of the Company (Andrew Sukawaty) received a fee of £100,000 per annum. |
Following a review of the remuneration of the non-executive Directors, it was agreed that with effect from 1 April 2004 the annual fees payable to the non-executive Directors would remain unchanged.
70
Back to Contents
Each non-executive Director has agreed that a portion of their after-tax fee, equivalent to a minimum of 50 per cent and up to a maximum of 100 per cent, would be invested in shares (the Share Portion). This arrangement was approved by the Board in 2002. Fees are paid quarterly in arrears and the shares are allotted on the same basis. The number of shares to be allotted in respect of each quarter is calculated by dividing the Share Portion for the quarter by the average middle market quotation on the three dealing days preceding the date of the quarterly allotment. The Group suspended this arrangement in relation to fees for the period 1 October 2003 to 31 March 2004.
Following Sir Derek Higgs’ review of the role and effectiveness of non-executive directors (the Higgs Report), the non-executive Directors have entered into revised letters of appointment with mmO2 covering, amongst other items, their terms of appointment and expected time commitment, together with a general statement of their role and duties. Non-executive Directors are appointed initially for three years unless otherwise terminated earlier by and at the discretion of either party upon one month’s written notice. Non-executive Directors are typically expected to serve two three-year terms subject to satisfactory performance and re-election by shareholders. The initial terms of three years began at demerger or 20 December 2001 in the case of Ian Meakins, 21 January 2003 in the case of David Chance and 1 April 2003 in the case of David Arculus. The non-executive Directors do not participate in any of mmO2’s pension or incentive arrangements.
The Group has complied with the 1998 Combined Code’s provisions relating to directors’ remuneration for the year ended 31 March 2004, except for the service contract in respect of Rudolf Gröger. His contract is for a fixed term ending on 31 October 2005 in recognition of local market practice, but will convert to a one-year rolling contract after the end of this initial period. In the event of termination of Rudolf Gröger’s employment within 12 months of a change of control of mmO2 or its German business, the employer is obliged to make a cash payment equal to two times his base salary and on-target bonus.
The revised Combined Code which was published in July 2003 will apply to the Company from 1 April 2004.
This report complies with the UK Directors’ Remuneration Report Regulations 2002 (the Regulations). The Regulations require the Group’s auditors to report to shareholders on the auditable part of the report and to state whether, in their opinion, that part of the report has been properly prepared in accordance with the Companies Act 1985 (as amended by the Regulations). The auditable sections of the report include those relating to Directors’ remuneration and benefits, share incentive schemes and pension benefits.
71
Back to Contents
Directors’ remuneration (excluding pension arrangements) was as follows:
| | | Salary and fees1
| | Annual bonus
| | Benefits excluding
pensions2
| | Gains from long-term
incentive plans
| | Total | | Total | |
| | | 2004 | | 2003 | | 2004 | | 2003 | | 2004 | | 2003 | | 2004 | | 2003 | | 2004 | | 2003 | |
| | |
|
| |
|
| |
|
| |
|
| |
|
| |
|
| |
|
| |
|
| |
|
| |
|
| |
| | | £ | | £ | | £ | | £ | | £ | | £ | | £ | | £ | | £ | | £ | |
| D Varney | | | 350,000 | | | 500,000 | 3 | | — | | | — | | | 36,125 | | | 17,308 | | | — | | | — | | | 386,125 | | | 517,308 | |
P Erskine4 | | | 607,500 | | | 537,500 | | | 564,200 | | | 387,000 | | | 40,602 | | | 36,651 | | | — | | | 48,303 | | | 1,212,302 | | | 1,009,454 | |
| D Finch | | | 395,833 | | | 370,833 | | | 364,000 | | | 206,250 | | | 24,705 | | | 48,158 | | | 146,717 | 5 | | 109,333 | | | 931,255 | | | 734,574 | |
R Gröger6 | | | 399,211 | | | — | | | 499,896 | | | — | | | 20,543 | | | — | | | — | | | — | | | 919,650 | | | — | |
D McGlade7 | | | 372,500 | | | — | | | 462,000 | | | — | | | 100,047 | 8 | | — | | | — | | | — | | | 934,547 | | | — | |
K Thexton9 | | | 279,508 | | | — | | | 374,691 | | | — | | | 27,288 | 10 | | — | | | — | | | — | | | 681,487 | | | — | |
A Sukawaty11 | | | 100,000 | | | 100,000 | | | — | | | — | | | — | | | — | | | — | | | — | | | 100,000 | | | 100,000 | |
D Arculus13,14 | | | 48,000 | | | — | | | — | | | — | | | — | | | — | | | — | | | — | | | 48,000 | | | — | |
D Chance11,15 | | | 48,000 | | | 7,064 | | | — | | | — | | | — | | | — | | | — | | | — | | | 48,000 | | | 7,064 | |
S Hodge11 | | | 55,000 | | | 36,000 | | | — | | | — | | | — | | | — | | | — | | | — | | | 55,000 | | | 36,000 | |
N Kroes12 | | | 50,000 | | | 36,000 | | | — | | | — | | | — | | | — | | | — | | | — | | | 50,000 | | | 36,000 | |
I Meakins11 | | | 50,000 | | | 36,000 | | | — | | | — | | | — | | | — | | | — | | | — | | | 50,000 | | | 36,000 | |
P Myners13 | | | 48,000 | | | 36,000 | | | — | | | — | | | — | | | — | | | — | | | — | | | 48,000 | | | 36,000 | |
| 1 | Salaries and fees are reviewed each year. |
| 2 | Benefits include car provision or cash allowance, healthcare, financial planning, dental care, home security and life cover. |
| 3 | With effect from 1 April 2003, David Varney served as part-time Chairman and the annual fee payable was £350,000. |
| 5 | Gain on vesting of Restricted Share Award (set out below). |
| 6 | Rudolf Gröger’s remuneration has been converted from Euro to Sterling at an exchange rate of €1 = £0.6943. Appointed 1 April 2003. |
| 8 | In addition to the benefits listed in Note 1, David McGlade received a benefit relating to the cessation of his expatriate accommodation allowance. |
| 9 | Appointed 1 April 2003. Resigned from the Board on 4 February 2004 and left employment on 31 March 2004. In relation to the period from 4 February 2004 to 31 March 2004, Kent Thexton received salary and benefits of £50,492 and £4,929 respectively under his existing contract. With effect from 1 April 2004, the Company entered into a consultancy agreement with Kent Thexton for 16 months, to have available his expert input regarding mobile data services. Over the 16 months, Kent Thexton will receive fees of £166,668. His time commitment is expected to be on average one to two days per calendar month. No termination payment has been or will be made to Kent Thexton, but during the consultancy period the Company will meet the cost of his personal tax and financial planning fees up to a value of £5,000. Details regarding the treatment of his share options and share awards are included below. |
| 10 | In addition to the benefits listed in Note 1, Kent Thexton received a benefit relating to the cessation of his expatriate accommodation allowance. |
| 11 | Elected to receive 50 per cent of Directors’ fees after tax in shares. |
| 12 | Elected to receive 75 per cent of Directors’ fees after tax in shares. |
| 13 | Elected to receive 100 per cent of Directors’ fees after tax in shares. |
| 14 | Appointed 1 April 2003. |
| 15 | Appointed 21 January 2003. |
72
Back to Contents
The table below includes the information required in relation to defined benefit schemes under the UKLA Listing Rules and Schedule 7A of the Companies Act 1985.
| | Total
accrued pension1
| | Transfer value of
accrued benefit2,3
| | Real increase in
accrued pension
during year
| | Increase in
accrued pension
during year
| | Transfer value
of real increase
in accrued benefit
(less Directors’
contributions)2,3
| | Increase in
transfer
value less | | | |
| | At 31
March | | At 31
March | | At 31
March | | At 31
March | | | | | | (including inflation) | | | | | | Directors’
contri- | | Directors’
contri- | |
| | 2004 | | 2003 | | 2004 | | 2003 | | 2004 | | 2003 | | 2004 | | 2003 | | 2004 | | 2003 | | butions | | butions | |
| |
|
| |
|
| |
|
| |
|
| |
|
| |
|
| |
|
| |
|
| |
|
| |
|
| |
|
| |
|
| |
| | £000 | | £000 | | £000 | | £000 | | £000 | | £000 | | £000 | | £000 | | £000 | | £000 | | £000 | | £000 | |
| Peter Erskine | | | | | | | | | | | | | | | | | | | | | | | | | | | | | | | | | | | | |
mmO2 Pension Plan | | 37 | | | 33 | | | 407 | | | 324 | | | 3 | | | 3 | | | 4 | | | 4 | | | 20 | | | 16 | | | 68 | | | 15 | |
| Unfunded Plan | | 203 | | | 160 | | | 3,124 | | | 2,155 | | | 39 | | | 41 | | | 43 | | | 43 | | | 598 | | | 543 | | | 969 | | | 0 | |
| |
|
| |
|
| |
|
| |
|
| |
|
| |
|
| |
|
| |
|
| |
|
| |
|
| |
|
| |
|
| |
| Total | | 240 | | | 193 | | | 3,531 | | | 2,479 | | | 42 | | | 44 | | | 47 | | | 47 | | | 618 | | | 559 | | | 1,037 | | | 15 | |
| |
|
| |
|
| |
|
| |
|
| |
|
| |
|
| |
|
| |
|
| |
|
| |
|
| |
|
| |
|
| |
| David Finch | | 9 | | | 5 | | | 72 | | | 40 | | | 3 | | | 3 | | | 4 | | | 3 | | | 27 | | | 24 | | | 32 | | | 0 | |
| |
|
| |
|
| |
|
| |
|
| |
|
| |
|
| |
|
| |
|
| |
|
| |
|
| |
|
| |
|
| |
Rudolf Gröger4,5 | | 69 | | | 34 | | | 1,540 | | | 682 | | | 35 | | | n/a | | | 35 | | | n/a | | | 744 | | | n/a | | | 858 | | | 0 | |
| |
|
| |
|
| |
|
| |
|
| |
|
| |
|
| |
|
| |
|
| |
|
| |
|
| |
|
| |
|
| |
| 1 | The accrued annual pension represents the maximum defined benefit liability for mmO2. The amounts will be reduced by any retained benefits from previous employment. |
| 2 | The transfer values have been calculated on the basis of actuarial advice. The transfer values of the Inland Revenue approved benefits have been calculated in accordance with Actuarial Guidance Note GN11 using the assumptions adopted by the mmO2 Pension Plan Actuary. The unapproved element of pension benefits has been valued using assumptions appropriate to the FRS 17 accounting standard, which is consistent with GN11 principles. |
| 3 | These figures represent liabilities of the Company and the mmO2 Pension Plan, not sums paid or due to the individual. |
| 4 | Rudolf Gröger became an executive Director on 1 April 2003. Therefore, no figures are shown for the year prior to this date. Although his benefit does not vest until after three years of service, the figures have been calculated on the assumption that he will complete three years of service. |
| 5 | Rudolf Gröger’s pension has been converted from Euro to Sterling at an exchange rate of €1 = £0.6943. |
Under arrangements to provide David Finch with supplementary benefits in respect of earnings above the statutory earnings cap for the year ended 31 March 2004, £83,125 (£77,875 for the year ended 31 March 2003) was paid to a defined contribution Funded Unapproved Retirement Benefit Scheme (FURBS) and £45,521 (£42,646 for the year ended 31 March 2003) was paid as a cash supplement.
David McGlade and Kent Thexton received a cash allowance of £74,500 and £66,000 respectively equating to 20 per cent of salary in lieu of pension benefits.
The closing market price of mmO2 shares at 31 March 2004 was 100.5p and the range from 1 April 2003 to that date was 45.75p to 112p.
73
Back to Contents
Beneficial interests in ordinary shares |
The beneficial interests of the Directors and their immediate families in mmO2 ordinary shares of 0.1p each as at 31 March 2004 are set out in the table below.
| | | As at 31 March 2004 | | As at 1 April 2003 | |
| | |
|
| |
|
| |
| David Varney | | | 279,554 | 1,2,3 | | 277,237 | |
| Peter Erskine | | | 537,027 | 1,3 | | 534,710 | |
| David Finch | | | 812,816 | 1,3 | | 608,964 | |
| David McGlade | | | 335,496 | 4 | | 335,496 | |
| Rudolf Gröger | | | — | | | — | |
| Andrew Sukawaty | | | 83,576 | | | 45,738 | |
| David Arculus | | | 24,078 | | | — | |
| David Chance | | | 15,029 | | | — | |
| Stephen Hodge | | | 91,914 | | | 74,159 | |
| Neelie Kroes | | | 59,890 | | | 27,529 | |
| Ian Meakins | | | 33,599 | | | 16,465 | |
| Paul Myners | | | 261,401 | | | 228,320 | |
| | | | | | | | |
| 1 | Since 31 March 2004 David Varney, Peter Erskine and David Finch have each acquired 253 additional ordinary shares under the terms of the mmO2 Share Ownership Plan. There have been no other changes in the Directors’ beneficial and non-beneficial interests in share capital, including options to subscribe for shares, or in the debentures of the Company and its subsidiaries between 31 March 2004 and 10 May 2004. |
| 2 | Includes 1,000 shares in the form of 100 mmO2 American Depositary Shares (ADSs) (1 ADS = 10 ordinary shares). |
| 3 | Includes shares held by the trustee of the mmO2 Share Ownership Plan. |
| 4 | Includes 4,130 shares in the form of 413 mmO2 American Depositary Shares (ADSs) (1 ADS = 10 ordinary shares). |
74
Back to Contents
The table below shows the options which remained outstanding under the share option element of the Portfolio held by Directors during the year ended 31 March 2004. Vesting is subject to the satisfaction of corporate performance criteria as detailed later in this section. The table also shows options over BT shares held by David Varney, David McGlade and Kent Thexton prior to demerger. These were regranted over mmO2 shares as indicated.
| | | Plan | | | Grant date | | | Number at
1 April
2003 | | | Options
granted
during
the year
ended
31 March
2004 | | | Exercised | | | Lapsed | | | Number at
31 March
2004 | | | Exercise
price | | | Date exercisable | |
| | |
| |
|
| |
|
| |
|
| |
|
| |
|
| |
|
| |
|
| |
|
| |
| D Varney | | mmO2 Legacy share | | | 22 June 2001 | | | 491,272 | | | — | | | — | | | — | | | 491,272 | | | 101.7 | p | | 2004-2011 | |
| | | option plan1 | | | | | | | | | | | | | | | | | | | | | | | | | |
| | | Executive share | | | 23 November | | | 1,724,137 | | | — | | | — | | | — | | | 1,724,137 | | | 87 | p | | 23 November 2004- | |
| | | option plan | | | 2001 | | | | | | | | | | | | | | | | | | | | | 22 November 2011 | |
| | | | | | 25 July 2002 | | | 3,260,869 | | | — | | | — | | | — | | | 3,260,869 | | | 46 | p | | 25 July 2005- | |
| | | | | | | | | | | | | | | | | | | | | | | | | | | 24 July 2012 | |
| | | | | | | | | | | | | | | | | | | | | | | | | | | | |
| P Erskine | | Executive share | | | 23 November | | | 1,724,137 | | | — | | | — | | | — | | | 1,724,137 | | | 87 | p | | 23 November 2004- | |
| | | option plan | | | 2001 | | | | | | | | | | | | | | | | | | | | | 22 November 2011 | |
| | | | | | 25 July 2002 | | | 3,554,347 | | | — | | | — | | | — | | | 3,554,347 | | | 46 | p | | 25 July 2005- | |
| | | | | | | | | | | | | | | | | | | | | | | | | | | 24 July 2012 | |
| | | | | | | | | | | | | | | | | | | | | | | | | | | | |
| D Finch | | Executive share | | | 23 November | | | 1,206,896 | | | — | | | — | | | — | | | 1,206,896 | | | 87 | p | | 23 November 2004- | |
| | | option plan | | | 2001 | | | | | | | | | | | | | | | | | | | | | 22 November 2011 | |
| | | | | | 25 July 2002 | | | 2,445,652 | | | — | | | — | | | — | | | 2,445,652 | | | 46 | p | | 25 July 2005- | |
| | | | | | | | | | | | | | | | | | | | | | | | | | | 24 July 2012 | |
| | | | | | | | | | | | | | | | | | | | | | | | | | | | |
| R Gröger | | Executive share | | | 23 November | | | 625,168 | | | — | | | — | | | — | | | 625,168 | | | 87 | p | | 23 November 2004- | |
| | | option plan | | | 2001 | | | | | | | | | | | | | | | | | | | | | 22 November 2011 | |
| | | | | | 25 July 2002 | | | 1,763,373 | | | — | | | — | | | — | | | 1,763,373 | | | 46 | p | | 25 July 2005- | |
| | | | | | | | | | | | | | | | | | | | | | | | | | | 24 July 2012 | |
| | | | | | | | | | | | | | | | | | | | | | | | | | | | |
| D McGlade | | mmO2 Legacy share | | | 1 October | | | 113,440 | | | — | | | — | | | — | | | 113,440 | | | $23.243 | | | 1 October 2001- | |
| | | option plan1 | | | 2000 | | | | | | | | | | | | | | | | | | | | | 30 September 2010 | |
| | | Executive share | | | 23 November | | | 122,059 | | | — | | | — | | | — | | | 122,059 | | | $11.873 | | | 23 November 2004- | |
| | | option plan | | | 20012 | | | | | | | | | | | | | | | | | | | | | 22 November 2011 | |
| | | | | | 25 July 2002 | | | 2,184,782 | | | — | | | — | | | — | | | 2,184,782 | | | 46 | p | | 25 July 2005- | |
| | | | | | | | | | | | | | | | | | | | | | | | | | | 24 July 2012 | |
| | | | | | | | | | | | | | | | | | | | | | | | | | | | |
| K Thexton | | mmO2 Legacy share | | | 8 September | | | 208,369 | | | — | | | — | | | (208,369 | ) | | — | | | 168 | p | | 8 September 2001- | |
| | | option plan1 | | | 1998 | | | | | | | | | | | | | | | | | | | | | 7 September 2008 | |
| | | | | | 16 February 1999 | | | 36,075 | | | — | | | — | | | (36,075 | ) | | — | | | 229 | p | | 16 February 2002- | |
| | | | | | | | | | | | | | | | | | | | | | | | | | | 15 February 2009 | |
| | | | | | 9 August 1999 | | | 244,678 | | | — | | | — | | | (244,678 | ) | | — | | | 207 | p | | 9 August 2002- | |
| | | | | | | | | | | | | | | | | | | | | | | | | | | 8 August 2009 | |
| | | Executive share | | | 23 November | | | 1,034,4824 | | | — | | | — | | | — | | | 1,034,482 | | | 87 | p | | 23 November 2002- | |
| | | option plan3 | | | 2001 | | | | | | | | | | | | | | | | | | | | | 28 July 2006 | |
| | | | | | 25 July 2002 | | | 1,956,5215 | | | — | | | — | | | — | | | 1,956,521 | | | 46 | p | | 25 July 2005- | |
| | | | | | | | | | | | | | | | | | | | | | | | | | | 18 October 2006 | |
| 1 | The options were regranted over mmO2 shares on 20 December 2001. David McGlade’s legacy options were awarded in the form of ADSs (one ADS = 10 mmO2 shares) at $23.243 per ADS, and vest in three equal annual tranches on the first, second and third anniversaries of grant. Kent Thexton’s legacy share options lapsed in full on 31 March 2004. |
| 2 | The options granted to David McGlade on 23 November 2001 were in the form of ADSs (one ADS = 10 mmO2 shares) at $11.873 per ADS. |
| 3 | On resigning as a Director of mmO2 on 4 February 2004, the Remuneration Committee permitted Kent Thexton to retain his options for the maximum periods referred to in the final column above. The exercisability of these options is dependent on the applicable performance targets being met, and on Mr Thexton’s compliance with certain obligations under his consultancy agreement including restrictive covenants. |
| 4 | The options granted to Kent Thexton on 23 November 2001 vest in two equal annual tranches on the first and second anniversaries of grant and can be retested on two subsequent occasions. Vesting of each tranche is dependent on mmO2’s TSR performance against the comparator group. No part of the first and second tranches of options have vested to date as the performance target has not been met. Performance will be retested for the final time in respect of the first tranche at 18 November 2004. Performance will be retested in respect of the second tranche at 18 November 2004 and 2005, if necessary. |
| 5 | The vesting of the options granted to Kent Thexton on 25 July 2002 is dependent on mmO2’s TSR performance against the comparator group at 18 July 2005. Performance may be retested at 18 July 2006, if necessary. |
75
Back to Contents
No share options were granted during the year, and no options were exercised by executive Directors during the year. Unrealised gains on executive share options were nil as at 31 March 2004. Options granted previously were granted on terms that they normally become exercisable on the third anniversary of grant subject to the TSR of the Company compared with the TSR performance of the companies in the FTSE 100. For options granted in the year ended 31 March 2003, the first performance test is expected to be in July 2005. If the performance goal is not satisfied in full after this period, it can be retested on two subsequent occasions, on the fourth and fifth anniversaries of grant, extending the length of the performance period at each test. The proportion of options that can be exercised will increase if the Company’s TSR performance improves between the test dates. TSR performance from 18 July 2002 (the start of the performance period) to 31 March 2004 places mmO2 at first position within the comparator group. For options granted in the year ended 31 March 2002, the first performance test is expected to be in November 2004. TSR performance from 19 November 2001 (the start of the performance period) to 31 March 2004 places mmO2 at 31st position within the comparator group. As noted above, these options will only become exercisable in full if the Company’s TSR performance meets the relevant target at one of the test dates described above. Should options be granted in the future, we will have regard to best practice at the time on retesting and performance conditions.
The table below shows the number of performance shares awarded to executive Directors under the operation of the Portfolio during the year ended 31 March 2004.
| | | Grant date | | Number at
1 April
2003 | | Granted
during the
year ended
31 March
2004 | | Vested | | Lapsed | | Number at
31 March
2004 | | Vesting
date | |
| | |
|
| |
|
| |
|
| |
|
| |
|
| |
|
| |
|
| |
| Peter Erskine | | | 31/07/03 | | | — | | | 1,403,773 | | | — | | | — | | | 1,403,773 | | | 31/07/06 | |
| David Finch | | | 31/07/03 | | | — | | | 905,660 | | | — | | | — | | | 905,660 | | | 31/07/06 | |
| Rudolf Gröger | | | 31/07/03 | | | — | | | 859,245 | | | — | | | — | | | 859,245 | | | 31/07/06 | |
| David McGlade | | | 31/07/03 | | | — | | | 815,094 | | | — | | | — | | | 815,094 | | | 31/07/06 | |
| Kent Thexton | | | 31/07/03 | | | — | | | 747,169 | | | — | | | (747,169 | )1 | | — | | | 31/07/06 | |
| 1 | Kent Thexton resigned from the Board on 4 February 2004 and left employment on 31 March 2004. No performance shares were granted between these dates and his award over performance shares lapsed in full on 31 March 2004. |
The table below shows the sharesave options over mmO2 ordinary shares held by Directors during the year ended 31 March 2004.
| | | Grant
date | | Number at
1 April
2003 | | Exercised | | Lapsed | | Number at
31 March
2004 | | Exercise
price | | Date exercisable | |
| | |
| |
|
| |
|
| |
|
| |
|
| |
|
| |
|
| |
| David Varney | | 21 December 2001 | | | 12,978 | | | — | | | — | | | 12,978 | | | 73.2 | p | | 14 February 2005-13 August 2005 | |
| Peter Erskine | | 21 December 2001 | | | 12,978 | | | — | | | — | | | 12,978 | | | 73.2 | p | | 14 February 2005-13 August 2005 | |
| David Finch | | 21 December 2001 | | | 12,978 | | | — | | | — | | | 12,978 | | | 73.2 | p | | 14 February 2005-13 August 2005 | |
| David McGlade | | 20 December 2002 | | | 21,477 | | | — | | | — | | | 21,477 | | | 44 | p | | 13 February 2006-12 August 2006 | |
| Kent Thexton | | 21 December 2001 | | | 12,978 | | | — | | | (12,978 | )1 | | — | | | 73.2 | p | | 14 February 2005-13 August 2005 | |
| 1 | Kent Thexton’s sharesave option lapsed in full on 31 March 2004. |
76
Back to Contents
The table below shows the number of restricted shares awarded to executive Directors under the operation of the Portfolio.
| | | Grant date | | Number at
1 April
20031 | | Vested | | Lapsed | | Number at
31 March
2004 | | Vesting date | |
| | |
|
| |
|
| |
|
| |
|
| |
|
| |
|
| |
Peter Erskine2 | | | 23/11/01 | | | 575,815 | | | — | | | — | | | 575,815 | | | 23/11/04 | |
David Finch3 | | | 23/11/01 | | | 403,071 | | | (201,535 | ) | | — | | | 201,536 | | | 23/11/04 | |
| Rudolf Gröger | | | 23/11/01 | | | 156,592 | | | — | | | — | | | 156,592 | | | 23/11/04 | |
| David McGlade | | | 23/11/01 | | | 385,790 | | | — | | | — | | | 385,790 | | | 23/11/04 | |
| | | | | | | | | | | | | | | | | | | | |
| 1 | Restricted share awards were granted to a small group of senior executives (including executive Directors) shortly after demerger. Most awards were granted on terms that they will normally only vest on the third anniversary of grant if the participant builds up a significant personal shareholding in the Company within 18 months of grant and retains this until the vesting date as well as remaining in employment with the mmO2 Group until this time. The awards vest on a pro rata basis if the participant builds up a lower personal investment. As at 31 March 2004 both Peter Erskine and David Finch had met their shareholding requirement, and are required to maintain that shareholding until the third anniversary of award in order for their restricted share awards to vest in full. |
| 2 | Vesting is subject to the satisfaction of a personal shareholding requirement as set out in note 1. The personal shareholding requirement for Peter Erskine is equal to the number of shares under award. |
| 3 | Vesting is subject to the satisfaction of a personal shareholding requirement. The personal shareholding requirement for David Finch is equal to one-third of the shares under award. The market price of an mmO2 share on the grant date was 87p. Under the terms of David Finch’s Restricted Share Plan award, 201,535 shares vested on 23 November 2002 at 54.5p and 201,535 shares vested on 23 November 2003 at 72.8p being the market value of a share at those dates. In relation to the awards which vested on 23 November 2002 and 23 November 2003, David Finch received £109,333 and £146,717 on these two dates respectively. |
Peter Erskine has the following mmO2 shares under award from BT Legacy Share Awards, a description of which can be found below. Following demerger, these awards were adjusted to relate solely to mmO2 shares, and any performance measure has been translated into a measure of mmO2 performance from demerger to the end of the performance period.
| | | Plan | | Year of
award | | Number of
mmO2 shares
1 April
2003 | | Vested | | Lapsed | | Number of
mmO2 shares
31 March
2004 | | Vesting date | |
| | |
| |
|
| |
|
| |
|
| |
|
| |
|
| |
|
| |
| Peter Erskine | | BT Executive Share Plan | | | 1998 | 1 | | 154,057 | | | — | | | (154,057 | ) | | — | | | 2003 | |
| | | | | | 1999 | 2 | | 144,198 | | | — | | | — | | | 144,198 | | | 2004 | |
| | | Total | | | | | | 298,255 | | | — | | | (154,057 | ) | | 144,198 | | | | |
| Peter Erskine | | BT Incentive Share Plan | | | 2000 | 3 | | 312,750 | | | — | | | (312,750 | ) | | — | | | 2003 | |
| Peter Erskine | | BT Deferred Bonus Plan4 | | | 2001 | | | 127,656 | | | — | | | — | | | 127,656 | | | 2004 | |
| 1 | The performance period for the 1998 BT Executive Share Plan ended on 31 March 2003. The performance condition was not met and as a result 154,057 shares lapsed in August 2003 following the year ended 31 March 2003. |
| 2 | The performance period for the 1999 BT Executive Share Plan ended on 31 March 2004. The performance condition was not met and as a result 144,198 shares will lapse in August 2004. |
| 3 | The performance period for the 2001 BT Incentive Share Plan ended on 31 March 2003. The performance condition was not met and as a result 312,750 shares lapsed in August 2003 following the year ended 31 March 2003. |
| 4 | The vesting of shares awarded under the BT Deferred Bonus Plan is subject only to the continued employment of the Director with the Company. |
77
Back to Contents
At 31 March 2004, Peter Erskine had a non-beneficial interest in 893,175 mmO2 ordinary shares held in trust by Ilford Trustees Limited as trustee of the BT Executive Share Plan and BT Deferred Bonus Plan.
At 31 March 2004, all executive Directors had a non-beneficial interest in 1,858,232 mmO2 ordinary shares and 81,573 mmO2 American Depositary Shares held in trust by Hill Samuel Offshore Trust Company Limited as trustee of the mmO2 Restricted Share Plan and mmO2 Performance Share Plan.
The aggregate remuneration of the Company Secretary and General Counsel, and members of the Executive Committee other than executive Directors for services in all capacities during the 2004 financial year was £2.4 million. In addition, loans outstanding to senior officers of the Company as at 31 March 2004 were £141,071.
The Company Secretary and General Counsel, and members of the Executive Committee beneficially own less than 1 per cent of the Company’s outstanding ordinary shares.
Former long-term incentives |
A number of key employees of mmO2 were participants in BT share plans prior to demerger. The awards made under these plans have been adjusted so that they relate solely to mmO2 shares, and any performance measure has been translated into a measure of mmO2 performance from demerger to the end of the performance period. On vesting, these awards will be satisfied in existing mmO2 shares held by an employee trust which has already been funded by BT.
No further awards will be made under these plans to mmO2 employees.
Subsisting options over BT shares granted under BT executive share option plans have been replaced with options over mmO2 shares, granted under the mmO2 Legacy Option Plan, for those participants now employed by mmO2. The replacement options were granted on the same terms, and are exercisable between the same dates, as the options for which they were exchanged.
There are no performance conditions relating to the vesting of these options other than continued employment with the mmO2 Group. This reflects the terms of the underlying BT option plan. The legacy options will be satisfied using new issue shares, and options granted under this plan do not count towards the dilution limits established for mmO2 share option plans.
Prior to demerger, a variety of cash-based incentive plans operated in the mmO2 businesses in the UK, Germany and Ireland and also within O2 Online. mmO2 has taken steps to terminate some plans early and does not intend to renew the others when they reach the end of their performance periods.
Under a plan introduced by O2 Germany in November 2000, eligible employees are entitled, no earlier than April 2004 and no later than April 2007, to a payment based on the value of the goodwill of O2 Germany at that time. Payment is only made if O2 Germany achieves positive EBITDA in the financial year prior to payment. As at 31 March 2004, the value of the goodwill of O2 Germany was such that awards have no value.
Under a plan operated by O2 Ireland, key employees and management are entitled to cash payments by reference to the performance of O2 Ireland up to the date of payment. The final payment in respect of this plan was made in the year ended 31 March 2004. All participation has ceased and no further awards will be made.
78
Back to Contents
The Board supports high standards in corporate governance. The application during the financial year of the principles in Section 1 of the Combined Code published by the Hampel Committee on Corporate Governance in 1998 is described in the appropriate sections of this Item 6C and in Item 6B. The Directors consider that the Company has fully complied with the provisions set out in Section 1 of the 1998 Combined Code, except for the service contract in respect of Rudolf Gröger, which is for a fixed term ending on 31 October 2005 in recognition of local market practice, but will convert to a one-year rolling contract after the end of this initial period. Additionally, in the event of termination of Mr Gröger’s employment within 12 months of a change of control of mmO2 or its German business, the employer is obliged to make a cash payment equal to two times his base salary and bonus. The amount of bonus payable will be that expected for an on-target performance. On-target bonus is equal to 80 per cent of base salary.
In July 2003, the Financial Reporting Council issued a revised Code on Corporate Governance (the revised Combined Code) which is effective for reporting years beginning on or after 1 November 2003. The Board has reviewed the Company’s corporate governance arrangements in the light of the revised Combined Code and this report also reflects changes which have been made as a consequence of that review.
The Directors’ biographies appear in Item 6A.
The Board currently comprises the Chairman, Chief Executive Officer, Chief Financial Officer, two further executive Directors, and seven independent non-executive Directors, which is considered to be an effective size and balance for the Company. The Board considers that all the non-executive Directors are independent under the criteria set out in the revised Combined Code, including David Arculus at the date of the announcement of his appointment as Chairman from the conclusion of the Annual General Meeting on 28 July 2004.
The division of responsibilities between the Chairman and the Chief Executive Officer has been set out in writing and agreed by the Board.
Andrew Sukawaty, the Deputy Chairman, is recognised as the senior independent Director to whom concerns can be conveyed independently of the Chairman or Chief Executive Officer or Chief Financial Officer by other Directors or by shareholders.
The differing roles of executive Directors and non-executive Directors are clearly delineated, with both having fiduciary duties towards shareholders.
Non-executive Directors are appointed initially for three years. During the financial year, the non-executive Directors entered into revised letters of appointment setting out their expected time commitment and key elements of the role, reflecting the guidelines in the Higgs Report. Their appointment is subject to one month’s notice from either the Company or the Director. Towards the end of the three-year period, the Board will consider whether to continue the appointment for a further three-year period.
At the time of a Director’s appointment to the Board, an internal induction programme is provided on the Group’s strategic and business plans and developments to date. The content of this induction programme and, where appropriate, any additional training which may be required by the Director is kept under review. Directors are also advised of their legal and other obligations as a Director of a listed company.
In accordance with the revised Combined Code and the Company’s Articles of Association, all Directors submit themselves for re-election every three years.
The Board as a whole is collectively responsible for the success of the Company and provides entrepreneurial leadership of the Company within a framework of prudent and effective controls which enables risk to be assessed and managed. It sets out the Company’s values and standards and ensures that its obligations to its shareholders and other stakeholders are understood and met.
79
Back to Contents
The Board has regular scheduled meetings throughout the year together with an annual off-site conference to review and discuss corporate strategy. Additional meetings are held as necessary. During the financial year ended 31 March 2004, the Board met nine times.
The Board has a formal schedule of matters specifically reserved to it for decision, including the approval of strategic plans and the annual operating plan, significant investments and capital projects, and treasury and risk management policies. All Directors take decisions objectively in the interests of the Company.
Guidelines are in place concerning the content, presentation and timely delivery of papers by management to Directors for each Board meeting, so that the Directors have enough information to be properly briefed. Where issues arise at Board meetings, the Chairman ensures that all Directors are properly briefed and, where necessary, appropriate further enquiries are made.
All Directors have access to the advice and services of the Company Secretary who, under the direction of the Chairman, is responsible to the Board for ensuring that Board procedures are followed, maintaining compliance with all applicable rules and regulations, and advising the Board on all governance matters. The appointment and removal of the Company Secretary is a matter for the Board as a whole. There is an agreed procedure for Directors to take, if necessary, independent professional advice at the Company’s expense.
Whilst not actively involved in the day-to-day management of the Company, the non-executive Directors play an important role in bringing their independent judgement and considerable knowledge and experience to the Board’s deliberations with their advice being reflected in management meetings. They have regular contact with senior managers in the business.
During the financial year, the Chairman met regularly with non-executive Directors without the executive Directors present and the non-executive Directors also met without the Chairman present under the leadership of the senior independent Director. One of these latter meetings was to review the performance of the Chairman.
During the financial year, the Board conducted an internal review of its performance and that of its principal Board Committees and individual Directors. Each Director completed a comprehensive questionnaire and there were one-to-one interviews between the Chairman and each Director. Directors were asked to comment on matters such as the culture and approach of the Board, the effective setting of strategy based on information about the business and how the market operates, the quality and timeliness of information provided, the composition of the Board, the role of the senior independent Director, Board meeting processes, the form of continuing professional development, and communication of Board decisions and discussions. The results of this review were considered in one-to-one discussions with the Chairman and collectively at a Board meeting. The Directors concluded that the Board and its Committees operated effectively and that, as individuals, the Directors were each contributing to the overall effectiveness of the Board.
There is a programme of regular dialogue with major institutional shareholders and fund managers and summaries of these discussions and meetings are provided to the Board. In addition, the Board received a presentation on the findings of an independent investor audit. These summaries and reports enable the Directors to gain an understanding of the views and opinions of those with an interest in the Company.
The Company maintains Directors’ and Officers’ Liability Insurance in respect of legal action against its Directors.
The Board has adopted appropriate governance policies dealing with the conduct of Board affairs and has delegated responsibility for monitoring the day-to-day performance of the Group as a whole, allocation of resources within agreed plans, implementation of policies and decisions relating to specific value-related commitments to the Executive Committee and designated managers in accordance with a schedule of delegated authorities.
80
Back to Contents
The attendance of Directors at Board and principal Board Committee meetings held during the year is detailed in the table below:
| | | Board
(9 meetings) | | Audit
Committee
(4 meetings) | | Nomination and
Governance
Committee
(2 meetings) | | Remuneration
Committee
(8 meetings) | |
| | |
|
| |
|
| |
|
| |
|
| |
| D Varney | | | 9 | | | n/a | | | 2 | | | n/a | |
| P Erskine | | | 9 | | | n/a | | | n/a | | | n/a | |
| D Finch | | | 9 | | | n/a | | | n/a | | | n/a | |
| R Gröger | | | 9 | | | n/a | | | n/a | | | n/a | |
| D McGlade | | | 8 | | | n/a | | | n/a | | | n/a | |
K Thexton1 | | | 7 | | | n/a | | | n/a | | | n/a | |
| A Sukawaty | | | 9 | | | n/a | | | 2 | | | 8 | |
| D Arculus | | | 9 | | | 2 | | | 2 | | | n/a | |
| D Chance | | | 9 | | | 4 | | | 2 | | | n/a | |
| S Hodge | | | 9 | | | 4 | | | n/a | | | 8 | |
| N Kroes | | | 9 | | | 2 | | | n/a | | | 8 | |
| I Meakins | | | 8 | | | 2 | | | n/a | | | 7 | |
| P Myners | | | 9 | | | n/a | | | 2 | | | 7 | |
| | |
|
| |
|
| |
|
| |
|
| |
| n/a – non-applicable as not a Committee member. |
| 1 | Kent Thexton resigned from the Board on 4 February 2004. |
Arrangements were made for any Directors who were unable to attend meetings to discuss the agenda items with the relevant Chairman of that meeting in advance.
The Board has delegated authority to the Committees described below on specific matters. All of the Committees have formal terms of reference. Minutes of meetings are formally recorded.
The terms of reference of the Audit, Nomination and Governance, and Remuneration Committees were reviewed and revised during the year in the light of the recommendations in the Higgs’ Report and Sir Robert Smith’s report on the role of audit committees. As part of that review, the Nomination Committee was renamed the Nomination and Governance Committee. The terms of reference of these Committees are posted on the Company’s website and are available, on request, from the Company Secretary and General Counsel who acts as Secretary to these Committees. The Board reviews the membership of the Committees on an annual basis at the start of each financial year or more frequently as circumstances require.
During the year, the Board disbanded the Finance Committee and delegated its responsibilities for reviewing and approving financing and investment decisions to the Chief Executive Officer and the Chief Financial Officer and other specified senior managers.
Chairman’s Committee. Chairman: David Varney |
The Chairman’s Committee advises and assists the Chairman in the preparation for Board meetings. The Committee also acts on behalf of the Board between scheduled Board meetings, in exceptional circumstances, where it is not possible or practicable to convene a meeting of the Board. In addition to the Chairman, Peter Erskine and David Finch are members of the Committee. Following the conclusion of the 2004 Annual General Meeting, David Arculus will become Chairman of the Committee.
81
Back to Contents
Audit Committee. Chairman: Stephen Hodge |
The Committee comprises Stephen Hodge, David Arculus, David Chance, Neelie Kroes and Ian Meakins.
The Committee monitors the integrity of the Company’s financial statements; reviews the Company’s internal financial control system and risk management systems; monitors and reviews the effectiveness of the Company’s internal audit function; makes recommendations to the Board in relation to the appointment of the external auditors and recommends the audit fee (and terms of engagement) to the Board following appointment by the shareholders in general meeting; monitors and reviews the external auditors’ independence, objectivity and effectiveness; considers management’s response to any major external or internal audit recommendations; approves the appointment or dismissal of the Head of Internal Audit; reviews the Company’s procedure for handling allegations from whistleblowers; and considers other topics, such as the Company’s policies for preventing or detecting fraud and its code of corporate conduct/business ethics.
Further details of the Committee and a report of its work during the financial year are set out below.
The composition of the Committee was reviewed at the end of the previous financial year as part of the Board’s overall review of its governance committee arrangements. Further details of the members of the Committee are set out in the biographies of the Directors in Item 6A.
Stephen Hodge, as Chairman of the Committee, is considered by the Board to be the audit committee financial expert and the member of the Committee with recent and relevant financial experience. He receives an additional fee of £5,000 for acting as Chairman of the Committee, which is included in the Directors’ remuneration table contained in the report on directors’ remuneration in Item 6B.
The Company Secretary and General Counsel is secretary to the Committee and minutes of meetings are circulated to all Board members. Regular attendees to Committee meetings, at the invitation of the Committee, include the Chairman, Chief Executive Officer, Chief Financial Officer, the Head of Internal Audit and representatives of the external auditors. The Committee has authority to seek any information that it requires from any employee; authority to obtain independent professional advice; and access to sufficient resources generally to carry out its activities.
As referred to earlier, the Committee undertook a review of its terms of reference following the issue of the revised Combined Code in July 2003 and reported back to the full Board. The amended terms of reference were approved by the Board in November 2003 and are available on the Company’s website and, on request, from the Company Secretary and General Counsel.
The Committee met four times during the financial year. Following each meeting, the Committee members met with the external auditors in private. The Committee members have also met privately with the Head of Internal Audit.
The Committee worked to a structured programme of activities, with agenda matters focused to coincide with key events of the annual financial reporting cycle, together with standing items that the Committee is required to consider at each meeting. The Committee reviewed the following matters and reported its conclusions to the full Board:
| • | the financial disclosures contained in the Company’s annual and interim reports to shareholders and other interested parties; |
| | |
| • | various accounting matters, including the Company’s accounting policies, raised by management and the external auditors in the context of the financial disclosures; |
| | |
| • | the Group’s risk management process, including monitoring and progress on the management of key risks identified by the Company and within the Group’s operating businesses; |
| | |
| • | the effectiveness of internal controls and measures to detect and prevent fraud; |
82
<<<Back to Contents
| • | the annual external audit plan for the Group’s auditors. This review included the audit objectives, auditor independence and objectivity policies, partner rotation, audit scope, team, timetable, deliverables and fee proposal; |
| | |
| • | the amount and purpose of non-audit fees. As noted in last year’s annual report, the Board has adopted a formal policy governing the independence of the Company’s external auditors and defining those non-audit services that may be provided to the Group, including those which require the prior approval of the Committee. This was further reviewed and amended during the financial year to provide for approval by the Chairman of the Committee of contracts relating to permissible tax services up to an aggregated value of £25,000 between scheduled Committee meetings. Details of non-audit services are reviewed at each meeting of the Committee. Further details of the statutory audit and non-audit services fees are set out in note 26 of the financial statements in Item 18. The policy also covers employment of former auditor employees by the Company and audit partner rotation; |
| | |
| • | the external auditors’ year-end report and the findings of their work and confirmation that all significant matters had been satisfactorily resolved; |
| | |
| • | the performance of the external auditors, which resulted in the Committee recommending the re-appointment of PricewaterhouseCoopers LLP as auditors to the Company; and |
| | |
| • | the internal audit plan and resources for the internal audit function. This review included detailed reports from the Head of Internal Audit on progress on matters identified in the plan, current resources of the internal audit function and updates on matters requested by the Committee. |
The Committee has reviewed the ongoing and updated process for the handling of complaints received by the Company regarding accounting, internal accounting controls or auditing matters and for the confidential, anonymous submission by employees of concerns regarding questionable accounting, auditing, employment, ethical or other matters.
The Committee received regular updates from the Company Secretary and General Counsel on corporate governance issues in the UK and US, emanating from the revised Combined Code and the Sarbanes-Oxley Act of 2002.
The Committee also received minutes of all meetings of the Disclosure Committee. Details of the remit of this Committee are provided in the internal control section of this section.
Nomination and Governance Committee. Chairman: David Varney |
The Committee comprises David Varney, David Arculus, David Chance, Paul Myners and Andrew Sukawaty. Following the conclusion of the 2004 Annual General Meeting, David Arculus will become Chairman of the Committee. The Committee is responsible for reviewing the structure, size and composition of the Board and for recommending candidates for Board membership for the approval of the Board.
In the appointment of new Directors, the Committee reviews the current balance of skills on the Board. It draws up a specification to include any specific knowledge or expertise it considers of future benefit to the Board having regard to the business throughout the Group and the overall strategy. External search agents are used during the recruitment process. The agents put forward a short list of candidates for the Committee to review before submitting its recommendation to the Board. Whilst the Chairman of the Board chairs this Committee, he is not permitted to chair meetings when the appointment of his successor is being reviewed.
The Committee ensures that the performance of the Chairman, senior independent Director and other Directors is regularly reviewed.
During the financial year, the Committee met twice. It recommended to the Board those Directors who should retire by rotation and seek re-election at the 2004 Annual General Meeting and considered the leadership needs and succession plans of the Group as a whole. It also established a sub-committee of all the non-executive Directors to review the performance evaluation processes and succession plans for all Directors. The process
83
Back to Contents
leading to the selection of the new Chairman was conducted by an ad-hoc committee of independent Directors headed by the Deputy Chairman and advised by an independent executive search agency.
Remuneration Committee. Chairman: Andrew Sukawaty |
The Committee comprises Andrew Sukawaty, Stephen Hodge, Neelie Kroes, Ian Meakins and Paul Myners. The Committee is responsible for determining the framework and broad policy for the remuneration of the Chairman, all executive Directors, the Company Secretary and General Counsel, and members of the Executive Committee, and for determining, within agreed terms of reference, specific remuneration packages for each of these, including any pension rights, any compensation payments and the implementation of executive incentive schemes. The Committee operates on the principle that members of the executive management should be provided with appropriate incentives to encourage superior performance and should, in a fair and responsible manner, be rewarded for their individual contributions to the success of the Group. The report on directors’ remuneration is set out in Item 6B.
The Executive Committee, chaired by Peter Erskine, and comprising the other executive Directors and his senior executive team, is responsible for the executive day-to-day running of the Company, the preparation and maintenance of strategic plans for the Group, and monitoring the day-to-day performance of the Group as a whole.
US corporate governance compliance |
mmO2 American Depositary Shares are traded on the New York Stock Exchange (NYSE). The Company is required to comply with those provisions of the Sarbanes-Oxley Act of 2002 implemented by the Securities and Exchange Commission as applicable to foreign issuers.
Under the NYSE rules, listed foreign issuers, like mmO2, must disclose any significant ways in which their corporate governance practices differ from those followed by US domestic companies under NYSE listing standards. There are no significant differences in the corporate governance practices followed by mmO2 as compared to those followed by US domestic companies under the NYSE listing standards, except that mmO2 follows the recommendations in the revised Combined Code with respect to membership of its Nomination and Governance Committee which permits membership of this Committee to be composed of a majority of independent non-executive Directors. The NYSE listing standards require that the Nomination Committee be composed entirely of independent Directors.
The Board has overall responsibility for the Group’s systems of internal control and risk management and for reviewing the effectiveness of those systems. Such systems are designed to manage, rather than eliminate, the risk of failure to achieve business objectives; any system can provide only reasonable and not absolute assurance against material misstatement or loss.
The Board sets the policy on Internal Control and Risk Management that is implemented by management. This policy is in accordance with the Turnbull Guidance “Internal Control: Guidance for Directors on the Combined Code”.
Internal Control compliance, Risk Management and Internal Audit are the responsibility of separate functions within the Company but they operate holistically to deliver an effective internal control system.
In the case of joint ventures and associated undertakings, where the Group does not have operating responsibility, our policy is to influence and encourage our own high standards of Internal Control and Risk Management and to offer practical advice wherever appropriate.
As referred to earlier in this report, the Audit Committee, on behalf of the Board, considers the effectiveness of the operation of internal control procedures in the Group during the financial year. It reviews reports from the
84
Back to Contents
Executive Committee and from both the internal and external auditors, keeping under review the scope and results of the audit and the cost effectiveness, independence and objectivity of the auditors and reports its conclusions to the Board. The Group’s internal auditors carry out regular assessments of the quality of the Internal Control and Risk Management process as part of their cyclical risk- based audit approach. The Internal Control and Risk Management policies were reviewed during the year, and the Internal Control policy was updated.
The Group has a detailed ongoing risk management process for identifying, evaluating and managing the significant risks faced by the Company.
Risk assessment and evaluation take place as an integral part of the Group’s annual strategic planning cycle and this includes the consideration of major business risks by senior management.
The risk management process comprises the following key elements:
| • | Group operating companies and key functions in the business carry out risk assessments, using workshop techniques, to determine the nature and extent of risks facing the Company; |
| | |
| • | the Executive Committee undertakes a formal Group-wide risk review every six months, which is reviewed by the Board. Risk management is a formal item at each Executive Committee meeting; |
| | |
| • | registers are produced which detail significant risks and indicate likelihood, impact, and the level of controls, together with mitigating actions; |
| | |
| • | the profile of the significant risks from the registers is summarised and tracked using a consolidated risk map; |
| | |
| • | senior management is accountable and responsible for managing risks within the Group, supported by dedicated risk managers. These risk managers assist in embedding risk management within the business culture via risk forums, team meetings, training sessions and the Company’s intranet; |
| | |
| • | the Internal Audit function also promotes effective risk management in the business operations; and |
| | |
| • | a fast track process for identifying and responding to evolving risks and significant changes to existing risks so that they are reported to an appropriate level of management and corrective action is taken. |
The Audit Committee receives a summary six-monthly report from the Chief Executive Officer on the effectiveness of the Company’s internal controls which is based on senior management reports on their area of responsibility. This includes:
| • | the Group risk registers, risk maps and dashboards; and |
| | |
| • | the Group Corporate Governance Certificates authorised by the Chief Executive Officer and Chief Financial Officer. |
The Company has a Disclosure Committee which considers the materiality of information and the respective disclosure obligations in releases made to regulatory bodies. This Committee assists the Chief Executive Officer and Chief Financial Officer to evaluate the effectiveness of the Group’s disclosure controls and procedures in order to ensure that material information relating to the Group is made known to them.
The Board has reviewed the nature, extent and development of the significant risks to the business. The Group’s current key risks are summarised in risk factors in Item 3D.
85
Back to Contents
On behalf of the Board, the Audit Committee has reviewed regularly the effectiveness of the system of internal controls and reported its findings to the Board.
The Chief Executive Officer and Chief Financial Officer have concluded, after evaluating the effectiveness of the Group’s disclosure controls and procedures as of the end of the period covered by this annual report on Form-20F that mmO2’s disclosure controls and procedures are effective in ensuring that material information relating to the Company is made known to them by others within the Group. The procedures provide reasonable assurance that problems are identified on a timely basis and dealt with accordingly.
There were no significant changes in the Company’s internal controls or in other factors that could significantly affect internal controls subsequent to the date of the most recent evaluation.
These processes have been in place for the whole of the financial year and have continued up to the date on which this document was approved.
To reinforce our commitment to achieve best practice in our standards of business ethics and corporate governance, mmO2has a set of Business Principles covering the whole Group including its Directors and senior financial officers, which have been endorsed by the Chairman. There have been no waivers or changes to these Business Principles during the year. A copy of the statement is available on the Company’s website. These high-level principles are supported by a confidential helpline and e-mail facility, which are available to employees who want to report incidents and for those who have questions regarding the application of the principles. The Company also continues to require its business partners and suppliers to apply these principles when dealing with mmO2.
The Board takes regular account of significant social, environmental and ethical issues that affect the Group. This includes risks and opportunities that relate to our people, our supply chain, our customers, the environment and society around us.
We are also producing a separate externally verified Corporate Responsibility report, which will be available in July 2004. Copies of the report can be obtained from the Company’s website or, on request, from the Company Secretary and General Counsel.
The Company is committed to ongoing development of open and effective communications with shareholders. The Chief Executive Officer and the Chief Financial Officer regularly meet with institutional shareholders and analysts and the Company’s Annual General Meeting is used as an opportunity to communicate with private investors and encourage their participation. All substantial issues, including the adoption of the annual report and financial statements, are proposed at the Annual General Meeting on separate resolutions. At last year’s Annual General Meeting the number of proxy votes received for or against each resolution, together with the number of proxy abstentions, were indicated after the vote had been dealt with on a show of hands. In accordance with evolving best practice, all of the resolutions being proposed at the Company’s 2004 Annual General Meeting will be conducted by way of a poll. The poll results will be notified to the UK Listing Authority and published on the Company’s website following verification by the Company’s share registrar. It is intended that the Chairmen of the Audit, Nomination and Governance, and Remuneration Committees will be available to answer questions at the Annual General Meeting.
The Company’s website provides financial and other business information about the Group. It contains an archive of past announcements and annual reports, share price information and a calendar of events as well as information on mmO2’s approach to corporate responsibility and the Company’s Business Principles.
86
Back to Contents
The Directors have reviewed the Group’s liquid resources and borrowing facilities, and the Group’s budget and cash flow forecast for the year to 31 March 2005, and outline projections for the subsequent year. On the basis of this review, the Directors are satisfied that the Group has adequate resources to continue in operational existence for the foreseeable future. For this reason, the Directors adopt the going-concern basis in the preparation of the financial statements.
The following tables present information concerning employee numbers and costs.
| | | 2004 | | 2003 | | 2002 | |
| | |
|
| |
|
| |
|
| |
| | | No. | | No. | | No. | |
| Average number of full time employee equivalents (including Executive Directors) by class of business: | | | | | | | | | | |
| Mobile telecommunications | | | 11,133 | | | 11,643 | | | 13,999 | |
| Mobile internet services | | | 301 | | | 269 | | | 307 | |
| Other businesses | | | 913 | | | 866 | | | 810 | |
| | |
|
| |
|
| |
|
| |
Total employees | | | 12,347 | | | 12,778 | | | 15,116 | |
| | |
|
| |
|
| |
|
| |
| Average number of full time employee equivalents (including Executive Directors) by geographic area: | | | | | | | | | | |
| UK | | | 7,328 | | | 7,081 | | | 8,750 | |
| Germany | | | 3,494 | | | 3,527 | | | 4,084 | |
| Other | | | 1,525 | | | 2,170 | | | 2,282 | |
| | |
|
| |
|
| |
|
| |
Total employees | | | 12,347 | | | 12,778 | | | 15,116 | |
| | |
|
| |
|
| |
|
| |
The costs incurred in respect of these employees were:
| | | 2004 | | 2003 | | 2002 | |
| | |
|
| |
|
| |
|
| |
| | | £m | | £m | | £m | |
| Wages and salaries | | | 456 | | | 446 | | | 483 | |
| Social security costs | | | 58 | | | 47 | | | 59 | |
| Employee share ownership scheme | | | 8 | | | 4 | | | 2 | |
| Pension costs (note 29 in Item 18) | | | 26 | | | 24 | | | 26 | |
| | |
|
| |
|
| |
|
| |
Total staff costs | | | 548 | | | 521 | | | 570 | |
| | |
|
| |
|
| |
|
| |
At 31 March 2004, the Group employed 12,905 (2003: 12,476, 2002: 14,300) full time employee equivalents.
In the United Kingdom, a number of our employees are represented by two labour unions: Connect, which has representation rights in respect of management employees and the Communications Workers Union, which has representation rights in respect of clerical, engineering and technical employees. Membership of these unions is individual and voluntary. In addition, certain managers are represented by a non-unionised employee representative body. Our other operating businesses also meet with their employee representative bodies, or works councils, regularly. We believe that our businesses have a good relationship with our employees and their representatives.
Approximately 67 per cent of our permanent employees are covered by collective bargaining agreements. These agreements are kept under review, with changes being made through discussion with the relevant representative body as required.
For the purposes of US GAAP reporting, the Group accounts for stock compensation in accordance with the requirements of APB Opinion No. 25 “Accounting for Stock Issued to Employees” and applies the disclosure
87
Back to Contents
provisions in SFAS No. 148, “Accounting for Stock-Based Compensation – Transition and Disclosure – an amendment to FASB Statement No. 123”.
Aggregate share compensation costs of £34 million (2003: £3 million, 2002: £2 million) have been recognised under APB No. 25 in the year. A charge of £8 million (2003: £2 million, 2002: £2 million) was recognised under UK GAAP.
The Group operates savings-related share option plans for its employees and those of participating subsidiaries and further share option plans (the mmO2 Share Option Plan and the mmO2 Legacy Option Plan) for selected Group employees.
The mmO2 Sharesave Plan is a savings-related share option scheme available to all employees. The scheme enables employees to acquire shares in the Company through monthly savings over a three-year or five-year Save-As-You-Earn contract. The savings are then used to purchase shares at the exercise price, which is set at the beginning of the savings contract, at a 20 per cent discount to the prevailing market price at invitation date. Invitations to participate in the scheme are normally made annually. Similar savings related schemes exist for Group employees based outside the UK.
In the year ended 31 March 2004, no options were granted to employees under this plan (2003: 1,041 employees for nil consideration). All such options have an exercise price equal to the market value at grant date. These options were granted on terms that they normally only become exercisable on the third anniversary of grant subject to certain performance criteria. If these criteria are not met on the third anniversary of grant, the performance goals will be retested on the fourth and fifth anniversaries. Options under this scheme generally have a life of ten years.
Options over BT shares granted under BT executive share option plans were replaced with options over mmO2 shares, granted under the Legacy Option Plan, for those participants now employed by mmO2. The replacement options were granted on the same terms, and are exercisable between the same dates, as the options for which they were exchanged. The exercise price of these options equals the market value as at original grant date. Options are normally exercisable up until the tenth anniversary of the date of the original grant.
88
Back to Contents
Options outstanding in relation to Group employees under the Sharesave Plan, mmO2 Share Option Plan and mmO2 Legacy Option Plan as at 31 March 2004 together with their exercise prices and vesting periods, were as follows:
| | | | | Options outstanding over
ordinary shares and ADSs | | Options exercisable over
ordinary shares and ADSs | |
| | | | |
| |
| |
Range of exercise prices1 | | Number
outstanding | | Weighted-
average
remaining
contractual
life | | Weighted
average
exercise
price | | Number
exercisable | | Weighted-
average
exercise
price | |
| |
|
| |
|
| |
|
| |
|
| |
|
| |
| | | (m) | | (years) | | (£) | | (m) | | (£) | |
| £0.44 | | | 35 | | | 2 | | | 0.44 | | | — | | | — | |
| £0.46 | | | 68 | | | 8 | | | 0.46 | | | — | | | — | |
| £0.48-0.49 | | | 1 | | | 9 | | | 0.48 | | | — | | | — | |
| £0.54 | | | 14 | | | 3 | | | 0.54 | | | — | | | – | |
| £0.64-0.69 | | | 7 | | | 8 | | | 0.67 | | | 4 | | | 0.69 | |
| £0.73-0.82 | | | 6 | | | 1 | | | 0.73 | | | — | | | — | |
| £0.87 | | | 35 | | | 8 | | | 0.87 | | | 3 | | | 0.87 | |
| £1.02-1.93 | | | 2 | | | 7 | | | 1.27 | | | 2 | | | 1.28 | |
| | |
|
| |
|
| |
|
| |
|
| |
|
| |
| | | | 168 | | | 6 | | | 0.58 | | | 9 | | | 0.83 | |
| | |
|
| |
|
| |
|
| |
|
| |
|
| |
| 1 | Share options over American Depositary Shares (ADS) have exercise prices termed in US Dollars. For purposes of disclosure, these options’ exercise prices have been translated into Sterling at the year end exchange rate. As each ADS represents ten ordinary shares, the number of options and exercise prices have been adjusted by this ratio to reflect the options on a like for like basis. |
Options granted, exercised and lapsed during the years ended 31 March 2004, 2003 and 2002 in respect of Group employees under these share option schemes were as follows:
| | | Options over
ordinary shares | | Options over ADSs | |
| | |
| |
| |
| | | Ordinary shares1 | | ADSs2 | |
| | |
| |
| |
Range of exercise prices1 | | Savings-
related
share
options | | Other
share
options | | Weighted-
average
exercise
price | | Other
share
options | | Weighted-
average
exercise
price | |
| |
|
| |
|
| |
|
| |
|
| |
|
| |
| | | (m) | | (m) | | (£) | | (m) | | (£) | |
| Balance at 31 March 2001 | | | 50 | | | 3 | | | 1.37 | | | — | | | — | |
| Lapsed on demerger | | | (50 | ) | | (3 | ) | | 1.37 | | | — | | | — | |
| | |
|
| |
|
| |
|
| |
|
| |
|
| |
| Balance on demerger | | | — | | | — | | | — | | | — | | | — | |
| Granted | | | 31 | | | 65 | | | 0.82 | | | 6 | | | 1.17 | |
| Lapsed | | | — | | | (2 | ) | | 0.84 | | | — | | | — | |
| | |
|
| |
|
| |
|
| |
|
| |
|
| |
| Balance at 31 March 2002 | | | 31 | | | 63 | | | 0.82 | | | 6 | | | 1.17 | |
| Granted | | | 37 | | | 81 | | | 0.45 | | | — | | | — | |
| Lapsed | | | (23 | ) | | (6 | ) | | (0.72 | ) | | (3 | ) | | 0.87 | |
| | |
|
| |
|
| |
|
| |
|
| |
|
| |
| Balance at 31 March 2003 | | | 45 | | | 138 | | | 0.60 | | | 3 | | | 1.49 | |
| Granted | | | 15 | | | — | | | 0.54 | | | — | | | — | |
| Lapsed | | | (5 | ) | | (23 | ) | | (0.76 | ) | | (1 | ) | | (1.69 | ) |
| Exercised | | | — | | | (4 | ) | | (0.70 | ) | | — | | | — | |
| | |
|
| |
|
| |
|
| |
|
| |
|
| |
Balance at 31 March 2004 | | | 55 | | | 111 | | | 0.57 | | | 2 | | | 0.93 | |
| | |
|
| |
|
| |
|
| |
|
| |
|
| |
| 1 | All options granted, exercised, lapsed and outstanding for periods prior to demerger have been adjusted to reflect the exchange ratio of 4.1266 shares of mmO2 per share of BT. |
| 2 | Share options over ADSs have exercise prices termed in US Dollars. For purposes of disclosure, these options’ exercise prices have been translated into Sterling at the year end exchange rate. As each ADS represents ten ordinary shares, the number of options and exercise prices have been adjusted by this ratio to reflect the options on a like for like basis. |
89
Back to Contents
The Group operates share award schemes for its employees.
mmO2 Restricted Share Plan |
Restricted share awards have been granted to a small group of senior executives. Most of these awards have been granted on terms that they will normally only vest on the third anniversary of grant if the participant builds up a predetermined personal shareholding in the Group, and remains in employment with the Group. Shares required to satisfy these awards are held in trust during the restricted period. In accordance with APB No. 25, an expense has been recognised to the extent that executives have commenced building their personal shareholding. No shares were granted under this plan in the years ended 31 March 2004 and 31 March 2003. The weighted average fair value at grant date of the 9.4 million shares granted under this plan in the year ended 31 March 2002 was £0.80.
mmO2 Performance Share Plan |
Performance related share awards have been granted to 1,005 employees during the year ended 31 March 2004. These awards are granted on terms that they will vest on the third anniversary of grant if the Company meets certain performance criteria, and the participant remains in employment with the Group. In accordance with APB No. 25, an expense has been recognised to the extent that it is expected that performance criteria will be achieved. The weighted average fair value at grant date of the 26.4 million shares granted under this plan in the year ended 31 March 2004 was £0.53.
A number of key employees of mmO2 were participants prior to demerger in BT share plans. The awards have been adjusted so that they relate solely to mmO2 plc shares, and any performance measure has been translated into a measure of the Group’s performance from demerger to the end of the performance period. On maturity these awards will be satisfied in existing mmO2 shares held by an employee trust which has already been funded by BT. In accordance with the rules of these plans the awards were converted into awards over mmO2 plc shares on the basis of an adjustment factor of 4.1266.
| | Incentive Share Plan (ISP) and Retention Share Plan (RSP) |
| | |
| | Participants are awarded shares which will normally vest at the end of a three-year period provided a predetermined total shareholder return (TSR) target is met. |
| | |
| | Executive Share Plan (ESP) |
| | |
| | Participants are awarded shares which will normally vest at the end of five years provided a predetermined TSR target is met. |
| | |
| | Deferred Bonus Plan (DBP) |
| | |
| | Awards of shares were made to executives based on their performance in the preceding financial year and vest after three years. Under the DBP there are no associated performance goals. |
Under the Separation Agreement between the Group and BT, it has been endorsed and agreed that all share awards required under the ISP, RSP, ESP and DBP will be honoured by BT and will be satisfied by issuance of existing mmO2 shares held by a BT trust which has already been funded by BT. Thus, the Group is not responsible for any of the options or shares under these schemes and will bear no compensation expense in association with them.
Further details on the above plans can be found by reference to Item 6 “Directors, Senior Management and Employees – B. Compensation”.
90
Back to Contents
| ITEM 7 | MAJOR SHAREHOLDERS AND RELATED PARTY TRANSACTIONS |
Share and ADR prices
As at 30 June 2004, no person or company is known to hold more than three per cent of the Company’s ordinary shares except for those disclosed in the following table:
Shareholder | | Number of mmO2 plc
ordinary shares | | Percentage of issued
ordinary share capital | |
| |
|
| |
|
| |
| FMR Corp. and Fidelity International Limited | | | 507,619,175 | | | 5.85 | |
| Legal & General Investment Management Limited | | | 301,411,186 | | | 3.47 | |
The Company is not directly or indirectly owned or controlled by any other company or any government.
| | | Pence per
ordinary share | | US$ per ADS | |
| | |
| |
| |
| | | High | | Low | | High | | Low | |
| | |
|
| |
|
| |
|
| |
|
| |
| | | pence | | pence | | $ | | $ | |
| January 2004 | | | 86.00 | | | 79.00 | | | 15.56 | | | 14.10 | |
| February 2004 | | | 107.00 | | | 82.75 | | | 20.08 | | | 15.19 | |
| March 2004 | | | 112.00 | | | 97.50 | | | 20.55 | | | 17.81 | |
| April 2004 | | | 103.75 | | | 99.75 | | | 19.10 | | | 17.54 | |
| May 2004 | | | 100.00 | | | 92.50 | | | 17.96 | | | 16.35 | |
| June 2004 | | | 99.75 | | | 92.75 | | | 18.25 | | | 16.72 | |
The prices are the highest and lowest closing middle market prices for mmO2 ordinary shares, as derived from the Daily Official List of the London Stock Exchange, and the highest and lowest sales prices of mmO2 ADSs, as reported on the New York Stock Exchange, for the months indicated.
Analysis of shareholdings |
| |
| | | | | | | Ordinary shares of
0.1p each | |
| | | | | | |
| |
Size of shareholding at 31 March 2004 | | Number of
shareholders | | Percentage
of total | | Number of
shares held | | Percentage
of total | |
| |
|
| |
|
| |
|
| |
|
| |
| 1 – 500 | | | 857,996 | | | 54.36 | | | 222,182,489 | | | 2.56 | |
| 501 – 999 | | | 375,422 | | | 23.79 | | | 262,335,968 | | | 3.02 | |
| 1,000 – 9,999 | | | 339,188 | | | 21.49 | | | 684,951,138 | | | 7.90 | |
| 10,000 – 99,999 | | | 4,512 | | | 0.29 | | | 86,017,905 | | | 0.99 | |
| 100,000 – 999,999 | | | 680 | | | 0.04 | | | 260,898,163 | | | 3.01 | |
| 1,000,000 – 4,999,999 | | | 333 | | | 0.02 | | | 769,811,856 | | | 8.87 | |
| 5,000,000 and above | | | 214 | | | 0.01 | | | 6,388,492,249 | | | 73.65 | |
| | |
|
| |
|
| |
|
| |
|
| |
Total | | | 1,578,345 | | | 100.00 | | | 8,674,689,768 | | | 100.00 | |
| | |
|
| |
|
| |
|
| |
|
| |
At 31 March 2004, the number of holders of record of mmO2 ordinary shares in the USA was 3,483 with holdings of 2,244,611 ordinary shares, and the number of registered holders of ADSs was 1,874 with holdings of 6,796,796 ADSs, representing 67,967,960 ordinary shares. Because certain of these ordinary shares and ADSs were held by brokers or other nominees, the number of holders of record or registered holders in the USA is not representative of the number of beneficial holders or of the residence of beneficial holders.
91
Back to Contents
Interest of management in certain transactions
During and at the end of the 2004 financial year, none of the Company’s Directors had a significant interest in any material transaction in relation to the Group’s business.
| B. | Related Party Transactions |
None
| C. | Interests of Experts and Counsel |
Not applicable.
| ITEM 8 | FINANCIAL STATEMENTS |
| | |
| A. | Consolidated Financial Statements and Other Financial Information |
| |
Audited Consolidated Financial Statements |
Please refer to Item 18 “Financial Statements” for our audited consolidated financial statements.
The Group does not believe there are any pending legal proceedings which would have a material adverse effect on the financial position or results of operations of the Group.
At the time of the demerger we expected that all available cash from operations would be used to finance the development and growth of the operating businesses and to meet capital and other expenditure requirements. We did not anticipate paying dividends in the foreseeable future. Having reported, for the first time, positive earnings per share and positive cash flow for the full year, and as visibility of the future financial profile of the Group becomes clearer, it is now appropriate to review the distribution policy established at the time of demerger. This review will be undertaken during the first half of the financial year to 31 March 2005, and we will aim to update the distribution policy at the time of our Interim Results announcement, scheduled for November 2004.
The Directors do not recommend the payment of a dividend for the year ended 31 March 2004.
There has been no significant change in our financial or trading position since 31 March 2004, the date to which our audited consolidated financial statements were prepared.
| ITEM 9 | THE OFFER AND LISTING |
| | |
| A. | Offer and Listing Details |
Our American Depositary Shares, each representing ten ordinary shares of nominal value 0.1p each, have been listed and traded on the New York Stock Exchange since 19 November 2001 under the symbol “OOM”. Our shares have also been listed on the London Stock Exchange since 19 November 2001 under the symbol “OOM”. Prior to these listings, there was no public market for our equity securities.
The New York Stock Exchange and the London Stock Exchange are the principal trading markets for our ADSs and ordinary shares.
The high and low closing sale prices of the ordinary shares on the London Stock Exchange and of the ADSs on the New York Stock Exchange for each of the last 6 months can be found by reference to Item 7. “Major Shareholder and Related Party Transactions – A. Major Shareholders – Share and ADR prices”.
92
Back to Contents
Not applicable.
The ordinary shares of the Company were listed on the London Stock Exchange on 19 November 2001. On the same date ADSs were also listed on the New York Stock Exchange. The ratio of ADSs to ordinary shares is 1:10. The ADSs have been issued by JPMorgan Chase Bank as Depositary for the ADSs.
Not applicable.
Not applicable.
Not applicable.
ITEM 10 ADDITIONAL INFORMATION |
Not applicable.
| B. | Memorandum and Articles of Association |
Incorporated by reference to our Registration Statement on Form 20-F filed with the Securities and Exchange Commission on 20 September 2001, and incorporated herein by reference except with respect to the following change to the Articles of Association:
On 20 December 2001, the one issued redeemable preference share of £50,000 was redeemed, following which, pursuant to a conditional special resolution passed on 11 September 2001, the authorised redeemable preference share capital was sub-divided into and redesignated as 50,000,000 ordinary shares with a face value of 0.1p each.
The following contracts, not being contracts entered into in the ordinary course of business, have been entered into by a member of our Group and either:
| • | have been entered into within the two years immediately preceding the date of this annual report and are material: or |
| | |
| • | contain any provision under which any member of our Group has any obligation or entitlement which is material at the date of this annual report: |
| | |
| (a) | a syndicated credit facilities agreement (which became available for drawdown on the date of our demerger), dated 14 September 2001 (the “Facility Agreement”), between mmO2 and O2 as borrowers, certain financial institutions who have participated in the credit facility (the “Banks”). |
| | |
| | The Facility Agreement provides for the Banks to make available to mmO2 and O2 a five-year committed £1,725 million multi-currency revolving credit facility (“Tranche A”) and provides a 364-day committed £1,750 million multi-currency revolving facility (“Tranche B”). |
| | |
| | Cash advances under Tranche A are for general corporate purposes of the mmO2 Group. £1,000 million of Tranche B was refinanced through €1,000 million and £375 million Eurobond issues launched in January |
93
Back to Contents
| | 2002 and which have a five-year and ten-year term, respectively. Tranche B matured 14 September 2001 and was replaced by a £300 million, 364-day syndicated committed multi-currency facility (the “Facility”). The Facility was reduced to £150 million on 31 December 2002 and matured 14 September 2003. |
| | |
| | The facilities are guaranteed by mmO2 in respect of drawings of each additional borrower, and by such subsidiaries of mmO2 as are nominated by mmO2 and accede to the Facility Agreement as guarantors. |
| | |
| (b) | A €5,000 million Euro Medium Term Note Programme (the “Programme”), was established for the issue of Euro Medium Term Notes (the “Notes”). Notes issued will be constituted by a trust deed dated 18 December 2001 entered into between the Issuer and Bankers Trustee Company Limited. Under the Programme, the Issuer may issue Notes denominated in any currency under the terms and conditions as set out in an offering circular dated 18 December 2001 (the “Offering Circular”) up to €5,000 million (or its equivalent in other currencies) outstanding at any time. The €1,000 million and £375 million Eurobond issues were launched in January 2002 under the Programme. |
There are currently no exchange controls or other limitations in the UK affecting security holders.
The following discussion is a general summary of certain material UK tax and US federal income tax considerations under present law relevant to the ownership and disposition of our shares or American Depositary Shares (ADSs). It applies only if you are a US holder (as defined below), you hold our shares or ADSs as capital assets and you use the US dollar as your functional currency. It does not address the tax treatment of US holders subject to special rules, such as US expatriates, banks, securities dealers, traders in securities that elect to mark to market, insurance companies, tax-exempt entities, holders that directly, indirectly or by attribution own ten per cent or more of our share capital or voting power, persons holding our shares or ADSs as part of a hedge, straddle, conversion or constructive sale transaction, persons who acquired their shares or ADSs pursuant to the exercise of options or similar derivative securities or otherwise as compensation and persons that are resident or ordinarily resident in the United Kingdom.
This summary does not consider your particular circumstances. It is not a substitute for tax advice. We urge you to consult your own tax advisers about the particular tax consequences to you in light of your particular circumstances of ownership of our shares or ADSs.
As used in this discussion, “US holder” means a beneficial owner of our shares or ADSs that is (i) a US citizen or individual resident, (ii) a corporation (or other entity taxable as a corporation under US federal income tax law) organised under US law, (iii) a trust subject to the control of a US person and the primary supervision of a US court, or (iv) an estate the income of which is subject to US federal income tax regardless of its source.
If a partnership holds shares or ADSs, the tax treatment of a partner generally will depend upon the status of the partner and the activities of the partnership. A partner in a partnership that holds shares or ADSs is urged to consult its own tax advisor regarding the specific tax consequences of owning and disposing of the shares or ADSs.
No tax is required to be withheld at source from dividends paid on our shares or ADSs.
Except as discussed below, you will not be liable for tax on capital gains realised on your disposal of our shares or ADSs unless you are resident or ordinarily resident in the United Kingdom, or you carry on a trade, profession or vocation in the United Kingdom through a branch, agency or permanent establishment in the UK and our
94
Back to Contents
shares or ADSs are or have been used, held or acquired for the purposes of such trade (or profession or vocation) or such branch, agency or permanent establishment.
If you are an individual who has ceased to be resident or ordinarily resident in the United Kingdom for a period of five years and you dispose of our shares or ADSs during that period, you may be liable for tax on capital gains on your return to the United Kingdom, subject to any available exemption or relief.
Our ordinary shares will be assets situated, and our ADSs are likely to be assets situated, in the United Kingdom for the purposes of the UK inheritance tax. Subject to the discussion of the UK-US estate tax treaty in the next paragraph, UK inheritance tax may apply if you hold our shares or ADSs, and you gift them or die even if you are neither domiciled nor deemed to be domiciled in the United Kingdom. If you transfer our shares or ADSs at less than full market value, you may be treated as making a gift. Special rules apply to gifts to close companies, to trustees of settlements and to gifts where the donor retains some benefit.
If you are domiciled in the United States for purposes of the current estate and gift tax convention between the United States and the United Kingdom (the “UK-US estate tax treaty”) and you are not a UK national, you will not be subject to UK inheritance tax unless our shares or ADSs are part of the business property of a UK permanent establishment or pertain to a UK fixed base of an individual used for the performance of independent personal services.
The UK-US estate tax treaty generally provides for a credit mechanism if our shares or ADSs are subject to both UK inheritance tax and to the US federal estate or gift tax.
UK Stamp duty and stamp duty reserve tax |
UK stamp duty and stamp duty reserve tax UK stamp duty and stamp duty reserve tax, or SDRT, are generally payable upon the issue and deposit of our shares with the depository or its nominee in exchange for our ADSs evidenced by ADRs. The current rate of stamp duty and SDRT imposed on these issues and transfers is 1.5 per cent applied, in each case, to the value of the consideration for the transfer or, in some circumstances, to the value of our shares. The stamp duty or SDRT is payable by the depository. In accordance with the terms of the deposit agreement holders of our ADRs must reimburse the depository for the stamp duty or SDRT.
In practice, no UK stamp duty will be payable on the transfer of our ADRs if the instrument of transfer is not executed in the United Kingdom and remains outside the United Kingdom. Transfer of our ADRs will not give rise to a liability for SDRT.
A transfer of our shares by the depository to an ADR holder where there is no change in beneficial ownership will result in UK stamp duty at the rate of £5 per transfer.
Transfers of our shares to persons other than the depository or its nominee will give rise to UK stamp duty or SDRT at the time of transfer or agreement to transfer, normally at the rate of 0.5 per cent (rounded up, in the case of stamp duty, to the nearest £5) of the amount payable for our shares. The purchaser usually pays SDRT or UK stamp duty. If our shares are later transferred to the depository, additional UK stamp duty or SDRT will normally be payable as described above.
US Federal Income Taxation |
If the obligations contemplated by the deposit agreement are performed in accordance with their terms, holders of our ADSs generally will be treated for US federal income tax purposes as the owners of our shares represented by those ADSs.
Dividends generally will be included in your gross income as dividend income from foreign sources on the date of receipt by the depositary (in the case of our ADSs) or the holder (in the case of our shares). Distributions in excess of our current and accumulated earnings and profits (as determined for US federal income tax purposes) generally will be treated first as a tax-free return of capital to the extent of the US holder’s adjusted tax basis in
95
Back to Contents
the share or ADSs, and to the extent in excess of such tax basis, will be treated as a gain from a sale or exchange of such shares or ADSs. The dividends will not be eligible for the dividends-received deduction available to corporations. Dividends paid in pounds sterling will be includible in income in a US dollar amount based on the exchange rate in effect on the date received by the depository (in the case of our ADSs) or the holder (in the case of our shares) whether or not the payment is converted into US dollars at that time. Any gain or loss you recognize on a subsequent conversion of pounds sterling for a different amount generally will be US source ordinary income or loss.
Recent US tax law changes applicable to individuals |
Under 2003 US tax legislation, some US holders (including individuals) are eligible for reduced rates of US federal income tax (currently a maximum of 15%) in respect of “qualified dividend income” received in taxable years beginning after 31 December 2002 and beginning before 1 January 2009. For this purpose, qualified dividend income generally includes dividends paid by non-US corporations if, among other things, certain minimum holding periods are met and either (i) the shares (or ADSs) with respect to which the dividend has been paid are readily tradable on an established securities market in the United States, or (ii) the non-US corporation is eligible for the benefits of a comprehensive US income tax treaty which provides for the exchange of information (such as the new United Kingdom – United States Income Tax Convention that entered into force on 31 March 2003). We currently believe that dividends paid with respect to our shares and ADSs should constitute qualified dividend income for US federal income tax purposes, provided the individual US holders of our shares and ADSs meet certain requirements. Some of the eligibility requirements for non-US corporations are not entirely certain, however, and further guidance from the IRS is anticipated. In addition, the IRS is expected to issue certification procedures in 2004 whereby a non-US corporation will be required to certify as to the eligibility of its dividends for the reduced US federal income tax rates.
You will recognize capital gain or loss on the sale or other disposition of our shares or ADSs in an amount equal to the difference between your adjusted tax basis in the shares or ADSs and the amount realized from the sale or other disposition. Gain or loss upon the disposition of shares or ADSs generally will be US source gain or loss, and will be treated as long-term capital gain or loss if, at the time of the disposition, the holding period for the shares or ADSs exceeds one year. If you are an individual, any capital gains generally will be subject to US federal income tax at preferential rates if specified minimum holding periods are met. The deductibility of capital losses is subject to significant limitations.
The surrender of ADSs in exchange for shares pursuant to the Deposit Agreement governing the ADSs will not be a taxable event for US federal income tax purposes. Accordingly, you will not recognize any gain or loss upon such surrender.
A US holder that receives pounds sterling on the sale or other disposition of our shares will realize an amount equal to the US dollar value of the pounds sterling on the date of sale (or, in the case of cash basis or electing accrual basis taxpayers, the settlement date). A US holder will have a tax basis in the pounds sterling received equal to the US dollar amount realized. Any gain or loss realized on a subsequent conversion of the pounds sterling for a different amount generally will be US source ordinary income or loss.
Passive foreign investment company status |
A non-US corporation will be classified as a Passive Foreign Investment Company (a “PFIC”) for any taxable year if at least 75% of its gross income consists of passive income or at least 50% of the average value of its assets consists of assets that produce, or are held for the production of, passive income. We currently believe that we did not qualify as a PFIC for the taxable year ending 31 March 2004 for US federal income tax purposes. However, PFIC status is a factual determination that must be made at the close of each taxable year and is based on, among other things, the type of income we receive and the value of our assets and shares, all of which will likely change from time to time. If we were to become a PFIC for any taxable year, US holders would suffer adverse tax consequences. These consequences may include having gains realized on the disposition of shares or
96
Back to Contents
ADSs treated as ordinary income rather than as capital gain and being subject to punitive interest charges on certain dividends and on the proceeds of the sale or other disposition of the shares or ADSs. Furthermore, dividends paid by us would not be “qualified dividend income” and would be subject to the higher rates applicable to other items of ordinary income. US holders should consult their own tax advisors regarding the potential application of the PFIC rules to our shares or ADSs.
US Information reporting and backup withholding |
Dividend payments made to holders of shares or ADSs and proceeds from the sale, exchange or redemption of shares or ADSs may be subject to information reporting requirements and US federal backup withholding tax at a current rate of 28 per cent. Certain exempt persons (such as corporations) are not subject to these information reporting requirements. Backup withholding will not apply, however, to a holder who furnishes a correct taxpayer identification number or certificate of foreign status and makes any other required certification or who is otherwise exempt from the backup withholding. US persons who are required to establish their exempt status generally must furnish a completed Internal Revenue Service Form W-9 (Request for Taxpayer Identification Number and Certification). Non-US holders generally will not be subject to US information reporting or backup withholding. However, such holders may be required to provide certification of non-US status in connection with payments received in the United States or through certain US-related financial intermediaries.
Backup withholding is not an additional tax. Amounts withheld as backup withholding may be credited against a holder’s US federal income tax liability, and a holder may obtain a refund of any excess amounts withheld under the backup withholding rules by filing the appropriate claim for refund with the US Internal Revenue Service and furnishing any required information.
| F. | Dividends and Paying Agents |
| | |
| | The documents that are exhibits to this annual report can be obtained from the Securities and Exchange Commission’s (“SEC”) public reference facilities at 450 Fifth Street, N.W., Washington DC 20549, USA, at prescribed rates. Additionally, copies of this material may also be obtained from the SEC’s Internet website at http://www.sec.gov. |
ITEM 11 QUANTITATIVE AND QUALITATIVE DISCLOSURES ABOUT MARKET RISK |
| | |
| | We are exposed to interest rate risk and foreign exchange rate risk. See note 18 to our consolidated financial statements in Item 18, “Financial Statements”, for a description of how we manage these risks. |
97
Back to Contents
ITEM 12 DESCRIPTION OF SECURITIES OTHER THAN EQUITY SECURITIES |
| D. | American Depositary Shares |
98
Back to Contents
PART II
ITEM 13 DEFAULTS, DIVIDEND ARREARAGES AND DELINQUENCIES |
ITEM 14 MATERIAL MODIFICATIONS TO THE RIGHTS OF SECURITY HOLDERS AND USE OF PROCEEDS |
ITEM 15 CONTROLS AND PROCEDURES |
| | |
| | Our chief executive office and chief financial officer, after evaluating the effectiveness of our disclosure controls and procedures (as defined in Exchange Acts Rule 13a-15(e)) as of the end of the period covered by this Form 20-F, have concluded that, as of such date, our disclosure controls and procedures were effective to ensure that material information relating to our company was made known to them by others within our company. |
| | |
| | There were no significant changes in our internal controls over financial reporting that occurred during the period covered by this Form 20-F, or are reasonably likely to materially affect, our internal controls over financial reporting. |
| |
ITEM 16A AUDIT COMMITTEE FINANCIAL EXPERT |
Stephen Hodge, the Chairman of the Audit Committee, is considered by the Company’s Board of Directors to be an audit committee financial expert, defined by this Item 16A.
To reinforce our commitment to achieve best practice in our standards of business integrity, we have adopted a code of ethics incorporating our business principles which are applicable to all of our employees, including our Chief Executive Officer and our Chief Financial Officer. This document is accessible on our Internet website at http://www.mmo2.com/cr/organisation_social3.asp.
ITEM 16C PRINCIPAL ACCOUNTANT FEES AND SERVICES |
The following table summarizes the aggregate fees billed in the years ended 31 March 2004 and 2003 by PricewaterhouseCoopers (PwC):
| | | 2004 | | 2003 | |
| | |
|
| |
|
| |
| | | (£ in thousands) | |
| Audit Fees | | | 1,032 | | | 1,017 | |
| Audit-Related Fees | | | 339 | | | 687 | |
| Tax Fees | | | 446 | | | 296 | |
| All Other Fees | | | — | | | 176 | |
| | |
|
| |
|
| |
Total | | | 1,817 | | | 2,176 | |
| | |
|
| |
|
| |
Audit fees are incurred by the Group for the standard audit work that needs to be performed each year in order to issue an opinion on the consolidated financial statements of the Group and to issue reports on the local statutory financial statements. These fees also include services that can only be provided by the Group auditor such as auditing of non-recurring transactions and application of new accounting policies, audits of significant and newly
99
Back to Contents
implemented system controls, pre-issuance reviews of quarterly financial results, consents and comfort letters and any other audit services required for US Securities Exchange commission or other regulatory filings.
Audit related fees include those other assurance services provided by auditors but not restricted to those that can only be provided by the auditor signing the audit report. They comprise amounts for services such as acquisition due diligence, audits of pension and benefit plans, contractual audits of third party arrangements, assurance services on corporate citizenship reporting, and consultation regarding new accounting pronouncements.
Tax services represent tax compliance and advisory services.
Include systems implementation services.
| (e) | Audit Committee’s pre-approval policies and procedures |
The Board has adopted a formal policy governing the independence of the Company’s external auditors and defining statutory audit and non-audit services which require the prior approval of the Audit Committee. The Audit Committee’s policy is to require pre-approval of all audit and non-audit services provided by the Company’s external auditors, including audit services, audit-related services, tax services and other services, as described above in sections (a) to (d) of this Item 16C. In particular, the policy sets forth certain prohibited non-audit services and the pre-approval of certain other non-audit services, listing in detail the services which are pre-approved, specificially those relating to accounting activities, internal audit and related activities, business development and transaction related activities, the Group’s tax affairs, employee tax affairs, and other services. This policy was further reviewed and amended during the financial year to provide for pre-approval by the Chairman of the Audit Committee of contracts relating to permissible tax services up to an aggregated value of £25,000 between scheduled Audit Committee meetings.
The Audit Committee will be presented quarterly with a schedule of the non-audit services provided by the external auditors and the fees involved.
The policy also covers employment of former auditor employees by the Company and audit partner rotation.
PART III
ITEM 17 FINANCIAL STATEMENTS |
100
Back to Contents
mmO2 GROUP
ITEM 18 FINANCIAL STATEMENTS |
Exhibit Number | | Description of Exhibits |
| |
|
| 1.1 | | Memorandum and Articles of Association of mmO2 plc.* |
| 2.1 | | Deposit Agreement among the mmO2 plc, Morgan Guaranty Trust Company of New York, as depositary, and Holders of American Depositary Receipts.** |
| 3.1 | | Not Applicable. |
| 4.1 | | Demerger Agreement between British Telecommunications plc, mmO2 plc and BT Group plc.** |
| 4.2 | | Separation Agreement between BT Group plc, British Telecommunications plc, mmO2 plc and O2 Limited.** |
| 4.3 | | Tax Agreement between BT Group plc and mmO2 plc.** |
| 4.4 | | Wireless Trading Agreement between British Telecommunications plc and BT Cellnet Limited.** |
| 4.5 | | Sponsors’ Agreement between mmO2 plc, British Telecommunications plc, Merrill Lynch International, Morgan Stanley & Co. International Limited and Salomon Brothers International Limited.** |
| 4.6 | | £3,500,000,000 Multicurrency Trading Revolving Facility between mmO2, as parent, mmO2 and O2 Limited, as original borrowers, Barclays Capital, Deutsche Bank AG London, HSBC Investment Bank plc, J.P. Morgan plc, Salomon Brothers International Limited and The Royal Bank of Scotland plc, as lead arrangers, certain financial institutions, as the original banks, The Royal Bank of Scotland plc, as agent, and the Royal Bank of Scotland plc, as the issuing bank.** |
| 4.7 | | Amended and Restated Separation Agreement between BT Group plc, mmO2 plc and O2 Limited.*** |
| 4.8 | | Programme Agreement in relation to the €5,000,000,000 Euro Medium Term Note Programme between mmO2, Bankers Trustee Company Limited as Trustee, Deutsche Bank AG London as arranger, Barclays Bank PLC, HSBC Bank plc, Salomon Brothers International Limited, Deutsche Bank AG London, J.P. Morgan Securities Ltd and The Royal Bank of Scotland plc, as dealers.**** |
| 4.9 | | Trust Deed relating to €5,000,000,000 Euro Medium Term Note Programme between mmO2 and Bankers Trustee Company Limited, as Trustee.**** |
| 4.10 | | BT Executive Share Plan***** |
| 4.11 | | BT Incentive Share Plan***** |
| 4.12 | | BT Deferred Bonus Plan***** |
| 4.13 | | mmO2 Legacy Option Plan***** |
| 4.14 | | mmO2 Executive Share Option Plan***** |
| 4.15 | | mmO2 Restricted Share Plan***** |
| 4.16 | | mmO2 Deferred Executive Incentive Plan |
| 4.17 | | Service Contract for David Arculus relating to his chairmanship of the Company due to commence on 28 July 2004 at the conclusion of the Company’s 2004 Annual General Meeting. |
| 4.18 | | Directors’ Service Contracts***** |
| 5.1 | | Not Applicable. |
| 6.1 | | Not Applicable. |
| 7.1 | | Not Applicable. |
| 8.1 | | See Item 4.C, “Information on the Company – Organisational Structure.” |
| 9.1 | | Not Applicable. |
| 12.0 | | Certification of Peter Erskine, Chief Executive Officer of mmO2 plc, pursuant to section 302 of the Sarbanes-Oxley Act of 2002. |
| 12.1 | | Certification of David Finch, Chief Financial Officer of mmO2 plc, pursuant to section 302 of the Sarbanes-Oxley Act of 2002. |
| 13.0 | | Joint Certification of Peter Erskine, Chief Executive Officer and David Finch,
Chief Financial Officer, pursuant to 18 U.S.C. Section 1350, as adopted pursuant to Section 906 of the Sarbanes-Oxley Act of 2002. |
F-1
Back to Contents
mmO2 GROUP
| * | Previously included in mmO2’s registration statement on Form 20-F, as filed with the Securities and Exchange Commission on 20 September 2001, and incorporated herein by reference except with respect to the following change to the Articles of Association: |
| | On 20 December 2001, the one issued redeemable preference share of £50,000 was redeemed, following which, pursuant to a conditional special resolution passed on 11 September 2001, the authorised redeemable preference share capital was sub-divided into and redesignated as 50,000,000 ordinary shares with a face value of 0.1p each. |
| ** | Previously included in mmO2’s registration statement on Form 20-F, as filed with the Securities and Exchange Commission on 20 September 2001, and incorporated herein by reference. |
| *** | Previously included in mmO2’s registration statement on Form 20F/A, as filed with the Securities and Exchange Commission on 31 October 2001, and incorporated herein by reference. |
| **** | Previously included in mmO2’s annual report on Form 20F, as filed with the Securities and Exchange Commission on 12 July, 2002, and incorporated herein by reference. |
| ***** | Previously included in mmO2’s annual report on Form 20F, as filed with the Securities and Exchange Commission on 7 July, 2003, and incorporated herein by reference. |
F-2
Back to Contents
mmO2 GROUP
INDEX TO THE FINANCIAL STATEMENTS
F-3
Back to Contents
mmO2 GROUP
REPORT OF INDEPENDENT REGISTERED PUBLIC ACCOUNTING FIRM
To the Board of Directors and Shareholders of mmO2 plc:
In our opinion, the accompanying consolidated balance sheets and the related consolidated profit and loss accounts, statements of total recognised gains and losses, reconciliations of movements in shareholders funds and cashflow statements present fairly, in all material respects, the financial position of mmO2 and its subsidiaries at 31 March 2004 and 31 March 2003, and the results of their operations and their cashflows for the three years in the period ended 31 March 2004, in conformity with accounting principles which, as described in Note 1, are generally accepted in the United Kingdom. These financial statements are the responsibility of the Company’s management; our responsibility is to express an opinion on these financial statements based on our audits. We conducted our audits of these statements in accordance with the standards of the Public Company Accounting Oversight Board (United States). Those standards require that we plan and perform the audit to obtain reasonable assurance about whether the financial statements are free of material misstatement. An audit includes examining, on a test basis, evidence supporting the amounts and disclosures in the financial statements, assessing the accounting principles used and significant estimates made by management, and evaluating the overall financial statement presentation. We believe that our audits provide a reasonable basis for our opinion.
As indicated in Note 1, mmO2 plc represents the mobile business which was demerged from British Telecommunications plc (“BT”) on 19 November 2001. The consolidated financial statements for the periods prior to the demerger have been prepared on a carve-out basis as described in Note 1. The balance sheets, profit and loss accounts and cash flow statements of mmO2 plc prepared on a carve-out basis differ from those presented in the mmO2 Annual Report and Financial Statements prepared for filing purposes in the United Kingdom (the “UK Statutory Accounts”). When preparing financial statements on a carve-out basis a portion of BT’s short- and long-term loans and other borrowings are allocated to mmO2 plc. The basis of preparation adopted for the UK Statutory Accounts shows the results and financial position of mmO2 plc with no push-down allocation of loans and other borrowings.
Accounting principles generally accepted in the United Kingdom vary in certain significant respects from accounting principles generally accepted in the United States of America. The application of the latter would have affected the determination of consolidated shareholders’ equity at 31 March 2004 and 2003 to the extent summarised in Note 31 to the consolidated financial statements.
PricewaterhouseCoopers LLP
Chartered Accountants and Registered Auditors
London, England
17 May 2004
F-4
Back to Contents
mmO2 GROUP
CONSOLIDATED PROFIT AND LOSS ACCOUNT |
| |
| | | Note | | 2004 | | 2003 | | 2002 | |
| | |
|
| |
|
| |
|
| |
|
| |
| | | | | £m | | £m | | £m | |
Turnover: Group and share of joint ventures and associates | | | 2 | | | 5,859 | | | 5,020 | | | 4,407 | |
| Group’s share of associates and joint ventures turnover | | | | | | (165 | ) | | (146 | ) | | (131 | ) |
| | | | | |
| |
| |
| |
Group turnover | | | 2 | | | 5,694 | | | 4,874 | | | 4,276 | |
| | | | | | | | | | | | | | |
Group turnover comprises: | | | | | | | | | | | | | |
| Continuing operations | | | | | | 5,646 | | | 4,611 | | | 4,076 | |
| Discontinued operation | | | | | | 48 | | | 263 | | | 200 | |
| | | | | | | | | | | | | | |
Net operating expenses (including exceptional items) | | | 3 | | | (5,536 | ) | | (13,652 | ) | | (5,132 | ) |
| | | | | |
| |
| |
| |
Group operating profit/(loss) | | | 3,4 | | | 158 | | | (8,778 | ) | | (856 | ) |
| | | | | | | | | | | | | | |
Group operating profit/(loss) comprises: | | | | | | | | | | | | | |
| Continuing operations | | | | | | 159 | | | (8,658 | ) | | (692 | ) |
| Discontinued operation | | | | | | (1 | ) | | (120 | ) | | (164 | ) |
| | | | | | | | | | | | | | |
| Group’s share of operating result of joint ventures and associates | | | | | | — | | | 5 | | | 8 | |
| | | | | |
| |
| |
| |
Total operating profit/(loss) | | | | | | 158 | | | (8,773 | ) | | (848 | ) |
| | | | | | | | | | | | | | |
| Provision for loss on sale of business | | | 21 | | | — | | | (1,364 | ) | | — | |
| Loss on sale of business – discontinued operation | | | 21 | | | (5 | ) | | — | | | — | |
| | | | | | | | | | | | | | |
Loss on sale of business comprises: | | | | | | | | | | | | | |
| Total loss on sale of business | | | | | | (1,369 | ) | | — | | | — | |
| Less provision recognised in the year ended 31 March 2003 | | | | | | 1,364 | | | — | | | — | |
| | | | | | | | | | | | | | |
| Net interest payable and similar charges | | | 5 | | | (58 | ) | | (66 | ) | | (781 | ) |
| | | | | |
| |
| |
| |
Profit/(loss) on ordinary activities before taxation | | | | | | 95 | | | (10,203 | ) | | (1,629 | ) |
| Tax on profit/(loss) on ordinary activities | | | 6 | | | 71 | | | 55 | | | 250 | |
| | | | | |
| |
| |
| |
Retained profit/(loss) for the financial year | | | 18 | | | 166 | | | (10,148 | ) | | (1,379 | ) |
| | | | | |
| |
| |
| |
The accompanying notes on pages F-9 to F-70 are an integral part of these financial statements.
F-5
Back to Contents
mmO2 GROUP
CONSOLIDATED BALANCE SHEET |
| |
| | | Note | | 2004 | | 2003 | |
| | |
|
| |
|
| |
|
| |
| | | | | £m | | £m | |
Fixed assets | | | | | | | | | | |
| Intangible assets | | | 8 | | | 7,354 | | | 7,582 | |
| Tangible assets | | | 9 | | | 3,996 | | | 3,875 | |
| Investments | | | 10 | | | 5 | | | 3 | |
| | | | | |
| |
| |
| | | | | | | 11,355 | | | 11,460 | |
| | | | | |
| |
| |
Current assets | | | | | | | | | | |
| Stocks | | | | | | 84 | | | 73 | |
| Debtors | | | 11 | | | 943 | | | 924 | |
| Investments | | | 12 | | | 993 | | | 848 | |
| Cash at bank and in hand | | | | | | 23 | | | 68 | |
| | | | | |
| |
| |
| | | | | | | 2,043 | | | 1,913 | |
Creditors: amounts falling due within one year | | | 13 | | | (1,681 | ) | | (1,572 | ) |
| | | | | |
| |
| |
Net current assets | | | | | | 362 | | | 341 | |
| | | | | |
| |
| |
Total assets less current liabilities | | | | | | 11,717 | | | 11,801 | |
| | | | | |
| |
| |
Creditors: amounts falling due after more than one year | | | 14 | | | (1,375 | ) | | (1,451 | ) |
Provisions for liabilities and charges | | | 16 | | | (251 | ) | | (284 | ) |
| | | | | |
| |
| |
Net assets | | | | | | 10,091 | | | 10,066 | |
| | | | | |
| |
| |
Capital and reserves | | | | | | | | | | |
| Called up share capital | | | 17 | | | 9 | | | 9 | |
| Share premium | | | 18 | | | 3 | | | — | |
| Other reserves | | | 18 | | | 11,074 | | | 12,087 | |
| Profit and loss account | | | 18 | | | (995 | ) | | (2,030 | ) |
| | | | | |
| |
| |
| | | | | | | 10,091 | | | 10,066 | |
| | | | | |
| |
| |
The Company balance sheet is shown in note 30.
These financial statements were approved by the Board of Directors on 17 May 2004 and were signed on its behalf by:
| P Erskine Chief Executive Officer | D Finch Chief Financial Officer |
The accompanying notes on pages F-9 to F-70 are an integral part of these financial statements.
F-6
Back to Contents
mmO2 GROUP
CONSOLIDATED STATEMENT OF TOTAL RECOGNISED GAINS AND LOSSES |
| |
| | | Note | | 2004 | | 2003 | | 2002 | |
| | |
| |
| |
| |
| |
| | | | | £m | | £m | | £m | |
Profit/(loss) for the financial year | | | | | | 166 | | | (10,148 | ) | | (1,379 | ) |
| Currency translation differences arising on foreign currency net investment in subsidiaries | | | 18 | | | (144 | ) | | 1,333 | | | 161 | |
| | | | | |
| |
| |
| |
Total recognised gains and losses relating to the year | | | | | | 22 | | | (8,815 | ) | | (1,218 | ) |
| | | | | |
| |
| |
| |
| | | Note | | 2004 | | 2003 | | | | |
| | |
| |
| |
| | | | |
| | | | | £m | | £m | | | | |
| Cash at bank and in hand | | | | | | 23 | | | 68 | | | | |
| Current asset investments | | | 12 | | | 993 | | | 848 | | | | |
| | | | | |
| |
| | | | |
| | | | | | | 1,016 | | | 916 | | | | |
| Euro medium-term notes (net of issue costs) | | | 14 | | | (1,012 | ) | | (1,015 | ) | | | |
| Loan notes | | | 13 | | | (8 | ) | | (19 | ) | | | |
| Obligations under finance leases and hire purchase contracts | | | 15 | | | (325 | ) | | (390 | ) | | | |
| Other loans and borrowings | | | | | | (37 | ) | | (41 | ) | | | |
| | | | | |
| |
| | | | |
Net debt | | | | | | (366 | ) | | (549 | ) | | | |
| | | | | |
| |
| | | | |
The accompanying notes on pages F-9 to F-70 are an integral part of these financial statements.
F-7
Back to Contents
mmO2 GROUP
RECONCILIATION OF GROUP OPERATING PROFIT/(LOSS) TO OPERATING CASH FLOWS |
| |
| | | 2004 | | 2003 | | 2002 | |
| | |
|
| |
|
| |
|
| |
| | | £m | | £m | | £m | |
| Group operating profit/(loss) | | | 158 | | | (8,778 | ) | | (856 | ) |
| Depreciation and amortisation charges | | | 1,136 | | | 9,637 | | | 1,139 | |
| Loss on disposal of fixed assets | | | 5 | | | 8 | | | 9 | |
| (Increase)/decrease in stocks | | | (17 | ) | | (5 | ) | | 89 | |
| (Increase)/decrease in debtors | | | (88 | ) | | 166 | | | (38 | ) |
| Increase in creditors | | | 142 | | | 58 | | | 24 | |
| Increase/(decrease) in provisions | | | 55 | | | (53 | ) | | 90 | |
| | |
|
| |
|
| |
|
| |
Net cash inflow from operating activities | | | 1,391 | | | 1,033 | | | 457 | |
| | |
| |
| |
| |
| |
CONSOLIDATED CASH FLOW STATEMENT |
| |
| | | Note | | 2004 | | 2003 | | 2002 | |
| | |
| |
| |
| |
| |
| | | | | £m | | £m | | £m | |
Net cash inflow from operating activities | | | | | | 1,391 | | | 1,033 | | | 457 | |
| Returns on investments and servicing of finance | | | 19 | | | (62 | ) | | (63 | ) | | (9 | ) |
| Taxation | | | 19 | | | (13 | ) | | (4 | ) | | (4 | ) |
| Capital expenditure and financial investment | | | 19 | | | (1,114 | ) | | (868 | ) | | (1,231 | ) |
| Acquisitions and disposals | | | 19 | | | (6 | ) | | — | | | (864 | ) |
| | | | | |
| |
| |
| |
Cash inflow/(outflow) before management of liquid resources and financing | | | | | | 196 | | | 98 | | | (1,651 | ) |
| Management of liquid resources | | | 19 | | | (191 | ) | | (3 | ) | | (459 | ) |
| Financing | | | 19 | | | (50 | ) | | (47 | ) | | 1,790 | |
| | | | | |
| |
| |
| |
(Decrease)/increase in cash in the year | | | 20 | | | (45 | ) | | 48 | | | (320 | ) |
| | | | | |
| |
| |
| |
The accompanying notes on pages F-9 to F-70 are an integral part of these financial statements.
F-8
Back to Contents
mmO2 GROUP
NOTES TO THE CONSOLIDATED FINANCIAL STATEMENTS
The financial statements are prepared under the historical cost convention and in accordance with applicable accounting standards and generally accepted accounting principles in the United Kingdom (UK GAAP). These differ in certain significant respects from accounting standards in the United States of America and a reconciliation to generally accepted accounting principles in the United States of America (US GAAP) is included in note 31 to the financial statements.
All principal subsidiary undertakings’ financial years are coterminous with those of mmO2 plc.
mmO2 plc was incorporated on 30 March 2001. On 19 November 2001, its ordinary shares were listed on the London Stock Exchange and the New York Stock Exchange. This was the culmination of a group reorganisation undertaken by British Telecommunications plc (“BT”) to demerge its wireless business.
The financial statements have been prepared as if the mmO2 Group had been dermerged from BT prior to 1 April 2000. This presents information which more accurately reflects the ongoing operations of the Group. Accordingly the demerger and related transactions have been accounted for using carve-out accounting priciples as applicable to group reorganisations up to the date of actual demerger. Whilst the financial information set out in the consolidated financial statements is an appropriate presentation, this financial information is not necessarily indicative of the financial results that might have occurred had mmO2 plc been an independently financed and managed public entity during the periods presented or of the financial results that may occur in any future period. During the period from 1 April 2001 to 19 November 2001 included in these financial statements, the Group was not constituted as a discrete legal group of companies under a single holding company. The new Group holding company, mmO2 plc, to which the Group’s operations were transferred on demerger was established on 30 March 2001. For the period to demerger, these financial statements therefore reflect the combination of the consolidated financial statements of these operations, which comprise the mmO2 Group following the demerger from BT. Included within the Group are the O2 UK group of companies in the United Kingdom, and the mobile operations of other companies in the Group owned prior to demerger either directly by BT or through its subsidiary companies, together with certain other business units within BT. Financial information in respect of companies or business units that have historically been integrated with other BT operations and that are now combined within the mmO2 Group, has been included in these financial statements on a carve-out basis.
Furthermore, for the purpose of these financial statements, a portion of BT’s short- and long-term loans has been allocated to the Group for the periods up to 19 November 2001, the date of demerger from BT. The allocation has been determined by reference to the amount of loans and other borrowings raised by BT to fund certain significant acquisitions in the year ended 31 March 2001, of mobile businesses and assets, including UMTS licences. This has resulted in an intercompany loan of £16.8 billion from 1 April 2001 to 19 November 2001 bearing an average annual interest rate of 7.2 per cent. The interest rates applied have been calculated with reference to the average annual composite interest cost of BT’s loans and other borrowings for the period. There are no hedging transactions associated with this intercompany loan. The interest expense allocated to the Group is not indicative of the interest expense that would have been incurred if the mmO2 Group had been a separate stand-alone group. As part of the demerger transaction, a large portion of this loan was capitalised so that at 19 November 2001, the date we demerged from BT, we had net debt of £506 million.
F-9
Back to Contents
mmO2 GROUP
NOTES TO THE CONSOLIDATED FINANCIAL STATEMENTS
| 1. | Accounting policies (Continued) |
The financial statements include the results for mmO2 plc and its subsidiaries. All intercompany accounts and transactions have been eliminated. Certain amounts relating to the prior year have been reclassified to conform with current year presentation.
The preparation of financial statements in conformity with generally accepted accounting principles requires management to make estimates and assumptions that affect the amounts reported in the consolidated financial statements and accompanying notes. Actual results could differ from those estimates. Estimates are used when accounting for certain items such as provision for bad and doubtful debtors, depreciation and amortisation, valuation of inventory, pensions and other benefits, and asset impairment.
Group turnover, which excludes value added tax and other sales taxes, comprises the value of services provided, equipment sales and other revenue.
Mobile telecommunications service turnover includes turnover earned for usage of the Group’s wireless network for voice and data transmission by O2 customers, subscription fees and interconnect revenue. Post-pay customers are billed in arrears based on usage and turnover is recognised when the service is rendered. Turnover for pre-pay customers is recorded as deferred revenue prior to commencement of services and is recognised as the pre-pay services are rendered. Inbound roaming revenue, earned from other mobile operators whose customers roam onto the O2 network, and outbound roaming revenue, earned from certain customers roaming outside their domestic coverage area, are recognised based upon usage and are included in mobile service turnover. Subscription fees are recognised evenly throughout the periods to which they relate.
Hardware turnover principally consists of revenue from the sale of wireless mobile devices. The revenue and related expenses associated with the sale of wireless handsets and accessories are recognised when the products are delivered and accepted by the customer. Other sales include connection charges which are deferred and recognised over the estimated customer relationship period.
Revenue is recognised on a gross basis where the Group’s role is that of principal in a transaction. The gross basis represents the gross value of the billing to the customer after trade discounts, with any related costs being charged to operating expenses. Where the Group acts as agent in a transaction, the net revenue earned is recognised as turnover.
Subscriber acquisition costs |
Subscriber acquisition costs, which include the commission costs associated with acquiring new subscribers and other incremental costs of customer acquisition, are charged to the profit and loss account as incurred.
Expenditure on research and development is written off in the year in which it is incurred.
Advertising costs are included in administrative expenses and are expensed as incurred.
F-10
Back to Contents
mmO2 GROUP
NOTES TO THE CONSOLIDATED FINANCIAL STATEMENTS
| 1. | Accounting policies (Continued) |
Transactions denominated in foreign currencies are translated at the exchange rates ruling at the dates of the transactions adjusted for the effects of any hedging arrangements, except for material exceptional items which are translated at the rate ruling at the date of the transaction. Monetary assets and liabilities denominated in foreign currencies at the balance sheet date are translated at the rates ruling at that date.
The balance sheets of foreign subsidiaries are translated into sterling at the closing rates of exchange and the differences arising from the translation of the opening net investment in subsidiaries at the closing rate are taken direct to reserves and are reported in the statement of total recognised gains and losses. The profit and loss and cash flows for the year of foreign subsidiaries are translated at the average rates of exchange for the year.
All other exchange gains or losses are dealt with in the profit and loss account.
Goodwill, arising from the purchase of subsidiary undertakings and interests in associates and joint ventures, represents the excess of the fair value of the purchase consideration over the fair value of the net assets acquired.
For all acquisitions arising on or after 1 April 1998, the goodwill arising is capitalised as an intangible asset. The goodwill is amortised on a straight-line basis from the time of acquisition over a period estimated by the Directors to be its useful economic life. The economic life is normally between 10 and 20 years, subject to review if and when an event or change occurs which may affect the asset life. Where applicable, goodwill relating to overseas businesses is held as a foreign currency denominated asset.
For acquisitions made before the adoption of Financial Reporting Standard (FRS) 10 “Goodwill and Intangible Assets”, on 1 April 1998, the goodwill was written off directly to reserves. The goodwill written off directly to reserves will be charged to the profit and loss account on the subsequent disposal of the business to which it relates.
Other intangible fixed assets |
Licence fees paid to governments, which permit telecommunication activities to be operated for defined periods, are capitalised at cost and are amortised from the later of the start of the licence period or market launch of service, to the end of the licence period on a straight-line basis. Other licences are amortised over the period of the licence on a straight-line basis.
Tangible fixed assets are stated at historical cost less depreciation. The cost of tangible fixed assets includes directly attributable incremental costs incurred in their acquisition and installation.
F-11
Back to Contents
mmO2 GROUP
NOTES TO THE CONSOLIDATED FINANCIAL STATEMENTS
| 1. | Accounting policies (Continued) |
Depreciation is provided on tangible fixed assets from the date they are brought into use, in equal instalments over their estimated useful lives, taking into account any residual values. The lives assigned to tangible fixed assets are:
| Freehold buildings | | 40 years | |
| Leasehold land and buildings | | Unexpired portion of lease or 40 years,
whichever is the shorter | |
| Network assets | | 5 to 15 years | |
| Plant and machinery | | 2 to 5 years | |
| Computers, software and office equipment | | 2 to 6 years | |
| Motor vehicles | | 5 years | |
No depreciation is provided on freehold land or assets in course of construction.
Investments in associates and joint ventures are included in the consolidated financial statements using the equity method of accounting. The profit and loss account includes the Group’s share of profits or losses of associates and joint ventures.
Other investments held as fixed assets comprise equity shareholdings and other interests and are stated at cost less provisions for impairment.
Options and share awards granted over the Company’s ordinary shares are accounted for using the intrinsic value method, with the difference between the fair value of the shares at the grant date and the exercise price charged to the profit and loss account over the vesting period.
The Company partially hedges its future obligations under certain share awards by holding its own shares in the mmO2 Employee Share Trust.
Own shares are held at cost less amortisation charged to date.
Goodwill and other intangible assets are reviewed for impairment: (i) at the end of the first full financial year following acquisition; and, together with tangible fixed assets, (ii) in other periods if events or changes in circumstances indicate that the carrying values may not be recoverable. Such events may include continuing operating losses, technological obsolescence or significant adverse changes in the business or the market in which the fixed asset is used.
The impairment review is performed by comparing the carrying value of the asset, or group of assets, with their recoverable amount. For assets used in the continuing operations of the Group the recoverable amount is the assets’ value in use which is estimated by calculating the present value of its future cash flows. For assets to be disposed, the recoverable amount is the assets’ net realisable value. Impairment charges are recognised in the profit and loss account to the extent that the carrying value exceeds the recoverable amount in the period in which the impairment is identified.
F-12
Back to Contents
mmO2 GROUP
NOTES TO THE CONSOLIDATED FINANCIAL STATEMENTS
| 1. | Accounting policies (Continued) |
Stocks comprise mainly handsets and are stated at the lower of cost and net realisable value (which reflects the value to the business of the handset in the hands of the subscriber) on a first-in, first-out basis, after provisions for obsolescence.
Debtors are stated at estimated net realisable value. Net realisable value is the invoiced amount less provisions for bad and doubtful debtors. Provisions are made specifically against debtors where there is evidence of a dispute or an inability to pay. An additional provision is made based on an analysis of balances by age, previous losses experienced and general economic conditions.
Provisions are recognised by the Group when three criteria are met: (i) the Group has a constructive or legal obligation as a result of a past event; (ii) if it is probable that a transfer of economic benefits will be required to settle the obligation and (iii) a reliable estimate of the obligation can be made.
A provision is made for the present value of the cost of restoration of mast sites at the date of acquisition of the site in accordance with FRS 12 “Provisions, contingent liabilities and contingent assets”.
The Group operates a number of pension schemes as disclosed in note 29 to the financial statements. All pension schemes are accounted for in accordance with the provisions of Statement of Standard Accounting Practice (SSAP) 24 “Accounting for pension costs”. The Group continues to apply the transitional disclosure requirements set out in FRS 17 “Retirement benefits”.
For funded and unfunded defined benefit schemes, the expected costs of providing pensions and other post retirement benefits, as calculated periodically by professionally qualified actuaries, are charged to the profit and loss account so as to spread the cost over the service lives of employees in the schemes in such a way that the pension cost is a substantially level percentage of current and expected future pensionable payroll. For the funded schemes, the assets of the schemes are held separately from those of the principal employer. For the unfunded schemes, no contributions are made by either employees or the employer to a separate pension fund but a provision is recorded on the balance sheet to recognise the cumulative accrued liability of the Group.
The Group also supports a number of defined contribution pension schemes where the benefits are based on the level of contributions paid. Costs arising from these schemes are charged to the profit and loss account in the period to which they relate.
Deferred tax is provided in full on all timing differences which result in an obligation at the balance sheet date to pay more tax, or a right to pay less tax, at a future date, at rates expected to apply when they crystallise based on current tax rates and law. Timing differences arise from the inclusion of items of income and expenditure in taxation computations in periods different from those in which they are included in the financial statements. Deferred tax assets are recognised to the extent that it is regarded as more likely than not that they will be recovered. Deferred tax assets and liabilities are not discounted.
F-13
Back to Contents
mmO2 GROUP
NOTES TO THE CONSOLIDATED FINANCIAL STATEMENTS
| 1. | Accounting policies (Continued) |
Debt instruments are stated at the amount of net proceeds received. Financing costs are amortised over the term of the debt to ensure a constant rate of charge.
Derivative financial instruments |
The Group considers its derivative financial instruments to be hedges when certain criteria are met. For foreign currency derivatives, the instrument must be related to actual foreign currency assets or liabilities or a probable commitment and whose characteristics have been identified. It must involve the same currency or similar currencies as the hedged item and must also reduce the risk of foreign currency exchange movements on the Group’s operations. For interest rate derivatives, the instrument must be related to assets or liabilities or a probable commitment, such as a future bond issue, and must also change the interest rate or the nature of the interest rate by converting a fixed rate to a variable rate or vice versa.
Interest differentials, under interest rate swap agreements used to vary the amounts and periods for which interest rates on borrowings are fixed, are recognised by adjustment of interest payable.
The forward exchange contracts used to change the currency mix of net debt are revalued at the closing rates of exchange with net unrealised gains and losses being matched to the underlying transactions being hedged. The forward exchange contracts hedging transaction exposures are revalued at the year end at the prevailing forward rate with net unrealised gains and losses being matched to the underlying transactions being hedged.
Leases and hire purchase contracts |
Rentals under operating leases are charged to the profit and loss account in equal annual amounts over the periods of the leases.
Assets held under finance leases and hire purchase contracts are capitalised at their fair value on the inception of the leases and depreciated over the shorter of the period of the lease and the estimated useful economic lives of the assets. The finance charges are allocated over the period of the lease in proportion to the capital amount outstanding and are charged to the profit and loss account.
The Group’s operations have been divided internally into three classes of business, in line with the day-to-day managerial and budgetary control during the year:
| 1) | the supply of mobile telecommunications services and products; |
| | |
| 2) | the provision of mobile internet services; and |
| | |
| 3) | other businesses, comprising O2 Airwave, a terrestrial trunked radio business, and Manx Telecom, the fixed and mobile telecommunications business in the Isle of Man. |
Mobile telecommunications services mainly derives its turnover from the calls made and received by its customers using mobile telephones, from subscription fees charged to its contract customers and from handset equipment sales. Mobile internet services generate revenue through advertising, provision of content and application and from e-commerce and m-commerce activities.
F-14
Back to Contents
mmO2 GROUP
NOTES TO THE CONSOLIDATED FINANCIAL STATEMENTS
| 2. | Segmental analysis (Continued) |
The segmental disclosures in respect of profit and loss account items are presented below.
| | | Group
turnover | | Depreciation,
amortisation
and
impairment1 | | Total
operating
profit/(loss) | |
| | |
|
| |
|
| |
|
| |
| | | £m | | £m | | £m | |
Year ended 31 March 2004 | | | | | | | | | | |
Continuing operations | | | | | | | | | | |
| Mobile telecommunications | | | | | | | | | | |
| UK | | | 3,451 | | | 638 | | | 346 | |
| Germany | | | 1,508 | | | 295 | | | (72 | ) |
| Ireland | | | 529 | | | 120 | | | 87 | |
| | |
|
| |
|
| |
|
| |
Total mobile telecommunications | | | 5,488 | | | 1,053 | | | 361 | |
| Mobile internet services | | | | | | | | | | |
| UK | | | 140 | | | 42 | | | (93 | ) |
| Other businesses | | | | | | | | | | |
| UK | | | 139 | | | 37 | | | (13 | ) |
| Central overheads and adjustments | | | — | | | 3 | | | (96 | ) |
| Inter-segment eliminations | | | (121 | ) | | — | | | — | |
| | |
|
| |
|
| |
|
| |
| | | | 5,646 | | | 1,135 | | | 159 | |
Discontinued operation | | | | | | | | | | |
| Mobile telecommunications | | | | | | | | | | |
| The Netherlands | | | 48 | | | 1 | | | (1 | ) |
| | |
|
| |
|
| |
|
| |
Group total | | | 5,694 | | | 1,136 | | | 158 | |
| | |
|
| |
|
| |
|
| |
Year ended 31 March 2003 | | | | | | | | | | |
Continuing operations | | | | | | | | | | |
| Mobile telecommunications | | | | | | | | | | |
| UK | | | 3,025 | | | 2,953 | | | (2,111 | ) |
| Germany | | | 1,060 | | | 5,006 | | | (4,979 | ) |
| Ireland | | | 442 | | | 1,488 | | | (1,331 | ) |
| | |
|
| |
|
| |
|
| |
| Total mobile telecommunications | | | 4,527 | | | 9,447 | | | (8,421 | ) |
| Mobile internet services | | | | | | | | | | |
| UK | | | 93 | | | 49 | | | (122 | ) |
| Other businesses | | | | | | | | | | |
| UK | | | 64 | | | 19 | | | (23 | ) |
| Central overheads and adjustments | | | — | | | 1 | | | (87 | ) |
| Inter-segment eliminations | | | (73 | ) | | — | | | — | |
| | |
|
| |
|
| |
|
| |
| | | | 4,611 | | | 9,516 | | | (8,653 | ) |
Discontinued operation | | | | | | | | | | |
| Mobile telecommunications | | | | | | | | | | |
The Netherlands2 | | | 263 | | | 121 | | | (120 | ) |
| | |
|
| |
|
| |
|
| |
Group total | | | 4,874 | | | 9,637 | | | (8,773 | ) |
| | |
|
| |
|
| |
|
| |
F-15
Back to Contents
mmO2 GROUP
NOTES TO THE CONSOLIDATED FINANCIAL STATEMENTS
| 2. | Segmental analysis (Continued) |
| | |
| | | Group
turnover | | Depreciation,
amortisation
and
impairment1 | | Total
operating
profit/(loss) | |
| | |
|
| |
|
| |
|
| |
| | | £m | | £m | | £m | |
Year ended 31 March 2002 | | | | | | | | | | |
Continuing operations | | | | | | | | | | |
| Mobile telecommunications | | | | | | | | | | |
| UK | | | 2,756 | | | 548 | | | 44 | |
| Germany | | | 875 | | | 277 | | | (472 | ) |
| Ireland | | | 395 | | | 179 | | | (57 | ) |
| | |
|
| |
|
| |
|
| |
| Total mobile telecommunications | | | 4,026 | | | 1,004 | | | (485 | ) |
| Mobile internet services | | | | | | | | | | |
| UK | | | 100 | | | 25 | | | (103 | ) |
| Other businesses | | | | | | | | | | |
| UK | | | 54 | | | 9 | | | (22 | ) |
| Central overheads and adjustments | | | — | | | — | | | (74 | ) |
| Inter-segment eliminations | | | (104 | ) | | — | | | — | |
| | |
|
| |
|
| |
|
| |
| | | | 4,076 | | | 1,038 | | | (684 | ) |
Discontinued operation | | | | | | | | | | |
| Mobile telecommunications | | | | | | | | | | |
| The Netherlands | | | 200 | | | 101 | | | (164 | ) |
| | |
|
| |
|
| |
|
| |
Group total | | | 4,276 | | | 1,139 | | | (848 | ) |
| | |
|
| |
|
| |
|
| |
| | | | | | | | | | | |
| 1 | In the year ended 31 March 2004, depreciation includes a charge of £2 million included within the exceptional operating cost disclosed in note 4. In the year ended 31 March 2003, the exceptional depreciation, amortisation and impairment charged to total operating profit of £8,300 million comprised a charge of £2,401 million in respect of impairment of goodwill and £5,899 million in respect of impairment of telecommunication licences and investments held in the Group’s businesses. |
| 2 | Excludes non-operating exceptional impairment charge of £1,364 million relating to the sale of O2 Netherlands. |
Turnover is based on the country of invoice origination, which is not materially different to turnover by destination. Central overheads and adjustments includes central costs, eliminations and other consolidation adjustments.
F-16
Back to Contents
mmO2 GROUP
NOTES TO THE CONSOLIDATED FINANCIAL STATEMENTS
| 2. | Segmental analysis (Continued) |
The segmental disclosures in respect of balance sheet items are presented below.
| | | Capital
expenditure1 | | Tangible
fixed assets | | Net operating
assets/
(liabilities)2 | |
| | |
|
| |
|
| |
|
| |
| | | £m | | £m | | £m | |
Year ended and as at 31 March 2004 | | | | | | | | | | |
Continuing operations | | | | | | | | | | |
| Mobile telecommunications | | | | | | | | | | |
| UK | | | 502 | | | 2,118 | | | 5,945 | |
| Germany | | | 308 | | | 1,051 | | | 3,160 | |
| Ireland | | | 52 | | | 233 | | | 1,086 | |
| | |
|
| |
|
| |
|
| |
| Total mobile telecommunications | | | 862 | | | 3,402 | | | 10,191 | |
| Mobile internet services | | | | | | | | | | |
| UK | | | 12 | | | 22 | | | 13 | |
| Other businesses | | | | | | | | | | |
| UK | | | 252 | | | 568 | | | 450 | |
| Central assets and adjustments | | | 2 | | | 4 | | | (65 | ) |
| | |
|
| |
|
| |
|
| |
| | | | 1,128 | | | 3,996 | | | 10,589 | |
Discontinued operation | | | | | | | | | | |
| Mobile telecommunications | | | | | | | | | | |
| The Netherlands | | | 5 | | | — | | | — | |
| | |
|
| |
|
| |
|
| |
Group total | | | 1,133 | | | 3,996 | | | 10,589 | |
| | |
|
| |
|
| |
|
| |
Year ended and as at 31 March 2003 | | | | | | | | | | |
Continuing operations | | | | | | | | | | |
| Mobile telecommunications | | | | | | | | | | |
| UK | | | 362 | | | 2,111 | | | 6,226 | |
| Germany | | | 141 | | | 1,072 | | | 3,203 | |
| Ireland | | | 57 | | | 257 | | | 1,186 | |
| | |
|
| |
|
| |
|
| |
| Total mobile telecommunications | | | 560 | | | 3,440 | | | 10,615 | |
| Mobile internet services | | | | | | | | | | |
| UK | | | 17 | | | 48 | | | 20 | |
| Other businesses | | | | | | | | | | |
| UK | | | 170 | | | 353 | | | 295 | |
| Central assets and adjustments | | | 1 | | | 3 | | | (109 | ) |
| | |
|
| |
|
| |
|
| |
| | | | 748 | | | 3,844 | | | 10,821 | |
Discontinued operation | | | | | | | | | | |
| Mobile telecommunications | | | | | | | | | | |
| The Netherlands | | | 59 | | | 31 | | | 12 | |
| | |
|
| |
|
| |
|
| |
Group total | | | 807 | | | 3,875 | | | 10,833 | |
| | |
|
| |
|
| |
|
| |
F-17
Back to Contents
mmO2 GROUP
NOTES TO THE CONSOLIDATED FINANCIAL STATEMENTS
| 2. | Segmental analysis (Continued) |
| | |
| | | Capital
expenditure1 | | Tangible
fixed assets | | Net operating
assets/
(liabilities)2 | |
| | |
|
| |
|
| |
|
| |
| | | £m | | £m | | £m | |
Year ended and as at 31 March 2002 | | | | | | | | | | |
Continuing operations | | | | | | | | | | |
| Mobile telecommunications | | | | | | | | | | |
| UK | | | 611 | | | 2,219 | | | 8,857 | |
| Germany | | | 248 | | | 1,065 | | | 7,183 | |
| Ireland | | | 83 | | | 239 | | | 2,333 | |
| | |
|
| |
|
| |
|
| |
| Total mobile telecommunications | | | 942 | | | 3,523 | | | 18,373 | |
| Mobile internet services | | | | | | | | | | |
| UK | | | 42 | | | 65 | | | 46 | |
| Other businesses | | | | | | | | | | |
| UK | | | 95 | | | 202 | | | 161 | |
| Central assets and adjustments | | | — | | | 3 | | | (36 | ) |
| | |
|
| |
|
| |
|
| |
| | | | 1,079 | | | 3,793 | | | 18,544 | |
Discontinued operation | | | | | | | | | | |
| Mobile telecommunications | | | | | | | | | | |
| The Netherlands | | | 97 | | | 301 | | | 1,234 | |
| | |
|
| |
|
| |
|
| |
Group total | | | 1,176 | | | 4,094 | | | 19,778 | |
| | |
|
| |
|
| |
|
| |
| | | | | | | | | | | |
| 1 | Capital expenditure comprises tangible fixed asset additions. |
| 2 | Net operating assets/(liabilities) comprise tangible and intangible fixed assets (including goodwill), stocks, debtors, creditors (excluding debt) falling due within and after one year and provisions (excluding deferred tax). |
| |
Associates and joint ventures |
Total turnover for the year ended 31 March 2004 was £5,859 million (2003: £5,020 million, 2002: £4,407 million) and included £165 million (2003: £146 million, 2002: £131 million) representing the Group’s share of the turnover of its associates and joint ventures in the UK mobile telecommunications business. The Group’s share of associates and joint ventures operating profit was nil (2003: £5 million, 2002: £8 million). The related investment carried in the balance sheet is £5 million (2003: nil, 2002: £34 million).
F-18
Back to Contents
mmO2 GROUP
NOTES TO THE CONSOLIDATED FINANCIAL STATEMENTS
| 2. | Segmental analysis (Continued) |
| | | 2004 | | 2003 | | 2002 | |
| | |
|
| |
|
| |
|
| |
| | | £m | | £m | | £m | |
Continuing operations | | | | | | | | | | |
| Mobile telecommunications | | | | | | | | | | |
| Service turnover | | | | | | | | | | |
| UK | | | 3,183 | | | 2,738 | | | 2,426 | |
| Germany | | | 1,347 | | | 944 | | | 696 | |
| Ireland | | | 500 | | | 415 | | | 366 | |
| | |
|
| |
|
| |
|
| |
Total service turnover | | | 5,030 | | | 4,097 | | | 3,488 | |
| | |
|
| |
|
| |
|
| |
| Equipment turnover | | | | | | | | | | |
| UK | | | 194 | | | 190 | | | 136 | |
| Germany | | | 147 | | | 94 | | | 127 | |
| Ireland | | | 23 | | | 20 | | | 21 | |
| | |
|
| |
|
| |
|
| |
Total equipment turnover | | | 364 | | | 304 | | | 284 | |
| | |
|
| |
|
| |
|
| |
| Other turnover | | | | | | | | | | |
| UK | | | 74 | | | 97 | | | 194 | |
| Germany | | | 14 | | | 22 | | | 52 | |
| Ireland | | | 6 | | | 7 | | | 8 | |
| | |
|
| |
|
| |
|
| |
Total other turnover | | | 94 | | | 126 | | | 254 | |
| | |
|
| |
|
| |
|
| |
Total mobile telecommunications turnover | | | 5,488 | | | 4,527 | | | 4,026 | |
| Mobile internet services | | | | | | | | | | |
| UK | | | 140 | | | 93 | | | 100 | |
| Other businesses | | | | | | | | | | |
| UK | | | 139 | | | 64 | | | 54 | |
| Less segmental eliminations | | | (121 | ) | | (73 | ) | | (104 | ) |
| | |
|
| |
|
| |
|
| |
Total continuing operations | | | 5,646 | | | 4,611 | | | 4,076 | |
Discontinued operation | | | | | | | | | | |
| Mobile telecommunications | | | | | | | | | | |
| The Netherlands | | | 48 | | | 263 | | | 200 | |
| | |
|
| |
|
| |
|
| |
Group turnover | | | 5,694 | | | 4,874 | | | 4,276 | |
| | |
|
| |
|
| |
|
| |
F-19
Back to Contents
mmO2 GROUP
NOTES TO THE CONSOLIDATED FINANCIAL STATEMENTS
| | | Continuing | | Discontinued | | | | |
| | | operations | | operation | | Total | |
| | |
|
| |
|
| |
|
| |
| | | £m | | £m | | £m | |
Year ended 31 March 2004 | | | | | | | | | | |
| Group turnover | | | 5,646 | | | 48 | | | 5,694 | |
| Cost of sales | | | (3,291 | ) | | (23 | ) | | (3,314 | ) |
| | |
|
| |
|
| |
|
| |
| Gross profit | | | 2,355 | | | 25 | | | 2,380 | |
| Administrative expenses | | | (2,196 | ) | | (26 | ) | | (2,222 | ) |
| | |
|
| |
|
| |
|
| |
Group operating profit/(loss) | | | 159 | | | (1 | ) | | 158 | |
| | |
|
| |
|
| |
|
| |
Year ended 31 March 2003 | | | | | | | | | | |
| Group turnover | | | 4,611 | | | 263 | | | 4,874 | |
| Cost of sales | | | (2,854 | ) | | (206 | ) | | (3,060 | ) |
| | |
|
| |
|
| |
|
| |
| Gross profit | | | 1,757 | | | 57 | | | 1,814 | |
| Administrative expenses | | | (10,415 | ) | | (177 | ) | | (10,592 | ) |
| | |
|
| |
|
| |
|
| |
Group operating loss | | | (8,658 | ) | | (120 | ) | | (8,778 | ) |
| | |
|
| |
|
| |
|
| |
Year ended 31 March 2002 | | | | | | | | | | |
| Group turnover | | | 4,076 | | | 200 | | | 4,276 | |
| Cost of sales | | | (2,519 | ) | | (195 | ) | | (2,714 | ) |
| | |
|
| |
|
| |
|
| |
| Gross profit | | | 1,557 | | | 5 | | | 1,562 | |
| Administrative expenses | | | (2,249 | ) | | (169 | ) | | (2,418 | ) |
| | |
|
| |
|
| |
|
| |
Group operating loss | | | (692 | ) | | (164 | ) | | (856 | ) |
| | |
|
| |
|
| |
|
| |
Net operating expenses comprise cost of sales and administrative expenses (including operating exceptional items) and total £5,536 million in 2004 (2003: £13,652 million, 2002: £5,132 million).
The sale of O2 Netherlands completed on 3 June 2003. In accordance with FRS 3 “Reporting financial performance”, the results of O2 Netherlands for the three years ended 31 March 2004 have been classified as discontinued. See note 21 for further details.
F-20
Back to Contents
mmO2 GROUP
NOTES TO THE CONSOLIDATED FINANCIAL STATEMENTS
| 4. | Group operating profit/(loss) |
Group operating profit/(loss) is stated after charging/(crediting):
| | | 2004 | | 2003 | | 2002 | |
| | |
|
| |
|
| |
|
| |
| | | £m | | £m | | £m | |
| Depreciation of tangible fixed assets: | | | | | | | | | | |
| Owned | | | 900 | | | 907 | | | 677 | |
| Held under hire purchase contracts | | | 28 | | | 25 | | | 70 | |
| Amortisation of intangible fixed assets (before impairment): | | | | | | | | | | |
| Goodwill | | | 201 | | | 374 | | | 369 | |
| Other | | | 7 | | | 31 | | | 23 | |
| Rentals under operating leases: | | | | | | | | | | |
| Hire of plant and machinery | | | 10 | | | 12 | | | 32 | |
| Other operating leases | | | 158 | | | 171 | | | 140 | |
| Advertising costs | | | 224 | | | 195 | | | 198 | |
| Staff costs (note 28) | | | 548 | | | 521 | | | 570 | |
| Own work capitalised | | | (106 | ) | | (62 | ) | | (121 | ) |
| Loss on disposal of fixed assets | | | 5 | | | 8 | | | 9 | |
| Research and development | | | 10 | | | 9 | | | 8 | |
| Exceptional items: | | | | | | | | | | |
Restructuring of central functions and property portfolio rationalisation1 | | | 75 | | | — | | | — | |
| Business closure and reorganisation | | | — | | | — | | | 123 | |
| Impairment of intangible assets | | | — | | | 8,300 | | | — | |
| Costs relating to demerger from BT | | | — | | | — | | | 27 | |
| | |
|
| |
|
| |
|
| |
| | | | | | | | | | | |
| 1 | In 2004 includes a loss on disposal of fixed assets of £5 million and depreciation of £2 million. |
In the year ended 31 March 2004, the Group incurred an exceptional charge of £75 million in respect of the restructuring of central functions and the resultant rationalisation of the Group’s property portfolio. This arose on the transfer of O2 Online, Products O2 and certain other central functions to the Group’s operating businesses in the UK, Germany and Ireland and includes provisions relating to redundancies and the termination of property leases. This charge gave rise to a cash outflow of £17 million in the year.
The impairment review performed by the Group during the year ended 31 March 2003 resulted in an exceptional non-cash operating charge in respect of the Group’s continuing businesses of £8,300 million. This comprised charges relating mainly to the impairment of UMTS licences and goodwill in O2 UK and O2 Germany (totalling £2,300 million and £4,700 million respectively) and the impairment of goodwill in O2 Ireland of £1,300 million. In 2002 the exceptional reorganisation costs related to the restructuring of the UK and German operations post demerger and included £87 million in respect of redundancy costs. They gave rise to a cash outflow of £27 million in that year.
F-21
Back to Contents
mmO2 GROUP
NOTES TO THE CONSOLIDATED FINANCIAL STATEMENTS
| 5. | Net interest payable and similar charges |
| | |
| | | 2004 | | 2003 | | 2002 | |
| | |
|
| |
|
| |
|
| |
| | | £m | | £m | | £m | |
Group | | | | | | | | | | |
| Interest receivable and similar income | | | 20 | | | 19 | | | 11 | |
| Interest payable and similar charges: | | | | | | | | | | |
| Bank loans, overdrafts and other borrowings | | | (13 | ) | | (19 | ) | | (21 | ) |
| Amortisation of debt issue costs | | | (4 | ) | | (3 | ) | | (4 | ) |
| Debentures | | | (62 | ) | | (63 | ) | | (12 | ) |
| Loans from BT | | | — | | | — | | | (756 | ) |
| | |
|
| |
|
| |
|
| |
| Group net interest payable | | | (59 | ) | | (66 | ) | | (782 | ) |
| | |
|
| |
|
| |
|
| |
Share of associates and joint ventures | | | | | | | | | | |
| Interest receivable and similar income | | | 1 | | | — | | | 1 | |
| | |
|
| |
|
| |
|
| |
| Net interest payable | | | (58 | ) | | (66 | ) | | (781 | ) |
| | |
|
| |
|
| |
|
| |
| | |
| 6. | Tax on profit/(loss) on ordinary activities |
| | |
| | | 2004 | | 2003 | | 2002 | |
| | |
|
| |
|
| |
|
| |
| | | £m | | £m | | £m | |
Current tax | | | | | | | | | | |
| United Kingdom corporation tax at 30 per cent | | | — | | | — | | | (13 | ) |
| Tax on Group’s share of results of associates and joint ventures | | | 1 | | | 2 | | | 2 | |
| Adjustments in respect of prior periods | | | (1 | ) | | — | | | (2 | ) |
| Non-United Kingdom tax | | | 13 | | | 8 | | | 2 | |
| | |
|
| |
|
| |
|
| |
Total current tax charge/(credit) | | | 13 | | | 10 | | | (11 | ) |
| | |
|
| |
|
| |
|
| |
Deferred tax (credit)/charge | | | | | | | | | | |
| Origination and reversal of timing differences | | | (86 | ) | | (72 | ) | | (233 | ) |
| Adjustments in respect of prior periods | | | 2 | | | 7 | | | (6 | ) |
| | |
|
| |
|
| |
|
| |
Total deferred tax credit | | | (84 | ) | | (65 | ) | | (239 | ) |
| | |
|
| |
|
| |
|
| |
Tax credit on profit/(loss) on ordinary activities | | | (71 | ) | | (55 | ) | | (250 | ) |
| | |
|
| |
|
| |
|
| |
In the year ended 31 March 2004, the profit on ordinary activities before taxation was £95 million (2003: loss of £10,203 million, 2002: loss of £1,629 million).
F-22
Back to Contents
mmO2 GROUP
NOTES TO THE CONSOLIDATED FINANCIAL STATEMENTS
| 6. | Tax on profit/(loss) on ordinary activities (Continued) |
The tax assessed for the year varied from the amount computed by applying the corporation tax rate to profit or loss on ordinary activities before taxation. The differences were attributable to the following factors:
| | | 2004 | | 2003 | | 2002 | |
| | |
|
| |
|
| |
|
| |
| | | £m | | £m | | £m | |
| United Kingdom corporation tax on profit/(loss) at standard rate | | | 29 | | | (3,061 | ) | | (489 | ) |
| Non-deductible depreciation, amortisation and impairment | | | 78 | | | 2,387 | | | 124 | |
| Non-deductible non-United Kingdom losses | | | — | | | 23 | | | 44 | |
| Non-United Kingdom tax rate differences | | | (16 | ) | | (7 | ) | | (3 | ) |
| Depreciation for the year in excess/(deficit) of capital allowances | | | 1 | | | 14 | | | (21 | ) |
| Losses carried forward | | | 30 | | | 657 | | | 260 | |
| Losses brought forward and utilised | | | (138 | ) | | — | | | — | |
| Non-deductible losses on sale of discontinued operations | | | 2 | | | — | | | — | |
| Pre-demerger losses | | | — | | | — | | | 74 | |
| Other timing differences and adjustments | | | 28 | | | (3 | ) | | — | |
| Prior year adjustments | | | (1 | ) | | — | | | — | |
| | |
|
| |
|
| |
|
| |
Current tax charge/(credit) for year | | | 13 | | | 10 | | | (11 | ) |
| | |
|
| |
|
| |
|
| |
| |
Factors that may affect future tax charges |
The Group expects to be able to claim capital allowances in excess of depreciation in future years. The future tax charges will also continue to be affected by goodwill amortisation for which no tax relief is available.
The deferred taxation credit arises as follows:
| | | 2004 | | 2003 | | 2002 | |
| | |
|
| |
|
| |
|
| |
| | | £m | | £m | | £m | |
| Excess capital allowances | | | 15 | | | 4 | | | 44 | |
| Other timing differences | | | (101 | ) | | (76 | ) | | (277 | ) |
| Adjustments in respect of prior periods | | | 2 | | | 7 | | | (6 | ) |
| | |
|
| |
|
| |
|
| |
Total deferred tax credit | | | (84 | ) | | (65 | ) | | (239 | ) |
| | |
|
| |
|
| |
|
| |
Other timing differences include the recognition of a deferred tax asset of £70 million in respect of UK tax losses carried forward owing to greater certainty regarding the availability of future taxable profits.
Deferred tax assets in respect of certain other UK and German losses carried forward and other timing differences totalling £3,190 million have not been recognised due to insufficient certainty regarding the availability of appropriate future taxable profits.
No deferred tax is currently recognised on unremitted earnings of overseas subsidiaries.
F-23
Back to Contents
mmO2 GROUP
NOTES TO THE CONSOLIDATED FINANCIAL STATEMENTS
| 7. | Earnings/(loss) per share |
| | |
| | | 2004 | |
| | |
|
| |
| Profit for the financial year (£m) | | | 166 | |
| | |
|
| |
| Weighted average number of shares in issue during the year and used to calculate basic earnings per share (millions) | | | 8,671 | |
| Dilutive potential ordinary shares (millions) | | | 44 | |
| | |
|
| |
| Weighted average number of shares outstanding and used to calculate diluted earnings per share (millions) | | | 8,715 | |
| | |
|
| |
Basic and diluted earnings per share (pence) | | | 1.9 | |
| | |
|
| |
In the year ended 31 March 2003, the basic and diluted loss per share of 117.0 pence (2002: 15.9 pence) has been calculated by dividing the loss for the year of £10,148 million (2002: £1,379 million) by the weighted average number of shares in issue for the year (2002: the period from demerger to 31 March 2002).
| | | Goodwill | | Licences
and other
intangible
assets | | Total | |
| | |
|
| |
|
| |
|
| |
| | | £m | | £m | | £m | |
Cost | | | | | | | | | | |
| At 1 April 2003 | | | 10,673 | | | 10,555 | | | 21,228 | |
| Additions | | | — | | | 85 | | | 85 | |
| Disposals | | | — | | | (8 | ) | | (8 | ) |
| Sale of subsidiary undertaking | | | (757 | ) | | (484 | ) | | (1,241 | ) |
| Currency movements | | | (212 | ) | | (200 | ) | | (412 | ) |
| | |
|
| |
|
| |
|
| |
At 31 March 2004 | | | 9,704 | | | 9,948 | | | 19,652 | |
| | |
|
| |
|
| |
|
| |
Amortisation | | | | | | | | | | |
| At 1 April 2003 | | | 7,255 | | | 6,391 | | | 13,646 | |
| Charge for the year | | | 201 | | | 7 | | | 208 | |
| Disposals | | | — | | | (7 | ) | | (7 | ) |
| Sale of subsidiary undertaking | | | (757 | ) | | (484 | ) | | (1,241 | ) |
| Currency movements | | | (184 | ) | | (124 | ) | | (308 | ) |
| | |
|
| |
|
| |
|
| |
At 31 March 2004 | | | 6,515 | | | 5,783 | | | 12,298 | |
| | |
|
| |
|
| |
|
| |
Net book value | | | | | | | | | | |
At 31 March 2004 | | | 3,189 | | | 4,165 | | | 7,354 | |
| | |
|
| |
|
| |
|
| |
| At 31 March 2003 | | | 3,418 | | | 4,164 | | | 7,582 | |
| | |
|
| |
|
| |
|
| |
F-24
Back to Contents
mmO2 GROUP
NOTES TO THE CONSOLIDATED FINANCIAL STATEMENTS
| | | Land and
buildings | | Plant and
equipment | | Assets in
course of
construction | | Total | |
| | |
| |
| |
| |
| |
| | | £m | | £m | | £m | | £m | |
Cost | | | | | | | | | | | | | |
| At 1 April 2003 | | | 325 | | | 6,245 | | | 658 | | | 7,228 | |
| Additions | | | 4 | | | 285 | | | 844 | | | 1,133 | |
| Transfers | | | 39 | | | 736 | | | (775 | ) | | — | |
| Disposals | | | (16 | ) | | (191 | ) | | — | | | (207 | ) |
| Sale of subsidiary undertaking | | | — | | | (514 | ) | | (18 | ) | | (532 | ) |
| Currency movements | | | (3 | ) | | (79 | ) | | (1 | ) | | (83 | ) |
| | |
|
| |
|
| |
|
| |
|
| |
At 31 March 2004 | | | 349 | | | 6,482 | | | 708 | | | 7,539 | |
| | |
|
| |
|
| |
|
| |
|
| |
Depreciation | | | | | | | | | | | | | |
| At 1 April 2003 | | | 124 | | | 3,211 | | | 18 | | | 3,353 | |
Charge for the year1 | | | 29 | | | 899 | | | — | | | 928 | |
| Disposals | | | (7 | ) | | (190 | ) | | — | | | (197 | ) |
| Sale of subsidiary undertaking | | | — | | | (479 | ) | | (18 | ) | | (497 | ) |
| Currency movements | | | — | | | (44 | ) | | — | | | (44 | ) |
| | |
|
| |
|
| |
|
| |
|
| |
At 31 March 2004 | | | 146 | | | 3,397 | | | — | | | 3,543 | |
| | |
|
| |
|
| |
|
| |
|
| |
Net book value | | | | | | | | | | | | | |
At 31 March 2004 | | | 203 | | | 3,085 | | | 708 | | | 3,996 | |
| | |
|
| |
|
| |
|
| |
|
| |
| At 31 March 2003 | | | 201 | | | 3,034 | | | 640 | | | 3,875 | |
| | |
|
| |
|
| |
|
| |
|
| |
| | | | | | | | | | | | | | |
| 1 | The charge for the year includes an exceptional charge of £2 million relating to the restructuring described in note 4. |
The net book value of land and buildings comprises:
| | | 2004 | | 2003 | |
| | |
|
| |
|
| |
| | | £m | | £m | |
| Freehold | | | 76 | | | 80 | |
| Long leases | | | 23 | | | 22 | |
| Short leases | | | 104 | | | 99 | |
| | |
|
| |
|
| |
| Net book value | | | 203 | | | 201 | |
| | |
|
| |
|
| |
| The net book value of assets held under hire purchase contracts comprises: | | | | | | | |
| Cost | | | 733 | | | 731 | |
| Accumulated depreciation | | | (368 | ) | | (347 | ) |
| | |
|
| |
|
| |
| Net book value | | | 365 | | | 384 | |
| | |
|
| |
|
| |
F-25
Back to Contents
mmO2 GROUP
NOTES TO THE CONSOLIDATED FINANCIAL STATEMENTS
10. Fixed asset investments |
| |
| | | Interests in
associates,
joint ventures
and other
investments | | Own
shares | | Total | |
| | |
|
| |
|
| |
|
| |
Group | | £m | | £m | | £m | |
Cost | | | | | | | | | | |
| At 1 April 2003 | | | 93 | | | 6 | | | 99 | |
| Additions | | | 5 | | | — | | | 5 | |
| | |
|
| |
|
| |
|
| |
At 31 March 2004 | | | 98 | | | 6 | | | 104 | |
| | |
|
| |
|
| |
|
| |
Provisions | | | | | | | | | | |
| At 1 April 2003 | | | 93 | | | 3 | | | 96 | |
| Charge for the year | | | — | | | 3 | | | 3 | |
| | |
|
| |
|
| |
|
| |
At 31 March 2004 | | | 93 | | | 6 | | | 99 | |
| | |
|
| |
|
| |
|
| |
Net book value | | | | | | | | | | |
At 31 March 2004 | | | 5 | | | — | | | 5 | |
| | |
|
| |
|
| |
|
| |
| At 31 March 2003 | | | — | | | 3 | | | 3 | |
| | |
|
| |
|
| |
|
| |
| | | | | | | | | | | |
| | | Shares in
subsidiary
undertakings | | Own
shares | |
| | |
|
| |
|
| |
Parent company | | £m | | £m | |
Cost | | | | | | | |
At 1 April 2003 and 31 March 2004 | | | 18,498 | | | 6 | |
| | |
|
| |
|
| |
Provisions | | | | | | | |
| At 1 April 2003 | | | 7,215 | | | 3 | |
| Charge for the year | | | — | | | 1 | |
| Transfer | | | — | | | 2 | |
| | |
|
| |
|
| |
At 31 March 2004 | | | 7,215 | | | 6 | |
| | |
|
| |
|
| |
Net book value | | | | | | | |
At 31 March 2004 | | | 11,283 | | | — | |
| | |
|
| |
|
| |
| At 31 March 2003 | | | 11,283 | | | 3 | |
| | |
|
| |
|
| |
The Directors consider that disclosing full particulars of all subsidiary undertakings would lead to a statement of excessive length. A list of principal subsidiary undertakings is given in note 24.
F-26
Back to Contents
mmO2 GROUP
NOTES TO THE CONSOLIDATED FINANCIAL STATEMENTS
| | | | | | | Parent | |
| | | Group | | company | |
| | |
| |
| |
| | | 2004 | | 2003 | | 2004 | | 2003 | |
| | |
|
| |
|
| |
|
| |
|
| |
| | | £m | | £m | | £m | | £m | |
| Trade debtors | | | 508 | | | 525 | | | — | | | — | |
| Amounts owed by Group undertakings | | | — | | | — | | | 175 | | | 440 | |
| Other debtors | | | 25 | | | 39 | | | 8 | | | 9 | |
| Prepayments | | | 166 | | | 204 | | | — | | | — | |
| Accrued income | | | 244 | | | 156 | | | — | | | — | |
| | |
|
| |
|
| |
|
| |
|
| |
| | | | 943 | | | 924 | | | 183 | | | 449 | |
| | |
|
| |
|
| |
|
| |
|
| |
Trade debtors are stated after deducting £132 million as at 31 March 2004 (2003: £128 million) for doubtful debts. The amount charged to the Group’s profit and loss account for doubtful debts for the year ended 31 March 2004 was £59 million (2003: £72 million).
| 12. | Current asset investments |
| | |
| | | | | | | Parent | |
| | | Group | | company | |
| | |
| |
| |
| | | 2004 | | 2003 | | 2004 | | 2003 | |
| | |
|
| |
|
| |
|
| |
|
| |
| | | £m | | £m | | £m | | £m | |
| Money market deposits | | | 631 | | | 414 | | | 631 | | | 414 | |
| Money market funds | | | 69 | | | 79 | | | 69 | | | 79 | |
| Other deposits | | | 293 | | | 355 | | | — | | | — | |
| | |
|
| |
|
| |
|
| |
|
| |
| | | | 993 | | | 848 | | | 700 | | | 493 | |
| | |
|
| |
|
| |
|
| |
|
| |
Other deposits of £293 million (2003: £354 million) are funds held in trust to meet the O2 UK hire purchase obligations disclosed in note 15. A further US$102 million in money market deposits is cash collateral for the bank guarantees issued to cover specific risks under the same hire purchase obligations.
| 13. | Creditors: amounts falling due within one year |
| | |
| | | | | | | Parent | |
| | | Group | | company | |
| | |
| |
| |
| | | 2004 | | 2003 | | 2004 | | 2003 | |
| | |
|
| |
|
| |
|
| |
|
| |
| | | £m | | £m | | £m | | £m | |
| Other loans | | | 6 | | | 8 | | | — | | | — | |
| Loan notes (note 15) | | | 8 | | | 19 | | | — | | | — | |
| Obligations under finance leases and hire purchase contracts (note 15) | | | 40 | | | 39 | | | — | | | — | |
| Trade creditors | | | 497 | | | 423 | | | — | | | — | |
| Corporation tax | | | 9 | | | 10 | | | — | | | — | |
| Other taxation and social security | | | 61 | | | 64 | | | — | | | — | |
| Other creditors | | | 39 | | | 28 | | | — | | | — | |
| Accrued expenses | | | 819 | | | 781 | | | 14 | | | 14 | |
| Deferred income | | | 202 | | | 200 | | | — | | | — | |
| | |
|
| |
|
| |
|
| |
|
| |
| | | | 1,681 | | | 1,572 | | | 14 | | | 14 | |
| | |
|
| |
|
| |
|
| |
|
| |
F-27
Back to Contents
mmO2 GROUP
NOTES TO THE CONSOLIDATED FINANCIAL STATEMENTS
| 14. | Creditors: amounts falling due after more than one year |
| | |
| | | | | | | Parent | |
| | | Group | | company | |
| | |
| |
| |
| | | 2004 | | 2003 | | 2004 | | 2003 | |
| | |
|
| |
|
| |
|
| |
|
| |
| | | £m | | £m | | £m | | £m | |
| Debentures (note 15) | | | 1,012 | | | 1,015 | | | 1,012 | | | 1,015 | |
| Other loans | | | 31 | | | 33 | | | — | | | — | |
| Obligations under finance leases and hire purchase contracts (note 15) | | | 285 | | | 351 | | | — | | | — | |
| Other creditors | | | 47 | | | 52 | | | — | | | — | |
| | |
|
| |
|
| |
|
| |
|
| |
| | | | 1,375 | | | 1,451 | | | 1,012 | | | 1,015 | |
| | |
|
| |
|
| |
|
| |
|
| |
| | |
| 15. | Debentures and other borrowings |
| | |
| | | | | | | Parent | |
| | | Group | | company | |
| | |
| |
| |
| | | 2004 | | 2003 | | 2004 | | 2003 | |
| | |
|
| |
|
| |
|
| |
|
| |
| | | £m | | £m | | £m | | £m | |
Analysis of loan repayments | | | | | | | | | | | | | |
| Within one year or on demand | | | 14 | | | 27 | | | — | | | — | |
| Between one and two years | | | 7 | | | 7 | | | — | | | — | |
| Between two and five years | | | 663 | | | 663 | | | 639 | | | 643 | |
| After five years | | | 373 | | | 378 | | | 373 | | | 372 | |
| | |
|
| |
|
| |
|
| |
|
| |
| | | | 1,057 | | | 1,075 | | | 1,012 | | | 1,015 | |
| | |
|
| |
|
| |
|
| |
|
| |
| |
Obligations under finance leases and hire purchase contracts |
| |
| | | Group | |
| | |
| |
| | | | | | | | |
| | | 2004 | | 2003 | |
| | |
|
| |
|
| |
| | | £m | | £m | |
| Within one year | | | 41 | | | 39 | |
| Between one and five years | | | 138 | | | 147 | |
| After five years | | | 254 | | | 348 | |
| | |
|
| |
|
| |
| | | | 433 | | | 534 | |
| Less: finance charges allocated to future periods | | | (108 | ) | | (144 | ) |
| | |
|
| |
|
| |
| | | | 325 | | | 390 | |
| | |
|
| |
|
| |
In January 2002 mmO2 plc issued two debentures in the form of a €1,000 million 6.375% fixed rate bond and a £375 million 7.625% fixed rate bond which have a five and ten-year term respectively. The debentures are recognised at the amount of net proceeds received and after the effects of any related hedging instruments. At 31 March 2004 this includes unamortised issue costs of £5 million (2003: £7 million).
Loan notes of £132 million were issued by O2 UK between March 1999 and April 2000 for the purchase of various businesses. At 31 March 2004 loan notes totalling £8 million (2003: £19 million) were outstanding and repayable on demand.
F-28
Back to Contents
mmO2 GROUP
NOTES TO THE CONSOLIDATED FINANCIAL STATEMENTS
| 15. | Debentures and other borrowings (Continued) |
Obligations under finance leases and hire purchase contracts are mainly in respect of hire purchase agreements for plant and equipment. On 30 March 2001 and 9 April 2001 hire purchase financing contracts were signed between O2 UK and a number of US leasing trusts. Under the contracts O2 UK sold and repurchased material portions of its GSM radio and switching equipment. O2 UK has deposited sufficient funds with a trust company to meet the future hire purchase obligations. The deposit account is included in current asset investments. The hire purchase agreement is for 16 years with an early buy out option after 12 years. In accordance with the Separation Agreement signed on demerger, BT continues to guarantee all future hire purchase obligations of O2 UK which has provided a counter indemnity to BT for this guarantee. mmO2 has put in place bank guarantees totalling US$102 million to cover specific risks under this hire purchase transaction.
| 16. | Provisions for liabilities and charges |
| | |
| | | Deferred | | | | Other | | | | |
| | | taxation | | Restructuring | | provisions | | Total | |
| | |
|
| |
|
| |
|
| |
|
| |
| | | £m | | £m | | £m | | £m | |
| | | | | | | | | | | | | | |
| At 1 April 2003 | | | 221 | | | — | | | 63 | | | 284 | |
| (Credit)/charge for the year | | | (84 | ) | | 75 | | | 9 | | | — | |
| Utilised in the year | | | — | | | (21 | ) | | (8 | ) | | (29 | ) |
| Other movements | | | — | | | — | | | (4 | ) | | (4 | ) |
| | |
|
| |
|
| |
|
| |
|
| |
At 31 March 2004 | | | 137 | | | 54 | | | 60 | | | 251 | |
| | |
|
| |
|
| |
|
| |
|
| |
The elements of deferred taxation provided for in the financial statements are as follows:
| | | 2004 | | 2003 | |
| | |
|
| |
|
| |
| | | £m | | £m | |
| Accelerated capital allowances | | | 281 | | | 362 | |
| Other | | | (22 | ) | | (11 | ) |
| Unrelieved tax losses carried forward | | | (122 | ) | | (130 | ) |
| | |
|
| |
|
| |
Total provision for deferred taxation | | | 137 | | | 221 | |
| | |
|
| |
|
| |
The restructuring provision arises in respect of the exceptional operating charge recognised in the year ended 31 March 2004 and described in note 4. Other provisions includes £26 million (2003: £25 million) in respect of mast site restoration costs and £16 million (2003: £12 million) in respect of unfunded pensions liabilities. It also includes amounts provided for legal claims.
F-29
Back to Contents
mmO2 GROUP
NOTES TO THE CONSOLIDATED FINANCIAL STATEMENTS
| 17. | Called up share capital |
| | |
| | | 2004 | | 2004 | | 2003 | | 2003 | |
| | |
|
| |
|
| |
|
| |
|
| |
| | | Number of shares | | £m | | Number of shares | | £m | |
Authorised | | | | | | | | | | | | | |
| Ordinary shares of 0.1 pence each | | | 20,050,000,000 | | | 20 | | | 20,050,000,000 | | | 20 | |
| Deferred shares of £1 each | | | 40 | | | — | | | 40 | | | — | |
| | |
|
| |
|
| |
|
| |
|
| |
| | | | 20,050,000,040 | | | 20 | | | 20,050,000,040 | | | 20 | |
| | |
|
| |
|
| |
|
| |
|
| |
Called up, allotted and fully paid | | | | | | | | | | | | | |
| Ordinary shares of 0.1 pence each | | | 8,674,689,768 | | | 9 | | | 8,670,181,627 | | | 9 | |
| Deferred shares of £1 each | | | 40 | | | — | | | 40 | | | — | |
| | |
|
| |
|
| |
|
| |
|
| |
| | | | 8,674,689,808 | | | 9 | | | 8,670,181,667 | | | 9 | |
| | |
|
| |
|
| |
|
| |
|
| |
During the year, the Company issued 4,508,141 ordinary shares of 0.1 pence each for a total cash consideration of £3,129,203.
The Company has in issue 40 deferred shares of £1 each. The holders of the deferred shares have no right to attend or vote at any general meeting of the Company. The deferred shares do confer the right to receive a cumulative dividend of 1 per cent of the nominal value of the deferred shares each year. On a return of capital on the winding-up of the Company, the holders are entitled to receive any accumulated unpaid dividends and, subject to all other classes of shares being repaid, the amount paid up on the deferred shares. The deferred shares are classified as non- equity.
F-30
Back to Contents
mmO2 GROUP
NOTES TO THE CONSOLIDATED FINANCIAL STATEMENTS
| 18. | Reconciliation of movements in shareholders’ funds |
| | |
| | | | | | | | | | | | | Total | |
| | | Called up | | Share | | Other | | Profit and | | Owners’ net | | shareholders’ | |
Group | | share capital | | premium | | reserves | | loss account | | investment | | funds | |
| |
|
| |
|
| |
|
| |
|
| |
|
| |
|
| |
| | | £m | | £m | | £m | | £m | | £m | | £m | |
| At 1 April 2001 | | | — | | | — | | | — | | | — | | | 2,452 | | | 2,452 | |
| Funding flows with BT | | | — | | | — | | | — | | | (1,003 | ) | | 17,591 | | | 16,588 | |
| Transfer on demerger | | | 9 | | | — | | | 23,189 | | | (3,146 | ) | | (20,043 | ) | | 9 | |
| Retained loss for the period after demerger | | | — | | | — | | | — | | | (376 | ) | | — | | | (376 | ) |
| Transfer from profit and loss account | | | — | | | — | | | (533 | ) | | 533 | | | — | | | — | |
| Currency translation differences | | | — | | | — | | | — | | | 161 | | | — | | | 161 | |
| | |
|
| |
|
| |
|
| |
|
| |
|
| |
|
| |
| At 31 March 2002 | | | 9 | | | — | | | 22,656 | | | (3,831 | ) | | — | | | 18,834 | |
| Retained loss for the year | | | — | | | — | | | — | | | (10,148 | ) | | — | | | (10,148 | ) |
| Reinstatement of goodwill previously written off to reserves | | | — | | | — | | | — | | | 47 | | | — | | | 47 | |
| Transfer from profit and loss account | | | — | | | — | | | (10,569 | ) | | 10,569 | | | — | | | — | |
| Currency translation differences | | | — | | | — | | | — | | | 1,333 | | | — | | | 1,333 | |
| | |
|
| |
|
| |
|
| |
|
| |
|
| |
|
| |
| At 31 March 2003 | | | 9 | | | — | | | 12,087 | | | (2,030 | ) | | — | | | 10,066 | |
| Retained profit for the year | | | — | | | — | | | — | | | 166 | | | — | | | 166 | |
| Issue of shares | | | — | | | 3 | | | — | | | — | | | — | | | 3 | |
| Transfer from profit and loss account | | | — | | | — | | | (1,013 | ) | | 1,013 | | | — | | | — | |
| Currency translation differences | | | — | | | — | | | — | | | (144 | ) | | — | | | (144 | ) |
| | |
|
| |
|
| |
|
| |
|
| |
|
| |
|
| |
At 31 March 2004 | | | 9 | | | 3 | | | 11,074 | | | (995 | ) | | — | | | 10,091 | |
| | |
|
| |
|
| |
|
| |
|
| |
|
| |
|
| |
Other reserves arose on demerger. They relate to the difference between the carrying value of the Group held by BT prior to demerger (representing BT’s investments and funding in the Group) and amounts settled with BT on demerger to acquire the assets and liabilities of the Group.
Aggregate goodwill as at 31 March 2004 in respect of acquisitions completed prior to 1 April 1998 of £15 million (2003: £15 million) has been written off against reserves in accordance with the accounting policy existing prior to the adoption of FRS 10 “Goodwill and intangible assets”.
F-31
Back to Contents
mmO2 GROUP
NOTES TO THE CONSOLIDATED FINANCIAL STATEMENTS
| 18. | Reconciliation of movements in shareholders’ funds (Continued) |
| | |
| | | Called up
share capital | | Share
premium | | Other
reserves | | Profit and
loss account | | Total
shareholders’
funds | |
| | |
|
| |
|
| |
|
| |
|
| |
|
| |
| | | £m | | £m | | £m | | £m | | £m | |
Company | | | | | | | | | | | | | | | | |
| At 1 April 2002 | | | 9 | | | — | | | 18,488 | | | (6 | ) | | 18,491 | |
| Retained loss for the year | | | — | | | — | | | — | | | (7,291 | ) | | (7,291 | ) |
| Transfer from profit and loss account | | | — | | | — | | | (7,215 | ) | | 7,215 | | | — | |
| | |
|
| |
|
| |
|
| |
|
| |
|
| |
| At 31 March 2003 | | | 9 | | | — | | | 11,273 | | | (82 | ) | | 11,200 | |
| Retained loss for the year | | | — | | | — | | | (63 | ) | | (63 | ) | | | |
| Issue of shares | | | — | | | 3 | | | — | | | — | | | 3 | |
| | |
|
| |
|
| |
|
| |
|
| |
|
| |
| At 31 March 2004 | | | 9 | | | 3 | | | 11,273 | | | (145 | ) | | 11,140 | |
| | |
|
| |
|
| |
|
| |
|
| |
|
| |
The Company has taken advantage of s.230 of the Companies Act 1985 not to present the Company’s own profit and loss account. The loss attributable to shareholders of the Company for the year was £63 million (2003: £7,291 million).
F-32
Back to Contents
mmO2 GROUP
NOTES TO THE CONSOLIDATED FINANCIAL STATEMENTS
| 19. | Analysis of cash flows for headings netted in the cash flow statement |
| | |
| | | 2004 | | 2003 | | 2002 | |
| | |
|
| |
|
| |
|
| |
| | | £m | | £m | | £m | |
Returns on investments and servicing of finance | | | | | | | | | | |
| Interest received | | | 16 | | | 18 | | | 31 | |
| Finance costs | | | — | | | — | | | (22 | ) |
| Interest paid | | | (78 | ) | | (81 | ) | | (18 | ) |
| | |
|
| |
|
| |
|
| |
| | | | (62 | ) | | (63 | ) | | (9 | ) |
| | |
|
| |
|
| |
|
| |
Taxation | | | | | | | | | | |
| Non-United Kingdom corporation tax paid | | | (13 | ) | | (4 | ) | | (4 | ) |
| | |
|
| |
|
| |
|
| |
| | | | (13 | ) | | (4 | ) | | (4 | ) |
| | |
|
| |
|
| |
|
| |
Capital expenditure and financial investment | | | | | | | | | | |
| Purchase of tangible fixed assets | | | (1,035 | ) | | (779 | ) | | (1,240 | ) |
| Purchase of intangible fixed assets | | | (85 | ) | | (89 | ) | | (21 | ) |
| Sale of tangible fixed assets | | | 6 | | | — | | | 30 | |
| | |
|
| |
|
| |
|
| |
| | | | (1,114 | ) | | (868 | ) | | (1,231 | ) |
| | |
|
| |
|
| |
|
| |
Acquisitions and disposals | | | | | | | | | | |
| Deferred consideration arising on purchase of subsidiary undertakings | | | (8 | ) | | — | | | (864 | ) |
| Sale of subsidiary undertakings (2004: disposed net of £10 million cash) | | | 7 | | | — | | | — | |
| Investments in joint ventures and associated undertakings | | | (5 | ) | | — | | | — | |
| | |
|
| |
|
| |
|
| |
| | | | (6 | ) | | — | | | (864 | ) |
| | |
|
| |
|
| |
|
| |
Management of liquid resources | | | | | | | | | | |
| Increase in money market deposits and money market funds | | | (191 | ) | | (3 | ) | | (459 | ) |
| | |
|
| |
|
| |
|
| |
| | | | (191 | ) | | (3 | ) | | (459 | ) |
| | |
|
| |
|
| |
|
| |
Financing | | | | | | | | | | |
| Net cash contributions from BT | | | — | | | — | | | 847 | |
| Debentures issued | | | — | | | — | | | 989 | |
| Other loans issued | | | — | | | — | | | 28 | |
| Shares issued | | | 3 | | | — | | | — | |
| Loan repayments | | | (53 | ) | | (47 | ) | | (74 | ) |
| | |
|
| |
|
| |
|
| |
| | | | (50 | ) | | (47 | ) | | 1,790 | |
| | |
|
| |
|
| |
|
| |
F-33
Back to Contents
mmO2 GROUP
NOTES TO THE CONSOLIDATED FINANCIAL STATEMENTS
| | | At 1 April
2003 | | Cash flow | | Other non-cash
changes and
exchange
movements | | At 31 March
2004 | |
| | |
|
| |
|
| |
|
| |
|
| |
| | | £m | | £m | | £m | | £m | |
| Cash at bank and in hand | | | 68 | | | (45 | ) | | — | | | 23 | |
| Current asset investments | | | 848 | | | 191 | | | (46 | ) | | 993 | |
| | |
|
| |
|
| |
|
| |
|
| |
| | | | 916 | | | 146 | | | (46 | ) | | 1,016 | |
| Debt due after one year | | | (1,048 | ) | | — | | | 5 | | | (1,043 | ) |
| Debt due within one year | | | (27 | ) | | 14 | | | (1 | ) | | (14 | ) |
| Obligations under finance lease and hire purchase contracts | | | (390 | ) | | 39 | | | 26 | | | (325 | ) |
| | |
|
| |
|
| |
|
| |
|
| |
| | | | (549 | ) | | 199 | | | (16 | ) | | (366 | ) |
| | |
|
| |
|
| |
|
| |
|
| |
| |
Reconciliation of net cash flow to movements in net debt |
| |
| | | 2004 | | 2003 | | 2002 | |
| | |
|
| |
|
| |
|
| |
| | | £m | | £m | | £m | |
| (Decrease)/increase in cash in the year | | | (45 | ) | | 48 | | | (320 | ) |
| Management of liquid resources | | | 191 | | | 3 | | | 459 | |
| Cash outflow/(inflow) from decrease/(increase) in debt | | | 53 | | | 47 | | | (1,295 | ) |
| | |
|
| |
|
| |
|
| |
| Change in net debt resulting from cash flows | | | 199 | | | 98 | | | (1,156 | ) |
| Other non-cash movements | | | (16 | ) | | (30 | ) | | 17,133 | |
| | |
|
| |
|
| |
|
| |
| Decrease/(increase) in net debt in the year | | | 183 | | | 68 | | | 15,977 | |
| Net (debt)/funds at beginning of year | | | (549 | ) | | (617 | ) | | (16,594 | ) |
| | |
|
| |
|
| |
|
| |
Net debt at end of year | | | (366 | ) | | (549 | ) | | (617 | ) |
| | |
|
| |
|
| |
|
| |
Other non-cash movements relate principally to the inception of new finance leases, interest accrued thereon and foreign exchange gains and losses arising in relation to items of net debt held in foreign currencies.
| 21. | Acquisitions and disposals |
On 14 April 2003, the Group announced that it had agreed the sale of its wholly owned Dutch subsidiary, O2 Netherlands, to Greenfield Capital Partners, an independent private equity and corporate finance group with existing interests in the fixed telecoms sector, for €25 million cash. The sale was completed on 3 June 2003 and took the form of the sale of all the issued shares of O2 Netherlands. In the year ended 31 March 2003, the Group recognised a non-operating exceptional provision for loss on disposal of O2 Netherlands of £1,364 million. This represented the impairment of the assets of O2 Netherlands, and goodwill relating to the original purchase of the stake in O2 Netherlands, down to their net recoverable amount which in this case was the sale proceeds less the estimated direct costs of disposal. The total loss on sale arising on completion was £1,369 million which, after utilisation of the provision recognised in 2003, resulted in a non-operating exceptional loss of £5 million in the year.
F-34
Back to Contents
mmO2 GROUP
NOTES TO THE CONSOLIDATED FINANCIAL STATEMENTS
| 21. | Acquisitions and disposals (Continued) |
In February 2001, Telenor exercised a put option to sell its remaining 49.5 per cent interest in O2 Ireland to the Group and this transaction was completed in April 2001, following approval by the regulator. The total consideration for this stake was £877 million including expenses resulting in additional goodwill of £884 million. The consideration included US$49 million payable to the former Managing Director for his 2 per cent stake in the non-voting shares of O2 Ireland, of which £8 million was paid during the year, leaving no outstanding balance.
| 22. | Financial commitments and contingent liabilities |
| |
Obligations under finance leases and hire purchase contracts |
Future gross finance lease and hire purchase payments payable by Group as at 31 March 2004 are as follows:
| | | £m | |
| Payable in the year ending 31 March | | | | |
| 2005 | | | 41 | |
| 2006 | | | 36 | |
| 2007 | | | 29 | |
| 2008 | | | 29 | |
| 2009 | | | 44 | |
| Thereafter | | | 254 | |
| | |
|
| |
Total future gross finance lease and hire purchase payments | | | 433 | |
| | |
|
| |
Finance lease and hire purchase commitments are mainly in respect of hire purchase agreements for plant and equipment. Full details of these leases are provided in note 15.
| | | 2004 | | 2003 | |
| | |
|
| |
|
| |
| | | £m | | £m | |
| Contracts placed for capital expenditure not provided in the accounts | | | 353 | | | 909 | |
| Contracts placed for non-capital expenditure not provided in the accounts | | | 113 | | | 151 | |
| | |
|
| |
|
| |
Total | | | 466 | | | 1,060 | |
| | |
|
| |
|
| |
| |
Operating lease commitments |
At 31 March 2004 the Group was committed to making the following payments during the next year in respect of operating leases:
| | | 2004
| | 2003
| |
| | | Land and
buildings | | Other | | Land and
buildings | | Other | |
| | |
|
| |
|
| |
|
| |
|
| |
| | | £m | | £m | | £m | | £m | |
Leases which expire | | | | | | | | | | | | | |
| Within one year | | | 2 | | | 1 | | | 7 | | | 4 | |
| Between one and five years | | | 31 | | | 12 | | | 32 | | | 25 | |
| After five years | | | 148 | | | — | | | 127 | | | 7 | |
| | |
|
| |
|
| |
|
| |
|
| |
| | | | 181 | | | 13 | | | 166 | | | 36 | |
| | |
|
| |
|
| |
|
| |
|
| |
F-35
Back to Contents
mmO2 GROUP
NOTES TO THE CONSOLIDATED FINANCIAL STATEMENTS
| 22. | Financial commitments and contingent liabilities (Continued) |
Future minimum operating lease payments due by the Group as at 31 March 2004 are as follows:
| | | £m | |
| Payable in the year ending 31 March | | | | |
| 2005 | | | 194 | |
| 2006 | | | 185 | |
| 2007 | | | 179 | |
| 2008 | | | 160 | |
| 2009 | | | 148 | |
| Thereafter | | | 981 | |
| | |
|
| |
Total future minimum operating lease payments | | | 1,847 | |
| | |
|
| |
mmO2 plc has provided a guarantee of all liabilities of Airwave mmO2 Limited under its contracts with PITO (the Police Information Technology Organisation) and the police force customers.
There are no other contingent liabilities or guarantees other than those detailed in note 15 to the financial statements and those arising in the ordinary course of the Group’s business on which no material losses are anticipated. The Group has insurance cover to certain limits for major risks on property and major claims in connection with legal liabilities arising in the course of its operations.
The Group does not believe there are any pending legal proceedings which would have a material adverse effect on the financial position or results of operations of the Group.
| 23. | Related party disclosures |
During the year the Group entered into transactions with related parties as follows:
| | | 2004 | | 2003 | |
| | |
|
| |
|
| |
| | | £m | | £m | |
Turnover | | | | | | | |
| The Link Stores Limited | | | 39 | | | 54 | |
| Tesco Mobile Limited | | | 3 | | | — | |
Purchases | | | | | | | |
| The Link Stores Limited | | | (47 | ) | | (79 | ) |
| | |
|
| |
|
| |
Total net transactions | | | (5 | ) | | (25 | ) |
| | |
|
| |
|
| |
During the year ended 31 March 2004, the Group provided a combination of loan notes and partly-paid equity totalling £6 million to its joint venture, Tesco Mobile Limited. The loan balance outstanding at 31 March 2004 was £3 million. The Group also provided other services to Tesco Mobile Limited with a value of £3 million. All transactions were at arm’s length rates.
Related party transactions with Directors are detailed in the Report on Directors’ remuneration in “Directors, Senior Management and Employees – B. Compensation – Directors’ Remuneration” in Item 6.
F-36
Back to Contents
mmO2 GROUP
NOTES TO THE CONSOLIDATED FINANCIAL STATEMENTS
| 24. | Principal subsidiary undertakings and associates |
The principal operating subsidiary undertakings are detailed below, all of which are included in the Group financial statements.
Name | | Country of incorporation and operation | | Activity | | Portion of ordinary shares held
% | |
| |
| |
| |
| |
O2 Limited | | England and Wales | | Intermediate holding company | | 100 | |
O2 (UK) Limited | | England and Wales | | Mobile cellular telephone system provider and operator | | 100 | |
O2 (Germany) GmbH & Co. OHG | | Germany | | Mobile cellular telephone system provider and operator | | 100 | |
O2 Communications (Ireland) Limited | | Ireland | | Mobile cellular telephone system provider and operator | | 100 | |
Airwave mmO2 Limited | | England and Wales | | Digital radio service for public safety organisations | | 100 | |
O2 (Online) Limited | | England and Wales | | Mobile internet business | | 100 | |
| Manx Telecom Limited | | Isle of Man | | Telecommunication services supplier | | 100 | |
The shares in O2 Limited are held directly by mmO2 plc. The shares of the other operating companies are held by O2 Limited or its wholly owned subsidiaries. The accounting reference date of all subsidiary undertakings is 31 March.
The Group also owns a 50 per cent stake in a joint venture, Tesco Mobile Limited, and a 40 per cent stake in an associate, The Link Stores Limited. Tesco Mobile Limited supplies mobile electronic communications and related services to consumers and is incorporated in England and Wales and operates throughout the United Kingdom. The accounting reference date of Tesco Mobile Limited is 28 February. The Link Stores Limited is a telecommunications equipment retailer which is incorporated and operates in England and Wales.
During the year the Group sold its entire interest in O2 Netherlands as disclosed in note 21.
| 25. | Financial instruments and risk management |
Financial risks are identified and managed by a centralised Group treasury function. The Group’s treasury policy, including details of the nature, terms and credit risk associated with financial instruments with off-balance sheet risk are described in the Treasury management and policies section of the Operating and financial review and prospects in Item 5.
Short-term debtors and creditors, where permitted by FRS 13 “Derivatives and Other Financial Instruments: Disclosures”, have been excluded from the following disclosures, which are after taking account of interest rate and currency swaps where applicable.
The Group holds or issues financial instruments principally to finance its operations, for the temporary investment of short-term funds and to manage currency and interest rate risks arising from its operations. Further details on the financing of operations is contained in the Source of Liquidity and Capital Resources section of Item 5, “Operating and Financial Review and Prospects”.
The Group uses derivative financial instruments to manage its exposure to market risks such as changes in interest rates and foreign exchange rates. The objective is to match the profile and characteristics of Group funding of equity and debt to that of the assets funded and to mitigate foreign exchange risk under the guidelines approved by the Board of Directors in accordance with the Group’s treasury policy.
F-37
Back to Contents
mmO2 GROUP
NOTES TO THE CONSOLIDATED FINANCIAL STATEMENTS
| 25. | Financial instruments and risk management (Continued) |
| |
Fair value of financial instruments |
The book and fair values of the Group’s financial assets and financial liabilities at 31 March 2004 are:
| | | Book value | | Fair value | | Book value | | Fair value | |
| | | 2004 | | 2004 | | 2003 | | 2003 | |
| | |
|
| |
|
| |
|
| |
|
| |
| | | £m | | £m | | £m | | £m | |
Liabilities | | | | | | | | | | | | | |
| Debentures | | | (1,042 | ) | | (1,135 | ) | | (1,065 | ) | | (1,105 | ) |
| Hire purchase contracts | | | (325 | ) | | (334 | ) | | (390 | ) | | (370 | ) |
| Loan notes | | | (8 | ) | | (8 | ) | | (19 | ) | | (19 | ) |
| Other loans and borrowings | | | (37 | ) | | (37 | ) | | (41 | ) | | (41 | ) |
| | |
|
| |
|
| |
|
| |
|
| |
Total financial liabilities | | | (1,412 | ) | | (1,514 | ) | | (1,515 | ) | | (1,535 | ) |
| | |
|
| |
|
| |
|
| |
|
| |
| | | | | | | | | | | | | | |
Assets | | | | | | | | | | | | | |
| Hire purchase contracts | | | 293 | | | 315 | | | 354 | | | 392 | |
| Short-term deposits | | | 631 | | | 631 | | | 414 | | | 414 | |
| Money market funds | | | 69 | | | 69 | | | 79 | | | 79 | |
| Cash at bank and in hand | | | 23 | | | 23 | | | 68 | | | 68 | |
| | |
|
| |
|
| |
|
| |
|
| |
Total financial assets | | | 1,016 | | | 1,038 | | | 915 | | | 953 | |
| | |
|
| |
|
| |
|
| |
|
| |
| | | | | | | | | | | | | | |
Derivative financial instruments held to manage the interest rate and currency profile of the Group | | | | | | | | | | | | | |
| Interest rate swaps | | | — | | | 17 | | | — | | | 15 | |
| Cross-currency swaps | | | 25 | | | 44 | | | 38 | | | 53 | |
| Forward foreign exchange contracts | | | 4 | | | 4 | | | 6 | | | 7 | |
| | |
|
| |
|
| |
|
| |
|
| |
| | | | 29 | | | 65 | | | 44 | | | 75 | |
| | |
|
| |
|
| |
|
| |
|
| |
| |
Summary of methods and assumptions |
Fair value is the amount at which a financial instrument could be exchanged in an arm’s length transaction between informed and willing parties, other than in a forced or liquidation sale, and excludes accrued interest. Book values are stated before deducting any unamortised issue costs.
For interest rate swaps, currency swaps and forward foreign exchange contracts, the fair value is based upon market price of comparable instruments where available and if not available by the discounting of future cash flows to net present values using appropriate interest and currency rates.
For short-term deposits and borrowings and cash at bank, the fair value of the short-term deposits, money market funds and cash at bank approximate to the book carrying value due to the short-term or on demand maturity of these instruments.
For long-term borrowings the fair value of the sterling and Euro denominated bonds have been estimated using quoted market prices.
For other borrowings the fair value of other short-term borrowings approximate to the carrying value due to the short-term or on demand maturity of these instruments.
F-38
Back to Contents
mmO2 GROUP
NOTES TO THE CONSOLIDATED FINANCIAL STATEMENTS
| 25. | Financial instruments and risk management (Continued) |
Under the Group’s accounting policy as detailed in note 1 to the financial statements, certain gains and losses on derivative instruments used for hedging are not recognised in the financial statements. The gains are as follows:
| | | Gains | |
| | |
|
| |
| | | £m | |
| Unrecognised gains at 1 April 2003 | | | 31 | |
| Gains arising in previous years that were recognised in the year | | | (1 | ) |
| | |
|
| |
| Gains arising in previous years that were not recognised in the year | | | 30 | |
| Gains arising in the year that were not recognised in the year | | | 6 | |
| | |
|
| |
| Unrecognised gains on hedges at 31 March 2004 | | | 36 | |
| Of which: | | | | |
| Gains expected to be recognised in 2004-05 | | | — | |
| Gains expected to be recognised in 2005-06 or later | | | 36 | |
| | |
|
| |
At 31 March 2004, Group companies whose functional currency was not sterling held net foreign currency monetary assets of £4 million denominated in US$.
Foreign exchange transaction risk management |
The Group’s identified exposure to the foreign currency risk of expected future sales and expenditure, after the effect of forward hedging instruments, was nil at 31 March 2004.
Financial instruments held for trading purposes |
The Group does not trade in financial instruments.
Financial assets consist of sterling and Euro denominated cash at bank, short-term money market deposits and investments in a AAA-rated money market fund. Money market deposits have a maturity profile between overnight and three months and earn interest at market rates. Investments in the money market fund can be called on either a same day or next day basis and yield income or interest on the basis of performance of the underlying assets measured against one-week and three-month LIBOR/EURIBOR benchmarks.
| | | Cash at
bank and
in hand | | Hire
purchase
related
assets | | Short-term
deposits
and money
market funds | | Total | | Cash at
bank and
in hand | | Hire
purchase
related
assets | | Short-term
deposits
and money
market funds | | Total | |
| | | | | | | | | 2004 | | | | | | | | 2003 | |
| | |
| |
| |
| |
| |
| |
| |
| |
| |
| | | £m | | £m | | £m | | £m | | £m | | £m | | £m | | £m | |
Currency | | | | | | | | | | | | | | | | | |
| Sterling | | (3 | ) | — | | 461 | | 458 | | 7 | | — | | 290 | | 297 | |
| Euro | | 22 | | — | | 184 | | 206 | | 58 | | — | | 137 | | 195 | |
| Other | | 4 | | 293 | | 55 | | 352 | | 3 | | 354 | | 66 | | 423 | |
| | |
| |
| |
| |
| |
| |
| |
| |
| |
At 31 March 2004 | | 23 | | 293 | | 700 | | 1,016 | | 68 | | 354 | | 493 | | 915 | |
| | |
| |
| |
| |
| |
| |
| |
| |
| |
At 31 March 2004, the Group had no fixed rate financial assets.
F-39
Back to Contents
mmO2 GROUP
NOTES TO THE CONSOLIDATED FINANCIAL STATEMENTS
| 25. | Financial instruments and risk management (Continued) |
| | | Fixed
rate
financial
liabilities | | Floating
rate
financial
liabilities | | Total | | Fixed rate
financial liabilities
weighted average
interest rate | | Fixed rate
financial liabilities
weighted average
period for which
rate is fixed 2004 | |
| | |
|
| |
|
| |
|
| |
|
| |
|
| |
| | | £m | | £m | | £m | | % | | (years) | |
Currency | | | | | | | | | | | | | | | | |
| Sterling | | | 431 | | | 570 | | | 1,001 | | | 7.32% | | | 7.2 | |
| Euro | | | — | | | 80 | | | 80 | | | — | | | — | |
| Other | | | 306 | | | — | | | 306 | | | 7.43% | | | 6.1 | |
| | |
|
| |
|
| |
|
| |
|
| |
|
| |
At 31 March 2004 | | | 737 | | | 650 | | | 1,387 | | | 7.36% | | | 6.7 | |
| | |
|
| |
|
| |
|
| |
|
| |
|
| |
| | | | | | | | | | | | | | | | | |
| | | Fixed
rate
financial
liabilities | | Floating
rate
financial
liabilities | | Total | | Fixed rate
financial liabilities
weighted average
interest rate | | Fixed rate
financial liabilities
weighted average
period for which
rate is fixed 2003 | |
| | |
|
| |
|
| |
|
| |
|
| |
|
| |
| | | £m | | £m | | £m | | % | | (years) | |
Currency | | | | | | | | | | | | | | | | |
| Sterling | | | 434 | | | 562 | | | 996 | | | 7.66% | | | 8.2 | |
| Euro | | | — | | | 103 | | | 103 | | | — | | | — | |
| Other | | | 372 | | | — | | | 372 | | | 6.68% | | | 6.3 | |
| | |
|
| |
|
| |
|
| |
|
| |
|
| |
| At 31 March 2003 | | | 806 | | | 665 | | | 1,471 | | | 7.21% | | | 7.3 | |
| | |
|
| |
|
| |
|
| |
|
| |
|
| |
The effect of the Group’s interest rate swaps are to classify €500 million of Euro borrowings as floating rate in both years. The Group has cross-currency and foreign exchange swaps, which classify €500 million and €380 million respectively of Euro borrowings as floating rate in sterling in both years. The impact of the cross-currency and foreign exchange swaps is to reduce the Euro borrowings and increase floating Sterling borrowings by £309 million (2003: £309 million) and £253 million (2003: £234 million) respectively.
Floating rate financial liabilities bear interest at rates, based on relevant national LIBOR/EURIBOR equivalents, which are fixed in advance for periods of six months.
The Group has the following undrawn committed floating rate borrowing facilities available at 31 March 2004 in respect of which all conditions precedent had been met at that date:
| | | Total
2004 | |
| | |
|
| |
| | | £m | |
| Expiring within one year | | | 100 | |
| Expiring in more than two years | | | 1,725 | |
| | |
|
| |
Total | | | 1,825 | |
| | |
|
| |
F-40
Back to Contents
mmO2 GROUP
NOTES TO THE CONSOLIDATED FINANCIAL STATEMENTS
| 25. | Financial instruments and risk management (Continued) |
The facility expiring within one year is a 364-day bilateral facility. If the facility is not renewed for a further period by the bank at its expiry, it can be drawn and then repaid in September 2006, otherwise it lapses. The facility expiring in more than two years is the five-year tranche of the RCF, which matures in September 2006. All facilities incur commitment fees at market rates.
| 26. | Auditors’ remuneration |
The aggregate fees paid to auditors during the year for audit and other services is analysed below:
| | | 2004 | | 2003 | | 2002 | |
| | |
|
| |
|
| |
|
| |
| | | £000 | | £000 | | £000 | |
| Audit services: | | | | | | | | | | |
| UK | | | 600 | | | 500 | | | 500 | |
| Other countries | | | 400 | | | 500 | | | 400 | |
| | |
|
| |
|
| |
|
| |
Total statutory audit fees | | | 1,000 | | | 1,000 | | | 900 | |
| Audit-related regulatory reporting | | | 32 | | | 17 | | | 188 | |
| | |
|
| |
|
| |
|
| |
Total audit and audit-related fees | | | 1,032 | | | 1,017 | | | 1,088 | |
| | |
|
| |
|
| |
|
| |
| Non-audit fees: | | | | | | | | | | |
| Other assurance services | | | 339 | | | 687 | | | 206 | |
| Tax compliance | | | 166 | | | 125 | | | 18 | |
| Tax advisory | | | 280 | | | 171 | | | 4 | |
| Systems implementation | | | — | | | 176 | | | — | |
| | |
|
| |
|
| |
|
| |
Total non-audit fees | | | 785 | | | 1,159 | | | 228 | |
| | |
|
| |
|
| |
|
| |
The audit fees for the Company were £10,000 (2003: £10,000, 2002: £10,000).
The emoluments of the Directors for the year ended 31 March 2004 and the benefits received under long-term incentive plans were, in summary, as follows:
| | | 2004 | | 2003 | | 2002 | |
| | |
|
| |
|
| |
|
| |
| | | £000 | | £000 | | £000 | |
| Salaries | | | 2,405 | | | 1,408 | | | 1,078 | |
Performance related bonus1 | | | 2,265 | | | 593 | | | 545 | |
Gains under long-term incentive plans2,3,4 | | | 147 | | | 158 | | | — | |
| Other benefits | | | 249 | | | 102 | | | 69 | |
| | |
|
| |
|
| |
|
| |
| | | | 5,066 | | | 2,261 | | | 1,692 | |
| Payments to non-executive Directors | | | 399 | | | 251 | | | 147 | |
| | |
|
| |
|
| |
|
| |
Total emoluments | | | 5,465 | | | 2,512 | | | 1,839 | |
| | |
|
| |
|
| |
|
| |
| 1 | Includes £150,000 paid by BT in 2002 in respect of David Varney’s contribution to the successful demerger. |
| 2 | In addition to the emoluments disclosed above, in 2002 an additional £186,880 was paid as a result of the early vesting of the BT Cellnet long-term incentive plan as a result of the demerger. |
| 3 | In 2003, represents gains on vesting of 1997 Executive Share Award and vesting of Restricted Share Award. |
| 4 | In 2004, represents gains on vesting of Restricted Share Award. |
F-41
Back to Contents
mmO2 GROUP
NOTES TO THE CONSOLIDATED FINANCIAL STATEMENTS
| 27. | Directors’ emoluments (Continued) |
During the year, three Directors (2003: two, 2002: two) accrued retirement benefits under a defined benefit pension plan. In addition, contributions of £83,125 (2003: £77,875, 2002: £43,167) in respect of one Director (2003: one, 2002: one) were paid to a defined contribution pension plan.
More detailed information concerning Directors’ remuneration, shareholdings, pension entitlement, share options and other long-term incentive plans is shown in the report on Directors’ remuneration in “Directors, Senior Management and Employees – B. Compensation – Directors’ Remuneration” in Item 6.
| | | 2004 | | 2003 | | 2002 | |
| | |
|
| |
|
| |
|
| |
| | | No. | | No. | | No. | |
| Average number of full time employee equivalents (including Executive Directors) by class of business: | | | | | | | | | | |
| Mobile telecommunications | | | 11,133 | | | 11,643 | | | 13,999 | |
| Mobile internet services | | | 301 | | | 269 | | | 307 | |
| Other businesses | | | 913 | | | 866 | | | 810 | |
| | |
|
| |
|
| |
|
| |
Total employees | | | 12,347 | | | 12,778 | | | 15,116 | |
| | |
|
| |
|
| |
|
| |
| Average number of full time employee equivalents (including Executive Directors) by geographic area: | | | | | | | | | | |
| UK | | | 7,328 | | | 7,081 | | | 8,750 | |
| Germany | | | 3,494 | | | 3,527 | | | 4,084 | |
| Other | | | 1,525 | | | 2,170 | | | 2,282 | |
| | |
|
| |
|
| |
|
| |
Total employees | | | 12,347 | | | 12,778 | | | 15,116 | |
| | |
|
| |
|
| |
|
| |
| | | | | | | | | | | |
| The costs incurred in respect of these employees were: | | 2004 | | 2003 | | 2002 | |
| | |
|
| |
|
| |
|
| |
| | | £m | | £m | | £m | |
| Wages and salaries | | | 456 | | | 446 | | | 483 | |
| Social security costs | | | 58 | | | 47 | | | 59 | |
| Employee share ownership scheme | | | 8 | | | 4 | | | 2 | |
| Pension costs (note 29) | | | 26 | | | 24 | | | 26 | |
| | |
|
| |
|
| |
|
| |
Total staff costs | | | 548 | | | 521 | | | 570 | |
| | |
|
| |
|
| |
|
| |
At 31 March 2004, the Group employed 12,905 (2003: 12,476, 2002: 14,300) full time employee equivalents.
The Group operates a number of employee incentive schemes including a sharesave plan, a share ownership plan and various executive and employee option schemes. Full details are disclosed in “Directors, Senior Management and Employees – E.Share Ownership” in Item 6.
F-42
Back to Contents
mmO2 GROUP
NOTES TO THE CONSOLIDATED FINANCIAL STATEMENTS
The Group operates a number of pension schemes in its businesses. All the Group’s pension schemes are provided through either defined benefit or defined contribution arrangements. Defined benefit schemes generally provide pensions based on the employee’s length of service and their final pensionable salary. Defined contribution schemes offer employees individual funds which are converted into pension benefits on retirement. The majority of the schemes’ assets are held independently of the Group’s finances.
The mmO2 Pension Plan (mmO2 PP) provides the pension benefits for the majority of UK employees and is divided into defined contribution and defined benefit sections.
Defined contribution section |
Prior to 1 July 2002, the Group participated in the BT Retirement Plan (BTRP), a defined contribution scheme established by BT. Members of the BTRP could elect to transfer their funds under management into the new mmO2 Plan (defined contribution section) on its inception. These funds were transferred on 14 March 2003.
Following the Group’s demerger from BT and until 30 June 2002, the Group was a participating employer in the BT Pension Scheme (BTPS), a funded defined benefit pension scheme. While participating the Group paid to the BTPS a predetermined percentage of the pensionable payroll costs of those Group employees who were members of the scheme. These costs have been charged in the period to which they relate. Details of the financial position of the BTPS and further information regarding the scheme are contained in the financial statements of BT Group plc.
On 1 July 2002 the mmO2 PP was established for employees in the United Kingdom by the Group. Any active member of the BTPS employed by the Group could join a defined benefit section of, and elect to transfer their past service liability from the BTPS to, the new plan. The vast majority of those eligible to transfer elected to do so. The benefits of all deferred and pensioner members at 30 June 2002 remain in the BTPS. A share of the assets of the BTPS, determined on the basis of the past service liabilities of the members electing to transfer their benefits to the new plan, were transferred to the mmO2 PP on 17 March 2003.
From 1 July 2002, the Group has been the principal employer of the mmO2 PP. The pension costs have been assessed in accordance with the advice of a qualified actuary using the projected unit method and taking assets at market value. The defined benefits sections of the mmO2 PP are closed to new entrants and therefore the current service cost is likely to increase as the members approach retirement.
The first full actuarial valuation of the defined benefit section of the mmO2 PP was undertaken at 30 June 2003 by a professionally qualified independent actuary using the projected unit method. The purpose of this valuation was to design a future funding plan to ensure that contributions to the plan are sufficient to meet future liabilities. As at 30 June 2003 the assets of the mmO2 PP had a market value of £230 million and were sufficient to cover 86 per cent of the benefits accrued to members at that date on the ongoing funding measure. As a result of the valuation, the Group has increased the employer’s regular contribution rate from 11.6 per cent to 13.1 per cent of pensionable salaries with effect from 1 April 2004. In order to meet the deficit, additional annual payments of £4.4 million are payable for 13 years (subject to review at future valuations). The employee’s contribution rate remains at 6 per cent of pensionable salary.
F-43
Back to Contents
mmO2 GROUP
NOTES TO THE CONSOLIDATED FINANCIAL STATEMENTS
| 29. | Pension costs (Continued) |
The main actuarial assumptions used in the valuation were as follows:
| | | % | |
| | |
|
| |
| Nominal rate of increase in salaries | | | 3.75-4.25 | |
| Nominal rate of increase of pensions in payment | | | 2.50 | |
| Investment return pre retirement | | | 7.00 | |
| Investment return post retirement | | | 5.50 | |
| Inflation assumption | | | 2.50 | |
| |
Other Group pension plans |
The Group operates several other defined benefit pension schemes. In the Isle of Man benefits are provided by a funded defined benefit pension scheme that is closed to new entrants. The Group also operates unfunded defined benefit schemes in the UK and in Germany. A provision, determined in accordance with SSAP 24, is recorded on the balance sheet to recognise the cumulative accrued liability for the unfunded schemes.
Until May 2001 the O2 Germany main scheme was unfunded. This scheme has been changed to a funded arrangement with payments being made to provide for previously unfunded liabilities over the period to the active members’ retirements. The vast majority of members of the O2 Germany main scheme are now accruing benefits under a defined contribution arrangement. The other defined benefit schemes in Germany are unfunded.
The Group operates defined contribution schemes in Germany, Ireland and the Isle of Man. The assets of these defined contribution arrangements are held separately from those of the Group in independently administered funds.
The assets and liabilities of the O2 Netherlands pension scheme were included in the disposal of O2 Netherlands to Greenfield Capital Partners.
Disclosures under SSAP 24 |
The total cost charged to the profit and loss account for all the Group’s pension schemes was £26 million (2003: £24 million, 2002: £26 million) as analysed below:
| | | 2004 | | 2003 | | 2002 | |
| | |
|
| |
|
| |
|
| |
| | | £m | | £m | | £m | |
mmO2 Pension Plan cost | | | 16 | | | 12 | | | — | |
| Contributions to the BT Pension Scheme | | | — | | | 4 | | | 20 | |
| Other defined benefit schemes | | | 3 | | | 4 | | | 4 | |
| Defined contribution schemes | | | 7 | | | 4 | | | 2 | |
| | |
|
| |
|
| |
|
| |
| | | | 26 | | | 24 | | | 26 | |
| | |
|
| |
|
| |
|
| |
Of the total cost, £24 million is regular cost (2003: £24 million, 2002: £26 million).
The cost of other defined benefit pension schemes comprises £1 million in respect of the Isle of Man scheme (2003: £1 million, 2002: £1 million), nil in respect of the O2 Germany main scheme (2003: nil, 2002: £2 million), nil in respect of the O2 Netherlands scheme (2003: nil, 2002: £1 million), and £2 million (2003: £3 million, 2002: nil million) in respect of the Group’s unfunded defined benefit arrangements in the UK and Germany.
F-44
Back to Contents
mmO2 GROUP
NOTES TO THE CONSOLIDATED FINANCIAL STATEMENTS
| 29. | Pension costs (Continued) |
The cost of the defined contribution schemes comprises £3 million (2003: £1 million, 2002: nil) in respect of the mmO2 PP, £3 million (2003: £2 million, 2002: nil) in respect of the O2 Germany scheme and £1 million (2003: £1 million, 2002: £1 million) in respect of the O2 Ireland scheme. In addition, contributions of £1 million were paid to the BTRP in the year ended 31 March 2002. There were no contributions outstanding or pre-paid at the year end.
The unfunded defined benefit arrangement in the UK has 23 members of whom 15 were active (2003: 23 members of whom 22 were active, 2002: 24 members of whom all were active).
At 31 March 2004, the mmO2 PP had 4,596 members of whom 4,014 were active. The O2 Germany schemes had 3,008 members of whom 2,996 were active. The Isle of Man schemes had 437 members of whom 281 were active. The O2 Ireland scheme had 1,112 members of whom 918 were active.
The principal assumptions used to determine the pension cost for the defined benefit section of the mmO2 PP for the year were:
| | | 2004 | | 2003 | |
| | |
|
| |
|
| |
| | | % | | % | |
| Nominal rate of increase in salaries | | | 3.75-4.25 | | | 4.25 | |
| Nominal rate of increase of pensions in payment | | | 2.50 | | | 2.50 | |
| Investment return pre retirement | | | 7.50 | | | 6.50 | |
| Investment return post retirement | | | 5.70 | | | 6.00 | |
| Inflation assumption | | | 2.50 | | | 2.50 | |
| | |
|
| |
|
| |
The assumptions for the other defined benefit schemes around the Group are consistent with those used for the mmO2 PP.
At 31 March 2004, using SSAP 24, a deficit of £12 million existed in the mmO2 PP. This difference between the assets and liabilities is being amortised over the expected future working lives of the active membership, of 13 years, using the straight line method and is included in the cost.
In accordance with the transitional arrangements of FRS 17 “Retirement benefits”, certain information regarding the Group’s pension arrangements are disclosed below.
The actuarial valuation of the mmO2 PP as at 30 June 2003 has been updated to 31 March 2004 by an independent qualified actuary in accordance with the transitional arrangements of FRS 17. In accordance with FRS 17, the defined benefit liabilities have been measured using the projected unit method. Plan assets are stated at their market value.
F-45
Back to Contents
mmO2 GROUP
NOTES TO THE CONSOLIDATED FINANCIAL STATEMENTS
| 29. | Pension costs (Continued) |
| |
| Main assumptions under FRS 17 |
| |
| | | 31 March 2004
mmO2 PP | | 31 March 2003
mmO2 PP | |
| | |
|
| |
|
| |
| | | % | | % | |
| Nominal rate of increase in salaries | | | 4.05-4.55 | | | 3.75 | |
| Nominal rate of increase of pensions in payment | | | | | | | |
| – Pension increases with inflation | | | 2.80 | | | 2.50 | |
| – Pension increases with inflation limited to 5% p.a. | | | 2.60 | | | 2.40 | |
| Discount rate | | | 5.70 | | | 5.80 | |
| Inflation assumption | | | 2.80 | | | 2.50 | |
| Expected long-term return for: | | | | | | | |
| – Equities | | | 7.80 | | | 7.50 | |
| – UK Government bonds | | | 4.70 | | | — | |
| – Other bonds | | | 5.70 | | | — | |
| – Other | | | 4.60 | | | 3.80 | |
| | |
|
| |
|
| |
The assumptions, adopted for FRS 17 purposes, for the other defined benefit schemes around the Group are consistent with those used for the mmO2 PP.
The assets and liabilities of the defined benefit pension schemes are:
| | | 31 March 2004
mmO2 PP | | 31 March 2004
other schemes | | 31 March 2003
mmO2 PP | | 31 March 2003
other schemes | |
| | |
|
| |
|
| |
|
| |
|
| |
| | | £m | | £m | | £m | | £m | |
| Fair value of assets comprises: | | | | | | | | | | | | | |
| – Equities | | | 245 | | | 12 | | | 177 | | | 11 | |
| – UK Government bonds | | | 14 | | | 6 | | | — | | | 5 | |
| – Other bonds | | | 14 | | | 2 | | | — | | | 5 | |
| – Other | | | 5 | | | 1 | | | 20 | | | — | |
| | |
|
| |
|
| |
|
| |
|
| |
| Fair value of assets | | | 278 | | | 21 | | | 197 | | | 21 | |
| Present value of liabilities | | | (362 | ) | | (42 | ) | | (268 | ) | | (39 | ) |
| | |
|
| |
|
| |
|
| |
|
| |
| Deficit | | | (84 | ) | | (21 | ) | | (71 | ) | | (18 | ) |
| Related deferred tax asset | | | 25 | | | 6 | | | 21 | | | 5 | |
| | |
|
| |
|
| |
|
| |
|
| |
| Net pension liability | | | (59 | ) | | (15 | ) | | (50 | ) | | (13 | ) |
| | |
|
| |
|
| |
|
| |
|
| |
F-46
Back to Contents
mmO2 GROUP
NOTES TO THE CONSOLIDATED FINANCIAL STATEMENTS
| 29. | Pension costs (Continued) |
The following table sets out the amounts which would be charged to the profit and loss account and statement of total recognised gains and losses in accordance with the requirements of FRS 17 for the Group’s defined benefit plans:
| | | | | | | | | | | | | | |
| | | Year ended
31 March 2004
mmO2 PP | | Year ended
31 March 2004
other schemes | | Period from
1 July 2002 to
31 March 2003
mmO2 PP | | Year ended
31 March 2003
other schemes | |
| | |
|
| |
|
| |
|
| |
|
| |
| | | £m | | £m | | £m | | £m | |
| Analysis of the amount charged to operating profit/(loss): | | | | | | | | | | | | | |
| Current service cost (employers’) | | | 16 | | | 2 | | | 14 | | | 3 | |
Curtailment and settlement1 | | | — | | | (2 | ) | | — | | | — | |
Vested past service cost2 | | | 2 | | | — | | | — | | | (1 | ) |
| | |
|
| |
|
| |
|
| |
|
| |
| Total operating charge | | | 18 | | | — | | | 14 | | | 2 | |
| | |
|
| |
|
| |
|
| |
|
| |
| Analysis of the amount credited/(charged) to net interest: | | | | | | | | | | | | | |
| Expected return on pension plan assets | | | 15 | | | 1 | | | 14 | | | 1 | |
| Interest on pension plan liabilities | | | (16 | ) | | (2 | ) | | (12 | ) | | (2 | ) |
| | |
|
| |
|
| |
|
| |
|
| |
| Net return | | | (1 | ) | | (1 | ) | | 2 | | | (1 | ) |
| | |
|
| |
|
| |
|
| |
|
| |
| Analysis of the amount recognised in the statement of total recognised gains and losses: | | | | | | | | | | | | | |
Actual return less expected return on pension plan assets3 | | | 39 | | | 2 | | | (62 | ) | | (7 | ) |
| Experience gains and losses arising on plan liabilities | | | 6 | | | (1 | ) | | (4 | ) | | 2 | |
| Changes in assumptions underlying the present value of plan liabilities | | | (57 | ) | | (4 | ) | | 26 | | | — | |
| | |
|
| |
|
| |
|
| |
|
| |
| Actuarial loss recognised in the statement of total recognised gains and losses | | | (12 | ) | | (3 | ) | | (40 | ) | | (5 | ) |
| | |
|
| |
|
| |
|
| |
|
| |
| 1 | In respect of O2 Netherlands. |
| 2 | Including a restructuring charge of £2 million which has been included in the exceptional charge for the year. |
| 3 | Excluding the returns on assets of the Group’s defined contribution arrangements which do not affect the balance sheet liability. |
For the mmO2 PP, the amount charged for the period from 1 April 2002 to 30 June 2002 is the contributions paid to the BTPS of £4 million and is in addition to charges shown above.
F-47
Back to Contents
mmO2 GROUP
NOTES TO THE CONSOLIDATED FINANCIAL STATEMENTS
| 29. | Pension costs (Continued) |
| | |
| | | mmO2 PP | | Other
schemes | |
| | |
|
| |
|
| |
| | | £m | | £m | |
Movement in deficit during the period/year | | | | | | | |
| Deficit at 1 July 2002/1 April 2002 | | | (32 | ) | | (13 | ) |
| Total current service cost | | | (21 | ) | | (4 | ) |
| Total contributions | | | 20 | | | 4 | |
| Vested past service costs | | | — | | | 1 | |
| Other finance income | | | 2 | | | (1 | ) |
| Actuarial loss recognised in the statement of total recognised gains and losses | | | (40 | ) | | (5 | ) |
| | |
|
| |
|
| |
| Deficit in plan at 31 March 2003 | | | (71 | ) | | (18 | ) |
Total current service cost1 | | | (24 | ) | | (3 | ) |
Total contributions1 | | | 26 | | | 2 | |
| Curtailment and settlement gain | | | — | | | 2 | |
| Vested past service costs | | | (2 | ) | | — | |
| Other finance cost | | | (1 | ) | | (1 | ) |
| Actuarial loss recognised in the statement of total recognised gains and losses | | | (12 | ) | | (3 | ) |
| | |
|
| |
|
| |
Deficit in plan at 31 March 2004 | | | (84 | ) | | (21 | ) |
| | |
|
| |
|
| |
| 1 | Includes £2 million in respect of restructuring costs disclosed in note 4. |
| | |
| | | Year ended
31 March 2004
mmO2 PP | | Year ended
31 March 2004
other schemes | | Period from
1 July 2002 to
31 March 2003
mmO2 PP | | Year ended
31 March 2003
other schemes | |
| | |
|
| |
|
| |
|
| |
|
| |
| | | £m | | £m | | £m | | £m | |
History of experience gains and losses | | | | | | | | | | | | | |
| Difference between the expected and actual return on plan assets: | | | | | | | | | | | | | |
| Amount – gain/(loss) | | | 39 | | | 2 | | | (62 | ) | | (7 | ) |
| Percentage of plan assets | | | 14% | | | 11% | | | (32% | ) | | (33% | ) |
| Experience gains and losses on plan liabilities: | | | | | | | | | | | | | |
| Amount – gain/(loss) | | | 6 | | | (2 | ) | | (4 | ) | | 2 | |
| Percentage of the present value of plan liabilities | | | 2% | | | (4% | ) | | (1% | ) | | 5% | |
| Total amount recognised in statement of total recognised gains and losses: | | | | | | | | | | | | | |
| Amount – loss | | | (12 | ) | | (3 | ) | | (40 | ) | | (6 | ) |
| Percentage of the present value of plan liabilities | | | (3% | ) | | (8% | ) | | (15% | ) | | (15% | ) |
| | |
|
| |
|
| |
|
| |
|
| |
F-48
Back to Contents
mmO2 GROUP
NOTES TO THE CONSOLIDATED FINANCIAL STATEMENTS
| 29. | Pension costs (Continued) |
If the Group had fully adopted the provisions of FRS 17 “Retirement benefits” in the year ended 31 March 2004, the Group pension schemes deficit (net of deferred tax) of £74 million (2003: £63 million) would have been recognised on the Group’s balance sheet. Instead the following analysis of reserves is provided in accordance with the transitional disclosures required regarding the pension schemes:
| | | 2004 | | 2003 | |
| | |
|
| |
|
| |
| | | £m | | £m | |
| Profit and loss account excluding pension deficit | | | (995 | ) | | (2,030 | ) |
| Pension deficit (net of related deferred tax asset) | | | (74 | ) | | (63 | ) |
| | |
|
| |
|
| |
Profit and loss account including pension deficit | | | (1,069 | ) | | (2,093 | ) |
| | |
|
| |
|
| |
| | |
| 30. | Parent company balance sheet of mmO2 plc at 31 March 2004 |
| | |
| | | Note | | 2004 | | 2003 | |
| | |
|
| |
|
| |
|
| |
| | | | | £m | | £m | |
Fixed assets | | | | | | | | | | |
| Investments in subsidiary undertakings | | | 10 | | | 11,283 | | | 11,283 | |
| Investment in own shares | | | 10 | | | — | | | 3 | |
| | | | | |
| |
| |
| | | | | | | 11,283 | | | 11,286 | |
Current assets | | | | | | | | | | |
| Debtors | | | 11 | | | 183 | | | 449 | |
| Investments | | | 12 | | | 700 | | | 493 | |
| Cash at bank and in hand | | | | | | — | | | 1 | |
| | | | | |
| |
| |
| | | | | | | 883 | | | 943 | |
Creditors: amounts falling due within one year | | | 13 | | | (14 | ) | | (14 | ) |
| | | | | |
| |
| |
Net current assets | | | | | | 869 | | | 929 | |
| | | | | |
| |
| |
Total assets less current liabilities | | | | | | 12,152 | | | 12,215 | |
| | | | | |
| |
| |
Creditors: amounts falling due after more than one year | | | 14 | | | (1,012 | ) | | (1,015 | ) |
| | | | | |
| |
| |
Net assets | | | | | | 11,140 | | | 11,200 | |
| | | | | |
| |
| |
Capital and reserves | | | | | | | | | | |
| Called up share capital | | | 17 | | | 9 | | | 9 | |
| Share premium | | | 18 | | | 3 | | | — | |
| Other reserves | | | 18 | | | 11,273 | | | 11,273 | |
| Profit and loss account | | | 18 | | | (145 | ) | | (82 | ) |
| | | | | |
| |
| |
Shareholders’ funds | | | | | | 11,140 | | | 11,200 | |
| | | | | |
| |
| |
These financial statements were approved by the Board of Directors on 17 May 2004 and were signed on its behalf by:
P Erskine Chief Executive Officer D Finch Chief Financial Officer
F-49
Back to Contents
mmO2 GROUP
NOTES TO THE CONSOLIDATED FINANCIAL STATEMENTS
| 31. | Reconciliation from UK GAAP to US GAAP and supplementary information |
| |
Reconciliation with US GAAP |
The Group’s financial statements are prepared in accordance with accounting principles generally accepted in the United Kingdom (UK GAAP). Note 1 to the financial statements provides additional information on the basis of preparation of the Group’s financial statements. UK GAAP differs in certain material respects from US GAAP. The following notes, disclosures and tables set out the key differences between US and UK GAAP.
| I. | Net profit/(loss) and shareholders’ funds reconciliation |
The following tables summarise the significant adjustments between net profit/(loss) and shareholders’ funds (net assets) from that reported under UK GAAP to that which would have been reported had US GAAP been applied.
| | | Note | | 2004 | | 2003 | | 2002 | |
| | |
|
| |
|
| |
|
| |
|
| |
Net profit/(loss) | | | | £m | | £m | | £m | |
| Net profit/(loss) under UK GAAP | | | | | | 166 | | | (10,148 | ) | | (1,379 | ) |
| Adjustment for: | | | | | | | | | | | | | |
| Capitalisation of interest, net of related depreciation | | | (a) | | | (77 | ) | | (67 | ) | | 579 | |
| Goodwill impairment | | | (b) | | | — | | | 482 | | | — | |
| Licence impairment | | | (b) | | | — | | | 5,899 | | | — | |
| Fixed asset impairment on discontinued operation | | | (b) | | | — | | | (25 | ) | | — | |
| Amortisation of goodwill | | | (b) | | | 201 | | | 374 | | | 23 | |
| Amortisation of software and other intangible assets | | | (b) | | | (37 | ) | | (37 | ) | | (217 | ) |
| Employee stock compensation | | | (c) | | | (26 | ) | | (1 | ) | | (1 | ) |
| Other employee compensation expense | | | (d) | | | — | | | — | | | (3 | ) |
| Restructuring costs | | | (e) | | | 19 | | | (21 | ) | | 21 | |
| Fair value of derivative financial instruments | | | (g) | | | 5 | | | 50 | | | (19 | ) |
| Long-term licence creditors | | | (h) | | | (1 | ) | | (1 | ) | | — | |
Loss on disposal of O2 Netherlands | | | (i) | | | (6 | ) | | — | | | — | |
| Current year adjustment of SFAS No. 143 | | | (j) | | | (4 | ) | | — | | | — | |
| Deferred tax on US GAAP adjustments | | | (k) | | | (56 | ) | | (176 | ) | | (467 | ) |
| | | | | |
| |
| |
| |
| Net profit/(loss) as adjusted for US GAAP before accumulative adjustment | | | | | | 184 | | | (3,671 | ) | | (1,463 | ) |
| Accumulative adjustment on adoption of SFAS No. 143 | | | (j) | | | (4 | ) | | — | | | — | |
| | | | | |
| |
| |
| |
| Net profit/(loss) as adjusted for US GAAP | | | | | | 180 | �� | | (3,671 | ) | | (1,463 | ) |
| | | | | |
| |
| |
| |
| Basic and diluted earnings/(loss) per share, as adjusted for US GAAP (pence) | | | (n) | | | 2.1 | | | (42.3 | ) | | (16.9 | ) |
| | | | | |
| |
| |
| |
The net profit/(loss) under UK GAAP has been prepared for statutory reporting purposes using accounting policies which differ in certain respects to those used in the Listing Particulars, Form 20-F/A and Form 20-F. The impact of the different accounting policies is set out below:
| | | 2004 | | 2003 | | 2002 | |
| | |
|
| |
|
| |
|
| |
| | | £m | | £m | | £m | |
| Net profit/(loss) on Form 20-F basis | | | 166 | | | (10,148 | ) | | (1,379 | ) |
| Notional loans due to BT | | | — | | | — | | | 756 | |
| Deferred tax on US GAAP differences | | | — | | | — | | | (227 | ) |
| | |
|
| |
|
| |
|
| |
| Net profit/(loss) under UK GAAP for UK statutory reporting purposes | | | 166 | | | (10,148 | ) | | (850 | ) |
| | |
|
| |
|
| |
|
| |
The above adjustments have no impact on the net profit/(loss) as adjusted for US GAAP.
F-50
Back to Contents
mmO2 GROUP
NOTES TO THE CONSOLIDATED FINANCIAL STATEMENTS
| 31. | Reconciliation from UK GAAP to US GAAP and supplementary information (Continued) |
| | |
| | | Note | | 2004 | | 2003 | |
| | |
|
| |
|
| |
|
| |
Shareholders’ funds | | | | £m | | £m | |
| Shareholders’ funds under UK GAAP | | | | | | 10,091 | | | 10,066 | |
| Adjustment for: | | | | | | | | | | |
| Capitalisation of interest, net of related depreciation | | | (a) | | | 804 | | | 912 | |
| Goodwill impairment | | | (b) | | | 435 | | | 435 | |
| Licence impairment | | | (b) | | | 5,899 | | | 5,899 | |
| Fixed asset impairment on discontinued operation | | | (b) | | | — | | | (25 | ) |
| Amortisation of goodwill and intangible assets | | | (b) | | | 233 | | | 69 | |
| Employee stock compensation | | | (c) | | | (30 | ) | | (4 | ) |
| Other employee compensation expense | | | (d) | | | (11 | ) | | (11 | ) |
| Restructuring costs | | | (e) | | | 19 | | | — | |
| Treasury stock | | | (f) | | | — | | | (3 | ) |
| Fair value of derivative financial instruments | | | (g) | | | 36 | | | 31 | |
| Long-term licence creditors | | | (h) | | | (2 | ) | | (1 | ) |
| Accumulative and current year adjustment on adoption of SFAS No. 143 | | | (j) | | | (8 | ) | | — | |
| Deferred tax on US GAAP adjustments | | | (k) | | | (334 | ) | | (278 | ) |
| Pension liability | | | (l) | | | (40 | ) | | (38 | ) |
| Foreign exchange | | | (m) | | | (152 | ) | | (7 | ) |
| | | | | |
| |
| |
| Shareholders’ funds as adjusted for US GAAP | | | | | | 16,940 | | | 17,045 | |
| | | | | |
| |
| |
On 3 June 2003 the Group completed the sale of O2 Netherlands, its wholly owned Dutch subsidiary, to Greenfield Capital Partners for €25 million in cash. The Group profit and loss account, note 2 and note 3 to the financial statements disclose the results of O2 Netherlands as a discontinued operation for the three years ended 31 March 2004, 2003 and 2002 under UK GAAP. The carrying amount of the major classes of assets and liabilities of O2 Netherlands under US GAAP at 31 March 2003 were tangible fixed assets of £38 million and net current liabilities of £22 million. O2 Netherlands incurred no tax benefit or expense in any year presented and the loss before tax is equal to the net loss shown in 2004, 2003 and 2002.
F-51
Back to Contents
mmO2 GROUP
NOTES TO THE CONSOLIDATED FINANCIAL STATEMENTS
| 31. | Reconciliation from UK GAAP to US GAAP and supplementary information (Continued) |
The following table analyses the US GAAP net profit/(loss) between continuing operations and discontinued operations.
| | | 2004 | | 2003 | | 2002 | |
| | |
|
| |
|
| |
|
| |
| | | £m | | £m | | £m | |
Net profit/(loss) adjusted for US GAAP comprises: | | | | | | | | | | |
| Continuing operations | | | 192 | | | (2,195 | ) | | (1,355 | ) |
| Discontinued operation | | | (12 | ) | | (1,476 | ) | | (108 | ) |
| | |
|
| |
|
| |
|
| |
| Net profit/(loss) as adjusted for US GAAP | | | 180 | | | (3,671 | ) | | (1,463 | ) |
| | |
|
| |
|
| |
|
| |
| | | | | | | | | | | |
Basic and diluted earnings/(loss) per share, in pence, comprises: | | | | | | | | | | |
| Continuing operations | | | 2.2 | | | (25.5 | ) | | (15.7 | ) |
| Discontinued operation | | | (0.1 | ) | | (16.8 | ) | | (1.2 | ) |
| | |
|
| |
|
| |
|
| |
| Basic and diluted earnings/(loss) per share, as adjusted for US GAAP (pence) | | | 2.1 | | | (42.3 | ) | | (16.9 | ) |
| | |
|
| |
|
| |
|
| |
| | |
| II. | Differences between accounting principles generally accepted in the United Kingdom and the United States of America |
The following are the main differences between UK GAAP and US GAAP which are relevant to the Group’s financial statements.
| (a) | Capitalisation of interest |
Under UK GAAP, the Group does not capitalise interest in its financial statements. To comply with US GAAP, the estimated amount of interest incurred whilst constructing major capital projects is included in fixed assets and depreciated over the lives of the related assets. This includes capitalisation of interest incurred on funding the UMTS licences for the period up to the market launch of the related services. As at 31 March 2004, under US GAAP, gross capitalised interest of £1,324 million (2003: £1,299 million) was subject to depreciation over periods of five to 20 years.
| (b) | Goodwill and other intangible and tangible assets |
Under UK GAAP, goodwill arising on the acquisition of subsidiary undertakings, associates and joint ventures completed by the Group prior to 1 April 1998 was written off against shareholders’ funds. The goodwill is reflected in the net income of the period of disposal, as part of the calculation of the gain or loss on divestment to the extent it has not already been recognised in the profit and loss account. Goodwill arising on acquisitions completed on or after 1 April 1998 is recognised as an intangible asset in the balance sheet and is amortised over its useful life. Under US GAAP, such goodwill has always been held as an intangible asset in the balance sheet and was previously amortised over its useful life with only the unamortised portion being included in any gain or loss on divestment.
In June 2001, the FASB issued Statement of Financial Accounting Standard (SFAS) No. 142, “Goodwill and Other Intangible Assets”. The Group adopted SFAS No. 142 on 1 April 2002. SFAS No. 142 required the cessation of amortisation of intangible fixed assets that have an indefinite useful life, including goodwill. Instead, such intangible fixed assets are reviewed for impairment annually, or sooner should a triggering event occur. From 1 April 2002 the Group ceased to amortise its goodwill balances and conducts annual impairment reviews of its goodwill balances.
F-52
Back to Contents
mmO2 GROUP
NOTES TO THE CONSOLIDATED FINANCIAL STATEMENTS
| 31. | Reconciliation from UK GAAP to US GAAP and supplementary information (Continued) |
Those intangible and tangible fixed assets that have definite useful lives continue to be amortised over their useful life, with impairment reviews being carried out when triggering events occur. Such definite lived intangible assets are tested for impairment in accordance with SFAS No. 144, “Accounting for the Impairment or Disposal of Long-Lived Assets”. In considering whether a triggering event has occurred under SFAS No. 142 and SFAS No. 144, the Group looks for the existence of facts and circumstances, either internal or external, which indicate that the carrying value of the asset may not be recovered.
Certain intangible fixed assets recognised under the US GAAP purchase accounting rules are subsumed within goodwill under UK GAAP. Under US GAAP, these separately identified intangible assets are valued and amortised over their useful lives. These include customer bases and internally developed software. In addition, under UK GAAP, contingent purchase consideration is generally included as part of the purchase cost at the date of acquisition. Under US GAAP, this cost is not recognised until the contingency is resolved or the amount is determinable beyond a reasonable doubt.
In the year ended 31 March 2004, the Group has not identified any triggering events which would indicate that an impairment review should be undertaken in respect of definite-lived tangible and intangible fixed assets. In accordance with SFAS No. 142, the Group’s indefinite-lived assets, being goodwill, were tested for impairment at 31 March 2004. This impairment review indicated that no impairment of goodwill was required.
The changes in the carrying amount of goodwill for the segments and in total for the years ended 31 March 2004 and 31 March 2003 are as follows:
| | | | | | | | | | | Total | | | | | | | |
| | | Mobile telecommunications | | Other | | continuing | | | | | | | |
| | | UK | | Germany | | Ireland | | businesses | | operations | | Netherlands | | Total | |
| | |
|
| |
|
| |
|
| |
|
| |
|
| |
|
| |
|
| |
| | | £m | | £m | | £m | | £m | | £m | | £m | | £m | |
| At 31 March 2002 | | | 2,820 | | | 605 | | | 1,790 | | | 5 | | | 5,220 | | | 607 | | | 5,827 | |
| Impairment charges | | | (409 | ) | | — | | | (1,475 | ) | | — | | | (1,884 | ) | | (684 | ) | | (2,568 | ) |
| Foreign exchange and other movements | | | — | | | 126 | | | 233 | | | — | | | 359 | | | 77 | | | 436 | |
| | |
|
| |
|
| |
|
| |
|
| |
|
| |
|
| |
|
| |
| At 31 March 2003 | | | 2,411 | | | 731 | | | 548 | | | 5 | | | 3,695 | | | — | | | 3,695 | |
| Foreign exchange and other movements | | | — | | | (24 | ) | | (17 | ) | | (5 | ) | | (46 | ) | | — | | | (46 | ) |
| | |
|
| |
|
| |
|
| |
|
| |
|
| |
|
| |
|
| |
At 31 March 2004 | | | 2,411 | | | 707 | | | 531 | | | — | | | 3,649 | | | — | | | 3,649 | |
| | |
|
| |
|
| |
|
| |
|
| |
|
| |
|
| |
|
| |
As at 31 March 2004, the gross carrying value of goodwill under US GAAP was £9,237 million (2003: £10,257 million).
F-53
Back to Contents
mmO2 GROUP
NOTES TO THE CONSOLIDATED FINANCIAL STATEMENTS
| 31. | Reconciliation from UK GAAP to US GAAP and supplementary information (Continued) |
The following table analyses definite-lived intangible assets for US GAAP purposes:
| | | Gross book
value | | Accumulated
amortisation | | Net book
value | | Gross book
value | | Accumulated
amortisation | | Net book
value | |
| | | | | | | 2004 | | | | | | 2003 | |
| | |
|
| |
|
| |
|
| |
|
| |
|
| |
|
| |
| | | £m | | £m | | £m | | £m | | £m | | £m | |
| Licences | | | 10,052 | | | (23 | ) | | 10,029 | | | 10,489 | | | (423 | ) | | 10,066 | |
| Other intangible assets | | | 499 | | | (329 | ) | | 170 | | | 519 | | | (302 | ) | | 217 | |
| | |
|
| |
|
| |
|
| |
|
| |
|
| |
|
| |
| | | | 10,551 | | | (352 | ) | | 10,199 | | | 11,008 | | | (725 | ) | | 10,283 | |
| | |
|
| |
|
| |
|
| |
|
| |
|
| |
|
| |
The current and expected amortisation expense for other definite-lived intangible assets for the current year and the subsequent five years is:
| | | Amount | |
| | |
|
| |
| | | £m | |
| Aggregate amortisation expense for the year ended 31 March: | | | | |
| 2004 | | | 44 | |
| | | | | |
| Expected amortisation expense for the year ending 31 March: | | | | |
| 2005 | | | 533 | |
| 2006 | | | 660 | |
| 2007 | | | 622 | |
| 2008 | | | 619 | |
| 2009 | | | 619 | |
The above table represents the Group’s estimate regarding future amortisation of definite-lived intangible assets recorded on the US GAAP balance sheet as at 31 March 2004. Due to the effects of foreign exchange, any future investments or capital expenditure on intangible assets and the date on which the assets are likely to be brought into service, it is likely that the actual charge will be different.
During the second half of the year ended 31 March 2003, certain events indicated the Group should perform impairment reviews of its four principal reporting units, being its mobile telecommunications operations in the UK, Germany, Ireland and the Netherlands, in accordance with SFAS No. 142 and SFAS No. 144.
These events included the announcement in April 2003 of the sale of O2 Netherlands resulting in an accounting loss of approximately £1.4 billion, which provided an indication that the valuation of mobile businesses may be lower than previously estimated. Additionally, following the Competition Commission’s report on mobile termination charges, the Group announced that it was reviewing the launch dates of its 3G services and would adopt a more prudent timetable where local regulatory requirements permitted. The revision in this timetable, together with the absence of evidence as to the mass market appeal of 3G services and the limited availability of 2G/3G compatible handsets, led management to review and revise the business plans of its mobile operations across its European footprint.
F-54
Back to Contents
mmO2 GROUP
NOTES TO THE CONSOLIDATED FINANCIAL STATEMENTS
| 31. | Reconciliation from UK GAAP to US GAAP and supplementary information (Continued) |
As a result of the above events and in conjunction with the Group’s annual impairment review under SFAS No. 142, the carrying value of the fixed assets of O2 UK, O2 Germany and O2 Ireland and the goodwill that arose on their acquisition was reviewed. In evaluating whether any long-lived assets and intangibles were impaired, the undiscounted cash flows of O2 UK, O2 Germany and O2 Ireland were compared to their carrying values. To test the carrying value of goodwill, the fair value of each reporting unit (RU), based on the present value of future cash flows, was compared to the carrying value of the RUs assets and liabilities. Where the carrying value of the RU exceeded the fair value, the fair value of all assets and liabilities of the RU, including any unrecognised intangible assets, was estimated in order to determine the implied value of goodwill.
The value in use of each RU was calculated with reference to the net present value of its future cash flows derived from the assets, using cash flow projections for the period up to 31 March 2013. These projections covered a ten-year period, as management believed that throughout the ten-year period, the annual growth rate of the RUs being assessed would differ from the average growth rates for the countries concerned. For the periods beyond 1 April 2013, the projections used a long-term growth rate assumed to be at or below the nominal GDP growth rate of the country concerned. The discount rates applied to the projections was based on the post-tax weighted average cost of capital for the Group. The effective pre-tax discount rate for each of our territories ranged between 10.4 per cent and 12.5 per cent.
In calculating the value in use there is considerable uncertainty as to the present value of the future cash flows. In assessing the future cash flows, assumptions have been made using the best estimates available at the time of performing the impairment review. These estimates include those used to reflect the growth rates up to 2013, the long-term growth rates beyond 2013, the discount rate, the competitive landscape, the take up and charge rate of data services and the availability of functioning technological infrastructure to support the 3G roll-out. The actual outcome is uncertain and these estimates may change over time as subsequent changes in the mobile telecommunications industry, including advances in technology, changes in the performance of our businesses as a result of competitive pressure or otherwise, or potential difficulty in the implementation of the UMTS network, may in the future shorten the estimated useful lives or result in a further write-down of these assets.
Based on the analyses, under US GAAP the Group recorded charges of £409 million and £1,475 million for the year ended 31 March 2003 to reduce the carrying value of the goodwill that arose on the acquisitions of O2 UK and O2 Ireland respectively. Under UK GAAP the Group recorded an impairment of £8,300 million of the intangible assets relating to O2 UK, O2 Germany and O2 Ireland, of which £2,401 million related to the impairment of goodwill and £5,899 million related to the impairment of long-lived assets. The difference in the impairment charges is primarily as a result of the requirement under US GAAP to first test the carrying value of long-lived assets using undiscounted cash flows and secondarily the difference in methodology for calculating the impairment of goodwill.
As a result of the announced disposal of O2 Netherlands, the carrying values of the net assets of O2 Netherlands were written down to their net realisable amount, being the sale proceeds less direct costs of disposal. This resulted in an impairment charge of £1,424 million being recognised in the profit and loss account for the year ended 31 March 2003 of which £684 million related to goodwill and £740 million related to long-lived assets. The difference between the impairment charge recorded for US GAAP and UK GAAP (under which a provision of £1,364 million was recognised) in respect of O2 Netherlands is due to the different carrying values of the net assets.
F-55
Back to Contents
mmO2 GROUP
NOTES TO THE CONSOLIDATED FINANCIAL STATEMENTS
| 31. | Reconciliation from UK GAAP to US GAAP and supplementary information (Continued) |
| | |
| (c) | Employee stock compensation |
The Group operates a number of share plans to grant options and share awards to its Directors and employees. Full details, including US GAAP disclosures, are given in section III. “Stock-based compensation” in the supplementary information for United States investors.
Under UK GAAP, options and share awards granted over the Company’s ordinary shares are accounted for using the intrinsic value method, with the difference between the fair value of the shares at grant date and the exercise price charged to the profit and loss account over the vesting period. Under US GAAP, the Group accounts for share options and share awards in accordance with the requirements of APB Opinion No. 25, “Accounting for Stock Issued to Employees” and applies the disclosure provisions in SFAS No. 148, “Accounting for Stock-Based Compensation – Transition and Disclosure – an amendment to FASB Statement No. 123”.
APB No. 25 uses the intrinsic value method although there are differences to the UK GAAP accounting treatment based on whether the options and share awards are considered fixed or variable. Under APB No. 25 the cost of compensation for fixed awards (being awards under which both the exercise price and the number of shares is fixed) is determined at the date the award becomes fixed, based on the difference between the fair value of the shares subject to the award and the exercise price. Compensation cost determined is expensed over the vesting period. Until the plan is fixed (including performance conditions are met), it is considered a variable plan and compensation cost is measured as the difference between the market price at the period end and the exercise price based on the number of awards expected to vest.
Share options have been granted under the Sharesave Plan at a 20 per cent discount to the market price of the date of grant. The Sharesave Plan falls outside the scope of the intrinsic value methodology under UK GAAP. Under US GAAP, a plan is considered compensatory when the discount to market price is in excess of 15 per cent. Compensation cost is recognised for the difference between the exercise price of the share options granted and the quoted market price of the shares at the measurement date and accrued over the vesting period of the options. The Group has applied the guidance in EITF 00-23 and if the offer to enter into a new Sharesave Plan is at a lower price than previous awards then variable accounting commences for all existing higher priced awards when the offer is made. Variable accounting continues until the awards are exercised, are forfeited, or expire unexercised. New awards issued within six months of the plan cancellation are accounted for as variable to the extent that previous higher priced options are cancelled.
Additionally, under US GAAP, provision for employee payroll taxes on employee stock compensation is recognised on the exercise date. Under UK GAAP, provision is made for payroll taxes on shares that are expected to be exercised and spread over the vesting period.
| (d) | Other employee compensation expense |
Under UK GAAP, certain amounts paid to former owners of purchased companies who are also employees are included as part of the acquisition cost of these companies. Under US GAAP, where payment of those amounts is based on achievement of certain performance goals, they qualify as employee compensation expense and are recognised in the financial statements when the performance goals are met.
F-56
Back to Contents
mmO2 GROUP
NOTES TO THE CONSOLIDATED FINANCIAL STATEMENTS
| 31. | Reconciliation from UK GAAP to US GAAP and supplementary information (Continued) |
In 2004 and 2002, the Group has recognised restructuring charges related to employee termination benefits and real estate closures. For the year ended 31 March 2004 this involved the transfer of O2 Online, Products O2 and certain other central functions to our operating businesses in the UK, Germany and Ireland, and includes provisions relating to redundancies and the termination of property leases. For the year ended 31 March 2002 the charges were incurred in the reduction of over 1,900 positions in the technical, retail and administrative departments of O2 UK and O2 Germany.
Under US GAAP, site closure costs can only be recognised for the period after cessation of operations at that site. Employee termination benefits paid to employees that are required to render service beyond their minimum retention period are spread over their remaining service period. Under UK GAAP the provision may be recognised at the time of managements’ commitment, communication and reasonable estimate of the associated cost. Accordingly, adjustments have been made to eliminate the UK GAAP provisions for restructuring that do not meet US GAAP criteria.
During the year ended 31 March 2004, the mmO2 Employee Share Trust purchased no shares of mmO2 plc on the open stock market (2003: 2 million shares for £1 million, 2002: 5 million shares for £5 million). Under UK GAAP these shares have been classified as fixed asset investments and a charge of £3 million (2003: £2 million, 2002: £1 million) has been recognised for stock compensation. Under US GAAP such shares are classified as treasury stock and are included as a deduction from shareholders’ funds. This treasury stock has been accounted for under the cost method.
| (g) | Derivative financial instruments |
Under UK GAAP certain derivative financial instruments qualify for hedge accounting but do not qualify for hedge accounting under US GAAP. The financial instruments, under US GAAP, are carried at market value with valuation adjustments recorded in the profit and loss account.
| (h) | Long-term licence creditors |
In the year ended 31 March 2003, O2 Ireland purchased a UMTS “B” licence. The total licence fee was €114 million with payments phased over 15 years. Under US GAAP the asset cost has been recorded at the discounted present value of the payments and a corresponding creditor established. Over the 15-year period an interest cost will be expensed to recognise the full €114 million due. Under UK GAAP the asset and creditor have been recognised at their undiscounted value.
| (i) | Loss on disposal of O2 Netherlands |
The carrying value of O2 Netherlands under US GAAP exceeded the carrying value under UK GAAP, owing to the recognition of capitalised interest costs in relation to fixed assets. Accordingly the loss on disposal under US GAAP is £6 million higher than under UK GAAP.
F-57
Back to Contents
mmO2 GROUP
NOTES TO THE CONSOLIDATED FINANCIAL STATEMENTS
| 31. | Reconciliation from UK GAAP to US GAAP and supplementary information (Continued) |
| | |
| (j) | Accumulative and current year adjustment on adoption of SFAS No. 143 |
In June 2001, the FASB issued Statement of Financial Accounting Standards (SFAS) No. 143, “Accounting for Asset Retirement Obligations”. This statement requires the Group to record the fair value of a liability for an asset retirement obligation (ARO) in the period in which it is incurred and capitalise the amount as part of the book value of the long-lived asset. Over time the liability is accreted to its present value, and the capitalised cost is depreciated over the useful life of the related asset. The Group adopted this new pronouncement with effect from 1 April 2003.
The Group has certain legal obligations related to network infrastructure, principally mast sites, which fall within the scope of SFAS No. 143. These legal obligations may include obligations to restore the leased site to its original condition at the termination of the lease. Under UK GAAP the Group follows the requirements of FRS 12 “Provisions, contingent liabilities and contingent assets” and a provision is made for the present value of the cost of restoration of mast sites at the date of acquisition. Under US GAAP an expected cash flow approach to the measurement of the fair value of the ARO is used, considering the costs that a third party would incur in performing the tasks that are necessary for it to retire the asset. The different methods used in calculating the ARO under US GAAP and UK GAAP results in an additional charge of £8 million for the year ended 31 March 2004. This comprises of a current year adjustment of £4 million and an accumulative adjustment of £4 million which represents the adjustment required for 2003 and prior periods.
The basic and diluted earnings per share before the accumulative adjustment of SFAS No. 143 was 2.1 pence for the year ended 31 March 2004. The accumulative adjustment does not have any impact on the basic and diluted earnings per share.
The following table illustrates the effect on the Group’s net profit/(loss) had the Group applied SFAS No. 143 in 2003 and 2002.
| | | 2004 | | 2003 | | 2002 | |
| | |
|
| |
|
| |
|
| |
| | | £m | | £m | | £m | |
Net profit/(loss) | | | | | | | | | | |
| As reported | | | 180 | | | (3,671 | ) | | (1,463 | ) |
| Add accumulative effect of change in accounting principle | | | 4 | | | — | | | — | |
| Deduct SFAS No. 143 adjustment | | | — | | | (1 | ) | | (1 | ) |
| | |
|
| |
|
| |
|
| |
| Pro forma | | | 184 | | | (3,672 | ) | | (1,464 | ) |
| | |
|
| |
|
| |
|
| |
If SFAS No. 143 had been applied in previous periods the ARO liability at 1 April 2002 would have been £33 million and at 31 March 2003 £42 million. The closing ARO liability at 31 March 2004 is £47 million.
| (k) | Deferred tax on US GAAP adjustments |
As at 31 March 2004, the adjustment of £(334) million (2003: £(278) million) reconciling shareholders’ funds under UK GAAP to those under US GAAP included the tax effect of US GAAP adjustments. This comprises an adjustment to increase non-current assets by £822 million (2003: £742 million) and increase long-term liabilities by £1,156 million (2003: £1,020 million).
F-58
Back to Contents
mmO2 GROUP
NOTES TO THE CONSOLIDATED FINANCIAL STATEMENTS
| 31. | Reconciliation from UK GAAP to US GAAP and supplementary information (Continued) |
Owing to the different methods of calculating pension liabilities under UK and US GAAP, the pension scheme deficit calculated under UK GAAP using FRS 17 differs from the calculation under SFAS No. 87 “Employers accounting for pensions”. A minimum liability relating to certain pension plans has been recognised in other comprehensive income under US GAAP, whereas under UK GAAP this balance is not recognised but included as a disclosure item only. US GAAP pension disclosure requirements under SFAS No. 123 (revised 2003) are included in section V. “Pensions” in the supplementary information for United States investors.
The Group carries a significant portion of its net assets in Euros. The foreign exchange adjustment reflects the retranslation of US GAAP adjustments which are Euro denominated and has been recognised in other comprehensive income under US GAAP.
| (n) | Earnings/(loss) per share |
The Group’s potentially dilutive share options were anti-dilutive for the years ended 31 March 2003 and 2002 and therefore, in accordance with US GAAP, are not included in the computation of weighted average shares used in computing the diluted loss per share. In the current year dilutive shares have been included but the impact of including them in the calculation is not material and therefore the basic and diluted earnings per share is the same.
| III. | Stock-based compensation |
For the purposes of US GAAP reporting, the Group accounts for stock compensation in accordance with the requirements of APB Opinion No. 25 “Accounting for Stock Issued to Employees” and applies the disclosure provisions in SFAS No. 148, “Accounting for Stock-Based Compensation – Transition and Disclosure – an amendment to FASB Statement No. 123”.
Aggregate share compensation costs of £34 million (2003: £3 million, 2002: £2 million) have been recognised under APB No. 25 in the year. A charge of £8 million (2003: £2 million, 2002: £2 million) was recognised under UK GAAP.
The Group operates savings-related share option plans for its employees and those of participating subsidiaries and further share option plans (the mmO2 Share Option Plan and the mmO2 Legacy Option Plan) for selected Group employees.
The mmO2 Sharesave Plan is a savings-related share option scheme available to all employees. The scheme enables employees to acquire shares in the Company through monthly savings over a three-year or five-year Save-As-You-Earn contract. The savings are then used to purchase shares at the exercise price, which is set at the beginning of the savings contract, at a 20 per cent discount to the prevailing market price at invitation date. Invitations to participate in the scheme are normally made annually. Similar savings related schemes exist for Group employees based outside the UK.
F-59
Back to Contents
mmO2 GROUP
NOTES TO THE CONSOLIDATED FINANCIAL STATEMENTS
| 31. | Reconciliation from UK GAAP to US GAAP and supplementary information (Continued) |
In the year ended 31 March 2004, no options were granted to employees under this plan (2003: 1,041 employees for nil consideration). All such options have an exercise price equal to the market value at grant date. These options were granted on terms that they normally only become exercisable on the third anniversary of grant subject to certain performance criteria. If these criteria are not met on the third anniversary of grant, the performance goals will be retested on the fourth and fifth anniversaries. Options under this scheme generally have a life of ten years.
Options over BT shares granted under BT executive share option plans were replaced with options over mmO2 shares, granted under the Legacy Option Plan, for those participants now employed by mmO2. The replacement options were granted on the same terms, and are exercisable between the same dates, as the options for which they were exchanged. The exercise price of these options equals the market value as at original grant date. Options are normally exercisable up until the tenth anniversary of the date of the original grant.
Options outstanding in relation to Group employees under the Sharesave Plan, mmO2 Share Option Plan and mmO2 Legacy Option Plan as at 31 March 2004 together with their exercise prices and vesting periods, were as follows:
| | | | | Options outstanding over
ordinary shares and ADSs
| | Options exercisable over
ordinary shares and ADSs
| |
Range of exercise prices1 | | Number
outstanding | | Weighted-
average
remaining
contractual
life | | Weigthted
average
exercise
price | | Number
exercisable | | Weighted-
average
exercise
price | |
| | |
|
| |
|
| |
|
| |
|
| |
|
| |
| | | (m) | | (years) | | (£) | | (m) | | (£) | |
| £0.44 | | | 35 | | | 2 | | | 0.44 | | | — | | | — | |
| £0.46 | | | 68 | | | 8 | | | 0.46 | | | — | | | — | |
| £0.48-0.49 | | | 1 | | | 9 | | | 0.48 | | | — | | | — | |
| £0.54 | | | 14 | | | 3 | | | 0.54 | | | — | | | — | |
| £0.64-0.69 | | | 7 | | | 8 | | | 0.67 | | | 4 | | | 0.69 | |
| £0.73-0.82 | | | 6 | | | 1 | | | 0.73 | | | — | | | — | |
| £0.87 | | | 35 | | | 8 | | | 0.87 | | | 3 | | | 0.87 | |
| £1.02-1.93 | | | 2 | | | 7 | | | 1.27 | | | 2 | | | 1.28 | |
| | |
|
| |
|
| |
|
| |
|
| |
|
| |
| | | | 168 | | | 6 | | | 0.58 | | | 9 | | | 0.83 | |
| | |
|
| |
|
| |
|
| |
|
| |
|
| |
| 1 | Share options over American Depositary Shares (ADS) have exercise prices termed in US Dollars. For purposes of disclosure, these options’ exercise prices have been translated into Sterling at the year end exchange rate. As each ADS represents ten ordinary shares, the number of options and exercise prices have been adjusted by this ratio to reflect the options on a like for like basis. |
F-60
<<<Back to Contents
mmO2 GROUP
NOTES TO THE CONSOLIDATED FINANCIAL STATEMENTS
| 31. | Reconciliation from UK GAAP to US GAAP and supplementary information (Continued) |
Options granted, exercised and lapsed during the years ended 31 March 2004, 2003 and 2002 in respect of Group employees under these share option schemes were as follows:
| | | Options over ordinary shares | | Options over ADSs | |
| | |
| |
| |
| | | Ordinary shares1 | | ADSs2 | |
| | |
| |
| |
Range of exercise prices1 | | Savings-
related
share
options | | Other
share
options | | Weighted-
average
exercise
price | | Other
share
options | | Weighted-
average
exercise
price | |
| | |
|
| |
|
| |
|
| |
|
| |
|
| |
| | | (m) | | (m) | | (£) | | (m) | | (£) | |
| Balance at 31 March 2001 | | | 50 | | | 3 | | | 1.37 | | | — | | | — | |
| Lapsed on demerger | | | (50 | ) | | (3 | ) | | 1.37 | | | — | | | — | |
| | |
|
| |
|
| |
|
| |
|
| |
|
| |
| Balance on demerger | | | — | | | — | | | — | | | — | | | — | |
| Granted | | | 31 | | | 65 | | | 0.82 | | | 6 | | | 1.17 | |
| Lapsed | | | — | | | (2 | ) | | 0.84 | | | — | | | — | |
| | |
|
| |
|
| |
|
| |
|
| |
|
| |
| Balance at 31 March 2002 | | | 31 | | | 63 | | | 0.82 | | | 6 | | | 1.17 | |
| Granted | | | 37 | | | 81 | | | 0.45 | | | — | | | — | |
| Lapsed | | | (23 | ) | | (6 | ) | | (0.72 | ) | | (3 | ) | | 0.87 | |
| | |
|
| |
|
| |
|
| |
|
| |
|
| |
| Balance at 31 March 2003 | | | 45 | | | 138 | | | 0.60 | | | 3 | | | 1.49 | |
| Granted | | | 15 | | | — | | | 0.54 | | | — | | | — | |
| Lapsed | | | (5 | ) | | (23 | ) | | (0.76 | ) | | (1 | ) | | (1.69 | ) |
| Exercised | | | — | | | (4 | ) | | (0.70 | ) | | — | | | — | |
| | |
|
| |
|
| |
|
| |
|
| |
|
| |
Balance at 31 March 2004 | | | 55 | | | 111 | | | 0.57 | | | 2 | | | 0.93 | |
| | |
|
| |
|
| |
|
| |
|
| |
|
| |
| 1 | All options granted, exercised, lapsed and outstanding for periods prior to demerger have been adjusted to reflect the exchange ratio of 4.1266 shares of mmO2 per share of BT. |
| 2 | Share options over ADSs have exercise prices termed in US Dollars. For purposes of disclosure, these options’ exercise prices have been translated into Sterling at the year end exchange rate. As each ADS represents ten ordinary shares, the number of options and exercise prices have been adjusted by this ratio to reflect the options on a like for like basis. |
Fair value disclosures (SFAS No. 123) |
For disclosure purposes, the fair value of all these share options granted is estimated using the Black-Scholes option-pricing model. The following weighted average assumptions have been used for valuing share options granted by the Group:
| | | 2004 | | 2003 | | 2002 | |
| | |
|
| |
|
| |
|
| |
| | | % | | % | | % | |
| Annual dividends | | | — | | | — | | | — | |
| Expected volatility | | | 23 | | | 27 | | | 55 | |
| Risk free interest rate | | | 5 | | | 4 | | | 5 | |
The expected life applied in the model anticipated the life of options extending one month later than the first exercise date.
F-61
Back to Contents
mmO2 GROUP
NOTES TO THE CONSOLIDATED FINANCIAL STATEMENTS
| 31. | Reconciliation from UK GAAP to US GAAP and supplementary information (Continued) |
Had share option compensation expense been determined on the basis of fair value pursuant to SFAS No. 123, net profit/(loss) and earnings/ (loss) per share would have been as follows:
| | | 2004 | | 2003 | | 2002 | |
| | |
|
| |
|
| |
|
| |
| | | (in £m, except per share data which is stated in pence) | |
Net profit/(loss) | | | | | | | | | | |
| As reported | | | 180 | | | (3,671 | ) | | (1,463 | ) |
| Stock compensation expense included in net profit/(loss) | | | 28 | | | — | | | — | |
| Stock compensation expense as determined under the fair value method | | | (21 | ) | | (5 | ) | | — | |
| | |
|
| |
|
| |
|
| |
Pro forma | | | 187 | | | (3,676 | ) | | (1,463 | ) |
| | |
|
| |
|
| |
|
| |
Earnings/(loss) per share | | | | | | | | | | |
| As reported | | | 2.1 | | | (42.3 | ) | | (16.9 | ) |
| | |
|
| |
|
| |
|
| |
Pro forma | | | 2.2 | | | (42.4 | ) | | (16.9 | ) |
| | |
|
| |
|
| |
|
| |
The weighted average fair value of share options granted in the year ended 31 March 2004 was £0.23 (2003: £0.13, 2002: £0.35) for options exercisable three years after the date of grant and £0.27 (2003: £0.23, 2002: £0.46) for options exercisable five years after the date of grant. The weighted average fair value of share options granted in the year ended 31 March 2002 was £0.16 for options exercisable one year after the date of grant and £0.22 for options exercisable two years after the date of grant.
The Group operates share award schemes for its employees.
mmO2 Restricted Share Plan |
Restricted share awards have been granted to a small group of senior executives. Most of these awards have been granted on terms that they will normally only vest on the third anniversary of grant if the participant builds up a predetermined personal shareholding in the Group, and remains in employment with the Group. Shares required to satisfy these awards are held in trust during the restricted period. In accordance with APB No. 25, an expense has been recognised to the extent that executives have commenced building their personal shareholding. No shares were granted under this plan in the years ended 31 March 2004 and 31 March 2003. The weighted average fair value at grant date of the 9.4 million shares granted under this plan in the year ended 31 March 2002 was £0.80.
mmO2 Performance Share Plan |
Performance related share awards have been granted to 1,005 employees during the year ended 31 March 2004. These awards are granted on terms that they will vest on the third anniversary of grant if the Company meets certain performance criteria, and the participant remains in employment with the Group. In accordance with APB No. 25, an expense has been recognised to the extent that it is expected that performance criteria will be achieved. The weighted average fair value at grant date of the 26.4 million shares granted under this plan in the year ended 31 March 2004 was £0.53.
F-62
Back to Contents
mmO2 GROUP
NOTES TO THE CONSOLIDATED FINANCIAL STATEMENTS
| 31. | Reconciliation from UK GAAP to US GAAP and supplementary information (Continued) |
A number of key employees of mmO2 were participants prior to demerger in BT share plans. The awards have been adjusted so that they relate solely to mmO2 plc shares, and any performance measure has been translated into a measure of the Group’s performance from demerger to the end of the performance period. On maturity these awards will be satisfied in existing mmO2 shares held by an employee trust which has already been funded by BT. In accordance with the rules of these plans the awards were converted into awards over mmO2 plc shares on the basis of an adjustment factor of 4.1266.
| | Incentive Share Plan (ISP) and Retention Share Plan (RSP) |
| | |
| | Participants are awarded shares which will normally vest at the end of a three-year period provided a predetermined total shareholder return (TSR) target is met. |
| | |
| | Executive Share Plan (ESP) |
| | |
| | Participants are awarded shares which will normally vest at the end of five years provided a predetermined TSR target is met. |
| | |
| | Deferred Bonus Plan (DBP) |
| | |
| | Awards of shares were made to executives based on their performance in the preceding financial year and vest after three years. Under the DBP there are no associated performance goals. |
Under the Separation Agreement between the Group and BT, it has been endorsed and agreed that all share awards required under the ISP, RSP, ESP and DBP will be honoured by BT and will be satisfied by issuance of existing mmO2 shares held by a BT trust which has already been funded by BT. Thus, the Group is not responsible for any of the options or shares under these schemes and will bear no compensation expense in association with them.
| IV. | Group cash flow statements |
Under UK GAAP, the Group cash flow statement is presented in accordance with FRS 1 “Cash flow statements”. The statements prepared under FRS 1 present substantially the same information as that required under SFAS No. 95 “Statement of Cash Flows”. The main presentational differences are described below.
The US GAAP cash flow statement reports changes in cash and cash equivalents, which includes short-term highly liquid investments with original maturities of three months or less. Under UK GAAP the cash balance includes only cash at bank and other cash balances. Under US reporting three categories of cash flows are reported; operating activities (including tax and interest), investing activities (including capital expenditure and disposals) and financing activities. Under FRS 1, there are four additional categories. Cash flows are presented for operating activities, returns on investments and servicing of finance, taxation, capital expenditure and financial investments, acquisitions and disposals, dividends paid and management of liquid resources and financing. Cash flows under FRS 1 in respect of interest received, interest paid and taxation would be included within operating activities under SFAS No. 95.
F-63
Back to Contents
mmO2 GROUP
NOTES TO THE CONSOLIDATED FINANCIAL STATEMENTS
| 31. | Reconciliation from UK GAAP to US GAAP and supplementary information (Continued) |
The following statements summarise the combined cash flow statements as if they had been presented in accordance with US GAAP, and include the adjustments that reconcile cash and cash equivalents under US GAAP to cash at bank and in hand reported under UK GAAP.
| | | 2004 | | 2003 | | 2002 | |
| | |
|
| |
|
| |
|
| |
| | | £m | | £m | | £m | |
| Net cash provided by operating activities | | | 1,316 | | | 966 | | | 444 | |
| Net cash used in investing activities | | | (1,120 | ) | | (868 | ) | | (2,095 | ) |
| Net cash (used)/provided by financing activities | | | (50 | ) | | (47 | ) | | 1,790 | |
| | |
|
| |
|
| |
|
| |
| Net increase in cash and cash equivalents | | | 146 | | | 51 | | | 139 | |
| Exchange movement on cash and cash equivalents | | | 16 | | | 31 | | | — | |
| Cash and cash equivalents under US GAAP at the beginning of the year | | | 561 | | | 479 | | | 340 | |
| | |
|
| |
|
| |
|
| |
| Cash and cash equivalents under US GAAP at the end of the year | | | 723 | | | 561 | | | 479 | |
| Short-term investments | | | (700 | ) | | (493 | ) | | (459 | ) |
| | |
|
| |
|
| |
|
| |
| Cash at bank and in hand under UK GAAP at the end of the year | | | 23 | | | 68 | | | 20 | |
| | |
|
| |
|
| |
|
| |
Information in respect of the net periodic benefit cost and related obligation determined in accordance with SFAS No. 87 and SFAS No. 132 (revised 2003) is given below. The measurement date used to establish the year end asset values and benefit obligations was 31 March 2004. The previous measurement date, used to establish 2003 costs, was 31 March 2003.
A description of the pension arrangements of the Group is given in note 29 to the financial statements. The assumptions used to determine the net periodic benefit cost and the year-end benefit obligation under US GAAP for the mmO2 Pension Plan (mmO2 PP) are shown below. The assumptions used for the other defined benefit schemes around the Group under US GAAP are consistent with those used for the mmO2 PP.
| | | Cost for
year ended
31 March 2004 | | 31 March 2004
benefit
obligation | | Cost for
period from
1 July 2002 to
31 March 2003 | | 31 March 2003
benefit
obligation | |
| | |
|
| |
|
| |
|
| |
|
| |
| | | % | | % | | % | | % | |
| Assumptions | | | | | | | | | | | | | |
| Discount rate | | | 5.80 | | | 5.70 | | | 6.00 | | | 5.80 | |
| Long-term rate of return on plan assets | | | 7.10 | | | 7.50 | | | 7.70 | | | 7.10 | |
| Increase in compensation levels | | | 3.70 | | | 4.05-4.55 | | | 4.20 | | | 3.70 | |
| Inflation rate | | | 2.50 | | | 2.80 | | | 2.70 | | | 2.50 | |
| Increase in payment of pensions | | | | | | | | | | | | | |
| – pension increases in line with inflation | | | 2.50 | | | 2.80 | | | 2.70 | | | 2.50 | |
| – pension increases limited to 5% p.a. | | | 2.40 | | | 2.60 | | | 2.70 | | | 2.40 | |
F-64
Back to Contents
mmO2 GROUP
NOTES TO THE CONSOLIDATED FINANCIAL STATEMENTS
| 31. | Reconciliation from UK GAAP to US GAAP and supplementary information (Continued) |
The investment strategy is determined by the Trustees of the mmO2 PP and responsibility delegated to the relevant investment manager. The Trustees aim to invest the assets of the Plan prudently to ensure that benefits promised to members are provided. The investment objectives include generating a return in excess of market indices. Ranges for the proportions to be held in each asset class have been set by the Trustees. The Plan’s target asset allocations at 31 March 2004 were 90 per cent equities and 10 per cent bonds and gilts. At 31 March 2004 the Plan held assets in the following proportions; equities 88 per cent (2003: 90 per cent), bonds 10 per cent (2003: nil) and other 2 per cent (2003: 10 per cent). Risk is managed in various ways including identifying investments considered to be unsuitable and placing limits on some types of investment. In particular, the funds are not permitted to invest directly in any mmO2 Group company. The investment strategy of the Group’s other pension arrangements is consistent with the assets actually held.
The expected rate of return on pension plan assets is determined as management’s best estimate of the long-term return of the relevant equities and bonds that constitute plan assets weighted by the actual allocation of assets among the categories at the measurement date. Estimated contributions to defined benefit pension schemes around the Group in 2005 are £20m.
Components of net benefit expenses |
No comparatives for the year ended 31 March 2002 are presented as in that period most pension obligations were provided by the BT Pension Scheme (BTPS). Under UK GAAP and US GAAP multi-employer accounting was applied to the Group’s participation in the BTPS. This applied until the inception of the mmO2 PP on 1 July 2002 for which the Group is the principal employer. The cost for the period from 1 April 2002 to 30 June 2002 equals the contributions paid to the BTPS of £4 million and is in addition to the costs shown below. For the Group’s other arrangements, the difference between UK GAAP and US GAAP is not significant.
F-65
Back to Contents
mmO2 GROUP
NOTES TO THE CONSOLIDATED FINANCIAL STATEMENTS
| 31. | Reconciliation from UK GAAP to US GAAP and supplementary information (Continued) |
The net benefit expense for the year ended 31 March 2004 for the Group’s defined benefit pension schemes in aggregate are analysed as follows:
| | | 2004 | | 2003 | |
| | |
|
| |
|
| |
| | | £m | | £m | |
| Service cost | | | (18 | ) | | (17 | ) |
| Interest cost on benefit obligation | | | (18 | ) | | (13 | ) |
| Expected return on plan assets | | | 16 | | | 15 | |
| Plan amendments | | | (2 | ) | | — | |
| Net amortisation and deferral – recognised losses | | | (4 | ) | | (1 | ) |
| | |
|
| |
|
| |
| Net periodic benefit cost | | | (26 | ) | | (16 | ) |
| Defined contribution cost | | | (7 | ) | | (4 | ) |
| | |
|
| |
|
| |
| Net benefit expense | | | (33 | ) | | (20 | ) |
| | |
|
| |
|
| |
The funded status of the Group’s pension schemes at 31 March 2004 was:
| | | 2004 | | 2003 | |
| | |
|
| |
|
| |
| | | £m | | £m | |
| Benefit obligation at end of year | | | (407 | ) | | (310 | ) |
| Fair value of plan assets | | | 299 | | | 218 | |
| | |
|
| |
|
| |
| Plan assets below benefit obligation | | | (108 | ) | | (92 | ) |
| Unrecognised net loss | | | 91 | | | 82 | |
| | |
|
| |
|
| |
| Net amount recognised | | | (17 | ) | | (10 | ) |
| | |
|
| |
|
| |
| Comprising: | | | | | | | |
| Benefit provision (including additional minimum liability) | | | (57 | ) | | (48 | ) |
| Amount recognised through accumulated other comprehensive income | | | 40 | | | 38 | |
| | |
|
| |
|
| |
| Net amount recognised | | | (17 | ) | | (10 | ) |
| | |
|
| |
|
| |
| | | | | | | | |
| | | 2004 | | 2003 | |
| | |
|
| |
|
| |
| | | £m | | £m | |
| Change in additional minimum liability before tax: | | | | | | | |
| Accrued pension benefit expense | | | 40 | | | 38 | |
| | |
|
| |
|
| |
| Other comprehensive income before tax | | | 40 | | | 38 | |
| | |
|
| |
|
| |
F-66
Back to Contents
mmO2 GROUP
NOTES TO THE CONSOLIDATED FINANCIAL STATEMENTS
| 31. | Reconciliation from UK GAAP to US GAAP and supplementary information (Continued) |
The change in the benefit obligation and the plan assets of the Group’s pension schemes in the year ended 31 March 2004 are analysed as follows:
| | | 2004 | | 2003 | |
| | |
|
| |
|
| |
| | | £m | | £m | |
| Benefit obligation at start of year | | | (310 | ) | | (298 | ) |
| Service cost | | | (18 | ) | | (17 | ) |
| Interest cost | | | (18 | ) | | (13 | ) |
| Contributions by plan participants | | | (9 | ) | | (8 | ) |
| Actuarial (losses)/gains | | | (58 | ) | | 26 | |
| Benefits paid | | | 1 | | | — | |
| Plan amendments | | | (2 | ) | | — | |
| Curtailments/settlements | | | 7 | | | — | |
| | |
|
| |
|
| |
| Benefit obligation at end of year | | | (407 | ) | | (310 | ) |
| | |
|
| |
|
| |
| | | | | | | | |
| | | 2004 | | 2003 | |
| | |
|
| |
|
| |
| | | £m | | £m | |
| Fair value of plan assets at start of year | | | 218 | | | 250 | |
| Actual return on plan assets | | | 58 | | | (56 | ) |
| Contributions by plan participants | | | 9 | | | 8 | |
| Contributions by employer | | | 20 | | | 16 | |
| Benefits paid | | | (1 | ) | | — | |
| Curtailment/settlement | | | (5 | ) | | — | |
| | |
|
| |
|
| |
| Fair value of plan assets at end of year | | | 299 | | | 218 | |
| | |
|
| |
|
| |
The benefit obligation shown above includes an allowance for future salary increases, whereas the accumulated benefit obligation does not include this allowance. The accumulated benefit obligations for the pension plans at 31 March 2004 amounted to £352 million. At 31 March 2003, the corresponding total of accumulated benefit obligations was £262 million.
F-67
Back to Contents
mmO2 GROUP
NOTES TO THE CONSOLIDATED FINANCIAL STATEMENTS
| 31. | Reconciliation from UK GAAP to US GAAP and supplementary information (Continued) |
The elements of deferred taxation to be considered for US GAAP purposes are as follows:
| | | As at 31 March | |
| | | 2004 | | 2003 | |
| | |
|
| |
|
| |
| | | £m | | £m | |
| Bad debt provision | | | 18 | | | 11 | |
| Other general provision | | | 4 | | | — | |
| | |
|
| |
|
| |
Deferred current tax assets | | | 22 | | | 11 | |
| | |
|
| |
|
| |
| Tax losses carried forward | | | 1,988 | | | 1,712 | |
| Other | | | 3 | | | 38 | |
| | |
|
| |
|
| |
Deferred non-current tax asset | | | 1,991 | | | 1,750 | |
| Allowance | | | (1,047 | ) | | (878 | ) |
| | |
|
| |
|
| |
Total deferred non-current tax asset after allowance | | | 944 | | | 872 | |
| | |
|
| |
|
| |
| Capitalised interest | | | (308 | ) | | (312 | ) |
| Intangible assets | | | (844 | ) | | (708 | ) |
| Accelerated capital allowance | | | (281 | ) | | (362 | ) |
| Other | | | (3 | ) | | — | |
| | |
|
| |
|
| |
Total deferred tax liabilities | | | (1,436 | ) | | (1,382 | ) |
| | |
|
| |
|
| |
Net deferred non-current liabilities (net of deferred tax assets) | | | (470 | ) | | (499 | ) |
| | |
|
| |
|
| |
The table below represents the deferred tax for loss carry forwards and expiry dates as at 31 March 2004:
| | | O2 | | O2 | | | | | | | |
| | | UK | | Germany | | Other | | Total | |
| | |
|
| |
|
| |
|
| |
|
| |
| | | £m | | £m | | £m | | £m | |
| Total (no expiration) | | | 550 | | | 1,436 | | | 2 | | | 1,988 | |
The Group provides a valuation allowance against its net deferred tax assets on a country by country basis if, based on available objective evidence, it is probable that they will not be fully realised.
| VII. | Additional US GAAP disclosures |
Under UK GAAP, the Group accounts for joint venture and associate investments using the equity method of accounting. The profit and loss account includes the Group’s share of the operating profit or loss, interest income or expense and attributable taxation of those companies. The balance sheet shows the Group’s share of the assets and liabilities of those companies and attributed goodwill. Under US GAAP, these investments would be accounted for using the net equity method. The profit and loss account would include on one line an item with the Group’s share of the profit before tax of £1 million (2003: £5 million, 2002: £9 million). The balance sheet would show on one line an item with the Group’s share of the net assets of those companies.
F-68
Back to Contents
mmO2 GROUP
NOTES TO THE CONSOLIDATED FINANCIAL STATEMENTS
| 31. | Reconciliation from UK GAAP to US GAAP and supplementary information (Continued) |
Under UK GAAP exceptional costs totalling £75 million have been recognised (2003: £8,300 million, 2002: £150 million). Under US GAAP these would not be considered exceptional items and would be classified within net operating expenses.
| (c) | Use of estimates in preparation of financial statements |
The preparation of financial statements in conformity with accounting principles generally accepted in the United Kingdom and the United States of America requires management to make estimates and assumptions that affect the reported amounts of assets and liabilities and disclosure of contingent assets and liabilities to the date of the financial statements and the reported amounts of revenue and expenses during the period. Actual results could differ from those estimates.
| (d) | Recent US GAAP accounting pronouncements |
In January 2003, the Financial Accounting Standards Board (FASB) issued FASB Interpretation No. 46 (FIN 46), “Consolidation of Variable Interest Entities, an interpretation of ARB No. 51”. FIN 46 was subsequently revised with the release of FIN 46R in December 2003. FIN 46R requires the Group to review the entity’s in which it holds an interest to determine whether the entity has sufficient equity to conduct its activities and to ensure that its equity holders have decision-making authority and exposure to the entity’s residual returns or losses. When any of these characteristics are lacking, the party exposed to a majority of the entity’s expected losses or residual returns, if any, is considered the primary beneficiary and would be required to consolidate. Consolidation is possible under FIN 46R regardless of whether the company holds equity or carries voting rights in the entity. Where consolidation is not required FIN 46R imposes an obligation to disclose significant interests held in variable interest entities.
FIN 46R is effective immediately for variable interests held in variable entities created after 31 January 2003. FIN 46R is effective 1 April 2004 for entities considered special purpose entities (SPEs) and for all non-SPEs as of the first US GAAP balance sheet presented thereafter. The adoption of the standard for entities created after 31 January 2003 did not have an impact on the Group’s results of operations, financial condition, or cash flows. Management is currently evaluating the effect that the adoption of FIN 46R for entities created prior to 1 February 2003 will have on its results of operations and financial condition.
In November 2002, the Emerging Issues Task Force (EITF) reached consensus on EITF No. 00-21, Accounting for Revenue Arrangements with Multiple Deliverables. This consensus requires that revenue arrangements with multiple deliverables be divided into separate units of accounting if the deliverables in the arrangement meet specific criteria. In addition, arrangement consideration must be allocated among the separate units of accounting based on their relative fair values, with certain limitations. The Group adopted this statement on 1 October 2003 and is applying it on a prospective basis. The initial adoption of this statement did not have a material impact on the results of operations, financial position, or cash flows of the Group.
F-69
Back to Contents
mmO2 GROUP
NOTES TO THE CONSOLIDATED FINANCIAL STATEMENTS
| 31. | Reconciliation from UK GAAP to US GAAP and supplementary information (Continued) |
| | |
| (e) | Recent UK accounting standards |
The Group continues to apply the transitional disclosure arrangements set out in FRS 17 “Retirement benefits”. Mandatory implementation is not required by the Group until the year ended 31 March 2006 by which time we expect to have adopted International Accounting Standards. The transitional disclosures required are provided in note 29 to the financial statements. The changes introduced by FRS 17 principally affect the way defined benefit pension schemes are accounted for. At each year-end the pension scheme assets should be measured at market value while pension scheme liabilities should be measured at a present value using a specified actuarial valuation method and discounted at a corporate bond rate. The resulting pension scheme surplus or deficit must be shown on the Group’s balance sheet, and could be volatile because of the dependence on market conditions at the balance sheet date.
Amendment to FRS 5 “Reporting the substance of transactions” – revenue recognition takes the form of an additional application note to FRS 5, being “Application Note G”. This codifies the basic principles of revenue recognition and provides specific guidance in five areas. Of particular importance to our Group is the guidance on presentation of turnover as agent or principal. The gross basis represents the value of the billing to the customer after trade discounts, with any related costs being charged to operating expenses. Where we act as agent in a transaction, we recognise the net revenue earned as turnover.
| (f) | International accounting standards |
The Council of the European Union announced in June 2002 that listed companies in Europe would be required to adopt International Financial Reporting Standards (IFRS) for accounting periods beginning on or after 1 January 2005. The adoption of IFRS will apply to our Group for the first time for the half year ending 30 September 2005 and the year ending 31 March 2006. We have established a project team to manage the conversion from UK GAAP to IFRS. We expect the adoption of IFRS by the Group for our year ending 31 March 2006 to result in significant changes in the accounting, presentation and disclosure of certain items in our financial statements. We expect to publish details of the differences, and a reconciliation between our existing UK GAAP results and net assets and those under IFRS in due course.
F-70
Back to Contents
GLOSSARY OF TERMS
Terms Used | | US Equivalent or Brief Description |
| |
|
| Articles of Association | | Bylaws |
| Associates | | Equity investments |
| Balance sheet | | Statement of financial position |
| Called-up share capital | | Ordinary shares, issued and fully paid |
| Capital allowances | | Tax depreciation allowances |
| Creditors | | Payables |
| Debtors | | Receivables |
| Finance lease | | Capital lease |
| Financial year | | Fiscal year |
| Freehold | | Ownership with absolute rights |
| Interest payable | | Interest expense |
| Interest receivable | | Interest income |
| Joint venture | | Equity investment |
| Nominal value | | Par value |
| Ordinary shares | | Common stock |
| Overdraft | | A line of credit, contractually repayable on demand unless a fixed-term has been agreed, established through a customer’s current account |
| Preference shares | | Preferred stock |
| Profit & loss account | | Income statement |
| Profit & loss account reserve | | Retained earnings |
| Provisions | | Reserves |
| Share capital | | Ordinary shares or common stock issued and fully paid |
| Shareholders’ funds | | Stockholders’ equity |
| Stock | | Inventories |
| Tangible fixed assets | | Property, plant and equipment |
| Turnover | | Revenue |
I
Back to Contents
DEFINITIONS
| The following definitions apply throughout this document unless the context requires otherwise: |
| | |
| “Airwave” | A secure TETRA communications system for the emergency services and other Public Safety Users. |
| | |
| “analogue” | The first generation of mobile telecommunications technology in which radio signals are modulated proportionally by the strength and frequency of audio sounds. |
| | |
| “ARPU” | Average Revenue Per User. |
| | |
| “BT” | British Telecommunications public limited company, a company incorporated in England and Wales with registered number 1800000. |
| | |
| “BT Group” | BT Group plc and its subsidiary undertakings from time to time. |
| | |
| “BT Group plc” | BT Group plc, a company incorporated in England and Wales with registered number 4190816. |
| | |
| “CRM” | Customer Relationship Management. |
| | |
| “GPRS” | General Packet Radio Service. A technology, sometimes referred to as 2.5G, that allows customers to remain connected to the network between calls for the receipt and transmission of data. |
| | |
| “GSM” | The Global System for Mobile communications. Originally defined as a pan-European standard for digital cellular telephone networks to support roaming, it is now one of the world’s main digital mobile standards. |
| | |
| “Manx Telecom” | Manx Telecom Limited, a company incorporated in the Isle of Man with registered number 28059. |
| | |
| “mmO2” or the “Company” | mmO2 plc, a company incorporated in England and Wales with registered number 4190833. |
| | |
| “mmO2 Group” or “Group” | mmO2 plc and its subsidiary undertakings from time to time. |
| “mmO2 Ordinary Shares” or | |
| “ordinary shares” | Ordinary shares of 0.1 pence each in the capital of mmO2. |
| | |
| “MMS” | Multimedia Messaging Services. |
| | |
| “O2” | O2 Limited, formerly BT Wireless Limited, formerly Cellnet Group Limited, a company incorporated in England and Wales with registered number 2604354 together, where the context requires, with its subsidiary and associated undertakings or, where the context so requires, a reference to our trade name or brand. |
| | |
| “O2 Airwave” | Airwave mmO Limited, a company incorporated in England and Wales with a registered number 3985643. |
II
Back to Contents
| “O2 Germany” | O2 (Germany) GmbH & Co. OHG, formerly VIAG Interkom GmbH & Co. OHG, a company incorporated in Germany. |
| | |
| “O2 Ireland” | O2 Communications (Ireland) Limited, formerly Digifone mmO2 Limited, formerly Esat Digifone Limited, a company incorporated in Ireland, together where the context requires with its subsidiary and associated undertakings. |
| | |
| “O2 Netherlands” | O2 (Netherlands) B.V., formerly Telfort Mobiel BV, a company incorporated in the Netherlands. |
| | |
| “O2 UK” | O2 (UK) Limited, formerly BT Cellnet Limited, a company incorporated in England and Wales with registered number 1743099 together, where the context requires, with its subsidiary and associated undertakings. |
| | |
| “PDA” | Personal Digital Assistant. |
“Public Safety Users”
or “PSU” | Any organisation, as determined by Ofcom, which has broadly fulfilled the following criteria: (a) responds to emergencies; (b) is involved in emergency situations reasonably frequently; (c) is civilian, or is required to respond to civilian emergencies; and (d) requires interaction with those who respond to emergencies. |
| | |
| “SAC” | Subscriber Acquisition Cost. |
| | |
| “SMS” | a service sometimes known as text messaging, which enables mobile telephone users to send and receive written messages on their handsets. |
| | |
| “TETRA” | Terrestrial Trunked Radio. Radio technology used in networks that require a high level of security and availability. |
| | |
| “UMTS” | Universal Mobile Telecommunications System. An international standard of third generation, or 3G, mobile telecommunications. |
| | |
| “WAP” | Wireless Application Protocol. A global, open standard for accessing online services through mobile devices. |
| | |
| “we” or “us” or “our” | mmO2 and/or, if the context so requires, one or more members of the mmO2 Group. |
III
Back to Contents
SIGNATURES
The registrant hereby certifies that it meets all of the requirements for filing on Form 20-F and that it has duly caused and authorised the undersigned to sign this annual report on its behalf.
mmO2 plc
| | By: /s/ David Finch
——————————
Name: David Finch
Title: Chief Financial Officer |
Date: 6 July 2004
IV
Back to Contents
mmO2 GROUP
EXHIBIT INDEX
Exhibit Number | | Description of Exhibits |
| |
|
| 1.1 | | Memorandum and Articles of Association of mmO2 plc.* |
| 2.1 | | Deposit Agreement among the mmO2 plc, Morgan Guaranty Trust Company of New York, as depositary, and Holders of American Depositary Receipts.** |
| 3.1 | | Not Applicable. |
| 4.1 | | Demerger Agreement between British Telecommunications plc, mmO2 plc and BT Group plc.** |
| 4.2 | | Separation Agreement between BT Group plc, British Telecommunications plc, mmO2 plc and O2 Limited.** |
| 4.3 | | Tax Agreement between BT Group plc and mmO2 plc.** |
| 4.4 | | Wireless Trading Agreement between British Telecommunications plc and BT Cellnet Limited.** |
| 4.5 | | Sponsors’ Agreement between mmO2 plc, British Telecommunications plc, Merrill Lynch International, Morgan Stanley & Co. International Limited and Salomon Brothers International Limited.** |
| 4.6 | | £3,500,000,000 Multicurrency Trading Revolving Facility between mmO2, as parent, mmO2 and O2 Limited, as original borrowers, Barclays Capital, Deutsche Bank AG London, HSBC Investment Bank plc, J.P. Morgan plc, Salomon Brothers International Limited and The Royal Bank of Scotland plc, as lead arrangers, certain financial institutions, as the original banks, The Royal Bank of Scotland plc, as agent, and the Royal Bank of Scotland plc, as the issuing bank.** |
| 4.7 | | Amended and Restated Separation Agreement between BT Group plc, mmO2 plc and O2 Limited.*** |
| 4.8 | | Programme Agreement in relation to the €5,000,000,000 Euro Medium Term Note Programme between mmO2, Bankers Trustee Company Limited as Trustee, Deutsche Bank AG London as arranger, Barclays Bank PLC, HSBC Bank plc, Salomon Brothers International Limited, Deutsche Bank AG London, J.P. Morgan Securities Ltd and The Royal Bank of Scotland plc, as dealers.**** |
| 4.9 | | Trust Deed relating to €5,000,000,000 Euro Medium Term Note Programme between mmO2 and Bankers Trustee Company Limited, as Trustee.**** |
| 4.10 | | BT Executive Share Plan***** |
| 4.11 | | BT Incentive Share Plan***** |
| 4.12 | | BT Deferred Bonus Plan***** |
| 4.13 | | mmO2 Legacy Option Plan***** |
| 4.14 | | mmO2 Executive Share Option Plan***** |
| 4.15 | | mmO2 Restricted Share Plan***** |
| | mmO2 Deferred Executive Incentive Plan |
| | Service Contract for David Arculus relating to his chairmanship of the Company due to commence on 28 July 2004 at the conclusion of the Company’s 2004 Annual General Meeting. |
| 4.18 | | Directors’ Service Contracts***** |
| 5.1 | | Not Applicable. |
| 6.1 | | Not Applicable. |
| 7.1 | | Not Applicable. |
| 8.1 | | See Item 4.C, “Information on the Company – Organisational Structure.” |
| 9.1 | | Not Applicable. |
| | Certification of Peter Erskine, Chief Executive Officer of mmO2 plc, pursuant to section 302 of the Sarbanes-Oxley Act of 2002. |
| | Certification of David Finch, Chief Financial Officer of mmO2 plc, pursuant to section 302 of the Sarbanes-Oxley Act of 2002. |
| | Joint Certification of Peter Erskine, Chief Executive Officer and David Finch,
Chief Financial Officer, pursuant to 18 U.S.C. Section 1350, as adopted pursuant to Section 906 of the Sarbanes-Oxley Act of 2002. |
| | | |
Back to Contents
mmO2 GROUP
| * | Previously included in mmO2’s registration statement on Form 20-F, as filed with the Securities and Exchange Commission on 20 September 2001, and incorporated herein by reference except with respect to the following change to the Articles of Association: |
| | On 20 December 2001, the one issued redeemable preference share of £50,000 was redeemed, following which, pursuant to a conditional special resolution passed on 11 September 2001, the authorised redeemable preference share capital was sub-divided into and redesignated as 50,000,000 ordinary shares with a face value of 0.1p each. |
| ** | Previously included in mmO2’s registration statement on Form 20-F, as filed with the Securities and Exchange Commission on 20 September 2001, and incorporated herein by reference. |
| *** | Previously included in mmO2’s registration statement on Form 20F/A, as filed with the Securities and Exchange Commission on 31 October 2001, and incorporated herein by reference. |
| **** | Previously included in mmO2’s annual report on Form 20F, as filed with the Securities and Exchange Commission on 12 July, 2002, and incorporated herein by reference. |
| ***** | Previously included in mmO2’s annual report on Form 20F, as filed with the Securities and Exchange Commission on 7 July, 2003, and incorporated herein by reference. |
| | |