Lloyds TSB Group has operations in both the UK and overseas; however, its earnings are heavily dependent upon its domestic activities and in 2006 substantially all of Lloyds TSB Group’s profit before tax was derived from its UK operations. The state of the UK economy, therefore, has significant implications for the way in which Lloyds TSB Group runs its business and its performance.
After increasing to growth of around 2.7 per cent in 2006, the UK economy is expected to slow somewhat to growth of around 2.6 per cent in 2007. Retail price inflation rose during 2006, partly following increases in fuel prices, and the Bank of England increased base rates from 4.5 per cent at the start of 2006 to 4.75 per cent in August 2006 and to 5.0 per cent in November 2006. House price inflation, however, remained buoyant and there was continuing growth in mortgage lending, although unsecured personal lending growth has levelled off. Looking forward to 2007, the Bank of England has raised interest rates by 0.25 per cent in January 2007 and a further 0.25 per cent in May 2007 and it is clear that rates will be raised further if this is deemed necessary in order to control inflation. Consumer confidence is expected to remain good as there will be an increase in demand for labour, although labour supply is also expected to grow as a result of immigration and the return to work of older workers. Slower global growth and the strength of sterling are, however, expected to act as a drag on exports in 2007.
Against this economic backdrop, there has been continued growth in each of Lloyds TSB Group’s three divisions: (i) UK Retail Banking, as a result of strong growth in mortgage and customer deposit balances with costs remaining tightly controlled, although unsecured personal lending is largely flat, and impairment charges rose significantly reflecting a marketwide deterioration in retail credit quality as a result of more customers, with higher levels of indebtedness, experiencing repayment difficulties; (ii) Insurance and Investments, as a result of increased sales, particularly of Open Ended Investment Company products, and an increase in the new business margin; and (iii) Wholesale and International Banking, which has seen further good progress in building the Corporate Markets business and strong franchise growth in Business Banking.
The preparation of financial statements requires management to make estimates and assumptions that affect amounts reported therein. Due to the inherent uncertainty involved in making estimates, actual results reported in future periods may be based upon amounts which differ from those estimates.
The accounting policies that are deemed critical to the Lloyds TSB Group’s results and financial position, based upon materiality and significant judgements and estimates, are discussed in note 2 to the Consolidated Financial Statements.
The Lloyds TSB Group first applied IFRS as adopted by the European Union (EU) in its financial statements for the year ended 31 December 2005. IFRSs as adopted by the EU are identical in all respects to the current IFRSs as issued by the IASB, except for the EU’s amendment to IAS 39. The Lloyds TSB Group has not taken advantage of the EU’s amendment to IAS 39; accordingly, there would be no change to the reported income or equity if Lloyds TSB Group were to adopt fully the current IFRSs as issued by the IASB. The rules for first time adoption of IFRS required the application of certain exceptions and permitted certain other transition exemptions. The application of these exceptions and exemptions means that the 2004 figures disclosed are not fully comparable with those presented in respect of 2005 and 2006.
Operating and financial review and prospects
2006 compared with 2005
In 2006 the Lloyds TSB Group’s profit before tax was £4,248 million which was £428 million, or 11 per cent, higher than £3,820 million in 2005. Profit attributable to shareholders was £310 million, or 12 per cent, higher at £2,803 million compared to £2,493 million in 2005. Earnings per share were 12 per cent higher at 49.9p in 2006, compared to 44.6p in 2005.
Net interest income decreased by £134 million, or 2 per cent, to £5,537 million compared to £5,671 million in 2005. Average interest-earning assets increased by £26,218 million, or £25,177 million excluding fine margin reverse repurchase agreement balances. This reflects growth in mortgage lending, in Corporate and Business Banking lending and in relatively low margin treasury and structured finance balances. The net interest margin was 34 basis points lower at 2.28 per cent, or 37 basis points lower at 2.44 per cent when the fine margin reverse repurchase agreement balances are excluded. This overall margin decline reflects a decrease in policyholder-related net interest income in the Insurance and Investments business together with a change in portfolio mix.
Other income was £2,919 million, or 17 per cent, lower at £14,136 million compared to £17,055 million in 2005. Fees and commission income was £126 million, or 4 per cent, higher at £3,116 million; UK current account fees were £59 million higher, reflecting growth in added value account packages, and other UK fees and commissions were £169 million higher with increased company registration, OEIC, private banking and asset management fees. However, insurance broking commissions were £52 million lower and card fees were also £52 million lower as a result of the sale of the Goldfish portfolio at the end of 2005. Fee and commission expense was little changed as decreases in asset finance dealer commissions and card fees payable were largely offset by activity-related increases in the insurance businesses. Net trading income was £2,957 million lower; this largely reflects lower policyholder gains within the insurance and investment businesses for which there is a largely offsetting movement within insurance claims expense. Insurance premium income was £250 million higher and other operating income was £334 million lower; this decrease reflects the impact of the UK Financial Services Authority’s (‘FSA’s’) new valuation rules upon the value of in-force business.
Insurance claims expense of £8,569 million in 2006 was £3,617 million, or 30 per cent, lower than £12,186 million in 2005. This decrease is principally attributable to lower returns on policyholder investments and the consequential reduction in amounts credited to policyholders. Claims expense has also been reduced by releases from actuarial reserves that offset the negative impact of the FSA’s Policy Statement on the value of in-force business.
Operating expenses were £170 million, or 3 per cent, lower at £5,301 million in 2006 compared to £5,471 million in 2005. Excluding the pension schemes related credit of £128 million in 2006 and the customer remediation provision of £150 million in 2005, operating expenses were £108 million, or 2 per cent, higher at £5,429 million in 2006 compared to £5,321 million in 2005. Staff costs, excluding the pension schemes related credit, were £14 million higher; the impact of annual pay rises and increased bonus and incentive payments was largely offset by reduced staff numbers and lower levels of redundancy and outsourcing costs. Premises and equipment costs were £33 million higher, as a result of business rate increases and higher levels of systems related spend. Other costs, excluding the £150 million customer remediation provision in 2005, were £87 million higher as a result of increased communication and data processing costs, higher levels of professional fees and a lower net credit in respect of the amortisation of deferred acquisition costs within the insurance businesses.
The impairment charge in respect of loans and advances and other credit risk provisions was £256 million, or 20 per cent, higher at £1,555 million compared to £1,299 million in 2005. The charge within UK Retail Banking was £127 million higher, or £173 million higher if the impact of the Goldfish portfolio sold in 2005 is excluded; charges in respect of unsecured loans, overdrafts and credit cards increased as a result of more customers with higher levels of indebtedness experiencing repayment difficulties and higher levels of bankruptcies and Individual Voluntary Arrangements. The overall charge in respect of Wholesale and International Banking was £120 million higher as a result of lower levels of corporate recoveries, lending growth in Business Banking and a deterioration in asset quality within Asset Finance. Overall, the Lloyds TSB Group’s charge in respect of impairment losses on loans and advances expressed as a percentage of average lending increased to 0.83 per cent in 2006 compared to 0.76 per cent in 2005.
The tax charge, at £1,341 million, represented 31.6 per cent of profit before tax compared to 33.1 per cent in 2005; the increase in effective tax rate caused by the consolidation of policyholder related items was less significant in 2006.
At the end of 2006, the total capital ratio was 10.7 per cent. Risk-weighted assets increased by £11,122 million, or 8 per cent, since the end of 2005 to £156,043 million at the end of 2006. Strong levels of customer lending growth in Business Banking and Corporate Markets, and good growth in mortgages, more than offset the expected slowdown in the rate of growth in unsecured personal lending. Total assets increased by 11 per cent to £343,598 million, with an 8 per cent increase in loans and advances to customers. Customer deposits increased by 6 per cent to £139,342 million, supported by good growth in current account credit balances and savings balances within UK Retail Banking.
2005 compared with 2004
In 2005 the Lloyds TSB Group’s profit before tax was £3,820 million, an increase of £343 million, or 10 per cent, compared to £3,477 million in 2004. Profit attributable to shareholders was £101 million, or 4 per cent, higher at £2,493 million compared to £2,392 million in 2004. Earnings per share were 44.6p compared to 42.8p in 2004, an increase of 4 per cent.
Net interest income was £561 million, or 11 per cent, higher at £5,671 million compared to £5,110 million in 2004. The international accounting standards implemented with effect from 1 January 2005 had a marked effect on the Lloyds TSB Group’s net interest income as certain amounts previously accounted for within fees receivable and administrative expenses were now included within the effective interest rate calculations. Adjusting for this effect, underlying net interest income was £403 million, or 8 per cent, higher. Average interest-earning assets increased as a result of continued strong lending growth, particularly in respect of mortgages, personal loans and credit cards as well as corporate lending and asset finance. The Lloyds TSB Group’s net interest margin fell by 10 basis points to 2.62 per cent; however, excluding the impact of the accounting standards applied with effect from 1 January 2005 and the growth in reverse repurchase agreement balances, the underlying net interest margin was 2.82 per cent in 2005, compared to 2.86 per cent in 2004; a fall of 4 basis points. This fall in the underlying margin reflected competitive pressures in both the personal and corporate lending books.
Other income, at £17,055 million, was £2,882 million, or 20 per cent, higher than £14,173 million in 2004. Fees and commissions receivable were £64 million, or 2 per cent, lower at £2,990 million; however, excluding the effect of the accounting standards applied with effect from 1 January 2005, underlying fees and commissions receivable were £261 million, or 9 per cent, higher at £3,315 million compared to £3,054 million in 2004. The increase in underlying fee income reflected good growth in current account fees, mortgage and other lending fees and wealth management products. Fees and commissions payable, again excluding the impact of the accounting standards applied with effect from 1 January 2005, were £74 million higher, largely as a result of increased volumes within Scottish Widows. Net trading income was £4,262 million higher, principally within the insurance and investment
15
Operating and financial review and prospects
businesses, and insurance premium income (excluding the impact of the accounting standards applied with effect from 1 January 2005) was £1,131 million higher. These increases reflected substantial inflows of funds from policyholders and strong investment gains over the year; this income, however, was largely for the benefit of policyholders and was matched by the commensurate increase in insurance claims.
Insurance claims, at £12,186 million, were £2,564 million, or 27 per cent, higher than £9,622 million in 2004. The impact of the accounting standards applied with effect from 1 January 2005 in respect of the insurance businesses caused a significant reduction in both the premium income and claims figures, as a large number of insurance products were reclassified as investment products. Adjusting for this effect, underlying insurance claims were £5,172 million, or 54 per cent, higher at £14,794 million compared to £9,622 million in 2004.
Operating expenses were £174 million, or 3 per cent, higher at £5,471 million compared to £5,297 million in 2004. Staff costs were £151 million, or 6 per cent, higher reflecting annual pay awards, increased bonus and incentive payments in certain areas as a result of business success and increased severance costs in relation to rationalisation programmes. Staff numbers, on a full time equivalent basis, decreased by 3,188 to 66,797 at 31 December 2005 compared to 69,985 at 31 December 2004; however, much of this fall occurred towards the end of the year and consequently there was little impact on staff costs. Premises and equipment costs were £35 million higher. Other costs were £19 million lower; an increase of £38 million in the charge in respect of provisions for customer redress, following a review of the expected cost by the Lloyds TSB Group, was more than offset by a net credit of £45 million in respect of deferred acquisition costs within the insurance businesses.
Impairment losses on loans and advances, at £1,299 million, were £433 million, or 50 per cent, higher than 2004. Excluding the impact of the accounting standards applied with effect from 1 January 2005 and a small release of £3 million from other credit risk provisions, underlying impairment losses on loans and advances were £227 million, or 26 per cent, higher at £1,093 million in 2005 compared to £866 million in 2004. The overall charge in respect of Wholesale and International Banking was little changed with the majority of the increase arising within UK Retail Banking. The underlying impairment charge in UK Retail Banking was £229 million higher as a result of volume growth in both personal loans and credit card lending and the absence of a mortgage related provision release which in 2004 totalled £39 million.
A net profit of £50 million arose on the sale and closure of businesses in 2005, principally as a result of the disposal of the Goldfish credit card portfolio, compared to a loss of £21 million in 2004, which largely reflected the sale of the Lloyds TSB Group’s businesses in Argentina and Colombia.
The tax charge, at £1,265 million, represented 33.1 per cent of profit before tax compared to 29.3 per cent in 2004; the increase in the effective tax rate largely reflected the IFRS requirement to include, within the tax charge, tax attributable to UK life insurance policyholder earnings and interests in Open Ended Investment Companies (OEICs).
At the end of 2005, the total capital ratio was 10.9 per cent. Risk-weighted assets increased by £13,091 million, or 10 per cent, since the beginning of 2005 to £144,921 million at the end of the year; this increase reflected new mortgage and other personal lending together with substantial growth in corporate, SME, asset finance and structured finance lending. Total assets grew by £25,332 million, or 9 per cent, to £309,754 million compared to £284,422 million at 31 December 2004. Of this growth, £9,649 million was due to the grossing-up of balances no longer eligible for set-off following the implementation of IAS 32 with effect from 1 January 2005. The remaining increase of £15,683 million was due to the lending growth and higher securities balances within the long-term insurance business.
Net interest income
| | | | | | | | | | |
| | | 2006 | | | 2005 | | | 2004 | |
| | | | | | | | | | | |
Net interest income £m | | | 5,537 | | | 5,671 | | | 5,110 | |
Average interest-earning assets £m | | | 242,371 | | | 216,153 | | | 187,643 | |
Average rates: | | | | | | | | | | |
– Gross yield on interest-earning assets%1 | | | 5.91 | | | 5.82 | | | 5.71 | |
– Interest spread%2 | | | 2.09 | | | 2.40 | | | 2.50 | |
– Net interest margin%3 | | | 2.28 | | | 2.62 | | | 2.72 | |
Margin excluding average balances held under reverse repurchase agreements4: | | | | | | | | | | |
– Net interest income £m | | | 5,537 | | | 5,671 | | | 5,110 | |
– Average interest-earning assets £m | | | 226,990 | | | 201,813 | | | 178,887 | |
– Net interest margin% | | | 2.44 | | | 2.81 | | | 2.86 | |
| | | | | | | | | | | |
| |
1 | Gross yield is the rate of interest earned on average interest-earning assets. |
| |
2 | Interest spread is the difference between the rate of interest earned on average interest-earning assets and the rate of interest paid on average interest-bearing liabilities. |
| |
3 | The net interest margin represents the interest spread together with the contribution of interest-free liabilities. It is calculated by expressing net interest income as a percentage of average interest-earning assets. |
| |
4 | Comparisons of net interest income and margins are impacted by the holdings of fine margin reverse repurchase agreements. To improve comparability, figures are also shown excluding average balances held under reverse repurchase agreements (2006: £15,381 million; 2005: £14,340 million; 2004: £8,756 million). |
16
Operating and financial review and prospects
2006 compared to 2005
Net interest income decreased by £134 million, or 2 per cent, to £5,537 million in 2006 compared to £5,671 million in 2005. The overall decrease was primarily as a result of lower levels of interest earned on policyholder investments, within the insurance and investment businesses, and an increase in the amounts payable to unitholders in those OEICs included in the consolidated results of the Lloyds TSB Group; since these are policyholder items there is no impact on profit attributable to shareholders. Net interest income within the Lloyds TSB Group’s retail and wholesale banking operations increased by £241 million, or 4 per cent, to £6,027 million in 2006 compared to £5,786 million in 2005.
Average interest-earning assets were £26,218 million, or 12 per cent, higher at £242,371 million in 2006 compared to £216,153 million in 2005. Excluding the fine margin reverse repurchase agreement assets held for liquidity purposes, average interest-earning assets were £25,177 million, or 12 per cent, higher at £226,990 million in 2006 compared to £201,813 million in 2005. Average interest-earning assets in UK Retail Banking were £6,447 million higher, £7,327 million higher when the impact of the sale of the Goldfish portfolio at the end of 2005 is excluded. Average mortgage balances were £6,831 million higher, reflecting net new lending over 2005 and 2006, and average balances in other personal lending, excluding the impact of the sale of the Goldfish portfolio, were £496 million higher due to the full-year benefit of growth over 2005. Average interest-earning assets within the insurance and investments businesses were £1,093 million higher, largely due to growth in the mortgage book within Scottish Widows Bank. Within Wholesale and International Banking, average interest-earning assets increased by £18,823 million, or £17,782 million excluding the fine margin reverse repurchase agreement balances. Average balances within Corporate Markets, excluding the reverse repurchase agreement balances, were £16,398 million higher reflecting strong growth in corporate lending, coupled with growth in lower margin balances within the treasury and structured finance areas. Strong growth in lending also led to a £994 million increase in average balances in Business Banking.
The Lloyds TSB Group’s net interest margin fell by 34 basis points to 2.28 per cent in 2006, compared to 2.62 per cent in 2005; if the average balances held under reverse repurchase agreements are excluded from both years, the margin in 2006 was 37 basis points lower at 2.44 per cent compared to 2.81 per cent in 2005. The net interest margin in UK Retail Banking was 11 basis points lower, or 10 basis points lower if the Goldfish portfolio sold at the end of 2005 is excluded; this fall in margin reflects competitive pressures and the fact that growth in average interest-earning assets has been within the mortgage portfolio. The margin within Wholesale and International Banking, excluding the fine margin reverse repurchase agreement balances, was 31 basis points lower; this again reflects competitive pressures and the fact that growth has been in corporate lending, treasury and structured finance balances where margins are finer. Within Insurance and Investments, the impact on net interest income of the adjustments required to consolidate policyholder items on a line-by-line basis was £232 million lower in 2006, contributing some 10 basis points to the fall in Lloyds TSB Group’s net interest margin.
2005 compared to 2004
Net interest income increased by £561 million, or 11 per cent, to £5,671 million compared to £5,110 million in 2004. However, net interest income was impacted by the accounting standards applied with effect from 1 January 2005 and adjusting for this, net interest income was £403 million, or 8 per cent, higher at £5,513 million compared to £5,110 million in 2004.
Average interest-earning assets grew by £28,510 million, or 15 per cent, to £216,153 million in 2005 compared to £187,643 million in 2004. However, comparisons are distorted by the substantial growth, during 2004 and 2005, in assets held under reverse repurchase agreements for liquidity purposes. Excluding the balances held under reverse repurchase agreements, average interest-earning assets grew by £22,926 million, of which the grossing-up of balances subject to set-off arrangements in 2005 following the implementation of IAS 32 accounted for £6,396 million. The underlying growth in average interest-earning assets was therefore £16,530 million, or 9 per cent, adding £475 million to net interest income. Good levels of consumer lending growth increased average personal lending and credit card balances by £1,691 million and average mortgage balances by £7,808 million. Average interest-earning assets within the insurance and investment businesses, which include policyholder and long-term fund balances, increased by £1,891 million as a result of business growth and increased fund activity. Strong lending growth led to an increase of £4,373 million in average interest-earning assets in the Business Banking and Corporate Markets franchises and average balances in Asset Finance were £484 million higher, reflecting the full year impact of lending growth over 2004.
The Lloyds TSB Group’s net interest margin fell by 10 basis points to 2.62 per cent in 2005, compared to 2.72 per cent in 2004; excluding the average balances held under reverse repurchase agreements from both years, the margin in 2005 was 5 basis points lower at 2.81 per cent compared to 2.86 per cent in 2004. After taking into account the impact of the accounting standards applied with effect from 1 January 2005 the underlying margin fell by 4 basis points reducing net interest income by £72 million. The underlying net interest margin in UK Retail Banking was 23 basis points lower, as a result of competitive pressures and a reduced benefit from current account funding balances. Within Wholesale and International Banking the underlying net interest margin was 5 basis points higher. On this basis, margins on treasury balances improved, as a result of a change in mix; the margin in Structured Finance improved as a result of the impact of new transactions; Corporate Banking margins were lower, as a result of competitive pressures on new lending balances; and margins were also down in Business Banking.
17
Operating and financial review and prospects
Other income
| | | | | | | | | | |
| | 2006 | | | 2005 | | | 2004 | | |
| | £m | | | £m | | | £m | | |
| | | | | | | | | | | |
Fee and commission income: | | | | | | | | | | |
| | | | | | | | | | |
– UK current account fees | | 652 | | | 593 | | | 637 | | |
– Other UK fees and commissions | | 1,210 | | | 1,041 | | | 1,087 | | |
– Insurance broking | | 629 | | | 681 | | | 672 | | |
– Card services | | 493 | | | 545 | | | 520 | | |
– International fees and commissions | | 132 | | | 130 | | | 138 | | |
| | | | | | | | | | |
| | 3,116 | | | 2,990 | | | 3,054 | | |
Fee and commission expense | | (846 | ) | | (842 | ) | | (844 | ) | |
| | | | | | | | | | | |
Net fee and commission income | | 2,270 | | | 2,148 | | | 2,210 | | |
Net trading income | | 6,341 | | | 9,298 | | | 5,036 | | |
Insurance premium income | | 4,719 | | | 4,469 | | | 6,070 | | |
Other operating income | | 806 | | | 1,140 | | | 857 | | |
| | | | | | | | | | | |
Total other income | | 14,136 | | | 17,055 | | | 14,173 | | |
| | | | | | | | | | | |
2006 compared to 2005
Other income was £2,919 million, or 17 per cent, lower at £14,136 million in 2006 compared to £17,055 million in 2005.
Fee and commission income was £126 million, or 4 per cent, higher at £3,116 million in 2006 compared to £2,990 million in 2005. UK current account fees were £59 million, or 10 per cent, higher at £652 million in 2006 compared to £593 million in 2005; this reflects a change in mix of added-value accounts, as customers are increasingly opening the more comprehensive account packages, together with the benefit of some tariff changes. Other UK fees and commissions were £169 million, or 16 per cent, higher at £1,210 million in 2006 compared to £1,041 million in 2005; this reflects good growth in company registration income and in fees from OEICs, asset management and private banking. Insurance broking commissions were £52 million, or 8 per cent, lower at £629 million in 2006 compared to £681 million in 2005; this reflects lower creditor protection income in respect of personal loans and credit cards and reduced levels of retrospective commissions. Fees in respect of card services were £52 million, or 10 per cent, lower at £493 million compared to £545 million in 2005; this primarily reflects the sale of the Goldfish portfolio towards the end of 2005. International fees were little changed at £132 million in 2006, compared to £130 million in 2005.
Fee and commission expense was £4 million higher at £846 million in 2006, compared to £842 million in 2005. Dealer commissions in the asset finance businesses were £30 million, or 12 per cent, lower at £217 million in 2006 compared to £247 million in 2005, as new business levels were not high enough to trigger bonus commissions. Card services fees payable were £44 million, or 24 per cent, lower at £138 million compared to £182 million in 2005, primarily due to the disposal of the Goldfish portfolio towards the end of 2005. These decreases, however, were offset by increased levels of fees payable within the general insurance business (commissions on new reinsurance products) and within the Scottish Widows businesses (reflecting increases in investment and other activities).
Net trading income, at £6,341 million, was £2,957 million, or 32 per cent, lower than £9,298 million in 2005. This decrease primarily relates to investment fluctuations in the long-term insurance businesses; IFRS requires that gross investment gains are reported within net trading income and the related allocation to policyholders within claims.
Insurance premium income was £250 million, or 6 per cent, higher at £4,719 million compared to £4,469 million in 2005. Life and pensions premiums were £212 million higher and general insurance premiums were £38 million higher, reflecting the commencement of underwriting of card and commercial loan protection products during 2006.
Other operating income was £334 million, or 29 per cent, lower at £806 million compared to £1,140 million in 2005. The main driver for this decrease was the £361 million year-on-year decrease in the movement of value in force to a reduction of £199 million compared to an increase of £162 million in 2005; this reflects a reduction of £429 million arising from the introduction of the new valuation rules in the FSA’s Policy Statement 06/14. Reductions of £11 million in operating lease rental income and £7 million in sale and lease-back profits were more than offset by a £41 million increase in income from investment property, held within the insurance and investment funds, reflecting property additions over 2005 and 2006.
2005 compared to 2004
Other income was £2,882 million, or 20 per cent, higher at £17,055 million compared to £14,173 million in 2004.
Fee and commission income was £64 million, or 2 per cent, lower at £2,990 million compared to £3,054 million in 2004. However, year-on-year comparisons were affected by the impact of IAS 39, which had been applied with effect from 1 January 2005 and resulted in some £325 million of income previously classified within fees and commissions being included within net interest income via the effective interest rate calculations. Adjusting for this, underlying fee and commission income was £261 million, or 9 per cent, higher at £3,315 million compared to £3,054 million in 2004. Underlying UK current account fees were £117 million higher reflecting continuing growth in added-value account products, the impact of pricing reviews in 2004 and 2005 and increased charges in respect of returned cheques and unauthorised borrowings. Also on this underlying basis, other UK fees and commissions were up £114 million, or 10 per cent, at £1,201 million compared to £1,087 million in 2004, reflecting increased levels of mortgage-related fees, increased wealth management fees as a result of higher sales and improved retention rates and increased levels of corporate lending and other fees. Insurance broking income was £9 million, or 1 per cent, higher at £681 million, compared to £672 million in 2004, as lower levels of loan protection income were more than offset by increased income in respect of motor insurance and retrospective commissions. Fees for card services were £25 million higher as a result of increased volumes and some tariff changes.
18
Operating and financial review and prospects
Fee and commission expense was £2 million lower at £842 million compared to £844 million in 2004; however, adjusting for fees payable of £76 million included within the effective interest rate calculations in 2005, underlying fees payable were £74 million, or 9 per cent, higher at £918 million compared to £844 million in 2004. The impact of increased business and trading volumes within Scottish Widows more than offset the lower level of dealership commissions within Asset Finance as a result of reduced new business levels.
Net trading income increased by £4,262 million, or 85 per cent, to £9,298 million compared to £5,036 million in 2004. The majority of this increase is attributable to the insurance businesses and reflected significant trading gains on policyholder investments over the year, which were largely matched by an increase in claims expense.
Insurance premium income was £1,601 million, or 26 per cent, lower at £4,469 million compared to £6,070 million in 2004. However, year-on-year comparisons were affected by the impact of IFRS 4, which caused a significant proportion of contracts to be reclassified as investment products with effect from 1 January 2005. Adjusting for this, underlying insurance premium income was £1,131 million, or 19 per cent, higher at £7,201 million in 2005. Long-term insurance income grew substantially as a result of strong sales through the Bancassurance and independent financial adviser channels; however general insurance premium income was little changed as growth in creditor insurance income was largely offset by reduced levels of health insurance premiums.
Other operating income was £283 million, or 33 per cent, higher at £1,140 million compared to £857 million in 2004; excluding the impact of accounting standards applied with effect from 1 January 2005, underlying other operating income was £139 million, or 16 per cent, higher in 2005. Income from investment properties was £114 million higher, in part reflecting portfolio growth, and there were increased gains from the sale and leaseback of premises.
Operating expenses
| | | | | | | | | | |
| | 2006 | | | 2005 | | | 2004 | | |
| | £m | | | £m | | | £m | | |
| | | | | | | | | | | |
Administrative expenses: | | | | | | | | | | |
Staff: | | | | | | | | | | |
| | | | | | | | | | |
– Salaries | | 2,117 | | | 2,068 | | | 1,970 | | |
– National insurance | | 161 | | | 154 | | | 144 | | |
– Pensions, net of pension schemes related credit† | | 165 | | | 308 | | | 307 | | |
– Other staff costs | | 298 | | | 325 | | | 283 | | |
| | | | | | | | | | |
| | 2,741 | | | 2,855 | | | 2,704 | | |
|
Premises and equipment: | | | | | | | | | | |
| | | | | | | | | | |
– Rent and rates | | 310 | | | 305 | | | 294 | | |
– Hire of equipment | | 15 | | | 13 | | | 17 | | |
– Repairs and maintenance | | 165 | | | 136 | | | 129 | | |
– Other | | 149 | | | 152 | | | 131 | | |
| | | | | | | | | | |
| | 639 | | | 606 | | | 571 | | |
Other expenses: | | | | | | | | | | |
| | | | | | | | | | |
– Communications and external data processing | | 499 | | | 467 | | | 449 | | |
– Advertising and promotion | | 184 | | | 207 | | | 205 | | |
– Professional fees | | 231 | | | 216 | | | 222 | | |
– Provisions for customer redress | | — | | | 150 | | | 112 | | |
– Other | | 388 | | | 325 | | | 396 | | |
| | | | | | | | | | |
| | 1,302 | | | 1,365 | | | 1,384 | | |
| | | | | | | | | | | |
Administrative expenses | | 4,682 | | | 4,826 | | | 4,659 | | |
Depreciation of tangible fixed assets | | 602 | | | 621 | | | 616 | | |
Amortisation of intangible assets | | 17 | | | 18 | | | 22 | | |
Impairment of goodwill | | — | | | 6 | | | — | | |
| | | | | | | | | | | |
Total operating expenses | | 5,301 | | | 5,471 | | | 5,297 | | |
| | | | | | | | | | | |
Cost: income ratio (%)* | | 47.7 | | | 51.9 | | | 54.8 | | |
| | | | | | | | | | | |
| |
† | Following recent changes in age discrimination legislation in the United Kingdom, the Lloyds TSB Group has taken the decision to cease to augment the pension entitlement of employees taking early retirement. This change has resulted in a credit to the income statement in 2006 of £128 million (2005: £nil; 2004: £nil). |
| |
* | Total operating expenses divided by total income, net of insurance claims. |
19
Operating and financial review and prospects
2006 compared to 2005
Operating expenses were £170 million, or 3 per cent, lower at £5,301 million compared to £5,471 million in 2005. Two significant items impact the comparison of operating expenses in 2006 to 2005. In 2006, following recent changes in age discrimination legislation in the United Kingdom, the Lloyds TSB Group took the decision to cease to augment the pension entitlement of employees taking early retirement; this resulted in a credit to the income statement in 2006 of £128 million. During 2005, following a review by the Lloyds TSB Group of the estimated cost of redress payments to customers, an additional £150 million provision for customer redress was charged; no such charge was required in 2006. Excluding the pension schemes related credit in 2006 and the provision for customer redress in 2005, operating expenses were £108 million, or 2 per cent, higher at £5,429 million compared to £5,321 million in 2005.
Staff costs were £114 million, or 4 per cent, lower at £2,741 million in 2006 compared to £2,855 million in 2005. However, excluding the £128 million pension schemes related credit in 2006, staff costs were £14 million higher at £2,869 million compared to £2,855 million in 2005. Salaries were £49 million, or 2 per cent, higher at £2,117 million compared to £2,068 million in 2005 as a result of the decrease in staff numbers (average staff numbers on a full-time equivalent basis for 2006 were 64,877 compared to 69,303 in 2005) largely offsetting the annual pay awards and increased bonus and incentive payments. Pension costs were £143 million, or 46 per cent, lower at £165 million compared to £308 million in 2005. Excluding the £128 million pension schemes related credit in 2006 pension costs were £15 million, or 5 per cent, lower at £293 million; a decrease of £22 million in the IAS 19 defined benefit charge, reflecting an improved expected return on the schemes’ assets, was in part offset by an increase of £7 million in contributions to the defined contribution schemes. Other staff costs were £27 million, or 8 per cent, lower at £298 million in 2006 compared to £325 million in 2005; this reflects a reduction in outsourcing costs and lower levels of redundancy costs.
Premises and equipment costs were £33 million, or 5 per cent, higher at £639 million compared to £606 million in 2005. There was a £5 million rise in business rates, reflecting annual increases together with the inclusion of new premises in London; and repair and maintenance costs were £29 million higher as a result of a number of systems initiatives and upgrades.
Other costs were £63 million, or 5 per cent, lower at £1,302 million in 2006 compared to £1,365 million in 2005; excluding the £150 million customer remediation provision in 2005, other costs were £87 million, or 7 per cent, higher at £1,302 million in 2006 compared to £1,215 million in 2005. Communications and external data processing costs were £32 million, or 7 per cent, higher at £499 million in 2006 compared to £467 million in 2005, principally due to additional spend on the outsourcing of IT work. Advertising and promotion costs were £23 million, or 11 per cent, lower at £184 million compared to £207 million in 2005, as lower print costs for promotional materials, as the Lloyds TSB Group moves increasingly towards paperless advertising streams, were only partly offset by increased brand-related spend within Scottish Widows. Professional fees were £15 million, or 7 per cent, higher at £231 million compared to £216 million in 2005, mainly due to fluctuations in project related spend. Other costs were £63 million, or 19 per cent, higher at £388 million compared to £325 million in 2005; this reflects a lower net credit in respect of the amortisation of deferred acquisition costs within the insurance businesses, due to new business fluctuations and actuarial model changes, increased administration charges in respect of clearing operations and certain contract closure costs.
The charge in respect of depreciation of tangible fixed assets was £19 million, or 3 per cent, lower at £602 million in 2006 compared to £621 million in 2005 as an increase of £7 million in respect of premises adaptation costs, reflecting the ongoing branch refurbishment programme, was more than offset by the impact, in 2006, of tranches of equipment becoming fully depreciated.
The cost: income ratio improved to 47.7 per cent in 2006 compared to 51.9 per cent in 2005.
2005 compared with 2004
Operating expenses were £174 million, or 3 per cent, higher at £5,471 million in 2005 compared to £5,297 million in 2004.
Staff costs were £151 million, or 6 per cent, higher at £2,855 million compared to £2,704 million in 2004. Salaries were £98 million higher at £2,068 million reflecting annual pay awards and an increase in levels of bonus and incentive payments in some parts of the Lloyds TSB Group. A reduction in overall staff numbers had little impact upon costs as this was biased towards the end of the year. National insurance costs were £10 million higher, reflecting the increase in salary costs, but pension costs were largely unchanged as a decrease in the charge in respect of defined benefit schemes was offset by an increase in cash payments to defined contribution schemes. Other staff costs were £42 million higher as decreases in agency and other costs were more than offset by an increase in severance charges, reflecting rationalisation programmes in a number of parts of the Lloyds TSB Group.
Premises and equipment costs were £35 million, or 6 per cent, higher at £606 million compared to £571 million in 2004. Rent and rates were £11 million higher as a result of general increases in property rental charges and a higher level of costs in relation to the expanding investment property portfolios within the insurance operations. A small decrease in equipment hire charges resulted from a favourable renegotiation of certain contracts, but this was more than offset by increased repairs and maintenance expenditure, in particular in relation to ATMs and network costs. Other premises and equipment costs were £21 million higher as a result of increased energy costs and other increased costs in relation to the investment property portfolios.
Other expenses were £19 million, or 1 per cent, lower at £1,365 million compared to £1,384 million in 2004. Communications and external data processing costs were £18 million higher as a result of increased network charges. Advertising costs were little changed at £207 million and professional fees were £6 million lower, reflecting some reduction in consultancy charges. The charge of £150 million in 2005 in respect of provisions for customer redress (£38 million higher than the £112 million charge in 2004) followed a review by the Lloyds TSB Group of the estimated cost of redress payments to customers, principally relating to past sales of mortgage endowment policies through the branch network. This review took in to account the introduction of time barring and the consequent increase in claims. Other costs were £71 million lower at £325 million. Much of this decrease reflected a credit of £45 million representing the net movement in deferred acquisition costs relating to the insurance businesses, the accounting for which changed as a result of the prospective IFRS accounting changes applied with effect from 1 January 2005. There were efficiency savings in stationery and other administrative costs and costs were also lower following the sale of certain Latin American businesses towards the end of 2004.
The depreciation charge was little changed at £639 million as a small reduction in the charge in respect of operating lease assets was offset by the effect of general portfolio growth in relation to own-use assets. There was a goodwill impairment charge in relation to an acquisition made in earlier years.
The cost: income ratio improved to 51.9 per cent in 2005 compared to 54.8 per cent in 2004.
20
Operating and financial review and prospects
Impairment losses on loans and advances
| | | | | | | | | | |
| | | 2006 | | | 2005 | | | 2004 | |
| | | £m | | | £m | | | £m | |
| | | | | | | | | | | |
Impairment losses on loans and advances | | | 1,560 | | | 1,302 | | | 866 | |
Other credit risk provisions | | | (5 | ) | | (3 | ) | | — | |
| | | | | | | | | | | |
Impairment losses on loans and advances and other credit risk provisions | | | 1,555 | | | 1,299 | | | 866 | |
| | | | | | | | | | | |
| | | | | | | | | | |
| | | 2006 | | | 2005 | | | 2004 | |
Impairment losses on loans and advances | | | £m | | | £m | | | £m | |
| | | | | | | | | | | |
UK Retail Banking | | | 1,238 | | | 1,111 | | | 676 | |
Insurance and Investments | | | — | | | — | | | (3 | ) |
Wholesale and International Banking | | | 313 | | | 191 | | | 193 | |
Central group items | | | 9 | | | — | | | — | |
| | | | | | | | | | | |
Total charge for impairment losses on loans and advances | | | 1,560 | | | 1,302 | | | 866 | |
| | | | | | | | | | | |
| | | | | | | | | | |
| | | % | | | % | | | % | |
| | | | | | | | | | | |
Charge as a percentage of average lending | | | 0.83 | | | 0.76 | | | 0.59 | |
| | | | | | | | | | | |
2006 compared to 2005
The impairment charge in respect of loans and advances and other credit risk provisions was £256 million, or 20 per cent, higher at £1,555 million in 2006 compared to £1,299 million in 2005. This represents a charge in respect of loans and advances of £1,560 million (2005: £1,302 million) slightly offset by a release of £5 million (2005: £3 million) from provisions held in respect of contingent liabilities and commitments.
The impairment charge in respect of loans and advances within UK Retail Banking was £1,238 million which was £127 million, or 11 per cent, higher than £1,111 million in 2005. The impairment charge in 2005 included £46 million in respect of the Goldfish portfolio which was sold at the end of that year; excluding this item the impairment charge of £1,238 million in 2006 was £173 million, or 16 per cent, higher than £1,065 million in 2005. The charge in respect of personal loans and overdrafts of £740 million was £84 million, or 13 per cent, higher than £656 million in 2005 and represented 5.85 per cent of average lending (2005: 5.33 per cent). The charge in respect of card balances (excluding the Goldfish portfolio sold in 2005) was £490 million, which was £94 million, or 24 per cent, higher than £396 million in 2005 and represented 6.99 per cent of average lending (2005: 5.80 per cent). This deterioration in respect of personal loans, overdrafts and card balances reflects the impact of more customers with higher levels of indebtedness experiencing repayment difficulties together with higher levels of bankruptcies and Individual Voluntary Arrangements, as well as some worsening of recovery experience. Mortgage credit quality remains good and, as a result, the impairment charge in 2006 of £8 million was £5 million, or 62 per cent, lower than £13 million in 2005.
The impairment charge in respect of loans and advances within Wholesale and International Banking was £313 million in 2006 which was £122 million, or 64 per cent, higher than £191 million in 2005; expressed as a percentage of average lending this represents a charge of 0.39 per cent compared to 0.28 per cent in 2005. There was a lower level of net releases within Corporate Markets, which reduced to £13 million in 2006, compared to £57 million in 2005, as some significant one-off releases in 2005 were not repeated. The charge within Business Banking of £87 million was £11 million, or 14 per cent, higher than £76 million in 2005, reflecting business growth. Within Asset Finance, rising levels of consumer arrears and voluntary terminations have led to an increase in the impairment charge of £40 million, or 20 per cent, to £245 million in 2006 compared to £205 million in 2005.
Overall, the Lloyds TSB Group’s charge in respect of impairment losses on loans and advances expressed as a percentage of average lending increased to 0.83 per cent in 2006 compared to 0.76 per cent in 2005.
21
Operating and financial review and prospects
2005 compared to 2004
The impairment charge in respect of loans and advances and other credit risk provisions was £433 million, or 50 per cent, higher at £1,299 million compared to £866 million in 2004. This represented a charge in respect of loans and advances of £1,302 million slightly offset by a release of £3 million from provisions held in respect of contingent liabilities and commitments.
The impairment charge in respect of loans and advances in 2005 was significantly affected by the adoption of the requirements of IAS 39 with effect from 1 January 2005. IAS 39 requires the impairment provision to be calculated by comparing the carrying value of the loan with the discounted value of future cash flows. As a result, in circumstances where a customer’s borrowings have been rescheduled onto a concessionary rate which is below market interest rate, an impairment allowance will be required even where full recovery of the principal is anticipated; this had the effect of increasing the 2005 charge by £209 million.
Excluding this effect, underlying impairment losses on loans and advances in 2005 totalled £1,093 million, £227 million or 26 per cent higher than £866 million in 2004.
The underlying charge in UK Retail Banking rose by £229 million, or 34 per cent, to £905 million in 2005. The charges in respect of personal loans and overdrafts and credit cards increased by £112 million and £65 million respectively as a result of volume growth and some deterioration in credit quality. There was a charge of £13 million in respect of the mortgage portfolio, compared to a release of £39 million in 2004.
The underlying charge in Wholesale and International Banking was £188 million compared to £193 million in 2004. The underlying charge within Corporate Markets was £91 million lower as a result of lower new provisions and maintaining a good level of recoveries; this was partially offset by higher charges in Asset Finance. The charge within Business Banking, which deals with small business customers, was little changed. Within International Banking, there was a credit of £15 million in 2005 compared to a credit of £39 million in 2004; both years benefited from good recoveries in Latin America although 2004 also benefited from a release of £30 million from the Lloyds TSB Group’s centrally held provision in respect of exposures in Argentina.
Overall, the Lloyds TSB Group’s charge in respect of impairment losses on loans and advances expressed as a percentage of average lending increased to 0.76 per cent compared to 0.59 per cent in 2004; although excluding the impact of IAS 39 the charge represented 0.66 per cent of average lending in 2005.
Taxation
| | | | | | | | | | |
| | 2006 | | | 2005 | | | 2004 | | |
| | £m | | | £m | | | £m | | |
| | | | | | | | | | | |
UK corporation tax: | | | | | | | | | | |
| | | | | | | | | | |
– Current tax on profits for the year | | 1,024 | | | 862 | | | 759 | | |
– Adjustments in respect of prior years | | (137 | ) | | (20 | ) | | (69 | ) | |
| | 887 | | | 842 | | | 690 | | |
| | | | | | | | | | |
Double taxation relief | | (195 | ) | | (138 | ) | | (57 | ) | |
| | | | | | | | | | | |
| | 692 | | | 704 | | | 633 | | |
| | | | | | | | | | |
Foreign tax: | | | | | | | | | | |
| | | | | | | | | | |
– Current tax on profits for the year | | 83 | | | 78 | | | 118 | | |
– Adjustments in respect of prior years | | (8 | ) | | (8 | ) | | (2 | ) | |
| | 75 | | | 70 | | | 116 | | |
| | | | | | | | | | | |
Current tax charge | | 767 | | | 774 | | | 749 | | |
Deferred tax | | 574 | | | 491 | | | 269 | | |
| | | | | | | | | | | |
Total charge | | 1,341 | | | 1,265 | | | 1,018 | | |
| | | | | | | | | | | |
2006 compared to 2005
The rate of tax is influenced by the geographic and business mix of profits. The effective rate of tax in 2006 was 31.6 per cent, compared to an effective rate of tax in 2005 of 33.1 per cent and the corporation tax rate in 2006 of 30 per cent (2005: 30 per cent). The effective tax rate is distorted by the requirement to include, within the income tax expense, the tax attributable to UK life insurance policyholder earnings and the Lloyds TSB Group’s interests in OEICs. Excluding these items the effective tax rate in 2006 was 28.0 per cent compared to 27.0 per cent in 2005. The increased effective tax rate in 2006 on this adjusted basis reflects normal fluctuations in disallowed and non-taxable items. Lloyds TSB Group does not expect the tax rate, excluding the impact of policyholders’ tax and OEICs, to vary significantly from the average UK corporation tax rate.
2005 compared to 2004
The effective rate of tax in 2005 was 33.1 per cent, compared to an effective rate of tax in 2004 of 29.3 per cent and the corporation tax rate in 2005 of 30 per cent (2004: 30 per cent). Excluding the policyholders’ tax and OEIC interests, the effective tax rate in 2005 was 27.0 per cent compared to 28.3 per cent in 2004. The reduced effective tax rate in 2005 on this adjusted basis was primarily due to tax benefits arising on disposal and other gains.
22
Operating and financial review and prospects
Economic profit
In pursuit of the Group’s aim to maximise shareholder value over time, management has for a number of years used a system of value based management as a framework to identify and measure value creation. Management uses economic profit, a non-GAAP measure, as a measure of performance, and believes that it provides important information for investors, because it captures both growth in investment and return; profit before tax is the comparable GAAP measure used by management. Lloyds TSB Group defines economic profit as the earnings on the equity invested in the business less a notional charge for the cost of the equity invested in that business.
The Lloyds TSB Group’s cost of equity is determined as:
risk-free interest rate + (equity risk premium x Lloyds TSB Group plc’s beta)
The principal limitations of economic profit, as calculated in the Lloyds TSB Group’s Form 20-F, as a financial measure are that:
| |
(i) | it is reliant on an estimate of the Lloyds TSB Group’s cost of equity, which is itself dependent upon assumptions made for the risk-free interest rate, the equity risk premium and the beta of Lloyds TSB Group plc. The beta is a quantitative measure of the volatility of Lloyds TSB Group plc shares relative to the overall market – a beta above 1 indicates that the stock is more volatile than the overall market, whilst a stock with a beta below 1 is less volatile than the overall market; and |
| |
(II) | it uses average shareholders’ equity calculated on an accounting basis as opposed to an economic equity amount, which takes into account the level of risk inherent in the business; the Lloyds TSB Group is currently developing an economic equity model to address this limitation. |
The Lloyds TSB Group does not attempt to estimate the assumptions on a prospective basis; the assumptions used are:
| |
(a) | the yield on the 10 year index for UK government stock as an approximation of the risk-free rate; |
| |
(b) | an equity risk premium of 3 per cent; and |
| |
(c) | the beta of Lloyds TSB Group plc’s shares based on experience over the last five years. |
The Lloyds TSB Group recognises that a wide range of approaches for economic profit can be justified and, therefore, believes that its usefulness as a financial measure relies upon a consistent approach, so as not to unnecessarily distort its trend.
Lloyds TSB Group believes that economic profit instils financial discipline in determining investment decisions throughout Lloyds TSB Group and that it enables Lloyds TSB Group to evaluate alternative strategies objectively, with a clear understanding of the value created by each strategy, and then to select the strategy which creates the greatest value. Awards to senior executives under the Lloyds TSB Group’s annual bonus arrangements are partly determined by the achievement of economic profit targets.
Management compensates for both of the above limitations by using a consistent basis of calculation, reviewing the results of the calculation regularly and, to ensure consistency of reporting, only adjusting the cost of capital if it changes significantly. As noted above, the Lloyds TSB Group is also currently developing its economic equity capabilities, which will address the current limitations. As noted, the principal factor in estimating the cost of equity is the risk-free interest rate. If this rate increases, management will consider raising its estimate of the cost of equity; if the rate falls, management will consider reducing its estimate of the cost of equity. The principal other external market factors considered are equity risk premium and Lloyds TSB Group plc’s share price volatility relative to the UK stock market as a whole. Any change to the estimated cost of equity will be disclosed. For the last three years, management has used a cost of equity of 9 per cent to reflect the shareholders’ minimum required rate of return on equity invested.
The table below summarises Lloyds TSB Group’s calculation of economic profit for the years indicated.
| | | | | | | | | | |
| | | 2006 | | | 2005 | | | 2004 | |
| | | £m | | | £m | | | £m | |
| | | | | | | | | | | |
Average shareholders’ equity | | | 10,531 | | | 9,747 | | | 10,493 | |
| | | | | | | | | | | |
| | | | | | | | | | |
Profit before tax | | | 4,248 | | | 3,820 | | | 3,477 | |
Taxation | | | (1,341 | ) | | (1,265 | ) | | (1,018 | ) |
Profit attributable to minority interests | | | (104 | ) | | (62 | ) | | (67 | ) |
| | | | | | | | | | | |
Profit attributable to equity shareholders | | | 2,803 | | | 2,493 | | | 2,392 | |
Less: notional charge for the cost of equity | | | (948 | ) | | (877 | ) | | (944 | ) |
| | | | | | | | | | | |
Economic profit | | | 1,855 | | | 1,616 | | | 1,448 | |
| | | | | | | | | | | |
The notional charge for the cost of equity has been calculated by multiplying average shareholders’ equity by the cost of equity. The Lloyds TSB Group’s average equity is determined using month-end retained profit and other equity balances.
23
Operating and financial review and prospects
2006 compared to 2005
Economic profit increased to £1,855 million in 2006 compared to £1,616 million in 2005. Profit attributable to equity shareholders increased by £310 million, or 12 per cent, to £2,803 million; the notional charge on average equity was £71 million higher, as a result of an 8 per cent increase in average equity to £10,531 million compared to £9,747 million in 2005. The increase in average equity primarily reflects profit retentions, after dividends, over 2005 and 2006.
2005 compared to 2004
Economic profit increased to £1,616 million in 2005 compared to £1,448 million in 2004. Profit attributable to equity shareholders increased by £101 million, or 4 per cent, to £2,493 million; the notional charge on average equity, however, was £67 million lower, as a result of a 7 per cent decrease in average equity to £9,747 million compared to £10,493 million in 2004. The decrease in average equity primarily reflected the decrease of £1,558 million arising from the implementation of IAS 32, IAS 39 and IFRS 4 with effect from 1 January 2005.
Line of business information
Summary
The impact of IFRS, and in particular the increased use of fair values, has resulted in greater earnings volatility. Profit before tax is analysed below on both a statutory basis and, in order to provide a more comparable representation of business performance, a basis which separately discloses this volatility. See page 33 for a description of volatility and its most significant limitations. The results of the businesses are set out below:
| | | | | | | | | | | | | | | | | | | |
| | Profit before tax | | Profit before tax | |
| | (statutory) | | (excluding volatility | |
| | | | | | |
| | | 2006 | | | 2005 | | | 2004 | * | | 2006 | | | 2005 | | | 2004* | |
| | | £m | | | £m | | | £m | | | £m | | | £m | | | £m | |
| | | | | | | | | | | | | | | | | | | | |
UK Retail Banking | | | 1,549 | | | 1,394 | | | 1,639 | | | 1,549 | | | 1,394 | | | 1,639 | |
Insurance and Investments | | | 1,383 | | | 1,474 | | | 916 | | | 973 | | | 725 | | | 778 | |
Wholesale and International Banking | | | 1,640 | | | 1,518 | | | 1,272 | | | 1,640 | | | 1,518 | | | 1,272 | |
Central group items | | | (324 | ) | | (566 | ) | | (350 | ) | | (321 | ) | | (442 | ) | | (350 | ) |
| | | | | | | | | | | | | | | | | | | | |
Profit before tax, excluding volatility | | | | | | | | | | | | 3,841 | | | 3,195 | | | 3,339 | |
Volatility | | | | | | | | | | | | 407 | | | 625 | | | 138 | |
| | | | | | | | | | | | | | | | | | | | |
Profit before tax | | | 4,248 | | | 3,820 | | | 3,477 | | | 4,248 | | | 3,820 | | | 3,477 | |
| | | | | | | | | | | | | | | | | | | | |
| |
* | Comparative figures for 2004 were restated to reflect the adoption of those IFRS standards which were required to be applied retrospectively, but do not reflect the additional impacts arising from first time application of IAS 32 ‘Financial Instruments: Disclosure and Presentation’, IAS 39 ‘Financial Instruments: Recognition and Measurement’ and IFRS 4 ‘Insurance Contracts’ (including UK Financial Reporting Standard 27 ‘Life Assurance’), which were implemented with effect from 1 January 2005, with the opening balance sheet at that date adjusted accordingly. |
UK Retail Banking
| | | | | | | | | | |
| | | 2006 | | | 2005 | | | 2004 | |
| | | £m | | | £m | | | £m | |
| | | | | | | | | | | |
Net interest income | | | 3,642 | | | 3,521 | | | 3,228 | |
Other income | | | 1,621 | | | 1,605 | | | 1,696 | |
| | | | | | | | | | | |
Total income | | | 5,263 | | | 5,126 | | | 4,924 | |
Operating expenses | | | (2,476 | ) | | (2,697 | ) | | (2,609 | ) |
| | | | | | | | | | | |
Trading surplus | | | 2,787 | | | 2,429 | | | 2,315 | |
Impairment losses on loans and advances | | | (1,238 | ) | | (1,111 | ) | | (676 | ) |
Profit on sale of businesses | | | — | | | 76 | | | — | |
| | | | | | | | | | | |
Profit before tax† | | | 1,549 | | | 1,394 | | | 1,639 | |
| | | | | | | | | | | |
Cost:income ratio | | | 47.0 | % | | 52.6 | % | | 53.0 | % |
Total assets (year-end)* | | | £108,381m | | | £103,930m | | | £96,472m | |
Total risk-weighted assets (year-end)* | | | £59,101m | | | £60,582m | | | £57,241m | |
| | | | | | | | | | | |
| |
† | No volatility arises within UK Retail Banking and so these results are both statutory and excluding volatility. |
| |
* | To ensure comparability, 2004 asset and risk-weighted asset figures are shown as at 1 January 2005, following implementation of those international accounting standards for which restated comparatives were not required. |
2006 compared to 2005
Profit before tax from UK Retail Banking increased by £155 million, or 11 per cent, to £1,549 million in 2006 compared to £1,394 million in 2005; this comparison includes, in 2005, a customer remediation provision of £150 million (2006: £nil) and the profit on disposal of the Goldfish portfolio of £76 million (2006: £nil); excluding these items, profit before tax of £1,549 million in 2006 was £81 million, or 6 per cent, higher than £1,468 million in 2005.
24
Operating and financial review and prospects
Net interest income was £121 million, or 3 per cent, higher at £3,642 million in 2006 compared to £3,521 million in 2005. Average interest-earning assets were £6,447 million, or 7 per cent, higher at £104,935 million in 2006 compared to £98,488 million in 2005; when the average balances in respect of the Goldfish portfolio sold at the end of 2005 are excluded, average-interest earning assets increased by £7,327 million compared to 2005. Average mortgage balances were £6,831 million higher, reflecting good growth over 2005 and 2006. Gross new mortgage lending for the Lloyds TSB Group totalled £27,599 million (2005: £25,979 million); and net new lending totalled £6,957 million (2005: £8,311 million) resulting in a market share of net new mortgage lending of 6.3 per cent (2005: 9.1 per cent); year end mortgage balances outstanding increased by 8 per cent to £95,333 million. Average balances in respect of other personal lending were £384 million lower; although they are £496 million higher in 2006 once the effect of the sale of the Goldfish portfolio is excluded. This underlying increase in average non-mortgage balances largely reflects net growth over 2005; period end balances on personal loans were 1 per cent higher at £11,099 million at the end of 2006 although period end credit card balances were 5 per cent lower at £6,877 million, compared to £7,209 million at 31 December 2005. Credit balances on savings and investment accounts at 31 December 2006 were 7 per cent higher at £75,661 million, compared to £71,019 million at 31 December 2005. The effect of this volume growth was, however, partly offset by an 11 basis point decrease in the net interest margin as a result of competitive pressures and a change in mix, as most of the growth has been in the relatively low margin mortgage sector.
Other income was £16 million higher at £1,621 million in 2006, compared to £1,605 million in 2005. This largely represents net fee and commission income; the moderate growth reflects the fact that good growth in current account fee income due to a change in mix towards the more comprehensive, and therefore higher fee-earning, added-value account packages has been partly offset by a reduction in card fee income following the sale of the Goldfish portfolio at the end of 2005. There has also been good growth in wealth management fee income.
Operating expenses were £221 million, or 8 per cent, lower at £2,476 million in 2006 compared to £2,697 million in 2005; this comparison includes, in 2005, a customer remediation provision of £150 million. Excluding this item, costs were £71 million, or 3 per cent, lower at £2,476 million. The reduction in underlying operating expenses reflects the sale of the Goldfish portfolio, efficiency savings, reduced levels of fraud and other operational losses and a lower level of marketing and brand spend.
The impairment charge on loans and advances at £1,238 million was £127 million, or 11 per cent, higher than £1,111 million in 2005. The impairment charge in 2005 included £46 million in respect of the Goldfish portfolio, which was sold at the end of that year. Adjusting for this the charge in 2006 was £173 million, or 16 per cent, higher at £1,238 million compared to £1,065 million in 2005. The charge in respect of personal loans and overdrafts was £84 million, or 13 per cent, higher at £740 million compared to £656 million in 2005 and represented 5.85 per cent of average lending (2005: 5.33 per cent); whilst the charge in respect of card balances was £94 million, or 24 per cent, higher at £490 million in 2006 compared to £396 million in 2005 (excluding charges in respect of the Goldfish portfolio). This reflects the impact of more customers with higher levels of indebtedness facing repayment difficulties, higher levels of bankruptcies and Individual Voluntary Arrangements, and deterioration in debt recovery experience. Mortgage quality remains good and there was an impairment charge of £8 million in 2006 compared to £13 million in 2005.
2005 compared to 2004
Profit before tax from UK Retail Banking decreased by £245 million, or 15 per cent, to £1,394 million, compared to £1,639 million in 2004. However, comparisons of performance were affected by the impact of the accounting standards implemented with effect from 1 January 2005, which reduced the profit of UK Retail Banking in 2005 by £213 million; excluding this profit before tax was £1,607 million in 2005 which was £32 million, or 2 per cent, lower than 2004.
Net interest income was £293 million, or 9 per cent, higher at £3,521 million compared to £3,228 million; excluding the impact of IAS 39 which was implemented with effect from 1 January 2005, net interest income was £79 million, or 2 per cent, higher at £3,307 million. During 2005, good levels of growth were achieved in all key product areas. Gross new mortgage lending for the Group totalled £25,979 million; net new lending totalled £8,311 million resulting in a market share of net new lending of 9.1 per cent, and mortgage balances outstanding increased by 10 per cent to £88,376 million. Personal loan balances outstanding at the year-end were £11,023 million, an increase of 3 per cent and credit card balances totalled £7,209 million, an increase of 9 per cent, after adjusting to exclude the effect of the Goldfish disposal. Credit balances on current accounts and savings and investment accounts increased by 7 per cent. The benefit of this volume growth was, however, partly offset by reduced margins on mortgages and personal loans, as a result of competitive pressures.
Other income was £91 million, or 5 per cent, lower at £1,605 million compared to £1,696 million in 2004; however, excluding the effect of those accounting standards applied with effect from 1 January 2005 other income was £115 million, or 7 per cent, higher at £1,811 million. This increase in underlying other income reflected growth in current account fees, due to the continuing success of added-value accounts and the benefit of tariff reviews; increased card fee income, particularly in relation to overseas-use charges; and income from the successful new wealth management products.
Operating expenses were £88 million, or 3 per cent, higher at £2,697 million. Of this increase, £50 million was as a result of an increased charge in respect of customer redress, mainly relating to past sales of endowment products through the branch network, following a review by the Lloyds TSB Group of the expected total cost, in the light of the introduction of time-barring and a consequent increase in claims. Underlying operating expenses remained well controlled with the residual increase being largely attributable to higher levels of restructuring costs as back office operations continued to be rationalised.
Impairment losses on loans and advances, at £1,111 million, were £435 million or 64 per cent higher than 2004. The impact of the accounting standards applied with effect from 1 January 2005 accounted for £206 million of this increase; excluding this underlying impairment losses were £229 million, or 34 per cent, higher at £905 million in 2005. The charge in respect of personal loans, overdrafts and credit cards increased as a result of volume growth over recent years as well as some deterioration in credit quality. Within the mortgage business there continued to be a low level of losses and as a result the impairment charge was £13 million, compared to a release of £39 million in 2004. C&G continued to focus on prime lending market segments during 2005. The average indexed loan-to-value ratio for C&G new mortgages and further advances written during 2005 was 64 per cent. At 31 December 2005, 95 per cent of C&G mortgage balances had an indexed loan-to-value ratio of less than 85 per cent and only 0.6 per cent of balances had an indexed loan-to-value ratio in excess of 95 per cent.
A profit of £76 million arose in 2005 on the disposal of the Goldfish credit card business.
25
Operating and financial review and prospects
Insurance and Investments
Lloyds TSB Group’s Insurance and Investments activities comprise the life, pensions and OEICs businesses of Scottish Widows and Abbey Life, general insurance underwriting and broking, and Scottish Widows Investment Partnership.
In addition to presenting Insurance and Investments results prepared in accordance with applicable accounting standards, all monthly financial reporting to the group executive committee and board separately presents the results of the businesses before volatility. The information set out below, therefore, presents the information both in accordance with applicable accounting standards (‘statutory’) and on a basis which excludes volatility (‘excluding volatility’). Further discussion on Lloyds TSB Group’s use of volatility is provided in ‘Operating and financial review and prospects – Line of business information – Volatility’.
| | | | | | | | | | | | | | | | | | | |
| | Statutory | | Excluding volatility | |
| | | | | | |
| | | 2006
£m | | | 2005
£m | | | 2004
£m | | | 2006
£m | | | 2005
£m | | | 2004
£m | |
| | | | | | | | | | | | | | | | | | | | |
Net interest income | | | 103 | | | 395 | | | 283 | | | 134 | | | 389 | | | 283 | |
Other income | | | 10,487 | | | 13,859 | | | 10,874 | | | 10,046 | | | 13,116 | | | 10,736 | |
| | | | | | | | | | | | | | | | | | | | |
Total income | | | 10,590 | | | 14,254 | | | 11,157 | | | 10,180 | | | 13,505 | | | 11,019 | |
Insurance claims | | | (8,569 | ) | | (12,186 | ) | | (9,622 | ) | | (8,569 | ) | | (12,186 | ) | | (9,622 | ) |
| | | | | | | | | | | | | | | | | | | | |
Total income, net of insurance claims | | | 2,021 | | | 2,068 | | | 1,535 | | | 1,611 | | | 1,319 | | | 1,397 | |
Operating expenses | | | (638 | ) | | (594 | ) | | (622 | ) | | (638 | ) | | (594 | ) | | (622 | ) |
| | | | | | | | | | | | | | | | | | | | |
Trading surplus | | | 1,383 | | | 1,474 | | | 913 | | | 973 | | | 725 | | | 775 | |
Impairment losses on loans and advances – credit | | | — | | | — | | | 3 | | | — | | | — | | | 3 | |
| | | | | | | | | | | | | | | | | | | | |
Profit before tax, excluding volatility | | | | | | | | | | | | 973 | | | 725 | | | 778 | |
Volatility | | | | | | | | | | | | 410 | | | 749 | | | 138 | |
| | | | | | | | | | | | | | | | | | | | |
Profit before tax | | | 1,383 | | | 1,474 | | | 916 | | | 1,383 | | | 1,474 | | | 916 | |
| | | | | | | | | | | | | | | | | | | | |
| | | | | | | | | | | | | | | �� | | | | |
Further analysis of other income: | | | | | | | | | | | | | | | | | | | |
Net fee and commission expense | | | (125 | ) | | (112 | ) | | (164 | ) | | (125 | ) | | (112 | ) | | (164 | ) |
Net trading income | | | 5,668 | | | 8,859 | | | 4,798 | | | 5,308 | | | 8,375 | | | 4,651 | |
Insurance premium income | | | 4,719 | | | 4,469 | | | 6,070 | | | 4,719 | | | 4,469 | | | 6,070 | |
Other operating income | | | 225 | | | 643 | | | 170 | | | 144 | | | 384 | | | 179 | |
| | | | | | | | | | | | | | | | | | | | |
Other income, excluding volatility | | | | | | | | | | | | 10,046 | | | 13,116 | | | 10,736 | |
Volatility | | | | | | | | | | | | 441 | | | 743 | | | 138 | |
| | | | | | | | | | | | | | | | | | | | |
Other income | | | 10,487 | | | 13,859 | | | 10,874 | | | 10,487 | | | 13,859 | | | 10,874 | |
| | | | | | | | | | | | | | | | | | | | |
| | | | | | | | | | | | | | | | | | | |
Analysis by area of business of profit before tax | | | | | | | | | | | | | | | | | | | |
Life, pensions and OEICs | | | 1,093 | | | 1,221 | | | 728 | | | 701 | | | 500 | | | 598 | |
General insurance | | | 261 | | | 237 | | | 180 | | | 243 | | | 209 | | | 172 | |
Scottish Widows Investment Partnership | | | 29 | | | 16 | | | 8 | | | 29 | | | 16 | | | 8 | |
| | | | | | | | | | | | | | | | | | | | |
Profit before tax, excluding volatility | | | | | | | | | | | | 973 | | | 725 | | | 778 | |
Volatility | | | | | | | | | | | | 410 | | | 749 | | | 138 | |
| | | | | | | | | | | | | | | | | | | | |
Profit before tax | | | 1,383 | | | 1,474 | | | 916 | | | 1,383 | | | 1,474 | | | 916 | |
| | | | | | | | | | | | | | | | | | | | |
26
Operating and financial review and prospects
2006 compared to 2005
Profit before tax from the Lloyds TSB Group’s Insurance and Investments businesses was £91 million, or 6 per cent, lower at £1,383 million compared to £1,474 million in 2005. This comparison is distorted by volatility arising from market movements (see ‘Operating and financial review and prospects – Line of business information – Volatility’); profit before tax excluding volatility was £248 million, or 34 per cent, higher at £973 million in 2006 compared to £725 million in 2005. However, results for the comparative year ended 31 December 2005 were also impacted by the £155 million provision for the strengthening of reserves in respect of annuitant mortality; if this item is also excluded, the profit before tax excluding volatility and strengthening of mortality reserves was £93 million, or 11 per cent, higher at £973 million in 2006 compared to £880 million in 2005.
Net interest income was £292 million, or 74 per cent, lower at £103 million in 2006 compared to £395 million in 2005. This decrease reflects a reduction in the level of interest income on cash deposit investments held in the long-term business and policyholder funds and, more significantly, an increase in the amounts payable to unitholders in those OEICs included in the consolidated results of the Lloyds TSB Group.
Other income was £3,372 million, or 24 per cent, lower at £10,487 million in 2006 compared to £13,859 million in 2005; excluding volatility, other income was £3,070 million, or 23 per cent, lower at £10,046 million in 2006 compared to £13,116 million in 2005. Net fee and commission expense was £13 million, or 12 per cent, higher at £125 million in 2006 compared to £112 million in 2005; the impact of good growth in OEIC management fee income and the benefit of reduced fees payable to UK Retail Banking were offset by a reduction in general insurance broking income and an increase in other fees payable. Net trading income was £3,191 million, or 36 per cent, lower at £5,668 million in 2006 compared to £8,859 million in 2005; this reflects fluctuations in the level of investment returns within the long-term business funds, with an offsetting reduction within the insurance claims figure and within interest expense in respect of the OEICs. Insurance premium income was £250 million, or 6 per cent, higher at £4,719 million in 2006 compared to £4,469 million in 2005. Life and pensions premiums were £212 million higher and general insurance premiums were £38 million higher, reflecting the commencement of underwriting of card and commercial loan protection products during 2006. Other operating income was £418 million, or 65 per cent, lower at £225 million in 2006 compared to £643 million in 2005; this reduction reflects a £429 million year-on-year decrease in the movement of value of in-force business as a result of the application of the new valuation rules in the FSA’s Policy Statement 06/14; this reduction is, however, largely offset by a similar reduction within insurance claims expense.
Operating expenses were £44 million, or 7 per cent, higher at £638 million in 2006 compared to £594 million in 2005. The impact of a decrease in staff numbers was largely offset by annual pay awards and there were increased advertising and promotion costs in respect of the Scottish Widows brand together with a lower net credit in respect of the amortisation of deferred acquisition costs (due to new business fluctuations and actuarial model changes).
The performance of the life, pensions and OEICs business and the general insurance business is discussed further below.
2005 compared to 2004
Profit before tax from the Lloyds TSB Group’s Insurance and Investments businesses was £1,474 million which was £558 million, or 61 per cent, higher than £916 million in 2004. However, much of this increase was due to volatility arising from market movements (see ‘Operating and financial review and prospects – Line of business information – Volatility’) and profit before tax excluding volatility was £53 million, or 7 per cent, lower at £725 million compared to £778 million in 2004. The 2005 results were reduced by a provision of £155 million for the strengthening of mortality reserves. The impact of the new accounting standards applied with effect from 1 January 2005 was to reduce profit before tax, excluding volatility, by £73 million; excluding this effect profit before tax was £20 million, or 3 per cent, higher at £798 million compared to £778 million in 2004.
Net interest income was £112 million, or 40 per cent, higher at £395 million compared to £283 million in 2004. This increase reflected higher average levels of cash deposit investments in long-term business and policyholder funds.
Other income, excluding volatility, was £2,380 million, or 22 per cent, higher at £13,116 million compared to £10,736 million in 2004. One of the impacts of the application of IFRS 4 with effect from 1 January 2005 was the need to reclassify as investment contracts certain transactions that were previously treated as insurance contracts. This resulted in a decrease in other income largely offset by a decrease in insurance claims. Adjusting for this effect, underlying other income in 2005 was £15,820 million which was £5,084 million, or 47 per cent, higher than £10,736 million in 2004. This increase in underlying other income was principally due to a £1,131 million increase in insurance premium income, reflecting improved sales and increased policyholder activity, together with a £3,724 million increase in net trading income. Net trading income represents the realised and unrealised gains on investments held in the long-term funds, together with the interest and dividend income on those investments, and the significant increase in 2005 reflected improved market returns.
The increases in premium income and trading income were largely offset by a matching increase in insurance claims, reflecting the fact that the majority of the premium inflows and investment gains are for the benefit of policyholders. Insurance claims were £2,564 million, or 27 per cent, higher at £12,186 million in 2005 compared to £9,622 million in 2004. If the 1 January 2005 reclassifications to investment contracts, described above, are excluded underlying insurance claims were £5,172 million, or 54 per cent, higher at £14,794 million in 2005, compared to £9,622 million in 2004.
Operating expenses reduced by £28 million, or 5 per cent, from £622 million in 2004 to £594 million in 2005. This decrease reflected the absence of a charge in respect of customer redress (£12 million in 2004) and a net credit in respect of deferred acquisition costs of £45 million in 2005, following the adoption of IFRS 4 with effect from 1 January 2005. Adjusting for these items, underlying operating expenses were £639 million in 2005, £29 million or 5 per cent higher than £610 million in 2004. This underlying increase in operating expenses reflected increased business volumes and some targeted project expenditure.
27
Operating and financial review and prospects
Life, pensions and OEICs
The tables below show measures of new business premiums for the life and pensions business and OEIC sales, which management monitor because they provide an indication of both the performance and the profitability of the business.
Weighted sales has historically been the UK insurance industry standard for measuring new business volumes; the weighting being made towards regular premium policies to reflect the long-term nature of these contracts. However, industry practice is now moving towards an alternative basis of calculation – Present Value of New Business Premiums (‘PVNBP’); this is calculated as the value of single premiums plus the discounted present value of future expected regular premiums. An analysis of new business sales on a PVNBP basis is set out below for 2006 and 2005 together with analyses on a weighted sales basis for 2006, 2005 and 2004. There are three main distribution channels for the sale of Lloyds TSB Group’s life, pension and OEIC products and the tables below show the relative importance of each.
| | | | | | | | | | |
Present value of new business premiums (PVNBP) | | | | | | 2006
£m | | | 2005
£m | |
| | | | | | | | | | | |
Life and pensions: | | | | | | | | | | |
Savings and investments | | | | | | 1,300 | | | 1,465 | |
Protection | | | | | | 232 | | | 255 | |
Individual pensions | | | | | | 2,219 | | | 2,197 | |
Corporate and other pensions | | | | | | 1,961 | | | 1,517 | |
Retirement income | | | | | | 960 | | | 658 | |
Managed fund business | | | | | | 348 | | | 535 | |
| | | | | | | | | | | |
Life and pensions | | | | | | 7,020 | | | 6,627 | |
OEICs | | | | | | 2,720 | | | 1,215 | |
| | | | | | | | | | | |
Life, pensions and OEICs | | | | | | 9,740 | | | 7,842 | |
| | | | | | | | | | | |
| | | | | | | | | | |
Single premium business | | | | | | 7,321 | | | 5,636 | |
Regular premium business | | | | | | 2,419 | | | 2,206 | |
| | | | | | | | | | | |
Life, pensions and OEICs | | | | | | 9,740 | | | 7,842 | |
| | | | | | | | | | | |
Bancassurance | | | | | | 3,421 | | | 2,114 | |
Independent financial advisers | | | | | | 5,358 | | | 4,698 | |
Direct | | | | | | 613 | | | 495 | |
Managed fund business | | | | | | 348 | | | 535 | |
| | | | | | | | | | | |
Life, pensions and OEICs | | | | | | 9,740 | | | 7,842 | |
| | | | | | | | | | | |
| | | | | | | | | | |
| | | 2006 | | | 2005 | | | 2004 | |
Weighted sales (regular + 1/10 single) | | | £m | | | £m | | | £m | |
| | | | | | | | | | | |
Life and pensions (including Managed Fund business) | | | 902 | | | 804 | | | 676 | |
OEICs | | | 290 | | | 148 | | | 86 | |
| | | | | | | | | | | |
Life, pensions and OEICs | | | 1,192 | | | 952 | | | 762 | |
| | | | | | | | | | | |
Weighted sales by distribution channel: | | | | | | | | | | |
Bancassurance | | | 403 | | | 274 | | | 242 | |
Independent financial advisers | | | 679 | | | 562 | | | 432 | |
Direct | | | 75 | | | 66 | | | 69 | |
| | | | | | | | | | | |
| | | 1,157 | | | 902 | | | 743 | |
Managed Fund business | | | 35 | | | 50 | | | 19 | |
| | | | | | | | | | | |
Life, pensions and OEICs | | | 1,192 | | | 952 | | | 762 | |
| | | | | | | | | | | |
28
Operating and financial review and prospects
2006 compared to 2005
Overall life, pensions and OEICs sales, measured on a PVNBP basis, were £1,898 million, or 24 per cent, higher at £9,740 million in 2006 compared to £7,842 million in 2005. The majority of the growth was in OEICs sales, which were £1,505 million, or 124 per cent, higher at £2,720 million in 2006 compared to £1,215 million in 2005. The growth in OEICs sales reflects an improved sales process through the branch network, a very successful tax year end campaign, and increasing success in selling to Wealth Management customers. OEICs sales have also benefited from the development of the Financial Planning Service sales force in the branch network and development of the relationships with the Community Banking and Wealth Management businesses within UK Retail Banking in order to gain better access to the targeted Mass Affluent market.
Life and pensions sales (including managed fund business), on a PVNBP basis, were £393 million, or 6 per cent, higher at £7,020 million in 2006 compared to £6,627 million in 2005. Corporate and other pension sales were £444 million, or 29 per cent, higher as a result of continuing strong sales following improvements in the product in 2005. Retirement income sales were £302 million, or 46 per cent, higher as a result of improvements in the Income Drawdown product and increased market activity following A-day (6 April 2006, when new legislation simplifying the pensions market came into force in the UK). These increases were, however, in part offset by a decrease of £165 million in Savings and investments sales and a reduction of £187 million in Managed fund business. The decrease in Savings and investments sales reflects competitive pressures and the limiting of investments into the SWIP Property Fund; Managed fund business is lower as 2005 included some exceptional benefits from mandate gains.
By distribution channel, Bancassurance sales were £1,307 million, or 62 per cent, higher at £3,421 million in 2006 compared to £2,114 million in 2005, as a result of the success of the developing Financial Planning Service sales force and the strong OEICs sales. Sales via independent financial advisers were £660 million, or 14 per cent, higher at £5,358 million in 2006 compared to £4,698 million in 2005; this reflects the strong Corporate pensions, Retirement income and OEIC sales via the dedicated Scottish Widows Investment Partnership sales force, partly offset by the decrease in Savings and investments sales.
On an annual premium equivalent basis, overall sales of life, pensions and OEIC products were £240 million, or 25 per cent, higher at £1,192 million in 2006 compared to £952 million in 2005. OEICs sales were £142 million, or 96 per cent, higher at £290 million in 2006 compared to £148 million in 2005; this reflects the successful tax year end campaign and developing sales through to the Mass Affluent market. Life and pensions sales were £98 million, or 12 per cent, higher at £902 million in 2006 compared to £804 million in 2005 as a result of the strong Corporate and other pensions and Retirement income sales, in part offset by the reduction in Savings and investments.
Profit before tax, on a statutory basis, from life, pensions and OEICs was £128 million, or 10 per cent, lower at £1,093 million in 2006 compared to £1,221 million in 2005. Excluding volatility, profit before tax was £201 million, or 40 per cent, higher at £701 million in 2006 compared to £500 million in 2005. However, the 2005 results were also impacted by the £155 million provision for the strengthening of reserves for annuitant mortality (£nil in 2006); also excluding this item, profit before tax was £46 million, or 7 per cent, higher at £701 million in 2006 compared to £655 million in 2005. New business profits improved as a result of the strong sales of Corporate and other pensions and this was coupled with a higher level of profits from existing business; these increases were only partly offset by reduced returns on shareholder net assets as a result of a lower economic basis in 2006 and lower free asset balances.
2005 compared to 2004
Overall, weighted sales in 2005 increased by £190 million, or 25 per cent, to £952 million in 2005 compared to £762 million in 2004 and as a result the Lloyds TSB Group’s life, pensions and investments market share increased significantly to 6.0 per cent, compared with 5.7 per cent in 2004. Strong growth in sales of pension products, as a result of more focused marketing, more than offset lower life protection sales, resulting from the slow down in the housing market. Single premium life sales increased, particularly the Unit Linked Flexible Options Bond product, and single premium pension sales were higher, again as a result of the specific marketing focus.
Total OEICs sales increased significantly compared to 2004. Regular premium sales were little changed with the increase being in single premium sales, primarily through Bancassurance; this reflected a successful campaign in relation to the April 2005 tax year end and built on the launch of the simplified product suite that was introduced at the end of 2004.
By distribution channel, Bancassurance weighted sales were £32 million, or 13 per cent, higher at £274 million compared to £242 million in 2004; this reflected, in particular, the successful OEIC sales. Weighted sales via independent financial advisers were £130 million, or 30 per cent, higher at £562 million in 2005 compared to £432 million in 2004 supported by significant product and service enhancements; as a result the Lloyds TSB Group’s market share of the IFA market improved to 6.5 per cent, compared with 5.9 per cent in 2004.
Profit before tax, on a statutory basis, from life, pensions and OEICs was £493 million, or 68 per cent, higher at £1,221 million in 2005 compared to £728 million in 2004. Profit before tax, excluding volatility, was £98 million, or 16 per cent, lower at £500 million compared to £598 million in 2004. Profitability in 2005 benefited from the absence of a provision for customer redress (2004: £12 million) but the results in 2005 were reduced by a provision of £155 million for the strengthening of mortality reserves. Adjusting for these items, profit before tax, excluding volatility, in 2005 was £655 million compared to £610 million in 2004, an increase of £45 million or 7 per cent. The strong sales led to an increased contribution from new business, partly offset by a commensurate increase in distribution costs. Improved investment earnings resulted from higher cash balances held for the account of the shareholder. OEICs profitability rose following improved markets and sales volumes.
29
Operating and financial review and prospects
General insurance
The results of the general insurance business are set out below.
| | | | | | | | | | | | | | | | | | | |
| | Statutory | | Excluding volatility | |
| | | | | | | | | | | | | | | | | | | | |
| | | 2006
£m | | | 2005
£m | | | 2004
£m | | | 2006
£m | | | 2005
£m | | | 2004
£m | |
| | | | | | | | | | | | | | | | | | | | |
Net interest income | | | 24 | | | 23 | | | 44 | | | 24 | | | 23 | | | 44 | |
Other income | | | 594 | | | 571 | | | 504 | | | 576 | | | 543 | | | 496 | |
| | | | | | | | | | | | | | | | | | | | |
Total income | | | 618 | | | 594 | | | 548 | | | 600 | | | 566 | | | 540 | |
Insurance claims | | | (200 | ) | | (197 | ) | | (214 | ) | | (200 | ) | | (197 | ) | | (214 | ) |
| | | | | | | | | | | | | | | | | | | | |
Total income, net of insurance claims | | | 418 | | | 397 | | | 334 | | | 400 | | | 369 | | | 326 | |
Operating expenses | | | (157 | ) | | (160 | ) | | (154 | ) | | (157 | ) | | (160 | ) | | (154 | ) |
| | | | | | | | | | | | | | | | | | | | |
Profit before tax, excluding volatility | | | | | | | | | | | | 243 | | | 209 | | | 172 | |
Volatility | | | | | | | | | | | | 18 | | | 28 | | | 8 | |
| | | | | | | | | | | | | | | | | | | | |
Profit before tax | | | 261 | | | 237 | | | 180 | | | 261 | | | 237 | | | 180 | |
| | | | | | | | | | | | | | | | | | | | |
| | | | | | | | | | | | | | | | | | | |
| | | | | | 2006
£m | | | | | | 2005
£m | | | | | | 2004
£m | |
| | | | | | | | | | | | | | | | | | | | |
Premium income from underwriting: | | | | | | | | | | | | | | | | | | | |
Creditor | | | | | | 180 | | | | | | 127 | | | | | | 114 | |
Home | | | | | | 424 | | | | | | 441 | | | | | | 442 | |
Health | | | | | | 13 | | | | | | 16 | | | | | | 27 | |
Reinsurance premiums | | | | | | (17 | ) | | | | | (22 | ) | | | | | (29 | ) |
| | | | | | | | | | | | | | | | | | | | |
| | | | | | 600 | | | | | | 562 | | | | | | 554 | |
| | | | | | | | | | | | | | | | | | | | |
Commissions from insurance broking: | | | | | | | | | | | | | | | | | | | |
Creditor | | | | | | 377 | | | | | | 396 | | | | | | 442 | |
Home | | | | | | 47 | | | | | | 49 | | | | | | 45 | |
Health | | | | | | 13 | | | | | | 15 | | | | | | 20 | |
Other | | | | | | 192 | | | | | | 221 | | | | | | 165 | |
| | | | | | | | | | | | | | | | | | | | |
| | | | | | 629 | | | | | | 681 | | | | | | 672 | |
| | | | | | | | | | | | | | | | | | | | |
2006 compared to 2005
Profit before tax, on a statutory basis, from the Lloyds TSB Group’s general insurance operations was £24 million, or 10 per cent, higher at £261 million in 2006 compared to £237 million in 2005. Excluding volatility, profit before tax was £34 million, or 16 per cent, higher at £243 million in 2006 compared to £209 million in 2005.
Net interest income was £1 million, or 4 per cent, higher at £24 million in 2006 compared to £23 million in 2005.
Other income, on a statutory basis, was £23 million, or 4 per cent, higher at £594 million in 2006 compared to £571 million in 2005. Insurance broking commissions receivable were £52 million, or 8 per cent, lower at £629 million in 2006 compared to £681 million in 2005; this reflects lower loan protection product sales in the first half of 2006, reduced card protection income due to lower average balances outstanding and fluctuations in the level of retrospective commissions. Premium income, net of reinsurance, was £38 million, or 7 per cent, higher at £600 million in 2006 compared to £562 million in 2005; this reflects the commencement, during 2006, of underwriting of card and commercial loan protection products, partly offset by a fall in home insurance income. Fees and commissions payable were £31 million, or 4 per cent, lower at £664 million in 2006 compared to £695 million in 2005; this largely reflects fluctuations in branch network sales volumes.
Insurance claims expense was £3 million, or 2 per cent, higher at £200 million in 2006 compared to £197 million in 2005 as the impact of the new creditor protection underwriting in 2006 has been partly offset by a lower charge in respect of home insurance.
Operating expenses were £3 million, or 2 per cent, lower at £157 million in 2006 compared to £160 million in 2005. Staff costs have increased due to the use of agency staff on project work, but this has been more than offset by lower marketing expenditure and other cost-saving initiatives.
30
Operating and financial review and prospects
2005 compared to 2004
Profit before tax, on a statutory basis, from the general insurance business was £57 million, or 32 per cent, higher at £237 million in 2005 compared to £180 million in 2004. Profit before tax, excluding volatility, was £209 million in 2005, which was £37 million, or 22 per cent, higher than £172 million in 2004. Net interest income was £21 million lower at £23 million, compared to £44 million in 2004, principally reflecting the adoption of IFRS 4 and IAS 39 from 1 January 2005.
Other income, excluding volatility, was £47 million, or 9 per cent, higher at £543 million compared to £496 million in 2004; £18 million of this reflected the impact of the accounting standards applied with effect from 1 January 2005 giving an underlying increase of £29 million, or 6 per cent. Premium income from underwriting, net of reinsurance, was £8 million, or 1 per cent, higher at £562 million; creditor insurance income was higher as a result of the business written in conjunction with the Lloyds TSB Group’s asset finance businesses but health premium income declined as a result of the transfer of part of this business to BUPA in 2004. Insurance broking commissions were £9 million, or 1 per cent, higher at £681 million compared to £672 million in 2004; creditor commissions were £46 million lower, as a result of a slowdown in unsecured lending growth during 2005. Other commissions, however, were £56 million higher due largely to higher levels of retrospective income on existing business.
Insurance claims, at £197 million, were £17 million, or 8 per cent, lower than £214 million in 2004. Creditor insurance payouts were lower due to a lower level of unemployment claims and home insurance claims were lower due to the relatively benign weather conditions. Health claims also fell, following the transfer of part of this business in 2004. The general insurance underwriting ratio improved to 34 per cent compared to 37 per cent in 2004.
Operating expenses, at £160 million, were £6 million, or 4 per cent, higher than £154 million in 2004; this increase reflected higher marketing spend together with some specific project costs.
Wholesale and International Banking
| | | | | | | | | | |
| | | 2006
£m | | | 2005
£m | | | 2004
£m | |
| | | | | | | | | | | |
Net interest income | | | 2,385 | | | 2,265 | | | 2,006 | |
Other income | | | 1,827 | | | 1,628 | | | 1,558 | |
| | | | | | | | | | | |
Total income | | | 4,212 | | | 3,893 | | | 3,564 | |
Operating expenses | | | (2,264 | ) | | (2,181 | ) | | (2,078 | ) |
| | | | | | | | | | | |
Trading surplus | | | 1,948 | | | 1,712 | | | 1,486 | |
Impairment losses on loans and advances | | | (308 | ) | | (188 | ) | | (193 | ) |
Loss on sale of businesses | | | — | | | (6 | ) | | (21 | ) |
| | | | | | | | | | | |
Profit before tax† | | | 1,640 | | | 1,518 | | | 1,272 | |
| | | | | | | | | | | |
Cost:income ratio | | | 53.8 | % | | 56.0 | % | | 58.3 | % |
Total assets (year-end)* | | £ | 147,836m | | | £124,044m | | | £123,826m | |
Total risk-weighted assets (year-end)* | | | £91,843m | | | £80,154m | | | £71,013m | |
| | | | | | | | | | | |
| |
† | No volatility arises within Wholesale and International Banking and so these results are both statutory and excluding volatility. |
| |
* | To ensure comparability, 2004 asset and risk-weighted asset figures are shown as at 1 January 2005, following implementation of those international accounting standards for which restated comparatives were not required. |
2006 compared to 2005
Profit before tax from Wholesale and International Banking was £122 million, or 8 per cent, higher at £1,640 million in 2006 compared to £1,518 million in 2005.
Net interest income was £120 million, or 5 per cent, higher at £2,385 million compared to £2,265 million in 2005. Average interest-earning assets were £18,823 million, or 18 per cent, higher at £122,575 million in 2006 compared to £103,752 million in 2005. Excluding the fine margin reverse repurchase agreement balances from both years, the increase was £17,782 million. Strong growth in corporate lending, as well as in lower-margin treasury and structured finance balances, led to an increase of £16,398 million in average balances within Corporate Markets. Continued lending growth led to a £994 million increase in average balances within Business Banking and average interest-earning assets in Asset Finance were £415 million higher, largely due to lending growth over 2005. The significant growth in average balances, however, was partly offset by a 31 basis point decrease in the net interest margin (excluding fine margin reverse repurchase agreement balances) as a result of a change in mix since the growth in assets has been predominately in corporate lending and in the finer margin treasury and structured finance balances.
Other income was £199 million, or 12 per cent, higher at £1,827 million compared to £1,628 million in 2005. Other income largely comprises net fee and commission income, trading profits and operating lease rental income. Net fee and commission income was higher from mid-corporate lending and new product revenue streams in structured products and debt capital markets, as well as good growth in asset backed lending and decreased dealer commissions payable within the asset finance business. There was a slight fall in operating lease rental income offset by increased gains on sale of available-for-sale investments.
31
Operating and financial review and prospects
Operating expenses were £83 million, or 4 per cent, higher at £2,264 million in 2006 compared to £2,181 million in 2005. Staff costs were higher as a result of annual pay awards and staff taken on to support the expansion of the business; business success also led to increasing levels of bonus payments. These increases were, in part, offset by efficiency savings.
Impairment losses on loans and advances and other credit risk provisions totalled £308 million in 2006 compared to £188 million in 2005. Impairment losses on loans and advances were £122 million, or 64 per cent, higher at £313 million in 2006 compared to £191 million in 2005. Within Corporate Markets, net releases of £13 million in 2006 were £44 million lower than in 2005, as some significant one-off releases were not repeated. The charge within Asset Finance was £40 million, or 20 per cent, higher at £245 million in 2006 compared to £205 million in 2005; this reflected rising levels of consumer arrears and voluntary terminations. Within Business Banking, the charge was £11 million, or 14 per cent, higher at £87 million in 2006 compared to £76 million in 2005 with the increase reflecting lending growth. Overall, the Wholesale and International Banking impairment charge in respect of loans and advances expressed as a percentage of average lending increased to 0.39 per cent in 2006 compared to 0.28 per cent in 2005.
2005 compared to 2004
Profit before tax from Wholesale and International Banking in 2005 was £246 million, or 19 per cent, higher at £1,518 million compared to £1,272 million in 2004. The overall impact of the accounting standards implemented with effect from 1 January 2005 was limited and accounted for £20 million of the increase in profits.
Net interest income was £259 million, or 13 per cent, higher at £2,265 million compared to £2,006 million in 2004. Of this increase, £100 million reflected the impact of implementation of IAS 39 from 1 January 2005 which caused certain income previously classified as fees to be included in the effective interest rate calculation. Excluding this impact, net interest income was £159 million, or 8 per cent, higher at £2,165 million compared to £2,006 million in 2004. This underlying growth in net interest income reflected good growth in average lending balances in Corporate Banking, Structured Finance, Asset Finance and Business Banking; net interest margins were higher within Financial Markets, as a result of a change in mix of balances held, and within Structured Finance, as a result of the terms of new transactions taken on, although Corporate Banking margins reduced as a result of competitive pressures.
Other income was £70 million, or 4 per cent, higher at £1,628 million compared to £1,558 million in 2004. However, excluding the impact of the accounting standards implemented with effect from 1 January 2005, other income was £152 million, or 10 per cent, higher. This growth in underlying other income reflected increases in customer volumes within Corporate Banking, Structured Finance and Business Banking which resulted in higher lending and other fees. Business Banking also benefited from tariff reviews and from a lower level of commission clawback in respect of insurance sales; Asset Finance income increased as a result of organic growth and the impact of the motor dealerships acquired by the Lloyds TSB Group’s Dutton Forshaw subsidiary during 2005.
Operating expenses were £103 million, or 5 per cent, higher at £2,181 million compared to £2,078 million in 2004. This largely reflected higher staff costs in support of the substantial business growth within Wholesale and International Banking over 2005, together with the impact of the motor dealership acquisitions.
Impairment losses on loans and advances were £5 million, or 3 per cent, lower at £188 million compared to £193 million in 2004. Charges within Corporate Banking and Structured Finance reduced by £94 million as a result of lower new provisions and a good level of recoveries in 2005, in part reflecting the benign economic environment. The impairment charge within Asset Finance was £66 million higher than in 2004 as a result of the substantial lending growth in recent years, particularly in respect of personal finance. There was also a lower level of releases within the International Banking businesses, which in 2004 had benefited from a release of £30 million from the Lloyds TSB Group’s centrally held provision in respect of exposures in Argentina.
Wholesale and International Banking profit in 2005 was also reduced by a charge of £6 million in respect of the sale of businesses; 2004 included a loss of £21 million which principally related to the sale of the Lloyds TSB Group’s businesses in Argentina and Colombia.
Central group items
| | | | | | | | | | | | | | | | | | | |
| | Statutory | | Excluding volatility | |
| | | | | | | | | | | | | | | | | | | | |
| | | 2006
£m | | | 2005
£m | | | 2004
£m | | | 2006
£m | | | 2005
£m | | | 2004
£m | |
| | | | | | | | | | | | | | | | | | | | |
Lloyds TSB Foundations | | | (37 | ) | | (34 | ) | | (31 | ) | | (37 | ) | | (34 | ) | | (31 | ) |
Funding cost of acquisitions less earnings on capital | | | (378 | ) | | (378 | ) | | (317 | ) | | (378 | ) | | (378 | ) | | (317 | ) |
Central costs and other unallocated items | | | (37 | ) | | (134 | ) | | (2 | ) | | (34 | ) | | (10 | ) | | (2 | ) |
Pension schemes related credit | | | 128 | | | — | | | — | | | 128 | | | — | | | — | |
Loss on sale and closure of businesses | | | �� | | | (20 | ) | | — | | | — | | | (20 | ) | | — | |
| | | | | | | | | | | | | | | | | | | | |
Profit before tax, excluding volatility | | | | | | | | | | | | (321 | ) | | (442 | ) | | (350 | ) |
Volatility | | | | | | | | | | | | (3 | ) | | (124 | ) | | — | |
| | | | | | | | | | | | | | | | | | | | |
Profit before tax | | | (324 | ) | | (566 | ) | | (350 | ) | | (324 | ) | | (566 | ) | | (350 | ) |
| | | | | | | | | | | | | | | | | | | | |
32
Operating and financial review and prospects
2006 compared to 2005
On a statutory basis, the loss before tax from Central group items was £242 million, or 43 per cent, lower at £324 million in 2006 compared to £566 million in 2005. Excluding volatility, the loss before tax was £121 million, or 27 per cent, lower at £321 million compared to £442 million in 2005.
The four independent Lloyds TSB Foundations support registered charities throughout the UK that enable people, particularly the disabled and disadvantaged, to play a fuller role in society. The Foundations receive 1 per cent of the Lloyds TSB Group’s pre-tax profit after adjusting for gains and losses on the disposal of businesses and pre-tax minority interests, averaged over three years, instead of a dividend on their shareholdings. In 2006, the Lloyds TSB Group accrued £37 million for payment to registered charities. See note 39 to the Consolidated Financial Statements.
The charge in respect of the funding cost of acquisitions, less earnings on capital, was unchanged at £378 million and a £24 million increase in the charge in respect of central costs and other unallocated items, excluding volatility, was largely offset by the non-repetition of the loss on sale and closure of businesses. The main reason for the overall reduction in the loss before tax, excluding volatility, however, was a pension schemes related credit of £128 million in 2006; following recent changes in age discrimination legislation in the United Kingdom, the Lloyds TSB Group has taken the decision to cease to augment the pension entitlement of employees taking early retirement, leading to a credit to the income statement.
2005 compared to 2004
On a statutory basis, the loss before tax from Central group items was £216 million, or 62 per cent, higher at £566 million in 2005 compared to £350 million in 2004. Excluding volatility, the loss before tax was £92 million, or 26 per cent, higher at £442 million in 2005 compared to £350 million in 2004. The accrual for payments to the four Lloyds TSB Foundations was £3 million higher in 2005 at £34 million. The funding cost of acquisitions, less earnings on capital, was £61 million higher in 2005 at £378 million; this increase principally reflected the reclassification, as a result of the implementation of IAS 39 with effect from 1 January 2005, of certain capital instruments from minority interests to loan capital. As a result, the funding cost is now reported within interest expense.
Volatility
| | | | | | | | | | |
| | | 2006
£m | | | 2005
£m | | | 2004
£m | |
| | | | | | | | | | | |
Banking volatility* | | | (3 | ) | | (124 | ) | | — | |
Insurance volatility† | | | 84 | | | 438 | | | 168 | |
Policyholder interests volatility† | | | 326 | | | 311 | | | (30 | ) |
| | | | | | | | | | | |
Total volatility | | | 407 | | | 625 | | | 138 | |
| | | | | | | | | | | |
| |
* | Included within Central group items on a statutory basis. |
| |
† | Included within Insurance and Investments on a statutory basis. |
In addition to presenting the Lloyds TSB Group’s results prepared in accordance with applicable accounting standards, all monthly financial reporting to the Lloyds TSB Group Executive Committee and Board separately presents the results of the businesses before volatility. It is one of the key measures used to evaluate the performance of each of the businesses and is the basis upon which annual incentive scheme awards are made to management.
Management believes that the use of profit before tax excluding volatility provides an additional measure of the performance of the business as it excludes amounts included within profit before tax which do not accrue to the Lloyds TSB Group’s equity holders and excludes the impact of changes in market variables which are beyond the control of management.
The most significant limitations associated with profit before tax excluding volatility are:
| |
(i) | Insurance volatility requires an assumption to be made for the normalised return on equities and other investments; and |
| |
(ii) | Banking and insurance volatility impact on the Lloyds TSB Group’s regulatory capital position, even though they are not included within profit before tax excluding volatility. |
Management compensates for the limitations above by:
| |
(i) | Monitoring closely the assumptions used to calculate the normalised return used within the calculation of insurance volatility; these assumptions are disclosed below; and |
| |
(ii) | Producing separate reports on the Lloyds TSB Group’s current and forecast capital ratios. |
33
Operating and financial review and prospects
Banking volatility
In accordance with IFRS, it is the Lloyds TSB Group’s policy to recognise all derivatives at fair value. The banking businesses manage their interest rate and other market risks primarily through the use of intra-Group derivatives, with the resulting net positions managed centrally using external derivatives. IFRS does not, however, permit the intra-Group derivatives to be used in a hedge relationship for reporting purposes. Although fair value accounting can have a significant impact on reported earnings, it does not impact on the business fundamentals or cash flows of the businesses. The Lloyds TSB Group has, therefore, implemented an internal pricing arrangement whereby divisions transfer to Central group items the volatility associated with marking-to-market derivatives held for risk management purposes where, as far as possible, the effect is minimised by establishing IAS 39 compliant hedge accounting relationships. ‘Banking volatility’ is principally comprised of the difference between the result that would be recognised on an accrual accounting basis for derivatives held for risk management purposes and their mark-to-market value.
During 2006, profit before tax included banking volatility of £(3) million, being a charge of £136 million to net interest income and a credit of £133 million to other income, (2005: £(124) million, being a charge of £79 million to net interest income and a charge of £45 million to other income; 2004: £nil). The significant reduction in this source of volatility reflects the beneficial effect of rising interest rates which has had the result of changing the way in which the gradual unwind of the Lloyds TSB Group’s fair value hedging relationships has impacted the income statement.
Insurance volatility
The Lloyds TSB Group’s insurance businesses have liability products that are supported by substantial holdings of investments, including equities, property and fixed interest investments, all of which have a volatile fair value. The value of the liabilities does not move exactly in line with changes in the fair value of the investments, yet IFRS requires that the changes in both the value of the liabilities and investments be reflected within the income statement. As these investments are substantial and movements in their fair value can have a significant impact on the profitability of the Insurance and Investments division, management believes that it is appropriate to disclose the division’s results on the basis of an expected return in addition to the actual return. The difference between the actual return on these investments and the expected return based upon economic assumptions made at the beginning of the period is included within insurance volatility.
Changes in market variables also affect the realistic valuation of the guarantees and options embedded within products written in the Scottish Widows With Profit Fund, the value of the in-force business and the value of shareholders’ funds. Fluctuations in these values caused by changes in market variables are also included within insurance volatility.
The expected investment returns used to determine the normalised profit of the business, which are based on prevailing market rates and published research into historic investment return differentials, are set out below:
| | | | | | | | | | | | | |
| | | 2007
% | | | 2006
% | | | 2005
% | | | 2004
% | |
| | | | | | | | | | | | | | |
Gilt yields (gross) | | | 4.62 | | | 4.12 | | | 4.57 | | | 4.85 | |
Equity returns (gross) | | | 7.62 | | | 6.72 | | | 7.17 | | | 7.45 | |
Dividend yield | | | 3.00 | | | 3.00 | | | 3.00 | | | 3.00 | |
Property return (gross) | | | 7.62 | | | 6.72 | | | 7.17 | | | 7.45 | |
Corporate bonds (gross) | | | 5.22 | | | 4.72 | | | 5.17 | | | 5.45 | |
| | | | | | | | | | | | | | |
During 2006, profit before tax included positive insurance volatility of £84 million, being a credit of £2 million to net interest income and a credit of £82 million to other income (2005: £438 million, being a credit of £6 million to net interest income and a credit of £432 million to other income; 2004: £168 million, being a credit to other income). Returns in 2005 benefited from rising stock markets and rising gilt values. Although equity values continued to rise in 2006, this was less marked than in 2005 and the effect was partly offset by falling gilt values and a charge following the change in the economic assumptions used to calculate the value of in-force business at 31 December 2006.
Policyholder interests volatility
As a result of the requirement contained in IFRS to consolidate life and pensions businesses on a line-by-line basis, the Lloyds TSB Group’s income statement includes amounts attributable to policyholders which affect profit before tax; the most significant of these items is policyholder tax.
Under IFRS, tax on policyholder investment returns is required to be included in the tax charge rather than being offset against the related income, as it is in actual distributions made to policyholders. The impact is, therefore, to either increase or decrease profit before tax with a corresponding change in the tax charge. Other items classified within policyholder interests volatility include the effects of investment vehicles which are only majority owned by the long-term assurance funds. In the case of these vehicles, the Lloyds TSB Group’s profit for the year includes the minorities’ share of the profits earned. As these amounts do not accrue to the equity holders, management believes a clearer representation of the underlying performance of the Lloyds TSB Group’s life and pensions businesses is presented by excluding policyholder interests volatility.
During 2006, profit before tax included positive policyholder interests volatility of £326 million, being a charge of £33 million to net interest income and a credit of £359 million to other income (2005: £311 million, being a credit to other income; 2004: £(30) million, being a charge to other income). The increase reflects an improved return from a property partnership majority owned by the policyholders, which more than offset a reduction in the policyholder tax charge as a result of a fall in the capital values of gilts and bonds and a smaller rise in equity markets.
34
Operating and financial review and prospects
Future accounting developments
Future developments in relation to the Lloyds TSB Group’s IFRS reporting are discussed in note 51 to the Consolidated Financial Statements and future developments in relation to US GAAP are discussed in note 52 to the Consolidated Financial Statements.
IFRS compared with US GAAP
Under US GAAP, Lloyds TSB Group’s net income for the year ended 31 December 2006 was £1,815 million (2005: £1,351 million; 2004: £1,508 million) compared to £2,803 million (2005: £2,493 million; 2004: £2,392 million) under IFRS. Reconciliations between IFRS and US GAAP figures, together with detailed explanations of the accounting differences, are included in note 52 to the Consolidated Financial Statements.
The Lloyds TSB Group’s IFRS net income increased by £310 million, or 12 per cent, in 2006 compared with 2005, whereas its US GAAP net income increased by £464 million, or 34 per cent. The US GAAP results have been significantly affected by the Lloyds TSB Group’s decision not to hedge any of its financial instruments for US GAAP accounting purposes, the requirement to consolidate certain variable interest entities under US GAAP and the increased US GAAP net pension charge.
Hedging and financial instruments.Under IFRS, changes in the fair value of derivatives that are designated as hedges are either offset against the change in fair value of the hedged asset or liability through earnings or recognised directly in equity until the hedged item is recognised in earnings, depending on the nature of the hedge. Under US GAAP, because Lloyds TSB Group has elected not to satisfy the onerous hedging criteria of SFAS No. 133 ‘Accounting for Derivative Instruments and for Hedging Activities’ in respect of derivative contracts, these instruments are treated as being held for trading purposes, with the unrealised mark-to-market gains and losses taken to income as they arise and the resulting assets or liabilities recorded on the balance sheet. As Lloyds TSB Group continues to hold a significant number of derivatives which are hedge accounted under IFRS this means that net income and shareholders’ equity under US GAAP are subject to greater volatility. In addition there is an IFRS/US GAAP difference in the accounting for unrealised foreign exchange gains and losses on available-for-sale securities; and the Lloyds TSB Group has elected, under IFRS, to classify certain of its financial instruments at fair value through profit or loss (this classification is not available under US GAAP and these financial instruments are, generally, classified as available-for-sale securities). These differences result in the gains or losses, which are recognised through the income statement under IFRS, being recognised in other comprehensive income under US GAAP.
Pensions.IFRS requires that the pension costs in the income statement reflect the cost of accruing benefits for active employees, the unwind of the interest cost of the scheme liabilities and the cost of severances borne by the schemes net of the expected return on scheme assets. The Lloyds TSB Group has elected to apply the corridor approach in respect of actuarial gains and losses and so, to the extent that the cumulative gains or losses remain within a corridor defined as the greater of 10 per cent of the scheme assets or liabilities, they are not reflected in the accounts. A similar method is used to recognise pension costs under US GAAP, although amounts that remain within the corridor are recognised within other comprehensive income.
Although the methodologies used to recognise the pension expense are similar, the respective standards were adopted on different dates and, as a result, the cumulative unrecognised actuarial losses at the beginning of the year exceeded the corridor limits on a US GAAP basis, but did not on an IFRS basis (as the only cumulative losses relevant for IFRS are those arising since the adoption of IAS 19, Employee Benefits, on 1 January 2004). Consequently, the 2006 US GAAP pension charge includes the amortisation of actuarial losses which is not recognised under IFRS.
Other areas where differences in accounting have had a significant effect upon the Lloyds TSB Group’s US GAAP results are as follows:
Insurance accounting.Under IFRS, for insurance contracts (and, in 2004, investment contracts within life assurance operations) the discounted value of the projected future cash flows attributable to the shareholder is recognised at the point of sale. IFRS therefore results in a proportion of the profit expected to accrue over the life of various products being recognised at their inception. Under US GAAP, income is recognised in the income statement in the period in which it is earned and expenses in the period in which they are incurred. This results, under US GAAP, in a more even recognition of profit over the life of the related policies.
Intangible assets.Under US GAAP, the Lloyds TSB Group has recognised intangible assets reflecting the value of the customer relationships associated with acquisitions made in prior periods. These intangible assets are amortised through the income statement reducing US GAAP net income. The reconciling item still exists, despite the convergence of IFRS and US GAAP in this area, as, on transition, the Lloyds TSB Group chose not to apply IFRS to business combinations that occurred before 1 January 2004.
Variable interest entities.US GAAP requires the consolidation of variable interest entities for which Lloyds TSB Group is deemed to be the primary beneficiary. The Lloyds TSB Group has a number of venture capital investments which do not require consolidation under IFRS, but for which Lloyds TSB Group is deemed to be the primary beneficiary. Consequently, the results of these entities are consolidated into the Lloyds TSB Group’s results for US GAAP purposes, rather than the Lloyds TSB Group recording the investments at fair value through profit or loss.
35
Operating and financial review and prospects
Average balance sheet and net interest income
| | | | | | | | | | | | | | | | | | | |
| | 2006 | | 2006 | | 2006 | | 2005 | | 2005 | | 2005 | | 2004 | | 2004 | | 2004 | |
| | Average
balance
£m | | Interest
income
£m | | Yield
% | | Average
balance
£m | | Interest
income
£m | | Yield
% | | Average
balance
£m | | Interest
income
£m | | Yield
% | |
| | | | | | | | | | | | | | | | | | | | |
Assets | | | | | | | | | | | | | | | | | | | |
Treasury bills and other eligible bills: | | | | | | | | | | | | | | | | | | | |
– Domestic offices | | | | | | | | | | | | | | 41 | | 2 | | 4.88 | |
– Foreign offices | | | | | | | | | | | | | | 161 | | 4 | | 2.48 | |
Loans and advances to banks: | | | | | | | | | | | | | | | | | | | |
– Domestic offices | | 35,842 | | 1,664 | | 4.64 | | 31,198 | | 1,111 | | 3.56 | | 26,731 | | 917 | | 3.43 | |
– Foreign offices | | 2,854 | | 162 | | 5.68 | | 2,224 | | 88 | | 3.96 | | 2,071 | | 62 | | 2.99 | |
Loans and advances to customers: | | | | | | | | | | | | | | | | | | | |
– Domestic offices | | 168,922 | | 10,621 | | 6.29 | | 152,469 | | 9,859 | | 6.47 | | 127,646 | | 8,221 | | 6.44 | |
– Foreign offices | | 5,948 | | 288 | | 4.84 | | 4,948 | | 236 | | 4.77 | | 5,514 | | 219 | | 3.97 | |
Available-for-sale financial assets: | | | | | | | | | | | | | | | | | | | |
– Domestic offices | | 13,334 | | 600 | | 4.50 | | 9,623 | | 349 | | 3.63 | | | | | | | |
– Foreign offices | | 5,046 | | 207 | | 4.10 | | 4,554 | | 159 | | 3.49 | | | | | | | |
Debt securities: | | | | | | | | | | | | | | | | | | | |
– Domestic offices | | | | | | | | | | | | | | 9,989 | | 300 | | 3.00 | |
– Foreign offices | | | | | | | | | | | | | | 4,372 | | 118 | | 2.70 | |
Lease and hire purchase receivables: | | | | | | | | | | | | | | | | | | | |
– Domestic offices | | 10,425 | | 774 | | 7.42 | | 11,137 | | 787 | | 7.07 | | 11,118 | | 864 | | 7.77 | |
– Foreign offices | | — | | — | | — | | — | | — | | — | | — | | — | | — | |
| | | | | | | | | | | | | | | | | | | | |
Total interest-earning assets of banking book | | 242,371 | | 14,316 | | 5.91 | | 216,153 | | 12,589 | | 5.82 | | 187,643 | | 10,707 | | 5.71 | |
Total interest-earning trading securities and other financial assets at fair value through profit or loss (2004: trading assets) | | 27,584 | | 1,831 | | 6.64 | | 31,185 | | 1,563 | | 5.01 | | 34,037 | | 1,536 | | 4.51 | |
| | | | | | | | | | | | | | | | | | | | |
Total interest-earning assets | | 269,955 | | 16,147 | | 5.98 | | 247,338 | | 14,152 | | 5.72 | | 221,680 | | 12,243 | | 5.52 | |
Allowance for impairment losses on loans and advances | | (2,171 | ) | | | | | (2,058 | ) | | | | | (1,729 | ) | | | | |
Non-interest earning assets: | | | | | | | | | | | | | | | | | | | |
– Domestic offices | | 63,175 | | | | | | 58,916 | | | | | | 47,510 | | | | | |
– Foreign offices | | 471 | | | | | | 919 | | | | | | 902 | | | | | |
| | | | | | | | | | | | | | | | | | | | |
Total average assets and interest income | | 331,430 | | 16,147 | | 4.87 | | 305,115 | | 14,152 | | 4.64 | | 268,363 | | 12,243 | | 4.56 | |
| | | | | | | | | | | | | | | | | | | | |
Percentage of assets applicable to foreign activities (%) | | 4.5 | | | | | | 4.2 | | | | | | 4.8 | | | | | |
| | | | | | | | | | | | | | | | | | | | |
| | | | | | | | | | | | | | | | | | | |
| | 2006 | | 2006 | | 2006 | | 2005 | | 2005 | | 2005 | | 2004 | | 2004 | | 2004 | |
| | Average
interest
earning
assets
£m | | Net
interest
income
£m | | Net
interest
margin
% | | Average
interest
earning
assets
£m | | Net
interest
income
£m | | Net
interest
margin
% | | Average
interest
earning
assets
£m | | Net
interest
income
£m | | Net
interest
margin
% | |
| | | | | | | | | | | | | | | | | | | | |
Average interest-earning assets and net interest income: | | | | | | | | | | | | | | | | | | | |
– Banking business | | 242,371 | | 5,537 | | 2.28 | | 216,153 | | 5,671 | | 2.62 | | 187,643 | | 5,110 | | 2.72 | |
– Trading securities and other financial assets at fair value through profit or loss (2004: trading assets) | | 27,584 | | 1,551 | | 5.62 | | 31,185 | | 1,114 | | 3.57 | | 34,037 | | 947 | | 2.78 | |
| | | | | | | | | | | | | | | | | | | | |
Net yield on interest-earning assets | | 269,955 | | 7,088 | | 2.63 | | 247,338 | | 6,785 | | 2.74 | | 221,680 | | 6,057 | | 2.73 | |
| | | | | | | | | | | | | | | | | | | | |
36
Operating and financial review and prospects
| | | | | | | | | | | | | | | | | | | |
| | 2006 | | 2006 | | 2006 | | 2005 | | 2005 | | 2005 | | 2004 | | 2004 | | 2004 | |
| | Average
balance
£m | | Interest
expense
£m | | Cost
% | | Average
balance
£m | | Interest
expense
£m | | Cost
% | | Average
balance
£m | | Interest
expense
£m | | Cost
% | |
| | | | | | | | | | | | | | | | | | | | |
Liabilities and shareholders’ funds | | | | | | | | | | | | | | | | | | | |
Deposits by banks: | | | | | | | | | | | | | | | | | | | |
– Domestic offices | | 33,861 | | 1,550 | | 4.58 | | 23,645 | | 854 | | 3.61 | | 20,199 | | 456 | | 2.26 | |
– Foreign offices | | 2,143 | | 130 | | 6.07 | | 4,075 | | 99 | | 2.43 | | 4,227 | | 102 | | 2.41 | |
Liabilities to banks under sale and repurchase agreements: | | | | | | | | | | | | | | | | | | | |
– Domestic offices | | 3,907 | | 230 | | 5.89 | | 4,419 | | 258 | | 5.84 | | 4,200 | | 192 | | 4.57 | |
– Foreign offices | | — | | — | | — | | 3 | | — | | 1.56 | | 4 | | — | | 2.41 | |
Customer accounts: | | | | | | | | | | | | | | | | | | | |
– Domestic offices | | 125,309 | | 3,621 | | 2.89 | | 117,622 | | 3,329 | | 2.83 | | 105,400 | | 2,963 | | 2.81 | |
– Foreign offices | | 3,242 | | 117 | | 3.61 | | 2,194 | | 72 | | 3.28 | | 2,303 | | 40 | | 1.74 | |
Liabilities to customers under sale and repurchase agreements: | | | | | | | | | | | | | | | | | | | |
– Domestic offices | | 1,969 | | 28 | | 1.42 | | 4,179 | | 134 | | 3.21 | | 2,787 | | 125 | | 4.49 | |
– Foreign offices | | 106 | | 2 | | 1.89 | | 106 | | 2 | | 1.89 | | 121 | | 2 | | 1.65 | |
Debt securities in issue: | | | | | | | | | | | | | | | | | | | |
– Domestic offices | | 39,795 | | 1,862 | | 4.68 | | 27,895 | | 1,199 | | 4.30 | | 19,837 | | 924 | | 4.66 | |
– Foreign offices | | 2,677 | | 121 | | 4.52 | | 3,026 | | 108 | | 3.57 | | 2,685 | | 48 | | 1.79 | |
Other interest-bearing liabilities: | | | | | | | | | | | | | | | | | | | |
– Domestic offices | | 4,382 | | 424 | | 9.68 | | 3,618 | | 262 | | 7.24 | | 2,635 | | 144 | | 5.46 | |
– Foreign offices | | — | | — | | — | | — | | — | | — | | — | | — | | — | |
Subordinated liabilities: | | | | | | | | | | | | | | | | | | | |
– Domestic offices | | 12,129 | | 694 | | 5.72 | | 11,515 | | 601 | | 5.22 | | 10,175 | | 601 | | 5.91 | |
– Foreign offices | | — | | — | | — | | — | | — | | — | | — | | — | | — | |
| | | | | | | | | | | | | | | | | | | | |
Total interest-bearing liabilities of banking book | | 229,520 | | 8,779 | | 3.82 | | 202,297 | | 6,918 | | 3.42 | | 174,573 | | 5,597 | | 3.21 | |
Total interest-bearing trading liabilities and other liabilities at fair value through profit or loss (2005 and 2004: trading liabilities) | | 6,349 | | 280 | | 4.41 | | 11,245 | | 449 | | 3.99 | | 14,992 | | 589 | | 3.93 | |
| | | | | | | | | | | | | | | | | | | | |
Total interest-bearing liabilities | | 235,869 | | 9,059 | | 3.84 | | 213,542 | | 7,367 | | 3.45 | | 189,565 | | 6,186 | | 3.26 | |
Interest-free liabilities | | | | | | | | | | | | | | | | | | | |
Non-interest bearing customer accounts: | | | | | | | | | | | | | | | | | | | |
– Domestic offices | | 3,862 | | | | | | 3,636 | | | | | | 3,134 | | | | | |
– Foreign offices | | 250 | | | | | | 267 | | | | | | 372 | | | | | |
Other interest-free liabilities: | | | | | | | | | | | | | | | | | | | |
– Domestic offices | | 78,712 | | | | | | 77,177 | | | | | | 63,364 | | | | | |
– Foreign offices | | 1,804 | | | | | | 447 | | | | | | 751 | | | | | |
| | | | | | | | | | | | | | | | | | | |
Minority interests and shareholders’ funds | | 10,933 | | | | | | 10,046 | | | | | | 11,177 | | | | | |
| | | | | | | | | | | | | | | | | | | | |
Total average liabilities and interest expense | | 331,430 | | 9,059 | | 2.73 | | 305,115 | | 7,367 | | 2.41 | | 268,363 | | 6,186 | | 2.31 | |
| | | | | | | | | | | | | | | | | | | | |
Percentage of liabilities applicable to foreign activities (%) | | 3.2 | | | | | | 3.4 | | | | | | 4.1 | | | | | |
| | | | | | | | | | | | | | | | | | | | |
Net interest margin for the banking book
| | | | | | | | | | |
| | | 2006
% | | | 2005
% | | | 2004
% | |
| | | | | | | | | | | |
Domestic offices | | | 2.30 | | | 2.68 | | | 2.79 | |
Foreign offices | | | 2.07 | | | 1.72 | | | 1.74 | |
Group margin | | | 2.28 | | | 2.62 | | | 2.72 | |
| | | | | | | | | | | |
Loans and advances to banks and customers include impaired lending. In 2004, interest receivable on such loans was only included to the extent to which cash payments had been received, in accordance with Lloyds TSB Group’s policy on income recognition. In 2005 and 2006, interest has been recognised using the effective interest rate method, as required by IAS 39.
Average balances are based on daily averages for the principal areas of the Lloyds TSB Group’s banking activities with monthly or less frequent averages used elsewhere. Management believes that the interest rate trends are substantially the same as they would be if all balances were averaged on the same basis.
37
Operating and financial review and prospects
Changes in net interest income – volume and rate analysis
The following table allocates changes in net interest income between volume and rate for 2006 compared with 2005 and for 2005 compared with 2004. Where variances have arisen from both changes in volume and rate these are allocated to volume.
| | | | | | | | | | | | | | | | | | | |
| | 2006 compared with 2005 | | 2005 compared with 2004 | |
| | Increase/(decrease) | | Increase/(decrease) | |
| | Total change | | Volume | | Rate | | Total change | | Volume | | Rate | |
| | £m | | £m | | £m | | £m | | £m | | £m | |
| | | | | | | | | | | | | | |
| | | | | | | | | | | | | | | | | | | |
Interest receivable and similar income | | | | | | | | | | | | | | | | | | | |
Loans and advances to banks: | | | | | | | | | | | | | | | | | | | |
– Domestic offices | | | 553 | | | 216 | | | 337 | | | 194 | | | 159 | | | 35 | |
– Foreign offices | | | 74 | | | 36 | | | 38 | | | 26 | | | 6 | | | 20 | |
Loans and advances to customers: | | | | | | | | | | | | | | | | | | | |
– Domestic offices | | | 762 | | | 1,034 | | | (272 | ) | | 1,638 | | | 1,605 | | | 33 | |
– Foreign offices | | | 52 | | | 48 | | | 4 | | | 17 | | | (27 | ) | | 44 | |
Available-for-sale financial assets (2004: Treasury and other eligible bills and Debt securities): | | | | | | | | | | | | | | | | | | | |
– Domestic offices | | | 251 | | | 167 | | | 84 | | | 47 | | | (15 | ) | | 62 | |
– Foreign offices | | | 48 | | | 20 | | | 28 | | | 37 | | | 1 | | | 36 | |
Lease and hire purchase receivables: | | | | | | | | | | | | | | | | | | | |
– Domestic offices | | | (13 | ) | | (53 | ) | | 40 | | | (77 | ) | | 1 | | | (78 | ) |
– Foreign offices | | | — | | | — | | | — | | | — | | | — | | | — | |
| | | | | | | | | | | | | | | | | | | | |
Total banking book interest receivable and similar income | | | 1,727 | | | 1,468 | | | 259 | | | 1,882 | | | 1,730 | | | 152 | |
Total interest receivable and similar income on trading securities and other financial assets at fair value through profit or loss (2004: trading assets) | | | 268 | | | (239 | ) | | 507 | | | 27 | | | (143 | ) | | 170 | |
| | | | | | | | | | | | | | | | | | | | |
Total interest receivable and similar income | | | 1,995 | | | 1,229 | | | 766 | | | 1,909 | | | 1,587 | | | 322 | |
| | | | | | | | | | | | | | | | | | | | |
Interest payable | | | | | | | | | | | | | | | | | | | |
Deposits by banks: | | | | | | | | | | | | | | | | | | | |
– Domestic offices | | | 696 | | | 468 | | | 228 | | | 398 | | | 124 | | | 274 | |
– Foreign offices | | | 31 | | | (117 | ) | | 148 | | | (3 | ) | | (4 | ) | | 1 | |
Liabilities to banks under sale and repurchase agreements: | | | | | | | | | | | | | | | | | | | |
– Domestic offices | | | (28 | ) | | (30 | ) | | 2 | | | 66 | | | 13 | | | 53 | |
– Foreign offices | | | — | | | — | | | — | | | — | | | — | | | — | |
Customer accounts: | | | | | | | | | | | | | | | | | | | |
– Domestic offices | | | 292 | | | 222 | | | 70 | | | 366 | | | 346 | | | 20 | |
– Foreign offices | | | 45 | | | 38 | | | 7 | | | 32 | | | (4 | ) | | 36 | |
Liabilities to customers under sale and repurchase agreements: | | | | | | | | | | | | | | | | | | | |
– Domestic offices | | | (106 | ) | | (31 | ) | | (75 | ) | | 9 | | | 45 | | | (36 | ) |
– Foreign offices | | | — | | | — | | | — | | | — | | | — | | | — | |
Debt securities in issue: | | | | | | | | | | | | | | | | | | | |
– Domestic offices | | | 663 | | | 557 | | | 106 | | | 275 | | | 346 | | | (71 | ) |
– Foreign offices | | | 13 | | | (16 | ) | | 29 | | | 60 | | | 12 | | | 48 | |
Other interest bearing liabilities: | | | | | | | | | | | | | | | | | | | |
– Domestic offices | | | 162 | | | 74 | | | 88 | | | 118 | | | 71 | | | 47 | |
– Foreign offices | | | — | | | — | | | — | | | — | | | — | | | — | |
Subordinated liabilities: | | | | | | | | | | | | | | | | | | | |
– Domestic offices | | | 93 | | | 35 | | | 58 | | | — | | | 70 | | | (70 | ) |
– Foreign offices | | | — | | | — | | | — | | | — | | | — | | | — | |
|
| | | | | | | | | | | | | | | | | | | | |
|
Total banking book interest payable | | | 1,861 | | | 1,200 | | | 661 | | | 1,321 | | | 1,019 | | | 302 | |
Total interest payable on trading and other liabilities at fair value through profit or loss (2005 and 2004: trading liabilities) | | | (169 | ) | | (216 | ) | | 47 | | | (140 | ) | | (150 | ) | | 10 | |
|
| | | | | | | | | | | | | | | | | | | | |
|
Total interest payable | | | 1,692 | | | 984 | | | 708 | | | 1,181 | | | 869 | | | 312 | |
|
| | | | | | | | | | | | | | | | | | | | |
38
| |
Operating and financial review and prospects | Audited information |
Risk management
Risk as a strategic differentiator
Lloyds TSB Group continues with the development of the risk framework through close alignment of risk capabilities to objectives. Substantial progress has been made in 2006 in embedding our approach across the business. This has included a focus on enhancing our capabilities in providing both qualitative and quantitative data to the board on risks associated with strategic objectives and facilitating more informed and effective decision making. The Group’s ability to take risks which are well understood, consistent with its strategy and plans and appropriately remunerated, is a key driver of shareholder return.
The maintenance of a strong control framework remains a priority and is the foundation for the delivery of effective risk management. Risk analysis and reporting capabilities continue to evolve to identify opportunities as well as risks, to improve the Group’s ability to take an aggregate view of the overall risk portfolio and assign clear responsibilities and timescales at group and divisional level for risk mitigation strategies. Risk continues to be a key component of routine management information reporting and is embedded within staff objectives via balanced scorecards.
The objective remains to go beyond risk mitigation and control to developing risk capabilities as a key strategic differentiator for Lloyds TSB.
Risk governance structures
Lloyds TSB Group maintains a risk governance structure that strengthens risk evaluation and management, whilst also positioning the Group to manage the changing regulatory environment in an efficient and effective manner.
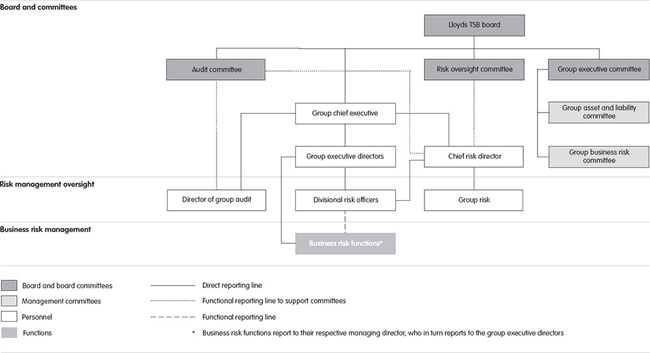
The board, assisted by its sub-committees, the risk oversight committee, the group executive committee and the audit committee, approves the Group’s overall risk management framework. The board also reviews the Group’s aggregate risk exposures and concentrations of risk to seek to ensure that these are consistent with the board’s appetite for risk. The risk oversight responsibilities of the board, audit committee and risk oversight committee are shown in the corporate governance section on pages 87 to 89, and further key risk oversight roles are described on the next page.
The group executive committee, assisted by its sub-committees, the group business risk committee and the group asset and liability committee, supports the group chief executive in ensuring the development, implementation and effectiveness of the Group’s risk management framework and the clear articulation of the Group’s risk policies, and reviews the Group’s aggregate risk exposures and concentrations of risk. The group executive committee’s duties are described more fully on page 87.
Directors of the Group’s businesses have primary responsibility for measuring, monitoring and controlling risks within their areas of accountability and are required to establish control frameworks for their businesses that are consistent with the Group’s high level policies and within the parameters set by the board, group executive committee and group risk. Compliance with policies and parameters is overseen by the risk oversight committee, the group business risk committee, the group asset and liability committee, group risk and the divisional risk officers.
The chief risk director, a member of the group executive committee and reporting directly to the group chief executive, oversees and promotes the development and implementation of a consistent group wide risk management framework. The chief risk director, supported by group risk, provides objective challenge to the Group’s senior management.
39
| |
Operating and financial review and prospects | Audited information |
Divisional risk officers provide oversight of risk management activity within each of the Group’s operating divisions. Reporting directly to the group executive directors responsible for the divisions and the chief risk director, their day-to-day contact with business management, business operations and risk initiatives seeks to provide an effective risk oversight mechanism. The direct reporting line to the chief risk director enables the Group to maintain a wide ranging and current perspective on material risks facing the Group and provides a mechanism to share best risk management practice.
The director of group audit provides the required independent assurance to the audit committee and the board that risks within the Group are recognised, monitored and managed within acceptable parameters. Group audit is fully independent of group risk, seeking to ensure objective challenge to the effectiveness of the risk governance framework.
Accountability of line management has been further reinforced in relation to the management of risks arising from the Group’s business and in developing the risk awareness and risk management capability of the Group’s staff. A key objective is to ensure that business decisions strike an appropriate balance between risk and reward, consistent with the Group’s risk appetite. The senior executive team and Board received regular briefings and guidance from the chief risk director to ensure awareness of the overarching risk model and a clear understanding of their accountabilities for risk and internal control.
During the year an enhanced Control Self-Assessment process has increased the focus of management at all levels on risk management and reinforced accountabilities. All business units, divisional risk offices and group functions have completed a Control Self-Assessment, reviewing the effectiveness of their internal controls and putting in place enhancements where appropriate. Managing directors and group executive directors have certified the accuracy of their assessment.
Business management forms part of a tiered risk management model, as shown on page 39, with the divisional risk officers providing oversight and challenge, as described above, and the chief risk director and group committees establishing the group wide perspective.
The model seeks to provide the Group with an effective mechanism for developing and embedding risk policies and risk management strategies which are aligned with the risks faced by its businesses. It also facilitates effective communication on these matters across the Group. These arrangements enable the Group to anticipate and pre-empt risks better, and to manage more effectively those risks which crystallise.
Reflecting the importance the Group places on risk management, risk is one of the five principal criteria that it includes in its balanced scorecard on which individual staff performance is judged. Business executives have specified risk management objectives, and incentive schemes take account of performance against these.
Risk management framework
Lloyds TSB Group uses an enterprise-wide framework for the identification, assessment, measurement and management of risk, designed to meet its customers’ needs and maximise value for shareholders over time by aligning risk management with the corporate strategy; assessing the impact of emerging risks from new technologies or markets; and developing risk tolerances and mitigating strategies. The framework strengthens the Group’s ability to identify and assess risks; aggregate group wide risks and define the corporate risk appetite; develop solutions for reducing or transferring risk, where appropriate; and exploit risks to gain competitive advantage, thereby seeking to increase shareholder value.
Principal risks
The Group’s risk language is designed to capture the Group’s principal risks referred to as the ‘primary risk drivers’. A description of each risk, including definition, appetite, control and exposures is included in the detail to this report. These are further broken down into 13 more granular risk types to enable more detailed review and facilitate appropriate reporting and analysis of root causes, as set out below.
Through Lloyds TSB’s risk management processes these risks are assessed on an ongoing basis to ensure optimisation of risk and reward and that, where required, appropriate mitigation is in place. Both quantitative and qualitative factors are considered in assessing Lloyds TSB’s current and potential future risks. At present the two most significant risks for the Group are:
| |
• | Legal and regulatory risk, reflecting the volume and pace of change from within the UK and Europe. This impacts Lloyds TSB both operationally in terms of cost of compliance and uncertainty about regulatory expectations, and strategically through pressure on key earnings streams. The latter could potentially result in major changes to business and pricing models, particularly in the UK retail market. Our business planning processes continue to reflect change to the regulatory environment. Major current regulatory reviews are described on pages 11 and 12. |
| |
• | Credit risk, reflecting the risk inherent in our lending businesses. Whilst credit quality remains satisfactory this will always be a significant risk for Lloyds TSB. The current focus is on unsecured retail credit, where lending criteria and limits have been tightened over the last two years and collections and recoveries processes enhanced. |
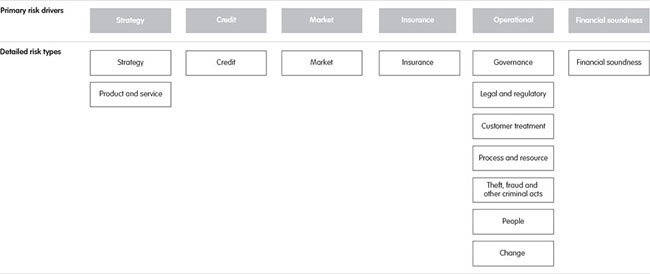
40
| |
Operating and financial review and prospects | Audited information |
Risk appetite
In enhancing the Lloyds TSB Group risk framework in 2005, the Group’s strategic vision and the desired outcomes for its key stakeholders were articulated. The risk implications are expressed in high level risk principles and risk appetite measures and metrics for the primary risk types. These are then translated into more detailed policies and measures which are applied to the businesses. A key focus in 2006 has been the enhancement of policy and development of risk appetite across our business and this work will continue throughout 2007.
The more detailed articulation of the risk principles and distribution of the risk appetite measures amongst the divisions and businesses is subsequently agreed by the group chief executive, through consultation with the group executive committee and on the advice of the group business risk committee and the group asset and liability committee.
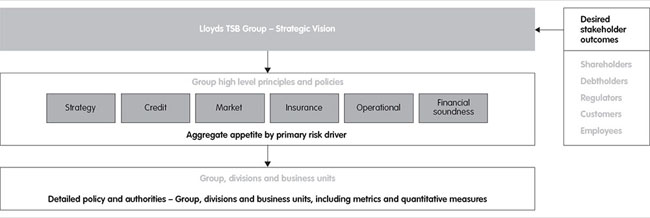
Policy
A key component of the risk management framework is the policy framework. The Group has continued to embed this further during 2006.
The main policy levels are identified below:
| |
• | Principles – high level principles for the six primary risk drivers |
| |
• | High level group policy – policy for the main risk types aligned to the risk drivers |
| |
• | Detailed group policy – detailed policy that applies across the Group |
| |
• | Divisional policy – local policy that specifically applies to a division |
| |
• | Business unit policy – local policy that specifically applies to a business unit |
Divisional and business unit policy is only produced by exception and is not necessary unless there is a specific area for which a particular division or business unit requires a greater level of detail than is appropriate for group level policy. The governance arrangements for development of, and compliance with, group, divisional and business unit policy and the associated accountabilities are clearly outlined. All staff are expected to be aware of the policies and procedures which apply to them and their work and to observe the relevant policies and procedures. Line management in each business area has primary responsibility for ensuring that group policies and the relevant local policies and procedures are known and observed by all staff within that area.
Group and divisional risk functions have responsibility for overseeing effective implementation of policy. Group audit provides independent assurance to the board about the effectiveness of the Group’s control framework and adherence to policy.
Policies are reviewed annually to seek to ensure they remain fit for purpose.
Risk reporting
Divisional risk functions use the standard language when reporting risks centrally, to enable risk aggregation, and when assessing risk levels of new products, change initiatives or business plans. Divisions monitor their risk levels against their risk appetite seeking to ensure effective mitigating action is being taken where appropriate. Divisional risk reports are reviewed by divisional executive committees to ensure divisional senior management are satisfied with the overall risk profile, risk accountabilities and progress on any necessary mitigating actions.
At group level a consolidated risk report is produced which is reviewed and debated by group business risk committee, group executive committee, risk oversight committee and board to ensure senior management and the board are satisfied with the overall risk profile, risk accountabilities and any necessary mitigating actions. During the year the Group’s consolidated risk report was further enhanced to support the identification, control and effective management of risk.
Strategy risk
The Group includes product and service risk within the wider definition of strategy risk and the two categories are described in further detail below.
Definition
Strategy risk is the risk arising from developing a strategy that does not maximise franchise value and/or fails to achieve the initiatives in the agreed strategic plan due to changing or flawed assumptions. In assessing strategic risk consideration is given to both:
| |
• | external factors (i.e. economic, technological, political, social and ethical, environmental, legal and regulatory, market expectations, reputation and competitive behaviour), and |
| |
• | internal factors (i.e. resource capability and availability, customer treatment, service level agreements, products and funding and the risk appetite of other risk categories). |
41
| |
Operating and financial review and prospects | Audited information |
Risk appetite
Strategy risk is encapsulated as the budget and medium-term plan sanctioned by the board on an annual basis. Divisions and business units subsequently align their plans to the Group’s overall strategic risk appetite.
Exposures
The market for UK financial services and the other markets within which the Group operates are highly competitive, and management expects such competition to intensify in response to consumer demand, technological changes, the impact of consolidation, regulatory actions and other factors, which could result in a reduction in profit margins. The Group’s ability to generate an appropriate return for its shareholders depends significantly upon the competitive environment and management’s response to it.
The Group seeks to achieve further organic growth by securing new customers and developing more business from existing customers. Lloyds TSB is currently expending significant resources and effort to bring about this growth, particularly with respect to its UK retail financial services business. If these expenditures and efforts did not meet with success, its operating results would grow more slowly or decline.
As well as the Group’s organic growth plans, management and planning resources are also devoted to identifying possible acquisitions which would provide further opportunities for growth. If these strategic plans do not meet with success, the Group’s earnings could grow more slowly or decline.
The Group’s businesses are conducted in a market place that is consolidating and significant cross-border mergers and acquisitions may happen in the coming years. Lloyds TSB’s ability to generate an appropriate return for its shareholders over the long term may depend upon whether management is able to achieve value creating acquisitions and/or mergers at the appropriate times and prices. Lloyds TSB cannot be sure that it will ultimately be able to make such mergers or acquisitions or that, if it does, such mergers or acquisitions will be integrated successfully or realise anticipated benefits.
Control
An annual strategic planning process is conducted at group and business level which includes a quantitative and qualitative assessment of the risks in the Group’s plan. Within the planning round, the Group conducts both scenario analysis and stress tests to assess risks to future earning streams.
The Group’s strategy is reviewed and approved by the board. Regular reports are provided to the group executive committee and the board on the progress of the Group’s key strategies and plans. Group risk conducts oversight to seek to ensure the business plans remain consistent with the Group’s strategy. Revenue and capital investment decisions require additional formal assessment and approval. Formal risk assessment is conducted as part of the financial approval process. Significant company mergers and acquisitions require specific approval by the board. In addition to the standard due diligence conducted during a merger or acquisition, group risk conducts, where appropriate, an independent risk assessment of the target company and its proposed integration into Lloyds TSB Group.
A common approach is applied across the Group to assess the creation of shareholder value. This is measured by economic profit (the profit attributable to shareholders, less a notional charge for the equity invested in the business). The focus on economic profit allows the Group to compare the returns being made on capital employed in each business. The use of risk-based economic capital and regulatory capital is closely monitored at business and group level. The Group’s economic capital model covers credit, market, insurance, business and operational risks.
Product and service risk
Definition
The risk of loss, both financial and reputational, from the inherent design, management or distribution of products, or from the failure to meet or exceed customer expectations, competitor offerings or regulatory requirements.
Control
The Group is strongly committed to the fair treatment of its customers. This is embedded into the processes and risk assessment which takes place to seek to ensure businesses have developed customer centric strategies for product and business development, marketing, selling and after sales service. Businesses maintain a range of products to meet customers’ needs and the business strategy and are responsible for managing and controlling product risks and complying with applicable regulations.
Businesses have formal processes for reviewing the range of their product portfolios and subject all product development to rigorous assessment. The assessment includes seeking to ensure that the product meets clearly defined customer needs. Businesses have a defined channel distribution strategy for products, consistent with the Group’s distribution strategy. Businesses launching new products are responsible for ensuring compliance with all applicable regulations and that the proposed sales activity is appropriate for the type of customer and their attitude to risk.
A product is defined as a solution that can be offered to a customer or counterparty that might satisfy a want or a need in order to generate revenue streams or gains (not necessarily financial) for the Group. In line with defined policy, businesses provide divisional risk management with details of new products at an early stage of product or service development to seek to ensure compliance with the Group’s risk appetite and strategy. Businesses are required to demonstrate that new products meet clearly defined customer needs and that the sales process mitigates the risks of unsuitable sales. Where appropriate, technical advice and approval is sought from specialist functions.
Businesses establish and monitor performance standards for all marketed products across a range of indicators, for example sales volumes, customer service and risk profile. Significant deviations from these standards are investigated and appropriate action taken.
Credit risk
Definition
The risk of reductions in earnings and/or value, through financial or reputational loss, as a result of the failure of the party with whom we have contracted to meet its obligations (both on and off balance sheet).
Risk appetite
Credit risk appetite is defined as the quantum and quality of the desired credit portfolio and the direction in which the Group wants to manage it, in order to achieve its short and long-term strategic goals.
Credit risk appetite is described and reported through a suite of metrics derived from a combination of accounting and economic equity model parameters which in turn uses the various credit risk rating systems as inputs. These metrics are supplemented by a variety of policies, sector caps and limits to manage concentration risk at an acceptable level.
42
| |
Operating and financial review and prospects | Audited information |
Exposures
The principal sources of credit risk within the Group arise from loans and advances to retail customers, financial institutions and corporate clients. The credit risk exposures of the Group are set out in note 47 to the Consolidated Financial Statements.
Credit risk can arise from lending or investing or through off balance sheet activities such as guarantees or the undertaking of settlement or delivery risk. The primary off balance sheet instruments used by the Group are guarantees together with standby, documentary and commercial letters of credit.
Credit risk exposures in the insurance businesses arise primarily from holding investments and from exposure to reinsurers.
Credit risk also arises from the use of derivatives. Note 16 to the Consolidated Financial Statements shows the total notional principal amount of interest rate, exchange rate, credit derivative and equity and other contracts outstanding at 31 December 2006. The notional principal amount does not, however, represent the Group’s credit risk exposure, which is limited to the current cost of replacing contracts with a positive value to the Group.
Credit risk may also arise through the existence of contracts for the provision of services or products to Lloyds TSB and this is also considered through individual credit assessments, where the risks of loss are material.
Control
Credit risk is managed according to baseline credit framework standards, against which all activity is assessed. This framework identifies the following key elements: governance, organisational framework, policies, people, processes and procedures, management information, and systems and technology.
In its principal retail portfolios, the Group uses statistically-based decisioning techniques (primarily credit scoring), although thresholds are set above which an individual credit assessment takes place. Divisional risk departments review scorecard effectiveness and approve changes, with material changes subject to group risk approval. Credit risk in non-retail portfolios is subject to individual credit assessments, which consider the strengths and weaknesses of individual transactions and the balance of risk and reward.
Day-to-day credit management and asset quality within each business is primarily the responsibility of the relevant business director.
Credit quality is supported by specialist units to provide, for example: intensive management and control; security perfection, maintenance and retention; expertise in documentation for lending and associated products; sector-specific expertise; and legal services applicable to the particular market place and product range offered by the business.
Impairment provisions are provided for losses that have been incurred at the balance sheet date. Changes in general economic conditions in the UK or in interest rates could result in losses that are different from those provided for at the balance sheet date.
The following are the principal control mechanisms through which the Group manages credit risk:
| |
• | Credit rating systems. All business units operate appropriate rating system(s) for their portfolio(s). All rating systems, which are authorised by executive management, comply with the Group’s standard methodology. The Group uses a ‘Master Scale’ rating structure with ratings corresponding to a range of probabilities of future default. The Group uses rating systems as an integral part of the credit process deployed within the credit life cycle. Whilst divisional risk teams have responsibility for monitoring rating model performance, group risk reviews new models and material changes to existing models, seeking executive management approval as necessary. |
| |
• | Portfolio monitoring and reporting. With group risk, businesses and divisions identify and define portfolios of credit and related risk exposures and the key benchmarks, behaviours and characteristics by which those portfolios are managed in terms of credit risk exposure. This entails the production and analysis of regular portfolio monitoring reports for review by group risk. Group risk in turn produces an aggregated review of credit risk throughout the Group, which is presented to the group business risk committee. |
| |
• | Credit principles and policy. Group risk sets out the group credit principles according to which credit risk is managed. These form the basis of the group credit policy, which in turn is the basis for divisional and business unit credit policy. Principles and policy are reviewed regularly and any changes are subject to a review and approval process. Business unit policy includes lending guidelines which define the responsibilities of lending officers and seek to provide a disciplined and focused benchmark for credit decisions. |
| |
• | Counterparty limits. Exposure to individual counterparties, groups of counterparties or customer risk segments is controlled through a tiered hierarchy of delegated sanctioning authorities. Approval requirements for each decision are based on the transaction amount, the customer’s aggregate facilities, credit risk ratings and the nature and term of the risk. Regular reports on significant credit exposures are provided to the group executive committee and board. |
| |
• | Cross-border and cross-currency exposures. Country limits are authorised and managed by a dedicated unit taking into account economic and political factors. |
| |
• | Concentration risk. Credit risk management sets portfolio controls on certain industries, sectors and product lines that reflect risk appetite, and monitors exposures to prevent excessive concentration of risk. These concentration risk controls are not necessarily in the form of a maximum limit on lending but may instead require new business in concentrated sectors to fulfil additional hurdle requirements. Amongst these controls is a series of sector caps to manage residual value risk exposure, seeking to ensure an acceptable distribution of risk. The Group’s large exposures are managed in accordance with regulatory reporting requirements. |
| |
• | Impairment process. The maintenance of adequate impairment allowances is considered a key issue from a credit control perspective. Impairment methodology is set out in credit policy and is subject to a rigorous governance process, including the preparation of a regular impairment review paper to executive management, consideration by dedicated business unit and divisional impairment review committees and the reporting to the group executive committee of material individual counterparty impairment charges. |
| |
• | Facilities database. A database is maintained of all non-retail customer relationships to assist in the identification and aggregation of cross-business unit commitments. The Group uses a system known as parent company executives, under which there is a central person responsible for each non-retail customer relationship, to whom other business units wishing to do business with the same customer must apply for credit limits. |
| |
• | Credit portfolio model. The Group models portfolio credit risk based on defaults, using a statistically-based model which calculates the economic equity employed and credit value at risk for each portfolio. |
| |
• | Stress testing and scenario analysis. The credit portfolio model is also used in stress-testing, to simulate a scenario and calculate its impact. Our modelling capabilities are currently subject to further development. Events are modelled both at a group wide level, at divisional and business unit level and by portfolio, for example, for a specific industry sector. |
43
| |
Operating and financial review and prospects | Audited information |
| |
• | Risk assurance and oversight. Divisional and group level oversight teams monitor credit performance trends, review and challenge exceptions to planned outcomes and test the adequacy of credit risk infrastructure and governance processes throughout the Group. This includes tracking portfolio performance against an agreed set of key risk indicators. Risk assurance teams and group audit are engaged where appropriate to conduct further credit reviews if a need for closer scrutiny is identified. |
Lloyds TSB Group also uses a range of approaches to mitigate credit risk. In the case of individual exposures, the Group makes use of credit enhancement techniques such as netting and collateralisation, where security is provided against the exposure. The Group also undertakes asset sales, securitisations and credit derivative-based approaches as appropriate for the nature of the assets and market conditions.
Where it is efficient and likely to be effective (generally with counterparties with which it undertakes a significant volume of transactions), the Group enters into master netting arrangements. Although master netting arrangements do not generally result in an offset of balance sheet assets and liabilities, as transactions are usually settled on a gross basis, they do reduce the credit risk to the extent that if an event of default occurs, all amounts with the counterparty are terminated and settled on a net basis. The Group’s overall exposure to credit risk on derivative instruments subject to master netting arrangements can change substantially within a short period since it is affected by each transaction subject to the arrangement.
| |
Loan portfolio | (unaudited) |
The tables below have been prepared in accordance with IFRS (for 2004, 2005 and 2006) and with UK Generally Accepted Accounting Principles (for 2002 and 2003) and, as a result, the information included in the tables for 2004, 2005 and 2006 is not directly comparable with that for 2002 and 2003.
Analysis of loans and advances to banks and customers
The following tables analyse loans to banks and customers by geographical area and type of loan at 31 December for each of the five years listed.
| | | | | | | | | | | | |
| | | 2006 | | | | 2005 | | | | 2004 | |
IFRS | | | £m | | | | £m | | | | £m | |
| | | | | | | | | | | | | |
Domestic | | | | | | | | | | | | |
Loans and advances to banks | | | 37,014 | | | | 28,859 | | | | 29,052 | |
Loans and advances to customers: | | | | | | | | | | | | |
– Mortgages | | | 95,167 | | | | 88,528 | | | | 80,065 | |
– Other personal lending | | | 22,782 | | | | 23,020 | | | | 22,934 | |
– Agriculture, forestry and fishing | | | 2,862 | | | | 2,405 | | | | 2,076 | |
– Energy and water supply | | | 1,493 | | | | 971 | | | | 420 | |
– Manufacturing | | | 6,816 | | | | 7,128 | | | | 3,980 | |
– Construction | | | 2,236 | | | | 2,092 | | | | 1,903 | |
– Transport, distribution and hotels | | | 9,784 | | | | 8,735 | | | | 7,669 | |
– Postal and telecommunications | | | 504 | | | | 404 | | | | 296 | |
– Financial, business and other services | | | 20,745 | | | | 19,675 | | | | 15,976 | |
– Property companies | | | 12,638 | | | | 8,571 | | | | 6,014 | |
– Lease financing | | | 4,802 | | | | 5,815 | | | | 6,227 | |
– Hire purchase | | | 5,060 | | | | 4,853 | | | | 4,828 | |
|
| | | | | | | | | | | | | |
|
Total domestic loans | | | 221,903 | | | | 201,056 | | | | 181,440 | |
Foreign | | | | | | | | | | | | |
Loans and advances to banks | | | 3,625 | | | | 2,797 | | | | 2,797 | |
Loans and advances to customers: | | | | | | | | | | | | |
– Mortgages | | | 434 | | | | 367 | | | | 277 | |
– Other personal lending | | | 243 | | | | 260 | | | | 256 | |
– Agriculture, forestry and fishing | | | 43 | | | | 46 | | | | 31 | |
– Energy and water supply | | | 531 | | | | 621 | | | | 533 | |
– Manufacturing | | | 697 | | | | 795 | | | | 511 | |
– Construction | | | 96 | | | | 130 | | | | 87 | |
– Transport, distribution and hotels | | | 706 | | | | 730 | | | | 1,041 | |
– Postal and telecommunications | | | 327 | | | | 142 | | | | 50 | |
– Financial, business and other services | | | 2,254 | | | | 1,586 | | | | 1,763 | |
– Property companies | | | 258 | | | | 142 | | | | 64 | |
Total foreign loans | | | 9,214 | | | | 7,616 | | | | 7,410 | |
| | | | | | | | | | | | | |
Total loans | | | 231,117 | | | | 208,672 | | | | 188,850 | |
Allowance for impairment losses | | | (2,194 | ) | | | (2,073 | ) | | | (1,663 | ) |
Interest held in suspense | | | | | | | | | | | (21 | ) |
| | | | | | | | | | | | | |
Total loans and advances net of allowance for impairment losses | | | 228,923 | | | | 206,599 | | | | 187,166 | |
| | | | | | | | | | | | | |
44
Operating and financial review and prospects
| | | | | | | | | | | |
UK GAAP | | 2003
£m | | | | | 2002
£m | |
| | |
Domestic | | | | | | | | | | |
Loans and advances to banks | | | 13,671 | | | | | | 15,291 | |
Loans and advances to customers: | | | | | | | | | | |
– Mortgages | | | 70,750 | | | | | | 62,467 | |
– Other personal lending | | | 20,280 | | | | | | 16,698 | |
– Agriculture, forestry and fishing | | | 2,025 | | | | | | 2,076 | |
– Energy and water supply | | | 425 | | | | | | 568 | |
– Manufacturing | | | 3,771 | | | | | | 3,972 | |
– Construction | | | 1,516 | | | | | | 1,491 | |
– Transport, distribution and hotels | | | 5,446 | | | | | | 5,382 | |
– Postal and telecommunications | | | 273 | | | | | | 371 | |
– Financial, business and other services | | | 10,635 | | | | | | 9,129 | |
– Property companies | | | 4,822 | | | | | | 4,276 | |
– Lease financing | | | 6,470 | | | | | | 7,285 | |
– Hire purchase | | | 4,701 | | | | | | 4,342 | |
| | |
Total domestic loans | | | 144,785 | | | | | | 133,348 | |
Foreign | | | | | | | | | | |
Loans and advances to banks | | | 1,894 | | | | | | | 2,239 | |
Loans and advances to customers: | | | | | | | | | | | |
– Mortgages | | | 331 | | | | | | | 4,763 | |
– Other personal lending | | | 263 | | | | | | | 1,098 | |
– Agriculture, forestry and fishing | | | 40 | | | | | | | 2,220 | |
– Energy and water supply | | | 711 | | | | | | | 1,051 | |
– Manufacturing | | | 926 | | | | | | | 1,608 | |
– Construction | | | 124 | | | | | | | 328 | |
– Transport, distribution and hotels | | | 1,423 | | | | | | | 2,459 | |
– Postal and telecommunications | | | 84 | | | | | | | 385 | |
– Financial, business and other services | | | 1,866 | | | | | | | 3,196 | |
– Property companies | | | 74 | | | | | | | 1,117 | |
– Lease financing | | | — | | | | | | | 15 | |
Total foreign loans | | | 7,736 | | | | | | 20,479 | |
| | |
Total loans | | | 152,521 | | | | | | 153,827 | |
Provisions for loan losses | | | (1,695 | ) | | | | | (1,767 | ) |
Interest held in suspense | | | (28 | ) | | | | | (57 | ) |
| | |
Total loans and advances net of provisions and interest held in suspense | | | 150,798 | | | | | | 152,003 | |
| | |
| | | | | | | | | | |
IFRS | | | 2006
£m | | | 2005
£m | | | 2004
£m | |
| | |
Analysis of foreign loans by region | | | | | | | | | | |
Loans and advances to customers: | | | | | | | | | | |
– Latin America | | | 169 | | | 173 | | | 125 | |
– USA | | | 2,253 | | | 1,984 | | | 2,385 | |
– Europe | | | 2,417 | | | 1,927 | | | 1,587 | |
– Rest of the world | | | 750 | | | 735 | | | 516 | |
| | |
| | | 5,589 | | | 4,819 | | | 4,613 | |
| | |
Loans and advances to banks: | | | | | | | | | | |
– Latin America | | | 55 | | | 76 | | | 72 | |
– USA | | | 2,235 | | | 315 | | | 69 | |
– Europe | | | 1,037 | | | 1,470 | | | 1,853 | |
– Rest of the world | | | 298 | | | 936 | | | 803 | |
| | |
| | | 3,625 | | | 2,797 | | | 2,797 | |
| | |
Total foreign loans | | | 9,214 | | | 7,616 | | | 7,410 | |
| | |
45
Operating and financial review and prospects
| | | | | | | | | | |
UK GAAP | | 2003
£m | | | | | 2002
£m | |
| | |
Analysis of foreign loans by region | | | | | | | | | | |
Loans and advances to customers: | | | | | | | | | | |
– New Zealand | | | — | | | | | | 10,447 | |
– Latin America | | | 557 | | | | | | 1,591 | |
– USA | | | 2,681 | | | | | | 3,412 | |
– Europe | | | 1,981 | | | | | | 2,142 | |
– Rest of the world | | | 623 | | | | | | 648 | |
| | |
| | | 5,842 | | | | | | 18,240 | |
| | |
Loans and advances to banks: | | | | | | | | | | |
– New Zealand | | | — | | | | | | 622 | |
– Latin America | | | 143 | | | | | | 52 | |
– USA | | | 95 | | | | | | 227 | |
– Europe | | | 1,408 | | | | | | 1,164 | |
– Rest of the world | | | 248 | | | | | | 174 | |
| | |
| | | 1,894 | | | | | | 2,239 | |
| | |
Total foreign loans | | | 7,736 | | | | | | 20,479 | |
| | |
The classification of lending as domestic or foreign is based on the location of the office recording the transaction, except for certain lending of the international business booked in London.
46
Operating and financial review and prospects
Summary of loan loss experience
The following tables analyse the movements in the allowance for impairment losses for each of the five years listed.
| | | | | | | | | | |
IFRS | | 2006
£m | | 2005
£m | | 2004
£m | |
| | |
Balance at beginning of year | | | | | | | | | | |
Domestic | | | 2,037 | | | 1,562 | | | 1,468 | |
Foreign | | | 36 | | | 101 | | | 227 | |
| | |
Total balance at beginning of year – before transition to IAS 39 | | | | | | 1,663 | | | 1,695 | |
Adjustment to reflect transition to IAS 39 on 1 January 2005 | | | | | | 256 | | | | |
| | |
Balance at beginning of year after transition to IAS 39 | | | 2,073 | | | 1,919 | | | | |
| | |
Exchange and other adjustments | | | (13 | ) | | 1 | | | (11 | ) |
Reclassifications | | | — | | | 43 | | | — | |
Acquisition and disposal of businesses and portfolios | | | (27 | ) | | (27 | ) | | (33 | ) |
Advances written off: | | | | | | | | | | |
Domestic | | | | | | | | | | |
Loans and advances to customers: | | | | | | | | | | |
– Mortgages | | | (9 | ) | | (6 | ) | | (2 | ) |
– Other personal lending | | | (1,188 | ) | | (900 | ) | | (760 | ) |
– Agriculture, forestry and fishing | | | (1 | ) | | (1 | ) | | (4 | ) |
– Energy and water supply | | | (17 | ) | | (20 | ) | | (18 | ) |
– Manufacturing | | | (21 | ) | | (26 | ) | | (39 | ) |
– Construction | | | (7 | ) | | (8 | ) | | (3 | ) |
– Transport, distribution and hotels | | | (50 | ) | | (37 | ) | | (33 | ) |
– Financial, business and other services | | | (137 | ) | | (151 | ) | | (35 | ) |
– Property companies | | | (1 | ) | | — | | | (15 | ) |
– Lease financing | | | (1 | ) | | (5 | ) | | (3 | ) |
– Hire purchase | | | (39 | ) | | (77 | ) | | (49 | ) |
Loans and advances to banks | | | — | | | — | | | (15 | ) |
| | |
Total domestic | | | (1,471 | ) | | (1,231 | ) | | (976 | ) |
Foreign | | | (18 | ) | | (5 | ) | | (52 | ) |
| | |
Total advances written off | | | (1,489 | ) | | (1,236 | ) | | (1,028 | ) |
| | |
Recoveries of advances written off: | | | | | | | | | | |
Domestic | | | | | | | | | | |
Loans and advances to customers: | | | | | | | | | | |
– Mortgages | | | 2 | | | 2 | | | 2 | |
– Other personal lending | | | 158 | | | 124 | | | 119 | |
– Agriculture, forestry and fishing | | | — | | | — | | | 1 | |
– Energy and water supply | | | 1 | | | 2 | | | — | |
– Manufacturing | | | 3 | | | 2 | | | 7 | |
– Construction | | | 1 | | | 1 | | | 7 | |
– Transport, distribution and hotels | | | 4 | | | 5 | | | 14 | |
– Financial, business and other services | | | 12 | | | 14 | | | 15 | |
– Hire purchase | | | 9 | | | 5 | | | 6 | |
| | |
Total domestic | | | 190 | | | 155 | | | 171 | |
Foreign | | | — | | | 3 | | | 3 | |
| | |
Total recoveries of advances written off | | | 190 | | | 158 | | | 174 | |
| | |
Net advances written off: | | | | | | | | | | |
Domestic | | | (1,281 | ) | | (1,076 | ) | | (805 | ) |
Foreign | | | (18 | ) | | (2 | ) | | (49 | ) |
| | |
Total net advances written off | | | (1,299 | ) | | (1,078 | ) | | (854 | ) |
| | |
47
Operating and financial review and prospects
| | | | | | | | | | |
IFRS | | 2006
£m | | 2005
£m | | 2004
£m | |
| | |
Effect of unwinding of discount recognised through interest income | | | (100 | ) | | (87 | ) | | | |
Allowances for impairment losses charged against income for the year: | | | | | | | | | | |
Domestic | | | | | | | | | | |
Loans and advances to customers: | | | | | | | | | | |
– Mortgages | | | 12 | | | 18 | | | 4 | |
– Other personal lending | | | 1,345 | | | 1,193 | | | 807 | |
– Agriculture, forestry and fishing | | | 1 | | | — | | | (3 | ) |
– Energy and water supply | | | 4 | | | 2 | | | 37 | |
– Manufacturing | | | 11 | | | 1 | | | (1 | ) |
– Construction | | | 5 | | | (3 | ) | | 4 | |
– Transport, distribution and hotels | | | 29 | | | 20 | | | 43 | |
– Postal and telecommunications | | | — | | | — | | | — | |
– Financial, business and other services | | | 54 | | | 8 | | | (15 | ) |
– Property companies | | | — | | | — | | | 15 | |
– Lease financing | | | 4 | | | (3 | ) | | 7 | |
– Hire purchase | | | 91 | | | 70 | | | 57 | |
– General provisions | | | | | | | | | (57 | ) |
| | |
Total domestic | | | 1,556 | | | 1,306 | | | 898 | |
Foreign | | | 4 | | | (4 | ) | | (32 | ) |
| | |
Total allowances for impairment losses charged against income for the year | | | 1,560 | | | 1,302 | | | 866 | |
| | |
Balance at end of year | | | | | | | | | | |
Domestic | | | 2,174 | | | 2,037 | | | 1,562 | |
Foreign | | | 20 | | | 36 | | | 101 | |
| | |
Total balance at end of year | | | 2,194 | | | 2,073 | | | 1,663 | |
| | |
Ratio of net write-offs during the year to average loans outstanding during the year | | | 0.7% | | | 0.6% | | | 0.6% | |
| | |
48
Operating and financial review and prospects
| | | | | | | | | | |
UK GAAP | | 2003
£m | | | | 2002
£m | |
| | |
Balance at beginning of year | | | | | | | | | | |
Domestic | | | 1,344 | | | | | | 1,162 | |
Foreign | | | 423 | | | | | | 306 | |
| | |
Total balance at beginning of year | | | 1,767 | | | | | | 1,468 | |
| | |
Exchange and other adjustments | | | (1 | ) | | | | | (58 | ) |
Acquisition and disposal of businesses | | | (54 | ) | | | | | 3 | |
Advances written off: | | | | | | | | | | |
Domestic | | | | | | | | | | |
Loans and advances to customers: | | | | | | | | | | |
– Mortgages | | | (1 | ) | | | | | (21 | ) |
– Other personal lending | | | (691 | ) | | | | | (554 | ) |
– Agriculture, forestry and fishing | | | (11 | ) | | | | | (2 | ) |
– Manufacturing | | | (30 | ) | | | | | (25 | ) |
– Construction | | | (11 | ) | | | | | (17 | ) |
– Transport, distribution and hotels | | | (40 | ) | | | | | (27 | ) |
– Postal and telecommunications | | | (8 | ) | | | | | (1 | ) |
– Financial, business and other services | | | (50 | ) | | | | | (54 | ) |
– Property companies | | | (36 | ) | | | | | (19 | ) |
– Lease financing | | | (4 | ) | | | | | (17 | ) |
– Hire purchase | | | (44 | ) | | | | | (50 | ) |
| | |
Total domestic | | | (926 | ) | | | | | (787 | ) |
Foreign | | | (219 | ) | | | | | (91 | ) |
| | |
Total advances written off | | | (1,145 | ) | | | | | (878 | ) |
| | |
Recoveries of advances written off: | | | | | | | | | | |
Domestic | | | | | | | | | | |
Loans and advances to customers: | | | | | | | | | | |
– Mortgages | | | 2 | | | | | | 5 | |
– Other personal lending | | | 103 | | | | | | 83 | |
– Agriculture, forestry and fishing | | | 2 | | | | | | 3 | |
– Energy and water supply | | | — | | | | | | 1 | |
– Manufacturing | | | 6 | | | | | | 17 | |
– Construction | | | 2 | | | | | | 3 | |
– Transport, distribution and hotels | | | 7 | | | | | | 12 | |
– Financial, business and other services | | | 7 | | | | | | 13 | |
– Property companies | | | 6 | | | | | | 10 | |
– Lease financing | | | 1 | | | | | | 3 | |
– Hire purchase | | | 6 | | | | | | 15 | |
| | |
Total domestic | | | 142 | | | | | | 165 | |
Foreign | | | 36 | | | | | | 38 | |
| | |
Total recoveries of advances written off | | | 178 | | | | | | 203 | |
| | |
Net advances written off: | | | | | | | | | | |
Domestic | | | (784 | ) | | | | | (622 | ) |
Foreign | | | (183 | ) | | | | | (53 | ) |
| | |
Total net advances written off | | | (967 | ) | | | | | (675 | ) |
| | |
49
Operating and financial review and prospects
| | | | | | | | | | |
UK GAAP | | 2003
£m | | | | 2002
£m | |
| | |
Provision for loan losses charged against income for the year: | | | | | | | | | | |
Domestic | | | | | | | | | | |
Loans and advances to customers: | | | | | | | | | | |
– Mortgages | | | (19 | ) | | | | | (5 | ) |
– Other personal lending | | | 679 | | | | | | 514 | |
– Agriculture, forestry and fishing | | | 8 | | | | | | — | |
– Energy and water supply | | | (9 | ) | | | | | 40 | |
– Manufacturing | | | — | | | | | | 31 | |
– Construction | | | 11 | | | | | | 14 | |
– Transport, distribution and hotels | | | 26 | | | | | | 28 | |
– Postal and telecommunications | | | — | | | | | | 2 | |
– Financial, business and other services | | | 90 | | | | | | 103 | |
– Property companies | | | 22 | | | | | | (1 | ) |
– Lease financing | | | 2 | | | | | | 3 | |
– Hire purchase | | | 40 | | | | | | 57 | |
– General provisions | | | 9 | | | | | | 14 | |
Loans and advances to banks | | | 16 | | | | | | — | |
| | |
Total domestic | | | 875 | | | | | | 800 | |
Foreign | | | 75 | | | | | | 229 | |
| | |
Total provision for loan losses charged against income for the year | | | 950 | | | | | | 1,029 | |
| | |
Balance at end of year | | | | | | | | | | |
Domestic | | | 1,468 | | | | | | 1,344 | |
Foreign | | | 227 | | | | | | 423 | |
| | |
Total balance at end of year | | | 1,695 | | | | | | 1,767 | |
| | |
Ratio of net write-offs during the year to average loans outstanding during the year | | | 0.7% | | | | | | 0.5% | |
| | |
50
Operating and financial review and prospects
The following tables analyse the coverage of the allowance for loan losses by category of loans.
| | | | | | | | | | | | | | | | | | | |
| | 2006 | | 2006 | | 2005 | | 2005 | | 2004 | | 2004 | |
| | Allowance | | Percentage of
loans in each
category to
total loans | | Allowance | | Percentage of
loans in each
category to
total loans | | Allowance | | Percentage of
loans in each
category to
total loans | |
IFRS | | £m | | % | | £m | | % | | £m | | % | |
| | | | | | | | | | | | | | | | | | | | |
Balance at year end applicable to: | | | | | | | | | | | | | | | | | | | |
Domestic: | | | | | | | | | | | | | | | | | | | |
Loans and advances to banks | | | 1 | | | 16.0 | | | 1 | | | 13.8 | | | 1 | | | 15.4 | |
Loans and advances to customers: | | | | | | | | | | | | | | | | | | | |
Mortgages | | | 42 | | | 41.2 | | | 36 | | | 42.4 | | | 11 | | | 42.3 | |
Other personal lending | | | 1,719 | | | 9.9 | | | 1,530 | | | 11.0 | | | 788 | | | 12.1 | |
Agriculture, forestry and fishing | | | 1 | | | 1.2 | | | 2 | | | 1.2 | | | 3 | | | 1.1 | |
Energy and water supply | | | 14 | | | 0.6 | | | 32 | | | 0.5 | | | 55 | | | 0.2 | |
Manufacturing | | | 23 | | | 2.9 | | | 29 | | | 3.4 | | | 64 | | | 2.1 | |
Construction | | | 6 | | | 1.0 | | | 8 | | | 1.0 | | | 17 | | | 1.0 | |
Transport, distribution and hotels | | | 40 | | | 4.2 | | | 58 | | | 4.2 | | | 84 | | | 4.1 | |
Postal and telecommunications | | | — | | | 0.2 | | | — | | | 0.2 | | | — | | | 0.2 | |
Financial, business and other services | | | 157 | | | 9.0 | | | 234 | | | 9.5 | | | 158 | | | 8.5 | |
Property companies | | | 3 | | | 5.5 | | | 4 | | | 4.1 | | | — | | | 3.2 | |
Lease financing | | | 7 | | | 2.1 | | | 4 | | | 2.8 | | | 10 | | | 3.3 | |
Hire purchase | | | 161 | | | 2.2 | | | 99 | | | 2.3 | | | 91 | | | 2.6 | |
| | | | | | | | | | | | | | | | | | | | |
Total domestic | | | 2,174 | | | 96.0 | | | 2,037 | | | 96.4 | | | 1,282 | | | 96.1 | |
Foreign | | | 20 | | | 4.0 | | | 36 | | | 3.6 | | | 101 | | | 3.9 | |
General provision | | | | | | | | | | | | | | | 280 | | | — | |
| | | | | | | | | | | | | | | | | | | | |
Total balance at year end | | | 2,194 | | | 100.0 | | | 2,073 | | | 100.0 | | | 1,663 | | | 100.0 | |
| | | | | | | | | | | | | | | | | | | | |
| | | | | | | | | | | | | |
| | 2003 | | 2003 | | 2002 | | 2002 | |
| | Allowance | | Percentage of
loans in each
category to
total loans | | Allowance | | Percentage of
loans in each
category to
total loans | |
UK GAAP | | £m | | % | | £m | | % | |
| | | | | | | | | | | | | | |
Balance at year end applicable to: | | | | | | | | | | | | | |
Domestic: | | | | | | | | | | | | | |
Loans and advances to banks | | | 16 | | | 9.0 | | | — | | | 9.9 | |
Loans and advances to customers: | | | | | | | | | | | | | |
Mortgages | | | 7 | | | 46.4 | | | 25 | | | 40.7 | |
Other personal lending | | | 622 | | | 13.2 | | | 495 | | | 10.9 | |
Agriculture, forestry and fishing | | | 9 | | | 1.3 | | | 10 | | | 1.3 | |
Energy and water supply | | | 31 | | | 0.3 | | | 25 | | | 0.4 | |
Manufacturing | | | 97 | | | 2.5 | | | 121 | | | 2.6 | |
Construction | | | 9 | | | 1.0 | | | 7 | | | 1.0 | |
Transport, distribution and hotels | | | 60 | | | 3.6 | | | 67 | | | 3.5 | |
Postal and telecommunications | | | — | | | 0.2 | | | — | | | 0.2 | |
Financial, business and other services | | | 198 | | | 6.9 | | | 176 | | | 5.9 | |
Property companies | | | — | | | 3.2 | | | 8 | | | 2.8 | |
Lease financing | | | 6 | | | 4.2 | | | 7 | | | 4.7 | |
Hire purchase | | | 77 | | | 3.1 | | | 75 | | | 2.8 | |
| | | | | | | | | | | | | | |
Total domestic | | | 1,132 | | | 94.9 | | | 1,016 | | | 86.7 | |
Foreign | | | 181 | | | 5.1 | | | 318 | | | 13.3 | |
General provision | | | 382 | | | — | | | 433 | | | — | |
| | | | | | | | | | | | | | |
Total balance at year end | | | 1,695 | | | 100.0 | | | 1,767 | | | 100.0 | |
| | | | | | | | | | | | | | |
51
Operating and financial review and prospects
Risk elements in the loan portfolio
The following discussion consists of an analysis of credit risk elements by categories which reflect US lending and accounting practices. These differ from those employed in the UK. In particular:
Non-performing lending
2004
In the US, it is the normal practice to stop accruing interest when payments are 90 days or more past due or when recovery of both principal and interest is doubtful. When the loans are transferred to non–accrual status, accrued interest is reversed from income and no further interest is recognised until it becomes probable that the principal and interest will be repaid in full. Loans on which interest has been accrued but suspended would be included in risk elements as loans accounted for on a non-accrual basis.
In addition, in the US non-performing loans and advances are typically written off more quickly than in the UK. Consequently a UK bank may appear to have a higher level of non-performing loans and advances than a comparable US bank although the reported income is likely to be similar in both the US and the UK.
In accordance with IFRS, Lloyds TSB Group continued to accrue interest, where appropriate, on doubtful debts when there was a realistic prospect of recovery. This interest was charged to the customer’s account but it was not credited to income; it was placed on a suspense account and only taken to income if there ceased to be significant doubt about its being paid. Loans were transferred to non-accrual status where the operation of the customer’s account had ceased. This lending was managed by specialist recovery departments and written down to its estimated realisable value. Interest was not added to the lending or placed on a suspense account as its recovery was considered unlikely; it was only taken to income if it was received.
2005 and 2006
In accordance with IFRS, Lloyds TSB Group continues to accrue and recognise interest on loans that have been written down as a result of an impairment loss. The interest recognised is based on the net carrying value of the loan and is less than that that would be recognised on a similar performing loan. Accordingly, no amounts are disclosed as non-accrual in 2005 and 2006. If there is objective evidence that impairment has occurred and the carrying value of the loan exceeds the present value of its estimated future cash flows discounted at the loan’s original effective interest rate then a provision is made.
Lloyds TSB Group now analyses its non-performing lending between impaired loans with a provision and impaired loans contractually past due 90 days or more without a provision.
Troubled debt restructurings
In the US, loans whose terms have been modified due to problems with the borrower are required to be separately disclosed. If the new terms were in line with market conditions at the time of the restructuring and the restructured loan remains current as to repayment of principal and interest then the disclosure can be discontinued at the end of the first year.
There are no similar disclosure requirements in the UK.
Potential problem loans
Potential problem loans are loans where known information about possible credit problems causes management to have concern as to the borrower’s ability to comply with the present loan repayment terms.
There are no similar disclosure requirements in the UK.
Assets acquired in exchange for advances
In most circumstances in the US, title to property securing residential real estate transfers to the lender upon foreclosure. The loan is written off and the property acquired in this way is reported in a separate balance sheet category with any recoveries recorded as an offset to the provision for loan losses recorded in the year. Upon sale of the acquired property, gains or losses are recorded in the income statement as a gain or loss on acquired property.
In the UK, although a bank is entitled to enforce a first charge on a property held as security, it typically does so only to the extent of enforcing its power of sale. In accordance with IFRS and industry practice, Lloyds TSB Group takes control of a property held as collateral on a loan at repossession but title does not transfer to it. Loans subject to repossession continue to be reported as loans in the balance sheet. Any gains or losses on sale of the acquired property are recorded within the allowance for impairment losses during the reporting period.
The difference in practices has no effect on net income reported in the UK compared to that reported in the US but it does result in a difference in classification of losses and recoveries in the income statement. It also has the effect of causing UK banks to report an increased level of non–performing loans compared with US banks.
52
Operating and financial review and prospects
The following tables analyse risk elements in the loan portfolio as at 31 December for the last five years.
| | | | | | | | | | |
IFRS† | | 2006
£m | | 2005
£m | | 2004
£m | |
| | | | | | | | | | | |
Loans accounted for on a non-accrual basis | | | | | | | | | | |
Domestic offices | | | | | | | | | 617 | |
Foreign offices | | | | | | | | | 56 | |
Total non-accrual loans | | | | | | | | | 673 | |
Accruing loans on which interest is being placed in suspense | | | | | | | | | | |
Domestic offices | | | | | | | | | 527 | |
Foreign offices | | | | | | | | | 40 | |
Total suspended interest loans | | | | | | | | | 567 | |
Accruing loans on which interest is still being accrued and taken to profit, and against which specific provisions have been made* | | | | | | | | | | |
Domestic offices | | | | | | | | | 1,363 | |
Foreign offices | | | | | | | | | 2 | |
Total accruing loans against which specific provisions have been made | | | | | | | | | 1,365 | |
Impaired lending against which provisions are held | | | | | | | | | | |
Domestic offices | | | 3,984 | | | 4,064 | | | | |
Foreign offices | | | 22 | | | 58 | | | | |
Total impaired lending against which provisions are held | | | 4,006 | | | 4,122 | | | | |
Loans contractually past due 90 days or more as to principal or interest, but against which no provisions have been made | | | | | | | | | | |
Domestic offices | | | 1,252 | | | 1,210 | | | 1,040 | |
Foreign offices | | | — | | | — | | | — | |
Total accruing loans | | | 1,252 | | | 1,210 | | | 1,040 | |
| | | | | | | | | | | |
Total non-performing lending | | | 5,258 | | | 5,332 | | | 3,645 | |
| | | | | | | | | | | |
Domestic offices | | | 5,236 | | | 5,274 | | | 3,547 | |
Foreign offices | | | 22 | | | 58 | | | 98 | |
| | | | | | | | | | | |
Total non-performing lending | | | 5,258 | | | 5,332 | | | 3,645 | |
| | | | | | | | | | | |
| |
† | Following the adoption of IAS 39 with effect from 1 January 2005, interest is accrued on all outstanding loans, including those treated as impaired; accordingly, it is no longer possible to classify non-performing lending as being accounted for on either a non-accrual basis or a suspended interest basis. As a result, the Lloyds TSB Group analyses its non-performing lending between impaired loans with a provision and impaired loans contractually past due 90 days or more without a provision. This figure is not directly comparable to the amounts disclosed in 2004, because prior to the adoption of IAS 39 provisions were only established in the event that the recovery of the principal balance was in serious doubt. |
| |
* | Included within accruing loans on which interest is still being accrued and taken to profit, and against which specific provisions have been made, in 2004 was £1 million in respect of troubled debt restructurings. There were no troubled debt restructurings in 2005 or 2006. |
53
Operating and financial review and prospects
| | | | | | | | | | |
UK GAAP | | 2003
£m | | | | | 2002
£m | |
| | | | | | | | | | | |
Loans accounted for on a non-accrual basis | | | | | | | | | | |
Domestic offices | | | 480 | | | | | | 421 | |
Foreign offices | | | 105 | | | | | | 241 | |
| | | | | | | | | | | |
Total non-accrual loans | | | 585 | | | | | | 662 | |
| | | | | | | | | | | |
Accruing loans on which interest is being placed in suspense | | | | | | | | | | |
Domestic offices | | | 545 | | | | | | 553 | |
Foreign offices | | | 88 | | | | | | 199 | |
| | | | | | | | | | | |
Total suspended interest loans | | | 633 | | | | | | 752 | |
| | | | | | | | | | | |
Accruing loans on which interest is still being accrued and taken to profit, and against which specific provisions have been made | | | | | | | | | | |
Domestic offices | | | 1,199 | | | | | | 1,217 | |
Foreign offices | | | 23 | | | | | | 66 | |
| | | | | | | | | | | |
Total accruing loans against which specific provisions have been made | | | 1,222 | | | | | | 1,283 | |
| | | | | | | | | | | |
Accruing loans on which interest is still being accrued and taken to profit, the lending is contractually past due 90 days or more as to principal or interest, but against which no provisions have been made | | | | | | | | | | |
Domestic offices | | | 875 | | | | | | 776 | |
Foreign offices | | | — | | | | | | 34 | |
| | | | | | | | | | | |
Total accruing loans against which no provisions have been made | | | 875 | | | | | | 810 | |
| | | | | | | | | | | |
Troubled debt restructurings | | | | | | | | | | |
Domestic offices | | | 1 | | | | | | 1 | |
Foreign offices | | | — | | | | | | 2 | |
| | | | | | | | | | | |
Total troubled debt restructurings | | | 1 | | | | | | 3 | |
| | | | | | | | | | | |
Total non-performing lending | | | | | | | | | | |
Domestic offices | | | 3,100 | | | | | | 2,968 | |
Foreign offices | | | 216 | | | | | | 542 | |
| | | | | | | | | | | |
Total non-performing lending | | | 3,316 | | | | | | 3,510 | |
| | | | | | | | | | | |
| | | | | | | | | | |
| | | | | | | | | | |
Interest foregone on non-performing lending | | | | | | | | | | |
| | | | | | | | | | |
The table below summarises the interest foregone on impaired lending. | | | | | | | | | | |
| | | | | | | | | | |
| | | | | | | | 2006
£m | |
| | | | | | | | | | | |
Interest income that would have been recognised under original contract terms | | | | | | | | | 431 | |
Interest income included in profit | | | | | | | | | (297 | ) |
| | | | | | | | | | | |
Interest foregone | | | | | | | | | 134 | |
| | | | | | | | | | | |
Potential problem loans
In addition to the non-performing lending disclosed above, lendings which were current as to payment of interest and principal but where concerns existed about the ability of the borrowers to comply with loan repayment terms in the near future were as follows:
| | | | | | | | | | |
IFRS | | 2006
£m | | 2005
£m | | 2004
£m | |
| | | | | | | | | | | |
Potential problem lending | | | 1,764 | | | 1,800 | | | 1,450 | |
| | | | | | | | | | | |
| | | | | | | | | | |
| | | | | | | | | | |
UK GAAP | | 2003
£m | | | | | 2002
£m | |
| | | | | | | | | | | |
Potential problem lending | | | 1,696 | | | | | | 1,734 | |
| | | | | | | | | | | |
The figures shown for potential problem lending are not indicative of the losses that might arise should the credit quality of this lending deteriorate since they do not take into account security held.
54
Operating and financial review and prospects
Cross border outstandings
The business of Lloyds TSB Group involves significant exposures in non-local currencies. These cross border outstandings comprise loans (including accrued interest), acceptances, interest-bearing deposits with other banks, other interest-bearing investments and any other monetary assets which are denominated in non-local currency. The following tables analyse, by type of borrower, foreign outstandings which individually represented in excess of 1 per cent of Lloyds TSB Group’s total assets.
| | | | | | | | | | | | | | | | |
IFRS | | % of assets | | Total
£m | | Governments
and official
institutions
£m | | Banks and
other
financial
institutions
£m | | Commercial,
industrial
and other
£m | |
| | | | | | | | | | | | |
| | | | | | | | | | | | | | | | |
As at 31 December 2006: | | | | | | | | | | | | | | | | |
Belgium | | | 1.5 | | | 5,081 | | | 3 | | | 4,607 | | | 471 | |
France | | | 1.3 | | | 4,389 | | | 40 | | | 3,224 | | | 1,125 | |
United States of America | | | 1.2 | | | 4,255 | | | 218 | | | 1,478 | | | 2,559 | |
Netherlands | | | 1.2 | | | 4,018 | | | 6 | | | 1,595 | | | 2,417 | |
Germany | | | 1.1 | | | 3,655 | | | 12 | | | 3,274 | | | 369 | |
| | | | | | | | | | | | | | | | |
As at 31 December 2005: | | | | | | | | | | | | | | | | |
Germany | | | 2.6 | | | 8,142 | | | 217 | | | 7,562 | | | 363 | |
Netherlands | | | 1.4 | | | 4,335 | | | — | | | 2,704 | | | 1,631 | |
Belgium | | | 1.3 | | | 4,133 | | | 12 | | | 4,006 | | | 115 | |
United States of America | | | 1.3 | | | 3,974 | | | 312 | | | 899 | | | 2,763 | |
| | | | | | | | | | | | | | | | |
As at 31 December 2004: | | | | | | | | | | | | | | | | |
Belgium | | | 2.5 | | | 7,033 | | | 796 | | | 6,161 | | | 76 | |
Germany | | | 2.1 | | | 5,872 | | | 331 | | | 5,118 | | | 423 | |
Netherlands | | | 1.2 | | | 3,480 | | | 415 | | | 2,173 | | | 892 | |
Japan | | | 1.1 | | | 3,235 | | | 550 | | | 1,037 | | | 1,648 | |
| | | | | | | | | | | | | | | | | |
As at 31 December 2006, Belgium had commitments of £33 million, Germany had commitments of £673 million, Netherlands had commitments of £1,322 million, United States of America had commitments of £551 million and France had commitments of £923 million.
As at 31 December 2006, there was no country with cross border outstandings of between 0.75 per cent and 1 per cent of assets.
As at 31 December 2005, the country with cross border outstandings of between 0.75 per cent and 1 per cent of assets, amounting to £2,448 million in total, was France.
As at 31 December 2004, the countries with cross border outstandings of between 0.75 per cent and 1 per cent of assets, amounting to £4,767 million in total, were France and United States of America.
| |
Market risk | (audited information) |
Definition
The risk of reductions in earnings and/or value, through financial or reputational loss, arising from unexpected changes in financial prices, including interest rates, exchange rates and bond, commodity and equity prices. It arises in all areas of Lloyds TSB Group’s activities and is managed by a variety of different techniques.
Risk appetite
Market risk appetite is defined as the quantum and composition of market risk that exists currently in the Group and the direction in which the Group wishes to manage this.
This statement of the Group’s overall appetite for market risk is reviewed and approved annually by the board. The group chief executive allocates this risk appetite across the Group. Individual members of the group executive committee ensure that market risk appetite is further delegated to an appropriate level within their areas of responsibility.
Exposures
The Group’s banking activities expose it to the risk of adverse movements in interest rates or exchange rates, with little or no exposure to equity or commodity risk.
| |
• | Most of the Group’s trading activity is undertaken to meet the requirements of wholesale and retail customers for foreign exchange and interest rate products. However, some interest rate and exchange rate positions are taken using derivatives and on-balance sheet instruments with the objective of earning a profit from favourable movements in market rates |
| |
• | Market risk in the Group’s retail portfolios and in the Group’s capital funds arises from the different repricing characteristics of the Group’s banking assets and liabilities. Interest rate risk arises from the mismatch between interest rate insensitive liabilities and interest rate sensitive assets |
| |
• | Foreign currency risk also arises from the Group’s investment in its overseas operations |
| |
The Group’s insurance activities also expose it to market risk, encompassing interest rate, exchange rate, property and equity risk. |
|
• | The management of with-profits funds leads to assets and liabilities that are mismatched with the aim of generating a higher rate of return to meet policyholders’ expectations |
| |
• | Unit-linked liabilities are matched with the same assets that are used to define the liability but future fee income is dependent upon the performance of those assets |
55
| |
Operating and financial review and prospects | Audited information |
| |
• | For other insurance liabilities the aim is to invest in assets such that the cash flows on investments will match those on the projected future liabilities. It is not possible to eliminate risk completely as the timing of insured events is uncertain and bonds are not available at all of the required maturities. As a result the cash flows cannot be precisely matched and so sensitivity tests are used to test the extent of the mismatch |
| |
• | Surplus assets are held primarily in three portfolios: the surplus in the non-profit fund within the Long Term Fund of Scottish Widows plc, assets in shareholder funds of life assurance companies and an investment portfolio within the general insurance business |
The Group’s defined benefit pension schemes are exposed to significant risks from the constituent parts of their assets, primarily equity and interest rate risk, and from the present value of their liabilities.
The primary market risk measure used within the Group is the Value at Risk (‘VaR’) methodology, which incorporates the volatility of relevant market prices and the correlation of their movements. Although an important measure of risk, VaR has limitations as a result of its use of historical data, assumed distribution, holding periods and frequency of calculation. The use of confidence levels does not convey any information about potential loss when the confidence level is exceeded. VaR is also not well suited to options positions. The Group recognises these limitations and supplements its use with a variety of other techniques. These reflect the nature of the business activity, and include interest rate re-pricing gaps, open exchange positions and sensitivity analysis. Stress testing and scenario analysis are also used in certain portfolios and at group level, to simulate extreme conditions to supplement these core measures.
The risk of loss measured by the VaR model is the potential loss in earnings. The total and average trading VaR does not assume any diversification benefit across the three risk types. The maximum and minimum VaR reported for each risk category did not necessarily occur on the same day as the maximum and minimum VaR reported as a whole.
Trading:
Based on the commonly used 95 per cent confidence level, assuming positions are held overnight and using observation periods of the preceding three years, the VaR for the years ended 31 December 2006 and 2005 based on the Group’s global trading positions was as detailed in the table below (the table also aggregates potential loss measures from options portfolios).
| | | | | | | | | | | | | | | | | | | | | | | | | |
| | 31 December 2006 | | 31 December 2005 | |
| | | | | |
| | Closing
£m | | Average
£m | | Maximum
£m | | Minimum
£m | | Closing
£m | | Average
£m | | Maximum
£m | | Minimum
£m | |
| | | | | | | | | | | | | | | | | | | | | | | | | | |
Interest rate risk | | | 3.3 | | | 2.3 | | | 4.6 | | | 0.6 | | | 0.9 | | | 1.8 | | | 4.5 | | | 0.5 | |
Foreign exchange risk | | | 0.3 | | | 0.3 | | | 0.7 | | | 0.0 | | | 0.2 | | | 0.3 | | | 0.4 | | | 0.2 | |
Equity risk | | | 0.0 | | | 0.0 | | | 0.0 | | | 0.0 | | | 0.0 | | | 0.0 | | | 0.0 | | | 0.0 | |
Total VaR (no diversification) | | | 3.6 | | | 2.6 | | | 5.0 | | | 0.9 | | | 1.1 | | | 2.1 | | | 4.7 | | | 0.8 | |
| | | | | | | | | | | | | | | | | | | | | | | | | | |
Non-trading:
The Group’s banking non-trading exposure is summarised in the form of an interest rate repricing table, as set out in note 47 to the Consolidated Financial Statements. Items are allocated to time bands by reference to the earlier of the next contractual interest rate repricing date and the maturity date. However, the table does not take into account the effect of interest rate options used by the Group to hedge its exposure.
It is estimated that a hypothetical immediate and sustained 100 basis point increase in interest rates on 1 January 2007 would decrease net interest income by £237.8 million for the 12 months to 31 December 2007, while a hypothetical immediate and sustained 100 basis point decrease in interest rates would increase net interest income by £237.4 million. An analysis by currency is shown below.
| | | | | | | | | | | | | | | | | | | |
| | UK
£m | | North
America
£m | | Asia &
Australasia
£m | | Europe &
Middle East
£m | | Total
2007
£m | | Total
2006
£m | |
| | | | | | | | | | | | | | | | | | | | |
Change in net interest income from a +100 basis point shift in yield curves | | | (207.6 | ) | | (12.8 | ) | | 0.3 | | | (17.7 | ) | | (237.8 | ) | | (112.5 | ) |
| | | | | | | | | | | | | | | | | | | |
Change in net interest income from a –100 basis point shift in yield curves | | | 207.2 | | | 12.8 | | | (0.3 | ) | | 17.7 | | | 237.4 | | | 104.7 | |
| | | | | | | | | | | | | | | | | | | | |
The analysis above is subject to certain simplifying assumptions including, but not limited to, all rates of all maturities worldwide move simultaneously by the same amount; all positions in the wholesale books run to maturity; and there is no management action in response to movements in interest rates, in particular no changes to product margins.
In practice, positions in both the retail and wholesale books are actively managed and actual impact on net interest income may be different to the model.
For the insurance businesses, the composition and value of surplus assets held in excess of liabilities are reported to group risk on a monthly basis. The figures quoted below are the sum of the two portfolios with no allowance for diversification between portfolios or asset classes and represents the potential loss in earnings.
The table below shows closing, average, maximum and minimum VaR for surplus assets held in excess of liabilities in the Group’s insurance businesses for the years ended 31 December 2006 and 2005 on a 99 per cent confidence ten day basis.
| | | | | | | | | | | | | | | | | | | | | | | | | |
| | 31 December 2006 | | 31 December 2005 | |
| | | | | |
| | Closing
£m | | Average
£m | | Maximum
£m | | Minimum
£m | | Closing
£m | | Average
£m | | Maximum
£m | | Minimum
£m | |
| | | | | | | | | | | | | | | | | | |
Interest rate risk | | | 17.9 | | | 19.1 | | | 20.5 | | | 16.9 | | | 19.8 | | | 17.9 | | | 20.0 | | | 15.8 | |
Foreign exchange risk | | | 2.6 | | | 3.2 | | | 3.5 | | | 2.6 | | | 3.3 | | | 2.8 | | | 3.5 | | | 2.3 | |
Equity risk | | | 43.1 | | | 40.9 | | | 43.1 | | | 39.4 | | | 41.7 | | | 47.7 | | | 57.3 | | | 39.4 | |
Total VaR | | | 63.6 | | | 63.2 | | | 65.9 | | | 59.7 | | | 64.8 | | | 68.4 | | | 77.8 | | | 59.1 | |
| | | | | | | | | | | | | | | | | | | | | | | | | | |
The Group’s structural foreign exchange position at 31 December 2006 is set out in note 47 to the Consolidated Financial Statements. The position implies that at 31 December 2006 a hypothetical increase of 10 per cent in the value of sterling against all other currencies would have led to a £43 million reduction in reserves, and vice versa. On this basis, there would have been no material impact on Lloyds TSB Group’s risk asset ratios.
56
| |
Operating and financial review and prospects | Audited information |
Control
The group asset and liability committee regularly reviews market risk exposure and makes recommendations to the group chief executive concerning overall market risk appetite and market risk policy.
Banking activity:
| |
• | Trading is restricted to a number of specialist centres, the most important centre being financial markets division in London. These centres also manage market risk in the wholesale banking books, both in the UK and internationally. The level of exposure is strictly controlled and monitored within approved limits. Active management of the wholesale book is necessary to meet customer requirements and changing market circumstances |
| |
• | Market risk in the Group’s retail portfolios and in the Group’s capital funds is managed within limits defined in the detailed group policy for interest rate risk in the banking book, which is reviewed annually by the group asset and liability committee. The structural foreign exchange position is managed having regard to the currency composition of the Group’s risk-weighted assets. The objective is to limit the effect of exchange rate movements on the published risk asset ratio |
| |
Insurance activity: |
|
• | Market risk exposures from the insurance businesses are controlled via approved investment policies set with reference to the Group’s overall risk appetite and regularly reviewed by the group asset and liability committee |
| |
• | With-profits funds are managed in accordance with the relevant fund’s Principles and Practices of Financial Management |
| |
• | The investment strategy for other insurance liabilities is determined by the term and nature of the underlying liabilities and asset/liability matching positions are actively monitored. Actuarial tools are used to project and match the cash flows |
| |
• | Investment strategy for surplus assets held in excess of liabilities takes account of the regulatory and internal business requirements for capital to be held to support the business now and in the future |
The Group discusses strategies for the overall mix of pension assets with the pension scheme trustees.
Insurance risk
Definition
The risk of reductions in earnings and/or value, through financial or reputational loss, due to fluctuations in the timing, frequency and severity of insured/underwritten events and to fluctuations in the timing and amount of claim settlements. This includes fluctuations in profits due to customer behaviour.
Risk appetite
Insurance risk appetite is defined as the quantum and composition of insurance risk that exists currently in the Group and the direction in which the Group wishes to manage this.
Exposures
The major sources of insurance risk within the Group are the insurance businesses and the Group’s defined benefit pension schemes. The nature of insurance business involves the accepting of insurance risks which relate primarily to mortality, morbidity, persistency, expenses, property damage and unemployment. The prime insurance risk carried by the Group’s pension schemes is related to mortality.
Insurance risks are measured using a variety of techniques including stress and scenario testing; and, where appropriate, stochastic modelling.
Control
A key element of the control framework is the consideration of insurance risk by a suitable combination of high level committees/boards. For the life assurance businesses the key control body is the board of Scottish Widows Group Limited with the more significant risks also being subject to approval by the Lloyds TSB group executive committee and/or the Lloyds TSB Group board. For the general insurance businesses the key control body is the Lloyds TSB Insurance executive committee with the more significant risks again being subject to Lloyds TSB group executive committee and/or Lloyds TSB Group board approval. All group pension scheme issues are covered by the group asset and liability committee.
New insurance proposals are underwritten to ensure an appropriate premium is charged for the risk or the risk is declined.
Limits are used as a control mechanism for insurance risk at policy level.
Some insurance risks are retained while others are reinsured with external underwriters. The retained risk level is carefully controlled and monitored, with close attention being paid to underwriting, claims management, product design, policy wordings, adequacy of reserves, solvency management and regulatory requirements.
General Insurance exposure to accumulations of risk and possible catastrophes is mitigated by reinsurance arrangements which are broadly spread over different reinsurers. Detailed modelling, including that of the probable maximum loss under various catastrophe scenarios, supports the choice of reinsurance arrangements. Appropriate reinsurance arrangements also apply within the life and pensions businesses with significant mortality risk and morbidity risk being transferred to our chosen reinsurers.
Options and guarantees are incorporated in new insurance products only after careful consideration of the risk management issues that they present.
Expenses are monitored by an analysis of the Group’s experience relative to budget. Reasons for any significant divergence from expectation are investigated and remedial action taken.
Persistency rates of life assurance policies, which relate to the rate of policy termination and the rate at which policies cease to pay regular premiums, are regularly assessed by reference to appropriate risk factors.
57
| |
Operating and financial review and prospects | Audited information |
Operational risk
Definition
The risk of reductions in earnings and/or value, through financial or reputational loss, from inadequate or failed internal processes and systems, or from people related or external events.
Risk appetite
Operational risk appetite is defined as the quantum and composition of operational risk that exists in the Group and the direction in which the Group wishes to manage it.
The Group has developed an impact on earnings approach to operational risk appetite. This involves looking at how much the Group could lose due to operational risk losses at various levels of severity. In setting operational risk appetite, the Group looks at both impact on solvency and the Group’s reputation, including customer service requirements.
Exposures
The main sources of operational risk within Lloyds TSB Group relate to uncertainties created by the changing business environment in which we operate and how this is managed across the Group. Throughout 2006 there has been ongoing development of operational risk metrics to ensure both current and potential future operational risk exposures are understood in terms of both risk and reward potential.
Control
The Group continues to develop and refine its approach to managing operational risk. A consistent operational risk management framework for the timely identification, measurement, monitoring and control of operational risk has been introduced across the Group. Further development of operational risk metrics is taking place to seek to ensure that current and potential future operational risk exposures are understood in terms of both risk and reward potential.
The Group has seven sub operational risk types: governance risk, legal and regulatory risk, customer treatment risk, process and resource risk, theft, fraud and other criminal acts risk, people risk and change-related risk each of which is described in further detail below.
Governance risk
Definition
The risk of reductions in earnings and/or value, through financial or reputational loss, from poor corporate governance at group, divisional and business unit level. Corporate governance in this context embraces the structures, systems and processes that provide direction, control and accountability for the enterprise.
Control
The Group’s governance arrangements are based upon the following core principles:
| |
• | the interests of shareholders and other stakeholders are protected by ensuring that excessive powers are not delegated to individuals; |
| |
• | decisions taken by management are consistent with the Group’s strategic objectives and risk appetite, which are approved by the board; |
| |
• | managers are accountable for the management of risk, including internal controls, in their business; |
| |
• | risk management arrangements and risk exposures (including material transactions, financial positions or portfolios) are subject to independent oversight; |
| |
• | business is conducted in line with authorities and accountabilities ultimately delegated by the board; these are described within specific policies; |
| |
• | clear accountabilities are delegated by management to people who have the right level of skills, competencies and experience; |
| |
• | managers are required to safeguard against conflicts of interest; |
| |
• | every member of staff is responsible for understanding and managing the risk they take on behalf of the Group and for ensuring that they act within the authorities and accountabilities delegated to them; and |
| |
• | all staff are required to comply with group policies. |
The Group’s policy is to maintain strong corporate governance arrangements, as it believes this is consistent with the Group’s objective of maximising shareholder value over time. This includes the means by which risks are effectively managed in order to enable successful implementation of the Group’s strategy. The Group’s high level governance arrangements are described on pages 87 to 89. These arrangements reflect the Group’s policy which is that the board adheres to the principles contained in the Combined Code on corporate governance, issued by the Financial Reporting Council, when determining and reviewing its governance arrangements. The directors review the application of the principles and provisions of the Code annually.
The policy regarding organisational structure is that the Group seeks to optimise performance by allowing divisions, subsidiaries and business units to operate within established capital and risk parameters and the Group’s policy framework. Group policy requires that they must do so in a way which is consistent with realising the Group’s strategy and meets agreed business performance targets.
Group functions (e.g. group human resources, group risk, group finance, group strategy, group audit) are established to provide functional leadership (e.g. policy, strategy and standards), challenge and support across the Group and ensure information is consolidated at group level.
Group audit has unrestricted access to all functions, property, records and staff. It independently reviews adherence to the policies and processes that make up the control environment, disseminating best practices throughout the Group in the course of its monitoring and corrective action activities. The director of group audit reports to and meets regularly with the group chief executive and the audit committee chairman and periodically with the audit committee.
The Group’s whistleblowing arrangements, reviewed and supported by the independent charity Public Concern at Work, encourage staff to speak up if they have concerns about any possible wrongdoing.
58
| |
Operating and financial review and prospects | Audited information |
Legal and regulatory risk
Definition
The risk of reductions in earnings and/or value, through financial or reputational loss, from failing to comply with the laws, regulations or codes applicable.
Control
The Group’s business is regulated primarily by the UK Financial Services Authority (‘FSA’), the Banking Code Standards Board (‘BCSB’) and the Office of Fair Trading (‘OFT’) and additionally by local regulators in offshore and overseas jurisdictions. Each business has a nominated individual with ‘compliance oversight’ responsibility under FSA rules. The role of such individuals is to advise and assist management to ensure that each business has a control structure which creates awareness of the rules and regulations to which the Group is subject, and to monitor and report on adherence to these rules and regulations.
All compliance personnel also have a reporting line to the group compliance director who sets compliance standards across the Group and provides independent reporting and assessment to the board and business directors.
Group compliance also provides leadership on compliance with money laundering and terrorist financing legislation and regulation across the Group. It sets group policy and standards on the topic and undertakes high level oversight of anti-money laundering risks. A specialist team within Group compliance provides a centre of excellence on the relevant legislation and regulation as well as interfacing with external public and private bodies in order to evolve the Group’s approach and seek to ensure greater effectiveness and focus on key risk areas. Its remit also includes compliance with financial sanctions.
Each business unit is responsible for complying with relevant laws and legal principles. Business units have access to legal advice both internal and external. The group chief legal adviser provides policies to assist business units identify areas where legal risk management procedures are necessary. Reports to the group chief legal adviser are required in relation to both significant litigation and also material legal issues.
The group compliance director and the group chief legal adviser have access to the chairman and group chief executive.
Customer treatment risk
Definition
The risk of reductions in earnings and/or value, through financial or reputational loss, from inappropriate or poor customer treatment.
Control
The Group is committed to the fair treatment of its customers. It is an essential part of the way the Group conducts its business and develops deep long-lasting relationships with its customers. A range of management information measures is in place across the Group to support the tracking of key customer treatment indicators. Group risk and group audit are required to report regularly on customer treatment risk, management information trends and on compliance with the Group’s standards.
Service improvements are monitored by customer satisfaction surveys, as well as internal process evaluations. The results of the research are fed into the Group’s CARE Index, which measures ongoing performance against five principal objectives: customer understanding; accessibility; responsibility; expertise; and overall service quality improvement. This is tracked monthly and is a key indicator for the Group.
A framework is in place to guide the consideration and documentation of customer treatment risk when developing policies and procedures. The Group has defined customer treatment principles and benchmark standards in all the key areas and enhanced its processes and procedures for a number of individual initiatives including the governance of responsible lending and complaints handling. The divisions are required to meet or exceed these standards, tailoring customer treatment to the needs of each customer segment. The revised detailed group product governance policy also requires customer treatment standards to be tailored.
Trends across all the CARE Index categories are monitored and fed into a programme of continuous customer service improvement. The Group also provides its staff with clear FSA compliant guidelines and processes for dealing with customer complaints.
All advertising and marketing material is required to comply with the Group’s governing policy on business conduct. Businesses are required to have procedures in place to seek to ensure that the material is clear, fair and not misleading bearing in mind the knowledge and sophistication of the customer. Any statement of fact should be substantiated through documentary evidence; any comparison should be made in a fair and balanced way; and any reference to past performance should clearly state the basis of measurement.
Process and resource risk
Definition
The risk of reductions in earnings and/or value, through financial or reputational loss, resulting from inadequate or failed internal processes and systems, people-related events, damage to resources (excluding human resources), and deficiencies in the performance of external suppliers/service providers.
Control
Businesses have primary responsibility for identifying and managing their process and resource risks. They employ internal control techniques to reduce their likelihood or impact to tolerable levels within the Group’s risk appetite. Where appropriate, risk is mitigated by way of insurance.
The Group has defined high-level process and resource risk policies to seek to ensure a wide-ranging and consistent approach to the identification and management of process and resource risk. These include policies covering physical and information security, business continuity, outsourcing, procurement and incident management when policy implementation and oversight is led by specialist teams with a group wide remit.
Theft, fraud and other criminal acts risk
Definition
The risk of reductions in earnings and/or value, through financial or reputational loss, resulting from frauds carried out against the Group, and/or theft of the Group’s assets, and other criminal acts.
59
| |
Operating and financial review and prospects | Audited information |
Control
The Group has in place appropriate policies, procedures and tools for the management of theft, fraud and other criminal acts risks, which fall under the remit of the Chief Security Office.
Business units and group functions have primary responsibility for identifying and managing fraud risk at a local level in consultation with the Group Financial Crime Unit. Additionally the group fraud strategy and policy committee is responsible for monitoring fraud risk as well as ensuring that fraud risks are effectively identified and assessed and that strategies for fraud prevention are effectively coordinated. This includes external scanning of the threat environment across all service delivery channels and translation mechanisms with particular focus on card payment and internet transactions.
The Chief Security Office establishes policy for the security of the people, premises and assets, including identifying and developing countermeasures to minimise the impact of physical threats to the Group. Business unit management seek to ensure that the level of security risk applicable to each site they occupy is assessed, and that the appropriate security countermeasures are determined in order to protect people, premises and assets.
People risk
Definition
The risk of reductions in earnings and/or value, through financial or reputational loss, from inappropriate staff behaviour, industrial action or health and safety issues. Loss can also be incurred through failure to recruit, retain, train, reward and incentivise appropriately skilled staff to achieve business objectives and through failure to take appropriate action as a result of staff underperformance.
Control
The Group’s approach to people management is to employ skilled, committed staff, working as a team for the benefit of customers and shareholders, who are given the opportunity to fulfil their potential; employ the highest ethical standards of behaviour and best practice management principles; and recruit on the basis of ability and competence.
| |
• | Standards of behaviour. The Group has a code of business conduct which applies to all employees. It seeks to ensure that employees act with integrity and endeavour to deliver high levels of customer service. It promotes a working environment free from discrimination, harassment, bullying or victimisation of any kind. Employees are encouraged and expected to alert management to suspected misconduct, fraud or other serious malpractice. We provide mechanisms to facilitate disclosure if an employee is unable to inform their direct line management and will thoroughly investigate any reports made in good faith. The code as amended from time to time is available to the public on the Company’s website at www.lloydstsb.com. |
| |
• | Performance and reward management. The Group seeks to ensure that all employees understand their role, the purpose of the role and where it fits into the wider team and organisational context. It manages and measures employees’ performance and contribution to collective goals and recognises the contribution of individuals in the context of the pay market and the performance of the business in which they work and rewards appropriately. |
| |
• | Training and development. The Group believes that long-term success depends on the quality and skills of its staff and that it has a joint responsibility with employees for their personal and career development to improve current performance and to enhance future prospects. |
Change risk
Definition
Change-related risk is the risk of reductions in earnings and/or value, through financial or reputational loss, from change initiatives failing to deliver to requirements, budget or timescale or failing to implement change effectively or realise the desired benefits.
Control
To deliver the Group’s strategic aims, change must be managed in an effective, risk-aware and appropriately controlled manner throughout the organisation. The Group’s change management standards seek to ensure appropriate control across the project portfolio and the approach is regularly benchmarked against other leading institutions and practices. The Group’s change management committee reviews the overall change portfolio monthly, with particular focus on initiatives having a high impact on customers and staff. The committee ensures that the aggregate impact of the implementation of change on customers, staff and systems is understood, managed and controlled.
Financial soundness
Definition
The risk of financial failure arising from lack of liquidity or capital, poor management or poor quality/volatile earnings.
Liquidity risk is defined as the risk that the Group will be unable to meet its financial obligations as they fall due. These obligations include the repayment of deposits on demand or at their contractual maturity; the repayment of loan capital and other borrowings as they mature; the payment of insurance policy benefits, claims and surrenders; the payment of lease obligations as they become due; the payment of operating expenses and taxation; the payment of dividends to shareholders; the ability to fund new and existing loan commitments; and the ability to take advantage of new business opportunities.
The international standard for measuring capital adequacy is the risk asset ratio, which relates to on- and off-balance sheet exposures weighted according to broad categories of risk. The Group’s capital ratios, calculated in line with the requirements of the FSA, are set out in detail on page 63.
Risk appetite
Financial soundness risk appetite is set and reported through various metrics that enable the Group to manage liquidity and capital constraints and shareholder expectations.
Exposures
The principal financial soundness risk uncertainties relate to liquidity and capital adequacy and each of these sources of risk is described in more detail below.
60
| |
Operating and financial review and prospects | Audited information |
Liquidity and capital resources
Liquidity sources
The principal sources of liquidity for Lloyds TSB Group plc are dividends received from its directly owned subsidiary company, Lloyds TSB Bank, and loans from this and other Lloyds TSB Group companies. The ability of Lloyds TSB Bank to pay dividends, or for Lloyds TSB Bank or other Lloyds TSB Group companies to make loans to Lloyds TSB Group plc, depends on a number of factors, including their own regulatory capital requirements, distributable reserves and financial performance.
Lloyds TSB Group plc is also able to raise funds by issuing loan capital or equity, although in practice the majority of Lloyds TSB Group’s loan capital has been issued by Lloyds TSB Bank. As at 31 December 2006, Lloyds TSB Group plc had £2,297 million of subordinated debt in issuance compared with £12,072 million for the consolidated Lloyds TSB Group. The cost and availability of subordinated debt finance are influenced by credit ratings. A reduction in these ratings could increase the cost and could reduce market access. At 31 December 2006, the credit ratings of Lloyds TSB Bank were as follows:
| | |
| Senior debt | |
| | | |
Moody’s | Aaa | |
Standard & Poor’s | AA | |
Fitch | AA + | |
| | | |
The ratings outlook from Moody’s, Standard & Poor’s and Fitch for Lloyds TSB Bank is stable. These credit ratings are not a recommendation to buy, hold or sell any security; and each rating should be evaluated independently of every other rating.
A significant part of the liquidity of the Lloyds TSB Group’s banking businesses arises from their ability to generate customer deposits. A substantial proportion of the customer deposit base is made up of current and savings accounts which, although repayable on demand, have traditionally provided a stable source of funding. During 2006, amounts deposited by customers increased by £8,272 million from £131,070 million at 31 December 2005 to £139,342 million at 31 December 2006. These customer deposits are supplemented by the issue of subordinated loan capital and wholesale funding sources in the capital markets, as well as from direct customer contracts. Wholesale funding sources include deposits taken on the inter-bank market, certificates of deposit, sale and repurchase agreements, a Euro Medium-Term Note programme, of which £6,806 million had been utilised for senior funding at 31 December 2006, and commercial paper programmes, under which £2,343 million had been utilised at 31 December 2006. The Group has also raised wholesale funding via the issuance of Residential Mortgage Backed Securities; £10,048 million was outstanding at 31 December 2006.
The ability to sell assets quickly is also an important source of liquidity for the Lloyds TSB Group’s banking businesses. The Lloyds TSB Group holds sizeable balances of marketable debt securities which could be disposed of to provide additional funding should the need arise.
| |
The following table sets out the amounts and maturities of Lloyds TSB Group’s contractual cash obligations at 31 December 2006 | (unaudited) |
| | | | | | | | | | | | | | | | |
| | Within
one year
£m | | One to
three years
£m | | Three to
five years
£m | | Over five
years
£m | | Total
£m | |
| | |
Long-term debt – dated | | | 300 | | | 459 | | | 1,094 | | | 2,399 | | | 4,252 | |
Euro Medium-Term Note programme | | | 417 | | | 799 | | | 978 | | | 4,612 | | | 6,806 | |
Commercial paper programme | | | 2,343 | | | — | | | — | | | — | | | 2,343 | |
Securitisation vehicles | | | 11,578 | | | 3,767 | | | 3,505 | | | 1,923 | | | 20,773 | |
Finance leases | | | 1 | | | — | | | — | | | 15 | | | 16 | |
Operating leases | | | 212 | | | 398 | | | 335 | | | 835 | | | 1,780 | |
Capital commitments | | | 129 | | | 31 | | | — | | | — | | | 160 | |
Other purchase obligations | | | 532 | | | 687 | | | 295 | | | 64 | | | 1,578 | |
| | | | | | | | | | | | | | | | | |
| | | 15,512 | | | 6,141 | | | 6,207 | | | 9,848 | | | 37,708 | |
| | | | | | | | | | | | | | | | | |
Other purchase obligations include amounts expected to be payable in respect of material contracts entered into by the Lloyds TSB Group, in the ordinary course of business, for the provision of outsourced and other services. The cost of these services will be charged to the income statement as it is incurred. The Lloyds TSB Group also has a constructive obligation to ensure that its defined post-retirement benefit schemes remain adequately funded. The amount and timing of the Lloyds TSB Group’s cash contributions to these schemes is uncertain and will be affected by factors such as future investment returns and demographic changes. Lloyds TSB Group expects to make cash contributions of approximately £530 million to these schemes in 2007.
At 31 December 2006, Lloyds TSB Group also had £7,820 million of preferred securities and undated subordinated liabilities outstanding.
| |
Off–balance sheet arrangements | (unaudited) |
The following table sets out the amounts and maturities of Lloyds TSB Group’s other commercial commitments at 31 December 2006. These commitments are not included in Lloyds TSB Group’s consolidated balance sheet.
| | | | | | | | | | | | | | | |
| | Within
one year
£m | | One to
three years
£m | | Three to
five years
£m | | Over five
years
£m | | Total
£m |
| | | | | | | | | | | |
Acceptances | | | 62 | | | 1 | | | — | | | — | | | 63 |
Other contingent liabilities | | | 953 | | | 976 | | | 263 | | | 522 | | | 2,714 |
| | | | | | | | | | | | | | | | |
Total contingent liabilities | | | 1,015 | | | 977 | | | 263 | | | 522 | | | 2,777 |
| | | | | | | | | | | | | | | | |
Lending commitments | | | 56,019 | | | 11,310 | | | 11,050 | | | 3,900 | | | 82,279 |
Other commitments | | | 5,945 | | | 109 | | | 23 | | | 61 | | | 6,138 |
| | | | | | | | | | | | | | | | |
Total commitments | | | 61,964 | | | 11,419 | | | 11,073 | | | 3,961 | | | 88,417 |
| | | | | | | | | | | | | | | | |
Total contingents and commitments | | | 62,979 | | | 12,396 | | | 11,336 | | | 4,483 | | | 91,194 |
| | | | | | | | | | | | | | | | |
61
| |
Operating and financial review and prospects | Audited information |
Lending commitments are agreements to lend to customers in accordance with contractual provisions; these are either for a specified period or, as in the case of credit cards and overdrafts, represent a revolving credit facility which can be drawn down at any time, provided that the agreement has not been terminated. The total amounts of unused commitments do not necessarily represent future cash requirements, in that commitments often expire without being drawn upon.
As explained in note 46 to the Consolidated Financial Statements, since 1 January 2006 all of the Lloyds TSB Group’s financial guarantee contracts have been accounted for as financial instruments and measured at fair value on the balance sheet. The contractual nominal amounts of these guarantees totalled £8,139 million at 31 December 2006 (with £4,679 million expiring within one year; £802 million between one and three years; £1,499 million between three and five years; and £1,159 million over five years).
Lloyds TSB Group’s banking businesses are also exposed to liquidity risk through the provision of securitisation facilities to certain corporate customers. Lloyds TSB Group currently offers securitisation facilities to its corporate and financial institution client base through two conduit securitisation vehicles, Cancara Asset Securitisation Limited (‘Cancara’) and Obelisk Funding (No.2) Limited (‘Obelisk’). These are funded in the global asset-backed commercial paper market. The assets and obligations of Cancara and Obelisk are included in Lloyds TSB Group’s consolidated balance sheet. Lloyds TSB Group provides short-term asset-backed commercial paper liquidity support facilities on commercial terms to the issuers of the commercial paper, for use in the event of a market disturbance should they be unable to roll over maturing commercial paper or obtain alternative sources of funding.
As at 31 December 2006 Cancara and Obelisk held assets of £10,913 million, primarily loans and investments. Lloyds TSB Bank provided asset-backed commercial paper liquidity support facilities of £12,412 million.
During 2006 the Lloyds TSB Group securitised part of its residential mortgage portfolio by transferring beneficial interests in those mortgages to special purpose entities which issued floating rate debt securities. At 31 December 2006 the total amount of residential mortgages subject to securitisation was £14,927 million in respect of which external funding at the year end amounted to £10,048 million. The successful development of the Lloyds TSB Group’s ability to securitise its own assets has provided a mechanism to tap a well established market, thereby diversifying the Lloyds TSB Group’s funding base. For further details, see note 18 to the Consolidated Financial Statements.
Within Lloyds TSB Group’s insurance and investments businesses, the principal sources of liquidity are premiums received from policyholders, charges levied upon policyholders, investment income and the proceeds from the sale and maturity of investments. The investment policies followed by Lloyds TSB Group’s life assurance companies take account of anticipated cash flow requirements including by matching the cash inflows with projected liabilities where appropriate. Cash deposits and highly liquid government securities are available to provide liquidity to cover any higher than expected cash outflows.
Based upon the levels of resources within the banking and insurance and investments businesses and the ability of Lloyds TSB Group to access the wholesale money markets or issue debt securities should the need arise, Lloyds TSB Group believes that its overall liquidity is sufficient to meet current obligations to customers, policyholders and debt holders, support expectations for future changes in asset and liability levels and carry on normal operations.
Capital resources
The total capital resources of Lloyds TSB Group are set out below:
| | | | | | | | | | |
| | 31 December
2006
£m | | | 31 December
2005
£m | | | 31 December
2004
£m | | |
| | | | | | | | | | | |
| | | | | | | | | | |
Called-up share capital | | 1,429 | | | 1,420 | | | 1,419 | | |
Share premium account | | 1,266 | | | 1,170 | | | 1,145 | | |
Other reserves | | 355 | | | 383 | | | 343 | | |
Retained profits | | 8,105 | | | 7,222 | | | 8,140 | | |
Shareholders’ equity | | 11,155 | | | 10,195 | | | 11,047 | | |
Minority interests | | 352 | | | 435 | | | 631 | | |
| | | | | | | | | | | |
| | 11,507 | | | 10,630 | | | 11,678 | | |
Preferred securities | | 2,957 | | | 2,549 | | | 1,388 | | |
Undated subordinated liabilities | | 4,863 | | | 5,184 | | | 4,464 | | |
Dated subordinated liabilities | | 4,252 | | | 4,669 | | | 4,400 | | |
| | | | | | | | | | | |
| | 23,579 | | | 23,032 | | | 21,930 | | |
| | | | | | | | | | | |
Lloyds TSB Group’s total capital resources increased by £547 million during 2006. Shareholders’ equity increased by £960 million as a result of the profit for the year, after dividends. Minority interests were £83 million lower as a result of the wind-down of property investment vehicles in Scottish Widows. Overall, preferred securities and other subordinated liabilities were £330 million lower, as the two issues of preference shares by Lloyds TSB Group plc have been more than offset by the repayment of other issues and the negative impact of exchange and other market movements.
Group regulatory capital ratios
The international standard for measuring capital adequacy is the risk asset ratio, which relates regulatory capital to balance sheet assets and off-balance sheet exposures weighted according to broad categories of risk.
The Group’s regulatory capital is divided into tiers defined by the European Community Banking Consolidation Directive as implemented in the UK by the FSA’s Interim Prudential Sourcebook for Banks. Tier 1 comprises mainly shareholders’ equity, tier 1 capital instruments and minority interests, after deducting goodwill and other intangible assets. Tier 2 comprises collective impairment provisions, and qualifying subordinated loan capital, with restrictions on the amount of collective impairment provisions and loan capital which may be included. The amount of qualifying tier 2 capital cannot exceed that of tier 1 capital. Total capital is reduced by deducting investments in subsidiaries and associates which are not consolidated for regulatory purposes and investments in the capital of other credit/financial institutions. In the case of Lloyds TSB Group, this means that the net assets of its life assurance and general insurance businesses are deducted from its regulatory capital.
Risk-weighted assets are determined according to a broad categorisation of the nature of each asset or exposure and counterparty and, for the trading book, by taking into account market-related risks.
The risk asset ratios as at 31 December 2006 and 31 December 2005 are shown below and, in order to provide a meaningful comparison, a risk asset ratio as at 1 January 2005 is also shown, since this is the date from which IAS 39 and IFRS 4 were applied. A risk asset ratio on a UK GAAP basis is also shown as at 31 December 2004.
62
Operating and financial review and prospects
| | | | | | | | | | |
IFRS | | 31 December
2006
£m | | 31 December
2005
£m | | 1 January
2005
£m | |
| | | | | | | | | | | |
Capital: | | | | | | | | | | |
Tier 1 | | | 12,828 | | | 11,478 | | | 10,753 | |
Tier 2 | | | 9,965 | | | 10,447 | | | 8,767 | |
| | | | | | | | | | | |
| | | 22,793 | | | 21,925 | | | 19,520 | |
Supervisory deductions | | | (6,158 | ) | | (6,160 | ) | | (6,219 | ) |
| | | | | | | | | | | |
Total regulatory capital | | | 16,635 | | | 15,765 | | | 13,301 | |
| | | | | | | | | | | |
Total risk-weighted assets | | | 156,043 | | | 144,921 | | | 131,830 | |
| | | | | | | | | | | |
Risk asset ratios: | | | | | | | | | | |
Total capital | | | 10.7 | % | | 10.9 | % | | 10.1 | % |
Tier 1 | | | 8.2 | % | | 7.9 | % | | 8.2 | % |
| | | | | | | | | | | |
| | | | | | | | | | |
| | | | | | | | | 31 December | |
| | | | | | | | | 2004 | |
UK GAAP | | | | | | | | | £m | |
| | | | | | | | | | | |
Capital: | | | | | | | | | | |
Tier 1 | | | | | | | | | 11,725 | |
Tier 2 | | | | | | | | | 8,800 | |
| | | | | | | | | | | |
| | | | | | | | | 20,525 | |
Supervisory deductions | | | | | | | | | (7,252 | ) |
| | | | | | | | | | | |
Total regulatory capital | | | | | | | | | 13,273 | |
| | | | | | | | | | | |
Total risk-weighted assets | | | | | | | | | 132,173 | |
| | | | | | | | | | | |
Risk asset ratios: | | | | | | | | | | |
Total capital | | | | | | | | | 10.0 | % |
Tier 1 | | | | | | | | | 8.9 | % |
| | | | | | | | | | | |
At 31 December 2006, the risk asset ratios were 10.7 per cent for total capital and 8.2 per cent for tier 1 capital.
The Lloyds TSB Group’s capital management policy is focused on optimising value for shareholders. There is a clear focus on delivering organic growth and expected capital retentions are sufficient to support planned levels of growth. However, management also wishes to maintain the flexibility to make value enhancing ‘in market’ acquisitions and therefore, at this stage, there are no plans to return capital to shareholders other than by way of dividend payments. Management will keep all options for the utilisation of capital under review.
The Group is making good progress in its preparations for the introduction of Basel II, and our credit risk waiver application was submitted in December 2006. Whilst our work is well advanced, some uncertainty remains with regard to the regulatory treatment of certain issues for capital purposes. The Group expects to maintain satisfactory capital ratios throughout the transition to Basel II in 2008, and continues to expect no deduction of investments in existing insurance subsidiaries from tier 1 capital until at least 2012.
There are strict limits imposed by the regulatory authorities as to the proportion of the Lloyds TSB Group’s regulatory capital base that can be made up of subordinated debt and preferred securities. The unpredictable nature of movements in the value of the investments supporting the long-term assurance funds could cause the amount of qualifying tier 2 capital to be restricted because of falling tier 1 resources. The Lloyds TSB Group seeks to ensure that even in the event of such restrictions the total capital ratio will remain adequate.
During 2006, total capital for regulatory purposes increased by £870 million to £16,635 million. Tier 1 capital increased by £1,350 million, as a result of profit retentions and issuance of capital instruments, in part offset by cash contributions into the defined benefit pension schemes. Tier 2 capital decreased by £482 million following loan capital redemptions and the negative impact of exchange movements. There was a decrease in supervisory deductions of £2 million, as profits for the year within the insurance and investment businesses were offset by dividends paid out.
| |
Control | (Audited information) |
In addition to complying with the FSA’s regulatory reporting framework, and similar regulatory/statutory requirements in other jurisdictions, the Group uses a number of internal tools to measure and control liquidity risk, detailed in the liquidity policy. These range from shorter term tactical measures (which include net cash flow profiles and various liquidity ratios) to longer term, more strategic analyses of the overall liquidity of the balance sheet. The reporting framework ensures that the relevant risk control functions have appropriate oversight, and the group asset and liability committee provides strategic direction for liquidity risk management.
For non-linked funds, investments are arranged to minimise the possibility of being a distressed seller whilst at the same time investing to meet policyholder obligations. For unit-linked business, deferral provisions are designed to give time to realise linked assets without being a forced seller.
Lloyds TSB Group and its regulated subsidiary banks have been allocated an Individual Capital Ratio by the FSA, and the board has agreed a formal buffer to be maintained in addition to the Individual Capital Ratio. Any breaches of the formal buffer must be notified to the FSA, together with proposed remedial action. No such notifications have been made during 2006.
Capital ratios are a key factor in the Lloyds TSB Group’s budgeting and planning processes and updates of expected ratios are prepared regularly during the year. Capital raised takes account of expected growth and currency of risk assets.
63
| |
Operating and financial review and prospects | Audited information |
The Group seeks to use appropriate accounting policies, consistently applied and supported by reasonable and prudent judgements and estimates. Each reporting entity within the Group has a finance function which is responsible for the production of financial, management and regulatory information. It is the responsibility of Group Finance to produce consolidated information for use internally and to meet external regulatory and statutory reporting requirements. Group Finance requires businesses and reporting entities to follow common processes and reporting standards.
Businesses or reporting entities have formal month-end and quarter-end procedures in place for preparation of management and financial accounts respectively, review and approval of management accounts at a determined level of detail, ensuring consistency with financial accounts, and preparation of forecasts and detailed annual budgets that are subject to formal review and approval. They are further required to implement measures to monitor performance at local level to identify significant fluctuations or unusual activity.
Life assurance businesses
Basis of determining regulatory capital of the life assurance businesses
Available capital resources
Available capital resources represent the excess of assets over liabilities calculated in accordance with detailed regulatory rules issued by the FSA. Different rules apply depending on the nature of the fund, as detailed below.
Statutory basis. Assets are generally valued on a basis consistent with that used for accounting purposes (with the exception that, in certain cases, the value attributed to assets is limited) and which follows a market value approach where possible. The liabilities are calculated using a projection of future cash flows after making prudent assumptions about matters such as investment return, expenses and mortality. Discount rates used to value the liabilities are set with reference to the risk adjusted yields on the underlying assets in accordance with the FSA rules. Other assumptions are based on recent actual experience, supplemented by industry information where appropriate. The assessment of liabilities does not include future bonuses for with-profits policies that are at the discretion of the company, but does include a value for policyholder options likely to be exercised.
‘Realistic’ basis. The FSA requires each life assurance company which contains a with-profits fund in excess of £500 million, including Scottish Widows plc (‘Scottish Widows’), to carry out a ‘realistic’ valuation of that fund. The word ‘realistic’ in this context reflects the terminology used for reporting to the FSA and is an assessment of the financial position of a with-profits fund calculated under a prescribed methodology.
The valuation of with-profits assets in a with-profits fund on a realistic basis differs from the valuation on a statutory basis as, in respect of non-profits business written in a with-profits fund (a relatively small amount of business in the case of Scottish Widows), it includes the present value of the anticipated future release of the prudent margins for adverse deviation. The realistic valuation uses the market value of assets without the limit affecting the statutory basis noted above.
The realistic valuation of liabilities is carried out using a stochastic simulation model which values liabilities on a basis consistent with tradable market option contracts (a ‘market-consistent’ basis). The model takes account of policyholder behaviour on a best-estimate basis and includes an adjustment to reflect future uncertainties where the exercise of options by policyholders might increase liabilities. Further details regarding the stochastic simulation model are given below in the section entitled ‘Options and guarantees’.
Regulatory capital requirements
Each life assurance company must retain sufficient capital to meet the regulatory capital requirements mandated by the FSA; the basis of calculating the regulatory capital requirement is given below. For Abbey Life Assurance Company Limited (‘Abbey Life’), the regulatory capital requirement is a combination of amounts held in respect of actuarial reserves, sums at risk and maintenance expenses (the Long-Term Insurance Capital Requirement) and amounts required to cover various stress tests. The regulatory capital requirement is deducted from the available capital resources to give ‘statutory excess capital’.
For Scottish Widows, no amount is required to cover the impact of stress tests on the actuarial reserves. However, a further test is required in respect of the With Profit Fund which compares the level of ‘realistic excess capital’ to the ‘statutory excess capital’ of the With Profit Fund. In circumstances where the ‘realistic excess capital’ position is less than ‘statutory excess capital’, the company is required to hold additional capital to cover the shortfall but only to the extent it exceeds the value, calculated in a prescribed way, of internal transfers from the With Profit Fund. Any additional capital requirement under this test is referred to as the With Profit Insurance Capital Component. The ‘realistic excess capital’ is calculated as the difference between realistic assets and realistic liabilities of the With Profit Fund with a further deduction to cover various stress tests.
The determination of realistic liabilities of the With Profit Fund in respect of Scottish Widows includes the value of internal transfers expected to be made from the With Profit Fund to the Non-Participating Fund of Scottish Widows. These internal transfers include charges on policies where the associated costs are borne by the Non-Participating Fund. The With Profit Insurance Capital Component is reduced by the value, calculated in the stress test scenario, of these internal transfers, but only to the extent that credit has not been taken for the value of these charges in deriving actuarial reserves for the Non-Participating Fund.
64
| |
Operating and financial review and prospects | Audited information |
Capital statement
The following table provides more detail regarding the sources of capital in the life assurance business. The figures that follow on pages 65 to 67 below are those quoted in the Lloyds TSB Group’s Annual Report and Accounts and were based on management’s expectation at that time, pending completion of the annual financial return to the FSA. The annual return has subsequently been submitted to the FSA and the figures therein were not materially different.
| | | | | | | | | | | |
| | With Profit
Fund
£m | | Non-
Participating
Fund
£m | | Total
Long Term
Fund
£m | | Shareholder
Fund
£m | | Total
£m | |
| | | | | | | | | | | | |
As at 31 December 2006 | | | | | | | | | | | |
Assets attributable to the shareholder held outside the long-term funds | | — | | — | | — | | 1,947 | | 1,947 | |
Assets attributable to the shareholder held within the long-term funds | | — | | 2,317 | | 2,317 | | — | | 2,317 | |
| | | | | | | | | | | | |
Total shareholders’ funds | | — | | 2,317 | | 2,317 | | 1,947 | | 4,264 | |
Adjustments onto a regulatory basis: | | | | | | | | | | | |
Life assurance business
Unallocated surplus within insurance business | | 631 | | — | | 631 | | — | | 631 | |
Adjustments to remove differences between IFRS and regulatory valuation of assets and liabilities | | — | | (109 | ) | (109 | ) | (855 | ) | (964 | ) |
Adjustment to include estimated ‘realistic’ liabilities payable to the shareholder | | (693 | ) | — | | (693 | ) | — | | (693 | ) |
Adjustment to replace ‘realistic’ liabilities with statutory liabilities | | 3,721 | | — | | 3,721 | | — | | 3,721 | |
Adjustment to remove the value of future profits recognised in respect of non-participating contracts written in the With Profit Fund | | (32 | ) | — | | (32 | ) | — | | (32 | ) |
Recognition of future profits for regulatory capital purposes | | — | | — | | — | | — | | — | |
Qualifying loan capital | | — | | — | | — | | 525 | | 525 | |
| | | | | | | | | | | | |
Available capital resources | | 3,627 | | 2,208 | | 5,835 | | 1,617 | | 7,452 | |
| | | | | | | | | | | | |
The figures shown above for available capital resources within the insurance business relate to Scottish Widows plc only. The amounts relating to the other life assurance subsidiaries within the Group are not significant.
The comparative position as at 31 December 2005 was as follows (again, relating to Scottish Widows plc only):
| | | | | | | | | | | |
| | With Profit
Fund
£m | | Non-
Participating
Fund
£m | | Total
Long Term
Fund
£m | | Shareholder
Fund
£m | | Total
£m | |
| | | | | | | | | | | | |
As at 31 December 2005 | | | | | | | | | | | |
Assets attributable to the shareholder held outside the long-term funds | | — | | — | | — | | 1,513 | | 1,513 | |
Assets attributable to the shareholder held within the long-term funds | | — | | 2,619 | | 2,619 | | — | | 2,619 | |
| | | | | | | | | | | | |
Total shareholders’ funds | | — | | 2,619 | | 2,619 | | 1,513 | | 4,132 | |
Adjustments onto a regulatory basis: | | | | | | | | | | | |
Life assurance business
Unallocated surplus within insurance business | | 494 | | — | | 494 | | — | | 494 | |
Adjustments to remove differences between IFRS and regulatory valuation of assets and liabilities | | — | | (456 | ) | (456 | ) | (767 | ) | (1,223 | ) |
Adjustment to include estimated ‘realistic’ liabilities payable to the shareholder | | (729 | ) | — | | (729 | ) | — | | (729 | ) |
Adjustment to replace ‘realistic’ liabilities with statutory liabilities | | 2,580 | | — | | 2,580 | | — | | 2,580 | |
Adjustment to remove the value of future profits recognised in respect of non-participating contracts written in the With Profit Fund | | (43 | ) | — | | (43 | ) | — | | (43 | ) |
Recognition of future profits for regulatory capital purposes | | — | | 500 | | 500 | | — | | 500 | |
Qualifying loan capital | | — | | — | | — | | 561 | | 561 | |
| | | | | | | | | | | | |
Available capital resources | | 2,302 | | 2,663 | | 4,965 | | 1,307 | | 6,272 | |
| | | | | | | | | | | | |
Formal intra-group capital arrangements
Scottish Widows has a formal arrangement with one of its subsidiary undertakings, Scottish Widows Unit Funds Limited, whereby the subsidiary company can draw down capital from Scottish Widows to finance new business which is reinsured from the parent to its subsidiary. Scottish Widows has also provided subordinated loans to its subsidiary Scottish Widows Annuities Limited and its fellow group undertaking Scottish Widows Bank plc.
Constraints over available capital resources
Scottish Widows was created following the demutualisation of Scottish Widows Fund and Life Assurance Society in 2000. The terms of the demutualisation are governed by a Court-approved Scheme of Transfer (the ‘Scheme’) which, inter alia, created a With Profit Fund and a Non-Participating Fund and established protected capital support for the with-profits policyholders in existence at the date of demutualisation. Much of that capital support is held in the Non-Participating Fund and, as such, the capital held in that fund is subject to the constraints noted below.
Requirement to maintain a Support Account:
The Scheme requires the maintenance of a ‘Support Account’ within the Non-Participating Fund. The quantum of the Support Account is calculated with reference to the value of assets backing current with-profits policies which also existed at the date of demutualisation and must be maintained until the value of these assets reaches a minimum level. Assets can only be transferred from the Non-Participating Fund if the value of the remaining assets in the fund exceeds the value of the Support Account. Scottish Widows has obtained from the FSA permission to include the value of the Support Account in assessing the realistic value of assets available to the With Profit Fund. At 31 December 2006, the estimated value of surplus admissible assets in the Non-Participating Fund was £2,208 million (31 December 2005: £2,163 million) and the estimated value of the Support Account was £964 million (31 December 2005: £1,115 million).
65
| |
Operating and financial review and prospects | Audited information |
Further Support Account:
The Further Support Account is an extra tier of capital support for the with-profits policies in existence at the date of demutualisation. The Scheme requires that assets can only be transferred from the Non-Participating Fund if the economic value of the remaining assets in the fund exceeds the aggregate of the Support Account and Further Support Account. Unlike the Support Account test, the economic value used for this test includes both admissible assets and the present value of future profits of business written in the Non-Participating Fund or by any subsidiaries of that fund. The balance of the Further Support Account is expected to reduce to nil by the year 2030. At 31 December 2006, the estimated net economic value of the Non-Participating Fund and its subsidiaries for the purposes of this test was £4,219 million (31 December 2005: £4,140 million) and the estimated combined value of the Support Account and Further Support Account was £2,869 million (31 December 2005: £2,836 million).
Other restrictions in the Non-Participating Fund:
In addition to the policies which existed at the date of demutualisation, the With Profit Fund includes policies which have been written since that date. As a result of statements made to policyholders that investment policy will usually be the same for both types of business, there is an implicit requirement to hold additional regulatory assets in respect of the business written after demutualisation. The estimated amount required to provide such support at 31 December 2006 is £210 million (31 December 2005: £267 million). Scottish Widows has obtained from the FSA permission to include the value of this support in assessing the realistic value of assets available to the With Profit Fund. There is a further test requiring that no amounts can be transferred from the Non-Participating Fund of Scottish Widows unless there are sufficient assets within the Long Term Fund to meet both policyholders’ reasonable expectations in light of liabilities in force at a year end and the new business expected to be written over the following year.
Movements in regulatory capital
The movements in Scottish Widows plc’s available capital resources can be analysed as follows:
| | | | | | | | | | | | | | | | |
| | With Profit
Fund
£m | | Non-
Participating
Fund
£m | | Total
Long Term
Fund
£m | | Shareholder
Fund
£m | | Total
£m | |
| | |
As at 31 December 2005 | | | 2,302 | | | 2,663 | | | 4,965 | | | 1,307 | | | 6,272 | |
Changes in assumptions used to measure life assurance liabilities | | | 208 | | | (29 | ) | | 179 | | | — | | | 179 | |
Dividends and capital transfers | | | — | | | (750 | ) | | (750 | ) | | 499 | | | (251 | ) |
Changes in regulatory requirements | | | — | | | 155 | | | 155 | | | 26 | | | 181 | |
New business and other factors | | | 1,117 | | | 169 | | | 1,286 | | | (215 | ) | | 1,071 | |
| | |
As at 31 December 2006 | | | 3,627 | | | 2,208 | | | 5,835 | | | 1,617 | | | 7,452 | |
| | |
The primary reasons for the movement in total available capital resources during the year are as follows:
With Profit Fund:
Available capital in the With Profit Fund has increased from £2,302 million at 31 December 2005 to an estimated £3,627 million at 31 December 2006 primarily as a result of strong investment market performance.
Non-Participating Fund:
Available capital in the Non-Participating Fund has decreased from £2,663 million at 31 December 2005 to an estimated £2,208 million at 31 December 2006. This is primarily a result of a proposed transfer from the Non-Participating Fund to the Shareholder Fund at the year end of £750 million, offset by regulatory changes which reduced liabilities and by the return generated from the business.
Shareholder Fund:
Available capital in the Shareholder Fund has increased from £1,307 million at 31 December 2005 to an estimated £1,617 million at 31 December 2006. During the year Scottish Widows Unit Trust Managers Limited was purchased at its market value of £380 million, and was written down to £47 million as required by the regulations. The resultant reduction in capital, together with dividends paid of £251 million, is offset by the proposed transfer from the Non-Participating Fund noted above and by net investment returns.
Financial information calculated on a ‘realistic’ basis
The estimated financial position of the With Profit Fund of Scottish Widows at 31 December 2006, calculated on a ‘realistic’ basis, is given in the following table, in the form reported to the FSA. As a result of the capital support arrangements, it is considered appropriate to also disclose the estimated ‘realistic’ financial position of the Long Term Fund of Scottish Widows as a whole, which consists of both the With Profit Fund and the Non-Participating Fund.
| | | | | | | | | | | | | |
| | 31 December 20061 | | 31 December 20052 | |
| | | | | |
| | With Profit
Fund
£m | | Long Term
Fund
£m | | With Profit
Fund
£m | | Long Term
Fund
£m | |
| | |
Realistic value of assets of fund | | | 18,121 | | | 22,330 | | | 19,018 | | | 23,242 | |
Support arrangement assets | | | 1,174 | | | — | | | 1,115 | | | — | |
| | |
Realistic value of assets available to the fund | | | 19,295 | | | 22,330 | | | 20,133 | | | 23,242 | |
Realistic value of liabilities of fund | | | (18,183 | ) | | (18,111 | ) | | (19,253 | ) | | (19,102 | ) |
| | |
Working capital for fund | | | 1,112 | | | 4,219 | | | 880 | | | 4,140 | |
| | |
Working capital ratio for fund | | | 5.8% | | | 18.9% | | | 4.4% | | | 17.8% | |
| | |
| |
1 | Subsequent to completion of Lloyds TSB Group’s Annual Report and Accounts, final revisions to the Scottish Widows admissable asset values led to changes in the working capital ratio for the Long Term Fund. The actual year end working capital ratio for the Long Term Fund was 17.9 per cent with the ratio for the With Profits Fund unchanged at 5.8 per cent. |
| |
2 | Subsequent to publication of the 2005 results, Scottish Widows obtained from the FSA permission to include the value of additional support assets in respect of policies written since demutualisation in assessing the realistic value of assets available to the With Profit Fund. The actual year end working capital ratios for the With Profit Fund and the Long Term Fund based on information from the final FSA returns were 5.5 per cent and 17.7 per cent respectively. |
66
| |
Operating and financial review and prospects | Audited information |
The financial information calculated on a ‘realistic’ basis reconciles to the Capital statement as follows:
| | | | | | | | | | | | | |
| | 31 December 2006 | | 31 December 2005 | |
| | | | | |
| | With Profit
Fund
£m | | Long Term
Fund
£m | | With Profit
Fund
£m | | Long Term
Fund
£m | |
| | |
Available regulatory capital | | | 3,627 | | | 5,835 | | | 2,302 | | | 4,965 | |
Support arrangement assets | | | 1,174 | | | — | | | 1,115 | | | — | |
Adjustments to replace statutory liabilities with ‘realistic’ liabilities | | | (3,721 | ) | | (3,544 | ) | | (2,580 | ) | | (2,291 | ) |
Adjustments to include the value of future profits recognised | | | | | | | | | | | | | |
in respect of Non-Participating business written in the With Profit Fund | | | 32 | | | 32 | | | 43 | | | 43 | |
Removal of future profits allowable for regulatory capital purposes | | | — | | | — | | | — | | | (500 | ) |
Recognition of future profits allowable for ‘realistic’ capital purposes | | | — | | | 1,896 | | | — | | | 1,923 | |
| | |
| | | 1,112 | | | 4,219 | | | 880 | | | 4,140 | |
| | |
Analysis of policyholder liabilities in respect of the Group’s life assurance business:
| | | | | | | | | | |
| | Scottish Widows plc
With Profit Fund
(in accordance
with FRS 27)
£m | | Other long-
term funds
£m | | Total life
business
£m | |
| | |
As at 31 December 2006 | | | | | | | | | | |
With Profit Fund liabilities | | | 17,827 | | | 116 | | | 17,943 | |
Unit-linked business (excluding that accounted for as investment contracts) | | | — | | | 12,734 | | | 12,734 | |
Other life assurance business | | | — | | | 10,181 | | | 10,181 | |
| | |
Insurance and participating investment contract liabilities | | | 17,827 | | | 23,031 | | | 40,858 | |
Non-participating investment contract liabilities | | | — | | | 24,370 | | | 24,370 | |
| | |
Total policyholder liabilities | | | 17,827 | | | 47,401 | | | 65,228 | |
| | |
| | | | | | | | | | |
| | Scottish Widows plc
With Profit Fund
(in accordance
with FRS 27)
£m | | Other long-
term funds
£m | | Total life
business
£m | |
| | |
As at 31 December 2005 | | | | | | | | | | |
With Profit Fund liabilities | | | 18,720 | | | 133 | | | 18,853 | |
Unit-linked business (excluding that accounted for as investment contracts) | | | — | | | 10,779 | | | 10,779 | |
Other life assurance business | | | — | | | 10,324 | | | 10,324 | |
| | |
Insurance and participating investment contract liabilities | | | 18,720 | | | 21,236 | | | 39,956 | |
Non-participating investment contract liabilities | | | — | | | 21,839 | | | 21,839 | |
| | |
Total policyholder liabilities | | | 18,720 | | | 43,075 | | | 61,795 | |
| | |
Capital sensitivities
Shareholders’ funds
Shareholders’ funds outside the long-term business fund, other than those used to match regulatory requirements, are mainly invested in assets that are less sensitive to market conditions.
With Profit Fund
The with-profits realistic liabilities and the available capital for the With Profit Fund are sensitive to both market conditions and changes to a number of non-economic assumptions that affect the valuation of the liabilities of the fund. The available capital resources (and capital requirements) are sensitive to the level of the stock market, with the position worsening at low stock market levels as a result of the guarantees to policyholders increasing in value. However, the exposure to guaranteed annuity options increases under rising stock market levels. An increase in the level of equity volatility implied by the market cost of equity put options also increases the market consistent value of the options given to policyholders and worsens the capital position.
The most critical non-economic assumptions are the level of take-up of options inherent in the contracts (higher take-up rates are more onerous), mortality rates (lower mortality rates are generally more onerous) and lapses prior to dates at which a guarantee would apply (lower lapse rates are generally more onerous where guarantees are in the money). The sensitivity of the capital position and capital requirements of the With Profit Fund is partly mitigated by the actions that can be taken by management.
67
| |
Operating and financial review and prospects | Audited information |
Other long-term funds
Outside the With Profit Fund, assets backing actuarial reserves in respect of policyholder liabilities are invested so that the values of the assets and liabilities are broadly matched. The most critical non-economic assumptions are mortality rates in respect of annuity business written (lower mortality rates are more onerous). Reinsurance arrangements are in place to reduce the Group’s exposure to deteriorating mortality rates in respect of life assurance contracts. In addition, poor cost control would gradually depreciate the available capital and lead to an increase in the valuation of the liabilities (through an increased allowance for future costs).
Assets held in excess of those backing actuarial reserves are invested across a range of investment categories including fixed interest securities, equities, properties and cash. The mix of investments is determined in line with the policy of Lloyds TSB Group to optimise shareholder risk and return. The value of the investments is sensitive to prevailing conditions in the markets selected.
Options and guarantees
The Group has sold insurance products that contain options and guarantees, both within the With Profit Fund and in other funds.
Options and guarantees within the With Profit Fund
The most significant options and guarantees provided from within the With Profit Fund are in respect of guaranteed minimum cash benefits on death, maturity, retirement or certain policy anniversaries, and guaranteed annuity options on retirement for certain pension policies. For those policies written pre-demutualisation containing potentially valuable options and guarantees, under the terms of the Scheme a separate memorandum account was set up within the With Profit Fund of Scottish Widows called the Additional Account which is available, inter alia, to meet any additional costs of providing guaranteed benefits in respect of those policies. The Additional Account had a value at 31 December 2006 of £1.8 billion (2005: £1.7 billion). The eventual cost of providing benefits on policies written both pre and post demutualisation is dependent upon a large number of variables, including future interest rates and equity values, demographic factors, such as persistency and mortality, and the proportion of policyholders who seek to exercise their options. The ultimate cost will therefore not be known for many years.
As noted above, under the realistic capital regime of the FSA, the liabilities of the With Profit Fund are valued using a market-consistent stochastic simulation model. This model is used in order to place a value on the options and guarantees which captures both their intrinsic value and their time value.
The most significant economic assumptions included in the model are:
| |
• | Risk-free yield. The risk-free yield is defined as 0.1 per cent higher than spot yields derived from the UK gilt yield curve |
| |
• | Investment volatility. This is derived from derivatives where possible, or historical observed volatility where it is not possible to observe meaningful prices. For example, as at 31 December 2006, the 10 year equity-implied at-the-money assumption was set at 20 per cent (31 December 2005: 20 per cent). The long-term at-the-money assumption for property was 15 per cent (31 December 2005: 15 per cent). The equivalent assumption for fixed interest stocks was 13 per cent (31 December 2005: 13.5 per cent) |
The model includes a matrix of the correlations between each of the underlying modelled asset types. The correlations used are consistent with long-term historical returns. The most significant non-economic assumptions included in the model are management actions (in respect of investment policy and bonus rates), guaranteed annuity option take-up rates and assumptions regarding persistency (both of which are based on recent actual experience and include an adjustment to reflect future uncertainties where the exercise of options by policyholders might increase liabilities), and assumptions regarding mortality (which are based on recent actual experience and industry tables).
Options and guarantees outside the With Profit Fund of Scottish Widows
Abbey Life currently has a number of policies in force which have a guaranteed annuity option. It holds traditional regulatory reserves of £257 million to cover this liability at 31 December 2006 (£332 million at 31 December 2005). These reserves have been determined using prudent future interest rate, mortality rate and rate of annuity option take-up assumptions and exceed the value that would be placed on them using a market-consistent stochastic model. It is estimated that a 0.5 per cent reduction in future interest rates would increase the liability by some £27 million.
Under some of Abbey Life’s older contracts, the maturity value or the surrender value at the end of the selected period is guaranteed to be not less than total premiums paid or sums assured. The total provision for these options was £4 million at 31 December 2006 (£5 million at 31 December 2005) and was established using stochastic techniques after making prudent assumptions.
In both Abbey Life and Scottish Widows, certain personal pension policyholders, for whom reinstatement to their occupational pension scheme was not an option, have been given a guarantee that their pension and other benefits will correspond in value to the benefits of the relevant occupational pension scheme. The key assumptions affecting the ultimate value of the guarantee are future salary growth, gilt yields at retirement, annuitant mortality at retirement, marital status at retirement and future investment returns. There is currently a provision, calculated on a deterministic basis, of £98 million (31 December 2005: £108 million) in respect of those guarantees. If future salary growth were 0.5 per cent per annum greater than assumed, the liability would increase by some £6 million. If yields were 0.5 per cent lower than assumed, the liability would increase by some £17 million.
68
Operating and financial review and prospects
Investment portfolio, maturities, deposits, short-term borrowings
The tables below have been prepared in accordance with IFRS.
Available-for-sale financial assets and trading securities and other financial assets at fair value through profit or loss (2004: investment securities and other securities)
The following table sets out the book values and valuations of Lloyds TSB Group’s debt securities, treasury and other eligible bills and equity shares at 31 December for each of the three years indicated.
| | | | | | | | | | | | | | | | | | | |
IFRS | | 2006
Book value
£m | | 2006
Valuation
£m | | 2005
Book value
£m | | 2005
Valuation
£m | | 2004
Book value
£m | | 2004
Valuation
£m | |
| | |
Available-for-sale financial assets (2004: investment securities) | | | | | | | | | | | | | | | | | | | |
Bank and building society certificates of deposit | | | 1,615 | | | 1,615 | | | 1,470 | | | 1,470 | | | 1,901 | | | 1,902 | |
Corporate and other debt securities | | | 4,817 | | | 4,817 | | | 3,065 | | | 3,065 | | | 3,721 | | | 3,728 | |
Mortgage backed securities | | | 5,662 | | | 5,662 | | | 4,161 | | | 4,161 | | | 2,774 | | | 2,781 | |
Other asset backed securities | | | 4,721 | | | 4,721 | | | 4,981 | | | 4,981 | | | 3,761 | | | 3,756 | |
Securities of the US treasury and US government agencies | | | 387 | | | 387 | | | 672 | | | 672 | | | 1,665 | | | 1,666 | |
Other government securities | | | 6 | | | 6 | | | 411 | | | 411 | | | 546 | | | 547 | |
Other public sector securities | | | 189 | | | 189 | | | 47 | | | 47 | | | — | | | — | |
Treasury bills and other eligible bills | | | 1,766 | | | 1,766 | | | 87 | | | 87 | | | 88 | | | 90 | |
Equity shares | | | 15 | | | 15 | | | 46 | | | 46 | | | 41 | | | 65 | |
| | |
| | | 19,178 | | | 19,178 | | | 14,940 | | | 14,940 | | | 14,497 | | | 14,535 | |
| | |
Trading securities and other financial assets at fair value through profit or loss (2004: other securities) | | | | | | | | | | | | | | | | | | | |
Securities of the US treasury and US government agencies | | | 138 | | | 138 | | | 186 | | | 186 | | | 164 | | | 164 | |
Other government securities | | | 8,668 | | | 8,668 | | | 10,987 | | | 10,987 | | | 13,854 | | | 13,854 | |
Other public sector securities | | | 44 | | | 44 | | | 119 | | | 119 | | | 321 | | | 321 | |
Bank and building society certificates of deposit | | | 573 | | | 573 | | | 898 | | | 898 | | | 488 | | | 488 | |
Corporate and other debt securities | | | 17,316 | | | 17,316 | | | 13,136 | | | 13,136 | | | 13,445 | | | 13,445 | |
Mortgage backed securities | | | 538 | | | 538 | | | 236 | | | 236 | | | 533 | | | 533 | |
Other asset backed securities | | | 1,456 | | | 1,456 | | | 691 | | | 691 | | | 312 | | | 312 | |
Treasury bills and other eligible bills | | | — | | | — | | | — | | | — | | | 4 | | | 4 | |
Equity shares | | | 38,127 | | | 38,127 | | | 33,505 | | | 33,505 | | | 27,269 | | | 27,269 | |
| | |
| | | 66,860 | | | 66,860 | | | 59,758 | | | 59,758 | | | 56,390 | | | 56,390 | |
| | |
69
Operating and financial review and prospects
Maturities and weighted average yields of interest-bearing securities
The weighted average yield for each range of maturities is calculated by dividing the annualised interest income prevailing at 31 December 2006 by the book value of securities held at that date.
| | | | | | | | | | | | | | | | | | | | | | | | | |
| | Maturing within
one year | | Maturing after one
but within five years | | Maturing after five
but within ten years | | Maturing after
ten years | |
| | Amount
£m | | Yield
% | | Amount
£m | | Yield
% | | Amount
£m | | Yield
% | | Amount
£m | | Yield
% | |
| | |
Available-for-sale financial assets | | | | | | | | | | | | | | | | | | | | | | | | | |
Bank and building society certificates of deposit | | | 1,615 | | | 5.1 | | | — | | | — | | | — | | | — | | | — | | | — | |
Corporate and other debt securities | | | 634 | | | 5.4 | | | 2,795 | | | 5.1 | | | 1,252 | | | 5.0 | | | 136 | | | 3.4 | |
Mortgage backed securities | | | 288 | | | 5.1 | | | 2,584 | | | 5.2 | | | 2,601 | | | 4.9 | | | 189 | | | 4.3 | |
Other asset backed securities | | | 861 | | | 4.5 | | | 1,483 | | | 5.3 | | | 2,199 | | | 5.4 | | | 178 | | | 5.4 | |
US treasury and US government agencies | | | 46 | | | 5.5 | | | 51 | | | 5.8 | | | 191 | | | 5.5 | | | 99 | | | 5.5 | |
Other government securities | | | — | | | — | | | 6 | | | 0.0 | | | — | | | — | | | — | | | — | |
Other public sector securities | | | 189 | | | 5.4 | | | — | | | — | | | — | | | — | | | — | | | — | |
Treasury bills | | | 1,766 | | | 0.1 | | | — | | | — | | | — | | | — | | | — | | | — | |
| | |
| | | 5,399 | | | | | | 6,919 | | | | | | 6,243 | | | | | | 602 | | | | |
| | |
Trading securities and other financial assets at fair value through profit or loss | | | | | | | | | | | | | | | | | | | | | | | | | |
Bank and building society certificates of deposit | | | 573 | | | 5.0 | | | — | | | — | | | — | | | — | | | — | | | — | |
Corporate and other debt securities | | | 896 | | | 4.4 | | | 3,950 | | | 4.5 | | | 3,001 | | | 5.2 | | | 9,469 | | | 4.7 | |
Mortgage backed securities | | | — | | | — | | | 77 | | | 4.3 | | | 208 | | | 4.8 | | | 253 | | | 4.9 | |
Other asset backed securities | | | — | | | — | | | 148 | | | 5.2 | | | 267 | | | 5.2 | | | 1,041 | | | 5.2 | |
US treasury and US government agencies | | | 1 | | | 3.5 | | | 64 | | | 4.2 | | | 40 | | | 4.4 | | | 33 | | | 5.2 | |
Other government securities | | | 670 | | | 3.5 | | | 1,075 | | | 4.5 | | | 2,628 | | | 4.7 | | | 4,295 | | | 4.6 | |
Other public sector securities | | | 2 | | | 12.2 | | | 11 | | | 8.2 | | | — | | | — | | | 31 | | | 5.9 | |
| | |
| | | 2,142 | | | | | | 5,325 | | | | | | 6,144 | | | | | | 15,122 | | | | |
| | |
|
Maturity analysis and interest rate sensitivity of loans and advances to customers and banks as at 31 December 2006 |
| |
The following table analyses the maturity profile and interest rate sensitivity of loans by type on a contractual repayment basis as at 31 December 2006. |
| |
All amounts are before deduction of impairment allowances. Demand loans are included in the ‘maturing in one year or less’ category. |
| | | | | | | | | | | | | | | | | | | | | | | | | |
| | | Maturing in one
year or less
£m | | | Maturing after
one but within
five years
£m | | | Maturing after
five years
£m | | | Total
£m | |
| | |
Domestic | | | | | | | | | | | | | | | | |
Loans and advances to banks | | | 24,225 | | | 7,442 | | | 5,347 | | | 37,014 | |
Loans and advances to customers: | | | | | | | | | | | | | | | | |
– Mortgages | | | 2,372 | | | 12,218 | | | 80,577 | | | 95,167 | |
– Other personal lending | | | 9,978 | | | 11,056 | | | 1,748 | | | 22,782 | |
– Financial, business and other services | | | 12,059 | | | 4,721 | | | 3,965 | | | 20,745 | |
– Lease financing | | | 234 | | | 1,232 | | | 3,336 | | | 4,802 | |
– Hire purchase | | | 1,744 | | | 3,188 | | | 128 | | | 5,060 | |
– Other | | | 18,808 | | | 7,615 | | | 9,910 | | | 36,333 | |
| | |
Total domestic loans | | | 69,420 | | | 47,472 | | | 105,011 | | | 221,903 | |
Total foreign loans | | | 4,177 | | | 3,640 | | | 1,397 | | | 9,214 | |
| | |
Total loans | | | 73,597 | | | 51,112 | | | 106,408 | | | 231,117 | |
| | |
Of which: | | | | | | | | | | | | | |
– Fixed interest rate | | | 39,290 | | | 24,890 | | | 54,457 | | | 118,637 | |
– Variable interest rate | | | 34,307 | | | 26,222 | | | 51,951 | | | 112,480 | |
| | |
70
Operating and financial review and prospects
Deposits
The following tables show the details of Lloyds TSB Group’s average customer deposits in each of the past three years.
| | | | | | | | | | | | | | | | | | | |
IFRS | | 2006
Average
balance
£m | | 2006
Average
rate
% | | 2005
Average
balance
£m | | 2005
Average
rate
% | | 2004
Average
balance
£m | | 2004
Average
rate
% | |
| |
Deposits in domestic offices | | | | | | | | | | | | | | | | | | | |
Non-interest bearing demand deposits | | | 3,862 | | | — | | | 3,636 | | | — | | | 3,134 | | | — | |
Interest-bearing demand deposits | | | 42,643 | | | 1.26 | | | 35,848 | | | 0.52 | | | 29,200 | | | 0.21 | |
Savings deposits | | | 68,686 | | | 3.39 | | | 66,558 | | | 3.65 | | | 62,085 | | | 3.83 | |
Time deposits | | | 13,980 | | | 5.38 | | | 15,216 | | | 4.69 | | | 14,115 | | | 3.71 | |
| |
Total domestic office deposits | | | 129,171 | | | 2.80 | | | 121,258 | | | 2.75 | | | 108,534 | | | 2.73 | |
| |
Deposits in foreign offices | | | | | | | | | | | | | | | | | | | |
Non-interest bearing demand deposits | | | 250 | | | — | | | 267 | | | — | | | 372 | | | — | |
Interest-bearing demand deposits | | | 593 | | | 2.02 | | | 809 | | | 1.11 | | | 673 | | | 0.89 | |
Savings deposits | | | 256 | | | 2.73 | | | 239 | | | 0.84 | | | 285 | | | 1.05 | |
Time deposits | | | 2,393 | | | 4.10 | | | 1,146 | | | 5.32 | | | 1,345 | | | 2.30 | |
| |
Total foreign office deposits | | | 3,492 | | | 3.35 | | | 2,461 | | | 2.93 | | | 2,675 | | | 1.50 | |
| |
Total average deposits | | | 132,663 | | | 2.82 | | | 123,719 | | | 2.75 | | | 111,209 | | | 2.70 | |
| |
Certificates of deposit and other time deposits
The following table gives details of Lloyds TSB Group’s certificates of deposit issued and other time deposits as at 31 December 2006 individually in excess of US$100,000 (or equivalent in another currency) by time remaining to maturity.
| | | | | | | | | | | | | | | | | | | |
| | | | | 3 months
or less
£m | | Over 3 months
but within
6 months
£m | | Over 6 months
but within
12 months
£m | | Over
12 months
£m | | Total
£m | |
| | |
Domestic | | | | | | | | | | | | | | | | | | | |
Certificates of deposit | | | | | | 14,087 | | | 3,306 | | | 4,026 | | | 27 | | | 21,446 | |
Time deposits | | | | | | 32,010 | | | 1,811 | | | 1,484 | | | 1,819 | | | 37,124 | |
| | |
| | | | | | 46,097 | | | 5,117 | | | 5,510 | | | 1,846 | | | 58,570 | |
Foreign | | | | | | | | | | | | | | | | | | | |
Certificates of deposit and other time deposits | | | | | | 12,030 | | | 1,128 | | | 285 | | | 6 | | | 13,449 | |
| | |
Total | | | | | | 58,127 | | | 6,245 | | | 5,795 | | | 1,852 | | | 72,019 | |
| | |
71
Operating and financial review and prospects
Short-term borrowings
Short-term borrowings are included within the balance sheet captions ‘Deposits by banks’, ‘Customer accounts’ and ‘Debt securities in issue’ and are not identified separately on the balance sheet. The short-term borrowings of Lloyds TSB Group consist of overdrafts from banks, securities sold under agreements to repurchase, notes issued as part of the residential mortgage securitisation, certificates of deposit issued, commercial paper and promissory notes issued and other marketable paper. Securities sold under agreements to repurchase, certificates of deposit issued, commercial paper and promissory notes and securitisation notes are the only significant short-term borrowings of Lloyds TSB Group.
The following tables give details of these significant short–term borrowings of Lloyds TSB Group for each of the past three years.
| | | | | | | | | | |
IFRS | | 2006
£m | | 2005
£m | | 2004
£m | |
| | |
Liabilities in respect of securities sold under repurchase agreements | | | | | | | | | | |
Balance at the year end | | | 2,521 | | | 9,434 | | | 10,571 | |
Average balance for the year | | | 5,982 | | | 8,707 | | | 7,112 | |
Maximum balance during the year | | | 10,119 | | | 14,251 | | | 13,096 | |
Average interest rate during the year | | | 4.4% | | | 4.5% | | | 4.5% | |
Interest rate at the year end | | | 4.6% | | | 4.6% | | | 4.6% | |
| | |
Certificates of deposit issued | | | | | | | | | | |
Balance at the year end | | | 25,244 | | | 22,101 | | | 15,226 | |
Average balance for the year | | | 23,289 | | | 22,017 | | | 17,470 | |
Maximum balance during the year | | | 27,510 | | | 27,376 | | | 19,287 | |
Average interest rate during the year | | | 4.7% | | | 4.4% | | | 3.6% | |
Interest rate at the year end | | | 5.2% | | | 4.5% | | | 4.1% | |
| | |
Commercial paper and promissory notes | | | | | | | | | | |
Balance at the year end | | | 13,067 | | | 10,421 | | | 8,026 | |
Average balance for the year | | | 12,004 | | | 8,270 | | | 6,134 | |
Maximum balance during the year | | | 13,458 | | | 10,421 | | | 8,026 | |
Average interest rate during the year | | | 4.6% | | | 3.4% | | | 2.2% | |
Interest rate at the year end | | | 4.0% | | | 2.9% | | | 3.8% | |
| | |
Securitisation notes | | | | | | | | | | |
Balance at the year end | | | 10,048 | | | — | | | — | |
Average balance for the year | | | 1,009 | | | — | | | — | |
Maximum balance during the year | | | 10,048 | | | — | | | — | |
Average interest rate during the year | | | 6.0% | | | — | | | — | |
Interest rate at the year end | | | 5.0% | | | — | | | — | |
| | |
72
Corporate responsibility
Supporting business strategy
In an increasingly competitive market where customers are able to exercise choice among providers, Lloyds TSB Group believes that shareholder value creation is closely linked to customer value creation. It is only by meeting its customers’ needs that Lloyds TSB Group will win the right to a bigger share of their total financial services spend.
Lloyds TSB Group believes that corporate responsibility, built around the creation of employee motivation, customer satisfaction and brand loyalty, has a major part to play in supporting its business strategy. Lloyds TSB Group’s commitment to corporate responsibility helps promote trust in the Lloyds TSB brand and reinforces customer loyalty and advocacy. Lloyds TSB is rooted in local communities throughout the UK and it takes its responsibilities to those communities seriously. By investing in the communities where it operates Lloyds TSB Group believes it not only creates economic value but also makes a positive social contribution. Through the Lloyds TSB Foundations, one per cent of the Lloyds TSB Group’s pre-tax profits, averaged over three years, is distributed to local charities.
The Lloyds TSB Group’s approach to corporate responsibility focuses on five areas: its people, its customers, its suppliers, its community and the environment.
People
Achieving the Lloyds TSB Group’s vision of being the best financial services company in the UK depends on its ability to create a high performance culture. Lloyds TSB Group knows that every high performance company needs committed and motivated staff.
Employee engagement
Recent internal research has shown that it is not just employee satisfaction but employee engagement which is critical to high performance and that it is directly related to key business outcomes such as customer satisfaction, improved business performance and lower staff turnover. So, it is essential that Lloyds TSB Group understands not only how engaged employees are but what the business and managers can do to both encourage and support high levels of engagement throughout the organisation.
Lloyds TSB Group tracks employee engagement using a quarterly engagement index survey, which attracts a consistently high response rate (see page 75).
Equality and diversity
Equality and diversity is not just a legal issue or something which is socially desirable, it is key for competitive advantage. In an ever-tightening employment market, Lloyds TSB Group needs to differentiate itself as an employer of choice to ensure that it attracts and retains the best cross section of talent. The Lloyds TSB Group also needs to be close to its customers, to understand their needs and provide them with the right products and services. By attracting and retaining a diverse workforce, the Lloyds TSB Group will better understand the needs of all its customers and be able to explore the immense opportunities available across communities.
Over the last few years Lloyds TSB Group has been working to increase the number of women and ethnic minority employees in management and senior management positions across the organisation. At the end of 2006, twenty-one per cent of Lloyds TSB Group’s senior managers are women, including three female board directors. Lloyds TSB Group is included in the Times top 50 places for women to work and is the top FTSE 100 company in terms of the number of female executive directors. During the year the Group won several diversity awards in the UK including first in the Race for Opportunity Benchmarking and fourth in the Employers’ Forum on Disability Benchmarking.
Training and development
To create a high performance company, Lloyds TSB Group recognises that it needs to provide all employees with the opportunity to learn, develop and to fulfil their potential. The University for Lloyds TSB is the Lloyds TSB Group’s centre of excellence for learning, providing an accessible, high quality service structured around the needs of both the business and the individual. In 2006, the University provided over 33,250 training days and over 17,000 delegate places in addition to online learning through a group wide network of 2,029 multimedia personal computers and 20 dedicated cyber-cafés.
Customers
Lloyds TSB Group wants to continue to build a great organisation, which is recognised for operating to high standards and is built on strong customer franchises. Treating its customers fairly is essential to helping Lloyds TSB Group achieve that goal and is one of the ways in which the Group can develop competitive advantage. Lloyds TSB Group aims to be fair, clear and straightforward in all its dealings with its customers. Lloyds TSB Group has simplified the number and range of products it has and the Lloyds TSB Group is continuing its drive to make its terms and conditions simpler to understand and ensure its charges are absolutely clear.
Responsible lending
Lloyds TSB Group is committed to being a responsible lender. It is in its interest to help customers borrow only those amounts they can repay. Lloyds TSB Group has a responsible lending programme with internal management reporting and accountability. Lloyds TSB Group’s employees are trained to offer the necessary advice and support to help customers manage their borrowing. Lloyds TSB Group’s Customer Support Unit provides help for customers who are in financial difficulties to find an appropriate solution through effective budgeting or rescheduling their borrowing. We also support independent money advice networks including the Money Advice Trust and the Consumer Credit Counselling Service. Payments totalling more than £2.5 million were made in 2006.
Financial inclusion
Lloyds TSB Group continues to develop financial services especially tailored to tackle the problem of financial exclusion. These include basic bank accounts, support for community credit unions and other community finance initiatives and loan and venture capital funds. The Lloyds TSB Group’s partnership with the Post Office allows its customers access to the UK network of post offices as well as over 2,000 of its own branches and 4,100 ATMs. At the end of 2006, Lloyds TSB Group had over 400,000 basic bank accounts.
Lloyds TSB Group also believes in the importance of financial education. The Lloyds TSB Group has collaborated with the Financial Services Authority to help lead the development and delivery of their Financial Capability in the Workplace programme.
Customer satisfaction
Lloyds TSB Group measures its customers’ satisfaction with the service they receive via monthly surveys and uses the results to calculate its CARE Index which is based on customer understanding, accessibility, responsibility and expertise. The Lloyds TSB Group seeks to address customer complaints as quickly as prudent whilst ensuring appropriate standards of investigation and communication are maintained (see page 75).
In 2006, in a poll of Finance Directors across the UK, Lloyds TSB Corporate was voted ‘Bank of the Year’ for the second year running at the Real Finance/CBI FD’s Excellence Awards, in recognition of its quality of service and understanding of its customers’ businesses. In 2006 Lloyds TSB Corporate was also voted ‘Adviser of the Year’ in the UK; in this category it was not only competing against other banks but also leading accountants and lawyers.
73
Corporate responsibility
Suppliers
Each year Lloyds TSB Group buys around £2 billion worth of goods and services. Lloyds TSB Group’s suppliers are important to it and the Lloyds TSB Group wants to ensure that it treats them fairly and pays them on time. Lloyds TSB Group’s supplier relationships are governed by a strict Code of Purchasing Ethics that defines the way it does business. The Lloyds TSB Group also has an established supplier review process that allows it to assess its suppliers’ social, ethical and environmental performance as part of the tendering process (see page 75).
Community
Continuing to grow a successful business is the best way for Lloyds TSB to create value for all its stakeholders and contribute to the wider economy. Lloyds TSB Group is a major employer with some 63,000 employees. In 2006, salaries, national insurance, pension contributions and other staff costs totalled over £2.7 billion. Over £1.3 billion was paid to governments in tax and £1.9 billion was distributed to shareholders in the form of dividends. When dividends are added to share price appreciation, Lloyds TSB Group delivered a total return to its shareholders of 24.8 per cent in 2006 (10.9 per cent in 2005).
In addition to its financial contribution Lloyds TSB Group recognises that it is in its long-term interest to help improve the social and commercial fabric of local communities where it operates. That is why the Lloyds TSB Group has one of the largest community investment programmes in the UK.
Lloyds TSB Foundations
The majority of Lloyds TSB’s charitable giving is channelled through the four Lloyds TSB Foundations, which cover England and Wales, Scotland, Northern Ireland and the Channel Islands. Their mission is to improve the lives of people in local communities, especially those who are disadvantaged.
Through their shares in the Lloyds TSB Group, the Lloyds TSB Foundations together receive one per cent of the Group’s pre-tax profits, averaged over three years, in lieu of their shareholder dividend. Over the last 10 years, Lloyds TSB Group has given a total of over £300 million to the Foundations, making Lloyds TSB one of the largest corporate charitable donors in the United Kingdom.
The Foundations recognise that their success as community and local funders depends on maintaining a presence in and actively engaging with communities. The England and Wales Foundation, for example, remains one of the few grant-makers with a significant regional presence and its regional structure enables the Foundation to respond directly and effectively to local needs.
Foundation funding supports charities working to meet social and community needs. The main grant programmes are designed to address essential community needs and, in particular, to support small ‘under funded’ charities. 38 per cent of the charities supported by the England and Wales Foundation in 2006 had a total income of £100,000 or less and 70 per cent had an income of £500,000 or less.
Employee volunteering and fundraising
In addition to the Foundations’ support for local community causes, thousands of Lloyds TSB Group’s employees volunteer to help in their communities, raise funds for the Group’s Charity of the Year or make direct donations to charity using the UK’s Give As You Earn system. In 2006, the Foundations provided matched funding for over 40,000 hours of time volunteered by Lloyds TSB employees in the community.
The Charity of the Year is chosen in an open ballot of staff. A team of Charity Champions across all parts of the Group leads the fundraising, inspiring and motivating their colleagues to organise and take part in events, sell pin badges and find new and innovative ways of raising money. In 2006 Lloyds TSB Group’s staff raised over £1.8 million for Breast Cancer Care, the third year in a row that over £1 million has been raised for the Group’s chosen charity. Lloyds TSB Group’s staff have chosen Barnardo’s as the charity of the year for 2007.
The environment
Lloyds TSB first introduced a formal environmental policy in 1996 and was also one of the first UK banks to develop an environmental risk assessment system for all of its business lending.
Climate change
The UK Government has stated its belief that climate change is the greatest long-term challenge facing the world today. Measures to tackle climate change will have potential implications for regulation, taxation and public policy and will carry both risks and opportunities for companies and the public.
In respect of Lloyds TSB Group’s direct environmental impacts the Group’s immediate priority is to reduce its carbon emissions. The Lloyds TSB Group has introduced a five-year carbon management programme which, through a series of energy saving projects and other initiatives, will not only reduce the Lloyds TSB Group’s carbon footprint but also deliver cost savings. In 2005 the Lloyds TSB Group set a target to reduce property related emissions by 30 per cent from 2004 levels by 2010. Lloyds TSB Group is exploring other opportunities in relation to waste reduction and business travel (see page 75).
While the Lloyds TSB Group’s direct carbon intensity is relatively low compared to other industry sectors, it still needs to fully understand the potential financial impact of climate change on others that it may lend to or invest in, so that the Lloyds TSB Group can manage the risks and identify business opportunities.
Lloyds TSB Group is in the process of establishing a group wide Climate Forum, led by the deputy group chief executive, to develop a holistic approach to managing climate related risks and opportunities.
Corporate responsibility management
The board reviews overall corporate responsibility performance annually and individual issues are subject to board discussion throughout the year. Lloyds TSB Group’s corporate responsibility steering group is chaired by the deputy group chief executive and comprises senior executives from all business divisions and relevant group functions. The steering group meets quarterly to recommend strategy and provide direction.
Lloyds TSB Group has adopted the European Foundation of Quality Management’s Corporate Responsibility Framework to help it align corporate responsibility with business strategy and also with individual balanced scorecard priorities. As part of the process Lloyds TSB Group has a network of almost 40 representatives across all business divisions, through whom it conducts an annual self-assessment of its performance with independent oversight and assurance. This allows the Lloyds TSB Group to identify strengths and areas for improvement and to prioritise actions and objectives. It also provides a benchmark against which the Lloyds TSB Group can compare its performance both internally and externally.
The board is satisfied that the systems in place to manage corporate responsibility risks are effective and that the relevant risks have been assessed during 2006 and managed in compliance with relevant policies and procedures.
74
Corporate responsibility
Corporate responsibility key performance indicators
| | | | | | | | | | | | | |
People | | | | | | | | | 2005 | | | 2006 | |
| | |
Employee engagement index* | | | | | | | | | 73.0% | | | 74.5% | |
| | | | | | | | | | | | | |
| | | 2003 | | | 2004 | | | 2005 | | | 2006 | |
| | |
Women in management positions | | | 36% | | | 37% | | | 38% | | | 38% | |
Women in senior management positions | | | 17% | | | 19% | | | 20% | | | 21% | |
| | | | | | | | | | | | | |
| | | 2003 | | | 2004 | | | 2005 | | | 2006 | |
| | |
Ethnic minority managers | | | 2.9% | | | 3.5% | | | 4.1% | | | 4.3% | |
Ethnic minority senior managers | | | 1.1% | | | 1.2% | | | 1.8% | | | 1.9% | |
| | |
| | | | | | | | | | | | | |
Customers | | | | | | | | | 2005 | | | 2006 | |
| | |
Customer service index** | | | | | | | | | 68.0% | | | 69.7% | |
Complaints resolved within 8 weeks | | | | | | | | | 86.0% | | | 94.8% | |
Service quality index† | | | | | | | | | 4.02 | | | 4.30 | |
| | |
| | | | | | | | | | | | | |
Suppliers | | | | | | 2004 | | | 2005 | | | 2006 | |
| | |
| | | | | | | | | | | | | |
Payment of suppliers | | | | | | | | | | | | | |
Number of supplier payments | | | | | | 360,257 | | | 379,613 | | | 344,422 | |
Value | | | | | | £2.20 billion | | | £2.16 billion | | | £2.29 billion | |
Average time to pay | | | | | | 28.02 days | | | 27.01 days | | | 29.72 days | |
Number/amount of compensation payments for late settlement | | | | | | 1 payment totalling £25 | | | None | | | None | |
| | |
| | | | | | | | | | | | | |
The environment | | | | | | | | | | | | | |
| | | | | | Tonnes CO2 | | | | | | | |
| | | | |
| | | 2003 | | | 2004 | | | 2005 | | | 2006 | |
| | |
Greenhouse gas emissions†† | | | | | | | | | | | | | |
Property | | | 195,175 | | | 188,624 | | | 177,047 | | | 181,086 | |
Property renewable | | | (730 | ) | | (4,438 | ) | | (14,606 | ) | | (18,944 | ) |
Travel | | | 26,998 | | | 29,499 | | | 29,540 | | | 27,231 | |
| | |
Total | | | 221,443 | | | 213,685 | | | 191,981 | | | 189,373 | |
| | | | | | | | | | | | | | |
| |
* | The employee engagement index is based on the results of a survey conducted quarterly, asking Lloyds TSB employees a series of questions which reflect both the drivers and outcomes of engagement. The data captures the percentage of total responses received which were favourable for each question, combined into a simple average overall score. |
| |
** | The customer service index is computed based on the results of a customer satisfaction survey performed monthly for Lloyds TSB by an external agency. Customers in each of six business units are asked to rate the service they receive on fives bases – overall satisfaction, understanding of the customer’s needs, accessibility of the service, and the responsiveness and expertise of the service provider. These scores are weighted to produce a group score based on the proportion of total group income each business unit represents. |
| |
† | The service quality index is based on SIGMA, deriving its provenance from the manufacturing world, where it measures Defects per Million Opportunities (‘DPMO’). For the Lloyds TSB Group’s purposes, a ‘defect’ is registered whenever there is a failure to deliver a process or product within a certain time period or to the required standard. The Lloyds TSB DPMO score is measured for over 150 end-to-end processes across eight business units, covering in excess of eighty per cent of transactions by volume. |
| |
†† | Lloyds TSB Group has reported its greenhouse gas emissions arising from its operations since 1999 using the DEFRA Guideline for Reporting Greenhouse Gas Emissions. The key activities which contribute to the Lloyds TSB Group’s Global Warming Impact are energy used in managing our buildings – lighting, building controls and IT; and in business travel – road, rail and air. |
75
Management and employees
Directors and senior management
The Group is led by a board comprising executive and non-executive directors with wide experience. The appointment of directors is considered by the board and, following the provisions in the articles of association, they must stand for election by the shareholders at the first annual general meeting following their appointment and must retire, and may stand for re-election by the shareholders, at least every three years. Independent non-executive directors are appointed for three-year renewable terms, which may be terminated without notice or payment of compensation.
The board meets at least nine times a year. It has a programme designed to enable the directors regularly to review corporate strategy and the operations and results of the businesses and discharge their duties within a framework of prudent and effective controls relating to the assessing and managing of risk.
The roles of the chairman, the group chief executive and the board and its governance arrangements, including the schedule of matters specifically reserved to the board for decision, are reviewed annually. The matters reserved to the board for decision include the approval of the annual report and accounts and any other financial statements; the payment of dividends; the long-term objectives of the Group; the strategies necessary to achieve these objectives; the Group’s budgets and plans; significant capital expenditure items; significant investments and disposals; the basis of allocation of capital within the Group; the organisation structure of the Group; the arrangements for ensuring that the Group manages risks effectively; any significant change in accounting policies or practices; the appointment of the Company’s main professional advisers and the approval of their fees; and the appointment of senior executives within the organisation and related succession planning.
The board has delegated to management the power to make decisions on operational matters, including those relating to credit, liquidity and market risk, within an agreed framework.
All directors have access to the services of the company secretary, and independent professional advice is available to the directors at the Group’s expense, where they judge it necessary to discharge their duties as directors.
During the year, the board conducted a formal evaluation of its performance and that of its committees and individual directors, with advice and assistance from Dr Tracy Long, of Boardroom Review. Directors were invited to comment, through questionnaires and interviews, and responses were reviewed and discussed by the board. Where areas for improvement were identified, action has been agreed.
The chairman’s performance was evaluated by the non-executive directors, taking account of the views of executive directors. This appraisal was discussed at a meeting of the non-executive directors, led by the senior independent director, without the chairman being present.
The remuneration committee reviewed the performance of the chairman, the group chief executive and the other group executive directors, when considering their remuneration arrangements. The nomination committee reviewed the performance of all the directors. The nomination committee and remuneration committee report to the board on their recommendations and decisions, including the results of these performance evaluations.
The chairman has a private discussion at least once a year with every director on a wide range of issues affecting the Group, including any matters which the directors, individually, wish to raise.
There is an induction programme for all new directors, which is tailored to their specific requirements and includes visits to individual businesses and meetings with senior management. Major shareholders are also offered the opportunity to meet new non-executive directors. Additional training and updates on particular issues are arranged as appropriate.
Meetings with shareholders
In order to develop an understanding of the views of major shareholders, the board receives regular reports from the group finance director and the director of investor relations.
The chairman, the group chief executive and the group finance director also have meetings with representatives of major shareholders and the senior independent director also attends some of these meetings. In addition, all directors are invited to attend investment analysts’ and stockbrokers’ briefings on the financial results.
All shareholders are encouraged to attend and participate in the Group’s annual general meeting.
76
Board of directors
The board of directors as of the date of filing of this annual report on Form 20-F are listed below. Directors who served during 2006 are indicated on page 88.
Sir Victor Blankuu†++
Chairman
Joined the board in March 2006 as deputy chairman and became chairman in May 2006. Former partner in Clifford-Turner (now Clifford Chance) from 1969 to 1981 and chairman and chief executive of Charterhouse until 1997. Director of The Royal Bank of Scotland from 1985 to 1993 and of GUS from 1993 to 2006 (chairman from 2000). Chairman of Trinity Mirror from 1999 to 2006. A member of the Financial Reporting Council and of the Council of Oxford University. Chairs two charities, WellBeing of Women and UJS Hillel, as well as the Council of University College School. Aged 64.
Wolfgang C G Berndt ‡u††
Joined the board in 2003. Joined Procter and Gamble in 1967 and held a number of senior and general management appointments in Europe, South America and North America, before retiring in 2001. A non-executive director of Cadbury Schweppes, GfK AG and Telekom Austria. Board member of the Institute for the Future. Aged 64.
Ewan Brown CBE FRSE**+
Chairman of Lloyds TSB Scotland
Joined the board in 1999. A non-executive director of Lloyds TSB Scotland since 1997. Joined Noble Grossart in 1969 and was an executive director of that company until December 2003. A non-executive director of Noble Grossart and Stagecoach Group and senior governor of the Court of the University of St Andrews. A former chairman of tie and non-executive director of John Wood Group. Aged 65.
Jan P du Plessis‡*u
Joined the board in 2005. Chairman of British American Tobacco. Held a number of senior and general management appointments in Rembrandt Group from 1981, before joining Compagnie Financière Richemont as group finance director in 1988, a position he held until 2004. A former chairman of RHM from 2005 to 2007 and group finance director of Rothmans International from 1990 to 1995. Aged 53.
Gavin J N Gemmell CBE‡*
Chairman of Scottish Widows
Joined the board in 2002. A non-executive director of Scottish Widows, having been appointed to the board of that company before it became a member of the Lloyds TSB Group. Retired as senior partner of Baillie Gifford in 2001, after 37 years with that firm. A non-executive director of Archangel Informal Investment. Chairman of the Court of Heriot-Watt University. Aged 65.
Philip N Green‡†
Joined the board in May 2007. Appointed chief executive of United Utilities in 2006. Formerly chief executive of Royal P&O Nedlloyd from 2003 to 2006, chief operating officer of Reuters Group from 2001 to 2003 and held senior and general management appointments in Reuters Group from 1999, DHL from 1990 to 1999 and Coloroll Group from 1980 to 1990. Aged 53.
Sir Julian Horn-Smith‡u†+
Joined the board in 2005. Held a number of senior and general management appointments in Vodafone from 1984 to 2006 including a directorship of that company from 1996 and of deputy chief executive officer from 2005. Previously held positions in Rediffusion from 1972 to 1978, Philips from 1978 to 1982 and Mars GB from 1982 to 1984. A non-executive director of Digicel Group, a member of the Altimo International advisory board and a senior adviser to UBS in relation to the global telecommunications sector. A former chairman of The Sage Group. Aged 58.
Lord Leitch‡*u+
Joined the board in 2005. Held a number of senior and general management appointments in Allied Dunbar, Eagle Star and Threadneedle Asset Management before the merger of Zurich Group and British American Tobacco’s financial services businesses in 1998. Subsequently served as chairman and chief executive officer of Zurich Financial Services (UK & Asia Pacific) until his retirement in 2004. Chairman of the government’s Review of Skills and deputy chairman of the Commonwealth Education Fund. Chairman of BUPA and Intrinsic Financial Services and a non-executive director of Paternoster and United Business Media. Former chairman of the National Employment Panel. Aged 59.
J Eric Daniels
Group Chief Executive
Joined the board in 2001 as group executive director, UK retail banking before his appointment as group chief executive in June 2003. Served with Citibank from 1975 and held a number of senior and general management appointments in the USA, South America and Europe before becoming chief operating officer of Citibank Consumer Bank in 1998. Following the Citibank/Travelers merger in 1998, he was chairman and chief executive officer of Travelers Life and Annuity until 2000. Chairman and chief executive officer of Zona Financiera from 2000 to 2001. Aged 55.
Michael E Fairey
Deputy Group Chief Executive
Joined TSB Group in 1991 and held a number of senior and general management appointments before being appointed to the board in 1997 and deputy group chief executive in 1998. Joined Barclays Bank in 1967 and held a number of senior and general management appointments, including managing director of Barclays Direct Lending Services from 1990 to 1991. President of The British Quality Foundation and chairman of Race for Opportunity. Aged 58.
Terri A Dial
Group Executive Director, UK Retail Banking
Joined the board in 2005. Served with Wells Fargo in the USA from 1973 to 2001 where she held a number of senior and general management appointments before becoming president and chief executive officer of Wells Fargo Bank in 1998. A non-executive director of the LookSmart Corporation and a member of the London Skills and Employment Board. Aged 57.
Archie G Kane
Group Executive Director, Insurance and Investments
Joined TSB Commercial Holdings in 1986 and held a number of senior and general management appointments in the Lloyds TSB Group before being appointed to the board in 2000, as group executive director, IT and operations. Appointed group executive director, insurance and investments in October 2003. After some 10 years in the accountancy profession, joined General Telephone & Electronics Corporation in 1980, serving as finance director in the UK from 1983 to 1985. A member of the board of the Association of British Insurers. Aged 54.
G Truett Tate
Group Executive Director, Wholesale and International Banking
Joined the group in 2003 as managing director, corporate banking before being appointed to the board in 2004. Served with Citigroup from 1972 to 1999, where he held a number of senior and general management appointments in the USA, South America, Asia and Europe. He was president and chief executive officer of eCharge Corporation from 1999 to 2001 and co-founder and vice chairman of the board of Chase Cost Management Inc from 1996 to 2003. Aged 57.
Helen A Weir
Group Finance Director
Joined the board in 2004. Group finance director of Kingfisher from 2000 to 2004. Previously finance director of B&Q from 1997, having joined that company in 1995, and held a senior position at McKinsey & Co from 1990 to 1995. Began her career at Unilever in 1983. A non-executive director of Royal Mail Holdings and a member of the Accounting Standards Board. Aged 44.
* Member of the audit committee ** Chairman of the audit committee uMember of the nomination committee uuChairman of the nomination committee† Member of the remuneration committee †† Chairman of the remuneration committee + Member of the risk oversight committee ++Chairman of the risk oversight committee ‡ Independent director Senior independent director
77
Compensation
Role of remuneration committee
The committee reviews the remuneration policy for the top management group, to ensure that members of the executive management are provided with appropriate incentives to encourage them to enhance the performance of the Group and that they are rewarded for their individual contribution to the success of the organisation. It advises on major changes of employee benefits schemes and it also agrees the policy for authorising claims for expenses from the group chief executive and the chairman. It has delegated power for settling remuneration for the chairman, the group executive directors, the company secretary and any group employee whose salary exceeds a specified amount.
All the independent non-executive directors are invited to attend meetings if they wish, and they receive the minutes and have the opportunity to comment and have their views taken into account before the committee’s decisions are implemented.
The committee’s terms of reference are available from the company secretary and are displayed on the Company’s website www.lloydstsb.com.
Remuneration committee membership
The remuneration committee is comprised of the following independent non-executive directors:
| |
• | Dr Berndt (chairman) |
| |
• | Mr Green (appointed on 10 May 2007) |
| |
• | Sir Julian Horn-Smith |
Sir Victor Blank, a non-executive director, joined the committee in August 2006 as permitted by the combined code on corporate governance issued by the Financial Reporting Council in June 2006.
Directors’ remuneration policy
The Group’s remuneration policy is to ensure that individual rewards are aligned with the Group’s performance and the interests of its shareholders, and that cost effective packages are provided which attract and retain executive directors and senior management of the highest calibre and motivate them to perform to the highest standards. The main principles are:
| |
• | FTSE 20 adopted as the comparator group used to benchmark overall competitiveness of the remuneration package whilst taking particular account of the remuneration practice of our direct competitors, namely the major UK banks. The FTSE 20 is regarded as providing a realistic and relevant comparison in terms of company size and sector, as well as being a key market for talent. |
| |
• | Basic salaries positioned to reflect the relevant market median and total direct compensation (basic salary, annual incentives and the value of long-term incentives) designed to enable upper quartile performance to be rewarded with upper quartile remuneration levels. |
| |
• | The majority of total compensation is linked to the achievement of stretching performance targets. |
| |
• | The long-term rewards are aligned to shareholder interests, which is achieved by taking account of measures that reflect shareholder interests, and by expecting executive directors to build a shareholding in the Group equivalent to 1.5 times (2 times for the group chief executive) the directors’ base pay. Executives are expected to retain at least 50 per cent of all net vested equity until the guideline is met. |
| |
• | The overall package reflects market practice and takes account of the terms and conditions applying to other employees of the Group. |
|
| |
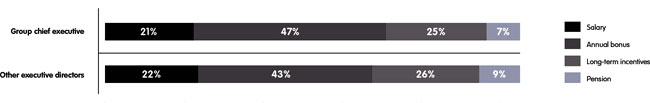
|
| |
In 2007, approximately 69 per cent (72 per cent for the group chief executive) of an executive director’s potential direct remuneration (salary, annual bonus, long-term incentives and pension) will be performance related, based upon maximum opportunity. The value of long-term incentives is the expected value calculated by using a ‘binomial’ model, which is a widely accepted methodology for this purpose.
Chairman’s remuneration
The chairman’s remuneration comprises salary and benefits which are broadly similar to those extended to the executive directors. However, he does not participate in the annual bonus and long-term incentive arrangements, nor is he entitled to pension benefits.
The chairman’s salary is reviewed annually, usually in December, taking into account performance and market information and then adjusted from 1 January of the following year. His salary from 1 January 2007 is £600,000.
Independent non-executive directors’ fees
The fees of the independent non-executive directors are agreed by the board within a total amount determined by the shareholders. Directors may also receive fees, agreed by the board, for membership of board committees. The fees are designed to recognise the various responsibilities of a non-executive director’s role and to attract individuals with relevant skills, knowledge and experience. The fees are neither performance related nor pensionable and are comparable with those paid by other companies. The annual fees from 1 January 2007 are listed below with the figures applicable since the previous review in April 2005 in brackets.
| | | | | | | |
| | | | | | | | |
Board | | | £60,000 | | | (£50,000 | ) |
Audit committee chairmanship | | | £50,000 | | | (£40,000 | ) |
Audit committee membership | | | £15,000 | | | (£15,000 | ) |
Nomination committee membership | | | £5,000 | | | (£5,000 | ) |
Remuneration committee chairmanship | | | £25,000 | | | (£20,000 | ) |
Remuneration committee membership | | | £15,000 | | | (£15,000 | ) |
Risk oversight committee membership | | | £15,000 | | | (£15,000 | ) |
| | | | | | | | |
Independent non-executive directors who serve on the boards of subsidiary companies may also receive fees from the subsidiaries. These are included in the table shown on page 81.
78
Compensation
Executive director basic salaries
Basic salaries are reviewed annually, usually in December, taking into account individual performance and market information (which is provided by Towers Perrin) and then adjusted from 1 January of the following year. Basic salary increases for other employees across the Group will be generally in the range of 0-10 per cent. Whilst the salary increases awarded to executive directors are normally consistent with this policy, any variation will be supported by robust and independent competitive market analysis. Salaries payable from 1 January 2007 are as follows:
| | | | | | | | | | | | | | | | | | | |
| | | | | | | | | | | | | | | | | | | | |
Name | | | J E Daniels | | | M E Fairey | | | T A Dial | | | A G Kane | | | G T Tate | | | H A Weir | |
Amount | | | £960,000 | | | £600,000 | | | £625,000 | | | £550,000 | | | £600,000 | | | £575,000 | |
| | | | | | | | | | | | | | | | | | | | |
Annual incentive scheme
The annual incentive scheme for executive directors is designed to reflect specific goals linked to the performance of the business.
Incentive awards for executive directors are based upon individual contribution and overall corporate results. Half of the bonus opportunity is driven by corporate performance based on the stretching budget relating to profit before tax and economic profit. The lower of profit before tax and economic profit will determine the extent to which the target has been met. The other half of the bonus opportunity is determined by divisional achievement driven through individual performance. Individual targets are contained in a balanced scorecard and include profitability, franchise growth, risk, service and other specific goals that are relevant to improving overall business performance. These targets are weighted differently for each of the executive directors, reflecting differing strategic priorities. The maximum bonus opportunity is 150 per cent (200 per cent from 2007) of basic salary for the achievement of exceptional performance targets; an amount equal to 75 per cent (100 per cent from 2007) of basic salary is available on the achievement of stretching budget and individual targets. Failure to achieve at least 90 per cent of the stretching budget target would result in no payment under the corporate half of the bonus.
Regarding Mr Daniels’ incentive award, and in line with the arrangements for the executive directors, half of his bonus is driven by corporate results and the other half by individual performance. His maximum bonus opportunity is 175 per cent (225 per cent from 2007) of basic salary for the achievement of exceptional performance targets. An amount equal to 112.5 per cent of basic salary is available on the achievement of a range of financial and non-financial measures contained in a balanced scorecard. The non-financial measures include key performance indicators relating to customer service, process efficiency, service quality, risk and employees (e.g. employee engagement). Failure to achieve at least 90 per cent of the stretching budget target would result in no payment under the corporate half of the bonus.
Following the adoption of the new long-term incentive plan, and the discontinuation of the performance share plan, awards under the annual incentive scheme are made in cash only.
PricewaterhouseCoopers LLP check the calculation of the annual incentive payments for executive directors based on the achievement of performance against targets set. In respect of performance in 2006, the bonus percentages awarded to the directors are shown in the table below:
| | | | | | | | | | | | | | | | | | | |
| | | | | | | | | | | | | | | | | | | | |
Name | | | J E Daniels | | | M E Fairey | | | T A Dial | | | A G Kane | | | G T Tate | | | H A Weir | |
Opportunity | | | 175% | | | 150% | | | 150% | | | 150% | | | 150% | | | 150% | |
% awarded | | | 162.5% | | | 140% | | | 150% | | | 140% | | | 140% | | | 140% | |
| | | | | | | | | | | | | | | | | | | | |
These payments reflect the significant progress made by the Group against its key performance indicators. Both the profit before tax and economic profit exceeded the amounts required for payment of the maximum award relating to corporate performance.
Long-term incentive plan
The aim of the new long-term incentive plan, approved by shareholders in 2006, is to deliver shareholder value through linking the receipt of shares to an improvement in the performance of the Group over a three year period. Under the plan, awards of shares may be made, with the number of shares received subject to the satisfaction of two distinct pre-determined performance conditions, measuring performance of the Group.
50 per cent of the award (the ‘TSR Award’) will be based on a condition measuring the Group’s TSR against the comparator group listed below. In order for the TSR Award to vest in full, it will be necessary for the Group’s TSR to exceed the median of the TSR of the comparator group by an average of 7.5 per cent per annum. 17.5 per cent of the TSR Award (8.75 per cent of the total award) will vest where the Group’s TSR is equal to median and vesting will occur on a straight line basis in between these points. Where the Group’s TSR is below the median of the comparator group, the TSR Award will lapse.
From 2007, and to align performance and vesting periods, the TSR performance period will start on the date awards are granted, and average the share price over three months before the grant date. This replaces the current approach of calculating the TSR in line with the financial year, taking an average share price over the preceding three months.
Other companies in the comparator group:
| | | |
| | | | |
Alliance & Leicester | Aviva | Banco Santander | Barclays |
Bradford & Bingley | Friends Provident | HBOS | HSBC Holdings |
Legal & General | Northern Rock | Prudential | Royal Bank of Scotland |
Royal & Sun Alliance | Standard Chartered | | |
| | | | |
The other 50 per cent of the award (the ‘EPS Award’) will be based on earnings per share (‘EPS’) growth calculated on a compound annualised basis. In order for the EPS Award to vest in full, the EPS growth over the performance period must be at least equivalent to an average of the Retail Price Index (‘RPI’) plus 6 per cent per annum. 17.5 per cent of the EPS Award (8.75 per cent of the total award) will vest where EPS growth is an average of the RPI plus 3 per cent per annum and vesting will occur on a straight line basis in between these points. Where the EPS growth is less than an average of the RPI plus 3 per cent per annum, the EPS Award will lapse.
Awards in any one financial year will not normally exceed three times basic salary at the time of award. In exceptional circumstances this may be increased up to four times basic salary. Awards will lapse at the end of the performance period to the extent that the performance conditions have not been satisfied. There will be no retesting.
EPS is the Group’s normalised earnings per ordinary share as shown in the Group’s report and accounts, adjusted if necessary for consistency.
Details of previous long-term incentive plans are shown on pages 85 and 86.
Other share plans
The executive directors and the chairman are also eligible to participate in the Group’s ‘sharesave’ scheme and the Group’s ‘shareplan’. These are ‘all-employee’ share schemes and performance conditions do not apply.
79
Compensation
Dilution limits
The following charts illustrate the shares available for the Group’s share schemes.
Pensions
Executive directors are either entitled to participate in the Group’s defined benefit pension schemes (based on salary and length of service, with a maximum pension of two thirds of final salary), or the Group’s defined contribution scheme (under which their final entitlement will depend on their contributions and the final value of their fund). The defined benefit schemes are closed to new entrants on recruitment.
Service agreements
The Group’s policy is for executive directors to have service agreements with notice periods of no more than one year. All current executive directors are entitled to receive 12 months’ notice from the Group, but would be required to give 6 months’ notice if they wished to leave. Executive directors normally retire at age 60. However, following the implementation of The Employment Equality (Age) Regulations 2006, they may now choose to delay their retirement until age 65.
Independent non-executive directors do not have service agreements and their appointment may be terminated, in accordance with the articles of association, at any time without compensation.
It is the Group’s policy that where compensation on early termination is due, it should be paid on a phased basis, mitigated in the event that alternative employment is secured, and that bonus payments should relate to the period of actual service, rather than the full notice period and will be determined on the basis of performance.
Any entitlements under the pension scheme or equity plans will be in accordance with the scheme rules on leaving.
| | |
| Notice to be given by the Company | Date of service agreement/letter of appointment |
| | | |
Sir Victor Blank | 6 months | 25 January 2006 |
J E Daniels | 12 months | 19 October 2001 |
M E Fairey | 12 months | 28 August 1991 |
T A Dial | 12 months | 23 May 2005 |
A G Kane | 12 months | 9 February 2000 |
G T Tate | 12 months | 29 July 2004 |
H A Weir | 12 months | 4 March 2004 |
| | | |
External appointments
The Group recognises that executive directors may be invited to become non-executive directors of other companies and that these appointments may broaden their knowledge and experience, to the benefit of the Group. Fees are normally retained by the individual directors as the post entails personal responsibility. Executive directors are generally allowed to accept one non-executive directorship.
During 2006, Ms Dial and Mrs Weir received fees of $159,475 and £36,000 respectively, which were retained by them, for serving as non-executive directors of other companies. In addition Mrs Weir received and retained £15,000 for serving as a member of the Accounting Standards Board in 2006.
Performance graph
The graph illustrates the performance of the Group measured by TSR against a ‘broad equity market index’ over the past five years. As the Group has been a constituent of the FTSE 100 index throughout this five-year period, that index is considered to be the most appropriate benchmark.
80
| |
Compensation | Audited information |
Directors’ emoluments for 2006
| | | | | | | | | | | | | | | | | | |
| | Salaries/
fees
£000 | | | | | Performance
related
payments
£000 | | Compensation
for loss of
office
£000 | | 2006
Total
£000 | | 2005
Total
£000 | |
| | | | Other benefits | | | | | |
| | | | Cash
£000 | | Non cash
£000 | | | | | |
| | | | | | | | | | | | | | | | |
| | | | | | | | | | | | | | | | | | | | | | |
Current directors who served during 2006 | | | | | | | | | | | | | | | | | | | | | | |
Executive directors | | | | | | | | | | | | | | | | | | | | | | |
J E Daniels | | | 880 | | | 103 | | | 5 | | | 1,456 | | | | | | 2,444 | | | 1,930 | |
M E Fairey | | | 570 | | | 493 | | | 7 | | | 815 | | | | | | 1,885 | | | 1,462 | |
T A Dial | | | 570 | | | 273 | | | 4 | | | 872 | | | | | | 1,719 | | | 877 | |
A G Kane | | | 500 | | | 19 | | | 18 | | | 715 | | | | | | 1,252 | | | 919 | |
G T Tate | | | 515 | | | 42 | | | 10 | | | 736 | | | | | | 1,303 | | | 1,075 | |
H A Weir | | | 500 | | | 77 | | | 18 | | | 715 | | | | | | 1,310 | | | 963 | |
| | | | | | | | | | | | | | | | | | | | | | |
Non-executive directors | | | | | | | | | | | | | | | | | | | | | | |
Sir Victor Blank | | | 405 | | | | | | | | | | | | | | | 405 | | | — | |
W C G Berndt | | | 72 | | | | | | | | | | | | | | | 72 | | | 67 | |
Ewan Brown | | | 134 | | | | | | | | | | | | | | | 134 | | | 122 | |
J P du Plessis | | | 67 | | | | | | | | | | | | | | | 67 | | | 16 | |
G J N Gemmell | | | 121 | | | | | | | | | | | | | | | 121 | | | 121 | |
Sir Julian Horn-Smith | | | 82 | | | | | | | | | | | | | | | 82 | | | 74 | |
D S Julius | | | 68 | | | | | | | | | | | | | | | 68 | | | 66 | |
Lord Leitch | | | 80 | | | | | | | | | | | | | | | 80 | | | 16 | |
| | | | | | | | | | | | | | | | | | | | | | |
Former directors who served during 2006 | | | | | | | | | | | | | | | | | | | | | | |
M A van den Bergh | | | 183 | | | 4 | | | | | | | | | | | | 187 | | | 487 | |
A A Knight | | | 92 | | | | | | | | | | | | | | | 92 | | | 105 | |
| | | | | | | | | | | | | | | | | | | | | | |
Former directors who served during 2005 | | | | | | | | | | | | | | | | | | | | | | |
P G Ayliffe | | | | | | | | | | | | | | | 36 | | | 36 | | | 401 | |
Others | | | | | | | | | | | | | | | | | | | | | 125 | |
| | | | | | | | | | | | | | | | | | | | | | |
| | | | | | | | | | | | | | | | | | | | | | | |
| | | 4,839 | | | 1,011 | | | 62 | | | 5,309 | | | 36 | | | 11,257 | | | 8,826 | |
| | | | | | | | | | | | | | | | | | | | | | | |
Mr Fairey waived fees payable to him as a director of Lloyds TSB Group Pension Trust (No.1) Limited and Lloyds TSB Group Pension Trust (No.2) Limited, which totalled £10,000 in 2006 (2005: £10,000 waived).
Mr Brown waived fees payable to him as a director and chairman of Lloyds TSB Group Pension Trust (No.1) Limited and Lloyds TSB Group Pension Trust (No.2) Limited, which totalled £14,750 in 2006 (2005: £14,000 waived).
The cash column under ‘other benefits’ includes flexible benefits payments (4 per cent of basic salary), the tax planning allowances for Mr Daniels and Ms Dial, the housing allowance and pension scheme allowance for Ms Dial, payments to certain directors who elect to take cash rather than a company car under the car scheme, cash balance of pension allowance for Mr Tate and Mrs Weir and an additional payment in respect of the contribution to the separate fund relating to Mr Fairey’s pension. The separate fund, which was mentioned in previous annual reports, was established to cover pension obligations of those who joined the Group after 1 June 1989 and who are subject to the earnings cap relating to pensions, introduced by the Finance Act 1989.
The non cash column includes amounts relating to the use of a company car, use of a company driver and private medical insurance. It also includes the value of any matching shares which are received under the terms of shareplan, through which employees have the opportunity to purchase shares up to a maximum of £125 per month and receive matching shares on a one for one basis up to a maximum value of £30 per month, rounded down to the nearest whole share.
Performance-related payments relate to cash bonuses based on group performance and the attainment of pre-determined targets relating to profit before tax and economic profit. These payments also include the value of any award made under shareplan, the first £3,000 of which is made in the form of shares in Lloyds TSB Group plc.
The amount shown for Mr Ayliffe reflects payments he received in accordance with his contractual entitlement.
81
| |
Compensation | Audited information |
Directors’ pensions
The executive directors are members of one of the pension schemes provided by the Lloyds TSB Group with benefits either on a defined benefit or defined contribution basis. Those directors who joined the Lloyds TSB Group after 1 June 1989 and are members of a defined benefit scheme, have pensions provided on salary in excess of the earnings cap either through membership of a funded unapproved retirement benefits scheme (‘FURBS’) or by an unfunded pension promise.
Retirement pensions accrue at rates of between 1/60 and 1/30 of basic salary.
Directors have a normal retirement age of 60. In the event of death in service, a lump sum of four times salary is payable plus, for members of a defined benefit scheme, a spouse’s pension of two-thirds of the member’s prospective pension. On death in retirement, a spouse’s pension of two-thirds of the member’s pension is payable. The defined benefit schemes are non-contributory. Members of defined contribution schemes are required to contribute.
Ms Dial elected to become a member of a pension scheme for life cover only. She joined the Lloyds TSB Group on 1 June 2005. She receives a salary supplement of 20 per cent of basic pay as an alternative to an employer contribution to a pension scheme.
Defined contribution scheme members
Mr Tate is a member of a defined contribution scheme. During the year to 31 December 2006, the employer has made contributions to the defined contribution scheme in respect of him totalling £79,825.
Mrs Weir is a member of a defined contribution scheme. During the year to 31 December 2006, the employer has made contributions to the defined contribution scheme in respect of her totalling £42,500.
Defined benefit scheme members
| | | | | | | | | | | | | | | | | | | | | | | | | |
| | Accrued
pension at
31 December
2006
£000
(a) | | Accrued
pension at
31 December
2005
£000
(b) | | Change in
accrued
pension
£000
(a)-(b) | | Transfer
value at
31 December
2006
£000
(c) | | Transfer
value at
31 December
2005
£000
(d) | | Change in
transfer
value
£000
(c)-(d) | | Additional
pension
earned to
31 December
2006
£000
(e) | | Transfer
value of the
increase
£000
(f) | |
| | | | | | | | | | | | | | | | | | |
| | | | | | | | | | | | | | | | | | | | | | | | | |
J E Daniels | | | 120 | | | 99 | | | 21 | | | 2,100 | | | 1,599 | | | 501 | | | 19 | | | 326 | |
M E Fairey | | | 287 | | | 256 | | | 31 | | | 6,024 | | | 5,003 | | | 1,021 | | | 24 | | | 501 | |
A G Kane | | | 265 | | | 240 | | | 25 | | | 4,415 | | | 3,700 | | | 715 | | | 19 | | | 310 | |
In addition, the following unfunded benefits have accrued for Mr van den Bergh instead of a salary increase in 2002: | | | | | | | | | | | | | | | | | | | | | | | | | |
M A van den Bergh | | | 13 | | | 13 | | | 0 | | | 196 | | | 190 | | | 6 | | | | | | | |
| | | | | | | | | | | | | | | | | | | | | | | | | |
| | | | | | | | | | | | | | | | | | | | | | | | | | |
The disclosures in columns (a) to (d) are as required by the Companies Act 1985 Schedule 7A.
Columns (a) and (b) represent the deferred pension to which the directors would have been entitled had they left the Group on 31 December 2006 and 2005, respectively (ignoring the two-year requirement to qualify for a deferred pension).
Column (c) is the transfer value of the deferred pension in column (a) calculated as at 31 December 2006 based on factors supplied by the actuary of the relevant Lloyds TSB Group pension scheme in accordance with actuarial guidance note GN11. The underlying bases used to arrive at the factors have not changed during the year.
Column (d) is the equivalent transfer value, but calculated as at 31 December 2005 on the assumption that the director left service at that date.
Column (e) is the increase in pension built up during the year, recognising (i) the accrual rate for the additional service based on the pensionable salary in force at the year end, and (ii) where appropriate the effect of pay changes in ‘real’ (inflation adjusted) terms on the pension already earned at the start of the year.
Column (f) is the capital value of the pension in column (e).
The disclosures in columns (e) and (f) are as required by the UK Listing Authority listing rules. The requirements of the listing rules differ from those of the Companies Act. The listing rules require the additional pension earned over the year to be calculated as the difference between the pension accrued at the end of the financial year and the pension accrued at the start of the financial year less the increase in the pension earned over the year solely due to inflation. The transfer value in column (f) can differ significantly from the change in transfer value as required by the Companies Act because the additional pension accrued over the year calculated in accordance with the listing rules makes allowance for inflation and the change in the transfer value required by the Companies Act will be significantly influenced by changes in the assumptions underlying the transfer value calculation at the beginning and end of the financial year.
Members of the Lloyds TSB Group’s pension schemes have the option to pay additional voluntary contributions: neither the contributions nor the resulting benefits are included in the above table.
Major changes to the legislation governing the provision of pensions in the UK (known as pension simplification) came into effect in April 2006. Benefits from an approved pension scheme will be limited to the Lifetime Allowance, currently £1.5 million which is equivalent to an annual pension of £75,000. Any benefit in excess of this amount will incur a tax charge for the individual. The Group has agreed that if an executive director has benefits in excess of the Lifetime Allowance they may cease to accrue benefits in the Scheme and receive a salary supplement as an alternative. This will not cost the Group more than the current arrangements. The Group will not compensate any individual in respect of any increased tax liability arising from pension simplification. To date, the executive directors affected have elected to continue to accrue benefits in the approved scheme.
82
Compensation
Directors’ interests
As detailed on page 85, the executive directors beneficially owned in aggregate 309,410 bonus shares under the Lloyds TSB Performance Share Plan at 31 December 2006 (151,147 shares at 1 January 2006).
Other interests, all beneficial, of those who were directors at 31 December 2006 in shares in Lloyds TSB Group were:
| | | | | |
Shares | | At 1 January 2006
(or later date of
appointment) | | At 31 December
2006 | |
| | | | | | |
| | | | | | | |
Executive directors | | | | | | | |
J E Daniels | | | 160,942 | | | 165,174 | |
M E Fairey | | | 79,104 | | | 82,864 | |
T A Dial | | | — | | | 577 | |
A G Kane | | | 100,101 | | | 136,078 | |
G T Tate | | | 1,356 | | | 4,139 | |
H A Weir | | | 3,992 | | | 6,255 | |
| | | | | | | |
Non-executive directors | | | | | | | |
Sir Victor Blank | | | 100,000 | | | 100,000 | |
W C G Berndt | | | 61,000 | | | 96,000 | |
Ewan Brown | | | 4,260 | | | 4,469 | |
J P du Plessis | | | 10,000 | | | 10,000 | |
G J N Gemmell | | | 70,000 | | | 70,000 | |
Sir Julian Horn-Smith | | | 5,000 | | | 5,000 | |
D S Julius | | | 2,000 | | | 2,000 | |
Lord Leitch | | | — | | | 10,000 | |
| | | | | | | |
| | | | | | | | |
The directors’ interests detailed above, in aggregate, represent 0.02% of the issued ordinary share capital of Lloyds TSB Group plc.
In addition, those who were directors at 31 December 2006 held, as at that date, options to acquire 8,410,807 shares, all of which were granted pursuant to the executive share option schemes, sharesave share option schemes and share retention plan; conditional awards of 1,048,858 performance shares under the Lloyds TSB Performance Share Plan; and conditional awards of 2,039,418 shares under the Lloyds TSB Long-Term Incentive Plan.
Non-beneficial interests
Directors had non-beneficial interests as follows:
Sir Victor Blank, Mr Daniels, Mr Fairey, Ms Dial, Mr Kane, Mr Tate and Mrs Weir, together with some 70,000 other employees, were potential beneficiaries in the 1,364 and 1,138,311 shares held at the end of the year by the Lloyds TSB qualifying employee share ownership trust and the Lloyds TSB Group employee share ownership trust respectively. 1,364 and 1,237,191 shares, respectively, were held by these trusts at the beginning of the year. In addition, the above directors, together with some 70,000 other employees, were potential participants in shareplan and were, therefore, treated as interested in the 898,320 shares held at the end of the year by the trustee of the shareplan. 582,462 shares were held by the trustee at the beginning of the year.
83
| |
Compensation | Audited information |
Interests in share options
| | | | | | | | | | | | | | | | | |
| | At
1 January
2006 | | Granted
during
the year | | Exercised/
lapsed
during
the year | | At
31 December
2006 | | Exercise
price | | Exercise periods | | | |
| | | | | | | | | | |
| | | | | | | From | | To | | Notes | |
| | | | | | | | | | | | | | | | | | |
J E Daniels | | 330,419 | | | | 330,419 | | — | | 715p | | 6/3/2005 | | 5/3/2012 | | d, j | |
| | 3,327 | | | | 3,327 | | — | | 284p | | 1/6/2006 | | 30/11/2006 | | a, i | |
| | 599,239 | | | | | | 599,239 | | 394.25p | | 21/2/2006 | | 20/2/2013 | | d, g | |
| | 305,232 | | | | | | 305,232 | | 430p | | 14/8/2006 | | 13/8/2013 | | d, g | |
| | 939,177 | | | | | | 939,177 | | 419.25p | | 18/3/2007 | | 17/3/2014 | | d, h | |
| | 521,876 | | | | | | 521,876 | | 474.25p | | 17/3/2008 | | 16/3/2015 | | e, h | |
| | | | 2,236 | | | | 2,236 | | 418p | | 1/6/2009 | | 30/11/2009 | | a, h | |
| | | | | | | | | | | | | | | | | | |
M E Fairey | | 797 | | | | 797 | | — | | 474p | | 1/11/2005 | | 30/4/2006 | | a, i | |
| | 54,000 | | | | 54,000 | | — | | 510p | | 26/3/2000 | | 25/3/2007 | | b, i | |
| | 48,000 | | | | | | 48,000 | | 859.5p | | 15/5/2001 | | 14/5/2008 | | b, f | |
| | 57,000 | | | | | | 57,000 | | 817p | | 2/8/2002 | | 1/8/2009 | | b, g | |
| | 85,896 | | | | | | 85,896 | | 549.5p | | 6/3/2003 | | 5/3/2010 | | c, g | |
| | 10,931 | | | | | | 10,931 | | 615.5p | | 8/8/2003 | | 7/8/2010 | | c, g | |
| | 42,884 | | | | | | 42,884 | | 655p | | 6/3/2004 | | 5/3/2011 | | c, g | |
| | 345,104 | | | | 345,104 | | — | | 715p | | 6/3/2005 | | 5/3/2012 | | d, j | |
| | 1,330 | | | | 1,330 | | — | | 284p | | 1/6/2006 | | 30/11/2006 | | a, i | |
| | 531 | | | | 531 | | — | | 348p | | 1/11/2006 | | 30/4/2007 | | a, i | |
| | 663,157 | | | | | | 663,157 | | 394.25p | | 21/2/2006 | | 20/2/2013 | | d, g | |
| | 555,992 | | | | | | 555,992 | | 419.25p | | 18/3/2007 | | 17/3/2014 | | d, h | |
| | 344,754 | | | | | | 344,754 | | 474.25p | | 17/3/2008 | | 16/3/2015 | | e, h | |
| | | | 1,789 | | | | 1,789 | | 418p | | 1/6/2009 | | 30/11/2009 | | a, h | |
| | | | | | | | | | | | | | | | | | |
T A Dial | | 464,134 | | | | | | 464,134 | | 474p | | 11/8/2008 | | 10/8/2015 | | e, h | |
| | | | | | | | | | | | | | | | | | |
A G Kane | | 25,000 | | | | 25,000 | | — | | 321p | | 28/3/1999 | | 27/3/2006 | | b, i | |
| | 40,000 | | | | 40,000 | | — | | 510p | | 26/3/2000 | | 25/3/2007 | | b, i | |
| | 50,000 | | | | | | 50,000 | | 880p | | 4/3/2001 | | 3/3/2008 | | b, f | |
| | 27,000 | | | | | | 27,000 | | 887.5p | | 4/3/2002 | | 3/3/2009 | | b, g | |
| | 64,786 | | | | | | 64,786 | | 549.5p | | 6/3/2003 | | 5/3/2010 | | c, g | |
| | 11,841 | | | | | | 11,841 | | 615.5p | | 8/8/2003 | | 7/8/2010 | | c, g | |
| | 34,759 | | | | | | 34,759 | | 655p | | 6/3/2004 | | 5/3/2011 | | c, g | |
| | 275,349 | | | | 275,349 | | — | | 715p | | 6/3/2005 | | 5/3/2012 | | d, j | |
| | 5,783 | | | | | | 5,783 | | 284p | | 1/6/2008 | | 30/11/2008 | | a, h | |
| | 529,105 | | | | | | 529,105 | | 394.25p | | 21/2/2006 | | 20/2/2013 | | d, g | |
| | 523,255 | | | | | | 523,255 | | 419.25p | | 18/3/2007 | | 17/3/2014 | | d, h | |
| | 300,474 | | | | | | 300,474 | | 474.25p | | 17/3/2008 | | 16/3/2015 | | e, h | |
| | | | | | | | | | | | | | | | | | |
G T Tate | | 348,837 | | | | | | 348,837 | | 430p | | 14/8/2006 | | 13/8/2013 | | d, g | |
| | 268,336 | | | | | | 268,336 | | 419.25p | | 18/3/2007 | | 17/3/2014 | | d, h | |
| | 195,409 | | | | | | 195,409 | | 403p | �� | 12/8/2007 | | 11/8/2014 | | d, h | |
| | 300,474 | | | | | | 300,474 | | 474.25p | | 17/3/2008 | | 16/3/2015 | | e, h | |
| | | | 3,851 | | | | 3,851 | | 418p | | 1/6/2011 | | 30/11/2011 | | a, h | |
| | | | | | | | | | | | | | | | | | |
H A Weir | | 556,208 | | | | | | 556,208 | | 424.75p | | 29/4/2007 | | 28/4/2014 | | d, h | |
| | 5,093 | | | | | | 5,093 | | 321p | | 1/11/2009 | | 30/4/2010 | | a, h | |
| | 300,474 | | | | | | 300,474 | | 474.25p | | 17/3/2008 | | 16/3/2015 | | e, h | |
| | | | | | | | | | | | | | | | | | |
Other share plan | | | | | | | | | | | | | | | | | |
T A Dial | | 242,825 | | | | | | 242,825 | | (see page 86 | ) | 1/6/2008 | | 30/11/2008 | | h | |
| | | | | | | | | | | | | | | | | | |
| |
a) | Sharesave. |
b) | Executive option granted between March 1996 and August 1999. |
c) | Executive option granted between March 2000 and March 2001. |
d) | Executive option granted between March 2002 and August 2004. |
e) | Executive options granted from March 2005. |
f) | Exercisable. |
g) | Not exercisable as the performance conditions had not been met. |
h) | Not exercisable as the option has not been held for the period required by the relevant scheme. |
i) | Market price on day of exercise was 515.5p. In that regard Mr Daniels made a gain of £7,702. |
| Market price on days of exercise was 545p, 565p, 515.5p and 560.5p respectively. In that regard Mr Fairey made an overall gain of £34,473. |
| Market price on days of exercise was 565p. In that regard Mr Kane made a gain of £83,000. |
| This is the difference between the market price of the shares on the day on which the share option was exercised and the price paid for the shares. |
j) | These share options lapsed as the performance condition had not been met. |
84
| |
Compensation | Audited information |
The market price for a share in the Company at 1 January 2006 and 31 December 2006 was 488.5p and 571.5p, respectively. The range of prices between 1 January 2006 and 31 December 2006 was 488.5p to 581p.
None of the other directors at 31 December 2006 had options to acquire shares in Lloyds TSB Group plc or its subsidiaries.
The following table contains information on the performance conditions for executive options granted since 1997. The remuneration committee chose the relevant performance condition because it was felt to be challenging, aligned to shareholders’ interests and appropriate at the time.
| |
Options granted | Performance conditions |
| | |
March 1997 – August 1999 | Growth in earnings per share which is equal to the aggregate percentage change in the retail price index plus two percentage points for each complete year of the relevant period plus a further condition that the Company’s ranking based on TSR over the relevant period should be in the top fifty companies of the FTSE 100. |
| | |
March 2000 – March 2001 | As for March 1997 – August 1999 except that there must have been growth in the earnings per share equal to the change in the retail price index plus three percentage points for each complete year of the relevant period. |
| | |
March 2002 – August 2004 | That the Company’s ranking based on TSR over the relevant period against a comparator group (17 UK and international financial services companies including Lloyds TSB) must be at least ninth, when 14 per cent of the option will be exercisable. If the Company is ranked first in the group, then 100 per cent of the option will be exercisable and if ranked tenth or below the performance condition is not met.
At the end of 2006 Lloyds TSB Group was ranked:
17th after four years of the performance period for options granted in 2003; and
10th after three years of the performance period for options granted in 2004.
Options granted in 2002 lapsed as the performance condition had not been met. |
| | |
March 2005 – August 2005 | That the Company’s ranking based on TSR over the relevant period against a comparator group (15 companies including Lloyds TSB) must be at least eighth, when 30 per cent of the option will be exercisable. If the Company is ranked first to fourth position in the group, then 100 per cent of the option will be exercisable and if ranked ninth or below the performance condition is not met.
At the end of 2006 Lloyds TSB Group was ranked:
11th after two years of the performance period for options granted in 2005. |
| | |
Lloyds TSB performance share plan
The following bonus and performance shares relating to the bonus awards in respect of 2004 and 2005 are available under the plan.
| | | | | | | | | | | | | | | | | | | | | | | | | |
| | Bonus shares | | Performance shares | | | | Bonus shares
release and
performance
share award
date | |
| | | | | | | | |
| | At
1 January
2006 | | Purchased
during the
year | | At
31 December
2006 | | At
1 January
2006 | | Conditional
award during
the year | | At
31 December
2006 | | Award
price | | |
| | | | | | | | | | | | | | | | | | |
J E Daniels | | | 57,737 | | | | | | 57,737 | | | 195,720 | | | | | | 195,720 | | | 479p | | | 18/3/2008 | |
| | | | | | 50,944 | | | 50,944 | | | | | | 172,694 | | | 172,694 | | | 566.10p | | | 20/3/2009 | |
M E Fairey | | | 31,901 | | | | | | 31,901 | | | 108,140 | | | | | | 108,140 | | | 479p | | | 18/3/2008 | |
| | | | | | 22,459 | | | 22,459 | | | | | | 76,134 | | | 76,134 | | | 566.10p | | | 20/3/2009 | |
T A Dial | | | — | | | 16,909 | | | 16,909 | | | — | | | 57,322 | | | 57,322 | | | 566.10p | | | 20/3/2009 | |
A G Kane | | | 22,171 | | | | | | 22,171 | | | 75,156 | | | | | | 75,156 | | | 479p | | | 18/3/2008 | |
| | | | | | 20,531 | | | 20,531 | | | | | | 69,598 | | | 69,598 | | | 566.10p | | | 20/3/2009 | |
G T Tate | | | 22,710 | | | | | | 22,710 | | | 76,982 | | | | | | 76,982 | | | 479p | | | 18/3/2008 | |
| | | | | | 27,358 | | | 27,358 | | | | | | 92,738 | | | 92,738 | | | 566.10p | | | 20/3/2009 | |
H A Weir | | | 16,628 | | | | | | 16,628 | | | 56,366 | | | | | | 56,366 | | | 479p | | | 18/3/2008 | |
| | | | | | 20,062 | | | 20,062 | | | | | | 68,008 | | | 68,008 | | | 566.10p | | | 20/3/2009 | |
| | | | | | | | | | | | | | | | | | | | | | | | | | |
The following table contains information on the performance conditions for performance shares. The remuneration committee chose the relevant performance condition because it was felt to be challenging, aligned to shareholders’ interests and appropriate at the time.
| |
Performance shares awarded | Performance conditions |
| | |
March 2005 and March 2006 | That the Company’s ranking based on TSR over the relevant period against a comparator group (15 companies including Lloyds TSB) must be at least eighth for any shares to be received. If ranked ninth or below no shares would be received. The maximum of two performance shares for each bonus share will be awarded only if the Company is first in the comparator group; one performance share will be awarded for each bonus share if the Company is placed fifth; and one performance share for every two bonus shares if the Company is placed eighth. Between first and fifth positions and fifth and eighth positions a sliding scale will apply. |
| |
| Whilst income tax was deducted from the deferred bonus before the conversion to bonus shares, where a match of performance shares is justified, these shares will be awarded as if income tax had not been deducted. This maintains the original design of the plan prior to the issue of guidance from HM Revenue & Customs in December 2004. |
| | |
85
| |
Compensation | Audited information |
Lloyds TSB long-term incentive plan
The following are conditional share awards available under the plan. The share price for the award was 520p. Further information regarding this plan can be found on page 79.
| | | | | | | | | | | | | |
| | At
1 January
2006 | | Awarded
during the
year | | At
31 December
2006 | | Year of
vesting | |
| | | | | | | | | | |
J E Daniels | | | — | | | 507,692 | | | 507,692 | | | 2009 | |
M E Fairey | | | — | | | 328,846 | | | 328,846 | | | 2009 | |
T A Dial | | | — | | | 328,846 | | | 328,846 | | | 2009 | |
A G Kane | | | — | | | 288,460 | | | 288,460 | | | 2009 | |
G T Tate | | | — | | | 297,114 | | | 297,114 | | | 2009 | |
H A Weir | | | — | | | 288,460 | | | 288,460 | | | 2009 | |
| | | | | | | | | | | | | | |
The following table contains information on the performance conditions for awards made under the long-term incentive plan. The remuneration committee chose the relevant performance condition because it was felt to be challenging, aligned to shareholders’ interests and appropriate at the time.
| |
Performance shares awarded | Performance conditions |
| | |
May 2006 | For 50 per cent of the award (the ‘EPS Award’) - the percentage increase in EPS of the Group (on a compound annualised basis) over the relevant period must be at least an average of 6 percentage points per annum greater than the percentage increase (if any) in the retail price index over the same period. If it is less than 3 per cent per annum the EPS Award will lapse. If the increase is more than 3 but less than 6 per cent per annum then the proportion of shares released will be on a straight line basis between 17.5 per cent and 100 per cent. |
|
| For the other 50 per cent of the award (the ‘TSR Award’) - it will be necessary for the Group’s TSR to exceed the median of a comparator group (14 companies) over the relevant period by an average of 7.5 per cent per annum for the TSR Award to vest in full. 17.5 per cent of the TSR Award will vest where the Group’s TSR is equal to median and vesting will occur on a straight line basis in between these points. Where the Group’s TSR is below the median of the comparator group, the TSR Award will lapse. |
| | |
Alithos Limited provided information for the testing of the TSR performance conditions for the Group’s long-term incentive schemes. EPS is the Group’s normalised earnings per share as shown in the Group’s report and accounts, subject to such adjustments as the remuneration committee regard as necessary for consistency.
Other share plan
Lloyds TSB Group executive share plan 2005
Ms Dial is the only participant in this plan and holds an option, granted to her in June 2005, to acquire 242,825 ordinary shares in Lloyds TSB Group plc for a total price of £1. The option was granted as part of the remuneration package considered necessary to attract her from the USA and is designed to encourage her to remain with Lloyds TSB Group plc. The option is not, therefore, subject to any performance condition but will normally become exercisable only if she remains an employee, and has not given notice of resignation, on 31 May 2008. Full details of the plan were set out in the annual report on Form 20-F for the year ended 31 December 2005.
None of those who were directors at the end of the year had any other interest in the capital of Lloyds TSB Group plc or its subsidiaries.
The register of directors’ interests, which is open to inspection, contains full particulars of directors’ shareholdings and options to acquire shares in Lloyds TSB Group.
Employees
As at 31 December 2006, Lloyds TSB Group employed 62,630 people (on a full-time equivalent basis), compared with 66,797 at 31 December 2005. At 31 December 2006 60,587 employees were located in the UK, 1,020 in continental Europe, 658 in the Americas, and 365 in the rest of the world. At the same date, 30,397 people were employed in UK Retail Banking, 5,451 in Insurance and Investments, 18,268 in Wholesale and International Banking, and 8,514 in other functions.
Lloyds TSB Group is committed to employment policies which follow best practice, based on equal opportunities for all employees irrespective of sex, race, national origin, religion, colour, disability, sexual orientation, age or marital status.
In the UK, Lloyds TSB Group supports Opportunity Now and is represented on the board of Race for Opportunity; campaigns to improve opportunities for women and ethnic minorities in the work place. Lloyds TSB Group is a gold card member of the Employers’ Forum on Disability, in support of employment of people with disabilities. This recognises the need for ensuring fair employment practices in recruitment and selection, and the retention, training and career development of disabled staff.
Employees are kept closely involved in major changes affecting them through such measures as team meetings, briefings, internal communications and opinion surveys. There are well established procedures, including regular meetings with recognised unions, to ensure that the views of employees are taken into account in reaching decisions.
Schemes offering share options or the acquisition of shares are available for most staff, to encourage their financial involvement in Lloyds TSB Group. Further details are given in ‘Compensation’.
86
Corporate governance
Statement on US corporate governance standards
As a non-US company listed on the New York Stock Exchange (NYSE) Lloyds TSB Group plc is required to disclose any significant ways in which its corporate governance practices differ from those followed by domestic US companies listed on the NYSE. As Lloyds TSB Group’s main listing is on the London Stock Exchange, it follows the principles contained in the combined code on corporate governance issued by the Financial Reporting Council. Sir Victor Blank, who was considered independent on appointment as chairman of the company, was appointed as an additional member of the remuneration committee in August 2006, as permitted by the new code issued in June 2006. Otherwise Lloyds TSB Group has complied with the provisions of the previous code, which was relevant for the 2006 financial year, and has done so throughout the year regarding the code provisions where the requirements are of a continuing nature. Key differences are set out below.
The board, rather than a separate corporate governance committee, sets the corporate governance principles applicable to the Company and conducts an annual evaluation of the performance of the board, its committees and its individual members.
The remuneration and nomination committees comprise the chairman and three and four independent non-executive directors respectively, rather than consisting entirely of independent directors.
The board and its committees
Audit committee
The audit committee comprises Mr Brown (chairman), Mr du Plessis, Mr Gemmell and Lord Leitch, all of whom have been determined by the board to be independent directors. The committee’s terms of reference are available from the company secretary and are displayed on the Company’s website www.lloydstsb.com.
The board of directors has determined that Mr du Plessis is an ‘audit committee financial expert’ (as defined in the rules under the U.S. Securities Exchange Act). Although Mr du Plessis has been identified as an audit committee financial expert for purposes of the SEC’s rules, the committee members are selected with a view to the expertise and experience of the committee as a whole, and the committee reports to the board of directors as a single entity. The designation of a person as an audit committee financial expert does not impose on such person any duties, obligations or liability that are greater than the duties, obligations and liability imposed on such person as a member of the audit committee and board of directors in the absence of such designation. Nor does the designation of a person as an audit committee financial expert affect the duties, obligations or liability of any other member of the audit committee or board of directors.
During the year, the audit committee received reports from, and held discussions with, management and the auditors. In discharging its duties, the committee has approved the auditors’ terms of engagement, including their remuneration and, in discussion with them, has assessed their independence and objectivity (more information about which is given in note 10 to the financial statements, in relation to the procedure for approving fees for audit and non-audit work) and recommended their re-appointment at the annual general meeting. The committee also reviewed the financial statements published in the name of the board and the quality and acceptability of the related accounting policies, practices and financial reporting disclosures; the scope of the work of the Group audit department, reports from that department and the adequacy of its resources; the effectiveness of the systems for internal control, risk management and compliance with financial services legislation and regulations (more information about which is given in the note about internal control on page 88); the results of the external audit and its cost effectiveness; and reports from the external auditors on audit planning and their findings on accounting and internal control systems. Procedures for handling complaints regarding accounting, internal accounting controls or auditing matters and for staff to raise concerns in confidence were established by the committee. The committee also had a meeting with the auditors, without executives present, and a meeting with the director of group audit alone.
Chairman’s committee
The chairman’s committee, comprising the chairman, the group chief executive and the deputy group chief executive, meets to assist the chairman in preparing for board meetings.
The committee may have specific powers delegated to it by the board from time to time and following the exercising of these powers, it reports to the board.
Group executive committee
The group executive committee, comprising the group chief executive, the deputy group chief executive, the group executive directors, the chief risk director, the group human resources director and the director of group IT and operations, meets to assist the group chief executive in performing his duties. Specifically, the committee considers the development and implementation of strategy, operational plans, policies and budgets; the monitoring of operating and financial performance; the assessment and control of risk; the prioritisation and allocation of resources; and the monitoring of competitive forces in each area of operation. The committee, assisted by its sub-committees, the group business risk and group asset and liability committees, also supports the group chief executive in endeavouring to ensure the development, implementation and effectiveness of the Group’s risk management framework and the clear articulation of the Group’s risk policies, and in reviewing the Group’s aggregate risk exposures and concentrations of risk.
The committee may have specific powers delegated to it by the board from time to time and following the exercising of these powers, it reports to the board. To comply with the Group’s articles of association, only committee members who are also directors of the Company participate in the exercising of any powers delegated by the board.
Nomination committee
The nomination committee, comprising Sir Victor Blank (chairman), Dr Berndt, Mr du Plessis, Sir Julian Horn-Smith and Lord Leitch, reviews the structure, size and composition of the board, taking into account the skills, knowledge and experience of directors and considers and makes recommendations to the board on potential candidates for appointment as directors. The committee also makes recommendations to the board concerning the re-appointment of any independent non-executive director by the board at the conclusion of his or her specified term; the re-election of any director by the shareholders under the retirement provisions of the articles of association; any matters relating to the continuation in office of a director of the Company; and the appointment of any director to executive or other office in the Company, although the chairman of the Company would not chair the committee when it was dealing with the appointment of a successor to the chairmanship of the Company.
In January 2006, it was announced that Mr van den Bergh had decided to retire as chairman and Sir Victor Blank, who became deputy chairman on 1 March, succeeded him as chairman of the Company at the conclusion of the annual general meeting in May. The selection process relating to Sir Victor’s appointment was described fully in the annual report for 2005.
The committee’s terms of reference are available from the company secretary and are displayed on the Company’s website www.lloydstsb.com.
Remuneration committee
Information about the remuneration committee’s membership and work is given in the directors’ remuneration report on pages 78 to 86 and its terms of reference are available from the company secretary and are displayed on the Company’s website www.lloydstsb.com.
87
Corporate governance
Risk oversight committee
The risk oversight committee comprises Sir Victor Blank (chairman), Mr Brown, Sir Julian Horn-Smith and Lord Leitch. All non-executive directors are also invited to attend meetings if they wish. The risk oversight committee’s duties include overseeing the development, implementation and maintenance of the Group’s overall risk management framework and its risk appetite, strategy, principles and policies, to ensure they are in line with emerging regulatory, corporate governance and industry best practice. The committee also oversees the Group’s risk exposures; facilitates the involvement of non-executive directors in risk issues and aids their understanding of these issues; oversees adherence to group risk policies and standards and considers any material amendments to them; and reviews the work of the group risk division.
Attendance at meetings
The attendance of directors at board meetings and at meetings of the audit, nomination, remuneration and risk oversight committees during 2006 was as follows:
| | | | | | | | | | | | | | | | |
| | Board | | Audit
committee | | Nomination
committee | | Remuneration
committee | | Risk oversight
committee | |
| | | | | | | | | | | | | | | | | |
Number of meetings during the year | | | 12 | | | 6 | | | 4 | | | 7 | | | 5 | |
| | | | | | | | | | | | | | | | | |
Current directors who served during 2006 | | | | | | | | | | | | | | | | |
W C G Berndt1 | | | 11 | | | | | | 2 | | | 7 | | | | |
Sir Victor Blank2 | | | 9 | | | | | | 3 | | | 2 | | | 3 | |
Ewan Brown3 | | | 12 | | | 5 | | | 3 | | | | | | 5 | |
J E Daniels | | | 12 | | | | | | | | | | | | | |
T A Dial | | | 11 | | | | | | | | | | | | | |
J P du Plessis1 | | | 10 | | | 6 | | | 2 | | | | | | | |
M E Fairey | | | 11 | | | | | | | | | | | | | |
G J N Gemmell | | | 11 | | | 6 | | | | | | | | | | |
Sir Julian Horn-Smith1 | | | 11 | | | | | | 2 | | | 6 | | | 4 | |
D S Julius3 | | | 7 | | | | | | 3 | | | 4 | | | | |
A G Kane | | | 10 | | | | | | | | | | | | | |
Lord Leitch4 | | | 11 | | | 4 | | | 2 | | | | | | 3 | |
G T Tate | | | 11 | | | | | | | | | | | | | |
H A Weir | | | 11 | | | | | | | | | | | | | |
| | | | | | | | | | | | | | | | | |
Former directors who served during 2006 | | | | | | | | | | | | | | | | |
A A Knight5 | | | 10 | | | 6 | | | | | | | | | | |
M A van den Bergh6 | | | 5 | | | | | | 1 | | | | | | 2 | |
| | | | | | | | | | | | | | | | | |
| |
1 | Appointed to the nomination committee from 1 August 2006. |
2 | Appointed to the board from 1 March 2006, nomination committee from 11 May 2006, remuneration committee from 1 August 2006 and risk oversight committee from 21 April 2006. |
3 | Left the nomination committee on 1 August 2006. |
4 | Appointed to the nomination committee from 1 August 2006 and risk oversight committee from 1 March 2006. |
5 | Left the board on 31 October 2006. |
6 | Left the board on 11 May 2006. |
Internal control
The board of directors is responsible for the establishment and review of the Lloyds TSB Group’s system of internal control, which is designed to ensure effective and efficient operations, quality of internal and external reporting, internal control, and compliance with laws and regulations including the Turnbull Guidance published in 2005. It should be noted, however, that such a system is designed to manage, rather than eliminate, the risk of failure to achieve business objectives. In establishing and reviewing the system of internal control the directors have regard to the nature and extent of relevant risks, the likelihood of a loss being incurred and the costs of control. It follows, therefore, that the system of internal control can only provide reasonable but not absolute assurance against the risk of material loss.
The directors and senior management are committed to maintaining a control-conscious culture across all areas of operation. This is communicated to all employees by way of published policies and procedures and regular management briefings. A requirement to comply with internal control risk policies is a key component of individual staff objectives expressed in the balanced scorecard. Key business risks are identified, and these are controlled by means of procedures such as physical controls, credit, trading and other authorisation limits and segregation of duties. In addition, there is an annual control self assessment exercise whereby the key businesses and head office functions review specific controls and attest to the accuracy of their assessments. The assessment covers all risk categories and is in accordance with the principles of the Combined Code. As in previous years, this exercise was completed for the year ended 31 December 2006. All returns have been satisfactorily completed and appropriately certified. The overall assessment of the control framework is satisfactory, acknowledging that there are specific areas for improvement where action plans are now in place and will be tracked to completion. None of the actions or areas of focus identified constitutes a significant failing or weakness.
The effectiveness of the internal control system is reviewed regularly by the audit committee and the board, which also receive reports of reviews undertaken around the Lloyds TSB Group by its risk management function and Group Audit. The audit committee receives reports from the Company’s auditors, PricewaterhouseCoopers LLP, (which include details of significant internal control matters that they have identified) and has a discussion with the auditors at least once a year without executives present, to ensure that there are no unresolved issues of concern.
88
Corporate governance
Disclosure controls and procedures
As of 31 December 2006, the Lloyds TSB Group, under the supervision and with the participation of the Lloyds TSB Group’s management, including the group chief executive and the group finance director, performed an evaluation of the effectiveness of the Lloyds TSB Group’s disclosure controls and procedures. Based on this evaluation, the group chief executive and group finance director concluded that the Lloyds TSB Group’s disclosure controls and procedures, as at 31 December 2006, were effective for gathering, analysing and disclosing with reasonable assurance the information the Lloyds TSB Group is required to disclose in the reports it files under the Securities Exchange Act of 1934, within the time periods specified in the SEC’s rules and forms. The Lloyds TSB Group’s management necessarily applied its judgement in assessing the costs and benefits of such controls and procedures, which by their nature can provide only reasonable assurance regarding management’s control objectives.
Changes in internal control over financial reporting
There has been no change in the Lloyds TSB Group’s internal control over financial reporting that occurred during the period covered by this annual report that has materially affected, or is reasonably likely to materially affect, the Lloyds TSB Group’s internal control over financial reporting.
Management Report on Internal Control over Financial Reporting
The management of Lloyds TSB Group plc is responsible for establishing and maintaining adequate internal control over financial reporting. Lloyds TSB Group plc’s internal control over financial reporting is a process designed to provide reasonable assurance regarding the reliability of financial reporting and the preparation of financial statements for external purposes in accordance with IFRS and for the purposes of the preparation of reconciliations to US GAAP.
The Lloyds TSB Group’s internal control over financial reporting includes those policies and procedures that (i) pertain to the maintenance of records that, in reasonable detail, accurately and fairly reflect transactions and dispositions of assets; (ii) provide reasonable assurance that transactions are recorded as necessary to permit preparation of financial statements in accordance with IFRS and of reconciliations under US GAAP and that receipts and expenditures are being made only in accordance with authorisations of management and directors of Lloyds TSB Group plc; and (iii) provide reasonable assurance regarding prevention or timely detection of unauthorised acquisition, use, or disposition of Lloyds TSB Group’s assets that could have a material effect on the financial statements.
Internal control systems, no matter how well designed, have inherent limitations and may not prevent or detect misstatements. Also, projections of any evaluation of effectiveness to future periods are subject to the risk that controls may become inadequate because of changes in conditions, or that the degree of compliance with the policies and procedures may deteriorate.
Lloyds TSB Group plc’s management assessed the effectiveness of the Lloyds TSB Group’s internal control over financial reporting as at 31 December 2006 based on the criteria set forth by the Committee of Sponsoring Organisations of the Treadway Commission (‘COSO’) in its report ‘Internal Control – Integrated Framework’. Based on this assessment, management concluded that, as at 31 December 2006, the Lloyds TSB Group’s internal control over financial reporting was effective.
Management’s assessment of the effectiveness of the Lloyds TSB Group’s internal control over financial reporting as at 31 December 2006 has been audited by PricewaterhouseCoopers LLP, the Lloyds TSB Group’s independent registered public accounting firm, as stated in their report appearing on page F-2, which expresses unqualified opinions on management’s assessment and on the effectiveness of the Lloyds TSB Group’s internal control over financial reporting as at 31 December 2006.
89
Major shareholders and related party transactions
Major shareholders
At 31 May 2007, notifications had been received that Legal & General Investment Management Limited, Barclays PLC and The Capital Group Companies had interests of 3.6% (203,071,629 shares), 3.84% (216,216,951 shares) and 4.86% (272,152,525 shares), respectively, in Lloyds TSB Group’s issued share capital with rights to vote which are exercisable in all circumstances at general meetings. Lloyds TSB Group plc does not know of any other shareholder with an interest in three per cent or more of the voting rights.
All shareholders within a class of the Company’s shares have the same voting rights. Lloyds TSB Group plc is not owned or controlled directly or indirectly by another corporation or by any government and Lloyds TSB Group plc is unaware of any arrangements which might result in a change in control.
Related party transactions
Lloyds TSB Group, as at 31 December 2006, had related party transactions with 19 key management personnel. See note 45 to the Consolidated Financial Statements. The transactions in question were made in the ordinary course of business, were made on substantially the same terms, including interest rates and collateral, as those prevailing at the time for comparable transactions with other persons, and did not involve more than the normal risk of collectability or present other unfavourable features.
90
Regulation
Regulatory Requirements for UK Financial Services Institutions
The cornerstone of the regulatory regime in the UK is the Financial Services and Markets Act 2000 (‘FSMA’) which came into force on 1 December 2001 (a date known as N2) and replaced much of the previous legislation under which banks, insurance companies and investment businesses had been authorised and supervised. In accordance with the provisions of the FSMA on 30 November 2001, the Financial Services Authority (‘FSA’) completed the process of assuming responsibility for the regulation and oversight of a wide range of financial services activities in the UK. Most recently these responsibilities have extended to include the regulation of mortgage lending, sales and administration (October 2004) and general insurance sales and administration (January 2005).
The FSA is responsible for the authorisation and supervision of institutions that provide regulated financial products and services as defined in the FSMA. As part of the authorisation process, the FSA reviews applicants to ensure that they satisfy the necessary criteria including honesty, competence and financial soundness, to engage in regulated activity. The majority of Lloyds TSB Group’s regulated financial institutions became authorised by the FSA through being ‘grandfathered’ as having been authorised under previous legislation to carry on financial services business. Following the new regulations that were introduced for mortgage and general insurance business, additional entities were authorised by the FSA.
Regulatory Approach of the FSA
The FSA’s regulatory approach aims to focus and reinforce the responsibility of senior management of a financial institution to ensure that it takes reasonable care to organise and control its affairs responsibly and effectively and that it develops and maintains adequate risk management systems. The FSA Handbook of Rules and Guidance (the ‘Handbook’) sets out eleven Principles for Businesses and the rules to which financial institutions are required to adhere.
A risk-based approach for the supervision of all financial institutions is adopted by the FSA and the starting point for the FSA’s supervision is based on a systematic analysis of that institution’s risk profile. Having determined the level of inherent risk, a minimum capital adequacy requirement is established, which the institution is required to meet at all times.
The FSA carries out its supervision of UK financial institutions through the collection of information from a series of prudential returns covering sterling and non-sterling operations, on-site reviews (through its ARROW reviews and through industry-wide Theme Reviews), desk-based reviews, meetings with senior management and reports obtained from skilled persons.
Regular reports required by the FSA include operating statements and returns covering (amongst other things) capital adequacy, liquidity, large single exposures and large exposures to related borrowers, lendings by industry sector and geographical area, maturity analyses and foreign exchange activities. Capital adequacy returns are submitted on a periodic basis for all the authorised institutions within the Lloyds TSB Group. Returns are also submitted on a consolidated basis for the Lloyds TSB Group as a whole.
The Handbook sets out rules and guidance across a range of issues with which financial institutions are required to comply. These include, inter alia:
| |
• | Authorisation requirements – standards that need to be met in order to be authorised and continue to be met on an ongoing basis. |
| |
• | Prudential rules – relating to capital adequacy. |
| |
• | Systems and Controls requirements – that are appropriate to the volume and complexity of activity undertaken. |
| |
• | Conduct of Business rules – that set out the requirements for aspects such as advising and selling, product disclosure, financial promotions (including compliance with the clear, fair and not misleading requirements), responsible lending and default. |
| |
• | Training and Competence (‘T&C’) rules – setting standards that apply to firms providing advice to retail customers. |
| |
• | Code of Market Conduct rules – with a view to preventing market abuse. |
A key theme running through most of the FSA’s rules and regulations is the concept of Treating Customers Fairly. The Lloyds TSB Group has developed its own work on this issue and has embedded this concept in its activity, operations and culture.
Financial Services Guarantee Schemes in the UK
Under the FSMA a compulsory single, industry wide, investor’s compensation scheme, the Financial Services Compensation Scheme (the ‘Scheme’) has been set up. All authorised institutions are required to be members of the Financial Services Compensation Scheme and are subject to a levy in proportion to their deposit base or volume of business undertaken. The Scheme applies to business undertaken by an FSA authorised institution or by the UK branch of a European Economic Area firm carrying on ‘home state regulated activity’.
FSMA allows for the establishment of different funds for different kinds of business and for different maximum amounts of claim:
| |
• | Bank depositors (who are eligible claimants) in the UK are provided with protection for their deposits with authorised institutions. Depositors with an institution which has been declared insolvent are entitled to receive 100 per cent of the first £2,000 and 90 per cent of the next £33,000 of their protected deposits from the Financial Services Compensation Scheme, subject to a maximum amount of £31,700, including both principal and accrued interest. |
| |
• | Investors can obtain a maximum award for compensation, if they have a claim against a firm which subsequently could not pay, of £48,000 (100 per cent of the first £30,000 and 90 per cent of the next £20,000). |
| |
• | Long-term insurance contracts compensation is limited to 100 per cent of the first £2,000 plus 90 per cent of the remainder of the value of the contract with no maximum. |
Authorised firms within the Lloyds TSB Group
There are currently 26 authorised institutions within the Lloyds TSB Group. These are regulated by the FSA on both an individual and a consolidated basis.
There are six UK authorised banks: Lloyds TSB Bank plc, Lloyds TSB Scotland plc, Cheltenham & Gloucester plc, Lloyds TSB Private Banking Limited, Scottish Widows Bank plc and AMC Bank Limited.
The investment firms authorised within the Group are: Lloyds TSB Stockbrokers Limited, Scottish Widows Investment Partnership Limited, Lloyds TSB Development Capital Limited, Lloyds TSB Venture Managers Limited, Lloyds TSB Financial Consultants Limited, Lloyds TSB Independent Financial Advisers Limited, SWIP Fund Management Limited, Scottish Widows Unit Trust Managers Limited, Scottish Widows Fund Management Limited and Lloyds TSB Investments Limited.
The regulated entities conducting insurance, life and pensions business are: Black Horse Limited, Lloyds TSB Bank Insurance Brokers Limited, Lloyds TSB Insurance Services Limited, Lloyds TSB General Insurance Limited, Scottish Widows Annuities Limited, Pensions Management (SWF) Limited, Scottish Widows Unit Funds Limited, Scottish Widows plc, Abbey Life Assurance Company Limited and Scottish Widows Administration Services Limited (following a change of company name on 7 November 2006 from Lloyds TSB Life Assurance Company Limited).
Basel II
Basel II has been implemented throughout the EU through the Capital Requirements Directive (which is discussed below under European Union Impact for UK Financial Services Regulation). This came into force for all European banks on 1 January 2007, following a consultative process which continued throughout 2006. Transitional provisions mean, however, that Lloyds TSB Group is not required to be in compliance with all of the rules until 1 January 2008. The Group has been actively involved with the UK regulatory authorities in the consultative process. The Group will adopt the Internal Ratings approach to credit risk and the Advanced Measurement Approach to operational risk, and work is being undertaken to ensure that the standards required by these advanced approaches will be met. It is expected that these approaches will also be a benefit to the Group in terms of its capital allocation.
91
Regulation
Other relevant legislation and regulation
Financial Ombudsman Service (‘FOS’)
The FOS was established at N2 pursuant to the FSMA to provide customers with a free and independent service designed to resolve disputes where the customer is not satisfied with the response received from the regulated firm. The FOS resolves disputes that cover most financial products and services provided in (or from) the UK, from insurance and pension plans to bank accounts and investments, for eligible complainants, private individuals and small businesses, charities or trusts. Although the FOS takes account of relevant regulation and legislation, their guiding principle is to resolve cases on the basis of what is fair and reasonable; in this regard, the FOS is not bound by law or even its own precedent. The decisions made by the FOS are binding on firms.
Banking Code Standards Board
The Banking Code Standards Board monitors compliance with the Banking Code and the Business Banking Code. These Codes are voluntary codes agreed by UK banks and building societies that initially came effective in 1992, with several subsequent revisions, and which have been adopted by Lloyds TSB Group. The Banking Code and Business Banking Code define the responsibilities of the banks and building societies to their personal customers and smaller business customers respectively in connection with the operation of their UK accounts and sets out minimum standards of service that these customers can expect from institutions which subscribe to the Code.
Office of Fair Trading (‘OFT’)
The OFT is responsible for regulating implementation of the Consumer Credit Act 1974 which regulates both brokerage and lending activities in the provision of personal secured and unsecured lending. The OFT is also responsible for regulating issues such as credit card default fees, payment protection insurance (in conjunction with the FSA), and payment services.
Information Commissioner’s Office
This office is responsible for overseeing implementation of the Data Protection Act 1998. This Act regulates, among other things, the retention and use of data relating to individual customers.
European Union Impact for UK Financial Services Regulation
Work continues on the Financial Services Action Plan which is intended to create a single market for financial services across the EU. The Lloyds TSB Group will continue to monitor the progress of these initiatives, provide specialist input on their drafting and assess the likely impact on its business.
EU directives, which are required to be implemented in EU member states through national legislation, have a strong influence over the framework for supervision and regulation of financial services in the UK. The directives aim to harmonise financial services regulation and supervision throughout the EU by setting minimum standards in key areas such as capital adequacy, access to financial markets, consumer protection and compensation schemes.
Financial institutions, such as those in the Lloyds TSB Group, are primarily regulated in their home state by a local regulator but the EU directives prescribe minimum criteria for the authorisation of such institutions and the prudential supervision applicable to them. Different directives require member states to give ‘mutual recognition’ to each other’s standards of regulation through the operation of a ‘passport’ concept. This passport gives a financial institution which has been authorised in its ‘home’ state the freedom to establish branches in, and to provide cross-border services into, other member states without the need for additional local authorisation.
Key directives currently being implemented are :
| | |
• | Capital Requirements Directive – this came into effect on 1 January 2007 and implements Basel II throughout the EU for banks and investment firms. The final rules for the UK jurisdiction were published during 2006, resulting in substantial changes to the capital adequacy rules applying to the Lloyds TSB Group. The Group was fully involved in the consultative process with the regulatory authorities. The new framework covers three main areas : |
| |
| – | Minimum capital requirements and methodologies for allocation of regulatory capital for credit and other risks including operational risk; |
| | |
| – | A supervisory review process, including the setting of capital ratios by bank supervisors; and |
| | |
| – | Improvement of transparency in the financial system by reliable and timely disclosure of risk information. |
| | |
• | MiFID – this is one of the key initiatives of the Financial Services Action Plan and will come into effect in November 2007. It will replace the 1996 Investment Services Directive. The Directive : |
| |
| – | Extends the coverage of the current regime for both firms and products ; |
| | |
| – | Introduces more extensive requirements, in particular in relation to conduct of business (both business operations and customer interaction) ; and |
| | |
| – | Details additional governance requirements, such as organisation of risk functions, outsourcing and conflicts of interest management. |
| | |
• | Third Money Laundering Directive – this comes into effect on 17 December 2007 and is designed to strengthen the fight against money laundering and terrorist financing. It will provide a common EU basis for implementing the revised Financial Action Task Force (‘FATF’) Recommendations (issued in June 2003) and replace the 1st and 2nd Money Laundering Directives. Although some enhancements to the Group’s processes may be required these are not expected to be significant or involve material change. Changes arising through this Directive will be incorporated into the UK’s Joint Money Laundering Steering Group (‘JMLSG’) Guidance Notes. In the UK the JMLSG has also recently reinforced a risk-based approach to anti-money laundering. |
US
In the United States, Lloyds TSB Bank maintains a branch in New York and an agency in Miami, licensed by the States of New York and Florida, respectively. A subsidiary of Lloyds TSB Bank maintains representative offices in several US cities. The existence of branch and agency offices of Lloyds TSB Bank in the US subjects Lloyds TSB Group plc and its subsidiaries doing business or conducting activities in the US to oversight by the Federal Reserve Board and limits the nature of the activities in which Lloyds TSB Group plc and its subsidiaries can engage in the US. Lloyds TSB Bank’s branch and agency offices are subject to extensive federal and state supervision and regulation relating to their operations, and the Group generally is expected to provide a measure of management and financial support and guidance to its US operations and activities. A major focus of US governmental policy relating to financial institutions in recent years has been combating money laundering and terrorist financing and enforcing compliance with US economic sanctions, with serious legal and reputational consequences for any failures arising in these areas.
Rest of the world
The Lloyds TSB Group operates in many other countries around the world. The Group’s overseas branches and subsidiaries are subject to reporting and reserve requirements and controls imposed by the relevant central banks and regulatory authorities.
92
Listing information
The information in this section has been extracted from publicly available documents from various sources, including officially prepared materials from the London Stock Exchange, and has not been prepared or independently verified by the Lloyds TSB Group.
The ordinary shares of Lloyds TSB Group plc are listed and traded on the London Stock Exchange under the symbol ‘LLOY.L’. The prices for shares as quoted in the official list of the London Stock Exchange are in pounds sterling. The following table shows the reported high and low closing prices for the ordinary shares on the London Stock Exchange. This information has been extracted from publicly available documents from various sources, including officially prepared materials from the London Stock Exchange, and has not been prepared or independently verified by the Lloyds TSB Group.
| | | | | | | |
| | Price per share
(in pence)
High | | Price per share
(in pence)
Low | |
| | | | | | | | |
Annual prices: | | | | | | | |
2006 | | | 581.00 | | | 489.75 | |
2005 | | | 509.00 | | | 439.50 | |
2004 | | | 476.25 | | | 391.75 | |
2003 | | | 483.00 | | | 295.75 | |
2002 | | | 817.00 | | | 427.50 | |
2001 | | | 772.00 | | | 590.00 | |
2000 | | | 774.50 | | | 517.00 | |
1999 | | | 1,060.00 | | | 725.00 | |
1998 | | | 1,075.00 | | | 575.50 | |
Quarterly prices: | | | | | | | |
2007 | | | | | | | |
First quarter | | | 614.00 | | | 532.00 | |
2006 | | | | | | | |
Fourth quarter | | | 581.00 | | | 539.50 | |
Third quarter | | | 544.00 | | | 507.00 | |
Second quarter | | | 552.00 | | | 491.50 | |
First quarter | | | 573.50 | | | 489.75 | |
2005 | | | | | | | |
Fourth quarter | | | 489.50 | | | 439.50 | |
Third quarter | | | 495.00 | | | 454.00 | |
Second quarter | | | 482.50 | | | 446.50 | |
First quarter | | | 509.00 | | | 463.50 | |
Monthly prices: | | | | | | | |
May 2007 | | | 587.00 | | | 573.00 | |
April 2007 | | | 586.00 | | | 564.00 | |
March 2007 | | | 573.50 | | | 532.00 | |
February 2007 | | | 614.00 | | | 574.00 | |
January 2007 | | | 597.50 | | | 575.50 | |
December 2006 | | | 574.00 | | | 539.50 | |
| | | | | | | | |
On 31 May 2007, the closing price of shares on the London Stock Exchange was 575.00 pence, equivalent to $11.38 per share translated at the Noon Buying Rate of $1.9797 per £1.00 on 31 May 2007.
93
Listing information
Lloyds TSB Group plc’s American Depositary Receipts (‘ADRs’) have been traded on the over-the-counter market in the US under the symbol ‘LLDTY’ since March 2000. Since 27 November 2001 Lloyds TSB Group plc American Depositary Shares (‘ADSs’) have been listed on The New York Stock Exchange under the symbol ‘LYG’. The prices for Lloyds TSB Group plc’s ADRs, as quoted below, are in US dollars. Each ADS represents four ordinary shares.
The following table shows the reported high and low closing prices for the ADRs in the over-the-counter market in the US.
| | | | | | | |
| | Price per ADR
(in US dollars)
High | | | Price per ADR
(in US dollars)
Low | |
| | | | | | | |
Annual prices: | | | | | | | |
2001 (to 26 November 2001) | | | 46.00 | | | 34.75 | |
2000 | | | 45.27 | | | 33.50 | |
Quarterly prices: | | | | | | | |
2001 | | | | | | | |
Fourth quarter (to 26 November 2001) | | | 43.88 | | | 38.25 | |
Third quarter | | | 44.00 | | | 35.50 | |
Second quarter | | | 43.94 | | | 38.94 | |
First quarter | | | 46.00 | | | 34.75 | |
| | | | | | | | |
The following table shows the reported high and low closing prices for ADSs on the New York Stock Exchange.
| | | | | | | |
| | Price per ADS
(in US dollars)
High | | Price per ADS
(in US dollars)
Low | |
| | | | | | |
Annual prices: | | | | | |
2006 | | | 45.41 | | | 34.72 | |
2005 | | | 39.06 | | | 31.12 | |
2004 | | | 36.88 | | | 29.47 | |
2003 | | | 32.55 | | | 19.65 | |
2002 | | | 48.55 | | | 27.85 | |
2001 (from 27 November 2001) | | | 44.99 | | | 41.30 | |
Quarterly prices: | | | | | | | |
2007 | | | | | | | |
First quarter | | | 48.44 | | | 41.64 | |
2006 | | | | | | | |
Fourth quarter | | | 45.41 | | | 40.70 | |
Third quarter | | | 40.70 | | | 38.00 | |
Second quarter | | | 40.38 | | | 36.91 | |
First quarter | | | 40.32 | | | 34.72 | |
2005 | | | | | | | |
Fourth quarter | | | 34.46 | | | 31.12 | |
Third quarter | | | 36.20 | | | 32.82 | |
Second quarter | | | 36.50 | | | 33.16 | |
First quarter | | | 39.06 | | | 35.12 | |
2004 | | | | | | | |
Fourth quarter | | | 36.88 | | | 31.35 | |
Third quarter | | | 31.61 | | | 29.47 | |
Second quarter | | | 32.90 | | | 29.59 | |
First quarter | | | 36.36 | | | 30.15 | |
Monthly prices: | | | | | | | |
May 2007 | | | 47.20 | | | 45.90 | |
April 2007 | | | 47.13 | | | 44.99 | |
March 2007 | | | 45.43 | | | 41.64 | |
February 2007 | | | 48.44 | | | 45.28 | |
January 2007 | | | 46.92 | | | 44.80 | |
December 2006 | | | 45.41 | | | 42.74 | |
| | | | | | |
On 31 May 2007, the closing price of ADSs on the New York Stock Exchange was $45.90.
94
Dividends
Lloyds TSB Group plc has paid an interim and final dividend each year since the merger of TSB Group plc and Lloyds Bank Plc in 1995. Dividends are typically paid in May and October and the record date for the purpose of determining the shareholders who will be entitled to a dividend is established a number of weeks before the dividend payment date. TSB Group plc, which was re-named Lloyds TSB Group plc after the merger, has paid an interim and final dividend every year since its flotation on the London Stock Exchange in September 1986, with the exception of 1986 when no final dividend was paid. Lloyds TSB Bank has paid a dividend every year since its incorporation as Lloyds Banking Company Limited in 1865.
Lloyds TSB Group plc’s ability to pay dividends is restricted under UK company law. Dividends may only be paid if distributable profits are available for that purpose. In the case of a public limited company, a dividend may only be paid if the amount of net assets is not less than the aggregate of the called-up share capital and undistributable reserves and if the payment of the dividend will not reduce the amount of the net assets to less than that aggregate. In addition, a company cannot pay a dividend if any of its UK insurance subsidiaries is insolvent on a regulatory valuation basis or, in the case of regulated entities, if the payment of a dividend results in regulatory capital requirements not being met. Similar restrictions exist over the ability of Lloyds TSB Group plc’s subsidiary companies to pay dividends to their immediate parent companies. Furthermore, in the case of Lloyds TSB Group plc, dividends may only be paid if sufficient distributable profits are available for distributions due in the financial year on certain preferred securities. The board has the discretion to decide whether to pay a dividend and the amount of any dividend. In making this decision, the board is mindful of the level of dividend cover and, consequently, profit growth may not necessarily result in increases in the dividend. The board recognises the importance attached by shareholders to the Lloyds TSB Group’s dividend. In the case of American Depositary Shares (‘ADSs’), dividends are paid through The Bank of New York which acts as paying and transfer agent.
The table below sets out the interim and final dividends which were declared in respect of the ordinary shares for fiscal years 2001 through 2006. The sterling amounts have been converted into US dollars at the Noon Buying Rate in effect on each payment date.
| | | | | | | | | | | | | |
| | Interim dividend
per share (£) | | Interim dividend
per share ($) | | Final dividend
per share (£) | | Final dividend
per share ($) | |
| | | | | | | | | | |
2001 | | | 0.102 | | | 0.149 | | | 0.235 | | | 0.344 | |
2002 | | | 0.107 | | | 0.167 | | | 0.235 | | | 0.374 | |
2003 | | | 0.107 | | | 0.178 | | | 0.235 | | | 0.419 | |
2004 | | | 0.107 | | | 0.190 | | | 0.235 | | | 0.447 | |
2005 | | | 0.107 | | | 0.189 | | | 0.235 | | | 0.433 | |
2006 | | | 0.107 | | | 0.202 | | | 0.235 | | | 0.468 | |
| | | | | | | | | | | | | | |
There are no UK governmental laws, decrees or regulations that affect the remittance of dividends or other shareholder payments to non-residents of the UK who hold shares of Lloyds TSB Group plc.
Memorandum and articles of association of Lloyds TSB Group plc
A summary of the material provisions of Lloyds TSB Group plc’s memorandum and articles of association is set out below. This has been updated from the summary that was incorporated into Lloyds TSB Group plc’s annual report on Form 20-F for the year ended 31 December 2005 filed with the SEC on 6 June 2006 and reflects changes to the memorandum and articles of association approved by the shareholders of Lloyds TSB Group plc at its annual general meeting in May 2007.
Lloyds TSB Group plc is incorporated in Scotland under the UK Companies Act 1985 with registered number SC95000.
Objects of Lloyds TSB Group plc
Lloyds TSB Group plc’s objects are:
| |
• | Clause 4(1)(a) of the memorandum of association of Lloyds TSB Group plc (the ‘Memorandum’): to take over and hold all or such part of the property and rights, and to assume and undertake all or such part of the liabilities and obligations, of the Trustee Savings Banks Central Board (‘the Central Board’), Trustee Savings Banks (Holdings) Limited (“TSB Holdings”) and the trustee savings banks (meaning the banks defined as the existing banks in the Trustee Savings Banks Act 1985, the ‘TSBA’) as shall be transferred to and vested in Lloyds TSB Group plc under the TSBA; and |
| |
• | Clause 4(1)(b) of the Memorandum: to act as the holding company for: |
| |
| (i) the companies formed or to be formed with objects including that of assuming and conducting, after the vesting day, as the same is defined in the TSBA, the respective business of the trustee savings banks and eligible to succeed them respectively within the meaning of Section 1(2) of the TSBA; and (ii) the companies which, immediately before the said vesting day, are subsidiaries of the trustee savings banks, the Central Board or TSB Holdings; and |
| |
• | Clause 4(7) of the Memorandum: to carry on the business of banking in all its aspects, including but not limited to all businesses of a financial or monetary nature and any business which now is or at any time during the existence of Lloyds TSB Group plc may be usually or commonly carried on as part of or in connection with, or which may conduce to or be calculated to facilitate or render profitable or more profitable the transaction of, the business of banking or of dealing in money or securities or the provision of financial services of any kind, in any part of the world. |
95
Memorandum and articles of association of Lloyds TSB Group plc
Voting rights
For the purposes of determining which persons are entitled to attend or vote at a meeting and how many votes such person may cast, Lloyds TSB Group plc may specify in the notice of the meeting a time, not more than 48 hours before the time fixed for the meeting, by which a person must be entered on the register in order to have the right to attend or vote at the meeting. Every holder of ordinary shares who is entitled to be and is present in person (including any corporation by its duly authorised representative) at a general meeting of Lloyds TSB Group plc and is entitled to vote will have one vote on a show of hands and, on a poll, if present in person or by proxy, will have one vote for every such share held by him, save that a member will not be entitled to exercise the right to vote carried by such shares if he or any person appearing to be interested in the shares held by him has been duly served with a notice under section 793 of the UK Companies Act 2006 (requiring disclosure of interests in shares) and is in default in supplying Lloyds TSB Group plc with information required by such notice. The limited voting shares confer the right to receive notice of and to attend and speak at all general meetings of Lloyds TSB Group plc, but do not confer a right to vote unless the business of the meeting includes the consideration of a resolution:
| |
• | to approve an acquisition or disposal by Lloyds TSB Group plc or any of its subsidiaries in circumstances in which the approval of shareholders in general meeting is either required by virtue of securities of Lloyds TSB Group plc being listed on a recognised exchange, or is sought by the directors, due to the significance of the transaction, or |
| |
• | for the winding-up of Lloyds TSB Group plc, or |
| |
• | to vary the rights of the limited voting shares. |
In any such case, the holder may vote the limited voting shares only in respect of such resolution and will have the same rights with regard to the number and exercise of votes as a holder of ordinary shares but in the case of a variation in the rights of limited voting shares, shall also have the protection of a requirement for approval of the variation by way of an extraordinary resolution at a separate class meeting of the holders of limited voting shares.
Preference shares confer such rights as may be determined by the directors on allotment, but unless the directors otherwise determine, fully paid preference shares confer identical rights as to voting, capital dividends and otherwise, notwithstanding that they are denominated in different currencies and shall be treated as if they are one single class of shares.
There are no limitations imposed by UK law or the memorandum and articles of association of Lloyds TSB Group plc restricting the rights of non-residents of the UK or non-citizens of the UK to hold or vote shares of Lloyds TSB Group plc.
General meetings
The directors may make arrangements to regulate the level of attendance at any place specified for the holding of a general meeting and, in any such case, shall direct that the meeting be held at a specified place, where the chairman of the meeting shall preside, and make arrangements for simultaneous attendance and participation by members and proxies at other locations. The chairman of a general meeting has express authority to adjourn the meeting if, in his opinion, it appears impracticable to hold or continue the meeting because of crowding or unruly conduct or because an adjournment is otherwise necessary for the proper conduct of the meeting. Annual general meetings of Lloyds TSB Group plc are to be held in Edinburgh or such other place in Scotland as the directors shall appoint.
Dividends and other distributions and return of capital
The shareholders in general meeting may by ordinary resolution declare dividends to be paid to members of Lloyds TSB Group plc, but no dividends shall be declared in excess of the amount recommended by the directors. The directors may pay fixed dividends on any class of shares carrying a fixed dividend and may also from time to time pay dividends, interim or otherwise, on shares of any class. Except in so far as the rights attaching to any shares otherwise provide, all dividends shall be apportioned and paid pro rata according to the amounts paid up thereon. Subject to the rights attaching to any shares, any dividend or other monies payable in respect of a share may be paid in such currency or currencies as the directors may determine using such exchange rates as the directors may select.
The opportunity to elect to receive new shares instead of any cash dividend recommended by the directors, may be offered to shareholders provided that the directors shall have obtained in advance the shareholders’ approval to do so as required by the articles of association.
The limited voting shares do not confer a right to participate in any distribution of profits by way of dividend. For any other distributions, the limited voting shares shall be deemed to confer rights and interests in the profits equally with the holders of ordinary shares according to the amounts paid up on such limited voting shares and ordinary shares respectively otherwise than in advance of calls.
On any distribution by way of capitalisation, the amount to be distributed will be appropriated amongst the holders of ordinary shares and limited voting shares in proportion to their holdings of ordinary shares and limited voting shares (pro rata to the amount paid up thereon). If the amount to be distributed is applied in paying up in full unissued ordinary shares and limited voting shares of Lloyds TSB Group plc, a shareholder will be entitled to receive bonus shares of the same class as the shares giving rise to his entitlement to participate in the capitalisation.
Any dividend unclaimed after a period of 12 years from the date of declaration of such dividend will be forfeited and revert to Lloyds TSB Group plc. No dividends or other monies payable on or in respect of a share shall bear interest against Lloyds TSB Group plc.
On a return of capital, whether in a winding-up or otherwise, the ordinary shares and the limited voting shares will rank equally in all respects and the preference shares will be entitled to the rights attaching to them on issue.
Conversion of limited voting shares
Each limited voting share will be converted into an ordinary share:
| |
• | on the day following the last date on which an amount could become due and payable to a holder of limited voting shares under a deed of covenant in favour of the Lloyds TSB Foundations. A deed of covenant is a legal document which records the obligation of one person to pay a specified sum to another for a specified number of years; or |
| |
• | if an offer is made to shareholders (or to all such shareholders other than the offeror and/or any body corporate controlled by the offeror and/or any persons acting in concert with the offeror) to acquire the whole or any part of the issued ordinary share capital of Lloyds TSB Group plc and the right to cast more than 50 per cent of the votes which may ordinarily be cast on a poll at a general meeting of Lloyds TSB Group plc becomes or is certain to become vested in the offeror and/or any bodies corporate controlled by the offeror and/or any persons acting in concert with the offeror. The publication of a scheme of arrangement under the statutes providing for the acquisition by any person of the whole or part of the ordinary share capital of Lloyds TSB Group plc shall be deemed to be the making of an offer for this purpose. |
The shares resulting from conversion will carry the right to receive all dividends and other distributions declared, made or paid on the ordinary share capital of Lloyds TSB Group plc by reference to a record date on or after the date of conversion and will rank equally in all other respects and form one class with the ordinary share capital of Lloyds TSB Group plc then in issue and fully paid.
Holders of limited voting shares will be entitled to participate in any offer made by way of rights to holders of ordinary shares as if the limited voting shares had been converted at the relevant record date.
96
Memorandum and articles of association of Lloyds TSB Group plc
Variation of rights and alteration of capital
Subject to the provisions of the UK Companies Act 1985, the CREST regulations and every other statute for the time being in force or any judgement or order of any court of competent jurisdiction concerning companies and affecting Lloyds TSB Group plc (the ‘statutes’), the rights attached to any class of shares for the time being in issue may (subject to their terms of issue) be varied, modified or abrogated with the consent in writing of the holders of not less than three fourths in nominal value of the issued shares of that class or with the sanction of an extraordinary resolution passed at a separate meeting of the holders of shares of that class. At any such separate meeting, the provisions of the articles of association relating to general meetings will apply, but the necessary quorum at any such meeting will be two persons holding or representing by proxy at least one-third in nominal value of the issued shares of that class (except at an adjourned meeting, at which the quorum shall be any holder of shares of the class, present in person or by proxy) and any such person may demand a poll.
Lloyds TSB Group plc may, by ordinary resolution, increase its share capital, consolidate and divide all or any of its shares into shares of larger amount, sub-divide all or any of its shares into shares of smaller amount and cancel any shares not taken or agreed to be taken by any person.
However, for so long as the limited voting shares have not been converted (as described above);
| |
• | Lloyds TSB Group plc is prohibited from consolidating or subdividing any of the ordinary shares without consolidating or subdividing the limited voting shares in like manner and to a like extent; and |
| |
• | Lloyds TSB Group plc will not create any new class of equity share capital, other than in connection with or pursuant to an employees’ share scheme approved by Lloyds TSB Group plc in general meeting, provided that the creation of equity share capital which carries (as compared with the existing Lloyds TSB Group plc shares) only restricted voting or no voting rights and no greater rights as regards dividends or capital shall not be deemed to be the creation of a new class of equity share capital. |
Subject to the provisions of the UK Companies Act 1985, Lloyds TSB Group plc may, by special resolution, reduce its share capital, any capital redemption reserve, share premium account or other undistributable reserve in any way.
Transfer of shares
All transfers of shares which are in certificated form may be effected by transfer in writing in any usual or common form or in any other form acceptable to the directors and must be executed by or on behalf of the transferor and, if the shares thereby transferred are not fully paid, by or on behalf of the transferee. The transferor will be deemed to remain the holder of the shares transferred until the name of the transferee is entered in the register of members of Lloyds TSB Group plc in respect thereof. All transfers of shares which are in uncertificated form may be effected by means of a relevant system.
The directors may, in the case of shares in certificated form, in their absolute discretion and without assigning any reason therefor, refuse to register any transfer of shares (not being fully paid shares) provided that, where any such shares are admitted to the official list maintained by the UK Listing Authority, such discretion may not be exercised in such a way as to prevent dealings in the shares of that class from taking place on an open and proper basis. The directors may also decline to register a transfer unless either:
| |
• | the instrument of transfer complies with the requirements of the articles of association and the transfer is in respect of only one class of shares; or |
| |
• | the transfer is in favour of not more than four persons as the transferee. |
The directors shall refuse to register the transfer of any share on which Lloyds TSB Group plc has a lien and shall refuse to register the transfer of any limited voting share unless the same is:
| |
• | between existing holders of limited voting shares; or |
| |
• | under a scheme established or order made by the Charity Commissioners or by the court to a transferee having charitable objects; or |
| |
• | in the course of a winding-up to an institution having charitable objects which prohibit distributions of income and property to members to at least the same extent as is imposed on the transferor by its memorandum of association; or |
| |
• | at the direction of the crown to another charity having similar objects. |
The articles of association otherwise contain no restrictions on the free transferability of fully paid shares.
Lloyds TSB Group plc’s shares are in registered form and the articles of association do not provide for bearer shares. The registration of share transfers may be suspended and the register may be closed at such times and for such periods as the directors may determine (not exceeding 30 days in any year), provided that if the shares are traded through an electronic trading system, the register may not be closed without the consent of the operator.
Subject to the statutes and the rules (as defined in the CREST regulations), the directors may determine that any class of shares may be held in uncertificated form and that title to such shares may be transferred by means of an electronic trading system or that shares of any class should cease to be so held and so transferred.
Untraced members
Lloyds TSB Group plc is empowered to sell, as the agent of a member, at the best price reasonably obtainable, any share registered in the name of a member remaining untraced for 12 years who fails to communicate with Lloyds TSB Group plc within 3 months following the publication of an advertisement of an intention to make such a disposal; provided that during the 12 year period at least three dividends have become payable and no dividend has been claimed. Lloyds TSB Group plc shall be obliged to account to the member for the proceeds of the disposal. However, any net proceeds of sale unclaimed after 12 years from the date of sale shall be forfeited and shall revert to Lloyds TSB Group plc.
Forfeiture and lien
If a member fails to pay in full any call or instalment of a call on or before the due date for payment, then, following notice by the directors requiring payment of the unpaid amount with any accrued interest and any expenses incurred, such share may be forfeited by a resolution of the directors to that effect (including all dividends declared in respect of the forfeited share and not actually paid before forfeiture). A member whose shares have been forfeited will cease to be a member in respect of the shares, but will, notwithstanding the forfeiture, remain liable to pay to Lloyds TSB Group plc all monies which at the date of forfeiture were presently payable together with interest. The directors may at their absolute discretion enforce payment without any allowance for the value of the shares at the time of forfeiture or for any consideration received on their disposal or waive payment in whole or part.
Lloyds TSB Group plc has a first and paramount lien on every share (not being a fully paid share) for all monies (whether presently payable or not) called or payable at a fixed time in respect of such share, and the directors may waive any lien which has arisen and may resolve that any share shall for some limited period be exempt from such a lien, either wholly or partially.
A forfeited share becomes the property of Lloyds TSB Group plc, and it may be sold, re-allotted, otherwise disposed of or cancelled as the directors see fit. Any share on which Lloyds TSB Group plc has a lien may be sold on the terms set out in the articles of association. The proceeds of sale shall first be applied towards payment of the amount in respect of the lien insofar as it is still payable and then on surrender of the share certificate for cancellation (in the case of shares in certificated form), to the person entitled to the shares at the time of sale.
97
Memorandum and articles of association of Lloyds TSB Group plc
Purchase of own shares
Subject to the provisions of the statutes, Lloyds TSB Group plc may purchase any of its own shares of any class, but if there are in issue any shares which are admitted to the official list maintained by the UK Listing Authority and which are convertible into equity share capital of Lloyds TSB Group plc of the class proposed to be purchased, then Lloyds TSB Group plc will not purchase such equity shares unless the terms of the convertible shares include provisions permitting Lloyds TSB Group plc to purchase its own equity shares or providing for adjustment to the conversion terms upon such a purchase or the purchase has first been approved by an extraordinary resolution passed at a separate meeting of the holders of such convertible shares.
Winding-up
If Lloyds TSB Group plc is wound up, the liquidator may, with the authority of an extraordinary resolution, divide amongst the members in specie or kind the whole or any part of the assets of Lloyds TSB Group plc. The liquidator may for such purpose set such value as he deems fair upon any one or more class or classes of property and may determine how such division shall be carried out as between the members or different classes of members. The liquidator may vest any part of the assets in trustees upon such trusts for the benefit of members as the liquidator thinks fit, and the liquidation may be closed and Lloyds TSB Group plc dissolved, but so that no contributory shall be compelled to accept any shares or other property in respect of which there is a liability.
Directors
General
The business and affairs of Lloyds TSB Group plc shall be managed by the directors who may exercise all such powers of Lloyds TSB Group plc as are not by the statutes or by the articles of association required to be exercised by Lloyds TSB Group plc in general meeting, subject to the articles of association, to the provisions of the statutes and to such regulations as may be set by special resolution of Lloyds TSB Group plc, but no regulation so made by Lloyds TSB Group plc will invalidate any prior act of the directors which would have been valid if such regulation had not been made.
The directors may confer upon any director holding any executive office any of the powers exercisable by them on such terms and conditions, and with such restrictions, as they think fit. The directors may also delegate any of their powers to committees. Any such committee shall have power to sub-delegate to sub-committees or to any person any of the powers delegated to it. Any such committee or sub-committee shall consist of one or more directors only. The meetings and proceedings of any such committee or sub-committee consisting of two or more persons shall be governed, with such changes as are appropriate, by the provisions of the articles of association regulating the meetings and proceedings of the directors.
Material interests
Subject to the provisions of the statutes, a director, provided that he has disclosed to the other directors the nature and extent of his interests:
| |
• | may be a party to, or otherwise interested in, any contract, transaction or arrangement with Lloyds TSB Group plc or in which Lloyds TSB Group plc is otherwise interested; |
| |
• | may be a director or other officer of, or employed by, or a party to any contract, transaction or arrangement with, or otherwise interested in, any body corporate promoted by Lloyds TSB Group plc or in which Lloyds TSB Group plc is otherwise interested; |
| |
• | may (or any firm of which he is a partner, employee or member may) act in a professional capacity for Lloyds TSB Group plc (other than as auditor) and be remunerated therefor; and |
| |
• | shall not, save as otherwise agreed by him, be accountable to Lloyds TSB Group plc for any benefit which he derives from any such contract, transaction or arrangement or from any such office or employment or from any interest in any such body corporate or for such remuneration, and no such contract, transaction or arrangement shall be liable to be avoided on the grounds of any such interest or benefit. |
Except as set out in the articles of association, a director shall not vote in respect of any contract or arrangement or any other proposal in which he has any material interest otherwise than by virtue of interests in shares or debentures or other securities of Lloyds TSB Group plc. A director shall not be counted in the quorum at a meeting in relation to any resolution on which he is not entitled to vote.
A director shall be entitled to vote and be counted in the quorum in respect of any proposal concerning indemnities in favour of directors or the funding by Lloyds TSB Group plc of expenditure by a director on defending proceedings against him or applications by him for relief from liability, including any action to enable such director to avoid incurring such expenditure.
Remuneration
The ordinary remuneration of the directors is determined by ordinary resolution of Lloyds TSB Group plc and is divisible among the directors as they may agree, or, failing agreement, equally. However, any director who holds office for only part of the period in respect of which remuneration is payable shall be entitled only to rank in such division for a proportion of the remuneration relating to the period during which he has held office. Any director who holds an executive office, or who serves on any committee of the directors, or who otherwise performs services which in the opinion of the directors are outside the scope of the ordinary duties of a director, may be paid extra remuneration by way of salary, commission or otherwise or may receive such other benefits as the directors may determine. The directors may repay to any director all such reasonable expenses as he may incur in attending and returning from meetings of the directors or of any committee of the directors or general meetings or otherwise in connection with the business of Lloyds TSB Group plc. The directors have the power to pay and agree to pay gratuities, pensions or other retirement, superannuation, death or disability benefits to, or to any person in respect of, any director or ex-director.
The quorum necessary for the transaction of business of the directors may be fixed from time to time by the directors and unless so fixed at any other number shall be four. Questions arising at any meeting of the directors shall be determined by a majority of votes. In the case of an equality of votes, the chairman of the meeting shall have a second or casting vote.
Borrowing powers
Under the Memorandum, Lloyds TSB Group plc may borrow or raise money in such manner and upon such terms and on such security as may seem to the directors to be expedient and in particular by the issue or deposit of debentures or debenture stock or other securities of any description and to secure all or any of Lloyds TSB Group plc’s liabilities in respect of money borrowed, raised or owing or any other debt or obligation of or binding on Lloyds TSB Group plc in such manner as may be thought expedient and in particular by mortgage, charge or lien upon all or any part of the undertaking, property and assets, present or future, and uncalled capital of Lloyds TSB Group plc.
Retirement
The articles of association provide that each director shall retire at the annual general meeting held in the third calendar year following the year in which he was elected or last re-elected.
Share qualification
A director is not required to hold any shares of Lloyds TSB Group plc by way of qualification.
98
Indemnity/Insurance
So far as may be permitted by the statutes, any person who is a director, officer, employee or trustee of Lloyds TSB Group plc (or any associated company) may be indemnified by Lloyds TSB Group plc against any liability incurred by him in connection with any negligence, default, breach of duty or breach of trust by him or any other liability incurred in the execution of his duties, the exercise of his powers or otherwise in connection with his duties, powers or offices. The directors of Lloyds TSB Group plc may also purchase insurance in respect of such liabilities and so far as may be permitted by the statutes, Lloyds TSB Group plc may also provide defence costs in relation to any criminal or civil proceedings to which any director, officer, employee or trustee of Lloyds TSB Group plc (or any associated company) is subject.
Electronic communications
In May 2007, shareholders approved proposals to amend the articles of association to allow Lloyds TSB Group plc to offer shareholders the opportunity to have documents and information made available to them through Lloyds TSB Group plc’s website and in electronic form.
Exchange controls
There are no UK laws, decrees or regulations that restrict Lloyds TSB Group plc’s export or import of capital, including the availability of cash and cash equivalents for use by Lloyds TSB Group, or that affect the remittance of dividends or other shareholders payments to non-UK holders of Lloyds TSB Group plc shares, expect as otherwise set out in ‘Taxation’.
Taxation
UK taxation
The following discussion is intended only as a general guide to current UK tax legislation, what is understood to be current UK HM Revenue & Customs practice and the terms of the current UK/US income tax treaty (the ‘Treaty’), all of which are subject to change at any time, possibly with retroactive effect.
The Treaty for the avoidance of double taxation with respect to taxes on income entered into force following the exchange of instruments of ratification by the UK Parliament and the US Senate on 31 March 2003.
The UK HM Revenue & Customs is the UK government department responsible for assessing and collecting UK tax revenues. The discussion is intended as a general guide and only applies to persons who are the beneficial owners of their ordinary shares or ADSs. References below to a US holder are to that term as defined, and subject to the exclusions described in the introduction, below under ‘US federal income tax considerations’. It may not apply to certain shareholders or ADS holders, such as dealers in securities.
Tax can be complicated and individual circumstances may need to be considered in more detail. Any person who is in any doubt as to his tax position should consult his own professional adviser.
Taxation of chargeable gains
UK residents
A disposal (or deemed disposal) of ordinary shares or ADSs by a shareholder or holder of ADSs resident or (in the case of an individual) ordinarily resident for tax purposes in the UK may, depending on the shareholder’s or ADS holder’s particular circumstances, and subject to any available exemption or relief, give rise to a chargeable gain or an allowable loss for the purposes of UK taxation on chargeable gains.
Individuals, other than US holders, temporarily non-resident in the UK
A shareholder or ADS holder who is an individual and who has, on or after 17 March 1998, ceased to be resident and ordinarily resident for tax purposes in the UK for a period of less than five years of assessment and who disposes of ordinary shares or ADSs during that period may be liable, on return to the UK, to UK taxation on chargeable gains arising during the period of absence, subject to any available exemption, relief and/or foreign tax credit.
US holders
Subject to the provisions set out in the next paragraph in relation to temporary non-residents, US holders generally will not be liable for UK tax on chargeable gains unless they carry on a trade, profession or vocation in the UK through a branch or agency and the ordinary shares or ADSs are or have been used or held by or for the purposes of the branch or agency, in which case such US holder might, depending on individual circumstances, be liable to UK tax on chargeable gains on any disposition of ordinary shares or ADSs. An individual US holder who is only temporarily not resident in the UK may, under anti-avoidance legislation, still be liable for UK tax on chargeable gains realised, subject to any available exemption, relief and/or foreign tax credit.
A US holder who is an individual and who has, on or after 17 March 1998, ceased to be resident or ordinarily resident for tax purposes in the UK for a period of less than five years of assessment and who disposes of ordinary shares or ADSs during that period may be liable, on return to the UK, to UK taxation on chargeable gains arising during the period of absence, subject to any available exemption, relief and/or foreign tax credit.
Other non-UK resident persons
Subject to the provisions set out above under ‘Individuals, other than US holders, temporarily non-resident in the UK’, shareholders or ADS holders who are neither resident nor ordinarily resident in the UK generally will not be liable for UK tax on chargeable gains unless they carry on a trade, profession or vocation in the UK through a branch or agency and the ordinary shares or ADSs are or have been used or held by or for the purposes of the branch or agency, in which case such shareholder or ADS holder might, depending on individual circumstances, be liable to UK tax on chargeable gains on any disposition of ordinary shares or ADSs. An individual holder of ordinary shares or ADSs who is only temporarily not resident in the UK may, under anti-avoidance legislation, still be liable for UK tax on chargeable gains realised, subject to any available exemption, relief and/or foreign tax credit.
99
Taxation
Taxation of dividends
UK residents
Lloyds TSB Group will not be required to withhold tax at source when paying a dividend on the ordinary shares or ADSs.
An individual shareholder or ADS holder who is resident in the UK for tax purposes will be entitled to a tax credit in respect of any dividend received from the Lloyds TSB Group and will be taxable on the gross dividend, which is the aggregate of the dividend received and related tax credit. The value of the tax credit will be equal to one-ninth of the dividend received (and, therefore, 10 per cent of the gross dividend). The gross dividend will be treated as an individual’s marginal taxable income. The tax credit will, however, be treated as discharging the individual’s liability to income tax in respect of the gross dividend, unless and except to the extent that the gross dividend falls above the threshold for the higher rate of income tax. A UK resident individual shareholder or ADS holder who is liable to income tax at the higher rate (currently 40 per cent) will be subject to tax at the rate applicable to dividends for such shareholders or ADS holders (currently 32.5 per cent) on the gross dividend. The tax credit will be set against but will not fully discharge such shareholders’ or ADS holders’ tax liability on the gross dividend and they will have to pay additional tax equal to 22.5 per cent of the gross dividend, being 25 per cent of the dividend received, to the extent that such sum, when treated as marginal income, falls above the threshold for the higher rate of income tax.
There will be no payment of the tax credit or any part of it to an individual whose liability to income tax on the dividend and the related tax credit is less than the tax credit.
UK resident shareholders or ADS holders who are not liable to UK tax on dividends, including pension funds and charities, will not be entitled to the payment of any tax credits in respect of dividends.
Subject to certain exceptions, such as for dealers in securities and for some insurance companies with overseas business, UK resident corporate shareholders or ADS holders will generally not be subject to corporation tax in respect of dividends received from Lloyds TSB Group, but will not be entitled to the payment of any tax credit with respect to the dividends.
US holders
Lloyds TSB Group will not be required to withhold tax at source when paying a dividend on the ordinary shares or ADSs to a US holder.
Other non-UK resident persons
Lloyds TSB Group will not be required to withhold tax at source when paying a dividend on the ordinary shares or ADSs to a holder, other than a US holder, who is not resident for tax purposes in the UK.
Holders of ordinary shares or ADSs, other than US holders, who are not resident for tax purposes in the UK and who receive a dividend from the Lloyds TSB Group will not have any further UK tax to pay in respect of the dividend, but will not normally be able to claim any additional payment in respect of the dividend from the UK HM Revenue & Customs under any applicable Double Tax Treaty.
Stamp duty and stamp duty reserve tax
UK residents, US holders and other non-UK resident persons
Any conveyance or transfer on sale of ordinary shares (whether effected using the CREST settlement system or not) will be subject to UK stamp duty or stamp duty reserve tax (‘SDRT’). The transfer on sale of ordinary shares will be liable to ad valorem UK stamp duty or SDRT, generally at the rate of 0.5 per cent of the consideration paid (rounded up to the next multiple of £5 in the case of stamp duty). Stamp duty is usually the liability of the purchaser or transferee of the ordinary shares. An unconditional agreement to transfer such ordinary shares will be liable to SDRT, generally at the rate of 0.5 per cent of the consideration paid, but such liability will be cancelled, or, if already paid, refunded, if the agreement is completed by a duly stamped transfer within six years of the agreement having become unconditional. SDRT is normally the liability of the purchaser or transferee of the ordinary shares.
Where Lloyds TSB Group issues ordinary shares or a holder of ordinary shares transfers such shares to the custodian or nominee for the depositary to facilitate the issue of ADSs to him representing the ordinary shares or to a person providing clearance services (or their nominee or agent), a liability to UK stamp duty or SDRT at the rate of 1.5 per cent (rounded up to the next multiple of £5 in the case of the stamp duty) of either the issue price or, in the case of transfer, the listed price of the ordinary shares, calculated in sterling, will arise. Where a holder of ordinary shares transfers such shares to the custodian or nominee for the depositary or clearance service this charge will generally be payable by the person receiving the ADSs or transferring the ordinary shares into the clearance service.
A liability to stamp duty at the fixed rate of £5 will arise as a result of the cancellation of any ADSs with the ordinary shares that they represent being transferred to the ADS holder.
No liability to UK stamp duty or SDRT will arise on a transfer of ADSs provided that any document that effects such transfer is not executed in the UK and that it remains at all subsequent times outside the UK. An agreement to transfer ADSs will not give rise to a liability to SDRT.
US federal income tax considerations
The following summary describes material US federal income tax consequences of the acquisition, ownership and disposition of ADSs or ordinary shares to US holders (defined below), but it does not purport to be a comprehensive description of all of the tax considerations that may be relevant to a decision to acquire such securities. The summary applies only to US holders that hold ADSs or ordinary shares as capital assets and does not address special classes of holders, such as:
| |
• | certain financial institutions; |
| |
• | insurance companies; |
| |
• | dealers in securities or foreign currencies; |
| |
• | holders holding ADSs or shares as part of a hedge, straddle, conversion or other integrated transaction; |
| |
• | holders whose functional currency for US federal income tax purposes is not the US dollar; |
| |
• | holders liable for alternative minimum tax; |
| |
• | holders who acquired ADSs or shares pursuant to the exercise of any employee stock option or otherwise as compensation; |
| |
• | partnerships or other entities classified as partnerships for US federal income tax purposes; or |
| |
• | holders that own 10 per cent or more of the voting shares of Lloyds TSB Group plc. |
100
Taxation
In addition, the summary is based in part on representations of the Depositary and assumes that each obligation provided for in or otherwise contemplated by the Deposit Agreement or any other related document will be performed in accordance with its terms. The US Treasury has expressed concerns that parties to whom ADSs are pre-released may be taking actions that are inconsistent with the claiming of foreign tax credits for US holders of ADSs. Such actions would also be inconsistent with the reduced rate of tax applicable to dividends received by certain non-corporate US holders. Accordingly, the analysis of the reduced rate of tax applicable to dividends received by certain non-corporate US holders described below could be affected by actions that may be taken by parties to whom ADSs are pre-released. The summary is based upon tax laws of the US including the Internal Revenue Code of 1986, as amended, (the ‘Code’), administrative pronouncements, judicial decisions and final, temporary and proposed Treasury Regulations, as well as the Treaty, all as of the date hereof, changes to any of which may affect the tax consequences described herein, possibly with retroactive effect. Prospective purchasers of the ADSs or ordinary shares should consult their own tax advisers as to the US, UK or other tax consequences of the purchase, ownership and disposition of such securities in their particular circumstances, including the effect of any US state or local tax laws.
As used herein, a ‘US holder’ is a beneficial owner of ADSs or shares, that is, for US federal income tax purposes:
| |
• | a citizen or resident of the US; |
| |
• | a corporation, or other entity taxable as a corporation, created or organised in or under the laws of the US or of any political subdivision thereof; or |
| |
• | an estate or trust the income of which is subject to US federal income taxation regardless of its source. |
For US federal income tax purposes, US holders of ADSs generally will be treated as the owners of the underlying ordinary shares.
Taxation of distributions
To the extent paid out of current or accumulated earnings and profits of Lloyds TSB Group plc (as determined in accordance with US federal income tax principles), distributions made with respect to ADSs or ordinary shares (other than certain pro rata distributions of shares of Lloyds TSB Group plc or rights to subscribe for shares of Lloyds TSB Group plc) will be includable in the income of a US holder as ordinary dividend income from non-US sources. Such dividends will not be eligible for the dividends-received deduction generally allowed to corporations under the Code.
Subject to applicable limitations that may vary depending upon a holder’s individual circumstances and the discussion above regarding concerns expressed by the US Treasury, dividends paid to certain non-corporate US holders in taxable years beginning before 1 January 2011 will be taxable at a maximum tax rate of 15 per cent. Non-corporate US holders should consult their own tax advisers to determine whether they are subject to any special rules that limit their ability to be taxed at this favourable rate.
The amount of the dividend will equal the US dollar value of the pounds sterling received, calculated by reference to the exchange rate in effect on the date such distribution is received by the Depository (in the case of ADSs) or by the US holder (in the case of shares) regardless of whether the payment is converted into US dollars on the date of receipt. If the pounds sterling received as a dividend are not converted into US dollars on the date of receipt, then the US holder’s tax basis in the pounds sterling received will equal such dollar amount and the US holder may realise an exchange gain or loss on the subsequent conversion into US dollars. Any gains or losses resulting from the conversion of pounds sterling into US dollars will be treated as US source ordinary income or loss.
Taxation of capital gains
Gain or loss realised by a US holder on a sale or exchange of ADSs or shares will be subject to US federal income tax as capital gain or loss in an amount equal to the difference between the US holder’s tax basis in the ADSs or shares and the amount realised on the disposition. Gains or losses, if any, will generally be US source and will be long-term if the ADSs or shares were held for more than one year.
Deposits and withdrawals of ordinary shares in exchange for ADSs will not result in taxable gain or loss for US federal income tax purposes.
Information reporting and backup withholding
Dividends paid on, and the sale proceeds from, ADSs or shares that are made within the US or through certain US-related financial intermediaries generally are subject to information reporting requirements. Such dividends may also be subject to backup withholding unless the US holder:
| |
• | is a corporation or comes within certain other exempt categories and, when required, demonstrates this fact, or |
| |
• | provides a taxpayer identification number on a properly completed Form W-9 or a substitute form and certifies that no loss of exemption from backup withholding has occurred and that such holder is a US person. |
Any amount withheld under these rules will be creditable against the US holder’s federal income tax liability. A US holder who does not provide a correct taxpayer identification number may be subject to certain penalties.
101
Where you can find more information
The documents concerning us which are referred to herein may be inspected at the Securities and Exchange Commission (‘SEC’). You may read and copy any document filed or furnished by us at the SEC’s public reference rooms in Washington D.C., New York and Chicago, Illinois. Please call the SEC at 1-800-SEC-0330 for further information on the reference rooms. The SEC also maintains a website at www.sec.gov which contains, in electronic form, each of the reports and other information that we have filed electronically with the SEC.
Enforceability of civil liabilities
Lloyds TSB Group plc is a public limited company incorporated under the laws of Scotland. Most of Lloyds TSB Group plc’s directors and executive officers and certain of the experts named herein are residents of the United Kingdom. A substantial portion of the assets of Lloyds TSB Group plc, and a substantial portion of the assets of such persons, are located outside the United States. As a result, it may not be possible for investors to effect service of process within the United States upon all such persons or to enforce against them in US courts judgements obtained in such courts, including those predicated upon the civil liability provisions of the federal securities laws of the United States. Furthermore, Lloyds TSB Group plc has been advised by its solicitors that there is doubt as to the enforceability in the United Kingdom, in original actions or in actions for enforcement of judgements of US courts, of certain civil liabilities, including those predicated solely upon the federal securities laws of the United States.
102
Risk factors
Set out below are certain risk factors which could affect Lloyds TSB Group’s future results and cause them to be materially different from expected results. Lloyds TSB Group’s results could also be affected by competition and other factors. The factors discussed below should not be regarded as a complete and comprehensive statement of all potential risks and uncertainties Lloyds TSB Group’s businesses face.
Lloyds TSB Group’s businesses are subject to inherent risks concerning borrower credit quality as well as general and sector specific UK and international economic conditions. The development of adverse conditions in the UK or in other major economies could cause profitability to decline
Lloyds TSB Group’s businesses are subject to inherent risks regarding borrower credit quality as well as general UK and international economic conditions. Each of these can change the level of demand for, and supply of, Lloyds TSB Group’s products and services. Changes in the credit quality of Lloyds TSB Group’s UK and/or international borrowers and counterparties could reduce the value of Lloyds TSB Group’s assets, and increase allowances for impairment losses. In addition, changes in economic conditions may result in a deterioration in the value of security held against lending exposures and increase the risk of loss in the event of borrower default. Furthermore, a general deterioration in the UK economy would also reduce Lloyds TSB Group’s profit from both its UK banking and financial services businesses. A general deterioration in any other major world economy could also adversely impact Lloyds TSB Group’s profitability. See ‘Operating and financial review and prospects – Risk management – Credit risk’.
Lloyds TSB Group’s businesses are inherently subject to the risk of market fluctuations, which could reduce profitability
Lloyds TSB Group’s businesses are inherently subject to the risk of market fluctuations. The most significant market risks Lloyds TSB Group faces are those that impact the Group’s pension schemes, principally equity risk and interest rate risk; adverse market movements would have an effect upon the financial condition of the pension schemes which would be reflected in the Lloyds TSB Group’s financial statements. Interest rate risk, foreign exchange risk and credit spread risk arise from banking and trading activities while equity risk is also present in the insurance businesses. See ‘Operating and financial review and prospects – Risk management – Market risk’ for a discussion of these risks.
Lloyds TSB Group’s insurance businesses are subject to inherent risks relating to changing demographic developments, changing customer behaviour, adverse weather and similar contingencies outside its control. Development of adverse conditions could reduce profitability
Lloyds TSB Group’s insurance businesses are subject to inherent risk relating to changing demographic developments (including mortality), changing customer behaviour, adverse weather and similar contingencies outside its control, both in the UK and overseas. Such contingencies can change the risk profile and profitability of such products and services.
Adverse experience in the operational risks inherent in Lloyds TSB Group’s businesses could have a negative impact on its results of operations
Operational risks, through inadequate or failed internal processes or from people related or external events, are present in Lloyds TSB Group’s businesses. Lloyds TSB Group’s businesses are dependent on their ability to process accurately and efficiently a high volume of complex transactions across numerous and diverse products and services, in different currencies and subject to a number of different legal and regulatory regimes. Lloyds TSB Group’s systems and processes are designed to ensure that the operational risks associated with its activities are appropriately controlled, but Lloyds TSB Group realises that any weakness in these systems could have a negative impact on its results of operations during the affected period. See ‘Operating and financial review and prospects – Risk management – Operational risk’.
Terrorist acts, other acts of war, geopolitical, pandemic or other such events could have a negative impact on the business and results of operations of Lloyds TSB Group
Terrorist acts, other acts of war or hostility, geopolitical, pandemic or other such events and responses to those acts/events, may create economic and political uncertainties, which could have a negative impact on UK and international economic conditions generally, and more specifically on the business and results of operations of Lloyds TSB Group in ways that cannot be predicted.
Lloyds TSB Group’s businesses are subject to substantial regulation, and regulatory and governmental oversight. Any significant adverse regulatory developments or changes in government policy could have a negative impact on Lloyds TSB Group’s results of operations
Lloyds TSB Group conducts its businesses subject to ongoing regulation and associated regulatory risks, including the effects of changes in the laws, regulations, policies, voluntary codes of practice and interpretations in the UK and the other markets where it operates. Future changes in regulation, fiscal or other policies are unpredictable and beyond the control of Lloyds TSB Group. For additional information, see ‘Regulation’.
In addition, in the UK and elsewhere, there is continuing political and regulatory scrutiny of the banking industry and, in particular, retail banking. In the UK, the Competition Commission and the Office of Fair Trading (‘OFT’) are carrying out several inquiries, which are referred to in the ‘Competitive environment’ section on page 11.
In recent years there have been several issues in the UK financial services industry in which the FSA has intervened directly, including the sale of personal pensions and the sale of mortgage related endowments. The FSA may intervene further in relation to the areas of industry risk already identified, or in new areas, which could adversely affect the Lloyds TSB Group.
Lloyds TSB Group is exposed to various forms of legal and regulatory risk including the risk of misselling financial products, acting in breach of legal or regulatory principles or requirements and giving negligent advice, any of which could have a negative impact on its results or its relations with its customers
Lloyds TSB Group is exposed to many forms of legal and regulatory risk, which may arise in a number of ways. Primarily:
| |
i) | certain aspects of the Lloyds TSB Group’s business may be determined by the authorities, the Financial Ombudsman Service (‘FOS’) or the courts as not being conducted in accordance with applicable laws, or, in the case of FOS, with what is fair and reasonable in the Ombudsman’s opinion; |
| |
ii) | the possibility of alleged misselling of retail financial products which, as a result, may require additional provisions; |
| |
iii) | contractual obligations may either not be enforceable as intended or may be enforced against Lloyds TSB Group in an adverse way; |
| |
iv) | the intellectual property of Lloyds TSB Group (such as its trade names) may not be adequately protected; and |
| |
v) | Lloyds TSB Group may be liable for damages to third parties harmed by the conduct of its business. |
In addition, Lloyds TSB Group faces risk where legal or regulatory proceedings or FOS or other complaints are brought against it in the UK or in jurisdictions outside the UK, including other European countries and the United States. Regardless of whether or not such claims have merit, the outcome of any proceeding or complaint is inherently uncertain and could have a material adverse effect on Lloyds TSB Group’s operations and/or financial condition, particularly if extended more broadly. For additional information, see ‘Regulation’.
Although Lloyds TSB Group has policies for the management of legal and regulatory risk, failure to manage these risks could impact Lloyds TSB Group adversely, both financially and reputationally.
Lloyds TSB Group is exposed to tax risk
Tax risk is the risk associated with changes in, or errors in the interpretation of, taxation rates or law. This could result in increased charges or financial loss. Although Lloyds TSB Group devotes considerable resources to managing tax risk, failure to manage this risk could impact Lloyds TSB Group adversely.
103
Risk factors
Lloyds TSB Group’s businesses are conducted in highly competitive environments. Creation of an appropriate return for shareholders depends upon management’s ability to respond effectively to competitive pressures
The market for UK financial services and the other markets within which Lloyds TSB Group operates are highly competitive, and management expects such competition to intensify in response to consumer demand, technological changes, the impact of consolidation, regulatory actions and other factors, which could result in a reduction in profit margins. Lloyds TSB Group’s ability to generate an appropriate return for its shareholders depends significantly upon the competitive environment and management’s response to it. See ‘Business – Competitive environment’.
Lloyds TSB Group is devoting considerable time and resources to securing new customers and developing more business from existing customers. If Lloyds TSB Group is unsuccessful, its organic growth prospects will decline
Lloyds TSB Group seeks to achieve further organic growth by securing new customers and developing more business from existing customers. Lloyds TSB Group is currently expending significant resources and effort to bring about this growth, particularly with respect to its UK retail financial services business. If these expenditures and efforts do not meet with success, its operating results would grow more slowly or decline.
Lloyds TSB Group’s strategic plans and related risks
Lloyds TSB Group devotes considerable management and planning resources to developing strategic plans for organic growth and identifying possible acquisitions which would provide further opportunities for growth. If these strategic plans do not meet with success, Lloyds TSB Group’s earnings could grow more slowly or decline.
Lloyds TSB Group’s businesses are conducted in a marketplace that is consolidating and significant cross-border mergers and acquisitions may happen in the coming years. Lloyds TSB Group’s ability to generate an appropriate return for its shareholders over the long term may depend upon whether management is able to achieve value creating acquisitions and/or mergers at the appropriate times and prices. Lloyds TSB Group cannot be sure that it will ultimately be able to make such mergers or acquisitions or that if it does, such mergers or acquisitions will be integrated successfully or realise anticipated benefits.
104
Forward looking statements
This annual report includes certain forward looking statements within the meaning of the US Private Securities Litigation Reform Act of 1995 with respect to the business, strategy and plans of Lloyds TSB Group and its current goals and expectations relating to its future financial condition and performance. Statements that are not historical facts, including statements about Lloyds TSB Group’s or management’s beliefs and expectations, are forward looking statements. Words such as ‘believes’, ‘anticipates’, ‘estimates’, ‘expects’, ‘intends’, ‘aims’, ‘potential’, ‘will’, ‘would’, ‘could’, ‘considered’, ‘likely’, ‘estimate’ and variations of these words and similar future or conditional expressions are intended to identify forward looking statements but are not the exclusive means of identifying such statements. By their nature, forward looking statements involve risk and uncertainty because they relate to events and depend upon circumstances that will occur in the future.
Examples of such forward looking statements include, but are not limited to, projections or expectations of profit attributable to shareholders, provisions, economic profit, dividends, capital structure or any other financial items or ratios; statements of plans, objectives or goals of Lloyds TSB Group or its management; statements about the future trends in interest rates, foreign exchange rates, stock market levels and demographic trends and any impact on Lloyds TSB Group; statements concerning any future UK or other economic environment or performance including in particular any such statements included in this annual report; statements about strategic goals, competition, regulation, dispositions and consolidation or technological developments in the financial services industry; and statements of assumptions underlying such statements.
Factors that could cause actual results to differ materially from the plans, objectives, expectations, estimates and intentions expressed in such forward looking statements made by Lloyds TSB Group or on Lloyds TSB Group’s behalf include, but are not limited to, general economic conditions in the UK and internationally; inflation, deflation, interest rate, policies of the Bank of England and other G-8 central banks, exchange rate, market and monetary fluctuations; changing demographic developments including mortality and changing customer behaviour including consumer spending, saving and borrowing habits, borrower credit quality, technological changes, natural and other disasters, adverse weather and similar contingencies outside the Lloyds TSB Group’s control; inadequate or failed internal or external processes, people and systems; terrorist acts, other acts of war, geopolitical, pandemic or other such events; changes in laws, regulations, taxation, government policies or accounting standards or practices, exposure to regulatory scrutiny, legal proceedings or complaints, changes in competition and pricing environments; the inability to hedge certain risks economically; the adequacy of loss reserves; the ability to secure new customers and develop more business from existing customers; the ability to achieve value-creating mergers and/or acquisitions at the appropriate time and prices and the success of the Lloyds TSB Group in managing the risks of the foregoing.
Lloyds TSB Group plc may also make or disclose written and/or oral forward looking statements in reports filed with or furnished to the US Securities and Exchange Commission, Lloyds TSB Group plc’s annual review, half year announcement, proxy statements, offering circulars, prospectuses, press releases and other written materials and in oral statements made by the directors, officers or employees of Lloyds TSB Group plc to third parties, including financial analysts. The forward looking statements contained in this annual report are made as of the date hereof, and Lloyds TSB Group undertakes no obligation to update any of its forward looking statements.
105
Lloyds TSB Group structure
The following is a list of the principal subsidiaries of Lloyds TSB Group plc at 31 December 2006. The audited consolidated accounts of Lloyds TSB Group plc for the year ended 31 December 2006 include the audited accounts of each of these companies.
| | | | | | | | |
Name of subsidiary undertaking | | Country of
registration/
incorporation | | Percentage of equity share
capital and voting
rights held | | Nature of business | | Registered office |
| | | | | | | | | |
Lloyds TSB Bank plc | | England | | 100% | | Banking and financial services | | 25 Gresham Street
London EC2V 7HN |
| | | | | | | | | |
Cheltenham & Gloucester plc | | England | | 100%* | | Mortgage lending and retail investments | | Barnett Way
Gloucester GL4 3RL |
| | | | | | | | | |
Lloyds TSB Commercial Finance Limited | | England | | 100%* | | Credit factoring | | Boston House
The Little Green, Richmond
Surrey TW9 1QE |
| | | | | | | | | |
Lloyds TSB Leasing Limited | | England | | 100%* | | Financial leasing | | 25 Gresham Street
London EC2V 7HN |
| | | | | | | | | |
Lloyds TSB Private Banking Limited | | England | | 100%* | | Private banking | | 25 Gresham Street
London EC2V 7HN |
| | | | | | | | | |
The Agricultural Mortgage Corporation PLC | | England | | 100%* | | Long-term agricultural finance | | Charlton Place
Charlton Road
Andover
Hampshire SP10 1RE |
| | | | | | | | | |
Lloyds TSB Offshore Limited | | Jersey | | 100%* | | Banking and financial services | | PO Box 160
25 New Street
St Helier
Jersey JE4 8RG |
| | | | | | | | | |
Lloyds TSB Scotland plc | | Scotland | | 100%* | | Banking and financial services | | Henry Duncan House
120 George Street
Edinburgh EH2 4LH |
| | | | | | | | | |
Lloyds TSB General Insurance Limited | | England | | 100%* | | General insurance | | 25 Gresham Street
London EC2V 7HN |
| | | | | | | | | |
Scottish Widows Investment Partnership Group Limited | | England | | 100%* | | Investment management | | 10 Fleet Place
London EC4M 7RH |
| | | | | | | | | |
Abbey Life Assurance Company Limited | | England | | 100%* | | Life assurance | | 80 Holdenhurst Road
Bournemouth
Dorset BH8 8ZQ |
| | | | | | | | | |
Lloyds TSB Insurance Services Limited | | England | | 100%* | | Insurance broking | | 25 Gresham Street
London EC2V 7HN |
| | | | | | | | | |
Lloyds TSB Asset Finance Division Limited | | England | | 100%* | | Consumer credit, leasing and
related services | | 25 Gresham Street
London EC2V 7HN |
| | | | | | | | | |
Black Horse Limited | | England | | 100%* | | Consumer credit, leasing and
related services | | 25 Gresham Street
London EC2V 7HN |
| | | | | | | | | |
Scottish Widows plc | | Scotland | | 100%* | | Life assurance | | 69 Morrison Street
Edinburgh EH3 8YF |
| | | | | | | | | |
Scottish Widows Annuities Limited | | Scotland | | 100%* | | Life assurance | | 69 Morrison Street
Edinburgh EH3 8YF |
| | | | | | | | | |
* Indirect interest | | | | | | | | |
106
Index to the consolidated financial statements
| | |
| | | |
Report of the independent Registered Public Accounting Firm | | F-2 |
| | | |
Consolidated income statement for the three years ended 31 December 2006, 31 December 2005 and 31 December 2004 | | F-3 |
| | | |
Consolidated balance sheet at 31 December 2006 and 31 December 2005 | | F-4 |
| | | |
Consolidated statement of changes in equity for the three years ended 31 December 2006, 31 December 2005 and 31 December 2004 | | F-6 |
| | | |
Consolidated cash flow statement for the three years ended 31 December 2006, 31 December 2005 and 31 December 2004 | | F-7 |
| | | |
Notes to the accounts | | F-8 |
| | | |
F-1
Report of the Independent Registered Public Accounting Firm
To the Shareholders of Lloyds TSB Group plc
We have completed an integrated audit of Lloyds TSB Group plc (the ‘Company’) and its subsidiaries’ 31 December 2006 consolidated financial statements and of its internal control over financial reporting as of 31 December 2006 and an audit of its 31 December 2005 and 31 December 2004 consolidated financial statements in accordance with the standards of the Public Company Accounting Oversight Board (United States). Our opinions, based on our audits, are presented below.
Consolidated financial statements
In our opinion, the accompanying consolidated income statement, consolidated balance sheet, consolidated statement of changes in equity and consolidated statement of cash flows present fairly, in all material respects, the financial position of Lloyds TSB Group plc and its subsidiaries at 31 December 2006 and 2005 and the results of their operations and cash flows for each of the three years in the period ended 31 December 2006, in conformity with International Financial Reporting Standards (IFRSs) as adopted by the European Union. These financial statements are the responsibility of the Company’s management. Our responsibility is to express an opinion on these financial statements based on our audits. We conducted our audits of these financial statements in accordance with the standards of the Public Company Accounting Oversight Board (United States). Those standards require that we plan and perform the audit to obtain reasonable assurance about whether the financial statements are free of material misstatement. An audit of financial statements includes examining, on a test basis, evidence supporting the amounts and disclosures in the financial statements, assessing the accounting principles used and significant estimates made by management, and evaluating the overall financial statements presentation. We believe that our audits provide a reasonable basis for our opinion.
As discussed in note 50 to the consolidated financial statements, the Group adopted International Accounting Standard (IAS) 32 ‘Financial Instruments: Disclosure and Presentation’, IAS 39 ‘Financial Instruments: Recognition and Measurement’ and IFRS 4 ‘Insurance Contracts’ in accordance with IFRS as adopted by the European Union. This change was accounted for with effect from 1 January 2005.
IFRSs as adopted by the European Union vary in certain significant respects from accounting principles generally accepted in the United States of America. Information relating to the nature and effect of such differences is presented in Note 52 to the consolidated financial statements.
Internal control over financial reporting
Also, in our opinion, management’s assessment, included in the Management Report on Internal Control over Financial Reporting as set out on page 89, that the Company maintained effective internal control over financial reporting as of 31 December 2006 based on criteria established in Internal Control - Integrated Framework issued by the Committee of Sponsoring Organisations of the Treadway Commission (COSO), is fairly stated, in all material respects, based on those criteria. Furthermore, in our opinion, the Company maintained, in all material respects, effective internal control over financial reporting as of 31 December 2006, based on criteria established in Internal Control - Integrated Framework issued by the COSO. The Company’s management is responsible for maintaining effective internal control over financial reporting and for its assessment of the effectiveness of internal control over financial reporting. Our responsibility is to express opinions on management’s assessment and on the effectiveness of the Company’s internal control over financial reporting based on our audit.
We conducted our audit of internal control over financial reporting in accordance with the standards of the Public Company Accounting Oversight Board (United States). Those standards require that we plan and perform the audit to obtain reasonable assurance about whether effective internal control over financial reporting was maintained in all material respects. An audit of internal control over financial reporting includes obtaining an understanding of internal control over financial reporting, evaluating management’s assessment, testing and evaluating the design and operating effectiveness of internal control, and performing such other procedures as we consider necessary in the circumstances. We believe that our audit provides a reasonable basis for our opinions.
A company’s internal control over financial reporting is a process designed to provide reasonable assurance regarding the reliability of financial reporting and the preparation of financial statements for external purposes in accordance with generally accepted accounting principles. A company’s internal control over financial reporting includes those policies and procedures that (i) pertain to the maintenance of records that, in reasonable detail, accurately and fairly reflect the transactions and dispositions of the assets of the company (ii) provide reasonable assurance that transactions are recorded as necessary to permit preparation of financial statements in accordance with generally accepted accounting principles, and that receipts and expenditures of the company are being made only in accordance with authorisations of management and directors of the company and (iii) provide reasonable assurance regarding prevention or timely detection of unauthorised acquisition, use, or disposition of the company’s assets that could have a material effect on the financial statements.
Because of its inherent limitations, internal control over financial reporting may not prevent or detect misstatements. Also projections of any evaluation of effectiveness to future periods are subject to the risk that controls may become inadequate because of changes in conditions, or that the degree of compliance with the policies or procedures may deteriorate.
PricewaterhouseCoopers LLP
Southampton, United Kingdom
8 June 2007
F-2
Consolidated income statement
| | | | | | | | | | | | | |
for the year ended 31 December 2006 | | | | | | | | | | | | | |
| | | | | | | | | | | | | | |
| | Note | | 2006
£ million | | 2005
£ million | | 2004
£ million | |
| | | | | | | | | | | | | | |
Interest and similar income | | | | | | 14,316 | | | 12,589 | | | 10,707 | |
Interest and similar expense | | | | | | (8,779 | ) | | (6,918 | ) | | (5,597 | ) |
| | | | | | | | | | | | | | |
Net interest income | | | 4 | | | 5,537 | | | 5,671 | | | 5,110 | |
Fee and commission income | | | | | | 3,116 | | | 2,990 | | | 3,054 | |
Fee and commission expense | | | | | | (846 | ) | | (842 | ) | | (844 | ) |
| | | | | | | | | | | | | | |
Net fee and commission income | | | 5 | | | 2,270 | | | 2,148 | | | 2,210 | |
Net trading income | | | 6 | | | 6,341 | | | 9,298 | | | 5,036 | |
Insurance premium income | | | 7 | | | 4,719 | | | 4,469 | | | 6,070 | |
Other operating income | | | 8 | | | 806 | | | 1,140 | | | 857 | |
Other income | | | | | | 14,136 | | | 17,055 | | | 14,173 | |
| | | | | | | | | | | | | | |
Total income | | | | | | 19,673 | | | 22,726 | | | 19,283 | |
Insurance claims | | | 9 | | | (8,569 | ) | | (12,186 | ) | | (9,622 | ) |
| | | | | | | | | | | | | | |
Total income, net of insurance claims | | | | | | 11,104 | | | 10,540 | | | 9,661 | |
Operating expenses | | | 10 | | | (5,301 | ) | | (5,471 | ) | | (5,297 | ) |
| | | | | | | | | | | | | | |
Trading surplus | | | | | | 5,803 | | | 5,069 | | | 4,364 | |
Impairment losses on loans and advances | | | 11 | | | (1,555 | ) | | (1,299 | ) | | (866 | ) |
Profit (loss) on sale and closure of businesses | | | 12 | | | — | | | 50 | | | (21 | ) |
| | | | | | | | | | | | | | |
Profit before tax | | | | | | 4,248 | | | 3,820 | | | 3,477 | |
Taxation | | | 13 | | | (1,341 | ) | | (1,265 | ) | | (1,018 | ) |
| | | | | | | | | | | | | | |
Profit for the year | | | | | | 2,907 | | | 2,555 | | | 2,459 | |
| | | | | | | | | | | | | | |
Profit attributable to minority interests | | | | | | 104 | | | 62 | | | 67 | |
Profit attributable to equity shareholders | | | | | | 2,803 | | | 2,493 | | | 2,392 | |
| | | | | | | | | | | | | | |
Profit for the year | | | | | | 2,907 | | | 2,555 | | | 2,459 | |
| | | | | | | | | | | | | | |
Basic earnings per share | | | 14 | | | 49.9p | | | 44.6p | | | 42.8p | |
| | | | | | | | | | | | | | |
Diluted earnings per share | | | 14 | | | 49.5p | | | 44.2p | | | 42.5p | |
| | | | | | | | | | | | | | |
Dividends per share | | | 43 | | | 34.2p | | | 34.2p | | | 34.2p | |
| | | | | | | | | | | | | | |
The accompanying notes are an integral part of the consolidated financial statements.
F-3
Consolidated balance sheet
| | | | | | | | | | |
at 31 December 2006 | | | | | | | | | | |
| | | | | | | | | | | |
| | Note | | 2006
£ million | | 2005
£ million | |
| | | | | | | | | | | |
Assets | | | | | | | | | | |
Cash and balances at central banks | | | | | | 1,898 | | | 1,156 | |
Items in the course of collection from banks | | | | | | 1,431 | | | 1,310 | |
Trading and other financial assets at fair value through profit or loss | | | 15 | | | 67,695 | | | 60,374 | |
Derivative financial instruments | | | 16 | | | 5,565 | | | 5,878 | |
Loans and advances to banks | | | 17 | | | 40,638 | | | 31,655 | |
Loans and advances to customers | | | 18 | | | 188,285 | | | 174,944 | |
Available-for-sale financial assets | | | 20 | | | 19,178 | | | 14,940 | |
Investment property | | | 21 | | | 4,739 | | | 4,260 | |
Goodwill | | | 22 | | | 2,377 | | | 2,373 | |
Value of in-force business | | | 23 | | | 2,723 | | | 2,922 | |
Other intangible assets | | | 24 | | | 138 | | | 50 | |
Tangible fixed assets | | | 25 | | | 4,252 | | | 4,291 | |
Other assets | | | 26 | | | 4,679 | | | 5,601 | |
| | | | | | | | | | | |
Total assets | | | | | | 343,598 | | | 309,754 | |
| | | | | | | | | | | |
The accompanying notes are an integral part of the consolidated financial statements.
The directors approved the consolidated financial statements on 22 February 2007.
| | |
Sir Victor Blank | J Eric Daniels | Helen A Weir |
Chairman | Group Chief Executive | Group Finance Director |
F-4
Consolidated balance sheet
| | | | | | | | | | |
at 31 December 2006 | | | | | | | | | | |
| | | | | | | | | | | |
Equity and liabilities | | Note | | 2006
£ million | | 2005
£ million | |
| | | | | | | | | | | |
Liabilities | | | | | | | | | | |
Deposits from banks | | | 27 | | | 36,394 | | | 31,527 | |
Customer accounts | | | 28 | | | 139,342 | | | 131,070 | |
Items in course of transmission to banks | | | | | | 781 | | | 658 | |
Trading and other liabilities at fair value through profit or loss | | | 29 | | | 1,184 | | | — | |
Derivative financial instruments | | | 16 | | | 5,763 | | | 6,396 | |
Debt securities in issue | | | 30 | | | 54,118 | | | 39,346 | |
Liabilities arising from insurance contracts and participating investment contracts | | | 31 | | | 41,445 | | | 40,550 | |
Liabilities arising from non-participating investment contracts | | | 32 | | | 24,370 | | | 21,839 | |
Unallocated surplus within insurance businesses | | | 33 | | | 683 | | | 518 | |
Other liabilities | | | 34 | | | 10,985 | | | 9,843 | |
Retirement benefit obligations | | | 35 | | | 2,462 | | | 2,910 | |
Current tax liabilities | | | | | | 817 | | | 552 | |
Deferred tax liabilities | | | 36 | | | 1,416 | | | 1,145 | |
Other provisions | | | 37 | | | 259 | | | 368 | |
Subordinated liabilities | | | 38 | | | 12,072 | | | 12,402 | |
| | | | | | | | | | | |
Total liabilities | | | | | | 332,091 | | | 299,124 | |
| | | | | | | | | | |
Equity | | | | | | | | | | |
Share capital | | | 39 | | | 1,429 | | | 1,420 | |
Share premium account | | | 40 | | | 1,266 | | | 1,170 | |
Other reserves | | | 41 | | | 355 | | | 383 | |
Retained profits | | | 42 | | | 8,105 | | | 7,222 | |
Shareholders’ equity | | | | | | 11,155 | | | 10,195 | |
Minority interests | | | | | | 352 | | | 435 | |
| | | | | | | | | | | |
Total equity | | | | | | 11,507 | | | 10,630 | |
| | | | | | | | | | | |
Total equity and liabilities | | | | | | 343,598 | | | 309,754 | |
| | | | | | | | | | | |
The accompanying notes are an integral part of the consolidated financial statements.
F-5
Consolidated statement of changes in equity
| | | | | | | | | | | | | | | | | | | |
| | | | | | | | | | | | | | | | | | | | |
|
| | Attributable to equity shareholders | | | | | | | | | | |
| | | | | | | | | | | | |
| | Share capital
and premium
£ million | | Other
reserves
£ million | | Retained
profits
£ million | | Total
£ million | | Minority
interests
£ million | | Total
£ million | |
| | | | | | | | | | | | | | |
Balance at 1 January 2004 | | | 2,554 | | | 343 | | | 7,646 | | | 10,543 | | | 782 | | | 11,325 | |
Currency translation differences | | | — | | | — | | | (12 | ) | | (12 | ) | | 1 | | | (11 | ) |
Profit for the year | | | — | | | — | | | 2,392 | | | 2,392 | | | 67 | | | 2,459 | |
Total recognised income for 2004 | | | — | | | — | | | 2,380 | | | 2,380 | | | 68 | | | 2,448 | |
Dividends | | | — | | | — | | | (1,913 | ) | | (1,913 | ) | | (68 | ) | | (1,981 | ) |
Purchase/sale of treasury shares | | | — | | | — | | | 8 | | | 8 | | | — | | | 8 | |
Employee share option schemes: | | | | | | | | | | | | | | | | | | | |
– value of employee services | | | — | | | — | | | 19 | | | 19 | | | — | | | 19 | |
– proceeds from shares issued | | | 10 | | | — | | | — | | | 10 | | | — | | | 10 | |
Repayment of capital to minority shareholders | | | — | | | — | | | — | | | — | | | (151 | ) | | (151 | ) |
| | | | | | | | | | | | | | | | | | | | |
Balance at 31 December 2004 | | | 2,564 | | | 343 | | | 8,140 | | | 11,047 | | | 631 | | | 11,678 | |
Adjustments on transition to IAS 32, IAS 39 and IFRS 4 (note 50) | | | — | | | 28 | | | (1,586 | ) | | (1,558 | ) | | (550 | ) | | (2,108 | ) |
| | | | | | | | | | | | | | | | | | | | |
Balance at 1 January 2005 | | | 2,564 | | | 371 | | | 6,554 | | | 9,489 | | | 81 | | | 9,570 | |
Movement in available-for-sale
financial assets, net of tax | | | — | | | 8 | | | — | | | 8 | | | — | | | 8 | |
Movement in cash flow hedges, net of tax | | | — | | | 11 | | | — | | | 11 | | | — | | | 11 | |
Currency translation differences | | | — | | | (7 | ) | | 24 | | | 17 | | | — | | | 17 | |
Net income recognised directly in equity | | | — | | | 12 | | | 24 | | | 36 | | | — | | | 36 | |
Profit for the year | | | — | | | — | | | 2,493 | | | 2,493 | | | 62 | | | 2,555 | |
| | | | | | | | | | | | | | | | | | | | |
Total recognised income for 2005 | | | — | | | 12 | | | 2,517 | | | 2,529 | | | 62 | | | 2,591 | |
Dividends | | | — | | | — | | | (1,914 | ) | | (1,914 | ) | | (37 | ) | | (1,951 | ) |
Purchase/sale of treasury shares | | | — | | | — | | | 18 | | | 18 | | | — | | | 18 | |
Employee share option schemes: | | | | | | | | | | | | | | | | | | | |
– value of employee services | | | — | | | — | | | 47 | | | 47 | | | — | | | 47 | |
– proceeds from shares issued | | | 26 | | | — | | | — | | | 26 | | | — | | | 26 | |
Capital invested by minority shareholders | | | — | | | — | | | — | | | — | | | 329 | | | 329 | |
| | | | | | | | | | | | | | | | | | | | |
Balance at 31 December 2005 | | | 2,590 | | | 383 | | | 7,222 | | | 10,195 | | | 435 | | | 10,630 | |
Movement in available-for-sale | | | | | | | | | | | | | | | | | | | |
financial assets, net of tax | | | — | | | (31 | ) | | — | | | (31 | ) | | — | | | (31 | ) |
Movement in cash flow hedges, net of tax | | | — | | | 1 | | | — | | | 1 | | | — | | | 1 | |
Currency translation differences | | | — | | | 2 | | | (31 | ) | | (29 | ) | | (4 | ) | | (33 | ) |
Net income recognised directly in equity | | | — | | | (28 | ) | | (31 | ) | | (59 | ) | | (4 | ) | | (63 | ) |
Profit for the year | | | — | | | — | | | 2,803 | | | 2,803 | | | 104 | | | 2,907 | |
| | | | | | | | | | | | | | | | | | | | |
Total recognised income for 2006 | | | — | | | (28 | ) | | 2,772 | | | 2,744 | | | 100 | | | 2,844 | |
Dividends | | | — | | | — | | | (1,919 | ) | | (1,919 | ) | | (32 | ) | | (1,951 | ) |
Purchase/sale of treasury shares | | | — | | | — | | | (35 | ) | | (35 | ) | | — | | | (35 | ) |
Employee share option schemes: | | | | | | | | | | | | | | | | | | | |
– value of employee services | | | — | | | — | | | 65 | | | 65 | | | — | | | 65 | |
– proceeds from shares issued | | | 105 | | | — | | | — | | | 105 | | | — | | | 105 | |
Repayment of capital to minority shareholders | | | — | | | — | | | — | | | — | | | (151 | ) | | (151 | ) |
| | | | | | | | | | | | | | | | | | | | |
Balance at 31 December 2006 | | | 2,695 | | | 355 | | | 8,105 | | | 11,155 | | | 352 | | | 11,507 | |
| | | | | | | | | | | | | | | | | | | | |
The accompanying notes are an integral part of the consolidated financial statements.
F-6
Consolidated cash flow statement
| | | | | | | | | | | | | |
for the year ended 31 December 2006 | | | | | | | | | | | | | |
| | | | | | | | | | | | | | |
| | | Note | | | 2006
£ million | | | 2005
£ million | | | 2004
£ million | |
| | | | | | | | | | | | | | |
Profit before tax | | | | | | 4,248 | | | 3,820 | | | 3,477 | |
Adjustments for: | | | | | | | | | | | | | |
Change in operating assets | | | 49 | (a) | | (31,995 | ) | | (17,158 | ) | | (21,335 | ) |
Change in operating liabilities | | | 49 | (b) | | 33,069 | | | 10,039 | | | 26,433 | |
Non-cash and other items | | | 49 | (c) | | 1,555 | | | 4,364 | | | 5,022 | |
Tax paid | | | | | | (798 | ) | | (708 | ) | | (763 | ) |
| | | | | | | | | | | | | | |
Net cash provided by operating activities | | | | | | 6,079 | | | 357 | | | 12,834 | |
| | | | | | | | | | | | | | |
Cash flows from investing activities: | | | | | | | | | | | | | |
Purchase of fixed asset investments | | | | | | | | | | | | (10,088 | ) |
Proceeds from sale and maturity of fixed asset investments | | | | | | | | | | | | 9,732 | |
Purchase of available-for-sale financial assets | | | | | | (23,448 | ) | | (10,108 | ) | | | |
Proceeds from sale and maturity of available-for-sale financial assets | | | | | | 18,106 | | | 10,266 | | | | |
Purchase of fixed assets | | | | | | (1,724 | ) | | (1,843 | ) | | (1,565 | ) |
Proceeds from sale of fixed assets | | | | | | 1,257 | | | 1,073 | | | 698 | |
Acquisition of businesses, net of cash acquired | | | 49 | (f) | | (20 | ) | | (27 | ) | | (16 | ) |
Disposal of businesses, net of cash disposed | | | 49 | (g) | | 936 | | | (4 | ) | | (25 | ) |
| | | | | | | | | | | | | | |
Net cash used in investing activities | | | | | | (4,893 | ) | | (643 | ) | | (1,264 | ) |
| | | | | | | | | | | | | | |
Cash flows from financing activities: | | | | | | | | | | | | | |
Dividends paid to equity shareholders | | | | | | (1,919 | ) | | (1,914 | ) | | (1,913 | ) |
Dividends paid to minority interests | | | 49 | (e) | | (32 | ) | | (37 | ) | | (68 | ) |
Interest paid on subordinated liabilities | | | | | | (713 | ) | | (668 | ) | | (606 | ) |
Proceeds from issue of subordinated liabilities | | | 49 | (e) | | 1,116 | | | 1,361 | | | 699 | |
Proceeds from issue of ordinary shares and transactions in own shares
held in respect of employee share schemes | | | 49 | (e) | | 105 | | | 26 | | | 11 | |
Repayment of subordinated liabilities | | | 49 | (e) | | (759 | ) | | (232 | ) | | (764 | ) |
Capital element of finance lease rental payments | | | 49 | (e) | | — | | | (2 | ) | | (1 | ) |
Capital invested by minority shareholders | | | 49 | (e) | | — | | | 329 | | | — | |
Repayment of capital to minority shareholders | | | 49 | (e) | | (151 | ) | | — | | | (151 | ) |
| | | | | | | | | | | | | | |
Net cash used in financing activities | | | | | | (2,353 | ) | | (1,137 | ) | | (2,793 | ) |
| | | | | | | | | | | | | | |
Effects of exchange rate changes on cash and cash equivalents | | | | | | (148 | ) | | (20 | ) | | (14 | ) |
| | | | | | | | | | | | | | |
Change in cash and cash equivalents | | | | | | (1,315 | ) | | (1,443 | ) | | 8,763 | |
Cash and cash equivalents at beginning of year | | | | | | 26,753 | | | 28,196 | | | 19,433 | |
| | | | | | | | | | | | | | |
Cash and cash equivalents at end of year | | | 49 | (d) | | 25,438 | | | 26,753 | | | 28,196 | |
| | | | | | | | | | | | | | |
The accompanying notes are an integral part of the consolidated financial statements.
F-7
Notes to the group accounts
1 Accounting policies
The consolidated financial statements have been prepared in accordance with International Financial Reporting Standards (‘IFRS’) as adopted by the European Union (‘EU’). IFRS comprises accounting standards prefixed IFRS issued by the International Accounting Standards Board (‘IASB’) and those prefixed IAS issued by the IASB’s predecessor body as well as interpretations issued by the International Financial Reporting Interpretations Committee and its predecessor body. The EU endorsed version of IAS 39 ‘Financial Instruments: Recognition and Measurement’ relaxes some of the hedge accounting requirements; the Group has not taken advantage of this relaxation.
The financial information has been prepared under the historical cost convention, as modified by the revaluation of investment properties, available-for-sale financial assets, trading securities and certain other financial assets and liabilities at fair value through profit or loss and all derivative contracts.
The following IFRS pronouncements relevant to the Group have been adopted in these consolidated financial statements:
| |
(i) | Amendment to IAS 19 ‘Actuarial Gains and Losses, Group Plans and Disclosures’. The Group has not changed its accounting policy for the recognition of actuarial gains and losses as a result of this amendment; the additional disclosures required have been provided in note 35. |
| |
(ii) | Amendment to IAS 39 ‘Financial Instruments: Recognition and Measurement – The Fair Value Option’. This amendment, which was effective from 1 January 2006, changed the criteria for financial assets to be designated at fair value through profit or loss and permitted financial liabilities meeting certain criteria to be designated at fair value for the first time. The adoption of these requirements had no effect upon the classification or valuation of those financial assets that were designated at fair value through profit or loss prior to 1 January 2006; at 31 December 2006, £1.2 billion of financial liabilities had been designated at inception into this category during the year. This change has had no material effect upon the Group’s income statement. |
| |
(iii) | Amendment to IAS 39 ‘Financial Instruments: Recognition and Measurement’ and IFRS 4 ‘Insurance Contracts – Financial Guarantee Contracts’. Since 1 January 2006, all of the Group’s financial guarantee contracts have been accounted for as financial instruments. This change has had no material effect upon the Group’s financial statements. |
| |
(iv) | IFRIC Interpretation 4 ‘Determining Whether an Arrangement Contains a Lease’. The Group has reviewed the terms of all contracts potentially affected by this interpretation; its adoption has had no material effect upon the Group’s financial statements. |
Details of those IFRS pronouncements which will be relevant to the Group but which were not effective at 31 December 2006 and which have not been applied in preparing these financial statements are given in note 50.
The Group’s accounting policies are set out below.
(a) Consolidation
The assets, liabilities and results of Group undertakings (including special purpose entities) are included in the financial statements on the basis of accounts made up to the reporting date. Group undertakings include all entities over which the Group has the power to govern the financial and operating policies which generally accompanies a shareholding of more than one half of the voting rights. The existence and effect of potential voting rights that are currently exercisable or convertible are considered when assessing whether the Group controls another entity. Group undertakings are fully consolidated from the date on which control is transferred to the Group; they are de-consolidated from the date that control ceases. Open Ended Investment Companies (‘OEICs’) and unit trusts where the Group, through the Group’s life funds, has a controlling interest are consolidated; the unit holders’ interest is reported in other liabilities. Intra-Group transactions, balances and unrealised gains and losses on transactions between Group companies are eliminated.
(b) Goodwill
Goodwill represents the excess of the cost of an acquisition over the fair value of the Group’s share of the identifiable net assets of the acquired entity at the date of acquisition. Goodwill is recognised as an asset at cost and is tested at least annually for impairment. If an impairment is identified the carrying value of the goodwill is written down immediately through the income statement and is not subsequently reversed. At the date of disposal of a Group undertaking, the carrying value of attributable goodwill is included in the calculation of the profit or loss on disposal except where it has been written off directly to reserves in the past.
(c) Other intangible assets
Other intangible assets comprise capitalised software enhancements and customer lists. Capitalised software enhancements are amortised over periods not exceeding five years, being their estimated useful lives, using the straight-line method. Customer lists are amortised over periods not exceeding 15 years, being their estimated useful lives, in line with the income expected to arise from those customers and are subject to annual reassessment. All other intangible assets are reviewed for impairment whenever events or any changes in circumstances indicate that the carrying amount may not be recoverable. In the event that an asset’s carrying amount is determined to be greater than its recoverable amount, it is written down immediately.
(d) Revenue recognition
Interest income and expense are recognised in the income statement for all interest-bearing financial instruments, except for those classified at fair value through profit or loss, using the effective interest method. The effective interest method is a method of calculating the amortised cost of a financial asset or liability and of allocating the interest income or interest expense. The effective interest rate is the rate that exactly discounts the estimated future cash payments or receipts over the expected life of the instrument or, when appropriate, a shorter period, to the net carrying amount of the financial asset or financial liability. The effective interest rate is calculated on initial recognition of the financial asset or liability, estimating the future cash flows after considering all the contractual terms of the instrument but not future credit losses. The calculation includes all amounts paid or received by the Group that are an integral part of the overall return, direct incremental transaction costs related to the acquisition, issue or disposal of a financial instrument and all other premiums or discounts. Once a financial asset or a group of similar financial assets has been written down as a result of an impairment loss, interest income is recognised using the rate of interest used to discount the future cash flows for the purpose of measuring the impairment loss (see j).
Fees and commissions which are not an integral part of the effective interest rate are generally recognised when the service has been provided. Loan commitment fees for loans that are likely to be drawn down are deferred (together with related direct costs) and recognised as an adjustment to the effective interest rate on the loan. Loan syndication fees are recognised as revenue when the syndication has been completed and the Group retains no part of the loan package for itself or retains a part at the same effective interest rate for all interest-bearing financial instruments, including loans and advances, as for the other participants.
Revenue recognition policies specific to life assurance and general insurance business are detailed below (see r).
F-8
Notes to the group accounts
1 Accounting policies(continued)
(e) Trading securities, other financial assets and liabilities at fair value through profit or loss, and available-for-sale financial assets
Debt securities and equity shares acquired principally for the purpose of selling in the short term or which are part of a portfolio which is managed for short-term gains are classified as trading securities and recognised in the balance sheet at their fair value. Gains and losses arising from changes in their fair value are recognised in the income statement within net trading income in the period in which they occur.
Other financial assets and liabilities at fair value through profit or loss are designated as such by management upon initial recognition. Such assets and liabilities are carried in the balance sheet at their fair value and gains and losses arising from changes in fair value together with interest coupons and dividend income are recognised in the income statement within net trading income in the period in which they occur.
Financial assets and liabilities are designated as at fair value through profit or loss:
| | |
• | When doing so results in more relevant information because either: |
| |
| – | it eliminates or significantly reduces the inconsistent treatment that would otherwise arise from measuring the assets and liabilities or recognising gains or losses on them on a different basis; or |
| | |
| – | the assets and liabilities are part of a group which is managed, and its performance evaluated, on a fair value basis in accordance with a documented risk management or investment strategy with management information also prepared on this basis, or |
| | |
• | Where the assets and liabilities contain one or more embedded derivatives that significantly modify the cash flows arising under the contract and would otherwise need to be separately accounted for. |
The fair values of assets and liabilities traded in active markets are based on current bid and offer prices respectively. If the market is not active the Group establishes a fair value by using valuation techniques. These include the use of recent arm’s-length transactions, reference to other instruments that are substantially the same, discounted cash flow analysis, option pricing models and other valuation techniques commonly used by market participants.
Debt securities and equity shares, other than those classified as trading securities or at fair value through profit or loss, are classified as available-for-sale and recognised in the balance sheet at their fair value. Gains and losses arising from changes in the fair value of investments classified as available-for-sale are recognised directly in equity, until the financial asset is either sold, becomes impaired or matures, at which time the cumulative gain or loss previously recognised in equity is recognised in the income statement. Interest calculated using the effective interest method is recognised in the income statement; dividends on available-for-sale equity instruments are recognised in the income statement when the Group’s right to receive payment is established.
Purchases and sales of securities and other financial assets and liabilities are recognised on trade date, being the date that the Group is committed to purchase or sell an asset. Trading securities and other financial assets and liabilities at fair value through profit or loss are initially recognised at fair value. Available-for-sale financial assets are initially recognised at fair value inclusive of transaction costs. These financial assets are derecognised when the rights to receive cash flows from the financial assets have expired or where the Group has transferred substantially all risks and rewards of ownership.
(f) Loans and advances to banks and customers
Loans and advances to banks and customers are accounted for at amortised cost using the effective interest method, except those which the Group intends to sell in the short term and which are accounted for at fair value, with the gains and losses arising from changes in their fair value reflected in the income statement. Loans and advances are initially recognised when cash is advanced to the borrowers at fair value inclusive of transaction costs. Loans and advances are derecognised when the rights to receive cash flows from them have expired or where the Group has transferred substantially all risks and rewards of ownership.
The Group has entered into securitisation and similar transactions to finance certain loans and advances to customers. Such financial assets continue to be recognised by the Group, together with a corresponding liability for the funding except in those cases where substantially all of the risks and rewards associated with the assets have been transferred or a significant proportion but not all of the risks and rewards have been transferred and the transferee has the ability to sell the assets when the assets are derecognised in full. If a fully proportional share of all, or of specifically identified, cash flows have been transferred, then that proportion of the assets is derecognised.
(g) Sale and repurchase agreements
Securities sold subject to repurchase agreements (‘repos’) are recognised on the balance sheet where all of the risks and rewards are retained; the counterparty liability is included in deposits from banks or customer accounts, as appropriate. Securities purchased under agreements to resell (‘reverse repos’) are recorded as loans and advances to banks or customers, as appropriate. The difference between sale and repurchase price is treated as interest and accrued over the life of the agreements using the effective interest method. Securities lent to counterparties are also retained in the financial statements.
Securities borrowed are not recognised in the financial statements, unless these are sold to third parties, in which case the obligation to return them is recorded at fair value as a trading liability.
(h) Derivative financial instruments and hedge accounting
All derivatives are recognised at their fair value. Fair values are obtained from quoted market prices in active markets, including recent market transactions, and using valuation techniques, including discounted cash flow and options pricing models, as appropriate. Derivatives are carried in the balance sheet as assets when their fair value is positive and as liabilities when their fair value is negative.
The method of recognising the movements in the fair value of the derivatives depends on whether they are designated as hedging instruments and, if so, the nature of the item being hedged. Derivatives may only be designated as hedges provided certain strict criteria are met. At the inception of a hedge its terms must be clearly documented and there must be an expectation that the derivative will be highly effective in offsetting changes in the fair value or cash flow of the hedged risk. The effectiveness of the hedging relationship must be tested throughout its life and if at any point it is concluded that it is no longer highly effective in achieving its objective the hedge relationship is terminated.
The Group designates certain derivatives as either: (1) hedges of the fair value of the interest rate risk inherent in recognised assets or liabilities (fair value hedges); (2) hedges of highly probable future cash flows attributable to recognised assets or liabilities (cash flow hedges); or (3) hedges of net investments in foreign operations (net investment hedges). These are accounted for as follows:
F-9
Notes to the group accounts
1 Accounting policies(continued)
(1) Fair value hedges
Changes in the fair value of derivatives that are designated and qualify as fair value hedges are recorded in the income statement, together with the changes in the fair value of the hedged asset or liability that are attributable to the hedged risk. If the hedge no longer meets the criteria for hedge accounting, changes in the fair value of the hedged risk are no longer recognised in the income statement; the adjustment that has been made to the carrying amount of a hedged item is amortised to the income statement over the period to maturity.
(2) Cash flow hedges
The effective portion of changes in the fair value of derivatives that are designated and qualify as cash flow hedges is recognised in equity. The gain or loss relating to the ineffective portion is recognised immediately in the income statement. Amounts accumulated in equity are recycled to the income statement in the periods in which the hedged item affects profit or loss. When a hedging instrument expires or is sold, or when a hedge no longer meets the criteria for hedge accounting, any cumulative gain or loss existing in equity at that time remains in equity and is recognised when the forecast transaction is ultimately recognised in the income statement. When a forecast transaction is no longer expected to occur, the cumulative gain or loss that was reported in equity is immediately transferred to the income statement.
(3) Net investment hedges
Hedges of net investments in foreign operations are accounted for similarly to cash flow hedges. Any gain or loss on the hedging instrument relating to the effective portion of the hedge is recognised in equity; the gain or loss relating to the ineffective portion is recognised immediately in the income statement. Gains and losses accumulated in equity are included in the income statement when the foreign operation is disposed of.
Changes in the fair value of any derivative instrument that is not part of a hedging relationship are recognised immediately in the income statement.
Derivatives embedded in financial instruments and insurance contracts (unless the embedded derivative is itself an insurance contract) are treated as separate derivatives when their economic characteristics and risks are not closely related to those of the host contract and the host contract is not carried at fair value through profit or loss. These embedded derivatives are measured at fair value with changes in fair value recognised in the income statement.
(i) Offset
Financial assets and liabilities are offset and the net amount reported in the balance sheet when there is a legally enforceable right of set-off and there is an intention to settle on a net basis, or realise the asset and settle the liability simultaneously.
(j) Impairment of financial assets
(1) Assets accounted for at amortised cost
At each balance sheet date the Group assesses whether, as a result of one or more events occurring after initial recognition, there is objective evidence that a financial asset or group of financial assets has become impaired. Evidence of impairment may include indications that the borrower or group of borrowers is experiencing significant financial difficulty, default or delinquency in interest or principal payments, or the fact that the debt is being restructured to reduce the burden on the borrower.
If there is objective evidence that an impairment loss has been incurred, a provision is established which is calculated as the difference between the balance sheet carrying value of the asset and the present value of estimated future cash flows discounted at that asset’s original effective interest rate. For the Group’s portfolios of smaller balance homogenous loans, such as the residential mortgage, personal lending and credit card portfolios, provisions are calculated for groups of assets taking into account historical cash flow experience. For the Group’s other lending portfolios, provisions are established on a case-by-case basis. If an asset has a variable interest rate, the discount rate used for measuring the impairment loss is the current effective interest rate. The calculation of the present value of the estimated future cash flows of a collateralised asset or group of assets reflects the cash flows that may result from foreclosure less the costs of obtaining and selling the collateral, whether or not foreclosure is probable.
If there is no objective evidence of individual impairment the asset is included in a group of financial assets with similar credit risk characteristics and collectively assessed for impairment. Segmentation takes into account such factors as the type of asset, industry, geographical location, collateral type, past-due status and other relevant factors. These characteristics are relevant to the estimation of future cash flows for groups of such assets as they are indicative of the borrower’s ability to pay all amounts due according to the contractual terms of the assets being evaluated. Future cash flows are estimated on the basis of the contractual cash flows of the assets in the group and historical loss experience for assets with similar credit risk characteristics. Historical loss experience is adjusted on the basis of current observable data to reflect the effects of current conditions that did not affect the period on which the historical loss experience is based and to remove the effects of conditions in the historical period that do not exist currently. The methodology and assumptions used for estimating future cash flows are reviewed regularly by the Group to reduce any differences between loss estimates and actual loss experience.
If, in a subsequent period, the amount of the impairment loss decreases and the decrease can be related objectively to an event occurring after the impairment was recognised, such as an improvement in the borrower’s credit rating, the provision is adjusted and the amount of the reversal is recognised in the income statement.
When a loan or advance is uncollectable, it is written off against the related provision once all the necessary procedures have been completed and the amount of the loss has been determined. Subsequent recoveries of amounts previously written off decrease the amount of impairment losses recorded in the income statement.
(2) Available-for-sale financial assets
The Group assesses at each balance sheet date whether there is objective evidence that an available-for-sale financial asset is impaired. In addition to the factors set out above, a significant or prolonged decline in the fair value of the asset below its cost is considered in determining whether an impairment loss has been incurred. If an impairment loss has been incurred, the cumulative loss measured as the difference between the original cost and the current fair value, less any impairment loss on that asset previously recognised, is removed from equity and recognised in the income statement. If, in a subsequent period, the fair value of a debt instrument classified as available-for-sale increases and the increase can be objectively related to an event occurring after the impairment loss was recognised, the impairment loss is reversed through the income statement. Impairment losses recognised in the income statement on equity instruments are not reversed through the income statement.
F-10
Notes to the group accounts
1 Accounting policies(continued)
(k) Investment property
Property held for long-term rental yields and capital appreciation within the long-term assurance funds is classified as investment property. Investment property comprises freehold and long leasehold land and buildings and is carried in the balance sheet at fair value. Fair value is based on active market prices, adjusted, if necessary, for any difference in the nature, location or condition of the specific asset. If this information is not available, the Group uses alternative valuation methods such as discounted cash flow projections or recent prices on less active markets. These valuations are reviewed at least annually by an independent valuation expert. Investment property being redeveloped for continuing use as investment property, or for which the market has become less active, continues to be measured at fair value. Changes in fair values are recorded in the income statement.
(l) Tangible fixed assets
Tangible fixed assets are included at cost less accumulated depreciation. The value of land (included in premises) is not depreciated. Depreciation on other assets is calculated using the straight-line method to allocate the difference between the cost and the residual value over their estimated useful lives, as follows:
Premises (excluding land):
| |
• | Freehold/long and short leasehold premises: shorter of 50 years or the remaining period of the lease |
| |
• | Leasehold improvements: shorter of 10 years or the remaining period of the lease |
Equipment:
| |
• | Fixtures and furnishings: 10-20 years |
| |
• | Other equipment and motor vehicles: 2-8 years |
The assets’ residual values and useful lives are reviewed, and adjusted if appropriate, at each balance sheet date.
Assets are reviewed for impairment whenever events or changes in circumstances indicate that the carrying amount may not be recoverable. In the event that an asset’s carrying amount is determined to be greater than its recoverable amount it is written down immediately.
(m) Leases
(1) As lessee
The leases entered into by the Group are primarily operating leases. Operating lease rentals are charged to the income statement on a straight-line basis over the period of the lease.
When an operating lease is terminated before the end of the lease period, any payment made to the lessor by way of penalty is recognised as an expense in the period of termination.
(2) As lessor
Assets leased to customers are classified as finance leases if the lease agreements transfer substantially all the risks and rewards of ownership to the lessee; all other leases are classified as operating leases. When assets are subject to finance leases, the present value of the lease payments is recognised as a receivable within loans and advances to banks and customers. Finance lease income is recognised over the term of the lease using the net investment method (before tax) reflecting a constant periodic rate of return.
Operating lease assets are included within fixed assets at cost and depreciated over the life of the lease after taking into account anticipated residual values. Operating lease rental income is recognised on a straight line basis over the life of the lease.
The Group evaluates non-lease arrangements such as outsourcing and similar contracts to determine if they contain a lease which is then separately accounted for.
(n) Borrowings
Borrowings are recognised initially at fair value, being their issue proceeds net of transaction costs incurred. Borrowings are subsequently stated at amortised cost using the effective interest method.
Preference shares and other instruments which carry a mandatory coupon or are redeemable on a specific date are classified as financial liabilities. The coupon on these instruments is recognised in the income statement as interest expense.
(o) Pensions and other post-retirement benefits
The Group operates a number of post-retirement benefit schemes for its employees including both defined benefit and defined contribution pension plans. A defined benefit scheme is a pension plan that defines an amount of pension benefit that an employee will receive on retirement, dependent on one or more factors such as age, years of service and salary. A defined contribution plan is a pension plan into which the Group pays fixed contributions; there is no legal or constructive obligation to pay further contributions.
Full actuarial valuations of the Group’s principal defined benefit schemes are carried out every three years with interim reviews in the intervening years; these valuations are updated to 31 December each year by qualified independent actuaries, or in the case of the Scottish Widows Retirement Benefits Scheme, by a qualified actuary employed by Scottish Widows. For the purposes of these annual updates scheme assets are included at their fair value and scheme liabilities are measured on an actuarial basis using the projected unit credit method adjusted for unrecognised actuarial gains and losses. The defined benefit scheme liabilities are discounted using rates equivalent to the market yields at the balance sheet date on high-quality corporate bonds that are denominated in the currency in which the benefits will be paid, and that have terms to maturity approximating to the terms of the related pension liability. The resulting net surplus or deficit is included in the Group’s balance sheet. Surpluses are only recognised to the extent that they are recoverable through reduced contributions in the future or through refunds from the schemes.
The Group’s income statement includes the current service cost of providing pension benefits, the expected return on the schemes’ assets, net of expected administration costs, and the interest cost on the schemes’ liabilities. Actuarial gains and losses arising from experience adjustments and changes in actuarial assumptions are not recognised unless the cumulative unrecognised gain or loss at the end of the previous reporting period exceeds the greater of 10 per cent of the scheme assets or liabilities (‘the corridor approach’). In these circumstances the excess is charged or credited to the income statement over the employees’ expected average remaining working lives. Past service costs are charged immediately to the income statement, unless the charges are conditional on the employees remaining in service for a specified period of time (the vesting period). In this case, the past service costs are amortised on a straight-line basis over the vesting period.
The Group recognises the effect of material changes to the terms of its defined benefit pension plans which reduce future benefits as curtailments; gains and losses are recognised in the income statement when the curtailments occur.
The costs of the Group’s defined contribution plans are charged to the income statement in the period in which they fall due.
F-11
Notes to the group accounts
1 Accounting policies(continued)
(p) Share-based compensation
The Group operates a number of equity-settled, share-based compensation plans. The value of the employee services received in exchange for equity instruments granted under these plans is recognised as an expense over the vesting period of the instruments, with a corresponding increase in equity. This expense is determined by reference to the fair value of the number of equity instruments that are expected to vest. The fair value of equity instruments granted is based on market prices, if available, at the date of grant. In the absence of market prices, the fair value of the instruments at the date of grant is estimated using an appropriate valuation technique, such as a Black-Scholes option pricing model. The determination of fair values excludes the impact of any non-market vesting conditions, which are included in the assumptions used to estimate the number of options that are expected to vest. At each balance sheet date, this estimate is reassessed and if necessary revised. Any revision of the original estimate is recognised in the income statement over the remaining vesting period, together with a corresponding adjustment to equity.
(q) Taxation
Current income tax which is payable on taxable profits is recognised as an expense in the period in which the profits arise.
For the Group’s long-term assurance businesses, the tax charge is analysed between tax that is payable in respect of policyholders’ returns and tax that is payable on equity holders’ returns. This allocation is based on an assessment of the rates of tax which will be applied to the returns under current UK tax rules.
Deferred tax is provided in full, using the liability method, on temporary differences arising between the tax bases of assets and liabilities and their carrying amounts in the consolidated financial statements. However, deferred income tax is not accounted for if it arises from initial recognition of an asset or liability in a transaction other than a business combination that at the time of the transaction affects neither accounting nor taxable profit or loss. Deferred tax is determined using tax rates that have been enacted or substantially enacted by the balance sheet date which are expected to apply when the related deferred tax asset is realised or the deferred tax liability is settled.
Deferred tax assets are recognised where it is probable that future taxable profit will be available against which the temporary differences can be utilised. Deferred tax is provided on temporary differences arising from investments in subsidiaries and associates, except where the timing of the reversal of the temporary difference is controlled by the Group and it is probable that the difference will not reverse in the foreseeable future. Income tax payable on profits is recognised as an expense in the period in which those profits arise. The tax effects of losses available for carry forward are recognised as an asset when it is probable that future taxable profits will be available against which these losses can be utilised. Deferred tax related to fair value re-measurement of available-for-sale investments and cash flow hedges, which are charged or credited directly to equity, is also credited or charged directly to equity and is subsequently recognised in the income statement together with the deferred gain or loss.
Deferred and current tax assets and liabilities are offset when they arise in the same tax reporting group and where there is both a legal right of offset and the intention to settle on a net basis or to realise the asset and settle the liability simultaneously.
(r) Insurance
The Group undertakes both life assurance and general insurance business.
For accounting purposes the life assurance business issues three types of contract:
Insurance contracts – these contracts contain significant insurance risk, which the group defines as the possibility of having to pay benefits on the occurrence of an insured event which are significantly more than the benefits payable if the insured event were not to occur.
Investment contracts containing a discretionary participation feature – these contracts do not contain significant insurance risk, but contain features which entitle the holder to receive, in addition to the guaranteed benefits, further amounts that are likely to be a significant proportion of the total benefits and the amount and timing of which is at the discretion of the group and based upon the performance of specified assets. Contracts with a discretionary participation feature are referred to as participating investment contracts.
Non-participating investment contracts – these contracts do not contain significant insurance risk or a discretionary participation feature.
For accounting purposes the general insurance business only issues insurance contracts.
(1) Life assurance business
(i) Accounting for insurance and participating investment contracts
| | |
• | Premiums and claims |
| |
| Premiums received in respect of insurance and participating investment contracts are recognised as revenue when due, except as detailed below in respect of unit-linked contracts. |
| |
| Claims are recorded as an expense when they are incurred. |
| |
• | Liabilities |
| |
| – | insurance or participating investment contracts in the Group’s With Profit Fund |
| | |
| Liabilities of the Group’s With Profit Fund, including guarantees and options embedded within products written by that fund, are stated at their realistic values in accordance with the Financial Services Authority’s realistic capital regime. |
| |
| – | insurance or participating investment contracts which are not unit-linked or in the Group’s With Profit Fund |
| | |
| A liability for contractual benefits that are expected to be incurred in the future is recorded when the premiums are recognised. The liability is calculated by estimating the future cash flows over the duration of in-force policies and discounting them back to the valuation date allowing for probabilities of occurrence. The liability will vary with movements in interest rates and with the cost of life assurance and annuity benefits where future mortality is uncertain. |
| |
| Assumptions are made in respect of all material factors affecting future cash flows, including future interest rates, mortality and costs. |
F-12
Notes to the group accounts
1 Accounting policies(continued)
| | |
| – | insurance or participating investment contracts which are unit-linked |
| | |
| Allocated premiums in respect of unit-linked contracts that are either insurance or participating investment contracts are recognised as liabilities. These liabilities are increased or reduced by the change in the unit prices and are reduced by policy administration fees, mortality and surrender charges and any withdrawals. The mortality charges deducted in each period from the policyholders as a group are considered adequate to cover the expected total death benefit claims in excess of the contract account balances in each period and hence no additional liability is established for these claims. Revenue consists of fees deducted for mortality, policy administration and surrender charges. Interest or changes in the unit prices credited to the account balances and excess benefit claims in excess of the account balances incurred in the period are charged as expenses in the income statement. |
| |
• | Unallocated surplus |
| |
| Any amounts in the With Profit Fund not yet determined as being due to policyholders are recognised as an unallocated surplus which is shown separately from other liabilities. |
| |
• | Value of in-force business |
| |
| The Group recognises as an asset the value of in-force business in respect of life insurance and participating investment contracts. The asset represents the present value of the shareholders’ interest in the profits expected to emerge from those contracts written at the balance sheet date determined using appropriate economic and actuarial assumptions, after making allowance for the realistic value of financial options and guarantees. The asset in the consolidated balance sheet is presented gross of attributable tax and movements in the asset are reflected within other operating income in the income statement. |
| |
| During 2006 the Group has changed the way in which it calculates the value of in-force business. Under the new method each cash flow is valued using the discount rate consistent with that applied to such a cash flow in the capital markets. The new market consistent discount rates replace the single discount rate previously used. The new method also includes an explicit allowance made for non-market risk. The effect of this change in methodology has been to reduce profit before tax in 2006 by £18 million. |
| |
(ii) | Accounting for non-participating investment contracts |
All of the Group’s non-participating investment contracts are unit-linked. In accordance with industry practice, these contracts are accounted for as financial liabilities whose value is contractually linked to the fair values of financial assets within the Group’s unitised investment funds. The value of the unit-linked financial liabilities is determined using current unit prices multiplied by the number of units attributed to the contract holders at the balance sheet date. Their value is never less than the amount payable on surrender, discounted for the required notice period where applicable.
Deposits and withdrawals are accounted for directly in the balance sheet as adjustments to the liability.
The Group receives investment management fees in respect of services rendered in conjunction with the issue and management of investment contracts where the Group actively manages the consideration received from its customers to fund a return that is based on the investment profile that the customer selected on origination of the instrument. These services comprise an indeterminate number of acts over the lives of the individual contracts and, therefore, the Group defers these fees and recognises them on a straight-line basis over the estimated lives of the contracts.
Directly incremental commissions that vary with and are related to either securing new or renewing existing non-participating investment contracts are deferred; all other costs are recognised as expenses when incurred. This asset is subsequently amortised over the period of the provision of investment management services and is reviewed for impairment in circumstances where its carrying amount may not be recoverable. If the asset is greater than its recoverable amount it is written down immediately.
(2) General insurance business
The Group both underwrites and acts as intermediary in the sale of general insurance products. Underwriting premiums are included, net of refunds, in the period in which insurance cover is provided to the customer; premiums received relating to future periods are deferred and only credited to the income statement when earned. Broking commission is recognised when the underwriter accepts the risk of providing insurance cover to the customer. Where appropriate, provision is made for the effect of future policy terminations based upon past experience.
The underwriting business makes provision for the estimated cost of claims notified but not settled and claims incurred but not reported at the balance sheet date. The provision for the cost of claims notified but not settled is based upon a best estimate of the cost of settling the outstanding claims after taking into account all known facts. In those cases where there is insufficient information to determine the required provision, statistical techniques are used which take into account the cost of claims that have recently been settled and make assumptions about the future development of the outstanding cases. Similar statistical techniques are used to determine the provision for claims incurred but not reported at the balance sheet date.
(3) Liability adequacy test
At each balance sheet date liability adequacy tests are performed to ensure the adequacy of insurance and participating investment contract liabilities. In performing these tests current best estimates of discounted future contractual cash flows and claims handling and administration expenses, as well as investment income from the assets backing such liabilities, are used. Any deficiency is immediately charged to profit or loss by establishing a provision for losses arising from liability adequacy tests.
(4) Reinsurance
Contracts entered into by the Group with reinsurers under which the Group is compensated for losses on one or more contracts issued by the Group and that meet the classification requirements for insurance contracts are classified as reinsurance contracts held. Insurance contracts entered into by the Group under which the contract holder is another insurer (inwards reinsurance) are included with insurance contracts.
The benefits to which the Group is entitled under its reinsurance contracts held are recognised as reinsurance assets. These assets consist of short-term balances due from reinsurers as well as longer term receivables that are dependent on the expected claims and benefits arising under the related reinsured insurance contracts. Amounts recoverable from or due to reinsurers are measured consistently with the amounts associated with the reinsured insurance contracts and in accordance with the terms of each reinsurance contract. Reinsurance liabilities are primarily premiums payable for reinsurance contracts and are recognised as an expense when due.
F-13
Notes to the group accounts
1 Accounting policies(continued)
(s) Foreign currency translation
(1) Functional and presentation currency
Items included in the financial statements of each of the Group’s entities are measured using the currency of the primary economic environment in which the entity operates (‘the functional currency’). The consolidated financial statements are presented in sterling, which is the Company’s functional and presentation currency.
(2) Transactions and balances
Foreign currency transactions are translated into the functional currency using the exchange rates prevailing at the dates of the transactions. Foreign exchange gains and losses resulting from the settlement of such transactions and from the translation at year end exchange rates of monetary assets and liabilities denominated in foreign currencies are recognised in the income statement, except when deferred in equity as qualifying cash flow or net investment hedges. Non-monetary assets that are measured at fair value are translated using the exchange rate at the date that the fair value was determined. Translation differences on equities and similar non-monetary items measured at fair value are recognised in profit or loss, except for differences on available-for-sale non-monetary financial assets such as equity shares, which are included in the fair value reserve in equity unless the asset is a hedged item in a fair value hedge.
(3) Group companies
The results and financial position of all the Group entities (none of which has the currency of a hyperinflationary economy) that have a functional currency different from the presentation currency are translated into the presentation currency as follows:
| |
(i) | assets and liabilities for each balance sheet presented are translated at the closing rate at the date of that balance sheet; |
| |
(ii) | income and expenses for each income statement are translated at average exchange rates (unless this average is not a reasonable approximation of the cumulative effect of the rates prevailing on the transaction dates, in which case income and expenses are translated at the dates of the transactions); and |
| |
(iii) | all resulting exchange differences are recognised as a separate component of equity. |
On consolidation, exchange differences arising from the translation of the net investment in foreign entities are taken to shareholders’ equity. When a foreign operation is sold, such exchange differences are recognised in the income statement as part of the gain or loss on sale.
Goodwill and fair value adjustments arising on the acquisition of a foreign entity are treated as assets and liabilities of the foreign entity and translated at the closing rate.
(t) Provisions
Provisions are recognised in respect of present obligations arising from past events where it is probable that outflows of resources will be required to settle the obligations and they can be reliably estimated.
The Group recognises provisions in respect of vacant leasehold property where the unavoidable costs of the present obligations exceed anticipated rental income.
Contingent liabilities are possible obligations whose existence depends on the outcome of uncertain future events or those present obligations where the outflows of resources are uncertain or cannot be measured reliably. Contingent liabilities are not recognised in the financial statements but are disclosed unless they are remote.
(u) Dividends
Dividends on ordinary shares are recognised in equity in the period in which they are paid.
(v) Cash and cash equivalents
For the purposes of the cash flow statement, cash and cash equivalents comprise cash and non-mandatory balances with central banks and amounts due from banks with a maturity of less than three months.
F-14
Notes to the group accounts
2 Critical accounting estimates and judgements
The preparation of financial statements requires management to make judgements, estimates and assumptions that affect the reported amounts of assets, liabilities, income and expenses. Due to the inherent uncertainty in making estimates, actual results reported in future periods may be based upon amounts which differ from those estimates. Estimates, judgements and assumptions are continually evaluated and are based on historical experience and other factors, including expectations of future events that are believed to be reasonable under the circumstances. Revisions to accounting estimates are recognised in the period in which the estimate is revised and in any future periods affected. The accounting policies deemed critical to the Group’s results and financial position, based upon materiality and significant judgements and estimates, are discussed below.
Loan impairment provisions
The Group regularly reviews its loan portfolios to assess for impairment. Impairment provisions are established to recognise incurred impairment losses in its loan portfolios carried at amortised cost. In determining whether an impairment has occurred at the balance sheet date the Group considers whether there is any observable data indicating that there has been a measurable decrease in the estimated future cash flows or their timings; such observable data includes whether there has been an adverse change in the payment status of borrowers or changes in economic conditions that correlate with defaults on loan repayment obligations. Where this is the case, the impairment loss is the difference between the carrying value of the loan and the present value of the estimated future cash flows discounted at the loan’s original effective interest rate.
At 31 December 2006 gross loans and advances to customers and banks totalled £231,117 million (2005: £208,672 million) against which impairment provisions of £2,194 million (2005: £2,073 million) had been made.
There are two components of the Group’s loan impairment provisions: individual and collective. All impaired loans which exceed a certain threshold, principally within the Group’s corporate banking business, are individually assessed for impairment having regard to expected future cash flows including those that could arise from the realisation of security. The determination of these provisions often requires the exercise of considerable judgement by management involving matters such as local economic conditions and the resulting trading performance of the customer and the value of the security held, for which there may not be a readily accessible market. The actual amount of the future cash flows and their timing may differ significantly from the assumptions made for the purposes of determining the impairment provision and consequently these provisions can be subject to variation as time progresses and the circumstances of the customer become clearer.
Impairment provisions for portfolios of smaller balance homogenous loans, such as residential mortgages, personal loans and credit card balances that are below the individual assessment thresholds, and for loan losses that have been incurred but not separately identified at the balance sheet date, are determined on a collective basis. Collective impairment provisions are calculated on a portfolio basis using formulae which take into account factors such as the length of time that the customer’s account has been out of order, historical loss rates, the credit quality of the portfolios and the value of any security held. The variables used in the formulae are kept under regular review to ensure that as far as possible they reflect current economic circumstances; however changes in interest rates, unemployment levels, particularly in the UK, and bankruptcy trends could result in actual losses differing from reported impairment provisions.
Pensions
The net liability recognised in the balance sheet at 31 December 2006 in respect of the Group’s retirement benefit obligations was £2,462 million (2005: £2,910 million) of which £2,362 million (2005: £2,809 million) related to defined benefit pension schemes. This liability excludes actuarial gains of £263 million (2005: losses of £485 million) which the Group is permitted to leave unrecognised. The defined benefit pension schemes’ gross deficit totalled £2,099 million (2005: £3,294 million) representing the difference between the schemes’ liabilities and the fair value of the related assets at the balance sheet date.
The schemes’ liabilities are calculated using the projected unit credit method, which takes into account projected earnings increases, using actuarial assumptions that give the best estimate of the future cash flows that will arise under the scheme liabilities. The resulting estimated cash flows are discounted at a rate equivalent to the market yield at the balance sheet date on high quality bonds with a similar duration and currency to the schemes’ liabilities. In order to estimate the future cash flows, a number of financial and non-financial assumptions are made by management, changes to which could have a material impact upon the overall deficit or the net cost recognised in the income statement.
Two important assumptions are the rate of inflation and the expected lifetime of the schemes’ members. The assumed rate of inflation affects the rate at which salaries are projected to grow and therefore the size of the pension that employees receive upon retirement and also the rate at which pensions in payment increase. Over the longer term rates of inflation can vary significantly; at 31 December 2006 it was assumed that the rate of inflation would be 2.9 per cent per annum (2005: 2.7 per cent), although if this was increased by 0.2 per cent the overall deficit would increase by approximately £559 million and the annual cost by approximately £20 million. A reduction of 0.2 per cent would reduce the overall deficit by approximately £539 million and the annual cost by approximately £15 million.
The cost of the benefits payable by the schemes will also depend upon the longevity of the members. Assumptions are made regarding the expected lifetime of scheme members based upon recent experience, however given the rates of advance in medical science and increasing levels of obesity, it is uncertain whether they will ultimately reflect actual experience. An increase of one year in the expected lifetime of scheme members would increase the overall deficit by approximately £459 million and the annual cost by approximately £30 million; a reduction of one year would reduce the overall deficit by approximately £460 million and the annual cost by approximately £30 million.
The size of the overall deficit is also sensitive to changes in the discount rate, which is affected by market conditions and therefore potentially subject to significant variations. At 31 December 2006 the discount rate used was 5.1 per cent (2005: 4.8 per cent); a reduction of 0.2 per cent would increase the overall deficit by approximately £592 million and the annual cost by approximately £14 million, while an increase of 0.2 per cent would reduce the net deficit by approximately £570 million and the annual cost by approximately £13 million.
Goodwill
At 31 December 2006 the Group carried goodwill on its balance sheet totalling £2,377 million (2005: £2,373 million), substantially all of which relates to acquisitions made a number of years ago.
The Group reviews the goodwill for impairment at least annually or when events or changes in economic circumstances indicate that impairment may have taken place. The impairment review is performed by projecting future cash flows, excluding finance and tax, based upon budgets and plans and making appropriate assumptions about rates of growth and discounting these using a rate that takes into account prevailing market interest rates and the risks inherent in the business. If the present value of the projected cash flows is less than the carrying value of the underlying net assets and related goodwill an impairment charge is required in the income statement. This calculation requires the exercise of significant judgement by management; if the estimates made prove to be incorrect or changes in the performance of the subsidiaries affect the amount and timing of future cash flows, goodwill may become impaired in future periods.
F-15
Notes to the group accounts
2 Critical accounting estimates and judgements(continued)
Insurance
Life assurance business
The Group carries in its balance sheet an asset representing the value of in-force business in respect of life insurance and participating investment contracts of £2,723 million at 31 December 2006 (2005: £2,922 million). This asset, which is presented gross of attributable tax, represents the present value of future profits expected to arise from the portfolio of in-force life insurance and participating investment contracts. To arrive at this value it is necessary for management to make assumptions about the future experience of the insurance portfolios which will be affected by factors such as stock market levels, rates of interest and price inflation, future mortality rates and future persistency rates. These factors are inherently uncertain. If actual experience differs from that assumed this could significantly affect the value attributed. The process for determining the key assumptions that have been made at 31 December 2006 is detailed in note 23.
At 31 December 2006 the Group also carried substantial liabilities to holders of life insurance policies in its balance sheet. The methodology used to value the liabilities is described in note 1 (r) (1). Liabilities arising from insurance contracts and participating investment contracts were £25,763 million and £15,095 million respectively (2005: £25,888 million and £14,068 million) and those arising from non-participating investment contracts totalled £24,370 million (2005: £21,839 million). Elements of the liabilities require assumptions about future investment returns, future mortality rates and future policyholder behaviour. The process for determining the key assumptions that have been made at 31 December 2006 and the impact on profit before tax of changes in key assumptions is detailed in note 31.
General insurance business
At 31 December 2006 the Group held a provision of £149 million (2005: £147 million) in respect of the estimated cost of claims notified but not settled and claims incurred but not reported at the balance sheet date. The provision for the cost of claims notified but not settled is based upon a best estimate of the cost of settling the outstanding claims after taking into account all known facts. In those cases where there is insufficient information to determine the required provision, statistical techniques are used which take into account the cost of claims that have recently been settled and make assumptions about the future development of the outstanding cases. Similar statistical techniques are used to determine the provision for claims incurred but not reported at the balance sheet date.
While management believes that the liability carried at year end is adequate, the application of statistical techniques requires significant judgment. An increase of 10 per cent in the cost of claims would result in the recognition of an additional loss of approximately £14 million. Similarly, an increase of 10 per cent in the ultimate number of such claims would lead to an additional loss of approximately £15 million. There is no relief arising from reinsurance contracts held.
Taxation
Significant judgement is required in determining the Group’s income tax liabilities. In arriving at the current tax liability of £817 million and deferred tax liability of £1,416 million at 31 December 2006 (2005: current tax liability of £552 million and deferred tax liability of £1,145 million), the Group has taken account of tax issues that are subject to ongoing discussions with HM Revenue & Customs and other tax authorities. Calculations of these liabilities have been based on management’s assessment of legal and professional advice, case law and other relevant guidance. In these situations, the various risks are categorised and approximate weightings applied in arriving at the assessment of the expected liability. Where the expected tax outcome of these matters is different from the amounts that were initially recorded, such differences will impact the current and deferred tax amounts in the period in which such determination is made.
F-16
|
Notes to the group accounts |
|
| |
3 Segmental analysis
Lloyds TSB Group is a leading financial services group, whose businesses provide a wide range of banking and financial services predominantly in the UK.
The Group’s activities are organised into three segments: UK Retail Banking, Insurance and Investments and Wholesale and International Banking. Services provided by UK Retail Banking encompass the provision of banking and other financial services to personal customers, private banking and mortgages. Insurance and Investments offers life assurance, pensions and savings products, general insurance and asset management services. Wholesale and International Banking provides banking and related services for major UK and multinational companies, banks and financial institutions, and small and medium-sized UK businesses. It also provides asset finance to personal and corporate customers, manages the Group’s activities in financial markets through its Treasury function and provides banking and financial services overseas.
Under the Group’s transfer pricing arrangements, inter-segment services are generally recharged at cost, with the exception of the internal commission arrangements between the UK branch and other distribution networks and the insurance product manufacturing businesses within the Group, where a profit margin is also charged. Inter-segment lending and deposits are generally entered into at market rates, except that non-interest bearing balances are priced at a rate that reflects the external yield that could be earned on such funds. In addition, for those derivative contracts entered into by business units for risk management purposes, the difference between the result that would have been recognised on an accruals accounting basis and the actual result calculated using fair values is charged or credited to the central segment where the resulting volatility is managed.
| | | | | | | | | | | | | | | | | | | | | | | | | | |
| | UK Retail
Banking
£m | | General
insurance
£m | | Life, pensions
and asset
management
£m | | | Insurance
and
Investments
£m | | Wholesale
and
International
Banking
£m | | Central
group items
£m | | Inter-segment
eliminations
£m | | Total
£m | |
| | | | | | | | | | | | | | | | | | | | | | | | | | | |
Year ended 31 December 2006 | | | | | | | | | | | | | | | | | | | | | | | | | | |
Interest and similar income | | | 6,913 | | | 24 | | | 820 | | | | 844 | | | 8,806 | | | 994 | | | (3,241 | ) | | 14,316 | |
Interest and similar expense | | | (3,271 | ) | | — | | | (741 | ) | | | (741 | ) | | (6,421 | ) | | (1,587 | ) | | 3,241 | | | (8,779 | ) |
| | | | | | | | | | | | | | | | | | | | | | | | | | | |
Net interest income | | | 3,642 | | | 24 | | | 79 | | | | 103 | | | 2,385 | | | (593 | ) | | — | | | 5,537 | |
Other income (net of fee and commission expense) | | | 1,621 | | | 594 | | | 9,893 | | | | 10,487 | | | 1,827 | | | 201 | | | — | | | 14,136 | |
| | | | | | | | | | | | | | | | | | | | | | | | | | | |
Total income | | | 5,263 | | | 618 | | | 9,972 | | | | 10,590 | | | 4,212 | | | (392 | ) | | — | | | 19,673 | |
Insurance claims | | | — | | | (200 | ) | | (8,369 | ) | | | (8,569 | ) | | — | | | — | | | — | | | (8,569 | ) |
| | | | | | | | | | | | | | | | | | | | | | | | | | | |
Total income, net of insurance claims | | | 5,263 | | | 418 | | | 1,603 | | | | 2,021 | | | 4,212 | | | (392 | ) | | — | | | 11,104 | |
Operating expenses | | | (2,476 | ) | | (157 | ) | | (481 | ) | | | (638 | ) | | (2,264 | ) | | 77 | | | — | | | (5,301 | ) |
| | | | | | | | | | | | | | | | | | | | | | | | | | | |
Trading surplus (deficit) | | | 2,787 | | | 261 | | | 1,122 | | | | 1,383 | | | 1,948 | | | (315 | ) | | — | | | 5,803 | |
Impairment losses on loans and advances | | | (1,238 | ) | | — | | | — | | | | — | | | (308 | ) | | (9 | ) | | — | | | (1,555 | ) |
| | | | | | | | | | | | | | | | | | | | | | | | | | | |
Profit (loss) before tax | | | 1,549 | | | 261 | | | 1,122 | | | | 1,383 | | | 1,640 | | | (324 | ) | | — | | | 4,248 | |
| | | | | | | | | | | | | | | | | | | | | | | | | | | |
External revenue | | | 8,136 | | | 1,249 | | | 10,888 | | | | 12,137 | | | 8,867 | | | 158 | | | — | | | 29,298 | |
Inter-segment revenue | | | 698 | | | 19 | | | 199 | | | | 218 | | | 2,276 | | | 910 | | | (4,102 | ) | | — | |
| | | | | | | | | | | | | | | | | | | | | | | | | | | |
Segment revenue | | | 8,834 | | | 1,268 | | | 11,087 | | | | 12,355 | | | 11,143 | | | 1,068 | | | (4,102 | ) | | 29,298 | |
| | | | | | | | | | | | | | | | | | | | | | | | | | | |
External assets | | | 108,381 | | | 1,115 | | | 84,959 | | | | 86,074 | | | 147,836 | | | 1,307 | | | — | | | 343,598 | |
Inter-segment assets | | | 3,331 | | | 502 | | | 4,050 | | | | 4,552 | | | 80,995 | | | 53,588 | | | (142,466 | ) | | — | |
| | | | | | | | | | | | | | | | | | | | | | | | | | | |
Total assets | | | 111,712 | | | 1,617 | | | 89,009 | | | | 90,626 | | | 228,831 | | | 54,895 | | | (142,466 | ) | | 343,598 | |
| | | | | | | | | | | | | | | | | | | | | | | | | | | |
External liabilities | | | 87,327 | | | 875 | | | 77,633 | | | | 78,508 | | | 150,779 | | | 15,477 | | | — | | | 332,091 | |
Inter-segment liabilities | | | 20,980 | | | 54 | | | 5,595 | | | | 5,649 | | | 72,793 | | | 43,044 | | | (142,466 | ) | | — | |
| | | | | | | | | | | | | | | | | | | | | | | | | | | |
Total liabilities | | | 108,307 | | | 929 | | | 83,228 | | | | 84,157 | | | 223,572 | | | 58,521 | | | (142,466 | ) | | 332,091 | |
| | | | | | | | | | | | | | | | | | | | | | | | | | | |
| | | | | | | | | | | | | | | | | | | | | | | | | | |
Other segment items: | | | | | | | | | | | | | | | | | | | | | | | | | | |
Capital expenditure | | | 82 | | | 7 | | | 845 | | | | 852 | | | 647 | | | 143 | | | — | | | 1,724 | |
Depreciation and amortisation | | | 202 | | | 9 | | | 29 | | | | 38 | | | 379 | | | — | | | — | | | 619 | |
Defined benefit scheme charges | | | 121 | | | 4 | | | 24 | | | | 28 | | | 100 | | | (140 | ) | | — | | | 109 | |
| | | | | | | | | | | | | | | | | | | | | | | | | | |
| | | | | | | | | | | | | | | | | | | | | | | | | | | |
F-17
Notes to the group accounts
3 Segmental analysis(continued)
| | | | | | | | | | | | | | | | | | | | | | | | | | |
| | UK Retail
Banking
£m | | General
insurance
£m | | Life, pensions
and asset
management
£m | | | Insurance
and
Investments
£m | | Wholesale
and
International
Banking
£m | | Central
group items
£m | | Inter-segment
eliminations
£m | | Total
£m | |
| | | | | | | | | | | | | | | | | | | | | | | | | | | |
Year ended 31 December 2005 | | | | | | | | | | | | | | | | | | | | | | | | | | |
Interest and similar income | | | 6,652 | | | 27 | | | 850 | | | | 877 | | | 6,944 | | | 1,091 | | | (2,975 | ) | | 12,589 | |
Interest and similar expense | | | (3,131 | ) | | (4 | ) | | (478 | ) | | | (482 | ) | | (4,679 | ) | | (1,601 | ) | | 2,975 | | | (6,918 | ) |
| | | | | | | | | | | | | | | | | | | | | | | | | | | |
Net interest income | | | 3,521 | | | 23 | | | 372 | | | | 395 | | | 2,265 | | | (510 | ) | | — | | | 5,671 | |
Other income (net of fee and commission expense) | | | 1,605 | | | 571 | | | 13,288 | | | | 13,859 | | | 1,628 | | | (37 | ) | | — | | | 17,055 | |
| | | | | | | | | | | | | | | | | | | | | | | | | | | |
Total income | | | 5,126 | | | 594 | | | 13,660 | | | | 14,254 | | | 3,893 | | | (547 | ) | | — | | | 22,726 | |
Insurance claims | | | — | | | (197 | ) | | (11,989 | ) | | | (12,186 | ) | | — | | | — | | | — | | | (12,186 | ) |
| | | | | | | | | | | | | | | | | | | | | | | | | | | |
Total income, net of insurance claims | | | 5,126 | | | 397 | | | 1,671 | | | | 2,068 | | | 3,893 | | | (547 | ) | | — | | | 10,540 | |
Operating expenses | | | (2,697 | ) | | (160 | ) | | (434 | ) | | | (594 | ) | | (2,181 | ) | | 1 | | | — | | | (5,471 | ) |
| | | | | | | | | | | | | | | | | | | | | | | | | | | |
Trading surplus (deficit) | | | 2,429 | | | 237 | | | 1,237 | | | | 1,474 | | | 1,712 | | | (546 | ) | | — | | | 5,069 | |
Impairment losses on loans and advances | | | (1,111 | ) | | — | | | — | | | | — | | | (188 | ) | | — | | | — | | | (1,299 | ) |
Profit (loss) on sale and closure of businesses | | | 76 | | | — | | | — | | | | — | | | (6 | ) | | (20 | ) | | — | | | 50 | |
| | | | | | | | | | | | | | | | | | | | | | | | | | | |
Profit (loss) before tax | | | 1,394 | | | 237 | | | 1,237 | | | | 1,474 | | | 1,518 | | | (566 | ) | | — | | | 3,820 | |
| | | | | | | | | | | | | | | | | | | | | | | | | | | |
| | | | | | | | | | | | | | | | | | | | | | | | | | |
External revenue | | | 7,833 | | | 1,272 | | | 14,127 | | | | 15,399 | | | 7,283 | | | (29 | ) | | — | | | 30,486 | |
Inter-segment revenue | | | 744 | | | 16 | | | 330 | | | | 346 | | | 1,686 | | | 1,175 | | | (3,951 | ) | | — | |
| | | | | | | | | | | | | | | | | | | | | | | | | | | |
Segment revenue | | | 8,577 | | | 1,288 | | | 14,457 | | | | 15,745 | | | 8,969 | | | 1,146 | | | (3,951 | ) | | 30,486 | |
| | | | | | | | | | | | | | | | | | | | | | | | | | | |
External assets | | | 103,930 | | | 968 | | | 79,180 | | | | 80,148 | | | 124,044 | | | 1,632 | | | — | | | 309,754 | |
Inter-segment assets | | | 2,146 | | | 593 | | | 3,893 | | | | 4,486 | | | 81,728 | | | 50,855 | | | (139,215 | ) | | — | |
| | | | | | | | | | | | | | | | | | | | | | | | | | | |
Total assets | | | 106,076 | | | 1,561 | | | 83,073 | | | | 84,634 | | | 205,772 | | | 52,487 | | | (139,215 | ) | | 309,754 | |
| | | | | | | | | | | | | | | | | | | | | | | | | | | |
External liabilities | | | 72,335 | | | 829 | | | 71,894 | | | | 72,723 | | | 141,878 | | | 12,188 | | | — | | | 299,124 | |
Inter-segment liabilities | | | 30,492 | | | 280 | | | 5,133 | | | | 5,413 | | | 59,224 | | | 44,086 | | | (139,215 | ) | | — | |
| | | | | | | | | | | | | | | | | | | | | | | | | | | |
Total liabilities | | | 102,827 | | | 1,109 | | | 77,027 | | | | 78,136 | | | 201,102 | | | 56,274 | | | (139,215 | ) | | 299,124 | |
| | | | | | | | | | | | | | | | | | | | | | | | | | | |
Other segment items: | | | | | | | | | | | | | | | | | | | | | | | | | | |
Capital expenditure | | | 77 | | | 13 | | | 844 | | | | 857 | | | 702 | | | 207 | | | — | | | 1,843 | |
Depreciation and amortisation | | | 219 | | | 11 | | | 26 | | | | 37 | | | 383 | | | — | | | — | | | 639 | |
Customer remediation provision | | | 150 | | | — | | | — | | | | — | | | — | | | — | | | — | | | 150 | |
Defined benefit scheme charges | | | 134 | | | 4 | | | 22 | | | | 26 | | | 84 | | | 15 | | | — | | | 259 | |
| | | | | | | | | | | | | | | | | | | | | | | | | | |
| | | | | | | | | | | | | | | | | | | | | | | | | | | |
F-18
Notes to the group accounts
3 Segmental analysis (continued)
| | | | | | | | | | | | | | | | | | | | | | | | | | |
| | UK Retail
Banking
£m | | General
insurance
£m | | Life, pensions
and asset
management
£m | | | Insurance
and
Investments
£m | | Wholesale
and
International
Banking
£m | | Central
group items
£m | | Inter-segment
eliminations
£m | | Total
£m | |
| | | | | | | | | | | | | | | | | | | |
Year ended 31 December 2004 | | | | | | | | | | | | | | | | | | | | | | | | | | |
Interest and similar income | | | 5,825 | | | 56 | | | 537 | | | | 593 | | | 5,954 | | | 883 | | | (2,548 | ) | | 10,707 | |
Interest and similar expense | | | (2,597 | ) | | (12 | ) | | (298 | ) | | | (310 | ) | | (3,948 | ) | | (1,290 | ) | | 2,548 | | | (5,597 | ) |
| | | | | | | | | | | | | | | | | | | | | | | | | | | |
Net interest income | | | 3,228 | | | 44 | | | 239 | | | | 283 | | | 2,006 | | | (407 | ) | | — | | | 5,110 | |
Other income (net of fee and commission expense) | | | 1,696 | | | 504 | | | 10,370 | | | | 10,874 | | | 1,558 | | | 45 | | | — | | | 14,173 | |
| | | | | | | | | | | | | | | | | | | | | | | | | | | |
Total income | | | 4,924 | | | 548 | | | 10,609 | | | | 11,157 | | | 3,564 | | | (362 | ) | | — | | | 19,283 | |
Insurance claims | | | — | | | (214 | ) | | (9,408 | ) | | | (9,622 | ) | | — | | | — | | | — | | | (9,622 | ) |
| | | | | | | | | | | | | | | | | | | | | | | | | | | |
Total income, net of insurance claims | | | 4,924 | | | 334 | | | 1,201 | | | | 1,535 | | | 3,564 | | | (362 | ) | | — | | | 9,661 | |
Operating expenses | | | (2,609 | ) | | (154 | ) | | (468 | ) | | | (622 | ) | | (2,078 | ) | | 12 | | | — | | | (5,297 | ) |
| | | | | | | | | | | | | | | | | | | | | | | | | | | |
Trading surplus (deficit) | | | 2,315 | | | 180 | | | 733 | | | | 913 | | | 1,486 | | | (350 | ) | | — | | | 4,364 | |
Impairment losses on loans and advances | | | (676 | ) | | — | | | 3 | | | | 3 | | | (193 | ) | | — | | | — | | | (866 | ) |
Loss on sale of businesses | | | — | | | — | | | — | | | | — | | | (21 | ) | | — | | | — | | | (21 | ) |
| | | | | | | | | | | | | | | | | | | | | | | | | | | |
Profit (loss) before tax | | | 1,639 | | | 180 | | | 736 | | | | 916 | | | 1,272 | | | (350 | ) | | — | | | 3,477 | |
| | | | | | | | | | | | | | | | | | | | | | | | | | | |
External revenue | | | 7,089 | | | 1,288 | | | 11,121 | | | | 12,409 | | | 6,135 | | | 91 | | | — | | | 25,724 | |
Inter-segment revenue | | | 791 | | | 48 | | | 19 | | | | 67 | | | 1,716 | | | 851 | | | (3,425 | ) | | — | |
| | | | | | | | | | | | | | | | | | | | | | | | | | | |
Segment revenue | | | 7,880 | | | 1,336 | | | 11,140 | | | | 12,476 | | | 7,851 | | | 942 | | | (3,425 | ) | | 25,724 | |
| | | | | | | | | | | | | | | | | | | | | | | | | | | |
External assets | | | 96,763 | | | 1,058 | | | 70,874 | | | | 71,932 | | | 114,086 | | | 1,641 | | | — | | | 284,422 | |
Inter-segment assets | | | 1,340 | | | 526 | | | 2,644 | | | | 3,170 | | | 70,947 | | | 39,503 | | | (114,960 | ) | | — | |
| | | | | | | | | | | | | | | | | | | | | | | | | | | |
Total assets | | | 98,103 | | | 1,584 | | | 73,518 | | | | 75,102 | | | 185,033 | | | 41,144 | | | (114,960 | ) | | 284,422 | |
| | | | | | | | | | | | | | | | | | | | | | | | | | | |
External liabilities | | | 68,149 | | | 931 | | | 62,305 | | | | 63,236 | | | 130,171 | | | 11,188 | | | — | | | 272,744 | |
Inter-segment liabilities | | | 27,035 | | | 75 | | | 4,105 | | | | 4,180 | | | 50,643 | | | 33,102 | | | (114,960 | ) | | — | |
| | | | | | | | | | | | | | | | | | | | | | | | | | | |
Total liabilities | | | 95,184 | | | 1,006 | | | 66,410 | | | | 67,416 | | | 180,814 | | | 44,290 | | | (114,960 | ) | | 272,744 | |
| | | | | | | | | | | | | | | | | | | | | | | | | | | |
Other segment items: | | | | | | | | | | | | | | | | | | | | | | | | | | |
Capital expenditure | | | 103 | | | — | | | 386 | | | | 386 | | | 907 | | | 169 | | | — | | | 1,565 | |
Depreciation and amortisation | | | 217 | | | 11 | | | 25 | | | | 36 | | | 385 | | | — | | | — | | | 638 | |
Customer remediation provision | | | 100 | | | — | | | 12 | | | | 12 | | | — | | | — | | | — | | | 112 | |
Defined benefit scheme charges | | | 142 | | | 3 | | | 24 | | | | 27 | | | 90 | | | 16 | | | — | | | 275 | |
| | | | | | | | | | | | | | | | | | | | | | | | | | |
| | | | | | | | | | | | | | | | | | | | | | | | | | | |
As the activities of the Group are predominantly carried out in the UK, no geographical analysis is presented.
F-19
Notes to the group accounts
| | | | | | | | | | | | | | | | | | |
| | Weighted average
effective interest rate | | | | | | | | | | | |
| | | | | | | | | | | | | |
| | 2006
% | | | 2005
% | | 2006
£m | | | 2005
£m | | 2004
£m | |
| | |
Interest receivable: | | | | | | | | | | | | | | | | | | |
Treasury bills and other eligible bills | | | | | | | | | | | | | | | | | 6 | |
|
Investment securities | | | | | | | | | | | | | | | | | 418 | |
Available-for-sale financial assets | | | 4.39 | | | | 3.58 | | | 807 | | | | 508 | | | | |
Loans and advances to customers | | | 6.24 | | | | 6.41 | | | 10,909 | | | | 10,095 | | | 8,440 | |
Loans and advances to banks | | | 4.72 | | | | 3.59 | | | 1,826 | | | | 1,199 | | | 979 | |
Lease and hire purchase receivables | | | 7.42 | | | | 7.07 | | | 774 | | | | 787 | | | 864 | |
| | |
| | | 5.91 | | | | 5.82 | | | 14,316 | | | | 12,589 | | | 10,707 | |
| | |
Interest payable: | | | | | | | | | | | | | | | | | | |
Deposits from banks | | | 4.67 | | | | 3.44 | | | (1,680 | ) | | | (953 | ) | | (558 | ) |
Customer accounts | | | 2.91 | | | | 2.84 | | | (3,738 | ) | | | (3,401 | ) | | (3,003 | ) |
Debt securities in issue | | | 4.67 | | | | 4.23 | | | (1,983 | ) | | | (1,307 | ) | | (972 | ) |
Subordinated liabilities | | | 5.72 | | | | 5.22 | | | (694 | ) | | | (601 | ) | | (601 | ) |
Liabilities under sale and repurchase agreements | | | 4.35 | | | | 4.53 | | | (260 | ) | | | (394 | ) | | (319 | ) |
Other | | | 9.68 | | | | 7.24 | | | (424 | ) | | | (262 | ) | | (144 | ) |
| | |
| | | 3.82 | | | | 3.42 | | | (8,779 | ) | | | (6,918 | ) | | (5,597 | ) |
| | |
Net interest income | | | | | | | | | | 5,537 | | | | 5,671 | | | 5,110 | |
| | | | | | | | | | | | | | | | | | | |
Included within interest receivable is £297 million (2005: £209 million) in respect of impaired financial assets. |
| | | | | | | | | | | | | | | | | | |
| | | | | | | | | | | | | | | | | | | |
| |
5 Net fee and commission income | | | | | | | | | | | | | | | |
|
| | 2006
£m | | | | | | 2005
£m | | | | | | 2004
£m | |
| | |
Fee and commission income: | | | | | | | | | | | | | | | | | | |
Current accounts | | | 652 | | | | | | | 593 | | | | | | | 637 | |
Insurance broking | | | 629 | | | | | | | 681 | | | | | | | 672 | |
Credit and debit card fees | | | 493 | | | | | | | 545 | | | | | | | 520 | |
Other | | | 1,342 | | | | | | | 1,171 | | | | | | | 1,225 | |
| | |
| | | 3,116 | | | | | | | 2,990 | | | | | | | 3,054 | |
Fee and commission expense: | | | | | | | | | | | | | | | | | | |
Credit and debit card fees | | | (138 | ) | | | | | | (182 | ) | | | | | | (176 | ) |
Dealer commissions | | | (217 | ) | | | | | | (247 | ) | | | | | | (272 | ) |
Other | | | (491 | ) | | | | | | (413 | ) | | | | | | (396 | ) |
| | | (846 | ) | | | | | | (842 | ) | | | | | | (844 | ) |
| | |
Net fee and commission income | | | 2,270 | | | | | | | 2,148 | | | | | | | 2,210 | |
| | | | | | | | | | | | | | | | | | | |
| | | | | | | | | | | | | | | | | | |
6 Net trading income | | | | | | | | | | | | | | | | | | |
|
| | 2006
£m | | | | | | 2005
£m | | | | | | 2004
£m | |
| | |
Foreign exchange translation gains | | | 32 | | | | | | | 13 | | | | | | | 22 | |
Gains on foreign exchange trading transactions | | | 98 | | | | | | | 150 | | | | | | | 152 | |
| | |
Total foreign exchange | | | 130 | | | | | | | 163 | | | | | | | 174 | |
Investment property gains (note 21) | | | 631 | | | | | | | 430 | | | | | | | 329 | |
Securities and other gains | | | 5,580 | | | | | | | 8,705 | | | | | | | 4,533 | |
| | |
| | | 6,341 | | | | | | | 9,298 | | | | | | | 5,036 | |
| | | | | | | | | | | | | | | | | | | |
Included within securities and other gains are net gains of £5,256 million (2005: £8,543 million; 2004: £nil) arising on assets held at fair value through profit or loss and net gains of £21 million (2005: £nil; 2004: £nil) arising on liabilities held at fair value through profit or loss.
F-20
Notes to the group accounts
|
| |
|
7 Insurance premium income |
| | | | | | | | | | | | |
| | 2006
£m | | | 2005
£m | | | 2004
£m | |
| | |
Life insurance | | | | | | | | | | | | |
Gross premiums | | | 4,308 | | | | 3,996 | | | | 5,581 | |
Ceded reinsurance premiums | | | (189 | ) | | | (89 | ) | | | (65 | ) |
Net earned premiums | | | 4,119 | | | | 3,907 | | | | 5,516 | |
| | | | | | | | | | | | |
Non-life insurance |
Gross premiums written | | | 608 | | | | 575 | | | | 635 | |
Ceded reinsurance premiums | | | (17 | ) | | | (22 | ) | | | (29 | ) |
| | | | | | | | | | | | | |
Net premiums | | | 591 | | | | 553 | | | | 606 | |
Change in provision for unearned premiums | | | 9 | | | | 9 | | | | (52 | ) |
Net earned premiums | | | 600 | | | | 562 | | | | 554 | |
| | | | | | | | | | | | | |
Total net earned premiums | | | 4,719 | | | | 4,469 | | | | 6,070 | |
| | | | | | | | | | | | | |
Life insurance gross written premiums can be further analysed as follows: | | | | | | | | | | | | |
| | 2006
£m | | | 2005
£m | | | 2004
£m | |
| | | | | | | | | | | | | |
Life | | | 1,831 | | | | 1,286 | | | | 2,100 | |
Pensions | | | 1,780 | | | | 2,136 | | | | 2,826 | |
Annuities | | | 681 | | | | 547 | | | | 626 | |
Other | | | 16 | | | | 27 | | | | 29 | |
| | | | | | | | | | | | | |
Gross premiums | | | 4,308 | | | | 3,996 | | | | 5,581 | |
| | | | | | | | | | | | | |
Non-life insurance gross written premiums can be further analysed as follows: | | | | | | | | | | | | |
| | 2006
£m | | | 2005
£m | | | 2004
£m | |
| | | | | | | | | | | | | |
Credit protection | | | 203 | | | | 173 | | | | 224 | |
Home | | | 394 | | | | 390 | | | | 396 | |
Health | | | 11 | | | | 12 | | | | 15 | |
| | | | | | | | | | | | | |
| | | 608 | | | | 575 | | | | 635 | |
| | | | | | | | | | | | | |
| | | | | | | | | | | | |
8 Other operating income | | | | | | | | | | | | |
| | 2006
£m | | | 2005
£m | | | 2004
£m | |
| | | | | | | | | | | | | |
Operating lease rental income | | | 422 | | | | 433 | | | | 422 | |
Rental income from investment property | | | 313 | | | | 272 | | | | 158 | |
Other rents receivable | | | 28 | | | | 30 | | | | 32 | |
Gains less losses on disposal of available-for-sale financial assets | | | 22 | | | | 5 | | | | | |
Gains less losses on disposal of investment securities, net of amounts written off | | | | | | | | | | | 74 | |
Movement in value of in-force business (note 23) | | | (199 | ) | | | 162 | | | | 16 | |
Other income | | | 220 | | | | 238 | | | | 155 | |
| | | | | | | | | | | | | |
| | | 806 | | | | 1,140 | | | | 857 | |
| | | | | | | | | | | | | |
F-21
Notes to the group accounts
| | | | | | | | | | | | |
Insurance claims comprise: | | | | | | | | | | | | |
| | 2006
£m | | | 2005
£m | | | 2004
£m | |
| | |
Life insurance and participating investment contracts | | | | | | | | | | | | |
Claims and surrenders: | | | | | | | | | | | | |
Gross | | | 5,375 | | | | 4,279 | | | | 5,242 | |
Reinsurers’ share | | | (76 | ) | | | (56 | ) | | | (62 | ) |
| | | 5,299 | | | | 4,223 | | | | 5,180 | |
Change in liabilities: | | | | | | | | | | | | |
Gross | | | 2,923 | | | | 7,641 | | | | 3,206 | |
Reinsurers’ share | | | (18 | ) | | | 33 | | | | (1 | ) |
| | | 2,905 | | | | 7,674 | | | | 3,205 | |
Change in unallocated surplus (note 33) | | | 165 | | | | 92 | | | | 1,023 | |
| | | | | | | | | | | | | |
Total life insurance and investment contracts | | | 8,369 | | | | 11,989 | | | | 9,408 | |
| | | | | | | | | | | | | |
Non-life insurance | | | | | | | | | | | | |
Claims and claims paid: | | | | | | | | | | | | |
Gross | | | 198 | | | | 195 | | | | 204 | |
Reinsurers’ share | | | — | | | | (1 | ) | | | (1 | ) |
| | | 198 | | | | 194 | | | | 203 | |
Changes in non-life insurance policyholder liabilities: | | | | | | | | | | | | |
Gross | | | 2 | | | | 3 | | | | 11 | |
Reinsurers’ share | | | — | | | | — | | | | — | |
| | | 2 | | | | 3 | | | | 11 | |
| | | | | | | | | | | | | |
Total non-life insurance | | | 200 | | | | 197 | | | | 214 | |
| | | | | | | | | | | | | |
Total insurance claims expense | | | 8,569 | | | | 12,186 | | | | 9,622 | |
| | | | | | | | | | | | | |
Life insurance gross claims can also be analysed as follows: | | | | | | | | | | | | |
Deaths | | | 286 | | | | 298 | | | | 354 | |
Maturities | | | 1,385 | | | | 1,197 | | | | 1,617 | |
Surrenders | | | 3,081 | | | | 2,204 | | | | 2,700 | |
Annuities | | | 558 | | | | 528 | | | | 528 | |
Other | | | 65 | | | | 52 | | | | 43 | |
| | | | | | | | | | | | | |
| | | 5,375 | | | | 4,279 | | | | 5,242 | |
| | | | | | | | | | | | | |
A non-life insurance claims development table is included in note 31. | | | | | | | | | | | | |
| | | | | | | | | | | | |
| | | | | | | | | | | | | |
| | | | | | | | | | | | |
10 Operating expenses | | | | | | | | | | | | |
| | 2006
£m | | | 2005
£m | | | 2004
£m | |
| | |
Salaries | | | 2,117 | | | | 2,068 | | | | 1,970 | |
Social security costs | | | 161 | | | | 154 | | | | 144 | |
Pensions and other post-retirement benefit schemes (note 35) | | | 165 | | | | 308 | | | | 307 | |
Other staff costs | | | 298 | | | | 325 | | | | 283 | |
| | �� | | | | | | | | | | | |
Staff costs | | | 2,741 | | | | 2,855 | | | | 2,704 | |
Other administrative expenses: | | | | | | | | | | | | |
Operating lease rentals | | | 254 | | | | 252 | | | | 249 | |
Repairs and maintenance | | | 165 | | | | 136 | | | | 129 | |
Communications and data processing | | | 499 | | | | 467 | | | | 449 | |
Advertising | | | 184 | | | | 207 | | | | 205 | |
Professional fees | | | 231 | | | | 216 | | | | 222 | |
Provisions for customer remediation (note 37) | | | — | | | | 150 | | | | 112 | |
Other | | | 608 | | | | 543 | | | | 589 | |
| | | 1,941 | | | | 1,971 | | | | 1,955 | |
Depreciation of tangible fixed assets (note 25) | | | 602 | | | | 621 | | | | 616 | |
Amortisation of other intangible assets (note 24) | | | 17 | | | | 18 | | | | 22 | |
Impairment charges: | | | | | | | | | | | | |
Goodwill (note 22) | | | — | | | | 6 | | | | — | |
| | | | | | | | | | | | | |
Total operating expenses | | | 5,301 | | | | 5,471 | | | | 5,297 | |
| | | | | | | | | | | | | |
F-22
Notes to the group accounts
10 Operating expenses(continued)
The average number of persons on a headcount basis employed by the Group during the year was as follows:
| | | | | | | | | | | | |
| | 2006 | | | 2005 | | | 2004 | |
| | |
UK | | | 74,079 | | | | 77,620 | | | | 79,581 | |
Overseas | | | 2,013 | | | | 1,974 | | | | 3,372 | |
| | | | | | | | | | | | | |
| | | 76,092 | | | | 79,594 | | | | 82,953 | |
| | | | | | | | | | | | | |
| | | | | | | | | | | | |
During the year the auditors earned the following fees: | | | | | | | | | | | | |
| | 2006
£m | | | 2005
£m | | | 2004
£m | |
| | |
| | | | | | | | | | | | |
Fees payable for the audit of the Company’s current year annual report | | | 6.0 | | | | 6.3 | | | | 4.3 | |
Fees payable for other services: | | | | | | | | | | | | |
Audit of the Company’s subsidiaries pursuant to legislation | | | 2.3 | | | | 1.7 | | | | 1.2 | |
Additional fees in respect of the previous year’s audit of subsidiaries | | | 0.6 | | | | — | | | | — | |
Other services supplied pursuant to legislation | | | 4.7 | | | | 0.8 | | | | 0.9 | |
Total audit fees | | | 13.6 | | | | 8.8 | | | | 6.4 | |
| | | | | | | | | | | | |
Other services – audit related fees | | | 1.4 | | | | 1.6 | | | | 6.4 | |
| | | | | | | | | | | | | |
Total audit and audit related fees | | | 15.0 | | | | 10.4 | | | | 12.8 | |
Services relating to taxation | | | 0.6 | | | | 0.6 | | | | 0.8 | |
Other non-audit fees: | | | | | | | | | | | | |
Services relating to corporate finance transactions | | | 1.0 | | | | 0.3 | | | | 0.9 | |
Other services | | | 0.4 | | | | 0.5 | | | | 0.3 | |
Total other non-audit fees | | | 1.4 | | | | 0.8 | | | | 1.2 | |
| | | | | | | | | | | | | |
Total fees payable to the Company’s auditors by the Group | | | 17.0 | | | | 11.8 | | | | 14.8 | |
| | | | | | | | | | | | | |
During the year, the auditors also earned fees payable by entities outside the consolidated Lloyds TSB Group in respect of the following: |
| | 2006
£m | | | 2005
£m | | | 2004
£m | |
| | |
Audits of Group pension schemes | | | 0.2 | | | | 0.1 | | | | 0.1 | |
Audits of the unconsolidated Open Ended Investment Companies managed by the Group | | | 0.4 | | | | 0.2 | | | | 0.2 | |
Reviews of the financial position of corporate and other borrowers | | | 1.6 | | | | 1.2 | | | | 1.4 | |
Acquisition due diligence and other work performed in respect of potential venture capital investments | | | 1.0 | | | | 0.6 | | | | 0.5 | |
| | | | | | | | | | | | | |
Other services supplied pursuant to legislation relate primarily to the costs associated with the Sarbanes-Oxley Act audit requirements together with the cost of the audit of the Group’s Form 20-F filing.
The following types of services are included in the categories listed above:
Audit fees:This category includes fees in respect of the audit of the Group’s annual financial statements and other services in connection with regulatory filings.
Audit related fees:This category includes fees in respect of services for assurance and related services that are reasonably related to the performance of the audit or review of the financial statements.
Services relating to taxation:This category includes tax compliance and tax advisory services.
Other non-audit fees:This category includes due diligence relating to corporate finance, including venture capital, transactions and other assurance and advisory services.
It is the Group’s policy to use the auditors on assignments in cases where their knowledge of the Group means that it is neither efficient nor cost effective to employ another firm of accountants. Such assignments typically relate to the provision of advice on tax issues, assistance in transactions involving the acquisition and disposal of businesses and accounting advice. The auditors are not permitted to provide management consultancy services to the Group.
The Group has procedures that are designed to ensure auditor independence, including that fees for audit and non-audit services are approved in advance. This approval can be obtained either on an individual engagement basis or, for certain types of non-audit services, particularly those of a recurring nature, through the approval of a fee cap covering all engagements of that type provided the fee is below that cap. All statutory audit work as well as non-audit assignments where the fee is expected to exceed the relevant fee cap must be pre-approved by the audit committee on an individual engagement basis. On a quarterly basis, the audit committee receives a report detailing all pre-approved services and amounts paid to the auditors for such pre-approved services.
F-23
|
Notes to the group accounts |
|
| |
11 Impairment losses on loans and advances
| | | | | | | | | | |
| | 2006
£m | | 2005
£m | | 2004
£m | |
| | | | | | | | |
|
Specific bad debt provisions | | | | | | | 953 | |
|
General bad debt provisions | | | | | | | (87 | ) |
|
| | | | | | | | | | | |
Impairment losses on loans and advances (note 19) | | | 1,560 | | | 1,302 | | | 866 | |
Other credit risk provisions (note 37) | | | (5 | ) | | (3 | ) | | — | |
| | | | | | | | | | | |
| | | 1,555 | | | 1,299 | | | 866 | |
| | | | | | | | | | | |
12Profit on sale and closure of businesses
During 2005, a net profit of £74 million arose on disposal of businesses, principally the Goldfish credit card business. This profit was partly offset by an adjustment to consideration received in respect of an earlier disposal and a provision for costs in respect of the closure of businesses, which together totalled £24 million. During the year ended 31 December 2004 the Group completed the sales of its principal businesses in Colombia and substantially all of the businesses of the branches of Lloyds TSB Bank plc in Argentina, Panama, Guatemala and Honduras, resulting in an overall net loss of £21 million.
The businesses sold in 2004 and 2005 were not material to the Group, and consequently they have not been treated as discontinued operations.
(a) Analysis of charge for the year
| | | | | | | | | | | | |
| | 2006
£m | | | 2005
£m | | | 2004
£m | |
| | | | | | | | | | |
UK corporation tax: | | | | | | | | | | | | |
Current tax on profit for the year | | 1,024 | | | 862 | | | 759 | |
Adjustments in respect of prior years | | (137 | ) | | (20 | ) | | (69 | ) |
| | | 887 | | | | 842 | | | | 690 | |
Double taxation relief | | | (195 | ) | | | (138 | ) | | | (57 | ) |
| | | | | | | | | | | | | |
| | | 692 | | | | 704 | | | | 633 | |
| | | | | | | | | | | | |
Foreign tax: | | | | | | | | | | | | |
Current tax on profit for the year | | 83 | | | 78 | | | 118 | |
Adjustments in respect of prior years | | (8 | ) | | (8 | ) | | (2 | ) |
| | | 75 | | | | 70 | | | | 116 | |
| | | | | | | | | | | | | |
Current tax charge | | | 767 | | | | 774 | | | | 749 | |
Deferred tax (note 36) | | | 574 | | | | 491 | | | | 269 | |
| | | | | | | | | | | | | |
| | | 1,341 | | | | 1,265 | | | | 1,018 | |
| | | | | | | | | | | | | |
The charge for tax on the profit for the year is based on a UK corporation tax rate of 30 per cent (2005: 30 per cent; 2004: 30 per cent).
The Group, as a proxy for policyholders in the UK, is required to record taxes on investment income and gains each year. Accordingly, the tax attributable to UK life insurance policyholder earnings is included in income tax expense. The tax expense attributable to policyholder earnings was £222 million (2005: £298 million; 2004: £36 million), including a prior year tax charge of £12 million (2005: tax credit of £25 million; 2004: tax credit of £6 million).
In addition to the income statement current tax charge, £15 million (2005: £nil; 2004: £nil) has been credited to equity in respect of share based payments and £33 million (2005: £nil; 2004: £nil) has been charged to equity in respect of foreign exchange differences.
(b) Factors affecting the tax charge for the year
A reconciliation of the charge that would result from applying the standard UK corporation tax rate to profit before tax to the tax charge for the year is given below:
| | | | | | | | | | |
| | 2006
£m | | 2005
£m | | 2004
£m | |
| | | | | | | | | | | |
Profit before tax | | | 4,248 | | | 3,820 | | | 3,477 | |
| | | | | | | | | | | |
Tax charge thereon at UK corporation tax rate of 30% | | | 1,274 | | | 1,146 | | | 1,043 | |
Factors affecting charge: | | | | | | | | | | |
Disallowed and non-taxable items | | | (8 | ) | | (47 | ) | | (32 | ) |
Overseas tax rate differences | | | (2 | ) | | (1 | ) | | (14 | ) |
Net tax effect of disposals and unrealised gains | | | (78 | ) | | (59 | ) | | (2 | ) |
Tax deductible coupons on non-equity minority interests | | | — | | | — | | | (12 | ) |
Policyholder interests and Open Ended Investment Companies | | | 139 | | | 223 | | | 33 | |
Other items | | | 16 | | | 3 | | | 2 | |
| | | | | | | | | | | |
Tax on profit on ordinary activities | | | 1,341 | | | 1,265 | | | 1,018 | |
| | | | | | | | | | | |
Effective rate | | | 31.6% | | | 33.1% | | | 29.3% | |
| | | | | | | | | | | |
The effective tax rate of the Group excluding gross policyholder and Open Ended Investment Company interests from profit before tax and the tax charge was 28.0 per cent (2005: 27.0 per cent; 2004: 28.3 per cent).
F-24
|
|
Notes to the group accounts |
|
| |
14 Earnings per share
Basic earnings per share are calculated by dividing the net profit attributable to shareholders by the weighted average number of ordinary shares in issue during the year, which has been calculated after deducting 5 million (2005: 5 million; 2004: 6 million) ordinary shares representing the Group’s holdings of own shares in respect of employee share schemes.
| | | | | | | | | | |
| | 2006 | | 2005 | | 2004 | |
| | | | | | | | | | | |
Profit attributable to equity shareholders | | | £2,803m | | | £2,493m | | | £2,392m | |
Weighted average number of ordinary shares in issue | | | 5,616m | | | 5,595m | | | 5,590m | |
Basic earnings per share | | | 49.9p | | | 44.6p | | | 42.8p | |
| | | | | | | | | | | |
For the calculation of diluted earnings per share the weighted average number of ordinary shares in issue is adjusted to assume conversion of all dilutive potential ordinary shares. The Company has dilutive potential ordinary shares in respect of share options and awards granted to employees. The number of shares that could have been acquired at market price (determined as the average annual share price of the Company’s shares) based on the monetary value of the subscription rights attached to outstanding share options and awards is determined; the residual bonus shares are added to the weighted average number of ordinary shares in issue, but no adjustment is made to the profit attributable to equity shareholders.
| | | | | | | | | | |
| | 2006 | | 2005 | | 2004 | |
| | | | | | | | |
Profit attributable to equity shareholders | | | £2,803m | | | £2,493m | | | £2,392m | |
Weighted average number of ordinary shares in issue | | | 5,616m | | | 5,595m | | | 5,590m | |
Adjustment for share options and awards | | | 51m | | | 44m | | | 35m | |
| | | | | | | | | | | |
Weighted average number of ordinary shares for diluted earnings per share | | | 5,667m | | | 5,639m | | | 5,625m | |
| | | | | | | | | | | |
Diluted earnings per share | | | 49.5p | | | 44.2p | | | 42.5p | |
| | | | | | | | | | | |
|
|
The weighted average number of anti-dilutive share options and awards excluded from the calculation of diluted earnings per share was 7 million at 31 December 2006 (2005: 17 million; 2004: 39 million). |
|
| |
15 Trading and other financial assets at fair value through profit or loss
| | | | | | | |
| | 2006
£m | | 2005
£m | |
| | | | | | | | |
Trading assets | | | 5,756 | | | 5,442 | |
Other financial assets at fair value through profit or loss | | | 61,939 | | | 54,932 | |
| | | | | | | | |
| | | 67,695 | | | 60,374 | |
| | | | | | | | |
These assets are comprised as follows:
| | | | | | | | | | | | | |
| | 2006 | | 2005 | |
| | | | | | | | |
| | Trading
assets
£m | | | Other financial
assets at fair
value through
profit or loss
£m | | | Trading
assets
£m | | | Other financial
assets at fair
value through
profit or loss
£m | |
| | | | | | | | | | | | | | | | | |
Loans and advances to banks | | | 34 | | | | 3 | | | | 5 | | | | 5 | |
Loans and advances to customers | | | 350 | | | | 448 | | | | 161 | | | | 445 | |
| | | | | | | | | | | | | | | | |
Debt securities: | | | | | | | | | | | | | | | | |
Government securities | | 180 | | | 8,626 | | | 535 | | | 10,638 | |
Other public sector securities | | — | | | 44 | | | 35 | | | 84 | |
Bank and building society certificates of deposit | | — | | | 573 | | | — | | | 898 | |
Mortgage backed securities | | 451 | | | 87 | | | 39 | | | 197 | |
Other asset backed securities | | 595 | | | 861 | | | — | | | 691 | |
Corporate and other debt securities | | 4,146 | | | 13,170 | | | 4,667 | | | 8,469 | |
| | | 5,372 | | | | 23,361 | | | | 5,276 | | | | 20,977 | |
Equity shares: | | | | | | | | | | | | | | | | |
Listed | | — | | | 29,275 | | | — | | | 27,497 | |
Unlisted | | — | | | 8,852 | | | — | | | 6,008 | |
| | | — | | | 38,127 | | | — | | | 33,505 | |
| | | | | | | | | | | | | | | | | |
| | | 5,756 | | | | 61,939 | | | | 5,442 | | | | 54,932 | |
| | | | | | | | | | | | | | | | | |
The maximum exposure to credit risk at 31 December 2006 of the loans and advances to banks and customers designated at fair value through profit or loss was £451 million (31 December 2005: £450 million); the Group does not hold any credit derivatives or other instruments in mitigation of this risk. There was no significant movement in the fair value of these loans attributable to changes in credit risk; this is determined by reference to the publicly available credit ratings of the instruments involved.
F-25
Notes to the group accounts
|
| |
|
16 Derivative financial instruments |
The principal derivatives used by the Group are interest rate and exchange rate contracts; particular attention is paid to the liquidity of the markets and products in which the Group trades to ensure that there are no undue concentrations of activity and risk.
Interest rate related contracts include interest rate swaps, forward rate agreements and options. An interest rate swap is an agreement between two parties to exchange fixed and floating interest payments, based upon interest rates defined in the contract, without the exchange of the underlying principal amounts. Forward rate agreements are contracts for the payment of the difference between a specified rate of interest and a reference rate, applied to a notional principal amount at a specific date in the future. An interest rate option gives the buyer, on payment of a premium, the right, but not the obligation, to fix the rate of interest on a future loan or deposit, for a specified period and commencing on a specified future date.
Exchange rate related contracts include forward foreign exchange contracts, currency swaps and options. A forward foreign exchange contract is an agreement to buy or sell a specified amount of foreign currency on a specified future date at an agreed rate. Currency swaps generally involve the exchange of interest payment obligations denominated in different currencies; the exchange of principal can be notional or actual. A currency option gives the buyer, on payment of a premium, the right, but not the obligation, to sell specified amounts of currency at agreed rates of exchange on or before a specified future date.
Credit derivatives, principally credit default swaps, are used by the Group as part of its customer product activity and to manage its own exposure to credit risk. A credit default swap is a swap in which one counterparty receives a premium at pre-set intervals in consideration for guaranteeing to make a specific payment should a negative credit event take place. As discussed in note 18, during 2006 the Group used credit default swaps to synthetically securitise £961 million of the Group’s commercial banking loans.
Equity derivatives are also used by the Group as part of its equity based retail product activity to eliminate the Group’s exposure to fluctuations in various international stock exchange indices. Index-linked equity options are purchased which give the Group the right, but not the obligation, to buy or sell a specified amount of equities, or basket of equities, in the form of published indices on or before a specified future date.
The principal amount of the contract does not represent the Group’s real exposure to credit risk which is limited to the current cost of replacing contracts with a positive value to the Group should the counterparty default. To reduce credit risk the Group uses a variety of credit enhancement techniques such as netting and collateralisation, where security is provided against the exposure. Fair values are obtained from quoted market prices in active markets, including recent market transactions, and using valuation techniques, including discounted cash flow and options pricing models, as appropriate.
| | | | | | | | | | | | |
| | Contract/notional
amount
£m | | | Fair value
assets
£m | | | Fair value
liabilities
£m | |
| | | | | | | | | | |
31 December 2006 | | | | | | | | | | | | |
Trading | | | | | | | | | | | | |
Exchange rate contracts: | | | | | | | | | | | | |
Spot, forwards and futures | | | 116,255 | | | | 794 | | | | 1,432 | |
Currency swaps | | | 20,618 | | | | 346 | | | | 496 | |
Options purchased | | | 3,076 | | | | 51 | | | | — | |
Options written | | | 3,822 | | | | — | | | | 32 | |
| | | 143,771 | | | | 1,191 | | | | 1,960 | |
Interest rate contracts: | | | | | | | | | | | | |
Interest rate swaps | | | 331,852 | | | | 2,980 | | | | 3,149 | |
Forward rate agreements | | | 40,876 | | | | 17 | | | | 18 | |
Options purchased | | | 17,034 | | | | 68 | | | | — | |
Options written | | | 12,588 | | | | — | | | | 63 | |
Futures | | | 33,066 | | | | — | | | | 1 | |
| | | 435,416 | | | | 3,065 | | | | 3,231 | |
Credit derivatives | | | 13,212 | | | | 25 | | | | 39 | |
Equity and other contracts | | | 4,026 | | | | 797 | | | | 67 | |
| | | | | | | | | | | | | |
Total derivative assets/liabilities held for trading | | | | | | | 5,078 | | | | 5,297 | |
| | | | | | | | | | | | | |
Hedging | | | | | | | | | | | | |
Derivatives designated as fair value hedges: | | | | | | | | | | | | |
Cross currency interest rate swaps | | | 80 | | | | 10 | | | | — | |
Interest rate swaps (including swap options) | | | 37,298 | | | | 333 | | | | 453 | |
| | | 37,378 | | | | 343 | | | | 453 | |
Derivatives designated as cash flow hedges: | | | | | | | | | | | | |
Interest rate swaps | | | 569 | | | | 5 | | | | 13 | |
Derivatives designated as net investment hedges: | | | | | | | | | | | | |
Cross currency swaps | | | 2,589 | | | | 139 | | | | — | |
| | | | | | | | | | | | | |
Total derivative assets/liabilities held for hedging | | | | | | | 487 | | | | 466 | |
| | | | | | | | | | | | | |
Total recognised derivative assets/liabilities | | | | | | | 5,565 | | | | 5,763 | |
| | | | | | | | | | | | | |
F-26
Notes to the group accounts
|
| |
|
16 Derivative financial instruments(continued) |
| | | | | | | | | | | | |
| | Contract/notional
amount
£m | | | Fair value
assets
£m | | | Fair value
liabilities
£m | |
| | | | | | | | | | |
31 December 2005 | | | | | | | | | | | | |
Trading | | | | | | | | | | | | |
Exchange rate contracts: | | | | | | | | | | | | |
Spot, forwards and futures | | | 145,591 | | | | 1,515 | | | | 1,345 | |
Currency swaps | | | 12,306 | | | | 267 | | | | 204 | |
Options purchased | | | 3,623 | | | | 58 | | | | — | |
Options written | | | 3,892 | | | | — | | | | 45 | |
| | | 165,412 | | | | 1,840 | | | | 1,594 | |
Interest rate contracts: | | | | | | | | | | | | |
Interest rate swaps | | | 288,725 | | | | 2,814 | | | | 3,860 | |
Forward rate agreements | | | 50,006 | | | | 16 | | | | 20 | |
Options purchased | | | 12,679 | | | | 108 | | | | — | |
Options written | | | 8,812 | | | | — | | | | 85 | |
Futures | | | 29,358 | | | | — | | | | — | |
| | | 389,580 | | | | 2,938 | | | | 3,965 | |
Credit derivatives | | | 562 | | | | 3 | | | | — | |
Equity and other contracts | | | 4,787 | | | | 607 | | | | 84 | |
| | | | | | | | | | | | | |
Total derivative assets/liabilities held for trading | | | | | | | 5,388 | | | | 5,643 | |
| | | | | | | | | | | | | |
Hedging | | | | | | | | | | | | |
Derivatives designated as fair value hedges: | | | | | | | | | | | | |
Cross currency interest rate swaps | | 69 | | | 12 | | | — | |
Interest rate swaps (including swap options) | | 39,499 | | | 473 | | | 730 | |
| | | 39,568 | | | | 485 | | | | 730 | |
Derivatives designated as cash flow hedges: | | | | | | | | | | | | |
Interest rate swaps | | | 648 | | | | 5 | | | | 23 | |
| | | | | | | | | | | | | |
Total derivative assets/liabilities held for hedging | | | | | | | 490 | | | | 753 | |
| | | | | | | | | | | | | |
Total recognised derivative assets/liabilities | | | | | | | 5,878 | | | | 6,396 | |
| | | | | | | | | | | | | |
17 Loans and advances to banks
| | | | | | | | | | |
| | 2006
£m | | | | | 2005
£m | |
| | | | | | | | | |
Lending to banks | | | 5,966 | | | | | | 2,510 | |
Money market placements with banks | | | 34,673 | | | | | | 29,146 | |
| | | | | | | | | | | |
Total loans and advances to banks | | | 40,639 | | | | | | 31,656 | |
Allowance for impairment losses (note 19) | | | (1 | ) | | | | | (1 | ) |
| | | | | | | | | | | |
| | | 40,638 | | | | | | 31,655 | |
| | | | | | | | | | | |
The Group holds collateral with a fair value of £6,837 million (2005: £6,381 million), which it is permitted to sell or repledge, of which £6,209 million (2005: £5,550 million) was repledged or sold to third parties for periods not exceeding three months from the transfer.
F-27
Notes to the group accounts
| | | | | | | | | |
| | | | | | | | | | | |
|
18 Loans and advances to customers | | | | | | | | | | |
| | 2006
£m | | | | 2005
£m | | |
| | | | | | | | | |
Agriculture, forestry and fishing | | | 2,905 | | | | | 2,451 | | |
Energy and water supply | | | 2,024 | | | | | 1,592 | | |
Manufacturing | | | 7,513 | | | | | 7,923 | | |
Construction | | | 2,332 | | | | | 2,222 | | |
Transport, distribution and hotels | | | 10,490 | | | | | 9,465 | | |
Postal and telecommunications | | | 831 | | | | | 546 | | |
Property companies | | | 12,896 | | | | | 8,713 | | |
Financial, business and other services | | | 22,999 | | | | | 21,261 | | |
Personal: | | | | | | | | | | |
Mortgages | | | 95,601 | | | | | 88,895 | | |
Other | | | 23,025 | | | | | 23,280 | | |
Lease financing | | | 4,802 | | | | | 5,815 | | |
Hire purchase | | | 5,060 | | | | | 4,853 | | |
| | | | | | | | | | | |
| | | 190,478 | | | | | 177,016 | | |
Allowance for impairment losses (note 19) | | | (2,193 | ) | | | | (2,072 | ) | |
| | | | | | | | | | | |
| | | 188,285 | | | | | 174,944 | | |
| | | | | | | | | | | |
The Group holds collateral with a fair value of £444 million (2005: £1,018 million), which it is permitted to sell or repledge, of which £238 million (2005: £741 million) was repledged or sold to third parties for periods not exceeding three months from the transfer.
Loans and advances to customers include finance lease receivables, which may be analysed as follows:
| | | | | | | | |
| | 2006
£m | | | 2005
£m | | |
| | | | | | | | |
Gross investment in finance leases, receivable: | | | | | | | | | |
Not later than 1 year | | | 637 | | | | 673 | | |
Later than 1 year and not later than 5 years | | | 2,358 | | | | 2,388 | | |
Later than 5 years | | | 5,358 | | | | 6,025 | | |
| | | | | | | | | | |
| | | 8,353 | | | | 9,086 | | |
Unearned future finance income on finance leases | | | (2,945 | ) | | | (2,954 | ) | |
Rentals received in advance | | | (163 | ) | | | (200 | ) | |
Commitments for expenditure in respect of equipment to be leased | | | (443 | ) | | | (117 | ) | |
| | | | | | | | | | |
Net investment in finance leases | | | 4,802 | | | | 5,815 | | |
| | | | | | | | | | |
| | | | | | | | | |
The net investment in finance leases represents amounts recoverable as follows: | | | | |
| | | | | | | | | |
| | 2006
£m | | | 2005
£m | | |
| | | | | | | | |
Not later than 1 year | | | 234 | | | | 648 | | |
Later than 1 year and not later than 5 years | | | 1,232 | | | | 1,610 | | |
Later than 5 years | | | 3,336 | | | | 3,557 | | |
| | | | | | | | | | |
| | | 4,802 | | | | 5,815 | | |
| | | | | | | | | | |
Equipment leased to customers under finance leases primarily relates to structured financing transactions to fund the purchase of aircraft, ships and other large individual value items. The allowance for uncollectable finance lease receivables included in the allowance for impairment losses is £7 million (2005: £4 million). The unguaranteed residual values included in finance lease receivables were as follows:
| | | | | | | |
| | 2006
£m | | 2005
£m | |
| | | | | | |
Not later than 1 year | | | — | | | — | |
Later than 1 year and not later than 5 years | | | — | | | 31 | |
Later than 5 years | | | 168 | | | 245 | |
| | | | | | | | |
Total | | | 168 | | | 276 | |
| | | | | | | | |
F-28
Notes to the group accounts
18 Loans and advances to customers(continued)
Securitisations
Loans and advances to customers include balances that have been securitised but not derecognised, comprising both residential mortgages and commercial loans.
Beneficial interests in residential mortgages were transferred during the year to special purpose entities which issued floating rate debt securities. Neither the Group nor any entities in the Group are obliged to support any losses that may be suffered by the note holders and do not intend to offer such support. The floating rate note holders only receive payments of interest and principal to the extent that the special purpose entities have received sufficient funds from the transferred mortgages and after certain expenses have been met. In the event of a deficiency, they have no recourse whatsoever to the Group.
At 31 December 2006 the total amount of residential mortgages subject to securitisation is £14,927 million (2005: £nil) in respect of which external funding at the year end amounted to £10,048 million (2005: £nil); external funding is shown in debt securities in issue (see note 30).
The Group participates in the securitisation through the provision of administration and other services, the provision of interest rate and currency swaps and in the form of unsecured loan financing which is subordinate to the interests of the floating rate note holders.
In addition the Group completed a £961 million synthetic securitisation of its commercial banking loans during the year (2005: £nil) utilising credit default swaps (‘CDSs’). The CDSs are accounted for as derivatives and are included in derivative financial instruments (note 16).
| | | | | | | | |
| | | | | | | | | |
19 Allowance for impairment losses on loans and advances | | 2006
£m | | | 2005
£m | | |
| | | | | | | | |
At 1 January | | | 2,073 | | | | 1,919 | | |
Exchange and other adjustments | | | (13 | ) | | | 1 | | |
Reclassifications | | | — | | | | 43 | | |
Adjustments on disposal of businesses and portfolios | | | (27 | ) | | | (27 | ) | |
Advances written off | | | (1,489 | ) | | | (1,236 | ) | |
Recoveries of advances written off in previous years | | | 190 | | | | 158 | | |
Unwinding of discount | | | (100 | ) | | | (87 | ) | |
Charge to the income statement | | | 1,560 | | | | 1,302 | | |
| | | | | | | | | | |
At 31 December | | | 2,194 | | | | 2,073 | | |
| | | | | | | | | | |
In respect of: | | | | | | | | | |
Loans and advances to banks (note 17) | | | 1 | | | | 1 | | |
Loans and advances to customers (note 18) | | | 2,193 | | | | 2,072 | | |
| | | | | | | | | | |
| | | 2,194 | | | | 2,073 | | |
| | | | | | | | | | |
| | | | | | | | | |
20 Available-for-sale financial assets | | 2006
£m | | | 2005
£m | | |
| | | | | | | | |
Debt securities: | | | | | | | | | |
Government securities | | | 393 | | | | 1,083 | | |
Other public sector securities | | | 189 | | | | 47 | | |
Bank and building society certificates of deposit | | | 1,615 | | | | 1,470 | | |
Mortgage backed securities | | | 5,662 | | | | 4,161 | | |
Other asset backed securities | | | 4,721 | | | | 4,981 | | |
Corporate and other debt securities | | | 4,817 | | | | 3,065 | | |
| | | 17,397 | | | | 14,807 | | |
Equity shares: | | | | | | | | | |
Listed | | | 1 | | | | 34 | | |
Unlisted | | | 14 | | | | 12 | | |
| | | 15 | | | | 46 | | |
Treasury bills and other bills: | | | | | | | | | |
Treasury bills and similar securities | | | 1,743 | | | | 70 | | |
Other bills | | | 23 | | | | 17 | | |
| | | 1,766 | | | | 87 | | |
| | | | | | | | | | |
| | | 19,178 | | | | 14,940 | | |
| | | | | | | | | | |
F-29
Notes to the group accounts
| | | | | | | | | | |
20 Available-for-sale financial assets(continued) | | | | | | | | | | |
| | | | | | | | | | |
The movement in available-for-sale financial assets is summarised as follows: | | Carrying value
before provisions
£m | | Provisions
£m | | Balance sheet
value
£m | |
| | | | | | | | |
At 1 January 2005 | | | 14,624 | | | (31 | ) | | 14,593 | |
Exchange and other adjustments | | | 559 | | | — | | | 559 | |
Additions | | | 10,108 | | | — | | | 10,108 | |
Disposals | | | (10,266 | ) | | — | | | (10,266 | ) |
Reclassifications | | | (31 | ) | | 31 | | | — | |
Amortisation of premiums and discounts | | | (65 | ) | | — | | | (65 | ) |
Changes in fair value (note 41) | | | 11 | | | — | | | 11 | |
| | | | | | | | | | | |
At 31 December 2005 | | | 14,940 | | | — | | | 14,940 | |
Exchange and other adjustments | | | (1,116 | ) | | — | | | (1,116 | ) |
Additions | | | 23,448 | | | — | | | 23,448 | |
Disposals | | | (18,106 | ) | | — | | | (18,106 | ) |
Amortisation of premiums and discounts | | | 22 | | | — | | | 22 | |
Changes in fair value (note 41) | | | (10 | ) | | — | | | (10 | ) |
| | | | | | | | | | | |
At 31 December 2006 | | | 19,178 | | | — | | | 19,178 | |
| | | | | | | | | | | |
| | | | | | | | | | |
21 Investment property | | | | | | | | | | |
|
| | 2006
£m | | | | | 2005
£m | |
| | | | | | | | | |
At 1 January | | | 4,260 | | | | | | 3,776 | |
Changes in fair value (note 6) | | | 631 | | | | | | 430 | |
Additions: | | | | | | | | | | |
Acquisitions of new properties | | | 675 | | | | | | 756 | |
Additional expenditure on existing properties | | | 75 | | | | | | 51 | |
Total additions | | | 750 | | | | | | 807 | |
Disposals | | | (902 | ) | | | | | (753 | ) |
| | | | | | | | | | | |
At 31 December | | | 4,739 | | | | | | 4,260 | |
| | | | | | | | | | | |
The investment properties are valued at least annually at open-market value, by independent, professionally qualified valuers, who have recent experience in the location and categories of the investment properties being valued.
| | | | | | | | | | |
In addition, the following amounts have been recognised in the income statement: | | | | | | | | | | |
| | 2006
£m | | | | | 2005
£m | |
| | | | | | | | | |
Rental income | | | 313 | | | | | | 272 | |
Direct operating expenses arising from investment properties that generate rental income | | | 24 | | | | | | 24 | |
| | | | | | | | | | | |
Capital expenditure in respect of investment properties: | | | | | | | | | | |
| | 2006
£m | | | | | 2005
£m | |
| | | | | | | | | |
Capital expenditure contracted for at the balance sheet date but not recognised in the financial statements | | | 85 | | | | | | 31 | |
| | | | | | | | | | | |
| | | | | | | | | | | |
22 Goodwill | | | | | | | | | | |
|
| | 2006
£m | | | | | 2005
£m | |
| | | | | | | | | |
At 1 January | | | 2,373 | | | | | | 2,469 | |
Acquisitions (note 48) | | | 4 | | | | | | 3 | |
Disposals | | | — | | | | | | (93 | ) |
Impairment charge | | | — | | | | | | (6 | ) |
| | | | | | | | | | | |
At 31 December | | | 2,377 | | | | | | 2,373 | |
| | | | | | | | | | | |
Cost* | | | 2,383 | | | | | | 2,379 | |
Accumulated impairment losses | | | (6 | ) | | | | | (6 | ) |
| | | | | | | | | | | |
| | | 2,377 | | | | | | 2,373 | |
| | | | | | | | | | | |
* For acquisitions made prior to 1 January 2004, the date of transition to IFRS, cost is included net of amounts amortised up to 31 December 2003.
The goodwill held in the Group’s balance sheet is tested at least annually for impairment. For the purposes of impairment testing the goodwill is allocated to the appropriate cash generating unit; of the total balance of £2,377 million (2005: £2,373 million), £1,836 million (or 77 per cent of the total) has been allocated to Scottish Widows and £521 million (or 22 per cent of the total) to Asset Finance.
F-30
Notes to the group accounts
22Goodwill(continued)
The recoverable amount of Scottish Widows has been based on a value in use calculation. The calculation uses projections of future cash flows based upon budgets and plans approved by management covering a five-year period, and a discount rate of 11 per cent (gross of tax). The budgets and plans are based upon past experience adjusted to take into account anticipated changes in sales volumes, product mix and margins having regard to expected market conditions and competitor activity. The discount rate is determined with reference to internal measures and available industry information. Cash flows beyond the five-year period have been extrapolated using a steady 3 per cent growth rate which does not exceed the long-term average growth rate for the life assurance market. Management believes that any reasonably possible change in the key assumptions would not cause the recoverable amount of Scottish Widows to fall below its balance sheet carrying value.
The recoverable amount of Asset Finance has also been based on a value in use calculation using cash flow projections based on financial budgets and plans approved by management covering a five-year period and a discount rate of 10 per cent (gross of tax). Due to similarities in the risk profile and the funding model management believes that Asset Finance is closely aligned to Lloyds TSB Group; the discount rate represents the Group’s weighted average cost of capital. The cash flows for each of the businesses of Asset Finance beyond the five-year period are extrapolated using steady growth rates, in each case not exceeding 4 per cent nor the long-term average growth rates for the markets in which the respective businesses of Asset Finance participate. Management also believes that any reasonably possible change in the key assumptions on which the recoverable amount of Asset Finance is based would not cause the carrying amount of Asset Finance to exceed its recoverable amount.
|
| |
23 Value of in-force business
|
The asset in the consolidated balance sheet and movement recognised in the income statement are as follows:
Gross value of in-force insurance and participating investment business
| | | | | | | |
| | 2006
£m | | 2005
£m | |
| | | | | | |
| | | | | | | |
At 1 January | | | 2,922 | | | 2,760 | |
Movement in value of in-force business | | | (199 | ) | | 162 | |
| | | | | | | | |
At 31 December | | | 2,723 | | | 2,922 | |
| | | | | | | | |
The movement in value of in-force business over 2006 contains effects from the introduction of the new valuation rules in the Financial Services Authority’s (‘FSA’s’) Policy Statement 06/14 and a revised allowance for risk. This reduced the amount of reserves required to be held for certain contract types. The value of in-force for these contract types is £429 million lower than it would have been if the FSA valuation rules had not changed. The reduction in the value of in-force business is more than offset by the lower reserves held under the new FSA valuation rules; the income statement impact of these changes is quantified in note 31, and further information on the Group’s life assurance business, including its available capital resources and regulatory capital requirements, the realistic value of its assets and liabilities and its capital sensitivities is given in note 31 and on pages 64 to 68.
The principal economic assumptions used in calculating the value of in-force business at 31 December 2005 were as follows:
| | | | |
| | | % | |
| | | | | |
Risk discount rate | | | 7.02 | |
Return on equities | | | 6.72 | |
Return on fixed interest securities | | | 4.12 | |
Expense inflation | | | 3.79 | |
| | | | | |
Following the change in the methodology used to calculate the value of in-force business in 2006 the principal assumptions that it is necessary to make have changed.
The principal features of the methodology and process used for determining key assumptions used in the calculation of the value of in-force business at 31 December 2006 are set out below:
Economic assumptions
Each cash flow is valued using the discount rate consistent with that applied to such a cash flow in the capital markets. In practice, to achieve the same result, where the cash flows are either independent of or move linearly with market movements, a method has been applied known as the ‘certainty equivalent’ approach whereby it is assumed that all assets earn the risk-free rate and all cash flows are discounted at the risk-free rate.
A market consistent approach has been adopted for the valuation of financial options and guarantees, using a stochastic option pricing technique calibrated to be consistent with the market price of relevant options at each valuation date.
The risk-free rate assumed in valuing in-force business is 10 basis points over the 15-year gilt yield. In valuing financial options and guarantees the risk-free rate is derived from gilt yields plus 10 basis points, in line with Scottish Widows’ FSA realistic balance sheet assumptions. The table below shows the range of resulting yields and other key assumptions at 31 December 2006:
% | | | | |
| | | % | |
| | | | | |
Risk-free rate (value of in-force) | | | 4.72 | |
Risk-free rate (financial options and guarantees) | | | 3.91 to 5.41 | |
Retail Price inflation | | | 3.23 | |
Expense inflation | | | 4.13 | |
| | | | | |
Non-market risk
An allowance for non-market risk is made through the choice of best estimate assumptions based upon experience, which generally will give the mean expected financial outcome for shareholders and hence no further allowance for non-market risk is required. However, in the case of operational risk and the with-profits fund there are asymmetries in the range of potential outcomes for which an explicit allowance is made.
Non-economic assumptions
Future maintenance expenses, mortality, morbidity, lapse and paid-up rate assumptions are based on an analysis of past experience and represent management’s best estimate of likely future experience.
F-31
Notes to the group accounts
| | | | | | | | | | | | | |
| | | | | | | | | | | | | | |
|
24 Other intangible assets | | | | | | | | | | | | | |
|
| | | | Customer
lists
£m | | Software
enhancements
£m | | Total
£m | |
| | | | | | | | | | | | | | |
Cost: | | | | | | | | | | | | | |
At 1 January 2005 | | | | | | — | | | 107 | | | 107 | |
Additions | | | | | | — | | | 40 | | | 40 | |
| | | | | | | | | | | | | | |
At 31 December 2005 | | | | | | — | | | 147 | | | 147 | |
Additions | | | | | | 54 | | | 51 | | | 105 | |
| | | | | | | | | | | | | | |
At 31 December 2006 | | | | | | 54 | | | 198 | | | 252 | |
| | | | | | | | | | | | | | |
Accumulated amortisation: | | | | | | | | | | | | | |
At 1 January 2005 | | | | | | — | | | 79 | | | 79 | |
Charge for the year | | | | | | — | | | 18 | | | 18 | |
| | | | | | | | | | | | | | |
At 31 December 2005 | | | | | | — | | | 97 | | | 97 | |
Charge for the year | | | | | | — | | | 17 | | | 17 | |
| | | | | | | | | | | | | | |
At 31 December 2006 | | | | | | — | | | 114 | | | 114 | |
| | | | | | | | | | | | | | |
Balance sheet amount at 31 December 2006 | | | | | | 54 | | | 84 | | | 138 | |
| | | | | | | | | | | | | | |
Balance sheet amount at 31 December 2005 | | | | | | — | | | 50 | | | 50 | |
| | | | | | | | | | | | | | |
Software enhancements principally comprise identifiable and directly associated internal staff and other costs. |
|
| | | | | | | | | | | | | | |
25 Tangible fixed assets
| | | | | | | | | | | | | |
| | Premises
£m | | Equipment
£m | | Operating
lease assets
£m | | Total tangible
fixed assets
£m | |
| | | | | | | | | | | | | | |
Cost: | | | | | | | | | | | | | |
At 1 January 2005 | | | 1,360 | | | 2,526 | | | 2,767 | | | 6,653 | |
Exchange and other adjustments | | | 1 | | | (3 | ) | | 63 | | | 61 | |
Adjustments on acquisition and disposal of businesses | | | 8 | | | — | | | — | | | 8 | |
Additions | | | 89 | | | 280 | | | 615 | | | 984 | |
Disposals | | | (37 | ) | | (136 | ) | | (484 | ) | | (657 | ) |
| | | | | | | | | | | | | | |
At 31 December 2005 | | | 1,421 | | | 2,667 | | | 2,961 | | | 7,049 | |
Exchange and other adjustments | | | — | | | (3 | ) | | (96 | ) | | (99 | ) |
Additions | | | 92 | | | 286 | | | 552 | | | 930 | |
Disposals | | | (25 | ) | | (101 | ) | | (551 | ) | | (677 | ) |
| | | | | | | | | | | | | | |
At 31 December 2006 | | | 1,488 | | | 2,849 | | | 2,866 | | | 7,203 | |
| | | | | | | | | | | | | | |
Accumulated depreciation and impairment: | | | | | | | | | | | | | |
At 1 January 2005 | | | 533 | | | 1,627 | | | 313 | | | 2,473 | |
Exchange and other adjustments | | | 3 | | | (1 | ) | | 9 | | | 11 | |
Charge for the year | | | 76 | | | 267 | | | 278 | | | 621 | |
Disposals | | | (11 | ) | | (97 | ) | | (239 | ) | | (347 | ) |
| | | | | | | | | | | | | | |
At 31 December 2005 | | | 601 | | | 1,796 | | | 361 | | | 2,758 | |
Exchange and other adjustments | | | (1 | ) | | (1 | ) | | (63 | ) | | (65 | ) |
Charge for the year | | | 82 | | | 248 | | | 272 | | | 602 | |
Disposals | | | (7 | ) | | (83 | ) | | (254 | ) | | (344 | ) |
| | | | | | | | | | | | | | |
At 31 December 2006 | | | 675 | | | 1,960 | | | 316 | | | 2,951 | |
| | | | | | | | | | | | | | |
Balance sheet amount at 31 December 2006 | | | 813 | | | 889 | | | 2,550 | | | 4,252 | |
| | | | | | | | | | | | | | |
Balance sheet amount at 31 December 2005 | | | 820 | | | 871 | | | 2,600 | | | 4,291 | |
| | | | | | | | | | | | | | |
F-32
Notes to the group accounts
25 Tangible fixed assets(continued)
At 31 December the future minimum rentals receivable under non-cancellable operating leases were as follows:
| | | | | | | |
| | 2006
£m | | 2005
£m | |
| | | | | | | | |
Receivable within 1 year | | | 431 | | | 393 | |
1 to 5 years | | | 747 | | | 695 | |
Over 5 years | | | 30 | | | 165 | |
| | | | | | | | |
| | | 1,208 | | | 1,253 | |
| | | | | | | | |
Equipment leased to customers under operating leases primarily relates to vehicle contract hire arrangements. During 2006 and 2005 no contingent rentals in respect of operating leases were recognised in the income statement.
In addition, total future minimum sub-lease income of £120 million at 31 December 2006 (£141 million at 31 December 2005) is expected to be received under non-cancellable sub-leases of the Group’s premises.
| | | | | | | |
| | | | | | | | |
|
26 Other assets | | | | | |
|
| | 2006 | | 2005 | |
| | £m | | £m | |
| | | | | | | | |
Assets arising from reinsurance contracts held | | | 451 | | | 548 | |
Deferred acquisition costs | | | 443 | | | 429 | |
Settlement balances | | | 285 | | | 336 | |
Other assets and prepayments | | | 3,500 | | | 4,288 | |
| | | | | | | | |
| | | 4,679 | | | 5,601 | |
| | | | | | | | |
|
Deferred acquisition costs: | | | 2006 | | | 2005 | |
| | | £m | | | £m | |
| | | | | | | | |
At 1 January | | | 429 | | | 293 | |
Acquisition costs deferred, net of amounts amortised to the income statement | | | 14 | | | 136 | |
| | | | | | | | |
At 31 December | | | 443 | | | 429 | |
| | | | | | | | |
27 Deposits from banks
The breakdown of deposits from banks between the domestic and international offices of the Group is set out below:
| | | | | | | |
| | | 2006 | | | 2005 | |
| | | £m | | | £m | |
| | | | | | | | |
Domestic: | | | | | | | |
Non-interest bearing | | | 89 | | | 105 | |
Interest bearing | | | 28,405 | | | 24,707 | |
| | | 28,494 | | | 24,812 | |
International: | | | | | | | |
Non-interest bearing | | | 31 | | | 24 | |
Interest bearing | | | 7,869 | | | 6,691 | |
| | | 7,900 | | | 6,715 | |
| | | | | | | | |
| | | 36,394 | | | 31,527 | |
| | | | | | | | |
|
28 Customer accounts | | | | | | | |
|
| | | 2006 | | | 2005 | |
| | | £m | | | £m | |
| | | | | | | | |
Non-interest bearing current accounts | | | 4,338 | | | 4,203 | |
Interest bearing current accounts | | | 43,064 | | | 40,365 | |
Savings and investment accounts | | | 66,151 | | | 62,206 | |
Other customer deposits | | | 25,789 | | | 24,296 | |
| | | | | | | | |
| | | 139,342 | | | 131,070 | |
| | | | | | | | |
The breakdown of customer accounts between the domestic and international offices of the Group is set out below:
| | | | | | | |
| | | 2006 | | | 2005 | |
| | | £m | | | £m | |
| | | | | | | | |
Domestic: | | | | | | | |
Non-interest bearing | | | 4,002 | | | 3,868 | |
Interest bearing | | | 131,781 | | | 123,522 | |
| | | 135,783 | | | 127,390 | |
International: | | | | | | | |
Non-interest bearing | | | 336 | | | 335 | |
Interest bearing | | | 3,223 | | | 3,345 | |
| | | 3,559 | | | 3,680 | |
| | | | | | | | |
| | | 139,342 | | | 131,070 | |
| | | | | | | | |
F-33
Notes to the group accounts
| | | | | | | |
| | | | | | | | |
|
29 Trading and other liabilities at fair value through profit or loss | | | | | |
| |
| | 2006 | | 2005 | |
| | £m | | £m | |
| | | | | | | | |
Liabilities held at fair value through profit or loss | | | 1,156 | | | — | |
Trading liabilities | | | 28 | | | — | |
| | | | | | | | |
| | | 1,184 | | | — | |
| | | | | | | | |
The amount contractually payable on maturity of the liabilities held at fair value through profit or loss at 31 December 2006 is £1,200 million, which is £44 million higher than the balance sheet carrying value. There was no significant movement in the fair value of these liabilities attributable to changes in credit risk; this is determined by reference to the publicly available credit ratings of Lloyds TSB Bank plc, the issuing entity within the Group.
| | | | | | | |
| | | | | | | | |
|
30 Debt securities in issue | | | | | |
|
| | 2006 | | 2005 | |
| | £m | | £m | |
| | | | | | | | |
Euro medium-term note programme | | | 5,650 | | | 6,683 | |
Other bonds and medium-term notes | | | 10,157 | | | 141 | |
Certificates of deposit issued | | | 25,244 | | | 22,101 | |
Commercial paper | | | 13,067 | | | 10,421 | |
| | | | | | | | |
Total debt securities in issue | | | 54,118 | | | 39,346 | |
| | | | | | | | |
Debt securities in issue at 31 December 2006 included £10,048 million (2005: £nil) in respect of the securitisation of mortgages (see note 18).
| | | | | | | |
| | | | | | | | |
31 Liabilities arising from insurance contracts and participating investment contracts
|
| | | | | | | |
| | | 2006 | | | 2005 | |
| | | £m | | | £m | |
| | | | | | | | |
Insurance contract liabilities | | | 26,350 | | | 26,482 | |
Participating investment contract liabilities | | | 15,095 | | | 14,068 | |
| | | | | | | | |
| | | 41,445 | | | 40,550 | |
| | | | | | | | |
Insurance contract liabilities
Insurance contract liabilities, substantially all of which relate to business written in the United Kingdom, are comprised as follows:
| | | | | | | | | | | | | | | | | | | |
| | 2006 | | 2005 | |
| | | | | |
| | Gross
£m | | Reinsurance*
£m | | Net
£m | | Gross
£m | | Reinsurance*
£m | | Net
£m | |
| | | | | | | | | | | | | | |
Life insurance (see (i) below) | | | 25,763 | | | (425 | ) | | 25,338 | | | 25,888 | | | (511 | ) | | 25,377 | |
Non-life insurance (see (ii) below): | | | | | | | | | | | | | | | | | | | |
Unearned premiums | | | 438 | | | — | | | 438 | | | 447 | | | — | | | 447 | |
Claims outstanding | | | 149 | | | (4 | ) | | 145 | | | 147 | | | (4 | ) | | 143 | |
| | | 587 | | | (4 | ) | | 583 | | | 594 | | | (4 | ) | | 590 | |
| | | | | | | | | | | | | | | | | | | | |
| | | 26,350 | | | (429 | ) | | 25,921 | | | 26,482 | | | (515 | ) | | 25,967 | |
| | | | | | | | | | | | | | | | | | | | |
* Reinsurance balances receivable are reported within other assets (note 26).
(i) Life insurance
The movement in life insurance contract liabilities over the year can be analysed as follows:
| | | | | | | | | | |
| | Gross
£m | | Reinsurance*
£m | | Net
£m | |
| | | | | | | | |
At 1 January 2005 | | | 23,659 | | | (577 | ) | | 23,082 | |
New business | | | 1,381 | | | (256 | ) | | 1,125 | |
Changes in existing business | | | 848 | | | 322 | | | 1,170 | |
| | | | | | | | | | | |
At 31 December 2005 | | | 25,888 | | | (511 | ) | | 25,377 | |
New business | | | 1,045 | | | (98 | ) | | 947 | |
Changes in existing business | | | (1,170 | ) | | 184 | | | (986 | ) |
| | | | | | | | | | | |
At 31 December 2006 | | | 25,763 | | | (425 | ) | | 25,338 | |
| | | | | | | | | | | |
* Reinsurance balances receivable are reported within other assets (note 26).
F-34
Notes to the group accounts
31 Liabilities arising from insurance contracts and participating investment contracts(continued)
The movement in liabilities arising from participating investment contracts may be analysed as follows:
| | | | |
| | | £m | |
| | | | | |
At 1 January 2005 | | | 12,469 | |
New business | | | 1,181 | |
Changes in existing business | | | 418 | |
| | | | | |
At 31 December 2005 | | | 14,068 | |
New business | | | 1,815 | |
Changes in existing business | | | (788 | ) |
| | | | | |
At 31 December 2006 | | | 15,095 | |
| | | | | |
Process for determining key assumptions
The process for determining the key assumptions for insurance contracts and participating investment contracts is set out below.
Insurance policy liabilities can be split into With Profit Fund liabilities, accounted for using the FSA’s realistic capital regime (realistic liabilities) and Non-Profit Fund liabilities, accounted for using a traditional prospective actuarial discounted cash flow methodology as described in the accounting policies.
With Profit Fund realistic liabilities
The Group’s With Profit Fund contains life insurance contracts and participating investment contracts. The calculation of With Profit Fund realistic liabilities uses best estimate assumptions for mortality and morbidity, persistency rates and expenses. These are calculated in a similar manner to those used for the value of in-force business as discussed in note 23. The persistency rates used for the realistic valuation of the With Profit Fund liabilities make an allowance for potential changes in future experience as the guarantees and options within with-profits contracts become more valuable under adverse market conditions.
Other key assumptions are:
| |
• | Investment returns and discount rates |
The realistic capital regime dictates that With Profit Fund liabilities are valued on a market-consistent basis. This is achieved by the use of a valuation model which values liabilities on a basis calibrated to tradable market option contracts and other observable market data. The With Profit Fund financial options and guarantees are valued using a stochastic simulation model where all assets are assumed to earn, on average, the risk-free yield and all cash flows are discounted using the risk-free yield. The risk-free yield is defined as 0.1 per cent higher than the spot yields derived from the UK gilt yield curve.
| |
• | Guaranteed annuity option take-up rates |
The guaranteed annuity option take-up rates are set with regard to the Group’s actual experience and make allowance for potential increases in take-up rates when the Guaranteed Annuity Options become more valuable to the policyholder.
Investment volatility is derived from derivatives where possible, or historical observed volatility where it is not possible to observe meaningful prices. For example, as at 31 December 2006, the 10 year equity-implied at-the-money assumption was set at 20 per cent (31 December 2005: 20 per cent). The long-term at-the-money assumptions for property and fixed interest stocks were 15 per cent (31 December 2005: 15 per cent) and 13 per cent (31 December 2005: 13.5 per cent) respectively.
Non-Profit Fund liabilities
Generally, assumptions used to value Non-Profit Fund liabilities are prudent in nature and therefore contain a margin for adverse deviation. This margin for adverse deviation is based on management’s judgement and reflects management’s views on the inherent level of uncertainty. The key assumptions used in the measurement of Non-Profit Fund liabilities are:
The rates used are derived in accordance with the FSA Rules. These limit the rates of interest that can be used by reference to a number of factors including the redemption yields on fixed interest assets at the valuation date.
Margins for risk are allowed for in the assumed interest rates. These are derived from the limits in the FSA Rules, including reductions made to the available yields to allow for default risk based upon the credit rating of each stock.
The mortality and morbidity assumptions, including allowances for improvements in longevity for annuitants, are set with regard to the Group’s actual experience where this provides a reliable basis, and relevant industry data otherwise, and includes a margin for adverse deviation.
Lapse rates, set with regard to the Group’s actual experience and with a margin for adverse deviation, are allowed for on some Non-Profit Fund contracts.
Allowance is made for future policy costs explicitly. Expenses are determined by reference to an internal analysis of current and expected future costs plus a margin for adverse deviation. Explicit allowance is made for future expense inflation.
F-35
Notes to the group accounts
31 Liabilities arising from insurance contracts and participating investment contracts(continued)
Key changes in assumptions
Changes in certain key assumptions were made during 2006 with the following impacts on profit before tax. These amounts include movements in liabilities and value of the in-force business in respect of insurance contracts and participating investment contracts:
| | | | |
| | Impact on
profit before tax
£m | |
| | | | |
Lapse rates1 | | | (114 | ) |
Modelling of options and guarantees in the With-Profits Fund2 | | | 66 | |
FSA rule changes under PS06/143 | | | 4 | |
Conversion to market consistent methodology4 | | | (18 | ) |
| | | | |
| |
1 | Lapse rates have been adjusted following a detailed review of the Group’s current and expected experience. |
| |
2 | Changes to the valuation of options and guarantees primarily reflect improved representation of the current regulatory regime and revised assumptions of future policyholder behaviours. |
| |
3 | Changes brought in by the FSA under PS06/14 have brought significant reductions to the reserves required to be held. There has been a large offsetting reduction in the value of in-force business, as explained in note 23. |
| |
4 | The value of in-force business asset is now derived using market-consistent methodology, consistent with the approach adopted for European Embedded Value supplementary reporting. |
Sensitivity analysis
The following table demonstrates the effect of changes in key assumptions on profit before tax disclosed in these financial statements assuming that the other assumptions remain unchanged. In practice this is unlikely to occur, and changes in some assumptions may be correlated. These amounts include movements in assets, liabilities and the value of the in-force business in respect of insurance contracts and participating investment contracts. The impact is shown in one direction but can be assumed to be reasonably symmetrical:
| | | | | | | |
| | Change in
variable | | Impact on
profit before tax
£m | |
| | | | | | |
Non-annuitant mortality | | | 5% reduction | | | 35 | |
Annuitant mortality | | | 5% reduction | | | (124 | ) |
Lapse rates | | | 10% reduction | | | 60 | |
Maintenance expenses | | | 10% reduction | | | 64 | |
Risk-free rate1 | | | 1% deduction | | | 243 | |
Guaranteed annuity option take up2 | | | 5% addition | | | (22 | ) |
Equity investment volatility3 | | | 1% addition | | | (6 | ) |
| | | | | | |
Assumptions have been flexed on the basis used to calculate the value of in-force business and the realistic and statutory reserving bases.
For the above sensitivities a 5 per cent reduction means a reduction to 95 per cent of the expected rate.
| |
1 | This sensitivity shows the impact on the value of in-force business, financial options and guarantee costs, statutory reserves and asset values of reducing the risk-free rate by 100 basis points. |
| |
2 | This sensitivity shows the impact of a flat 5 per cent addition to the expected rate. |
| |
3 | This sensitivity shows the impact of a flat 1 per cent addition to the expected rate. |
(ii) Non-life insurance
Non-life insurance contract liabilities are analysed by line of business as follows:
| | | | | | | |
| | 2006
£m | | 2005
£m | |
| | | | | | |
Credit protection | | | 268 | | | 284 | |
Home | | | 314 | | | 304 | |
Health | | | 5 | | | 6 | |
| | | | | | |
| | | 587 | | | 594 | |
| | | | | | | | |
For non-life insurance contracts, the methodology and assumptions used in relation to determining the bases of the earned premium and claims provisioning levels are derived for each individual underwritten product. Assumptions are intended to be neutral estimates of the most likely or expected outcome. There has been no significant change in the assumptions and methodologies used for setting reserves.
The reserving methodology and associated assumptions are set out below:
The unearned premium reserve is determined on a basis that reflects the length of time for which contracts have been in force and the projected incidence of risk over the term of each contract.
Claims outstanding comprise those claims that have been notified and those that have been incurred but not reported. Claims incurred but not reported are determined based on the historical emergence of claims and their average cost. The notified claims element represents the best estimate of the cost of claims reported using projections and estimates based on historical experience.
F-36
Notes to the group accounts
31 Liabilities arising from insurance contracts and participating investment contracts(continued)
The movements in non-life insurance contract liabilities and reinsurance assets over the year have been as follows:
| | | | | | | | | | |
Provisions for unearned premiums | | Gross
£m | | Reinsurance*
£m | | Net
£m | |
| | | | | | | | |
At 1 January 2005 | | | 456 | | | — | | | 456 | |
Increase in the year | | | 575 | | | — | | | 575 | |
Release in the year | | | (584 | ) | | — | | | (584 | ) |
| | | | | | | | |
At 31 December 2005 | | | 447 | | | — | | | 447 | |
Increase in the year | | | 608 | | | (17 | ) | | 591 | |
Release in the year | | | (617 | ) | | 17 | | | (600 | ) |
| | | | | | | | |
At 31 December 2006 | | | 438 | | | — | | | 438 | |
| | | | | | | | | | | |
| |
* | Reinsurance balances receivable are reported within other assets (note 26). |
These provisions represent the liability for short-term insurance contracts for which the Group’s obligations are not expired at the year end.
Claims and loss adjustment expenses
| | | | | | | | | | |
| | Gross
£m | | Reinsurance*
£m | | Net
£m | |
| | | | | | | | |
Notified claims | | | 117 | | | (4 | ) | | 113 | |
Incurred but not reported | | | 24 | | | — | | | 24 | |
| | | | | | | | |
At 1 January 2005 | | | 141 | | | (4 | ) | | 137 | |
Cash paid for claims settled in the year | | | (221 | ) | | — | | | (221 | ) |
Increase in liabilities: | | | | | | | | | | |
Arising from current year claims | | | 239 | | | — | | | 239 | |
Arising from prior year claims | | | (12 | ) | | — | | | (12 | ) |
| | | | | | | | |
At 31 December 2005 | | | 147 | | | (4 | ) | | 143 | |
Cash paid for claims settled in the year | | | (223 | ) | | — | | | (223 | ) |
Increase in liabilities: | | | | | | | | | | |
Arising from current year claims | | | 231 | | | — | | | 231 | |
Arising from prior year claims | | | (6 | ) | | — | | | (6 | ) |
| | | | | | | | |
At 31 December 2006 | | | 149 | | | (4 | ) | | 145 | |
| | | | | | | | | | | |
Notified claims | | | 127 | | | (4 | ) | | 123 | |
Incurred but not reported | | | 22 | | | — | | | 22 | |
| | | | | | | | |
At 31 December 2006 | | | 149 | | | (4 | ) | | 145 | |
| | | | | | | | | | | |
Notified claims | | | 120 | | | (4 | ) | | 116 | |
Incurred but not reported | | | 27 | | | — | | | 27 | |
| | | | | | | | |
At 31 December 2005 | | | 147 | | | (4 | ) | | 143 | |
| | | | | | | | | | | |
| |
* | Reinsurance balances receivable are reported within other assets (note 26). |
Non-life insurance claims development table
The development of insurance liabilities provides a measure of the Group’s ability to estimate the ultimate value of claims. The top half of the table below illustrates how the Group’s estimate of total claims outstanding for each accident year has changed at successive year ends. The bottom half of the table reconciles the cumulative claims to the amount appearing in the balance sheet. The accident year basis is considered the most appropriate for the business written by the Group.
Non-life insurance all risks – gross
Accident year
| | | | | | | | | | | | | | | | | | | |
| | 2002
£m | | 2003
£m | | 2004
£m | | 2005
£m | | 2006
£m | | Total
£m | |
| | | | | | | | | | | | | | |
Estimate of ultimate claims costs: | | | | | | | | | | | | | | | | | | | |
At end of accident year | | | 242 | | | 234 | | | 227 | | | 211 | | | 208 | | | 1,122 | |
One year later | | | 230 | | | 220 | | | 209 | | | 207 | | | | | | | |
Two years later | | | 228 | | | 223 | | | 207 | | | | | | | | | | |
Three years later | | | 224 | | | 221 | | | | | | | | | | | | | |
Four years later | | | 224 | | | | | | | | | | | | | | | | |
| | | | | | | | | | | | | | |
Current estimate of cumulative claims | | | 224 | | | 221 | | | 207 | | | 207 | | | 208 | | | 1,067 | |
Cumulative payments to date | | | 223 | | | 211 | | | 199 | | | 189 | | | 115 | | | 937 | |
| | | | | | | | | | | | | | |
Liability recognised in the balance sheet | | | 1 | | | 10 | | | 8 | | | 18 | | | 93 | | | 130 | |
| | | | | | | | | | | | | | |
Liability in respect of earlier years | | | | | | | | | | | | | | | | | | 9 | |
| | | | | | | | | | | | | | |
Total liability included in the balance sheet | | | | | | | | | | | | | | | | | | 139 | |
| | | | | | | | | | | | | | | | | | | | |
The liability of £139 million shown in the above table excludes £10 million of unallocated claims handling expenses.
F-37
Notes to the group accounts
32 Liabilities arising from non-participating investment contracts
The movement in liabilities arising from non-participating investment contracts may be analysed as follows:
| | | | | | | | | | |
| | Gross
£m | | Reinsurance*
£m | | Net
£m | |
| | | | | | | | |
At 1 January 2005 | | | 16,361 | | | (26 | ) | | 16,335 | |
New business | | | 3,413 | | | (7 | ) | | 3,406 | |
Changes in existing business | | | 2,065 | | | — | | | 2,065 | |
| | | | | | | | |
At 31 December 2005 | | | 21,839 | | | (33 | ) | | 21,806 | |
New business | | | 2,316 | | | — | | | 2,316 | |
Changes in existing business | | | 215 | | | 11 | | | 226 | |
| | | | | | | | |
At 31 December 2006 | | | 24,370 | | | (22 | ) | | 24,348 | |
| | | | | | | | | | | |
| |
* | Reinsurance balances receivable are reported within other assets (note 26). |
| |
| | |
33 Unallocated surplus within insurance businesses
The movement in the unallocated surplus within long-term insurance business over the year can be analysed as follows:
| | | | | | | | | | |
| | 2006
£m | | | | 2005
£m | |
| | | | | | | | |
At 1 January | | | 518 | | | | | | 426 | |
Change in unallocated surplus recognised in the income statement (note 9) | | | 165 | | | | | | 92 | |
| | | | | | | | |
At 31 December | | | 683 | | | | | | 518 | |
| | | | | | | | | | | |
| | | | | | | | | | |
34 Other liabilities | | | | | | | | | | |
| | | | | | | | | | |
| | | 2006
£m | | | | | | 2005
£m | |
| | | | | | | | | | | |
Settlement balances | | | 475 | | | | | | 779 | |
Unitholders’ interest in Open Ended Investment Companies | | | 4,583 | | | | | | 3,296 | |
Other creditors and accruals | | | 5,927 | | | | | | 5,768 | |
| | | | | | | | | | | |
| | | 10,985 | | | | | | 9,843 | |
| | | | | | | | | | | |
35 Retirement benefit obligations
Charge to the income statement: | | | | | | | | | | |
| | 2006
£m | | 2005
£m | | 2004
£m | |
| | | | | | | | |
Defined benefit pension schemes* | | | 104 | | | 243 | | | 268 | |
Other post-retirement benefit schemes | | | 5 | | | 16 | | | 7 | |
| | | | | | | | |
Total defined benefit schemes | | | 109 | | | 259 | | | 275 | |
Defined contribution pension schemes | | | 56 | | | 49 | | | 32 | |
| | | | | | | | |
| | | 165 | | | 308 | | | 307 | |
| | | | | | | | | | | |
| | | | | | | | | | |
Amounts recognised in the balance sheet: | | | | | | | | | | |
| | | | | | | | | | |
| | | 2006
£m | | | 2005
£m | | | | |
| | | | | | | | | | | |
Defined benefit pension schemes | | | 2,362 | | | 2,809 | | | | |
Other post-retirement benefit schemes | | | 100 | | | 101 | | | | |
| | | | | | | | | | | |
| | | 2,462 | | | 2,910 | | | | |
| | | | | | | | | | | |
| |
* | In 2006 this amount is shown net of a credit of £128 million following the Group’s decision to cease augmenting the pension entitlement of employees taking early retirement. |
Pension schemes
Defined benefit schemes
The Group has established a number of defined benefit pension schemes in the UK and overseas. The majority of the Group’s employees are members of the defined benefit sections of the Lloyds TSB Group Pension Schemes No’s 1 and 2. These schemes provide retirement benefits calculated as a percentage of final salary depending upon the length of service; the minimum retirement age under the rules of the schemes is 50.
The latest full valuations of the two main schemes were carried out as at 30 June 2005; these have been updated to 31 December 2006 by qualified independent actuaries. The last full valuations of other Group schemes were carried out on a number of different dates; these have been updated to 31 December 2006 by qualified independent actuaries or, in the case of the Scottish Widows Retirement Benefits Scheme, by a qualified actuary employed by Scottish Widows.
F-38
Notes to the group accounts
35 Retirement benefit obligations(continued)
The Group’s obligations in respect of its defined benefit schemes are funded. The Group expects to pay contributions of approximately £530 million to its defined benefit schemes in 2007.
| | | | | | | |
Amount included in the balance sheet: | | | | | | | |
| | | | | | | |
| | | 2006
£m | | | 2005
£m | |
| | | | | | | | |
Present value of funded obligations | | | 17,378 | | | 17,320 | |
Fair value of scheme assets | | | (15,279 | ) | | (14,026 | ) |
| | | | | | | | |
| | | 2,099 | | | 3,294 | |
Unrecognised actuarial gains (losses) | | | 263 | | | (485 | ) |
| | | | | | | | |
Liability in the balance sheet | | | 2,362 | | | 2,809 | |
| | | | | | | | |
| | | | | | | |
Movements in the defined benefit obligation: | | | | | | | |
| | | | | | | |
| | | 2006
£m | | | 2005
£m | |
| | | | | | | | |
At 1 January | | | 17,320 | | | 14,866 | |
Current service cost | | | 325 | | | 292 | |
Interest cost | | | 817 | | | 775 | |
Actuarial (gains) losses | | | (434 | ) | | 1,786 | |
Benefits paid | | | (555 | ) | | (446 | ) |
Past service cost | | | 32 | | | 15 | |
Curtailment | | | (129 | ) | | — | |
Exchange and other adjustments | | | 2 | | | 32 | |
| | | | | | | | |
At 31 December | | | 17,378 | | | 17,320 | |
| | | | | | | | |
| | | | | | | |
Changes in the fair value of scheme assets: | | | | | | | |
| | | | | | | |
| | | 2006
£m | | | 2005
£m | |
| | | | | | | | |
At 1 January | | | 14,026 | | | 11,648 | |
Expected return | | | 942 | | | 839 | |
Employer contributions | | | 550 | | | 419 | |
Actuarial gains | | | 314 | | | 1,538 | |
Benefits paid | | | (555 | ) | | (446 | ) |
Exchange and other adjustments | | | 2 | | | 28 | |
| | | | | | | | |
At 31 December | | | 15,279 | | | 14,026 | |
| | | | | | | | |
Actual return on scheme assets | | | 1,256 | | | 2,377 | |
| | | | | | | | |
Assumptions
The principal actuarial and financial assumptions used in valuations of the defined benefit pension schemes were as follows:
| | | | | | | | | | |
| | 2006
% | | 2005
% | | 2004
% | |
| | | | | | | | |
Discount rate | | | 5.10 | | | 4.80 | | | 5.30 | |
Rate of inflation | | | 2.90 | | | 2.70 | | | 2.60 | |
Rate of salary increases | | | 3.93 | | | 3.98 | | | 4.14 | |
Rate of increase for pensions in payment and deferred pensions | | | 2.70 | | | 2.50 | | | 2.60 | |
| | | | | | | | |
| | | | | | | | | | |
| | Years | | Years | | Years | |
| | | | | | | | |
Life expectancy for member aged 60, on the valuation date: | | | | | | | | | | |
Men | | | 25.8 | | | 25.6 | | | 24.7 | |
Women | | | 27.8 | | | 27.6 | | | 26.8 | |
Life expectancy for member aged 60, 15 years after the valuation date: | | | | | | | | | | |
Men | | | 27.0 | | | 26.8 | | | 25.7 | |
Women | | | 28.9 | | | 28.7 | | | 27.8 | |
| | | | | | | | | | | |
The mortality assumptions used in the scheme valuations are based on standard tables published by the Institute and Faculty of Actuaries which were adjusted in line with both current industry experience and the actual experience of the relevant schemes. The table shows that a member retiring at age 60 as at 31 December 2006 is assumed to live for, on average, 25.8 years for a male and 27.8 years for a female. In practice there will be much variation between individual members but these assumptions are expected to be appropriate across all members. It is assumed that younger members will live longer in retirement than those retiring now. This reflects the expectation that mortality rates will continue to fall over time as medical science and standards of living improve. To illustrate the degree of improvement assumed the table also shows the life expectancy for members aged 45 now, when they retire in 15 years time at age 60.
An analysis of the impact of a reasonable change in these assumptions is provided in note 2.
F-39
Notes to the group accounts
35 Retirement benefit obligations(continued)
The expected return on scheme assets has been calculated using the following assumptions:
| | | | | | | | | | |
| | 2006
% | | 2005
% | | 2004
% | |
| | | | | | | | |
Equities | | | 8.0 | | | 8.2 | | | 8.1 | |
Fixed interest gilts | | | 4.1 | | | 4.6 | | | 4.8 | |
Index linked gilts | | | 3.9 | | | 4.3 | | | 4.4 | |
Non-government bonds | | | 4.8 | | | 5.3 | | | 5.4 | |
Property | | | 6.4 | | | 6.9 | | | 7.1 | |
Cash | | | 3.7 | | | 3.6 | | | 3.5 | |
| | | | | | | | |
The expected return on scheme assets in 2007 will be calculated using the following assumptions:
| | | | | | | |
| | | | 2007
% | |
| | | | | | |
Equities | | | | | | 8.0 | |
Fixed interest gilts | | | | | | 4.6 | |
Index linked gilts | | | | | | 4.2 | |
Non-government bonds | | | | | | 5.1 | |
Property | | | | | | 6.5 | |
Cash | | | | | | 3.9 | |
| | | | | | |
| | | | | | | |
Composition of scheme assets: | | | | | | | |
| | | | | | | |
| | 2006
£m | | 2005
£m | |
| | | | | | |
Equities | | | 9,677 | | | 9,021 | |
Fixed interest gilts | | | 1,114 | | | 946 | |
Index linked gilts | | | 921 | | | 920 | |
Non-government bonds | | | 1,543 | | | 1,415 | |
Property | | | 1,333 | | | 1,185 | |
Cash | | | 691 | | | 539 | |
| | | | | | |
At 31 December | | | 15,279 | | | 14,026 | |
| | | | | | | | |
The assets of all the funded plans are held independently of the Group’s assets in separate trustee administered funds.
The expected return on plan assets was determined by considering the expected returns available on the assets underlying the current investment policy. Expected yields on fixed interest investments are based on gross redemption yields at the balance sheet date. Expected returns on equity and property investments reflect long-term real rates of return experienced in the respective markets.
Experience adjustments history (since the date of adoption of IAS 19):
| | | | | | | | | | |
| | 2006
£m | | 2005
£m | | 2004
£m | |
| | | | | | | | | | | |
Present value of defined benefit obligation | | | 17,378 | | | 17,320 | | | 14,866 | |
Fair value of scheme assets | | | (15,279 | ) | | (14,026 | ) | | (11,648 | ) |
| | | | | | | | | | | |
| | | 2,099 | | | 3,294 | | | 3,218 | |
| | | | | | | | | | | |
Experience losses on scheme liabilities | | | (50 | ) | | (69 | ) | | (126 | ) |
| | | | | | | | | | | |
Experience gains on scheme assets | | | 314 | | | 1,538 | | | 362 | |
| | | | | | | | | | | |
| | | | | | | | | | |
The expense recognised in the income statement for the year ended 31 December comprises: |
| | | | | | | | | | |
| | 2006
£m | | 2005
£m | | 2004
£m | |
| | | | | | | | | | | |
Current service cost | | | 325 | | | 292 | | | 280 | |
Interest cost | | | 817 | | | 775 | | | 728 | |
Expected return on scheme assets | | | (942 | ) | | (839 | ) | | (757 | ) |
Curtailment* | | | (128 | ) | | — | | | — | |
Past service cost | | | 32 | | | 15 | | | 17 | |
| | | | | | | | | | | |
Total defined benefit pension expense | | | 104 | | | 243 | | | 268 | |
| | | | | | | | | | | |
| |
* | Following recent changes in age discrimination legislation, the Group has ceased to augment the pension entitlement of employees taking early retirement; this change has reduced the Group’s defined benefit pension liability by £129 million (£1 million of which is unrecognised) and resulted in a one-off credit to the 2006 income statement of £128 million. |
Defined contribution schemes
The Group operates a number of defined contribution pension schemes in the UK and overseas, principally the defined contribution sections of the Lloyds TSB Group Pension Schemes No’s 1 and 2.
During the year ended 31 December 2006 the charge to the income statement in respect of these schemes was £56 million (2005: £49 million; 2004: £32 million), representing the contributions payable by the employer in accordance with each scheme’s rules.
Other post-retirement benefit schemes
The Group operates a number of schemes which provide post-retirement healthcare benefits to certain employees, retired employees and their dependent relatives. The principal scheme relates to former Lloyds Bank staff and under this scheme the Group has undertaken to meet the cost of post-retirement healthcare for all eligible former employees (and their dependents) who retired prior to 1 January 1996. The Group has entered into an insurance contract to provide these benefits and a provision has been made for the estimated cost of future insurance premiums payable.
F-40
Notes to the group accounts
35 Retirement benefit obligations(continued)
For the principal post-retirement healthcare scheme, the latest actuarial valuation of the liability was carried out at 31 December 2000; this valuation has been updated to 31 December 2006 by qualified independent actuaries. The principal assumptions used were as set out above, except that the rate of increase in healthcare premiums has been assumed at 7.02 per cent (2005: 6.81 per cent; 2004: 6.70 per cent).
Amount included in the balance sheet:
| | | | | | | | | | |
| | 2006
£m | | | | 2005
£m | |
| | | | | | | | |
Present value of unfunded obligations | | | 110 | | | | | | 112 | |
Unrecognised actuarial losses | | | (10 | ) | | | | | (11 | ) |
| | | | | | | | | | | |
Liability in the balance sheet | | | 100 | | | | | | 101 | |
| | | | | | | | | | | |
| | | | | | | | | | |
Movements in the other post-retirement benefits obligation: |
| | | | | | | | | | |
| | |
2006
£m
| | | | | | 2005
£m | |
| | | | | | | | | | | |
At 1 January | | | 112 | | | | | | 104 | |
Exchange and other adjustments | | | — | | | | | | (3 | ) |
Actuarial (gain) loss | | | (1 | ) | | | | | 1 | |
Insurance premiums paid | | | (6 | ) | | | | | (6 | ) |
Charge for the year | | | 5 | | | | | | 16 | |
| | | | | | | | | | | |
At 31 December | | | 110 | | | | | | 112 | |
| | | | | | | | | | | |
| | | | | | | | | | |
36 Deferred tax liabilities | | | | | | | | | | |
| | | | | | | | | | |
The movement in the net deferred tax balance is as follows: |
| | | | | | | | | | |
| | | 2006
£m | | | | | | 2005
£m | |
| | | | | | | | | | | |
At 1 January | | | 1,145 | | | | | | 925 | |
Exchange and other adjustments | | | (3 | ) | | | | | (2 | ) |
Disposals | | | (281 | ) | | | | | (256 | ) |
Income statement charge (note 13) | | | 574 | | | | | | 491 | |
| | | | | | | | | | |
Amount charged (credited) to equity: | | | | | | | | | | |
Available-for-sale financial assets | | | — | | | | | | (2 | ) |
Cash flow hedges | | | — | | | | | | 1 | |
Share based compensation | | | (19 | ) | | | | | (16 | ) |
| | | (19 | ) | | | | | (17 | ) |
Amounts released to the income statement in respect of cash flow hedges | | | — | | | | | | 4 | |
| | | | | | | | | | | |
At 31 December | | | 1,416 | | | | | | 1,145 | |
| | | | | | | | | | | |
| | | | | | | | | | |
The deferred tax charge in the income statement comprises the following temporary differences: |
| | | | | | | | | | |
| | | 2006
£m | | | 2005
£m | | | 2004
£m | |
| | | | | | | | | | | |
Accelerated capital allowances | | | 175 | | | 59 | | | 80 | |
Pensions and other post-retirement benefits | | | 134 | | | 44 | | | 37 | |
Investment reserve | | | 59 | | | — | | | 96 | |
Allowances for impairment losses (provisions for bad and doubtful debts in 2004) | | | 22 | | | 23 | | | 48 | |
Unrealised gains | | | 162 | | | 279 | | | 40 | |
Tax on value of in-force business | | | (59 | ) | | 64 | | | (18 | ) |
Other temporary differences | | | 81 | | | 22 | | | (14 | ) |
| | | | | | | | | | | |
| | | 574 | | | 491 | | | 269 | |
| | | | | | | | | | | |
| | | | | | | | | | |
Deferred tax assets and liabilities are comprised as follows: |
| | | | | | | | | | |
| | | 2006
£m | | | | | | 2005
£m | |
| | | | | | | | | | | |
Deferred tax assets: | | | | | | | | | | |
Pensions and other post-retirement benefits | | | (739 | ) | | | | | (873 | ) |
Allowances for impairment losses | | | (143 | ) | | | | | (165 | ) |
Other provisions | | | (39 | ) | | | | | (31 | ) |
Derivatives | | | (161 | ) | | | | | (164 | ) |
Tax losses carried forward | | | (326 | ) | | | | | (322 | ) |
Other temporary differences | | | (255 | ) | | | | | (270 | ) |
| | | | | | | | | | | |
| | | (1,663 | ) | | | | | (1,825 | ) |
| | | | | | | | | | | |
F-41
Notes to the group accounts
36 Deferred tax liabilities(continued)
| | | | | | | | | | |
| | | 2006
£m | | | | | | 2005
£m | |
| | | | | | | | | | | |
Deferred tax liabilities: | | | | | | | | | | |
Accelerated capital allowances | | | 1,252 | | | | | | 1,358 | |
Investment reserve | | | 149 | | | | | | 90 | |
Unrealised gains | | | 500 | | | | | | 338 | |
Tax on value of in-force business | | | 875 | | | | | | 934 | |
Other temporary differences | | | 303 | | | | | | 250 | |
| | | | | | | | | | | |
| | | 3,079 | | | | | | 2,970 | |
| | | | | | | | | | | |
Deferred tax assets
Deferred tax assets are recognised for tax losses and tax credit carry forwards to the extent that the realisation of the related tax benefit through future taxable profits is probable.
Deferred tax assets of £567 million (2005: £526 million) have not been recognised in respect of capital losses carried forward as there are no predicted future capital profits. Capital losses can be carried forward indefinitely.
In addition, deferred tax assets have not been recognised in respect of Eligible Unrelieved Foreign Tax (‘EUFT’) and other foreign tax credits carried forward as at 31 December 2006 of £138 million (2005: £88 million), as there are no predicted future taxable profits against which the unrelieved foreign tax credits can be utilised. EUFT can be carried forward indefinitely.
Deferred tax liabilities
Deferred tax liabilities have not been recognised for tax that may be payable if earnings of certain subsidiaries were remitted to the UK. Such amounts are either reinvested for the foreseeable future or can be remitted free of tax. Unremitted earnings totalled £689 million (2005: £609 million).
Future transfers from Scottish Widows plc’s long-term business funds to its Shareholder Fund will be subject to a shareholder tax charge. Under IAS 12, no provision is required to be made to the extent that the timing of such transfers is under Scottish Widows plc’s control. Accordingly, deferred tax liabilities of £110 million (2005: £110 million) have not been recognised.
| | | | | | | | | | | | | |
| | | | | | | | | | | | | | |
| | | | | | | | | | | | | |
37 Other provisions |
| | | | | | | | | | | | | |
| | Provisions for
contingent
liabilities and
commitments
£m | | Customer
remediation
provisions
£m | | Vacant
leasehold
property
and other
£m | | Total
£m | |
| | | | | | | | | | |
At 1 January 2006 | | | 33 | | | 194 | | | 141 | | | 368 | |
Exchange and other adjustments | | | — | | | — | | | 3 | | | 3 | |
Provisions applied | | | (1 | ) | | (93 | ) | | (22 | ) | | (116 | ) |
Amortisation of discount | | | — | | | — | | | 4 | | | 4 | |
Charge (release) for the year | | | (5 | ) | | — | | | 5 | | | — | |
| | | | | | | | | | |
At 31 December 2006 | | | 27 | | | 101 | | | 131 | | | 259 | |
| | | | | | | | | | | | | | |
Provisions for contingent liabilities and commitments
Provisions are held in cases where the Group is irrevocably committed to provide additional funds, but where there is doubt as to the potential borrower’s ability to meet its repayment obligations.
Customer remediation provisions
The Group has established provisions for the estimated cost of making redress payments to customers in respect of past product sales, in those cases where the original sales processes have been found to be deficient. During 2006 management have reviewed the adequacy of the provisions held having regard to current complaint volumes and the level of payments being made and are satisfied that no additional charge is required (in 2005 a charge of £150 million was made; in 2004 a charge of £112 million was made).
At 31 December 2006 the remaining provisions held relate to past sales of a number of products, including mortgage endowment policies, sold through the branch networks of Lloyds TSB Bank, Lloyds TSB Scotland and Cheltenham & Gloucester and underwritten by life assurance companies within the Group and also by third parties. The principal assumptions that are made in the assessment of the adequacy of the provision relate to the number of cases that are likely to require redress, taking into account any time barring, and the estimated average cost per case. The ultimate cost and timing of the payments remains highly uncertain and will be influenced by external factors beyond the control of management, such as regulatory actions, media interest and the performance of the financial markets. However, it is expected that the majority of the remaining expenditure will be incurred over the next year.
Vacant leasehold property and other
Vacant leasehold property provisions are made by reference to a prudent estimate of expected sub-let income, compared to the head rent, and the possibility of disposing of the Group’s interest in the lease, taking into account conditions in the property market. These provisions are reassessed on an annual basis and will normally run off over the period of under-recovery of the leases concerned, currently averaging three years; where a property is disposed of earlier than anticipated, any remaining balance in the provision relating to that property is released.
The Group also carries provisions in respect of its obligations relating to UIC Insurance Company Limited (‘UIC’), which is in provisional liquidation. The Group has indemnified a third party against losses in the event that UIC does not honour its obligations under a reinsurance contract, which is subject to asbestosis and pollution claims in the US. The ultimate cost of settling the Group’s exposure in respect of the insurance business of UIC and the timing remains uncertain. The provision held represents management’s current best estimate of the cost after having regard to the financial condition of UIC and actuarial estimates of future claims.
F-42
Notes to the group accounts
38 Subordinated liabilities
| | | | | | | | | | | |
| | Note | | 2006
£m | | 2005
£m | |
| | | | | | | | |
Preferred securities | | | | | | | | | | | |
6.90% Perpetual Capital Securities callable 2007 (US$1,000 million) | | | b, e | | | 483 | | | | 553 | |
Fixed/Floating Rate Non-Cumulative Callable Preference Shares callable 2015 (£600 million) | | | a | | | 587 | | | | — | |
Fixed/Floating Rate Non-Cumulative Callable Preference Shares callable 2016 (US$1,000 million) | | | a | | | 504 | | | | — | |
6% Non-cumulative Redeemable Preference Shares | | | m | | | — | | | | — | |
6.625% Perpetual Capital Securities callable 2006 (€750 million) | | | b, d | | | — | | | | 518 | |
Euro Step-up Non-Voting Non-Cumulative Preferred Securities callable 2012 (€430 million) | | | b, k | | | 312 | | | | 337 | |
6.35% Step-up Perpetual Capital Securities callable 2013 (€500 million) | | | b, d, i | | | 345 | | | | 371 | |
Sterling Step-up Non-Voting Non-Cumulative Preferred Securities callable 2015 (£250 million) | | | b, l | | | 248 | | | | 248 | |
4.385% Step-up Perpetual Capital Securities callable 2017 (€750 million) | | | b, d, i | | | 478 | | | | 522 | |
| | | | | | 2,957 | | | | 2,549 | |
Undated subordinated liabilities | | | | | | | | | | | |
Primary Capital Undated Floating Rate Notes: | | | b, c | | | | | | | | |
Series 1 (US$750 million) | | | | | | 383 | | | | 436 | |
Series 2 (US$500 million) | | | | | | 255 | | | | 291 | |
Series 3 (US$600 million) | | | | | | 306 | | | | 349 | |
113/4% Perpetual Subordinated Bonds (£100 million) | | | | | | 100 | | | | 100 | |
5 5/8% Undated Subordinated Step-up Notes callable 2009 (€1,250 million) | | | b, i | | | 845 | | | | 892 | |
Undated Step-up Floating Rate Notes callable 2009 (€150 million) | | | b, c | | | 101 | | | | 103 | |
6 5/8% Undated Subordinated Step-up Notes callable 2010 (£410 million) | | | b, h | | | 408 | | | | 407 | |
5.125% Step-up Perpetual Subordinated Notes callable 2015 (£560 million) | | | b, f | | | 525 | | | | 553 | |
5.57% Undated Subordinated Step-up Coupon Notes callable 2015 (¥20,000 million) | | | b, j | | | 107 | | | | 127 | |
5.125% Undated Subordinated Step-up Notes callable 2016 (£500 million) | | | b | | | 475 | | | | 501 | |
6 1/2% Undated Subordinated Step-up Notes callable 2019 (£270 million) | | | b, h | | | 255 | | | | 269 | |
8% Undated Subordinated Step-up Notes callable 2023 (£200 million) | | | b, h | | | 189 | | | | 202 | |
6 1/2% Undated Subordinated Step-up Notes callable 2029 (£450 million) | | | b, h | | | 447 | | | | 457 | |
6% Undated Subordinated Step-up Guaranteed Bonds callable 2032 (£500 million) | | | b, h | | | 467 | | | | 497 | |
| | | | | | 4,863 | | | | 5,184 | |
Dated subordinated liabilities | | | | | | | | | | | |
8 1/2% Subordinated Bonds 2006 (£250 million) | | | | | | — | | | | 250 | |
7 3/4% Subordinated Bonds 2007 (£300 million) | | | | | | 300 | | | | 300 | |
5 1/4% Subordinated Notes 2008 (DM 750 million) | | | | | | 260 | | | | 274 | |
10 5/8% Guaranteed Subordinated Loan Stock 2008 (£100 million) | | | g | | | 100 | | | | 100 | |
9 1/2% Subordinated Bonds 2009 (£100 million) | | | | | | 99 | | | | 99 | |
6 1/4% Subordinated Notes 2010 (€400 million) | | | | | | 283 | | | | 303 | |
12% Guaranteed Subordinated Bonds 2011 (£100 million) | | | g | | | 100 | | | | 100 | |
9 1/8% Subordinated Bonds 2011 (£150 million) | | | | | | 149 | | | | 149 | |
4 3/4% Subordinated Notes 2011 (€850 million) | | | | | | 562 | | | | 597 | |
5 7/8% Subordinated Guaranteed Bonds 2014 (€750 million) | | | | | | 560 | | | | 606 | |
5 7/8% Subordinated Notes 2014 (£150 million) | | | | | | 149 | | | | 148 | |
6 5/8% Subordinated Notes 2015 (£350 million) | | | | | | 330 | | | | 345 | |
Subordinated Step-up Floating Rate Notes 2016 callable 2011 (£300 million) | | | c | | | 300 | | | | 300 | |
Subordinated Step-up Floating Rate Notes 2016 callable 2011 (€500 million) | | | c | | | 336 | | | | 343 | |
Subordinated Floating Rate Notes 2020 (€100 million) | | | c | | | 67 | | | | 68 | |
5.75% Subordinated Step-up Notes 2025 callable 2020 (£350 million) | | | | | | 328 | | | | 346 | |
9 5/8% Subordinated Bonds 2023 (£300 million) | | | | | | 329 | | | | 341 | |
| | | | | | 4,252 | | | | 4,669 | |
| | | | | | | | | | | | |
Total subordinated liabilities | | | | | | 12,072 | | | | 12,402 | |
| | | | | | | | | | | | |
These liabilities will, in the event of the winding-up of the issuer, be subordinated to the claims of depositors and all other creditors of the issuer.
F-43
| |
| Notes to the group accounts |
| |
| 38 Subordinated liabilities(continued) |
| |
a) | These securities were issued during 2006 primarily to finance the development and expansion of the business of the Group. Any repayment of preference shares would require prior notification to the Financial Services Authority. The sterling preference shares can be redeemed at the option of the Company on 25 August 2015 or quarterly thereafter; at this call date, dividends will be reset at a margin of 1.28 per cent over 3 month LIBOR. The US dollar preference shares can be redeemed at the option of the Company on 14 November 2016 or every 10 years thereafter; at this call date, dividends will be reset at a margin of 1.035 per cent over 3 month LIBOR. In certain circumstances, the shares may be mandatorily exchanged for qualifying non-innovative tier 1 securities. The Company may declare no dividend or a partial dividend on these preference shares. Dividends may be reduced if the distributable profits of the Company are insufficient to cover the payment in full of the dividends and also the payment in full of all other dividends on shares issued by the Company. |
| |
b) | In certain circumstances, these notes, bonds and securities would acquire the characteristics of preference share capital. Any repayments of undated loan capital would require prior notification to the Financial Services Authority. They are accounted for as liabilities since coupon payments are mandatory as a consequence of the terms of certain preference shares. |
| |
c) | These notes bear interest at rates fixed periodically in advance based on London Interbank rates. |
| |
d) | In certain circumstances the interest payments on these securities can be deferred although in this case neither Lloyds TSB Bank plc nor Lloyds TSB Group plc can declare or pay a dividend until any deferred payments have been made. In the event of a winding up of Lloyds TSB Bank plc, these securities will acquire the characteristics of preference shares. |
| |
e) | In certain circumstances the interest payments on these securities can be deferred although in this case neither Lloyds TSB Bank plc nor Lloyds TSB Group plc can declare or pay a dividend until payments are resumed. Any deferred payments will be made good on redemption of the securities. The securities can be redeemed at par at the option of Lloyds TSB Bank plc on or after 22 November 2007. |
| |
f) | In certain circumstances the interest payments on these securities can be deferred although in this case Scottish Widows plc cannot declare or pay a dividend until any deferred payments have been made. |
| |
g) | Issued by a group undertaking under the Company’s subordinated guarantee. |
| |
h) | At the callable date the coupon on these notes will be reset by reference to the applicable five year benchmark gilt rate. |
| |
i) | In the event that these notes are not redeemed at the callable date, the coupon will be reset to a floating rate. |
| |
j) | In the event that these notes are not redeemed at the callable date, the coupon will be reset to a margin of 1.60 per cent over the five year Yen swap rate. |
| |
k) | These securities constitute limited partnership interests in Lloyds TSB Capital 1 L.P., a Jersey limited partnership in which Lloyds TSB (General Partner) Limited, a wholly owned subsidiary, is the general partner. Non-cumulative income distributions accrue at a fixed rate of 7.375 per cent per annum up to 7 February 2012; thereafter they will accrue at a margin of 2.33 per cent over EURIBOR. This issue was made under the limited subordinated guarantee of Lloyds TSB Bank plc. In certain circumstances these preferred securities will be mandatorily exchanged for preference shares in Lloyds TSB Group plc. Lloyds TSB Group plc has entered into an agreement whereby dividends may only be paid on its ordinary shares if sufficient distributable profits are available for distributions due in the financial year on these preferred securities. |
| |
l) | These securities constitute limited partnership interests in Lloyds TSB Capital 2 L.P., a Jersey limited partnership in which Lloyds TSB (General Partner) Limited, a wholly owned subsidiary, is the general partner. Non-cumulative income distributions accrue at a fixed rate of 7.834 per cent per annum up to 7 February 2015; thereafter they will accrue at a margin of 3.50 per cent over a rate based on the yield of specified UK government stock. This issue was made under the limited subordinated guarantee of Lloyds TSB Bank plc. In certain circumstances these preferred securities will be mandatorily exchanged for preference shares in Lloyds TSB Group plc. Lloyds TSB Group plc has entered into an agreement whereby dividends may only be paid on its ordinary shares if sufficient distributable profits are available for distributions due in the financial year on these preferred securities. |
| |
m) | Throughout 2005 and 2006, the Company has had in issue 400 6 per cent non-cumulative preference shares of 25p each. The shares, which are redeemable at the option of the Company at any time, carry the rights to a fixed rate non-cumulative preferential dividend of 6 per cent per annum; no dividend shall be payable in the event that the directors determine that prudent capital ratios would not be maintained if the dividend were paid. Upon winding up, the shares rank equally with any other preference shares issued by the Company. |
39 Share capital
| | | | | | | | | | |
| | 2006 | | 2005 | | 2004 | |
| | | | | | | | |
Authorised share capital | | | | | | | | | | |
Sterling | | | £m | | | £m | | | £m | |
6,911 million Ordinary shares of 25p each | | | 1,728 | | | 1,728 | | | 1,728 | |
79 million Limited voting ordinary shares of 25p each | | | 20 | | | 20 | | | 20 | |
175 million Preference shares of 25p each | | | 44 | | | 44 | | | 44 | |
| | | | | | | | | | | |
| | | 1,792 | | | 1,792 | | | 1,792 | |
| | | | | | | | | | | |
US dollars | | | US$m | | | US$m | | | US$m | |
160 million Preference shares of US$25 cents each | | | 40 | | | 40 | | | 40 | |
| | | | | | | | | | | |
Euro | | | €m | | | €m | | | €m | |
160 million Preference shares of €25 cents each | | | 40 | | | 40 | | | 40 | |
| | | | | | | | | | | |
Japanese yen | | | ¥m | | | ¥m | | | ¥m | |
50 million Preference shares of ¥25 each | | | 1,250 | | | 1,250 | | | 1,250 | |
| | | | | | | | | | | |
F-44
Notes to the group accounts
39 Share capital(continued)
Issued and fully paid ordinary shares
| | | | | | | | | | | | | | | | | | | |
| | 2006
Number
of shares | | 2005
Number
of shares | | 2004
Number
of shares | | 2006
£m | | 2005
£m | | 2004
£m | |
| | | | | | | | | | | | | | |
Ordinary shares of 25p each | | | | | | | | | | | | | | | | | | | |
At 1 January | | | 5,602,613,600 | | | 5,596,397,111 | | | 5,593,737,422 | | | 1,400 | | | 1,399 | | | 1,398 | |
Issued under employee share schemes | | | 35,350,837 | | | 6,216,489 | | | 2,659,689 | | | 9 | | | 1 | | | 1 | |
| | | | | | | | | | | | | | | | | | | | |
At 31 December | | | 5,637,964,437 | | | 5,602,613,600 | | | 5,596,397,111 | | | 1,409 | | | 1,400 | | | 1,399 | |
Limited voting ordinary shares of 25p each | | | | | | | | | | | | | | | | | | | |
At 1 January and 31 December | | | 78,947,368 | | | 78,947,368 | | | 78,947,368 | | | 20 | | | 20 | | | 20 | |
| | | | | | | | | | | | | | | | | | | | |
| | | | | | | | | | | | 1,429 | | | 1,420 | | | 1,419 | |
| | | | | | | | | | | | | | | | | | | | |
The limited voting ordinary shares are held by the Lloyds TSB Foundations. These shares carry no rights to dividends but rank pari passu with the ordinary shares in respect of other distributions and in the event of winding up. These shares do not have any right to vote at general meetings other than on resolutions concerning acquisitions or disposals of such importance that they require shareholder consent, or for the winding up of the Company, or for a variation in the class rights of the limited voting ordinary shares. Lloyds TSB Group plc has entered into deeds of covenant with the Lloyds TSB Foundations, under the terms of which the Company makes annual donations to the foundations equal, in total, to 1 per cent of the Group’s pre-tax profits (after certain adjustments) averaged over three years. The deeds of covenant can be cancelled by the Company at nine years’ notice.
Issued and fully paid preference shares
During 2004, the Company issued 400 6 per cent non-cumulative redeemable preference shares of 25p each. The shares, which are redeemable at the option of the Company at any time, carry the rights to a fixed rate non-cumulative preferential dividend at a rate of 6 per cent per annum; no dividend shall be payable in the event that the directors determine that prudent capital ratios would not be maintained if the dividend were paid. Upon winding up, the shares rank equally with any other preference shares issued by the Company. In accordance with IFRS, these shares have been reported within liabilities since 1 January 2005.
In addition, during 2006 the Company issued 600,000 Fixed/Floating Rate Non-Cumulative Callable Preference Shares of 25 pence each with a liquidation preference of £1,000 per share and 1,000,000 Fixed/Floating Rate Non-Cumulative Callable Preference Shares of 25 cents each with a liquidation preference of US$1,000 per share. Both issues of preference shares are perpetual, although the two issues can be redeemed at the option of the Company on or after 25 August 2015 and 14 November 2016 respectively and carry the right to non-cumulative dividends which are fixed until those first redemption dates. The terms of these two issues of preference shares are such that the Company cannot declare and pay a dividend on any other junior class of share (including the mandatory dividend on the 400 6 per cent non-cumulative redeemable preference shares mentioned above) until the coupon has been paid on these preference shares. As the Company is effectively committed to the payment of a coupon on these shares they are classified as liabilities on the balance sheet in accordance with IFRS (see note 38).
40 Share premium account
| | | | | | | | | | |
| | | 2006
£m | | | 2005
£m | | | 2004
£m | |
| | | | | | | | |
At 1 January | | | 1,170 | | | 1,145 | | | 1,136 | |
Premium arising on issue of shares under share option schemes | | | 96 | | | 25 | | | 9 | |
| | | | | | | | |
At 31 December | | | 1,266 | | | 1,170 | | | 1,145 | |
| | | | | | | | |
| | | | | | | | | | |
41 Other reserves
| | | | | | | | | | |
| | | 2006
£m | | | 2005
£m | | | 2004
£m | |
| | | | | | | | | |
Other reserves comprise: | | | | | | | | | | |
Merger reserve | | | 343 | | | 343 | | | 343 | |
Revaluation reserve in respect of available-for-sale financial assets | | | — | | | 29 | | | | |
| | | | | | | | | | |
Cash flow hedging reserve | | | 12 | | | 11 | | | | |
| | | | | | | | |
| | | 355 | | | 383 | | | 343 | |
| | | | | | | | |
Movements in other reserves were as follows:
| | | | | | | | | | |
| | | 2006
£m | | | 2005
£m | | | 2004
£m | |
| | | | | | | | |
Merger reserve | | | | | | | | | | |
At 1 January and 31 December | | | 343 | | | 343 | | | 343 | |
| | | | | | | | |
F-45
Notes to the group accounts
41 Other reserves(continued)
| | | | | | | | | | | | | |
| | | 2006
£m | | | | | | | | 2005
£m | | |
| | | | | | | | | | | | | | |
Revaluation reserve in respect of available-for-sale financial assets | | | | | | | | | | | | | |
At 1 January (following, in 2005, the implementation of IAS 32 and IAS 39; see note 50) | | | 29 | | | | | | | | 28 | | |
Exchange and other adjustments | | | 2 | | | | | | | | (7 | ) | |
Change in fair value of available-for-sale financial assets | | | (10 | ) | | | | | | | 11 | | |
Deferred tax | | | — | | | | | | | | 2 | | |
| | | (10 | ) | | | | | | | 13 | | |
Income statement transfer | | | | | | | | | | | | | |
Disposal | | | (22 | ) | | | | | | | (5 | ) | |
Current tax | | | 1 | | | | | | | | — | | |
| | | (21 | ) | | | | | | | (5 | ) | |
| | | | | | | | | | | | | | |
At 31 December | | | — | | | | | | | | 29 | | |
| | | | | | | | | | | | | | |
| | | | | | | | | | | | | |
| | | 2006
£m | | | | | | | | 2005
£m | | |
| | | | | | | | | | | | | | |
Cash flow hedging reserve | | | | | | | | | | | | | |
At 1 January (following, in 2005, the implementation of IAS 32 and IAS 39; see note 50) | | | 11 | | | | | | | | — | | |
Change in fair value of hedging derivatives | | | — | | | | | | | | 4 | | |
Deferred tax | | | — | | | | | | | | (1 | ) | |
| | | — | | | | | | | | 3 | | |
Income statement transfer | | | 1 | | | | | | | | 12 | | |
Deferred tax | | | — | | | | | | | | (4 | ) | |
| | | 1 | | | | | | | | 8 | | |
| | | | | | | | | | | | | | |
At 31 December | | | 12 | | | | | | | | 11 | | |
| | | | | | | | | | | | | | |
| | | | | | | | | | | | | |
42 Retained profits | | | | | | | | | | | | | |
| | | | | | | | | | | | | |
| | | 2006
£m | | | | 2005
£m | | | | 2004
£m | | |
| | | | | | | | | | | | | | |
At 1 January | | | 7,222 | | | | 8,140 | | | | 7,646 | | |
Restatement on implementation of IAS 32, IAS 39 and IFRS 4 (see note 50) | | | | | | | (1,586 | ) | | | | | |
| | | | | | | | | | | | | |
| | | | | | | | | | | | | | |
| | | | | | | | | | | | | |
At 1 January – restated | | | | | | | 6,554 | | | | | | |
Currency translation differences (see analysis below) | | | (31 | ) | | | 24 | | | | (12 | ) | |
Profit for the year | | | 2,803 | | | | 2,493 | | | | 2,392 | | |
Dividends | | | (1,919 | ) | | | (1,914 | ) | | | (1,913 | ) | |
Purchase/sale of treasury shares | | | (35 | ) | | | 18 | | | | 8 | | |
Employee share option schemes – value of employee services | | | 65 | | | | 47 | | | | 19 | | |
| | | | | | | | | | | | | | |
At 31 December | | | 8,105 | | | | 7,222 | | | | 8,140 | | |
| | | | | | | | | | | | | | |
Retained profits are stated after deducting £87 million (2005: £73 million; 2004: £94 million) representing 15 million (2005: 14 million; 2004: 18 million) treasury shares held.
Value of employee services includes a credit of £31 million (2005: £31 million; 2004: £30 million) reflecting the income statement charge in respect of SAYE and executive options, together with a related tax credit of £34 million (2005: credit of £16 million; 2004: charge of £11 million). Purchase/sale of treasury shares includes a credit of £27 million (2005: £45 million; 2004: £35 million) relating to the cost of other share scheme awards.
The movements over the year in the cumulative amount of foreign exchange differences taken directly to retained profits are as follows:
| | | | | | | | | | | | | |
| | | 2006
£m | | | | 2005
£m | | | | 2004
£m | | |
| | | | | | | | | | | | | | |
| | | | | | | | | | | | | |
At 1 January | | | 12 | | | | (12 | ) | | | | | |
| | | | | | | | | | | | | |
Currency translation differences arising in the year | | | (108 | ) | | | 24 | | | | (12 | ) | |
Foreign currency gains on net investment hedges | | | 110 | | | | — | | | | — | | |
Current tax | | | (33 | ) | | | — | | | | — | | |
| | | 77 | | | | — | | | | — | | |
| | | | | | | | | | | | | | |
At 31 December | | | (19 | ) | | | 12 | | | | (12 | ) | |
| | | | | | | | | | | | | |
F-46
Notes to the group accounts
| | | | | | | | | | | | | | | | | | | |
| | 2006
Pence
per share | | 2005
Pence
per share | | 2004
Pence
per share | | 2006
£m | | 2005
£m | | 2004
£m | |
| | | | | | | | | | | | | | | | | | | | |
Final dividend for previous year paid during the current year | | | 23.5 | | | 23.5 | | | 23.5 | | | 1,316 | | | 1,315 | | | 1,314 | |
Interim dividend | | | 10.7 | | | 10.7 | | | 10.7 | | | 603 | | | 599 | | | 599 | |
| | | | | | | | | | | | | | | | | | | | |
| | | 34.2 | | | 34.2 | | | 34.2 | | | 1,919 | | | 1,914 | | | 1,913 | |
| | |
The directors have proposed a final dividend of 23.5 pence per share (2005: 23.5 pence per share; 2004: 23.5 pence per share) representing a total cost of £1,324 million (2005: £1,316 million; 2004: £1,315 million) which will be paid on 2 May 2007.
The Bank of New York Nominees have waived the right to all dividends on the Lloyds TSB Group plc shares that they hold (holding at 31 December 2006: 10 shares).
In addition, the trustees of the following holdings of Lloyds TSB Group plc shares in relation to employee share schemes retain the right to receive dividends but chose to waive their entitlement to the dividends on those shares as indicated: the Lloyds TSB Group Shareplan (holding at 31 December 2006: 1,138,311 shares, waived right to all dividends), the Lloyds TSB Group Employee Share Ownership Trust (holding at 31 December 2006: 898,320 shares, waived right to all dividends), Lloyds TSB Group Holdings (Jersey) Limited (holding at 31 December 2006: 41,801 shares, waived right to all but a nominal amount of 1 penny in total) and the Lloyds TSB Qualifying Employee Share Ownership Trust (holding at 31 December 2006: 1,364 shares, waived right to all but a nominal amount of 1 penny in total).
|
| |
|
44 Share based payments |
|
Charge to the income statement |
| | | | | | | | | | | | | |
The charge to the income statement is set out below: | | | | | | | | | | | | | |
| | | 2006
£m | | | | 2005
£m | | | | 2004
£m | | |
| | | | | | | | | | | | | | |
| | | | | | | | | | | | | |
Executive and SAYE schemes: | | | | | | | | | | | | | |
Options granted in the year | | | 6 | | | | 4 | | | | 3 | | |
Options granted in prior years | | | 25 | | | | 27 | | | | 27 | | |
| | | 31 | | | | 31 | | | | 30 | | |
Share incentive plan: | | | | | | | | | | | | | |
Shares granted in the year | | | 12 | | | | 24 | | | | 19 | | |
Shares granted in prior years | | | 15 | | | | 21 | | | | 16 | | |
| | | 27 | | | | 45 | | | | 35 | | |
| | | |
| | | 58 | | | | 76 | | | | 65 | | |
| | | |
During the year ended 31 December 2006 the Group operated the following share based payment schemes, all of which are equity settled.
Executive schemes
The Executive share option schemes were long-term incentive schemes available to certain senior executives of the Group, with grants usually made annually. Options were granted within limits set by the rules of the schemes relating to the number of shares under option and the price payable on the exercise of options. The last grant of executive options was made in March 2005. These options were granted without a performance multiplier and the maximum limit for the grant of options in normal circumstances was three times annual salary. Between April 2001 and August 2004, the aggregate value of the award based upon the market price at the date of grant could not exceed four times the executive’s annual remuneration and, normally, the limit for the grant of options to an executive in any one year would be equal to 1.5 times annual salary with a maximum performance multiplier of 3.5. Prior to 18 April 2001, the normal limit was equal to one year’s remuneration and no performance multiplier was applied.
Performance conditions for executive options
For options granted up to March 2001
| | |
Options granted | | Performance conditions |
| | | |
Prior to March 1996 | | None |
| | | |
March 1996 | | Growth in earnings per share which is equal to the aggregate percentage change in the Retail Price Index plus two percentage points for each complete year of the relevant period. |
| | | |
March 1997 – August 1999 | | As for March 1996, plus a further condition that Lloyds TSB Group plc’s ranking based on shareholder return (calculated by reference to both dividends and growth in share price) over the relevant period should be in the top fifty companies of the FTSE 100. |
| | | |
March 2000 – March 2001 | | As for March 1997 – August 1999 except that there must have been growth in the earnings per share equal to the change in the Retail Price Index plus three percentage points for each complete year of the relevant period. |
| | | |
In respect of options granted between March 1996 and March 2001, the relevant period for the performance conditions begins at the end of the financial year preceding the date of grant and will continue until the end of the third subsequent year following commencement or, if not met, the end of such later year in which the conditions are met. Once the conditions have been satisfied the options will remain exercisable without further conditions. If they are not satisfied by the tenth anniversary of the grant the option will lapse.
F-47
Notes to the group accounts
44 Share based payments(continued)
For options granted from August 2001 to August 2004
The performance condition is linked to the performance of Lloyds TSB Group plc’s total shareholder return (calculated by reference to both dividends and growth in share price) against a comparator group of 17 companies including Lloyds TSB Group plc.
The performance condition is measured over a three year period commencing at the end of the financial year preceding the grant of the option and continuing until the end of the third subsequent year. If the performance condition is not then met, it will be measured at the end of the fourth financial year. If the condition has not then been met, the options will lapse.
To meet the performance conditions, the Group’s ranking against the comparator group must be at least ninth. The full grant of options will only become exercisable if the Group is ranked first. A performance multiplier (of between nil and 100 per cent) will be applied below this level to calculate the number of shares in respect of which options granted to executive directors will become exercisable, and will be calculated on a sliding scale. If Lloyds TSB Group plc is ranked below median the options will not be exercisable.
Options granted to senior executives other than executive directors are not so highly leveraged and, as a result, different performance multipliers are applied to their options. For the majority of executives, options are granted with the performance condition but no performance multiplier.
For options granted in 2005
The same conditions apply as for grants made up to August 2004, except that:
| |
– | the performance condition is linked to the performance of Lloyds TSB Group plc’s total shareholder return (calculated by reference to both dividends and growth in share price) against a comparator group of 15 companies including Lloyds TSB Group plc; |
| |
– | if the performance condition has not been met at the end of the third subsequent year, the options will lapse; and |
| |
– | the full grant of options becomes exercisable only if the Group is ranked in the top four places of the comparator group. A sliding scale applies between fourth and eighth positions. If Lloyds TSB Group is ranked below the median (ninth or below) the options will not be exercisable and will lapse. |
Movements in the number of share options outstanding under the Executive share option schemes during 2005 and 2006 are set out below:
| | | | | | | | | | | | | |
| | 2006 | | 2005 | |
| | | | | |
| | Number of
options | | Weighted average
exercise price
(pence) | | Number of
options | | Weighted average
exercise price
(pence) | |
| | | | | | | | | | |
Outstanding at 1 January | | | 43,977,411 | | | 485.35 | | | 39,289,430 | | | 515.95 | |
Granted | | | — | | | — | | | 10,869,357 | | | 474.23 | |
Exercised | | | (328,218 | ) | | 437.03 | | | (202,708 | ) | | 273.37 | |
Forfeited | | | (11,189,600 | ) | | 560.77 | | | (5,978,668 | ) | | 673.41 | |
| | | | | | | | | | | | | | |
Outstanding at 31 December | | | 32,459,593 | | | 459.84 | | | 43,977,411 | | | 485.35 | |
| | | | | | | | | | | | | | |
Exercisable at 31 December | | | 819,139 | | | 744.90 | | | 1,430,218 | | | 685.23 | |
| | |
The weighted average share price at the time that the options were exercised during 2006 was 552.29 pence (2005: 490.15 pence). The weighted average remaining contractual life of options outstanding at the end of the year was 6.8 years (2005: 7.4 years).
Save-As-You-Earn schemes
Eligible employees may enter into contracts through the Save-As-You-Earn (SAYE) schemes to save up to £250 per month and, at the expiry of a fixed term of three or five years, have the option to use these savings within six months of the expiry of the fixed term to acquire shares in the Group at a price equal to 80 per cent of the market price at the date the options were granted. Grants in periods up to 31 December 2001 also had options exercising after seven years.
Movements in the number of share options outstanding under the SAYE schemes are set out below:
| | | | | | | | | | | | | |
| | 2006 | | 2005 | |
| | | | | |
| | Number of
options | | Weighted average
exercise price
(pence) | | Number of
options | | Weighted average
exercise price
(pence) | |
| | | | | | | | | | |
Outstanding at 1 January | | | 114,459,474 | | | 314.17 | | | 122,115,907 | | | 321.71 | |
Granted | | | 19,301,716 | | | 418.00 | | | 9,610,466 | | | 380.00 | |
Exercised | | | (35,148,982 | ) | | 294.84 | | | (6,086,150 | ) | | 418.80 | |
Forfeited | | | (3,440,257 | ) | | 339.47 | | | (4,404,042 | ) | | 315.36 | |
Cancelled | | | (3,984,599 | ) | | 427.14 | | | (3,722,135 | ) | | 415.76 | |
Expired | | | (967,208 | ) | | 503.13 | | | (3,054,572 | ) | | 488.49 | |
| | |
Outstanding at 31 December | | | 90,220,144 | | | 335.94 | | | 114,459,474 | | | 314.17 | |
| | |
Exercisable at 31 December | | | 889,479 | | | 475.41 | | | 2,153,227 | | | 497.86 | |
| | |
The weighted average share price at the time that the options were exercised during 2006 was 524.36 pence (2005: 465.51 pence). The weighted average remaining contractual life of options outstanding at the end of the year was 2.2 years (2005: 2.2 years).
F-48
Notes to the group accounts
44 Share based payments(continued)
Other share option plans
Lloyds TSB Group Executive Share Plan 2003
The plan was adopted in December 2003 and under the plan share options may be granted to senior employees, who may also be directors of Lloyds TSB Group. Options granted to date under this scheme were granted specifically to facilitate recruitment. Options granted under this plan are not subject to any performance conditions.
| | | | | | | | | | | | | |
| | 2006 | | 2005 | |
| | | | | |
| | Number of
options | | Weighted average
exercise price
(pence) | | Number of
options | | Weighted average
exercise price
(pence) | |
| | | | | | | | | | |
Outstanding at 1 January | | | 268,918 | | | Nil | | | 206,647 | | | Nil | |
Granted | | | 165,395 | | | Nil | | | 62,271 | | | Nil | |
Exercised | | | (77,190 | ) | | Nil | | | — | | | — | |
| | |
Outstanding at 31 December | | | 357,123 | | | Nil | | | 268,918 | | | Nil | |
| | |
The weighted average fair value of options granted in the year was £4.58 (2005: £4.18; 2004: £3.69). The weighted average share price at the time that the options were exercised during 2006 was 557.25 pence. No options outstanding at 31 December were exercisable. The weighted average remaining contractual life of options outstanding at the end of the year was 2.0 years (2005: 1.9 years).
Lloyds TSB Group executive share plan 2005
This plan was adopted by the Group in 2005, specifically to facilitate the recruitment of Ms Dial. Ms Dial is the only participant in the plan. Options granted under this plan are not subject to any performance conditions and will normally become exercisable only if Ms Dial remains as an employee, and has not given notice of resignation, on 31 May 2008. The option will also be exercisable if Ms Dial ceases to be an employee before that date in certain circumstances described in her service agreement, in which case the options will be exercisable for six months and then lapse.
| | | | | | | | | | | | | |
| | 2006 | | 2005 | |
| | | | | |
| | Number of
options | | Weighted average
exercise price
(pence) | | Number of
options | | Weighted average
exercise price
(pence) | |
| | | | | | | | | | |
Outstanding at 1 January | | | 242,825 | | | Nil | | | — | | | — | |
Granted | | | — | | | — | | | 242,825 | | | Nil | |
| | |
Outstanding at 31 December | | | 242,825 | | | Nil | | | 242,825 | | | Nil | |
| | |
The weighted average fair value of options granted in 2005 was £3.63. No options outstanding at 31 December were exercisable. The weighted average remaining contractual life of options outstanding at the end of the year was 1.9 years (2005: 2.9 years).
Long-Term Incentive Plan
The Long-Term Incentive Plan introduced in 2006 is a long-term incentive scheme aimed at delivering shareholder value by linking the receipt of shares to an improvement in the performance of the Group over a three year period. Awards are made within limits set by the rules of the plan, with the limits determining the maximum number of shares that can be awarded equating to three times annual salary, in exceptional circumstances this may increase up to four times annual salary.
For awards made in 2006 there are two performance conditions measured over a performance period commencing on 1 January 2006 and ending on 31 December 2008.
50 per cent of the award will be based on a condition measuring the Group’s total shareholder return (calculated by reference to both dividends and growth in share price) against a comparator group of 15 companies including Lloyds TSB Group plc. To vest in full, the Group’s total shareholder return must exceed the median of the total shareholder return of the comparator group by an average of 7.5 per cent per annum. 8.75 per cent of the award will vest where the Group’s total shareholder return is equal to the median and vesting will be on a straight-line basis between these points. Where the Group’s total shareholder return is below the median, this part of the award will lapse.
The remaining 50 per cent of the award will be based on earnings per share growth calculated on a compound annualised basis. For the award to vest in full, the earnings per share growth over the performance period must be at least equivalent to an average of the Retail Price Index plus 6 per cent per annum. 8.75 per cent of the award will vest where earnings per share growth is an average of the Retail Price Index plus 3 per cent per annum and vesting will be on a straight-line basis between these points. Where the earnings per share growth is less than an average of the Retail Price Index plus 3 per cent per annum this part of the award will lapse.
| | | | |
| | 2006
Number of shares | |
| | | | |
Outstanding at 1 January | | | — | |
Granted | | | 5,852,386 | |
Forfeited | | | (64,278 | ) |
| | |
Outstanding at 31 December | | | 5,788,108 | |
| | |
The fair value of the share awards granted in 2006 was £2.96.
| | | | |
F-49
Notes to the group accounts
44 Share based payments(continued)
Performance share plan
Under the performance share plan, introduced during 2005, participating executives will be eligible for an award of free shares, known as performance shares, to match the bonus shares awarded as part of their 2004 and 2005 bonus. The maximum match will be two performance shares for each bonus share, awarded at the end of a three year period. The actual number of shares awarded will depend on the Group’s total shareholder return performance measured over a three year period, compared to other companies in the comparator group. The maximum of two performance shares for each bonus share will be awarded only if the Group’s total shareholder return performance places it first in the comparator group; one performance share for each bonus share will be granted if the Group is placed fifth; and one performance share for every two bonus shares if the Group is placed eighth (median). Between first and fifth, and fifth and eighth, sliding scales will apply. If the total shareholder return performance is below median, no performance shares will be awarded. There will be no retest. Whilst income tax is deducted from the bonus before deferral into the plan, where a match of performance shares is justified, these shares will be awarded as if income tax had not been deducted.
| | | | | | | |
| | 2006
Number of shares | | 2005
Number of shares | |
| | | | | | |
Outstanding at 1 January | | | 826,438 | | | — | |
Granted | | | 1,035,564 | | | 854 ,116 | |
Forfeited | | | (12,900 | ) | | (27,678 | ) |
| | |
Outstanding at 31 December | | | 1,849,102 | | | 826,438 | |
| | |
The fair value of the matching element of the performance shares awarded during 2006 was £1.92 (2005: £1.78).
The ranges of exercise prices, weighted average exercise prices, weighted average remaining contractual life and number of options outstanding for the option schemes were as follows:
| | | | | | | | | | | | | | | | | | | | | | | | | | | | |
| | Executive schemes | | SAYE schemes | | Other share option plans | |
| | | | | | | |
| | Weighted
average
exercise
price (pence) | | Weighted
average
remaining
life (years) | | Number of
options | | Weighted
average
exercise
price (pence) | | Weighted
average
remaining
life (years) | | Number of
options | | Weighted
average
exercise
price (pence) | | Weighted
average
remaining
life (years) | | Number of
options | |
| | | | | | | | | | | | | | | | | | | | |
31 December 2006 | | | | | | | | | | | | | | | | | | | | | | | | | | | | |
Exercise price range | | | | | | | | | | | | | | | | | | | | | | | | | | | | |
£0 to £2 | | | — | | | — | | | — | | | — | | | — | | | — | | | Nil | | | 1.9 | | | 599,948 | |
£2 to £3 | | | — | | | — | | | — | | | 284.00 | | | 1.8 | | | 45,234,578 | | | — | | | — | | | — | |
£3 to £4 | | | 394.25 | | | 6.2 | | | 6,265,105 | | | 345.97 | | | 2.3 | | | 23,320,638 | | | — | | | — | | | — | |
£4 to £5 | | | 444.24 | | | 7.7 | | | 22,497,465 | | | 422.94 | | | 3.1 | | | 20,125,284 | | | — | | | — | | | — | |
£5 to £6 | | | 541.32 | | | 2.6 | | | 1,424,507 | | | 571.24 | | | 0.7 | | | 1,522,876 | | | — | | | — | | | — | |
£6 to £7 | | | 652.98 | | | 4.2 | | | 1,332,177 | | | — | | | — | | | — | | | — | | | — | | | — | |
£7 to £8 | | | — | | | — | | | — | | | 718.00 | | | 0.2 | | | 16,768 | | | — | | | — | | | — | |
£8 to £9 | | | 873.12 | | | 1.7 | | | 940,339 | | | — | | | — | | | — | | | — | | | — | | | — | |
| | | | | | | | | | | | | | | | | | | | | | | | | | | | | |
| | | | | | | | | | | | | | | | | | | | | | | | | | | | |
| | Executive schemes | | SAYE schemes | | Other share option plans | |
| | | | | | | |
| | Weighted
average
exercise
price (pence) | | Weighted
average
remaining
life (years) | | Number of
options | | Weighted
average
exercise
price (pence) | | Weighted
average
remaining
life (years) | | Number of
options | | Weighted
average
exercise
price (pence) | | Weighted
average
remaining
life (years) | | Number of
options | |
| | | | | | | | | | | | | | | | | | | | |
31 December 2005 | | | | | | | | | | | | | | | | | | | | | | | | | | | | |
Exercise price range | | | | | | | | | | | | | | | | | | | | | | | | | | | | |
£0 to £2 | | | — | | | — | | | — | | | — | | | — | | | — | | | Nil | | | 2.2 | | | 511,743 | |
£2 to £3 | | | — | | | — | | | — | | | 284.00 | | | 2.0 | | | 78,553,860 | | | — | | | — | | | — | |
£3 to £4 | | | 393.33 | | | 7.1 | | | 10,112,857 | | | 346.71 | | | 3.1 | | | 28,535,928 | | | — | | | — | | | — | |
£4 to £5 | | | 444.04 | | | 8.6 | | | 24,177,788 | | | 469.50 | | | 1.4 | | | 3,415,737 | | | — | | | — | | | — | |
£5 to £6 | | | 542.22 | | | 3.7 | | | 2,320,524 | | | 544.77 | | | 1.1 | | | 3,821,055 | | | — | | | — | | | — | |
£6 to £7 | | | 652.79 | | | 5.1 | | | 1,823,756 | | | 632.00 | | | 0.2 | | | 95,572 | | | — | | | — | | | — | |
£7 to £8 | | | 715.04 | | | 6.2 | | | 4,111,758 | | | 720.20 | | | 1.0 | | | 37,322 | | | — | | | — | | | — | |
£8 to £9 | | | 868.08 | | | 2.8 | | | 1,430,728 | | | — | | | — | | | — | | | — | | | — | | | — | |
| | | | | | | | | | | | | | | | | | | | | | | | | | | | | |
The weighted average fair value of options granted during the year was £nil (2005: £0.67; 2004: £0.47) for executive options and £1.00 (2005: £0.98; 2004: £0.92) for SAYE options. The values for executive options have been determined using a binomial model that uses a stochastic projection model to determine the effect of the market based conditions. The values for the SAYE options have been determined using a standard Black-Scholes model. The fair value calculations are based on the following assumptions:
F-50
Notes to the group accounts
44 Share based payments(continued)
| | | | | | | | | | |
| | SAYE | | Other option
schemes | | Other share
plans | |
| | | | | | | | |
Risk-free interest rate | | | 4.44% | | | 4.55% | | | 4.79% | |
Expected life | | | 3.5 years | | | 2.9 years | | | 3.0 years | |
Expected volatility | | | 23% | | | 21% | | | 19% | |
Expected dividend yield | | | 6.5% | | | 6.2% | | | 6.7% | |
Weighted average share price | | | £5.23 | | | £5.50 | | | £5.15 | |
Weighted average exercise price | | | £4.18 | | | — | | | — | |
Expected forfeitures | | | 6% | | | 5% | | | 5% | |
| | | | | | | | | | | |
Expected volatility is a measure of the amount by which the Group’s shares are expected to fluctuate during the life of an option. The expected volatility is estimated based on the historical volatility of the closing daily share price over the most recent period that is commensurate with the expected life of the option. The historical volatility is compared to the implied volatility generated from market traded options in the Group’s shares to assess the reasonableness of the historical volatility and adjustments made where appropriate.
Share incentive plan
Free shares
An award of shares may be made annually to employees based on a percentage of the employees’ salary in the preceding year up to maximum of £3,000. The percentage is normally announced concurrently with the Group’s annual results and the price of the shares awarded is announced at the time of grant. The shares awarded are held in trust for a mandatory period of three years on the employees’ behalf. The award is subject to a non-market based condition: if an employee leaves the Group within this three year period for other than a ‘good’ reason, all of the shares awarded will be forfeited (for awards made up to April 2005, only a portion of the shares would be forfeited: 75 per cent within one year of the award, 50 per cent within two years and 25 per cent within three years).
The number of shares awarded relating to free shares in 2006 was 7,725,195 (2005: 8,748,521), with an average fair value of £5.28 (2005: £4.57; 2004: £4.27), based on the market price at the date of award.
Matching shares
The Group undertakes to match shares purchased by employees up to the value of £30 per month, these shares are held in trust for a mandatory period of three years on the employees’ behalf. The award is subject to a non-market based condition; if an employee leaves within this three year period for other than a ‘good’ reason or the accompanying partnership shares are sold within that time, 100 per cent of the matching shares are forfeited (or the portion relating to the shares sold).
The number of shares awarded relating to matching shares in 2006 was 2,036,423 (2005: 2,296,575), with an average fair value of £5.40 (2005: £4.73; 2004: £4.28), based on market prices at the date of award.
F-51
Notes to the group accounts
| |
| |
|
45 | Related party transactions |
Key management personnel
Key management personnel are those persons having authority and responsibility for planning, directing and controlling the activities of an entity; the Group’s key management personnel are the members of the Lloyds TSB Group plc group executive committee together with its non-executive directors.
The table below details, on an aggregated basis, key management personnel compensation:
| | | | | | | | | | |
| | 2006
£m | | 2005
£m | | 2004
£m | |
| | | | | | | | |
Compensation | | | | | | | | | | |
Salaries and other short-term benefits | | | 14 | | | 11 | | | 10 | |
Post-employment benefits | | | 3 | | | 3 | | | 3 | |
Termination benefits | | | — | | | — | | | 1 | |
Share based payments | | | 3 | | | 2 | | | 2 | |
| | | | | | | | | | | |
| | | 20 | | | 16 | | | 16 | |
| | | | | | | | | | | |
| | | | | | | | | | |
| | 2006
million | | 2005
million | | 2004
million | |
| | | | | | | | | | | |
Share options | | | | | | | | | | |
At 1 January | | | 12 | | | 12 | | | 10 | |
Granted (including options of appointed directors) | | | — | | | 3 | | | 5 | |
Exercised/lapsed (including options of retired directors) | | | (1 | ) | | (3 | ) | | (3 | ) |
| | | | | | | | | | | |
At 31 December | | | 11 | | | 12 | | | 12 | |
| | | | | | | | | | | |
The tables below detail, on an aggregated basis, balances outstanding at the year end and related income and expense, together with information relating to other transactions between the Group and its key management personnel:
|
| | | | | | | | | | |
| | 2006
£m | | 2005
£m | | 2004
£m | |
| | | | | | | | | | | |
Loans | | | | | | | | | | |
At 1 January | | | 3 | | | 3 | | | 3 | |
Advanced | | | — | | | 1 | | | 1 | |
Interest | | | — | | | — | | | — | |
Repayments | | | (1 | ) | | (1 | ) | | (1 | ) |
| | | | | | | | | | | |
At 31 December | | | 2 | | | 3 | | | 3 | |
| | | | | | | | | | | |
| | | | | | | | | | |
The loans are on both a secured and unsecured basis and are expected to be settled in cash. The loans attracted interest rates of between 5.1 per cent and19.9 per cent in 2006 (2005: 4.6 per cent and 17.9 per cent; 2004: 5.4 per cent and 17.9 per cent). |
| | | | | | | | | | |
No provisions have been recognised in respect of loans given to key management personnel (2005: £nil; 2004: £nil). |
| | | | | | | | | | |
| | 2006
£m | | 2005
£m | | 2004
£m | |
| | | | | | | | | | | |
Deposits | | | | | | | | | | |
At 1 January | | | 5 | | | 2 | | | 2 | |
Placed | | | 12 | | | 22 | | | 5 | |
Interest | | | — | | | — | | | — | |
Withdrawn | | | (12 | ) | | (19 | ) | | (5 | ) |
| | | | | | | | | | | |
At 31 December | | | 5 | | | 5 | | | 2 | |
| | | | | | | | | | | |
Deposits placed by key management personnel attracted interest rates of up to 5.2 per cent (2005: 4.5 per cent; 2004: 4.8 per cent).
At 31 December 2006, the Group provided guarantees totalling £19,744 in respect of one director (2005: £19,744 in respect of one director; 2004: £nil).
At 31 December 2006, transactions, arrangements and agreements entered into by the Group’s banking subsidiaries with directors and connected persons included amounts outstanding in respect of loans and credit card transactions of £2 million with four directors and four connected persons (2005: £3 million with four directors and three connected persons; 2004: £3 million with four directors and their connected persons).
Subsidiaries
Details of the principal subsidiaries are given in note 53d. In accordance with IAS 27 transactions and balances with subsidiaries that have been eliminated on consolidation are not reported.
Other related party disclosures
At 31 December 2006, the Group’s pension funds had call deposits with Lloyds TSB Bank plc amounting to £19 million (2005: £14 million).
The Group manages 89 (2005: 86) Open Ended Investment Companies (‘OEICs’), and of these 38 (2005: 36) are consolidated. The Group invested £372 million (2005: £345 million) and redeemed £237 million (2005: £265 million) in the unconsolidated OEICs during the year and had investments, at fair value, of £1,746 million (2005: £2,074 million) at 31 December. The Group earned fees of £149 million from the unconsolidated OEICs (2005: £85 million; 2004: £78 million). The Company held no investments in OEICs at any time during 2005 or 2006.
The Group has a number of venture capital associates that it accounts for at fair value through profit or loss. At 31 December 2006, these companies had total assets of approximately £1,625 million (2005: £1,194 million), total liabilities of approximately £1,609 million (2005: £1,072 million) and for the year ended 31 December 2006 had turnover of £2,409 million (2005: £1,782 million) and made a net loss of approximately £5 million (2005: net profit £36 million; 2004: net profit of £42 million). In addition, the Group has provided £460 million (2005: £363 million) of financing to these companies on which it received £20 million (2005: £19 million; 2004: £13 million) of interest income in the year.
F-52
Notes to the group accounts
| |
| |
|
46 | Contingent liabilities and commitments |
Legal proceedings
During the ordinary course of business the Group is subject to threatened or actual legal proceedings. All material cases are periodically reassessed, with the assistance of external professional advisors where appropriate, to determine the likelihood of the Group incurring a liability. In those instances where it is concluded that it is more likely than not that a payment will be made, a provision is established to management’s best estimate of the amount required to settle the obligation at the balance sheet date.
In some cases it will not be possible to form a view, either because the facts are unclear or because further time is needed to properly assess the merits of the case. No provisions are held against such cases, however the Group does not currently expect the final outcome to have a material effect upon the Group’s financial position.
Contingent liabilities and commitments arising from the banking business
Acceptances and endorsements arise where the Lloyds TSB Group agrees to guarantee payment on a negotiable instrument drawn up by a customer.
Other items serving as direct credit substitutes include standby letters of credit, or other irrevocable obligations, serving as financial guarantees where the Lloyds TSB Group has an irrevocable obligation to pay a third party beneficiary if the customer fails to repay an outstanding commitment; they also include acceptances drawn under letters of credit or similar facilities where the acceptor does not have specific title to an identifiable underlying shipment of goods.
Performance bonds and other transaction-related contingencies (which include bid or tender bonds, advance payment guarantees, VAT Customs & Excise bonds and standby letters of credit relating to a particular contract or non-financial transaction) are undertakings where the requirement to make payment under the guarantee depends on the outcome of a future event.
Where the guarantees are issued on behalf of customers, Lloyds TSB Group usually holds collateral against the exposure or has a right of recourse to the customer.
Lloyds TSB Group’s maximum exposure to loss is represented by the contractual nominal amount detailed in the table below. Consideration has not been taken of any possible recoveries from customers for payments made in respect of such guarantees under recourse provisions or from collateral held.
| | | | | | | | | |
| | | | | | | | | |
| | 2006
£m | | | 2005
£m | | |
| | | | | | | | | | |
Contingent liabilities | | | | | | | | | |
Acceptances and endorsements | | | 63 | | | | 35 | | |
Guarantees | | | –* | | | | 9,373 | | |
Other: | | | | | | | | | |
Other items serving as direct credit substitutes | | | 618 | | | | 550 | | |
Performance bonds and other transaction-related contingencies | | | 2,096 | | | | 1,737 | | |
| | | 2,714 | | | | 2,287 | | |
| | | | | | | | | | |
| | | 2,777 | | | | 11,695 | | |
| | | | | | | | | | |
| |
* | As indicated in note 1, since 1 January 2006 all of the Group’s financial guarantee contracts have been accounted for as financial instruments and measured at fair value on the Group’s balance sheet. |
|
| The contingent liabilities of the Group, as detailed above, arise in the normal course of its banking business and it is not practicable to quantify their future financial effect. |
| | | | | | | | | |
| | 2006
£m | | | 2005
£m | | |
| | | | | | | | | | |
Commitments | | | | | | | | | |
Documentary credits and other short-term trade-related transactions | | | 374 | | | | 283 | | |
Forward asset purchases and forward deposits placed | | | 5,764 | | | | 277 | | |
Undrawn formal standby facilities, credit lines and other commitments to lend: | | | | | | | | | |
Less than 1 year maturity: | | | | | | | | | |
Mortgage offers made | | | 4,071 | | | | 2,983 | | |
Other commitments | | | 49,731 | | | | 55,310 | | |
| | | 53,802 | | | | 58,293 | | |
1 year or over maturity | | | 28,477 | | | | 24,123 | | |
| | | | | | | | | | |
| | | 88,417 | | | | 82,976 | | |
| | | | | | | | | | |
Of the amounts shown above in respect of undrawn formal standby facilities, credit lines and other commitments to lend £51,288 million (2005: £43,094 million) was irrevocable.
F-53
Notes to the group accounts
| |
46 | Contingent liabilities and commitments(continued) |
Operating lease commitments
Where a Group company is the lessee the future minimum lease payments under non-cancellable premises operating leases are as follows:
| | | | | | | |
| | 2006
£m | | 2005
£m | |
| | | | | | |
Not later than 1 year | | | 212 | | | 216 | |
Later than 1 year and not later than 5 years | | | 733 | | | 784 | |
Later than 5 years | | | 835 | | | 1,016 | |
| | | | | | | | |
| | | 1,780 | | | 2,016 | |
| | | | | | | | |
| | | | | | | |
Operating lease payments represent rental payable by the Group for certain of its properties. Some of these operating lease arrangements have renewal options and rent escalation clauses, although the effect of these is not material. No arrangements have been entered into for contingent rental payments. |
| | | | | | | |
Finance lease commitments | | | | | | | |
| | | | | | | |
Where a Group company is the lessee the future obligations payable under finance leases are as follows: |
| | | | | | | |
| | 2006
£m | | 2005
£m | |
| | | | | | | | |
Not later than 1 year | | | 1 | | | 1 | |
Later than 1 year and not later than 5 years | | | — | | | — | |
Later than 5 years | | | 15 | | | 15 | |
| | | | | | | | |
| | | 16 | | | 16 | |
| | | | | | | | |
Finance lease payments relate to leases of premises with a net book value of £14 million (2005: £14 million) and equipment with a net book value of £1 million (2005: £2 million). No arrangements have been entered into for contingent rental payments. The fair value of these finance lease obligations approximates their carrying amount at 31 December 2006 and 2005.
Capital commitments
Excluding commitments in respect of investment property (see note 21), capital expenditure contracted but not provided for at 31 December 2006 amounted to £75 million (2005: £223 million). Of this amount, £74 million (2005: £215 million) related to assets to be leased to customers under operating leases. The Group’s management is confident that future net revenues and funding will be sufficient to cover these commitments.
| |
| |
|
47 | Financial risk management |
Strategy in using financial instruments
The Group uses financial instruments (including derivatives) to meet the financial needs of its customers, as part of its trading activities and to reduce its own exposure to market and credit risks.
The Group accepts deposits from and makes loans to commercial and retail customers at both fixed and floating rates and for various periods. Such exposures to customers involve both on-balance sheet loans and advances and guarantees and other commitments such as letters of credit and irrevocable commitments.
The primary risks affecting the Group through its use of financial instruments are: credit risk; market risk, which includes interest rate risk and foreign exchange risk; and liquidity risk. Information about the Group’s management of these risks is given on pages 39 to 64, with further disclosure provided below.
Interest rate risk
In the Group’s retail banking business interest rate risk arises from the different repricing characteristics of the assets and liabilities. Liabilities are either insensitive to interest rate movements, for example interest free or very low interest customer deposits, or are sensitive to interest rate changes but bear rates which may be varied at the Group’s discretion and that for competitive reasons generally reflect changes in the Bank of England’s base rate. There are a relatively small volume of deposits whose rate is contractually fixed for their term to maturity.
Many banking assets are sensitive to interest rate movements; there is a large volume of managed rate assets such as variable rate mortgages which may be considered as a natural offset to the interest rate risk arising from the managed rate liabilities. However a significant proportion of the Group’s lending assets, for example personal loans and mortgages, bear interest rates which are contractually fixed for periods of up to five years or longer.
The interest rate risk arising from the Group’s retail banking activities is managed centrally, in part by the use of internal interest rate swaps. For accounting purposes IAS 39 does not permit the use of internal derivatives in hedge relationships and, although economically the position is hedged, this leads to volatility in the income statement. In response to this the Group has created a function the purpose of which is to establish accounting hedge relationships in order to reduce the volatility arising in the income statement.
The Group establishes two types of hedge accounting relationships for interest rate risk: fair value hedges and cash flow hedges. The Group is exposed to fair value interest rate risk on its fixed rate customer loans, its fixed rate customer deposits and the majority of its subordinated debt, and to cash flow interest rate risk on its variable rate loans and deposits together with its floating rate subordinated debt. The majority of the Group’s hedge accounting relationships are fair value hedges where interest rate swaps are used to hedge the interest rate risk inherent in the fixed rate mortgage portfolio. At 31 December 2006 the aggregate notional principal of interest rate swaps designated as fair value hedges was £37,378 million (2005: £39,568 million) with a net fair value liability of £110 million (2005: £245 million) (see note 16). In addition the Group has a small number of cash flow hedges which are primarily used to hedge the variability in the cost of funding within the wholesale business. These cash flows are expected to occur over the next six years and will be reported in the income statement as they take place. The notional principal of the interest rate swaps designated as cash flow hedges at 31 December 2006 was £569 million (2005: £648 million) with a net fair value liability of £8 million (2005: £18 million) (see note 16).
F-54
Notes to the group accounts
47 Financial risk management(continued)
The table below summarises the repricing mismatches of the Group’s financial assets and liabilities. Items are allocated to time bands by reference to the earlier of the next contractual interest rate repricing date and the maturity date:
| | | | | | | | | | | | | | | | | | | | | | |
| | 1 month
or less
£m | | 3 months
or less
but over
1 month
£m | | 1 year
or less
but over
3 months
£m | | 5 years
or less
but over
1 year
£m | | Over
5 years
£m | | Non-
interest
bearing
£m | | Total
£m | |
| | | | | | | | | | | | | | | | |
As at 31 December 2006 | | | | | | | | | | | | | | | | | | | | | | |
Assets | | | | | | | | | | | | | | | | | | | | | | |
Trading and other financial assets at fair value through profit or loss | | | 1,455 | | | 867 | | | 1,012 | | | 5,177 | | | 21,057 | | | 38,127 | | | 67,695 | |
Derivative financial instruments* | | | — | | | — | | | — | | | — | | | — | | | 5,565 | | | 5,565 | |
Loans and advances to banks | | | 24,652 | | | 1,561 | | | 1,561 | | | 7,449 | | | 5,346 | | | 69 | | | 40,638 | |
Loans and advances to customers | | | 71,041 | | | 17,711 | | | 19,572 | | | 60,845 | | | 19,110 | | | 6 | | | 188,285 | |
Available-for-sale financial assets | | | 5,525 | | | 10,732 | | | 1,594 | | | 1,174 | | | 138 | | | 15 | | | 19,178 | |
Other assets | | | 828 | | | 48 | | | — | | | — | | | — | | | 21,361 | | | 22,237 | |
| | | | | | | | | | | | | | | | | | | | | | | |
Total assets | | | 103,501 | | | 30,919 | | | 23,739 | | | 74,645 | | | 45,651 | | | 65,143 | | | 343,598 | |
| | | | | | | | | | | | | | | | | | | | | | | |
Liabilities | | | | | | | | | | | | | | | | | | | | | | |
Deposits from banks | | | 28,157 | | | 3,654 | | | 1,716 | | | 827 | | | 1,920 | | | 120 | | | 36,394 | |
Customer accounts | | | 124,726 | | | 3,444 | | | 4,802 | | | 1,809 | | | 223 | | | 4,338 | | | 139,342 | |
Derivative financial instruments, trading and other liabilities at fair value through profit or loss* | | | — | | | — | | �� | 55 | | | 467 | | | 634 | | | 5,791 | | | 6,947 | |
Debt securities in issue | | | 29,672 | | | 13,562 | | | 5,059 | | | 1,339 | | | 4,486 | | | — | | | 54,118 | |
Liabilities arising from insurance and investment contracts | | | — | | | — | | | — | | | — | | | — | | | 66,498 | | | 66,498 | |
Other liabilities | | | 37 | | | 27 | | | 2 | | | — | | | 4,583 | | | 12,071 | | | 16,720 | |
Subordinated liabilities | | | 737 | | | 561 | | | 750 | | | 2,806 | | | 7,218 | | | — | | | 12,072 | |
| | | | | | | | | | | | | | | | | | | | | | | |
Total liabilities | | | 183,329 | | | 21,248 | | | 12,384 | | | 7,248 | | | 19,064 | | | 88,818 | | | 332,091 | |
| | | | | | | | | | | | | | | | | | | | | | | |
Net repricing gap | | | (79,828 | ) | | 9,671 | | | 11,355 | | | 67,397 | | | 26,587 | | | (23,675 | ) | | 11,507 | |
| | | | | | | | | | | | | | | | | | | | | | | |
| |
* | Derivative financial instruments which are exposed to interest rate risk are carried in the balance sheet at fair value and for the purposes of this analysis have been treated as non-interest bearing. |
| | | | | | | | | | | | | | | | | | | | | | |
| | 1 month
or less
£m | | 3 months
or less
but over
1 month
£m | | 1 year
or less
but over
3 months
£m | | 5 years
or less
but over
1 year
£m | | Over
5 years
£m | | Non-
interest
bearing
£m | | Total
£m | |
| | | | | | | | | | | | | | | | |
As at 31 December 2005 | | | | | | | | | | | | | | | | | | | | | | |
Assets | | | | | | | | | | | | | | | | | | | | | | |
Trading and other financial assets at fair value through profit or loss | | | 1,734 | | | 2,418 | | | 1,035 | | | 3,796 | | | 17,886 | | | 33,505 | | | 60,374 | |
Derivative financial instruments* | | | �� | | | — | | | — | | | — | | | — | | | 5,878 | | | 5,878 | |
Loans and advances to banks | | | 25,107 | | | 2,483 | | | 2,923 | | | 370 | | | 57 | | | 715 | | | 31,655 | |
Loans and advances to customers | | | 72,912 | | | 17,048 | | | 20,327 | | | 51,044 | | | 13,594 | | | 19 | | | 174,944 | |
Available-for-sale financial assets | | | 1,695 | | | 8,674 | | | 1,221 | | | 1,497 | | | 1,678 | | | 175 | | | 14,940 | |
Other assets | | | 195 | | | 50 | | | — | | | — | | | — | | | 21,718 | | | 21,963 | |
| | | | | | | | | | | | | | | | | | | | | | | |
Total assets | | | 101,643 | | | 30,673 | | | 25,506 | | | 56,707 | | | 33,215 | | | 62,010 | | | 309,754 | |
| | | | | | | | | | | | | | | | | | | | | | | |
Liabilities | | | | | | | | | | | | | | | | | | | | | | |
Deposits from banks | | | 23,859 | | | 4,866 | | | 1,472 | | | 131 | | | 1,070 | | | 129 | | | 31,527 | |
Customer accounts | | | 112,551 | | | 4,901 | | | 3,941 | | | 4,061 | | | 1,413 | | | 4,203 | | | 131,070 | |
Derivative financial instruments, trading and other liabilities at fair value through profit or loss* | | | — | | | — | | | — | | | — | | | — | | | 6,396 | | | 6,396 | |
Debt securities in issue | | | 20,411 | | | 8,396 | | | 3,905 | | | 1,709 | | | 4,925 | | | — | | | 39,346 | |
Liabilities arising from insurance and investment contracts | | | — | | | — | | | — | | | — | | | — | | | 62,907 | | | 62,907 | |
Other liabilities | | | 50 | | | 23 | | | 65 | | | 1 | | | 3,296 | | | 12,041 | | | 15,476 | |
Subordinated liabilities | | | 746 | | | 890 | | | 504 | | | 2,375 | | | 7,887 | | | — | | | 12,402 | |
| | | | | | | | | | | | | | | | | | | | | | | |
Total liabilities | | | 157,617 | | | 19,076 | | | 9,887 | | | 8,277 | | | 18,591 | | | 85,676 | | | 299,124 | |
| | | | | | | | | | | | | | | | | | | | | | | |
Net repricing gap | | | (55,974 | ) | | 11,597 | | | 15,619 | | | 48,430 | | | 14,624 | | | (23,666 | ) | | 10,630 | |
| | | | | | | | | | | | | | | | | | | | | | | |
| |
* | Derivative financial instruments which are exposed to interest rate risk are carried in the balance sheet at fair value and for the purposes of this analysis have been treated as non-interest bearing. |
F-55
Notes to the group accounts
| |
47 | Financial risk management(continued) |
Currency risk
Foreign exchange exposures comprise those originating in treasury trading activities and structural foreign exchange exposures, which arise from investment in the Group’s overseas operations.
The corporate and retail businesses incur foreign exchange risk in the course of providing services to their customers. All non-structural foreign exchange exposures in the non-trading book are transferred to the trading area where they are monitored and controlled. These risks reside in the authorised trading centres who are allocated exposure limits. The limits are monitored daily by the local centres and reported to Group Treasury. Group Treasury calculates the associated VaR and the closing, average, maximum and minimum for 2005 and 2006 are disclosed on page 56.
Risk arises from the Group’s investments in its overseas operations. The Group’s structural foreign currency exposure is represented by the net asset value of the foreign currency equity and subordinated debt investments in its subsidiaries and branches. Gains or losses on structural foreign currency exposures are taken to retained earnings.
The Group hedges part of the currency translation risk of a net investment in a foreign operation using a cross currency swap. At 31 December 2006 the notional principal of this cross currency swap was £2,589 million with a net fair value asset of £139 million (see note 16) and was designated on an after-tax basis as a hedge of a net investment in a foreign operation.
The structural position is managed by Lloyds TSB Group Capital Funds having regard to the currency composition of the Group’s risk-weighted assets and reported to the group asset and liability committee on a monthly basis. The Group’s main overseas operations are in the Americas and Europe. Details of the Group’s structural foreign currency exposures are as follows:
| | | | | | | | |
| | 2006
£m | | | 2005
£m | |
| | | | | | | |
Functional currency of Group operations: | | | | | | | | |
Euro | | | 76 | | | | 80 | |
US dollar | | | 97 | | | | 102 | |
Swiss franc | | | 70 | | | | 56 | |
Other non-sterling | | | 188 | | | | 183 | |
| | | | | | | | | |
| | | 431 | | | | 421 | |
| | | | | | | | | |
| | | | | | | | |
Credit risk | | | | | | | | |
| | | | | | | | |
The maximum credit risk exposure of the Group in the event of other parties failing to perform their obligations is detailed below. No account is taken of any collateral held and the maximum exposure to loss is considered to be the balance sheet carrying amount or, for non-derivative off-balance sheet transactions and financial guarantees, their contractual nominal amounts. |
| | | | | | | | |
| | 2006
£m | | | 2005
£m | |
| | | | | | | | | |
|
Loans and advances to banks | | | 40,639 | | | | 31,656 | |
Loans and advances to customers | | | 190,478 | | | | 177,016 | |
Deposit amounts available for offset1 | | | (6,392 | ) | | | (6,414 | ) |
Impairment losses | | | (2,194 | ) | | | (2,073 | ) |
| | | 222,531 | | | | 200,185 | |
Available-for-sale debt securities and treasury bills | | | 19,163 | | | | 14,894 | |
Contingent liabilities | | | 2,777 | | | | 11,695 | |
Financial guarantees | | | 8,139 | | | | — | |
Undrawn irrevocable formal standby facilities, credit lines and other commitments to lend2 | | | 51,288 | | | | 43,094 | |
Derivative assets, before netting | | | 5,565 | | | | 5,878 | | |
Amounts available for offset under master netting arrangements1 | | | (2,761 | ) | | | (3,235 | ) | |
| | | 2,804 | | | | 2,643 | |
Trading and other financial assets at fair value through profit or loss | | | 29,568 | | | | 26,869 | |
| | | | | | | | | |
| | | 336,270 | | | | 299,380 | |
| | | | | | | | | |
| |
1 | Deposit amounts available for offset and amounts available for offset under master netting arrangements do not meet the criteria under IAS 32 to enable loans and advances and derivative assets respectively to be presented net of these balances in the financial statements. |
|
2 | See note 46 – Contingent liabilities and commitments for further information. |
Liquidity risk
The Group is exposed to daily calls on its cash resources from current account and other amounts repayable on demand, overnight and other maturing deposits, loan draw-downs and cash-settled derivative instruments.
The Group’s policy requires that each business unit meets its financial obligations as they fall due, that the Group complies with the Financial Services Authority Sterling Stock Liquidity Policy in the UK and that all local regulatory requirements are met.
A substantial proportion of the customer deposit base is made up of current and savings accounts which, although repayable on demand, have traditionally provided a stable source of funding. During 2006, amounts deposited by customers increased by £8,272 million from £131,070 million at 31 December 2005 to £139,342 million at 31 December 2006. These customer deposits are supplemented by the issue of subordinated loan capital and wholesale funding sources in the capital markets, as well as from direct customer contracts. Wholesale funding sources include deposits taken on the inter-bank market, certificates of deposit, sale and repurchase agreements, a Euro Medium-Term Note programme and commercial paper programmes. The Group has also raised wholesale funding via the issuance of Residential Mortgage Backed Securities; £10,048 million was outstanding at 31 December 2006.
The ability to sell assets quickly is also an important source of liquidity for the Group’s banking businesses. The Group holds sizeable balances of marketable debt securities which could be disposed of to provide additional funding should the need arise.
F-56
Notes to the group accounts
| |
47 | Financial risk management (continued) |
The table below analyses assets and liabilities of the Group into relevant maturity groupings based on the remaining period at the balance sheet date; balances with no fixed maturity are included in the over 5 years category.
Maturities of assets and liabilities
| | | | | | | | | | | | | | | | | | | |
| | Up to
1 month
£m | | 1-3
months
£m | | 3-12
months
£m | | 1-5
years
£m | | Over 5
years
£m | | Total
£m | |
| | | | | | | | | | | | | | |
As at 31 December 2006 | | | | | | | | | | | | | | | | | | | |
Assets | | | | | | | | | | | | | | | | | | | |
Trading and other financial assets at fair value through profit or loss | | | 886 | | | 782 | | | 905 | | | 5,589 | | | 59,533 | | | 67,695 | |
Derivative financial instruments | | | 559 | | | 740 | | | 1,198 | | | 1,750 | | | 1,318 | | | 5,565 | |
Loans and advances to banks | | | 22,491 | | | 1,349 | | | 1,539 | | | 9,807 | | | 5,452 | | | 40,638 | |
Loans and advances to customers | | | 28,099 | | | 8,223 | | | 10,716 | | | 40,633 | | | 100,614 | | | 188,285 | |
Available-for-sale financial assets | | | 652 | | | 1,301 | | | 3,446 | | | 6,919 | | | 6,860 | | | 19,178 | |
Other assets | | | 6,228 | | | 191 | | | 61 | | | 175 | | | 15,582 | | | 22,237 | |
| | | | | | | | | | | | | | | | | | | | |
Total assets | | | 58,915 | | | 12,586 | | | 17,865 | | | 64,873 | | | 189,359 | | | 343,598 | |
| | | | | | | | | | | | | | | | | | | | |
Liabilities | | | | | | | | | | | | | | | | | | | |
Deposits from banks | | | 28,268 | | | 3,659 | | | 1,707 | | | 818 | | | 1,942 | | | 36,394 | |
Customer accounts | | | 128,911 | | | 3,394 | | | 4,960 | | | 1,854 | | | 223 | | | 139,342 | |
Derivative financial instruments, trading and other liabilities at fair value through profit or loss | | | 932 | | | 709 | | | 751 | | | 1,972 | | | 2,583 | | | 6,947 | |
Debt securities in issue | | | 28,320 | | | 4,866 | | | 5,912 | | | 8,611 | | | 6,409 | | | 54,118 | |
Liabilities arising from insurance and investment contracts | | | 945 | | | 832 | | | 2,292 | | | 12,474 | | | 49,955 | | | 66,498 | |
Other liabilities | | | 5,707 | | | 325 | | | 361 | | | 274 | | | 10,053 | | | 16,720 | |
Subordinated liabilities | | | — | | | — | | | 300 | | | 1,553 | | | 10,219 | | | 12,072 | |
| | | | | | | | | | | | | | | | | | | | |
Total liabilities | | | 193,083 | | | 13,785 | | | 16,283 | | | 27,556 | | | 81,384 | | | 332,091 | |
| | | | | | | | | | | | | | | | | | | | |
Net liquidity gap | | | (134,168 | ) | | (1,199 | ) | | 1,582 | | | 37,317 | | | 107,975 | | | 11,507 | |
| | | | | | | | | | | | | | | | | | | | |
As at 31 December 2005 | | | | | | | | | | | | | | | | | | | |
Assets | | | | | | | | | | | | | | | | | | | |
Trading and other financial assets at fair value through profit or loss | | | 520 | | | 818 | | | 1,051 | | | 6,271 | | | 51,714 | | | 60,374 | |
Derivative financial instruments | | | 848 | | | 617 | | | 603 | | | 1,906 | | | 1,904 | | | 5,878 | |
Loans and advances to banks | | | 24,372 | | | 1,513 | | | 3,955 | | | 1,357 | | | 458 | | | 31,655 | |
Loans and advances to customers | | | 22,999 | | | 7,696 | | | 10,859 | | | 39,132 | | | 94,258 | | | 174,944 | |
Available-for-sale financial assets | | | 130 | | | 1,092 | | | 1,839 | | | 6,638 | | | 5,241 | | | 14,940 | |
Other assets | | | 6,284 | | | 246 | | | 66 | | | 154 | | | 15,213 | | | 21,963 | |
| | | | | | | | | | | | | | | | | | | | |
Total assets | | | 55,153 | | | 11,982 | | | 18,373 | | | 55,458 | | | 168,788 | | | 309,754 | |
| | | | | | | | | | | | | | | | | | | | |
Liabilities | | | | | | | | | | | | | | | | | | | |
Deposits from banks | | | 23,839 | | | 4,778 | | | 1,710 | | | 141 | | | 1,059 | | | 31,527 | |
Customer accounts | | | 117,410 | | | 5,065 | | | 3,317 | | | 3,773 | | | 1,505 | | | 131,070 | |
Derivative financial instruments | | | 690 | | | 639 | | | 799 | | | 1,893 | | | 2,375 | | | 6,396 | |
Debt securities in issue | | | 20,629 | | | 8,395 | | | 3,887 | | | 1,586 | | | 4,849 | | | 39,346 | |
Liabilities arising from insurance and investment contracts | | | 1,030 | | | 359 | | | 1,263 | | | 9,502 | | | 50,753 | | | 62,907 | |
Other liabilities | | | 5,602 | | | 340 | | | 524 | | | 265 | | | 8,745 | | | 15,476 | |
Subordinated liabilities | | | — | | | 250 | | | — | | | 1,076 | | | 11,076 | | | 12,402 | |
| | | | | | | | | | | | | | | | | | | | |
Total liabilities | | | 169,200 | | | 19,826 | | | 11,500 | | | 18,236 | | | 80,362 | | | 299,124 | |
| | | | | | | | | | | | | | | | | | | | |
Net liquidity gap | | | (114,047 | ) | | (7,844 | ) | | 6,873 | | | 37,222 | | | 88,426 | | | 10,630 | |
| | | | | | | | | | | | | | | | | | | | |
The matching and controlled mismatching of the maturities and interest rates of assets and liabilities is fundamental to the management of the Group. An unmatched position potentially enhances profitability, but also increases the risk of losses.
Fair values of financial assets and liabilities
Financial instruments include financial assets, financial liabilities and derivatives. The fair value of a financial instrument is the amount at which the instrument could be exchanged in a current transaction between willing parties, other than in a forced or liquidation sale.
Wherever possible, fair values have been estimated using market prices for instruments held by the Group. Where market prices are not available, fair values have been estimated using quoted values for instruments with characteristics either identical or similar to those of the instruments held by the Group. In certain cases, where no ready markets currently exist, various techniques (such as discounted cash flows, or observations of similar recent market transactions) have been developed to estimate what the approximate fair value of such instruments might be. These estimation techniques are necessarily subjective in nature and involve several assumptions.
The fair values presented in the following table are at a specific date and may be significantly different from the amounts which will actually be paid or received on the maturity or settlement date.
Because a variety of estimation techniques are employed and significant estimates made, comparisons of fair values between financial institutions may not be meaningful. Readers of these financial statements are thus advised to use caution when using this data to evaluate the Group’s financial position.
F-57
Notes to the group accounts
47 Financial risk management(continued)
Fair value information is not provided for items that do not meet the definition of a financial instrument. These items include intangible assets, such as the value of the Group’s branch network, the long-term relationships with depositors and credit card relationships; premises and equipment; and shareholders’ equity. These items are material and accordingly the Group believes that the fair value information presented does not represent the underlying value of the Group.
The valuation technique for each major category of financial instrument is discussed below.
Trading and other financial assets at fair value through profit or loss
Fair value is determined using market prices.
Derivative financial instruments
All derivatives are recognised at their fair value. Fair values are obtained from quoted market prices in active markets, including recent market transactions, and using valuation techniques, including discounted cash flow and options pricing models, as appropriate. Derivatives are carried in the balance sheet as assets when their fair value is positive and as liabilities when their fair value is negative.
Loans and advances to banks and customers
The Group provides loans and advances to commercial, corporate and personal customers at both fixed and variable rates. The carrying value of the variable rate loans and those relating to lease financing is assumed to be their fair value. For fixed rate lending, several different techniques are used to estimate fair value, as considered appropriate. For commercial and personal customers, fair value is principally estimated by discounting anticipated cash flows (including interest at contractual rates) at market rates for similar loans offered by the Group and other financial institutions. The fair value for corporate loans is estimated by discounting anticipated cash flows at a rate which reflects the effects of interest rate changes, adjusted for changes in credit risk. Certain loans secured on residential properties are made at a fixed rate for a limited period, typically two to five years, after which the loans revert to the relevant variable rate. The fair value of such loans is estimated by reference to the market rates for similar loans of maturity equal to the remaining fixed interest rate period.
Available-for-sale financial assets
Listed securities are valued at current bid prices. Unlisted securities and other financial assets are valued based on discounted cash flows, market prices of similar instruments and other appropriate valuation techniques.
Investment properties
Fair values represent open-market values determined by an independent, professionally qualified valuer.
Deposits from banks and customer accounts
The fair value of deposits repayable on demand is considered to be equal to their carrying value. The fair value for all other deposits and customer accounts is estimated using discounted cash flows applying either market rates, where applicable, or current rates for deposits of similar remaining maturities.
Debt securities in issue and subordinated liabilities
The fair value of short-term debt securities in issue is approximately equal to their carrying value. Fair value for other debt securities and for subordinated liabilities is estimated using quoted market prices.
Trading and other liabilities at fair value through profit or loss
Fair value is determined using valuation techniques based upon market prices.
Liabilities arising from non-participating investment contracts
The value of the Group’s non-participating investment contracts, all of which are unit-linked, is contractually linked to the fair values of financial assets within the Group’s unitised investment funds and is determined using current unit prices multiplied by the number of units attributed to the contract holders at the balance sheet date. Their value is never less than the amount payable on surrender, discounted for the required notice period where applicable.
Financial commitments and contingent liabilities
Financial guarantees are valued on the basis of cash premiums receivable. The Group considers that it is not meaningful to provide an estimate of the fair value of other contingent liabilities and financial commitments, given the lack of an established market, the diversity of fee structures and the difficulty of separating the value of the instruments from the value of the overall transaction. Therefore only financial guarantees are included in the following table.
| | | | | | | | | | | | | |
| | Carrying value
2006
£m | | Carrying value
2005
£m | | Fair value
2006
£m | | Fair value
2005
£m | |
| | | | | | | | | | |
Financial assets | | | | | | | | | | | | | |
Trading and other financial assets at fair value through profit or loss | | | 67,695 | | | 60,374 | | | 67,695 | | | 60,374 | |
Derivative financial instruments | | | 5,565 | | | 5,878 | | | 5,565 | | | 5,878 | |
Loans and advances to banks | | | 40,638 | | | 31,655 | | | 40,641 | | | 31,691 | |
Loans and advances to customers | | | 188,285 | | | 174,944 | | | 187,977 | | | 175,554 | |
Available-for-sale financial assets | | | 19,178 | | | 14,940 | | | 19,178 | | | 14,940 | |
Investment properties | | | 4,739 | | | 4,260 | | | 4,739 | | | 4,260 | |
| | | | | | | | | | | | | |
Financial liabilities | | | | | | | | | | | | | |
Deposits from banks | | | 36,394 | | | 31,527 | | | 36,383 | | | 31,508 | |
Customer accounts | | | 139,342 | | | 131,070 | | | 139,263 | | | 131,052 | |
Trading and other liabilities at fair value through profit or loss | | | 1,184 | | | — | | | 1,184 | | | — | |
Derivative financial instruments | | | 5,763 | | | 6,396 | | | 5,763 | | | 6,396 | |
Debt securities in issue | | | 54,118 | | | 39,346 | | | 54,070 | | | 39,352 | |
Liabilities arising from non-participating investment contracts | | | 24,370 | | | 21,839 | | | 24,370 | | | 21,839 | |
Financial guarantees | | | 49 | | | — | | | 49 | | | — | |
Subordinated liabilities | | | 12,072 | | | 12,402 | | | 12,767 | | | 13,262 | |
| | | | | | | | | | | | | | |
F-58
Notes to the group accounts
During 2006, the Group, through its Asset Finance subsidiaries, acquired two businesses engaged in consumer finance for a total consideration of £16 million, settled in cash. Goodwill of £4 million arose on these acquisitions; no significant fair value adjustments were made.
In 2005 the Group, through its subsidiary The Dutton-Forshaw Motor Company Limited, completed the purchases of the assets and trade of three separate motor dealership businesses for a total consideration of £16 million, settled in cash. Goodwill of £3 million arose on these acquisitions; no significant fair value adjustments were made.
| | | | | | | | | | | | | |
| | | | | | | | | | | | | | |
| | | | | | | | | | | | | |
49 Consolidated cash flow statement | | | | | | | | | | | | | |
| | | | | | | | | | | | | |
(a) Change in operating assets | | | 2006 | | | | 2005 | | | | 2004 | | |
| | | £m | | | | £m | | | | £m | | |
| | | | | | | | | | | | | | |
| | | | | | | | | | | | | |
Change in loans and advances to banks | | | (11,063 | ) | | | (1,319 | ) | | | (964 | ) | |
Change in loans and advances to customers | | | (13,910 | ) | | | (14,525 | ) | | | (19,681 | ) | |
Change in derivative financial instruments, trading and other financial assets at | | | | | | | | | | | | | |
fair value through profit or loss | | | (7,072 | ) | | | (103 | ) | | | 844 | | |
Change in other operating assets | | | 50 | | | | (1,211 | ) | | | (1,534 | ) | |
| | | | | | | | | | | | | | |
Change in operating assets | | | (31,995 | ) | | | (17,158 | ) | | | (21,335 | ) | |
| | | | | | | | | | | | | | |
| | | | | | | | | | | | | |
(b) Change in operating liabilities | | | 2006 | | | | 2005 | | | | 2004 | | |
| | | £m | | | | £m | | | | £m | | |
| | | | | | | | | | | | | | |
Change in deposits from banks | | | 5,222 | | | | (8,168 | ) | | | 16,046 | | |
Change in customer accounts | | | 8,523 | | | | 4,619 | | | | 5,676 | | |
Change in debt securities in issue | | | 15,068 | | | | 10,280 | | | | 1,876 | | |
Change in derivative financial instruments, trading and other liabilities at | | | | | | | | | | | | | |
fair value through profit or loss | | | 556 | | | | (3,937 | ) | | | — | | |
Change in investment contract liabilities | | | 3,795 | | | | 6,094 | | | | — | | |
Change in other operating liabilities | | | (95 | ) | | | 1,151 | | | | 2,835 | | |
| | | | | | | | | | | | | | |
Change in operating liabilities | | | 33,069 | | | | 10,039 | | | | 26,433 | | |
| | | | | | | | | | | | | | |
| | | | | | | | | | | | | |
(c) Non-cash and other items | | | 2006 | | | | 2005 | | | | 2004 | | |
| | | £m | | | | £m | | | | £m | | |
| | | | | | | | | | | | | | |
Depreciation of fixed assets | | | 619 | | | | 639 | | | | 638 | | |
Revaluation of investment property | | | (631 | ) | | | (430 | ) | | | (329 | ) | |
Allowance for loan losses | | | 1,560 | | | | 1,302 | | | | 866 | | |
Write-off of allowance for loan losses | | | (1,299 | ) | | | (1,078 | ) | | | (854 | ) | |
Impairment of goodwill | | | — | | | | 6 | | | | — | | |
Insurance claims | | | 8,569 | | | | 12,186 | | | | 9,622 | | |
Insurance claims paid | | | (7,509 | ) | | | (8,269 | ) | | | (5,338 | ) | |
Customer remediation provision | | | — | | | | 150 | | | | 112 | | |
Customer remediation paid | | | (93 | ) | | | (77 | ) | | | (245 | ) | |
Other provision movements | | | (19 | ) | | | (7 | ) | | | — | | |
Net charge in respect of defined benefit schemes | | | 109 | | | | 259 | | | | 275 | | |
Contributions to defined benefit schemes | | | (556 | ) | | | (425 | ) | | | (374 | ) | |
Other non-cash items | | | 104 | | | | (525 | ) | | | 146 | | |
| | | | | | | | | | | | | | |
Total non-cash items | | | 854 | | | | 3,731 | | | | 4,519 | | |
Interest expense on subordinated liabilities | | | 744 | | | | 698 | | | | 601 | | |
Profit on disposal of businesses | | | — | | | | (50 | ) | | | 21 | | |
Other | | | (43 | ) | | | (15 | ) | | | (119 | ) | |
Total other items | | | 701 | | | | 633 | | | | 503 | | |
| | | | | | | | | | | | | | |
Non-cash and other items | | | 1,555 | | | | 4,364 | | | | 5,022 | | |
| | | | | | | | | | | | | | |
F-59
Notes to the group accounts
| | | | | | | | | | | | | |
49 Consolidated cash flow statement (continued) | | | | | | | | | | | | | |
| | | | | | | | | | | | | |
(d) Analysis of cash and cash equivalents as shown in the balance sheet | | | 2006 | | | | 2005 | | | | 2004 | | |
| | | £m | | | | £m | | | | £m | | |
| | | | | | | | | | | | | | |
| | | | | | | | | | | | | |
Cash and balances with central banks | | | 1,898 | | | | 1,156 | | | | 1,078 | | |
Less: mandatory reserve deposits1 | | | (300 | ) | | | (288 | ) | | | (245 | ) | |
| | | 1,598 | | | | 868 | | | | 833 | | |
| | | | | | | | | | | | | |
Loans and advances to banks | | | 40,638 | | | | 31,655 | | | | 31,848 | | |
Less: amounts with a maturity of three months or more | | | (16,798 | ) | | | (5,770 | ) | | | (4,485 | ) | |
| | | 23,840 | | | | 25,885 | | | | 27,363 | | |
| | | | | | | | | | | | | | |
Total cash and cash equivalents | | | 25,438 | | | | 26,753 | | | | 28,196 | | |
| | | | | | | | | | | | | | |
| |
1 Mandatory reserve deposits are held with local central banks in accordance with statutory requirements; these deposits are not available to finance the Group’s day-to-day operations. |
| |
Included within cash and cash equivalents at 31 December 2006 is £9,054 million (2005: £8,860 million; 2004: £7,920 million) held within the Group’s life funds, which is not immediately available for use in the business. |
| |
| | | | | | | | | | | | | |
(e) Analysis of changes in financing during the year | | | 2006 | | | | 2005 | | | | 2004 | | |
| | | £m | | | | £m | | | | £m | | |
| | | | | | | | | | | | | | |
Share capital (including share premium account): | | | | | | | | | | | | | |
At 1 January | | | 2,590 | | | | 2,564 | | | | 2,554 | | |
Issue of share capital | | | 105 | | | | 26 | | | | 10 | | |
| | | | | | | | | | | | | | |
At 31 December | | | 2,695 | | | | 2,590 | | | | 2,564 | | |
| | | | | | | | | | | | | | |
| | | | | | | | | | | | | |
The amounts shown as cash inflows from financing include proceeds in respect of the above issues of share capital together with a net cash inflow in 2004 of £1 million relating to transactions in own shares held in respect of employee share schemes. |
| | | | | | | | | | | | | |
| | | 2006 | | | | 2005 | | | | 2004 | | |
| | | £m | | | | £m | | | | £m | | |
| | | | | | | | | | | | | | |
Minority interests: | | | | | | | | | | | | | |
At 1 January | | | 435 | | | | 631 | | | | 782 | | |
Adjustments on adoption of IAS 32, IAS 39 and IFRS 4 | | | | | | | (550 | ) | | | | | |
| | | | | | | | | | | | | |
| | | | | | | | | | | | | | |
| | | | | | | | | | | | | |
At 1 January – restated | | | | | | | 81 | | | | | | |
Exchange and other adjustments | | | (4 | ) | | | — | | | | 1 | | |
Capital invested by minority shareholders | | | — | | | | 329 | | | | — | | |
Repayment of capital to minority shareholders | | | (151 | ) | | | — | | | | (151 | ) | |
Minority share of profit after tax | | | 104 | | | | 62 | | | | 67 | | |
Dividends to minority shareholders | | | (32 | ) | | | (37 | ) | | | (68 | ) | |
| | | | | | | | | | | | | | |
At 31 December | | | 352 | | | | 435 | | | | 631 | | |
| | | | | | | | | | | | | | |
| | | | | | | | | | | | | |
| | | 2006 | | | | 2005 | | | | 2004 | | |
| | | £m | | | | £m | | | | £m | | |
| | | | | | | | | | | | | | |
| | | | | | | | | | | | | |
Subordinated liabilities and finance leases: | | | | | | | | | | | | | |
At 1 January | | | 12,418 | | | | 10,273 | | | | 10,469 | | |
Adjustments on adoption of IAS 32, IAS 39 and IFRS 4 | | | | | | | 959 | | | | | | |
| | | | | | | | | | | | | |
| | | | | | | | | | | | | | |
| | | | | | | | | | | | | |
At 1 January – restated | | | | | | | 11,232 | | | | | | |
Exchange and other adjustments | | | (687 | ) | | | 59 | | | | (136 | ) | |
Issue of subordinated liabilities | | | 1,116 | | | | 1,361 | | | | 699 | | |
Repayments of subordinated liabilities | | | (759 | ) | | | (232 | ) | | | (764 | ) | |
Lease financing | | | — | | | | — | | | | 6 | | |
Finance lease capital repayments | | | — | | | | (2 | ) | | | (1 | ) | |
| | | | | | | | | | | | | | |
At 31 December | | | 12,088 | | | | 12,418 | | | | 10,273 | | |
| | | | | | | | | | | | | | |
F-60
Notes to the group accounts
| | | | | | | | | | | | | |
49 Consolidated cash flow statement (continued) | | | | | | | | | | | | | |
| | | | | | | | | | | | | |
(f) Acquisition of group undertakings and businesses | | | 2006 | | | | 2005 | | | | 2004 | | |
| | | £m | | | | £m | | | | £m | | |
| | | | | | | | | | | | | | |
Net assets acquired: | | | | | | | | | | | | | |
Loans and advances to customers | | | 11 | | | | — | | | | — | | |
Other assets | | | 1 | | | | 8 | | | | — | | |
Tangible fixed assets | | | — | | | | 8 | | | | — | | |
Other liabilities | | | — | | | | (3 | ) | | | — | | |
| | | | | | | | | | | | | | |
| | | 12 | | | | 13 | | | | — | | |
Goodwill arising on consolidation | | | 4 | | | | 3 | | | | — | | |
| | | | | | | | | | | | | | |
Net cash outflow from acquisitions in the year* | | | 16 | | | | 16 | | | | — | | |
Payments to former members of Scottish Widows Fund and Life Assurance Society acquired during 2000 | | | 4 | | | | 11 | | | | 15 | | |
Deferred consideration in respect of acquisition in 2002 | | | — | | | | — | | | | 1 | | |
| | | | | | | | | | | | | | |
Net cash outflow from acquisitions | | | 20 | | | | 27 | | | | 16 | | |
| | | | | | | | | | | | | | |
| |
* The consideration in respect of the acquisitions in both 2005 and 2006 was settled in cash in the year concerned. |
| | | | | | | | | | | | | |
(g) Disposal and closure of group undertakings and businesses | | | 2006 | | | | 2005 | | | | 2004 | | |
| | | £m | | | | £m | | | | £m | | |
| | | | | | | | | | | | | | |
Cash and cash equivalents | | | — | | | | — | | | | 46 | | |
Loans and advances to banks | | | — | | | | — | | | | 132 | | |
Loans and advances to customers | | | — | | | | 803 | | | | 257 | | |
Debt securities and treasury bills | | | — | | | | — | | | | 59 | | |
Goodwill | | | — | | | | 93 | | | | 10 | | |
Other intangible assets | | | — | | | | — | | | | 9 | | |
Deposits by banks | | | — | | | | — | | | | (42 | ) | |
Customer accounts | | | — | | | | — | | | | (327 | ) | |
Debt securities in issue | | | — | | | | — | | | | (111 | ) | |
Other net assets and liabilities | | | — | | | | (946 | ) | | | 9 | | |
| | | | | | | | | | | | | | |
| | | — | | | | (50 | ) | | | 42 | | |
Profit (loss) on sale and closure of businesses | | | — | | | | 50 | | | | (21 | ) | |
| | | | | | | | | | | | | | |
Cash and cash equivalent consideration received | | | — | | | | — | | | | 21 | | |
Cash and cash equivalents disposed of | | | — | | | | — | | | | (46 | ) | |
| | | | | | | | | | | | | | |
Net cash outflow from disposals in the year | | | — | | | | — | | | | (25 | ) | |
Consideration for 2005 disposal settled in cash | | | 936 | | | | — | | | | — | | |
Adjustment to consideration received in respect of prior period disposals | | | — | | | | (4 | ) | | | — | | |
| | | | | | | | | | | | | | |
Net cash inflow (outflow) from disposals | | | 936 | | | | (4 | ) | | | (25 | ) | |
| | | | | | | | | | | | | | |
50 Adoption of International Financial Reporting Standards in 2005
When the Lloyds TSB Group adopted IFRS in 2005, this differed in certain respects from the Lloyds TSB Group’s previous accounting policies, which complied with UK Generally Accepted Accounting Principles (‘UK GAAP’). Comparatives for 2004 were restated in a number of respects, but certain standards (IAS 32 ‘Financial Instruments: Disclosure and Presentation’, IAS 39 ‘Financial Instruments: Recognition and Measurement’ and IFRS 4 ‘Insurance Contracts’) were only applied prospectively from 1 January 2005. Set out below are explanations and reconciliations showing the effect of the adoption of the prospective IFRS and FRS 27 upon the Lloyds TSB Group’s previously published financial information.
Accounting changes effective from 1 January 2005 and which do not affect 2004 comparatives:
Fees integral to effective yield (IAS 18, IAS 39)
Fees and commissions that are an integral part of the effective yield on a financial instrument, and direct incremental costs associated with its origination, are included in the calculation of the effective interest rate and recognised over the expected life of the instrument, or a shorter period if appropriate. As a result the recognition of up-front fees and costs that were recognised when received, or incurred, under UK GAAP, for example those related to loan origination, are now deferred and the recognition of fee income typically charged at the end of an agreement, for example early redemption charges on mortgages, brought forward.
Loan impairment (IAS 39)
IFRS adopts an incurred loss model for impairment losses on loans and provides guidance on the measurement of impairment. Any provision required is calculated by comparing the book value of the loans with the net present value of the expected future cash flows from the loans discounted at their effective interest rates or, as a practical expedient for variable rate loans, using observable market prices. The impairment principles under IFRS are similar to those followed by the Group under UK GAAP, with the exception of the requirements to discount the expected cash flows at the original effective interest rate when determining the provisioning requirement.
Netting (IAS 32)
IFRS prohibits financial assets and financial liabilities from being offset unless there is a legal right of set-off and the asset and liability are in practice normally settled, or there is an intention to settle, on a net basis. In the banking business, this has resulted in the grossing-up on the balance sheet of certain assets and liabilities subject to set-off arrangements that were presented net under UK GAAP.
F-61
Notes to the group accounts
50 Adoption of International Financial Reporting Standards in 2005(continued)
Derivative financial instruments and hedging (IAS 39)
The Group enters into derivative contracts for both trading purposes and to hedge exposures arising from within the banking book. Under UK GAAP trading derivatives were carried at fair value but hedging derivatives were accounted for on the same basis as the underlying hedged item, mainly on an accruals basis. IAS 39 requires that all derivative contracts are carried at fair value on the Group’s balance sheet and movements in their fair value are reflected in the income statement except where cash flow hedging is applied; this results in a mismatch between the accounting and the underlying economics where the Group has hedged its economic risk resulting from the different treatment of the derivative and the underlying hedged position.
The Group has not changed the way it hedges its economic exposures as a result of the implementation of IFRS, but the Group seeks to mitigate the resulting income statement volatility by the application of hedge accounting. Although the Group intends to mitigate the volatility arising from the requirement to fair value all derivatives as far as possible, this will be a source of increased volatility in the income statement in 2005 and beyond.
Other non-derivative financial assets (IAS 39)
IAS 39 permits financial assets to be designated at the time of initial recognition as being held at fair value, with unrecognised gains or losses reported in the income statement. Certain loans and advances and debt securities previously carried at amortised cost under UK GAAP have been designated as held at fair value through profit or loss on adoption of IAS 39 and have been valued at their fair value at 1 January 2005.
Under UK GAAP debt securities held for continuing use in the business were classified as investment securities and carried in the balance sheet at cost less any provisions for permanent diminution in value. IAS 39 introduces strict requirements to be met before debt securities can be carried at amortised cost and the Group has determined that it does not meet these. Accordingly debt securities previously classified as investment securities have been reclassified as available-for-sale and valued at their fair values at 1 January 2005. Equity investments may not be carried at cost under IAS 39 and these have also been reclassified as available-for-sale.
Insurance (IFRS 4, IAS 39, IAS 18)
IFRS 4 applies to contracts under which the insurer agrees to compensate the policyholder if a specified uncertain future event adversely affects the policyholder as well as to investment contracts which entitle the holder to receive additional discretionary benefits depending on performance. For contracts within the scope of IFRS 4, accounting practices are largely unchanged except for the modifications introduced by FRS 27 which is dealt with separately below.
Investment contracts that are not within the scope of IFRS 4 are accounted for as financial instruments under IAS 39. The principal effects of this change on the accounting for non-participating investment contracts are the removal of that portion of the embedded value which represents the value of in-force business relating to those contracts, the recognition of an asset for deferred acquisition costs, and the deferral of up-front fees received for investment management services; deferred acquisition costs and deferred up-front fees are amortised over the period of the provision of investment management services.
Life assurance (FRS 27)
Following the implementation of FRS 27, the Group excludes from the value of in-force business recognised in the balance sheet any amounts that reflect future investment margins and measures the liabilities of the Scottish Widows With-Profits Fund in accordance with the realistic capital regime of the Financial Services Authority. This basis includes a realistic valuation of guarantees and options embedded within products written by the With-Profits Fund. The principal effect of these new requirements is on the measurement of the in-force business, as the valuation of the With-Profits Fund on a realistic basis reduces the expected income to the shareholder from that fund. Changes in the valuation are reflected in the income statement and because this is market related it is inherently volatile.
Equity to debt reclassification (IAS 32)
The classification of the majority of the Group’s capital and subordinated debt instruments continues to follow their UK GAAP treatment. However, the Group’s preferred securities, which were treated as non-equity minority interests under UK GAAP, have been reclassified as debt because the coupon payment is not discretionary. Distributions on these securities are shown as interest expense rather than as minority interests.
Derecognition of financial liabilities (IAS 39)
Under IFRS a financial liability may only be removed from the balance sheet after it has been settled, it has expired or alternatively the debtor has been legally released from the liability, either by process of law or by the creditor. Upon adoption of IFRS, certain financial liabilities in respect of which amounts had been released to the income statement under UK GAAP on the basis that the likelihood of their settlement was remote have been remeasured as at 1 January 2005 to reflect the entire legal obligation.
F-62
Notes to the group accounts
50 Adoption of International Financial Reporting Standards(continued)
Restated consolidated balance sheet (reconciliation of equity) at 1 January 2005 (includes effects of IAS 32, IAS 39 and IFRS 4)
| | | | | | | | | | | | | | | | | | | | | | | | | | | | | | | | | | | | | | | | | | | | |
| | Restated
31 December
2004
£m | | Reclassi-
fications
£m | | Effective
interest
rate
£m | | Impair-
ment
£m | | Offset
£m | | Derivatives
£m | | Available-
for-sale
£m | | Insurance
£m | | Debt
equity
£m | | Other
£m | | 1 January
2005
£m | |
| | | | | | | | | | | | | | | | | | | | | | | | |
| | | | | | | | | | | | | | | | | | | | | | | | | | | | | | | | | | |
Assets | | | | | | | | | | | | | | | | | | | | | | | | | | | | | | | | | | |
Cash and balances at central banks | | | 1,078 | | | — | | | — | | | — | | | — | | | — | | | — | | | — | | | — | | | — | | | 1,078 | |
Items in the course of collection from banks | | | 1,462 | | | — | | | — | | | — | | | — | | | — | | | — | | | — | | | — | | | — | | | 1,462 | |
Treasury bills and other eligible bills | | | 92 | | | (92 | ) | | — | | | — | | | — | | | — | | | — | | | — | | | — | | | — | | | | |
Trading securities and other financial | | | | | | | | | | | | | | | | | | | | | | | | | | | | | | | | | | |
assets at fair value through profit or loss | | | | | | 56,865 | | | — | | | — | | | — | | | 25 | | | — | | | (45 | ) | | — | | | (5 | ) | | 56,840 | |
|
Derivative financial instruments | | | | | | 4,869 | | | — | | | — | | | 3,956 | | | 438 | | | — | | | — | | | — | | | — | | | 9,263 | |
Loans and advances to banks | | | 31,848 | | | — | | | 3 | | | — | | | — | | | — | | | — | | | — | | | — | | | — | | | 31,851 | |
Loans and advances to customers | | | 155,318 | | | (337 | ) | | 108 | | | (314 | ) | | 6,287 | | | 95 | | | — | | | — | | | — | | | 5 | | | 161,162 | |
Debt securities | | | 43,485 | | | (43,485 | ) | | — | | | — | | | — | | | — | | | — | | | — | | | — | | | — | | | | |
|
Equity shares | | | 27,310 | | | (27,310 | ) | | — | | | — | | | — | | | — | | | — | | | — | | | — | | | — | | | | |
Available-for-sale financial assets | | | | | | 14,385 | | | — | | | — | | | — | | | 175 | | | 33 | | | — | | | — | | | — | | | 14,593 | |
Investment property | | | 3,776 | | | — | | | — | | | — | | | — | | | — | | | — | | | — | | | — | | | — | | | 3,776 | |
Goodwill | | | 2,469 | | | — | | | — | | | — | | | — | | | — | | | — | | | — | | | — | | | — | | | 2,469 | |
Value of in-force business | | | 4,363 | | | — | | | — | | | — | | | — | | | — | | | — | | | (1,603 | ) | | — | | | — | | | 2,760 | |
Intangible assets | | | 28 | | | — | | | — | | | — | | | — | | | — | | | — | | | — | | | — | | | — | | | 28 | |
Fixed assets | | | 4,180 | | | — | | | — | | | — | | | — | | | — | | | — | | | — | | | — | | | — | | | 4,180 | |
Other assets | | | 9,013 | | | (4,869 | ) | | (137 | ) | | — | | | — | | | (910 | ) | | — | | | 291 | | | — | | | 4 | | | 3,392 | |
| | | | | | | | | | | | | | | | | | | | | | | | | | | | | | | | | | | |
Total assets | | | 284,422 | | | 26 | | | (26 | ) | | (314 | ) | | 10,243 | | | (177 | ) | | 33 | | | (1,357 | ) | | — | | | 4 | | | 292,854 | |
| | | | | | | | | | | | | | | | | | | | | | | | | | | | | | | | | | | |
Equity and liabilities | | | | | | | | | | | | | | | | | | | | | | | | | | | | | | | | | | |
Liabilities | | | | | | | | | | | | | | | | | | | | | | | | | | | | | | | | | | |
Deposits from banks | | | 39,723 | | | — | | | — | | | — | | | — | | | — | | | — | | | — | | | — | | | — | | | 39,723 | |
Customer accounts | | | 119,811 | | | (36 | ) | | (13 | ) | | — | | | 6,287 | | | 127 | | | — | | | — | | | — | | | 173 | | | 126,349 | |
Items in course of transmission to banks | | | 631 | | | — | | | — | | | — | | | — | | | — | | | — | | | — | | | — | | | — | | | 631 | |
Derivative financial instruments and | | | | | | | | | | | | | | | | | | | | | | | | | | | | | | | | | | |
other trading liabilities | | | | | | 5,943 | | | — | | | — | | | 3,956 | | | 435 | | | — | | | — | | | — | | | — | | | 10,334 | |
Liabilities to customers under | | | | | | | | | | | | | | | | | | | | | | | | | | | | | | | | | | |
investment contracts | | | | | | 16,354 | | | — | | | — | | | — | | | — | | | — | | | 7 | | | — | | | — | | | 16,361 | |
Debt securities in issue | | | 28,770 | | | — | | | — | | | — | | | — | | | (42 | ) | | — | | | — | | | — | | | — | | | 28,728 | |
Insurance contract liabilities | | | 52,289 | | | (16,354 | ) | | — | | | — | | | — | | | — | | | — | | | 790 | | | — | | | — | | | 36,725 | |
Unallocated surplus within insurance | | | | | | | | | | | | | | | | | | | | | | | | | | | | | | | | | | |
business | | | 1,362 | | | — | | | — | | | — | | | — | | | — | | | — | | | (936 | ) | | — | | | — | | | 426 | |
Other liabilities | | | 14,916 | | | (5,940 | ) | | (45 | ) | | — | | | — | | | (784 | ) | | — | | | 416 | | | — | | | (37 | ) | | 8,526 | |
Deferred tax liabilities | | | 1,704 | | | — | | | 10 | | | (93 | ) | | — | | | (82 | ) | | 5 | | | (568 | ) | | — | | | (51 | ) | | 925 | |
Other provisions | | | 211 | | | 59 | | | — | | | — | | | — | | | — | | | — | | | — | | | — | | | — | | | 270 | |
Retirement benefit obligations | | | 3,075 | | | — | | | — | | | — | | | — | | | — | | | — | | | — | | | — | | | — | | | 3,075 | |
Subordinated liabilities | | | 10,252 | | | — | | | — | | | — | | | — | | | 361 | | | — | | | — | | | 550 | | | 48 | | | 11,211 | |
| | | | | | | | | | | | | | | | | | | | | | | | | | | | | | | | | | | |
Total liabilities | | | 272,744 | | | 26 | | | (48 | ) | | (93 | ) | | 10,243 | | | 15 | | | 5 | | | (291 | ) | | 550 | | | 133 | | | 283,284 | |
| | | | | | | | | | | | | | | | | | | | | | | | | | | | | | | | | | | |
Equity | | | | | | | | | | | | | | | | | | | | | | | | | | | | | | | | | | |
Share capital | | | 1,419 | | | | — | | | | — | | | | — | | | | — | | | | — | | | | — | | | | — | | | | — | | | | — | | | | 1,419 | |
Share premium account | | | 1,145 | | | | — | | | | — | | | | — | | | | — | | | | — | | | | — | | | | — | | | | — | | | | — | | | | 1,145 | |
Other reserves | | | 343 | | | | — | | | | — | | | | — | | | | — | | | | — | | | | 28 | | | | — | | | | — | | | | — | | | | 371 | |
Retained profits | | | 8,140 | | | | — | | | | 22 | | | | (221 | ) | | | — | | | | (192 | ) | | | — | | | | (1,066 | ) | | | — | | | | (129 | ) | | | 6,554 | |
Shareholders’ equity | | | 11,047 | | | — | | | 22 | | | (221 | ) | | — | | | (192 | ) | | 28 | | | (1,066 | ) | | — | | | (129 | ) | | 9,489 | |
Minority interests | | | 631 | | | — | | | — | | | — | | | — | | | — | | | — | | | — | | | (550 | ) | | — | | | 81 | |
| | | | | | | | | | | | | | | | | | | | | | | | | | | | | | | | | | | |
Total equity | | | 11,678 | | | — | | | 22 | | | (221 | ) | | — | | | (192 | ) | | 28 | | | (1,066 | ) | | (550 | ) | | (129 | ) | | 9,570 | |
| | | | | | | | | | | | | | | | | | | | | | | | | | | | | | | | | | | |
Total equity and liabilities | | | 284,422 | | | 26 | | | (26 | ) | | (314 | ) | | 10,243 | | | (177 | ) | | 33 | | | (1,357 | ) | | — | | | 4 | | | 292,854 | |
| | | | | | | | | | | | | | | | | | | | | | | | | | | | | | | | | | | |
F-63
Notes to the group accounts
51 Future developments
The following pronouncements will be relevant to the Group but were not effective at 31 December 2006 and have not been applied in preparing these financial statements.
| | | | |
Pronouncement | | Nature of change | | Effective date |
| | | | | |
| |
IFRS 7 Financial Instruments: Disclosures1 | | Consolidates the current financial instruments disclosures into a single standard and requires more detailed qualitative and quantitative disclosures about exposure to risks arising from financial instruments. | | Annual periods beginning on or after 1 January 2007. |
| |
| | | | | |
| |
Amendment to IAS 1 Presentation of Financial Statements – Capital Disclosures | | Introduces additional disclosures of the objectives, policies and processes for managing capital, quantitative data about what the entity regards as capital, and compliance with capital requirements. | | Annual periods beginning on or after 1 January 2007. |
| |
| | | | | |
| |
IFRIC 11 IFRS 2 – Group and Treasury Share Transactions2,3 | | Clarifies the application of IFRS 2 Share-based Payment to certain share-based payment arrangements involving own equity instruments and arrangements involving equity instruments of a parent entity. | | Annual periods beginning on or after 1 March 2007. |
| |
| | | | | |
| |
IFRS 8 Operating Segments2,3 | | Replaces IAS 14 Segment Reporting and requires reporting of financial and descriptive information about operating segments which are based on how financial information is reported and evaluated internally. | | Annual periods beginning on or after 1 January 2009. |
| |
| | | | | |
| |
1 | Includes consequential changes to other pronouncements. |
| |
2 | At the date of this report, these pronouncements are awaiting EU endorsement. |
| |
3 | Pending EU endorsement, the Group has not yet made a final decision as to whether it will apply these pronouncements in the 2007 financial statements. |
| |
| The full impact of these accounting changes is being assessed by the Group; none of these pronouncements are expected to cause any material adjustments to the financial statements. |
F-64
Notes to the group accounts
52 Differences between IFRS and US GAAP
The accounts presented in this report have been prepared in accordance with International Financial Reporting Standards (‘IFRS’) as adopted by the European Union (‘EU’). These differ in significant respects from the accounting principles generally accepted in the United States (‘US GAAP’). A summary of significant differences applicable to Lloyds TSB Group is detailed below. IFRS as adopted by the EU is identical in all respects to IFRS as issued by the IASB except for the EU’s amendment to IAS 39. The Lloyds TSB Group has not taken advantage of the EU’s amendment to IAS 39; accordingly, there would be no change to the reported income or equity if Lloyds TSB Group were to have applied IFRS as issued by the IASB.
| | |
IFRS | | US GAAP |
| | | |
Business combinations | | |
| | | |
IFRS 3 ‘Business Combinations’ requires that the purchase method be used for all business combinations. Under the transitional provisions of IFRS 1 ‘First Time Adoption of IFRS’, Lloyds TSB Group has not applied IFRS 3, or its predecessor IAS 22 ‘Business Combinations’ to transactions that occurred before 1 January 2004, the date of transition to IFRS. These transactions have been accounted for under UK GAAP, which permitted merger accounting, subject to certain criteria being met. | | Following the implementation of Statement of Financial Accounting Standards (SFAS) 141 ‘Business Combinations’, which supersedes Accounting Principles Board (APB) Opinion 16 ‘Business Combinations’, the purchase method must be used for all business combinations initiated after 30 June 2001. For business combinations initiated before 1 July 2001, APB Opinion 16 required that a business combination be accounted for as a pooling-of-interests if two previously independent entities combined as a result of one entity issuing common stock in exchange for substantially all the common stock of the second entity provided that certain other conditions were met. If these conditions were not met, then the business combination was required to be accounted for as a purchase. |
| | | |
Intangible assets | | |
| | | |
IFRS 3 requires that goodwill arising on all acquisitions by group and associated undertakings is capitalised but not amortised and is subject to regular review for impairment. Under the transitional provisions of IFRS 1, Lloyds TSB Group has not applied IFRS 3, or its predecessor IAS 22, to transactions that occurred before 1 January 2004, the date of transition to IFRS. Accordingly, goodwill previously written off to reserves, as permitted under UK GAAP until the implementation of FRS 10 ‘Goodwill and intangible assets’ in 1998, has not been reinstated nor will it be written back on disposal. Amortisation of goodwill that has been charged up to 31 December 2003 has not been reversed and the deemed carrying value of the goodwill on transition to IFRS is equal to the net book value as at 31 December 2003.
For acquisitions occurring on or after 1 January 2004, IFRS 3 requires that, when assessing the value of the assets of an acquired entity, certain identifiable intangible assets, which may not be the same as those recognised under US GAAP, must be recognised and amortised through the income statement over an appropriate period. | | Following the implementation in full of SFAS 142 ‘Goodwill and Other Intangible Assets’ on 1 January 2002, goodwill arising on all acquisitions by group and associated undertakings is capitalised but not amortised and is subject to regular review for impairment. Prior to the adoption of SFAS 142, the Group accounted for goodwill under the provisions of APB 17 ‘Intangible Assets’ which required that all goodwill be capitalised and amortised over its estimated useful life, which should not exceed 40 years; the Group amortised goodwill over periods of up to 20 years. Goodwill amortised prior to the adoption of SFAS 142 is not permitted to be reinstated.
For acquisitions occurring on or after 1 July 2001, SFAS 141 requires that, when assessing the value of the assets of an acquired entity, certain identifiable intangible assets must be recognised. Such identifiable intangible assets include the asset representing the value of customer relationships, which is capitalised separately and amortised through the income statement over the estimated average life of the customer relationships. Prior to 1 July 2001, the Group applied the provisions contained within SFAS 72 ‘Accounting for Certain Transactions of Bank and Thrift Institutions’ in assessing the value of assets of an acquired financial institution. |
| | | |
Pension costs | | |
| | | |
IAS 19 ‘Employee Benefits’ requires that the pension costs in the income statement reflect the cost of accruing benefits for active employees, benefit improvements and the cost of severances borne by the schemes net of the expected return on scheme assets.
The Lloyds TSB Group has elected to apply the corridor approach to determine the treatment of actuarial gains and losses arising during the year. This means that to the extent that the cumulative gains or losses remain within a corridor defined as the greater of 10 per cent of the scheme assets or liabilities, they are not reflected in the accounts. If the cumulative gains or losses exceed the corridor, the excess is charged or credited to the income statement on a straight line basis over the average remaining service lives of those employees who are members of the schemes. | | SFAS 87 ‘Employers’ Accounting for Pensions’ prescribes a similar method but allows that a certain portion of actuarial gains and losses be deferred and allocated in equal amounts over the average remaining service lives of the current employees. Prior to the adoption of SFAS 158 (see below), if the fair value of plan assets fell below the accumulated benefit obligation (which is the current value of accrued benefits without allowance for future salary increases) an additional minimum liability was recognised.
SFAS 158 ‘Employers’ Accounting for Defined Benefit Pension and other Post Retirement Plans – an amendment of FASB Statements 87, 88, 106 and 132(R) (SFAS 158)’, was adopted by Lloyds TSB Group as at 31 December 2006. Under SFAS 158, the funded status of Lloyds TSB Group’s benefit plan (the difference between plan assets at fair value and the plan benefit obligation) is recognised on the balance sheet.
As permitted by US GAAP, Lloyds TSB Group uses the ‘corridor method’, whereby actuarial gains and losses outside a certain range are recognised in the income statement in equal amounts over the remaining service lives of current employees. That range is 10 per cent of the greater of plan assets and plan liabilities.
The adjustments on transition to SFAS 158 are recognised as a component of Accumulated other comprehensive income. |
F-65
Notes to the group accounts
52 Differences between IFRS and US GAAP(continued)
| | |
IFRS | | US GAAP |
| | | |
Leasing | | |
| | | |
Profits or losses arising on sale and leaseback transactions that result in an operating lease are taken to profit as they arise. | | Under SFAS 28 ‘Accounting for Sales with Leasebacks’ profits or losses arising on a sale and leaseback are deferred and amortised. For leasebacks resulting in a finance lease, the amounts are amortised in proportion to the amortisation of the leased asset; for leasebacks resulting in an operating lease, the amounts are amortised in proportion to the gross rental charged to expense over the lease term. |
| | |
| | | |
Interest recognition | | |
| | | |
IAS 39, ‘Financial Instruments: Recognition and Measurement’, which was adopted with effect from 1 January 2005, requires directly attributable loan origination fees and costs to be deferred and amortised over the expected life of the loan as an adjustment to yield. IAS 39 does not consider certain internal costs to be directly incremental to the origination of financial instruments and accordingly these costs are expensed as incurred.
Estimates of early repayment fees receivable for a portfolio of loans are deferred and amortised over the expected life of the instrument using the effective yield method.
Prior to adoption of IAS 39, directly attributable loan origination fees and costs were not included within interest although certain fees received were deferred and amortised within fees and commissions. Early repayment fees were recognised evenly over the period from the date of receipt to the contractual maturity of the product settled early. | | SFAS 91 requires directly attributable loan origination fees and costs to be deferred and amortised over the expected life of the loan as an adjustment to yield. SFAS 91 includes within directly attributable costs certain internal costs which are directly related to specified activities performed by the lender.
Early repayment fees are recognised in income as received.
Where the interest rate increases during the term of the loan, interest income is not recognised to the extent that the net investment in the loan would increase to an amount greater than the amount at which the borrower could settle the obligation. |
| | | |
Property | | |
| | | |
Investment properties are carried at fair value with the change in fair value recognised in net income for the period. | | Investment properties are carried at historical cost less any accumulated depreciation and impairment losses. Investment properties are depreciated over their estimated useful economic lives. |
| | | |
Share compensation schemes | | |
| | | |
The Group accounts for share compensation schemes based on their estimated fair values at the date of the grant in accordance with IFRS 2 ‘Share based payments’.
IFRS 2 requires that, for those option schemes that retain a service condition, where an employee withdraws from the plan but remains with the Group, irrespective of whether they contribute into a new plan, the accumulated costs incurred are reversed.
Under IFRS, the measurement of the deferred tax asset in each period is based on an estimate of the future tax deduction, if any, for the award measured at the end of each reporting period. In accordance with UK tax rules, changes in the share price impact the future tax deduction; this means that the estimate of the tax deduction is based on the current share price (its intrinsic value). The excess of the tax benefit over the tax effect of the related cumulative remuneration expense is recorded in equity. | | The Group accounts for share compensation schemes based on their estimated fair values at the date of the grant in accordance with SFAS 123 (Revised 2004) ‘Share Based Payment’, which replaces SFAS 123 ‘Accounting for Stock Based Compensation’ and supersedes APB Opinion No. 25 ‘Accounting for Stock Issued to Employees’.
SFAS 123(R) has precise requirements regarding the determination of the period over which compensation costs are recognised. This can lead to the US GAAP compensation cost being recognised over a different period than the IFRS compensation cost.
All cancellations, whether by employees or employers, are subject to an accelerated recognition of the remaining charge in the period of cancellation.
The adjustments on transition to SFAS 123(R) are recognised in the income statement.
Under US GAAP, the adjustments to the deferred tax assets to reflect increases or decreases in Lloyds TSB Group plc’s share price are not recorded. On the settlement date, the tax deduction is compared to the cumulative book compensation cost. To the extent that the tax deduction exceeds the cumulative book compensation cost, the tax benefit of the excess deduction is a windfall tax benefit. Conversely, when the tax deduction is less than the cumulative book compensation cost, a shortfall occurs. |
|
| | |
F-66
Notes to the group accounts
52 Differences between IFRS and US GAAP(continued)
| | | |
IFRS | | US GAAP |
| | | |
Insurance activities | | |
| | | |
| | |
Insurance contracts as defined by IFRS 4 ‘Insurance Contracts’ which was adopted with effect from 1 January 2005, are recognised at the present value of future profits of the contracts in–force at the reporting date. Components of the future profits to be included in this calculation are set out in FRS 27 ‘Life Assurance’, which was also adopted prospectively from 1 January 2005.
Contracts which do not meet the qualification of insurance contracts (‘investment contracts’) are accounted for under the provisions of IFRS 4 if there is a participating feature in the contract and under IAS 39 if there is no such interest.
Prior to the adoption of IFRS 4 and FRS 27, both insurance and investment contracts were reported at the present value of future profits of the contracts in–force at the reporting date.
Additional information on the differences between accounting for insurance activities under IFRS and US GAAP is provided within the Insurance section of this note on pages F-88 to F-90. | | The present value of the profits inherent in the policies of the long–term assurance fund is not recognised upon inception of the policy. An adjustment is made for the amortisation of acquisition costs and fees.
Additional information on the differences between accounting for insurance activities under IFRS and US GAAP is provided within the Insurance section of this note on pages F-88 to F-90. |
| | |
| | | |
Hedging and financial instruments | | |
| | | |
IAS 39, which was adopted with effect from 1 January 2005, requires all financial assets to be classified as either (i) held at fair value through profit or loss; (ii) available-for-sale, (iii) held-to-maturity; or (iv) loans and receivables at amortised cost.
(i) Financial assets can only be held at fair value through profit or loss if they are held for trading or designated on initial recognition as at fair value through profit or loss; the decision to classify financial assets as held at fair value through profit or loss (including trading) is irrevocable. Financial assets so designated are recognised initially at fair value and subsequently remeasured at fair value with changes in fair value recognised in the income statement.
(ii) Available-for-sale financial assets are initially measured at fair value and subsequently remeasured at fair value with changes in fair value recognised in (a) net income to the extent that they relate to the foreign currency translation of the amortised cost of debt securities; and (b) equity for all other fair value movements. On sale, the cumulative gains or losses previously recognised in equity are recognised through the income statement.
(iii) Financial assets can only be classified as held-to-maturity where there is the intent and the ability to hold them to maturity; they are measured at amortised cost.
(iv) Loans and receivables not included within the above categories are held at amortised cost.
Prior to the adoption of IAS 39, all financial assets other than those designated as trading were carried at amortised cost.
Equity shares for which fair value cannot be reliably determined are measured at cost, less any provision for impairment. IFRS regards a fair value as reliable if (i) the variability in the range of reasonable fair values is not significant; and (ii) the probabilities of the various estimates within the range can be reasonably assessed.
IAS 39 permits a financial liability to be held at fair value through profit or loss if it is designated on initial recognition as at fair value through profit or loss; the decision to classify financial liabilities as held at fair value through profit or loss is irrevocable. Financial liabilities so designated are recognised initially at fair value and subsequently remeasured at fair value with changes in fair value recognised in the income statement.
Under IAS 39, an asset is deemed impaired if there is objective evidence of impairment as a result of one or more events. Market recoveries leading to a reversal of an impairment provision for debt securities are recognised in the income statement. Impairment losses for equity instruments classified as available for sale are not permitted to be reversed through the income statement. | | SFAS 115 ‘Accounting for Certain Investments in Debt and Equity Securities’ requires that all investments in debt securities and those equity shares with readily determinable fair values be classified as (i) held for trading; (ii) available- for-sale at fair value; or (iii) held-to-maturity. |
(i) | Financial assets held for trading are recognised initially at fair value and subsequently remeasured at fair value with changes in fair value recognised in the income statement. US GAAP does not permit the change in fair value of financial assets other than those that meet the definition of trading securities in SFAS 115 to be reflected in the income statement. |
| |
(ii) | Available-for-sale financial assets are initially measured at fair value and subsequently remeasured at fair value with changes in fair value, including those relating to foreign currency translation, recognised in equity. On sale, the cumulative gains or losses previously recognised in equity are recognised through the income statement. |
|
|
| |
(iii) | Financial assets can only be classified as held-to-maturity where there is the intent and the ability to hold them to maturity; they are measured at amortised cost. |
| |
Equity shares that do not have a readily determinable fair value are measured at cost, less any provisions for impairment. Under US GAAP, the fair value of an equity security is readily determinable if sales price or bid-and-ask quotations are publicly available.
Financial liabilities are not generally measured at fair value, however SFAS 155, which was adopted from 1 January 2006, permits a hybrid financial instrument that contains an embedded derivative that otherwise would require bifurcation to be held at fair value. Such hybrid financial instruments may comprise financial assets and liabilities. The change in fair value of hybrid financial instruments measured in this way is recognised in the income statement.
All securities held as available-for-sale are subject to assessment for other than temporary impairment in accordance with SFAS 115 and, for asset backed securities, in accordance with the Emerging Issues Task Force (EITF) Abstract 99-20 ‘Recognition of Interest Income and Impairment on Purchased and Retained Beneficial Interests in Securitised Financial Assets’. Market recoveries on available-for-sale securities are not permitted to be reversed through the income statement.
|
F-67
Notes to the group accounts
52 Differences between IFRS and US GAAP(continued)
| | |
IFRS | | US GAAP |
| | | |
Hedging and financial instruments(continued) | | |
| | | |
IAS 39 requires that all derivatives be recognised at fair value. Changes in the fair value of derivatives that are not hedges are reported in the income statement. Changes in the fair value of derivatives that are designated as hedges are either offset against the change in fair value of the hedged asset or liability through earnings or recognised directly in equity until the hedged item is recognised in earnings, depending on the nature of the hedge. The ineffective portion of the hedge’s change in fair value is immediately recognised in earnings. A derivative may only be classified as a hedge if an entity meets stringent qualifying criteria in respect of documentation and hedge effectiveness.
IAS 39 further requires a derivative that is embedded within a financial instrument to be separated from the host contract and fair valued if it is not deemed to be closely related to the host. If the derivative cannot be reliably measured, the entire instrument must be treated as a trading security.
IAS 39 permits fair value hedging to be used for a portfolio hedge of interest rate risk. In particular it allows the hedged item to be designated as an amount of a currency rather than individual assets or liabilities and allows prepayment risk to be incorporated by scheduling prepayable items into repricing time periods based on expected, rather than contractual, repricing dates.
Prior to the adoption of IAS 39, derivatives used in the Group’s non-trading activities were accounted for on an accruals basis, in line with the underlying items which they were hedging. Derivatives embedded within financial instruments were not required to be separately analysed. | | SFAS 133 ‘Accounting for Derivative Instruments and for Hedging Activities’ requires that all derivatives be recognised at fair value. Changes in the fair value of derivatives that are not designated as hedges are reported in the income statement. Changes in the fair value of derivatives that are designated as hedges are either offset against the change in fair value of the hedged asset, liability, or firm commitment through earnings or recognised in other comprehensive income until the hedged item is recognised in earnings, depending on the nature of the hedge. The ineffective portion of a hedge’s change in fair value is immediately recognised in earnings. A derivative may only be classified as a hedge if an entity meets stringent qualifying criteria in respect of documentation and hedge effectiveness.
SFAS 133 further requires a derivative that is embedded within another instrument to be separated from the host contract and fair valued if it is not deemed to be clearly and closely related to the host. If the derivative cannot be reliably separated, SFAS 133 requires the entire instrument to be fair valued.
Positions which achieve hedge accounting under IFRS do not necessarily meet hedge accounting conditions under US GAAP. Any positions designated as hedges under US GAAP must have SFAS 133 compliant documentation. |
|
| | | |
Acceptances | | |
| | | |
Acceptances are not recorded on the balance sheet. | | Acceptances and the related customer liabilities are recorded on the balance sheet. |
| | |
| | | |
Own shares | | |
| | | |
Own shares held are reclassified as Treasury stock and deducted from shareholders’ equity, where the Lloyds TSB Group has an economic interest. | | All own shares held are reclassified as Treasury stock and deducted from shareholders’ equity in accordance with the AICPA Accounting Research Bulletin (ARB) 51 ‘Consolidated Financial Statements’. |
| | |
| | | |
Provision for credit losses | | |
| | | |
IAS 39, which was adopted with effect from 1 January 2005, requires the assessment of whether there is any objective evidence that a financial asset (or group of assets that are not individually significant) is impaired at each balance sheet date. The amount of impairment, if any, to be recognised is measured as the difference between the asset’s carrying amount and the present value of estimated future cash flows discounted at the asset’s original effective interest rate. Financial assets with similar risk characteristics that are not individually significant may be assessed collectively. | | Under SFAS 114 ‘Accounting by Creditors for Impairment of a Loan’ an asset is deemed impaired if it is probable that all amounts due under the contractual terms will not be able to be collected. The impairment is first assessed based on the undiscounted cash flows of the asset. If these cash flows show a shortfall against the carrying value, the amount of impairment is based upon the present value of expected future cash flows, discounted at the loan’s original effective interest rate or, as a practical expedient, on the loan’s observable market value, or the fair value of the collateral if the loan is collateral dependent. Smaller balance homogeneous consumer loans that are collectively valued for impairment are outside the scope of SFAS 114. Provisions are made against such loans when losses have been incurred but not yet identified as of the balance sheet date. |
| | |
| | | |
Consolidation of special purpose vehicles | | |
| | | |
Entities that fall within the definition of special purpose entities as set out in the IASB’s Standards Interpretation Committee Interpretation 12 (‘SIC-12’) are consolidated into the Group accounts if the substance of the relationship indicates that the special purpose entity is controlled by the Group or that the Group has the majority of the risks and rewards. | | FASB Interpretation 46 (revised December 2003), ‘Consolidation of Variable Interest Entities’ (‘FIN 46-R’) requires the consolidation of variable interest entities (VIEs) for which Lloyds TSB Group is deemed to be the primary beneficiary. A more detailed discussion of VIEs can be found on pages F-86 to F-87. |
| | |
| | | |
Netting | | |
| | | |
Under IAS 32, ‘Financial Instruments: Disclosure and Presentation’, which was adopted from 1 January 2005, financial assets and financial liabilities are not permitted to be offset against each other unless there is both a legally enforceable right and an intention to either settle on a net basis or to realise the asset and settle the liability simultaneously.
Prior to the adoption of IAS 32, assets and liabilities were permitted to be offset if there was a legal right of set-off and the Group had the ability to settle on a net basis. | | US GAAP has similar requirements although it also permits assets and liabilities that are subject to a master netting agreement to be offset. |
|
| | | |
F-68
Notes to the group accounts
52 Differences between IFRS and US GAAP(continued)
Current and future accounting developments
US GAAP pronouncements effective during 2006
SFAS 123 (Revised 2004) – Share-Based Payment
In December 2004, the FASB issued Statement 123(R), which is effective for the fiscal year beginning after 15 June 2005. Statement 123(R) replaces SFAS 123, Accounting for Stock-Based Compensation, supersedes APB Opinion 25, Accounting for Stock Issued to Employees, and covers a wide range of share–based compensation arrangements including share options, restricted share plans, performance–based awards, share appreciation rights, and employee share purchase plans. As Lloyds TSB Group had already elected to follow the fair value method encouraged by SFAS 123 in its US GAAP financial statements, adoption of this Statement has not had a material impact on Lloyds TSB Group’s US GAAP financial statements.
FSP FAS 123(R)-2 Practical Accommodation to the Application of Grant Date as Defined in FASB Statement No. 123(R)
This FSP was issued on and effective from 18 October 2005 and clarifies the definition of “mutual understanding” in determining the grant date. Assuming all other criteria in the grant date definition have been met, a mutual understanding shall be presumed to exist at the date that the award is approved, if both the award is a unilateral grant and the key terms and conditions of the award are expected to be communicated to an individual recipient within a relatively short time period from the date of approval. Adoption of this FSP has not had a material impact on Lloyds TSB Group’s US GAAP financial statements.
EITF Issue 05-6, Determining the Amortisation Period for Leasehold Improvements Purchased After Lease Inception or Acquired in a Business Combination
EITF Issue 05-6 was issued in June 2005 and is effective for reporting periods beginning after 29 June 2005, and is to be applied prospectively to the amortisation period for newly acquired leasehold improvements and the unamortised portion of existing leasehold improvements that were either purchased subsequent to the inception of the lease or acquired in a business combination. The EITF requires that the cost of such assets be amortised over the shorter of the useful life of the assets or a term that includes required lease periods and renewals that are deemed to be reasonably assured. Adoption of this EITF has not had a material impact on Lloyds TSB Group’s US GAAP financial statements.
SFAS 153 – Exchanges of Nonmonetary Assets, an amendment of APB Opinion 29, Accounting for Nonmonetary Transactions
In December 2004, the FASB issued SFAS 153 which is effective for nonmonetary asset exchanges occurring in fiscal periods beginning after 15 June 2005. This Statement provides for a general exception from fair value measurement for exchanges of nonmonetary assets that do not have commercial substance. Adoption of this Statement has not had a material impact on Lloyds TSB Group’s US GAAP financial statements.
FSP FIN46(R)-5 – Implicit Variable Interests under FASB Interpretation No. 46(R) Consolidation of Variable Interest Entities
FSP FIN46(R)-5 was issued in March 2005 and addresses whether a reporting entity has an implicit variable interest in a variable interest entity or potential variable interest entity when specific conditions exist. Implicit variable interests are implied financial interests in an entity that change with changes in the fair value of the entity’s net assets exclusive of variable interests. This FSP is effective for the first reporting period beginning after 3 March 2005. Adoption of this FSP has not had a material impact on Lloyds TSB Group’s US GAAP financial statements.
SFAS 154 – Accounting Changes and Error Correction – a replacement of APB Opinion 20 and FASB Statement No. 3
SFAS 154 was issued in May 2005 and is effective for accounting changes and corrections of errors made in fiscal years beginning after 15 December 2005. SFAS 154 provides guidance on the accounting for and reporting of accounting changes (voluntary and those required by the issuance of an accounting pronouncement) and error corrections. APB Opinion 20 previously required that most voluntary changes in accounting principle be recognised by including in net income, in the period of the changes, the cumulative effect of changing to the new accounting principle. SFAS 154 requires retrospective application of the direct effects of a change in accounting principle unless there are explicit transition requirements specific to the newly adopted accounting principle or it is impracticable. The correction of an error in previously issued financial statements is not an accounting change although the reporting of an error correction involves adjustments to previously issued financial statements similar to those for reporting an accounting change. Adoption of this Statement has not had a material impact on Lloyds TSB Group’s US GAAP financial statements.
SFAS 155 Accounting for Certain Hybrid Financial Instruments – an amendment of FASB Statements 133 and 140
SFAS 155 was issued in February 2006 and is mandatory for all financial instruments acquired, issued or subject to a remeasurement event occurring after the beginning of the first fiscal year that begins after 15 September 2006; the Lloyds TSB Group has chosen to adopt this in its US GAAP financial statements for the year ended 31 December 2006. This Statement permits fair value measurement for any hybrid financial instrument that contains an embedded derivative that otherwise would require bifurcation and requires that interests in securitised financial assets are evaluated to determine whether they are free standing derivatives or whether they contain embedded derivatives that require bifurcation. The adoption of SFAS 155 has not had a material impact on the Lloyds TSB Group’s US GAAP financial statements.
SFAS 158 Employers’ Accounting for Defined Benefit Pension and other Post Retirement Plans – an amendment of FASB Statements 87, 88, 106 and 132(R) (SFAS 158)
SFAS 158 was adopted by Lloyds TSB Group as at 31 December 2006. Under SFAS 158, the funded status of Lloyds TSB Group’s benefit plans (the difference between plan assets at fair value and the plan benefit obligations) is recognised on the balance sheet. The impact of the adoption of SFAS 158 on the Lloyds TSB Group’s US GAAP financial statements is set out on page F-78.
FSP APB 18-1 Accounting by an Investor for its Proportionate Share of Accumulated Other Comprehensive Income of an Investee Accounted for Under the Equity Method in Accordance With APB Opinion No. 18 Upon a Loss of Significant Influence
This FSP was issued in July 2005 and is effective for the first reporting period beginning after 12 July 2005. The FSP requires that an investor’s proportionate share of an investee’s equity adjustments for Other Comprehensive Income should be offset against the carrying value of the investment at the time significant influence is lost. To the extent that the offset results in a carrying value of the investment that is less than zero, an investor should (a) reduce the carrying value of the investment to zero and (b) record the remaining balance in income. Adoption of this FSP has not had a material impact on Lloyds TSB Group’s US GAAP financial statements.
FSP FAS 13-1 Accounting for Rental Costs Incurred during a Construction Period
This FSP was issued in October 2005, and requires that rental costs incurred during and after a construction period (which includes the construction of leasehold improvements) for building and ground operating leases should be expensed as incurred and is applicable to the first reporting period beginning after 15 December 2005. Adoption of this FSP has not had a material impact on Lloyds TSB Group’s US GAAP financial statements.
F-69
Notes to the group accounts
52 Differences between IFRS and US GAAP(continued)
FSP FAS 115-1 and FAS 124-1 The Meaning of Other-Than-Temporary Impairment and Its Application to Certain Investments
This FSP was issued in November 2005, nullifies the guidance in EITF 03-1 The Meaning of Other-Than-Temporary Impairment and Its Application to Certain Investments and addresses the determination as to when an investment is considered impaired, whether the impairment is other than temporary, and the measurement of any impairment loss. An investment is deemed impaired if the fair value of the investment is less than cost. This impairment is either temporary or other than temporary but not permanent. If the impairment is other than temporary, an impairment loss equal to the difference between the investment’s cost and fair value is recognised. The fair value becomes the new cost base and is not adjusted for any recoveries in value. This FSP is applicable to the first reporting period beginning after 15 December 2005. Adoption of this FSP has not had a material impact on Lloyds TSB Group’s US GAAP financial statements.
US GAAP pronouncements effective after 31 December 2006
FSP FAS No. 143-1 Accounting for Electronic Equipment Waste Obligations
This FSP was issued in June 2005 and becomes effective for the later of the period ending after 8 June 2005 or the date of the adoption of the law by the relevant EU member state. The Directive was adopted by the UK on 12 December 2006, and became effective 2 January 2007. The FSP addresses the accounting for “new” waste (products put onto the market after 13 August 2005) held by commercial users and requires that a liability be established for disposal together with an increase in the carrying amount of the asset. The increase in the carrying amount of the asset would be amortised over the expected life of the asset. Adoption of this FSP is not expected to have a material impact on Lloyds TSB Group’s US GAAP financial statements.
FSP FAS 123(R)-4 Classification of Options and Similar Instruments Issued as Employee Compensation That Allow for Cash Settlement upon the Occurrence of a Contingent Event
This FSP was issued in February 2006 and is effective upon initial adoption of Statement 123(R) or the first reporting period beginning after 3 February 2006 if an entity had adopted Statement 123(R) prior to the issuance of this FSP. A cash settlement feature that can be exercised only upon the occurrence of a contingent event that is outside the employee’s control does not meet the conditions in SFAS 123(R) for the options to be classified as a liability until it becomes probable that the event will occur. An option that is classified as equity but subsequently becomes a liability is accounted for in a similar way to a modification from an equity to a liability award. The adoption of this FSP is not expected to have a material impact on Lloyds TSB Group’s US GAAP financial statements.
FSP FIN 46(R)-6 Determining the Variability to Be Considered in Applying FASB Interpretation No. 46(R)
This FSP was issued in April 2006 and sets out the variability to be considered in applying FIN 46(R) to determine (a) whether an entity is a variable interest entity (VIE), (b) which interests are variable interests in that entity, and (c) which party, if any, is the primary beneficiary of the VIE. This FSP is applied prospectively to all entities (including newly created entities) with which an enterprise first becomes involved and to all entities previously required to be analysed under FIN 46(R), when a reconsideration event has occurred pursuant to paragraph 7 of FIN 46(R), from the start of the first reporting period beginning after June 15, 2006. Lloyds TSB Group is currently considering the impact that adoption of FSP FIN 46(R)-6 will have on its US GAAP financial statements.
FSP FIN 46(R)-7, Application of FASB Interpretation 46(R) to Investment Companies, and SOP 07-1, Clarification of the Scope of the Audit and Accounting Guide, Investment Companies, and Accounting by Parent Companies and Equity Method Investors for Investments in Investment Companies
This FSP provides a scope exemption from FASB Interpretation No. 46 (revised December 2003), Consolidation of Variable Interest Entities, for an entity that accounts for its investments at fair value in accordance with the specialised accounting guidance in the AICPA Audit and Accounting Guide, Investment Companies. Under SOP 07-1, an entity’s investment objectives and activities should determine whether it meets the description of an investment company. The impact of these statements on Lloyds TSB Group’s US GAAP financial statements is that certain companies that are currently consolidated would be presented as investments at fair value. The final application of FIN 46(R)-7 has been deferred pending issuance of SOP 07-1.
Statement of Position 05-1, Accounting by Insurance Enterprises for Deferred Acquisition Costs in connection with Modifications or Exchanges of Insurance Contracts
SOP 05-1, issued in September 2005, provides guidance to entities that incur deferred acquisition costs on internal replacements of insurance and investment contracts other than those specifically described in the Statement of Financial Accounting Standards No. 97, Accounting and Reporting by Insurance Enterprises for Certain Long-Duration Contracts and for Realised Gains and Losses from the Sale of Investments. SOP 05-1 defines internal replacements as modifications in product benefits, features, rights, or coverages that occur by the exchange of a contract for a new contract, or by amendment, endorsement, or rider to a contract, or by the election of a feature or coverage with a contract. The accounting treatment for such replacements depends on whether, under the provisions of SOP 05-1, the replacement contract is considered substantially changed from the replaced contract. A substantial change would be treated as the extinguishment of the replaced contract. All unamortised deferred acquisition costs, unearned revenue liabilities, and deferred sales inducement assets from the replaced contract would no longer be deferred in connection with the replacement contract. A replacement contract that is substantially unchanged should be accounted for as a continuation of the original contract. SOP 05-1 will be effective for internal replacements occurring in fiscal years beginning after 15 December 2006, with earlier adoption encouraged. Adoption of SOP 05-1 is not expected to have a material effect on Lloyds TSB Group’s US GAAP financial statements.
FASB Interpretation No. 48, Accounting for Uncertainty in Income Taxes – an Interpretation of FASB Statement 109
FIN 48, issued in June 2006, establishes recognition threshold and measurement attributes for financial statement measurement and recognition of tax positions taken or expected to be taken in a tax return. FIN 48 also provides guidance on derecognition, classification, interest and penalties, accounting in interim periods, disclosure and transition. FIN 48 is effective for fiscal years beginning after 15 December 2006. Adoption of FIN 48 is not expected to have a material effect on Lloyds TSB Group’s US GAAP financial statements.
SFAS 156 ‘Accounting for Servicing of Financial Assets – an amendment of FASB Statement No. 140’
SFAS 156, issued in March 2006, becomes effective for the first reporting period beginning after 15 September, 2006. SFAS 156 amends SFAS 140, Accounting for Transfers and Servicing of Financial Assets and Extinguishments of Liabilities, with respect to the accounting for separately recognised servicing assets and liabilities. SFAS 156 requires that all separately recognised servicing assets and liabilities be initially measured at fair value with subsequent measurement at either fair value, with changes in fair value reported in the income statement when they occur, or using the amortisation method. At the date of adoption, SFAS 156 permits a one-time reclassification of available-for-sale securities to trading securities where those securities are identified as offsetting exposure to changes in the fair value of servicing assets and liabilities that have been elected to be subsequently measured at fair value. Lloyds TSB Group is considering the impact that adoption of SFAS 156 will have on its US GAAP financial statements.
SFAS 157 ‘Fair Value Measurements’
SFAS 157, issued in September 2006, defines fair value, establishes a framework for measuring fair value in US GAAP and requires expanded disclosures about fair value measurements. SFAS 157 applies under many other existing US GAAP accounting pronouncements that require or permit fair value as the relevant measurements, although it does not extend the use of fair value for measurement purposes. SFAS 157 is effective for fiscal years beginning after 15 November 2007, Lloyds TSB Group is currently considering the impact that adoption of SFAS 157 will have on its US GAAP financial statements.
F-70
Notes to the group accounts
52 Differences between IFRS and US GAAP(continued)
SFAS 159 The Fair Value Option for Financial Assets and Financial Liabilities
SFAS 159, issued in February 2007, creates an option to measure many financial instruments and certain other items at fair value, under which an entity may irrevocably elect fair value as the initial and subsequent measurement attribute for certain financial assets and liabilities on a contract-by-contract basis, with changes in fair value recognised in earnings as these changes occur. SFAS 159 provides an opportunity to mitigate volatility in reported earnings caused by measuring related assets and liabilities differently without having to apply complex hedge accounting provisions. SFAS 159 is effective as of the beginning of the first fiscal year beginning after 15 November 2007. Lloyds TSB Group is currently considering the impact that adoption of SFAS 159 will have on its US GAAP financial statements.
The following tables summarise the adjustments to net income and shareholders’ equity which would arise from the application of US GAAP:
Reconciliation of net income
| | | | | | | | | | | | | |
| | | Note | | | 2006
£m | | | 2005
£m | | | 2004
£m | |
| | | | | | | | | | | | | | |
Profit for the year attributable to equity shareholders under IFRS | | | | | | 2,803 | | | 2,493 | | | 2,392 | |
Insurance activities, excluding tax effects | | | o | | | (427 | ) | | (438 | ) | | (35 | ) |
Banking and Group activities: | | | | | | | | | | | | | |
– Disposal and closure of businesses | | | b | | | — | | | 18 | | | 1 | |
– Amortisation of customer related intangibles | | | a | | | (146 | ) | | (157 | ) | | (157 | ) |
– Pension costs | | | c | | | (577 | ) | | (304 | ) | | (129 | ) |
– Leasing | | | | | | (6 | ) | | 12 | | | (43 | ) |
– Share compensation schemes | | | d | | | 28 | | | (2 | ) | | (6 | ) |
– Extinguishment of liabilities | | | f | | | — | | | (184 | ) | | — | |
– Hedging and financial instruments | | | g | | | 83 | | | (136 | ) | | (60 | ) |
– Variable interest entities | | | l | | | (177 | ) | | (33 | ) | | 2 | |
– Loan impairment | | | n | | | — | | | (314 | ) | | — | |
– Other | | | | | | (20 | ) | | (14 | ) | | 5 | |
Total banking and Group activities, excluding tax effects | | | | | | (815 | ) | | (1,114 | ) | | (387 | ) |
| | | | | | | | | | | | | |
Taxation, including deferred tax on GAAP differences | | | i | | | 254 | | | 410 | | | 92 | |
| | | | | | | | | | | | | | |
Total adjustments before accounting changes | | | | | | (988 | ) | | (1,142 | ) | | (330 | ) |
| | | | | | | | | | | | | | |
Net income before accounting changes | | | | | | 1,815 | | | 1,351 | | | 2,062 | |
Cumulative effect of changes in accounting principles (net) | | | l,o | | | — | | | — | | | (554 | ) |
| | | | | | | | | | | | | | |
Net income under US GAAP | | | | | | 1,815 | | | 1,351 | | | 1,508 | |
| | | | | | | | | | | | | | |
Reconciliation of shareholders’ equity
| | | | | | | | | | |
| | | Note | | | 2006
£m | | | 2005
£m | |
| | | | | | | | | | | |
Shareholders’ funds under IFRS | | | | | | 11,155 | | | 10,195 | |
| | | | | | | | | | |
Insurance activities, excluding tax effects | | | o | | | (1,544 | ) | | (1,076 | ) |
Banking and Group activities: | | | | | | | | | | |
– Goodwill | | | a | | | 1,311 | | | 1,311 | |
– Customer related intangibles | | | a | | | — | | | 146 | |
– Pension costs | | | c | | | 270 | | | 685 | |
– Leasing | | | | | | (86 | ) | | (80 | ) |
– Hedging and financial instruments | | | g | | | (146 | ) | | 128 | |
– Variable interest entities | | | l | | | (307 | ) | | (141 | ) |
– Own shares related items | | | | | | (96 | ) | | (110 | ) |
– Other | | | | | | (75 | ) | | (55 | ) |
Total banking and Group activities, excluding tax effects | | | | | | 871 | | | 1,884 | |
Taxation, including deferred tax on GAAP differences | | | i | | | 270 | | | (22 | ) |
| | | | | | | | | | | |
Total adjustments, after tax | | | | | | (403 | ) | | 786 | |
| | | | | | | | | | | |
Shareholders’ equity under US GAAP | | | | | | 10,752 | | | 10,981 | |
| | | | | | | | | | | |
F-71
Notes to the group accounts
52 Differences between IFRS and US GAAP(continued)
Reconciliation of movements in consolidated shareholders’ equity under US GAAP
| | | | | | | | | | |
| | 2006
£m | | 2005
£m | | 2004
£m | |
| | | | | | | | | | | |
Net income in period | | | 1,815 | | | 1,351 | | | 1,508 | |
Dividends | | | (1,919 | ) | | (1,914 | ) | | (1,913 | ) |
| | | | | | | | | | | |
| | | (104 | ) | | (563 | ) | | (405 | ) |
New share capital subscribed | | | 105 | | | 26 | | | 10 | |
Movement in own shares | | | (21 | ) | | 31 | | | 8 | |
Share compensation schemes | | | 2 | | | 49 | | | 35 | |
Pensions and other post-retirement benefits | | | 755 | | | 67 | | | (48 | ) |
Change in the fair value of available-for-sale securities – insurance activities | | | (29 | ) | | (92 | ) | | 31 | |
Change in the fair value of available-for-sale securities – banking activities | | | (190 | ) | | (19 | ) | | (51 | ) |
SFAS 158 transition adjustment, net of tax | | | (641 | ) | | — | | | — | |
Exchange and other adjustments | | | (106 | ) | | 24 | | | (14 | ) |
| | | | | | | | | | | |
| | | (229 | ) | | (477 | ) | | (434 | ) |
Shareholders’ equity at beginning of period | | | 10,981 | | | 11,458 | | | 11,892 | |
| | | | | | | | | | | |
Shareholders’ equity at end of period | | | 10,752 | | | 10,981 | | | 11,458 | |
| | | | | | | | | | | |
| | | | | | | | | | |
Consolidated accumulated other comprehensive income under US GAAP |
| | | | | | | | | | |
| | | 2006
£m | | | 2005
£m | | | 2004
£m | |
| | | | | | | | | | | |
Exchange translation differences | | | (254 | ) | | (148 | ) | | (172 | ) |
Pensions and other post-retirement benefits | | | (3,091 | ) | | (3,205 | ) | | (3,272 | ) |
Available-for-sale securities: | | | | | | | | | | |
– Net unrealised gains – insurance activities | | | 133 | | | 485 | | | 314 | |
– Related amortisation of deferred acquisition costs | | | (205 | ) | | (514 | ) | | (211 | ) |
– Net unrealised (losses) gains – banking activities | | | (257 | ) | | 7 | | | 36 | |
– Taxation | | | 96 | | | 8 | | | (42 | ) |
| | | (233 | ) | | (14 | ) | | 97 | |
| | | | | | | | | | | |
Accumulated other comprehensive income under US GAAP | | | (3,578 | ) | | (3,367 | ) | | (3,347 | ) |
| | | | | | | | | | | |
F-72
Notes to the group accounts
52 Differences between IFRS and US GAAP(continued)
Condensed Consolidated US GAAP Income Statement
The following table provides a condensed consolidated income statement for the Group, incorporating the US GAAP adjustments arising.
| | | | | | | | | | | | | | | |
| | 2006
£m | | | | 2005
£m | | | | 2004
£m | | |
| | | | | | | | | | | | | |
Loan interest, including fees | | | 13,509 | | | | | 11,989 | | | | | 10,380 | | |
Other interest and dividends | | | 1,319 | | | | | 2,606 | | | | | 2,453 | | |
Insurance premiums | | | 2,053 | | | | | 1,766 | | | | | 1,871 | | |
Commissions and fees | | | 3,024 | | | | | 2,739 | | | | | 2,976 | | |
Realised gains from sales of investments | | | 118 | | | | | 236 | | | | | 142 | | |
Foreign exchange trading income | | | 493 | | | | | 180 | | | | | 178 | | |
Securities and other trading gains | | | 5,154 | | | | | 6,159 | | | | | 2,678 | | |
Other income | | | 2,080 | | | | | 1,420 | | | | | 1,584 | | |
| | | | | | | | | | | | | | | | |
Total revenues | | | 27,750 | | | | | 27,095 | | | | | 22,262 | | |
Interest expense | | | (8,429 | ) | | | | (6,682 | ) | | | | (5,594 | ) | |
| | | | | | | | | | | | | | | | |
Total revenues, net of interest expense | | | 19,321 | | | | | 20,413 | | | | | 16,668 | | |
Policyholder benefits and claims expense | | | (5,647 | ) | | | | (7,476 | ) | | | | (4,473 | ) | |
Movement in undistributed earnings to policyholders | | | (741 | ) | | | | (1,632 | ) | | | | (777 | ) | |
Allowance for loan losses | | | (1,555 | ) | | | | (1,613 | ) | | | | (866 | ) | |
Amounts written off fixed asset investments | | | (55 | ) | | | | (17 | ) | | | | (52 | ) | |
Total benefits, claims and provisions | | | (7,998 | ) | | | | (10,738 | ) | | | | (6,168 | ) | |
Non-insurance compensation and benefits | | | (2,994 | ) | | | | (2,895 | ) | | | | (2,547 | ) | |
Insurance underwriting, operating and acquisition expenses | | | (628 | ) | | | | (561 | ) | | | | (583 | ) | |
Other operating expenses | | | (3,083 | ) | | | | (2,714 | ) | | | | (3,108 | ) | |
Depreciation | | | (631 | ) | | | | (647 | ) | | | | (628 | ) | |
Amortisation of intangible fixed assets: | | | | | | | | | | | | | | | |
– Customer related intangibles | | | (146 | ) | | | | (157 | ) | | | | (157 | ) | |
– Value of long-term assurance business acquired | | | (95 | ) | | | | (158 | ) | | | | (243 | ) | |
– Goodwill impairment | | | (89 | ) | | | | (6 | ) | | | | — | | |
| | | (330 | ) | | | | (321 | ) | | | | (400 | ) | |
Profit (loss) on sale and closure of businesses | | | — | | | | | 68 | | | | | (20 | ) | |
| | | (7,666 | ) | | | | (7,070 | ) | | | | (7,286 | ) | |
| | | | | | | | | | | | | | | | |
Income before tax | | | 3,657 | | | | | 2,605 | | | | | 3,214 | | |
Provision for income taxes* | | | (1,087 | ) | | | | (855 | ) | | | | (926 | ) | |
Minority interests, net of income taxes | | | (755 | ) | | | | (399 | ) | | | | (226 | ) | |
| | | | | | | | | | | | | | | | |
Net income before accounting changes | | | 1,815 | | | | | 1,351 | | | | | 2,062 | | |
Cumulative effect of changes in accounting principles (net) | | | — | | | | | — | | | | | (554 | ) | |
| | | | | | | | | | | | | | | | |
Net income under US GAAP | | | 1,815 | | | | | 1,351 | | | | | 1,508 | | |
Other comprehensive income (net of tax): | | | | | | | | | | | | | | | |
Exchange translation and other differences | | | (106 | ) | | | | 24 | | | | | (14 | ) | |
Additional minimum pension liability | | | 755 | | | | | 67 | | | | | (48 | ) | |
Available-for-sale securities: | | | | | | | | | | | | | | | |
– Net unrealised gains – insurance activities | | | (352 | ) | | | | 171 | | | | | 132 | | |
– Related amortisation of deferred acquisition costs | | | 309 | | | | | (303 | ) | | | | (86 | ) | |
– Net unrealised losses – banking activities | | | (264 | ) | | | | (29 | ) | | �� | | (73 | ) | |
– Taxation | | | 88 | | | | | 50 | | | | | 7 | | |
| | | (219 | ) | | | | (111 | ) | | | | (20 | ) | |
| | | | | | | | | | | | | | | | |
Comprehensive income under US GAAP | | | 2,245 | | | | | 1,331 | | | | | 1,426 | | |
| | | | | | | | | | | | | | | | |
Earnings per share (pence) (note e) | | | 32.3 | p | | | | 24.1 | p | | | | 27.0 | p | |
Diluted earnings per share (pence) (note e) | | | 32.1 | p | | | | 24.0 | p | | | | 26.8 | p | |
Effect of changes in accounting principles on: | | | | | | | | | | | | | | | |
Earnings per share (pence) | | | — | | | | | — | | | | | (9.9 | )p | |
Diluted earnings per share (pence) | | | — | | | | | — | | | | | (9.8 | )p | |
| |
* | Significant items affecting the Group’s effective tax rate under US GAAP include the fact that tax is levied on UK life assurance and pension businesses under specialised rules not based on the income statement. In addition, under US GAAP a tax provision is required for unrealised gains that are attributable to the policyholders. The amount provided will vary depending upon the fluctuations of the stock market and this movement can result in significant changes in the effective rate of tax. |
F-73
Notes to the group accounts
52 Differences between IFRS and US GAAP(continued)
Condensed Consolidated US GAAP Balance Sheet
The following table provides a condensed consolidated balance sheet for the Group, incorporating the US GAAP adjustments arising.
| | | | | | | |
| | 2006
£m | | 2005
£m | |
| | | | | | | | |
Assets | | | | | | | |
Cash and due from banks | | | 9,357 | | | 5,844 | |
Deposits at interest with banks | | | 23,799 | | | 13,110 | |
Securities purchased under resale agreements | | | 10,120 | | | 15,810 | |
Trading and other investments | | | 59,535 | | | 54,466 | |
Investment securities | | | 29,135 | | | 22,200 | |
Investment property | | | 3,195 | | | 3,497 | |
Loans, net of provisions | | | 188,886 | | | 173,981 | |
Tangible fixed assets | | | 4,463 | | | 4,478 | |
Intangible fixed assets: | | | | | | | |
– Goodwill | | | 3,960 | | | 3,867 | |
– Customer related intangibles | | | 54 | | | 146 | |
– Value of long-term assurance business acquired | | | 1,334 | | | 1,429 | |
– Pension liability related intangible | | | — | | | 226 | |
– Capitalised software | | | 84 | | | 50 | |
Deferred acquisition costs | | | 1,719 | | | 1,479 | |
Other assets | | | 4,564 | | | 5,334 | |
| | | | | | | | |
Total assets | | | 340,205 | | | 305,917 | |
| | | | | | | | |
Liabilities | | | | | | | |
Deposits | | | 175,736 | | | 162,491 | |
Trading account liabilities | | | 2,889 | | | 3,104 | |
Hybrid financial instruments held at fair value | | | 95 | | | — | |
Debt securities and securitisation funding | | | 55,516 | | | 39,523 | |
Policyholder liabilities | | | 62,054 | | | 58,855 | |
Undistributed policyholder allocations | | | 3,877 | | | 3,137 | |
Commitments and contingencies | | | 259 | | | 368 | |
Deferred tax | | | 1,076 | | | 1,167 | |
Long-term debt | | | 12,140 | | | 12,082 | |
Pension and other post-retirement obligations | | | 2,192 | | | 2,451 | |
Other liabilities | | | 8,709 | | | 7,995 | |
| | | | | | | | |
Total liabilities | | | 324,543 | | | 291,173 | |
Minority interests | | | 4,910 | | | 3,763 | |
Shareholders’ equity: | | | | | | | |
– Common stock | | | 1,429 | | | 1,420 | |
– Additional paid-in capital | | | 5,220 | | | 5,122 | |
– Retained earnings | | | 7,864 | | | 7,989 | |
– Treasury stock | | | (183 | ) | | (183 | ) |
– Accumulated other comprehensive income | | | (3,578 | ) | | (3,367 | ) |
| | | | | | | | |
Total shareholders’ equity | | | 10,752 | | | 10,981 | |
| | | | | | | | |
Total liabilities, minority interests and shareholders’ equity | | | 340,205 | | | 305,917 | |
| | | | | | | | |
Contingent liabilities and commitments are set out in note 46.
F-74
Notes to the group accounts
52 Differences between IFRS and US GAAP(continued)
Certain classification differences exist in financial reporting under IFRS and US GAAP. For the Lloyds TSB Group, such differences primarily arise in the balance sheet and a comparison by line item follows.
Balance sheet presentation
| |
IFRS | US GAAP |
| | |
Cash and balances at central banks | Cash and due from banks |
Items in the course of collection from banks | Cash and due from banks |
Trading and other financial assets at fair value through profit or loss | Classified as ‘Trading and other investments’, ‘Investment Securities’ and ‘Loans, net of provisions’ where appropriate. |
Derivative financial instruments | Trading and other investments |
Loans and advances to banks | Loans to banks due on demand classified as ‘Cash and due from banks’; Reverse repos classified as ‘Securities purchased under resale agreements’; remainder classified as ‘Deposits at interest with banks’ |
Loans and advances to customers | Reverse repos classified as ‘Securities purchased under resale agreements’; remainder classified as ‘Loans, net of provisions’ |
Available-for-sale financial assets | Investment securities |
Investment property | Investment property |
Goodwill | Intangible fixed assets: Goodwill |
Value of in-force business | n/a |
Other intangible assets | Customer related intangibles; Capitalised software |
Tangible fixed assets | Tangible fixed assets |
Other assets | Deferred acquisition costs; Other assets |
Deposits from banks | Deposits |
Customer accounts | Deposits |
Items in course of transmission to banks | Cash and due from banks |
Trading and other liabilities at fair value through profit or loss | Trading account liabilities; Hybrid financial instruments; Debt securities and securitisation funding |
Derivative financial instruments | Trading account liabilities |
Debt securities in issue | Debt securities and securitisation funding |
Liabilities arising from insurance contracts and participating investment contracts | Policyholder liabilities |
Liabilities arising from non-participating investment contracts | Policyholder liabilities |
Unallocated surplus within insurance businesses | Undistributed policyholder allocations |
Other liabilities | Other liabilities |
Retirement benefit obligations | Pension and other post-retirement obligations |
Current tax liabilities | Other liabilities |
Deferred tax liabilities | Deferred tax |
Other provisions | Commitments and contingencies |
Subordinated liabilities | Long-term debt |
Share capital | Common stock |
Share premium account | Additional paid-in capital |
Other reserves | Accumulated other comprehensive income |
Retained profits | Retained earnings |
Minority interests | Minority interests |
Consolidated statement of cash flows
The Group’s IFRS primary statements contain a consolidated cash flow statement (page F-7) prepared under the provisions of IAS 7.
F-75
Notes to the group accounts
52 Differences between IFRS and US GAAP(continued)
Notes to the IFRS/US GAAP reconciliation
| |
a | Goodwill and customer related intangible assets |
On adoption of IFRS on 1 January 2004, Lloyds TSB Group took advantage of the transitional provisions of IFRS 1 to not apply IFRS 3, or its predecessor IAS 22, to transactions that occurred before 1 January 2004; goodwill has been retained at the balance sheet amount at that date. Goodwill previously written off directly to reserves under UK GAAP has not been reinstated and will not be included in calculating any subsequent profit or loss on disposal.
Under US GAAP, from 1 January 2002 the Group adopted the remaining provisions of SFAS 142 and accordingly all goodwill arising in respect of acquisitions is capitalised but no longer amortised and is subject to regular review for impairment; in periods prior to 1 January 2002, goodwill arising in respect of acquisitions was amortised over periods of up to 20 years. Goodwill amortised prior to the full adoption of SFAS 142 is not permitted to be reinstated.
The Group has performed the required impairment tests under both IFRS and US GAAP with the result that an impairment of £89 million has been recorded in respect of certain of the goodwill arising on consolidation of variable interest entities for US GAAP purposes. For the purposes of the income reconciliation on page F-71, this impairment charge is included within the variable interest entities item of £177 million. An impairment charge of £6 million was made, under both IFRS and US GAAP, during 2005 following a strategic review of a business acquired in previous years. No impairment charge was required in 2004.
The treatment of the Group’s major acquisitions is detailed below:
Abbey Life
In 1988, Lloyds Bank Plc transferred a minority interest in five businesses to Abbey Life Group plc, a life insurance company, in return for a majority interest in the enlarged Abbey Life Group. Under UK GAAP, this transaction was accounted for as a merger. Under US GAAP, the same transaction would be accounted for as an acquisition. Accordingly the net assets of Abbey Life Group plc (later renamed Lloyds Abbey Life plc) have been fair valued in accordance with US GAAP and a purchase price determined based on the fair value of the minority interest transferred. In 1996, Lloyds TSB Group plc acquired the remaining minority interest in Lloyds Abbey Life plc. Under UK GAAP the transaction was treated as an acquisition and the resulting goodwill written off directly to reserves. This goodwill was not reinstated upon adoption of IFRS and accordingly no goodwill is held on the Lloyds TSB Group’s IFRS balance sheet in respect of this transaction. Under US GAAP, the transaction is accounted for as an acquisition and the resulting goodwill held on the Lloyds TSB Group’s US GAAP balance sheet. Certain other differences also arise under US GAAP regarding the determination of fair value of life insurance companies and accordingly an adjustment has been made for the items affected.
Cheltenham & Gloucester
Under UK and US GAAP, the purchase of the business of Cheltenham & Gloucester Building Society by Lloyds Bank Plc in August 1995 was treated as an acquisition. Under UK GAAP the transaction was accounted for as an acquisition and the resulting goodwill written off directly to reserves. This goodwill was not reinstated upon adoption of IFRS and accordingly no goodwill is held on the Lloyds TSB Group’s IFRS balance sheet in respect of this transaction. Certain other differences also arise under US GAAP regarding the fair value of the net assets. In addition, the net assets acquired included £521 million relating to customer related intangibles, which has now been fully amortised.
TSB Group plc
The business combination of Lloyds Bank Plc and TSB Group plc in December 1995 was accounted for as a merger as permitted under UK GAAP at that time, although legally TSB Group plc was deemed to have acquired Lloyds Bank Plc. This treatment has not been amended under IFRS, since the Lloyds TSB Group has elected not to revisit transactions prior to 1 January 2004. Under US GAAP, the same transaction would have been accounted for as an acquisition of TSB Group plc by Lloyds Bank Plc. Accordingly, for US GAAP, the net assets of TSB Group plc have been fair valued as at the date of the business combination and a purchase price determined based on the value of TSB Group plc shares at that time. The net assets include £1,596 million relating to customer related intangibles which has now been fully amortised.
Scottish Widows
In March 2000, the Group acquired the business of Scottish Widows’ Fund and Life Assurance Society, a life insurance and pensions provider. Under UK GAAP, the transaction was accounted for as an acquisition; the resulting goodwill was not amortised through the profit and loss account but was subjected to an annual impairment review. On adoption of IFRS the goodwill was retained on Lloyds TSB Group’s balance sheet. Under US GAAP, the purchase is also treated as an acquisition, however certain differences arise under US GAAP regarding the determination of fair value of the life insurance business, and there are certain other differences between IFRS and US GAAP such as the treatment of pensions and own shares, for which adjustments have been made.
The movement in US GAAP goodwill is summarised as follows:
| | | | | | | | | | | | | | | | | | | |
| | IFRS
£m | | 2006
US GAAP
adjustment
£m | | US
GAAP
£m | | IFRS
£m | | 2005
US GAAP
adjustment
£m | | US
GAAP
£m | |
| | | | | | | | | | | | | | | | | | | | |
Carrying value | | | | | | | | | | | | | | | | | | | |
Balance at 1 January | | | 2,373 | | | 1,494 | | | 3,867 | | | 2,469 | | | 1,393 | | | 3,862 | |
Acquisitions | | | 4 | | | — | | | 4 | | | 3 | | | — | | | 3 | |
Impairment charge | | | — | | | — | | | — | | | (6 | ) | | — | | | (6 | ) |
Disposals | | | — | | | — | | | — | | | (93 | ) | | 93 | | | — | |
Arising from FIN 46–R (see note I) | | | — | | | 89 | | | 89 | | | — | | | 8 | | | 8 | |
| | | | | | | | | | | | | | | | | | | | |
Balance at 31 December | | | 2,377 | | | 1,583 | | | 3,960 | | | 2,373 | | | 1,494 | | | 3,867 | |
| | | | | | | | | | | | | | | | | | | | |
The adjustment in respect of variable interest entities included within the reconciliation of shareholders’ equity on page F-71 includes goodwill of £272 million (2005: £183 million) resulting from the consolidation for US GAAP purposes of certain variable interest entities.
The US GAAP adjustment above in respect of FIN46-R in 2006 of £89 million is the net impact of additions and disposals of variable interest entities and the impairment recorded in respect of goodwill arising on their consolidation.
F-76
Notes to the group accounts
52 Differences between IFRS and US GAAP(continued)
The movement in US GAAP goodwill by segment is as follows:
| | | | | | | | | | | | | |
| | UK Retail
Banking
£m | | Insurance
and
Investments
£m | | Wholesale and
International
Banking
£m | | Total
£m | |
| | |
Balance at 1 January 2005 | | | 660 | | | 2,160 | | | 1,042 | | | 3,862 | |
Acquisitions | | | — | | | — | | | 3 | | | 3 | |
Impairment charge | | | (6 | ) | | — | | | — | | | (6 | ) |
Arising from FIN 46-R (see note I) | | | — | | | — | | | 8 | | | 8 | |
| | | | | | | | | | | | | | |
Balance at 31 December 2005 | | | 654 | | | 2,160 | | | 1,053 | | | 3,867 | |
Acquisitions | | | — | | | — | | | 4 | | | 4 | |
Arising from FIN 46-R (see note I) | | | — | | | — | | | 89 | | | 89 | |
| | | | | | | | | | | | | | |
Balance at 31 December 2006 | | | 654 | | | 2,160 | | | 1,146 | | | 3,960 | |
| | | | | | | | | | | | | | |
|
Under US GAAP, the intangible asset representing the value of customer relationships associated with an acquisition is capitalised separately and amortised in the consolidated income statement over the estimated average life of the customer relationships. |
|
The movement in US GAAP customer related intangible assets is summarised as follows: |
| | | | | | | | | | | | | |
| | | | 2006
£m | | | | 2005
£m | |
| | | | | | | | | | |
Cost | | | | | | | | | | | | | |
Balance at 1 January | | | | | | 2,127 | | | | | | 2,223 | |
Additions | | | | | | 54 | | | | | | — | |
Disposals | | | | | | — | | | | | | (96 | ) |
| | | | | | | | | | | | | | |
Balance at 31 December | | | | | | 2,181 | | | | | | 2,127 | |
| | | | | | | | | | | | | | |
Amortisation | | | | | | | | | | | | | |
Balance at 1 January | | | | | | 1,981 | | | | | | 1,845 | |
Charge for the year | | | | | | 146 | | | | | | 157 | |
Disposals | | | | | | — | | | | | | (21 | ) |
| | | | | | | | | | | | | | |
Balance at 31 December | | | | | | 2,127 | | | | | | 1,981 | |
| | | | | | | | | | | | | | |
Net book value | | | | | | 54 | | | | | | 146 | |
| | | | | | | | | | | | | | |
| | | | | | | | | | | | | |
Over the next 5 years, estimated amortisation is expected to be: | | | | | | | | | | | |
| | | | | | | | | | |
2007: £4 million | | | | | | | | | | | | | |
2008: £6 million | | | | | | | | | | | | | |
2009: £6 million | | | | | | | | | | | | | |
2010: £5 million | | | | | | | | | | | | | |
2011: £5 million | | | | | | | | | | | | | |
| | | | | | | | | | |
| | | | | | | | | | | | | | |
| |
b | Disposal and closure of businesses |
During 2005 the Lloyds TSB Group disposed of its Goldfish credit card business and incurred some additional costs in relation to business closures and previous disposals; during 2004, the Lloyds TSB Group disposed of substantially all of its interests in Argentina, Colombia, Guatemala, Honduras and Panama.
In 2005, the profit on disposal under US GAAP was £18 million greater than that recorded under IFRS as a result of the difference in the aggregate net book value of goodwill and other intangibles. This amount was lower under US GAAP as the customer related intangible (which is not separately identified in the IFRS financial statements as the acquisition took place prior to 1 January 2004) had been amortised up to the date of sale. In 2004, the loss on disposal under US GAAP was £1 million lower than under IFRS.
Under US GAAP, all goodwill is capitalised and, up to 31 December 2001, was amortised over its estimated useful life. From 1 January 2002, goodwill is no longer amortised but instead subject to impairment testing. Upon disposal of a business or undertaking, the goodwill is included in the calculation of the profit or loss on disposal. Under IFRS, goodwill previously written off directly to reserves prior to 1 January 1998 has not been reinstated and is not required to be included in calculating any subsequent profit or loss on disposal. As a result, any profit on disposal recognised under US GAAP for disposals of businesses acquired before 1January 1998 will be less than that recognised under IFRS, and similarly any loss on disposal will be greater than that recognised under IFRS.
The trading results of those businesses sold in 2005 and 2004 were not significant and they have not been classified as discontinued operations.
| |
| |
|
c | Pension and other post–retirement costs |
The measurement of the US GAAP pension cost is undertaken in accordance with the requirements of SFAS 87, SFAS 106 and SFAS 158. The disclosures reflect the amendments arising from SFAS 132 ‘Employers’ Disclosures about Pensions and Other Postretirement Benefits’ (revised 2003).
F-77
Notes to the group accounts
52 Differences between IFRS and US GAAP(continued)
For the reconciliations below, the Group has applied SFAS 87 to the Lloyds TSB Group Pension Schemes No’s 1 and 2 with effect from 31 December 1997 as it was not feasible to apply it as of January 1989, the date specified in the standard. The Scottish Widows pension scheme has been included from 3 March 2000, the date of acquisition.
Pension and other post-retirement obligations include a liability of £110 million (2005: £101 million) in respect of post–retirement healthcare; the related income statement charge is £5 million (2005: £16 million; 2004: £7 million).
Pension expense
The components of the defined benefit pension expense which arise under US GAAP are estimated as:
| | | | | | | | | | |
| | 2006
£m | | 2005
£m | | 2004
£m | |
| | |
Service cost | | | 326 | | | 298 | | | 286 | |
Interest cost | | | 822 | | | 780 | | | 730 | |
Expected return on plan assets | | | (896 | ) | | (832 | ) | | (824 | ) |
Amortisation of experience gains and losses | | | 400 | | | 289 | | | 183 | |
Prior service cost | | | 34 | | | 28 | | | 29 | |
| | | | | | | | | | | |
Net pension charge | | | 686 | | | 563 | | | 404 | |
Net charge recognised under IFRS | | | 109 | | | 259 | | | 275 | |
| | | | | | | | | | | |
US GAAP adjustment | | | 577 | | | 304 | | | 129 | |
| | | | | | | | | | | |
The estimated net actuarial loss and prior service cost that will be amortised from accumulated other comprehensive income via the pension expense in 2007 are £348 million and £13 million respectively.
On 31 December 2006, Lloyds TSB Group adopted the recognition and disclosure provisions of SFAS 158 ‘Employers’ Accounting for Defined benefit pension and Other Postretirement Plans – an amendment of FASB Statements No. 87, 88, 106 and 132(R)’ (SFAS 158). Under SFAS 158, the funded status of Lloyds TSB Group’s benefit plans (the difference between plan assets at fair value and plan benefit obligations) is recognised on the balance sheet.
Under SFAS 158, the amount recognised as an asset or liability for pension and other post-retirement benefit plans is measured as the difference between the benefit obligation and the fair value of plan assets. Overfunded plans are aggregated and recognised as an asset while underfunded plans are aggregated and recognised as a liability. The offsetting entry for previously unrecognised actuarial gains and losses, and prior service cost or credits, is made in accumulated other comprehensive income. The amounts in accumulated other comprehensive income are recognised net of income tax effects with respective adjustments in deferred tax assets and liabilities. The adoption of SFAS 158 does not impact the recognition policies for pension costs in the consolidated income statement. The transition adjustments, net of tax, for adoption of SFAS 158 for pensions and other post-retirement costs were as follows:
| | | | | | | | | | |
| | Before application
of SFAS 158
£m | | Adjustments
£m | | After application
of SFAS 158
£m | |
| | | | | | | | |
Intangible assets | | | 107 | | | (107 | ) | | — | |
Retirement benefit liabilities | | | 1,383 | | | 809 | | | 2,192 | |
Deferred tax | | | 1,351 | | | (275 | ) | | 1,076 | |
Total shareholders’ equity | | | 11,393 | | | (641 | ) | | 10,752 | |
| | | | | | | | | | | |
|
Obligations and funded status | | | | | | | | | | |
| | | | | | | | | | |
| | 2006
£m | | | | | 2005
£m | |
| | | | | | | | | |
Change in plan assets | | | | | | | | | | |
Plan assets at fair value as at 1 January | | | 14,033 | | | | | | 11,658 | |
Exchange and other movements | | | 2 | | | | | | — | |
Actual return on plan assets | | | 1,266 | | | | | | 2,402 | |
Employer contributions | | | 556 | | | | | | 425 | |
Benefits paid | | | (561 | ) | | | | | (452 | ) |
| | | | | | | | | | | |
Plan assets at fair value at 31 December | | | 15,296 | | | | | | 14,033 | |
| | | | | | | | | | | |
Change in projected benefit obligation | | | | | | | | | | |
Projected benefit obligation as at 1 January | | | 17,423 | | | | | | 14,973 | |
Exchange and other movements | | | 2 | | | | | | 2 | |
Service cost | | | 326 | | | | | | 298 | |
Interest cost | | | 822 | | | | | | 780 | |
Amendments | | | (85 | ) | | | | | 24 | |
Net actuarial (gain) loss | | | (439 | ) | | | | | 1,798 | |
Benefits paid | | | (561 | ) | | | | | (452 | ) |
| | | | | | | | | | | |
Projected benefit obligation at 31 December | | | 17,488 | | | | | | 17,423 | |
| | | | | | | | | | | |
Funded status | | | (2,192 | ) | | | | | (3,390 | ) |
| | | | | | | | | | | |
Balance sheet presentation following adoption of SFAS 158 | | | | | | | | | | |
Recognised within retained earnings | | | 2,224 | | | | | | | |
|
Recognised within accumulated other comprehensive income* | | | (4,416 | ) | | | | | | |
| | | | | | | | | | | |
|
Liability - Pension and other post-retirement obligations | | | (2,192 | ) | | | | | | |
| | | | | | | | | | | |
| |
* | This is recognised in accumulated other comprehensive income net of deferred tax of £1,325 million. |
F-78
Notes to the group accounts
52 Differences between IFRS and US GAAP(continued)
| | | | | | | | | | |
| | 2006
£m | | | | | 2005
£m | |
| | | | | | | | | | | |
Balance sheet presentation in 2005 | | | | | | | | | | |
Funded status, as above | | | | | | | | | (3,390 | ) |
|
Unrecognised net actuarial loss | | | | | | | | | 5,517 | |
|
Unrecognised prior service cost | | | | | | | | | 226 | |
| | | | | | | | | | | |
|
| | | | | | | | | 2,353 | |
| | | | | | | | | | | |
|
Liability – Pension and other post-retirement obligations | | | | | | | | | (2,451 | ) |
|
Intangible asset recognised | | | | | | | | | 226 | |
|
Accumulated other comprehensive income | | | | | | | | | 4,578 | |
| | | | | | | | | | | |
|
Net amount recognised | | | | | | | | | 2,353 | |
| | | | | | | | | | | |
|
US GAAP adjustment | | | | | | | | | | |
US GAAP liability – Pension and other post-retirement obligations | | | (2,192 | ) | | | | | (2,451 | ) |
|
US GAAP intangible asset recognised | | | | | | | | | 226 | |
|
| | | | | | | | | | | |
Net US GAAP liability | | | (2,192 | ) | | | | | (2,225 | ) |
Liability recognised under IFRS | | | 2,462 | | | | | | 2,910 | |
| | | | | | | | | | | |
US GAAP adjustment to shareholders’ equity | | | 270 | | | | | | 685 | |
| | | | | | | | | | | |
| | | | | | | | | | |
Accumulated benefit obligations | | | | | | | | | | |
| | | | | | | | | | |
The accumulated benefit obligations for all defined benefit pension schemes were £16,679 million at 31 December 2006 (2005: £16,484 million). |
| | | | | | | | | | |
Information for pension plans with an accumulated benefit obligation in excess of plan assets is presented in aggregate below: |
| | | | | | | | | | |
| | 2006
£m | | | | | 2005
£m | |
| | | | | | | | | | | |
Projected benefit obligation | | | 16,849 | | | | | | 17,423 | |
Accumulated benefit obligation | | | 16,096 | | | | | | 16,484 | |
Fair value of plan assets | | | 14,681 | | | | | | 14,033 | |
| | | | | | | | | | | |
|
In 2005, the additional minimum pension liability arising on all plans of £4,804 million was recognised in accumulated other comprehensive income, net of the related intangible asset of £226 million and deferred taxes of £1,373 million. |
| | | | | | | | | | |
Assumptions | | | | | | | | | | |
| | | | | | | | | | |
The financial assumptions used to calculate the projected benefit obligation at 31 December 2006 and 2005 are as follows: |
| | | | | | | | | | |
| | 2006
% | | | | | 2005
% | |
| | | | | | | | | | | |
Discount rate | | | 5.10 | | | | | | 4.80 | |
Expected rate of salary increases | | | 3.93 | | | | | | 3.98 | |
Rate of pension increases | | | 2.70 | | | | | | 2.50 | |
| | | | | | | | | | | |
| | | | | | | | | | |
The financial assumptions used to determine net cost for the years ended 31 December 2006, 2005 and 2004 are as follows: |
| | | | | | | | | | |
| | 2006
% | | 2005
% | | 2004
% | |
| | | | | | | | |
Discount rate | | | 4.80 | | | 5.30 | | | 5.40 | |
Expected return on assets | | | 6.90 | | | 6.60 | | | 6.60 | |
Expected rate of salary increases | | | 3.98 | | | 4.14 | | | 4.04 | |
Rate of pension increases | | | 2.50 | | | 2.60 | | | 2.50 | |
| | | | | | | | | | | |
The overall expected return on assets assumption has been determined with the aim of reflecting the average rate of growth expected on the funds invested. In deriving this return the aim is to use a stable, realistic long-term rate of return. The Lloyds TSB Group considers annually whether the rate of return is reasonable having regard to the weighted average of the expected returns from each of the main asset classes.
The expected return for each asset class reflects a combination of historical performance analysis, the forward looking views of the financial markets (as suggested by the yields available) and the views of investment organisations. Consideration is also given to the rate of return expected to be available for reinvestment.
Assets
The assets of the pension schemes are invested primarily in equities and fixed interest securities. In accordance with SFAS 87, the excess of the plan assets over the projected benefit obligation at the transition date (1 January 1998) is recognised as a reduction to pension expense on a prospective basis over approximately 15 years, which was the average remaining service period of employees expected to receive benefits under the plans.
F-79
Notes to the group accounts
52 Differences between IFRS and US GAAP(continued)
The pension schemes’ asset allocation at 31 December 2006 and 2005 and the target allocation for 2007 is as follows:
| | | | | | | | | | |
| | Fair value of
plan assets at
31 December 2006
% | | Fair value of
plan assets at
31 December 2005
% | | Target
allocation 2007
% | |
| | | | | | | | |
Equities | | | 63.4 | | | 65.0 | | | 65.0 | |
Debt securities | | | 23.4 | | | 23.1 | | | 25.0 | |
Property | | | 8.7 | | | 8.7 | | | 8.0 | |
Other | | | 4.5 | | | 3.2 | | | 2.0 | |
| | | | | | | | |
| | | 100.0 | | | 100.0 | | | 100.0 | |
| | | | | | | | | | | |
The principal investment objective is to hold suitable assets of appropriate liquidity which will generate income and capital growth to meet, together with new contributions from members and the employer, the cost of current and future benefits which the schemes provide.
Following an asset-liability modelling study conducted in 2002, the trustees of Lloyds TSB Group Pension Schemes No’s. 1 and 2 considered the target asset allocation in the table above to be appropriate for the purposes of meeting this long-term objective. In determining this allocation, the trustees had regard to the benefits of diversification, the historical rates of return earned, their expected future returns and the expected short-term volatility of each asset class.
The trustees have taken advice from the schemes’ actuaries and investment consultant to ensure that this target allocation is suitable for the schemes given their liability profiles. A number of investment managers have been employed to manage the schemes’ assets and each has been given a specific benchmark and performance objective.
The approach taken by the trustees of Lloyds TSB Group Pension Schemes No’s. 1 and 2 is similar to that taken by the trustees of the other Lloyds TSB Group pension schemes.
Employers’ contributions
Employers’ contributions were £556 million during 2006 (2005: £425 million). Employers’ contributions are expected to be approximately £530 million during 2007.
Employers’ benefits payments
Employers’ benefit payments were £561 million during 2006 (2005: £452 million). Estimated future benefit payments are expected to be:
| |
2007 | £507 million |
2008 | £539 million |
2009 | £571 million |
2010 | £605 million |
2011 | £641 million |
2012-2016 | £3,756 million |
Defined contribution schemes
Full details of those schemes operated by the Group are given in note 35 to the financial statements.
|
| |
|
d Share compensation schemes |
Full details of the share compensation schemes operated by the Group are given in note 44 to the financial statements. In accordance with SFAS 123R the Group accounts for share compensation schemes based on their estimated fair values at the date of grant. Historical data is used to estimate option exercise and employee termination. It has been assumed that employees exercise their options a certain number of years after the grant date. The US GAAP charge for share based payments, which are all equity settled, in respect of grants since 1 January 1996 was £30 million in the year ended 31 December 2006 (2005: £78 million; 2004: £71 million) compared to £58 million (2005: £76 million; 2004: £65 million) under IFRS (see note 44). The related tax benefit was £9 million (2005: £23 million; 2004: £21 million); the tax benefit from share options exercised during the year was £24 million (2005: £1 million; 2004: £nil).
The table below details the unrecognised share based payment charge at 31 December 2006 and 2005 for the various share based compensation schemes of the Lloyds TSB Group:
| | | | | | | | | | | | | |
| | Total unrecognised share based
payment charge | | Weighted average remaining
vesting period | |
| | 31 December
2006
£m | | 31 December
2005
£m | | 31 December
2006
Years | | 31 December
2005
Years | |
| | | | | | | | | | |
Save-As-You-Earn schemes | | | 32 | | | 38 | | | 2.2 | | | 2.4 | |
Executive schemes | | | 3 | | | 8 | | | 1.1 | | | 1.8 | |
Other share option plans | | | 1 | | | 2 | | | 1.7 | | | 2.0 | |
Share plans | | | 43 | | | 27 | | | 2.1 | | | 2.1 | |
| | | | | | | | | | |
| | | 79 | | | 75 | | | | | | | |
| | | | | | | | | | | | | | |
F-80
Notes to the group accounts
52 Differences between IFRS and US GAAP(continued)
The table below details the total non-vested shares granted under the Lloyds TSB Group’s various share compensation plans for the year ended 31 December 2006:
| | | | | | | | | | |
| | Number of
non-vested
shares
millions | | | | | Weighted average
grant date
fair value
pence | |
| | | | | | | | | |
Outstanding at 1 January 2006 | | | 115 | | | | | | 4.33 | |
Granted | | | 59 | | | | | | 5.01 | |
Forfeited | | | (14 | ) | | | | | 4.78 | |
Vested | | | (32 | ) | | | | | 4.05 | |
| | | | | | | | | |
Outstanding at 31 December 2006 | | | 128 | | | | | | 4.66 | |
| | | | | | | | | | | |
e Earnings per share
Basic earnings per share under US GAAP differ from IFRS (see note 14) only to the extent that income calculated under US GAAP differs from IFRS.
Diluted earnings per share measure the effect that existing share options would have on the basic earnings per share if they were to be exercised, by increasing the number of ordinary shares, although any options that are anti-dilutive are excluded from this calculation. For US GAAP purposes, assumed proceeds include the related amount of average unrecognised share based payment costs. An option is considered anti-dilutive when the value of the exercise price exceeds the market price.
| | | | | | | | | | |
| | 2006 | | 2005 | | 2004 | |
| | | | | | | | | | | |
Basic | | | | | | | | | | |
Net income (US GAAP) | | | £1,815m | | | £1,351m | | | £1,508m | |
Weighted average number of ordinary shares in issue | | | 5,616m | | | 5,595m | | | 5,590m | |
Earnings per share | | | 32.3p | | | 24.1p | | | 27.0p | |
Diluted | | | | | | | | | | |
Net income (US GAAP) | | | £1,815m | | | £1,351m | | | £1,508m | |
Weighted average number of ordinary shares in issue | | | 5,652m | | | 5,639m | | | 5,625m | |
Earnings per share | | | 32.1p | | | 24.0p | | | 26.8p | |
The weighted average number of anti-dilutive shares excluded from the calculation of diluted earnings per share was 7 million at 31 December 2006 (2005: 17 million; 2004: 39 million).
f Extinguishment of liabilities
As of 1 January 2005 under IAS 39 a financial liability could only be removed from the balance sheet after it had been settled, it had expired or alternatively the debtor had been released from the liability, either by process of law or by the creditor. Prior to that date, certain financial liabilities relating to deposit accounts were permitted to be and were released to the income statement. In accordance with the transition rules of IFRS 1, the liabilities were remeasured in reserves at 1 January 2005 to reflect the entire legal obligation. No such amounts were released to the income statement in 2004, 2005 or 2006 nor will be released to the income statement in the future.
US GAAP has similar requirements to IFRS. For periods prior to 1 January 2005, the Lloyds TSB Group did not recognise these financial liabilities as the effect was not significant. An adjustment was made to the 2005 income statement reducing income before and after tax by £184 million and £131 million respectively. This adjustment was made in respect of all historical amounts released to income and, as a result, no similar adjustments had been made in the past; no adjustment has been made in 2006 nor will any adjustment be required in the future.
g Hedging and financial instruments
The Lloyds TSB Group uses a variety of financial instruments, including derivatives, to manage its interest rate and other market risks. These activities are discussed more fully on pages 55 to 57 and in note 47.
Hedging
In 2005 and 2006, following the adoption of IAS 39 from 1 January 2005, all derivatives are recognised on the balance sheet at fair value under IFRS. The method of recognising the movements in the fair value of the derivatives depends on whether they are designated as hedging instruments, and if so, the nature of the item being hedged. Further information on the Lloyds TSB Group’s IFRS accounting policy is included within note 1.
Under IFRS in 2004, prior to the adoption of IAS 39, derivatives used in transactions that qualified for hedge accounting were accounted for on an accruals basis, in line with the underlying instruments being hedged.
The Lloyds TSB Group has chosen not to designate any of its derivatives as hedging instruments for US GAAP purposes.
Financial instruments
Under IFRS, Lloyds TSB Group holds financial assets classified as held at fair value through profit or loss, including trading; available-for-sale; and loans and receivables at amortised cost. In addition, the Group designates certain of its financial assets as hedged instruments and has elected to classify certain of its issued debt securities as held at fair value through profit or loss.
Under US GAAP, Lloyds TSB holds securities classified as trading and available-for-sale. In addition, the Group designates certain of its issued debt securities (that contain an embedded derivative that otherwise would require bifurcation) to be held at fair value. The Group has chosen not to designate any of its financial assets or liabilities as hedged instruments for US GAAP purposes.
In total, the US GAAP adjustments in respect of hedging and financial instruments increased net income, before tax, by £83 million in the year ended 31 December 2006 (2005: reduction of £136 million; 2004: reduction of £60 million) with consequent adjustments to the related assets and liabilities on the balance sheet.
F-81
Notes to the group accounts
52 Differences between IFRS and US GAAP(continued)
g Hedging and financial instruments(continued)
The variety of classifications available for financial assets and liabilities results in a number of different IFRS / US GAAP adjustments relating to financial instruments; the following are the most significant for the Lloyds TSB Group:
Available-for-sale securities: Under IFRS, these securities are either classified as available-for-sale or held at fair value through profit or loss. For those securities classified as available-for-sale under IFRS, a GAAP difference arises in the treatment of unrealised foreign exchange gains and losses on the amortised cost of debt securities which are recognised in the income statement under IFRS and in equity under US GAAP. For those securities classified as held at fair value through profit or loss under IFRS, a GAAP difference arises in respect of the entire change in fair value which is recognised in the income statement under IFRS and in equity under US GAAP. In 2006, the income statement impact of these adjustments was an increase in income of £172 million (2005: an increase in income of £11 million; 2004: £nil).
Loans and advances: In addition to measuring loans and advances at amortised cost less impairment, certain loans and advances are hedged under IFRS and their carrying value is therefore adjusted for changes in fair value that are attributable to the hedged risk, and certain others are carried at fair value through profit or loss. Under US GAAP all loans and advances are carried at amortised cost less impairment. In 2006, the impact of this adjustment was an increase in income of £314 million (2005: an increase in income of £27 million; 2004: £nil).
Debt securities: Under IFRS, Lloyds TSB Group has designated certain of its debt securities as held at fair value through profit or loss. A number of these securities are hybrid financial instruments that contain an embedded derivative that otherwise would require bifurcation and are carried at fair value under US GAAP; there is no adjustment in respect of these securities. The remainder are included within US GAAP debt securities at amortised cost. In 2006, the impact of this adjustment was a reduction in income of £21 million (2005: £nil; 2004 £nil).
Other liabilities: Certain of the Lloyds TSB Group’s long-term debt and balances held under reverse repurchase agreements are hedged under IFRS and their carrying value, therefore, adjusted for changes in fair value that are attributable to the hedged risk. These liabilities are not hedged instruments under US GAAP and, as a result, are held at amortised cost. In 2006, the impact of this adjustment was a reduction in income of £492 million (2005: a reduction in income of £174 million; 2004: £nil).
Net investment hedge under IFRS: The Lloyds TSB Group has established a net investment hedge in respect of a new subsidiary set up during the year. The Group has chosen not to designate any of its derivatives as hedging instruments under US GAAP and, as a result, the impact of this hedge is reversed under US GAAP. In 2006, the impact of this adjustment was an increase in income of £110 million (2005: £nil; 2004: £nil).
Carrying value of derivatives: Prior to the adoption of IAS 39, derivatives used in the Group’s non-trading activities were accounted for on an accruals basis, in line with the underlying items which they were hedging. This resulted in a reduction in income in 2004 of £60 million.
h Analyses of investment securities
The disclosures for investment securities in the tables below include those as reported in note 20, and those included as a result of consolidation under the provisions of FIN 46-R (see note l). The Group had no held-to-maturity securities at 31 December 2006 or 31 December 2005.
| | | | | | | | | | |
| | 2006
£m | | | | 2005
£m | |
| | | | | | | | |
Proceeds from sales and maturities of available-for-sale investment securities | | | 22,320 | | | | | | 15,575 | |
Gross realised gains | | | (126 | ) | | | | | (241 | ) |
Gross realised losses | | | 8 | | | | | | 5 | |
| | | | | | | | |
Net amount sold | | | 22,202 | | | | | | 15,339 | |
| | | | | | | | | | | |
F-82
Notes to the group accounts
52 Differences between IFRS and US GAAP(continued)
Realised gains and losses are computed using the weighted average cost method. No gross gains were recorded on securities transferred from available-for-sale to trading.
| | | | | | | | | | | | | |
2006 | | Amortised
cost
£m | | Gross
unrealised
gains
£m | | Gross
unrealised
losses
£m | | Carrying
Value
£m | |
| | | | | | | | | | |
Available-for-sale investment securities: | | | | | | | | | | | | | |
Securities of the US treasury and US government agencies | | | 386 | | | 1 | | | — | | | 387 | |
Other government securities | | | 1,114 | | | 23 | | | (15 | ) | | 1,122 | |
Other public sector securities | | | 225 | | | 2 | | | — | | | 227 | |
Bank and building society certificates of deposit | | | 2,021 | | | 3 | | | (2 | ) | | 2,022 | |
Mortgage backed securities | | | 5,823 | | | 7 | | | (126 | ) | | 5,704 | |
Other asset backed securities | | | 5,095 | | | 21 | | | (100 | ) | | 5,016 | |
Corporate and other debt securities | | | 12,766 | | | 163 | | | (99 | ) | | 12,830 | |
| | | | | | | | | | |
Debt securities | | | 27,430 | | | 220 | | | (342 | ) | | 27,308 | |
Equity shares | | | 61 | | | — | | | — | | | 61 | |
Treasury bills | | | 1,768 | | | — | | | (2 | ) | | 1,766 | |
| | | | | | | | | | |
| | | 29,259 | | | 220 | | | (344 | ) | | 29,135 | |
| | | | | | | | | | | | | | |
Of which: | | | | | | | | | | | | | |
Banking | | | 22,623 | | | 24 | | | (281 | ) | | 22,366 | |
Insurance | | | 6,636 | | | 196 | | | (63 | ) | | 6,769 | |
| | | | | | | | | | |
| | | 29,259 | | | 220 | | | (344 | ) | | 29,135 | |
| | | | | | | | | | | | | | |
| | | | | | | | | | | | | |
2005 | | | Amortised
cost
£m | | | Gross
unrealised
gains
£m | | | Gross
unrealised
losses
£m | | | Carrying
Value
£m | |
| | | | | | | | | | | | | | |
Available-for-sale investment securities: | | | | | | | | | | | | | |
Securities of the US treasury and US government agencies | | | 672 | | | — | | | — | | | 672 | |
Other government securities | | | 1,975 | | | 93 | | | (1 | ) | | 2,067 | |
Other public sector securities | | | 103 | | | 4 | | | — | | | 107 | |
Bank and building society certificates of deposit | | | 1,847 | | | — | | | — | | | 1,847 | |
Mortgage backed securities | | | 4,259 | | | 14 | | | — | | | 4,273 | |
Other asset backed securities | | | 5,512 | | | 53 | | | (35 | ) | | 5,530 | |
Corporate and other debt securities | | | 7,216 | | | 342 | | | (6 | ) | | 7,552 | |
| | | | | | | | | | | | | | |
Debt securities | | | 21,584 | | | 506 | | | (42 | ) | | 22,048 | |
Equity shares | | | 37 | | | 28 | | | — | | | 65 | |
Treasury bills | | | 87 | | | — | | | — | | | 87 | |
| | | | | | | | | | | | | | |
| | | 21,708 | | | 534 | | | (42 | ) | | 22,200 | |
| | | | | | | | | | | | | | |
Of which: | | | | | | | | | | | | | |
Banking | | | 15,204 | | | 47 | | | (40 | ) | | 15,211 | |
Insurance | | | 6,504 | | | 487 | | | (2 | ) | | 6,989 | |
| | | | | | | | | | | | | | |
| | | 21,708 | | | 534 | | | (42 | ) | | 22,200 | |
| | | | | | | | | | | | | | |
F-83
Notes to the group accounts
52 Differences between IFRS and US GAAP(continued)
For those investments on which there is a gross unrealised loss at 31 December, the fair values and analysis by period for which there has been a loss position are as follows:
| | | | | | | | | | | | | | | | | | | |
| | Period investment has been in an unrealised loss position | | | | | |
| | Less than one year | | Greater than one year | | Total | |
2006 | | Unrealised
losses
£m | | Fair value
£m | | Unrealised
losses
£m | | Fair value
£m | | Unrealised
losses
£m | | Fair value
£m | |
| | | | | | | | | | | | | | |
Other government securities | | | 16 | | | 805 | | | — | | | 9 | | | 16 | | | 814 | |
Other public sector securities | | | — | | | — | | | — | | | 5 | | | — | | | 5 | |
Bank and building society certificates of deposit | | | 2 | | | 1,380 | | | — | | | — | | | 2 | | | 1,380 | |
Mortgage backed securities | | | 126 | | | 2,544 | | | — | | | 687 | | | 126 | | | 3,231 | |
Other asset backed securities | | | 97 | | | 2,217 | | | 3 | | | 142 | | | 100 | | | 2,359 | |
Corporate and other debt securities | | | 87 | | | 4,625 | | | 11 | | | 188 | | | 98 | | | 4,813 | |
Treasury bills | | | 2 | | | 1,707 | | | — | | | — | | | 2 | | | 1,707 | |
| | | | | | | | | | | | | | |
Total | | | 330 | | | 13,278 | | | 14 | | | 1,031 | | | 344 | | | 14,309 | |
| | | | | | | | | | | | | | | | | | | | |
| | | | | | | | | | | | | | | | | | | |
| | Period investment has been in an unrealised loss position | | | |
| | Less than one year | | Greater than one year | | Total | |
2005 | | Unrealised
losses
£m | | Fair value
£m | | Unrealised
losses
£m | | Fair value
£m | | Unrealised
losses
£m | | Fair value
£m | |
| | | | | | | | | | | | | | |
Other government securities | | | 1 | | | 85 | | | — | | | 8 | | | 1 | | | 93 | |
Other public sector securities | | | — | | | 2 | | | — | | | 3 | | | — | | | 5 | |
Bank and building society certificates of deposit | | | 5 | | | 321 | | | — | | | 41 | | | 5 | | | 362 | |
Other asset backed securities | | | 26 | | | 1,250 | | | 9 | | | 253 | | | 35 | | | 1,503 | |
Corporate and other debt securities | | | 1 | | | 1,467 | | | — | | | 19 | | | 1 | | | 1,486 | |
| | | | | | | | | | | | | | |
Total | | | 33 | | | 3,125 | | | 9 | | | 324 | | | 42 | | | 3,449 | |
| | | | | | | | | | | | | | | | | | | | |
The changes in fair value in 2005 and 2006 are primarily caused by movements in interest rates rather than movements in credit ratings. Accordingly, Lloyds TSB Group considers that these unrealised losses are temporary in nature and consequently no charge has been made for other-than-temporary impairment. The Lloyds TSB Group has the ability to hold these positions until maturity.
| | | | | | | | | | | | | | | | | | | |
2006 | | Due
within
1 year
£m | | Due
between
1 and 5
years
£m | | Due
between
5 and 10
years
£m | | Due over
10 years
£m | | No fixed
maturity
£m | | Total
£m | |
| | | | | | | | | | | | | | |
Maturity of investment debt securities and treasury bills: | | | | | | | | | | | | | | | | | | | |
Available-for-sale | | | | | | | | | | | | | | | | | | | |
Amortised cost | | | 5,955 | | | 8,061 | | | 9,004 | | | 5,845 | | | 333 | | | 29,198 | |
Fair value | | | 5,894 | | | 7,944 | | | 8,951 | | | 5,942 | | | 343 | | | 29,074 | |
| | | | | | | | | | | | | | | | | | | | |
2005 | | | | | | | | | | | | | | | | | | | |
| | | | | | | | | | | | | | | | | | | | |
Maturity of investment debt securities and treasury bills: | | | | | | | | | | | | | | | | | | | |
Available-for-sale | | | | | | | | | | | | | | | | | | | |
Amortised cost | | | 3,525 | | | 7,351 | | | 4,698 | | | 5,834 | | | 263 | | | 21,671 | |
Fair value | | | 3,528 | | | 7,403 | | | 4,733 | | | 6,181 | | | 290 | | | 22,135 | |
| | | | | | | | | | | | | | | | | | | | |
i Deferred taxation
In accordance with the provisions of SFAS 109, the US GAAP deferred tax liability is:
| | | | | | | | | | |
| | 2006
£m | | | | 2005
£m | |
| | | | | | | | |
Deferred tax liabilities | | | | | | | | | | |
Assets used in the business | | | 72 | | | | | | 39 | |
Assets leased to customers | | | 1,179 | | | | | | 1,294 | |
Value of business acquired | | | 200 | | | | | | 346 | |
Deferred acquisition costs | | | 434 | | | | | | 374 | |
Unrealised gains on investment securities | | | 473 | | | | | | 310 | |
Other | | | 657 | | | | | | 735 | |
| | | | | | | | |
Total deferred tax liabilities | | | 3,015 | | | | | | 3,098 | |
| | | | | | | | |
Deferred tax assets | | | | | | | | | | |
Loan loss allowance | | | (143 | ) | | | | | (165 | ) |
Tax losses: | | | | | | | | | | |
– Pensions business | | | (1,457 | ) | | | | | (1,455 | ) |
– Other | | | (826 | ) | | | | | (752 | ) |
Pension schemes | | | (678 | ) | | | | | (689 | ) |
Other | | | (772 | ) | | | | | (719 | ) |
| | | | | | | | |
Total deferred tax assets | | | (3,876 | ) | | | | | (3,780 | ) |
| | | | | | | | |
Valuation allowance | | | 1,937 | | | | | | 1,849 | |
| | | | | | | | |
US GAAP deferred tax liability | | | 1,076 | | | | | | 1,167 | |
| | | | | | | | | | | |
F-84
Notes to the group accounts
52 Differences between IFRS and US GAAP(continued)
Valuation allowance
Scottish Widows has a significant with-profits pensions business. This business is subject to UK corporation tax on the basis of a notional return determined by the UK taxation authorities. To the extent that the actual return from the business is less than the notional return, tax losses accumulate which may be carried forward and offset against excess returns in future years. The value of these losses at 31 December 2006 was £1,131 million (2005: £1,131 million). Excess returns do not occur regularly and are only likely to be triggered in the future if interest rates increase significantly or there is significant volatility in the markets or the actuarial valuation basis alters significantly. Given the current low interest rate environment and in view of the fact that the actuarial valuation basis is currently considered unlikely to alter significantly, in the opinion of management it is more likely than not that these losses will not be realised and therefore a full valuation allowance has been established against this balance.
A further valuation allowance of £806 million (2005: £718 million) has been established against other tax losses which are not expected to be utilised in the foreseeable future. Under UK tax legislation, certain capital losses may only be offset against taxable gains of a particular type and consequently the associated deferred tax assets are less certain of realisation.
Assessments have been made as to the likelihood of gains arising that can be offset against these losses and, to the extent that it is more likely than not that these losses will not be realised, appropriate valuation allowances have been established. In relation to other tax losses, the pattern of utilisation of losses over previous years has been reviewed together with gains that may be realised in the foreseeable future and an appropriate valuation allowance established to the extent that it is more likely than not that these losses will not be realised.
Eligible unrelieved foreign tax credits may only be offset against foreign income from a particular source and therefore utilisation of the credits is uncertain. To the extent that utilisation is uncertain, appropriate valuation allowances have been established.
Tax losses
The Group has the following tax losses available to be carried forward and offset against the future taxable profits of certain subsidiaries. The majority of the losses may be carried forward indefinitely.
| | | | | | | | | | |
| | 2006
£m | | | | 2005
£m | |
| | |
Trading losses | | | 1,628 | | | | | | 1,612 | |
Capital losses | | | 2,240 | | | | | | 2,831 | |
Pensions business | | | 3,771 | | | | | | 3,771 | |
| | |
| | | | | | | | | | |
| | | 7,639 | | | | | | 8,214 | |
| | |
US GAAP reconciliation
The following tables reconcile the IFRS tax charge and deferred tax liability to the US GAAP tax charge and deferred tax liability as disclosed on pages F-73 and F-74.
| | | | | | | | | | |
| | 2006
£m | | 2005
£m | | 2004
£m | |
| | | | | | | | |
IFRS income statement tax charge | | | 1,341 | | | 1,265 | | | 1,018 | |
Current tax – US GAAP adjustments* | | | 178 | | | — | | | — | |
Deferred tax – US GAAP | | | (57 | ) | | (13 | ) | | (4 | ) |
Deferred tax – US GAAP reconciling items, excluding tax relating to changes in accounting principles | | | (375 | ) | | (397 | ) | | (88 | ) |
| | | | | | | | |
US GAAP income statement tax charge | | | 1,087 | | | 855 | | | 926 | |
| | | | | | | | | | | |
* This adjustment relates to IFRS net investment hedges taken out in 2006, that do not meet the US GAAP hedging criteria; investment securities for which there are differences in the amounts recognised in the income statement; and amounts which are offset by amounts within the deferred tax US GAAP adjustment (therefore having no overall effect on the US GAAP income statement tax charge).
| | | | | | | | | | |
| | 2006
£m | | | | 2005
£m | |
| | | | | | | | |
IFRS deferred tax liability | | | 1,416 | | | | | | 1,145 | |
Deferred tax – US GAAP | | | (40 | ) | | | | | (18 | ) |
Deferred tax – US GAAP reconciling items | | | (300 | ) | | | | | 40 | |
| | | | | | | | |
US GAAP deferred tax liability | | | 1,076 | | | | | | 1,167 | |
| | | | | | | | | | | |
j Significant Group concentrations of credit risk
SFAS 107 ‘Disclosure about Fair Value of Financial Instruments’ states that concentrations of credit risk exist if a number of counterparties are engaged in similar activities and have similar economic characteristics that would cause their ability to meet contractual obligations to be similarly affected by changes in economic or other conditions. The Group’s exposure to credit risk is concentrated in the United Kingdom where the majority of the Group’s activities are conducted and is detailed further in note 18.
F-85
Notes to the group accounts
52 Differences between IFRS and US GAAP(continued)
k Additional balance sheet disclosures
Repos, reverse repos and stocklending transactions
The Group enters into reverse repo transactions which are accounted for as collateralised loans. It is the Group’s policy to seek collateral which is at least equal to the amount loaned. At 31 December 2006, the fair value of collateral accepted under reverse repo transactions that the Group is permitted by contract or custom to sell or repledge was £6,446 million (2005: £6,289 million). Of this, £6,445 million (2005: £6,288 million) was sold or repledged as at 31 December 2006. The remainder has been held for continuing use within the business. The Group also enters into repos which are accounted for as secured borrowings. As at 31 December 2006, the carrying value of assets that have been pledged as collateral under repo transactions where the secured party is permitted by contract or custom to sell or repledge was £1,099 million (2005: £111 million). The carrying value of assets that are subject to stocklending arrangements was £1,781 million at 31 December 2006 (2005: £305 million) all of which the secured party is permitted by contract or custom to sell or repledge.
Gross investment in finance leases
Gross future rentals under finance leases are receivable as follows:
| | | | | | | | | | |
| | 2006
£m | | | | 2005
£m | |
| | | | | | | | |
Not later than 1 year | | | 637 | | | | | | 673 | |
Later than 1 year and not later than 2 years | | | 559 | | | | | | 577 | |
Later than 2 years and not later than 3 years | | | 531 | | | | | | 591 | |
Later than 3 years and not later than 4 years | | | 603 | | | | | | 572 | |
Later than 4 years and not later than 5 years | | | 665 | | | | | | 648 | |
Later than 5 years | | | 5,358 | | | | | | 6,025 | |
| | | | | | | | |
| | | 8,353 | | | | | | 9,086 | |
| | | | | | | | | | | |
l Variable interest entities
In January 2003, the FASB released FIN 46 ‘Consolidation of Variable Interest Entities’ and subsequently issued a revised version, FIN 46-R, in December 2003. FIN 46-R changes the method of determining whether certain entities should be included in the Group’s consolidated financial statements. An entity is called a variable interest entity (VIE) and is subject to the requirements of FIN 46-R if it has:
| |
• | equity that is insufficient to permit the entity to finance its activities without additional subordinated support; or |
| |
• | equity investors that cannot make significant decisions about the entity’s operations, or that do not have the obligation to absorb the expected losses or the right to receive the expected residual returns of the entity; or |
| |
• | some equity investors whose obligations to absorb the expected losses or rights to receive the expected residual returns are disproportionate to those voting rights and substantially all of the entity’s activities are conducted on behalf of those equity investors. |
| |
A VIE is consolidated by its primary beneficiary, which is the party involved with the VIE that has a majority of the expected losses or a majority of the expected returns or both. The implementation of FIN 46-R in full from January 2004 has resulted in the consolidation of additional VIEs, which has increased total assets by £860 million (2005: £605 million), reduced shareholders’ equity by £307 million (2005: £141 million) and decreased profit before tax and accounting changes by £177 million (2005: £33 million; 2004 an increase of £2 million). The transition rules contained within FIN 46-R require that, if initial application of the requirements of FIN46-R resulted in initial consolidation of an entity created before 31 December 2003, the difference between the net amount added to the balance sheet and the amount of any previously recognised interest in the newly consolidated entity should be recognised as the cumulative effect of a change in accounting principle. This reduced US GAAP profit before tax in 2004 by £330 million and profit after tax by £249 million.
The nature of the activities of VIEs in which Lloyds TSB Group has a significant variable interest include:
Financing vehicles
These entities have predominantly pre-determined activities, the nature of which are primarily lending and investments and are undertaken in order to improve the efficiency of Lloyds TSB Group’s normal lending and deposit taking activities. Lloyds TSB Group’s procedures are designed to ensure that, prior to entering in to a structure, it is determined that the structure meets Lloyds TSB Group’s risk management and control requirements. These vehicles are consolidated under IFRS.
Leasing partnerships
These relate to limited partnerships which have been created with a third party investor to acquire significant capital items which are then leased out to third parties, typically on an operating lease. These vehicles are consolidated under IFRS.
Securitisation conduit vehicles
These vehicles are investment-purchasing companies which purchase asset-backed securities (which are backed by third party assets) from the market and initially from Lloyds TSB Group. These vehicles form part of Lloyds TSB Group’s overall securitisation conduit and are consolidated under IFRS as they are considered to be directly controlled by Lloyds TSB Group.
Venture capital enterprises
These relate to medium-sized entities which typically have low equity investment, with a substantial portion of the financing provided by the Group in the form of subordinated lending. Without this lending, the entities would not have sufficient capital to finance their activities.
Open Ended Investment Companies (OEICs) and unit trusts
These types of vehicle operate in a similar way except that an OEIC is legally constituted as a limited company. A unit trust fund invests cash pooled from many investors in a wide range of equity shares, corporate bonds or government securities. Each investor has units in the fund proportionate to their cash investment. These units are of equal value and can be freely traded. Their value rises and falls depending on the performance of the underlying investments. The funds are managed by an appointed fund manager. These vehicles are consolidated under IFRS in those cases where the Lloyds TSB Group has a controlling interest.
The following table represents the carrying amounts and classification of consolidated assets for those VIE operations that are (1) consolidated under both IFRS and US GAAP and (2) those additional VIEs which are consolidated under FIN 46-R but are not consolidated under IFRS:
F-86
Notes to the group accounts
| | | | | | | | | | |
52 Differences between IFRS and US GAAP(continued) | | | | | | | | | | |
|
31 December 2006 | | VIEs consolidated
under IFRS
£m | | VIEs consolidated
under FIN 46-R
£m | | Total
£m | |
| | | | | | | | |
Cash | | | 27 | | | 87 | | | 114 | |
Tangible fixed assets | | | 1,724 | | | 202 | | | 1,926 | |
Investment securities | | | 9,638 | | | (433) | | | 9,205 | |
Trading and other investments | | | 750 | | | — | | | 750 | |
Loans | | | 12,768 | | | — | | | 12,768 | |
Goodwill | | | — | | | 272 | | | 272 | |
Other assets | | | 229 | | | 732 | | | 961 | |
| | | | | | | | | | | |
Total assets of consolidated VIEs | | | 25,136 | | | 860 | | | 25,996 | |
| | | | | | | | | | | |
| | | | | | | | | | |
The total assets of consolidated VIEs are attributable to the following types of vehicles: | | |
|
31 December 2006 | | VIEs consolidated
under IFRS
£m | | VIEs consolidated
under FIN 46-R
£m | | Total
£m | |
| | | | | | | | | | | |
Financing vehicles | | | 8,064 | | | — | | | 8,064 | |
Leasing partnerships | | | 1,739 | | | — | | | 1,739 | |
Securitisation conduit vehicles | | | 10,913 | | | — | | | 10,913 | |
Venture capital enterprises | | | 2 | | | 860 | | | 862 | |
OEICs and unit trusts | | | 4,418 | | | — | | | 4,418 | |
| | | | | | | | | | | |
| | | 25,136 | | | 860 | | | 25,996 | |
| | | | | | | | | | | |
| | | | | | | |
31 December 2005 | | VIEs consolidated
under IFRS
£m | | VIEs consolidated
under FIN 46-R
£m | | Total
£m | |
| | | | | | | | | | | |
Cash | | | 20 | | | 28 | | | 48 | |
Tangible fixed assets | | | 1,824 | | | 178 | | | 2,002 | |
Investment securities | | | 7,620 | | | (294) | | | 7,326 | |
Loans | | | 7,961 | | | — | | | 7,961 | |
Goodwill | | | — | | | 183 | | | 183 | |
Other assets | | | 288 | | | 510 | | | 798 | |
| | | | | | | | | | | |
Total assets of consolidated VIEs | | | 17,713 | | | 605 | | | 18,318 | |
| | | | | | | | | | | |
| | | | | | | | | | |
The total assets of consolidated VIEs are attributable to the following types of vehicles: |
|
31 December 2005 | | VIEs consolidated
under IFRS
£m | | VIEs consolidated
under FIN 46-R
£m | | Total
£m | |
| | | | | | | | | | | |
Financing vehicles | | | 4,990 | | | — | | | 4,990 | |
Leasing partnerships | | | 1,954 | | | — | | | 1,954 | |
Securitisation conduit vehicles | | | 7,364 | | | — | | | 7,364 | |
Venture capital enterprises | | | 2 | | | 605 | | | 607 | |
OEICs and unit trusts | | | 3,403 | | | — | | | 3,403 | |
| | | | | | | | | | | |
| | | 17,713 | | | 605 | | | 18,318 | |
| | | | | | | | | | | |
| | | | | | | | | | |
The following tables show the total assets and maximum exposure to loss, as at 31 December 2006 and 31 December 2005, for those entities where Lloyds TSB Group has a significant variable interest in a VIE but is not determined to be the primary beneficiary: |
| | | | | | | | | | |
2006 | | Total assets
£m | | | | | Maximum exposure
to loss
£m | |
| | | | | | | | | | | |
Venture capital enterprises | | | 942 | | | | | | 942 | |
| | | | | | | | | | | |
| | | | | | | | | | |
2005 | | Total assets
£m | | | | Maximum exposure
to loss
£m | |
| | | | | | | | | | | |
Venture capital enterprises | | | 934 | | | | | | 934 | |
| | | | | | | | | | | |
| | | | | | | | | | |
The FASB continues to provide additional guidance on implementing FIN 46-R through FASB Staff Positions. As this guidance is issued, the Group will continue to review the status of VIEs with which it is involved and, as a result, the scope of VIEs to be consolidated may change. | |
|
| | |
F-87
Notes to the group accounts
52 Differences between IFRS and US GAAP(continued)
m Guarantees
Lloyds TSB Group utilises a number of different types of lending–related financial instruments, such as commitments and guarantees, to meet the financing needs of its customers. These are discussed more fully in note 46. Most of these guarantees and commitments expire without being drawn. Under the provisions of FIN 45, ‘Guarantor’s Accounting and Disclosure Requirements for Guarantees, including Indirect Guarantees of Indebtedness of Others’, which establishes accounting and disclosure requirements for guarantors, a liability is required to be recognised for the fair value of guarantees issued from 1 January 2003. The fair value of the obligation is, in the substantial majority of cases, the amount of premium received under the contract. The adoption of FIN 45 did not have a material impact on Lloyds TSB Group’s US GAAP financial statements.
n Loan impairment
The impairment principles under IAS 39, which was adopted by the Lloyds TSB Group on 1 January 2005, are similar to those previously followed by the Lloyds TSB Group under UK GAAP with the exception of the requirements to discount the expected cash flows at the original effective interest rate when determining the provisioning requirement.
This change did not have a significant impact on the IFRS carrying value of the Lloyds TSB Group’s loans assessed under SFAS 114. At 31 December 2005, the Lloyds TSB Group estimated that the difference between the carrying value of its loan portfolio assessed under SFAS 114 and the carrying value of these loans in its IFRS balance sheet was such that no adjustment to net income or total shareholders’ equity was required.
In 2004, Lloyds TSB Group determined the carrying value of its loans under IFRS and US GAAP using the same methodology. On 1 January 2005, the Lloyds TSB Group adopted IAS 39 and, as a result, calculated the carrying value of its loans by discounting the expected cash flows. As described in note 50, an adjustment to equity of £221 million was made at 1 January 2005 and the carrying value of the loans reduced by £314 million (with associated deferred tax of £93 million).
On 1 January 2005, the Lloyds TSB Group adopted a similar methodology under US GAAP. This change in the model for estimating the carrying value of loans was considered a change of estimate and the adjustment detailed above included within the allowance for loan losses in the income statement in 2005. At 31 December 2006, the carrying value of Lloyds TSB Group’s loans under IFRS is such that no adjustment to net income or total shareholders’ equity is required.
o Insurance activities
The following tables summarise the adjustments to the income statement and balance sheet which would arise from the application of US GAAP to the Group’s insurance businesses.
| | | | | | | | | | | | | |
Income statement | | Note | | 2006
Life
£m | | 2005
Life
£m | | 2004
Life
£m | |
| | | | | | | | | | |
Reversal of value in force | | | i | ) | | 199 | | | (162 | ) | | (16 | ) |
Amortisation of value of business acquired | | | ii | ) | | (95 | ) | | (158 | ) | | (243 | ) |
Investment properties | | | iii | ) | | (505 | ) | | (376 | ) | | (34 | ) |
Deferred acquisition costs | | | v | ) | | 225 | | | 195 | | | 283 | |
Deferred income | | | | | | (22 | ) | | (105 | ) | | (134 | ) |
Policyholder liabilities expense | | | vi | ) | | 15 | | | 1,924 | | | 6 | |
Movement in undistributed policyholder allocations | | | vii | ) | | (576 | ) | | (1,540 | ) | | 245 | |
Investment securities | | | iv | ) | | 350 | | | (216 | ) | | (132 | ) |
Other | | | | | | (18 | ) | | — | | | (10 | ) |
| | | | | | | | | | | | | | |
Total adjustment before accounting changes | | | | | | (427 | ) | | (438 | ) | | (35 | ) |
Cumulative effect of change in accounting principles (before tax)* | | | viii | ) | | — | | | — | | | (449 | ) |
| | | | | | | | | | | | | | |
Total adjustments before tax | | | | | | (427 | ) | | (438 | ) | | (484 | ) |
| | | | | | | | | | | | | | |
| |
* | The cumulative effect of change in accounting principles of £449 million (before tax) in 2004 relates to the adoption of SOP 03-1 (see below). In addition, the cumulative effect of change in accounting principles in respect of the consolidation of variable interest entities under FIN 46-R in 2004, discussed on page F-86, includes £205 million (before tax) in respect of the consolidation of OEICs. |
| | | | | | | | | | |
Balance sheet | | Note | | 2006
Life
£m | | 2005
Life
£m | |
| | | | | | | | |
Reversal of value in force | | | i | ) | | (2,723 | ) | | (2,922 | ) |
Recognition of value of business acquired | | | ii | ) | | 1,334 | | | 1,429 | |
Investment properties | | | iii | ) | | (1,532 | ) | | (1,043 | ) |
Deferred acquisition costs | | | v | ) | | 1,276 | | | 1,051 | |
Deferred income reserve | | | | | | (140 | ) | | (118 | ) |
Policyholder liabilities | | | vi | ) | | 3,468 | | | 3,146 | |
Undistributed policyholder allocations | | | vii | ) | | (3,194 | ) | | (2,619 | ) |
Other | | | | | | (33 | ) | | — | |
| | | | | | | | | | | |
Total adjustments before tax | | | | | | (1,544 | ) | | (1,076 | ) |
| | | | | | | | | | | |
F-88
Notes to the group accounts
52 Differences between IFRS and US GAAP(continued)
Adoption of SOP 03-1
In 2004, Lloyds TSB Group adopted SOP 03-1 ‘Accounting and Reporting by Insurance Enterprises for Certain Nontraditional Long-Duration Contracts and for Separate Accounts’. Prior to the issue of SOP 03-1, the unit-linked investment contract business of the Group was classified as ‘separate account’ and was held at fair value. SOP 03-1 sets stringent criteria for the use of the ‘separate account’ classification which UK unit-linked funds are unable to meet. As a consequence, the assets and liabilities previously classified as separate account items were subsequently accounted for in the same way as other general account assets (as prescribed by SFAS 60) and general account liabilities.
Transition rules relating to the implementation of SOP 03-1 require that no prior year adjustments were made and that the opening balance sheet impact is reflected in the current year income statement as a cumulative effect of change in accounting principle. This reduced profit before tax for the year ended 31 December 2004 by £449 million and profit after tax by £305 million. This reduction primarily relates to the effect of carrying the unit-linked investment properties at depreciated cost rather than at fair value and the write-down by £264 million of the value of business acquired as a result of the new Guaranteed Annuity Option reserving requirements.
i) Value in force
Under IFRS, contracts must be classified as insurance, participating or investment as defined by IFRS 4. The Group accounts for its life assurance operations using the appropriate IFRS for investment contracts and the embedded value basis of accounting for insurance and participating contracts. All of the Group’s investment contracts are unit-linked. These contracts are accounted for as financial liabilities whose value is contractually linked to the fair values of the financial assets within the Group’s unitised funds. The embedded value calculation for insurance and participating contracts is an actuarially determined estimate of the economic value of the business in question, excluding any value which may be attributed to future new business. The embedded value is the sum of the net assets of the life assurance company and the present value of the in-force business. The value of the in-force business is calculated on a market consistent basis. Under this method, each cash flow is valued using the discount rate consistent with that applied to such a cash flow in the capital markets. In 2006 market consistent discount rates replace the single discount rate previously used and also include an explicit allowance made for non-market risk.
US GAAP requires that results of the life assurance business should be reported on a gross basis and reflected in appropriate captions in the income statement. Premiums from conventional with-profits policies and other protection-type life insurance policies are recognised as revenue when due from the policyholder. Premiums from unitised with-profits life insurance policies and investment contracts, which have minimal mortality risk, are reported as increases in policyholder account balances when received. Revenues derived from these policies consist of mortality charges, policy administration charges, investment management fees and surrender charges that are deducted from policyholders’ accounts and are disclosed within other income.
Under US GAAP, premiums and policy charges received that relate to future periods are deferred until the period to which they relate. For limited payment annuities, the excess of the gross premium over the US GAAP net benefit premium is deferred and amortised in relation to the expected future benefit payments. For investment contracts, policy charges that benefit future periods are deferred and amortised in relation to expected gross profits.
ii) Value of long-term assurance business acquired
Under US GAAP, the value of the long-term assurance business acquired (‘VOBA’) is calculated at acquisition by discounting future earnings to a present value. In subsequent years the VOBA is amortised over the premium recognition period for with-profits life insurance and other protection-type insurance policies using assumptions consistent with those used in computing policyholder benefit provisions. VOBA for investment-type policies and unitised insurance policies is amortised in relation to expected gross profits. Expected gross profits are evaluated regularly against actual experience and revisions made to allow for the effect of any changes.
| | | | | | | |
| | 2006
£m | | 2005
£m | |
| | | | | | |
Balance at 1 January | | | 1,429 | | | 1,587 | |
Interest accrued on unamortised balance | | | 125 | | | 193 | |
Amortisation | | | (220 | ) | | (351 | ) |
| | | | | | | | |
Balance at 31 December | | | 1,334 | | | 1,429 | |
| | | | | | | | |
Over the next 5 years the movement in the VOBA asset is expected to be:
| |
2007: | £118 million |
2008: | £109 million |
2009: | £102 million |
2010: | £98 million |
2011 | £94 million |
iii) Investment properties
Investment properties are carried at depreciated historical cost for US GAAP purposes and so US GAAP income differs from IFRS income by the amount of unrealised gains and losses recognised in the income statement under IFRS; and there will be a difference in equity equal to the cumulative unrealised gains and losses.
iv) Investment securities
Under IFRS, debt securities and equity shares held within the long-term assurance funds are included in the Group’s balance sheet at market value and investment properties are included at open-market value; in both cases movements in value are taken through the income statement.
To the extent that debt securities and equity shares are classified as available-for-sale for US GAAP purposes, US GAAP income differs from IFRS income by the amount of unrealised gains and losses recognised in the income statement under IFRS.
For those securities classified as available-for-sale, the disclosures required under SFAS 115 are presented in aggregate with the banking business on pages F-82 to F-84.
F-89
Notes to the group accounts
52 Differences between IFRS and US GAAP(continued)
v) Deferred acquisition costs
Under IFRS, directly incremental costs that vary with and are related to either securing new business or renewing existing non-participating investment contracts are capitalised as deferred acquisition costs. This asset is then amortised over the period of the provision of investment management services. For insurance or participating investment contracts, the cost of acquiring new and renewal life assurance business is recognised in the embedded value calculation as incurred.
Under US GAAP, the costs incurred by the Group in the acquisition of new and renewal life insurance business are capitalised. These consist of the acquisition costs, principally relating to: commissions, marketing and advertising, processing and policy issuance. Together these are capitalised as an asset and amortised in relation to the profit margin of the policies acquired.
Deferred acquisition costs for conventional with-profits life insurance and other protection-type insurance policies are amortised in relation to premium income using assumptions consistent with those used in computing policyholder benefits provisions. Investment, universal life, and separate account contracts are amortised in proportion to the estimated gross profits or other appropriate measure arising from the contracts.
vi) Policyholder liabilities
Under IFRS, future policyholder benefit provisions included in the Group’s balance sheet are calculated using either net or gross premium methods for conventional with-profits life insurance and other protection-type policies and are mainly based on fund value amongst other methods for unitised with-profits insurance policies and investment-type policies. Net premiums are calculated using assumptions for interest, mortality, morbidity and expenses. These assumptions are determined as prudent best estimates at the date of valuation.
Under US GAAP, for unitised with-profits insurance and other investment-type policies, the liability is represented by the policyholder’s account balance before any applicable surrender charges. Policyholder benefit liabilities for conventional with-profits life insurance and other protection–type insurance policies are developed using the net level premiums method. Assumptions for interest, mortality, morbidity, withdrawals and expenses were prepared using best estimates at date of policy issue (or date of company acquisition by the Group, if later) plus a provision for adverse deviation based on Group experience. Interest assumptions range from 4 per cent to 11 per cent.
vii) Undistributed policyholder allocations
With-profits policies entitle the policyholder to participate in the surplus within the with-profits life fund of the insurance company which issued the policy. Regular bonuses are determined annually by the issuing company’s Head of Actuarial Function and its board of directors. The bonuses that may be declared are highly correlated to the overall performance of the underlying assets and liabilities of the fund in which the contracts participate and are the subject of normal variability and volatility. Terminal bonuses are paid on maturity of the contract and are designed to provide policyholders with a share of the total performance of the issuing company during the period of the contract.
The contract for conventional with-profits business written into the with-profits fund provides that approximately 90 per cent of the surplus arising from the net assets of the fund is allocated to policyholders in the form of annual bonuses. For unitised with-profits business written into the with-profits fund, all of the surplus is allocated to policyholders as bonus.
Under IFRS, all amounts in the with-profits fund not yet allocated to policyholders or shareholders are recorded in the liabilities attributable to policyholders on the Group’s balance sheet.
Under US GAAP, a liability is established for undistributed policyholder allocations. The excess of assets over liabilities in the with-profits fund is allocated to the policyholders and shareholders in accordance with the proportions prescribed by the contracts. The remaining liability comprises the obligation of the insurance company to the policyholders.
viii) Separate account assets and liabilities
Under IFRS, segregated accounts are established for policyholder business for which policyholder benefits are wholly or partly determined by reference to specific investments or to an investment-related index. This is referred to as linked business. Linked business can either be unit-linked, property-linked or index-linked. In the case of the unit-linked and property-linked business the policyholders bear the investment risk. The Group bears the investment risk relating to the index-linked business.
Under US GAAP, in 2004, Lloyds TSB Group adopted SOP 03-1. Prior to the issue of SOP 03-1, the unit-linked investment contract business of the Group was classified as ‘separate account’ and was held at fair value. SOP 03-1 sets stringent criteria for the use of the ‘separate account’ classification which UK unit-linked funds are unable to meet. As a consequence, the assets and liabilities previously classified as separate account are now accounted for in the same way as other general account assets (as prescribed by SFAS 60) and general account liabilities.
p Parent company US GAAP information
Note 53 sets out information in respect of Lloyds TSB Group plc, the parent company, on an IFRS basis. Set out below are the IFRS to US GAAP net income and equity reconciliations in respect of this company:
| | | | | | | |
Reconciliation to US GAAP | | | | | |
| | 2006
£m | | 2005
£m | |
| | | | | | |
Shareholders’ funds (IFRS) | | | 4,721 | | | 4,645 | |
Derivatives and hedging, including related deferred tax | | | 29 | | | 94 | |
Revaluation of shares in group undertakings | | | 6,002 | | | 6,242 | |
| | | | | | | | |
Shareholders’ equity (US GAAP) | | | 10,752 | | | 10,981 | |
| | | | | | | | |
F-90
Notes to the group accounts
52 Differences between IFRS and US GAAP(continued)
Under IFRS shares in group undertakings are held at cost; under US GAAP they are held at the parent company’s share of the net assets of the group undertakings.
Reconciliation of movements in shareholders’ equity under US GAAP
| | | | | | | | | | |
| | 2006
£m | | 2005
£m | | 2004
£m | |
| | | | | | | | | | | |
Profit after tax (IFRS) | | | 1,877 | | | 1,898 | | | 1,928 | |
Derivatives and hedging, including related deferred tax | | | (65 | ) | | (8 | ) | | — | |
Share compensation schemes | | | 28 | | | (2 | ) | | (6 | ) |
| | | | | | | | | | | |
Net income (US GAAP) | | | 1,840 | | | 1,888 | | | 1,922 | |
Dividends paid | | | (1,919 | ) | | (1,914 | ) | | (1,913 | ) |
| | | | | | | | | | | |
| | | (79 | ) | | (26 | ) | | 9 | |
Issue of shares | | | 105 | | | 26 | | | 10 | |
Purchase/sale of treasury shares | | | (20 | ) | | (2 | ) | | 9 | |
Share compensation schemes | | | 5 | | | 49 | | | 25 | |
Revaluation of shares in group undertakings | | | (240 | ) | | (524 | ) | | (487 | ) |
| | | | | | | | | | | |
| | | (229 | ) | | (477 | ) | | (434 | ) |
Shareholders’ equity at 1 January (US GAAP) | | | 10,981 | | | 11,458 | | | 11,892 | |
| | | | | | | | | | | |
Shareholders’ equity at 31 December (US GAAP) | | | 10,752 | | | 10,981 | | | 11,458 | |
| | | | | | | | | | | |
| | | | | | | | | | |
53 Parent company disclosures | | | | | | | | | | |
| | | | | | | | | | |
a Company income statement | | | | | | | | | | |
| | | | | | | | | | |
| | 2006
£m | | 2005
£m | | 2004
£m | |
| | | | | | | | | | | |
Net interest income | | | 18 | | | 22 | | | 20 | |
Other income | | | 1,917 | | | 1,898 | | | 1,913 | |
| | | | | | | | | | | |
Total income | | | 1,935 | | | 1,920 | | | 1,933 | |
Operating expenses | | | (42 | ) | | (38 | ) | | (39 | ) |
| | | | | | | | | | | |
Profit on ordinary activities before tax | | | 1,893 | | | 1,882 | | | 1,894 | |
Taxation (charge) credit | | | (16 | ) | | 16 | | | 34 | |
| | | | | | | | | | | |
Profit for the year | | | 1,877 | | | 1,898 | | | 1,928 | |
| | | | | | | | | | | |
F-91
Notes to the group accounts
53 Parent company disclosures(continued)
b Company balance sheet
| | | | | | | | |
| | | 2006 | | | 2005 | |
| | | £m | | | £m | |
| | | | | | | | |
Assets | | | | | | | |
Non-current assets: | | | | | | | |
Investments in subsidiaries | | | 5,589 | | | 5,589 | |
Loans to subsidiaries | | | 1,723 | | | 1,723 | |
Deferred tax assets | | | — | | | 21 | |
| | | | | | | | |
| | | 7,312 | | | 7,333 | |
Current assets: | | | | | | | |
Derivative financial instruments | | | 114 | | | | 188 | |
Other assets | | | 146 | | | | 131 | |
Amounts due from subsidiaries | | | 203 | | | | 164 | |
Cash and cash equivalents | | | 1,213 | | | | 107 | |
| | | 1,676 | | | 590 | |
| | | | | | | | |
Total assets | | | 8,988 | | | 7,923 | |
| | | | | | | | |
Equity and liabilities | | | | | | | |
Capital and reserves: | | | | | | | |
Share capital | | | 1,429 | | | 1,420 | |
Share premium account | | | 1,266 | | | 1,170 | |
Retained profits | | | 2,026 | | | 2,055 | |
| | | | | | | | |
Total equity | | | 4,721 | | | 4,645 | |
| | | | | | | | |
Non-current liabilities: | | | | | | | |
Subordinated liabilities | | | 2,297 | | | 1,502 | |
| | | | | | | | |
| | | 2,297 | | | 1,502 | |
Current liabilities: | | | | | | | |
Current tax liabilities | | | 43 | | | | 5 | |
Amounts owed to subsidiaries | | | 1,850 | | | | 1,692 | |
Other liabilities | | | 77 | | | | 79 | |
| | | 1,970 | | | 1,776 | |
| | | | | | | | |
Total liabilities | | | 4,267 | | | 3,278 | |
| | | | | | | | |
Total equity and liabilities | | | 8,988 | | | 7,923 | |
| | | | | | | | |
F-92
Notes to the group accounts
53 Parent company disclosures(continued)
c Company cash flow statement
| | | | | | | | | | |
| | 2006
£m | | 2005
£m | | 2004
£m | |
| | | | | | | | | | | |
Profit before tax | | | 1,893 | | | 1,882 | | | 1,894 | |
Profit on disposal of subsidiary | | | — | | | — | | | (1 | ) |
Dividend income | | | (1,918 | ) | | (1,913 | ) | | (1,913 | ) |
Fair value adjustment | | | 3 | | | 9 | | | — | |
Change in other assets | | | (44 | ) | | (72 | ) | | — | |
Change in other liabilities | | | 156 | | | (44 | ) | | (24 | ) |
Tax received (paid) | | | 46 | | | 12 | | | (122 | ) |
| | | | | | | | | | | |
Net cash used in operating activities | | | 136 | | | (126 | ) | | (166 | ) |
| | | | | | | | | | | |
Cash flows from investing activities: | | | | | | | | | | |
Disposal of businesses, net of cash disposed | | | — | | | — | | | 1 | |
| | | | | | | | | | | |
Net cash generated by investing activities | | | — | | | — | | | 1 | |
| | | | | | | | | | | |
Cash flows from financing activities: | | | | | | | | | | |
Dividends received from subsidiaries | | | 1,918 | | | 1,913 | | | 1,913 | |
Dividends paid to equity shareholders | | | (1,919 | ) | | (1,914 | ) | | (1,913 | ) |
Proceeds from issue of subordinated liabilities | | | 1,116 | | | — | | | — | |
Proceeds from issue of ordinary shares and transactions in own shares held in respect of employee share schemes | | | 105 | | | 26 | | | 11 | |
Repayment of subordinated liabilities | | | (250 | ) | | — | | | — | |
| | | | | | | | | | | |
Net cash generated by financing activities | | | 970 | | | 25 | | | 11 | |
| | | | | | | | | | | |
Change in cash and cash equivalents | | | 1,106 | | | (101 | ) | | (154 | ) |
Cash and cash equivalents at beginning of year | | | 107 | | | 208 | | | 362 | |
| | | | | | | | | | | |
Cash and cash equivalents at end of year | | | 1,213 | | | 107 | | | 208 | |
| | | | | | | | | | | |
The above cash flow statement has been prepared under the provisions of IAS 7.
d Interests in subsidiaries
The principal subsidiaries, all of which have prepared accounts to 31 December and whose results are included in the consolidated accounts of Lloyds TSB Group plc, are:
| | | | | | |
| | Country of
registration/
incorporation | | Percentage of equity
share capital and
voting rights held | | Nature of business |
| | | | | | | |
Lloyds TSB Bank plc | | England | | 100% | | Banking and financial services |
Cheltenham & Gloucester plc | | England | | 100%† | | Mortgage lending and retail investments |
Lloyds TSB Commercial Finance Limited | | England | | 100%† | | Credit factoring |
Lloyds TSB Leasing Limited | | England | | 100%† | | Financial leasing |
Lloyds TSB Private Banking Limited | | England | | 100%† | | Private banking |
The Agricultural Mortgage Corporation PLC | | England | | 100%† | | Long-term agricultural finance |
Lloyds TSB Offshore Limited | | Jersey | | 100%† | | Banking and financial services |
Lloyds TSB Scotland plc | | Scotland | | 100%† | | Banking and financial services |
Lloyds TSB General Insurance Limited | | England | | 100%† | | General insurance |
Scottish Widows Investment Partnership Group Limited | | England | | 100%† | | Investment management |
Abbey Life Assurance Company Limited | | England | | 100%† | | Life assurance |
Lloyds TSB Insurance Services Limited | | England | | 100%† | | Insurance broking |
Lloyds TSB Asset Finance Division Limited | | England | | 100%† | | Consumer credit, leasing and related services |
Black Horse Limited | | England | | 100%† | | Consumer credit, leasing and related services |
Scottish Widows plc | | Scotland | | 100%† | | Life assurance |
Scottish Widows Annuities Limited | | Scotland | | 100%† | | Life assurance |
| | | | | | | |
| |
† | Indirect interest |
| |
| The country of registration/incorporation is also the principal area of operation for each of the above group undertakings except as follows: |
| |
| Lloyds TSB Bank plc operates principally in the UK but also through branches in Belgium, Dubai, Ecuador, France, Gibraltar, Hong Kong, Japan, Luxembourg, Malaysia, Monaco, Netherlands, Paraguay, Singapore, Spain, Switzerland, Uruguay and the USA, and a representative office in China. |
F-93
THIS PAGE INTENTIONALLY LEFT BLANK
F-94
Glossary
| | |
Term used | | US equivalent or brief description |
| | | |
Accounts | | Financial statements. |
| | | |
Allotted | | Issued. |
| | | |
Associates | | Long–term equity investments accounted for by the equity method. |
| | | |
Attributable profit | | Net income. |
| | | |
ATM | | Automatic Teller Machine. |
| | | |
Balance sheet | | Statement of financial position. |
| | | |
Broking | | Brokerage. |
| | | |
Building society | | A building society is a mutual institution set up to lend money to its members for house purchases. See also ‘Demutualisation’. |
| | | |
Called-up share capital | | Ordinary shares, issued and fully paid. |
| | | |
Contract hire | | Leasing. |
| | | |
Creditors | | Payables. |
| | | |
Dealing | | Trading. |
| | | |
Debtors | | Receivables. |
| | | |
Deferred tax | | Deferred income tax. |
| | | |
Demutualisation | | Process by which a mutual institution is converted into a public limited company. |
| | | |
Depreciation | | Amortisation. |
| | | |
Economic profit | | See definition under ‘Operating and financial review and prospects – Economic profit’. |
| | | |
Endowment mortgage | | An interest–only mortgage to be repaid by the proceeds of an endowment insurance policy which is assigned to the lender providing the mortgage. The sum insured, which is payable on maturity or upon the death of the policyholder, is used to repay the mortgage. |
| | | |
Finance lease | | Capital lease. |
| | | |
Freehold | | Ownership with absolute rights in perpetuity. |
| | | |
Hire purchase | | See ‘Business – Business and activities of Lloyds TSB Group – Wholesale and International Banking – Asset Finance’. |
| | | |
Interchange | | System allowing customers of different ATM operators to use any ATM that is part of the system. |
| | | |
ISA | | Individual Savings Account. |
| | | |
Leasehold | | Land or property which is rented from the owner for a specified term under a lease. At the expiry of the term the land or property reverts back to the owner. |
| | | |
Lien | | Under UK law, a right to retain possession pending payment. |
| | | |
Life assurance | | Life insurance. |
| | | |
Loan capital | | Long–term debt. |
| | | |
Members | | Shareholders. |
| | | |
Memorandum and articles of association | | Articles and bylaws. |
| | | |
National Insurance | | A form of taxation payable in the UK by employees, employers and the self-employed, used to fund benefits at the national level including state pensions, medical benefits through the National Health Service (NHS), unemployment and maternity. It is part of the UK’s national social security system and ultimately controlled by HM Revenue & Customs. |
| | | |
Nominal value | | Par value. |
| | | |
Open Ended Investment Company (‘OEIC’) | | Mutual fund. |
| | | |
Ordinary shares | | Common stock. |
| | | |
107
| | |
Term used | | US equivalent or brief description. |
| | | |
Overdraft | | A line of credit, contractually repayable on demand unless a fixed–term has been agreed, established through a customer’s current account. |
| | | |
Preference shares | | Preferred stock. |
| | | |
Premises | | Real estate. |
| | | |
Profit attributable to equity shareholders | | Net income. |
| | | |
Provisions | | Reserves. |
| | | |
Regular premium | | Premiums which are payable throughout the duration of a policy or for some shorter fixed period. |
| | | |
Reinsurance | | The insuring again by an insurer of the whole or part of a risk that it has already insured with another insurer called a reinsurer. |
| | | |
Retained profits | | Retained earnings. |
| | | |
Share capital | | Capital stock. |
| | | |
Shareholders’ equity | | Stockholders’ equity. |
| | | |
Share premium account | | Additional paid-in capital. |
| | | |
Shares in issue | | Shares outstanding. |
| | | |
Single premium | | A premium in relation to an insurance policy payable once at the commencement of the policy. |
| | | |
Tangible fixed assets | | Property and equipment. |
| | | |
Undistributable reserves | | Restricted surplus. |
| | | |
VaR | | Value at Risk, see definition under ‘Operating and financial review and prospects – Risk management – Market risk – Exposures’. |
| | | |
Weighted sales | | The sum of regular premiums plus one-tenth of single premiums paid by customers on life insurance, pensions and unit trusts. |
| | | |
With-profits sub-fund | | See ‘Business – Business and activities of Lloyds TSB Group – Insurance and Investments – Life assurance, pensions and investments’. |
| | | |
Write-offs | | Charge-offs. |
| | | |
108
Form 20–F Cross-reference Sheet
| | | | | |
| Form 20–F Item Number and Caption | | Location | Page |
| | | | | |
Part I | | | | | |
Item 1. | Identity of Directors, Senior Management and Advisors | | | |
| A. | Directors and senior management | | Not applicable. | |
| B. | Advisors | | Not applicable. | |
| C. | Auditors | | Not applicable. | |
Item 2. | Offer Statistics and Expected Timetable | | | |
| A. | Offer statistics | | Not applicable. | |
| B. | Method and expected timetable | | Not applicable. | |
Item 3. | Key Information | | | |
| A. | Selected Financial Data | | “Selected Consolidated Financial Data” | 3 |
| B. | Capitalisation and indebtedness | | Not applicable. | |
| C. | Reason for the offer and use of Proceeds | | Not applicable. | |
| D. | Risk factors | | “Risk Factors” | 103 |
Item 4. | Information on the Company | | | |
| A. | History and development of the Company | | “Business” | 6 |
| B. | Business overview | | “Business Overview” | 2 |
| C. | Organisational structure | | “Lloyds TSB Group Structure” | 106 |
| D. | Property, plant and equipment | | “Business – Properties” | 11 |
Item 4A. | Unresolved Staff Comments | | Not applicable. | |
Item 5. | Operating and Financial Review and Prospects | | | |
| A. | Operating results | | “Operating and Financial Review and Prospects” | 13 |
| B. | Liquidity and capital resources | | “Operating and Financial Review and Prospects–Liquidity and capital resources” | 61 |
| | | | “Dividends” | 95 |
| | | | “Operating and Financial Review and Prospects – Risk Elements in the Loan Portfolio – Cross border outstandings” | 55 |
| | | | “Operating and Financial Review and Prospects – Investment portfolio, maturities, deposits, short-term borrowings” | 69 |
| C. | Research and development, patents and licenses, etc. | | Not applicable. | |
| D. | Trend information | | “Operating and Financial Review and Prospects – Overview and trend information” | 14 |
| E. | Off balance sheet arrangements | | “Operating and Financial Review and Prospects – Liquidity and capital resources – Off balance sheet arrangements” | 61 |
| F. | Tabular disclosure of contractual obligations | | “Operating and Financial Review and Prospects – Liquidity and capital resources – Liquidity sources” | 61 |
Item 6. | Directors, Senior Management and Employees | | | |
| A. | Directors and senior management | | “Management and Employees–Directors and senior management” | 76 |
| B. | Compensation | | “Management and Employees – Compensation” | 78 |
| C. | Board practices | | “Management and Employees – Corporate governance – The board and its committees” | 87 |
| D. | Employees | | “Management and Employees – Employees” | 86 |
| E. | Share ownership | | “Management and Employees – Directors’ interests” | 83 |
Item 7. | Major Shareholders and Related Party Transactions | | | |
| A. | Major shareholders | | “Major Shareholders and Related Party Transactions – Major shareholders” | 90 |
| B. | Related party transactions | | “Major Shareholders and Related Party Transactions – Related party transactions” | 90 |
| C. | Interests of experts and counsel | | Not applicable. | |
Item 8. | Financial Information | | | |
| A. | Consolidated Statements and Other Financial Information | | “Consolidated Financial Statements” | F-1 |
| | | | “Business – Legal actions” | 11 |
| | | | “Dividends” | 95 |
| B. | Significant changes | | “Business – Recent developments” | 10 |
Item 9. | The Offer and Listing | | | |
| A. | Offer and listing details | | “Listing Information” | 93 |
| B. | Plan of distribution | | Not applicable. | |
| C. | Markets | | “Listing Information” | 93 |
| D. | Selling shareholders | | Not applicable. | |
| E. | Dilution | | Not applicable. | |
| F. | Expenses of the issue | | Not applicable. | |
109
| | | | | |
| Form 20–F Item Number and Caption | | Location | Page |
| | | | | |
Item 10. | Additional Information | | | |
| A. | Share capital | | Not applicable. | |
| B. | Memorandum and Articles of Association | | “Memorandum and Articles of Association of Lloyds TSB Group plc” | 95 |
| C. | Material contracts | | “Business – Material contracts”. | 10 |
| D. | Exchange controls | | “Exchange Controls” | 99 |
| E. | Taxation | | “Taxation” | 99 |
| F. | Dividends and paying agents | | Not applicable. | |
| G. | Statements by experts | | Not applicable. | |
| H. | Documents on display | | “Where You Can Find More Information” | 102 |
| I. | Subsidiary information | | “Lloyds TSB Group Structure” | 106 |
Item 11. | Quantitative and Qualitative Disclosures about Market Risk | | “Operating and Financial Review and Prospects – Risk management” | 39 |
| | | | “Operating and Financial Review and Prospects – Risk
management – Market risk” | 55 |
| | | “Notes to the accounts – Note 47 – Financial risk management” | F-54 |
Item 12. | Description of Securities Other than Equity Securities | | | |
| A. | Debt securities | | Not applicable. | |
| B. | Warrants and rights | | Not applicable. | |
| C. | Other securities | | Not applicable. | |
| D. | American Depositary Shares | | Not applicable. | |
Part II | | | | | |
Item 13. | Defaults, Dividends Arrearages and Delinquencies | | Not applicable. | |
Item 14. | Material Modifications to the Rights of Security Holders and Use of Proceeds | | Not applicable. | |
Item 15. | Controls and Procedures | | “Management and Employees – Corporate governance” | 87 |
Item 16. | [Reserved by the Securities and Exchange Commission] | | | |
| A. | Audit committee financial expert | | “Management and Employees – Corporate governance – The board and its committees – Audit committee” | 87 |
| | | | | |
| B. | Code of ethics | | “Operating and Financial Review and Prospects – Risk management – People risk” | 60 |
| C. | Principal accountant fees and services | | “Management and Employees – Corporate governance – The board and its committees – Audit committee” | 87 |
| | | | “Notes to the accounts – Note 10 – Operating expenses” | F–23 |
| D. | Exemptions from the listing standards for audit committees | | Not applicable. | |
| E. | Purchases of equity securities by the issuer and affiliated purchasers | | Not applicable. | |
Part III | | | | | |
Item 17. | Financial statements | | Not applicable. | |
Item 18. | Financial statements | | “Consolidated Financial Statements” | F–1 |
Item 19. | Exhibits | | “Exhibit Index” and the pages following | 111 |
110
Exhibit Index
| | | |
1. | Memorandum and articles of association of Lloyds TSB Group plc. |
| | | |
2. | (i) | Limited Partnership Agreements dated 4 February 2000, relating to the preference securities.* |
| | | |
| (ii) | Trust Deed dated 25 April 2001, relating to the perpetual capital securities.* |
| | | |
4. | (b) | (i) | Service agreement dated 6 September 1991 between Lloyds TSB Bank plc and Michael E. Fairey.† |
| | (ii) | Service agreement dated 9 February 2000 between Lloyds TSB Bank plc and Archie G. Kane.† |
| | (iii) | Service agreement dated 19 October 2001 between Lloyds TSB Bank plc and J. Eric Daniels.† |
| | (iv) | Service agreement dated 28 July 2000 between Lloyds TSB Group plc and Maarten A. van den Bergh.† |
| | (v) | Service agreement dated 4 March 2004 between Lloyds TSB Bank plc and Helen A. Weir. |
| | (vi) | Service agreement dated 29 July 2004 between Lloyds TSB Bank plc and G. Truett Tate. ¾ |
| | (vii) | Service agreement dated 23 May 2005 between Lloyds TSB Bank plc and Teresa A. Dial. ¾ |
| | (viii) | Service agreement dated 25 January 2006 between Lloyds TSB Group plc and Sir Victor Blank. ˜ |
| | (ix) | Letter of appointment dated 24 April 2003 between Lloyds TSB Group plc and Wolfgang C. G. Berndt. ˜ |
| | (x) | Letter of appointment dated 20 November 1998 between Lloyds TSB Group plc and Ewan Brown. ˜ |
| | (xi) | Letter of appointment dated 21 September 2005 between Lloyds TSB Group plc and Jan P. Du Plessis. ˜ |
| | (xii) | Letter of appointment dated 13 November 2001 between Lloyds TSB Group plc and Gavin J. N. Gemmell. ˜ |
| | (xiii) | Letter of appointment dated 18 November 2004 between Lloyds TSB Group plc and Sir Julian Horn-Smith. ˜ |
| | (xiv) | Letter of appointment dated 20 September 2001 between Lloyds TSB Group plc and DeAnne Julius. ˜ |
| | (xv) | Letter of appointment dated 24 April 2003 between Lloyds TSB Group plc and Angela A. Knight. ˜ |
| | (xvi) | Letter of appointment dated 14 September 2005 between Lloyds TSB Group plc and Lord Leitch. ˜ |
| | (xvii) | Letter of appointment dated 10 May 2007 between Lloyds TSB Group plc and Philip N. Green. |
| | | |
8.1 | List of subsidiaries, their jurisdiction of incorporation and the names under which they conduct business. |
| | | |
12.1 | Certification of J. Eric Daniels filed pursuant to 17 CFR 240.13a-14(a) and 15 U.S.C. 7241 |
| | | |
12.2 | Certification of Helen A. Weir filed pursuant to 17 CFR 240.13a-14(a) and 15 U.S.C. 7241 |
| | | |
13.1 | Certification of J. Eric Daniels and Helen A. Weir furnished pursuant to 17 CFR 240.13a-14(b) and 18 U.S.C. 1350. |
| | | |
* | Previously filed with the SEC, together with Lloyds TSB Group’s registration statement, on 25 September 2001. |
† | Previously filed with the SEC on Lloyds TSB Group’s Form 20–F filed 23 June 2003. |
| Previously filed with the SEC on Lloyds TSB Group’s Form 20–F filed 5 April 2004. |
¾ | Previously filed with the SEC on Lloyds TSB Group’s Form 20–F filed 29 June 2005. |
˜ | Previously filed with the SEC on Lloyds TSB Group’s Form 20–F filed 6 June 2006. |
The exhibits shown above are listed according to the number assigned to them by the Form 20–F.
111
Signatures
The registrant hereby certifies that it meets all of the requirements for filing on Form 20-F and that it has duly caused and authorised the undersigned to sign this annual report.
| | |
| LLOYDS TSB GROUP plc | |
| By: | /s/ H A Weir |
| | |
| Name: | Helen A Weir |
| Title: | Group Finance Director |
| | |
| Dated: | 8 June 2007 |
112