| OMB APPROVAL |
OMB Number: 3235-0570 Expires: August 31, 2011 Estimated average burden hours per response: 18.9 |
UNITED STATES
SECURITIES AND EXCHANGE COMMISSION
Washington, D.C. 20549
FORM N-CSR
CERTIFIED SHAREHOLDER REPORT OF REGISTERED MANAGEMENT
INVESTMENT COMPANIES
Investment Company Act file number 811-10529
| The GKM Funds |
| (Exact name of registrant as specified in charter) |
| 11150 Santa Monica Boulevard, Suite 850 Los Angeles, California 90025 |
(Address of principal executive offices) (Zip code) |
Timothy J. Wahl
| First Western Investment Management, Inc. |
| 11150 Santa Monica Boulevard, Suite 850 Los Angeles, California 90025 |
| (Name and address of agent for service) |
Registrant's telephone number, including area code: (310) 268-2605
Date of fiscal year end: July 31, 2011
Date of reporting period: July 31, 2011
Form N-CSR is to be used by management investment companies to file reports with the Commission not later than 10 days after the transmission to stockholders of any report that is required to be transmitted to stockholders under Rule 30e-1 under the Investment Company Act of 1940 (17 CFR 270.30e-1). The Commission may use the information provided on Form N-CSR in its regulatory, disclosure review, inspection, and policymaking roles.
A registrant is required to disclose the information specified by Form N-CSR, and the Commission will make this information public. A registrant is not required to respond to the collection of information contained in Form N-CSR unless the Form displays a currently valid Office of Management and Budget ("OMB") control number. Please direct comments concerning the accuracy of the information collection burden estimate and any suggestions for reducing the burden to Secretary, Securities and Exchange Commission, 450 Fifth Street, NW, Washington, DC 20549-0609. The OMB has reviewed this collection of information under the clearance requirements of 44 U.S.C. § 3507.
| Item 1. | Reports to Stockholders. |
 | GKM FUNDS |
GKM Growth Fund | |
Annual Report July 31, 2011 | |
GKM Growth Fund |
September 2011
Dear Shareholders:
We closed our tenth fiscal year on July 31, 2011 and I would like to thank you for joining us as shareholders of the GKM Growth Fund (the “Fund”). All of us at First Western Investment Management, Inc. continue to share a common goal – to help our clients realize their financial objectives through the long-term compounding of capital.
GKM GROWTH FUND PERFORMANCE
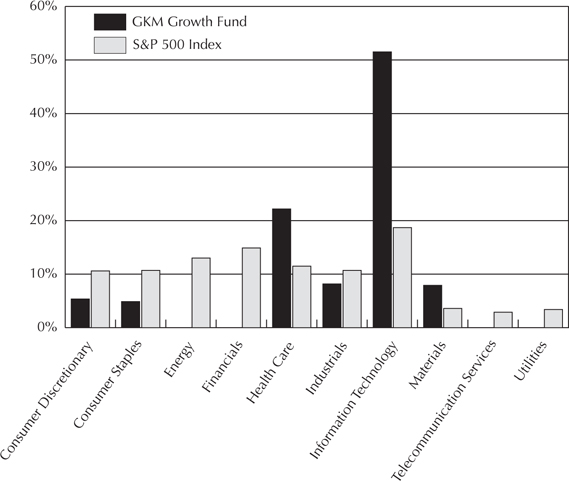
Consistent over the life of the Fund, our largest concentrations have been and continue to be in what we consider to be the most dynamic, growing and profitable areas of the economy: Information Technology and Health Care, currently representing 74% of the Fund’s net assets in the aggregate.
The decision to overweight these two sectors was made, in part, to increase the Fund’s international exposure. This international exposure has become an ever larger theme of our investment thinking over the last decade as we believe foreign sales will continue to grow as a percentage of total global revenues, especially in the so called “BRIC” nations of Brazil, Russia, India and China and other emerging nations. Standard & Poor’s reported that companies in the S&P 500 Index (the “S&P 500”) had approximately 47% of their sales occur outside the U.S. in 2009 while the Information Technology sector had the highest percentage of foreign sales at 56%. Both of these numbers have been increasing over the years and we expect that trend to continue. The Fund’s performance is clearly driven by these two growing areas of the economy as well as avoidance of troubled industries such as Automobiles, Banks and Airlines.
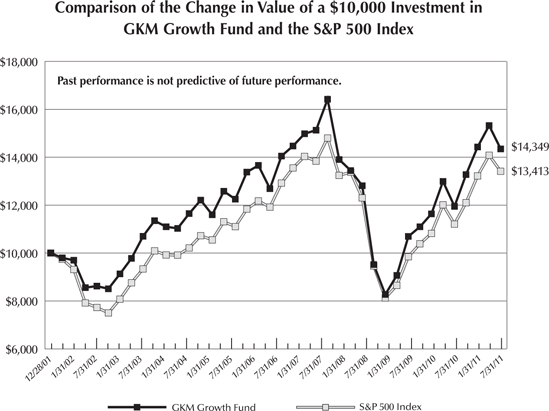
For the fiscal year ended July 31, 2011, the Fund’s total return was 20.08% vs. a return for the S&P 500 of 19.65%. Since the Fund’s inception on December 28th, 2001, the Fund has had a cumulative total return of 43.49% vs. the S&P 500’s cumulative return of 34.13%. Since inception, the Fund has realized an average annualized return of 3.84% vs. the S&P 500’s average annualized return of 3.11%.
The biggest contributor to the Fund’s performance this year was Information Technology (“IT”). The IT sector of the S&P 500, the largest of the 10 sectors that make up the index at 19%, performed roughly in line with the index as a whole, gaining 19.1%. The Fund’s IT holdings, representing 52% of the Fund’s net assets (a little more than three and a half times the S&P 500 weighting), gained 23.1% for the fiscal year ended July 31, 2011. Thus the Fund’s largest sector weighting (IT) positively impacted the performance of the Fund relative to the index for the fiscal year ended July 31, 2011.
Health Care, our second largest sector holding (22% vs. 12% for the S&P 500) gained 19.3%, in line with the S&P 500. At the end of the current fiscal year, we held no companies in the Telecommunication Services, Utilities or Financials sectors, which on a sector basis gained 16.9%, 13.8% and 1.9%, respectively. The Telecommunication Services, Utilities and Financials sectors all underperformed the S&P 500 and our lack of holdings in these sectors positively impacted the relative performance of the Fund during the fiscal year.
The biggest detractor to the Fund’s performance this year was Energy. Energy, the third largest of the 10 S&P 500 sectors at 13%, was also the best performing, gaining 42.0%. We held no companies in the Energy sector. Thus, our lack of Energy holdings negatively impacted the relative performance of the Fund during the fiscal year.
1
We underweighted (5% Fund vs. 11% S&P 500) and underperformed the Consumer Discretionary sector this last fiscal year. The Fund’s exposure to the Consumer Discretionary sector posted a gain of 15.4% vs. a plus 28.3% for the Consumer Discretionary sector of the S&P 500. Our underweighting in and the underperformance of our holdings in the sector negatively impacted the relative performance of the Fund during the fiscal year.
As stated in previous annual letters and worth repeating, over the life of the Fund we have avoided what we consider to be non-traditional growth areas in the economy, some of which have performed quite well. Since the inception of the Fund, the top three performing S&P 500 sectors – Energy (+167%), Materials (+79%), and Consumer Staples (+45%) – happen to be sectors we consider non-traditional growth sectors. While the Fund currently maintains twice the market weighting in the Materials sector as compared to the S&P 500, the Fund has not held any positions in Energy and we currently hold approximately a 4% market weighting in the Consumer Staples sector as compared to a little over 10% for the S&P 500. Given the dominant performance for the Energy and Consumer Staples sectors, the Fund’s underweighting has negatively impacted the Fund’s performance relative to the S&P 500 over the life of the Fund. Also, the consistent overweighting and outperformance of IT (+100% for the Fund vs. +18% for the IT sector of the S&P 500) has positively impacted performance relative to the S&P 500 over the life of the Fund.
RISK MANAGEMENT AND DIVERSIFICATION
Our investment philosophy dictates we pay attention to the management of risk. We define risk simply as the permanent loss of capital. We endeavor to manage risk by investing in what we consider to be superior companies with profitable operating histories and managements focused towards not only building and maintaining but expanding defendable franchises with ample cash flows and sound balance sheets. Additionally, we manage sector risk by diversifying among sectors of the economy that we believe will show continuous growth over many years. It is important to note that at times our security selection process results in the Fund being more or less concentrated in various sectors of the S&P 500, thus potentially adding to the Fund’s sector risk.
Finally, we mitigate specific stock risk through holding a diversified portfolio of companies in the Fund. As of July 31, 2011, the Fund held positions in 44 companies, with the Fund’s top 10 holdings representing 46.7% of the Fund’s net assets and the largest holding representing 9.5% of net assets.
PORTFOLIO TURNOVER
We do not confuse activity with progress. The average portfolio turnover ratio for equity funds within the mutual fund industry is approximately 100%, meaning that the average stock holding period for most funds is about 1 year. The average of the Fund’s portfolio turnover ratios for each of the first 10 fiscal years is 9.4%, which means that we hold our positions an average of 10.6 years, or 10 times as long as the average mutual fund. It’s important to understand that it is impossible to outperform the S&P 500, as we have done over the long-term with low turnover, unless you’re buying the right companies in the first place. Our turnover ratio for the fiscal year ended July 31, 2011 was 25%.
Our low turnover rate also has the added benefit of minimizing what can be a potentially large drag on investment performance – taxes. A Securities and Exchange Commission report on Mutual Fund Fees and Expenses by the Division of Investment Management (http://www.sec.gov/news/studies/feestudy.htm#P1107_143799) states that although fund expenses play a key role in determining ultimate shareholder wealth, taxes play an even larger role for many investors in mutual funds. For example, the report found that taxes reduced the investment performance
2
of the median domestic stock fund by 2.6% per year. We consider this transaction oriented performance drag of 2.6% to be self inflicted by portfolio managers. It is a drag we attempt to minimize by seeking out good long-term investments, ultimately enabling the Fund to maintain a below average turnover ratio.
MARKET COMMENTARY
In last summer’s annual report we wrote that fear and volatility had returned to the investment world, producing a negative quarterly return of -11.4% (ended June 30, 2010) for the first time since the market bottomed in March 2009. In the midst of this anxiety what followed were four consecutive positive calendar quarter returns of +11.3%, +10.8%, +5.9% and +0.1% producing an annual return for the S&P 500 of 30.7% for the year ended June 30, 2011. Significant moves up in the market are extremely difficult to time and devastating to miss for the long term equity investor.
Similar to last summer, the geographies of the problems remain consistent. Concerns continue to center around uncertainty in the United States, Europe and Japan, as well as unrest in other parts of the world. The Japanese Earthquake and related Tsunami in March added structural duress to an already stagnant Japanese economy. Europe continued to unravel, with Spain and Italy joining the chorus of struggling European economies. The Arab Spring, which began in Tunisia in December of 2010, has marched onward through Egypt and Libya with all eyes now on Syria. Also, India has recently experienced a Gandhi like uprising-to be monitored.
Investor fear and volatility have returned, as witnessed by the late August near 18% sell off in the equity markets, as measured by the S&P 500. Common to previous cycles, the capital invested in equities appears to have found a home in fixed income just as stocks go on sale and the yield on the 10-year Treasury bond falls below 2%, a low not reached since 1940-41. This generationally low yield translates into the risk that investors will earn a negative real return. The term “real” denotes the return to the investor after the damaging effects of inflation are taken into account. If the rate of inflation exceeds the yield, purchasing power is destroyed. Fear, uncertainty and doubt have spread like a virus and, in our opinion, greatly reduced the attractiveness of fixed income as an asset class.
Our investment discipline dictates we accumulate high quality, growing franchises at attractive valuations. In the current low growth environment, we’re able to find world class companies at attractive valuations that aren’t looking to just survive, but to dominate and accumulate market share so that when the economy improves they are best positioned to translate increased volume into profitable growth and wealth for shareholders. Average investors will not have participated if they are moving out of equities following the media reported crisis du jour. Our goal is to invest in and accumulate the best asset class capitalism has to offer—equities—compounding the Fund’s capital over the long term. Successful long term investing best serves the well disciplined.
Dividends are another consideration in our investment process. We currently hold six stocks in the portfolio that have a cost basis yield of more than 100% of their current yield. To better explain: if we purchased a stock at $100 a share and it paid a $2.50 a share dividend it would have a current yield of 2.5% ($2.50 divided by $100). Over time, a growing company has the luxury of paying a higher dividend. Let’s say the stock appreciates to $200 a share and the company wants to maintain a current yield of 2.5%. This would require a $5 dollar a share dividend ($5 divided by $200 = 2.5%). In our example, the yield based on the price paid for the stock doubles to 5% ($2.50 a share dividend grows to $5.00 divided by the cost of $100). As of July 31, 2011, we owned QUALCOMM with a current yield of 1.6% and a cost basis yield of 5.4%, or more than three times the current yield. This is a strategy we’ve deployed over the life of the Fund.
3
One last observation on dividends we find of note. American dividend-paying stocks have produced total returns — appreciation, including any related to buybacks (repurchase of company stock), plus dividends — of 8.3% a year on average since 1972. Stocks of companies that don’t pay dividends, but may still sometimes undertake buybacks, have returned a paltry 1.4% annually. To be clear, we prefer capital returned to investors in the form of dividends, not buybacks.
Currently, we believe American multinational corporations look attractive. They are outperforming the developed economies of the United States, Europe and Japan by efficiently allocating resources towards the faster growing developing countries. They are focusing their resources on the rapidly growing global middle class, mainly in Asia, Latin America, India, Russia and Africa. The Organization for Economic Co-operation and Development (OECD) projects the purchasing power of the emerging middle class in developing countries to grow approximately 150% over the next two decades with 80% of this projected growth to come from Asia alone. We’re investing in companies that have plenty of access to capital and the ability to derive revenues and earnings from these faster growing emerging economies. In our view, this will better enable our portfolio of companies to continue to grow earnings and dividends in excess of the slower growing developed economies of the West.
In our opinion, the U.S., Europe and Japan all are experiencing serious leadership deficiencies, weakening consumer and business confidence, leading to the discussion of recession amid an already weak recovery. We’ve experienced a downgrade of U.S. debt and an investor flight into Gold and bonds, which we believe to be an emotional and harmful short term reaction to fear and directly in conflict to our established long term investment philosophy. Real estate and unemployment continue to weigh on the American psyche, further delaying the confidence required for a more normal recovery.
Our research tells us the corporate recovery remains alive and well. The companies making up the S&P 500 just finished reporting their highest quarterly operating profit in history, with record amounts of cash on their balance sheets. This is in direct conflict with the broader economic slow down we’ve been experiencing of late. We expect the macro economy will eventually recover, as it has from every previous recession, and continue its long term upward trajectory. Therefore, we will continue to buy and hold those multinational companies that we believe can achieve the highest quality growth our capital markets have to offer.
Our summary from last year’s annual report once again applies: Our primary areas of concern remain expiring consumer incentives, continued high unemployment and depressed housing prices going nowhere despite the Fed keeping interest rates at very low levels in an effort to accommodate the housing and credit markets. We believe consumer confidence and spending will not dramatically turn for the better until we see a significant improvement in real estate and the employment markets. This is where we would like to see Washington come together and lead.
Sincerely,
Timothy J. Wahl CPA
President and Co-Portfolio Manager
GKM Funds
4
Past performance is not predictive of future performance. Investment results and principal value will fluctuate so that shares, when redeemed, may be worth more or less than their original cost. Current performance may be higher or lower than the performance data quoted. Performance data, current to the most recent month-end, are available at www.gkmfunds.com.
An investor should consider the investment objectives, risks, charges and expenses of the Fund carefully before investing. The Fund’s prospectus contains this and other important information. To obtain a copy of the Fund’s prospectus please visit www.gkmfunds.com or call 1-888-456-9518 and a copy will be sent to you free of charge. Please read the prospectus carefully before you invest. The GKM Growth Fund is distributed by Ultimus Fund Distributors, LLC.
The Letter to Shareholders seeks to describe some of the adviser’s current opinions and views of the financial markets. Although the adviser believes it has a reasonable basis for any opinions or views expressed, actual results may differ, sometimes significantly so, from those expected or expressed.
The GKM Growth Fund’s expense ratio was 1.60% during the year ended July 31, 2011. The expense ratio in the December 1, 2010 prospectus was 1.59%.
5
GKM Growth Fund Performance Information July 31, 2011 (Unaudited) |
Average Annual Total Returns* (for periods ended July 31, 2011) | |||||
| 1 Year | 5 Years | Since Inception** | |||
GKM Growth Fund (a) | 20.08% | 2.49% | 3.84% | ||
| S&P 500 Index | 19.65% | 2.39% | 3.11% | ||
(a) The Fund’s expense ratio was 1.60% during its most recent fiscal year ended July 31, 2011. The expense ratio in the December 1, 2010 prospectus was 1.59% | |||||
| * | The total returns shown do not reflect the deduction of taxes that a shareholder would pay on Fund distributions or the redemption of Fund shares. |
| ** | Initial public offering of shares was December 28, 2001. |
6
GKM Growth Fund Portfolio Information July 31, 2011 (Unaudited) |
Sector Concentration vs. the S&P 500 Index (% of Total Investments)
Top 10 Equity Holdings
Security Description | % of Net Assets | |
| Apple, Inc. | 9.5% | |
| Google, Inc. - Class A | 6.2% | |
| International Business Machines Corporation | 6.0% | |
| Intuit, Inc. | 4.8% | |
| Trimble Navigation Ltd. | 3.9% | |
| Intuitive Surgical, Inc. | 3.4% | |
| Scotts Miracle-Gro Company (The) - Class A | 3.4% | |
| EMC Corporation | 3.4% | |
| Microsoft Corporation | 3.1% | |
| Accenture Ltd. - Class A | 3.0% |
7
GKM Growth Fund Schedule of Investments July 31, 2011 |
Common Stocks — 100.9% | Shares | Value | ||||||
| Consumer Discretionary — 5.4% | ||||||||
| Hotels, Restaurants & Leisure — 2.1% | ||||||||
Yum! Brands, Inc. | 14,000 | $ | 739,480 | |||||
| Household Durables — 3.3% | ||||||||
Tupperware Brands Corporation | 14,000 | 874,860 | ||||||
Whirlpool Corporation | 4,000 | 276,920 | ||||||
| 1,151,780 | ||||||||
| Consumer Staples — 4.9% | ||||||||
| Beverages — 2.5% | ||||||||
Coca-Cola Company (The) | 13,000 | 884,130 | ||||||
| Food & Staples Retailing — 1.1% | ||||||||
Costco Wholesale Corporation | 5,000 | 391,250 | ||||||
| Household Products — 1.3% | ||||||||
Church & Dwight Company, Inc. | 11,000 | 443,740 | ||||||
| Health Care — 22.4% | ||||||||
| Biotechnology — 0.8% | ||||||||
Celgene Corporation* | 5,000 | 296,500 | ||||||
| Health Care Equipment & Supplies — 12.1% | ||||||||
Baxter International, Inc. | 9,000 | 523,530 | ||||||
Conceptus, Inc.* | 22,500 | 256,275 | ||||||
C.R. Bard, Inc. | 3,500 | 345,380 | ||||||
Intuitive Surgical, Inc.* | 3,000 | 1,201,650 | ||||||
Medtronic, Inc. | 21,000 | 757,050 | ||||||
St. Jude Medical, Inc. | 16,000 | 744,000 | ||||||
Stryker Corporation | 7,500 | 407,550 | ||||||
| 4,235,435 | ||||||||
| Health Care Providers & Services — 3.5% | ||||||||
Henry Schein, Inc.* | 12,700 | 844,042 | ||||||
McKesson Corporation | 4,500 | 365,040 | ||||||
| 1,209,082 | ||||||||
| Life Sciences Tools & Services — 1.9% | ||||||||
Covance, Inc.* | 11,400 | 652,650 | ||||||
| Pharmaceuticals — 4.1% | ||||||||
Novartis AG - ADR | 6,000 | 367,200 | ||||||
Roche Holdings AG - ADR | 7,000 | 311,850 | ||||||
8
GKM Growth Fund Schedule of Investments (Continued) |
Common Stocks — 100.9% (Continued) | Shares | Value | ||||||
Health Care — 22.4% (Continued) | ||||||||
Pharmaceuticals — 4.1% (Continued) | ||||||||
Teva Pharmaceutical Industries Ltd. - ADR | 16,000 | $ | 746,240 | |||||
| 1,425,290 | ||||||||
| Industrials — 8.2% | ||||||||
| Air Freight & Logistics — 1.3% | ||||||||
FedEx Corporation | 5,300 | 460,464 | ||||||
| Commercial Services & Supplies — 1.4% | ||||||||
Stericycle, Inc.* | 6,000 | 492,720 | ||||||
| Electrical Equipment — 1.4% | ||||||||
Babcock & Wilcox Company (The)* | 20,000 | 499,600 | ||||||
| Machinery — 2.6% | ||||||||
Pall Corporation | 18,100 | 897,398 | ||||||
| Road & Rail — 1.5% | ||||||||
Norfolk Southern Corporation | 7,000 | 529,900 | ||||||
| Information Technology — 52.0% | ||||||||
| Communications Equipment — 2.2% | ||||||||
QUALCOMM, Inc. | 13,700 | 750,486 | ||||||
| Computers & Peripherals — 14.3% | ||||||||
Apple, Inc.* | 8,500 | 3,319,080 | ||||||
EMC Corporation* | 45,000 | 1,173,600 | ||||||
Stratasys, Inc.* | 20,000 | 510,000 | ||||||
| 5,002,680 | ||||||||
| Electronic Equipment, Instruments & Components — 3.9% | ||||||||
Trimble Navigation Ltd.* | 37,800 | 1,344,924 | ||||||
| Internet Software & Services — 6.2% | ||||||||
Google, Inc. - Class A* | 3,600 | 2,173,284 | ||||||
| IT Services — 11.7% | ||||||||
Accenture Ltd. - Class A | 17,900 | 1,058,606 | ||||||
Automatic Data Processing, Inc. | 7,000 | 360,430 | ||||||
International Business Machines Corporation | 11,500 | 2,091,275 | ||||||
Western Union Company (The) | 30,000 | 582,300 | ||||||
| 4,092,611 | ||||||||
9
GKM Growth Fund Schedule of Investments (Continued) |
Common Stocks — 100.9% (Continued) | Shares | Value | ||||||
Information Technology — 52.0% (Continued) | ||||||||
| Semiconductors & Semiconductor Equipment — 0.9% | ||||||||
Texas Instruments, Inc. | 11,000 | $ | 327,250 | |||||
| Software — 12.8% | ||||||||
Intuit, Inc.* | 36,000 | 1,681,200 | ||||||
Microsoft Corporation | 40,000 | 1,096,000 | ||||||
Nuance Communications, Inc. * | 20,000 | 400,200 | ||||||
Oracle Corporation | 30,000 | 917,400 | ||||||
Symantec Corporation* | 20,000 | 381,200 | ||||||
| 4,476,000 | ||||||||
| Materials — 8.0% | ||||||||
| Chemicals — 8.0% | ||||||||
Ecolab, Inc. | 15,000 | 750,000 | ||||||
Scotts Miracle-Gro Company (The) - Class A | 23,600 | 1,190,856 | ||||||
Sigma-Aldrich Corporation | 12,600 | 845,460 | ||||||
| 2,786,316 | ||||||||
Total Common Stocks (Cost $22,355,424) | $ | 35,262,970 | ||||||
Money Market Funds — 0.0% | Shares | Value | ||||||
First American Treasury Obligations Fund - Class Y, 0.00%(a) (Cost $317) | 317 | $ | 317 | |||||
Total Investments at Value(b) — 100.9% (Cost $22,355,741) | $ | 35,263,287 | ||||||
Liabilities in Excess of Other Assets — (0.9%) | (320,757 | ) | ||||||
Net Assets — 100.0% | $ | 34,942,530 | ||||||
| ADR - American Depositary Receipt. | |
| * | Non-income producing security. |
| (a) | Variable rate security. Rate shown is the 7-day effective yield as of July 31, 2011. |
| (b) | All securities are pledged as collateral for the Fund’s bank line of credit (Note 5). |
| See accompanying notes to financial statements. | |
10
GKM Growth Fund Statement of Assets and Liabilities July 31, 2011 |
| ASSETS | ||||
| Investments in securities: | ||||
At acquisition cost | $ | 22,355,741 | ||
At value (Note 2) | $ | 35,263,287 | ||
Dividends receivable | 7,395 | |||
Receivable for investment securities sold | 843,116 | |||
Receivable for capital shares sold | 1,433 | |||
Total Assets | 36,115,231 | |||
| LIABILITIES | ||||
Line of credit payable (Note 5) | 1,086,500 | |||
Payable for capital shares redeemed | 43,443 | |||
Accrued investment advisory fees (Note 4) | 33,958 | |||
Accrued Trustees’ fees (Note 4) | 2,260 | |||
Other liabilities | 6,540 | |||
Total Liabilities | 1,172,701 | |||
NET ASSETS | $ | 34,942,530 | ||
| Net assets consist of: | ||||
Paid-in capital | $ | 25,660,780 | ||
Accumulated net realized losses from security transactions | (3,625,796 | ) | ||
Net unrealized appreciation on investments | 12,907,546 | |||
Net assets | $ | 34,942,530 | ||
| Shares of beneficial interest outstanding (unlimited number of shares authorized, no par value) | 2,445,466 | |||
| Net asset value, redemption price and offering price per share (Note 2) | $ | 14.29 | ||
| See accompanying notes to financial statements. |
11
GKM Growth Fund Statement of Operations For the Year Ended July 31, 2011 |
| INVESTMENT INCOME | ||||
Dividends (Net of foreign tax of $2,037) | $ | 361,253 | ||
| EXPENSES | ||||
Investment advisory fees (Note 4) | 490,886 | |||
Trustees’ fees (Note 4) | 3,000 | |||
Interest expense (Note 5) | 69,019 | |||
Total Expenses | 562,905 | |||
NET INVESTMENT LOSS | (201,652 | ) | ||
| REALIZED AND UNREALIZED GAINS ON INVESTMENTS | ||||
Net realized gains from security transactions | 2,110,265 | |||
| Net change in unrealized appreciation/depreciation on investments | 4,191,313 | |||
| NET REALIZED AND UNREALIZED GAINS ON INVESTMENTS | 6,301,578 | |||
NET INCREASE IN NET ASSETS FROM OPERATIONS | $ | 6,099,926 | ||
| See accompanying notes to financial statements. |
12
GKM Growth Fund Statements of Changes in Net Assets |
Year Ended July 31, 2011 | Year Ended July 31, 2010 | |||||||
| FROM OPERATIONS | ||||||||
Net investment loss | $ | (201,652 | ) | $ | (153,362 | ) | ||
Net realized gains (losses) from security transactions | 2,110,265 | (638,127 | ) | |||||
Net change in unrealized appreciation/ depreciation on investments | 4,191,313 | 4,075,013 | ||||||
Net increase in net assets resulting from operations | 6,099,926 | 3,283,524 | ||||||
| FROM CAPITAL SHARE TRANSACTIONS | ||||||||
Proceeds from shares sold | 4,042,996 | 3,073,177 | ||||||
Payments for shares redeemed | (5,211,864 | ) | (5,072,607 | ) | ||||
Net decrease in net assets from capital share transactions | (1,168,868 | ) | (1,999,430 | ) | ||||
TOTAL INCREASE IN NET ASSETS | 4,931,058 | 1,284,094 | ||||||
| NET ASSETS | ||||||||
Beginning of year | 30,011,472 | 28,727,378 | ||||||
End of year | $ | 34,942,530 | $ | 30,011,472 | ||||
UNDISTRIBUTED NET INVESTMENT INCOME | $ | — | $ | — | ||||
| CAPITAL SHARE ACTIVITY | ||||||||
Shares sold | 292,658 | 257,390 | ||||||
Shares redeemed | (369,440 | ) | (431,555 | ) | ||||
Net decrease in shares outstanding | (76,782 | ) | (174,165 | ) | ||||
Shares outstanding, beginning of year | 2,522,248 | 2,696,413 | ||||||
Shares outstanding, end of year | 2,445,466 | 2,522,248 | ||||||
| See accompanying notes to financial statements. |
13
GKM Growth Fund Statement of Cash Flows For the Year Ended July 31, 2011 |
| CASH FLOWS FROM OPERATING ACTIVITIES | ||||
Net increase in net assets resulting from operations | $ | 6,099,926 | ||
| Adjustments to reconcile net increase in net assets resulting from operations to net cash provided by operating activities: | ||||
Net realized gains from security transactions | (2,110,265 | ) | ||
Unrealized appreciation on investments | (4,191,313 | ) | ||
Increase in dividends receivable | (1,305 | ) | ||
Increase in investment securities sold receivable | (843,116 | ) | ||
Proceeds from investment securities litigation settlements | 1,438 | |||
Purchase of investment securities | (9,230,691 | ) | ||
Sale of short-term investments, net | 314 | |||
Proceeds from sale of investment securities | 13,222,790 | |||
Decrease in other liabilities | (500 | ) | ||
Increase in accrued investment advisory fees | 2,017 | |||
| NET CASH PROVIDED BY OPERATING ACTIVITIES | 2,949,295 | |||
| CASH FLOWS FROM FINANCING ACTIVITIES | ||||
Decrease in line of credit payable | (1,818,200 | ) | ||
Decrease in receivable for capital shares sold | 350 | |||
Increase in payable for capital shares redeemed | 37,423 | |||
Payment for shares redeemed, net | (1,168,868 | ) | ||
NET CASH USED IN FINANCING ACTIVITIES | (2,949,295 | ) | ||
| NET CHANGE IN CASH | — | |||
Cash, beginning of year | — | |||
Cash, end of year | $ | — | ||
During the year ended July 31, 2011, interest paid was $69,518.
| See accompanying notes to financial statements. |
14
GKM Growth Fund Financial Highlights |
Per Share Data and Ratios for a Share Outstanding Throughout Each Year | ||||||||||||||||||||
Years Ended | ||||||||||||||||||||
July 31, 2011 | July 31, 2010 | July 31, 2009 | July 31, 2008 | July 31, 2007 | ||||||||||||||||
| Net asset value at beginning of year | $ | 11.90 | $ | 10.65 | $ | 12.76 | $ | 15.12 | $ | 12.69 | ||||||||||
Income (loss) from investment operations: | ||||||||||||||||||||
| Net investment income (loss) | (0.08 | ) | (0.06 | ) | (0.03 | ) | (0.09 | ) | 0.06 | |||||||||||
| Net realized and unrealized gains (losses) on investments | 2.47 | 1.31 | (2.08 | ) | (2.22 | ) | 2.38 | |||||||||||||
| Total from investment operations | 2.39 | 1.25 | (2.11 | ) | (2.31 | ) | 2.44 | |||||||||||||
| Less distributions from: | ||||||||||||||||||||
| Net investment income | — | — | — | (0.05 | ) | (0.01 | ) | |||||||||||||
| Net asset value at end of year | $ | 14.29 | $ | 11.90 | $ | 10.65 | $ | 12.76 | $ | 15.12 | ||||||||||
Total return(a) | 20.08% | 11.74% | (16.54% | ) | (15.32% | ) | 19.24% | |||||||||||||
| Net assets at end of year (000’s) | $ | 34,943 | $ | 30,011 | $ | 28,727 | $ | 40,676 | $ | 49,527 | ||||||||||
| Ratio of expenses to average net assets | 1.60% | 1.59% | 1.70% | 1.83% | 1.41% | |||||||||||||||
Ratio of expenses to average net assets excluding borrowing costs | 1.41% | 1.41% | 1.41% | 1.41% | 1.41% | |||||||||||||||
Ratio of net investment income (loss) to average net assets | (0.57% | ) | (0.50% | ) | (0.29% | ) | (0.63% | ) | 0.45% | |||||||||||
Portfolio turnover rate | 25% | 8% | 12% | 9% | 3% | |||||||||||||||
| (a) | Total return is a measure of the change in value of an investment in the Fund over the periods covered, which assumes any dividends or capital gains distributions are reinvested in shares of the Fund. Returns shown do not reflect the deduction of taxes a shareholder would pay on Fund distributions or the redemption of Fund shares. |
| See accompanying notes to financial statements. |
15
GKM Growth Fund Notes to Financial Statements July 31, 2011 |
1. Organization
GKM Growth Fund (the “Fund”) is a diversified series of The GKM Funds (the “Trust”), an open-end management investment company established under the laws of Ohio by an Agreement and Declaration of Trust dated October 2, 2001. The public offering of shares of the Fund commenced on December 28, 2001.
The investment objective of the Fund is long term capital appreciation.
2. Significant Accounting Policies
The following is a summary of the Fund’s significant accounting policies used in the preparation of its financial statements. These policies are in conformity with accounting principles generally accepted in the United States of America (“GAAP”).
Securities valuation – Equity securities of the Fund generally are valued by using market quotations, but may be valued on the basis of prices furnished by a pricing service when the Adviser believes such prices more accurately reflect the fair market value of such securities. Securities that are traded on any stock exchange are generally valued at the last quoted sale price. Lacking a last sale price, an exchange traded security is generally valued at its last bid price. Securities traded on NASDAQ are valued at the NASDAQ Official Closing Price. When market quotations are not readily available, when the Adviser determines that the market quotation or the price provided by the pricing service does not accurately reflect the current market value or when restricted securities are being valued, such securities are valued as determined in good faith by the Adviser, in conformity with guidelines adopted by and subject to review of the Board of Trustees of the Trust and will be classified as Level 2 or 3 (see below) within the fair value hierarchy, depending on the inputs used. Securities with remaining maturities of 60 days or less are valued at amortized cost, absent unusual circumstances.
GAAP establishes a single authoritative definition of fair value, sets out a framework for measuring fair value and requires additional disclosures about fair value measurements.
Various inputs are used in determining the value of the Fund’s investments. These inputs are summarized in the three broad levels listed below:
• Level 1 – quoted prices in active markets for identical securities
• Level 2 – other significant observable inputs
• Level 3 – significant unobservable inputs
The inputs or methodology used for valuing securities are not necessarily an indication of the risks associated with investing in those securities. The inputs used to measure fair value may fall into different levels of the fair value hierarchy. In such cases, for disclosure purposes, the level in the fair value hierarchy within which the fair value measurement falls in its entirety is determined based on the lowest level input that is significant to the fair value measurement.
16
GKM Growth Fund Notes to Financial Statements (Continued) |
The following is a summary of the inputs used to value the Fund’s investments by security type, as of July 31, 2011:
Level 1 | Level 2 | Level 3 | Total | |||||||||||||
Common Stocks | $ | 35,262,970 | $ | — | $ | — | $ | 35,262,970 | ||||||||
Money Market Funds | 317 | — | — | 317 | ||||||||||||
Total | $ | 35,263,287 | $ | — | $ | — | $ | 35,263,287 | ||||||||
Refer to the Fund’s Schedule of Investments for a listing of the common stocks valued using Level 1 inputs by industry type. The Fund did not have any significant transfers in and out of any Level during the year ended July 31, 2011. The Fund held no Level 3 securities or derivative instruments as of or during the year ended July 31, 2011.
Share valuation – The net asset value of the Fund’s shares is calculated as of the close of trading on the New York Stock Exchange (normally 4:00 p.m., Eastern time) on each day that the Trust is open for business. The net asset value is calculated by dividing the value of the Fund’s total assets, minus liabilities, by the total number of shares outstanding. The offering price and redemption price per share are equal to the net asset value per share.
Security transactions and investment income – Security transactions are accounted for on trade date. Gains and losses on securities sold are determined on a specific identification basis. Dividend income is recorded on the ex-dividend date. Interest income is accrued as earned. Withholding taxes on foreign dividends have been provided for in accordance with the Fund’s understanding of the applicable country’s tax rules and rates.
Distributions to shareholders – Dividends arising from net investment income and net capital gains, if any, are declared and paid annually in December. The amount of distributions from net investment income and net realized gains are determined in accordance with income tax regulations which may differ from GAAP. There were no distributions to shareholders during the years ended July 31, 2011 and July 31, 2010.
Estimates – The preparation of financial statements in conformity with GAAP requires management to make estimates and assumptions that affect the reported amounts of assets and liabilities and disclosure of contingent assets and liabilities as of the date of the financial statements and the reported amounts of income and expenses during the reporting period. Actual results could differ from those estimates.
Federal income tax – It is the Fund’s policy to comply with the special provisions of Subchapter M of the Internal Revenue Code applicable to regulated investment companies. As provided therein, in any fiscal year in which the Fund so qualifies and distributes at least 90% of its taxable net income, the Fund (but not its shareholders) will be relieved of federal income tax on the income distributed. Accordingly, no provision for income taxes has been made.
In order to avoid imposition of the excise tax applicable to regulated investment companies, it is also the Fund’s intention to declare as dividends in each calendar year at least 98% of its net investment income (earned during the calendar year) and 98.2% of its net realized capital gains (earned during the twelve months ended October 31) plus undistributed amounts from prior years.
17
GKM Growth Fund Notes to Financial Statements (Continued) |
The following information is computed on a tax basis for each item as of July 31, 2011:
| Cost of portfolio investments | $ | 22,355,741 | ||
| Gross unrealized appreciation | $ | 13,762,248 | ||
| Gross unrealized depreciation | (854,702 | ) | ||
| Net unrealized appreciation | $ | 12,907,546 | ||
| Capital loss carryforwards | (3,625,796 | ) | ||
| Total distributable earnings | $ | 9,281,750 |
As of July 31, 2011, the Fund had capital loss carryforwards of $3,625,796 which expire on July 31, 2018. These capital loss carryforwards may be utilized in future years to offset any net realized capital gains prior to distributing such gains to shareholders. During the year ended July 31, 2011, the Fund utilized capital loss carryforwards of $2,107,102 to offset current year realized gains.
For the year ended July 31, 2011, the Fund reclassified $201,652 of net investment loss against paid-in capital on the Statement of Assets and Liabilities. Such reclassification, the result of permanent differences between financial statement and income tax reporting requirements, had no effect on the Fund’s net assets or net asset value per share.
The Fund recognizes the tax benefits or expenses of uncertain tax positions only when the position is “more-likely-than-not” to be sustained assuming examination by tax authorities. Management has reviewed the tax positions taken on Federal income tax returns for all open tax years (tax years ended July 31, 2008 through July 31, 2011) and has concluded that no provision for unrecognized tax benefits or expenses is required in these financial statements.
3. Investment Transactions
During the year ended July 31, 2011, cost of purchases and proceeds from sales of investment securities, other than short-term investments, amounted to $9,230,691 and $13,222,790, respectively.
4. Transactions with Affiliates
A Trustee and certain officers of the Trust are affiliated with First Western Investment Management, Inc. (the “Adviser”) or with Ultimus Fund Solutions, LLC (“Ultimus”), the Fund’s administrator, transfer agent and fund accounting agent.
Under the terms of the Management Agreement between the Trust and the Adviser, the Adviser serves as the investment adviser to the Fund. For its services, the Fund pays the Adviser an investment management fee at the annual rate of 1.40% of the Fund’s average daily net assets.
18
GKM Growth Fund Notes to Financial Statements (Continued) |
The Adviser pays all of the operating expenses of the Fund except brokerage, taxes, borrowing costs, fees and expenses of non-interested person Trustees, extraordinary expenses and distribution and/or service related expenses incurred pursuant to Rule 12b-1 under the Investment Company Act of 1940 (if any).
The Trust has entered into mutual fund services agreements with Ultimus, pursuant to which Ultimus provides day-to-day operational services to the Fund including, but not limited to, accounting, administrative, transfer agent, dividend disbursing, and recordkeeping services. The fees payable to Ultimus are paid by the Adviser (not the Fund).
The Trust and the Adviser have entered into a Distribution Agreement with Ultimus Fund Distributors, LLC (the “Distributor”), pursuant to which the Distributor provides distribution services to the Fund and serves as principal underwriter to the Fund. The Distributor is a wholly-owned subsidiary of Ultimus. The fees payable to the Distributor are paid by the Adviser (not the Fund).
The Fund pays each Trustee who is not affiliated with the Adviser $1,000 annually. Trustees who are affiliated with the Adviser do not receive compensation from the Fund.
5. Bank Line of Credit
The Fund has a secured bank line of credit with U.S. Bank, N.A. that provides a maximum borrowing of up to $9,000,000. The line of credit may be used to cover redemptions or it may be used by the Adviser for investment purposes. When used for investment purposes, the Fund will be using the investment technique of “leverage.” Please see the Fund’s prospectus for detailed information on the investment strategies and associated risks involved with the use of leverage by the Fund. Borrowings under this arrangement bear interest at a rate per annum equal to the Prime Rate minus 0.25% at the time of borrowing. The line of credit matures on December 15, 2011. During the year ended July 31, 2011, the Fund incurred $69,019 of interest expense related to borrowings. The average debt outstanding and the average interest rate during the year ended July 31, 2011 were $2,269,090 and 3.04%, respectively. The largest outstanding borrowing during the year ended July 31, 2011 was $3,791,800. As of July 31, 2011, the Fund had outstanding borrowings of $1,086,500. All of the Fund’s securities are pledged as collateral for the Fund’s bank line of credit.
6. Contingencies and Commitments
The Fund indemnifies the Trust’s officers and Trustees for certain liabilities that might arise from their performance of their duties to the Fund. Additionally, in the normal course of business, the Fund enters into contracts that contain a variety of representations and warranties and which provide general indemnifications. The Fund’s maximum exposure under these arrangements is unknown, as this would involve future claims that may be made against the Fund that have not yet occurred. However, based on experience, the Fund expects the risk of loss to be remote.
19
GKM Growth Fund Notes to Financial Statements (Continued) |
7. Sector Risk
If the Fund’s portfolio is overweighted in a certain sector, any negative development affecting that sector will have a greater impact on the Fund than a fund that is not overweighted in that sector. For example, to the extent the Fund is overweighted in the Information Technology sector or the Health Care sector, it will be affected by developments affecting the applicable sector. These sectors are subject to changing government regulations. Companies in these sectors also may be significantly affected by intense competition. In addition, technology and health care products may be subject to rapid obsolescence.
8. Subsequent Events
The Fund is required to recognize in the financial statements the effects of all subsequent events that provide additional evidence about conditions that existed as of the date of the Statement of Assets and Liabilities. For non-recognized subsequent events that must be disclosed to keep the financial statements from being misleading, the Fund is required to disclose the nature of the event as well as an estimate of its financial effect, or a statement that such an estimate cannot be made. Management has evaluated subsequent events through the issuance of these financial statements and has noted no such events.
9. Recent Accounting Pronouncement and New Legislation
In May 2011, the Financial Accounting Standards Board issued Accounting Standards Update (“ASU”) No. 2011-04 “Amendments to Achieve Common Fair Value Measurement and Disclosure Requirements in U.S. GAAP and IFRs.” ASU No. 2011-04 establishes common requirements for measuring fair value and for disclosing information about fair value measurements in accordance with GAAP and International Financial Reporting Standards. ASU No. 2011-04 is effective for interim and annual periods beginning after December 15, 2011 and is applied prospectively. Management is currently evaluating the impact ASU No. 2011-04 may have on financial statement disclosures.
The Regulated Investment Company Modernization Act of 2010 (the “Act”) was enacted on December 22, 2010. The Act makes changes to several tax rules impacting the Fund. In general, the provisions of the Act will be effective for the Fund’s fiscal year ending July 31, 2012. Although the Act provides several benefits, including unlimited carryover on future capital losses, there may be greater likelihood that all or a portion of the Fund’s pre-enactment capital loss carryovers may expire without being utilized due to the fact that post-enactment capital losses must be utilized before pre-enactment capital loss carryovers. Relevant information regarding the impact of the Act on the Fund, if any, will be included in the Annual Report for the year ending July 31, 2012.
20
GKM Growth Fund Report of Independent Registered Public Accounting Firm |
To the Board of Trustees of The GKM Funds
and the Shareholders of GKM Growth Fund
We have audited the accompanying statement of assets and liabilities, including the schedule of investments, of the GKM Growth Fund, a series of shares of The GKM Funds, as of July 31, 2011, and the related statement of operations and the statement of cash flows for the year then ended, the statements of changes in net assets for each of the years in the two year period then ended, and the financial highlights for each of the years in the five year period then ended. These financial statements and financial highlights are the responsibility of the Fund’s management. Our responsibility is to express an opinion on these financial statements and financial highlights based on our audits.
We conducted our audits in accordance with the standards of the Public Company Accounting Oversight Board (United States). Those standards require that we plan and perform the audits to obtain reasonable assurance about whether the financial statements and financial highlights are free of material misstatement. An audit includes examining, on a test basis, evidence supporting the amounts and disclosures in the financial statements. Our procedures included confirmation of securities owned as of July 31, 2011 by correspondence with the custodian. An audit also includes assessing the accounting principles used and significant estimates made by management, as well as evaluating the overall financial statement presentation. We believe that our audits provide a reasonable basis for our opinion.
In our opinion, the financial statements and financial highlights referred to above present fairly, in all material respects, the financial position of the GKM Growth Fund as of July 31, 2011, the results of its operations and its cash flows for the year then ended, the changes in its net assets for each of the years in the two year period then ended, and the financial highlights for each of the years in the five year period then ended, in conformity with accounting principles generally accepted in the United States of America.

BBD, LLP
Philadelphia, Pennsylvania
September 21, 2011
21
GKM Growth Fund About Your Fund’s Expenses (Unaudited) |
We believe it is important for you to understand the impact of costs on your investment. As a shareholder of the Fund, you incur ongoing costs, including management fees and other operating expenses. The following examples are intended to help you understand your ongoing costs (in dollars) of investing in the Fund and to compare these costs with the ongoing costs of investing in other mutual funds.
A mutual fund’s ongoing costs are expressed as a percentage of its average net assets. This figure is known as the expense ratio. The examples below are based on an investment of $1,000 made at the beginning of the period shown and held for the entire period (February 1, 2011 – July 31, 2011).
The table below illustrates the Fund’s ongoing costs in two ways:
Actual fund return – This section helps you to estimate the actual expenses that you paid over the period. The “Ending Account Value” shown is derived from the Fund’s actual return, and the third column shows the dollar amount of operating expenses that would have been paid by an investor who started with $1,000 in the Fund. You may use the information here, together with the amount you invested, to estimate the expenses that you paid over the period.
To do so, simply divide your account value by $1,000 (for example, an $8,600 account value divided by $1,000 = 8.6), then multiply the result by the number given for the Fund under the heading “Expenses Paid During Period.”
Hypothetical 5% return – This section is intended to help you compare the Fund’s ongoing costs with those of other mutual funds. It assumes that the Fund had an annual return of 5% before expenses during the period shown, but that the expense ratio is unchanged. In this case, because the return used is not the Fund’s actual return, the results do not apply to your investment. The example is useful in making comparisons because the Securities and Exchange Commission (the “SEC”) requires all mutual funds to calculate expenses based on a 5% return before expenses. You can assess the Fund’s ongoing costs by comparing this hypothetical example with the hypothetical examples that appear in shareholder reports of other funds.
Note that expenses shown in the table are meant to highlight and help you compare ongoing costs only. The Fund does not impose any sales loads or redemption fees.
The calculations assume no shares were bought or sold during the period. Your actual costs may have been higher or lower, depending on the amount of your investment and the timing of any purchases or redemptions.
More information about the Fund’s expenses, including annual expense ratios for the most recent five fiscal years, can be found in this report. For additional information on operating expenses and other shareholder costs, please refer to the Fund’s prospectus.
22
GKM Growth Fund About Your Fund’s Expenses (Unaudited) (Continued) |
Beginning Account Value February 1, 2011 | Ending Account Value July 31, 2011 | Expenses Paid During Period* | |
| Based on Actual Fund Return | $1,000.00 | $994.40 | $8.11 |
| Based on Hypothetical 5% Return (before expenses) | $1,000.00 | $1,016.66 | $8.20 |
| * | Expenses are equal to the Fund’s annualized expense ratio of 1.64% for the period, multiplied by the average account value over the period, multiplied by 181/365 (to reflect the one-half year period). |
Other Information (Unaudited) |
A description of the policies and procedures that the Fund uses to vote proxies relating to portfolio securities is available without charge upon request by calling toll-free 1-888-GKM-9518, or on the SEC’s website at http://www.sec.gov. Information regarding how the Fund voted proxies relating to portfolio securities during the most recent 12-month period ended June 30 is available without charge upon request by calling toll-free 1-888-GKM-9518, or on the SEC’s website at http://www.sec.gov.
The Trust files a complete listing of portfolio holdings of the Fund with the SEC as of the end of the first and third quarters of each fiscal year on Form N-Q. The filings are available upon request by calling 1-888-GKM-9518. Furthermore, you may obtain a copy of the filings on the SEC’s website at http://www.sec.gov. The Trust’s Forms N-Q may also be reviewed and copied at the SEC’s Public Reference Room in Washington, DC, and information on the operation of the Public Reference Room may be obtained by calling 1-800-SEC-0330.
23
GKM Growth Fund Information Regarding Trustees and Officers (Unaudited) |
Overall responsibility for management of the Fund rests with the Board of Trustees. The Trustees serve during the lifetime of the Trust and until its termination, or until death, resignation, retirement or removal. The Trustees, in turn, elect the officers of the Trust to actively supervise its day-to-day operations. The officers have been elected for an annual term.
The following table provides information regarding each Trustee who is not an “interested person” of the Trust, as defined in the Investment Company Act of 1940.
| Name, Address and Age | Position(s) Held with Trust | Length of Time Served |
Darrin F. DelConte 11150 Santa Monica Blvd., Suite 850 Los Angeles, CA 90025 Year of Birth: 1966 | Trustee | Since December 2001 |
Principal Occupations During Past 5 Years | Number of Portfolios in Fund Complex Overseen by Trustee | Other Directorships Held by Trustee |
| Darrin F. DelConte is Executive Vice President of Pacific Crane Maintenance Co. (marine maintenance company). | 1 | None |
| Name, Address and Age | Position(s) Held with Trust | Length of Time Served |
Nicholas G. Tonsich 11150 Santa Monica Blvd., Suite 850 Los Angeles, CA 90025 Year of Birth: 1961 | Trustee | Since December 2001 |
Principal Occupations During Past 5 Years | Number of Portfolios in Fund Complex Overseen by Trustee | Other Directorships Held by Trustee |
| Nicholas G. Tonsich is Partner in Glaser & Tonsich, LLP (law firm). | 1 | None |
| Name, Address and Age | Position(s) Held with Trust | Length of Time Served |
Brian D. Horner 11150 Santa Monica Blvd., Suite 850 Los Angeles, CA 90025 Year of Birth: 1961 | Trustee | Since January 2005 |
Principal Occupations During Past 5 Years | Number of Portfolios in Fund Complex Overseen by Trustee | Other Directorships Held by Trustee |
| Brian D. Horner is President of Alcole Properties, Inc. (property management company). Prior to September 2009, Chairman of Venture West Funding, Inc. (mortgage brokerage company). | 1 | None |
24
GKM Growth Fund Information Regarding Trustees and Officers (Unaudited) (Continued) |
The following table provides information regarding each Trustee who is an “interested person” of the Trust, as defined in the Investment Company Act of 1940, and each executive officer of the Trust.
| Name, Address and Age | Position(s) Held with Trust | Length of Time Served |
Timothy J. Wahl1 11150 Santa Monica Blvd., Suite 850 Los Angeles, CA 90025 Year of Birth: 1965 | President and Trustee | Since October 2001 |
Principal Occupations During Past 5 Years | Number of Portfolios in Fund Complex Overseen by Trustee | Other Directorships Held by Trustee |
| Timothy J. Wahl is Managing Director of First Western Investment Management, Inc. Prior to May 1, 2009, he was President, Director and Investment Committee Member of GKM Advisers, LLC (the Fund’s previous investment adviser). | 1 | None |
| Name, Address and Age | Position(s) Held with Trust | Length of Time Served |
David L. Kahn1 11150 Santa Monica Blvd., Suite 850 Los Angeles, CA 90025 Year of Birth: 1957 | Chief Compliance Officer; Secretary | Since September 2004 Since October 2001 |
| Principal Occupations During Past 5 Years | Other Directorships Held by Trustee | |
| David L. Kahn is Senior Vice President of First Western Investment Management, Inc. Prior to May 1, 2009, he was Operations Manager of GKM Advisers, LLC. | N/A | |
| Name, Address and Age | Position(s) Held with Trust | Length of Time Served |
Robert G. Dorsey 225 Pictoria Drive, Suite 450 Cincinnati, OH 45246 Year of Birth: 1957 | Vice President | Since December 2001 |
| Principal Occupations During Past 5 Years | Other Directorships Held by Trustee | |
| Robert G. Dorsey is a Managing Director of Ultimus Fund Solutions, LLC and Ultimus Fund Distributors, LLC. | N/A | |
| Name, Address and Age | Position(s) Held with Trust | Length of Time Served |
Mark J. Seger 225 Pictoria Drive, Suite 450 Cincinnati, OH 45246 Year of Birth: 1962 | Treasurer | Since December 2001 |
| Principal Occupations During Past 5 Years | Other Directorships Held by Trustee | |
| Mark J. Seger is a Managing Director of Ultimus Fund Solutions, LLC and Ultimus Fund Distributors, LLC. | N/A | |
| 1 | Mr. Wahl is an “interested person” of the Trust because he is an officer of the Adviser. |
Additional information about members of the Board of Trustees and the executive officers is available in the Statement of Additional Information (“SAI”). To obtain a free copy of the SAI, please call 1-888-GKM-9518.
25
GKM FUNDS Investment Adviser First Western Investment Management, Inc. 11150 Santa Monica Boulevard Suite 850 Los Angeles, California 90025 Administrator Ultimus Fund Solutions, LLC 225 Pictoria Drive Suite 450 Cincinnati, Ohio 45246 1.888.GKM.9518 Legal Counsel Thompson Hine LLP 312 Walnut Street 14th Floor Cincinnati, Ohio 45202 Custodian US Bank NA 425 Walnut Street Cincinnati, Ohio 45202 Board of Trustees Darrin F. DelConte Brian D. Horner Nicholas G. Tonsich Timothy J. Wahl Officers Timothy J. Wahl, President Robert G. Dorsey, Vice President David L. Kahn, CCO and Secretary Mark J. Seger, Treasurer |
| Item 2. | Code of Ethics. |
As of the end of the period covered by this report, the registrant has adopted a code of ethics that applies to the registrant’s principal executive officer, principal financial officer, principal accounting officer or controller, or persons performing similar functions, regardless of whether these individuals are employed by the registrant or a third party. Pursuant to Item 12(a)(1), a copy of registrant’s code of ethics is filed as an exhibit to this Form N-CSR. During the period covered by this report, the code of ethics has not been amended, and the registrant has not granted any waivers, including implicit waivers, from the provisions of the code of ethics.
| Item 3. | Audit Committee Financial Expert. |
The registrant’s board of trustees has determined that the registrant does not have an audit committee financial expert serving on its audit committee. The audit committee determined that, although none of its members meet the technical definition of an audit committee financial expert, the members have sufficient financial expertise to address any issues that are likely to come before the committee. It was the consensus of the audit committee members that it is not necessary at the present time for the committee to seek to recruit an additional trustee who would qualify as an audit committee financial expert. It was the view of the committee that, if novel issues ever arise, the committee will consider hiring an expert to assist it as needed.
| Item 4. | Principal Accountant Fees and Services. |
| (a) | Audit Fees. The aggregate fees billed for professional services rendered by the principal accountant for the audit of the registrant’s annual financial statements or for services that are normally provided by the accountant in connection with statutory and regulatory filings or engagements were $13,500 and $13,000 with respect to the registrant’s fiscal years ended July 31, 2011 and 2010, respectively. |
| (b) | Audit-Related Fees. No fees were billed in either of the last two fiscal years for assurance and related services by the principal accountant that are reasonably related to the performance of the audit of the registrant’s financial statements and are not reported under paragraph (a) of this Item. |
| (c) | Tax Fees. The aggregate fees billed for professional services rendered by the principal accountant for tax compliance, tax advice, and tax planning were $2,000 and $2,000 with respect to the registrant’s fiscal years ended July 31, 2011 and 2010, respectively. The services comprising these fees are the preparation of the registrant’s federal income and excise tax returns. |
| (d) | All Other Fees. No fees were billed in either of the last two fiscal years for products and services provided by the principal accountant, other than the services reported in paragraphs (a) through (c) of this Item. |
| (e)(1) | The audit committee has not adopted pre-approval policies and procedures described in paragraph (c)(7) of Rule 2-01 of Regulation S-X. |
| (e)(2) | None of the services described in paragraph (b) through (d) of this Item were approved by the audit committee pursuant to paragraph (c)(7)(i)(C) of Rule 2-01 of Regulation S-X. |
| (f) | Less than 50% of hours expended on the principal accountant’s engagement to audit the registrant’s financial statements for the most recent fiscal year were attributed to work performed by persons other than the principal accountant’s full-time, permanent employees. |
| (g) | With respect to the fiscal years ended July 31, 2011 and 2010, aggregate non-audit fees of $2,000 and $2,000, respectively, were billed by the registrant’s principal accountant for services rendered to the registrant. No non-audit fees were billed in either of the last two fiscal years by the registrant’s principal accountant for services rendered to the registrant’s investment adviser (not including any sub-adviser whose role is primarily portfolio management and is subcontracted with or overseen by another investment adviser), and any entity controlling, controlled by, or under common control with the adviser that provides ongoing services to the registrant. |
| (h) | The principal accountant has not provided any non-audit services to the registrant’s investment adviser (not including any sub-adviser whose role is primarily portfolio management and is subcontracted with or overseen by another investment adviser), and any entity controlling, controlled by, or under common control with the investment adviser that provides ongoing services to the registrant. |
| Item 5. | Audit Committee of Listed Registrants. |
Not applicable
| Item 6 | Schedule of Investments. |
| (a) | Not applicable [schedule filed with Item 1] |
| (b) | Not applicable |
| Item 7. | Disclosure of Proxy Voting Policies and Procedures for Closed-End Management Investment Companies. |
Not applicable
| Item 8. | Portfolio Managers of Closed-End Management Investment Companies. |
Not applicable
| Item 9. | Purchases of Equity Securities by Closed-End Management Investment Company and Affiliated Purchasers. |
Not applicable
| Item 10. | Submission of Matters to a Vote of Security Holders. |
The registrant has not adopted procedures by which shareholders may recommend nominees to the registrant’s board of trustees.
| Item 11. | Controls and Procedures. |
(a) Based on their evaluation of the registrant’s disclosure controls and procedures (as defined in Rule 30a-3(c) under the Investment Company Act of 1940) as of a date within 90 days of the filing date of this report, the registrant’s principal executive officer and principal financial officer have concluded that such disclosure controls and procedures are reasonably designed and are operating effectively to ensure that material information relating to the registrant, including its consolidated subsidiaries, is made known to them by others within those entities, particularly during the period in which this report is being prepared, and that the information required in filings on Form N-CSR is recorded, processed, summarized, and reported on a timely basis.
(b) There were no changes in the registrant’s internal control over financial reporting (as defined in Rule 30a-3(d) under the Investment Company Act of 1940) that occurred during the second fiscal quarter of the period covered by this report that have materially affected, or are reasonably likely to materially affect, the registrant’s internal control over financial reporting.
| Item 12. | Exhibits. |
File the exhibits listed below as part of this Form. Letter or number the exhibits in the sequence indicated.
(a)(1) Any code of ethics, or amendment thereto, that is the subject of the disclosure required by Item 2, to the extent that the registrant intends to satisfy the Item 2 requirements through filing of an exhibit: Attached hereto
(a)(2) A separate certification for each principal executive officer and principal financial officer of the registrant as required by Rule 30a-2(a) under the Act (17 CFR 270.30a-2(a)): Attached hereto
(a)(3) Any written solicitation to purchase securities under Rule 23c-1 under the Act (17 CFR 270.23c-1) sent or given during the period covered by the report by or on behalf of the registrant to 10 or more persons: Not applicable
(b) Certifications required by Rule 30a-2(b) under the Act (17 CFR 270.30a-2(b)): Attached hereto
| Exhibit 99.CODE ETH | Code of Ethics |
| Exhibit 99.CERT | Certifications required by Rule 30a-2(a) under the Act |
| Exhibit 99.906CERT | Certifications required by Rule 30a-2(b) under the Act |
SIGNATURES
Pursuant to the requirements of the Securities Exchange Act of 1934 and the Investment Company Act of 1940, the registrant has duly caused this report to be signed on its behalf by the undersigned, thereunto duly authorized.
(Registrant) The GKM Funds
| By (Signature and Title)* | /s/ Timothy J. Wahl | ||
| Timothy J. Wahl, President | |||
| Date | October 3, 2011 | ||
Pursuant to the requirements of the Securities Exchange Act of 1934 and the Investment Company Act of 1940, this report has been signed below by the following persons on behalf of the registrant and in the capacities and on the dates indicated.
| By (Signature and Title)* | /s/ Timothy J. Wahl | ||
| Timothy J. Wahl, President | |||
| Date | October 3, 2011 | ||
| By (Signature and Title)* | /s/ Mark J. Seger | ||
| Mark J. Seger, Treasurer | |||
| Date | October 3, 2011 | ||
* Print the name and title of each signing officer under his or her signature.