| OMB APPROVAL |
OMB Number: 3235-0570 Expires: January 31, 2014 Estimated average burden hours per response: 20.6 |
UNITED STATES
SECURITIES AND EXCHANGE COMMISSION
Washington, D.C. 20549
FORM N-CSR
CERTIFIED SHAREHOLDER REPORT OF REGISTERED
MANAGEMENT INVESTMENT COMPANIES
Investment Company Act file number 811-10529
The Investment House Funds
(Exact name of registrant as specified in charter)
| 11150 Santa Monica Boulevard, Suite 350 Los Angeles, California | 90025 |
| (Address of principal executive offices) | (Zip code) |
Timothy J. Wahl
The Investment House LLC
11150 Santa Monica Boulevard, Suite 350 Los Angeles, California 90025
(Name and address of agent for service)
Registrant's telephone number, including area code: (310) 268-2605
Date of fiscal year end: July 31, 2012
Date of reporting period: July 31, 2012
Form N-CSR is to be used by management investment companies to file reports with the Commission not later than 10 days after the transmission to stockholders of any report that is required to be transmitted to stockholders under Rule 30e-1 under the Investment Company Act of 1940 (17 CFR 270.30e-1). The Commission may use the information provided on Form N-CSR in its regulatory, disclosure review, inspection, and policymaking roles.
A registrant is required to disclose the information specified by Form N-CSR, and the Commission will make this information public. A registrant is not required to respond to the collection of information contained in Form N-CSR unless the Form displays a currently valid Office of Management and Budget ("OMB") control number. Please direct comments concerning the accuracy of the information collection burden estimate and any suggestions for reducing the burden to Secretary, Securities and Exchange Commission, 450 Fifth Street, NW, Washington, DC 20549-0609. The OMB has reviewed this collection of information under the clearance requirements of 44 U.S.C. § 3507.
| Item 1. | Reports to Stockholders. |
The Investment House Funds | ||
The Investment House Growth Fund | ||
Annual Report July 31, 2012 |
The Investment House Growth Fund Letter to Shareholders July 31, 2012 |
The Investment House Growth Fund (formerly GKM Growth Fund) (the “Fund”) closed out its eleventh fiscal year on July 31, 2012 and I would like to thank you for joining us as shareholders. All of us at The Investment House LLC continue to share a common goal: to help our investors realize their financial goals through the long-term compounding of capital.
For the fiscal year ended July 31, 2012, the Fund’s total return was 16.45% versus 9.13% for the S&P 500 Index (the “Index”). Since the Fund’s inception on December 28, 2001, the Fund has had a cumulative total return of 67.09% versus 46.38% for the Index.
Our largest sector concentrations continue to be in Information Technology (58.3% vs. 19.8% for the Index) and Health Care (18.9% vs. 11.8%), together comprising 77.2% of the Fund’s holdings at year end. The balance of our holdings was comprised of 9.0% Industrials; 5.9% Materials; 4.5% Consumer Staples; and 3.4% Consumer Discretionary.
Our top 5 holdings comprised 29.9% of the portfolio, and were all related in some way to the Information Technology sector. However, it is important to remember that such categorizations we view as somewhat arbitrary, as they stretch across a vast landscape of different kinds of businesses, from 3-D industrial dimensional printing manufacturers (Stratasys); to Internet search (Google); to productivity services (Intuit); to a branded lifestyle, entertainment, and productivity enhancer (Apple). In fact, in this age, it is very hard to find a business which does not in some important way directly make use of and benefit from Information Technology, and therefore we regard the Fund’s allocation to companies within the Information Technology category as more economically and financially diverse than the single name “Information Technology” would suggest.
Nevertheless, we are glad we were overweight the Information Technology sector because it generated 73.36% of the Fund’s total returns, or 12.07% for the year. Unfortunately, our underweight to Consumer Discretionary names (3.4% vs. 10.8% for the Index) hindered performance. The Index’s allocation advanced 42.51% versus 11.97% for the Fund’s allocation. In Health Care we had the reverse picture: our allocation was 18.9% vs. 11. 8% for the Index, but our stocks in that sector were up 5.88% on average vs. 15.66% for the Index. Our decision not to allocate any Fund assets to Telecommunication Services (vs. 3.4% for the Index) detracted from our returns, as the sector advanced 28.79% on the year. Likewise, Real Estate and Utilities advanced 14.92% and 19.21%, respectively, and since our allocations to each of these sectors was 0% (vs. 1.85% and 3.8% in the Index, respectively), it further restrained our performance. Our allocation to Materials (4.5% vs. 3.3% for the Index) was a positive contributor, as our companies advanced 2.12% vs. a decline for the Index of 9.39%. Our decision not to allocate Fund assets to the Financials (0% vs. 14.2% for the Index) detracted from our performance as the Index advanced 1.3%. Overall, the Fund returned 16.45% for the year vs. 9.13% for the Index.
RISK MANAGEMENT AND DIVERSIFICATION
Our attitude toward risk management remains the same: we define risk as the chance of permanent capital loss. We attempt to limit this risk by selecting the very best companies we can, and to manage portfolio risk by diversifying our separate company holdings. To the extent that such holdings, though in different companies, remain in or are related to the
1
same sectors of the economy, then such concentrations may add to sector risk. Our largest single holding (Apple) represented 12.8% of the Fund (vs. a 3.72% weight in the Index) and returned 56.41% on the year, thus contributing 4.07% of our overall Fund performance.
PORTFOLIO TURNOVER
We continue to believe that less portfolio activity with the right companies is far superior to more activity with the wrong ones. This policy of enlightened lethargy has resulted, according to Morningstar, in an average annualized “Tax-adjusted Return” of 4.95% per year for the Fund since its inception, versus a pre-tax return of 4.97%. Our inactivity, therefore, has benefited our shareholders by costing us only 2 basis points (0.02%) in average annual returns over the course of our eleven years. Of course, we still have just a little way to go to hit zero, but we are mighty close. As a comparison, according to Morningstar, the largest fund in the Large Growth Category paid 255 basis points (2.55%) per year in average annual returns due to taxes incurred.
Our portfolio turnover rate for the fiscal year just ended was 4%. As in the past, we try to invest in companies we believe have strong, profitable competitive advantages which are growing and sustainable long into the future, such that time is our best friend in owning them. Sometimes we get it wrong, or there is a change in circumstance which requires a change in our positioning. In all cases though, we are motivated by producing the greatest after tax growth of capital consistent with our desire to minimize the risk of permanent capital loss.
MARKET COMMENTARY
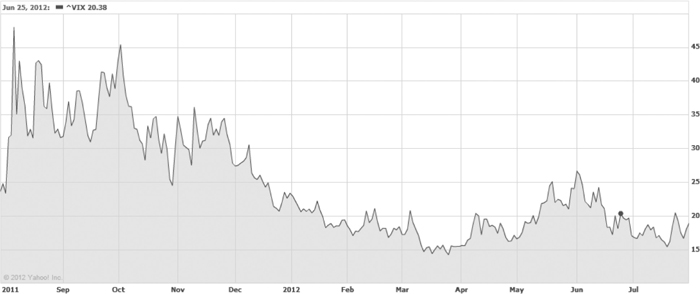
During the fiscal year ended July 31, 2012, while economic uncertainty abounded, and the financial instability of Europe provided daily grist for the market mill, a funny thing happened: your Investment House Growth Fund (“TIHGX”) rose 16.45% (as compared to 9.13% for the S&P 500 Index), and equity volatility as measured by the VIX (see chart below) dove relentlessly, from a high above 45 to the low around 15. The sequence in which this occurred was instructive, with our 1st fiscal quarter (last autumn) return of 0.63%, followed by sequential gains of 7.02% and 11.76% for the second and third quarters, respectively. Our last fiscal quarter registered a -3.26% result. While the exact magnitude and sequence of such volatility is never predictable, we can remain confident of 2 things: 1) We will always have volatility of some kind; and 2) If we choose our companies wisely, the underlying growth of economic value they generate should power us through it, eventually.
2
Broadly, the themes in the investment world remain the same this year as last: the large, developed economies are undergoing a process of fiscal contraction as they seek to address the large amounts of debt taken on during a period of rising asset prices. Smaller, high growth economies are slowing in accordance with the export markets on which they depend. In the early part of the last year, many high growth economies, such a Brazil and China, were actively restricting their monetary policy by raising interest rates, even as the growth drivers in their natural export markets were decaying. In the U.S., the chief indicia of this slowdown was and remains the high unemployment rate and the stubbornly slow recovery in housing values. Nevertheless, the solid performance of equities combined with the steady decrease in volatility is impressive, under the circumstances.
In Europe, the large debt incurred through social welfare expenditures is imposing higher and higher risk premium on government borrowers, while banks in Spain, Portugal and Italy suffer serious decreases in their capital bases due to their ownership of such “at risk” debt. This financial contraction makes the fight to stimulate real economic growth even more difficult. And domestic politicians in countries the world over are not and never will be known for their ability to deliver bad news to an already stressed electorate, making elusive the ability to implement the kind of unified response undertaken by the U.S. with TARP. Add to the mix a continuing concern about the survivability of the Euro currency, and one has a great prescription for bad equity markets: The Euro Stoxx 50 Index declined over 22% for the year ended July 31, 2012, while the S&P 500 Index rose 9.13%. Likewise, with important European export markets slowing, the FTSE Far East 50 Index declined over 5%, signaling the difficulty in higher growth economies is inextricably linked to their larger, older brethren. ‘Decoupling’ is just another Santa Claus, after all.
One of the most outstanding features of this period is the way the investing public has taken refuge in U.S. Treasuries. The benchmark 10-year U.S. Treasury Note increased 15.54% during the year ended July 31, 2012, continuing its run of 6 consecutive years of gains, during which the yield dropped from over 5% to under 1.5%.
Last year we wrote:
“Our investment discipline dictates we accumulate high quality, growing franchises at attractive valuations. In the current low growth environment, we’re able to find world class companies at attractive valuations that aren’t just looking to survive, but to dominate…”
We feel the same way this year, and we believe there are some important reasons why this period of uncertainty contains within it the seed of great opportunity for long term capital growth.
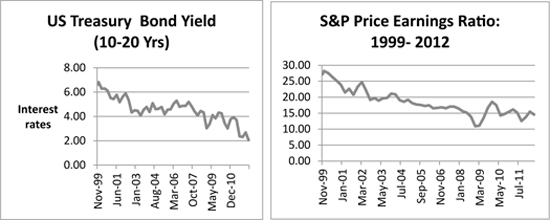
Almost 15 years ago, as the charts below point out, the worldwide investing public was willing to give up a U.S. government-guaranteed return of almost 7% per year on Treasury bonds in order to pay roughly $28 for each $1 of S&P 500 earnings (P/E of 28). Today, the circumstances are exactly reversed: every month, more and more people are willing to receive only 1.5% to 2% from the U.S. Treasury (or for short maturities .25%), in order that they be spared the risk of buying $14 of S&P earnings for that same $1 invested (P/E of 14). Some people refer to this condition as risk aversion – i.e., the desire to be in “safe” (fixed income) assets as opposed to “risky” (equity) ones. As we observed above, this instinct has expressed itself most visibly in major asset classes continuing their inverse relation with each other, i.e. stocks and bonds moving in opposite directions.
This inverse relationship, while not uniform throughout market history, has nevertheless continued broadly since the late 1990s, when both earnings multiples and interest rates were higher, and earnings were lower.
3
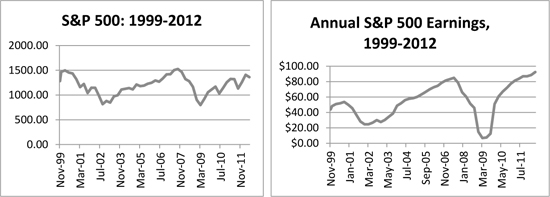
And yet, after all of the financial events of the last 13 years, the S&P 500 Index stands roughly in the same spot as it did so many years ago, except you get more than twice as much for the money from an earnings perspective: average earnings for Index companies have more than doubled.
At the same time, remarkably, the dividend yields of stocks have surpassed that of long term bonds, making stocks the greater income vehicle. For example, today, the 10-year U.S. Treasury Note yields roughly 1.5%, while the approximate yield on the S&P 500 Index is almost a full percentage point per annum higher, at 2.3%.
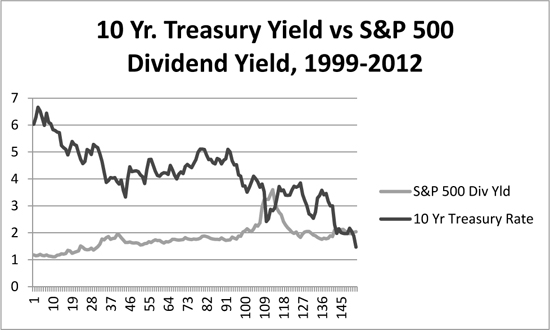
We cannot know when this relation will cease and reverse, or why it will do so, only that, eventually, it will. At that point it may occur to those who sought a riskless return in U.S. Treasuries, their efforts brought them more of a return-less risk instead.
4
In the meantime, long term interest rates are very low, and the Federal Reserve’s commitment to very low short term rates is expected to continue for the foreseeable future. The strength of corporate balance sheets and cash flows suggest that dividend yields have ample room to grow, making them, in our view, a continuing source of investment value for equity investors. This is particularly so in the case of companies whose business are deeply rooted in areas of persistent economic growth. Given the myriad uncertainties in the economic environment, the value of this growth should prove itself to be great indeed, and this is what we seek in our companies.
Looking ahead, the Presidential election and the Fiscal Cliff loom as two of many of the upcoming challenges which markets face, and as usual, while we can all agree on the materiality of their eventual resolution, we cannot know what this will be until after the fact. We can, however, hope to find companies which are likely to participate in persistent economic growth regardless of the future scenario, and build our capital accordingly.
As ever, this is what we aim to do.
| Sincerely, | Sincerely, |
| Timothy J. Wahl | Jed M. Cohen |
| Portfolio Manager | Portfolio Manager |
Past performance is not predictive of future performance. Investment results and principal value will fluctuate so that shares, when redeemed, may be worth more or less than their original cost. Current performance may be higher or lower than the performance data quoted.
An investor should consider the investment objectives, risks, charges and expenses of the Fund carefully before investing. The Fund’s prospectus contains this and other important information. To obtain a copy of the Fund’s prospectus please visit www.tihfunds.com or call 1-888-456-9518 and a copy will be sent to you free of charge. Please read the prospectus carefully before you invest. The Investment House Growth Fund is distributed by Ultimus Fund Distributors, LLC.
The Letter to Shareholders seeks to describe some of the adviser’s current opinions and views of the financial markets. Although the adviser believes it has a reasonable basis for any opinions or views expressed, actual results may differ, sometimes significantly so, from those expected or expressed.
Some of the information given in this publication has been produced by unaffiliated third parties and, while it is deemed reliable, the adviser does not guarantee its timeliness, sequence, accuracy, adequacy, or completeness and makes no warranties with respect to results to be obtained from its use.
The Investment House Growth Fund’s expense ratio was 1.86% during the year ended July 31, 2012. The expense ratio disclosed in the December 1, 2011 prospectus was 1.60%.
5
The Investment House Growth Fund Performance Information July 31, 2012 (Unaudited) |
Comparison of the Change in Value of a $10,000 Investment in
The Investment House Growth Fund and the
S&P 500 Index Since Inception**
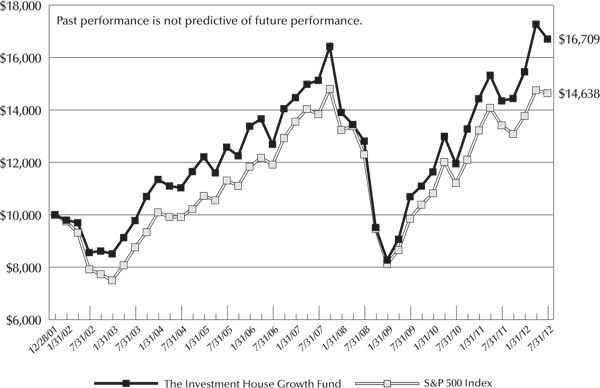
Average Annual Total Returns* (for periods ended July 31, 2012) | ||||||
| 1 Year | 5 Years | 10 Years | Since Inception** | |||
The Investment House Growth Fund (a) | 16.45% | 2.00% | 6.92% | 4.97% | ||
| S&P 500 Index | 9.13% | 1.13% | 6.34% | 3.66% | ||
| (a) | The Fund’s expense ratio was 1.86% during the year ended July 31, 2012. The expense ratio in the December 1, 2011 prospectus was 1.60%. |
| * | The total returns shown do not reflect the deduction of taxes that a shareholder would pay on Fund distributions or the redemption of Fund shares. |
| ** | Initial public offering of shares was December 28, 2001. |
6
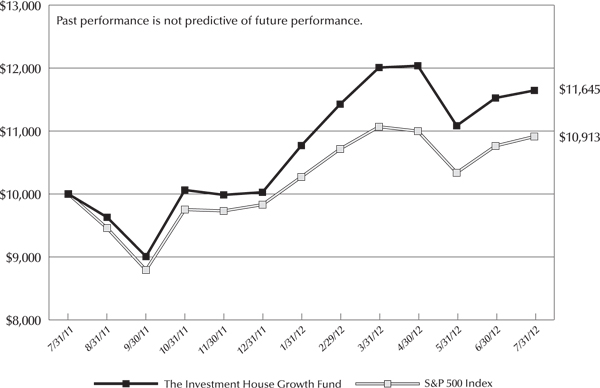
The Investment House Growth Fund Performance Information July 31, 2012 (Unaudited) |
Comparison of the Change in Value of a $10,000 Investment in
The Investment House Growth Fund and the
S&P 500 Index for 1 Year Ended July 31, 2012
7
The Investment House Growth Fund Portfolio Information July 31, 2012 (Unaudited) |
Sector Diversification vs. the S&P 500 Index
(% of Total Investments)

Top 10 Holdings
Security Description | % of Net Assets | |
| Apple, Inc. | 12.8% | |
| Stratasys, Inc. | 6.0% | |
| Google, Inc. - Class A | 5.6% | |
| International Business Machines Corporation | 5.5% | |
| Intuit, Inc. | 5.1% | |
| eBay, Inc. | 4.9% | |
| Trimble Navigation Ltd. | 4.1% | |
| Microsoft Corporation | 4.0% | |
| Intuitive Surgical, Inc. | 3.6% | |
| EMC Corporation | 2.9% |
8
The Investment House Growth Fund Schedule of Investments July 31, 2012 |
Common Stocks — 117.6% | Shares | Value | ||||||
| Consumer Discretionary — 4.0% | ||||||||
| Hotels, Restaurants & Leisure — 2.2% | ||||||||
Yum! Brands, Inc. | 14,000 | $ | 907,760 | |||||
| Household Durables — 1.8% | ||||||||
Tupperware Brands Corporation | 14,000 | 733,880 | ||||||
| Consumer Staples — 5.4% | ||||||||
| Beverages — 2.6% | ||||||||
Coca-Cola Company (The) | 13,000 | 1,050,400 | ||||||
| Food & Staples Retailing — 1.2% | ||||||||
Costco Wholesale Corporation | 5,000 | 480,900 | ||||||
| Household Products — 1.6% | ||||||||
Church & Dwight Company, Inc. | 11,000 | 633,710 | ||||||
| Health Care — 22.2% | ||||||||
| Biotechnology — 0.8% | ||||||||
Celgene Corporation* | 5,000 | 342,300 | ||||||
| Health Care Equipment & Supplies — 10.4% | ||||||||
Baxter International, Inc. | 9,000 | 526,590 | ||||||
Conceptus, Inc.* | 22,500 | 418,050 | ||||||
Intuitive Surgical, Inc.* | 3,000 | 1,444,500 | ||||||
Medtronic, Inc. | 21,000 | 827,820 | ||||||
St. Jude Medical, Inc. | 16,000 | 597,760 | ||||||
Stryker Corporation | 7,500 | 390,225 | ||||||
| 4,204,945 | ||||||||
| Health Care Providers & Services — 4.3% | ||||||||
Henry Schein, Inc.* | 12,700 | 950,087 | ||||||
McKesson Corporation | 9,000 | 816,570 | ||||||
| 1,766,657 | ||||||||
| Pharmaceuticals — 6.7% | ||||||||
Allergan, Inc. | 8,500 | 697,595 | ||||||
Mylan, Inc.* | 30,000 | 690,900 | ||||||
Novartis AG - ADR | 6,000 | 351,720 | ||||||
Roche Holdings AG - ADR | 7,000 | 310,520 | ||||||
Teva Pharmaceutical Industries Ltd. - ADR | 16,000 | 654,240 | ||||||
| 2,704,975 | ||||||||
9
The Investment House Growth Fund Schedule of Investments (Continued) |
Common Stocks — 117.6% (Continued) | Shares | Value | ||||||
| Industrials — 10.5% | ||||||||
| Air Freight & Logistics — 1.2% | ||||||||
FedEx Corporation | 5,300 | $ | 478,590 | |||||
| Commercial Services & Supplies — 1.4% | ||||||||
Stericycle, Inc.* | 6,000 | 557,100 | ||||||
| Electrical Equipment — 1.2% | ||||||||
Babcock & Wilcox Company (The)* | 20,000 | 502,000 | ||||||
| Industrial Conglomerates — 2.0% | ||||||||
General Electric Co. | 40,000 | 830,000 | ||||||
| Machinery — 3.4% | ||||||||
Cummins, Inc. | 4,500 | 431,550 | ||||||
Pall Corporation | 18,100 | 966,721 | ||||||
| 1,398,271 | ||||||||
| Road & Rail — 1.3% | ||||||||
Norfolk Southern Corporation | 7,000 | 518,350 | ||||||
| Information Technology — 68.6% | ||||||||
| Communications Equipment — 2.0% | ||||||||
QUALCOMM, Inc. | 13,700 | 817,616 | ||||||
| Computers & Peripherals — 22.7% | ||||||||
3D Systems Corporation* | 10,000 | 380,000 | ||||||
Apple, Inc.* | 8,500 | 5,191,460 | ||||||
EMC Corporation* | 45,000 | 1,179,450 | ||||||
Stratasys, Inc.* | 40,000 | 2,451,200 | ||||||
| 9,202,110 | ||||||||
| Electronic Equipment, Instruments & Components — 4.1% | ||||||||
Trimble Navigation Ltd.* | 37,800 | 1,673,028 | ||||||
| Internet Software & Services — 10.5% | ||||||||
eBay, Inc.* | 45,000 | 1,993,500 | ||||||
Google, Inc. - Class A* | 3,600 | 2,278,692 | ||||||
| 4,272,192 | ||||||||
| IT Services — 9.2% | ||||||||
Accenture Ltd. - Class A | 17,900 | 1,079,370 | ||||||
Automatic Data Processing, Inc. | 7,000 | 395,850 | ||||||
International Business Machines Corporation | 11,500 | 2,253,770 | ||||||
| 3,728,990 | ||||||||
10
The Investment House Growth Fund Schedule of Investments (Continued) |
Common Stocks — 117.6% (Continued) | Shares | Value | ||||||
| Information Technology — 68.6% (Continued) | ||||||||
| Semiconductors & Semiconductor Equipment — 2.3% | ||||||||
Texas Instruments, Inc. | 35,000 | $ | 953,400 | |||||
| Software — 17.8% | ||||||||
Adobe Systems, Inc.* | 12,000 | 370,560 | ||||||
Autodesk, Inc.* | 11,000 | 373,120 | ||||||
Intuit, Inc. | 36,000 | 2,088,720 | ||||||
Microsoft Corporation | 55,000 | 1,620,850 | ||||||
Nuance Communications, Inc. * | 20,000 | 407,000 | ||||||
Oracle Corporation | 30,000 | 906,000 | ||||||
SAP AG | 13,000 | 823,680 | ||||||
Symantec Corporation* | 40,000 | 630,000 | ||||||
| 7,219,930 | ||||||||
| Materials — 6.9% | ||||||||
| Chemicals — 6.9% | ||||||||
Ecolab, Inc. | 15,000 | 981,750 | ||||||
Scotts Miracle-Gro Company (The) - Class A | 23,600 | 941,640 | ||||||
Sigma-Aldrich Corporation | 12,600 | 871,920 | ||||||
| 2,795,310 | ||||||||
Total Common Stocks (Cost $28,950,173) | $ | 47,772,414 | ||||||
Money Market Funds — 0.0% | Shares | Value | ||||||
First American Treasury Obligations Fund - Class Y, 0.00%(a) (Cost $249) | 249 | $ | 249 | |||||
Total Investments at Value(b) — 117.6% (Cost $28,950,422) | $ | 47,772,663 | ||||||
Liabilities in Excess of Other Assets — (17.6%) | (7,161,409 | ) | ||||||
Net Assets — 100.0% | $ | 40,611,254 | ||||||
| ADR - American Depositary Receipt. | |
| * | Non-income producing security. |
| (a) | Variable rate security. Rate shown is the 7-day effective yield as of July 31, 2012. |
| (b) | All securities are pledged as collateral for the Fund's bank line of credit (Note 5). |
| See accompanying notes to financial statements. | |
11
The Investment House Growth Fund Statement of Assets and Liabilities July 31, 2012 |
| ASSETS | ||||
| Investments in securities: | ||||
At acquisition cost | $ | 28,950,422 | ||
At value (Note 2) | $ | 47,772,663 | ||
Dividends receivable | 13,925 | |||
Receivable for capital shares sold | 1,457 | |||
Total Assets | 47,788,045 | |||
| LIABILITIES | ||||
Line of credit payable (Note 5) | 7,061,100 | |||
Payable for capital shares redeemed | 19,968 | |||
Accrued investment advisory fees (Note 4) | 35,015 | |||
Accrued Trustees’ fees (Note 4) | 2,268 | |||
Other liabilities | 58,440 | |||
Total Liabilities | 7,176,791 | |||
NET ASSETS | $ | 40,611,254 | ||
| Net assets consist of: | ||||
Paid-in capital | $ | 25,568,965 | ||
Accumulated net investment loss | (195,357 | ) | ||
Accumulated net realized losses from security transactions | (3,584,595 | ) | ||
Net unrealized appreciation on investments | 18,822,241 | |||
Net assets | $ | 40,611,254 | ||
Shares of beneficial interest outstanding (unlimited number of shares authorized, no par value) | 2,440,010 | |||
| Net asset value, redemption price and offering price per share (Note 2) | $ | 16.64 | ||
| See accompanying notes to financial statements. |
12
The Investment House Growth Fund Statement of Operations For the Year Ended July 31, 2012 |
| INVESTMENT INCOME | ||||
Dividends (Net of foreign tax of $10,488) | $ | 448,690 | ||
| EXPENSES | ||||
Investment advisory fees (Note 4) | 517,760 | |||
Interest expense (Note 5) | 120,978 | |||
Extraordinary expenses for the selection of a new investment adviser (Note 4) | 46,532 | |||
Trustees’ fees (Note 4) | 3,009 | |||
Total Expenses | 688,279 | |||
NET INVESTMENT LOSS | (239,589 | ) | ||
| REALIZED AND UNREALIZED GAINS ON INVESTMENTS | ||||
Net realized gains from security transactions | 41,201 | |||
| Net change in unrealized appreciation/depreciation on investments | 5,914,695 | |||
| NET REALIZED AND UNREALIZED GAINS ON INVESTMENTS | 5,955,896 | |||
NET INCREASE IN NET ASSETS FROM OPERATIONS | $ | 5,716,307 | ||
| See accompanying notes to financial statements. |
13
The Investment House Growth Fund Statements of Changes in Net Assets |
Year Ended July 31, 2012 | Year Ended July 31, 2011 | |||||||
| FROM OPERATIONS | ||||||||
Net investment loss | $ | (239,589 | ) | $ | (201,652 | ) | ||
Net realized gains from security transactions | 41,201 | 2,110,265 | ||||||
Net change in unrealized appreciation/ depreciation on investments | 5,914,695 | 4,191,313 | ||||||
Net increase in net assets resulting from operations | 5,716,307 | 6,099,926 | ||||||
| FROM CAPITAL SHARE TRANSACTIONS | ||||||||
Proceeds from shares sold | 5,950,170 | 4,042,996 | ||||||
Payments for shares redeemed | (5,997,753 | ) | (5,211,864 | ) | ||||
Net decrease in net assets from capital share transactions | (47,583 | ) | (1,168,868 | ) | ||||
TOTAL INCREASE IN NET ASSETS | 5,668,724 | 4,931,058 | ||||||
| NET ASSETS | ||||||||
Beginning of year | 34,942,530 | 30,011,472 | ||||||
End of year | $ | 40,611,254 | $ | 34,942,530 | ||||
ACCUMULATED NET INVESTMENT LOSS | $ | (193,357 | ) | $ | — | |||
| CAPITAL SHARE ACTIVITY | ||||||||
Shares sold | 380,725 | 292,658 | ||||||
Shares redeemed | (386,181 | ) | (369,440 | ) | ||||
Net decrease in shares outstanding | (5,456 | ) | (76,782 | ) | ||||
Shares outstanding, beginning of year | 2,445,466 | 2,522,248 | ||||||
Shares outstanding, end of year | 2,440,010 | 2,445,466 | ||||||
| See accompanying notes to financial statements. |
14
The Investment House Growth Fund Statement of Cash Flows For the Year Ended July 31, 2012 |
| CASH FLOWS FROM OPERATING ACTIVITIES | ||||
Net increase in net assets resulting from operations | $ | 5,716,307 | ||
Adjustments to reconcile net increase in net assets resulting from operations to net cash used in operating activities: | ||||
Net realized gains from security transactions | (41,201 | ) | ||
| Net change in unrealized appreciation/depreciation on investments | (5,914,695 | ) | ||
Increase in dividends receivable | (6,530 | ) | ||
Decrease in receivable for investment securities sold | 843,116 | |||
Purchase of investment securities | (8,395,051 | ) | ||
Sale of short-term investments, net | 68 | |||
Proceeds from sale of investment securities | 1,841,503 | |||
Increase in other liabilities | 51,900 | |||
Increase in accrued investment advisory fees | 1,057 | |||
Increase in accrued Trustees' fees | 8 | |||
NET CASH USED IN OPERATING ACTIVITIES | (5,903,518 | ) | ||
| CASH FLOWS FROM FINANCING ACTIVITIES | ||||
Increase in line of credit payable | 5,974,600 | |||
Increase in receivable for capital shares sold | (24 | ) | ||
Decrease in payable for capital shares redeemed | (23,475 | ) | ||
Payment for shares redeemed, net | (47,583 | ) | ||
| NET CASH PROVIDED BY FINANCING ACTIVITIES | 5,903,518 | |||
| NET CHANGE IN CASH | — | |||
Cash, beginning of year | — | |||
Cash, end of year | $ | — | ||
During the year ended July 31, 2012, interest paid was $109,078.
| See accompanying notes to financial statements. |
15
The Investment House Growth Fund Financial Highlights |
Per Share Data and Ratios for a Share Outstanding Throughout Each Year | ||||||||||||||||||||
Years Ended | ||||||||||||||||||||
July 31, 2012 | July 31, 2011 | July 31, 2010 | July 31, 2009 | July 31, 2008 | ||||||||||||||||
| Net asset value at beginning of year | $ | 14.29 | $ | 11.90 | $ | 10.65 | $ | 12.76 | $ | 15.12 | ||||||||||
| Income (loss) from investment operations: | ||||||||||||||||||||
| Net investment loss | (0.10 | ) | (0.08 | ) | (0.06 | ) | (0.03 | ) | (0.09 | ) | ||||||||||
Net realized and unrealized gains (losses) on investments | 2.45 | 2.47 | 1.31 | (2.08 | ) | (2.22 | ) | |||||||||||||
| Total from investment operations | 2.35 | 2.39 | 1.25 | (2.11 | ) | (2.31 | ) | |||||||||||||
| Less distributions from: | ||||||||||||||||||||
| Net investment income | — | — | — | — | (0.05 | ) | ||||||||||||||
| Net asset value at end of year | $ | 16.64 | $ | 14.29 | $ | 11.90 | $ | 10.65 | $ | 12.76 | ||||||||||
Total return(a) | 16.45% | 20.08% | 11.74% | (16.54% | ) | (15.32% | ) | |||||||||||||
| Net assets at end of year (000’s) | $ | 40,611 | $ | 34,943 | $ | 30,011 | $ | 28,727 | $ | 40,676 | ||||||||||
| Ratio of expenses to average net assets | 1.86% | 1.60% | 1.59% | 1.70% | 1.83% | |||||||||||||||
Ratio of expenses to average net assets excluding borrowing costs | 1.53% | 1.41% | 1.41% | 1.41% | 1.41% | |||||||||||||||
| Ratio of net investment loss to average net assets | (0.65% | ) | (0.57% | ) | (0.50% | ) | (0.29% | ) | (0.63% | ) | ||||||||||
| Portfolio turnover rate | 4% | 25% | 8% | 12% | 9% | |||||||||||||||
| (a) | Total return is a measure of the change in value of an investment in the Fund over the periods covered, which assumes any dividends or capital gains distributions are reinvested in shares of the Fund. Returns shown do not reflect the deduction of taxes a shareholder would pay on Fund distributions or the redemption of Fund shares. |
| See accompanying notes to financial statements. | |
16
The Investment House Growth Fund Notes to Financial Statements July 31, 2012 |
1. Organization
The Investment House Growth Fund (formerly GKM Growth Fund) (the “Fund”) is a diversified series of The Investment House Funds (formerly The GKM Funds) (the “Trust”), an open-end management investment company established under the laws of Ohio by an Agreement and Declaration of Trust dated October 2, 2001. The public offering of shares of the Fund commenced on December 28, 2001.
The investment objective of the Fund is long term capital appreciation.
2. Significant Accounting Policies
The following is a summary of the Fund’s significant accounting policies used in the preparation of its financial statements. These policies are in conformity with accounting principles generally accepted in the United States of America (“GAAP”).
Securities valuation – Equity securities of the Fund generally are valued by using market quotations, but may be valued on the basis of prices furnished by a pricing service when the Adviser believes such prices more accurately reflect the fair market value of such securities. Securities that are traded on any stock exchange are generally valued at the last quoted sale price. Lacking a last sale price, an exchange traded security is generally valued at its last bid price. Securities traded on NASDAQ are valued at the NASDAQ Official Closing Price. When market quotations are not readily available, when the Adviser determines that the market quotation or the price provided by the pricing service does not accurately reflect the current market value or when restricted securities are being valued, such securities are valued as determined in good faith by the Adviser, in conformity with guidelines adopted by and subject to review of the Board of Trustees of the Trust and will be classified as Level 2 or 3 (see below) within the fair value hierarchy, depending on the inputs used. Securities with remaining maturities of 60 days or less at the time of purchase are valued at amortized cost, which approximates market value.
GAAP establishes a single authoritative definition of fair value, sets out a framework for measuring fair value and requires additional disclosures about fair value measurements.
Various inputs are used in determining the value of the Fund’s investments. These inputs are summarized in the three broad levels listed below:
| • | Level 1 – quoted prices in active markets for identical securities |
| • | Level 2 – other significant observable inputs |
| • | Level 3 – significant unobservable inputs |
The inputs or methodology used for valuing securities are not necessarily an indication of the risks associated with investing in those securities. The inputs used to measure fair value may fall into different levels of the fair value hierarchy. In such cases, for disclosure purposes, the level in the fair value hierarchy within which the fair value measurement falls in its entirety is determined based on the lowest level input that is significant to the fair value measurement.
17
The Investment House Growth Fund Notes to Financial Statements (Continued) |
The following is a summary of the inputs used to value the Fund’s investments by security type, as of July 31, 2012:
Level 1 | Level 2 | Level 3 | Total | |||||||||||||
Common Stocks | $ | 47,772,414 | $ | — | $ | — | $ | 47,772,414 | ||||||||
Money Market Funds | 249 | — | — | 249 | ||||||||||||
Total | $ | 47,772,663 | $ | — | $ | — | $ | 47,772,663 | ||||||||
Refer to the Fund’s Schedule of Investments for a listing of the common stocks valued using Level 1 inputs by industry type. The Fund did not have any transfers in and out of any Level as of the year ended July 31, 2012. The Fund held no Level 2 or Level 3 securities or derivative instruments as of the year ended July 31, 2012. It is the Fund’s policy to recognize transfers into and out of all Levels at the end of the reporting period.
Share valuation – The net asset value of the Fund’s shares is calculated as of the close of trading on the New York Stock Exchange (normally 4:00 p.m., Eastern time) on each day that the Trust is open for business. The net asset value is calculated by dividing the value of the Fund’s total assets, minus liabilities, by the total number of shares outstanding. The offering price and redemption price per share are equal to the net asset value per share.
Security transactions and investment income – Security transactions are accounted for on trade date. Gains and losses on securities sold are determined on a specific identification basis. Dividend income is recorded on the ex-dividend date. Interest income is accrued as earned. Withholding taxes on foreign dividends have been provided for in accordance with the Fund’s understanding of the applicable country’s tax rules and rates.
Distributions to shareholders – Dividends arising from net investment income and net capital gains, if any, are declared and paid annually in December. The amount of distributions from net investment income and net realized gains are determined in accordance with income tax regulations which may differ from GAAP. There were no distributions to shareholders during the years ended July 31, 2012 and July 31, 2011.
Estimates – The preparation of financial statements in conformity with GAAP requires management to make estimates and assumptions that affect the reported amounts of assets and liabilities and disclosure of contingent assets and liabilities as of the date of the financial statements and the reported amounts of income and expenses during the reporting period. Actual results could differ from those estimates.
Federal income tax – It is the Fund’s policy to comply with the special provisions of Subchapter M of the Internal Revenue Code applicable to regulated investment companies. As provided therein, in any fiscal year in which the Fund so qualifies and distributes at least 90% of its taxable net income, the Fund (but not its shareholders) will be relieved of federal income tax on the income distributed. Accordingly, no provision for income taxes has been made.
18
The Investment House Growth Fund Notes to Financial Statements (Continued) |
In order to avoid imposition of the excise tax applicable to regulated investment companies, it is also the Fund’s intention to declare as dividends in each calendar year at least 98% of its net investment income (earned during the calendar year) and 98.2% of its net realized capital gains (earned during the twelve months ended October 31) plus undistributed amounts from prior years.
The following information is computed on a tax basis for each item as of July 31, 2012:
| Cost of portfolio investments | $ | 28,950,422 | ||
| Gross unrealized appreciation | $ | 19,745,132 | ||
| Gross unrealized depreciation | (922,891 | ) | ||
| Net unrealized appreciation | 18,822,241 | |||
| Capital loss carryforwards | (3,529,843 | ) | ||
| Qualified late year losses | (250,109 | ) | ||
| Total distributable earnings | $ | 15,042,289 |
As of July 31, 2012, the Fund had short-term capital loss carryforwards of $3,529,843 which expire on July 31, 2018. These capital loss carryforwards may be utilized in future years to offset any net realized capital gains prior to distributing such gains to shareholders.
Net qualified late year losses incurred after October 31, 2011 and within the taxable year are deemed to arise on the first day of the Fund’s next taxable year. For the year ended July 31, 2012, the Fund intends to defer $195,357 of late year ordinary losses and $54,752 of late year capital losses to August 1, 2012 for federal tax purposes.
During the year ended July 31, 2012, the Fund utilized capital loss carryforwards of $95,953 to offset current year realized gains.
Under the Regulated Investment Company Modernization Act of 2010 (the “Act”), net capital losses recognized after July 31, 2011 may be carried forward indefinitely, and their character is retained as short-term and/or long-term losses. Under the law in effect prior to the Act, pre-enactment net capital losses were carried forward for eight years and treated as short-term losses. As a transition rule, the Act requires that post-enactment net capital losses be used before pre-enactment net capital losses. Therefore, there may be a greater likelihood that all or a portion of the Fund’s pre-enactment capital loss carryovers may expire without being utilized.
For the year ended July 31, 2012, the Fund reclassified $44,232 of net investment loss against paid-in capital on the Statement of Assets and Liabilities. Such reclassification, the result of permanent differences between financial statement and income tax reporting requirements, had no effect on the Fund’s net assets or net asset value per share.
The Fund recognizes the tax benefits or expenses of uncertain tax positions only when the position is “more-likely-than-not” to be sustained assuming examination by tax authorities. Management has reviewed the tax positions taken on Federal income tax returns for all open tax years (tax years ended July 31, 2009 through July 31, 2012) and has concluded that no provision for unrecognized tax benefits or expenses is required in these financial statements.
19
The Investment House Growth Fund Notes to Financial Statements (Continued) |
3. Investment Transactions
During the year ended July 31, 2012, cost of purchases and proceeds from sales of investment securities, other than short-term investments, amounted to $8,395,051 and $1,841,503, respectively.
4. Transactions with Affiliates
A Trustee and certain officers of the Trust are affiliated with The Investment House LLC (the “Adviser”), Ultimus Fund Solutions, LLC (“Ultimus”), the Fund’s administrator, transfer agent and fund accounting agent, or Ultimus Fund Distributors, LLC (the “Distributor”), the principal underwriter of the Fund’s shares.
Under the terms of an Interim Management Agreement effective July 1, 2012, between the Trust and the Adviser, the Adviser serves as the investment adviser to the Fund. For its services, the Fund pays the Adviser an investment management fee at the annual rate of 1.40% of the Fund’s average daily net assets. The Adviser pays all of the operating expenses of the Fund except brokerage, taxes, borrowing costs, fees and expenses of non-interested person Trustees, extraordinary expenses and distribution and/or service related expenses incurred pursuant to Rule 12b-1 under the Investment Company Act of 1940 (if any).
Prior to July 1, 2012, under the terms of a Management Agreement between the Trust and First Western Investment Management, Inc. (“First Western”), First Western served as the investment adviser to the Fund. For its services, the Fund paid First Western an investment management fee at the annual rate of 1.40% of the Fund’s average daily net assets. First Western paid all of the operating expenses of the Fund except brokerage, taxes, borrowing costs, fees and expenses of non-interested person Trustees, extraordinary expenses and distribution and/or service related expenses incurred pursuant to Rule 12b-1 under the Investment Company Act of 1940 (if any).
On June 20, 2012, the Board of Trustees of the Trust unanimously approved a new Investment Management Agreement (the “New Management Agreement”) with the Adviser. Shareholders of the Fund will be receiving in the mail a proxy statement seeking shareholder approval of the New Management Agreement. The New Management Agreement, if approved by shareholders, will replace the Interim Management Agreement.As of July 31, 2012, the Fund has incurred extraordinary expenses of $46,532 related to the Board’s selection of the Adviser to replace First Western as the investment adviser to the Fund.
The Trust has entered into mutual fund services agreements with Ultimus, pursuant to which Ultimus provides day-to-day operational services to the Fund including, but not limited to, accounting, administrative, transfer agent, dividend disbursing, and recordkeeping services. Effective July 1, 2012, the fees payable to Ultimus are paid by the Adviser (not the Fund). Prior to July 1, 2012, the fees payable to Ultimus were paid by First Western (not the Fund).
20
The Investment House Growth Fund Notes to Financial Statements (Continued) |
The Trust and the Adviser have entered into a Distribution Agreement with the Distributor, pursuant to which the Distributor provides distribution services to the Fund and serves as principal underwriter to the Fund. The Distributor is a wholly-owned subsidiary of Ultimus. Effective July 1, 2012, the fees payable to the Distributor are paid by the Adviser (not the Fund). Prior to July 1, 2012, the fees payable to the Distributor were paid by First Western (not the Fund).
The Fund pays each Trustee who is not affiliated with the Adviser $1,000 annually. Trustees who are affiliated with the Adviser do not receive compensation from the Fund.
5. Bank Line of Credit
The Fund has a secured bank line of credit with US Bank NA that provides a maximum borrowing of up to $12,000,000. The line of credit may be used to cover redemptions or it may be used by the Adviser for investment purposes. When used for investment purposes, the Fund will be using the investment technique of “leverage.” Please see the Fund’s prospectus for detailed information on the investment strategies and associated risks involved with the use of leverage by the Fund. Borrowings under this arrangement bear interest at a rate per annum equal to the Prime Rate minus 0.25% at the time of borrowing. The line of credit matures on December 15, 2012. During the year ended July 31, 2012, the Fund incurred $120,978 of interest expense related to borrowings. The average debt outstanding and the average interest rate during the year ended July 31, 2012 were $3,966,068 and 3.05%, respectively. The largest outstanding borrowing during the year ended July 31, 2012 was $8,117,100. As of July 31, 2012, the Fund had outstanding borrowings of $7,061,100. All of the Fund’s securities are pledged as collateral for the Fund’s bank line of credit.
6. Contingencies and Commitments
The Fund indemnifies the Trust’s officers and Trustees for certain liabilities that might arise from their performance of their duties to the Fund. Additionally, in the normal course of business, the Fund enters into contracts that contain a variety of representations and warranties and which provide general indemnifications. The Fund’s maximum exposure under these arrangements is unknown, as this would involve future claims that may be made against the Fund that have not yet occurred. However, based on experience, the Fund expects the risk of loss to be remote.
7. Sector Risk
If the Fund’s portfolio is overweighted in a certain sector, any negative development affecting that sector will have a greater impact on the Fund than a fund that is not overweighted in that sector. For example, to the extent the Fund is overweighted in the Information Technology sector or the Health Care sector, it will be affected by developments affecting the applicable sector. These sectors are subject to changing government regulations. Companies in these sectors also may be significantly affected by intense competition. In addition, technology and health care products may be subject to rapid obsolescence.
21
The Investment House Growth Fund Notes to Financial Statements (Continued) |
8. Subsequent Events
The Fund is required to recognize in the financial statements the effects of all subsequent events that provide additional evidence about conditions that existed as of the date of the Statement of Assets and Liabilities. For non-recognized subsequent events that must be disclosed to keep the financial statements from being misleading, the Fund is required to disclose the nature of the event as well as an estimate of its financial effect, or a statement that such an estimate cannot be made. Management has evaluated subsequent events through the issuance of these financial statements and has noted no such events.
22
The Investment House Growth Fund Report of Independent Registered Public Accounting Firm |
To the Board of Trustees of The Investment House Funds
and the Shareholders of Investment House Growth Fund
We have audited the accompanying statement of assets and liabilities, including the schedule of investments, of the Investment House Growth Fund, a series of shares of The Investment House Funds, as of July 31, 2012, and the related statement of operations and the statement of cash flows for the year then ended, the statements of changes in net assets for each of the years in the two year period then ended, and the financial highlights for each of the years in the five year period then ended. These financial statements and financial highlights are the responsibility of the Fund’s management. Our responsibility is to express an opinion on these financial statements and financial highlights based on our audits.
We conducted our audits in accordance with the standards of the Public Company Accounting Oversight Board (United States). Those standards require that we plan and perform the audits to obtain reasonable assurance about whether the financial statements and financial highlights are free of material misstatement. An audit includes examining, on a test basis, evidence supporting the amounts and disclosures in the financial statements. Our procedures included confirmation of securities owned as of July 31, 2012 by correspondence with the custodian. An audit also includes assessing the accounting principles used and significant estimates made by management, as well as evaluating the overall financial statement presentation. We believe that our audits provide a reasonable basis for our opinion.
In our opinion, the financial statements and financial highlights referred to above present fairly, in all material respects, the financial position of the Investment House Growth Fund as of July 31, 2012, the results of its operations and its cash flows for the year then ended, the changes in its net assets for each of the years in the two year period then ended, and the financial highlights for each of the years in the five year period then ended, in conformity with accounting principles generally accepted in the United States of America.
 | |
| BBD, LLP |
Philadelphia, Pennsylvania
September 18, 2012
23
The Investment House Growth Fund About Your Fund’s Expenses (Unaudited) |
We believe it is important for you to understand the impact of costs on your investment. As a shareholder of the Fund, you incur ongoing costs, including management fees and other operating expenses. The following examples are intended to help you understand your ongoing costs (in dollars) of investing in the Fund and to compare these costs with the ongoing costs of investing in other mutual funds.
A mutual fund’s ongoing costs are expressed as a percentage of its average net assets. This figure is known as the expense ratio. The examples below are based on an investment of $1,000 made at the beginning of the period shown and held for the entire period (February 1, 2012 – July 31, 2012).
The table below illustrates the Fund’s ongoing costs in two ways:
Actual fund return – This section helps you to estimate the actual expenses that you paid over the period. The “Ending Account Value” shown is derived from the Fund’s actual return, and the third column shows the dollar amount of operating expenses that would have been paid by an investor who started with $1,000 in the Fund. You may use the information here, together with the amount you invested, to estimate the expenses that you paid over the period.
To do so, simply divide your account value by $1,000 (for example, an $8,600 account value divided by $1,000 = 8.6), then multiply the result by the number given for the Fund under the heading “Expenses Paid During Period.”
Hypothetical 5% return – This section is intended to help you compare the Fund’s ongoing costs with those of other mutual funds. It assumes that the Fund had an annual return of 5% before expenses during the period shown, but that the expense ratio is unchanged. In this case, because the return used is not the Fund’s actual return, the results do not apply to your investment. The example is useful in making comparisons because the Securities and Exchange Commission (the “SEC”) requires all mutual funds to calculate expenses based on a 5% return before expenses. You can assess the Fund’s ongoing costs by comparing this hypothetical example with the hypothetical examples that appear in shareholder reports of other funds.
Note that expenses shown in the table are meant to highlight and help you compare ongoing costs only. The Fund does not impose any sales loads or redemption fees.
The calculations assume no shares were bought or sold during the period. Your actual costs may have been higher or lower, depending on the amount of your investment and the timing of any purchases or redemptions.
More information about the Fund’s expenses, including annual expense ratios for the most recent five fiscal years, can be found in this report. For additional information on operating expenses and other shareholder costs, please refer to the Fund’s prospectus.
24
The Investment House Growth Fund About Your Fund’s Expenses (Unaudited) (Continued) |
Beginning Account Value February 1, 2012 | Ending Account Value July 31, 2012 | Expenses Paid During Period* | |
| Based on Actual Fund Return | $ 1,000.00 | $ 1,081.20 | $ 10.97 |
| Based on Hypothetical 5% Return (before expenses) | $ 1,000.00 | $ 1,014.32 | $ 10.62 |
| * | Expenses are equal to the Fund’s annualized expense ratio of 2.12% for the period, multiplied by the average account value over the period, multiplied by 182/366 (to reflect the one-half year period). |
Other Information (Unaudited) |
A description of the policies and procedures that the Fund uses to vote proxies relating to portfolio securities is available without charge upon request by calling toll-free 1-888-456-9518, or on the SEC’s website at http://www.sec.gov. Information regarding how the Fund voted proxies relating to portfolio securities during the most recent 12-month period ended June 30 is available without charge upon request by calling toll-free 1-888-456-9518, or on the SEC’s website at http://www.sec.gov.
The Trust files a complete listing of portfolio holdings of the Fund with the SEC as of the end of the first and third quarters of each fiscal year on Form N-Q. The filings are available upon request by calling 1-888-456-9518. Furthermore, you may obtain a copy of the filings on the SEC’s website at http://www.sec.gov. The Trust’s Forms N-Q may also be reviewed and copied at the SEC’s Public Reference Room in Washington, DC, and information on the operation of the Public Reference Room may be obtained by calling 1-800-SEC-0330.
25
The Investment House Growth Fund Approval of Investment Management Agreement (Unaudited) |
On June 20, 2012, the Board of Trustees unanimously approved a Management Agreement between The Investment House Funds, on behalf of The Investment House Growth Fund, and The Investment House LLC (“TIHL”), at an in-person meeting (the “Management Agreement”). At the same meeting, the Board authorized management to schedule a Special Meeting of Shareholders where shareholders are being asked to approve the Management Agreement. The Special Meeting of shareholders is scheduled for October 12, 2012.
During the Board’s review of the Management Agreement, the Trustees were advised by independent counsel of their statutory, fiduciary and other legal obligations in evaluating and approving the Management Agreement.
Before approving the Management Agreement, the Trustees requested such information from TIHL as they deemed reasonably necessary to evaluate the terms of the Management Agreement. The Trustees reviewed, among other things:
| • | The investment performance of the Fund; |
| • | The investment support services provided to the Fund; |
| • | The administration services provided to the Fund; |
| • | The expense charged to the Fund; |
| • | The extent to which economies of scale would be realized as the Fund grows; and |
| • | The potential profits to be realized by TIHL from its relationship with the Fund. |
The Trustees also reviewed the background, qualifications, education and experience of TIHL’s investment, compliance and operational personnel. They considered Messrs. Cohen’s and Wahl’s decision to continue serving as the Fund’s portfolio managers. The Trustees further considered Mr. David Kahn’s decision to remain as Chief Compliance Officer of the Trust and oversee the Trust’s relationships with the other service providers. The Independent Trustees were advised by experienced independent counsel throughout the process. Prior to voting, the Independent Trustees reviewed the Management Agreement with representatives of TIHL and also met with counsel in a private session where no representatives of TIHL were present.
Investment Performance
The Trustees discussed the importance of the Fund’s investment performance in evaluating TIHL and noted that investment performance is a key indicator of the nature and quality of an investment adviser’s services. In considering investment performance, the Trustees were advised by independent counsel that the Board could appropriately consider the Fund’s prior performance because Messrs. Wahl and Cohen managed the Fund’s assets while at FWIM, and they will continue to do so at TIHL. The Trustees also reviewed Messrs. Wahl’s and Cohen’s responsibilities for managing the Fund’s assets.
The Trustees reviewed information regarding the Fund’s prior performance, including comparative performance reports prepared by management, the Fund’s Morningstar DirectSM investment summary, and Fund performance information provided by TIHL. The Trustees observed that the Fund has out-performed the S&P 500 Index and Russell 3000
26
The Investment House Growth Fund Approval of Investment Management Agreement (Unaudited) (Continued) |
Index over 1-, 5-, and 10-year periods. While aware that past performance is not necessarily indicative of future results, the Trustees concluded that the historical performance of the Fund compared favorably in relation to similar funds, and that it was reasonable to expect that the Fund would provide satisfactory performance in the future.
The Trustees discussed the Fund’s low portfolio turnover ratio in achieving its performance, noting that a low portfolio turnover rate generally means that the Fund has incurred significantly less transaction costs than other funds.
Investment Support Services
The Trustees discussed investment support service considerations. They noted that investment research, portfolio management, trading, administration, and distribution/marketing are factors that they should consider. The Trustees reviewed TIHL’s Form ADV (Part 1 and 2A) and the proposed portfolio managers’ biographies. The Trustees observed that Mr. Wahl currently serves as President of TIHL, is primarily responsible for research and equity management, and has spent the last 20 years in the capital markets arena. They also observed that Mr. Cohen is currently the Senior Managing Director of TIHL and has over 50 years of investment experience. They noted that Messrs. Wahl and Cohen would jointly and primarily be responsible for the Fund’s day-to-day management under the Management Agreement. The Trustees also reviewed a summary of TIHL’s securities trading practices.
The Trustees reviewed TIHL’s compliance policies and procedures. They noted that TIHL has adopted compliance policies and procedures modeled after those used by the Fund’s previous advisers. The Trustees considered representations made by the Trust’s Chief Compliance Officer that the policies and procedures are adequate to cover the operations of TIHL and in particular the services provided to the Fund.
Administration Services
Ultimus Fund Solutions, LLC (“Ultimus”) would continue to provide administration services to the Fund, as it has done since December 2001. The Trustees reviewed Ultimus’ services including: management and supervision of Fund operations, coordination of Board and shareholder meetings, regulatory and compliance assistance, and Fund accounting and pricing services. The Trustees also reviewed the transfer agency and shareholder services that Ultimus provides, which include: transaction processing (including complete servicing in support of all distribution channels), shareholder servicing, communications with shareholders, and anti-money laundering compliance and identity theft prevention. The Trustees observed that the services that Ultimus would provide would be identical to those services that it currently provides to the Fund.
Expenses
The Trustees understood that a fund’s expense ratio is another “traditional yardstick” of an adviser’s performance and that the expense ratio should be examined in relation to the nature and quality of the services provided. They noted that the Management Agreement has the same fee and expense arrangement as the Fund had under its prior management agreement with FWIM. They also noted that, except for certain designated expenses, TIHL would charge the Fund a unitary fee of 1.40% on an annualized basis.
27
The Investment House Growth Fund Approval of Investment Management Agreement (Unaudited) (Continued) |
In addition, the Trustees reviewed other materials relating to the Fund’s expenses on a comparative basis. Among other information, the Trustees reviewed Morningstar DirectSM expense ratio information, a comparative management-prepared expense summary, and Morningstar DirectSM large cap growth category information.
TIHL will pay the majority of the Fund’s operating expenses from its own resources, unlike the arrangements of most of the other funds included in the Morningstar comparisons. For this reason, the Trustees determined to attach more relevance to the comparisons with the Fund’s overall expense ratio than to the advisory fee comparisons.
The Trustees reviewed the comparative Fund expense information. They specifically noted that the Fund’s total expense ratio (1.41% excluding borrowing costs in the most recent fiscal year), while higher than the average of all funds classified by Morningstar as large growth (1.32%), is less than the average expense ratio of such funds having less than $50 million in assets (1.63%).
Economies of Scale
The Trustees understood that an investment adviser may realize “economies of scale” in operational costs as a fund’s assets increase. They further understood that an adviser sharing economies of scale with fund shareholders is an important factor to consider in determining the propriety of an advisory contract. The Trustees observed that economies of scale were not presently an issue regarding TIHL’s operations since TIHL is a relatively new adviser. The Trustees agreed to revisit the economies of scale factor should there be significant growth in the Fund’s assets
Profitability
The Trustees understood that an adviser’s profitability from its fund business is another factor to consider in evaluating an advisory agreement. Because the Fund’s engagement of TIHL would be new, there was no history of TIHL’s profitability with regard to the Fund. However, the Trustees reviewed pro forma financial statements for TIHL and a pro forma profitability analysis for TIHL. The Trustees concluded that the projected profit margin that TIHL from Fund operations would realize would be within an acceptable range and was reasonable. The Trustees also considered representations from TIHL that the principals of TIHL are committed to supporting the operations and financial commitments of TIHL
The Independent Trustees also considered any “fallout benefits” to TIHL, which would include other fees and benefits such as brokerage commissions, that TIHL would receive from serving as adviser to the Fund. They observed that there did not appear to be any such benefits. Therefore, they viewed any possible fallout benefits as secondary factors in connection with evaluating the reasonableness of the Fund’s advisory fees.
Legal Actions
The Trustees reviewed legal actions that involved certain TIHL personnel. The Trustees considered statements made by representatives of TIHL that any anticipated litigation expenses are not expected to hinder TIHL’s financial ability to serve the Fund.
28
The Investment House Growth Fund Approval of Investment Management Agreement (Unaudited) (Continued) |
Conclusion
Based on the Trustees’ review of the noted factors as well as others, the Board, including each of the Independent Trustees, concluded that: (i) the Management Agreement is in the best interests of the Fund and its shareholders; (ii) the nature and quality of the services to be provided under the Management Agreement are necessary for the operation of the Fund; and (iii) the fees to be charged pursuant to the Management Agreement are fair and reasonable with respect to the Fund.
No single factor was considered in isolation or to be determinative to the decision of the Board to approve the Management Agreement. Rather, the Board concluded, in light of a weighing and balancing of all factors considered, that it would be in the best interests of the Fund and its shareholders to approve the Management Agreement.
29
The Investment House Growth Fund Information Regarding Trustees and Officers (Unaudited) |
Overall responsibility for management of the Fund rests with the Board of Trustees. The Trustees serve during the lifetime of the Trust and until its termination, or until death, resignation, retirement or removal. The Trustees, in turn, elect the officers of the Trust to actively supervise its day-to-day operations. The officers have been elected for an annual term.
The following table provides information regarding each Trustee who is not an “interested person” of the Trust, as defined in the Investment Company Act of 1940.
| Name, Address and Age | Position(s) Held with Trust | Length of Time Served |
Darrin F. DelConte 11150 Santa Monica Blvd., Suite 850 Los Angeles, CA 90025 Year of Birth: 1966 | Trustee | Since December 2001 |
| Principal Occupations During Past 5 Years | Number of Portfolios in Fund Complex Overseen by Trustee | Other Directorships Held by Trustee |
| Darrin F. DelConte is Executive Vice President of Pacific Crane Maintenance Co. (marine maintenance company). | 1 | None |
| Name, Address and Age | Position(s) Held with Trust | Length of Time Served |
Nicholas G. Tonsich 11150 Santa Monica Blvd., Suite 850 Los Angeles, CA 90025 Year of Birth: 1961 | Trustee | Since December 2001 |
| Principal Occupations During Past 5 Years | Number of Portfolios in Fund Complex Overseen by Trustee | Other Directorships Held by Trustee |
| Nicholas G. Tonsich is Partner in Glaser & Tonsich, LLP (law firm). | 1 | None |
| Name, Address and Age | Position(s) Held with Trust | Length of Time Served |
Brian D. Horner 11150 Santa Monica Blvd., Suite 850 Los Angeles, CA 90025 Year of Birth: 1961 | Trustee | Since January 2005 |
| Principal Occupations During Past 5 Years | Number of Portfolios in Fund Complex Overseen by Trustee | Other Directorships Held by Trustee |
| Brian D. Horner is President of Alcole Properties, Inc. (property management company). Prior to September 2009, Chairman of Venture West Funding, Inc. (mortgage brokerage company). | 1 | None |
30
The Investment House Growth Fund Information Regarding Trustees and Officers (Unaudited) (Continued) |
The following table provides information regarding each Trustee who is an “interested person” of the Trust, as defined in the Investment Company Act of 1940, and each executive officer of the Trust.
| Name, Address and Age | Position(s) Held with Trust | Length of Time Served |
Timothy J. Wahl1 11150 Santa Monica Blvd., Suite 850 Los Angeles, CA 90025 Year of Birth: 1965 | President and Trustee | Since October 2001 |
| Principal Occupations During Past 5 Years | Number of Portfolios in Fund Complex Overseen by Trustee | Other Directorships Held by Trustee |
| Timothy J. Wahl is President of The Investment House LLC. From May 2009 to April 2012, he was Managing Director of First Western Investment Management, Inc. Prior to May 2009, he was President, Director and Investment Committee Member of GKM Advisers, LLC. | 1 | None |
| Name, Address and Age | Position(s) Held with Trust | Length of Time Served |
David L. Kahn 11150 Santa Monica Blvd., Suite 850 Los Angeles, CA 90025 Year of Birth: 1957 | Chief Compliance Officer; Secretary | Since September 2004 Since October 2001 |
| Principal Occupations During Past 5 Years | Other Directorships Held by Trustee | |
| David L. Kahn is Director of Compliance and Operations of The Investment House LLC. From May 2009 to May 2012, he was Senior Vice President of First Western Investment Management, Inc. Prior to May 2009, he was Operations Manager of GKM Advisers, LLC. | N/A | |
| Name, Address and Age | Position(s) Held with Trust | Length of Time Served |
Robert G. Dorsey 225 Pictoria Drive, Suite 450 Cincinnati, OH 45246 Year of Birth: 1957 | Vice President | Since December 2001 |
| Principal Occupations During Past 5 Years | Other Directorships Held by Trustee | |
| Robert G. Dorsey is a Managing Director of Ultimus Fund Solutions, LLC and Ultimus Fund Distributors, LLC. | N/A | |
| Name, Address and Age | Position(s) Held with Trust | Length of Time Served |
Mark J. Seger 225 Pictoria Drive, Suite 450 Cincinnati, OH 45246 Year of Birth: 1962 | Treasurer | Since December 2001 |
| Principal Occupations During Past 5 Years | Other Directorships Held by Trustee | |
| Mark J. Seger is a Managing Director of Ultimus Fund Solutions, LLC and Ultimus Fund Distributors, LLC. | N/A | |
| 1 | Mr. Wahl is an “interested person” of the Trust because he is an officer of the Adviser. |
Additional information about members of the Board of Trustees and the executive officers is available in the Statement of Additional Information (“SAI”). To obtain a free copy of the SAI, please call 1-888-456-9518.
31
This page intentionally left blank.
This page intentionally left blank.
THE INVESTMENT HOUSE FUNDS Investment Adviser The Investment House LLC 11150 Santa Monica Boulevard Los Angeles, California 90025 Administrator Ultimus Fund Solutions, LLC 225 Pictoria Drive Suite 450 Cincinnati, Ohio 45246 1.888.456.9518 Legal Counsel Dechert LLP 2010 Main Street Suite 500 Irvine, California 92614 Custodian US Bank NA 425 Walnut Street Cincinnati, Ohio 45202 Board of Trustees Darrin F. DelConte Brian D. Horner Nicholas G. Tonsich Timothy J. Wahl Officers Timothy J. Wahl, President Robert G. Dorsey, Vice President David L. Kahn, CCO and Secretary Mark J. Seger, Treasurer | ||
| Item 2. | Code of Ethics. |
As of the end of the period covered by this report, the registrant has adopted a code of ethics that applies to the registrant’s principal executive officer, principal financial officer, principal accounting officer or controller, or persons performing similar functions, regardless of whether these individuals are employed by the registrant or a third party. Pursuant to Item 12(a)(1), a copy of registrant’s code of ethics is filed as an exhibit to this Form N-CSR. During the period covered by this report, the code of ethics has not been amended, and the registrant has not granted any waivers, including implicit waivers, from the provisions of the code of ethics.
| Item 3. | Audit Committee Financial Expert. |
The registrant’s board of trustees has determined that the registrant does not have an audit committee financial expert serving on its audit committee. The audit committee determined that, although none of its members meet the technical definition of an audit committee financial expert, the members have sufficient financial expertise to address any issues that are likely to come before the committee. It was the consensus of the audit committee members that it is not necessary at the present time for the committee to seek to recruit an additional trustee who would qualify as an audit committee financial expert. It was the view of the committee that, if novel issues ever arise, the committee will consider hiring an expert to assist it as needed.
| Item 4. | Principal Accountant Fees and Services. |
| (a) | Audit Fees. The aggregate fees billed for professional services rendered by the principal accountant for the audit of the registrant’s annual financial statements or for services that are normally provided by the accountant in connection with statutory and regulatory filings or engagements were $13,500 and $13,500 with respect to the registrant’s fiscal years ended July 31, 2012 and 2011, respectively. |
| (b) | Audit-Related Fees. No fees were billed in either of the last two fiscal years for assurance and related services by the principal accountant that are reasonably related to the performance of the audit of the registrant’s financial statements and are not reported under paragraph (a) of this Item. |
| (c) | Tax Fees. The aggregate fees billed for professional services rendered by the principal accountant for tax compliance, tax advice, and tax planning were $2,000 and $2,000 with respect to the registrant’s fiscal years ended July 31, 2012 and 2011, respectively. The services comprising these fees are the preparation of the registrant’s federal income and excise tax returns. |
| (d) | All Other Fees. No fees were billed in either of the last two fiscal years for products and services provided by the principal accountant, other than the services reported in paragraphs (a) through (c) of this Item. |
| (e)(1) | The audit committee has not adopted pre-approval policies and procedures described in paragraph (c)(7) of Rule 2-01 of Regulation S-X. |
| (e)(2) | None of the services described in paragraph (b) through (d) of this Item were approved by the audit committee pursuant to paragraph (c)(7)(i)(C) of Rule 2-01 of Regulation S-X. |
| (f) | Less than 50% of hours expended on the principal accountant’s engagement to audit the registrant’s financial statements for the most recent fiscal year were attributed to work performed by persons other than the principal accountant’s full-time, permanent employees. |
| (g) | With respect to the fiscal years ended July 31, 2012 and 2011, aggregate non-audit fees of $2,000 and $2,000, respectively, were billed by the registrant’s principal accountant for services rendered to the registrant. No non-audit fees were billed in either of the last two fiscal years by the registrant’s principal accountant for services rendered to the registrant’s investment adviser (not including any sub-adviser whose role is primarily portfolio management and is subcontracted with or overseen by another investment adviser), and any entity controlling, controlled by, or under common control with the adviser that provides ongoing services to the registrant. |
| (h) | The principal accountant has not provided any non-audit services to the registrant’s investment adviser (not including any sub-adviser whose role is primarily portfolio management and is subcontracted with or overseen by another investment adviser), and any entity controlling, controlled by, or under common control with the investment adviser that provides ongoing services to the registrant. |
| Item 5. | Audit Committee of Listed Registrants. |
Not applicable
| Item 6. | Schedule of Investments. |
| (a) | Not applicable [schedule filed with Item 1] |
| (b) | Not applicable |
| Item 7. | Disclosure of Proxy Voting Policies and Procedures for Closed-End Management Investment Companies. |
Not applicable
| Item 8. | Portfolio Managers of Closed-End Management Investment Companies. |
Not applicable
| Item 9. | Purchases of Equity Securities by Closed-End Management Investment Company and Affiliated Purchasers. |
Not applicable
| Item 10. | Submission of Matters to a Vote of Security Holders. |
The registrant has not adopted procedures by which shareholders may recommend nominees to the registrant’s board of trustees.
| Item 11. | Controls and Procedures. |
(a) Based on their evaluation of the registrant’s disclosure controls and procedures (as defined in Rule 30a-3(c) under the Investment Company Act of 1940) as of a date within 90 days of the filing date of this report, the registrant’s principal executive officer and principal financial officer have concluded that such disclosure controls and procedures are reasonably designed and are operating effectively to ensure that material information relating to the registrant, including its consolidated subsidiaries, is made known to them by others within those entities, particularly during the period in which this report is being prepared, and that the information required in filings on Form N-CSR is recorded, processed, summarized, and reported on a timely basis.
(b) There were no changes in the registrant’s internal control over financial reporting (as defined in Rule 30a-3(d) under the Investment Company Act of 1940) that occurred during the second fiscal quarter of the period covered by this report that have materially affected, or are reasonably likely to materially affect, the registrant’s internal control over financial reporting.
| Item 12. | Exhibits. |
File the exhibits listed below as part of this Form. Letter or number the exhibits in the sequence indicated.
(a)(1) Any code of ethics, or amendment thereto, that is the subject of the disclosure required by Item 2, to the extent that the registrant intends to satisfy the Item 2 requirements through filing of an exhibit: Attached hereto
(a)(2) A separate certification for each principal executive officer and principal financial officer of the registrant as required by Rule 30a-2(a) under the Act (17 CFR 270.30a-2(a)): Attached hereto
(a)(3) Any written solicitation to purchase securities under Rule 23c-1 under the Act (17 CFR 270.23c-1) sent or given during the period covered by the report by or on behalf of the registrant to 10 or more persons: Not applicable
(b) Certifications required by Rule 30a-2(b) under the Act (17 CFR 270.30a-2(b)): Attached hereto
| Exhibit 99.CODE ETH | Code of Ethics | |
| Exhibit 99.CERT | Certifications required by Rule 30a-2(a) under the Act | |
| Exhibit 99.906CERT | Certifications required by Rule 30a-2(b) under the Act |
SIGNATURES
Pursuant to the requirements of the Securities Exchange Act of 1934 and the Investment Company Act of 1940, the registrant has duly caused this report to be signed on its behalf by the undersigned, thereunto duly authorized.
(Registrant) The Investment House Funds
| By (Signature and Title)* | /s/ Timothy J. Wahl | ||
| Timothy J. Wahl, President | |||
| Date | September 26, 2012 | ||
| Pursuant to the requirements of the Securities Exchange Act of 1934 and the Investment Company Act of 1940, this report has been signed below by the following persons on behalf of the registrant and in the capacities and on the dates indicated. | |||
| By (Signature and Title)* | /s/ Timothy J. Wahl | ||
| Timothy J. Wahl, President | |||
| Date | September 26, 2012 | ||
| By (Signature and Title)* | /s/ Mark J. Seger | ||
| Mark J. Seger, Treasurer | |||
| Date | September 26, 2012 | ||
* Print the name and title of each signing officer under his or her signature.