| OMB APPROVAL |
OMB Number: 3235-0570 Expires: January 31, 2017 Estimated average burden hours per response: 20.6 |
| Investment Company Act file number | 811-10529 |
| The Investment House Funds |
| (Exact name of registrant as specified in charter) |
| 11150 Santa Monica Boulevard, Suite 850 | Los Angeles, California 90025 |
| (Address of principal executive offices) | (Zip code) |
| 11150 Santa Monica Boulevard, Suite 850 Los Angeles, California 90025 |
| (Name and address of agent for service) |
| Registrant's telephone number, including area code: | (310) 873-3020 |
| Date of fiscal year end: | July 31, 2015 | |
| Date of reporting period: | July 31, 2015 |
The Investment House Growth Fund
Letter to Shareholders
July 31, 2015
We closed out our thirteenth fiscal year on July 31, 2015, and I would like to thank you for joining us as shareholders of The Investment House Growth Fund (the “Fund”). All of us at The Investment House, LLC continue to share a common goal: to help our clients realize their financial goals through the long-term compounding of capital.
For the fiscal year ended July 31, 2015, the Fund’s total return was 11.76% versus 11.21% for the S&P 500 Index (the “S&P 500”). Since the Fund’s inception on December 28, 2001, the Fund has had a cumulative total return through July 31, 2015 of 174.47% versus 137.95% for the S&P 500.
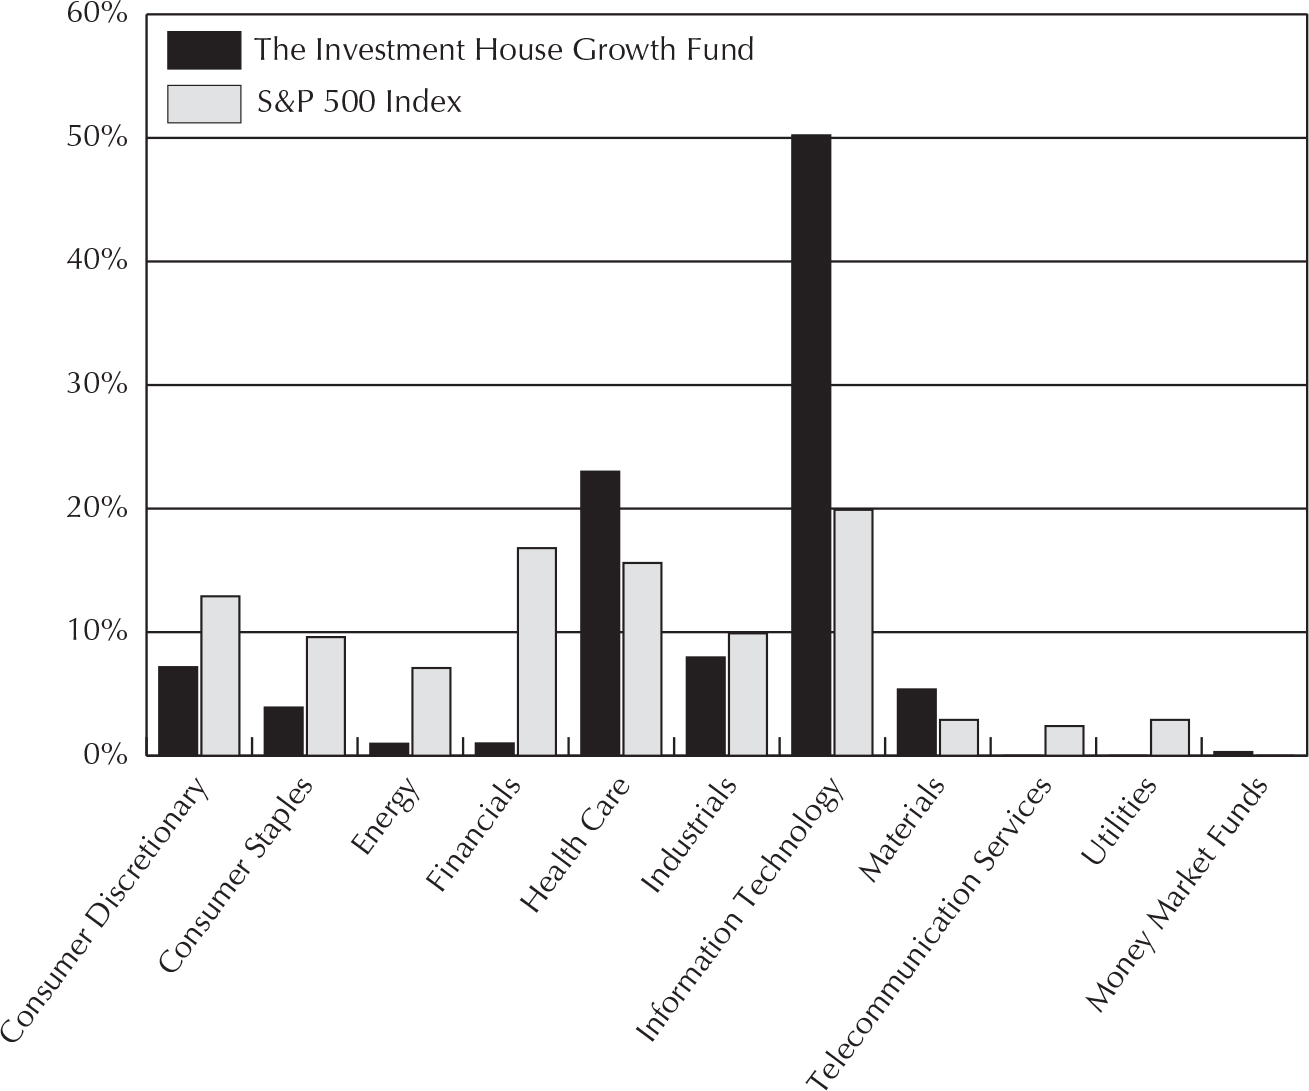
Our largest sector concentrations continue to be in Information Technology (50.2% vs. 17.9% for the S&P 500) and Health Care (23.0% vs. 14.9%), together comprising 73.2% of the Fund’s holdings at year-end. The balance of our holdings was comprised of 8.1% Industrials; 5.4% Basic Materials; 7.2% Consumer Discretionary; 3.9% Consumer Staples; 1.0% Financials; and 1.0% Energy.
Our 5 largest holdings comprised 27.9% of the portfolio, and were all related in some way to the Information Technology sector. However, it is important to remember that such categorizations we view as somewhat arbitrary, as they stretch across a vast landscape of different kinds of businesses, from the pre-eminent social networking company (Facebook); to internet search (Google); to financial management software platforms (Intuit); to a branded lifestyle, entertainment, and productivity enhancer (Apple). In fact, in this age, it is very hard to find a business which does not in some important way directly make use of and benefit from Information Technology, and therefore we regard the 50.2% Information Technology sector membership of our portfolio companies as a far more economically and financially diverse sector than the single name “Information Technology” would suggest.
This year, our technology security selection hurt our overall performance, as we gained 4.61% on average vs. the benchmark’s technology gain of 10.63%. Our underperformance in this sector was largely attributable to the 80% decline in one of our largest holdings, 3D printer manufacturer Stratasys, which suffered from an industry-wide slow down and valuation correction. Our 1.0% weight in the Financials sector (vs. 14.8% for the S&P 500) also detracted from our result, as benchmark Financials advanced 16.8% and although our own Financials advanced somewhat more (21.42%), our underweighting in this sector hurt our performance. In Health Care, our weighting led the S&P 500 23.0% to 14.9%, while the performance of our selected names was 26.9% to 28.3% for the S&P 500. In Materials, our allocation was 5.4% vs. 3.1% for the S&P 500, and our stocks in that sector were up 11.2% vs. -5.1% for the S&P 500. Our Consumer Discretionary weight was 7.2% vs. 10.6% for the S&P 500, with returns of 17.1% and 22.7%, respectively. Our small Energy allocation of 1.0% vs. 8.8% for the S&P 500 returned -22.1% vs. -25.80% for the Index. Overall, the Fund returned 11.76% for the year vs. 11.21% for the S&P 500.
1
RISK MANAGEMENT AND DIVERSIFICATION
Our attitude toward Risk Management remains the same: we define risk as the chance of permanent capital loss. We attempt to limit this risk by investing in a diverse portfolio of what we believe are the very best companies. To the extent that such holdings, though in different companies, remain in or are related to the same sectors of the economy, then such concentrations may add to sector risk. Our largest single holding (Facebook) represented 8.9% of the Fund’s net assets (vs. a 1.1% weight in the S&P 500) and returned 18.77% on the year, thus contributing 1.08% to our overall Fund performance.
PORTFOLIO TURNOVER
We continue to believe that less portfolio activity with the right companies is far superior to more activity with the wrong ones. According to Morningstar, this policy of enlightened lethargy has resulted in an average annual “Tax-adjusted Return” of 7.66% per year (through July 31, 2015) for the Fund since its inception, versus an average annual pre-tax return of 7.71%. Our inactivity, therefore, has benefited our shareholders by costing the Fund only 5 basis points (five one hundredths of a percentage point) in average annual total return over the course of our thirteen years. Of course, we still have just a little way to go to hit zero, but we are mighty close.
The Fund’s portfolio turnover rate for the fiscal year was 8%. As in the past, we try to invest in companies we believe have strong, profitable, competitive advantages that are growing and sustainable long into the future, such that time is our best friend in owning them. Sometimes we get it wrong, or there is a change in circumstance that requires a change in our positioning. In all cases, however, we are motivated to produce the greatest after-tax growth of capital consistent with our desire to minimize the risk of permanent capital loss.
Average Annual Total Returns | 1 Year | 5 Years | 10 Years | Since Inception |
Returns Before Taxes | 11.76% | 18.09% | 8.11% | 7.71% |
Returns After Taxes on Distributions | 11.67% | 17.95% | 8.04% | 7.66% |
Returns After Taxes on Distributions and Sale of Fund Shares | 6.73% | 14.72% | 6.62% | 6.41% |
The performance above presents the impact of taxes on the Fund’s returns. After-tax returns are calculated using the historical highest individual federal marginal income tax rates and do not reflect the impact of state and local taxes. Actual after-tax returns depend on an investor’s tax situation and may differ from those shown. If you own the Fund in a tax-deferred account, such as an IRA or 401(k) plan, after-tax returns are not relevant to your investment because such accounts are subject to taxes only upon distribution.
2
MARKET COMMENTARY
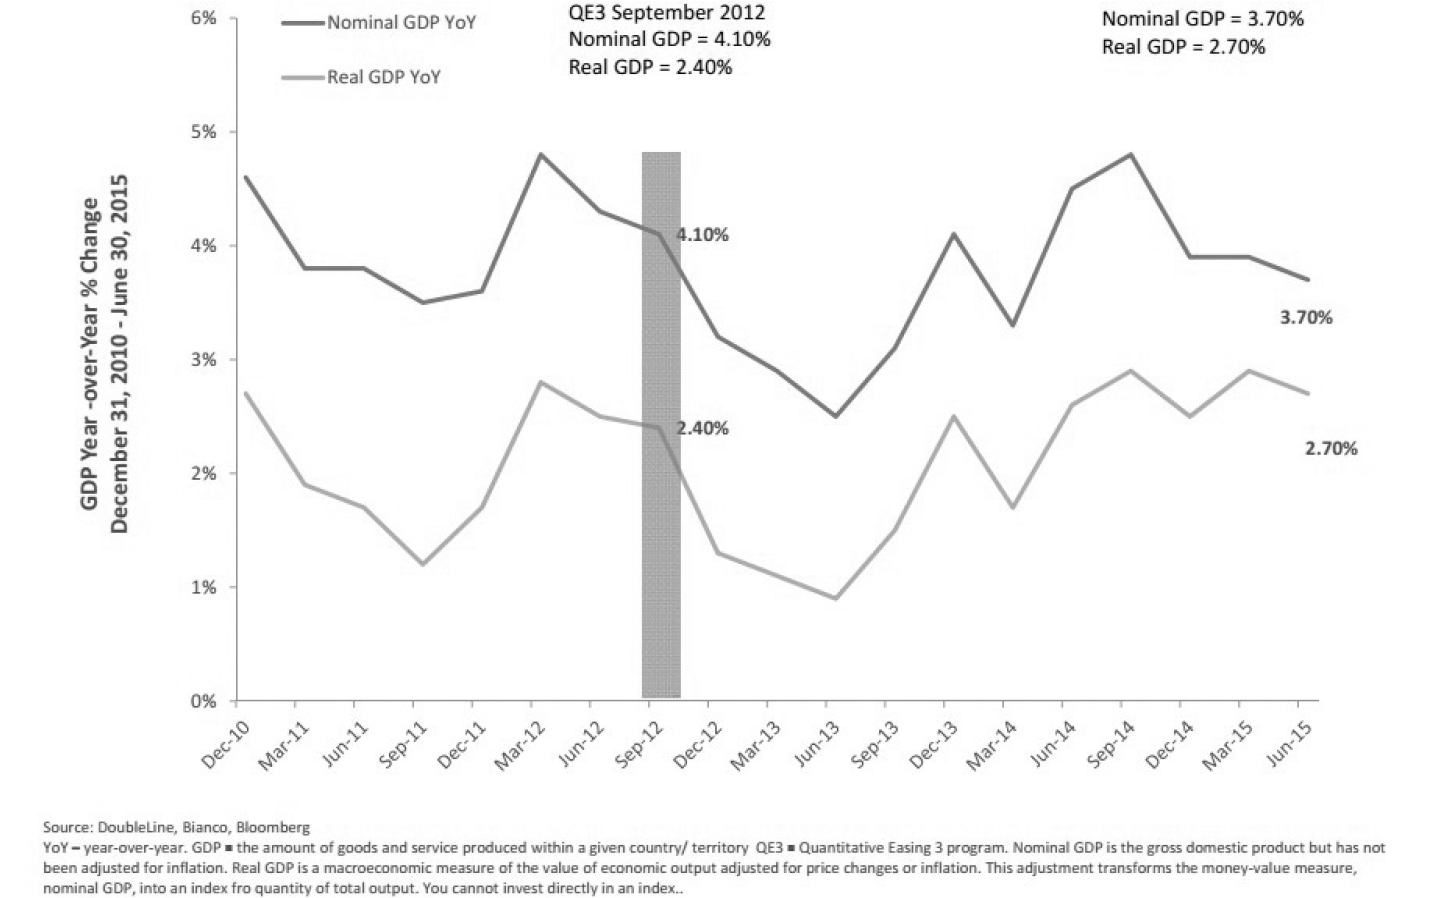
As we look back upon the past year, and anticipate a return to ‘normal’ monetary policy, it is interesting to reflect on where we are, economically speaking, after our extraordinary period of Quantitative Easing (“QE”). The chart below shows that, in spite of the best intentions, QE has failed to stimulate economic growth in the U.S., and in fact, nominal GDP has actually declined significantly. The only reason for the small increase in real GDP growth has been the persistent decline in inflation, contrary to the expressed objectives of the Federal Reserve.
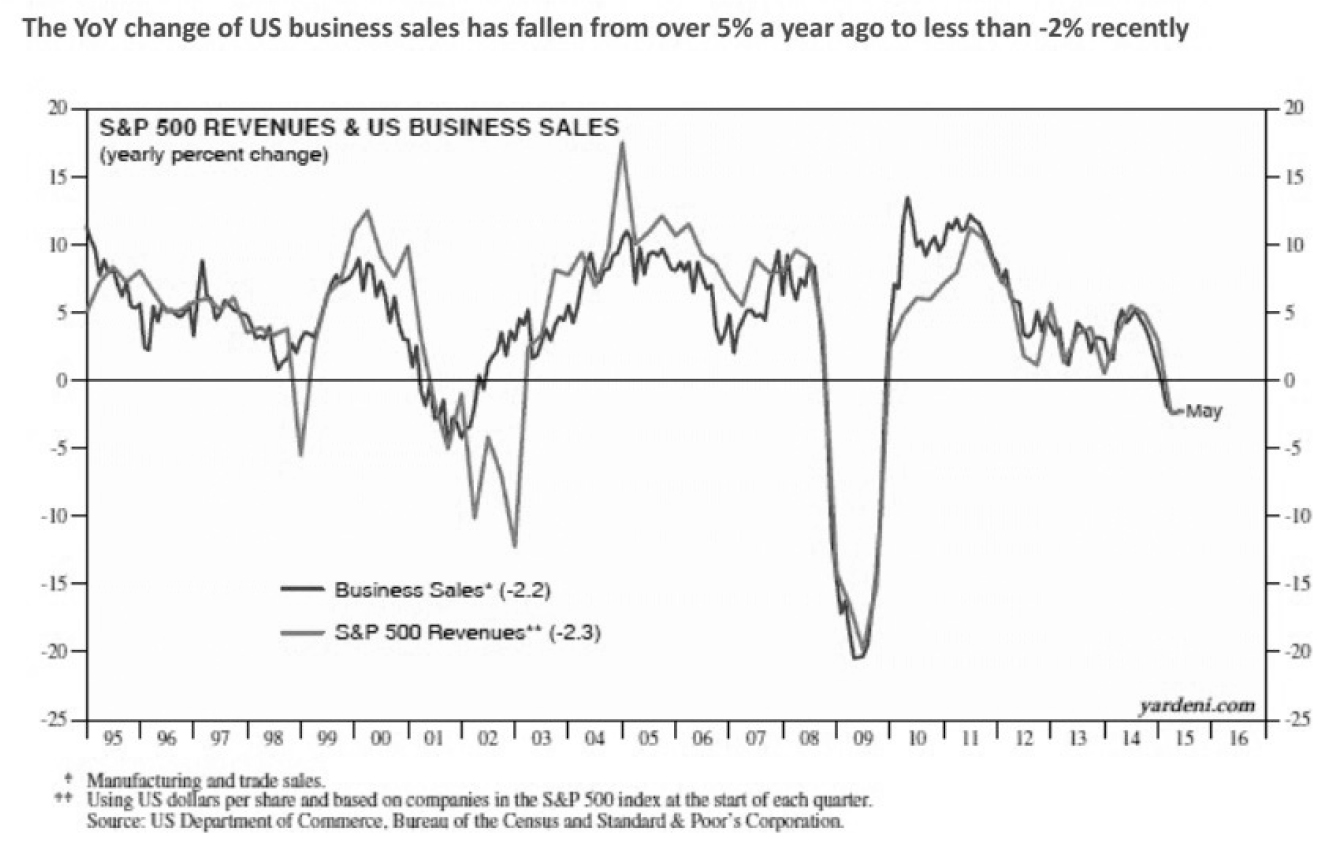
Meanwhile, the picture on the corporate side likewise shows a modest recovery, and recently, a decline.
3
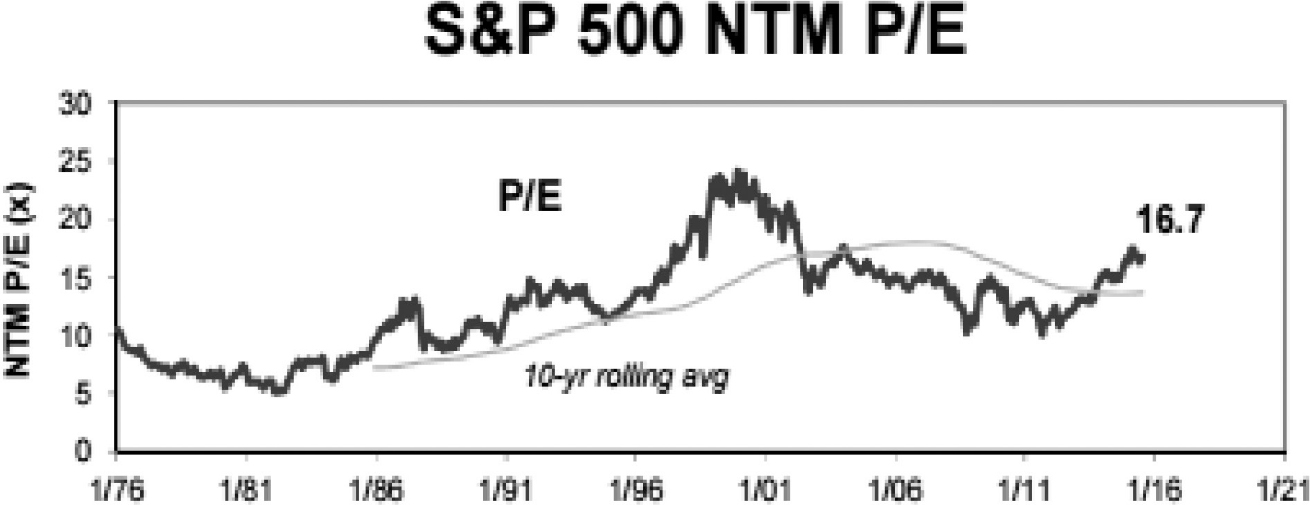
In view of the fact that valuations of the broad equity market in the U.S. are closer to historical highs than to their lows – as shown below in a chart from Goldman Sachs – and that the Federal Reserve has indicated in its public pronouncements that it has ended its loosening cycle, we believe that the long period of expanding price earnings multiples and low volatility may well be coming to a close too. Should this occur, we believe opportunities to purchase superior companies at more attractive valuations will be far more plentiful than in the past several years, and we look forward to such an environment with enthusiasm.
(Source: Goldman Sachs)
Sincerely, | Sincerely, |
| Timothy J. Wahl | Jed M. Cohen |
Portfolio Manager | Portfolio Manager |
Past performance is not predictive of future performance. Investment results and principal value will fluctuate so that shares, when redeemed, may be worth more or less than their original cost. Current performance may be higher or lower than the performance data quoted.
An investor should consider the investment objectives, risks, charges and expenses of the Fund carefully before investing. The Fund’s prospectus contains this and other important information. To obtain a copy of the Fund’s prospectus please visit www.tihfunds.com or call 1-888-456-9518 and a copy will be sent to you free of charge. Please read the prospectus carefully before you invest. The Investment House Growth Fund is distributed by Ultimus Fund Distributors, LLC.
The Letter to Shareholders seeks to describe some of the adviser’s current opinions and views of the financial markets. Although the adviser believes it has a reasonable basis for any opinions or views expressed, actual results may differ, sometimes significantly so, from those expected or expressed.
Some of the information given in this publication has been produced by unaffiliated third parties and, while it is deemed reliable, the adviser does not guarantee its timeliness, sequence, accuracy, adequacy, or completeness and makes no warranties with respect to results to be obtained from its use.
The Investment House Growth Fund’s expense ratio was 1.62% during the year ended July 31, 2015. The expense ratio disclosed in the December 1, 2014 prospectus was 1.48%.
4
| The Investment House Growth Fund Performance Information July 31, 2015 (Unaudited) |
Comparison of the Change in Value of a $10,000 Investment in
The Investment House Growth Fund and the S&P 500 Index Since Inception*
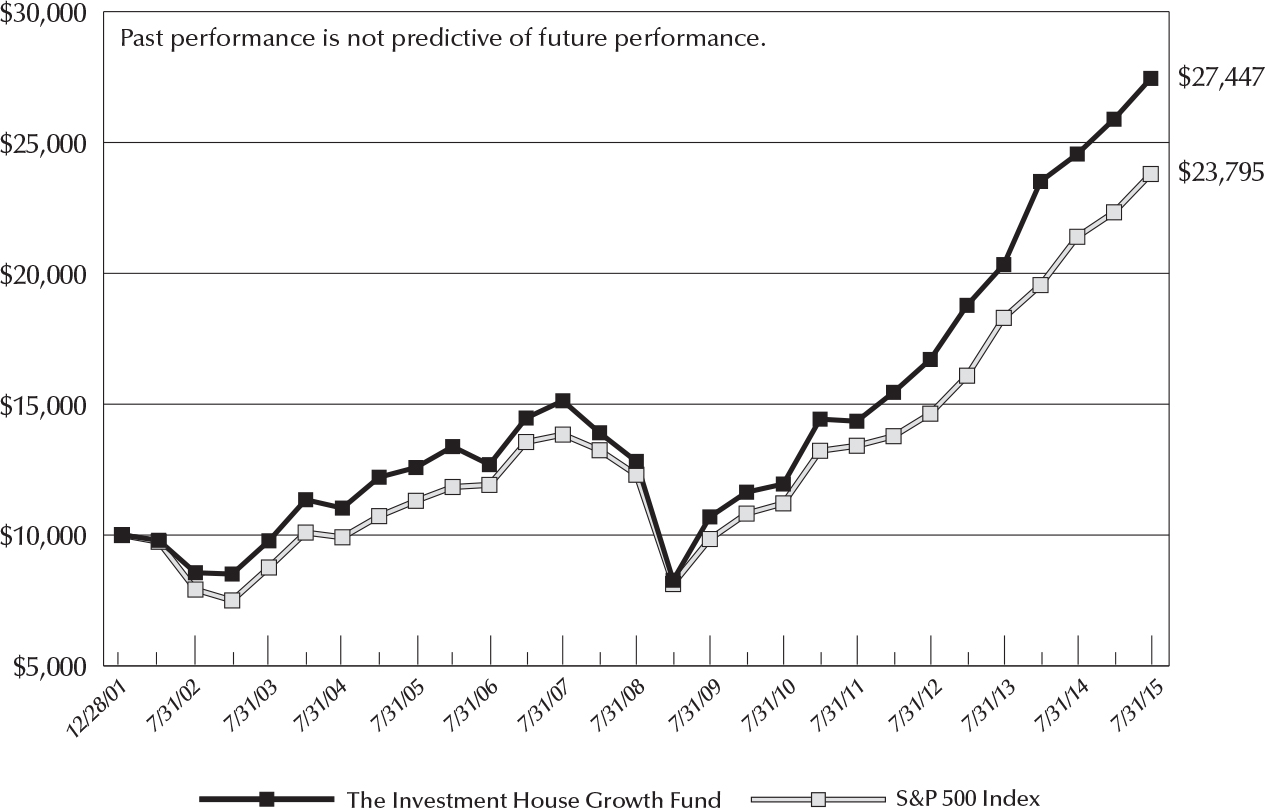
Average Annual Total Returns** | ||||
1 Year | 5 Years | 10 Years | Since | |
The Investment House Growth Fund (a) | 11.76% | 18.09% | 8.11% | 7.71% |
S&P 500 Index | 11.21% | 16.24% | 7.72% | 6.59% |
* | Initial public offering of shares was December 28, 2001. |
** | The total returns shown do not reflect the deduction of taxes that a shareholder would pay on Fund distributions or the redemption of Fund shares. |
(a) | The Fund’s expense ratio was 1.62% during the year ended July 31, 2015. The expense ratio in the December 1, 2014 prospectus was 1.48%. |
5
The Investment House Growth Fund Portfolio Information July 31, 2015 (Unaudited) |
Sector Diversification vs. the S&P 500 Index
(% of Total Investments)
Top 10 Holdings
Security Description | % of Net Assets | |
Facebook, Inc. - Class A | 8.9% | |
Apple, Inc. | 6.6% | |
Intuit, Inc. | 5.6% | |
Google, Inc. - Class A | 3.5% | |
Google, Inc. - Class C | 3.3% | |
McKesson Corporation | 2.9% | |
Henry Schein, Inc. | 2.8% | |
Accenture plc - Class A | 2.7% | |
Texas Instruments, Inc. | 2.5% | |
Trimble Navigation Ltd. | 2.5% |
6
The Investment House Growth Fund | ||||||||
Common Stocks — 99.8% | Shares | Value | ||||||
Consumer Discretionary — 7.2% | ||||||||
Hotels, Restaurants & Leisure — 1.8% | ||||||||
Yum! Brands, Inc. | 14,000 | $ | 1,228,640 | |||||
Household Durables — 2.0% | ||||||||
Harman International Industries, Inc. | 5,250 | 565,215 | ||||||
Tupperware Brands Corporation | 14,000 | 818,580 | ||||||
1,383,795 | ||||||||
Internet & Catalog Retail — 3.4% | ||||||||
Amazon.com, Inc.* | 3,000 | 1,608,450 | ||||||
Priceline Group, Inc. (The)* | 550 | 683,964 | ||||||
2,292,414 | ||||||||
Consumer Staples — 3.9% | ||||||||
Food & Staples Retailing — 2.5% | ||||||||
Costco Wholesale Corporation | 5,000 | 726,500 | ||||||
CVS Health Corporation | 9,000 | 1,012,230 | ||||||
1,738,730 | ||||||||
Household Products — 1.4% | ||||||||
Church & Dwight Company, Inc. | 11,000 | 949,630 | ||||||
Energy — 1.0% | ||||||||
Energy Equipment & Services — 1.0% | ||||||||
Schlumberger Ltd. | 8,000 | 662,560 | ||||||
Financials — 1.0% | ||||||||
Diversified Financial Services — 1.0% | ||||||||
Intercontinental Exchange, Inc. | 3,000 | 684,120 | ||||||
Health Care — 23.0% | ||||||||
Biotechnology — 4.1% | ||||||||
Baxalta, Inc.* | 9,000 | 295,470 | ||||||
Celgene Corporation* | 10,000 | 1,312,500 | ||||||
Gilead Sciences, Inc. | 10,000 | 1,178,600 | ||||||
2,786,570 | ||||||||
Health Care Equipment & Supplies — 6.4% | ||||||||
Baxter International, Inc. | 9,000 | 360,720 | ||||||
Intuitive Surgical, Inc.* | 3,000 | 1,599,510 | ||||||
Medtronic plc | 21,000 | 1,646,190 | ||||||
Stryker Corporation | 7,500 | 767,025 | ||||||
4,373,445 | ||||||||
7
The Investment House Growth Fund | ||||||||
Common Stocks — 99.8% (Continued) | Shares | Value | ||||||
Health Care — 23.0% (Continued) | ||||||||
Health Care Providers & Services — 6.7% | ||||||||
HCA Holdings, Inc.* | 7,500 | $ | 697,575 | |||||
Henry Schein, Inc.* | 12,700 | 1,879,346 | ||||||
McKesson Corporation | 9,000 | 1,985,130 | ||||||
4,562,051 | ||||||||
Life Sciences Tools & Services — 1.1% | ||||||||
Charles River Laboratories International, Inc.* | 10,000 | 776,200 | ||||||
Pharmaceuticals — 4.7% | ||||||||
Allergan plc* | 3,130 | 1,036,500 | ||||||
Mylan N.V.* | 30,000 | 1,679,700 | ||||||
Roche Holdings AG - ADR | 14,000 | 505,540 | ||||||
3,221,740 | ||||||||
Industrials — 8.1% | ||||||||
Air Freight & Logistics — 1.3% | ||||||||
FedEx Corporation | 5,300 | 908,526 | ||||||
Airlines — 2.6% | ||||||||
American Airlines Group, Inc. | 20,000 | 802,000 | ||||||
Delta Air Lines, Inc. | 22,500 | 997,650 | ||||||
1,799,650 | ||||||||
Commercial Services & Supplies — 1.2% | ||||||||
Stericycle, Inc.* | 6,000 | 845,820 | ||||||
Electrical Equipment — 1.2% | ||||||||
Eaton Corporation plc | 13,000 | 787,540 | ||||||
Machinery — 0.9% | ||||||||
Cummins, Inc. | 4,500 | 582,885 | ||||||
Road & Rail — 0.9% | ||||||||
Norfolk Southern Corporation | 7,000 | 590,310 | ||||||
Information Technology — 50.2% | ||||||||
Communications Equipment — 1.3% | ||||||||
QUALCOMM, Inc. | 13,700 | 882,143 | ||||||
Electronic Equipment, Instruments & Components — 2.5% | ||||||||
Trimble Navigation Ltd.* | 75,600 | 1,746,360 | ||||||
8
The Investment House Growth Fund | ||||||||
Common Stocks — 99.8% (Continued) | Shares | Value | ||||||
Information Technology — 50.2% (Continued) | ||||||||
Internet Software & Services — 21.4% | ||||||||
Alibaba Group Holding Ltd. - ADR* | 11,000 | $ | 861,740 | |||||
eBay, Inc.* | 45,000 | 1,265,400 | ||||||
Facebook, Inc. - Class A* | 65,000 | 6,110,650 | ||||||
Google, Inc. - Class A* | 3,600 | 2,367,000 | ||||||
Google, Inc. - Class C* | 3,609 | 2,257,826 | ||||||
PayPal Holdings, Inc.* | 45,000 | 1,741,500 | ||||||
14,604,116 | ||||||||
IT Services — 4.9% | ||||||||
Accenture plc - Class A | 17,900 | 1,845,669 | ||||||
Alliance Data Systems Corporation* | 2,250 | 618,840 | ||||||
Automatic Data Processing, Inc. | 7,000 | 558,390 | ||||||
Xerox Corporation | 30,000 | 330,600 | ||||||
3,353,499 | ||||||||
Semiconductors & Semiconductor Equipment — 2.5% | ||||||||
Texas Instruments, Inc. | 35,000 | 1,749,300 | ||||||
Software — 9.2% | ||||||||
Adobe Systems, Inc.* | 12,000 | 983,880 | ||||||
Autodesk, Inc.* | 11,000 | 556,380 | ||||||
Intuit, Inc. | 36,000 | 3,807,720 | ||||||
SAP SE - ADR | 13,000 | 931,710 | ||||||
6,279,690 | ||||||||
Technology Hardware, Storage & Peripherals — 8.4% | ||||||||
Apple, Inc. | 37,000 | 4,488,100 | ||||||
Stratasys Ltd.* | 40,000 | 1,229,200 | ||||||
5,717,300 | ||||||||
Materials — 5.4% | ||||||||
Chemicals — 5.4% | ||||||||
Ecolab, Inc. | 15,000 | 1,737,150 | ||||||
Monsanto Company | 5,000 | 509,450 | ||||||
Scotts Miracle-Gro Company (The) - Class A | 23,600 | 1,425,204 | ||||||
3,671,804 | ||||||||
Total Common Stocks (Cost $35,990,058) | $ | 68,178,838 | ||||||
9
The Investment House Growth Fund | ||||||||
Money Market Funds — 0.3% | Shares | Value | ||||||
First American Government Obligations Fund - Class Z, 0.01%(a) (Cost $202,978) | 202,978 | $ | 202,978 | |||||
Total Investments at Value — 100.1% (Cost $36,193,036) | $ | 68,381,816 | ||||||
Liabilities in Excess of Other Assets — (0.1%) | (46,543 | ) | ||||||
Net Assets — 100.0% | $ | 68,335,273 | ||||||
ADR - American Depositary Receipt. | |
* | Non-income producing security. |
(a) | Rate shown is the 7-day effective yield as of July 31, 2015. |
See accompanying notes to financial statements. | |
10
The Investment House Growth Fund | ||||
ASSETS | ||||
Investments in securities: | ||||
At acquisition cost | $ | 36,193,036 | ||
At value (Note 2) | $ | 68,381,816 | ||
Dividends and reclaims receivable | 35,567 | |||
Receivable for capital shares sold | 972 | |||
Total Assets | 68,418,355 | |||
LIABILITIES | ||||
Accrued investment advisory fees (Note 4) | 68,082 | |||
Accrued Trustees' fees (Note 4) | 15,000 | |||
Total Liabilities | 83,082 | |||
NET ASSETS | $ | 68,335,273 | ||
Net assets consist of: | ||||
Paid-in capital | $ | 27,627,262 | ||
Accumulated net investment loss | (190,373 | ) | ||
Accumulated net realized gains from security transactions | 8,709,604 | |||
Net unrealized appreciation on investments | 32,188,780 | |||
Net assets | $ | 68,335,273 | ||
Shares of beneficial interest outstanding (unlimited number of shares authorized, no par value) | 2,568,351 | |||
Net asset value, redemption price and offering price per share (Note 2) | $ | 26.61 | ||
See accompanying notes to financial statements. |
11
The Investment House Growth Fund | ||||
INVESTMENT INCOME | ||||
Dividend income (Net of foreign tax of $4,539) | $ | 725,529 | ||
EXPENSES | ||||
Investment advisory fees (Note 4) | 913,081 | |||
Interest expense and fees (Note 5) | 131,134 | |||
Trustees’ fees (Note 4) | 15,000 | |||
Total Expenses | 1,059,215 | |||
NET INVESTMENT LOSS | (333,686 | ) | ||
REALIZED AND UNREALIZED GAINS (LOSSES) ON INVESTMENTS | ||||
Net realized gains from security transactions | 8,709,605 | |||
Net change in unrealized appreciation/depreciation on investments | (1,321,681 | ) | ||
NET REALIZED AND UNREALIZED GAINS ON INVESTMENTS | 7,387,924 | |||
NET INCREASE IN NET ASSETS RESULTING FROM OPERATIONS | $ | 7,054,238 | ||
See accompanying notes to financial statements. |
12
The Investment House Growth Fund | ||||||||
Year | Year | |||||||
FROM OPERATIONS | ||||||||
Net investment loss | $ | (333,686 | ) | $ | (248,798 | ) | ||
Net realized gains from security transactions | 8,709,605 | 1,745,180 | ||||||
Net change in unrealized appreciation/depreciation on investments | (1,321,681 | ) | 9,060,794 | |||||
Net increase in net assets resulting from operations | 7,054,238 | 10,557,176 | ||||||
FROM DISTRIBUTIONS TO SHAREHOLDERS | ||||||||
From net realized gains on investments | (223,251 | ) | (1,351,058 | ) | ||||
FROM CAPITAL SHARE TRANSACTIONS | ||||||||
Proceeds from shares sold | 4,674,260 | 3,860,127 | ||||||
Reinvestment of distributions to shareholders | 213,348 | 1,115,138 | ||||||
Payments for shares redeemed | (3,324,370 | ) | (6,218,059 | ) | ||||
Net increase (decrease) in net assets from capital share transactions | 1,563,238 | (1,242,794 | ) | |||||
TOTAL INCREASE IN NET ASSETS | 8,394,225 | 7,963,324 | ||||||
NET ASSETS | ||||||||
Beginning of year | 59,941,048 | 51,977,724 | ||||||
End of year | $ | 68,335,273 | $ | 59,941,048 | ||||
ACCUMULATED NET INVESTMENT LOSS | $ | (190,373 | ) | $ | (162,107 | ) | ||
CAPITAL SHARE ACTIVITY | ||||||||
Shares sold | 180,561 | 169,116 | ||||||
Shares issued in reinvestment of distributions to shareholders | 8,187 | 49,628 | ||||||
Shares redeemed | (129,508 | ) | (275,929 | ) | ||||
Net increase (decrease) in shares outstanding | 59,240 | (57,185 | ) | |||||
Shares outstanding, beginning of year | 2,509,111 | 2,566,296 | ||||||
Shares outstanding, end of year | 2,568,351 | 2,509,111 | ||||||
See accompanying notes to financial statements. |
13
The Investment House Growth Fund | ||||
CASH FLOWS FROM OPERATING ACTIVITIES | ||||
Net increase in net assets resulting from operations | $ | 7,054,238 | ||
Adjustments to reconcile net increase in net assets resulting from operations to net cash provided by operating activities: | ||||
Purchase of investment securities | (5,224,289 | ) | ||
Proceeds from sales of investment securities | 12,402,310 | |||
Purchase of short-term investments, net | (202,201 | ) | ||
Proceeds from investment securities litigation settlements | 5,170 | |||
Proceeds from return of capital | 10,167 | |||
Decrease in dividends and reclaims receivable | 3,221 | |||
Increase in accrued investment advisory fees | 7,700 | |||
Increase in accrued Trustees' fees | 15,000 | |||
Decrease in other liabilities | (12,840 | ) | ||
Net realized gains from security transactions | (8,709,605 | ) | ||
Net change in unrealized appreciation/depreciation on investments | 1,321,681 | |||
NET CASH PROVIDED BY OPERATING ACTIVITIES | 6,670,552 | |||
CASH FLOWS FROM FINANCING ACTIVITIES | ||||
Decrease in line of credit payable | (8,008,000 | ) | ||
Proceeds from capital shares sold | 4,674,221 | |||
Payments for capital shares redeemed | (3,326,870 | ) | ||
Cash distributions paid to shareholders from net realized gains on investments | (9,903 | ) | ||
NET CASH USED IN FINANCING ACTIVITIES | (6,670,552 | ) | ||
NET CHANGE IN CASH | — | |||
Cash, beginning of year | — | |||
Cash, end of year | $ | — | ||
During the year ended July 31, 2015, interest and fees paid were $143,974.
Non-cash financing activities not included consist of reinvestment of distributions of $213,348.
See accompanying notes to financial statements. |
14
The Investment House Growth Fund | ||||||||||||||||||||
Per Share Data and Ratios for a Share Outstanding Throughout Each Year | ||||||||||||||||||||
Years Ended | ||||||||||||||||||||
| July 31, | July 31, | July 31, | July 31, | July 31, | |||||||||||||||
Net asset value at beginning of year | $ | 23.89 | $ | 20.25 | $ | 16.64 | $ | 14.29 | $ | 11.90 | ||||||||||
Income (loss) from investment operations: | ||||||||||||||||||||
Net investment loss | (0.13 | ) | (0.10 | ) | (0.06 | ) | (0.10 | ) | (0.08 | ) | ||||||||||
Net realized and unrealized gains on investments | 2.94 | 4.27 | 3.67 | 2.45 | 2.47 | |||||||||||||||
Total from investment operations | 2.81 | 4.17 | 3.61 | 2.35 | 2.39 | |||||||||||||||
Less distributions: | ||||||||||||||||||||
From net realized gains on investments | (0.09 | ) | (0.53 | ) | — | — | — | |||||||||||||
Net asset value at end of year | $ | 26.61 | $ | 23.89 | $ | 20.25 | $ | 16.64 | $ | 14.29 | ||||||||||
Total return(a) | 11.76 | % | 20.77 | % | 21.69 | % | 16.45 | % | 20.08 | % | ||||||||||
Net assets at end of year (000’s) | $ | 68,335 | $ | 59,941 | $ | 51,978 | $ | 40,611 | $ | 34,943 | ||||||||||
Ratio of expenses to average net assets | 1.62 | % | 1.48 | % | 1.79 | % | 1.86 | % | 1.60 | % | ||||||||||
Ratio of expenses to average net assets | 1.42 | % | 1.43 | % | 1.44 | % | 1.53 | % | 1.41 | % | ||||||||||
Ratio of net investment loss to average net assets | (0.51 | %) | (0.43 | %) | (0.33 | %) | (0.65 | %) | (0.57 | %) | ||||||||||
Portfolio turnover rate | 8 | % | 9 | % | 8 | % | 4 | % | 25 | % | ||||||||||
(a) | Total return is a measure of the change in value of an investment in the Fund over the years covered, which assumes any dividends or capital gains distributions are reinvested in shares of the Fund. Returns shown do not reflect the deduction of taxes a shareholder would pay on Fund distributions or the redemption of Fund shares. |
See accompanying notes to financial statements. | |
15
The Investment House Growth Fund |
1. Organization
The Investment House Growth Fund (the “Fund”) is a diversified series of The Investment House Funds (the “Trust”), an open-end management investment company established under the laws of Ohio by an Agreement and Declaration of Trust dated October 2, 2001. The public offering of shares of the Fund commenced on December 28, 2001.
The investment objective of the Fund is long term capital appreciation.
2. Significant Accounting Policies
The following is a summary of the Fund’s significant accounting policies used in the preparation of its financial statements. These policies are in conformity with accounting principles generally accepted in the United States of America (“GAAP”). As an investment company, as defined in Financial Accounting Standards Board (“FASB”) Accounting Standards Update 2013-08, the Fund follows accounting and reporting guidance under FASB Accounting Standards Codification Topic 946, “Financial Services – Investment Companies.”
Securities valuation – Equity securities of the Fund generally are valued at their market value, but if market prices are not available or The Investment House LLC, the investment adviser to the Fund (the “Adviser”), believes such prices do not accurately reflect the market value of such securities, securities will be valued by the Adviser at their fair value, according to procedures approved by the Board of Trustees and such securities will be classified as Level 2 or 3 within the fair value hierarchy (see below), depending on the inputs used. Securities that are traded on any stock exchange are generally valued at the last quoted sale price. Lacking a last sale price, an exchange traded security is generally valued at its last bid price. Securities traded on NASDAQ are valued at the NASDAQ Official Closing Price.
GAAP establishes a single authoritative definition of fair value, sets out a framework for measuring fair value and requires additional disclosures about fair value measurements.
Various inputs are used in determining the value of each of the Fund’s investments. These inputs are summarized in the three broad levels listed below:
● | Level 1 – quoted unadjusted prices for identical instruments in active markets to which the Fund has access at the date of measurement. |
● | Level 2 – quoted prices for similar instruments in active markets; quoted prices for identical or similar instruments in markets that are not active; and model-derived valuations in which all significant inputs and significant value drivers are observable in active markets. Level 2 inputs are those in markets for which there are few transactions, the prices are not current, little public information exists or instances where prices vary substantially over time or among brokered market makers. |
● | Level 3 – model derived valuations in which one or more significant inputs or significant value drivers are unobservable. Unobservable inputs are those inputs that reflect the Fund’s own assumptions that market participants would use to price the asset or liability based on the best available information. |
16
The Investment House Growth Fund |
The inputs or methodology used for valuing securities are not necessarily an indication of the risks associated with investing in those securities. The inputs used to measure fair value may fall into different levels of the fair value hierarchy. In such cases, for disclosure purposes, the level in the fair value hierarchy within which the fair value measurement falls in its entirety is determined based on the lowest level input that is significant to the fair value measurement.
The following is a summary of the inputs used to value the Fund’s investments as of July 31, 2015 by security type:
| Level 1 | Level 2 | Level 3 | Total | ||||||||||||
Common Stocks | $ | 68,178,838 | $ | — | $ | — | $ | 68,178,838 | ||||||||
Money Market Funds | 202,978 | — | — | 202,978 | ||||||||||||
Total | $ | 68,381,816 | $ | — | $ | — | $ | 68,381,816 | ||||||||
Refer to the Fund’s Schedule of Investments for a listing of the common stocks by industry type. As of July 31, 2015, the Fund did not have any transfers into and out of any Level. There were no Level 2 or Level 3 securities or derivative instruments held by the Fund as of July 31, 2015. It is the Fund’s policy to recognize transfers into and out of all Levels at the end of the reporting period.
Share valuation – The net asset value of the Fund’s shares is calculated as of the close of trading on the New York Stock Exchange (normally 4:00 p.m., Eastern time) on each day that the Trust is open for business. The net asset value is calculated by dividing the value of the Fund’s total assets, minus liabilities, by the total number of shares outstanding. The offering price and redemption price per share are equal to the net asset value per share.
Security transactions and investment income – Security transactions are accounted for on trade date. Gains and losses on securities sold are determined on a specific identification basis. Dividend income is recorded on the ex-dividend date. Interest income is accrued as earned. Withholding taxes on foreign dividends have been provided for in accordance with the Fund’s understanding of the applicable country’s tax rules and rates.
Distributions to shareholders – Dividends arising from net investment income and distributions of net realized capital gains, if any, are declared and paid annually in December. The amount of distributions from net investment income and net realized capital gains are determined in accordance with income tax regulations, which may differ from GAAP. Dividends and distributions are recorded on the ex-dividend date. The tax character of the Fund’s distributions paid during the years ended July 31, 2015 and July 31, 2014 was long-term capital gains.
Estimates – The preparation of financial statements in conformity with GAAP requires management to make estimates and assumptions that affect the reported amounts of assets and liabilities and disclosure of contingent assets and liabilities as of the date of the financial statements and the reported amounts of increases and decreases in net assets from operations during the reporting period. Actual results could differ from those estimates.
17
The Investment House Growth Fund |
Federal income tax – The Fund has qualified and intends to continue to qualify each year as a “regulated investment company” under Subchapter M of the Internal Revenue Code of 1986 (the “Code”). By so qualifying, the Fund will not be subject to federal income taxes to the extent that the Fund distributes its net investment income and any realized capital gains in accordance with the Code. Accordingly, no provision for income tax has been made.
In order to avoid imposition of the excise tax applicable to regulated investment companies, it is also the Fund’s intention to declare as dividends in each calendar year at least 98% of its net investment income (earned during the calendar year) and 98.2% of its net realized capital gains (earned during the twelve months ended October 31) plus undistributed amounts from prior years.
The following information is computed on a tax basis for each item as of July 31, 2015:
Cost of portfolio investments | $ | 36,193,036 | ||
Gross unrealized appreciation | $ | 34,712,435 | ||
Gross unrealized depreciation | (2,523,655 | ) | ||
Net unrealized appreciation | 32,188,780 | |||
Undistributed long-term gains | 8,709,604 | |||
Qualified late year losses | (190,373 | ) | ||
Total distributable earnings | $ | 40,708,011 |
Net qualified late year losses incurred after December 31, 2014 and within the taxable year are deemed to arise on the first day of the Fund’s next taxable year. For the year ended July 31, 2015, the Fund intends to defer $190,373 of late year ordinary losses to August 1, 2015 for federal income tax purposes.
For the year ended July 31, 2015, the Fund reclassified $305,420 of net investment loss against paid-in capital on the Statement of Assets and Liabilities. Such reclassification, the result of permanent differences between the financial statement and income tax reporting requirements, has no effect on the Fund’s net assets or net asset value per share.
The Fund recognizes the tax benefits or expenses of uncertain tax positions only when the position is “more-likely-than-not” to be sustained assuming examination by tax authorities. Management has reviewed the tax positions taken on Federal income tax returns for all open tax years (tax years ended July 31, 2012 through July 31, 2015) and has concluded that no provision for unrecognized tax benefits or expenses is required in these financial statements.
3. Investment Transactions
During the year ended July 31, 2015, cost of purchases and proceeds from sales of investment securities, other than short-term investments, amounted to $5,224,289 and $12,402,310, respectively.
18
The Investment House Growth Fund |
4. Transactions with Related Parties
A Trustee and certain officers of the Trust are affiliated with the Adviser, Ultimus Fund Solutions, LLC (“Ultimus”), the Fund’s administrator, transfer agent and fund accounting agent, or Ultimus Fund Distributors, LLC (the “Distributor”), the principal underwriter of the Fund’s shares.
Under the terms of a Management Agreement between the Trust and the Adviser, the Adviser serves as the investment adviser to the Fund. For its services, the Fund pays the Adviser an investment management fee at the annual rate of 1.40% of the Fund’s average daily net assets. The Adviser pays all of the operating expenses of the Fund except brokerage, taxes, borrowing costs, fees and expenses of non-interested Trustees, extraordinary expenses and distribution and/or service related expenses incurred pursuant to Rule 12b-1 under the Investment Company Act of 1940 (if any).
The Trust has entered into mutual fund services agreements with Ultimus, pursuant to which Ultimus provides day-to-day operational services to the Fund including, but not limited to, accounting, administrative, transfer agent, dividend disbursing, and recordkeeping services. The fees payable to Ultimus are paid by the Adviser (not the Fund).
The Trust has entered into a Distribution Agreement with the Distributor, pursuant to which the Distributor provides distribution services to the Fund and serves as principal underwriter to the Fund. The Distributor is a wholly-owned subsidiary of Ultimus. The fees payable to the Distributor are paid by the Adviser (not the Fund).
The Fund pays each Trustee who is not affiliated with the Adviser $7,500 annually. Trustees who are affiliated with the Adviser do not receive compensation from the Fund.
5. Bank Line of Credit
The Fund has a secured bank line of credit with US Bank NA that provides a maximum borrowing of up to $17,000,000. The line of credit may be used to cover redemptions and/or it may be used by the Adviser for investment purposes. When used for investment purposes, the Fund will be using the investment technique of “leverage.” Because the Fund’s investments will fluctuate in value, whereas the interest obligations on borrowed funds may be fixed, during times of borrowing the Fund’s NAV may tend to increase more when its investments increase in value, and decrease more when its investments decrease in value. In addition, interest costs on borrowings may fluctuate with changing market interest rates and may partially offset or exceed the return earned on the borrowed funds. Also, during times of borrowing under adverse market conditions, the Fund might have to sell portfolio securities to meet interest or principal payments at a time when fundamental investment considerations would not favor such sales. Unless profits on assets acquired with borrowed funds exceed the costs of borrowing, the use of borrowing will diminish the investment performance of the Fund compared with what it would have been without borrowing.
19
The Investment House Growth Fund |
Borrowings under this arrangement bear interest at a rate per annum equal to the Prime Rate minus 0.25% at the time of borrowing plus an annual renewal fee of $500. The line of credit matures on December 14, 2015. During the year ended July 31, 2015, the Fund incurred $131,134 of interest expense and fees related to borrowings. The average debt outstanding and the average interest rate for days with borrowings during the year ended July 31, 2015 were $5,405,556 and 3.00%, respectively. The largest outstanding borrowing during the year ended July 31, 2015 was $8,410,000. As of July 31, 2015, the Fund did not have any outstanding borrowings.
6. Contingencies and Commitments
The Fund indemnifies the Trust’s officers and Trustees for certain liabilities that might arise from their performance of their duties to the Fund. Additionally, in the normal course of business, the Fund enters into contracts that contain a variety of representations and warranties and which provide general indemnifications. The Fund’s maximum exposure under these arrangements is unknown, as this would involve future claims that may be made against the Fund that have not yet occurred. However, based on experience, the Fund expects the risk of loss to be remote.
7. Sector Risk
If the Fund’s portfolio is overweighted in a certain sector, any negative development affecting that sector will have a greater impact on the Fund than a fund that is not overweighted in that sector. To the extent the Fund is overweighted in the Information Technology sector, it will be affected by developments affecting the sector. Companies in this sector may be significantly affected by intense competition. In addition, technology products may be subject to rapid obsolescence. As of July 31, 2015, the Fund had 50.2% of the value of its net assets invested within the Information Technology sector.
8. Subsequent Events
The Fund is required to recognize in the financial statements the effects of all subsequent events that provide additional evidence about conditions that existed as of the date of the Statement of Assets and Liabilities. For non-recognized subsequent events that must be disclosed to keep the financial statements from being misleading, the Fund is required to disclose the nature of the event as well as an estimate of its financial effect, or a statement that such an estimate cannot be made. Management has evaluated subsequent events through the issuance of these financial statements and has noted no such events.
20
The Investment House Growth Fund |
To the Board of Trustees of the Investment House Funds
and the Shareholders of the Investment House Growth Fund
We have audited the accompanying statement of assets and liabilities of The Investment House Growth Fund, a series of shares of The Investment House Funds, including the schedule of investments, as of July 31, 2015, and the related statement of operations and cash flows for the year then ended, the statements of changes in net assets for each of the years in the two-year period then ended and the financial highlights for each of the years in the five-year period then ended. These financial statements and financial highlights are the responsibility of the Fund’s management. Our responsibility is to express an opinion on these financial statements and financial highlights based on our audits.
We conducted our audits in accordance with the standards of the Public Company Accounting Oversight Board (United States). Those standards require that we plan and perform the audits to obtain reasonable assurance about whether the financial statements and financial highlights are free of material misstatement. An audit includes examining, on a test basis, evidence supporting the amounts and disclosures in the financial statements. Our procedures included confirmation of securities owned as of July 31, 2015 by correspondence with the custodian. An audit also includes assessing the accounting principles used and significant estimates made by management, as well as evaluating the overall financial statement presentation. We believe that our audits provide a reasonable basis for our opinion.
In our opinion, the financial statements and financial highlights referred to above present fairly, in all material respects, the financial position of The Investment House Growth Fund as of July 31, 2015, and the results of its operations and its cash flows for the year then ended, the changes in its net assets for each of the years in the two-year period then ended, and the financial highlights for each of the years in the five-year period then ended, in conformity with accounting principles generally accepted in the United States of America.
 | |
BBD, LLP |
Philadelphia, Pennsylvania
September 25, 2015
21
The Investment House Growth Fund |
We believe it is important for you to understand the impact of costs on your investment. As a shareholder of the Fund, you incur ongoing costs, including management fees and other operating expenses. The following examples are intended to help you understand your ongoing costs (in dollars) of investing in the Fund and to compare these costs with the ongoing costs of investing in other mutual funds.
A mutual fund’s ongoing costs are expressed as a percentage of its average net assets. This figure is known as the expense ratio. The examples below are based on an investment of $1,000 made at the beginning of the period shown and held for the entire period (February 1, 2015 – July 31, 2015).
The table below illustrates the Fund’s ongoing costs in two ways:
Actual fund return – This section helps you to estimate the actual expenses that you paid over the period. The “Ending Account Value” shown is derived from the Fund’s actual return, and the third column shows the dollar amount of operating expenses that would have been paid by an investor who started with $1,000 in the Fund. You may use the information here, together with the amount you invested, to estimate the expenses that you paid over the period.
To do so, simply divide your account value by $1,000 (for example, an $8,600 account value divided by $1,000 = 8.6), then multiply the result by the number given for the Fund under the heading “Expenses Paid During Period.”
Hypothetical 5% return – This section is intended to help you compare the Fund’s ongoing costs with those of other mutual funds. It assumes that the Fund had an annual return of 5% before expenses during the period shown, but that the expense ratio is unchanged. In this case, because the return used is not the Fund’s actual return, the results do not apply to your investment. The example is useful in making comparisons because the Securities and Exchange Commission (the “SEC”) requires all mutual funds to calculate expenses based on a 5% return before expenses. You can assess the Fund’s ongoing costs by comparing this hypothetical example with the hypothetical examples that appear in shareholder reports of other funds.
Note that expenses shown in the table are meant to highlight and help you compare ongoing costs only. The Fund does not impose any sales loads or redemption fees.
The calculations assume no shares were bought or sold during the period. Your actual costs may have been higher or lower, depending on the amount of your investment and the timing of any purchases or redemptions.
More information about the Fund’s expenses, including annual expense ratios for the most recent five fiscal years, can be found in this report. For additional information on operating expenses and other shareholder costs, please refer to the Fund’s prospectus.
22
The Investment House Growth Fund |
| Beginning Account Value | Ending | Expenses Paid |
Based on Actual Fund Return | $1,000.00 | $1,060.20 | $7.56 |
Based on Hypothetical 5% Return (before expenses) | $1,000.00 | $1,017.46 | $7.40 |
* | Expenses are equal to the Fund’s annualized expense ratio of 1.48% for the period, multiplied by the average account value over the period, multiplied by 181/365 (to reflect the one-half year period). |
Other Information (Unaudited) |
A description of the policies and procedures that the Fund uses to vote proxies relating to portfolio securities is available without charge upon request by calling toll-free 1-888-456-9518, or on the SEC’s website at http://www.sec.gov. Information regarding how the Fund voted proxies relating to portfolio securities during the most recent 12-month period ended June 30 is available without charge upon request by calling toll-free 1-888-456-9518, or on the SEC’s website at http://www.sec.gov.
The Trust files a complete listing of portfolio holdings of the Fund with the SEC as of the end of the first and third quarters of each fiscal year on Form N-Q. The filings are available upon request by calling 1-888-456-9518. Furthermore, you may obtain a copy of the filings on the SEC’s website at http://www.sec.gov. The Trust’s Forms N-Q may also be reviewed and copied at the SEC’s Public Reference Room in Washington, DC, and information on the operation of the Public Reference Room may be obtained by calling 1-800-SEC-0330.
23
The Investment House Growth Fund |
Overall responsibility for management of the Fund rests with the Board of Trustees. The Trustees serve during the lifetime of the Trust and until its termination, or until death, resignation, retirement or removal. The Trustees, in turn, elect the officers of the Trust to actively supervise its day-to-day operations. The officers have been elected for an annual term.
The following table provides information regarding each Trustee who is not an “interested person” of the Trust, as defined in the Investment Company Act of 1940.
Name, Address and Age | Position(s) Held with Trust | Length of Time Served |
Darrin F. DelConte Year of Birth: 1966 | Trustee | Since December 2001 |
Principal Occupations During Past 5 Years | Number of Portfolios in Fund Complex Overseen by Trustee | Other Directorships |
Darrin F. DelConte is Executive Vice President of Pacific Crane Maintenance Co. (marine maintenance company). | 1 | None |
Name, Address and Age | Position(s) Held with Trust | Length of Time Served |
Nicholas G. Tonsich | Trustee | Since December 2001 |
Principal Occupations During Past 5 Years | Number of Portfolios in Fund Complex Overseen by Trustee | Other Directorships Held by Trustee |
Nicholas G. Tonsich is an attorney. Prior to 2014 he was a Partner in Glaser & Tonsich, LLP (law firm). Mr. Tonsich is President of Ocean Terminal Services, Inc. (equipment maintenance company) and Clean Air Engineering-Maritime, Inc. (an environmental services company for the shipping industry). | 1 | None |
Name, Address and Age | Position(s) Held with Trust | Length of Time Served |
Michael A. Zupanovich | Trustee | Since June 2015 |
Principal Occupations During Past 5 Years | Number of Portfolios in Fund Complex Overseen by Trustee | Other Directorships Held by Trustee |
Michael A. Zupanovich is President of Harbor Diesel & Equipment, Inc. (heavy equipment repair company). | 1 | None |
24
The Investment House Growth Fund |
The following table provides information regarding each Trustee who is an “interested person” of the Trust, as defined in the Investment Company Act of 1940, and each executive officer of the Trust.
Name, Address and Age | Position(s) Held with Trust | Length of Time Served |
Timothy J. Wahl1 | President and Trustee | Since October 2001 |
Principal Occupations During Past 5 Years | Number of Portfolios in Fund Complex Overseen by Trustee | Other Directorships Held by Trustee |
Timothy J. Wahl is President of The Investment House LLC since May 2012. From May 2009 to April 2012, he was Managing Director and Investment Committee member of First Western Investment Management, Inc. | 1 | None |
| ||
Name, Address and Age | Position(s) Held with Trust | Length of Time Served |
David L. Kahn | Chief Compliance Officer; | Since September 2004 |
Principal Occupations During Past 5 Years | Other Directorships Held by Trustee | |
David L. Kahn is Chief Compliance Officer of The Investment House LLC since May 2012. From May 2009 to May 2012, he was Senior Vice President of First Western Investment Management, Inc. | N/A | |
| ||
Name, Address and Age | Position(s) Held with Trust | Length of Time Served |
Robert G. Dorsey | Vice President | Since December 2001 |
Principal Occupations During Past 5 Years | Other Directorships Held by Trustee | |
Robert G. Dorsey is a Managing Director of Ultimus Fund Solutions, LLC and Ultimus Fund Distributors, LLC. | N/A | |
| ||
Name, Address and Age | Position(s) Held with Trust | Length of Time Served |
Brian J. Lutes | Treasurer | Since January 2015 |
Principal Occupations During Past 5 Years | Other Directorships Held by Trustee | |
Brian J. Lutes is Vice President, Mutual Fund Controller of Fund Accounting of Ultimus Fund Solutions, LLC. | N/A | |
1 | Mr. Wahl is an “interested person” of the Trust because he is an owner and officer of the Adviser. |
Additional information about members of the Board of Trustees and the executive officers is available in the Statement of Additional Information (“SAI”). To obtain a free copy of the SAI, please call 1-888-456-9518.
25

| (a) | Audit Fees. The aggregate fees billed for professional services rendered by the principal accountant for the audit of the registrant’s annual financial statements or for services that are normally provided by the accountant in connection with statutory and regulatory filings or engagements were $14,000 and $14,000 with respect to the registrant’s fiscal years ended July 31, 2015 and 2014, respectively. |
| (b) | Audit-Related Fees. No fees were billed in either of the last two fiscal years for assurance and related services by the principal accountant that are reasonably related to the performance of the audit of the registrant’s financial statements and are not reported under paragraph (a) of this Item. |
| (c) | Tax Fees. The aggregate fees billed for professional services rendered by the principal accountant for tax compliance, tax advice, and tax planning were $2,000 and $2,000 with respect to the registrant’s fiscal years ended July 31, 2015 and 2014, respectively. The services comprising these fees are the preparation of the registrant’s federal income and excise tax returns. |
| (d) | All Other Fees. No fees were billed in either of the last two fiscal years for products and services provided by the principal accountant, other than the services reported in paragraphs (a) through (c) of this Item. |
| (e)(1) | The audit committee has not adopted pre-approval policies and procedures described in paragraph (c)(7) of Rule 2-01 of Regulation S-X. |
| (e)(2) | None of the services described in paragraph (b) through (d) of this Item were approved by the audit committee pursuant to paragraph (c)(7)(i)(C) of Rule 2-01 of Regulation S-X. |
| (f) | Less than 50% of hours expended on the principal accountant’s engagement to audit the registrant’s financial statements for the most recent fiscal year were attributed to work performed by persons other than the principal accountant’s full-time, permanent employees. |
| (g) | With respect to the fiscal years ended July 31, 2015 and 2014, aggregate non-audit fees of $2,000 and $2,000, respectively, were billed by the registrant’s principal accountant for services rendered to the registrant. No non-audit fees were billed in either of the last two fiscal years by the registrant’s principal accountant for services rendered to the registrant’s investment adviser (not including any sub-adviser whose role is primarily portfolio management and is subcontracted with or overseen by another investment adviser), and any entity controlling, controlled by, or under common control with the adviser that provides ongoing services to the registrant. |
| (h) | The principal accountant has not provided any non-audit services to the registrant’s investment adviser (not including any sub-adviser whose role is primarily portfolio management and is subcontracted with or overseen by another investment adviser), and any entity controlling, controlled by, or under common control with the investment adviser that provides ongoing services to the registrant. |
| (a) | Not applicable [schedule filed with Item 1] |
| (b) | Not applicable |
| Exhibit 99.CODE ETH | Code of Ethics |
| Exhibit 99.CERT | Certifications required by Rule 30a-2(a) under the Act |
| Exhibit 99.906CERT | Certifications required by Rule 30a-2(b) under the Act |
| (Registrant) | The Investment House Funds | ||
| By (Signature and Title)* | /s/ Timothy J. Wahl | ||
| Timothy J. Wahl, President | |||
| Date | October 1, 2015 | ||
| Pursuant to the requirements of the Securities Exchange Act of 1934 and the Investment Company Act of 1940, this report has been signed below by the following persons on behalf of the registrant and in the capacities and on the dates indicated. | |||
| By (Signature and Title)* | /s/ Timothy J. Wahl | ||
| Timothy J. Wahl, President | |||
| Date | October 1, 2015 | ||
| By (Signature and Title)* | /s/ Brian J. Lutes | ||
| Brian J. Lutes, Treasurer | |||
| Date | October 1, 2015 | ||
* | Print the name and title of each signing officer under his or her signature. |