| OMB APPROVAL |
OMB Number: 3235-0570
Expires: July 31, 2022
Estimated average burden hours per response: 20.6 |
UNITED STATES
SECURITIES AND EXCHANGE COMMISSION
Washington, D.C. 20549
FORM N-CSR
CERTIFIED SHAREHOLDER REPORT OF REGISTERED
MANAGEMENT INVESTMENT COMPANIES
| Investment Company Act file number | 811-10529 | |
| The Investment House Funds |
| (Exact name of registrant as specified in charter) |
| 300 Corporate Pointe, Suite 380 | Culver City, California 90230 |
| (Address of principal executive offices) | (Zip code) |
Timothy J. Wahl
The Investment House LLC
| 300 Corporate Pointe, Suite 380, Culver City, California 90230 |
| (Name and address of agent for service) |
| Registrant's telephone number, including area code: | (310) 873-3020 | |
| Date of fiscal year end: | July 31 | |
| | | |
| Date of reporting period: | July 31, 2021 | |
Form N-CSR is to be used by management investment companies to file reports with the Commission not later than 10 days after the transmission to stockholders of any report that is required to be transmitted to stockholders under Rule 30e-1 under the Investment Company Act of 1940 (17 CFR 270.30e-1). The Commission may use the information provided on Form N-CSR in its regulatory, disclosure review, inspection, and policymaking roles.
A registrant is required to disclose the information specified by Form N-CSR, and the Commission will make this information public. A registrant is not required to respond to the collection of information contained in Form N-CSR unless the Form displays a currently valid Office of Management and Budget (“OMB”) control number. Please direct comments concerning the accuracy of the information collection burden estimate and any suggestions for reducing the burden to Secretary, Securities and Exchange Commission, 450 Fifth Street, NW, Washington, DC 20549-0609. The OMB has reviewed this collection of information under the clearance requirements of 44 U.S.C. § 3507.
Item 1. Reports to Stockholders.
| | | | | | | |
| | | | | | | |
| | | | | | | |
| | | | | | | |
| | | | | | | |
| | | | | | | |
| | | | | | | |
| | | | | | | |
| | | | | | | |
| | | | | | | |
| | | | | | | |
| | | | | | | |
| | | | | | | |
| | | | | | | |
| | | | | | | |
| | | | The Investment House Funds | | | |
| | | | | | | |
| | | | | | | |
| | | The Investment House Growth Fund | | |
| | | | | | | |
| | | | | | | |
| | | | | | | |
| | | | | | | |
| | | | | | | |
| | | | | | | |
| | | | | | | |
| | | | | | | |
| | | Annual Report | | |
| | | July 31, 2021 | | |
| | | | | |
| | | | | |
| | | | | |
| | | | | |
| | | | | |
| | | | | |
| | | | | |
| | | | | |
| | | | | |
| | | | | |
| | | | | |
| | | | | |
| | | | | |
| | | | | |
| | | | | |
| | | | | |
| | | | | |
| | | | | |
| | | | | |
| | | | | |
| | | | | |
| | | | | |
The Investment House Growth Fund
Letter to Shareholders
July 31, 2021 (Unaudited)
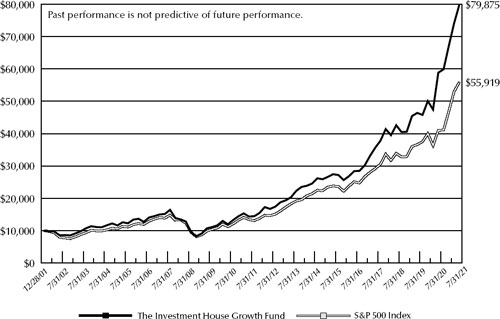
We closed out fiscal 2021 on July 31, 2021 and would like to thank you for joining us as shareholders of The Investment House Growth Fund (the “Fund”). This is our 20th year advising the Fund, and for those of you who have been with us from the beginning, we are pleased to report a cumulative return since inception of 698.75% versus 459.19% for the S&P 500 Index.
Since the Fund’s inception on December 28, 2001, the Fund has had an average annual return of 11.19% through July 31, 2021 versus 9.18% for the S&P 500 Index for the same period.
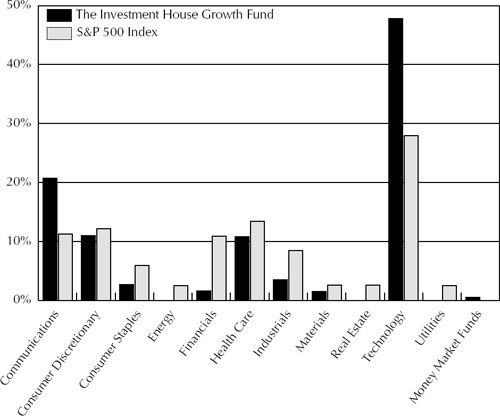
Our largest sector concentrations continue to be in Technology (47.8% vs. 27.8% for the S&P) and Communications (20.7% vs. 11.2%), together comprising 68.5% of the Fund’s net assets at year end. The balance of our holdings were comprised of 11.0% Consumer Discretionary; 10.8% Health Care; 3.5% Industrials; 2.7% Consumer Staples; 1.5% Materials; 1.6% Financials; and 0% Utilities, Real Estate, and Energy.
Our top 5 holdings comprised 44.1% of the portfolio and were all related in some way to the Technology or Communications sectors. It is important to remember that such categorizations we view as somewhat arbitrary, as they stretch across a vast landscape of different kinds of businesses, from internet & social media (Facebook, Alphabet); to information management (Intuit); to a branded lifestyle, entertainment, and productivity ecosystem (Apple), to e-commerce (Amazon). In fact, in this age, it is very hard to find any business which does not, in some important way, directly make use of and benefit from digital information or communications technologies, and therefore we regard the 68.5% Technology & Communications category membership of our portfolio companies as a far more economically and financially diverse sector than the single name “Technology” (or “Communications”) would suggest.
Below is a table reflecting the weights of the key S&P sectors vs the corresponding weights of the Fund’s holdings:
| | | Fund Weight |
| Sector | S&P Weight (%) | (% of net assets) |
| Communications | 11.2 | 20.7 |
| Consumer Discretionary | 12.1 | 11.0 |
| Consumer Staples | 5.9 | 2.7 |
| Energy | 2.5 | 0 |
| Financials | 10.9 | 1.6 |
| Health Care | 13.4 | 10.8 |
| Industrials | 8.4 | 3.5 |
| Materials | 2.6 | 1.5 |
| Real Estate | 2.6 | 0 |
| Technology | 27.8 | 47.8 |
| Utilities | 2.5 | 0 |
For the year ended July 31, 2021, the Fund was up 35.70% vs 36.45% for the S&P 500 Index, underperforming by less than 1%.
The size and performance of our 10 largest holdings are shown in the table below:
| | Weight | 8/1/20 – 7/31/21 |
| Fund Holding | (% of net assets) | Return (%) |
| Facebook, Inc. - Class A | 10.3 | | 30.4 |
| Apple, Inc. | 9.6 | | 10.3 |
| Alphabet, Inc - Classes A and C | 8.7 | | 53.7 |
| Intuit, Inc. | 8.5 | | 40.1 |
| Amazon.com, Inc. | 7.0 | | 2.2 |
| PayPal Holdings, Inc. | 5.5 | | 17.7 |
| Intuitive Surgical, Inc. | 4.0 | | 21.2 |
| Adobe, Inc | 3.3 | | 24.3 |
| Texas Instruments | 3.0 | | 18.2 |
| Square, Inc. - Class A | 2.8 | | 13.6 |
| Total | | 62.7 | | |
RISK MANAGEMENT AND DIVERSIFICATION
Our attitude toward Risk Management remains the same: we define risk as the chance of permanent capital loss. We attempt to limit this risk by selecting the very best companies we can, and to manage portfolio risk by diversifying our separate company holdings. To the extent that such holdings, though in different companies, remain in or are related to the same sectors of the economy, then such concentrations may add to sector risk.
PORTFOLIO TURNOVER
We continue to believe that less portfolio activity with the right companies is far superior to more activity with the wrong ones. This policy of enlightened lethargy has resulted in an average annualized after tax return on distributions before the sale of Fund shares since inception of 10.98% for the Fund through July 31, 2021 versus a pre-tax return of 11.19%. Our inactivity, therefore, has benefited you, our shareholders, by costing the Fund only 21 basis points (21 hundredths of a percentage point) in average annual returns over the course of our nineteen plus years. Of course, we still have just a little way to go to hit zero, but we are mighty close.
Our average rate of turnover for the fiscal year was approximately 1%. As in the past, we try to invest in companies we believe have strong, profitable competitive advantages which are growing and sustainable long into the future, such that time is our best friend in owning them. Sometimes we get it wrong, or there is a change in circumstance which requires a change in our positioning. In all cases though, we are motivated by producing the greatest after-tax growth of capital consistent with our desire to minimize the risk of permanent capital loss.
The Tide Which Lifts All Boats
Earlier this year we commented on the remarkable rebound in markets, earnings, and business activity in the post pandemic period. Once again, the resilience, adaptive power, and innovation of American businesses has created lemonade from lemons, having recently surpassed 2019’s aggregate corporate earnings, and set a new post-war profit margin high, even as roughly 8 million employees remain unemployed and about as many job openings remain unfilled. The last year has shown the dynamism of the American economy to be impressive indeed.
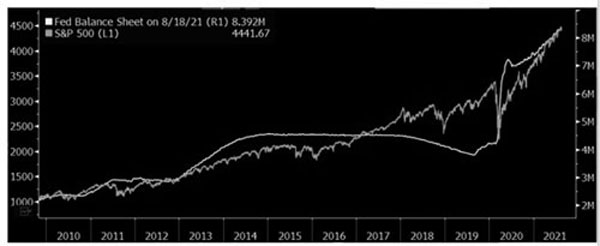
Part of this success is no doubt due to the crisis measures the Federal Reserve (Fed) and the government undertook to hasten the recovery. The program of QE, or ‘quantitative easing’ (the purchase by the Federal Reserve of Treasury, Mortgage-backed, and corporate debt in the open market) was first implemented during the Great Financial Crisis (GFC) of mid-2007 through early 2009 as a means of stimulating risk-taking business investment by lowering the alternative rates of return available in the government bond (i.e., low credit risk) markets. This program was re-implemented at much larger scale by the Fed in March 2020, and as the chart below shows, had a similar effect – increasing the Fed’s balance sheet to almost $9 trillion (or 3.5x its size during the GFC), and successfully incentivizing the purchase of riskier assets – equities.
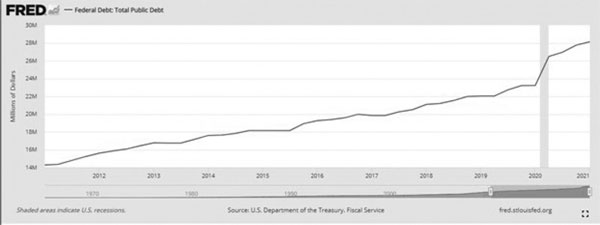
Likewise, the fiscal measures undertaken by the federal government – primarily in the form of supplementary unemployment benefits - resulted in an additional $6 trillion of fiscal support since March 2020, roughly doubling the size of federal debt over the past 10 years. These payments helped individuals and businesses cope with the long months of total shutdown which the pandemic containment measures required. Most economists and business leaders have judged these measures to have been critical in creating the conditions for a speedy recovery, although some differ on whether the extent of such measures will add too much to inflationary pressures on the one hand, or long-term debt on the other. On this, as in other things, time will tell; history shows that few are rewarded for averting a crisis, so the Monday-morning quarterbacking of the chirping classes should not distract us from what is in consideration of what might have been.
Now that the period of acute business slowdown is behind us, the Fed has recently declared its intention to ‘taper’ – or moderate – its monthly purchases of $120 billion of government securities, probably commencing toward the end of this year or the beginning of next. Likewise, the last of the federal government’s stimulus programs is just now winding its way through congress, after which, in the autumn, a corporate and personal tax bill is expected to take shape, in order to commence raising revenues sufficient to pay down this debt over time.
We cannot know what affect these combined measures will have, but it is fair to say that the wind down of these extraordinary measures will certainly withdraw significant support from the economy and from certain types of assets. With what consequences, again, we cannot know – but as investors we view with enthusiasm periods when high quality, growing businesses are available at attractive prices, independent of any particular macro regime, and thus we look forward to the future with enthusiasm.
Sincerely
The Investment House LLC
Past performance is not predictive of future performance. Investment results and principal value will fluctuate so that shares, when redeemed, may be worth more or less than their original cost. Current performance may be higher or lower than the performance data quoted.
An investor should consider the investment objectives, risks, charges and expenses of the Fund carefully before investing. The Fund’s prospectus contains this and other important information. To obtain a copy of the Fund’s prospectus please visit www.tihfunds.com or call 1-888-456-9518 and a copy will be sent to you free of charge. Please read the prospectus carefully before you invest. The Investment House Growth Fund is distributed by Ultimus Fund Distributors, LLC.
The Letter to Shareholders seeks to describe some of the adviser’s current opinions and views of the financial markets. Although the adviser believes it has a reasonable basis for any opinions or views expressed, actual results may differ, sometimes significantly so, from those expected or expressed.
Some of the information given in this publication has been produced by unaffiliated third parties and, while it is deemed reliable, the adviser does not guarantee its timeliness, sequence, accuracy, adequacy, or completeness and makes no warranties with respect to results to be obtained from its use.
The Investment House Growth Fund
Performance Information
July 31, 2021 (Unaudited)
Comparison of the Change in Value of a $10,000 Investment in
The Investment House Growth Fund and the
S&P 500 Index Since Inception*
Average Annual Total Returns
(for periods ended July 31, 2021) |
| | | | | | | | | |
| | | | | | | | Since | |
| | 1 Year | | 5 Years | | 10 Years | | Inception* | |
| The Investment House Growth Fund (a)(b) | 35.70% | | 22.97% | | 18.73% | | 11.19% | |
| S&P 500 Index | 36.45% | | 17.35% | | 15.35% | | 9.18% | |
| | | | | | | | | |
| * | Initial public offering of shares was December 28, 2001. |
| (a) | The Fund’s total returns shown do not reflect the deduction of taxes that a shareholder would pay on Fund distributions or the redemption of Fund shares. |
| (b) | The Fund’s expense ratio for the year ended July 31, 2021 was 1.41%. The expense ratio as disclosed in the December 1, 2020 prospectus was 1.43%. |
The Investment House Growth Fund
Portfolio Information
July 31, 2021 (Unaudited)
Sector Diversification vs. the S&P 500 Index
(% of Net Assets)
Top 10 Holdings
| | | % of |
| Security Description | | Net Assets |
| Facebook, Inc. - Class A | | 10.3% |
| Apple, Inc. | | 9.6% |
| Alphabet, Inc. - Classes A and C | | 8.7% |
| Intuit, Inc. | | 8.5% |
| Amazon.com, Inc. | | 7.0% |
| PayPal Holdings, Inc. | | 5.5% |
| Intuitive Surgical, Inc. | | 4.0% |
| Adobe, Inc. | | 3.3% |
| Texas Instruments, Inc. | | 3.0% |
| Square, Inc. - Class A | | 2.8% |
| The Investment House Growth Fund |
| Schedule of Investments |
| July 31, 2021 |
| COMMON STOCKS — 98.1% | | Shares | | | Value | |
| Communications — 20.7% | | | | | | |
| Entertainment Content — 1.3% | | | | | | | | |
| Take-Two Interactive Software, Inc. (a) | | | 17,000 | | | $ | 2,948,140 | |
| | | | | | | | | |
| Internet Media & Services — 19.0% | | | | | | | | |
| Alphabet, Inc. - Class A (a) | | | 3,600 | | | | 9,700,308 | |
| Alphabet, Inc. - Class C (a) | | | 3,609 | | | | 9,760,252 | |
| Facebook, Inc. - Class A (a) | | | 65,000 | | | | 23,159,500 | |
| | | | | | | | 42,620,060 | |
| Telecommunications — 0.4% | | | | | | | | |
| Verizon Communications, Inc. | | | 17,000 | | | | 948,260 | |
| | | | | | | | | |
| Consumer Discretionary — 11.0% | | | | | | | | |
| E-Commerce Discretionary — 9.1% | | | | | | | | |
| Alibaba Group Holding Ltd. - ADR (a) | | | 24,000 | | | | 4,684,560 | |
| Amazon.com, Inc. (a) | | | 4,725 | | | | 15,722,863 | |
| | | | | | | | 20,407,423 | |
| Home & Office Products — 1.9% | | | | | | | | |
| Scotts Miracle-Gro Company (The) | | | 23,600 | | | | 4,176,256 | |
| | | | | | | | | |
| Consumer Staples — 2.7% | | | | | | | | |
| Household Products — 1.5% | | | | | | | | |
| Church & Dwight Company, Inc. | | | 22,000 | | | | 1,904,760 | |
| Clorox Company (The) | | | 8,000 | | | | 1,447,120 | |
| | | | | | | | 3,351,880 | |
| Retail - Consumer Staples — 1.2% | | | | | | | | |
| Costco Wholesale Corporation | | | 5,000 | | | | 2,148,600 | |
| Walmart, Inc. | | | 4,000 | | | | 570,200 | |
| | | | | | | | 2,718,800 | |
| Financials — 1.6% | | | | | | | | |
| Institutional Financial Services — 1.6% | | | | | | | | |
| Intercontinental Exchange, Inc. | | | 30,000 | | | | 3,594,900 | |
| | | | | | | | | |
| Health Care — 9.3% | | | | | | | | |
| Biotech & Pharma — 2.2% | | | | | | | | |
| AbbVie, Inc. | | | 7,500 | | | | 872,250 | |
| Eli Lilly & Company | | | 3,500 | | | | 852,250 | |
| Emergent BioSolutions, Inc. (a) | | | 9,000 | | | | 593,100 | |
| Johnson & Johnson | | | 4,000 | | | | 688,800 | |
| Merck & Company, Inc. | | | 7,000 | | | | 538,090 | |
| The Investment House Growth Fund |
| Schedule of Investments |
| July 31, 2021 (Continued) |
| COMMON STOCKS — 98.1% (Continued) | | Shares | | | Value | |
| Health Care — 9.3% (Continued) | | | | | | | | |
| Biotech & Pharma — 2.2% (Continued) | | | | | | | | |
| Novartis AG - ADR | | | 7,000 | | | $ | 646,730 | |
| Organon & Company (a) | | | 700 | | | | 20,307 | |
| Vertex Pharmaceuticals, Inc. (a) | | | 4,000 | | | | 806,320 | |
| | | | | | | | 5,017,847 | |
| Health Care Facilities & Services — 1.9% | | | | | | | | |
| Charles River Laboratories International, Inc. (a) | | | 10,000 | | | | 4,069,200 | |
| Invitae Corporation (a) | | | 8,000 | | | | 223,920 | |
| | | | | | | | 4,293,120 | |
| Medical Equipment & Devices — 5.2% | | | | | | | | |
| Baxter International, Inc. | | | 9,000 | | | | 696,150 | |
| Intuitive Surgical, Inc. (a) | | | 9,000 | | | | 8,923,140 | |
| Stryker Corporation | | | 7,500 | | | | 2,032,050 | |
| | | | | | | | 11,651,340 | |
| Industrials — 3.5% | | | | | | | | |
| Commercial Support Services — 1.7% | | | | | | | | |
| Waste Management, Inc. | | | 25,000 | | | | 3,706,500 | |
| | | | | | | | | |
| Transportation & Logistics — 1.8% | | | | | | | | |
| Norfolk Southern Corporation | | | 7,000 | | | | 1,804,810 | |
| United Parcel Service, Inc. - Class B | | | 12,000 | | | | 2,296,320 | |
| | | | | | | | 4,101,130 | |
| Materials — 1.5% | | | | | | | | |
| Chemicals — 1.5% | | | | | | | | |
| Ecolab, Inc. | | | 15,000 | | | | 3,312,450 | |
| | | | | | | | | |
| Technology — 47.8% | | | | | | | | |
| Semiconductors — 5.8% | | | | | | | | |
| NVIDIA Corporation | | | 20,000 | | | | 3,899,800 | |
| QUALCOMM, Inc. | | | 16,000 | | | | 2,396,800 | |
| Texas Instruments, Inc. | | | 35,000 | | | | 6,671,700 | |
| | | | | | | | 12,968,300 | |
| Software — 16.7% | | | | | | | | |
| Adobe, Inc. (a) | | | 12,000 | | | | 7,459,560 | |
| Autodesk, Inc. (a) | | | 11,000 | | | | 3,532,430 | |
| CrowdStrike Holdings, Inc. - Class A (a) | | | 16,000 | | | | 4,057,760 | |
| Intuit, Inc. | | | 36,000 | | | | 19,078,920 | |
| Microsoft Corporation | | | 12,000 | | | | 3,418,920 | |
| | | | | | | | 37,547,590 | |
| The Investment House Growth Fund |
| Schedule of Investments |
| July 31, 2021 (Continued) |
| COMMON STOCKS — 98.1% (Continued) | | Shares | | | Value | |
| Technology — 47.8% (Continued) | | | | | | | | |
| Technology Hardware — 11.5% | | | | | | | | |
| Apple, Inc. | | | 148,000 | | | $ | 21,587,280 | |
| Cisco Systems, Inc. | | | 30,000 | | | | 1,661,100 | |
| Corning, Inc. | | | 60,000 | | | | 2,511,600 | |
| | | | | | | | 25,759,980 | |
| Technology Services — 13.8% | | | | | | | | |
| Accenture plc - Class A | | | 17,900 | | | | 5,686,472 | |
| Automatic Data Processing, Inc. | | | 7,000 | | | | 1,467,410 | |
| Paychex, Inc. | | | 24,000 | | | | 2,731,680 | |
| PayPal Holdings, Inc. (a) | | | 45,000 | | | | 12,398,850 | |
| Square, Inc. - Class A (a) | | | 25,000 | | | | 6,181,500 | |
| Visa, Inc. - Class A | | | 10,000 | | | | 2,463,900 | |
| | | | | | | | 30,929,812 | |
| | | | | | | | | |
| Total Common Stocks (Cost $38,442,749) | | | | | | $ | 220,053,788 | |
| EXCHANGE-TRADED FUNDS — 1.5% | | Shares | | | Value | |
| Health Care — 1.5% | | | | | | | | |
| Biotech & Pharma — 1.5% | | | | | | | | |
| iShares Biotechnology ETF (Cost $2,083,074) | | | 20,000 | | | $ | 3,315,600 | |
| The Investment House Growth Fund |
| Schedule of Investments |
| July 31, 2021 (Continued) |
| MONEY MARKET FUNDS — 0.5% | | Shares | | | Value | |
| First American Government Obligations Fund - Class Z, 0.02% (b) (Cost $1,096,651) | | | 1,096,651 | | | $ | 1,096,651 | |
| | | | | | | | | |
| Total Investments at Value — 100.1% (Cost $41,622,474) | | | | | | $ | 224,466,039 | |
| | | | | | | | | |
| Liabilities in Excess of Other Assets — (0.1%) | | | | | | | (162,536 | ) |
| | | | | | | | | |
| Net Assets — 100.0% | | | | | | $ | 224,303,503 | |
ADR - American Depositary Receipt.
| (a) | Non-income producing security. |
| (b) | The rate shown is the 7-day effective yield as of July 31, 2021. |
See accompanying notes to financial statements.
| The Investment House Growth Fund |
| Statement of Assets and Liabilities |
| July 31, 2021 |
| ASSETS | | | |
| Investments in securities: | | | | |
| At acquisition cost | | $ | 41,622,474 | |
| At value (Note 2) | | $ | 224,466,039 | |
| Receivable for capital shares sold | | | 11,037 | |
| Dividends receivable | | | 100,955 | |
| Tax reclaims receivable | | | 13,252 | |
| Total Assets | | | 224,591,283 | |
| | | | | |
| LIABILITIES | | | | |
| Accrued investment advisory fees (Note 4) | | | 265,341 | |
| Accrued Trustees’ fees (Note 4) | | | 22,439 | |
| Total Liabilities | | | 287,780 | |
| | | | | |
| NET ASSETS | | $ | 224,303,503 | |
| | | | | |
| Net assets consist of: | | | | |
| Paid-in capital | | $ | 45,381,752 | |
| Accumulated earnings | | | 178,921,751 | |
| Net assets | | $ | 224,303,503 | |
| | | | | |
| Shares of beneficial interest outstanding (unlimited number of shares authorized, no par value) | | | 3,319,308 | |
| | | | | |
| Net asset value, redemption price and offering price per share (Note 2) | | $ | 67.58 | |
See accompanying notes to financial statements.
| The Investment House Growth Fund |
| Statement of Operations |
| For the Year Ended July 31, 2021 |
| INVESTMENT INCOME | | | |
| Dividend income (net of foreign tax of $3,764) | | $ | 1,351,947 | |
| | | | | |
| EXPENSES | | | | |
| Investment advisory fees (Note 4) | | | 2,684,506 | |
| Trustees’ fees (Note 4) | | | 22,500 | |
| Borrowing costs and bank fees (Note 5) | | | 10,455 | |
| Total expenses | | | 2,717,461 | |
| | | | | |
| NET INVESTMENT LOSS | | | (1,365,514 | ) |
| | | | | |
| REALIZED AND UNREALIZED GAINS ON INVESTMENTS | | | | |
| Net realized gains from investment transactions | | | 320,662 | |
| Net change in unrealized appreciation (depreciation) on investments | | | 59,824,041 | |
| NET REALIZED AND UNREALIZED GAINS ON INVESTMENTS | | | 60,144,703 | |
| | | | | |
| NET INCREASE IN NET ASSETS RESULTING FROM OPERATIONS | | $ | 58,779,189 | |
See accompanying notes to financial statements.
| The Investment House Growth Fund |
| Statements of Changes in Net Assets |
| | | Year | | | Year | |
| | | Ended | | | Ended | |
| | | July 31, 2021 | | | July 31, 2020 | |
| FROM OPERATIONS | | | | | | | | |
| Net investment loss | | $ | (1,365,514 | ) | | $ | (700,410 | ) |
| Net realized gains (losses) from investment transactions | | | 320,662 | | | | (2,558,748 | ) |
| Net change in unrealized appreciation (depreciation) on investments | | | 59,824,041 | | | | 38,282,762 | |
| Net increase in net assets resulting from operations | | | 58,779,189 | | | | 35,023,604 | |
| | | | | | | | | |
| FROM CAPITAL SHARE TRANSACTIONS | | | | | | | | |
| Proceeds from shares sold | | | 11,030,253 | | | | 10,187,212 | |
| Payments for shares redeemed | | | (9,331,745 | ) | | | (8,129,341 | ) |
| Net increase in net assets from capital share transactions | | | 1,698,508 | | | | 2,057,871 | |
| | | | | | | | | |
| TOTAL INCREASE IN NET ASSETS | | | 60,477,697 | | | | 37,081,475 | |
| | | | | | | | | |
| NET ASSETS | | | | | | | | |
| Beginning of year | | | 163,825,806 | | | | 126,744,331 | |
| End of year | | $ | 224,303,503 | | | $ | 163,825,806 | |
| | | | | | | | | |
| CAPITAL SHARE ACTIVITY | | | | | | | | |
| Shares sold | | | 192,593 | | | | 256,922 | |
| Shares redeemed | | | (163,094 | ) | | | (195,552 | ) |
| Net increase in shares outstanding | | | 29,499 | | | | 61,370 | |
| Shares outstanding, beginning of year | | | 3,289,809 | | | | 3,228,439 | |
| Shares outstanding, end of year | | | 3,319,308 | | | | 3,289,809 | |
See accompanying notes to financial statements.
| The Investment House Growth Fund |
| Financial Highlights |
Per Share Data and Ratios for a Share Outstanding Throughout Each Year
| | | Years Ended | |
| | | July 31, | | | July 31, | | | July 31, | | | July 31, | | | July 31, | |
| | | 2021 | | | 2020 | | | 2019 | | | 2018 | | | 2017 | |
| Net asset value at beginning of year | | $ | 49.80 | | | $ | 39.26 | | | $ | 36.03 | | | $ | 30.13 | | | $ | 24.03 | |
| | | | | | | | | | | | | | | | | | | | | |
| Income (loss) from investment operations: | | | | | | | | | | | | | | | | | | | | |
| Net investment loss | | | (0.41 | ) | | | (0.21 | ) | | | (0.16 | ) | | | (0.18 | ) | | | (0.11 | ) |
| Net realized and unrealized gains on investments | | | 18.19 | | | | 10.75 | | | | 3.39 | | | | 6.08 | | | | 6.21 | |
| Total from investment operations | | | 17.78 | | | | 10.54 | | | | 3.23 | | | | 5.90 | | | | 6.10 | |
| | | | | | | | | | | | | | | | | | | | | |
| Net asset value at end of year | | $ | 67.58 | | | $ | 49.80 | | | $ | 39.26 | | | $ | 36.03 | | | $ | 30.13 | |
| | | | | | | | | | | | | | | | | | | | | |
| Total return (a) | | | 35.70 | % | | | 26.85 | % | | | 8.96 | % | | | 19.58 | % | | | 25.38 | % |
| | | | | | | | | | | | | | | | | | | | | |
| Net assets at end of year (000’s) | | $ | 224,304 | | | $ | 163,826 | | | $ | 126,744 | | | $ | 111,562 | | | $ | 92,667 | |
| | | | | | | | | | | | | | | | | | | | | |
| Ratio of total expenses to average net assets | | | 1.41 | % | | | 1.42 | % | | | 1.42 | % | | | 1.43 | % | | | 1.45 | % |
| Ratio of net expenses to average net assets excluding borrowing costs | | | 1.41 | % | | | 1.42 | % | | | 1.42 | % | | | 1.42 | % | | | 1.43 | % |
| Ratio of net investment loss to average net assets | | | (0.71 | %) | | | (0.52 | %) | | | (0.47 | %) | | | (0.55 | %) | | | (0.42 | %) |
| Portfolio turnover rate | | | 1 | % | | | 11 | % | | | 6 | % | | | 5 | % | | | 7 | % |
| (a) | Total return is a measure of the change in value of an investment in the Fund over the periods covered, which assumes any dividends or capital gains distributions are reinvested in shares of the Fund. The returns shown do not reflect the deduction of taxes a shareholder would pay on Fund distributions or the redemption of Fund shares. |
See accompanying notes to financial statements.
| The Investment House Growth Fund |
| Notes to Financial Statements |
| July 31, 2021 |
The Investment House Growth Fund (the “Fund”) is a diversified series of The Investment House Funds (the “Trust”), an open-end management investment company established under the laws of Ohio by an Agreement and Declaration of Trust dated October 2, 2001.
The investment objective of the Fund is long term capital appreciation.
2. Significant Accounting Policies
The Fund follows accounting and reporting guidance under Financial Accounting Standards Board Accounting Standards Codification Topic 946, “Financial Services – Investment Companies.” The following is a summary of the Fund’s significant accounting policies used in the preparation of its financial statements. These policies are in conformity with accounting principles generally accepted in the United States of America (“GAAP”).
Securities valuation – The Fund values its portfolio securities at market value as of close of regular trading on the New York Stock Exchange (the “NYSE”) (normally 4:00 p.m. Eastern time) on each business day the NYSE is open. Exchange-traded funds (“ETFs”) are valued at the last sale price on the security’s primary exchange. Lacking a last sale price, an exchange-traded security is generally valued at its last bid price. Securities traded on NASDAQ are valued at the NASDAQ Official Closing Price. Investments representing shares of money market funds and other open-end investment companies, except for ETFs, are valued at their net asset value (“NAV”) as reported by such companies. When using a quoted price and when the market for the security is considered active, the security will be classified as Level 1 within the fair value hierarchy (see below). If market prices are not available or The Investment House LLC, the investment adviser to the Fund (the “Adviser”), believes such prices do not accurately reflect the market value of such securities, securities will be valued by the Adviser at their fair value, according to procedures approved by the Board of Trustees and such securities will be classified as Level 2 or 3 within the fair value hierarchy, depending on the inputs used.
GAAP establishes a single authoritative definition of fair value, sets out a framework for measuring fair value and requires additional disclosures about fair value measurements.
Various inputs are used in determining the value of each of the Fund’s investments. These inputs are summarized in the three broad levels listed below:
| ● | Level 1 – quoted unadjusted prices for identical instruments in active markets to which the Fund has access at the date of measurement. |
| ● | Level 2 – quoted prices for similar instruments in active markets; quoted prices for identical or similar instruments in markets that are not active; and model-derived valuations in which all significant inputs and significant value drivers are observable in active markets. Level 2 inputs are those in markets for which there are few transactions, the prices are not current, little public information exists or instances where prices vary substantially over time or among brokered market makers. |
| The Investment House Growth Fund |
| Notes to Financial Statements (Continued) |
| ● | Level 3 – model derived valuations in which one or more significant inputs or significant value drivers are unobservable. Unobservable inputs are those inputs that reflect the Fund’s own assumptions that market participants would use to price the asset or liability based on the best available information. |
The inputs or methodology used for valuing securities are not necessarily an indication of the risks associated with investing in those securities. The inputs used to measure fair value may fall into different levels of the fair value hierarchy. In such cases, for disclosure purposes, the level in the fair value hierarchy within which the fair value measurement falls in its entirety is determined based on the lowest level input that is significant to the fair value measurement.
The following is a summary of the Fund’s investments and the inputs used to value the investments as of July 31, 2021 by security type:
| | | Level 1 | | | Level 2 | | | Level 3 | | | Total | |
| Common Stocks | | $ | 220,053,788 | | | $ | — | | | $ | — | | | $ | 220,053,788 | |
| Exchange-Traded Funds | | | 3,315,600 | | | | — | | | | — | | | | 3,315,600 | |
| Money Market Funds | | | 1,096,651 | | | | — | | | | — | | | | 1,096,651 | |
| Total | | $ | 224,466,039 | | | $ | — | | | $ | — | | | $ | 224,466,039 | |
Refer to the Fund’s Schedule of Investments for a listing of the common stocks by sector and industry type. There were no Level 2 or Level 3 securities or derivative instruments held by the Fund as of or during the year ended July 31, 2021.
Share valuation – The NAV is calculated daily by dividing the value of the Fund’s total assets, minus liabilities, by the total number of shares outstanding. The offering price and redemption price per share are equal to the NAV per share.
Investment transactions and investment income – Investment transactions are accounted for on trade date. Realized gains and losses on investments sold are determined on a specific identification basis. Dividend income is recorded on the ex-dividend date. Non-cash dividends included in dividend income, if any, are recorded at the fair market value of the securities received. Interest income is accrued as earned. Withholding taxes on foreign dividends have been recorded in accordance with the Fund’s understanding of the applicable country’s tax rules and rates.
Distributions to shareholders – Dividends arising from net investment income and distributions of net realized capital gains, if any, are declared and paid annually in December. The amount of distributions from net investment income and net realized capital gains are determined in accordance with income tax regulations, which may differ from GAAP. Dividends and distributions are recorded on the ex-dividend date. There were no distributions paid to shareholders during the years ended July 31, 2021 and 2020.
| The Investment House Growth Fund |
| Notes to Financial Statements (Continued) |
Estimates – The preparation of financial statements in conformity with GAAP requires management to make estimates and assumptions that affect the reported amounts of assets and liabilities and disclosure of contingent assets and liabilities as of the date of the financial statements and the reported amounts of increases and decreases in net assets from operations during the reporting period. Actual results could differ from those estimates.
Federal income tax – The Fund has qualified and intends to continue to qualify each year as a “regulated investment company” under Subchapter M of the Internal Revenue Code of 1986, as amended (the “Code”). By so qualifying, the Fund will not be subject to federal income taxes to the extent that the Fund distributes its net investment income and any net realized capital gains in accordance with the Code.
In order to avoid imposition of the excise tax applicable to regulated investment companies, it is also the Fund’s intention to declare as dividends in each calendar year at least 98% of its net investment income (earned during the calendar year) and 98.2% of its net realized capital gains (earned during the twelve months ended October 31) plus undistributed amounts from prior years.
The following information is computed on a tax basis for each item as of July 31, 2021:
| Cost of portfolio investments | | $ | 41,622,474 | |
| Gross unrealized appreciation | | $ | 182,986,649 | |
| Gross unrealized depreciation | | | (143,084 | ) |
| Net unrealized appreciation | | | 182,843,565 | |
| Accumulated capital and other losses | | | (3,921,814 | ) |
| Accumulated earnings | | $ | 178,921,751 | |
During the year ended July 31, 2021, the Fund utilized $795,487 of long-term capital loss carryforwards to offset current year gains. As of July 31, 2021, the Fund had short-term capital loss carryforwards of $1,133,688 and long-term capital loss carryforwards of $1,868,493 for federal income tax purposes. These capital loss carryforwards, which do not expire, may be utilized in future years to offset net realized capital gains, if any, prior to distributing such gains to shareholders.
Net qualified late-year ordinary losses incurred after December 31, 2020 are deemed to arise on the first day of the Fund’s next taxable year. For the year ended July 31, 2021, the Fund deferred $919,633 of ordinary losses to August 1, 2021 for income tax purposes.
For the year ended July 31, 2021, the Fund reclassified $865,266 of net investment loss against paid-in capital on the Statement of Assets and Liabilities. Such reclassification, the result of permanent differences between the financial statement and income tax reporting requirements, had no effect on the Fund’s net assets or NAV per share.
The Fund recognizes the tax benefits or expenses of uncertain tax positions only when the position is “more-likely-than-not” to be sustained assuming examination by tax authorities. Management has reviewed the tax positions taken on Federal income tax returns for all open tax years (generally, three years) and has concluded that no provision for unrecognized tax benefits or expenses is required in these financial statements.
| The Investment House Growth Fund |
| Notes to Financial Statements (Continued) |
| 3. | Investment Transactions |
During the year ended July 31, 2021, cost of purchases and proceeds from sales of investment securities, other than short-term investments, amounted to $2,114,821 and $4,658,114, respectively.
| 4. | Transactions with Related Parties |
A Trustee and certain officers of the Trust are affiliated with the Adviser, Ultimus Fund Solutions, LLC (“Ultimus”), the Fund’s administrator, transfer agent and fund accounting agent, or Ultimus Fund Distributors, LLC (the “Distributor”), the principal underwriter of the Fund’s shares.
Under the terms of a Management Agreement between the Trust and the Adviser, the Adviser serves as the investment adviser to the Fund. For its services, the Fund pays the Adviser an investment management fee, which is accrued daily and paid monthly, at the annual rate of 1.40% of the Fund’s average daily net assets. The Adviser pays all of the operating expenses of the Fund except brokerage, taxes, borrowing costs, fees and expenses of non-interested Trustees, extraordinary expenses and distribution and/or service related expenses incurred pursuant to Rule 12b-1 under the Investment Company Act of 1940 (if any).
The Trust has entered into mutual fund services agreements with Ultimus, pursuant to which Ultimus provides day-to-day operational services to the Fund including, but not limited to, accounting, administrative, transfer agent, dividend disbursing, and recordkeeping services. The fees payable to Ultimus are paid by the Adviser (not the Fund).
The Trust has entered into a Distribution Agreement with the Distributor, pursuant to which the Distributor provides distribution services to the Fund and serves as principal underwriter to the Fund. The Distributor is a wholly-owned subsidiary of Ultimus. The fees payable to the Distributor are paid by the Adviser (not the Fund).
The Fund pays each Trustee who is not affiliated with the Adviser $7,500 annually. Trustees who are affiliated with the Adviser do not receive compensation from the Fund.
The Fund has a secured bank line of credit with U.S. Bank, N.A. that provides a maximum borrowing of up to $20,000,000. The line of credit may be used to cover redemptions and/or it may be used by the Adviser for investment purposes. When used for investment purposes, the Fund will be using the investment technique of “leverage.” Because the Fund’s investments will fluctuate in value, whereas the interest obligations on borrowed funds may be fixed, during times of borrowing the Fund’s NAV may tend to increase more when its investments increase in value, and decrease more when its investments decrease in value.
In addition, interest costs on borrowings may fluctuate with changing market interest rates and may partially offset or exceed the return earned on the borrowed funds. Also, during times of borrowing under adverse market conditions, the Fund might have to sell portfolio securities to meet interest or principal payments at a time when fundamental investment
| The Investment House Growth Fund |
| Notes to Financial Statements (Continued) |
considerations would not favor such sales. Unless profits on assets acquired with borrowed funds exceed the costs of borrowing, the use of borrowing will diminish the investment performance of the Fund compared with what it would have been without borrowing.
Borrowings under this arrangement bear interest at a rate per annum equal to the Prime Rate minus 0.25% at the time of borrowing. The Fund also pays an annual renewal fee of $1,000 plus any legal fees related to the arrangement. The line of credit matures February 7, 2022. During the year ended July 31, 2021, the Fund incurred $10,455 of interest expense and fees related to the borrowings. The average debt outstanding and the average interest rate for the days with borrowings during the year ended July 31, 2021 were $2,157,325 and 4.75%. The largest outstanding borrowing during the year ended July 31, 2021 was $2,547,000. As of July 31, 2021, there were no outstanding borrowings for the Fund.
| 6. | Contingencies and Commitments |
The Fund indemnifies the Trust’s officers and Trustees for certain liabilities that might arise from their performance of their duties to the Fund. Additionally, in the normal course of business, the Fund enters into contracts that contain a variety of representations and warranties and which provide general indemnifications. The Fund’s maximum exposure under these arrangements is unknown, as this would involve future claims that may be made against the Fund that have not yet occurred. However, based on experience, the Fund expects the risk of loss to be remote.
If the Fund’s portfolio is overweighted in a certain sector, any negative development affecting that sector will have a greater impact on the Fund than a fund that is not overweighted in that sector. To the extent the Fund is overweighted in the Technology sector, it will be affected by developments affecting that sector. Companies in this sector may be significantly affected by intense competition. In addition, technology products may be subject to rapid obsolescence. As of July 31, 2021, the Fund had 47.8% of the value of its net assets invested in companies within the Technology sector.
| 8. | Coronavirus (COVID-19) Pandemic |
The COVID-19 pandemic has caused financial markets to experience significant volatility and uncertainty exists as to its long-term impact. COVID-19 has resulted in closing borders, quarantines, disruptions to supply chains and customer activity, as well as general concern and economic uncertainty. The impact of the outbreak may be short term or may last for an extended period of time. The impact of epidemics and pandemics such as COVID-19 could affect the economies of many nations, individual companies and the market in general in ways that cannot necessarily be foreseen at the present time. As a result, the Fund’s performance and the ability to achieve its investment objective may be adversely impacted. Management is monitoring the development of the pandemic and evaluating its impact on the financial position and operating results of the Fund.
| The Investment House Growth Fund |
| Notes to Financial Statements (Continued) |
The Fund is required to recognize in the financial statements the effects of all subsequent events that provide additional evidence about conditions that existed as of the date of the Statement of Assets and Liabilities. For non-recognized subsequent events that must be disclosed to keep the financial statements from being misleading, the Fund is required to disclose the nature of the event as well as an estimate of its financial effect, or a statement that such an estimate cannot be made. Management has evaluated subsequent events through the issuance of these financial statements and has noted no such events.
| The Investment House Growth Fund |
| Report of Independent Registered Public |
| Accounting Firm |
To the Board of Trustees of The Investment House Funds
and the Shareholders of The Investment House Growth Fund
Opinion on the Financial Statements
We have audited the accompanying statement of assets and liabilities of The Investment House Growth Fund, a series of shares of beneficial interest in The Investment House Funds (the “Fund”), including the schedule of investments, as of July 31, 2021, and the related statement of operations for the year then ended, the statements of changes in net assets for each of the years in the two-year period then ended and the financial highlights for each of the years in the five-year period then ended, and the related notes (collectively referred to as the “financial statements”). In our opinion, the financial statements present fairly, in all material respects, the financial position of the Fund as of July 31, 2021, and the results of its operations for the year then ended, the changes in its net assets for each of the years in the two-year period then ended and its financial highlights for each of the years in the five-year period then ended, in conformity with accounting principles generally accepted in the United States of America.
Basis for Opinion
These financial statements are the responsibility of the Fund’s management. Our responsibility is to express an opinion on the Fund’s financial statements based on our audits. We are a public accounting firm registered with the Public Company Accounting Oversight Board (United States) (“PCAOB”) and are required to be independent with respect to the Fund in accordance with the U.S. federal securities law and the applicable rules and regulations of the Securities and Exchange Commission and the PCAOB.
We conducted our audits in accordance with the standards of the PCAOB. Those standards require that we plan and perform the audits to obtain reasonable assurance about whether the financial statements are free of material misstatement, whether due to error or fraud. The Fund is not required to have, nor were we engaged to perform, an audit of its internal control over financial reporting. As part of our audits we are required to obtain an understanding of internal control over financial reporting but not for the purpose of expressing an opinion on the effectiveness of the Fund’s internal control over financial reporting. Accordingly, we express no such opinion.
| The Investment House Growth Fund |
| Report of Independent Registered Public |
| Accounting Firm (Continued) |
Our audits included performing procedures to assess the risk of material misstatement of the financial statements, whether due to error or fraud, and performing procedures that respond to those risks. Such procedures included examining, on a test basis, evidence regarding the amounts and disclosures in the financial statements. Our procedures included confirmation of securities owned as of July 31, 2021 by correspondence with the custodian. Our audits also included evaluating the accounting principles used and significant estimates made by management, as well as evaluating the overall presentation of the financial statements. We believe that our audits provide a reasonable basis for our opinion.
 |
| |
| BBD, LLP |
We have served as the auditor of The Investment House Funds since 2005.
Philadelphia, Pennsylvania
September 21, 2021
| The Investment House Growth Fund |
| About Your Fund’s Expenses (Unaudited) |
We believe it is important for you to understand the impact of costs on your investment. As a shareholder of the Fund, you incur ongoing costs, including management fees and other operating expenses. The following examples are intended to help you understand your ongoing costs (in dollars) of investing in the Fund and to compare these costs with the ongoing costs of investing in other mutual funds.
A mutual fund’s ongoing costs are expressed as a percentage of its average net assets. This figure is known as the expense ratio. The examples below are based on an investment of $1,000 made at the beginning of the period shown and held for the entire period (February 1, 2021 – July 31, 2021).
The table below illustrates the Fund’s ongoing costs in two ways:
Actual fund return – This section helps you to estimate the actual expenses that you paid over the period. The “Ending Account Value” shown is derived from the Fund’s actual return, and the third column shows the dollar amount of operating expenses that would have been paid by an investor who started with $1,000 in the Fund. You may use the information here, together with the amount you invested, to estimate the expenses that you paid over the period.
To do so, simply divide your account value by $1,000 (for example, an $8,600 account value divided by $1,000 = 8.6), then multiply the result by the number given for the Fund under the heading “Expenses Paid During Period.”
Hypothetical 5% return – This section is intended to help you compare the Fund’s ongoing costs with those of other mutual funds. It assumes that the Fund had an annual return of 5% before expenses during the period shown, but that the expense ratio is unchanged. In this case, because the return used is not the Fund’s actual return, the results do not apply to your investment. The example is useful in making comparisons because the U.S. Securities and Exchange Commission (the “SEC”) requires all mutual funds to calculate expenses based on a 5% return before expenses. You can assess the Fund’s ongoing costs by comparing this hypothetical example with the hypothetical examples that appear in shareholder reports of other funds.
Note that expenses shown in the table are meant to highlight and help you compare ongoing costs only. The Fund does not impose any sales loads or redemption fees.
The calculations assume no shares were bought or sold during the period. Your actual costs may have been higher or lower, depending on the amount of your investment and the timing of any purchases or redemptions.
| The Investment House Growth Fund |
| About Your Fund’s Expenses (Unaudited) (Continued) |
More information about the Fund’s expenses, including annual expense ratios for the most recent five fiscal years, can be found in this report. For additional information on operating expenses and other shareholder costs, please refer to the Fund’s prospectus.
| | | Beginning | | Ending | | |
| | | Account Value | | Account Value | | Expenses Paid |
| | | February 1, 2021 | | July 31, 2021 | | During Period* |
| Based on Actual Fund Return | | $1,000.00 | | $1,189.20 | | $7.65 |
| Based on Hypothetical 5% Return (before expenses) | | $1,000.00 | | $1,017.80 | | $7.05 |
| * | Expenses are equal to the Fund’s annualized expense ratio of 1.41% for the period, multiplied by the average account value over the period, multiplied by 181/365 (to reflect the one-half year period). |
| Other Information (Unaudited) |
A description of the policies and procedures that the Fund uses to vote proxies relating to portfolio securities is available without charge upon request by calling toll-free 1-888-456-9518, or on the SEC’s website at www.sec.gov. Information regarding how the Fund voted proxies relating to portfolio securities during the most recent 12-month period ended June 30 is available without charge upon request by calling toll-free 1-888-456-9518, or on the SEC’s website at www.sec.gov.
The Trust files a complete listing of portfolio holdings of the Fund with the SEC as of the end of the first and third quarters of each fiscal year as an exhibit to its reports on Form N-PORT. The filings are available upon request by calling 1-888-456-9518. Furthermore, you may obtain a copy of the filings on the SEC’s website at www.sec.gov.
| The Investment House Growth Fund |
| Information Regarding Trustees and Officers |
| (Unaudited) |
Overall responsibility for management of the Fund rests with the Board of Trustees. The Trustees serve during the lifetime of the Trust and until its termination, or until death, resignation, retirement or removal. The Trustees, in turn, elect the officers of the Trust to actively supervise its day-to-day operations. The officers have been elected for an annual term.
The following table provides information regarding each Trustee who is not an “interested person” of the Trust, as defined in the Investment Company Act of 1940.
| Name, Address and Age | Position(s) Held with Trust | Length of Time Served |
Darrin F. DelConte
300 Corporate Pointe, Suite 380
Culver City, CA 90230
Year of Birth: 1966 | Trustee | Since December 2001 |
| Principal Occupations During Past 5 Years | Number of Portfolios in Fund
Complex Overseen by Trustee | Other Directorships
Held by Trustee |
Darrin F. DelConte is Executive Vice President
of Pacific Crane Maintenance Co. (marine
maintenance company), since 1994. | 1 | None |
| |
| Name, Address and Age | Position(s) Held with Trust | Length of Time Served |
Nicholas G. Tonsich
300 Corporate Pointe, Suite 380
Culver City, CA 90230
Year of Birth: 1961 | Trustee | Since December 2001 |
| Principal Occupations During Past 5 Years | Number of Portfolios in Fund
Complex Overseen by Trustee | Other Directorships
Held by Trustee |
| Nicholas G. Tonsich is an attorney. Mr. Tonsich is President of Ocean Terminal Services, Inc. (equipment maintenance company), since 2008 and Clean Air Engineering-Maritime, Inc. (an environmental services company for the shipping industry), since 2009. | 1 | None |
| |
| Name, Address and Age | Position(s) Held with Trust | Length of Time Served |
Michael A. Zupanovich
300 Corporate Pointe, Suite 380
Culver City, CA 90230
Year of Birth: 1965 | Trustee | Since June 2015 |
| Principal Occupations During Past 5 Years | Number of Portfolios in Fund
Complex Overseen by Trustee | Other Directorships
Held by Trustee |
| Michael A. Zupanovich is President of Harbor Diesel & Equipment, Inc. (heavy equipment repair company), since 1993. | 1 | None |
| The Investment House Growth Fund |
| Information Regarding Trustees and Officers |
| (Unaudited) (Continued) |
The following table provides information regarding each Trustee who is an “interested person” of the Trust, as defined in the Investment Company Act of 1940, and each executive officer of the Trust.
| Name, Address and Age | Position(s) Held with Trust | Length of Time Served |
Timothy J. Wahl1
300 Corporate Pointe, Suite 380
Culver City, CA 90230
Year of Birth: 1965 | President and Trustee | Since October 2001 |
| Principal Occupations During Past 5 Years | Number of Portfolios in Fund
Complex Overseen by Trustee | Other Directorships
Held by Trustee |
Timothy J. Wahl is President of The Investment
House LLC since 2012. | 1 | None |
| |
| Name, Address and Age | Position(s) Held with Trust | Length of Time Served |
David L. Kahn
300 Corporate Pointe, Suite 380
Culver City, CA 90230
Year of Birth: 1957 | Chief Compliance Officer; Secretary | Since September 2004
Since October 2001 |
| Principal Occupations During Past 5 Years |
| David L. Kahn is Chief Compliance Officer of The Investment House LLC, since 2012. |
| |
| Name, Address and Age | Position(s) Held with Trust | Length of Time Served |
David R. Carson
225 Pictoria Drive, Suite 450
Cincinnati, OH 45246
Year of Birth: 1958 | Vice President | Since January 2021 |
| Principal Occupations During Past 5 Years |
| David R. Carson is Senior Vice President, Client Strategies of Ultimus Fund Solutions, LLC, since 2013. |
| |
| Name, Address and Age | Position(s) Held with Trust | Length of Time Served |
Brian J. Lutes
225 Pictoria Drive, Suite 450
Cincinnati, OH 45246
Year of Birth: 1975 | Treasurer | Since January 2015 |
| Principal Occupations During Past 5 Years |
| Brian J. Lutes is Senior Vice President, Fund Accounting of Ultimus Fund Solutions, LLC, since 2005. |
| 1 | Mr. Wahl is an “interested person” of the Trust because he is an owner and officer of the Adviser. |
Additional information about members of the Board of Trustees and the executive officers is available in the Statement of Additional Information (“SAI”). To obtain a free copy of the SAI, please call 1-888-456-9518.
This page intentionally left blank.
This page intentionally left blank.
This page intentionally left blank.
| | | | | | | |
| | | | | | | |
| | | | | | | |
| | | | | |
| | | | | |
| | | | | |
| | | | | |
| | | | | |
| | | THE INVESTMENT HOUSE FUNDS | | |
| | | | | |
| | | Investment Adviser | | |
| | | The Investment House LLC | | |
| | | 300 Corporate Pointe | | |
| | | Suite 380 | | |
| | | Culver City, CA 90230 | | |
| | | | | |
| | | Administrator | | |
| | | Ultimus Fund Solutions, LLC | | |
| | | 225 Pictoria Drive | | |
| | | Suite 450 | | |
| | | Cincinnati, Ohio 45246 | | |
| | | 1.888.456.9518 | | |
| | | | | |
| | | Legal Counsel | | |
| | | Thompson Hine LLP | | |
| | | 312 Walnut Street | | |
| | | Suite 2000 | | |
| | | Cincinnati, Ohio 45202 | | |
| | | | | |
| | | Custodian | | |
| | | U.S. Bank, N.A. | | |
| | | 425 Walnut Street | | |
| | | Cincinnati, Ohio 45202 | | |
| | | | | |
| | | Board of Trustees | | |
| | | Darrin F. DelConte | | |
| | | Nicholas G. Tonsich | | |
| | | Timothy J. Wahl | | |
| | | Michael A. Zupanovich | | |
| | | | | |
| | | Officers | | |
| | | Timothy J. Wahl, President | | |
| | | David R. Carson, Vice President | | |
| | | David L. Kahn, CCO and Secretary | | |
| | | Brian J. Lutes, Treasurer | | |
| | | | | |
| | | | | |
| | | | | |
| | | Investment House-AR-21 | | |
| | | | | |
| | | | | |
| | | | | |
As of the end of the period covered by this report, the registrant has adopted a code of ethics that applies to the registrant’s principal executive officer, principal financial officer, principal accounting officer or controller, or persons performing similar functions, regardless of whether these individuals are employed by the registrant or a third party. Pursuant to Item 12(a)(1), a copy of registrant’s code of ethics is filed as an exhibit to this Form N-CSR. During the period covered by this report, the code of ethics has not been amended, and the registrant has not granted any waivers, including implicit waivers, from the provisions of the code of ethics.
| Item 3. | Audit Committee Financial Expert. |
The registrant’s board of trustees has determined that the registrant does not have an audit committee financial expert serving on its audit committee. The audit committee determined that, although none of its members meet the technical definition of an audit committee financial expert, the members have sufficient financial expertise to address any issues that are likely to come before the committee. It was the consensus of the audit committee members that it is not necessary at the present time for the committee to seek to recruit an additional trustee who would qualify as an audit committee financial expert. It was the view of the committee that, if novel issues ever arise, the committee will consider hiring an expert to assist it as needed.
| Item 4. | Principal Accountant Fees and Services. |
| (a) | Audit Fees. The aggregate fees billed for professional services rendered by the principal accountant for the audit of the registrant’s annual financial statements or for services that are normally provided by the accountant in connection with statutory and regulatory filings or engagements were $13,250 and $13,250 with respect to the registrant’s fiscal years ended July 31, 2021 and 2020, respectively. |
| (b) | Audit-Related Fees. No fees were billed in either of the last two fiscal years for assurance and related services by the principal accountant that are reasonably related to the performance of the audit of the registrant’s financial statements and are not reported under paragraph (a) of this Item. |
| (c) | Tax Fees. The aggregate fees billed for professional services rendered by the principal accountant for tax compliance, tax advice, and tax planning were $3,000 and $3,000 with respect to the registrant’s fiscal years ended July 31, 2021 and 2020, respectively. The services comprising these fees are the preparation of the registrant’s federal income and excise tax returns. |
| (d) | All Other Fees. No fees were billed in either of the last two fiscal years for products and services provided by the principal accountant, other than the services reported in paragraphs (a) through (c) of this Item. |
| (e)(1) | The audit committee has not adopted pre-approval policies and procedures described in paragraph (c)(7) of Rule 2-01 of Regulation S-X. |
| (e)(2) | None of the services described in paragraph (b) through (d) of this Item were approved by the audit committee pursuant to paragraph (c)(7)(i)(C) of Rule 2-01 of Regulation S-X. |
| (f) | Less than 50% of hours expended on the principal accountant’s engagement to audit the registrant’s financial statements for the most recent fiscal year were attributed to work performed by persons other than the principal accountant’s full-time, permanent employees. |
| (g) | With respect to the fiscal years ended July 31, 2021 and 2020, aggregate non-audit fees of $3,000 and $3,000, respectively, were billed by the registrant’s principal accountant for services rendered to the registrant. No non-audit fees were billed in either of the last two fiscal years by the registrant’s principal accountant for services rendered to the registrant’s investment adviser (not including any sub-adviser whose role is primarily portfolio management and is subcontracted with or overseen by another investment adviser), and any entity controlling, controlled by, or under common control with the adviser that provides ongoing services to the registrant. |
| (h) | The principal accountant has not provided any non-audit services to the registrant’s investment adviser (not including any sub-adviser whose role is primarily portfolio management and is subcontracted with or overseen by another investment adviser), and any entity controlling, controlled by, or under common control with the investment adviser that provides ongoing services to the registrant. |
| Item 5. | Audit Committee of Listed Registrants. |
Not applicable
| Item 6. | Schedule of Investments. |
| (a) | Not applicable [schedule filed with Item 1] |
| Item 7. | Disclosure of Proxy Voting Policies and Procedures for Closed-End Management Investment Companies. |
Not applicable
| Item 8. | Portfolio Managers of Closed-End Management Investment Companies. |
Not applicable
| Item 9. | Purchases of Equity Securities by Closed-End Management Investment Company and Affiliated Purchasers. |
Not applicable
| Item 10. | Submission of Matters to a Vote of Security Holders. |
The registrant has not adopted procedures by which shareholders may recommend nominees to the registrant’s board of trustees.
| Item 11. | Controls and Procedures. |
(a) Based on their evaluation of the registrant’s disclosure controls and procedures (as defined in Rule 30a-3(c) under the Investment Company Act of 1940) as of a date within 90 days of the filing date of this report, the registrant’s principal executive officer and principal financial officer have concluded that such disclosure controls and procedures are reasonably designed and are operating effectively to ensure that material information relating to the registrant, including its consolidated subsidiaries, is made known to them by others within those entities, particularly during the period in which this report is being prepared, and that the information required in filings on Form N-CSR is recorded, processed, summarized, and reported on a timely basis.
(b) There were no changes in the registrant’s internal control over financial reporting (as defined in Rule 30a-3(d) under the Investment Company Act of 1940) that occurred during the period covered by this report that have materially affected, or are reasonably likely to materially affect, the registrant’s internal control over financial reporting.
| Item 12. | Disclosure of Securities Lending Activities for Closed-End Management Investment Companies. |
Not applicable.
File the exhibits listed below as part of this Form. Letter or number the exhibits in the sequence indicated.
(a)(1) Any code of ethics, or amendment thereto, that is the subject of the disclosure required by Item 2, to the extent that the registrant intends to satisfy the Item 2 requirements through filing of an exhibit: Attached hereto
(a)(2) A separate certification for each principal executive officer and principal financial officer of the registrant as required by Rule 30a-2(a) under the Act (17 CFR 270.30a-2(a)): Attached hereto
(a)(3) Any written solicitation to purchase securities under Rule 23c-1 under the Act (17 CFR 270.23c-1) sent or given during the period covered by the report by or on behalf of the registrant to 10 or more persons: Not applicable
(a)(4) Change in the registrant’s independent public accountants: Not applicable.
(b) Certifications required by Rule 30a-2(b) under the Act (17 CFR 270.30a-2(b)): Attached hereto
Exhibit 99.CODE ETH Code of Ethics
Exhibit 99.CERT Certifications required by Rule 30a-2(a) under the Act
Exhibit 99.906CERT Certifications required by Rule 30a-2(b) under the Act
SIGNATURES
Pursuant to the requirements of the Securities Exchange Act of 1934 and the Investment Company Act of 1940, the registrant has duly caused this report to be signed on its behalf by the undersigned, thereunto duly authorized.
| (Registrant) | The Investment House Funds | | |
| | | | |
| By (Signature and Title)* | /s/ Timothy J. Wahl | |
| | | Timothy J. Wahl, President | |
| | | | |
| Date | September 30, 2021 | | |
| | | | |
| Pursuant to the requirements of the Securities Exchange Act of 1934 and the Investment Company Act of 1940, this report has been signed below by the following persons on behalf of the registrant and in the capacities and on the dates indicated. |
| | | | |
| By (Signature and Title)* | /s/ Timothy J. Wahl | |
| | | Timothy J. Wahl, President | |
| | | | |
| Date | September 30, 2021 | | |
| | | | |
| By (Signature and Title)* | /s/ Brian J. Lutes | |
| | | Brian J. Lutes, Treasurer | |
| | | | |
| Date | September 30, 2021 | | |
* Print the name and title of each signing officer under his or her signature.