UNITED STATES
SECURITIES AND EXCHANGE COMMISSION
Washington, D.C. 20549
FORM N-CSR
CERTIFIED SHAREHOLDER REPORT OF REGISTERED
MANAGEMENT INVESTMENT COMPANIES
| Investment Company Act file number | 811-10529 |
| | |
| The Investment House Funds |
| (Exact name of registrant as specified in charter) |
| |
| 5940 S. Rainbow Blvd., Suite 400, PMB 57150 | Las Vegas, Nevada 89118 |
| (Address of principal executive offices) | (Zip code) |
| | |
Timothy J. Wahl
The Investment House LLC
| 5940 S. Rainbow Blvd., Suite 400, PMB 57150, Las Vegas, Nevada 89118 |
| (Name and address of agent for service) |
| |
| Registrant’s telephone number, including area code: | (310) 873-3020 |
| | |
| Date of fiscal year end: | July 31 |
| | |
| Date of reporting period: | July 31, 2024 |
| | |
Form N-CSR is to be used by management investment companies to file reports with the Commission not later than 10 days after the transmission to stockholders of any report that is required to be transmitted to stockholders under Rule 30e-1 under the Investment Company Act of 1940 (17 CFR 270.30e-1). The Commission may use the information provided on Form N-CSR in its regulatory, disclosure review, inspection, and policy making roles.
A registrant is required to disclose the information specified by Form N-CSR, and the Commission will make this information public. A registrant is not required to respond to the collection of information contained in Form N-CSR unless the Form displays a currently valid Office of Management and Budget (“OMB”) control number. Please direct comments concerning the accuracy of the information collection burden estimate and any suggestions for reducing the burden to Secretary, Securities and Exchange Commission, 450 Fifth Street, NW, Washington, DC 20549-0609. The OMB has reviewed this collection of information under the clearance requirements of 44 U.S.C. § 3507.
| Item 1. | Reports to Stockholders. |
The Investment House Growth Fund
Annual Shareholder Report - July 31, 2024
This annual shareholder report contains important information about The Investment House Growth Fund (the "Fund") for the period of August 1, 2023 to July 31, 2024. You can find additional information about the Fund at www.tihllc.com. You can also request this information by contacting us at (888) 456-9518.
What were the Fund’s costs for the last year?
(based on a hypothetical $10,000 investment)
| Fund Name | Costs of a $10,000 investment | Costs paid as a percentage of a $10,000 investment |
|---|
| Investment House Growth Fund (The) | $165 | 1.45% |
How did the Fund perform during the reporting period?
For the fiscal year ended July 31, 2024, the Fund returned 28.2% vs 22.2% for the S&P 500 Index (the “benchmark”). The Fund continued to benefit from its heavy allocation to the Information Technology (46.8% vs 31.4% for the benchmark) sector although the Fund’s sector performance lagged 32.1% vs 35.2% for the benchmark. Communications Services concentration was also heavier, 21.1% vs 8.9% for the benchmark, while our companies outperformed the benchmark’s allocation to Consumer Services companies 37.4% to 30.05%. Energy, Real Estate, and Utilities all had positive benchmark performance, whereas the Fund had no exposure to these sectors. In Financials and Healthcare, the Fund’s allocations were roughly half the benchmark’s (12.5% vs 25.0%) and in the former the Fund underperformed 14.7% to 26.1%, whereas in the latter the Fund outperformed 30.4% to 13.5%. In Consumer Discretionary the Fund’s exposure was about even with the benchmark (11.9% vs 10.0% for the S&P), but the Fund outperformed 33.2% to 12.1%. Likewise in Materials the Fund outperformed 27.3% to 9.8%, although the Fund’s weight (1.6%) was lower than the index (2.2%).
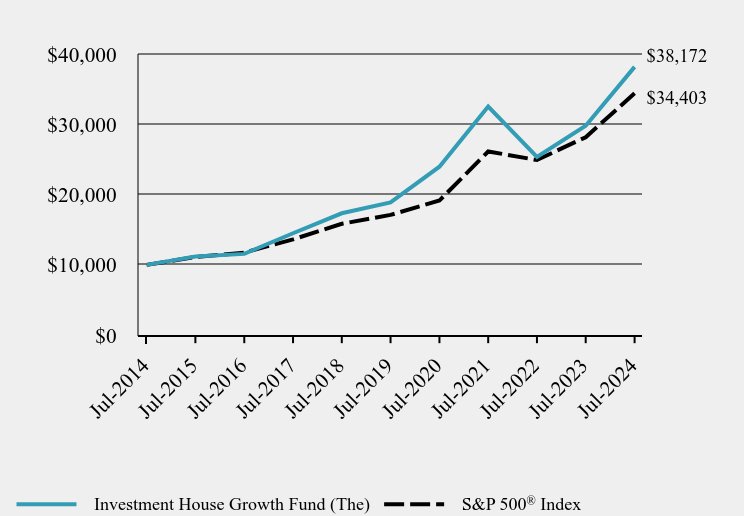
How has the Fund performed over the last ten years?
Total Return Based on $10,000 Investment
| Investment House Growth Fund (The) | S&P 500® Index |
|---|
| Jul-2014 | $10,000 | $10,000 |
| Jul-2015 | $11,176 | $11,121 |
| Jul-2016 | $11,565 | $11,745 |
| Jul-2017 | $14,501 | $13,629 |
| Jul-2018 | $17,341 | $15,843 |
| Jul-2019 | $18,895 | $17,108 |
| Jul-2020 | $23,968 | $19,153 |
| Jul-2021 | $32,525 | $26,134 |
| Jul-2022 | $25,349 | $24,921 |
| Jul-2023 | $29,787 | $28,165 |
| Jul-2024 | $38,172 | $34,403 |
Average Annual Total Returns
| 1 Year | 5 Years | 10 Years |
|---|
| Investment House Growth Fund (The) | 28.15% | 15.10% | 14.33% |
S&P 500® Index | 22.15% | 15.00% | 13.15% |
The Fund's past performance is not a good predictor of how the Fund will perform in the future. The graph and table do not reflect the deduction of taxes that a shareholder would pay on fund distributions or redemption of fund shares.
- Net Assets$214,410,384
- Number of Portfolio Holdings36
- Advisory Fee $2,880,762
- Portfolio Turnover1%
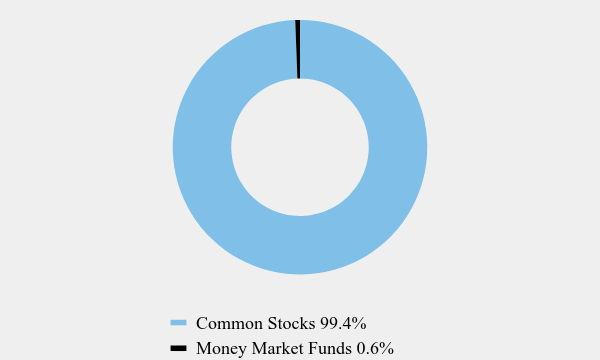
Asset Weighting (% of total investments)
| Value | Value |
|---|
| Common Stocks | 99.4% |
| Money Market Funds | 0.6% |
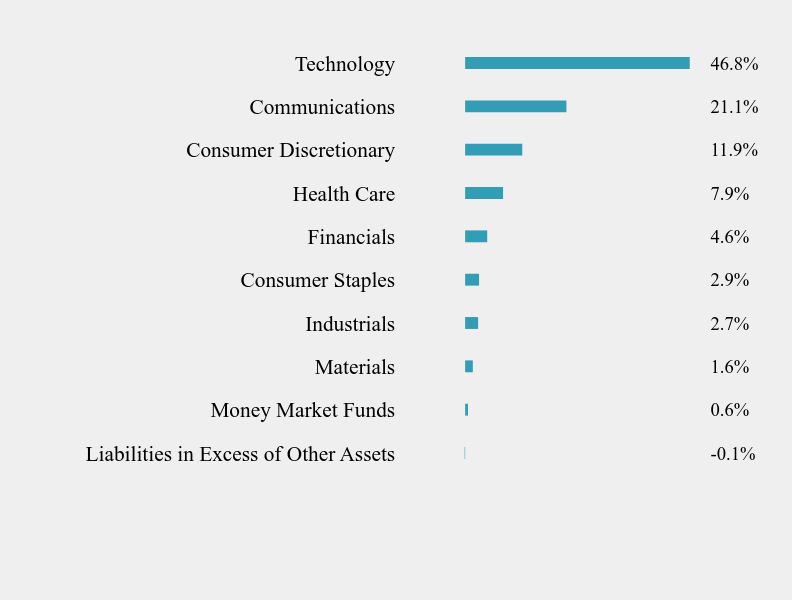
What did the Fund invest in?
Sector Weighting (% of net assets)
| Value | Value |
|---|
| Liabilities in Excess of Other Assets | -0.1% |
| Money Market Funds | 0.6% |
| Materials | 1.6% |
| Industrials | 2.7% |
| Consumer Staples | 2.9% |
| Financials | 4.6% |
| Health Care | 7.9% |
| Consumer Discretionary | 11.9% |
| Communications | 21.1% |
| Technology | 46.8% |
Top 10 Holdings (% of net assets)
| Holding Name | % of Net Assets |
| Meta Platforms, Inc. - Class A | 13.7% |
| Intuit, Inc. | 8.5% |
| Amazon.com, Inc. | 8.2% |
| Apple, Inc. | 8.1% |
| Alphabet, Inc. - Classes A & C | 7.4% |
| NVIDIA Corporation | 7.0% |
| Intuitive Surgical, Inc. | 5.6% |
| Texas Instruments, Inc. | 3.3% |
| Adobe, Inc. | 3.1% |
| Accenture plc - Class A | 2.8% |
No material changes occurred during the year ended July 31, 2024.
The Investment House Growth Fund (TIHGX)
Annual Shareholder Report - July 31, 2024
Where can I find additional information about the Fund?
Additional information is available on the Fund's website (www.tihllc.com), including its:
Prospectus
Financial information
Holdings
Proxy voting information
As of the end of the period covered by this report, the registrant has adopted a code of ethics that applies to the registrant’s principal executive officer, principal financial officer, principal accounting officer or controller, or persons performing similar functions, regardless of whether these individuals are employed by the registrant or a third party. Pursuant to Item 12(a)(1), a copy of registrant’s code of ethics is filed as an exhibit to this Form N-CSR. During the period covered by this report, the code of ethics has not been amended, and the registrant has not granted any waivers, including implicit waivers, from the provisions of the code of ethics.
| Item 3. | Audit Committee Financial Expert. |
The registrant’s board of trustees has determined that the registrant does not have an audit committee financial expert serving on its audit committee. The audit committee determined that, although none of its members meet the technical definition of an audit committee financial expert, the members have sufficient financial expertise to address any issues that are likely to come before the committee. It was the consensus of the audit committee members that it is not necessary at the present time for the committee to seek to recruit an additional trustee who would qualify as an audit committee financial expert. It was the view of the committee that, if novel issues ever arise, the committee will consider hiring an expert to assist it as needed.
| Item 4. | Principal Accountant Fees and Services. |
| (a) | Audit Fees. The aggregate fees billed for professional services rendered by the principal accountant for the audit of the registrant’s annual financial statements or for services that are normally provided by the accountant in connection with statutory and regulatory filings or engagements were $14,100 and $13,500 with respect to the registrant’s fiscal years ended July 31, 2024 and 2023, respectively. |
| (b) | Audit-Related Fees. No fees were billed in either of the last two fiscal years for assurance and related services by the principal accountant that are reasonably related to the performance of the audit of the registrant’s financial statements and are not reported under paragraph (a) of this Item. |
| (c) | Tax Fees. The aggregate fees billed for professional services rendered by the principal accountant for tax compliance, tax advice, and tax planning were $3,100 and $3,100 with respect to the registrant’s fiscal years ended July 31, 2024 and 2023, respectively. The services comprising these fees are the preparation of the registrant’s federal income and excise tax returns. |
| (d) | All Other Fees. No fees were billed in either of the last two fiscal years for products and services provided by the principal accountant, other than the services reported in paragraphs (a) through (c) of this Item. |
| (e)(1) | The audit committee has not adopted pre-approval policies and procedures described in paragraph (c)(7) of Rule 2-01 of Regulation S-X. |
| (e)(2) | None of the services described in paragraph (b) through (d) of this Item were approved by the audit committee pursuant to paragraph (c)(7)(i)(C) of Rule 2-01 of Regulation S-X. |
| (f) | Less than 50% of hours expended on the principal accountant’s engagement to audit the registrant’s financial statements for the most recent fiscal year were attributed to work performed by persons other than the principal accountant’s full-time, permanent employees. |
| (g) | With respect to the fiscal years ended July 31, 2024 and 2023, aggregate non-audit fees of $3,100 and $3,100, respectively, were billed by the registrant’s principal accountant for services rendered to the registrant. No non-audit fees were billed in either of the last two fiscal years by the registrant’s principal accountant for services rendered to the registrant’s investment adviser (not including any sub-adviser whose role is primarily portfolio management and is subcontracted with or overseen by another investment adviser), and any entity controlling, controlled by, or under common control with the adviser that provides ongoing services to the registrant. |
| (h) | The principal accountant has not provided any non-audit services to the registrant’s investment adviser (not including any sub-adviser whose role is primarily portfolio management and is subcontracted with or overseen by another investment adviser), and any entity controlling, controlled by, or under common control with the investment adviser that provides ongoing services to the registrant. |
| Item 5. | Audit Committee of Listed Registrants. |
Not applicable
| (a) | The Registrant(s) schedule(s) of investments is included in the Financial Statements under Item 7 of this form. |
| Item 7. | Financial Statements and Financial Highlights for Open-End Management Investment Companies |
| | | | | | | |
| | | | | | | |
| | | | | | | |
| | | | | | | |
| | | | | | | |
| | | | | | | |
| | | | | | | |
| | | | | | | |
| | | | | | | |
| | | | | | | |
| | | | | | | |
| | | | | | | |
| | | | | | | |
| | | | The Investment House Funds | | | |
| | | | | | | |
| | | | | | | |
| | | | | | | |
| | | | | | | |
| | | | | | | |
| | | | | | | |
| | | The Investment House Growth Fund | | |
| | | | | | | |
| | | | | | | |
| | | | | | | |
| | | | | | | |
| | | | | | | |
| | | | | | | |
| | | | | | | |
| | | Financial Statements | | |
| | | July 31, 2024 | | |
| | | | | |
| | | | | |
| | | | | |
| | | | | |
| | | | | |
| | | | | |
| | | | | |
| | | | | |
| | | | | |
| | | | | |
| | | | | |
| | | | | |
| | | | | |
| | | | | |
| | | | | |
| | | | | |
| | | | | |
| | | | | |
| | | | | |
| The Investment House Growth Fund |
| Schedule of Investments |
| July 31, 2024 |
| COMMON STOCKS — 99.5% | | Shares | | | Value | |
| Communications — 21.1% | | | | | | | | |
| Internet Media & Services — 21.1% | | | | | | | | |
| Alphabet, Inc. - Class A | | | 65,500 | | | $ | 11,235,870 | |
| Alphabet, Inc. - Class C | | | 26,350 | | | | 4,562,502 | |
| Meta Platforms, Inc. - Class A | | | 62,000 | | | | 29,439,460 | |
| | | | | | | | 45,237,832 | |
| Consumer Discretionary — 11.9% | | | | | | | | |
| E-Commerce Discretionary — 9.8% | | | | | | | | |
| Amazon.com, Inc. (a) | | | 94,500 | | | | 17,669,610 | |
| MercadoLibre, Inc. (a) | | | 1,950 | | | | 3,254,355 | |
| | | | | | | | 20,923,965 | |
| Retail - Discretionary — 2.1% | | | | | | | | |
| Lowe’s Companies, Inc. | | | 8,500 | | | | 2,086,835 | |
| Williams-Sonoma, Inc. | | | 16,000 | | | | 2,474,880 | |
| | | | | | | | 4,561,715 | |
| Consumer Staples — 2.9% | | | | | | | | |
| Household Products — 1.0% | | | | | | | | |
| Church & Dwight Company, Inc. | | | 22,000 | | | | 2,156,220 | |
| | | | | | | | | |
| Retail - Consumer Staples — 1.9% | | | | | | | | |
| Costco Wholesale Corporation | | | 5,000 | | | | 4,110,000 | |
| | | | | | | | | |
| Financials — 4.6% | | | | | | | | |
| Institutional Financial Services — 3.3% | | | | | | | | |
| Intercontinental Exchange, Inc. | | | 30,000 | | | | 4,546,800 | |
| Nu Holdings Ltd. - Class A (a) | | | 210,000 | | | | 2,547,300 | |
| | | | | | | | 7,094,100 | |
| Specialty Finance — 1.3% | | | | | | | | |
| American Express Company | | | 11,000 | | | | 2,783,440 | |
| | | | | | | | | |
| Health Care — 7.9% | | | | | | | | |
| Health Care Facilities & Services — 1.1% | | | | | | | | |
| Charles River Laboratories International, Inc. (a) | | | 10,000 | | | | 2,441,000 | |
| | | | | | | | | |
| Medical Equipment & Devices — 6.8% | | | | | | | | |
| Intuitive Surgical, Inc. (a) | | | 27,000 | | | | 12,004,470 | |
| Stryker Corporation | | | 7,500 | | | | 2,455,875 | |
| | | | | | | | 14,460,345 | |
See accompanying notes to financial statements.
| The Investment House Growth Fund |
| Schedule of Investments |
| July 31, 2024 |
| COMMON STOCKS — 99.5% (Continued) | | Shares | | | Value | |
| Industrials — 2.7% | | | | | | | | |
| Commercial Support Services — 1.1% | | | | | | | | |
| Waste Management, Inc. | | | 12,000 | | | $ | 2,431,920 | |
| | | | | | | | | |
| Transportation & Logistics — 1.6% | | | | | | | | |
| Norfolk Southern Corporation | | | 7,000 | | | | 1,746,920 | |
| United Parcel Service, Inc. - Class B | | | 12,000 | | | | 1,564,440 | |
| | | | | | | | 3,311,360 | |
| Materials — 1.6% | | | | | | | | |
| Chemicals — 1.6% | | | | | | | | |
| Ecolab, Inc. | | | 15,000 | | | | 3,460,350 | |
| | | | | | | | | |
| Technology — 46.8% | | | | | | | | |
| Semiconductors — 11.5% | | | | | | | | |
| NVIDIA Corporation | | | 127,555 | | | | 14,926,486 | |
| QUALCOMM, Inc. | | | 13,700 | | | | 2,479,015 | |
| Texas Instruments, Inc. | | | 35,000 | | | | 7,133,350 | |
| | | | | | | | 24,538,851 | |
| Software — 17.0% | | | | | | | | |
| Adobe, Inc. (a) | | | 12,000 | | | | 6,619,800 | |
| Autodesk, Inc. (a) | | | 11,000 | | | | 2,722,720 | |
| CrowdStrike Holdings, Inc. - Class A (a) | | | 16,000 | | | | 3,711,360 | |
| Intuit, Inc. | | | 28,275 | | | | 18,303,822 | |
| Microsoft Corporation | | | 12,000 | | | | 5,020,200 | |
| | | | | | | | 36,377,902 | |
| Technology Hardware — 9.9% | | | | | | | | |
| Apple, Inc. | | | 78,028 | | | | 17,328,458 | |
| Motorola Solutions, Inc. | | | 10,000 | | | | 3,989,200 | |
| | | | | | | | 21,317,658 | |
See accompanying notes to financial statements.
| The Investment House Growth Fund |
| Schedule of Investments |
| July 31, 2024 |
| COMMON STOCKS — 99.5% (Continued) | | Shares | | | Value | |
| Technology — 46.8% (Continued) | | | | | | | | |
| Technology Services — 8.4% | | | | | | | | |
| Accenture plc - Class A | | | 17,900 | | | $ | 5,918,098 | |
| Automatic Data Processing, Inc. | | | 7,000 | | | | 1,838,340 | |
| Block, Inc. - Class A (a) | | | 25,000 | | | | 1,547,000 | |
| Paychex, Inc. | | | 24,000 | | | | 3,072,480 | |
| PayPal Holdings, Inc. (a) | | | 45,000 | | | | 2,960,100 | |
| Visa, Inc. - Class A | | | 10,000 | | | | 2,656,700 | |
| | | | | | | | 17,992,718 | |
| | | | | | | | | |
| Total Common Stocks (Cost $32,438,726) | | | | | | $ | 213,199,376 | |
| | | | | | | | | |
| MONEY MARKET FUND — 0.6% | | Shares | | | Value | |
| First American Government Obligations Fund - Class Z, 5.19% (b) (Cost $1,328,237) | | | 1,328,237 | | | $ | 1,328,237 | |
| | | | | | | | | |
| Total Investments at Value — 100.1% (c) | | | | | | | | |
| (Cost $33,766,963) | | | | | | $ | 214,527,613 | |
| | | | | | | | | |
| Liabilities in Excess of Other Assets — (0.1%) | | | | | | | (117,229 | ) |
| | | | | | | | | |
| Net Assets — 100.0% | | | | | | $ | 214,410,384 | |
| (a) | Non-income producing security. |
| (b) | The rate shown is the 7-day effective yield as of July 31, 2024. |
| (c) | All securities are pledged as collateral for the Fund’s bank line of credit (Note 5). |
See accompanying notes to financial statements.
| The Investment House Growth Fund |
| Statement of Assets and Liabilities |
| July 31, 2024 |
| ASSETS | | | | |
| Investments in securities: | | | | |
| At cost | | $ | 33,766,963 | |
| At value (Note 2) | | $ | 214,527,613 | |
| Receivable for capital shares sold | | | 51,749 | |
| Dividends receivable | | | 106,890 | |
| Tax reclaims receivable | | | 11,874 | |
| Total Assets | | | 214,698,126 | |
| | | | | |
| LIABILITIES | | | | |
| Accrued investment advisory fees (Note 4) | | | 265,303 | |
| Accrued Trustees’ fees (Note 4) | | | 22,439 | |
| Total Liabilities | | | 287,742 | |
| | | | | |
| NET ASSETS | | | 214,410,384 | |
| | | | | |
| Net assets consist of: | | | | |
| Paid-in capital | | $ | 34,919,314 | |
| Distributable earnings | | | 179,491,070 | |
| Net assets | | $ | 214,410,384 | |
| | | | | |
| Shares of beneficial interest outstanding | | | | |
| (unlimited number of shares authorized, no par value) | | | 2,715,920 | |
| | | | | |
| Net asset value, redemption price and offering price per share (Note 2) | | $ | 78.95 | |
See accompanying notes to financial statements.
| The Investment House Growth Fund |
| Statement of Operations |
| For the Year Ended July 31, 2024 |
| INVESTMENT INCOME | | | | |
| Dividend income | | $ | 1,387,633 | |
| | | | | |
| EXPENSES | | | | |
| Investment advisory fees (Note 4) | | | 2,880,762 | |
| Borrowing costs and bank fees (Note 5) | | | 69,153 | |
| Trustees’ fees (Note 4) | | | 22,500 | |
| Total expenses | | | 2,972,415 | |
| | | | | |
| NET INVESTMENT LOSS | | | (1,584,782 | ) |
| | | | | |
| REALIZED AND UNREALIZED GAINS (LOSSES) ON INVESTMENTS | | | | |
| Net realized loss from investment transactions | | | (263,607 | ) |
| Net realized gains from in-kind redemptions | | | 29,995,047 | |
| Net change in unrealized appreciation (depreciation) on investments | | | 24,219,900 | |
| NET REALIZED AND UNREALIZED GAINS ON INVESTMENTS | | | 53,951,340 | |
| | | | | |
| NET INCREASE IN NET ASSETS RESULTING FROM OPERATIONS | | | 52,366,558 | |
See accompanying notes to financial statements.
| The Investment House Growth Fund |
| Statements of Changes in Net Assets |
| | | Year | | | Year | |
| | | Ended | | | Ended | |
| | | July 31, 2024 | | | July 31, 2023 | |
| FROM OPERATIONS | | | | | | | | |
| Net investment loss | | $ | (1,584,782 | ) | | $ | (966,537 | ) |
| Net realized gains (losses) from investment transactions | | | (263,607 | ) | | | 1,898,841 | |
| Net realized gains from in-kind redemptions | | | 29,995,047 | | | | — | |
| Net change in unrealized appreciation (depreciation) on investments | | | 24,219,900 | | | | 27,500,651 | |
| Net increase in net assets resulting from operations | | | 52,366,558 | | | | 28,432,955 | |
| | | | | | | | | |
| DISTRIBUTIONS TO SHAREHOLDERS (Note 2) | | | (886,283 | ) | | | — | |
| | | | | | | | | |
| FROM CAPITAL SHARE TRANSACTIONS | | | | | | | | |
| Proceeds from shares sold | | | 12,181,545 | | | | 7,108,569 | |
| Net asset value of shares issued in reinvestment of distributions to shareholders | | | 845,451 | | | | — | |
| Payments for shares redeemed | | | (45,414,267 | ) | | | (10,711,032 | ) |
| Net decrease in net assets from capital share transactions | | | (32,387,269 | ) | | | (3,602,463 | ) |
| | | | | | | | | |
| TOTAL INCREASE IN NET ASSETS | | | 19,093,005 | | | | 24,830,492 | |
| | | | | | | | | |
| NET ASSETS | | | | | | | | |
| Beginning of year | | | 195,317,378 | | | | 170,486,886 | |
| End of year | | | 214,410,384 | | | $ | 195,317,378 | |
| | | | | | | | | |
| CAPITAL SHARE ACTIVITY | | | | | | | | |
| Shares sold | | | 175,034 | | | | 138,725 | |
| Shares reinvested | | | 13,595 | | | | — | |
| Shares redeemed | | | (628,544 | ) | | | (219,804 | ) |
| Net decrease in shares outstanding | | | (439,915 | ) | | | (81,079 | ) |
| Shares outstanding, beginning of year | | | 3,155,835 | | | | 3,236,914 | |
| Shares outstanding, end of year | | | 2,715,920 | | | | 3,155,835 | |
See accompanying notes to financial statements.
| The Investment House Growth Fund |
| Financial Highlights |
Per Share Data and Ratios for a Share Outstanding Throughout Each Year
| | | Years Ended | |
| | | July 31, | | | July 31, | | | July 31, | | | July 31, | | | July 31, | |
| | | 2024 | | | 2023 | | | 2022 | | | 2021 | | | 2020 | |
| Net asset value at beginning of year | | $ | 61.89 | | | $ | 52.67 | | | $ | 67.58 | | | $ | 49.80 | | | $ | 39.26 | |
| | | | | | | | | | | | | | | | | | | | | |
| Income (loss) from investment operations: | | | | | | | | | | | | | | | | | | | | |
| Net investment loss (a) | | | (0.61 | ) | | | (0.31 | ) | | | (0.49 | ) | | | (0.41 | ) | | | (0.21 | ) |
| Net realized and unrealized gains (losses) on investments | | | 17.96 | | | | 9.53 | | | | (14.42 | ) | | | 18.19 | | | | 10.75 | |
| Total from investment operations | | | 17.35 | | | | 9.22 | | | | (14.91 | ) | | | 17.78 | | | | 10.54 | |
| | | | | | | | | | | | | | | | | | | | | |
| Less distributions: | | | | | | | | | | | | | | | | | | | | |
| From net realized gains on investments | | | (0.29 | ) | | | — | | | | — | | | | — | | | | — | |
| | | | | | | | | | | | | | | | | | | | | |
| Net asset value at end of year | | $ | 78.95 | | | $ | 61.89 | | | $ | 52.67 | | | $ | 67.58 | | | $ | 49.80 | |
| | | | | | | | | | | | | | | | | | | | | |
| Total return (b) | | | 28.15 | % | | | 17.50 | % | | | (22.06 | %) | | | 35.70 | % | | | 26.85 | % |
| | | | | | | | | | | | | | | | | | | | | |
| Net assets at end of year (000’s) | | $ | 214,410 | | | $ | 195,317 | | | $ | 170,487 | | | $ | 224,304 | | | $ | 163,826 | |
| | | | | | | | | | | | | | | | | | | | | |
| Ratio of total expenses to average net assets (c) | | | 1.45 | % | | | 1.42 | % | | | 1.41 | % | | | 1.41 | % | | | 1.42 | % |
| Ratio of net investment loss to average net assets (a)(c) | | | (0.77 | %) | | | (0.60 | %) | | | (0.78 | %) | | | (0.71 | %) | | | (0.52 | %) |
| Portfolio turnover rate | | | 1 | % | | | 9 | % | | | 10 | % | | | 1 | % | | | 11 | % |
| (a) | Recognition of net investment loss by the Fund is affected by the timing of the declarations of dividends by the underlying investment companies, if any, in which the Fund invests. |
| (b) | Total return is a measure of the change in value of an investment in the Fund over the periods covered, which assumes any dividends or capital gains distributions are reinvested in shares of the Fund. The returns shown do not reflect the deduction of taxes a shareholder would pay on Fund distributions or the redemption of Fund shares. |
| (c) | The ratios of expenses and net investment loss to average net assets do not reflect the Fund’s proportionate share of expenses of the underlying investment companies, if any, in which the Fund invests. |
See accompanying notes to financial statements.
The Investment House Growth Fund |
| Notes to Financial Statements |
| July 31, 2024 |
1. Organization
The Investment House Growth Fund (the “Fund”) is a diversified series of The Investment House Funds (the “Trust”), an open-end management investment company established under the laws of Ohio by an Agreement and Declaration of Trust dated October 2, 2001.
The investment objective of the Fund is long term capital appreciation.
2. Significant Accounting Policies
The Fund follows accounting and reporting guidance under Financial Accounting Standards Board Accounting Standards Codification Topic 946, “Financial Services – Investment Companies.” The following is a summary of the Fund’s significant accounting policies used in the preparation of its financial statements. These policies are in conformity with accounting principles generally accepted in the United States of America (“GAAP”).
Regulatory update – Tailored Shareholder Reports for Mutual Funds and Exchange-Traded Funds (“ETFs”) – Effective January 24, 2023, the Securities and Exchange Commission (the “SEC”) adopted rule and form amendments to require mutual funds and ETFs to transmit concise and visually engaging streamlined annual and semiannual reports to shareholders that highlight key information. Other information, including financial statements, will no longer appear in a streamlined shareholder report but must be available online, delivered free of charge upon request, and filed on a semiannual basis on Form N-CSR. The rule and form amendments have a compliance date of July 24, 2024. The Fund has implemented the rule and form requirements, as applicable, and is currently adhering to the requirements.
Securities valuation – The Fund values its portfolio securities at market value as of close of regular trading on the New York Stock Exchange (the “NYSE”) (normally 4:00 p.m. Eastern time) on each business day the NYSE is open. Exchange-traded funds (“ETFs”) are valued at the last sale price on the security’s primary exchange. Lacking a last sale price, an exchange-traded security is generally valued at its last bid price. Securities traded on NASDAQ are valued at the NASDAQ Official Closing Price. Investments representing shares of money market funds and other open-end investment companies, except for ETFs, are valued at their net asset value (“NAV”) as reported by such companies. When using a quoted price and when the market for the security is considered active, the security will be classified as Level 1 within the fair value hierarchy (see below). If market prices are not available or The Investment House LLC, the investment adviser to the Fund (the “Adviser”), believes such prices do not accurately reflect the market value of such securities, securities will be valued by the Adviser as “valuation designee”, in accordance with procedures adopted by the Board of Trustees (the “Board”) pursuant to Rule 2a-5 under the Investment Company Act of 1940, as amended (the “1940 Act”). The Adviser has adopted written policies and procedures for valuing securities and other assets in circumstances where market quotes are not readily available. In the event that market quotes are not readily available, and the security or asset cannot be valued pursuant to one of the valuation methods, the value of the security or asset will be determined in good faith by the Adviser pursuant to its policies
| The Investment House Growth Fund |
| Notes to Financial Statements (Continued) |
and procedures. On a quarterly basis, the Adviser’s fair valuation determinations, if any, will be reviewed by the Board. Under these policies, the securities will be classified as Level 2 or 3 within the fair value hierarchy, depending on the inputs used.
GAAP establishes a single authoritative definition of fair value, sets out a framework for measuring fair value and requires additional disclosures about fair value measurements.
Various inputs are used in determining the value of each of the Fund’s investments. These inputs are summarized in the three broad levels listed below:
| ● | Level 1 – quoted unadjusted prices for identical instruments in active markets to which the Fund has access at the date of measurement. |
| ● | Level 2 – quoted prices for similar instruments in active markets; quoted prices for identical or similar instruments in markets that are not active; and model-derived valuations in which all significant inputs and significant value drivers are observable in active markets. Level 2 inputs are those in markets for which there are few transactions, the prices are not current, little public information exists or instances where prices vary substantially over time or among brokered market makers. |
| ● | Level 3 – model derived valuations in which one or more significant inputs or significant value drivers are unobservable. Unobservable inputs are those inputs that reflect the Fund’s own assumptions that market participants would use to price the asset or liability based on the best available information. |
The inputs or methodology used for valuing securities are not necessarily an indication of the risks associated with investing in those securities. The inputs used to measure fair value may fall into different levels of the fair value hierarchy. In such cases, for disclosure purposes, the level in the fair value hierarchy within which the fair value measurement falls in its entirety is determined based on the lowest level input that is significant to the fair value measurement.
The following is a summary of the Fund’s investments and the inputs used to value the investments as of July 31, 2024 by security type:
| | | Level 1 | | | Level 2 | | | Level 3 | | | Total | |
| Common Stocks | | $ | 213,199,376 | | | $ | — | | | $ | — | | | $ | 213,199,376 | |
| Money Market Fund | | | 1,328,237 | | | | — | | | | — | | | | 1,328,237 | |
| Total | | $ | 214,527,613 | | | $ | — | | | $ | — | | | $ | 214,527,613 | |
| | | | | | | | | | | | | | | | | |
Refer to the Fund’s Schedule of Investments for a listing of the common stocks by sector and industry type. There were no Level 2 or Level 3 securities or derivative instruments held by the Fund as of or during the year ended July 31, 2024.
Share valuation – The NAV is calculated daily by dividing the value of the Fund’s total assets, minus liabilities, by the total number of shares outstanding. The offering price and redemption price per share are equal to the NAV per share.
| The Investment House Growth Fund |
| Notes to Financial Statements (Continued) |
Investment transactions and investment income – Investment transactions are accounted for on trade date. Realized gains and losses on investments sold are determined on a specific identification basis. Dividend income is recorded on the ex-dividend date. Non-cash dividends included in dividend income, if any, are recorded at the fair market value of the securities received. Interest income is accrued as earned. Withholding taxes on foreign dividends have been recorded in accordance with the Fund’s understanding of the applicable country’s tax rules and rates.
Distributions to shareholders – Dividends arising from net investment income and distributions of net realized capital gains, if any, are declared and paid annually in December. The amount of distributions from net investment income and net realized capital gains are determined in accordance with income tax regulations, which may differ from GAAP. Dividends and distributions are recorded on the ex-dividend date. The tax character of the Fund’s distributions paid by the Fund during the years ended July 31, 2024 and 2023 was as follows:
| | | Long-Term | | | Total | |
| Years Ended | | Capital Gains | | | Distributions | |
| July 31, 2024 | | $ | 886,283 | | | $ | 886,283 | |
| July 31, 2023 | | $ | — | | | $ | — | |
Estimates – The preparation of financial statements in conformity with GAAP requires management to make estimates and assumptions that affect the reported amounts of assets and liabilities and disclosure of contingent assets and liabilities as of the date of the financial statements and the reported amounts of increases and decreases in net assets from operations during the reporting period. Actual results could differ from those estimates.
Federal income tax – The Fund has qualified and intends to continue to qualify each year as a “regulated investment company” under Subchapter M of the Internal Revenue Code of 1986, as amended (the “Code”). By so qualifying, the Fund will not be subject to federal income taxes to the extent that the Fund distributes its net investment income and any net realized capital gains in accordance with the Code.
In order to avoid imposition of the excise tax applicable to regulated investment companies, it is also the Fund’s intention to declare as dividends in each calendar year at least 98% of its net investment income (earned during the calendar year) and 98.2% of its net realized capital gains (earned during the twelve months ended October 31) plus undistributed amounts from prior years.
The following information is computed on a tax basis for each item as of July 31, 2024:
| Cost of investments | | $ | 33,766,963 | |
| Gross unrealized appreciation | | $ | 180,760,650 | |
| Gross unrealized depreciation | | | — | |
| Net unrealized appreciation | | | 180,760,650 | |
| Accumulated capital and other losses | | | (1,269,580 | ) |
| Distributable earnings | | $ | 179,491,070 | |
| | | | | |
| The Investment House Growth Fund |
| Notes to Financial Statements (Continued) |
Redemption proceeds normally are paid in cash. However, the Fund reserves the right to pay redemption proceeds in portfolio securities rather than cash. These redemptions “in-kind” usually occur if the amount to be redeemed is large enough to affect Fund operations (for example, if it represents more than 1% of the Fund’s assets). For book purposes, the Fund will recognize a gain on the redemption in-kind to the extent the value of the distributed securities on the date of redemption exceeds the cost of those securities; the Fund recognizes a loss if cost exceeds value. Gains and losses realized on a redemption in-kind are generally not recognized for tax purposes. During the year ended July 31, 2024, shares redeemed included redemption in-kind transactions of 185,500 shares valued at $31,045,885. The Fund had realized gains on these transactions of $29,995,047 recorded in the accompanying Statement of Operations.
For the year ended July 31, 2024, the Fund reclassified $1,162,986 of net investment loss against paid-in capital on the Statement of Assets and Liabilities. Such reclassification, the result of permanent differences between the financial statement and income tax reporting requirements, had no effect on the Fund’s net assets or NAV per share.
As of July 31, 2024, the Fund had short-term capital loss carryforwards of $263,607 for federal income tax purposes. These capital loss carryforwards, which do not expire, may be utilized in future years to offset net realized capital gains, if any, prior to distributing such gains to shareholders.
Net qualified late-year ordinary losses incurred after December 31, 2023 are deemed to arise on the first day of the Fund’s next taxable year. For the year ended July 31, 2024, the Fund deferred $1,005,973 of ordinary losses to August 1, 2024 for income tax purposes.
The Fund recognizes the tax benefits or expenses of uncertain tax positions only when the position is “more-likely-than-not” to be sustained assuming examination by tax authorities. Management has reviewed the tax positions taken on Federal income tax returns for all open tax years (generally, three years) and has concluded that no provision for unrecognized tax benefits or expenses is required in these financial statements.
The Fund recognizes interest and penalties, if any, related to unrecognized tax benefits as income tax expense on the Statement of Operations. During the year ended July 31, 2024, the Fund did not incur any interest or penalties.
3. Investment Transactions
During the year ended July 31, 2024, cost of purchases and proceeds from sales of investment securities, other than short-term investments and in-kind transactions, if any, amounted to $2,127,660 and $6,074,108, respectively.
4. Transactions with Related Parties
A Trustee is affiliated with the Adviser and certain officers of the Trust are affiliated with Ultimus Fund Solutions, LLC (“Ultimus”), the Fund’s administrator, transfer agent and fund accounting agent, or Ultimus Fund Distributors, LLC (the “Distributor”), the principal underwriter of the Fund’s shares.
| The Investment House Growth Fund |
| Notes to Financial Statements (Continued) |
Under the terms of a Management Agreement between the Trust and the Adviser, the Adviser serves as the investment adviser to the Fund. For its services, the Fund pays the Adviser an investment management fee, which is accrued daily and paid monthly, at the annual rate of 1.40% of the Fund’s average daily net assets. The Adviser pays all operating expenses of the Fund not specifically assumed by the Fund. The Fund pays all brokerage fees and commissions, taxes, borrowing costs (such as (a) interest and (b) dividend expenses on securities sold short), fees and expenses of the non-interested person trustees and such extraordinary or non recurring expenses as may arise, including litigation to which the Fund may be a party and indemnification of the Trust’s trustees and officers with respect thereto. The Fund also pays expenses which it is authorized to pay pursuant to Rule 12b-1 under the 1940 Act.
The Trust has entered into mutual fund services agreements with Ultimus, pursuant to which Ultimus provides day-to-day operational services to the Fund including, but not limited to, accounting, administrative, transfer agent, dividend disbursing, and recordkeeping services. The fees payable to Ultimus are paid by the Adviser (not the Fund).
The Trust has entered into a Distribution Agreement with the Distributor, pursuant to which the Distributor provides distribution services to the Fund and serves as principal underwriter to the Fund. The Distributor is a wholly-owned subsidiary of Ultimus. The fees payable to the Distributor are paid by the Adviser (not the Fund).
The Fund pays each Trustee who is not affiliated with the Adviser $7,500 annually. Trustees who are affiliated with the Adviser do not receive compensation from the Fund.
PRINCIPAL HOLDER OF FUND SHARES
As of July 31, 2024, the following shareholder of record owned 25% or more of the outstanding shares of the Fund:
| Name of Record Owner | % Ownership |
| Charles Schwab & Company (for the benefit of its customers) | 54% |
A beneficial owner of 25% or more of the Fund’s outstanding shares may be considered a controlling person. That shareholder’s vote could have more significant effect on matters presented at a shareholders’ meeting.
5. Bank Line of Credit
The Fund has a secured bank line of credit with U.S. Bank, N.A. that provides a maximum borrowing of up to $20,000,000. The line of credit may be used to cover redemptions and/or it may be used by the Adviser for investment purposes. When used for investment purposes, the Fund will be using the investment technique of “leverage.” Because the Fund’s investments will fluctuate in value, whereas the interest obligations on borrowed funds may be fixed, during times of borrowing the Fund’s NAV may tend to increase more when its investments increase in value, and decrease more when its investments decrease in value.
| The Investment House Growth Fund |
| Notes to Financial Statements (Continued) |
In addition, interest costs on borrowings may fluctuate with changing market interest rates and may partially offset or exceed the return earned on the borrowed funds. Also, during times of borrowing under adverse market conditions, the Fund might have to sell portfolio securities to meet interest or principal payments at a time when fundamental investment considerations would not favor such sales. Unless profits on assets acquired with borrowed funds exceed the costs of borrowing, the use of borrowing will diminish the investment performance of the Fund compared with what it would have been without borrowing.
Borrowings under this arrangement bear interest at a rate per annum equal to the Prime Rate minus 0.25% at the time of borrowing. The Fund also pays an annual renewal fee of $1,000 plus any legal fees related to the arrangement. The line of credit matures February 3, 2025. During the year ended July 31, 2024, the Fund incurred $69,153 of interest expense and fees related to the borrowings. The average debt outstanding and the average interest rate for the days with borrowing during the year ended July 31, 2024 were $1,260,753 and 8.25%. The largest outstanding borrowing during the year ended July 31, 2024 was $4,154,000. As of July 31, 2024, there were no outstanding borrowings for the Fund.
6. Contingencies and Commitments
The Fund indemnifies the Trust’s officers and Trustees for certain liabilities that might arise from their performance of their duties to the Fund. Additionally, in the normal course of business, the Fund enters into contracts that contain a variety of representations and warranties and which provide general indemnifications. The Fund’s maximum exposure under these arrangements is unknown, as this would involve future claims that may be made against the Fund that have not yet occurred. However, based on experience, the Fund expects the risk of loss to be remote.
7. Sector Risk
If the Fund’s portfolio is overweighted in a certain sector, any negative development affecting that sector will have a greater impact on the Fund than a fund that is not overweighted in that sector. To the extent the Fund is overweighted in the Technology sector, it will be affected by developments affecting that sector. Companies in this sector may be significantly affected by intense competition. In addition, technology products may be subject to rapid obsolescence. As of July 31, 2024, the Fund had 46.8% of the value of its net assets invested in companies within the Technology sector.
8. Subsequent Events
The Fund is required to recognize in the financial statements the effects of all subsequent events that provide additional evidence about conditions that existed as of the date of the Statement of Assets and Liabilities. For non-recognized subsequent events that must be disclosed to keep the financial statements from being misleading, the Fund is required to disclose the nature of the event as well as an estimate of its financial effect, or a statement that such an estimate cannot be made. Management has evaluated subsequent events through the issuance of these financial statements and has noted no such events.
| The Investment House Growth Fund |
| Report of Independent Registered Public |
| Accounting Firm |
To the Shareholders of The Investment House Growth Fund and
Board of Trustees of The Investment House Funds
Opinion on the Financial Statements
We have audited the accompanying statement of assets and liabilities, including the schedule of investments, of The Investment House Funds comprising The Investment House Growth Fund (the “Fund”) as of July 31, 2024, the related statement of operations for the year then ended, and the statements of changes in net assets and financial highlights for each of the two years in the period then ended, and the related notes (collectively referred to as the “financial statements”). In our opinion, the financial statements present fairly, in all material respects, the financial position of the Fund as of July 31, 2024, the results of its operations for the year then ended, and the changes in net assets and financial highlights for each of the two years in the period then ended, in conformity with accounting principles generally accepted in the United States of America.
The Fund’s financial highlights for the years ended July 31, 2022, and prior, were audited by other auditors whose report dated September 22, 2022, expressed an unqualified opinion on those financial highlights.
Basis for Opinion
These financial statements are the responsibility of the Fund’s management. Our responsibility is to express an opinion on the Fund’s financial statements based on our audits. We are a public accounting firm registered with the Public Company Accounting Oversight Board (United States) (“PCAOB”) and are required to be independent with respect to the Fund in accordance with the U.S. federal securities laws and the applicable rules and regulations of the Securities and Exchange Commission and the PCAOB.
We conducted our audits in accordance with the standards of the PCAOB. Those standards require that we plan and perform the audit to obtain reasonable assurance about whether the financial statements are free of material misstatement whether due to error or fraud.
Our audits included performing procedures to assess the risks of material misstatement of the financial statements, whether due to error or fraud, and performing procedures that respond to those risks. Such procedures included examining, on a test basis, evidence regarding the amounts and disclosures in the financial statements. Our procedures included confirmation of securities owned as of July 31, 2024, by correspondence with the custodian. Our audits
| The Investment House Growth Fund |
| Report of Independent Registered Public |
| Accounting Firm (Continued) |
also included evaluating the accounting principles used and significant estimates made by management, as well as evaluating the overall presentation of the financial statements. We believe that our audits provide a reasonable basis for our opinion.
We have served as the Fund’s auditor since 2023.

COHEN & COMPANY, LTD.
Philadelphia, Pennsylvania
September 27, 2024
| The Investment House Growth Fund |
| Other Information (Unaudited) |
A description of the policies and procedures that the Fund uses to vote proxies relating to portfolio securities is available without charge upon request by calling toll-free 1-888-456-9518, or on the SEC’s website at www.sec.gov. Information regarding how the Fund voted proxies relating to portfolio securities during the most recent 12-month period ended June 30 is available without charge upon request by calling toll-free 1-888-456-9518, or on the SEC’s website at www.sec.gov.
The Trust files a complete listing of portfolio holdings of the Fund with the SEC as of the end of the first and third quarters of each fiscal year as an exhibit to its reports on Form N-PORT. The filings are available upon request by calling 1-888-456-9518. Furthermore, you may obtain a copy of the filings on the SEC’s website at www.sec.gov and on the Fund’s website www.tihllc.com.
This page intentionally left blank.
| | | | | | | |
| | | | | | | |
| | | | | | | |
| | | | | |
| | | | | |
| | | | | |
| | | | | |
| | | | | |
| | | | | |
| | | | | |
| | | | | |
| | | | | |
| | | THE INVESTMENT HOUSE FUNDS | | |
| | | | | |
| | | | | |
| | | | | |
| | | Investment Adviser | | |
| | | The Investment House LLC | | |
| | | 5940 S. Rainbow Blvd, Suite 400 | | |
| | | PMB 57150 | | |
| | | Las Vegas, NV 89118 | | |
| | | | | |
| | | Administrator | | |
| | | Ultimus Fund Solutions, LLC | | |
| | | 225 Pictoria Drive | | |
| | | Suite 450 | | |
| | | Cincinnati, Ohio 45246 | | |
| | | 1.888.456.9518 | | |
| | | | | |
| | | Legal Counsel | | |
| | | Practus, LLP | | |
| | | 11300 Tomahawk Creek Pkwy | | |
| | | Suite 310 | | |
| | | Leawood, Kansas 66211 | | |
| | | | | |
| | | Custodian | | |
| | | U.S. Bank, N.A. | | |
| | | 425 Walnut Street | | |
| | | Cincinnati, Ohio 45202 | | |
| | | | | |
| | | Board of Trustees | | |
| | | Darrin F. DelConte | | |
| | | Nicholas G. Tonsich | | |
| | | Timothy J. Wahl | | |
| | | Michael A. Zupanovich | | |
| | | | | |
| | | Officers | | |
| | | Timothy J. Wahl, President | | |
| | | Stacey A. Havens, Vice President | | |
| | | David L. Kahn, CCO and Secretary | | |
| | | Brian J. Lutes, Treasurer | | |
| | | | | |
| | | | | |
| | | | | |
| | | | | |
| | | | | |
| | | | | |
| | | | | |
| | | | | |
| | | | | |
| | | | | |
| | | | | |
| | | | | |
| Item 8. | Changes in and Disagreements with Accountants for Open-End Management Investment Companies. |
Not applicable
| Item 9. | Proxy Disclosures for Open-End Management Investment Companies. |
Not applicable [filed under item 7]
| Item 10. | Remuneration Paid to Directors, Officers, and Others of Open-End Management Investment Companies. |
Included under Item 7
| Item 11. | Statement Regarding Basis for Approval of Investment Advisory Contract. |
Not applicable [included under Item 7 if applicable]
| Item 12. | Disclosure of Proxy Voting Policies and Procedures for Closed-End Management Investment Companies. |
Not applicable
| Item 13. | Portfolio Managers of Closed-End Management Investment Companies. |
Not applicable
| Item 14. | Purchases of Equity Securities by Closed-End Management Investment Company and Affiliated Purchasers. |
Not applicable
| Item 15. | Submission of Matters to a Vote of Security Holders. |
Not applicable
| Item 16. | Controls and Procedures. |
(a) Based on their evaluation of the registrant’s disclosure controls and procedures (as defined in Rule 30a-3(c) under the Investment Company Act of 1940) as of a date within 90 days of the filing date of this report, the registrant’s principal executive officer and principal financial officer have concluded that such disclosure controls and procedures are reasonably designed and are operating effectively to ensure that material information relating to the registrant, including its consolidated subsidiaries, is made known to them by others within those entities, particularly during the period in which this report is being prepared, and that the information required in filings on Form N-CSR is recorded, processed, summarized, and reported on a timely basis.
(b) There were no changes in the registrant’s internal control over financial reporting (as defined in Rule 30a-3(d) under the Investment Company Act of 1940) that occurred during the period covered by this report that have materially affected, or are reasonably likely to materially affect, the registrant’s internal control over financial reporting.
| Item 17. | Disclosure of Securities Lending Activities for Closed-End Management Investment Companies. |
Not applicable
| Item 18. | Recovery of Erroneously Awarded Compensation |
File the exhibits listed below as part of this Form. Letter or number the exhibits in the sequence indicated.
(a)(1) Any code of ethics, or amendment thereto, that is the subject of the disclosure required by Item 2, to the extent that the registrant intends to satisfy the Item 2 requirements through filing of an exhibit: Attached hereto
(a)(2) A separate certification for each principal executive officer and principal financial officer of the registrant as required by Rule 30a-2(a) under the Act (17 CFR 270.30a-2(a)): Attached hereto
| (2) | Change in the registrant’s independent public accountants: Not applicable. |
| (b) | Certifications required by Rule 30a-2(b) under the Act (17 CFR 270.30a-2(b)): Attached hereto |
SIGNATURES
Pursuant to the requirements of the Securities Exchange Act of 1934 and the Investment Company Act of 1940, the registrant has duly caused this report to be signed on its behalf by the undersigned, thereunto duly authorized.
| (Registrant) | The Investment House Funds | |
| | | |
| By (Signature and Title)* | /s/ Timothy J. Wahl |
| | | Timothy J. Wahl, President |
| | | |
| Date | October 4, 2024 | |
| | | |
| Pursuant to the requirements of the Securities Exchange Act of 1934 and the Investment Company Act of 1940, this report has been signed below by the following persons on behalf of the registrant and in the capacities and on the dates indicated. |
| | | |
| By (Signature and Title)* | /s/ Timothy J. Wahl |
| | | Timothy J. Wahl, President |
| | | |
| Date | October 4, 2024 | |
| | | |
| By (Signature and Title)* | /s/ Brian J. Lutes |
| | | Brian J. Lutes, Treasurer |
| | | |
| Date | October 4, 2024 | |
| | | |
| * | Print the name and title of each signing officer under his or her signature. |