SECURITIES AND EXCHANGE COMMISSION
Washington, D.C. 20549
FORM 6-K
REPORT OF FOREIGN ISSUER
Pursuant to Rule 13a-16 or 15d-16 of the
Securities Act of 1934
January 29, 2004
of Chile, Bank
(Translation of Registrant’s name into English)
Chile
(Jurisdiction of incorporation or organization)
Ahumada 251
Santiago, Chile
(Address of principal executive offices)
Indicate by check mark whether the registrant files or will file annual reports under cover of Form 20-F or Form 40-F.
| Form 20-Fx | Form 40-F¨ |
Indicate by check mark whether the registrant by furnishing the information contained in this Form is also thereby furnishing the information to the Commission pursuant to Rule 12g-3-2(b) under the Securities Exchange Act of 1934.
| Yes¨ | Nox |
(If “Yes” is marked, indicate below the file number assigned to the registrant in connection with Rule 12g3-2(b): 82- .)
BANCO DE CHILE
REPORT ON FORM 6-K
Attached is a Press Release issued by Banco de Chile (“theBank”) on January 29, 2004 regarding the Consolidated Financial Statements of the Bank as of December 31, 2003.
![]()
www.bancochile.cl
Banco de Chile Announces 2003 Fourth-Quarter and Year End Results
Santiago, Chile, January 29, 2004 — Banco de Chile (NYSE: BCH), a Chilean full-service financial institution, market leader in a wide variety of credit and non-credit products and services across all segments of the Chilean financial market, today announced results for the fourth quarter and year ended December 31, 2003. The results have been prepared in accordance with Chilean GAAP on an unaudited, consolidated basis. All figures are expressed in constant Chilean pesos as of December 31, 2003, unless otherwise stated. Therefore, all growth rates are in real terms.
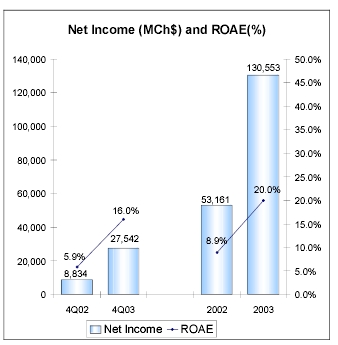
Net income for 2003 reached a record level of Ch$130,553 million (Ch$1.92/share or US$1.92/ADS), which represents an increase of 145.6% when compared to Ch$53,161 million recorded in 2002.
2003 Selected Financial Data
| 2002 | 2003 | % Change 2003/2002 | 4Q02 | 4Q03 | % Change 4Q02/4Q03 | |||||||||||||
Income Statement (Millions, Chilean pesos) | ||||||||||||||||||
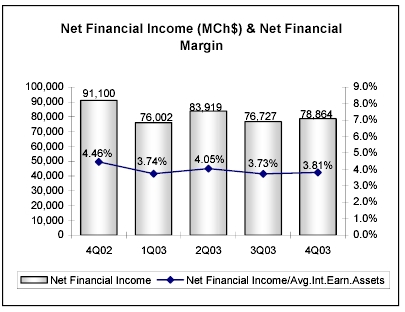
Net Financial Income | 339,284 | 315,531 | (7.0 | )% | 91,100 | 78,864 | (13.4 | )% | ||||||||||
Income from Services | 79,407 | 103,389 | 30.2 | % | 21,172 | 29,998 | 41.7 | % | ||||||||||
Gains on Sales of Financial Instruments | 1,130 | 5,330 | 371.7 | % | 4,211 | (3,836 | ) | — | ||||||||||
Operating Revenues | 419,821 | 424,250 | 1.1 | % | 116,483 | 105,026 | (9.8 | )% | ||||||||||
Provisions for Loan Losses | (119,045 | ) | (60,069 | ) | (49.5 | )% | (28,525 | ) | (16,772 | ) | (41.2 | )% | ||||||
Voluntary Provisions | 17,395 | 0 | — | (358 | ) | 0 | — | |||||||||||
Total Operating Expenses | (250,517 | ) | (224,436 | ) | (10.4 | )% | (73,995 | ) | (59,660 | ) | (19.4 | )% | ||||||
Net Income | 53,161 | 130,553 | 145.6 | % | 8,834 | 27,542 | 211.8 | % | ||||||||||
Earning per Share (Chilean pesos) | ||||||||||||||||||
Net income per Share | 0.78 | 1.92 | 145.6 | % | 0.13 | 0.40 | 211.8 | % | ||||||||||
Book value per Share | 9.17 | 10.22 | 11.4 | % | 9.17 | 10.22 | 11.4 | % | ||||||||||
Balance Sheet (Millions, Chilean pesos) | ||||||||||||||||||
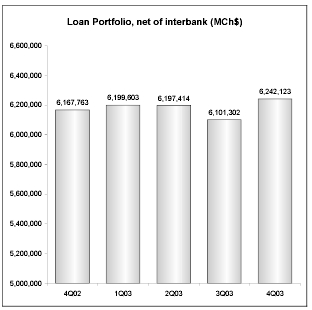
Loan Portfolio, Net of Interbank | 6,167,763 | 6,242,123 | 1.2 | % | 6,167,763 | 6,242,123 | 1.2 | % | ||||||||||
Total Assets | 8,679,770 | 9,249,902 | 6.6 | % | 8,679,770 | 9,249,902 | 6.6 | % | ||||||||||
Shareholders’ Equity | 624,412 | 695,676 | 11.4 | % | 624,412 | 695,676 | 11.4 | % | ||||||||||
Ratios | ||||||||||||||||||
Profitability | ||||||||||||||||||
ROAA | 0.59 | % | 1.44 | % | — | 0.39 | % | 1.19 | % | — | ||||||||
ROAE | 8.9 | % | 20.0 | % | — | 5.9 | % | 16.0 | % | — | ||||||||
Net Financial Margin | 4.1 | % | 3.8 | % | — | 4.5 | % | 3.8 | % | — | ||||||||
Efficiency ratio | 59.7 | % | 52.9 | % | — | 63.5 | % | 56.8 | % | — | ||||||||
Asset Quality | ||||||||||||||||||
Past Due Loans / Total Loans | 2.35 | % | 1.69 | % | — | 2.35 | % | 1.69 | % | — | ||||||||
Allowances / Total Loans | 3.51 | % | 2.87 | % | — | 3.51 | % | 2.87 | % | — | ||||||||
Allowances / Past Due Loans | 149.1 | % | 170.0 | % | — | 149.1 | % | 170.0 | % | — | ||||||||
Capital Adequacy | ||||||||||||||||||
Total Capital / Risk Adjusted Assets | 13.7 | % | 13.2 | % | — | 13.7 | % | 13.2 | % | — | ||||||||
Page 1 of 23
2003 Highlights
The Bank
| • | 2003 Strong Results. The Bank achieved strong and record results during 2003 as a consequence of its successful consolidation as the leading Chilean-owned Bank, posting an annual increase of 145.6% in net income, compare to a respective 4.9% increase for the rest of the financial system. During 2003, important post-merger synergies were reached, allowing lower operating expenses, a significant decrease in provisions and notable increase in fee income. The good results showed on a 20.0% ROAE for 2003, well above the Banking System’s respective ratio 14.9%. |
| • | Loan Portfolio. As of December 31, 2003 the Bank’s loan portfolio, net of interbank loans, totaled Ch$6,242,123 million, representing an annual increase of 1.2% and a quarterly expansion of 2.3% mainly fuelled by consumer and foreign trade loans. At the same date, the Bank reached and 18.5% market share. |
| • | Important Rise in Fee Income. A significant 30.2% growth in fee income during year 2003 resulted from the jointly effort of the Bank and its Subsidiaries in increasing this source of income which is an area of strategic importance within the Bank’s total net income. |
| • | Demand Deposits Growth. Demand deposit balance grew by 14.1% during the last twelve-months, contributing importantly to a better funding mix. This expansion was principally related to an increase of approximately 17,700 checking accounts and also due to higher volumes maintained as interest rates remained low. In terms of market share, the Bank concentrated 20.2% of demand deposit volumes as of December 31, 2003. |
| • | Efficiency Ratio. Cost savings produced by the merger were fully reflected during 2003, allowing the Bank to reach the lowest efficiency ratio of the last 10 years. Operating expenses decreased by 10.4% in the last twelve-months while the efficiency ratio improved to 52.9% as of December 2003 from 59.7% twelve-month earlier. |
| • | Leadership Position of Banco de Chile’s Subsidiaries. Banco de Chile continued reinforcing its leadership position in the Chilean market in non-traditional products and services offered through its subsidiaries. The Bank maintained its leadership position during the full year 2003 in the Stock Brokerage and General Fund Administrator Subsidiaries, holding the largest market shares, while Factoring subsidiary ranked first as of December 31, 2003 with an estimated market share of 23.0% at that date. |
| • | Banco de Chile’s Brokerage Subsidiary to Trade in Latibex. The Bank’s stock brokerage subsidiary should start its operations on Madrid’s Latin American securities market (Latibex) during the first quarter of 2004, via a Latibex terminal in Santiago. The Stock brokerage subsidiary will be the second Latin American broker to operate on the Latibex market and its aim is to participate as a “market maker”, fostering businesses between Chilean and European Capital Markets. |
| • | Banco de Chile was distinguished as the Best Bank in Latin America according to America Economia Magazine’s Ranking. Banco de Chile was ranked first in the most recent ranking elaborated by the Latin America magazine “America Economía” out from the 100 biggest banks in Latin America according to total assets. It is important to point out that for the first time, this |
Page 2 of 23
ranking considered not only the financial strength but also service quality, evaluated through its corporate image. |
Financial System Highlights
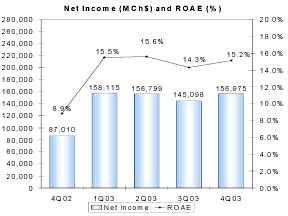
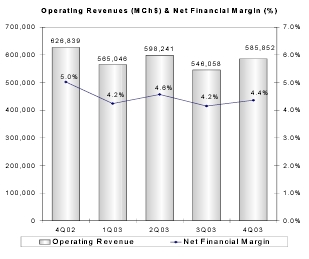
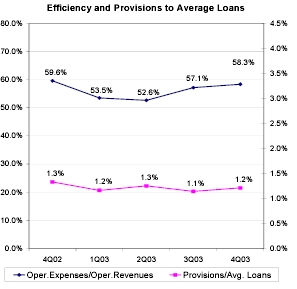
| • | Financial System’s Net Income increased by 19.3% in 2003 posting a net profit of Ch$617 billion during the last twelve-months and a ROAE of 14.9% as of December 31, 2003. The increase in net income was mainly fuelled by higher fees, lower operating expenses and lower provisions, which more than offset the 3.9% decline in net financial income. |
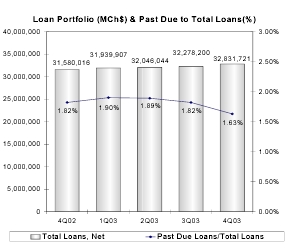
| • | Total loan portfolio, net of interbank loans has risen by 4.0% during the last twelve-months ending December 31, 2003 due to record low interest rates maintained during the year which impacted positively consumer and mortgage loans. In terms of credit quality, past due loans to total loans decreased from 1.82% at December 31, 2002 to 1.63% at December 31, 2003. |
Financial System’s Main Figures:
 |  | |
 |  | |
Page 3 of 23
Chilean Economy
| • | Signs of reactivation and higher dynamism were shown during 2003posting an annual GDP growth of 3.3% during 2003, mainly fueled by the export sector, compared to a 2.1% for 2002. Chilean inflation rate fell during 2003 to its lowest level since 1935 as the peso strengthened importantly against the dollar, allowing thus further reductions in the central bank’s interest rate reaching a record low level of 1.75% as of January 2004. |
| • | Positive Outlook for 2004as stronger domestic spending and external demand are expected in line with an annual GDP growth between 4.5% and 5.0% for the full year 2004. The Chilean economy should continue to benefit from the acceleration in the global economy and the high copper prices as well as from the US-Chile FTA, which will also reinforce the economic activity. In addition, improved consumer confidence and low interest rates will contribute to the domestic recovery. Regarding Inflation, it should remain close to the low end of the Central Bank’s target range of between 2%-4% for the end of 2004. |
Page 4 of 23
Banco Chile 2003 Fourth-Quarter and Year ended Consolidated Results
NET INCOME
Bank, Subsidiaries and Foreign Branches’ Net Income
(in millions of Chilean pesos, except for percentages)
| 2002 | 2003 | % Change 2003/2002 | 4Q02 | 4Q03 | % Change 4Q03/4Q02 | ||||||||||||
Bank | 45,203 | 100,878 | 123.2 | % | 2,212 | 21,381 | 866.6 | % | |||||||||
Stock Brokerage | 5,548 | 9,010 | 62.4 | % | 1,170 | 2,678 | 128.9 | % | |||||||||
Gral Adm. of Funds | 4,921 | 5,767 | 17.2 | % | 1,492 | 1,811 | 21.4 | % | |||||||||
Insurance Brokerage | 823 | 718 | (12.8 | )% | 162 | 197 | 21.6 | % | |||||||||
Financial Advisory | 660 | 782 | 18.5 | % | 139 | 44 | (68.3 | )% | |||||||||
Factoring | 1,289 | 1,911 | 48.3 | % | 275 | 567 | 106.2 | % | |||||||||
Securitization | 66 | 26 | (60.6 | )% | 127 | 84 | (33.9 | )% | |||||||||
Promarket1 | 57 | (72 | ) | — | (22 | ) | 36 | — | |||||||||
Socofin2 | 38 | 138 | 263.2 | % | 356 | 171 | (52.0 | )% | |||||||||
Foreign Branches | (5,444 | ) | 11,395 | — | 2,923 | 573 | (80.4 | )% | |||||||||
Total Net Income | 53,161 | 130,553 | 145.6 | % | 8,834 | 27,542 | 211.8 | % | |||||||||
Consolidated net income for the year ended December 31, 2003 reached a historic high level of Ch$130,553 million. The main drivers that explained the important increase of 146% in net income during 2003 were the decrease in provisions for loan losses, a 30.2% rise in fee income, lower operating expenses and higher recoveries of loans previously charged-off.
In addition, the Ch$18,280 million profit reached by the Bank’s subsidiaries during 2003, involved a 36.4% increase compared to 2002, mainly explained by the Stock Brokerage company and, to a lesser extent, by the General Fund Administrator and Factoring companies, leaders in their respective markets.
In turn, higher income obtained by the Stock Brokerage was principally due to significant fees obtained from higher stock trading volume (in line with the good performance of the overall stock market during 2003) and, to a lesser extent, to higher gains from trading of US dollars during 2003 as the exchange rate registered significant fluctuations during the year. General Fund Administrator’s higher net income was boosted by an important growth in fee income as average funds under management, on behalf of 116,255 participants, increased by 9.2% during the year. The Factoring subsidiary posted an important net income during 2003 compared to 2002 due to a 28.3% increase in its volumes and, to a lesser extent, to lower provisions for loan losses.
Foreign branches also contributed significantly to 2003 net income with a positive result of Ch$11,395 million as of December 31, 2003. This figure was principally influenced by extraordinary earnings obtained from the sale of latin American investment securities, which during 2002 accounted for significant mark to market losses against results.
| 1 | Subsidiary incorporated to the Bank during the 2Q02 that provides sale services to the Bank and its subsidiaries. |
| 2 | Subsidiary, incorporated to the Bank during the 3Q02, in charge of the judicial and extrajudicial collection of loans on behalf of the Bank or third parties. |
Page 5 of 23
Regarding the 212% higher net income during 4Q03 relative to last year’s same period, it was mainly explained by lower operating expenses, a decrease in provisions for loan losses and higher fee income.
Net income for 2003 resulted in an annualized return on average assets(ROAA) and annualized return on average shareholders’ equity(ROAE) of 1.44% and 20.0%, respectively, above the financial system’s comparable figures of 1.22% and 14.9%, for the same period and record levels of the year.
Page 6 of 23
NET FINANCIAL INCOME3
Net Interest Revenue
(in millions of Chilean pesos, except for percentages)
| 2002 | 2003 | % Change 2003/2002 | 4Q02 | 4Q03 | % Change 4Q03/4Q02 | |||||||||||||
Interest revenue | 696,603 | 428,704 | (38.5 | )% | 166,220 | 61,038 | (63.3 | )% | ||||||||||
Interest expense | (325,338 | ) | (204,234 | ) | (37.2 | )% | (91,768 | ) | (40,063 | ) | (56.3 | )% | ||||||
Foreign Exchange transaction, net | (31,981 | ) | 91,061 | — | 16,648 | 57,889 | 247.7 | % | ||||||||||
Net Financial Income | 339,284 | 315,531 | (7.0 | )% | 91,100 | 78,864 | (13.4 | )% | ||||||||||
Avg. Interest earning assets | 8,255,272 | 8,233,091 | (0.3 | )% | 8,176,935 | 8,271,893 | 1.2 | % | ||||||||||
Net Financial Margin4 | 4.1 | % | 3.8 | % | — | 4.5 | % | 3.8 | % | — | ||||||||
Net financial income totaled Ch$315,531 million for 2003, a 7.0% decrease compared to 2002 mainly as a consequence of the drop in net financial margin4 of 28 basis points during the year.
Net financial margin during 2003 was negatively impacted by a lower inflation rate. During 2003, the UF5 variation was 1.05% versus a 2.96% in 2002, and implied that during 2003 the Bank earned lower interest income on the portion of interest earning assets denominated in UF financed by interest bearing liabilities denominated in nominal Chilean pesos and by non-interest bearing liabilities. It is worth mentioning that Chile’s inflation rate during 2003 reached its lowest level since 1935.
| 3 | For analysis purposes, results from foreign exchange transactions, which consist mainly of the results of forward contracts which hedge foreign currencies and dollar-adjustable Chilean peso positions, have been included in the calculation of net financial income and the net financial margin. Under SBIF guidelines these gains/losses cannot be registered as interest revenue, but must be considered as gains/losses from foreign exchange transactions and, accordingly, registered in a different line of the income statements. This accounting asymmetry distorts net interest revenue and foreign exchange transaction gains, especially in periods of high volatility in the exchange rate. |
| 4 | Net financial income divided by average interest earning assets. |
| 5 | The UF is an accounting unit which is linked to the Chilean CPI, and changes daily to reflect fluctuations in the index over the previous month. It is worth mentioning that the CPI showed negative variations in six months within the year 2003. |
Page 7 of 23
It is worth noting that the fluctuation in the exchange rate has almost no effect at the bottom line, since the Bank does not take significant positions in foreign exchange currency in line with its conservative currency risk policies. However, the significant decrease recorded in the exchange rate during 2003 negatively impacted the net asset positions denominated in US dollars reflected at the operating income level, in the mentioned period. As counter effect the decrease in the exchange rate implied a decrease in the amount of allowances for loan losses associated to loans denominated in US dollars.
Finally, the absence of significant repricing benefits during 2003, as Chile’s Central Bank left its benchmark interest rate unchanged at a 2.75 percent between February and December 11, 2003, pulled down the net financial margin compared to the earlier year. On the contrary, during 2002 successive decreases in interest rates benefited 2002 net financial margin as the Bank’s interest bearing liabilities have a shorter repricing period than the interest earning assets.
Regarding the slightly decrease of 0.3% in average interest earning assets during 2003 compared to 2002, it was mainly driven by remunerated regulatory reserves (interbank bearing) and financial investments. However, average interest earning assets figures for 2003 are not totally comparable to the year-earlier figures as, in May 2003, the Chilean Central Bank reduced the rate of reserve requirements that Banks must hold in demand and time deposits denominated in foreign currency, which in turn reduced the volumes of reserves maintained as interest interbank deposits.
Net financial income decreased by 13.4% during the 4Q03 compared with 4Q02 principally due to a 65 basis points decrease in net financial margin partially offset by a slight increase in average interest earning assets and a better funding mix, reflected in the improvement of the ratio of interest bearing liabilities to interest earning assets which decreased to 71.7% in 4Q03 from 73.2% in 4Q02. The decrease in the net financial margin was mostly in response to the negative inflation rate of 0.2% during 4Q03 with respect to an extraordinary high inflation rate of 1.8% registered in the 4Q02.
Page 8 of 23
LOAN PORTFOLIO
Loan Portfolio
(in millions of Chilean pesos, except for percentages)
| Dec.02 | Sept.03 | Dec.03 | % Change 12-months | % Change 4Q03/3Q03 | ||||||||
Commercial Loans | 2,542,492 | 2,528,213 | 2,557,000 | 0.6 | % | 1.1 | % | |||||
Mortgage Loans1 | 1,199,144 | 1,150,668 | 1,128,030 | (5.9 | )% | (2.0 | )% | |||||
Consumer Loans | 416,885 | 435,884 | 478,093 | 14.7 | % | 9.7 | % | |||||
Foreign trade Loans | 617,788 | 617,850 | 658,280 | 6.6 | % | 6.5 | % | |||||
Contingent Loans | 385,585 | 397,584 | 409,612 | 6.2 | % | 3.0 | % | |||||
Others Outstanding Loans2 | 607,899 | 580,425 | 636,649 | 4.7 | % | 9.7 | % | |||||
Leasing Contracts | 251,584 | 266,920 | 268,956 | 6.9 | % | 0.8 | % | |||||
Past-due Loans | 146,386 | 123,758 | 105,503 | (27.9 | )% | (14.8 | )% | |||||
Total Loans, net | 6,167,763 | 6,101,302 | 6,242,123 | 1.2 | % | 2.3 | % | |||||
Interbank Loans | 55,366 | 29,627 | 13,223 | (76.1 | )% | (55.4 | )% | |||||
Total Loans | 6,223,129 | 6,130,929 | 6,255,346 | 0.5 | % | 2.0 | % | |||||
| 1 | Mortgage loans financed by mortgage bonds. |
| 2 | Includes mortgage loans financed by the Bank’s general borrowings. |
Total loan portfolio, net of interbank loans, amounted to Ch$6,242,123 million as of December 2003, the highest lending volume of 2003, reflecting a 1.2% annual increase and a 2.3% quarterly expansion. It is worth mentioning that the annual expansion was partially offset by the decrease in the exchange rate and by Ch$96,312 million of loans charge-offs.
Main drivers of the loan portfolio during 2003 were consumer and foreign trade loans. Consumer loans grew by 14.7% on the year to a record level since the merger. This increase was a consequence of the Bank’s focus on this higher yield product supported by several promotional campaigns mainly oriented to the higher income segment and, offering advantageous conditions sustained by the record low interest rates and Chile’s better economic expectations. Regarding foreign trade loans, the Bank attained the leadership in the Banking System reaching a market share of 23.9% as of December
Page 9 of 23
2003 as a consequence of improving service quality. The Ch$658,280 million in foreign trade loans was reached despite the negative effect of the 15.9% decline experienced by the exchange rate in the last twelve-months.
The line of other outstanding loans also performed well during the year and especially during the 4Q03 mainly due to a significant increase in factoring contracts, as the Bank’s subsidiary became the leader in the system, and also in mortgage loans financed by the Bank’s general borrowings, which totally offset the 5.9% annual decrease in mortgage loans financed by mortgage bonds. It is worth noting that the Bank experienced an overall increase of 10.6% in residential mortgage lending during the last twelve-months.
In addition, contingent loans and lease contracts continued with its positive trend in terms of volume expansion, while commercial loans remained almost stable during 2003, improving slightly in the last quarter of the year as further economic recovery is expected for year 2004.
In terms of segments, the largest increases in loan volumes were concentrated on middle market companies and high income individuals. As far as the lower-middle income individuals segment is concerned, it is important to note that at the beginning of year 2003 the Bank conducted a reappraisal in both the commercial and credit areas of the Bank’s consumer division, Credichile, in order to strengthen the growth in its loan portfolio. Growth for 4Q03 reported a 2.0% quarter on quarter, breaking the decreasing trend showed in the first half of the year.
Past Due Loans
(in millions of Chilean pesos, except for percentages)
| Dec.02 | Sept.03 | Dec.03 | % Change 12-months | % Change 4Q03/3Q03 | ||||||||
Commercial loans | 131,445 | 107,321 | 90,953 | (30.8 | )% | (15.3 | )% | |||||
Consumer loans | 4,594 | 3,086 | 3,370 | (26.6 | )% | 9.2 | % | |||||
Residential mortgage loans | 10,347 | 13,351 | 11,180 | 8.1 | % | (16.3 | )% | |||||
Total Past Due Loans | 146,386 | 123,758 | 105,503 | (27.9 | )% | (14.8 | )% | |||||
Year 2003 was marked by a more effective credit and collection policy, resulting in a significant reduction in past due loans, higher amounts of recoveries and a decrease in provisions for loan losses. Accordingly, past due loans’ decrease was mainly related lower risks of the overall loan portfolio and to important amounts of charge-offs loans during 2003, which were mostly previously provisioned. Past due loans were reduced by 27.9% to Ch$105,503 million as of December 31, 2003 from Ch$146,386 million at December 31, 2002 mainly related to commercial and consumer loans. As far as the ratio of past due loans to total loans is concerned, it improved to 1.69% in 2003 from 2.35% in 2002.
As we mentioned in our previous releases past due loans coming from residential mortgage loans have increased during the year as a consequence of the Bank’s decision of strengthening its collection process thus anticipating the legal collection proceedings on those loans, in which case the entire outstanding balance has to be included as past-due.
Page 10 of 23
![]()
FUNDING
Funding
(in millions of Chilean pesos, except for percentages)
| Dec.02 | Sept.03 | Dec.03 | % Change 12-months | % Change 4Q03/3Q03 | ||||||||
Non-interest Bearing Liabilities | ||||||||||||
Current Accounts | 1,082,905 | 1,110,932 | 1,227,877 | 13.4 | % | 10.5 | % | |||||
Bankers drafts and other deposits | 574,318 | 719,796 | 663,451 | 15.5 | % | (7.8 | )% | |||||
Other Liabilities | 558,534 | 618,537 | 669,509 | 19.9 | % | 8.2 | % | |||||
Total | 2,215,757 | 2,449,265 | 2,560,837 | 15.6 | % | 4.6 | % | |||||
Interest Bearing Liabilities | ||||||||||||
Savings & Time Deposits | 3,532,426 | 3,489,698 | 3,422,535 | (3.1 | )% | (1.9 | )% | |||||
Central Bank Borrowings | 3,801 | 3,127 | 27,881 | 633.5 | % | 791.6 | % | |||||
Securities sold under agreements to repurchase | 279,442 | 304,968 | 426,741 | 52.7 | % | 39.9 | % | |||||
Mortgage Finance Bonds | 1,094,881 | 1,027,430 | 1,014,452 | (7.3 | )% | (1.3 | )% | |||||
Subordinated Bonds | 280,431 | 273,383 | 271,197 | (3.3 | )% | (0.8 | )% | |||||
Other Bonds | 4,639 | 3,755 | 3,127 | (32.6 | )% | (16.7 | )% | |||||
Borrowings from Domestic Financ. Inst. | 50,993 | 62,691 | 49,882 | (2.2 | )% | (20.4 | )% | |||||
Foreign Borrowings | 515,447 | 580,692 | 717,969 | 39.3 | % | 23.6 | % | |||||
Other Obligations | 77,538 | 39,207 | 59,600 | (23.1 | )% | 52.0 | % | |||||
Total | 5,839,598 | 5,784,951 | 5,993,384 | 2.6 | % | 3.6 | % | |||||
Total Liabilities | 8,055,355 | 8,234,216 | 8,554,221 | 6.2 | % | 3.9 | % | |||||
Total liabilities increased by 6.2% during the last twelve-months and 3.9% during the third quarter of 2003, as both non-interest and interest bearing liabilities expanded in line with higher volumes in interest earning assets.
The increase in non-interest bearing liabilities was mainly a consequence of an increase of approximately 17,700 checking accounts during the year and higher balances maintained by the Bank’s customers influenced by lower nominal interest rates prevailed during 2003.
Page 11 of 23
Higher balance in interest bearing liabilities was principally driven by foreign borrowings and repurchase agreements. Foreign borrowings have expanded during 2003 in response to the increase in assets denominated in US dollar and denominated in Chilean pesos readjusted in accordance with changes in the U.S. dollar exchange rate (mainly Central Bank securities and Foreign Trade loans).
In overall terms, the Bank’s funding structure has improved showing a decrease in the ratio of average interest bearing liabilities to average interest earning assets from 75.0% in 2002 to 72.4% in 2003. The same positive trend can be observed in the 4Q03 in comparison to the previous quarter.
INVESTMENT PORTFOLIO
As of December 31, 2003, the Bank’s investment portfolio totaled Ch$1,916,324 million, representing 20.7% of the Bank’s total assets at that date. The Bank maintains a highly liquid portfolio, concentrated mainly in Chilean Central Bank Securities.
During the year 2003, the investment portfolio grew by 18.7% mainly during the 1Q03 and 4Q03 as a consequence of an increase in short-term Central Bank’s securities in order to comply with higher technical reserve requirements6 as a result of the significant growth in checking accounts in those periods. In addition, the Bank has also enlarged its exposure in Chilean Central Bank securities driven by the attractive levels of return of these assets.
At December 31, 2003, the investment portfolio was comprised principally by:
![]()
| 6 | Technical reserve applies to demand deposits, checking accounts, or obligations payable on sight, other deposits unconditionally payable immediately or within a term of less than 30 days and time deposits payable within 10 days prior to maturity, to the extent their aggregate amount exceeds 2.5 times the amount of a bank’s capital and reserves. |
Page 12 of 23
INCOME FROM SERVICES, NET
![]()
Income from Services
(in millions of Chilean pesos, except for percentages)
Composition by Company | 2002 | 2003 | % Change 2003/2002 | 4Q02 | 4Q03 | % Change 4Q03/4Q02 | ||||||||
Bank | 51,548 | 65,770 | 27.6 | % | 12,935 | 18,653 | 44.2 | % | ||||||
General Adm. of Funds | 11,986 | 13,448 | 12.2 | % | 3,584 | 3,833 | 6.9 | % | ||||||
Financial Advisory | 1,073 | 1,371 | 27.8 | % | 294 | 209 | (28.9 | )% | ||||||
Insurance Brokerage | 2,879 | 2,928 | 1.7 | % | 749 | 853 | 13.9 | % | ||||||
Stock Brokerage | 3,518 | 9,255 | 163.1 | % | 1,188 | 3,257 | 174.2 | % | ||||||
Factoring | 294 | 732 | 149.0 | % | 85 | 428 | 403.5 | % | ||||||
Socofin | 6,398 | 8,617 | 34.7 | % | 1,872 | 2,499 | 33.5 | % | ||||||
Securitization | 211 | 166 | (21.3 | )% | 193 | 128 | (33.7 | )% | ||||||
Foreign Branches | 1,500 | 1,102 | (26.5 | )% | 272 | 138 | (49.3 | )% | ||||||
Total Income from services, net | 79,407 | 103,389 | 30.2 | % | 21,172 | 29,998 | 41.7 | % | ||||||
The Bank’s fee income posted an important annual increase of 30.2% to Ch$103,389 million as of December 31, 2003. Total fees involved a contribution of 24.4% to operating income in 2003 compared to a 18.9% in 2002, reflecting the progress coming from both banking and non-banking services. The Bank registered higher fee income coming principally from: (i) financial services granted to corporations, in particular associated to the structure of syndicated loans, (ii) checking and sight accounts due to an increase in the number of checking accounts, a new fee structure associated mainly to overdrafts and higher ATM transactions, (iii) fees on lines of credit and, (iv) fees on prepaid loans.
Subsidiaries’ fee income increased by 38.5% during year 2003 mainly driven by the outstanding performance of the Stock Brokerage Subsidiary showing its strengthened position in the market, in a
Page 13 of 23
context of high volumes of stock transactions and high trading volumes of US dollars (as a consequence of the volatility in the exchange rate), all of which generated significant gains. The General Administrator of Funds, Factoring and Financial Advisory subsidiaries also achieved a better performance, supported by the Bank’s powerful brand and its extended distribution network. In addition, Socofin, the collection subsidiary, improved fee income generation as it has gradually absorbed Banco de Chile’s entire portfolio. During 2002, the Bank also used other suppliers for its collection services.
Regarding the 4Q03 increase of 41.7% in fee income compared to the year-earlier comparable quarter, it was also explained by higher banking fees, related to checking and demand accounts, ATMs transactions and prepaid consumer loans. A significant increase in fees coming from the Stock Brokerage, Socofin, the Factoring and the General Fund Administrator subsidiaries were led mainly by enhanced business volumes managed at the end of 2003, partly influenced by positive economic expectations for year 2004.
With this growth in fees, the ratio of fees over average loans picked to 1.91% in 4Q03 from 1.35% in 4Q02.
GAINS ON SALES OF FINANCIAL INSTRUMENTS, NET
The Bank’s total gains on sales of financial instruments reached Ch$5,330 million during year 2003, compared to Ch$1,130 million for 2002.
Despite the important mark to market and trading earnings obtained from Central Bank securities and mortgage finance bonds during 2002 (as a consequence of an approximately 75 basis points decline in long term interest rates during the year), the overall annual results for this item were impacted by the approximately Ch$13,900 million of mark to market losses coming from Argentinean securities7, accounted against results during the third quarter of 2002.
On the other hand, during 2003 local long-term interest rates experienced less volatility than in 2002 (remaining relatively stable around 4%) producing minor changes in the market value of the Chilean investment portfolio. Nevertheless, 2003 results were positively impacted by important earnings obtained from the sale of Argentinean securities, previously marked to market and booked in the New York Branch.
Regarding quarter on quarter figures, gains on sales of financial instruments declined from Ch$4,211 million in 4Q02 to a loss of Ch$3,836 million in 4Q03. The 4Q03 figure was mainly explained by: (i) marked to market losses as a consequence of a slight increase in local and international long-term interest rates during 4Q03, and, (ii) losses coming from the sale of an Argentinean bank’s loan booked in the New York Branch (as this client was previously provisioned, during this quarter the Bank released allowances for a similar amount).
| 7 | These investments were previously accounted as available for sale securities and marked to market against the equity line in the New York Branch. |
Page 14 of 23
PROVISIONS
Allowances and Provisions
(in millions of Chilean pesos, except for percentages)
| 2002 | 2003 | % Change 2003/2002 | 4Q02 | 4Q03 | % Change 4Q03/4Q02 | |||||||||||||
Allowances | ||||||||||||||||||
Allowances at the beginning of each period | 235,124 | 218,202 | (7.2 | )% | 215,769 | 178,882 | (17.1 | )% | ||||||||||
Price-level restatement | (6,500 | ) | (2,748 | ) | (57.7 | )% | (3,584 | ) | 196 | — | ||||||||
Charge-off | (112,072 | ) | (96,132 | ) | (14.2 | )% | (22,866 | ) | (16,459 | ) | (28.0 | )% | ||||||
Provisions for loan losses established, net | 119,045 | 60,069 | (49.5 | )% | 28,525 | 16,772 | (41.2 | )% | ||||||||||
Voluntary Provisions established, net | (17,395 | ) | 0 | — | 358 | 0 | — | |||||||||||
Allowances at the end of each period | 218,202 | 179,391 | (17.8 | )% | 218,202 | 179,391 | (17.8 | )% | ||||||||||
Provisions | ||||||||||||||||||
Provisions | (101,650 | ) | (60,069 | ) | (40.9 | )% | (28,883 | ) | (16,772 | ) | (41.9 | )% | ||||||
Ratios | ||||||||||||||||||
Allowances / Total loans | 3.51 | % | 2.87 | % | 3.51 | % | 2.87 | % | — | |||||||||
Risk Index | 3.04 | % | 2.36 | % | 3.04 | % | 2.36 | % | — | |||||||||
Provisions / Avg. Loans | 1.65 | % | 0.96 | % | 1.84 | % | 1.07 | % | — | |||||||||
Charge-offs / Avg. Loans | 1.82 | % | 1.53 | % | 1.46 | % | 1.05 | % | — | |||||||||
Recoveries / Avg. Loans | 0.20 | % | 0.40 | % | 0.25 | % | 0.48 | % | — | |||||||||
Provisions for year 2003 were Ch$60,069 million, far lower than the Ch$101,650 million reported in 2002. This 40.9% decline in provisions for loan losses is based on: (i) the important efforts made by the Bank in terms of credit quality which resulted in the establishment of significant allowances during 2002 and, (ii) the improved economic performance and expectations reflected in the downward trend of interest rates, inflation and unemployment and in the recovery of the GDP growth rate. Also, the sharp decline of 15.9% in the exchange rate during 2003 caused the decrease in the amount of allowances for those loans denominated in foreign currency (in 2002 the exchange rate increased by 3.0%). As a result, the ratio of provisions to average loans decreased to 0.96% in 2003 from 1.65% in 2002.
It is worth mentioning that during 2002 significant provisions were related to covering commercial loans mainly coming from Chilean medium size companies hurt by a weak economy and high unemployment, and from debtors in Argentina given its deteriorated economic situation. Also, during 2002, additional provisions were established as a consequence of the merger process due to the leveling of the credit risk classifications of commercial loans and to criteria unification on consumer loans.
The decrease in provisions for loan losses for the 4Q03 in comparison to the last quarter of 2002 also reflected Chile’s better economic conditions and stability. As a consequence, provisions to average loans, declined to 1.07% in 4Q03 from 1.84% in 4Q02.
As the Bank’s risk index is concerned, it showed a significant improvement significantly from 3.04% at the end of 2002, to 2.36% as of December 31, 2003.
Page 15 of 23
OTHER INCOME AND EXPENSES
Total Other Income and Expenses increased to Ch$8,748 million in 2003 from a loss of Ch$5,965 million in 2002 mainly due to higher recoveries of loans previously charged-off and lower non-operating expenses as during 2002 non-recurring expenses, such as provisions and charge-offs on premises, were charged as a result of the merger process. In addition, during 2003 the Bank registered lower provisions and charge-offs on assets received in lieu of payment compared to the earlier year.
Losses in participation in earnings of equity investments in both years were mainly related to an affiliate that offers e-commerce services to corporate customers.
OPERATING EXPENSES
![]()
Operating Expenses
(in millions of Chilean pesos, except for percentages)
| 2002 | 2003 | % Change 2003/ 2002 | 4Q02 | 4Q03 | % Change 4Q03/ 4Q02 | |||||||||||||
Personnel salaries and expenses | (135,443 | ) | (125,199 | ) | (7.6 | )% | (40,735 | ) | (35,780 | ) | (12.2 | )% | ||||||
Administrative and other expenses | (92,920 | ) | (82,280 | ) | (11.5 | )% | (28,706 | ) | (20,054 | ) | (30.1 | )% | ||||||
Depreciation and amortization | (22,154 | ) | (16,957 | ) | (23.5 | )% | (4,554 | ) | (3,826 | ) | (16.0 | )% | ||||||
Total operating expenses | (250,517 | ) | (224,436 | ) | (10.4 | )% | (73,995 | ) | (59,660 | ) | (19.4 | )% | ||||||
Bank’s operating expenses | 221,059 | 190,861 | (13.7 | )% | 66,069 | 50,381 | (23.7 | )% | ||||||||||
Subsidiaries and F. Branches’ oper.expenses | 29,458 | 33,575 | 14.0 | % | 7,926 | 9,279 | 17.1 | % | ||||||||||
Efficiency Ratio* | 59.7 | % | 52.9 | % | — | 63.5 | % | 56.8 | % | — | ||||||||
Efficiency Ratio** | 54.4 | % | 48.9 | % | — | 59.6 | % | 53.2 | % | — | ||||||||
| * | Operating expenses/Operating revenues |
| ** | Excludes depreciation and amortization |
Page 16 of 23
Total operating expenses reached Ch$224,436 million as of December 31, 2003 reflecting a year-over-year contraction of 10.4% mainly as a result of synergies and cost savings reached in response to the merger.
Personnel salaries and expenses dropped by 7.6% during the last twelve-months due to higher severance payments related to the headcount reductions of 881 employees during 2002. However, this impact was partially offset by an increase in personnel salaries in 2003 related to variable salaries paid as a consequence of higher profits generated by the Bank and its subsidiaries and to the leveling of compensation criteria between both banks. Regarding administrative costs, as a consequence of the merger, they experienced an overall decline mostly on maintenance of fixed asset and rental expenses (related to branch refurbishing on 2002), advisories, computers, advertising and utility expenses.
Lower depreciation expenses during 2003 were closely related to higher charge-offs during 2002 of discontinued software and of assets in those rented branches that were closed during the first half of 2002 as well as to higher depreciation of technological equipment, related to acquisitions necessary to integrate the information technology systems of both banks, the prior year.
In terms of quarters, the decline in 4Q03 operating expenses was mainly explained by merger costs previously mentioned and, to a lesser extent, by a one-time bonus payment during the 4Q02, related to the collective bargaining four-year agreement subscribed by Banco de Chile and one of its workers’ unions.
As a consequence of the continued efforts to reduce the Bank’s operating expenses, the efficiency ratio improved to a low record level of 52.9% in year 2003 from 59.7% in 2002, allowing the Bank to face future challenges and keep on emphasizing cost control as a key driver of growth and profitability.
LOSS FROM PRICE- LEVEL RESTATEMENT
Loss from price-level restatement amounted to Ch$4,036 million in 2003 compared to Ch$9,692 million during the 2002, mainly reflecting the decrease in the inflation rate used for adjustment purposes from 3.0% in 2002 to a 1.0% in 2003.
INCOME TAXES
During 2003, the Bank’s income taxes totaled Ch$13,902 million, compared to a tax credit of Ch$1,165 million in 2002. The annual increase in the income tax was mainly influenced by the following factors: (i) a higher income tax base in 2003 as a result of the 178% increase in net income before taxes between both years, (ii) an increase in the statutory tax rate from 16.0% in 2002 to 16.5% in 2003, (iii) a lower tax credit in 2003 relative to the amortization of the complementary accounts on deferred taxes accumulated for periods prior to 1999 and, (iv) non-recurring earnings in 2002 related to the recognition of deferred taxes as a consequence of the increase in the first category tax rate as from 2002 onwards.
It is important to note that the Bank’s effective rate is lower than the statutory corporate income tax rate, as under tax regulations the Bank is permitted to deduct dividend payments made to SAOS from its net income for tax calculation purposes.
Page 17 of 23
SHAREHOLDERS’ EQUITY
Shareholders’ Equity
(in million of Chilean Pesos)
| Dec.02 | Sept.03 | Dec.03 | %Change 12-months | |||||||
Capital and Reserves | 560,978 | 560,670 | 561,245 | 0.0 | % | |||||
Accumulated adjustment for translation differences8 | 8,755 | 6,350 | 3,605 | (58.8 | )% | |||||
Unrealized gain (loss) on permanent financial invest9 | 1,518 | (683 | ) | 273 | (82.0 | )% | ||||
Net Income | 53,161 | 102,702 | 130,553 | 145.6 | % | |||||
Total Shareholders’ equity | 624,412 | 669,039 | 695,676 | 11.4 | % | |||||
As of December 31, 2003, the Bank’s Shareholder Equity totaled Ch$695,676 million (US$1,160.6 million), an annual expansion of 11.4%, mainly as a consequence of higher net income recorded during 2003.
At the end of December 2003, on a consolidated basis, Total Capital to Risk-Adjusted Assets (BIS ratio) was 13.2%, and Basic Capital to Total Assets was 6.1%, both well above the minimum requirements applicable to Banco de Chile of 10% and 3%, respectively.
Note: All figures expressed in US dollars (except earnings per ADR) were converted using the exchange rate of Ch$599.42 for US$1.00 as of December 31, 2003. Earnings per ADR were calculated considering the nominal net income and the exchange rate existing at the end of each period.
— Financial Tables Follow —
| 8 | Represents the effect of the variation in the exchange rate on investments abroad that exceed the restatement of these investments according to the change in the consumer price index. |
| 9 | Financial investments traded on a secondary market are shown adjusted to market value, following specific instructions from the Superintendency of Banks and Financial Institutions. These instructions state that such adjustments should be recognized against income, except in the case of the permanent portfolio, when an equity account, “Unrealized gains (losses) on permanent financial investments”, may be directly charged or credited. |
Page 18 of 23
BANCO DE CHILE
CONSOLIDATED STATEMENTS OF INCOME (Under Chilean GAAP)
(Expressed in millions of constant Chilean pesos (MCh$) as of December 31, 2003 and millions of US dollars (MUS$))
| Quarters | % Change | Year ended | % Change | |||||||||||||||||||||||||||
| 4Q02 MCh$ | 3Q03 MCh$ | 4Q03 MCh$ | 4Q03 MUS$ | 4Q03-4Q02 | 4Q03-3Q03 | Dec 02 MCh$ | Dec 03 MCh$ | Dec 03 MUS$ | Dec 03-Dec 02 | |||||||||||||||||||||
Interest revenue and expense | ||||||||||||||||||||||||||||||
Interest revenue | 166,220 | 93,542 | 61,038 | 101.8 | (63.3 | )% | (34.7 | )% | 696,603 | 428,704 | 715.2 | (38.5 | )% | |||||||||||||||||
Interest expense | (91,768 | ) | (41,890 | ) | (40,063 | ) | (66.8 | ) | (56.3 | )% | (4.4 | )% | (325,338 | ) | (204,234 | ) | (340.7 | ) | (37.2 | )% | ||||||||||
Net interest revenue | 74,452 | 51,652 | 20,975 | 35.0 | (71.8 | )% | (59.4 | )% | 371,265 | 224,470 | 374.5 | (39.5 | )% | |||||||||||||||||
Income from services, net | ||||||||||||||||||||||||||||||
Income from fees and other services | 30,074 | 34,815 | 39,526 | 65.9 | 31.4 | % | 13.5 | % | 105,129 | 136,250 | 227.3 | 29.6 | % | |||||||||||||||||
Other services expenses | (8,902 | ) | (8,229 | ) | (9,528 | ) | (15.9 | ) | 7.0 | % | 15.8 | % | (25,722 | ) | (32,861 | ) | (54.8 | ) | 27.8 | % | ||||||||||
Income from services, net | 21,172 | 26,586 | 29,998 | 50.0 | 41.7 | % | 12.8 | % | 79,407 | 103,389 | 172.5 | 30.2 | % | |||||||||||||||||
Other operating income, net | ||||||||||||||||||||||||||||||
Gains on financial instruments, net | 4,211 | 461 | (3,836 | ) | (6.4 | ) | n/a | n/a | 1,130 | 5,330 | 8.9 | 371.7 | % | |||||||||||||||||
Foreign exchange transactions, net | 16,648 | 25,075 | 57,889 | 96.6 | 247.7 | % | 130.9 | % | (31,981 | ) | 91,061 | 151.9 | n/a | |||||||||||||||||
Total other operating income, net | 20,859 | 25,536 | 54,053 | 90.2 | 159.1 | % | 111.7 | % | (30,851 | ) | 96,391 | 160.8 | n/a | |||||||||||||||||
Operating Revenues | 116,483 | 103,774 | 105,026 | 175.2 | (9.8 | )% | 1.2 | % | 419,821 | 424,250 | 707.8 | 1.1 | % | |||||||||||||||||
Provision for loan losses | (28,883 | ) | (13,017 | ) | (16,772 | ) | (28.0 | ) | (41.9 | )% | 28.8 | % | (101,650 | ) | (60,069 | ) | (100.2 | ) | (40.9 | )% | ||||||||||
Other income and expenses | ||||||||||||||||||||||||||||||
Recovery of loans previously charged-off | 3,993 | 7,633 | 7,477 | 12.5 | 87.3 | % | (2.0 | )% | 12,033 | 25,391 | 42.4 | 111.0 | % | |||||||||||||||||
Non-operating income | 1,626 | 2,009 | 1,593 | 2.7 | (2.0 | )% | (20.7 | )% | 6,464 | 6,137 | 10.2 | (5.1 | %) | |||||||||||||||||
Non-operating expenses | (9,444 | ) | (5,890 | ) | (8,251 | ) | (13.8 | ) | (12.6 | )% | 40.1 | % | (23,482 | ) | (21,560 | ) | (36.0 | ) | (8.2 | %) | ||||||||||
Participation in earnings of equity investments | (408 | ) | 124 | 840 | 1.4 | n/a | 577.4 | % | (980 | ) | (1,220 | ) | (2.0 | ) | 24.5 | % | ||||||||||||||
Total other income and expenses | (4,233 | ) | 3,876 | 1,659 | 2.8 | n/a | (57.2 | )% | (5,965 | ) | 8,748 | 14.6 | n/a | |||||||||||||||||
Operating expenses | ||||||||||||||||||||||||||||||
Personnel salaries and expenses | (40,735 | ) | (30,741 | ) | (35,780 | ) | (59.7 | ) | (12.2 | )% | 16.4 | % | (135,443 | ) | (125,199 | ) | (208.9 | ) | (7.6 | )% | ||||||||||
Administrative and other expenses | (28,706 | ) | (19,780 | ) | (20,054 | ) | (33.5 | ) | (30.1 | )% | 1.4 | % | (92,920 | ) | (82,280 | ) | (137.3 | ) | (11.5 | )% | ||||||||||
Depreciation and amortization | (4,554 | ) | (4,080 | ) | (3,826 | ) | (6.4 | ) | (16.0 | )% | (6.2 | )% | (22,154 | ) | (16,957 | ) | (28.3 | ) | (23.5 | )% | ||||||||||
Total operating expenses | (73,995 | ) | (54,601 | ) | (59,660 | ) | (99.6 | ) | (19.4 | )% | 9.3 | % | (250,517 | ) | (224,436 | ) | (374.5 | ) | (10.4 | )% | ||||||||||
Loss from price-level restatement | (5,740 | ) | (399 | ) | 611 | 1.0 | n/a | n/a | (9,692 | ) | (4,036 | ) | (6.7 | ) | (58.4 | )% | ||||||||||||||
Minority interest in consolidated subsidiaries | (3 | ) | 0 | (1 | ) | 0.0 | (66.7 | )% | n/a | (1 | ) | (2 | ) | 0.0 | 100.0 | % | ||||||||||||||
Income before income taxes | 3,629 | 39,633 | 30,863 | 51.4 | 750.5 | % | (22.1 | )% | 51,996 | 144,455 | 241.0 | 177.8 | % | |||||||||||||||||
Income taxes | 5,205 | (3,223 | ) | (3,321 | ) | (5.5 | ) | n/a | 3.0 | % | 1,165 | (13,902 | ) | (23.2 | ) | n/a | ||||||||||||||
Net income | 8,834 | 36,410 | 27,542 | 45.9 | 211.8 | % | (24.4 | )% | 53,161 | 130,553 | 217.8 | 145.6 | % | |||||||||||||||||
BANCO DE CHILE
CONSOLIDATED BALANCE SHEETS (Under Chilean GAAP)
(Expressed in millions of constant Chilean pesos (MCh$) as of December 31, 2003 and millions of US dollars (MUS$))
| Dec 01 MCh$ | Dec 02 MCh$ | Sep 03 MCh$ | Dec 03 MCh$ | Dec 03 MUS$ | % Change | ||||||||||||||||
| Dec 03-Sep 03 | Dec 03-Dec 02 | ||||||||||||||||||||
ASSETS | |||||||||||||||||||||
Cash and due from banks | |||||||||||||||||||||
Noninterest bearing | 691,913 | 603,680 | 692,634 | 644,078 | 1,074.5 | (7.0 | %) | 6.7 | % | ||||||||||||
Interbank bearing | 111,004 | 79,507 | 37,799 | 212,756 | 354.9 | 462.9 | % | 167.6 | % | ||||||||||||
Total cash and due from banks | 802,917 | 683,187 | 730,433 | 856,834 | 1,429.4 | 17.3 | % | 25.4 | % | ||||||||||||
Financial investments | |||||||||||||||||||||
Government securities | 1,157,200 | 878,045 | 1,113,301 | 1,010,249 | 1,685.4 | (9.3 | %) | 15.1 | % | ||||||||||||
Investments purchase under agreements to resell | 51,978 | 32,499 | 15,258 | 29,660 | 49.5 | 94.4 | % | (8.7 | %) | ||||||||||||
Investment collateral under agreements to repurchase | 230,501 | 279,222 | 296,728 | 417,933 | 697.2 | 40.8 | % | 49.7 | % | ||||||||||||
Other investments | 650,550 | 425,124 | 411,259 | 458,482 | 764.9 | 11.5 | % | 7.8 | % | ||||||||||||
Total financial investments | 2,090,229 | 1,614,890 | 1,836,546 | 1,916,324 | 3,197.0 | 4.3 | % | 18.7 | % | ||||||||||||
Loans, Net | |||||||||||||||||||||
Commercial loans | 2,819,241 | 2,542,492 | 2,528,213 | 2,557,000 | 4,265.8 | 1.1 | % | 0.6 | % | ||||||||||||
Consumer loans | 403,142 | 416,885 | 435,884 | 478,093 | 797.6 | 9.7 | % | 14.7 | % | ||||||||||||
Mortgage loans | 1,316,769 | 1,199,144 | 1,150,668 | 1,128,030 | 1,881.9 | (2.0 | %) | (5.9 | %) | ||||||||||||
Foreign trade loans | 541,510 | 617,788 | 617,850 | 658,280 | 1,098.2 | 6.5 | % | 6.6 | % | ||||||||||||
Interbank loans | 29,950 | 55,366 | 29,627 | 13,223 | 22.1 | (55.4 | %) | (76.1 | %) | ||||||||||||
Lease contracts | 258,010 | 251,584 | 266,920 | 268,956 | 448.7 | 0.8 | % | 6.9 | % | ||||||||||||
Other outstanding loans | 441,831 | 607,899 | 580,425 | 636,649 | 1,062.1 | 9.7 | % | 4.7 | % | ||||||||||||
Past due loans | 125,544 | 146,386 | 123,758 | 105,503 | 176.0 | (14.8 | %) | (27.9 | %) | ||||||||||||
Contingent loans | 386,246 | 385,585 | 397,584 | 409,612 | 683.3 | 3.0 | % | 6.2 | % | ||||||||||||
Total loans | 6,322,243 | 6,223,129 | 6,130,929 | 6,255,346 | 10,435.7 | 2.0 | % | 0.5 | % | ||||||||||||
Allowances | (235,124 | ) | (218,202 | ) | (178,882 | ) | (179,391 | ) | (299.3 | ) | 0.3 | % | (17.8 | %) | |||||||
Total loans, net | 6,087,119 | 6,004,927 | 5,952,047 | 6,075,955 | 10,136.4 | 2.1 | % | 1.2 | % | ||||||||||||
Other assets | |||||||||||||||||||||
Assets received in lieu of payment | 34,179 | 19,187 | 17,049 | 15,627 | 26.1 | (8.3 | %) | (18.6 | %) | ||||||||||||
Bank premises and equipment | 150,362 | 140,736 | 129,570 | 127,755 | 213.1 | (1.4 | %) | (9.2 | %) | ||||||||||||
Investments in other companies | 5,416 | 4,825 | 3,508 | 5,296 | 8.8 | 51.0 | % | 9.8 | % | ||||||||||||
Other | 165,096 | 212,018 | 234,106 | 252,111 | 420.6 | 7.7 | % | 18.9 | % | ||||||||||||
Total other assets | 355,053 | 376,766 | 384,233 | 400,789 | 668.6 | 4.3 | % | 6.4 | % | ||||||||||||
Total assets | 9,335,318 | 8,679,770 | 8,903,259 | 9,249,902 | 15,431.4 | 3.9 | % | 6.6 | % | ||||||||||||
BANCO DE CHILE
CONSOLIDATED BALANCE SHEETS (Under Chilean GAAP)
(Expressed in millions of constant Chilean pesos (MCh$) as of December 31, 2003 and millions of US dollars (MUS$))
| Dec 01 MCh$ | Dec 02 MCh$ | Sep 03 MCh$ | Dec 03 MCh$ | Dec 03 MUS$ | % Change | |||||||||||
| Dec 03 - Sep 03 | Dec 03 - Dec 02 | |||||||||||||||
LIABILITIES & SHAREHOLDERS’ EQUITY | ||||||||||||||||
Deposits | ||||||||||||||||
Current accounts | 947,776 | 1,082,905 | 1,110,932 | 1,227,877 | 2,048.5 | 10.5 | % | 13.4 | % | |||||||
Bankers drafts and other deposits | 526,047 | 574,318 | 719,796 | 663,451 | 1,106.8 | (7.8 | %) | 15.5 | % | |||||||
Saving accounts and time deposits | 4,149,117 | 3,532,426 | 3,489,698 | 3,422,535 | 5,709.7 | (1.9 | %) | (3.1 | %) | |||||||
Total deposits | 5,622,940 | 5,189,649 | 5,320,426 | 5,313,863 | 8,865.0 | (0.1 | %) | 2.4 | % | |||||||
Borrowings | ||||||||||||||||
Central Bank borrowings | 80,068 | 3,801 | 3,127 | 27,881 | 46.5 | 791.6 | % | 633.5 | % | |||||||
Securities sold under agreements to repurchase | 257,828 | 279,442 | 304,968 | 426,741 | 711.9 | 39.9 | % | 52.7 | % | |||||||
Mortgage finance bonds | 1,409,294 | 1,094,881 | 1,027,430 | 1,014,452 | 1,692.4 | (1.3 | %) | (7.3 | %) | |||||||
Other bonds | 8,253 | 4,639 | 3,755 | 3,127 | 5.2 | (16.7 | %) | (32.6 | %) | |||||||
Subordinated bonds | 274,243 | 280,431 | 273,383 | 271,197 | 452.4 | (0.8 | %) | (3.3 | %) | |||||||
Borrowings from domestic financial institutions | 46,721 | 50,993 | 62,691 | 49,882 | 83.2 | (20.4 | %) | (2.2 | %) | |||||||
Foreign borrowings | 339,477 | 515,447 | 580,692 | 717,969 | 1,197.8 | 23.6 | % | 39.3 | % | |||||||
Other obligations | 75,545 | 77,538 | 39,207 | 59,600 | 99.5 | 52.0 | % | (23.1 | %) | |||||||
Total borrowings | 2,491,429 | 2,307,172 | 2,295,253 | 2,570,849 | 4,288.9 | 12.0 | % | 11.4 | % | |||||||
Other liabilities | ||||||||||||||||
Contingent liabilities | 385,873 | 384,802 | 397,991 | 409,638 | 683.4 | 2.9 | % | 6.5 | % | |||||||
Other | 171,736 | 173,732 | 220,546 | 259,871 | 433.5 | 17.8 | % | 49.6 | % | |||||||
Total other liabilities | 557,609 | 558,534 | 618,537 | 669,509 | 1,116.9 | 8.2 | % | 19.9 | % | |||||||
Minority interest in consolidated subsidiaries | 3 | 3 | 4 | 5 | 0.0 | 25.0 | % | 66.7 | % | |||||||
Shareholders’ equity | ||||||||||||||||
Capital and Reserves | 562,354 | 571,251 | 566,337 | 565,123 | 942.8 | (0.2 | %) | (1.1 | %) | |||||||
Net income for the year | 100,983 | 53,161 | 102,702 | 130,553 | 217.8 | 27.1 | % | 145.6 | % | |||||||
Total shareholders’ equity | 663,337 | 624,412 | 669,039 | 695,676 | 1,160.6 | 4.0 | % | 11.4 | % | |||||||
Total liabilities & shareholders’ equity | 9,335,318 | 8,679,770 | 8,903,259 | 9,249,902 | 15,431.4 | 3.9 | % | 6.6 | % | |||||||
BANCO DE CHILE
SELECTED CONSOLIDATED FINANCIAL INFORMATION
| Quarters | Year ended | ||||||||||||||
| 4Q02 | 3Q03 | 4Q03 | Dec 02 | Dec 03 | |||||||||||
Earnings per Share | |||||||||||||||
Net income per Share (Ch$) (1) | 0.13 | 0.53 | 0.40 | 0.78 | 1.92 | ||||||||||
Net income per ADS (Ch$)(1) | 77.86 | 320.89 | 242.73 | 468.52 | 1,150.59 | ||||||||||
Net income per ADS (US$)(2) | 0.11 | 0.48 | 0.40 | 0.66 | 1.92 | ||||||||||
Book value per Share (Ch$)(1) | 9.17 | 9.83 | 10.22 | 9.17 | 10.22 | ||||||||||
Shares outstanding (Millions) | 68,080 | 68,080 | 68,080 | 68,080 | 68,080 | ||||||||||
Profitability Ratios(3)(4) | |||||||||||||||
Net Interest Margin | 3.64 | % | 2.51 | % | 1.01 | % | 4.50 | % | 2.73 | % | |||||
Net Financial Margin | 4.46 | % | 3.73 | % | 3.81 | % | 4.11 | % | 3.83 | % | |||||
Fees / Avg. Interest Earnings Assets | 1.04 | % | 1.29 | % | 1.45 | % | 0.96 | % | 1.26 | % | |||||
Other Operating Revenues / Avg. Interest Earnings Assets | 1.02 | % | 1.24 | % | 2.61 | % | -0.37 | % | 1.17 | % | |||||
Operating Revenues / Avg. Interest Earnings Assets | 5.70 | % | 5.04 | % | 5.08 | % | 5.09 | % | 5.15 | % | |||||
Return on Average Total Assets | 0.39 | % | 1.59 | % | 1.19 | % | 0.59 | % | 1.44 | % | |||||
Return on Average Shareholders’ Equity | 5.86 | % | 21.93 | % | 15.99 | % | 8.88 | % | 20.01 | % | |||||
Capital Ratios | |||||||||||||||
Shareholders Equity / Total Assets | 7.19 | % | 7.51 | % | 7.52 | % | 7.19 | % | 7.52 | % | |||||
Basic capital / total assets | 6.55 | % | 6.32 | % | 6.08 | % | 6.55 | % | 6.08 | % | |||||
Basic Capital / Risk-Adjusted Assets | 9.41 | % | 9.42 | % | 9.20 | % | 9.41 | % | 9.20 | % | |||||
Total Capital / Risk-Adjusted Assets | 13.69 | % | 13.58 | % | 13.22 | % | 13.69 | % | 13.22 | % | |||||
Credit Quality Ratios | |||||||||||||||
Past Due Loans / Total Loans | 2.35 | % | 2.02 | % | 1.69 | % | 2.35 | % | 1.69 | % | |||||
Allowance for loan losses / past due loans | 149.06 | % | 144.54 | % | 170.03 | % | 149.06 | % | 170.03 | % | |||||
Allowance for Loans Losses / Total Loans | 3.51 | % | 2.92 | % | 2.87 | % | 3.51 | % | 2.87 | % | |||||
Provision for Loan Losses / Avg. Loans(4) | 1.84 | % | 0.83 | % | 1.07 | % | 1.65 | % | 0.96 | % | |||||
Risk index consolidated | 3.04 | % | 2.42 | % | 2.36 | % | 3.04 | % | 2.36 | % | |||||
Operating and Productivity Ratios | |||||||||||||||
Operating Expenses / Operating Revenue | 63.52 | % | 52.62 | % | 56.80 | % | 59.67 | % | 52.90 | % | |||||
Operating Expenses / Average Total Assets(3) | 3.29 | % | 2.38 | % | 2.58 | % | 2.77 | % | 2.47 | % | |||||
Loans per employee (million Ch$)(1) | 719 | 680 | 685 | 719 | 685 | ||||||||||
Average Balance Sheet Data(1)(3) | |||||||||||||||
Avg. Interest Earnings Assets (million Ch$) | 8,176,935 | 8,236,708 | 8,271,893 | 8,255,272 | 8,233,091 | ||||||||||
Avg. Assets (million Ch$) | 9,004,001 | 9,158,225 | 9,242,143 | 9,052,546 | 9,093,085 | ||||||||||
Avg. Shareholders Equity (million Ch$) | 603,308 | 664,059 | 688,999 | 598,875 | 652,423 | ||||||||||
Avg. Loans | 6,276,610 | 6,275,565 | 6,279,817 | 6,160,712 | 6,275,485 | ||||||||||
Avg. Interest Bearing Liabilities (million Ch$) | 5,985,835 | 6,004,733 | 5,932,288 | 6,195,229 | 5,963,821 | ||||||||||
Other Data | |||||||||||||||
Inflation Rate | 0.34 | % | 0.27 | % | -0.78 | % | 2.82 | % | 1.07 | % | |||||
Exchange rate (Ch$) | 712.38 | 665.13 | 599.42 | 712.38 | 599.42 | ||||||||||
Employees | 8,655 | 9,013 | 9,130 | 8,655 | 9,130 | ||||||||||
Notes
| (1) | These figures were expressed in constant Chilean pesos as of December 31, 2003. |
| (2) | These figures were calculated considering the nominal net income, the shares outstanding and the exchange rates existing at the end of each period. |
| (3) | The ratios were calculated as an average of daily balances. |
| (4) | Annualized data. |
FORWARD-LOOKING INFORMATION
The information contained herein incorporates by reference statements which constitute “forward-looking statements,” in that they include statements regarding the intent, belief or current expectations of our directors and officers with respect to our future operating performance. Such statements include any forecasts, projections and descriptions of anticipated cost savings or other synergies. You should be aware that any such forward-looking statements are not guarantees of future performance and may involve risks and uncertainties, and that actual results may differ from those set forth in the forward-looking statements as a result of various factors (including, without limitations, the actions of competitors, future global economic conditions, market conditions, foreign exchange rates, and operating and financial risks related to managing growth and integrating acquired businesses), many of which are beyond our control. The occurrence of any such factors not currently expected by us would significantly alter the results set forth in these statements.
Factors that could cause actual results to differ materially and adversely include, but are not limited to:
| • | changes in general economic, business or political or other conditions in Chile or changes in general economic or business conditions in Latin America; |
| • | changes in capital markets in general that may affect policies or attitudes toward lending to Chile or Chilean companies; |
| • | unexpected developments in certain existing litigation; |
| • | increased costs; |
| • | unanticipated increases in financing and other costs or the inability to obtain additional debt or equity financing on attractive terms; and |
You should not place undue reliance on such statements, which speak only as of the date that they were made. Our independent public accountants have not examined or compiled the forward-looking statements and, accordingly, do not provide any assurance with respect to such statements. These cautionary statements should be considered in connection with any written or oral forward-looking statements that we may issue in the future. We do not undertake any obligation to release publicly any revisions to such forward-looking statements after completion of this offering to reflect later events or circumstances or to reflect the occurrence of unanticipated events.
Contacts-Banco de Chile:
Ximena Tarzijan
(56-2) 637 2868
xtarzijan@bancochile.cl
Jacqueline Barrio
(56-2) 637 2938
jbarrio@bancochile.cl
Ricardo Morales
(56-2) 637 3519
rmorales@bancochile.cl
SIGNATURE
Pursuant to the requirements of the Securities Exchange Act of 1934, the registrant has duly caused this report to be signed on its behalf by the undersigned, thereunto duly authorized.
Date: January 29, 2004
Banco de Chile | ||
/s/ Pablo Granifo | ||
By: Pablo Granifo General Manager | ||