SECURITIES AND EXCHANGE COMMISSION
Washington, D.C. 20549
FORM 6-K
REPORT OF FOREIGN ISSUER
Pursuant to Rule 13a-16 or 15d-16 of the
Securities Act of 1934
For the month of November, 2003
of Chile, Bank
(Translation of Registrant’s name into English)
Chile
(Jurisdiction of incorporation or organization)
Ahumada 251
Santiago, Chile
(Address of principal executive offices)
Indicate by check mark whether the registrant files or will file annual reports under cover of Form 20-F or Form 40-F.
Form 20-F x Form 40-F ¨
Indicate by check mark whether the registrant by furnishing the information contained in this Form is also thereby furnishing the information to the Commission pursuant to Rule 12g-3-2(b) under the Securities Exchange Act of 1934. Yes ¨ No x
(If “Yes” is marked, indicate below the file number assigned to the registrant in connection with Rule 12g3-2(b): 82- .)
BANCO DE CHILE
REPORT ON FORM 6-K
Attached is an English translation of a Press Release issued by Banco de Chile (“the Bank”) on November 6, 2003, regarding its financial statements for the nine months ended September 30, 2003.

www.bancochile.cl
Banco de Chile Announces 2003 Third-Quarter Results
Santiago, Chile, November 6, 2003—Banco de Chile (NYSE: BCH), a Chilean full-service financial institution, market leader in a wide variety of credit and non-credit products and services across all segments of the Chilean financial market, today announced results for the third quarter ended September 30, 2003. The results have been prepared in accordance with Chilean GAAP on an unaudited, consolidated basis. All figures are expressed in constant Chilean pesos as of September 30, 2003, unless otherwise stated. Therefore, all growth rates are in real terms.
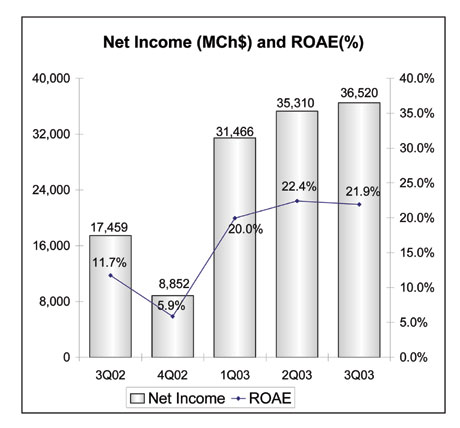
Net income for the third quarter of 2003 was Ch$36,520 million (Ch$0.54/share or US$0.48/ADS), which represents an important increase of 109.2% when compared to Ch$17,459 million recorded in the third quarter of 2002.
2003 Third-Quarter Selected Financial Data
| 3Q02 | 2Q03 | 3Q03 | % Change 3Q03/3Q02 | |||||||||
Income Statement (Millions, Chilean pesos) | ||||||||||||
Net Financial Income | 84,962 | 84,170 | 76,957 | (9.4 | )% | |||||||
Income from Services | 24,501 | 26,077 | 27,117 | 10.7 | % | |||||||
Gains on Sales of Financial Instruments | (15,171 | ) | 2,862 | 193 | — | |||||||
Operating Revenues | 94,292 | 113,109 | 104,267 | 10.6 | % | |||||||
Provisions for Loan Losses | (19,064 | ) | (16,937 | ) | (13,056 | ) | (31.5 | )% | ||||
Voluntary Provisions | 13,910 | 0 | 0 | — | ||||||||
Total Operating Expenses | (64,404 | ) | (56,494 | ) | (54,947 | ) | (14.7 | )% | ||||
Net Income | 17,459 | 35,310 | 36,520 | 109.2 | % | |||||||
Earning per Share (Chilean pesos) | ||||||||||||
Net income per Share | 0.26 | 0.52 | 0.54 | 109.2 | % | |||||||
Book value per Share | 9.04 | 9.34 | 9.86 | 9.0 | % | |||||||
Balance Sheet (Millions, Chilean pesos) | ||||||||||||
Loan Portfolio | 6,397,245 | 6,240,026 | 6,149,376 | (3.9 | )% | |||||||
Total Assets | 9,505,596 | 9,301,432 | 8,932,164 | (6.0 | )% | |||||||
Shareholders’ Equity | 615,449 | 635,772 | 671,052 | 9.0 | % | |||||||
Ratios | ||||||||||||
Profitability | ||||||||||||
ROAA | 0.75 | % | 1.55 | % | 1.59 | % | — | |||||
ROAE | 11.7 | % | 22.4 | % | 21.9 | % | — | |||||
Net Financial Margin | 4.0 | % | 4.1 | % | 3.7 | % | — | |||||
Efficiency ratio | 68.3 | % | 50.0 | % | 52.7 | % | — | |||||
Asset Quality | ||||||||||||
Past Due Loans / Total Loans | 2.51 | % | 2.32 | % | 2.02 | % | — | |||||
Allowances / Total Loans | 3.38 | % | 3.29 | % | 2.92 | % | — | |||||
Allowances / Past Due Loans | 134.9 | % | 141.6 | % | 144.5 | % | — | |||||
Capital Adequacy | ||||||||||||
Total Capital / Risk Adjusted Assets | 13.0 | % | 13.6 | % | 13.6 | % | — | |||||
Page 1 of 17
Third Quarter 2003 Highlights
The Bank
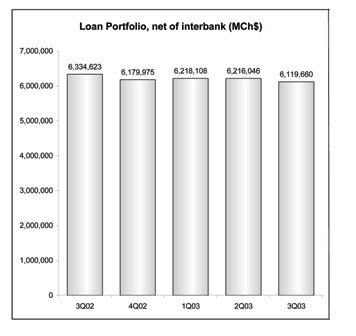
| • | Loan Portfolio. As of September 30, 2003 the Bank’s loan portfolio, net of interbank loans, totaled Ch$6,119,660 million, reaching an 18.2% market share. Total loan portfolio decreased by 3.4% compared to September 2002, however, excluding the negative impact of the decline in the exchange rate on loans denominated in foreign currency, the loan portfolio would have decreased only by 0.9% between the same periods. |
| • | Upward Trend of ROAE. The Bank continued the trend of positive results showed in the first half of 2003, posting a ROAE of 21.93% for the third quarter of 2003, in line with the Bank’s plans and well above the Banking System’s ROAE of 14.3% for the same period. |
| • | New Technology Platform. The Bank continued advancing in the development of a new technological platform project in order to improve efficiency and service quality. This will enable the Bank to increase business volumes and our market share. The technology medium term plan will be implemented with the support of an important technology company, and will imply an investment of approximately US$ 40 million on the first stage. |
| • | Strong Performance of Subsidiaries. Total income coming from subsidiaries during 3Q03 continued showing a strong performance, increasing by 59.2% compared to the previous year same quarter. These positive results were mainly led by the Stock Brokerage, the General Administration of Funds and the Factoring subsidiaries, the first two ones leaders in terms of market share within the financial system. |
| • | Banco de Chile Stands Out For its Financial Strength and Human Resources Quality.The Bank was once again considered within the top 10 most respected companies in Chile as per the mentioned attributes, according to a survey conducted by PricewaterhouseCoopers Consulting and Diario Financiero (a Chilean Financial Newspaper) which included the opinion of about 200 CEOs and Directors of the most important companies in Chile, across different economic sectors. |
| • | Banco de Chile carried out a successful local placement of bonds issued by Metro de Santiago.Banco de Chile jointly with the Financial Advisory and Stock Brokerage subsidiaries materialized a successful placement of a 25 year bond for an amount of 4,000,000 UF (approximately Ch$67,784 million) issued by Metro de Santiago, for the purpose of financing the construction of a new line of the light urban train in Santiago thus importantly improving the public transportation system. |
Financial System Highlights
| • | The Financial System’s Net Income decreased by 7.5% in 3Q03 compared to 2Q03, due to a decline in net financial income, resulting in a drop in the system’s ROAE to 14.3% from 15.6% in 2Q03. |
| • | Total loan portfolio, net of interbank loans as of September 2003 continued to show a weak performance, increasing a slight 0.60% and 0.72% on an annual and quarterly basis, respectively. However, this slight increase was negatively impacted by the decrease in the exchange rate. Indeed, excluding this negative effect, the system’s loan portfolio would have increased approximately 2.8% and 1.4% related to September 2002 and June 2003, respectively. |
Page 2 of 17
| • | During the 3Q03 anew local bank initiated its operations while a new license for the creation of another bank was granted by the Superintendency of Banks. In turn, as of September 30, 2003 the Chilean Financial System was comprised by 26 Banks compared to 25 at the same date last year. |
Financial System’s Main Figures:
Page 3 of 17
Banco Chile 2003 Third-Quarter Consolidated Results
NET INCOME
The 109.2% increase inconsolidated net income for the 3Q03 compared to the 3Q02 was mainly explained by a 14.7% decline in operating expenses coupled with a 10.6% increase in operating revenues and, to a lesser extent, by the 31.5% decrease in provisions for loan losses.
Higher results coming from theBank’s subsidiaries, mainly from the Stock Brokerage company, during 3Q03 also explained in part the better results of this quarter related to last year same quarter. Net income from subsidiaries totaled Ch$4,744 million during the third quarter of 2003, a 59.2% rise from the third quarter of 2002, mainly fueled by the better performance of the Stock Brokerage subsidiary, which remains as the leader in securities transaction volume with a 27.3% market share as of September 30, 2003 and, to a lesser extent, to higher net income obtained by the Factoring Subsidiary as volumes increased and provisions for loan losses decreased.
Regarding the results of ourforeign branchesduring 3Q02, they were mainly explained by marked to market losses coming from Argentinean investments that were accounted against results for an amount of approximately Ch$13,900 million. As we mentioned in the 3Q02 release, these investments were previously accounted as available for sale securities and marked to market against equity line in the New York branch. Also it is important to note that during 3Q02, a release of voluntary provisions for an equivalent amount totally offset the effect on the bottom line. On the other hand, special mention should we made of the significant decrease experienced by the exchange rate during year 2003, which has reduced the results attained by these branches in terms of Chilean pesos during the second and third quarter of 2003.
The 3.4% increase in net income during 3Q03 relative to the previous quarter was primarily explained by lower provisions for loan losses and, to a lesser extent, by higher other income and expenses, higher fees and lower operating expenses. These positive effects more than offset the decline in net financial income and in foreign branches’ results, as during 2Q03, the New York branch obtained significant earnings related mainly to sales of Argentinean securities.
Page 4 of 17
Third quarter 2003 net income resulted in an annualized return on average assets(ROAA) and annualized return on average shareholders’ equity(ROAE) of 1.59% and 21.93%, respectively, well above the financial system’s comparable figures of 1.13% and 14.32%, for the same period.
Bank, Subsidiaries and Foreign Branches’ Net Income
(in millions of Chilean pesos, except for percentages)
| 3Q02 | 2Q03 | 3Q03 | % Change 3Q03/3Q02 | |||||||||
Bank | 28,257 | 26,704 | 30,457 | 7.8 | % | |||||||
Foreign Branches | (13,777 | ) | 3,871 | 1,319 | — | |||||||
Stock Brokerage | 1,392 | 2,361 | 2,423 | 74.1 | % | |||||||
Gral Adm. of Funds1 | 1,292 | 1,270 | 1,354 | 4.8 | % | |||||||
Insurance Brokerage | 141 | 123 | 227 | 61.0 | % | |||||||
Financial Advisory | 180 | 615 | 157 | (12.8 | )% | |||||||
Factoring | 272 | 436 | 538 | 97.8 | % | |||||||
Securitization | (17 | ) | (20 | ) | (19 | ) | 11.8 | % | ||||
Promarket2 | 42 | (103 | ) | (8 | ) | — | ||||||
Socofin3 | (323 | ) | 53 | 72 | — | |||||||
Total Net Income | 17,459 | 35,310 | 36,520 | 109.2 | % | |||||||
| 1 | Subsidiary resulted from the merger between Banchile Mutual Fund Subsidiary and Banchile Investment Fund Subsidiary. |
| 2 | Subsidiary incorporated to the Bank during the 2Q02 that provides sale services to the Bank and its subsidiaries. |
| 3 | Subsidiary, incorporated to the Bank during the 3Q02, in charge of the judicial and extrajudicial collection of loans on behalf of the Bank or third parties. During the 3Q02, the Bank recognized in its Income Statements Socofin’s results for the first nine months of 2002. As a consequence the 3Q02 figures are not comparable to the others quarters. |
Page 5 of 17
NET FINANCIAL INCOME4
Net Interest Revenue
(in millions of Chilean pesos, except for percentages)
| 3Q02 | 2Q03 | 3Q03 | % Change 3Q03/3Q02 | |||||||||
Interest revenue | 188,983 | 134,299 | 93,843 | (50.3 | )% | |||||||
Interest expense | (77,253 | ) | (69,848 | ) | (42,016 | ) | (45.6 | )% | ||||
Foreign Exchange transaction, net | (26,768 | ) | 19,719 | 25,130 | — | |||||||
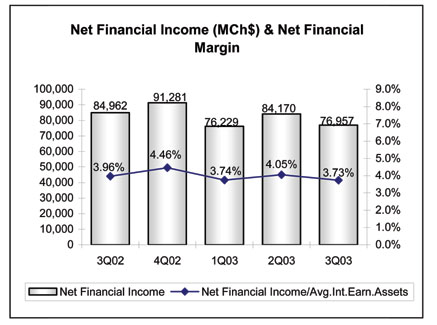
Net Financial Income | 84,962 | 84,170 | 76,957 | (9.4 | )% | |||||||
Avg. Interest earning assets | 8,574,952 | 8,312,142 | 8,261,493 | (3.7 | )% | |||||||
Net Financial Margin5 | 4.0 | % | 4.1 | % | 3.7 | % | — | |||||
Net Interest Margin | 5.2 | % | 3.1 | % | 2.5 | % | — | |||||
Net financial income totaled Ch$76,957 million for the third quarter of 2003, a 9.4% and 8.6% decrease compared to the third quarter of 2002 and the second quarter of 2003, respectively. These decreases were mainly due to a decline of 32 and 23 basis points in net financial margin5 compared to 2Q03 and 3Q02, respectively, and to a decrease in average interest earning assets.
The decrease in average interest earning assets during 3Q03 compared to 3Q02 was mainly driven by average financial investments and average interest bearing interbank deposits and, to a lesser extent, by lower mortgage loans.
| 4 | For analysis purposes, results from foreign exchange transactions, which consist mainly of the results of forward contracts which hedge foreign currencies and dollar-adjustable Chilean peso positions, have been included in the calculation of net financial income and the net financial margin. Under SBIF guidelines these gains/losses cannot be registered as interest revenue, but must be considered as gains/losses from foreign exchange transactions and, accordingly, registered in a different line of the income statements. This accounting asymmetry distorts net interest revenue and foreign exchange transaction gains, especially in periods of high volatility in the exchange rate. |
| 5 | Net financial income divided by average interest earning assets. |
Page 6 of 17
However, average interest earning assets figures for 2003 are not totally comparable to the year-earlier same figures, as in the 4Q02 the Superintendency of Banks changed the accounting guidelines affecting the presentation of mortgage finance bonds6 maintained as financial investments. In addition, in May 2003, the Chilean Central Bank reduced the rate of reserve requirements that Banks must hold in demand and time deposits denominated in foreign currency, which in turn reduced the volumes of reserves maintained as interest bearing interbank deposits. Excluding both effects in 3Q02, average interest earning assets would have decreased by approximately 0.7% instead of 3.7%.
In addition, despite the matched spreads remained stable, net financial margin during 3Q03 was negatively impacted by:
| (1) | a lower inflation rate, measured by the variation of the UF7 which was (0.1)% in 3Q03 versus a 1.05% in 2Q03 and 0.6% in 3Q02, which implied that during the 3Q03 the Bank earned lower interest income on the portion of interest earning assets denominated in UF financed by interest bearing liabilities denominated in nominal Chilean pesos and by non-interest bearing liabilities and, |
| (2) | a significant decrease in the exchange rate which in turn negatively impacted the net asset positions denominated in US dollars (as counterparty the decrease in the exchange rate implied a decrease in the amount of allowances for loan losses associated to loans denominated in US dollars) |
However, these negative effects were partially offset by a better funding mix, reflected in the improvement of the ratio of interest bearing liabilities to interest earning assets which decreased to 72.9% in 3Q03 from 74.5% in 3Q02.
LOAN PORTFOLIO
| 6 | In accordance to the new guidelines dictated by the Superintendency of Banks, since October, 2002, the Bank excludes from its financial investments, the mortgage bonds issued by the Bank excluding as well the corresponding liability. |
| 7 | The UF is an accounting unit which is linked to the Chilean CPI, and changes daily to reflect fluctuations in the index over the previous month. |
Page 7 of 17
Loan Portfolio
(in millions of Chilean pesos, except for percentages)
| Sept.02 | June.03 | Sept.03 | % Change 12-months | % Change 3Q03/2Q03 | ||||||||
Commercial Loans | 2,605,011 | 2,541,430 | 2,535,820 | (2.7 | )% | (0.2 | )% | |||||
Mortgage Loans1 | 1,238,062 | 1,163,976 | 1,154,130 | (6.8 | )% | (0.8 | )% | |||||
Consumer Loans | 400,774 | 405,187 | 437,196 | 9.1 | % | 7.9 | % | |||||
Foreign trade Loans | 716,515 | 683,532 | 619,709 | (13.5 | )% | (9.3 | )% | |||||
Contingent Loans | 388,718 | 407,590 | 398,780 | 2.6 | % | (2.2 | )% | |||||
Others Outstanding Loans2 | 574,539 | 600,272 | 582,172 | 1.3 | % | (3.0 | )% | |||||
Leasing Contracts | 250,573 | 269,103 | 267,723 | 6.8 | % | (0.5 | )% | |||||
Past-due Loans | 160,431 | 144,956 | 124,130 | (22.6 | )% | (14.4 | )% | |||||
Total Loans, net | 6,334,623 | 6,216,046 | 6,119,660 | (3.4 | )% | (1.6 | )% | |||||
Interbank Loans | 62,622 | 23,980 | 29,716 | (52.5 | )% | 23.9 | % | |||||
Total Loans | 6,397,245 | 6,240,026 | 6,149,376 | (3.9 | )% | (1.5 | )% | |||||
| 1 | Mortgage loans financed by mortgage bonds. |
| 2 | Includes mortgage loans financed by the Bank’s general borrowings. |
As of September 30, 2003, the Bank’s loan portfolio, net of interbank loans, totaled Ch$6,119,660 million, a 1.6% and 3.4% quarterly and annual contraction, respectively.
The annual decrease in the loan portfolio was mainly driven by foreign trade and commercial loans granted to large corporations and also by a drop in mortgage loans. In addition, Ch$102,313 million of loans’ charge-offs during the last twelve-months have contributed to such contraction.
The weak performance showed by commercial loans during year 2003 is basically in line with the industry trend, as long term investments projects have been delayed by corporations until the economy shows better signs of recovery. The fall in foreign trade loans, mainly concentrated in the current quarter, was influenced mostly by the significant decline experienced by the exchange rate (11% decrease in the last twelve-months) and also related to the payment of some loans of corporate clients.
The 6.8% annual decline in mortgage loans was in part explained by management’s strategy of substituting mortgage loans financed by mortgage bonds, by mortgage loans financed by the Bank’s general borrowings (reflected in other outstanding loans) with the aim of improving mortgage lending yields.
On the other hand consumer loans, lease and factoring contracts, which are higher yield products, have shown an important annual expansion. Consumer loans have increased mainly in high-income individuals, supported by the aggressive corporate marketing campaign launched in different publicity mediums aiming to increase cross-selling, number of clients as well as clients’ loyalty. Regarding lease contracts, the 6.8% annual expansion was mainly explained by the Bank’s effort in increasing the number of contracts, which during the last-twelve months grew by 15%. Factoring loans, accounted in other outstanding loans, increased by 72.5% in terms of volume between September 2003 and 2002.
Total loans, net of interbank, decreased 1.6% during the 3Q03 compared to the 2Q03 principally due to the already mentioned decreased in foreign trade loans. However this decline was partially offset by higher consumer loans as interest rates remain in attractive levels and consumers are recovering confidence in the Chilean economy.
Page 8 of 17
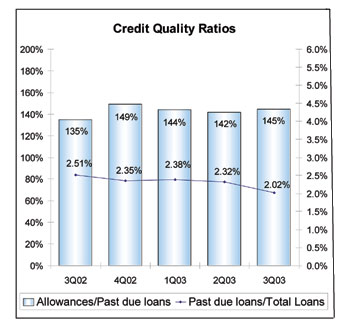
Past Due Loans
(in millions of Chilean pesos, except for percentages)
| Sept.02 | June.03 | Sept.03 | % Change 12-months | % Change 3Q03/2Q03 | ||||||||
Commercial loans | 144,351 | 127,534 | 107,644 | (25.4 | )% | (15.6 | )% | |||||
Consumer loans | 6,100 | 4,120 | 3,095 | (49.3 | )% | (24.9 | )% | |||||
Residential mortgage loans | 9,980 | 13,302 | 13,391 | 34.2 | % | 0.7 | % | |||||
Total Past Due Loans | 160,431 | 144,956 | 124,130 | (22.6 | )% | (14.4 | )% | |||||
Past due loans decreased to Ch$124,130 million as of September 30, 2003 from Ch$144,956 million at June 30, 2003. This 14.4% decrease was mainly related to commercial loans from the financial services, manufacturing and trade sectors mainly due to significant charge-off efforts in line with the Bank’s policy of maintaining a healthy loan portfolio. Regarding the annual contraction in past due loans it was concentrated on commercial and consumer loans. As we mentioned in our previous release the annual increase in past due loans coming from residential mortgage loans was a consequence of the Bank’s decision of strengthening its collection process thus anticipating the legal collection proceedings on those loans, in which case the entire outstanding balance has to be included as past-due. As far as the ratio of past due loans to total loans is concerned, it stood at 2.02% in 3Q03 down from 2.32% in 2Q03 or 2.51% 3Q02.
Page 9 of 17
FUNDING
Funding
(in millions of Chilean pesos, except for percentages)
| Sept.02 | June.03 | Sept.03 | % Change 12-months | % Change 3Q03/2Q03 | ||||||||
Non-interest Bearing Liabilities | ||||||||||||
Current Accounts | 1,039,696 | 1,152,890 | 1,114,275 | 7.2 | % | (3.3 | )% | |||||
Bankers drafts and other deposits | 754,577 | 936,868 | 721,962 | (4.3 | )% | (22.9 | )% | |||||
Other Liabilities | 756,912 | 755,361 | 622,516 | (17.8 | )% | (17.6 | )% | |||||
Total | 2,551,185 | 2,845,119 | 2,458,753 | (3.6 | )% | (13.6 | )% | |||||
Interest Bearing Liabilities | ||||||||||||
Savings & Time Deposits | 3,739,863 | 3,551,302 | 3,500,199 | (6.4 | )% | (1.4 | )% | |||||
Central Bank Borrowings | 3,927 | 3,192 | 3,136 | (20.1 | )% | (1.8 | )% | |||||
Repurchase agreements | 425,742 | 295,636 | 305,886 | (28.2 | )% | 3.5 | % | |||||
Mortgage Finance Bonds | 1,335,733 | 1,049,821 | 1,030,522 | (22.8 | )% | (1.8 | )% | |||||
Subordinated Bonds | 280,956 | 276,808 | 274,206 | (2.4 | )% | (0.9 | )% | |||||
Other Bonds | 5,852 | 3,908 | 3,766 | (35.6 | )% | (3.6 | )% | |||||
Borrowings from Domestic Financ. Inst. | 97,639 | 87,960 | 62,880 | (35.6 | )% | (28.5 | )% | |||||
Foreign Borrowings | 367,081 | 514,435 | 582,439 | 58.7 | % | 13.2 | % | |||||
Other Obligations | 82,169 | 37,479 | 39,325 | (52.1 | )% | 4.9 | % | |||||
Total | 6,338,962 | 5,820,541 | 5,802,359 | (8.5 | )% | (0.3 | )% | |||||
Total Liabilities | 8,890,147 | 8,665,660 | 8,261,112 | (7.1 | )% | (4.7 | )% | |||||
Total liabilities decreased by 7.1% during the last twelve-months and 4.7% during the third quarter of 2003, in line with the reduction in interest earning assets during the same periods.
Regarding the 7.1% annual decrease in total liabilities, it was mainly a consequence of the decline in mortgage finance bonds, time deposits and repurchase agreements, partially offset by an increase in foreign borrowings. Mortgage finance bonds decline was mainly due to a change in the Chilean guidelines dictated by the Superintendency of Banks in 4Q02, which affected the accounting presentation of mortgage finance bonds issued by the Bank6 and, to a lesser extent, to a decline in mortgage loans during the same period. Despite the decrease in the exchange rate, foreign borrowings have expanded as a consequence of the Bank’s decision to switch funding in local currency for liabilities in foreign currency and forward contracts in order to take advantage of the attractive international rates, thus lowering the funding costs.
It is worth mentioning that the Bank’s funding structure has improved showing a decrease in the ratio of average interest bearing liabilities to average interest earning assets from 74.5% in 3Q02 to 72.9% in 3Q03.
The quarterly decrease was mainly explained by a 13.6% decrease in non interest bearing liabilities fueled by a drop in bankers’ drafts and other deposits and a decrease in other liabilities attributable to foreign currency transactions pending settlement (which volumes are very volatile). It is worth mentioning that the high balance in bankers’ drafts and other deposits in 2Q03 was mainly related to technical reserve requirements (reserva técnica) and to the Bank’s cash clearing accounts (Canje).
| 6 | See page 7 |
Page 10 of 17
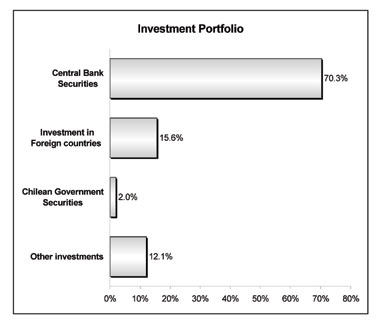
INVESTMENT PORTFOLIO
As of September 30, 2003, the Bank’s investment portfolio totaled Ch$1,842,072 million, a 0.5% increase relative to Ch$1,833,753 million maintained as of June 30, 2003. This slight increase was mainly concentrated in Central Bank and Government securities, partially offset by a decline in foreign investment securities as a consequence of a reduction in the exposure maintained in Latin American Bonds (mainly Brazilian) and also due to the effect of the 4.6% decline in the exchange rate during this quarter.
Regarding the 4.4% annual decline in the investment portfolio, it was mainly explained by the already mentioned (in previous releases) accounting change instructed by the Chilean Superintendency of Banks in October 2002 of the presentation of financial investments in mortgage finance bonds issued by the Bank6. Excluding this effect, the investment portfolio would have increased by 7.1% year-on-year.
As of September 30, 2003, the Bank maintained a highly liquid investment portfolio, as 50.4% of the total portfolio has duration of less than one year and 68.8% has a duration of less than two years. At the same date, the investment portfolio represented 20.6% of the Bank’s total assets being Chilean Central Bank Securities more than 70%, with a deep secondary market. At September 30, 2003, the investment portfolio was comprised principally by:
| 6 | See page 7 |
Page 11 of 17
INCOME FROM SERVICES, NET
Income from Services
(in millions of Chilean pesos, except for percentages)
Composition by Company | 3Q02 | 2Q03 | 3Q03 | % Change 3Q03/3Q02 | |||||
Bank | 14,825 | 16,145 | 16,471 | 11.1 | % | ||||
General Adm. of Funds | 2,781 | 3,073 | 3,495 | 25.7 | % | ||||
Financial Advisory | 284 | 855 | 266 | (6.3 | )% | ||||
Insurance Brokerage | 659 | 614 | 755 | 14.6 | % | ||||
Stock Brokerage | 782 | 2,755 | 3,125 | 299.6 | % | ||||
Factoring | 63 | 78 | 163 | 158.7 | % | ||||
Socofin | 4,612 | 2,148 | 2,239 | (51.5 | )% | ||||
Securization | 6 | 12 | 13 | 116.7 | % | ||||
Promarket | 40 | 135 | 182 | 355.0 | % | ||||
Foreign Branches | 449 | 262 | 408 | (9.1 | )% | ||||
Total Income from services, net | 24,501 | 26,077 | 27,117 | 10.7 | % | ||||
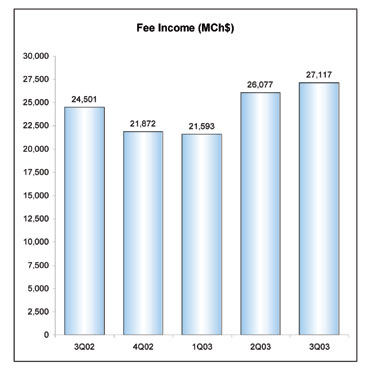
Income from services performed well during 3Q03, totaling Ch$27,117 million compared to Ch$24,501 million in 3Q02. The 10.7% increase in fee income between both quarters came principally from traditional banking services and also from higher fees related to our subsidiaries, mainly the Stock Brokerage and the General Administrator of Funds, which have increased their market shares.
Regarding the higher banking services fees, they were mainly fueled by: (i) fees coming from checking and sight accounts from both segments high- income and lower- income individuals, principally due to a new fee structure, an increase in ATM transactions, and the opening of approximately 10,700 new checking accounts during the last twelve-months, (ii) large corporation financial services related fees, (iii) consumer loan’s fees and, (iv) income related to the sale of assets received in lieu of payment.
Page 12 of 17
It is worth mentioning that this annual increase in fee income was partially offset by higher fees recorded in Socofin during 3Q02. However, these figures are not comparable, as in 3Q02 the Bank recognized in its income statement the overall first nine-months results of this Subsidiary, which was incorporated into the Bank during such quarter.
Regarding the quarterly increase of 4.0% in fee income, it was also explained by higher checking accounts fees associated to overdrafts and ATMs and by the better performance of the Stock Brokerage and the General Administrator of Funds, which partially offset the lower fees obtained by the Advisory subsidiary, as in 2Q03 this company generated significant earnings related to a debt-restructuring loan.
In terms of fees over average loans, this ratio increased to 1.72% in 3Q03 from 1.65% in 2Q03 or 1.55% in 3Q02.
GAINS ON SALES OF FINANCIAL INSTRUMENTS, NET
The Bank’s total gains on sales of financial instruments reached Ch$193 million during the third quarter of 2003, compared to a loss of Ch$15,171 million for the third quarter of 2002. The significant difference between these figures was mainly attributable to the approximately Ch$13,900 million of marked to market losses coming from Argentinean securities8 accounted against results during the third quarter of 2002, on the back of the deterioration of the Argentinean situation.
On the other hand, gains on sales of financial instruments slipped from Ch$2,862 million in 2Q03 to Ch$193 million in 3Q03 mainly as a consequence of significant earnings obtained from the sale of Argentinean securities held in the New York branch in 2Q03.
| 8 | These investments were previously accounted as available for sale securities and marked to market against the equity line in the New York Branch. |
Page 13 of 17
PROVISIONS
Allowances and Provisions
(in millions of Chilean pesos, except for percentages)
| 3Q02 | 2Q03 | 3Q03 | % Change 3Q03/3Q02 | |||||||||
Allowances | ||||||||||||
Allowances at the beginning of each period | 254,487 | 214,310 | 205,185 | (19.4 | )% | |||||||
Price-level restatement | (1,405 | ) | (1,645 | ) | (373 | ) | (73.5 | )% | ||||
Charge-off | (41,837 | ) | (24,417 | ) | (38,448 | ) | (8.1 | )% | ||||
Provisions for loan losses established, net | 19,064 | 16,937 | 13,056 | (31.5 | )% | |||||||
Voluntary Provisions established, net | (13,910 | ) | 0 | 0 | — | |||||||
Allowances at the end of each period | 216,399 | 205,185 | 179,420 | (17.1 | )% | |||||||
Provisions | ||||||||||||
Provisions | (5,154 | ) | (16,937 | ) | (13,056 | ) | 153.3 | % | ||||
Ratios | ||||||||||||
Allowances / Total loans | 3.38 | % | 3.29 | % | 2.92 | % | — | |||||
Risk Index | 2.91 | % | 2.81 | % | 2.42 | % | — | |||||
Provisions / Avg. Loans | 0.33 | % | 1.07 | % | 0.83 | % | — | |||||
Charge-offs / Avg. Loans | 2.64 | % | 1.55 | % | 2.44 | % | — | |||||
Recoveries / Avg. Loans | 0.18 | % | 0.37 | % | 0.49 | % | — | |||||
Provisions amounted to Ch$13,056 million in the third quarter of 2003, a significant increase compared to the Ch$5,154 million recorded in the third quarter of 2002, mainly as a consequence of a voluntary allowance release of approximately Ch$13,900 million in 3Q02 in order to offset the effect on results of marked to market losses coming from Argentinean securities during such quarter. Excluding this effect provisions decreased by 31.5% compared to last year same quarter. Provisions for loan losses during 3Q03 and 2Q03 were positively impacted by the general economic improvement and by the 4.6% and 4.1% decrease observed in the exchange rate, respectively, versus a 7.2% increase in this rate during the 3Q02 (the decrease in exchange rate implies a decrease in the amount of allowances in loans denominated in foreign currency).
The 22.9% quarterly decrease in provisions for loan losses relative to the 2Q03 was mainly attributable to an overall improvement in the risk classification of corporate clients. As a result, the Bank’s risk index continued improving since the end of 2002, reaching a 2.42% in 3Q03 compared to 2.81% in 2Q03. In terms of provisions to average loans ratio, it declined to 0.83% in 3Q03 from 1.07% in 2Q03.
OTHER INCOME AND EXPENSES
Total Other Income and Expenses increased to Ch$3,889 million in 3Q03 from Ch$(2,850) million in 3Q02 mainly due to higher recoveries of loans previously charged-off and, to a lesser extent, to lower provisions on assets received in lieu of payment accounted in non-operating income.
Regarding the 49.4% increase in total other income and expenses relative to 2Q03, it was also explained by higher recoveries of loans previously charged off, which were partially offset by higher cobranding expenses and provisions on recovered leased assets, both recorded in non-operating income. In addition, during 2Q03 the Bank decided to establish allowances in equity investments associated to the expected effects of the reappraisal of some technological assets in an affiliate, explaining thus the losses recorded in participation in earnings of equity investment in such quarter.
Page 14 of 17
OPERATING EXPENSES
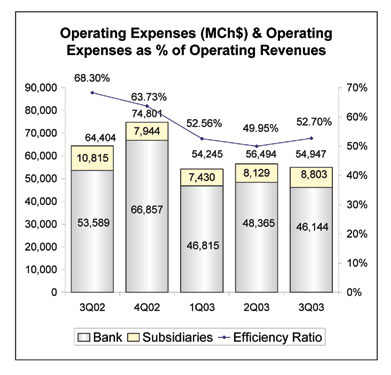
Operating Expenses
(in millions of Chilean pesos, except for percentages)
| 3Q02 | 2Q03 | 3Q03 | % Change 3Q03/ 3Q02 | |||||||||
Personnel salaries and expenses | (35,188 | ) | (29,734 | ) | (31,009 | ) | (11.9 | )% | ||||
Administrative and other expenses | (22,652 | ) | (22,340 | ) | (19,716 | ) | (13.0 | )% | ||||
Depreciation and amortization | (6,564 | ) | (4,420 | ) | (4,222 | ) | (35.7 | )% | ||||
Total operating expenses | (64,404 | ) | (56,494 | ) | (54,947 | ) | (14.7 | )% | ||||
Bank’s operting expenses | (53,589 | ) | (48,365 | ) | (46,144 | ) | (13.9 | )% | ||||
Subsidiaries and F. Branches’ oper.expenses | (10,815 | ) | (8,129 | ) | (8,803 | ) | (18.6 | )% | ||||
Efficiency Ratio* | 68.3 | % | 50.0 | % | 52.7 | % | — | |||||
Efficiency Ratio** | 61.3 | % | 46.0 | % | 48.7 | % | ||||||
| * | Operating expenses/Operating revenues |
| ** | Excludes depreciation and amortization |
Total operating expenses reached Ch$54,947 million during the third quarter of 2003, level that already reflects cost savings from the merger. The 14.7% operating expenses contraction during 3Q03 compared to 3Q02 mainly reveals the significant merger-related costs charged during 3Q02, principally severance payments, charge-offs of discontinued software and of assets in rented branches that were closed during the first half of 2002, and depreciation of technological equipment acquired to integrate the technological systems of both banks. It is worth mentioning that higher variable personnel compensations associated to the better performance of the Bank’s business during 3Q03 and the leveling of compensation criteria during this year between both banks involved a minor increase in personnel salaries compared to the previous quarter.
Page 15 of 17
In addition, total operating expenses decreased by 2.7% in 3Q03 compared to the previous quarter mainly due to lower administrative and other expenses related to the maintenance of fixed assets and rental expenses and, to a lesser extent, to a decrease in depreciation and amortization expenses.
The efficiency ratio has declined to 52.7% in the third quarter of 2003, from 68.3% in last year’s same quarter but increased slightly from 50.0% in the second quarter of 2003 due to the lower level of operating revenues reached during the current quarter (mainly as a consequence of lower inflation rate).
LOSS FROM PRICE- LEVEL RESTATEMENT
Loss from price-level restatement amounted to Ch$400 million in 3Q03 compared to Ch$2,392 million during the 3Q02, mainly reflecting the decrease in the inflation rate used for adjustment purposes from 0.7% in 3Q02 to a 0.1% in 3Q03.
INCOME TAXES
During the third quarter of 2003, the Bank’s income taxes totaled Ch$3,233 million, a 58.9% increase compared to Ch$2,035 million in 3Q02 mainly as a consequence of: (i) a higher income tax base in 3Q03 as a result of the 103.9% increase in net income before taxes between both quarters, and (ii) an increase in the statutory tax rate from 16.0% in 2002 to 16.5% in 2003.
It is important to note that the Bank’s effective rate is lower than the statutory corporate income tax rate, as under tax regulations the Bank is permitted to deduct dividend payments made to SAOS from its net income for tax calculation purposes.
Page 16 of 17
SHAREHOLDERS’ EQUITY
Shareholders’ Equity
(in million of Chilean Pesos)
| Sept.02 | June.03 | Sept.03 | %Change 12-months | |||||||||
Capital and Reserves | 562,163 | 562,363 | 562,357 | 0.0 | % | |||||||
Accumulated adjustment for translation differences9 | 11,204 | 7,774 | 6,368 | (43.2 | )% | |||||||
Unrealized gain (loss) on permanent financial invest.10 | (3,079 | ) | (922 | ) | (684 | ) | (77.8 | )% | ||||
Net Income | 45,161 | 66,557 | 103,011 | 128.1 | % | |||||||
Total Shareholders’ equity | 615,449 | 635,772 | 671,052 | 9.0 | % | |||||||
As of September 30, 2003, the Bank’s Shareholder Equity totaled Ch$671,052 million (US$1,008.9 million), a year on year 9.0% expansion, mainly as a consequence of higher net income recorded during the first nine-months of 2003 and, to a lesser extent, due to higher losses on mark to market financial investments10 held as available for sale as of September 2002, and accounted for against capital.
At the end of September 2003, on a consolidated basis, Total Capital to Risk-Adjusted Assets (BIS ratio) was 13.6%, and Basic Capital to Total Assets was 6.3%, both well above the minimum requirements applicable to Banco de Chile of 10% and 3%, respectively.
Note: All figures expressed in US dollars (except earnings per ADR) were converted using the exchange rate of Ch$665.13 for US$1.00 as of September 30, 2003. Earnings per ADR were calculated considering the nominal net income and the exchange rate existing at the end of each period.
—Financial Tables Follow—
| 9 | Represents the effect of the variation in the exchange rate on investments abroad that exceed the restatement of these investments according to the change in the consumer price index. |
| 10 | Financial investments traded on a secondary market are shown adjusted to market value, following specific instructions from the Superintendency of Banks and Financial Institutions. These instructions state that such adjustments should be recognized against income, except in the case of the permanent portfolio, when an equity account, “Unrealized gains (losses) on permanent financial investments”, may be directly charged or credited. |
Page 17 of 17
BANCO DE CHILE
CONSOLIDATED STATEMENTS OF INCOME (Under Chilean GAAP)
(Expressed in millions of constant Chilean pesos (MCh$) as of September 30, 2003 and millions of US dollars (MUS$))
| Quarters | % Change | Year ended | % Change | ||||||||||||||||||||||||||||||
| 3Q02 | 2Q03 | 3Q03 | 3Q03 | 3Q03-3Q02 | 3Q03-2Q03 | Sep-02 | Dec02 | Sep-03 | Sep-03 | Sep 03-Sep 02 | |||||||||||||||||||||||
| MCh$ | MCh$ | MCh$ | MUS$ | MCh$ | MCh$ | MCh$ | MUS$ | ||||||||||||||||||||||||||
Interest revenue and expense | |||||||||||||||||||||||||||||||||
Interest revenue | 188,983 | 134,299 | 93,843 | 141.1 | (50.3 | )% | (30.1 | )% | 540,383 | 697,998 | 367,707 | 552.8 | (32.0 | )% | |||||||||||||||||||
Interest expense | (77,253 | ) | (69,848 | ) | (42,016 | ) | (63.2 | ) | (45.6 | )% | (39.8 | )% | (237,964 | ) | (325,982 | ) | (164,171 | ) | (246.8 | ) | (31.0 | )% | |||||||||||
Net interest revenue | 111,730 | 64,451 | 51,827 | 77.9 | (53.6 | )% | (19.6 | )% | 302,419 | 372,016 | 203,536 | 306.0 | (32.7 | )% | |||||||||||||||||||
Income from services, net | |||||||||||||||||||||||||||||||||
Income from fees and other services | 30,414 | 34,159 | 35,371 | 53.2 | 16.3 | % | 3.5 | % | 76,558 | 106,085 | 97,923 | 147.2 | 27.9 | % | |||||||||||||||||||
Other services expenses | (5,913 | ) | (8,082 | ) | (8,254 | ) | (12.4 | ) | 39.6 | % | 2.1 | % | (17,136 | ) | (25,773 | ) | (23,333 | ) | (35.1 | ) | 36.2 | % | |||||||||||
Income from services, net | 24,501 | 26,077 | 27,117 | 40.8 | 10.7 | % | 4.0 | % | 59,422 | 80,312 | 74,590 | 112.1 | 25.5 | % | |||||||||||||||||||
Other operating income, net | |||||||||||||||||||||||||||||||||
Gains (losses) on financial instruments, net | (15,171 | ) | 2,862 | 193 | 0.3 | n/a | (93.3 | )% | (3,139 | ) | 1,132 | 8,391 | 12.6 | n/a | |||||||||||||||||||
Foreign exchange transactions, net | (26,768 | ) | 19,719 | 25,130 | 37.8 | n/a | 27.4 | % | (49,566 | ) | (32,059 | ) | 33,131 | 49.8 | n/a | ||||||||||||||||||
Total other operating income, net | (41,939 | ) | 22,581 | 25,323 | 38.1 | n/a | 12.1 | % | (52,705 | ) | (30,927 | ) | 41,522 | 62.4 | n/a | ||||||||||||||||||
Operating Revenues | 94,292 | 113,109 | 104,267 | 156.8 | 10.6 | % | (7.8 | )% | 309,136 | 421,401 | 319,648 | 480.5 | 3.4 | % | |||||||||||||||||||
Provisions | (5,154 | ) | (16,937 | ) | (13,056 | ) | (19.6 | ) | 153.3 | % | (22.9 | )% | (74,136 | ) | (101,852 | ) | (43,297 | ) | (65.1 | ) | (41.6 | )% | |||||||||||
Other income and expenses | |||||||||||||||||||||||||||||||||
Recovery of loans previously charged-off | 2,847 | 5,909 | 7,656 | 11.5 | 168.9 | % | 29.6 | % | 8,192 | 12,057 | 17,914 | 26.9 | 118.7 | % | |||||||||||||||||||
Non-operating income | 1,402 | 1,460 | 2,017 | 3.0 | 43.9 | % | 38.2 | % | 4,926 | 6,476 | 4,544 | 6.9 | (7.8 | )% | |||||||||||||||||||
Non-operating expenses | (6,883 | ) | (3,134 | ) | (5,908 | ) | (8.9 | ) | (14.2 | )% | 88.5 | % | (14,303 | ) | (23,528 | ) | (13,309 | ) | (20.0 | ) | (6.9 | )% | |||||||||||
Participation in earnings of equity investments | (216 | ) | (1,632 | ) | 124 | 0.2 | n/a | n/a | (582 | ) | (982 | ) | (2,060 | ) | (3.1 | ) | 254.0 | % | |||||||||||||||
Total other income and expenses | (2,850 | ) | 2,603 | 3,889 | 5.8 | n/a | 49.4 | % | (1,767 | ) | (5,977 | ) | 7,089 | 10.7 | n/a | ||||||||||||||||||
Operating expenses | |||||||||||||||||||||||||||||||||
Personnel salaries and expenses | (35,188 | ) | (29,734 | ) | (31,009 | ) | (46.6 | ) | (11.9 | )% | 4.3 | % | (96,765 | ) | (135,799 | ) | (89,866 | ) | (135.1 | ) | (7.1 | )% | |||||||||||
Administrative and other expenses | (22,652 | ) | (22,340 | ) | (19,716 | ) | (29.6 | ) | (13.0 | )% | (11.7 | )% | (65,237 | ) | (93,764 | ) | (62,221 | ) | (93.5 | ) | (4.6 | )% | |||||||||||
Depreciation and amortization | (6,564 | ) | (4,420 | ) | (4,222 | ) | (6.3 | ) | (35.7 | )% | (4.5 | )% | (17,931 | ) | (22,198 | ) | (13,113 | ) | (19.7 | ) | (26.9 | )% | |||||||||||
Total operating expenses | (64,404 | ) | (56,494 | ) | (54,947 | ) | (82.5 | ) | (14.7 | )% | (2.7 | )% | (179,933 | ) | (251,761 | ) | (165,200 | ) | (248.3 | ) | (8.2 | )% | |||||||||||
Loss from price-level restatement | (2,392 | ) | (2,031 | ) | (400 | ) | (0.6 | ) | (83.3 | )% | (80.3 | )% | (4,026 | ) | (9,711 | ) | (4,647 | ) | (7.0 | ) | 15.4 | % | |||||||||||
Minority interest in consolidated subsidiaries | 2 | (1 | ) | 0 | 0.0 | n/a | n/a | 2 | (1 | ) | (1 | ) | 0.0 | n/a | |||||||||||||||||||
Income before income taxes | 19,494 | 40,249 | 39,753 | 59.9 | 103.9 | % | (1.2 | )% | 49,276 | 52,099 | 113,592 | 170.8 | 130.5 | % | |||||||||||||||||||
Income taxes | (2,035 | ) | (4,939 | ) | (3,233 | ) | (4.9 | ) | 58.9 | % | (34.5 | )% | (4,115 | ) | 1,168 | (10,581 | ) | (15.9 | ) | 157.1 | % | ||||||||||||
Net income | 17,459 | 35,310 | 36,520 | 55.0 | 109.2 | % | 3.4 | % | 45,161 | 53,267 | 103,011 | 154.9 | 128.1 | % | |||||||||||||||||||
BANCO DE CHILE
CONSOLIDATED BALANCE SHEETS (Under Chilean GAAP)
(Expressed in millions of constant Chilean pesos (MCh$) as of September 30, 2003 and millions of US dollars (MUS$))
ASSETS
| Dec 01 | Sep-02 | Dec-02 | Jun-03 | Sep-03 | Sep-03 | % Change | ||||||||||||||||||
| Sep 03 - Jun 03 | Sep 03 - Sep 02 | |||||||||||||||||||||||
| MCh$ | MCh$ | MCh$ | MCh$ | MCh$ | MUS$ | |||||||||||||||||||
Cash and due from banks | ||||||||||||||||||||||||
Noninterest bearing | 693,283 | 694,832 | 604,875 | 1,004,293 | 694,718 | 1,044.5 | (30.8 | )% | 0.0 | % | ||||||||||||||
Interbank bearing | 111,224 | 251,265 | 79,665 | 49,115 | 37,913 | 57.0 | (22.8 | )% | (84.9 | )% | ||||||||||||||
Total cash and due from banks | 804,507 | 946,097 | 684,540 | 1,053,408 | 732,631 | 1,101.5 | (30.5 | )% | (22.6 | )% | ||||||||||||||
Financial investments | ||||||||||||||||||||||||
Government securities | 1,159,491 | 831,719 | 879,783 | 1,051,902 | 1,116,651 | 1,678.8 | 6.2 | % | 34.3 | % | ||||||||||||||
Investments purchase under agreements to resell | 52,080 | 20,429 | 32,563 | 37,522 | 15,304 | 23.0 | (59.2 | )% | (25.1 | )% | ||||||||||||||
Investment collateral under agreements to repurchase | 230,958 | 421,978 | 279,774 | 268,505 | 297,621 | 447.5 | 10.8 | % | (29.5 | )% | ||||||||||||||
Other investments | 651,838 | 653,158 | 425,966 | 475,824 | 412,496 | 620.2 | (13.3 | )% | (36.8 | )% | ||||||||||||||
Total financial investments | 2,094,367 | 1,927,284 | 1,618,086 | 1,833,753 | 1,842,072 | 2,769.5 | 0.5 | % | (4.4 | )% | ||||||||||||||
Loans, Net | ||||||||||||||||||||||||
Commercial loans | 2,824,824 | 2,605,011 | 2,547,527 | 2,541,430 | 2,535,820 | 3,812.5 | (0.2 | )% | (2.7 | )% | ||||||||||||||
Consumer loans | 403,941 | 400,774 | 417,710 | 405,187 | 437,196 | 657.3 | 7.9 | % | 9.1 | % | ||||||||||||||
Mortgage loans | 1,319,377 | 1,238,062 | 1,201,518 | 1,163,976 | 1,154,130 | 1,735.2 | (0.8 | )% | (6.8 | )% | ||||||||||||||
Foreign trade loans | 542,583 | 716,515 | 619,011 | 683,532 | 619,709 | 931.7 | (9.3 | )% | (13.5 | )% | ||||||||||||||
Interbank loans | 30,010 | 62,622 | 55,476 | 23,980 | 29,716 | 44.7 | 23.9 | % | (52.5 | )% | ||||||||||||||
Lease contracts | 258,521 | 250,573 | 252,082 | 269,103 | 267,723 | 402.5 | (0.5 | )% | 6.8 | % | ||||||||||||||
Other outstanding loans | 442,706 | 574,539 | 609,103 | 600,272 | 582,172 | 875.3 | (3.0 | )% | 1.3 | % | ||||||||||||||
Past due loans | 125,793 | 160,431 | 146,676 | 144,956 | 124,130 | 186.6 | (14.4 | )% | (22.6 | )% | ||||||||||||||
Contingent loans | 387,011 | 388,718 | 386,348 | 407,590 | 398,780 | 599.6 | (2.2 | )% | 2.6 | % | ||||||||||||||
Total loans | 6,334,766 | 6,397,245 | 6,235,451 | 6,240,026 | 6,149,376 | 9,245.4 | (1.5 | )% | (3.9 | )% | ||||||||||||||
Allowances | (235,590 | ) | (216,399 | ) | (218,635 | ) | (205,185 | ) | (179,420 | ) | (269.8 | ) | (12.6 | )% | (17.1 | )% | ||||||||
Total loans, net | 6,099,176 | 6,180,846 | 6,016,816 | 6,034,841 | 5,969,956 | 8,975.6 | (1.1 | )% | (3.4 | )% | ||||||||||||||
Other assets | ||||||||||||||||||||||||
Assets received in lieu of payment | 34,247 | 21,404 | 19,225 | 19,327 | 17,100 | 25.7 | (11.5 | )% | (20.1 | )% | ||||||||||||||
Bank premises and equipment | 150,660 | 147,535 | 141,015 | 133,132 | 129,960 | 195.4 | (2.4 | )% | (11.9 | )% | ||||||||||||||
Investments in other companies | 5,427 | 5,247 | 4,834 | 3,429 | 3,519 | 5.3 | 2.6 | % | (32.9 | )% | ||||||||||||||
Other | 166,836 | 277,183 | 214,617 | 223,542 | 236,926 | 356.2 | 6.0 | % | (14.5 | )% | ||||||||||||||
Total other assets | 357,170 | 451,369 | 379,691 | 379,430 | 387,505 | 582.6 | 2.1 | % | (14.1 | )% | ||||||||||||||
Total assets | 9,355,220 | 9,505,596 | 8,699,133 | 9,301,432 | 8,932,164 | 13,429.2 | (4.0 | )% | (6.0 | )% | ||||||||||||||
BANCO DE CHILE
CONSOLIDATED BALANCE SHEETS (Under Chilean GAAP)
(Expressed in millions of constant Chilean pesos (MCh$) as of September 30, 2003 and millions of US dollars (MUS$))
LIABILITIES & SHAREHOLDERS’ EQUITY
| Dec 01 | Sep-02 | Dec-02 | Jun-03 | Sep-03 | Sep-03 | % Change | ||||||||||||
| Sep 03 - Jun 03 | Sep 03 - Sep 02 | |||||||||||||||||
| MCh$ | MCh$ | MCh$ | MCh$ | MCh$ | MUS$ | |||||||||||||
Deposits | ||||||||||||||||||
Current accounts | 949,653 | 1,039,696 | 1,085,049 | 1,152,890 | 1,114,275 | 1,675.3 | (3.3 | )% | 7.2 | % | ||||||||
Bankers drafts and other deposits | 527,089 | 754,577 | 575,456 | 936,868 | 721,962 | 1,085.4 | (22.9 | )% | (4.3 | )% | ||||||||
Saving accounts and time deposits | 4,157,333 | 3,739,863 | 3,539,420 | 3,551,302 | 3,500,199 | 5,262.4 | (1.4 | )% | (6.4 | )% | ||||||||
Total deposits | 5,634,075 | 5,534,136 | 5,199,925 | 5,641,060 | 5,336,436 | 8,023.1 | (5.4 | )% | (3.6 | )% | ||||||||
Borrowings | ||||||||||||||||||
Central Bank borrowings | 80,226 | 3,927 | 3,808 | 3,192 | 3,136 | 4.7 | (1.8 | )% | (20.1 | )% | ||||||||
Securities sold under agreements to repurchase | 258,339 | 425,742 | 279,995 | 295,636 | 305,886 | 459.9 | 3.5 | % | (28.2 | )% | ||||||||
Mortgage finance bonds | 1,412,085 | 1,335,733 | 1,097,049 | 1,049,821 | 1,030,522 | 1,549.4 | (1.8 | )% | (22.8 | )% | ||||||||
Other bonds | 8,269 | 5,852 | 4,648 | 3,908 | 3,766 | 5.7 | (3.6 | )% | (35.6 | )% | ||||||||
Subordinated bonds | 274,786 | 280,956 | 280,986 | 276,808 | 274,206 | 412.3 | (0.9 | )% | (2.4 | )% | ||||||||
Borrowings from domestic financial institutions | 46,813 | 97,639 | 51,094 | 87,960 | 62,880 | 94.5 | (28.5 | )% | (35.6 | )% | ||||||||
Foreign borrowings | 340,149 | 367,081 | 516,468 | 514,435 | 582,439 | 875.7 | 13.2 | % | 58.7 | % | ||||||||
Other obligations | 75,694 | 82,169 | 77,691 | 37,479 | 39,325 | 59.1 | 4.9 | % | (52.1 | )% | ||||||||
Total borrowings | 2,496,361 | 2,599,099 | 2,311,739 | 2,269,239 | 2,302,160 | 3,461.3 | 1.5 | % | (11.4 | )% | ||||||||
Other liabilities | ||||||||||||||||||
Contingent liabilities | 386,637 | 388,930 | 385,564 | 407,639 | 399,189 | 600.2 | (2.1 | )% | 2.6 | % | ||||||||
Other | 173,493 | 367,977 | 176,253 | 347,717 | 223,323 | 335.7 | (35.8 | )% | (39.3 | )% | ||||||||
Total other liabilities | 560,130 | 756,907 | 561,817 | 755,356 | 622,512 | 935.9 | (17.6 | )% | (17.8 | )% | ||||||||
Minority interest in consolidated subsidiaries | 3 | 5 | 3 | 5 | 4 | 0.0 | (20.0 | )% | (20.0 | )% | ||||||||
Shareholders’ equity | ||||||||||||||||||
Capital and Reserves | 563,468 | 570,288 | 572,382 | 569,215 | 568,041 | 854.0 | (0.2 | )% | (0.4 | )% | ||||||||
Net income for the year | 101,183 | 45,161 | 53,267 | 66,557 | 103,011 | 154.9 | 54.8 | % | 128.1 | % | ||||||||
Total shareholders’ equity | 664,651 | 615,449 | 625,649 | 635,772 | 671,052 | 1,008.9 | 5.5 | % | 9.0 | % | ||||||||
Total liabilities & shareholders’ equity | 9,355,220 | 9,505,596 | 8,699,133 | 9,301,432 | 8,932,164 | 13,429.2 | (4.0 | )% | (6.0 | )% | ||||||||
BANCO DE CHILE
SELECTED CONSOLIDATED FINANCIAL INFORMATION
| Quarters | Year ended | |||||||||||||||||
| 3Q02 | 2Q03 | 3Q03 | Sep 02 | Dec 02 | Sep 03 | |||||||||||||
Earnings per Share | ||||||||||||||||||
Net income per Share (Ch$) (1) | 0.26 | 0.52 | 0.54 | 0.66 | 0.78 | 1.51 | ||||||||||||
Net income per ADS (Ch$) (1) | 153.87 | 311.20 | 321.86 | 398.01 | 469.45 | 907.86 | ||||||||||||
Net income per ADS (US$) (2) | 0.21 | 0.45 | 0.48 | 0.53 | 0.66 | 1.36 | ||||||||||||
Book value per Share (Ch$) (1) | 9.04 | 9.34 | 9.86 | 9.04 | 9.19 | 9.86 | ||||||||||||
Shares outstanding (Millions) | 68,079.78 | 68,079.78 | 68,079.78 | 68,079.78 | 68,079.78 | 68,079.78 | ||||||||||||
Profitability Ratios(3)(4) | ||||||||||||||||||
Net interest margin | 5.21 | % | 3.10 | % | 2.51 | % | 4.78 | % | 4.50 | % | 3.30 | % | ||||||
Net financial margin | 3.96 | % | 4.05 | % | 3.73 | % | 4.00 | % | 4.11 | % | 3.84 | % | ||||||
Fees / Avg. Interest Earnings Assets | 1.14 | % | 1.25 | % | 1.31 | % | 0.94 | % | 0.97 | % | 1.21 | % | ||||||
Other Operating Revenues / Avg. Interest Earnings Assets | (1.96 | )% | 1.09 | % | 1.23 | % | (0.83 | )% | (0.37 | )% | 0.67 | % | ||||||
Operating Revenues / Avg. Interest Earnings Assets | 4.40 | % | 5.44 | % | 5.05 | % | 4.89 | % | 5.09 | % | 5.18 | % | ||||||
Return on average total assets | 0.75 | % | 1.55 | % | 1.59 | % | 0.65 | % | 0.59 | % | 1.52 | % | ||||||
Return on average shareholders’ equity | 11.74 | % | 22.42 | % | 21.93 | % | 9.89 | % | 8.88 | % | 21.45 | % | ||||||
Capital Ratios | ||||||||||||||||||
Shareholders equity / total assets | 6.47 | % | 6.84 | % | 7.51 | % | 6.47 | % | 7.19 | % | 7.51 | % | ||||||
Basic capital / total assets | 5.98 | % | 6.10 | % | 6.32 | % | 5.98 | % | 6.55 | % | 6.32 | % | ||||||
Basic capital / risk-adjusted assets | 8.91 | % | 9.41 | % | 9.42 | % | 8.91 | % | 9.41 | % | 9.42 | % | ||||||
Total capital / risk-adjusted assets | 13.04 | % | 13.61 | % | 13.58 | % | 13.04 | % | 13.69 | % | 13.58 | % | ||||||
Credit Quality Ratios | ||||||||||||||||||
Past due loans / total loans | 2.51 | % | 2.32 | % | 2.02 | % | 2.51 | % | 2.35 | % | 2.02 | % | ||||||
Allowances / past due loans | 134.89 | % | 141.55 | % | 144.54 | % | 134.89 | % | 149.06 | % | 144.54 | % | ||||||
Allowances / total loans | 3.38 | % | 3.29 | % | 2.92 | % | 3.38 | % | 3.51 | % | 2.92 | % | ||||||
Provisions /Avg.Loans | 0.33 | % | 1.07 | % | 0.83 | % | 1.58 | % | 1.65 | % | 0.92 | % | ||||||
Risk index consolidated | 2.91 | % | 2.81 | % | 2.42 | % | 2.91 | % | 3.04 | % | 2.42 | % | ||||||
Operating and Productivity Ratios | ||||||||||||||||||
Operating expenses / operating revenue | 68.30 | % | 49.95 | % | 52.70 | % | 58.21 | % | 59.74 | % | 51.68 | % | ||||||
Operating expenses / average total assets(3) | 2.76 | % | 2.48 | % | 2.39 | % | 2.60 | % | 2.78 | % | 2.44 | % | ||||||
Loans per employee (million Ch$)(1) | 713 | 702 | 681 | 713 | 720 | 681 | ||||||||||||
Average Balance Sheet Data(1)(3) | ||||||||||||||||||
Avg. Interest earnings assets (million Ch$) | 8,574,952 | 8,312,142 | 8,261,493 | 8,437,173 | 8,271,619 | 8,220,157 | ||||||||||||
Avg. Assets (million Ch$) | 9,327,112 | 9,096,783 | 9,185,783 | 9,239,328 | 9,070,472 | 9,043,399 | ||||||||||||
Avg. Shareholders equity (million Ch$) | 594,617 | 629,834 | 666,057 | 608,636 | 600,061 | 640,231 | ||||||||||||
Avg. Loans | 6,337,283 | 6,306,870 | 6,294,449 | 6,237,247 | 6,172,912 | 6,274,041 | ||||||||||||
Avg. Interest bearing liabilities (million Ch$) | 6,385,617 | 6,026,545 | 6,022,802 | 6,382,884 | 6,207,497 | 5,974,332 | ||||||||||||
Other Data | ||||||||||||||||||
Inflation Rate | 1.67 | % | (0.48 | )% | 0.27 | % | 2.48 | % | 2.82 | % | 1.87 | % | ||||||
Exchange rate (Ch$) | 747.62 | 697.23 | 665.13 | 747.62 | 712.38 | 665.13 | ||||||||||||
Employees | 8,978 | 8,886 | 9,035 | 8,978 | 8,655 | 9,035 | ||||||||||||
Notes
| (1) | These figures were expressed in constant Chilean pesos as of September 30, 2003. |
| (2) | These figures were calculated considering the nominal net income, the shares outstanding and the exchange rates existing at the end of each period. |
| (3) | The ratios were calculated as an average of daily balances. |
| (4) | Annualized data. |
FORWARD-LOOKING INFORMATION
The information contained herein incorporates by reference statements which constitute “forward-looking statements,” in that they include statements regarding the intent, belief or current expectations of our directors and officers with respect to our future operating performance. Such statements include any forecasts, projections and descriptions of anticipated cost savings or other synergies. You should be aware that any such forward-looking statements are not guarantees of future performance and may involve risks and uncertainties, and that actual results may differ from those set forth in the forward-looking statements as a result of various factors (including, without limitations, the actions of competitors, future global economic conditions, market conditions, foreign exchange rates, and operating and financial risks related to managing growth and integrating acquired businesses), many of which are beyond our control. The occurrence of any such factors not currently expected by us would significantly alter the results set forth in these statements.
Factors that could cause actual results to differ materially and adversely include, but are not limited to:
| • | changes in general economic, business or political or other conditions in Chile or changes in general economic or business conditions in Latin America; |
| • | changes in capital markets in general that may affect policies or attitudes toward lending to Chile or Chilean companies; |
| • | unexpected developments in certain existing litigation; |
| • | increased costs; |
| • | unanticipated increases in financing and other costs or the inability to obtain additional debt or equity financing on attractive terms; and |
You should not place undue reliance on such statements, which speak only as of the date that they were made. Our independent public accountants have not examined or compiled the forward-looking statements and, accordingly, do not provide any assurance with respect to such statements. These cautionary statements should be considered in connection with any written or oral forward-looking statements that we may issue in the future. We do not undertake any obligation to release publicly any revisions to such forward-looking statements after completion of this offering to reflect later events or circumstances or to reflect the occurrence of unanticipated events.
Contacts: | Ricardo Morales | Jacqueline Barrio | ||
| Banco de Chile | Banco de Chile | |||
| (56-2) 637 3519 | (56-2) 637 2938 | |||
| rmorales@bancochile.cl | jbarrio@bancochile.cl |
SIGNATURE
Pursuant to the requirements of the Securities Exchange Act of 1934, the registrant has duly caused this report to be signed on its behalf by the undersigned, thereunto duly authorized.
Date: November 6, 2003
| Banco de Chile |
| /s/ Pablo Granifo Lavin |
By: Pablo Granifo Lavín General Manager |