SECURITIES AND EXCHANGE COMMISSION
Washington, D.C. 20549
FORM 6-K
REPORT OF FOREIGN ISSUER
Pursuant to Rule 13a-16 or 15d-16 of the
Securities Act of 1934
For the month of August, 2003
of Chile, Bank
(Translation of Registrant’s name into English)
Chile
(Jurisdiction of incorporation or organization)
Ahumada 251
Santiago, Chile
(Address of principal executive offices)
Indicate by check mark whether the registrant files or will file annual reports under cover of Form 20-F or Form 40-F.
| Form 20-F X | Form 40-F |
Indicate by check mark whether the registrant by furnishing the information contained in this Form is also thereby furnishing the information to the Commission pursuant to Rule 12g-3-2(b) under the Securities Exchange Act of 1934.
| Yes | No X |
(If “Yes” is marked, indicate below the file number assigned to the registrant in connection with Rule 12g3-2(b): 82- .)
BANCO DE CHILE
REPORT ON FORM 6-K
Attached is an English translation of a press release issued by Banco de Chile (“the Bank”) on August 12, 2003, regarding Consolidated Financial Statements as of June 30, 2003.

www.bancochile.cl
Banco de Chile Announces 2003 Second-Quarter Results
Santiago, Chile, August 12, 2003 — Banco de Chile (NYSE: BCH), a Chilean full-service financial institution, market leader in a wide variety of credit and non-credit products and services across all segments of the Chilean financial market, today announced results for the second quarter ended June 30, 2003. The results have been prepared in accordance with Chilean GAAP on an unaudited, consolidated basis. All figures are expressed in constant Chilean pesos as of June 30, 2003, unless otherwise stated. Therefore, all growth rates are in real terms.
Net income for the second quarter of 2003 was Ch$35,275 million (Ch$0.52/share or US$0.45/ADS), which represents an important increase of 138.9% when compared to Ch$14,767 million recorded in the second quarter of 2002.
| 2003 Second-Quarter Selected Financial Data | |||||||||||||
| 2Q02 | 1Q03 | 2Q03 | % Change 2Q03/2Q02 | ||||||||||
Income Statement(Millions, Chilean pesos) | |||||||||||||
Net Financial Income | 91,660 | 76,153 | 84,086 | (8.3 | )% | ||||||||
Income from Services | 18,771 | 22,731 | 26,843 | 43.0 | % | ||||||||
Gains on Sales of Financial Instruments | 5,952 | 5,352 | 2,729 | (54.1 | )% | ||||||||
Operating Revenues | 116,383 | 104,236 | 113,658 | (2.3 | )% | ||||||||
Provisions for Loan Losses | (34,228 | ) | (13,414 | ) | (16,920 | ) | (50.6 | )% | |||||
Voluntary Provisions | (336 | ) | 0 | 0 | — | ||||||||
Bank’s operating expenses | (54,009 | ) | (48,310 | ) | (49,056 | ) | (9.2 | )% | |||||
Subsidiaries & Foreign. Br. oper. expenses | (5,750 | ) | (7,421 | ) | (8,122 | ) | 41.3 | % | |||||
Total Operating Expenses | (59,759 | ) | (55,731 | ) | (57,178 | ) | (4.3 | )% | |||||
Net Income | 14,767 | 31,435 | 35,275 | 138.9 | % | ||||||||
Earning per Share (Chilean pesos) | |||||||||||||
Net income per Share | 0.22 | 0.46 | 0.52 | 138.9 | % | ||||||||
Book value per Share | 8.60 | 8.86 | 9.33 | 8.5 | % | ||||||||
Balance Sheet (Millions, Chilean pesos) | |||||||||||||
Loan Portfolio | 6,234,258 | 6,231,600 | 6,233,791 | (0.0 | )% | ||||||||
Total Assets | 9,255,664 | 8,984,144 | 9,292,188 | 0.4 | % | ||||||||
Shareholders’ Equity | 585,424 | 602,857 | 635,137 | 8.5 | % | ||||||||
Ratios | |||||||||||||
Profitability | |||||||||||||
ROAA | 0.63 | % | 1.41 | % | 1.55 | % | — | ||||||
ROAE | 10.2 | % | 20.0 | % | 22.4 | % | — | ||||||
Net Financial Margin | 4.3 | % | 3.7 | % | 4.1 | % | — | ||||||
Efficiency ratio | 51.4 | % | 53.5 | % | 50.3 | % | — | ||||||
Asset Quality | |||||||||||||
Past Due Loans / Total Loans | 2.34 | % | 2.38 | % | 2.32 | % | — | ||||||
Allowances / Total Loans | 4.08 | % | 3.43 | % | 3.29 | % | — | ||||||
Allowances / Past Due Loans | 174.2 | % | 144.2 | % | 141.5 | % | — | ||||||
Capital Adequacy | |||||||||||||
Total Capital / Risk Adjusted Assets | 13.3 | % | 13.7 | % | 13.6 | % | — | ||||||
Page 1 of 22
Second Quarter 2003 Highlights
The Bank
| · | Loan Portfolio. As of June 30, 2003 the Bank’s loan portfolio, net of interbank loans, totaled Ch$6,209,835 million, remaining stable compared to the previous quarter and increasing by 0.9% in twelve months. Regarding the Bank’s loans market share, it stood at the same level of the prior quarter, reaching an 18.6% as of June 30, 2003. |
| · | ROAE Improvement. Solid second quarter result has led to a strong annualized ROAE of 22.4%, compared to the 20.0% of the first quarter of 2003 and significantly above the 10.2% recorded during the second quarter of 2002, mainly due to lower provisions for loan losses, higher fee income and a decrease in operating expenses. |
| · | Significant Increase in Fee Income. Fee income increased a significant 43.0% during the 2Q03 compared to the 2Q02, mainly driven by both, higher traditional banking fees and higher fees coming from the Stock brokerage and Financial Advisory’s subsidiaries. |
| · | Improvement of Efficiency. The Bank’s efficiency ratio reached a 50.3% during 2Q03, showing a substantial improvement compared to 51.4% recorded in last year’s same quarter, or 53.5% in the first quarter of 2003. |
| · | Better performance of Subsidiaries and Foreign Branches. Subsidiaries and Foreign Branches showed a high performance during 2Q03 reflected in a year-on-year increase of 37.4% in its quarterly overall net income. |
| · | Stable Domestic Ratings-Outlook. During this quarter, Feller-Rate and Fitch Ratings agencies, confirmed Banco de Chile’s current domestic risk classification for all its instruments, reflecting the Bank’s healthy level of capitalization, its strong competitive position and the diversification of its earnings. |
| · | Banco de Chile was distinguished as one of Chile’s most admired companies. The Bank was distinguished a one of the top 10 companies with outstanding leadership qualities in accordance to the annual survey “Chile’s most admired companies” conducted by Adimark (a Chilean opinion and market research firm). This survey singles out companies that outstand in different fields such as trustworthiness and solvency, innovative capacity and technology, commitment with its workers and contribution to social and cultural activities, high customer service as well as concern for the community and the environment in which it operates. |
Financial System Highlights
| · | The second capital market reform was already presented by the Ministry of Finance and will be promptly sent to the congress. This reform contains six changes in the general banking law aimed to strengthen competitiveness and ensure stability of the Chilean financial system. It also focuses on facilitating financial access to emerging enterprises in order to boost economic growth and contains legal and regulatory incentives for the development of the venture capital industry. |
| · | The Superintendency of Banks dictated anew regulation allowing the use of incentives, other than interest rates, for credit products to individuals, including consumer and mortgage loans, in order to level the scope of competition between banks and non-bank entities that provide credit. |
Page 2 of 22
| · | Following theconsolidation process of the Chilean financial system, during the 2Q03 the Superintendency of Banks granted authorization for the creation of a new Bank related to a department store and, at the same time, received a new request for the creation of a niche Bank related to an important financial group. In addition, a local Bank acquired Bank Sudameris’ assets and liabilities, which accounted for a 0.2% loans market share. |
| · | The Financial System’s Net Income increased a significant 15.8% in 2Q03 compared to 2Q02, allowing a recovery in the system’s ROAE to 15.6% from 14.7% in 2Q02. |
| · | Total loan portfolio, net of interbank loans registered an annual and quarterly expansion of 2.10% and 0.33%, respectively. |
Financial System’s Main Figures:
 |  | |
 |  |
Page 3 of 22
Banco Chile 2003 Second-Quarter Consolidated Results
NET INCOME
Bank, Subsidiaries and Foreign Branches’ Net Income | ||||||||||||
(in millions of Chilean pesos, except for percentages) | ||||||||||||
| 2Q02 | 1Q03 | 2Q03 | % Change 2Q03/2Q02 | |||||||||
Bank | 8,511 | 22,520 | 26,677 | 213.4 | % | |||||||
Foreign Branches | 2,922 | 5,675 | 3,867 | 32.3 | % | |||||||
Stock Brokerage | 1,377 | 1,561 | 2,359 | 71.3 | % | |||||||
Gral Adm. of Funds1 | 1,195 | 1,341 | 1,269 | 6.2 | % | |||||||
Insurance Brokerage | 118 | 172 | 123 | 4.2 | % | |||||||
Financial Advisory | 298 | (33 | ) | 614 | 106.0 | % | ||||||
Factoring | 339 | 373 | 436 | 28.6 | % | |||||||
Securitization | (31 | ) | (18 | ) | (20 | ) | (35.5 | )% | ||||
Promarket2 | 38 | 3 | (103 | ) | — | |||||||
Socofin3 | 0 | (159 | ) | 53 | — | |||||||
Total Net Income | 14,767 | 31,435 | 35,275 | 138.9 | % | |||||||
Second quarter consolidatednet income reached a record level after the merger, totaling Ch$35,275 million (US$50.6 million), a significant increase compared to the net income of Ch$14,767 million for last year’s same quarter. This 138.9% increase was mainly fueled by a 51.0% decrease in provisions, 43.0% increase in fee income, a 4.3% reduction in operating expenses and a 119.8% increase in recovery of loans previously charged-off. In addition, the better performance attained byforeign branchesand by the Bank’ssubsidiaries positively impacted the overall 2Q03 net income in comparison to 2Q02.
Regarding the 32.3% increase inforeign branches’ net income, it reflected higher gains mainly on sales related to Argentinean securities held by the New York branch.
Net income from subsidiaries totaled Ch$4,731 million during the second quarter of 2003, up 41.9% from the second quarter of 2002. This increase was mainly explained by higher results reached by the Stock Brokerage subsidiary and, to a lesser extent, by the improved revenues generated by the Financial Advisory and the Factoring. The year-on-year growth in the Stock Brokerage’s net income was mainly related to the higher stock trading volumes during 2Q03, which in average almost doubled the 2Q02 volumes. The good performance of the Financial Advisory during 2Q03 was largely explained by fees obtained from a loan restructure transaction. In turn, the Factoring’s higher net income reported during 2Q03 was the result of the increase in loan volumes and lower provisions for loan losses.
| 1 | Subsidiary resulted from the merger between Banchile Mutual Fund Subsidiary and Banchile Investment Fund Subsidiary. |
| 2 | Subsidiary incorporated to the Bank during the 2Q02 that provides sale services to the Bank and its subsidiaries. |
| 3 | Subsidiary, incorporated to the Bank during the 3Q02, in charge of the judicial and extrajudicial collection of loans on behalf of the Bank or third parties. |
Page 4 of 22
The 12.2% quarterly increase in net income during 2Q03 relative to the previous quarter was primarily explained by higher net financial margin and higher fee income coming from both, the Bank and its subsidiaries (principally the Stock Brokerage and the Financial Advisory).
The second quarter 2003 net income resulted in an annualized return on average assets(ROAA) and annualized return on average shareholders’ equity(ROAE) of 1.55% and 22.43%, respectively, the highest levels since the merger and well above the financial system’s comparable figures of 1.23% and 15.61%, for the same period.
Page 5 of 22
NET FINANCIAL INCOME4
| Net Interest Revenue | ||||||||||||
| (in millions of Chilean pesos, except for percentages) | ||||||||||||
| 2Q02 | 1Q03 | 2Q03 | % Change 2Q03/2Q02 | |||||||||
Interest revenue | 208,831 | 140,677 | 134,165 | (35.8 | )% | |||||||
Interest expense | (97,078 | ) | (52,744 | ) | (69,778 | ) | (28.1 | )% | ||||
Foreign Exchange transaction, net | (20,093 | ) | (11,780 | ) | 19,699 | — | ||||||
Net Financial Income | 91,660 | 76,153 | 84,086 | (8.3 | )% | |||||||
Avg. Interest earning assets | 8,549,439 | 8,151,806 | 8,303,838 | (2.9 | )% | |||||||
Net Financial Margin5 | 4.3 | % | 3.7 | % | 4.1 | % | — | |||||
Net Interest Margin | 5.2 | % | 4.3 | % | 3.1 | % | — | |||||
Net financial income totaled Ch$84,086 million for the second quarter of 2003, an 8.3% decrease compared to the second quarter of 2002, mainly due to a reduction of 24 basis points in the net financial margin5. Net financial margin decrease was mainly attributable to:
| • | lower repricing benefits during 2Q03 as since February 2003 the interest rates have remained stable (on the contrary, during 2002 successive decreases in interest rates benefited the 2Q02 net financial margin as the Bank’s interest bearing liabilities have a shorter repricing period than the interest earning assets), |
| • | lower levels of nominal interest rates which reduces the profitability associated to non-interest bearing demand deposits and, |
| 4 | For analysis purposes, results from foreign exchange transactions, which consist mainly of the results of forward contracts which hedge foreign currencies and dollar-adjustable Chilean peso positions, have been included in the calculation of net financial income and the net financial margin. Under SBIF guidelines these gains/losses cannot be registered as interest revenue, but must be considered as gains/losses from foreign exchange transactions and, accordingly, registered in a different line of the income statements. This accounting asymmetry distorts net interest revenue and foreign exchange transaction gains, especially in periods of high volatility in the exchange rate. |
| 5 | Net financial income divided by average interest earning assets. |
Page 6 of 22
| • | lower lending spreads as a result of lower levels of nominal interest rates during the 2Q03. |
As we mentioned in our previous release, average interest earning assets figures for 2003 are not totally comparable to the year-earlier same figures, as in the 4Q02 the Superintendency of Banks changed the accounting guidelines affecting the presentation of mortgage finance bonds6 maintained as financial investments. Excluding this effect, of approximately Ch$209,321 million in 2Q02, average interests earning assets would have decreased only by 0.4%, instead of the 2.9%.
On the other hand, net financial income increased by 10.4% in 2Q03 compared to the previous quarter, mainly due to an increase of 1.9% in average interest earning assets and 31 basis points increase in the net financial margin as a result of the increase experienced by the inflation rate (measured by the variation of the UF7 which was 0.24% in 1Q03 and 1.05% in 2Q03). The higher inflation rate implied that during the 2Q03 the Bank earned higher interest income on the portion of interest earning assets denominated in UF financed by interest bearing liabilities denominated in nominal Chilean pesos and non-interest bearing liabilities.
LOAN PORTFOLIO

| 6 | In accordance to the new guidelines dictated by the Superintendendency of Banks, since October, 2002, the Bank excludes from its financial investments, the mortgage bonds issued by the Bank excluding as well the corresponding liability. |
| 7 | The UF is an accounting unit which is linked to the Chilean CPI, and changes daily to reflect fluctuations in the Iindex over the previous month. |
Page 7 of 22
Loan Portfolio | ||||||||||
| (in millions of Chilean pesos except for percentages) | ||||||||||
| June.02 | March.03 | June.03 | % Change 12-months | % Change 2Q03/1Q03 | ||||||
Commercial Loans | 2,574,176 | 2,543,136 | 2,538,891 | (1.4)% | (0.2)% | |||||
Mortgage Loans1 | 1,281,701 | 1,165,262 | 1,162,813 | (9.3)% | (0.2)% | |||||
Consumer Loans | 401,749 | 433,982 | 404,782 | 0.8 % | (6.7)% | |||||
Foreign trade Loans | 618,193 | 636,167 | 682,849 | 10.5 % | 7.3 % | |||||
Contingent Loans | 382,419 | 382,197 | 407,183 | 6.5 % | 6.5 % | |||||
Others Outstanding Loans2 | 500,043 | 634,214 | 599,672 | 19.9 % | (5.4)% | |||||
Leasing Contracts | 250,807 | 268,587 | 268,834 | 7.2 % | 0.1 % | |||||
Past-due Loans | 145,909 | 148,395 | 144,811 | (0.8)% | (2.4)% | |||||
Total Loans, net | 6,154,997 | 6,211,940 | 6,209,835 | 0.9 % | (0.0)% | |||||
Interbank Loans | 79,261 | 19,660 | 23,956 | (69.8)% | 21.9 % | |||||
Total Loans | 6,234,258 | 6,231,600 | 6,233,791 | (0.0)% | 0.0 % | |||||
| 1 | Mortgage loans financed by mortgage bonds. |
| 2 | Includes mortgage loans financed by the Bank’s general borrowings. |
As of June 30, 2003, the Bank’s loan portfolio, net of interbank loans, totaled Ch$6,209,835 million, remaining almost flat on a quarterly basis, while growing a 0.9% relative to the year earlier comparable period. It is worth mentioning that the annual loan growth was impacted by Ch$106,000 million in loan charge-offs during the same period.
Regarding segments, the annual expansion was mainly driven by middle market companies and high income individuals. At the same time, the Bank reduced its loan exposure in lower-middle income individuals and in large corporations.
In terms of type of credit, year-on year loan growth was mainly driven by 19.9% expansion in other outstanding loans, 10.5% growth in foreign trade and 7.2% increase in lease contracts. Regarding other outstanding loans, its expansion was mainly related to residential mortgage loans financed by the Bank’s general borrowings. In addition, factoring loans which are classified as other outstanding loans have increased by 62.9% in the last twelve-months. Growths in foreign trade and contingent loans (mainly letter of credits in foreign currency) were a consequence of the Bank’s successful “Comex” sales campaign oriented to both large and middle market companies. Also, the increase in lease loans has been supported by the “Extraleasing” campaign and special commercial agreements which aim was to increase the number of contracts.
On the other hand, commercial loans continued to show a weak performance in the industry, as a consequence of the slow recovery of the Chilean economy. However, the Financial System, as a whole, expects more dynamism associated to the Free Trade agreement signed by US and Chile. Consumer loans have expanded 0.8% in an annual basis as interest rates are lower and unemployment levels have shown some improvement.
The 9.3% annual decline in mortgage loans was in part explained by the substitution of mortgage loans financed by mortgage bonds; by mortgage loans financed by the Bank’s general borrowings reflected in other outstanding loans. It is worth mentioning that overall residential mortgage loans increased by 7.5% during the last twelve-months.
Page 8 of 22
During the 2Q03 total loans, net of interbank, remained almost stable as the expansion in foreign trade and contingent loans of 7.3% and 6.5%, respectively (despite the effect of the 4.1% decline in the exchange rate), almost offset the contraction in consumer loans and in other outstanding loans during the last quarterly period.
| Past Due Loans | ||||||||||
| (in millions of Chilean pesos, except for percentages) | ||||||||||
| June.02 | March.03 | June.03 | % Change 12-months | % Change 2Q03/1Q03 | ||||||
Commercial loans | 129,989 | 133,462 | 127,406 | (2.0)% | (4.5)% | |||||
Consumer loans | 5,716 | 4,588 | 4,116 | (28.0)% | (10.3)% | |||||
Residential mortgage loans | 10,204 | 10,345 | 13,289 | 30.2 % | 28.5 % | |||||
Total Past Due Loans | 145,909 | 148,395 | 144,811 | (0.8)% | (2.4)% | |||||
Past due loans totaled Ch$144,811 million as of June 30, 2003, a 2.4% decrease compared to Ch$148,395 million at March 31, 2003 or a 0.8% decrease relative to June 30, 2002. The mentioned quarterly decrease was concentrated in commercial and consumer loans mainly associated to higher levels of charge-offs. The increase experienced in past due of residential mortgage loans was mainly explained by the Bank’s decision of strengthening its collection process thus anticipating the legal collection proceedings on these loans, in which case the entire outstanding balance has to be included as past- due. In overall terms, however, the ratio of past due loans to total loans improved to 2.32% in 2Q03 from 2.34% in 2Q02 and 2.38% in 1Q03.
Page 9 of 22
FUNDING
| Funding | |||||||||||||
| (in millions of Chilean pesos, except for percentages) | |||||||||||||
| June.02 | March.03 | June.03 | % Change 12-months | % Change 2Q03/1Q03 | |||||||||
| Non-interest Bearing Liabilities | |||||||||||||
Current Accounts | 913,243 | 1,184,143 | 1,151,738 | 26.1 | % | (2.7 | )% | ||||||
Bankers drafts and other deposits | 748,881 | 585,665 | 935,932 | 25.0 | % | 59.8 | % | ||||||
Other Liabilities | 783,709 | 652,211 | 754,655 | (3.7 | )% | 15.7 | % | ||||||
Total | 2,445,833 | 2,422,019 | 2,842,325 | 16.2 | % | 17.4 | % | ||||||
| Interest Bearing Liabilities | |||||||||||||
Savings & Time Deposits | 3,740,202 | 3,549,863 | 3,547,754 | (5.1 | )% | (0.1 | )% | ||||||
Central Bank Borrowings | 14,422 | 3,609 | 3,189 | (77.9 | )% | (11.6 | )% | ||||||
Repurchase agreements | 393,209 | 383,401 | 295,341 | (24.9 | )% | (23.0 | )% | ||||||
Mortgage Finance Bonds | 1,373,779 | 1,046,077 | 1,048,772 | (23.7 | )% | 0.3 | % | ||||||
Subordinated Bonds | 271,714 | 278,133 | 276,531 | 1.8 | % | (0.6 | )% | ||||||
Other Bonds | 6,480 | 4,512 | 3,904 | (39.8 | )% | (13.5 | )% | ||||||
Borrowings from Domestic Financ. Inst. | 77,654 | 86,728 | 87,872 | 13.2 | % | 1.3 | % | ||||||
Foreign Borrowings | 277,576 | 562,471 | 513,921 | 85.1 | % | (8.6 | )% | ||||||
Other Obligations | 69,371 | 44,474 | 37,442 | (46.0 | )% | (15.8 | )% | ||||||
Total | 6,224,407 | 5,959,268 | 5,814,726 | (6.6 | )% | (2.4 | )% | ||||||
Total Liabilities | 8,670,240 | 8,381,287 | 8,657,051 | (0.2 | )% | 3.3 | % | ||||||
Total liabilities increased by 3.3% during the second quarter of 2003 and decreased by 0.2% in a year-on-year basis. The quarterly increase was largely explained by a 17.4% increase in non interest bearing liabilities, fueled by bankers’ drafts and other liabilities. This growth was mainly attributable to technical reserve requirements (reserva técnica) which increased temporarily Bankers’ drafts and also the Bank’s cash clearing accounts (Canje).
Regarding the 0.2% annual decrease, it was mainly a consequence of a change in the Chilean guidelines dictated by the Superintendency of Banks in 4Q02, which affected the accounting presentation of mortgage finance bonds issued by the Bank6. Excluding this effect, total liabilities would have increased by approximately 2.2% year-on-year basis.
In terms of annual fluctuation, special mention should be made of the 26.1% growth experienced in checking account balances, which have been positively impacted by the lower nominal interest rates prevailing during 2003 which allowed the maintenance of higher balances in these liabilities. In addition, the Bank has opened approximately 7,529 new checking accounts during the last twelve-months. On the other hand, it is also worth mentioning that the decline observed in time deposits and in repurchase agreements was partially offset by the rise experienced by foreign borrowings. As we mentioned in our previous release, foreign borrowings have expanded as a consequence of the Bank’s decision to switch funding in local currency for liabilities in foreign currency in order to take advantage of the attractive international rates, thus lowering the cost of fund.
6 See page 7
Page 10 of 22
INVESTMENT PORTFOLIO
As of June 30, 2003, the Bank’s investment portfolio totaled Ch$1,831,922 million, a 0.8% increase relative to Ch$1,817,358 million maintained as of March 31, 2003. This slight increase was mainly concentrated in Central Bank securities denominated in Chilean pesos. At the same time, the Bank has extended the duration of certain Central Bank securities from short-term to medium-term, in order to benefit from higher yielding securities.
As we mentioned in our previous release, in October, 2002 the accounting presentation of financial investments in mortgage finance bonds issued by the Bank changed in accordance with new instructions of the Chilean Superintendency of Banks, thus explaining the annual decrease in the investment portfolio6. Excluding this effect, the investment portfolio would have expanded by 3.8% year-on-year basis.
As of June 30, 2003, the investment portfolio maintained by the Bank represented 19.7% of total assets and was comprised principally by:

6 See page 7
Page 11 of 22
INCOME FROM SERVICES, NET
Income from Services
(in millions of Chilean pesos, except for percentages)
Composition by Company | 2Q02 | 1Q03 | 2Q03 | % Change 2Q03/2Q02 | |||||
Bank | 13,208 | 15,779 | 16,921 | 28.1 | % | ||||
General Adm. of Funds | 3,296 | 3,071 | 3,070 | (6.9 | )% | ||||
Financial Advisory | 423 | 42 | 854 | 101.9 | % | ||||
Insurance Brokerage | 644 | 712 | 613 | (4.8 | )% | ||||
Stock Brokerage | 613 | 902 | 2,752 | 348.9 | % | ||||
Factoring | 100 | 63 | 78 | (22.0 | )% | ||||
Socofin | 0 | 1,745 | 2,146 | — | |||||
Securization | 12 | 12 | 12 | 0.0 | % | ||||
Promarket | 51 | 108 | 135 | 164.7 | % | ||||
Foreign Branches | 424 | 297 | 262 | (38.2 | )% | ||||
Total Income from services, net | 18,771 | 22,731 | 26,843 | 43.0 | % | ||||
Income from services totaled Ch$26,843 million in 2Q03, an increase of 43.0% compared to 2Q02. The highly satisfactory fee income level reached during this quarter responded to the bank’s effort in maximizing its relationship with both its corporate and retail segments. Regarding the first one, during the reporting period, the bank, through its corporate division and financial advisory subsidiary, obtained significant fees related to debt-restructuring loans to corporations related to the infrastructure and fishing sector. In addition, fees related to foreign trade transactions expanded as the Bank encouraged these loans through different promotional campaigns.
Page 12 of 22
In terms of the retail segment, fees grew principally in checking accounts and insurance related products. Higher checking account fees were mainly related to: (i) a new fee structure, (ii) an increase in ATM transactions and, (iii) the result of the opening of 7,529 new checking accounts during the year.
In terms of subsidiaries, the Stock Brokerage company also contributed importantly to the 43.0% year-on-year increase in fee income mainly in response to higher stock volumes traded during 2Q03 compared to 2Q02.
Mention should also be made to the annual increase in the fee income base, originated from the incorporation of Socofin, the debt collection subsidiary which accounted for 8.0% of the total fees during the current quarter.
In terms of fees over average loans, this ratio increased to 1.70% in 2Q03 from 1.20% in 2Q02. Excluding Socofin fees, the ratio would have been 1.57% in the second quarter of 2003.
Regarding the quarterly increase of 18.1% in fee income, it was also explained by the participation on debt-restructuring credits by the Bank and the Advisory subsidiary and, to a lesser extent, to higher contribution in fee coming from the Stock Brokerage and Socofin during 2Q03 and to higher other operating income related to the sale of assets received in lieu of payments.
GAINS ON SALES OF FINANCIAL INSTRUMENTS, NET
The Bank’s total gains on sales of financial instruments reached Ch$2,729 million during the second quarter of 2003, a 54.1% decrease compared to Ch$5,952 million for the second quarter of 2002. This decline was mainly due to the significant mark to market gains obtained on Central Bank securities during 2Q02 as interest rates in Chile declined sharply in that quarter, from 5.05% in March 2002 to 4.00% in June 2002. It is worth mentioning that since February 2003 the interest rate has remained stable in 2.75%. Regarding the important amount of gains on sales of financial instruments recorded during 1Q03, it was principally explained by significant earnings obtained from the sale of Argentinean corporate securities booked in the New York branch in that quarter.
Page 13 of 22
PROVISIONS
| Allowances and Provisions | |||||||||||||
(in millions of Chilean pesos, except for percentages) | |||||||||||||
Allowances | 2Q02 | 1Q03 | 2Q03 | % Change 2Q03/2Q02 | |||||||||
Allowances at the beginning of each period | 244,809 | 218,370 | 214,049 | (12.6 | )% | ||||||||
Price-level restatement | (2,133 | ) | (785 | ) | (1,644 | ) | (22.9 | )% | |||||
Charge-off | (23,049 | ) | (16,950 | ) | (24,393 | ) | 5.8 | % | |||||
Provisions for loan losses established, net | 34,228 | 13,414 | 16,920 | (50.6 | )% | ||||||||
Voluntary Provisions established, net | 336 | 0 | 0 | — | |||||||||
Allowances at the end of each period | 254,191 | 214,049 | 204,932 | (19.4 | )% | ||||||||
Provisions | |||||||||||||
Provisions | (34,564 | ) | (13,414 | ) | (16,920 | ) | (51.0 | )% | |||||
Ratios | |||||||||||||
Allowances/Total loans | 4.08 | % | 3.43 | % | 3.29 | % | — | ||||||
Risk Index | 3.39 | % | 2.96 | % | 2.81 | % | — | ||||||
Provisions/Avg. Loans | 2.20 | % | 0.86 | % | 1.07 | % | — | ||||||
Charge-offs/Avg. Loans | 1.47 | % | 1.08 | % | 1.55 | % | — | ||||||
Recoveries/Avg. Loans | 0.17 | % | 0.28 | % | 0.37 | % | — | ||||||
Provisions amounted to Ch$16,920 million in the second quarter of 2003, a substantial decrease compared to the Ch$34,564 million recorded in the second quarter of 2002. During 2003, the Bank has experienced a reduction in its level of provisions as a result of a better economic scenario and to the strict credit policy sustained by the Bank which implied the establishment of important volumes of allowances during the prior years. In addition, provisions for loan losses during 2Q03 were positively impacted by the 4.1% decrease observed in the exchange rate versus a 5.0% increase in the same figure during the 2Q02. In terms of economic sectors, during the second quarter of 2003 provisions for loan losses were mainly concentrated in corporate debtors related to the communication and construction sectors.
The lower level of provisions during 2Q03 implied a reduction in the ratio of provisions to average loans to 1.07% in 2Q03 from 2.20% in 2Q02. Regarding the Bank’s risk index, it has shown a decreasing trend (reaching 2.81% in 2Q03 compared to 3.39% in 2Q02), in part as a consequence of important charge-off efforts.
The 26% increase in provisions for loan losses during 2Q03 compared to the previous quarter was mainly due to the low net provisioning during the previous quarter after the release of allowances associated to one client of the fishing sector during 1Q03, which at the same time reduced its loan exposure and improved its risk classification.
Page 14 of 22
OTHER INCOME AND EXPENSES
Total Other Income and Expenses increased to Ch$2,679 million in 2Q03 from Ch$(634) million in last year same quarter. This increase was mostly explained by higher recoveries of loans previously charged-off and, to a lesser extent, to lower charge-off on assets received in lieu of payment. During 2Q03 the Bank decided to establish allowances in equity investments associated to the expected effects of the reappraisal of some technological assets in an affiliate.
OPERATING EXPENSES
| OPERATING EXPENSES | |||||||||||
| (in millions of Chilean pesos, except for percentages) | |||||||||||
| 2Q02 | 1Q03 | 2Q03 | % Change 2Q03/2Q02 | ||||||||
Personnel salaries and expenses | (30,845) | (29,357) | (29,704) | (3.7)% | |||||||
Administrative and other expenses | (23,030) | (21,868) | (23,058) | 0.1 % | |||||||
Depreciation and amortization | (5,884) | (4,506) | (4,416) | (24.9)% | |||||||
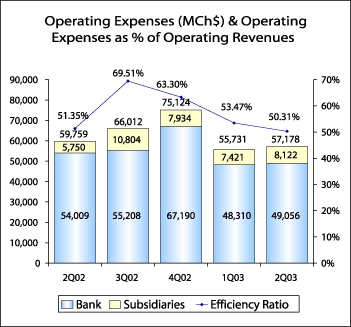
Total operating expenses | (59,759) | (55,731) | (57,178) | (4.3)% | |||||||
Bank’s operating expenses | (54,009) | (48,310) | (49,056) | (9.2)% | |||||||
Subsidiaries and F. Branches’ oper. expenses | (5,750) | (7,421) | (8,122) | 41.3 % | |||||||
Efficiency Ratio* | 51.4 | % | 53.5 | % | 50.3 | % | — | ||||
Efficiency Ratio** | 46.3 | % | 49.1 | % | 46.4 | % | |||||
* Operating expenses/Operating revenues ** Excludes depreciation and amortization | |||||||||||
Page 15 of 22
Total operating expenses reached Ch$57,178 million during the second quarter of 2003, reflecting a year-over-year contraction of 4.3% mainly as a consequence of significant merger-related costs charged during 2Q02, principally severance payments and charge-offs of discontinued software and of assets in rented branches that were closed during the first half of 2002. However, the decrease in operating expenses during 2Q03 compared to 2Q02 was partially offset by the following factors:
| (i) | an increase in cost base due to the incorporation of Socofin subsidiary in 3Q02, |
| (ii) | higher personnel expenses as a result of the leveling of compensation criteria between both banks and also due to the establishment of allowances for annual variable compensations, |
| (iii) | higher variable personnel compensations associated to higher volume businesses reached by some of our subsidiaries. |
Regarding the 2.6% increase in operating expenses during 2Q03 relative to the 1Q03, it was mainly explained by higher personnel expenses and administrative expenses. Higher personnel expenses were mainly associated to the already mentioned allowances for annual variable compensations and variable compensations associated to higher volume businesses reached primarily by the Stock Brokerage subsidiary. Higher administrative expenses were principally driven by a rise in advertising expenses related to different promotional campaigns and in telecommunication expenses, in addition to a slight increase in insurances and fixed assets maintenance expenses.
Regarding the efficiency ratio, it has declined to 50.3% in the second quarter of 2003, from 51.4% in last year’s same quarter or 53.5% in the first quarter of 2003.
LOSS FROM PRICE-LEVEL RESTATEMENT
Loss from price-level restatement amounted to Ch$2,029 million in 2Q03 compared to Ch$3,414 million during the 2Q02, reflecting mainly the decrease in the inflation rate used for adjustment purposes from 1.0% in 2Q02 to 0.7% in 2Q03.
INCOME TAXES
During the second quarter of 2003, the Bank’s income taxes totaled Ch$4,934 million, a 52% increase compared to Ch$3,245 million in 2Q02. This increase was mainly a consequence of: (1) a higher income tax base in 2Q03 as a result of the increase in net income before taxes which more than double the 2Q02 same figure, and (2) an increase in the statutory tax rate from 16.0% in 2002 to 16.5% in 2003.
It is important to note that the Bank’s effective rate is lower than the statutory corporate income tax rate, as under tax regulations applicable to any kind of subordinated debt of a bank or a bank affiliate originated in the 1980’s banking crisis, every payment to the Central Bank is deductible from the net income of the bank for tax calculation purposes.
Page 16 of 22
SHAREHOLDERS’ EQUITY
| Shareholders’ Equity | |||||||||||||
| (in million of Chilean Pesos) | |||||||||||||
| June.02 | March.03 | June.03 | % Change 12-months | ||||||||||
Capital and Reserves | 561,534 | 562,375 | 561,801 | 0.0 | % | ||||||||
Accumulated adjustment for translation differences8 | 8,845 | 9,275 | 7,765 | (12.2 | )% | ||||||||
Unrealized gain (loss) on permanent financial invest.9 | (12,818 | ) | (228 | ) | (920 | ) | (92.8 | )% | |||||
Net Income | 27,863 | 31,435 | 66,491 | 138.6 | % | ||||||||
Total Shareholders’ equity | 585,424 | 602,857 | 635,137 | 8.5 | % | ||||||||
As of June 30, 2003, the Bank’s Shareholder Equity totaled Ch$635,137 million (US$911.0 million), as compared to Ch$585,424 million (US$839.6 million) as of June 30, 2002, mainly reflecting higher net income registered during the first half of 2003 and, to a lesser extent, lower losses on mark to market financial investments9 held as available for sale. It is worth mentioning that the losses registered on available for sale financial investments as of June 2002 were related to Argentinean and Brazilian Corporate bonds, booked in the New York Branch.
At the end of June 2003, on a consolidated basis, the Bank’s Total Capital to Risk-Adjusted Assets ratio (BIS ratio) was 13.6%, and the Basic Capital to Total Assets ratio was 6.10%, both in full compliance with the minimum requirements applicable to Banco de Chile of 10% and 3%, respectively.
Note: All figures expressed in US dollars (except earnings per ADR) were converted using the exchange rate of Ch$697.23 for US$1.00 as of June 30, 2003. Earnings per ADR were calculated considering the nominal net income and the exchange rate existing at the end of each period.
— Financial Tables Follow —
| 8 | Represents the effect of the variation in the exchange rate on investments abroad that exceed the restatement of these investments according to the change in the consumer price index. |
| 9 | Financial investments traded on a secondary market are shown adjusted to market value, following specific instructions from the Superintendency of Banks and Financial Institutions. These instructions state that such adjustments should be recognized against income, except in the case of the permanent portfolio, when an equity account, “Unrealized gains (losses) on permanent financial investments”, may be directly charged or credited. |
Page 17 of 22
BANCO DE CHILE
CONSOLIDATED STATEMENTS OF INCOME (Under Chilean GAAP)
(Expressed in millions of constant Chilean pesos (MCh$) as of June 30, 2003 and millions of US dollars (MUS$))
| Quarters | % Change | Year ended | % Change | ||||||||||||||||||||||||||||||
2Q02 MCh$ | 1Q03 MCh$ | 2Q03 MCh$ | 2Q03 MUS$ | 2Q03-2Q02 | 2Q03-1Q03 | June 02 MCh$ | Dec 02 MCh$ | June 03 MCh$ | June 03 MUS$ | June 03-Jun 02 | |||||||||||||||||||||||
Interest revenue and expense | |||||||||||||||||||||||||||||||||
Interest revenue | 208,831 | 140,677 | 134,165 | 192.4 | (35.8 | )% | (4.6 | )% | 353,443 | 697,300 | 273,864 | 392.8 | (22.5 | )% | |||||||||||||||||||
Interest expense | (97,078 | ) | (52,744 | ) | (69,778 | ) | (100.1 | ) | (28.1 | )% | 32.3 | % | (161,648 | ) | (325,660 | ) | (122,155 | ) | (175.2 | ) | (24.4 | )% | |||||||||||
Net interest revenue | 111,753 | 87,933 | 64,387 | 92.3 | (42.4 | )% | (26.8 | )% | 191,795 | 371,640 | 151,709 | 217.6 | (20.9 | )% | |||||||||||||||||||
Income from services, net | |||||||||||||||||||||||||||||||||
Income from fees and other services | 23,885 | 28,626 | 34,125 | 48.9 | 42.9 | % | 19.2 | % | 46,413 | 105,980 | 62,552 | 89.7 | 34.8 | % | |||||||||||||||||||
Other services expenses | (5,114 | ) | (5,895 | ) | (7,282 | ) | (10.4 | ) | 42.4 | % | 23.5 | % | (8,829 | ) | (20,846 | ) | (13,136 | ) | (18.8 | ) | 48.8 | % | |||||||||||
Income from services, net | 18,771 | 22,731 | 26,843 | 38.5 | 43.0 | % | 18.1 | % | 37,584 | 85,134 | 49,416 | 70.9 | 31.5 | % | |||||||||||||||||||
Other operating income, net | |||||||||||||||||||||||||||||||||
Gains on financial instruments, net | 5,952 | 5,352 | 2,729 | 3.9 | (54.1 | )% | (49.0 | )% | 12,061 | 902 | 8,044 | 11.5 | (33.3 | )% | |||||||||||||||||||
Foreign exchange transactions, net | (20,093 | ) | (11,780 | ) | 19,699 | 28.3 | — | — | (23,034 | ) | (32,263 | ) | 8,001 | 11.5 | — | ||||||||||||||||||
Total other operating income, net | (14,141 | ) | (6,428 | ) | 22,428 | 32.2 | — | — | (10,973 | ) | (31,361 | ) | 16,045 | 23.0 | — | ||||||||||||||||||
Operating Revenues | 116,383 | 104,236 | 113,658 | 163.0 | (2.3 | )% | 9.0 % | | 218,406 | 425,413 | 217,170 | 311.5 | (0.6 | )% | |||||||||||||||||||
Provisions | (34,564 | ) | (13,414 | ) | (16,920 | ) | (24.3 | ) | (51.0 | )% | 26.1 | % | (69,384 | ) | (101,751 | ) | (30,241 | ) | (43.4 | ) | (56.4 | )% | |||||||||||
Other income and expenses | |||||||||||||||||||||||||||||||||
Recovery of loans previously charged-off | 2,686 | 4,385 | 5,903 | 8.5 | 119.8 | % | 34.6 | % | 5,376 | 12,045 | 10,258 | 14.7 | 90.8 | % | |||||||||||||||||||
Non-operating income | 1,548 | 1,537 | 1,407 | 2.0 | (9.1 | )% | (8.5 | )% | 4,273 | 6,858 | 2,933 | 4.3 | (31.4 | )% | |||||||||||||||||||
Non-operating expenses | (4,653 | ) | (4,275 | ) | (3,001 | ) | (4.3 | ) | (35.5 | )% | (29.8 | )% | (7,423 | ) | (23,276 | ) | (7,247 | ) | (10.3 | ) | (2.4 | )% | |||||||||||
Participation in earnings of equity investments | (215 | ) | (558 | ) | (1,630 | ) | (2.3 | ) | 658.1 | % | 192.1 | % | (368 | ) | (981 | ) | (2,184 | ) | (3.1 | ) | 493.5 | % | |||||||||||
Total other income and expenses | (634 | ) | 1,089 | 2,679 | 3.9 | (522.6 | )% | 146.0 | % | 1,858 | (5,354 | ) | 3,760 | 5.6 | 102.4 | % | |||||||||||||||||
Operating expenses | |||||||||||||||||||||||||||||||||
Personnel salaries and expenses | (30,845 | ) | (29,357 | ) | (29,704 | ) | (42.6 | ) | (3.7 | )% | 1.2 % | | (61,514 | ) | (135,665 | ) | (58,857 | ) | (84.4 | ) | (4.3 | )% | |||||||||||
Administrative and other expenses | (23,030 | ) | (21,868 | ) | (23,058 | ) | (33.1 | ) | 0.1 | % | 5.4 % | | (46,332 | ) | (98,716 | ) | (44,774 | ) | (64.2 | ) | (3.4 | )% | |||||||||||
Depreciation and amortization | (5,884 | ) | (4,506 | ) | (4,416 | ) | (6.3 | ) | (24.9 | )% | (2.0 | )% | (11,434 | ) | (22,176 | ) | (8,891 | ) | (12.8 | ) | (22.2 | )% | |||||||||||
Total operating expenses | (59,759 | ) | (55,731 | ) | (57,178 | ) | (82.0 | ) | (4.3 | )% | 2.6 % | | (119,280 | ) | (256,557 | ) | (112,522 | ) | (161.4 | ) | (5.7 | )% | |||||||||||
Loss from price-level restatement | (3,414 | ) | (2,234 | ) | (2,029 | ) | (2.9 | ) | (40.6 | )% | (9.2 | )% | (1,644 | ) | (9,702 | ) | (4,247 | ) | (6.1 | ) | 158.3 | % | |||||||||||
Minority interest in consolidated subsidiaries | 0 | 0 | (1 | ) | 0.0 | — | — | 0 | (1 | ) | (1 | ) | 0.0 | — | |||||||||||||||||||
Income before income taxes | 18,012 | 33,946 | 40,209 | 57.7 | 123.2 | % | 18.4 | % | 29,956 | 52,048 | 73,919 | 106.2 | 146.8 | % | |||||||||||||||||||
Income taxes | (3,245 | ) | (2,511 | ) | (4,934 | ) | (7.1 | ) | 52.0 | % | 96.5 | % | (2,093 | ) | 1,166 | (7,428 | ) | (10.7 | ) | 254.9 | % | ||||||||||||
Net income | 14,767 | 31,435 | 35,275 | 50.6 | 138.9 | % | 12.2 | % | 27,863 | 53,214 | 66,491 | 95.5 | 138.6 | % | |||||||||||||||||||
BANCO DE CHILE
CONSOLIDATED BALANCE SHEETS (Under Chilean GAAP)
(Expressed in millions of constant Chilean pesos (MCh$) as of June 30, 2003 and millions of US dollars (MUS$))
| ASSETS | Dec 01 | Jun 02 | Dec 02 | Mar 03 | Jun 03 | Jun 03 | % Change | ||||||||||||||||||||
| MCh$ | MCh$ | MCh$ | MCh$ | MCh$ | MUS$ | Jun 03-Jun 02 | Jun 03-Dec 02 | Jun 03-Mar 03 | |||||||||||||||||||
Cash and due from banks | |||||||||||||||||||||||||||
Noninterest bearing | 748,632 | 779,498 | 669,027 | 664,086 | 1,052,356 | 1,509.3 | 35.0 | % | 57.3 | % | 58.5 | % | |||||||||||||||
Interbank bearing | 55,080 | 94,587 | 14,836 | 110,600 | 0 | 0.0 | (100.0 | )% | (100.0 | )% | (100.0 | )% | |||||||||||||||
Total cash and due from banks | 803,712 | 874,085 | 683,863 | 774,686 | 1,052,356 | 1,509.3 | 20.4 | % | 53.9 | % | 35.8 | % | |||||||||||||||
Financial investments | |||||||||||||||||||||||||||
Government securities | 1,158,345 | 958,031 | 878,914 | 950,476 | 1,050,851 | 1,507.2 | 9.7 | % | 19.6 | % | 10.6 | % | |||||||||||||||
Investments purchase under agreements to resell | 52,029 | 24,977 | 32,531 | 19,721 | 37,485 | 53.8 | 50.1 | ��% | 15.2 | % | 90.1 | % | |||||||||||||||
Investment collateral under agreements to repurchase | 230,730 | 386,307 | 279,498 | 371,471 | 268,237 | 384.7 | (30.6 | )% | (4.0 | )% | (27.8 | )% | |||||||||||||||
Other investments | 651,194 | 596,050 | 425,545 | 475,690 | 475,349 | 681.8 | (20.3 | )% | 11.7 | % | (0.1 | )% | |||||||||||||||
Total financial investments | 2,092,298 | 1,965,365 | 1,616,488 | 1,817,358 | 1,831,922 | 2,627.5 | (6.8 | )% | 13.3 | % | 0.8 | % | |||||||||||||||
Loans, Net | |||||||||||||||||||||||||||
Commercial loans | 2,822,032 | 2,574,176 | 2,545,010 | 2,543,136 | 2,538,891 | 3,641.4 | (1.4 | )% | (0.2 | )% | (0.2 | )% | |||||||||||||||
Consumer loans | 403,541 | 401,749 | 417,297 | 433,982 | 404,782 | 580.6 | 0.8 | % | (3.0 | )% | (6.7 | )% | |||||||||||||||
Mortgage loans | 1,318,073 | 1,281,701 | 1,200,331 | 1,165,262 | 1,162,813 | 1,667.8 | (9.3 | )% | (3.1 | )% | (0.2 | )% | |||||||||||||||
Foreign trade loans | 542,047 | 618,193 | 618,399 | 636,167 | 682,849 | 979.4 | 10.5 | % | 10.4 | % | 7.3 | % | |||||||||||||||
Interbank loans | 29,980 | 79,261 | 55,421 | 19,660 | 23,956 | 34.4 | (69.8 | )% | (56.8 | )% | 21.9 | % | |||||||||||||||
Leasing contracts | 258,265 | 250,807 | 251,833 | 268,587 | 268,834 | 385.6 | 7.2 | % | 6.8 | % | 0.1 | % | |||||||||||||||
Other outstanding loans | 442,268 | 500,043 | 608,501 | 634,214 | 599,672 | 860.1 | 19.9 | % | (1.5 | )% | (5.4 | )% | |||||||||||||||
Past due loans | 125,669 | 145,909 | 146,531 | 148,395 | 144,811 | 207.7 | (0.8 | )% | (1.2 | )% | (2.4 | )% | |||||||||||||||
Contingent loans | 386,628 | 382,419 | 385,966 | 382,197 | 407,183 | 584.0 | 6.5 | % | 5.5 | % | 6.5 | % | |||||||||||||||
Total loans | 6,328,503 | 6,234,258 | 6,229,289 | 6,231,600 | 6,233,791 | 8,941.0 | (0.0 | )% | 0.1 | % | 0.0 | % | |||||||||||||||
Allowances | (235,307 | ) | (254,191 | ) | (218,370 | ) | (214,049 | ) | (204,932 | ) | (293.9 | ) | (19.4 | )% | (6.2 | )% | (4.3 | )% | |||||||||
Total loans, net | 6,093,196 | 5,980,067 | 6,010,919 | 6,017,551 | 6,028,859 | 8,647.1 | 0.8 | % | 0.3 | % | 0.2 | % | |||||||||||||||
Other assets | |||||||||||||||||||||||||||
Assets received in lieu of payment | 34,213 | 32,365 | 19,206 | 19,487 | 19,308 | 27.7 | (40.3 | )% | 0.5 | % | (0.9 | )% | |||||||||||||||
Bank premises and equipment | 150,511 | 147,686 | 140,876 | 137,934 | 132,999 | 190.8 | (9.9 | )% | (5.6 | )% | (3.6 | )% | |||||||||||||||
Investments in other companies | 5,421 | 5,783 | 4,830 | 4,407 | 3,426 | 4.9 | (40.8 | )% | (29.1 | )% | (22.3 | )% | |||||||||||||||
Other | 166,673 | 250,313 | 214,404 | 212,721 | 223,318 | 320.3 | (10.8 | )% | 4.2 | % | 5.0 | % | |||||||||||||||
Total other assets | 356,818 | 436,147 | 379,316 | 374,549 | 379,051 | 543.7 | (13.1 | )% | (0.1 | )% | 1.2 | % | |||||||||||||||
Total assets | 9,346,024 | 9,255,664 | 8,690,586 | 8,984,144 | 9,292,188 | 13,327.6 | 0.4 | % | 6.9 | % | 3.4 | % | |||||||||||||||
BANCO DE CHILE
CONSOLIDATED BALANCE SHEETS (Under Chilean GAAP)
(Expressed in millions of constant Chilean pesos (MCh$) as of June 30, 2003 and millions of US dollars (MUS$))
LIABILITIES & SHAREHOLDERS’ EQUITY | |||||||||||||||||||||
| Dec 01 | Jun 02 | Dec 02 | Mar 03 | Jun 03 | Jun 03 | % Change | |||||||||||||||
| MCh$ | MCh$ | MCh$ | MCh$ | MCh$ | MUS$ | Jun 03-Jun 02 | Jun 03-Dec 02 | Jun 03-Mar 03 | |||||||||||||
Deposits | |||||||||||||||||||||
Current accounts | 948,714 | 913,243 | 1,083,977 | 1,184,143 | 1,151,738 | 1,651.9 | 26.1 | % | 6.3 | % | (2.7 | )% | |||||||||
Bankers drafts and other deposits | 526,568 | 748,881 | 574,887 | 585,665 | 935,932 | 1,342.4 | 25.0 | % | 62.8 | % | 59.8 | % | |||||||||
Saving accounts and time deposits | 4,153,225 | 3,740,202 | 3,535,923 | 3,549,863 | 3,547,754 | 5,088.4 | (5.1 | )% | 0.3 | % | (0.1 | )% | |||||||||
Total deposits | 5,628,507 | 5,402,326 | 5,194,787 | 5,319,671 | 5,635,424 | 8,082.7 | 4.3 | % | 8.5 | % | 5.9 | % | |||||||||
Borrowings | |||||||||||||||||||||
Central Bank borrowings | 80,147 | 14,422 | 3,804 | 3,609 | 3,189 | 4.6 | (77.9 | )% | (16.2 | )% | (11.6 | )% | |||||||||
Securities sold under agreements to repurchase | 258,083 | 393,209 | 279,718 | 383,401 | 295,341 | 423.6 | (24.9 | )% | 5.6 | % | (23.0 | )% | |||||||||
Mortgage finance bonds | 1,410,690 | 1,373,779 | 1,095,965 | 1,046,077 | 1,048,772 | 1,504.2 | (23.7 | )% | (4.3 | )% | 0.3 | % | |||||||||
Subordinated bonds | 274,514 | 271,714 | 280,708 | 278,133 | 276,531 | 396.6 | 1.8 | % | (1.5 | )% | (0.6 | )% | |||||||||
Other bonds | 8,261 | 6,480 | 4,644 | 4,512 | 3,904 | 5.6 | (39.8 | )% | (15.9 | )% | (13.5 | )% | |||||||||
Borrowings from domestic financial institutions | 46,767 | 77,654 | 51,043 | 86,728 | 87,872 | 126.0 | 13.2 | % | 72.2 | % | 1.3 | % | |||||||||
Foreign borrowings | 339,813 | 277,576 | 515,958 | 562,471 | 513,921 | 737.1 | 85.1 | % | (0.4 | )% | (8.6 | )% | |||||||||
Other obligations | 75,619 | 69,371 | 77,614 | 44,474 | 37,442 | 53.7 | (46.0 | )% | (51.8 | )% | (15.8 | )% | |||||||||
Total borrowings | 2,493,894 | 2,484,205 | 2,309,454 | 2,409,405 | 2,266,972 | 3,251.4 | (8.7 | )% | (1.8 | )% | (5.9 | )% | |||||||||
Other liabilities | |||||||||||||||||||||
Contingent liabilities | 386,255 | 381,827 | 385,183 | 382,240 | 407,232 | 584.1 | 6.7 | % | 5.7 | % | 6.5 | % | |||||||||
Other | 173,371 | 401,877 | 176,128 | 269,967 | 347,418 | 498.4 | (13.6 | )% | 97.3 | % | 28.7 | % | |||||||||
Total other liabilities | 559,626 | 783,704 | 561,311 | 652,207 | 754,650 | 1,082.5 | (3.7 | )% | 34.4 | % | 15.7 | % | |||||||||
Minority interest in consolidated subsidiaries | 3 | 5 | 3 | 4 | 5 | 0.0 | 0.0 | % | 66.7 | % | 25.0 | % | |||||||||
Shareholders’ equity | |||||||||||||||||||||
Capital and Reserves | 562,911 | 557,561 | 571,817 | 571,422 | 568,646 | 815.6 | 2.0 | % | (0.6 | )% | (0.5 | )% | |||||||||
Net income for the year | 101,083 | 27,863 | 53,214 | 31,435 | 66,491 | 95.4 | 138.6 | % | 25.0 | % | 111.5 | % | |||||||||
Total shareholders’ equity | 663,994 | 585,424 | 625,031 | 602,857 | 635,137 | 911.0 | 8.5 | % | 1.6 | % | 5.4 | % | |||||||||
Total liabilities & shareholders’ equity | 9,346,024 | 9,255,664 | 8,690,586 | 8,984,144 | 9,292,188 | 13,327.6 | 0.4 | % | 6.9 | % | 3.4 | % | |||||||||
BANCO DE CHILE
SELECTED CONSOLIDATED FINANCIAL INFORMATION
| Quarters | Year ended | |||||||||||||||||
| 2Q02 | 1Q03 | 2Q03 | Jun-02 | Dec 02 | Jun-03 | |||||||||||||
Earnings per Share | ||||||||||||||||||
Net income per Share (Ch$)(1) | 0.22 | 0.46 | 0.52 | 0.41 | 0.78 | 0.98 | ||||||||||||
Net income per ADS (Ch$)(1) | 130.15 | 277.04 | 310.89 | 245.56 | 469.20 | 586.00 | ||||||||||||
Net income per ADS (US$)(2) | 0.19 | 0.38 | 0.45 | 0.35 | 0.66 | 0.84 | ||||||||||||
Book value per Share (Ch$)(1) | 8.60 | 8.86 | 9.33 | 8.60 | 9.18 | 9.33 | ||||||||||||
Shares outstanding (Millions) | 68,079.78 | 68,079.78 | 68,079.78 | 68,079.8 | 68,079.8 | 68,079.8 | ||||||||||||
Profitability Ratios(3)(4) | ||||||||||||||||||
Net interest margin | 5.23 | % | 4.31 | % | 3.10 | % | 4.51 | % | 4.47 | % | 3.70 | % | ||||||
Net financial margin | 4.29 | % | 3.74 | % | 4.05 | % | 3.97 | % | 4.08 | % | 3.90 | % | ||||||
Fees / Avg. Interest Earnings Assets | 0.88 | % | 1.12 | % | 1.29 | % | 0.88 | % | 1.02 | % | 1.21 | % | ||||||
Operating Revenues / Avg. Interest Earnings Assets | 5.45 | % | 5.11 | % | 5.47 | % | 5.14 | % | 5.12 | % | 5.30 | % | ||||||
Return on average total assets | 0.63 | % | 1.41 | % | 1.55 | % | 0.59 | % | 0.58 | % | 1.48 | % | ||||||
Return on average shareholders’ equity | 10.17 | % | 19.96 | % | 22.43 | % | 8.95 | % | 8.85 | % | 21.20 | % | ||||||
Capital Ratios | ||||||||||||||||||
Shareholders equity / total assets | 6.3 | % | 6.7 | % | 6.8 | % | 6.3 | % | 7.2 | % | 6.8 | % | ||||||
Basic capital / total assets | 6.0 | % | 6.3 | % | 6.1 | % | 6.0 | % | 6.6 | % | 6.1 | % | ||||||
Basic capital / risk-adjusted assets | 9.0 | % | 9.5 | % | 9.4 | % | 9.0 | % | 9.4 | % | 9.4 | % | ||||||
Total capital / risk-adjusted assets | 13.3 | % | 13.7 | % | 13.6 | % | 13.3 | % | 13.7 | % | 13.6 | % | ||||||
Credit Quality Ratios | ||||||||||||||||||
Past due loans / total loans | 2.34 | % | 2.38 | % | 2.32 | % | 2.34 | % | 2.35 | % | 2.32 | % | ||||||
Allowances / past due loans | 174.21 | % | 144.24 | % | 141.52 | % | 174.21 | % | 149.03 | % | 141.52 | % | ||||||
Allowances / total loans | 4.08 | % | 3.43 | % | 3.29 | % | 4.08 | % | 3.51 | % | 3.29 | % | ||||||
Provisions / Avg.Loans | 2.20 | % | 0.86 | % | 1.07 | % | 2.21 | % | 1.64 | % | 0.97 | % | ||||||
Risk index | 3.39 | % | 2.96 | % | 2.81 | % | 3.39 | % | 3.04 | % | 2.81 | % | ||||||
Operating and Productivity Ratios | ||||||||||||||||||
Operating expenses / operating revenue | 51.4 | % | 53.5 | % | 50.3 | % | 54.6 | % | 60.3 | % | 51.8 | % | ||||||
Operating expenses / average total assets(3) | 2.54 | % | 2.50 | % | 2.52 | % | 2.54 | % | 2.81 | % | 2.51 | % | ||||||
Loans per employee (million Ch$)(1) | 782 | 721 | 702 | 782 | 720 | 702 | ||||||||||||
Average Balance Sheet Data(1)(3) | ||||||||||||||||||
Avg. Interest earnings assets (million Ch$) | 8,549,439 | 8,151,806 | 8,303,838 | 8,501,426 | 8,312,951 | 8,199,489 | ||||||||||||
Avg. Assets (million Ch$) | 9,406,410 | 8,918,716 | 9,087,695 | 9,373,991 | 9,133,673 | 8,972,207 | ||||||||||||
Avg. Shareholders equity (million Ch$) | 581,088 | 629,809 | 629,205 | 622,826 | 601,065 | 627,318 | ||||||||||||
Avg. Loans | 6,274,982 | 6,270,695 | 6,300,569 | 6,291,636 | 6,205,986 | 6,263,837 | ||||||||||||
Avg. Interest bearing liabilities (million Ch$) | 6,702,477 | 6,137,960 | 6,240,901 | 6,673,395 | 6,431,235 | 6,168,097 | ||||||||||||
Other Data | ||||||||||||||||||
Inflation Rate | 0.34 | % | 2.08 | % | (0.48 | %) | 0.79 | % | 2.82 | % | 1.59 | % | ||||||
Exchange rate (Ch$) | 697.62 | 727.36 | 697.23 | 697.62 | 712.38 | 697.23 | ||||||||||||
Employees | 7,975 | 8,648 | 8,886 | 7,975 | 8,655 | 8,886 | ||||||||||||
Notes
| (1) | These figures were expressed in constant Chilean pesos as of June 30, 2003. |
| (2) | These figures were calculated considering the nominal net income, the shares outstanding and the exchange rates existing at the end of each period. |
| (3) | The ratios were calculated as an average of daily balances. |
| (4) | Annualized data. |
Page 21 of 22
FORWARD-LOOKING INFORMATION
The information contained herein incorporates by reference statements which constitute “forward-looking statements,” in that they include statements regarding the intent, belief or current expectations of our directors and officers with respect to our future operating performance. Such statements include any forecasts, projections and descriptions of anticipated cost savings or other synergies. You should be aware that any such forward-looking statements are not guarantees of future performance and may involve risks and uncertainties, and that actual results may differ from those set forth in the forward-looking statements as a result of various factors (including, without limitations, the actions of competitors, future global economic conditions, market conditions, foreign exchange rates, and operating and financial risks related to managing growth and integrating acquired businesses), many of which are beyond our control. The occurrence of any such factors not currently expected by us would significantly alter the results set forth in these statements.
Factors that could cause actual results to differ materially and adversely include, but are not limited to:
| • | changes in general economic, business or political or other conditions in Chile or changes in general economic or business conditions in Latin America; |
| • | changes in capital markets in general that may affect policies or attitudes toward lending to Chile or Chilean companies; |
| • | unexpected developments in certain existing litigation; |
| • | increased costs; |
| • | unanticipated increases in financing and other costs or the inability to obtain additional debt or equity financing on attractive terms; and |
You should not place undue reliance on such statements, which speak only as of the date that they were made. Our independent public accountants have not examined or compiled the forward-looking statements and, accordingly, do not provide any assurance with respect to such statements. These cautionary statements should be considered in connection with any written or oral forward-looking statements that we may issue in the future. We do not undertake any obligation to release publicly any revisions to such forward-looking statements after completion of this offering to reflect later events or circumstances or to reflect the occurrence of unanticipated events.
Contacts:
| Ricardo Morales | Jacqueline Barrio | |||
| Banco de Chile | Banco de Chile | |||
| (56-2) 637 3519 | (56-2) 637 2938 | |||
| rmorales@bancochile.cl | jbarrio@bancochile.cl |
Page 22 of 22
SIGNATURE
Pursuant to the requirements of the Securities Exchange Act of 1934, the registrant has duly caused this report to be signed on its behalf by the undersigned, thereunto duly authorized.
Date: August 12, 2003
| BANCODE CHILE | ||
By: | /s/ PABLO GRANIFO L. | |
Pablo Granifo Lavín General Manager | ||