SECURITIES AND EXCHANGE COMMISSION
Washington, D.C. 20549
FORM 6-K
REPORT OF FOREIGN ISSUER
Pursuant to Rule 13a-16 or 15d-16 of the
Securities Act of 1934
For the month of May, 2003
of Chile, Bank
(Translation of Registrant’s name into English)
Chile
(Jurisdiction of incorporation or organization)
Ahumada 251
Santiago, Chile
(Address of principal executive offices)
Indicate by check mark whether the registrant files or will file annual reports under cover of Form 20-F or Form 40-F.
Form 20-F x | Form 40-F ¨ |
Indicate by check mark whether the registrant by furnishing the information contained in this Form is also thereby furnishing the information to the Commission pursuant to Rule 12g-3-2(b) under the Securities Exchange Act of 1934.
Yes ¨ | No x |
(If “Yes” is marked, indicate below the file number assigned to the registrant in connection with Rule 12g3-2(b): 82- )
BANCO DE CHILE
REPORT ON FORM 6-K
Attached is an English translation of a Press Release issued by Banco de Chile (“the Bank”) on May 8, 2003, regarding financial statements for the three months ended March 31, 2003.

www.bancochile.cl
Banco de Chile Announces 2003 First-Quarter Results
Santiago, Chile,—May 8, 2003—Banco de Chile (NYSE: BCH), a Chilean full-service financial institution, market leader in a wide variety of credit and non-credit products and services across all segments of the Chilean financial market, today announced results for the first quarter ended March 31, 2003. The results have been prepared in accordance with Chilean GAAP on an unaudited, consolidated basis. All figures are expressed in constant Chilean pesos as of March 31, 2003, unless otherwise stated. Therefore, all growth rates are in real terms.
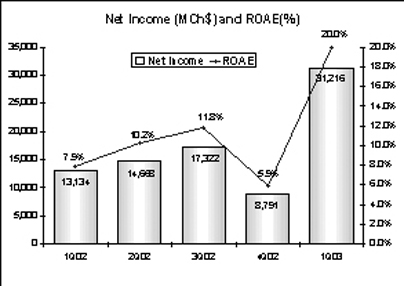
Net income for the first quarter of 2003 was Ch$31,216 million (Ch$0.46/share or US$0.38/ADS), which represents an increase of 137.7% when compared to Ch$13,134 million recorded in the first quarter of 2002.
2003 First-Quarter Selected Financial Data
1Q02 | 4Q02 | 1Q03 | % Change 1Q03/1Q02 | |||||||||
Income Statement (Millions, Chilean pesos) | ||||||||||||
Net Financial Income | 77,316 |
| 91,093 |
| 75,595 |
| (2.2 | )% | ||||
Income from Services | 18,778 |
| 24,352 |
| 23,530 |
| 25.3 | % | ||||
Gains on Sales of Financial Instruments | 6,127 |
| 4,009 |
| 5,315 |
| (13.3 | )% | ||||
Operating Revenues | 102,221 |
| 119,454 |
| 104,440 |
| 2.2 | % | ||||
Provisions for Loan Losses | (39,472 | ) | (28,384 | ) | (13,321 | ) | (66.3 | )% | ||||
Voluntary Provisions | 4,551 |
| (356 | ) | 0 |
| — |
| ||||
Operating Expenses | (59,694 | ) | (76,157 | ) | (56,272 | ) | (5.7 | )% | ||||
Net Income | 13,134 |
| 8,791 |
| 31,216 |
| 137.7 | % | ||||
Earning per Share (Chilean pesos) | ||||||||||||
Net income per Share | 0.19 |
| 0.13 |
| 0.46 |
| 137.7 | % | ||||
Book value per Share | 8.38 |
| 9.13 |
| 8.79 |
| 5.0 | % | ||||
Balance Sheet (Millions, Chilean pesos) | ||||||||||||
Loan Portfolio | 6,201,164 |
| 6,192,320 |
| 6,188,281 |
| (0.2 | )% | ||||
Total Assets | 9,234,965 |
| 8,639,010 |
| 8,921,691 |
| (3.4 | )% | ||||
Shareholders’ Equity | 570,249 |
| 621,321 |
| 598,666 |
| 5.0 | % | ||||
Total Capital / Risk Adjusted Assets | 13.5 | % | 13.7 | % | 13.7 | % | — |
| ||||
Profitability Ratios | ||||||||||||
ROAA | 0.56 | % | 0.40 | % | 1.41 | % | — |
| ||||
ROAE | 7.9 | % | 5.9 | % | 20.0 | % | — |
| ||||
Net Financial Margin | 3.6 | % | 4.6 | % | 3.7 | % | — |
| ||||
Efficiency ratio | 58.4 | % | 63.8 | % | 53.9 | % | — |
| ||||
Asset Quality Ratios | ||||||||||||
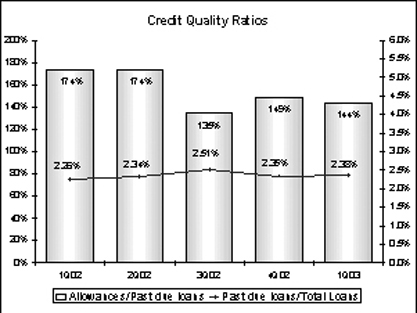
Past Due Loans / Total Loans | 2.26 | % | 2.35 | % | 2.38 | % | — |
| ||||
Allowances / Total Loans | 3.92 | % | 3.51 | % | 3.43 | % | — |
| ||||
Allowances / Past Due Loans | 173.7 | % | 149.0 | % | 144.2 | % | — |
|
Page 1 of 22
First Quarter 2003 Highlights
The Bank
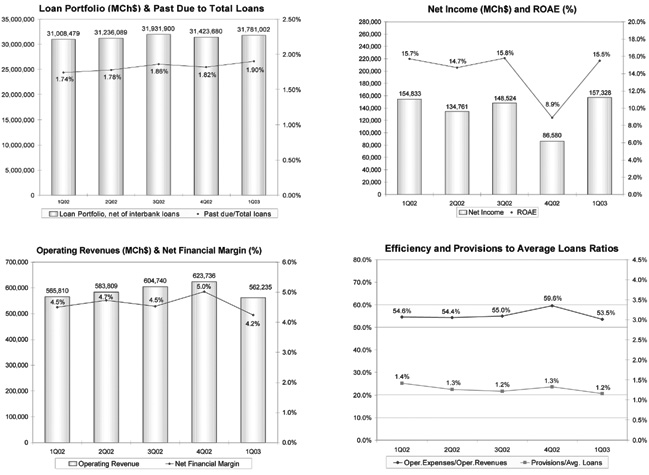
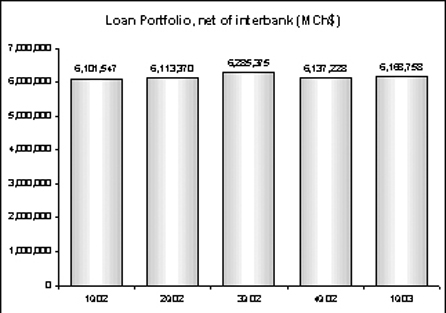
| • | Loan Portfolio. As of March 31, 2003 the Bank’s loan portfolio, net of interbank loans, totaled Ch$6,168,758 million, representing an annual growth of 1.1% or an increase of 0.5% compared to the previous quarter. At the end of March 2003, the Bank ranked second in the Chilean Banking System with an 18.5% market share over total loans net of interbank loans. |
| • | ROAE Improvement. During the first quarter of 2003, the Bank’s ROAE showed a substantial recovery reaching a 20.0% on annualized basis. This increase was mainly a consequence of a decrease in provisions for loan losses and an improvement in the efficiency ratio, following the decrease in operating expenses. |
| • | Sales Campaigns. During this quarter, the Bank continued launching several sales campaigns, as part of its commercial strategy of further developing the retail segment. These campaigns resulted in an increase in the number of customers and higher business volumes mainly in credit cards, consumer loans, lease contracts and insurance products. Among these campaigns we can mention the automated bill payment system through credit cards, consumer loans promotions, lease loans, insurance for credit cards and checking accounts, as well as home and life insurance. |
| • | Distribution of Dividends. At the Ordinary Shareholders Meeting of the Bank, held on March 20, 2003, it was agreed the distribution and payment of dividend N°191, in the amount of Ch$0.7731 per Banco de Chile common share, corresponding to the 100% of the 2002 net income of Banco de Chile. |
| • | Program to Purchase Shares Issued by the Bank was Approved. At the Bank’s Extraordinary Shareholders’ Meeting, held on March 20, 2003, it was agreed to approve the program, presented by the Board of Directors enabling the Bank to purchase shares issued by the Bank itself, according to Articles 27 to 27D of the Chilean Companies Law N°18,046 and to adopt all necessary agreements. The Program will have the following purposes: |
| (a) | To invest through the acquisition and selling of its own shares, according to the price fluctuations throughout the extension of the Program, as established by the Extraordinary Shareholders Meeting Agreement and the Law, and/or |
| (b) | To offer the shares so acquired in the markets, where shares or ADRs of Banco de Chile are quoted now or in the future, according to price fluctuations throughout the extension of the Program as established by the Extraordinary Shareholders Meeting Agreement and the Law. |
The Extraordinary Shareholders Meeting Agreement established the conditions under which the Board of Directors can decide the purchase.
The conditions are the following: (1) the maximum percentage of shares to be eventually purchased will be equivalent to 3% of the shares issued and paid in and up to retained net income from prior years, (2) the minimum price to be paid for the shares will be the weighed average of the closing prices of the share as quoted by the Santiago Stock Exchange for the last 45 business days before the purchase. The maximum price to be paid for the shares will be 15% in excess of the weighed average of the closing prices of the share as quoted by the Santiago Stock Exchange for the last 45 business days before the purchase. The Board will determine the acquisition price of the shares, inside the limits before mentioned, for all the extension of the Program, (3) the tenor of
Page 2 of 22
the Program will be 2 years counted from the date of the authorization provided by the Superintendency of Banks and Financial Institutions, (4) up to 1% of the issued shares may be bought directly in the Stock Exchange through a period of 12 months, without applying apro-rata and/or a tender offer procedure and, (5) shares so bought shall be sold before 24 months from their acquisition. Otherwise, paid in capital shall be reduced in the same amount. Shareholders will have a preferential right to acquire those shares if the bank decides to sell them. Notwithstanding, such preferential right will not be mandatory if the Board approves to sell directly the shares in stock exchanges in Chile or outside of Chile, for up to 1% of the issued shares of the Bank during a period of 12 months.
Shares ought to be bought in Chilean Stock Exchanges and/or through a tender offer (Oferta Pública de Adquisición de Acciones) according to the Law.
Page 3 of 22
Financial System Highlights
| • | In the 1Q03 net Income increased by 81.7% and 1.6% compared to 4Q02 and 1Q02, respectively reaching a ROAE of 15.5% in 1Q03. |
| • | Efficiency ratio improved to 53.5% in 1Q03 from 59.6% in 4Q02 or 54.6% in 1Q02. |
| • | Total loan Portfolio, net of interbank loans registered an annual and quarterly expansion of 2.5% and 1.1%, respectively. |
| • | Past due loans to total loans ratio increased to 1.90% in 1Q03 from 1.82% in 4Q02 or 1.74% in 1Q02. |
Page 4 of 22
Banco Chile 2003 First-Quarter Consolidated Results
NET INCOME
Bank, Subsidiaries and Foreign branches’ net income
(in millions of Chilean pesos, except for percentages)
1Q02 | 4Q02 | 1Q03 | % Change 1Q03/1Q02 | |||||||||
Bank | 7,142 |
| 2,202 |
| 22,363 |
| 213.1 | % | ||||
Foreign Branches | 2,368 |
| 2,909 |
| 5,636 |
| 138.0 | % | ||||
Stock Brokerage | 1,715 |
| 1,164 |
| 1,550 |
| (9.6 | )% | ||||
Gral Adm. of Funds1 | 1,023 |
| 1,484 |
| 1,332 |
| 30.2 | % | ||||
Insurance Brokerage | 419 |
| 161 |
| 171 |
| (59.2 | )% | ||||
Financial Advisory | 54 |
| 139 |
| (33 | ) | — |
| ||||
Factoring | 428 |
| 273 |
| 370 |
| (13.6 | )% | ||||
Securitization | (15 | ) | 127 |
| (18 | ) | 20.0 | % | ||||
Promarket2 | 0 |
| (22 | ) | 3 |
| — |
| ||||
Socofin3 | 0 |
| 354 |
| (158 | ) | — |
| ||||
Total Net Income | 13,134 |
| 8,791 |
| 31,216 |
| 137.7 | % | ||||
The Bank’s consolidatednet income for the first quarter of 2003 amounted to Ch$31,216 million (US$42.9 million), a significant recovery compared to the Ch$13,134 million reported in the first quarter of 2002. This 137.7% increase in results was mainly driven by a sharp decline of 61.9% in provisions for loan losses and, to a lesser extent, to a decrease in operating expenses and an increase in fee income. It is worth noting that during 1Q02 operating expenses and provisions for loan losses were impacted by the merger process, initiated on January 1st, 2002.
Also, net income for the first quarter of 2003 was positively impacted by higher results fromForeign Branches, boosted by Ch$4,345 million earnings obtained from the sale of Argentinean corporate securities accounted for in the New York branch.
Net income from subsidiaries totaled Ch$3,217 million during the first quarter of 2003, representing a contribution of 10.3% to the Bank’s consolidated results. The 11.2% decrease compared to the Ch$3,624 million reported during the first quarter of 2002 was mainly driven by a lower result reached by the Insurance Brokerage and Stock Brokerage subsidiaries during 1Q03. It is worth noting that, a change in the agreement between the Bank and the Insurance Brokerage subsidiary during 2Q02, implied higher revenue for the Bank and lower fee income for the subsidiary from that quarter onward. In addition, the incorporation of Socofin3, the collection subsidiary, during the 2Q02, negatively influenced the 1Q03 consolidated results mainly in response to its cyclical business related to third parties.
| 1 | Subsidiary resulted from the merger between Banchile Mutual Fund Subsidiary and Banchile Investment Fund Subsidiary. |
| 2 | Subsidiary incorporated to the Bank during the 2Q02 that provides sale services to the Bank and its subsidiaries. |
| 3 | Subsidiary, incorporated to the Bank during the 2Q02, in charged of the judicial and extrajudicial collection of loans on behalf of the Bank or third parties. |
Page 5 of 22
Regarding higher net income posted during 1Q03 relative to 4Q02, it was also mainly explained by lower provisions for loan losses as well as an important decrease in operating expenses.
First quarter 2003 net income resulted in an annualized return on average assets(ROAA) and annualized return on average shareholders’ equity(ROAE) of 1.41% and 20.0%, respectively, compared with 0.56% and 7.9%, respectively, for the first quarter of 2002.
Page 6 of 22
NET FINANCIAL INCOME4
Net Interest Revenue
(in millions of Chilean pesos, except for percentages)
1Q02 | 4Q02 | 1Q03 | % Change 1Q03/1Q02 | |||||||||
Interest revenue | 145,031 |
| 165,390 |
| 139,699 |
| (3.7 | )% | ||||
Interest expense | (64,758 | ) | (91,313 | ) | (52,377 | ) | (19.1 | )% | ||||
Foreign Exchange transaction, net | (2,957 | ) | 17,016 |
| (11,727 | ) | 296.6 | % | ||||
Net Financial Income | 77,316 |
| 91,093 |
| 75,595 |
| (2.2 | )% | ||||
Avg. Interest earning assets | 8,477,915 |
| 7,986,857 |
| 8,095,005 |
| (4.5 | )% | ||||
Net Financial Margin | 3.6 | % | 4.6 | % | 3.7 | % | — |
| ||||
Net Interest Margin | 3.8 | % | 3.7 | % | 4.3 | % | — |
| ||||
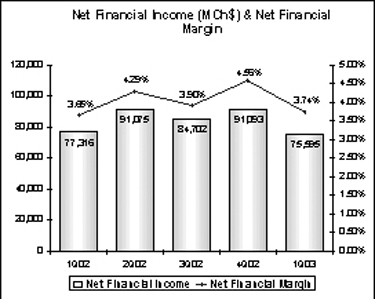
Net financial income totaled Ch$75,595 million for the first quarter of 2003, a 2.2% decrease compared to the first quarter of 2002. This decrease was mainly due to: (1) the decline in average interest earning assets fueled by the investment portfolio and loan portfolio in similar amounts, (2) lower repricing benefits and, (3) lower lending spreads as a result of lower levels of nominal interest rates during the 1Q03. It is worth mentioning that these effects were partially offset by a better funding mix, reflected in the improvement of the ratio of interest bearing liabilities to interest earning assets which improved from 78.6% in 1Q02 to 75.3% in 1Q03, and a higher inflation rate in 1Q03 which implied that the bank earned higher interest income on the portion of interest earning assets denominated in UF financed by interest bearing liabilities denominated in nominal Chilean pesos and non-interest bearing liabilities.
| 4 | For analysis purposes, results from foreign exchange transactions, which consist mainly of the results of forward contracts which hedge foreign currencies and dollar-adjustable Chilean peso positions, have been included in the calculation of net financial income and the net financial margin. Under SBIF guidelines these gains/losses cannot be registered as interest revenue, but must be considered as gains/losses from foreign exchange transactions and, accordingly, registered in a different line of the income statements. This accounting asymmetry distorts net interest revenue and foreign exchange transaction gains, especially in periods of high volatility in the exchange rate. |
Page 7 of 22
It is noteworthy that the average interest earning assets and net financial margin figures are not totally comparable, as during the 4Q02 the Superintendency of Banks changed the guidelines affecting the accounting presentation of mortgage finance bonds5 maintained as financial investments. Excluding this effect, of approximately Ch$187,017 million in 1Q02, average interests earning assets decreased by 2.4%, instead of the 4.5% and the net financial margin (net financial income as a percentage of the average interest earnings assets) remained stable at 3.7%.
Regarding the 17.0% decrease in net financial income in 1Q03 compared to the previous quarter, it responded principally to a decline of 82 basis points in the net financial margin as a result of a lower inflation rate, reflected in a variation of 0.2% in the unidad de fomento6 in 1Q03 versus 1.8% variation in the same index in 4Q02. This meant that during 4Q02, the Bank earned higher interest income on the portion of interest earning assets denominated in UF financed by interest bearing liabilities denominated in nominal Chilean pesos and non-interest bearing liabilities.
| 5 | In accordance to the new guidelines dictated by the Superintendency of Banks, since October, 2002, the Bank excludes from its financial investments, the mortgage bonds issued by the Bank excluding as well the corresponding liability. |
| 6 | The UF is an accounting unit which is linked to the Chilean CPI, and which changes daily to reflect fluctuations in the index over the previous month. |
Page 8 of 22
LOAN PORTFOLIO
Loan Portfolio
(in millions of Chilean pesos, except for percentages)
March.02 | Dec.02 | March.03 | % Change 12-months | ||||||
Commercial Loans | 2,618,828 | 2,529,906 | 2,525,458 | (3.6 | )% | ||||
Mortgage Loans | 1,304,767 | 1,193,207 | 1,157,162 | (11.3 | )% | ||||
Consumer Loans | 427,154 | 414,821 | 430,965 | 0.9 | % | ||||
Foreign trade Loans | 570,138 | 614,729 | 631,745 | 10.8 | % | ||||
Contingent Loans | 351,132 | 383,676 | 379,540 | 8.1 | % | ||||
Others Outstanding Loans | 441,380 | 604,889 | 629,805 | 42.7 | % | ||||
Leasing Contracts | 248,162 | 250,338 | 266,720 | 7.5 | % | ||||
Past-due Loans | 139,986 | 145,662 | 147,363 | 5.3 | % | ||||
Total Loans, net | 6,101,547 | 6,137,228 | 6,168,758 | 1.1 | % | ||||
Interbank Loans | 99,617 | 55,092 | 19,523 | (80.4 | )% | ||||
Total Loans | 6,201,164 | 6,192,320 | 6,188,281 | (0.2 | )% | ||||
As of March 31, 2003, the Bank’s loan portfolio, net of interbank loans, totaled Ch$6,168,758 million, registering an annual increase of 1.1% and a growth of 0.5% relative to the previous quarter.
In terms of volume, the annual increase was primarily fueled by other outstanding loans, foreign trade loans and leasing loans. Regarding the increase in other outstanding loans it was largely the result of the Bank’s efforts on substituting mortgage loans (financed by mortgage bonds) by mortgage loans financed by the Bank’s general borrowings (reflected in other outstanding loans), which are higher margin loans and, to a lesser extend, to an increase in factoring loans. Concerning the growth in foreign trade loans, it is mostly explained by the 9.5% increase, in nominal terms, in the exchange rate during the last twelve months. Lease loans continued growing as new agreements and promotions have been launched in order to increase the volume of these higher yield loans. On the other hand, the annual decrease in commercial corporate loans was mainly related to the financial services and
Page 9 of 22
manufacturing sectors. Mention should also be made to the change, boosted by the Bank, in the composition of commercial loans towards peso denominated loans from commercial loans adjusted in UFs.
The 11.3% annual decline in mortgage loans, was mainly explained by the aforementioned substitution of mortgage loans by mortgage loans financed by the Bank’s general borrowings. In overall terms, mortgage loans decreased only by 3.0% in 1Q03 relative to 1Q02 due to a decline of 16.0% in non-residential mortgage loans which more than offset the 8.9% increase in residential mortgage loans.
Regarding market segments, the annual loan portfolio expansion was mostly associated to high income individuals and middle market companies.
The quarterly growth in the loan portfolio was related to an increase in lines of credit (accounted in other outstanding loans), lease contracts and consumer loans which were positively influenced by promotional sales campaigns launched during this period, and foreign trade loans that were once again fostered by a 2.1% increase in the exchange rate.
Past Due Loans
(in millions of Chilean pesos, except for percentages)
March.02 | Dec.02 | March.03 | % Change 12-months | % Change 1Q03/4Q02 | ||||||||
Commercial loans | 125,621 | 130,794 | 132,534 | 5.5 | % | 1.3 | % | |||||
Consumer loans | 5,207 | 4,572 | 4,556 | (12.5 | )% | (0.3 | )% | |||||
Residential mortgage loans | 9,158 | 10,296 | 10,273 | 12.2 | % | (0.2 | )% | |||||
Total Past Due Loans | 139,986 | 145,662 | 147,363 | 5.3 | % | 1.2 | % | |||||
Past due loans totaled Ch$147,363 million as of March 31, 2003, a slight 1.2% quarterly increase compared to Ch$145,662 million at December 31, 2002. This increase was mainly concentrated in commercial corporate loans related to the trade sector. As a consequence, the ratio of past due loans to total loans grew to 2.38% in 1Q03 from 2.35% in 4Q02. Regarding the coverage ratio, it declined to 144.2% in the first quarter of 2003 from 149.0% in the previous quarter.
Page 10 of 22
FUNDING
Funding
(in millions of Chilean pesos, except for percentages)
March.02 | Dec.02 | March.03 | % Change 12-months | ||||||
Non-interest Bearing Liabilities | |||||||||
Current Accounts | 901,483 | 1,077,544 | 1,175,912 | 30.4 | % | ||||
Bankers drafts and other deposits | 716,331 | 571,475 | 581,594 | (18.8 | )% | ||||
Other Liabilities | 717,596 | 557,980 | 647,671 | (9.7 | )% | ||||
Total | 2,335,410 | 2,206,999 | 2,405,177 | 3.0 | % | ||||
Interest Bearing Liabilities | |||||||||
Savings & Time Deposits | 3,922,773 | 3,514,938 | 3,525,187 | (10.1 | )% | ||||
Central Bank Borrowings | 4,326 | 3,782 | 3,584 | (17.2 | )% | ||||
Repurchase agreements | 348,527 | 278,058 | 380,736 | 9.2 | % | ||||
Mortgage Finance Bonds | 1,395,807 | 1,089,461 | 1,038,805 | (25.6 | )% | ||||
Subordinated Bonds | 270,253 | 279,042 | 276,200 | 2.2 | % | ||||
Other Bonds | 6,922 | 4,616 | 4,481 | (35.3 | )% | ||||
Borrowings from Domestic Financ. Inst. | 48,161 | 50,740 | 86,125 | 78.8 | % | ||||
Foreign Borrowings | 264,595 | 512,896 | 558,561 | 111.1 | % | ||||
Other Obligations | 67,938 | 77,154 | 44,165 | (35.0 | )% | ||||
Total | 6,329,302 | 5,810,687 | 5,917,844 | (6.5 | )% | ||||
Total Liabilities | 8,664,712 | 8,017,686 | 8,323,021 | (3.9 | )% | ||||
Total non-interest bearing liabilities increased by 3.0% in a year-on-year basis and 9.0% during the first quarter of 2003, mainly fueled by higher checking account balances as a consequence of: (1) the lower nominal interest rate prevailing during the year which justified the maintenance of higher balances in checking accounts, (2) an increase of approximately 3,000 checking accounts during the year and, (3) the effect of the collapse of the Inverlink Group (a local financial group which managed mutual funds) which originated a switch of funds from mutual funds towards banks deposits especially checking accounts. (See Income from services).
Total interest bearing liabilities decreased by 6.5% relative to the first quarter of 2002, however, as we mentioned before, these figures are not comparable as in the 4Q02 there was a change in the Chilean guidelines dictated by the Superintendency of Banks, which affected the accounting presentation of mortgage finance bonds issued by the Bank5. Excluding this effect, total interest bearing liabilities decreased by approximately 3.4% largely explained by a decrease in time deposits, in part, as a response to the increase in checking accounts, which implies lower global cost of funds. In addition, foreign borrowings have expanded during the year, as a consequence of the Bank’s decision to switch funding in local currency for liabilities in foreign currency in order to take advantage of the attractive international rates, lowering thus the cost of fund.
| 5 | See page 8 |
Page 11 of 22
INVESTMENT PORTFOLIO
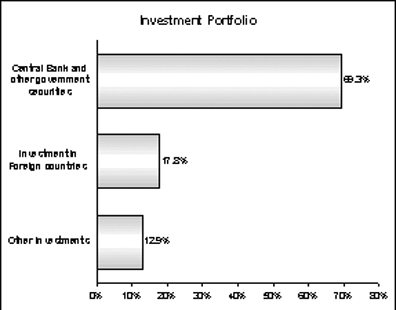
As of March 31, 2003, the Bank’s investment portfolio totaled Ch$1,804,725 million, a 12.3% increase relative to Ch$1,606,895 million maintained at December 31, 2002. This expansion was mainly a consequence of an increase in short-term Central Bank’s securities (PDBC) in order to comply with the technical reserve7 requirements as a result of the 9.1% increase in checking accounts during the 1Q03. To a lesser extent, it responds to a growth in Treasury bonds and Chilean Corporate Securities investments booked in the New York Branch.
Regarding the 10.9% annual decrease in the investment portfolio, it is explained by an accounting change in the guidelines of the Superintendency which affected the presentation of mortgage finance bonds5maintained as financial investments. Excluding this effect, the investment portfolio remained stable year-on-year basis.
As of March 31, 2003, the investment portfolio maintained by the Bank represented 20.2% of total assets and was comprised principally by:
| 5 | See page 8 |
| 7 | Technical reserve applies to demand deposits, checking accounts, or obligations payable on sight, other deposits unconditionally payable immediately or within a term of less than 30 days and time deposits payable within 10 days prior to maturity, to the extent their aggregate amount exceeds 2.5 times the amount of a bank’s capital and reserves. |
Page 12 of 22
INCOME FROM SERVICES, NET
Income from Services
(in millions of Chilean pesos, except for percentages)
Composition by Company | 1Q02 | 4Q02 | 1Q03 | % Change 1Q03/1Q02 | |||||
Bank | 13,852 | 16,018 | 16,597 | 19.8 | % | ||||
General Adm. of Funds | 2,522 | 3,567 | 3,050 | 20.9 | % | ||||
Financial Advisory | 89 | 292 | 42 | (52.8 | )% | ||||
Insurance Brokerage | 878 | 746 | 707 | (19.5 | )% | ||||
Stock Brokerage | 1,000 | 667 | 925 | (7.5 | )% | ||||
Factoring | 51 | 84 | 63 | 23.5 | % | ||||
Socofin | 0 | 1,862 | 1,733 | — |
| ||||
Securization | 0 | 192 | 12 | — |
| ||||
Promarket | 0 | 654 | 107 | — |
| ||||
Foreign Branches | 386 | 270 | 294 | (23.8 | )% | ||||
Total Income from services, net | 18,778 | 24,352 | 23,530 | 25.3 | % | ||||
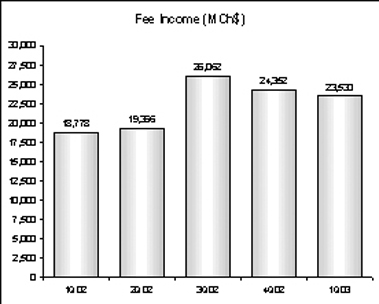
Total fee income for the first quarter of 2003 amounted to Ch$23,530 million, a strong 25.3% increase compared to the year-earlier comparable quarter. This annual increase was mainly driven by an improvement in income from services coming from the traditional banking services and from the General Administrator of Funds, in addition to the increase in the fee income base originated from the incorporation of Socofin, the debt collection subsidiary which accounted for 7.4% of the total fees during the quarter. The rise in fee income coming from the traditional banking business was mainly reflected in higher insurance fees, greater fees on checking accounts, higher fees on leasing operations as these loans increased by 7.5% during the last twelve-months, and fees obtained as leader bank of the restructure of the liabilities of a company in the electricity sector. It is worth noting that higher insurance fees were in part consequence of a change in the agreement between the Bank and the Insurance Brokerage subsidiary during 2Q02, which implied a redistribution of the earnings
Page 13 of 22
generated by this business, increasing the proportion received by the Bank and, at the same time, decreasing the proportion recorded by the subsidiary.
In terms of fees over average loans, this ratio increased to 1.51% from 1.19% for the first quarter of 2002. Excluding Socofin fees, the ratio would have been 1.40% in the first quarter of 2003.
Regarding the quarterly decrease of 3.4% in fee income, it was mainly a consequence of the drop experienced in fee income associated to the General Administrator of Funds and in Promarket subsidiary. Regarding the General Administrator of Funds, its lower results were impacted by the Inverlink Group (a local financial group which managed mutual funds) collapse, which affected all the industry reducing the amounts of funds administrated by mostly 20%. Despite this reduction, Banchile General Administrator of Funds was able to increase its market share from 26.3% in December 2002 to 28.4% as of March 2003, revealing the strong market position of our subsidiary. It is worth mentioning that the funds withdrawn from mutual funds positively impacted the balance kept in the Bank’s checking accounts (See Funding).
GAINS ON SALES OF FINANCIAL INSTRUMENTS, NET
The Bank’s total gains on sales of financial instruments reached Ch$5,315 million during the first quarter of 2003, compared to Ch$6,127 million for the year earlier quarter. This 13.3% decline was largely consequence of important mark to market and trading earnings obtained from Central Bank securities and mortgage finance bonds during the 1Q02 as a consequence of the decline in the interest rates during such period. On the other hand, the 1Q03 figure was principally comprised by Ch$4,345 million earnings obtained from the sale of Argentinean corporate securities booked in the New York branch.
Page 14 of 22
PROVISIONS
Allowances and Provisions
(in millions of Chilean pesos, except for percentages)
Allowances | 1Q02 | 4Q02 | 1Q03 | % Change 1Q03/1Q02 | ||||||||
Allowances at the beginning of each period | 233,911 |
| 214,667 |
| 217,074 |
| (7.2 | )% | ||||
Price-level restatement | 696 |
| (3,580 | ) | (1,002 | ) | — |
| ||||
Charge-off | (26,359 | ) | (22,753 | ) | (16,832 | ) | (36.1 | )% | ||||
Provisions for loan losses established, net | 39,472 |
| 28,384 |
| 13,321 |
| (66.3 | )% | ||||
Voluntary Provisions established, net | (4,551 | ) | 356 |
| 0 |
| — |
| ||||
Allowances at the end of each period | 243,169 |
| 217,074 |
| 212,561 |
| (12.6 | )% | ||||
Provisions | ||||||||||||
Provisions | (34,921 | ) | (28,740 | ) | (13,321 | ) | (61.9 | )% | ||||
Ratios | ||||||||||||
Allowances / Total loans | 3.92 | % | 3.51 | % | 3.43 | % | — |
| ||||
Risk Index | 3.21 | % | 3.04 | % | 2.96 | % | — |
| ||||
Provisions / Avg. Loans | 2.21 | % | 1.88 | % | 0.86 | % | — |
| ||||
Charge-offs / Avg. Loans | 1.67 | % | 1.49 | % | 1.08 | % | — |
| ||||
Recoveries / Avg. Loans | 0.17 | % | 0.26 | % | 0.28 | % | — |
| ||||
Provisions for loan losses amounted to Ch$13,321 million in the first quarter of 2003, an important decline relative to the Ch$34,921 million registered in last year’s same quarter. The 1Q03 figure reveals an important regularization in the level of provisions, reflected in the reduction of the ratio of provisions to average loans to 0.86% in 1Q03 from 2.21% in 1Q02. In terms of economic sectors, during the first quarter of 2003 provisions for loan losses were mainly concentrated in corporate debtors related to the manufacturing, trade and construction sectors. As we mentioned in our 1Q02 press release, provisions for loan losses during that quarter were impacted by: (i) provisions related to Argentinean debtors as a consequence of the economic deterioration in this region, (ii) the establishment of allowances related to some medium size companies and debtors related to the construction sector (particularly for second homes and resort projects), and, (iii) the leveling of the credit risk classifications of the commercial loans as well as from the unification of the risk criteria of consumer loans as a consequence of a merger process. In addition, provisions for loan losses in 1Q02 included a voluntary allowance release for an amount of Ch$4,551 million. Excluding this effect, provisions for loan losses for 1Q03 decreased by 66.3% compared to 1Q02.
As far as the Bank’s risk index is concerned, as charge-offs were higher than the net provisions established during the 1Q03, the risk index improved to 2.96% in 1Q03 from 3.04% in 4Q02.
OTHER INCOME AND EXPENSES
Total Other Income and Expenses for the first quarter of 2003, decreased to Ch$1,081 million from Ch$2,597 million in the first quarter of 2002. This decline was primarily attributable to lower non- operating income partially offset by higher recovery of loans previously charged-off.
Non-operating income decreased principally due to higher charge-offs on assets received in lieu of payment and lower income related to the sale of fixed assets.
Regarding the negative figure of 4Q02, as we mentioned in our previous release, it was principally related to provisions and charge-offs coming from closed branches as a result of the merger process and charge offs on assets received in lieu of payment.
Page 15 of 22
OPERATING EXPENSES
Operating Expenses
(in millions of Chilean pesos, except for percentages)
1Q02 | 4Q02 | 1Q031 | % Change Q03/ 1Q02 | |||||||||
Personnel salaries and expenses | (30,758 | ) | (40,352 | ) | (29,153 | ) | (5.2 | )% | ||||
Administrative and other expenses | (23,370 | ) | (31,273 | ) | (22,644 | ) | (3.1 | )% | ||||
Depreciation and amortization | (5,566 | ) | (4,532 | ) | (4,475 | ) | (19.6 | )% | ||||
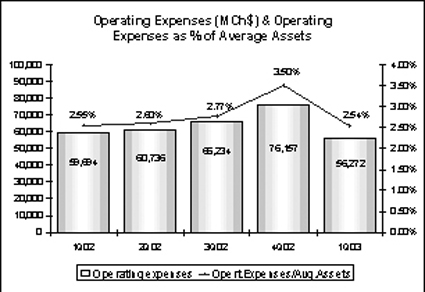
Total operating expenses | (59,694 | ) | (76,157 | ) | (56,272 | ) | (5.7 | )% | ||||
Total operating expenses amounted to Ch$56,272 million in the first quarter of 2003, a 5.7% decrease compared to the 1Q02 and a decrease of 26.1% relative to the 4Q02 mainly as a consequence of significant merger related costs charged during the first and fourth quarters of 2002. In addition, it is worth noting that the 1Q03 operating cost includes costs coming from Socofin and Promarket subsidiaries, which were incorporated into the Bank during the 2Q02. Excluding these subsidiaries and merger related expenses, total operating expenses would have increased by 5.3% compared to 1Q02 and decreased by 22.0% as respect to 4Q02. The increase in operating expenses during 1Q03 relative to 1Q02, excluding the aforementioned effects, was mainly attributable to provisions for bonuses established during 1Q03 (expense that was not incorporated in the cost base of 1Q02), and an increase in personnel salaries as a result of the leveling of compensation criteria between both banks.
As the efficiency ratio is concerned, it reached 53.9% in the first quarter of 2003, a significant improvement compared to 58.4% in the same period of last year and 63.8% in the previous quarter.
Page 16 of 22
LOSS FROM PRICE-LEVEL RESTATEMENT
Loss from price-level restatement amounted to Ch$2,218 million in 1Q03 compared to a positive figure of Ch$1,776 million during the 1Q02, as a result of an inflation rate of 0.5% used for adjustment purposes in 1Q03, whilst in 1Q02 this was a negative 0.4%.
INCOME TAXES
During the first quarter of 2003, the Bank’s income taxes totaled Ch$(2,494) million, an increase compared to Ch$1,155 million in 1Q02. The increase in income taxes was a result of the following factors: (1) a higher income tax base in 1Q03 as a result of the increase in net income, (2) an increase in the statutory tax rate from 16.0% in 2002 to 16.5% in 2003, (3) a lower tax credit in 1Q03 originated from the application of the benefits coming from the recognition of deferred income taxes for periods prior to 1999 (Ch$320 million in 1Q03 versus Ch$635 million in 1Q02), and, (4) higher permanent deductions from the financial income tax base in 1Q02. It is worth mentioning that the Bank’s effective tax rate is lower than the statutory corporate income tax rate, as under a specific tax regulation applicable to Banco de Chile, the Bank is allowed to deduct from net income every payment made by the shareholder SAOS to the Central Bank regarding its subordinated debt.
SHAREHOLDERS’ EQUITY
Shareholders’ Equity
(in million of Chilean Pesos)
March.02 | Dec.02 | March.03 | % Change 12-months | ||||||||
Capital and Reserves | 557,571 |
| 558,202 | 558,467 |
| 0.2 | % | ||||
Accumulated adjustment for translation differences8 | 7,378 |
| 8,711 | 9,211 |
| 24.8 | % | ||||
Unrealized gain (loss) on permanent financial invest.9 | (7,834 | ) | 1,510 | (228 | ) | (97.1 | )% | ||||
Net Income | 13,134 |
| 52,898 | 31,216 |
| 137.7 | % | ||||
Total Shareholders’ equity | 570,249 |
| 621,321 | 598,666 |
| 5.0 | % | ||||
As of March 31, 2003, the Bank’s Shareholder Equity totaled Ch$598,666 million (US$823.1 million), as compared to Ch$570,249 million (US$784.0 million) as of March 31, 2002, mainly reflecting higher net income registered during the first quarter of 2003 and, to a lesser extent, lower losses on mark to market financial investments9 available for sale. It is worth mentioning that the losses registered on permanent financial investments as of March 2002 were related to Argentinean bonds, booked in the New York Branch, which were charged off in September 2002.
| 8 | Represents the effect of the variation in the exchange rate on investments abroad that exceed the restatement of these investments according to the change in the consumer price index. |
| 9 | Financial investments traded on a secondary market are shown adjusted to market value, following specific instructions from the Superintendency of Banks and Financial Institutions. These instructions state that such adjustments should be recognized against income, except in the case of the permanent portfolio, when an equity account, “Unrealized gains (losses) on permanent financial investments”, may be directly charged or credited. |
Page 17 of 22
At the end of March 2003, on a consolidated basis, the Bank’s Total Capital to Risk-Adjusted Assets ratio (BIS ratio) was 13.7%, and the Basic Capital to Total Assets ratio was 6.34%, both in full compliance with the general minimum requirements of 8% and 3%, respectively. It is important to point out that, as a condition imposed by the Chilean Central Bank in order to approve the merger, the Bank must maintain a minimum BIS ratio of 10%.
Note: All figures expressed in US dollars (except earnings per ADR) were converted using the exchange rate of Ch$727.36 for US$1.00 as of March 31, 2003. Earnings per ADR were calculated considering the nominal net income and the exchange rate existing at the end of each period.
—Financial Tables Follow—
Page 18 of 22
BANCO DE CHILE
CONSOLIDATED STATEMENTS OF INCOME (Under Chilean GAAP)
(Expressed in millions of constant Chilean pesos (MCh$) as of March 31, 2003 and millions of US dollars (MUS$))
Q u a r t e r s | % C h a n g e | Y e a r e n d e d | % Change | |||||||||||||||||||||||||||
1Q02 MCh$ | 4Q02 MCh$ | 1Q03 MCh$ | 1Q03 MUS$ | 1Q03-1Q02 | 1Q03-4Q02 | Dec 01 MCh$ | Dec 02 MCh$ | Dec 02 MUS$ | Dec 02-Dec 01 | |||||||||||||||||||||
Interest revenue and expense | ||||||||||||||||||||||||||||||
Interest revenue | 145,031 |
| 165,390 |
| 139,699 |
| 192.1 |
| (3.7 | )% | (15.5 | )% | 820,814 |
| 693,162 |
| 973.0 |
| (15.6 | )% | ||||||||||
Interest expense | (64,758 | ) | (91,313 | ) | (52,377 | ) | (72.0 | ) | (19.1 | )% | (42.6 | )% | (472,458 | ) | (323,728 | ) | (454.4 | ) | (31.5 | )% | ||||||||||
Net interest revenue | 80,273 |
| 74,077 |
| 87,322 |
| 120.1 |
| 8.8 | % | 17.9 | % | 348,356 |
| 369,434 |
| 518.6 |
| 6.1 | % | ||||||||||
Income from services, net | ||||||||||||||||||||||||||||||
Income from fees and other services | 22,503 |
| 30,770 |
| 28,456 |
| 39.1 |
| 26.5 | % | (7.5 | )% | 95,434 |
| 104,351 |
| 146.5 |
| 9.3 | % | ||||||||||
Other services expenses | (3,725 | ) | (6,418 | ) | (4,926 | ) | (6.8 | ) | 32.2 | % | (23.2 | )% | (18,083 | ) | (17,232 | ) | (24.2 | ) | (4.7 | )% | ||||||||||
Income from services, net | 18,778 |
| 24,352 |
| 23,530 |
| 32.3 |
| 25.3 | % | (3.4 | )% | 77,351 |
| 87,119 |
| 122.3 |
| 12.6 | % | ||||||||||
Other operating income, net | ||||||||||||||||||||||||||||||
Gains on financial instruments, net | 6,127 |
| 4,009 |
| 5,315 |
| 7.3 |
| (13.3 | )% | 32.6 | % | 8,050 |
| 896 |
| 1.3 |
| (88.9 | )% | ||||||||||
Foreign exchange transactions, net | (2,957 | ) | 17,016 |
| (11,727 | ) | (16.1 | ) | 296.6 | % | (168.9 | )% | 4,038 |
| (31,072 | ) | (43.6 | ) | — |
| ||||||||||
Total other operating income, net | 3,170 |
| 21,025 |
| (6,412 | ) | (8.8 | ) | (302.3 | )% | (130.5 | )% | 12,088 |
| (30,176 | ) | (42.3 | ) | — |
| ||||||||||
Operating Revenues | 102,221 |
| 119,454 |
| 104,440 |
| 143.6 |
| 2.2 | % | (12.6 | )% | 437,795 |
| 426,377 |
| 598.6 |
| (2.6 | )% | ||||||||||
Provisions | (34,921 | ) | (28,740 | ) | (13,321 | ) | (18.3 | ) | (61.9 | )% | (53.6 | )% | (93,731 | ) | (101,147 | ) | (142.0 | ) | 7.9 | % | ||||||||||
Other income and expenses | ||||||||||||||||||||||||||||||
Recovery of loans previously charged-off | 2,698 |
| 3,974 |
| 4,355 |
| 6.0 |
| 61.4 | % | 9.6 | % | 16,152 |
| 11,974 |
| 16.8 |
| (25.9 | )% | ||||||||||
Non-operating income | 2,831 |
| 418 |
| 1,526 |
| 2.1 |
| (46.1 | )% | 265.1 | % | 12,189 |
| 6,817 |
| 9.6 |
| (44.1 | )% | ||||||||||
Non-operating expenses | (2,778 | ) | (9,198 | ) | (4,746 | ) | (6.6 | ) | 70.8 | % | (48.4 | )% | (10,994 | ) | (23,136 | ) | (32.5 | ) | 110.4 | % | ||||||||||
Participation in earnings of equity investments | (154 | ) | (425 | ) | (54 | ) | (0.1 | ) | (64.9 | )% | (87.3 | )% | 3 |
| (975 | ) | (1.4 | ) | — |
| ||||||||||
Total other income and expenses | 2,597 |
| (5,231 | ) | 1,081 |
| 1.4 |
| (58.4 | )% | (120.7 | )% | 17,350 |
| (5,320 | ) | (7.5 | ) | (130.7 | )% | ||||||||||
Operating expenses | ||||||||||||||||||||||||||||||
Personnel salaries and expenses | (30,758 | ) | (40,352 | ) | (29,153 | ) | (40.1 | ) | (5.2 | )% | (27.8 | )% | (133,703 | ) | (134,860 | ) | (189.3 | ) | 0.9 | % | ||||||||||
Administrative and other expenses | (23,370 | ) | (31,273 | ) | (22,644 | ) | (31.1 | ) | (3.1 | )% | (27.6 | )% | (99,096 | ) | (101,621 | ) | (142.6 | ) | 2.5 | % | ||||||||||
Depreciation and amortization | (5,566 | ) | (4,532 | ) | (4,475 | ) | (6.2 | ) | (19.6 | )% | (1.3 | )% | (18,118 | ) | (22,045 | ) | (30.9 | ) | 21.7 | % | ||||||||||
Total operating expenses | (59,694 | ) | (76,157 | ) | (56,272 | ) | (77.4 | ) | (5.7 | )% | (26.1 | )% | (250,917 | ) | (258,526 | ) | (362.8 | ) | 3.0 | % | ||||||||||
Loss from price-level restatement | 1,776 |
| (5,711 | ) | (2,218 | ) | (3.0 | ) | — |
| (61.2 | )% | (10,300 | ) | (9,644 | ) | (13.5 | ) | (6.4 | )% | ||||||||||
Minority interest in consolidated subsidiaries | 0 |
| (3 | ) | 0 |
| 0.0 |
| — |
| (100.0 | )% | (1 | ) | (1 | ) | 0.0 |
| 0.0 | % | ||||||||||
Income before income taxes | 11,979 |
| 3,612 |
| 33,710 |
| 46.3 |
| 181.4 | % | 833.3 | % | 100,196 |
| 51,739 |
| 72.8 |
| (48.4 | )% | ||||||||||
Income taxes | 1,155 |
| 5,179 |
| (2,494 | ) | (3.4 | ) | — |
| (148.2 | )% | 287 |
| 1,159 |
| 1.6 |
| 303.8 | % | ||||||||||
Net income | 13,134 |
| 8,791 |
| 31,216 |
| 42.9 |
| 137.7 | % | 255.1 | % | 100,483 |
| 52,898 |
| 74.4 |
| (47.4 | )% | ||||||||||
BANCO DE CHILE
CONSOLIDATED BALANCE SHEETS (Under Chilean GAAP)
(Expressed in millions of constant Chilean pesos (MCh$) as of March 31, 2003 and millions of US dollars (MUS$))
Dec 01 MCh$ | Mar 02 MCh$ | Sep 02 MCh$ | Dec 02 MCh$ | Mar 03 MCh$ | Mar 03 MUS$ | % C h a n g e | |||||||||||||||||||||
ASSETS | Dec 02-Dec 01 | Mar 03-Mar 02 | Mar 03-Dec 02 | ||||||||||||||||||||||||
Cash and due from banks | |||||||||||||||||||||||||||
Noninterest bearing | 744,189 |
| 726,139 |
| 908,056 |
| 665,057 |
| 659,470 |
| 906.7 |
| (10.6 | )% | (9.2 | )% | (0.8 | )% | |||||||||
Interbank bearing | 54,753 |
| 57,934 |
| 30,685 |
| 14,748 |
| 109,831 |
| 151.0 |
| (73.1 | )% | 89.6 | % | 644.7 | % | |||||||||
Total cash and due from banks | 798,942 |
| 784,073 |
| 938,741 |
| 679,805 |
| 769,301 |
| 1,057.7 |
| (14.9 | )% | (1.9 | )% | 13.2 | % | |||||||||
Financial investments | |||||||||||||||||||||||||||
Government securities | 1,151,471 |
| 1,077,363 |
| 825,253 |
| 873,698 |
| 943,869 |
| 1,297.7 |
| (24.1 | )% | (12.4 | )% | 8.0 | % | |||||||||
Investments purchase under agreements to resell | 51,720 |
| 20,981 |
| 20,270 |
| 32,338 |
| 19,584 |
| 26.9 |
| (37.5 | )% | (6.7 | )% | (39.4 | )% | |||||||||
Investment collateral under agreements to repurchase | 229,360 |
| 334,841 |
| 418,698 |
| 277,839 |
| 368,889 |
| 507.2 |
| 21.1 | % | 10.2 | % | 32.8 | % | |||||||||
Other investments | 647,329 |
| 592,569 |
| 648,080 |
| 423,020 |
| 472,383 |
| 649.4 |
| (34.7 | )% | (20.3 | )% | 11.7 | % | |||||||||
Total financial investments | 2,079,880 |
| 2,025,754 |
| 1,912,301 |
| 1,606,895 |
| 1,804,725 |
| 2,481.2 |
| (22.7 | )% | (10.9 | )% | 12.3 | % | |||||||||
Loans, Net | |||||||||||||||||||||||||||
Commercial loans | 2,805,284 |
| 2,618,828 |
| 2,584,758 |
| 2,529,906 |
| 2,525,458 |
| 3,472.1 |
| (9.8 | )% | (3.6 | )% | (0.2 | )% | |||||||||
Consumer loans | 401,147 |
| 427,154 |
| 397,664 |
| 414,821 |
| 430,965 |
| 592.5 |
| 3.4 | % | 0.9 | % | 3.9 | % | |||||||||
Mortgage loans | 1,310,250 |
| 1,304,767 |
| 1,228,437 |
| 1,193,207 |
| 1,157,162 |
| 1,590.9 |
| (8.9 | )% | (11.3 | )% | (3.0 | )% | |||||||||
Foreign trade loans | 538,830 |
| 570,138 |
| 710,945 |
| 614,729 |
| 631,745 |
| 868.5 |
| 1.41 | % | 10.8 | % | 2.8 | % | |||||||||
Interbank loans | 29,802 |
| 99,617 |
| 62,135 |
| 55,092 |
| 19,523 |
| 26.8 |
| 84.9 | % | (80.4 | )% | (64.6 | )% | |||||||||
Leasing contracts | 256,733 |
| 248,162 |
| 248,625 |
| 250,338 |
| 266,720 |
| 366.7 |
| (2.5 | )% | 7.5 | % | 6.5 | % | |||||||||
Other outstanding loans | 439,644 |
| 441,380 |
| 570,066 |
| 604,889 |
| 629,805 |
| 865.9 |
| 37.6 | % | 42.7 | % | 4.1 | % | |||||||||
Past due loans | 124,923 |
| 139,986 |
| 159,184 |
| 145,662 |
| 147,363 |
| 202.6 |
| 16.6 | % | 5.3 | % | 1.2 | % | |||||||||
Contingent loans | 384,334 |
| 351,132 |
| 385,696 |
| 383,676 |
| 379,540 |
| 521.8 |
| (0.2 | )% | 8.1 | % | (1.1 | )% | |||||||||
Total loans | 6,290,947 |
| 6,201,164 |
| 6,347,510 |
| 6,192,320 |
| 6,188,281 |
| 8,507.8 |
| (1.6 | )% | (0.2 | )% | (0.1 | )% | |||||||||
Allowances | (233,911 | ) | (243,169 | ) | (214,667 | ) | (217,074 | ) | (212,561 | ) | (292.2 | ) | (7.2 | )% | (12.6 | )% | (2.1 | )% | |||||||||
Total loans, net | 6,057,036 |
| 5,957,995 |
| 6,132,843 |
| 5,975,246 |
| 5,975,720 |
| 8,215.6 |
| (1.4 | )% | 0.3 | % | 0.0 | % | |||||||||
Other assets | |||||||||||||||||||||||||||
Assets received in lieu of payment | 34,010 |
| 34,546 |
| 21,238 |
| 19,092 |
| 19,352 |
| 26.6 |
| (43.9 | )% | (44.0 | )% | 1.4 | % | |||||||||
Bank premises and equipment | 149,617 |
| 149,359 |
| 146,388 |
| 140,040 |
| 136,975 |
| 188.3 |
| (6.4 | )% | (8.3 | )% | (2.2 | )% | |||||||||
Investments in other companies | 5,389 |
| 5,534 |
| 5,206 |
| 4,801 |
| 4,376 |
| 6.0 |
| (10.9 | )% | (20.9 | )% | (8.9 | )% | |||||||||
Other | 165,684 |
| 277,704 |
| 275,027 |
| 213,131 |
| 211,242 |
| 290.4 |
| 28.6 | % | (23.9 | )% | (0.9 | )% | |||||||||
Total other assets | 354,700 |
| 467,143 |
| 447,859 |
| 377,064 |
| 371,945 |
| 511.3 |
| 6.3 | % | (20.4 | )% | (1.4 | )% | |||||||||
Total assets | 9,290,558 |
| 9,234,965 |
| 9,431,744 |
| 8,639,010 |
| 8,921,691 |
| 12,265.8 |
| (7.0 | )% | (3.4 | )% | 3.3 | % | |||||||||
20
BANCO DE CHILE
CONSOLIDATED BALANCE SHEETS (Under Chilean GAAP)
(Expressed in millions of constant Chilean pesos (MCH$) as of March 31, 2003 and millions of US dollars (MUS$))
Dec 01 | Mar 02 | Sep 02 | Dec 02 | Mar 03 | Mar 03 | % C h a n g e | |||||||||||||||
LIABILITIES & SHAREHOLDERS’ EQUITY | MCh$ | MCh$ | MCh$ | MCh$ | MCh$ | MUS$ | Dec 02-Dec 01 | Mar 03-Mar 02 | Mar 03-Dec 02 | ||||||||||||
Deposits | |||||||||||||||||||||
Current accounts | 943,084 | 901,483 | 1,031,613 | 1,077,544 | 1,175,912 | 1,616.7 | 14.3 | % | 30.4 | % | 9.1 | % | |||||||||
Bankers drafts and other deposits | 523,443 | 716,331 | 748,711 | 571,475 | 581,594 | 799.6 | 9.2 | % | (18.8 | )% | 1.8 | % | |||||||||
Saving accounts and time deposits | 4,128,577 | 3,922,773 | 3,710,788 | 3,514,938 | 3,525,187 | 4,846.6 | (14.9 | )% | (10.1 | )% | 0.3 | % | |||||||||
Total deposits | 5,595,104 | 5,540,587 | 5,491,112 | 5,163,957 | 5,282,693 | 7,262.9 | (7.7 | )% | (4.7 | )% | 2.3 | % | |||||||||
Borrowings | |||||||||||||||||||||
Central Bank borrowings | 79,671 | 4,326 | 3,896 | 3,782 | 3,584 | 4.9 | (95.3 | )% | (17.2 | )% | (5.2 | )% | |||||||||
Securities sold under agreements to repurchase | 256,552 | 348,527 | 422,432 | 278,058 | 380,736 | 523.4 | 8.4 | % | 9.2 | % | 36.9 | % | |||||||||
Mortgage finance bonds | 1,402,318 | 1,395,807 | 1,325,348 | 1,089,461 | 1,038,805 | 1,428.2 | (22.3 | )% | (25.6 | )% | (4.6 | )% | |||||||||
Subordinated bonds | 272,885 | 270,253 | 278,772 | 279,042 | 276,200 | 379.7 | 2.3 | % | 2.2 | % | (1.0 | )% | |||||||||
Other bonds | 8,212 | 6,922 | 5,806 | 4,616 | 4,481 | 6.2 | (43.8 | )% | (35.3 | )% | (2.9 | )% | |||||||||
Borrowings from domestic financial institutions | 46,490 | 48,161 | 96,880 | 50,740 | 86,125 | 118.4 | 9.1 | % | 78.8 | % | 69.7 | % | |||||||||
Foreign borrowings | 337,796 | 264,595 | 364,227 | 512,896 | 558,561 | 767.9 | 51.8 | % | 111.1 | % | 8.9 | % | |||||||||
Other obligations | 75,171 | 67,938 | 81,530 | 77,154 | 44,165 | 60.7 | 2.6 | % | (35.0 | )% | (42.8 | )% | |||||||||
Total borrowings | 2,479,095 | 2,406,529 | 2,578,891 | 2,295,749 | 2,392,657 | 3,289.4 | (7.4 | )% | (0.6 | )% | 4.2 | % | |||||||||
Other liabilities | |||||||||||||||||||||
Contingent liabilities | 383,963 | 350,712 | 385,906 | 382,897 | 379,583 | 521.9 | (0.3 | )% | 8.2 | % | (0.9 | )% | |||||||||
Other | 172,340 | 366,884 | 365,165 | 175,083 | 268,088 | 368.5 | 1.6 | % | (26.9 | )% | 53.1 | % | |||||||||
Total other liabilities | 556,303 | 717,596 | 751,071 | 557,980 | 647,671 | 890.4 | 0.3 | % | (9.7 | )% | 16.1 | % | |||||||||
Minority interest in consolidated subsidiaries | 3 | 4 | 5 | 3 | 4 | 0.0 | 0.0 | % | 0.0 | % | 33.3 | % | |||||||||
Shareholders’ equity | |||||||||||||||||||||
Capital and Reserves | 559,570 | 557,115 | 565,855 | 568,423 | 567,450 | 780.2 | 1.6 | % | 1.9 | % | (0.2 | )% | |||||||||
Net income for the year | 100,483 | 13,134 | 44,810 | 52,898 | 31,216 | 42.9 | (47.4 | )% | 137.7 | % | (41.0 | )% | |||||||||
Total shareholders’ equity | 660,053 | 570,249 | 610,665 | 621,321 | 598,666 | 823.1 | (5.9 | )% | 5.0 | % | (3.6 | )% | |||||||||
Total liabilities & shareholders’ equity | 9,290,558 | 9,234,965 | 9,431,744 | 8,639,010 | 8,921,691 | 12,265.8 | (7.0 | )% | (3.4 | )% | 3.3 | % | |||||||||
BANCO DE CHILE
SELECTED CONSOLIDATED FINANCIAL INFORMATION
Q u a r t e r s | Y e a r e n d e d | ||||||||||||||
1Q02 | 4Q02 | 1Q03 | Dec 01 | Dec 02 | |||||||||||
Earnings per Share | |||||||||||||||
Net income per Share (Ch$)(1) | 0.19 |
| 0.13 |
| 0.46 |
| 1.48 |
| 0.78 |
| |||||
Net income per ADS (Ch$)(1) | 115.75 |
| 77.48 |
| 275.11 |
| 885.58 |
| 466.20 |
| |||||
Net income per ADS (US$)(2) | 0.17 |
| 0.11 |
| 0.38 |
| 1.35 |
| 0.65 |
| |||||
Book value per Share (Ch$)(1) | 8.38 |
| 9.13 |
| 8.79 |
| 9.70 |
| 9.13 |
| |||||
Shares outstanding (Millions) | 68,079.78 |
| 68,079.78 |
| 68,079.78 |
| 68,079.78 |
| 68,079.78 |
| |||||
Profitability Ratios(3)(4) | |||||||||||||||
Net interest margin | 3.79 | % | 3.71 | % | 4.31 | % | 4.09 | % | 4.47 | % | |||||
Net financial margin | 3.65 | % | 4.56 | % | 3.74 | % | 4.13 | % | 4.09 | % | |||||
Fees / Avg. Interest Earnings Assets | 0.89 | % | 1.22 | % | 1.16 | % | 0.91 | % | 1.05 | % | |||||
Other Operating Revenues / Avg. Interest Earnings Assets | 0.15 | % | 1.05 | % | -0.32 | % | 0.14 | % | -0.37 | % | |||||
Operating Revenues / Avg. Interest Earnings Assets | 4.82 | % | 5.98 | % | 5.16 | % | 5.13 | % | 5.16 | % | |||||
Return on average total assets | 0.56 | % | 0.40 | % | 1.41 | % | 1.07 | % | 0.58 | % | |||||
Return on average shareholders’ equity | 7.88 | % | 5.86 | % | 19.96 | % | 16.22 | % | 8.85 | % | |||||
Capital Ratios | |||||||||||||||
Shareholders equity / total assets | 6.17 | % | 7.19 | % | 6.71 | % | 7.10 | % | 7.19 | % | |||||
Basic capital / risk – adjusted assets | 9.9 | % | 9.4 | % | 9.5 | % | 9.6 | % | 9.4 | % | |||||
Total capital / risk – adjusted assets | 13.5 | % | 13.7 | % | 13.7 | % | 12.3 | % | 13.7 | % | |||||
Credit Quality Ratios | |||||||||||||||
Past due loans / total loans | 2.26 | % | 2.35 | % | 2.38 | % | 1.99 | % | 2.35 | % | |||||
Allowances / past due loans | 173.71 | % | 149.03 | % | 144.24 | % | 187.24 | % | 149.03 | % | |||||
Allowances / total loans | 3.92 | % | 3.51 | % | 3.43 | % | 3.72 | % | 3.51 | % | |||||
Provisions / Avg. Loans | 2.21 | % | 1.88 | % | 0.86 | % | 1.45 | % | 1.64 | % | |||||
Risk index | 3.21 | % | 3.04 | % | 2.96 | % | 2.40 | % | 3.04 | % | |||||
Operating and Productivity Ratios | |||||||||||||||
Operating expenses / operating revenue | 58.40 | % | 63.75 | % | 53.88 | % | 57.31 | % | 60.63 | % | |||||
Operating expenses / average total assets(3) | 2.55 | % | 3.50 | % | 2.54 | % | 2.68 | % | 2.85 | % | |||||
Loans per employee (million Ch$)(1) | 856 |
| 690 |
| 691 |
| 840 |
| 690 |
| |||||
Average Balance Sheet Data(1)(3) | |||||||||||||||
Avg. Interest earnings assets (million Ch$) | 8,477,915 |
| 7,986,857 |
| 8,095,005 |
| 8,525,747 |
| 8,263,612 |
| |||||
Avg. Assets (million Ch$) | 9,368,651 |
| 8,705,740 |
| 8,856,719 |
| 9,354,588 |
| 9,079,467 |
| |||||
Avg. Shareholders equity (million Ch$) | 666,489 |
| 600,392 |
| 625,431 |
| 619,647 |
| 597,498 |
| |||||
Avg. Loans | 6,326,573 |
| 6,115,033 |
| 6,227,105 |
| 6,484,515 |
| 6,169,152 |
| |||||
Avg. Interest bearing liabilities (million Ch$) | 6,663,576 |
| 6,136,325 |
| 6,095,293 |
| 6,825,588 |
| 6,393,068 |
| |||||
Other Data | |||||||||||||||
Inflation Rate (%) | 0.46 | % | 0.34 | % | 2.08 | % | 2.64 | % | 2.82 | % | |||||
Exchange rate (Ch$) | 664.44 |
| 712.38 |
| 727.36 |
| 656.20 |
| 712.38 |
| |||||
Notes
| (1) | These figures were expressed in constant Chilean pesos as of March 31, 2003. |
| (2) | These figures were calculated considering the nominal net income, the shares outstanding and the exchange rates existing at the end of each period. |
| (3) | The ratios were calculated as an average of daily balances. |
| (4) | Annualized data. |
FORWARD-LOOKING INFORMATION
The information contained herein incorporates by reference statements which constitute “forward-looking statements,” in that they include statements regarding the intent, belief or current expectations of our directors and officers with respect to our future operating performance. Such statements include any forecasts, projections and descriptions of anticipated cost savings or other synergies. You should be aware that any such forward-looking statements are not guarantees of future performance and may involve risks and uncertainties, and that actual results may differ from those set forth in the forward-looking statements as a result of various factors (including, without limitations, the actions of competitors, future global economic conditions, market conditions, foreign exchange rates, and operating and financial risks related to managing growth and integrating acquired businesses), many of which are beyond our control. The occurrence of any such factors not currently expected by us would significantly alter the results set forth in these statements.
Factors that could cause actual results to differ materially and adversely include, but are not limited to:
| • | changes in general economic, business or political or other conditions in Chile or changes in general economic or business conditions in Latin America; |
| • | changes in capital markets in general that may affect policies or attitudes toward lending to Chile or Chilean companies; |
| • | unexpected developments in certain existing litigation; |
| • | increased costs; |
| • | unanticipated increases in financing and other costs or the inability to obtain additional debt or equity financing on attractive terms; and |
You should not place undue reliance on such statements, which speak only as of the date that they were made. Our independent public accountants have not examined or compiled the forward-looking statements and, accordingly, do not provide any assurance with respect to such statements. These cautionary statements should be considered in connection with any written or oral forward-looking statements that we may issue in the future. We do not undertake any obligation to release publicly any revisions to such forward-looking statements after completion of this offering to reflect later events or circumstances or to reflect the occurrence of unanticipated events.
Contacts: | Ricardo Morales | Jacqueline Barrio | ||||||||
Banco de Chile | Banco de Chile | |||||||||
(56-2) 637 3519 | (56-2) 637 2938 | |||||||||
rmorales@bancochile.cl | jbarrio@bancochile.cl |
SIGNATURE
Pursuant to the requirements of the Securities Exchange Act of 1934, the registrant has duly caused this report to be signed on its behalf by the undersigned, thereunto duly authorized.
Date: May 8, 2003
Banco de Chile |
/s/ PABLO GRANIFO L. |
By: Pablo Granifo Lavín |
General Manager |