Table of Contents
FORM 6-K
U.S. SECURITIES AND EXCHANGE COMMISSION
Washington, D.C. 20549
Report of Foreign Private Issuer
Pursuant to Rule 13a-16 or 15d-16 of
the Securities Exchange Act of 1934
Commission File Number: 1-15270
For the month of February 2021
NOMURA HOLDINGS, INC.
(Translation of registrant’s name into English)
13-1, Nihonbashi 1-chome
Chuo-ku, Tokyo 103-8645
Japan
(Address of principal executive offices)
Indicate by check mark whether the registrant files or will file annual reports under cover Form 20-F or Form 40-F.
Form 20-F X Form 40-F
Indicate by check mark if the registrant is submitting the Form 6-K in paper as permitted by Regulation S-T Rule 101(b)(1):
Indicate by check mark if the registrant is submitting the Form 6-K in paper as permitted by Regulation S-T Rule 101(b)(7):
Table of Contents
Information furnished on this form:
Exhibit Number
| 1. | Consolidated Results of Operations (US GAAP), Third quarter, year ending March 2021 |
Table of Contents
SIGNATURES
Pursuant to the requirements of the Securities Exchange Act of 1934, the registrant has duly caused this report to be signed on its behalf by the undersigned, thereunto duly authorized.
| NOMURA HOLDINGS, INC. | ||||
| Date: February 10, 2021 | By: | /s/ Go Sugiyama | ||
| Go Sugiyama | ||||
| Senior Managing Director | ||||
Table of Contents
|

Connecting Markets East & West Consolidated Results of Operations Third quarter, year ending March 2021 (US GAAP) Nomura Holdings, Inc. February 2021 © Nomura
Table of Contents
|
Outline Presentation Executive summary (P2-5) Overview of results (P6) Business segment results (P7) Retail (P8-9) Asset Management (P10-11) Wholesale (P12-14) Non-interest expenses (P15) Robust financial position (P16) Funding and liquidity (P17) Financial Supplement Consolidated balance sheet (P19) Value at risk (P20) Consolidated financial highlights (P21) Consolidated income (P22) Main revenue items (P23) Consolidated results: Income (loss) before income taxes by segment and region (P24) Segment “Other” (P25) Retail related data (P26-29) Asset Management related data (P30-31) Wholesale related data (P32) Number of employees (P33)
Table of Contents
|
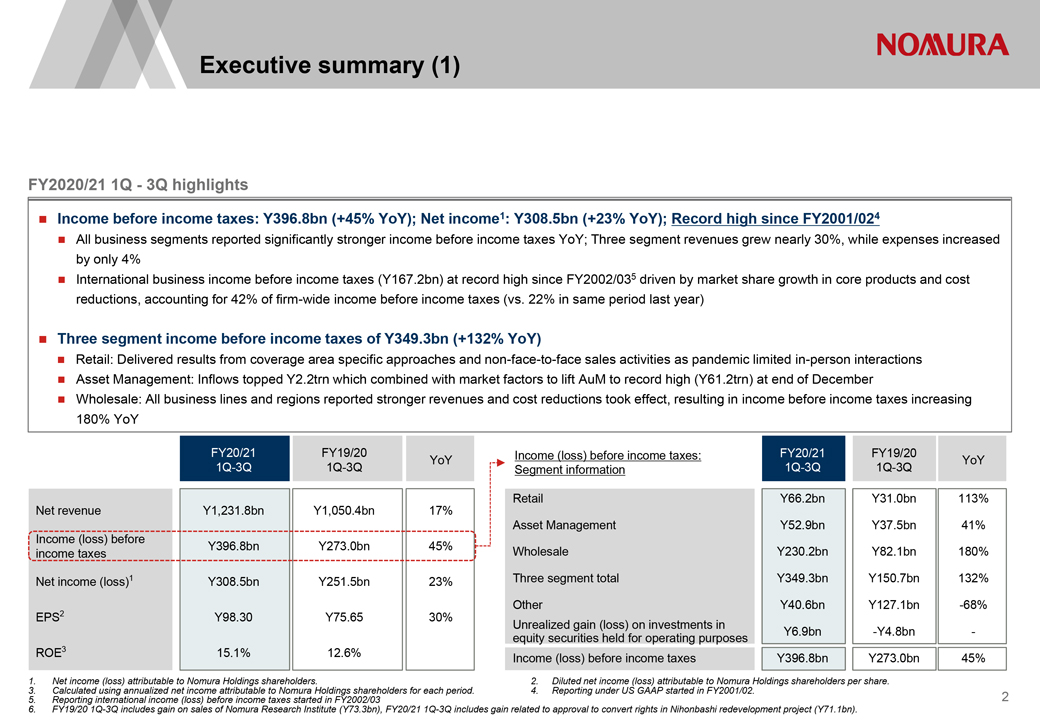
Executive summary (1) FY2020/21 1Q—3Q highlights Income before income taxes: Y396.8bn (+45% YoY); Net income1: Y308.5bn (+23% YoY); Record high since FY2001/024 All business segments reported significantly stronger income before income taxes YoY; Three segment revenues grew nearly 30%, while expenses increased by only 4% International business income before income taxes (Y167.2bn) at record high since FY2002/035 driven by market share growth in core products and cost reductions, accounting for 42% of firm-wide income before income taxes (vs. 22% in same period last year) Three segment income before income taxes of Y349.3bn (+132% YoY) Retail: Delivered results from coverage area specific approaches and non-face-to-face sales activities as pandemic limited in-person interactions Asset Management: Inflows topped Y2.2trn which combined with market factors to lift AuM to record high (Y61.2trn) at end of December Wholesale: All business lines and regions reported stronger revenues and cost reductions took effect, resulting in income before income taxes increasing 180% YoY FY20/21 FY19/20 1Q-3Q 1Q-3Q YoY Net revenue Y1,231.8bn Y1,050.4bn 17% Income (loss) before Y396.8bn Y273.0bn 45% income taxes Net income (loss)1 Y308.5bn Y251.5bn 23% EPS2 Y98.30 Y75.65 30% ROE3 15.1% 12.6% Income (loss) before income taxes: FY20/21 FY19/20 YoY Segment information 1Q-3Q 1Q-3Q Retail Y66.2bn Y31.0bn 113% Asset Management Y52.9bn Y37.5bn 41% Wholesale Y230.2bn Y82.1bn 180% Three segment total Y349.3bn Y150.7bn 132% Other Y40.6bn Y127.1bn -68% Unrealized gain (loss) on investments in equity securities held for operating purposes Y6.9bn -Y4.8bn—Income (loss) before income taxes Y396.8bn Y273.0bn 45% 1. Net income (loss) attributable to Nomura Holdings shareholders. 2. Diluted net income (loss) attributable to Nomura Holdings shareholders per share. 3. Calculated using annualized net income attributable to Nomura Holdings shareholders for each period. 4. Reporting under US GAAP started in FY2001/02. 5. Reporting international income (loss) before income taxes started in FY2002/03 6. FY19/20 1Q-3Q includes gain on sales of Nomura Research Institute (Y73.3bn), FY20/21 1Q-3Q includes gain related to approval to convert rights in Nihonbashi redevelopment project (Y71.1bn).
Table of Contents
|
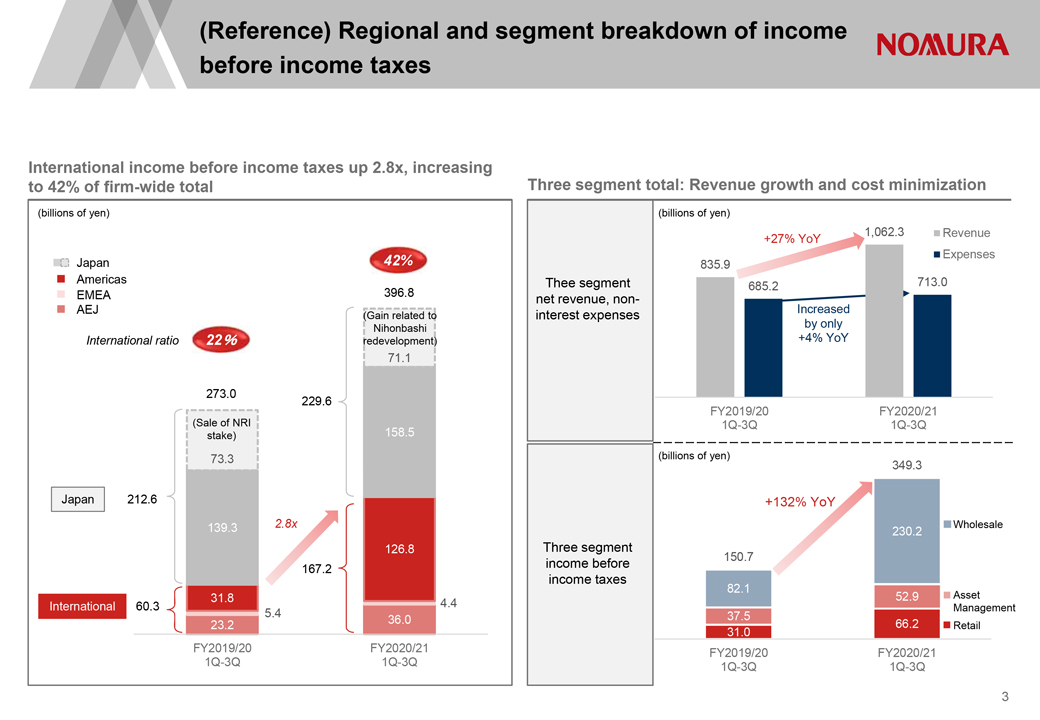
(Reference) Regional and segment breakdown of income before income taxes International income before income taxes up 2.8x, increasing to 42% of firm-wide total (billions of yen) Japan 42% Americas EMEA 396.8 AEJ (Gain related to Nihonbashi International ratio 22% redevelopment) 71.1 273.0 229.6 (Sale of NRI stake) 158.5 73.3 Japan 212.6 139.3 2.8x 126.8 International 60.3 31.8 4.4 5.4 23.2 36.0 FY2019/20 FY2020/21 1Q-3Q 1Q-3Q Three segment total: Revenue growth and cost minimization (billions of yen) +27% YoY 1,062.3 Revenue Expenses 835.9 Thee segment 685.2 713.0 net revenue, non- interest expenses Increased by only +4% YoY FY2019/20 FY2020/21 1Q-3Q 1Q-3Q (billions of yen) 349.3 +132% YoY 230.2 Wholesale Three segment income before 150.7 income taxes 82.1 52.9 Asset Management 37.5 31.0 66.2 Retail FY2019/20 FY2020/21 1Q-3Q 1Q-3Q 3
Table of Contents
|
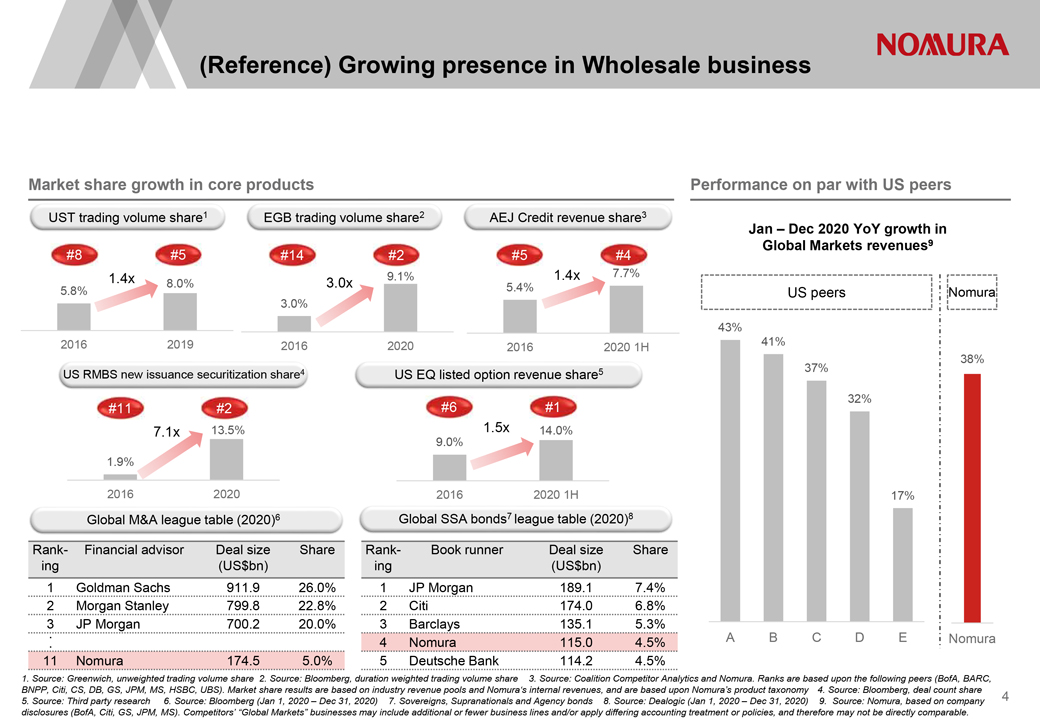
(Reference) Growing presence in Wholesale business Market share growth in core products UST trading volume share1 EGB trading volume share2 AEJ Credit revenue share3 #8 #5 #14 #2 #5 #4 1.4x 8.0% 3.0x 9.1% 1.4x 7.7% 5.8% 5.4% 3.0% 2016 2019 2016 2020 2016 2020 1H US RMBS new issuance securitization share4 US EQ listed option revenue share5 #11 #2 #6 #1 7.1x 13.5% 1.5x 14.0% 9.0% 1.9% 2016 2020 2016 2020 1H Global M&A league table (2020)6 Rank- Financial advisor Deal size Share ing (USbn)$ 1 Goldman Sachs 911.9 26.0% 2 Morgan Stanley 799.8 22.8% 3 JP Morgan 700.2 20.0% ・ ・ 11 Nomura 174.5 5.0% Global SSA bonds7 league table (2020)8 Rank- Book runner Deal size Share ing (US$bn) 1 JP Morgan 189.1 7.4% 2 Citi 174.0 6.8% 3 Barclays 135.1 5.3% 4 Nomura 115.0 4.5% 5 Deutsche Bank 114.2 4.5% Performance on par with US peers Jan – Dec 2020 YoY growth in Global Markets revenues9 US peers Nomura 43% 41% 38% 37% 32% 17% A B C D E Nomura 1. Source: Greenwich, unweighted trading volume share 2. Source: Bloomberg, duration weighted trading volume share 3. Source: Coalition Competitor Analytics and Nomura. Ranks are based upon the following peers (BofA, BARC, BNPP, Citi, CS, DB, GS, JPM, MS, HSBC, UBS). Market share results are based on industry revenue pools and Nomura‘s internal revenues, and are based upon Nomura’s product taxonomy 4. Source: Bloomberg, deal count share 5. Source: Third party research 6. Source: Bloomberg (Jan 1, 2020 – Dec 31, 2020) 7. Sovereigns, Supranationals and Agency bonds 8. Source: Dealogic (Jan 1, 2020 – Dec 31, 2020) 9. Source: Nomura, based on company disclosures (BofA, Citi, GS, JPM, MS). Competitors’ “Global Markets” businesses may include additional or fewer business lines and/or apply differing accounting treatment or policies, and therefore may not be directly comparable. 4
Table of Contents
|
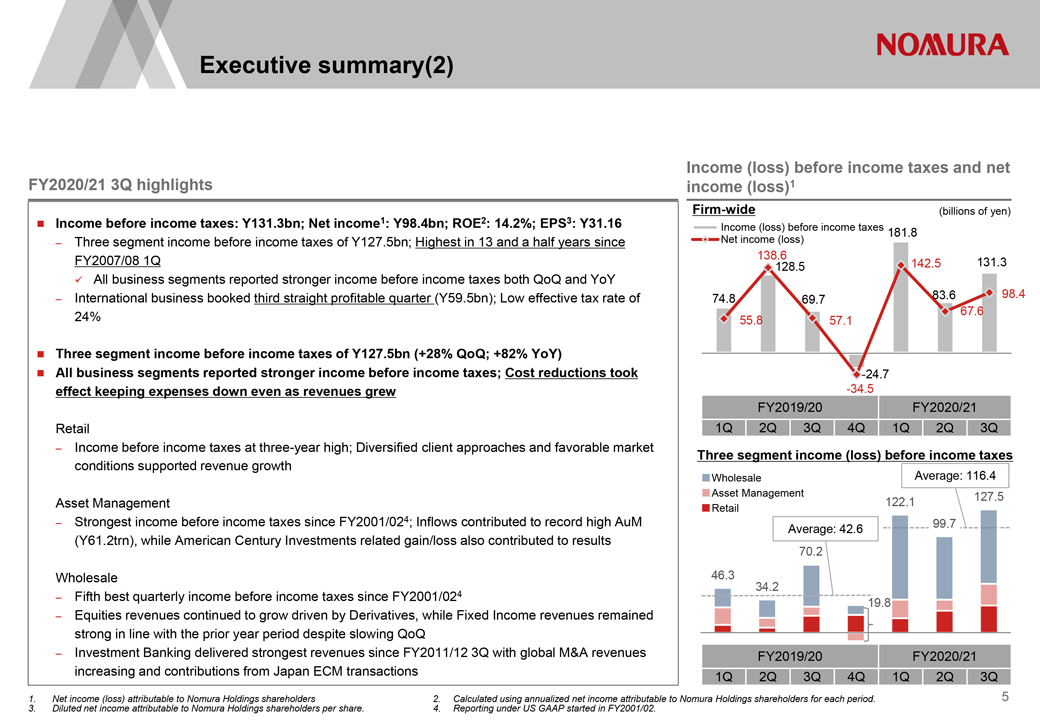
Executive summary(2) FY2020/21 3Q highlights Income before income taxes: Y131.3bn; Net income1: Y98.4bn; ROE2: 14.2%; EPS3: Y31.16 Three segment income before income taxes of Y127.5bn; Highest in 13 and a half years since FY2007/08 1Q All business segments reported stronger income before income taxes both QoQ and YoY International business booked third straight profitable quarter (Y59.5bn); Low effective tax rate of 24% Three segment income before income taxes of Y127.5bn (+28% QoQ; +82% YoY) All business segments reported stronger income before income taxes; Cost reductions took effect keeping expenses down even as revenues grew Retail Income before income taxes at three-year high; Diversified client approaches and favorable market conditions supported revenue growth Asset Management Strongest income before income taxes since FY2001/024; Inflows contributed to record high AuM (Y61.2trn), while American Century Investments related gain/loss also contributed to results Wholesale Fifth best quarterly income before income taxes since FY2001/024 Equities revenues continued to grow driven by Derivatives, while Fixed Income revenues remained strong in line with the prior year period despite slowing QoQ Investment Banking delivered strongest revenues since FY2011/12 3Q with global M&A revenues increasing and contributions from Japan ECM transactions 1. Net income (loss) attributable to Nomura Holdings shareholders 2. Calculated using annualized net income attributable to Nomura Holdings shareholders for each period. 3. Diluted net income attributable to Nomura Holdings shareholders per share. 4. Reporting under US GAAP started in FY2001/02. Income (loss) before income taxes and net income (loss)1 Firm-wide (billions of yen) Income (loss) before income taxes 181.8 Net income (loss) 138.6 128.5 142.5 131.3 74.8 69.7 83.6 98.4 67.6 55.8 57.1 -24.7 -34.5 FY2019/20 FY2020/21 1Q 2Q 3Q 4Q 1Q 2Q 3Q Three segment income (loss) before income taxes Wholesale Average: 116.4 Asset Management 122.1 127.5 Retail Average: 42.6 99.7 70.2 46.3 34.2 19.8 FY2019/20 FY2020/21 1Q 2Q 3Q 4Q 1Q 2Q 3Q Three segment income (loss) before income taxes Wholesale Average: 116.4 Asset Management 122.1 127.5 Retail Average: 42.6 99.7 70.2 46.3 34.2 19.8 FY2019/20 FY2020/21 1Q 2Q 3Q 4Q 1Q 2Q 3Q 5
Table of Contents
|
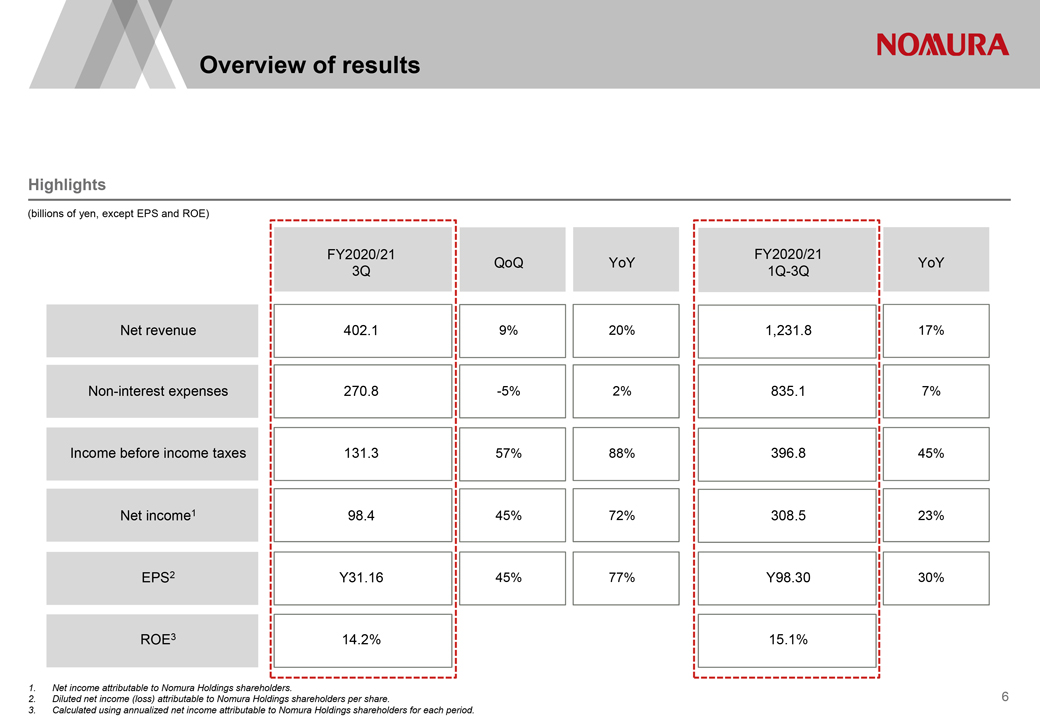
Overview of results Highlights (billions of yen, except EPS and ROE) FY2020/21 FY2020/21 QoQ YoY YoY 3Q 1Q-3Q Net revenue 402.1 9% 20% 1,231.8 17% Non-interest expenses 270.8 -5% 2% 835.1 7% Income before income taxes 131.3 57% 88% 396.8 45% Net income1 98.4 45% 72% 308.5 23% EPS2 Y31.16 45% 77% Y98.30 30% ROE3 14.2% 15.1% 1. Net income attributable to Nomura Holdings shareholders. 2. Diluted net income (loss) attributable to Nomura Holdings shareholders per share. 3. Calculated using annualized net income attributable to Nomura Holdings shareholders for each period. 6
Table of Contents
|
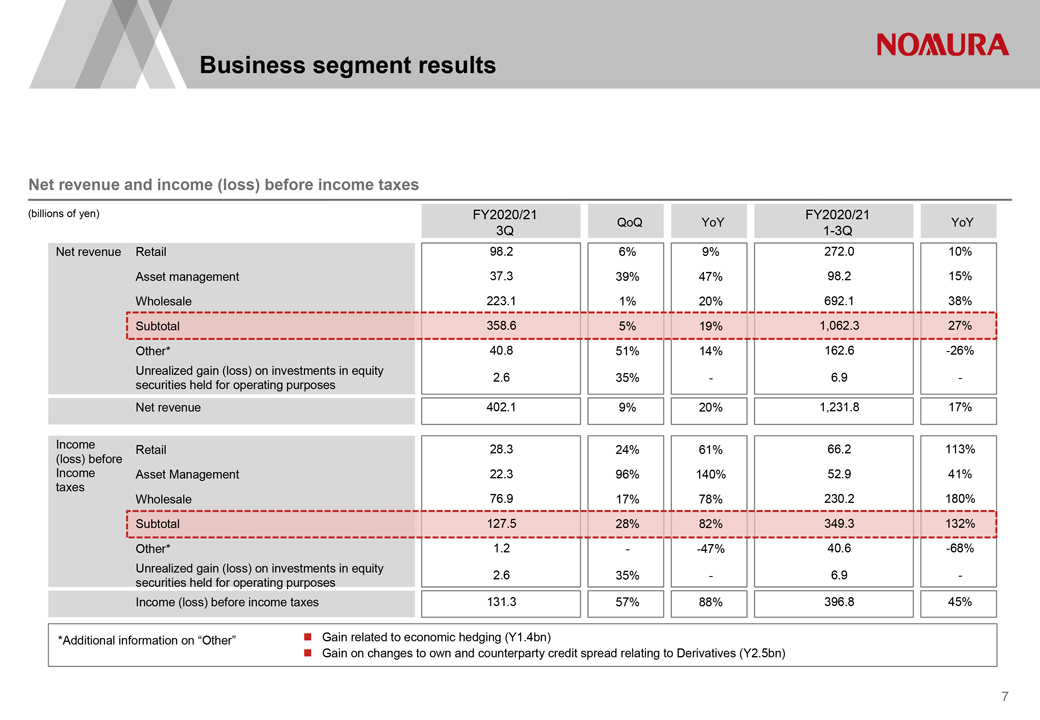
Business segment results Net revenue and income (loss) before income taxes (billions of yen) FY2020/21 FY2020/21 QoQ YoY YoY 3Q 1-3Q Net revenue Retail 98.2 6% 9% 272.0 10% Asset management 37.3 39% 47% 98.2 15% Wholesale 223.1 1% 20% 692.1 38% Subtotal 358.6 5% 19% 1,062.3 27% Other* 40.8 51% 14% 162.6 -26% Unrealized gain (loss) on investments in equity 2.6 35%—6.9— securities held for operating purposes Net revenue 402.1 9% 20% 1,231.8 17% Income Retail 28.3 24% 61% 66.2 113% (loss) before Income Asset Management 22.3 96% 140% 52.9 41% taxes Wholesale 76.9 17% 78% 230.2 180% Subtotal 127.5 28% 82% 349.3 132% Other* 1.2—-47% 40.6 -68% Unrealized gain (loss) on investments in equity 2.6 35%—6.9— securities held for operating purposes Income (loss) before income taxes 131.3 57% 88% 396.8 45% *Additional information on “Other” Gain related to economic hedging (Y1.4bn) Gain on changes to own and counterparty credit spread relating to Derivatives (Y2.5bn) 7
Table of Contents
|
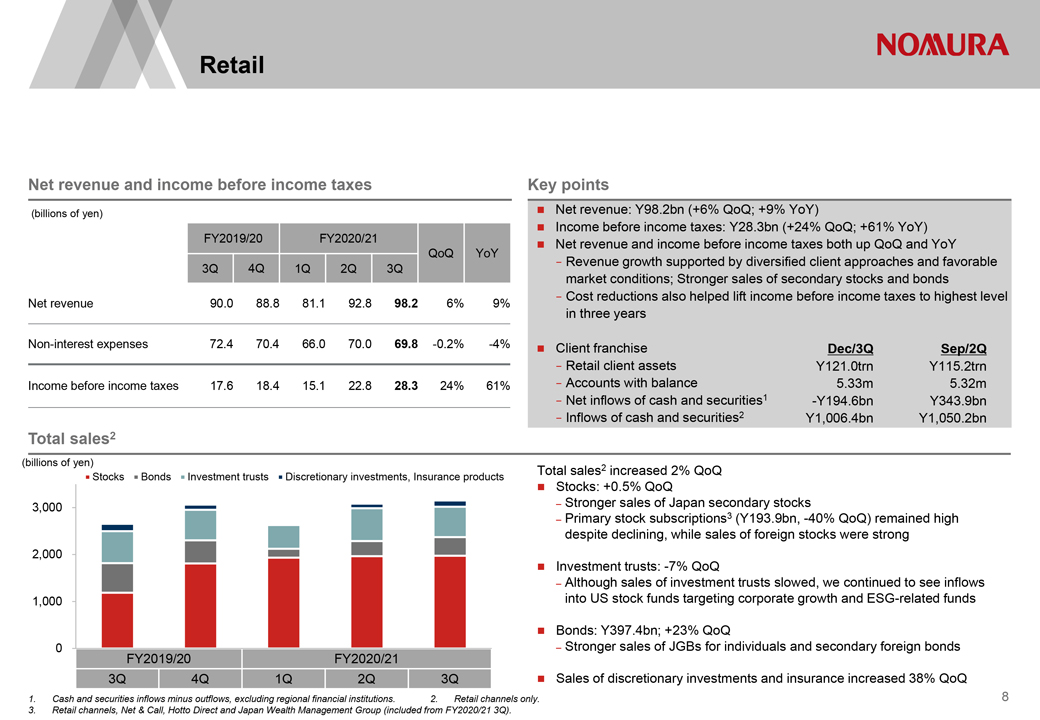
Retail Net revenue and income before income taxes (billions of yen) FY2019/20 FY2020/21 QoQ YoY 3Q 4Q 1Q 2Q 3Q Net revenue 90.0 88.8 81.1 92.8 98.2 6% 9% Non-interest expenses 72.4 70.4 66.0 70.0 69.8 -0.2% -4% Income before income taxes 17.6 18.4 15.1 22.8 28.3 24% 61% Key points Net revenue: Y98.2bn (+6% QoQ; +9% YoY) Income before income taxes: Y28.3bn (+24% QoQ; +61% YoY) Net revenue and income before income taxes both up QoQ and YoY—Revenue growth supported by diversified client approaches and favorable market conditions; Stronger sales of secondary stocks and bonds—Cost reductions also helped lift income before income taxes to highest level in three years Client franchise Dec/3Q Sep/2Q —Retail client assets Y121.0trn Y115.2trn —Accounts with balance 5.33m 5.32m —Net inflows of cash and securities1 -Y194.6bn Y343.9bn —Inflows of cash and securities2 Y1,006.4bn Y1,050.2bn Total sales2 (billions of yen) Stocks Bonds Investment trusts Discretionary investments, Insurance products 3,000 2,000 1,000 0 FY2019/20 FY2020/21 3Q 4Q 1Q 2Q 3Q Total sales2 increased 2% QoQ Stocks: +0.5% QoQ – Stronger sales of Japan secondary stocks – Primary stock subscriptions3 (Y193.9bn, -40% QoQ) remained high despite declining, while sales of foreign stocks were strong Investment trusts: -7% QoQ Although sales of investment trusts slowed, we continued to see inflows into US stock funds targeting corporate growth and ESG-related funds Bonds: Y397.4bn; +23% QoQ Stronger sales of JGBs for individuals and secondary foreign bonds Sales of discretionary investments and insurance increased 38% QoQ 1. Cash and securities inflows minus outflows, excluding regional financial institutions. 2. Retail channels only. 3. Retail channels, Net & Call, Hotto Direct and Japan Wealth Management Group (included from FY2020/21 3Q). 8
Table of Contents
|
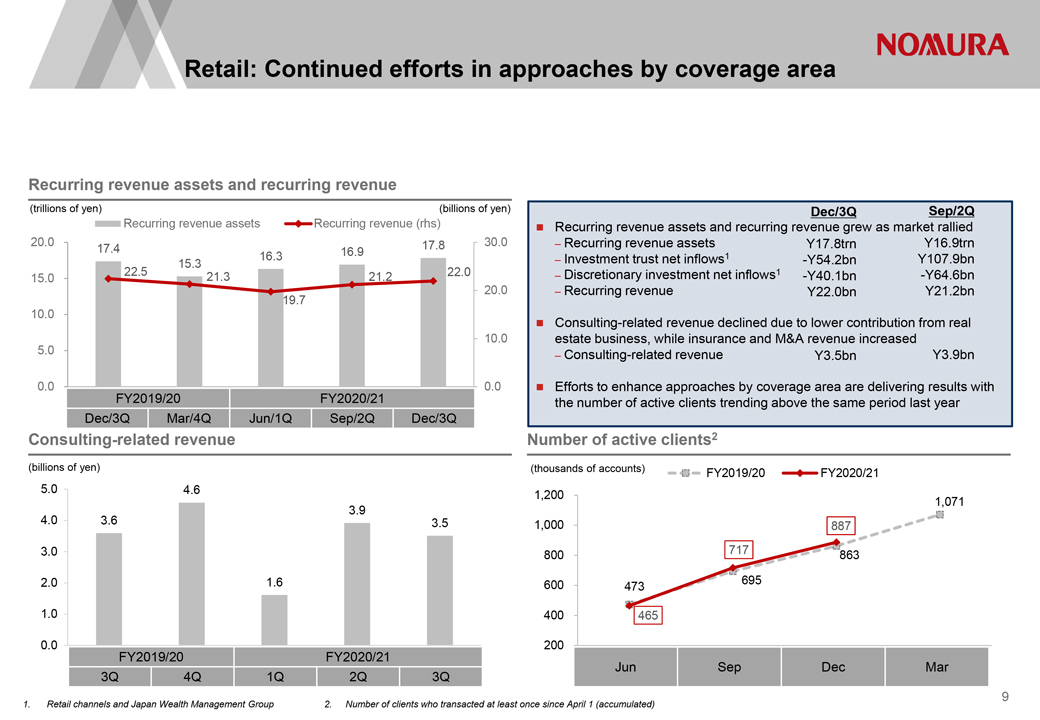
Retail: Continued efforts in approaches by coverage area Recurring revenue assets and recurring revenue (trillions of yen) (billions of yen) Recurring revenue assets Recurring revenue (rhs) 20.0 17.4 16.3 16.9 17.8 30.0 15.3 15.0 22.5 21.3 21.2 22.0 20.0 19.7 10.0 10.0 5.0 0.0 0.0 FY2019/20 FY2020/21 Dec/3Q Mar/4Q Jun/1Q Sep/2Q Dec/3Q Consulting-related revenue (billions of yen) 5.0 4.6 3.9 4.0 3.6 3.5 3.0 2.0 1.6 1.0 0.0 FY2019/20 FY2020/21 3Q 4Q 1Q 2Q 3Q Dec/3Q Sep/2Q Recurring revenue assets and recurring revenue grew as market rallied – Recurring revenue assets Y17.8trn Y16.9trn – Investment trust net inflows1 -Y54.2bn Y107.9bn – Discretionary investment net inflows1 -Y40.1bn -Y64.6bn – Recurring revenue Y22.0bn Y21.2bn Consulting-related revenue declined due to lower contribution from real estate business, while insurance and M&A revenue increased – Consulting-related revenue Y3.5bn Y3.9bn Efforts to enhance approaches by coverage area are delivering results with the number of active clients trending above the same period last year Number of active clients2 (thousands of accounts) FY2019/20 FY2020/21 1,200 1,071 1,000 887 800 717 863 600 473 695 400 465 200 Jun Sep Dec Mar Retail channels and Japan Wealth Management Group 2. Number of clients who transacted at least once since April 1 (accumulated) 9
Table of Contents
|
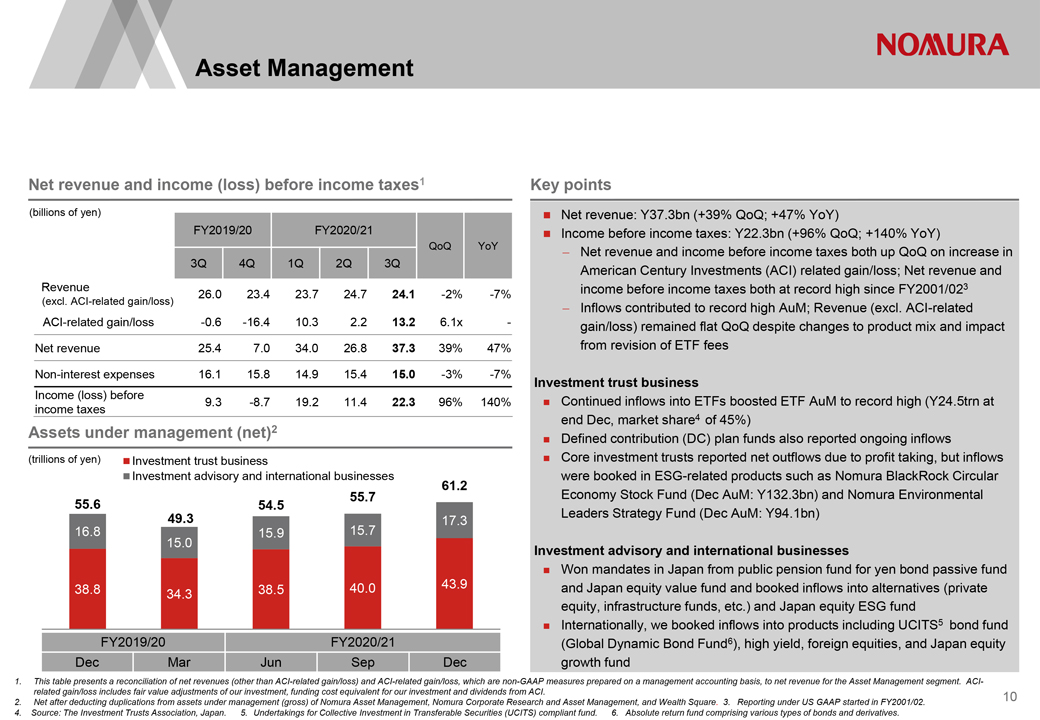
Asset Management Net revenue and income (loss) before income taxes1 (billions of yen) FY2019/20 FY2020/21 QoQ YoY 3Q 4Q 1Q 2Q 3Q Revenue 26.0 23.4 23.7 24.7 24.1 -2% -7% (excl. ACI-related gain/loss) ACI-related gain/loss -0.6 -16.4 10.3 2.2 13.2 6.1x—Net revenue 25.4 7.0 34.0 26.8 37.3 39% 47% Non-interest expenses 16.1 15.8 14.9 15.4 15.0 -3% -7% Income (loss) before 9.3 -8.7 19.2 11.4 22.3 96% 140% income taxes Assets under management (net)2 (trillions of yen) Investment trust business Investment advisory and international businesses 61.2 55.6 54.5 55.7 49.3 17.3 16.8 15.9 15.7 15.0 38.8 34.3 38.5 40.0 43.9 FY2019/20 FY2020/21 Dec Mar Jun Sep Dec Key points Net revenue: Y37.3bn (+39% QoQ; +47% YoY) Income before income taxes: Y22.3bn (+96% QoQ; +140% YoY) Net revenue and income before income taxes both up QoQ on increase in American Century Investments (ACI) related gain/loss; Net revenue and income before income taxes both at record high since FY2001/023 Inflows contributed to record high AuM; Revenue (excl. ACI-related gain/loss) remained flat QoQ despite changes to product mix and impact from revision of ETF fees Investment trust business Continued inflows into ETFs boosted ETF AuM to record high (Y24.5trn at end Dec, market share4 of 45%) Defined contribution (DC) plan funds also reported ongoing inflows Core investment trusts reported net outflows due to profit taking, but inflows were booked in ESG-related products such as Nomura BlackRock Circular Economy Stock Fund (Dec AuM: Y132.3bn) and Nomura Environmental Leaders Strategy Fund (Dec AuM: Y94.1bn) Investment advisory and international businesses Won mandates in Japan from public pension fund for yen bond passive fund and Japan equity value fund and booked inflows into alternatives (private equity, infrastructure funds, etc.) and Japan equity ESG fund Internationally, we booked inflows into products including UCITS5 bond fund (Global Dynamic Bond Fund6), high yield, foreign equities, and Japan equity growth fund 1. This table presents a reconciliation of net revenues (other than ACI-related gain/loss) and ACI-related gain/loss, which are non-GAAP measures prepared on a management accounting basis, to net revenue for the Asset Management segment. ACI-related gain/loss includes fair value adjustments of our investment, funding cost equivalent for our investment and dividends from ACI. 2. Net after deducting duplications from assets under management (gross) of Nomura Asset Management, Nomura Corporate Research and Asset Management, and Wealth Square. 3. Reporting under US GAAP started in FY2001/02. 4. Source: The Investment Trusts Association, Japan. 5. Undertakings for Collective Investment in Transferable Securities (UCITS) compliant fund. 6. Absolute return fund comprising various types of bonds and derivatives. 10
Table of Contents
|
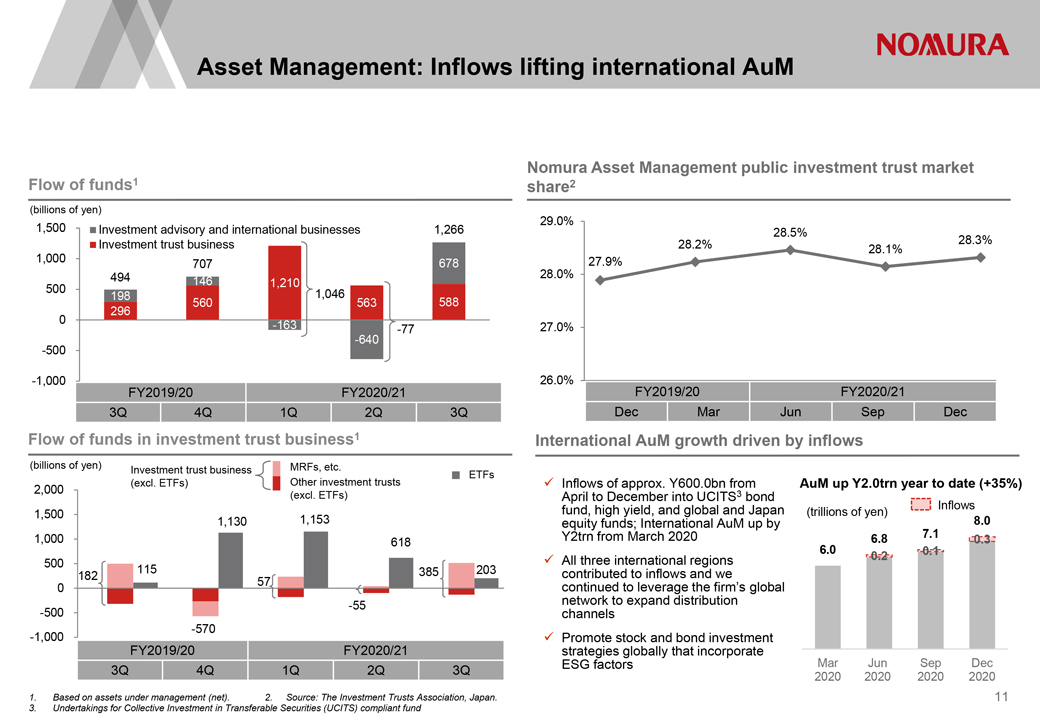
Asset Management: Inflows lifting international AuM Flow of funds1 (billions of yen) 1,500 Investment advisory and international businesses 1,266 Investment trust business 1,000 707 678 494 146 1,210 500 198 1,046 560 563 588 296 0 -163 -77 -640 -500 -1,000 FY2019/20 FY2020/21 3Q 4Q 1Q 2Q 3Q Flow of funds in investment trust business1 (billions of yen) Investment trust business MRFs, etc. ETFs (excl. ETFs) Other investment trusts 2,000 (excl. ETFs) 1,500 1,130 1,153 1,000 618 500 182 115 385 203 0 57 -500 -55 -570 -1,000 FY2019/20 FY2020/21 3Q 4Q 1Q 2Q 3Q 1. Based on assets under management (net). 2. Source: The Investment Trusts Association, Japan. 3. Undertakings for Collective Investment in Transferable Securities (UCITS) compliant fund Nomura Asset Management public investment trust market share2 29.0% 28.5% 28.2% 28.1% 28.3% 27.9% 28.0% 27.0% 26.0% FY2019/20 FY2020/21 Dec Mar Jun Sep Dec International AuM growth driven by inflows Inflows of approx. Y600.0bn from April to December into UCITS3 bond fund, high yield, and global and Japan equity funds; International AuM up by Y2trn from March 2020 All three international regions contributed to inflows and we continued to leverage the firm’s global network to expand distribution channels Promote stock and bond investment strategies globally that incorporate ESG factors AuM up Y2.0trn year to date (+35%) (trillions of yen) Inflows 8.0 6.8 7.1 0.3 6.0 0.2 0.1 Mar Jun Sep Dec 2020 2020 2020 2020 11
Table of Contents
|
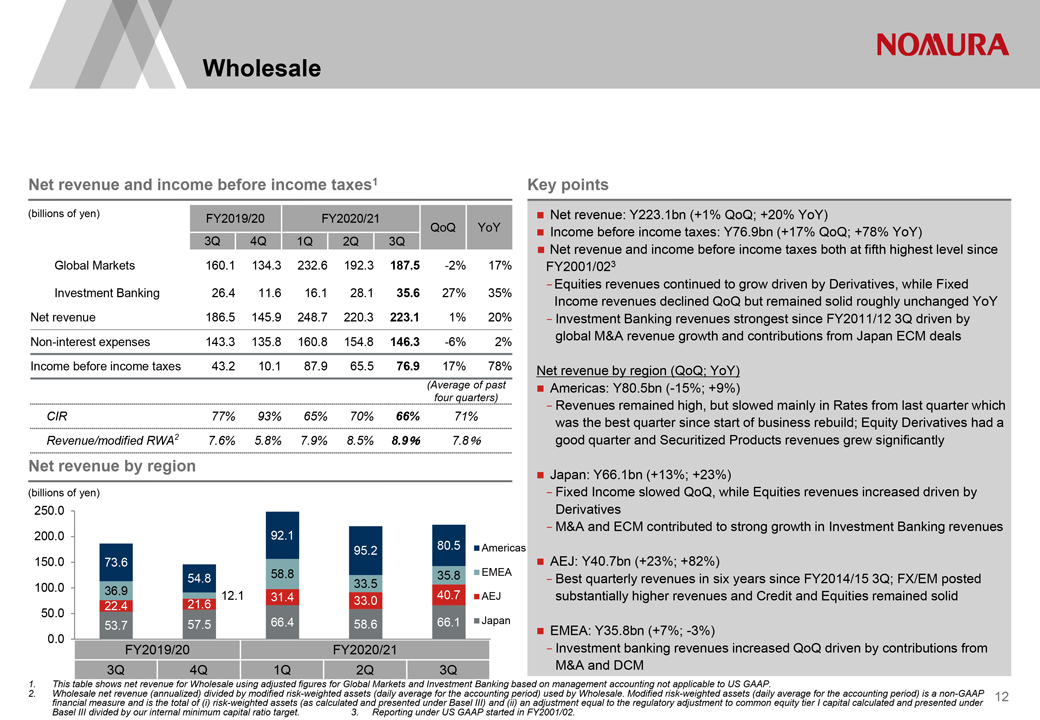
Wholesale Net revenue and income before income taxes1 (billions of yen) FY2019/20 FY2020/21 QoQ YoY 3Q 4Q 1Q 2Q 3Q Global Markets 160.1 134.3 232.6 192.3 187.5 -2% 17% Investment Banking 26.4 11.6 16.1 28.1 35.6 27% 35% Net revenue 186.5 145.9 248.7 220.3 223.1 1% 20% Non-interest expenses 143.3 135.8 160.8 154.8 146.3 -6% 2% Income before income taxes 43.2 10.1 87.9 65.5 76.9 17% 78% (Average of past four quarters) CIR 77% 93% 65% 70% 66% 71% Revenue/modified RWA2 7.6% 5.8% 7.9% 8.5% 8.9% 7.8% Net revenue by region (billions of yen) 250.0 200.0 92.1 95.2 80.5 Americas 150.0 73.6 54.8 58.8 33.5 35.8 EMEA 100.0 36.9 12.1 31.4 40.7 AEJ 50.0 22.4 21.6 33.0 53.7 57.5 66.4 58.6 66.1 Japan 0.0 FY2019/20 FY2020/21 3Q 4Q 1Q 2Q 3Q 1. This table shows net revenue for Wholesale using adjusted figures for Global Markets and Investment Banking based on management accounting not applicable to US GAAP. 2. Wholesale net revenue (annualized) divided by modified risk-weighted assets (daily average for the accounting period) used by Wholesale. Modified risk-weighted assets (daily average for the accounting period) is a non-GAAP financial measure and is the total of (i) risk-weighted assets (as calculated and presented under Basel III) and (ii) an adjustment equal to the regulatory adjustment to common equity tier I capital calculated and presented under Basel III divided by our internal minimum capital ratio target. 3. Reporting under US GAAP started in FY2001/02. Key points Net revenue: Y223.1bn (+1% QoQ; +20% YoY) Income before income taxes: Y76.9bn (+17% QoQ; +78% YoY) Net revenue and income before income taxes both at fifth highest level since FY2001/023 —Equities revenues continued to grow driven by Derivatives, while Fixed Income revenues declined QoQ but remained solid roughly unchanged YoY —Investment Banking revenues strongest since FY2011/12 3Q driven by global M&A revenue growth and contributions from Japan ECM deals Net revenue by region (QoQ; YoY) Americas: Y80.5bn (-15%; +9%) —Revenues remained high, but slowed mainly in Rates from last quarter which was the best quarter since start of business rebuild; Equity Derivatives had a good quarter and Securitized Products revenues grew significantly Japan: Y66.1bn (+13%; +23%) —Fixed Income slowed QoQ, while Equities revenues increased driven by Derivatives —M&A and ECM contributed to strong growth in Investment Banking revenues AEJ: Y40.7bn (+23%; +82%) —Best quarterly revenues in six years since FY2014/15 3Q; FX/EM posted substantially higher revenues and Credit and Equities remained solid EMEA: Y35.8bn (+7%; -3%) —Investment banking revenues increased QoQ driven by contributions from M&A and DCM 12
Table of Contents
|
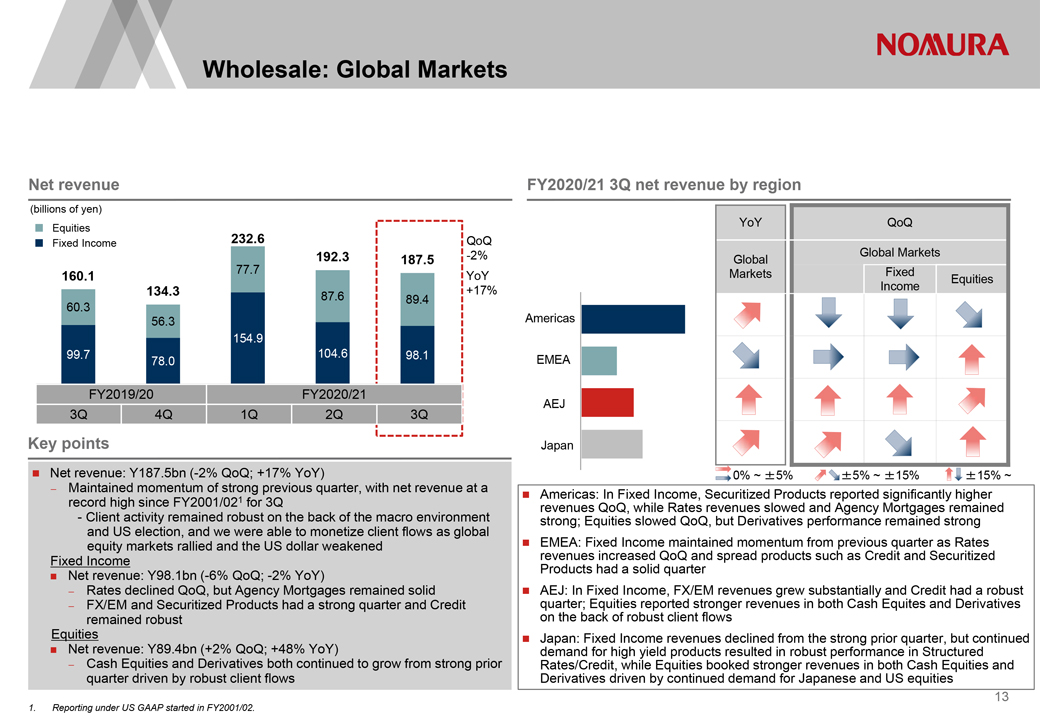
Wholesale: Global Markets Net revenue (billions of yen) Equities Fixed Income 232.6 QoQ 192.3 187.5 -2% 77.7 160.1 YoY 134.3 +17% 60.3 87.6 89.4 56.3 154.9 99.7 104.6 98.1 78.0 FY2019/20 FY2020/21 3Q 4Q 1Q 2Q 3Q FY2020/21 3Q net revenue by region YoY QoQ Global Global Markets Markets Fixed Equities Income Americas EMEA AEJ Japan 0% ~ ±5% ±5% ~ ±15% ±15% ~ Key points Net revenue: Y187.5bn (-2% QoQ; +17% YoY) Maintained momentum of strong previous quarter, with net revenue at a record high since FY2001/021 for 3Q —Client activity remained robust on the back of the macro environment and US election, and we were able to monetize client flows as global equity markets rallied and the US dollar weakened Fixed Income Net revenue: Y98.1bn (-6% QoQ; -2% YoY) Rates declined QoQ, but Agency Mortgages remained solid FX/EM and Securitized Products had a strong quarter and Credit remained robust Equities Net revenue: Y89.4bn (+2% QoQ; +48% YoY) Cash Equities and Derivatives both continued to grow from strong prior quarter driven by robust client flows Americas: In Fixed Income, Securitized Products reported significantly higher revenues QoQ, while Rates revenues slowed and Agency Mortgages remained strong; Equities slowed QoQ, but Derivatives performance remained strong EMEA: Fixed Income maintained momentum from previous quarter as Rates revenues increased QoQ and spread products such as Credit and Securitized Products had a solid quarter AEJ: In Fixed Income, FX/EM revenues grew substantially and Credit had a robust quarter; Equities reported stronger revenues in both Cash Equites and Derivatives on the back of robust client flows Japan: Fixed Income revenues declined from the strong prior quarter, but continued demand for high yield products resulted in robust performance in Structured Rates/Credit, while Equities booked stronger revenues in both Cash Equities and Derivatives driven by continued demand for Japanese and US equities 1. Reporting under US GAAP started in FY2001/02. 13
Table of Contents
|
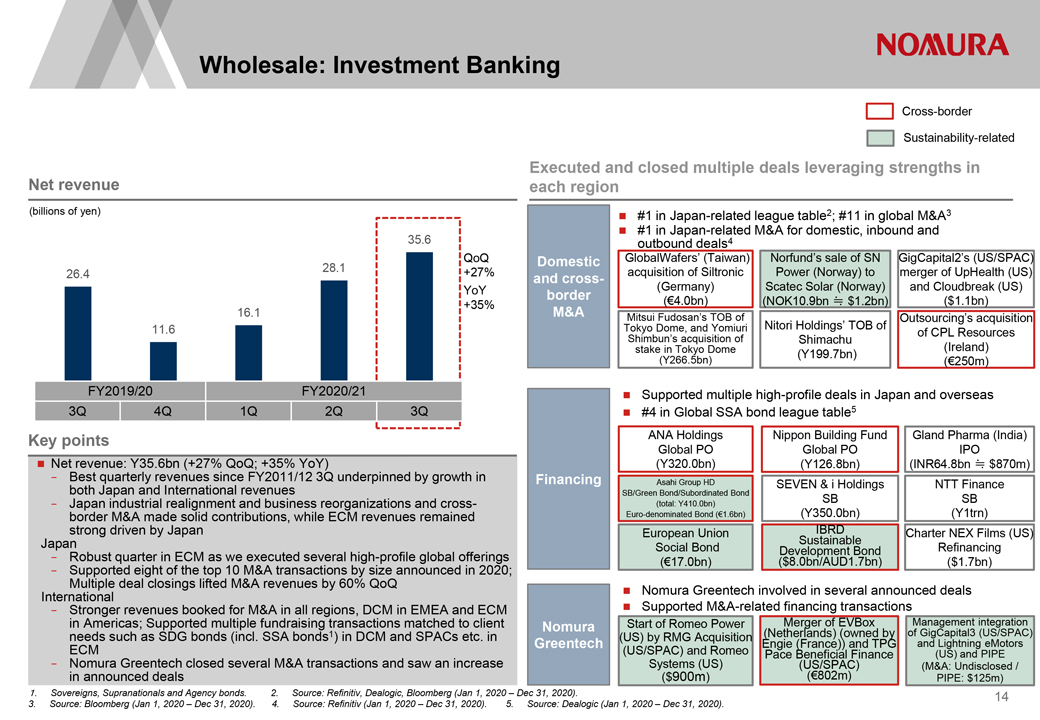
Wholesale: Investment Banking Net revenue (billions of yen) 35.6 QoQ 26.4 28.1 +27% YoY 16.1 +35% 11.6 FY2019/20 FY2020/21 3Q 4Q 1Q 2Q 3Q Key points Net revenue: Y35.6bn (+27% QoQ; +35% YoY)—Best quarterly revenues since FY2011/12 3Q underpinned by growth in both Japan and International revenues—Japan industrial realignment and business reorganizations and cross- border M&A made solid contributions, while ECM revenues remained strong driven by Japan Japan—Robust quarter in ECM as we executed several high-profile global offerings—Supported eight of the top 10 M&A transactions by size announced in 2020; Multiple deal closings lifted M&A revenues by 60% QoQ International—Stronger revenues booked for M&A in all regions, DCM in EMEA and ECM in Americas; Supported multiple fundraising transactions matched to client needs such as SDG bonds (incl. SSA bonds1) in DCM and SPACs etc. in ECM—Nomura Greentech closed several M&A transactions and saw an increase in announced deals Cross-border Sustainability-related Executed and closed multiple deals leveraging strengths in each region #1 in Japan-related league table2; #11 in global M&A3 #1 in Japan-related M&A for domestic, inbound and outbound deals4 Domestic GlobalWafers’ (Taiwan) Norfund’s sale of SN GigCapital2’s (US/SPAC) and cross- acquisition of Siltronic Power (Norway) to merger of UpHealth (US) (Germany) Scatec Solar (Norway) and Cloudbreak (US) border (€4.0bn) (NOK10.9bn ≒ $1.2bn) ($1.1bn) M&A Mitsui Fudosan’s TOB of Outsourcing’s acquisition Tokyo Dome, and Yomiuri Nitori Holdings’ TOB of of CPL Resources Shimbun’s acquisition of Shimachu stake in Tokyo Dome (Y199.7bn) (Ireland) (Y266.5bn) (€250m) Supported multiple high-profile deals in Japan and overseas #4 in Global SSA bond league table5 ANA Holdings Nippon Building Fund Gland Pharma (India) Global PO Global PO IPO (Y320.0bn) (Y126.8bn) (INR64.8bn ≒ $870m) Financing Asahi Group HD SEVEN & i Holdings NTT Finance SB/Green Bond/Subordinated Bond SB SB (total: Y410.0bn) Euro-denominated Bond (€1.6bn) (Y350.0bn) (Y1trn) European Union IBRD Charter NEX Films (US) Sustainable Social Bond Development Bond Refinancing (€17.0bn) ($8.0bn/AUD1.7bn) ($1.7bn) Nomura Greentech involved in several announced deals Supported M&A-related financing transactions Nomura Start of Romeo Power Merger of EVBox Management integration (US) by RMG Acquisition (Netherlands) (owned by of GigCapital3 (US/SPAC) Greentech Engie (France)) and TPG and Lightning eMotors (US/SPAC) and Romeo Pace Beneficial Finance (US) and PIPE Systems (US) (US/SPAC) (M&A: Undisclosed / ($900m) (€802m) PIPE: $125m) . Sovereigns, Supranationals and Agency bonds. 2. Source: Refinitiv, Dealogic, Bloomberg (Jan 1, 2020 – Dec 31, 2020). 3. Source: Bloomberg (Jan 1, 2020 – Dec 31, 2020). 4. Source: Refinitiv (Jan 1, 2020 – Dec 31, 2020). 5. Source: Dealogic (Jan 1, 2020 – Dec 31, 2020). 14
Table of Contents
|
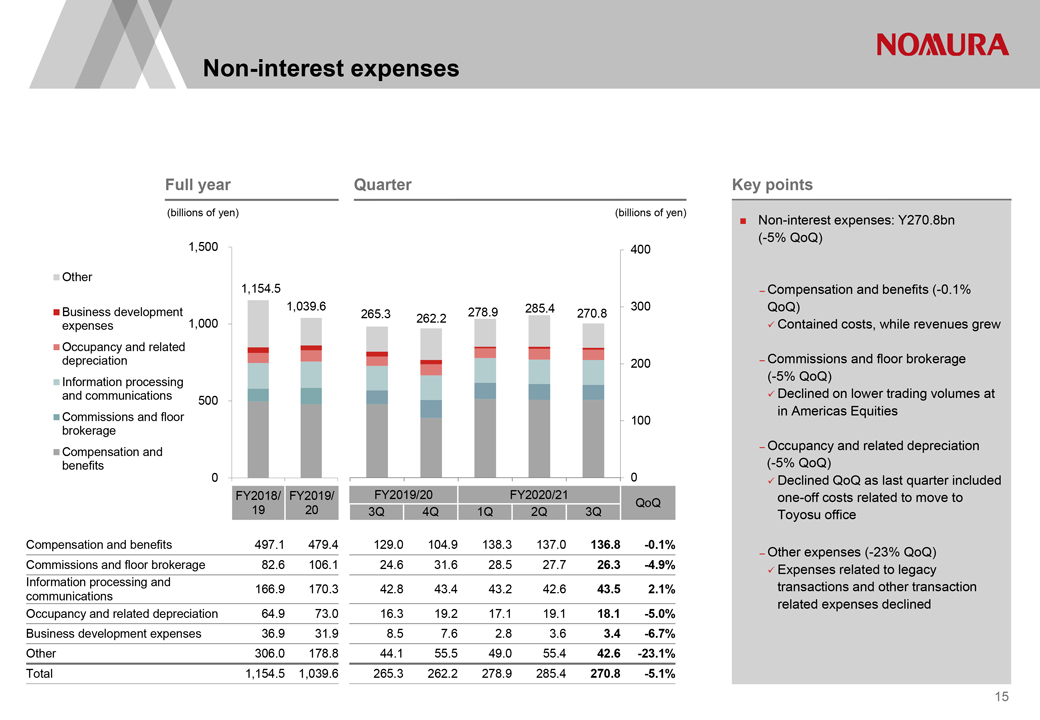
Non-interest expenses Full year Quarter (billions of yen) (billions of yen) 1,500 400 Other 1,154.5 Business development 1,039.6 265.3 278.9 285.4 270.8 300 expenses 1,000 262.2 Occupancy and related depreciation 200 Information processing and communications 500 Commissions and floor 100 brokerage Compensation and benefits 0 0 FY2018/ FY2019/ FY2019/20 FY2020/21 QoQ 19 20 3Q 4Q 1Q 2Q 3Q Compensation and benefits 497.1 479.4 129.0 104.9 138.3 137.0136.8 -0.1% Commissions and floor brokerage 82.6 106.1 24.6 31.6 28.5 27.7 26.3 -4.9% Information processing and 166.9 170.3 42.8 43.4 43.2 42.6 43.5 2.1% communications Occupancy and related depreciation 64.9 73.0 16.3 19.2 17.1 19.1 18.1 -5.0% Business development expenses 36.9 31.9 8.5 7.6 2.8 3.6 3.4 -6.7% Other 306.0 178.8 44.1 55.5 49.0 55.4 42.6 -23.1% Total 1,154.5 1,039.6 265.3 262.2 278.9 285.4 270.8 -5.1% Key points Non-interest expenses: Y270.8bn (-5% QoQ) – Compensation and benefits (-0.1% QoQ) Contained costs, while revenues grew – Commissions and floor brokerage (-5% QoQ) Declined on lower trading volumes at in Americas Equities – Occupancy and related depreciation (-5% QoQ) Declined QoQ as last quarter included one-off costs related to move to Toyosu office – Other expenses (-23% QoQ) Expenses related to legacy transactions and other transaction related expenses declined 15
Table of Contents
|
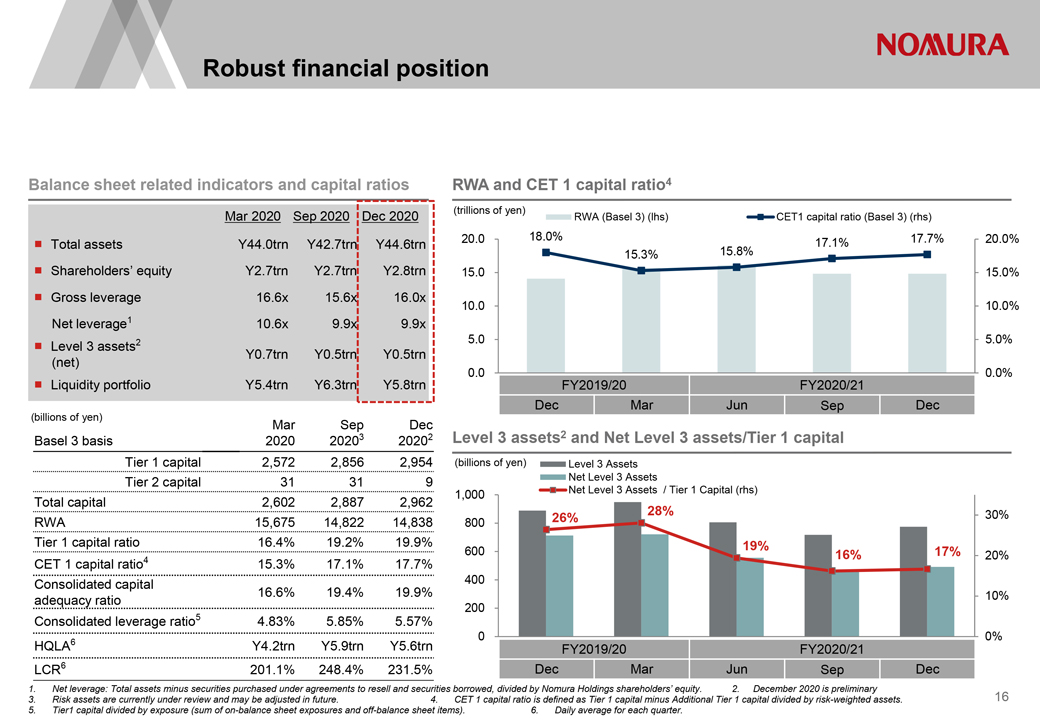
Robust financial position Balance sheet related indicators and capital ratios Mar 2020 Sep 2020 Dec 2020 Total assets Y44.0trn Y42.7trn Y44.6trn Shareholders’ equity Y2.7trn Y2.7trn Y2.8trn Gross leverage 16.6x 15.6x 16.0x Net leverage1 10.6x 9.9x 9.9x Level 3 assets2 (net) Y0.7trn Y0.5trn Y0.5trn Liquidity portfolio Y5.4trn Y6.3trn Y5.8trn (billions of yen) Mar Sep Dec Basel 3 basis 2020 20203 20202 Tier 1 capital 2,572 2,856 2,954 Tier 2 capital 31 31 9 Total capital 2,602 2,887 2,962 RWA 15,675 14,822 14,838 Tier 1 capital ratio 16.4% 19.2% 19.9% CET 1 capital ratio4 15.3% 17.1% 17.7% Consolidated capital adequacy ratio 16.6% 19.4% 19.9% Consolidated leverage ratio5 4.83% 5.85% 5.57% HQLA6 Y4.2trn Y5.9trn Y5.6trn LCR6 201.1% 248.4% 231.5% RWA and CET 1 capital ratio4 (trillions of yen) RWA (Basel 3) (lhs) CET1 capital ratio (Basel 3) (rhs) 20.0 18.0% 17.1% 17.7% 20.0% 15.3% 15.8% 15.0 15.0% 10.0 10.0% 5.0 5.0% 0.0 0.0% FY2019/20 FY2020/21 Dec Mar Jun Sep Dec Level 3 assets2 and Net Level 3 assets/Tier 1 capital (billions of yen) Level 3 Assets Net Level 3 Assets 1,000 Net Level 3 Assets / Tier 1 Capital (rhs) 26% 28% 30% 800 600 19% 16% 17% 20% 400 10% 200 0 0% FY2019/20 FY2020/21 Dec Mar Jun Sep Dec 1. Net leverage: Total assets minus securities purchased under agreements to resell and securities borrowed, divided by Nomura Holdings shareholders’ equity. 2. December 2020 is preliminary 3. Risk assets are currently under review and may be adjusted in future. 4. CET 1 capital ratio is defined as Tier 1 capital minus Additional Tier 1 capital divided by risk-weighted assets. 5. Tier1 capital divided by exposure (sum of on-balance sheet exposures and off-balance sheet items). 6. Daily average for each quarter. 16
Table of Contents
|
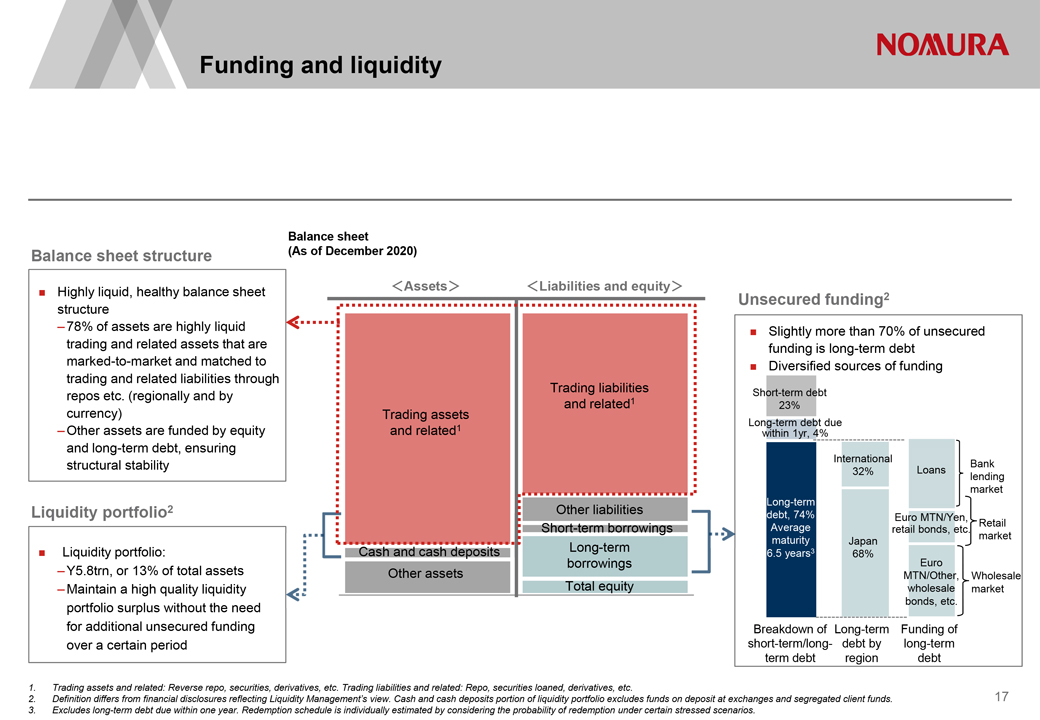
Funding and liquidity Balance sheet structure Highly liquid, healthy balance sheet structure –78% of assets are highly liquid trading and related assets that are marked-to-market and matched to trading and related liabilities through repos etc. (regionally and by currency) –Other assets are funded by equity and long-term debt, ensuring structural stability Liquidity portfolio2 Liquidity portfolio: –Y5.8trn, or 13% of total assets –Maintain a high quality liquidity portfolio surplus without the need for additional unsecured funding over a certain period Balance sheet (As of December 2020) <Assets><Liabilities and equity> Trading liabilities and related1 Trading assets and related1 Other liabilities Short-term borrowings Cash and cash deposits Long-term borrowings Other assets Total equity Unsecured funding2 Slightly more than 70% of unsecured funding is long-term debt Diversified sources of funding Short-term debt 23% Long-term debt due within 1yr, 4% International Bank 32% Loans lending market Long-term debt, 74% Euro MTN/Yen, Average retail bonds, etc. Retail maturity Japan market 6.5 years3 68% Euro MTN/Other, Wholesale wholesale market bonds, etc. Breakdown of Long-term Funding of short-term/long- debt by long-term term debt region debt 1. Trading assets and related: Reverse repo, securities, derivatives, etc. Trading liabilities and related: Repo, securities loaned, derivatives, etc. 2. Definition differs from financial disclosures reflecting Liquidity Management’s view. Cash and cash deposits portion of liquidity portfolio excludes funds on deposit at exchanges and segregated client funds. 3. Excludes long-term debt due within one year. Redemption schedule is individually estimated by considering the probability of redemption under certain stressed scenarios. 17
Table of Contents
|

Financial Supplement
Table of Contents
|
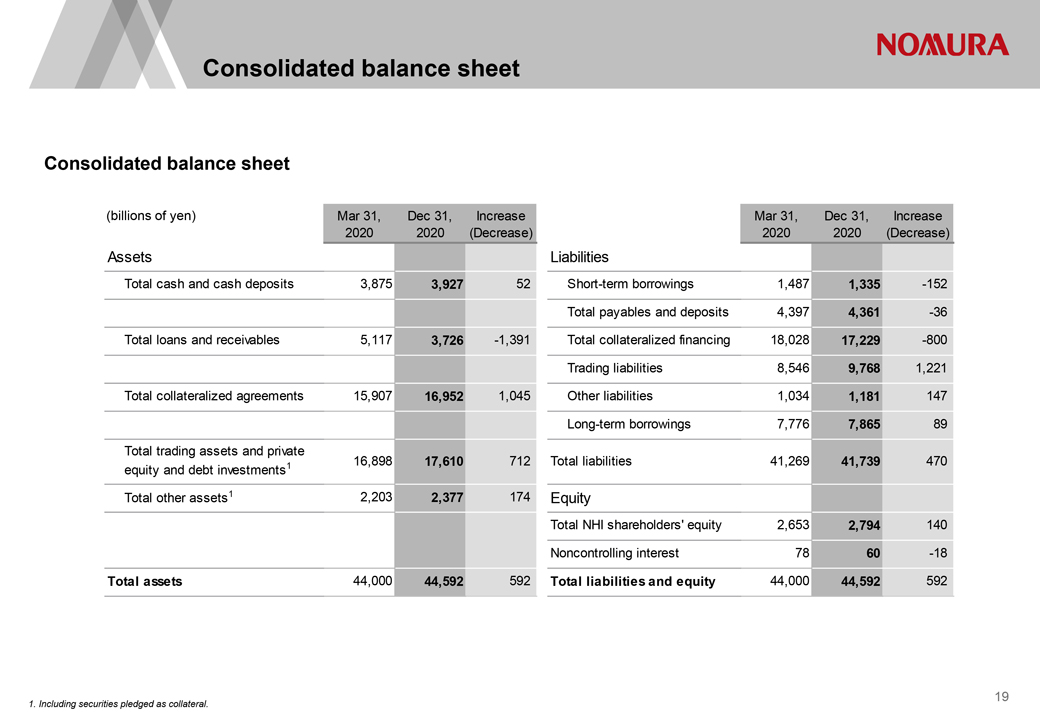
Consolidated balance sheet Consolidated balance sheet (billions of yen) Mar 31, Dec 31, Increase 2020 2020 (Decrease) Assets Total cash and cash deposits 3,875 3,927 52 Total loans and receivables 5,117 3,726 -1,391 Total collateralized agreements 15,907 16,952 1,045 Total trading assets and private equity and debt investments1 16,898 17,610 712 Total other assets1 2,203 2,377 174 Total assets 44,000 44,592 592 Mar 31, Dec 31, Increase 2020 2020 (Decrease) Liabilities Short-term borrowings 1,487 1,335 -152 Total payables and deposits 4,397 4,361 -36 Total collateralized financing 18,028 17,229 -800 Trading liabilities 8,546 9,768 1,221 Other liabilities 1,034 1,181 147 Long-term borrowings 7,776 7,865 89 Total liabilities 41,269 41,739 470 Equity Total NHI shareholders’ equity 2,653 2,794 140 Noncontrolling interest 78 60 -18 Total liabilities and equity 44,000 44,592 592 1. Including securities pledged as collateral. 19
Table of Contents
|
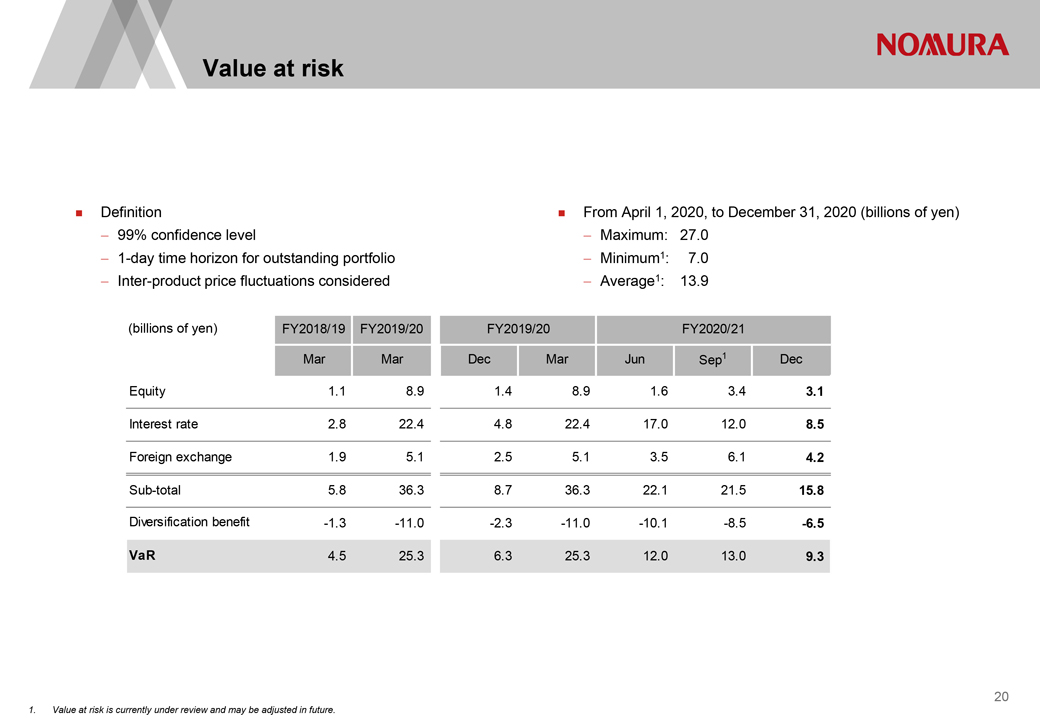
Value at risk Definition From April 1, 2020, to December 31, 2020 (billions of yen) 99% confidence level Maximum: 27.0 1-day time horizon for outstanding portfolio Minimum1: 7.0 Inter-product price fluctuations considered Average1: 13.9 (billions of yen) FY2018/19 FY2019/20 FY2019/20 FY2020/21 Mar Mar Dec Mar Jun Sep1 Dec Equity 1.1 8.9 1.4 8.9 1.6 3.4 3.1 Interest rate 2.8 22.4 4.8 22.4 17.0 12.0 8.5 Foreign exchange 1.9 5.1 2.5 5.1 3.5 6.1 4.2 Sub-total 5.8 36.3 8.7 36.3 22.1 21.5 15.8 Diversification benefit -1.3 -11.0 -2.3 -11.0 -10.1 -8.5 -6.5 VaR 4.5 25.3 6.3 25.3 12.0 13.0 9.3 1. Value at risk is currently under review and may be adjusted in future. 20
Table of Contents
|
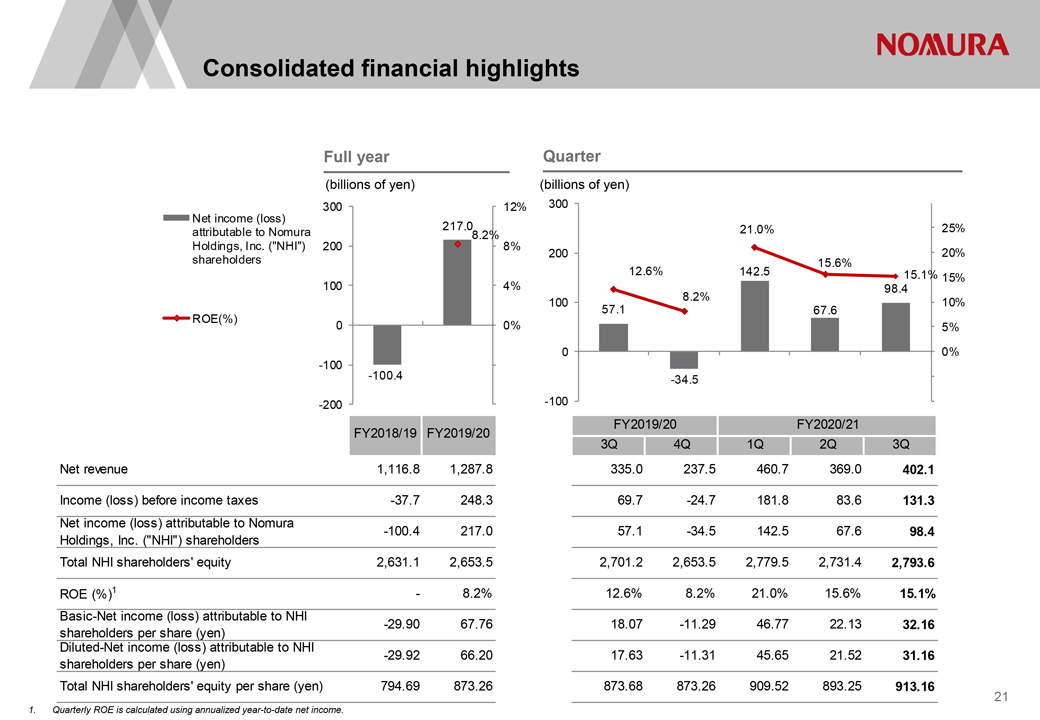
Consolidated financial highlights Full year (billions of yen) 300 12% Net income (loss) 217.0 attributable to Nomura 8.2% Holdings, Inc. (“NHI”) 200 8% shareholders 100 4% ROE(%) 0 0% -100 -100.4 -200 Quarter (billions of yen) 300 21.0% 25% 200 20% 15.6% 12.6% 142.5 15.1% 15% 8.2% 98.4 100 10% 57.1 67.6 5% 0 0% -34.5 -100 FY2018/19 FY2019/20 Net revenue 1,116.8 1,287.8 Income (loss) before income taxes -37.7 248.3 Net income (loss) attributable to Nomura -100.4 217.0 Holdings, Inc. (“NHI”) shareholders Total NHI shareholders’ equity 2,631.1 2,653.5 ROE (%)1—8.2% Basic-Net income (loss) attributable to NHI -29.90 67.76 shareholders per share (yen) Diluted-Net income (loss) attributable to NHI -29.92 66.20 shareholders per share (yen) Total NHI shareholders’ equity per share (yen) 794.69 873.26 FY2019/20 FY2020/21 3Q 4Q 1Q 2Q 3Q 335.0 237.5 460.7 369.0 402.1 69.7 -24.7 181.8 83.6 131.3 57.1 -34.5 142.5 67.6 98.4 2,701.2 2,653.5 2,779.5 2,731.4 2,793.6 12.6% 8.2% 21.0% 15.6% 15.1% 18.07 -11.29 46.77 22.13 32.16 17.63 -11.31 45.65 21.52 31.16 873.68 873.26 909.52 893.25 913.16 1. Quarterly ROE is calculated using annualized year-to-date net income. 21
Table of Contents
|
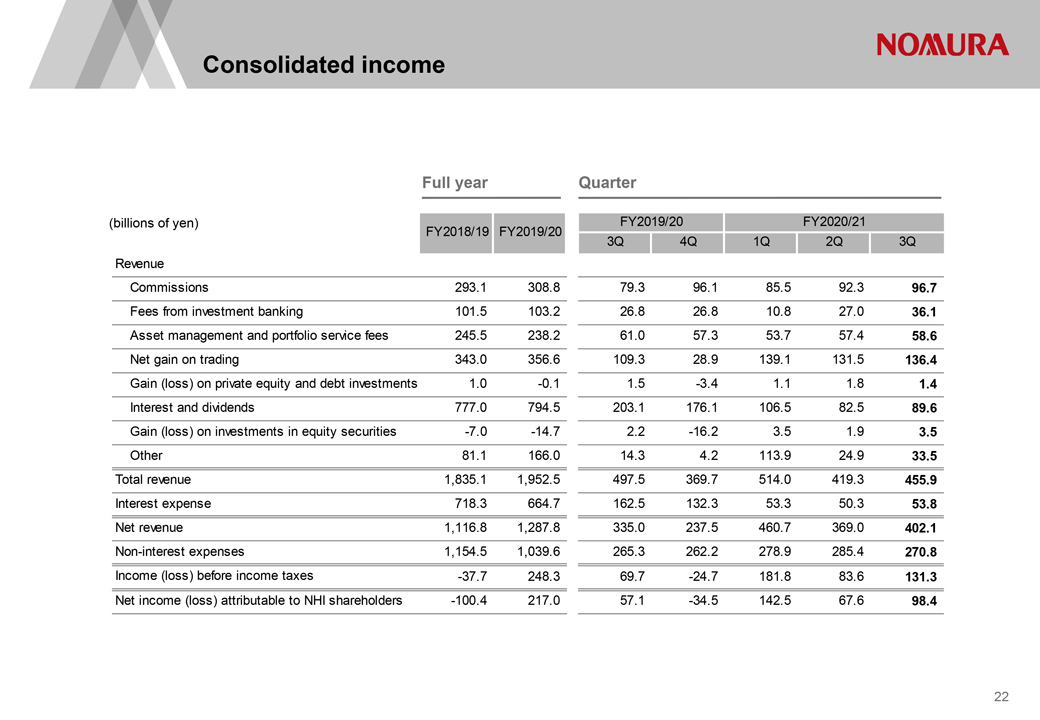
Consolidated income Full year Quarter (billions of yen) FY2019/20 FY2020/21 FY2018/19 FY2019/20 3Q 4Q 1Q 2Q 3Q Revenue Commissions 293.1 308.8 79.3 96.1 85.5 92.3 96.7 Fees from investment banking 101.5 103.2 26.8 26.8 10.8 27.0 36.1 Asset management and portfolio service fees 245.5 238.2 61.0 57.3 53.7 57.4 58.6 Net gain on trading 343.0 356.6 109.3 28.9 139.1 131.5 136.4 Gain (loss) on private equity and debt investments 1.0 -0.1 1.5 -3.4 1.1 1.8 1.4 Interest and dividends 777.0 794.5 203.1 176.1 106.5 82.5 89.6 Gain (loss) on investments in equity securities -7.0 -14.7 2.2 -16.2 3.5 1.9 3.5 Other 81.1 166.0 14.3 4.2 113.9 24.9 33.5 Total revenue 1,835.1 1,952.5 497.5 369.7 514.0 419.3 455.9 Interest expense 718.3 664.7 162.5 132.3 53.3 50.3 53.8 Net revenue 1,116.8 1,287.8 335.0 237.5 460.7 369.0 402.1 Non-interest expenses 1,154.5 1,039.6 265.3 262.2 278.9 285.4 270.8 Income (loss) before income taxes -37.7 248.3 69.7 -24.7 181.8 83.6 131.3 Net income (loss) attributable to NHI shareholders -100.4 217.0 57.1 -34.5 142.5 67.6 98.4 22
Table of Contents
|
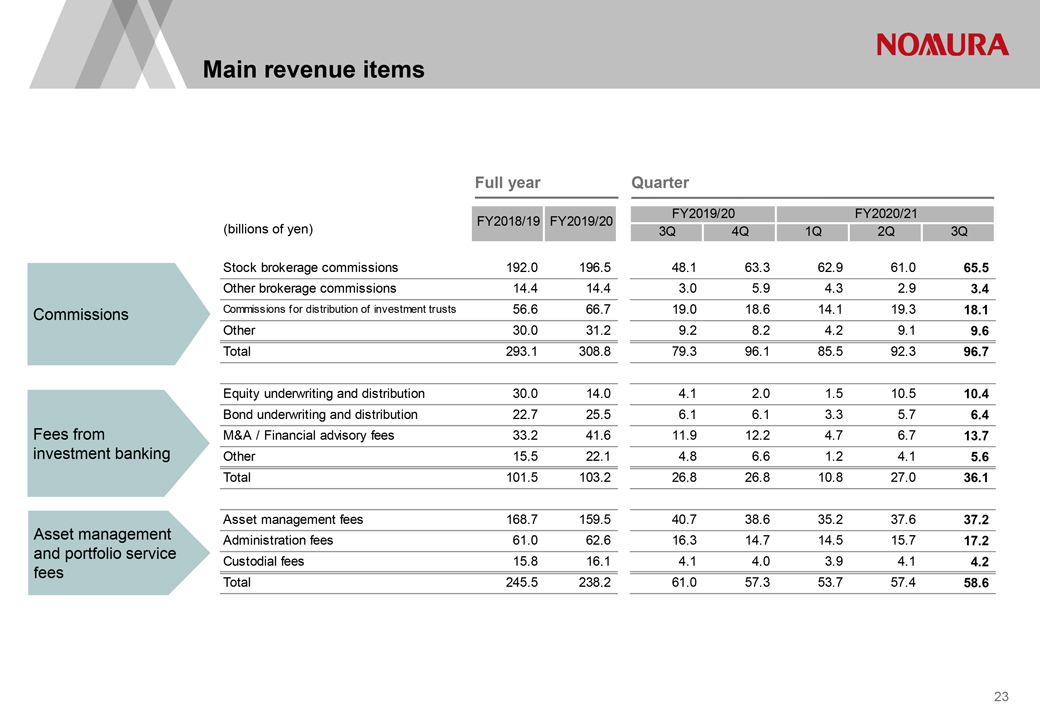
Main revenue items Commissions Fees from investment banking Asset management and portfolio service fees Full year Quarter FY2018/19 FY2019/20 FY2019/20 FY2020/21 (billions of yen) 3Q 4Q 1Q 2Q 3Q Stock brokerage commissions 192.0 196.5 48.1 63.3 62.9 61.0 65.5 Other brokerage commissions 14.4 14.4 3.0 5.9 4.3 2.9 3.4 Commissions for distribution of investment trusts 56.6 66.7 19.0 18.6 14.1 19.3 18.1 Other 30.0 31.2 9.2 8.2 4.2 9.1 9.6 Total 293.1 308.8 79.3 96.1 85.5 92.3 96.7 Equity underwriting and distribution 30.0 14.0 4.1 2.0 1.5 10.5 10.4 Bond underwriting and distribution 22.7 25.5 6.1 6.1 3.3 5.7 6.4 M&A / Financial advisory fees 33.2 41.6 11.9 12.2 4.7 6.7 13.7 Other 15.5 22.1 4.8 6.6 1.2 4.1 5.6 Total 101.5 103.2 26.8 26.8 10.8 27.0 36.1 Asset management fees 168.7 159.5 40.7 38.6 35.2 37.6 37.2 Administration fees 61.0 62.6 16.3 14.7 14.5 15.7 17.2 Custodial fees 15.8 16.1 4.1 4.0 3.9 4.1 4.2 Total 245.5 238.2 61.0 57.3 53.7 57.4 58.6 23
Table of Contents
|
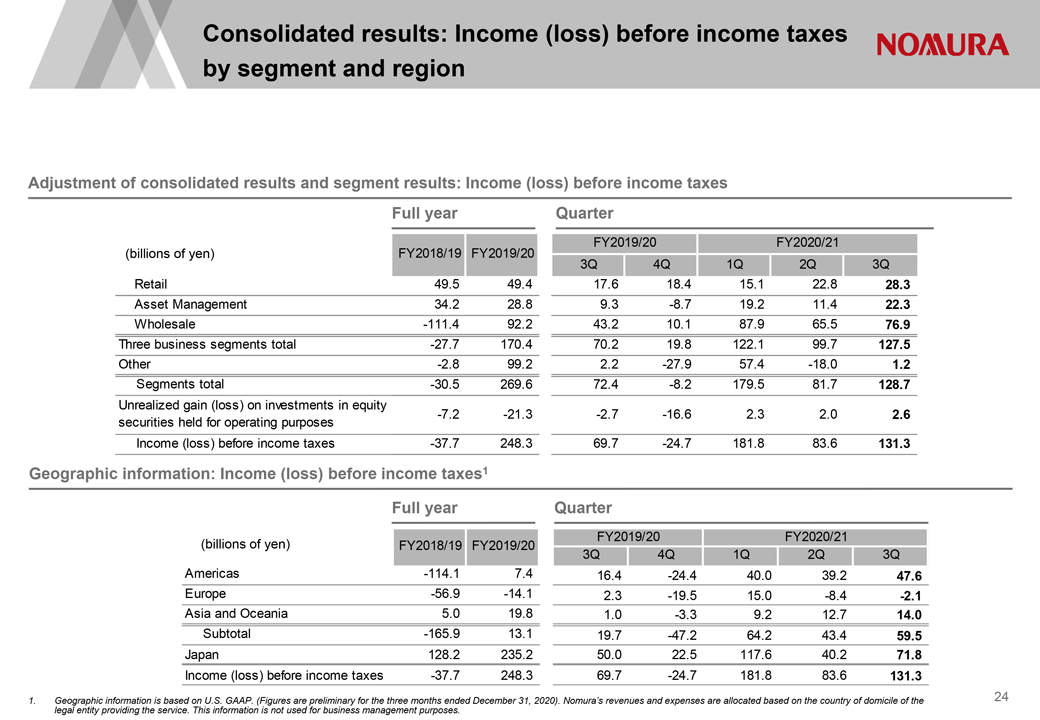
Consolidated results: Income (loss) before income taxes by segment and region Adjustment of consolidated results and segment results: Income (loss) before income taxes Full year Quarter FY2019/20 FY2020/21 (billions of yen) FY2018/19 FY2019/20 3Q 4Q 1Q 2Q 3Q Retail 49.5 49.4 17.6 18.4 15.1 22.8 28.3 Asset Management 34.2 28.8 9.3 -8.7 19.2 11.4 22.3 Wholesale -111.4 92.2 43.2 10.1 87.9 65.5 76.9 Three business segments total -27.7 170.4 70.2 19.8 122.1 99.7 127.5 Other -2.8 99.2 2.2 -27.9 57.4 -18.0 1.2 Segments total -30.5 269.6 72.4 -8.2 179.5 81.7 128.7 Unrealized gain (loss) on investments in equity securities held for operating purposes -7.2 -21.3 -2.7 -16.6 2.3 2.0 2.6 Income (loss) before income taxes -37.7 248.3 69.7 -24.7 181.8 83.6 131.3 Geographic information: Income (loss) before income taxes1 Full year Quarter (billions of yen) FY2018/19 FY2019/20 FY2019/20 FY2020/21 3Q 4Q 1Q 2Q 3Q Americas -114.1 7.4 16.4 -24.4 40.0 39.2 47.6 Europe -56.9 -14.1 2.3 -19.5 15.0 -8.4 -2.1 Asia and Oceania 5.0 19.8 1.0 -3.3 9.2 12.7 14.0 Subtotal -165.9 13.1 19.7 -47.2 64.2 43.4 59.5 Japan 128.2 235.2 50.0 22.5 117.6 40.2 71.8 Income (loss) before income taxes -37.7 248.3 69.7 -24.7 181.8 83.6 131.3 1. Geographic information is based on U.S. GAAP. (Figures are preliminary for the three months ended December 31, 2020). Nomura’s revenues and expenses are allocated based on the country of domicile of the legal entity providing the service. This information is not used for business management purposes. 24
Table of Contents
|
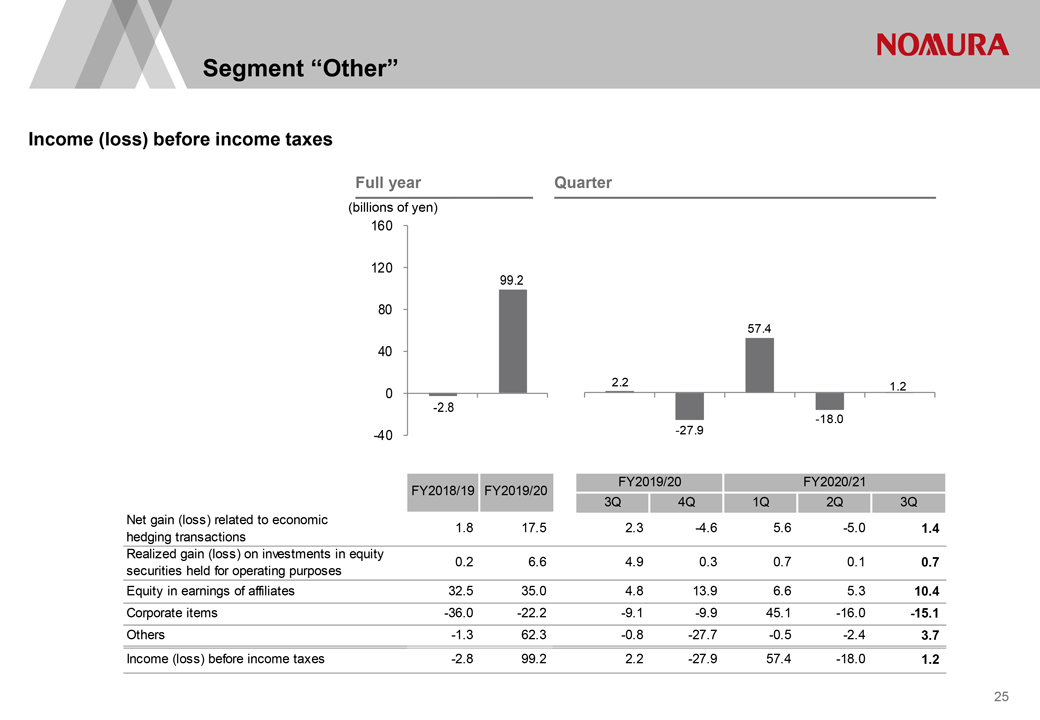
Segment “Other” Income (loss) before income taxes Full year Quarter (billions of yen) 160 120 99.2 80 57.4 40 2.2 1.2 0 -2.8 -18.0 -40 -27.9 1 2345 FY2019/20 FY2020/21 FY2018/19 FY2019/20 3Q 4Q 1Q 2Q 3Q Net gain (loss) related to economic 1.8 17.5 2.3 -4.6 5.6 -5.0 1.4 hedging transactions Realized gain (loss) on investments in equity 0.2 6.6 4.9 0.3 0.7 0.1 0.7 securities held for operating purposes Equity in earnings of affiliates 32.5 35.0 4.8 13.9 6.6 5.3 10.4 Corporate items -36.0 -22.2 -9.1 -9.9 45.1 -16.0 -15.1 Others -1.3 62.3 -0.8 -27.7 -0.5 -2.4 3.7 Income (loss) before income taxes -2.8 99.2 2.2 -27.9 57.4 -18.0 1.2 25
Table of Contents
|
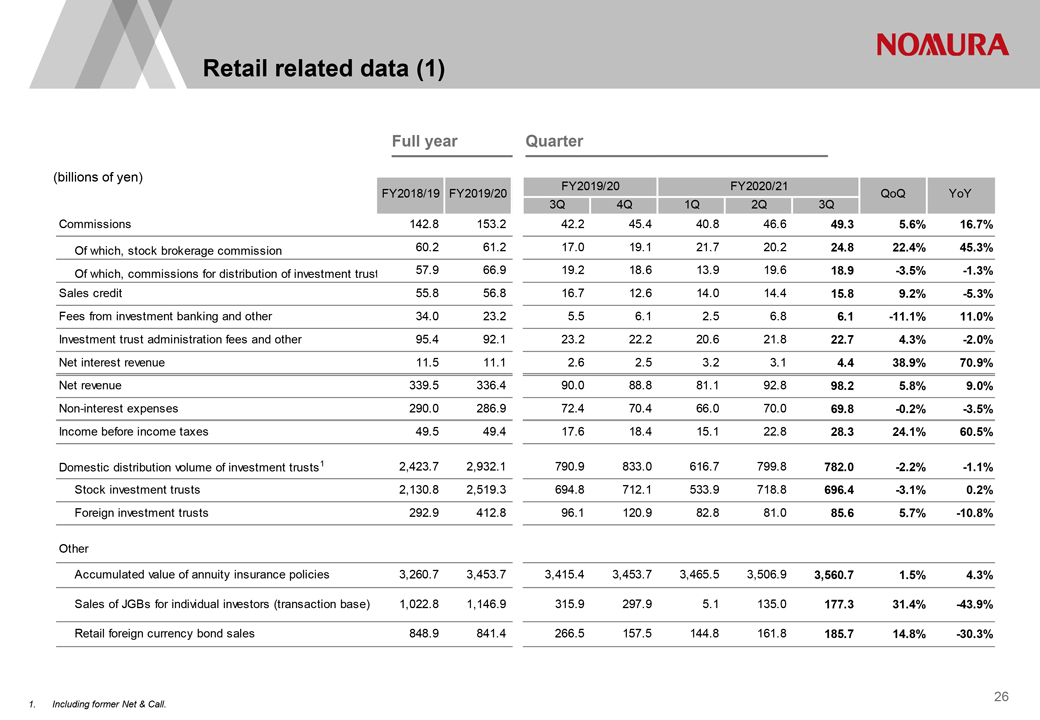
Retail related data (1) Full year Quarter (billions of yen) FY2019/20 FY2020/21 FY2018/19 FY2019/20 QoQ YoY 3Q 4Q 1Q 2Q 3Q Commissions 142.8 153.2 42.2 45.4 40.8 46.6 49.3 5.6% 16.7% Of which, stock brokerage commission 60.2 61.2 17.0 19.1 21.7 20.2 24.8 22.4% 45.3% Of which, commissions for distribution of investment trust 57.9 66.9 19.2 18.6 13.9 19.6 18.9 -3.5% -1.3% Sales credit 55.8 56.8 16.7 12.6 14.0 14.4 15.8 9.2% -5.3% Fees from investment banking and other 34.0 23.2 5.5 6.1 2.5 6.8 6.1 -11.1% 11.0% Investment trust administration fees and other 95.4 92.1 23.2 22.2 20.6 21.8 22.7 4.3% -2.0% Net interest revenue 11.5 11.1 2.6 2.5 3.2 3.1 4.4 38.9% 70.9% Net revenue 339.5 336.4 90.0 88.8 81.1 92.8 98.2 5.8% 9.0% Non-interest expenses 290.0 286.9 72.4 70.4 66.0 70.0 69.8 -0.2% -3.5% Income before income taxes 49.5 49.4 17.6 18.4 15.1 22.8 28.3 24.1% 60.5% Domestic distribution volume of investment trusts1 2,423.7 2,932.1 790.9 833.0 616.7 799.8 782.0 -2.2% -1.1% Stock investment trusts 2,130.8 2,519.3 694.8 712.1 533.9 718.8 696.4 -3.1% 0.2% Foreign investment trusts 292.9 412.8 96.1 120.9 82.8 81.0 85.6 5.7% -10.8% Other Accumulated value of annuity insurance policies 3,260.7 3,453.7 3,415.4 3,453.7 3,465.5 3,506.9 3,560.7 1.5% 4.3% Sales of JGBs for individual investors (transaction base) 1,022.8 1,146.9 315.9 297.9 5.1 135.0 177.3 31.4% -43.9% Retail foreign currency bond sales 848.9 841.4 266.5 157.5 144.8 161.8 185.7 14.8% -30.3% 1. Including former Net & Call. 26
Table of Contents
|
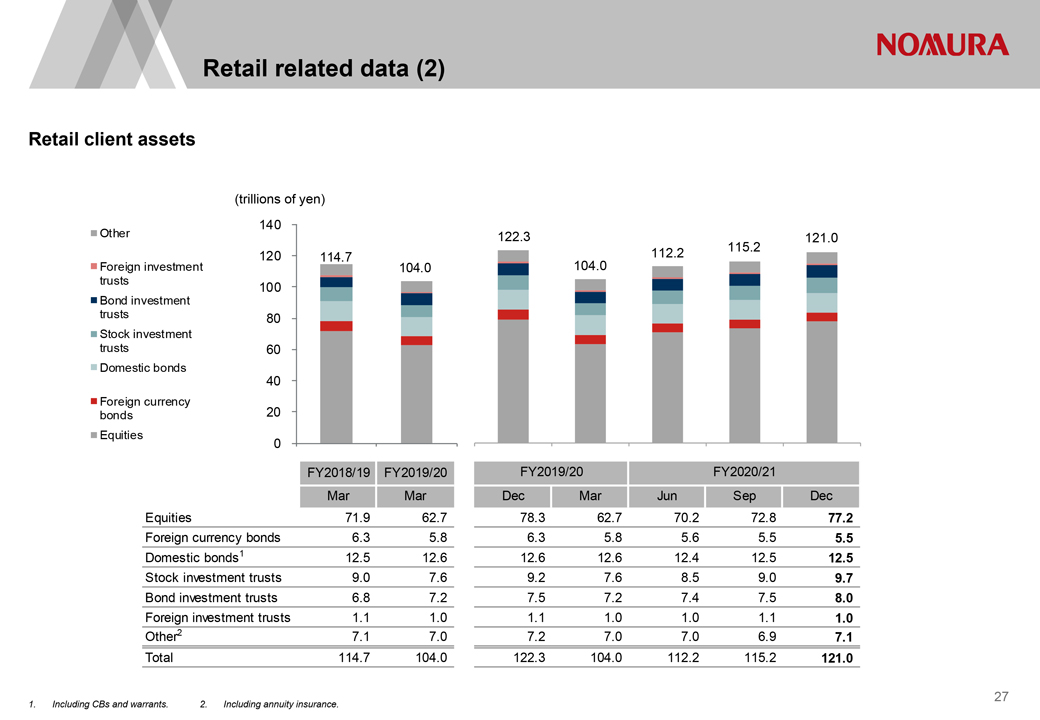
Retail related data (2) Retail client assets (trillions of yen) 140 Other 122.3 121.0 120 114.7 112.2 115.2 Foreign investment 104.0 104.0 trusts 100 Bond investment trusts 80 Stock investment trusts 60 Domestic bonds 40 Foreign currency bonds 20 Equities 0 FY2018/19 FY2019/20 FY2019/20 FY2020/21 Mar Mar Dec Mar Jun Sep Dec Equities 71.9 62.7 78.3 62.7 70.2 72.8 77.2 Foreign currency bonds 6.3 5.8 6.3 5.8 5.6 5.5 5.5 Domestic bonds1 12.5 12.6 12.6 12.6 12.4 12.5 12.5 Stock investment trusts 9.0 7.6 9.2 7.6 8.5 9.0 9.7 Bond investment trusts 6.8 7.2 7.5 7.2 7.4 7.5 8.0 Foreign investment trusts 1.1 1.0 1.1 1.0 1.0 1.1 1.0 Other2 7.1 7.0 7.2 7.0 7.0 6.9 7.1 Total 114.7 104.0 122.3 104.0 112.2 115.2 121.0 Including CBs and warrants. 2. Including annuity insurance. 27
Table of Contents
|
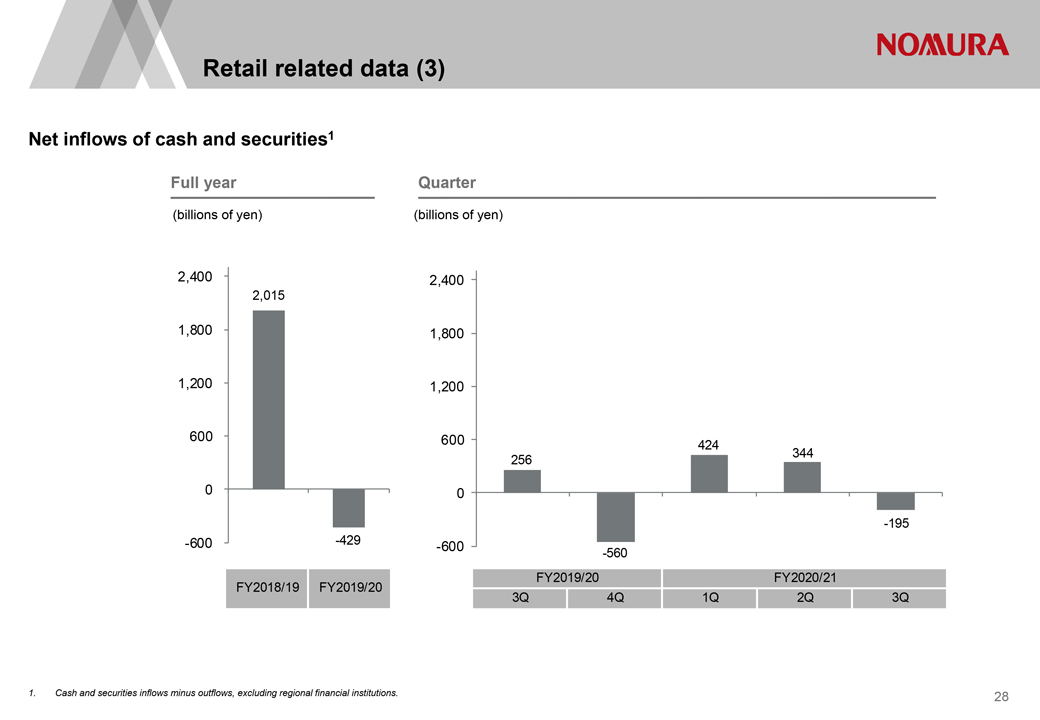
Retail related data (3) Net inflows of cash and securities1 Full year (billions of yen) 2,400 2,015 1,800 1,200 600 0 -600 -429 FY2018/19 FY2019/20 Quarter (billions of yen) 2,400 1,800 1,200 600 424 256 344 0 -195 -600 -560 FY2019/20 FY2020/21 3Q 4Q 1Q 2Q 3Q 1. Cash and securities inflows minus outflows, excluding regional financial institutions. 28
Table of Contents
|
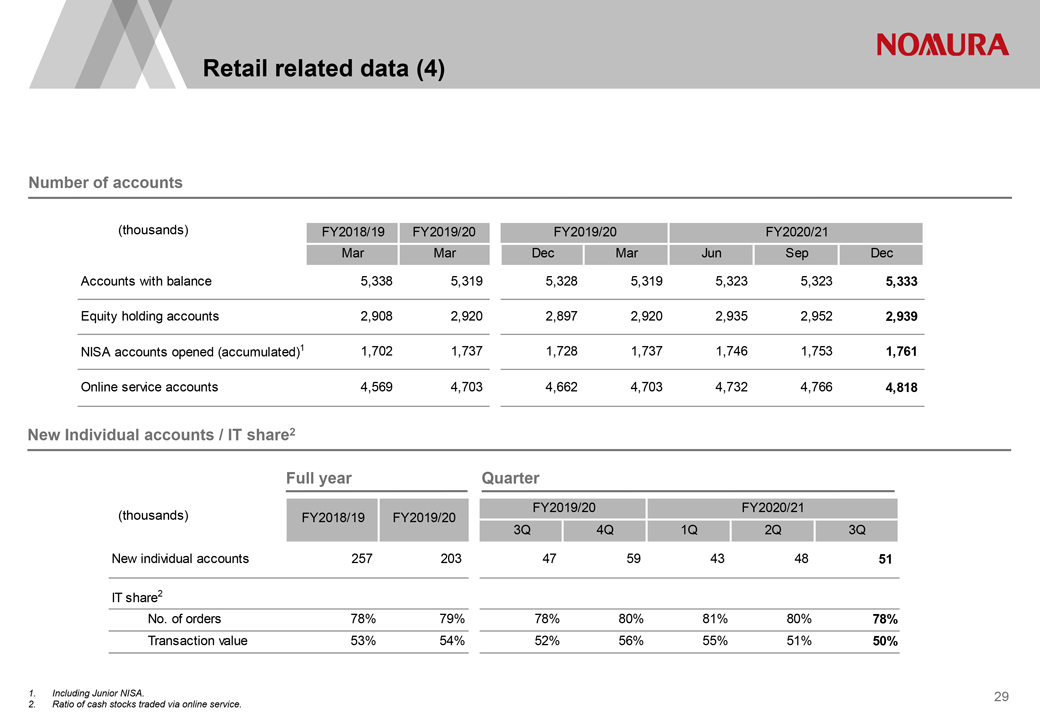
Retail related data (4) Number of accounts (thousands) FY2018/19 FY2019/20 FY2019/20 FY2020/21 Mar Mar Dec Mar Jun Sep Dec Accounts with balance 5,338 5,319 5,328 5,319 5,323 5,323 5,333 Equity holding accounts 2,908 2,920 2,897 2,920 2,935 2,952 2,939 NISA accounts opened (accumulated)1 1,702 1,737 1,728 1,737 1,746 1,753 1,761 Online service accounts 4,569 4,703 4,662 4,703 4,732 4,766 4,818 New Individual accounts / IT share2 Full year Quarter (thousands) FY2018/19 FY2019/20 FY2019/20 FY2020/21 3Q 4Q 1Q 2Q 3Q New individual accounts 257 203 47 59 43 48 51 IT share2 No. of orders 78% 79% 78% 80% 81% 80% 78% Transaction value 53% 54% 52% 56% 55% 51% 50% 1. Including Junior NISA. 2. Ratio of cash stocks traded via online service. 29
Table of Contents
|
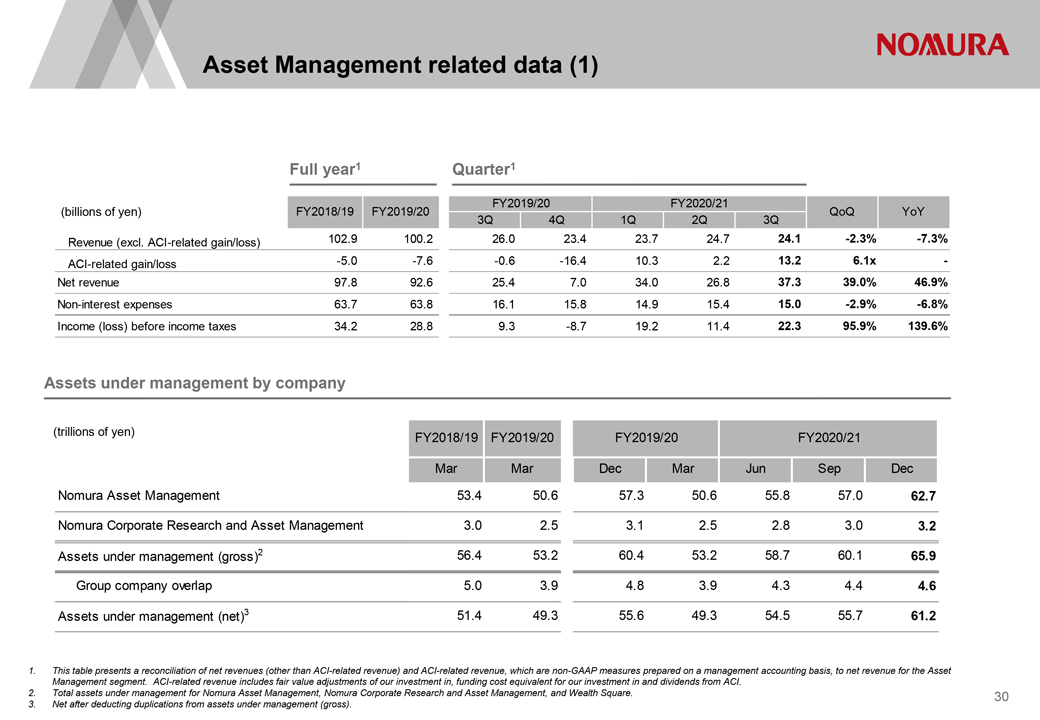
Asset Management related data (1) Full year1 Quarter1 FY2019/20 FY2020/21 (billions of yen) FY2018/19 FY2019/20 QoQ YoY 3Q 4Q 1Q 2Q 3Q Revenue (excl. ACI-related gain/loss) 102.9 100.2 26.0 23.4 23.7 24.7 24.1 -2.3% -7.3% ACI-related gain/loss -5.0 -7.6 -0.6 -16.4 10.3 2.2 13.2 6.1x—Net revenue 97.8 92.6 25.4 7.0 34.0 26.8 37.3 39.0% 46.9% Non-interest expenses 63.7 63.8 16.1 15.8 14.9 15.4 15.0 -2.9% -6.8% Income (loss) before income taxes 34.2 28.8 9.3 -8.7 19.2 11.4 22.3 95.9% 139.6% Assets under management by company (trillions of yen) FY2018/19 FY2019/20 FY2019/20 FY2020/21 Mar Mar Dec Mar Jun Sep Dec Nomura Asset Management 53.4 50.6 57.3 50.6 55.8 57.0 62.7 Nomura Corporate Research and Asset Management 3.0 2.5 3.1 2.5 2.8 3.0 3.2 Assets under management (gross)2 56.4 53.2 60.4 53.2 58.7 60.1 65.9 Group company overlap 5.0 3.9 4.8 3.9 4.3 4.4 4.6 Assets under management (net)3 51.4 49.3 55.6 49.3 54.5 55.7 61.2 1. This table presents a reconciliation of net revenues (other than ACI-related revenue) and ACI-related revenue, which are non-GAAP measures prepared on a management accounting basis, to net revenue for the Asset Management segment. ACI-related revenue includes fair value adjustments of our investment in, funding cost equivalent for our investment in and dividends from ACI. 2. Total assets under management for Nomura Asset Management, Nomura Corporate Research and Asset Management, and Wealth Square. 3. Net after deducting duplications from assets under management (gross). 30
Table of Contents
|
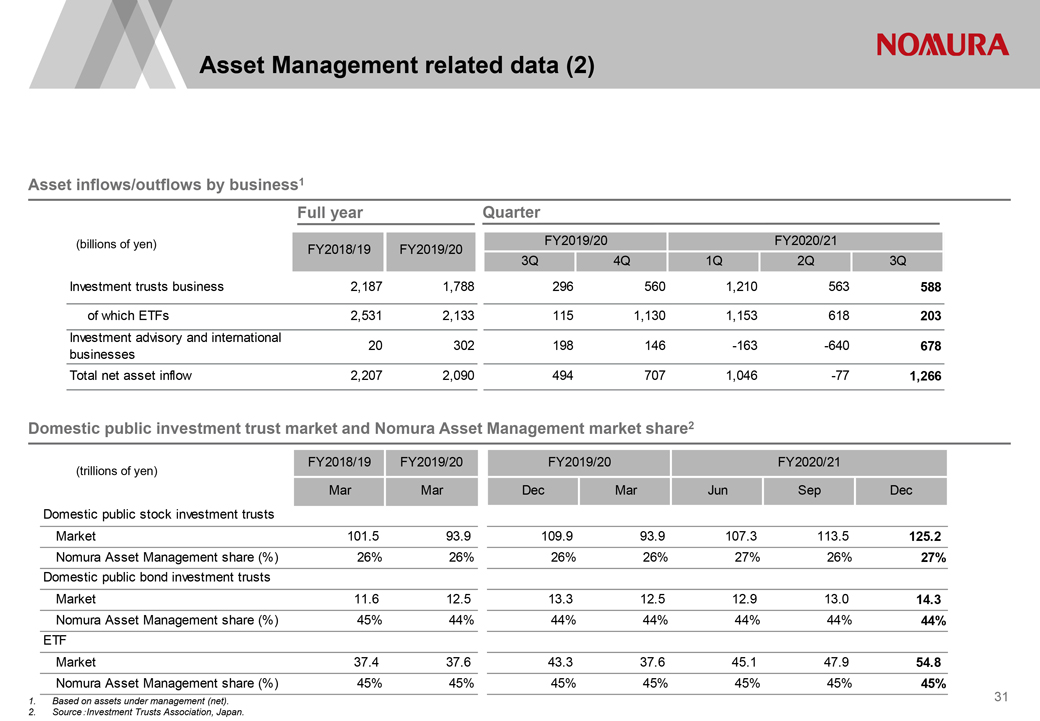
Asset Management related data (2) Asset inflows/outflows by business1 Full year Quarter (billions of yen) FY2018/19 FY2019/20 FY2019/20 FY2020/21 3Q 4Q 1Q 2Q 3Q Investment trusts business 2,187 1,788 296 560 1,210 563 588 of which ETFs 2,531 2,133 115 1,130 1,153 618 203 Investment advisory and international 20 302 198 146 -163 -640 678 businesses Total net asset inflow 2,207 2,090 494 707 1,046 -77 1,266 Domestic public investment trust market and Nomura Asset Management market share2 FY2018/19 FY2019/20 FY2019/20 FY2020/21 (trillions of yen) Mar Mar Dec Mar Jun Sep Dec Domestic public stock investment trusts Market 101.5 93.9 109.9 93.9 107.3 113.5 125.2 Nomura Asset Management share (%) 26% 26% 26% 26% 27% 26% 27% Domestic public bond investment trusts Market 11.6 12.5 13.3 12.5 12.9 13.0 14.3 Nomura Asset Management share (%) 45% 44% 44% 44% 44% 44% 44% ETF Market 37.4 37.6 43.3 37.6 45.1 47.9 54.8 Nomura Asset Management share (%) 45% 45% 45% 45% 45% 45% 45% 1. Based on assets under management (net). 2. Source: Investment Trusts Association, Japan. 31
Table of Contents
|
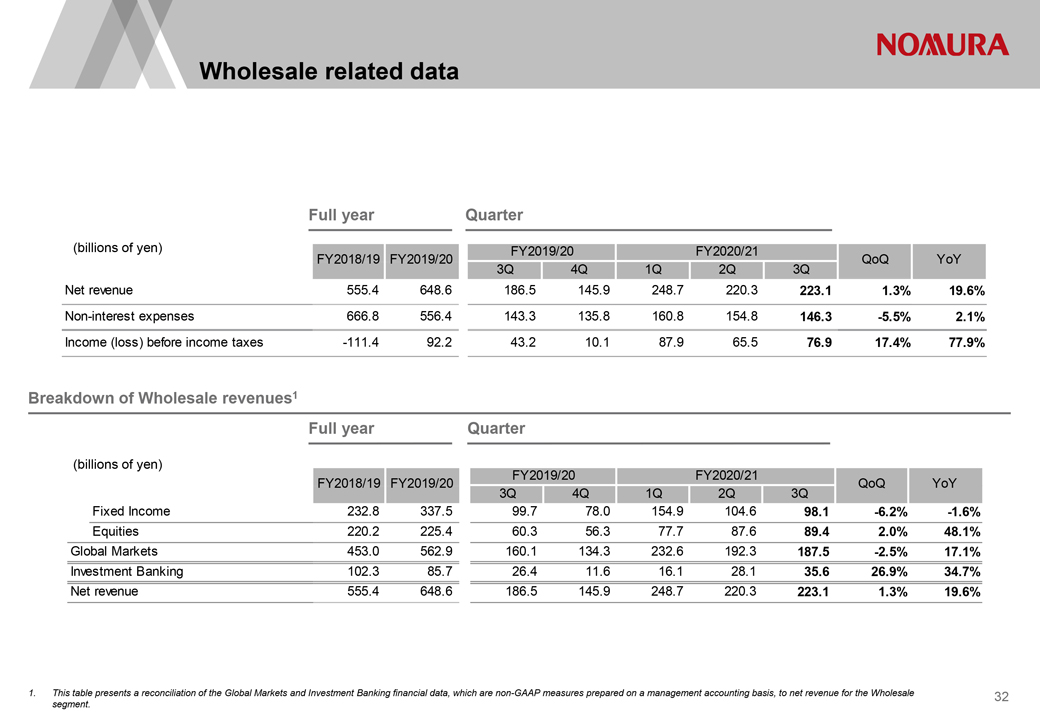
Wholesale related data Full year Quarter (billions of yen) FY2019/20 FY2020/21 FY2018/19 FY2019/20 QoQ YoY 3Q 4Q 1Q 2Q 3Q Net revenue 555.4 648.6 186.5 145.9 248.7 220.3 223.1 1.3% 19.6% Non-interest expenses 666.8 556.4 143.3 135.8 160.8 154.8 146.3 -5.5% 2.1% Income (loss) before income taxes -111.4 92.2 43.2 10.1 87.9 65.5 76.9 17.4% 77.9% Breakdown of Wholesale revenues1 Full year Quarter (billions of yen) FY2019/20 FY2020/21 FY2018/19 FY2019/20 QoQ YoY 3Q 4Q 1Q 2Q 3Q Fixed Income 232.8 337.5 99.7 78.0 154.9 104.6 98.1 -6.2% -1.6% Equities 220.2 225.4 60.3 56.3 77.7 87.6 89.4 2.0% 48.1% Global Markets 453.0 562.9 160.1 134.3 232.6 192.3 187.5 -2.5% 17.1% Investment Banking 102.3 85.7 26.4 11.6 16.1 28.1 35.6 26.9% 34.7% Net revenue 555.4 648.6 186.5 145.9 248.7 220.3 223.1 1.3% 19.6% 1. This table presents a reconciliation of the Global Markets and Investment Banking financial data, which are non-GAAP measures prepared on a management accounting basis, to net revenue for the Wholesale segment. 32
Table of Contents
|
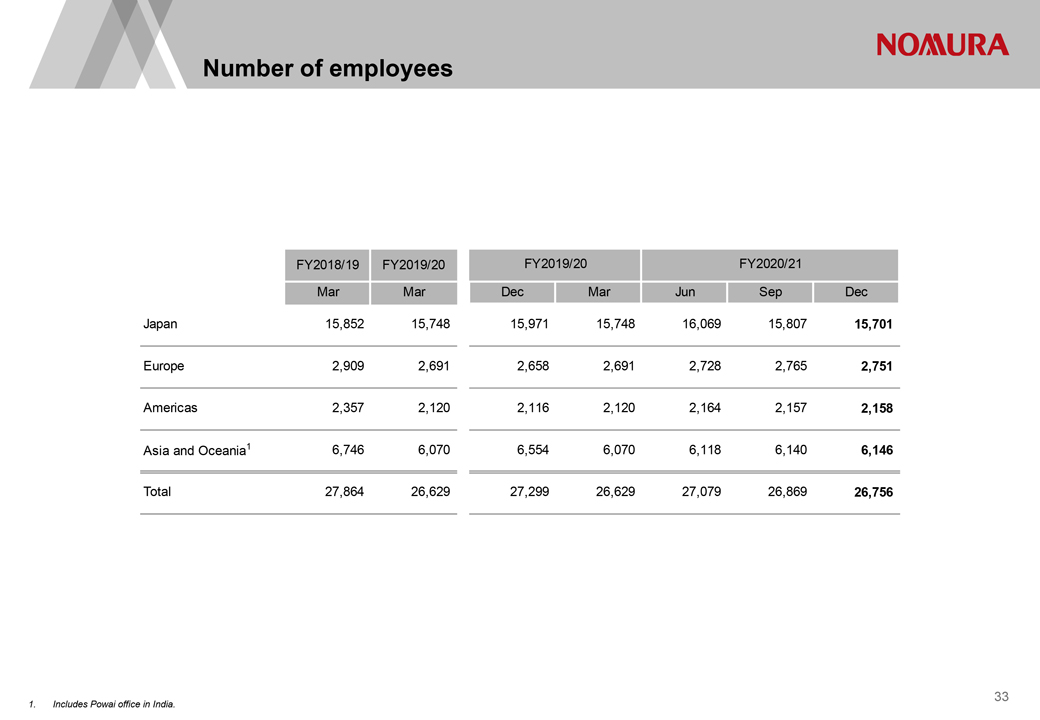
Number of employees FY2018/19 FY2019/20 FY2019/20 FY2020/21 Mar Mar Dec Mar Jun Sep Dec Japan 15,852 15,748 15,971 15,748 16,069 15,807 15,701 Europe 2,909 2,691 2,658 2,691 2,728 2,765 2,751 Americas 2,357 2,120 2,116 2,120 2,164 2,157 2,158 Asia and Oceania1 6,746 6,070 6,554 6,070 6,118 6,140 6,146 Total 27,864 26,629 27,299 26,629 27,079 26,869 26,756 1. Includes Powai office in India. 33
Table of Contents
|
Disclaimer This document is produced by Nomura Holdings, Inc. (“Nomura”). Nothing in this document shall be considered as an offer to sell or solicitation of an offer to buy any security, commodity or other instrument, including securities issued by Nomura or any affiliate thereof. Offers to sell, sales, solicitations to buy, or purchases of any securities issued by Nomura or any affiliate thereof may only be made or entered into pursuant to appropriate offering materials or a prospectus prepared and distributed according to the laws, regulations, rules and market practices of the jurisdictions in which such offers or sales may be made. The information and opinions contained in this document have been obtained from sources believed to be reliable, but no representations or warranty, express or implied, are made that such information is accurate or complete and no responsibility or liability can be accepted by Nomura for errors or omissions or for any losses arising from the use of this information. All rights regarding this document are reserved by Nomura unless otherwise indicated. No part of this document shall be reproduced, stored in a retrieval system or transmitted in any form or by any means, electronic, mechanical, photocopying, recording or otherwise, without the prior written permission of Nomura. This document contains statements that may constitute, and from time to time our management may make “forward-looking statements” within the meaning of the safe harbor provisions of The Private Securities Litigation Reform Act of 1995. Any such statements must be read in the context of the offering materials pursuant to which any securities may be offered or sold in the United States. These forward-looking statements are not historicalfacts but instead represent only our belief regarding future events, many of which, by their nature, are inherently uncertain and outside our control. Actual results and financial condition may differ, possibly materially, from what is indicated in those forward-looking statements. You should not place undue reliance on any forward-looking statement and should consider all of the following uncertainties and risk factors, as well as those more fully discussed under Nomura’s most recent Annual Report on Form 20-F and other reports filed with the U.S. Securities and Exchange Commission (“SEC”) that are available on Nomura’s website (http://www.nomura.com) and on the SEC‘s website (http://www.sec.gov); Important risk factors that could cause actual results to differ from those in specific forward-looking statements include, without limitation, economic and market conditions, political events and investor sentiments, liquidity of secondary markets, level and volatility of interest rates, currency exchange rates, security valuations, competitive conditions and size, and the number and timing of transactions. Forward-looking statements speak only as of the date they are made, and Nomura undertakes no obligation to update any forward-looking statement to reflect the impact of circumstances or events that arise after the date the forward-looking statement was made. The consolidated financial information in this document is unaudited.
Table of Contents
|

Nomura Holdings, Inc. www.nomura.com