Exhibit 99.2
Highly Confidential Information Provided Pursuant to Confidentiality Agreement Subject to FRE 408
Appvion
Presentation to Secured Noteholders
September 7, 2017
Forward-Looking Statements
This presentation contains forward-looking statements. The words “will,” “may,” “should,” “believes,”
“anticipates,” “intends,” “estimates,” “expects,” “projects,” “plans,” “seek” or similar expressions are intended to identify forward-looking statements. All statements in this news release, other than statements of historical fact, including statements which address Appvion’s strategy, future operations, future financial position, estimated revenues, projected costs, prospects, plans and objectives of management and events or developments that Appvion expects or anticipates will occur, are forward-looking statements. All forward-looking statements speak only as of the date on which they are made. They rely on a number of assumptions concerning future events and are subject to a number of risks and uncertainties, many of which are outside the Company’s control that could cause actual results to differ materially from such statements. These risks and uncertainties include, but are not limited to, the factors listed under “Item 1A—Risk Factors” in the Annual Report on Form10-K for the year ended December 31, 2016, as amended by the10-Q for the period ending June 30, 2017. Many of these factors are beyond Appvion’s ability to control or predict. Given these uncertainties, you should not place undue reliance on the forward-looking statements. Neither Appvion nor any of its advisors (including Guggenheim Securities) undertake any obligation to update or revise any forward-looking statements, whether as a result of new information, future events or otherwise.
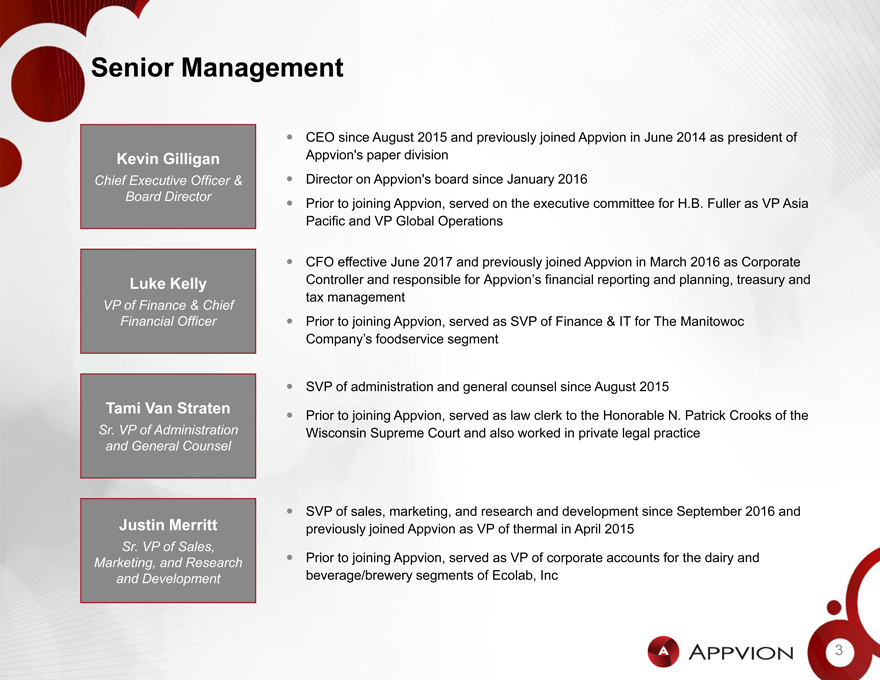
Senior Management
CEO since August 2015 and previously joined Appvion in June 2014 as president of Kevin Gilligan Appvion’s paper division Chief Executive Officer & ï,— Director on Appvion’s board since January 2016
Board Director
Prior to joining Appvion, served on the executive committee for H.B. Fuller as VP Asia Pacific and VP Global Operations
CFO effective June 2017 and previously joined Appvion in March 2016 as Corporate Luke Kelly Controller and responsible for Appvion’s financial reporting and planning, treasury and tax management
VP of Finance & Chief
Financial Officer Prior to joining Appvion, served as SVP of Finance & IT for The Manitowoc Company’s foodservice segment
SVP of administration and general counsel since August 2015
Tami Van Straten
Prior to joining Appvion, served as law clerk to the Honorable N. Patrick Crooks of the Sr. VP of Administration Wisconsin Supreme Court and also worked in private legal practice and General Counsel
Justin Merritt SVP of sales, marketing, and research and development since September 2016 and previously joined Appvion as VP of thermal in April 2015
Sr. VP of Sales,
Marketing, and Research Prior to joining Appvion, served as VP of corporate accounts for the dairy and and Development beverage/brewery segments of Ecolab, Inc
3

Table of Contents
1. Executive Summary
2. Company Overview a) Thermal Segment Overview b) Carbonless Segment Overview
3. Financial Summary
4

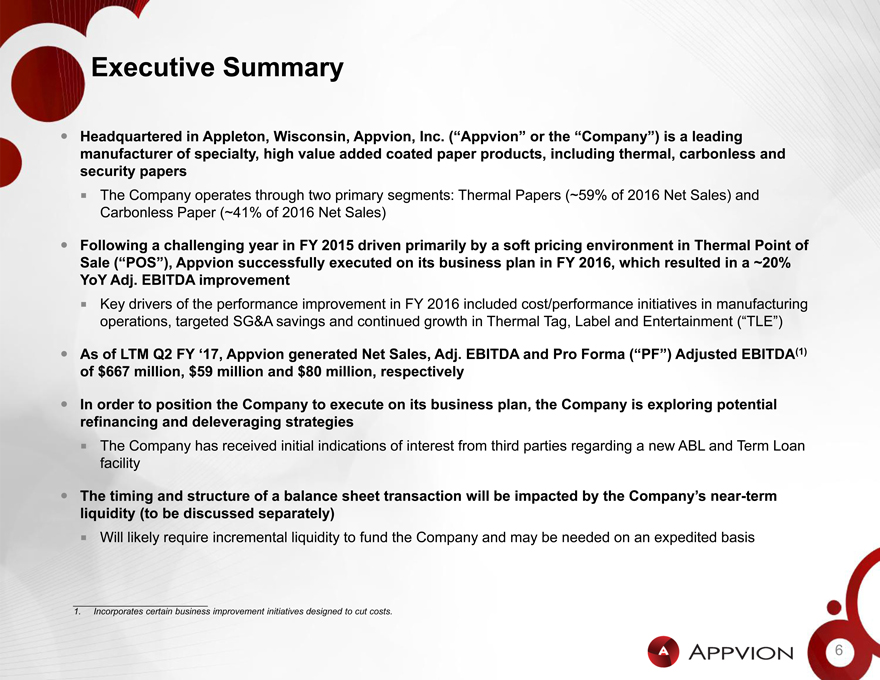
Executive Summary
5
Executive Summary
Headquartered in Appleton, Wisconsin, Appvion, Inc. (“Appvion” or the “Company”) is a leading
manufacturer of specialty, high value added coated paper products, including thermal, carbonless and
security papers
The Company operates through two primary segments: Thermal Papers (~59% of 2016 Net Sales) and
Carbonless Paper (~41% of 2016 Net Sales)
Following a challenging year in FY 2015 driven primarily by a soft pricing environment in Thermal Point of
Sale (“POS”), Appvion successfully executed on its business plan in FY 2016, which resulted in a ~20%
YoY Adj. EBITDA improvement
Key drivers of the performance improvement in FY 2016 included cost/performance initiatives in manufacturing
operations, targeted SG&A savings and continued growth in Thermal Tag, Label and Entertainment (“TLE”)
As of LTM Q2 FY ‘17, Appvion generated Net Sales, Adj. EBITDA and Pro Forma (“PF”) Adjusted EBITDA(1)
of $667 million, $59 million and $80 million, respectively
In order to position the Company to execute on its business plan, the Company is exploring potential refinancing and deleveraging strategies
The Company has received initial indications of interest from third parties regarding a new ABL and Term Loan
facility
The timing and structure of a balance sheet transaction will be impacted by the Company’s near-term
liquidity (to be discussed separately)
Will likely require incremental liquidity to fund the Company and may be needed on an expedited basis
1. Incorporates certain business improvement initiatives designed to cut costs.
6
Appvion Overview
Global leader in specialty coating formulation with diverse end markets
Company Overview
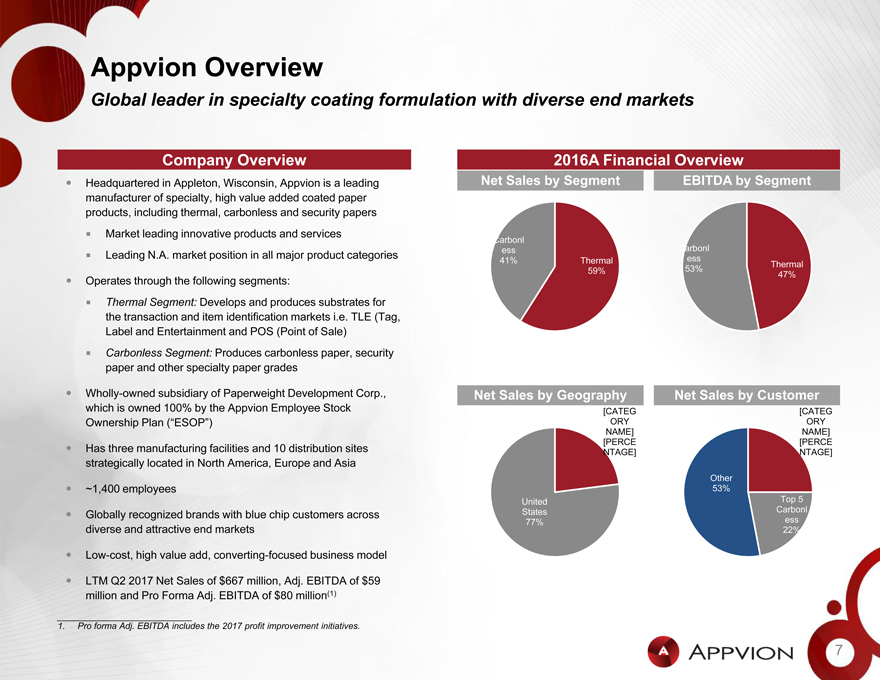
Headquartered in Appleton, Wisconsin, Appvion is a leading manufacturer of specialty, high value added coated paper products, including thermal, carbonless and security papers Market leading innovative products and services Leading N.A. market position in all major product categories
Operates through the following segments:
Thermal Segment: Develops and produces substrates for the transaction and item identification markets i.e. TLE (Tag, Label and Entertainment and POS (Point of Sale) Carbonless Segment: Produces carbonless paper, security paper and other specialty paper grades
Wholly-owned subsidiary of Paperweight Development Corp., which is owned 100% by the Appvion Employee Stock Ownership Plan (“ESOP”)
Has three manufacturing facilities and 10 distribution sites strategically located in North America, Europe and Asia
~1,400 employees
Globally recognized brands with blue chip customers across diverse and attractive end markets
Low-cost, high value add, converting-focused business model
LTM Q2 2017 Net Sales of $667 million, Adj. EBITDA of $59 million and Pro Forma Adj. EBITDA of $80 million(1)
2016A Financial Overview
Net Sales by Segment EBITDA by Segment
Carbonl Carbonl
ess ess
41% Thermal 53% Thermal
59% 47%
Net Sales by Geography Net Sales by Customer
[CATEG [CATEG
ORY ORY
NAME] NAME]
[PERCE [PERCE
NTAGE] NTAGE]
Other
53%
United Top 5
States Carbonl
77% ess
22%
1. Pro forma Adj. EBITDA includes the 2017 profit improvement initiatives.
7
Key Credit Highlights
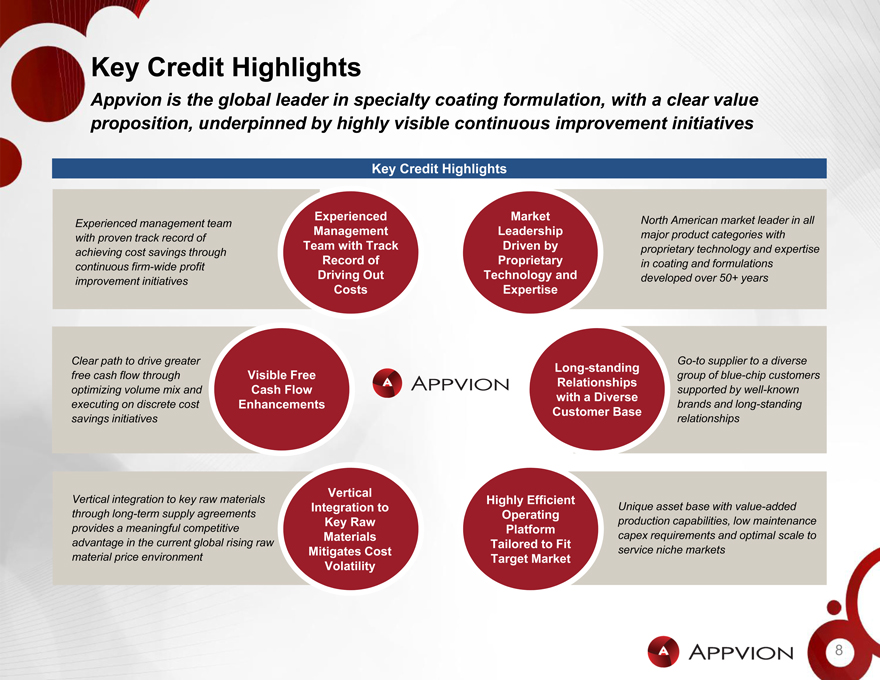
Appvion is the global leader in specialty coating formulation, with a clear value proposition, underpinned by highly visible continuous improvement initiatives
Key Credit Highlights
Experienced Market North American market leader in all Experienced management team Management Leadership major product categories with with proven track record of Team with Track Driven by proprietary technology and expertise achieving cost savings through Record of Proprietary in coating and formulations continuous firm-wide profit
Driving Out Technology and developed over 50+ years improvement initiatives
Costs Expertise
Clear path to drive greaterGo-to supplier to a diverse
Long-standing free cash flow through Visible Free group of blue-chip customers
Relationships optimizing volume mix and Cash Flow supported by well-known with a Diverse executing on discrete cost Enhancements brands and long-standing
Customer Base savings initiatives relationships
Vertical
Vertical integration to key raw materials Highly Efficient
Integration to Unique asset base with value-added through long-term supply agreements Operating Key Raw production capabilities, low maintenance provides a meaningful competitive Platform Materials capex requirements and optimal scale to advantage in the current global rising raw Tailored to Fit Mitigates Cost service niche markets material price environment Target Market Volatility
8
Key Performance Drivers
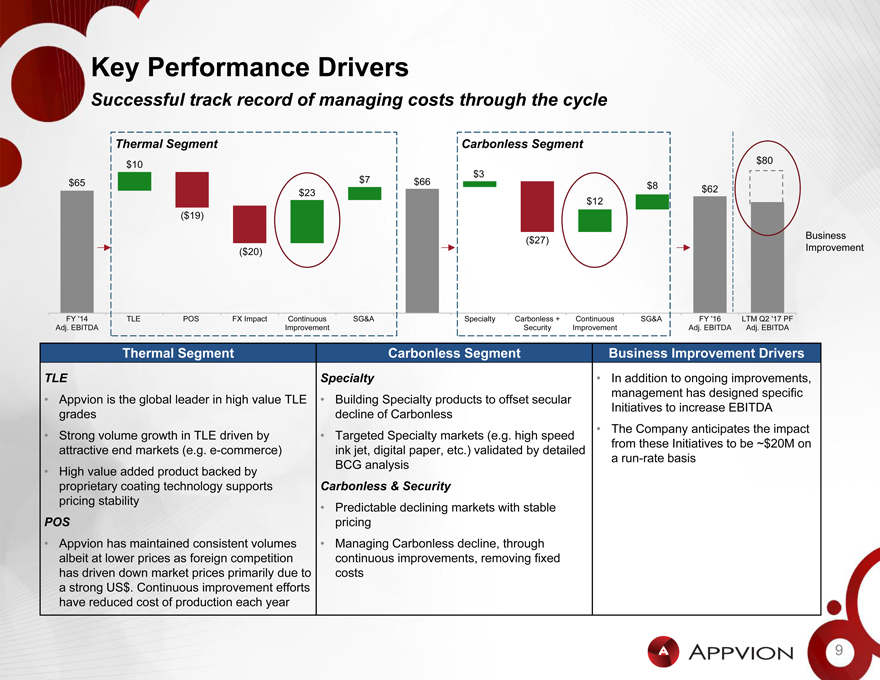
Successful track record of managing costs through the cycle
Thermal Segment
$10
$65 $7 $23
($19)
($20)
FY ‘14 TLE POS FX Impact Continuous SG&A Adj. EBITDA Improvement
Carbonless Segment
$3
$66 $8 $12
($27)
Specialty Carbonless + Continuous SG&A Security Improvement
$80
$62
Business Improvement
FY ‘16 LTM Q2 ‘17 PF Adj. EBITDA Adj. EBITDA
Thermal Segment Carbonless Segment Business Improvement Drivers
TLE Specialty In addition to ongoing improvements,
management has designed specific
Appvion is the global leader in high value TLE Building Specialty products to offset secular
Initiatives to increase EBITDA
grades decline of Carbonless
The Company anticipates the impact
Strong volume growth in TLE driven by Targeted Specialty markets (e.g. high speed
from these Initiatives to be ~$20M on
attractive end markets (e.g.e-commerce) ink jet, digital paper, etc.) validated by detailed
arun-rate basis
BCG analysis
High value added product backed by
proprietary coating technology supports Carbonless & Security
pricing stability
Predictable declining markets with stable
POS pricing
Appvion has maintained consistent volumes Managing Carbonless decline, through
albeit at lower prices as foreign competition continuous improvements, removing fixed
has driven down market prices primarily due to costs a strong US$. Continuous improvement efforts
have reduced cost of production each year
9

Company Overview
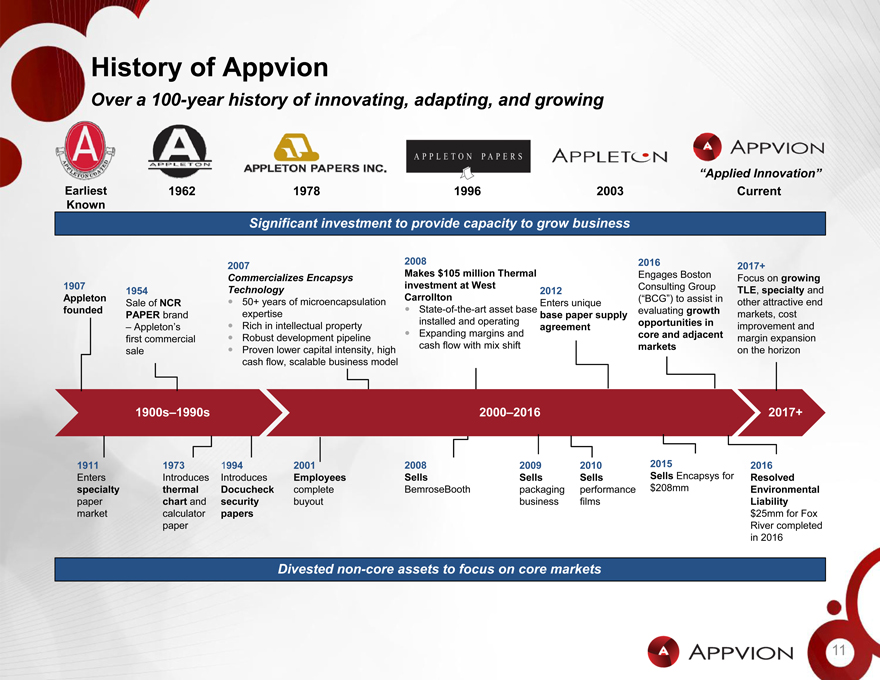
History of Appvion
Over a100-year history of innovating, adapting, and growing
“Applied Innovation”
Earliest 1962 1978 1996 2003 Current
Known
Significant investment to provide capacity to grow business
2008 2016
2007 2017+
Makes $105 million Thermal Engages Boston
Commercializes Encapsys Focus on growing
1907 investment at West Consulting Group
1954 Technology 2012 TLE, specialty and
Appleton Carrollton (“BCG”) to assist in
Sale of NCR 50+ years of microencapsulation Enters unique other attractive end
foundedState-of-the-art asset base evaluating growth
PAPER brand expertise base paper supply markets, cost
installed and operating opportunities in
– Appleton’s Rich in intellectual property agreement improvement and
Expanding margins and core and adjacent
first commercial Robust development pipeline margin expansion
cash flow with mix shift markets
saleï,— Proven lower capital intensity, high on the horizon
cash flow, scalable business model
1900s–1990s 2000–2016 2017+
1911 1973 1994 2001 2008 2009 2010 2015 2016
Enters Introduces Introduces Employees Sells Sells Sells Sells Encapsys for Resolved
specialty thermal Docucheck complete BemroseBooth packaging performance $208mm Environmental
paper chart and security buyout business films Liability
market calculator papers $25mm for Fox
paper River completed in 2016
Divestednon-core assets to focus on core markets
11
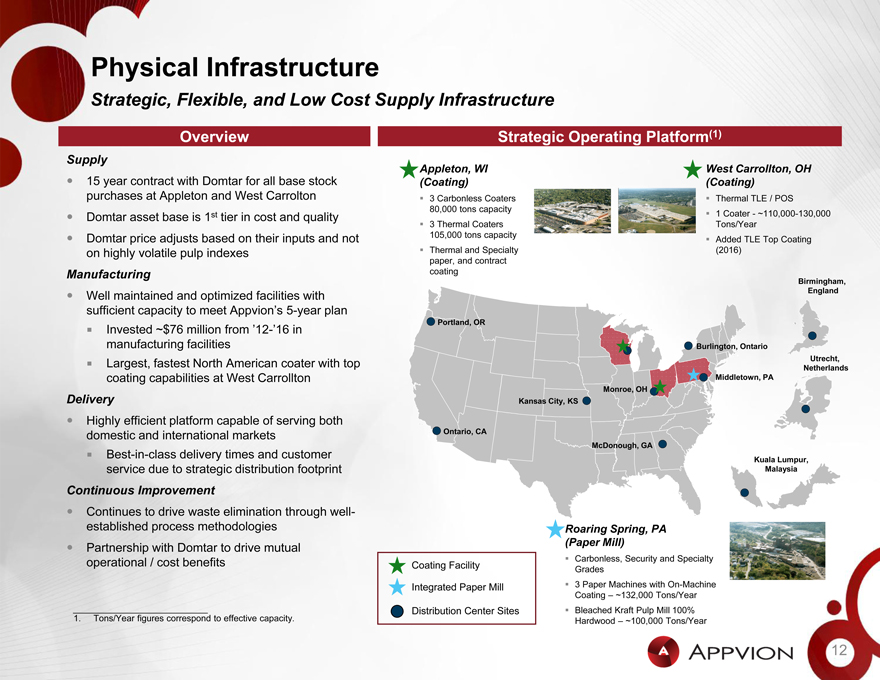
Physical Infrastructure
Strategic, Flexible, and Low Cost Supply Infrastructure
Overview Strategic Operating Platform(1)
Supply
Appleton, WI West Carrollton, OH
15 year contract with Domtar for all base stock (Coating) (Coating)
purchases at Appleton and West Carrolton 3 Carbonless Coaters Thermal TLE / POS
80,000 tons capacity
Domtar asset base is 1st tier in cost and quality1Coater—~110,000-130,000
3 Thermal Coaters Tons/Year
105,000 tons capacity
Domtar price adjusts based on their inputs and not Added TLE Top Coating
on highly volatile pulp indexes Thermal and Specialty (2016)
paper, and contract
Manufacturing coating
Birmingham,
Well maintained and optimized facilities with England
sufficient capacity to meet Appvion’s5-year plan
Portland, OR
Invested ~$76 million from’12-’16 in
manufacturing facilities Burlington, Ontario
American coater with top Utrecht,
Largest, fastest North Netherlands
coating capabilities at West Carrollton Middletown, PA
Delivery Monroe, OH
Kansas City, KS
Highly efficient platform capable of serving both
domestic and international markets Ontario, CA
McDonough, GA
Best-in-class delivery times and customer
Kuala Lumpur,
service due to strategic distribution footprint Malaysia
Continuous Improvement
Continues to drive waste elimination through well-
established process methodologies Roaring Spring, PA
to drive mutual (Paper Mill)
Partnership with Domtar
operational / cost benefits Carbonless, Security and Specialty
Coating Facility Grades
Integrated Paper Mill 3 Paper Machines withOn-Machine
Coating ~132,000 Tons/Year
Distribution Center Sites Bleached Kraft Pulp Mill 100%
1. Tons/Year figures correspond to effective capacity. Hardwood – ~100,000 Tons/Year
12
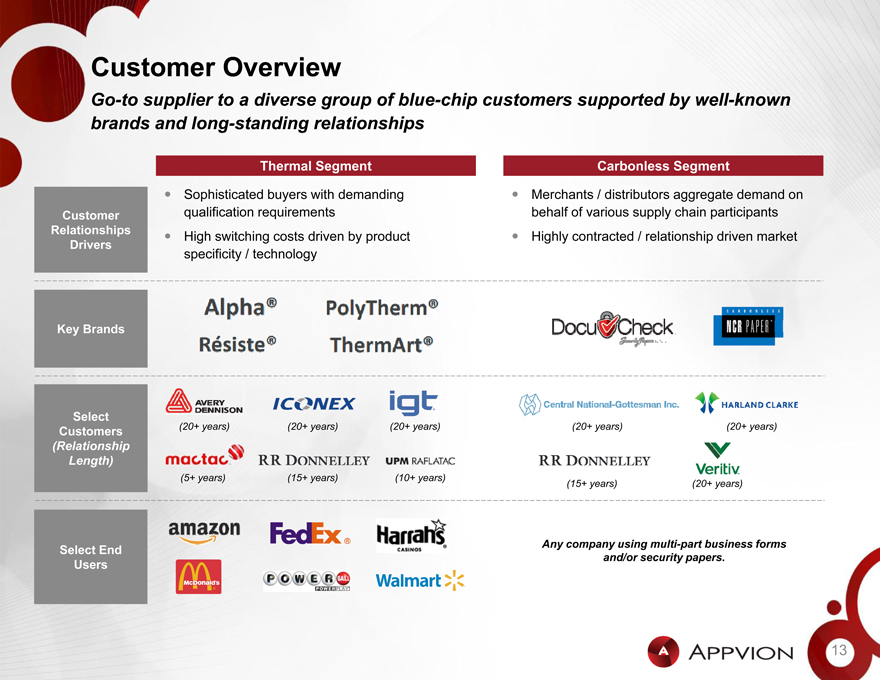
Customer Overview
Go-to supplier to a diverse group of blue-chip customers supported by well-known brands and long-standing relationships
Thermal Segment Carbonless Segment
Sophisticated buyers with demanding Merchants / distributors aggregate demand on Customer qualification requirements behalf of various supply chain participants
Relationships
High switching costs driven by product Highly contracted / relationship driven market
Drivers specificity / technology
Key Brands
Select (20+ years) (20+ years) (20+ years) (20+ years) (20+ years)
Customers
(Relationship Length)
(5+ years) (15+ years) (10+ years)
(15+ years) (20+ years)
Any company using multi-part business forms
Select End and/or security papers.
Users
13
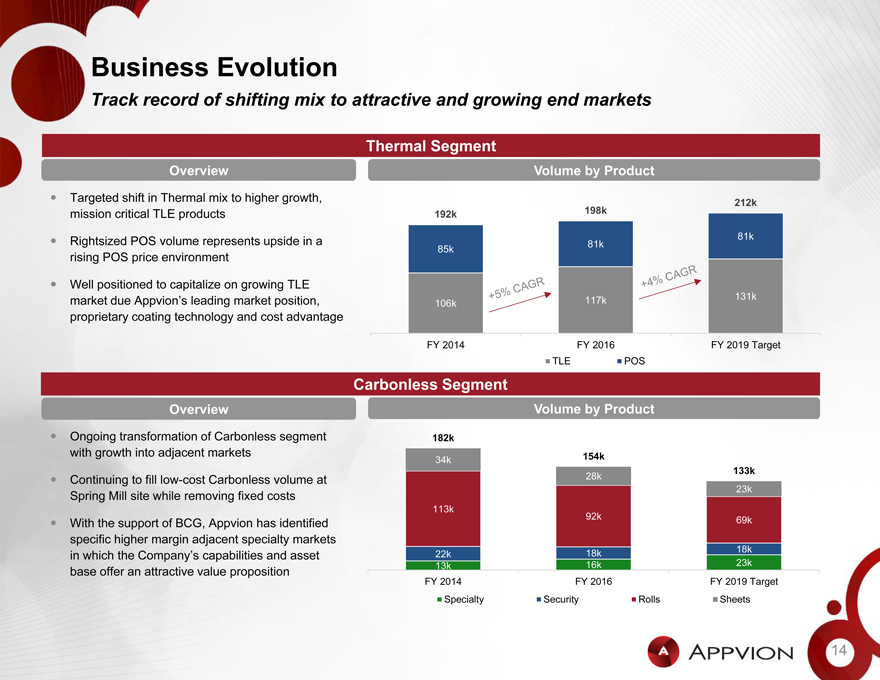
Business Evolution
Track record of shifting mix to attractive and growing end markets
Thermal Segment
Overview Volume by Product
ï,— Targeted shift in Thermal mix to higher growth, 212k mission critical TLE products 192k 198kï,— Rightsized POS volume represents upside in a 81k 81k 85k rising POS price environment
ï,— Well positioned to capitalize on growing TLE market due Appvion’s leading market position, 117k 131k 106k proprietary coating technology and cost advantage
FY 2014 FY 2016 FY 2019 Target TLE POS
Carbonless Segment
Overview Volume by Product
Ongoing transformation of Carbonless segment 182k with growth into adjacent markets 154k
34k
133k
Continuing to filllow-cost Carbonless volume at 28kst
23k
Spring Mill site while removing fixed costs
113k
92k 69k
With the support of BCG, Appvion has identified specific higher margin adjacent specialty markets 18k in which the Company’s capabilities and asset 22k 18k
13k 16k 23k
base offer an attractive value proposition FY 2014 FY 2016 FY 2019 Target
Specialty Security Rolls Sheets
14
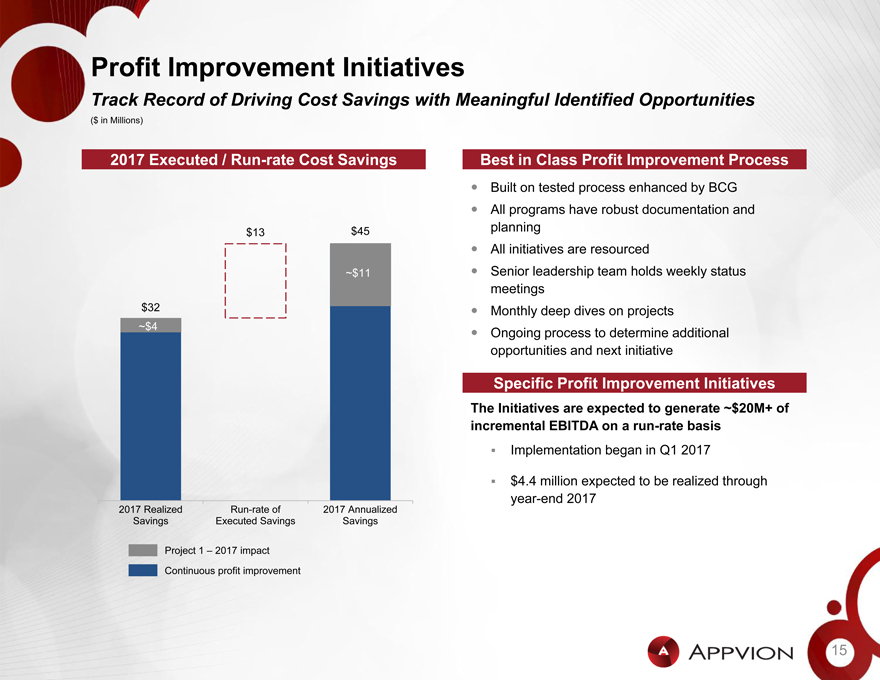
Profit Improvement Initiatives
Track Record of Driving Cost Savings with Meaningful Identified Opportunities
($ in Millions)
2017 Executed /Run-rate Cost Savings Best in Class Profit Improvement Process
Built on tested process enhanced by BCG All programs have robust documentation and
$13 $45 planning
All initiatives are resourced
~$11 Senior leadership team holds weekly status meetings
$32 Monthly deep dives on projects
~$4
Ongoing process to determine additional opportunities and next initiative
Specific Profit Improvement Initiatives
The Initiatives are expected to generate ~$20M+ of incremental EBITDA on arun-rate basis
Implementation began in Q1 2017
$4.4 million expected to be realized throughyear-end 2017
2017 RealizedRun-rate of 2017 Annualized Savings Executed Savings Savings
Project 1 – 2017 impact Continuous profit improvement
15
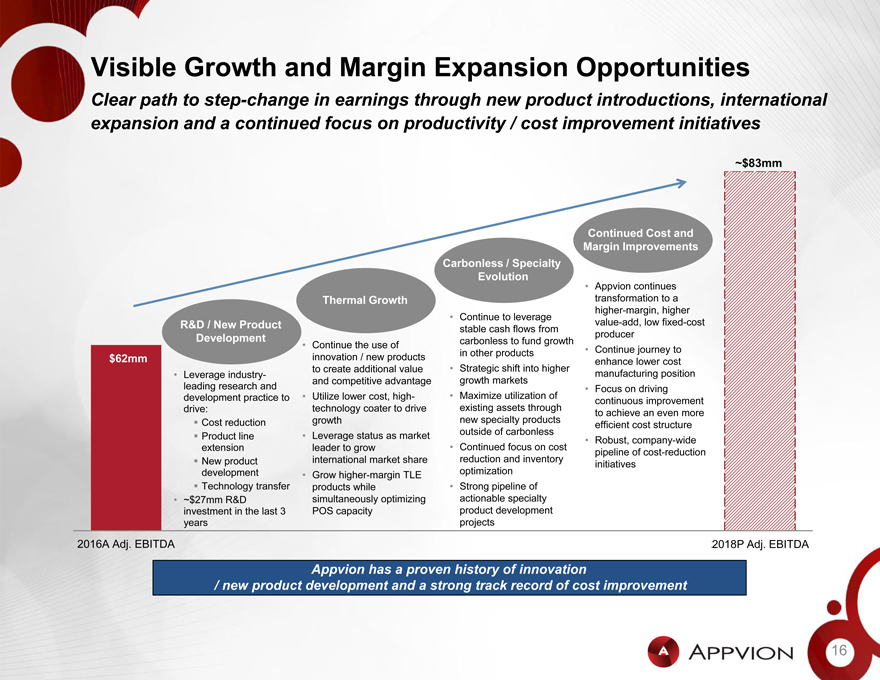
Visible Growth and Margin Expansion Opportunities
Clear path to step-change in earnings through new product introductions, international expansion and a continued focus on productivity / cost improvement initiatives
~$83mm
Continued Cost and
Margin Improvements
Carbonless / Specialty
Evolution Appvion continues
Thermal Growth transformation to a
higher-margin, higher
Continue to leverage
R&D / New Productvalue-add, low fixed-cost
stable cash flows from
Development producer
Continue the use of carbonless to fund growth Continue journey to
innovation / new products in other products
$62mm Strategic shift into higher enhance lower cost
to create additional value
Leverage industry- manufacturing position
and competitive advantage growth markets
leading research and Maximize utilization of Focus on driving
development practice to Utilize lower cost, high-
continuous improvement
drive: technology coater to drive existing assets through
to achieve an even more
Cost reduction growth new specialty products
efficient cost structure
Leverage status as market outside of carbonless
Product line Robust, company-wide
extension leader to grow Continued focus on cost
pipeline of cost-reduction
New product international market share reduction and inventory
initiatives
development Grow higher-margin TLE optimization
Technology transfer products while Strong pipeline of
~$27mm R&D simultaneously optimizing actionable specialty
investment in the last 3 POS capacity product development
years projects
2016A Adj. EBITDA 2018P Adj. EBITDA
Appvion has a proven history of innovation
/ new product development and a strong track record of cost improvement
16

Thermal Paper Segment Overview
17
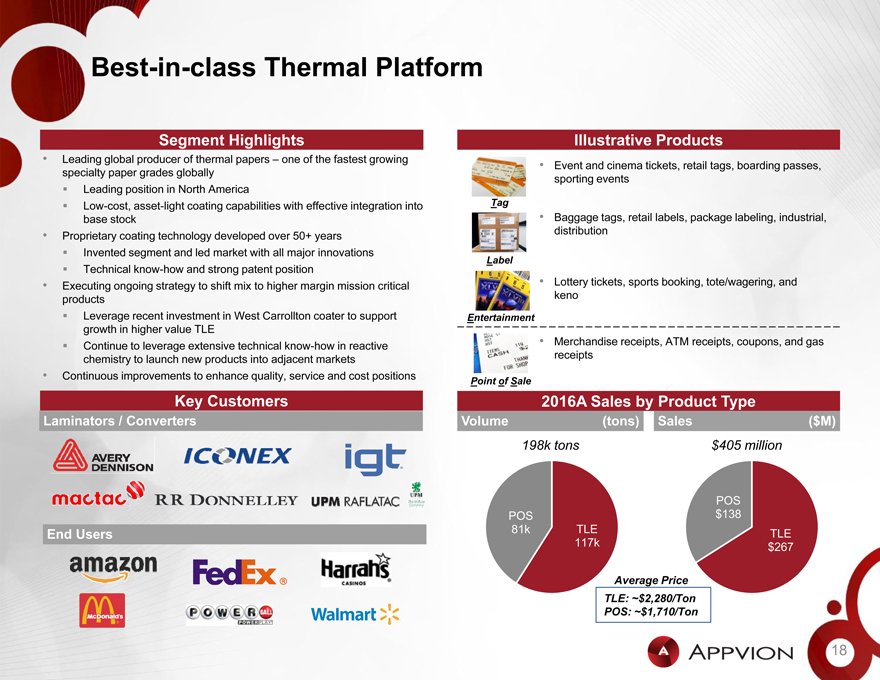
Best-in-class Thermal Platform
Segment Highlights Illustrative Products
Leading global producer of thermal papers – one of the fastest growing
Event and cinema tickets, retail tags, boarding passes, specialty paper grades globally Leading position in North America sporting eventsLow-cost, asset-light coating capabilities with effective integration into Tag base stock Baggage tags, retail labels, package labeling, industrial, distribution
Proprietary coating technology developed over 50+ years Invented segment and led market with all major innovations
Label
Technicalknow-how and strong patent position
Executing ongoing strategy to shift mix to higher margin mission critical Lottery tickets, sports booking, tote/wagering, and products kenoï,§ Leverage recent investment in West Carrollton coater to support Entertainment growth in higher value TLE Continue to leverage extensive technicalknow-how in reactive Merchandise receipts, ATM receipts, coupons, and gas chemistry to launch new products into adjacent markets receipts
Continuous improvements to enhance quality, service and cost positions
Point of Sale
Key Customers 2016A Sales by Product Type
Laminators / Converters Volume (tons) Sales ($M)
198k tons $405 million
POS POS $138
End Users 81k TLE TLE 117k $267
Average Price TLE: ~$2,280/Ton POS: ~$1,710/Ton
18
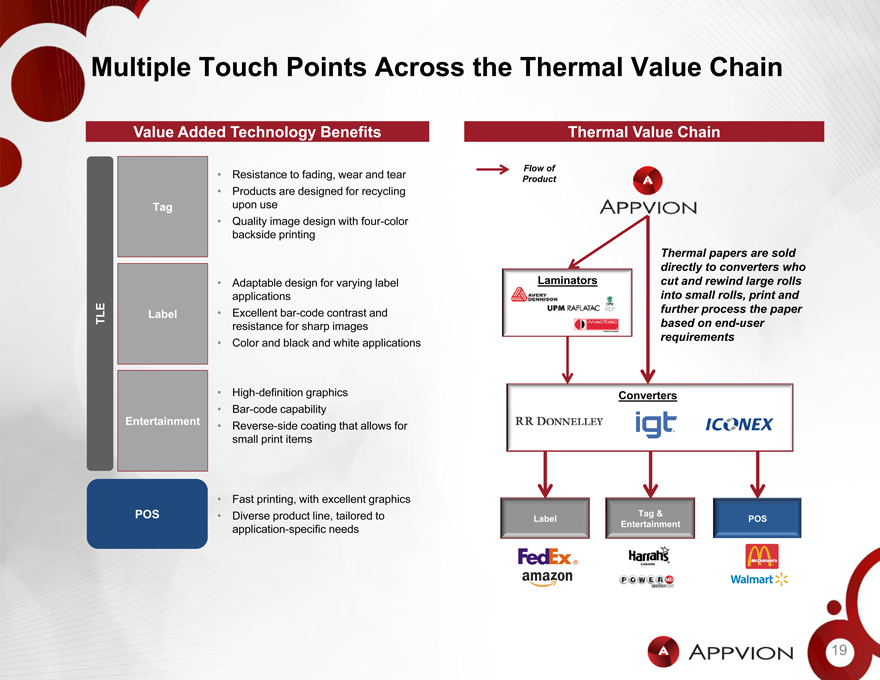
Multiple Touch Points Across the Thermal Value Chain
Value Added Technology Benefits
Resistance to fading, wear and tear
Products are designed for recycling
Tag upon use
Quality image design with four-color
backside printing
Adaptable design for varying label
applications
TLE Label Excellentbar-code contrast and
resistance for sharp images
Color and black and white applications
High-definition graphics
Bar-code capability
Entertainment Reverse-side coating that allows for
small print items
Fast printing, with excellent graphics
POS Diverse product line, tailored to
application-specific needs
Thermal Value Chain
Flow of Product
Thermal papers are sold directly to converters who Laminators cut and rewind large rolls into small rolls, print and further process the paper based onend-user requirements
Converters
Tag &
Label POS Entertainment
19

Carbonless Segment Overview
20
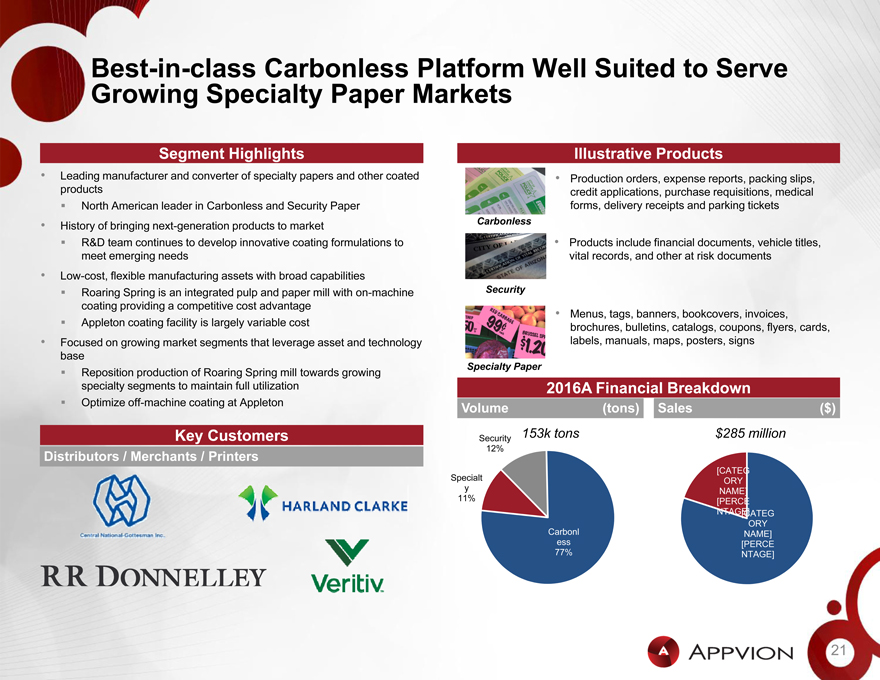
Best-in-class Carbonless Platform Well Suited to Serve Growing Specialty Paper Markets
Segment Highlights
Leading manufacturer and converter of specialty papers and other coated products North American leader in Carbonless and Security Paper
History of bringing next-generation products to market
R&D team continues to develop innovative coating formulations to meet emerging needs
Low-cost, flexible manufacturing assets with broad capabilities
Roaring Spring is an integrated pulp and paper mill withon-machine coating providing a competitive cost advantage Appleton coating facility is largely variable cost
Focused on growing market segments that leverage asset and technology base Reposition production of Roaring Spring mill towards growing specialty segments to maintain full utilization Optimizeoff-machine coating at Appleton
Key Customers
Distributors / Merchants / Printers
Illustrative Products
Production orders, expense reports, packing slips, credit applications, purchase requisitions, medical forms, delivery receipts and parking tickets
Carbonless
Products include financial documents, vehicle titles, vital records, and other at risk documents
Security
Menus, tags, banners, bookcovers, invoices, brochures, bulletins, catalogs, coupons, flyers, cards, labels, manuals, maps, posters, signs
Specialty Paper
2016A Financial Breakdown
Volume (tons) Sales ($)
Security 153k tons $285 million
12%
[CATEG Specialt ORY y NAME] 11% [PERCE
NTAGE] [CATEG Carbonl ORY ess NAME] 77% [PERCE
NTAGE]
21
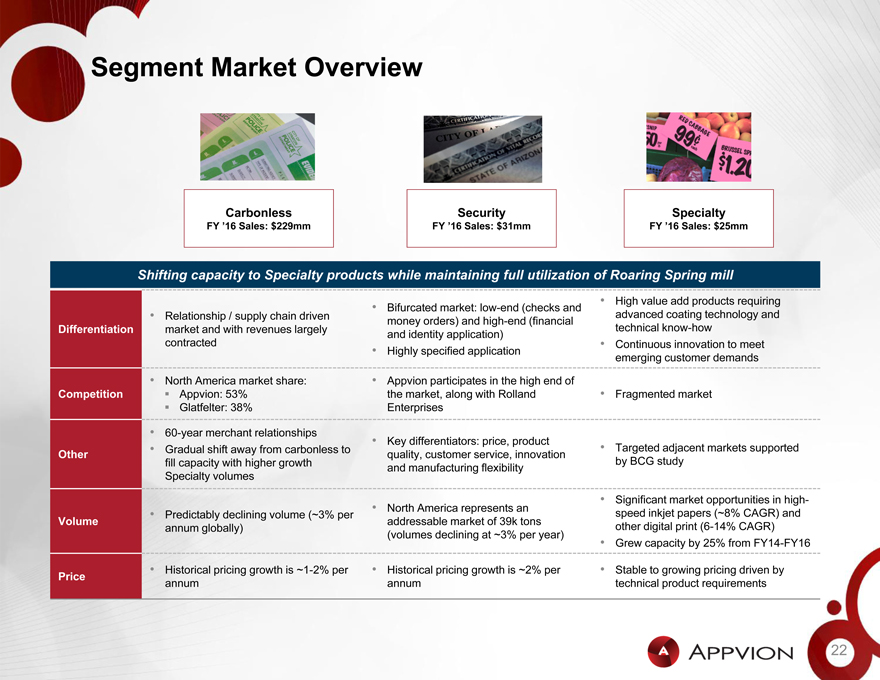
Segment Market Overview
Carbonless Security Specialty
FY ’16 Sales: $229mm FY ’16 Sales: $31mm FY ’16 Sales: $25mm
Shifting capacity to Specialty products while maintaining full utilization of Roaring Spring mill
High value add products requiring
Bifurcated market:low-end (checks and
Relationship / supply chain driven advanced coating technology and
money orders) andhigh-end (financial
Differentiation market and with revenues largely technicalknow-how
and identity application)
contracted Continuous innovation to meet
Highly specified application
emerging customer demands
North America market share: Appvion participates in the high end of
Competitionï,§ Appvion: 53% the market, along with Rolland Fragmented market
Glatfelter: 38% Enterprises
60-year merchant relationships
Key differentiators: price, product
Gradual shift away from carbonless to Targeted adjacent markets supported
Other quality, customer service, innovation
fill capacity with higher growth by BCG study
and manufacturing flexibility
Specialty volumes
Significant market opportunities in high-
North America represents an speed inkjet papers (~8% CAGR) and
Predictably declining volume (~3% per
Volume addressable market of 39k tons other digital print(6-14% CAGR)
annum globally)
(volumes declining at ~3% per year)
Grew capacity by 25% from FY14-FY16
Historical pricing growth is~1-2% per Historical pricing growth is ~2% per Stable to growing pricing driven by
Price
annum annum technical product requirements
22
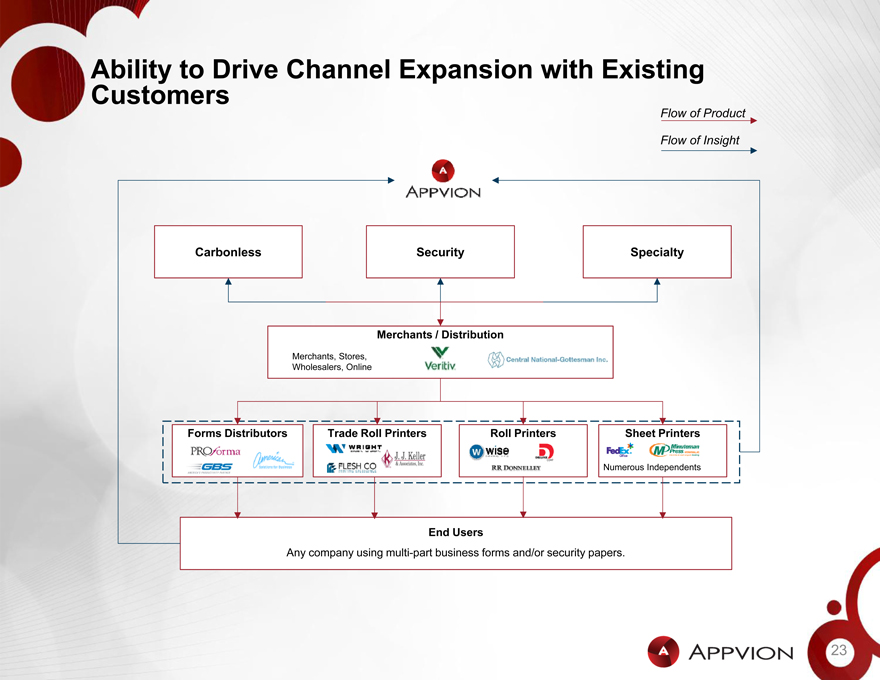
Ability to Drive Channel Expansion with Existing Customers
Flow of Product
Flow of Insight
Carbonless Security Specialty
Merchants / Distribution
Merchants, Stores, Wholesalers, Online
Forms Distributors Trade Roll Printers Roll Printers Sheet Printers
Numerous Independents
End Users
Any company using multi-part business forms and/or security papers.
23

Historical Financial Summary
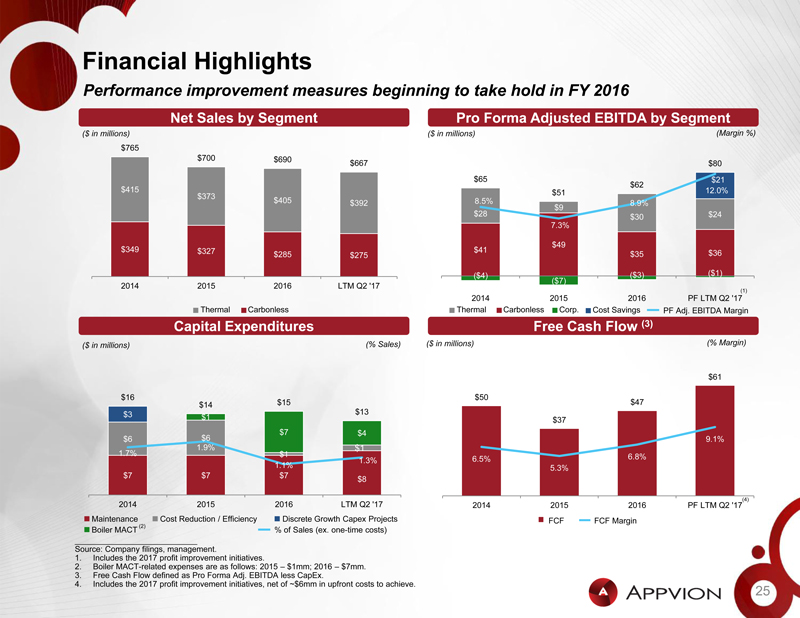
Financial Highlights
Performance improvement measures beginning to take hold in FY 2016
Net Sales by Segment Pro Forma Adjusted EBITDA by Segment
($ in millions) ($ in millions) (Margin %) $765 $700 $690 $667 $80
$65 $21 $62 $415 $51 12.0% $373 $405 $392 8.5% $9 8.9%
$28 $30 $24 7.3%
$49 $349 $327 $41 $36 $285 $275 $35
($4) ($7) ($3) ($1) 2014 2015 2016 LTM Q2 ‘17
(1)
2014 2015 2016 PF LTM Q2 ‘17 Thermal Carbonless Thermal Carbonless Corp. Cost Savings PF Adj. EBITDA Margin
Capital Expenditures Free Cash Flow (3)
($ in millions) (% Sales) ($ in millions) (% Margin)
$61
$16 $50
$14 $15 $47
$3 $13
$1 $37
$7 $4
$6 $6 9.1% 1.9% $1 1.7% $1 6.8% 1.3% 6.5% 1.1% 5.3%
$7 $7 $7 $8
(4)
2014 2015 2016 LTM Q2 ‘17 2014 2015 2016 PF LTM Q2 ‘17 Maintenance Cost Reduction / Efficiency Discrete Growth Capex Projects FCF FCF Margin Boiler MACT (2) % of Sales (ex.one-time costs Source: Company filings, management.
1. Includes the 2017 profit improvement initiatives.
2. Boiler MACT-related expenses are as follows: 2015 – $1mm; 2016 – $7mm.
3. Free Cash Flow defined as Pro Forma Adj. EBITDA less CapEx.
4. Includes the 2017 profit improvement initiatives, net of ~$6mm in upfront costs to achieve.
25
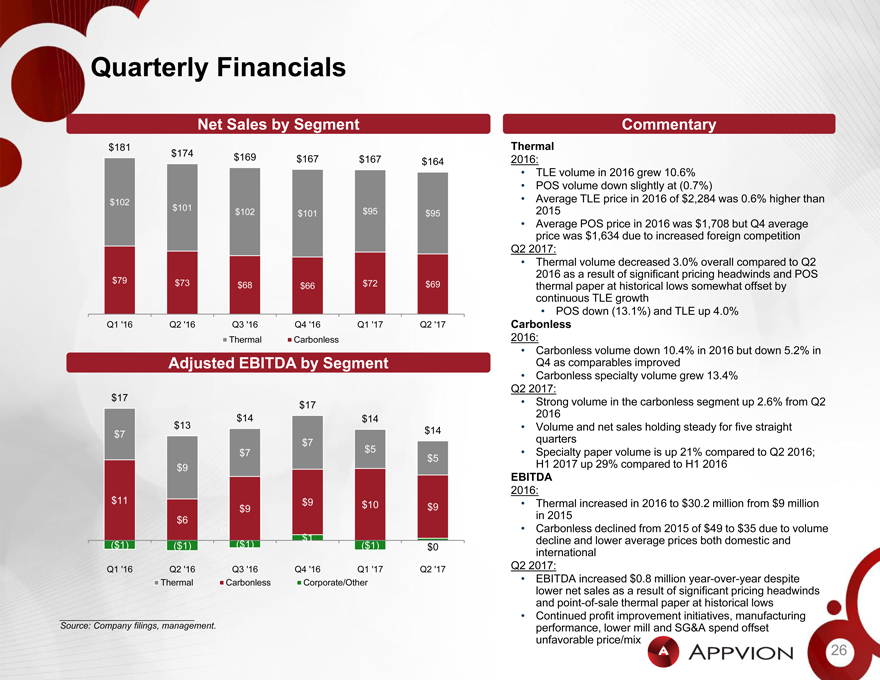
Quarterly Financials
Net Sales by Segment Commentary
$181 Thermal $174 $169 $167 $167 $164 2016:
TLE volume in 2016 grew 10.6%
POS volume down slightly at (0.7%) $102 $101 Average TLE price in 2016 of $2,284 was 0.6% higher than $102 $101 $95 $95 2015
Average POS price in 2016 was $1,708 but Q4 average price was $1,634 due to increased foreign competition Q2 2017:
Thermal volume decreased 3.0% overall compared to Q2 2016 as a result of significant pricing headwinds and POS
$79 $73 $72 $69
$68 $66 thermal paper at historical lows somewhat offset by continuous TLE growth
POS down (13.1%) and TLE up 4.0%
Q1 ‘16 Q2 ‘16 Q3 ‘16 Q4 ‘16 Q1 ‘17 Q2 ‘17 Carbonless Thermal Carbonless 2016:
Carbonless volume down 10.4% in 2016 but down 5.2% in Adjusted EBITDA by Segment Q4 as comparables improved
Carbonless specialty volume grew 13.4%
$17 Q2 2017:
$17 Strong volume in the carbonless segment up 2.6% from Q2
$14 2016 $14
$13 Volume and net sales holding steady for five straight
$7 $14 $7 quarters
$7 $5 $5 Specialty paper volume is up 21% compared to Q2 2016;
$9 H1 2017 up 29% compared to H1 2016
EBITDA
2016:
$11 $9 $10 Thermal increased in 2016 to $30.2 million from $9 million
$9 $9 $6 in 2015
(1) Carbonless declined from 2015 of $49 to $35 due to volume $1 decline and lower average prices both domestic and
($1) ($1) ($1) ($1) $0 international
Q1 ‘16 Q2 ‘16 Q3 ‘16 Q4 ‘16 Q1 ‘17 Q2 ‘17 Q2 2017:
Thermal Carbonless Corporate/Other EBITDA increased $0.8 million year-over-year despite lower net sales as a result of significant pricing headwinds andpoint-of-sale thermal paper at historical lows
Continued profit improvement initiatives, manufacturing Source: Company filings, management. performance, lower mill and SG&A spend offset unfavorable price/mix
26

Projected Financial Summary
27
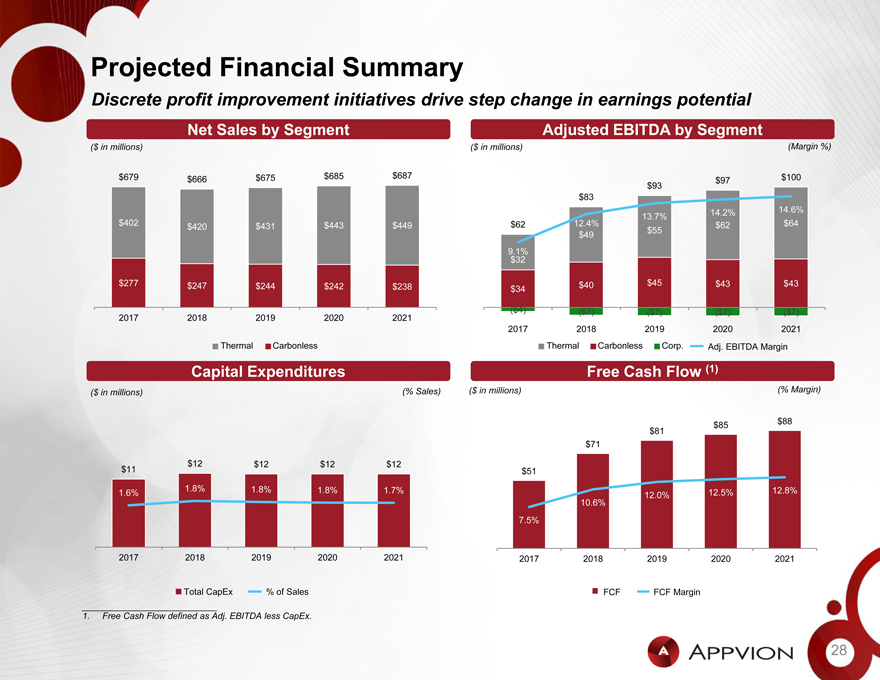
Projected Financial Summary
Discrete profit improvement initiatives drive step change in earnings potential
Net Sales by Segment Adjusted EBITDA by Segment
($ in millions) ($ in millions) (Margin %)
$679 $666 $675 $685 $687 $100 $97 $93 $83
14.2% 14.6%
13.7% $402 $420 $431 $443 $449 $62 12.4% $55 $62 $64 $49
9$ .1% 32 $277 $247 $244 $242 $238 $40 $45 $43 $43 $34
2017 2018 2019 2020 2021 ($4) ($7) ($7) ($7) ($7) 2017 2018 2019 2020 2021 Thermal Carbonless Thermal Carbonless Corp. Adj. EBITDA Margin
Capital Expenditures Free Cash Flow (1)
($ in millions) (% Sales) ($ in millions) (% Margin)
$85 $88 $81 $71
$12 $12 $12 $12
$11 $51
1.8% 1.8% 1.8% 1.7% 12.8%
1.6% 12.0% 12.5%
10.6%
7.5%
2017 2018 2019 2020 2021 2017 2018 2019 2020 2021
Total CapEx % of Sales FCF FCF Margin
1. Free Cash Flow defined as Adj. EBITDA less CapEx.
28
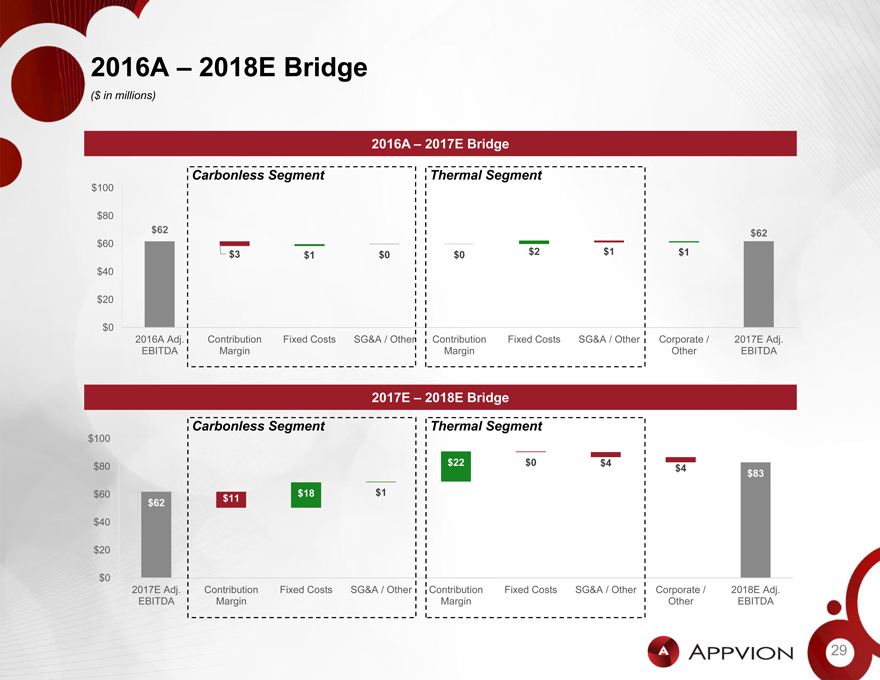
2016A – 2018E Bridge
($ in millions)
2016A – 2017E Bridge
Carbonless Segment Thermal Segment
$100
$80
$62 $62
$60
$3 $1 $0 $0 $2 $1 $1
$40
$20
$0
2016A Adj. Contribution Fixed Costs SG&A / Other Contribution Fixed Costs SG&A / Other Corporate / 2017E Adj.
EBITDA Margin Margin Other EBITDA
2017E – 2018E Bridge
Carbonless Segment Thermal Segment
$100
$80 $22 $0 $4
$4
$83
$60 $18 $1
$11
$62
$40
$20
$0
2017E Adj. Contribution Fixed Costs SG&A / Other Contribution Fixed Costs SG&A / Other Corporate / 2018E Adj.
EBITDA Margin Margin Other EBITDA
29
Notice to Investors
This Presentation (together with any and all attendant oral information, the “Presentation”) has been prepared by Paperweight Development Corp. and its affiliates (“Appvion”, the “Company,” “we” or “us,” as the context may require) solely as a summary document for informational purposes (as further described below). The disclosure of this Presentation to each recipient hereof is subject to the terms and conditions of that certainnon-disclosure agreement (“NDA”) previously executed between the Company and such recipient. We understand the recipient to be a financial advisor to certain of the Company’s secured noteholders, each of whom is a sophisticated institutional “accredited investor” within the meaning of rule 501(a) under the US Securities Act of 1933, as amended (the “Securities Act”) and an “institutional account” (as defined in Rule 4512(c) of the Financial Industry Regulatory Authority). We ask that the recipient inform us immediately if that is not the case.
This Presentation and any associated information and materials provided heretofore, herewith or hereafter, whether communicated in written, electronic or oral form (collectively, the “Materials”), are being furnished solely for the purpose of enabling the recipient to determine whether it wishes to proceed with any further investigation of the Company and/or any transaction therewith (each, a “Transaction”). The Materials are not intended to form the basis of any investment decision and do not attempt to present all the information that prospective investors may require for purposes of making an investment decision. The Company anticipates providing prospective investors with the opportunity to ask questions, receive answers, obtain additional information and complete their own due diligence review concerning the Company prior to entering into any definitive agreement relating to any possible Transaction among the Company and such investors. By accepting delivery of these Materials, each recipient of the Materials agrees to undertake and rely on its own independent investigation and analysis and consult with its own attorneys, accountants and other professional advisors regarding the Company and the merits and risks of participating in any Transaction, including all related legal, investment, tax and other matters.
Each recipient acknowledges that: (a) all information included in the Materials and otherwise furnished in connection with any transaction is submitted to such recipient on a strictly and permanently confidential basis, except as otherwise expressly agreed by the Company, (b) any reproduction or further distribution of the Materials or any such information is prohibited, (c) by accepting delivery of this Presentation, each recipient of Materials agrees that neither such recipient nor any of its employees, agents or advisors will use the Materials or any such information for any purpose other than evaluating the Company and any Transaction, (d) except as indicated below or otherwise expressly agreed by the Company, each recipient of Materials also agrees not to disclose to any person the fact that such recipient has been furnished with Materials or any such information or any terms, conditions or other information with respect to the Company or any Transaction, and (e) by accepting delivery of this Presentation, each recipient of Materials agrees that, if such recipient decides not to further evaluate the Company or any Transaction, or if the Company or its financial advisor, Guggenheim Securities, LLC (“Guggenheim Securities”), so requests at any time, such recipient will promptly return to the Company or Guggenheim Securities all Materials furnished to it in connection the Transaction without retaining any copies thereof.
None of Guggenheim Securities or any of its subsidiaries, affiliates, directors, officers, employees, representatives, consultants, legal counsel and/or agents has independently verified the accuracy and/or completeness of this Presentation and any other Materials, including without limitation any estimates or financial forecasts or projections. None of the Company, Guggenheim Securities or any of their respective subsidiaries, affiliates, directors, officers, employees, representatives, consultants, legal counsel and/or agents (i) makes any representation, guaranty or warranty (express or implied) as to the accuracy or completeness of this Presentation or any other Materials, including without limitation any estimates or financial forecasts or projections; or (ii) will have any responsibility, obligation or liability with respect to any information contained in, or for any omissions from, this Presentation or any other
Materials and/or any other written or oral communication transmitted to the recipient in the course of such recipient’s investigation and evaluation of the Company and any Transaction.
Until the execution of definitive documentation relating to any Transaction, the Company reserves the right, in its sole discretion and for any reason, to modify or amend the terms of such Transaction, to approve or disapprove any prospective lender or other investor, to accept or reject, in whole or in part, any request by an investor to participate as lender, participant or otherwise in such Transaction, to allocate to any investor a smaller portion of such Transaction than the amount sought by such investor and to withdraw from any further discussions, negotiations or transaction. None of the Company or Guggenheim Securities will have any liability or obligation whatsoever to any prospective investor in the event of any of the foregoing.
30
Notice to Investors (Continued)
This Presentation speaks as of the date hereof. Neither the delivery of this Presentation nor any eventual consummation of any Transaction shall, under any circumstances, imply that the information contained herein is correct as of any future date or that there has been no change in the affairs of the Company after the date hereof. Nothing contained herein is, or should be relied upon as, a promise or representation as to future performance. None of the Company or Guggenheim Securities undertakes any obligation to update, correct or otherwise revise this Presentation or any other Materials.
This Presentation is intended solely for the use of the recipient to whom it is initially provided. This Presentation does not constitute an offer to sell to or solicitation of an offer to purchase from any investor or in any jurisdiction in which such an offer or solicitation is not authorized or would be unlawful. Each investor must comply with all legal requirements in each jurisdiction in which it purchases, offers or sells any portion of any Transaction or possesses this Presentation or any other Materials, and must independently obtain any consent, approval or permission required by it in connection with any Transaction. The Company and Guggenheim Securities make no representation or warranty regarding, and shall have no responsibility for, the legality of an investment or other participation in any Transaction under any investment, securities or similar laws. Prospective investors are not to construe the contents of this Presentation or any other Materials as investment, legal, business or tax advice of any kind.
This Presentation may contain descriptions of a Transaction and certain other documents relevant to a Transaction that do not set forth all the information that is included in or may be derived from those documents. Prospective investors should read the complete text of the documents carefully and in their entirety prior to making any investment decision. Copies of documents may be requested from Guggenheim Securities.
By accepting delivery of this Presentation, each recipient will be deemed to acknowledge and agree to the matters above. In addition, and without limiting the foregoing, as the Company’s financial advisor, Guggenheim Securities has obligations solely to the Company and will be entitled to be paid a fee or fees upon the successful consummation of certain Transactions or otherwise pursuant to the terms of its engagement letter. By accepting this Presentation, each recipient hereby acknowledges and agrees that neither Guggenheim Securities nor any of its subsidiaries, affiliates, directors, officers, employees, representatives, consultants, legal counsel and/or agents (i) is acting as a financial advisor, private placement agent, arranger or in any other advisory capacity to such recipient (with respect to any Transaction or otherwise) or (ii) owes such recipient any duty of loyalty or care (whether in contract, in tort or otherwise) with respect to the Presentation, any other Materials or any Transaction, in all cases notwithstanding any commercial relationship that may currently exist or have previously existed between such recipient and Guggenheim Securities or any of its subsidiaries, affiliates, directors, officers, employees, representatives or consultants, legal counsel and/or agents.