Exhibit 13.1

Comcast 2006 Annual Report

Comcastic!
It’s about record-breaking results from innovative products with constantly improving features and functions. It means getting there first, and sustaining our advantage by increasing and extending the business while revving up our next growth engine.
It’s making phone, computer and television faster, better and more interactive. It’s adding choice, control and simplicity to the mix in one neat package.
Of course, it also describes the power of 90,000 exceptional employees — all committed to realizing the entertainment and communications dreams of our customers. Put it all together, and it’s a superior experience.
And that’s simply Comcastic!
On the cover:
Comcast employees are all smiles these days. Why? Their hard work, dedication and enthusiasm is really paying off. That’s why we’ve decided to feature them in this Annual Report — they make Comcast a great place to work.

Comcastic is.
turning a triple play into a grand slam.
“You’ve heard of a ‘win-win.’ Well, think of Triple Play as a ‘win-win-win.’ Subscribers get video, high-speed Internet and phone service in one convenient package —and all at a great value. No wonder our phones just keep ringing.”
Robert Negrete Manager, Call Center Operations Morgan Hill, CA
Triple Play has been a phenomenal growth engine for Comcast in 2006. With one call and a single installation, customers get digital cable, high-speed Internet and digital voice for $99 a month. Plus, it’s great for business because:
• Triple Play results in higher average monthly revenue per customer.
other
$99 +products = $130 $120 –
per month
$33 $33 $33

• Triple Play is lifting sign-up rates for our three products — they all grew faster than ever in 2006.
• Triple Play is accelerating revenue and operating cash flow growth.
03

Comcastic is.
meeting every demand with ON DEMAND.
ON DEMAND viewership has grown exponentially, building customer satisfaction and loyalty with every view.
• 12.7 million, or 52%, of our video customers take digital services — all of them with access to ON DEMAND. Some 36% also take HD/DVR.
• ON DEMAND movie purchases increased pay-per-view revenue 27%, to $633 million, in 2006, the third consecutive year of growth greater than 20%.
More than 3.7 Billion ON DEMAND Views Since 2004:
(in millions) 1,855
1,361
567
2004
2005
2006
04

“People want what they want, when they want it. Nothing beats our ON DEMAND service. It gives our customers more than 8,000 viewing options today, most at no additional charge.”
Denise Higgins VOD Content Supervisor New Castle, DE

COM001 Comcast 2006 AR / Front 2/23/07 9a p.6
Comcastic is.
building strong brands that deliver must-have content across multiple platforms.
“Our brands are laser-focused on individual interests and passions. Whether it’s fashion on the red carpet, or horror films, or the stars of golf on the course, we’re delivering great content on television, on demand and online.”
Suzanne Kolb EVP, Marketing and Communications E! and Style Networks Los Angeles, CA
With first-rate content, Comcast appeals to sports fans, kids and even horror flick fans. Our networks include:
COM001 Comcast 2006 AR / Front 2/23/07 9a p.8
Comcastic is.
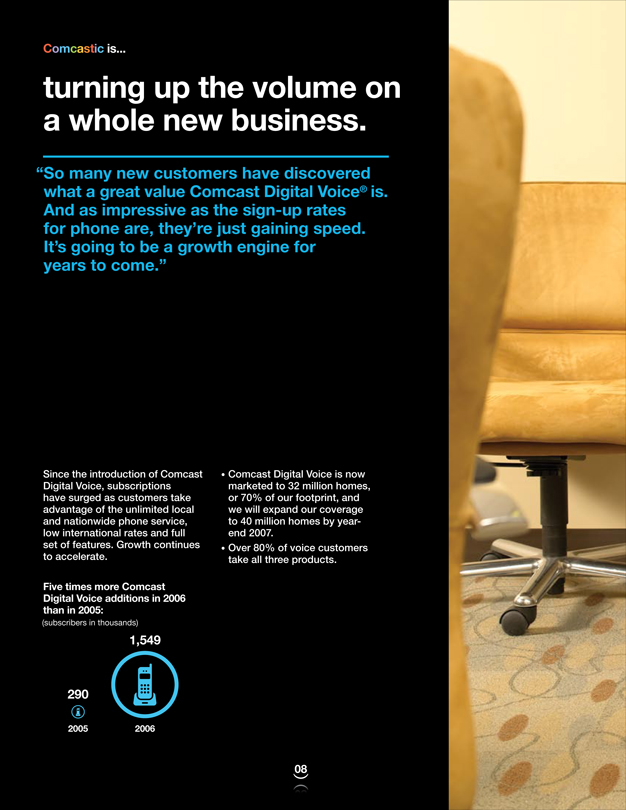
turning up the volume on a whole new business.
“So many new customers have discovered what a great value Comcast Digital Voice® is. And as impressive as the sign-up rates for phone are, they’re just gaining speed. It’s going to be a growth engine for years to come.”
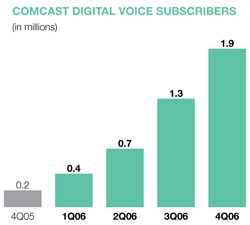
Since the introduction of Comcast Digital Voice, subscriptions have surged as customers take advantage of the unlimited local and nationwide phone service, low international rates and full set of features. Growth continues to accelerate.
Five times more Comcast Digital Voice additions in 2006 than in 2005:
(subscribers in thousands)
• Comcast Digital Voice is now marketed to 32 million homes, or 70% of our footprint, and we will expand our coverage to 40 million homes by year-end 2007.
• Over 80% of voice customers take all three products.
1,549
290
2005
2006
08

Mohammed Haroon Director, Telephony Operations Twin Cities Region St. Paul, MN

Comcastic is.
taking high-speed Internet to a higher level.
Comcast High-Speed Internet delivers the speed and tools customers need to get the most from their Internet experience.
• We increased the speed of our service four times in the last three years, at no extra cost to consumers.
• In 2006, we introduced PowerBoost, which can burst speeds to 12 or 16 Mbps for large downloads, and we plan to roll out an upstream version in 2007.
• We launched 65 new features in the last three years, including McAfee® security, Video Mail, PhotoShow and many others.
• Through The Fan™ video player, we delivered 700 million video downloads in 2006 and ranked in the top 15 providers of video on the Internet.
• Comcast.net also ranked among the top 10 in Internet search traffic.
“Our high-speed Internet service is simply a better broadband experience. With a steady stream of new features and faster speeds, it makes video downloads and interactive media a snap.”
Melinda Lindsley Director,
Business Requirements /Cross-Product Systems Philadelphia, PA

Comcastic is.
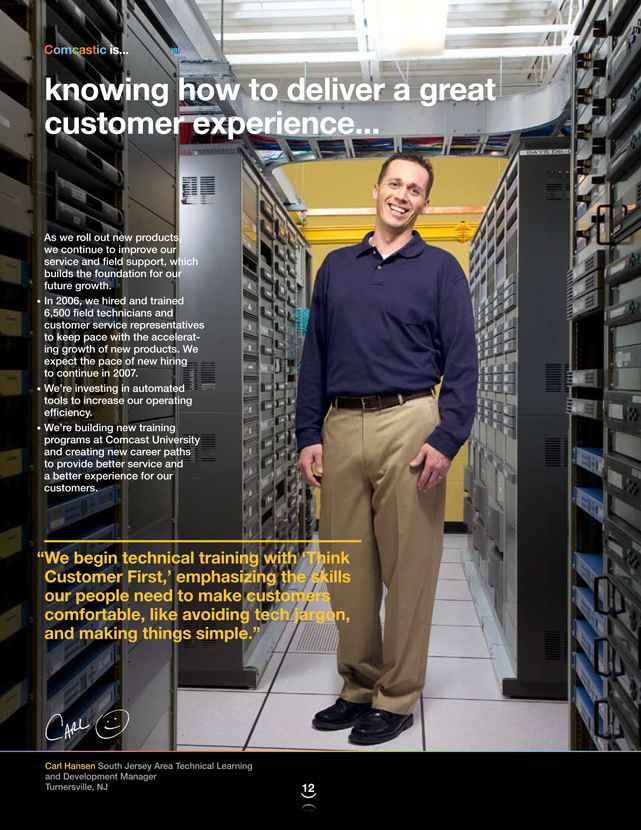
knowing how to deliver a great customer experience.
As we roll out new products, we continue to improve our service and field support, which builds the foundation for our future growth.
• In 2006, we hired and trained 6,500 field technicians and customer service representatives to keep pace with the accelerating growth of new products. We expect the pace of new hiring to continue in 2007.
• We’re investing in automated tools to increase our operating efficiency.
• We’re building new training programs at Comcast University and creating new career paths to provide better service and a better experience for our customers.
“We begin technical training with ‘Think Customer First,’ emphasizing the skills our people need to make customers comfortable, like avoiding tech jargon, and making things simple.”
Carl Hansen South Jersey Area Technical Learning and Development Manager Turnersville, NJ
12

and staying true to who we are.
“Since my first day with Comcast 25 years ago, the company has totally supported my volunteer activities — from backing my involvement in a special-needs camp, to giving me time off to help out in New York City after 9/11.”
Comcast is deeply rooted in local communities. We focus our civic efforts in three areas: youth leadership, literacy and volunteerism.
• Comcast is a national partner of City Year, which recruits young people to give a year to full-time community service and leadership development. In 2006, the company provided City Year with $1.4 million in grants and in-kind support.
• Comcast’s Leaders and
Achievers® Scholarship Program recognized 1,728 high school seniors nationwide. Based on their community involvement and academic achievement, each earned a $1,000 college scholarship.
• Comcast recruited a diverse group of students to participate as summer interns through our ongoing partnership with the Emma Bowen Foundation. Last year, we hosted 25 interns who received funds for college in addition to their intern stipend.
William “Billy” Malone Dispatch Manager Union, NJ
13

Comcastic! is.
14


Dear Comcast Shareholders, Employees and Friends:
About 18 months ago, we decided that it was time to launch Comcast’s very first nationwide advertising campaign. Surveys showed that customers loved our new products — such as ON DEMAND, high- speed Internet and more. This led us to look for a smart way to express our customers’ enthusiasm for Comcast’s new and improved experience — and that’s how “Comcastic!” was born.
I’m glad our team came up with that word, because I can’t think of a better way to describe 2006. It was our best year ever. It was truly Comcastic!
clockwise from left:
Brian L. Roberts Chairman and Chief Executive Officer
Stephen B. Burke Chief Operating Officer President Comcast Cable
Ralph J. Roberts Founder Chairman, Executive and Finance Committee
17
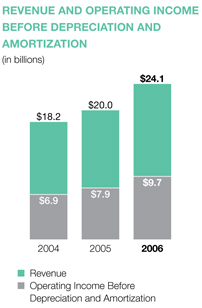
We broke all records in 2006, driven by our cable business.(a) Cable revenues increased 12%, to $26.3 billion. Operating cash flow(b) rose 15%, to $10.5 billion, making 2006 our sixth straight year — capping 26 consecutive quarters — of double-digit operating cash flow growth. During the year, our customers bought five million new products —or what we call “revenue-generating units” (RGUs)(c) — an increase of 69% from 2005. And each of our services — basic cable, digital cable, high-speed Internet and digital voice — added more new customers than ever before. We have real momentum. The past year was sensational, but 2007 and the future have the potential to be even better.
The big story behind these wonderful results is the rollout of Comcast’s Triple Play.
Triple Play: It’s a Whole New Ball Game
Our Triple Play offering of video, high-speed Internet and digital voice is just what consumers want. We can deliver our superior products in a compelling value package, providing a simple, convenient and attractive option for everyone. With one phone call and one installation visit, we become the primary provider of communications and entertainment services to the home — and at an introductory price of $99 a month, our biggest challenge has been to keep up with demand. With the widespread introduction of Triple Play to 70%, or 32 million, of the homes in our markets in 2006, consumers are embracing our Comcast Digital Voice® service, loaded with attractive features and with more to come. It’s clear that Triple Play is boosting our overall take rates for video and high-speed Internet as well. As customers see the great value they’re getting, they take additional digital and premium video services, too. As a result, revenue per Triple Play customer averages $120 – $130 per month.
Our Triple Play offer of video, high-speed Internet and voice has proven to be a powerful formula for growth.
We were determined to be first to market on a wide scale with these three services, and we have succeeded in getting the jump on the competition. As we expand the availability of Triple Play to 85% of our customer base by the end of 2007, we expect it will continue to power our growth.
See notes and definitions on page 23.
18
Innovate. Differentiate. Win.
That’s been our mantra for the past several years. We’re absolutely focused on delivering superior products and services, and doing it better than our competitors. We added 1.9 million digital customers in 2006, an increase of 59% from 2005. Today, more than 12.7 million, or 52%, of our video customers take our digital cable services. Digital growth has been steady as consumers see and want ON DEMAND, our industry-leading video-on-demand platform, digital video recorders (DVRs) and high-definition television (HDTV) as part of their lives.
ON DEMAND gives our digital cable customers unmatched choice and control. It’s truly the personalization of TV.
With more than 8,000 programming choices available today — and growing every year — ON DEMAND gives our digital cable customers unmatched choice and control. It’s truly the personalization of TV. And as the penetration of HDTV sets accelerates, we’re expanding our high-definition ON DEMAND offerings, too. We now offer more than 150 hours of high-definition programming ON DEMAND, primarily movies in high definition. We plan to double that number in 2007 and again in 2008, and continue to expand our linear HDTV channels, so that we remain the HDTV market leader with the most sports and movies in high definition.
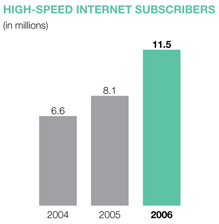
With our high-speed Internet service, we deliver a better experience by continually increasing the speed of our service and adding a wealth of new features. We added 1.9 million high-speed Internet subscribers in 2006, the highest level of annual high-speed Internet additions in our history, and ended the year with 11.5 million high-speed Internet customers, representing 25% penetration of homes in our markets. We believe we will keep growing not only by continuing to attract new customers, but also by capitalizing on the capabilities of our service to power innovation and develop new online services. We created Comcast Interactive Media to focus on those opportunities. In 2006, we launched several new digital media platforms, including Ziddio, TV Planner and Game Invasion, and in 2007 we plan to launch other new online services.
19
With the dramatic ramp-up of Comcast Digital Voice in 2006, we have built a fantastic new engine for continued growth. We added 1.5 million Comcast Digital Voice customers last year, more than five times the number added in 2005. By year’s end, we were marketing this service to 32 million homes, or 70% of our footprint, yet we are only at 6% penetration. We intend to increase that dramatically in 2007. Our goal is to reach at least 20% penetration, or nine million customers, by 2009. Given the power of Triple Play, we are on pace to achieve that goal.
We are also excited about our latest initiative: expanding into commercial business services — providing phone, Internet and video services to small and medium-sized businesses (SMBs). In 2007, we are beginning to target an estimated five million SMBs in our markets. We estimate that those businesses generated $12 – $15 billion in revenue for other providers in 2006, and our goal is to capture 20% or more of this market over the next five years. Buoyed by our success in the high-speed Internet and residential digital voice markets, and riding on much of the same network and infrastructure, we enter this new field with great confidence.
Our programming division continues to be a major value creator for the company and helps us to partner and work with new platforms to help differentiate and grow our cable business. In 2006, we acquired the remaining interest in E! Entertainment Television and now own 100% of it. We brought in new on-air talent, like Ryan Seacrest, and invested in programming that increased revenues and ratings at E!. We made similar investments at The Golf Channel and VERSUS, drawing higher distribution and ratings as the result of our expanded relationships with the PGA TOUR and the National Hockey League.
Investing in a Future of Opportunity
Consumers want the best services at a great price. They want things to be simple and convenient. They want to feel in control. The next great frontier for Comcast is to integrate our products in ways never before imaginable — like providing a single access point for customers to manage all their communications, or to plan and schedule their TV experience no matter where they are.
Our product teams and Comcast Interactive Media are focused on developing integrated services that offer entertainment and communications to consumers across multiple platforms. Our programming networks are also working on that strategy. PBS KIDS Sprout is available on a linear channel, on demand and online. In October 2006, we launched FEARnet, a new advertising-supported, multiplatform network delivering the best of modern horror films, streaming video and original content — on demand, online and to mobile devices.
20
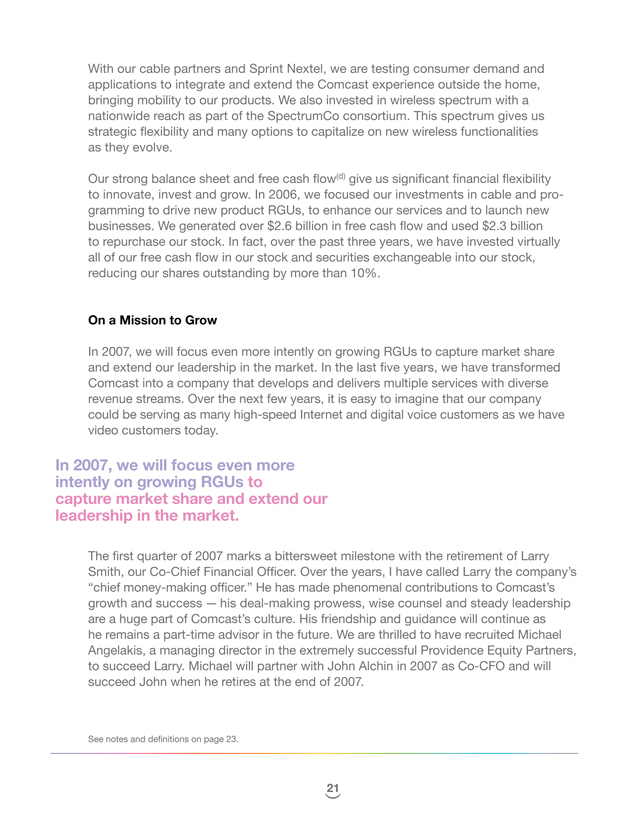
With our cable partners and Sprint Nextel, we are testing consumer demand and applications to integrate and extend the Comcast experience outside the home, bringing mobility to our products. We also invested in wireless spectrum with a nationwide reach as part of the SpectrumCo consortium. This spectrum gives us strategic flexibility and many options to capitalize on new wireless functionalities as they evolve.
Our strong balance sheet and free cash flow(d) give us significant financial flexibility to innovate, invest and grow. In 2006, we focused our investments in cable and programming to drive new product RGUs, to enhance our services and to launch new businesses. We generated over $2.6 billion in free cash flow and used $2.3 billion to repurchase our stock. In fact, over the past three years, we have invested virtually all of our free cash flow in our stock and securities exchangeable into our stock, reducing our shares outstanding by more than 10%.
On a Mission to Grow
In 2007, we will focus even more intently on growing RGUs to capture market share and extend our leadership in the market. In the last five years, we have transformed Comcast into a company that develops and delivers multiple services with diverse revenue streams. Over the next few years, it is easy to imagine that our company could be serving as many high-speed Internet and digital voice customers as we have video customers today.
In 2007, we will focus even more intently on growing RGUs to capture market share and extend our leadership in the market.
The first quarter of 2007 marks a bittersweet milestone with the retirement of Larry Smith, our Co-Chief Financial Officer. Over the years, I have called Larry the company’s “chief money-making officer.” He has made phenomenal contributions to Comcast’s growth and success — his deal-making prowess, wise counsel and steady leadership are a huge part of Comcast’s culture. His friendship and guidance will continue as he remains a part-time advisor in the future. We are thrilled to have recruited Michael Angelakis, a managing director in the extremely successful Providence Equity Partners, to succeed Larry. Michael will partner with John Alchin in 2007 as Co-CFO and will succeed John when he retires at the end of 2007.
See notes and definitions on page 23.
21
Finally, since we’re talking about a year of record results, I want to highlight two other records set by Comcasters in 2006. Our nationwide employee United Way campaign reached $4.2 million, a new record that places us in the top tier of United Way corporate campaigns in America. And on October 7, more than 32,000 employees and their families participated in Comcast Cares Day, our national day of volunteerism, delivering over 192,000 hours of community service to 300 projects in 34 states in a single day. This extraordinary effort represents one of the largest single corporate days of service in America.
2006 represents a turning point in our history, as we have once again positioned ourselves for growth and success.
As you read this year’s report in print or online, you’ll see many great Comcasters who exemplify the commitment, confidence, diversity and enthusiasm that made 2006 possible and make the future look so wonderful. Each of them, and every one of our 90,000 employees, gives so much to the company every day. They are our greatest asset, and we’re really proud to highlight them this year.
I will never forget what this company achieved in 2006. In many ways, it represents a turning point in our history, as we have once again positioned ourselves for growth and success. It was a phenomenal effort, led by Steve Burke and his fabulous team. My father, Ralph, and I believe we’re poised for even more great achievements in 2007.
It is an honor to help lead this company. Thank you for your continued support.
Sincerely,
Brian L. Roberts
Chairman and Chief Executive Officer Comcast Corporation February 23, 2007
22
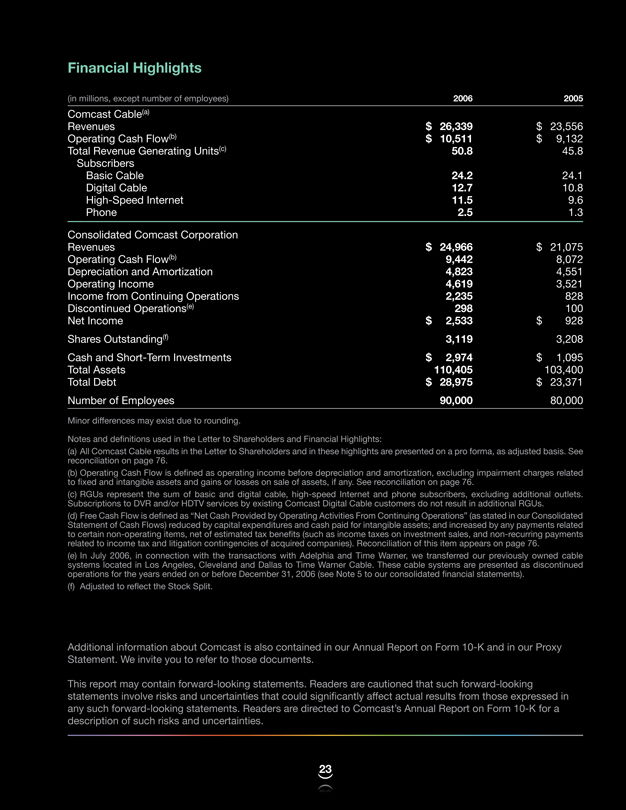
Financial Highlights
(in millions, except number of employees) 2006 2005
Comcast Cable(a)
Revenues $ 26,339 $ 23,556
Operating Cash Flow(b) $ 10,511 $ 9,132
Total Revenue Generating Units(c) 50.8 45.8
Subscribers
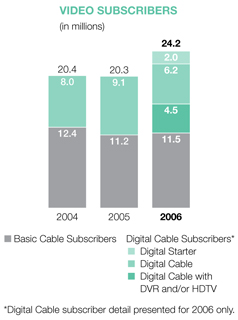
Basic Cable 24.2 24.1
Digital Cable 12.7 10.8
High-Speed Internet 11.5 9.6
Phone 2.5 1.3
Consolidated Comcast Corporation
Revenues $ 24,966 $ 21,075
Operating Cash Flow(b) 9,442 8,072
Depreciation and Amortization 4,823 4,551
Operating Income 4,619 3,521
Income from Continuing Operations 2,235 828
Discontinued Operations(e) 298 100
Net Income $ 2,533 $ 928
Shares Outstanding(f) 3,119 3,208
Cash and Short-Term Investments $ 2,974 $ 1,095
Total Assets 110,405 103,400
Total Debt $ 28,975 $ 23,371
Number of Employees 90,000 80,000
Minor differences may exist due to rounding.
Notes and definitions used in the Letter to Shareholders and Financial Highlights:
(a) All Comcast Cable results in the Letter to Shareholders and in these highlights are presented on a pro forma, as adjusted basis. See reconciliation on page 76.
(b) Operating Cash Flow is defined as operating income before depreciation and amortization, excluding impairment charges related to fixed and intangible assets and gains or losses on sale of assets, if any. See reconciliation on page 76.
(c) RGUs represent the sum of basic and digital cable, high-speed Internet and phone subscribers, excluding additional outlets. Subscriptions to DVR and/or HDTV services by existing Comcast Digital Cable customers do not result in additional RGUs.
(d) Free Cash Flow is defined as “Net Cash Provided by Operating Activities From Continuing Operations” (as stated in our Consolidated Statement of Cash Flows) reduced by capital expenditures and cash paid for intangible assets; and increased by any payments related to certain non-operating items, net of estimated tax benefits (such as income taxes on investment sales, and non-recurring payments related to income tax and litigation contingencies of acquired companies). Reconciliation of this item appears on page 76.
(e) In July 2006, in connection with the transactions with Adelphia and Time Warner, we transferred our previously owned cable systems located in Los Angeles, Cleveland and Dallas to Time Warner Cable. These cable systems are presented as discontinued operations for the years ended on or before December 31, 2006 (see Note 5 to our consolidated financial statements).
(f) | | Adjusted to reflect the Stock Split. |
Additional information about Comcast is also contained in our Annual Report on Form 10-K and in our Proxy Statement. We invite you to refer to those documents.
This report may contain forward-looking statements. Readers are cautioned that such forward-looking statements involve risks and uncertainties that could significantly affect actual results from those expressed in any such forward-looking statements. Readers are directed to Comcast’s Annual Report on Form 10-K for a description of such risks and uncertainties.
23
Financial Report
24
Management’s Discussion and Analysis of Financial Condition and Results of Operations
Introduction and Overview
We are the largest cable operator in the United States and offer a variety of consumer entertainment and communication products and services. As of December 31, 2006, our cable systems served approximately 23.4 million video subscribers, 11 million high-speed Internet subscribers and 2.4 million phone subscribers and passed approximately 45.7 million homes in 39 states and the District of Columbia.
We classify our operations in two reportable segments: Cable and Programming. Our Cable segment, which generates approximately 95% of our consolidated revenues, manages and operates our cable systems. Our Programming segment consists of our six national programming networks. During 2006, our operations generated consolidated revenues of approximately $25 billion.
Our Cable segment earns revenues primarily through subscriptions to our video, high-speed Internet and phone services (“cable services”). Our video revenues continue to increase as a result of digital subscriber growth and demand for our other digital cable services, including video on demand, which we refer to as ON DEMAND, Digital Video Recorder (“DVR”) and High Definition Television (“HDTV”), as well as higher pricing on our basic video service. As of December 31, 2006, approximately 51% of the homes in the areas we serve subscribed to our video service and approximately 52% of those video subscribers subscribed to at least one of our digital cable services. Our high-speed Internet service with Internet access at downstream speeds from 6Mbps to 16Mbps, depending on the level of service selected, has been one of our fastest growing services over the past several years. As of December 31, 2006, approximately 25% of the homes in the areas we serve subscribed to our high-speed Internet service. Comcast Digital Voice, our phone service that provides unlimited local and domestic long-distance calling and other features, is our most recent cable service offering. As of December 31, 2006, approximately 6% of the homes in the areas we serve subscribed to Comcast Digital Voice. In 2006, we began offering our video, high-speed Internet and Comcast Digital Voice services in a package that we refer to as the “triple play.” In addition to cable services, other Cable segment revenue sources include advertising and the operation of our regional sports and news networks.
Our Programming segment consists of our consolidated national programming networks: E!, Style, The Golf Channel, VERSUS (formerly known as OLN), G4 and AZN Television. Revenue from our Programming segment is earned primarily from advertising revenues and from monthly per subscriber license fees paid by cable and satellite distributors.
Our other business interests include Comcast Spectacor, which owns the Philadelphia Flyers, the Philadelphia 76ers and two large multipurpose arenas in Philadelphia, and manages other
facilities for sporting events, concerts and other events. Comcast Spectacor and all other consolidated businesses not included in our Cable or Programming segments are included in “Corporate and Other” activities.
On January 31, 2007, our Board of Directors approved a three-for-two stock split in the form of a 50% stock dividend (the “Stock Split”) payable on February 21, 2007, to shareholders of record on February 14, 2007. The number of shares outstanding and related amounts have been adjusted to reflect the Stock Split for all periods presented.
2006 Financial and Operational Highlights
| • | | consolidated revenue growth of 18.5% and consolidated operating income growth of 31.2%, both driven by results in our Cable segment |
| • | | Cable segment revenue growth of 20.6% and growth in operating income before depreciation and amortization of 22.1%, both driven by revenue generating units (“RGUs”) growth and the success of our triple play offering, as well as growth from acquisitions |
2006 Business Developments
| • | | completed transactions with Adelphia and Time Warner that resulted in a net increase of 1.7 million video subscribers, a net cash payment by us of approximately $1.5 billion and the disposition of our ownership interest in Time Warner Cable Inc. (“TWC”) and Time Warner Entertainment Company, L.P. (“TWE”), the assets of two cable system partnerships and the transfer of our previously owned cable systems in Los Angeles, Cleveland and Dallas. We collectively refer to these transactions as the “Adelphia and Time Warner transactions.” |
| • | | initiated the dissolution of the Texas and Kansas City Cable Partnership (“TKCCP”) that resulted in our acquisition of cable systems serving Houston, Texas (approximately 700,000 video subscribers) in January 2007 |
| • | | acquired the cable systems of Susquehanna Communications serving approximately 200,000 video subscribers for approximately $775 million |
| • | | acquired the 39.5% interest in E! Entertainment Television (which operates the E! and Style programming networks) that we did not already own for approximately $1.2 billion |
| • | | participated in a consortium of investors (“SpectrumCo”) that acquired wireless spectrum licenses covering approximately 91% of the population in the United States for approximately $2.4 billion (our portion was $1.3 billion) |
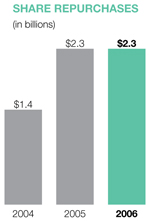
| • | | repurchased approximately 113 million shares (adjusted to reflect the Stock Split) of our Class A Special common stock pursuant to our Board-authorized share repurchase program for approximately $2.3 billion |
Refer toNote 5 to our consolidated financial statements for information about acquisitions and other significant events.
| | | | |
| | 25 | | Comcast 2006 Annual Report |
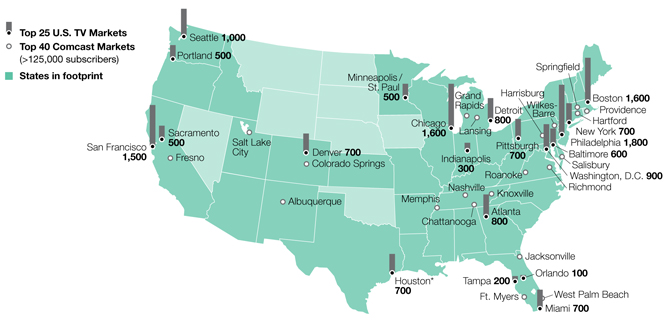
The Areas We Serve
The map below highlights our 40 major markets with emphasis on our operations in the top 25 U.S. TV markets. Approximately 90% of our video subscribers are in the markets listed (subscribers in thousands).
The following provides further details of our highlights and insights into our consolidated financial statements, including discussion of our results of operations and our liquidity and capital resources. As a result of transferring our previously owned cable systems located in Los Angeles, Cleveland and Dallas (“Comcast Exchange Systems”), the operating results of the Comcast Exchange Systems are reported as discontinued operations for all periods presented.
Consolidated Operating Results
| | | | | | | | | | | | | | | | | | |
| Year Ended December 31 (in millions) | | 2006 | | | 2005 | | | 2004 | | | % Change
2005 to 2006 | | | % Change
2004 to 2005 | |
Revenues | | $ | 24,966 | | | $ | 21,075 | | | $ | 19,221 | | | 18.5 | % | | 9.6 | % |
Costs and Expenses | | | | | | | | | | | | | | | | | | |
Operating, Selling, General and Administrative (excluding depreciation) | | | 15,524 | | | | 13,003 | | | | 12,041 | | | 19.4 | | | 8.0 | |
Depreciation | | | 3,828 | | | | 3,413 | | | | 3,197 | | | 12.2 | | | 6.8 | |
Amortization | | | 995 | | | | 1,138 | | | | 1,154 | | | (12.5 | ) | | (1.5 | ) |
Operating Income | | | 4,619 | | | | 3,521 | | | | 2,829 | | | 31.2 | | | 24.4 | |
Other Income (Expense) Items, net | | | (1,025 | ) | | | (1,801 | ) | | | (1,086 | ) | | (43.1 | ) | | 65.8 | |
Income from Continuing Operations before Income Taxes and Minority Interest | | | 3,594 | | | | 1,720 | | | | 1,743 | | | 109.0 | | | (1.4 | ) |
Income Tax Expense | | | (1,347 | ) | | | (873 | ) | | | (801 | ) | | 54.3 | | | 9.0 | |
Income from Continuing Operations before Minority Interest | | | 2,247 | | | | 847 | | | | 942 | | | 165.5 | | | (10.2 | ) |
Minority Interest | | | (12 | ) | | | (19 | ) | | | (14 | ) | | (36.8 | ) | | 35.7 | |
Income from Continuing Operations | | | 2,235 | | | | 828 | | | | 928 | | | 169.9 | | | (10.8 | ) |
Discontinued Operations, net of Tax | | | 298 | | | | 100 | | | | 42 | | | 198.0 | | | 138.1 | |
Net Income | | $ | 2,533 | | | $ | 928 | | | $ | 970 | | | 173.0 | % | | (4.3 | )% |
All percentages are calculated based on actual amounts. Minor differences may exist due to rounding.
| | | | |
| MD&A Comcast 2006 Annual Report | | 26 | | |
Consolidated Revenues
Our Cable and Programming segments accounted for substantially all of the increases in consolidated revenues for 2006 and 2005. Cable segment and Programming segment revenues are discussed separately below. The remaining changes relate to our other business activities, primarily Comcast Spectacor, whose revenues were negatively affected in 2005 by the National Hockey League (“NHL”) lockout.
Consolidated Operating, Selling, General and Administrative Expenses
Our Cable and Programming segments accounted for substantially all of the increases in consolidated operating, selling, general and administrative expenses for 2006 and 2005. Cable segment and Programming segment expenses are discussed separately below. The remaining changes relate to our other business activities, primarily Comcast Spectacor, and the impact of adopting Statement of Financial Accounting Standards (“SFAS”) No. 123R, “Share-Based Payment” (“SFAS No. 123R”).
Effective January 1, 2006, we adopted SFAS No. 123R using the Modified Prospective Approach. SFAS No. 123R revises SFAS No. 123, “Accounting for Stock-Based Compensation” (“SFAS No. 123”) and supersedes Accounting Principles Board (“APB”) Opinion No. 25, “Accounting for Stock Issued to Employees” (“APB No. 25”). SFAS No. 123R requires the cost of all share-based payments to employees, including grants of employee stock options, to be recognized in the financial statements based on their fair values at grant date, or the date of later modification, over the requisite service period. In addition, SFAS No. 123R requires unrecognized cost (based on the amounts previously disclosed in our pro forma footnote disclosure) related to options vesting after the date of initial adoption to be recognized in the financial statements over the remaining requisite service period.
The incremental pretax share-based compensation expense recognized because of the adoption of SFAS No. 123R for the year ended December 31, 2006, was $126 million. Total share-based compensation expense recognized under SFAS No. 123R, including the incremental pretax share-based compensation expense, was $190 million for the year ended December 31, 2006. Share-based compensation expense is reflected in the operating results of each of our business segments. Refer toNote 10 andNote 14 to our consolidated financial statements for further details on our adoption of SFAS No. 123R.
Consolidated Depreciation and Amortization
The increases in depreciation expense for 2006 and 2005 are primarily a result of capital expenditures in our Cable segment and, in 2006, the depreciation associated with acquisitions of cable systems.
The decreases in amortization expense for 2006 and 2005 are primarily a result of decreases in the amortization of our franchise-related customer relationship intangible assets, partially offset by increased amortization expense related to software-related intangibles acquired in various transactions, and in 2006, the customer relationship intangible assets recorded in connection with the acquisitions of cable systems.
Segment Operating Results
Certain adjustments have been made in our segment presentation to be consistent with our management reporting presentation. These adjustments primarily relate to the adoption of SFAS No. 123R and are further discussed in Note 14 to our consolidated financial statements.
To measure the performance of our operating segments, we use operating income before depreciation and amortization, excluding impairment charges related to fixed and intangible assets, and gains or losses from the sale of assets, if any. This measure eliminates the significant level of noncash depreciation and amortization expense that results from the capital-intensive nature of our businesses and from intangible assets recognized in business combinations. It is also unaffected by our capital structure or investment activities. We use this measure to evaluate our consolidated operating performance, the operating performance of our operating segments, and to allocate resources and capital to our operating segments. It is also a significant performance measure in our annual incentive compensation programs. We believe that this measure is useful to investors because it is one of the bases for comparing our operating performance with other companies in our industries, although our measure may not be directly comparable to similar measures used by other companies. Because we use this metric to measure our segment profit or loss, we reconcile it to operating income, the most directly comparable financial measure calculated and presented in accordance with generally accepted accounting principles in the United States (“GAAP”) in the business segment footnote to our consolidated financial statements. You should not consider this measure a substitute for operating income (loss), net income (loss), net cash provided by operating activities, or other measures of performance or liquidity we have reported in accordance with GAAP.
Cable Segment Overview
Our cable systems simultaneously deliver video, high-speed Internet and phone services to our subscribers. The majority of our Cable segment revenue is earned from subscriptions to these cable services. Subscribers typically pay us monthly, based on their chosen level of service, number of services and the type of equipment they use, and generally may discontinue service at any time. We measure our success in selling subscription-based services to customers by a metric referred to as a revenue generating unit (“RGU”). Each individual cable service (basic cable, digital cable, high-speed Internet or phone service) that a subscriber receives represents one RGU. As of December 31, 2006, we had approximately
| | | | |
| | 27 | | Comcast 2006 Annual ReportMD&A |
50.8 million RGUs. As a result of continued and growing demand for our existing and new products and services, including our triple play offering, as well as other factors discussed below, we have increased our revenues and operating income before depreciation and amortization.
Cable Segment Results of Operations
The comparability of the results of operations and subscriber information of our Cable segment are impacted by the Adelphia and Time Warner transactions (closed July 31, 2006) and the acquisition of the cable systems of Susquehanna Communications (closed
April 30, 2006). Further, consistent with our management reporting presentation, the operating results and subscriber information of the cable systems serving Houston, Texas have been included in the Cable segment beginning August 1, 2006. However, the operating results of the Houston cable systems are eliminated in our consolidated financial statements as TKCCP continued to be accounted for as an equity method investment for external financial reporting purposes until the Houston cable systems were actually acquired on January 1, 2007 (see Note 5). We collectively refer to these cable systems as the “newly acquired cable systems.” The newly acquired cable systems accounted for $1.7 billion of increased revenue in 2006.
Cable Segment Revenues
Video.We offer a full range of video services, ranging from a limited basic service and a digital starter service, to our full digital cable service, which provides access to over 250 channels, including premium and pay-per-view channels; ON DEMAND (which allows access to a library of movies, sports and news, starting a selection at any time, and pausing, rewinding and fast-forwarding selections); music channels; and an interactive, on-screen program guide (which allows navigating the channel lineup and ON DEMAND library). Digital cable subscribers may also subscribe to additional digital cable services, including DVR (which allows digital recording of programs, and pausing and rewinding of live television), and HDTV (which provides multiple channels in high definition).
As of December 31, 2006, approximately 52% of our video subscribers subscribed to at least one of our digital cable services, compared to approximately 45% and approximately 39% as of December 31, 2005 and 2004, respectively.
| | | | | | | | | | | | | | | |
| Year Ended December 31 (in millions) | | 2006 | | 2005 | | 2004 | | % Change
2005 to 2006 | | | % Change
2004 to 2005 | |
Video | | $ | 15,096 | | $ | 12,918 | | $ | 12,211 | | 16.9 | % | | 5.8 | % |
High-speed Internet | | | 4,986 | | | 3,757 | | | 2,938 | | 32.7 | | | 27.9 | |
Phone | | | 913 | | | 617 | | | 620 | | 48.0 | | | (0.5 | ) |
Advertising | | | 1,537 | | | 1,272 | | | 1,206 | | 20.8 | | | 5.4 | |
Other | | | 851 | | | 789 | | | 654 | | 7.8 | | | 20.7 | |
Franchise fees | | | 717 | | | 634 | | | 601 | | 13.1 | | | 5.3 | |
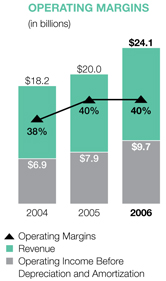
Revenues | | | 24,100 | | | 19,987 | | | 18,230 | | 20.6 | | | 9.6 | |
Operating expenses | | | 8,600 | | | 7,041 | | | 6,656 | | 22.1 | | | 5.8 | |
Selling, general and administrative expenses | | | 5,796 | | | 4,999 | | | 4,634 | | 15.9 | | | 7.8 | |
Operating income before depreciation and amortization | | $ | 9,704 | | $ | 7,947 | | $ | 6,940 | | 22.1 | % | | 14.5 | % |
| | | | |
| MD&A Comcast 2006 Annual Report | | 28 | | |
Revenues increased as a result of higher pricing on our basic video service, growth in our digital cable services and, in 2006, the addition of our newly acquired cable systems. Our newly acquired cable systems added approximately 3.7 million video subscribers and contributed $1.143 billion of our video revenue growth for the year ended December 31, 2006. As a result of these factors, our average monthly video revenue per video subscriber increased from $50 in 2004 to $57 in 2006.
High-Speed Internet.We offer high-speed Internet service with Internet access at downstream speeds from 6Mbps to 16Mbps, depending on the level of service selected. This service also includes our interactive portal, Comcast.net, which provides multiple e-mail addresses and online storage, as well as a variety of proprietary content and value-added features and enhancements that are designed to take advantage of the speed of the Internet service we provide.
Revenues increased in 2006 and 2005 as a result of subscriber growth and, in 2006, the addition of our newly acquired cable systems. As of December 31, 2006, 24.5% of our homes passed subscribed to our high-speed Internet service, compared to 21.1% and 17.8% as of December 31, 2005 and 2004, respectively. Our newly acquired cable systems added approximately 1.7 million high-speed Internet subscribers and contributed $379 million of our high-speed Internet revenue growth for the year ended December 31, 2006. Average monthly revenue per high-speed Internet subscriber has remained relatively stable between $42 and $43 from 2004 through 2006. The rate of subscriber and revenue growth may slow as the market continues to mature and competition increases.
Phone.We offer Comcast Digital Voice, our IP-enabled phone service that provides unlimited local and domestic long-distance calling and includes such features as Voice Mail, Caller ID and Call Waiting. Comcast Digital Voice was available to 32 million homes as of December 31, 2006. We expect that by the end of 2007 approximately 85% of our homes passed will have access to Comcast Digital Voice. In some areas, we provide our circuit-switched local phone service. Subscribers to this service have access to a full array of calling features and third-party long-distance services.
Revenues increased in 2006 as a result of the increase in Comcast Digital Voice subscribers, partially offset by the loss of approximately 300,000 circuit-switched subscribers. Our newly acquired cable systems added approximately 156,000 phone subscribers and contributed $40 million of our phone revenue growth for the year ended December 31, 2006. The decrease in phone revenues in 2005 from 2004 was primarily the result of a reduction in the number of circuit-switched phone subscribers as we began the deployment of Comcast Digital Voice. We expect the number of phone subscribers will grow as we expand Comcast Digital Voice to new markets in 2007. We expect the number of subscribers to our circuit-switched local phone service to continue to decrease in 2007 as our marketing efforts are now focused on Comcast Digital Voice.
| | | | |
| | 29 | | Comcast 2006 Annual ReportMD&A |
Advertising.As part of our programming license agreements with programming networks, we receive an allocation of scheduled advertising time that we may sell to local, regional and national advertisers. We also coordinate the advertising sales efforts of other cable operators in some markets, and in other markets we have formed and operate advertising interconnects, which establish a physical, direct link between multiple cable systems and provide for the sale of regional and national advertising across larger geographic areas than could be provided by a single cable operator.
Advertising revenues increased in 2006 as a result of the strong growth in political advertising and the addition of our newly acquired cable systems. We expect slower growth in our advertising revenues in 2007, primarily as a result of lower levels of political advertising.
Other.We also generate revenues from our regional sports and news networks, video installation services, commissions from third-party electronic retailing, and fees for other services, such as providing businesses with data connectivity and networked applications. Our regional sports and news networks include Comcast SportsNet (Philadelphia), Comcast SportsNet Mid-Atlantic (Baltimore/Washington), Cable Sports Southeast, CN8 — The Comcast Network, Comcast SportsNet Chicago, Comcast SportsNet West (Sacramento) and MountainWest Sports Network. These networks earn revenue through the sale of advertising time and receive programming license fees paid by cable and satellite distributors.
Franchise Fees.Our franchise fee revenues represent the pass-through to our subscribers of the fees required to be paid to state and local franchising authorities. Under the terms of our franchise agreements, we are generally required to pay up to 5% of our gross video revenues to the local franchising authority. The increases in franchise fees are primarily a result of the increases in our revenues upon which the fees apply.
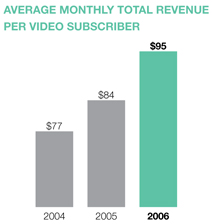
Total Cable Segment Revenue.As a result of the growth in revenues from our products and services, we have been able to increase our total average monthly revenue per video subscriber (including all revenue sources) from approximately $77 in 2004 to approximately $95 in 2006.
Cable Segment Expenses
We continue to focus on controlling the growth of expenses. Our operating margins (operating income before depreciation and amortization as a percentage of revenue) were 40.2%, 39.8% and 38.1% for the years ended December 31, 2006, 2005 and 2004, respectively.
Cable Segment Operating Expenses.Cable programming expenses, our largest expense, are the fees we pay to programming networks to license the programming we package, offer and distribute to our cable subscribers. These expenses are affected by changes in the rates charged by programming networks, the number of subscribers and the programming options we offer to subscribers. Cable programming expenses increased to $4.9 billion in 2006 as a result of increases in rates and the newly acquired cable systems, from $4.1 billion in 2005 and $3.9 billion in 2004. We anticipate our cable programming expenses will increase in the future, as the fees charged by programming networks increase and as we provide additional channels and ON DEMAND programming options to our subscribers. We anticipate that these increases may be mitigated to some extent by volume discounts.
Other operating expenses increased to $3.7 billion in 2006 from $2.9 billion in 2005 and $2.8 billion in 2004. In 2006, our newly acquired cable systems contributed approximately $650 million of our increases in other operating expenses. The remaining increases in 2006 were primarily a result of growth in the number of subscribers to our cable services, which required additional personnel to handle service calls and provide customer support, and costs associated with the delivery of these services. The increase in 2005 was primarily a result of increases in our technical services group due to the launch of Comcast Digital Voice, the deployment of digital simulcasting, the implementation of a new provisioning system and, to a lesser degree, the repair of our cable systems as a result of weather-related damage.
| | | | |
| MD&A Comcast 2006 Annual Report | | 30 | | |
Cable Segment Selling, General and Administrative Expenses.
Selling, general and administrative expenses increased $797 million to $5.8 billion in 2006. In 2006, our newly acquired cable systems contributed approximately $400 million of our increases in sellin general and administrative expenses. The remaining increases in 2006 were primarily a result of growth in the number
of subscribers to our cable services, which required additional employees to handle customer service, marketing and other administrative costs. The increase in 2005 was primarily a result of the launch of Comcast Digital Voice, the deployment of digital simulcasting and the implementation of a new provisioning system.
Programming Segment Overview
Our Programming segment consists of our consolidated national programming networks:
| | | | |
| Programming Network | | Approximate
U.S. Subscribers
(in millions) | | Description |
E! | | 81 | | Pop culture and entertainment-related programming |
Style | | 37 | | Lifestyle-related programming |
The Golf Channel | | 63 | | Golf and golf-related programming |
VERSUS | | 61 | | Sports and leisure programming |
G4 | | 53 | | Gamer lifestyle programming |
AZN Television | | 14 | | Asian American programming |
We also own interests in MGM (20%), iN DEMAND (54%), TV One (33%), PBS KIDS Sprout (40%), FEARnet (33%) and ExerciseTV (55%). The operating results of these entities are not included in our Programming segment’s operating results as they are presented in equity in net (losses) income of affiliates, net or Corporate and Other activities.
Programming Segment Results of Operations
| | | | | | | | | | | | | | | |
| Year Ended December 31 (in millions) | | 2006 | | 2005 | | 2004 | | % Change
2005 to 2006 | | | % Change
2004 to 2005 | |
Revenues | | $ | 1,053 | | $ | 919 | | $ | 787 | | 14.6 | % | | 16.7 | % |
Operating, selling, general and administrative expenses | | | 812 | | | 647 | | | 518 | | 25.6 | | | 24.7 | |
Operating income before depreciation and amortization | | $ | 241 | | $ | 272 | | $ | 269 | | (11.4 | )% | | 1.3 | % |
Programming Segment Revenues
Revenues from our Programming segment are earned primarily from the sale of advertising time and from monthly per subscriber license fees paid by cable and satellite distributors. Programming revenues for 2006 and 2005 increased as a result of increases in advertising and license fee revenues. For 2006, 2005 and 2004, approximately 11% to 12% of our Programming segment revenues were generated from our Cable segment and are eliminated in our consolidated financial statements, but are included in the amounts presented above.
Programming Segment Operating, Selling, General and Administrative Expenses
Operating, selling, general and administrative expenses consist mainly of the cost of producing television programs and live events, the purchase of programming rights, marketing and promoting our programming networks, and administrative costs. Programming expenses for 2006 and 2005 increased as a result of an increase in production and programming rights costs for new and live event programming for our programming networks, including the NHL on VERSUS, and a corresponding increase in marketing expenses for this programming. The full-year impact of our 2004 acquisitions of TechTV and AZN Television also contributed to the growth in
2005 expenses. We have and expect to continue to invest in new and live event programming, such as our recent rights agreement with the PGA TOUR, that will cause our Programming segment expenses to increase in the future.
Consolidated Other Income (Expense) Items
| | | | | | | | | | | | |
| Year Ended December 31 (in millions) | | 2006 | | | 2005 | | | 2004 | |
Interest expense | | $ | (2,064 | ) | | $ | (1,795 | ) | | $ | (1,874 | ) |
Investment income (loss), net | | | 990 | | | | 89 | | | | 472 | |
Equity in net (losses) income of affiliates, net | | | (124 | ) | | | (42 | ) | | | (81 | ) |
Other income (expense) | | | 173 | | | | (53 | ) | | | 397 | |
Total | | $ | (1,025 | ) | | $ | (1,801 | ) | | $ | (1,086 | ) |
Interest Expense
The increase in interest expense for 2006 from 2005 was primarily the result of an increase in our average debt outstanding and higher interest rates on our variable-rate debt, as well as $57 million of gains recognized in 2005 in connection with the early extinguishment of some of our debt facilities. The decrease in interest expense for 2005
| | | | |
| | 31 | | Comcast 2006 Annual ReportMD&A |
from 2004 was primarily the result of $57 million of gains recognized in 2005 and $69 million of losses recognized in 2004 in connection with the early extinguishment of some of our debt facilities, partially offset by the effects of higher interest rates on variable-rate debt in 2005.
Investment Income (Loss), Net
The components of investment income (loss), net for 2006, 2005 and 2004 are presented in a table inNote 6 to our consolidated financial statements. In connection with the Adelphia and Time Warner transactions, we recognized gains of approximately $646 million for the year ended December 31, 2006.
We have entered into derivative financial instruments that we account for at fair value and which economically hedge the market price fluctuations in the common stock of substantially all of our investments accounted for as trading securities. The differences between the unrealized gains (losses) on trading securities and the mark to market adjustments on derivatives related to trading securities, as presented in the table inNote 6, result from one or more of the following:
| • | | we did not maintain an economic hedge for our entire investment in the security during some or all of the period |
| • | | there were changes in the derivative valuation assumptions such as interest rates, volatility and dividend policy |
| • | | the magnitude of the difference between the market price of the underlying security to which the derivative relates and the strike price of the derivative |
| • | | the change in the time value component of the derivative value during the period |
| • | | the security to which the derivative relates changed due to a corporate reorganization of the issuing company to a security with a different volatility rate |
Equity in Net (losses) Income of Affiliates, Net
The increase in equity in net losses of affiliates for 2006 from 2005 was primarily a result of other-than-temporary impairment charges recognized in 2006. The decrease in equity in net losses of affiliates for 2005 from 2004 was primarily a result of changes in the net income or loss of our equity investees.
Other Income (Expense)
Other income for 2006 consisted principally of $170 million of gains on the sales of investment assets. Other expense for 2005 consisted principally of a $170 million payment representing our share of the settlement amount related to certain of AT&T’s litigation with At Home, partially offset by a $24 million gain on the exchange of one of our equity method investments and $62 million of gains recognized on the sale or restructuring of investment assets in 2005. Other income for 2004 consisted principally of the
$250 million reduction in the estimated fair value liability associated with the securities litigation of an acquired company and the $94 million gain recognized on the sale of our investment in DHC Ventures, LLC (“Discovery Health Channel”).
Income Tax Expense
Our effective income tax rate was 37.5%, 50.7% and 45.9% for 2006, 2005 and 2004, respectively. Tax expense reflects an effective income tax rate that differs from the federal statutory rate primarily as a result of state income taxes and adjustments to prior year accruals, including related interest. Adjustments to prior year accruals in 2006 are principally related to the favorable resolution of issues and revised estimates of the outcome of unresolved issues with various taxing authorities.
Discontinued Operations
The operating results of our previously owned cable systems located in Los Angeles, Dallas and Cleveland, reported as discontinued operations for 2006, include seven months of operations, as the closing date of the transaction was July 31, 2006. For 2005 and 2004, results include 12 months of operations. As a result of the exchange transaction, we recognized a gain on the sale of these systems of $195 million, net of tax of $541 million (seeNote 5). The effective tax rate on the gain is higher than the federal statutory rate primarily as a result of the nondeductible amounts attributed to goodwill.
Liquidity and Capital Resources
As we describe further below, our businesses generate significant cash flow from operating activities. The proceeds from monetizing our nonstrategic investments have also provided us with a significant source of cash flow. We believe that we will be able to meet our current and long-term liquidity and capital requirements, including fixed charges, through our cash flow from operating activities, existing cash, cash equivalents and investments; through available borrowings under our existing credit facilities; and through our ability to obtain future external financing. We anticipate continuing to use a substantial portion of our cash flow to fund our capital expenditures, invest in business opportunities and repurchase our stock.
Operating Activities
Net cash provided by operating activities amounted to $6.618 billion for 2006, primarily as a result of our operating income before depreciation and amortization, the timing of interest and income tax payments, and changes in other operating assets and liabilities.
Financing Activities
Net cash provided by financing activities was $3.546 billion for 2006, and consisted principally of our proceeds from borrowings of
| | | | |
| MD&A Comcast 2006 Annual Report | | 32 | | |
$7.497 billion, partially offset by our debt repayments of $2.039 billion, and our repurchase of approximately 113 million shares of our Class A Special common stock at a weighted-average share price of $20.76 for $2.347 billion (recognized on a settlement date or cash basis and adjusted to reflect the Stock Split). We have made, and may from time to time in the future make, optional repayments on our debt obligations, which may include repurchases of our outstanding public notes and debentures, depending on various factors, such as market conditions. See Note 8 to our consolidated financial statements for further discussion of our financing activities, including details of our debt repayments and borrowings.
Available Borrowings Under Credit Facilities
We traditionally maintain significant availability under lines of credit and our commercial paper program to meet our short-term liquidity requirements. As of December 31, 2006, amounts available under these facilities totaled $4.464 billion.
Debt Covenants
We and our cable subsidiaries that have provided guarantees (seeNote 8) are subject to the covenants and restrictions set forth in the indentures governing our public debt securities and in the credit agreement governing our bank credit facilities. We and the guarantors are in compliance with the covenants, and we believe that neither the covenants nor the restrictions in our indentures or loan documents will limit our ability to operate our business or raise additional capital. Our covenants are tested on an ongoing basis. The only financial covenant in our $5.0 billion revolving credit facility relates to leverage (ratio of debt to operating income before depreciation and amortization), which we met by a significant margin as of December 31, 2006. Our ability to comply with this financial covenant in the future does not depend on further debt reduction or on improved operating results.
Share Repurchase Program
As of December 31, 2006, the maximum dollar value of shares remaining that may be repurchased under our Board-authorized share repurchase program was approximately $3 billion. We expect such repurchases to continue from time to time in the open market or in private transactions, subject to market conditions.
Investing Activities
Net cash used in investing activities was $9.872 billion for 2006 and consists principally of cash paid for acquisitions of $5.110 billion (primarily related to the Adelphia transaction, Susquehanna Communications acquisition and the acquisition of our additional interest in E! Entertainment Television), capital expenditures of $4.395 billion, and investments of $2.812 billion (primarily related to our interest in SpectrumCo and the additional funding related to the dissolution of TKCCP). These cash outflows were partially offset by proceeds from sales, settlements and restructuring of investments of $2.720 billion (primarily related to our disposition of our ownership interest in TWE and TWC).
Refer toNotes 5,6 and7 to our consolidated financial statements for a discussion of our acquisitions and other significant events, investments, and our intangible assets, respectively.
Capital Expenditures
Our most significant recurring investing activity has been capital expenditures, and we expect that this will continue in the future. The following chart illustrates the capital expenditures we incurred in our Cable segment from 2004 through 2006:
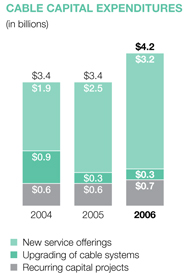
In 2006, approximately 75% of Cable capital expenditures were variable and directly associated with continued and growing demand for our existing and new products and services, which leads to increases in RGUs. The amounts of capital expenditures in our Programming segment and our other business activities have not been significant and have been relatively stable from 2004 through 2006. The amounts of our capital expenditures for 2007 and for subsequent years will depend on numerous factors, including acquisitions, competition, changes in technology and the timing and rate of deployment of new services.
| | | | |
| | 33 | | Comcast 2006 Annual ReportMD&A |
Interest Rate Risk Management
We maintain a mix of fixed and variable-rate debt. Approximately 94% of our total debt of $28.975 billion is at fixed rates with the remaining at variable rates. We are exposed to the market risk of adverse changes in interest rates. In order to manage the cost and volatility relating to the interest cost of our outstanding debt, we enter into various interest rate risk management derivative transactions pursuant to our policies.
We monitor our interest rate risk exposures using techniques that include market value and sensitivity analyses. We do not hold or issue any derivative financial instruments for speculative purposes and we are not a party to any leveraged derivative instruments.
We manage the credit risks associated with our derivative financial instruments through the evaluation and monitoring of the creditworthiness of the
counterparties. Although we may be exposed to losses in the event of nonperformance by the counterparties, we do not expect such losses, if any, to be significant.
Our interest rate derivative financial instruments, which can include swaps, rate locks, caps and collars, represent an integral part of our interest rate risk management program. Our interest rate derivative financial instruments reduced the portion of our total debt at fixed-rates from 94% to 83% as of December 31, 2006. The effect of our interest rate derivative financial instruments increased our interest expense by approximately $39 million in 2006, and decreased our interest expense by approximately $16 million and $66 million in 2005 and 2004, respectively. Interest rate risk management instruments may have a significant effect on our interest expense in the future.
The table set forth below summarizes the fair values and contract terms of financial instruments subject to interest rate risk maintained by us as of December 31, 2006:
| | | | | | | | | | | | | | | | | | | | | | | | | | | | | | | | |
(in millions) | | | 2007 | | | | 2008 | | | | 2009 | | | | 2010 | | | | 2011 | | | | Thereafter | | | | Total | | |
| Fair Value
12/31/06 |
|
Debt | | | | | | | | | | | | | | | | | | | | | | | | | | | | | | | | |
Fixed-Rate | | $ | 908 | | | $ | 1,474 | | | $ | 990 | | | $ | 1,109 | | | $ | 1,741 | | | $ | 20,982 | | | $ | 27,204 | | | $ | 28,923 | |
Average Interest Rate | | | 8.3 | % | | | 7.3 | % | | | 7.5 | % | | | 5.7 | % | | | 6.4 | % | | | 7.2 | % | | | 7.2 | % | | | | |
Variable-Rate | | $ | 75 | | | $ | 194 | | | $ | 1,259 | | | $ | 211 | | | $ | 26 | | | $ | 6 | | | $ | 1,771 | | | $ | 1,771 | |
Average Interest Rate | | | 5.8 | % | | | 5.5 | % | | | 5.3 | % | | | 5.1 | % | | | 5.9 | % | | | 6.8 | % | | | 5.3 | % | | | | |
Interest Rate Instruments(a) | | | | | | | | | | | | | | | | | | | | | | | | | | | | | | | | |
Fixed to Variable Swaps | | $ | — | | | $ | 600 | | | $ | 750 | | | $ | 200 | | | $ | 750 | | | $ | 900 | | | $ | 3,200 | | | $ | (103 | ) |
Average Pay Rate | | | — | % | | | 7.2 | % | | | 7.0 | % | | | 6.1 | % | | | 6.1 | % | | | 5.4 | % | | | 6.3 | % | | | | |
Average Receive Rate | | | — | % | | | 6.2 | % | | | 6.9 | % | | | 5.9 | % | | | 5.5 | % | | | 5.3 | % | | | 5.9 | % | | | | |
| (a) | We did not have any variable to fixed swaps as of December 31, 2006. |
We use the notional amounts on the instruments to calculate the interest to be paid or received. The notional amounts do not represent the amount of our exposure to credit loss. The estimated fair value approximates the payments necessary to settle the outstanding contracts. We estimate interest rates on variable debt using the average implied forward London Interbank Offered Rate (“LIBOR”) rates for the year of maturity based on the yield curve in effect on December 31, 2006, plus the applicable margin in effect on December 31, 2006. We estimate the floating rates on our swaps using the average implied forward LIBOR for the year of maturity based on the yield curve in effect on December 31, 2006.
As a matter of practice, we typically do not structure our financial contracts to include credit-ratings-based triggers that could affect our liquidity. In the ordinary course of business, some of our swaps could be subject to termination provisions if we do not
maintain investment grade credit ratings. As of December 31, 2006, and 2005, the estimated fair value of those swaps was a liability of $60 million and $69 million, respectively. The amount to be paid or received upon termination, if any, would be based upon the fair value of those outstanding contracts at that time.
Equity Price Risk Management
We are exposed to the market risk of changes in the equity prices of our investments in marketable securities. We enter into various derivative transactions pursuant to our policies to manage the volatility relating to these exposures.
Through market value and sensitivity analyses, we monitor our equity price risk exposures to ensure that the instruments are matched with the underlying assets or liabilities, reduce our risks relating to equity prices and maintain a high correlation to the risk inherent in the hedged item.
To limit our exposure to and benefits from price fluctuations in the common stock of some of our investments, we use equity derivative financial instruments. These derivative financial instruments include equity collar agreements, prepaid forward sales agreements and indexed or exchangeable debt instruments and are accounted for at fair value.
| | | | |
| MD&A Comcast 2006 Annual Report | �� | 34 | | |
Except as described in “Investment Income (Loss), Net” (see above), the changes in the fair value of our investments that we accounted for as trading securities were substantially offset by the changes in the fair values of the equity derivative financial instruments.
Refer toNote 2 to our consolidated financial statements for a discussion of our accounting policies for derivative financial instruments and toNote 6 andNote 8 to our consolidated financial statements for discussions of our derivative financial instruments.
Contractual Obligations
Our unconditional contractual obligations as of December 31, 2006, which consist primarily of our debt obligations and their amounts in future periods, are summarized in the following table:
| | | | | | | | | | | | | | | |
| | | Payments Due by Period |
| (in millions) | | Total | | Year 1 | | Years
2 – 3 | | Years
4 – 5 | | More than 5 |
Debt obligations(a) | | $ | 28,909 | | $ | 962 | | $ | 3,900 | | $ | 3,079 | | $ | 20,968 |
Capital lease obligations | | | 66 | | | 21 | | | 17 | | | 8 | | | 20 |
Operating lease obligations | | | 1,614 | | | 292 | | | 491 | | | 253 | | | 578 |
Purchase obligations(b) | | | 12,068 | | | 3,809 | | | 3,056 | | | 2,150 | | | 3,053 |
Other long-term liabilities reflected on the balance sheet: | | | | | | | | | | | | | | | |
Acquisition-related obligations(c) | | | 364 | | | 271 | | | 75 | | | 11 | | | 7 |
Other long-term obligations(d) | | | 4,361 | | | 283 | | | 449 | | | 207 | | | 3,422 |
Total | | $ | 47,382 | | $ | 5,638 | | $ | 7,989 | | $ | 5,707 | | $ | 28,048 |
Refer toNote 8 (long-term debt) andNote 13 (commitments) to our consolidated financial statements.
(a) Excludes interest payments.
(b) Purchase obligations consist of agreements to purchase goods and services that are legally binding on us and specify all significant terms, including fixed or minimum quantities to be purchased and price provisions. Our purchase obligations primarily relate to our Cable segment, including contracts with programming networks, customer premise equipment manufacturers, communication vendors, other cable operators for which we provide advertising sales representation, and other contracts entered into in the normal course of business. We also have purchase obligations through Comcast Spectacor for the players and coaches of our professional sports teams. We did not include contracts with immaterial future commitments.
(c) Acquisition-related obligations consist primarily of costs related to terminated employees, costs relating to exiting contractual obligations, and other assumed contractual obligations of the acquired entity.
(d) Other long-term obligations consist primarily of our prepaid forward sales transactions of equity securities we hold, subsidiary preferred shares, deferred compensation obligations, pension, postretirement and postemployment benefit obligations, and programming rights payable under license agreements.
Off-Balance Sheet Arrangements
We do not have any significant off-balance sheet arrangements that are reasonably likely to have a current or future effect on our financial condition, results of operations, liquidity, capital expenditures or capital resources.
Critical Accounting Judgments and Estimates
The preparation of our financial statements requires us to make estimates that affect the reported amounts of assets, liabilities, revenues and expenses, and related disclosure of contingent assets and contingent liabilities. We base our judgments on historical experience and on various other assumptions that we believe are reasonable under the circumstances, the results of which form the basis for making estimates about the carrying values of assets and liabilities that are not readily apparent from other sources. Actual results may differ from these estimates under different assumptions or conditions.
We believe our judgments and related estimates associated with the valuation and impairment testing of our cable franchise rights and the accounting for income taxes and legal contingencies are critical in the preparation of our financial statements. Management has discussed the development and selection of these critical accounting judgments and estimates with the Audit Committee of our Board of Directors, and the Audit Committee has reviewed our disclosures relating to them presented below.
Refer toNote 2 to our consolidated financial statements for a discussion of our accounting policies with respect to these and other items.
Valuation and Impairment Testing of Cable Franchise Rights
Our largest asset, our cable franchise rights, results from agreements we have with state and local governments that allow us to construct and operate a cable business within a specified geographic area. The value of a franchise is derived from the economic
| | | | |
| | 35 | | Comcast 2006 Annual ReportMD&A |
benefits we receive from the right to solicit new subscribers and to market new services such as additional digital cable services, high speed Internet and phone services in a particular service area. The amounts we record for cable franchise rights are primarily the result of cable system acquisitions. Typically when we acquire a cable system, the most significant asset we record is the value of the franchise intangible. Often these cable system acquisitions include multiple franchise areas. We currently serve approximately 6,000 franchise areas in the United States.
We have concluded that our cable franchise rights have an indefinite useful life since there are no legal, regulatory, contractual, competitive, economic or other factors which limit the period over which these rights will contribute to our cash flows. Accordingly, we do not amortize our cable franchise rights but assess the carrying value of our cable franchise rights annually, or more frequently whenever events or changes in circumstances indicate that the carrying amount may exceed its fair value (the “impairment test”) in accordance with SFAS No. 142, “Goodwill and Other Intangible Assets.”
If we determine the value of our cable franchise rights is less than the carrying amount, we recognize an impairment charge for the difference between the estimated fair value and the carrying value of the assets. For the purpose of our impairment testing, we have grouped the recorded values of our various cable franchise rights into geographic regions. We evaluate these groups periodically to ensure impairment testing is performed at an appropriate level. We estimate the fair value of our cable franchise rights primarily based on a discounted cash flow analysis that involves significant judgment in developing individual assumptions for each of the geographic regions, including long-term growth rate and discount rate assumptions. We have not recorded any significant impairment charges as a result of our impairment testing.
We could record impairment charges in the future if there are changes in market conditions, operating results, federal or state regulations, or groupings of the geographic regions in which we test for impairment, in any such case that prevent us from recovering the carrying value of these cable franchise rights. At our last impairment test date, the amounts by which the estimated fair value of our cable franchise rights exceeded the carrying value for our geographic regions ranged from zero to in excess of $2.0 billion. A 10% decline in the estimated fair value of the cable franchise rights for each of these regions would result in an impairment in three of these regions and an impairment charge of approximately $540 million.
Income Taxes
Our provision for income taxes is based on our current period income, changes in deferred income tax assets and liabilities, income tax rates and tax planning opportunities available in the jurisdictions in which we operate. From time to time, we engage
in transactions in which the tax consequences may be subject to uncertainty. Examples of such transactions include business acquisitions and disposals, including like-kind exchanges of cable systems, issues related to consideration paid or received in connection with acquisitions, and certain financing transactions. Significant judgment is required in assessing and estimating the tax consequences of these transactions. We prepare and file tax returns based on our interpretation of tax laws and regulations, and we record estimates based on these judgments and interpretations.
In the normal course of business, our tax returns are subject to examination by various taxing authorities. Such examinations may result in future tax and interest assessments by these taxing authorities. We adjust our estimates periodically because of ongoing examinations by and settlements with the various taxing authorities, as well as changes in tax laws, regulations and precedent. The effects on our financial statements of income tax uncertainties that arise in connection with business combinations and those associated with entities acquired in business combinations are discussed inNote 2 to our consolidated financial statements. The consolidated tax provision of any given year includes adjustments to prior year income tax accruals that are considered appropriate and any related estimated interest. We believe that adequate accruals have been made for income taxes. Differences between the estimated and actual amounts determined upon ultimate resolution, individually or in the aggregate, are not expected to have a material adverse effect on our consolidated financial position, but could possibly be material to our consolidated results of operations or cash flow of any one period.
Legal Contingencies
We are subject to legal, regulatory and other proceedings and claims that arise in the ordinary course of our business and, in certain cases, those that we assume from an acquired entity in a business combination. We record an estimated liability for those proceedings and claims arising in the ordinary course of business based upon the probable and reasonably estimable criteria contained in SFAS No. 5, “Accounting for Contingencies.” For those litigation contingencies assumed in a business combination, we record a liability based on estimated fair value when we can determine such fair value. We review outstanding claims with internal as well as external counsel to assess the probability and the estimates of loss. We reassess the risk of loss as new information becomes available, and we adjust liabilities as appropriate. The actual cost of resolving a claim may be substantially different from the amount of the liability recorded. Differences between the estimated and actual amounts determined upon ultimate resolution, individually or in the aggregate, are not expected to have a material adverse effect on our consolidated financial position, but could possibly be material to our consolidated results of operations or cash flow of any one period.
| | | | |
| MD&A Comcast 2006 Annual Report | | 36 | | |
Report of Management
Management’s Report on Financial Statements
Our management is responsible for the preparation, integrity and fair presentation of information in our consolidated financial statements, including estimates and judgments. The consolidated financial statements presented in this report have been prepared in accordance with accounting principles generally accepted in the United States. Our management believes the consolidated financial statements and other financial information included in this report fairly present, in all material respects, our financial condition, results of operations and cash flows as of and for the periods presented in this report. The consolidated financial statements have been audited by Deloitte & Touche LLP, an independent registered public accounting firm, as stated in their report, which is included herein.
Management’s Report on Internal Control Over Financial Reporting
Our management is responsible for establishing and maintaining an adequate system of internal control over financial reporting. Our system of internal control over financial reporting is designed to provide reasonable assurance regarding the reliability of financial reporting and the preparation of financial statements for external purposes in accordance with accounting principles generally accepted in the United States.
Our internal control over financial reporting includes those policies and procedures that:
| • | | Pertain to the maintenance of records that, in reasonable detail, accurately and fairly reflect our transactions and dispositions of our assets. |
| • | | Provide reasonable assurance that our transactions are recorded as necessary to permit preparation of our financial statements in accordance with accounting principles generally accepted in the United States, and that our receipts and expenditures are being made only in accordance with authorizations of our management and our directors. |
| • | | Provide reasonable assurance regarding prevention or timely detection of unauthorized acquisition, use or disposition of our assets that could have a material effect on the financial statements. |
Because of its inherent limitations, a system of internal control over financial reporting can provide only reasonable assurance and may not prevent or detect misstatements. Further, because of changes in conditions, effectiveness of internal controls over financial reporting may vary over time. Our system contains self-monitoring mechanisms, and actions are taken to correct deficiencies as they are identified.
Our management conducted an evaluation of the effectiveness of the system of internal control over financial reporting based on the framework in Internal Control — Integrated Framework issued by the Committee of Sponsoring Organizations of the Treadway Commission. Based on this evaluation, our management concluded that our system of internal control over financial reporting was effective as of December 31, 2006. Our management’s assessment of the effectiveness of our internal control over financial reporting has been audited by Deloitte & Touche LLP, an independent registered public accounting firm, as stated in their report, which is included herein.
Audit Committee Oversight
The Audit Committee of the Board of Directors, which is comprised solely of independent directors, has oversight responsibility for our financial reporting process and the audits of our consolidated financial statements and internal control over financial reporting. The Audit Committee meets regularly with management and with our internal auditors and independent registered public accounting firm (collectively, the “auditors”) to review matters related to the quality and integrity of our financial reporting, internal control over financial reporting (including compliance matters related to our Code of Ethics and Business Conduct), and the nature, extent, and results of internal and external audits. Our auditors have full and free access and report directly to the Audit Committee. The Audit Committee recommended, and the Board of Directors approved, that the audited consolidated financial statements be included in this Annual Report.
| | | | | | |

| | 
| | 
| | 
|
| | | |
| Brian L. Roberts | | John R. Alchin | | Lawrence S. Smith | | Lawrence J. Salva |
Chairman and CEO | | Executive Vice President, | | Executive Vice President and | | Senior Vice President, |
| | Co-Chief Financial Officer | | Co-Chief Financial Officer | | Chief Accounting Officer |
| | and Treasurer | | | | and Controller |
| | | | |
| | 37 | | Comcast 2006 Annual Report |
Report of Independent Registered Public Accounting Firm
Board of Directors and Stockholders
Comcast Corporation
Philadelphia, Pennsylvania
We have audited the accompanying consolidated balance sheet of Comcast Corporation and subsidiaries (the “Company”) as of December 31, 2006 and 2005, and the related consolidated statements of operations, cash flows and stockholders’ equity for each of the three years in the period ended December 31, 2006. We also have audited management’s assessment, included under the caption Management’s Report on Internal Control Over Financial Reporting, that the Company maintained effective internal control over financial reporting as of December 31, 2006, based on criteria established in Internal Control — Integrated Framework issued by the Committee of Sponsoring Organizations of the Treadway Commission. The Company’s management is responsible for these financial statements, for maintaining effective internal control over financial reporting, and for its assessment of the effectiveness of internal control over financial reporting. Our responsibility is to express an opinion on these financial statements, an opinion on management’s assessment, and an opinion on the effectiveness of the Company’s internal control over financial reporting based on our audits.
We conducted our audits in accordance with the standards of the Public Company Accounting Oversight Board (United States). Those standards require that we plan and perform the audits to obtain reasonable assurance about whether the financial statements are free of material misstatement and whether effective internal control over financial reporting was maintained in all material respects. Our audits of the financial statements included examining, on a test basis, evidence supporting the amounts and disclosures in the financial statements, assessing the accounting principles used and significant estimates made by management, and evaluating the overall financial statement presentation. Our audit of internal control over financial reporting included obtaining an understanding of internal control over financial reporting, evaluating management’s assessment, testing and evaluating the design and operating effectiveness of internal control, and performing such other procedures as we considered necessary in the circumstances. We believe that our audits provide a reasonable basis for our opinions.
A company’s internal control over financial reporting is a process designed by, or under the supervision of, the company’s principal executive and principal financial officers, or persons performing similar functions, and effected by the company’s board of directors, management, and other personnel to provide reasonable assurance regarding the reliability of financial reporting and the preparation of financial statements for external purposes in accordance with generally accepted accounting principles. A company’s internal control over financial reporting includes those policies and procedures that (1) pertain to the maintenance of records that, in reasonable detail, accurately and fairly reflect the transactions and dispositions of the assets of the company; (2) provide reasonable assurance that transactions are recorded as necessary to permit preparation of financial statements in accordance with generally accepted accounting principles and that receipts and expenditures of the company are being made only in accordance with authorizations of management and directors of the company; and (3) provide reasonable assurance regarding prevention or timely detection of unauthorized acquisition, use, or disposition of the company’s assets that could have a material effect on the financial statements.
Because of the inherent limitations of internal control over financial reporting, including the possibility of collusion or improper management override of controls, material misstatements due to error or fraud may not be prevented or detected on a timely basis. Also, projections of any evaluation of the effectiveness of the internal control over financial reporting to future periods are subject to the risk that the controls may become inadequate because of changes in conditions, or that the degree of compliance with the policies or procedures may deteriorate.
In our opinion, the consolidated financial statements referred to above present fairly, in all material respects, the financial position of Comcast Corporation and subsidiaries as of December 31, 2006 and 2005, and the results of their operations and their cash flows for each of the three years in the period ended December 31, 2006, in conformity with accounting principles generally accepted in the United States of America. Also, in our opinion, management’s assessment that the Company maintained effective internal control over financial reporting as of December 31, 2006, is fairly stated, in all material respects, based on the criteria established in Internal Control — Integrated Framework issued by the Committee of Sponsoring Organizations of the Treadway Commission. Furthermore, in our opinion, the Company maintained, in all material respects, effective internal control over financial reporting as of December 31, 2006, based on the criteria established in Internal Control — Integrated Framework issued by the Committee of Sponsoring Organizations of the Treadway Commission.
As discussed in Note 10 to the consolidated financial statements, the Company adopted Statement of Financial Accounting Standards No. 123R, “Share Based Payments,” effective January 1, 2006.
|

|
|
| Deloitte & Touche LLP |
Philadelphia, Pennsylvania |
February 23, 2007 |
| | | | |
| Comcast 2006 Annual Report | | 38 | | |
Consolidated Balance Sheet
| | | | | | | | |
| December 31 (in millions, except share data) | | 2006 | | | 2005 | |
Assets | | | | | | | | |
Current Assets | | | | | | | | |
Cash and cash equivalents | | $ | 1,239 | | | $ | 947 | |
Investments | | | 1,735 | | | | 148 | |
Accounts receivable, less allowance for doubtful accounts of $157 and $ 132 | | | 1,450 | | | | 1,008 | |
Other current assets | | | 778 | | | | 685 | |
Current assets of discontinued operations | | | — | | | | 60 | |
Total current assets | | | 5,202 | | | | 2,848 | |
Investments | | | 8,847 | | | | 12,675 | |
Property and equipment, net of accumulated depreciation of $15,506 and $ 12,079 | | | 21,248 | | | | 17,704 | |
Franchise rights | | | 55,927 | | | | 48,804 | |
Goodwill | | | 13,768 | | | | 13,498 | |
Other intangible assets, net of accumulated amortization of $5,543 and $ 4,635 | | | 4,881 | | | | 3,118 | |
Other noncurrent assets, net | | | 532 | | | | 635 | |
Noncurrent assets of discontinued operations, net | | | — | | | | 4,118 | |
| | | $ | 110,405 | | | $ | 103,400 | |
| | |
Liabilities and Stockholders’ Equity | | | | | | | | |
Current Liabilities | | | | | | | | |
Accounts payable and accrued expenses related to trade creditors | | $ | 2,862 | | | $ | 2,239 | |
Accrued salaries and wages | | | 453 | | | | 360 | |
Other current liabilities | | | 2,579 | | | | 2,122 | |
Deferred income taxes | | | 563 | | | | 2 | |
Current portion of long-term debt | | | 983 | | | | 1,689 | |
Current liabilities of discontinued operations | | | — | | | | 112 | |
Total current liabilities | | | 7,440 | | | | 6,524 | |
Long-term debt, less current portion | | | 27,992 | | | | 21,682 | |
Deferred income taxes | | | 27,089 | | | | 27,370 | |
Other noncurrent liabilities | | | 6,476 | | | | 6,920 | |
Noncurrent liabilities of discontinued operations | | | — | | | | 28 | |
Minority interest | | | 241 | | | | 657 | |
Commitments and contingencies (Note 13) | | | | | | | | |
Stockholders’ equity | | | | | | | | |
Preferred stock — authorized 20,000,000 shares; issued, zero | | | — | | | | — | |
Class A common stock, $0.01 par value — authorized, 7,500,000,000 shares; issued, 2,425,818,710 and 2,410,511,727; outstanding, 2,060,357,960, and 2,045,050,977 | | | 24 | | | | 24 | |
Class A Special common stock, $0.01 par value — authorized, 7,500,000,000 shares; issued 1,120,659,771 and 1,224,368,823; outstanding, 1,049,725,007 and 1,153,434,059 | | | 11 | | | | 12 | |
Class B common stock, $0.01 par value — authorized, 75,000,000 shares; issued and outstanding, 9,444,375 | | | — | | | | — | |
Additional capital | | | 42,401 | | | | 42,989 | |
Retained earnings | | | 6,214 | | | | 4,825 | |
Treasury stock, 365,460,750 Class A common shares and 70,934,764 Class A Special common shares | | | (7,517 | ) | | | (7,517 | ) |
Accumulated other comprehensive income (loss) | | | 34 | | | | (114 | ) |
Total stockholders’ equity | | | 41,167 | | | | 40,219 | |
| | | $ | 110,405 | | | $ | 103,400 | |
See notes to consolidated financial statements.
| | | | |
| | 39 | | Comcast 2006 Annual Report |
Consolidated Statement of Operations
| | | | | | | | | | | | |
| Year Ended December 31 (in millions, except per share data) | | 2006 | | | 2005 | | | 2004 | |
Revenues | | $ | 24,966 | | | $ | 21,075 | | | $ | 19,221 | |
Costs and Expenses | | | | | | | | | | | | |
Operating (excluding depreciation) | | | 9,010 | | | | 7,513 | | | | 7,036 | |
Selling, general and administrative | | | 6,514 | | | | 5,490 | | | | 5,005 | |
Depreciation | | | 3,828 | | | | 3,413 | | | | 3,197 | |
Amortization | | | 995 | | | | 1,138 | | | | 1,154 | |
| | | 20,347 | | | | 17,554 | | | | 16,392 | |
Operating income | | | 4,619 | | | | 3,521 | | | | 2,829 | |
Other Income (Expense) | | | | | | | | | | | | |
Interest expense | | | (2,064 | ) | | | (1,795 | ) | | | (1,874 | ) |
Investment income (loss), net | | | 990 | | | | 89 | | | | 472 | |
Equity in net (losses) income of affiliates, net | | | (124 | ) | | | (42 | ) | | | (81 | ) |
Other income (expense) | | | 173 | | | | (53 | ) | | | 397 | |
| | | (1,025 | ) | | | (1,801 | ) | | | (1,086 | ) |
Income from continuing operations before income taxes and minority interest | | | 3,594 | | | | 1,720 | | | | 1,743 | |
Income tax expense | | | (1,347 | ) | | | (873 | ) | | | (801 | ) |
Income from continuing operations before minority interest | | | 2,247 | | | | 847 | | | | 942 | |
Minority interest | | | (12 | ) | | | (19 | ) | | | (14 | ) |
Income from continuing operations | | | 2,235 | | | | 828 | | | | 928 | |
Income from discontinued operations, net of tax | | | 103 | | | | 100 | | | | 42 | |
Gain on discontinued operations, net of tax | | | 195 | | | | — | | | | — | |
Net Income | | $ | 2,533 | | | $ | 928 | | | $ | 970 | |
Basic earnings for common stockholders per common share | | | | | | | | | | | | |
Income from continuing operations | | $ | 0.71 | | | $ | 0.25 | | | $ | 0.28 | |
Income from discontinued operations | | | 0.03 | | | | 0.03 | | | | 0.01 | |
Gain on discontinued operations | | | 0.06 | | | | — | | | | — | |
Net income | | $ | 0.80 | | | $ | 0.28 | | | $ | 0.29 | |
Diluted earnings for common stockholders per common share | | | | | | | | | | | | |
Income from continuing operations | | $ | 0.70 | | | $ | 0.25 | | | $ | 0.28 | |
Income from discontinued operations | | | 0.03 | | | | 0.03 | | | | 0.01 | |
Gain on discontinued operations | | | 0.06 | | | | — | | | | — | |
Net income | | $ | 0.79 | | | $ | 0.28 | | | $ | 0.29 | |
See notes to consolidated financial statements.
| | | | |
| Comcast 2006 Annual Report | | 40 | | |
Consolidated Statement of Cash Flows
| | | | | | | | | | | | |
| Year Ended December 31 (in millions) | | 2006 | | | 2005 | | | 2004 | |
Operating Activities | | | | | | | | | | | | |
Net income | | $ | 2,533 | | | $ | 928 | | | $ | 970 | |
Adjustments to reconcile net income to net cash provided by operating activities: | | | | | | | | | | | | |
Depreciation | | | 3,828 | | | | 3,413 | | | | 3,197 | |
Amortization | | | 995 | | | | 1,138 | | | | 1,154 | |
Depreciation and amortization of discontinued operations | | | 139 | | | | 253 | | | | 272 | |
Share-based compensation expenses | | | 190 | | | | 56 | | | | 33 | |
Noncash interest expense, net | | | 99 | | | | 8 | | | | 33 | |
Equity in net losses (income) of affiliates, net | | | 124 | | | | 42 | | | | 81 | |
(Gains) losses on investments and noncash other (income) expense, net | | | (979 | ) | | | (54 | ) | | | (703 | ) |
Gain on discontinued operations | | | (736 | ) | | | — | | | | — | |
Noncash contribution expense | | | 33 | | | | 10 | | | | 25 | |
Minority interest | | | 12 | | | | 19 | | | | 14 | |
Deferred income taxes | | | 674 | | | | 183 | | | | 531 | |
Proceeds from sales of trading securities | | | — | | | | — | | | | 680 | |
Changes in operating assets and liabilities, net of effects of acquisitions and divestitures: | | | | | | | | | | | | |
Change in accounts receivable, net | | | (357 | ) | | | (97 | ) | | | (54 | ) |
Change in accounts payable and accrued expenses related to trade creditors | | | 560 | | | | (152 | ) | | | (163 | ) |
Change in other operating assets and liabilities | | | (497 | ) | | | (912 | ) | | | 12 | |
Net cash provided by (used in) operating activities | | | 6,618 | | | | 4,835 | | | | 6,082 | |
Financing Activities | | | | | | | | | | | | |
Proceeds from borrowings | | | 7,497 | | | | 3,978 | | | | 1,030 | |
Retirements and repayments of debt | | | (2,039 | ) | | | (2,706 | ) | | | (2,323 | ) |
Repurchases of common stock | | | (2,347 | ) | | | (2,313 | ) | | | (1,361 | ) |
Issuances of common stock | | | 410 | | | | 93 | | | | 113 | |
Other | | | 25 | | | | 15 | | | | 25 | |
Net cash provided by (used in) financing activities | | | 3,546 | | | | (933 | ) | | | (2,516 | ) |
Investing Activities | | | | | | | | | | | | |
Capital expenditures | | | (4,395 | ) | | | (3,621 | ) | | | (3,660 | ) |
Cash paid for intangible assets | | | (306 | ) | | | (281 | ) | | | (615 | ) |
Acquisitions, net of cash acquired | | | (5,110 | ) | | | (199 | ) | | | (296 | ) |
Proceeds from sales and restructuring of investments | | | 2,720 | | | | 861 | | | | 228 | |
Purchases of investments | | | (2,812 | ) | | | (306 | ) | | | (156 | ) |
Proceeds from sales (purchases) of short-term investments, net | | | 33 | | | | (86 | ) | | | (13 | ) |
Proceeds from settlement of contract of acquired company | | | — | | | | — | | | | 26 | |
Other | | | (2 | ) | | | (116 | ) | | | (26 | ) |
Net cash provided by (used in) investing activities | | | (9,872 | ) | | | (3,748 | ) | | | (4,512 | ) |
Increase (decrease) in cash and cash equivalents | | | 292 | | | | 154 | | | | (946 | ) |
Cash and cash equivalents, beginning of year | | | 947 | | | | 793 | | | | 1,739 | |
Cash and cash equivalents, end of year | | $ | 1,239 | | | $ | 947 | | | $ | 793 | |
See notes to consolidated financial statements.
| | | | |
| | 41 | | Comcast 2006 Annual Report |
Consolidated Statement of Stockholders’ Equity
| | | | | | | | | | | | | | | | | | | | | | | | | | | | | | | | | | | | | | |
| | | | | | | | | | | | | | | | | | | Accumulated Other Comprehensive Income (Loss) | | | | |
| | | Common Stock Class | | | | | | | | | | | | | | | | | | | | | |
| (in millions) | | A | | Special | | | B | | Additional
Capital | | | Retained
Earnings | | | Treasury
Stock At Cost | | | Unrealized
Gains
(Losses) | | | Cumulative
Translation
Adjustments | | | Minimum
Pension
Liability | | | Total | |
Balance, January 1, 2004 | | $ | 24 | | $ | 14 | | | $ | — | | $ | 44,729 | | | $ | 4,552 | | | $ | (7,517 | ) | | $ | (112 | ) | | $ | (28 | ) | | $ | — | | | $ | 41,662 | |
Comprehensive income: | | | | | | | | | | | | | | | | | | | | | | | | | | | | | | | | | | | | | | |
Net income | | | | | | | | | | | | | | | | | 970 | | | | | | | | | | | | | | | | | | | | | |
Reclassification adjustments for losses included in net income, net of deferred taxes | | | | | | | | | | | | | | | | | | | | | | | | | 1 | | | | | | | | | | | | | |
Cumulative translation adjustments | | | | | | | | | | | | | | | | | | | | | | | | | | | | | 20 | | | | | | | | | |
Total comprehensive income | | | | | | | | | | | | | | | | | | | | | | | | | | | | | | | | | | | | | 991 | |
Stock compensation plans | | | | | | | | | | | | | 130 | | | | (73 | ) | | | | | | | | | | | | | | | | | | | 57 | |
Repurchase and retirement of common stock | | | | | | (1 | ) | | | | | | (757 | ) | | | (558 | ) | | | | | | | | | | | | | | | | | | | (1,316 | ) |
Employee stock purchase plan | | | | | | | | | | | | | 28 | | | | | | | | | | | | | | | | | | | | | | | | 28 | |
Balance, December 31, 2004 | | | 24 | | | 13 | | | | — | | | 44,130 | | | | 4,891 | | | | (7,517 | ) | | | (111 | ) | | | (8 | ) | | | — | | | | 41,422 | |
Comprehensive income: | | | | | | | | | | | | | | | | | | | | | | | | | | | | | | | | | | | | | | |
Net income | | | | | | | | | | | | | | | | | 928 | | | | | | | | | | | | | | | | | | | | | |
Unrealized gains on marketable securities, net of deferred taxes of $ 11 | | | | | | | | | | | | | | | | | | | | | | | | | 20 | | | | | | | | | | | | | |
Reclassification adjustments for income included in net income, net of deferred taxes of $ 2 | | | | | | | | | | | | | | | | | | | | | | | | | (4 | ) | | | | | | | | | | | | |
Minimum pension liability, net of deferred taxes of $ 7 | | | | | | | | | | | | | | | | | | | | | | | | | | | | | | | | | (12 | ) | | | | |
Cumulative translation adjustments | | | | | | | | | | | | | | | | | | | | | | | | | | | | | 1 | | | | | | | | | |
Total comprehensive income | | | | | | | | | | | | | | | | | | | | | | | | | | | | | | | | | | | | | 933 | |
Stock compensation plans | | | | | | | | | | | | | 120 | | | | | | | | | | | | | | | | | | | | | | | | 120 | |
Repurchase and retirement of common stock | | | | | | (1 | ) | | | | | | (1,294 | ) | | | (994 | ) | | | | | | | | | | | | | | | | | | | (2,289 | ) |
Employee stock purchase plan | | | | | | | | | | | | | 33 | | | | | | | | | | | | | | | | | | | | | | | | 33 | |
Balance, December 31, 2005 | | | 24 | | | 12 | | | | — | | | 42,989 | | | | 4,825 | | | | (7,517 | ) | | | (95 | ) | | | (7 | ) | | | (12 | ) | | | 40,219 | |
Comprehensive income: | | | | | | | | | | | | | | | | | | | | | | | | | | | | | | | | | | | | | | |
Net income | | | | | | | | | | | | | | | | | 2,533 | | | | | | | | | | | | | | | | | | | | | |
Unrealized gains on marketable securities, net of deferred taxes of $ 69 | | | | | | | | | | | | | | | | | | | | | | | | | 128 | | | | | | | | | | | | | |
Reclassification adjustments for income included in net income, net of deferred taxes of $ 6 | | | | | | | | | | | | | | | | | | | | | | | | | 11 | | | | | | | | | | | | | |
Minimum pension liability, net of deferred taxes of $ 4 | | | | | | | | | | | | | | | | | | | | | | | | | | | | | | | | | 7 | | | | | |
Cumulative translation adjustments | | | | | | | | | | | | | | | | | | | | | | | | | | | | | 2 | | | | | | | | | |
Total comprehensive income | | | | | | | | | | | | | | | | | | | | | | | | | | | | | | | | | | | | | 2,681 | |
Stock compensation plans | | | | | | | | | | | | | 604 | | | | (33 | ) | | | | | | | | | | | | | | | | | | | 571 | |
Repurchase and retirement of common stock | | | | | | (1 | ) | | | | | | (1,235 | ) | | | (1,111 | ) | | | | | | | | | | | | | | | | | | | (2,347 | ) |
Employee stock purchase plan | | | | | | | | | | | | | 43 | | | | | | | | | | | | | | | | | | | | | | | | 43 | |
Balance, December 31, 2006 | | $ | 24 | | $ | 11 | | | $ | — | | $ | 42,401 | | | $ | 6,214 | | | $ | (7,517 | ) | | $ | 44 | | | $ | (5 | ) | | $ | (5 | ) | | $ | 41,167 | |
See notes to consolidated financial statements.
| | | | |
| Comcast 2006 Annual Report | | 42 | | |
Notes to Consolidated Financial Statements
Note 1: Organization and Business
We are a Pennsylvania corporation and were incorporated in December 2001. Through our predecessors, we have developed, managed and operated cable systems since 1963. We classify our operations in two reportable segments: Cable and Programming.
Our Cable segment is principally involved in the management and operation of cable systems in the United States. As of December 31, 2006, we served approximately 23.4 million video subscribers, 11 million high-speed Internet subscribers and 2.4 million phone subscribers. Our regional sports and news networks are included in our Cable segment because they derive a substantial portion of their revenues from our cable operations.
Our Programming segment operates our consolidated national programming networks: E!, Style, The Golf Channel, VERSUS (formerly known as OLN), G4 and AZN Television.
Our other businesses consist principally of Comcast Spectacor, which owns the Philadelphia Flyers, the Philadelphia 76ers and two large multipurpose arenas in Philadelphia, and manages other facilities for sporting events, concerts and other special events, and our corporate activities. We also own equity method investments in other programming networks.
Stock Split
On January 31, 2007, our Board of Directors approved a three-for-two stock split in the form of a 50% stock dividend (the “Stock Split”) payable on February 21, 2007, to shareholders of record on February 14, 2007. The stock dividend was in the form of an additional 0.5 share for every share held and was payable in shares of Class A common stock on the existing Class A common stock and payable in shares of Class A Special common stock on the existing Class A Special common stock and Class B common stock with cash being paid in lieu of fractional shares. Our stock began trading ex-dividend on February 22, 2007. The number of shares outstanding and related prices, per share amounts, share conversions and share-based data have been adjusted to reflect the Stock Split for all periods presented.
Note 2: Summary of Significant Accounting policies
Basis of Consolidation
The accompanying consolidated financial statements include (i) all of our accounts, (ii) all entities in which we have a controlling voting interest (“subsidiaries”) and (iii) variable interest entities (“VIEs”) required to be consolidated in accordance with generally accepted accounting principles in the United States (“GAAP”). We have eliminated all significant intercompany accounts and transactions among consolidated entities.
Our Use of Estimates
We prepare our consolidated financial statements in conformity with GAAP, which requires us to make estimates and assumptions that affect the reported amounts and disclosures. Actual results could differ from those estimates. Estimates are used when accounting for various items, such as allowances for doubtful accounts, investments, derivative financial instruments, asset impairment, nonmonetary transactions, certain acquisition-related liabilities, programming-related liabilities, pensions and other postretirement benefits, revenue recognition, depreciation and amortization, income taxes and legal contingencies.
Fair Values
We have determined the estimated fair value amounts presented in these consolidated financial statements using available market information and appropriate methodologies. However, considerable judgment is required in interpreting market data to develop the estimates of fair value. The estimates presented in these consolidated financial statements are not necessarily indicative of the amounts that we could realize in a current market exchange. The use of different market assumptions and/or estimation methodologies may have a material effect on the estimated fair value amounts. We based these fair value estimates on pertinent information available to us as of December 31, 2006 and 2005.
Cash Equivalents
The carrying amounts of our cash equivalents approximate their fair value. Our cash equivalents principally consist of commercial paper, money market funds, U.S. government obligations and certificates of deposit with maturities of less than three months when purchased.
Investments
We review our investment portfolio each reporting period to determine whether a decline in the market value is considered to be other than temporary. If an investment is deemed to have experienced an other than temporary decline below its cost basis, we reduce the carrying amount of the investment to its fair market value. We charge the impairment to earnings and establish a new cost basis for the investment.
Purchases of or proceeds from the sale of trading securities are classified as cash flows from operating activities, while cash flows from all other investment securities are classified as cash flows from investing activities.
We classify unrestricted publicly traded investments as available-for-sale (“AFS”) or trading securities and record them at fair value. For AFS securities, we record unrealized gains or losses resulting from changes in fair value between measurement dates as a component of other comprehensive income (loss), except when we consider declines in value to be other than temporary. These other than temporary declines are recognized as a component of investment income (loss), net. For trading securities, we record unrealized
| | | | |
| | 43 | | Comcast 2006 Annual Report |
gains or losses resulting from changes in fair value between measurement dates as a component of investment income (loss), net. We recognize realized gains and losses associated with our fair value method investments using the specific identification method.
We use the equity method to account for investments in which we have the ability to exercise significant influence over the investee’s operating and financial policies. Equity method investments are recorded at original cost and adjusted to recognize our proportionate share of the investee’s net income or losses after the date of investment, amortization of basis differences, additional contributions made and dividends received, and impairment charges resulting from adjustments to fair value. We generally record our share of the investee’s net income or loss one quarter in arrears due to the timing of our receipt of such information.
If a consolidated subsidiary or equity method investee issues additional securities that change our proportionate share of the entity, we recognize the change as a gain or loss in our consolidated statement of operations. In cases where gain realization is not assured, we record the gain to additional capital.
Restricted publicly traded investments and investments in privately held companies are stated at cost and adjusted for any known decrease in value (see Note 6).
Property and Equipment
Property and equipment are stated at cost. We capitalize improvements that extend asset lives and expense other repairs and maintenance charges as incurred. For assets that are sold or retired, we remove the applicable cost and accumulated depreciation and, unless the gain or loss on disposition is presented separately, we recognize it as a component of depreciation expense.
We capitalize the costs associated with the construction of our cable transmission and distribution facilities and new service installations. Costs include all direct labor and materials, as well as various indirect costs.
We record depreciation using the straight-line method over estimated useful lives. Our significant components of property and equipment are as follows:
| | | | | | | | | | |
| December 31 (in millions) | | Useful Life | | 2006 | | | 2005 | |
Cable transmission and distribution facilities | | 2 –15 years | | $ | 31,870 | | | $ | 25,737 | |
Buildings and building improvements | | 5 –40 years | | | 1,366 | | | | 1,279 | |
Land | | — | | | 163 | | | | 148 | |
Other | | 3 –10 years | | | 3,355 | | | | 2,619 | |
Property and equipment, at cost | | | | | 36,754 | | | | 29,783 | |
Less: accumulated depreciation | | | | | (15,506 | ) | | | (12,079 | ) |
Property and equipment, net | | | | $ | 21,248 | | | $ | 17,704 | |
Intangible Assets
Cable franchise rights represent the value attributed to agreements with local authorities that allow access to homes in cable service areas acquired in connection with business combinations. We do not amortize cable franchise rights because we have determined that they have an indefinite life. We reassess this determination periodically for each franchise based on the factors included in Statement of Financial Accounting Standards No. 142, “Goodwill and Other Intangible Assets” (“SFAS No. 142”). Costs we incur in negotiating and renewing cable franchise agreements are included in other intangible assets and are principally amortized on a straight-line basis over the term of the franchise renewal period.
Other intangible assets consist principally of franchise-related customer relationships acquired in business combinations, cable and satellite television distribution rights, cable franchise renewal costs, contractual operating rights, computer software, programming agreements and rights, patents and other technology rights, and noncompetition agreements. We record these costs as assets and amortize them on a straight-line basis over the term of the related agreements or estimated useful life.
Our Programming subsidiaries enter into multi-year license agreements with various cable and satellite distributors for distribution of their respective programming (“distribution rights”). We capitalize distribution rights and amortize them on a straight-line basis over the term of the related license agreements. We classify the amortization of these distribution rights as a reduction of revenue unless the Programming subsidiary receives, or will receive, an identifiable benefit from the cable or satellite system distributor separate from the fee paid for the distribution right, in which case we recognize the fair value of the identified benefit as an operating expense in the period in which it is received.
We capitalize direct development costs associated with internal-use software, including external direct costs of material and services, and payroll costs for employees devoting time to these software projects. We include these costs within other intangible assets and amortize them over a period not to exceed five years, beginning when the asset is substantially ready for use. We expense maintenance and training costs, as well as costs incurred during the preliminary project stage, as they are incurred. We capitalize initial operating system software costs and amortize them over the life of the associated hardware.
SeeNote 7 for the ranges of useful lives of our intangible assets.
Asset Impairments
Property and Equipment and Intangible Assets Subject to Amortization
We periodically evaluate the recoverability and estimated lives of our property and equipment and intangible assets subject to amortization in accordance with SFAS No. 144, “Accounting for the
| | | | |
| Notes to Consolidated Financial Statements Comcast 2006 Annual Report | | 44 | | |
Impairment or Disposal of Long-Lived Assets” (“SFAS No. 144”). Our evaluations occur whenever events or changes in circumstances indicate that the carrying amount may not be recoverable or the useful life has changed, and they include analyses based on the cash flows generated by the underlying assets and profitability information, including estimated future operating results, trends or other determinants of fair value. If the total of the expected future undiscounted cash flows is less than the carrying amount of the asset, we recognize a loss for the difference between the fair value and the carrying value of the asset. Unless presented separately, the loss is included as a component of either depreciation expense or amortization expense, as appropriate.
Franchise Rights
We evaluate the recoverability of our franchise rights annually, or more frequently whenever events or changes in circumstances indicate that the assets might be impaired. We estimate the fair value of our cable franchise rights utilizing various valuation techniques, including discounted cash flow analysis, multiples of operating income before depreciation and amortization generated by the underlying assets, analyses of current market transactions and profitability information. If the value of our cable franchise rights determined by these evaluations is less than the carrying amount, we recognize an impairment charge for the difference between the estimated fair value and the carrying value of the assets. When we perform our impairment test, we group the recorded values of our various cable franchise rights into geographic regions. We evaluate these groups periodically to ensure impairment testing is performed at an appropriate level. We have not recorded any significant impairment charges as a result of our impairment testing.
Goodwill
Goodwill is the excess of the acquisition cost of an acquired entity over the fair value of the identifiable net assets acquired. We evaluate the recoverability of our goodwill annually, or more frequently whenever events or changes in circumstances indicate that the asset might be impaired. We perform the impairment assessment of our goodwill one level below the business segment level, except for our Cable business. In our Cable business, since components one level below the segment level are not separate reporting units and have similar economic characteristics, we aggregate the components into one reporting unit at the Cable segment level.
Asset Retirement Obligations
SFAS No. 143, “Accounting for Asset Retirement Obligations,” as interpreted by Financial Accounting Standards Board (“FASB”) Interpretation (“FIN”) No. 47, “Accounting for Conditional Asset Retirement Obligations — an Interpretation of FASB Statement No. 143,” requires that a liability be recognized for an asset retirement obligation in the period in which it is incurred if a reasonable estimate of fair value can be made.
Certain of our franchise and lease agreements contain provisions requiring us to restore facilities or remove property in the event
that the franchise or lease agreement is not renewed. We expect to continually renew our franchise agreements; however, a remote possibility exists that such agreements could terminate unexpectedly, which could result in us incurring significant expense in complying with the restoration or removal provisions under such agreements. No such liabilities have been recorded in our consolidated financial statements as the obligations related to the restoration and removal provisions contained in our agreements or any disposal obligations related to our properties are not material to our consolidated financial statements or cannot be reasonably estimated.
Revenue Recognition
Cable revenues are principally derived from subscriber fees received for our video, high-speed Internet and phone services (“cable services”) and from advertising. We recognize revenues from cable services as the service is provided. We manage credit risk by screening applicants through the use of credit bureau data. If a subscriber’s account is delinquent, various measures are used to collect outstanding amounts, including termination of the subscriber’s cable service. We recognize advertising revenue at estimated realizable values when the advertising is aired. Installation revenues obtained from the connection of subscribers to our cable systems are less than related direct selling costs. Therefore, such revenues are recognized as connections are completed. Revenues earned from other sources are recognized when services are provided or events occur. Under the terms of our franchise agreements, we are generally required to pay to the local franchise authority up to 5% of our gross revenues earned from providing cable services within the local franchise area. We normally pass these fees through to our cable subscribers and classify the fees as a component of revenues.
Our Programming businesses recognize revenue from cable and satellite distributors as programming is provided, generally pursuant to multiyear distribution agreements. From time to time these agreements expire while programming continues to be provided to the operator based on interim arrangements while the parties negotiate new contractual terms. Revenue recognition is generally limited to current payments being made by the operator, typically pursuant to the prior contract terms, until a new contract is negotiated, sometimes with effective dates that affect prior periods. Differences between actual amounts determined upon resolution of negotiations and amounts recorded during these interim arrangements are recorded in the period of resolution.
Advertising revenue for our Programming businesses is recognized in the period in which commercial announcements or programs are aired. In some instances, our Programming businesses guarantee viewer ratings for their programming. Revenue is deferred to the extent of an estimated shortfall in the ratings. Such shortfalls are primarily settled by providing additional advertising time, at which point the revenue is recognized.
| | | | |
| | 45 | | Comcast 2006 Annual ReportNotes to Consolidated Financial Statements |
Cable Programming Expenses
Cable programming expenses are the fees we pay to programming networks to license the programming we package, offer and distribute to our cable subscribers. Programming is acquired for distribution to our cable subscribers, generally pursuant to multiyear distribution agreements, with rates typically based on the number of subscribers that receive the programming. From time to time these contracts expire and programming continues to be provided based on interim arrangements while the parties negotiate new contractual terms, sometimes with effective dates that affect prior periods. While payments are typically made under the prior contract terms, the amount of our programming expenses recorded during these interim arrangements is based on our estimates of the ultimate contractual terms expected to be negotiated.
Our cable subsidiaries have received or may receive incentives from programming networks for the licensing of their programming. We classify the deferred portion of these fees within noncurrent liabilities and recognize the fees as a reduction of programming expenses (included in operating expenses) over the term of the contract.
Share-Based Compensation
Prior to January 1, 2006, we accounted for our share-based compensation plans in accordance with the provisions of Accounting Principles Board (“APB”) Opinion No. 25, “Accounting for Stock Issued to Employees” (“APB No. 25”), as permitted by SFAS No. 123, “Accounting for Stock-Based Compensation” (“SFAS No. 123”), and accordingly did not recognize compensation expense for stock options with an exercise price equal to or greater than the market price of the underlying stock at the date of grant.
Effective January 1, 2006, we adopted SFAS No. 123R, “Share-Based Payment” (“SFAS No. 123R”), using the Modified Prospective Approach. Under the Modified Prospective Approach, the amount of compensation cost recognized includes: (i) compensation cost for all share-based payments granted prior to but not yet vested as of January 1, 2006, based on the grant date fair value estimated in accordance with the provisions of SFAS No. 123 and (ii) compensation cost for all share-based payments granted or modified subsequent to January 1, 2006, based on the estimated fair value at the date of grant or subsequent modification date in accordance with the provisions of SFAS No. 123R.
SFAS No. 123R also required us to change the classification, in our consolidated statement of cash flows, of any income tax benefits realized upon the exercise of stock options or issuance of restricted share unit awards in excess of that which is associated with the expense recognized for financial reporting purposes. These amounts are presented as a financing cash inflow rather than as a reduction of income taxes paid in our consolidated statement of cash flows. SeeNote 10 for further details regarding the adoption of SFAS No. 123R.
Postretirement and Postemployment Benefits
We charge to operations the estimated costs of retiree benefits and benefits for former or inactive employees, after employment but before retirement, during the years the employees provide services (seeNote 9).
Income Taxes
We recognize deferred tax assets and liabilities for temporary differences between the financial reporting basis and the tax basis of our assets and liabilities and the expected benefits of utilizing net operating loss carryforwards. The impact on deferred taxes of changes in tax rates and laws, if any, applied to the years during which temporary differences are expected to be settled, is reflected in the consolidated financial statements in the period of enactment (seeNote 11).
We account for income tax uncertainties that arise in connection with business combinations and those that are associated with entities acquired in business combinations in accordance with Emerging Issues Task Force (“EITF”) Issue No. 93-7, “Uncertainties Related to Income Taxes in a Purchase Business Combination.” Deferred tax assets and liabilities are recorded as of the date of a business combination and are based on our estimate of the ultimate tax basis that will be accepted by the various taxing authorities. Liabilities for contingencies associated with prior tax returns filed by the acquired entity are recorded based on our estimate of the ultimate settlement that will be accepted by the various taxing authorities. Estimated interest expense on these liabilities subsequent to the acquisition is reflected in our consolidated income tax provision. We adjust these deferred tax accounts and liabilities periodically to reflect revised estimated tax bases and any estimated settlements with the various taxing authorities. The effect of these adjustments is generally applied to goodwill except for post-acquisition interest expense, which is recognized as an adjustment of income tax expense.
Derivative Financial Instruments
We use derivative financial instruments for a number of purposes. We manage our exposure to fluctuations in interest rates by entering into instruments, which may include interest rate exchange agreements (“swaps”), interest rate lock agreements (“rate locks”), interest rate cap agreements (“caps”) and interest rate collar agreements (“collars”). We manage our exposure to fluctuations in the value of some of our investments by entering into equity collar agreements (“equity collars”) and equity put option agreements (“equity put options”). We are also a party to equity warrant agreements (“equity warrants”). We have issued indexed debt instruments (“Exchangeable Notes” and “ZONES”) and have entered into prepaid forward sale agreements (“prepaid forward sales”) whose value, in part, is derived from the market value of certain publicly traded common stock. We have also sold call options on some of our investments in equity securities. We use equity hedges to manage exposure to changes in equity prices associated with stock appreciation rights of acquired companies. These equity hedges are recorded at fair value based on market quotes.
| | | | |
| Notes to Consolidated Financial Statements Comcast 2006 Annual Report | | 46 | | |
For derivative instruments designated and effective as fair value hedges, such as fixed to variable swaps, changes in the fair value of the derivative instrument are substantially offset in the consolidated statement of operations by changes in the fair value of the hedged item. For derivative instruments designated as cash flow hedges, such as variable to fixed swaps and rate locks, the effective portion of any hedge is reported in other comprehensive income (loss) until it is recognized in earnings during the same period in which the hedged item affects earnings. The ineffective portion of all hedges is recognized each period in current earnings. Changes in the fair value of derivative instruments that are not designated as a hedge are recorded each period in current earnings.
When a derivative instrument designated as a fair value hedge is terminated, sold, exercised or has expired, any gain or loss is deferred and recognized in earnings over the remaining life of the hedged item. When a hedged item is settled or sold, the adjustment in the carrying amount of the hedged item is recognized in earnings. When hedged variable-rate debt is settled, the previously deferred effective portion of the hedge is written off similar to debt extinguishment costs.
Equity warrants and equity collars are adjusted to estimated fair value on a current basis with the result included in investment income (loss), net in our consolidated statement of operations.
Derivative instruments embedded in other contracts, such as our Exchangeable Notes, ZONES and prepaid forward sales, are separated into their host and derivative financial instrument components. The derivative component is recorded at its estimated fair value in our consolidated balance sheet, and changes in estimated fair value are recorded in investment income (loss), net in our consolidated statement of operations.
All derivative transactions must comply with our Board-authorized derivatives policy. We do not hold or issue any derivative financial instruments for speculative or trading purposes and are not a party to leveraged derivative instruments (seeNote 8). We manage the credit risks associated with our derivative financial instruments through the evaluation and monitoring of the creditworthiness of the counterparties. Although we may be exposed to losses in the event of nonperformance by the counterparties, we do not expect such losses, if any, to be significant.
We periodically examine the instruments we use to hedge exposure to interest rate and equity price risks to ensure that the instruments are matched with underlying assets or liabilities, reduce our risks relating to interest rates or equity prices and, through market value and sensitivity analysis, maintain a high correlation to the risk inherent in the hedged item. For those instruments that do not meet the above criteria, variations in their fair value are reflected on a current basis in our consolidated statement of operations.
Securities Lending Transactions
We may enter into securities lending transactions in which we require the borrower to provide cash collateral equal to the value of the loaned securities, as adjusted for any changes in the value of the underlying loaned securities. Loaned securities for which we maintain effective control are included in investments in our consolidated balance sheet.
Note 3: Recent Accounting Pronouncements
SFAS No. 155
In February 2006, the FASB issued SFAS No. 155, “Accounting for Certain Hybrid Financial Instruments — an Amendment of FASB Statements No. 133 and 140” (“SFAS No. 155”). SFAS No. 155 allows financial instruments that contain an embedded derivative and that otherwise would require bifurcation to be accounted for as a whole on a fair value basis, at the holder’s election. SFAS No. 155 also clarifies and amends certain other provisions of SFAS No. 133 and SFAS No. 140. This statement is effective for all financial instruments acquired or issued in fiscal years beginning after September 15, 2006. We do not expect SFAS No. 155 to have a material impact on our consolidated financial statements.
SFAS No. 157
In September 2006, the FASB issued SFAS No. 157, “Fair Value Measurements” (“SFAS No. 157”). SFAS No. 157 defines fair value, establishing a framework for measuring fair value and expands disclosure about fair value measurements. SFAS No. 157 is effective for fiscal years beginning after November 15, 2007. We do not expect SFAS No. 157 to have a material impact on our consolidated financial statements.
SFAS No. 158
In September 2006, the FASB issued SFAS No. 158, “Employers’ Accounting for Defined Benefit Pension and Other Postretirement Plans” (“SFAS No. 158”). SFAS No. 158 requires companies to recognize in their statement of financial position an asset for a plan’s overfunded status or a liability for a plan’s underfunded status and to measure a plan’s assets and its obligations that determine its funded status as of the end of the company’s fiscal year. Additionally, SFAS No. 158 requires companies to recognize changes in the funded status of a defined benefit postretirement plan in the year that the changes occur and to report these in other comprehensive income (loss). The application of SFAS No. 158 did not have a material impact on our consolidated financial statements.
FASB Interpretation No. 48
In July 2006, the FASB issued FIN 48, “Accounting for Uncertainty in Income Taxes — an interpretation of FASB Statement No. 109” (“FIN 48”). FIN 48 clarifies the recognition threshold and measurement of a tax position taken on a tax return. FIN 48 is effective for fiscal years beginning after December 15, 2006. FIN 48 also requires expanded disclosure with respect to the uncertainty in
| | | | |
| | 47 | | Comcast 2006 Annual ReportNotes to Consolidated Financial Statements |
income taxes. We do not expect FIN 48 to have a material impact on our consolidated financial statements.
EITF Issue No. 06-1
In June 2006, the EITF reached a consensus on EITF Issue No. 06-1, “Accounting for Consideration Given by a Service Provider to Manufacturers or Resellers of Specialized Equipment Necessary for an End-Customer to Receive Service from the Service Provider” (“EITF 06-1”). EITF 06-1 provides guidance on the accounting for consideration given by a vendor to a customer. The provisions of EITF 06-1 will be effective for us as of December 31, 2007. We do not expect EITF 06-1 to have a material impact on our consolidated financial statements.
EITF Issue No. 06-3
In June 2006, the EITF reached a consensus on EITF Issue No. 06-3, “How Taxes Collected from Customers and Remitted to Governmental Authorities Should Be Presented in the Income Statement (That Is, Gross versus Net Presentation)” (“EITF 06-3”). EITF 06-3 provides that the presentation of taxes assessed by a governmental authority that is directly imposed on a revenue producing transaction between a seller and a customer on either a gross basis (included in revenues and costs) or on a net basis (excluded from revenues) is an accounting policy decision that should be disclosed. The provisions of EITF 06-3 will be effective for us as of January 1, 2007. We do not expect EITF 06-3 to have a material impact on our consolidated financial statements.
SAB No. 108
In September 2006, the Securities Exchange Commission Staff issued Staff Accounting Bulletin No. 108, “Considering the Effects of Prior Year Misstatements when Quantifying Misstatements in the Current Year Financial Statements” (“SAB No. 108”). SAB No. 108 requires the use of two alternative approaches in quantitatively evaluating materiality of misstatements. If the misstatement as quantified under either approach is material to the current year
financial statements, the misstatement must be corrected. If the effect of correcting the prior year misstatements, if any, in the current year income statement is material, the prior year financial statements should be corrected. In the year of adoption (fiscal years ending after November 15, 2006, or calendar year 2006 for us), the misstatements may be corrected as an accounting change by adjusting opening retained earnings rather than including the adjustment in the current year income statement. Upon completing our evaluation of the requirements of SAB No. 108, we determined it did not affect our consolidated financial statements.
Note 4: Earnings Per Share
Basic earnings for common stockholders per common share (“Basic EPS”) is computed by dividing net income for common stockholders by the weighted-average number of common shares outstanding during the period.
Our potentially dilutive securities include potential common shares related to our stock options and restricted share units. Diluted earnings for common stockholders per common share (“Diluted EPS”) considers the impact of potentially dilutive securities except in periods in which there is a loss because the inclusion of the potential common shares would have an antidilutive effect. Diluted EPS excludes the impact of potential common shares related to our stock options in periods in which the option exercise price is greater than the average market price of our Class A common stock and our Class A Special common stock during the period (seeNote 10).
Diluted EPS for 2006, 2005 and 2004 excludes approximately 116 million, 126 million and 154 million, respectively, of potential common shares related to our share-based compensation plans because the inclusion of the potential common shares would have an antidilutive effect.
The following table reconciles the numerator and denominator of the computations of Diluted EPS from continuing operations for the years presented (adjusted to reflect the Stock Split):
| | | | | | | | | | | | | | | | | | | | | | | | |
| | | 2006 | | 2005 | | 2004 |
Year Ended December 31 (in millions, except per share data) | | Income | | Shares | | Per
Share
Amount | | Income | | Shares | | Per
Share
Amount | | Income | | Shares | | Per
Share
Amount |
Basic EPS | | $ | 2,235 | | 3,160 | | $ | 0.71 | | $ | 828 | | 3,295 | | $ | 0.25 | | $ | 928 | | 3,360 | | $ | 0.28 |
Effect of Dilutive Securities | | | | | | | | | | | | | | | | | | | | | | | | |
Assumed exercise or issuance of shares relating to stock plans | | | | | 20 | | | | | | | | 17 | | | | | | | | 15 | | | |
Diluted EPS | | $ | 2,235 | | 3,180 | | $ | 0.70 | | $ | 828 | | 3,312 | | $ | 0.25 | | $ | 928 | | 3,375 | | $ | 0.28 |
| | | | |
| Notes to Consolidated Financial Statements Comcast 2006 Annual Report | | 48 | | |
Note 5: Acquisitions and Other Significant Events
Adelphia and Time Warner Transactions
In April 2005, we entered into an agreement with Adelphia Communications (“Adelphia”) in which we agreed to acquire certain assets and assume certain liabilities of Adelphia (the “Adelphia Acquisition”). At the same time, we and Time Warner Cable Inc. and certain of its affiliates (“TWC”) entered into several agreements in which we agreed to (i) have our interest in Time Warner Entertainment Company, L.P. (“TWE”) redeemed, (ii) have our interest in TWC redeemed (together with the TWE redemption, the “Redemptions”), and (iii) exchange certain cable systems acquired from Adelphia and certain Comcast cable systems with TWC (the “Exchanges”). On July 31, 2006, these transactions were completed. We collectively refer to the Adelphia Acquisition, the Redemptions and the Exchanges as the “Adelphia and Time Warner transactions.” Also in April 2005, Adelphia and TWC entered into an agreement for the acquisition of substantially all of the remaining cable system assets and the assumption of certain of the liabilities of Adelphia.
The Adelphia and Time Warner transactions, which are described in more detail below, resulted in a net increase of 1.7 million video subscribers, a net cash payment by us of approximately $1.5 billion and the disposition of our ownership interests in TWE and TWC and the assets of two cable system partnerships.
The Adelphia and Time Warner transactions added cable systems located in 16 states (California, Colorado, Connecticut, Florida, Georgia, Louisiana, Maryland, Massachusetts, Minnesota, Mississippi, Oregon, Pennsylvania, Tennessee, Vermont, Virginia and West Virginia). We expect that the larger systems will result in economies of scale.
The Adelphia Acquisition
We paid approximately $3.6 billion in cash for the acquisition of Adelphia’s interest in two cable system partnerships and certain Adelphia cable systems and to satisfy certain related liabilities. Approximately $2.3 billion of the amount paid was related to the acquisition of Adelphia’s interest in Century — TCI California Communications, L.P. (“Century”) and Parnassos Communications, L.P. (“Parnassos” and together with Century, the “Partnerships”). We held a 25% interest in Century and a 33.33% interest in Parnassos. Our prior interests in the Partnerships were accounted for as cost method investments. After acquiring Adelphia’s interests in the Partnerships, we transferred the cable systems held by the Partnerships to TWC in the Exchanges, as discussed further below.
In addition to acquiring Adelphia’s interest in Century and Parnassos, we acquired cable systems from Adelphia for approximately $600 million in cash that we continue to own and operate.
The Redemptions
Our 4.7% interest in TWE was redeemed in exchange for 100% of the equity interests in a subsidiary of TWE holding cable systems
with a fair value of approximately $600 million and approximately $147 million in cash. Our 17.9% interest in TWC was redeemed in exchange for 100% of the capital stock of a subsidiary of TWC holding cable systems with a fair value of approximately $2.7 billion and approximately $1.9 billion in cash. Our ownership interests in TWE and TWC were accounted for as cost method investments.
We recognized a gain of approximately $535 million, in the aggregate, on the Redemptions, which is included in investment income (loss), net.
The Exchanges
The estimated fair value of the cable systems we transferred to and received from TWC was approximately $8.6 billion and $8.5 billion, respectively. TWC made net cash payments aggregating approximately $67 million to us for certain preliminary adjustments related to the Exchanges.
The cable systems we transferred to TWC included our previously owned cable systems located in Los Angeles, Cleveland and Dallas (“Comcast Exchange Systems”) and the cable systems held by Century and Parnassos. The operating results of the Comcast Exchange Systems are reported as discontinued operations for all periods and are presented in accordance with SFAS No. 144 (see “Discontinued Operations” below).
As a result of the Exchanges, we recognized a gain on the sale of discontinued operations of $195 million, net of tax of $541 million and a gain on the sale of the Century and Parnassos cable systems of approximately $111 million that is included within investment income (loss), net.
The cable systems that TWC transferred to us in the Exchanges included cable systems that TWC acquired from Adelphia in its asset purchase from Adelphia and TWC’s Philadelphia cable system.
Purchase Price Allocation
The cable systems acquired in the Adelphia and Time Warner transactions were accounted for in accordance with SFAS No. 141, “Business Combinations” (“SFAS No. 141”). The results of operations for the acquired cable systems have been included in our consolidated financial statements since the acquisition date (July 31, 2006) and are reported in our Cable segment. As a result of the redemption of our investment in TWC and the exchange of the cable systems held by Century and Parnassos, we reversed deferred tax liabilities of approximately $760 million, primarily related to the excess of tax basis of the assets acquired over the tax basis of the assets exchanged and reduced the amount of goodwill and other noncurrent assets that would have otherwise been recorded in the acquisition. Substantially all of the goodwill recorded is expected to be amortizable for tax purposes. The purchase price allocation is preliminary and subject to refinement as valuations are finalized. The weighted-average amortization period of the franchise-related customer relationship intangible assets acquired was seven years.
| | | | |
| | 49 | | Comcast 2006 Annual ReportNotes to Consolidated Financial Statements |
The following represents the purchase price allocation to assets acquired and liabilities assumed, exclusive of the cable systems held by Century and Parnassos and transferred to TWC, as a result of the Adelphia and Time Warner transactions:
| | | | |
| (in millions) | | 2006 | |
Property and equipment | | $ | 2,692 | |
Franchise-related customer relationships | | | 1,648 | |
Cable franchise rights | | | 6,842 | |
Goodwill | | | 271 | |
Other assets | | | 111 | �� |
Total liabilities | | | (397 | ) |
Net assets acquired | | $ | 11,167 | |
Discontinued Operations
As discussed above, the operating results of the Comcast Exchange Systems transferred to TWC are reported as discontinued operations for all periods and are presented in accordance with SFAS No. 144. The following represents the operating results of the Comcast Exchange Systems through the closing date of the Exchanges (July 31, 2006):
| | | | | | | | | | | | |
| (in millions) | | 2006 | | | 2005 | | | 2004 | |
Revenues | | $ | 734 | | | $ | 1,180 | | | $ | 1,086 | |
Income before income taxes | | | 121 | | | | 159 | | | | 67 | |
Income tax expense | | | (18 | ) | | | (59 | ) | | | (25 | ) |
Net income | | $ | 103 | | | $ | 100 | | | $ | 42 | |
Unaudited Pro Forma Information
The following unaudited pro forma information has been presented as if the Adelphia and Time Warner transactions occurred on January 1, 2005. This information is based on historical results of operations, adjusted for purchase price allocations and is not necessarily indicative of what the results would have been had we operated the entities since January 1, 2005.
| | | | | | |
| Year Ended December 31 (in millions) | | 2006 | | 2005 |
Revenues | | $ | 26,616 | | $ | 23,672 |
Income from continuing operations | | | 2,284 | | | 770 |
Income from discontinued operations, net of tax | | | 103 | | | 100 |
Gain on discontinued operations, net of tax | | | 195 | | | — |
Net Income | | $ | 2,582 | | $ | 870 |
Basic earnings for common stockholders per common share | | $ | 0.82 | | $ | 0.26 |
Diluted earnings for common stockholders per common share | | $ | 0.81 | | $ | 0.26 |
Texas and Kansas City Cable Partnership
In July 2006, we initiated the dissolution of Texas and Kansas City Cable Partners (“TKCCP”), our 50%-50% cable system partnership with TWC. Once the dissolution was triggered, the non-triggering party had the right to choose and take full ownership of one of two pools of TKCCP’s cable systems together with any debt allocated to such asset pool by the triggering partner. One pool consisted of cable systems serving Houston, Texas (“Houston Asset Pool”) and the other pool consisted of cable systems serving Kansas City, south and west Texas, and New Mexico (“Kansas City Asset Pool”).
In July 2006, we notified TWC of our election to dissolve TKCCP and the allocation of all of its debt, which totaled approximately $2 billion as of July 1, 2006, to the Houston Asset Pool. In August 2006, TWC notified us that it selected the Kansas City Asset Pool and as a result, we were to receive the Houston Asset Pool. The $2 billion of debt allocated to the Houston Asset Pool was required to be refinanced within 60 days of the August 1, 2006, selection date. This debt included $600 million owed to each partner (for an aggregate of $1.2 billion). We refinanced this debt in October 2006 (see Note 8). To be consistent with our management reporting presentation, the results of operations of the Houston Asset Pool have been reported in our Cable segment since August 1, 2006. The operating results of the Houston Asset Pool are eliminated in our consolidated financial statements (see Note 14).
In January 2007, the distribution of assets by TKCCP was completed and we received the Houston Asset Pool. We will account for the distribution of assets by TKCCP as a sale of our 50% interest in the Kansas City Asset Pool in exchange for acquiring an additional 50% interest in the Houston Asset Pool and expect to record a gain on this transaction.
E! Entertainment Television
In November 2006, we acquired the 39.5% of E! Entertainment Television (which operates the E! and Style programming networks) that we did not already own for approximately $1.2 billion. We have historically consolidated the results of operations of E! Entertainment Television. We allocated the purchase price to intangibles and goodwill.
Susquehanna
In April 2006, we acquired the cable systems of Susquehanna Cable Co. and its subsidiaries (“Susquehanna”) for a total purchase price of approximately $775 million. The Susquehanna systems acquired are located primarily in Pennsylvania, New York, Maine, and Mississippi.
Prior to the acquisition, we held an approximate 30% equity ownership interest in Susquehanna that we accounted for as an equity method investment. On May 1, 2006, Susquehanna Cable Co. redeemed the approximate 70% equity ownership interest in Susquehanna held by Susquehanna Media Co., which resulted in Susquehanna becoming 100% owned by us.
| | | | |
| Notes to Consolidated Financial Statements Comcast 2006 Annual Report | | 50 | | |
The results of operations of the Susquehanna cable systems have been included in our consolidated financial statements since the acquisition date and are reported in our Cable segment. We allocated the purchase price to property and equipment, franchise related customer relationship intangibles, nonamortizing cable franchise rights and goodwill. The acquisition of the Susquehanna cable systems was not significant to our consolidated financial statements for 2006.
Motorola
In March 2005, we entered into two joint ventures with Motorola under which we are developing and licensing next-generation programming access security (known as “conditional access”) technology for cable systems and related products. One of the ventures will license such products to equipment manufacturers and other cable companies. The other venture will provide us greater participation in the design and development of conditional access technology for our cable systems. In addition to funding approximately 50% of the annual cost requirements, we have paid $20 million to Motorola and have committed to pay up to $80 million to Motorola over a four-year period based on the achievement of certain milestones. Motorola contributed licenses to conditional access and related technology to the ventures.
These two ventures are both considered VIEs and we have consolidated both of these ventures as we are considered the primary beneficiary. Accordingly, we have recorded approximately $190 million in intangible assets, of which we recorded a charge of approximately $20 million related to in-process research and development in 2005 that has been included in amortization expense.
Liberty Media Exchange Agreement
In July 2004, we exchanged approximately 120 million shares of Liberty Media Corporation (“Liberty Media”) Series A common stock that we held, valued at approximately $1.022 billion based upon the price of Liberty Media common stock on the closing date of the transaction with Liberty Media for 100% of the stock of Liberty’s subsidiary, Encore ICCP, Inc. Encore’s assets consisted of cash of approximately $547 million, a 10.4% interest in E! Entertainment Television and 100% of International Channel Networks (which operates AZN Television). We also received all of Liberty Media’s rights, benefits and obligations under the TCI Music contribution agreement, which resulted in the resolution of all pending litigation between Liberty Media and us regarding the contribution agreement. The exchange was structured as a tax-free transaction. We allocated the value of the shares exchanged in the transaction among cash, our additional investment in E! Entertainment Television, International Channel Networks and the resolution of the litigation related to the contribution agreement. The effects of our acquisition of the additional interest in E! Entertainment Television and our acquisition of International Channel Networks have been reflected in our consolidated statement of operations from the date of the transaction.
TechTV
In May 2004, we completed the acquisition of TechTV Inc. by acquiring all outstanding common and preferred stock of TechTV from Vulcan Programming Inc. for approximately $300 million in cash. Substantially all of the purchase price has been recorded to intangible assets and is being amortized over a period of 2 to 22 years. On May 28, 2004, G4 and TechTV began operating as one network. The effects of our acquisition of TechTV have been reflected in our consolidated statement of operations from the date of the transaction. We have classified G4 as part of our Programming segment.
Gemstar
In March 2004, we entered into a long-term, non-exclusive patent license and distribution agreement with Gemstar-TV Guide International (“Gemstar”) in exchange for a one-time payment of $250 million to Gemstar. If our total subscribers exceed a specified threshold, we will be required to make additional one-time payments to Gemstar for each subscriber in excess of such threshold. This agreement allows us to utilize Gemstar’s intellectual property and technology and the TV Guide brand and content on our interactive program guides. We have allocated the $250 million amount paid based on the fair value of the components of the contract to various intangible and other assets, which are being amortized over a period of 3 to 12 years. In addition, we and Gemstar formed an entity to develop and enhance interactive programming guides.
Note 6: Investments
| | | | | | |
| December 31 (in millions) | | 2006 | | 2005 |
Fair value method | | | | | | |
Cablevision Systems Corporation | | $ | 146 | | $ | 120 |
Discovery Holding Company | | | 161 | | | 152 |
Embarq Corporation | | | 69 | | | — |
Liberty Capital | | | 490 | | | — |
Liberty Global | | | 439 | | | 336 |
Liberty Interactive | | | 539 | | | — |
Liberty Media | | | — | | | 787 |
Sprint Nextel | | | 493 | | | 614 |
Time Warner | | | 1,052 | | | 994 |
Vodafone | | | 61 | | | 54 |
Other | | | 63 | | | 90 |
| | | 3,513 | | | 3,147 |
Equity method, principally cable-related | | | 5,394 | | | 2,823 |
Cost method, principally AirTouch as of | | | | | | |
December 31, 2006, and | | | | | | |
Time Warner Cable and AirTouch as of | | | | | | |
December 31, 2005 | | | 1,675 | | | 6,853 |
Total investments | | | 10,582 | | | 12,823 |
Less current investments | | | 1,735 | | | 148 |
Noncurrent investments | | $ | 8,847 | | $ | 12,675 |
| | | | |
| | 51 | | Comcast 2006 Annual ReportNotes to Consolidated Financial Statements |
Fair Value Method
We hold unrestricted equity investments in publicly traded companies that we account for as AFS or trading securities. The net unrealized pretax gains on investments accounted for as AFS securities as of December 31, 2006 and 2005, of $254 million and $56 million, respectively, have been reported in our consolidated balance sheet principally as a component of accumulated other comprehensive income (loss), net of related deferred income taxes of $89 million and $19 million, respectively.
The cost, fair value and unrealized gains and losses related to our AFS securities are as follows:
| | | | | | | |
| Year Ended December 31 (in millions) | | 2006 | | 2005 | |
Cost | | $ | 936 | | $ | 1,104 | |
Unrealized gains | | | 254 | | | 62 | |
Unrealized losses | | | — | | | (6 | ) |
Fair value | | $ | 1,190 | | $ | 1,160 | |
Proceeds from the sales of AFS securities for the years ended December 31, 2006, 2005 and 2004 were $209 million, $490 million and $67 million, respectively. Gross realized gains on these sales for the years ended December 31, 2006, 2005 and 2004 were $59 million, $18 million and $10 million, respectively. Sales of AFS securities for the years ended December 31, 2006 and 2005 consisted principally of sales of Time Warner common stock.
As of December 31, 2006 and 2005, approximately $1.879 billion and $1.496 billion, respectively, of our fair value method securities support our obligations under our exchangeable notes or prepaid forward contracts.
Cablevision Systems Corporation
In June 2005, we, through a majority-owned partnership, entered into a prepaid forward sale that terminates in 2013 of approximately 5.1 million shares of Cablevision Systems Corporation (“Cablevision”) Class A common stock for cash proceeds of $114 million. We have designated the derivative component of the prepaid forward as a fair value hedge of the related Cablevision shares. Accordingly, the mark to market adjustment on 2.9 million of the Cablevision shares held by us and classified as AFS securities will be recorded to investment income (loss), net over the term of the prepaid forward.
Discovery Holding Company
In July 2005, we received 10 million shares of Discovery Holding Company (“Discovery”) Series A common stock in connection with the spin-off by Liberty Media of Discovery. All of these shares collateralize a portion of our Liberty Media prepaid forward sales obligation that terminates in 2014.
Embarq Corporation
In May 2006, we received approximately 1.3 million shares of Embarq Corporation (“Embarq”) common stock in connection with the spin-off by Sprint Nextel of Embarq, its local communications business. In the spin-off, each share of Sprint Nextel Corporation common stock received 0.05 shares of the new Embarq common stock. Of these shares, 100,000 shares collateralize our Sprint Nextel prepaid forward sales obligation that terminates in 2011.
Liberty Capital and Liberty Interactive
In May 2006, we received 25 million shares of Liberty Media Interactive (“Liberty Interactive”) Series A common stock and 5 million shares of Liberty Media Capital (“Liberty Capital”) Series A common stock in connection with Liberty Media’s restructuring. In the restructuring, each share of Liberty Media Series A common stock received 0.25 shares of the new Liberty Interactive Series A common stock and 0.05 shares of Liberty Capital Series A common stock in exchange for each share of Liberty Media Series A common stock. All of these shares collateralize a portion of our Liberty Media prepaid forward sales obligation that terminates in 2014.
Liberty Global
In June 2004, we received approximately 11 million shares of Liberty Global, Inc. (“Liberty Global”) Series A common stock in connection with its spin-off by Liberty Media. In the spin-off, each share of Liberty Media Series A common stock received 0.05 shares of the new Liberty Global Series A common stock. Approximately 5 million of these shares collateralize a portion of our Liberty Media prepaid forward sales obligation that terminates in 2014.
In December 2004, we sold 3 million shares of Liberty Global Series A common stock to Liberty Media in a private transaction for cash proceeds of $128 million.
In February 2005, we entered into a prepaid forward sale that terminates in 2015 of approximately 2.7 million shares of Liberty Global Series A common stock for cash proceeds of $99 million.
In September 2005, we received approximately 7.7 million shares of Liberty Global Series C common stock in connection with Liberty Global’s special stock dividend. All of these shares collateralize a portion of our Liberty Media prepaid forward sales obligation that terminates in 2014 and a portion of our Liberty Global prepaid forward sales obligation that terminates in 2015.
Sprint Nextel
In March 2006, we received cash proceeds of $62 million in connection with Sprint Nextel’s redemption of all of its outstanding Seventh Series B Convertible Preferred Stock (“Sprint Preferred Stock”), including all 61,726 shares of Sprint Preferred Stock held by us. In connection with the redemption transaction, we recognized investment income of $8 million.
| | | | |
| Notes to Consolidated Financial Statements Comcast 2006 Annual Report | | 52 | | |
Equity Method
Our recorded investments exceed our proportionate interests in the book value of the investees’ net assets by $984 million and $1.210 billion as of December 31, 2006 and 2005, respectively (principally related to our investments in TKCCP (50% interest), Insight Midwest (50% interest), and MGM (20% interest)). A portion of this basis difference has been attributed to franchise-related customer relationships of some of the investees. This difference is amortized to equity in (loss) income of affiliates, net over a period of four years. The portion of the basis difference attributable to goodwill is tested for impairment annually, or more frequently whenever events or changes in circumstances indicate that the investment might be impaired.
SpectrumCo, LLC
SpectrumCo, LLC (“SpectrumCo”), a consortium of investors including us, was the successful bidder for 137 wireless spectrum licenses for approximately $2.4 billion in the Federal Communications Commission’s advanced wireless spectrum auction that concluded in September 2006. Our portion of the total cost to purchase the licenses was approximately $1.3 billion. Based on its currently planned activities, we have determined that SpectrumCo is not a VIE. We account for this joint venture as an equity method investment based on its governance structure, notwithstanding our majority interest.
Dissolution of TKCCP
In October 2006, we contributed $1.362 billion to TKCCP to refinance the outstanding bank and partnership debt of the Houston Asset Pool. We have historically accounted for our interest in TKCCP as an equity method investment. However, effective July 1, 2006 (the beginning of the month when dissolution was initiated), the economic return to us on our interest in TKCCP tracked the performance of the Houston Asset Pool, and we were no longer entitled to any benefits of ownership or responsible for the obligations of the Kansas City Asset Pool. As a result, we began reporting our share of the earnings and losses of TKCCP based solely on the operating results of the Houston Asset Pool. For segment reporting purposes, we have included the operating results of the Houston Asset Pool in our Cable segment. However, the operating results of the Houston Asset Pool are eliminated in our consolidated financial statements (see Note 14). On January 1, 2007, the distribution of assets of TKCCP was completed and we received the Houston Asset Pool (seeNote 5).
MGM
In April 2005, we completed a transaction with a group of investors to acquire Metro-Goldwyn-Mayer Inc. We acquired a 20% economic interest for approximately $250 million in cash.
DHC Ventures, LLC
In September 2004, we sold our 20% interest in DHC Ventures, LLC (“Discovery Health Channel”) to Discovery Communications, Inc. for approximately $149 million in cash and recognized a gain on the sale of approximately $94 million to other income.
Cost Method
AirTouch Communications, Inc.
We hold two series of preferred stock of AirTouch Communications, Inc. (“AirTouch”), a subsidiary of Vodafone, that are recorded at $1.451 billion and $1.437 billion as of December 31, 2006 and 2005, respectively. The dividend and redemption activity of the AirTouch preferred stock is tied to the dividend and redemption payments associated with substantially all of the preferred shares issued by one of our consolidated subsidiaries, which is a VIE. The subsidiary has three series of preferred stock outstanding with an aggregate redemption value of $1.750 billion. Substantially all of the preferred shares are redeemable in April 2020 at a redemption value of $1.650 billion, with one of the series bearing a 9.08% dividend rate. The two redeemable series of subsidiary preferred shares are recorded at $1.451 billion and $1.437 billion, and such amounts are included in other noncurrent liabilities as of December 31, 2006 and 2005, respectively. The non-redeemable series of subsidiary preferred shares is recorded at $100 million as of both December 31, 2006 and 2005, and such amounts are included in minority interest.
Investment Income (Loss), Net
Investment income (loss), net includes the following:
| | | | | | | | | | | | |
| Year Ended December 31 (in millions) | | 2006 | | | 2005 | | | 2004 | |
Interest and dividend income | | $ | 178 | | | $ | 112 | | | $ | 160 | |
Gains on sales and exchanges of investments, net | | | 733 | | | | 17 | | | | 45 | |
Investment impairment losses | | | (4 | ) | | | (3 | ) | | | (16 | ) |
Unrealized gains (losses) on trading securities and hedged items | | | 339 | | | | (259 | ) | | | 378 | |
Mark to market adjustments on derivatives related to trading securities and hedged items | | | (238 | ) | | | 206 | | | | (120 | ) |
Mark to market adjustments on derivatives | | | (18 | ) | | | 16 | | | | 25 | |
Investment income (loss), net | | $ | 990 | | | $ | 89 | | | $ | 472 | |
In connection with the Adelphia and Time Warner transactions, we recognized gains of approximately $646 million, in the aggregate, on the Redemptions and the exchange of cable systems held by Century and Parnassos (seeNote 5). These gains are included within the “Gains on sales and exchanges of investments, net” caption in the table above.
| | | | |
| | 53 | | Comcast 2006 Annual ReportNotes to Consolidated Financial Statements |
Note 7: Goodwill and Intangible Assets
The December 31, 2005 and 2004 Cable segment goodwill balances exclude $720 million related to discontinued operations. The changes in the carrying amount of goodwill by business segment (seeNote 14) for the periods presented are as follows:
| | | | | | | | | | | | | | |
| (in millions) | | Cable | | | Programming | | Corporate
and Other | | Total | |
Balance, December 31, 2004 | | $ | 12,278 | | | $ | 824 | | $ | 198 | | $ | 13,300 | |
Settlements and adjustments | | | (50 | ) | | | 89 | | | — | | | 39 | |
Acquisitions | | | 45 | | | | 53 | | | 61 | | | 159 | |
Balance, December 31, 2005 | | | 12,273 | | | | 966 | | | 259 | | | 13,498 | |
Settlements and adjustments | | | (695 | ) | | | 7 | | | — | | | (688 | ) |
Acquisitions | | | 432 | | | | 468 | | | 58 | | | 958 | |
Balance, December 31, 2006 | | $ | 12,010 | | | $ | 1,441 | | $ | 317 | | $ | 13,768 | |
Settlements and adjustments are primarily related to certain pre-acquisition tax liabilities. Acquisitions in 2006 are primarily related to the Adelphia and Time Warner transactions, and the Susquehanna and E! Entertainment Television transactions.
The gross carrying amount and accumulated amortization of our intangible assets subject to amortization are as follows:
| | | | | | | | | | | | | | | | |
| | | 2006 | | | 2005 | |
| December 31 (in millions) | | Useful Life | | Gross
Carrying
Amount | | Accumulated
Amortization | | | Gross
Carrying
Amount | | Accumulated
Amortization | |
Franchise-related customer relationships | | 4 – 11 years | | $ | 4,954 | | $ | (3,188 | ) | | $ | 3,273 | | $ | (2,701 | ) |
Cable and satellite television distribution rights | | 5 – 11 years | | | 1,267 | | | (533 | ) | | | 1,333 | | | (685 | ) |
Cable franchise renewal costs and contractual operating rights | | 10 years | | | 982 | | | (283 | ) | | | 863 | | | (198 | ) |
Computer software | | 1 – 5 years | | | 1,104 | | | (515 | ) | | | 871 | | | (252 | ) |
Patents and other technology rights | | 3 – 12 years | | | 214 | | | (62 | ) | | | 214 | | | (62 | ) |
Programming agreements and rights | | 2 – 4 years | | | 1,026 | | | (782 | ) | | | 772 | | | (520 | ) |
Other agreements and rights | | 2 – 22 years | | | 877 | | | (180 | ) | | | 427 | | | (217 | ) |
Total | | | | $ | 10,424 | | $ | (5,543 | ) | | $ | 7,753 | | $ | (4,635 | ) |
Estimated amortization expense for each of the next five years is as follows:
| | | |
| (in millions) | | Estimated
Amortization |
2007 | | $ | 997 |
2008 | | | 751 |
2009 | | | 679 |
2010 | | | 561 |
2011 | | | 375 |
| | | | |
| Notes to Consolidated Financial Statements Comcast 2006 Annual Report | | 54 | | |
Note 8: Long-Term Debt
| | | | | | | | | | | |
| December 31 (in millions) | | Weighted Average
Interest Rate as of
December 31, 2006 | | | 2006 | | 2005 | | |
Commercial paper | | 5.42 | % | | $ | 199 | | $ | 549 | | |
Term loan, due 2008 | | 5.85 | % | | | 185 | | | — | | |
Senior notes, due 2006 – 2097 | | 6.93 | % | | | 26,942 | | | 20,993 | | |
Senior subordinated notes, due 2006 – 2012 | | 10.63 | % | | | 202 | | | 349 | | |
ZONES due 2029 | | 2.00 | % | | | 747 | | | 752 | | |
Debt supporting Trust | | | | | | | | | | | |
Preferred Securities, due 2027 | | 9.65 | % | | | 283 | | | 284 | | |
Exchangeable notes, due 2007 | | 5.77 | % | | | 49 | | | 46 | | |
Other, including capital lease obligations | | — | | | | 368 | | | 398 | | |
Total debt | | | | | | 28,975 | | | 23,371 | | |
Less: current portion | | | | | | 983 | | | 1,689 | | |
Long-term debt | | | | | $ | 27,992 | | $ | 21,682 | | |
As of December 31, 2006, maturities of long-term debt outstanding were as follows:
| | | |
| (in millions) | | Maturities |
2007 | | $ | 983 |
2008 | | | 1,668 |
2009 | | | 2,249 |
2010 | | | 1,320 |
2011 | | | 1,767 |
Thereafter | | | 20,988 |
Guarantee Structures
Comcast Corporation (our parent corporation) and a number of our wholly owned subsidiaries that hold substantially all of our cable assets have unconditionally guaranteed each other’s debt securities and indebtedness for borrowed money, including amounts outstanding under our $5.0 billion revolving bank credit facility. As of December 31, 2006, $27.141 billion of our debt was included in this cross-guarantee structure.
Comcast Holdings Corporation (“Comcast Holdings”), our wholly owned subsidiary, is not part of the cross-guarantee structure. However, Comcast Corporation has unconditionally guaranteed Comcast Holdings’ ZONES due October 2029 and its 105/8% Senior Subordinated Debentures due 2012, which totaled $683 million as of December 31, 2006. The Comcast Holdings guarantee is subordinate to the guarantees under the cross-guarantee structure.
Debt Borrowings
During 2006, we issued $7.485 billion aggregate principal amount of senior notes as follows:
| | | |
| (in millions) | | Principal |
Floating-rate notes (LIBOR + 0.3%), due 2009 | | $ | 1,250 |
5.90% Senior notes, due 2016 | | | 1,000 |
6.50% Senior notes, due 2017 | | | 1,000 |
5.875% Senior notes, due 2018 | | | 900 |
6.45% Senior notes, due 2037 | | | 1,865 |
7.00% Senior notes, due 2055 | | | 1,470 |
| | | $ | 7,485 |
We used the net proceeds of these offerings for working capital and general corporate purposes, including the repayment of commercial paper obligations (see below), the Adelphia and Time Warner transactions, the refinancing of debt associated with the Houston Asset Pool, and the acquisition of the remaining portion of E! Entertainment Television that we did not already own (seeNote 5).
Debt Repayments
During 2006, we repaid $1.607 billion aggregate principal amount of senior notes and senior subordinated notes at their scheduled maturity dates as follows:
| | | |
| (in millions) | | Principal |
6.375% Senior notes | | $ | 500 |
6.875% Senior notes | | | 388 |
8.3% Senior notes | | | 600 |
10.5% Senior subordinated notes | | | 119 |
| | | $ | 1,607 |
During 2006, we also repaid $350 million outstanding under our commercial paper program and $82 million of other debt.
Commercial Paper
Our commercial paper program provides a lower cost borrowing source of liquidity to fund our short-term working capital requirements. The program allows for a maximum of $2.25 billion of commercial paper to be issued at any one time. Our revolving bank credit facility supports this program. Amounts outstanding under the program are classified as long-term in our consolidated balance sheet because we have both the ability and the intent to refinance these obligations, if necessary, on a long-term basis with amounts available under our revolving bank credit facility.
Revolving Bank Credit Facility
We have a $5.0 billion revolving bank credit facility due October 2010 (the “credit facility”) with a syndicate of banks. The base rate, chosen at our option, is either London Interbank Offered Rate (“LIBOR”) or the greater of the prime rate or the Federal Funds rate plus 0.5%. The borrowing margin is based on our senior unsecured debt ratings. As of December 31, 2006, the interest rate for borrowings under the credit facility is LIBOR plus 0.35% based on our credit ratings.
| | | | |
| | 55 | | Comcast 2006 Annual ReportNotes to Consolidated Financial Statements |
Lines and Letters of Credit
As of December 31, 2006, we and certain of our subsidiaries had unused lines of credit totaling $4.464 billion under various credit facilities and unused irrevocable standby letters of credit totaling $377 million to cover potential fundings under various agreements.
ZONES
At maturity, holders of our 2.0% Exchangeable Subordinated Debentures due 2029 (the “ZONES”) are entitled to receive in cash an amount equal to the higher of the principal amount of the outstanding ZONES of $1.807 billion or the market value of 24,124,398 shares of Sprint Nextel common stock and 1,205,049 shares of Embarq common stock. Prior to maturity, each ZONES is exchangeable at the holder’s option for an amount of cash equal to 95% of the aggregate market value of one share of Sprint Nextel common stock and 0.05 shares of Embarq common stock.
We separate the accounting for the ZONES into derivative and debt components. We record the change in the fair value of the derivative component of the ZONES (seeNote 6) and the change in the carrying value of the debt component of the ZONES as follows:
| | | | | | | | | | | |
Year Ended December 31, 2006
(in millions) | | Debt
Component | | Derivative
Component | | | Total | |
Balance at beginning of year | | $ | 568 | | $ | 184 | | | $ | 752 | |
Change in debt component to interest expense | | | 28 | | | — | | | | 28 | |
Change in derivative component to investment income (loss), net | | | — | | | (33 | ) | | | (33 | ) |
Balance at end of year | | $ | 596 | | $ | 151 | | | $ | 747 | |
Interest Rates
Excluding the derivative component of our Exchangeable Notes due 2007 and the ZONES whose changes in fair value are recorded to investment income (loss), net, our effective weighted-average interest rate on our total debt outstanding was 7.07% and 7.32% as of December 31, 2006 and 2005, respectively. As of December 31, 2006 and 2005, accrued interest was $501 million and $422 million, respectively.
Interest Rate Risk Management
We are exposed to the market risk of adverse changes in interest rates. To manage the volatility relating to these exposures, our policy is to maintain a mix of fixed-rate and variable-rate debt and to enter into various interest rate derivative transactions as described below.
Using swaps, we agree to exchange, at specified intervals, the difference between fixed and variable interest amounts calculated by reference to an agreed-upon notional principal amount. Rate locks are sometimes used to hedge the risk that the cash flows related to the interest payments on an anticipated issuance or assumption of fixed-rate debt may be adversely affected by interest rate fluctuations.
The following table summarizes the terms of our existing swaps:
| | | | | | | | | | | | | | | |
| (in millions) | | Notional
Amount | | Maturities | | Average
Pay
Rate | | | Average
Receive
Rate | | | Estimated
Fair Value | |
As of December 31, 2006 | | | | | | | | | | | | | | | |
Fixed to Variable Swaps | | $ | 3,200 | | 2008 – 2014 | | 7.2 | % | | 5.9 | % | | $ | (103 | ) |
As of December 31, 2005 | | | | | | | | | | | | | | | |
Fixed to Variable Swaps | | $ | 3,600 | | 2006 – 2014 | | 6.5 | % | | 6.0 | % | | $ | (97 | ) |
The notional amounts of interest rate instruments, as presented in the above table, are used to measure interest to be paid or received and do not represent the amount of exposure to credit loss. The estimated fair value approximates the proceeds or payments to settle the outstanding contracts. Swaps and rate locks represent an integral part of our interest rate risk management program. The effect of our interest rate derivative financial instruments was to increase our interest expense by approximately $39 million in 2006, and to decrease our interest expense by approximately $16 million and $66 million in 2005 and 2004, respectively.
We have entered into rate locks to hedge the risk that the cash flows related to the interest payments on an anticipated issuance or assumption of fixed-rate debt may be adversely affected by interest-rate fluctuations. Upon the issuance or assumption of fixed-rate debt, the value of the rate locks is being recognized as an adjustment to interest expense, similar to a deferred financing cost, over the same period in which the related interest costs on the debt are recognized in earnings (approximately 11 years remaining, unless earlier retired). The unrealized pretax losses on cash flow hedges as of December 31, 2006 and 2005, of $185 million and
| | | | |
| Notes to Consolidated Financial Statements Comcast 2006 Annual Report | | 56 | | |
$203 million, respectively, have been reported in our balance sheet as a component of accumulated other comprehensive income (loss), net of related deferred income taxes of $65 million and $71 million, respectively.
Estimated Fair Value
Our debt had estimated fair values of $28.923 billion and $25.305 billion as of December 31, 2006 and 2005, respectively. The estimated fair value of our publicly traded debt is based on quoted market values for that debt. Interest rates that are currently available to us for issuance of debt with similar terms and remaining maturities are used to estimate fair value for debt issues for which quoted market prices are not available.
Debt Covenants
Some of our loan agreements require that we maintain financial ratios based on debt, interest and operating income before depreciation and amortization, as defined in the agreements. We were in compliance with all financial covenants for all periods presented.
Note 9: Pension, Postretirement and Other Employee Benefit Plans
We sponsor two pension plans that together provide benefits to substantially all former employees of a previously acquired company. As of December 31, 2006, future benefits for both plans have been frozen. Total pension expense recognized for the years ended December 31, 2006, 2005 and 2004, was $8 million, $8 million and $9 million, respectively.
Our postretirement medical benefits cover substantially all of our employees who meet certain age and service requirements. The majority of eligible employees participate in the Comcast Postretirement Healthcare Stipend Program (the “Stipend Plan”), and a small number of eligible employees participate in legacy plans of acquired companies. The Stipend Plan provides an annual stipend for reimbursement of healthcare costs to each eligible employee based on years of service. Based on the benefit design of the Stipend Plan, we are not exposed to the cost of increasing healthcare, since the amounts under the Stipend Plan are fixed at a predetermined amount. Postretirement expense recognized for the years ended December 31, 2006, 2005 and 2004, was $29 million, $25 million and $23 million, respectively.
The following table provides condensed information relating to our pension benefits and postretirement benefits for the periods presented:
| | | | | | | | | | | | | | | | |
| | | 2006 | | | 2005 | |
| Year Ended December 31 (in millions) | | Pension
Benefits | | | Postretirement
Benefits | | | Pension
Benefits | | | Postretirement
Benefits | |
Benefit obligation | | $ | 184 | | | $ | 280 | | | $ | 194 | | | $ | 247 | |
Fair value of plan assets | | $ | 122 | | | $ | — | | | $ | 98 | | | $ | – | |
Plan funded status and recorded benefit obligation | | $ | (62 | ) | | $ | (280 | ) | | $ | (96 | ) | | $ | (236 | ) |
Portion of benefit obligation not yet recognized as a component of net periodic benefit cost | | $ | 12 | | | $ | (4 | ) | | $ | 18 | | | | — | |
Discount rate | | | 5.75 | % | | | 6.00 | % | | | 5.50 | % | | | 5.75 | % |
Expected return on plan assets | | | 7.00 | % | | | N/A | | | | 7.00 | % | | | N/A | |
We sponsor various retirement investment plans that allow eligible employees to contribute a portion of their compensation through payroll deductions in accordance with specified guidelines. We match a percentage of the employees’ contributions up to certain limits. Expenses related to these plans amounted to $125 million, $115 million and $100 million for the years ended December 31, 2006, 2005 and 2004, respectively.
We also maintain unfunded, nonqualified deferred compensation plans, which were created for key executives, other members of management and nonemployee directors (each a “Participant”). The amount of compensation deferred by each Participant is based on Participant elections. Account balances of Participants are credited with income based generally on a fixed annual rate of interest. Participants will be eligible to receive distributions of the amounts credited to their account balance based on elected deferral periods that are consistent with the plans and applicable tax law. Interest expense recognized under the plans totaled $50
million, $40 million and $33 million for the years ended December 31, 2006, 2005 and 2004, respectively. The unfunded obligation of the plans total $554 million and $469 million as of December 31, 2006 and 2005, respectively. We have purchased life insurance policies to fund a portion of this unfunded obligation. As of December 31, 2006, the cash surrender value of these policies, which are included in “Other Assets,” was approximately $40 million.
Note 10: Stockholders’ Equity
Preferred Stock
We are authorized to issue, in one or more series, up to a maximum of 20 million shares of preferred stock. We can issue the shares with such designations, preferences, qualifications, privileges, limitations, restrictions, options, conversion rights and other
| | | | |
| | 57 | | Comcast 2006 Annual ReportNotes to Consolidated Financial Statements |
special or related rights as our Board of Directors shall from time to time fix by resolution.
Common Stock
Our Class A Special common stock is generally nonvoting. Holders of our Class A common stock in the aggregate hold 66 2/3% of the aggregate voting power of our common stock. The number of votes that each share of our Class A common stock will have at any given time will depend on the number of shares of Class A common stock and Class B common stock then outstanding. Each share of our Class B common stock is entitled to 15 votes, and all shares of our Class B common stock in the aggregate have 33 1/3% of the voting power of all of our common stock. The 33 1/3% aggregate voting power of our Class B common stock will not be diluted by additional issuances of any other class of our common stock. Our Class B common stock is convertible, share for share, into Class A or Class A Special common stock, subject to certain restrictions.
Board-Authorized Share Repurchase Program
During 2006, 2005 and 2004, we repurchased approximately 113 million, 119 million and 70 million shares, respectively (adjusted to reflect the Stock Split), of our Class A Special common stock for aggregate consideration of $2.347 billion, $2.290 billion and $1.328 billion, respectively, pursuant to our Board-authorized share repurchase program.
The maximum dollar value of shares remaining that may be repurchased under the program is approximately $3 billion as of December 31, 2006. We expect repurchases to continue from time to time in the open market or in private transactions, subject to market conditions.
The following table summarizes our share activity for the periods presented (adjusted to reflect the Stock Split):
| | | | | | | |
| Common Stock | | Class A | | Class A Special | | | Class B |
Balance, January 1, 2004 | | 2,036,280,835 | | 1,331,386,738 | | | 9,444,375 |
Stock compensation plans | | 1,537,284 | | 8,153,658 | | | — |
Employee Stock Purchase Plan | | 1,702,427 | | — | | | — |
Repurchases of common stock | | — | | (70,401,353 | ) | | — |
Balance, December 31, 2004 | | 2,039,520,546 | | 1,269,139,043 | | | 9,444,375 |
Stock compensation plans | | 3,586,731 | | 2,975,453 | | | — |
Employee Stock Purchase Plan | | 1,943,700 | | — | | | — |
Repurchases of common stock | | — | | (118,680,437 | ) | | — |
Balance, December 31, 2005 | | 2,045,050,977 | | 1,153,434,059 | | | 9,444,375 |
Stock compensation plans | | 13,140,825 | | 9,362,105 | | | — |
Employee Stock Purchase Plan | | 2,166,158 | | — | | | — |
Repurchases of common stock | | — | | (113,071,157 | ) | | — |
Balance, December 31, 2006 | | 2,060,357,960 | | 1,049,725,007 | | | 9,444,375 |
Comcast Option Plans
We maintain stock option plans for certain employees under which fixed-price stock options may be granted and the option price is generally not less than the fair value of a share of the underlying stock at the date of grant. Under our stock option plans, approximately 236 million shares (adjusted to reflect the Stock Split) of our Class A and Class A Special common stock are reserved for issuance upon the exercise of options, including those outstanding as of December 31, 2006. Option terms are generally 10 years, with options generally becoming exercisable between two and nine and one half years from the date of grant.
The fair value of each stock option is estimated on the date of grant using the Black-Scholes option pricing model that uses the assumptions summarized in the following table. Expected volatility is based on a blend of implied and historical volatility of our Class
A common stock. We use historical data on exercises of stock options and other factors to estimate the expected term of the options granted. The risk-free rate is based on the U.S. Treasury yield curve in effect at the date of grant.
The following table summarizes the weighted-average fair values at date of grant (adjusted to reflect the Stock Split) of a Class A common stock option granted under our stock option plans and the related weighted-average valuation assumptions:
| | | | | | | | | | | | |
| | | 2006 | | | 2005 | | | 2004 | |
Fair value | | $ | 7.30 | | | $ | 8.67 | | | $ | 7.63 | |
Dividend yield | | | 0 | % | | | 0 | % | | | 0 | % |
Expected volatility | | | 26.9 | % | | | 27.1 | % | | | 28.6 | % |
Risk-free interest rate | | | 4.8 | % | | | 4.3 | % | | | 3.5 | % |
Expected option life (in years) | | | 7.0 | | | | 7.0 | | | | 7.0 | |
| | | | |
| Notes to Consolidated Financial Statements Comcast 2006 Annual Report | | 58 | | |
The following table summarizes the activity of our stock option plans for the year ended December 31, 2006 (adjusted to reflect the Stock Split):
| | | | | | | | | | | |
| | | Options (in thousands) | | | Weighted-Average
Exercise Price | | Weighted-Average
Remaining
Contractual Term
(in years) | | Aggregate
Intrinsic Value
(in millions) |
Class A Common Stock | | | | | | | | | | | |
Outstanding as of January 1, 2006 | | 121,240 | | | $ | 24.73 | | | | | |
Granted | | 18,594 | | | $ | 18.12 | | | | | |
Exercised | | (12,222 | ) | | $ | 19.18 | | | | | |
Forfeited | | (4,113 | ) | | $ | 19.76 | | | | | |
Expired | | (1,722 | ) | | $ | 26.10 | | | | | |
Outstanding as of December 31, 2006 | | 121,777 | | | $ | 24.43 | | 5.5 | | $ | 812.3 |
Exercisable as of December 31, 2006 | | 67,297 | | | $ | 28.33 | | 3.6 | | $ | 343.1 |
Class A Special Common Stock | | | | | | | | | | | |
Outstanding as of January 1, 2006 | | 76,948 | | | $ | 20.90 | | | | | |
Exercised | | (10,545 | ) | | $ | 15.31 | �� | | | | |
Forfeited | | (95 | ) | | $ | 21.75 | | | | | |
Expired | | (1,707 | ) | | $ | 23.96 | | | | | |
Outstanding as of December 31, 2006 | | 64,601 | | | $ | 21.75 | | 3.5 | | $ | 410.6 |
Exercisable as of December 31, 2006 | | 57,081 | | | $ | 21.95 | | 3.4 | | $ | 353.1 |
We also maintain a deferred stock option plan for certain employees and directors that provided the optionees with the opportunity to defer the receipt of shares of our Class A or Class A Special common stock that would otherwise be deliverable upon exercise by the optionees of their stock options. As of December 31, 2006, approximately 2.0 million shares (adjusted to reflect the Stock Split) of Class A Special common stock were issuable under exercised options, the receipt of which was irrevocably deferred by the optionees pursuant to our deferred stock option plan.
Stock Option Liquidity Program
During 2004, we repurchased 16.6 million options (adjusted to reflect the Stock Split) from various nonemployee holders of stock options under a stock option liquidity program, targeted primarily to employees of a previously acquired company. The former option holders received $37 million for their options under the program. A financial counterparty we engaged in connection with the stock option liquidity program funded the cost of the program through the simultaneous purchase by the counterparty of new stock options from us that had similar economic terms as the options being purchased by us from the option holders. As of December 31, 2006, 13.9 million options remain outstanding, with a weighted-average exercise price of $30.89 per share (adjusted to reflect the Stock Split), and these options will expire over the course of the next six years.
Restricted Stock Plan
We maintain a restricted stock plan under which certain employees and directors (“Participants”) may be granted restricted share unit awards in our Class A or Class A Special common stock (the “Restricted Stock Plan”). Under our Restricted Stock Plan, approximately 40 million shares (adjusted to reflect the Stock Split) of our Class A and Class A Special common stock are reserved for issuance pursuant to awards under the plan, including those outstanding as of December 31, 2006. Awards of restricted share units are valued by reference to shares of common stock that entitle Participants to receive, upon the settlement of the unit, one share of common stock for each unit. The awards vest annually, generally over a period not to exceed five years from the date of the award, and do not have voting rights.
The following table summarizes the weighted-average fair value at date of grant (adjusted to reflect the Stock Split) and the compensation expense recognized related to restricted share unit awards:
| | | | | | | | | |
| | | 2006 | | 2005 | | 2004 |
Weighted-average fair value | | $ | 19.98 | | $ | 22.13 | | $ | 20.73 |
Compensation expense recognized (in millions) | | $ | 62 | | $ | 57 | | $ | 33 |
| | | | |
| | 59 | | Comcast 2006 Annual ReportNotes to Consolidated Financial Statements |
The following table summarizes the activity of the Restricted Stock Plan for the year ended December 31, 2006 (adjusted to reflect the Stock Split):
| | | | | | |
| | | Number of Nonvested
Share Unit Awards (in thousands) | | | Weighted-
Average Grant
Date Fair Value |
Class A Common Stock | | | | | | |
Nonvested awards as of January 1, 2006 | | 8,474 | | | $ | 21.70 |
Granted | | 7,539 | | | $ | 19.98 |
Vested | | (1,635 | ) | | $ | 21.90 |
Forfeited | | (894 | ) | | $ | 20.76 |
Nonvested awards as of December 31, 2006 | | 13,484 | | | $ | 20.78 |
Class A Special Common Stock | | | | | | |
Nonvested awards as of January 1, 2006 | | 104 | | | $ | 24.46 |
Vested | | (103 | ) | | $ | 24.75 |
Nonvested awards as of December 31, 2006 | | 1 | | | $ | 18.31 |
As of December 31, 2006, approximately 605,000 and 145,000 shares (adjusted to reflect the Stock Split) of Class A common stock and Class A Special common stock, respectively, were issuable under vested restricted share unit awards, the receipt of which was irrevocably deferred by Participants pursuant to the Restricted Stock Plan.
Share-Based Compensation
Effective January 1, 2006, we adopted SFAS No. 123R using the Modified Prospective Approach. SFAS No. 123R revises SFAS No. 123 and supersedes APB No. 25. SFAS No. 123R requires the cost of all share-based payments to employees, including grants of employee stock options, to be recognized in the financial statements based on their fair values at grant date, or the date of later modification, over the requisite service period. In addition, SFAS No. 123R requires unrecognized cost (based on the amounts previously disclosed in our pro forma footnote disclosure) related to options vesting after the date of initial adoption to be recognized in the financial statements over the remaining requisite service period.
Under the Modified Prospective Approach, the amount of compensation cost recognized includes: (i) compensation cost for all share-based payments granted prior to, but not yet vested as of January 1, 2006, based on the grant date fair value estimated in accordance with the provisions of SFAS No. 123 and (ii) compensation cost for all share-based payments granted subsequent to January 1, 2006, based on the grant date fair value estimated in accordance with the provisions of SFAS No. 123R, prior to the
adoption of SFAS No. 123R, we recognized the majority of our share-based compensation costs using the accelerated recognition method. We recognize the cost of previously granted share-based awards under the accelerated recognition method and recognize the cost of new share-based awards on a straight-line basis over the requisite service period. The incremental pretax share-based compensation expense recognized due to the adoption of SFAS No. 123R for the year ended December 31, 2006, was $126 million. Total share-based compensation expense recognized under SFAS No. 123R, including the incremental pretax share-based compensation expense, was $190 million, with an associated tax benefit of $66 million for the year ended December 31, 2006. Prior to the adoption of SFAS No. 123R, we recognized share-based compensation expense of $67 million and $44 million with associated tax benefits of $25 million and $16 million for the years ended December 31, 2005 and 2004, respectively. The amount of share-based compensation capitalized or related to discontinued operations was not material to our consolidated financial statements.
Cash received from option exercises under all share-based payment arrangements for the year ended December 31, 2006, was $372 million. The total intrinsic value (market value on date of exercise less exercise price) of options exercised for the years ended December 31, 2006, 2005 and 2004, was $180 million, $59 million and $88 million, respectively. The tax benefit realized from stock options exercised for the years ended December 31, 2006, 2005 and 2004, was $62 million, $19 million and $30 million, respectively.
As of December 31, 2006, there was $207 million of total unrecognized, pretax compensation cost related to nonvested stock options. This cost is expected to be recognized over a weighted average period of approximately two and one half years.
The total fair value of restricted share units vested during the years ended December 31, 2006, 2005 and 2004, was $32 million, $28 million and $7 million, respectively. As of December 31, 2006, there was $177 million of total unrecognized pretax compensation cost related to nonvested restricted share unit awards. This cost is expected to be recognized over a weighted-average period of approximately two and one half years.
SFAS No. 123R also required us to change the classification, in our consolidated statement of cash flows, of any tax benefits realized upon the exercise of stock options or issuance of restricted share unit awards in excess of that which is associated with the expense recognized for financial reporting purposes. These amounts are presented as a financing cash inflow rather than as a reduction of income taxes paid in our consolidated statement of cash flows. The excess cash tax benefit classified as a financing cash inflow for the year ended December 31, 2006, was $33 million.
| | | | |
| Notes to Consolidated Financial Statements Comcast 2006 Annual Report | | 60 | | |
Prior to January 1, 2006, we accounted for our share-based compensation plans in accordance with the provisions of APB No. 25, as permitted by SFAS No. 123, and accordingly did not recognize compensation expense for stock options with an exercise price equal to or greater than the market price of the underlying stock at the date of grant. Had the fair-value-based method as prescribed by SFAS No. 123 been applied, additional pretax compensation expense of $166 million and $283 million would have been recognized for the years ended December 31, 2005 and 2004, respectively. The pretax compensation expense includes the expense related to discontinued operations, which for each of the years ended December 31, 2005 and 2004, was $4 million. Had the fair-value-based method as prescribed by SFAS No. 123 been applied, the effect on net income and earnings per share would have been as follows (adjusted to reflect the Stock Split):
| | | | | | | | |
| (in millions, except per share data) | | 2005 | | | 2004 | |
Net income, as reported | | $ | 928 | | | $ | 970 | |
Add: Share-based compensation expense included in net income, as reported above, net of related tax effects | | | 42 | | | | 27 | |
Less: Share-based compensation expense determined under fair value-based method for all awards, net of related tax effects | | | (150 | ) | | | (206 | ) |
Pro forma, net income | | $ | 820 | | | $ | 791 | |
Basic earnings for common stockholders per common share: | | | | | | | | |
As reported | | $ | 0.28 | | | $ | 0.29 | |
Pro forma | | $ | 0.25 | | | $ | 0.24 | |
Diluted earnings for common stockholders per common share: | | | | | | | | |
As reported | | $ | 0.28 | | | $ | 0.29 | |
Pro forma | | $ | 0.25 | | | $ | 0.23 | |
On December 23, 2004, the Compensation Committee of our Board of Directors approved the acceleration of vesting of all unvested options granted prior to January 1, 2003, to purchase shares of our Class A Special common stock having an exercise price of $22.67 (adjusted to reflect the Stock Split) or greater and held by current employees. Options with respect to approximately 23.3 million shares (adjusted to reflect the Stock Split) of our Class A Special common stock were subject to this acceleration. This acceleration was effective as of December 31,
2004, except for those holders of incentive stock options (“ISOs”), who were given the opportunity to decline the acceleration of an option if such acceleration would have the effect of changing the status of the option for federal income tax purposes from an ISO to a nonqualified stock option. Because these options had exercise prices in excess of current market values (were “underwater”) and were not fully achieving their original objectives of incentive compensation and employee retention, the acceleration may have had a positive effect on employee morale, retention and perception of option value. The acceleration also took into account the fact that in December 2004, we completed the repurchase of stock options held by certain nonemployees for cash (including underwater options) under a stock option liquidity program (see above), and that no such offer (nor any other “solution” for underwater options) was made to current employees. The acceleration had no effect on reported net income, an immaterial impact on pro forma net income in 2005 and an approximate $39 million, net of tax, impact on pro forma net income in 2004. The impacts of the acceleration are reflected in the pro forma amounts above. This acceleration eliminated the future compensation expense we would have otherwise recognized in our statement of operations with respect to these options subsequent to the adoption of SFAS No. 123R.
Note 11: Income Taxes
We join with our 80% or more owned subsidiaries in filing consolidated federal income tax returns. E! Entertainment filed separate consolidated federal income tax returns for periods prior to our obtaining 100% ownership, which occurred in November 2006 (seeNote 5). Income tax (expense) benefit consists of the following components:
| | | | | | | | | | | | |
| Year Ended December 31 (in millions) | | 2006 | | | 2005 | | | 2004 | |
Current (expense) benefit | | | | | | | | | | | | |
Federal | | $ | (887 | ) | | $ | (590 | ) | | $ | (120 | ) |
State | | | (77 | ) | | | (123 | ) | | | (208 | ) |
| | | | (964 | ) | | | (713 | ) | | | (328 | ) |
Deferred (expense) benefit | | | | | | | | | | | | |
Federal | | | (301 | ) | | | (66 | ) | | | (536 | ) |
State | | | (82 | ) | | | (94 | ) | | | 63 | |
| | | | (383 | ) | | | (160 | ) | | | (473 | ) |
Income tax (expense) benefit | | $ | (1,347 | ) | | $ | (873 | ) | | $ | (801 | ) |
| | | | |
| | 61 | | Comcast 2006 Annual ReportNotes to Consolidated Financial Statements |
Our effective income tax (expense) benefit differs from the federal statutory amount because of the effect of the following items:
| | | | | | | | | | | | |
Year Ended December 31
(in millions) | | 2006 | | | 2005 | | | 2004 | |
Federal tax at statutory rate | | $ | (1,258 | ) | | $ | (602 | ) | | $ | (610 | ) |
State income taxes, net of federal benefit | | | (132 | ) | | | (105 | ) | | | (20 | ) |
Nondeductible losses from joint ventures and equity in net (losses) income of affiliates, net | | | 18 | | | | (24 | ) | | | (9 | ) |
Adjustments to prior year income tax accrual and related interest | | | 97 | | | | (105 | ) | | | (157 | ) |
Other | | | (72 | ) | | | (37 | ) | | | (5 | ) |
Income tax (expense) benefit | | $ | (1,347 | ) | | $ | (873 | ) | | $ | (801 | ) |
Our net deferred tax liability consists of the following components:
| | | | | | |
| December 31 (in millions) | | 2006 | | 2005 |
Deferred tax assets: | | | | | | |
Net operating loss carryforwards | | $ | 309 | | $ | 331 |
Differences between book and tax basis of long-term debt | | | 177 | | | 191 |
Nondeductible accruals and other | | | 742 | | | 904 |
| | | | 1,228 | | | 1,426 |
Deferred tax liabilities: | | | | | | |
Differences between book and tax basis of property and equipment and intangible assets | | $ | 25,527 | | $ | 23,712 |
Differences between book and tax basis of investments | | | 2,633 | | | 4,442 |
Differences between book and tax basis of indexed debt securities | | | 720 | | | 644 |
| | | | 28,880 | | | 28,798 |
Net deferred tax liability | | $ | 27,652 | | $ | 27,372 |
We recorded $(27) million and $319 million of deferred income tax liabilities (assets) in 2006 through income from discontinued operations and gain on discontinued operations, respectively. We decreased net deferred income tax liabilities by $474 million in 2006, principally in connection with the Adelphia and Time Warner transactions, the acquisition of the interest in E! Entertainment Television that we did not already own and Susquehanna (seeNote 5).
We recorded an increase (decrease) of $79 million, $2 million and $(12) million to net deferred income tax liabilities in 2006, 2005 and 2004, respectively, in connection with unrealized gains (losses) on marketable securities, cash flow hedges and other amounts that are included in accumulated other comprehensive income (loss).
Net deferred tax liabilities included in current liabilities are related primarily to our current investments. We have federal net operating loss carryforwards of $178 million and various state carryforwards that expire in periods through 2026. The determination of the state net operating loss carryforwards is dependent upon the subsidiaries’ taxable income or loss, apportionment percentages and other respective state laws that can change from year to year and impact the amount of such carryforward.
In 2006, 2005 and 2004, income tax benefits attributable to share based compensation of approximately $60 million, $35 million and $80 million, respectively, were allocated to stockholders’ equity.
In the ordinary course of business, our tax returns, including those of acquired subsidiaries, are subject to examination by various taxing authorities.
In December 2004, the Internal Revenue Service concluded an examination of the tax returns of MediaOne Group, Inc., a subsidiary acquired in our 2002 acquisition of AT&T Corp.’s cable business, for the period of 1996 through 2000. We received a notice of adjustment disallowing certain deductions, principally a $1.5 billion breakup fee paid by MediaOne in 1999. The National Office of the IRS has issued a Technical Advice Memorandum that is adverse to us. We do not agree with the adjustment. We have received a final assessment and are in the process of preparing an appeal. In November 2005, we made a payment of $557 million to reduce the accruing of interest on the pending assessment. If we are successful in part or full, all or some of the funds would be refundable. If the IRS prevails, there would be no material effect on our consolidated results of operations for any period.
During 2005, the IRS proposed the disallowance of noncash interest deductions taken on the ZONES (seeNote 8). The National Office of the IRS has issued a Technical Advice Memorandum that is adverse to us. We have recognized a cumulative federal tax benefit of $523 million through December 31, 2006, which will reverse and become payable upon the maturity or retirement of the ZONES; we have recorded this amount as a deferred tax liability. If the IRS’s position is sustained, the income tax benefits previously recognized would be disallowed, and interest would be assessed on amounts disallowed. Accordingly, the amounts recorded as deferred taxes would become payable. We do not agree with the IRS’s position and have appealed. The ultimate resolution of this issue is not expected to have a material effect on our consolidated results of operations for any period.
Other examinations of our tax returns may result in future tax and interest assessments by the taxing authorities, and we have accrued a liability when we believe that it is probable that we will be assessed. Differences between the estimated and actual amounts determined upon ultimate resolution, individually or in the aggregate, are not expected to have a material adverse effect on our consolidated financial position but could possibly be material
| | | | |
| Notes to Consolidated Financial Statements Comcast 2006 Annual Report | | 62 | | |
to our consolidated results of operations or cash flows of any one period.
Note 12: Statement of Cash Flows — Supplemental Information
In 2006, we began presenting our cash overdrafts resulting from checks drawn on zero balance accounts (“book overdrafts”) within accounts payable and accrued expenses related to trade creditors. Previously, these book overdrafts were included within cash and cash equivalents. The financial statements reflect this revised presentation in prior periods. Accordingly, the reported amounts of our cash and cash equivalents and accounts payable and accrued expenses related to trade creditors increased as of December 31, 2005, 2004 and 2003, by $254 million, $341 million and $189 million, respectively, and net cash provided by operating activities decreased by $87 million in 2005 and increased by $152 million in 2004.
The following table summarizes our cash payments for interest and income taxes:
| | | | | | | | | |
Year Ended December 31
(in millions) | | 2006 | | 2005 | | 2004 |
Interest | | $ | 1,880 | | $ | 1,809 | | $ | 1,898 |
Income taxes | | $ | 1,284 | | $ | 1,137 | | $ | 205 |
During 2006, we:
| • | | exchanged investments for cable systems in the Redemptions with a fair value of approximately $3.2 billion and cable systems for cable systems in the Exchanges with a fair value of approximately $8.5 billion (seeNote 5), which are considered noncash investing activities |
| • | | acquired an additional equity interest with a fair value of $21 million and recorded a liability, for a corresponding amount in connection with our achievement of certain subscriber launch milestones, which is considered a noncash investing and operating activity |
| • | | in connection with the Susquehanna transaction (seeNote 5), we assumed a $185 million principal amount variable-rate term loan due 2008, which is considered a noncash financing and investing activity |
During 2005, we:
| • | | settled through noncash financing and investing activities approximately $1.347 billion related to our Exchangeable Notes by delivering the underlying securities to the counterparties upon maturity of the instruments, and the equity collar agreements related to the underlying securities were exercised |
| • | | acquired $170 million of intangible assets and incurred a corresponding liability in connection with the formation of the ventures in the Motorola transaction, which is considered a noncash investing and financing activity |
| • | | acquired an equity method investment with a fair value of $91 million and incurred a corresponding liability, which is considered a noncash investing and financing activity |
| • | | acquired an additional equity interest with a fair value of $45 million and recorded a liability for a corresponding amount in connection with our achievement of certain subscriber launch milestones, which is considered a noncash investing and operating activity |
During 2004, we:
| • | | settled through noncash financing and investing activities approximately $1.944 billion related to our Exchangeable Notes by delivering the underlying securities to the counterparties upon maturity of the instruments, and the equity collar agreements related to the underlying securities were exercised |
| • | | received noncash consideration of approximately $475 million in connection with the Liberty Media Exchange Agreement (seeNote 5), which is considered a noncash investing activity |
| • | | acquired cable systems through the assumption of $68 million of debt, which is considered a noncash investing and financing activity |
| • | | issued shares of G4 with a value of approximately $70 million in connection with the acquisition of TechTV (seeNote 5), which is considered a noncash financing and investing activity |
| • | | received federal income tax refunds of approximately $591 million |
| | | | |
| | 63 | | Comcast 2006 Annual ReportNotes to Consolidated Financial Statements |
Note 13: Commitments and Contingencies
Commitments
Our programming networks have entered into license agreements for programs and sporting events that are available for telecast. In addition, we, through Comcast Spectacor, have employment agreements with both players and coaches of our professional sports teams. Certain of these employment agreements, which provide for payments that are guaranteed regardless of employee injury or termination, are covered by disability insurance if certain conditions are met.
Certain of our subsidiaries support debt compliance with respect to obligations of certain cable television partnerships and investments in which we hold an ownership interest (seeNote 6). The obligations expire between May 2008 and March 2011. Although there can be no assurance, we believe that we will not be required to meet our obligations under such commitments. The total notional amount of our commitments was $965 million as of December 31, 2006, at which time there were no quoted market prices for similar agreements.
The following table summarizes our minimum annual commitments under programming license agreements of our programming networks and our minimum annual rental commitments for office space, equipment and transponder service agreements under noncancelable operating leases:
| | | | | | |
| December 31, 2006 (in millions) | | Program
License
Agreements | | Operating
Leases |
2007 | | $ | 381 | | $ | 292 |
2008 | | | 343 | | | 268 |
2009 | | | 273 | | | 223 |
2010 | | | 284 | | | 147 |
2011 | | | 285 | | | 106 |
Thereafter | | | 2,338 | | | 578 |
The following table summarizes our rental expense charged to operations:
| | | | | | | | | |
| Year Ended December 31 (in millions) | | 2006 | | 2005 | | 2004 |
Rental expense | | $ | 273 | | $ | 212 | | $ | 184 |
Contingencies
We and the minority owner group in Comcast Spectacor each have the right to initiate an exit process under which the fair market value of Comcast Spectacor would be determined by appraisal. Following such determination, we would have the option to acquire the 24.3% interest in Comcast Spectacor owned by the minority owner group based on the appraised fair market value. In the event we do not exercise this option, we and
the minority owner group would then be required to use our best efforts to sell Comcast Spectacor. This exit process includes the minority owner group’s interest in Comcast SportsNet.
A minority owner of G4 is entitled to trigger an exit process whereby on May 10, 2009 (the fifth anniversary of the closing date), and on each successive anniversary of the closing date or the occurrence of certain other defined events, G4 would be required to purchase the minority owner’s 15% interest at fair market value (as determined by an appraisal process). The minority owners in certain of our technology development ventures also have rights to trigger an exit process after a certain period of time based on the fair value of the entities at the time the exit process is triggered.
At Home Cases
Litigation has been filed against us as a result of our alleged conduct with respect to our investment in and distribution relationship with At Home Corporation. At Home was a provider of high-speed Internet services that filed for bankruptcy protection in September 2001. Filed actions are: (i) class action lawsuits against us, AT&T (the former controlling shareholder of At Home and also a former distributor of the At Home service) and others in the United States District Court for the Southern District of New York, alleging securities law violations and common law fraud in connection with disclosures made by At Home in 2001; and (ii) a lawsuit brought in the United States District Court for the District of Delaware in the name of At Home by certain At Home bondholders against us, Brian L. Roberts (our Chairman and Chief Executive Officer and a director), Cox (Cox is also an investor in At Home and a former distributor of the At Home service) and others, alleging breaches of fiduciary duty relating to March 2000 agreements (which, among other things, revised the distributor relationships), and seeking recovery of alleged short-swing profits pursuant to Section 16(b) of the Exchange Act (purported to have arisen in connection with certain transactions relating to At Home stock effected pursuant to the March 2000 agreements).
In the Southern District of New York actions (item (i) above), the court dismissed all claims. The plaintiffs’ appealed this decision, and the Court of Appeals for the Second Circuit denied the plaintiffs’ appeal. The plaintiffs petitioned the Court of Appeals for rehearing. The Delaware case (item (ii) above) was transferred to the United States District Court for the Southern District of New York. The court dismissed the Section 16(b) claims, and the breach of fiduciary duty claim, for lack of federal jurisdiction. The Court of Appeals for the Second Circuit denied the plaintiffs’ appeal from the decision dismissing the Section 16(b) claims, and the U.S. Supreme Court denied the plaintiffs’ petition for a further appeal. The plaintiffs recommenced the breach of fiduciary duty claim in Delaware Chancery Court. The Court has set a trial date in October 2007.
| | | | |
| Notes to Consolidated Financial Statements Comcast 2006 Annual Report | | 64 | | |
Under the terms of our 2002 acquisition of AT&T Corp.’s cable business, we are contractually liable for 50% of any liabilities of AT&T in the actions described in items (i) and (ii) above (in which we are also a defendant).
We deny any wrongdoing in connection with the claims that have been made directly against us, our subsidiaries and Brian L. Roberts, and are defending all of these claims vigorously. The final disposition of these claims is not expected to have a material adverse effect on our consolidated financial position, but could possibly be material to our consolidated results of operations of any one period. Further, no assurance can be given that any adverse outcome would not be material to our consolidated financial position.
AT&T — TCI Cases
In June 1998, class action lawsuits were filed by then-shareholders of Tele-Communications, Inc. (“TCI”) Series A TCI Group Common Stock (“Common A”) against AT&T and the directors of TCI relating to the acquisition of TCI by AT&T, alleging that former members of the TCI board of directors breached their fiduciary duties to Common A shareholders by agreeing to transaction terms whereby holders of the Series B TCI Group Common Stock received a 10% premium over what Common A shareholders received.
In connection with the TCI acquisition (completed in early 1999), AT&T agreed under certain circumstances to indemnify TCI’s former directors for certain liabilities, potentially including those incurred in connection with this action. Under the terms of our acquisition of AT&T Corp.’s cable business, (i) we agreed to indemnify AT&T for certain liabilities, potentially including those incurred by AT&T in connection with this action, and (ii) we assumed certain obligations of TCI to indemnify its former directors, potentially including those incurred in connection with this action.
In October 2006 these lawsuits were settled. We agreed to contribute approximately $44 million to the settlement. This amount was paid in November 2006 and did not have a material impact on our results of operations for the year ended December 31, 2006. The settlement was approved in February 2007.
Patent Litigation
We are a defendant in several unrelated lawsuits claiming infringement of various patents relating to various aspects of our businesses. In certain of these cases other industry participants are also defendants, and also in certain of these cases we expect that any potential liability would be in part or in whole the responsibility of our equipment vendors pursuant to applicable contractual indemnification provisions. To the extent that the allegations in these lawsuits can be analyzed by us at this stage of their proceedings, we believe the claims are without merit and intend to defend the actions vigorously. The final disposition of
these claims is not expected to have a material adverse effect on our consolidated financial position, but could possibly be material to our consolidated results of operations of any one period. Further, no assurance can be given that any adverse outcome would not be material to our consolidated financial position.
Antitrust Cases
We are defendants in two purported class actions originally filed in the United States District Courts for the District of Massachusetts and the Eastern District of Pennsylvania, respectively. The potential class in the Massachusetts case is our subscriber base in the “Boston Cluster” area, and the potential class in the Pennsylvania case is our subscriber base in the “Philadelphia and Chicago clusters,” as those terms are defined in the complaints. In each case, the plaintiffs allege that certain subscriber exchange transactions with other cable providers resulted in unlawful “horizontal market restraints” in those areas and seek damages pursuant to antitrust statutes, including treble damages.
As a result of recent events in both cases relating to the procedural issue of whether the plaintiffs’ claims could proceed in court or, alternatively, whether the plaintiffs should be compelled to arbitrate their claims pursuant to arbitration clauses in their subscriber agreements, it has become more likely that these cases will proceed in court. Our motion to dismiss the Pennsylvania case on the pleadings was denied, and the plaintiffs have moved to certify a class action. We are opposing the plaintiffs’ motion and are proceeding with class discovery. We have moved to dismiss the Massachusetts case. The Massachusetts case was recently transferred to the Eastern District of Pennsylvania and plaintiffs are seeking to consolidate it with the Pennsylvania case.
We believe the claims in these actions are without merit and are defending the actions vigorously. The final disposition of these claims is not expected to have a material adverse effect on our consolidated financial position, but could possibly be material to our consolidated results of operations of any one period. Further, no assurance can be given that any adverse outcome would not be material to our consolidated financial position.
Other
We are subject to other legal proceedings and claims that arise in the ordinary course of our business. The amount of ultimate liability with respect to such actions is not expected to materially affect our financial position, results of operations or liquidity.
Note 14: Financial Data by Business Segment
Our reportable segments consist of our Cable and Programming businesses. In evaluating the profitability of our segments, the components of net income (loss) below operating income (loss) before depreciation and amortization are not separately evaluated by our management. Assets are not allocated to segments for management reporting. Our financial data by business segment is as follows:
| | | | |
| | 65 | | Comcast 2006 Annual ReportNotes to Consolidated Financial Statements |
| | | | | | | | | | | | | | | | | |
| (in millions) | | Cable(a)(b) | | Programming(c) | | Corporate
and Other(d)(e) | | | Eliminations(e)(f) | | | Total |
2006 | | | | | | | | | | | | | | | | | |
Revenues(g) | | $ | 24,100 | | $ | 1,053 | | $ | 355 | | | $ | (542 | ) | | $ | 24,966 |
Operating income (loss) before depreciation and amortization(h) | | | 9,704 | | | 241 | | | (357 | ) | | | (146 | ) | | | 9,442 |
Depreciation and amortization | | | 4,657 | | | 166 | | | 80 | | | | (80 | ) | | | 4,823 |
Operating income (loss) | | | 5,047 | | | 75 | | | (437 | ) | | | (66 | ) | | | 4,619 |
Capital Expenditures | | | 4,244 | | | 16 | | | 31 | | | | 104 | | | | 4,395 |
2005 | | | | | | | | | | | | | | | | | |
Revenues(g) | | $ | 19,987 | | $ | 919 | | $ | 315 | | | $ | (146 | ) | | $ | 21,075 |
Operating income (loss) before depreciation and amortization(h)(i) | | | 7,947 | | | 272 | | | (302 | ) | | | 155 | | | | 8,072 |
Depreciation and amortization | | | 4,346 | | | 154 | | | 71 | | | | (20 | ) | | | 4,551 |
Operating income (loss)(i) | | | 3,601 | | | 118 | | | (373 | ) | | | 175 | | | | 3,521 |
Capital Expenditures | | | 3,409 | | | 16 | | | 38 | | | | 158 | | | | 3,621 |
2004 | | | | | | | | | | | | | | | | | |
Revenues(g) | | $ | 18,230 | | $ | 787 | | $ | 332 | | | $ | (128 | ) | | $ | 19,221 |
Operating income (loss) before depreciation and amortization(h)(i) | | | 6,940 | | | 269 | | | (310 | ) | | | 281 | | | | 7,180 |
Depreciation and amortization | | | 4,102 | | | 162 | | | 105 | | | | (18 | ) | | | 4,351 |
Operating income (loss)(i) | | | 2,838 | | | 107 | | | (415 | ) | | | 299 | | | | 2,829 |
Capital Expenditures | | | 3,394 | | | 17 | | | 21 | | | | 228 | | | | 3,660 |
(a) For the years ended December 31, 2006, 2005 and 2004, Cable segment revenues were derived from the following services:
| | | | | | | | | |
| | | 2006 | | | 2005 | | | 2004 | |
Video | | 62.6 | % | | 64.6 | % | | 67.0 | % |
High-speed Internet | | 20.7 | | | 18.8 | | | 16.1 | |
Phone | | 3.8 | | | 3.1 | | | 3.4 | |
Advertising | | 6.4 | | | 6.4 | | | 6.6 | |
Other | | 6.5 | | | 7.1 | | | 6.9 | |
Total | | 100.0 | % | | 100.0 | % | | 100.0 | % |
(b) Our regional sports and news networks (Comcast SportsNet, Comcast SportsNet Mid-Atlantic, Comcast SportsNet Chicago, Comcast SportsNet West, Cable Sports Southeast, MountainWest Sports Network and CN8 — The Comcast Network) are included in our Cable segment. To be consistent with our management reporting presentation, beginning August 1, 2006, the Cable segment also includes the operating results of the cable systems serving Houston, Texas held in the TKCCP (seeNote 5). The operating results of the cable systems serving Houston, Texas are reversed in the Eliminations column to reconcile to our consolidated financial statements.
(c) Programming includes our consolidated national programming networks: E!, Style, The Golf Channel, VERSUS, G4 and AZN Television.
(d) Corporate and Other includes Comcast Spectacor, a portion of operating results of our less than wholly owned technology development ventures (see “(e)” below), corporate activities and all other businesses not presented in our Cable or Programming segments.
(e) We consolidate our less than wholly owned technology development ventures, which we control or of which we are considered the primary beneficiary. These ventures are with various corporate partners, such as Motorola and Gemstar. The ventures have been created to share the costs of development of new technologies for set-top boxes and other devices. The results of these entities are included within Corporate and Other. Cost allocations are made to the Cable segment based on our percentage ownership in each entity. The remaining net costs related to the minority corporate partners are included in Corporate and Other.
(f) Included in the Eliminations column are intersegment transactions that our segments enter into with one another. The most common types of transactions are the following:
• our Programming segment generates revenue by selling cable network programming to our Cable segment, which represents a substantial majority of the revenue elimination amount
• our Cable segment receives incentives offered by our Programming segment when negotiating programming contracts that are recorded as a reduction of programming expenses
• our Cable segment generates revenue by selling the use of satellite feeds to our Programming segment
(g) Non-U.S. revenues were not significant in any period. No single customer accounted for a significant amount of our revenue in any period.
(h) To measure the performance of our operating segments, we use operating income before depreciation and amortization, excluding impairment charges related to fixed and intangible assets, and gains or losses from the sale of assets, if any. This measure eliminates the significant level of noncash depreciation and amortization expense that results from the capital-intensive nature of our businesses and from intangible assets recognized in business combinations. It is also unaffected by our capital structure or investment activities. We use this measure to evaluate our consolidated operating performance, the operating performance of our operating segments, and to allocate resources and capital to our operating segments. It is also a significant performance measure in our annual incentive compensation programs. We believe that this measure is useful to investors because it is one of the bases for comparing our operating performance with other companies in our industries, although our measure may not be directly comparable to similar measures used by other companies. This measure should not be considered a substitute for operating income (loss), net income (loss), net cash provided by operating activities or other measures of performance or liquidity reported in accordance with GAAP.
(i) To be consistent with our management reporting presentation, the 2005 and 2004 segment amounts have been adjusted as if stock options had been expensed as of January 1, 2004 (seeNote 10). The total adjustments are reversed in the Eliminations column to reconcile to our consolidated 2005 and 2004 amounts. For the years ended December 31, 2005 and 2004, the adjustments reducing operating income (loss) before depreciation and amortization by segment were as follows:
| | | | | | | |
| (in millions) | | 2005 | | 2004 | |
Cable | | $ | 116 | | $ | 180 | |
Programming | | | 1 | | | (4 | ) |
Corporate and Other | | | 49 | | | 107 | |
Total | | $ | 166 | | $ | 283 | |
| | | | |
| Notes to Consolidated Financial Statements Comcast 2006 Annual Report | | 66 | | |
Note 15: Quarterly Financial Information (Unaudited)
| | | | | | | | | | | | | | | | |
| (in millions, except per share data) | | First
Quarter | | Second
Quarter | | Third
Quarter | | Fourth
Quarter | | | Total Year |
2006 | | | | | | | | | | | | | | | | |
Revenues | | $ | 5,595 | | $ | 5,908 | | $ | 6,432 | | $ | 7,031 | | | $ | 24,966 |
Operating income | | | 1,004 | | | 1,173 | | | 1,224 | | | 1,218 | | | | 4,619 |
Income from continuing operations | | | 438 | | | 399 | | | 969 | | | 429 | (a) | | | 2,235 |
Income from discontinued operations | | | 28 | | | 61 | | | 14 | | | — | | | | 103 |
Gain on discontinued operations | | | — | | | — | | | 234 | | | (39 | )(a) | | | 195 |
Net income | | $ | 466 | | $ | 460 | | $ | 1,217 | | $ | 390 | | | $ | 2,533 |
Basic earnings for common stockholders per common share(c) | | | | | | | | | | | | | | | | |
Income from continuing operations | | $ | 0.14 | | $ | 0.13 | | $ | 0.31 | | $ | 0.14 | | | $ | 0.71 |
Income from discontinued operations | | | 0.01 | | | 0.02 | | | — | | | — | | | | 0.03 |
Gain on discontinued operations | | | — | | | — | | | 0.07 | | | (.01 | ) | | | 0.06 |
Net income | | $ | 0.15 | | $ | 0.15 | | $ | 0.38 | | $ | 0.13 | | | $ | 0.80 |
Diluted earnings for common stockholders per common share(c) | | | | | | | | | | | | | | | | |
Income from continuing operations | | $ | 0.14 | | $ | 0.13 | | $ | 0.31 | | $ | 0.14 | | | $ | 0.70 |
Income from discontinued operations | | | 0.01 | | | 0.02 | | | — | | | — | | | | 0.03 |
Gain on discontinued operations | | | — | | | — | | | 0.07 | | | (0.01 | ) | | | 0.06 |
Net income | | $ | 0.15 | | $ | 0.15 | | $ | 0.38 | | $ | 0.13 | | | $ | 0.79 |
2005 | | | | | | | | | | | | | | | | |
Revenues | | $ | 5,074 | | $ | 5,301 | | $ | 5,284 | | $ | 5,416 | | | $ | 21,075 |
Operating income | | | 829 | | | 1,002 | | | 841 | | | 849 | | | | 3,521 |
Income from continuing operations | | | 122 | | | 401 | | | 198 | | | 107 | | | | 828 |
Income from discontinued operations | | | 21 | | | 29 | | | 24 | | | 26 | | | | 100 |
Net income | | $ | 143 | | $ | 430 | | $ | 222 | | $ | 133 | (b) | | $ | 928 |
Basic earnings for common stockholders per common share(c) | | | | | | | | | | | | | | | | |
Income from continuing operations | | $ | 0.04 | | $ | 0.12 | | $ | 0.06 | | $ | 0.03 | | | $ | 0.25 |
Income from discontinued operations | | | — | | | 0.01 | | | 0.01 | | | 0.01 | | | | 0.03 |
Net income | | $ | 0.04 | | $ | 0.13 | | $ | 0.07 | | $ | 0.04 | | | $ | 0.28 |
Diluted earnings for common stockholders per common share(c) | | | | | | | | | | | | | | | | |
Income from continuing operations | | $ | 0.04 | | $ | 0.12 | | $ | 0.06 | | $ | 0.03 | | | $ | 0.25 |
Income from discontinued operations | | | — | | | 0.01 | | | 0.01 | | | 0.01 | | | | 0.03 |
Net income | | $ | 0.04 | | $ | 0.13 | | $ | 0.07 | | $ | 0.04 | | | $ | 0.28 |
(a) Includes adjustments reducing estimated gains recorded on transactions that closed in the third quarter of 2006.
(b) Includes refinement to our effective tax rate in the fourth quarter of 2005.
(c) Adjusted to reflect the Stock Split
| | | | |
| | 67 | | Comcast 2006 Annual ReportNotes to Consolidated Financial Statements |
Note 16: Condensed Consolidating Financial Information
Comcast Corporation and five of our cable holding company subsidiaries, Comcast Cable Communications, LLC (“CCCL”), Comcast Cable Communications Holdings, Inc. (“CCCH”), Comcast MO Group, Inc. (“Comcast MO Group”), Comcast Cable Holdings, LLC (“CCH”), and Comcast MO of Delaware, LLC (“Comcast MO of Delaware”) fully and unconditionally guaranteed each other’s debt securities. Comcast MO Group, CCH and Comcast MO of Delaware are collectively referred to as the “Combined CCHMO Parents.”
In September 2005, Comcast Corporation unconditionally guaranteed Comcast Holdings’ ZONES due October 2029 and its 10 5/8% Senior Subordinated Debentures due 2012, both of which were issued by Comcast Holdings; accordingly, we have added Comcast Holdings’ condensed consolidated financial information for all periods presented. Our condensed consolidating financial information is as follows:
Condensed Consolidating Balance Sheet
As of December 31, 2006
| | | | | | | | | | | | | | | | | | | | | | | | | |
| (in millions) | | Comcast
Parent | | CCCL
Parent | | CCCH
Parent | | Combined
CCHMO
Parents | | Comcast
Holdings | | Non-
Guarantor
Subsidiaries | | Elimination
and
Consolidation
Adjustments | | | Consolidated
Comcast Corporation |
Assets | | | | | | | | | | | | | | | | | | | | | | | | | |
Cash and cash equivalents | | $ | 77 | | $ | — | | $ | — | | $ | — | | $ | — | | $ | 1,162 | | $ | — | | | $ | 1,239 |
Investments | | | — | | | — | | | — | | | — | | | — | | | 1,735 | | | — | | | | 1,735 |
Accounts receivable, net | | | — | | | — | | | — | | | — | | | — | | | 1,450 | | | — | | | | 1,450 |
Other current assets | | | 15 | | | 1 | | | — | | | — | | | — | | | 762 | | | — | | | | 778 |
Total current assets | | | 92 | | | 1 | | | — | | | — | | | — | | | 5,109 | | | — | | | | 5,202 |
Investments | | | — | | | — | | | — | | | — | | | — | | | 8,847 | | | — | | | | 8,847 |
Investments in and amounts due from subsidiaries eliminated upon consolidation | | | 62,622 | | | 31,152 | | | 37,757 | | | 41,151 | | | 23,984 | | | 1,895 | | | (198,561 | ) | | | — |
Property and equipment, net | | | 17 | | | — | | | 1 | | | — | | | — | | | 21,230 | | | — | | | | 21,248 |
Franchise rights | | | — | | | — | | | — | | | — | | | — | | | 55,927 | | | — | | | | 55,927 |
Goodwill | | | — | | | — | | | — | | | — | | | — | | | 13,768 | | | — | | | | 13,768 |
Other intangible assets, net | | | — | | | — | | | — | | | — | | | — | | | 4,881 | | | — | | | | 4,881 |
Other noncurrent assets, net | | | 176 | | | 16 | | | 20 | | | — | | | 31 | | | 289 | | | — | | | | 532 |
Total assets | | $ | 62,907 | | $ | 31,169 | | $ | 37,778 | | $ | 41,151 | | $ | 24,015 | | $ | 111,946 | | $ | (198,561 | ) | | $ | 110,405 |
Liabilities and Stockholders’ Equity | | | | | | | | | | | | | | | | | | | | | | | | | |
Accounts payable and accrued expenses related to trade creditors | | $ | 11 | | $ | — | | $ | — | | $ | — | | $ | — | | $ | 2,851 | | $ | — | | | $ | 2,862 |
Accrued expenses and other current liabilities | | | 616 | | | 247 | | | 83 | | | 106 | | | 69 | | | 1,911 | | | — | | | | 3,032 |
Deferred income taxes | | | — | | | — | | | — | | | — | | | — | | | 563 | | | — | | | | 563 |
Current portion of long-term debt | | | — | | | 600 | | | — | | | 242 | | | — | | | 141 | | | — | | | | 983 |
Total current liabilities | | | 627 | | | 847 | | | 83 | | | 348 | | | 69 | | | 5,466 | | | — | | | | 7,440 |
Long-term debt, less current portion | | | 15,358 | | | 4,397 | | | 3,498 | | | 3,046 | | | 683 | | | 1,010 | | | — | | | | 27,992 |
Deferred income taxes | | | 4,638 | | | — | | | — | | | — | | | 887 | | | 21,564 | | | — | | | | 27,089 |
Other noncurrent liabilities | | | 1,117 | | | 46 | | | — | | | — | | | 76 | | | 5,237 | | | — | | | | 6,476 |
Minority interest | | | — | | | — | | | — | | | — | | | — | | | 241 | | | — | | | | 241 |
Stockholders’ Equity | | | | | | | | | | | | | | | | | | | | | | | | | |
Common stock | | | 35 | | | — | | | — | | | — | | | — | | | — | | | — | | | | 35 |
Other stockholders’ equity | | | 41,132 | | | 25,879 | | | 34,197 | | | 37,757 | | | 22,300 | | | 78,428 | | | (198,561 | ) | | | 41,132 |
Total stockholders’ equity | | | 41,167 | | | 25,879 | | | 34,197 | | | 37,757 | | | 22,300 | | | 78,428 | | | (198,561 | ) | | | 41,167 |
Total liabilities and stockholders’ equity | | $ | 62,907 | | $ | 31,169 | | $ | 37,778 | | $ | 41,151 | | $ | 24,015 | | $ | 111,946 | | $ | (198,561 | ) | | $ | 110,405 |
| | | | |
| Notes to Consolidated Financial Statements Comcast 2006 Annual Report | | 68 | | |
Condensed Consolidating Balance Sheet
As of December 31, 2005
| | | | | | | | | | | | | | | | | | | | | | | | | |
| (in millions) | | Comcast
Parent | | CCCL
Parent | | CCCH
Parent | | Combined
CCHMO
Parents | | Comcast
Holdings | | Non-
Guarantor
Subsidiaries | | Elimination
and
Consolidation
Adjustments | | | Consolidated
Comcast
Corporation |
Assets | | | | | | | | | | | | | | | | | | | | | | | | | |
Cash and cash equivalents | | $ | — | | $ | — | | $ | — | | $ | — | | $ | — | | $ | 947 | | $ | — | | | $ | 947 |
Investments | | | — | | | — | | | — | | | — | | | — | | | 148 | | | — | | | | 148 |
Accounts receivable, net | | | — | | | — | | | — | | | — | | | — | | | 1,008 | | | — | | | | 1,008 |
Other current assets | | | 16 | | | — | | | — | | | — | | | — | | | 669 | | | — | | | | 685 |
Current assets of discontinued operations | | | — | | | — | | | — | | | — | | | — | | | 60 | | | — | | | | 60 |
Total current assets | | | 16 | | | — | | | — | | | — | | | — | | | 2,832 | | | — | | | | 2,848 |
Investments | | | — | | | — | | | — | | | — | | | — | | | 12,675 | | | — | | | | 12,675 |
Investments in and amounts due from subsidiaries eliminated upon consolidation | | | 53,103 | | | 29,562 | | | 36,042 | | | 40,482 | | | 22,742 | | | 955 | | | (182,886 | ) | | | — |
Property and equipment, net | | | 11 | | | — | | | 2 | | | — | | | 3 | | | 17,688 | | | — | | | | 17,704 |
Franchise rights | | | — | | | — | | | — | | | — | | | — | | | 48,804 | | | — | | | | 48,804 |
Goodwill | | | — | | | — | | | — | | | — | | | — | | | 13,498 | | | — | | | | 13,498 |
Other intangible assets, net | | | — | | | — | | | — | | | — | | | 4 | | | 3,114 | | | — | | | | 3,118 |
Other noncurrent assets, net | | | 122 | | | 21 | | | 23 | | | — | | | 43 | | | 426 | | | — | | | | 635 |
Other noncurrent assets of discontinued operations, net | | | — | | | — | | | — | | | — | | | — | | | 4,118 | | | — | | | | 4,118 |
Total assets | | $ | 53,252 | | $ | 29,583 | | $ | 36,067 | | $ | 40,482 | | $ | 22,792 | | $ | 104,110 | | $ | (182,886 | ) | | $ | 103,400 |
Liabilities and Stockholders’ Equity | | | | | | | | | | | | | | | | | | | | | | | | | |
Accounts payable and accrued expenses related to trade creditors | | $ | — | | $ | — | | $ | — | | $ | — | | $ | — | | $ | 2,239 | | $ | — | | | $ | 2,239 |
Accrued expenses and other current liabilities | | | 447 | | | 224 | | | 113 | | | 127 | | | 89 | | | 1,482 | | | — | | | | 2,482 |
Deferred income taxes | | | — | | | — | | | — | | | — | | | — | | | 2 | | | — | | | | 2 |
Current portion of long-term debt | | | — | | | 620 | | | — | | | 995 | | | — | | | 74 | | | — | | | | 1,689 |
Current liability of discontinued operations | | | — | | | — | | | — | | | — | | | — | | | 112 | | | — | | | | 112 |
Total current liabilities | | | 447 | | | 844 | | | 113 | | | 1,122 | | | 89 | | | 3,909 | | | — | | | | 6,524 |
Long term-debt, less current portion | | | 8,243 | | | 4,988 | | | 3,498 | | | 3,318 | | | 981 | | | 654 | | | — | | | | 21,682 |
Deferred income taxes | | | 3,470 | | | — | | | — | | | — | | | 811 | | | 23,089 | | | — | | | | 27,370 |
Other noncurrent liabilities | | | 873 | | | 54 | | | — | | | — | | | 50 | | | 5,943 | | | — | | | | 6,920 |
Minority interest | | | — | | | — | | | — | | | — | | | — | | | 657 | | | — | | | | 657 |
Noncurrent liabilities of discontinued operations | | | — | | | — | | | — | | | — | | | — | | | 28 | | | — | | | | 28 |
Stockholders’ Equity | | | | | | | | | | | | | | | | | | | | | | | | | |
Common stock | | | 36 | | | — | | | — | | | — | | | — | | | — | | | — | | | | 36 |
Other stockholders’ equity | | | 40,183 | | | 23,697 | | | 32,456 | | | 36,042 | | | 20,861 | | | 69,830 | | | (182,886 | ) | | | 40,183 |
Total stockholders’ equity | | | 40,219 | | | 23,697 | | | 32,456 | | | 36,042 | | | 20,861 | | | 69,830 | | | (182,886 | ) | | | 40,219 |
Total liabilities and stockholders’ equity | | $ | 53,252 | | $ | 29,583 | | $ | 36,067 | | $ | 40,482 | | $ | 22,792 | | $ | 104,110 | | $ | (182,886 | ) | | $ | 103,400 |
| | | | |
| | 69 | | Comcast 2006 Annual ReportNotes to Consolidated Financial Statements |
Condensed Consolidating Statement of Operations
For the Year Ended December 31, 2006
| | | | | | | | | | | | | | | | | | | | | | | | | | | | | | | | |
| (in millions) | | Comcast
Parent | | | CCCL
Parent | | | CCCH
Parent | | | Combined
CCHMO
Parents | | | Comcast
Holdings | | | Non-
Guarantor
Subsidiaries | | | Elimination
and
Consolidation
Adjustments | | | Consolidated
Comcast
Corporation | |
Revenues | | | | | | | | | | | | | | | | | | | | | | | | | | | | | | | | |
Service revenues | | $ | — | | | $ | — | | | $ | — | | | $ | — | | | $ | — | | | $ | 24,966 | | | $ | — | | | $ | 24,966 | |
Management fee revenue | | | 526 | | | | 193 | | | | 298 | | | | 298 | | | | 8 | | | | — | | | | (1,323 | ) | | | — | |
| | | | 526 | | | | 193 | | | | 298 | | | | 298 | | | | 8 | | | | 24,966 | | | | (1,323 | ) | | | 24,966 | |
Costs and Expenses | | | | | | | | | | | | | | | | | | | | | | | | | | | | | | | | |
Operating (excluding depreciation) | | | — | | | | — | | | | — | | | | — | | | | — | | | | 9,010 | | | | — | | | | 9,010 | |
Selling, general and administrative | | | 256 | | | | 193 | | | | 298 | | | | 298 | | | | 16 | | | | 6,776 | | | | (1,323 | ) | | | 6,514 | |
Depreciation | | | 8 | | | | — | | | | — | | | | — | | | | 2 | | | | 3,818 | | | | — | | | | 3,828 | |
Amortization | | | — | | | | — | | | | — | | | | — | | | | 4 | | | | 991 | | | | — | | | | 995 | |
| | | 264 | | | | 193 | | | | 298 | | | | 298 | | | | 22 | | | | 20,595 | | | | (1,323 | ) | | | 20,347 | |
Operating income (loss) | | | 262 | | | | — | | | | — | | | | — | | | | (14 | ) | | | 4,371 | | | | — | | | | 4,619 | |
Other Income (Expense) | | | | | | | | | | | | | | | | | | | | | | | | | | | | | | | | |
Interest expense | | | (776 | ) | | | (400 | ) | | | (325 | ) | | | (259 | ) | | | (68 | ) | | | (236 | ) | | | — | | | | (2,064 | ) |
Investment income (loss), net | | | — | | | | — | | | | — | | | | — | | | | 34 | | | | 956 | | | | — | | | | 990 | |
Equity in net income (losses) of affiliates | | | 2,867 | | | | 1,509 | | | | 1,900 | | | | 2,069 | | | | 1,266 | | | | (138 | ) | | | (9,597 | ) | | | (124 | ) |
Other income (expense) | | | — | | | | — | | | | — | | | | — | | | | — | | | | 173 | | | | — | | | | 173 | |
| | | 2,091 | | | | 1,109 | | | | 1,575 | | | | 1,810 | | | | 1,232 | | | | 755 | | | | (9,597 | ) | | | (1,025 | ) |
Income (loss) from continuing operations before income taxes and minority interest | | | 2,353 | | | | 1,109 | | | | 1,575 | | | | 1,810 | | | | 1,218 | | | | 5,126 | | | | (9,597 | ) | | | 3,594 | |
Income tax (expense) benefit | | | 180 | | | | 143 | | | | 114 | | | | 90 | | | | 26 | | | | (1,900 | ) | | | — | | | | (1,347 | ) |
Income (loss) from continuing operations before minority interest | | | 2,533 | | | | 1,252 | | | | 1,689 | | | | 1,900 | | | | 1,244 | | | | 3,226 | | | | (9,597 | ) | | | 2,247 | |
Minority interest | | | — | | | | — | | | | — | | | | — | | | | — | | | | (12 | ) | | | — | | | | (12 | ) |
Income from continuing operations | | | 2,533 | | | | 1,252 | | | | 1,689 | | | | 1,900 | | | | 1,244 | | | | 3,214 | | | | (9,597 | ) | | | 2,235 | |
Income from discontinued operations, net of tax | | | — | | | | — | | | | — | | | | — | | | | — | | | | 103 | | | | — | | | | 103 | |
Gain on discontinued operations, net of tax | | | — | | | | — | | | | — | | | | — | | | | — | | | | 195 | | | | — | | | | 195 | |
Net Income | | $ | 2,533 | | | $ | 1,252 | | | $ | 1,689 | | | $ | 1,900 | | | $ | 1,244 | | | $ | 3,512 | | | $ | (9,597 | ) | | $ | 2,533 | |
| | | | |
| Notes to Consolidated Financial Statements Comcast 2006 Annual Report | | 70 | | |
Condensed Consolidating Statement of Operations
For the Year Ended December 31, 2005
| | | | | | | | | | | | | | | | | | | | | | | | | | | | | | | | |
| (in millions) | | Comcast
Parent | | | CCCL
Parent | | | CCCH
Parent | | | Combined
CCHMO
Parents | | | Comcast
Holdings | | | Non-
Guarantor
Subsidiaries | | | Elimination
and
Consolidation
Adjustments | | | Consolidated
Comcast
Corporation | |
Revenues | | | | | | | | | | | | | | | | | | | | | | | | | | | | | | | | |
Service revenues | | $ | — | | | $ | — | | | $ | — | | | $ | — | | | $ | — | | | $ | 21,075 | | | $ | — | | | $ | 21.075 | |
Management fee revenue | | | 457 | | | | 174 | | | | 278 | | | | 278 | | | | 8 | | | | — | | | | (1,195 | ) | | | — | |
| | | | 457 | | | | 174 | | | | 278 | | | | 278 | | | | 8 | | | | 21,075 | | | | (1,195 | ) | | | 21,075 | |
Costs and Expenses | | | | | | | | | | | | | | | | | | | | | | | | | | | | | | | | |
Operating (excluding depreciation) | | | — | | | | — | | | | — | | | | — | | | | — | | | | 7,513 | | | | — | | | | 7,513 | |
Selling, general and administrative | | | 204 | | | | 174 | | | | 278 | | | | 278 | | | | 15 | | | | 5,736 | | | | (1,195 | ) | | | 5,490 | |
Depreciation | | | 3 | | | | — | | | | — | | | | — | | | | 3 | | | | 3,407 | | | | — | | | | 3,413 | |
Amortization | | | — | | | | — | | | | — | | | | — | | | | 10 | | | | 1,128 | | | | — | | | | 1,138 | |
| | | 207 | | | | 174 | | | | 278 | | | | 278 | | | | 28 | | | | 17,784 | | | | (1,195 | ) | | | 17,554 | |
Operating income (loss) | | | 250 | | | | — | | | | — | | | | — | | | | (20 | ) | | | 3,291 | | | | — | | | | 3,521 | |
Other Income (Expense) | | | | | | | | | | | | | | | | | | | | | | | | | | | | | | | | |
Interest expense | | | (371 | ) | | | (477 | ) | | | (329 | ) | | | (306 | ) | | | (101 | ) | | | (211 | ) | | | — | | | | (1,795 | ) |
Investment income (loss), net | | | — | | | | — | | | | — | | | | — | | | | (16 | ) | | | 105 | | | | — | | | | 89 | |
Equity in net income (losses) of affiliates | | | 1,007 | | | | 1,372 | | | | 605 | | | | 804 | | | | 977 | | | | 43 | | | | (4,850 | ) | | | (42 | ) |
Other income (expense) | | | — | | | | — | | | | — | | | | — | | | | — | | | | (53 | ) | | | — | | | | (53 | ) |
| | | 636 | | | | 895 | | | | 276 | | | | 498 | | | | 860 | | | | (116 | ) | | | (4,850 | ) | | | (1,801 | ) |
Income (loss) from continuing operations before income taxes and minority interest | | | 886 | | | | 895 | | | | 276 | | | | 498 | | | | 840 | | | | 3,175 | | | | (4,850 | ) | | | 1,720 | |
Income tax (expense) benefit | | | 42 | | | | 167 | | | | 115 | | | | 107 | | | | 48 | | | | (1,352 | ) | | | — | | | | (873 | ) |
Income (loss) from continuing operations before minority interest | | | 928 | | | | 1,062 | | | | 391 | | | | 605 | | | | 888 | | | | 1,823 | | | | (4,850 | ) | | | 847 | |
Minority interest | | | — | | | | — | | | | — | | | | — | | | | — | | | | (19 | ) | | | — | | | | (19 | ) |
Income from continuing operations | | $ | 928 | | | $ | 1,062 | | | $ | 391 | | | $ | 605 | | | $ | 888 | | | $ | 1,804 | | | $ | (4,850 | ) | | $ | 828 | |
Income from discontinued operations, net of tax | | | — | | | | — | | | | — | | | | — | | | | — | | | | 100 | | | | — | | | | 100 | |
Net Income | | $ | 928 | | | $ | 1,062 | | | $ | 391 | | | $ | 605 | | | $ | 888 | | | $ | 1,904 | | | $ | (4,850 | ) | | $ | 928 | |
| | | | |
| | 71 | | Comcast 2006 Annual ReportNotes to Consolidated Financial Statements |
Condensed Consolidating Statement of Operations
For the Year Ended December 31, 2004
| | | | | | | | | | | | | | | | | | | | | | | | | | | | | | | | |
| (in millions) | | Comcast
Parent | | | CCCL
Parent | | | CCCH
Parent | | | Combined
CCHMO
Parents | | | Comcast
Holdings | | | Non-
Guarantor
Subsidiaries | | | Elimination
and
Consolidation
Adjustments | | | Consolidated
Comcast
Corporation | |
Revenues | | | | | | | | | | | | | | | | | | | | | | | | | | | | | | | | |
Service revenues | | $ | — | | | $ | — | | | $ | — | | | $ | — | | | $ | — | | | $ | 19,221 | | | $ | — | | | $ | 19,221 | |
Management fee revenue | | | 416 | | | | 161 | | | | 253 | | | | 253 | | | | 8 | | | | — | | | | (1,091 | ) | | | — | |
| | | | 416 | | | | 161 | | | | 253 | | | | 253 | | | | 8 | | | | 19,221 | | | | (1,091 | ) | | | 19,221 | |
Costs and Expenses | | | | | | | | | | | | | | | | | | | | | | | | | | | | | | | | |
Operating (excluding depreciation) | | | — | | | | — | | | | — | | | | — | | | | — | | | | 7,036 | | | | — | | | | 7,036 | |
Selling, general and administrative | | | 168 | | | | 161 | | | | 253 | | | | 253 | | | | 13 | | | | 5,248 | | | | (1,091 | ) | | | 5,005 | |
Depreciation | | | 2 | | | | — | | | | — | | | | — | | | | 3 | | | | 3,192 | | | | — | | | | 3,197 | |
Amortization | | | — | | | | — | | | | — | | | | — | | | | 11 | | | | 1,143 | | | | — | | | | 1,154 | |
| | | 170 | | | | 161 | | | | 253 | | | | 253 | | | | 27 | | | | 16,619 | | | | (1,091 | ) | | | 16,392 | |
Operating income (loss) | | | 246 | | | | — | | | | — | | | | — | | | | (19 | ) | | | 2,602 | | | | — | | | | 2,829 | |
Other Income (Expense) | | | | | | | | | | | | | | | | | | | | | | | | | | | | | | | | |
Interest expense | | | (289 | ) | | | (474 | ) | | | (348 | ) | | | (399 | ) | | | (98 | ) | | | (266 | ) | | | — | | | | (1,874 | ) |
Investment income (loss), net | | | — | | | | — | | | | — | | | | — | | | | 100 | | | | 372 | | | | — | | | | 472 | |
Equity in net income (losses) of affiliates | | | 998 | | | | 1,170 | | | | 310 | | | | 569 | | | | 997 | | | | (216 | ) | | | (3,909 | ) | | | (81 | ) |
Other income (expense) | | | — | | | | — | | | | — | | | | — | | | | — | | | | 397 | | | | — | | | | 397 | |
| | | 709 | | | | 696 | | | | (38 | ) | | | 170 | | | | 999 | | | | 287 | | | | (3,909 | ) | | | (1,086 | ) |
Income (loss) from continuing operations before income taxes and minority interest | | | 955 | | | | 696 | | | | (38 | ) | | | 170 | | | | 980 | | | | 2,889 | | | | (3,909 | ) | | | 1,743 | |
Income tax (expense) benefit | | | 15 | | | | 166 | | | | 122 | | | | 140 | | | | 6 | | | | (1,250 | ) | | | — | | | | (801 | ) |
Income (loss) from continuing operations before minority interest | | | 970 | | | | 862 | | | | 84 | | | | 310 | | | | 986 | | | | 1,639 | | | | (3,909 | ) | | | 942 | |
Minority interest | | | — | | | | — | | | | — | | | | — | | | | — | | | | (14 | ) | | | — | | | | (14 | ) |
Income from continuing operations | | | 970 | | | | 862 | | | | 84 | | | | 310 | | | | 986 | | | | 1,625 | | | | (3,909 | ) | | | 928 | |
Income from discontinued operations, net of tax | | | — | | | | — | | | | — | | | | — | | | | — | | | | 42 | | | | — | | | | 42 | |
Net Income | | $ | 970 | | | $ | 862 | | | $ | 84 | | | $ | 310 | | | $ | 986 | | | $ | 1,667 | | | $ | (3,909 | ) | | $ | 970 | |
| | | | |
| Notes to Consolidated Financial Statements Comcast 2006 Annual Report | | 72 | | |
Condensed Consolidating Statement of Cash Flows
For the Year Ended December 31, 2006
| | | | | | | | | | | | | | | | | | | | | | | | | | | | | | | |
| (in millions) | | Comcast
Parent | | | CCCL
Parent | | | CCCH
Parent | | | Combined
CCHMO
Parents | | | Comcast
Holdings | | | Non-
Guarantor
Subsidiaries | | | Elimination
and
Consolidation
Adjustments | | Consolidated
Comcast
Corporation | |
Operating Activities | | | | | | | | | | | | | | | | | | | | | | | | | | | | | | | |
Net cash provided by (used in) operating activities | | $ | 90 | | | $ | (240 | ) | | $ | (226 | ) | | $ | (224 | ) | | $ | 20 | | | $ | 7,198 | | | $ | — | | $ | 6,618 | |
Financing Activities | | | | | | | | | | | | | | | | | | | | | | | | | | | | | | | |
Proceeds from borrowings | | | 7,474 | | | | — | | | | — | | | | — | | | | — | | | | 23 | | | | — | | | 7,497 | |
Retirements and repayments of debt | | | (350 | ) | | | (619 | ) | | | — | | | | (988 | ) | | | (27 | ) | | | (55 | ) | | | — | | | (2,039 | ) |
Repurchases of common stock | | | (2,347 | ) | | | — | | | | — | | | | — | | | | — | | | | — | | | | — | | | (2,347 | ) |
Issuances of common stock | | | 410 | | | | — | | | | — | | | | — | | | | — | | | | — | | | | — | | | 410 | |
Other | | | 33 | | | | — | | | | — | | | | — | | | | — | | | | (8 | ) | | | — | | | 25 | |
Net cash provided by (used in) financing activities | | | 5,220 | | | | (619 | ) | | | — | | | | (988 | ) | | | (27 | ) | | | (40 | ) | | | — | | | 3,546 | |
Investing Activities | | | | | | | | | | | | | | | | | | | | | | | | | | | | | | | |
Net transactions with affiliates | | | (5,272 | ) | | | 859 | | | | 226 | | | | 1,212 | | | | (3 | ) | | | 2,978 | | | | — | | | — | |
Capital expenditures | | | (8 | ) | | | — | | | | — | | | | — | | | | — | | | | (4,387 | ) | | | — | | | (4,395 | ) |
Cash paid for intangible assets | | | — | | | | — | | | | — | | | | — | | | | — | | | | (306 | ) | | | — | | | (306 | ) |
Acquisitions, net of cash acquired | | | — | | | | — | | | | — | | | | — | | | | — | | | | (5,110 | ) | | | — | | | (5,110 | ) |
Proceeds from sales and restructuring of investments | | | 47 | | | | — | | | | — | | | | — | | | | 10 | | | | 2,663 | | | | — | | | 2,720 | |
Purchases of investments | | | — | | | | — | | | | — | | | | — | | | | — | | | | (2,812 | ) | | | — | | | (2,812 | ) |
Proceeds from sales (purchases) of short-term investments, net | | | — | | | | — | | | | — | | | | — | | | | — | | | | 33 | | | | — | | | 33 | |
Other | | | — | | | | — | | | | — | | | | — | | | | — | | | | (2 | ) | | | — | | | (2 | ) |
Net cash provided by (used in) investing activities | | | (5,233 | ) | | | 859 | | | | 226 | | | | 1,212 | | | | 7 | | | | (6,943 | ) | | | — | | | (9,872 | ) |
Increase in cash and cash equivalents | | | 77 | | | | — | | | | — | | | | — | | | | — | | | | 215 | | | | — | | | 292 | |
Cash and cash equivalents, beginning of year | | | — | | | | — | | | | — | | | | — | | | | — | | | | 947 | | | | — | | | 947 | |
Cash and cash equivalents, end of year | | $ | 77 | | | $ | — | | | $ | — | | | $ | — | | | $ | — | | | $ | 1,162 | | | $ | — | | $ | 1,239 | |
| | | | |
| | 73 | | Comcast 2006 Annual ReportNotes to Consolidated Financial Statements |
Condensed Consolidating Statement of Cash Flows
For the Year Ended December 31, 2005
| | | | | | | | | | | | | | | | | | | | | | | | | | | | | | | |
| (in millions) | | Comcast
Parent | | | CCCL
Parent | | | CCCH
Parent | | | Combined
CCHMO
Parents | | | Comcast
Holdings | | | Non-
Guarantor
Subsidiaries | | | Elimination
and
Consolidation
Adjustments | | Consolidated
Comcast
Corporation | |
Operating Activities | | | | | | | | | | | | | | | | | | | | | | | | | | | | | | | |
Net cash provided by (used in) operating activities | | $ | 61 | | | $ | (256 | ) | | $ | (204 | ) | | $ | (387 | ) | | $ | (110 | ) | | $ | 5,731 | | | $ | — | | $ | 4,835 | |
Financing Activities | | | | | | | | | | | | | | | | | | | | | | | | | | | | | | | |
Proceeds from borrowings | | | 3,972 | | | | — | | | | — | | | | — | | | | — | | | | 6 | | | | — | | | 3,978 | |
Retirements and repayments of debt | | | — | | | | (700 | ) | | | — | | | | (1,628 | ) | | | (13 | ) | | | (365 | ) | | | — | | | (2,706 | ) |
Repurchases of common stock | | | (2,313 | ) | | | — | | | | — | | | | — | | | | — | | | | — | | | | — | | | (2,313 | ) |
Issuances of common stock | | | 93 | | | | — | | | | — | | | | — | | | | — | | | | — | | | | — | | | 93 | |
Other | | | — | | | | — | | | | — | | | | — | | | | — | | | | 15 | | | | — | | | 15 | |
Net cash provided by (used in) financing activities | | | 1,752 | | | | (700 | ) | | | — | | | | (1,628 | ) | | | (13 | ) | | | (344 | ) | | | — | | | (933 | ) |
Investing Activities | | | | | | | | | | | | | | | | | | | | | | | | | | | | | | | |
Net transactions with affiliates | | | (1,813 | ) | | | 956 | | | | 204 | | | | 2,015 | | | | 123 | | | | (1,485 | ) | | | — | | | — | |
Capital expenditures | | | — | | | | — | | | | — | | | | — | | | | — | | | | (3,621 | ) | | | — | | | (3,621 | ) |
Cash paid for intangible assets | | | — | | | | — | | | | — | | | | — | | | | — | | | | (281 | ) | | | — | | | (281 | ) |
Acquisitions, net of cash acquired | | | — | | | | — | | | | — | | | | — | | | | — | | | | (199 | ) | | | — | | | (199 | ) |
Proceeds from sales and restructuring of investments | | | — | | | | — | | | | — | | | | — | | | | — | | | | 861 | | | | — | | | 861 | |
Purchases of investments | | | — | | | | — | | | | — | | | | — | | | | — | | | | (306 | ) | | | — | | | (306 | ) |
Proceeds from sales (purchases) of short-term investments, net | | | — | | | | — | | | | — | | | | — | | | | — | | | | (86 | ) | | | — | | | (86 | ) |
Other | | | — | | | | — | | | | — | | | | — | | | | — | | | | (116 | ) | | | — | | | (116 | ) |
Net cash provided by (used in) investing activities | | | (1,813 | ) | | | 956 | | | | 204 | | | | 2,015 | | | | 123 | | | | (5,233 | ) | | | — | | | (3,748 | ) |
Increase in cash and cash equivalents | | | — | | | | — | | | | — | | | | — | | | | — | | | | 154 | | | | — | | | 154 | |
Cash and cash equivalents, beginning of year | | | — | | | | — | | | | — | | | | — | | | | — | | | | 793 | | | | — | | | 793 | |
Cash and cash equivalents, end of year | | $ | — | | | $ | — | | | $ | — | | | $ | — | | | $ | — | | | $ | 947 | | | $ | — | | $ | 947 | |
| | | | |
| Notes to Consolidated Financial Statements Comcast 2006 Annual Report | | 74 | | |
Condensed Consolidating Statement of Cash Flows
For the Year Ended December 31, 2004
| | | | | | | | | | | | | | | | | | | | | | | | | | | | | | | |
| (in millions) | | Comcast
Parent | | | CCCL
Parent | | | CCCH
Parent | | | Combined
CCHMO
Parents | | | Comcast
Holdings | | | Non-
Guarantor
Subsidiaries | | | Elimination
and
Consolidation
Adjustments | | Consolidated
Comcast
Corporation | |
Operating Activities | | | | | | | | | | | | | | | | | | | | | | | | | | | | | | | |
Net cash provided by (used in) operating activities | | $ | 482 | | | $ | (143 | ) | | $ | (155 | ) | | $ | (478 | ) | | $ | 8 | | | $ | 6,368 | | | $ | — | | $ | 6,082 | |
Financing Activities | | | | | | | | | | | | | | | | | | | | | | | | | | | | | | | |
Proceeds from borrowings | | | 620 | | | | — | | | | 400 | | | | — | | | | — | | | | 10 | | | | — | | | 1,030 | |
Retirements and repayments of debt | | | (300 | ) | | | (561 | ) | | | (400 | ) | | | (306 | ) | | | — | | | | (756 | ) | | | — | | | (2,323 | ) |
Repurchases of common stock | | | (1,361 | ) | | | — | | | | — | | | | — | | | | — | | | | — | | | | — | | | (1,361 | ) |
Issuances of common stock | | | 113 | | | | — | | | | — | | | | — | | | | — | | | | — | | | | — | | | 113 | |
Other | | | 8 | | | | — | | | | — | | | | — | | | | — | | | | 17 | | | | — | | | 25 | |
Net cash provided by (used in) financing activities | | | (920 | ) | | | (561 | ) | | | — | | | | (306 | ) | | | — | | | | (729 | ) | | | — | | | (2,516 | ) |
Investing Activities | | | | | | | | | | | | | | | | | | | | | | | | | | | | | | | |
Net transactions with affiliates | | | 438 | | | | 704 | | | | 155 | | | | 784 | | | | (8 | ) | | | (2,073 | ) | | | — | | | — | |
Capital expenditures | | | — | | | | — | | | | — | | | | — | | | | — | | | | (3,660 | ) | | | — | | | (3,660 | ) |
Cash paid for intangible assets | | | — | | | | — | | | | — | | | | — | | | | — | | | | (615 | ) | | | — | | | (615 | ) |
Acquisitions, net of cash acquired | | | — | | | | — | | | | — | | | | — | | | | — | | | | (296 | ) | | | — | | | (296 | ) |
Proceeds from sales and restructuring of investments | | | — | | | | — | | | | — | | | | — | | | | — | | | | 228 | | | | — | | | 228 | |
Purchases of investments | | | — | | | | — | | | | — | | | | — | | | | — | | | | (156 | ) | | | — | | | (156 | ) |
Proceeds from sales (purchases) of short-term investments, net | | | — | | | | — | | | | — | | | | — | | | | — | | | | (13 | ) | | | — | | | (13 | ) |
Proceeds from settlement of contract of acquired company | | | — | | | | — | | | | — | | | | — | | | | — | | | | 26 | | | | — | | | 26 | |
Other | | | — | | | | — | | | | — | | | | — | | | | — | | | | (26 | ) | | | — | | | (26 | ) |
Net cash provided by (used in) investing activities | | | 438 | | | | 704 | | | | 155 | | | | 784 | | | | (8 | ) | | | (6,585 | ) | | | — | | | (4,512 | ) |
Decrease in cash and cash equivalents | | | — | | | | — | | | | — | | | | — | | | | — | | | | (946 | ) | | | — | | | (946 | ) |
Cash and cash equivalents, beginning of year | | | — | | | | — | | | | — | | | | — | | | | — | | | | 1,739 | | | | — | | | 1,739 | |
Cash and cash equivalents, end of year | | $ | — | | | $ | — | | | $ | — | | | $ | — | | | $ | — | | | $ | 793 | | | $ | — | | $ | 793 | |
| | | | |
| | 75 | | Comcast 2006 Annual ReportNotes to Consolidated Financial Statements |
Reconciliation of Non-GAAP Measures
Reconciliation of 2006 Operating Income to Operating Cash Flow
| | | |
| (in millions) | | |
Operating Income | | $ | 4,619 |
Depreciation and Amortization | | | 4,823 |
Operating Cash Flow(a) | | $ | 9,442 |
(a) Operating Cash Flow (as presented above) is defined as operating income before depreciation and amortization, excluding impairment charges related to fixed and intangible assets and gains or losses on sale of assets, if any.
Calculation of 2006 Free Cash Flow
| | | | |
| (in millions) | | | |
Net Cash Provided by Operating Activities | | $ | 6,618 | |
Capital Expenditures | | | (4,395 | ) |
Cash Paid For Intangible Assets | | | (306 | ) |
Nonoperating Items, Net of Tax | | | 706 | |
Free Cash Flow(a) | | $ | 2,623 | |
(a) Free Cash Flow (as presented above) is defined as “Net Cash Provided by Operating Activities” (as stated in our Consolidated Statement of Cash Flows) reduced by capital expenditures and cash paid for intangible assets; and increased by any payments related to certain nonoperating items, net of estimated tax benefits (such as income taxes on investment sales, and nonrecurring payments related to income tax and litigation contingencies of acquired companies).
Reconciliation of Cable Segment pro Forma, “As Adjusted” Financial Data
| | | | | | | | | | | | | | | |
| (in millions) | | Cable | | Pro Forma
Adjustments(a) | | Cable Pro Forma | | Pro Forma
% Growth | | | % Growth | |
2006 | | | | | | | | | | | | | | | |
Revenue | | $ | 24,100 | | $ | 2,239 | | $ | 26,339 | | 12 | % | | 21 | % |
Operating Expenses (excluding depreciation and amortization) | | | 14,396 | | | 1,432 | | | 15,828 | | | | | | |
Operating Cash Flow | | $ | 9,704 | | $ | 807 | | $ | 10,511 | | 15 | % | | 22 | % |
Depreciation and Amortization | | | 4,657 | | | 608 | | | 5,265 | | | | | | |
Operating Income | | $ | 5,047 | | $ | 199 | | $ | 5,246 | | | | | | |
2005 | | | | | | | | | | | | | | | |
Revenue | | $ | 19,987 | | $ | 3,569 | | $ | 23,556 | | | | | | |
Operating Expenses (excluding depreciation and amortization) | | | 11,924 | | | 2,384 | | | 14,308 | | | | | | |
Stock option adjustment(b) | | | 116 | | | — | | | 116 | | | | | | |
Operating Cash Flow | | $ | 7,947 | | $ | 1,185 | | $ | 9,132 | | | | | | |
Depreciation and Amortization | | | 4,346 | | | 1,134 | | | 5,480 | | | | | | |
Operating Income | | $ | 3,601 | | $ | 51 | | $ | 3,652 | | | | | | |
(a) Pro forma results adjust only for certain acquisitions and dispositions, including Susquehanna Communications (April 2006), the Adelphia and Time Warner transactions (July 2006) and the dissolution of the Texas and Kansas City cable partnership (effective January 1, 2007). Cable segment results are presented as if the transactions noted above were effective on January 1, 2005.
(b) To be consistent with our management reporting, the 2005 Cable segment amounts have been adjusted as if stock options had been expensed as of January 1, 2005.
| | | | |
| Comcast 2006 Annual Report | | 76 | | |
Market for the Registrant’s Common Equity
Our Class A common stock is listed on the Nasdaq Global Select Market under the symbol CMCSA and our Class A Special common stock is listed on the Nasdaq Global Select Market under the symbol CMCSK. There is no established public trading market for our Class B common stock. Our Class B common stock can be converted, on a share for share basis, into Class A or Class A Special common stock. The following table sets forth, for the indicated periods, the high and low sales prices of our Class A and Class A Special common stock (adjusted to reflect the Stock Split).
| | | | | | | | | | | | |
| | | Class A | | Class A Special |
| | | High | | Low | | High | | Low |
2006 | | | | | | | | | | | | |
First Quarter | | $ | 18.97 | | $ | 16.90 | | $ | 18.87 | | $ | 16.73 |
Second Quarter | | | 22.37 | | | 17.45 | | | 22.27 | | | 17.33 |
Third Quarter | | | 24.77 | | | 20.67 | | | 24.74 | | | 20.64 |
Fourth Quarter | | | 28.94 | | | 24.17 | | | 28.69 | | | 24.14 |
2005 | | | | | | | | | | | | |
First Quarter | | $ | 23.00 | | $ | 20.69 | | $ | 22.77 | | $ | 20.33 |
Second Quarter | | | 22.69 | | | 20.37 | | | 22.47 | | | 19.80 |
Third Quarter | | | 21.54 | | | 19.16 | | | 21.25 | | | 18.82 |
Fourth Quarter | | | 19.56 | | | 17.20 | | | 19.24 | | | 17.01 |
We have not declared and paid any cash dividends on our Class A, Class A Special or Class B common stock in our last two fiscal years and do not intend to do so for the foreseeable future.
As of December 31, 2006, there were 921,275 record holders of our Class A common stock, 2,266 record holders of our Class A Special common stock and three record holders of our Class B common stock.
Stock Performance Graph
The following graph compares the yearly percentage change in the cumulative total shareholder return on our Class A common stock and Class A Special common stock during the five years ended December 31, 2006, with the cumulative total return on the Standard & Poor’s 500 Stock Index and with a selected peer group consisting of us and other companies engaged in the cable, telecommunications and media industries. This peer group consists of Cablevision Systems Corporation (Class A), Time Warner Inc., The DirecTV Group Inc. and Echostar Communications Corp. The comparison assumes $100 was invested on December 31, 2001, in our Class A common stock and Class A Special common stock and in each of the following indices and assumes the reinvestment of dividends.
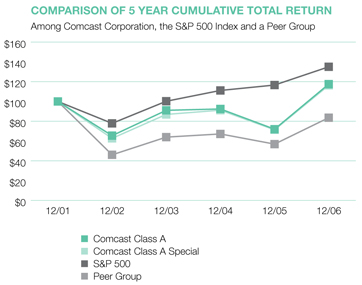
| | | | | | | | | | |
| (in dollars) | | 2002 | | 2003 | | 2004 | | 2005 | | 2006 |
Comcast Class A | | 65 | | 91 | | 92 | | 72 | | 118 |
Comcast Class A Special | | 63 | | 87 | | 91 | | 71 | | 116 |
S&P 500 Stock Index | | 78 | | 100 | | 111 | | 117 | | 135 |
Peer Group Index | | 46 | | 64 | | 67 | | 57 | | 84 |
| | | | |
| | 77 | | Comcast 2006 Annual Report |
Selected Financial Data
| | | | | | | | | | | | | | | | | | | | |
| Year Ended December 31 (in millions, except per share data) | | 2006 | | | 2005 | | | 2004 | | | 2003 | | | 2002 | |
Statement of Operations Data | | | | | | | | | | | | | | | | | | | | |
Revenues | | $ | 24,966 | | | $ | 21,075 | | | $ | 19,221 | | | $ | 17,330 | | | $ | 7,997 | |
Operating income | | | 4,619 | | | | 3,521 | | | | 2,829 | | | | 1,938 | | | | 948 | |
Income (loss) from continuing operations | | | 2,235 | | | | 828 | | | | 928 | | | | (222 | ) | | | (452 | ) |
Discontinued operations(a)(b) | | | 298 | | | | 100 | | | | 42 | | | | 3,462 | | | | 178 | |
Net income (loss) | | | 2,533 | | | | 928 | | | | 970 | | | | 3,240 | | | | (274 | ) |
Basic earnings( loss) for common stockholders per common share(c) | | | | | | | | | | | | | | | | | | | | |
Income (loss) from continuing operations | | $ | 0.71 | | | $ | 0.25 | | | $ | 0.28 | | | $ | (0.07 | ) | | $ | (0.27 | ) |
Discontinued operations(a)(b) | | | 0.09 | | | | 0.03 | | | | 0.01 | | | | 1.02 | | | | 0.11 | |
Net income (loss) | | $ | 0.80 | | | $ | 0.28 | | | $ | 0.29 | | | $ | 0.95 | | | $ | (0.16 | ) |
Diluted earnings (loss) for common stockholders per common share(c) | | | | | | | | | | | | | | | | | | | | |
Income (loss) from continuing operations | | $ | 0.70 | | | $ | 0.25 | | | $ | 0.28 | | | $ | (0.07 | ) | | $ | (0.27 | ) |
Discontinued operations(a)(b) | | | 0.09 | | | | 0.03 | | | | 0.01 | | | | 1.02 | | | | 0.11 | |
Net income (loss) | | $ | 0.79 | | | $ | 0.28 | | | $ | 0.29 | | | $ | 0.95 | | | $ | (0.16 | ) |
Balance Sheet Data (at year end) | | | | | | | | | | | | | | | | | | | | |
Total assets | | $ | 110,405 | | | $ | 103,400 | | | $ | 105,035 | | | $ | 109,348 | | | $ | 113,485 | |
Long-term debt | | | 27,992 | | | | 21,682 | | | | 20,093 | | | | 23,835 | | | | 27,956 | |
Stockholders’ equity | | | 41,167 | | | | 40,219 | | | | 41,422 | | | | 41,662 | | | | 38,329 | |
Statement of Cash Flows Data | | | | | | | | | | | | | | | | | | | | |
Net cash provided by (used in): | | | | | | | | | | | | | | | | | | | | |
Operating activities | | $ | 6,618 | | | $ | 4,835 | | | $ | 6,082 | | | $ | 2,686 | | | $ | 2,518 | |
Financing activities | | | 3,546 | | | | (933 | ) | | | (2,516 | ) | | | (7,048 | ) | | | (1,005 | ) |
Investing activities | | | (9,872 | ) | | | (3,748 | ) | | | (4,512 | ) | | | 5,239 | | | | (1,125 | ) |
(a) In July 2006, in connection with the transactions with Adelphia and Time Warner, we transferred our previously owned cable systems located in Los Angeles, Cleveland and Dallas to Time Warner Cable. These cable systems are presented as discontinued operations for the years ended on or before December 31, 2006 (seeNote 5 to our consolidated financial statements).
(b) In September 2003, we sold our interest in QVC to Liberty Media Corporation. QVC is presented as a discontinued operation for the years ended on and before December 31, 2003.
(c) Adjusted to reflect the Stock Split.
| | | | |
| Comcast 2006 Annual Report | | 78 | | |
Board of Directors and Corporate Executives
| | | | | | |
| Board of Directors | | | | | | |
| | | |
| S. Decker Anstrom | | Edward D. Breen | | J. Michael Cook | | Ralph J. Roberts |
| President and | | Chairman and | | Retired Chairman and | | Founder |
| Chief Operating Officer | | Chief Executive Officer | | Chief Executive Officer | | Chairman, Executive and |
| Landmark Communications, Inc. | | Tyco International, Ltd. | | Deloitte & Touche LLP | | Finance Committee |
| | | |
| Kenneth J. Bacon | | Julian A. Brodsky | | Jeffrey A. Honickman | | Dr. Judith Rodin |
| Executive Vice President | | Non-Executive Vice Chairman | | Chief Executive Officer | | President |
| Housing and | | | | Pepsi-Cola and | | The Rockefeller Foundation |
| Community Development | | Joseph J. Collins | | National Brand Beverage, Ltd. | | |
| Fannie Mae | | Chairman | | | | Michael I. Sovern |
| | Aegis, LLC | | Brian L. Roberts | | Chairman |
| Sheldon M. Bonovitz | | Retired Chairman and | | Chairman and CEO | | Sotheby’s Holdings, Inc. |
| Chairman and | | Chief Executive Officer | | | | |
| Chief Executive Officer | | Time Warner Cable | | | | |
| Duane Morris LLP | | | | | | |
| | | |
| Corporate Executives | | | | | | |
| | | |
| Brian L. Roberts | | Arthur R. Block | | Joseph F. DiTrolio | | Charisse R. Lille |
| Chairman and | | Senior Vice President, | | Vice President | | Vice President |
| Chief Executive Officer | | General Counsel and | | Financial Operations | | Human Resources |
| | Secretary | | | | |
| Ralph J. Roberts | | | | Marlene S. Dooner | | Kenneth Mikalauskas |
| Founder | | Mark A. Coblitz | | Vice President | | Vice President |
| Chairman, Executive and | | Senior Vice President | | Investor Relations | | Finance |
| Finance Committee | | Strategic Planning | | | | |
| | | | William E. Dordelman | | Marc A. Rockford |
| John R. Alchin | | Robert S. Pick | | Vice President | | Vice President and |
| Executive Vice President and | | Senior Vice President | | Finance | | Senior Deputy General Counsel |
| Co-Chief Financial Officer | | Corporate Development | | | | |
| | | | Kamal Dua | | D’Arcy F. Rudnay |
| Stephen B. Burke | | Lawrence J. Salva | | Vice President | | Vice President |
| Executive Vice President and | | Senior Vice President, | | Internal Audit and | | Corporate Communications |
| Chief Operating Officer | | Chief Accounting Officer and | | General Auditor | | |
| President, Comcast Cable | | Controller | | | | Joseph W. Waz, Jr. |
| | | | Leonard J. Gatti | | Vice President |
| David L. Cohen | | C. Stephen Backstrom | | Vice President | | External Affairs and |
| Executive Vice President | | Vice President | | Financial Reporting | | Public Policy Counsel |
| | Taxation | | | | |
| Lawrence S. Smith | | | | Gregg M. Goldstein | | |
| Executive Vice President and | | Payne D. Brown | | Vice President | | |
| Co-Chief Financial Officer | | Vice President | | Corporate Development | | |
| | Strategic Initiatives | | | | |
| Amy L. Banse | | | | Kerry Knott | | |
| Senior Vice President | | Karen Dougherty Buchholz | | Vice President | | |
| Interactive Media | | Vice President | | Government Affairs | | |
| President | | Administration | | | | |
| Comcast Interactive Media | | | | | | |
| | | | |
| | 79 | | Comcast 2006 Annual Report |
Division Executives
| | | | | | |
| Comcast Cable | | | | | | |
| | | |
| Stephen B. Burke | | John D. Schanz | | Douglas Gaston | | Michael A. Doyle |
President | | Executive Vice President | | General Counsel | | President |
| | National Engineering and | | | | Eastern Division |
| David A. Scott | | Technology Operations | | Suzanne L. Keenan | | |
Executive Vice President | | | | Senior Vice President | | Bradley P. Dusto |
Finance and Administration | | Tony G. Werner | | Customer Service and | | President |
| | Executive Vice President and | | Comcast University | | Western Division |
| David N. Watson | | Chief Technology Officer | | | | |
Executive Vice President | | | | Charisse R. Lille | | John H. Ridall |
Operations | | Catherine Avgiris | | Senior Vice President | | President |
| | Senior Vice President and | | Human Resources | | Southern Division |
| Madison Bond | | General Manager | | | | |
Executive Vice President | | Voice Services | | Kevin M. Casey | | William E. Stemper |
Content Acquisition | | | | President | | President |
| | Greg R. Butz | | Northern Division | | Comcast Business Services |
| David A. Juliano | | Senior Vice President | | | | |
Executive Vice President | | Product Development | | William Connors | | Charles W. Thurston |
Marketing and | | General Manager | | President | | President |
Product Development | | Media Services | | Midwest Division | | Comcast Spotlight |
| | | |
| Comcast Programming | | | | | | |
| | | |
| Jeff Shell | | Ted Harbert | | Diane L. Robina | | Sandy Wax |
President | | President and CEO | | President | | President and General Manager |
| | Comcast Entertainment Group | | Emerging Networks | | PBS KIDS Sprout |
| Joseph M. Donnelly | | | | | | |
Chief Financial Officer | | Gavin Harvey | | Rod Shanks | | Jack L. Williams |
| | President | | President | | President |
| David T. Cassaro | | VERSUS | | AZN | | Comcast Sports |
President | | | | | | Management Services |
Comcast Network | | David Manougian | | Neal Tiles | | President and |
Advertising Sales | | Chief Executive Officer | | President | | Chief Executive Offier |
| | The Golf Channel | | G4 | | Comcast SportsNet |
| | | |
| Comcast Interactive Media | | | | | | |
| | | |
| Amy L. Banse | | Samuel H. Schwartz | | | | |
President | | Executive Vice President | | | | |
| | Strategy and Development | | | | |
| | | |
| Comcast Spectacor | | | | | | |
| | | |
| Edward M. Snider | | Peter A. Luukko | | Sanford Lipstein | | Philip I. Weinberg |
Chairman | | President | | Executive Vice President | | Executive Vice President and |
| | | | Finance and | | General Counsel |
| Fred A. Shabel | | | | Chief Financial Officer | | |
Vice Chairman | | | | | | |
| | | | |
| Comcast 2006 Annual Report | | 80 | | |
Shareholder Information
Corporate Headquarters
Comcast Corporation 1500 Market Street Philadelphia, PA 19102-2148 215-665-1700 www.comcast.com
Stock Listings
Comcast’s stock trades on the Nasdaq Global Select Market under the following trading symbols: Class A common stock: CMCSA
Class A Special common stock: CMCSK
Stock Transfer Agent and Registrar
Computershare Trust Co., N.A. P.O. Box 43091 Providence, RI 02940-3091 Domestic: 888-883-8903 TTD Domestic: 800-952-9245 International: 781-575-4730 www.computershare.com/comcast
Shareholder Services
Please contact our Stock Transfer Agent and Registrar with inquiries concerning shareholder accounts of record, stock transfer matters, information on Book Entry ownership, account consolidations or lost certificates.
To eliminate duplicate mailings, please contact Computershare (if you are a registered shareholder) or your broker (if you hold your stock through a brokerage firm).
If you wish to receive all shareholder information exclusively online, you can register by going to www.cmcsa.com or www.cmcsk.com and following the instructions under Enroll for E-Delivery on our Shareholder Services page.
Investor Relations
Comcast Investor Relations 1500 Market Street Philadelphia, PA 19102-2148 866-281-2100 www.cmcsa.com or www.cmcsk.com
To e-mail Investor Relations, go to our Web site and click on Contact Investor Relations.
2006 Annual Report on Form 10-K
This Annual Report to Shareholders contains much of the information that is included in the 2006 Annual Report on Form 10-K filed with the U.S. Securities and Exchange Commission. For a copy of Comcast’s Form 10-K for the year ended December 31, 2006, visit our Investor Relations Web site (www.cmcsa.com or www.cmcsk.com) or call our Investor Relations Hotline toll-free at 866-281-2100. Other printed information is also available through this hotline.
Stock Split
On January 31, 2007, our Board of Directors approved a three-for-two stock split in the form of a 50% stock dividend (the “Stock Split”) payable on February 21, 2007, to shareholders of record on February 14, 2007. The number of shares outstanding and related amounts presented in this Annual Report to Shareholders have been adjusted to reflect the Stock Split for all periods presented.
2007 Annual Meeting of Shareholders
Pennsylvania Convention Center One Convention Center Place 1101 Arch Street Philadelphia, PA 19107 May 23, 2007 9 a.m. Eastern Time
Legal Counsel
Davis Polk & Wardwell, New York, NY
Independent Registered Public Accounting Firm
Deloitte & Touche LLP, Philadelphia, PA
Design: Sequel Studio, New York Photography: Catherine Ledner Printing: Sandy Alexander, Inc., Clifton, N.J.

1500 Market Street
Philadelphia, PA 19102-2148 215-665-1700 www.comcast.com
CO-AR-07