SECURITIES AND EXCHANGE COMMISSION
CERTIFIED SHAREHOLDER REPORT OF REGISTERED MANAGEMENT
Investment Company Act file number:
811-21077
PIMCO California Municipal Income Fund II
(Exact name of registrant as specified in charter)
1633 Broadway, New York, NY 10019
(Address of principal executive offices)
Treasurer (Principal Financial & Accounting Officer)
650 Newport Center Drive, Newport Beach, CA 92660
(Name and address of agent for service)
Copies to:
Registrant’s telephone number, including area code: (844) 337-4626
Date of fiscal year end: December 31
Date of reporting period: December 31, 2023
Form N-CSR is to be used by management investment companies to file reports with the Commission not later than 10 days after the transmission to stockholders of any report that is required to be transmitted to stockholders under Rule 30e-1 under the Investment Company Act of 1940 (17 CFR 270.30e-1). The Commission may use the information provided on Form N-CSR in its regulatory, disclosure review, inspection, and policymaking roles.
A registrant is required to disclose the information specified by Form N-CSR, and the Commission will make this information public. A registrant is not required to respond to the collection of information contained in Form N-CSR unless the Form displays a currently valid Office of Management and Budget (“OMB”) control number. Please direct comments concerning the accuracy of the information collection burden estimate and any suggestions for reducing the burden to Secretary, Securities and Exchange Commission, 450 Fifth Street, NW, Washington, DC 20549-0609. The OMB has reviewed this collection of information under the clearance requirements of 44 U.S.C. § 3507.
The following is a copy of the report transmitted to shareholders pursuant to Rule 30e-1 under the Investment Company Act of 1940, as amended (the “1940 Act”) (17 CFR 270.30e-1).
Annual Report
December 31, 2023
PIMCO California Municipal Income Fund | PCQ | NYSE
PIMCO California Municipal Income Fund II | PCK | NYSE
PIMCO California Municipal Income Fund III | PZC | NYSE
PIMCO New York Municipal Income Fund | PNF | NYSE
PIMCO New York Municipal Income Fund II | PNI | NYSE
PIMCO New York Municipal Income Fund III | PYN | NYSE
PIMCO Municipal Income Fund | PMF | NYSE
PIMCO Municipal Income Fund II | PML | NYSE
PIMCO Municipal Income Fund III | PMX | NYSE
| | | | | | | | |
| | |
| | | | | | Page | |
| | | | | | | | |
| | |
| | | | | | | 2 | |
| | |
| | | | | | | 3 | |
| | |
| | | | | | | 16 | |
| | |
| | | | | | | 18 | |
| | |
| | | | | | | 24 | |
| | |
| | | | | | | 25 | |
| | |
| | | | | | | 26 | |
| | |
| | | | | | | 27 | |
| | |
| | | | | | | 28 | |
| | |
| | | | | | | 30 | |
| | |
| | | | | | | 31 | |
| | |
| | | | | | | 32 | |
| | |
| | | | | | | 72 | |
| | |
| | | | | | | 97 | |
| | |
| | | | | | | 98 | |
| | |
| | | | | | | 99 | |
| | |
| | | | | | | 100 | |
| | |
| | | | | | | 102 | |
| | |
| | | | | | | 105 | |
| | |
| | | | | | | 106 | |
| | |
| | | | | | | 108 | |
| | |
| | | | | | | 109 | |
| | |
| | | | | | | 113 | |
| | |
| | | | | | | 139 | |
| | |
| | | | | | | 140 | |
| | |
| | | | | | | 146 | |
| | |
| | | | | | | 148 | |
| | |
| | | | | | | 149 | |
| | |
| | | | | | | 153 | |
| | | | | | | | |
| | |
| Fund | | Fund
Summary | | | Schedule of
Investments | |
| | | | | | | | |
| | |
| | | 7 | | | | 33 | |
| | |
| | | 8 | | | | 37 | |
| | |
| | | 9 | | | | 41 | |
| | |
| | | 10 | | | | 45 | |
| | |
| | | 11 | | | | 48 | |
| | |
| | | 12 | | | | 51 | |
| | |
| | | 13 | | | | 54 | |
| | |
| | | 14 | | | | 60 | |
| | |
| | | 15 | | | | 66 | |
| | | Consolidated Schedule of Investments |
Dear Shareholder,
This annual report covers the
12-month
reporting period ended December 31, 2023 (the “reporting period”). On the subsequent pages, you will find details regarding investment results and a discussion of certain factors that affected performance during the reporting period.
The global economy continued to grow despite inflation that remains elevated, interest rate increases, tighter credit conditions, and geopolitical concerns affecting many countries. This resilience was particularly evident in the United States (“U.S.”). In contrast, some European economies recently experienced relatively flat growth.
Central banks slowed interest rate hikes
Inflation eased over the reporting period, and several bank officials suggested that central banks may slow aggressive interest-rate hikes. From March 2022 through July 2023, the U.S. Federal Reserve (the “Fed”) raised the federal funds rate a total of 5.25 percentage points. In September, November and December 2023, the Fed did not increase interest rates. In December 2023, Fed communications conveyed a belief that the policy rate may be likely at or near its peak for the tightening cycle. From July 2022 through September 2023, the European Central Bank (“ECB”) raised its deposit facility overnight rate a total of 4.50 percentage points and then held rates steady at its October and December 2023 meetings. Meanwhile, from December 2019 through July 2023, the Bank of England (“BoE”) raised its Bank Rate a total of 5.15 percentage points and then held rates steady in September, November and December 2023. Both the ECB and BoE acknowledged the possibility of rate cuts in 2024.
Mixed financial market returns
The yield on the benchmark
10-year
U.S. Treasury increased during the reporting period. In many other developed markets, yields on
10-year
government bonds fluctuated. Overall, the global bond market rallied toward the end of 2023, bolstered by central bank officials’ policy pronouncements signaling a possible end to monetary tightening. During the reporting period, lower-rated global bonds generally outperformed their higher-rated counterparts. Global equities rallied sharply, while commodities were mixed given economic uncertainties. The U.S. dollar strengthened against the Japanese yen, but fell relative to the euro and British pound.
We continue to work diligently to navigate dynamic global markets and manage the assets that you have entrusted with us. We encourage you to speak with your financial advisor about your goals and visit global.pimco.com for our latest insights.
Sincerely,
| | |
 | |  |
| |
 | |  |
| Deborah A. DeCotis | | Joshua D. Ratner |
| Chair of the Board of Trustees | | President |
| | |
| |
Total Returns of Certain Asset Classes for the
Period Ended December 31, 2023 |
| | |
| Asset Class (as measured by, currency) | | |
| | |
| U.S. large cap equities (S&P 500 Index, USD) | | 26.29% |
| | |
| Global equities (MSCI World Index, USD) | | 23.79% |
| | |
| European equities (MSCI Europe Index, EUR) | | 15.83% |
| | |
| Emerging market equities (MSCI Emerging Markets Index, EUR) | | 9.83% |
| | |
| Japanese equities (Nikkei 225 Index, JPY) | | 30.90% |
| | |
| Emerging market local bonds (JPMorgan Government Bond Index-Emerging Markets Global Diversified Index, USD Unhedged) | | 12.70% |
| | |
| Emerging market external debt (JPMorgan Emerging Markets Bond Index (EMBI) Global, USD Hedged) | | 10.45% |
| | |
Below investment grade bonds (ICE BofAML Developed Markets High Yield Constrained Index, USD Hedged) | | 13.78% |
| | |
| Global investment grade credit bonds (Bloomberg Global Aggregate Credit Index, USD Hedged) | | 8.68% |
| | |
| Fixed-rate, local currency government debt of investment grade countries (Bloomberg Global Treasury Index, USD Hedged) | | 6.72% |
Past performance is no guarantee of future results. Unless otherwise noted, index returns reflect the reinvestment of income distributions and capital gains, if any, but do not reflect fees, brokerage commissions or other expenses of investing. It is not possible to invest directly in an unmanaged index.
Statements concerning financial market trends are based on current market conditions, which will fluctuate. There is no guarantee that these investment strategies will work under all market conditions or are appropriate for all investors and each investor should evaluate their ability to invest for the long-term, especially during periods of downturn in the market. Outlook and strategies are subject to change without notice.
| | | | |
Important Information About the Funds | | | | |
Information regarding each Fund’s principal investment strategies, principal risks and risk management strategies, the effects of each Fund’s leverage, and each Fund’s fundamental investment restrictions, including a summary of certain changes thereto during the most recent fiscal year, can be found within the relevant sections of this report. Please refer to the Table of Contents for further information.
We believe that bond funds have an important role to play in a well-diversified investment portfolio. In an environment where interest rates may trend upward, rising rates would negatively impact the performance of most bond funds, and fixed-income securities and other instruments held by a Fund are likely to decrease in value. A wide variety of factors can cause interest rates or yields of U.S. Treasury securities (or yields of other types of bonds) to rise (e.g., central bank monetary policies, inflation rates, general economic conditions, etc). In addition, changes in interest rates can be sudden and unpredictable, and there is no guarantee that Fund management will anticipate such movement accurately. A Fund may lose money as a result of movement in interest rates.
As of the date of this report, interest rates in the United States and many parts of the world, including certain European countries, remain elevated from historical levels and, for certain countries, have continued to increase. In efforts to combat inflation, the U.S. Federal Reserve raised interest rates multiple times in 2022 and 2023. Thus, the Funds currently face a heightened level of risk associated with rising interest rates and/or bond yields. This could be driven by a variety of factors, including but not limited to central bank monetary policies, changing inflation or real growth rates, general economic conditions, increasing bond issuances or reduced market demand for low yielding investments. Further, while bond markets have steadily grown over the past three decades, dealer inventories of corporate bonds are near historic lows in relation to market size. As a result, there has been a significant reduction in the ability of dealers to “make markets.”
Bond funds and individual bonds with a longer duration (a measure used to determine the sensitivity of a security’s price to changes in interest rates) tend to be more sensitive to changes in interest rates, usually making them more volatile than securities or funds with shorter durations. In addition, in a low interest rate environment, the market price of the Funds’ common shares may be particularly sensitive to changes in interest rates or the perception that there will be a change in interest rates. All of the factors mentioned above, individually or collectively, could lead to increased volatility and/or lower liquidity in the fixed income markets or negatively impact a Fund’s performance or cause a Fund to incur losses.
Investing in the municipal bond market involves the risks of investing in debt securities generally and certain other risks. The amount of public information available about the municipal bonds in which a Fund may invest is generally less than that for corporate equities or bonds, and the investment performance of a Fund’s investment in municipal bonds may therefore be more dependent on the analytical abilities of Pacific
Investment Management Company LLC (“PIMCO”) than its investments in taxable bonds. The secondary market for municipal bonds also tends to be less well-developed or liquid than many other securities markets, which may adversely affect a Fund’s ability to sell its bonds at attractive prices.
The ability of municipal issuers to make timely payments of interest and principal may be diminished during general economic downturns, by litigation, legislation or political events, or by the bankruptcy of the issuer. Issuers of municipal securities also might seek protection under the bankruptcy laws. In the event of bankruptcy of such an issuer, a Fund could experience delays in collecting principal and interest and the Fund may not, in all circumstances, be able to collect all principal and interest to which it is entitled.
A Fund that has substantial exposures to California municipal bonds may be affected significantly by economic, regulatory or political developments affecting the ability of California issuers to pay interest or repay principal. Certain issuers of California municipal bonds have experienced serious financial difficulties in the past and reoccurrence of these difficulties may impair the ability of certain California issuers to pay principal or interest on their obligations. Provisions of the California Constitution and State statutes that limit the taxing and spending authority of California governmental entities may impair the ability of California issuers to pay principal and/or interest on their obligations. While California’s economy is broad, it does have major concentrations in advanced technology, aerospace and defense-related manufacturing, trade, entertainment, real estate and financial services, and may be sensitive to economic problems affecting those industries. Future California political and economic developments, constitutional amendments, legislative measures, executive orders, administrative regulations, litigation and voter initiatives could have an adverse effect on the debt obligations of California issuers.
A Fund that has substantial exposures to New York municipal bonds may be affected significantly by economic, regulatory or political developments affecting the ability of New York issuers to pay interest or repay principal. While New York’s economy is broad, it does have concentrations in the financial services industry, and may be sensitive to economic problems affecting that industry. Certain issuers of New York municipal bonds have experienced serious financial difficulties in the past and reoccurrence of these difficulties may impair the ability of certain New York issuers to pay principal or interest on their obligations. The financial health of New York City affects that of the State, and when New York City experiences financial difficulty, it may have an adverse effect on New York municipal bonds held by a Fund. The growth rate of New York has at times been somewhat slower than the nation overall. The economic and financial condition of New York also may be affected by various financial, social, economic and political factors.
Classifications of the Funds’ portfolio holdings in this report are made according to financial reporting standards. The classification of a particular portfolio holding as shown in the Allocation Breakdown and Schedule of Investments or Consolidated Schedule of Investments, as
| | | | |
Important Information About the Funds | | | | |
applicable, sections of this report may differ from the classification used for the Funds’ compliance calculations, including those used in the Funds’ then-current prospectus, investment objectives, regulatory, and other investment limitations and policies, which may be based on different asset class, sector or geographical classifications. Each Fund is separately monitored for compliance with respect to investment parameters and regulatory requirements.
The geographical classification of foreign (non-U.S.) securities in this report, if any, are classified by the country of incorporation of a holding. In certain instances, a security’s country of incorporation may be different from its country of economic exposure.
In February 2022, Russia launched an invasion of Ukraine. As a result, Russia and other countries, persons and entities that have provided material aid to Russia’s aggression against Ukraine, have been the subject of economic sanctions and import and export controls imposed by countries throughout the world, including the United States. Such measures have had and may continue to have an adverse effect on the Russian, Belarusian and other securities and economies, which may, in turn, negatively impact a Fund. The extent, duration and impact of Russia’s military action in Ukraine, related sanctions and retaliatory actions are difficult to ascertain, but could be significant and have severe adverse effects on the region, including significant adverse effects on the regional, European, and global economies and the markets for certain securities and commodities, such as oil and natural gas, as well as other sectors. Further, a Fund may have investments in securities and instruments that are economically tied to the region and may have been negatively impacted by the sanctions and counter-sanctions by Russia, including declines in value and reductions in liquidity. The sanctions may cause a Fund to sell portfolio holdings at a disadvantageous time or price or to continue to hold investments that a Fund may no longer seek to hold. PIMCO will continue to actively manage these positions in the best interests of a Fund and its shareholders.
The United States’ enforcement of restrictions on U.S. investments in certain issuers and tariffs on goods from certain other countries has contributed to and may continue to contribute to international trade tensions and may impact portfolio securities. The United States’ enforcement of sanctions or other similar measures on various Russian entities and persons, and the Russian government’s response, may also negatively impact securities and instruments that are economically tied to Russia.
The Funds may invest in certain instruments that rely in some fashion upon the London Interbank Offered Rate (“LIBOR”). LIBOR was traditionally an average interest rate, determined by the ICE Benchmark Administration, that banks charge one another for the use of short-term money. The United Kingdom’s Financial Conduct Authority, which regulates LIBOR, has announced plans to ultimately phase out the use of LIBOR. Although the transition process away from LIBOR for many instruments has been completed, some LIBOR use is continuing and
there are potential effects related to the transition away from LIBOR or continued use of LIBOR on a Fund, or on certain instruments in which the Fund invests, which can be difficult to ascertain, and may vary depending on factors that include, but are not limited to: (i) existing fallback or termination provisions in individual contracts and (ii) whether, how, and when industry participants develop and adopt new reference rates and fallbacks for both legacy and new products and instruments. On March 15, 2022, the Adjustable Interest Rate (LIBOR) Act was signed into law. This law provides a statutory fallback mechanism on a nationwide basis to replace LIBOR with a benchmark rate that is selected by the Board of Governors of the Federal Reserve System based on the Secured Overnight Financing Rate (“SOFR”) for tough legacy contracts. On February 27, 2023, the Federal Reserve System’s final rule in connection with this law became effective, establishing benchmark replacements based on SOFR and Term SOFR (a forward-looking measurement of market expectations of SOFR implied from certain derivatives markets) for applicable tough legacy contracts governed by U.S. law. In addition, the FCA has announced that it will require the publication of synthetic LIBOR for the one-month, three-month and six-month U.S. Dollar LIBOR settings after June 30, 2023 through at least September 30, 2024. The possible scope and effect of synthetic LIBOR for U.S. Dollar LIBOR contracts and the LIBOR transition is unknown at this time. Moreover, certain aspects of the transition from LIBOR will rely on the actions of third-party market participants, such as clearing houses, trustees, administrative agents, asset servicers and certain service providers; PIMCO cannot guarantee the performance of such market participants and any failure on the part of such market participants to manage their part of the LIBOR transition could impact a Fund. The transition of investments from LIBOR to a replacement rate as a result of amendment, application of existing fallbacks, statutory requirements or otherwise may also result in a reduction in the value of certain instruments held by a Fund or a reduction in the effectiveness of related Fund transactions such as hedges. In addition, an instrument’s transition to a replacement rate could result in variations in the reported yields of a Fund that holds such instrument. Any such effects of the transition away from LIBOR, as well as other unforeseen effects, could result in losses to a Fund.
The common shares of the Funds trade on the New York Stock Exchange. As with any stock, the price of a Fund’s common shares will fluctuate with market conditions and other factors. If you sell your common shares of a Fund, the price received may be more or less than your original investment.
Shares of closed-end investment management companies, such as the Funds, frequently trade at a discount from their net asset value (“NAV”) and may trade at a price that is less than the initial offering price and/or the NAV of such shares. Further, if a Fund’s shares trade at a price that is more than the initial offering price and/or the NAV of such shares, including at a substantial premium and/or for an extended period of time, there is no assurance that any such premium
will be sustained for any period of time and will not decrease, or that the shares will not trade at a discount to NAV thereafter.
U.S. and global markets have experienced ongoing volatility, including as a result of the failures in March and April 2023 of certain U.S. and non-U.S. banks, which could be harmful to the Funds and issuers in which they invest. For example, if a bank at which a Fund or issuer has an account fails, any cash or other assets in bank or custody accounts, which may be substantial in size, could be temporarily inaccessible or permanently lost by the Fund or issuer. If a bank that provides a subscription line credit facility, asset-based facility, other credit facility and/or other services to an issuer or a fund fails, the issuer or fund could be unable to draw funds under its credit facilities or obtain replacement credit facilities or other services from other lending institutions with similar terms.
Issuers in which a Fund may invest can be affected by volatility in the banking sector. Even if banks used by issuers in which the Funds invest remain solvent, continued volatility in the banking sector could contribute to, cause or intensify an economic recession, increase the costs of capital and banking services or result in the issuers being unable to obtain or refinance indebtedness at all or on as favorable terms as could otherwise have been obtained. Conditions in the banking sector are evolving, and the scope of any potential impacts to the Funds and issuers, both from market conditions and also potential legislative or regulatory responses, are uncertain. Such conditions and responses, as well as a changing interest rate environment, can contribute to decreased market liquidity and erode the value of certain holdings, including those of U.S. and non-U.S. banks. Continued market volatility and uncertainty and/or a downturn in market and economic and financial conditions, as a result of developments in the banking sector or otherwise (including as a result of delayed access to cash or credit facilities), could have an adverse impact on the Funds and issuers in which they invest.
On each Fund Summary page in this Shareholder Report, the Average Annual Total Return table and Cumulative Returns chart measure performance assuming that any dividend and capital gain distributions were reinvested. Total return is calculated by determining the percentage change in NAV or market price (as applicable) in the specified period. Returns do not reflect the deduction of taxes that a shareholder would pay on Fund distributions. Total return for a period of more than one year represents the average annual total return. Performance at market price will differ from results at NAV. Although market price returns tend to reflect investment results over time, during shorter periods returns at market price can also be influenced by factors such as changing views about a Fund, market conditions, supply and demand for the Fund’s shares, or changes in the Fund’s dividends. Performance shown is net of fees and expenses. Historical NAV performance for a Fund may have been positively impacted by fee waivers or expense limitations in place during some or all of the periods shown, if applicable. Future performance (including total return or yield) and distributions may be negatively impacted by the expiration or reduction of any such fee waivers or expense limitations.
The dividend rate that a Fund pays on its common shares may vary as portfolio and market conditions change, and will depend on a number of factors, including without limit the amount of a Fund’s undistributed net investment income and net short- and long-term capital gains, as well as the costs of any leverage obtained by a Fund. As portfolio and market conditions change, the rate of distributions on the common shares and a Fund’s dividend policy could change. There can be no assurance that a change in market conditions or other factors will not result in a change in a Fund’s distribution rate or that the rate will be sustainable in the future.
The following table discloses the inception date and diversification status of each Fund:
| | | | | | | | | | |
| | | |
| | | | | | | | |
| PIMCO Municipal Income Fund | | | | | | | 06/29/01 | | | Diversified |
| PIMCO Municipal Income Fund II | | | | | | | 06/28/02 | | | Diversified |
| PIMCO Municipal Income Fund III | | | | | | | 10/31/02 | | | Diversified |
| PIMCO California Municipal Income Fund | | | | | | | 06/29/01 | | | Diversified |
| PIMCO California Municipal Income Fund II | | | | | | | 06/28/02 | | | Diversified |
| PIMCO California Municipal Income Fund III | | | | | | | 10/31/02 | | | Diversified |
| PIMCO New York Municipal Income Fund | | | | | | | 06/29/01 | | | |
| PIMCO New York Municipal Income Fund II | | | | | | | 06/28/02 | | | Diversified |
| PIMCO New York Municipal Income Fund III | | | | | | | 10/31/02 | | | Non-diversified |
An investment in a Fund is not a bank deposit and is not guaranteed or insured by the Federal Deposit Insurance Corporation or any other government agency. It is possible to lose money on investments in a Fund.
The Trustees are responsible generally for overseeing the management of the Funds. The Trustees authorize the Funds to enter into service agreements with PIMCO and other service providers in order to provide, and in some cases authorize service providers to procure through other parties, necessary or desirable services on behalf of the Funds. Shareholders are not parties to or third-party beneficiaries of such service agreements. Neither a Fund’s prospectus or Statement of Additional Information
(“SAI”), any press release or shareholder report, any contracts filed as exhibits to a Fund’s registration statement, nor any other communications, disclosure documents or regulatory filings (including this report) from or on behalf of a Fund creates a contract between or among any shareholders of a Fund, on the one hand, and the Fund, a service provider to the Fund, and/or the Trustees or officers of the Fund, on the other hand. The Trustees (or the Funds and their officers, service providers or other delegates acting under authority of the Trustees) may amend its most recent prospectus or use a new prospectus or SAI with respect to a Fund, adopt and disclose new or amended policies and other changes in press releases and shareholder reports and/or amend, file and/or issue any other communications, disclosure documents or regulatory filings, and may amend or enter into any contracts to which a Fund is a party, and interpret the investment objective(s), policies, restrictions and contractual provisions
| | | | |
Important Information About the Funds | | | | |
applicable to any Fund, without shareholder input or approval, except in circumstances in which shareholder approval is specifically required by law (such as changes to fundamental investment policies) or where a shareholder approval requirement was specifically disclosed in a Fund’s prospectus, SAI or shareholder report and is otherwise still in effect.
PIMCO has adopted written proxy voting policies and procedures (“Proxy Policy”) as required by Rule
206(4)-6
under the Investment Advisers Act of 1940, as amended. The Proxy Policy has been adopted by the Funds as the policies and procedures that PIMCO will use when voting proxies on behalf of the Funds. A description of the policies and procedures that PIMCO uses to vote proxies relating to portfolio securities of each Fund, and information about how each Fund voted proxies relating to portfolio securities held during the most recent twelve-month period ended June 30th, are available without charge, upon request, by calling the Funds at (844) 33-PIMCO, on the Funds’ website at www.pimco.com, and on the Securities and Exchange Commission’s (“SEC”) website at www.sec.gov.
The Funds file their complete schedules of portfolio holdings with the SEC for the first and third quarters of each fiscal year as an exhibit to their reports on Form N-PORT. The Funds’ Form N-PORT reports are available to the public on the SEC’s website at www.sec.gov and on PIMCO’s website at www.pimco.com, and upon request by calling PIMCO at (844) 33-PIMCO.
SEC rules allow the Fund to fulfill their obligation to deliver shareholder reports to investors by providing access to such reports online free of charge and by mailing a notice that the report is electronically available. Investors may elect to receive all future reports in paper free of charge by contacting their financial intermediary or, if invested directly with a Fund, investors can inform the Fund by calling (844) 33-PIMCO. Any election to receive reports in paper will apply to all funds held with the fund complex if invested directly with a Fund or to all funds held in the investor’s account if invested through a financial intermediary, such as a broker-dealer or bank.
In May 2022, the SEC proposed a framework that would require certain registered funds (such as the Funds) to disclose their environmental, social, and governance (“ESG”) investing practices. Among other things, the proposed requirements would mandate that funds meeting three pre-defined classifications (i.e., integrated, ESG focused and/or impact funds) provide prospectus and shareholder report disclosure related to the ESG factors, criteria and processes used in managing the fund. The proposal’s impact on the Funds will not be known unless and until any final rulemaking is adopted.
In October 2022, the SEC adopted changes to the mutual fund and exchange-traded fund (“ETF”) shareholder report and registration statement disclosure requirements and the registered fund advertising rules, which will impact the disclosures provided to shareholders. The rule amendments are effective as of January 24, 2023, but the SEC is
providing an 18-month compliance period following the effective date for such amendments other than those addressing fee and expense information in advertisements that might be materially misleading.
In November 2022, the SEC adopted amendments to Form N-PX under the Act to improve the utility to investors of proxy voting information reported by mutual funds, ETFs and certain other funds. The rule amendments will expand the scope of funds’ Form N-PX reporting obligations, subject managers to Form N-PX reporting obligations for “Say on Pay” votes, enhance Form N-PX disclosures, permit joint reporting by funds, managers and affiliated managers on Form N-PX; and require website availability of fund proxy voting records. The amendments will become effective on July 1, 2024. Funds and managers will be required to file their first reports covering the period from July 1, 2023 to June 30, 2024 on amended Form N-PX by August 31, 2024.
In September 2023, the SEC adopted amendments to a current rule governing fund naming conventions. In general, the current rule requires funds with certain types of names to adopt a policy to invest at least 80% of their assets in the type of investment suggested by the name. The amendments expand the scope of the current rule in a number of ways that are expected to result in an increase in the types of fund names that would require the fund to adopt an 80% investment policy under the rule. Additionally, the amendments address deviations from a fund’s 80% investment policy and the use and valuation of derivatives instruments for purposes of the rule. The amendments are effective as of December 11, 2023, but the SEC is providing a 24-month compliance period following the effective date for fund groups with net assets of $1 billion or more (and a 30-month compliance period for fund groups with net assets of less than $1 billion).
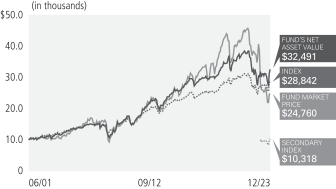
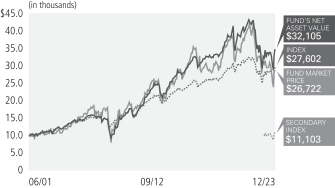
PIMCO California Municipal Income Fund
Cumulative Returns Through December 31, 2023
$10,000 invested at the end of the month when the Fund commenced operations.
Allocation Breakdown
| | | | |
| Municipal Bonds & Notes | | | | |
| |
| Ad Valorem Property Tax | | | 29.7% | |
| |
| Health, Hospital & Nursing Home Revenue | | | 11.2% | |
| |
| General Fund | | | 7.2% | |
| |
| Local or Guaranteed Housing | | | 7.1% | |
| |
| College & University Revenue | | | 7.0% | |
| |
| Port, Airport & Marina Revenue | | | 6.1% | |
| |
| Lease (Abatement) | | | 4.6% | |
| |
| Tobacco Settlement Funded | | | 4.6% | |
| |
| Sales Tax Revenue | | | 4.3% | |
| |
| Natural Gas Revenue | | | 4.2% | |
| |
| Electric Power & Light Revenue | | | 2.6% | |
| |
| Sewer Revenue | | | 2.1% | |
| |
| Water Revenue | | | 1.8% | |
| |
| Highway Revenue Tolls | | | 1.6% | |
| |
| | | 1.5% | |
| |
| Special Tax | | | 1.5% | |
| |
| Other | | | 2.2% | |
| |
| Short-Term Instruments | | | 0.7% | |
| | | % of Investments, at value. |
| | | Allocation Breakdown and % of investments exclude securities sold short and financial derivative instruments, if any. |
Fund Information
(as of December 31, 2023)
(1)
| | | | |
| Market Price | | | $9.32 | |
| |
| NAV | | | $10.66 | |
| |
| Premium/(Discount) to NAV | | | (12.57)% | |
| |
Market Price Distribution Rate (2) | | | 4.64% | |
| |
| | | 4.05% | |
| |
Total Effective Leverage (3) | | | 41.65% | |
| | | | | | | | | | | | | | | | | | | | | | |
|
Average Annual Total Return (1) for the period ended December 31, 2023 | |
| | | | | | |
| | | | | 1 Year | | | 5 Year | | | 10 Year | | | Since launch of
Secondary Index
01/25/23* | | | Commencement
of Operations
(06/29/01) | |
 | | Market Price | | | (35.33)% | | | | (5.94)% | | | | 2.19% | | | | (14.27)% | | | | 4.11% | |
 | | NAV | | | 7.84% | | | | 1.36% | | | | 4.51% | | | | 1.85% | | | | 5.38% | |
 | | Bloomberg CA Muni 22+ Year Index | | | 9.13% | | | | 2.42% | | | | 4.15% | | | | 4.69% | | | | 4.82% | |
 | | ICE California Long Duration Municipal Securities Index** | | | — | | | | — | | | | — | | | | 3.12% | | | | — | |
All Fund returns are net of fees and expenses and include applicable fee waivers and/or expense limitations. Absent any applicable fee waivers and/or expense limitations, performance would have been lower and there can be no assurance that any such waivers or limitations will continue in the future.
It is not possible to invest directly in an unmanaged index.
Average Annual Return since 06/30/2001.
** Secondary Index refers to ICE California Long Duration Municipal Securities Index. The launch date of the ICE California Long Duration Municipal Securities Index is January 25, 2023. Total return is presented for the less than
one-year
period since launch and is not annualized.
| Performance quoted represents past performance. Past performance is not a guarantee or a reliable indicator of future results. Current performance may be lower or higher than performance shown. Investment return and the principal value of an investment will fluctuate. Total return is not annualized for a “since launch” date of less than one year. Returns shown do not reflect the deduction of taxes that a shareholder would pay on Fund distributions or the sale of Fund shares. Total return, market price, NAV, market price distribution rate, and NAV distribution rate will fluctuate with changes in market conditions. Performance current to the most recent month-end is available at www.pimco.com or via (844) 33-PIMCO. Performance is calculated assuming all dividends and distributions are reinvested at prices obtained under the Fund’s dividend reinvestment plan. Performance does not reflect any brokerage commissions in connection with the purchase or sale of Fund shares. |
| | Performance of an index is shown in light of a requirement by the Securities and Exchange Commission that the performance of an appropriate broad-based securities market index be disclosed. However, the Fund is not managed to an index nor should the index be viewed as a “benchmark” for the Fund’s performance. The indexes are not intended to be indicative of the Fund’s investment strategies, portfolio components or past or future performance. Please see Additional Information Regarding the Funds for a description of the Fund’s principal investment strategies. |
| Distribution rates are not performance and are calculated by annualizing the most recent distribution per share and dividing by the NAV or Market Price, as applicable, as of the reported date. Distributions may be comprised of ordinary income, net capital gains, and/or a return of capital (“ROC”) of your investment in the Fund. Because the distribution rate may include a ROC, it should not be confused with yield or income. If the Fund estimates that a portion of its distribution may be comprised of amounts from sources other than net investment income in accordance with its policies and good accounting practices, the Fund will notify shareholders of the estimated composition of such distribution through a Section 19 Notice. Please refer to the most recent Section 19 Notice, if applicable, for additional information regarding the estimated composition of distributions. Please visit www.pimco.com for most recent Section 19 Notice, if applicable. Final determination of a distribution’s tax character will be provided to shareholders when such information is available. |
| Represents total effective leverage outstanding, as a percentage of total managed assets. Total effective leverage consists of preferred shares, reverse repurchase agreements and other borrowings, credit default swap notional and floating rate notes issued in tender option bond transactions, as applicable (collectively “Total Effective Leverage”). The Fund may engage in other transactions not included in Total Effective Leverage disclosed above that may give rise to a form of leverage, including certain derivative transactions. For the purpose of calculating Total Effective Leverage outstanding as a percentage of total managed assets, total managed assets refer to total assets (including assets attributable to Total Effective Leverage that may be outstanding) minus accrued liabilities (other than liabilities representing Total Effective Leverage). |
Investment Objective and Strategy Overview
PIMCO California Municipal Income Fund’s investment objective is to seek to provide current income exempt from federal and California income tax.
Fund Insights at NAV
The following affected performance (on a gross basis) during the reporting period:
| » | | Exposure to the general obligation segment contributed to performance, as the segment posted positive returns. |
| » | | Exposure to municipal revenue bonds within the special tax sector contributed to performance, as the sector posted positive returns. |
| » | | Exposure to municipal revenue bonds within the healthcare sector contributed to performance, as the sector posted positive returns. |
| » | | The costs associated with one or more forms of leverage detracted from performance. The costs of leverage generally will reduce returns to the extent they exceed the rate of return on the additional investments purchased with such leverage. |
| » | | There were no other material detractors for this Fund. |
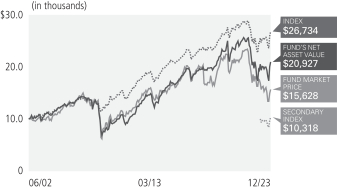
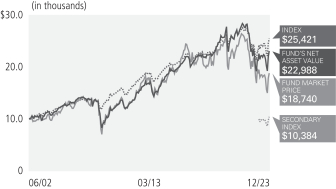
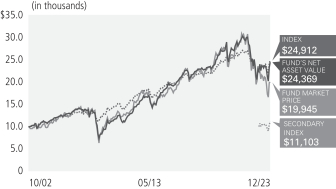
PIMCO California Municipal Income Fund II
Cumulative Returns Through December 31, 2023
$10,000 invested at the end of the month when the Fund commenced operations.
Allocation Breakdown as of December 31, 2023
| | | | |
| Municipal Bonds & Notes | | | | |
| |
| Ad Valorem Property Tax | | | 28.6% | |
| |
| Health, Hospital & Nursing Home Revenue | | | 10.0% | |
| |
| Local or Guaranteed Housing | | | 7.4% | |
| |
| General Fund | | | 6.8% | |
| |
| Tobacco Settlement Funded | | | 5.7% | |
| |
| College & University Revenue | | | 5.6% | |
| |
| Natural Gas Revenue | | | 5.4% | |
| |
| Port, Airport & Marina Revenue | | | 4.7% | |
| |
| Electric Power & Light Revenue | | | 4.0% | |
| |
| Sales Tax Revenue | | | 3.8% | |
| |
| Highway Revenue Tolls | | | 2.9% | |
| |
| Lease (Abatement) | | | 2.7% | |
| |
| Sewer Revenue | | | 2.2% | |
| |
| Special Tax | | | 1.7% | |
| |
| | | 1.4% | |
| |
| Other | | | 3.9% | |
| |
| Short-Term Instruments | | | 3.2% | |
| | | % of Investments, at value. |
| | | Allocation Breakdown and % of investments exclude securities sold short and financial derivative instruments, if any. |
Fund Information (as of December 31, 2023)
(1)
| | | | |
| Market Price | | | $5.80 | |
| |
| NAV | | | $6.80 | |
| |
| Premium/(Discount) to NAV | | | (14.71)% | |
| |
Market Price Distribution Rate (2) | | | 4.45% | |
| |
| | | 3.79% | |
| |
Total Effective Leverage (3) | | | 41.29% | |
| | | | | | | | | | | | | | | | | | | | | | |
|
Average Annual Total Return (1) for the period ended December 31, 2023 | |
| | | | | | |
| | | | | 1 Year | | | 5 Year | | | 10 Year | | | Since launch of
Secondary Index
01/25/23* | | | Commencement
of Operations
(06/28/02) | |
| | Market Price | | | (10.74)% | | | | (1.04)% | | | | 1.24% | | | | (6.76)% | | | | 2.16% | |
| | NAV | | | 8.34% | | | | 0.94% | | | | 4.81% | | | | 1.91% | | | | 3.49% | |
| | Bloomberg CA Muni 22+ Year Index | | | 9.13% | | | | 2.42% | | | | 4.15% | | | | 4.69% | | | | 4.68% | |
| | ICE California Long Duration Municipal Securities Index** | | | — | | | | — | | | | — | | | | 3.12% | | | | — | |
All Fund returns are net of fees and expenses and include applicable fee waivers and/or expense limitations. Absent any applicable fee waivers and/or expense limitations, performance would have been lower and there can be no assurance that any such waivers or limitations will continue in the future.
It is not possible to invest directly in an unmanaged index.
Average Annual Return since 06/30/2002.
** Secondary Index refers to ICE California Long Duration Municipal Securities Index. The launch date of the ICE California Long Duration Municipal Securities Index is January 25, 2023. Total return is presented for the less than
one-year
period since launch and is not annualized.
| Performance quoted represents past performance. Past performance is not a guarantee or a reliable indicator of future results. Current performance may be lower or higher than performance shown. Investment return and the principal value of an investment will fluctuate. Total return is not annualized for a “since launch” date of less than one year. Returns shown do not reflect the deduction of taxes that a shareholder would pay on Fund distributions or the sale of Fund shares. Total return, market price, NAV, market price distribution rate, and NAV distribution rate will fluctuate with changes in market conditions. Performance current to the most recent month-end is available at www.pimco.com or via (844) 33-PIMCO. Performance is calculated assuming all dividends and distributions are reinvested at prices obtained under the Fund’s dividend reinvestment plan. Performance does not reflect any brokerage commissions in connection with the purchase or sale of Fund shares. |
| | Performance of an index is shown in light of a requirement by the Securities and Exchange Commission that the performance of an appropriate broad-based securities market index be disclosed. However, the Fund is not managed to an index nor should the index be viewed as a “benchmark” for the Fund’s performance. The indexes are not intended to be indicative of the Fund’s investment strategies, portfolio components or past or future performance. Please see Additional Information Regarding the Funds for a description of the Fund’s principal investment strategies. |
| Distribution rates are not performance and are calculated by annualizing the most recent distribution per share and dividing by the NAV or Market Price, as applicable, as of the reported date. Distributions may be comprised of ordinary income, net capital gains, and/or a return of capital (“ROC”) of your investment in the Fund. Because the distribution rate may include a ROC, it should not be confused with yield or income. If the Fund estimates that a portion of its distribution may be comprised of amounts from sources other than net investment income in accordance with its policies and good accounting practices, the Fund will notify shareholders of the estimated composition of such distribution through a Section 19 Notice. Please refer to the most recent Section 19 Notice, if applicable, for additional information regarding the estimated composition of distributions. Please visit www.pimco.com for most recent Section 19 Notice, if applicable. Final determination of a distribution’s tax character will be provided to shareholders when such information is available. |
| Represents total effective leverage outstanding, as a percentage of total managed assets. Total effective leverage consists of preferred shares, reverse repurchase agreements and other borrowings, credit default swap notional and floating rate notes issued in tender option bond transactions, as applicable (collectively “Total Effective Leverage”). The Fund may engage in other transactions not included in Total Effective Leverage disclosed above that may give rise to a form of leverage, including certain derivative transactions. For the purpose of calculating Total Effective Leverage outstanding as a percentage of total managed assets, total managed assets refer to total assets (including assets attributable to Total Effective Leverage that may be outstanding) minus accrued liabilities (other than liabilities representing Total Effective Leverage). |
Investment Objective and Strategy Overview
PIMCO California Municipal Income Fund II’s investment objective is to seek to provide current income exempt from federal and California income tax.
Fund Insights at NAV
The following affected performance (on a gross basis) during the reporting period:
| » | | Exposure to the general obligation segment contributed to performance, as the segment posted positive returns. |
| » | | Exposure to municipal revenue bonds within the special tax sector contributed to performance, as the sector posted positive returns. |
| » | | Exposure to municipal revenue bonds within the industrial revenue sector contributed to performance, as the sector posted positive returns. |
| » | | The costs associated with one or more forms of leverage detracted from performance. The costs of leverage generally will reduce returns to the extent they exceed the rate of return on the additional investments purchased with such leverage. |
| » | | There were no other material detractors for this Fund. |
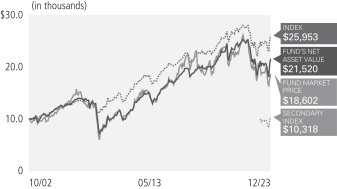
PIMCO California Municipal Income Fund III
Cumulative Returns Through December 31, 2023
$10,000 invested at the end of the month when the Fund commenced operations.
Allocation Breakdown as of December 31, 2023
| | | | |
| Municipal Bonds & Notes | | | | |
| |
| Ad Valorem Property Tax | | | 27.5% | |
| |
| Health, Hospital & Nursing Home Revenue | | | 13.7% | |
| |
| Local or Guaranteed Housing | | | 7.4% | |
| |
| Tobacco Settlement Funded | | | 7.1% | |
| |
| General Fund | | | 6.1% | |
| |
| College & University Revenue | | | 5.5% | |
| |
| Port, Airport & Marina Revenue | | | 4.7% | |
| |
| Sales Tax Revenue | | | 4.3% | |
| |
| Lease (Abatement) | | | 3.6% | |
| |
| Electric Power & Light Revenue | | | 3.1% | |
| |
| Special Tax | | | 2.8% | |
| |
| Water Revenue | | | 2.6% | |
| |
| Natural Gas Revenue | | | 2.1% | |
| |
| Sewer Revenue | | | 1.8% | |
| |
| | | 1.5% | |
| |
| Other | | | 3.8% | |
| |
| Short-Term Instruments | | | 2.4% | |
| | | % of Investments, at value. |
| | | Allocation Breakdown and % of investments exclude securities sold short and financial derivative instruments, if any. |
Fund Information (as of December 31, 2023)
(1)
| | | | |
| Market Price | | | $7.37 | |
| |
| NAV | | | $7.89 | |
| |
| Premium/(Discount) to NAV | | | (6.59)% | |
| |
Market Price Distribution Rate (2) | | | 4.80% | |
| |
| | | 4.49% | |
| |
Total Effective Leverage (3) | | | 41.20% | |
| | | | | | | | | | | | | | | | | | | | | | |
|
Average Annual Total Return (1) for the period ended December 31, 2023 | |
| | | | | | |
| | | | | 1 Year | | | 5 Year | | | 10 Year | | | Since launch of
Secondary Index
01/25/23* | | | Commencement
of Operations
(10/31/02) | |
| | Market Price | | | (7.46)% | | | | (0.33)% | | | | 3.41% | | | | (4.83)% | | | | 2.98% | |
| | NAV | | | 7.33% | | | | 1.25% | | | | 4.65% | | | | 1.79% | | | | 3.69% | |
| | Bloomberg CA Muni 22+ Year Index | | | 9.13% | | | | 2.42% | | | | 4.15% | | | | 4.69% | | | | 4.61% | |
| | ICE California Long Duration Municipal Securities Index** | | | — | | | | — | | | | — | | | | 3.12% | | | | — | |
All Fund returns are net of fees and expenses and include applicable fee waivers and/or expense limitations. Absent any applicable fee waivers and/or expense limitations, performance would have been lower and there can be no assurance that any such waivers or limitations will continue in the future.
It is not possible to invest directly in an unmanaged index.
** Secondary Index refers to ICE California Long Duration Municipal Securities Index. The launch date of the ICE California Long Duration Municipal Securities Index is January 25, 2023. Total return is presented for the less than
one-year
period since launch and is not annualized.
| Performance quoted represents past performance. Past performance is not a guarantee or a reliable indicator of future results. Current performance may be lower or higher than performance shown. Investment return and the principal value of an investment will fluctuate. Total return is not annualized for a “since launch” date of less than one year. Returns shown do not reflect the deduction of taxes that a shareholder would pay on Fund distributions or the sale of Fund shares. Total return, market price, NAV, market price distribution rate, and NAV distribution rate will fluctuate with changes in market conditions. Performance current to the most recent month-end is available at www.pimco.com or via (844) 33-PIMCO. Performance is calculated assuming all dividends and distributions are reinvested at prices obtained under the Fund’s dividend reinvestment plan. Performance does not reflect any brokerage commissions in connection with the purchase or sale of Fund shares. |
| | Performance of an index is shown in light of a requirement by the Securities and Exchange Commission that the performance of an appropriate broad-based securities market index be disclosed. However, the Fund is not managed to an index nor should the index be viewed as a “benchmark” for the Fund’s performance. The indexes are not intended to be indicative of the Fund’s investment strategies, portfolio components or past or future performance. Please see Additional Information Regarding the Funds for a description of the Fund’s principal investment strategies. |
| Distribution rates are not performance and are calculated by annualizing the most recent distribution per share and dividing by the NAV or Market Price, as applicable, as of the reported date. Distributions may be comprised of ordinary income, net capital gains, and/or a return of capital (“ROC”) of your investment in the Fund. Because the distribution rate may include a ROC, it should not be confused with yield or income. If the Fund estimates that a portion of its distribution may be comprised of amounts from sources other than net investment income in accordance with its policies and good accounting practices, the Fund will notify shareholders of the estimated composition of such distribution through a Section 19 Notice. Please refer to the most recent Section 19 Notice, if applicable, for additional information regarding the estimated composition of distributions. Please visit www.pimco.com for most recent Section 19 Notice, if applicable. Final determination of a distribution’s tax character will be provided to shareholders when such information is available. |
| Represents total effective leverage outstanding, as a percentage of total managed assets. Total effective leverage consists of preferred shares, reverse repurchase agreements and other borrowings, credit default swap notional and floating rate notes issued in tender option bond transactions, as applicable (collectively “Total Effective Leverage”). The Fund may engage in other transactions not included in Total Effective Leverage disclosed above that may give rise to a form of leverage, including certain derivative transactions. For the purpose of calculating Total Effective Leverage outstanding as a percentage of total managed assets, total managed assets refer to total assets (including assets attributable to Total Effective Leverage that may be outstanding) minus accrued liabilities (other than liabilities representing Total Effective Leverage). |
Investment Objective and Strategy Overview
PIMCO California Municipal Income Fund III’s investment objective is to seek to provide current income exempt from federal and California income tax.
Fund Insights at NAV
The following affected performance (on a gross basis) during the reporting period:
| » | | Exposure to the general obligation segment contributed to performance, as the segment posted positive returns. |
| » | | Exposure to municipal revenue bonds within the healthcare sector contributed to performance, as the sector posted positive returns. |
| » | | Exposure to municipal revenue bonds within the special tax sector contributed to performance, as the sector posted positive returns. |
| » | | The costs associated with one or more forms of leverage detracted from performance. The costs of leverage generally will reduce returns to the extent they exceed the rate of return on the additional investments purchased with such leverage. |
| » | | There were no other material detractors for this Fund. |
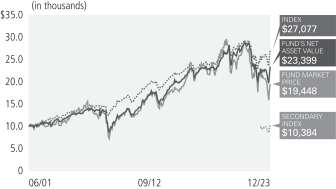
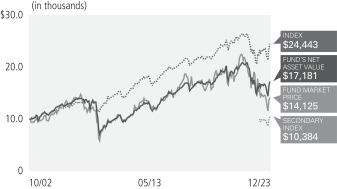
PIMCO New York Municipal Income Fund
Cumulative Returns Through December 31, 2023
$10,000 invested at the end of the month when the Fund commenced operations.
Allocation Breakdown as of December 31, 2023
| | | | |
| Municipal Bonds & Notes | | | | |
| |
| Water Revenue | | | 10.2% | |
| |
| College & University Revenue | | | 10.1% | |
| |
| Port, Airport & Marina Revenue | | | 9.6% | |
| |
| Tobacco Settlement Funded | | | 9.3% | |
| |
| Health, Hospital & Nursing Home Revenue | | | 9.1% | |
| |
| Income Tax Revenue | | | 8.0% | |
| |
| Electric Power & Light Revenue | | | 7.2% | |
| |
| General Fund | | | 5.4% | |
| |
| Ad Valorem Property Tax | | | 4.6% | |
| |
| Industrial Revenue | | | 4.0% | |
| |
| Local or Guaranteed Housing | | | 3.7% | |
| |
| Transit Revenue | | | 3.5% | |
| |
| Highway Revenue Tolls | | | 2.5% | |
| |
| Sales Tax Revenue | | | 2.2% | |
| |
| Miscellaneous Revenue | | | 2.0% | |
| |
| Appropriations | | | 1.7% | |
| |
| Miscellaneous Taxes | | | 1.1% | |
| |
| Other | | | 3.4% | |
| |
| Short-Term Instruments | | | 2.4% | |
| | | % of Investments, at value. |
| | | Allocation Breakdown and % of investments exclude securities sold short and financial derivative instruments, if any. |
Fund Information (as of December 31, 2023)
(1)
| | | | |
| Market Price | | | $7.86 | |
| |
| NAV | | | $8.98 | |
| |
| Premium/(Discount) to NAV | | | (12.47)% | |
| |
Market Price Distribution Rate (2) | | | 5.11% | |
| |
| | | 4.48% | |
| |
Total Effective Leverage (3) | | | 32.09% | |
| | | | | | | | | | | | | | | | | | | | | | |
|
Average Annual Total Return (1) for the period ended December 31, 2023 | |
| | | | | | |
| | | | | 1 Year | | | 5 Year | | | 10 Year | | | Since launch of
Secondary Index
01/25/23* | | | Commencement
of Operations
(06/29/01) | |
| | Market Price | | | (8.59)% | | | | (3.12)% | | | | 2.76% | | | | (16.34)% | | | | 3.00% | |
| | NAV | | | 8.09% | | | | 0.18% | | | | 3.94% | | | | 1.73% | | | | 3.85% | |
| | Bloomberg NY Muni 22+ Year Index | | | 10.66% | | | | 2.04% | | | | 3.66% | | | | 4.98% | | | | 4.52% | |
| | ICE New York Long Duration Municipal Securities Index** | |
| —
|
| | | — | | | | — | | | | 3.79% | | | | — | |
All Fund returns are net of fees and expenses and include applicable fee waivers and/or expense limitations. Absent any applicable fee waivers and/or expense limitations, performance would have been lower and there can be no assurance that any such waivers or limitations will continue in the future.
It is not possible to invest directly in an unmanaged index.
Average Annual Return since 06/30/2001.
** Secondary Index refers to ICE New York Long Duration Municipal Securities Index. The launch date of the ICE New York Long Duration Municipal Securities Index is January 25, 2023. Total return is presented for the less than
one-year
period since launch and is not annualized.
| Performance quoted represents past performance. Past performance is not a guarantee or a reliable indicator of future results. Current performance may be lower or higher than performance shown. Investment return and the principal value of an investment will fluctuate. Total return is not annualized for a “since launch” date of less than one year. Returns shown do not reflect the deduction of taxes that a shareholder would pay on Fund distributions or the sale of Fund shares. Total return, market price, NAV, market price distribution rate, and NAV distribution rate will fluctuate with changes in market conditions. Performance current to the most recent month-end is available at www.pimco.com or via (844) 33-PIMCO. Performance is calculated assuming all dividends and distributions are reinvested at prices obtained under the Fund’s dividend reinvestment plan. Performance does not reflect any brokerage commissions in connection with the purchase or sale of Fund shares. |
| | Performance of an index is shown in light of a requirement by the Securities and Exchange Commission that the performance of an appropriate broad-based securities market index be disclosed. However, the Fund is not managed to an index nor should the index be viewed as a “benchmark” for the Fund’s performance. The indexes are not intended to be indicative of the Fund’s investment strategies, portfolio components or past or future performance. Please see Additional Information Regarding the Funds for a description of the Fund’s principal investment strategies. |
| Distribution rates are not performance and are calculated by annualizing the most recent distribution per share and dividing by the NAV or Market Price, as applicable, as of the reported date. Distributions may be comprised of ordinary income, net capital gains, and/or a return of capital (“ROC”) of your investment in the Fund. Because the distribution rate may include a ROC, it should not be confused with yield or income. If the Fund estimates that a portion of its distribution may be comprised of amounts from sources other than net investment income in accordance with its policies and good accounting practices, the Fund will notify shareholders of the estimated composition of such distribution through a Section 19 Notice. Please refer to the most recent Section 19 Notice, if applicable, for additional information regarding the estimated composition of distributions. Please visit www.pimco.com for most recent Section 19 Notice, if applicable. Final determination of a distribution’s tax character will be provided to shareholders when such information is available. |
| Represents total effective leverage outstanding, as a percentage of total managed assets. Total effective leverage consists of preferred shares, reverse repurchase agreements and other borrowings, credit default swap notional and floating rate notes issued in tender option bond transactions, as applicable (collectively “Total Effective Leverage”). The Fund may engage in other transactions not included in Total Effective Leverage disclosed above that may give rise to a form of leverage, including certain derivative transactions. For the purpose of calculating Total Effective Leverage outstanding as a percentage of total managed assets, total managed assets refer to total assets (including assets attributable to Total Effective Leverage that may be outstanding) minus accrued liabilities (other than liabilities representing Total Effective Leverage). |
Investment Objective and Strategy Overview
PIMCO New York Municipal Income Fund’s investment objective is to seek to provide current income exempt from federal, New York State and New York City income tax.
Fund Insights at NAV
The following affected performance (on a gross basis) during the reporting period:
| » | | Exposure to municipal revenue bonds within the special tax sector contributed to performance, as the sector posted positive returns. |
| » | | Exposure to municipal revenue bonds within the transportation sector contributed to performance, as the sector posted positive returns. |
| » | | Exposure to municipal revenue bonds within the education sector contributed to performance, as the sector posted positive returns. |
| » | | The costs associated with one or more forms of leverage detracted from performance. The costs of leverage generally will reduce returns to the extent they exceed the rate of return on the additional investments purchased with such leverage. |
| » | | There were no other material detractors for this Fund. |
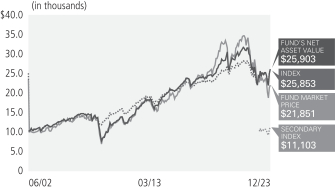
PIMCO New York Municipal Income Fund II
Cumulative Returns Through December 31, 2023
$10,000 invested at the end of the month when the Fund commenced operations.
Allocation Breakdown
| | | | |
| Municipal Bonds & Notes | | | | |
| |
| College & University Revenue | | | 11.9% | |
| |
| Tobacco Settlement Funded | | | 11.8% | |
| |
| Income Tax Revenue | | | 10.8% | |
| |
| Water Revenue | | | 9.3% | |
| |
| Port, Airport & Marina Revenue | | | 9.1% | |
| |
| Electric Power & Light Revenue | | | 8.8% | |
| |
| Health, Hospital & Nursing Home Revenue | | | 7.1% | |
| |
| Highway Revenue Tolls | | | 4.1% | |
| |
| Sales Tax Revenue | | | 3.5% | |
| |
| Miscellaneous Revenue | | | 3.4% | |
| |
| Local or Guaranteed Housing | | | 3.0% | |
| |
| Ad Valorem Property Tax | | | 2.8% | |
| |
| Industrial Revenue | | | 2.7% | |
| |
| Lease (Appropriation) | | | 2.0% | |
| |
| General Fund | | | 1.4% | |
| |
| Appropriations | | | 1.1% | |
| |
| Other | | | 3.7% | |
| |
| Short-Term Instruments | | | 3.5% | |
| | | % of Investments, at value. |
| | | Allocation Breakdown and % of investments exclude securities sold short and financial derivative instruments, if any. |
Fund Information
(as of December 31, 2023)
(1)
| | | | |
| Market Price | | | $7.59 | |
| |
| NAV | | | $8.66 | |
| |
| Premium/(Discount) to NAV | | | (12.36)% | |
| |
Market Price Distribution Rate (2) | | | 4.66% | |
| |
| | | 4.09% | |
| |
Total Effective Leverage (3) | | | 40.47% | |
| | | | | | | | | | | | | | | | | | | | | | |
|
Average Annual Total Return (1) for the period ended December 31, 2023 | |
| | | | | | |
| | | | | 1 Year | | | 5 Year | | | 10 Year | | | Since launch of
Secondary Index
01/25/23* | | | Commencement
of Operations
(06/28/02) | |
| | Market Price | | | 0.12% | | | | (1.76)% | | | | 2.51% | | | | (3.61)% | | | | 3.01% | |
| | NAV | | | 8.97% | | | | 0.31% | | | | 4.27% | | | | 1.85% | | | | 3.95% | |
| | Bloomberg NY Muni 22+
Year Index | | | 10.66% | | | | 2.04% | | | | 3.66% | | | | 4.98% | | | | 4.43% | |
| | ICE New York Long Duration Municipal Securities Index** | | | — | | | | — | | | | — | | | | 3.79% | | | | — | |
All Fund returns are net of fees and expenses and include applicable fee waivers and/or expense limitations. Absent any applicable fee waivers and/or expense limitations, performance would have been lower and there can be no assurance that any such waivers or limitations will continue in the future.
It is not possible to invest directly in an unmanaged index.
Average Annual Return since 06/30/2002.
** Secondary Index refers to ICE New York Long Duration Municipal Securities Index. The launch date of the ICE New York Long Duration Municipal Securities Index is January 25, 2023. Total return is presented for the less than
one-year
period since launch and is not annualized.
| Performance quoted represents past performance. Past performance is not a guarantee or a reliable indicator of future results. Current performance may be lower or higher than performance shown. Investment return and the principal value of an investment will fluctuate. Returns shown do not reflect the deduction of taxes that a shareholder would pay on Fund distributions or the sale of Fund shares. Total return, market price, NAV, market price distribution rate, and NAV distribution rate will fluctuate with changes in market conditions. Performance current to the most recent month-end is available at www.pimco.com or via (844) 33-PIMCO. Performance is calculated assuming all dividends and distributions are reinvested at prices obtained under the Fund’s dividend reinvestment plan. Performance does not reflect any brokerage commissions in connection with the purchase or sale of Fund shares. |
| | Performance of an index is shown in light of a requirement by the Securities and Exchange Commission that the performance of an appropriate broad-based securities market index be disclosed. However, the Fund is not managed to an index nor should the index be viewed as a “benchmark” for the Fund’s performance. The index is not intended to be indicative of the Fund’s investment strategies, portfolio components or past or future performance. Please see Additional Information Regarding the Funds for a description of the Fund’s principal investment strategies. |
| Distribution rates are not performance and are calculated by annualizing the most recent distribution per share and dividing by the NAV or Market Price, as applicable, as of the reported date. Distributions may be comprised of ordinary income, net capital gains, and/or a return of capital (“ROC”) of your investment in the Fund. Because the distribution rate may include a ROC, it should not be confused with yield or income. If the Fund estimates that a portion of its distribution may be comprised of amounts from sources other than net investment income in accordance with its policies and good accounting practices, the Fund will notify shareholders of the estimated composition of such distribution through a Section 19 Notice. Please refer to the most recent Section 19 Notice, if applicable, for additional information regarding the estimated composition of distributions. Please visit www.pimco.com for most recent Section 19 Notice, if applicable. Final determination of a distribution’s tax character will be provided to shareholders when such information is available. |
| Represents total effective leverage outstanding, as a percentage of total managed assets. Total effective leverage consists of preferred shares, reverse repurchase agreements and other borrowings, credit default swap notional and floating rate notes issued in tender option bond transactions, as applicable (collectively “Total Effective Leverage”). The Fund may engage in other transactions not included in Total Effective Leverage disclosed above that may give rise to a form of leverage, including certain derivative transactions. For the purpose of calculating Total Effective Leverage outstanding as a percentage of total managed assets, total managed assets refer to total assets (including assets attributable to Total Effective Leverage that may be outstanding) minus accrued liabilities (other than liabilities representing Total Effective Leverage). |
Investment Objective and Strategy Overview
PIMCO New York Municipal Income Fund II’s investment objective is to seek to provide current income exempt from federal, New York State and New York City income tax.
Fund Insights at NAV
The following affected performance (on a gross basis) during the reporting period:
| » | | Exposure to municipal revenue bonds within the special tax sector contributed to performance, as the sector posted positive returns. |
| » | | Exposure to municipal revenue bonds within the transportation sector contributed to performance, as the sector posted positive returns. |
| » | | Exposure to municipal revenue bonds within the industrial revenue sector contributed to performance, as the sector posted positive returns. |
| » | | The costs associated with one or more forms of leverage detracted from performance. The costs of leverage generally will reduce returns to the extent they exceed the rate of return on the additional investments purchased with such leverage. |
| » | | There were no other material detractors for this Fund. |
PIMCO New York Municipal Income Fund III
Cumulative Returns Through December 31, 2023
$10,000 invested at the end of the month when the Fund commenced operations.
Allocation Breakdown
| | | | |
| Municipal Bonds & Notes | | | | |
| |
| Tobacco Settlement Funded | | | 10.6% | |
| |
| Water Revenue | | | 10.6% | |
| |
| College & University Revenue | | | 10.3% | |
| |
| Port, Airport & Marina Revenue | | | 9.1% | |
| |
| Income Tax Revenue | | | 9.1% | |
| |
| Electric Power & Light Revenue | | | 7.2% | |
| |
| Health, Hospital & Nursing Home Revenue | | | 6.6% | |
| |
| Industrial Revenue | | | 6.2% | |
| |
| Ad Valorem Property Tax | | | 4.1% | |
| |
| Local or Guaranteed Housing | | | 4.1% | |
| |
| Sales Tax Revenue | | | 3.2% | |
| |
| Transit Revenue | | | 3.2% | |
| |
| Highway Revenue Tolls | | | 3.0% | |
| |
| Lease (Appropriation) | | | 2.7% | |
| |
| General Fund | | | 2.6% | |
| |
| Miscellaneous Revenue | | | 2.5% | |
| |
| Fuel Sales Tax Revenue | | | 1.3% | |
| |
| Other | | | 0.9% | |
| |
| Short-Term Instruments | | | 2.7% | |
| | | % of Investments, at value. |
| | | Allocation Breakdown and % of investments exclude securities sold short and financial derivative instruments, if any. |
Fund Information
(as of December 31, 2023)
(1)
| | | | |
| Market Price | | | $5.96 | |
| |
| NAV | | | $6.88 | |
| |
| Premium/(Discount) to NAV | | | (13.37)% | |
| |
Market Price Distribution Rate (2) | | | 4.99% | |
| |
| | | 4.33% | |
| |
Total Effective Leverage (3) | | | 39.69% | |
| | | | | | | | | | | | | | | | | | | | | | |
|
Average Annual Total Return (1) for the period ended December 31, 2023 | |
| | | | | | |
| | | | | 1 Year | | | 5 Year | | | 10 Year | | | Since launch of
Secondary Index
01/25/23* | | | Commencement
of Operations
(10/31/02) | |
| | Market Price | | | (8.35)% | | | | (2.52)% | | | | 1.81% | | | | (9.73)% | | | | 1.65% | |
| | NAV | | | 8.02% | | | | 0.29% | | | | 3.70% | | | | 1.68% | | | | 2.59% | |
| | Bloomberg NY Muni 22+ Year Index | | | 10.66% | | | | 2.04% | | | | 3.66% | | | | 4.98% | | | | 4.31% | |
| | ICE New York Long Duration Municipal Securities Index** | | | — | | | | — | | | | — | | | | 3.79% | | | | — | |
All Fund returns are net of fees and expenses and include applicable fee waivers and/or expense limitations. Absent any applicable fee waivers and/or expense limitations, performance would have been lower and there can be no assurance that any such waivers or limitations will continue in the future.
It is not possible to invest directly in an unmanaged index.
** Secondary Index refers to ICE New York Long Duration Municipal Securities Index. The launch date of the ICE New York Long Duration Municipal Securities Index is January 25, 2023. Total return is presented for the less than
one-year
period since launch and is not annualized.
| Performance quoted represents past performance. Past performance is not a guarantee or a reliable indicator of future results. Current performance may be lower or higher than performance shown. Investment return and the principal value of an investment will fluctuate. Total return is not annualized for a “since launch” date of less than one year. Returns shown do not reflect the deduction of taxes that a shareholder would pay on Fund distributions or the sale of Fund shares. Total return, market price, NAV, market price distribution rate, and NAV distribution rate will fluctuate with changes in market conditions. Performance current to the most recent month-end is available at www.pimco.com or via (844) 33-PIMCO. Performance is calculated assuming all dividends and distributions are reinvested at prices obtained under the Fund’s dividend reinvestment plan. Performance does not reflect any brokerage commissions in connection with the purchase or sale of Fund shares. |
| | Performance of an index is shown in light of a requirement by the Securities and Exchange Commission that the performance of an appropriate broad-based securities market index be disclosed. However, the Fund is not managed to an index nor should the index be viewed as a “benchmark” for the Fund’s performance. The indexes are not intended to be indicative of the Fund’s investment strategies, portfolio components or past or future performance. Please see Additional Information Regarding the Funds for a description of the Fund’s principal investment strategies. |
| Distribution rates are not performance and are calculated by annualizing the most recent distribution per share and dividing by the NAV or Market Price, as applicable, as of the reported date. Distributions may be comprised of ordinary income, net capital gains, and/or a return of capital (“ROC”) of your investment in the Fund. Because the distribution rate may include a ROC, it should not be confused with yield or income. If the Fund estimates that a portion of its distribution may be comprised of amounts from sources other than net investment income in accordance with its policies and good accounting practices, the Fund will notify shareholders of the estimated composition of such distribution through a Section 19 Notice. Please refer to the most recent Section 19 Notice, if applicable, for additional information regarding the estimated composition of distributions. Please visit www.pimco.com for most recent Section 19 Notice, if applicable. Final determination of a distribution’s tax character will be provided to shareholders when such information is available. |
| Represents total effective leverage outstanding, as a percentage of total managed assets. Total effective leverage consists of preferred shares, reverse repurchase agreements and other borrowings, credit default swap notional and floating rate notes issued in tender option bond transactions, as applicable (collectively “Total Effective Leverage”). The Fund may engage in other transactions not included in Total Effective Leverage disclosed above that may give rise to a form of leverage, including certain derivative transactions. For the purpose of calculating Total Effective Leverage outstanding as a percentage of total managed assets, total managed assets refer to total assets (including assets attributable to Total Effective Leverage that may be outstanding) minus accrued liabilities (other than liabilities representing Total Effective Leverage). |
Investment Objective and Strategy Overview
PIMCO New York Municipal Income Fund III’s investment objective is to seek to provide current income exempt from federal, New York State and New York City income tax.
Fund Insights at NAV
The following affected performance (on a gross basis) during the reporting period:
| » | | Exposure to municipal revenue bonds within the special tax sector contributed to performance, as the sector posted positive returns. |
| » | | Exposure to municipal revenue bonds within the industrial revenue sector contributed to performance, as the sector posted positive returns. |
| » | | Exposure to municipal revenue bonds within the transportation sector contributed to performance, as the sector posted positive returns. |
| » | | The costs associated with one or more forms of leverage detracted from performance. The costs of leverage generally will reduce returns to the extent they exceed the rate of return on the additional investments purchased with such leverage. |
| » | | There were no other material detractors for this Fund. |
PIMCO Municipal Income Fund
Cumulative Returns Through December 31, 2023
$10,000 invested at the end of the month when the Fund commenced operations.
Allocation Breakdown as of December 31, 2023
| | | | |
| Municipal Bonds & Notes | | | | |
| |
| Health, Hospital & Nursing Home Revenue | | | 15.2% | |
| |
| Ad Valorem Property Tax | | | 10.7% | |
| |
| Sales Tax Revenue | | | 5.9% | |
| |
| Highway Revenue Tolls | | | 5.3% | |
| |
| Miscellaneous Revenue | | | 5.2% | |
| |
| Tobacco Settlement Funded | | | 5.0% | |
| |
| Industrial Revenue | | | 4.9% | |
| |
| Water Revenue | | | 4.9% | |
| |
| Local or Guaranteed Housing | | | 4.0% | |
| |
| Lease (Appropriation) | | | 4.0% | |
| |
| Electric Power & Light Revenue | | | 3.9% | |
| |
| Natural Gas Revenue | | | 3.5% | |
| |
| Sewer Revenue | | | 3.3% | |
| |
| College & University Revenue | | | 3.2% | |
| |
| Port, Airport & Marina Revenue | | | 2.7% | |
| |
| Appropriations | | | 2.5% | |
| |
| Income Tax Revenue | | | 2.4% | |
| |
| Fuel Sales Tax Revenue | | | 2.0% | |
| |
| Nuclear Revenue | | | 1.6% | |
| |
| General Fund | | | 1.5% | |
| |
| Miscellaneous Taxes | | | 1.3% | |
| |
| Resource Recovery Revenue | | | 1.1% | |
| |
| Other | | | 4.4% | |
| |
| Short-Term Instruments | | | 0.4% | |
| |
| Other | | | 1.1% | |
| | | % of Investments, at value. |
| | | Allocation Breakdown and % of investments exclude securities sold short and financial derivative instruments, if any. |
Fund Information (as of December 31, 2023)
(1)
| | | | |
| Market Price | | | $9.33 | |
| |
| NAV | | | $9.73 | |
| |
| Premium/(Discount) to NAV | | | (4.11)% | |
| |
Market Price Distribution Rate (2) | | | 5.40% | |
| |
| | | 5.18% | |
| |
Total Effective Leverage (3) | | | 41.84% | |
| | | | | | | | | | | | | | | | | | | | | | |
|
Average Annual Total Return (1) for the period ended December 31, 2023 | |
| | | | | | |
| | | | | 1 Year | | | 5 Year | | | 10 Year | | | Since launch of
Secondary Index
12/09/22 | | | Commencement
of Operations
(06/29/01) | |
| | Market Price | | | (5.62)% | | | | (0.57)% | | | | 3.22% | | | | (6.66)% | | | | 4.46% | |
| | NAV | | | 7.88% | | | | 0.70% | | | | 4.49% | | | | 4.22% | | | | 5.32% | |
| | Bloomberg Long Municipal
Bond Index | | | 9.35% | | | | 2.22% | | | | 3.95% | | | | 7.41% | | | | 4.51% | |
| | ICE Long Duration National Municipal Securities Index* | | | 11.03% | | | | — | | | | — | | | | 7.60% | | | | — | |
All Fund returns are net of fees and expenses and include applicable fee waivers and/or expense limitations. Absent any applicable fee waivers and/or expense limitations, performance would have been lower and there can be no assurance that any such waivers or limitations will continue in the future.
It is not possible to invest directly in an unmanaged index.
Average Annual Return since 06/30/2002.
* Secondary Index refers to ICE Long Duration National Municipal Securities Index.
| Performance quoted represents past performance. Past performance is not a guarantee or a reliable indicator of future results. Current performance may be lower or higher than performance shown. Investment return and the principal value of an investment will fluctuate. Returns shown do not reflect the deduction of taxes that a shareholder would pay on Fund distributions or the sale of Fund shares. Total return, market price, NAV, market price distribution rate, and NAV distribution rate will fluctuate with changes in market conditions. Performance current to the most recent month-end is available at www.pimco.com or via (844) 33-PIMCO. Performance is calculated assuming all dividends and distributions are reinvested at prices obtained under the Fund’s dividend reinvestment plan. Performance does not reflect any brokerage commissions in connection with the purchase or sale of Fund shares. |
| | Performance of an index is shown in light of a requirement by the Securities and Exchange Commission that the performance of an appropriate broad-based securities market index be disclosed. However, the Fund is not managed to an index nor should the index be viewed as a “benchmark” for the Fund’s performance. The indexes are not intended to be indicative of the Fund’s investment strategies, portfolio components or past or future performance. Please see Additional Information Regarding the Funds for a description of the Fund’s principal investment strategies. |
| Distribution rates are not performance and are calculated by annualizing the most recent distribution per share and dividing by the NAV or Market Price, as applicable, as of the reported date. Distributions may be comprised of ordinary income, net capital gains, and/or a return of capital (“ROC”) of your investment in the Fund. Because the distribution rate may include a ROC, it should not be confused with yield or income. If the Fund estimates that a portion of its distribution may be comprised of amounts from sources other than net investment income in accordance with its policies and good accounting practices, the Fund will notify shareholders of the estimated composition of such distribution through a Section 19 Notice. Please refer to the most recent Section 19 Notice, if applicable, for additional information regarding the estimated composition of distributions. Please visit www.pimco.com for most recent Section 19 Notice, if applicable. Final determination of a distribution’s tax character will be provided to shareholders when such information is available. |
| Represents total effective leverage outstanding, as a percentage of total managed assets. Total effective leverage consists of preferred shares, reverse repurchase agreements and other borrowings, credit default swap notional and floating rate notes issued in tender option bond transactions, as applicable (collectively “Total Effective Leverage”). The Fund may engage in other transactions not included in Total Effective Leverage disclosed above that may give rise to a form of leverage, including certain derivative transactions. For the purpose of calculating Total Effective Leverage outstanding as a percentage of total managed assets, total managed assets refer to total assets (including assets attributable to Total Effective Leverage that may be outstanding) minus accrued liabilities (other than liabilities representing Total Effective Leverage). |
Investment Objective and Strategy Overview
PIMCO Municipal Income Fund’s investment objective is to seek to provide current income exempt from federal income tax.
Fund Insights at NAV
The following affected performance (on a gross basis) during the reporting period:
| » | | Exposure to municipal revenue bonds within the special tax sector contributed to performance, as the sector posted positive returns. |
| » | | Exposure to municipal revenue bonds within the industrial revenue sector contributed to performance, as the sector posted positive returns. |
| » | | Exposure to municipal revenue bonds within the transportation sector contributed to performance, as the sector posted positive returns. |
| » | | The costs associated with one or more forms of leverage detracted from performance. The costs of leverage generally will reduce returns to the extent they exceed the rate of return on the additional investments purchased with such leverage. |
| » | | There were no other material detractors for this Fund. |
PIMCO Municipal Income Fund II
Cumulative Returns Through December 31, 2023
$10,000 invested at the end of the month when the Fund commenced operations.
Allocation Breakdown as of December 31, 2023
| | | | |
| Municipal Bonds & Notes | | | | |
| |
| Health, Hospital & Nursing Home Revenue | | | 15.9% | |
| |
| Ad Valorem Property Tax | | | 9.2% | |
| |
| Industrial Revenue | | | 5.2% | |
| |
| Tobacco Settlement Funded | | | 5.2% | |
| |
| Sales Tax Revenue | | | 5.2% | |
| |
| Natural Gas Revenue | | | 5.1% | |
| |
| Sewer Revenue | | | 4.6% | |
| |
| Lease (Appropriation) | | | 4.5% | |
| |
| Electric Power & Light Revenue | | | 4.1% | |
| |
| Highway Revenue Tolls | | | 4.1% | |
| |
| College & University Revenue | | | 3.9% | |
| |
| Water Revenue | | | 3.8% | |
| |
| Miscellaneous Revenue | | | 3.8% | |
| |
| Local or Guaranteed Housing | | | 3.3% | |
| |
| Port, Airport & Marina Revenue | | | 3.0% | |
| |
| Appropriations | | | 2.9% | |
| |
| Fuel Sales Tax Revenue | | | 2.2% | |
| |
| Income Tax Revenue | | | 2.1% | |
| |
| General Fund | | | 1.5% | |
| |
| Hotel Occupancy Tax | | | 1.4% | |
| |
| Miscellaneous Taxes | | | 1.3% | |
| |
| Nuclear Revenue | | | 1.1% | |
| |
| Resource Recovery Revenue | | | 1.1% | |
| |
| Government Fund/Grant Revenue | | | 1.0% | |
| |
| Other | | | 3.4% | |
| |
| Short-Term Instruments | | | 0.1% | |
| |
| Other | | | 1.0% | |
| | † | % of Investments, at value. |
| | § | Allocation Breakdown and % of investments exclude securities sold short and financial derivative instruments, if any. |
Fund Information (as of December 31, 2023)
(1)
| | | | |
| Market Price | | | $8.30 | |
| |
| NAV | | | $9.01 | |
| |
| Premium/(Discount) to NAV | | | (7.88)% | |
| |
Market Price Distribution Rate (2) | | | 5.71% | |
| |
| | | 5.26% | |
| |
Total Effective Leverage (3) | | | 38.27% | |
| | | | | | | | | | | | | | | | | | | | | | |
|
Average Annual Total Return (1) for the period ended December 31, 2023 | |
| | | | | | |
| | | | | 1 Year | | | 5 Year | | | 10 Year | | | Since launch of
Secondary Index
12/09/22 | | | Commencement
of Operations
(06/28/02) | |
| | Market Price | | | (2.97)% | | | | (3.70)% | | | | 3.58% | | | | (7.06)% | | | | 3.77% | |
| | NAV | | | 8.57% | | | | 1.01% | | | | 4.56% | | | | 4.79% | | | | 4.52% | |
| | Bloomberg Long Municipal Bond Index | | | 9.35% | | | | 2.22% | | | | 3.95% | | | | 7.41% | | | | 4.51% | |
| | ICE Long Duration National Municipal Securities Index* | | | 11.03% | | | | — | | | | — | | | | 7.60% | | | | — | |
All Fund returns are net of fees and expenses and include applicable fee waivers and/or expense limitations. Absent any applicable fee waivers and/or expense limitations, performance would have been lower and there can be no assurance that any such waivers or limitations will continue in the future.
It is not possible to invest directly in an unmanaged index.
Average Annual Return since 06/30/2002.
* Secondary Index refers to ICE Long Duration National Municipal Securities Index.
| Performance quoted represents past performance. Past performance is not a guarantee or a reliable indicator of future results. Current performance may be lower or higher than performance shown. Investment return and the principal value of an investment will fluctuate. Returns shown do not reflect the deduction of taxes that a shareholder would pay on Fund distributions or the sale of Fund shares. Total return, market price, NAV, market price distribution rate, and NAV distribution rate will fluctuate with changes in market conditions. Performance current to the most recent month-end is available at www.pimco.com or via (844) 33-PIMCO. Performance is calculated assuming all dividends and distributions are reinvested at prices obtained under the Fund’s dividend reinvestment plan. Performance does not reflect any brokerage commissions in connection with the purchase or sale of Fund shares. |
| | Performance of an index is shown in light of a requirement by the Securities and Exchange Commission that the performance of an appropriate broad-based securities market index be disclosed. However, the Fund is not managed to an index nor should the index be viewed as a “benchmark” for the Fund’s performance. The indexes are not intended to be indicative of the Fund’s investment strategies, portfolio components or past or future performance. Please see Additional Information Regarding the Funds for a description of the Fund’s principal investment strategies. |
| Distribution rates are not performance and are calculated by annualizing the most recent distribution per share and dividing by the NAV or Market Price, as applicable, as of the reported date. Distributions may be comprised of ordinary income, net capital gains, and/or a return of capital (“ROC”) of your investment in the Fund. Because the distribution rate may include a ROC, it should not be confused with yield or income. If the Fund estimates that a portion of its distribution may be comprised of amounts from sources other than net investment income in accordance with its policies and good accounting practices, the Fund will notify shareholders of the estimated composition of such distribution through a Section 19 Notice. Please refer to the most recent Section 19 Notice, if applicable, for additional information regarding the estimated composition of distributions. Please visit www.pimco.com for most recent Section 19 Notice, if applicable. Final determination of a distribution’s tax character will be provided to shareholders when such information is available. |
| Represents total effective leverage outstanding, as a percentage of total managed assets. Total effective leverage consists of preferred shares, reverse repurchase agreements and other borrowings, credit default swap notional and floating rate notes issued in tender option bond transactions, as applicable (collectively “Total Effective Leverage”). The Fund may engage in other transactions not included in Total Effective Leverage disclosed above that may give rise to a form of leverage, including certain derivative transactions. For the purpose of calculating Total Effective Leverage outstanding as a percentage of total managed assets, total managed assets refer to total assets (including assets attributable to Total Effective Leverage that may be outstanding) minus accrued liabilities (other than liabilities representing Total Effective Leverage). |
Investment Objective and Strategy Overview
PIMCO Municipal Income Fund II’s investment objective is to seek to provide current income exempt from federal income tax.
Fund Insights at NAV
The following affected performance (on a gross basis) during the reporting period:
| » | | Exposure to municipal revenue bonds within the industrial revenue sector contributed to performance, as the sector posted positive returns. |
| » | | Exposure to municipal revenue bonds within the special tax sector contributed to performance, as the sector posted positive returns. |
| » | | Exposure to municipal revenue bonds within the healthcare sector contributed to performance, as the sector posted positive returns. |
| » | | The costs associated with one or more forms of leverage detracted from performance. The costs of leverage generally will reduce returns to the extent they exceed the rate of return on the additional investments purchased with such leverage. |
| » | | There were no other material detractors for this Fund. |
PIMCO Municipal Income Fund III
Cumulative Returns Through December 31, 2023
$10,000 invested at the end of the month when the Fund commenced operations.
Allocation Breakdown
| | | | |
| Municipal Bonds & Notes | | | | |
| |
| Health, Hospital & Nursing Home Revenue | | | 13.1% | |
| |
| Ad Valorem Property Tax | | | 10.0% | |
| |
| Sales Tax Revenue | | | 6.1% | |
| |
| Local or Guaranteed Housing | | | 5.4% | |
| |
| Electric Power & Light Revenue | | | 5.2% | |
| |
| Highway Revenue Tolls | | | 4.9% | |
| |
| Industrial Revenue | | | 4.6% | |
| |
| Sewer Revenue | | | 4.5% | |
| |
| Natural Gas Revenue | | | 4.4% | |
| |
| Tobacco Settlement Funded | | | 4.1% | |
| |
| Water Revenue | | | 4.1% | |
| |
| Port, Airport & Marina Revenue | | | 4.0% | |
| |
| Fuel Sales Tax Revenue | | | 3.6% | |
| |
| Lease (Appropriation) | | | 3.5% | |
| |
| College & University Revenue | | | 3.1% | |
| |
| Appropriations | | | 2.8% | |
| |
| Income Tax Revenue | | | 2.6% | |
| |
| Miscellaneous Revenue | | | 2.1% | |
| |
| General Fund | | | 1.9% | |
| |
| Nuclear Revenue | | | 1.4% | |
| |
| Miscellaneous Taxes | | | 1.2% | |
| |
| Resource Recovery Revenue | | | 1.1% | |
| |
| Other | | | 5.3% | |
| |
| Short-Term Instruments | | | 0.1% | |
| |
| Other | | | 0.9% | |
| | | % of Investments, at value. |
| | | Allocation Breakdown and % of investments exclude securities sold short and financial derivative instruments, if any. |
Fund Information
(as of December 31, 2023)
(1)
| | | | |
| Market Price | | | $7.39 | |
| |
| NAV | | | $8.30 | |
| |
| Premium/(Discount) to NAV | | | (10.96)% | |
| |
Market Price Distribution Rate (2) | | | 5.36% | |
| |
| | | 4.77% | |
| |
Total Effective Leverage (3) | | | 40.31% | |
| | | | | | | | | | | | | | | | | | | | | | |
|
Average Annual Total Return (1) for the period ended December 31, 2023 | |
| | | | | | |
| | | | | 1 Year | | | 5 Year | | | 10 Year | | | Since launch of
Secondary Index
12/09/22 | | | Commencement
of Operations
(10/31/02) | |
| | Market Price | | | (10.64)% | | | | (2.91)% | | | | 3.02% | | | | (13.79)% | | | | 3.32% | |
| | NAV | | | 8.71% | | | | 0.64% | | | | 4.96% | | | | 4.87% | | | | 4.30% | |
| | Bloomberg Long Municipal Bond Index | | | 9.35% | | | | 2.22% | | | | 3.95% | | | | 7.41% | | | | 4.40% | |
| | ICE Long Duration National Municipal Securities Index* | | | 11.03% | | | | — | | | | — | | | | 7.60% | | | | — | |
All Fund returns are net of fees and expenses and include applicable fee waivers and/or expense limitations. Absent any applicable fee waivers and/or expense limitations, performance would have been lower and there can be no assurance that any such waivers or limitations will continue in the future.
It is not possible to invest directly in an unmanaged index.
* Secondary Index refers to ICE Long Duration National Municipal Securities Index.
| Performance quoted represents past performance. Past performance is not a guarantee or a reliable indicator of future results. Current performance may be lower or higher than performance shown. Investment return and the principal value of an investment will fluctuate. Returns shown do not reflect the deduction of taxes that a shareholder would pay on Fund distributions or the sale of Fund shares. Total return, market price, NAV, market price distribution rate, and NAV distribution rate will fluctuate with changes in market conditions. Performance current to the most recent month-end is available at www.pimco.com or via (844) 33-PIMCO. Performance is calculated assuming all dividends and distributions are reinvested at prices obtained under the Fund’s dividend reinvestment plan. Performance does not reflect any brokerage commissions in connection with the purchase or sale of Fund shares. |
| | Performance of an index is shown in light of a requirement by the Securities and Exchange Commission that the performance of an appropriate broad-based securities market index be disclosed. However, the Fund is not managed to an index nor should the index be viewed as a “benchmark” for the Fund’s performance. The indexes are not intended to be indicative of the Fund’s investment strategies, portfolio components or past or future performance. Please see Additional Information Regarding the Funds for a description of the Fund’s principal investment strategies. |
| Distribution rates are not performance and are calculated by annualizing the most recent distribution per share and dividing by the NAV or Market Price, as applicable, as of the reported date. Distributions may be comprised of ordinary income, net capital gains, and/or a return of capital (“ROC”) of your investment in the Fund. Because the distribution rate may include a ROC, it should not be confused with yield or income. If the Fund estimates that a portion of its distribution may be comprised of amounts from sources other than net investment income in accordance with its policies and good accounting practices, the Fund will notify shareholders of the estimated composition of such distribution through a Section 19 Notice. Please refer to the most recent Section 19 Notice, if applicable, for additional information regarding the estimated composition of distributions. Please visit www.pimco.com for most recent Section 19 Notice, if applicable. Final determination of a distribution’s tax character will be provided to shareholders when such information is available. |
| Represents total effective leverage outstanding, as a percentage of total managed assets. Total effective leverage consists of preferred shares, reverse repurchase agreements and other borrowings, credit default swap notional and floating rate notes issued in tender option bond transactions, as applicable (collectively “Total Effective Leverage”). The Fund may engage in other transactions not included in Total Effective Leverage disclosed above that may give rise to a form of leverage, including certain derivative transactions. For the purpose of calculating Total Effective Leverage outstanding as a percentage of total managed assets, total managed assets refer to total assets (including assets attributable to Total Effective Leverage that may be outstanding) minus accrued liabilities (other than liabilities representing Total Effective Leverage). |
Investment Objective and Strategy Overview
PIMCO Municipal Income Fund III’s investment objective is to seek to provide current income exempt from federal income tax.
Fund Insights at NAV
The following affected performance (on a gross basis) during the reporting period:
| » | | Exposure to municipal revenue bonds within the special tax sector contributed to performance, as the sector posted positive returns. |
| » | | Exposure to municipal revenue bonds within the transportation sector contributed to performance, as the sector posted positive returns. |
| » | | Exposure to municipal revenue bonds within the industrial revenue sector contributed to performance, as the sector posted positive returns. |
| » | | The costs associated with one or more forms of leverage detracted from performance. The costs of leverage generally will reduce returns to the extent they exceed the rate of return on the additional investments purchased with such leverage. |
| » | | There were no other material detractors for this Fund. |
| | |
| | |
| |
| Bloomberg Long Municipal Bond Index | | Bloomberg Long Municipal Bond Index is a rules-based, market-value-weighted index engineered for the long-term tax-exempt bond market. |
| |
| Bloomberg CA Muni 22+ Year Index | | The Bloomberg CA Muni 22+ Year Index is the long maturity California component of the Bloomberg Municipal Bond Index, which consists of a broad selection of investment grade general obligation and revenue bonds. It is an unmanaged index representative of the tax-exempt bond market. |
| |
| Bloomberg NY Muni 22+ Year Index | | The Bloomberg NY Muni 22+ Year Index is the long maturity New York component of the Bloomberg Municipal Bond Index, which consists of a broad selection of investment grade general obligation and revenue bonds. It is an unmanaged index representative of the tax-exempt bond market. |
| |
| ICE California Long Duration Municipal Securities Index | | ICE California Long Duration Municipal Securities Index is a subset of the ICE Long Duration National Municipal Securities Index including only securities issued within the State of California. The ICE Long Duration National Municipal Securities Index tracks the performance of long duration rated and unrated US dollar denominated tax-exempt debt publicly issued by US states and territories, and their political subdivisions, in the US domestic market. |
| |
| ICE Long Duration National Municipal Securities Index | | ICE Long Duration National Municipal Securities Index tracks the performance of long duration rated and unrated US dollar denominated tax-exempt debt publicly issued by US states and territories, and their political subdivisions, in the US domestic market. |
| |
| ICE New York Long Duration Municipal Securities Index | | ICE New York Long Duration Municipal Securities Index is a subset of the ICE Long Duration National Municipal Securities Index including only securities issued within the State of New York. The ICE Long Duration National Municipal Securities Index tracks the performance of long duration rated and unrated US dollar denominated tax-exempt debt publicly issued by US states and territories, and their political subdivisions, in the US domestic market. |
* It is not possible to invest directly in an unmanaged index.
(THIS PAGE INTENTIONALLY LEFT BLANK)
| | | | | | | | | | | | | | | | | | | | | | | | | | | | | | | | | | | | | | | | | | | | | | | | | | | | |
| | | | | | | | | Less Distributions to Preferred Shareholders (c) | | | | | | Less Distributions to Common Shareholders (d) | | | | | | | | | | |
| | | | | | | | | | | | | | | | | | | | | | | | | | | | | | | | | | | | | | | | |
Selected Per Share Data for the
Year Ended^: | | | | | | | | | | | | | | From Net
Realized
Capital
Gains | | | Net Increase
(Decrease)
in Net Assets
Applicable
to Common
Shareholders
Resulting
from
Operations | | | | | | | | | | | | | | | | | | Increase
Resulting
from
Common
Share
Offering | | | Offering
Cost
Charged to
Paid in
Capital | |
| | | | | | | | | | | | | |
PIMCO California Municipal Income Fund | | | | | | | | | | | | | | | | | | | | | | | | | | | | | | | | | | | | | | | | | | | | | | | | | | | | |
| | | | | | | | | | | | | |
| 12/31/2023 | | $ | 10.31 | | | $ | 0.55 | | | $ | 0.57 | | | $ | (0.37 | ) | | $ | 0.00 | | | $ | 0.75 | | | $ | (0.24 | ) | | $ | 0.00 | | | $ | (0.19 | ) | | $ | (0.43 | ) | | $ | 0.03 | | | $ | N/A | | | $ | N/A | |
| | | | | | | | | | | | | |
| 12/31/2022 | | | 14.08 | | | | 0.65 | | | | (3.48 | ) | | | (0.14 | ) | | | 0.00 | | | | (2.97 | ) | | | (0.59 | ) | | | (0.02 | ) | | | (0.19 | ) | | | (0.80 | ) | | | 0.00 | | | | N/A | | | | N/A | |
| | | | | | | | | | | | | |
| 12/31/2021 | | | 14.28 | | | | 0.71 | | | | (0.12 | ) | | | (0.01 | ) | | | 0.00 | | | | 0.58 | | | | (0.78 | ) | | | 0.00 | | | | 0.00 | | | | (0.78 | ) | | | 0.00 | | | | N/A | | | | N/A | |
| | | | | | | | | | | | | |
| 12/31/2020 | | | 14.20 | | | | 0.74 | | | | 0.20 | | | | (0.07 | ) | | | 0.00 | | | | 0.87 | | | | (0.78 | ) | | | (0.01 | ) | | | 0.00 | | | | (0.79 | ) | | | 0.00 | | | | N/A | | | | N/A | |
| | | | | | | | | | | | | |
| 12/31/2019 | | | 13.32 | | | | 0.80 | | | | 1.16 | | | | (0.16 | ) | | | 0.00 | | | | 1.80 | | | | (0.92 | ) | | | 0.00 | | | | 0.00 | | | | (0.92 | ) | | | 0.00 | | | | N/A | | | | N/A | |
| | | | | | | | | | | | | |
PIMCO California Municipal Income Fund II | | | | | | | | | | | | | | | | | | | | | | | | | | | | | | | | | | | | | | | | | | | | | | | | | | | | |
| | | | | | | | | | | | | |
| 12/31/2023 | | $ | 6.53 | | | $ | 0.33 | | | $ | 0.38 | | | $ | (0.22 | ) | | $ | 0.00 | | | $ | 0.49 | | | $ | (0.16 | ) | | $ | 0.00 | | | $ | (0.10 | ) | | $ | (0.26 | ) | | $ | 0.05 | | | $ | N/A | | | $ | N/A | |
| | | | | | | | | | | | | |
| 12/31/2022 | | | 9.11 | | | | 0.39 | | | | (2.50 | ) | | | (0.09 | ) | | | 0.00 | | | | (2.20 | ) | | | (0.36 | ) | | | 0.00 | | | | (0.02 | ) | | | (0.38 | ) | | | 0.00 | | | | N/A | | | | N/A | |
| | | | | | | | | | | | | |
| 12/31/2021 | | | 9.13 | | | | 0.40 | | | | (0.04 | ) | | | 0.00 | | | | 0.00 | | | | 0.36 | | | | (0.38 | ) | | | 0.00 | | | | 0.00 | | | | (0.38 | ) | | | 0.00 | | | | N/A | | | | N/A | |
| | | | | | | | | | | | | |
| 12/31/2020 | | | 8.98 | | | | 0.41 | | | | 0.17 | | | | (0.04 | ) | | | 0.00 | | | | 0.54 | | | | (0.38 | ) | | | (0.01 | ) | | | 0.00 | | | | (0.39 | ) | | | 0.00 | | | | N/A | | | | N/A | |
| | | | | | | | | | | | | |
| 12/31/2019 | | | 8.29 | | | | 0.50 | | | | 0.87 | | | | (0.10 | ) | | | 0.00 | | | | 1.27 | | | | (0.42 | ) | | | (0.16 | ) | | | 0.00 | | | | (0.58 | ) | | | 0.00 | | | | N/A | | | | N/A | |
| | | | | | | | | | | | | |
PIMCO California Municipal Income Fund III | | | | | | | | | | | | | | | | | | | | | | | | | | | | | | | | | | | | | | | | | | | | | | | | | | | | |
| | | | | | | | | | | | | |
| 12/31/2023 | | $ | 7.70 | | | $ | 0.39 | | | $ | 0.37 | | | $ | (0.25 | ) | | $ | 0.00 | | | $ | 0.51 | | | $ | (0.27 | ) | | $ | 0.00 | | | $ | (0.08 | ) | | $ | (0.35 | ) | | $ | 0.03 | | | $ | N/A | | | $ | N/A | |
| | | | | | | | | | | | | |
| 12/31/2022 | | | 10.20 | | | | 0.48 | | | | (2.43 | ) | | | (0.09 | ) | | | 0.00 | | | | (2.04 | ) | | | (0.46 | ) | | | 0.00 | | | | 0.00 | | | | (0.46 | ) | | | 0.00 | | | | N/A | | | | N/A | |
| | | | | | | | | | | | | |
| 12/31/2021 | | | 10.29 | | | | 0.52 | | | | (0.15 | ) | | | 0.00 | | | | 0.00 | | | | 0.37 | | | | (0.46 | ) | | | 0.00 | | | | 0.00 | | | | (0.46 | ) | | | 0.00 | | | | N/A | | | | N/A | |
| | | | | | | | | | | | | |
| 12/31/2020 | | | 10.20 | | | | 0.52 | | | | 0.09 | | | | (0.05 | ) | | | 0.00 | | | | 0.56 | | | | (0.46 | ) | | | (0.01 | ) | | | 0.00 | | | | (0.47 | ) | | | 0.00 | | | | N/A | | | | N/A | |
| | | | | | | | | | | | | |
| 12/31/2019 | | | 9.46 | | | | 0.56 | | | | 0.80 | | | | (0.11 | ) | | | 0.00 | | | | 1.25 | | | | (0.51 | ) | | | 0.00 | | | | 0.00 | | | | (0.51 | ) | | | 0.00 | | | | N/A | | | | N/A | |
| | | | | | | | | | | | | |
PIMCO New York Municipal Income Fund | | | | | | | | | | | | | | | | | | | | | | | | | | | | | | | | | | | | | | | | | | | | | | | | | | | | |
| | | | | | | | | | | | | |
| 12/31/2023 | | $ | 8.70 | | | $ | 0.45 | | | $ | 0.47 | | | $ | (0.29 | ) | | $ | 0.00 | | | $ | 0.63 | | | $ | (0.15 | ) | | $ | 0.00 | | | $ | (0.25 | ) | | $ | (0.40 | ) | | $ | 0.05 | | | $ | N/A | | | $ | N/A | |
| | | | | | | | | | | | | |
| 12/31/2022 | | | 12.13 | | | | 0.48 | | | | (3.30 | ) | | | (0.11 | ) | | | 0.00 | | | | (2.93 | ) | | | (0.40 | ) | | | 0.00 | | | | (0.10 | ) | | | (0.50 | ) | | | 0.00 | | | | N/A | | | | N/A | |
| | | | | | | | | | | | | |
| 12/31/2021 | | | 12.01 | | | | 0.54 | | | | 0.09 | | | | (0.01 | ) | | | 0.00 | | | | 0.62 | | | | (0.50 | ) | | | 0.00 | | | | 0.00 | | | | (0.50 | ) | | | 0.00 | | | | N/A | | | | N/A | |
| | | | | | | | | | | | | |
| 12/31/2020 | | | 12.15 | | | | 0.60 | | | | (0.17 | ) | | | (0.06 | ) | | | 0.00 | | | | 0.37 | | | | (0.50 | ) | | | (0.01 | ) | | | 0.00 | | | | (0.51 | ) | | | 0.00 | | | | N/A | | | | N/A | |
| | | | | | | | | | | | | |
| 12/31/2019 | | | 11.29 | | | | 0.68 | | | | 0.96 | | | | (0.13 | ) | | | 0.00 | | | | 1.51 | | | | (0.65 | ) | | | 0.00 | | | | 0.00 | | | | (0.65 | ) | | | 0.00 | | | | N/A | | | | N/A | |
| | | | | | | | | | | | | |
PIMCO New York Municipal Income Fund II | | | | | | | | | | | | | | | | | | | | | | | | | | | | | | | | | | | | | | | | | | | | | | | | | | | | |
| | | | | | | | | | | | | |
| 12/31/2023 | | $ | 8.29 | | | $ | 0.44 | | | $ | 0.55 | | | $ | (0.30 | ) | | $ | 0.00 | | | $ | 0.69 | | | $ | (0.23 | ) | | $ | 0.00 | | | $ | (0.12 | ) | | $ | (0.35 | ) | | $ | 0.03 | | | $ | N/A | | | $ | N/A | |
| | | | | | | | | | | | | |
| 12/31/2022 | | | 11.66 | | | | 0.47 | | | | (3.25 | ) | | | (0.11 | ) | | | 0.00 | | | | (2.89 | ) | | | (0.48 | ) | | | 0.00 | | | | 0.00 | | | | (0.48 | ) | | | 0.00 | | | | N/A | | | | N/A | |
| | | | | | | | | | | | | |
| 12/31/2021 | | | 11.50 | | | | 0.48 | | | | 0.17 | | | | (0.01 | ) | | | 0.00 | | | | 0.64 | | | | (0.48 | ) | | | 0.00 | | | | 0.00 | | | | (0.48 | ) | | | 0.00 | | | | N/A | | | | N/A | |
| | | | | | | | | | | | | |
| 12/31/2020 | | | 11.59 | | | | 0.56 | | | | (0.12 | ) | | | (0.05 | ) | | | 0.00 | | | | 0.39 | | | | (0.48 | ) | | | 0.00 | | | | 0.00 | | | | (0.48 | ) | | | 0.00 | | | | N/A | | | | N/A | |
| | | | | | | | | | | | | |
| 12/31/2019 | | | 10.67 | | | | 0.63 | | | | 0.93 | | | | (0.13 | ) | | | 0.00 | | | | 1.43 | | | | (0.51 | ) | | | 0.00 | | | | 0.00 | | | | (0.51 | ) | | | 0.00 | | | | N/A | | | | N/A | |
| | | | | | | | | | | | | |
PIMCO New York Municipal Income Fund III | | | | | | | | | | | | | | | | | | | | | | | | | | | | | | | | | | | | | | | | | | | | | | | | | | | | |
| | | | | | | | | | | | | |
| 12/31/2023 | | $ | 6.66 | | | $ | 0.39 | | | $ | 0.40 | | | $ | (0.30 | ) | | $ | 0.00 | | | $ | 0.49 | | | $ | (0.10 | ) | | $ | 0.00 | | | $ | (0.20 | ) | | $ | (0.30 | ) | | $ | 0.03 | | | $ | N/A | | | $ | N/A | |
| | | | | | | | | | | | | |
| 12/31/2022 | | | 9.20 | | | | 0.42 | | | | (2.42 | ) | | | (0.11 | ) | | | 0.00 | | | | (2.11 | ) | | | (0.33 | ) | | | 0.00 | | | | (0.10 | ) | | | (0.43 | ) | | | 0.00 | | | | N/A | | | | N/A | |
| | | | | | | | | | | | | |
| 12/31/2021 | | | 9.15 | | | | 0.44 | | | | 0.05 | | | | (0.01 | ) | | | 0.00 | | | | 0.48 | | | | (0.43 | ) | | | 0.00 | | | | 0.00 | | | | (0.43 | ) | | | 0.00 | | | | N/A | | | | N/A | |
| | | | | | | | | | | | | |
| 12/31/2020 | | | 9.29 | | | | 0.48 | | | | (0.14 | ) | | | (0.05 | ) | | | 0.00 | | | | 0.29 | | | | (0.42 | ) | | | 0.00 | | | | (0.01 | ) | | | (0.43 | ) | | | 0.00 | | | | N/A | | | | N/A | |
| | | | | | | | | | | | | |
| 12/31/2019 | | | 8.66 | | | | 0.55 | | | | 0.66 | | | | (0.13 | ) | | | 0.00 | | | | 1.08 | | | | (0.41 | ) | | | 0.00 | | | | (0.04 | ) | | | (0.45 | ) | | | 0.00 | | | | N/A | | | | N/A | |
| | | | | | | | | | | | | |
PIMCO Municipal Income Fund (Consolidated) | | | | | | | | | | | | | | | | | | | | | | | | | | | | | | | | | | | | | | | | | | | | | | | | | | | | |
| | | | | | | | | | | | | |
| 12/31/2023 | | $ | 9.51 | | | $ | 0.61 | | | $ | 0.43 | | | $ | (0.37 | ) | | $ | 0.00 | | | $ | 0.67 | | | $ | (0.37 | ) | | $ | 0.00 | | | $ | (0.13 | ) | | $ | (0.50 | ) | | $ | 0.05 | | | $ | N/A | | | $ | N/A | |
| | | | | | | | | | | | | |
| 12/31/2022 | | | 13.33 | | | | 0.68 | | | | (3.71 | ) | | | (0.14 | ) | | | 0.00 | | | | (3.17 | ) | | | (0.65 | ) | | | 0.00 | | | | 0.00 | | | | (0.65 | ) | | | 0.00 | | | | N/A | | | | N/A | |
| | | | | | | | | | | | | |
| 12/31/2021 | | | 13.22 | | | | 0.71 | | | | 0.06 | | | | (0.01 | ) | | | 0.00 | | | | 0.76 | | | | (0.65 | ) | | | 0.00 | | | | 0.00 | | | | (0.65 | ) | | | 0.00 | | | | N/A | | | | N/A | |
| | | | | | | | | | | | | |
| 12/31/2020 | | | 13.35 | | | | 0.74 | | | | (0.07 | ) | | | (0.07 | ) | | | 0.00 | | | | 0.60 | | | | (0.65 | ) | | | (0.08 | ) | | | 0.00 | | | | (0.73 | ) | | | 0.00 | | | | N/A | | | | N/A | |
| | | | | | | | | | | | | |
| 12/31/2019 | | | 12.36 | | | | 0.81 | | | | 1.07 | | | | (0.16 | ) | | | 0.00 | | | | 1.72 | | | | (0.72 | ) | | | (0.01 | ) | | | 0.00 | | | | (0.73 | ) | | | 0.00 | | | | N/A | | | | N/A | |
| | | | | | | | | | | | | |
PIMCO Municipal Income Fund II (Consolidated) | | | | | | | | | | | | | | | | | | | | | | | | | | | | | | | | | | | | | | | | | | | | | | | | | | | | |
| | | | | | | | | | | | | |
| 12/31/2023 | | $ | 8.76 | | | $ | 0.52 | | | $ | 0.40 | | | $ | (0.25 | ) | | $ | 0.00 | | | $ | 0.67 | | | $ | (0.30 | ) | | $ | 0.00 | | | $ | (0.17 | ) | | $ | (0.47 | ) | | $ | 0.05 | | | $ | 0.00 | | | $ | 0.00 | |
| | | | | | | | | | | | | |
| 12/31/2022 | | | 12.37 | | | | 0.60 | | | | (3.43 | ) | | | (0.10 | ) | | | 0.00 | | | | (2.93 | ) | | | (0.60 | ) | | | 0.00 | | | | (0.11 | ) | | | (0.71 | ) | | | 0.00 | | | | 0.03 | | | | 0.00 | |
| | | | | | | | | | | | | |
| 12/31/2021 | | | 12.42 | | | | 0.66 | | | | 0.00 | | | | 0.00 | | | | 0.00 | | | | 0.66 | | | | (0.71 | ) | | | 0.00 | | | | 0.00 | | | | (0.71 | ) | | | 0.00 | | | | N/A | | | | N/A | |
| | | | | | | | | | | | | |
| 12/31/2020 | | | 12.50 | | | | 0.69 | | | | (0.01 | ) | | | (0.05 | ) | | | 0.00 | | | | 0.63 | | | | (0.71 | ) | | | 0.00 | | | | 0.00 | | | | (0.71 | ) | | | 0.00 | | | | N/A | | | | N/A | |
| | | | | | | | | | | | | |
| 12/31/2019 | | | 11.62 | | | | 0.77 | | | | 1.01 | | | | (0.12 | ) | | | 0.00 | | | | 1.66 | | | | (0.78 | ) | | | 0.00 | | | | 0.00 | | | | (0.78 | ) | | | 0.00 | | | | N/A | | | | N/A | |
| | | | | | | | | | | | | | | | | | | | | | | | | | | | | | | | | | | | | | |
| | | | |
| | | | | | | | | | | | | Ratios to Average Net Assets Applicable to Common Shareholders | | | | |
| | | | | | | | | | | | | | | | | | | | | | | | | | | | |
| | | | | | | | | |
|
|
| | | | | | | | | | | | | | | | | | | | | | | | | | | | | | | | | | | | |
| | | | | | | | | |
| $ | 10.66 | | | $ | 9.32 | | | | (35.33 | )% | | $ | 202,306 | | | | 2.16 | % | | | 2.16 | % | | | 1.34 | % | | | 1.34 | % | | | 5.43 | % | | | 28 | % |
| | | | | | | | | |
| | 10.31 | | | | 15.07 | | | | (14.34 | ) | | | 195,462 | | | | 1.78 | | | | 1.78 | | | | 1.26 | | | | 1.26 | | | | 5.73 | | | | 28 | |
| | | | | | | | | |
| | 14.08 | | | | 18.58 | | | | 7.99 | | | | 266,321 | | | | 1.44 | | | | 1.44 | | | | 1.20 | | | | 1.20 | | | | 5.05 | | | | 11 | |
| | | | | | | | | |
| | 14.28 | | | | 17.98 | | | | (4.94 | ) | | | 269,561 | | | | 1.67 | | | | 1.67 | | | | 1.22 | | | | 1.22 | | | | 5.28 | | | | 15 | |
| | | | | | | | | |
| | 14.20 | | | | 19.86 | | | | 29.47 | | | | 267,390 | | | | 2.09 | | | | 2.09 | | | | 1.18 | | | | 1.18 | | | | 5.75 | | | | 16 | |
| | | | | | | | | |
|
|
| | | | | | | | | | | | | | | | | | | | | | | | | | | | | | | | | | | | |
| | | | | | | | | |
| $ | 6.81 | | | $ | 5.80 | | | | (10.74 | )% | | $ | 219,490 | | | | 2.29 | % | | | 2.29 | % | | | 1.37 | % | | | 1.37 | % | | | 5.12 | % | | | 25 | % |
| | | | | | | | | |
| | 6.53 | | | | 6.79 | | | | (23.32 | ) | | | 210,581 | | | | 1.77 | | | | 1.77 | | | | 1.29 | | | | 1.29 | | | | 5.49 | | | | 27 | |
| | | | | | | | | |
| | 9.11 | | | | 9.35 | | | | 7.99 | | | | 293,165 | | | | 1.41 | | | | 1.41 | | | | 1.21 | | | | 1.21 | | | | 4.44 | | | | 11 | |
| | | | | | | | | |
| | 9.13 | | | | 9.03 | | | | (5.58 | ) | | | 293,591 | | | | 1.62 | | | | 1.62 | | | | 1.23 | | | | 1.23 | | | | 4.68 | | | | 19 | |
| | | | | | | | | |
| | 8.98 | | | | 10.00 | | | | 36.01 | | | | 288,138 | | | | 1.99 | | | | 1.99 | | | | 1.18 | | | | 1.18 | | | | 5.61 | | | | 16 | |
| | | | | | | | | |
|
|
| | | | | | | | | | | | | | | | | | | | | | | | | | | | | | | | | | | | |
| | | | | | | | | |
| $ | 7.89 | | | $ | 7.37 | | | | (7.46 | )% | | $ | 177,348 | | | | 2.33 | % | | | 2.33 | % | | | 1.36 | % | | | 1.36 | % | | | 5.20 | % | | | 30 | % |
| | | | | | | | | |
| | 7.70 | | | | 8.35 | | | | (20.55 | ) | | | 172,972 | | | | 1.80 | | | | 1.80 | | | | 1.27 | | | | 1.27 | | | | 5.71 | | | | 28 | |
| | | | | | | | | |
| | 10.20 | | | | 11.10 | | | | 13.11 | | | | 228,733 | | | | 1.45 | | | | 1.45 | | | | 1.21 | | | | 1.21 | | | | 5.06 | | | | 13 | |
| | | | | | | | | |
| | 10.29 | | | | 10.25 | | | | (5.89 | ) | | | 230,271 | | | | 1.68 | | | | 1.68 | | | | 1.23 | | | | 1.23 | | | | 5.13 | | | | 13 | |
| | | | | | | | | |
| | 10.20 | | | | 11.41 | | | | 25.66 | | | | 227,745 | | | | 2.12 | | | | 2.12 | | | | 1.20 | | | | 1.20 | | | | 5.59 | | | | 16 | |
| | | | | | | | | |
|
|
| | | | | | | | | | | | | | | | | | | | | | | | | | | | | | | | | | | | |
| | | | | | | | | |
| $ | 8.98 | | | $ | 7.86 | | | | (8.59 | )% | | $ | 70,675 | | | | 1.48 | % | | | 1.48 | % | | | 1.39 | % | | | 1.39 | % | | | 5.16 | % | | | 45 | % |
| | | | | | | | | |
| | 8.70 | | | | 9.03 | | | | (22.47 | ) | | | 68,397 | | | | 1.49 | | | | 1.49 | | | | 1.24 | | | | 1.24 | | | | 4.90 | | | | 45 | |
| | | | | | | | | |
| | 12.13 | | | | 12.29 | | | | 9.70 | | | | 95,190 | | | | 1.25 | | | | 1.25 | | | | 1.20 | | | | 1.20 | | | | 4.44 | | | | 23 | |
| | | | | | | | | |
| | 12.01 | | | | 11.68 | | | | (11.51 | ) | | | 94,059 | | | | 1.52 | | | | 1.52 | | | | 1.23 | | | | 1.23 | | | | 5.13 | | | | 26 | |
| | | | | | | | | |
| | 12.15 | | | | 13.80 | | | | 24.04 | | | | 95,010 | | | | 1.97 | | | | 1.97 | | | | 1.19 | | | | 1.19 | | | | 5.74 | | | | 25 | |
| | | | | | | | | |
|
|
| | | | | | | | | | | | | | | | | | | | | | | | | | | | | | | | | | | | |
| | | | | | | | | |
| $ | 8.66 | | | $ | 7.59 | | | | 0.12 | % | | $ | 97,066 | | | | 2.13 | % | | | 2.13 | % | | | 1.43 | % | | | 1.43 | % | | | 5.34 | % | | | 46 | % |
| | | | | | | | | |
| | 8.29 | | | | 7.95 | | | | (26.06 | ) | | | 92,937 | | | | 1.93 | | | | 1.93 | | | | 1.38 | | | | 1.38 | | | | 5.10 | | | | 42 | |
| | | | | | | | | |
| | 11.66 | | | | 11.35 | | | | 8.87 | | | | 130,581 | | | | 1.57 | | | | 1.57 | | | | 1.31 | | | | 1.31 | | | | 4.18 | | | | 14 | |
| | | | | | | | | |
| | 11.50 | | | | 10.87 | | | | (5.82 | ) | | | 128,709 | | | | 1.84 | | | | 1.84 | | | | 1.35 | | | | 1.35 | | | | 4.97 | | | | 22 | |
| | | | | | | | | |
| | 11.59 | | | | 12.07 | | | | 20.57 | | | | 129,596 | | | | 2.16 | | | | 2.16 | | | | 1.27 | | | | 1.27 | | | | 5.62 | | | | 17 | |
| | | | | | | | | |
|
|
| | | | | | | | | | | | | | | | | | | | | | | | | | | | | | | | | | | | |
| | | | | | | | | |
| $ | 6.88 | | | $ | 5.96 | | | | (8.35 | )% | | $ | 39,552 | | | | 1.73 | % | | | 1.73 | % | | | 1.73 | % | | | 1.73 | % | | | 5.91 | % | | | 58 | % |
| | | | | | | | | |
| | 6.66 | | | | 6.83 | | | | (22.40 | ) | | | 38,240 | | | | 1.69 | | | | 1.69 | | | | 1.55 | | | | 1.55 | | | | 5.64 | | | | 38 | |
| | | | | | | | | |
| | 9.20 | | | | 9.31 | | | | 8.99 | | | | 52,786 | | | | 1.62 | | | | 1.62 | | | | 1.49 | | | | 1.49 | | | | 4.78 | | | | 16 | |
| | | | | | | | | |
| | 9.15 | | | | 8.93 | | | | (2.75 | ) | | | 52,414 | | | | 1.80 | | | | 1.80 | | | | 1.49 | | | | 1.49 | | | | 5.32 | | | | 27 | |
| | | | | | | | | |
| | 9.29 | | | | 9.63 | | | | 16.76 | | | | 53,135 | | | | 2.19 | | | | 2.19 | | | | 1.47 | | | | 1.47 | | | | 6.06 | | | | 14 | |
| | | | | | | | | |
|
|
| | | | | | | | | | | | | | | | | | | | | | | | | | | | | | | | | | | | |
| | | | | | | | | |
| $ | 9.73 | | | $ | 9.33 | | | | (5.62 | )% | | $ | 255,236 | | | | 1.98 | % | | | 1.98 | % | | | 1.35 | % | | | 1.35 | % | | | 6.49 | % | | | 36 | % |
| | | | | | | | | |
| | 9.51 | | | | 10.43 | | | | (27.24 | ) | | | 248,707 | | | | 1.67 | | | | 1.67 | | | | 1.26 | | | | 1.26 | | | | 6.38 | | | | 36 | |
| | | | | | | | | |
| | 13.33 | | | | 15.22 | | | | 15.11 | | | | 347,062 | | | | 1.36 | | | | 1.36 | | | | 1.19 | | | | 1.19 | | | | 5.33 | | | | 18 | |
| | | | | | | | | |
| | 13.22 | | | | 13.85 | | | | (2.99 | ) | | | 343,020 | | | | 1.59 | | | | 1.59 | | | | 1.23 | | | | 1.23 | | | | 5.71 | | | | 21 | |
| | | | | | | | | |
| | 13.35 | | | | 15.10 | | | | 26.76 | | | | 345,113 | | | | 1.92 | | | | 1.92 | | | | 1.18 | | | | 1.18 | | | | 6.20 | | | | 16 | |
| | | | | | | | | |
|
|
| | | | | | | | | | | | | | | | | | | | | | | | | | | | | | | | | | | | |
| | | | | | | | | |
| $ | 9.01 | | | $ | 8.30 | | | | (2.97 | )% | | $ | 598,635 | | | | 2.28 | % | | | 2.28 | % | | | 1.22 | % | | | 1.22 | % | | | 5.97 | % | | | 35 | % |
| | | | | | | | | |
| | 8.76 | | | | 9.04 | | | | (33.71 | ) | | | 578,039 | | | | 1.77 | | | | 1.77 | | | | 1.14 | | | | 1.14 | | | | 6.08 | | | | 33 | |
| | | | | | | | | |
| | 12.37 | | | | 14.61 | | | | 7.47 | | | | 783,316 | | | | 1.30 | | | | 1.30 | | | | 1.08 | | | | 1.08 | | | | 5.32 | | | | 13 | |
| | | | | | | | | |
| | 12.42 | | | | 14.30 | | | | (4.81 | ) | | | 782,327 | | | | 1.59 | | | | 1.59 | | | | 1.11 | | | | 1.11 | | | | 5.70 | | | | 20 | |
| | | | | | | | | |
| | 12.50 | | | | 15.87 | | | | 25.88 | | | | 782,682 | | | | 2.06 | | | | 2.06 | | | | 1.06 | | | | 1.06 | | | | 6.25 | | | | 12 | |
| | | | | | | | | | | | | | | | | | | | | | | | | | | | | | | | | | | | | | | | | | | | | | | | | | | | |
| | | | | | | | | Less Distributions to Preferred Shareholders (c) | | | | | | Less Distributions to Common Shareholders (d) | | | | | | | | | | |
| | | | | | | | | | | | | | | | | | | | | | | | | | | | | | | | | | | | | | | | |
Selected Per Share Data for the
Year Ended^: | | | | | | | | | | | | | | From Net
Realized
Capital
Gains | | | Net Increase
(Decrease)
in Net Assets
Applicable
to Common
Shareholders
Resulting
from
Operations | | | | | | | | | | | | | | | | | | Increase
Resulting
from
Common
Share
Offering | | | Offering
Cost
Charged to
Paid in
Capital | |
| | | | | | | | | | | | | |
PIMCO Municipal Income Fund III (Consolidated) | | | | | | | | | | | | | | | | | | | | | | | | | | | | | | | | | | | | | | | | | | | | | | | | | | | | |
| | | | | | | | | | | | | |
| 12/31/2023 | | $ | 8.02 | | | $ | 0.49 | | | $ | 0.41 | | | $ | (0.26 | ) | | $ | 0.00 | | | $ | 0.64 | | | $ | (0.30 | ) | | $ | 0.00 | | | $ | (0.10 | ) | | $ | (0.40 | ) | | $ | 0.04 | | | $ | N/A | | | $ | N/A | |
| | | | | | | | | | | | | |
| 12/31/2022 | | | 11.41 | | | | 0.57 | | | | (3.31 | ) | | | (0.10 | ) | | | 0.00 | | | | (2.84 | ) | | | (0.55 | ) | | | 0.00 | | | | 0.00 | | | | (0.55 | ) | | | 0.00 | | | | N/A | | | | N/A | |
| | | | | | | | | | | | | |
| 12/31/2021 | | | 11.36 | | | | 0.59 | | | | 0.01 | | | | 0.00 | | | | 0.00 | | | | 0.60 | | | | (0.55 | ) | | | 0.00 | | | | 0.00 | | | | (0.55 | ) | | | 0.00 | | | | N/A | | | | N/A | |
| | | | | | | | | | | | | |
| 12/31/2020 | | | 11.34 | | | | 0.62 | | | | 0.01 | | | | (0.05 | ) | | | 0.00 | | | | 0.58 | | | | (0.55 | ) | | | (0.01 | ) | | | 0.00 | | | | (0.56 | ) | | | 0.00 | | | | N/A | | | | N/A | |
| | | | | | | | | | | | | |
| 12/31/2019 | | | 10.49 | | | | 0.72 | | | | 0.87 | | | | (0.12 | ) | | | 0.00 | | | | 1.47 | | | | (0.62 | ) | | | 0.00 | | | | 0.00 | | | | (0.62 | ) | | | 0.00 | | | | N/A | | | | N/A | |
| | | | | | | | | | | | | | | | | | | | | | | | | | | | | | | | | | | | | | |
| | | | |
| | | | | | | | | | | | | Ratios to Average Net Assets Applicable to Common Shareholders | | | | |
| | | | | | | | | | | | | | | | | | | | | | | | | | | | |
| | | | | | | | | |
|
|
| | | | | | | | | | | | | | | | | | | | | | | | | | | | | | | | | | | | |
| | | | | | | | | |
| $ | 8.30 | | | $ | 7.39 | | | | (10.64 | )% | | $ | 277,608 | | | | 2.25 | % | | | 2.25 | % | | | 1.32 | % | | | 1.32 | % | | | 6.07 | % | | | 40 | % |
| | | | | | | | | |
| | 8.02 | | | | 8.71 | | | | (27.40 | ) | | | 267,714 | | | | 1.76 | | | | 1.76 | | | | 1.22 | | | | 1.22 | | | | 6.32 | | | | 32 | |
| | | | | | | | | |
| | 11.41 | | | | 12.75 | | | | 12.32 | | | | 379,521 | | | | 1.37 | | | | 1.37 | | | | 1.15 | | | | 1.15 | | | | 5.18 | | | | 9 | |
| | | | | | | | | |
| | 11.36 | | | | 11.89 | | | | (0.54 | ) | | | 376,741 | | | | 1.64 | | | | 1.64 | | | | 1.18 | | | | 1.18 | | | | 5.57 | | | | 25 | |
| | | | | | | | | |
| | 11.34 | | | | 12.58 | | | | 19.03 | | | | 374,805 | | | | 2.04 | | | | 2.04 | | | | 1.14 | | | | 1.14 | | | | 6.48 | | | | 14 | |
| | | | | | | | | | | | | | | | | | | | | | | | | | | | | | | | |
| | | | | | | |
| Selected Per Share Data for the Year Ended^: | | | | | Asset Coverage per Preferred Share (1) | | | Involuntary Liquidating Preference per Preferred Share (2) | | | Average Market Value per ARPS (3) | | | | | | Asset Coverage per Preferred Share (1) | | | Involuntary Liquidating Preference per Preferred Share (2) | | | Average Market Value per RVMTP (4) | |
| | | | | | | | |
PIMCO California Municipal Income Fund | | | | | | | | | | | | | | | | | | | | | | | | | | | | | | | | |
| 12/31/2023 | | $ | 109,900,000 | | | $ | 59,968 | | | $ | 25,000 | | | | N/A | | | $ | 34,600,000 | | | $ | 239,870 | | | $ | 100,000 | | | | N/A | |
| 12/31/2022 | | | 120,625,000 | | | | 58,655 | | | | 25,000 | | | | N/A | | | | 24,400,000 | | | | 234,620 | | | | 100,000 | | | | N/A | |
| 12/31/2021 | | | 120,625,000 | | | | 69,408 | | | | 25,000 | | | | N/A | | | | 29,300,000 | | | | 277,630 | | | | 100,000 | | | | N/A | |
| 12/31/2020 | | | 120,625,000 | | | | 69,948 | | | | 25,000 | | | | N/A | | | | 29,300,000 | | | | 279,790 | | | | 100,000 | | | | N/A | |
| 12/31/2019 | | | 120,625,000 | | | | 69,580 | | | | 25,000 | | | | N/A | | | | 29,300,000 | | | | 278,320 | | | | 100,000 | | | | N/A | |
| | | | | | | | |
PIMCO California Municipal Income Fund II | | | | | | | | | | | | | | | | | | | | | | | | | | | | | | | | |
| 12/31/2023 | | $ | 97,875,000 | | | $ | 60,470 | | | $ | 25,000 | | | | N/A | | | $ | 56,700,000 | | | $ | 241,880 | | | $ | 100,000 | | | | N/A | |
| 12/31/2022 | | | 128,675,000 | | | | 58,680 | | | | 25,000 | | | | N/A | | | | 27,500,000 | | | | 234,720 | | | | 100,000 | | | | N/A | |
| 12/31/2021 | | | 128,675,000 | | | | 69,970 | | | | 25,000 | | | | N/A | | | | 34,300,000 | | | | 279,880 | | | | 100,000 | | | | N/A | |
| 12/31/2020 | | | 128,675,000 | | | | 70,035 | | | | 25,000 | | | | N/A | | | | 34,300,000 | | | | 280,140 | | | | 100,000 | | | | N/A | |
| 12/31/2019 | | | 128,675,000 | | | | 69,188 | | | | 25,000 | | | | N/A | | | | 34,300,000 | | | | 276,750 | | | | 100,000 | | | | N/A | |
| | | | | | | | |
PIMCO California Municipal Income Fund III | | | | | | | | | | | | | | | | | | | | | | | | | | | | | | | | |
| 12/31/2023 | | $ | 86,775,000 | | | $ | 60,620 | | | $ | 25,000 | | | | N/A | | | $ | 37,600,000 | | | $ | 242,480 | | | $ | 100,000 | | | | N/A | |
| 12/31/2022 | | | 97,875,000 | | | | 59,578 | | | | 25,000 | | | | N/A | | | | 27,100,000 | | | | 238,310 | | | | 100,000 | | | | N/A | |
| 12/31/2021 | | | 97,875,000 | | | | 70,755 | | | | 25,000 | | | | N/A | | | | 27,100,000 | | | | 283,020 | | | | 100,000 | | | | N/A | |
| 12/31/2020 | | | 97,875,000 | | | | 71,063 | | | | 25,000 | | | | N/A | | | | 27,100,000 | | | | 284,250 | | | | 100,000 | | | | N/A | |
| 12/31/2019 | | | 97,875,000 | | | | 70,545 | | | | 25,000 | | | | N/A | | | | 27,100,000 | | | | 282,180 | | | | 100,000 | | | | N/A | |
| | | | | | | | |
PIMCO New York Municipal Income Fund | | | | | | | | | | | | | | | | | | | | | | | | | | | | | | | | |
| 12/31/2023 | | $ | 33,400,000 | | | $ | 77,838 | | | $ | 25,000 | | | | N/A | | | | N/A | | | | N/A | | | $ | 100,000 | | | | N/A | |
| 12/31/2022 | | | 41,025,000 | | | | 66,640 | | | | 25,000 | | | | N/A | | | | N/A | | | | N/A | | | | 100,000 | | | | N/A | |
| 12/31/2021 | | | 41,025,000 | | | | 83,005 | | | | 25,000 | | | | N/A | | | | N/A | | | | N/A | | | | 100,000 | | | | N/A | |
| 12/31/2020 | | | 41,025,000 | | | | 82,318 | | | | 25,000 | | | | N/A | | | | N/A | | | | N/A | | | | 100,000 | | | | N/A | |
| 12/31/2019 | | | 41,025,000 | | | | 82,875 | | | | 25,000 | | | | N/A | | | | N/A | | | | N/A | | | | 100,000 | | | | N/A | |
| | | | | | | | |
PIMCO New York Municipal Income Fund II | | | | | | | | | | | | | | | | | | | | | | | | | | | | | | | | |
| 12/31/2023 | | $ | 51,100,000 | | | $ | 61,733 | | | $ | 25,000 | | | | N/A | | | $ | 14,900,000 | | | $ | 246,930 | | | $ | 100,000 | | | | N/A | |
| 12/31/2022 | | | 58,000,000 | | | | 56,845 | | | | 25,000 | | | | N/A | | | | 14,900,000 | | | | 227,380 | | | | 100,000 | | | | N/A | |
| 12/31/2021 | | | 58,000,000 | | | | 66,323 | | | | 25,000 | | | | N/A | | | | 21,000,000 | | | | 265,290 | | | | 100,000 | | | | N/A | |
| 12/31/2020 | | | 58,000,000 | | | | 65,730 | | | | 25,000 | | | | N/A | | | | 21,000,000 | | | | 262,920 | | | | 100,000 | | | | N/A | |
| 12/31/2019 | | | 58,000,000 | | | | 66,003 | | | | 25,000 | | | | N/A | | | | 21,000,000 | | | | 264,010 | | | | 100,000 | | | | N/A | |
| | | | | | | | |
PIMCO New York Municipal Income Fund III | | | | | | | | | | | | | | | | | | | | | | | | | | | | | | | | |
| 12/31/2023 | | $ | 26,025,000 | | | $ | 62,943 | | | $ | 25,000 | | | | N/A | | | | N/A | | | | N/A | | | $ | 100,000 | | | | N/A | |
| 12/31/2022 | | | 29,450,000 | | | | 57,425 | | | | 25,000 | | | | N/A | | | | N/A | | | | N/A | | | | 100,000 | | | | N/A | |
| 12/31/2021 | | | 29,450,000 | | | | 69,808 | | | | 25,000 | | | | N/A | | | | N/A | | | | N/A | | | | 100,000 | | | | N/A | |
| 12/31/2020 | | | 29,450,000 | | | | 69,493 | | | | 25,000 | | | | N/A | | | | N/A | | | | N/A | | | | 100,000 | | | | N/A | |
| 12/31/2019 | | | 29,450,000 | | | | 70,100 | | | | 25,000 | | | | N/A | | | | N/A | | | | N/A | | | | 100,000 | | | | N/A | |
| | | | | | | | |
PIMCO Municipal Income Fund (Consolidated) | | | | | | | | | | | | | | | | | | | | | | | | | | | | | | | | |
| 12/31/2023 | | $ | 145,125,000 | | | $ | 59,698 | | | $ | 25,000 | | | | N/A | | | $ | 38,600,000 | | | $ | 238,790 | | | $ | 100,000 | | | | N/A | |
| 12/31/2022 | | | 166,700,000 | | | | 58,598 | | | | 25,000 | | | | N/A | | | | 18,200,000 | | | | 234,390 | | | | 100,000 | | | | N/A | |
| 12/31/2021 | | | 166,700,000 | | | | 70,665 | | | | 25,000 | | | | N/A | | | | 23,300,000 | | | | 282,660 | | | | 100,000 | | | | N/A | |
| 12/31/2020 | | | 166,700,000 | | | | 70,133 | | | | 25,000 | | | | N/A | | | | 23,300,000 | | | | 280,530 | | | | 100,000 | | | | N/A | |
| 12/31/2019 | | | 166,700,000 | | | | 70,395 | | | | 25,000 | | | | N/A | | | | 23,300,000 | | | | 281,580 | | | | 100,000 | | | | N/A | |
| | | | | | | | |
PIMCO Municipal Income Fund II (Consolidated) | | | | | | | | | | | | | | | | | | | | | | | | | | | | | | | | |
| 12/31/2023 | | $ | 239,650,000 | | | $ | 66,098 | | | $ | 25,000 | | | | N/A | | | $ | 124,200,000 | | | $ | 264,390 | | | $ | 100,000 | | | | N/A | |
| 12/31/2022 | | | 298,275,000 | | | | 64,345 | | | | 25,000 | | | | N/A | | | | 68,700,000 | | | | 257,380 | | | | 100,000 | | | | N/A | |
| 12/31/2021 | | | 298,275,000 | | | | 78,363 | | | | 25,000 | | | | N/A | | | | 68,700,000 | | | | 313,450 | | | | 100,000 | | | | N/A | |
| 12/31/2020 | | | 298,275,000 | | | | 78,293 | | | | 25,000 | | | | N/A | | | | 68,700,000 | | | | 313,170 | | | | 100,000 | | | | N/A | |
| 12/31/2019 | | | 298,275,000 | | | | 78,308 | | | | 25,000 | | | | N/A | | | | 68,700,000 | | | | 313,230 | | | | 100,000 | | | | N/A | |
| | | | | | | | | | | | | | | | | | | | | | | | | | | | | | | | |
| | | | | | | |
| Selected Per Share Data for the Year Ended^: | | | | | Asset Coverage per Preferred Share (1) | | | Involuntary Liquidating Preference per Preferred Share (2) | | | Average Market Value per ARPS (3) | | | | | | Asset Coverage per Preferred Share (1) | | | Involuntary Liquidating Preference per Preferred Share (2) | | | Average Market Value per RVMTP (4) | |
| | | | | | | | |
PIMCO Municipal Income Fund III (Consolidated) | | | | | | | | | | | | | | | | | | | | | | | | | | | | | | | | |
| 12/31/2023 | | $ | 129,425,000 | | | $ | 61,958 | | | $ | 25,000 | | | | N/A | | | $ | 58,200,000 | | | $ | 247,830 | | | $ | 100,000 | | | | N/A | |
| 12/31/2022 | | | 154,700,000 | | | | 60,383 | | | | 25,000 | | | | N/A | | | | 34,300,000 | | | | 241,530 | | | | 100,000 | | | | N/A | |
| 12/31/2021 | | | 154,700,000 | | | | 75,200 | | | | 25,000 | | | | N/A | | | | 34,300,000 | | | | 300,800 | | | | 100,000 | | | | N/A | |
| 12/31/2020 | | | 154,700,000 | | | | 74,833 | | | | 25,000 | | | | N/A | | | | 34,300,000 | | | | 299,330 | | | | 100,000 | | | | N/A | |
| 12/31/2019 | | | 154,700,000 | | | | 74,565 | | | | 25,000 | | | | N/A | | | | 34,300,000 | | | | 298,260 | | | | 100,000 | | | | N/A | |
| ^ | A zero balance may reflect actual amounts rounding to less than $0.01 or 0.01%. |
| Includes adjustments required by U.S. GAAP and may differ from net asset values and performance reported elsewhere by the Funds. |
| Per share amounts based on average number of common shares outstanding during the year. |
| Auction Rate Preferred Shareholders (“ARPS”). See Note 13, Preferred Shares, in the Notes to Financial Statements for more information. |
| The tax characterization of distributions is determined in accordance with Federal income tax regulations. See Note 2, Distributions — Common Shares, in the Notes to Financial Statements for more information. |
| Total investment return is calculated assuming a purchase of a common share at the market price on the first day and a sale of a common share at the market price on the last day of each year reported. Dividends and distributions, if any, are assumed, for purposes of this calculation, to be reinvested at prices obtained under the Funds’ dividend reinvestment plan. Total investment return does not reflect brokerage commissions in connection with the purchase or sale of Fund shares. |
| Calculated on the basis of income and expenses applicable to both common and preferred shares relative to the average net assets of common shareholders. The expense ratio and net investment income do not reflect the effects of dividend payments to preferred shareholders. |
| Ratio includes interest expense which primarily relates to participation in borrowing and financing transactions, interest paid to RVMTP shareholders and the amortization of debt issuance costs of RVMTP Shares. See Note 5, Borrowings and Other Financing Transactions and Note 13, Preferred Shares in the Notes to Financial Statements for more information. |
| “Asset Coverage per Preferred Share” means the ratio that the value of the total assets of the Fund, less all liabilities and indebtedness not represented by ARPS or RVMTP, bears to the aggregate of the involuntary liquidation preference of ARPS or RVMTP, expressed as a dollar amount per ARPS or RVMTP. |
| “Involuntary Liquidating Preference” means the amount to which a holder of ARPS or RVMTP would be entitled upon the involuntary liquidation of the Fund in preference to the Common Shareholders, expressed as a dollar amount per Preferred Share. |
| The ARPS have no readily ascertainable market value. Auctions for the ARPS have failed since February 2008, there is currently no active trading market for the ARPS and the Fund is not able to reliably estimate what their value would be in a third-party market sale. The liquidation value of the ARPS represents its liquidation preference, which approximates fair value of the shares less any accumulated unpaid dividends. See Note 13, Preferred Shares, in the Notes to Financial Statements for more information. |
| The RVMTP have no readily ascertainable market value. The liquidation value of the RVMTP represents its liquidation preference, which approximates fair value of the shares less any unamortized debt issuance costs. See Note 13, in the Notes to Financial Statements for more information. |
| Prior to July 14, 2021, RVMTP Shares were Variable Rate MuniFund Term Preferred Shares. See Note 13, Preferred Shares. |
| | | | |
Statements of Assets and Liabilities | | | | December 31, 2023 |
| | | | | | | | | | | | | | | | | | | | | | | | |
(Amounts in thousands , except per share amounts) | | | | | PIMCO
California
Municipal
Income
Fund II | | | PIMCO
California
Municipal
Income
Fund III | | | PIMCO
New York
Municipal
Income
Fund | | | PIMCO
New York
Municipal
Income
Fund II | | | PIMCO
New York
Municipal
Income
Fund III | |
| | | | | | |
| | | | | | | | | | | | | | | | | | | | | | | | |
| | | | | | |
| | | | | | | | | | | | | | | | | | | | | | | | |
| Investments in securities* | | $ | 343,481 | | | $ | 371,063 | | | $ | 299,358 | | | $ | 104,233 | | | $ | 162,378 | | | $ | 63,581 | |
| Cash | | | 1 | | | | 0 | | | | 1 | | | | 0 | | | | 1 | | | | 1 | |
| Receivable for investments sold | | | 0 | | | | 0 | | | | 0 | | | | 1,032 | | | | 1,296 | | | | 1,659 | |
| Interest and/or dividends receivable | | | 4,250 | | | | 4,054 | | | | 3,296 | | | | 862 | | | | 1,575 | | | | 559 | |
| Other assets | | | 165 | | | | 89 | | | | 78 | | | | 31 | | | | 42 | | | | 19 | |
| | | 347,897 | | | | 375,206 | | | | 302,733 | | | | 106,158 | | | | 165,292 | | | | 65,819 | |
| | | | | | |
| | | | | | | | | | | | | | | | | | | | | | | | |
| | | | | | |
| Remarketable Variable Rate MuniFund Term Preferred Shares, at liquidation value** | | $ | 34,497 | | | $ | 56,519 | | | $ | 37,497 | | | $ | 0 | | | $ | 14,889 | | | $ | 0 | |
| Payable for investments purchased | | | 0 | | | | 0 | | | | 0 | | | | 1,689 | | | | 1,689 | | | | 0 | |
| Distributions payable to common shareholders | | | 683 | | | | 693 | | | | 663 | | | | 264 | | | | 331 | | | | 143 | |
| Distributions payable to auction rate preferred shareholders | | | 135 | | | | 123 | | | | 88 | | | | 40 | | | | 60 | | | | 36 | |
| Accrued management fees | | | 212 | | | | 229 | | | | 187 | | | | 70 | | | | 104 | | | | 49 | |
| Other liabilities | | | 164 | | | | 277 | | | | 175 | | | | 20 | | | | 53 | | | | 14 | |
| | | 35,691 | | | | 57,841 | | | | 38,610 | | | | 2,083 | | | | 17,126 | | | | 242 | |
| | | | | | |
Commitments and contingent liabilities ^ | | | | | | | | | | | | | | | | | | | | | | | | |
| | | | | | |
Auction Rate Preferred Shares ^^ | | | 109,900 | | | | 97,875 | | | | 86,775 | | | | 33,400 | | | | 51,100 | | | | 26,025 | |
| | | | | | |
Net Assets Applicable to Common Shareholders | | $ | 202,306 | | | $ | 219,490 | | | $ | 177,348 | | | $ | 70,675 | | | $ | 97,066 | | | $ | 39,552 | |
| | | | | | |
Net Assets Applicable to Common Shareholders Consist of: | | | | | | | | | | | | | | | | | | | | | | | | |
| | | | | | |
| | $ | 0 | | | $ | 0 | | | $ | 0 | | | $ | 0 | | | $ | 0 | | | $ | 0 | |
| Paid in capital in excess of par | | | 218,950 | | | | 230,616 | | | | 192,822 | | | | 80,930 | | | | 110,568 | | | | 44,447 | |
| Distributable earnings (accumulated loss) | | | (16,644 | ) | | | (11,126 | ) | | | (15,474 | ) | | | (10,255 | ) | | | (13,502 | ) | | | (4,895 | ) |
| | | | | | |
Net Assets Applicable to Common Shareholders | | $ | 202,306 | | | $ | 219,490 | | | $ | 177,348 | | | $ | 70,675 | | | $ | 97,066 | | | $ | 39,552 | |
| | | | | | |
Net Asset Value Per Common Share (a) | | $ | 10.66 | | | $ | 6.81 | | | $ | 7.89 | | | $ | 8.98 | | | $ | 8.66 | | | $ | 6.88 | |
| | | | | | |
Common Shares Outstanding | | | 18,981 | | | | 32,253 | | | | 22,484 | | | | 7,868 | | | | 11,209 | | | | 5,747 | |
| | | | | | |
Auction Rate Preferred Shares Issued and Outstanding | | | 4 | | | | 4 | | | | 3 | | | | 1 | | | | 2 | | | | 1 | |
| | | | | | |
| Cost of investments in securities | | $ | 338,678 | | | $ | 359,597 | | | $ | 296,319 | | | $ | 103,568 | | | $ | 160,580 | | | $ | 62,467 | |
| | | | | | |
| * Includes repurchase agreements of: | | $ | 2,454 | | | $ | 12,050 | | | $ | 7,135 | | | $ | 2,539 | | | $ | 5,658 | | | $ | 1,732 | |
| | | | | | |
| ** Includes unamortized debt issuance cost of | | $ | 103 | | | $ | 181 | | | $ | 103 | | | $ | 0 | | | $ | 11 | | | $ | 0 | |
| A zero balance may reflect actual amounts rounding to less than one thousand. |
| See Note 9, Fees and Expenses, in the Notes to Financial Statements for more information. |
| ($0.00001 par value and $25,000 liquidation preference per share) |
| Includes adjustments required by U.S. GAAP and may differ from net asset values and performance reported elsewhere by the Funds. |
| | | | |
Consolidated Statements of Assets and Liabilities | | | | December 31, 2023 |
| | | | | | | | | | | | |
(Amounts in thousands , except per share amounts) | | | | | | | | | |
| | | |
| | | | | | | | | | | | |
| | | |
| | | | | | | | | | | | |
| Investments in securities* | | $ | 444,337 | | | $ | 969,878 | | | $ | 470,553 | |
| Cash | | | 0 | | | | 1 | | | | 1 | |
| Receivable for investments sold | | | 0 | | | | 0 | | | | 14 | |
| Interest and/or dividends receivable | | | 5,013 | | | | 10,819 | | | | 5,263 | |
| Other assets | | | 117 | | | | 219 | | | | 124 | |
| | | 449,467 | | | | 980,917 | | | | 475,955 | |
| | | |
| | | | | | | | | | | | |
| | | |
Borrowings & Other Financing Transactions | | | | | | | | | | | | |
| Payable for tender option bond floating rate certificates | | $ | 0 | | | $ | 7,582 | | | $ | 0 | |
| Remarketable Variable Rate MuniFund Term Preferred Shares, at liquidation value** | | | 38,453 | | | | 123,904 | | | | 58,041 | |
| Payable for investments purchased | | | 5,875 | | | | 0 | | | | 5,875 | |
| Payable for unfunded loan commitments | | | 2,995 | | | | 7,088 | | | | 3,195 | |
| Distributions payable to common shareholders | | | 1,101 | | | | 2,624 | | | | 1,103 | |
| Distributions payable to auction rate preferred shareholders | | | 172 | | | | 290 | | | | 154 | |
| Accrued management fees | | | 268 | | | | 572 | | | | 285 | |
| Other liabilities | | | 242 | | | | 572 | | | | 269 | |
| | | 49,106 | | | | 142,632 | | | | 68,922 | |
| | | |
Commitments and Contingent Liabilities ^ | | | | | | | | | | | | |
| | | |
Auction Rate Preferred Shares ^^ | | | 145,125 | | | | 239,650 | | | | 129,425 | |
| | | |
Net Assets Applicable to Common Shareholders | | $ | 255,236 | | | $ | 598,635 | | | $ | 277,608 | |
| | | |
Net Assets Applicable to Common Shareholders Consist of: | | | | | | | | | | | | |
| | | |
| | $ | 0 | | | $ | 1 | | | $ | 0 | |
| Paid in capital in excess of par | | | 286,324 | | | | 670,612 | | | | 311,693 | |
| Distributable earnings (accumulated loss) | | | (31,088 | ) | | | (71,978 | ) | | | (34,085 | ) |
| | | |
Net Assets Applicable to Common Shareholders | | $ | 255,236 | | | $ | 598,635 | | | $ | 277,608 | |
| | | |
Net Asset Value Per Common Share (a) | | $ | 9.73 | | | $ | 9.01 | | | $ | 8.30 | |
| | | |
Common Shares Outstanding | | | 26,226 | | | | 66,417 | | | | 33,428 | |
| | | |
Auction Rate Preferred Shares Issued and Outstanding | | | 6 | | | | 10 | | | | 5 | |
| | | |
| Cost of investments in securities | | $ | 438,422 | | | $ | 948,433 | | | $ | 460,528 | |
| | | |
| * Includes repurchase agreements of: | | $ | 1,848 | | | $ | 987 | | | $ | 411 | |
| | | |
| ** Includes unamortized debt issuance cost of | | $ | 147 | | | $ | 296 | | | $ | 159 | |
| A zero balance may reflect actual amounts rounding to less than one thousand. |
| See Note 8, Fees and Expenses, in the Notes to Financial Statements for more information. |
| ($0.00001 par value and $25,000 liquidation preference per share) |
| Includes adjustments required by U.S. GAAP and may differ from net asset values and performance reported elsewhere by the Funds. |
| | | | | | | | | | | | |
| See Accompanying Notes | | | | | | | | | | DECEMBER 31, 2023 | | | |
| | | | | | | | | | | | | | | | | | | | | | | | |
| Year Ended December 31, 2023 | |
| | PIMCO
California
Municipal
Income
Fund | | | PIMCO
California
Municipal
Income
Fund II | | | PIMCO
California
Municipal
Income
Fund III | | | PIMCO
New York
Municipal
Income
Fund | | | PIMCO
New York
Municipal
Income
Fund II | | | PIMCO
New York
Municipal
Income
Fund III | |
| | | | | | |
| | | | | | | | | | | | | | | | | | | | | | | | |
| | | | | | |
| Interest | | $ | 14,651 | | | $ | 15,438 | | | $ | 12,802 | | | $ | 4,521 | | | $ | 6,958 | | | $ | 2,906 | |
| Miscellaneous Income | | | 11 | | | | 12 | | | | 6 | | | | 0 | | | | 12 | | | | 0 | |
| Total Income | | | 14,662 | | | | 15,450 | | | | 12,808 | | | | 4,521 | | | | 6,970 | | | | 2,906 | |
| | | | | | |
| | | | | | | | | | | | | | | | | | | | | | | | |
| | | | | | |
| Management fees | | | 2,381 | | | | 2,565 | | | | 2,107 | | | | 823 | | | | 1,205 | | | | 571 | |
| Trustee fees and related expenses | | | 40 | | | | 43 | | | | 35 | | | | 54 | | | | 20 | | | | 8 | |
| Interest expense | | | 1,585 | | | | 1,922 | | | | 1,644 | | | | 60 | | | | 656 | | | | 0 | |
| Auction agent fees and commissions | | | 151 | | | | 232 | | | | 153 | | | | 56 | | | | 99 | | | | 67 | |
| Auction rate preferred shares related expenses | | | 11 | | | | 11 | | | | 11 | | | | 12 | | | | 11 | | | | 12 | |
| Miscellaneous expense | | | 2 | | | | 2 | | | | 2 | | | | 1 | | | | 1 | | | | 0 | |
| Total Expenses | | | 4,170 | | | | 4,775 | | | | 3,952 | | | | 1,006 | | | | 1,992 | | | | 658 | |
| | | | | | |
Net Investment Income (Loss) | | | 10,492 | | | | 10,675 | | | | 8,856 | | | | 3,515 | | | | 4,978 | | | | 2,248 | |
| | | | | | |
Net Realized Gain (Loss): | | | | | | | | | | | | | | | | | | | | | | | | |
| | | | | | |
| Investments in securities | | | (4,648 | ) | | | (5,692 | ) | | | (3,759 | ) | | | (2,953 | ) | | | (3,210 | ) | | | (1,444 | ) |
| | | | | | |
| | | (4,648 | ) | | | (5,692 | ) | | | (3,759 | ) | | | (2,953 | ) | | | (3,210 | ) | | | (1,444 | ) |
| | | | | | |
Net Change in Unrealized Appreciation (Depreciation): | | | | | | | | | | | | | | | | | | | | | | | | |
| | | | | | |
| Investments in securities | | | 15,447 | | | | 17,630 | | | | 12,099 | | | | 6,707 | | | | 9,278 | | | | 3,724 | |
| | | | | | |
Net Change in Unrealized Appreciation (Depreciation) | | | 15,447 | | | | 17,630 | | | | 12,099 | | | | 6,707 | | | | 9,278 | | | | 3,724 | |
| | | | | | |
Net Increase (Decrease) in Net Assets Resulting from Operations | | $ | 21,291 | | | $ | 22,613 | | | $ | 17,196 | | | $ | 7,269 | | | $ | 11,046 | | | $ | 4,528 | |
| | | | | | |
Distributions on Auction Rate Preferred Shares from Net Investment Income and/or Realized Capital Gains | | $ | (6,998 | ) | | $ | (7,129 | ) | | $ | (5,655 | ) | | $ | (2,313 | ) | | $ | (3,329 | ) | | $ | (1,701 | ) |
| | | | | | |
Net Increase (Decrease) in Net Assets Applicable to Common Shareholders Resulting from Operations | | $ | 14,293 | | | $ | 15,484 | | | $ | 11,541 | | | $ | 4,956 | | | $ | 7,717 | | | $ | 2,827 | |
| A zero balance may reflect actual amounts rounding to less than one thousand. |
| | | | |
Consolidated Statements of Operations | | | | |
| | | | | | | | | | | | |
| Year Ended December 31, 2023 | |
| | | | | | | | | |
| | | |
| | | | | | | | | | | | |
| | | |
| Interest | | $ | 20,933 | | | $ | 47,579 | | | $ | 22,218 | |
| Miscellaneous income | | | 22 | | | | 33 | | | | 15 | |
| Total Income | | | 20,955 | | | | 47,612 | | | | 22,233 | |
| | | |
| | | | | | | | | | | | |
| | | |
| Management fees | | | 3,041 | | | | 6,455 | | | | 3,209 | |
| Trustee fees and related expenses | | | 51 | | | | 113 | | | | 54 | |
| Interest expense | | | 1,570 | | | | 6,129 | | | | 2,475 | |
| Auction agent fees and commissions | | | 230 | | | | 420 | | | | 254 | |
| Auction rate preferred shares related expenses | | | 11 | | | | 12 | | | | 12 | |
| Miscellaneous expense | | | 3 | | | | 4 | | | | 2 | |
| Total Expenses | | | 4,906 | | | | 13,133 | | | | 6,006 | |
| | | |
Net Investment Income (Loss) | | | 16,049 | | | | 34,479 | | | | 16,227 | |
| | | |
Net Realized Gain (Loss): | | | | | | | | | | | | |
| | | |
| Investments in securities | | | (13,462 | ) | | | (32,858 | ) | | | (18,254 | ) |
| | | |
| | | (13,462 | ) | | | (32,858 | ) | | | (18,254 | ) |
| | | |
Net Change in Unrealized Appreciation (Depreciation): | | | | | | | | | | | | |
| | | |
| Investments in securities | | | 24,752 | | | | 60,084 | | | | 32,194 | |
| | | |
Net Change in Unrealized Appreciation (Depreciation) | | | 24,752 | | | | 60,084 | | | | 32,194 | |
| | | |
Net Increase (Decrease) in Net Assets Resulting from Operations | | $ | 27,339 | | | $ | 61,705 | | | $ | 30,167 | |
| | | |
Distributions on Auction Rate Preferred Shares from Net Investment Income and/or Realized Capital Gains | | $ | (9,566 | ) | | $ | (16,754 | ) | | $ | (8,784 | ) |
| | | |
Net Increase (Decrease) in Net Assets Applicable to Common Shareholders Resulting from Operations | | $ | 17,773 | | | $ | 44,951 | | | $ | 21,383 | |
| A zero balance may reflect actual amounts rounding to less than one thousand. |
| | | | |
Statements of Changes in Net Assets | | | | |
| | | | | | | | | | | | | | | | |
| | | California Municipal Income Fund | | | California Municipal Income Fund II | |
| | | | |
| | Year Ended
December 31, 2023 | | | Year Ended
December 31, 2022 | | | Year Ended
December 31, 2023 | | | Year Ended
December 31, 2022 | |
| | | | |
Increase (Decrease) in Net Assets from: | | | | | | | | | | | | | | | | |
| | | | |
| | | | | | | | | | | | | | | | |
| | | | |
| Net investment income (loss) | | $ | 10,492 | | | $ | 12,325 | | | $ | 10,675 | | | $ | 12,690 | |
| Net realized gain (loss) | | | (4,648 | ) | | | (17,271 | ) | | | (5,692 | ) | | | (15,771 | ) |
| Net change in unrealized appreciation (depreciation) | | | 15,447 | | | | (48,923 | ) | | | 17,630 | | | | (64,772 | ) |
| | | | |
Net Increase (Decrease) in Net Assets Resulting from Operations | | | 21,291 | | | | (53,869 | ) | | | 22,613 | | | | (67,853 | ) |
| | | | |
| Distributions on auction rate preferred shares from net investment income and/or realized capital gains | | | (6,998 | ) | | | (2,654 | ) | | | (7,129 | ) | | | (2,738 | ) |
| | | | |
Net Increase (Decrease) in Net Assets Applicable to Common Shareholders Resulting from Operations | | | 14,293 | | | | (56,523 | ) | | | 15,484 | | | | (70,591 | ) |
| | | | |
Distributions to Common Shareholders: | | | | | | | | | | | | | | | | |
| From net investment income and/or net realized capital gains | | | (4,534 | ) | | | (11,443 | ) | | | (5,001 | ) | | | (11,735 | ) |
| Tax basis return of capital | | | (3,665 | ) | | | (3,671 | ) | | | (3,320 | ) | | | (634 | ) |
| | | | |
Total Distributions to Common Shareholders (a) | | | (8,199 | ) | | | (15,114 | ) | | | (8,321 | ) | | | (12,369 | ) |
| | | | |
Auction-Rate Preferred Share Transactions: | | | | | | | | | | | | | | | | |
| | | | |
| Net Increase (Decrease) resulting from tender of Auction Rate Preferred Shares | | | 590 | | | | 0 | | | | 1,694 | | | | 0 | |
| | | | |
Common Share Transactions*: | | | | | | | | | | | | | | | | |
| | | | |
| Issued as reinvestment of distributions | | | 160 | | | | 778 | | | | 52 | | | | 376 | |
| | | | |
Total increase (decrease) in net assets applicable to common shareholders | | | 6,844 | | | | (70,859 | ) | | | 8,909 | | | | (82,584 | ) |
| | | | |
Net Assets Applicable to Common Shareholders: | | | | | | | | | | | | | | | | |
| | | | |
| Beginning of year | | | 195,462 | | | | 266,321 | | | | 210,581 | | | | 293,165 | |
| End of year | | $ | 202,306 | | | $ | 195,462 | | | $ | 219,490 | | | $ | 210,581 | |
| | | | |
* Common Share Transactions: | | | | | | | | | | | | | | | | |
| | | | |
| Shares issued as reinvestment of distributions | | | 14 | | | | 52 | | | | 7 | | | | 55 | |
| A zero balance may reflect actual amounts rounding to less than one thousand. |
| The tax characterization of distributions is determined in accordance with Federal income tax regulations. See Note 2, Distributions — Common Shares, in the Notes to Financial Statements for more information. |
| | | | | | | | | | | | | | | | | | | | | | | | | | | | | | |
California Municipal Income Fund III | | | New York Municipal Income Fund | | | New York Municipal Income Fund II | | | New York Municipal Income Fund III | |
| | | | | | | |
Year Ended
December 31, 2023 | | | Year Ended
December 31, 2022 | | | Year Ended
December 31, 2023 | | | Year Ended
December 31, 2022 | | | Year Ended
December 31, 2023 | | | Year Ended
December 31, 2022 | | | Year Ended
December 31, 2023 | | | Year Ended
December 31, 2022 | |
| | | | | | | |
| | | | | | | | | | | | | | | | | | | | | | | | | | | | | | |
| | | | | | | |
| | | | | | | | | | | | | | | | | | | | | | | | | | | | | | |
| | | | | | | |
| $ | 8,856 | | | $ | 10,740 | | | $ | 3,515 | | | $ | 3,747 | | | $ | 4,978 | | | $ | 5,292 | | | $ | 2,248 | | | $ | 2,420 | |
| | (3,759 | ) | | | (13,379 | ) | | | (2,953 | ) | | | (6,413 | ) | | | (3,210 | ) | | | (7,103 | ) | | | (1,444 | ) | | | (4,298 | ) |
| | 12,099 | | | | (41,145 | ) | | | 6,707 | | | | (19,399 | ) | | | 9,278 | | | | (29,274 | ) | | | 3,724 | | | | (9,675 | ) |
| | | | | | | |
| | 17,196 | | | | (43,784 | ) | | | 7,269 | | | | (22,065 | ) | | | 11,046 | | | | (31,085 | ) | | | 4,528 | | | | (11,553 | ) |
| | | | | | | |
|
(5,655 |
) | | | (2,094 | ) | | | (2,313 | ) | | | (879 | ) | | | (3,329 | ) | | | (1,226 | ) | | | (1,701 | ) | | | (628 | ) |
| | | | | | | |
|
11,541 |
| | | (45,878 | ) | | | 4,956 | | | | (22,944 | ) | | | 7,717 | | | | (32,311 | ) | | | 2,827 | | | | (12,181 | ) |
| | | | | | | |
| | | | | | | | | | | | | | | | | | | | | | | | | | | | | | |
| | (6,169 | ) | | | (10,233 | ) | | | (1,197 | ) | | | (3,155 | ) | | | (2,581 | ) | | | (5,385 | ) | | | (556 | ) | | | (1,858 | ) |
| | (1,788 | ) | | | 0 | | | | (1,966 | ) | | | (804 | ) | | | (1,387 | ) | | | 0 | | | | (1,154 | ) | | | (587 | ) |
| | | | | | | |
| | (7,957 | ) | | | (10,233 | ) | | | (3,163 | ) | | | (3,959 | ) | | | (3,968 | ) | | | (5,385 | ) | | | (1,710 | ) | | | (2,445 | ) |
| | | | | | | |
| | | | | | | | | | | | | | | | | | | | | | | | | | | | | | |
| | | | | | | |
| | 611 | | | | 0 | | | | 419 | | | | 0 | | | | 380 | | | | 0 | | | | 188 | | | | 0 | |
| | | | | | | |
| | | | | | | | | | | | | | | | | | | | | | | | | | | | | | |
| | | | | | | |
| | 181 | | | | 350 | | | | 66 | | | | 110 | | | | 0 | | | | 52 | | | | 7 | | | | 80 | |
| | | | | | | |
| | 4,376 | | | | (55,761 | ) | | | 2,278 | | | | (26,793 | ) | | | 4,129 | | | | (37,644 | ) | | | 1,312 | | | | (14,546 | ) |
| | | | | | | |
| | | | | | | | | | | | | | | | | | | | | | | | | | | | | | |
| | | | | | | |
| | 172,972 | | | | 228,733 | | | | 68,397 | | | | 95,190 | | | | 92,937 | | | | 130,581 | | | | 38,240 | | | | 52,786 | |
| $ | 177,348 | | | $ | 172,972 | | | $ | 70,675 | | | $ | 68,397 | | | $ | 97,066 | | | $ | 92,937 | | | $ | 39,552 | | | $ | 38,240 | |
| | | | | | | |
| | | | | | | | | | | | | | | | | | | | | | | | | | | | | | |
| | | | | | | |
| | 23 | | | | 42 | | | | 7 | | | | 11 | | | | 0 | | | | 6 | | | | 1 | | | | 10 | |
| | | | |
Consolidated Statements of Changes in Net Assets | | | | |
| | | | | | | | | | | | | | | | | | | | | | | | |
| | | | | | | | | Municipal Income Fund III | |
| | | | | | |
| | Year Ended
December 31, 2023 | | | Year Ended
December 31, 2022 | | | Year Ended
December 31, 2023 | | | Year Ended
December 31, 2022 | | | Year Ended
December 31, 2023 | | | Year Ended
December 31, 2022 | |
| | | | | | |
Increase (Decrease) in Net Assets from: | | | | | | | | | | | | | | | | | | | | | | | | |
| | | | | | |
| | | | | | | | | | | | | | | | | | | | | | | | |
| | | | | | |
| Net investment income (loss) | | $ | 16,049 | | | $ | 17,777 | | | $ | 34,479 | | | $ | 38,433 | | | $ | 16,227 | | | $ | 19,124 | |
| Net realized gain (loss) | | | (13,462 | ) | | | (18,654 | ) | | | (32,858 | ) | | | (49,732 | ) | | | (18,254 | ) | | | (22,757 | ) |
| Net change in unrealized appreciation (depreciation) | | | 24,752 | | | | (78,341 | ) | | | 60,084 | | | | (168,223 | ) | | | 32,194 | | | | (87,689 | ) |
| | | | | | |
Net Increase (Decrease) in Net Assets Resulting from Operations | | | 27,339 | | | | (79,218 | ) | | | 61,705 | | | | (179,522 | ) | | | 30,167 | | | | (91,322 | ) |
| Distributions on auction rate preferred shares from net investment income and/or realized capital gains | | | (9,566 | ) | | | (3,548 | ) | | | (16,754 | ) | | | (6,348 | ) | | | (8,784 | ) | | | (3,291 | ) |
| | | | | | |
Net Increase (Decrease) in Net Assets Applicable to Common Shareholders Resulting from Operations | | | 17,773 | | | | (82,766 | ) | | | 44,951 | | | | (185,870 | ) | | | 21,383 | | | | (94,613 | ) |
| | | | | | |
Distributions to Common Shareholders: | | | | | | | | | | | | | | | | | | | | | | | | |
| | | | | | |
| From net investment income and/or net realized capital gains | | | (9,815 | ) | | | (16,905 | ) | | | (20,242 | ) | | | (38,324 | ) | | | (9,970 | ) | | | (18,392 | ) |
| Tax basis return of capital | | | (3,390 | ) | | | 0 | | | | (11,189 | ) | | | (6,891 | ) | | | (3,266 | ) | | | 0 | |
| | | | | | |
Total Distributions to Common Shareholders (a) | | | (13,205 | ) | | | (16,905 | ) | | | (31,431 | ) | | | (45,215 | ) | | | (13,236 | ) | | | (18,392 | ) |
| | | | | | |
Auction Rate Preferred Share Transactions: | | | | | | | | | | | | | | | | | | | | | | | | |
| | | | | | |
| Net Increase (Decrease) resulting from tender of Auction Rate Preferred Shares | | | 1,187 | | | | 0 | | | | 3,224 | | | | 0 | | | | 1,390 | | | | 0 | |
| | | | | | |
Common Share Transactions*: | | | | | | | | | | | | | | | | | | | | | | | | |
| | | | | | |
Net proceeds from offering | | | 0 | | | | 0 | | | | 1,377 | | | | 20,978 | | | | 0 | | | | 0 | |
| Issued as reinvestment of distributions | | | 773 | | | | 1,316 | | | | 2,475 | | | | 4,830 | | | | 357 | | | | 1,198 | |
| | | | | | |
Total increase (decrease) in net assets applicable to common shareholders | | | 6,528 | | | | (98,355 | ) | | | 20,596 | | | | (205,277 | ) | | | 9,894 | | | | (111,807 | ) |
| | | | | | |
Net Assets Applicable to Common Shareholders: | | | | | | | | | | | | | | | | | | | | | | | | |
| | | | | | |
| Beginning of year | | | 248,707 | | | | 347,062 | | | | 578,039 | | | | 783,316 | | | | 267,714 | | | | 379,521 | |
| End of year | | $ | 255,236 | | | $ | 248,707 | | | $ | 598,635 | | | $ | 578,039 | | | $ | 277,608 | | | $ | 267,714 | |
| | | | | | |
* Common Share Transactions: | | | | | | | | | | | | | | | | | | | | | | | | |
| | | | | | |
| Shares sold | | | 0 | | | | 0 | | | | 149 | | | | 2,216 | | | | 0 | | | | 0 | |
| Shares issued as reinvestment of distributions | | | 78 | | | | 120 | | | | 278 | | | | 456 | | | | 42 | | | | 130 | |
| A zero balance may reflect actual amounts rounding to less than one thousand. |
| The tax characterization of distributions is determined in accordance with Federal income tax regulations. See Note 2, Distributions — Common Shares, in the Notes to Financial Statements for more information. |
| | | | | | | | | | | | |
| Year Ended December 31, 2023 | | | | | | | | | |
| | | | | | | | | |
| | | |
Cash Flows Provided by (Used for) Operating Activities: | | | | | | | | | | | | |
| | | |
| Net increase (decrease) in net assets resulting from operations | | $ | 21,291 | | | $ | 22,613 | | | $ | 17,196 | |
| | | |
Adjustments to Reconcile Net Increase (Decrease) in Net Assets from Operations to Net Cash Provided by (Used for) Operating Activities: | | | | | | | | | | | | |
| | | |
| Purchases of long-term securities | | | (98,808 | ) | | | (91,094 | ) | | | (92,129 | ) |
| Proceeds from sales of long-term securities | | | 114,193 | | | | 117,839 | | | | 111,623 | |
| (Purchases) Proceeds from sales of short-term portfolio investments, net | | | 980 | | | | (10,727 | ) | | | (5,569 | ) |
| (Increase) decrease in interest and/or dividends receivable | | | 221 | | | | 309 | | | | 437 | |
| (Increase) decrease in other assets | | | (57 | ) | | | (61 | ) | | | (48 | ) |
| Increase (decrease) in accrued management fees | | | (8 | ) | | | (7 | ) | | | (8 | ) |
| Increase (decrease) in other liabilities | | | 115 | | | | 230 | | | | 124 | |
| | | | | | | | | | | | |
| Investments in securities | | | 4,648 | | | | 5,692 | | | | 3,759 | |
Net Change in Unrealized (Appreciation) Depreciation | | | | | | | | | | | | |
| Investments in securities | | | (15,447 | ) | | | (17,630 | ) | | | (12,099 | ) |
| Net amortization (accretion) on investments | | | 175 | | | | (423 | ) | | | (39 | ) |
| Amortization of debt issuance cost | | | 11 | | | | 21 | | | | 31 | |
| | | |
Net Cash Provided by (Used for) Operating Activities | | | 27,314 | | | | 26,762 | | | | 23,278 | |
| | | |
Cash Flows Received from (Used for) Financing Activities: | | | | | | | | | | | | |
| | | |
| Payments resulting from tender of Auction Rate Preferred Shares | | | (10,135 | ) | | | (29,106 | ) | | | (10,489 | ) |
| Cash distributions paid to comon shareholders* | | | (8,589 | ) | | | (8,608 | ) | | | (7,966 | ) |
| Cash distributions paid to auction rate preferred shareholders | | | (7,024 | ) | | | (7,130 | ) | | | (5,648 | ) |
| Proceeds from tender option bond transactions | | | 3,875 | | | | 3,625 | | | | 3,175 | |
| Payments on tender option bond transactions | | | (15,561 | ) | | | (14,580 | ) | | | (12,749 | ) |
| Proceeds on Remarketable Variable Rate MuniFund Term Preferred Shares Net | | | 10,121 | | | | 29,036 | | | | 10,400 | |
| | | |
Net Cash Received from (Used for) Financing Activities | | | (27,313 | ) | | | (26,763 | ) | | | (23,277 | ) |
| | | |
Net Increase (Decrease) in Cash and Foreign Currency | | | 1 | | | | (1 | ) | | | 1 | |
| | | |
Cash and Foreign Currency: | | | | | | | | | | | | |
| | | |
| Beginning of year | | | 0 | | | | 1 | | | | 0 | |
| End of year | | $ | 1 | | | $ | 0 | | | $ | 1 | |
| | | |
| *Reinvestment of distributions to common shareholders | | $ | 160 | | | $ | 52 | | | $ | 181 | |
| | | |
Supplemental Disclosure of Cash Flow Information: | | | | | | | | | | | | |
| | | |
| Interest expense paid during the year | | $ | 1,637 | | | $ | 1,981 | | | $ | 1,664 | |
| A zero balance may reflect actual amounts rounding to less than one thousand. |
A Statement of Cash Flows is presented when a Fund has a significant amount of borrowing during the year, based on the average total borrowing outstanding in relation to total assets or when substantially all of a Fund's investments are not classified as Level 1 or 2 in the fair value hierarchy.
| | | | |
Consolidated Statements of Cash Flows | | | | |
| | | | | | | | |
| Year Ended December 31, 2023 | | | | | | |
| | PIMCO
Municipal
Income Fund II | | | PIMCO
Municipal
Income Fund III | |
| | |
Cash Flows Provided by (Used for) Operating Activities: | | | | | | | | |
| | |
| Net increase (decrease) in net assets resulting from operations | | $ | 61,705 | | | $ | 30,167 | |
| | |
Adjustments to Reconcile Net Increase (Decrease) in Net Assets from Operations to Net Cash Provided by (Used for) Operating Activities: | | | | | | | | |
| | |
| Purchases of long-term securities | | | (392,606 | ) | | | (200,275 | ) |
| Proceeds from sales of long-term securities | | | 468,616 | | | | 220,964 | |
| (Purchases) Proceeds from sales of short-term portfolio investments, net | | | 370 | | | | 1,998 | |
| (Increase) decrease in receivable for investments sold | | | 0 | | | | (14 | ) |
| (Increase) decrease in interest and/or dividends receivable | | | 806 | | | | 348 | |
| (Increase) decrease in other assets | | | (134 | ) | | | (72 | ) |
| Increase (decrease) in payable for investments purchased | | | (1,032 | ) | | | 3,812 | |
| Increase (decrease) in payable for unfunded loan commitments | | | 7,088 | | | | 3,195 | |
| Increase (decrease) in accrued management fees | | | (22 | ) | | | (10 | ) |
| Increase (decrease) in other liabilities | | | 461 | | | | 212 | |
| | | | | | | | |
| Investments in securities | | | 32,858 | | | | 18,254 | |
Net Change in Unrealized (Appreciation) Depreciation | | | | | | | | |
| Investments in securities | | | (60,084 | ) | | | (32,194 | ) |
| Net amortization (accretion) on investments | | | (2,843 | ) | | | (1,410 | ) |
| Amortization of debt issuance cost | | | 65 | | | | 39 | |
| | |
Net Cash Provided by (Used for) Operating Activities | | | 115,248 | | | | 45,014 | |
| | |
Cash Flows Received from (Used for) Financing Activities: | | | | | | | | |
| | |
| Payments resulting from tender of Auction Rate Preferred Shares | | | (55,401 | ) | | | (23,885 | ) |
| Proceeds from shares sold | | | 1,377 | | | | 0 | |
| Cash distributions paid to common shareholders* | | | (30,226 | ) | | | (13,312 | ) |
| Cash distributions paid to auction rate preferred shareholders | | | (16,750 | ) | | | (8,777 | ) |
| Proceeds from tender option bond transactions | | | 22,975 | | | | 7,540 | |
| Payments on tender option bond transactions | | | (92,420 | ) | | | (30,320 | ) |
| Proceeds on Remarketable Variable Rate MuniFund Term Preferred Shares Net | | | 55,197 | | | | 23,740 | |
| | |
Net Cash Received from (Used for) Financing Activities | | | (115,248 | ) | | | (45,014 | ) |
| | |
Net Increase (Decrease) in Cash and Foreign Currency | | | 0 | | | | 0 | |
| | |
Cash and Foreign Currency: | | | | | | | | |
| | |
| Beginning of year | | | 1 | | | | 1 | |
| End of year | | $ | 1 | | | $ | 1 | |
| | |
| *Reinvestment of distributions to common shareholders | | $ | 2,475 | | | $ | 357 | |
| | |
Supplemental Disclosure of Cash Flow Information: | | | | | | | | |
| | |
| Interest expense paid during the year | | $ | 6,585 | | | $ | 2,608 | |
| A zero balance may reflect actual amounts rounding to less than one thousand. |
A Statement of Cash Flows is presented when a Fund has a significant amount of borrowing during the Year, based on the average total borrowing outstanding in relation to total assets or when substantially all of a Fund's investments are not classified as Level 1 or 2 in the fair value hierarchy.
| | | | | | |
| | PIMCO California Municipal Income Fund | | | | December 31, 2023 |
(Amounts in thousands*, except number of shares, contracts, units and ounces, if any)
| | | | | | | | | | | | |
| | | | | | | | | | | |
INVESTMENTS IN SECURITIES 169.8% | |
| |
MUNICIPAL BONDS & NOTES 168.6% | |
| |
| |
|
Arizona Industrial Development Authority Revenue Bonds, Series 2020 | |
7.750% due 07/01/2050 ^(a) | | $ | | | 850 | | | $ | | | 51 | |
| | | | | | | | | | | | |
| |
| |
|
Alameda Corridor Transportation Authority, California Revenue Bonds, Series 2022 | |
0.000% due 10/01/2049 (c) | | | | | 2,890 | | | | | | 1,561 | |
|
Alhambra Unified School District, California General Obligation Bonds, Series 2022 | |
| | | | | 870 | | | | | | 993 | |
|
Anaheim City School District, California General Obligation Bonds, (BAM Insured), Series 2023 | |
| | | | | 2,500 | | | | | | 2,548 | |
|
Antelope Valley Community College District, California General Obligation Bonds, Series 2022 | |
0.000% due 08/01/2047 (b) | | | | | 680 | | | | | | 212 | |
|
Bay Area Toll Authority, California Revenue Bonds, Series 2017 | |
| | | | | 1,750 | | | | | | 1,900 | |
|
Bay Area Toll Authority, California Revenue Bonds, Series 2023 | |
| | | | | 1,700 | | | | | | 1,721 | |
|
Butte-Glenn Community College District, California General Obligation Bonds, Series 2022 | |
| | | | | 1,500 | | | | | | 1,515 | |
|
California Community Choice Financing Authority Revenue Bonds, Series 2023 | |
| | | | | 2,000 | | | | | | 2,167 | |
|
California Community Housing Agency Revenue Bonds, Series 2019 | |
| | | | | 3,925 | | | | | | 3,271 | |
| | | | | 1,000 | | | | | | 942 | |
|
California Community Housing Agency Revenue Bonds, Series 2021 | |
| | | | | 1,000 | | | | | | 752 | |
|
California Community Housing Agency Revenue Bonds, Series 2022 | |
| | | | | 1,000 | | | | | | 828 | |
|
California County Tobacco Securitization Agency Revenue Bonds, Series 2002 | |
| | | | | 1,660 | | | | | | 1,662 | |
|
California County Tobacco Securitization Agency Revenue Bonds, Series 2007 | |
0.000% due 06/01/2057 (b) | | | | | 7,000 | | | | | | 1,053 | |
|
California County Tobacco Securitization Agency Revenue Bonds, Series 2020 | |
0.000% due 06/01/2055 (b) | | | | | 4,700 | | | | | | 850 | |
|
California Educational Facilities Authority Revenue Bonds, Series 2018 | |
| | | | | 1,250 | | | | | | 1,266 | |
| | | | | 1,000 | | | | | | 1,044 | |
|
California Health Facilities Financing Authority Revenue Bonds, Series 2015 | |
| | | | | 1,300 | | | | | | 1,322 | |
|
California Health Facilities Financing Authority Revenue Bonds, Series 2016 | |
| | | | | 2,960 | | | | | | 3,036 | |
| | | | | 6,000 | | | | | | 6,139 | |
|
California Health Facilities Financing Authority Revenue Bonds, Series 2017 | |
| | | | | 1,400 | | | | | | 1,425 | |
| | | | | 2,500 | | | | | | 2,474 | |
|
California Health Facilities Financing Authority Revenue Bonds, Series 2020 | |
| | | | | 4,000 | | | | | | 4,007 | |
|
California Health Facilities Financing Authority Revenue Bonds, Series 2021 | |
| | | | | 2,500 | | | | | | 2,532 | |
| | | | | | | | | | | | |
| | | | | | | | | | | |
|
California Infrastructure & Economic Development Bank Revenue Bonds, Series 2020 | |
0.000% due 01/01/2060 (b) | | $ | | | 5,250 | | | $ | | | 291 | |
| | | | | 915 | | | | | | 873 | |
| | | | | 1,650 | | | | | | 1,680 | |
|
California Municipal Finance Authority Certificates of Participation Bonds, (AGM Insured), Series 2022 | |
| | | | | 1,700 | | | | | | 1,908 | |
|
California Municipal Finance Authority Revenue Bonds, (BAM Insured), Series 2021 | |
| | | | | 700 | | | | | | 689 | |
|
California Municipal Finance Authority Revenue Bonds, Series 2018 | |
| | | | | 500 | | | | | | 515 | |
| | | | | 1,370 | | | | | | 1,466 | |
| | | | | 1,370 | | | | | | 1,452 | |
|
California Municipal Finance Authority Revenue Bonds, Series 2021 | |
4.000% due 09/01/2050 (d) | | | | | 1,200 | | | | | | 1,062 | |
|
California Public Finance Authority Revenue Bonds, Series 2019 | |
| | | | | 1,350 | | | | | | 1,424 | |
|
California School Finance Authority Revenue Bonds, Series 2019 | |
| | | | | 1,000 | | | | | | 1,012 | |
|
California State General Obligation Bonds, (AGM Insured), Series 2007 | |
| | | | | 3,500 | | | | | | 4,261 | |
|
California State General Obligation Bonds, Series 2017 | |
| | | | | 2,750 | | | | | | 2,779 | |
|
California State General Obligation Bonds, Series 2018 | |
| | | | | 1,275 | | | | | | 1,321 | |
|
California State General Obligation Bonds, Series 2021 | |
| | | | | 1,500 | | | | | | 1,711 | |
|
California State General Obligation Bonds, Series 2022 | |
| | | | | 1,350 | | | | | | 1,417 | |
| | | | | 2,250 | | | | | | 2,304 | |
|
California State General Obligation Bonds, Series 2023 | |
| | | | | 1,800 | | | | | | 1,882 | |
|
California State General Obligation Notes, Series 2021 | |
| | | | | 2,700 | | | | | | 3,096 | |
|
California State University Revenue Bonds, Series 2015 | |
| | | | | 8,000 | | | | | | 8,230 | |
|
California State University Revenue Bonds, Series 2023 | |
| | | | | 1,000 | | | | | | 1,158 | |
|
California Statewide Communities Development Authority Revenue Bonds, (AGM Insured), Series 2022 | |
| | | | | 1,000 | | | | | | 1,113 | |
|
California Statewide Communities Development Authority Revenue Bonds, (CM Insured), Series 2018 | |
| | | | | 1,000 | | | | | | 1,023 | |
| | | | | 350 | | | | | | 355 | |
| | | | | 1,750 | | | | | | 1,764 | |
|
California Statewide Communities Development Authority Revenue Bonds, Series 2016 | |
| | | | | 225 | | | | | | 224 | |
| | | | | 5,700 | | | | | | 5,644 | |
|
California Statewide Communities Development Authority Revenue Bonds, Series 2018 | |
| | | | | 1,000 | | | | | | 1,004 | |
| | | | | 1,700 | | | | | | 1,747 | |
| | | | | 1,775 | | | | | | 1,816 | |
|
California Statewide Communities Development Authority Revenue Bonds, Series 2019 | |
| | | | | 1,795 | | | | | | 1,643 | |
|
California Statewide Financing Authority Revenue Bonds, Series 2002 | |
| | | | | 1,935 | | | | | | 1,965 | |
|
Calistoga Joint Unified School District, California General Obligation Bonds, Series 2023 | |
| | | | | 1,445 | | | | | | 1,619 | |
|
Chino Valley Unified School District, California General Obligation Bonds, Series 2020 | |
| | | | | 2,000 | | | | | | 2,165 | |
| | | | | | | | | | | | |
| | | | | | | | | | | |
|
Chino Valley Unified School District, California General Obligation Bonds, Series 2022 | |
0.000% due 08/01/2036 (b) | | $ | | | 1,395 | | | $ | | | 890 | |
0.000% due 08/01/2042 (b) | | | | | 1,500 | | | | | | 693 | |
|
CMFA Special Finance Agency VII, California Revenue Bonds, Series 2021 | |
| | | | | 2,500 | | | | | | 1,658 | |
| | | | | 595 | | | | | | 477 | |
|
CMFA Special Finance Agency, California Revenue Bonds, Series 2021 | |
| | | | | 750 | | | | | | 613 | |
|
Corona Norco Unified School District, California General Obligation Bonds, Series 2018 | |
| | | | | 1,650 | | | | | | 1,659 | |
|
CSCDA Community Improvement Authority, California Revenue Bonds, Series 2021 | |
| | | | | 500 | | | | | | 340 | |
| | | | | 1,000 | | | | | | 753 | |
| | | | | 450 | | | | | | 345 | |
| | | | | 250 | | | | | | 189 | |
| | | | | 600 | | | | | | 432 | |
|
CSCDA Community Improvement Authority, California Revenue Bonds, Series 2022 | |
0.000% due 09/01/2062 (c) | | | | | 2,000 | | | | | | 1,017 | |
|
Department of Veterans Affairs Veteran’s Farm & Home Purchase Program, California Revenue Bonds, Series 2022 | |
| | | | | 340 | | | | | | 358 | |
|
El Monte School District, California General Obligation Bonds, (BAM Insured), Series 2023 | |
| | | | | 1,600 | | | | | | 1,753 | |
|
El Monte, California Certificates of Participation Bonds, (AMBAC Insured), Series 2001 | |
| | | | | 8,780 | | | | | | 8,977 | |
|
Elk Grove Finance Authority, California Special Tax Bonds, Series 2016 | |
| | | | | 1,000 | | | | | | 1,013 | |
|
Folsom Cordova Unified School District, California General Obligation Bonds, (AGM Insured), Series 2019 | |
| | | | | 1,315 | | | | | | 1,318 | |
|
Foothill-Eastern Transportation Corridor Agency, California Revenue Bonds, Series 2014 | |
| | | | | 860 | | | | | | 812 | |
|
Fresno Unified School District, California General Obligation Bonds, Series 2016 | |
| | | | | 2,410 | | | | | | 2,399 | |
|
Glendale Community College District, California General Obligation Bonds, Series 2020 | |
| | | | | 1,500 | | | | | | 1,511 | |
|
Golden State, California Tobacco Securitization Corp. Revenue Bonds, Series 2018 | |
| | | | | 2,000 | | | | | | 2,224 | |
|
Golden State, California Tobacco Securitization Corp. Revenue Bonds, Series 2021 | |
0.000% due 06/01/2066 (b) | | | | | 20,500 | | | | | | 2,422 | |
|
Hacienda La Puente Unified School District, California General Obligation Bonds, Series 2017 | |
| | | | | 2,000 | | | | | | 2,014 | |
|
Hartnell Community College District, California General Obligation Bonds, Series 2017 | |
| | | | | 3,400 | | | | | | 3,468 | |
|
Hastings Campus Housing Finance Authority, California Revenue Bonds, Series 2020 | |
| | | | | 2,000 | | | | | | 1,708 | |
|
Hayward Unified School District, California General Obligation Bonds, Series 2015 | |
| | | | | 6,000 | | | | | | 6,076 | |
|
Long Beach Bond Finance Authority, California General Obligation Bonds, Series 2023 | |
| | | | | 2,000 | | | | | | 1,998 | |
|
Long Beach Bond Finance Authority, California Revenue Bonds, Series 2007 | |
| | | | | 1,000 | | | | | | 1,075 | |
| | | | | | | | | | | | |
| See Accompanying Notes | | | | | | | | | | DECEMBER 31, 2023 | | | |
| | | | | | |
| | PIMCO California Municipal Income Fund | | | | |
| | | | | | | | | | | | |
| | | | | | | | | | | |
|
Los Angeles County, California Metropolitan Transportation Authority Sales Tax Revenue Bonds, Series 2021 | |
| | $ | | | 1,750 | | | $ | | | 1,883 | |
|
Los Angeles County, California Sanitation District, Financing Authority Revenue Bonds, Series 2016 | |
| | | | | 1,500 | | | | | | 1,520 | |
|
Los Angeles Department of Airports, California Revenue Bonds, Series 2020 | |
| | | | | 2,185 | | | | | | 2,137 | |
|
Los Angeles Department of Airports, California Revenue Bonds, Series 2021 | |
| | | | | 2,500 | | | | | | 2,761 | |
|
Los Angeles Department of Water & Power Water System, California Revenue Bonds, Series 2022 | |
| | | | | 1,335 | | | | | | 1,500 | |
|
Los Angeles Department of Water & Power, California Revenue Bonds, Series 2014 | |
| | | | | 2,000 | | | | | | 2,000 | |
|
Los Angeles Department of Water & Power, California Revenue Bonds, Series 2021 | |
| | | | | 1,500 | | | | | | 1,700 | |
|
Los Angeles Unified School District, California General Obligation Bonds, Series 2022 | |
| | | | | 2,500 | | | | | | 2,881 | |
|
Energy Authority, California Revenue Bonds, Series 2009 | |
| | | | | 10,345 | | | | | | 13,330 | |
|
Manteca Unified School District, California General Obligation Bonds, Series 2020 | |
| | | | | 880 | | | | | | 889 | |
|
Metropolitan Water District, of Southern California Revenue Bonds, Series 2020 | |
| | | | | 2,000 | | | | | | 2,180 | |
|
Monterey Peninsula Unified School District, California General Obligation Bonds, Series 2019 | |
| | | | | 3,000 | | | | | | 3,088 | |
|
Mount San Jacinto Community College District, California General Obligation Bonds, Series 2018 | |
| | | | | 2,650 | | | | | | 2,708 | |
|
Municipal Improvement Corp. of Los Angeles, California Revenue Bonds, Series 2021 | |
| | | | | 2,000 | | | | | | 2,332 | |
|
New Haven Unified School District, California General Obligation Bonds, (AGC Insured), Series 2008 | |
0.000% due 08/01/2030 (b) | | | | | 1,875 | | | | | | 1,540 | |
|
Norwalk-La Mirada Unified School District, California General Obligation Bonds, Series 2019 | |
| | | | | 2,550 | | | | | | 2,564 | |
|
Oceanside Unified School District, California General Obligation Bonds, Series 2022 | |
| | | | | 1,020 | | | | | | 1,055 | |
|
Ontario International Airport Authority, California Revenue Bonds, (AGM Insured), Series 2021 | |
| | | | | 500 | | | | | | 507 | |
|
Ontario Montclair School District, California General Obligation Bonds, Series 2017 | |
| | | | | 1,650 | | | | | | 1,740 | |
|
Orange County, California Community Facilities District, Special Tax Bonds, Series 2022 | |
| | | | | 1,275 | | | | | | 1,311 | |
|
Pacifica School District, California General Obligation Bonds, Series 2018 | |
| | | | | 1,750 | | | | | | 1,759 | |
|
Redwood City School District, California General Obligation Bonds, Series 2023 | |
| | | | | 1,900 | | | | | | 2,139 | |
|
Richmond, California Wastewater Revenue Bonds, Series 2019 | |
| | | | | 1,350 | | | | | | 1,360 | |
|
Rio Hondo Community College District, California General Obligation Bonds, Series 2022 | |
0.000% due 08/01/2045 (b) | | | | | 1,650 | | | | | | 605 | |
| | | | | | | | | | | | |
| | | | | | | | | | | |
|
River Islands Public Financing Authority, California Special Tax, (AGM Insured), Series 2022 | |
| | $ | | | 1,000 | | | $ | | | 1,019 | |
|
Riverside County, California Transportation Commission Revenue Bonds, Series 2021 | |
| | | | | 1,125 | | | | | | 1,152 | |
|
Riverside, California Sewer Revenue Bonds, Series 2018 | |
| | | | | 4,250 | | | | | | 4,391 | |
|
Sacramento City Unified School District, California General Obligation Bonds, (AGM Insured), Series 2021 | |
| | | | | 1,400 | | | | | | 1,401 | |
|
Sacramento County, California Sanitation District, Financing Authority Revenue Bonds, Series 2020 | |
| | | | | 1,000 | | | | | | 1,099 | |
|
Sacramento County, California Special Tax Bonds, Series 2022 | |
| | | | | 450 | | | | | | 456 | |
|
Sacramento Municipal Utility District, California Revenue Bonds, Series 2023 | |
| | | | | 500 | | | | | | 572 | |
|
Sacramento, California Special Tax Bonds, Series 2021 | |
| | | | | 1,500 | | | | | | 1,332 | |
|
San Bernardino Community College District, California General Obligation Bonds, Series 2023 | |
| | | | | 3,300 | | | | | | 3,640 | |
|
San Diego County, California Certificates of Participation Bonds, Series 2023 | |
| | | | | 3,350 | | | | | | 3,752 | |
|
San Diego County, California Regional Airport Authority Revenue Bonds, Series 2021 | |
| | | | | 2,750 | | | | | | 2,670 | |
| | | | | 2,215 | | | | | | 2,316 | |
|
San Diego Public Facilities Financing Authority, California Revenue Bonds, Series 2022 | |
| | | | | 1,000 | | | | | | 1,122 | |
|
San Diego Unified School District, California General Obligation Bonds, Series 2020 | |
| | | | | 1,000 | | | | | | 1,005 | |
|
San Diego Unified School District, California General Obligation Bonds, Series 2023 | |
| | | | | 4,500 | | | | | | 4,505 | |
| | | | | 1,000 | | | | | | 1,142 | |
|
San Francisco, California City & County Airport Comm-San Francisco International Airport Revenue Bonds, Series 2017 | |
| | | | | 2,625 | | | | | | 2,745 | |
|
San Francisco, California City & County Airport Comm-San Francisco International Airport Revenue Bonds, Series 2019 | |
| | | | | 2,000 | | | | | | 2,196 | |
| | | | | 2,000 | | | | | | 2,138 | |
| | | | | 1,900 | | | | | | 2,026 | |
|
San Francisco, California City & County General Obligation Bonds, Series 2022 | |
| | | | | 2,750 | | | | | | 3,081 | |
|
San Francisco, California City & County Public Utilities Commission Power Revenue Bonds, Series 2023 | |
| | | | | 1,700 | | | | | | 1,932 | |
|
San Francisco, California Public Utilities Commission Water Revenue Bonds, Series 2020 | |
| | | | | 1,100 | | | | | | 1,213 | |
|
San Francisco, California Public Utilities Commission Water Revenue Bonds, Series 2023 | |
| | | | | 1,250 | | | | | | 1,446 | |
|
San Jose Evergreen Community College District, California General Obligation Bonds, Series 2014 | |
| | | | | 1,000 | | | | | | 1,009 | |
|
San Jose Financing Authority, California Revenue Bonds, Series 2022 | |
| | | | | 1,700 | | | | | | 1,917 | |
|
San Mateo County, California Community College District, General Obligation Bonds, (NPFGC Insured), Series 2006 | |
0.000% due 09/01/2034 (b) | | | | | 3,000 | | | | | | 2,205 | |
| | | | | | | | | | | | |
| | | | | | | | | | | |
|
San Mateo County, California Community College District, General Obligation Bonds, Series 2018 | |
| | $ | | | 4,000 | | | $ | | | 4,323 | |
|
San Mateo Joint Powers Financing Authority, California Revenue Bonds, Series 2018 | |
| | | | | 1,650 | | | | | | 1,662 | |
|
Santa Clarita Community College District, California General Obligation Bonds, Series 2016 | |
| | | | | 2,000 | | | | | | 2,014 | |
|
Santa Monica, California Community College District, General Obligation Bonds, Series 2022 | |
| | | | | 1,190 | | | | | | 1,226 | |
|
Silicon Valley Tobacco Securitization Authority, California Revenue Bonds, Series 2007 | |
0.000% due 06/01/2036 (b) | | | | | 1,000 | | | | | | 507 | |
|
Southwestern Community College District, California General Obligation Bonds, Series 2021 | |
| | | | | 4,300 | | | | | | 4,376 | |
|
State Center Community College District, California General Obligation Bonds, Series 2022 | |
| | | | | 1,690 | | | | | | 1,898 | |
|
Sweetwater Union High School District, California General Obligation Bonds, Series 2022 | |
| | | | | 2,025 | | | | | | 2,222 | |
|
Tobacco Securitization Authority of Northern California Revenue Bonds, Series 2021 | |
0.000% due 06/01/2060 (b) | | | | | 15,900 | | | | | | 2,652 | |
|
Tobacco Securitization Authority of Southern California Revenue Bonds, Series 2006 | |
0.000% due 06/01/2046 (b) | | | | | 4,000 | | | | | | 742 | |
|
University of California Revenue Bonds, Series 2018 | |
| | | | | 5,000 | | | | | | 5,348 | |
|
University of California Revenue Bonds, Series 2022 | |
| | | | | 5,100 | | | | | | 5,688 | |
|
Upland, California Certificates of Participation Bonds, Series 2017 | |
| | | | | 3,250 | | | | | | 3,107 | |
|
Washington Township Health Care District, California General Obligation Bonds, Series 2015 | |
| | | | | 2,500 | | | | | | 2,500 | |
|
Washington Township Health Care District, California General Obligation Bonds, Series 2023 | |
| | | | | 1,350 | | | | | | 1,538 | |
|
West Valley-Mission Community College District, California General Obligation Bonds, Series 2022 | |
| | | | | 2,000 | | | | | | 2,052 | |
| | | | | | | | | | | | |
| | | | | | | | | | | 306,851 | |
| | | | | | | | | | | | |
| |
| |
|
Affordable Housing Opportunities Trust, Delaware Revenue Bonds, Series 2022 | |
| | | | | 2,725 | | | | | | 2,419 | |
| | | | | 480 | | | | | | 476 | |
| | | | | | | | | | | | |
| | | | | | | | | | | 2,895 | |
| | | | | | | | | | | | |
| |
| |
|
Chicago, Illinois General Obligation Bonds, Series 2007 | |
| | | | | 2,000 | | | | | | 2,012 | |
|
Chicago, Illinois General Obligation Bonds, Series 2017 | |
| | | | | 1,500 | | | | | | 1,576 | |
|
Illinois State General Obligation Bonds, Series 2020 | |
| | | | | 2,000 | | | | | | 2,051 | |
|
Illinois State General Obligation Notes, Series 2017 | |
| | | | | 1,000 | | | | | | 1,075 | |
| | | | | | | | | | | | |
| | | | | | | | | | | 6,714 | |
| | | | | | | | | | | | |
| |
| |
|
New Hampshire Business Finance Authority Revenue Bonds, Series 2023 | |
| | | | | 1,981 | | | | | | 1,955 | |
| | | | | | | | | | | | |
| |
| | | | | | | | | | | | |
| | | | | | | | | | | |
| |
|
New York Power Authority Revenue Bonds, Series 2020 | |
| | $ | | | 525 | | | $ | | | 523 | |
| | | | | | | | | | | | |
| |
| |
|
Grand Forks County, North Dakota Revenue Bonds, Series 2021 | |
7.000% due 12/15/2043 ^(a) | | | | | 650 | | | | | | 130 | |
| | | | | | | | | | | | |
| |
| |
|
Pennsylvania Economic Development Financing Authority Revenue Bonds, Series 2021 | |
| | | | | 1,170 | | | | | | 1,291 | |
| | | | | | | | | | | | |
| |
| |
|
Children’s Trust Fund, Puerto Rico Revenue Bonds, Series 2008 | |
0.000% due 05/15/2057 (b) | | | | | 20,400 | | | | | | 1,556 | |
|
Commonwealth of Puerto Rico Bonds, Series 2022 | |
| | | | | 2,164 | | | | | | 1,182 | |
| | | | | 2,586 | | | | | | 1,257 | |
|
Commonwealth of Puerto Rico General Obligation Bonds, Series 2021 | |
0.000% due 07/01/2033 (b) | | | | | 1,250 | | | | | | 781 | |
| | | | | | | | | | | | |
| | | | | | | | | | | |
| | $ | | | 1,200 | | | $ | | | 1,105 | |
|
Puerto Rico Sales Tax Financing Corp. Sales Tax Revenue Bonds, Series 2018 | |
0.000% due 07/01/2051 (b) | | | | | 25,500 | | | | | | 5,986 | |
|
Puerto Rico Sales Tax Financing Corp. Sales Tax Revenue Bonds, Series 2019 | |
| | | | | 4,951 | | | | | | 4,893 | |
| | | | | | | | | | | | |
| | | | | | | | | | | 16,760 | |
| | | | | | | | | | | | |
| |
| |
|
Angelina & Neches River Authority, Texas Revenue Bonds, Series 2021 | |
| | | | | 460 | | | | | | 305 | |
| | | | | 800 | | | | | | 693 | |
| | | | | | | | | | | | |
| | | | | | | | | | | 998 | |
| | | | | | | | | | | | |
| |
| |
|
Matching Fund Special Purpose Securitization Corp., U.S. Virgin Islands Revenue Bonds, Series 2022 | |
| | | | | 1,860 | | | | | | 1,870 | |
| | | | | | | | | | | | |
| |
| |
|
Virginia Small Business Financing Authority Revenue Bonds, Series 2019 | |
0.000% due 07/01/2061 (b) | | | | | 17,000 | | | | | | 531 | |
| | | | | | | | | | | | |
| | | | | | | | | | | |
| | $ | | | 500 | | | $ | | | 458 | |
| | | | | | | | | | | | |
| | | | | | | | | | | 989 | |
| | | | | | | | | | | | |
Total Municipal Bonds & Notes (Cost $336,224) | | | | |
| | | | |
| |
SHORT-TERM INSTRUMENTS 1.2% | |
| |
REPURCHASE AGREEMENTS (e) 1.2% | |
| | | | | | | | | | | 2,454 | |
| | | | | | | | | | | | |
Total Short-Term Instruments
(Cost $2,454) | | | | |
| | | | |
| | | | |
| | | | | | | | | | | | |
Total Investments in Securities (Cost $338,678) | | | | |
| |
| | | | |
Total Investments 169.8%
(Cost $338,678) | | | $ | | | | |
| |
Auction Rate Preferred Shares (54.3)% | | | | |
| |
Remarketable Variable Rate MuniFund Term Preferred Shares, at liquidation value (17.1)% | | | | | | | |
| |
Other Assets and Liabilities, net 1.6% | | | | |
| | | | |
Net Assets Applicable to Common Shareholders 100.0% | | | $ | | | | |
| | | | | | | | | | | | |
NOTES TO SCHEDULE OF INVESTMENTS:
| A zero balance may reflect actual amounts rounding to less than one thousand. |
| Security is not accruing income as of the date of this report. |
| Security becomes interest bearing at a future date. |
(d) RESTRICTED SECURITIES:
| | | | | | | | | | | | | | | | | | | | | | |
| | | | | | | | | | | | | | | | Market Value
as Percentage
of Net Assets
Applicable to
Common
Shareholders
| |
California Municipal Finance Authority Revenue Bonds, Series 2021 | | 4.000% | | | 09/01/2050 | | | | 08/03/2022 | | | | $ 1,088 | | | $ | 1,062 | | | | 0.53% | |
| | | | | | | | | | | | | | | | | | | | | | |
BORROWINGS AND OTHER FINANCING TRANSACTIONS
(e) REPURCHASE AGREEMENTS:
| | | | | | | | | | | | | | | | | | | | | | | | | | | | | | |
| | | | | | | | | | | | | | | | | | | Repurchase
Agreements,
at Value | | | Repurchase Agreement Proceeds to be Received (1) | |
| FICC | | | 2.600 | % | | | 12/29/2023 | | | | 01/02/2024 | | | $ | 2,454 | | | U.S. Treasury Notes 0.375% due 11/30/2025 | | $ | (2,503 | ) | | $ | 2,454 | | | $ | 2,455 | |
| | | | | | | | | | | | | | | | | | | | | | | | | | | | | | |
Total Repurchase Agreements | | | | | | | | | | | | | | | |
| | | | | | | | | | | | | | | |
| | | | | | | | | | | | |
| See Accompanying Notes | | | | | | | | | | DECEMBER 31, 2023 | | | |
| | | | | | |
| | PIMCO California Municipal Income Fund | | | | December 31, 2023 |
BORROWINGS AND OTHER FINANCING TRANSACTIONS SUMMARY
The following is a summary by counterparty of the market value of Borrowings and Other Financing Transactions and collateral pledged/(received) as of December 31, 2023:
| | | | | | | | | | | | | | | | | | | | | | | | |
| | Repurchase Agreement Proceeds to be Received (1) | | | Payable for
Reverse
Repurchase
Agreements | | | Payable for Sale-Buyback Transactions | | | Total
Borrowings and
Other Financing
Transactions | | | Collateral
Pledged/(Received) | | | | |
Global/Master Repurchase Agreement | |
| | $ | 2,455 | | | $ | 0 | | | $ | 0 | | | $ | 2,455 | | | $ | (2,503 | ) | | $ | (48 | ) |
| | | | | | | | | | | | | | | | | | | | | | | | |
Total Borrowings and Other Financing Transactions | | | | | | | | | | | | | | | | | | | | | | | | |
| | | | | | | | | | | | | | | | | | | | | | | | |
| Includes accrued interest. |
| Net Exposure represents the net receivable/(payable) that would be due from/to the counterparty in the event of default. Exposure from borrowings and other financing transactions can only be netted across transactions governed under the same master agreement with the same legal entity. See Note 7, Master Netting Arrangements, in the Notes to Financial Statements for more information. |
The following is a summary of the fair valuations according to the inputs used as of December 31, 2023 in valuing the Fund’s assets and
liabilities:
| | | | | | | | | | | | | | | | |
| | | | | | | | | | | | |
Investments in Securities, at Value | |
| |
| | $ | 0 | | | $ | 51 | | | $ | 0 | | | $ | 51 | |
| | | 0 | | | | 306,851 | | | | 0 | | | | 306,851 | |
| | | 0 | | | | 2,895 | | | | 0 | | | | 2,895 | |
| | | 0 | | | | 6,714 | | | | 0 | | | | 6,714 | |
| | | 0 | | | | 1,955 | | | | 0 | | | | 1,955 | |
| | | 0 | | | | 523 | | | | 0 | | | | 523 | |
| | | 0 | | | | 130 | | | | 0 | | | | 130 | |
| | | 0 | | | | 1,291 | | | | 0 | | | | 1,291 | |
| | | | | | | | | | | | | | | | |
| | | | | | | | | | | | |
| | $ | 0 | | | $ | 16,760 | | | $ | 0 | | | $ | 16,760 | |
| | | 0 | | | | 998 | | | | 0 | | | | 998 | |
| | | 0 | | | | 1,870 | | | | 0 | | | | 1,870 | |
| | | 0 | | | | 989 | | | | 0 | | | | 989 | |
| |
| | | 0 | | | | 2,454 | | | | 0 | | | | 2,454 | |
| | | | | | | | | | | | | | | | |
| | | | |
| | $ | 0 | | | $ | 343,481 | | | $ | 0 | | | $ | 343,481 | |
| | | | | | | | | | | | | | | | |
There were no significant transfers into or out of Level 3 during the period ended December 31, 2023.
| | | | | | |
| | PIMCO California Municipal Income Fund II | | | | December 31, 2023 |
(Amounts in thousands*, except number of shares, contracts, units and ounces, if any)
| | | | | | | | | | | | |
| | | | | | | | | | | |
INVESTMENTS IN SECURITIES 169.1% | |
| |
MUNICIPAL BONDS & NOTES 163.6% | |
| |
| |
|
Arizona Industrial Development Authority Revenue Bonds, Series 2020 | |
7.750% due 07/01/2050 ^(a) | | $ | | | 940 | | | $ | | | 56 | |
| | | | | | | | | | | | |
| |
| |
|
Alameda Corridor Transportation Authority, California Revenue Bonds, Series 2022 | |
0.000% due 10/01/2049 (c) | | | | | 3,085 | | | | | | 1,667 | |
|
Anaheim City School District, California General Obligation Bonds, (BAM Insured), Series 2023 | |
| | | | | 2,700 | | | | | | 2,751 | |
|
Antelope Valley Community College District, California General Obligation Bonds, Series 2022 | |
0.000% due 08/01/2047 (b) | | | | | 720 | | | | | | 225 | |
|
Bay Area Toll Authority, California Revenue Bonds, Series 2014 | |
| | | | | 3,000 | | | | | | 3,050 | |
|
Bay Area Toll Authority, California Revenue Bonds, Series 2017 | |
| | | | | 3,000 | | | | | | 3,012 | |
| | | | | 2,000 | | | | | | 2,171 | |
|
Bay Area Toll Authority, California Revenue Bonds, Series 2023 | |
| | | | | 1,800 | | | | | | 1,822 | |
|
Butte-Glenn Community College District, California General Obligation Bonds, Series 2022 | |
| | | | | 1,600 | | | | | | 1,616 | |
|
California Community Choice Financing Authority Revenue Bonds, Series 2023 | |
| | | | | 2,000 | | | | | | 2,167 | |
|
California Community Housing Agency Revenue Bonds, Series 2019 | |
| | | | | 4,400 | | | | | | 3,667 | |
| | | | | 1,000 | | | | | | 942 | |
|
California Community Housing Agency Revenue Bonds, Series 2021 | |
| | | | | 1,000 | | | | | | 752 | |
|
California Community Housing Agency Revenue Bonds, Series 2022 | |
| | | | | 1,000 | | | | | | 828 | |
|
California County Tobacco Securitization Agency Revenue Bonds, Series 2002 | |
| | | | | 885 | | | | | | 885 | |
| | | | | 1,000 | | | | | | 1,001 | |
|
California County Tobacco Securitization Agency Revenue Bonds, Series 2007 | |
0.000% due 06/01/2057 (b) | | | | | 9,000 | | | | | | 1,354 | |
|
California County Tobacco Securitization Agency Revenue Bonds, Series 2020 | |
0.000% due 06/01/2055 (b) | | | | | 5,100 | | | | | | 922 | |
|
California Educational Facilities Authority Revenue Bonds, Series 2018 | |
| | | | | 1,300 | | | | | | 1,371 | |
| | | | | 1,320 | | | | | | 1,379 | |
|
California Health Facilities Financing Authority Revenue Bonds, Series 2015 | |
| | | | | 5,000 | | | | | | 5,086 | |
|
California Health Facilities Financing Authority Revenue Bonds, Series 2016 | |
| | | | | 6,275 | | | | | | 6,421 | |
|
California Health Facilities Financing Authority Revenue Bonds, Series 2017 | |
| | | | | 1,500 | | | | | | 1,527 | |
| | | | | 2,750 | | | | | | 2,721 | |
|
California Health Facilities Financing Authority Revenue Bonds, Series 2021 | |
| | | | | 1,200 | | | | | | 1,216 | |
|
California Infrastructure & Economic Development Bank Revenue Bonds, Series 2020 | |
0.000% due 01/01/2060 (b) | | | | | 6,250 | | | | | | 346 | |
| | | | | | | | | | | | |
| | | | | | | | | | | |
| | $ | | | 850 | | | $ | | | 851 | |
| | | | | 1,900 | | | | | | 1,935 | |
|
California Municipal Finance Authority Certificates of Participation Bonds, (AGM Insured), Series 2022 | |
| | | | | 1,800 | | | | | | 2,021 | |
|
California Municipal Finance Authority Revenue Bonds, (BAM Insured), Series 2021 | |
| | | | | 500 | | | | | | 502 | |
|
California Municipal Finance Authority Revenue Bonds, Series 2018 | |
| | | | | 1,000 | | | | | | 1,030 | |
| | | | | 1,465 | | | | | | 1,567 | |
|
California Municipal Finance Authority Revenue Bonds, Series 2021 | |
4.000% due 09/01/2050 (d) | | | | | 1,500 | | | | | | 1,327 | |
|
California Public Finance Authority Revenue Bonds, Series 2019 | |
| | | | | 1,650 | | | | | | 1,740 | |
|
California State General Obligation Bonds, Series 2017 | |
| | | | | 3,250 | | | | | | 3,284 | |
|
California State General Obligation Bonds, Series 2018 | |
| | | | | 4,500 | | | | | | 4,514 | |
| | | | | 2,000 | | | | | | 2,073 | |
|
California State General Obligation Bonds, Series 2020 | |
| | | | | 1,500 | | | | | | 1,574 | |
|
California State General Obligation Bonds, Series 2022 | |
| | | | | 1,500 | | | | | | 1,575 | |
|
California State General Obligation Bonds, Series 2023 | |
| | | | | 2,000 | | | | | | 2,091 | |
|
California State General Obligation Notes, Series 2021 | |
| | | | | 3,000 | | | | | | 3,440 | |
|
California State University Revenue Bonds, Series 2015 | |
| | | | | 5,000 | | | | | | 5,144 | |
|
California State University Revenue Bonds, Series 2023 | |
| | | | | 1,000 | | | | | | 1,158 | |
|
California Statewide Communities Development Authority Revenue Bonds, (AGM Insured), Series 2022 | |
| | | | | 1,100 | | | | | | 1,224 | |
|
California Statewide Communities Development Authority Revenue Bonds, (CM Insured), Series 2018 | |
| | | | | 1,350 | | | | | | 1,369 | |
|
California Statewide Communities Development Authority Revenue Bonds, Series 2016 | |
| | | | | 225 | | | | | | 224 | |
| | | | | 2,000 | | | | | | 1,904 | |
| | | | | 2,000 | | | | | | 1,980 | |
| | | | | 3,550 | | | | | | 3,561 | |
|
California Statewide Communities Development Authority Revenue Bonds, Series 2018 | |
| | | | | 1,000 | | | | | | 1,004 | |
| | | | | 230 | | | | | | 224 | |
| | | | | 2,000 | | | | | | 1,948 | |
| | | | | 2,800 | | | | | | 2,878 | |
| | | | | 2,200 | | | | | | 2,250 | |
|
California Statewide Communities Development Authority Revenue Bonds, Series 2019 | |
| | | | | 1,995 | | | | | | 1,826 | |
|
California Statewide Financing Authority Revenue Bonds, Series 2002 | |
| | | | | 1,290 | | | | | | 1,310 | |
|
Calistoga Joint Unified School District, California General Obligation Bonds, Series 2023 | |
| | | | | 1,565 | | | | | | 1,754 | |
|
Chino Valley Unified School District, California General Obligation Bonds, Series 2020 | |
| | | | | 2,000 | | | | | | 2,165 | |
|
Chino Valley Unified School District, California General Obligation Bonds, Series 2022 | |
0.000% due 08/01/2037 (b) | | | | | 1,000 | | | | | | 605 | |
0.000% due 08/01/2040 (b) | | | | | 1,400 | | | | | | 717 | |
0.000% due 08/01/2043 (b) | | | | | 1,750 | | | | | | 769 | |
0.000% due 08/01/2044 (b) | | | | | 1,405 | | | | | | 587 | |
|
City of California, Eureka City Schools, General Obligation Bonds, (BAM Insured), Series 2020 | |
| | | | | 3,000 | | | | | | 3,009 | |
| | | | | | | | | | | | |
| | | | | | | | | | | |
|
CMFA Special Finance Agency VII, California Revenue Bonds, Series 2021 | |
| | $ | | | 1,000 | | | $ | | | 663 | |
| | | | | 595 | | | | | | 477 | |
|
CMFA Special Finance Agency, California Revenue Bonds, Series 2021 | |
| | | | | 750 | | | | | | 613 | |
|
Corona Norco Unified School District, California General Obligation Bonds, Series 2018 | |
| | | | | 1,790 | | | | | | 1,799 | |
|
CSCDA Community Improvement Authority, California Revenue Bonds, Series 2021 | |
| | | | | 500 | | | | | | 340 | |
| | | | | 1,000 | | | | | | 753 | |
| | | | | 445 | | | | | | 341 | |
| | | | | 250 | | | | | | 189 | |
| | | | | 550 | | | | | | 396 | |
|
CSCDA Community Improvement Authority, California Revenue Bonds, Series 2022 | |
0.000% due 09/01/2062 (c) | | | | | 2,200 | | | | | | 1,118 | |
|
Department of Veterans Affairs Veteran’s Farm & Home Purchase Program, California Revenue Bonds, Series 2022 | |
| | | | | 360 | | | | | | 379 | |
|
El Monte School District, California General Obligation Bonds, (BAM Insured), Series 2023 | |
| | | | | 1,635 | | | | | | 1,792 | |
|
Elk Grove Finance Authority, California Special Tax Bonds, Series 2016 | |
| | | | | 1,670 | | | | | | 1,691 | |
|
Folsom Cordova Unified School District, California General Obligation Bonds, (AGM Insured), Series 2019 | |
| | | | | 1,415 | | | | | | 1,418 | |
|
Foothill-Eastern Transportation Corridor Agency, California Revenue Bonds, Series 2014 | |
| | | | | 920 | | | | | | 869 | |
|
Fremont Community Facilities District No. 1, California Special Tax Bonds, Series 2015 | |
| | | | | 1,400 | | | | | | 1,417 | |
|
Fresno Unified School District, California General Obligation Bonds, Series 2016 | |
| | | | | 2,605 | | | | | | 2,593 | |
|
Golden State, California Tobacco Securitization Corp. Revenue Bonds, Series 2018 | |
| | | | | 1,500 | | | | | | 1,668 | |
| | | | | 4,500 | | | | | | 5,003 | |
|
Golden State, California Tobacco Securitization Corp. Revenue Bonds, Series 2021 | |
0.000% due 06/01/2066 (b) | | | | | 20,000 | | | | | | 2,363 | |
|
Hacienda La Puente Unified School District, California General Obligation Bonds, Series 2017 | |
| | | | | 3,000 | | | | | | 3,021 | |
|
Hartnell Community College District, California General Obligation Bonds, Series 2017 | |
| | | | | 3,500 | | | | | | 3,570 | |
|
Hastings Campus Housing Finance Authority, California Revenue Bonds, Series 2020 | |
| | | | | 2,650 | | | | | | 2,263 | |
|
Hayward Unified School District, California General Obligation Bonds, Series 2015 | |
| | | | | 3,000 | | | | | | 3,038 | |
|
Long Beach Bond Finance Authority, California General Obligation Bonds, Series 2023 | |
| | | | | 2,000 | | | | | | 1,998 | |
|
Long Beach Bond Finance Authority, California Revenue Bonds, Series 2007 | |
| | | | | 7,500 | | | | | | 8,739 | |
|
Los Angeles County, California Facilities, Inc., Revenue Bonds, Series 2018 | |
| | | | | 2,500 | | | | | | 2,528 | |
|
Los Angeles County, California Metropolitan Transportation Authority Sales Tax Revenue Bonds, Series 2021 | |
| | | | | 2,000 | | | | | | 2,153 | |
| | | | | | | | | | | | |
| See Accompanying Notes | | | | | | | | | | DECEMBER 31, 2023 | | | |
| | | | | | |
| | PIMCO California Municipal Income Fund II | | | | |
| | | | | | | | | | | | |
| | | | | | | | | | | |
|
Los Angeles County, California Sanitation District, Financing Authority Revenue Bonds, Series 2016 | |
| | $ | | | 2,000 | | | $ | | | 2,026 | |
|
Los Angeles Department of Airports, California Revenue Bonds, Series 2021 | |
| | | | | 2,500 | | | | | | 2,761 | |
|
Los Angeles Department of Water & Power Water System, California Revenue Bonds, Series 2022 | |
| | | | | 1,475 | | | | | | 1,658 | |
|
Los Angeles Department of Water & Power, California Revenue Bonds, Series 2014 | |
| | | | | 3,000 | | | | | | 3,000 | |
|
Los Angeles Department of Water & Power, California Revenue Bonds, Series 2018 | |
| | | | | 2,000 | | | | | | 2,157 | |
|
Los Angeles Department of Water & Power, California Revenue Bonds, Series 2021 | |
| | | | | 3,900 | | | | | | 4,421 | |
|
Los Angeles, California Wastewater System Revenue Bonds, Series 2017 | |
| | | | | 1,000 | | | | | | 1,072 | |
|
Energy Authority, California Revenue Bonds, Series 2009 | |
| | | | | 7,810 | | | | | | 10,064 | |
| | | | | 1,000 | | | | | | 1,289 | |
|
Mount San Jacinto Community College District, California General Obligation Bonds, Series 2018 | |
| | | | | 2,200 | | | | | | 2,248 | |
|
Municipal Improvement Corp. of Los Angeles, California Revenue Bonds, Series 2021 | |
| | | | | 2,200 | | | | | | 2,566 | |
|
Norwalk-La Mirada Unified School District, California General Obligation Bonds, Series 2019 | |
| | | | | 2,750 | | | | | | 2,765 | |
|
Ontario International Airport Authority, California Revenue Bonds, (AGM Insured), Series 2021 | |
| | | | | 500 | | | | | | 507 | |
|
Ontario Montclair School District, California General Obligation Bonds, Series 2017 | |
| | | | | 1,825 | | | | | | 1,925 | |
|
Orange County, California Community Facilities District Special Tax Bonds, Series 2022 | |
| | | | | 1,360 | | | | | | 1,399 | |
|
Pacifica School District, California General Obligation Bonds, Series 2018 | |
| | | | | 2,000 | | | | | | 2,010 | |
|
Poway Unified School District, California General Obligation Bonds, Series 2011 | |
0.000% due 08/01/2040 (b) | | | | | 11,000 | | | | | | 5,896 | |
0.000% due 08/01/2046 (b) | | | | | 16,000 | | | | | | 6,000 | |
|
Redwood City School District, California General Obligation Bonds, Series 2023 | |
| | | | | 2,140 | | | | | | 2,409 | |
|
Richmond, California Wastewater Revenue Bonds, Series 2019 | |
| | | | | 1,460 | | | | | | 1,471 | |
|
Rio Hondo Community College District, California General Obligation Bonds, Series 2022 | |
0.000% due 08/01/2045 (b) | | | | | 1,850 | | | | | | 679 | |
|
River Islands Public Financing Authority, California Special Tax, (AGM Insured), Series 2022 | |
| | | | | 1,100 | | | | | | 1,121 | |
|
Riverside, California Sewer Revenue Bonds, Series 2018 | |
| | | | | 3,500 | | | | | | 3,616 | |
|
Sacramento City Unified School District, California General Obligation Bonds, (AGM Insured), Series 2021 | |
| | | | | 1,500 | | | | | | 1,501 | |
|
Sacramento County, California Sanitation District, Financing Authority Revenue Bonds, Series 2020 | |
| | | | | 1,200 | | | | | | 1,319 | |
|
Sacramento County, California Special Tax Bonds, Series 2022 | |
| | | | | 500 | | | | | | 506 | |
| | | | | | | | | | | | |
| | | | | | | | | | | |
|
Sacramento Municipal Utility District, California Revenue Bonds, Series 2023 | |
| | $ | | | 500 | | | $ | | | 572 | |
|
San Bernardino Community College District, California General Obligation Bonds, Series 2023 | |
| | | | | 3,700 | | | | | | 4,081 | |
|
San Diego County, California Certificates of Participation Bonds, Series 2023 | |
| | | | | 3,650 | | | | | | 4,088 | |
|
San Diego County, California Regional Airport Authority Revenue Bonds, Series 2021 | |
| | | | | 3,000 | | | | | | 2,922 | |
| | | | | 2,360 | | | | | | 2,467 | |
|
San Diego Public Facilities Financing Authority, California Revenue Bonds, Series 2022 | |
| | | | | 1,000 | | | | | | 1,122 | |
|
San Diego Unified School District, California General Obligation Bonds, Series 2020 | |
| | | | | 900 | | | | | | 904 | |
|
San Diego Unified School District, California General Obligation Bonds, Series 2023 | |
| | | | | 4,500 | | | | | | 4,505 | |
| | | | | 1,000 | | | | | | 1,142 | |
|
San Francisco Bay Area Rapid Transit District, California General Obligation Bonds, Series 2017 | |
| | | | | 1,000 | | | | | | 1,051 | |
|
San Francisco, California City & County Airport Comm-San Francisco International Airport Revenue Bonds, Series 2017 | |
| | | | | 2,750 | | | | | | 2,876 | |
|
San Francisco, California City & County Airport Comm-San Francisco International Airport Revenue Bonds, Series 2019 | |
| | | | | 4,000 | | | | | | 4,142 | |
|
San Francisco, California City & County Certificates of Participation Bonds, Series 2015 | |
| | | | | 1,530 | | | | | | 1,531 | |
|
San Francisco, California City & County Public Utilities Commission Power Revenue Bonds, Series 2023 | |
| | | | | 1,800 | | | | | | 2,045 | |
|
San Francisco, California Public Utilities Commission Water Revenue Bonds, Series 2020 | |
| | | | | 1,200 | | | | | | 1,323 | |
|
San Jose Evergreen Community College District, California General Obligation Bonds, Series 2014 | |
| | | | | 1,750 | | | | | | 1,766 | |
|
San Jose Financing Authority, California Revenue Bonds, Series 2022 | |
| | | | | 1,800 | | | | | | 2,029 | |
|
San Marcos Redevelopment Agency Successor Agency, California Tax Allocation Bonds, Series 2015 | |
| | | | | 850 | | | | | | 882 | |
| | | | | 1,125 | | | | | | 1,167 | |
|
San Mateo County, California Community College District General Obligation Bonds, (NPFGC Insured), Series 2006 | |
0.000% due 09/01/2034 (b) | | | | | 12,000 | | | | | | 8,820 | |
|
San Mateo Joint Powers Financing Authority, California Revenue Bonds, Series 2018 | |
| | | | | 1,800 | | | | | | 1,813 | |
|
Santa Ana Unified School District, California General Obligation Bonds, Series 2019 | |
| | | | | 1,750 | | | | | | 1,765 | |
|
Santa Clarita Community College District, California General Obligation Bonds, Series 2016 | |
| | | | | 2,200 | | | | | | 2,215 | |
|
Santa Monica, California Community College District General Obligation Bonds, Series 2022 | |
| | | | | 1,270 | | | | | | 1,308 | |
|
Silicon Valley Tobacco Securitization Authority, California Revenue Bonds, Series 2007 | |
0.000% due 06/01/2036 (b) | | | | | 1,000 | | | | | | 507 | |
|
Southwestern Community College District, California General Obligation Bonds, Series 2021 | |
| | | | | 4,850 | | | | | | 4,935 | |
| | | | | | | | | | | | |
| | | | | | | | | | | |
|
State Center Community College District, California General Obligation Bonds, Series 2022 | |
| | $ | | | 1,815 | | | $ | | | 2,039 | |
|
Sweetwater Union High School District, California General Obligation Bonds, Series 2022 | |
| | | | | 2,190 | | | | | | 2,403 | |
|
Tobacco Securitization Authority of Northern California Revenue Bonds, Series 2021 | |
0.000% due 06/01/2060 (b) | | | | | 19,480 | | | | | | 3,249 | |
|
Tobacco Securitization Authority of Southern California Revenue Bonds, Series 2006 | |
0.000% due 06/01/2046 (b) | | | | | 5,000 | | | | | | 920 | |
|
University of California Revenue Bonds, Series 2022 | |
| | | | | 8,800 | | | | | | 9,814 | |
|
Upland, California Certificates of Participation Bonds, Series 2017 | |
| | | | | 3,000 | | | | | | 2,868 | |
|
Washington Township Health Care District, California General Obligation Bonds, Series 2015 | |
| | | | | 3,000 | | | | | | 3,000 | |
|
Washington Township Health Care District, California General Obligation Bonds, Series 2023 | |
| | | | | 1,500 | | | | | | 1,709 | |
| | | | | | | | | | | | |
| | | | | | | | | | | 323,591 | |
| | | | | | | | | | | | |
| |
| |
|
Affordable Housing Opportunities Trust, Delaware Revenue Bonds, Series 2022 | |
| | | | | 2,930 | | | | | | 2,602 | |
| | | | | 520 | | | | | | 515 | |
| | | | | | | | | | | | |
| | | | | | | | | | | 3,117 | |
| | | | | | | | | | | | |
| |
| |
|
Chicago, Illinois General Obligation Bonds, Series 2007 | |
| | | | | 2,350 | | | | | | 2,365 | |
|
Illinois State General Obligation Bonds, Series 2018 | |
| | | | | 1,000 | | | | | | 1,061 | |
|
Illinois State General Obligation Bonds, Series 2020 | |
| | | | | 1,500 | | | | | | 1,538 | |
| | | | | | | | | | | | |
| | | | | | | | | | | 4,964 | |
| | | | | | | | | | | | |
| |
| |
|
New Hampshire Business Finance Authority Revenue Bonds, Series 2023 | |
| | | | | 2,111 | | | | | | 2,083 | |
| | | | | | | | | | | | |
| |
| |
|
New York Liberty Development Corp. Revenue Bonds, Series 2005 | |
| | | | | 1,250 | | | | | | 1,488 | |
|
New York Power Authority Revenue Bonds, Series 2020 | |
| | | | | 550 | | | | | | 548 | |
| | | | | | | | | | | | |
| | | | | | | | | | | 2,036 | |
| | | | | | | | | | | | |
| |
| |
|
Grand Forks County, North Dakota Revenue Bonds, Series 2021 | |
7.000% due 12/15/2043 ^(a) | | | | | 720 | | | | | | 144 | |
| | | | | | | | | | | | |
| |
| |
|
Pennsylvania Economic Development Financing Authority Revenue Bonds, Series 2021 | |
| | | | | 1,275 | | | | | | 1,407 | |
| | | | | | | | | | | | |
| |
| |
|
Children’s Trust Fund, Puerto Rico Revenue Bonds, Series 2008 | |
0.000% due 05/15/2057 (b) | | | | | 24,300 | | | | | | 1,826 | |
| | | | | | | | | | | | |
| | | | | | | | | | | |
|
Commonwealth of Puerto Rico Bonds, Series 2022 | |
| | $ | | | 2,752 | | | $ | | | 1,338 | |
|
Commonwealth of Puerto Rico General Obligation Bonds, Series 2021 | |
0.000% due 07/01/2033 (b) | | | | | 1,250 | | | | | | 781 | |
| | | | | 1,300 | | | | | | 1,197 | |
|
Puerto Rico Sales Tax Financing Corp. Sales Tax Revenue Bonds, Series 2018 | |
0.000% due 07/01/2051 (b) | | | | | 20,000 | | | | | | 4,695 | |
|
Puerto Rico Sales Tax Financing Corp. Sales Tax Revenue Bonds, Series 2019 | |
| | | | | 5,425 | | | | | | 5,361 | |
| | | | | | | | | | | | |
| | | | | | | | | | | 15,198 | |
| | | | | | | | | | | | |
| |
| |
|
Angelina & Neches River Authority, Texas Revenue Bonds, Series 2021 | |
| | | | | 500 | | | | | | 331 | |
| | | | | 850 | | | | | | 736 | |
| | | | | | | | | | | | |
| | | | | | | | | | | |
|
San Antonio Municipal Facilities Corp., Texas Revenue Bonds, Series 2021 | |
| | $ | | | 2,300 | | | $ | | | 2,282 | |
| | | | | | | | | | | | |
| | | | | | | | | | | 3,349 | |
| | | | | | | | | | | | |
| |
| |
|
Matching Fund Special Purpose Securitization Corp., U.S. Virgin Islands Revenue Bonds, Series 2022 | |
| | | | | 2,005 | | | | | | 2,016 | |
| | | | | | | | | | | | |
| |
| |
|
Virginia Small Business Financing Authority Revenue Bonds, Series 2019 | |
0.000% due 07/01/2061 (b) | | | | | 19,000 | | | | | | 594 | |
| | | | | 500 | | | | | | 458 | |
| | | | | | | | | | | | |
| | | | | | | | | | | 1,052 | |
| | | | | | | | | | | | |
Total Municipal Bonds & Notes (Cost $347,547) | | | | |
| | | | |
| |
| | | | | | | | | | | | |
| | | | | | | | | | | |
SHORT-TERM INSTRUMENTS 5.5% | |
| |
REPURCHASE AGREEMENTS (e) 5.5% | |
| | | | | | | | $ | | | 12,050 | |
| | | | | | | | | | | | |
Total Short-Term Instruments
(Cost $12,050) | | | | |
| | | | |
| | | | |
| | | | | | | | | | | | |
Total Investments in Securities
(Cost $359,597) | | | | |
| |
| | | | |
Total Investments 169.1%
(Cost $359,597) | | | $ | | | | |
| |
Auction Rate Preferred Shares (44.6)% | | | | | | | |
| |
Remarketable Variable Rate MuniFund Term Preferred Shares, at liquidation value (25.8)% | | | | | | | |
| |
Other Assets and Liabilities, net 1.3% | | | | |
| | | | |
Net Assets Applicable to Common Shareholders 100.0% | | | $ | | | | |
| | | | | | | |
NOTES TO SCHEDULE OF INVESTMENTS:
| A zero balance may reflect actual amounts rounding to less than one thousand. |
| Security is not accruing income as of the date of this report. |
| Security becomes interest bearing at a future date. |
(d) RESTRICTED SECURITIES:
| | | | | | | | | | | | | | | | | | | | | | |
| | | | | | | | | | | | | | | | Market Value
as Percentage
of Net Assets
Applicable to
Common
Shareholders
| |
California Municipal Finance Authority Revenue Bonds, Series 2021 | | 4.000% | | | 09/01/2050 | | | | 08/03/2022 | | | | $ 1,360 | | | $ | 1,327 | | | | 0.60% | |
| | | | | | | | | | | | | | | | | | | | | | |
BORROWINGS AND OTHER FINANCING TRANSACTIONS
(e) REPURCHASE AGREEMENTS:
| | | | | | | | | | | | | | | | | | | | | | | | | | | | | | |
| | | | | | | | | | | | | | | | | | | Repurchase
Agreements,
at Value | | | Repurchase Agreement Proceeds to be Received (1) | |
| FICC | | | 2.600 | % | | | 12/29/2023 | | | | 01/02/2024 | | | $ | 12,050 | | | U.S. Treasury Notes 4.875% due 11/30/2025 | | $ | (12,291 | ) | | $ | 12,050 | | | $ | 12,053 | |
| | | | | | | | | | | | | | | | | | | | | | | | | | | | | | |
Total Repurchase Agreements | | | | | | | | | | | | | | | |
| | | | | | | | | | | | | | | |
BORROWINGS AND OTHER FINANCING TRANSACTIONS SUMMARY
The following is a summary by counterparty of the market value of Borrowings and Other Financing Transactions and collateral pledged/(received) as of December 31, 2023:
| | | | | | | | | | | | | | | | | | | | | | | | |
| | Repurchase Agreement Proceeds to be Received (1) | | | Payable for
Reverse
Repurchase
Agreements | | | Payable for Sale-Buyback Transactions | | | Total
Borrowings and
Other Financing
Transactions | | | Collateral
Pledged/(Received) | | | | |
Global/Master Repurchase Agreement | |
| | $ | 12,053 | | | $ | 0 | | | $ | 0 | | | $ | 12,053 | | | $ | (12,291 | ) | | $ | (238 | ) |
| | | | | | | | | | | | | | | | | | | | | | | | |
Total Borrowings and Other Financing Transactions | | | | | | | | | | | | | | | | | | | | | | | | |
| | | | | | | | | | | | | | | | | | | | | | | | |
| Includes accrued interest. |
| Net Exposure represents the net receivable/(payable) that would be due from/to the counterparty in the event of default. Exposure from borrowings and other financing transactions can only be netted across transactions governed under the same master agreement with the same legal entity. See Note 7, Master Netting Arrangements, in the Notes to Financial Statements for more information. |
| | | | | | | | | | | | |
| See Accompanying Notes | | | | | | | | | | DECEMBER 31, 2023 | | | |
| | | | | | |
| | PIMCO California Municipal Income Fund II | | | | December 31, 2023 |
The following is a summary of the fair valuations according to the inputs used as of December 31, 2023 in valuing the Fund’s assets and
liabilities:
| | | | | | | | | | | | | | | | |
| | | | | | | | | | | | |
Investments in Securities, at Value | |
| |
| | $ | 0 | | | $ | 56 | | | $ | 0 | | | $ | 56 | |
| | | 0 | | | | 323,591 | | | | 0 | | | | 323,591 | |
| | | 0 | | | | 3,117 | | | | 0 | | | | 3,117 | |
| | | 0 | | | | 4,964 | | | | 0 | | | | 4,964 | |
| | | 0 | | | | 2,083 | | | | 0 | | | | 2,083 | |
| | | 0 | | | | 2,036 | | | | 0 | | | | 2,036 | |
| | | 0 | | | | 144 | | | | 0 | | | | 144 | |
| | | | | | | | | | | | | | | | |
| | | | | | | | | | | | |
| | $ | 0 | | | $ | 1,407 | | | $ | 0 | | | $ | 1,407 | |
| | | 0 | | | | 15,198 | | | | 0 | | | | 15,198 | |
| | | 0 | | | | 3,349 | | | | 0 | | | | 3,349 | |
| | | 0 | | | | 2,016 | | | | 0 | | | | 2,016 | |
| | | 0 | | | | 1,052 | | | | 0 | | | | 1,052 | |
| |
| | | 0 | | | | 12,050 | | | | 0 | | | | 12,050 | |
| | | | | | | | | | | | | | | | |
| | | | |
| | $ | 0 | | | $ | 371,063 | | | $ | 0 | | | $ | 371,063 | |
| | | | | | | | | | | | | | | | |
There were no significant transfers into or out of Level 3 during the period ended December 31, 2023.
| | | | | | |
| | PIMCO California Municipal Income Fund III | | | | December 31, 2023 |
(Amounts in thousands*, except number of shares, contracts, units and ounces, if any)
| | | | | | | | | | | | |
| | | | | | | | | | | |
INVESTMENTS IN SECURITIES 168.8% | |
| |
MUNICIPAL BONDS & NOTES 164.8% | |
| |
| |
|
Arizona Industrial Development Authority Revenue Bonds, Series 2020 | |
7.750% due 07/01/2050 ^(a) | | $ | | | 730 | | | $ | | | 44 | |
| | | | | | | | | | | | |
| |
| |
|
Alameda Corridor Transportation Authority, California Revenue Bonds, Series 2022 | |
0.000% due 10/01/2049 (c) | | | | | 2,525 | | | | | | 1,364 | |
|
Anaheim City School District, California General Obligation Bonds, (BAM Insured), Series 2023 | |
| | | | | 2,300 | | | | | | 2,344 | |
|
Antelope Valley Community College District, California General Obligation Bonds, Series 2022 | |
0.000% due 08/01/2047 (b) | | | | | 600 | | | | | | 187 | |
|
Bay Area Toll Authority, California Revenue Bonds, Series 2007 | |
| | | | | 590 | | | | | | 590 | |
|
Bay Area Toll Authority, California Revenue Bonds, Series 2023 | |
| | | | | 1,500 | | | | | | 1,518 | |
|
Butte-Glenn Community College District, California General Obligation Bonds, Series 2022 | |
| | | | | 1,330 | | | | | | 1,343 | |
|
California Community Choice Financing Authority Revenue Bonds, Series 2023 | |
| | | | | 1,750 | | | | | | 1,896 | |
|
California Community Housing Agency Revenue Bonds, Series 2019 | |
| | | | | 3,700 | | | | | | 3,083 | |
| | | | | 1,000 | | | | | | 942 | |
|
California Community Housing Agency Revenue Bonds, Series 2021 | |
| | | | | 1,000 | | | | | | 752 | |
|
California Community Housing Agency Revenue Bonds, Series 2022 | |
| | | | | 1,000 | | | | | | 828 | |
|
California County Tobacco Securitization Agency Revenue Bonds, Series 2002 | |
| | | | | 1,805 | | | | | | 1,832 | |
| | | | | 7,000 | | | | | | 7,105 | |
| | | | | 1,000 | | | | | | 1,001 | |
|
California County Tobacco Securitization Agency Revenue Bonds, Series 2007 | |
0.000% due 06/01/2057 (b) | | | | | 4,000 | | | | | | 602 | |
|
California County Tobacco Securitization Agency Revenue Bonds, Series 2020 | |
0.000% due 06/01/2055 (b) | | | | | 4,000 | | | | | | 723 | |
|
California Educational Facilities Authority Revenue Bonds, Series 2018 | |
| | | | | 1,000 | | | | | | 1,054 | |
|
California Health Facilities Financing Authority Revenue Bonds, Series 2015 | |
| | | | | 3,000 | | | | | | 3,052 | |
|
California Health Facilities Financing Authority Revenue Bonds, Series 2016 | |
| | | | | 2,960 | | | | | | 3,036 | |
| | | | | 5,000 | | | | | | 5,116 | |
|
California Health Facilities Financing Authority Revenue Bonds, Series 2017 | |
| | | | | 1,220 | | | | | | 1,242 | |
| | | | | 2,250 | | | | | | 2,227 | |
|
California Health Facilities Financing Authority Revenue Bonds, Series 2020 | |
| | | | | 1,000 | | | | | | 1,002 | |
|
California Health Facilities Financing Authority Revenue Bonds, Series 2021 | |
| | | | | 2,300 | | | | | | 2,330 | |
|
California Infrastructure & Economic Development Bank Revenue Bonds, Series 2020 | |
0.000% due 01/01/2060 (b) | | | | | 5,000 | | | | | | 277 | |
| | | | | | | | | | | | |
| | | | | | | | | | | |
| | $ | | | 860 | | | $ | | | 837 | |
| | | | | 1,450 | | | | | | 1,477 | |
|
California Municipal Finance Authority Certificates of Participation Bonds, (AGM Insured), Series 2022 | |
| | | | | 1,500 | | | | | | 1,684 | |
|
California Municipal Finance Authority Revenue Bonds, Series 2018 | |
| | | | | 1,165 | | | | | | 1,246 | |
| | | | | 1,100 | | | | | | 1,166 | |
|
California Municipal Finance Authority Revenue Bonds, Series 2021 | |
4.000% due 09/01/2050 (d) | | | | | 1,200 | | | | | | 1,062 | |
|
California Public Finance Authority Revenue Bonds, Series 2017 | |
| | | | | 2,000 | | | | | | 2,000 | |
|
California Public Finance Authority Revenue Bonds, Series 2019 | |
| | | | | 1,250 | | | | | | 1,318 | |
|
California State General Obligation Bonds, Series 2017 | |
| | | | | 1,500 | | | | | | 1,516 | |
|
California State General Obligation Bonds, Series 2018 | |
| | | | | 2,000 | | | | | | 2,073 | |
|
California State General Obligation Bonds, Series 2020 | |
| | | | | 850 | | | | | | 892 | |
|
California State General Obligation Bonds, Series 2021 | |
| | | | | 1,500 | | | | | | 1,711 | |
|
California State General Obligation Bonds, Series 2022 | |
| | | | | 1,150 | | | | | | 1,207 | |
| | | | | 1,750 | | | | | | 1,792 | |
|
California State General Obligation Bonds, Series 2023 | |
| | | | | 1,600 | | | | | | 1,673 | |
|
California State General Obligation Notes, Series 2019 | |
| | | | | 1,615 | | | | | | 1,746 | |
|
California State General Obligation Notes, Series 2021 | |
| | | | | 2,000 | | | | | | 2,293 | |
|
California State University Revenue Bonds, Series 2015 | |
| | | | | 6,750 | | | | | | 6,944 | |
|
California State University Revenue Bonds, Series 2023 | |
| | | | | 1,000 | | | | | | 1,158 | |
|
California Statewide Communities Development Authority Revenue Bonds, (AGM Insured), Series 2022 | |
| | | | | 950 | | | | | | 1,057 | |
|
California Statewide Communities Development Authority Revenue Bonds, (CM Insured), Series 2018 | |
| | | | | 250 | | | | | | 252 | |
|
California Statewide Communities Development Authority Revenue Bonds, Series 2008 | |
| | | | | 2,000 | | | | | | 2,000 | |
|
California Statewide Communities Development Authority Revenue Bonds, Series 2016 | |
| | | | | 200 | | | | | | 199 | |
| | | | | 1,000 | | | | | | 952 | |
| | | | | 3,100 | | | | | | 3,069 | |
| | | | | 3,750 | | | | | | 3,762 | |
|
California Statewide Communities Development Authority Revenue Bonds, Series 2018 | |
| | | | | 2,500 | | | | | | 2,472 | |
| | | | | 850 | | | | | | 854 | |
| | | | | 2,000 | | | | | | 1,948 | |
| | | | | 1,505 | | | | | | 1,547 | |
|
California Statewide Communities Development Authority Revenue Bonds, Series 2019 | |
| | | | | 1,495 | | | | | | 1,369 | |
|
Calistoga Joint Unified School District, California General Obligation Bonds, Series 2023 | |
| | | | | 1,275 | | | | | | 1,429 | |
|
Chino Valley Unified School District, California General Obligation Bonds, Series 2022 | |
0.000% due 08/01/2038 (b) | | | | | 1,300 | | | | | | 744 | |
0.000% due 08/01/2039 (b) | | | | | 1,600 | | | | | | 865 | |
0.000% due 08/01/2041 (b) | | | | | 1,935 | | | | | | 940 | |
0.000% due 08/01/2046 (b) | | | | | 1,500 | | | | | | 567 | |
|
Chino Valley Unified School District, California General Obligation Notes, Series 2022 | |
0.000% due 08/01/2030 (b) | | | | | 1,135 | | | | | | 938 | |
| | | | | | | | | | | | |
| | | | | | | | | | | |
|
City of California, Eureka City Schools, General Obligation Bonds, (BAM Insured), Series 2020 | |
| | $ | | | 2,000 | | | $ | | | 2,006 | |
|
CMFA Special Finance Agency VII, California Revenue Bonds, Series 2021 | |
| | | | | 1,500 | | | | | | 995 | |
| | | | | 595 | | | | | | 477 | |
|
CMFA Special Finance Agency, California Revenue Bonds, Series 2021 | |
| | | | | 750 | | | | | | 613 | |
|
Corona Norco Unified School District, California General Obligation Bonds, Series 2018 | |
| | | | | 1,460 | | | | | | 1,468 | |
|
CSCDA Community Improvement Authority, California Revenue Bonds, Series 2021 | |
| | | | | 500 | | | | | | 340 | |
| | | | | 1,000 | | | | | | 753 | |
| | | | | 350 | | | | | | 268 | |
| | | | | 500 | | | | | | 377 | |
| | | | | 750 | | | | | | 539 | |
|
CSCDA Community Improvement Authority, California Revenue Bonds, Series 2022 | |
0.000% due 09/01/2062 (c) | | | | | 1,800 | | | | | | 915 | |
|
Department of Veterans Affairs Veteran’s Farm & Home Purchase Program, California Revenue Bonds, Series 2022 | |
| | | | | 300 | | | | | | 316 | |
|
El Monte School District, California General Obligation Bonds, (BAM Insured), Series 2023 | |
| | | | | 1,400 | | | | | | 1,534 | |
|
Elk Grove Finance Authority, California Special Tax Bonds, Series 2016 | |
| | | | | 1,000 | | | | | | 1,013 | |
|
Folsom Cordova Unified School District, California General Obligation Bonds, (AGM Insured), Series 2019 | |
| | | | | 1,160 | | | | | | 1,163 | |
|
Foothill-Eastern Transportation Corridor Agency, California Revenue Bonds, Series 2014 | |
| | | | | 720 | | | | | | 680 | |
|
Fremont Community Facilities District, No. 1, California Special Tax Bonds, Series 2015 | |
| | | | | 1,400 | | | | | | 1,417 | |
|
Fresno Unified School District, California General Obligation Bonds, Series 2016 | |
| | | | | 2,125 | | | | | | 2,115 | |
|
Glendale Community College District, California General Obligation Bonds, Series 2020 | |
| | | | | 1,000 | | | | | | 1,007 | |
|
Golden State, California Tobacco Securitization Corp. Revenue Bonds, Series 2018 | |
| | | | | 1,500 | | | | | | 1,668 | |
|
Golden State, California Tobacco Securitization Corp. Revenue Bonds, Series 2021 | |
0.000% due 06/01/2066 (b) | | | | | 20,500 | | | | | | 2,422 | |
|
Hartnell Community College District, California General Obligation Bonds, Series 2017 | |
| | | | | 1,150 | | | | | | 1,173 | |
|
Hastings Campus Housing Finance Authority, California Revenue Bonds, Series 2020 | |
| | | | | 2,000 | | | | | | 1,708 | |
|
Hayward Unified School District, California General Obligation Bonds, Series 2015 | |
| | | | | 5,000 | | | | | | 5,064 | |
|
Irvine Facilities Financing Authority, California Special Tax Bonds, (BAM Insured), Series 2023 | |
| | | | | 2,000 | | | | | | 1,980 | |
|
Irvine Ranch Water District, California Special Assessment Bonds, Series 2009 | |
| | | | | 1,295 | | | | | | 1,295 | |
|
Long Beach Bond Finance Authority, California General Obligation Bonds, Series 2023 | |
| | | | | 1,250 | | | | | | 1,249 | |
|
Long Beach Bond Finance Authority, California Revenue Bonds, Series 2023 | |
| | | | | 1,250 | | | | | | 1,231 | |
| | | | | | | | | | | | |
| See Accompanying Notes | | | | | | | | | | DECEMBER 31, 2023 | | | |
| | | | | | |
| | PIMCO California Municipal Income Fund III | | | | |
| | | | | | | | | | | | |
| | | | | | | | | | | |
|
Long Beach Unified School District, California General Obligation Bonds, Series 2009 | |
| | $ | | | 305 | | | $ | | | 306 | |
|
Los Angeles County, California Facilities, Inc., Revenue Bonds, Series 2018 | |
| | | | | 2,000 | | | | | | 2,022 | |
|
Los Angeles County, California Metropolitan Transportation Authority Sales Tax Revenue Bonds, Series 2021 | |
| | | | | 1,500 | | | | | | 1,614 | |
|
Los Angeles County, California Sanitation District, Financing Authority Revenue Bonds, Series 2016 | |
| | | | | 1,185 | | | | | | 1,200 | |
|
Los Angeles Department of Airports, California Revenue Bonds, Series 2018 | |
| | | | | 1,800 | | | | | | 1,876 | |
|
Los Angeles Department of Water & Power Water System, California Revenue Bonds, Series 2001 | |
| | | | | 1,000 | | | | | | 1,000 | |
|
Los Angeles Department of Water & Power Water System, California Revenue Bonds, Series 2022 | |
| | | | | 1,190 | | | | | | 1,337 | |
|
Los Angeles Department of Water & Power, California Revenue Bonds, Series 2014 | |
| | | | | 1,000 | | | | | | 1,000 | |
|
Los Angeles Department of Water & Power, California Revenue Bonds, Series 2021 | |
| | | | | 3,175 | | | | | | 3,599 | |
|
Energy Authority, California Revenue Bonds, Series 2009 | |
| | | | | 2,700 | | | | | | 3,480 | |
| | | | | 2,285 | | | | | | 2,945 | |
|
Manteca Financing Authority, California Revenue Bonds, Series 2009 | |
| | | | | 1,000 | | | | | | 1,012 | |
|
Manteca Unified School District, California General Obligation Bonds, Series 2020 | |
| | | | | 1,800 | | | | | | 1,818 | |
|
Monterey Peninsula Unified School District, California General Obligation Bonds, Series 2019 | |
| | | | | 2,545 | | | | | | 2,619 | |
|
Mount San Jacinto Community College District, California General Obligation Bonds, Series 2018 | |
| | | | | 3,650 | | | | | | 3,729 | |
|
Municipal Improvement Corp. of Los Angeles, California Revenue Bonds, Series 2021 | |
| | | | | 1,790 | | | | | | 2,087 | |
|
Norwalk-La Mirada Unified School District, California General Obligation Bonds, Series 2019 | |
| | | | | 2,200 | | | | | | 2,212 | |
|
Oakland Redevelopment Agency Successor Agency, California Tax Allocation Bonds, (AGM Insured), Series 2015 | |
| | | | | 800 | | | | | | 823 | |
|
Ontario International Airport Authority, California Revenue Bonds, (AGM Insured), Series 2021 | |
| | | | | 400 | | | | | | 406 | |
|
Ontario Montclair School District, California General Obligation Bonds, Series 2017 | |
| | | | | 1,525 | | | | | | 1,608 | |
|
Orange County, California Community Facilities District, Special Tax Bonds, Series 2022 | |
| | | | | 1,115 | | | | | | 1,147 | |
|
Orange County, California Water District, Certificates of Participation Bonds, Series 2003 | |
| | | | | 1,190 | | | | | | 1,190 | |
|
Pacifica School District, California General Obligation Bonds, Series 2018 | |
| | | | | 1,250 | | | | | | 1,256 | |
|
Redwood City School District, California General Obligation Bonds, Series 2023 | |
| | | | | 1,700 | | | | | | 1,914 | |
|
Richmond, California Wastewater Revenue Bonds, Series 2019 | |
| | | | | 1,190 | | | | | | 1,199 | |
| | | | | | | | | | | | |
| | | | | | | | | | | |
|
Rio Hondo Community College District, California General Obligation Bonds, Series 2022 | |
0.000% due 08/01/2045 (b) | | $ | | | 1,500 | | | $ | | | 550 | |
|
River Islands Public Financing Authority, California Special Tax, (AGM Insured), Series 2022 | |
| | | | | 900 | | | | | | 917 | |
|
Riverside, California Sewer Revenue Bonds, Series 2018 | |
| | | | | 2,000 | | | | | | 2,066 | |
|
Sacramento City Unified School District, California General Obligation Bonds, (AGM Insured), Series 2021 | |
| | | | | 1,340 | | | | | | 1,341 | |
|
Sacramento County, California Sanitation District, Financing Authority Revenue Bonds, Series 2020 | |
| | | | | 1,000 | | | | | | 1,099 | |
|
Sacramento County, California Special Tax Bonds, Series 2022 | |
| | | | | 400 | | | | | | 405 | |
|
Sacramento Municipal Utility District, California Revenue Bonds, Series 2023 | |
| | | | | 500 | | | | | | 572 | |
|
San Bernardino Community College District, California General Obligation Bonds, Series 2023 | |
| | | | | 3,000 | | | | | | 3,309 | |
|
San Diego County, California Certificates of Participation Bonds, Series 2023 | |
| | | | | 3,000 | | | | | | 3,360 | |
|
San Diego County, California Regional Airport Authority Revenue Bonds, Series 2021 | |
| | | | | 2,250 | | | | | | 2,181 | |
| | | | | 1,925 | | | | | | 2,012 | |
|
San Diego Public Facilities Financing Authority, California Revenue Bonds, Series 2022 | |
| | | | | 1,000 | | | | | | 1,122 | |
|
San Diego Unified School District, California General Obligation Bonds, Series 2023 | |
| | | | | 4,000 | | | | | | 4,005 | |
| | | | | 2,000 | | | | | | 2,285 | |
|
San Francisco, California City & County Airport Comm-San Francisco International Airport Revenue Bonds, Series 2017 | |
| | | | | 2,125 | | | | | | 2,222 | |
|
San Francisco, California City & County Airport Comm-San Francisco International Airport Revenue Bonds, Series 2019 | |
| | | | | 3,750 | | | | | | 3,883 | |
|
San Francisco, California City & County Certificates of Participation Bonds, Series 2015 | |
| | | | | 1,500 | | | | | | 1,501 | |
|
San Francisco, California City & County General Obligation Bonds, Series 2022 | |
| | | | | 2,265 | | | | | | 2,538 | |
|
San Francisco, California City & County Public Utilities Commission Power Revenue Bonds, Series 2023 | |
| | | | | 1,500 | | | | | | 1,704 | |
|
San Francisco, California City & County Redevelopment Agency Special Tax Bonds, Series 2013 | |
| | | | | 1,505 | | | | | | 1,510 | |
|
San Francisco, California Public Utilities Commission Water Revenue Bonds, Series 2020 | |
| | | | | 1,500 | | | | | | 1,654 | |
|
San Francisco, California Public Utilities Commission Water Revenue Bonds, Series 2023 | |
| | | | | 1,250 | | | | | | 1,446 | |
|
San Jose Evergreen Community College District, California General Obligation Bonds, Series 2014 | |
| | | | | 1,250 | | | | | | 1,262 | |
|
San Jose Financing Authority, California Revenue Bonds, Series 2022 | |
| | | | | 1,500 | | | | | | 1,691 | |
|
San Marcos Redevelopment Agency Successor Agency, California Tax Allocation Bonds, Series 2015 | |
| | | | | 885 | | | | | | 918 | |
| | | | | | | | | | | | |
| | | | | | | | | | | |
|
San Mateo County, California Community College District, General Obligation Bonds, (NPFGC Insured), Series 2006 | |
0.000% due 09/01/2034 (b) | | $ | | | 2,530 | | | $ | | | 1,860 | |
|
San Mateo County, California Community College District, General Obligation Bonds, Series 2018 | |
| | | | | 2,000 | | | | | | 2,162 | |
|
San Mateo County, California Transportation Authority Revenue Bonds, Series 2020 | |
| | | | | 1,500 | | | | | | 1,500 | |
|
San Mateo Joint Powers Financing Authority, California Revenue Bonds, Series 2018 | |
| | | | | 1,550 | | | | | | 1,561 | |
|
Santa Ana Unified School District, California General Obligation Bonds, Series 2019 | |
| | | | | 1,250 | | | | | | 1,261 | |
|
Santa Clarita Community College District, California General Obligation Bonds, Series 2016 | |
| | | | | 1,800 | | | | | | 1,812 | |
|
Santa Monica, California Community College District, General Obligation Bonds, Series 2022 | |
| | | | | 1,040 | | | | | | 1,071 | |
|
Silicon Valley Tobacco Securitization Authority, California Revenue Bonds, Series 2007 | |
0.000% due 06/01/2036 (b) | | | | | 1,000 | | | | | | 507 | |
|
South San Francisco Unified School, California General Obligation Bonds, Series 2023 | |
| | | | | 2,000 | | | | | | 2,015 | |
|
Southwestern Community College District, California General Obligation Bonds, Series 2021 | |
| | | | | 3,850 | | | | | | 3,918 | |
|
State Center Community College District, California General Obligation Bonds, Series 2022 | |
| | | | | 1,495 | | | | | | 1,679 | |
|
Sweetwater Union High School District, California General Obligation Bonds, Series 2022 | |
| | | | | 1,785 | | | | | | 1,959 | |
|
Tobacco Securitization Authority of Northern California Revenue Bonds, Series 2021 | |
0.000% due 06/01/2060 (b) | | | | | 20,000 | | | | | | 3,336 | |
|
Tobacco Securitization Authority of Southern California Revenue Bonds, Series 2006 | |
0.000% due 06/01/2046 (b) | | | | | 3,995 | | | | | | 741 | |
|
University of California Revenue Bonds, Series 2018 | |
| | | | | 1,050 | | | | | | 1,065 | |
|
University of California Revenue Bonds, Series 2022 | |
| | | | | 4,500 | | | | | | 5,018 | |
|
Upland, California Certificates of Participation Bonds, Series 2017 | |
| | | | | 2,250 | | | | | | 2,151 | |
|
Washington Township Health Care District, California General Obligation Bonds, Series 2015 | |
| | | | | 2,500 | | | | | | 2,500 | |
|
Washington Township Health Care District, California General Obligation Bonds, Series 2023 | |
| | | | | 1,270 | | | | | | 1,447 | |
| | | | | | | | | | | | |
| | | | | | | | | | | 266,506 | |
| | | | | | | | | | | | |
| |
| |
|
Affordable Housing Opportunities Trust, Delaware Revenue Bonds, Series 2022 | |
| | | | | 2,380 | | | | | | 2,113 | |
| | | | | 420 | | | | | | 416 | |
| | | | | | | | | | | | |
| | | | | | | | | | | 2,529 | |
| | | | | | | | | | | | |
| |
| |
|
Illinois Finance Authority Revenue Bonds, Series 2020 | |
| | | | | 1,000 | | | | | | 1,000 | |
|
Illinois State General Obligation Notes, Series 2017 | |
| | | | | 1,000 | | | | | | 1,075 | |
| | | | | | | | | | | | |
| | | | | | | | | | | 2,075 | |
| | | | | | | | | | | | |
| |
| | | | | | | | | | | | |
| | | | | | | | | | | |
| |
|
New Hampshire Business Finance Authority Revenue Bonds, Series 2023 | |
| | $ | | | 1,685 | | | $ | | | 1,663 | |
| | | | | | | | | | | | |
| |
| |
|
New York Power Authority Revenue Bonds, Series 2020 | |
| | | | | 425 | | | | | | 423 | |
| | | | | | | | | | | | |
| |
| |
|
Grand Forks County, North Dakota Revenue Bonds, Series 2021 | |
7.000% due 12/15/2043 ^(a) | | | | | 570 | | | | | | 114 | |
| | | | | | | | | | | | |
| |
| |
|
Pennsylvania Economic Development Financing Authority Revenue Bonds, Series 2021 | |
| | | | | 1,005 | | | | | | 1,109 | |
| | | | | | | | | | | | |
| |
| |
|
Children’s Trust Fund, Puerto Rico Revenue Bonds, Series 2008 | |
0.000% due 05/15/2057 (b) | | | | | 18,000 | | | | | | 1,370 | |
|
Commonwealth of Puerto Rico Bonds, Series 2022 | |
| | | | | 1,890 | | | | | | 1,032 | |
| | | | | 2,591 | | | | | | 1,269 | |
|
Commonwealth of Puerto Rico General Obligation Bonds, Series 2021 | |
0.000% due 07/01/2033 (b) | | | | | 1,000 | | | | | | 625 | |
| | | | | | | | | | | | |
| | | | | | | | | | | |
| | $ | | | 1,000 | | | $ | | | 921 | |
|
Puerto Rico Sales Tax Financing Corp. Sales Tax Revenue Bonds, Series 2018 | |
0.000% due 07/01/2046 (b) | | | | | 7,700 | | | | | | 2,424 | |
0.000% due 07/01/2051 (b) | | | | | 6,630 | | | | | | 1,557 | |
|
Puerto Rico Sales Tax Financing Corp. Sales Tax Revenue Bonds, Series 2019 | |
| | | | | 4,280 | | | | | | 4,229 | |
| | | | | | | | | | | | |
| | | | | | | | | | | 13,427 | |
| | | | | | | | | | | | |
| |
| |
|
Angelina & Neches River Authority, Texas Revenue Bonds, Series 2021 | |
| | | | | 390 | | | | | | 258 | |
| | | | | 650 | | | | | | 563 | |
| | | | | | | | | | | | |
| | | | | | | | | | | 821 | |
| | | | | | | | | | | | |
| |
| |
|
Matching Fund Special Purpose Securitization Corp., U.S. Virgin Islands Revenue Bonds, Series 2022 | |
| | | | | 1,615 | | | | | | 1,624 | |
| | | | | | | | | | | | |
| |
| |
|
Virginia Small Business Financing Authority Revenue Bonds, Series 2019 | |
0.000% due 07/01/2061 (b) | | | | | 15,000 | | | | | | 469 | |
| | | | | 500 | | | | | | 458 | |
| | | | | | | | | | | | |
| | | | | | | | | | | 927 | |
| | | | | | | | | | | | |
| |
| | | | | | | | | | | | |
| | | | | | | | | | | |
| |
|
Wisconsin Center District, Revenue Bonds, (AGM Insured), Series 2020 | |
0.000% due 12/15/2055 (b) | | $ | | | 4,100 | | | $ | | | 961 | |
| | | | | | | | | | | | |
Total Municipal Bonds & Notes
(Cost $289,184) | | | | |
| | | | |
| |
SHORT-TERM INSTRUMENTS 4.0% | |
| |
REPURCHASE AGREEMENTS (e) 4.0% | |
| | | | | | | | | | | 7,135 | |
| | | | | | | | | | | | |
Total Short-Term Instruments
(Cost $7,135) | | | | |
| | | | |
| | | | |
| | | | | | | | | | | | |
Total Investments in Securities
(Cost $296,319) | | | | |
| |
| | | | |
Total Investments 168.8%
(Cost $296,319) | | | $ | | | | |
| |
Auction Rate Preferred Shares (48.9)% | | | | | | | |
| |
Remarketable Variable Rate MuniFund Term Preferred Shares, at liquidation value (21.1)% | | | | | | | |
| |
Other Assets and Liabilities, net 1.2% | | | | | | | |
| | | | |
Net Assets Applicable to Common Shareholders 100.0% | | | $ | | | | |
| | | | | | | |
NOTES TO SCHEDULE OF INVESTMENTS:
| A zero balance may reflect actual amounts rounding to less than one thousand. |
| Security is not accruing income as of the date of this report. |
| Security becomes interest bearing at a future date. |
(d) RESTRICTED SECURITIES:
| | | | | | | | | | | | | | | | | | | | | | | | |
| | | | | | | | | | | | | | | | | | |
California Municipal Finance Authority Revenue Bonds, Series 2021 | | | 4.000% | | | | 09/01/2050 | | | | 08/03/2022 | | | $ | 1,088 | | | $ | 1,062 | | | | 0.60% | |
| | | | | | | | | | | | | | | | | | | | | | | | |
BORROWINGS AND OTHER FINANCING TRANSACTIONS
(e) REPURCHASE AGREEMENTS:
| | | | | | | | | | | | | | | | | | | | | | | | | | | | | | |
| | | | | | | | | | | | | | | | | | | Repurchase
Agreements,
at Value | | | Repurchase Agreement Proceeds to be Received (1) | |
| FICC | | | 2.600 | % | | | 12/29/2023 | | | | 01/02/2024 | | | $ | 7,135 | | | U.S. Treasury Notes 4.875% due 11/30/2025 | | $ | (7,278 | ) | | $ | 7,135 | | | $ | 7,137 | |
| | | | | | | | | | | | | | | | | | | | | | | | | | | | | | |
Total Repurchase Agreements | | | | | | | | | | | | | | | |
| | | | | | | | | | | | | | | | | | | | | | | | | | | | | | |
| | | | | | | | | | | | |
| See Accompanying Notes | | | | | | | | | | DECEMBER 31, 2023 | | | |
| | | | | | |
| | PIMCO California Municipal Income Fund III | | | | December 31, 2023 |
BORROWINGS AND OTHER FINANCING TRANSACTIONS SUMMARY
The following is a summary by counterparty of the market value of Borrowings and Other Financing Transactions and collateral pledged/(received) as of December 31, 2023:
| | | | | | | | | | | | | | | | | | | | | | | | |
| | Repurchase Agreement Proceeds to be Received (1) | | | Payable for
Reverse
Repurchase
Agreements | | | Payable for Sale-Buyback Transactions | | | Total
Borrowings and
Other Financing
Transactions | | | Collateral
Pledged/(Received) | | | | |
Global/Master Repurchase Agreement | |
| | $ | 7,137 | | | $ | 0 | | | $ | 0 | | | $ | 7,137 | | | $ | (7,278 | ) | | $ | (141 | ) |
| | | | | | | | | | | | | | | | | | | | | | | | |
Total Borrowings and Other Financing Transactions | | | | | | | | | | | | | | | | | | | | | | | | |
| | | | | | | | | | | | | | | | | | | | | | | | |
| Includes accrued interest. |
| Net Exposure represents the net receivable/(payable) that would be due from/to the counterparty in the event of default. Exposure from borrowings and other financing transactions can only be netted across transactions governed under the same master agreement with the same legal entity. See Note 7, Master Netting Arrangements, in the Notes to Financial Statements for more information. |
The following is a summary of the fair valuations according to the inputs used as of December 31, 2023 in valuing the Fund’s assets and liabilities:
| | | | | | | | | | | | | | | | |
| | | | | | | | | | | | |
Investments in Securities, at Value | |
| |
| | $ | 0 | | | $ | 44 | | | $ | 0 | | | $ | 44 | |
| | | 0 | | | | 266,506 | | | | 0 | | | | 266,506 | |
| | | 0 | | | | 2,529 | | | | 0 | | | | 2,529 | |
| | | 0 | | | | 2,075 | | | | 0 | | | | 2,075 | |
| | | 0 | | | | 1,663 | | | | 0 | | | | 1,663 | |
| | | 0 | | | | 423 | | | | 0 | | | | 423 | |
| | | 0 | | | | 114 | | | | 0 | | | | 114 | |
| | | 0 | | | | 1,109 | | | | 0 | | | | 1,109 | |
| | | | | | | | | | | | | | | | |
| | | | | | | | | | | | |
| | $ | 0 | | | $ | 13,427 | | | $ | 0 | | | $ | 13,427 | |
| | | 0 | | | | 821 | | | | 0 | | | | 821 | |
| | | 0 | | | | 1,624 | | | | 0 | | | | 1,624 | |
| | | 0 | | | | 927 | | | | 0 | | | | 927 | |
| | | 0 | | | | 961 | | | | 0 | | | | 961 | |
| |
| | | 0 | | | | 7,135 | | | | 0 | | | | 7,135 | |
| | | | | | | | | | | | | | | | |
| | | | |
| | $ | 0 | | | $ | 299,358 | | | $ | 0 | | | $ | 299,358 | |
| | | | | | | | | | | | | | | | |
There were no significant transfers into or out of Level 3 during the period ended December 31, 2023.
| | | | | | |
| | PIMCO New York Municipal Income Fund | | | | December 31, 2023 |
(Amounts in thousands*, except number of shares, contracts, units and ounces, if any)
| | | | | | | | | | | | |
| | | | | | | | | | | |
INVESTMENTS IN SECURITIES 147.5% | |
| |
MUNICIPAL BONDS & NOTES 143.9% | |
| |
| |
|
Arizona Industrial Development Authority Revenue Bonds, Series 2020 | |
7.750% due 07/01/2050 ^(b) | | $ | | | 300 | | | $ | | | 18 | |
| | | | | | | | | | | | |
| |
| |
|
California Health Facilities Financing Authority Revenue Bonds, Series 2016 | |
| | | | | 890 | | | | | | 913 | |
| | | | | | | | | | | | |
| |
| |
|
Affordable Housing Opportunities Trust, Delaware Revenue Bonds, Series 2022 | |
| | | | | 980 | | | | | | 870 | |
| | | | | 175 | | | | | | 174 | |
| | | | | | | | | | | | |
| | | | | | | | | | | 1,044 | |
| | | | | | | | | | | | |
| |
| |
|
New Hampshire Business Finance Authority Revenue Notes, Series 2023 | |
| | | | | 662 | | | | | | 675 | |
| | | | | | | | | | | | |
| |
| |
|
Build NYC Resource Corp., New York Revenue Bonds, Series 2018 | |
| | | | | 1,190 | | | | | | 1,116 | |
|
Build NYC Resource Corp., New York Revenue Bonds, Series 2023 | |
| | | | | 750 | | | | | | 779 | |
|
Dutchess County, New York Local Development Corp. Revenue Bonds, Series 2017 | |
| | | | | 435 | | | | | | 436 | |
|
Dutchess County, New York Local Development Corp. Revenue Bonds, Series 2020 | |
| | | | | 410 | | | | | | 440 | |
|
Dutchess County, New York Local Development Corp. Revenue Bonds, Series 2022 | |
| | | | | 765 | | | | | | 736 | |
|
Erie County, New York Industrial Development Agency Revenue Bonds, (FNMA Insured), Series 2023 | |
| | | | | 1,400 | | | | | | 1,397 | |
|
Housing Development Corp., New York Revenue Bonds, Series 2017 | |
| | | | | 1,000 | | | | | | 901 | |
|
Hudson Yards Infrastructure Corp., New York Revenue Bonds, Series 2017 | |
| | | | | 1,200 | | | | | | 1,200 | |
|
Huntington Local Development Corp., New York Revenue Bonds, Series 2021 | |
| | | | | 500 | | | | | | 394 | |
|
Long Island Power Authority, New York Revenue Bonds, Series 2023 | |
| | | | | 1,000 | | | | | | 1,123 | |
|
Metropolitan Transportation Authority, New York Revenue Bonds, Series 2014 | |
| | | | | 1,000 | | | | | | 1,004 | |
|
Metropolitan Transportation Authority, New York Revenue Bonds, Series 2016 | |
| | | | | 2,500 | | | | | | 2,607 | |
| | | | | 1,000 | | | | | | 1,025 | |
|
Monroe County Industrial Development Corp, New York Revenue Bonds, Series 2023 | |
| | | | | 750 | | | | | | 828 | |
|
Monroe County Industrial Development Corp., New York Revenue Bonds, Series 2020 | |
| | | | | 750 | | | | | | 739 | |
|
Nassau County, New York General Obligation Bonds, (AGM Insured), Series 2018 | |
| | | | | 2,000 | | | | | | 2,175 | |
| | | | | | | | | | | | |
| | | | | | | | | | | |
|
Nassau County, New York Industrial Development Agency Revenue Bonds, Series 2021 | |
0.000% due 01/01/2058 ^(b) | | $ | | | 1,092 | | | $ | | | 262 | |
|
Nassau County, New York Tobacco Settlement Corp. Revenue Bonds, Series 2006 | |
| | | | | 1,230 | | | | | | 1,159 | |
|
New York City Transitional Finance Authority Future Tax Secured, New York Revenue Bonds, Series 2020 | |
| | | | | 1,000 | | | | | | 1,004 | |
|
New York City Water & Sewer System, New York Revenue Bonds, Series 2016 | |
| | | | | 830 | | | | | | 830 | |
|
New York City Water & Sewer System, New York Revenue Bonds, Series 2018 | |
| | | | | 2,700 | | | | | | 2,882 | |
|
New York City, New York General Obligation Bonds, Series 2018 | |
| | | | | 1,300 | | | | | | 1,380 | |
|
New York City, New York Health and Hospitals Corp. Revenue Bonds, Series 2021 | |
| | | | | 880 | | | | | | 865 | |
|
New York City, New York Municipal Water Finance Authority Revenue Bonds, Series 2020 | |
| | | | | 600 | | | | | | 597 | |
|
New York City, New York Municipal Water Finance Authority Revenue Bonds, Series 2022 | |
| | | | | 2,000 | | | | | | 2,250 | |
|
New York City, New York Municipal Water Finance Authority Revenue Bonds, Series 2023 | |
| | | | | 700 | | | | | | 801 | |
| | | | | 700 | | | | | | 794 | |
|
New York City, New York Transitional Finance Authority Future Tax Secured Revenue Bonds, Series 2022 | |
| | | | | 3,500 | | | | | | 3,963 | |
|
New York City, New York Transitional Finance Authority Revenue Bonds, Series 2024 | |
5.000% due 11/01/2041 (a) | | | | | 1,500 | | | | | | 1,750 | |
|
New York Convention Center Development Corp. Revenue Bonds, Series 2016 | |
| | | | | 750 | | | | | | 768 | |
|
New York County, New York Tobacco Trust Revenue Bonds, Series 2005 | |
0.000% due 06/01/2050 (c) | | | | | 20,000 | | | | | | 4,334 | |
0.000% due 06/01/2055 (c) | | | | | 7,000 | | | | | | 585 | |
|
New York Liberty Development Corp. Revenue Bonds, Series 2005 | |
| | | | | 770 | | | | | | 917 | |
|
New York Liberty Development Corp. Revenue Bonds, Series 2007 | |
| | | | | 750 | | | | | | 897 | |
|
New York Liberty Development Corp. Revenue Bonds, Series 2014 | |
| | | | | 1,650 | | | | | | 1,641 | |
|
New York Liberty Development Corp. Revenue Bonds, Series 2021 | |
| | | | | 440 | | | | | | 336 | |
|
New York Power Authority Revenue Bonds, (AGM Insured), Series 2022 | |
| | | | | 750 | | | | | | 749 | |
| | | | | 750 | | | | | | 734 | |
|
New York Power Authority Revenue Bonds, Series 2020 | |
| | | | | 2,100 | | | | | | 2,091 | |
|
New York State Dormitory Authority Memorial Sloan-Kettering Cancer Revenue Bonds, Series 2022 | |
| | | | | 1,200 | | | | | | 1,189 | |
|
New York State Dormitory Authority Revenue Bonds, (AGM/CR Insured), Series 2022 | |
| | | | | 850 | | | | | | 848 | |
|
New York State Dormitory Authority Revenue Bonds, Series 2017 | |
| | | | | 500 | | | | | | 498 | |
|
New York State Dormitory Authority Revenue Bonds, Series 2018 | |
| | | | | 750 | | | | | | 758 | |
| | | | | 1,000 | | | | | | 1,007 | |
| | | | | | | | | | | | |
| | | | | | | | | | | |
|
New York State Dormitory Authority Revenue Bonds, Series 2019 | |
| | $ | | | 1,200 | | | $ | | | 1,216 | |
|
New York State Dormitory Authority Revenue Bonds, Series 2020 | |
| | | | | 4,355 | | | | | | 4,335 | |
| | | | | 650 | | | | | | 694 | |
|
New York State Dormitory Authority Revenue Bonds, Series 2022 | |
| | | | | 345 | | | | | | 332 | |
| | | | | 345 | | | | | | 350 | |
|
New York State Dormitory Authority Revenue Bonds, Series 2023 | |
| | | | | 300 | | | | | | 332 | |
|
New York State Environmental Facilities Corp. Revenue Bonds, Series 2022 | |
| | | | | 1,750 | | | | | | 1,770 | |
|
New York State Thruway Authority Revenue Bonds, Series 2019 | |
| | | | | 1,250 | | | | | | 1,270 | |
|
New York State Thruway Authority Revenue Bonds, Series 2021 | |
| | | | | 750 | | | | | | 768 | |
|
New York State Thruway Authority Revenue Bonds, Series 2022 | |
| | | | | 400 | | | | | | 437 | |
|
New York State Urban Development Corp. Revenue Bonds, Series 2019 | |
| | | | | 600 | | | | | | 605 | |
|
New York State Urban Development Corp. Revenue Bonds, Series 2023 | |
| | | | | 5,000 | | | | | | 5,603 | |
|
New York Transportation Development Corp. Revenue Bonds, (AGM Insured), Series 2023 | |
| | | | | 1,200 | | | | | | 1,259 | |
|
New York Transportation Development Corp. Revenue Bonds, Series 2016 | |
| | | | | 700 | | | | | | 700 | |
| | | | | 855 | | | | | | 856 | |
|
New York Transportation Development Corp. Revenue Bonds, Series 2020 | |
| | | | | 800 | | | | | | 810 | |
|
New York Transportation Development Corp. Revenue Bonds, Series 2022 | |
| | | | | 1,670 | | | | | | 1,588 | |
|
Onondaga County, New York Trust for Cultural Resources Revenue Bonds, Series 2019 | |
| | | | | 1,300 | | | | | | 1,295 | |
|
Port Authority of New York & New Jersey Revenue Bonds, Series 2017 | |
| | | | | 4,500 | | | | | | 4,700 | |
|
Port Authority of New York & New Jersey Revenue Bonds, Series 2020 | |
| | | | | 350 | | | | | | 329 | |
|
Port Authority of New York & New Jersey Revenue Bonds, Series 2023 | |
| | | | | 475 | | | | | | 518 | |
|
Schenectady County Capital Resource Corp. Union College Project, New York Revenue Notes, Series 2022 | |
| | | | | 340 | | | | | | 407 | |
|
Suffolk County, New York Economic Development Corp. Revenue Bonds, Series 2021 | |
| | | | | 350 | | | | | | 290 | |
|
Suffolk Tobacco Asset Securitization Corp., New York Revenue Bonds, Series 2021 | |
0.000% due 06/01/2066 (c) | | | | | 5,000 | | | | | | 560 | |
| | | | | 500 | | | | | | 457 | |
|
The Genesee County Funding Corporation Tax-Exempt, New York Revenue Bonds, Series 2022 | |
| | | | | 1,000 | | | | | | 1,057 | |
|
Triborough Bridge & Tunnel Authority Sales Tax, New York Revenue Bonds, Series 2022 | |
| | | | | 1,500 | | | | | | 1,676 | |
|
Triborough Bridge & Tunnel Authority, New York Revenue Bonds, Series 2019 | |
| | | | | 500 | | | | | | 538 | |
| | | | | | | | | | | | |
| See Accompanying Notes | | | | | | | | | | DECEMBER 31, 2023 | | | |
| | | | | | |
| | PIMCO New York Municipal Income Fund | | | | |
| | | | | | | | | | | | |
| | | | | | | | | | | |
|
Triborough Bridge & Tunnel Authority, New York Revenue Bonds, Series 2021 | |
| | $ | | | 1,000 | | | $ | | | 1,090 | |
|
TSASC, Inc., New York Revenue Bonds, Series 2017 | |
| | | | | 2,000 | | | | | | 2,028 | |
|
Ulster County, New York Capital Resource Corp. Revenue Bonds, Series 2017 | |
| | | | | 500 | | | | | | 373 | |
|
Utility Debt Securitization Authority, New York Revenue Bonds, Series 2023 | |
| | | | | 2,500 | | | | | | 2,827 | |
| | | | | | | | | | | | |
| | | | | | | | | | | 93,859 | |
| | | | | | | | | | | | |
| |
| |
|
Grand Forks County, North Dakota Revenue Bonds, Series 2021 | |
7.000% due 12/15/2043 ^(b) | | | | | 230 | | | | | | 46 | |
| | | | | | | | | | | | |
| |
| |
|
Pennsylvania Economic Development Financing Authority Revenue Bonds, Series 2021 | |
| | | | | 425 | | | | | | 469 | |
| | | | | | | | | | | | |
| |
| |
|
Children’s Trust Fund, Puerto Rico Revenue Bonds, Series 2008 | |
0.000% due 05/15/2057 (c) | | | | | 7,700 | | | | | | 579 | |
| | | | | | | | | | | | |
| | | | | | | | | | | |
|
Commonwealth of Puerto Rico Bonds, Series 2022 | |
| | $ | | | 818 | | | $ | | | 447 | |
| | | | | 766 | | | | | | 418 | |
|
Commonwealth of Puerto Rico General Obligation Bonds, Series 2021 | |
| | | | | 450 | | | | | | 414 | |
|
Puerto Rico Sales Tax Financing Corp. Sales Tax Revenue Bonds, Series 2018 | |
0.000% due 07/01/2051 (c) | | | | | 2,580 | | | | | | 606 | |
| | | | | | | | | | | | |
| | | | | | | | | | | 2,464 | |
| | | | | | | | | | | | |
| |
| |
|
Angelina & Neches River Authority, Texas Revenue Bonds, Series 2021 | |
| | | | | 160 | | | | | | 106 | |
| | | | | 275 | | | | | | 238 | |
|
Texas Water Development Board Revenue Bonds, Series 2022 | |
| | | | | 650 | | | | | | 714 | |
| | | | | | | | | | | | |
| | | | | | | | | | | 1,058 | |
| | | | | | | | | | | | |
| |
| |
|
Virginia Small Business Financing Authority Revenue Bonds, Series 2019 | |
0.000% due 07/01/2061 (c) | | | | | 6,000 | | | | | | 188 | |
| | | | | 500 | | | | | | 458 | |
| | | | | | | | | | | | |
| | | | | | | | | | | 646 | |
| | | | | | | | | | | | |
| | | | | | | | | | | | |
| | | | | | | | | | | |
| |
|
Wisconsin Health & Educational Facilities Authority Revenue Bonds, Series 2022 | |
| | $ | | | 525 | | | $ | | | 502 | |
| | | | | | | | | | | | |
Total Municipal Bonds & Notes (Cost $101,029) | | | | |
| | | | |
| |
SHORT-TERM INSTRUMENTS 3.6% | |
| |
REPURCHASE AGREEMENTS (d) 3.6% | |
| | | | | | | | | | | 2,539 | |
| | | | | | | | | | | | |
Total Short-Term Instruments
(Cost $2,539) | | | | |
| | | | |
| | | | |
| | | | | | | | | | | | |
Total Investments in Securities
(Cost $103,568) | | | | |
| | | | |
| | | | | | | | | | | | |
Total Investments 147.5%
(Cost $103,568) | | | $ | | | | |
| | | | | | | | | | | | |
Auction Rate Preferred Shares (47.3)% | | | | |
| | | | | | | | | | | | |
Other Assets and Liabilities, net (0.2)% | | | | |
| | | | |
Net Assets Applicable to Common Shareholders 100.0% | | | $ | | | | |
| | | | | | | |
NOTES TO SCHEDULE OF INVESTMENTS:
| A zero balance may reflect actual amounts rounding to less than one thousand. |
| Security is not accruing income as of the date of this report. |
BORROWINGS AND OTHER FINANCING TRANSACTIONS
(d) REPURCHASE AGREEMENTS:
| | | | | | | | | | | | | | | | | | | | | | | | | | | | | | |
| | | | | | | | | | | | | | | | | | | Repurchase
Agreements,
at Value | | | Repurchase Agreement Proceeds to be Received (1) | |
| FICC | | | 2.600 | % | | | 12/29/2023 | | | | 01/02/2024 | | | $ | 2,539 | | | U.S. Treasury Notes 0.375% due 11/30/2025 | | $ | (2,590 | ) | | $ | 2,539 | | | $ | 2,540 | |
| | | | | | | | | | | | | | | | | | | | | | | | | | | | | | |
Total Repurchase Agreements | | | | | | | | | | | | | | | |
| | | | | | | | | | | | | | | |
BORROWINGS AND OTHER FINANCING TRANSACTIONS SUMMARY
The following is a summary by counterparty of the market value of Borrowings and Other Financing Transactions and collateral pledged/(received) as of December 31, 2023:
| | | | | | | | | | | | | | | | | | | | | | | | |
| | Repurchase Agreement Proceeds to be Received (1) | | | Payable for
Reverse
Repurchase
Agreements | | | Payable for Sale-Buyback Transactions | | | Total
Borrowings and
Other Financing
Transactions | | | Collateral
Pledged/(Received) | | | | |
Global/Master Repurchase Agreement | |
| | $ | 2,540 | | | $ | 0 | | | $ | 0 | | | $ | 2,540 | | | $ | (2,590 | ) | | $ | (50 | ) |
| | | | | | | | | | | | | | | | | | | | | | | | |
Total Borrowings and Other Financing Transactions | | | | | | | | | | | | | | | | | | | | | | | | |
| | | | | | | | | | | | | | | | | | | | | | | | |
| Includes accrued interest. |
| Net Exposure represents the net receivable/(payable) that would be due from/to the counterparty in the event of default. Exposure from borrowings and other financing transactions can only be netted across transactions governed under the same master agreement with the same legal entity. See Note 7, Master Netting Arrangements, in the Notes to Financial Statements for more information. |
The following is a summary of the fair valuations according to the inputs used as of December 31, 2023 in valuing the Fund’s assets and liabilities:
| | | | | | | | | | | | | | | | |
| | | | | | | | | | | | |
Investments in Securities, at Value | |
| |
| | $ | 0 | | | $ | 18 | | | $ | 0 | | | $ | 18 | |
| | | 0 | | | | 913 | | | | 0 | | | | 913 | |
| | | 0 | | | | 1,044 | | | | 0 | | | | 1,044 | |
| | | 0 | | | | 675 | | | | 0 | | | | 675 | |
| | | 0 | | | | 93,859 | | | | 0 | | | | 93,859 | |
| | | 0 | | | | 46 | | | | 0 | | | | 46 | |
| | | 0 | | | | 469 | | | | 0 | | | | 469 | |
| | | | | | | | | | | | | | | | |
| | | | | | | | | | | | |
| | $ | 0 | | | $ | 2,464 | | | $ | 0 | | | $ | 2,464 | |
| | | 0 | | | | 1,058 | | | | 0 | | | | 1,058 | |
| | | 0 | | | | 646 | | | | 0 | | | | 646 | |
| | | 0 | | | | 502 | | | | 0 | | | | 502 | |
| |
| | | 0 | | | | 2,539 | | | | 0 | | | | 2,539 | |
| | | | | | | | | | | | | | | | |
| | | | |
| | $ | 0 | | | $ | 104,233 | | | $ | 0 | | | $ | 104,233 | |
| | | | | | | | | | | | | | | | |
There were no significant transfers into or out of Level 3 during the period ended December 31, 2023.
| | | | | | | | | | | | |
| See Accompanying Notes | | | | | | | | | | DECEMBER 31, 2023 | | | |
| | | | | | |
| | PIMCO New York Municipal Income Fund II | | | | |
(Amounts in thousands*, except number of shares, contracts, units and ounces, if any)
| | | | | | | | | | | | |
| | | | | | | | | | | |
INVESTMENTS IN SECURITIES 167.3% | |
| |
MUNICIPAL BONDS & NOTES 161.5% | |
| |
| |
|
Arizona Industrial Development Authority Revenue Bonds, Series 2020 | |
7.750% due 07/01/2050 ^(b) | | $ | | | 400 | | | $ | | | 24 | |
| | | | | | | | | | | | |
| |
| |
|
Affordable Housing Opportunities Trust, Delaware Revenue Bonds, Series 2022 | |
| | | | | 1,330 | | | | | | 1,181 | |
| | | | | 235 | | | | | | 233 | |
| | | | | | | | | | | | |
| | | | | | | | | | | 1,414 | |
| | | | | | | | | | | | |
| |
| |
|
Chicago, Illinois General Obligation Bonds, Series 2017 | |
| | | | | 1,000 | | | | | | 1,050 | |
| | | | | | | | | | | | |
| |
| |
|
New Hampshire Business Finance Authority Revenue Notes, Series 2023 | |
| | | | | 985 | | | | | | 1,004 | |
| | | | | | | | | | | | |
| |
| |
|
Build NYC Resource Corp., New York Revenue Bonds, Series 2018 | |
| | | | | 1,745 | | | | | | 1,637 | |
|
Build NYC Resource Corp., New York Revenue Bonds, Series 2023 | |
| | | | | 1,250 | | | | | | 1,299 | |
|
Dutchess County, New York Local Development Corp. Revenue Bonds, Series 2015 | |
| | | | | 3,000 | | | | | | 3,047 | |
|
Dutchess County, New York Local Development Corp. Revenue Bonds, Series 2017 | |
| | | | | 590 | | | | | | 591 | |
|
Erie County, New York Industrial Development Agency Revenue Bonds, (FNMA Insured), Series 2023 | |
| | | | | 1,900 | | | | | | 1,896 | |
|
Housing Development Corp., New York Revenue Bonds, Series 2017 | |
| | | | | 1,000 | | | | | | 901 | |
|
Hudson Yards Infrastructure Corp., New York Revenue Bonds, Series 2017 | |
| | | | | 400 | | | | | | 400 | |
|
Hudson Yards Infrastructure Corp., New York Revenue Bonds, Series 2021 | |
| | | | | 1,400 | | | | | | 1,451 | |
|
Huntington Local Development Corp., New York Revenue Bonds, Series 2021 | |
| | | | | 700 | | | | | | 551 | |
|
Long Island Power Authority, New York Revenue Bonds, Series 2014 | |
| | | | | 3,500 | | | | | | 3,521 | |
|
Long Island Power Authority, New York Revenue Bonds, Series 2023 | |
| | | | | 1,300 | | | | | | 1,459 | |
|
Metropolitan Transportation Authority, New York Revenue Bonds, Series 2014 | |
| | | | | 1,500 | | | | | | 1,506 | |
|
Metropolitan Transportation Authority, New York Revenue Bonds, Series 2016 | |
| | | | | 1,370 | | | | | | 1,404 | |
|
Monroe County Industrial Development Corp, New York Revenue Bonds, Series 2023 | |
| | | | | 1,000 | | | | | | 1,105 | |
|
Monroe County Industrial Development Corp., New York Revenue Bonds, Series 2017 | |
| | | | | 1,400 | | | | | | 1,352 | |
| | | | | | | | | | | | |
| | | | | | | | | | | |
|
Monroe County Industrial Development Corp., New York Revenue Bonds, Series 2020 | |
| | $ | | | 1,000 | | | $ | | | 986 | |
|
Nassau County, New York General Obligation Bonds, Series 2022 | |
| | | | | 2,245 | | | | | | 2,271 | |
|
Nassau County, New York Industrial Development Agency Revenue Bonds, Series 2021 | |
0.000% due 01/01/2058 ^(b) | | | | | 1,638 | | | | | | 392 | |
|
Nassau County, New York Tobacco Settlement Corp. Revenue Bonds, Series 2006 | |
| | | | | 4,000 | | | | | | 3,769 | |
|
New York City Transitional Finance Authority Building Aid, New York Revenue Bonds, Series 2016 | |
| | | | | 1,000 | | | | | | 1,003 | |
|
New York City Transitional Finance Authority Future Tax Secured, New York Revenue Bonds, Series 2017 | |
| | | | | 5,000 | | | | | | 4,982 | |
|
New York City Transitional Finance Authority Future Tax Secured, New York Revenue Bonds, Series 2018 | |
| | | | | 685 | | | | | | 690 | |
|
New York City Transitional Finance Authority Future Tax Secured, New York Revenue Bonds, Series 2020 | |
| | | | | 1,350 | | | | | | 1,356 | |
|
New York City Water & Sewer System, New York Revenue Bonds, Series 2016 | |
| | | | | 1,130 | | | | | | 1,130 | |
|
New York City Water & Sewer System, New York Revenue Bonds, Series 2018 | |
| | | | | 2,300 | | | | | | 2,455 | |
|
New York City Water & Sewer System, New York Revenue Bonds, Series 2020 | |
| | | | | 2,750 | | | | | | 2,966 | |
|
New York City, New York Municipal Water Finance Authority Revenue Bonds, Series 2020 | |
| | | | | 1,000 | | | | | | 996 | |
|
New York City, New York Municipal Water Finance Authority Revenue Bonds, Series 2022 | |
| | | | | 2,000 | | | | | | 2,250 | |
|
New York City, New York Municipal Water Finance Authority Revenue Bonds, Series 2023 | |
| | | | | 900 | | | | | | 1,029 | |
| | | | | 900 | | | | | | 1,021 | |
|
New York City, New York Transitional Finance Authority Revenue Bonds, Series 2024 | |
5.000% due 11/01/2041 (a) | | | | | 1,500 | | | | | | 1,751 | |
|
New York Convention Center Development Corp. Revenue Bonds, Series 2015 | |
| | | | | 230 | | | | | | 227 | |
|
New York County, New York Tobacco Trust Revenue Bonds, Series 2005 | |
0.000% due 06/01/2050 (c) | | | | | 30,000 | | | | | | 6,501 | |
0.000% due 06/01/2055 (c) | | | | | 9,000 | | | | | | 752 | |
|
New York County, New York Tobacco Trust Revenue Bonds, Series 2016 | |
| | | | | 1,000 | | | | | | 1,024 | |
| | | | | 1,000 | | | | | | 1,013 | |
|
New York Liberty Development Corp. Revenue Bonds, Series 2005 | |
| | | | | 3,130 | | | | | | 3,726 | |
|
New York Liberty Development Corp. Revenue Bonds, Series 2014 | |
| | | | | 2,000 | | | | | | 1,990 | |
|
New York Liberty Development Corp. Revenue Bonds, Series 2021 | |
| | | | | 605 | | | | | | 462 | |
|
New York Power Authority Revenue Bonds, (AGM Insured), Series 2022 | |
| | | | | 1,250 | | | | | | 1,249 | |
| | | | | 1,000 | | | | | | 978 | |
|
New York Power Authority Revenue Bonds, Series 2020 | |
| | | | | 3,135 | | | | | | 3,121 | |
|
New York State Dormitory Authority Memorial Sloan-Kettering Cancer Revenue Bonds, Series 2022 | |
| | | | | 1,500 | | | | | | 1,486 | |
| | | | | | | | | | | | |
| | | | | | | | | | | |
|
New York State Dormitory Authority Revenue Bonds, (AMBAC Insured), Series 2005 | |
| | $ | | | 1,490 | | | $ | | | 1,789 | |
|
New York State Dormitory Authority Revenue Bonds, Series 2017 | |
| | | | | 750 | | | | | | 747 | |
|
New York State Dormitory Authority Revenue Bonds, Series 2018 | |
| | | | | 2,750 | | | | | | 2,753 | |
| | | | | 2,000 | | | | | | 2,014 | |
| | | | | 2,625 | | | | | | 2,787 | |
|
New York State Dormitory Authority Revenue Bonds, Series 2019 | |
| | | | | 1,600 | | | | | | 1,621 | |
| | | | | 1,000 | | | | | | 1,085 | |
| | | | | 1,575 | | | | | | 1,700 | |
|
New York State Dormitory Authority Revenue Bonds, Series 2020 | |
| | | | | 2,000 | | | | | | 2,071 | |
| | | | | 5,365 | | | | | | 5,340 | |
| | | | | 1,000 | | | | | | 1,068 | |
|
New York State Dormitory Authority Revenue Bonds, Series 2022 | |
| | | | | 465 | | | | | | 447 | |
| | | | | 465 | | | | | | 472 | |
|
New York State Dormitory Authority Revenue Bonds, Series 2023 | |
| | | | | 400 | | | | | | 443 | |
|
New York State Environmental Facilities Corp. Revenue Bonds, Series 2022 | |
| | | | | 2,250 | | | | | | 2,276 | |
|
New York State Thruway Authority Revenue Bonds, Series 2018 | |
| | | | | 1,000 | | | | | | 1,031 | |
|
New York State Thruway Authority Revenue Bonds, Series 2019 | |
| | | | | 1,775 | | | | | | 1,742 | |
|
New York State Thruway Authority Revenue Bonds, Series 2022 | |
| | | | | 1,000 | | | | | | 1,092 | |
|
New York State Urban Development Corp. Revenue Bonds, Series 2019 | |
| | | | | 1,000 | | | | | | 1,008 | |
|
New York State Urban Development Corp. Revenue Bonds, Series 2023 | |
| | | | | 2,000 | | | | | | 2,241 | |
|
New York Transportation Development Corp. Revenue Bonds, (AGM Insured), Series 2023 | |
| | | | | 2,000 | | | | | | 2,099 | |
|
New York Transportation Development Corp. Revenue Bonds, Series 2016 | |
| | | | | 1,150 | | | | | | 1,150 | |
| | | | | 1,165 | | | | | | 1,166 | |
|
New York Transportation Development Corp. Revenue Bonds, Series 2020 | |
| | | | | 1,200 | | | | | | 1,215 | |
|
New York Transportation Development Corp. Revenue Bonds, Series 2022 | |
| | | | | 2,290 | | | | | | 2,178 | |
|
Niagara Tobacco Asset Securitization Corp., New York Revenue Bonds, Series 2014 | |
| | | | | 500 | | | | | | 501 | |
|
Onondaga County, New York Trust for Cultural Resources Revenue Bonds, Series 2019 | |
| | | | | 2,000 | | | | | | 2,002 | |
|
Port Authority of New York & New Jersey Revenue Bonds, Series 2017 | |
| | | | | 6,865 | | | | | | 7,170 | |
|
Port Authority of New York & New Jersey Revenue Bonds, Series 2020 | |
| | | | | 400 | | | | | | 376 | |
|
Port Authority of New York & New Jersey Revenue Bonds, Series 2023 | |
| | | | | 630 | | | | | | 687 | |
| | | | | | | | | | | | |
| | | | | | | | | | | |
|
Schenectady County Capital Resource Corp. Union College Project, New York Revenue Notes, Series 2022 | |
| | $ | | | 470 | | | $ | | | 562 | |
|
Suffolk County, New York Economic Development Corp. Revenue Bonds, Series 2021 | |
| | | | | 475 | | | | | | 393 | |
|
Suffolk Tobacco Asset Securitization Corp., New York Revenue Bonds, Series 2021 | |
0.000% due 06/01/2066 (c) | | | | | 5,000 | | | | | | 560 | |
| | | | | 750 | | | | | | 686 | |
|
Triborough Bridge & Tunnel Authority Sales Tax, New York Revenue Bonds, Series 2022 | |
| | | | | 1,250 | | | | | | 1,213 | |
| | | | | 750 | | | | | | 838 | |
|
Triborough Bridge & Tunnel Authority, New York Revenue Bonds, Series 2019 | |
| | | | | 750 | | | | | | 806 | |
|
Triborough Bridge & Tunnel Authority, New York Revenue Bonds, Series 2021 | |
| | | | | 1,250 | | | | | | 1,355 | |
| | | | | 2,810 | | | | | | 3,033 | |
|
Troy Capital Resource Corp., New York Revenue Bonds, Series 2020 | |
| | | | | 1,800 | | | | | | 2,005 | |
|
TSASC, Inc., New York Revenue Bonds, Series 2017 | |
| | | | | 3,000 | | | | | | 3,108 | |
| | | | | 500 | | | | | | 507 | |
|
Ulster County, New York Capital Resource Corp. Revenue Bonds, Series 2017 | |
| | | | | 1,000 | | | | | | 746 | |
|
Utility Debt Securitization Authority, New York Revenue Bonds, Series 2023 | |
| | | | | 3,500 | | | | | | 3,957 | |
|
Westchester County, New York Local Development Corp. Revenue Bonds, Series 2014 | |
| | | | | 1,000 | | | | | | 1,003 | |
| | | | | | | | | | | | |
| | | | | | | | | | | 146,739 | |
| | | | | | | | | | | | |
| | | | | | | | | | | | |
| | | | | | | | | | | |
| |
|
Grand Forks County, North Dakota Revenue Bonds, Series 2021 | |
7.000% due 12/15/2043 ^(b) | | $ | | | 320 | | | $ | | | 64 | |
| | | | | | | | | | | | |
| |
| |
|
Pennsylvania Economic Development Financing Authority Revenue Bonds, Series 2021 | |
| | | | | 560 | | | | | | 618 | |
| | | | | | | | | | | | |
| |
| |
|
Children’s Trust Fund, Puerto Rico Revenue Bonds, Series 2008 | |
0.000% due 05/15/2057 (c) | | | | | 10,200 | | | | | | 774 | |
|
Commonwealth of Puerto Rico Bonds, Series 2022 | |
| | | | | 1,080 | | | | | | 590 | |
| | | | | 283 | | | | | | 154 | |
|
Commonwealth of Puerto Rico General Obligation Bonds, Series 2021 | |
| | | | | 550 | | | | | | 506 | |
|
Puerto Rico Sales Tax Financing Corp. Sales Tax Revenue Bonds, Series 2018 | |
0.000% due 07/01/2051 (c) | | | | | 3,900 | | | | | | 916 | |
| | | | | | | | | | | | |
| | | | | | | | | | | 2,940 | |
| | | | | | | | | | | | |
| |
| |
|
Angelina & Neches River Authority, Texas Revenue Bonds, Series 2021 | |
| | | | | 220 | | | | | | 145 | |
| | | | | 400 | | | | | | 347 | |
|
Texas Water Development Board Revenue Bonds, Series 2022 | |
| | | | | 890 | | | | | | 978 | |
| | | | | | | | | | | | |
| | | | | | | | | | | 1,470 | |
| | | | | | | | | | | | |
| |
| | | | | | | | | | | | |
| | | | | | | | | | | |
| |
|
Virginia Small Business Financing Authority Revenue Bonds, Series 2019 | |
0.000% due 07/01/2061 (c) | | $ | | | 8,000 | | | $ | | | 250 | |
| | | | | 500 | | | | | | 458 | |
| | | | | | | | | | | | |
| | | | | | | | | | | 708 | |
| | | | | | | | | | | | |
| |
| |
|
Wisconsin Health & Educational Facilities Authority Revenue Bonds, Series 2022 | |
| | | | | 720 | | | | | | 689 | |
| | | | | | | | | | | | |
Total Municipal Bonds & Notes (Cost $154,922) | | | | |
| | | | |
| |
SHORT-TERM INSTRUMENTS 5.8% | |
| |
REPURCHASE AGREEMENTS (d) 5.8% | |
| | | | | | | | | | | 5,658 | |
| | | | | | | | | | | | |
Total Short-Term Instruments (Cost $5,658) | | | | | | | |
| | | | |
| | | | |
| | | | | | | | | | | | |
Total Investments in Securities (Cost $160,580) | | | | | | | |
| | | | |
| | | | | | | | | | | | |
Total Investments 167.3% (Cost $160,580) | | | $ | | | | |
| |
Auction Rate Preferred Shares (52.7)% | | | | | | | |
| |
Remarketable Variable Rate MuniFund Term Preferred Shares, at liquidation value (15.3)% | | | | | | | |
| |
Other Assets and Liabilities, net 0.7% | | | | |
| | | | |
Net Assets Applicable to Common Shareholders 100.0% | | | $ | | | | |
| | | | | | | |
NOTES TO SCHEDULE OF INVESTMENTS:
| A zero balance may reflect actual amounts rounding to less than one thousand. |
| Security is not accruing income as of the date of this report. |
BORROWINGS AND OTHER FINANCING TRANSACTIONS
(d) REPURCHASE AGREEMENTS:
| | | | | | | | | | | | | | | | | | | | | | | | | | | | | | |
| | | | | | | | | | | | | | | | | | | Repurchase
Agreements,
at Value | | | Repurchase Agreement Proceeds to be Received (1) | |
| FICC | | | 2.600 | % | | | 12/29/2023 | | | | 01/02/2024 | | | $ | 5,658 | | | U.S. Treasury Notes 4.875% due 11/30/2025 | | $ | (5,771 | ) | | $ | 5,658 | | | $ | 5,659 | |
| | | | | | | | | | | | | | | | | | | | | | | | | | | | | | |
Total Repurchase Agreements | | | | | | | | | | | | | | | |
| | | | | | | | | | | | | | | |
| | | | | | | | | | | | |
| See Accompanying Notes | | | | | | | | | | DECEMBER 31, 2023 | | | |
| | | | | | |
| | PIMCO New York Municipal Income Fund II | | | | December 31, 2023 |
BORROWINGS AND OTHER FINANCING TRANSACTIONS SUMMARY
The following is a summary by counterparty of the market value of Borrowings and Other Financing Transactions and collateral pledged/(received) as of December 31, 2023:
| | | | | | | | | | | | | | | | | | | | | | | | |
| | Repurchase Agreement Proceeds to be Received (1) | | | Payable for
Reverse
Repurchase
Agreements | | | Payable for Sale-Buyback Transactions | | | Total
Borrowings and
Other Financing
Transactions | | | Collateral
Pledged/(Received) | | | | |
Global/Master Repurchase Agreement | |
| | $ | 5,659 | | | $ | 0 | | | $ | 0 | | | $ | 5,659 | | | $ | (5,771 | ) | | $ | (112 | ) |
| | | | | | | | | | | | | | | | | | | | | | | | |
Total Borrowings and Other Financing Transactions | | | | | | | | | | | | | | | | | | | | | | | | |
| | | | | | | | | | | | | | | | | | | | | | | | |
| Includes accrued interest. |
| Net Exposure represents the net receivable/(payable) that would be due from/to the counterparty in the event of default. Exposure from borrowings and other financing transactions can only be netted across transactions governed under the same master agreement with the same legal entity. See Note 7, Master Netting Arrangements, in the Notes to Financial Statements for more information. |
The following is a summary of the fair valuations according to the inputs used as of December 31, 2023 in valuing the Fund’s assets and
liabilities:
| | | | | | | | | | | | | | | | |
| | | | | | | | | | | | |
Investments in Securities, at Value | |
| |
| | $ | 0 | | | $ | 24 | | | $ | 0 | | | $ | 24 | |
| | | 0 | | | | 1,414 | | | | 0 | | | | 1,414 | |
| | | 0 | | | | 1,050 | | | | 0 | | | | 1,050 | |
| | | 0 | | | | 1,004 | | | | 0 | | | | 1,004 | |
| | | 0 | | | | 146,739 | | | | 0 | | | | 146,739 | |
| | | 0 | | | | 64 | | | | 0 | | | | 64 | |
| | | 0 | | | | 618 | | | | 0 | | | | 618 | |
| | | | | | | | | | | | | | | | |
| | | | | | | | | | | | |
| | $ | 0 | | | $ | 2,940 | | | $ | 0 | | | $ | 2,940 | |
| | | 0 | | | | 1,470 | | | | 0 | | | | 1,470 | |
| | | 0 | | | | 708 | | | | 0 | | | | 708 | |
| | | 0 | | | | 689 | | | | 0 | | | | 689 | |
| |
| | | 0 | | | | 5,658 | | | | 0 | | | | 5,658 | |
| | | | | | | | | | | | | | | | |
| | | | |
| | $ | 0 | | | $ | 162,378 | | | $ | 0 | | | $ | 162,378 | |
| | | | | | | | | | | | | | | | |
There were no significant transfers into or out of Level 3 during the period ended December 31, 2023.
| | | | | | |
| | PIMCO New York Municipal Income Fund III | | | | December 31, 2023 |
(Amounts in thousands*, except number of shares, contracts, units and ounces, if any)
| | | | | | | | | | | | |
| | | | | | | | | | | |
INVESTMENTS IN SECURITIES 160.8% | |
| |
MUNICIPAL BONDS & NOTES 156.4% | |
| |
| |
|
Arizona Industrial Development Authority Revenue Bonds, Series 2020 | |
7.750% due 07/01/2050 ^(a) | | $ | | | 150 | | | $ | | | 9 | |
| | | | | | | | | | | | |
| |
| |
|
Affordable Housing Opportunities Trust, Delaware Revenue Bonds, Series 2022 | |
| | | | | 550 | | | | | | 488 | |
| | | | | 95 | | | | | | 94 | |
| | | | | | | | | | | | |
| | | | | | | | | | | 582 | |
| | | | | | | | | | | | |
| |
| |
|
New Hampshire Business Finance Authority Revenue Notes, Series 2023 | |
| | | | | 492 | | | | | | 502 | |
| | | | | | | | | | | | |
| |
| |
|
Build NYC Resource Corp., New York Revenue Bonds, Series 2018 | |
| | | | | 730 | | | | | | 685 | |
|
Build NYC Resource Corp., New York Revenue Bonds, Series 2023 | |
| | | | | 500 | | | | | | 520 | |
|
Dutchess County, New York Local Development Corp. Revenue Bonds, Series 2017 | |
| | | | | 245 | | | | | | 246 | |
|
Dutchess County, New York Local Development Corp. Revenue Bonds, Series 2022 | |
| | | | | 435 | | | | | | 419 | |
|
Erie County, New York Industrial Development Agency Revenue Bonds, (FNMA Insured), Series 2023 | |
| | | | | 800 | | | | | | 798 | |
|
Housing Development Corp., New York Revenue Bonds, Series 2017 | |
| | | | | 500 | | | | | | 450 | |
|
Hudson Yards Infrastructure Corp., New York Revenue Bonds, Series 2017 | |
| | | | | 400 | | | | | | 400 | |
|
Hudson Yards Infrastructure Corp., New York Revenue Bonds, Series 2021 | |
| | | | | 600 | | | | | | 622 | |
|
Huntington Local Development Corp., New York Revenue Bonds, Series 2021 | |
| | | | | 300 | | | | | | 236 | |
|
Long Island Power Authority, New York Revenue Bonds, Series 2023 | |
| | | | | 500 | | | | | | 561 | |
|
Metropolitan Transportation Authority, New York Revenue Bonds, Series 2014 | |
| | | | | 2,000 | | | | | | 2,008 | |
|
Metropolitan Transportation Authority, New York Revenue Bonds, Series 2016 | |
| | | | | 500 | | | | | | 512 | |
|
Monroe County Industrial Development Corp, New York Revenue Bonds, Series 2023 | |
| | | | | 500 | | | | | | 552 | |
|
Monroe County Industrial Development Corp., New York Revenue Bonds, Series 2020 | |
| | | | | 425 | | | | | | 419 | |
|
Nassau County, New York General Obligation Bonds, Series 2022 | |
| | | | | 950 | | | | | | 961 | |
|
Nassau County, New York Industrial Development Agency Revenue Bonds, Series 2021 | |
0.000% due 01/01/2058 ^(a) | | | | | 341 | | | | | | 82 | |
|
New York City Transitional Finance Authority Building Aid, New York Revenue Bonds, Series 2018 | |
| | | | | 1,000 | | | | | | 1,111 | |
| | | | | | | | | | | | |
| | | | | | | | | | | |
|
New York City Transitional Finance Authority Future Tax Secured, New York Revenue Bonds, Series 2020 | |
| | $ | | | 550 | | | $ | | | 552 | |
|
New York City Water & Sewer System, New York Revenue Bonds, Series 2016 | |
| | | | | 465 | | | | | | 465 | |
|
New York City, New York General Obligation Bonds, Series 2018 | |
| | | | | 900 | | | | | | 955 | |
|
New York City, New York Health and Hospitals Corp. Revenue Bonds, Series 2021 | |
| | | | | 265 | | | | | | 265 | |
|
New York City, New York Municipal Water Finance Authority Revenue Bonds, Series 2007 | |
| | | | | 1,300 | | | | | | 1,300 | |
|
New York City, New York Municipal Water Finance Authority Revenue Bonds, Series 2020 | |
| | | | | 600 | | | | | | 597 | |
|
New York City, New York Municipal Water Finance Authority Revenue Bonds, Series 2022 | |
| | | | | 750 | | | | | | 835 | |
| | | | | 1,000 | | | | | | 1,125 | |
|
New York City, New York Municipal Water Finance Authority Revenue Bonds, Series 2023 | |
| | | | | 500 | | | | | | 506 | |
| | | | | 400 | | | | | | 457 | |
| | | | | 400 | | | | | | 454 | |
|
New York City, New York Transitional Finance Authority Future Tax Secured Revenue Bonds, Series 2022 | |
| | | | | 500 | | | | | | 566 | |
|
New York County, New York Tobacco Trust Revenue Bonds, Series 2001 | |
| | | | | 320 | | | | | | 326 | |
|
New York County, New York Tobacco Trust Revenue Bonds, Series 2005 | |
0.000% due 06/01/2050 (b) | | | | | 10,000 | | | | | | 2,167 | |
0.000% due 06/01/2055 (b) | | | | | 7,500 | | | | | | 627 | |
|
New York Liberty Development Corp. Revenue Bonds, Series 2005 | |
| | | | | 450 | | | | | | 536 | |
|
New York Liberty Development Corp. Revenue Bonds, Series 2007 | |
| | | | | 1,650 | | | | | | 1,973 | |
|
New York Liberty Development Corp. Revenue Bonds, Series 2014 | |
| | | | | 1,000 | | | | | | 995 | |
|
New York Liberty Development Corp. Revenue Bonds, Series 2021 | |
| | | | | 250 | | | | | | 191 | |
|
New York Power Authority Revenue Bonds, (AGM Insured), Series 2022 | |
| | | | | 900 | | | | | | 899 | |
|
New York Power Authority Revenue Bonds, Series 2020 | |
| | | | | 1,400 | | | | | | 1,394 | |
|
New York State Dormitory Authority Memorial Sloan-Kettering Cancer Revenue Bonds, Series 2022 | |
| | | | | 750 | | | | | | 743 | |
|
New York State Dormitory Authority Revenue Bonds, Series 2017 | |
| | | | | 250 | | | | | | 249 | |
|
New York State Dormitory Authority Revenue Bonds, Series 2018 | |
| | | | | 405 | | | | | | 409 | |
|
New York State Dormitory Authority Revenue Bonds, Series 2019 | |
| | | | | 620 | | | | | | 628 | |
| | | | | 1,700 | | | | | | 1,834 | |
|
New York State Dormitory Authority Revenue Bonds, Series 2020 | |
| | | | | 2,280 | | | | | | 2,269 | |
| | | | | 350 | | | | | | 374 | |
|
New York State Dormitory Authority Revenue Bonds, Series 2022 | |
| | | | | 190 | | | | | | 183 | |
| | | | | 190 | | | | | | 193 | |
| | | | | | | | | | | | |
| | | | | | | | | | | |
|
New York State Dormitory Authority Revenue Bonds, Series 2023 | |
| | $ | | | 500 | | | $ | | | 554 | |
|
New York State Environmental Facilities Corp. Revenue Bonds, Series 2022 | |
| | | | | 1,000 | | | | | | 1,011 | |
|
New York State Thruway Authority Revenue Bonds, Series 2019 | |
| | | | | 600 | | | | | | 610 | |
|
New York State Thruway Authority Revenue Bonds, Series 2021 | |
| | | | | 500 | | | | | | 512 | |
|
New York State Thruway Authority Revenue Bonds, Series 2022 | |
| | | | | 600 | | | | | | 655 | |
|
New York State Urban Development Corp. Revenue Bonds, Series 2019 | |
| | | | | 1,500 | | | | | | 1,513 | |
|
New York State Urban Development Corp. Revenue Bonds, Series 2023 | |
| | | | | 1,500 | | | | | | 1,681 | |
|
New York Transportation Development Corp. Revenue Bonds, (AGM Insured), Series 2023 | |
| | | | | 750 | | | | | | 787 | |
|
New York Transportation Development Corp. Revenue Bonds, Series 2016 | |
| | | | | 500 | | | | | | 500 | |
| | | | | 480 | | | | | | 481 | |
|
New York Transportation Development Corp. Revenue Bonds, Series 2020 | |
| | | | | 500 | | | | | | 506 | |
|
New York Transportation Development Corp. Revenue Bonds, Series 2022 | |
| | | | | 940 | | | | | | 894 | |
|
Niagara Tobacco Asset Securitization Corp., New York Revenue Bonds, Series 2014 | |
| | | | | 500 | | | | | | 500 | |
|
Onondaga County, New York Trust for Cultural Resources Revenue Bonds, Series 2019 | |
| | | | | 1,000 | | | | | | 1,001 | |
|
Port Authority of New York & New Jersey Revenue Bonds, Series 2017 | |
| | | | | 2,500 | | | | | | 2,611 | |
|
Port Authority of New York & New Jersey Revenue Bonds, Series 2020 | |
| | | | | 250 | | | | | | 235 | |
|
Port Authority of New York & New Jersey Revenue Bonds, Series 2023 | |
| | | | | 275 | | | | | | 300 | |
|
Schenectady County Capital Resource Corp. Union College Project, New York Revenue Notes, Series 2022 | |
| | | | | 190 | | | | | | 227 | |
|
Suffolk County, New York Economic Development Corp. Revenue Bonds, Series 2021 | |
| | | | | 200 | | | | | | 166 | |
|
Suffolk Tobacco Asset Securitization Corp., New York Revenue Bonds, Series 2021 | |
0.000% due 06/01/2066 (b) | | | | | 5,000 | | | | | | 560 | |
| | | | | 250 | | | | | | 229 | |
|
The Genesee County Funding Corporation Tax-Exempt, New York Revenue Bonds, Series 2022 | |
| | | | | 500 | | | | | | 529 | |
|
Triborough Bridge & Tunnel Authority Sales Tax, New York Revenue Bonds, Series 2022 | |
| | | | | 750 | | | | | | 838 | |
|
Triborough Bridge & Tunnel Authority, New York Revenue Bonds, Series 2019 | |
| | | | | 750 | | | | | | 806 | |
|
Triborough Bridge & Tunnel Authority, New York Revenue Bonds, Series 2022 | |
| | | | | 300 | | | | | | 311 | |
|
Troy Capital Resource Corp., New York Revenue Bonds, Series 2020 | |
| | | | | 585 | | | | | | 652 | |
| | | | | | | | | | | | |
| See Accompanying Notes | | | | | | | | | | DECEMBER 31, 2023 | | | |
| | | | | | |
| | PIMCO New York Municipal Income Fund III | | | | |
| | | | | | | | | | | | |
| | | | | | | | | | | |
|
TSASC, Inc., New York Revenue Bonds, Series 2017 | |
| | $ | | | 2,000 | | | $ | | | 2,028 | |
|
Ulster County, New York Capital Resource Corp. Revenue Bonds, Series 2017 | |
| | | | | 500 | | | | | | 373 | |
|
Utility Debt Securitization Authority, New York Revenue Bonds, Series 2023 | |
| | | | | 1,500 | | | | | | 1,696 | |
| | | | | | | | | | | | |
| | | | | | | | | | | 57,415 | |
| | | | | | | | | | | | |
| |
| |
|
Grand Forks County, North Dakota Revenue Bonds, Series 2021 | |
7.000% due 12/15/2043 ^(a) | | | | | 130 | | | | | | 26 | |
| | | | | | | | | | | | |
| |
| |
|
Pennsylvania Economic Development Financing Authority Revenue Bonds, Series 2021 | |
| | | | | 225 | | | | | | 248 | |
| | | | | | | | | | | | |
| |
| |
|
Children’s Trust Fund, Puerto Rico Revenue Bonds, Series 2008 | |
0.000% due 05/15/2057 (b) | | | | | 4,400 | | | | | | 330 | |
| | | | | | | | | | | | |
| | | | | | | | | | | |
|
Commonwealth of Puerto Rico Bonds, Series 2022 | |
| | $ | | | 362 | | | $ | | | 197 | |
| | | | | 497 | | | | | | 272 | |
|
Commonwealth of Puerto Rico General Obligation Bonds, Series 2021 | |
| | | | | 250 | | | | | | 230 | |
|
Puerto Rico Sales Tax Financing Corp. Sales Tax Revenue Bonds, Series 2018 | |
0.000% due 07/01/2046 (b) | | | | | 3,850 | | | | | | 1,212 | |
| | | | | | | | | | | | |
| | | | | | | | | | | 2,241 | |
| | | | | | | | | | | | |
| |
| |
|
Angelina & Neches River Authority, Texas Revenue Bonds, Series 2021 | |
| | | | | 90 | | | | | | 60 | |
| | | | | 150 | | | | | | 130 | |
| | | | | | | | | | | | |
| | | | | | | | | | | 190 | |
| | | | | | | | | | | | |
| |
| |
|
Virginia Small Business Financing Authority Revenue Bonds, Series 2019 | |
0.000% due 07/01/2061 (b) | | | | | 4,000 | | | | | | 125 | |
| | | | | 250 | | | | | | 229 | |
| | | | | | | | | | | | |
| | | | | | | | | | | 354 | |
| | | | | | | | | | | | |
| | | | | | | | | | | | |
| | | | | | | | | | | |
| |
|
Wisconsin Health & Educational Facilities Authority Revenue Bonds, Series 2022 | |
| | $ | | | 295 | | | $ | | | 282 | |
| | | | | | | | | | | | |
Total Municipal Bonds & Notes
(Cost $60,735) | | | | |
| | | | |
| |
SHORT-TERM INSTRUMENTS 4.4% | |
| |
REPURCHASE AGREEMENTS (c) 4.4% | |
| | | | | | | | | | | 1,732 | |
| | | | | | | | | | | | |
Total Short-Term Instruments
(Cost $1,732) | | | | |
| | | | |
| |
| | | | |
Total Investments in Securities
(Cost $62,467) | | | | |
| |
| | | | |
Total Investments 160.8%
(Cost $62,467) | | | $ | | | | |
| |
Auction Rate Preferred Shares (65.8)% | | | | | | | |
| |
Other Assets and Liabilities, net 5.0% | | | | |
| | | | |
Net Assets Applicable to Common Shareholders 100.0% | | | $ | | | | |
| | | | | | | |
NOTES TO SCHEDULE OF INVESTMENTS:
| A zero balance may reflect actual amounts rounding to less than one thousand. |
| Security is not accruing income as of the date of this report. |
BORROWINGS AND OTHER FINANCING TRANSACTIONS
(c) REPURCHASE AGREEMENTS:
| | | | | | | | | | | | | | | | | | | | | | | | | | | | | | |
| | | | | | | | | | | | | | | | | | | Repurchase
Agreements,
at Value | | | Repurchase Agreement Proceeds to be Received (1) | |
| FICC | | | 2.600 | % | | | 12/29/2023 | | | | 01/02/2024 | | | $ | 1,732 | | | U.S. Treasury Notes 4.875% due 11/30/2025 | | $ | (1,767 | ) | | $ | 1,732 | | | $ | 1,732 | |
| | | | | | | | | | | | | | | | | | | | | | | | | | | | | | |
Total Repurchase Agreements | | | | | | | | | | | | | | | |
| | | | | | | | | | | | | | | |
BORROWINGS AND OTHER FINANCING TRANSACTIONS SUMMARY
The following is a summary by counterparty of the market value of Borrowings and Other Financing Transactions and collateral pledged/(received) as of December 31, 2023:
| | | | | | | | | | | | | | | | | | | | | | | | |
| | Repurchase Agreement Proceeds to be Received (1) | | | Payable for
Reverse
Repurchase
Agreements | | | Payable for Sale-Buyback Transactions | | | Total
Borrowings and
Other Financing
Transactions | | | Collateral
Pledged/(Received) | | | | |
Global/Master Repurchase Agreement | |
| | $ | 1,732 | | | $ | 0 | | | $ | 0 | | | $ | 1,732 | | | $ | (1,767 | ) | | $ | (35 | ) |
| | | | | | | | | | | | | | | | | | | | | | | | |
Total Borrowings and Other Financing Transactions | | | | | | | | | | | | | | | | | | | | | | | | |
| | | | | | | | | | | | | | | | | | | | | | | | |
| Includes accrued interest. |
| Net Exposure represents the net receivable/(payable) that would be due from/to the counterparty in the event of default. Exposure from borrowings and other financing transactions can only be netted across transactions governed under the same master agreement with the same legal entity. See Note 7, Master Netting Arrangements, in the Notes to Financial Statements for more information. |
The following is a summary of the fair valuations according to the inputs used as of December 31, 2023 in valuing the Fund’s assets and liabilities:
| | | | | | | | | | | | | | | | |
| | | | | | | | | | | | |
Investments in Securities, at Value | |
| |
| | $ | 0 | | | $ | 9 | | | $ | 0 | | | $ | 9 | |
| | | 0 | | | | 582 | | | | 0 | | | | 582 | |
| | | 0 | | | | 502 | | | | 0 | | | | 502 | |
| | | 0 | | | | 57,415 | | | | 0 | | | | 57,415 | |
| | | 0 | | | | 26 | | | | 0 | | | | 26 | |
| | | 0 | | | | 248 | | | | 0 | | | | 248 | |
| | | | | | | | | | | | | | | | |
| | | | | | | | | | | | |
| | $ | 0 | | | $ | 2,241 | | | $ | 0 | | | $ | 2,241 | |
| | | 0 | | | | 190 | | | | 0 | | | | 190 | |
| | | 0 | | | | 354 | | | | 0 | | | | 354 | |
| | | 0 | | | | 282 | | | | 0 | | | | 282 | |
| |
| | | 0 | | | | 1,732 | | | | 0 | | | | 1,732 | |
| | | | | | | | | | | | | | | | |
| | | | |
| | $ | 0 | | | $ | 63,581 | | | $ | 0 | | | $ | 63,581 | |
| | | | | | | | | | | | | | | | |
There were no significant transfers into or out of Level 3 during the period ended December 31, 2023.
| | | | | | | | | | | | |
| See Accompanying Notes | | | | | | | | | | DECEMBER 31, 2023 | | | |
| | | | | | |
Consolidated Schedule of Investments | | PIMCO Municipal Income Fund | | | | |
(Amounts in thousands*, except number of shares, contracts, units and ounces, if any)
| | | | | | | | | | | | |
| | | | | | | | | | | |
INVESTMENTS IN SECURITIES 174.1% | |
| |
LOAN PARTICIPATIONS AND ASSIGNMENTS 1.2% | |
|
| |
| | $ | | | 500 | | | $ | | | 505 | |
TBD% - 7.947% due 10/26/2063 «µ | | | | | 2,500 | | | | | | 2,625 | |
| | | | | | | | | | | | |
Total Loan Participations and Assignments (Cost $3,000) | | | | |
| | | | |
| |
MUNICIPAL BONDS & NOTES 171.5% | |
| |
| |
|
Jefferson County, Alabama Sewer Revenue Bonds, Series 2013 | |
| | | | | 750 | | | | | | 788 | |
| | | | | 10,000 | | | | | | 10,500 | |
|
Tuscaloosa County, Alabama Industrial Development Authority Revenue Bonds, Series 2019 | |
| | | | | 1,575 | | | | | | 1,456 | |
| | | | | | | | | | | | |
| | | | | | | | | | | 12,744 | |
| | | | | | | | | | | | |
| |
| |
|
Alaska Industrial Development & Export Authority Revenue Bonds, Series 2007 | |
6.000% due 12/01/2036 ^(b) | | | | | 900 | | | | | | 1 | |
|
Municipality of Anchorage, Alaska Solid Waste Services Revenue Bonds, Series 2022 | |
| | | | | 1,080 | | | | | | 1,156 | |
| | | | | | | | | | | | |
| | | | | | | | | | | 1,157 | |
| | | | | | | | | | | | |
| |
| |
|
Arizona Industrial Development Authority Revenue Bonds, Series 2019 | |
| | | | | 900 | | | | | | 518 | |
| | | | | 550 | | | | | | 285 | |
| | | | | 1,500 | | | | | | 730 | |
|
Arizona Industrial Development Authority Revenue Bonds, Series 2020 | |
7.750% due 07/01/2050 ^(b) | | | | | 1,100 | | | | | | 66 | |
|
Industrial Development Authority of the County, Arizona of Pima Revenue Bonds, Series 2020 | |
| | | | | 1,100 | | | | | | 966 | |
|
Maricopa County, Arizona Industrial Development Authority Revenue Bonds, Series 2017 | |
| | | | | 750 | | | | | | 751 | |
|
Maricopa County, Arizona Industrial Development Authority Revenue Bonds, Series 2019 | |
| | | | | 3,500 | | | | | | 3,491 | |
|
Maricopa County, Arizona School District No 83, Cartwright Elementary Revenue Bonds, Series 2020 | |
| | | | | 3,600 | | | | | | 3,303 | |
| | | | | | | | | | | | |
| | | | | | | | | | | 10,110 | |
| | | | | | | | | | | | |
| |
| |
|
Arkansas Development Finance Authority Revenue Bonds, (AMBAC Insured), Series 2006 | |
0.000% due 07/01/2036 (c) | | | | | 5,500 | | | | | | 3,422 | |
|
County of Pulaski Hospital, Arkansas Revenue Bonds, Series 2023 | |
| | | | | 700 | | | | | | 763 | |
| | | | | | | | | | | | |
| | | | | | | | | | | 4,185 | |
| | | | | | | | | | | | |
| |
| |
|
California County Tobacco Securitization Agency Revenue Bonds, Series 2002 | |
| | | | | 835 | | | | | | 836 | |
|
California Statewide Communities Development Authority Revenue Bonds, Series 2016 | |
| | | | | 1,500 | | | | | | 1,485 | |
| | | | | | | | | | | | |
| | | | | | | | | | | |
|
Golden State, California Tobacco Securitization Corp. Revenue Bonds, Series 2021 | |
0.000% due 06/01/2066 (c) | | $ | | | 2,500 | | | $ | | | 295 | |
|
Golden State, California Tobacco Securitization Corp. Revenue Bonds, Series 2022 | |
| | | | | 1,000 | | | | | | 1,049 | |
|
Los Angeles County, California Public Works Financing Authority Revenue Bonds, Series 2021 | |
| | | | | 1,385 | | | | | | 1,415 | |
|
Los Angeles Department of Water & Power, California Revenue Bonds, Series 2023 | |
| | | | | 1,100 | | | | | | 1,260 | |
|
Energy Authority, California Revenue Bonds, Series 2009 | |
| | | | | 1,640 | | | | | | 1,779 | |
|
San Diego County, California Regional Airport Authority Revenue Bonds, Series 2021 | |
| | | | | 1,000 | | | | | | 957 | |
|
San Francisco, California City & County Public Utilities Commission Wastewater Revenue Bonds, Series 2021 | |
| | | | | 675 | | | | | | 680 | |
| | | | | | | | | | | | |
| | | | | | | | | | | 9,756 | |
| | | | | | | | | | | | |
| |
| |
|
Colorado Health Facilities Authority Revenue Bonds, Series 2019 | |
| | | | | 2,200 | | | | | | 2,231 | |
| | | | | 2,000 | | | | | | 1,921 | |
|
Colorado International Center Metropolitan District No 7, General Obligation Bonds, Series 2021 | |
0.000% due 12/01/2051 (d) | | | | | 715 | | | | | | 420 | |
|
Colorado State Building Excellent School Certificates of Participation Bonds, Series 2018 | |
| | | | | 1,015 | | | | | | 1,021 | |
|
Dominion Water & Sanitation District, Colorado Revenue Bonds, Series 2022 | |
| | | | | 1,000 | | | | | | 1,002 | |
|
Harvest Crossing Metropolitan District No 4, Colorado General Obligation Bonds, Series 2022 | |
| | | | | 1,250 | | | | | | 1,236 | |
|
Public Authority for Colorado Energy Revenue Bonds, Series 2008 | |
| | | | | 500 | | | | | | 631 | |
|
Senac South Metropolitan District No 1, Colorado General Obligation Bonds, Series 2021 | |
| | | | | 500 | | | | | | 441 | |
| | | | | | | | | | | | |
| | | | | | | | | | | 8,903 | |
| | | | | | | | | | | | |
| |
| |
|
Connecticut State Health & Educational Facilities Authority Revenue Bonds, Series 2022 | |
| | | | | 1,300 | | | | | | 1,402 | |
| | | | | | | | | | | | |
| |
| |
|
Affordable Housing Opportunities Trust, Delaware Revenue Bonds, Series 2022 | |
| | | | | 4,940 | | | | | | 4,647 | |
| | | | | 870 | | | | | | 877 | |
| | | | | | | | | | | | |
| | | | | | | | | | | 5,524 | |
| | | | | | | | | | | | |
| |
DISTRICT OF COLUMBIA 0.8% | |
|
District of Columbia Revenue Bonds, Series 2022 | |
| | | | | 1,625 | | | | | | 1,937 | |
| | | | | | | | | | | | |
| |
| |
|
Avenir Community Development District, Florida Special Assessment Bonds, Series 2023 | |
| | | | | 740 | | | | | | 743 | |
| | | | | | | | | | | | |
| | | | | | | | | | | |
|
Central Florida Expressway Authority Revenue Bonds, Series 2017 | |
| | $ | | | 1,950 | | | $ | | | 1,960 | |
|
Charlotte County Industrial Development Authority, Florida Revenue Bonds, Series 2021 | |
| | | | | 500 | | | | | | 447 | |
| | | | | 2,500 | | | | | | 2,060 | |
|
Hillsborough County, Florida Industrial Development Authority Revenue Bonds, Series 2020 | |
| | | | | 1,650 | | | | | | 1,543 | |
|
Miami-Dade County, Florida Transit System Revenue Bonds, Series 2018 | |
| | | | | 1,000 | | | | | | 1,009 | |
| | | | | 1,000 | | | | | | 1,001 | |
|
Miami-Dade County, Florida Water & Sewer System Revenue Bonds, Series 2019 | |
| | | | | 2,500 | | | | | | 2,449 | |
|
Miami-Dade Seaport Department, Florida Revenue Bonds, Series 2023 | |
| | | | | 1,600 | | | | | | 1,711 | |
|
Orange County Health Facilities Authority, Florida Revenue Bonds, Series 2023 | |
| | | | | 910 | | | | | | 972 | |
|
Tampa, Florida Revenue Bonds, Series 2016 | |
| | | | | 2,500 | | | | | | 2,443 | |
|
Tampa-Hillsborough County, Florida Expressway Authority Revenue Bonds, Series 2017 | |
| | | | | 2,250 | | | | | | 2,244 | |
| | | | | | | | | | | | |
| | | | | | | | | | | 18,582 | |
| | | | | | | | | | | | |
| |
| |
|
Atlanta Development Authority, Georgia Revenue Bonds, Series 2017 | |
6.750% due 01/01/2035 ^(b) | | | | | 1,600 | | | | | | 720 | |
|
Municipal Electric Authority of Georgia Revenue Bonds, Series 2015 | |
| | | | | 9,000 | | | | | | 9,036 | |
|
Municipal Electric Authority of Georgia Revenue Bonds, Series 2022 | |
| | | | | 1,000 | | | | | | 1,040 | |
| | | | | | | | | | | | |
| | | | | | | | | | | 10,796 | |
| | | | | | | | | | | | |
| |
| |
|
Chicago O’Hare International Airport, Illinois Revenue Bonds, Series 2018 | |
| | | | | 3,000 | | | | | | 3,160 | |
|
Chicago, Illinois General Obligation Bonds, Series 2003 | |
| | | | | 1,750 | | | | | | 1,773 | |
|
Chicago, Illinois General Obligation Bonds, Series 2007 | |
| | | | | 2,400 | | | | | | 2,415 | |
|
Illinois Finance Authority Revenue Bonds, Series 2017 | |
5.000% due 02/15/2037 ^(b) | | | | | 945 | | | | | | 255 | |
|
Illinois Finance Authority Revenue Bonds, Series 2019 | |
5.000% due 11/01/2035 ^(b) | | | | | 1,000 | | | | | | 928 | |
|
Illinois State General Obligation Bonds, Series 2018 | |
| | | | | 2,000 | | | | | | 2,065 | |
|
Illinois State General Obligation Notes, Series 2017 | |
| | | | | 9,500 | | | | | | 10,214 | |
|
Illinois State Toll Highway Authority Revenue Bonds, Series 2024 | |
5.000% due 01/01/2036 (a) | | | | | 5,000 | | | | | | 6,084 | |
|
Metropolitan Pier & Exposition Authority, Illinois Revenue Bonds, (AGM/CR/NPFGC Insured), Series 2002 | |
0.000% due 12/15/2040 (c) | | | | | 2,000 | | | | | | 1,022 | |
|
Metropolitan Pier & Exposition Authority, Illinois Revenue Bonds, Series 2012 | |
0.000% due 12/15/2051 (c) | | | | | 2,500 | | | | | | 668 | |
|
Metropolitan Pier & Exposition Authority, Illinois Revenue Bonds, Series 2022 | |
0.000% due 06/15/2036 (c) | | | | | 1,000 | | | | | | 636 | |
| | | | | | | | | | | | |
| | | | | | | | | | | |
|
Regional Transportation Authority, Illinois Revenue Bonds, Series 2018 | |
| | $ | | | 3,500 | | | $ | | | 3,762 | |
|
Sales Tax Securitization Corp., Illinois Revenue Bonds, Series 2018 | |
| | | | | 650 | | | | | | 632 | |
| | | | | | | | | | | | |
| | | | | | | | | | | 33,614 | |
| | | | | | | | | | | | |
| |
| |
|
Indiana Finance Authority Midwestern Disaster Relief Revenue Bonds, Series 2012 | |
| | | | | 1,250 | | | | | | 1,268 | |
|
Indiana Finance Authority Revenue Bonds, Series 2019 | |
| | | | | 1,710 | | | | | | 1,278 | |
|
Indiana Health & Educational Facilities Financing Authority Revenue Bonds, Series 2006 | |
| | | | | 1,000 | | | | | | 963 | |
|
Indianapolis Local Public Improvement Bond Bank Revenue Bonds, Series 2023 | |
| | | | | 1,000 | | | | | | 1,083 | |
| | | | | 1,000 | | | | | | 1,093 | |
| | | | | | | | | | | | |
| | | | | | | | | | | 5,685 | |
| | | | | | | | | | | | |
| |
| |
|
Iowa Finance Authority Midwestern Disaster Area Revenue Refunding Bonds, Series 2012 | |
| | | | | 1,500 | | | | | | 1,478 | |
|
Iowa Finance Authority Midwestern Disaster Area Revenue Refunding Bonds, Series 2022 | |
| | | | | 5,030 | | | | | | 5,260 | |
|
Iowa Finance Authority Revenue Bonds, Series 2022 | |
| | | | | 800 | | | | | | 746 | |
| | | | | | | | | | | | |
| | | | | | | | | | | 7,484 | |
| | | | | | | | | | | | |
| |
| |
|
Lenexa, Kansas Tax Allocation Bonds, Series 2007 | |
6.000% due 04/01/2027 ^(b) | | | | | 677 | | | | | | 101 | |
| | | | | | | | | | | | |
| |
| |
|
Louisiana Gasoline & Fuels Tax State Revenue Bonds, Series 2017 | |
| | | | | 4,000 | | | | | | 3,999 | |
|
Louisiana Public Facilities Authority Revenue Bonds, Series 2017 | |
| | | | | 2,500 | | | | | | 2,565 | |
|
Louisiana Public Facilities Authority Revenue Bonds, Series 2020 | |
| | | | | 90 | | | | | | 98 | |
|
Louisiana Public Facilities Authority Revenue Bonds, Series 2023 | |
| | | | | 1,780 | | | | | | 1,935 | |
|
Parish of St James, Louisiana Revenue Bonds, Series 2010 | |
| | | | | 1,250 | | | | | | 1,365 | |
| | | | | | | | | | | | |
| | | | | | | | | | | 9,962 | |
| | | | | | | | | | | | |
| |
| |
|
Maryland Economic Development Corp. Revenue Bonds, Series 2020 | |
| | | | | 500 | | | | | | 473 | |
| | | | | | | | | | | | |
| |
| |
|
Commonwealth of Massachusetts General Obligation Bonds, Series 2018 | |
| | | | | 1,000 | | | | | | 1,025 | |
|
Commonwealth of Massachusetts Transportation Fund Revenue Bonds, Series 2023 | |
| | | | | 2,250 | | | | | | 2,486 | |
| | | | | | | | | | | | |
| | | | | | | | | | | |
|
Massachusetts Development Finance Agency Revenue Bonds, Series 2016 | |
| | $ | | | 1,000 | | | $ | | | 1,009 | |
| | | | | | | | | | | | |
| | | | | | | | | | | 4,520 | |
| | | | | | | | | | | | |
| |
| |
|
Detroit City School District, Michigan General Obligation Bonds, (AGM/Q-SBLF Insured), Series 2001 | |
| | | | | 1,280 | | | | | | 1,422 | |
|
Great Lakes Water Authority Water Supply System, Michigan Revenue Bonds, Series 2023 | |
| | | | | 2,500 | | | | | | 2,852 | |
|
Michigan Finance Authority Hospital Revenue Refunding Bonds, Series 2022 | |
| | | | | 1,000 | | | | | | 998 | |
|
Michigan Finance Authority Revenue Bonds, Series 2017 | |
| | | | | 2,330 | | | | | | 2,384 | |
|
Michigan Finance Authority Revenue Bonds, Series 2019 | |
| | | | | 3,500 | | | | | | 3,372 | |
| | | | | 2,000 | | | | | | 1,891 | |
|
Michigan State Housing Development Authority Revenue Bonds, Series 2015 | |
| | | | | 920 | | | | | | 920 | |
|
Michigan Tobacco Settlement Finance Authority Revenue Bonds, Series 2008 | |
0.000% due 06/01/2058 (c) | | | | | 15,000 | | | | | | 633 | |
| | | | | | | | | | | | |
| | | | | | | | | | | 14,472 | |
| | | | | | | | | | | | |
| |
| |
|
Duluth Economic Development Authority Health Care Facilities, Minnesota Revenue Bonds, Series 2022 | |
| | | | | 500 | | | | | | 516 | |
|
Rochester, Minnesota Revenue Bonds, Series 2018 | |
| | | | | 1,500 | | | | | | 1,485 | |
| | | | | | | | | | | | |
| | | | | | | | | | | 2,001 | |
| | | | | | | | | | | | |
| |
| |
|
Health & Educational Facilities Authority of the State of Missouri Revenue Bonds, Series 2019 | |
| | | | | 600 | | | | | | 605 | |
|
Health & Educational Facilities Authority of the State of Missouri Revenue Bonds, Series 2023 | |
| | | | | 1,150 | | | | | | 1,301 | |
|
Missouri Development Finance Board Revenue Bonds, Series 2022 | |
| | | | | 1,000 | | | | | | 1,081 | |
| | | | | | | | | | | | |
| | | | | | | | | | | 2,987 | |
| | | | | | | | | | | | |
| |
| |
|
University of Nebraska Facilities Corp Revenue Bonds, Series 2021 | |
| | | | | 1,125 | | | | | | 1,081 | |
| | | | | | | | | | | | |
| |
| |
|
Las Vegas Convention & Visitors Authority, Nevada Revenue Bonds, Series 2023 | |
| | | | | 1,700 | | | | | | 1,862 | |
|
Reno, Nevada Revenue Bonds, Series 2018 | |
0.000% due 07/01/2058 (c) | | | | | 10,500 | | | | | | 1,088 | |
| | | | | | | | | | | | |
| | | | | | | | | | | 2,950 | |
| | | | | | | | | | | | |
| |
| |
|
New Hampshire Business Finance Authority Revenue Bonds, Series 2023 | |
| | | | | 2,706 | | | | | | 2,676 | |
| | | | | | | | | | | | |
| |
| | | | | | | | | | | | |
| | | | | | | | | | | |
| |
|
Cherry Hill Township School District, New Jersey General Obligation Bonds, Series 2022 | |
| | $ | | | 2,600 | | | $ | | | 2,663 | |
|
Federal Home Loan Mortgage Corp. Enhanced Receipt, New Jersey Revenue Bonds, Series 2019 | |
3.870% due 11/15/2035 (e) | | | | | 68 | | | | | | 64 | |
|
New Jersey Economic Development Authority Revenue Bonds, Series 2016 | |
| | | | | 2,500 | | | | | | 2,682 | |
|
New Jersey Economic Development Authority Special Assessment Bonds, Series 2002 | |
| | | | | 2,050 | | | | | | 2,057 | |
|
New Jersey Health Care Facilities Financing Authority Revenue Bonds, Series 2013 | |
| | | | | 2,000 | | | | | | 2,002 | |
|
New Jersey State General Obligation Notes, Series 2020 | |
| | | | | 1,400 | | | | | | 1,515 | |
|
New Jersey Transportation Trust Fund Authority Revenue Bonds, (AGM Insured), Series 2006 | |
0.000% due 12/15/2034 (c) | | | | | 1,500 | | | | | | 1,062 | |
|
New Jersey Transportation Trust Fund Authority Revenue Bonds, Series 2019 | |
| | | | | 1,000 | | | | | | 1,068 | |
|
New Jersey Transportation Trust Fund Authority Revenue Bonds, Series 2023 | |
| | | | | 1,150 | | | | | | 1,278 | |
|
New Jersey Turnpike Authority Revenue Bonds, Series 2019 | |
| | | | | 1,500 | | | | | | 1,598 | |
|
South Jersey Port Corp., New Jersey Revenue Bonds, Series 2017 | |
| | | | | 250 | | | | | | 258 | |
|
Tobacco Settlement Financing Corp., New Jersey Revenue Bonds, Series 2018 | |
| | | | | 1,000 | | | | | | 1,074 | |
| | | | | 5,595 | | | | | | 5,681 | |
| | | | | | | | | | | | |
| | | | | | | | | | | 23,002 | |
| | | | | | | | | | | | |
| |
| |
|
Build NYC Resource Corp., New York Revenue Bonds, Series 2023 | |
| | | | | 1,000 | | | | | | 1,043 | |
|
Erie County, New York Industrial Development Agency Revenue Bonds, (FNMA Insured), Series 2023 | |
| | | | | 1,100 | | | | | | 1,098 | |
|
Metropolitan Transportation Authority, New York Revenue Bonds, Series 2020 | |
| | | | | 2,000 | | | | | | 2,122 | |
|
Monroe County Industrial Development Corp, New York Revenue Bonds, Series 2023 | |
| | | | | 1,250 | | | | | | 1,381 | |
|
Monroe County Industrial Development Corp., New York Revenue Bonds, Series 2020 | |
| | | | | 1,780 | | | | | | 1,755 | |
|
Nassau County, New York Industrial Development Agency Revenue Bonds, Series 2021 | |
0.000% due 01/01/2058 ^(b) | | | | | 2,867 | | | | | | 687 | |
|
New York City Transitional Finance Authority Future Tax Secured, New York Revenue Bonds, Series 2019 | |
| | | | | 1,110 | | | | | | 1,130 | |
|
New York City, New York General Obligation Bonds, Series 2018 | |
| | | | | 750 | | | | | | 818 | |
| | | | | 2,300 | | | | | | 2,441 | |
|
New York City, New York Municipal Water Finance Authority Revenue Bonds, Series 2022 | |
| | | | | 4,000 | | | | | | 4,454 | |
| | | | | 2,500 | | | | | | 2,812 | |
|
New York City, New York Transitional Finance Authority Future Tax Secured Revenue Bonds, Series 2022 | |
| | | | | 2,000 | | | | | | 2,345 | |
| | | | | | | | | | | | |
| See Accompanying Notes | | | | | | | | | | DECEMBER 31, 2023 | | | |
| | | | | | |
Consolidated Schedule of Investments | | PIMCO Municipal Income Fund | | | | |
| | | | | | | | | | | | |
| | | | | | | | | | | |
|
New York Liberty Development Corp. Revenue Bonds, Series 2005 | |
| | $ | | | 10,000 | | | $ | | | 11,904 | |
|
New York Liberty Development Corp. Revenue Bonds, Series 2007 | |
| | | | | 3,000 | | | | | | 3,587 | |
|
New York Liberty Development Corp. Revenue Bonds, Series 2021 | |
| | | | | 1,625 | | | | | | 1,240 | |
|
New York Power Authority Revenue Bonds, (AGM Insured), Series 2022 | |
| | | | | 850 | | | | | | 831 | |
|
New York Power Authority Revenue Bonds, Series 2020 | |
| | | | | 1,250 | | | | | | 1,230 | |
|
New York State Dormitory Authority Revenue Bonds, Series 2017 | |
| | | | | 1,500 | | | | | | 1,494 | |
|
New York State Dormitory Authority Revenue Bonds, Series 2019 | |
| | | | | 1,000 | | | | | | 1,086 | |
|
New York State Dormitory Authority Revenue Bonds, Series 2020 | |
| | | | | 3,375 | | | | | | 3,366 | |
|
New York State Thruway Authority Revenue Bonds, Series 2019 | |
| | | | | 575 | | | | | | 564 | |
|
New York State Thruway Authority Revenue Bonds, Series 2021 | |
| | | | | 2,000 | | | | | | 2,007 | |
|
New York State Thruway Authority Revenue Bonds, Series 2021 | |
| | | | | 1,500 | | | | | | 1,534 | |
|
New York State Urban Development Corp. Revenue Bonds, Series 2019 | |
| | | | | 1,200 | | | | | | 1,210 | |
|
New York State Urban Development Corp. Revenue Bonds, Series 2021 | |
| | | | | 2,750 | | | | | | 2,764 | |
|
New York State Urban Development Corp. Revenue Bonds, Series 2023 | |
| | | | | 1,000 | | | | | | 1,110 | |
|
New York Transportation Development Corp. Revenue Bonds, (AGM Insured), Series 2023 | |
| | | | | 2,500 | | | | | | 2,624 | |
|
Onondaga County, New York Trust for Cultural Resources Revenue Bonds, Series 2019 | |
| | | | | 1,100 | | | | | | 1,101 | |
|
Suffolk Tobacco Asset Securitization Corp., New York Revenue Bonds, Series 2021 | |
| | | | | 1,500 | | | | | | 1,372 | |
|
Triborough Bridge & Tunnel Authority Sales Tax, New York Revenue Bonds, Series 2022 | |
| | | | | 2,750 | | | | | | 2,669 | |
|
Triborough Bridge & Tunnel Authority, New York Revenue Bonds, Series 2021 | |
| | | | | 2,635 | | | | | | 2,857 | |
|
Utility Debt Securitization Authority, New York Revenue Bonds, Series 2023 | |
| | | | | 700 | | | | | | 791 | |
| | | | | | | | | | | | |
| | | | | | | | | | | 67,427 | |
| | | | | | | | | | | | |
| |
| |
|
University of North Carolina Hospitals at Chapel Hill Revenue Bonds, Series 2016 | |
| | | | | 2,500 | | | | | | 2,445 | |
| | | | | | | | | | | | |
| |
| |
|
Grand Forks County, North Dakota Revenue Bonds, Series 2021 | |
7.000% due 12/15/2043 ^(b) | | | | | 850 | | | | | | 170 | |
| | | | | | | | | | | | |
| |
| | | | | | | | | | | | |
| | | | | | | | | | | |
| |
|
Buckeye Tobacco Settlement Financing Authority, Ohio Revenue Bonds, Series 2020 | |
0.000% due 06/01/2057 (c) | | $ | | | 36,500 | | | $ | | | 3,926 | |
|
Canton City School District, Ohio General Obligation Bonds, Series 2023 | |
| | | | | 1,500 | | | | | | 1,679 | |
|
Montgomery County, Ohio Dayton Children’s Hospital Revenue Bonds, Series 2021 | |
| | | | | 2,250 | | | | | | 2,207 | |
|
Ohio Air Quality Development Authority Dayton Power And Light Company Project Revenue Bonds, Series 2015 | |
| | | | | 2,000 | | | | | | 2,018 | |
|
Ohio Air Quality Development Authority Revenue Bonds, Series 2019 | |
| | | | | 1,250 | | | | | | 1,146 | |
|
Ohio Air Quality Development Authority Revenue Notes, Series 2019 | |
| | | | | 850 | | | | | | 822 | |
|
Southern Ohio Port Authority Revenue Notes, Series 2020 | |
| | | | | 1,000 | | | | | | 758 | |
|
Worthington City School District, Ohio General Obligation Bonds, Series 2023 | |
| | | | | 455 | | | | | | 516 | |
| | | | | | | | | | | | |
| | | | | | | | | | | 13,072 | |
| | | | | | | | | | | | |
| |
| |
|
Oklahoma Development Finance Authority Revenue Bonds, Series 2021 | |
| | | | | 750 | | | | | | 599 | |
|
Oklahoma Turnpike Authority Revenue Bonds, Series 2023 | |
| | | | | 2,510 | | | | | | 2,551 | |
| | | | | | | | | | | | |
| | | | | | | | | | | 3,150 | |
| | | | | | | | | | | | |
| |
| |
|
Medford Hospital Facilities Authority, Oregon Revenue Bonds, Series 2020 | |
| | | | | 1,000 | | | | | | 1,013 | |
| | | | | 1,500 | | | | | | 1,425 | |
|
Multnomah County School District 40, Oregon General Obligation Bonds, Series 2023 | |
0.000% due 06/15/2051 (c) | | | | | 1,590 | | | | | | 413 | |
|
Washington & Multnomah Counties School District No 48J Beaverton, Oregon General Obligation Bonds, Series 2022 | |
0.000% due 06/15/2048 (c) | | | | | 2,310 | | | | | | 724 | |
| | | | | 1,000 | | | | | | 1,094 | |
| | | | | | | | | | | | |
| | | | | | | | | | | 4,669 | |
| | | | | | | | | | | | |
| |
| |
|
Commonwealth of Pennsylvania General Obligation Bonds, Series 2023 | |
| | | | | 2,800 | | | | | | 2,873 | |
|
Pennsylvania Economic Development Financing Authority Revenue Bonds, (AGM Insured), Series 2022 | |
| | | | | 3,000 | | | | | | 3,321 | |
|
Pennsylvania Economic Development Financing Authority Revenue Bonds, Series 2021 | |
| | | | | 1,500 | | | | | | 1,655 | |
|
Pennsylvania Turnpike Commission Revenue Bonds, Series 2018 | |
| | | | | 4,250 | | | | | | 4,542 | |
|
Philadelphia Authority for Industrial Development, Pennsylvania Revenue Bonds, Series 2017 | |
| | | | | 1,000 | | | | | | 912 | |
| | | | | | | | | | | | |
| | | | | | | | | | | 13,303 | |
| | | | | | | | | | | | |
| |
| | | | | | | | | | | | |
| | | | | | | | | | | |
| |
|
Children’s Trust Fund, Puerto Rico Revenue Bonds, Series 2008 | |
0.000% due 05/15/2057 (c) | | $ | | | 28,000 | | | $ | | | 2,128 | |
|
Commonwealth of Puerto Rico Bonds, Series 2022 | |
| | | | | 2,708 | | | | | | 1,212 | |
|
Commonwealth of Puerto Rico General Obligation Bonds, Series 2021 | |
0.000% due 07/01/2033 (c) | | | | | 1,750 | | | | | | 1,093 | |
| | | | | 1,700 | | | | | | 1,565 | |
|
Puerto Rico Sales Tax Financing Corp. Sales Tax Revenue Bonds, Series 2018 | |
0.000% due 07/01/2046 (c) | | | | | 9,650 | | | | | | 3,037 | |
0.000% due 07/01/2051 (c) | | | | | 10,000 | | | | | | 2,348 | |
|
Puerto Rico Sales Tax Financing Corp. Sales Tax Revenue Bonds, Series 2019 | |
| | | | | 3,395 | | | | | | 3,355 | |
| | | | | | | | | | | | |
| | | | | | | | | | | 14,738 | |
| | | | | | | | | | | | |
| |
| |
|
Tobacco Settlement Financing Corp., Rhode Island Revenue Bonds, Series 2015 | |
| | | | | 2,000 | | | | | | 2,009 | |
| | | | | | | | | | | | |
| |
| |
|
South Carolina Public Service Authority Revenue Obligations Revenue Bonds, Series 2013 | |
| | | | | 5,000 | | | | | | 5,000 | |
| | | | | 1,100 | | | | | | 1,100 | |
| | | | | | | | | | | | |
| | | | | | | | | | | 6,100 | |
| | | | | | | | | | | | |
| |
| |
|
Shelby County, Tennessee Health Educational & Housing Facilities Board Revenue Bonds, Series 2019 | |
| | | | | 700 | | | | | | 521 | |
|
Tennessee Energy Acquisition Corp. Revenue Bonds, Series 2006 | |
| | | | | 5,000 | | | | | | 5,097 | |
| | | | | 5,000 | | | | | | 5,038 | |
| | | | | | | | | | | | |
| | | | | | | | | | | 10,656 | |
| | | | | | | | | | | | |
| |
| |
|
Angelina & Neches River Authority, Texas Revenue Bonds, Series 2021 | |
| | | | | 590 | | | | | | 390 | |
| | | | | 1,000 | | | | | | 867 | |
|
Board of Regents of the University of Texas System Revenue Bonds, Series 2022 | |
| | | | | 2,500 | | | | | | 2,500 | |
|
Brazoria County, Texas Industrial Development Corp. Revenue Bonds, Series 2023 | |
| | | | | 2,000 | | | | | | 2,015 | |
|
Central Texas Turnpike System Revenue Bonds, Series 2015 | |
0.000% due 08/15/2036 (c) | | | | | 1,250 | | | | | | 726 | |
0.000% due 08/15/2037 (c) | | | | | 3,500 | | | | | | 1,942 | |
|
Clifton Higher Education Finance Corp., Texas Revenue Bonds, Series 2018 | |
| | | | | 1,000 | | | | | | 1,012 | |
|
Coppell Independent School District, Texas General Obligation Bonds, (PSF Insured), Series 2023 | |
| | | | | 850 | | | | | | 865 | |
|
Corpus Christi Independent School District, Texas General Obligation Bonds, (PSF Insured), Series 2023 | |
| | | | | 1,200 | | | | | | 1,212 | |
|
Dallas Area Rapid Transit, Texas Revenue Bonds, Series 2021 | |
| | | | | 2,250 | | | | | | 2,219 | |
|
Dallas Fort Worth International Airport, Texas Revenue Bonds, Series 2022 | |
| | | | | 1,000 | | | | | | 1,150 | |
| | | | | | | | | | | | |
| | | | | | | | | | | |
|
Edgewood Independent School District/Van Zandt County, Texas General Obligation Bonds, (PSF Insured), Series 2023 | |
| | $ | | | 1,200 | | | $ | | | 1,210 | |
|
EP Tuscany Zaragosa PFC, Texas Revenue Notes, Series 2023 | |
| | | | | 3,750 | | | | | | 3,728 | |
|
Fort Bend County Texas Public Facility Corp. Revenue Bonds, Series 2023 | |
| | | | | 3,000 | | | | | | 3,285 | |
|
Garland Independent School District, Texas General Obligation Bonds, (PSF Insured), Series 2023 | |
| | | | | 2,800 | | | | | | 3,122 | |
|
Grand Parkway Transportation Corp., Texas Revenue Bonds, (AGM/CR Insured), Series 2020 | |
| | | | | 900 | | | | | | 899 | |
|
Hays Consolidated Independent School District, Texas General Obligation Bonds, (PSF Insured), Series 2023 | |
| | | | | 1,250 | | | | | | 1,373 | |
|
Houston, Texas Combined Utility System Revenue Bonds, Series 2020 | |
| | | | | 1,000 | | | | | | 995 | |
|
Lamar Consolidated Independent School District, Texas General Obligation Bonds, (PSF Insured), Series 2023 | |
| | | | | 1,250 | | | | | | 1,263 | |
|
Lamar Consolidated Independent School District, Texas General Obligation Bonds, (PSF Insured), Series 2023 | |
| | | | | 4,500 | | | | | | 4,979 | |
|
Lamar Consolidated Independent School District, Texas General Obligation Bonds, Series 2023 | |
| | | | | 2,500 | | | | | | 2,491 | |
|
Medina Valley Independent School District, Texas General Obligation Bonds, (PSF Insured), Series 2023 | |
| | | | | 1,000 | | | | | | 1,047 | |
|
New Hope Cultural Education Facilities Finance Corp., Texas Revenue Bonds, Series 2021 | |
| | | | | 1,300 | | | | | | 998 | |
|
North Texas Tollway Authority Revenue Bonds, Series 2017 | |
| | | | | 1,500 | | | | | | 1,504 | |
| | | | | 1,250 | | | | | | 1,285 | |
|
Rockwall Independent School District, Texas General Obligation Bonds, (PSF Insured), Series 2022 | |
| | | | | 4,000 | | | | | | 4,346 | |
|
San Antonio Municipal Facilities Corp., Texas Revenue Bonds, Series 2021 | |
| | | | | 2,700 | | | | | | 2,679 | |
|
Southwest Independent School District, Texas General Obligation Bonds, (PSF Insured), Series 2023 | |
| | | | | 900 | | | | | | 997 | |
|
Tarrant County, Texas Cultural Education Facilities Finance Corp. Revenue Bonds, Series 2017 | |
| | | | | 500 | | | | | | 506 | |
|
Tarrant County, Texas Cultural Education Facilities Finance Corp. Revenue Bonds, Series 2022 | |
| | | | | 1,380 | | | | | | 1,472 | |
| | | | | | | | | | | | |
| | | | | | | | | | | |
|
Tarrant County, Texas Hospital District General Obligation Bonds, Series 2023 | |
| | $ | | | 2,600 | | | $ | | | 2,897 | |
|
Texas Municipal Gas Acquisition & Supply Corp. Revenue Bonds, Series 2008 | |
| | | | | 2,800 | | | | | | 2,931 | |
|
Texas Water Development Board Revenue Bonds, Series 2022 | |
| | | | | 800 | | | | | | 860 | |
| | | | | 2,380 | | | | | | 2,615 | |
|
Texas Water Development Board Revenue Bonds, Series 2023 | |
| | | | | 1,500 | | | | | | 1,643 | |
| | | | | 1,000 | | | | | | 1,107 | |
|
West Harris County, Texas Regional Water Authority Revenue Bonds, (BAM Insured), Series 2021 | |
| | | | | 1,160 | | | | | | 1,111 | |
| | | | | | | | | | | | |
| | | | | | | | | | | 66,241 | |
| | | | | | | | | | | | |
| |
| |
|
County of Salt Lake, Utah Revenue Bonds, (AMBAC Insured), Series 2001 | |
| | | | | 7,000 | | | | | | 7,135 | |
|
Ogden City Redevelopment Agency, Utah Revenue Bonds, Series 2023 | |
| | | | | 600 | | | | | | 653 | |
| | | | | | | | | | | | |
| | | | | | | | | | | 7,788 | |
| | | | | | | | | | | | |
| |
| |
|
Virginia Small Business Financing Authority Revenue Bonds, Series 2019 | |
0.000% due 07/01/2061 (c) | | | | | 23,000 | | | | | | 719 | |
| | | | | 1,470 | | | | | | 1,373 | |
|
Virginia Small Business Financing Authority Revenue Bonds, Series 2020 | |
| | | | | 11,200 | | | | | | 10,755 | |
| | | | | | | | | | | | |
| | | | | | | | | | | 12,847 | |
| | | | | | | | | | | | |
| |
| |
|
Washington State Convention Center Public Facilities District Revenue Bonds, Series 2018 | |
| | | | | 2,155 | | | | | | 1,980 | |
| | | | | | | | | | | | |
| |
| |
|
Monongalia County, West Virginia Commission Special District Revenue Bonds, Series 2017 | |
| | | | | 1,000 | | | | | | 1,030 | |
|
West Virginia Economic Development Authority Revenue Bonds, Series 2017 | |
| | | | | 2,500 | | | | | | 2,534 | |
| | | | | | | | | | | | |
| | | | | | | | | | | 3,564 | |
| | | | | | | | | | | | |
| |
| | | | | | | | | | | | |
| | | | | | | | | | | |
| |
|
Public Finance Authority, Wisconsin Revenue Bonds, Series 2017 | |
| | $ | | | 2,500 | | | $ | | | 2,734 | |
|
Public Finance Authority, Wisconsin Revenue Bonds, Series 2018 | |
| | | | | 3,000 | | | | | | 1,350 | |
|
Public Finance Authority, Wisconsin Revenue Bonds, Series 2020 | |
0.000% due 01/01/2060 (c) | | | | | 7,500 | | | | | | 399 | |
|
Public Finance Authority, Wisconsin Revenue Bonds, Series 2021 | |
| | | | | 1,100 | | | | | | 912 | |
| | | | | 820 | | | | | | 636 | |
|
Wisconsin Center District Revenue Bonds, (AGM Insured), Series 2020 | |
0.000% due 12/15/2045 (c) | | | | | 7,000 | | | | | | 2,717 | |
|
Wisconsin Health & Educational Facilities Authority Revenue Bonds, Series 2016 | |
| | | | | 695 | | | | | | 712 | |
|
Wisconsin Health & Educational Facilities Authority Revenue Bonds, Series 2022 | |
| | | | | 1,920 | | | | | | 1,837 | |
| | | | | | | | | | | | |
| | | | | | | | | | | 11,297 | |
| | | | | | | | | | | | |
Total Municipal Bonds & Notes (Cost $431,705) | | | | |
| | | | |
| |
NON-AGENCY MORTGAGE-BACKED SECURITIES 0.7% | |
|
| |
| | | | | 1,990 | | | | | | 1,799 | |
| | | | | | | | | | | | |
Total Non-Agency Mortgage-Backed Securities (Cost $1,869) | | | | |
| | | | |
| |
SHORT-TERM INSTRUMENTS 0.7% | |
| |
REPURCHASE AGREEMENTS (f) 0.7% | |
| | | | | | | | | | | 1,848 | |
| | | | | | | | | | | | |
Total Short-Term Instruments
(Cost $1,848) | | | | |
| | | | |
| | | | |
| | | | | | | | | | | | |
Total Investments in Securities
(Cost $438,422) | | | | |
| |
| | | | |
Total Investments 174.1%
(Cost $438,422) | | | $ | | | | |
| |
Auction Rate Preferred Shares (56.9)% | | | | | | | |
| |
Remarketable Variable Rate MuniFund Term Preferred Shares, at liquidation value (15.0)% | | | | | | | |
| |
Other Assets and Liabilities, net (2.2)% | | | | |
| | | | |
Net Assets Applicable to Common Shareholders 100.0% | | | $ | | | | |
| | | | | | | |
NOTES TO CONSOLIDATED SCHEDULE OF INVESTMENTS:
| A zero balance may reflect actual amounts rounding to less than one thousand. |
| Security valued using significant unobservable inputs (Level 3). |
| All or a portion of this amount represents unfunded loan commitments. The interest rate for the unfunded portion will be determined at the time of funding. See Note 4, Securities and Other Investments, in the Notes to Financial Statements for more information regarding unfunded loan commitments. |
| Security is not accruing income as of the date of this report. |
| Security becomes interest bearing at a future date. |
| | | | | | | | | | | | |
| See Accompanying Notes | | | | | | | | | | DECEMBER 31, 2023 | | | |
| | | | | | |
Consolidated Schedule of Investments | | PIMCO Municipal Income Fund | | | | |
(e) RESTRICTED SECURITIES:
| | | | | | | | | | | | | | | | | | | | | | |
| | | | | | | | | | | | | | | | Market Value
as Percentage
of Net Assets
Applicable to
Common
Shareholders | |
Federal Home Loan Mortgage Corp. Enhanced Receipt, New Jersey Revenue Bonds, Series 2019 | | 3.870% | | | 11/15/2035 | | | | 10/26/2020 | | | | $ 77 | | | $ | 64 | | | | 0.03% | |
| | | | | | | | | | | | | | | | | | | | | | |
BORROWINGS AND OTHER FINANCING TRANSACTIONS
(f) REPURCHASE AGREEMENTS:
| | | | | | | | | | | | | | | | | | | | | | | | | | | | | | |
| | | | | | | | | | | | | | | | | | | Repurchase
Agreements,
at Value | | | Repurchase Agreement Proceeds to be Received (1) | |
| FICC | | | 2.600 | % | | | 12/29/2023 | | | | 01/02/2024 | | | $ | 1,848 | | | U.S. Treasury Notes 0.375% due 11/30/2025 | | $ | (1,885 | ) | | $ | 1,848 | | | $ | 1,848 | |
| | | | | | | | | | | | | | | | | | | | | | | | | | | | | | |
Total Repurchase Agreements | | | | | | | | | | | | | | | |
| | | | | | | | | | | | | | | | | | | | | | | | | | | | | | |
BORROWINGS AND OTHER FINANCING TRANSACTIONS SUMMARY
The following is a summary by counterparty of the market value of Borrowings and Other Financing Transactions and collateral pledged/(received) as of December 31, 2023:
| | | | | | | | | | | | | | | | | | | | | | | | |
| | Repurchase Agreement Proceeds to be Received (1) | | | Payable for
Reverse
Repurchase
Agreements | | | Payable for Sale-Buyback Transactions | | | Total
Borrowings and
Other Financing
Transactions | | | Collateral
Pledged/(Received) | | | | |
Global/Master Repurchase Agreement | |
| | $ | 1,848 | | | $ | 0 | | | $ | 0 | | | $ | 1,848 | | | $ | (1,885 | ) | | $ | (37 | ) |
| | | | | | | | | | | | | | | | | | | | | | | | |
Total Borrowings and Other Financing Transactions | | | | | | | | | | | | | | | | | | | | | | | | |
| | | | | | | | | | | | | | | | | | | | | | | | |
| Includes accrued interest. |
| Net Exposure represents the net receivable/(payable) that would be due from/to the counterparty in the event of default. Exposure from borrowings and other financing transactions can only be netted across transactions governed under the same master agreement with the same legal entity. See Note 7, Master Netting Arrangements, in the Notes to Financial Statements for more information. |
The following is a summary of the fair valuations according to the inputs used as of December 31, 2023 in valuing the Fund’s assets and
liabilities:
| | | | | | | | | | | | | | | | |
| | | | | | | | | | | | |
Investments in Securities, at Value | |
Loan Participations and Assignments | | $ | 0 | | | $ | 0 | | | $ | 3,130 | | | $ | 3,130 | |
| |
| | | 0 | | | | 12,744 | | | | 0 | | | | 12,744 | |
| | | 0 | | | | 1,157 | | | | 0 | | | | 1,157 | |
| | | 0 | | | | 10,110 | | | | 0 | | | | 10,110 | |
| | | 0 | | | | 4,185 | | | | 0 | | | | 4,185 | |
| | | 0 | | | | 9,756 | | | | 0 | | | | 9,756 | |
| | | 0 | | | | 8,903 | | | | 0 | | | | 8,903 | |
| | | 0 | | | | 1,402 | | | | 0 | | | | 1,402 | |
| | | 0 | | | | 5,524 | | | | 0 | | | | 5,524 | |
| | | 0 | | | | 1,937 | | | | 0 | | | | 1,937 | |
| | | 0 | | | | 18,582 | | | | 0 | | | | 18,582 | |
| | | 0 | | | | 10,796 | | | | 0 | | | | 10,796 | |
| | | 0 | | | | 33,614 | | | | 0 | | | | 33,614 | |
| | | 0 | | | | 5,685 | | | | 0 | | | | 5,685 | |
| | | 0 | | | | 7,484 | | | | 0 | | | | 7,484 | |
| | | 0 | | | | 101 | | | | 0 | | | | 101 | |
| | | 0 | | | | 9,962 | | | | 0 | | | | 9,962 | |
| | | 0 | | | | 473 | | | | 0 | | | | 473 | |
| | | 0 | | | | 4,520 | | | | 0 | | | | 4,520 | |
| | | 0 | | | | 14,472 | | | | 0 | | | | 14,472 | |
| | | 0 | | | | 2,001 | | | | 0 | | | | 2,001 | |
| | | 0 | | | | 2,987 | | | | 0 | | | | 2,987 | |
| | | 0 | | | | 1,081 | | | | 0 | | | | 1,081 | |
| | | 0 | | | | 2,950 | | | | 0 | | | | 2,950 | |
| | | | | | | | | | | | | | | | |
| | | | | | | | | | | | |
| | $ | 0 | | | $ | 2,676 | | | $ | 0 | | | $ | 2,676 | |
| | | 0 | | | | 23,002 | | | | 0 | | | | 23,002 | |
| | | 0 | | | | 67,427 | | | | 0 | | | | 67,427 | |
| | | 0 | | | | 2,445 | | | | 0 | | | | 2,445 | |
| | | 0 | | | | 170 | | | | 0 | | | | 170 | |
| | | 0 | | | | 13,072 | | | | 0 | | | | 13,072 | |
| | | 0 | | | | 3,150 | | | | 0 | | | | 3,150 | |
| | | 0 | | | | 4,669 | | | | 0 | | | | 4,669 | |
| | | 0 | | | | 13,303 | | | | 0 | | | | 13,303 | |
| | | 0 | | | | 14,738 | | | | 0 | | | | 14,738 | |
| | | 0 | | | | 2,009 | | | | 0 | | | | 2,009 | |
| | | 0 | | | | 6,100 | | | | 0 | | | | 6,100 | |
| | | 0 | | | | 10,656 | | | | 0 | | | | 10,656 | |
| | | 0 | | | | 66,241 | | | | 0 | | | | 66,241 | |
| | | 0 | | | | 7,788 | | | | 0 | | | | 7,788 | |
| | | 0 | | | | 12,847 | | | | 0 | | | | 12,847 | |
| | | 0 | | | | 1,980 | | | | 0 | | | | 1,980 | |
| | | 0 | | | | 3,564 | | | | 0 | | | | 3,564 | |
| | | 0 | | | | 11,297 | | | | 0 | | | | 11,297 | |
Non-Agency Mortgage-Backed Securities | | | 0 | | | | 1,799 | | | | 0 | | | | 1,799 | |
| |
| | | 0 | | | | 1,848 | | | | 0 | | | | 1,848 | |
| | | | | | | | | | | | | | | | |
| | | | |
| | $ | 0 | | | $ | 441,207 | | | $ | 3,130 | | | $ | 444,337 | |
| | | | | | | | | | | | | | | | |
The following is a reconciliation of the fair valuations using significant unobservable inputs (Level 3) for the Fund during the period ended December 31, 2023:
| | | | | | | | | | | | | | | | | | | | | | | | | | | | | | | | | | | | | | | | |
| | Beginning
Balance
at 12/31/2022 | | | | | | | | | Accrued
Discounts/
(Premiums) | | | | | | Net Change in Unrealized Appreciation/ (Depreciation) (1) | | | | | | | | | Ending
Balance
at 12/31/2023 | | | Net Change in Unrealized Appreciation/ (Depreciation) on Investments Held at 12/31/2023 (1) | |
Investments in Securities, at Value | |
Loan Participations and Assignments | | $ | 0 | | | $ | 3,000 | | | $ | 0 | | | $ | 0 | | | $ | 0 | | | $ | 130 | | | $ | 0 | | | $ | 0 | | | $ | 3,130 | | | $ | 130 | |
| | | | | | | | | | | | | | | | | | | | | | | | | | | | | | | | | | | | | | | | |
| | | | | | | | | | |
| | $ | 0 | | | $ | 3,000 | | | $ | 0 | | | $ | 0 | | | $ | 0 | | | $ | 130 | | | $ | 0 | | | $ | 0 | | | $ | 3,130 | | | $ | 130 | |
| | | | | | | | | | | | | | | | | | | | | | | | | | | | | | | | | | | | | | | | |
The following is a summary of significant unobservable inputs used in the fair valuations of assets and liabilities categorized within Level 3 of the fair value hierarchy:
| | | | | | | | | | | | | | | | |
| | Ending
Balance
at 12/31/2023 | | | | | | | (% Unless Noted Otherwise) | |
| | | | | | |
Investments in Securities, at Value | |
Loan Participations and Assignments | | $ | 3,130 | | | Proxy Pricing | | Base Price | | | | | | | 100.116 | |
| | | | | | | | | | | | | | | | |
| | $ | 3,130 | | | | | | | | | | | | | |
| | | | | | | | | | | | | | | | |
| Any difference between Net Change in Unrealized Appreciation/(Depreciation) and Net Change in Unrealized Appreciation/(Depreciation) on Investments Held at December 31, 2023 may be due to an investment no longer held or categorized as Level 3 at period end. |
| | | | | | | | | | | | |
| See Accompanying Notes | | | | | | | | | | DECEMBER 31, 2023 | | | |
| | | | | | |
Consolidated Schedule of Investments | | PIMCO Municipal Income Fund II | | | | |
(Amounts in thousands*, except number of shares, contracts, units and ounces, if any)
| | | | | | | | | | | | |
| | | | | | | | | | | |
INVESTMENTS IN SECURITIES 162.0% | |
| |
LOAN PARTICIPATIONS AND ASSIGNMENTS 1.2% | |
|
| |
| | $ | | | 1,200 | | | $ | | | 1,211 | |
TBD% - 7.947% due 10/26/2063 «µ | | | | | 5,900 | | | | | | 6,195 | |
| | | | | | | | | | | | |
Total Loan Participations and Assignments (Cost $7,100) | | | | |
| | | | |
| |
MUNICIPAL BONDS & NOTES 160.2% | |
| |
| |
|
Jefferson County, Alabama Sewer Revenue Bonds, Series 2013 | |
| | | | | 18,000 | | | | | | 18,907 | |
| | | | | 14,750 | | | | | | 15,488 | |
|
Tuscaloosa County, Alabama Industrial Development Authority Revenue Bonds, Series 2019 | |
| | | | | 3,300 | | | | | | 3,051 | |
| | | | | | | | | | | | |
| | | | | | | | | | | 37,446 | |
| | | | | | | | | | | | |
| |
| |
|
Municipality of Anchorage, Alaska Solid Waste Services Revenue Bonds, Series 2022 | |
| | | | | 2,450 | | | | | | 2,622 | |
| | | | | | | | | | | | |
| |
| |
|
Arizona Industrial Development Authority Revenue Bonds, Series 2019 | |
| | | | | 740 | | | | | | 447 | |
| | | | | 950 | | | | | | 500 | |
| | | | | 1,500 | | | | | | 758 | |
| | | | | 1,500 | | | | | | 730 | |
|
Arizona Industrial Development Authority Revenue Bonds, Series 2020 | |
7.750% due 07/01/2050 ^(a) | | | | | 2,500 | | | | | | 150 | |
|
Industrial Development Authority of the County, Arizona of Pima Revenue Bonds, Series 2020 | |
| | | | | 2,400 | | | | | | 2,107 | |
|
Maricopa County, Arizona Industrial Development Authority Revenue Bonds, Series 2017 | |
| | | | | 1,500 | | | | | | 1,503 | |
|
Maricopa County, Arizona Industrial Development Authority Revenue Bonds, Series 2019 | |
| | | | | 7,700 | | | | | | 7,679 | |
|
Maricopa County, Arizona School District No 83, Cartwright Elementary Revenue Bonds, Series 2020 | |
| | | | | 8,600 | | | | | | 7,891 | |
|
Salt River Project Agricultural Improvement & Power District, Arizona Revenue Bonds, Series 2023 | |
| | | | | 2,000 | | | | | | 2,225 | |
|
Salt Verde Financial Corp., Arizona Revenue Bonds, Series 2007 | |
| | | | | 4,930 | | | | | | 5,386 | |
| | | | | 22,400 | | | | | | 24,980 | |
| | | | | | | | | | | | |
| | | | | | | | | | | 54,356 | |
| | | | | | | | | | | | |
| |
| |
|
Arkansas Development Finance Authority Revenue Bonds, Series 2022 | |
| | | | | 350 | | | | | | 351 | |
|
County of Pulaski Hospital, Arkansas Revenue Bonds, Series 2023 | |
| | | | | 1,600 | | | | | | 1,743 | |
| | | | | | | | | | | | |
| | | | | | | | | | | 2,094 | |
| | | | | | | | | | | | |
| |
| |
|
California Health Facilities Financing Authority Revenue Bonds, Series 2016 | |
| | | | | 7,400 | | | | | | 7,591 | |
| | | | | | | | | | | | |
| | | | | | | | | | | |
|
California Statewide Communities Development Authority Revenue Bonds, Series 2016 | |
| | $ | | | 3,000 | | | $ | | | 2,970 | |
|
Golden State, California Tobacco Securitization Corp. Revenue Bonds, Series 2021 | |
0.000% due 06/01/2066 (b) | | | | | 7,500 | | | | | | 886 | |
|
Golden State, California Tobacco Securitization Corp. Revenue Bonds, Series 2022 | |
| | | | | 2,000 | | | | | | 2,097 | |
|
Los Angeles County, California Public Works Financing Authority Revenue Bonds, Series 2021 | |
| | | | | 3,435 | | | | | | 3,510 | |
|
Los Angeles Department of Water & Power, California Revenue Bonds, Series 2023 | |
| | | | | 2,700 | | | | | | 3,092 | |
|
Energy Authority, California Revenue Bonds, Series 2009 | |
| | | | | 1,750 | | | | | | 2,255 | |
|
San Diego County, California Regional Airport Authority Revenue Bonds, Series 2021 | |
| | | | | 2,715 | | | | | | 2,599 | |
|
San Francisco, California City & County Public Utilities Commission Wastewater Revenue Bonds, Series 2021 | |
| | | | | 1,570 | | | | | | 1,581 | |
|
West Valley-Mission Community College District, California General Obligation Bonds, Series 2022 | |
| | | | | 3,000 | | | | | | 3,078 | |
| | | | | | | | | | | | |
| | | | | | | | | | | 29,659 | |
| | | | | | | | | | | | |
| |
| |
|
Colorado Health Facilities Authority Revenue Bonds, Series 2018 | |
| | | | | 12,555 | | | | | | 12,037 | |
|
Colorado Health Facilities Authority Revenue Bonds, Series 2019 | |
| | | | | 5,300 | | | | | | 5,374 | |
| | | | | 4,000 | | | | | | 3,842 | |
|
Colorado International Center Metropolitan District No 7, General Obligation Bonds, Series 2021 | |
0.000% due 12/01/2051 (c) | | | | | 1,615 | | | | | | 948 | |
|
Colorado State Building Excellent School Certificates of Participation Bonds, Series 2018 | |
| | | | | 3,250 | | | | | | 3,271 | |
|
Denver, Colorado City & County Revenue Bonds, Series 2021 | |
| | | | | 1,750 | | | | | | 1,778 | |
|
Dominion Water & Sanitation District, Colorado Revenue Bonds, Series 2022 | |
| | | | | 2,500 | | | | | | 2,505 | |
|
Harvest Crossing Metropolitan District No 4, Colorado General Obligation Bonds, Series 2022 | |
| | | | | 3,500 | | | | | | 3,462 | |
|
Public Authority for Colorado Energy Revenue Bonds, Series 2008 | |
| | | | | 1,430 | | | | | | 1,803 | |
|
Senac South Metropolitan District No 1, Colorado General Obligation Bonds, Series 2021 | |
| | | | | 1,000 | | | | | | 881 | |
|
Third Creek Metropolitan District No 1, Colorado General Obligation Bonds, Series 2022 | |
| | | | | 775 | | | | | | 612 | |
| | | | | | | | | | | | |
| | | | | | | | | | | 36,513 | |
| | | | | | | | | | | | |
| |
| |
|
Connecticut Special Tax Revenue State Special Tax Bonds, Series 2020 | |
| | | | | 2,000 | | | | | | 2,117 | |
|
Connecticut State Health & Educational Facilities Authority Revenue Bonds, Series 2022 | |
| | | | | 3,000 | | | | | | 3,235 | |
| | | | | | | | | | | | |
| | | | | | | | | | | 5,352 | |
| | | | | | | | | | | | |
| |
| | | | | | | | | | | | |
| | | | | | | | | | | |
| |
|
Affordable Housing Opportunities Trust, Delaware Revenue Bonds, Series 2022 | |
| | $ | | | 5,360 | | | $ | | | 5,042 | |
| | | | | 945 | | | | | | 953 | |
| | | | | | | | | | | | |
| | | | | | | | | | | 5,995 | |
| | | | | | | | | | | | |
| |
DISTRICT OF COLUMBIA 0.4% | |
|
District of Columbia Revenue Bonds, Series 2022 | |
| | | | | 1,850 | | | | | | 2,202 | |
| | | | | | | | | | | | |
| |
| |
|
Avenir Community Development District, Florida Special Assessment Bonds, Series 2023 | |
| | | | | 1,715 | | | | | | 1,721 | |
|
Babcock Ranch Community Independent Special District, Florida Special Assessment Bonds, Series 2022 | |
| | | | | 1,230 | | | | | | 1,200 | |
|
Central Florida Expressway Authority Revenue Bonds, Series 2017 | |
| | | | | 4,290 | | | | | | 4,313 | |
|
Charlotte County Industrial Development Authority, Florida Revenue Bonds, Series 2021 | |
| | | | | 1,250 | | | | | | 1,030 | |
|
Hillsborough County, Florida Industrial Development Authority Revenue Bonds, Series 2020 | |
| | | | | 3,700 | | | | | | 3,460 | |
|
Miami-Dade County, Florida Water & Sewer System Revenue Bonds, Series 2019 | |
| | | | | 5,000 | | | | | | 5,000 | |
| | | | | 2,500 | | | | | | 2,449 | |
|
Miami-Dade Seaport Department, Florida Revenue Bonds, Series 2023 | |
| | | | | 3,800 | | | | | | 4,064 | |
|
Orange County Health Facilities Authority, Florida Revenue Bonds, Series 2023 | |
| | | | | 2,110 | | | | | | 2,255 | |
|
Palm Beach County, Florida Health Facilities Authority Revenue Bonds, Series 2022 | |
| | | | | 2,850 | | | | | | 2,933 | |
|
Tampa-Hillsborough County, Florida Expressway Authority Revenue Bonds, Series 2017 | |
| | | | | 5,300 | | | | | | 5,285 | |
| | | | | | | | | | | | |
| | | | | | | | | | | 33,710 | |
| | | | | | | | | | | | |
| |
| |
|
Atlanta Development Authority, Georgia Revenue Bonds, Series 2015 | |
| | | | | 3,895 | | | | | | 3,918 | |
|
Atlanta Development Authority, Georgia Revenue Bonds, Series 2017 | |
6.750% due 01/01/2035 ^(a) | | | | | 3,750 | | | | | | 1,687 | |
|
Fayette County, Georgia Hospital Authority Revenue Bonds, Series 2016 | |
| | | | | 7,000 | | | | | | 7,148 | |
|
Municipal Electric Authority of Georgia Revenue Bonds, Series 2015 | |
| | | | | 19,680 | | | | | | 19,759 | |
|
Municipal Electric Authority of Georgia Revenue Bonds, Series 2022 | |
| | | | | 1,000 | | | | | | 1,040 | |
| | | | | | | | | | | | |
| | | | | | | | | | | 33,552 | |
| | | | | | | | | | | | |
| |
| |
|
Chicago Board of Education, Illinois General Obligation Bonds, Series 2018 | |
| | | | | 7,000 | | | | | | 6,981 | |
|
Chicago O’Hare International Airport, Illinois Revenue Bonds, (AGM Insured), Series 2020 | |
| | | | | 3,000 | | | | | | 3,061 | |
| | | | | | | | | | | | |
| | | | | | | | | | | |
|
Chicago O’Hare International Airport, Illinois Revenue Bonds, Series 2018 | |
| | $ | | | 3,000 | | | $ | | | 3,028 | |
|
Chicago Park District, Illinois General Obligation Bonds, Series 2020 | |
| | | | | 1,300 | | | | | | 1,336 | |
|
Chicago, Illinois General Obligation Bonds, Series 2007 | |
| | | | | 4,000 | | | | | | 4,052 | |
|
Chicago, Illinois Revenue Bonds, Series 2002 | |
| | | | | 2,000 | | | | | | 2,036 | |
|
Illinois Finance Authority Revenue Bonds, Series 2017 | |
5.000% due 02/15/2037 ^(a) | | | | | 2,155 | | | | | | 582 | |
|
Illinois Finance Authority Revenue Bonds, Series 2019 | |
5.000% due 11/01/2035 ^(a) | | | | | 2,000 | | | | | | 1,856 | |
|
Illinois State General Obligation Bonds, Series 2017 | |
| | | | | 1,000 | | | | | | 1,071 | |
|
Illinois State General Obligation Bonds, Series 2018 | |
| | | | | 2,175 | | | | | | 2,245 | |
| | | | | 1,500 | | | | | | 1,563 | |
|
Illinois State General Obligation Notes, Series 2017 | |
| | | | | 12,590 | | | | | | 13,021 | |
| | | | | 6,140 | | | | | | 6,602 | |
|
Illinois State Toll Highway Authority Revenue Bonds, Series 2016 | |
| | | | | 12,500 | | | | | | 12,860 | |
|
Metropolitan Pier & Exposition Authority, Illinois Revenue Bonds, (AGM/CR/NPFGC Insured), Series 2002 | |
0.000% due 12/15/2040 (b) | | | | | 6,000 | | | | | | 3,067 | |
|
Metropolitan Pier & Exposition Authority, Illinois Revenue Bonds, Series 2012 | |
0.000% due 12/15/2051 (b) | | | | | 5,000 | | | | | | 1,337 | |
|
Metropolitan Pier & Exposition Authority, Illinois Revenue Bonds, Series 2022 | |
0.000% due 12/15/2036 (b) | | | | | 1,750 | | | | | | 1,085 | |
0.000% due 06/15/2037 (b) | | | | | 1,000 | | | | | | 603 | |
|
Regional Transportation Authority, Illinois Revenue Bonds, Series 2018 | |
| | | | | 8,000 | | | | | | 8,599 | |
|
Sales Tax Securitization Corp., Illinois Revenue Bonds, Series 2018 | |
| | | | | 1,400 | | | | | | 1,361 | |
| | | | | | | | | | | | |
| | | | | | | | | | | 76,346 | |
| | | | | | | | | | | | |
| |
| |
|
Indiana Finance Authority Midwestern Disaster Relief Revenue Bonds, Series 2012 | |
| | | | | 3,000 | | | | | | 3,044 | |
|
Indiana Finance Authority Revenue Bonds, Series 2019 | |
| | | | | 2,920 | | | | | | 2,182 | |
|
Indiana Health & Educational Facilities Financing Authority Revenue Bonds, Series 2006 | |
| | | | | 1,000 | | | | | | 963 | |
|
Indianapolis Local Public Improvement Bond Bank Revenue Bonds, Series 2023 | |
| | | | | 1,000 | | | | | | 1,082 | |
| | | | | 2,500 | | | | | | 2,733 | |
| | | | | | | | | | | | |
| | | | | | | | | | | 10,004 | |
| | | | | | | | | | | | |
| |
| |
|
Iowa Finance Authority Midwestern Disaster Area Revenue Refunding Bonds, Series 2012 | |
| | | | | 2,000 | | | | | | 1,971 | |
|
Iowa Finance Authority Midwestern Disaster Area Revenue Refunding Bonds, Series 2022 | |
| | | | | 10,715 | | | | | | 11,206 | |
|
Iowa Finance Authority Revenue Bonds, Series 2014 | |
| | | | | 680 | | | | | | 693 | |
|
Iowa Finance Authority Revenue Bonds, Series 2022 | |
| | | | | 1,900 | | | | | | 1,772 | |
| | | | | | | | | | | | |
| | | | | | | | | | | 15,642 | |
| | | | | | | | | | | | |
| |
| | | | | | | | | | | | |
| | | | | | | | | | | |
| |
|
Louisiana Gasoline & Fuels Tax State Revenue Bonds, Series 2017 | |
| | $ | | | 7,000 | | | $ | | | 6,998 | |
|
Louisiana Public Facilities Authority Revenue Bonds, Series 2017 | |
| | | | | 7,750 | | | | | | 7,986 | |
|
Louisiana Public Facilities Authority Revenue Bonds, Series 2023 | |
| | | | | 4,125 | | | | | | 4,485 | |
|
Parish of St James, Louisiana Revenue Bonds, Series 2010 | |
| | | | | 2,800 | | | | | | 3,056 | |
| | | | | | | | | | | | |
| | | | | | | | | | | 22,525 | |
| | | | | | | | | | | | |
| |
| |
|
Maine Health & Higher Educational Facilities Authority Revenue Bonds, Series 2020 | |
| | | | | 2,000 | | | | | | 1,931 | |
| | | | | | | | | | | | |
| |
| |
|
Maryland Economic Development Corp. Revenue Bonds, Series 2020 | |
| | | | | 1,400 | | | | | | 1,265 | |
| | | | | | | | | | | | |
| |
| |
|
Commonwealth of Massachusetts Transportation Fund Revenue Bonds, Series 2023 | |
| | | | | 5,300 | | | | | | 5,855 | |
|
Massachusetts Development Finance Agency Revenue Bonds, Series 2010 | |
7.625% due 10/15/2037 ^(a) | | | | | 444 | | | | | | 4 | |
|
Massachusetts Development Finance Agency Revenue Bonds, Series 2016 | |
| | | | | 2,500 | | | | | | 2,523 | |
| | | | | | | | | | | | |
| | | | | | | | | | | 8,382 | |
| | | | | | | | | | | | |
| |
| |
|
Great Lakes Water Authority Sewage Disposal System, Michigan Revenue Bonds, Series 2023 | |
| | | | | 4,000 | | | | | | 4,562 | |
|
Great Lakes Water Authority Water Supply System, Michigan Revenue Bonds, Series 2023 | |
| | | | | 2,000 | | | | | | 2,281 | |
|
Michigan Finance Authority Hospital Revenue Refunding Bonds, Series 2022 | |
| | | | | 2,000 | | | | | | 1,997 | |
|
Michigan Finance Authority Revenue Bonds, Series 2017 | |
| | | | | 4,945 | | | | | | 5,059 | |
|
Michigan Finance Authority Revenue Bonds, Series 2020 | |
| | | | | 185 | | | | | | 153 | |
| | | | | 300 | | | | | | 235 | |
|
Michigan Finance Authority Revenue Notes, Series 2020 | |
| | | | | 100 | | | | | | 91 | |
|
Michigan State Housing Development Authority Revenue Bonds, Series 2015 | |
| | | | | 2,000 | | | | | | 2,000 | |
|
Michigan Tobacco Settlement Finance Authority Revenue Bonds, Series 2008 | |
0.000% due 06/01/2058 (b) | | | | | 25,000 | | | | | | 1,055 | |
| | | | | | | | | | | | |
| | | | | | | | | | | 17,433 | |
| | | | | | | | | | | | |
| |
| |
|
Duluth Economic Development Authority Health Care Facilities, Minnesota Revenue Bonds, Series 2022 | |
| | | | | 2,000 | | | | | | 2,063 | |
| | | | | | | | | | | | |
| | | | | | | | | | | |
|
Rochester, Minnesota Revenue Bonds, Series 2018 | |
| | $ | | | 3,500 | | | $ | | | 3,467 | |
| | | | | | | | | | | | |
| | | | | | | | | | | 5,530 | |
| | | | | | | | | | | | |
| |
| |
|
Mississippi Development Bank Revenue Bonds, (AMBAC Insured), Series 1999 | |
| | | | | 40 | | | | | | 40 | |
| | | | | | | | | | | | |
| |
| |
|
Health & Educational Facilities Authority of the State of Missouri Revenue Bonds, Series 2013 | |
| | | | | 10,000 | | | | | | 10,006 | |
|
Health & Educational Facilities Authority of the State of Missouri Revenue Bonds, Series 2019 | |
| | | | | 510 | | | | | | 521 | |
| | | | | 425 | | | | | | 457 | |
|
Health & Educational Facilities Authority of the State of Missouri Revenue Bonds, Series 2023 | |
| | | | | 2,700 | | | | | | 3,054 | |
|
Missouri Development Finance Board Revenue Bonds, Series 2022 | |
| | | | | 2,000 | | | | | | 2,163 | |
| | | | | | | | | | | | |
| | | | | | | | | | | 16,201 | |
| | | | | | | | | | | | |
| |
| |
|
University of Nebraska Facilities Corp Revenue Bonds, Series 2021 | |
| | | | | 2,650 | | | | | | 2,547 | |
| | | | | | | | | | | | |
| |
| |
|
Las Vegas Convention & Visitors Authority, Nevada Revenue Bonds, Series 2023 | |
| | | | | 4,450 | | | | | | 4,873 | |
|
Reno, Nevada Revenue Bonds, Series 2018 | |
0.000% due 07/01/2058 (b) | | | | | 24,000 | | | | | | 2,487 | |
| | | | | | | | | | | | |
| | | | | | | | | | | 7,360 | |
| | | | | | | | | | | | |
| |
| |
|
New Hampshire Business Finance Authority Revenue Bonds, Series 2023 | |
| | | | | 5,502 | | | | | | 5,441 | |
| | | | | | | | | | | | |
| |
| |
|
Cherry Hill Township School District, New Jersey General Obligation Bonds, Series 2022 | |
| | | | | 6,400 | | | | | | 6,555 | |
|
Federal Home Loan Mortgage Corp. Enhanced Receipt, New Jersey Revenue Bonds, Series 2019 | |
3.870% due 11/15/2035 (e) | | | | | 155 | | | | | | 145 | |
|
New Jersey Economic Development Authority Revenue Bonds, Series 2016 | |
| | | | | 5,000 | | | | | | 5,363 | |
|
New Jersey Health Care Facilities Financing Authority Revenue Bonds, Series 2013 | |
| | | | | 4,000 | | | | | | 4,004 | |
|
New Jersey Transportation Trust Fund Authority Revenue Bonds, (AGM Insured), Series 2006 | |
0.000% due 12/15/2034 (b) | | | | | 2,500 | | | | | | 1,770 | |
|
New Jersey Transportation Trust Fund Authority Revenue Bonds, Series 2018 | |
| | | | | 1,500 | | | | | | 1,631 | |
|
New Jersey Transportation Trust Fund Authority Revenue Bonds, Series 2019 | |
| | | | | 4,000 | | | | | | 4,272 | |
|
New Jersey Transportation Trust Fund Authority Revenue Bonds, Series 2023 | |
| | | | | 2,650 | | | | | | 2,943 | |
| | | | | | | | | | | | |
| See Accompanying Notes | | | | | | | | | | DECEMBER 31, 2023 | | | |
| | | | | | |
Consolidated Schedule of Investments | | PIMCO Municipal Income Fund II | | | | |
| | | | | | | | | | | | |
| | | | | | | | | | | |
|
South Jersey Port Corp., New Jersey Revenue Bonds, Series 2017 | |
| | $ | | | 1,010 | | | $ | | | 1,042 | |
|
Tobacco Settlement Financing Corp., New Jersey Revenue Bonds, Series 2018 | |
| | | | | 11,465 | | | | | | 11,642 | |
| | | | | | | | | | | | |
| | | | | | | | | | | 39,367 | |
| | | | | | | | | | | | |
| |
| |
|
Build NYC Resource Corp., New York Revenue Bonds, Series 2023 | |
| | | | | 1,000 | | | | | | 1,043 | |
|
Erie County, New York Industrial Development Agency Revenue Bonds, (FNMA Insured), Series 2023 | |
| | | | | 2,600 | | | | | | 2,595 | |
|
Monroe County Industrial Development Corp, New York Revenue Bonds, Series 2023 | |
| | | | | 2,500 | | | | | | 2,762 | |
|
Monroe County Industrial Development Corp., New York Revenue Bonds, Series 2020 | |
| | | | | 4,130 | | | | | | 4,072 | |
|
Nassau County, New York Industrial Development Agency Revenue Bonds, Series 2021 | |
0.000% due 01/01/2058 ^(a) | | | | | 751 | | | | | | 180 | |
|
New York City, New York Municipal Water Finance Authority Revenue Bonds, Series 2022 | |
| | | | | 6,000 | | | | | | 6,682 | |
| | | | | 6,000 | | | | | | 6,749 | |
|
New York City, New York Municipal Water Finance Authority Revenue Bonds, Series 2023 | |
| | | | | 1,800 | | | | | | 2,043 | |
|
New York City, New York Transitional Finance Authority Future Tax Secured Revenue Bonds, Series 2022 | |
| | | | | 5,000 | | | | | | 5,862 | |
|
New York Liberty Development Corp. Revenue Bonds, Series 2005 | |
5.250% due 10/01/2035 (d) | | | | | 11,505 | | | | | | 13,696 | |
|
New York Liberty Development Corp. Revenue Bonds, Series 2014 | |
| | | | | 9,250 | | | | | | 9,202 | |
|
New York Liberty Development Corp. Revenue Bonds, Series 2021 | |
| | | | | 3,775 | | | | | | 2,882 | |
|
New York Power Authority Revenue Bonds, (AGM Insured), Series 2022 | |
| | | | | 2,000 | | | | | | 1,956 | |
|
New York Power Authority Revenue Bonds, Series 2020 | |
| | | | | 3,500 | | | | | | 3,444 | |
|
New York State Dormitory Authority Northwell Health Obligated Group Revenue Bonds, Series 2022 | |
| | | | | 2,000 | | | | | | 2,136 | |
|
New York State Dormitory Authority Revenue Bonds, Series 2017 | |
| | | | | 4,000 | | | | | | 3,983 | |
|
New York State Dormitory Authority Revenue Bonds, Series 2020 | |
| | | | | 8,000 | | | | | | 7,978 | |
|
New York State Thruway Authority Revenue Bonds, Series 2019 | |
| | | | | 2,900 | | | | | | 2,946 | |
| | | | | 1,305 | | | | | | 1,281 | |
|
New York State Thruway Authority Revenue Bonds, Series 2021 | |
| | | | | 7,375 | | | | | | 7,402 | |
|
New York State Urban Development Corp. Revenue Bonds, Series 2019 | |
| | | | | 2,900 | | | | | | 2,924 | |
|
New York State Urban Development Corp. Revenue Bonds, Series 2021 | |
| | | | | 6,250 | | | | | | 6,282 | |
|
New York State Urban Development Corp. Revenue Bonds, Series 2023 | |
| | | | | 2,500 | | | | | | 2,774 | |
| | | | | | | | | | | | |
| | | | | | | | | | | |
|
New York Transportation Development Corp. Revenue Bonds, (AGM Insured), Series 2023 | |
| | $ | | | 5,500 | | | $ | | | 5,772 | |
|
Onondaga County, New York Trust for Cultural Resources Revenue Bonds, Series 2019 | |
| | | | | 2,250 | | | | | | 2,253 | |
|
Port Authority of New York & New Jersey Revenue Bonds, Series 2017 | |
| | | | | 3,300 | | | | | | 3,447 | |
|
Suffolk Tobacco Asset Securitization Corp., New York Revenue Bonds, Series 2021 | |
| | | | | 2,920 | | | | | | 2,670 | |
|
Triborough Bridge & Tunnel Authority Sales Tax, New York Revenue Bonds, Series 2022 | |
| | | | | 6,000 | | | | | | 5,823 | |
|
Triborough Bridge & Tunnel Authority, New York Revenue Bonds, Series 2021 | |
| | | | | 6,125 | | | | | | 6,640 | |
|
Utility Debt Securitization Authority, New York Revenue Bonds, Series 2023 | |
| | | | | 1,580 | | | | | | 1,786 | |
| | | | | | | | | | | | |
| | | | | | | | | | | 129,265 | |
| | | | | | | | | | | | |
| |
| |
|
North Carolina Turnpike Authority Revenue Bonds, Series 2018 | |
| | | | | 3,000 | | | | | | 3,039 | |
| | | | | | | | | | | | |
| |
| |
|
Grand Forks County, North Dakota Revenue Bonds, Series 2021 | |
7.000% due 12/15/2043 ^(a) | | | | | 1,950 | | | | | | 390 | |
| | | | | | | | | | | | |
| |
| |
|
Buckeye Tobacco Settlement Financing Authority, Ohio Revenue Bonds, Series 2020 | |
0.000% due 06/01/2057 (b) | | | | | 79,500 | | | | | | 8,552 | |
|
Canton City School District, Ohio General Obligation Bonds, Series 2023 | |
| | | | | 3,700 | | | | | | 4,141 | |
|
Geisinger Authority, Ohio Revenue Bonds, Series 2017 | |
| | | | | 11,000 | | | | | | 10,353 | |
|
Montgomery County, Ohio Dayton Children’s Hospital Revenue Bonds, Series 2021 | |
| | | | | 5,500 | | | | | | 5,395 | |
|
Ohio Air Quality Development Authority Dayton Power And Light Company Project Revenue Bonds , Series 2015 | |
| | | | | 3,000 | | | | | | 3,028 | |
|
Ohio Air Quality Development Authority Revenue Bonds, Series 2019 | |
| | | | | 2,500 | | | | | | 2,291 | |
|
Ohio Air Quality Development Authority Revenue Notes, Series 2019 | |
| | | | | 1,700 | | | | | | 1,644 | |
|
Southern Ohio Port Authority Revenue Notes, Series 2020 | |
| | | | | 2,600 | | | | | | 1,970 | |
|
Worthington City School District, Ohio General Obligation Bonds, Series 2023 | |
| | | | | 1,060 | | | | | | 1,202 | |
| | | | | | | | | | | | |
| | | | | | | | | | | 38,576 | |
| | | | | | | | | | | | |
| |
| |
|
Oklahoma Development Finance Authority Revenue Bonds, Series 2018 | |
| | | | | 2,000 | | | | | | 2,009 | |
|
Oklahoma Development Finance Authority Revenue Bonds, Series 2021 | |
| | | | | 1,750 | | | | | | 1,396 | |
| | | | | | | | | | | | |
| | | | | | | | | | | |
|
Oklahoma Turnpike Authority Revenue Bonds, Series 2023 | |
| | $ | | | 5,900 | | | $ | | | 5,997 | |
| | | | | | | | | | | | |
| | | | | | | | | | | 9,402 | |
| | | | | | | | | | | | |
| |
| |
|
Medford Hospital Facilities Authority, Oregon Revenue Bonds, Series 2020 | |
| | | | | 1,545 | | | | | | 1,565 | |
|
Multnomah County School District 40, Oregon General Obligation Bonds, Series 2023 | |
0.000% due 06/15/2051 (b) | | | | | 3,700 | | | | | | 961 | |
|
Washington & Multnomah Counties School District No 48J Beaverton, Oregon General Obligation Bonds, Series 2022 | |
0.000% due 06/15/2048 (b) | | | | | 5,195 | | | | | | 1,628 | |
| | | | | 2,000 | | | | | | 2,188 | |
| | | | | | | | | | | | |
| | | | | | | | | | | 6,342 | |
| | | | | | | | | | | | |
| |
| |
|
Bucks County, Pennsylvania Water and Sewer Authority Revenue Bonds, (AGM Insured), Series 2022 | |
| | | | | 1,800 | | | | | | 1,841 | |
|
Commonwealth of Pennsylvania General Obligation Bonds, Series 2023 | |
| | | | | 6,625 | | | | | | 6,798 | |
|
Montgomery County Industrial Development Authority, Pennsylvania Revenue Bonds, Series 2023 | |
| | | | | 3,000 | | | | | | 3,049 | |
|
Pennsylvania Economic Development Financing Authority Revenue Bonds, (AGM Insured), Series 2022 | |
| | | | | 7,000 | | | | | | 7,749 | |
|
Pennsylvania Economic Development Financing Authority Revenue Bonds, Series 2021 | |
| | | | | 3,400 | | | | | | 3,751 | |
|
Pennsylvania Higher Educational Facilities Authority Revenue Bonds, Series 2015 | |
| | | | | 4,915 | | | | | | 4,945 | |
|
Pennsylvania Higher Educational Facilities Authority Revenue Bonds, Series 2018 | |
| | | | | 4,800 | | | | | | 4,827 | |
|
Philadelphia Authority for Industrial Development, Pennsylvania Revenue Bonds, Series 2017 | |
| | | | | 1,000 | | | | | | 912 | |
| | | | | | | | | | | | |
| | | | | | | | | | | 33,872 | |
| | | | | | | | | | | | |
| |
| |
|
Children’s Trust Fund, Puerto Rico Revenue Bonds, Series 2008 | |
0.000% due 05/15/2057 (b) | | | | | 63,000 | | | | | | 4,787 | |
|
Commonwealth of Puerto Rico Bonds, Series 2022 | |
| | | | | 6,411 | | | | | | 3,502 | |
| | | | | 7,819 | | | | | | 3,674 | |
|
Commonwealth of Puerto Rico General Obligation Bonds, Series 2021 | |
0.000% due 07/01/2033 (b) | | | | | 3,750 | | | | | | 2,343 | |
| | | | | 3,500 | | | | | | 3,222 | |
|
Puerto Rico Sales Tax Financing Corp. Sales Tax Revenue Bonds, Series 2018 | |
0.000% due 07/01/2051 (b) | | | | | 52,000 | | | | | | 12,208 | |
|
Puerto Rico Sales Tax Financing Corp. Sales Tax Revenue Bonds, Series 2019 | |
| | | | | 7,005 | | | | | | 6,922 | |
| | | | | | | | | | | | |
| | | | | | | | | | | 36,658 | |
| | | | | | | | | | | | |
| |
| |
|
Tobacco Settlement Financing Corp., Rhode Island Revenue Bonds, Series 2015 | |
| | | | | 18,450 | | | | | | 18,529 | |
| | | | | | | | | | | | |
| |
| | | | | | | | | | | | |
| | | | | | | | | | | |
| |
|
South Carolina Public Service Authority Revenue Obligations Revenue Bonds, Series 2013 | |
| | $ | | | 10,000 | | | $ | | | 10,003 | |
| | | | | | | | | | | | |
| |
| |
|
Shelby County, Tennessee Health Educational & Housing Facilities Board Revenue Bonds, Series 2019 | |
| | | | | 1,550 | | | | | | 1,153 | |
|
Tennessee Energy Acquisition Corp. Revenue Bonds, Series 2006 | |
| | | | | 6,000 | | | | | | 6,116 | |
| | | | | | | | | | | | |
| | | | | | | | | | | 7,269 | |
| | | | | | | | | | | | |
| |
| |
|
Angelina & Neches River Authority, Texas Revenue Bonds, Series 2021 | |
| | | | | 1,345 | | | | | | 890 | |
| | | | | 2,250 | | | | | | 1,950 | |
|
Board of Regents of the University of Texas System Revenue Bonds, Series 2022 | |
| | | | | 6,500 | | | | | | 6,501 | |
|
Brazoria County, Texas Industrial Development Corp. Revenue Bonds, Series 2023 | |
| | | | | 4,000 | | | | | | 4,030 | |
|
Calhoun County, Texas Navigation Industrial Development Authority Revenue Notes, Series 2021 | |
| | | | | 2,600 | | | | | | 2,416 | |
|
Central Texas Turnpike System Revenue Bonds, Series 2015 | |
0.000% due 08/15/2036 (b) | | | | | 2,500 | | | | | | 1,453 | |
0.000% due 08/15/2037 (b) | | | | | 8,000 | | | | | | 4,439 | |
|
Clifton Higher Education Finance Corp., Texas Revenue Bonds, Series 2018 | |
| | | | | 1,750 | | | | | | 1,772 | |
|
Coppell Independent School District, Texas General Obligation Bonds, (PSF Insured), Series 2023 | |
| | | | | 2,000 | | | | | | 2,035 | |
|
Corpus Christi Independent School District, Texas General Obligation Bonds, (PSF Insured), Series 2023 | |
| | | | | 2,800 | | | | | | 2,828 | |
|
Dallas Area Rapid Transit, Texas Revenue Bonds, Series 2021 | |
| | | | | 5,250 | | | | | | 5,177 | |
|
Dallas Fort Worth International Airport, Texas Revenue Bonds, Series 2022 | |
| | | | | 2,000 | | | | | | 2,300 | |
|
Edgewood Independent School District/Van Zandt County, Texas General Obligation Bonds, (PSF Insured), Series 2023 | |
| | | | | 2,800 | | | | | | 2,823 | |
|
EP Tuscany Zaragosa PFC, Texas Revenue Notes, Series 2023 | |
| | | | | 7,455 | | | | | | 7,411 | |
|
Fort Bend County Texas Public Facility Corp. Revenue Bonds, Series 2023 | |
| | | | | 7,125 | | | | | | 7,801 | |
|
Garland Independent School District, Texas General Obligation Bonds, (PSF Insured), Series 2023 | |
| | | | | 6,600 | | | | | | 7,358 | |
|
Grand Parkway Transportation Corp., Texas Revenue Bonds, (AGM/CR Insured), Series 2020 | |
| | | | | 2,100 | | | | | | 2,097 | |
|
Hays Consolidated Independent School District, Texas General Obligation Bonds, (PSF Insured), Series 2023 | |
| | | | | 3,000 | | | | | | 3,294 | |
|
Houston, Texas Combined Utility System Revenue Bonds, Series 2020 | |
| | | | | 1,510 | | | | | | 1,502 | |
|
Lamar Consolidated Independent School District, Texas General Obligation Bonds, (PSF Insured), Series 2023 | |
| | | | | 2,500 | | | | | | 2,527 | |
| | | | | | | | | | | | |
| | | | | | | | | | | |
|
Lamar Consolidated Independent School District, Texas General Obligation Bonds, (PSF Insured), Series 2023 | |
| | $ | | | 10,600 | | | $ | | | 11,729 | |
|
Medina Valley Independent School District, Texas General Obligation Bonds, (PSF Insured), Series 2023 | |
| | | | | 2,000 | | | | | | 2,095 | |
|
New Hope Cultural Education Facilities Finance Corp., Texas Revenue Bonds, Series 2016 | |
5.000% due 07/01/2046 ^(a) | | | | | 1,030 | | | | | | 706 | |
|
New Hope Cultural Education Facilities Finance Corp., Texas Revenue Bonds, Series 2021 | |
| | | | | 3,250 | | | | | | 2,494 | |
|
North Texas Tollway Authority Revenue Bonds, Series 2017 | |
| | | | | 3,590 | | | | | | 3,600 | |
|
North Texas Tollway Authority Revenue Bonds, Series 2018 | |
| | | | | 1,000 | | | | | | 1,046 | |
|
San Antonio Public Facilities Corp., Texas Revenue Bonds, Series 2012 | |
| | | | | 10,000 | | | | | | 10,000 | |
|
Southwest Independent School District, Texas General Obligation Bonds, (PSF Insured), Series 2023 | |
| | | | | 5,000 | | | | | | 5,001 | |
|
Tarrant County, Texas Cultural Education Facilities Finance Corp. Revenue Bonds, Series 2017 | |
| | | | | 1,000 | | | | | | 1,012 | |
|
Tarrant County, Texas Cultural Education Facilities Finance Corp. Revenue Bonds, Series 2022 | |
| | | | | 3,140 | | | | | | 3,350 | |
|
Tarrant County, Texas Hospital District General Obligation Bonds, Series 2023 | |
| | | | | 6,300 | | | | | | 7,018 | |
|
Texas Municipal Gas Acquisition & Supply Corp. Revenue Bonds, Series 2008 | |
| | | | | 8,350 | | | | | | 8,740 | |
|
Texas Water Development Board Revenue Bonds, Series 2022 | |
| | | | | 1,800 | | | | | | 1,934 | |
| | | | | 5,395 | | | | | | 5,927 | |
|
West Harris County, Texas Regional Water Authority Revenue Bonds, (BAM Insured), Series 2021 | |
| | | | | 1,250 | | | | | | 1,198 | |
| | | | | | | | | | | | |
| | | | | | | | | | | 136,454 | |
| | | | | | | | | | | | |
| |
| |
|
Mida Mountain Village Public Infrastructure District, Utah Special Assessment Notes, Series 2021 | |
| | | | | 1,000 | | | | | | 946 | |
|
Military Installation Development Authority, Utah Revenue Bonds, Series 2021 | |
| | | | | 2,000 | | | | | | 1,497 | |
|
Ogden City Redevelopment Agency, Utah Revenue Bonds, Series 2023 | |
| | | | | 1,440 | | | | | | 1,568 | |
| | | | | | | | | | | | |
| | | | | | | | | | | 4,011 | |
| | | | | | | | | | | | |
| |
| |
|
Virginia Housing Development Authority Revenue Bonds, (FHA Insured), Series 2023 | |
| | | | | 2,210 | | | | | | 2,404 | |
|
Virginia Small Business Financing Authority Revenue Bonds, Series 2019 | |
0.000% due 07/01/2061 (b) | | | | | 51,000 | | | | | | 1,594 | |
| | | | | 2,445 | | | | | | 2,284 | |
| | | | | | | | | | | | |
| | | | | | | | | | | 6,282 | |
| | | | | | | | | | | | |
| |
| |
|
Washington State Convention Center Public Facilities District Revenue Bonds, Series 2018 | |
| | | | | 2,960 | | | | | | 2,719 | |
| | | | | | | | | | | | |
| |
| | | | | | | | | | | | |
| | | | | | | | | | | |
| |
|
Monongalia County, West Virginia Commission Special District Revenue Bonds, Series 2017 | |
| | $ | | | 2,000 | | | $ | | | 2,060 | |
|
West Virginia Economic Development Authority Revenue Bonds, Series 2017 | |
| | | | | 7,110 | | | | | | 7,207 | |
| | | | | | | | | | | | |
| | | | | | | | | | | 9,267 | |
| | | | | | | | | | | | |
| |
| |
|
Public Finance Authority, Wisconsin Revenue Bonds, Series 2017 | |
| | | | | 500 | | | | | | 365 | |
| | | | | 4,500 | | | | | | 4,921 | |
|
Public Finance Authority, Wisconsin Revenue Bonds, Series 2018 | |
| | | | | 4,000 | | | | | | 1,800 | |
|
Public Finance Authority, Wisconsin Revenue Bonds, Series 2020 | |
0.000% due 01/01/2060 (b) | | | | | 15,000 | | | | | | 798 | |
|
Public Finance Authority, Wisconsin Revenue Bonds, Series 2021 | |
| | | | | 1,700 | | | | | | 1,445 | |
| | | | | 900 | | | | | | 746 | |
| | | | | 2,900 | | | | | | 2,249 | |
|
Public Finance Authority, Wisconsin Revenue Bonds, Series 2022 | |
| | | | | 5,500 | | | | | | 5,856 | |
|
Wisconsin Center District Revenue Bonds, (AGM Insured), Series 2020 | |
0.000% due 12/15/2045 (b) | | | | | 3,855 | | | | | | 1,496 | |
0.000% due 12/15/2055 (b) | | | | | 20,420 | | | | | | 4,784 | |
|
Wisconsin Health & Educational Facilities Authority Revenue Bonds, Series 2016 | |
| | | | | 4,345 | | | | | | 4,455 | |
|
Wisconsin Health & Educational Facilities Authority Revenue Bonds, Series 2022 | |
| | | | | 4,470 | | | | | | 4,278 | |
| | | | | | | | | | | | |
| | | | | | | | | | | 33,193 | |
| | | | | | | | | | | | |
Total Municipal Bonds & Notes (Cost $937,543) | | | | |
| | | | |
| |
NON-AGENCY MORTGAGE-BACKED SECURITIES 0.4% | |
|
| |
| | | | | 2,985 | | | | | | 2,699 | |
| | | | | | | | | | | | |
Total Non-Agency Mortgage-Backed Securities (Cost $2,803) | | | | |
| | | | |
| |
SHORT-TERM INSTRUMENTS 0.2% | |
| |
REPURCHASE AGREEMENTS (f) 0.2% | |
| | | | | | | | | | | 987 | |
| | | | | | | | | | | | |
Total Short-Term Instruments
(Cost $987) | | | | |
| | | | |
| | | | |
| | | | | | | | | | | | |
Total Investments in Securities
(Cost $948,433) | | | | |
| |
| | | | |
Total Investments 162.0%
(Cost $948,433) | | | $ | | | | |
| |
Auction Rate Preferred Shares (40.0)% | | | | | | | |
| |
Remarketable Variable Rate MuniFund Term Preferred Shares, at liquidation value (20.7)% | | | | | | | |
| |
Other Assets and Liabilities, net (1.3)% | | | | |
| | | | |
Net Assets Applicable to Common Shareholders 100.0% | | | | | | | | $ | | | | |
| | | | | | | | | | | | |
| | | | | | | | | | | | |
| See Accompanying Notes | | | | | | | | | | DECEMBER 31, 2023 | | | |
| | | | | | |
Consolidated Schedule of Investments | | PIMCO Municipal Income Fund II | | | | |
NOTES TO CONSOLIDATED SCHEDULE OF INVESTMENTS:
| A zero balance may reflect actual amounts rounding to less than one thousand. |
| Security valued using significant unobservable inputs (Level 3). |
| All or a portion of this amount represents unfunded loan commitments. The interest rate for the unfunded portion will be determined at the time of funding. See Note 4, Securities and Other Investments, in the Notes to Financial Statements for more information regarding unfunded loan commitments. |
| Security is not accruing income as of the date of this report. |
| Security becomes interest bearing at a future date. |
| Represents an underlying municipal bond transferred to a tender option bond trust established in a tender option bond transaction in which the Fund sold, or caused the sale of, the underlying municipal bond and purchased the residual interest certificate. The security serves as collateral in a financing transaction. See Note 5, Tender Option Bond Transactions, in the Notes to Financial Statements for more information. |
(e) RESTRICTED SECURITIES:
| | | | | | | | | | | | | | | | | | | | | | |
| | | | | | | | | | | | | | | | | |
Federal Home Loan Mortgage Corp. Enhanced Receipt, New Jersey Revenue Bonds, Series 2019 | | 3.870% | | | 11/15/2035 | | | | 10/26/2020 | | | | $ 175 | | | $ | 145 | | | | 0.02% | |
| | | | | | | | | | | | | | | | | | | | | | |
BORROWINGS AND OTHER FINANCING TRANSACTIONS
(f) REPURCHASE AGREEMENTS:
| | | | | | | | | | | | | | | | | | | | | | | | | | | | | | |
| | | | | | | | | | | | | | | | | | | Repurchase
Agreements,
at Value | | | Repurchase Agreement Proceeds to be Received (1) | |
| FICC | | | 2.600 | % | | | 12/29/2023 | | | | 01/02/2024 | | | $ | 987 | | | U.S. Treasury Notes 4.875% due 11/30/2025 | | $ | (1,007 | ) | | $ | 987 | | | $ | 987 | |
| | | | | | | | | | | | | | | | | | | | | | | | | | | | | | |
Total Repurchase Agreements | | | | | | | | | | | | | | | |
| | | | | | | | | | | | | | | | | | | | | | | | | | | | | | |
BORROWINGS AND OTHER FINANCING TRANSACTIONS SUMMARY
The following is a summary by counterparty of the market value of Borrowings and Other Financing Transactions and collateral pledged/(received) as of December 31, 2023:
| | | | | | | | | | | | | | | | | | | | | | | | |
| | Repurchase Agreement Proceeds to be Received (1) | | | Payable for
Reverse
Repurchase
Agreements | | | Payable for Sale-Buyback Transactions | | | Total
Borrowings and
Other Financing
Transactions | | | Collateral
Pledged/(Received) | | | | |
Global/Master Repurchase Agreement | |
| | $ | 987 | | | $ | 0 | | | $ | 0 | | | $ | 987 | | | $ | (1,007 | ) | | $ | (20 | ) |
| | | | | | | | | | | | | | | | | | | | | | | | |
Total Borrowings and Other Financing Transactions | | | | | | | | | | | | | | | | | | | | | | | | |
| | | | | | | | | | | | | | | | | | | | | | | | |
| Includes accrued interest. |
| Net Exposure represents the net receivable/(payable) that would be due from/to the counterparty in the event of default. Exposure from borrowings and other financing transactions can only be netted across transactions governed under the same master agreement with the same legal entity. See Note 7, Master Netting Arrangements, in the Notes to Financial Statements for more information. |
The following is a summary of the fair valuations according to the inputs used as of December 31, 2023 in valuing the Fund’s assets and
liabilities:
| | | | | | | | | | | | | | | | |
| | | | | | | | | | | | |
Investments in Securities, at Value | |
Loan Participations and Assignments | | $ | 0 | | | $ | 0 | | | $ | 7,406 | | | $ | 7,406 | |
| |
| | | 0 | | | | 37,446 | | | | 0 | | | | 37,446 | |
| | | 0 | | | | 2,622 | | | | 0 | | | | 2,622 | |
| | | 0 | | | | 54,356 | | | | 0 | | | | 54,356 | |
| | | 0 | | | | 2,094 | | | | 0 | | | | 2,094 | |
| | | | | | | | | | | | | | | | |
| | | | | | | | | | | | |
| | $ | 0 | | | $ | 29,659 | | | $ | 0 | | | $ | 29,659 | |
| | | 0 | | | | 36,513 | | | | 0 | | | | 36,513 | |
| | | 0 | | | | 5,352 | | | | 0 | | | | 5,352 | |
| | | 0 | | | | 5,995 | | | | 0 | | | | 5,995 | |
| | | 0 | | | | 2,202 | | | | 0 | | | | 2,202 | |
| | | 0 | | | | 33,710 | | | | 0 | | | | 33,710 | |
| | | 0 | | | | 33,552 | | | | 0 | | | | 33,552 | |
| | | | | | | | | | | | | | | | |
| | | | | | | | | | | | |
| | $ | 0 | | | $ | 76,346 | | | $ | 0 | | | $ | 76,346 | |
| | | 0 | | | | 10,004 | | | | 0 | | | | 10,004 | |
| | | 0 | | | | 15,642 | | | | 0 | | | | 15,642 | |
| | | 0 | | | | 22,525 | | | | 0 | | | | 22,525 | |
| | | 0 | | | | 1,931 | | | | 0 | | | | 1,931 | |
| | | 0 | | | | 1,265 | | | | 0 | | | | 1,265 | |
| | | 0 | | | | 8,382 | | | | 0 | | | | 8,382 | |
| | | 0 | | | | 17,433 | | | | 0 | | | | 17,433 | |
| | | 0 | | | | 5,530 | | | | 0 | | | | 5,530 | |
| | | 0 | | | | 40 | | | | 0 | | | | 40 | |
| | | 0 | | | | 16,201 | | | | 0 | | | | 16,201 | |
| | | 0 | | | | 2,547 | | | | 0 | | | | 2,547 | |
| | | 0 | | | | 7,360 | | | | 0 | | | | 7,360 | |
| | | 0 | | | | 5,441 | | | | 0 | | | | 5,441 | |
| | | 0 | | | | 39,367 | | | | 0 | | | | 39,367 | |
| | | 0 | | | | 129,265 | | | | 0 | | | | 129,265 | |
| | | 0 | | | | 3,039 | | | | 0 | | | | 3,039 | |
| | | 0 | | | | 390 | | | | 0 | | | | 390 | |
| | | 0 | | | | 38,576 | | | | 0 | | | | 38,576 | |
| | | | | | | | | | | | | | | | |
| | | | | | | | | | | | |
| | $ | 0 | | | $ | 9,402 | | | $ | 0 | | | $ | 9,402 | |
| | | 0 | | | | 6,342 | | | | 0 | | | | 6,342 | |
| | | 0 | | | | 33,872 | | | | 0 | | | | 33,872 | |
| | | 0 | | | | 36,658 | | | | 0 | | | | 36,658 | |
| | | 0 | | | | 18,529 | | | | 0 | | | | 18,529 | |
| | | 0 | | | | 10,003 | | | | 0 | | | | 10,003 | |
| | | 0 | | | | 7,269 | | | | 0 | | | | 7,269 | |
| | | 0 | | | | 136,454 | | | | 0 | | | | 136,454 | |
| | | 0 | | | | 4,011 | | | | 0 | | | | 4,011 | |
| | | 0 | | | | 6,282 | | | | 0 | | | | 6,282 | |
| | | 0 | | | | 2,719 | | | | 0 | | | | 2,719 | |
| | | 0 | | | | 9,267 | | | | 0 | | | | 9,267 | |
| | | 0 | | | | 33,193 | | | | 0 | | | | 33,193 | |
Non-Agency Mortgage-Backed Securities | | | 0 | | | | 2,699 | | | | 0 | | | | 2,699 | |
| |
| | | 0 | | | | 987 | | | | 0 | | | | 987 | |
| | | | | | | | | | | | | | | | |
| | | | |
| | $ | 0 | | | $ | 962,472 | | | $ | 7,406 | | | $ | 969,878 | |
| | | | | | | | | | | | | | | | |
The following is a reconciliation of the fair valuations using significant unobservable inputs (Level 3) for the Fund during the period ended December 31, 2023:
| | | | | | | | | | | | | | | | | | | | | | | | | | | | | | | | | | | | | | | | |
| | Beginning
Balance
at 12/31/2022 | | | | | | | | | Accrued
Discounts/
(Premiums) | | | | | | Net Change in Unrealized Appreciation/ (Depreciation) (1) | | | | | | | | | Ending
Balance
at 12/31/2023 | | | Net Change in Unrealized Appreciation/ (Depreciation) on Investments Held at 12/31/2023 (1) | |
Investments in Securities, at Value | |
Loan Participations and Assignments | | $ | 0 | | | $ | 7,100 | | | $ | 0 | | | $ | 0 | | | $ | 0 | | | $ | 306 | | | $ | 0 | | | $ | 0 | | | $ | 7,406 | | | $ | 306 | |
| | | | | | | | | | | | | | | | | | | | | | | | | | | | | | | | | | | | | | | | |
| | | | | | | | | | |
| | $ | 0 | | | $ | 7,100 | | | $ | 0 | | | $ | 0 | | | $ | 0 | | | $ | 306 | | | $ | 0 | | | $ | 0 | | | $ | 7,406 | | | $ | 306 | |
| | | | | | | | | | | | | | | | | | | | | | | | | | | | | | | | | | | | | | | | |
The following is a summary of significant unobservable inputs used in the fair valuations of assets and liabilities categorized within Level 3 of the fair value hierarchy:
| | | | | | | | | | | | | | | | |
| | Ending
Balance
at 12/31/2023 | | | | | | | (% Unless Noted Otherwise) | |
| | | | | | |
Investments in Securities, at Value | |
Loan Participations and Assignments | | $ | 7,406 | | | Proxy Pricing | | Base Price | | | | | | | 100.118 | |
| | | | | | | | | | | | | | | | |
| | $ | 7,406 | | | | | | | | | | | | | |
| | | | | | | | | | | | | | | | |
| Any difference between Net Change in Unrealized Appreciation/(Depreciation) and Net Change in Unrealized Appreciation/(Depreciation) on Investments Held at December 31, 2023 may be due to an investment no longer held or categorized as Level 3 at period end. |
| | | | | | | | | | | | |
| See Accompanying Notes | | | | | | | | | | DECEMBER 31, 2023 | | | |
| | | | | | |
Consolidated Schedule of Investments | | PIMCO Municipal Income Fund III | | | | |
(Amounts in thousands*, except number of shares, contracts, units and ounces, if any)
| | | | | | | | | | | | |
| | | | | | | | | | | |
INVESTMENTS IN SECURITIES 169.5% | |
| |
LOAN PARTICIPATIONS AND ASSIGNMENTS 1.2% | |
|
| |
| | $ | | | 500 | | | $ | | | 505 | |
TBD% - 7.947% due 10/26/2063 «µ | | | | | 2,700 | | | | | | 2,835 | |
| | | | | | | | | | | | |
Total Loan Participations and Assignments
(Cost $3,200) | | | | |
| | | | |
| |
MUNICIPAL BONDS & NOTES 167.9% | |
| |
| |
|
Jefferson County, Alabama Sewer Revenue Bonds, Series 2013 | |
| | | | | 7,500 | | | | | | 7,878 | |
| | | | | 9,000 | | | | | | 9,450 | |
|
Tuscaloosa County, Alabama Industrial Development Authority Revenue Bonds, Series 2019 | |
| | | | | 1,625 | | | | | | 1,503 | |
| | | | | | | | | | | | |
| | | | | | | | | | | 18,831 | |
| | | | | | | | | | | | |
| |
| |
|
Municipality of Anchorage, Alaska Solid Waste Services Revenue Bonds, Series 2022 | |
| | | | | 1,165 | | | | | | 1,247 | |
| | | | | | | | | | | | |
| |
| |
|
Arizona Industrial Development Authority Revenue Bonds, Series 2019 | |
| | | | | 675 | | | | | | 443 | |
| | | | | 710 | | | | | | 447 | |
| | | | | 750 | | | | | | 431 | |
|
Arizona Industrial Development Authority Revenue Bonds, Series 2020 | |
7.750% due 07/01/2050 ^(b) | | | | | 1,200 | | | | | | 72 | |
|
Industrial Development Authority of the County, Arizona of Pima Revenue Bonds, Series 2020 | |
| | | | | 1,200 | | | | | | 1,053 | |
|
Maricopa County, Arizona Industrial Development Authority Revenue Bonds, Series 2017 | |
| | | | | 750 | | | | | | 752 | |
|
Maricopa County, Arizona Industrial Development Authority Revenue Bonds, Series 2019 | |
| | | | | 3,800 | | | | | | 3,790 | |
|
Maricopa County, Arizona School District No 83, Cartwright Elementary Revenue Bonds, Series 2020 | |
| | | | | 4,120 | | | | | | 3,780 | |
|
Salt River Project Agricultural Improvement & Power District, Arizona Revenue Bonds, Series 2023 | |
| | | | | 1,000 | | | | | | 1,113 | |
|
Salt Verde Financial Corp., Arizona Revenue Bonds, Series 2007 | |
| | | | | 11,600 | | | | | | 12,936 | |
| | | | | | | | | | | | |
| | | | | | | | | | | 24,817 | |
| | | | | | | | | | | | |
| |
| |
|
County of Pulaski Hospital, Arkansas Revenue Bonds, Series 2023 | |
| | | | | 700 | | | | | | 763 | |
| | | | | | | | | | | | |
| |
| |
|
California Statewide Communities Development Authority Revenue Bonds, Series 2016 | |
| | | | | 1,500 | | | | | | 1,485 | |
|
Folsom Cordova Unified School District, California General Obligation Bonds, (AGM Insured), Series 2019 | |
| | | | | 1,810 | | | | | | 1,814 | |
|
Golden State, California Tobacco Securitization Corp. Revenue Bonds, Series 2021 | |
0.000% due 06/01/2066 (c) | | | | | 2,500 | | | | | | 295 | |
| | | | | | | | | | | | |
| | | | | | | | | | | |
|
Golden State, California Tobacco Securitization Corp. Revenue Bonds, Series 2022 | |
| | $ | | | 1,050 | | | $ | | | 1,101 | |
|
Los Angeles County, California Public Works Financing Authority Revenue Bonds, Series 2021 | |
| | | | | 1,490 | | | | | | 1,523 | |
|
Los Angeles Department of Water & Power, California Revenue Bonds, Series 2023 | |
| | | | | 1,200 | | | | | | 1,374 | |
|
Energy Authority, California Revenue Bonds, Series 2009 | |
| | | | | 2,000 | | | | | | 2,577 | |
|
San Diego County, California Regional Airport Authority Revenue Bonds, Series 2021 | |
| | | | | 1,100 | | | | | | 1,053 | |
|
San Francisco, California City & County Public Utilities Commission Wastewater Revenue Bonds, Series 2021 | |
| | | | | 730 | | | | | | 735 | |
| | | | | | | | | | | | |
| | | | | | | | | | | 11,957 | |
| | | | | | | | | | | | |
| |
| |
|
Colorado Health Facilities Authority Revenue Bonds, Series 2019 | |
| | | | | 2,500 | | | | | | 2,535 | |
| | | | | 2,000 | | | | | | 1,921 | |
|
Colorado International Center Metropolitan District No 7 General Obligation Bonds, Series 2021 | |
0.000% due 12/01/2051 (d) | | | | | 1,615 | | | | | | 948 | |
|
Colorado State Building Excellent School Certificates of Participation Bonds, Series 2018 | |
| | | | | 1,250 | | | | | | 1,258 | |
|
Dominion Water & Sanitation District, Colorado Revenue Bonds, Series 2022 | |
| | | | | 1,250 | | | | | | 1,252 | |
|
Harvest Crossing Metropolitan District No 4, Colorado General Obligation Bonds, Series 2022 | |
| | | | | 1,250 | | | | | | 1,236 | |
|
Public Authority for Colorado Energy Revenue Bonds, Series 2008 | |
| | | | | 500 | | | | | | 631 | |
|
Senac South Metropolitan District No 1, Colorado General Obligation Bonds, Series 2021 | |
| | | | | 550 | | | | | | 485 | |
|
Third Creek Metropolitan District No 1, Colorado General Obligation Bonds, Series 2022 | |
| | | | | 500 | | | | | | 395 | |
| | | | | | | | | | | | |
| | | | | | | | | | | 10,661 | |
| | | | | | | | | | | | |
| |
| |
|
Connecticut Special Tax Revenue State Special Tax Bonds, Series 2020 | |
| | | | | 2,000 | | | | | | 2,212 | |
|
Connecticut State Health & Educational Facilities Authority Revenue Bonds, Series 2022 | |
| | | | | 1,380 | | | | | | 1,488 | |
| | | | | | | | | | | | |
| | | | | | | | | | | 3,700 | |
| | | | | | | | | | | | |
| |
| |
|
Affordable Housing Opportunities Trust, Delaware Revenue Bonds, Series 2022 | |
| | | | | 11,120 | | | | | | 10,461 | |
| | | | | 1,965 | | | | | | 1,980 | |
| | | | | | | | | | | | |
| | | | | | | | | | | 12,441 | |
| | | | | | | | | | | | |
| |
DISTRICT OF COLUMBIA 0.8% | |
|
District of Columbia Revenue Bonds, Series 2022 | |
| | | | | 1,800 | | | | | | 2,143 | |
| | | | | | | | | | | | |
| |
| | | | | | | | | | | | |
| | | | | | | | | | | |
| |
|
Avenir Community Development District, Florida Special Assessment Bonds, Series 2023 | |
| | $ | | | 795 | | | $ | | | 798 | |
|
Central Florida Expressway Authority Revenue Bonds, Series 2017 | |
| | | | | 1,940 | | | | | | 1,950 | |
|
Charlotte County Industrial Development Authority, Florida Revenue Bonds, Series 2021 | |
| | | | | 500 | | | | | | 447 | |
| | | | | 1,250 | | | | | | 1,030 | |
|
Hillsborough County, Florida Industrial Development Authority Revenue Bonds, Series 2020 | |
| | | | | 1,800 | | | | | | 1,683 | |
|
Miami-Dade County, Florida Transit System Revenue Bonds, Series 2018 | |
| | | | | 1,000 | | | | | | 1,009 | |
|
Miami-Dade County, Florida Water & Sewer System Revenue Bonds, Series 2019 | |
| | | | | 2,500 | | | | | | 2,449 | |
|
Miami-Dade Seaport Department, Florida Revenue Bonds, Series 2023 | |
| | | | | 1,850 | | | | | | 1,979 | |
|
Orange County Health Facilities Authority, Florida Revenue Bonds, Series 2023 | |
| | | | | 980 | | | | | | 1,047 | |
|
South Miami Health Facilities Authority, Florida Revenue Bonds, Series 2017 | |
| | | | | 3,750 | | | | | | 3,613 | |
|
Tampa-Hillsborough County, Florida Expressway Authority Revenue Bonds, Series 2017 | |
| | | | | 2,450 | | | | | | 2,443 | |
| | | | | | | | | | | | |
| | | | | | | | | | | 18,448 | |
| | | | | | | | | | | | |
| |
| |
|
Atlanta Development Authority, Georgia Revenue Bonds, Series 2017 | |
6.750% due 01/01/2035 ^(b) | | | | | 1,750 | | | | | | 788 | |
|
Fayette County, Georgia Hospital Authority Revenue Bonds, Series 2016 | |
| | | | | 3,000 | | | | | | 3,063 | |
|
Municipal Electric Authority of Georgia Revenue Bonds, Series 2015 | |
| | | | | 10,000 | | | | | | 10,040 | |
| | | | | | | | | | | | |
| | | | | | | | | | | 13,891 | |
| | | | | | | | | | | | |
| |
| |
|
Chicago Board of Education, Illinois General Obligation Bonds, Series 2018 | |
| | | | | 4,000 | | | | | | 3,989 | |
|
Chicago O’Hare International Airport, Illinois Revenue Bonds, Series 2018 | |
| | | | | 3,800 | | | | | | 4,003 | |
|
Chicago Park District, Illinois General Obligation Bonds, Series 2020 | |
| | | | | 1,435 | | | | | | 1,453 | |
|
Chicago, Illinois General Obligation Bonds, Series 2007 | |
| | | | | 400 | | | | | | 405 | |
| | | | | 1,000 | | | | | | 1,006 | |
|
Chicago, Illinois General Obligation Bonds, Series 2017 | |
| | | | | 3,000 | | | | | | 3,151 | |
|
Chicago, Illinois Revenue Bonds, Series 2002 | |
| | | | | 1,750 | | | | | | 1,782 | |
|
Illinois Finance Authority Revenue Bonds, Series 2017 | |
5.000% due 02/15/2037 ^(b) | | | | | 1,030 | | | | | | 278 | |
|
Illinois Finance Authority Revenue Bonds, Series 2019 | |
5.000% due 11/01/2035 ^(b) | | | | | 1,010 | | | | | | 937 | |
|
Illinois State General Obligation Bonds, Series 2018 | |
| | | | | 2,000 | | | | | | 2,065 | |
| | | | | 1,500 | | | | | | 1,563 | |
|
Illinois State General Obligation Notes, Series 2017 | |
| | | | | 1,150 | | | | | | 1,189 | |
| | | | | 7,000 | | | | | | 7,526 | |
| | | | | | | | | | | | |
| | | | | | | | | | | |
|
Illinois State Toll Highway Authority Revenue Bonds, Series 2024 | |
5.000% due 01/01/2036 (a) | | $ | | | 5,000 | | | $ | | | 6,084 | |
|
Metropolitan Pier & Exposition Authority, Illinois Revenue Bonds, (AGM/CR/NPFGC Insured), Series 2002 | |
0.000% due 12/15/2040 (c) | | | | | 2,000 | | | | | | 1,022 | |
|
Metropolitan Pier & Exposition Authority, Illinois Revenue Bonds, Series 2012 | |
0.000% due 12/15/2051 (c) | | | | | 2,500 | | | | | | 668 | |
|
Regional Transportation Authority, Illinois Revenue Bonds, Series 2018 | |
| | | | | 3,900 | | | | | | 4,192 | |
|
Sales Tax Securitization Corp., Illinois Revenue Bonds, Series 2018 | |
| | | | | 700 | | | | | | 681 | |
| | | | | | | | | | | | |
| | | | | | | | | | | 41,994 | |
| | | | | | | | | | | | |
| |
| |
|
Indiana Finance Authority Midwestern Disaster Relief Revenue Bonds, Series 2012 | |
| | | | | 1,400 | | | | | | 1,420 | |
|
Indiana Finance Authority Revenue Bonds, Series 2019 | |
| | | | | 1,710 | | | | | | 1,278 | |
|
Indiana Health & Educational Facilities Financing Authority Revenue Bonds, Series 2006 | |
| | | | | 2,500 | | | | | | 2,407 | |
|
Indianapolis Local Public Improvement Bond Bank Revenue Bonds, Series 2023 | |
| | | | | 1,000 | | | | | | 1,083 | |
| | | | | 1,000 | | | | | | 1,093 | |
| | | | | | | | | | | | |
| | | | | | | | | | | 7,281 | |
| | | | | | | | | | | | |
| |
| |
|
Iowa Finance Authority Midwestern Disaster Area Revenue Refunding Bonds, Series 2012 | |
| | | | | 1,500 | | | | | | 1,478 | |
|
Iowa Finance Authority Midwestern Disaster Area Revenue Refunding Bonds, Series 2022 | |
| | | | | 5,455 | | | | | | 5,704 | |
|
Iowa Finance Authority Revenue Bonds, Series 2014 | |
| | | | | 356 | | | | | | 364 | |
|
Iowa Finance Authority Revenue Bonds, Series 2022 | |
| | | | | 875 | | | | | | 816 | |
| | | | | | | | | | | | |
| | | | | | | | | | | 8,362 | |
| | | | | | | | | | | | |
| |
| |
|
Louisiana Gasoline & Fuels Tax State Revenue Bonds, Series 2017 | |
| | | | | 4,000 | | | | | | 3,999 | |
|
Louisiana Public Facilities Authority Revenue Bonds, Series 2017 | |
| | | | | 2,500 | | | | | | 2,565 | |
|
Louisiana Public Facilities Authority Revenue Bonds, Series 2020 | |
| | | | | 90 | | | | | | 98 | |
|
Louisiana Public Facilities Authority Revenue Bonds, Series 2023 | |
| | | | | 1,915 | | | | | | 2,082 | |
|
Parish of St James, Louisiana Revenue Bonds, Series 2010 | |
| | | | | 1,350 | | | | | | 1,474 | |
| | | | | | | | | | | | |
| | | | | | | | | | | 10,218 | |
| | | | | | | | | | | | |
| |
| |
|
Maine Health & Higher Educational Facilities Authority Revenue Bonds, Series 2020 | |
| | | | | 2,000 | | | | | | 1,984 | |
| | | | | | | | | | | | |
| |
| | | | | | | | | | | | |
| | | | | | | | | | | |
| |
|
Maryland Economic Development Corp. Revenue Bonds, Series 2020 | |
| | $ | | | 500 | | | $ | | | 473 | |
| | | | | | | | | | | | |
| |
| |
|
Commonwealth of Massachusetts General Obligation Bonds, Series 2018 | |
| | | | | 1,000 | | | | | | 1,025 | |
|
Commonwealth of Massachusetts Transportation Fund Revenue Bonds, Series 2023 | |
| | | | | 2,450 | | | | | | 2,707 | |
|
Massachusetts Development Finance Agency Revenue Bonds, Series 2010 | |
7.625% due 10/15/2037 ^(b) | | | | | 228 | | | | | | 2 | |
|
Massachusetts Development Finance Agency Revenue Bonds, Series 2016 | |
| | | | | 1,000 | | | | | | 1,009 | |
|
Massachusetts Housing Finance Agency Revenue Bonds, Series 2003 | |
| | | | | 525 | | | | | | 525 | |
| | | | | | | | | | | | |
| | | | | | | | | | | 5,268 | |
| | | | | | | | | | | | |
| |
| |
|
Gerald R Ford International Airport Authority, Michigan Revenue Bonds, Series 2021 | |
| | | | | 2,500 | | | | | | 2,648 | |
|
Great Lakes Water Authority Sewage Disposal System, Michigan Revenue Bonds, Series 2023 | |
| | | | | 2,875 | | | | | | 3,279 | |
|
Michigan Finance Authority Revenue Bonds, Series 2017 | |
| | | | | 2,425 | | | | | | 2,481 | |
|
Michigan State Housing Development Authority Revenue Bonds, Series 2015 | |
| | | | | 920 | | | | | | 920 | |
|
Michigan Tobacco Settlement Finance Authority Revenue Bonds, Series 2008 | |
0.000% due 06/01/2058 (c) | | | | | 12,500 | | | | | | 527 | |
|
Michigan Trunk Line State Revenue Bonds, Series 2021 | |
| | | | | 5,000 | | | | | | 5,106 | |
| | | | | | | | | | | | |
| | | | | | | | | | | 14,961 | |
| | | | | | | | | | | | |
| |
| |
|
Rochester, Minnesota Revenue Bonds, Series 2018 | |
| | | | | 1,750 | | | | | | 1,733 | |
| | | | | | | | | | | | |
| |
| |
|
Health & Educational Facilities Authority of the State of Missouri Revenue Bonds, Series 2018 | |
| | | | | 3,000 | | | | | | 2,953 | |
|
Health & Educational Facilities Authority of the State of Missouri Revenue Bonds, Series 2019 | |
| | | | | 500 | | | | | | 540 | |
|
Health & Educational Facilities Authority of the State of Missouri Revenue Bonds, Series 2023 | |
| | | | | 1,250 | | | | | | 1,414 | |
|
Missouri Development Finance Board Revenue Bonds, Series 2022 | |
| | | | | 1,000 | | | | | | 1,082 | |
| | | | | | | | | | | | |
| | | | | | | | | | | 5,989 | |
| | | | | | | | | | | | |
| |
| |
|
University of Nebraska Facilities Corp Revenue Bonds, Series 2021 | |
| | | | | 1,310 | | | | | | 1,259 | |
| | | | | | | | | | | | |
| |
| | | | | | | | | | | | |
| | | | | | | | | | | |
| |
|
Las Vegas Convention & Visitors Authority, Nevada Revenue Bonds, Series 2023 | |
| | $ | | | 1,800 | | | $ | | | 1,971 | |
|
Reno, Nevada Revenue Bonds, Series 2018 | |
0.000% due 07/01/2058 (c) | | | | | 11,000 | | | | | | 1,140 | |
| | | | | | | | | | | | |
| | | | | | | | | | | 3,111 | |
| | | | | | | | | | | | |
| |
| |
|
New Hampshire Business Finance Authority Revenue Bonds, Series 2023 | |
| | | | | 2,696 | | | | | | 2,667 | |
| | | | | | | | | | | | |
| |
| |
|
Cherry Hill Township School District, New Jersey General Obligation Bonds, Series 2022 | |
| | | | | 3,000 | | | | | | 3,073 | |
|
Federal Home Loan Mortgage Corp. Enhanced Receipt, New Jersey Revenue Bonds, Series 2019 | |
3.870% due 11/15/2035 (e) | | | | | 74 | | | | | | 70 | |
|
New Jersey Economic Development Authority Revenue Bonds, Series 2016 | |
| | | | | 5,000 | | | | | | 5,363 | |
|
New Jersey Health Care Facilities Financing Authority Revenue Bonds, Series 2013 | |
| | | | | 2,000 | | | | | | 2,002 | |
|
New Jersey Transportation Trust Fund Authority Revenue Bonds, (AGM Insured), Series 2006 | |
0.000% due 12/15/2034 (c) | | | | | 3,200 | | | | | | 2,266 | |
|
New Jersey Transportation Trust Fund Authority Revenue Bonds, Series 2023 | |
| | | | | 1,200 | | | | | | 1,333 | |
|
South Jersey Port Corp., New Jersey Revenue Bonds, Series 2017 | |
| | | | | 900 | | | | | | 928 | |
|
Tobacco Settlement Financing Corp., New Jersey Revenue Bonds, Series 2018 | |
| | | | | 1,200 | | | | | | 1,289 | |
| | | | | 6,525 | | | | | | 6,625 | |
| | | | | | | | | | | | |
| | | | | | | | | | | 22,949 | |
| | | | | | | | | | | | |
| |
| |
|
Build NYC Resource Corp., New York Revenue Bonds, Series 2023 | |
| | | | | 2,000 | | | | | | 2,086 | |
|
Erie County, New York Industrial Development Agency Revenue Bonds, (FNMA Insured), Series 2023 | |
| | | | | 1,200 | | | | | | 1,197 | |
|
Metropolitan Transportation Authority, New York Revenue Bonds, (AGM Insured), Series 2019 | |
| | | | | 2,120 | | | | | | 2,073 | |
|
Monroe County Industrial Development Corp, New York Revenue Bonds, Series 2023 | |
| | | | | 1,250 | | | | | | 1,381 | |
|
Monroe County Industrial Development Corp., New York Revenue Bonds, Series 2020 | |
| | | | | 1,915 | | | | | | 1,888 | |
|
Nassau County, New York Industrial Development Agency Revenue Bonds, Series 2021 | |
0.000% due 01/01/2058 ^(b) | | | | | 785 | | | | | | 188 | |
|
New York City Transitional Finance Authority Future Tax Secured, New York Revenue Bonds, Series 2020 | |
| | | | | 3,000 | | | | | | 3,013 | |
|
New York City, New York Municipal Water Finance Authority Revenue Bonds, Series 2022 | |
| | | | | 2,530 | | | | | | 2,846 | |
|
New York City, New York Municipal Water Finance Authority Revenue Bonds, Series 2023 | |
| | | | | 800 | | | | | | 908 | |
| | | | | | | | | | | | |
| See Accompanying Notes | | | | | | | | | | DECEMBER 31, 2023 | | | |
| | | | | | |
Consolidated Schedule of Investments | | PIMCO Municipal Income Fund III | | | | |
| | | | | | | | | | | | |
| | | | | | | | | | | |
|
New York City, New York Transitional Finance Authority Future Tax Secured Revenue Bonds, Series 2022 | |
| | $ | | | 2,250 | | | $ | | | 2,638 | |
|
New York Liberty Development Corp. Revenue Bonds, Series 2007 | |
| | | | | 1,700 | | | | | | 2,032 | |
|
New York Liberty Development Corp. Revenue Bonds, Series 2021 | |
| | | | | 1,760 | | | | | | 1,344 | |
|
New York Power Authority Revenue Bonds, (AGM Insured), Series 2022 | |
| | | | | 925 | | | | | | 905 | |
|
New York Power Authority Revenue Bonds, Series 2020 | |
| | | | | 1,750 | | | | | | 1,722 | |
|
New York State Dormitory Authority Revenue Bonds, Series 2017 | |
| | | | | 500 | | | | | | 498 | |
|
New York State Dormitory Authority Revenue Bonds, Series 2019 | |
| | | | | 1,000 | | | | | | 1,086 | |
|
New York State Dormitory Authority Revenue Bonds, Series 2020 | |
| | | | | 3,625 | | | | | | 3,615 | |
|
New York State Thruway Authority Revenue Bonds, Series 2019 | |
| | | | | 5,250 | | | | | | 5,334 | |
| | | | | 620 | | | | | | 608 | |
|
New York State Urban Development Corp. Revenue Bonds, Series 2019 | |
| | | | | 1,425 | | | | | | 1,437 | |
|
New York State Urban Development Corp. Revenue Bonds, Series 2021 | |
| | | | | 3,250 | | | | | | 3,267 | |
|
New York State Urban Development Corp. Revenue Bonds, Series 2023 | |
| | | | | 1,300 | | | | | | 1,443 | |
|
New York Transportation Development Corp. Revenue Bonds, (AGM Insured), Series 2023 | |
| | | | | 2,500 | | | | | | 2,624 | |
|
Onondaga County, New York Trust for Cultural Resources Revenue Bonds, Series 2019 | |
| | | | | 1,230 | | | | | | 1,231 | |
|
Port Authority of New York & New Jersey Revenue Bonds, Series 2017 | |
| | | | | 2,120 | | | | | | 2,206 | |
|
Triborough Bridge & Tunnel Authority Sales Tax, New York Revenue Bonds, Series 2022 | |
| | | | | 2,750 | | | | | | 2,669 | |
| | | | | 1,000 | | | | | | 1,117 | |
|
Triborough Bridge & Tunnel Authority, New York Revenue Bonds, Series 2021 | |
| | | | | 2,835 | | | | | | 3,073 | |
|
Utility Debt Securitization Authority, New York Revenue Bonds, Series 2023 | |
| | | | | 700 | | | | | | 791 | |
| | | | | | | | | | | | |
| | | | | | | | | | | 55,220 | |
| | | | | | | | | | | | |
| |
| |
|
Grand Forks County, North Dakota Revenue Bonds, Series 2021 | |
7.000% due 12/15/2043 ^(b) | | | | | 940 | | | | | | 188 | |
| | | | | | | | | | | | |
| |
| |
|
Buckeye Tobacco Settlement Financing Authority, Ohio Revenue Bonds, Series 2020 | |
0.000% due 06/01/2057 (c) | | | | | 39,500 | | | | | | 4,249 | |
|
Canton City School District, Ohio General Obligation Bonds, Series 2023 | |
| | | | | 1,750 | | | | | | 1,958 | |
|
Geisinger Authority, Ohio Revenue Bonds, Series 2017 | |
| | | | | 5,310 | | | | | | 4,998 | |
| | | | | | | | | | | | |
| | | | | | | | | | | |
|
Montgomery County, Ohio Dayton Children’s Hospital Revenue Bonds, Series 2021 | |
| | $ | | | 2,250 | | | $ | | | 2,207 | |
|
Ohio Air Quality Development Authority Dayton Power And Light Company Project Revenue Bonds , Series 2015 | |
| | | | | 2,000 | | | | | | 2,019 | |
|
Ohio Air Quality Development Authority Revenue Bonds, Series 2019 | |
| | | | | 1,250 | | | | | | 1,146 | |
|
Ohio Air Quality Development Authority Revenue Notes, Series 2019 | |
| | | | | 900 | | | | | | 870 | |
|
Southern Ohio Port Authority Revenue Notes, Series 2020 | |
| | | | | 1,400 | | | | | | 1,061 | |
|
Worthington City School District, Ohio General Obligation Bonds, Series 2023 | |
| | | | | 485 | | | | | | 550 | |
| | | | | | | | | | | | |
| | | | | | | | | | | 19,058 | |
| | | | | | | | | | | | |
| |
| |
|
Oklahoma Development Finance Authority Revenue Bonds, Series 2018 | |
| | | | | 1,600 | | | | | | 1,607 | |
|
Oklahoma Development Finance Authority Revenue Bonds, Series 2021 | |
| | | | | 1,000 | | | | | | 798 | |
|
Oklahoma Turnpike Authority Revenue Bonds, Series 2023 | |
| | | | | 2,825 | | | | | | 2,871 | |
| | | | | | | | | | | | |
| | | | | | | | | | | 5,276 | |
| | | | | | | | | | | | |
| |
| |
|
Medford Hospital Facilities Authority, Oregon Revenue Bonds, Series 2020 | |
| | | | | 1,000 | | | | | | 1,013 | |
|
Multnomah County School District 40, Oregon General Obligation Bonds, Series 2023 | |
0.000% due 06/15/2051 (c) | | | | | 1,710 | | | | | | 444 | |
|
Washington & Multnomah Counties School District No 48J Beaverton, Oregon General Obligation Bonds, Series 2022 | |
0.000% due 06/15/2048 (c) | | | | | 2,495 | | | | | | 782 | |
| | | | | 1,000 | | | | | | 1,094 | |
| | | | | | | | | | | | |
| | | | | | | | | | | 3,333 | |
| | | | | | | | | | | | |
| |
| |
|
Commonwealth of Pennsylvania General Obligation Bonds, Series 2023 | |
| | | | | 3,075 | | | | | | 3,155 | |
|
Montgomery County, Pennsylvania Higher Education and Health Authority Revenue Bonds, Series 2022 | |
| | | | | 1,750 | | | | | | 1,772 | |
|
Pennsylvania Economic Development Financing Authority Revenue Bonds, (AGM Insured), Series 2022 | |
| | | | | 3,000 | | | | | | 3,321 | |
|
Pennsylvania Economic Development Financing Authority Revenue Bonds, Series 2021 | |
| | | | | 1,650 | | | | | | 1,821 | |
|
Philadelphia Authority for Industrial Development, Pennsylvania Revenue Bonds, Series 2017 | |
| | | | | 1,000 | | | | | | 912 | |
| | | | | | | | | | | | |
| | | | | | | | | | | 10,981 | |
| | | | | | | | | | | | |
| |
| |
|
Children’s Trust Fund, Puerto Rico Revenue Bonds, Series 2008 | |
0.000% due 05/15/2057 (c) | | | | | 31,000 | | | | | | 2,353 | |
| | | | | | | | | | | | |
| | | | | | | | | | | |
|
Commonwealth of Puerto Rico Bonds, Series 2022 | |
| | $ | | | 4,099 | | | $ | | | 1,950 | |
|
Commonwealth of Puerto Rico General Obligation Bonds, Series 2021 | |
0.000% due 07/01/2033 (c) | | | | | 1,750 | | | | | | 1,093 | |
| | | | | 1,700 | | | | | | 1,565 | |
|
Puerto Rico Sales Tax Financing Corp. Sales Tax Revenue Bonds, Series 2018 | |
0.000% due 07/01/2046 (c) | | | | | 9,650 | | | | | | 3,037 | |
0.000% due 07/01/2051 (c) | | | | | 10,500 | | | | | | 2,465 | |
|
Puerto Rico Sales Tax Financing Corp. Sales Tax Revenue Bonds, Series 2019 | |
| | | | | 4,260 | | | | | | 4,210 | |
| | | | | | | | | | | | |
| | | | | | | | | | | 16,673 | |
| | | | | | | | | | | | |
| |
| |
|
Tobacco Settlement Financing Corp., Rhode Island Revenue Bonds, Series 2015 | |
| | | | | 3,000 | | | | | | 3,013 | |
| | | | | | | | | | | | |
| |
| |
|
South Carolina Public Service Authority Revenue Obligations Revenue Bonds, Series 2013 | |
| | | | | 5,000 | | | | | | 5,000 | |
| | | | | 1,750 | | | | | | 1,751 | |
| | | | | | | | | | | | |
| | | | | | | | | | | 6,751 | |
| | | | | | | | | | | | |
| |
| |
|
Shelby County, Tennessee Health Educational & Housing Facilities Board Revenue Bonds, Series 2019 | |
| | | 750 | | | | | | 558 | |
| | | | | | | | | | |
| |
| |
|
Angelina & Neches River Authority, Texas Revenue Bonds, Series 2021 | |
| | | | | 650 | | | | | | 430 | |
| | | | | 1,100 | | | | | | 953 | |
|
Bexar County Texas Hospital District, General Obligation Bonds, Series 2018 | |
| | | | | 2,500 | | | | | | 2,500 | |
|
Brazoria County, Texas Industrial Development Corp. Revenue Bonds, Series 2023 | |
| | | | | 2,000 | | | | | | 2,015 | |
|
Calhoun County, Texas Navigation Industrial Development Authority Revenue Notes, Series 2021 | |
| | | | | 1,250 | | | | | | 1,161 | |
|
Central Texas Turnpike System Revenue Bonds, Series 2015 | |
0.000% due 08/15/2036 (c) | | | | | 1,250 | | | | | | 726 | |
0.000% due 08/15/2037 (c) | | | | | 4,000 | | | | | | 2,220 | |
|
Clifton Higher Education Finance Corp., Texas Revenue Bonds, Series 2018 | |
| | | | | 1,000 | | | | | | 1,012 | |
|
Coppell Independent School District, Texas General Obligation Bonds, (PSF Insured), Series 2023 | |
| | | | | 925 | | | | | | 941 | |
|
Corpus Christi Independent School District, Texas General Obligation Bonds, (PSF Insured), Series 2023 | |
| | | | | 1,260 | | | | | | 1,273 | |
|
Dallas Area Rapid Transit, Texas Revenue Bonds, Series 2021 | |
| | | | | 2,500 | | | | | | 2,465 | |
|
Dallas Fort Worth International Airport, Texas Revenue Bonds, Series 2022 | |
| | | | | 1,000 | | | | | | 1,150 | |
|
Edgewood Independent School District/Van Zandt County, Texas General Obligation Bonds, (PSF Insured), Series 2023 | |
| | | | | 1,290 | | | | | | 1,301 | |
|
EP Tuscany Zaragosa PFC, Texas Revenue Notes, Series 2023 | |
| | | | | 4,000 | | | | | | 3,977 | |
| | | | | | | | | | | | |
| | | | | | | | | | | |
|
Fort Bend County Texas Public Facility Corp. Revenue Bonds, Series 2023 | |
| | $ | | | 3,375 | | | $ | | | 3,695 | |
|
Garland Independent School District, Texas General Obligation Bonds, (PSF Insured), Series 2023 | |
| | | | | 3,100 | | | | | | 3,456 | |
|
Grand Parkway Transportation Corp., Texas Revenue Bonds, (AGM/CR Insured), Series 2020 | |
| | | | | 1,045 | | | | | | 1,043 | |
|
Hays Consolidated Independent School District, Texas General Obligation Bonds, (PSF Insured), Series 2023 | |
| | | | | 1,250 | | | | | | 1,373 | |
|
Houston, Texas Combined Utility System Revenue Bonds, Series 2020 | |
| | | | | 1,000 | | | | | | 995 | |
|
Lamar Consolidated Independent School District, Texas General Obligation Bonds, (PSF Insured), Series 2023 | |
| | | | | 1,250 | | | | | | 1,263 | |
|
Lamar Consolidated Independent School District, Texas General Obligation Bonds, (PSF Insured), Series 2023 | |
| | | | | 4,900 | | | | | | 5,422 | |
|
Lamar Consolidated Independent School District, Texas General Obligation Bonds, Series 2023 | |
| | | | | 2,500 | | | | | | 2,491 | |
|
Lower Colorado River Authority, Texas Revenue Bonds, Series 2020 | |
| | | | | 1,750 | | | | | | 1,864 | |
|
Medina Valley Independent School District, Texas General Obligation Bonds, (PSF Insured), Series 2023 | |
| | | | | 1,000 | | | | | | 1,047 | |
|
New Hope Cultural Education Facilities Finance Corp., Texas Revenue Bonds, Series 2021 | |
| | | | | 1,400 | | | | | | 1,075 | |
|
North Texas Tollway Authority Revenue Bonds, Series 2017 | |
| | | | | 1,500 | | | | | | 1,504 | |
| | | | | 1,250 | | | | | | 1,285 | |
|
San Antonio Municipal Facilities Corp., Texas Revenue Bonds, Series 2021 | |
| | | | | 3,000 | | | | | | 2,977 | |
|
Southwest Independent School District, Texas General Obligation Bonds, (PSF Insured), Series 2023 | |
| | | | | 900 | | | | | | 997 | |
|
Tarrant County, Texas Cultural Education Facilities Finance Corp. Revenue Bonds, Series 2017 | |
| | | | | 500 | | | | | | 506 | |
|
Tarrant County, Texas Cultural Education Facilities Finance Corp. Revenue Bonds, Series 2022 | |
| | | | | 1,480 | | | | | | 1,579 | |
|
Tarrant County, Texas Hospital District General Obligation Bonds, Series 2023 | |
| | | | | 2,900 | | | | | | 3,231 | |
|
Texas Municipal Gas Acquisition & Supply Corp. Revenue Bonds, Series 2006 | |
| | | | | 150 | | | | | | 156 | |
|
Texas Municipal Gas Acquisition & Supply Corp. Revenue Bonds, Series 2008 | |
| | | | | 4,140 | | | | | | 4,333 | |
| | | | | | | | | | | | |
| | | | | | | | | | | |
|
Texas Water Development Board Revenue Bonds, Series 2022 | |
| | $ | | | 800 | | | $ | | | 860 | |
| | | | | 2,560 | | | | | | 2,813 | |
|
Texas Water Development Board Revenue Bonds, Series 2023 | |
| | | | | 1,700 | | | | | | 1,862 | |
| | | | | 1,100 | | | | | | 1,218 | |
|
University of North Texas System Revenue Bonds, Series 2018 | |
| | | | | 2,200 | | | | | | 2,133 | |
|
West Harris County, Texas Regional Water Authority Revenue Bonds, (BAM Insured), Series 2021 | |
| | | | | 2,700 | | | | | | 2,587 | |
| | | | | | | | | | | | |
| | | | | | | | | | | 73,889 | |
| | | | | | | | | | | | |
| |
| |
|
Military Installation Development Authority, Utah Revenue Bonds, Series 2021 | |
| | | | | 1,000 | | | | | | 862 | |
|
Ogden City Redevelopment Agency, Utah Revenue Bonds, Series 2023 | |
| | | | | 700 | | | | | | 762 | |
| | | | | | | | | | | | |
| | | | | | | | | | | 1,624 | |
| | | | | | | | | | | | |
| |
| |
|
Virginia Small Business Financing Authority Revenue Bonds, Series 2019 | |
0.000% due 07/01/2061 (c) | | | | | 25,000 | | | | | | 781 | |
| | | | | 1,465 | | | | | | 1,369 | |
| | | | | | | | | | | | |
| | | | | | | | | | | 2,150 | |
| | | | | | | | | | | | |
| |
| |
|
Seattle, Washington Municipal Light & Power Revenue Bonds, Series 2018 | |
| | | | | 4,000 | | | | | | 4,028 | |
|
Washington State Convention Center Public Facilities District Revenue Bonds, Series 2018 | |
| | | | | 1,345 | | | | | | 1,236 | |
|
Washington State Housing Finance Commission Revenue Bonds, Series 2018 | |
| | | | | 825 | | | | | | 672 | |
| | | | | | | | | | | | |
| | | | | | | | | | | 5,936 | |
| | | | | | | | | | | | |
| |
| |
|
Monongalia County, West Virginia Commission Special District Revenue Bonds, Series 2017 | |
| | | | | 1,000 | | | | | | 1,030 | |
| | | | | | | | | | | | |
| |
| |
|
Public Finance Authority, Wisconsin Revenue Bonds, Series 2017 | |
| | | | | 2,500 | | | | | | 2,734 | |
| | | | | | | | | | | | |
| | | | | | | | | | | |
|
Public Finance Authority, Wisconsin Revenue Bonds, Series 2018 | |
| | $ | | | 2,500 | | | $ | | | 1,125 | |
|
Public Finance Authority, Wisconsin Revenue Bonds, Series 2020 | |
0.000% due 01/01/2060 (c) | | | | | 7,500 | | | | | | 399 | |
|
Public Finance Authority, Wisconsin Revenue Bonds, Series 2021 | |
| | | | | 1,260 | | | | | | 1,071 | |
| | | | | 885 | | | | | | 687 | |
|
Public Finance Authority, Wisconsin Revenue Bonds, Series 2022 | |
| | | | | 2,000 | | | | | | 2,129 | |
|
Wisconsin Center District Revenue Bonds, (AGM Insured), Series 2020 | |
0.000% due 12/15/2045 (c) | | | | | 6,500 | | | | | | 2,523 | |
|
Wisconsin Health & Educational Facilities Authority Revenue Bonds, Series 2016 | |
| | | | | 415 | | | | | | 425 | |
|
Wisconsin Health & Educational Facilities Authority Revenue Bonds, Series 2022 | |
| | | | | 2,070 | | | | | | 1,981 | |
| | | | | | | | | | | | |
| | | | | | | | | | | 13,074 | |
| | | | | | | | | | | | |
Total Municipal Bonds & Notes
(Cost $455,983) | | | | |
| | | | |
| |
NON-AGENCY MORTGAGE-BACKED SECURITIES 0.3% | |
|
| |
| | | | | 995 | | | | | | 900 | |
| | | | | | | | | | | | |
Total Non-Agency Mortgage-Backed Securities (Cost $934) | | | | |
| | | | |
| |
SHORT-TERM INSTRUMENTS 0.1% | |
| |
REPURCHASE AGREEMENTS (f) 0.1% | |
| | | | | | | | | | | 411 | |
| | | | | | | | | | | | |
Total Short-Term Instruments
(Cost $411) | | | | | | | |
| | | | | | | | | | | | |
| | | | |
| | | | | | | | | | | | |
Total Investments in Securities (Cost $460,528) | | | | | | | |
| | | | |
| | | | | | | | | | | | |
Total Investments 169.5%
(Cost $460,528) | | | $ | | | | |
| |
Auction Rate Preferred Shares (46.6)% | | | | | | | |
| |
Remarketable Variable Rate MuniFund Term Preferred Shares, at liquidation value (20.9)% | | | | | | | |
| |
Other Assets and Liabilities, net (2.0)% | | | | |
| | | | | | | | | | | | |
Net Assets Applicable to Common Shareholders 100.0% | | | $ | | | | |
| | | | | | | | | | | | |
NOTES TO CONSOLIDATED SCHEDULE OF INVESTMENTS:
| A zero balance may reflect actual amounts rounding to less than one thousand. |
| Security valued using significant unobservable inputs (Level 3). |
| All or a portion of this amount represents unfunded loan commitments. The interest rate for the unfunded portion will be determined at the time of funding. See Note 4, Securities and Other Investments, in the Notes to Financial Statements for more information regarding unfunded loan commitments. |
| Security is not accruing income as of the date of this report. |
| Security becomes interest bearing at a future date. |
| | | | | | | | | | | | |
| See Accompanying Notes | | | | | | | | | | DECEMBER 31, 2023 | | | |
| | | | | | |
Consolidated Schedule of Investments | | PIMCO Municipal Income Fund III | | | | |
(e) RESTRICTED SECURITIES:
| | | | | | | | | | | | | | | | | | | | | | | | |
| | | | | | | | | | | | | | | | | Market Value
as Percentage
of Net Assets
Applicable to
Common
Shareholders | |
Federal Home Loan Mortgage Corp. Enhanced Receipt, New Jersey Revenue Bonds, Series 2019 | | | 3.870% | | | | 11/15/2035 | | | | 10/26/2020 | | | $ | 84 | | | $ | 70 | | | | 0.03% | |
| | | | | | | | | | | | | | | | | | | | | | | | |
BORROWINGS AND OTHER FINANCING TRANSACTIONS
(f) REPURCHASE AGREEMENTS:
| | | | | | | | | | | | | | | | | | | | | | | | | | | | | | |
| | | | | | | | | | | | | | | | | | | Repurchase
Agreements,
at Value | | | Repurchase Agreement Proceeds to be Received (1) | |
| FICC | | | 2.600 | % | | | 12/29/2023 | | | | 01/02/2024 | | | $ | 411 | | | U.S. Treasury Notes 4.875% due 11/30/2025 | | $ | (419 | ) | | $ | 411 | | | $ | 411 | |
| | | | | | | | | | | | | | | | | | | | | | | | | | | | | | |
Total Repurchase Agreements | | | | | | | | | | | | | | | |
| | | | | | | | | | | | | | | |
BORROWINGS AND OTHER FINANCING TRANSACTIONS SUMMARY
The following is a summary by counterparty of the market value of Borrowings and Other Financing Transactions and collateral pledged/(received) as of December 31, 2023:
| | | | | | | | | | | | | | | | | | | | | | | | |
| | Repurchase Agreement Proceeds to be Received (1) | | | Payable for
Reverse
Repurchase
Agreements | | | Payable for Sale-Buyback Transactions | | | Total
Borrowings and
Other Financing
Transactions | | | Collateral
Pledged/(Received) | | | | |
Global/Master Repurchase Agreement | |
| | $ | 411 | | | $ | 0 | | | $ | 0 | | | $ | 411 | | | $ | (419 | ) | | $ | (8 | ) |
| | | | | | | | | | | | | | | | | | | | | | | | |
Total Borrowings and Other Financing Transactions | | | | | | | | | | | | | | | | | | | | | | | | |
| | | | | | | | | | | | | | | | | | | | | | | | |
| Includes accrued interest. |
| Net Exposure represents the net receivable/(payable) that would be due from/to the counterparty in the event of default. Exposure from borrowings and other financing transactions can only be netted across transactions governed under the same master agreement with the same legal entity. See Note 7, Master Netting Arrangements, in the Notes to Financial Statements for more information. |
The following is a summary of the fair valuations according to the inputs used as of December 31, 2023 in valuing the Fund’s assets and liabilities:
| | | | | | | | | | | | | | | | |
| | | | | | | | | | | | |
Investments in Securities, at Value | |
Loan Participations and Assignments | | $ | 0 | | | $ | 0 | | | $ | 3,340 | | | $ | 3,340 | |
| |
| | | 0 | | | | 18,831 | | | | 0 | | | | 18,831 | |
| | | 0 | | | | 1,247 | | | | 0 | | | | 1,247 | |
| | | 0 | | | | 24,817 | | | | 0 | | | | 24,817 | |
| | | 0 | | | | 763 | | | | 0 | | | | 763 | |
| | | 0 | | | | 11,957 | | | | 0 | | | | 11,957 | |
| | | 0 | | | | 10,661 | | | | 0 | | | | 10,661 | |
| | | 0 | | | | 3,700 | | | | 0 | | | | 3,700 | |
| | | 0 | | | | 12,441 | | | | 0 | | | | 12,441 | |
| | | 0 | | | | 2,143 | | | | 0 | | | | 2,143 | |
| | | 0 | | | | 18,448 | | | | 0 | | | | 18,448 | |
| | | 0 | | | | 13,891 | | | | 0 | | | | 13,891 | |
| | | 0 | | | | 41,994 | | | | 0 | | | | 41,994 | |
| | | 0 | | | | 7,281 | | | | 0 | | | | 7,281 | |
| | | 0 | | | | 8,362 | | | | 0 | | | | 8,362 | |
| | | 0 | | | | 10,218 | | | | 0 | | | | 10,218 | |
| | | 0 | | | | 1,984 | | | | 0 | | | | 1,984 | |
| | | 0 | | | | 473 | | | | 0 | | | | 473 | |
| | | 0 | | | | 5,268 | | | | 0 | | | | 5,268 | |
| | | 0 | | | | 14,961 | | | | 0 | | | | 14,961 | |
| | | 0 | | | | 1,733 | | | | 0 | | | | 1,733 | |
| | | 0 | | | | 5,989 | | | | 0 | | | | 5,989 | |
| | | 0 | | | | 1,259 | | | | 0 | | | | 1,259 | |
| | | | | | | | | | | | | | | | |
| | | | | | | | | | | | |
| | $ | 0 | | | $ | 3,111 | | | $ | 0 | | | $ | 3,111 | |
| | | 0 | | | | 2,667 | | | | 0 | | | | 2,667 | |
| | | 0 | | | | 22,949 | | | | 0 | | | | 22,949 | |
| | | 0 | | | | 55,220 | | | | 0 | | | | 55,220 | |
| | | 0 | | | | 188 | | | | 0 | | | | 188 | |
| | | 0 | | | | 19,058 | | | | 0 | | | | 19,058 | |
| | | 0 | | | | 5,276 | | | | 0 | | | | 5,276 | |
| | | 0 | | | | 3,333 | | | | 0 | | | | 3,333 | |
| | | 0 | | | | 10,981 | | | | 0 | | | | 10,981 | |
| | | 0 | | | | 16,673 | | | | 0 | | | | 16,673 | |
| | | 0 | | | | 3,013 | | | | 0 | | | | 3,013 | |
| | | 0 | | | | 6,751 | | | | 0 | | | | 6,751 | |
| | | 0 | | | | 558 | | | | 0 | | | | 558 | |
| | | 0 | | | | 73,889 | | | | 0 | | | | 73,889 | |
| | | 0 | | | | 1,624 | | | | 0 | | | | 1,624 | |
| | | 0 | | | | 2,150 | | | | 0 | | | | 2,150 | |
| | | 0 | | | | 5,936 | | | | 0 | | | | 5,936 | |
| | | 0 | | | | 1,030 | | | | 0 | | | | 1,030 | |
| | | 0 | | | | 13,074 | | | | 0 | | | | 13,074 | |
Non-Agency Mortgage-Backed Securities | | | 0 | | | | 900 | | | | 0 | | | | 900 | |
| |
| | | 0 | | | | 411 | | | | 0 | | | | 411 | |
| | | | | | | | | | | | | | | | |
| | | | |
| | $ | 0 | | | $ | 467,213 | | | $ | 3,340 | | | $ | 470,553 | |
| | | | | | | | | | | | | | | | |
The following is a reconciliation of the fair valuations using significant unobservable inputs (Level 3) for the Fund during the period ended December 31, 2023:
| | | | | | | | | | | | | | | | | | | | | | | | | | | | | | | | | | | | | | | | |
| | Beginning
Balance
at 12/31/2022 | | | | | | | | | Accrued
Discounts/
(Premiums) | | | | | | Net Change in Unrealized Appreciation/ (Depreciation) (1) | | | | | | | | | Ending
Balance
at 12/31/2023 | | | Net Change in Unrealized Appreciation/ (Depreciation) on Investments Held at 12/31/2023 (1) | |
Investments in Securities, at Value | |
Loan Participations and Assignments | | $ | 0 | | | $ | 3,200 | | | $ | 0 | | | $ | 0 | | | $ | 0 | | | $ | 140 | | | $ | 0 | | | $ | 0 | | | $ | 3,340 | | | $ | 140 | |
| | | | | | | | | | | | | | | | | | | | | | | | | | | | | | | | | | | | | | | | |
| | | | | | | | | | |
| | $ | 0 | | | $ | 3,200 | | | $ | 0 | | | $ | 0 | | | $ | 0 | | | $ | 140 | | | $ | 0 | | | $ | 0 | | | $ | 3,340 | | | $ | 140 | |
| | | | | | | | | | | | | | | | | | | | | | | | | | | | | | | | | | | | | | | | |
The following is a summary of significant unobservable inputs used in the fair valuations of assets and liabilities categorized within Level 3 of the fair value hierarchy:
| | | | | | | | | | | | | | | | |
| | Ending
Balance
at 12/31/2023 | | | | | | | (% Unless Noted Otherwise) | |
| | | | | | |
Investments in Securities, at Value | |
Loan Participations and Assignments | | $ | 3,340 | | | Proxy Pricing | | Base Price | | | | | | | 100.109 | |
| | | | | | | | | | | | | | | | |
| | $ | 3,340 | | | | | | | | | | | | | |
| | | | | | | | | | | | | | | | |
| Any difference between Net Change in Unrealized Appreciation/(Depreciation) and Net Change in Unrealized Appreciation/(Depreciation) on Investments Held at December 31, 2023 may be due to an investment no longer held or categorized as Level 3 at period end. |
| | | | | | | | | | | | |
| See Accompanying Notes | | | | | | | | | | DECEMBER 31, 2023 | | | |
| | | | |
Notes to Financial Statements | | | | |
1. ORGANIZATION
PIMCO California Municipal Income Fund, PIMCO California Municipal Income Fund II, PIMCO California Municipal Income Fund III, PIMCO New York Municipal Income Fund, PIMCO New York Municipal Income Fund II, PIMCO New York Municipal Income Fund III, PIMCO Municipal Income Fund, PIMCO Municipal Income Fund II and PIMCO Municipal Income Fund III (each a “Fund” and collectively, the “Funds”) are organized as
closed-end
management investment companies registered under the Investment Company Act of 1940, as amended, and the rules and regulations thereunder (the “Act”). Each Fund was organized as a Massachusetts business trust on the dates shown in the table below. Pacific Investment Management Company LLC (“PIMCO” or the “Manager”) serves as the Funds’ investment manager.
| | | | | | | | |
| | | | | | |
| | |
| PIMCO California Municipal Income Fund | | | | | | | May 10, 2001 | |
| | |
| PIMCO California Municipal Income Fund II | | | | | | | March 29, 2002 | |
| | |
| PIMCO California Municipal Income Fund III | | | | | | | August 20, 2002 | |
| | |
| PIMCO New York Municipal Income Fund | | | | | | | May 10, 2001 | |
| | |
| PIMCO New York Municipal Income Fund II | | | | | | | March 29, 2002 | |
| | |
| PIMCO New York Municipal Income Fund III | | | | | | | August 20, 2002 | |
| | |
| PIMCO Municipal Income Fund | | | | | | | May 9, 2001 | |
| | |
| PIMCO Municipal Income Fund II | | | | | | | March 29, 2002 | |
| | |
| PIMCO Municipal Income Fund III | | | | | | | August 20, 2002 | |
PIMCO Municipal Income Fund, PIMCO Municipal Income Fund II and PIMCO Municipal Income Fund III have established wholly-owned subsidiaries in Delaware. See Note 14, Basis for Consolidation in the Notes to Financial Statements for more information regarding the treatment of each Fund’s subsidiaries in the financial statements.
Hereinafter, the Board of Trustees of the Funds shall be collectively referred to as the “Board.”
2. SIGNIFICANT ACCOUNTING POLICIES
The following is a summary of significant accounting policies consistently followed by each Fund in the preparation of its financial statements in conformity with accounting principles generally accepted in the United States of America (“U.S. GAAP”). Each Fund is treated as an investment company under the reporting requirements of U.S. GAAP. The functional and reporting currency for the Funds is the U.S. dollar. The preparation of financial statements in accordance with U.S. GAAP requires management to make estimates and assumptions that affect the reported amounts of assets and liabilities and disclosure of contingent assets and liabilities at the date of the financial statements and the reported amounts of increases and decreases in net assets from operations during the reporting period. Actual results could differ from those estimates.
(a) Securities Transactions and Investment Income
Securities transactions are recorded as of the trade date for financial reporting
purposes. Securities purchased or sold on a when-issued or delayed-delivery basis may be settled beyond a standard settlement period for the security after the trade date. Realized gains (losses) from securities sold are recorded on the identified cost basis. Dividend income is recorded on the
ex-dividend
date, except certain dividends from foreign securities where the
ex-dividend
date may have passed, which are recorded as soon as a Fund is informed of the
ex-dividend
date. Interest income, adjusted for the accretion of discounts and amortization of premiums, is recorded on the accrual basis from settlement date, with the exception of securities with a forward starting effective date, where interest income is recorded on the accrual basis from effective date. For convertible securities, premiums attributable to the conversion feature are not amortized. Estimated tax liabilities on certain foreign securities are recorded on an accrual basis and are reflected as components of interest income or net change in unrealized appreciation (depreciation) on investments on the Statements of Operations, as appropriate. Tax liabilities realized as a result of such security sales are reflected as a component of net realized gain (loss) on investments on the Statements of Operations. Paydown gains (losses) on mortgage-related and other asset-backed securities, if any, are recorded as components of interest income on the Statements of Operations. Income or short-term capital gain distributions received from registered investment companies, if any, are recorded as dividend income. Long-term capital gain distributions received from registered investment companies, if any, are recorded as realized gains.
Debt obligations may be placed on
non-accrual
status and related interest income may be reduced by ceasing current accruals and writing off interest receivable when the collection of all or a portion of interest has become doubtful based on consistently applied procedures. A debt obligation is removed from
non-accrual
status when the issuer resumes interest payments or when collectability of interest is probable. A debt obligation may be granted, in certain situations, a contractual or
non-contractual
forbearance for interest payments that are expected to be paid after agreed upon pay dates.
(b) Distributions — Common Shares
The following table shows the anticipated frequency of distributions from net investment income to common shareholders.
| | | | | | | | | | | | |
| | | | | | | |
| | | |
| | | | | | | | | |
| | | |
| PIMCO California Municipal Income Fund | | | | | | | Monthly | | | | Monthly | |
| | | |
| PIMCO California Municipal Income Fund II | | | | | | | Monthly | | | | Monthly | |
| | | |
| PIMCO California Municipal Income Fund III | | | | | | | Monthly | | | | Monthly | |
| | | |
| PIMCO New York Municipal Income Fund | | | | | | | Monthly | | | | Monthly | |
| | | |
| PIMCO New York Municipal Income Fund II | | | | | | | Monthly | | | | Monthly | |
| | | |
| PIMCO New York Municipal Income Fund III | | | | | | | Monthly | | | | Monthly | |
| | | |
| PIMCO Municipal Income Fund | | | | | | | Monthly | | | | Monthly | |
| | | |
| PIMCO Municipal Income Fund II | | | | | | | Monthly | | | | Monthly | |
| | | |
| PIMCO Municipal Income Fund III | | | | | | | Monthly | | | | Monthly | |
Each Fund intends to distribute at least annually to its shareholders all or substantially all of its net
tax-exempt
interest and any investment company taxable income, and may distribute its net capital gain. A Fund may revise its distribution policy or postpone the payment of distributions at any time.
Income distributions and capital gain distributions are determined in accordance with income tax regulations which may differ from U.S. GAAP. Differences between tax regulations and U.S. GAAP may cause timing differences between income and capital gain recognition. Further, the character of investment income and capital gains may be different for certain transactions under the two methods of accounting. As a result, income distributions and capital gain distributions declared during a fiscal period may differ significantly from the net investment income (loss) and realized gains (losses) reported on each Fund’s annual financial statements presented under U.S. GAAP.
Separately, if a Fund determines or estimates, as applicable, that a portion of a distribution may be comprised of amounts from sources other than net investment income in accordance with its policies, accounting records (if applicable), and accounting practices, the Fund will notify shareholders of the estimated composition of such distribution through a Section 19 Notice. For these purposes, a Fund determines or estimates, as applicable, the source or sources from which a distribution is paid, to the close of the period as of which it is paid, in reference to its internal accounting records and related accounting practices. If, based on such accounting records and practices, it is determined or estimated, as applicable, that a particular distribution does not include capital gains or
paid-in
surplus or other capital sources, a Section 19 Notice generally would not be issued. It is important to note that differences exist between a Fund’s daily internal accounting records and practices, a Fund’s financial statements presented in accordance with U.S. GAAP, and recordkeeping practices under income tax regulations. For instance, a Fund’s internal accounting records and practices may take into account, among other factors,
tax-related
characteristics of certain sources of distributions that differ from treatment under U.S. GAAP. Examples of such differences may include but are not limited to, for certain Funds, the treatment of periodic payments under interest rate swap contracts. Accordingly, among other consequences, it is possible that a Fund may not issue a Section 19 Notice in situations where a Fund’s financial statements prepared later and in accordance with U.S. GAAP and/or the final tax character of those distributions might later report that the sources of those distributions included capital gains and/or a return of capital. Please visit www.pimco.com for the most recent Section 19 Notice, if applicable, for additional information regarding the estimated composition of distributions. Final determination of a distribution’s tax character will be provided to shareholders when such information is available.
Distributions classified as a tax basis return of capital at a Fund’s fiscal year end, if any, are reflected on the Statements of Changes in Net Assets and have been recorded to paid in capital on the Statements of Assets and Liabilities. In addition, other amounts have been reclassified between distributable earnings (accumulated loss) and paid in capital on the Statements of Assets and Liabilities to more appropriately conform U.S. GAAP to tax characterizations of distributions.
(c) New Accounting Pronouncements and Regulatory Updates
In March 2020, the Financial Accounting Standards Board (“FASB”) issued an Accounting Standards Update (“ASU”), ASU
2020-04,
Reference Rate Reform (Topic 848), which provides optional guidance to ease the potential accounting burden associated with transitioning away from the London Interbank Offered Rate and other reference rates that are expected to be discontinued. ASU
2020-04
is effective for certain reference rate-related contract modifications that occur or will occur during the period March 12, 2020 through December 31, 2024. In January 2021 and December 2022, FASB issued ASU 2021-01 and ASU
2022-06,
which include additional amendments to Topic 848. Management is continuously evaluating the potential effect a discontinuation of LIBOR could have on the Funds’ investments and has determined that it is unlikely the ASU’s adoption will have a material impact on the Funds’ financial statements.
In June 2022, the FASB issued ASU
2022-03,
Fair Value Measurement (Topic 820), which affects all entities that have investments in equity securities measured at fair value that are subject to a contractual sale restriction. The amendments in ASU
2022-03
clarify that a contractual restriction on the sale of an equity security is not considered part of the unit of account of the equity security and, therefore, is not considered in measuring the fair value. The amendments also require additional disclosures for equity securities subject to contractual sale restrictions that are measured at fair value in accordance with Topic 820. The effective date for the amendments in ASU
2022-03
is for fiscal years beginning after December 15, 2023 and interim periods within those fiscal years. At this time, management is evaluating the implications of these changes on the financial statements.
The U.S. Securities and Exchange Commission (“SEC”) made a final ruling on February 15, 2023 to adopt proposed amendments to the Settlement Cycle Rule (Rule
15c6-1)
and other related rules under the Securities Exchange Act of 1934, as amended, to shorten the standard settlement cycle for most broker-dealer transactions from two business days after the trade date (T+2) to one business day after the trade date (T+1). The effective date was May 5, 2023, and the compliance date for the amendments is May 28, 2024. At this time, management is evaluating the implications of these changes on the financial statements.
In September 2023, the SEC adopted amendments to a current rule governing fund naming conventions. In general, the current rule
| | | | |
Notes to Financial Statements | | | | |
requires funds with certain types of names to adopt a policy to invest at least 80% of their assets in the type of investment suggested by the name. The amendments expand the scope of the current rule in a number of ways that are expected to result in an increase in the types of fund names that would require the fund to adopt an 80% investment policy under the rule. Additionally, the amendments address deviations from a fund’s 80% investment policy and the use and valuation of derivatives instruments for purposes of the rule. The amendments are effective as of December 11, 2023, but the SEC is providing a
24-month
compliance period following the effective date for fund groups with net assets of $1 billion or more (and a
30-month
compliance period for fund groups with net assets of less than $1 billion). At this time, management is evaluating the implications of these changes on the financial statements.
3. INVESTMENT VALUATION AND FAIR VALUE MEASUREMENTS
(a) Investment Valuation Policies
The NAV of a Fund’s shares, or each of their respective share classes as applicable, is determined by dividing the total value of portfolio investments and other assets attributable to the Funds or class, less any liabilities, as applicable, by the total number of shares outstanding.
On each day that the New York Stock Exchange (“NYSE”) is open, the Funds’ shares are ordinarily valued as of the close of regular trading (normally 4:00 p.m., Eastern time) (“NYSE Close”). Information that becomes known to the Funds or their agents after the time as of which NAV has been calculated on a particular day will not generally be used to retroactively adjust the price of a security or the NAV determined earlier that day. If regular trading on the NYSE closes earlier than scheduled, each Fund may calculate its NAV as of the earlier closing time or calculate its NAV as of the NYSE Close for that day. Each Fund generally does not calculate its NAV on days on which the NYSE is not open for business. If the NYSE is closed on a day it would normally be open for business, each Fund may calculate its NAV as of the NYSE Close for such day or such other time that a Fund may determine.
For purposes of calculating NAV, portfolio securities and other assets for which market quotations are readily available are valued at market value. A market quotation is readily available only when that quotation is a quoted price (unadjusted) in active markets for identical investments that a Fund can access at the measurement date, provided that a quotation will not be readily available if it is not reliable. Market value is generally determined on the basis of official closing prices or the last reported sales prices. The Funds will normally use pricing data for domestic equity securities received shortly after the NYSE Close and do not normally take into account trading, clearances or settlements
that take place after the NYSE Close. A foreign
(non-U.S.)
equity security traded on a foreign exchange or on more than one exchange is typically valued using pricing information from the exchange considered by PIMCO to be the primary exchange. If market value pricing is used, a foreign
(non-U.S.)
equity security will be valued as of the close of trading on the foreign exchange, or the NYSE Close, if the NYSE Close occurs before the end of trading on the foreign exchange.
Investments for which market quotations are not readily available are valued at fair value as determined in good faith pursuant to Rule
2a-5
under the Act. As a general principle, the fair value of a security or other asset is the price that would be received to sell an asset or paid to transfer a liability in an orderly transaction between market participants at the measurement date. Pursuant to Rule
2a-5,
the Board has designated PIMCO as the valuation designee (“Valuation Designee”) for each Fund to perform the fair value determination relating to all Fund investments. PIMCO may carry out its designated responsibilities as Valuation Designee through various teams and committees. The Valuation Designee’s policies and procedures govern the Valuation Designee’s selection and application of methodologies for determining and calculating the fair value of Fund investments. The Valuation Designee may value Fund portfolio securities for which market quotations are not readily available and other Fund assets utilizing inputs from pricing services, quotation reporting systems, valuation agents and other third-party sources (together, “Pricing Sources”).
Domestic and foreign
(non-U.S.)
fixed income securities,
non-exchange
traded derivatives, and equity options are normally valued on the basis of quotes obtained from brokers and dealers or Pricing Sources using data reflecting the earlier closing of the principal markets for those securities. Prices obtained from Pricing Sources may be based on, among other things, information provided by market makers or estimates of market values obtained from yield data relating to investments or securities with similar characteristics. Certain fixed income securities purchased on a delayed-delivery basis are marked to market daily until settlement at the forward settlement date. Exchange traded options, except equity options, futures and options on futures are valued at the settlement price determined by the relevant exchange. Swap agreements are valued on the basis of bid quotes obtained from brokers and dealers or market-based prices supplied by Pricing Sources. With respect to any portion of a Fund’s assets that are invested in one or more
open-end
management investment companies (other than ETFs), the Fund’s NAV will be calculated based on the NAVs of such investments.
If a foreign
(non-U.S.)
equity security’s value has materially changed after the close of the security’s primary exchange or principal market but before the NYSE Close, the security may be valued at fair value.
Foreign
(non-U.S.)
equity securities that do not trade when the NYSE is open are also valued at fair value. With respect to foreign
(non-U.S.)
equity securities, a Fund may determine the fair value of investments based on information provided by Pricing Sources, which may recommend fair value or adjustments with reference to other securities, indexes or assets. In considering whether fair valuation is required and in determining fair values, the Valuation Designee may, among other things, consider significant events (which may be considered to include changes in the value of U.S. securities or securities indexes) that occur after the close of the relevant market and before the NYSE Close. A Fund may utilize modeling tools provided by third-party vendors to determine fair values of foreign
(non-U.S.)
securities. For these purposes, unless otherwise determined by the Valuation Designee, any movement in the applicable reference index or instrument (“zero trigger”) between the earlier close of the applicable foreign market and the NYSE Close may be deemed to be a significant event, prompting the application of the pricing model (effectively resulting in daily fair valuations). Foreign exchanges may permit trading in foreign
(non-U.S.)
equity securities on days when a Fund is not open for business, which may result in a Fund’s portfolio investments being affected when shareholders are unable to buy or sell shares.
Whole loans may be fair valued using inputs that take into account borrower- or loan-level data (e.g., credit risk of the borrower) that is updated periodically throughout the life of each individual loan; any new borrower- or loan-level data received in written reports periodically by the Fund normally will be taken into account in calculating the NAV. The Fund’s whole loan investments, including those originated by the Fund, generally are fair valued in accordance with procedures approved by the Board.
Investments valued in currencies other than the U.S. dollar are converted to the U.S. dollar using exchange rates obtained from Pricing Sources. As a result, the value of such investments and, in turn, the NAV of a Fund’s shares may be affected by changes in the value of currencies in relation to the U.S. dollar. The value of investments traded in markets outside the United States or denominated in currencies other than the U.S. dollar may be affected significantly on a day that a Fund is not open for business. As a result, to the extent that a Fund holds foreign
(non-U.S.)
investments, the value of those investments may change at times when shareholders are unable to buy or sell shares and the value of such investments will be reflected in a Fund’s next calculated NAV.
Fair valuation may require subjective determinations about the value of a security. While the Funds’ and Valuation Designee’s policies and procedures are intended to result in a calculation of a Fund’s NAV that fairly reflects security values as of the time of pricing, a Fund cannot ensure that fair values accurately reflect the price that a Fund could
obtain for a security if it were to dispose of that security as of the time of pricing (for instance, in a forced or distressed sale). The prices used by a Fund may differ from the value that would be realized if the securities were sold.
(b) Fair Value Hierarchy
U.S. GAAP describes fair value as the price that a Fund would receive to sell an asset or pay to transfer a liability in an orderly transaction between market participants at the measurement date. It establishes a fair value hierarchy that prioritizes inputs to valuation methods and requires disclosure of the fair value hierarchy, separately for each major category of assets and liabilities, that segregates fair value measurements into levels (Level 1, 2 or 3). The inputs or methodology used for valuing securities are not necessarily an indication of the risks associated with investing in those securities. Levels 1, 2 and 3 of the fair value hierarchy are defined as follows:
| | Level 1 — Quoted prices (unadjusted) in active markets or exchanges for identical assets and liabilities. |
| | Level 2 — Significant other observable inputs, which may include, but are not limited to, quoted prices for similar assets or liabilities in markets that are active, quoted prices for identical or similar assets or liabilities in markets that are not active, inputs other than quoted prices that are observable for the assets or liabilities (such as interest rates, yield curves, volatilities, prepayment speeds, loss severities, credit risks and default rates) or other market corroborated inputs. |
| | Level 3 — Significant unobservable inputs based on the best information available in the circumstances, to the extent observable inputs are not available, which may include assumptions made by the Valuation Designee that are used in determining the fair value of investments. |
In accordance with the requirements of U.S. GAAP, the amounts of transfers into and out of Level 3, if material, are disclosed in the Notes to Schedule of Investments for each respective Fund.
For fair valuations using significant unobservable inputs, U.S. GAAP requires a reconciliation of the beginning to ending balances for reported fair values that presents changes attributable to realized gain (loss), unrealized appreciation (depreciation), purchases and sales, accrued discounts (premiums), and transfers into and out of the Level 3 category during the period. The end of period value is used for the transfers between Levels of a Fund’s assets and liabilities. Additionally, U.S. GAAP requires quantitative information regarding the significant unobservable inputs used in the determination of fair value of assets or liabilities categorized as Level 3 in the fair value hierarchy. In accordance with the requirements of U.S. GAAP, a fair value hierarchy and, if material, a Level 3 reconciliation and details of significant unobservable inputs, have been included in the Notes to Schedule of Investments for each respective Fund.
| | | | |
Notes to Financial Statements | | | | |
(c) Valuation Techniques and the Fair Value Hierarchy
Level
1, Level
2 and Level
3 trading assets and trading liabilities, at fair value
The valuation methods (or “techniques”) and significant inputs used in determining the fair values of portfolio securities or other assets and liabilities categorized as Level 1, Level 2 and Level 3 of the fair value hierarchy are as follows:
Common stocks, ETFs, exchange-traded notes and financial derivative instruments, such as futures contracts, rights and warrants, or options on futures that are traded on a national securities exchange, are stated at the last reported sale or settlement price on the day of valuation. To the extent these securities are actively traded and valuation adjustments are not applied, they are categorized as Level 1 of the fair value hierarchy.
Investments in registered
open-end
investment companies (other than ETFs) will be valued based upon the NAVs of such investments and are categorized as Level 1 of the fair value hierarchy. Investments in unregistered
open-end
investment companies will be calculated based upon the NAVs of such investments and are considered Level 1 provided that the NAVs are observable, calculated daily and are the value at which both purchases and sales will be conducted.
Fixed income securities including corporate, convertible and municipal bonds and notes, U.S. government agencies, U.S. treasury obligations, sovereign issues, bank loans, convertible preferred securities,
non-U.S.
bonds, and short-term debt instruments (such as commercial paper, time deposits, and certificates of deposit) are normally valued on the basis of quotes obtained from brokers and dealers or Pricing Sources that use broker-dealer quotations, reported trades or valuation estimates from their internal pricing models. The Pricing Sources’ internal models use inputs that are observable such as issuer details, interest rates, yield curves, prepayment speeds, credit risks/spreads, default rates and quoted prices for similar assets. Securities that use similar valuation techniques and inputs as described above are categorized as Level 2 of the fair value hierarchy.
Fixed income securities purchased on a delayed-delivery basis or as a repurchase commitment in a sale-buyback transaction are marked to market daily until settlement at the forward settlement date and are categorized as Level 2 of the fair value hierarchy.
Proxy pricing procedures set the base price of a fixed income security and subsequently adjust the price proportionally to market value changes of a pre-determined security deemed to be comparable in duration, generally a U.S. Treasury or sovereign note based on country of issuance. The base price may be a broker-dealer quote, transaction price or an internal value as derived by analysis of market data. The base price of the security may be reset on a periodic basis based on the availability of market data and procedures approved by the Valuation
Oversight Committee. Significant changes in the unobservable inputs of the proxy pricing process (the base price) would result in direct and proportional changes in the fair value of the security. These securities are categorized as Level 3 of the fair value hierarchy.
Short-term debt instruments (such as commercial paper, time deposits, and certificates of deposit) having a remaining maturity of 60 days or less may be valued at amortized cost, so long as the amortized cost value of such short-term debt instruments is approximately the same as the fair value of the instrument as determined without the use of amortized cost valuation. These securities are categorized as Level 2 or Level 3 of the fair value hierarchy depending on the source of the base price.
When a fair valuation method is applied by PIMCO that uses significant unobservable inputs, investments will be priced by a method that the Valuation Designee believes reflects fair value and are categorized as Level 3 of the fair value hierarchy.
4. SECURITIES AND OTHER INVESTMENTS
Investments in Securities
The Funds may utilize the investments and strategies described below to the extent permitted by each Fund’s respective investment policies.
Loans and Other Indebtedness, Loan Participations and Assignments
are direct debt instruments which are interests in amounts owed to lenders or lending syndicates by corporate, governmental, or other borrowers. A Fund’s investments in loans may be in the form of direct investments, participations in loans or assignments of all or a portion of loans from third parties or exposure to investments in loans through investments in a mutual fund or other pooled investment vehicle. A loan is often administered by a bank or other financial institution (the “agent”) that acts as agent for all holders. The agent administers the terms of the loan, as specified in the loan agreement. A Fund may invest in multiple series or tranches of a loan, which may have varying terms and carry different associated risks. A Fund generally has no right to enforce compliance with the terms of the loan agreement with the borrower. As a result, a Fund may be subject to the credit risk of both the borrower and the agent that is selling the loan agreement.
In the event of the insolvency of the agent selling a participation, a Fund may be treated as a general creditor of the agent and may not benefit from any
set-off
between the agent and the borrower. When a Fund purchases assignments from agents it acquires direct rights against the borrowers of the loans. These loans may include participations in bridge loans, which are loans taken out by borrowers for a short period (typically less than one year) pending arrangement of more permanent financing through, for example, the issuance of bonds, frequently high yield bonds issued for the purpose of acquisitions.
Investments in loans are generally subject to risks similar to those of investments in other types of debt obligations, including, among others, credit risk, interest rate risk, variable and floating rate securities risk, and risks associated with mortgage-related securities. In addition, in many cases loans are subject to the risks associated with below investment grade securities. The Funds may be subject to heightened or additional risks and potential liabilities and costs by investing in mezzanine and other subordinated loans, including those arising under bankruptcy, fraudulent conveyance, equitable subordination, environmental and other laws and regulations, and risks and costs associated with debt servicing and taking foreclosure actions associated with the loans.
Additionally, because loans are not ordinarily registered with the SEC or any state securities commission or listed on any securities exchange, there is usually less publicly available information about such instruments. In addition, loans may not be considered “securities” for purposes of the anti-fraud provisions under the federal securities laws and, as a result, as a purchaser of these instruments, a Fund may not be entitled to the anti-fraud protections of the federal securities laws. In the course of investing in such instruments, a Fund may come into possession of material nonpublic information and, because of prohibitions on trading in securities of issuers while in possession of such information, the Fund may be unable to enter into a transaction in a publicly-traded security of that issuer when it would otherwise be advantageous for the Fund to do so. Alternatively, a Fund may choose not to receive material nonpublic information about an issuer of such loans, with the result that the Fund may have less information about such issuers than other investors who transact in such assets.
The types of loans and related investments in which the Funds may invest include, among others, senior loans, subordinated loans (including second lien loans,
B-Notes
and mezzanine loans), whole loans, commercial real estate and other commercial loans and structured loans. The Funds may acquire direct interests in loans through primary loan distributions and/or in private transactions. In the case of subordinated loans, there may be significant indebtedness ranking ahead of the borrower’s obligation to the holder of such a loan, including in the event of the borrower’s insolvency. Mezzanine loans are typically secured by a pledge of an equity interest in the mortgage borrower that owns the real estate rather than an interest in a mortgage.
Investments in loans may include unfunded loan commitments, which are contractual obligations for future funding. Unfunded loan commitments may include revolving credit facilities, which may obligate a Fund to supply additional cash to the borrower on demand. Unfunded loan commitments represent a future obligation in full, even though a percentage of the committed amount may not be utilized by
the borrower. When investing in a loan participation, a Fund has the right to receive payments of principal, interest and any fees to which it is entitled only from the agent selling the loan agreement and only upon receipt of payments by the agent from the borrower. Because investing in unfunded loan commitments creates a future obligation for a Fund to provide funding to a borrower upon demand in exchange for a fee, the Fund will segregate or earmark liquid assets with the Fund’s custodian in amounts sufficient to satisfy any such future obligations. A Fund may receive a commitment fee based on the undrawn portion of the underlying line of credit portion of a loan. In certain circumstances, a Fund may receive a penalty fee upon the prepayment of a loan by a borrower. Fees earned or paid are recorded as a component of interest income or interest expense, respectively, on the Statements of Operations. Unfunded loan commitments, if any, are reflected as a liability on the Statements of Assets and Liabilities.
Mortgage-Related and Other Asset-Backed Securities
directly or indirectly represent a participation in, or are secured by and payable from, loans on real property. Mortgage-related securities are created from pools of residential or commercial mortgage loans, including mortgage loans made by savings and loan institutions, mortgage bankers, commercial banks and others. These securities provide a monthly payment which consists of both interest and principal. Interest may be determined by fixed or adjustable rates. The rate of prepayments on underlying mortgages will affect the price and volatility of a mortgage-related security, and may have the effect of shortening or extending the effective duration of the security relative to what was anticipated at the time of purchase. The timely payment of principal and interest of certain mortgage-related securities is guaranteed with the full faith and credit of the U.S. Government. Pools created and guaranteed by
non-governmental
issuers, including government-sponsored corporations, may be supported by various forms of insurance or guarantees, but there can be no assurance that private insurers or guarantors can meet their obligations under the insurance policies or guarantee arrangements. Many of the risks of investing in mortgage-related securities secured by commercial mortgage loans reflect the effects of local and other economic conditions on real estate markets, the ability of tenants to make lease payments, and the ability of a property to attract and retain tenants. These securities may be less liquid and may exhibit greater price volatility than other types of mortgage-related or other asset-backed securities. Other asset-backed securities are created from many types of assets, including, but not limited to, auto loans, accounts receivable, such as credit card receivables and hospital account receivables, home equity loans, student loans, boat loans, mobile home loans, recreational vehicle loans, manufactured housing loans, aircraft leases, computer leases and syndicated bank loans.
| | | | |
Notes to Financial Statements | | | | |
Collateralized Mortgage Obligations
(“CMOs”) are debt obligations of a legal entity that are collateralized by whole mortgage loans or private mortgage bonds and divided into classes. CMOs are structured into multiple classes, often referred to as “tranches”, with each class bearing a different stated maturity and entitled to a different schedule for payments of principal and interest, including prepayments. CMOs may be less liquid and that exhibit greater price volatility than other types of mortgage or asset-backed securities.
Restricted Investments
are subject to legal or contractual restrictions on resale and may generally be sold privately, but may be required to be registered or exempted from such registration before being sold to the public. Private placement securities are generally considered to be restricted except for those securities traded between qualified institutional investors under the provisions of Rule 144A of the Securities Act of 1933. Disposal of restricted investments may involve time-consuming negotiations and expenses, and prompt sale at an acceptable price may be difficult to achieve. Restricted investments held by the Funds as of December 31, 2023, as applicable, are disclosed in the Notes to Schedules of Investments.
Securities Issued by U.S. Government Agencies or Government-Sponsored Enterprises
are obligations of and, in certain cases, guaranteed by, the U.S. Government, its agencies or instrumentalities. Some U.S. Government securities, such as Treasury bills, notes and bonds, and securities guaranteed by the Government National Mortgage Association, are supported by the full faith and credit of the U.S. Government; others, such as those of the Federal Home Loan Banks, are supported by the right of the issuer to borrow from the U.S. Department of the Treasury (the “U.S. Treasury”); and others, such as those of the Federal National Mortgage Association (“FNMA” or “Fannie Mae”), are supported by the discretionary authority of the U.S. Government to purchase the agency’s obligations. U.S. Government securities may include zero coupon securities which do not distribute interest on a current basis and tend to be subject to a greater risk than interest-paying securities of similar maturities.
Government-related guarantors (i.e., not backed by the full faith and credit of the U.S. Government) include FNMA and the Federal Home Loan Mortgage Corporation (“FHLMC” or “Freddie Mac”). FNMA is a government-sponsored corporation. FNMA purchases conventional (i.e., not insured or guaranteed by any government agency) residential mortgages from a list of approved seller/servicers which include state and federally chartered savings and loan associations, mutual savings banks, commercial banks and credit unions and mortgage bankers. Pass-through securities issued by FNMA are guaranteed as to timely payment of principal and interest by FNMA, but are not backed by the full faith and credit of the U.S. Government. FHLMC issues Participation Certificates (“PCs”), which are pass-through securities, each
representing an undivided interest in a pool of residential mortgages. FHLMC guarantees the timely payment of interest and ultimate collection of principal, but PCs are not backed by the full faith and credit of the U.S. Government. Instead, they are supported only by the discretionary authority of the U.S. Government to purchase the agency’s obligations.
When-Issued Transactions
are purchases or sales made on a when-issued basis. These transactions are made conditionally because a security, although authorized, has not yet been issued in the market. Transactions to purchase or sell securities on a when-issued basis involve a commitment by the Fund to purchase or sell these securities for a predetermined price or yield, with payment and delivery taking place beyond the customary settlement period. The Fund may sell when-issued securities before they are delivered, which may result in a realized gain (loss).
5. BORROWINGS AND OTHER FINANCING TRANSACTIONS
The Funds may enter into the borrowings and other financing transactions described below to the extent permitted by each Fund’s respective investment policies.
The following disclosures contain information on a Fund’s ability to lend or borrow cash or securities to the extent permitted under the Act, which may be viewed as borrowing or financing transactions by a Fund. The location of these instruments in each Fund’s financial statements is described below.
(a) Repurchase Agreements
Under the terms of a typical repurchase agreement, a Fund purchases an underlying debt obligation (collateral) subject to an obligation of the seller to repurchase, and a Fund to resell, the obligation at an agreed-upon price and time. In an open maturity repurchase agreement, there is no
pre-determined
repurchase date and the agreement can be terminated by a Fund or counterparty at any time. The underlying securities for all repurchase agreements are held by a Fund’s custodian or designated subcustodians (in the case of
tri-party
repurchase agreements) and in certain instances will remain in custody with the counterparty. Traditionally, a Fund has used bilateral repurchase agreements wherein the underlying securities will be held by a Fund’s custodian. The market value of the collateral must be equal to or exceed the total amount of the repurchase obligations, including interest. Repurchase agreements, if any, including accrued interest, are included on the Statements of Assets and Liabilities. Interest earned is recorded as a component of interest income on the Statements of Operations. In periods of increased demand for collateral, a Fund may pay a fee for the receipt of collateral, which may result in interest expense to a Fund.
(b) Tender Option Bond Transactions
In a tender option bond transaction (“TOB”), a tender option bond trust (“TOB Trust”) issues floating rate certificates (“TOB Floater”) and residual interest certificates (“TOB Residual”) and utilizes the proceeds of such issuances to purchase a fixed rate municipal bond (“Fixed Rate Bond”) that is either owned or identified by a Fund. The TOB Floater is generally issued to third party investors (typically a money market fund) and the TOB Residual is generally issued to a Fund that sold or identified the Fixed Rate Bond. The TOB Trust divides the income stream provided by the Fixed Rate Bond to create two securities, the TOB Floater, which is a short-term security, and the TOB Residual, which is a longer-term security. The interest rates payable on the TOB Residual issued to a Fund bear an inverse relationship to the interest rate on the TOB Floater. The interest rate on the TOB Floater is reset by a remarketing process typically every 7 to 35 days. After income is paid on the TOB Floater at current rates, the residual income from the Fixed Rate Bond goes to the TOB Residual. Therefore, rising short-term rates result in lower income for the TOB Residual, and vice versa. In the case of a TOB Trust that utilizes the cash received (less transaction expenses) from the issuance of the TOB Floater and TOB Residual to purchase the Fixed Rate Bond from a Fund, a Fund may then invest the cash received in additional securities, generating leverage for the Fund. Other PIMCO-managed accounts may also contribute municipal bonds to a TOB Trust into which the Fund has contributed Fixed Rate Bonds. If multiple PIMCO-managed accounts participate in the same TOB Trust, the economic rights and obligations under the TOB Residual will be shared among the funds ratably in proportion to their participation in the TOB Trust.
The TOB Residual may be more volatile and less liquid than other municipal bonds of comparable maturity. In most circumstances the TOB Residual holder bears substantially all of the underlying Fixed Rate Bond’s downside investment risk and also benefits from any appreciation in the value of the underlying Fixed Rate Bond. Investments in a TOB Residual typically will involve greater risk than investments in Fixed Rate Bonds.
A TOB Residual held by a Fund provides the Fund with the right to: (i) cause the holders of the TOB Floater to tender their notes at par, and (ii) cause the sale of the Fixed Rate Bond held by the TOB Trust, thereby collapsing the TOB Trust. TOB Trusts are generally supported by a liquidity facility provided by a third party bank or other financial institution (the “Liquidity Provider”) that provides for the purchase of TOB Floaters that cannot be remarketed. The holders of the TOB Floaters have the right to tender their certificates in exchange for payment of par plus accrued interest on a periodic basis (typically weekly) or on the occurrence of certain mandatory tender events. The tendered TOB Floaters are remarketed by a remarketing agent, which is typically an affiliated entity of the Liquidity Provider. If the TOB Floaters
cannot be remarketed, the TOB Floaters are purchased by the TOB Trust either from the proceeds of a loan from the Liquidity Provider or from a liquidation of the Fixed Rate Bond.
The TOB Trust may also be collapsed without the consent of a Fund, as the TOB Residual holder, upon the occurrence of certain “tender option termination events” (or “TOTEs”) as defined in the TOB Trust agreements. Such termination events typically include the bankruptcy or default of the Fixed Rate Bond, a substantial downgrade in credit quality of the Fixed Rate Bond, or a judgment or ruling that interest on the Fixed Rate Bond is subject to Federal income taxation. Upon the occurrence of a termination event, the TOB Trust would generally be liquidated in full with the proceeds typically applied first to any accrued fees owed to the trustee, remarketing agent and liquidity provider, and then to the holders of the TOB Floater up to par plus accrued interest owed on the TOB Floater and a portion of gain share, if any, with the balance paid out to the TOB Residual holder. In the case of a mandatory termination event, after the payment of fees, the TOB Floater holders would be paid before the TOB Residual holders (i.e., the Funds). In contrast, in the case of a TOTE, after payment of fees, the TOB Floater holders and the TOB Residual holders would be paid pro rata in proportion to the respective face values of their certificates.
If there are insufficient proceeds from the liquidation of the TOB Trust, the party that would bear the losses would depend upon whether a Fund holds a
non-recourse
TOBs Residual or a recourse TOBs Residual. If a Fund holds a
non-recourse
TOBs Residual, the Liquidity Provider or holders of the TOBs Floaters would bear the losses on those securities and there would be no recourse to the Fund’s assets. If a Fund holds a recourse TOBs Residual, the Fund (and, indirectly, holders of the Fund’s Common Shares) would typically bear the losses. In particular, if a Fund holds a recourse TOBs Residual, it will typically have entered into an agreement pursuant to which the Fund would be required to pay to the Liquidity Provider the difference between the purchase price of any TOBs Floaters put to the Liquidity Provider by holders of the TOBs Floaters and the proceeds realized from the remarketing of those TOBs Floaters or the sale of the assets in the TOBs Issuer. Each Fund may invest in both
non-recourse
and recourse TOBs Residuals to leverage its portfolio.
Each Fund’s transfer of Fixed Rate Bonds to a TOB Trust is considered a secured borrowing for financial reporting purposes. The cash received by the TOB Trust from the sale of the TOB Floaters, less certain transaction expenses, is paid to a Fund. A Fund typically invests the cash received in additional municipal bonds. The Funds account for the transactions described above as secured borrowings by including the Fixed Rate Bonds in their Schedules of Investments, and account for the TOB Floater as a liability under the caption “Payable for tender option bond floating rate certificates” in the Funds’ Statements of Assets and Liabilities.
| | | | |
Notes to Financial Statements | | | | |
Interest income, including amortization and accretion of premiums and discounts, from the underlying municipal bonds is recorded by each Fund on an accrual basis and is shown as interest on the Statements of Operations. Interest expense incurred on the secured borrowing is shown as interest expense on the Statements of Operations.
The Funds may also purchase TOB Residuals in a secondary market transaction without transferring a fixed rate municipal bond into a TOB Trust. Such transactions are not accounted for as secured borrowings but rather as a security purchase with the TOB Residual being included in the Schedule of Investments.
In December 2013, regulators finalized rules implementing Section 619 (the “Volcker Rule”) and Section 941 (the “Risk Retention Rules”) of the Dodd-Frank Wall Street Reform and Consumer Protection Act. Both the Volcker Rule and the Risk Retention Rules apply to tender option bond programs. The Volcker Rule precludes banking entities from (i) sponsoring or acquiring interests in the trusts used to hold a municipal bond in the creation of TOB Trusts; and (ii) continuing to service or maintain relationships with existing programs involving TOB Trusts to the same extent and in the same capacity as existing programs. The Risk Retention Rules require the sponsor to a TOB Trust (e.g., a Fund) to retain at least five percent of the credit risk of the underlying assets supporting the TOB Trust’s municipal bonds. The Risk Retention Rules may adversely affect a Fund’s ability to engage in tender option bond trust transactions or increase the costs of such transactions in certain circumstances.
In response to these rules, industry participants explored various structuring alternatives for TOB Trusts established after December 31, 2013 and TOB Trusts established prior to December 31, 2013 (“Legacy
TOB Trusts”) and agreed on a new tender option bond structure in which the Funds hire service providers to assist with establishing, structuring and sponsoring a TOB Trust. Service providers to a TOB Trust, such as administrators, liquidity providers, trustees and remarketing agents act at the direction of, and as agent of, the Funds as the TOB residual holders.
The Funds have restructured their Legacy TOB Trusts in conformity with regulatory guidelines. Under the new TOB Trust structure, the Liquidity Provider or remarketing agent will no longer purchase the tendered TOB Floaters, even in the event of failed remarketing. This may increase the likelihood that a TOB Trust will need to be collapsed and liquidated in order to purchase the tendered TOB Floaters. The TOB Trust may draw upon a loan from the Liquidity Provider to purchase the tendered TOB Floaters. Any loans made by the Liquidity Provider will be secured by the purchased TOB Floaters held by the TOB Trust and will be subject to an interest rate agreed upon with the liquidity provider.
For the period ended December 31, 2023, the Funds’ average leverage outstanding from the use of TOB transactions and the daily weighted average interest rate, including fees, were as follows:
| | | | | | | | | | | | |
| | | | | Average
Leverage
Outstanding | | | | |
| | | |
| PIMCO California Municipal Income Fund | | | | | | $ | 9,867 | | | | 3.75% | |
| | | |
| PIMCO California Municipal Income Fund II | | | | | | | 8,480 | | | | 3.71% | |
| | | |
| PIMCO California Municipal Income Fund III | | | | | | | 8,226 | | | | 3.76% | |
| | | |
| PIMCO New York Municipal Income Fund | | | | | | | 1,576 | | | | 3.69% | |
| | | |
| PIMCO Municipal Income Fund | | | | | | | 12,878 | | | | 3.71% | |
| | | |
| PIMCO Municipal Income Fund II | | | | | | | 62,312 | | | | 3.78% | |
| | | |
| PIMCO Municipal Income Fund III | | | | | | | 17,290 | | | | 3.73% | |
6. PRINCIPAL AND OTHER RISKS
In the normal course of business, the Funds trade financial instruments and enter into financial transactions where risk of potential loss exists due to such things as changes in the market (market risk) or failure or inability of the other party to a transaction to perform (credit and counterparty risk). See below for a detailed description of select principal risks. For a complete list of the principal risks the Funds may be subject to, please see the Principal Risks of the Funds section of this report.
| | | | | | | | | | | | | | | | | | | | | | |
| | | | | | | | | | | | | | | | | | | | | | |
| | | | | | | | | | |
| AMT Bonds | | | | | | X | | X | | X | | X | | X | | X | | X | | X | | X |
| | | | | | | | | | |
| Asset Allocation | | | | | | X | | X | | X | | X | | X | | X | | X | | X | | X |
| | | | | | | | | | |
| California State Specific | | | | | | X | | X | | X | | X | | X | | X | | — | | — | | — |
| | | | | | | | | | |
| Call | | | | | | X | | X | | X | | X | | X | | X | | X | | X | | X |
| | | | | | | | | | |
| Counterparty | | | | | | X | | X | | X | | X | | X | | X | | X | | X | | X |
| | | | | | | | | | |
| Credit | | | | | | X | | X | | X | | X | | X | | X | | X | | X | | X |
| | | | | | | | | | |
| Cyber Security | | | | | | X | | X | | X | | X | | X | | X | | X | | X | | X |
| | | | | | | | | | |
| Derivatives | | | | | | X | | X | | X | | X | | X | | X | | X | | X | | X |
| | | | | | | | | | | | | | | | | | | | | | |
| | | | | | | | | | | | | | | | | | | | | | |
| | | | | | | | | | |
| Distribution Rate | | | | | | X | | X | | X | | X | | X | | X | | X | | X | | X |
| | | | | | | | | | |
| High Yield Securities | | | | | | X | | X | | X | | X | | X | | X | | X | | X | | X |
| | | | | | | | | | |
| Illinois State Specific | | | | | | X | | X | | X | | — | | — | | — | | — | | — | | — |
| | | | | | | | | | |
| Inflation/Deflation | | | | | | X | | X | | X | | X | | X | | X | | X | | X | | X |
| | | | | | | | | | |
| Insurance | | | | | | X | | X | | X | | X | | X | | X | | X | | X | | X |
| | | | | | | | | | |
| Interest Rate | | | | | | X | | X | | X | | X | | X | | X | | X | | X | | X |
| | | | | | | | | | |
| Issuer | | | | | | X | | X | | X | | X | | X | | X | | X | | X | | X |
| | | | | | | | | | |
| Leverage | | | | | | X | | X | | X | | X | | X | | X | | X | | X | | X |
| | | | | | | | | | |
| Liquidity | | | | | | X | | X | | X | | X | | X | | X | | X | | X | | X |
| | | | | | | | | | |
| Loan Origination | | | | | | X | | X | | X | | X | | X | | X | | X | | X | | X |
| | | | | | | | | | |
| Loans and Other Indebtedness; Loan Participations and Assignments | | | | | | X | | X | | X | | X | | X | | X | | X | | X | | X |
| | | | | | | | | | |
| Management | | | | | | X | | X | | X | | X | | X | | X | | X | | X | | X |
| | | | | | | | | | |
| Market Disruptions | | | | | | X | | X | | X | | X | | X | | X | | X | | X | | X |
| | | | | | | | | | |
| Market Discount | | | | | | X | | X | | X | | X | | X | | X | | X | | X | | X |
| | | | | | | | | | |
| Market | | | | | | X | | X | | X | | X | | X | | X | | X | | X | | X |
| | | | | | | | | | |
| Mortgage-Related and Other Asset-Backed Instruments | | | | | | X | | X | | X | | X | | X | | X | | X | | X | | X |
| | | | | | | | | | |
| Municipal Bond Market | | | | | | X | | X | | X | | X | | X | | X | | X | | X | | X |
| | | | | | | | | | |
| Municipal Bond | | | | | | X | | X | | X | | X | | X | | X | | X | | X | | X |
| | | | | | | | | | |
| Municipal Project-Specific | | | | | | X | | X | | X | | X | | X | | X | | X | | X | | X |
| | | | | | | | | | |
| New York State-Specific | | | | | | X | | X | | X | | — | | — | | — | | X | | X | | X |
| | | | | | | | | | |
| | | | | | — | | — | | — | | — | | — | | — | | X | | — | | X |
| | | | | | | | | | |
| Operational | | | | | | X | | X | | X | | X | | X | | X | | X | | X | | X |
| | | | | | | | | | |
| Other Investment Companies | | | | | | X | | X | | X | | X | | X | | X | | X | | X | | X |
| | | | | | | | | | |
| Portfolio Turnover | | | | | | X | | X | | X | | X | | X | | X | | X | | X | | X |
| | | | | | | | | | |
| Potential Conflicts of Interest — Allocation of Investment Opportunities | | | | | | X | | X | | X | | X | | X | | X | | X | | X | | X |
| | | | | | | | | | |
| Privacy and Data Security | | | | | | X | | X | | X | | X | | X | | X | | X | | X | | X |
| | | | | | | | | | |
| Private Placement and Restricted Securities | | | | | | X | | X | | X | | X | | X | | X | | X | | X | | X |
| | | | | | | | | | |
| Puerto Rico Specific | | | | | | X | | X | | X | | X | | X | | X | | X | | X | | X |
| | | | | | | | | | |
| Regulatory Changes | | | | | | X | | X | | X | | X | | X | | X | | X | | X | | X |
| | | | | | | | | | |
| Regulatory — LIBOR | | | | | | X | | X | | X | | X | | X | | X | | X | | X | | X |
| | | | | | | | | | |
| Reinvestment | | | | | | X | | X | | X | | X | | X | | X | | X | | X | | X |
| | | | | | | | | | |
| Repurchase Agreements | | | | | | X | | X | | X | | X | | X | | X | | X | | X | | X |
| | | | | | | | | | |
| Securities Lending | | | | | | X | | X | | X | | X | | X | | X | | X | | X | | X |
| | | | | | | | | | |
| Short Exposure | | | | | | X | | X | | X | | X | | X | | X | | X | | X | | X |
| | | | | | | | | | |
| Structured Investments | | | | | | X | | X | | X | | X | | X | | X | | X | | X | | X |
| | | | | | | | | | |
| Tax | | | | | | X | | X | | X | | X | | X | | X | | X | | X | | X |
| | | | | | | | | | |
| U.S. Government Securities | | | | | | X | | X | | X | | X | | X | | X | | X | | X | | X |
| | | | | | | | | | |
| Valuation | | | | | | X | | X | | X | | X | | X | | X | | X | | X | | X |
AMT Bonds Risk
is the risk that investments by a Fund in AMT Bonds may expose a Fund to certain risks in addition to those typically associated with municipal bonds. Interest or principal on AMT Bonds paid out of current or anticipated revenues from a specific project or specific asset may be adversely impacted by declines in revenue from the project or asset. Declines in general business activity could also affect the economic viability of facilities that are the sole source of revenue to support AMT Bonds. In this regard, AMT Bonds may entail greater risks than general obligation municipal bonds. For shareholders subject to the federal alternative minimum tax, a portion of a Fund’s distributions may not be exempt from gross federal income, which may give rise to alternative minimum tax liability.
Asset Allocation Risk
is the risk that a Fund could lose money as a result of less than optimal or poor asset allocation decisions. A Fund could miss attractive investment opportunities by underweighting markets that subsequently experience significant returns and could lose value by overweighting markets that subsequently experience significant declines.
California State-Specific Risk
is the risk that a Fund, by investing in municipal bonds issued by or on behalf of the State of California and its political subdivisions, financing authorities and their agencies, a Fund may be affected significantly by economic, regulatory, or political
| | | | |
Notes to Financial Statements | | | | |
developments affecting the ability of California
tax-exempt
issuers to pay interest or repay principal.
Call Risk
is the risk that an issuer may exercise its right to redeem a fixed income security earlier than expected (a call). Issuers may call outstanding securities prior to their maturity for a number of reasons (e.g., declining interest rates, changes in credit spreads and improvements in the issuer’s credit quality). If an issuer calls a security in which the Fund has invested, the Fund may not recoup the full amount of its initial investment or may not realize the full anticipated earnings from the investment and may be forced to reinvest in lower-yielding securities, securities with greater credit risks or securities with other, less favorable features.
Counterparty Risk
is the risk that the Fund will be subject to credit risk with respect to the counterparties to the derivative contracts and other instruments entered into by the Fund or held by special purpose or structured vehicles in which the Fund invests. If a counterparty becomes bankrupt or otherwise fails to perform its obligations under a derivative contract due to financial difficulties, the Fund may experience significant delays in obtaining any recovery (including recovery of any collateral it has provided to the counterparty) in a dissolution, assignment for the benefit of creditors, liquidation,
winding-up,
bankruptcy, or other analogous proceeding.
Credit Risk
is the risk that a Fund could lose money if the issuer or guarantor of a fixed income security (including a security purchased with securities lending collateral), the counterparty to a derivative contract, or the issuer or guarantor of collateral, repurchase agreement or a loan of portfolio securities, is unable or unwilling, or is perceived (whether by market participants, rating agencies, pricing services or otherwise) as unable or unwilling, to make timely principal and/or interest payments or to otherwise honor its financial obligations. The risk that such issuer, guarantor or counterparty is less willing or able to do so is heightened in market environments where interest rates are rising. Rising or high interest rates may deteriorate the credit quality of an issuer or counterparty, particularly if an issuer or counterparty faces challenges rolling or refinancing its obligations. Securities are subject to varying degrees of credit risk, which are often reflected in credit ratings.
Cyber Security Risk
is the risk that, as the use of technology, including cloud-based technology, has become more prevalent in the course of business, the Funds have become potentially more susceptible to operational and information security risks resulting from breaches in cyber security. A breach in cyber security refers to both intentional and unintentional cyber events from outside threat actors or internal resources that may, among other things, cause a Fund to lose proprietary information, suffer data corruption and/ or destruction, lose operational capacity, result in the unauthorized release or other misuse of confidential information, or otherwise disrupt normal business
operations. Cyber security failures or breaches may result in financial losses to a Fund and its shareholders. These failures or breaches may also result in disruptions to business operations, potentially resulting in financial losses; interference with a Fund’s ability to calculate its net asset value, process shareholder transactions or otherwise transact business with shareholders; impediments to trading; violations of applicable privacy and other laws; regulatory fines; penalties; third party claims in litigation; reputational damage; reimbursement or other compensation costs; additional compliance and cyber security risk management costs and other adverse consequences. In addition, substantial costs may be incurred in order to prevent any cyber incidents in the future. There is also a risk that cyber security breaches may not be detected. The Funds and their shareholders may suffer losses as a result of a cyber security breach related to the Funds, their service providers, trading counterparties or the issuers in which a Fund invests.
Derivatives Risk
is the risk of investing in derivative instruments (such as forwards, futures, swaps and structured securities) and other similar investments, including leverage risk, liquidity risk (which may be heightened for highly-customized derivatives), interest rate risk, market risk, counterparty (including credit) risk, operational risk (such as documentation issues, settlement issues and systems failures), legal risk (such as insufficient documentation, insufficient capacity or authority of a counterparty, and issues with the legality or enforceability of a contract), counterparty risk, tax risk and management risk as well as risks arising from changes in applicable requirements, risks arising from margin requirements and risks arising from mispricing or valuation complexity. Changes in the value of a derivative or other similar investments may not correlate perfectly with, and may be more sensitive to market events than, the underlying asset, rate or index, and a Fund could lose more than the initial amount invested.
Changes in the value of a derivative or other similar instrument may also create margin delivery or settlement payment obligations for a Fund. A Fund’s use of derivatives or other similar investments may result in losses to a Fund, a reduction in a Fund’s returns and/or increased volatility.
(“OTC”) derivatives or other similar investments are also subject to the risk that a counterparty to the transaction will not fulfill its contractual obligations to the other party, as many of the protections afforded to centrally-cleared derivative transactions might not be available for OTC derivatives or other similar investments. The primary credit risk on derivatives or other similar investments that are exchange-traded or traded through a central clearing counterparty resides with a Fund’s clearing broker, or the clearinghouse. Changes in regulation relating to a registered fund’s use of derivatives and related instruments could potentially limit or impact the Fund’s ability to invest in derivatives, limit a Fund’s ability to employ certain strategies that use derivatives or other similar
investments and/ or adversely affect the value of derivatives or other similar investments and a Fund’s performance.
Distribution Rate Risk
is the risk that, to the extent a Fund seeks to maintain a level distribution rate, the Fund’s distribution rate may be affected by numerous factors, including but not limited to changes in realized and projected market returns, fluctuations in market interest rates, Fund performance and other factors. There can be no assurance that a change in market conditions or other factors will not result in a change in a Fund’s distribution rate or that the rate will be sustainable in the future.
High Yield Securities Risk
is the risk that high yield securities and unrated securities of similar credit quality (commonly known as “junk bonds”) are subject to greater levels of credit, call and liquidity risks, including the risk that a court will subordinate high yield senior debt to other debt of the issuer or take other actions detrimental to holders of the senior debt. High yield securities are considered primarily speculative with respect to the issuer’s continuing ability to make principal and interest payments, and may be more volatile than higher-rated securities of similar maturity.
Illinois State-Specific Risk
is the risk that by concentrating its investments in Illinois municipal bonds, the Fund may be affected significantly by economic, regulatory or political developments affecting the ability of Illinois issuers to pay interest or repay principal.
Inflation/Deflation Risk
is the risk that the value of assets or income from the Fund’s investments will be worth less in the future as inflation decreases the value of payments at future dates. As inflation increases, the real value of the Fund’s portfolio could decline. Deflation risk is the risk that prices throughout the economy decline over time. Deflation may have an adverse effect on the creditworthiness of issuers and may make issuer default more likely, which may result in a decline in the value of the Fund’s portfolio and common shares.
Insurance Risk
is the risk that the Fund may purchase municipal securities that are secured by insurance, bank credit agreements or escrow accounts and the credit quality of the companies that provide such credit enhancements will affect the value of those securities. The insurance feature of a municipal security does not guarantee the full payment of principal and interest through the life of an insured obligation, the market value of the insured obligation or the net asset value of the common shares represented by such insured obligation.
Interest Rate Risk
is the risk that fixed income securities and other instruments in the Fund’s portfolio will fluctuate in value because of a change in interest rates; a fund with a longer average portfolio duration will be more sensitive to changes in interest rates than a fund with a shorter average portfolio duration. Further, in market environments where interest rates are rising, issuers may be less willing
or able to make principal and interest payments on fixed income investments when due.
Issuer Risk
is the risk that the value of a security may decline for a reason directly related to the issuer, such as management performance, major litigation, investigations or other controversies, changes in financial condition or credit rating, changes in government regulations affecting the issuer or its competitive environment and strategic initiatives such as mergers, acquisitions or dispositions and the market response to any such initiatives, financial leverage, reputation or reduced demand for the issuer’s goods or services.
Leverage Risk
is the risk that certain transactions of a Fund, such as reverse repurchase agreements, loans of portfolio securities, and the use of when-issued, delayed delivery or forward commitment transactions, or derivative instruments, may give rise to leverage, magnifying gains and losses and causing a Fund to be more volatile than if it had not been leveraged. Leveraging transactions pursued by a Fund may increase its duration and sensitivity to interest rate movements. This means that leverage entails a heightened risk of loss.
Liquidity Risk
is the risk that a particular investment may be difficult to purchase or sell and that a Fund may be unable to sell illiquid investments at an advantageous time or price or possibly require a Fund to dispose of other investments at unfavorable times or prices in order to satisfy its obligations, which could prevent the Fund from taking advantage of other investment opportunities. Additionally, the market for certain investments may become illiquid under adverse market or economic conditions independent of any specific adverse changes in the conditions of a particular issuer.
Loan Origination Risk
is the risk associated with the fact that a Fund may also seek to originate loans, including, without limitation, residential and/or commercial real estate or mortgage-related loans, consumer loans or other types of loans, which may be in the form of whole loans, secured and unsecured notes, senior and second lien loans, mezzanine loans, bridge loans or similar investments. A Fund may originate loans to corporations and/or other legal entities and individuals, including foreign
(non-U.S.)
entities and individuals. Such borrowers may have credit ratings that are determined by one or more NRSROs or PIMCO to be below investment grade. This may include loans to public or private firms or individuals, such as in connection with housing development projects. The loans the Fund invests in or originates may vary in maturity and/or duration. The Fund is not limited in the amount, size or type of loans it may invest in and/or originate, including with respect to a single borrower or with respect to borrowers that are determined to be below investment grade, other than pursuant to any applicable law. The Fund’s investment in or origination of loans may also be limited by the requirements the Fund intends to observe under Subchapter M of the Code in order to qualify as a RIC. A Fund may subsequently offer such investments for sale
| | | | |
Notes to Financial Statements | | | | |
to third parties, provided that there is no assurance that a Fund will complete the sale of such an investment. If a Fund is unable to sell, assign or successfully close transactions for the loans that it originates, a Fund will be forced to hold its interest in such loans for an indeterminate period of time. This could result in a Fund’s investments having high exposure to certain borrowers. A Fund will be responsible for the expenses associated with originating a loan (whether or not consummated). This may include significant legal and due diligence expenses, which will be indirectly borne by a Fund and Common Shareholders.
Loans and Other Indebtedness; Loan Participations and Assignments Risk
is the risk that scheduled interest or principal payments will not be made in a timely manner or at all, either of which may adversely affect the values of a loan. Additionally, there is a risk that the collateral underlying a loan may be unavailable or insufficient to satisfy a borrower’s obligation, and the Fund could become part owner of any collateral if a loan is foreclosed, subjecting a Fund to costs associated with owning and disposing of the collateral. In the event of the insolvency of the lender selling a participation, there is a risk that a Fund may be treated as a general creditor of the lender and may not benefit from any
set-off
between the lender and the borrower. If a loan is foreclosed, the Fund may become owner of the loan’s collateral. The Fund may bear the costs and liabilities associated with owning and holding or disposing of the collateral. There is the risk that a Fund may have difficulty disposing of loans and loan participations due to the lack of a liquid secondary market for loans and loan participations. To the extent a Fund acquires loans, including bank loans, a Fund may be subject to greater levels of credit risk, call risk, settlement risk and liquidity risk than funds that do not acquire such instruments.
Management Risk
is the risk that the investment techniques and risk analyses applied by PIMCO will not produce the desired results and that actual or potential conflicts of interest, legislative, regulatory, or tax restrictions, policies or developments may affect the investment techniques available to PIMCO and the individual portfolio managers in connection with managing the Fund and may cause PIMCO to restrict or prohibit participation in certain investments. There is no guarantee that the investment objective of the Fund will be achieved.
Market Discount Risk
is the risk that the price of the Fund’s common shares of beneficial interest will fluctuate with market conditions and other factors. Shares of
closed-end
management investment companies frequently trade at a discount from their net asset value.
Market Disruptions Risk
is the risk of investment and operational risks associated with financial, economic and other global market developments and disruptions, including those arising from war, terrorism, social unrest, recessions, supply chain disruptions, market manipulation, government interventions, defaults and shutdowns, political changes or diplomatic developments, public health
emergencies (such as the spread of infectious diseases, pandemics and epidemics) and natural/environmental disasters, climate change and climate related events, which can all negatively impact the securities markets, interest rates, auctions, secondary trading, ratings, credit risk, inflation, deflation or other factors relating to the Fund’s investments or PIMCO’s operations and cause a Fund to lose value. Furthermore, events involving limited liquidity, defaults,
non-performance
or other adverse developments that affect financial institutions or the financial services industry generally, or concerns or rumors about any events of these kinds or other similar risks, have in the past and may in the future lead to market-wide liquidity problems. These events can also impair the technology and other operational systems upon which a Fund’s service providers, including PIMCO as a Fund’s investment adviser, rely, and could otherwise disrupt a Fund’s service providers’ ability to fulfill their obligations to a Fund.
Market Risk
is the risk that the value of securities owned by a Fund may go up or down, sometimes rapidly or unpredictably, due to factors affecting securities markets generally or particular industries or companies.
Municipal Bond Market Risk
is the risk that the Fund may be adversely affected due to factors such as limited amount of public information available regarding the municipal bonds held in the Fund as compared to that for corporate equities or bonds, legislative changes and local and business developments, general conditions of the municipal bond market, the size of the particular offering, the rating of the issue and the maturity of the obligation.
Municipal Bond Risk
is the risk that the Fund may be affected significantly by the economic, regulatory or political developments affecting the ability of issuers of debt securities whose interest is, in the opinion of bond counsel for the issuer at the time of issuance, exempt from federal income tax to pay interest or repay principal.
Municipal Project-Specific Risk
is the risk that the Fund may be more sensitive to adverse economic, business or political developments if it invests a substantial portion of its assets in the bonds of specific projects (such as those relating to education, health care, housing, transportation, and utilities), industrial development bonds, or in bonds from issuers in a single state.
New York State-Specific Risk
is the risk that a Fund, by investing in municipal bonds issued by or on behalf of the State of New York and its political subdivisions, financing authorities and their agencies, may be affected significantly by political, economic, regulatory, social, environmental, or public health developments affecting the ability of New York
tax-exempt
issuers to pay interest or repay principal.
is the risk of focusing investments in a small number of issuers, including being more susceptible to risks associated
with a single economic, political or regulatory occurrence than a more diversified portfolio might be. Funds that are
“non-diversified”
may invest a greater percentage of their assets in the securities of a single issuer (such as bonds issued by a particular state) than funds that
Operational Risk
is the risk arising from factors such as processing errors, human errors, inadequate or failed internal or external processes, failures in systems and technology, changes in personnel and errors caused by third-party service providers. The occurrence of any of these failures, errors or breaches could result in a loss of information, regulatory scrutiny, reputational damage or other events, any of which could have a material adverse effect on a Fund. While a Fund seeks to minimize such events through controls and oversight, there may still be failures that could cause losses to the Fund.
Other Investment Companies Risk
is the risk that Common Shareholders may be subject to duplicative expenses to the extent the Fund invests in other investment companies. In addition, these other investment companies may utilize leverage, in which case an investment would subject the Fund to additional risks associated
Portfolio Turnover Risk
is the risk that a high portfolio turnover will result in greater expenses to the Fund, including brokerage commissions or dealer
mark-ups
and other transaction costs on the sale of securities and reinvestments in other securities. Such sales may result in realization of taxable capital gains (including short-term capital gains, which are generally taxed to shareholders at ordinary income tax rates when distributed net of short-term capital losses and net long-term capital losses) and may adversely affect the Fund’s
Potential Conflicts of Interest Risk — Allocation of Investment Opportunities
is the risk that PIMCO’s or any of its affiliate’s interests or the interests of its clients may conflict with those of the Funds and the results of the Fund’s investment activities may differ from those of the Fund’s affiliates, or another account managed by PIMCO or its affiliates, and it is possible that the Fund could sustain losses during periods in which one or more of the Fund’s affiliates and/or other accounts managed by PIMCO or its affiliates, including proprietary accounts, achieve profits on their trading.
Privacy and Data Security Risk
is the risk resulting from the fact that the Gramm-Leach-Bliley Act (“GLBA”) and other laws limit the disclosure of certain
non-public
personal information about a consumer to
non-affiliated
third parties and require financial institutions to disclose certain privacy policies and practices with respect to information sharing with both affiliates and
non-affiliated
third parties. Many states and a number of
non-U.S.
jurisdictions have enacted privacy and data security laws requiring safeguards on the privacy and
security of consumers’ personally identifiable information. Other laws deal with obligations to safeguard and dispose of private information in a manner designed to avoid its dissemination. Privacy rules adopted by the U.S. Federal Trade Commission and the SEC implement GLBA and other requirements and govern the disclosure of consumer financial information by certain financial institutions, ranging from banks to private investment funds. U.S. platforms following certain models generally are required to have privacy policies that conform to these GLBA and other requirements. In addition, such platforms typically have policies and procedures intended to maintain platform participants’ personal information securely and dispose of it properly.
Private Placement and Restricted Securities Risk
is the risk that securities received in a private placement may be subject to strict restrictions on resale, and there may be no liquid secondary market or ready purchaser for such securities and the risk that the Fund’s investment in securities that have not been registered for public sale, but that are eligible for purchase and sale pursuant to Rule 144A under the Securities Act, may be relatively less liquid than registered securities traded on established securities markets. The Fund may be unable to dispose of such securities when it desires to do so, or at the most favorable time or price. Private placements may also raise valuation risks.
Puerto Rico-Specific Risk
is the risk that is associated with the fact that by investing in municipal bonds issued by Puerto Rico or its instrumentalities, the Fund may be affected significantly by political, economic, environmental, social, regulatory or restructuring developments affecting the ability of Puerto Rican municipal issuers to pay interest or repay principal.
Regulatory Changes Risk
is the risk that is associated with the fact that financial entities, such as investment companies and investment advisers, are generally subject to extensive government regulation and intervention. Government regulation and/or intervention may change the way the Fund is regulated, affect the expenses incurred directly by the Fund and the value of its investments, and limit and /or preclude the Fund’s ability to achieve its investment objective(s). Government regulation may change frequently and may have significant adverse consequences. The current direction of governments and regulators may have the effect of reducing market liquidity, market resiliency and money supply, whether through higher rates, tighter financial regulations or rule proposals that may prevent funds from participating in certain markets. The Fund and the Investment Manager have historically been eligible for exemptions from certain regulations. However, there is no assurance that the Fund and the Investment Manager will continue to be eligible for such exemptions.
Regulatory Risk — LIBOR
is the risk related to the discontinuation and replacement of the London Interbank Offered Rate (“LIBOR”). Certain instruments held by the Fund rely or relied in some fashion
| | | | |
Notes to Financial Statements | | | | |
upon LIBOR. Although the transition process away from LIBOR for most instruments has been completed, some LIBOR use is continuing and there are potential effects related to the transition away from LIBOR or the continued use of LIBOR on a Fund, or on certain instruments in which a Fund invests, which can be difficult to ascertain and could result in losses to a Fund.
Reinvestment Risk
is the risk that income from the Fund’s portfolio will decline if and when the Fund invests the proceeds from matured, traded or called debt obligations at market interest rates that are below the portfolio’s current earnings rate. The Fund also may choose to sell higher yielding portfolio securities and to purchase lower yielding securities to achieve greater portfolio diversification, because the portfolio managers believe the current holdings are overvalued or for other investment-related reasons.
Repurchase Agreements Risk
is the risk that, if the party agreeing to repurchase a security should default, the Fund will seek to sell the securities which it holds, which could involve procedural costs or delays in addition to a loss on the securities if their value should fall below their repurchase price.
Securities Lending Risk
is the risk that, when a Fund lends portfolio securities, its investment performance will continue to reflect changes in the value of the securities loaned and lose rights in the collateral or delay in recovery of the collateral if the borrower fails to return the security loaned or becomes insolvent. The Fund may pay lending fees to a party arranging the loan, which may be an affiliate of the Fund.
Short Exposure Risk
is the risk of entering into short sales or other short positions, including the potential loss of more money than the actual cost of the investment, and the risk that the third party to the short sale or other short position will not fulfill its contractual obligations, causing a loss to a Fund.
Structured Investments Risk
is the risk that the Fund’s investment in structured products, including, structured notes, credit-linked notes and other types of structured products bear the risks of the underlying investments, index or reference obligation and are subject to counterparty risk. The Fund may have the right to receive payments only from the structured product, and generally does not have direct rights against the issuer or the entity that sold the assets to be securitized. Structured products generally entail risks associated with derivative instruments.
Tax Risk
is the risk that if, in any year, the Fund were to fail to qualify for treatment as a regulated investment company under the Tax Code, and were ineligible to or did not otherwise cure such failure, the Fund would be subject to tax on its taxable income at corporate rates and, when such income is distributed, shareholders
would be subject to a further tax to the extent of the Fund’s current or accumulated earnings and profits.
U.S. Government Securities Risk
is the risk that the obligations supported by (i) the full faith and credit of the United States, (ii) the right of the issuer to borrow from the U.S. Treasury, (iii) the discretionary authority of the U.S. Government to purchase the agency’s obligations (iv) or only by the credit of the agency, instrumentality or corporation will not be satisfied in full, or that such obligations will decrease in value or default. U.S. government securities are subject to market risk, interest rate risk and credit risk.
Valuation Risk
is the risk that fair value pricing used when market quotations are not readily available may not result in adjustments to the prices of securities or other assets, or that fair value pricing may not reflect actual market value. It is possible that the fair value determined in good faith for a security or other asset will be materially different from quoted or published prices, from the prices used by others for the same security or other asset and/or from the value that actually could be or is realized upon the sale of that security or other asset.
In general, a Fund may be subject to additional risks, including, but not limited to, risks related to government regulation and intervention in financial markets, operational risks, risks associated with financial, economic and global market disruptions, and cyber security risks. Please see a Fund’s prospectus and Statement of Additional Information for a more detailed description of the risks of investing in the Fund. Please see the Important Information section of this report for additional discussion of certain regulatory and market developments that may impact a Fund’s performance.
7. MASTER NETTING ARRANGEMENTS
A Fund may be subject to various netting arrangements (“Master Agreements”) with select counterparties. Master Agreements govern the terms of certain transactions, and are intended to reduce the counterparty risk associated with relevant transactions by specifying credit protection mechanisms and providing standardization that is intended to improve legal certainty. Each type of Master Agreement governs certain types of transactions. Different types of transactions may be traded out of different legal entities or affiliates of a particular organization, resulting in the need for multiple agreements with a single counterparty. As the Master Agreements are specific to unique operations of different asset types, they allow a Fund to close out and net its total exposure to a counterparty in the event of a default with respect to all the transactions governed under a single Master Agreement with a counterparty. For financial reporting purposes the Statements of Assets and Liabilities generally present derivative assets and liabilities on a gross basis, which reflects the full risks and exposures prior to netting.
Master Agreements can also help limit counterparty risk by specifying collateral posting arrangements at
pre-arranged
exposure levels. Under most Master Agreements, collateral is routinely transferred if the total net exposure to certain transactions (net of existing collateral already in place) governed under the relevant Master Agreement with a counterparty in a given account exceeds a specified threshold, which typically ranges from zero to $250,000 depending on the counterparty and the type of Master Agreement. United States Treasury Bills and U.S. dollar cash are generally the preferred forms of collateral, although other securities may be used depending on the terms outlined in the applicable Master Agreement. Securities and cash pledged as collateral are reflected as assets on the Statements of Assets and Liabilities as either a component of Investments at value (securities) or Deposits with counterparty. Cash collateral received is not typically held in a segregated account and as such is reflected as a liability on the Statements of Assets and Liabilities as Deposits from counterparty. The market value of any securities received as collateral is not reflected as a component of NAV. A Fund’s overall exposure to counterparty risk can change substantially within a short period, as it is affected by each transaction subject to the relevant Master Agreement.
Master Repurchase Agreements and Global Master Repurchase Agreements (individually and collectively “Master Repo Agreements”) govern repurchase, reverse repurchase, and certain sale-buyback transactions between a Fund and select counterparties. Master Repo Agreements maintain provisions for, among other things, initiation, income payments, events of default, and maintenance of collateral. The market value of transactions under the Master Repo Agreement, collateral pledged or received, and the net exposure by counterparty as of period end are disclosed in the Notes to Schedules of Investments.
International Swaps and Derivatives Association, Inc. Master Agreements and Credit Support Annexes (“ISDA Master Agreements”) govern bilateral OTC derivative transactions entered into by a Fund with select counterparties. ISDA Master Agreements maintain provisions for general obligations, representations, agreements, collateral posting and events of default or termination. Events of termination include conditions that may entitle counterparties to elect to terminate early and cause settlement of all outstanding transactions under the applicable ISDA Master Agreement. Any election to terminate early could be material to the financial statements. The ISDA Master Agreement may contain additional provisions that add counterparty protection beyond coverage of existing daily exposure if the counterparty has a decline in credit quality below a predefined level or as required by regulation. Similarly, if required by regulation, a Fund may be required to post additional collateral beyond coverage of daily exposure. These amounts, if any, may (or if required by law, will) be segregated with a third-party custodian. To the extent a Fund is required by regulation to post additional collateral beyond coverage of daily exposure, it could potentially incur costs, including in procuring
eligible assets to meet collateral requirements, associated with such posting. The market value of OTC financial derivative instruments, collateral received or pledged, and net exposure by counterparty as of period end are disclosed in the Notes to Schedules of Investments.
8. FEES AND EXPENSES
(a) Management Fee
PIMCO is a majority-owned subsidiary of Allianz Asset Management of America LLC (“Allianz Asset Management”) and serves as the Manager to the Funds, pursuant to an investment management agreement. Pursuant to the Investment Management Agreement with PIMCO (the “Agreement”), and subject to the supervision of the Board, PIMCO is responsible for providing to each Fund investment guidance and policy direction in connection with the management of the Fund, including oral and written research, analysis, advice, and statistical and economic data and information. In addition, pursuant to the Agreement and subject to the general supervision of the Board, PIMCO, at its expense, provides or causes to be furnished most other supervisory and administrative services the Funds require, including but not limited to, expenses of most third-party service providers (e.g., audit, custodial, legal, transfer agency, printing) and other expenses, such as those associated with insurance, proxy solicitations and mailings for shareholder meetings, NYSE listing and related fees, tax services, valuation services and other services the Funds require for their daily operations.
Pursuant to the Agreement, PIMCO receives an annual fee, payable monthly, at the annual rates shown in the table below:
| | | | | | | | |
| | | | | | |
| | |
| PIMCO California Municipal Income Fund | | | | | | | 0.705% | |
| | |
| PIMCO California Municipal Income Fund II | | | | | | | 0.705% | |
| | |
| PIMCO California Municipal Income Fund III | | | | | | | 0.715% | |
| | |
| PIMCO New York Municipal Income Fund | | | | | | | 0.770% | |
| | |
| PIMCO New York Municipal Income Fund II | | | | | | | 0.735% | |
| | |
| PIMCO New York Municipal Income Fund III | | | | | | | 0.860% | |
| | |
| PIMCO Municipal Income Fund | | | | | | | 0.705% | |
| | |
| PIMCO Municipal Income Fund II | | | | | | | 0.685% | |
| | |
| PIMCO Municipal Income Fund III | | | | | | | 0.705% | |
| Management fees calculated based on a Fund’s average daily NAV (including daily net assets attributable to any preferred shares of the Fund that may be outstanding). |
In rendering investment advisory services to each Fund, PIMCO may use the resources of one or more foreign
(non-U.S.)
affiliates that are not registered under the Investment Advisers Act of 1940, as amended (the “Advisers Act”) (the “PIMCO Overseas Affiliates”), to provide portfolio management, research and trading services to a Fund under the Memorandums of Understanding (“MOUs”). Each of the PIMCO Overseas Affiliates are Participating Affiliates of PIMCO as that term is used in relief granted by the staff of the SEC allowing U.S. registered advisers to use investment advisory and trading resources of unregistered advisory affiliates subject to the regulatory supervision of the registered
| | | | |
Notes to Financial Statements | | | | |
adviser. Each PIMCO Overseas Affiliate and any of their respective employees who provide services to the Funds are considered under the MOUs to be “associated persons” of PIMCO as that term is defined in the Advisers Act for purposes of PIMCO’s required supervision.
(b) Fund Expenses
Each Fund bears other expenses, which may vary and affect the total level of expenses paid by shareholders, such as (i) salaries and other compensation or expenses, including travel expenses of any of the Fund’s executive officers and employees, if any, who are not officers, directors, shareholders, members, partners or employees of PIMCO or its subsidiaries or affiliates; (ii) taxes and governmental fees, if any, levied against the Fund; (iii) brokerage fees and commissions and other portfolio transaction expenses incurred by or for the Fund (including, without limitation, fees and expenses of outside legal counsel or third-party consultants retained in connection with reviewing, negotiating and structuring specialized loans and other investments made by the Fund, subject to specific or general authorization by the Board (for example,
so-called
“broken-deal costs” (e.g., fees, costs, expenses and liabilities, including, for example, due diligence-related fees, costs, expenses and liabilities, with respect to unconsummated investments))); (iv) expenses of the Fund’s securities lending (if any), including any securities lending agent fees, as governed by a separate securities lending agreement; (v) costs, including interest expenses, of borrowing money or engaging in other types of leverage financing, including, without limitation, through the use by the Fund of reverse repurchase agreements, tender option bonds, bank borrowings and credit facilities; (vi) costs, including dividend and/or interest expenses and other costs (including, without limitation, offering and related legal costs, fees to brokers, fees to auction agents, fees to transfer agents, fees to ratings agencies and fees to auditors associated with satisfying ratings agency requirements for preferred shares or other securities issued by the Fund and other related requirements in the Fund’s organizational documents) associated with the Fund’s issuance, offering, redemption and maintenance of preferred shares, commercial paper or other senior securities for the purpose of incurring leverage; (vii) fees and expenses of any underlying funds or other pooled vehicles in which the Fund invests; (viii) dividend and interest expenses on short positions taken by the Fund; (ix) fees and expenses, including travel expenses, and fees and expenses of legal counsel retained for their benefit, of Trustees who are not officers, employees, partners, shareholders or members of PIMCO or its subsidiaries or affiliates; (x) extraordinary expenses, including extraordinary legal expenses, that may arise, including expenses incurred in connection with litigation, proceedings, other claims, and the legal obligations of the Fund to indemnify its Trustees, officers, employees, shareholders, distributors, and agents with respect thereto; (xi) organizational and offering expenses of the Funds, including with respect to share offerings, such as rights offerings and shelf offerings, following the Fund’s initial offering, and expenses associated with tender offers and other share repurchases and
redemptions; and (xii) expenses of the Fund which are capitalized in accordance with U.S. GAAP. Without limiting the generality or scope of the foregoing, it is understood that the Funds may bear such expenses either directly or indirectly through contracts or arrangements with PIMCO or an affiliated or unaffiliated third party.
Each of the Trustees of the Funds who is not an “interested person” under Section 2(a)(19) of the Act, (the “Independent Trustees”) also serves as a trustee of a number of other
closed-end
funds for which PIMCO serves as investment manager (together with the Funds, the “PIMCO
Closed-End
Funds”), as well as PIMCO California Flexible Municipal Income Fund, PIMCO Flexible Emerging Markets Income Fund, PIMCO Flexible Credit Income Fund and PIMCO Flexible Municipal Income Fund, each a closed end management investment company managed by PIMCO that is operated as an “interval fund” and PIMCO Managed Accounts Trust, an
open-end
management investment company with multiple series for which PIMCO serves as investment adviser and administrator.
The Funds pay no compensation directly to any Trustee or any other officer who is affiliated with the Manager, all of whom receive remuneration for their services to the Funds from the Manager or its affiliates.
9. RELATED PARTY TRANSACTIONS
The Manager is a related party. Fees payable to this party are disclosed in Note 8, Fees and Expenses, and the accrued related party fee amounts are disclosed on the Statements of Assets and Liabilities.
Certain Funds are permitted to purchase or sell securities from or to certain related affiliated funds under specified conditions outlined in procedures adopted by the Board. The procedures have been designed to ensure that any purchase or sale of securities by the Funds from or to another fund or portfolio that are, or could be, considered an affiliate, or an affiliate of an affiliate, by virtue of having a common investment adviser (or affiliated investment advisers), common Trustees and/or common officers complies with applicable SEC rules and interpretations under the Act. Further, as defined under the procedures, each transaction is effected at the current market price. Purchases and sales of securities pursuant to applicable SEC rules and interpretations under the Act for the period ended December 31, 2023, were as follows (amounts in thousands
):
| | | | | | | | | | | | | | | | |
| | | | | | | | | | | | |
| | | | |
| PIMCO California Municipal Income Fund | | | | | | $ | 0 | | | $ | 23,299 | | | $ | (1,901 | ) |
| | | | |
| PIMCO California Municipal Income Fund II | | | | | | | 487 | | | | 29,167 | | | | (2,219 | ) |
| | | | |
| PIMCO California Municipal Income Fund III | | | | | | | 822 | | | | 29,582 | | | | (2,713 | ) |
| | | | |
| PIMCO New York Municipal Income Fund | | | | | | | 3,745 | | | | 8,708 | | | | (1,284 | ) |
| | | | |
| PIMCO New York Municipal Income Fund II | | | | | | | 6,642 | | | | 13,544 | | | | (2,030 | ) |
| | | | |
| PIMCO New York Municipal Income Fund III | | | | | | | 2,300 | | | | 7,077 | | | | (799 | ) |
| | | | |
| PIMCO Municipal Income Fund | | | | | | | 23,280 | | | | 52,208 | | | | (7,176 | ) |
| | | | |
| PIMCO Municipal Income Fund II | | | | | | | 43,454 | | | | 94,489 | | | | (16,151 | ) |
| | | | |
| PIMCO Municipal Income Fund III | | | | | | | 25,622 | | | | 55,777 | | | | (8,654 | ) |
| A zero balance may reflect actual amounts rounding to less than one thousand. |
10. GUARANTEES AND INDEMNIFICATIONS
Under each Fund’s organizational documents, each Trustee and officer is indemnified, to the extent permitted by the Act, against certain liabilities that may arise out of performance of their duties to the Funds. Additionally, in the normal course of business, the Funds enter into contracts that contain a variety of indemnification clauses. The Funds’ maximum exposure under these arrangements is unknown as this would involve future claims that may be made against the Funds that have not yet occurred. However, the Funds have not had prior claims or losses pursuant to these contracts.
11. PURCHASES AND SALES OF SECURITIES
The length of time a Fund has held a particular security is not generally a consideration in investment decisions. A change in the securities held
by a Fund is known as “portfolio turnover.” Each Fund may engage in frequent and active trading of portfolio securities to achieve its investment objective(s), particularly during periods of volatile market movements. High portfolio turnover may involve correspondingly greater transaction costs, including brokerage commissions or dealer
mark-ups
and other transaction costs on the sale of securities and reinvestments in other securities, which are borne by the Fund. Such sales may also result in realization of taxable capital gains, including short-term capital gains (which are generally taxed at ordinary income tax rates when distributed to shareholders). The transaction costs associated with portfolio turnover may adversely affect a Fund’s performance. The portfolio turnover rates are reported in the Financial Highlights.
Purchases and sales of securities (excluding short-term investments) for the period ended December 31, 2023, were as follows (amounts in thousands
):
| | | | | | | | | | | | | | | | | | | | |
| | | | | | | | |
| | | | |
| | | | | | | | | | | | | |
| | | | | |
| PIMCO California Municipal Income Fund | | | | | | $ | 0 | | | $ | 0 | | | $ | 95,775 | | | $ | 100,596 | |
| | | | | |
| PIMCO California Municipal Income Fund II | | | | | | | 0 | | | | 0 | | | | 91,094 | | | | 104,197 | |
| | | | | |
| PIMCO California Municipal Income Fund III | | | | | | | 0 | | | | 0 | | | | 89,096 | | | | 100,864 | |
| | | | | |
| PIMCO New York Municipal Income Fund | | | | | | | 0 | | | | 0 | | | | 48,467 | | | | 65,263 | |
| | | | | |
| PIMCO New York Municipal Income Fund II | | | | | | | 0 | | | | 0 | | | | 73,499 | | | | 86,793 | |
| | | | | |
| PIMCO New York Municipal Income Fund III | | | | | | | 0 | | | | 0 | | | | 36,790 | | | | 42,386 | |
| | | | | |
| PIMCO Municipal Income Fund | | | | | | | 1,875 | | | | 2,541 | | | | 158,065 | | | | 163,735 | |
| | | | | |
| PIMCO Municipal Income Fund II | | | | | | | 2,813 | | | | 5,748 | | | | 349,614 | | | | 398,500 | |
| | | | | |
| PIMCO Municipal Income Fund III | | | | | | | 938 | | | | 2,773 | | | | 189,962 | | | | 199,139 | |
| A zero balance may reflect actual amounts rounding to less than one thousand. |
12. COMMON SHARES OFFERING
In August 2022, PIMCO Municipal Income Fund II (“PML”) filed an automatically effective shelf registration statement (the “2022 Registration Statement”) and a prospectus supplement, pursuant to the 2022 Registration Statement (the “2022 Prospectus Supplement”), relating to the offer and sale of the Fund’s common shares having an
aggregate offering price of up to $225,000,000 under the Fund’s then current “at the market” program (the “ATM Shares”). As of March 2023, the offering of unsold ATM Shares pursuant to the 2022 Registration Statement has been terminated.
The aggregate dollar amount of Common Shares registered under PML’s Shelf Registration Statement (or its most recent prospectus supplement, if less than such registered amount) as of the end of the period and prior fiscal period were as follows:
| | | | | | | | | | | | |
| | | | | | | | | | |
| Common Shares registered (aggregate $) | | $ | 225,000,000 | | | $ | 225,000,000 | |
| | | |
| Common Shares sold | | | | | | | 148,545 | | | | 2,215,907 | |
| | | |
| Offering proceeds (net of offering costs) | | | | | | $ | 1,376,698 | | | $ | 20,977,865 | |
13. PREFERRED SHARES
(a) Auction-Rate Preferred Shares Each series of Auction-Rate Preferred Shares (“ARPS”) outstanding of each Fund has a liquidation preference of $25,000 per share plus any accumulated, unpaid dividends. Dividends are accumulated daily at an annual rate that is typically reset every seven days through auction procedures (or through default procedures in the event of failed auctions). Distributions of net realized capital gains, if any, are paid at least annually.
| | | | |
Notes to Financial Statements | | | | |
For the period ended December 31, 2023, the annualized dividend rates on the ARPS ranged from:
| | | | | | | | | | | | | | | | | | | | |
| | | | | Shares
Issued and
Outstanding | | | | | | | | | | |
PIMCO California Municipal Income Fund | | | | | | | | | | | | | | | | | | | | |
| Series A | | | | | | | 1,421 | | | | 8.046% | | | | 4.936% | | | | 6.553% | |
| Series B | | | | | | | 1,371 | | | | 8.016% | | | | 4.936% | | | | 7.150% | |
| Series C | | | | | | | 1,604 | | | | 8.016% | | | | 4.936% | | | | 6.553% | |
PIMCO California Municipal Income Fund II | | | | | | | | | | | | | | | | | | | | |
| Series A | | | | | | | 878 | | | | 8.046% | | | | 4.936% | | | | 6.553% | |
| Series B | | | | | | | 736 | | | | 8.031% | | | | 4.936% | | | | 7.150% | |
| Series C | | | | | | | 706 | | | | 8.016% | | | | 4.936% | | | | 7.150% | |
| Series D | | | | | | | 811 | | | | 8.016% | | | | 4.936% | | | | 7.150% | |
| Series E | | | | | | | 784 | | | | 8.016% | | | | 4.936% | | | | 6.553% | |
PIMCO California Municipal Income Fund III | | | | | | | | | | | | | | | | | | | | |
| Series A | | | | | | | 1,674 | | | | 8.031% | | | | 4.936% | | | | 7.150% | |
| Series B | | | | | | | 1,797 | | | | 8.016% | | | | 4.936% | | | | 7.150% | |
PIMCO New York Municipal Income Fund | | | | | | | | | | | | | | | | | | | | |
| Series A | | | | | | | 1,336 | | | | 8.031% | | | | 4.936% | | | | 7.150% | |
PIMCO New York Municipal Income Fund II | | | | | | | | | | | | | | | | | | | | |
| Series A | | | | | | | 1,055 | | | | 8.016% | | | | 4.936% | | | | 7.150% | |
| Series B | | | | | | | 989 | | | | 8.016% | | | | 4.936% | | | | 6.553% | |
PIMCO New York Municipal Income Fund III | | | | | | | | | | | | | | | | | | | | |
| Series A | | | | | | | 1,041 | | | | 8.046% | | | | 4.936% | | | | 6.553% | |
PIMCO Municipal Income Fund | | | | | | | | | | | | | | | | | | | | |
| Series A | | | | | | | 1,107 | | | | 8.046% | | | | 4.936% | | | | 6.553% | |
| Series B | | | | | | | 1,285 | | | | 8.031% | | | | 4.936% | | | | 7.150% | |
| Series C | | | | | | | 1,153 | | | | 8.016% | | | | 4.936% | | | | 7.150% | |
| Series D | | | | | | | 1,044 | | | | 8.016% | | | | 4.936% | | | | 7.150% | |
| Series E | | | | | | | 1,216 | | | | 8.016% | | | | 4.936% | | | | 6.553% | |
PIMCO Municipal Income Fund II | | | | | | | | | | | | | | | | | | | | |
| | | | | | | 1,941 | | | | 8.046% | | | | 4.936% | | | | 6.553% | |
| | | | | | | 1,930 | | | | 8.031% | | | | 4.936% | | | | 7.150% | |
| | | | | | | 2,089 | | | | 8.016% | | | | 4.936% | | | | 7.150% | |
| | | | | | | 1,853 | | | | 8.016% | | | | 4.936% | | | | 7.150% | |
| | | | | | | 1,773 | | | | 8.016% | | | | 4.936% | | | | 6.553% | |
PIMCO Municipal Income Fund III | | | | | | | | | | | | | | | | | | | | |
| Series A | | | | | | | 738 | | | | 8.046% | | | | 4.936% | | | | 6.553% | |
| Series B | | | | | | | 1,020 | | | | 8.031% | | | | 4.936% | | | | 7.150% | |
| Series C | | | | | | | 1,192 | | | | 8.016% | | | | 4.936% | | | | 7.150% | |
| Series D | | | | | | | 1,119 | | | | 8.016% | | | | 4.936% | | | | 7.150% | |
| Series E | | | | | | | 1,108 | | | | 8.016% | | | | 4.936% | | | | 6.553% | |
Each Fund is subject to certain limitations and restrictions while ARPS are outstanding. Failure to comply with these limitations and restrictions could preclude a Fund from declaring or paying any dividends or distributions to common shareholders or repurchasing common shares and/or could trigger the mandatory redemption of ARPS at their liquidation preference plus any accumulated, unpaid dividends.
Ratings agencies may change their methodologies for evaluating and providing ratings for shares of
closed-end
funds at any time and in their sole discretion, which may affect the rating (if any) of Fund’s shares. In addition, ratings downgrades may result in an increase to a Fund’s Maximum Rate, as defined below.
Auction Rate Preferred shareholders of each Fund, who are entitled to one vote per share, generally vote together with the common shareholders of the Fund but vote separately as a class to elect two Trustees of the Fund and on certain matters adversely affecting the rights of the ARPS.
Since
mid-February
2008, holders of ARPS issued by the Funds have been directly impacted by a lack of liquidity, which has similarly affected ARPS holders in many of the nation’s
closed-end
funds. Since then, regularly scheduled auctions for ARPS issued by the Funds have consistently “failed” because of insufficient demand (bids to buy shares) to meet the supply (shares offered for sale) at each auction. In a
failed auction, ARPS holders cannot sell all, and may not be able to sell any, of their shares tendered for sale. While repeated auction failures have affected the liquidity for ARPS, they do not constitute a default or automatically alter the credit quality of the ARPS, and ARPS holders have continued to receive dividends at the defined “maximum rate,” as defined for the Funds in the table below.
| | | | | | | | | | | | | | |
| | | | | | | | | | | |
| | | | | | | The higher of 30-day “AA” Financial Composite Commercial Paper Rates | | | | | | | | |
| | | x | | | OR | | | = | | | | Maximum Rate for the Funds | |
| | | | | | | The Taxable Equivalent of the Short-Term Municipal Obligation Rate 2 | | | | | | | | |
| 150% if all or part of the dividend consists of taxable income or capital gain. |
| “Taxable Equivalent of the Short-Term Municipal Obligation Rate” means 90% of the quotient of (A) the per annum rate expressed on an interest equivalent basis equal to the S&P 7 Day Index divided by (B) 1.00 minus the Marginal Tax Rate (expressed as a decimal). |
The maximum rate is a function of short-term interest rates and is typically, but not necessarily, higher than the rate that would have otherwise been set through a successful auction. If the Funds’ ARPS auctions continue to fail and the “maximum rate” payable on the ARPS rises as a result of changes in short-term interest rates, returns for each Fund’s common shareholders could be adversely affected.
On August 14, 2023, each Fund commenced a voluntary tender offer for up to 100% of its outstanding auction rate preferred shares (“ARPS”) at a price equal to 94.5% of the ARPS’ per share liquidation preference of $25,000 per share (or $23,625 per share) and any unpaid but accrued dividends (each, a “Tender Offer”).
Each Fund’s Tender Offer expired at 5:00 p.m., New York City time, on September 18, 2023.
Details of the ARPS tendered and not withdrawn for each Fund for the reporting period ended December 31, 2023 are provided in the table below:
| | | | | | | | | | | | | | | | | | | | | | | | | | | | | | |
| | | | | | | | | | | | | | | | | | | | | | | |
| | | | | | | | |
| PIMCO California Municipal Income Fund | | | | $ | 25,000 | | | $ | 23,625 | | | | 95 | % | | $ | 10,135,125 | | | | 4,825 | | | | 429 | | | | 4,396 | |
| | | | | | | | |
| PIMCO California Municipal Income Fund II | | | | | 25,000 | | | | 23,625 | | | | 95 | | | | 29,106,000 | | | | 5,147 | | | | 1,232 | | | | 3,915 | |
| | | | | | | | |
| PIMCO California Municipal Income Fund III | | | | | 25,000 | | | | 23,625 | | | | 95 | | | | 10,489,500 | | | | 3,915 | | | | 444 | | | | 3,471 | |
| | | | | | | | |
| PIMCO New York Municipal Income Fund | | | | | 25,000 | | | | 23,625 | | | | 95 | | | | 7,205,625 | | | | 1,641 | | | | 305 | | | | 1,336 | |
| | | | | | | | |
| PIMCO New York Municipal Income Fund II | | | | | 25,000 | | | | 23,625 | | | | 95 | | | | 6,520,500 | | | | 2,320 | | | | 276 | | | | 2,044 | |
| | | | | | | | |
| PIMCO New York Municipal Income Fund III | | | | | 25,000 | | | | 23,625 | | | | 95 | | | | 3,236,225 | | | | 1,178 | | | | 137 | | | | 1,041 | |
| | | | | | | | |
| PIMCO Municipal Income Fund | | | | | 25,000 | | | | 23,625 | | | | 95 | | | | 20,388,375 | | | | 6,668 | | | | 863 | | | | 5,805 | |
| | | | | | | | |
| PIMCO Municipal Income Fund II | | | | | 25,000 | | | | 23,625 | | | | 95 | | | | 55,400,625 | | | | 11,931 | | | | 2,345 | | | | 9,586 | |
| | | | | | | | |
| PIMCO Municipal Income Fund III | | | | | 25,000 | | | | 23,625 | | | | 95 | | | | 23,884,875 | | | | 6,188 | | | | 1,011 | | | | 5,177 | |
(b) Remarketable Variable Rate MuniFund Term Preferred Shares On September 18, 2018, each of PIMCO Municipal Income Fund, PIMCO Municipal Income Fund II, PIMCO Municipal Income Fund III, PIMCO California Municipal Income Fund, PIMCO California Municipal Income Fund II, PIMCO California Municipal Income Fund III and PIMCO New York Municipal Income Fund II (each, a “RVMTP Fund” and collectively, the “RVMTP Funds”) issued a single series of Variable Rate MuniFund Term Preferred Shares, Series 2022 (the “VMTP Shares”).
On June 30, 2021, pursuant to the authority expressly vested in the Boards of Trustees of the RVMTP Funds, the Boards of Trustees of the RVMTP Funds authorized the redesignation (the “Redesignation”) of each Fund’s VMTP Shares as Remarketable Variable Rate MuniFund Term Preferred Shares, Series 2051 (the “Series 2051 RVMTP Shares”). Pursuant to such authority, the Redesignation occurred on July 14, 2021 (the “Redesignation Date”). As redesignated, the Series 2051 RVMTP Shares have a term of 30 years, subject to remarketing every three years and in certain other instances.
On September 20, 2023, each of PIMCO Municipal Income Fund, PIMCO Municipal Income Fund II, PIMCO Municipal Income Fund III, PIMCO
California Municipal Income Fund, PIMCO California Municipal Income Fund II and PIMCO California Municipal Income Fund III issued an additional series of preferred shares designated as Remarketable Variable Rate MuniFund Term Preferred Shares, Series 2053 (the “Series 2053 RVMTP Shares,” and together with the Series 2051 RVMTP Shares, the “RVMTP Shares,” and together with the ARPS, the “Preferred Shares”). The Series 2053 RVMTP Shares have a term of 30 years, subject to remarketing every three years and in certain other instances.
In the RVMTP Funds’ Statements of Assets and Liabilities, the RVMTP Shares’ aggregate liquidation preference is shown as a liability since they are considered debt of the issuer. Costs directly related to the Redesignation and issuance of each series of RVMTP Shares are considered debt issuance costs and are being amortized into interest expense on a straight-line basis through each Early Term Redemption Date (defined below). The liquidation value of the RVMTP Shares in each RVMTP Fund’s Statements of Assets and Liabilities is shown as a liability and represents its liquidation preference, which approximates fair value of the shares and is considered level 2 under the fair value hierarchy, less any unamortized debt issuance costs. The RVMTP
| | | | |
Notes to Financial Statements | | | | |
Shares can be redeemed in whole or in part, at their liquidation preference of $100,000 per share plus any accumulated, unpaid
dividends. No RVMTP Shares were redeemed during the period ended December 31, 2023.
Dividends paid with respect to the RVMTP Shares, which are payable monthly, are treated as interest expense, are accrued daily and are reflected, with respect to the RVMTP Shares, as a component of interest expense in the Statements of Operations. For the period ended December 31, 2023, the amount of the RVMTP Shares outstanding, interest expense related to the dividends paid to RVMTP Shares and the daily weighted average interest rate, including issuance costs, can be found in the table below.
| | | | | | | | | | | | | | | | |
| | | | | | | | | | | Weighted
Average
Interest
Rate* | |
PIMCO California Municipal Income Fund | | | | | | | | | | | | | | | | |
| | | | |
| Series 2051 | | | | | | | 244 | | | | 1,063 | | | | 4.36% | |
| | | | |
| Series 2053 | | | | | | | 102 | | | | 147 | | | | 5.09% | |
| | | | |
PIMCO California Municipal Income Fund II | | | | | | | | | | | | | | | | |
| | | | |
| Series 2051 | | | | | | | 275 | | | | 1,195 | | | | 4.34% | |
| | | | |
| Series 2053 | | | | | | | 292 | | | | 408 | | | | 4.95% | |
| | | | |
PIMCO California Municipal Income Fund III | | | | | | | | | | | | | | | | |
| | | | |
| Series 2051 | | | | | | | 271 | | | | 1,178 | | | | 4.35% | |
| | | | |
| Series 2053 | | | | | | | 105 | | | | 152 | | | | 5.12% | |
| | | | |
PIMCO New York Municipal Income Fund II | | | | | | | | | | | | | | | | |
| | | | |
| Series 2051 | | | | | | | 149 | | | | 656 | | | | 4.41% | |
| | | | |
PIMCO Municipal Income Fund | | | | | | | | | | | | | | | | |
| | | | |
| Series 2051 | | | | | | | 182 | | | | 796 | | | | 4.37% | |
| | | | |
| Series 2053 | | | | | | | 204 | | | | 289 | | | | 5.01% | |
| | | | |
PIMCO Municipal Income Fund II | | | | | | | | | | | | | | | | |
| | | | |
| Series 2051 | | | | | | | 687 | | | | 2,963 | | | | 4.31% | |
| | | | |
| Series 2053 | | | | | | | 555 | | | | 773 | | | | 4.94% | |
| | | | |
PIMCO Municipal Income Fund III | | | | | | | | | | | | | | | | |
| | | | |
| Series 2051 | | | | | | | 343 | | | | 1,485 | | | | 4.33% | |
| | | | |
| Series 2053 | | | | | | | 239 | | | | 336 | | | | 4.98% | |
| * | The rate presented is inclusive of the amortized debt issuance cost. As a result, the rate shown may not fall into the range presented in the table below. |
For the period ended December 31, 2023, the dividend rate on the RVMTP Shares ranged from:
| | | | | | | | | | | | | | | | | | | | |
| | | | | Shares
Issued and
Outstanding | | | | | | | | | | |
| | | | | |
PIMCO California Municipal Income Fund | | | | | | | | | | | | | | | | | | | | |
| | | | | |
| Series 2051 | | | | | | | 244 | | | | 5.44% | | | | 2.58% | | | | 4.790% | |
| | | | | |
| Series 2053 | | | | | | | 102 | | | | 5.47% | | | | 3.92% | | | | 4.820% | |
| | | | | |
PIMCO California Municipal Income Fund II | | | | | | | | | | | | | | | | | | | | |
| | | | | |
| Series 2051 | | | | | | | 275 | | | | 5.44% | | | | 2.58% | | | | 4.790% | |
| | | | | |
| Series 2053 | | | | | | | 292 | | | | 5.47% | | | | 3.92% | | | | 4.820% | |
| | | | | |
PIMCO California Municipal Income Fund III | | | | | | | | | | | | | | | | | | | | |
| | | | | |
| Series 2051 | | | | | | | 271 | | | | 5.44% | | | | 2.58% | | | | 4.790% | |
| | | | | |
| Series 2053 | | | | | | | 105 | | | | 5.47% | | | | 3.92% | | | | 4.820% | |
| | | | | |
PIMCO New York Municipal Income Fund II | | | | | | | | | | | | | | | | | | | | |
| | | | | |
| Series 2051 | | | | | | | 149 | | | | 5.44% | | | | 2.58% | | | | 4.790% | |
| | | | | |
PIMCO Municipal Income Fund | | | | | | | | | | | | | | | | | | | | |
| | | | | |
| Series 2051 | | | | | | | 182 | | | | 5.44% | | | | 2.58% | | | | 4.790% | |
| | | | | |
| Series 2053 | | | | | | | 204 | | | | 5.47% | | | | 3.92% | | | | 4.820% | |
| | | | | |
PIMCO Municipal Income Fund II | | | | | | | | | | | | | | | | | | | | |
| | | | | |
| Series 2051 | | | | | | | 687 | | | | 5.44% | | | | 2.58% | | | | 4.790% | |
| | | | | |
| Series 2053 | | | | | | | 555 | | | | 5.47% | | | | 3.92% | | | | 4.820% | |
| | | | | |
PIMCO Municipal Income Fund III | | | | | | | | | | | | | | | | | | | | |
| | | | | |
| Series 2051 | | | | | | | 343 | | | | 5.44% | | | | 2.58% | | | | 4.790% | |
| | | | | |
| Series 2053 | | | | | | | 239 | | | | 5.47% | | | | 3.92% | | | | 4.820% | |
Each RVMTP Fund, at its option, may designate special terms applicable to all of the outstanding RVMTP Shares for a certain period (a “Special Terms Period”) pursuant to a notice of special terms. Such special terms may differ from those provided in the current governing documents of the RVMTP Shares and may include, without limitation, changes to the dividend rate, dividend payment dates and redemption provisions; provided that such special terms do not affect the parity ranking of the RVMTP Shares to any other class or series of Preferred Shares then outstanding with respect to dividends or distribution of assets upon dissolution, liquidation, or winding up of the affairs of the RVMTP Fund. No Special Terms Period with respect to a series of RVMTP Shares will become effective unless certain conditions are satisfied, including that all of the RVMTP Shares in such series are remarketed (except with respect to any RVMTP Shares whose holders have elected to retain their RVMTP Shares for the Special Terms Period).
In addition, a “Mandatory Tender Event” will occur on each date that is (i) 20 business days before each three-year anniversary since the Redesignation Date (each an “Early Term Redemption”, and the date on which such occurs, an “Early Term Redemption Date”), (ii) the date an RVMTP Fund delivers a notice designating a Special Terms Period, and (iii) 20 business days before the end of a Special Terms Period (provided that no subsequent Special Terms Period is designated). Upon the occurrence of a Mandatory Tender Event, all RVMTP Shares will be subject to mandatory tender (subject to the holders’ election to retain their RVMTP Shares) and the RVMTP Fund will issue or cause to be issued a notice of mandatory tender to the holders of the RVMTP Shares for remarketing on the corresponding Mandatory Tender Date. If any RVMTP Shares subject to a Mandatory Tender Event upon an Early Term Redemption Date of the RVMTP Shares or upon the end of a Special Terms Period (each, an “RVMTP Share Early Term Redemption Date”) have not been either retained by the holders or remarketed by the Mandatory Tender Date, the RVMTP Fund will redeem such RVMTP Shares on the RVMTP Share Early Term Redemption Date.
With respect to the Mandatory Tender Events described in clauses (i), (ii) and (iii) above, the corresponding “Mandatory Tender Date” means, respectively: (i) the date that is 180 calendar days following the Early Term Redemption Date, (ii) the date on which the related Special Terms Period becomes effective, and (iii) the last day of the related Special Terms Period (subject, in each case, to the holders’ election to retain their RVMTP Shares). No Mandatory Tender Event occurred during the period ended December 31, 2023.
Each RVMTP Fund is subject to certain limitations and restrictions while the RVMTP Shares are outstanding. Failure to comply with these limitations and restrictions could preclude an RVMTP Fund from declaring or paying any dividends or distributions to common shareholders or repurchasing common shares and/or could trigger the
mandatory redemption of the RVMTP Shares at their liquidation preference plus any accumulated, unpaid dividends and other distributions. Any resulting suspension of payment of common share dividends may result in a tax penalty for the applicable RVMTP Fund and, in certain circumstances, the loss of treatment as a regulated investment company. Any such mandatory redemption will be conducted on a pro rata basis among each series of the RVMTP Shares and the ARPS based upon the proportion that the aggregate liquidation preference of any series bears to the aggregate liquidation preference of all outstanding series of such RVMTP Fund’s preferred shares. Under the terms of a purchase agreement between each RVMTP Fund and the investor in the RVMTP Shares, each RVMTP Fund is subject to various investment requirements. These requirements may be more restrictive than those to which the RVMTP Fund is otherwise subject in accordance with its investment objective(s) and policies. In addition, each RVMTP Fund is subject to certain restrictions on its investments imposed by guidelines of the rating agencies that rate the RVMTP Shares, which guidelines may be changed by the applicable rating agency, in its sole discretion, from time to time. These guidelines may impose asset coverage or portfolio composition requirements that are more stringent than those imposed on the RVMTP Fund by the Act.
Each RVMTP Fund is required to maintain certain asset coverage with respect to all outstanding senior securities of the RVMTP Fund which are stocks for purposes of the Act, including the RVMTP Shares and ARPS, as set forth in such RVMTP Fund’s governing documents and the Act. One such requirement under the Act is that a RVMTP Fund is not permitted to declare or pay common share dividends unless immediately thereafter the RVMTP Fund has a minimum asset coverage ratio of 200% with respect to all outstanding senior securities of the Fund which are stocks for purposes of the Act after deducting the amount of such common share dividends. The asset coverage per share for each RVMTP Fund is reported in the Financial Highlights and is disclosed as the product of the asset coverage ratio as of period end and the current liquidation preference.
With respect to the payment of dividends and as to the distribution of assets of each RVMTP Fund, ARPS and RVMTP Shares rank on parity with each other, and are both senior in priority to the RVMTP Funds’ outstanding common shares. Holders of preferred shares of each RVMTP Fund, who are entitled to one vote per share, including holders of RVMTP Shares and ARPS, generally vote together as one class with the common shareholders of each RVMTP Fund, but preferred shareholders (RVMTP Shares and ARPS together) vote separately as a class to elect two Trustees of each Fund, as required by the Act, and on certain matters adversely affecting the rights of preferred shareholders. Under the Act, preferred shareholders, including holders of the RVMTP Shares and ARPS, are also entitled to elect a majority of the trustees at any time when dividends on the preferred shares are unpaid for two full years.
| | | | |
Notes to Financial Statements | | | | |
The RVMTP Shares’ Dividend Rate (as defined below) is determined over the course of a
seven-day
period, which generally commences each Thursday and ends the following Wednesday (the “Rate Period”). The dividends per share for RVMTP Shares for a given Rate Period are dependent on the RVMTP Share dividend rate for that Rate Period (the “RVMTP Share Dividend Rate”). The RVMTP Share Dividend Rate is equal to the greater of (i) the sum of the Index Rate
1
plus the Applicable Spread
2
for the Rate Period plus the “Failed Remarketing Spread”
3
, if any, and (ii) the sum of (a) the product of the Index Rate multiplied by the Applicable Multiplier
4
for such Rate Period plus (b) 0.92% plus (c) the Failed Remarketing Spread, if any.
5
| | | | | | | | | | | | | | | | | | | | |
| | | | | | | | | | | |
| | | | | | | Number of days in the Rate Period (or a part thereof) | | | | | | | | | | | | | | |
| Dividend Rate | | | x | | | Divided by | | x | | | 100,000 | | | | = | | | | Dividends per RVMTP Share | |
| | | | | | | Total number of days in the year | | | | | | | | | | | | | | |
| The Index Rate is determined by reference to a weekly, high-grade index comprised of seven-day, tax-exempt variable rate demand notes, generally the Securities Industry and Financial Markets Association Municipal Swap Index. |
| The Applicable Spread for a Rate Period is a percentage per year that is based on the long-term rating most recently assigned by the applicable ratings agency to the RVMTP Shares. |
| In connection with a failed remarketing related to an Early Term Redemption, the Failed Remarketing Spread is (i) 0.75% for the first 59 days following the applicable Early Term Redemption Date, (ii) 1.00% for the 60th to the 89th day following such Early Term Redemption Date, (iii) 1.25% for the 90th to the 119th day following such Early Term Redemption Date, (iv) 1.50% for the 120th to the 149th day following such Early Term Redemption Date, and (v) 1.75% for the 150th day following such Early Term Redemption Date to the date of the associated mandatory redemption of the RVMTP Shares. In connection with a failed remarketing related to a Special Terms Period (each a “Failed Special Terms Period Remarketing”), the Failed Remarketing Spread means (i) for so long as two or more Failed Special Terms Period Remarketings have not occurred, 0.05%, and (ii) following the second occurrence of a Failed Special Terms Period Remarketing, 0.10% multiplied by the number of Failed Special Terms Period Remarketings that have occurred after the first Failed Special Terms Period Remarketing. |
| The Applicable Multiplier for a Rate Period is a percentage that is based on the long-term rating most recently assigned by the applicable ratings agency to the RVMTP Shares. |
| The Dividend Rate will in no event exceed 15% per year. |
14. BASIS FOR CONSOLIDATION
PIMCO Municipal Income Fund, PIMCO Municipal Income Fund II, and PIMCO Municipal Income Fund III’s subsidiaries were each formed as a wholly owned subsidiary acting as an investment vehicle for the Fund in order to effect certain investments for the Fund consistent with the Fund’s investment objectives and policies in effect from time to time. Each Fund’s investment portfolio has been consolidated and includes the portfolio holdings of the Fund and its respective subsidiary. Accordingly, the consolidated financial statements include the accounts of each Fund and its respective subsidiary. All inter-company transactions and balances have been eliminated. This structure was established so that certain investments could be held by a separate legal entity from the Fund. See the table below for details regarding the structure, incorporation and relationship as of period end of the subsidiaries.
| | | | | | | | | | | | | | | | |
| | | | | | | | | | | | |
| | | | |
| PIMCO Municipal Income Fund | | | | | | | 1800 SPV I LLC | | | | 06/29/2023 | | | | 0.1% | |
| | | | |
| PIMCO Municipal Income Fund II | | | | | | | 1860 SPV I LLC | | | | 06/29/2023 | | | | 0.1% | |
| | | | |
| PIMCO Municipal Income Fund III | | | | | | | 1830 SPV I LLC | | | | 06/29/2023 | | | | 0.1% | |
| A zero balance may reflect actual amounts rounding to less than one thousand. |
15. REGULATORY AND LITIGATION MATTERS
The Funds are not named as defendants in any material litigation or arbitration proceedings and are not aware of any material litigation or claim pending or threatened against them.
The foregoing speaks only as of the date of this report.
16. FEDERAL INCOME TAX MATTERS
Each Fund intends to qualify as a regulated investment company under Subchapter M of the Internal Revenue Code (the “Code”) and distribute all of its income and net realized gains, if applicable, to shareholders. Accordingly, no provision for Federal income taxes has been made. Due to the timing of when distributions are made by a Fund, the Fund may be subject to an excise tax of 4% of the amount by
which 98% of the Fund’s annual taxable income and 98.2% of net realized gains exceed the distributions from such taxable income and realized gains for the calendar year.
A Fund may be subject to local withholding taxes, including those imposed on realized capital gains. Any applicable foreign capital gains tax is accrued daily based upon net unrealized gains, and may be payable following the sale of any applicable investments.
In accordance with U.S. GAAP, the Manager has reviewed the Funds’ tax positions for all open tax years. As of December 31, 2023, the Funds have recorded no liability for net unrecognized tax benefits relating to uncertain income tax positions they have taken or expect to take in future tax returns.
The Funds file U.S. federal, state, and local tax returns as required. The Funds’ tax returns are subject to examination by relevant tax authorities until expiration of the applicable statute of limitations, which is generally three years after the filing of the tax return but which
can be extended to six years in certain circumstances. Tax returns for open years have incorporated no uncertain tax positions that require a provision for income taxes.
As of December 31, 2023, the components of distributable taxable earnings are as follows (amounts in thousands
):
| | | | | | | | | | | | | | | | | | | | | | | | | | | | | | | | | | | | | | | | |
| | | | | | Undistributed
Tax Exempt
Income | | | Undistributed Ordinary Income (1) | | | Undistributed
Long-Term
Capital Gains | | | Net Tax Basis Unrealized Appreciation/ (Depreciation) (2) | | | Other Accounting Differences (3) | | | Accumulated Capital Losses (4) | | | Qualified Late- Year Loss Deferral - Capital (5) | | | Qualified Late-Year Loss Deferral - Ordinary (6) | | | Total
Components
of
Distributable
Earnings | |
| | | | | | | | | | |
| PIMCO California Municipal Income Fund | | | | | | $ | 0 | | | $ | 0 | | | $ | 0 | | | $ | 4,711 | | | $ | (819 | ) | | $ | (20,536 | ) | | $ | 0 | | | $ | 0 | | | $ | (16,644 | ) |
| | | | | | | | | | |
| PIMCO California Municipal Income Fund II | | | | | | | 0 | | | | 0 | | | | 0 | | | | 11,542 | | | | (817 | ) | | | (21,851 | ) | | | 0 | | | | 0 | | | | (11,126 | ) |
| | | | | | | | | | |
| PIMCO California Municipal Income Fund III | | | | | | | 0 | | | | 0 | | | | 0 | | | | 2,954 | | | | (751 | ) | | | (17,677 | ) | | | 0 | | | | 0 | | | | (15,474 | ) |
| | | | | | | | | | |
| PIMCO New York Municipal Income Fund | | | | | | | 0 | | | | 0 | | | | 0 | | | | 434 | | | | (304 | ) | | | (10,385 | ) | | | 0 | | | | 0 | | | | (10,255 | ) |
| | | | | | | | | | |
| PIMCO New York Municipal Income Fund II | | | | | | | 0 | | | | 0 | | | | 0 | | | | 1,713 | | | | (390 | ) | | | (14,825 | ) | | | 0 | | | | 0 | | | | (13,502 | ) |
| | | | | | | | | | |
| PIMCO New York Municipal Income Fund III | | | | | | | 0 | | | | 0 | | | | 0 | | | | 963 | | | | (179 | ) | | | (5,679 | ) | | | 0 | | | | 0 | | | | (4,895 | ) |
| | | | | | | | | | |
| PIMCO Municipal Income Fund | | | | | | | 0 | | | | 0 | | | | 0 | | | | 4,818 | | | | (1,274 | ) | | | (34,632 | ) | | | 0 | | | | 0 | | | | (31,088 | ) |
| | | | | | | | | | |
| PIMCO Municipal Income Fund II | | | | | | | 0 | | | | 0 | | | | 0 | | | | 20,364 | | | | (2,913 | ) | | | (89,429 | ) | | | 0 | | | | 0 | | | | (71,978 | ) |
| | | | | | | | | | |
| PIMCO Municipal Income Fund III | | | | | | | 0 | | | | 0 | | | | 0 | | | | 9,552 | | | | (1,257 | ) | | | (42,380 | ) | | | 0 | | | | 0 | | | | (34,085 | ) |
| A zero balance may reflect actual amounts rounding to less than one thousand. |
| Includes undistributed short-term capital gains, if any. |
| Adjusted for open wash sale loss deferrals. Also adjusted for differences between book and tax realized and unrealized gain (loss) on interest accrued on defaulted securities, other debt adjustments, and tax-exempt securities. |
| Represents differences in income tax regulations and financial accounting principles generally accepted in the United States of America, mainly for distributions payable at fiscal year end. |
| Capital losses available to offset future net capital gains as shown below. |
| Capital losses realized during the period November 1, 2023 through December 31, 2023 which the Funds elected to defer to the following taxable year pursuant to income tax regulations. |
| Specified losses realized during the period November 1, 2023 through December 31, 2023 which the Funds elected to defer to the following taxable year pursuant to income tax regulations. |
Under the Regulated Investment Company Modernization Act of 2010, a fund is permitted to carry forward any new capital losses for an unlimited period. Additionally, such capital losses that are carried forward will retain their character as either short-term or long-term capital losses rather than being considered all short-term under previous law.
As of December 31, 2023, the Funds had the following post-effective capital losses with no expiration (amounts in thousands
):
| | | | | | | | | | | | |
| | | | | | | | | | |
| | | |
| PIMCO California Municipal Income Fund | | | | | | $ | 9,045 | | | $ | 11,491 | |
| | | |
| PIMCO California Municipal Income Fund II | | | | | | | 10,028 | | | | 11,823 | |
| | | |
| PIMCO California Municipal Income Fund III | | | | | | | 7,934 | | | | 9,743 | |
| | | |
| PIMCO New York Municipal Income Fund | | | | | | | 2,181 | | | | 8,204 | |
| | | |
| PIMCO New York Municipal Income Fund II | | | | | | | 5,293 | | | | 9,532 | |
| | | |
| PIMCO New York Municipal Income Fund III | | | | | | | 1,073 | | | | 4,606 | |
| | | |
| PIMCO Municipal Income Fund | | | | | | | 12,755 | | | | 21,877 | |
| | | |
| PIMCO Municipal Income Fund II | | | | | | | 31,764 | | | | 57,665 | |
| | | |
| PIMCO Municipal Income Fund III | | | | | | | 12,755 | | | | 29,625 | |
| A zero balance may reflect actual amounts rounding to less than one thousand. |
| | | | |
Notes to Financial Statements | | | | December 31, 2023 |
As of December 31, 2023, the aggregate cost and the net unrealized appreciation/(depreciation) of investments for federal income tax purposes are as follows (amounts in thousands
):
| | | | | | | | | | | | | | | | | | | | |
| | | | | | | | | | | | | | | Net Unrealized Appreciation/ (Depreciation) (7) | |
| | | | | |
| PIMCO California Municipal Income Fund | | | | | | $ | 337,846 | | | $ | 11,158 | | | $ | (5,523 | ) | | $ | 5,635 | |
| | | | | |
| PIMCO California Municipal Income Fund II | | | | | | | 358,845 | | | | 18,385 | | | | (6,167 | ) | | | 12,218 | |
| | | | | |
| PIMCO California Municipal Income Fund III | | | | | | | 296,389 | | | | 8,121 | | | | (5,152 | ) | | | 2,969 | |
| | | | | |
| PIMCO New York Municipal Income Fund | | | | | | | 103,672 | | | | 3,194 | | | | (2,633 | ) | | | 561 | |
| | | | | |
| PIMCO New York Municipal Income Fund II | | | | | | | 160,619 | | | | 5,472 | | | | (3,713 | ) | | | 1,759 | |
| | | | | |
| PIMCO New York Municipal Income Fund III | | | | | | | 62,599 | | | | 2,341 | | | | (1,359 | ) | | | 982 | |
| | | | | |
| PIMCO Municipal Income Fund | | | | | | | 439,749 | | | | 19,845 | | | | (15,257 | ) | | | 4,588 | |
| | | | | |
| PIMCO Municipal Income Fund II | | | | | | | 949,172 | | | | 45,701 | | | | (24,995 | ) | | | 20,706 | |
| | | | | |
| PIMCO Municipal Income Fund III | | | | | | | 461,149 | | | | 22,207 | | | | (12,803 | ) | | | 9,404 | |
| A zero balance may reflect actual amounts rounding to less than one thousand. |
| Adjusted for open wash sale loss deferrals. Also adjusted for differences between book and tax realized and unrealized gain (loss) on interest accrued on defaulted securities, other debt adjustments, and tax-exempt securities. |
For the fiscal years ended December 31, 2023 and December 31, 2022, respectively, the Funds made the following tax basis distributions (amounts in thousands
):
| | | | | | | | | | | | | | | | | | | | | | | | | | | | | | | | | | | | |
| | | | | | | | | | |
| | | | | | | | | |
| | | | | | Tax-Exempt Income Distributions | | | Ordinary Income Distributions (8) | | | Long-Term
Capital Gain
Distributions | | | | | | Tax-Exempt Income Distributions | | | Ordinary Income Distributions (8) | | | Long-Term
Capital Gain
Distributions | | | | |
| | | | | | | | | |
| PIMCO California Municipal Income Fund | | | | | | $ | 11,043 | | | $ | 489 | | | $ | 0 | | | $ | 3,665 | | | $ | 13,546 | | | $ | 427 | | | $ | 124 | | | $ | 3,671 | |
| | | | | | | | | |
| PIMCO California Municipal Income Fund II | | | | | | | 11,683 | | | | 447 | | | | 0 | | | | 3,320 | | | | 14,231 | | | | 242 | | | | 0 | | | | 634 | |
| | | | | | | | | |
| PIMCO California Municipal Income Fund III | | | | | | | 11,314 | | | | 510 | | | | 0 | | | | 1,788 | | | | 12,155 | | | | 172 | | | | 0 | | | | 0 | |
| | | | | | | | | |
| PIMCO New York Municipal Income Fund | | | | | | | 3,337 | | | | 173 | | | | 0 | | | | 1,966 | | | | 3,935 | | | | 99 | | | | 0 | | | | 804 | |
| | | | | | | | | |
| PIMCO New York Municipal Income Fund II | | | | | | | 5,681 | | | | 229 | | | | 0 | | | | 1,387 | | | | 6,457 | | | | 154 | | | | 0 | | | | 0 | |
| | | | | | | | | |
| PIMCO New York Municipal Income Fund III | | | | | | | 2,120 | | | | 137 | | | | 0 | | | | 1,154 | | | | 2,425 | | | | 61 | | | | 0 | | | | 587 | |
| | | | | | | | | |
| PIMCO Municipal Income Fund | | | | | | | 18,511 | | | | 870 | | | | 0 | | | | 3,390 | | | | 19,763 | | | | 690 | | | | 0 | | | | 0 | |
| | | | | | | | | |
| PIMCO Municipal Income Fund II | | | | | | | 35,402 | | | | 1,594 | | | | 0 | | | | 11,189 | | | | 43,708 | | | | 964 | | | | 0 | | | | 6,891 | |
| | | | | | | | | |
| PIMCO Municipal Income Fund III | | | | | | | 18,096 | | | | 658 | | | | 0 | | | | 3,266 | | | | 21,683 | | | | 0 | | | | 0 | | | | 0 | |
| | | | | | | | | | | | | | | | | | | | | | | | | | | | | | | | | | | | |
| A zero balance may reflect actual amounts rounding to less than one thousand. |
| Includes short-term capital gains distributed, if any. |
| A portion of the distributions made represents a tax return of capital. Return of capital distributions have been reclassified from undistributed net investment income to paid-in capital to more appropriately conform financial accounting to tax accounting. |
17. SUBSEQUENT EVENTS
In preparing these financial statements, the Funds’ management has evaluated events and transactions for potential recognition or disclosure through the date the financial statements were issued.
On January 02, 2024, the following distributions were declared to common shareholders payable February 01, 2024 to shareholders of record on January 12, 2024:
| | | | | | | | |
| | |
| PIMCO California Municipal Income Fund | | | | | | $ | 0.036000 per common share | |
| | |
| PIMCO California Municipal Income Fund II | | | | | | $ | 0.021500 per common share | |
| | |
| PIMCO California Municipal Income Fund III | | | | | | $ | 0.029500 per common share | |
| | |
| PIMCO New York Municipal Income Fund | | | | | | $ | 0.033500 per common share | |
| | |
| PIMCO New York Municipal Income Fund II | | | | | | $ | 0.029500 per common share | |
| | |
| PIMCO New York Municipal Income Fund III | | | | | | $ | 0.024800 per common share | |
| | |
| PIMCO Municipal Income Fund | | | | | | $ | 0.042000 per common share | |
| | |
| PIMCO Municipal Income Fund II | | | | | | $ | 0.039500 per common share | |
| | |
| PIMCO Municipal Income Fund III | | | | | | $ | 0.033000 per common share | |
On February 01, 2024, the following distributions were declared to common shareholders payable March 01, 2024 to shareholders of record on February 12, 2024:
| | | | | | | | |
| | |
| PIMCO California Municipal Income Fund | | | | | | $ | 0.036000 per common share | |
| | |
| PIMCO California Municipal Income Fund II | | | | | | $ | 0.021500 per common share | |
| | |
| PIMCO California Municipal Income Fund III | | | | | | $ | 0.029500 per common share | |
| | |
| PIMCO New York Municipal Income Fund | | | | | | $ | 0.033500 per common share | |
| | |
| PIMCO New York Municipal Income Fund II | | | | | | $ | 0.029500 per common share | |
| | |
| PIMCO New York Municipal Income Fund III | | | | | | $ | 0.024800 per common share | |
| | |
| PIMCO Municipal Income Fund | | | | | | $ | 0.042000 per common share | |
| | |
| PIMCO Municipal Income Fund II | | | | | | $ | 0.039500 per common share | |
| | |
| PIMCO Municipal Income Fund III | | | | | | $ | 0.033000 per common share | |
There were no other subsequent events identified that require recognition or disclosure.
| | | | |
Report of Independent Registered Public Accounting Firm | | | | |
To the Board of Trustees and Shareholders of PIMCO California Municipal Income Fund, PIMCO California Municipal Income Fund II, PIMCO California Municipal Income Fund III, PIMCO New York Municipal Income Fund, PIMCO New York Municipal Income Fund II, PIMCO New York Municipal Income Fund III, PIMCO Municipal Income Fund, PIMCO Municipal Income Fund II and PIMCO Municipal Income Fund III
Opinions on the Financial Statements
We have audited the accompanying statements of assets and liabilities, including the schedules of investments, of each of the funds listed in the table below (hereafter collectively referred to as the “Funds”) as of December 31, 2023, the related statements of operations, of changes in net assets and, for the funds indicated in the table below, of cash flows, for each of the periods indicated in the table below, including the related notes, and the financial highlights for each of the five years in the period ended December 31, 2023 (collectively referred to as the “financial statements”). In our opinion, the financial statements present fairly, in all material respects, the financial position of each of the Funds listed in the table below as of December 31, 2023, the results of each of their operations, the changes in each of their net assets and, for the funds indicated in the table below, each of their cash flows, for the periods indicated in the table below, and each of the financial highlights for each of the five years in the period ended December 31, 2023, in conformity with accounting principles generally accepted in the United States of America.
PIMCO California Municipal Income Fund
(1)
PIMCO California Municipal Income Fund II
(1)
PIMCO California Municipal Income Fund III
(1)
PIMCO New York Municipal Income Fund
(2)
PIMCO New York Municipal Income Fund II
(2)
PIMCO New York Municipal Income Fund III
(2)
PIMCO Municipal Income Fund
(2)
*
PIMCO Municipal Income Fund II
(1)
*
PIMCO Municipal Income Fund III
(1)
*
| Statement of operations and statement of cash flows for the year ended December 31, 2023, and statement of changes in net assets for the years ended December 31, 2023 and 2022 |
| Statement of operations for the year ended December 31, 2023 and statement of changes in net assets for the years ended December 31, 2023 and 2022 |
| * | The financial statements for PIMCO Municipal Income Fund, PIMCO Municipal Income Fund II, and PIMCO Municipal Income Fund III are presented on a consolidated basis |
These financial statements are the responsibility of the Funds’ management. Our responsibility is to express an opinion on the Funds’ financial statements based on our audits. We are a public accounting firm registered with the Public Company Accounting Oversight Board (United States) (PCAOB) and are required to be independent with respect to the Funds in accordance with the U.S. federal securities laws and the applicable rules and regulations of the Securities and Exchange Commission and the PCAOB.
We conducted our audits of these financial statements in accordance with the standards of the PCAOB. Those standards require that we plan and perform the audit to obtain reasonable assurance about whether the financial statements are free of material misstatement, whether due to error or fraud.
Our audits included performing procedures to assess the risks of material misstatement of the financial statements, whether due to error or fraud, and performing procedures that respond to those risks. Such procedures included examining, on a test basis, evidence regarding the amounts and disclosures in the financial statements. Our audits also included evaluating the accounting principles used and significant estimates made by management, as well as evaluating the overall presentation of the financial statements. Our procedures included confirmation of securities owned as of December 31, 2023 by correspondence with the custodian, brokers and agent banks; when replies were not received from brokers or agent banks, we performed other auditing procedures. We believe that our audits provide a reasonable basis for our opinions.
/s/ PricewaterhouseCoopers LLP
We have served as the auditor of one or more investment companies in PIMCO
Non-Taxable
Closed-End
Funds since 2002.
| | | | | | |
| | (abbreviations that may be used in the preceding statements) | | | | (Unaudited) |
| | | | | | | | | | |
| | | | |
Counterparty Abbreviations: | | | | | | | | |
| | | | | |
| | Fixed Income Clearing Corporation | | | | | | | | |
| | | | |
| | | | | | | | |
| | | | | |
| | | | | | | | | | |
| | | | |
Municipal Bond or Agency Abbreviations: | | | | | | | | |
| | | | | |
| | | | | | California Mortgage Insurance | | | | National Public Finance Guarantee Corp. |
| | | | | |
| | Assured Guaranty Municipal | | | | | | | | |
| | | | | |
| | American Municipal Bond Assurance Corp. | | | | Federal Housing Administration | | | | Qualified School Bond Loan Fund |
| | | | | |
| | Build America Mutual Assurance | | | | Federal National Mortgage Association | | | | |
| | | | |
| | | | | | | | |
| | | | | |
| | | | | | | | | | Interest rate to be determined when loan settles or at the time of funding |
| | | | |
Federal Income Tax Information | | | | (Unaudited) |
As required by the Internal Revenue Code (“Code”) and Treasury Regulations, if applicable, shareholders must be notified within 60 days of the Funds’ fiscal year end regarding the status of qualified dividend income and the dividend received deduction.
Dividend Received Deduction.
Corporate shareholders are generally entitled to take the dividend received deduction on the portion of a fund’s dividend distribution that qualifies under tax law. The percentage of the following Funds’ fiscal 2023 ordinary income dividend that qualifies for the corporate dividend corporate dividend received deduction is set forth below:
Qualified Dividend Income.
Under the Jobs and Growth Tax Relief Reconciliation Act of 2003, the following percentage of ordinary dividends paid during the fiscal year ended December 31, 2023 was designated as ‘‘qualified dividend income’’ as defined in the Jobs and Growth Tax Relief Reconciliation Act of 2003 subject to reduced tax rates in 2023:
Qualified Interest Income and Qualified Short-Term Capital Gain (for
non-U.S.
resident shareholders only).
Under the American Jobs Creation Act of 2004, the following amounts of ordinary dividends paid during the fiscal year ended December 31, 2023 are considered to be derived from “qualified interest income,” as defined in Section 871(k)(1)(E) of the Code, and therefore are designated as interest-related dividends, as defined in Section 871(k)(1)(C) of the Code. Further, the following amounts of ordinary dividends paid during the fiscal year ended December 31, 2023 are considered to be derived from “qualified short-term capital gain,” as defined in Section 871(k)(2)(D) of the Code, and therefore are designated as qualified short-term gain dividends, as defined by Section 871(k)(2)(C) of the Code.
Section 163(j) Interest Dividends.
The Funds intend to pass through the maximum amount allowable as Section 163(j) Interest defined in Proposed Treasury
Section 1.163(j)-1(b).
The 163(j) percentage of ordinary income distributions are as follows:
| | | | | | | | | | | | | | | | | | | | | | | | |
| | | | | | Dividend
Received
Deduction
% | | | | | | Qualified Interest Income (000s) | | | Qualified Short-Term Capital Gains (000s) | | | 163(j) Interest Dividends (000s) | |
| | | | | | |
| PIMCO California Municipal Income Fund | | | | | | | 0% | | | | 0% | | | $ | 11,532 | | | $ | 0 | | | $ | 0 | |
| | | | | | |
| PIMCO California Municipal Income Fund II | | | | | | | 0% | | | | 0% | | | | 12,130 | | | | 0 | | | | 0 | |
| | | | | | |
| PIMCO California Municipal Income Fund III | | | | | | | 0% | | | | 0% | | | | 11,824 | | | | 0 | | | | 0 | |
| | | | | | |
| PIMCO New York Municipal Income Fund | | | | | | | 0% | | | | 0% | | | | 3,510 | | | | 0 | | | | 0 | |
| | | | | | |
| PIMCO New York Municipal Income Fund II | | | | | | | 0% | | | | 0% | | | | 5,910 | | | | 0 | | | | 0 | |
| | | | | | |
| PIMCO New York Municipal Income Fund III | | | | | | | 0% | | | | 0% | | | | 2,257 | | | | 0 | | | | 0 | |
| | | | | | |
| PIMCO Municipal Income Fund | | | | | | | 0% | | | | 0% | | | | 19,381 | | | | 0 | | | | 0 | |
| | | | | | |
| PIMCO Municipal Income Fund II | | | | | | | 0% | | | | 0% | | | | 36,996 | | | | 0 | | | | 0 | |
| | | | | | |
| PIMCO Municipal Income Fund III | | | | | | | 0% | | | | 0% | | | | 18,754 | | | | 0 | | | | 0 | |
| A zero balance may reflect actual amounts rounding to less than one thousand. |
Shareholders are advised to consult their own tax advisor with respect to the tax consequences of their investment in the Trust. In January 2024, you will be advised on IRS Form
1099-DIV
as to the federal tax status of the dividends and distributions received by you in calendar year 2023.
Section 199A Dividends.
Non-corporate
shareholders meeting certain holding period requirements may be able to deduct up to 20 percent of qualified REIT dividends passed through and reported to the shareholders as IRC section 199A dividends. The IRC section 199A percentage of ordinary dividends are as follows:
| | | | | | | | |
| | | | | | | |
| | |
| PIMCO California Municipal Income Fund | | | | | | | 0% | |
| | |
| PIMCO California Municipal Income Fund II | | | | | | | 0% | |
| | |
| PIMCO California Municipal Income Fund III | | | | | | | 0% | |
| | |
| PIMCO New York Municipal Income Fund | | | | | | | 0% | |
| | |
| PIMCO New York Municipal Income Fund II | | | | | | | 0% | |
| | |
| PIMCO New York Municipal Income Fund III | | | | | | | 0% | |
| | |
| PIMCO Municipal Income Fund | | | | | | | 0% | |
| | |
| PIMCO Municipal Income Fund II | | | | | | | 0% | |
| | |
| PIMCO Municipal Income Fund III | | | | | | | 0% | |
For purposes of Section 19 of the Investment Company Act of 1940 (the “Act”), the Funds estimated the periodic sources of any dividends paid during the period covered by this report in accordance with good accounting practice. Pursuant to Rule
19a-1(e)
under the Act, the table below sets forth the actual source information for dividends paid during the six month period ended December 31, 2023 calculated as of each distribution period pursuant to Section 19 of the Act. The information below is not provided for U.S. federal income tax reporting purposes. The tax character of all dividends and distributions is reported on Form
1099-DIV
(for shareholders who receive U.S. federal tax reporting) at the end of each calendar year. See the Financial Highlights section of this report for the tax characterization of distributions determined in accordance with federal income tax regulations for the fiscal year.
| | | | | | | | | | | | | | | | | | | | |
PIMCO California Municipal Income Fund | | | | | | | | Net Realized
Capital Gains* | | | Paid-in Surplus or Other Capital Sources** | | | | |
| | | | | |
| July 2023 | | | | | | $ | 0.0130 | | | $ | 0.0000 | | | $ | 0.0230 | | | $ | 0.0360 | |
| | | | | |
| August 2023 | | | | | | $ | 0.0121 | | | $ | 0.0000 | | | $ | 0.0239 | | | $ | 0.0360 | |
| | | | | |
| September 2023 | | | | | | $ | 0.0105 | | | $ | 0.0000 | | | $ | 0.0255 | | | $ | 0.0360 | |
| | | | | |
| October 2023 | | | | | | $ | 0.0135 | | | $ | 0.0000 | | | $ | 0.0225 | | | $ | 0.0360 | |
| | | | | |
| November 2023 | | | | | | $ | 0.0207 | | | $ | 0.0000 | | | $ | 0.0153 | | | $ | 0.0360 | |
| | | | | |
| December 2023 | | | | | | $ | 0.0097 | | | $ | 0.0000 | | | $ | 0.0263 | | | $ | 0.0360 | |
| | | | | |
PIMCO California Municipal Income Fund II | | | | | | | | Net Realized
Capital Gains* | | | Paid-in Surplus or Other Capital Sources** | | | | |
| | | | | |
| July 2023 | | | | | | $ | 0.0080 | | | $ | 0.0000 | | | $ | 0.0135 | | | $ | 0.0215 | |
| | | | | |
| August 2023 | | | | | | $ | 0.0075 | | | $ | 0.0000 | | | $ | 0.0140 | | | $ | 0.0215 | |
| | | | | |
| September 2023 | | | | | | $ | 0.0059 | | | $ | 0.0000 | | | $ | 0.0156 | | | $ | 0.0215 | |
| | | | | |
| October 2023 | | | | | | $ | 0.0091 | | | $ | 0.0000 | | | $ | 0.0124 | | | $ | 0.0215 | |
| | | | | |
| November 2023 | | | | | | $ | 0.0116 | | | $ | 0.0000 | | | $ | 0.0099 | | | $ | 0.0215 | |
| | | | | |
| December 2023 | | | | | | $ | 0.0071 | | | $ | 0.0000 | | | $ | 0.0144 | | | $ | 0.0215 | |
| | | | | |
PIMCO California Municipal Income Fund III | | | | | | | | Net Realized
Capital Gains* | | | Paid-in Surplus or Other Capital Sources** | | | | |
| | | | | |
| July 2023 | | | | | | $ | 0.0098 | | | $ | 0.0000 | | | $ | 0.0197 | | | $ | 0.0295 | |
| | | | | |
| August 2023 | | | | | | $ | 0.0095 | | | $ | 0.0000 | | | $ | 0.0200 | | | $ | 0.0295 | |
| | | | | |
| September 2023 | | | | | | $ | 0.0080 | | | $ | 0.0000 | | | $ | 0.0215 | | | $ | 0.0295 | |
| | | | | |
| October 2023 | | | | | | $ | 0.0102 | | | $ | 0.0000 | | | $ | 0.0193 | | | $ | 0.0295 | |
| | | | | |
| November 2023 | | | | | | $ | 0.0157 | | | $ | 0.0000 | | | $ | 0.0138 | | | $ | 0.0295 | |
| | | | | |
| December 2023 | | | | | | $ | 0.0070 | | | $ | 0.0000 | | | $ | 0.0225 | | | $ | 0.0295 | |
| | | | | |
PIMCO New York Municipal Income Fund | | | | | | | | Net Realized
Capital Gains* | | | Paid-in Surplus or Other Capital Sources** | | | | |
| | | | | |
| July 2023 | | | | | | $ | 0.0077 | | | $ | 0.0000 | | | $ | 0.0258 | | | $ | 0.0335 | |
| | | | | |
| August 2023 | | | | | | $ | 0.0104 | | | $ | 0.0000 | | | $ | 0.0231 | | | $ | 0.0335 | |
| | | | | |
| September 2023 | | | | | | $ | 0.0070 | | | $ | 0.0000 | | | $ | 0.0265 | | | $ | 0.0335 | |
| | | | | |
| October 2023 | | | | | | $ | 0.0134 | | | $ | 0.0000 | | | $ | 0.0201 | | | $ | 0.0335 | |
| | | | | |
| November 2023 | | | | | | $ | 0.0195 | | | $ | 0.0000 | | | $ | 0.0140 | | | $ | 0.0335 | |
| | | | | |
| December 2023 | | | | | | $ | 0.0115 | | | $ | 0.0000 | | | $ | 0.0220 | | | $ | 0.0335 | |
| | | | | |
PIMCO New York Municipal Income Fund II | | | | | | | | Net Realized
Capital Gains* | | | Paid-in Surplus or Other Capital Sources** | | | | |
| | | | | |
| July 2023 | | | | | | $ | 0.0073 | | | $ | 0.0000 | | | $ | 0.0222 | | | $ | 0.0295 | |
| | | | | |
| August 2023 | | | | | | $ | 0.0090 | | | $ | 0.0000 | | | $ | 0.0205 | | | $ | 0.0295 | |
| | | | | |
| September 2023 | | | | | | $ | 0.0077 | | | $ | 0.0000 | | | $ | 0.0218 | | | $ | 0.0295 | |
| | | | | |
| October 2023 | | | | | | $ | 0.0115 | | | $ | 0.0000 | | | $ | 0.0180 | | | $ | 0.0295 | |
| | | | | |
| November 2023 | | | | | | $ | 0.0155 | | | $ | 0.0000 | | | $ | 0.0140 | | | $ | 0.0295 | |
| | | | | |
| December 2023 | | | | | | $ | 0.0099 | | | $ | 0.0000 | | | $ | 0.0196 | | | $ | 0.0295 | |
| | | | | | | | | | | | | | | | | | | | |
PIMCO New York Municipal Income Fund III | | | | | | | | Net Realized
Capital Gains* | | | Paid-in Surplus or Other Capital Sources** | | | | |
| | | | | |
| July 2023 | | | | | | $ | 0.0058 | | | $ | 0.0000 | | | $ | 0.0190 | | | $ | 0.0248 | |
| | | | | |
| August 2023 | | | | | | $ | 0.0066 | | | $ | 0.0000 | | | $ | 0.0182 | | | $ | 0.0248 | |
| | | | | |
| September 2023 | | | | | | $ | 0.0017 | | | $ | 0.0000 | | | $ | 0.0231 | | | $ | 0.0248 | |
| | | | | |
| October 2023 | | | | | | $ | 0.0083 | | | $ | 0.0000 | | | $ | 0.0165 | | | $ | 0.0248 | |
| | | | | |
| November 2023 | | | | | | $ | 0.0120 | | | $ | 0.0000 | | | $ | 0.0128 | | | $ | 0.0248 | |
| | | | | |
| December 2023 | | | | | | $ | 0.0023 | | | $ | 0.0000 | | | $ | 0.0225 | | | $ | 0.0248 | |
| | | | | |
PIMCO Municipal Income Fund | | | | | | | | Net Realized
Capital Gains* | | | Paid-in Surplus or Other Capital Sources** | | | | |
| | | | | |
| July 2023 | | | | | | $ | 0.0164 | | | $ | 0.0000 | | | $ | 0.0256 | | | $ | 0.0420 | |
| | | | | |
| August 2023 | | | | | | $ | 0.0196 | | | $ | 0.0000 | | | $ | 0.0224 | | | $ | 0.0420 | |
| | | | | |
| September 2023 | | | | | | $ | 0.0147 | | | $ | 0.0000 | | | $ | 0.0273 | | | $ | 0.0420 | |
| | | | | |
| October 2023 | | | | | | $ | 0.0194 | | | $ | 0.0000 | | | $ | 0.0226 | | | $ | 0.0420 | |
| | | | | |
| November 2023 | | | | | | $ | 0.0230 | | | $ | 0.0000 | | | $ | 0.0190 | | | $ | 0.0420 | |
| | | | | |
| December 2023 | | | | | | $ | 0.0167 | | | $ | 0.0000 | | | $ | 0.0253 | | | $ | 0.0420 | |
| | | | | |
PIMCO Municipal Income Fund II | | | | | | | | Net Realized
Capital Gains* | | | Paid-in Surplus or Other Capital Sources** | | | | |
| | | | | |
| July 2023 | | | | | | $ | 0.0220 | | | $ | 0.0000 | | | $ | 0.0175 | | | $ | 0.0395 | |
| | | | | |
| August 2023 | | | | | | $ | 0.0200 | | | $ | 0.0000 | | | $ | 0.0195 | | | $ | 0.0395 | |
| | | | | |
| September 2023 | | | | | | $ | 0.0168 | | | $ | 0.0000 | | | $ | 0.0227 | | | $ | 0.0395 | |
| | | | | |
| October 2023 | | | | | | $ | 0.0204 | | | $ | 0.0000 | | | $ | 0.0191 | | | $ | 0.0395 | |
| | | | | |
| November 2023 | | | | | | $ | 0.0272 | | | $ | 0.0000 | | | $ | 0.0123 | | | $ | 0.0395 | |
| | | | | |
| December 2023 | | | | | | $ | 0.0195 | | | $ | 0.0000 | | | $ | 0.0200 | | | $ | 0.0395 | |
| | | | | |
PIMCO Municipal Income Fund III | | | | | | | | Net Realized
Capital Gains* | | | Paid-in Surplus or Other Capital Sources** | | | | |
| | | | | |
| July 2023 | | | | | | $ | 0.0168 | | | $ | 0.0000 | | | $ | 0.0162 | | | $ | 0.0330 | |
| | | | | |
| August 2023 | | | | | | $ | 0.0173 | | | $ | 0.0000 | | | $ | 0.0157 | | | $ | 0.0330 | |
| | | | | |
| September 2023 | | | | | | $ | 0.0139 | | | $ | 0.0000 | | | $ | 0.0191 | | | $ | 0.0330 | |
| | | | | |
| October 2023 | | | | | | $ | 0.0176 | | | $ | 0.0000 | | | $ | 0.0154 | | | $ | 0.0330 | |
| | | | | |
| November 2023 | | | | | | $ | 0.0214 | | | $ | 0.0000 | | | $ | 0.0116 | | | $ | 0.0330 | |
| | | | | |
| December 2023 | | | | | | $ | 0.0154 | | | $ | 0.0000 | | | $ | 0.0176 | | | $ | 0.0330 | |
| * | The source of dividends provided in the table differs, in some respects, from information presented in this report prepared in accordance with generally accepted accounting principles, or U.S. GAAP. For example, net earnings from certain interest rate swap contracts are included as a source of net investment income for purposes of Section 19(a). Accordingly, the information in the table may differ from information in the accompanying financial statements that are presented on the basis of U.S. GAAP and may differ from tax information presented in the footnotes. Amounts shown may include accumulated, as well as fiscal period net income and net profits. |
| ** | Occurs when a fund distributes an amount greater than its accumulated net income and net profits. Amounts are not reflective of a fund’s net income, yield, earnings or investment performance. |
| | | | |
Shareholder Meeting Results | | | | |
Annual Shareholder Meeting Results
The Funds held their annual meetings of shareholders on December 15, 2023.
PIMCO Municipal Income Fund — PMF
Common and Preferred Shareholders, voting together as a single class, voted as indicated below with respect to the
re-election
of Joseph B. Kittredge, Jr. and David Fisher and the election of Libby D. Cantrill as Trustees of the Fund.
| | | | | | | | | | | | |
| | | | | | | | | | |
| | | |
Election of Libby D. Cantrill — Class I to serve until the annual meeting held during the 2024 fiscal year | | | | | | | 18,086,153 | | | | 970,003 | |
| | | |
Re-Election of David Fisher — Class III to serve until the annual meeting held during the 2026 fiscal year | | | | | | | 18,086,153 | | | | 970,003 | |
| | | |
Re-election of Joseph B. Kittredge, Jr. — Class III to serve until the annual meeting held during the 2026 fiscal year | | | | | | | 18,086,153 | | | | 970,003 | |
The other members of the Board of Trustees at the time of the Meeting, namely, Mses. Cogan, DeCotis, McCartney and Vandecruze and Mr. Rappaport continued to serve as Trustees of the Fund.
PIMCO Municipal Income Fund II — PML
Common and Preferred Shareholders, voting together as a single class, voted as indicated below with respect to the
re-election
of Joseph B. Kittredge, Jr. and David Fisher and the election of Libby D. Cantrill as Trustees of the Fund.
| | | | | | | | | | | | |
| | | | | | | | | | |
| | | |
Election of Libby D. Cantrill — Class I to serve until the annual meeting held during the 2024 fiscal year | | | | | | | 47,651,012 | | | | 2,406,010 | |
| | | |
Re-Election of David Fisher — Class III to serve until the annual meeting held during the 2026 fiscal year | | | | | | | 47,651,012 | | | | 2,406,010 | |
| | | |
Re-election of Joseph B. Kittredge, Jr. — Class III to serve until the annual meeting held during the 2026 fiscal year | | | | | | | 47,651,012 | | | | 2,406,010 | |
The other members of the Board of Trustees at the time of the Meeting, namely, Mses. Cogan, DeCotis, McCartney and Vandecruze and Mr. Rappaport continued to serve as Trustees of the Fund.
PIMCO Municipal Income Fund III — PMX
Common and Preferred Shareholders, voting together as a single class, voted as indicated below with respect to the
re-election
of Deborah DeCotis and David Fisher and the election of Libby D. Cantrill as Trustees of the Fund.
| | | | | | | | | | | | |
| | | | | | | | | | |
| | | |
Election of Libby D. Cantrill — Class I to serve until the annual meeting held during the 2024 fiscal year | | | | | | | 22,871,136 | | | | 1,514,176 | |
| | | |
Re-election of Deborah DeCotis — Class III to serve until the annual meeting held during the 2026 fiscal year | | | | | | | 22,871,136 | | | | 1,514,176 | |
| | | |
Re-election of David Fisher — Class III to serve until the annual meeting held during the 2026 fiscal year | | | | | | | 22,871,136 | | | | 1,514,176 | |
The other members of the Board of Trustees at the time of the Meeting, namely, Mses. Cogan, McCartney and Vandecruze and Messrs. Kittredge and Rappaport continued to serve as Trustees of the Fund.
PIMCO California Municipal Income Fund — PCQ
Common and Preferred Shareholders, voting together as a single class, voted as indicated below with respect to the
re-election
of Joseph B. Kittredge, Jr. and David Fisher and the election of Libby D. Cantrill as Trustees of the Fund.
| | | | | | | | | | | | |
| | | | | | | | | | |
| | | |
Election of Libby D. Cantrill — Class I to serve until the annual meeting held during the 2024 fiscal year | | | | | | | 12,005,526 | | | | 1,714,611 | |
| | | |
Re-Election of David Fisher — Class III to serve until the annual meeting held during the 2026 fiscal year | | | | | | | 12,005,526 | | | | 1,714,611 | |
| | | |
Re-election of Joseph B. Kittredge, Jr. — Class III to serve until the annual meeting held during the 2026 fiscal year | | | | | | | 12,005,526 | | | | 1,714,611 | |
The other members of the Board of Trustees at the time of the Meeting, namely, Mses. Cogan, DeCotis, McCartney and Vandecruze and Mr. Rappaport continued to serve as Trustees of the Fund.
PIMCO California Municipal Income Fund II — PCK
Common and Preferred Shareholders, voting together as a single class, voted as indicated below with respect to the
re-election
of Joseph B. Kittredge, Jr. and David Fisher and the election of Libby D. Cantrill as Trustees of the Fund.
| | | | | | | | | | | | |
| | | | | | | | | | |
| | | |
Election of Libby D. Cantrill — Class I to serve until the annual meeting held during the 2024 fiscal year | | | | | | | 21,774,804 | | | | 1,760,903 | |
| | | |
Re-Election of David Fisher — Class III to serve until the annual meeting held during the 2026 fiscal year | | | | | | | 21,774,804 | | | | 1,760,903 | |
| | | |
Re-election of Joseph B. Kittredge, Jr. — Class III to serve until the annual meeting held during the 2026 fiscal year | | | | | | | 21,774,804 | | | | 1,760,903 | |
The other members of the Board of Trustees at the time of the Meeting, namely, Mses. Cogan, DeCotis, McCartney and Vandecruze and Mr. Rappaport continued to serve as Trustees of the Fund.
PIMCO California Municipal Income Fund III — PZC
Common and Preferred Shareholders, voting together as a single class, voted as indicated below with respect to the
re-election
of Deborah DeCotis and David Fisher and the election of Libby D. Cantrill as Trustees of the Fund.
| | | | | | | | | | | | |
| | | | | | | | | | |
| | | |
Election of Libby D. Cantrill — Class I to serve until the annual meeting held during the 2024 fiscal year | | | | | | | 14,868,710 | | | | 1,143,531 | |
| | | |
Re-election of Deborah DeCotis — Class III to serve until the annual meeting held during the 2026 fiscal year | | | | | | | 14,868,710 | | | | 1,143,531 | |
| | | |
Re-election of David Fisher — Class III to serve until the annual meeting held during the 2026 fiscal year | | | | | | | 14,868,710 | | | | 1,143,531 | |
The other members of the Board of Trustees at the time of the Meeting, namely, Mses. Cogan, McCartney and Vandecruze and Messrs. Kittredge and Rappaport continued to serve as Trustees of the Fund.
PIMCO New York Municipal Income Fund — PNF
Common and Preferred Shareholders, voting together as a single class, voted as indicated below with respect to the
re-election
of Joseph B. Kittredge, Jr. and David Fisher and the election of Libby D. Cantrill as Trustees of the Fund.
| | | | | | | | | | | | |
| | | | | | | | | | |
| | | |
Election of Libby D. Cantrill — Class I to serve until the annual meeting held during the 2024 fiscal year | | | | | | | 5,892,137 | | | | 442,583 | |
| | | |
Re-Election of David Fisher — Class III to serve until the annual meeting held during the 2026 fiscal year | | | | | | | 5,892,137 | | | | 442,583 | |
| | | |
Re-election of Joseph B. Kittredge, Jr. — Class III to serve until the annual meeting held during the 2026 fiscal year | | | | | | | 5,892,137 | | | | 442,583 | |
The other members of the Board of Trustees at the time of the Meeting, namely, Mses. Cogan, DeCotis, McCartney and Vandecruze and Mr. Rappaport continued to serve as Trustees of the Fund.
PIMCO New York Municipal Income Fund II — PNI
Common and Preferred Shareholders, voting together as a single class, voted as indicated below with respect to the
re-election
of Joseph B. Kittredge, Jr. and David Fisher and the election of Libby D. Cantrill as Trustees of the Fund.
| | | | | | | | | | | | |
| | | | | | | | | | |
| | | |
Election of Libby D. Cantrill — Class I to serve until the annual meeting held during the 2024 fiscal year | | | | | | | 7,163,009 | | | | 649,334 | |
| | | |
Re-Election of David Fisher — Class III to serve until the annual meeting held during the 2026 fiscal year | | | | | | | 7,163,009 | | | | 649,334 | |
| | | |
Re-election of Joseph B. Kittredge, Jr. — Class III to serve until the annual meeting held during the 2026 fiscal year | | | | | | | 7,163,009 | | | | 649,334 | |
The other members of the Board of Trustees at the time of the Meeting, namely, Mses. Cogan, DeCotis, McCartney and Vandecruze and Mr. Rappaport continued to serve as Trustees of the Fund.
| | | | |
Shareholder Meeting Results | | | | (Unaudited) |
PIMCO New York Municipal Income Fund III — PYN
Common and Preferred Shareholders, voting together as a single class, voted as indicated below with respect to the
re-election
of Deborah DeCotis and Joseph B. Kittredge, Jr. and the election of Libby D. Cantrill as Trustees of the Fund.
| | | | | | | | | | | | |
| | | | | | | | | | |
| | | |
Election of Libby D. Cantrill — Class III to serve until the annual meeting held during the 2026 fiscal year | | | | | | | 3,790,421 | | | | 310,581 | |
| | | |
Re-election of Deborah DeCotis — Class III to serve until the annual meeting held during the 2026 fiscal year | | | | | | | 3,790,421 | | | | 310,581 | |
| | | |
Re-election of Joseph B. Kittredge, Jr. — Class III to serve until the annual meeting held during the 2026 fiscal year | | | | | | | 3,790,421 | | | | 310,581 | |
The other members of the Board of Trustees at the time of the Meeting, namely, Mses. Cogan, McCartney and Vandecruze and Messrs. Fisher and Rappaport continued to serve as Trustees of the Fund.
| | | | |
Changes to Board of Trustees / Changes to Portfolio Managers | | | | (Unaudited) |
Changes to Boards of Trustees
Effective April 30, 2023, Mr. John C. Maney retired from his position as Trustee of the Funds.
Effective April 30, 2023, the Board of Trustees appointed Ms. Libby D. Cantrill as a Class I Trustee of PIMCO Municipal Income Fund, PIMCO Municipal Income Fund II, PIMCO Municipal Income Fund III, PIMCO California Municipal Income Fund, PIMCO California Municipal Income Fund II, PIMCO California Municipal Income Fund III, PIMCO New York Municipal Income Fund and PIMCO New York Municipal Income Fund II and a Class III Trustee of PIMCO New York Municipal Income Fund III.
Changes to Portfolio Managers
Effective June 16, 2023, each Fund’s portfolio is jointly and primarily managed by David Hammer and Kyle Christine.
Mr. Christine has been a portfolio manager of the Fund since June 2023. He is a Senior Vice President and municipal bond portfolio manager in the Newport Beach office. Mr. Christine has previously served as a rotating member of PIMCO’s Americas portfolio committee. Prior to joining PIMCO in 2017, he was an institutional high yield and taxable municipal bond trader at Morgan Stanley. He has 10 years of investment and financial services experience and holds an undergraduate degree from Union College (NY).
| | | | |
Dividend Reinvestment Plan | | | | |
Each Fund has adopted a Dividend Reinvestment Plan (the “Plan”) which allows common shareholders to reinvest Fund distributions in additional common shares of the Fund. American Stock Transfer & Trust Company, LLC (the “Plan Agent”) serves as agent for common shareholders in administering the Plan. It is important to note that participation in the Plan and automatic reinvestment of Fund distributions does not ensure a profit, nor does it protect against losses in a declining market.
Automatic enrollment/voluntary participation
Under the Plan, common shareholders whose shares are registered with the Plan Agent (“registered shareholders”) are automatically enrolled as participants in the Plan and will have all Fund distributions of income, capital gains and returns of capital (together, “distributions”) reinvested by the Plan Agent in additional common shares of a Fund, unless the shareholder elects to receive cash. Registered shareholders who elect not to participate in the Plan will receive all distributions in cash paid by check and mailed directly to the shareholder of record (or if the shares are held in street or other nominee name, to the nominee) by the Plan Agent. Participation in the Plan is voluntary. Participants may terminate or resume their enrollment in the Plan at any time without penalty by notifying the Plan Agent online at www.amstock.com, by calling (844) 33-PIMCO, by writing to the Plan Agent, American Stock Transfer & Trust Company, LLC, at P.O. Box 922, Wall Street Station, New York, NY 10269-0560, or, as applicable, by completing and returning the transaction form attached to a Plan statement. A proper notification will be effective immediately and apply to each Fund’s next distribution if received by the Plan Agent at least three (3) days prior to the record date for the distribution; otherwise, a notification will be effective shortly following the Fund’s next distribution and will apply to the Fund’s next succeeding distribution thereafter. If you withdraw from the Plan and so request, the Plan Agent will arrange for the sale of your shares and send you the proceeds, minus brokerage commissions.
How shares are purchased under the Plan
For each Fund distribution, the Plan Agent will acquire common shares for participants either (i) through receipt of newly issued common shares from each Fund (“newly issued shares”) or (ii) by purchasing common shares of the Fund on the open market (“open market purchases”). If, on a distribution payment date, the NAV per common share of each Fund is equal to or less than the market price per common share plus estimated brokerage commissions (often referred to as a “market premium”), the Plan Agent will invest the distribution amount on behalf of participants in newly issued shares at a price equal to the greater of (i) NAV or (ii) 95% of the market price per common share on the payment date. If the NAV is greater than the market price per
common shares plus estimated brokerage commissions (often referred to as a “market discount”) on a distribution payment date, the Plan agent will instead attempt to invest the distribution amount through open market purchases. If the Plan Agent is unable to invest the full distribution amount in open market purchases, or if the market discount shifts to a market premium during the purchase period, the Plan Agent will invest any un-invested portion of the distribution in newly issued shares at a price equal to the greater of (i) NAV or (ii) 95% of the market price per share as of the last business day immediately prior to the purchase date (which, in either case, may be a price greater or lesser than the NAV per common shares on the distribution payment date). No interest will be paid on distributions awaiting reinvestment. Under the Plan, the market price of common shares on a particular date is the last sales price on the exchange where the shares are listed on that date or, if there is no sale on the exchange on that date, the mean between the closing bid and asked quotations for the shares on the exchange on that date.
The NAV per common share on a particular date is the amount calculated on that date (normally at the close of regular trading on the New York Stock Exchange) in accordance with each Fund’s then current policies.
Fees and expenses
No brokerage charges are imposed on reinvestments in newly issued shares under the Plan. However, all participants will pay a pro rata share of brokerage commissions incurred by the Plan Agent when it makes open market purchases. There are currently no direct service charges imposed on participants in the Plan, although each Fund reserves the right to amend the Plan to include such charges. The Plan Agent imposes a transaction fee (in addition to brokerage commissions that are incurred) if it arranges for the sale of your common shares held under the Plan.
Shares held through nominees
In the case of a registered shareholder such as a broker, bank or other nominee (together, a “nominee”) that holds common shares for others who are the beneficial owners, the Plan Agent will administer the Plan on the basis of the number of common shares certified by the nominee/record shareholder as representing the total amount registered in such shareholder’s name and held for the account of beneficial owners who are to participate in the Plan. If your common shares are held through a nominee and are not registered with the Plan Agent, neither you nor the nominee will be participants in or have distributions reinvested under the Plan. If you are a beneficial owner of common shares and wish to participate in the Plan, and your nominee is unable or unwilling to become a registered shareholder and a Plan participant on your behalf, you may request that your nominee arrange to have all or a portion of your shares re-registered with the Plan Agent in your
name so that you may be enrolled as a participant in the Plan. Please contact your nominee for details or for other possible alternatives. Participants whose shares are registered with the Plan Agent in the name of one nominee firm may not be able to transfer the shares to another firm and continue to participate in the Plan.
Tax consequences
Automatically reinvested dividends and distributions are taxed in the same manner as cash dividends and distributions — i.e., automatic reinvestment in additional shares does not relieve shareholders of, or defer the need to pay, any income tax that may be payable (or that is required to be withheld) on Fund dividends and distributions. The Funds and the Plan Agent reserve the right to amend or terminate the Plan. Additional information about the Plan, as well as a copy of the full Plan itself, may be obtained from the Plan Agent, American Stock Transfer & Trust Company, LLC, at P.O. Box 922, Wall Street Station, New York, NY 10269-0560; telephone number:
(844) 33-PIMCO;
website: www.amstock.com.
| | | | |
Additional Information Regarding the Funds | | | | (Unaudited) |
CHANGES OCCURRING SINCE PRIOR ANNUAL REPORT
The following information in this annual report is a summary of certain changes during the period since the date of the Funds’ last annual report to shareholders. This information may not reflect all of the changes that have occurred since you purchased shares of a Fund.
| | 1. | As of April 12, 2023, each Fund is permitted to, as a principal investment strategy, invest in and/or originate loans, including, without limitation, to, on behalf of, authorized by, sponsored by, and/or in connection with a project for which authority and responsibility lies with one or more U.S. states or territories, cities in a U.S. state or territory, or political subdivisions, agencies, authorities or instrumentalities of such states, territories or cities, which may be in the form of whole loans, assignments, participations, secured and unsecured notes, senior and second lien loans, mezzanine loans, bridge loans or similar investments, including to borrowers that are unrated or have credit ratings that are determined by one or more nationally recognized statistical rating organizations (“NRSROs”) and/or Pacific Investment Management Company LLC (“PIMCO”) to be below investment grade. This may include loans to public or private firms or individuals, such as in connection with housing development projects. The loans a Fund invests in or originates may vary in maturity and/or duration. The Funds are not limited in the amount, size or type of loans they may invest in and/or originate, including with respect to a single borrower or with respect to borrowers that are determined to be below investment grade, other than pursuant to any applicable law. Each Fund’s investment in or origination of loans may also be limited by the requirements the Fund intends to observe under Subchapter M of the Internal Revenue Code of 1986, as amended (the “Code”), in order to qualify as a regulated investment company (“RIC”). The loans acquired by a Fund may be “municipal bonds” (including of a particular state) for purposes of each Fund’s investment policies to invest a certain minimum of their assets in securities that produce income that is exempt from federal income tax and, as applicable, the income taxes of a particular state, or may be loans that produce income that is subject to applicable regular income tax, subject to each Fund’s investment limits. |
| | 2. | As of October 27, 2023, each Fund’s investment guideline limiting the Fund’s investments in securities which are illiquid at the time of investment was removed. |
The following principal risk disclosures have been added with respect to each Fund:
Unresolved Staff Comments
The Funds do not believe that there are any material unresolved written comments received 180 days or more before December 31, 2023 from the Staff of the SEC regarding any of the Funds’ periodic or current reports under the Securities Exchange Act or the 1940 Act, or their registration statements.
| | | | |
Principal Investment Strategies | | | | (Unaudited) |
Unless otherwise noted, the information in this section is as of December 31, 2023.
When used in this prospectus, the term “invest” includes both direct investing and indirect investing and the term “investments” includes both direct investments and indirect investments. For example, a Fund may invest indirectly by investing in derivatives or through its wholly-owned subsidiaries (each, a “Subsidiary” and collectively, the “Subsidiaries”). The allocation of the Fund’s assets to a Subsidiary will vary over time and will likely not include all of the different types of investments described herein at any given time.
INVESTMENT OBJECTIVES AND POLICIES
The investment objective of each of PCQ, PCK and PZC is to provide current income exempt from federal and California income tax. The investment objective of each of PMF, PML and PMX is to provide current income exempt from federal income tax. The investment objective of PNF, PNI and PYN is to provide current income exempt from federal, New York State and New York City income tax. In pursuing each Fund’s investment objective, the Fund’s investment manager, Pacific Investment Management Company LLC (“PIMCO or the “Investment Manager”), also seeks to preserve and enhance the value of the Fund’s holdings relative to the municipal bond market generally, using proprietary analytical models that test and evaluate the sensitivity of those holdings to changes in interest rates and yield relationships. A Fund cannot assure you that it will achieve its investment objective, and you could lose all of your investment in the Fund.
Portfolio Management Strategies
Under normal circumstances, each of PCQ, PCK and PZC invests at least 90% of its net assets in municipal bonds which pay interest that, in the opinion of bond counsel to the issuer (or on the basis of other authority believed by PIMCO to be reliable), is exempt from regular federal and California income taxes (i.e., excluded from gross income for federal and California income tax purposes but not necessarily exempt from the federal alternative minimum tax (“California Municipal Bonds”)). These may include, but are not limited to, investments in loans, pools of loans, mortgages, pools of mortgages, and other debt instruments, as to which there is an opinion that income therefrom is exempt from regular federal and California income taxes, such as certain affordable housing loans, etc. Subject to its other investment policies, the Fund may invest up to 20% of its total assets in investments the interest from which is subject to the federal alternative minimum tax.
Under normal circumstances, each of PMF, PML and PMX invests at least 90% of its net assets in municipal bonds which pay interest that,
in the opinion of bond counsel to the issuer (or on the basis of other authority believed by PIMCO to be reliable), is exempt from regular federal income taxes (i.e., excluded from gross income for federal income tax purposes but not necessarily exempt from the federal alternative minimum tax). These may include, but are not limited to, investments in loans, pools of loans, mortgages, pools of mortgages, and other debt instruments, as to which there is an opinion that income therefrom is exempt from regular federal income taxes, such as certain affordable housing loans, etc. Subject to its other investment policies, the Fund may invest up to 20% of its total assets in investments the interest from which is subject to the federal alternative minimum tax.
Under normal circumstances, each of PNF, PNI and PYN invests at least 90% of its net assets in municipal bonds which pay interest that, in the opinion of bond counsel to the issuer (or on the basis of other authority believed by PIMCO to be reliable) is exempt from regular federal, New York State and New York City income taxes (i.e., excluded from gross income for federal, New York State and New York City income tax purposes but not necessarily exempt from the federal alternative minimum tax (“New York Municipal Bonds”)). These may include, but are not limited to, investments in loans, pools of loans, mortgages, pools of mortgages, and other debt instruments, as to which there is an opinion that income therefrom is exempt from regular federal, New York State and New York City income taxes, etc. Subject to its other investment policies, the Fund may invest up to 20% of its total assets in investments the interest from which is subject to the federal alternative minimum tax.
Each Fund invests at least 80% of its net assets in municipal bonds that are, at the time of purchase, rated “investment grade” by at least one of Moody’s Investors Service, Inc. (“Moody’s”), S&P Global Ratings (“S&P”) or Fitch, Inc. (“Fitch”), or unrated but determined by PIMCO to be of comparable quality. “Investment grade” means a rating, in the case of Moody’s, of Baa3 or higher, or in the case of S&P and Fitch, of
BBB-
or higher. Each Fund may invest up to 20% of its net assets in municipal bonds that are, at the time of investment, rated Ba or B or lower by Moody’s, BB or B or lower by S&P or Fitch or that are unrated but judged to be of comparable quality by PIMCO. These bonds are rated below investment grade and are commonly known as “high yield securities” or “junk bonds.” Bonds of below investment grade quality are regarded as having predominantly speculative characteristics with respect to capacity to pay interest and repay principal and are commonly referred to as “junk bonds.” Bonds in the lowest investment grade category may also be considered to possess some speculative characteristics. In the event that ratings services assign different ratings to the same security, PIMCO will use the highest rating as the credit rating for that security.
| | | | |
Principal Investment Strategies | | | | |
Each Fund’s investment in municipal bonds may be based on PIMCO’s belief that they have attractive yield and/or total return potential. Each Fund attempts to produce returns relative to the municipal bond market generally by prudent selection of municipal bonds. The Funds may invest in bonds associated with a particular municipal market sector (for example, electric utilities), issued by a particular municipal issuer, or having particular structural characteristics, that PIMCO believes may be undervalued. PIMCO may purchase such a bond for a Fund’s portfolio because it represents a market sector or issuer that PIMCO considers undervalued. For example, municipal bonds of particular types (e.g., hospital bonds, industrial revenue bonds or bonds issued by a particular municipal issuer) could be undervalued if there is a temporary excess of supply in that market sector, or because of a general decline in the market price of municipal bonds of the market sector for reasons that do not apply to the particular municipal bonds that are considered undervalued.
For each of PML, PMF and PMX, the municipal bonds in which the Fund invests are generally issued by a U.S. state or territory, a city in a U.S. state or territory, or a political subdivision, agency, authority, or instrumentality of such state, territory or city.
For each of PCQ, PCK and PZC, the California Municipal Bonds in which the Fund invests are generally issued by the State of California, a city in California, or a political subdivision, agency, authority, or instrumentality of such state or city, but may be issued by other U.S. states and/or U.S. territories, the interest from which is exempt from California and federal income taxes.
For each of PNF, PNI and PYN, the New York Municipal Bonds in which the Fund invests are generally issued by the State of New York, a city in New York (including New York City) or a political subdivision, agency, authority or instrumentality of such state or city, but may be issued by other U.S. states and/or U.S. territories, the interest from which is exempt from New York, New York City and federal income taxes.
Each of PCQ, PCK, PZC, PNF, PNI and PYN may also invest up to 10% of its net assets in municipal bonds issued by a U.S. state or territory, a city in a U.S. state or territory, or a political subdivision, agency, authority, or instrumentality of such state, territory or city, the interest from which is not exempt from California or New York and New York City income taxes, as applicable.
Also included within the general category of municipal bonds in which each Fund may invest are loans (including participations and assignments of loans and loans originated by the Fund) and participations in lease obligations. A lease obligation is an obligation
in the form of a lease or installment purchase that is issued by a state or local government to acquire equipment and facilities. Income from such obligations generally is exempt from state and local tax in the state of issuance. Lease obligations may be secured or unsecured. Lease obligations do not constitute general obligations of the municipality for which the municipality’s taxing power is pledged.
Each Fund may invest in “structured” notes, which are privately negotiated debt obligations where the principal and/or interest is determined by reference to the performance of a benchmark asset or market, such as selected securities or an index of securities, or the differential performance of two assets or markets, such as indices reflecting taxable and
tax-exempt
bonds. Each such Fund may do so for the purpose of reducing the interest rate sensitivity of the Fund’s portfolio (and thereby decreasing the Fund’s exposure to interest rate risk). The rate of interest on an income-producing security may be fixed, floating or variable.
Each Fund may purchase municipal bonds that are additionally secured by insurance, bank credit agreements, or escrow accounts. The credit quality of companies which provide such credit enhancements will affect the value and overall credit risk posed by investments in such securities. Although the insurance feature reduces certain financial risks, the premiums for insurance and the higher market price paid for insured obligations may reduce the Fund’s income.
Each Fund may buy and sell municipal bonds on a when-issued, delayed delivery or forward commitment basis, making payment or taking delivery at a later date. Each Fund may invest in floating rate debt instruments (“floaters”), including inverse floaters, and engage in credit spread trades. A credit spread trade is an investment position relating to a difference in the prices or interest rates of two bonds or other securities, in which the value of the investment position is determined by changes in the difference between the prices or interest rates, as the case may be, of the respective securities.
Each Fund may invest in and/or originate loans, including, without limitation, to, on behalf of, authorized by, sponsored by, and/or in connection with a project for which authority and responsibility lies with one or more U.S. states or territories, cities in a U.S. state or territory, or political subdivisions, agencies, authorities or instrumentalities of such states, territories or cities, which may be in the form of whole loans, assignments, participations, secured and unsecured notes, senior and second lien loans, mezzanine loans, bridge loans or similar investments. This may include loans to public or private firms or individuals, such as in connection with housing development projects. When investing in or originating loans, each Fund is not restricted by any particular credit risk criteria and/or qualifications. Each Fund also is not limited in the amount, size or type
of loans it may invest in and/or originate, including with respect to a single borrower, other than pursuant to any applicable law. The loans a Fund invests in or originates may vary in maturity and/or duration. A Fund’s investment in or origination of loans may also be limited by the requirements the Fund intends to observe under Subchapter M of the Code in order to qualify as a RIC. The loans acquired by a Fund may be “municipal bonds” (including of a particular state) for purposes of the Fund’s investment policies to invest a certain minimum of their assets in securities that produce income that is exempt from federal income tax and, as applicable, the income taxes of a particular state, or may be loans that produce income that is subject to applicable regular income tax, subject to the Fund’s investment limits. A Fund may seek to originate loans through its Subsidiaries (as defined herein, and for purposes of this disclosure, references to the Fund originating loans also shall refer to a loan originated by any applicable Subsidiary — accordingly, the Fund intends to “look through” any Subsidiary for purposes of determining compliance of loan-related investments with any applicable investment guidelines or covenants of any borrowings or preferred shares of the Fund, if any).
Each Fund may invest in trust certificates issued in tender option bond (“TOB”) programs. In these programs, a trust typically issues two classes of certificates, floating rate certificates (“TOB Floaters”) and residual interest certificates (“TOB Residuals”), and seeks to use the proceeds to purchase municipal securities having longer maturities and that may bear interest at a higher fixed interest rate than prevailing short-term
tax-exempt
rates. Service providers of such trusts may have recourse against a Fund in certain cases, such as if the Fund holds recourse TOB Residuals. Each Fund may invest in both
non-recourse
and recourse TOB Residuals to leverage its portfolio.
Each Fund may also invest up to 10% of its total assets in securities of other open- or
closed-end
investment companies that invest primarily in municipal bonds of the types in which the Fund may invest directly. Each Fund may invest in other investment companies either during periods when it has large amounts of uninvested cash, during periods when there is a shortage of attractive, high-yielding municipal bonds available in the market, or when PIMCO believes share prices of other investment companies offer attractive values. Each Fund may invest in investment companies that are advised by PIMCO or its affiliates to the extent permitted by applicable law and/or pursuant to exemptive relief from the Securities and Exchange Commission. As a shareholder of an investment company, the Fund will bear its ratable share of that investment company’s expenses and would remain subject to payment of the Fund’s management fees and other expenses with respect to assets so invested.
Each Fund may invest in securities of other open-or
closed-end
investment companies (including those advised by PIMCO), including,
without limitation, ETFs, to the extent that such investments are consistent with the Fund’s investment objectives, strategies and policies and permissible under the 1940 Act. Each Fund may invest in other investment companies to gain broad market or sector exposure or for cash management purposes, including during periods when it has large amounts of uninvested cash or when PIMCO believes share prices of other investment companies offer attractive values. Each Fund may invest in certain money market funds and/or short-term bond funds (“Central Funds”), to the extent permitted by the 1940 Act, the rules thereunder or exemptive relief therefrom. The Central Funds are registered investment companies created for use by certain registered investment companies advised by PIMCO in connection with their cash management activities. Each Fund treats its investments in other investment companies that invest primarily in types of securities in which the Fund may invest directly as investments in such types of securities for purposes of the Fund’s investment policies (e.g., the Fund’s investment in an investment company that invests primarily in debt securities will be treated by the Fund as an investment in a debt security). As a shareholder in an investment company, each Fund would bear its ratable share of that investment company’s expenses and would remain subject to payment of each Fund’s management fees and other expenses with respect to assets so invested. Common Shareholders would therefore be subject to duplicative expenses to the extent each Fund invests in other investment companies. The securities of other investment companies may be leveraged, in which case the NAV and/or market value of the investment company’s shares will be more volatile than unleveraged investments.
Each Fund generally intends to invest primarily in municipal bonds with longer-term maturities (for example,
15-30
years), but may invest in bonds of any maturity and otherwise seek a shorter average weighted maturity of its portfolio.
Each Fund may purchase and sell (write) a variety of derivatives, such as put options and call options on securities, short sales, credit default swaps, swap agreements, and securities indexes, and enter into interest rate and index futures contracts and purchase and sell options on such futures contracts for hedging purposes or as part of its overall investment strategy. Each Fund also may enter into swap agreements with respect to interest rates and indexes of securities. If other types of financial instruments, including other types of options, futures contracts, or futures options are traded in the future, the Fund may also use those instruments.
Each Fund may invest without limit in illiquid investments (i.e., investments that the Fund reasonably expects cannot be sold or disposed of in current market conditions in seven calendar days or less without the sale or disposition significantly changing the market value of the investment).
| | | | |
Principal Investment Strategies | | | | (Unaudited) |
There have been no significant changes in each Fund’s portfolio turnover rates over the last two fiscal years, and no significant change to the portfolio turnover rates of the Fund described in the Financial Highlights can currently be predicted.
Each Fund may enter into repurchase agreements, in which the Fund purchases a security from a bank or broker-dealer, which agrees to repurchase the security at the Fund’s cost plus interest within a specified time.
Each Fund has outstanding auction rate preferred shares of beneficial interest (“ARPS”) and, except for PNF and PYN, remarketable variable rate munifund term preferred shares of beneficial interest (“RVMTP” and together with the ARPS and any other preferred shares a Fund may have outstanding, “Preferred Shares”). In connection with rating each Fund’s Preferred Shares, Moody’s and Fitch, as applicable, impose specific asset coverage tests and other limitations and restrictions that may limit a Fund’s ability to engage in certain of the transactions described above. In addition, failure to comply with these limitations and restrictions could, among other things, preclude a Fund from declaring or paying dividend or distributions or require them to sell assets at inopportune times.
Each Fund may make investments in debt instruments and other securities or instruments directly or through one or more Subsidiaries. Each Subsidiary may invest, for example, in whole loans or in shares, certificates, notes or other securities representing the right to receive principal and interest payments due on fractions of whole loans or pools of whole loans, risk retention investments or any other security or other instrument that the Fund may hold directly.
Temporary Defensive Investments.
Each Fund may make short-term investments when attempting to respond to adverse market, economic, political, or other conditions, as determined by PIMCO. Upon PIMCO’s recommendation, for temporary defensive purposes and in order to keep a Fund’s cash fully invested, each Fund may invest up to 100% of its net assets in high quality, short-term investments, including U.S. Government, mortgage-backed and corporate debt securities that may be either
tax-exempt
or taxable.
To the extent a Fund invests in taxable short-term investments, such Fund will not at such times be in a position to achieve its investment objective.
Each Fund currently utilizes leverage principally through its outstanding Preferred Shares and TOB programs. Each Fund may also enter into transactions other than those noted above that may give rise to a form of leverage including, among others, futures contracts, options on futures contracts, forward contracts, or any interest rate,
securities-related or other hedging instrument, including swap agreements and other derivative instruments. Each Fund may increase leverage, such as by determining to issue other types of Preferred Shares, or determine to decrease the leverage it currently maintains, such as by redeeming its outstanding Preferred Shares or unwinding TOBs and may or may not determine to replace such leverage through other sources.
Depending upon market conditions and other factors, a Fund may or may not determine to add leverage following a Common Share offering to maintain or increase the total amount of leverage (as a percentage of the Fund’s total assets) that the Fund currently maintains, taking into account the additional assets raised through the issuance of Common Shares in such offering. Each Fund utilizes certain kinds of leverage, including, without limitation, Preferred Shares and TOBs, opportunistically and may choose to increase or decrease, or eliminate entirely, its use of such leverage over time and from time to time based on PIMCO’s assessment of the yield curve environment, interest rate trends, market conditions and other factors. If a Fund determines to add leverage following an offering, it is not possible to predict with accuracy the precise amount of leverage that would be added, in part because it is not possible to predict the number of Common Shares that ultimately will be sold in an offering or series of offerings. To the extent that a Fund does not add additional leverage following an offering, the Fund’s total amount of leverage as a percentage of its total assets will decrease, which could result in a reduction of investment income available for distribution to Common Shareholders.
| | | | |
Principal Risks of the Funds | | | | (Unaudited) |
The information in this section is as of December 31, 2023.
The factors that are most likely to have a material effect on a particular Fund’s portfolio as a whole are called “principal risks.” Each Fund is subject to the principal risks indicated below, whether through direct or indirect investments, investment company investments or derivative positions, as applicable. Each Fund may be subject to additional risks other than those identified and described below because the types of investments made by a Fund can change over time.
Investments by the Funds in “AMT Bonds,” which are municipal securities that pay interest that is taxable under the federal alternative minimum tax applicable to noncorporate taxpayers, may expose the Funds to certain risks in addition to those typically associated with municipal bonds. Interest or principal on AMT Bonds paid out of current or anticipated revenues from a specific project or specific asset may be adversely impacted by declines in revenue from the project or asset. Declines in general business activity could also affect the economic viability of facilities that are the sole source of revenue to support AMT Bonds. In this regard, AMT Bonds may entail greater risks than general obligation municipal bonds. For shareholders subject to the federal alternative minimum tax, a portion of a Fund’s distributions may not be exempt from gross federal income, which may give rise to alternative minimum tax liability.
Each Fund’s Amended and Restated Agreement and Declaration of Trust and Bylaws (collectively, the “Organizational Documents”), include provisions that could limit the ability of other entities or persons to acquire control of the Fund or to convert the Fund to
open-end
status. These provisions in the Organizational Documents could have the effect of depriving the holders of the Fund’s common shares of beneficial interest (“Common Shares”) of opportunities to sell their Common Shares at a premium over the then-current market price of the Common Shares or at NAV.
A Fund’s investment performance depends upon how its assets are allocated and reallocated. A principal risk of investing in a Fund is that PIMCO may make less than optimal or poor asset allocation decisions. PIMCO employs an active approach to allocation among multiple fixed-income sectors within a Fund’s investment objectives and strategies, but there is no guarantee that such allocation techniques will produce the desired results. It is possible that PIMCO will focus on an investment that performs poorly, underperforms other investments under various market conditions, or underperforms as compared to funds with similar investment objectives and strategies. . You could lose money on your investment in a Fund as a result of these allocation decisions.
California State-Specific Risk
A Fund may invest in municipal bonds issued by or on behalf of the State of California and its political subdivisions, financing authorities and their agencies, and therefore may be affected significantly by political, economic, regulatory, social, environmental, or public health developments affecting the ability of California tax exempt issuers to pay interest or repay principal. Certain issuers of California municipal bonds have experienced serious financial difficulties in the past and reoccurrence of these difficulties may impair the ability of certain California issuers to pay principal or interest on their obligations.
Provisions of the California Constitution and State statutes that limit the taxing and spending authority of California governmental entities may impair the ability of California issuers to pay principal and/or interest on their obligations, particularly given large budget deficits that have been identified and may continue. While California’s economy is broad, it does have major concentrations in advanced technology, aerospace and defense-related manufacturing, trade, entertainment, real estate and financial services, and may be sensitive to economic problems affecting those industries, and its government revenues tend to rely heavily on certain earners (revenues therefore are likely to be more volatile and to be adversely affected if the number of such earners (or their recognized income within a particular period of time) decreases). Future California political and economic developments, constitutional amendments, legislative measures, executive orders, administrative regulations, litigation and voter initiatives as well as environmental events, natural disasters, pandemics, epidemics or social unrest could have an adverse effect on the debt obligations of California issuers.
Call risk refers to the possibility that an issuer may exercise its right to redeem a fixed income security earlier than expected (a call). Issuers may call outstanding securities prior to their maturity for a number of reasons (e.g., declining interest rates, changes in credit spreads and improvements in the issuer’s credit quality). If an issuer calls a security in which a Fund has invested, the Fund may not recoup the full amount of its initial investment or may not realize the full anticipated earnings from the investment and may be forced to reinvest in lower-yielding securities, securities with greater credit risks or securities with other, less favorable features.
Certain broker-dealers may be considered to be affiliated persons of the Funds and/or the Investment Manager due to their possible affiliations with Allianz SE, the ultimate parent of the Investment Manager, or another Allianz entity. Allianz Asset Management of America LP merged with Allianz Asset Management of America LLC (“Allianz Asset Management”), with the latter being the surviving
| | | | |
Principal Risks of the Funds | | | | |
entity, effective January 1, 2023. Following the merger, Allianz Asset Management is PIMCO LLC’s managing member and direct parent entity. Absent an exemption from the SEC or other regulatory relief, the Funds are generally precluded from effecting certain principal transactions with affiliated brokers, and its ability to purchase securities being underwritten by an affiliated broker or a syndicate including an affiliated broker, or to utilize affiliated brokers for agency transactions, is subject to restrictions. This could limit a Fund’s ability to engage in securities transactions and take advantage of market opportunities.
Each Fund has received exemptive relief from the SEC that, to the extent a Fund relies on such relief, permits it to (among other things)
co-invest
with certain other persons, including certain affiliates of the Investment Manager and certain public or private funds managed by the Investment Manager and its affiliates, subject to certain terms and conditions. The exemptive relief from the SEC with respect to
co-investments
imposes extensive conditions on any
co-investments
made in reliance on such relief.
Confidential Information Access Risk
In managing a Fund (and other PIMCO clients), PIMCO may from time to time have the opportunity to receive material,
non-public
information (“Confidential Information”) about the issuers of certain investments, including, without limitation, senior floating rate loans, other loans and related investments being considered for acquisition by a Fund or held in a Fund’s portfolio. For example, an issuer of privately placed loans considered by a Fund may offer to provide PIMCO with financial information and related documentation regarding the issuer that is not publicly available. Pursuant to applicable policies and procedures, PIMCO may (but is not required to) seek to avoid receipt of Confidential Information about such issuers so as to avoid possible restrictions on its ability to purchase and sell investments on behalf of a Fund and other clients to which such Confidential Information relates. In such circumstances, a Fund (and other PIMCO clients) may be disadvantaged in comparison to other investors, including with respect to the price a Fund pays or receives when it buys or sells an investment. Further, PIMCO’s and a Fund’s abilities to assess the desirability of proposed consents, waivers or amendments with respect to certain investments may be compromised if they are not privy to available Confidential Information. PIMCO may also determine to receive such Confidential Information in certain circumstances under its applicable policies and procedures. If PIMCO intentionally or unintentionally comes into possession of Confidential Information, it may be unable, potentially for a substantial period of time, to purchase or sell investments to which such Confidential Information relates.
A Fund will be subject to credit risk with respect to the counterparties to the derivative contracts and other instruments entered into by the Fund or held by special purpose or structured vehicles in which the Fund invests. In the event that a Fund enters into a derivative transaction with a counterparty that subsequently becomes insolvent or becomes the subject of a bankruptcy case, the derivative transaction may be terminated in accordance with its terms and a Fund’s ability to realize its rights under the derivative instrument and its ability to distribute the proceeds could be adversely affected. If a counterparty becomes bankrupt or otherwise fails to perform its obligations under a derivative contract due to financial difficulties, a Fund may experience significant delays in obtaining any recovery (including recovery of any collateral it has provided to the counterparty) in a dissolution, assignment for the benefit of creditors, liquidation,
winding-up,
bankruptcy or other analogous proceeding. In addition, in the event of the insolvency of a counterparty to a derivative transaction, the derivative transaction would typically be terminated at its fair market value. If a Fund is owed this fair market value in the termination of the derivative transaction and its claim is unsecured, the Fund will be treated as a general creditor of such counterparty and will not have any claim with respect to any underlying security or asset. A Fund may obtain only a limited recovery or may obtain no recovery in such circumstances. While a Fund may seek to manage its counterparty risk by transacting with a number of counterparties, concerns about the solvency of, or a default by, one large market participant could lead to significant impairment of liquidity and other adverse consequences for other counterparties.
Credit Default Swaps Risk
Credit default swap agreements may involve greater risks than if a Fund had invested in the reference obligation directly since, in addition to general market risks, credit default swaps are subject to leverage risk, illiquidity risk, counterparty risk and credit risk. A buyer generally also will lose its investment and recover nothing should no credit event occur and the swap is held to its termination date. If a credit event were to occur, the value of any deliverable obligation received by the seller (if any), coupled with the upfront or periodic payments previously received, may be less than the full notional value it pays to the buyer, resulting in a loss of value to the seller. When a Fund acts as a seller of a credit default swap, it is exposed to many of the same risks of leverage described herein. As the seller, a Fund would receive a stream of payments over the term of the swap agreement provided that no event of default has occurred with respect to the referenced debt obligation upon which the swap is based. A Fund would effectively add leverage to its portfolio because, if a default occurs, the stream of payments may stop and, in addition to its total net assets, the Fund would be subject to investment exposure on the notional amount of the swap.
Although a Fund may seek to realize gains by selling credit default swaps that increase in value, to realize gains on selling credit default swaps, an active secondary market for such instruments must exist or a Fund must otherwise be able to close out these transactions at advantageous times. In addition to the risk of losses described above, if no such secondary market exists or a Fund is otherwise unable to close out these transactions at advantageous times, selling credit default swaps may not be profitable for the Fund.
The market for credit default swaps has become more volatile as the creditworthiness of certain counterparties has been questioned and/or downgraded. A Fund will be subject to credit risk with respect to the counterparties to the credit default swap contract (whether a clearing corporation or another third party). If a counterparty’s credit becomes significantly impaired, multiple requests for collateral posting in a short period of time could increase the risk that the Fund may not receive adequate collateral. A Fund may exit its obligations under a credit default swap only by terminating the contract and paying applicable breakage fees, or by entering into an offsetting credit default swap position, which may cause the Fund to incur more losses.
A Fund could lose money if the issuer or guarantor of a fixed income security (including a security purchased with securities lending collateral), or the counterparty to a derivatives contract, or the issuer or guarantor of collateral, repurchase agreement or a loan of portfolio securities is unable or unwilling, or is perceived (whether by market participants, rating agencies, pricing services or otherwise) as unable or unwilling, to make timely principal and/or interest payments or to otherwise honor its obligations. The risk that such issuer, guarantor or counterparty is less willing or able to do so is heightened in market environments where interest rates are rising. The downgrade of the credit of a security or of the issuer of a security held by a Fund may decrease its value. Measures such as average credit quality may not accurately reflect the true credit risk of the Fund. This is especially the case if the Fund consists of securities with widely varying credit ratings. Securities are subject to varying degrees of credit risk, which are often reflected in credit ratings. Credit risk is greater to the extent a Fund uses leverage or derivatives in connection with the management of the Fund. Municipal bonds are subject to the risk that litigation, legislation or other political events, local business or economic conditions, or the bankruptcy of the issuer could have a significant effect on an issuer’s ability to make payments of principal and/or interest. Rising or high interest rates may deteriorate the credit quality of an issuer or counterparty, particularly if an issuer or counterparty faces challenges rolling or refinancing its obligations.
As the use of technology, including cloud-based technology, has become more prevalent in the course of business, the Funds are potentially more susceptible to operational and information security risks resulting from breaches in cyber security. A breach in cyber security refers to both intentional and unintentional cyber events from outside threat actors or internal resources that may, among other things, cause a Fund to lose proprietary information, suffer data corruption and/or destruction, lose operational capacity, result in the unauthorized release or other misuse of confidential information or otherwise disrupt normal business operations. Cyber security breaches may involve unauthorized access to a Fund’s digital information systems (e.g., through “hacking” or malicious software coding), and may come from multiple sources, including outside attacks such as
attacks (i.e., efforts to make network services unavailable to intended users) or cyber extortion, including exfiltration of data held for ransom and/or “ransomware” attacks that renders systems inoperable until ransom is paid, or insider actions (e.g., intentionally or unintentionally harmful acts of PIMCO personnel). In addition, cyber security breaches involving a Fund’s third party service providers (including but not limited to advisers, subadvisers, administrators, transfer agents, custodians, vendors, suppliers, distributors and other third parties), trading counterparties or issuers in which a Fund invests can also subject the Fund to many of the same risks associated with direct cyber security breaches or extortion of company data. Recently, geopolitical tensions may have increased the scale and sophistication of deliberate cybersecurity attacks, particularly those from nation-states or from entities with nation-state backing.
PIMCO’s use of cloud-based service providers could heighten or change these risks. In addition, work-from-home arrangements by a Fund, the Investment Manager or their service providers could increase all of the above risks, create additional data and information accessibility concerns, and make a Fund, the Investment Manager or their service providers susceptible to operational disruptions, any of which could adversely impact their operations. Furthermore, a Fund may be an appealing target for cybersecurity threats such as hackers and malware.
Cyber security failures or breaches may result in financial losses to a Fund and its shareholders. For example, cyber security failures or breaches involving trading counterparties or issuers in which a Fund invests could adversely impact such counterparties or issuers and cause the Fund’s investment to lose value. These failures or breaches may also result in disruptions to business operations, potentially resulting in financial losses; interference with a Fund’s ability to calculate its NAV, process shareholder transactions or otherwise transact business with shareholders; impediments to trading;
| | | | |
Principal Risks of the Funds | | | | |
violations of applicable privacy and other laws; regulatory fines; penalties; third-party claims in litigation; reputational damage; reimbursement or other compensation costs; additional compliance and cyber security risk management costs and other adverse consequences. In addition, substantial costs may be incurred in order to prevent any cyber incidents in the future.
Like with operational risk in general, the Funds have established business continuity plans and risk management systems designed to reduce the risks associated with cyber security. However, there are inherent limitations in these plans and systems, including that certain risks may not have been identified, in large part because different or unknown threats may emerge in the future. As such, there is no guarantee that such efforts will succeed, especially because a Fund does not directly control the cyber security systems of issuers in which the Fund may invest, trading counterparties or third-party service providers to the Fund. Such entities have experienced cyber attacks and other attempts to gain unauthorized access to systems from time to time, and there is no guarantee that efforts to prevent or mitigate the effects of such attacks or other attempts to gain unauthorized access will be successful. There is also a risk that cyber security breaches may not be detected. A Fund and its shareholders may suffer losses as a result of a cyber security breach related to the Fund, its service providers, trading counterparties or the issuers in which the Fund invests.
A Fund may, but is not required to, utilize a variety of derivative instruments (both long and short positions) for investment or risk management purposes. Derivatives are financial contracts whose value depends on, or is derived from, the value of an underlying asset, reference rate or index. For example, a Fund may use derivative instruments for purposes of increasing liquidity, providing efficient portfolio management, broadening investment opportunities (including taking short or negative positions), implementing a tax or cash management strategy, gaining exposure to a particular security or segment of the market, modifying the effective duration of a Fund’s portfolio investments and/or enhancing total return. The use of derivative instruments involves risks different from, or possibly greater than, the risks associated with investing directly in securities and other traditional investments. Derivatives and other similar instruments (referred to collectively as “derivatives”), which may increase market exposure, are subject to a number of risks, including leverage risk, liquidity risk (which may be heightened for highly-customized derivatives), interest rate risk, market risk, counterparty (including credit) risk, operational risk (such as documentation issues, settlement issues and systems failures), legal risk (such as insufficient documentation, insufficient capacity or authority of a counterparty, and issues with the legality or enforceability of a contract),
counterparty risk, tax risk and management risk, as well as risks arising from changes in applicable requirements, risks arising from margin requirements and risks arising from mispricing or valuation complexity. They also involve the risk that changes in the value of a derivative instrument may not correlate perfectly with the underlying asset, rate or index. By investing in a derivative instrument, a Fund could lose more than the amount invested and derivatives may increase the volatility of a Fund, especially in unusual or extreme market conditions. Certain derivatives have the potential for unlimited loss, regardless of the size of the initial investment. The Investment Company Act of 1940 and related rules no longer require asset segregation for derivatives transactions, however asset segregation and posting of collateral may still be utilized for risk management or other purposes. A Fund may be required to hold additional cash or sell other investments in order to obtain cash to close out a position and changes in the value of a derivative may also create margin delivery or settlement payment obligations for the Fund. Also, suitable derivative transactions may not be available in all circumstances and there can be no assurance that a Fund will engage in these transactions to reduce exposure to other risks when that would be beneficial or that, if used, such strategies will be successful. A Fund’s use of derivatives may increase or accelerate the amount of taxes payable by Common Shareholders.
(“OTC”) derivatives are also subject to the risk that a counterparty to the transaction will not fulfill its contractual obligations to the other party, as many of the protections afforded to centrally-cleared derivative transactions might not be available for OTC derivative. The primary credit risk on derivatives that are exchange-traded or traded through a central clearing counterparty resides with a Fund’s clearing broker, or the clearinghouse itself.
Participation in the markets for derivative instruments involves investment risks and transaction costs to which a Fund may not be subject absent the use of these strategies. The skills needed to successfully execute derivative strategies may be different from those needed for other types of transactions. If a Fund incorrectly forecasts the value and/or creditworthiness of securities, currencies, interest rates, counterparties or other economic factors involved in a derivative transaction, the Fund might have been in a better position if the Fund had not entered into such derivative transaction. In evaluating the risks and contractual obligations associated with particular derivative instruments, it is important to consider that certain derivative transactions may be modified or terminated only by mutual consent of a Fund and its counterparty.
Therefore, it may not be possible for a Fund to modify, terminate, or offset the Fund’s obligations or the Fund’s exposure to the risks associated with a derivative transaction prior to its scheduled
termination or maturity date, which may create a possibility of increased volatility and/or decreased liquidity to the Fund. Hedges are sometimes subject to imperfect matching between the derivative and the underlying instrument, and there can be no assurance that a Fund’s hedging transactions will be effective. In such case, a Fund may lose money.
Because the markets for certain derivative instruments (including markets located in foreign countries) are relatively new and still developing, appropriate derivative transactions may not be available in all circumstances for risk management or other purposes. Upon the expiration of a particular contract, a Fund may wish to retain its position in the derivative instrument by entering into a similar contract but may be unable to do so if the counterparty to the original contract is unwilling to enter into the new contract and no other appropriate counterparty can be found. When such markets are unavailable, a Fund will be subject to increased liquidity and investment risk.
A Fund may enter into opposite sides of interest rate swap and other derivatives for the principal purpose of generating distributable gains on the one side (characterized as ordinary income for tax purposes) that are not part of the Fund’s duration or yield curve management strategies (“paired swap transactions”), and with a substantial possibility that the Fund will experience a corresponding capital loss and decline in NAV with respect to the opposite side transaction (to the extent it does not have corresponding offsetting capital gains).
Consequently, Common Shareholders may receive distributions and owe tax on amounts that are effectively a taxable return of the shareholder’s investment in the Fund, at a time when their investment in the Fund has declined in value, which tax may be at ordinary income rates. The tax treatment of certain derivatives in which the Fund invests may be unclear and thus subject to recharacterization.
Any recharacterization of payments made or received by a Fund pursuant to derivatives potentially could affect the amount, timing or character of Fund distributions. In addition, the tax treatment of such investment strategies may be changed by regulation or otherwise.
When a derivative is used as a hedge against a position that a Fund holds, any loss generated by the derivative generally should be substantially offset by gains on the hedged investment, and vice versa. Although hedging can reduce or eliminate losses, it can also reduce or eliminate gains. Hedges are sometimes subject to imperfect matching between the derivative and the underlying instrument, and there can be no assurance that a Fund’s hedging transactions will be effective The regulation of the derivatives markets has increased over the past several years, and additional future regulation of the derivatives markets may make derivatives more costly, may limit the availability or reduce the liquidity of derivatives or may otherwise adversely affect
the value or performance of derivatives. Any such adverse future developments could impair the effectiveness or raise the costs of a Fund’s derivative transactions, impede the employment of a Fund’s derivatives strategies, or adversely affect a Fund’s performance.
Although the Funds may seek to maintain level distributions, a Fund’s distribution rate may be affected by numerous factors, including but not limited to changes in realized and projected market returns, fluctuations in market interest rates, Fund performance, and other factors. There can be no assurance that a change in market conditions or other factors will not result in a change in a Fund’s distribution rate or that the rate will be sustainable in the future.
For instance, during periods of low or declining interest rates, a Fund’s distributable income and dividend levels may decline for many reasons. For example, a Fund may have to deploy uninvested assets (whether from sales of Fund shares, proceeds from matured, traded or called debt obligations or other sources) in new, lower yielding instruments. Additionally, payments from certain instruments that may be held by a Fund (such as variable and floating rate securities) may be negatively impacted by declining interest rates, which may also lead to a decline in the Fund’s distributable income and dividend levels.
Substantial exposure to municipal bonds of particular issuers, geographies and/or jurisdictions will result in susceptibility to political, economic, regulatory and other factors affecting issuers of such bonds, their ability to meet their obligations and the economic condition of the facility or specific revenue source from whose revenues payments of obligations may be made. The ability of state, county, or local governments or other issuers to meet their obligations will depend primarily on the availability of tax and other revenues to those entities. The amounts of tax and other revenues available to issuers may be affected from time to time by economic, political and demographic conditions that specifically impact such issuers. In addition, there are constitutional and statutory restrictions that limit the power of certain issuers to raise revenues or increase taxes. The availability of federal, state and local aid to issuers may also affect their ability to meet their obligations. The creditworthiness of obligations issued by local issuers within a given state may be unrelated to the creditworthiness of obligations issued by the state and there is no obligation on the part of the state to make payment on such local obligations in the event of default. Any reduction in the actual or perceived ability of an issuer to meet its obligations (including a reduction in the rating of its outstanding securities) would likely affect adversely the market value and marketability of its obligations and could adversely affect the values of other bonds as well. Moreover, in such circumstances, the value of the Fund’s shares may fluctuate more widely than the value of shares of a more diversified fund.
| | | | |
Principal Risks of the Funds | | | | |
Many factors, including national economic, social and environmental policies and conditions, which are not within the control of issuers, could affect or could have an adverse impact on the financial condition of the issuers. A Fund is unable to predict whether or to what extent such factors or other factors may affect issuers, the market value or marketability of such bonds or the ability of the respective issuers of the bonds acquired by the Fund to pay interest on or principal of such bonds.
High Yield Securities Risk
To the extent that a Fund invests in high yield securities and unrated securities of similar credit quality (commonly known as “high yield securities” or “junk bonds”), the Fund may be subject to greater levels of credit risk, call risk and liquidity risk than funds that do not invest in such securities, which could have a negative effect on the NAV and market price of the Fund’s Common Shares or Common Share dividends. These securities are considered predominantly speculative with respect to an issuer’s continuing ability to make principal and interest payments and may be more volatile than other types of securities. An economic downturn or individual corporate developments could adversely affect the market for these securities and reduce a Fund’s ability to sell these securities at an advantageous time or price.
High yield securities structured as
zero-coupon
bonds or
kind securities tend to be especially volatile as they are particularly sensitive to downward pricing pressures from rising interest rates or widening spreads and may require a Fund to make taxable distributions of imputed income without receiving the actual cash currency. Issuers of high yield securities may have the right to “call” or redeem the issue prior to maturity, which may result in a Fund having to reinvest the proceeds in other high yield securities or similar instruments that may pay lower interest rates. A Fund may also be subject to greater levels of liquidity risk than funds that do not invest in high yield securities. Consequently, transactions in high yield securities may involve greater costs than transactions in more actively traded securities. A lack of publicly-available information, irregular trading activity and wide bid/ask spreads among other factors, may, in certain circumstances, make high yield debt more difficult to sell at an advantageous time or price than other types of securities or instruments. These factors may result in a Fund being unable to realize full value for these securities and/or may result in the Fund not receiving the proceeds from a sale of a high yield security for an extended period after such sale, each of which could result in losses to the Fund. Because of the risks involved in investing in high yield securities, an investment in a Fund should be considered speculative.
In general, lower rated debt securities carry a greater degree of risk that the issuer will lose its ability to make interest and principal
payments, which could have a negative effect on a Fund. Securities of below investment grade quality are regarded as having predominantly speculative characteristics with respect to capacity to pay interest and repay principal and are commonly referred to as “high yield” securities or “junk bonds.” High yield securities involve a greater risk of default and their prices are generally more volatile and sensitive to actual or perceived negative developments. Debt securities in the lowest investment grade category also may be considered to possess some speculative characteristics by certain rating agencies. A Fund may purchase stressed or distressed securities that are in default or the issuers of which are in bankruptcy, which involve heightened risks.
An economic downturn could severely affect the ability of issuers (particularly those that are highly leveraged) to service or repay their debt obligations. Lower-rated securities are generally less liquid than higher-rated securities, which may have an adverse effect on a Fund’s ability to dispose of them. For example, under adverse market or economic conditions, the secondary market for below investment grade securities could contract further, independent of any specific adverse changes in the condition of a particular issuer, and certain securities in a Fund’s portfolio may become illiquid or less liquid. As a result, a Fund could find it more difficult to sell these securities or may be able to sell these securities only at prices lower than if such securities were widely traded. To the extent a Fund focuses on below investment grade debt obligations, PIMCO’s capabilities in analyzing credit quality and associated risks will be particularly important, and there can be no assurance that PIMCO will be successful in this regard. A Fund’s credit quality policies apply only at the time a security is purchased, and a Fund is not required to dispose of a security in the event that a rating agency or PIMCO downgrades its assessment of the credit characteristics of a particular issue. In determining whether to retain or sell such a security, PIMCO may consider factors including, but not limited to, PIMCO’s assessment of the credit quality of the issuer of such security, the price at which such security could be sold and the rating, if any, assigned to such security by other rating agencies. Analysis of creditworthiness may be more complex for issuers of high yield securities than for issuers of higher quality debt securities.
Illinois State-Specific Risk
A Fund may invest in municipal bonds issued by or on behalf of the State of Illinois and its political subdivisions, financing authorities and their agencies, and therefore may be affected significantly by political, economic, regulatory, social, environmental, or public health developments affecting the ability of Illinois issuers to pay interest or repay principal. Certain issuers of Illinois municipal bonds have experienced serious financial difficulties in the past and reoccurrence of these difficulties may impair the ability of certain Illinois issuers to
pay principal or interest on their obligations. Provisions of the Illinois Constitution and State statutes which limit the taxing and spending authority of Illinois governmental entities may impair the ability of Illinois issuers to pay principal and/or interest on their obligations, particularly given large budget deficits that have been identified and may continue. While Illinois’ economy is broad, it does have major concentrations in certain industries and may be sensitive to economic problems affecting those industries, and its government revenues tend to rely heavily on certain earners (revenues therefore are likely to be more volatile and to be adversely affected if the number of such earners (or their recognized income within a particular period of time) decreases). Future Illinois political and economic developments, constitutional amendments, legislative measures, executive orders, administrative regulations, litigation and voter initiatives as well as environmental events, natural disasters, pandemics, epidemics or social unrest could have an adverse effect on the debt obligations of Illinois issuers.
Inflation risk is the risk that the value of assets or income from a Fund’s investments will be worth less in the future as inflation decreases the value of payments at future dates. As inflation increases, the real value of a Fund’s portfolio could decline. Inflation has increased and cannot be predicted when, if, or the degree to which it may decline. Deflation risk is the risk that prices throughout the economy decline over time. Deflation may have an adverse effect on the creditworthiness of issuers and may make issuer default more likely, which may result in a decline in the value of a Fund’s portfolio and Common Shares.
A Fund may purchase municipal securities that are secured by insurance, bank credit agreements or escrow accounts. The credit quality of the companies that provide such credit enhancements will affect the value of those securities. Certain significant providers of insurance for municipal securities have incurred significant losses as a result of exposure to
sub-prime
mortgages and other lower credit quality investments that have experienced recent defaults or otherwise suffered extreme credit deterioration. As a result, such losses reduced the insurers’ capital and called into question their continued ability to perform their obligations under such insurance if they are called upon to do so in the future. If the insurer of a municipal security suffers a downgrade in its credit rating or the market discounts the value of the insurance provided by the insurer, the rating of the underlying municipal security may be more relevant and the value of the municipal security may more closely, if not entirely, reflect such rating. In such a case, the value of insurance associated with a municipal security may decline and may not add any value. The insurance feature
of a municipal security does not guarantee the full payment of principal and interest through the life of an insured obligation, the market value of the insured obligation or the net asset value of the common shares represented by such insured obligation.
Interest rate risk is the risk that fixed income securities and other instruments in a Fund’s portfolio will fluctuate in value because of a change in interest rates. For example, as nominal interest rates rise, the value of certain fixed income securities held by a Fund is likely to decrease. A nominal interest rate can be described as the sum of a real interest rate and an expected inflation rate. Interest rate changes can be sudden and unpredictable, and a Fund may lose money as a result of movements in interest rates. A Fund may not be able to effectively hedge against changes in interest rates or may choose not to do so for cost or other reasons.
A wide variety of factors can cause interest rates or yields of U.S. Treasury securities (or yields of other types of bonds) to rise, including but not limited to central bank monetary policies, changing inflation or real growth rates, general economic conditions, increasing bond issuances or reduced market demand for low yielding investments. Risks associated with rising interest rates are heightened under current market conditions given that the U.S. Federal Reserve (the “Federal Reserve”) has been raising interest rates from historically low levels and may continue to raise interest rates. In addition, changes in monetary policy may exacerbate the risks associated with changing interest rates. Further, in market environments where interest rates are rising, issuers may be less willing or able to make principal and interest payments on fixed-income investments when due.
Further, fixed income securities with longer durations tend to be more sensitive to changes in interest rates, usually making them more volatile. Duration is a measure used to determine the sensitivity of a security’s price to changes in interest rates that incorporates a security’s yield, coupon, final maturity and call features, among other characteristics. Duration is useful primarily as a measure of the sensitivity of a fixed income security’s market price to interest rate (i.e., yield) movements. All other things remaining equal, for each one percentage point increase in interest rates, the value of a portfolio of fixed income investments would generally be expected to decline by one percent for every year of the portfolio’s average duration above zero. For example, the value of a portfolio of fixed income securities with an average duration of eight years would generally be expected to decline by approximately 8% if interest rates rose by one percentage point.
Variable and floating rate securities may decline in value if their interest rates do not rise as much, or as quickly, as interest rates in general.
| | | | |
Principal Risks of the Funds | | | | |
Conversely, floating rate securities will not generally increase in value if interest rates decline. Inverse floating rate securities may decrease in value if interest rates increase. Inverse floating rate securities may also exhibit greater price volatility than a fixed rate obligation with similar credit quality. When a Fund holds variable or floating rate securities, a decrease (or, in the case of inverse floating rate securities, an increase) in market interest rates will adversely affect the income received from such securities and the NAV of the Fund’s shares.
During periods of very low or negative interest rates, a Fund may be unable to maintain positive returns. Very low or negative interest rates may magnify interest rate risk. Changing interest rates, including rates that fall below zero, may have unpredictable effects on markets, may result in heightened market volatility and may detract from Fund performance to the extent a Fund is exposed to such interest rates.
Measures such as average duration may not accurately reflect the true interest rate sensitivity of a Fund. This is especially the case if a Fund consists of securities with widely varying durations. Therefore, if a Fund has an average duration that suggests a certain level of interest rate risk, the Fund may in fact be subject to greater interest rate risk than the average would suggest. This risk is greater to the extent a Fund uses leverage or derivatives in connection with the management of the Fund.
Convexity is an additional measure used to understand a security’s or Fund’s interest rate sensitivity. Convexity measures the rate of change of duration in response to changes in interest rates. With respect to a security’s price, a larger convexity (positive or negative) may imply more dramatic price changes in response to changing interest rates. Convexity may be positive or negative. Negative convexity implies that interest rate increases result in increased duration, meaning increased sensitivity in prices in response to rising interest rates. Thus, securities with negative convexity, which may include bonds with traditional call features and certain mortgage-backed securities, may experience greater losses in periods of rising interest rates. Accordingly, if a Fund holds such securities, the Fund may be subject to a greater risk of losses in periods of rising interest rates.
Rising interest rates may result in a decline in value of a Fund’s fixed income investments and in periods of volatility. Also, when interest rates rise, issuers are less likely to refinance existing debt securities, causing the average life of such securities to extend. Further, while U.S. bond markets have steadily grown over the past three decades, dealer “market making” ability has remained relatively stagnant. As a result, dealer inventories of certain types of bonds and similar instruments, which provide a core indication of the ability of financial intermediaries to “make markets,” are at or near historic lows in relation to market size. Because market makers provide stability to a
market through their intermediary services, the significant reduction in dealer inventories could potentially lead to decreased liquidity and increased volatility in the fixed income markets. Such issues may be exacerbated during periods of economic uncertainty. All of these factors, collectively and/or individually, could cause a Fund to lose value.
The value of a security may decline for a number of reasons that directly relate to the issuer, such as management performance, major litigation, investigations or other controversies, changes in financial condition or credit rating, changes in government regulations affecting the issuer or its competitive environment and strategic initiatives such as mergers, acquisitions or dispositions and the market response to any such initiatives, financial leverage, reputation or reduced demand for the issuer’s goods or services, as well as the historical and prospective earnings of the issuer and the value of its assets. A change in the financial condition of a single issuer may affect one or more other issuers or securities markets as a whole. These risks can apply to the Common Shares issued by a Fund and to the issuers of securities and other instruments in which the Fund invests.
A Fund’s use of leverage, if any, creates the opportunity for increased Common Share net income, but also creates special risks for Common Shareholders (including an increased risk of loss). To the extent used, there is no assurance that a Fund’s leveraging strategies will be successful. Leverage is a speculative technique that may expose a Fund to greater risk and increased costs. A Fund’s assets attributable to leverage, if any, will be invested in accordance with the Fund’s investment objective and policies. Interest expense payable by a Fund with respect to derivatives and other forms of leverage, and dividends payable with respect to any preferred shares outstanding, if any, will generally be based on shorter-term interest rates that would be periodically reset. So long as a Fund’s portfolio investments provide a higher rate of return (net of applicable Fund expenses) than the interest expenses and other costs to a Fund of such leverage, the investment of the proceeds thereof will generate more income than will be needed to pay the costs of the leverage. If so, and all other things being equal, the excess may be used to pay higher dividends to Common Shareholders than if a Fund were not so leveraged. If, however, shorter-term interest rates rise relative to the rate of return on a Fund’s portfolio, the interest and other costs to the Fund of leverage could exceed the rate of return on the debt obligations and other investments held by the Fund, thereby reducing return to Common Shareholders. Leveraging transactions pursued by a Fund may increase its duration and sensitivity to interest rate movements. In addition, fees and expenses of any form of leverage used by a Fund will be borne entirely by the Common Shareholders (and not by
preferred shareholders, if any) and will reduce the investment return of the Common Shares. Therefore, there can be no assurance that a Fund’s use of leverage will result in a higher yield on the Common Shares, and it may result in losses. In addition, any preferred shares issued by a Fund are expected to pay cumulative dividends, which may tend to increase leverage risk.
Leverage creates several major types of risks for Common Shareholders, including:
| | the likelihood of greater volatility of NAV and market price of Common Shares, and of the investment return to Common Shareholders, than a comparable portfolio without leverage; |
| | the possibility either that Common Share dividends will fall if the interest and other costs of leverage rise, or that dividends paid on Common Shares will fluctuate because such costs vary over time; and |
| | the effects of leverage in a declining market or a rising interest rate environment, as leverage is likely to cause a greater decline in the NAV of the Common Shares than if a Fund were not leveraged. |
In addition, the counterparties to a Fund’s leveraging transactions and any preferred shareholders of the Fund will have complete priority over the Fund’s Common Shareholders in the distribution of the Fund’s assets.
In addition to TOBs and Preferred Shares, a Fund may engage in other transactions that may give rise to a form of leverage including, among others, loans of portfolio securities, short sales and when-issued, delayed delivery and forward commitment transactions, credit default swaps, reverse repurchases, or other derivatives. A Fund’s use of such transactions gives rise to associated leverage risks described above, and may adversely affect a Fund’s income, distributions and total returns to Common Shareholders. A Fund may offset derivatives positions against one another or against other assets to manage effective market exposure resulting from derivatives in its portfolio. To the extent that any offsetting positions do not behave in relation to one another as expected, a Fund may perform as if it is leveraged through use of these derivative strategies.
Reverse repurchase agreements involve the risks that the interest income earned on the investment of the proceeds will be less than the interest expense and Fund expenses associated with the repurchase agreement, that the market value of the securities sold by a Fund may decline below the price at which the Fund is obligated to repurchase such securities and that the securities may not be returned to a Fund. There is no assurance that reverse repurchase agreements can be successfully employed. Dollar roll/buy back transactions involve the risk
that the market value of the securities a Fund is required to purchase may decline below the agreed upon repurchase price of those securities.
Successful use of dollar rolls/buy backs may depend upon the Investment Manager’s ability to correctly predict interest rates and prepayments. There is no assurance that dollar rolls/buy backs can be successfully employed. In connection with reverse repurchase agreements and dollar rolls/buy backs, a Fund will also be subject to counterparty risk with respect to the purchaser of the securities. If the broker/dealer to whom a Fund sells securities becomes insolvent, the Fund’s right to purchase or repurchase securities may be restricted.
A Fund may engage in total return swaps, reverse repurchases, loans of portfolio securities, short sales and when-issued, delayed delivery and forward commitment transactions, credit default swaps, basis swaps and other swap agreements, purchases or sales of futures and forward contracts (including foreign currency exchange contracts), call and put options or other derivatives. A Fund’s use of such transactions gives rise to associated leverage risks described above, and may adversely affect a Fund’s income, distributions and total returns to Common Shareholders. To the extent that any offsetting positions do not behave in relation to one another as expected, a Fund may perform as if it is leveraged through use of these derivative strategies.
Any preferred shares, TOBs, total return swaps, reverse repurchases, loans of portfolio securities, short sales and when-issued, delayed delivery and forward commitment transactions, credit default swaps, basis swaps and other swap agreements, purchases or sales of futures and forward contracts (including foreign currency exchange contracts), call and put options or other derivatives by a Fund or counterparties to the Fund’s other leveraging transactions, if any, would have seniority over the Fund’s Common Shares.
A Fund is required to satisfy certain asset coverage requirements in connection with its use of Preferred Shares, including those imposed by regulatory and rating agency requirements. Accordingly, any decline in the net asset value of the Fund’s investments could result in the risk that the Fund will fail to meet its asset coverage requirements for Preferred Shares or the risk of the Preferred Shares being downgraded by a rating agency. In an extreme case, the Fund’s current investment income might not be sufficient to meet the dividend requirements on Preferred Shares outstanding. A Fund’s current investment income might not be sufficient to meet the dividend requirements on Preferred Shares outstanding. In order to address these types of events, the Fund might need to liquidate investments in order to fund a redemption of some or all of the Preferred Shares. Liquidation at times of adverse economic conditions may result in a loss to the Fund. At other times, these liquidations may result in gain at the Fund level and
| | | | |
Principal Risks of the Funds | | | | |
thus in additional taxable distributions to Common Shareholders. Any Preferred Shares, total return swaps, reverse repurchases, TOBs, loans of portfolio securities, short sales and when-issued, delayed delivery and forward commitment transactions, credit default swaps, basis swaps and other swap agreements, purchases or sales of futures and forward contracts (including foreign exchange contracts), call and put options other derivatives by the Fund or counterparties to the Fund’s other leveraging transactions, if any, would have, seniority over the Fund’s Common Shares.
When a Fund issues Preferred Shares, the Fund pays (and the Common Shareholders bear) all costs and expenses relating to the issuance and ongoing maintenance of Preferred Shares. In addition, holders of Preferred Shares issued by the Fund would have complete priority over Common Shareholders in the distribution of the Fund’s assets. Furthermore, preferred shareholders, voting separately as a single class, have the right to elect two members of the Board at all times and to elect a majority of the trustees in the event two full years’ dividends on the Preferred Shares are unpaid, and also have separate class voting rights on certain matters. Accordingly, preferred shareholders may have interests that differ from those of Common Shareholders, and may at times have disproportionate influence over the Fund’s affairs.
Because the fees received by the Investment Manager may increase depending on the types of leverage utilized by a Fund, the Investment Manager has a financial incentive for the Fund to use certain forms of leverage, which may create a conflict of interest between the Investment Manager, on the one hand, and the Common Shareholders, on the other hand.
1
Liquidity risk exists when particular investments are difficult to purchase or sell. Illiquid investments are investments that a Fund reasonably expects cannot be sold or disposed of in current market conditions in seven calendar days or less without the sale or disposition significantly changing the market value of the investment.
Illiquid investments may become harder to value, especially in changing markets. A Fund’s investments in illiquid investments may reduce the returns of the Fund because it may be unable to sell the illiquid investments at an advantageous time or price or possibly require the Fund to dispose of other investments at unfavorable times or prices in order to satisfy its obligations, which could prevent the Fund from taking advantage of other investment opportunities.
Additionally, the market for certain investments may become illiquid under adverse market or economic conditions independent of any specific adverse changes in the conditions of a particular issuer. Bond
| The types of leverage on which fees are received by the Investment Manager with respect to the Fund are discussed in Note 8 in the Notes to Financial Statements. |
markets have consistently grown over the past three decades while the capacity for traditional dealer counterparties to engage in fixed income trading has not kept pace and in some cases has decreased. As a result, dealer inventories of corporate bonds, which provide a core indication of the ability of financial intermediaries to “make markets,” are at or near historic lows in relation to market size. Because market makers seek to provide stability to a market through their intermediary services, the significant reduction in dealer inventories could potentially lead to decreased liquidity and increased volatility in the fixed income markets. Such issues may be exacerbated during periods of economic uncertainty. In such cases, a Fund, due to regulatory limitations on investments in illiquid investments and the difficulty in purchasing and selling such securities or instruments, may be unable to achieve its desired level of exposure to a certain sector.
Further, fixed income securities with longer durations until maturity face heightened levels of liquidity risk as compared to fixed income securities with shorter durations until maturity. The risks associated with illiquid instruments may be particularly acute in situations in which a Fund’s operations require cash (such as in connection with repurchase offers) and could result in the Fund borrowing to meet its short-term needs or incurring losses on the sale of illiquid instruments. It may also be the case that other market participants may be attempting to liquidate fixed income holdings at the same time as a Fund, causing increased supply in the market and contributing to liquidity risk and downward pricing pressure.
Loans and Other Indebtedness; Loan Acquisitions, Participations and Assignments Risk
Loan interests may take the form of (i) direct interests acquired during a primary distribution or other purchase of a loan, (ii) loans originated by the Fund or (iii) assignments of, novations of or participations in all or a portion of a loan acquired in secondary markets. In addition to credit risk and interest rate risk, a Fund’s exposure to loan interests may be subject to additional risks. For example, purchasers of loans and other forms of direct indebtedness depend primarily upon the creditworthiness of the borrower for payment of principal and interest. Loans are subject to the risk that scheduled interest or principal payments will not be made in a timely manner or at all, either of which may adversely affect the value of the loan. If a Fund does not receive scheduled interest or principal payments on such indebtedness, the Fund’s share price and yield could be adversely affected. Loans that are fully secured may offer a Fund more protection than an unsecured loan in the event of
non-payment
of scheduled interest or principal if the Fund is able to access and monetize the collateral. However, the collateral underlying a loan, if any, may be unavailable or insufficient to satisfy a borrower’s obligation. If a Fund becomes owner, whole or in part, of any collateral after a loan is foreclosed, the
Fund may incur costs associated with owning and/or monetizing its ownership of the collateral.
During periods of deteriorating economic conditions, such as recessions or periods of rising unemployment, or changing interest rates (notably increases), delinquencies and losses generally increase, sometimes dramatically, with respect to obligations under such loans. An economic downturn or individual corporate developments could adversely affect the market for these instruments and reduce a Fund’s ability to sell these instruments at an advantageous time or price. An economic downturn would generally lead to a higher
non-payment
rate and, a senior loan may lose significant market value before a default occurs.
Investments in loans through a purchase of a loan, loan origination or a direct assignment of a financial institution’s interests with respect to a loan may involve additional risks to a Fund. For example, if a loan is foreclosed, the Fund could become owner, in whole or in part, of any collateral, which could include, among other assets, real estate or other real or personal property, and would bear the costs and liabilities associated with owning and holding or disposing of the collateral. The purchaser of an assignment typically succeeds to all the rights and obligations under the loan agreement with the same rights and obligations as the assigning lender. Assignments may, however, be arranged through private negotiations between potential assignees and potential assignors, and the rights and obligations acquired by the purchaser of an assignment may differ from, and be more limited than, those held by the assigning lender.
In connection with purchasing loan participations, a Fund generally will have no right to enforce compliance by the borrower with the terms of the loan agreement relating to the loan, nor any rights of
set-off
against the borrower, and the Fund may not directly benefit from any collateral supporting the loan in which it has purchased the loan participation. As a result, the Fund will be subject to the credit risk of both the borrower and the lender that is selling the participation. In the event of the insolvency of the lender selling a participation, the Fund may be treated as a general creditor of the lender and may not benefit from any
set-off
between the lender and the borrower. Certain loan participations may be structured in a manner designed to prevent purchasers of participations from being subject to the credit risk of the lender, but even under such a structure, in the event of the lender’s insolvency, the lender’s servicing of the participation may be delayed and the assignability of the participation impaired.
A Fund may have difficulty disposing of loans and loan participations. Because there may not be a liquid market for many such investments, the Fund anticipates that such investments could be sold only to a
limited number of institutional investors. The lack of a liquid secondary market may have an adverse impact on the value of such investments and a Fund’s ability to dispose of particular loans and loan participations when that would be desirable, including in response to a specific economic event such as a deterioration in the creditworthiness of the borrower. The lack of a liquid secondary market for loans and loan participations also may make it more difficult for a Fund to assign a value to these securities for purposes of valuing the Fund’s portfolio.
Investments in loans may include participations in bridge loans, which are loans taken out by borrowers for a short period (typically less than one year) pending arrangement of more permanent financing through, for example, the issuance of bonds, frequently high yield bonds issued for the purpose of acquisitions.
Investments in loans may include acquisitions of, or participation in, delayed funding loans and revolving credit facilities. These commitments may have the effect of requiring a Fund to increase its investment in a borrower at a time when it might not otherwise decide to do so (including at a time when the company’s financial condition makes it unlikely that such amounts will be repaid). Delayed funding loans and revolving credit facilities may be subject to restrictions on transfer, and only limited opportunities may exist to resell such instruments. As a result, a Fund may be unable to sell such investments at an opportune time or may have to resell them at less than fair market value. Further, a Fund may need to hold liquid assets in order to provide funding for these types of commitments, meaning the Fund may not be able to invest in other attractive investments, or the Fund may need to liquidate existing assets in order to provide such funding.
To the extent a Fund invests in loans, including bank loans, or originates loans, the Fund may be subject to greater levels of credit risk, call risk, settlement risk and liquidity risk. These instruments are considered predominantly speculative with respect to an issuer’s continuing ability to make principal and interest payments and may be more volatile than other types of securities. The Fund may also be subject to greater levels of liquidity risk than funds that do not invest in loans. In addition, the loans in which a Fund invests may not be listed on any exchange and a secondary market for such loans may be comparatively illiquid relative to markets for other more liquid fixed income securities. Consequently, transactions in loans may involve greater costs than transactions in more actively traded securities. In connection with certain loan transactions, transaction costs that are borne by a Fund may include the expenses of third parties that are retained to assist with reviewing and conducting diligence, negotiating, structuring and servicing a loan transaction, and/or providing other services in connection therewith. Furthermore, the
| | | | |
Principal Risks of the Funds | | | | |
Fund may incur such costs in connection with loan transactions that are pursued by the Fund but not ultimately consummated
(so-called
“broken deal costs”).
Restrictions on transfers in loan agreements, a lack of publicly-available information, irregular trading activity and wide bid/ask spreads, among other factors, may, in certain circumstances, make loans more difficult to sell at an advantageous time or price than other types of securities or instruments. These factors may result in a Fund being unable to realize full value for the loans and/or may result in the Fund not receiving the proceeds from a sale of a loan for an extended period after such sale, each of which could result in losses to the Fund. Some loans may have extended trade settlement periods, including settlement periods of greater than seven days, which may result in cash not being immediately available to the Fund. If an issuer of a loan prepays or redeems the loan prior to maturity, a Fund may have to reinvest the proceeds in other loans or similar instruments that may pay lower interest rates. Because of the risks involved in investing in loans, an investment in a Fund should be considered speculative.
A Fund’s investments in subordinated and unsecured loans generally are subject to similar risks as those associated with investments in secured loans. Subordinated or unsecured loans are lower in priority of payment to secured loans and are subject to the additional risk that the cash flow of the borrower and property securing the loan or debt, if any, may be insufficient to meet scheduled payments after giving effect to the senior secured obligations of the borrower. This risk is generally higher for subordinated unsecured loans or debt, which are not backed by a security interest in any specific collateral. Subordinated and unsecured loans generally have greater price volatility than secured loans and may be less liquid. There is also a possibility that originators will not be able to sell participations in subordinated or unsecured loans, which would create greater credit risk exposure for the holders of such loans. Subordinate and unsecured loans share the same risks as other below investment grade securities.
There may be less readily available information about most loans and the underlying borrowers than is the case for many other types of securities. Loans may be issued by borrowers that are not subject to SEC reporting requirements and therefore may not be required to file reports with the SEC or may file reports that are not required to comply with SEC form requirements. In addition, such borrowers may be subject to a less stringent liability disclosure regime than companies subject to SEC reporting requirements. Loans may not be considered “securities,” and purchasers, such as the Funds, therefore may not be entitled to rely on the anti-fraud protections of the federal securities laws. Because there is limited public information available regarding loan investments, a Fund is particularly dependent on the analytical abilities of the Fund’s portfolio managers.
Economic exposure to loan interests through the use of derivative transactions may involve greater risks than if a Fund had invested in the loan interest directly during a primary distribution, through direct originations or through assignments of, novations of or participations in a loan acquired in secondary markets since, in addition to the risks described above, certain derivative transactions may be subject to leverage risk and greater illiquidity risk, counterparty risk, valuation risk and other risks.
Each Fund may invest in and/or originate loans, including, without limitation, to, on behalf of, authorized by, sponsored by, and/or in connection with a project for which authority and responsibility lies with one or more U.S. states or territories, cities in a U.S. state or territory, or political subdivisions, agencies, authorities or instrumentalities of such states, territories or cities, which may be in the form of whole loans, assignments, participations, secured and unsecured notes, senior and second lien loans, mezzanine loans, bridge loans or similar investments. This may include loans to public or private firms or individuals, such as in connection with housing development projects. When investing in or originating loans, a Fund is not restricted by any particular credit risk criteria and/or qualifications. A Fund also is not limited in the amount, size or type of loans it may invest in and/or originate, including with respect to a single borrower, other than pursuant to any applicable law. The loans a Fund invests in or originates may vary in maturity and/or duration. A Fund’s investment in or origination of loans may also be limited by the requirements the Fund intends to observe under Subchapter M of the Code, in order to qualify as a RIC. The loans acquired by a Fund may be “Municipal Bonds” (including of a particular state) for purposes of the Fund’s investment policies to invest a certain minimum of their assets in securities that produce income that is exempt from federal income tax and, as applicable, the income taxes of a particular state, or may be loans that produce income that is subject to applicable regular income tax, subject to the Fund’s investment limits. A Fund may subsequently offer such investments for sale to third parties; provided, that there is no assurance that the Fund will complete the sale of such an investment. If a Fund is unable to sell, assign or successfully close transactions for the loans that it originates, the Fund will be forced to hold its interest in such loans for an indeterminate period of time. This could result in the Fund’s investments having high exposure to certain borrowers. A Fund will be responsible for the expenses associated with originating a loan (whether or not consummated). This may include significant legal and due diligence expenses, which will be borne by the Fund and common shareholders.
Bridge loans are generally made with the expectation that the borrower will be able to obtain permanent financing in the near future. Any delay in obtaining permanent financing subjects the bridge
loan investor to increased risk. A borrower’s use of bridge loans also involves the risk that the borrower may be unable to locate permanent financing to replace the bridge loan, which may impair the borrower’s perceived creditworthiness.
Loan origination and servicing companies are routinely involved in legal proceedings concerning matters that arise in the ordinary course of their business. In addition, a number of participants in the loan origination and servicing industry (including control persons of industry participants) have been the subject of regulatory actions by state regulators, including state attorneys general, and by the federal government. Governmental investigations, examinations or regulatory actions, or private lawsuits, including purported class action lawsuits, may adversely affect such companies’ financial results. To the extent a Fund engages in origination and/or servicing directly, or has a financial interest in, or is otherwise affiliated with, an origination or servicing company, a Fund will be subject to enhanced risks of litigation, regulatory actions and other proceedings. As a result, a Fund may be required to pay legal fees, settlement costs, damages, penalties or other charges, any or all of which could materially adversely affect a Fund and its holdings.
The Funds are subject to management risk because they are actively managed investment portfolios. PIMCO and each individual portfolio manager will apply investment techniques and risk analysis in making investment decisions for a Fund, but there can be no guarantee that these decisions will produce the desired results. Certain securities or other instruments in which a Fund seeks to invest may not be available in the quantities desired. In addition, regulatory restrictions, actual or potential conflicts of interest or other considerations may cause PIMCO to restrict or prohibit participation in certain investments. In such circumstances, PIMCO or the individual portfolio managers may determine to purchase other securities or instruments as substitutes. Such substitute securities or instruments may not perform as intended, which could result in losses to the Funds. To the extent a Fund employs strategies targeting perceived pricing inefficiencies, arbitrage strategies or similar strategies, it is subject to the risk that the pricing or valuation of the securities and instruments involved in such strategies may change unexpectedly, which may result in reduced returns or losses to the Fund. Each Fund is also subject to the risk that deficiencies in the internal systems or controls of PIMCO or another service provider will cause losses for the Fund or hinder Fund operations. For example, trading delays or errors (both human and systemic) could prevent a Fund from purchasing a security expected to appreciate in value. Additionally, actual or potential conflicts of interest, legislative, regulatory, or tax restrictions, policies or developments may affect the investment techniques available to PIMCO and each individual portfolio manager in connection with
managing a Fund and may also adversely affect the ability of the Fund to achieve its investment objective. There also can be no assurance that all of the personnel of PIMCO will continue to be associated with PIMCO for any length of time. The loss of the services of one or more key employees of PIMCO could have an adverse impact on a Fund’s ability to realize its investment objectives.
In addition, each Fund may rely on various third-party sources to calculate its NAV. As a result, each Fund is subject to certain operational risks associated with reliance on service providers and service providers’ data sources. In particular, errors or systems failures and other technological issues may adversely impact a Fund’s calculations of its NAV, and such NAV calculation issues may result in inaccurately calculated NAVs, delays in NAV calculation and/or the inability to calculate NAVs over extended periods. A Fund may be unable to recover any losses associated with such failures.
The market price of securities owned by the Funds may go up or down, sometimes rapidly or unpredictably. Securities may decline in value due to factors affecting securities markets generally or particular industries or companies represented in the securities markets. The value of a security may decline due to general market conditions that are not specifically related to a particular company, such as real or perceived adverse economic conditions, changes in the general outlook for corporate earnings, changes in interest or currency rates, financial system instability, adverse changes to credit markets or adverse investor sentiment generally. The value of a security may also decline due to factors that affect a particular industry or industries, such as labor shortages or increased production costs and competitive conditions within an industry. During a general downturn in the securities markets, multiple asset classes may decline in value simultaneously even if the performance of those asset classes is not otherwise historically correlated. Investments may also be negatively impacted by market disruptions and by attempts by other market participants to manipulate the prices of particular investments. Equity securities generally have greater price volatility than fixed income securities. Credit ratings downgrades may also negatively affect securities held by the Fund. Even when markets perform well, there is no assurance that the investments held by the Fund will increase in value along with the broader market.
In addition, market risk includes the risk that geopolitical and other events will disrupt the economy on a national or global level. For instance, war, terrorism, social unrest, recessions, supply chain disruptions, market manipulation, government defaults, government shutdowns, political changes, diplomatic developments or the imposition of sanctions and other similar measures, public health emergencies (such as the spread of infectious diseases, pandemics and
| | | | |
Principal Risks of the Funds | | | | |
epidemics),natural/environmental disasters, climate-change and climate related events can all negatively impact the securities markets, which could cause the Fund to lose value. These events could reduce consumer demand or economic output, result in market closures, changes in interest rates, inflation/deflation, travel restrictions or quarantines, and significantly adversely impact the economy. As computing technology and data analytics continually advance, there has been an increasing trend towards machine driven and artificially intelligent trading systems, particularly providing such systems with increasing levels of autonomy in trading decisions. Regulators of financial markets have become increasingly focused on the potential impact of artificial intelligence on investment activities and may issue regulations that are intended to affect the use of artificial technology in trading activities. Any such regulations may not have the intended affect on financial markets. Moreover, advancements in artificial intelligence and other technologies may suffer from the introduction of errors, defects or security vulnerabilities which can go undetected. The potential speed of trading and other technologies may exacerbate the impact of any such flaws, particularly where such flaws are exploited by other artificially intelligent systems and may act to impair or prevent the intervention of a human control. The current contentious domestic political environment, as well as political and diplomatic events within the United States and abroad, such as presidential elections in the U.S. or abroad or the U.S. government’s inability at times to agree on a long-term budget and deficit reduction plan, has in the past resulted, and may in the future result, in a government shutdown or otherwise adversely affect the U.S. regulatory landscape, the general market environment and/or investor sentiment, which could have an adverse impact on the Fund’s investments and operations. Additional and/or prolonged U.S. federal government shutdowns may affect investor and consumer confidence and may adversely impact financial markets and the broader economy, perhaps suddenly and to a significant degree. Governmental and quasi-governmental authorities and regulators throughout the world have previously responded to serious economic disruptions with a variety of significant fiscal and monetary policy changes, including but not limited to, direct capital infusions into companies, new monetary programs and dramatically lower interest rates. An unexpected or sudden reversal of these policies, or the ineffectiveness of these policies, could increase volatility in securities markets, which could adversely affect the Fund’s investments. Any market disruptions could also prevent the Fund from executing advantageous investment decisions in a timely manner. Funds that have focused their investments in a region enduring geopolitical market disruption will face higher risks of loss. Thus, investors should closely monitor current market conditions to determine whether the Fund meets their individual financial needs and tolerance for risk.
Recently, there have been inflationary price movements. As such, fixed income securities markets may experience heightened levels of interest rate, volatility and liquidity risk. As discussed more under “Interest Rate Risk,” the Federal Reserve has been raising interest rates from historically low levels and may continue to raise interest rates. Any additional interest rate increases in the future could cause the value of any Fund, such as the Fund, that invests in fixed income securities to decrease. Although interest rates have significantly increased since 2022 through the date of this shareholder report, the prices of real estate-related assets generally have not decreased as much as may be expected based on historical correlations between interest rates and prices of real estate-related assets. This presents an increased risk of a correction or severe downturn in real estate-related asset prices, which could adversely impact the value of other investments as well (such as loans, securitized debt and other fixed income securities). This risk is particularly present with respect to commercial real estate-related asset prices, and the value of other investments with a connection to the commercial real estate sector. As examples of the current risks faced by real estate-related assets: tenant vacancy rates, tenant turnover and tenant concentration have increased; owners of real estate have faced headwinds, delinquencies and difficulties in collecting rents and other payments (which increases the risk of owners being unable to pay or otherwise defaulting on their own borrowings and obligations); property values have declined; inflation, upkeep costs and other expenses have increased; and rents have declined for many properties.
Exchanges and securities markets may close early, close late or issue trading halts on specific securities, which may result in, among other things, a Fund being unable to buy or sell certain securities or financial instruments at an advantageous time or accurately price its portfolio investments.
The price of a Fund’s Common Shares will fluctuate with market conditions and other factors. If you sell your Common Shares, the price received may be more or less than your original investment. The Common Shares are designed for long-term investors and should not be treated as trading vehicles. Shares of
closed-end
management investment companies frequently trade at a discount from their NAV. The Common Shares may trade at a price that is less than the offering price for Common Shares issued pursuant to an offering. This risk may be greater for investors who sell their Common Shares relatively shortly after completion of an offering. The sale of Common Shares by a Fund (or the perception that such sales may occur), particularly if sold at a discount to the then current market price of the Common Shares, may have an adverse effect on the market price of the Common Shares.
Each Fund is subject to investment and operational risks associated with financial, economic and other global market developments and disruptions, including those arising from war, terrorism, market manipulation, government interventions, defaults and shutdowns, political changes or diplomatic developments, public health emergencies (such as the spread of infectious diseases, pandemics and epidemics) and natural/environmental disasters, which can all negatively impact the securities markets, interest rates, auctions, secondary trading, ratings, credit risk, inflation, deflation, other factors relating to a Fund’s investments or the Investment Manager’s operations and the value of an investment in a Fund, its distributions and its returns. These events can also impair the technology and other operational systems upon which a Fund’s service providers, including PIMCO as each Fund’s investment adviser, rely, and could otherwise disrupt a Fund’s service providers’ ability to fulfill their obligations to a Fund. Furthermore, events involving limited liquidity, defaults,
non-
performance or other adverse developments that affect financial institutions or the financial services industry generally, or concerns or rumors about any events of these kinds or other similar risks, have in the past and may in the future lead to market-wide liquidity problems.
Mortgage-Related and Other Asset-Backed Instruments Risk
The mortgage-related assets in which the Fund may invest include, but are not limited to, any security, instrument or other asset that is related to U.S. or
non-U.S.
mortgages, including those issued by private originators or issuers, or issued or guaranteed as to principal or interest by the U.S. government or its agencies or instrumentalities or by
non-U.S.
governments or authorities, such as, without limitation, assets representing interests in, collateralized or backed by, or whose values are determined in whole or in part by reference to any number of mortgages or pools of mortgages or the payment experience of such mortgages or pools of mortgages, including REMICs, which could include
Re-REMICs,
mortgage pass-through securities, inverse floaters, CMOs, CLOs, multiclass pass-through securities, private mortgage pass-through securities, stripped mortgage securities (generally interest-only and principal-only securities), mortgage-related asset backed securities and mortgage-related loans (including through participations, assignments, originations and whole loans), including commercial and residential mortgage loans. Exposures to mortgage-related assets through derivatives or other financial instruments will be considered investments in mortgage-related assets.
A Fund may also invest in other types of ABS, including CDOs, CBOs and CLOs and other similarly structured securities.
Mortgage-related and other asset-backed instruments represent interests in “pools” of mortgages or other assets such as consumer loans or receivables held in trust and often involve risks that are
different from or possibly more acute than risks associated with other types of debt instruments.
Generally, rising interest rates tend to extend the duration of fixed rate mortgage-related assets, making them more sensitive to changes in interest rates. Compared to other fixed income investments with similar maturity and credit, mortgage-related securities may increase in value to a lesser extent when interest rates decline and may decline in value to a similar or greater extent when interest rates rise. As a result, in a period of rising interest rates, a Fund may exhibit additional volatility since individual mortgage holders are less likely to exercise prepayment options, thereby putting additional downward pressure on the value of these securities and potentially causing the Fund to lose money. This is known as extension risk.
Mortgage-backed securities can be highly sensitive to rising interest rates, such that even small movements can cause a Fund to lose value. Mortgage-backed securities, and in particular those not backed by a government guarantee, are subject to credit risk. When interest rates decline, borrowers may pay off their mortgages sooner than expected. This can reduce the returns of a Fund because the Fund may have to reinvest that money at the lower prevailing interest rates. In addition, the creditworthiness, servicing practices, and financial viability of the servicers of the underlying mortgage pools present significant risks. For instance, a servicer may be required to make advances in respect of delinquent loans underlying the mortgage-related securities; however, servicers experiencing financial difficulties may not be able to perform these obligations. Additionally, both mortgage-related securities and asset-backed securities are subject to risks associated with fraud or negligence by, or defalcation of, their servicers. These securities are also subject to the risks of the underlying loans. In some circumstances, a servicer’s or originator’s mishandling of documentation related to the underlying collateral (e.g., failure to properly document a security interest in the underlying collateral) may affect the rights of security holders in and to the underlying collateral. In addition, the underlying loans may have been extended pursuant to inappropriate underwriting guidelines, to no underwriting guidelines at all, or to fraudulent origination practices. The owner of a mortgage-backed security’s ability to recover against the sponsor, servicer or originator is uncertain and is often limited. A Fund’s investments in other asset-backed instruments are subject to risks similar to those associated with mortgage-related assets, as well as additional risks associated with the nature of the assets and the servicing of those assets. Payment of principal and interest on asset-backed instruments may be largely dependent upon the cash flows generated by the assets backing the instruments, and asset-backed instruments may not have the benefit of any security interest in the related assets.
| | | | |
Principal Risks of the Funds | | | | |
Subordinate mortgage-backed or asset-backed instruments are paid interest only to the extent that there are funds available to make payments. To the extent the collateral pool includes a large percentage of delinquent loans, there is a risk that interest payments on subordinate mortgage-backed or asset-backed instruments will not be fully paid.
There are multiple tranches of mortgage-backed and asset-backed instruments, offering investors various maturity and credit risk characteristics. For example, tranches may be categorized as senior, mezzanine, and subordinated/equity or “first loss,” according to their degree of risk. The most senior tranche of a mortgage-backed or asset-backed instrument generally has the greatest collateralization and generally pays the lowest interest rate. If there are defaults or the collateral otherwise underperforms, scheduled payments to senior tranches generally take precedence over those of mezzanine tranches, and scheduled payments to mezzanine tranches take precedence over those to subordinated/equity tranches. Lower tranches represent lower degrees of credit quality and pay higher interest rates intended to compensate for the attendant risks. The return on the lower tranches is especially sensitive to the rate of defaults in the collateral pool. The lowest tranche (i.e., the “equity” or “residual” tranche) generally specifically receives the residual interest payments (i.e., money that is left over after the higher tranches have been paid and expenses of the issuing entities have been paid) rather than a fixed interest rate. A Fund may also invest in the residual or equity tranches of mortgage-related and other asset-backed instruments, which may be referred to as subordinate mortgage-backed or asset-backed instruments and interest-only mortgage-backed or asset-backed instruments. A Fund expects that investments in subordinate mortgage-backed and other asset-backed instruments will be subject to risks arising from delinquencies and foreclosures, thereby exposing its investment portfolio to potential losses. Subordinate securities of mortgage-backed and other asset-backed instruments are also subject to greater credit risk than those mortgage-backed or other asset-backed instruments that are more highly rated.
The mortgage markets in the United States and in various foreign countries have experienced extreme difficulties in the past that adversely affected the performance and market value of certain of a Fund’s mortgage-related investments. Delinquencies and losses on residential and commercial mortgage loans (especially subprime and second-lien mortgage loans) may increase, and a decline in or flattening of housing and other real property values may exacerbate such delinquencies and losses. In addition, reduced investor demand for mortgage loans and mortgage-related securities and increased investor yield requirements have caused limited liquidity in the secondary market for mortgage-related securities, which can adversely affect the market value of mortgage-related securities. It is possible
that such limited liquidity in such secondary markets could continue or worsen.
Mortgage-Related Derivative Instruments Risk
A Fund may engage in derivative transactions related to mortgage-backed securities, including purchasing and selling exchange-listed and OTC put and call options, futures and forwards on mortgages and mortgage-backed securities. A Fund may also invest in mortgage-backed securities credit default swaps, which include swaps the reference obligation for which is a mortgage-backed security or related index, such as the CMBX Index (a tradeable index referencing a basket of commercial mortgage-backed securities), the TRX Index (a tradeable index referencing total return swaps based on commercial mortgage-backed securities) or the ABX (a tradeable index referencing a basket of
sub-prime
mortgage-backed securities). A Fund may invest in newly developed mortgage related derivatives that may hereafter become available.
Derivative mortgage-backed securities (such as principal-only (“POs”), interest-only (“IOs”) or inverse floating rate securities) are particularly exposed to call and extension risks. Small changes in mortgage prepayments can significantly impact the cash flows and the market value of these derivative instruments. In general, the risk of faster than anticipated prepayments adversely affects IOs, super floaters and premium priced mortgage-backed securities. The risk of slower than anticipated prepayments generally affects POs, floating-rate securities subject to interest rate caps, support tranches and discount priced mortgage-backed securities. In addition, particular derivative instruments may be leveraged such that their exposure (i.e., price sensitivity) to interest rate and/or prepayment risk is magnified.
Mortgage-related derivative instruments involve risks associated with mortgage-related and other asset-backed instruments, privately-issued mortgage-related securities, the mortgage market, the real estate industry, derivatives and credit default swaps.
Investing in the municipal bond market involves the risks of investing in debt securities generally and certain other risks. The amount of public information available about the municipal bonds in which a Fund may invest is generally less than that for corporate equities or bonds, and the investment performance of the Fund’s investment in municipal bonds may therefore be more dependent on the analytical abilities of PIMCO than its investments in taxable bonds. The secondary market for municipal bonds, particularly below investment grade bonds in which a Fund may invest, also tends to be less well developed or liquid than many other securities markets, which may adversely affect a Fund’s ability to sell municipal bonds at attractive prices or value municipal bonds.
The ability of municipal issuers to make timely payments of interest and principal may be diminished during general economic downturns, by litigation, legislation or political events, or by the bankruptcy of the issuer. Laws, referenda, ordinances or regulations enacted in the future by Congress or state legislatures or the applicable governmental entity could extend the time for payment of principal and/or interest, or impose other constraints on enforcement of such obligations, or on the ability of municipal issuers to levy taxes. Issuers of municipal securities also might seek protection under the bankruptcy laws. In the event of bankruptcy of such an issuer, a Fund could experience delays in collecting principal and interest and the Fund may not, in all circumstances, be able to collect all principal and interest to which it is entitled. To enforce its rights in the event of a default in the payment of interest or repayment of principal, or both, a Fund may take possession of and manage the assets securing the issuer’s obligations on such securities, which may increase the Fund’s operating expenses.
Adverse economic, business, legal or political developments might affect all or a substantial portion of a Fund’s municipal bonds in the same manner. A Fund will be particularly subject to these risks to the extent that it focuses its investments in municipal bonds in a particular state or geographic region.
A Fund may invest in trust certificates issued in TOB programs. In these programs, a trust typically issues two classes of certificates and uses the proceeds to purchase municipal securities having relatively long maturities and bearing interest at a fixed interest rate substantially higher than prevailing short-term
tax-exempt
rates. There is a risk that a Fund will not be considered the owner of a TOB for federal income tax purposes, and thus will not be entitled to treat such interest as exempt from federal income tax. Certain TOBs may be less liquid or may become less liquid as a result of, among other things, a credit rating downgrade, a payment default or a disqualification from
tax-exempt
status. A Fund’s investment in the securities issued by a TOB trust may involve greater risk and volatility than an investment in a fixed rate bond, and the value of such securities may decrease significantly when market interest rates increase. TOB trusts could be terminated due to market, credit or other events beyond the Fund’s control, which could require the Fund to dispose of portfolio investments at inopportune times and prices. A Fund may use a TOB program as a way of achieving leverage in its portfolio, in which case the Fund will be subject to leverage risk. The use of TOBs will impact a Fund’s duration and cause a Fund to be subject to increased duration and interest rate risk.
A Fund may invest in revenue bonds, which are typically issued to fund a wide variety of capital projects including electric, gas, water and sewer systems; highways, bridges and tunnels; port and airport facilities; colleges and universities; and hospitals. Because the principal
security for a revenue bond is generally the net revenues derived from a particular facility or group of facilities or, in some cases, from the proceeds of a special excise or other specific revenue source or annual revenues, there is no guarantee that the particular project will generate enough revenue to pay its obligations, in which case a Fund’s performance may be adversely affected.
A Fund may invest in taxable municipal bonds, such as Build America Bonds. Build America Bonds are tax credit bonds created by the American Recovery and Reinvestment Act of 2009, which authorized state and local governments to issue Build America Bonds as taxable bonds in 2009 and 2010, without volume limitations, to finance any capital expenditures for which such issuers could otherwise issue traditional
tax-exempt
bonds. A Fund’s investments in Build America Bonds or similar taxable municipal bonds will result in taxable income and the Fund may elect to pass through to holders of the Fund’s Common Shareholders the corresponding tax credits. The tax credits can generally be used to offset federal income taxes and the alternative minimum tax, but such credits are generally not refundable. Taxable municipal bonds involve similar risks as
tax-exempt
municipal bonds, including credit and market risk.
A Fund may invest in
pre-refunded
Municipal Bonds.
Pre-refunded
Municipal Bonds are
tax-exempt
bonds that have been refunded to a call date prior to the final maturity of principal, or, in the case of
pre-refunded
Municipal Bonds commonly referred to as
bonds,” to the final maturity of principal, and remain outstanding in the municipal market. The payment of principal and interest of the
pre-refunded
Municipal Bonds held by a Fund is funded from securities in a designated escrow account that holds U.S. Treasury securities or other obligations of the U.S. Government (including its agencies and instrumentalities (“Agency Securities”)). As the payment of principal and interest is generated from securities held in an escrow account established by the municipality and an independent escrow agent, the pledge of the municipality has been fulfilled and the original pledge of revenue by the municipality is no longer in place.
Pre-refunded
and/or escrowed to maturity Municipal Bonds may bear an investment grade rating (for example, if
re-rated
by a rating service or, if not
re-rated,
determined by PIMCO to be of comparable quality) because they are backed by U.S. Treasury securities, Agency Securities or other investment grade securities. For the avoidance of any doubt, PIMCO’s determination of an issue’s credit rating will generally be used for compliance with the Fund’s investment parameters when an issue either loses its rating or is not
re-rated
upon
pre-refunding.
Because the payment of principal and interest is generated from securities held in an escrow account established by the municipality and an independent escrow agent, the pledge of the municipality has been fulfilled and the original pledge of revenue by the municipality is no longer in place. The escrow account
| | | | |
Principal Risks of the Funds | | | | |
securities pledged to pay the principal and interest of the
pre-refunded
municipal bond do not guarantee the price movement of the bond before maturity. Issuers of municipal bonds refund in advance of maturity the outstanding higher cost debt and issue new, lower cost debt, placing the proceeds of the lower cost issuance into an escrow account to
pre-refund
the older, higher cost debt. Investment in
pre-refunded
municipal bonds held by the Fund may subject the Fund to interest rate risk and market risk. In addition, while a secondary market exists for
pre-refunded
municipal bonds, if the Fund sells
pre-refunded
municipal bonds prior to maturity, the price received may be more or less than the original cost, depending on market conditions at the time of sale.
A Fund may invest in participations in lease obligations or installment purchase contract obligations of municipal authorities or entities. Although a municipal lease obligation does not constitute a general obligation of the municipality for which the municipality’s taxing power is pledged, a municipal lease obligation is ordinarily backed by the municipality’s covenant to budget for, appropriate and make the payments due under the municipal lease obligation. However, certain municipal lease obligations contain
“non-appropriation”
clauses, which provide that the municipality has no obligation to make lease or installment purchase payments in future years unless money is appropriated for such purpose on a yearly basis. In the case of a
“non-appropriation”
lease, a Fund’s ability to recover under the lease in the event of
non-appropriation
or default will be limited solely to the repossession of the leased property, without recourse to the general credit of the lessee, and the disposition or
re-leasing
of the property might prove difficult.
Municipal securities are also subject to interest rate, credit, and liquidity risk.
The value of municipal securities, similar to other fixed income securities, will likely drop as interest rates rise in the general market. Conversely, when rates decline, bond prices generally rise.
The risk that a borrower may be unable to make interest or principal payments when they are due. A fund that invests in municipal securities relies on the ability of the issuer to service its debt.
This subjects a Fund to credit risk in that the municipal issuer may be fiscally unstable or exposed to large liabilities that could impair its ability to honor its obligations. Municipal issuers with significant debt service requirements, in the
near-to
mid-term;
unrated issuers and those with less capital and liquidity to absorb additional expenses may be most at risk. To the extent a Fund invests in lower quality or high yield municipal securities, it may be more sensitive to the adverse credit events in the municipal market. The treatment of municipalities
in bankruptcy is more uncertain, and potentially more adverse to debt holders, than for corporate issues.
The risk that investors may have difficulty finding a buyer when they seek to sell, and therefore, may be forced to sell at a discount to the market value. Liquidity may sometimes be impaired in the municipal market and because a Fund primarily invests in municipal securities, it may find it difficult to purchase or sell such securities at opportune times. Liquidity can be impaired due to interest rate concerns, credit events, or general supply and demand imbalances.
Depending on the particular issuer and current economic conditions, municipal securities could be deemed more volatile investments.
In addition to general municipal market risks, different municipal sectors may face different risks.
Revenue bonds are secured by special tax revenues or other revenue sources. If the specified revenues do not materialize, then the bonds may not be repaid.
Private activity bonds are yet another type of municipal security. Municipalities use private activity bonds to finance the development of industrial facilities for use by private enterprise. Principal and interest payments are to be made by the private enterprise benefiting from the development, which means that the holder of the bond is exposed to the risk that the private issuer may default on the bond.
Moral obligation bonds are usually issued by special purpose public entities. If the public entity defaults, repayment becomes a “moral obligation” instead of a legal one. The lack of a legally enforceable right to payment in the event of default poses a special risk for a holder of the bond because it has little or no ability to seek recourse in the event of default.
In addition, a significant restructuring of federal income tax rates or even serious discussion on the topic in Congress could cause municipal bond prices to fall. The demand for municipal securities is strongly influenced by the value of
tax-exempt
income to investors relative to taxable income. Lower income tax rates potentially reduce the advantage of owning municipal securities.
Similarly, changes to state or federal regulation tied to a specific sector, such as the hospital sector, could have an impact on the revenue stream for a given subset of the market.
Municipal notes are similar to general municipal debt obligations, but they generally possess shorter terms. Municipal notes can be used to provide interim financing and may not be repaid if anticipated revenues are not realized.
Municipal Project-Specific Risk
A Fund may be more sensitive to adverse economic, business or political developments if it invests a substantial portion of its assets in the bonds of specific projects (such as those relating to education, health care, housing, transportation, and utilities), industrial development bonds, or in general obligation bonds, particularly if there is a large concentration from issuers in a single state. This is because the value of municipal securities can be significantly affected by the political, economic, legal, and legislative realities of the particular issuer’s locality or municipal sector events. Similarly, changes to state or federal regulation tied to a specific sector, such as the hospital sector, could have an impact on the revenue stream for a given subset of the market.
Municipal Project Housing-Related Risk
A Fund may invest in the bonds of projects focused on
low-income,
affordable or other housing developments and businesses located in
low-income
areas or invest in or originate loans that finance or are generally related to such projects. There are significant risks associated with a Fund’s investment in the bonds of these types of projects and loans related to such projects. There may be federal, state and local governmental regulatory restrictions on the operation, rental and transfer of these projects, such as the requirement that the owners of these affordable housing developments rent or sell certain residential units to persons or families of low or moderate income and that the amount of rent that may be charged for these units may be less than market rates. These restrictions may adversely affect economic performance relative to properties that are not subject to these restrictions. There are also no assurances that a project owner will be able to achieve and maintain sufficient rental income in order to pay all operating expenses and maintenance and repair costs of such a project and the debt service on the related bonds or loan on a timely basis. In the event that a project owner is unable to pay all such costs, expenses and debt service, a default on the related bonds or loan is likely to occur.
New York State-Specific Risk
A Fund that concentrates its investments in New York municipal bonds may be affected significantly by economic, regulatory or political developments affecting the ability of New York issuers to pay interest or repay principal. Certain issuers of New York municipal bonds have experienced serious financial difficulties in the past and reoccurrence of these difficulties may impair the ability of certain New York issuers to pay principal or interest on their obligations, particularly given large budget deficits that have been identified and may continue. Provisions of the New York Constitution and State statutes which limit the taxing and spending authority of New York governmental entities may impair the ability of New York issuers to pay principal and/or interest on their obligations. While New York’s economy is broad, it does have major
concentrations in certain industries, such as financial services, and may be sensitive to economic problems affecting those industries, and its government revenues tend to rely heavily on certain earners (revenues therefore are likely to be more volatile and to be adversely affected if the number of such earners (or their recognized income within a particular period of time) decreases). Future New York political and economic developments, constitutional amendments, legislative measures, executive orders, administrative regulations, litigation and voter initiatives as well as environmental events, natural disasters, pandemics, epidemics or social unrest could have an adverse effect on the debt obligations of New York issuers to pay principal or interest on their obligations. The financial health of New York City affects that of the State, and when New York City experiences financial difficulty it may have an adverse affect on New York municipal bonds held by such Fund. The growth rate of New York has at times been somewhat slower than the nation overall. The economic and financial condition of New York also may be affected by various financial, social, economic and political factors.
Each of PNF and PYN is a
“non-diversified”
fund, which means that the Fund may invest a significant portion of its assets in the securities of a smaller number of issuers than a diversified fund. Focusing investments in a small number of issuers increases risk. A fund that invests in a relatively smaller number of issuers is more susceptible to risks associated with a single economic, political or regulatory occurrence than a diversified fund might be. Some of those issuers also may present substantial credit or other risks. Similarly, a
non-diversified
fund may be subject to increased economic, business or political risk to the extent that it invests a substantial portion of its assets in a particular currency, in a group of related industries, in a particular issuer, in the bonds of similar projects or in a narrowly defined geographic area outside the U.S. Notwithstanding a Fund’s status as a
“non-diversified”
investment company under the 1940 Act, each
non-diversified
Fund intends to qualify as a regulated investment company accorded favorable tax treatment under the Code, which imposes its own diversification requirements.
An investment in a Fund, like any fund, can involve operational risks arising from factors such as processing errors, human errors, inadequate or failed internal or external processes, failures in systems and technology, changes in personnel and errors caused by third-party service providers. The occurrence of any of these failures, errors or breaches could result in a loss of information, regulatory scrutiny, reputational damage or other events, any of which could have a material adverse effect on a Fund. While each Fund seeks to minimize such events through controls and oversight, there may still be failures that could cause losses to the Fund.
| | | | |
Principal Risks of the Funds | | | | |
Other Investment Companies Risk
When investing in an investment company, a Fund will generally bear its ratable share of that investment company’s expenses and would remain subject to payment of the Fund’s investment management fees with respect to assets so invested. Common Shareholders would therefore be subject to duplicative expenses to the extent a Fund invests in other investment companies. In addition, these other investment companies may utilize leverage, in which case an investment would subject a Fund to additional risks associated with leverage. Due to its own financial interest or other business considerations, the Investment Manager may choose to invest a portion of a Fund’s assets in investment companies sponsored or managed by the Investment Manager or its related parties in lieu of investments by a Fund directly in portfolio securities, or may choose to invest in such investment companies over investment companies sponsored or managed by others. Applicable law may limit a Fund’s ability to invest in other investment companies.
The Investment Manager manages the Funds without regard generally to restrictions on portfolio turnover. The use of futures contracts and other derivative instruments with relatively short maturities may tend to exaggerate the portfolio turnover rate for the Funds. Trading in fixed income securities does not generally involve the payment of brokerage commissions but does involve indirect transaction costs. The use of futures contracts and other derivative instruments may involve the payment of commissions to futures commission merchants or other intermediaries. Higher portfolio turnover involves correspondingly greater expenses to each Fund, including brokerage commissions or dealer
mark-ups
and other transaction costs on the sale of securities and reinvestments in other securities. The higher the rate of portfolio turnover of a Fund, the higher these transaction costs borne by the Fund generally will be. Such sales may result in realization of taxable capital gains (including short-term capital gains, which are generally taxed to shareholders at ordinary income tax rates when distributed net of short-term capital losses and net long-term capital losses) and may adversely impact a Fund’s
after-tax
returns.
Potential Conflicts of Interest Risk — Allocation of Investment Opportunities
The Investment Manager and its affiliates are involved worldwide with a broad spectrum of financial services and asset management activities and may engage in the ordinary course of business in activities in which their interests or the interests of their clients may conflict with those of a Fund. The Investment Manager may provide investment management services to other funds and discretionary managed accounts that follow an investment program similar to that of a Fund. Subject to the requirements of the 1940 Act, the Investment Manager intends to engage in such activities and may receive compensation
from third parties for its services. The results of a Fund’s investment activities may differ from those of the Fund’s affiliates, or another account managed by the Investment Manager or its affiliates, and it is possible that the Fund could sustain losses during periods in which one or more of the Fund’s affiliates and/or other accounts managed by the Investment Manager or its affiliates, including proprietary accounts, achieve profits on their trading.
Additional Risks Associated with the Funds’ Preferred Shares
Although the Funds’ ARPS ordinarily would pay dividends at rates set at periodic auctions, the weekly auctions for the ARPS (and auctions for similar preferred shares issued by
closed-end
funds in the U.S.) have failed since 2008. The dividend rates on the ARPS since that time have been paid, and the Funds expect that they will continue to be paid for the foreseeable future, at the “maximum applicable rate.”
The maximum applicable rate for the ARPS and the RVMTP Share Dividend Rate is based in part on a multiple of or a spread plus a reference rate). An increase in market interest rates generally, therefore, could increase substantially the dividend rate required to be paid by the Funds to the holders of Preferred Shares, which would increase the costs associated with the Funds’ leverage and reduce the Funds’ net income available for distribution to holders of Common Shares. In addition, the multiple or spread used to calculate the maximum applicable rate for the ARPS and the RVMTP Share Dividend Rate is based in part on the credit rating assigned to the ARPS or RVMTP Shares by the applicable rating agency(ies), with the multiple or spread generally increasing as the rating declines. Accordingly, future ratings downgrades may result in increases to the maximum applicable rate for the ARPS or to the RVMTP Share Dividend Rate.
Therefore, it is possible that a substantial rise in market interest rates and/or further ratings downgrades of the Preferred Shares could, by reducing income available for distribution to the holders of Common Shares and otherwise detracting from the Funds’ investment performance, make the Funds’ continued use of Preferred Shares for leverage purposes less attractive than such use is currently considered to be. In such case, a Fund may elect to redeem some or all of the Preferred Shares outstanding, which may require it to dispose of investments at inopportune times and to incur losses on such dispositions. Such dispositions may adversely affect the Fund’s investment performance generally, and the resultant loss of leverage may materially and adversely affect the Fund’s investment returns.
The Funds are also subject to certain asset coverage tests associated with the rating agencies that rate the Preferred Shares. Failure by a Fund to maintain the asset coverages (or to cure such failure in a timely manner) may require the Fund to redeem Preferred Shares and could preclude the Funds from declaring or paying any dividends or distributions to holders of Common Shares. Failure to satisfy ratings
agency asset coverage tests or other guidelines could also result in the applicable ratings agency downgrading its then-current ratings on the Preferred Shares, as described above. Moreover, the rating agency guidelines impose restrictions or limitations on the Funds’ use of certain financial instruments or investment techniques that the Funds might otherwise utilize in order to achieve its investment objective, which may adversely affect the Funds’ investment performance. Rating agency guidelines may be modified by the rating agencies in the future and such modifications may make such guidelines substantially more restrictive or otherwise result in downgrades, which could further negatively affect the Fund’s investment performance. The ratings agencies that have assigned ratings to a Fund’s Preferred Shares may change their rating methodologies, perhaps substantially. Such a change could adversely affect the ratings assigned to a Fund’s Preferred Shares, the dividend rates paid thereon, and the expenses borne by such Fund’s Common Shareholders.
Privacy and Data Security Risk
The Gramm-Leach-Bliley Act (“GLBA”) and other laws limit the disclosure of certain
non-public
personal information about a consumer to
non-affiliated
third parties and require financial institutions to disclose certain privacy policies and practices with respect to information sharing with both affiliates and
non-affiliated
third parties. Many states and a number of
non-U.S.
jurisdictions have enacted privacy and data security laws requiring safeguards on the privacy and security of consumers’ personally identifiable information. Other laws deal with obligations to safeguard and dispose of private information in a manner designed to avoid its dissemination. Privacy rules adopted by the U.S. Federal Trade Commission and SEC implement GLBA and other requirements and govern the disclosure of consumer financial information by certain financial institutions, ranging from banks to private investment funds. U.S. platforms following certain models generally are required to have privacy policies that conform to these GLBA and other requirements. In addition, such platforms typically have policies and procedures intended to maintain platform participants’ personal information securely and dispose of it properly.
Each Fund generally does not intend to obtain or hold borrowers’
non-public
personal information, and each Fund has implemented procedures designed to prevent the disclosure of borrowers’
non-public
personal information to a Fund. However, service providers to a Fund or its direct or indirect fully-owned subsidiaries, including their custodians and the platforms acting as loan servicers for a Fund or its direct or indirect fully-owned subsidiaries, may obtain, hold or process such information. A Fund cannot guarantee the security of
non-public
personal information in the possession of such a service provider and cannot guarantee that service providers have been and will continue to comply with GLBA, other data security and privacy
laws and any other related regulatory requirements. Violations of GLBA and other laws could subject a Fund to litigation and/or fines, penalties or other regulatory action, which, individually or in the aggregate, could have an adverse effect on the Fund. A Fund may also face regulations related to privacy and data security in the other jurisdictions in which a Fund invests.
Private Placements and Restricted Securities Risk
A private placement involves the sale of securities that have not been registered under the Securities Act or relevant provisions of applicable
non-U.S.
law to certain institutional and qualified individual purchasers, such as the Funds. In addition to the general risks to which all securities are subject, securities received in a private placement generally are subject to strict restrictions on resale, and there may be no liquid secondary market or ready purchaser for such securities. Therefore, the Funds may be unable to dispose of such securities when it desires to do so, or at the most favorable time or price. Private placements may also raise valuation risks. Restricted securities are often purchased at a discount from the market price of unrestricted securities of the same issuer reflecting the fact that such securities may not be readily marketable without some time delay. Such securities are often more difficult to value and the sale of such securities often requires more time and results in higher brokerage charges or dealer discounts and other selling expenses than does the sale of liquid securities trading on national securities exchanges or in the
markets. Until the Fund can sell such securities into the public markets, its holdings may be less liquid and any sales will need to be made pursuant to an exemption under the Securities Act.
Puerto Rico-Specific Risk
A Fund that invests in Municipal Bonds issued by Puerto Rico or its instrumentalities may be affected by certain developments, such as political, economic, environmental, social, regulatory or debt restructuring developments that impact the ability or obligation of Puerto Rico municipal issuers to pay interest or repay principal. Certain issuers of Puerto Rico Municipal Bonds have experienced significant financial difficulties and the continuation or reoccurrence of these difficulties may impair their ability to pay principal or interest on their obligations. Provisions of the Puerto Rico Constitution and Commonwealth laws, including a federally-appointed oversight board to oversee the Commonwealth’s financial operations, which limit the taxing and spending authority of Puerto Rico governmental entities may impair the ability of Puerto Rico issuers to pay principal and/or interest on their obligations. Puerto Rico’s economy has sizable concentrations in certain industries, such as the manufacturing and service industries, and may be sensitive to economic problems affecting those industries. Future Puerto Rico-related developments, such as political and economic developments, constitutional
| | | | |
Principal Risks of the Funds | | | | |
amendments, legislative measures, executive orders, administrative regulations, litigation, debt restructuring, and voter initiatives as well as environmental events, natural disasters, pandemics, epidemics or social unrest could have an adverse effect on the debt obligations of Puerto Rico issuers.
Financial entities, such as investment companies and investment advisers, are generally subject to extensive government regulation and intervention. Government regulation and/or intervention may change the way a Fund is regulated, affect the expenses incurred directly by the Fund and the value of its investments, and limit and /or preclude the Fund’s ability to achieve its investment objective. Government regulation may change frequently and may have significant adverse consequences. The Funds and the Investment Manager have historically been eligible for exemptions from certain regulations.
However, there is no assurance that the Funds and the Investment Manager will continue to be eligible for such exemptions. Actions by governmental entities may also impact certain instruments in which a Fund invests.
Moreover, government regulation may have unpredictable and unintended effects. The current direction of governments and regulators may have the effect of reducing market liquidity, market resiliency and money supply, such as through higher rates, tighter financial regulations and proposals related to
open-end
fund liquidity that may prevent mutual funds and exchange-traded funds from participating in certain markets. Legislative or regulatory actions to address perceived liquidity or other issues in fixed income markets generally, or in particular markets such as the municipal securities market, may alter or impair a Fund’s ability to pursue its investment objectives or utilize certain investment strategies and techniques.
While there continues to be uncertainty about the full impact of these and other regulatory changes, it is the case that a Fund will be subject to a more complex regulatory framework, and may incur additional costs to comply with new requirements as well as to monitor for compliance in the future. Actions by governmental entities may also impact certain instruments in which a Fund invests and reduce market liquidity and resiliency.
Regulatory Risk — Commodity Pool Operator
The Commodities Futures Trading Commission (“CFTC”) has adopted regulations that subject registered investment companies and their investment advisers to regulation by the CFTC if the registered investment company invests more than a prescribed level of its liquidation value in futures, options on futures or commodities, swaps, or other financial instruments regulated under the Commodity Exchange Act, as amended, and the rules thereunder (“commodity
interests”), or if a Fund markets itself as providing investment exposure to such instruments. The Investment Manager is registered with the CFTC as a Commodity Pool Operator (“CPO”). However, with respect to each Fund, the Investment Manager has claimed an exclusion from registration as a CPO pursuant to CFTC Rule 4.5. For the Investment Manager to remain eligible for this exclusion, each Fund must comply with certain limitations, including limits on its ability to use any commodity interests and limits on the manner in which the Fund holds out its use of such commodity interests. These limitations may restrict a Fund’s ability to pursue its investment objective and strategies increase the costs of implementing its strategies, result in higher expenses for a Fund, and/or adversely affect a Fund’s total return. To the extent the Investment Manager becomes ineligible for this exclusion from CFTC regulation, the Fund may consider steps in order to continue to qualify for exemption from CFTC regulation, or may determine to operate subject to CFTC regulation.
Regulatory Risk — London Interbank Offered Rate (“LIBOR”)
A Fund’s investments (including, but not limited to, repurchase agreements, collateralized loan obligations and mortgage-backed securities), payment obligations and financing terms may rely in some fashion on LIBOR. LIBOR was traditionally an average interest rate, determined by the ICE Benchmark Administration, that banks charge one another for the use of short-term money. On March 5, 2021, the Financial Conduct Authority (“FCA”), the United Kingdom’s financial regulatory body and regulator of LIBOR, publicly announced that all U.S. Dollar LIBOR settings will either cease to be provided by any administrator or will no longer be representative (i) immediately after December 31, 2021 for
one-week
and
two-month
U.S. Dollar LIBOR settings and (ii) immediately after June 30, 2023 for the remaining U.S. Dollar LIBOR settings. As of January 1, 2022, as a result of supervisory guidance from U.S. regulators, some U.S. regulated entities have generally ceased entering into new LIBOR contracts with limited exceptions. Publication of all Japanese yen and the
one-and
six-month
sterling LIBOR settings have ceased, and while publication of the
three-month
Sterling LIBOR setting will continue through the end of March 2024 on the basis of a changed methodology (known as “synthetic LIBOR”), this rate has been designated by the FCA as unrepresentative of the underlying market it seeks to measure and is solely available for use in legacy transactions. Certain bank-sponsored committees in other jurisdictions, including Europe, the United Kingdom, Japan and Switzerland, have selected alternative reference rates denominated in other currencies. Although the transition process away from LIBOR for many instruments has been completed, some LIBOR use is continuing and there are potential effects related to the transition away from LIBOR or continued use of LIBOR on the Fund, or on certain instruments in which the Fund invests can be difficult to ascertain, and may vary depending on factors that include, but are not
limited to: (i) existing fallback or termination provisions in individual contracts and (ii) whether, how, and when industry participants adopt new reference for affected instruments.
So-called
“tough legacy” contracts have LIBOR interest rate provisions with no fallback provisions contemplating a permanent discontinuation of LIBOR, inadequate fallback provisions or fallback provisions which may not effectively result in a transition away from LIBOR prior to LIBOR’s planned replacement date. On March 15, 2022, the Adjustable Interest Rate (LIBOR) Act was signed into law. This law provides a statutory fallback mechanism on a nationwide basis to replace LIBOR with a benchmark rate that is selected by the Board of Governors of the Federal Reserve System based on the Secured Overnight Financing Rate (“SOFR”) for tough legacy contracts. On February 27, 2023, the Federal Reserve System’s final rule in connection with this law became effective, establishing benchmark replacements based on SOFR and Term SOFR (a forward-looking measurement of market expectations of SOFR implied from certain derivatives markets) for applicable tough legacy contracts governed by U.S. law. In addition, the FCA has announced that it will require the publication of synthetic LIBOR for the
one-month,
three-month and
six-month
U.S. Dollar LIBOR settings after June 30, 2023, through at least September 30, 2024. Certain of a Fund’s investments may involve individual tough legacy contracts which may be subject to the Adjustable Interest Rate (LIBOR) Act or synthetic LIBOR and no assurances can be given that these measures will have had the intended effects. Moreover, certain aspects of the transition from LIBOR have relied or will continue to rely on the actions of third-party market participants, such as clearing houses, trustees, administrative agents, asset servicers and certain service providers; PIMCO cannot guarantee the performance of such market participants and any failure on the part of such market participants to manage their part of the LIBOR transition could impact the Fund. The transition of investments from LIBOR to a replacement rate as a result of amendment, application of existing fallbacks, statutory requirements or otherwise may also result in a reduction in the value of certain instruments held by the Fund, or a reduction in the effectiveness of related Fund transactions such as hedges. In addition, an instrument’s transition to a replacement rate could result in variations in the reported yields of the Fund that holds such instrument. Any such effects of the transition away from LIBOR, as well as other unforeseen effects, could result in losses to the Fund.
Income from a Fund’s portfolio will decline if and when the Fund invests the proceeds from matured, traded or called debt obligations at market interest rates that are below the portfolio’s current earnings rate. For instance, during periods of declining interest rates, an issuer of debt obligations may exercise an option to redeem securities prior to maturity, forcing the Fund to invest in lower-yielding securities. A
Fund also may choose to sell higher yielding portfolio securities and to purchase lower yielding securities to achieve greater portfolio diversification, because the portfolio managers believe the current holdings are overvalued or for other investment-related reasons. A decline in income received by a Fund from its investments is likely to have a negative effect on dividend levels and the market price, NAV and/or overall return of the Common Shares.
Repurchase Agreements Risk
A Fund may enter into repurchase agreements, in which the Fund purchases a security from a bank or broker-dealer, which agrees to repurchase the security at the Fund’s cost plus interest within a specified time. If the party agreeing to repurchase should default, a Fund would seek to sell the securities which it holds. This could involve procedural costs or delays in addition to a loss on the securities if their value should fall below their repurchase price. Repurchase agreements may be or become illiquid. These events could also trigger adverse tax consequences for a Fund.
For the purpose of achieving income, a Fund may lend its portfolio securities to brokers, dealers, and other financial institutions provided a number of conditions are satisfied, including that the loan is fully collateralized. When a Fund lends portfolio securities, its investment performance will continue to reflect changes in the value of the securities loaned, and the Fund will also receive a fee or interest on the collateral. Securities lending involves the risk of loss of rights in the collateral or delay in recovery of the collateral if the borrower fails to return the security loaned or becomes insolvent. A Fund may pay lending fees to a party arranging the loan, which may be an affiliate of the Fund. Cash collateral received by a Fund in securities lending transactions may be invested in short-term liquid fixed income instruments or in money market or short-term mutual funds, or similar investment vehicles, including affiliated money market or short-term mutual funds. A Fund bears the risk of such investments.
A Fund’s short sales and short positions, if any, are subject to special risks. A short sale involves the sale by the Fund of a security that it does not own with the hope of purchasing the same security at a later date at a lower price. A Fund may also enter into a short position through a forward commitment or a short derivative position through a futures contract or swap agreement. If the price of the security or derivative has increased during this time, then the Fund will incur a loss equal to the increase in price from the time that the short sale was entered into plus any transaction costs (i.e., premiums and interest) paid to the broker-dealer to borrow securities. Therefore, short sales involve the risk that losses may be exaggerated, potentially losing more money than the actual cost of the investment. By contrast,
| | | | |
Principal Risks of the Funds | | | | |
a loss on a long position arises from decreases in the value of the security and is limited by the fact that a security’s value cannot decrease below zero.
By investing the proceeds received from selling securities short, a Fund could be deemed to be employing a form of leverage, which creates special risks. The use of leverage may increase a Fund’s exposure to long security positions and make any change in the Fund’s NAV greater than it would be without the use of leverage. This could result in increased volatility of returns. There is no guarantee that any leveraging strategy a Fund employs will be successful during any period in which it is employed.
In times of unusual or adverse market, economic, regulatory or political conditions, a Fund may not be able, fully or partially, to implement its short selling strategy. Periods of unusual or adverse market, economic, regulatory or political conditions generally may exist for long periods of time. In response to market events, the SEC and regulatory authorities in other jurisdictions may adopt (and in certain cases, have adopted) bans on, and/or reporting requirements for, short sales of certain securities, including short positions on such securities acquired through swaps. Also, there is the risk that the third party to the short sale or short position will not fulfill its contractual obligations, causing a loss to the Fund.
Structured Investments Risk
Holders of structured products, including structured notes, credit-linked notes and other types of structured products, bear the risks of the underlying investments, index or reference obligation and are subject to counterparty risk. A Fund may have the right to receive payments only from the structured product, and generally does not have direct rights against the issuer or the entity that sold the assets to be securitized. While certain structured products enable the investor to acquire interests in a pool of securities without the brokerage and other expenses associated with directly holding the same securities, investors in structured products generally pay their share of the structured product’s administrative and other expenses. Although it is difficult to predict whether the prices of indexes and securities underlying structured products will rise or fall, these prices (and, therefore, the prices of structured products) are generally influenced by the same types of political and economic events that affect issuers of securities and capital markets generally. If the issuer of a structured product uses shorter term financing to purchase longer term securities, the issuer may be forced to sell its securities at below market prices if it experiences difficulty in obtaining such financing, which may adversely affect the value of the structured products owned by a Fund.
Structured products generally entail risks associated with derivative instruments.
Each Fund has elected to be treated as a “regulated investment company” (a “RIC”) under the Internal Revenue Code (the “Code”) and intends each year to qualify and be eligible to be treated as such, so that it generally will not be subject to U.S. federal income tax on its net investment income or net short-term or long-term capital gains, that are distributed (or deemed distributed, as described below) to shareholders. In order to qualify and be eligible for such treatment, a Fund must meet certain asset diversification tests, derive at least 90% of its gross income for such year from certain types of qualifying income, and distribute to its shareholders at least 90% of its “investment company taxable income” as that term is defined in the Code (which includes, among other things, dividends, taxable interest and the excess of any net short-term capital gains over net long-term capital losses, as reduced by certain deductible expenses).
A Fund’s investment strategy will potentially be limited by its intention to continue qualifying for treatment as a RIC and can limit a Fund’s ability to continue qualifying as such. The tax treatment of certain of a Fund’s investments under one or more of the qualification or distribution tests applicable to regulated investment companies is uncertain. An adverse determination or future guidance by the IRS or a change in law might affect a Fund’s ability to qualify or be eligible for treatment as a RIC. Income and gains from certain of a Fund’s activities may not constitute qualifying income to a RIC for purposes of the 90% gross income test. If a Fund were to treat income or gain from a particular investment or activity as qualifying income and the income or gain were later determined not to constitute qualifying income and, together with any other nonqualifying income, caused the Fund’s nonqualifying income to exceed 10% of its gross income in any taxable year, the Fund would fail to qualify as a RIC unless it is eligible to and does pay a tax at the Fund level.
If, in any year, a Fund were to fail to qualify for treatment as a RIC under the Code and were ineligible to or did not otherwise cure such failure, the Fund would be subject to tax on its taxable income at corporate rates and, when such income is distributed, shareholders would be subject to a further tax on such distributions to the extent of the Fund’s current or accumulated earnings and profits.
To qualify to pay exempt-interest dividends, which are treated as items of interest excludable from gross income for federal income tax purposes, at least 50% of the value of the total assets of a Fund must consist of obligations exempt from regular income tax as of the close of each quarter of the Fund’s taxable year. If the proportion of taxable investments held by a Fund exceeds 50% of the Fund’s total assets as of the close of any quarter of the Fund’s taxable year, the Fund will not for that taxable year satisfy the general eligibility test that otherwise permits it to pay exempt-interest dividends.
The value of a Fund’s investments and its net asset value may be adversely affected by changes in tax rates and policies. Because interest income from municipal securities is normally not subject to regular federal income taxation, the attractiveness of municipal securities in relation to other investment alternatives is affected by changes in federal income tax rates or changes in the
tax-exempt
status of interest income from municipal securities. Any proposed or actual changes in such rates or exempt status, therefore, can significantly affect the demand for and supply, liquidity and marketability of municipal securities. This could in turn affect a Fund’s net asset value and ability to acquire and dispose of municipal securities at desirable yield and price levels. Additionally, no Fund is a suitable investment for individual retirement accounts, for other
tax-exempt
or
tax-deferred
accounts or for investors who are not sensitive to the federal income tax consequences of their investments.
U.S. Government Securities Risk
Certain U.S. government securities such as U.S. Treasury bills, notes and bonds and mortgage-related securities guaranteed by the GNMA, are supported by the full faith and credit of the United States; others, such as those of Federal Home Loan Banks (“FHLBs”) or the Federal Home Loan Mortgage Corporation (“FHLMC”), are supported by the right of the issuer to borrow from the U.S. Treasury; others, such as those of the FNMA, are supported by the discretionary authority of the U.S. government to purchase the agency’s obligations; and still others are supported only by the credit of the agency, instrumentality or corporation. U.S. government securities are subject to market risk, interest rate risk and credit risk. Although legislation has been enacted to support certain government sponsored entities, including the FHLBs, FHLMC and FNMA, there is no assurance that the obligations of such entities will be satisfied in full, or that such obligations will not decrease in value or default. It is difficult, if not impossible, to predict the future political, regulatory or economic changes that could impact the government sponsored entities and the values of their related securities or obligations. In addition, certain governmental entities, including FNMA and FHLMC, have been subject to regulatory scrutiny regarding their accounting policies and practices and other concerns that may result in legislation, changes in regulatory oversight and/or other consequences that could adversely affect the credit quality, availability or investment character of securities issued by these entities. Yields available from U.S. government debt securities are generally lower than the yields available from such other securities. The values of U.S. government securities change as interest rates fluctuate. Periodically, uncertainty regarding the status of negotiations in the U.S. government to increase the statutory debt ceiling could increase the risk that the U.S. government may default on payments on certain U.S. government securities, cause the credit rating of the U.S. government to be downgraded, increase volatility in the stock
and bond markets, result in higher interest rates, reduce prices of U.S. Treasury and other securities, and/or increase the costs of various kinds of debt. If a government-sponsored entity is negatively impacted by legislative or regulatory action (or lack thereof), is unable to meet its obligations, or its creditworthiness declines, the performance of a fund that holds securities of the entity will be adversely impacted.
Certain securities in which a Fund invests may be less liquid and more difficult to value than other types of securities. Investments for which market quotations are not readily available are valued at fair value as determined in good faith pursuant to Rule
2a-5
under the 1940 Act. Fair value pricing may require subjective determinations about the value of a security or other asset. As a result, there can be no assurance that fair value pricing will result in adjustments to the prices of securities or other assets or that fair value pricing will reflect actual market value, and it is possible that the fair value determined for a security or other asset will be materially different from quoted or published prices, from the prices used by others for the same security or other asset and/or from the value that actually could be or is realized upon the sale of that security or other asset.
Zero-Coupon Bond,
Step-Ups
and
Securities Risk
The market prices of
zero-coupon,
step-ups
and
securities are generally more volatile than the prices of securities that pay interest periodically and in cash, and are likely to respond to changes in interest rates to a greater degree than other types of debt securities with similar maturities and credit quality. Because
zero-coupon
securities bear no interest, their prices are especially volatile and, because
zero-coupon
bondholders do not receive interest payments, the prices of
zero-coupon
securities generally fall more dramatically than those of bonds that pay interest on a current basis when interest rates rise. The market for
zero-coupon
and
securities may suffer decreased liquidity. In addition, as these securities may not pay cash interest, the Fund’s investment exposure to these securities and their risks, including credit risk, will increase during the time these securities are held in the Fund’s portfolio. Further, to maintain its qualification for treatment as a RIC and to avoid Fund-level U.S. federal income and/or excise taxes, the Fund is required to distribute to its shareholders any income it is deemed to have received in respect of such investments, notwithstanding that cash has not been received currently, and the value of
interest. Consequently, the Fund may have to dispose of portfolio securities under disadvantageous circumstances to generate the cash, or may have to leverage itself by borrowing the cash to satisfy this distribution requirement. The required distributions, if any, would result in an increase in the Fund’s exposure to these securities. Zero coupon bonds,
step-ups
and
| | | | |
Principal Risks of the Funds | | | | (Unaudited) |
securities allow an issuer to avoid or delay the need to generate cash to meet current interest payments and, as a result, may involve greater credit risk than bonds that pay interest currently or in cash. The Fund would be required to distribute the income on these instruments as it accrues, even though the Fund will not receive the income on a current basis or in cash. Thus, the Fund may sell other investments, including when it may not be advisable to do so, to make income distributions to its shareholders.
Derivatives strategies and instruments that a Fund may use include, among others, reverse repurchase agreements; interest rate swaps; total return swaps; credit default swaps; basis swaps; other types of swap agreements or options thereon; dollar rolls; futures and forward contracts (including foreign currency exchange contracts); short sales; options on financial futures; options based on either an index of municipal securities or taxable debt securities whose prices, PIMCO believes, correlate with the prices of the Fund’s investments; other derivative transactions; loans of portfolio securities and when-issued, delayed delivery and forward commitment transactions. Income earned by a Fund from its hedging and related transactions may be subject to one or more special U.S. federal income tax rules that can affect the amount, timing and/or character of distributions to holders of the Fund’s Common Shares. For instance, many hedging activities will be treated as capital gain and, if not offset by net realized capital loss, will be distributed to shareholders in taxable distributions. If effectively used, hedging strategies will offset in varying percentages losses incurred on a Fund’s investments due to adverse interest rate changes. There is no assurance that these hedging strategies will be available at any time or that PIMCO will determine to use them for a Fund or, if used, that the strategies will be successful. PIMCO may determine not to engage in hedging strategies or to do so only in unusual circumstances or market conditions. In addition, a Fund may be subject to certain restrictions on its use of hedging strategies imposed by guidelines of one or more ratings agencies that may issue ratings on any preferred shares issued by the Fund.
| | | | |
Risk Management Strategies | | | | (Unaudited) |
A Fund may (but is not required to) use various investment strategies to attempt to hedge exposure to reduce the risk of price fluctuations of its portfolio securities, the risk of loss, and to preserve capital. Derivatives strategies and instruments that a Fund may use include, among others, reverse repurchase agreements; interest rate swaps; total return swaps; credit default swaps; basis swaps; other types of swap agreements or options thereon; dollar rolls/buybacks; futures and forward contracts (including foreign currency exchange contracts); short sales; options on financial futures; options based on either an index of municipal securities or taxable debt securities whose prices, PIMCO believes, correlate with the prices of the Fund’s investments; other derivative transactions; loans of portfolio securities and when-issued, delayed delivery and forward commitment transactions. Income earned by a Fund from its hedging and related transactions may be subject to one or more special U.S. federal income tax rules that can affect the amount, timing and/or character of distributions to holders of the Fund’s Common Shares. For instance, many hedging activities will be treated as capital gain and, if not offset by net realized capital loss, will be distributed to shareholders in taxable distributions. If effectively used, hedging strategies will offset in varying percentages losses incurred on a Fund’s investments due to adverse interest rate changes. There is no assurance that these hedging strategies will be available at any time or that PIMCO will determine to use them for a Fund or, if used, that the strategies will be successful. PIMCO may determine not to engage in hedging strategies or to do so only in unusual circumstances or market conditions. In addition, a Fund may be subject to certain restrictions on its use of hedging strategies imposed by guidelines of one or more ratings agencies that may issue ratings on any preferred shares issued by the Fund.
A Fund may take certain actions if short-term interest rates increase, or market conditions otherwise change (or the Fund anticipates such an increase or change) and the Fund’s leverage begins (or is expected) to adversely affect holders of its Common Shares. In order to attempt to offset such a negative impact of leverage on holders of Common Shares, a Fund may shorten the average maturity or duration of its investment portfolio (by investing in short-term, high quality securities or implementing certain hedging strategies). Should a Fund issue preferred shares, the Fund also may attempt to reduce leverage by redeeming or otherwise purchasing preferred shares or by reducing any holdings in other instruments that create leverage. The success of any such attempt to limit leverage risk depends on PIMCO’s ability to accurately predict interest rate or other market changes. Because of the difficulty of making such predictions, a Fund may not be successful in managing its interest rate exposure in the manner described above.
A Fund may use derivative instruments for other purposes, including to seek to increase liquidity, provide efficient portfolio management,
broaden investment opportunities (including taking short or negative positions), implement a tax or cash management strategy, gain exposure to a particular security or segment of the market, modify the effective duration of the Fund’s portfolio investments and/or enhance total return.
In addition, each Fund has adopted certain investment limitations designed to limit investment risk. See “Fundamental Investment Restrictions” below for a description of these limitations.
| | | | |
Fundamental Investment Restrictions | | | | |
For purposes of this section, “majority of the outstanding,” when used with respect to particular shares of a Fund (whether voting together as a single class or voting as separate classes), has the meaning set forth in the Investment Company Act of 1940, as amended.
PIMCO Municipal Income Fund (PMF)
Unless otherwise indicated, the investment restrictions set forth below are each a fundamental policy of the Fund that may not be changed without the approval of the holders of a majority of the outstanding Common Shares and any outstanding preferred shares of beneficial interest (including Preferred Shares) voting together as a single class, and of the holders of a majority of any outstanding preferred shares of beneficial interest (including Preferred Shares) voting as a separate class. The Fund may not:
| (1) | Concentrate its investments in a particular “industry,” as that term is used in the Investment Company Act of 1940, as amended, and as interpreted, modified, or otherwise permitted by regulatory authority having jurisdiction, from time to time. |
| (2) | With respect to 75% of the Fund’s total assets, purchase the securities of any issuer, except securities issued or guaranteed by the U.S. Government or any of its agencies or instrumentalities or securities issued by other investment companies, if, as a result, (i) more than 5% of the Fund’s total assets would be invested in the securities of that issuer, or (ii) the Fund would hold more than 10% of the outstanding voting securities of that issuer. For the purpose of this restriction, each state and each separate political subdivision, agency, authority or instrumentality of such state, each multi-state agency or authority, and each obligor, if any, is treated as a separate issuer of municipal bonds. |
| (3) | Purchase or sell real estate, although it may purchase securities (including municipal bonds) secured by real estate or interests therein, or securities issued by companies which invest in real estate, or interests therein. |
| (4) | Purchase or sell commodities or commodities contracts or oil, gas or mineral programs. This restriction shall not prohibit the Fund (as described in the “Portfolio Contents” section above) from purchasing, selling or entering into futures contracts, options on futures contracts, forward contracts, or any interest rate, securities-related or other hedging instrument, including swap agreements and other derivative instruments, subject to compliance with any applicable provisions of the federal securities or commodities laws. |
| (5) | Borrow money or issue any senior security, except to the extent permitted under the Investment Company Act of 1940, as amended, and as interpreted, modified, or otherwise permitted by regulatory authority having jurisdiction, from time to time. |
| (6) | Make loans, except to the extent permitted under the Investment Company Act of 1940, as amended, and as interpreted, modified, or otherwise permitted by regulatory authority having jurisdiction, from time to time. |
| (7) | Act as an underwriter of securities of other issuers, except to the extent that in connection with the disposition of portfolio securities, it may be deemed to be an underwriter under the federal securities laws. |
With respect to the Fund’s policy of investing at least 80% of its net assets in municipal bonds, for the avoidance of doubt, the Fund complies with the requirements of Rule
35d-1
under the Investment Company Act of 1940 and invests at least 80% of its net assets (plus borrowings for investment purposes) in municipal bonds which pay interest that, in the opinion of bond counsel to the issuer (or on the basis of authority believed by PIMCO to be reliable), is exempt from regular federal income tax (i.e. excluded from gross income for federal income tax purposes but not necessarily exempt from the federal alternative minimum tax), and will not change this policy without the shareholder approval required by Rule
35d-1.
PIMCO Municipal Income Fund II (PML)
Unless otherwise indicated, the investment restrictions set forth below are each a fundamental policy of the Fund that may not be changed without the approval of the holders of a majority of the outstanding Common Shares and any outstanding preferred shares of beneficial interest (including Preferred Shares) voting together as a single class, and of the holders of a majority of any outstanding preferred shares of beneficial interest (including Preferred Shares) voting as a separate class. The Fund may not:
| (1) | Concentrate its investments in a particular “industry,” as that term is used in the Investment Company Act of 1940, as amended, and as interpreted, modified, or otherwise permitted by regulatory authority having jurisdiction, from time to time. |
| (2) | With respect to 75% of the Fund’s total assets, purchase the securities of any issuer, except securities issued or guaranteed by the U.S. Government or any of its agencies or instrumentalities or securities issued by other investment companies, if, as a result, (i) more than 5% of the Fund’s total assets would be invested in the securities of that issuer, or (ii) the Fund would hold more than 10% of the outstanding voting securities of that issuer. For the purpose of this restriction, each state and each separate political subdivision, agency, authority or instrumentality of such state, each multi-state agency or authority, and each obligor, if any, is treated as a separate issuer of municipal bonds. |
| (3) | Purchase or sell real estate, although it may purchase securities (including municipal bonds) secured by real estate or interests therein, or securities issued by companies which invest in real estate, or interests therein. |
| (4) | Purchase or sell commodities or commodities contracts or oil, gas or mineral programs. This restriction shall not prohibit the Fund (as described in the “Portfolio Contents” section above) from purchasing, selling or entering into futures contracts, options on futures contracts, forward contracts, or any interest rate, securities-related or other hedging instrument, including swap agreements and other derivative instruments, subject to compliance with any applicable provisions of the federal securities or commodities laws. |
| (5) | Borrow money or issue any senior security, except to the extent permitted under the Investment Company Act of 1940, as amended, and as interpreted, modified, or otherwise permitted by regulatory authority having jurisdiction, from time to time. |
| (6) | Make loans, except to the extent permitted under the Investment Company Act of 1940, as amended, and as interpreted, modified, or otherwise permitted by regulatory authority having jurisdiction, from time to time. |
| (7) | Act as an underwriter of securities of other issuers, except to the extent that in connection with the disposition of portfolio securities, it may be deemed to be an underwriter under the federal securities laws. |
| (8) | Make an investment if, at the time of such investment, the Fund has invested less than 80% of its “assets” (as that term is defined in Rule 35d 1 under the Investment Company Act of 1940, as amended) in investments the income from which is, in the opinion of bond counsel to the issuer (or on the basis of other authority believed by the Fund’s portfolio manager to be reliable), exempt from federal income tax (not including, for these purposes, the federal alternative minimum tax). |
PIMCO Municipal Income Fund III (PMX)
Unless otherwise indicated, the investment restrictions set forth below are each a fundamental policy of the Fund that may not be changed without the approval of the holders of a majority of the outstanding Common Shares and any outstanding preferred shares of beneficial interest (including Preferred Shares) voting together as a single class, and of the holders of a majority of any outstanding preferred shares of beneficial interest (including Preferred Shares) voting as a separate class. The Fund may not:
| (1) | Concentrate its investments in a particular “industry,” as that term is used in the Investment Company Act of 1940, as amended, and as interpreted, modified, or otherwise permitted by regulatory authority having jurisdiction, from time to time. |
| (2) | With respect to 75% of the Fund’s total assets, purchase the securities of any issuer, except securities issued or guaranteed by the U.S. Government or any of its agencies or instrumentalities or |
| | securities issued by other investment companies, if, as a result, (i) more than 5% of the Fund’s total assets would be invested in the securities of that issuer, or (ii) the Fund would hold more than 10% of the outstanding voting securities of that issuer. For the purpose of this restriction, each state and each separate political subdivision, agency, authority or instrumentality of such state, each multi-state agency or authority, and each obligor, if any, is treated as a separate issuer of municipal bonds. |
| (3) | Purchase or sell real estate, although it may purchase securities (including municipal bonds) secured by real estate or interests therein, or securities issued by companies which invest in real estate, or interests therein. |
| (4) | Purchase or sell commodities or commodities contracts or oil, gas or mineral programs. This restriction shall not prohibit the Fund (as described in the “Portfolio Contents” section above) from purchasing, selling or entering into futures contracts, options on futures contracts, forward contracts, or any interest rate, securities-related or other hedging instrument, including swap agreements and other derivative instruments, subject to compliance with any applicable provisions of the federal securities or commodities laws. |
| (5) | Borrow money or issue any senior security, except to the extent permitted under the Investment Company Act of 1940, as amended, and as interpreted, modified, or otherwise permitted by regulatory authority having jurisdiction, from time to time. |
| (6) | Make loans, except to the extent permitted under the Investment Company Act of 1940, as amended, and as interpreted, modified, or otherwise permitted by regulatory authority having jurisdiction, from time to time. |
| (7) | Act as an underwriter of securities of other issuers, except to the extent that in connection with the disposition of portfolio securities, it may be deemed to be an underwriter under the federal securities laws. |
In addition, as a fundamental policy, the Fund must, under normal circumstances, invest at least 80% of its Assets (as that term is defined in Rule
35d-1
under the Investment Company Act of 1940, as amended), measured at the time of investment, in investments the income from which is, in the opinion of bond counsel to the issuer (or on the basis of other authority believed by the Fund’s portfolio manager to be reliable), exempt from federal income tax. For purposes of this policy, the Fund may count investments that generate income subject to the alternative minimum tax toward the 80% investment requirement. Rule
35d-1
currently defines “Assets” to mean “net assets, plus the amount of any borrowings for investment purposes.”
| | | | |
Fundamental Investment Restrictions | | | | |
PIMCO California Municipal Income Fund (PCQ)
Unless otherwise indicated, the investment restrictions set forth below are each a fundamental policy of the Fund that may not be changed without the approval of the holders of a majority of the outstanding Common Shares and any outstanding preferred shares of beneficial interest (including Preferred Shares) voting together as a single class, and of the holders of a majority of any outstanding preferred shares of beneficial interest (including Preferred Shares) voting as a separate class. The Fund may not:
| (1) | Concentrate its investments in a particular “industry,” as that term is used in the Investment Company Act of 1940, as amended, and as interpreted, modified, or otherwise permitted by regulatory authority having jurisdiction, from time to time. |
| (2) | Purchase or sell real estate, although it may purchase securities (including municipal bonds) secured by real estate or interests therein, or securities issued by companies which invest in real estate, or interests therein. |
| (3) | Purchase or sell commodities or commodities contracts or oil, gas or mineral programs. This restriction shall not prohibit the Fund (as described in the “Portfolio Contents” section above) from purchasing, selling or entering into futures contracts, options on futures contracts, forward contracts, or any interest rate, securities-related or other hedging instrument, including swap agreements and other derivative instruments, subject to compliance with any applicable provisions of the federal securities or commodities laws. |
| (4) | Borrow money or issue any senior security, except to the extent permitted under the Investment Company Act of 1940, as amended, and as interpreted, modified, or otherwise permitted by regulatory authority having jurisdiction, from time to time. |
| (5) | Make loans, except to the extent permitted under the Investment Company Act of 1940, as amended, and as interpreted, modified, or otherwise permitted by regulatory authority having jurisdiction, from time to time. |
| (6) | Act as an underwriter of securities of other issuers, except to the extent that in connection with the disposition of portfolio securities, it may be deemed to be an underwriter under the federal securities laws. |
In addition, with respect to 75% of the Fund’s total assets, the Fund may not purchase the securities of any issuer, except securities issued or guaranteed by the U.S. Government or any of its agencies or instrumentalities or securities issued by other investment companies, if, as a result, (i) more than 5% of the Fund’s total assets would be invested in the securities of that issuer, or (ii) the Fund would hold more than 10% of the outstanding voting securities of that issuer. For the purpose of this restriction, each state and each separate political
subdivision, agency, authority or instrumentality of such state, each multi-state agency or authority, and each obligor, if any, is treated as a separate issuer of municipal bonds.
With respect to the Fund’s policy of investing at least 80% of its net assets in municipal bonds, for the avoidance of doubt, the Fund complies with the requirements of Rule
35d-1
and invests at least 80% of its net assets (plus borrowings for investment purposes) in municipal bonds which pay interest that, in the opinion of bond counsel to the issuer (or on the basis of authority believed by PIMCO to be reliable), is exempt from regular federal income tax (i.e. excluded from gross income for federal income tax purposes but not necessarily exempt from the federal alternative minimum tax), and will not change this policy without the shareholder approval required by Rule
35d-1.
PIMCO California Municipal Income Fund II (PCK)
Unless otherwise indicated, the investment restrictions set forth below are each a fundamental policy of the Fund that may not be changed without the approval of the holders of a majority of the outstanding Common Shares and any outstanding preferred shares of beneficial interest (including Preferred Shares) voting together as a single class, and of the holders of a majority of any outstanding preferred shares of beneficial interest (including Preferred Shares) voting as a separate class. The Fund may not:
| (1) | Concentrate its investments in a particular “industry,” as that term is used in the Investment Company Act of 1940, as amended, and as interpreted, modified, or otherwise permitted by regulatory authority having jurisdiction, from time to time. |
| (2) | Purchase or sell real estate, although it may purchase securities (including municipal bonds) secured by real estate or interests therein, or securities issued by companies which invest in real estate, or interests therein. |
| (3) | Purchase or sell commodities or commodities contracts or oil, gas or mineral programs. This restriction shall not prohibit the Fund (as described in the “Portfolio Contents” section above) from purchasing, selling or entering into futures contracts, options on futures contracts, forward contracts, or any interest rate, securities-related or other hedging instrument, including swap agreements and other derivative instruments, subject to compliance with any applicable provisions of the federal securities or commodities laws. |
| (4) | Borrow money or issue any senior security, except to the extent permitted under the Investment Company Act of 1940, as amended, and as interpreted, modified, or otherwise permitted by regulatory authority having jurisdiction, from time to time. |
| (5) | Make loans, except to the extent permitted under the Investment Company Act of 1940, as amended, and as interpreted, |
| | modified, or otherwise permitted by regulatory authority having jurisdiction, from time to time. |
| (6) | Act as an underwriter of securities of other issuers, except to the extent that in connection with the disposition of portfolio securities, it may be deemed to be an underwriter under the federal securities laws. |
As a fundamental policy, with respect to 75% of the Fund’s total assets, the Fund may also not purchase the securities of any issuer, except securities issued or guaranteed by the U.S. Government or any of its agencies or instrumentalities or securities issued by other investment companies, if, as a result, (i) more than 5% of the Fund’s total assets would be invested in the securities of that issuer, or (ii) the Fund would hold more than 10% of the outstanding voting securities of that issuer. For the purpose of this restriction, each state and each separate political subdivision, agency, authority or instrumentality of such state, each multi-state agency or authority, and each obligor, if any, is treated as a separate issuer of municipal bonds.
In addition, as a fundamental policy, the Fund must, under normal circumstances, invest at least 80% of its Assets (as that term is defined in Rule
35d-1
under the Investment Company Act of 1940, as amended), measured at the time of investment, in investments the income from which is, in the opinion of bond counsel to the issuer (or on the basis of other authority believed by the Fund’s portfolio manager to be reliable), exempt from federal and California state income taxes. For purposes of this policy, the Fund may count investments that generate income subject to the alternative minimum tax toward the 80% investment requirement.
PIMCO California Municipal Income Fund III (PZC)
Unless otherwise indicated, the investment restrictions set forth below are each a fundamental policy of the Fund that may not be changed without the approval of the holders of a majority of the outstanding Common Shares and any outstanding preferred shares of beneficial interest (including Preferred Shares) voting together as a single class, and of the holders of a majority of any outstanding preferred shares of beneficial interest (including Preferred Shares) voting as a separate class. The Fund may not:
| (1) | Concentrate its investments in a particular “industry,” as that term is used in the Investment Company Act of 1940, as amended, and as interpreted, modified, or otherwise permitted by regulatory authority having jurisdiction, from time to time. |
| (2) | Purchase or sell real estate, although it may purchase securities (including municipal bonds) secured by real estate or interests therein, or securities issued by companies which invest in real estate, or interests therein. |
| (3) | Purchase or sell commodities or commodities contracts or oil, gas or mineral programs. This restriction shall not prohibit the Fund (as described in the “Portfolio Contents” section above) from purchasing, selling or entering into futures contracts, options on futures contracts, forward contracts, or any interest rate, securities-related or other hedging instrument, including swap agreements and other derivative instruments, subject to compliance with any applicable provisions of the federal securities or commodities laws. |
| (4) | Borrow money or issue any senior security, except to the extent permitted under the Investment Company Act of 1940, as amended, and as interpreted, modified, or otherwise permitted by regulatory authority having jurisdiction, from time to time. |
| (5) | Make loans, except to the extent permitted under the Investment Company Act of 1940, as amended, and as interpreted, modified, or otherwise permitted by regulatory authority having jurisdiction, from time to time. |
| (6) | Act as an underwriter of securities of other issuers, except to the extent that in connection with the disposition of portfolio securities, it may be deemed to be an underwriter under the federal securities laws. |
As a fundamental policy, with respect to 75% of the Fund’s total assets, the Fund may also not purchase the securities of any issuer, except securities issued or guaranteed by the U.S. Government or any of its agencies or instrumentalities or securities issued by other investment companies, if, as a result, (i) more than 5% of the Fund’s total assets would be invested in the securities of that issuer, or (ii) the Fund would hold more than 10% of the outstanding voting securities of that issuer. For the purpose of this restriction, each state and each separate political subdivision, agency, authority or instrumentality of such state, each multi-state agency or authority, and each obligor, if any, is treated as a separate issuer of municipal bonds.
In addition, as a fundamental policy, the Fund must, under normal circumstances, invest at least 80% of its Assets (as that term is defined in Rule
35d-1
under the Investment Company Act of 1940, as amended), measured at the time of investment, in investments the income from which is, in the opinion of bond counsel to the issuer (or on the basis of other authority believed by the Fund’s portfolio manager to be reliable), exempt from federal and California state income taxes. For purposes of this policy, the Fund may count investments that generate income subject to the alternative minimum tax toward the 80% investment requirement. Rule
35d-1
currently defines “Assets” to mean “net assets, plus the amount of any borrowings for investment purposes.”
| | | | |
Fundamental Investment Restrictions | | | | |
PIMCO New York Municipal Income Fund (PNF)
Unless otherwise indicated, the investment restrictions set forth below are each a fundamental policy of the Fund that may not be changed without the approval of the holders of a majority of the outstanding Common Shares and any outstanding preferred shares of beneficial interest (including Preferred Shares) voting together as a single class, and of the holders of a majority of any outstanding preferred shares of beneficial interest (including Preferred Shares) voting as a separate class. The Fund may not:
| (1) | Concentrate its investments in a particular “industry,” as that term is used in the Investment Company Act of 1940, as amended, and as interpreted, modified, or otherwise permitted by regulatory authority having jurisdiction, from time to time. |
| (2) | Purchase or sell real estate, although it may purchase securities (including municipal bonds) secured by real estate or interests therein, or securities issued by companies which invest in real estate, or interests therein. |
| (3) | Purchase or sell commodities or commodities contracts or oil, gas or mineral programs. This restriction shall not prohibit the Fund (as described in the “Portfolio Contents” section above) from purchasing, selling or entering into futures contracts, options on futures contracts, forward contracts, or any interest rate, securities-related or other hedging instrument, including swap agreements and other derivative instruments, subject to compliance with any applicable provisions of the federal securities or commodities laws. |
| (4) | Borrow money or issue any senior security, except to the extent permitted under the Investment Company Act of 1940, as amended, and as interpreted, modified, or otherwise permitted by regulatory authority having jurisdiction, from time to time. |
| (5) | Make loans, except to the extent permitted under the Investment Company Act of 1940, as amended, and as interpreted, modified, or otherwise permitted by regulatory authority having jurisdiction, from time to time. |
| (6) | Act as an underwriter of securities of other issuers, except to the extent that in connection with the disposition of portfolio securities, it may be deemed to be an underwriter under the federal securities laws. |
With respect to the Fund’s policy of investing at least 80% of its net assets in municipal bonds, for the avoidance of doubt, the Fund complies with the requirements of Rule
35d-1
and invests at least 80% of its net assets (plus borrowings for investment purposes) in municipal bonds which pay interest that, in the opinion of bond counsel to the issuer (or on the basis of authority believed by PIMCO to be reliable), is exempt from regular federal income tax (i.e. excluded from gross income for federal income tax purposes but not necessarily
exempt from the federal alternative minimum tax), and will not change this policy without the shareholder approval required by Rule
35d-1.
PIMCO New York Municipal Income Fund II (PNI)
Unless otherwise indicated, the investment restrictions set forth below are each a fundamental policy of the Fund that may not be changed without the approval of the holders of a majority of the outstanding Common Shares and any outstanding preferred shares of beneficial interest (including Preferred Shares) voting together as a single class, and of the holders of a majority of any outstanding preferred shares of beneficial interest (including Preferred Shares) voting as a separate class. The Fund may not:
| (1) | Concentrate its investments in a particular “industry,” as that term is used in the Investment Company Act of 1940, as amended, and as interpreted, modified, or otherwise permitted by regulatory authority having jurisdiction, from time to time. |
| (2) | Purchase or sell real estate, although it may purchase securities (including municipal bonds) secured by real estate or interests therein, or securities issued by companies which invest in real estate, or interests therein. |
| (3) | Purchase or sell commodities or commodities contracts or oil, gas or mineral programs. This restriction shall not prohibit the Fund (as described in the “Portfolio Contents” section above) from purchasing, selling or entering into futures contracts, options on futures contracts, forward contracts, or any interest rate, securities-related or other hedging instrument, including swap agreements and other derivative instruments, subject to compliance with any applicable provisions of the federal securities or commodities laws. |
| (4) | Borrow money or issue any senior security, except to the extent permitted under the Investment Company Act of 1940, as amended, and as interpreted, modified, or otherwise permitted by regulatory authority having jurisdiction, from time to time. |
| (5) | Make loans, except to the extent permitted under the Investment Company Act of 1940, as amended, and as interpreted, modified, or otherwise permitted by regulatory authority having jurisdiction, from time to time. |
| (6) | Act as an underwriter of securities of other issuers, except to the extent that in connection with the disposition of portfolio securities, it may be deemed to be an underwriter under the federal securities laws. |
As a fundamental policy, with respect to 75% of the Fund’s total assets, the Fund may also not purchase the securities of any issuer, except securities issued or guaranteed by the U.S. Government or any of its agencies or instrumentalities or securities issued by other investment companies, if, as a result, (i) more than 5% of the Fund’s
total assets would be invested in the securities of that issuer, or (ii) the Fund would hold more than 10% of the outstanding voting securities of that issuer. For the purpose of this restriction, each state and each separate political subdivision, agency, authority or instrumentality of such state, each multi-state agency or authority, and each obligor, if any, is treated as a separate issuer of municipal bonds.
In addition, as a fundamental policy, the Fund must, under normal circumstances, invest at least 80% of its Assets (as that term is defined in Rule
35d-1
under the Investment Company Act of 1940, as amended), measured at the time of investment, in investments the income from which is, in the opinion of bond counsel to the issuer (or on the basis of other authority believed by the Fund’s portfolio manager to be reliable), exempt from federal and New York state income taxes. For purposes of this policy, the Fund may count investments that generate income subject to the alternative minimum tax toward the 80% investment requirement.
PIMCO New York Municipal Income Fund III (PYN)
Unless otherwise indicated, the investment restrictions set forth below are each a fundamental policy of the Fund that may not be changed without the approval of the holders of a majority of the outstanding Common Shares and any outstanding preferred shares of beneficial interest (including Preferred Shares) voting together as a single class, and of the holders of a majority of any outstanding preferred shares of beneficial interest (including Preferred Shares) voting as a separate class. The Fund may not:
| (1) | Concentrate its investments in a particular “industry,” as that term is used in the Investment Company Act of 1940, as amended, and as interpreted, modified, or otherwise permitted by regulatory authority having jurisdiction, from time to time. |
| (2) | Purchase or sell real estate, although it may purchase securities (including municipal bonds) secured by real estate or interests therein, or securities issued by companies which invest in real estate, or interests therein. |
| (3) | Purchase or sell commodities or commodities contracts or oil, gas or mineral programs. This restriction shall not prohibit the Fund (as described in the “Portfolio Contents” section above) from purchasing, selling or entering into futures contracts, options on futures contracts, forward contracts, or any interest rate, securities-related or other hedging instrument, including swap agreements and other derivative instruments, subject to compliance with any applicable provisions of the federal securities or commodities laws. |
| (4) | Borrow money or issue any senior security, except to the extent permitted under the Investment Company Act of 1940, as amended, and as interpreted, modified, or otherwise permitted by regulatory authority having jurisdiction, from time to time. |
| (5) | Make loans, except to the extent permitted under the Investment Company Act of 1940, as amended, and as interpreted, modified, or otherwise permitted by regulatory authority having jurisdiction, from time to time. |
| (6) | Act as an underwriter of securities of other issuers, except to the extent that in connection with the disposition of portfolio securities, it may be deemed to be an underwriter under the federal securities laws. |
In addition, as a fundamental policy, the Fund must, under normal circumstances, invest at least 80% of its Assets (as that term is defined in Rule
35d-1
under the Investment Company Act of 1940, as amended), measured at the time of investment, in investments the income from which is, in the opinion of bond counsel to the issuer (or on the basis of other authority believed by the Fund’s portfolio manager to be reliable), exempt from federal and New York state income taxes. For purposes of this policy, the Fund may count investments that generate income subject to the alternative minimum tax toward the 80% investment requirement.
Unless otherwise indicated, all limitations applicable to each Fund’s investments (as stated in this or other sections) apply only at the time a transaction is entered into. For example, any subsequent change in a rating assigned by any rating service to a security (or, if unrated, deemed by PIMCO to be of comparable quality), or change in the percentage of a Fund’s assets invested in certain securities or other instruments, or change in the average maturity or duration of a Fund’s investment portfolio, resulting from market fluctuations or other changes in a Fund’s total assets will not require the Fund to dispose of an investment. From time to time, a Fund may voluntarily participate in actions (for example, rights offerings, conversion privileges, exchange offers, credit event settlements, etc.) including, but not limited to, where the issuer or counterparty offers securities or instruments to holders or counterparties, such as the Fund, and the acquisition is determined to be beneficial to Fund shareholders (“Voluntary Action”). Notwithstanding any percentage investment limitation listed under this “Fundamental Investment Restrictions” section or any percentage investment limitation of the 1940 Act or rules thereunder, if a Fund has the opportunity to acquire a permitted security or instrument through a Voluntary Action, and the Fund will exceed a percentage investment limitation following the acquisition, it will not constitute a violation if, prior to the receipt of the securities or instruments and after announcement of the offering, the Fund sells an offsetting amount of assets that are subject to the investment limitation in question at a price at least equal to the value of the securities or instruments to be acquired.
Unless otherwise indicated, all percentage limitations on Fund investments (as stated herein) that are not: (i) specifically included in this “Fundamental Investment Restrictions” section; or (ii) imposed by the 1940 Act, rules thereunder, the Code or related regulations (the “Elective Investment Restrictions”), will apply only at the time of investment unless the acquisition is a Voluntary Action. For the avoidance of doubt, unless otherwise stated, all percentage limitations on Fund investments that are (i) specifically included in this “Fundamental Investment Restrictions” section; or (ii) Elective Investment Restrictions, will apply at the time of investment. In addition, and notwithstanding the foregoing, for purposes of this policy, certain
Non-Fundamental
Investment Restrictions, as noted above, are also considered Elective Investment Restrictions. The percentage limitations and absolute prohibitions with respect to Elective Investment Restrictions are not applicable to the Fund’s acquisition of securities or instruments through a Voluntary Action. Certain percentage limitations or absolute prohibitions stated in certain Elective Investment Restrictions by their terms apply only with respect to specific securities or instruments as opposed to asset classes or economic exposures represented by such securities or instruments; for purposes of applying such limitations or prohibitions, a Fund may
not count investments in derivatives or other instruments that are not the specific securities or instruments limited or prohibited by the express terms of the Elective Investment Restriction. In such cases, a Fund may obtain greater economic exposure to asset classes represented by such specific securities or instruments because such exposure is not restricted by the express terms of the Elective Investment Restriction.
A Fund may engage in roll-timing strategies where the Fund seeks to extend the expiration or maturity of a position, such as a forward contract, futures contract or TBA transaction, on an underlying asset by closing out the position before expiration and contemporaneously opening a new position with respect to the same underlying asset that has substantially similar terms except for a later expiration date. Such “rolls” enable a Fund to maintain continuous investment exposure to an underlying asset beyond the expiration of the initial position without delivery of the underlying asset. Similarly, as certain standardized swap agreements transition from OTC trading to mandatory exchange-trading and clearing due to the implementation of Dodd-Frank Act regulatory requirements, a Fund may “roll” an existing OTC swap agreement by closing out the position before expiration and contemporaneously entering into a new exchange-traded and cleared swap agreement on the same underlying asset with substantially similar terms except for a later expiration date. These types of new positions opened contemporaneous with the closing of an existing position on the same underlying asset with substantially similar terms are collectively referred to as “Roll Transactions.” Elective Investment Restrictions (defined in the preceding paragraph), which normally apply at the time of investment, do not apply to Roll Transactions (although Elective Investment Restrictions will apply to the Fund’s entry into the initial position). In addition, and notwithstanding the foregoing, for purposes of this policy, those
Non-Fundamental
Investment Restrictions that are considered Elective Investment Restrictions for purposes of the policy on Voluntary Actions (described in the preceding paragraph) are also Elective Investment Restrictions for purposes of this policy on Roll Transactions. The Fund will test for compliance with Elective Investment Restrictions at the time of the Fund’s initial entry into a position, but the percentage limitations and absolute prohibitions set forth in the Elective Investment Restrictions are not applicable to the Fund’s subsequent acquisition of securities or instruments through a Roll Transaction.
PIMCO employs and/or relies on algorithms, models or other systems in connection with many of its investment activities, including research, forecasting, selection, optimization, order routing, execution, and allocation processes (together, “Systems”). These Systems, which may be employed together and operate without human intervention,
rely heavily on the use of proprietary and nonproprietary data, software, hardware, and intellectual property, including data, software and hardware that may be licensed or otherwise obtained from third parties. The use of such Systems has inherent limitations and risks. Although PIMCO seeks to develop and use Systems appropriately and effectively, there can be no assurance that it will successfully do so. The Systems are extremely complex and may involve the use of financial, economic, econometric and statistical theories, research and modeling and related translation into computer code. Errors may occur in the design, writing, testing, monitoring, and/or implementation of Systems, including in the manner in which Systems function together. The effectiveness of Systems may diminish over time, including as a result of market changes and changes in the behavior of market participants. The quality of the resulting analysis, investment selections, portfolio construction, asset allocations, proposed trades, risk management, allocations of investment opportunities and trading strategies depends on a number of factors including the accuracy and quality of data inputs into the Systems, including through automated and manual integration of completed transactions, the mathematical and analytical assumptions and underpinnings of the Systems’ coding, the accuracy in translating those analytics into program code or interpreting the output of a System by another System in order to facilitate a transaction, change in market conditions, the successful integration of the various Systems into the portfolio selection and trading process and whether actual market events correspond to one or more assumptions underlying the Systems. Accordingly, Systems are subject to errors and/or mistakes (“System Incidents”) that may adversely impact the Fund.
PIMCO relies on quantitative models, data, and trading algorithms supplied by third parties for certain funds. Such models, data and algorithms are used to construct sets of transactions and investments, to implement investment decisions, and to provide risk management insights. When the third-party models, data or algorithms prove to be incorrect or incomplete, any decisions or investments made in reliance thereon expose applicable funds to additional risks. For these reasons, and subject to PIMCO satisfying its standard of care, PIMCO generally will not compensate applicable funds for any losses associated with third-party models, data, or algorithms, and applicable funds will bear all such losses. PIMCO, subject to satisfying its standard of care, generally does not expect to disclose certain such events to applicable funds.
The Systems rely heavily on appropriate data inputs, and it is impossible and impracticable to factor all relevant, available data into the Systems. PIMCO will use its discretion to determine what data to gather and what subset of data the Systems utilize. PIMCO has full discretion to select the data it utilizes and may elect to use or may
refrain from using any specific data or type of data in the Systems. The data used in the development of use of Systems may not be the most accurate data available or free of errors. Most Systems require continual monitoring and enhancements, and there is no guarantee that such monitoring and enhancements will be successful or that Systems will operate as intended. PIMCO has adopted policies and procedures that it believes are reasonably designed to prevent, detect, escalate and remediate System Incidents. PIMCO will address System Incidents in accordance with this policy but there is no guarantee that measures taken to address a System Incident will be successful.
PIMCO has policies and procedures that address identification and correction of errors that may occur in connection with PIMCO’s management of the Fund and other client accounts (“Trade Errors”). PIMCO generally does not classify System Incidents to be Trade Errors and applicable funds generally will bear all losses associated with System Incidents, subject to PIMCO satisfying its standard of care. Further, PIMCO generally does not expect to disclose System Incidents to the Fund.
Where applicable, PIMCO considers relevant Environmental, Social and Governance (“ESG”) factors in its investment research process with the goal of enhancing risk-adjusted returns. Integrating relevant factors into the evaluation process does not mean that ESG related information is the sole or primary consideration for an investment decision. PIMCO’s portfolio managers and analyst teams consider a variety of factors including the materiality of those factors to make investment decisions. Where material, ESG factors can be important considerations when evaluating long-term investment opportunities and risks for asset classes, where applicable. The materiality of ESG considerations to investment decisions typically varies across asset classes, strategies, products and valuations.
The following table is furnished in response to requirements of the SEC. It is designed to illustrate the effects of leverage through the use of senior securities, as that term is defined under Section 18 of the 1940 Act, on Common Share total return, assuming investment portfolio total returns (consisting of income and changes in the value of investments held in a Fund’s portfolio) of -10%, -5%, 0%, 5% and 10%. The table below reflects each Fund’s continued use of reverse repurchase agreements, as applicable averaged over the fiscal year ended December 31, 2023 as a percentage of total average managed assets (including assets attributable to such leverage), the estimated annual effective interest expense rate payable by the Fund on such instruments (based on market conditions as of December 31, 2023, and the annual return that the Fund’s portfolio must experience (net of expenses) in order to cover such costs of the reverse repurchase agreements based on such estimated annual effective interest expense rate. The information below does not reflect any Fund’s use of certain other forms of economic leverage achieved through the use of other
instruments or transactions not considered to be senior securities under the 1940 Act, such as covered credit default swaps or other derivative instruments.
The assumed investment portfolio returns in the table below are hypothetical figures and are not necessarily indicative of the investment portfolio returns experienced or expected to be experienced by the Fund. Your actual returns may be greater or less than those appearing below. In addition, actual borrowing expenses associated with reverse repurchase agreements (or dollar rolls or borrowings, if any) used by the Fund may vary frequently and may be significantly higher or lower than the rate used for the example below.
The information below does not reflect a Fund’s use of certain other forms of economic leverage achieved through the use of other instruments or transactions not considered to be senior securities under the 1940 Act, such as total return swaps or other derivative instruments.
| | | | | | | | | | | | | | | | | | | | | | | | | | | | | | | | | | | | | | | | |
| | | | | | California
Municipal
Income
Fund
(PCQ) | | | California
Municipal
Income
Fund II
(PCK) | | | California
Municipal
Income
Fund III
(PZC) | | | New York
Municipal
Income
Fund
(PNF) | | | New York
Municipal
Income
Fund II
(PNI) | | | New York
Municipal
Income
Fund III
(PYN) | | | | | | Municipal
Income
Fund II
(PML) | | | Municipal
Income
Fund III
(PMX) | |
| | | | | | | | | | |
| Preferred Shares as a Percentage of Total Managed Assets (Including Assets Attributable to Preferred Shares and TOBs) | | | | | | | 41.49 | % | | | 41.52 | % | | | 41.00 | % | | | 32.32 | % | | | 38.07 | % | | | 34.73 | % | | | 41.32 | % | | | 36.20 | % | | | 39.68 | % |
| | | | | | | | | | |
| Estimated Annual Effective Preferred Share Dividend Rate | | | | | | | 5.98 | % | | | 5.98 | % | | | 5.99 | % | | | 5.98 | % | | | 5.96 | % | | | 5.98 | % | | | 5.98 | % | | | 5.98 | % | | | 5.98 | % |
| | | | | | | | | | |
| TOBs as a Percentage of Total Managed Assets (Including Assets Attributable to Preferred Shares and TOBs) | | | | | | | 2.83 | % | | | 2.28 | % | | | 2.71 | % | | | 1.53 | % | | | 8.02 | % | | | 14.33 | % | | | 2.90 | % | | | 6.20 | % | | | 3.66 | % |
| | | | | | | | | | |
| Estimated Annual Effective Interest Expense Rate Payable by Fund on TOBs | | | | | | | 3.75 | % | | | 3.71 | % | | | 3.76 | % | | | 3.69 | % | | | 1.02 | % | | | 0.91 | % | | | 3.71 | % | | | 3.78 | % | | | 3.73 | % |
| | | | | | | | | | |
| Annual Return Fund Portfolio Must Experience (net of expenses) to Cover Estimated Annual Effective Preferred Share Dividend Rate and Interest Expense Rate on TOBs | | | | | | | 2.47 | % | | | 2.39 | % | | | 2.41 | % | | | 1.99 | % | | | 2.25 | % | | | 2.21 | % | | | 2.48 | % | | | 2.25 | % | | | 2.37 | % |
| | | | | | | | | | |
| Common Share Total Return for (10.00)% Assumed Portfolio Total Return | | | | | | | (22.40 | )% | | | (22.04 | )% | | | (22.05 | )% | | | (18.12 | )% | | | (22.72 | )% | | | (23.97 | )% | | | (22.37 | )% | | | (21.27 | )% | | | (21.82 | )% |
| | | | | | | | | | |
| Common Share Total Return for (5.00)% Assumed Portfolio Total Return | | | | | | | (13.42 | )% | | | (13.15 | )% | | | (13.17 | )% | | | (10.57 | )% | | | (13.45 | )% | | | (14.15 | )% | | | (13.40 | )% | | | (12.59 | )% | | | (13.00 | )% |
| | | | | | | | | | |
| Common Share Total Return for 0.00% Assumed Portfolio Total Return | | | | | | | (4.44 | )% | | | (4.25 | )% | | | (4.28 | )% | | | (3.01 | )% | | | (4.17 | )% | | | (4.34 | )% | | | (4.44 | )% | | | (3.91 | )% | | | (4.17 | )% |
| | | | | | | | | | |
| Common Share Total Return for 5.00% Assumed Portfolio Total Return | | | | | | | 4.54 | % | | | 4.64 | % | | | 4.60 | % | | | 4.55 | % | | | 5.10 | % | | | 5.48 | % | | | 4.52 | % | | | 4.77 | % | | | 4.65 | % |
| | | | | | | | | | |
| Common Share Total Return for 10.00% Assumed Portfolio Total Return | | | | | | | 13.52 | % | | | 13.54 | % | | | 13.48 | % | | | 12.11 | % | | | 14.37 | % | | | 15.30 | % | | | 13.49 | % | | | 13.45 | % | | | 13.47 | % |
The chart below identifies Trustees and Officers of the Funds. Unless otherwise indicated, the address of all persons below is c/o Pacific Investment Management Company LLC, 1633 Broadway, New York, New York 10019.
A list of officers and trustees of PIMCO containing information as to any business, profession, vocation, or employment of a substantial nature engaged in by such officers and directors during the past two years is included in the most recent Form ADV filed by PIMCO pursuant to the Investment Advisers Act of 1940.
The Fund’s Statement of Additional Information includes more information about the Trustees and Officers. To request a free copy, call PIMCO at (844)
312-2113.
| | | | | | | | | | |
| | Position(s)
Held
with the
Funds | | Term of
Office and
Length of
Time Served* | | | | Number
of Portfolios
in Fund
Complex
Overseen by
Trustee | | Other
Directorships
Held by
Trustee
During the
Past 5 Years |
|
|
| | | | | |
| | Chair of the Board, Trustee | | Trustee of the Funds since 2011, expected to stand for re-election at the annual meeting of shareholders during the 2025 fiscal year for PMF, PCQ, PNF, PML, PCK, and PNI and during the 2026 fiscal year for PMX, PZC and PYN. | | Advisory Director, Morgan Stanley & Co., Inc. (since 1996); Member, Circle Financial Group (since 2009); Member, Council on Foreign Relations (since 2013); Trustee, Smith College (since 2017); Director, Watford Re (since 2017); and Director, Cadre Inc., a manufacturer of safety equipment (since 2022). Formerly, Co-Chair Special Projects Committee, Memorial Sloan Kettering (2005-2015); Trustee, Stanford University (2010-2015); Principal, LaLoop LLC, a retail accessories company (1999-2014); Director, Helena Rubenstein Foundation (1997-2010); and Director, Armor Holdings (2002-2010). | | 30 | | Trustee, Allianz Funds (2011-2021); Trustee, Virtus Funds (2021-Present). |
| | | | | |
| | Trustee | | Trustee of the Funds since 2019, expected to stand for election at the annual meeting of the shareholders during the 2025 fiscal year for PMF, PCQ, PNF, PML, PCK, PNI and PYN and during the 2024 fiscal year for PMX and PZC. | | Retired Partner, Simpson Thacher & Bartlett LLP (law firm) (1989-2018); Director, Girl Scouts of Greater New York, Inc. (since 2016); and Trustee, Natural Resources Defense Council, Inc. (since 2013). | | 30 | | Trustee, Allianz Funds (2019-2021); Trustee, Virtus Funds (2021-Present). |
| | | | | |
| | Trustee | | Trustee of the Funds since 2020, expected to stand for re-election at the annual meeting of shareholders during the 2025 fiscal year for PMX and PZC and during the 2026 fiscal year for PMF, PCQ, PNF, PML, PCK, PNI and PYN. | | Trustee (since 2019) and Governance Committee (since 2020), Vermont Law School (since 2019); Director and Treasurer, Center for Reproductive Rights (since 2015); Formerly, Director (2013-2020) and Chair (2018-2020), ACLU of Massachusetts; General Counsel, Grantham, Mayo, Van Otterloo & Co. LLC (2005-2018) and Partner (2007-2018); President, GMO Trust (institutional mutual funds) (2009-2018); Chief Executive Officer, GMO Trust (2009-2015); and President and Chief Executive Officer, GMO Series Trust (platform based mutual funds) (2011-2013). | | 30 | | Trustee, GMO Trust (2010-2018); Chairman of the Board of Trustees, GMO Series Trust (2011-2018). |
| | | | | |
| | Trustee | | Trustee of the Funds since 2022, expected to stand for re-election at the annual meeting of shareholders during the 2025 fiscal year for PMF, PCQ, PNF, PML, PCK, PNI PMX, PZC and PYN. | | Director (since 2013) and President (since 2020), Five Colleges, Inc., consortium of liberal arts colleges and universities; President Emerita, Smith College (since 2023); Formerly, President, Smith College (2013-2023); Director, American Council on Education Board of Directors, (2015-2019); Director, Consortium on Financing Higher Education Board of Directors (2015-2019); Director, edX Board of Directors, online course provider (2012-2013); Director, Bellwether Education Partners Board, national nonprofit organization (2010-2013); Dean, Harvard Graduate School of Education (2006-2013); and Trustee, Tufts University (2007-2013). | | 30 | | None. |
| | | | | | | | | | |
| | Position(s)
Held
with the
Funds | | Term of
Office and
Length of
Time Served* | | | | Number
of Portfolios
in Fund
Complex
Overseen by
Trustee | | Other
Directorships
Held by
Trustee
During the
Past 5 Years |
| | | | | |
| | Trustee | | Trustee of the Funds since 2010, expected to stand for re-election at the annual meeting of shareholders during the 2024 fiscal year for PMF, PCQ, PNF, PML, PCK, PNI and PYN and during the 2025 fiscal year for PMX and PZC. | | Director, Victory Capital Holdings, Inc., an asset management firm (since 2013). Formerly, Adjunct Professor, New York University Stern School of Business (2011-2020); Lecturer, Stanford University Graduate School of Business (2013-2020); Advisory Director (formerly Vice Chairman), Roundtable Investment Partners (2009-2018); Member of Board of Overseers, NYU Langone Medical Center (2015-2016); Trustee, American Museum of Natural History (2005-2015); Trustee, NYU Langone Medical Center (2007-2015); and Vice Chairman (formerly, Chairman and President), U.S. Trust (formerly, Private Bank of Bank of America, the predecessor entity of U.S. Trust) (2001-2008). | | 30 | | Trustee, Allianz Funds (2010-2021); Trustee, Virtus Closed-End Funds (2021-2023). |
| | | | | |
| | Trustee | | Trustee of the Funds since 2021, expected to stand for re-election at the annual meeting of shareholders during the 2024 fiscal year for each Fund. | | Founder and Managing Director, Grace Global Capital LLC, a strategic advisory firm to the insurance industry (since 2006); Director, The Doctors Company, a medical malpractice insurance company (since 2020); Director, Link Logistic REIT, a real estate company (since 2021); Director and Member of the Investment & Risk Committee, Resolution Life Group Holdings, a global life insurance group (since 2021); Director, Wharton Graduate Executive Board; Chief Financial Officer, ShoulderUp Technology Acquisition Corp, a special purpose acquisition company (since 2021); and Director, Blackstone Private Equity Strategies Fund L.P. (since 2022). Formerly, Director, Resolution Holdings (2015-2019); Director and Member of the Audit Committee and the Wealth Solutions Advisory Committee, M Financial Group, a life insurance company (2015-2021); Chief Financial Officer, Athena Technology Acquisition Corp, a special purpose acquisition company (2021-2022); and Director, SBLI USA, a life insurance company (2015-2018). | | 30 | | None |
|
|
| | | | | |
| | Trustee | | Trustee of the Funds since April 2023 , expected to stand for re-election at the annual meeting of shareholders during the 2024 fiscal year for PMF, PCQ, PNF, PML, PCK, PNI, PMX and PZC and during the 2026 fiscal year for PYN. | | Managing Director, Head of Public Policy, PIMCO (since 2007); Institutional Account Manager, PIMCO (2007-2010); Legislative Aide, House of Representatives (2003-2005); Investment Banking Analyst, Morgan Stanley (2000-2003). | | 30 | | Member of the Board of Directors, Covenant House New York (2021-Present); Member of the Board, Securities Industry and Financial Markets Association (2022-Present). |
| | | | | | | | | | |
| | Position(s)
Held
with the
Funds | | Term of
Office and
Length of
Time Served* | | | | Number
of Portfolios
in Fund
Complex
Overseen by
Trustee | | Other
Directorships
Held by
Trustee
During the
Past 5 Years |
| | | | | |
| | Trustee | | Trustee of the Funds since 2019, expected to stand for election at the annual meeting of the shareholders during the 2025 fiscal year for PYN and during the 2026 fiscal year for PMF, PCQ, PNF, PML, PCK, PNI, PMX and PZC. | | Managing Director and Co-Head of U.S. Global Wealth Management Strategic Accounts, PIMCO (since 2021); and Director, Court Appointed Special Advocates (CASA) of Orange County, a non-profit organization (since 2015). Formerly, Managing Director and Head of Traditional Product Strategies, PIMCO (2015-2021); Global Bond Strategist, PIMCO (2008-2015); and Managing Director and Head of Global Fixed Income, HSBC Global Asset Management (2005-2008). | | 30 | | None |
| * | Under the Fund’s Amended and Restated Agreement and Declaration of Trust, a Trustee serves until his or her retirement, removal, disqualification, resignation or replacement. |
| ** | Ms. Cantrill and Mr. Fisher are “interested persons” of the Fund, as defined in Section 2(a)(19) of the Act, due to their affiliations with PIMCO and its affiliates. Their address is 650 Newport Center Drive, Newport Beach, California 92660. |
| | | | | | |
Name, Address and
Year of Birth | | Position(s) Held
with Funds | | Term of Office and
Length of Time Served | | Principal Occupation(s) During the Past 5 Years |
| | | |
| | President | | Since 2019 | | Executive Vice President and Head of Americas Operations; Deputy General Counsel, PIMCO. President, PIMCO-Managed Funds, PIMCO Flexible Real Estate Income Fund, PIMCO Funds, PIMCO Variable Insurance Trust, PIMCO ETF Trust, PIMCO Equity Series and PIMCO Equity Series VIT. |
| | | |
| | Chief Compliance Officer | | Since 2018 | | Executive Vice President and Deputy Chief Compliance Officer, PIMCO. Chief Compliance Officer, PIMCO-Managed Funds, PIMCO Flexible Real Estate Income Fund, PIMCO Funds, PIMCO Variable Insurance Trust, PIMCO ETF Trust, PIMCO Equity Series, PIMCO Equity Series VIT and PIMCO Capital Solutions BDC Corp. |
| | | |
| | Chief Legal Officer | | Since 2019 | | Executive Vice President and Deputy General Counsel, PIMCO. Chief Legal Officer, PIMCO-Managed Funds, PIMCO Flexible Real Estate Income Fund and PIMCO Capital Solutions BDC Corp. Chief Legal Officer and Secretary, PIMCO Funds, PIMCO Variable Insurance Trust, PIMCO ETF Trust, PIMCO Equity Series and PIMCO Equity Series VIT. Formerly, Associate, Willkie Farr & Gallagher LLP. |
| | | |
| | Senior Vice President | | Since 2019 | | Managing Director and Co-Chief Operating Officer, PIMCO. Senior Vice President, PIMCO-Managed Funds, PIMCO Funds, PIMCO Variable Insurance Trust, PIMCO ETF Trust, PIMCO Equity Series and PIMCO Equity Series VIT. Formerly, Chief Administrative Officer, PIMCO. |
| | | |
| | Vice President, Senior Counsel and Secretary | | Since 2018 | | Senior Vice President and Senior Counsel, PIMCO. Vice President, Senior Counsel and Secretary, PIMCO-Managed Funds, PIMCO Flexible Real Estate Income Fund and PIMCO Capital Solutions BDC Corp. Assistant Secretary, PIMCO Funds, PIMCO Variable Insurance Trust, PIMCO ETF Trust, PIMCO Equity Series and PIMCO Equity Series VIT. Formerly, Assistant General Counsel, VanEck Associates Corp. |
| | | |
| | Vice President | | Since 2022 | | Senior Vice President, PIMCO. Vice President, PIMCO-Managed Funds, PIMCO Flexible Real Estate Income Fund, PIMCO Funds, PIMCO Variable Insurance Trust, PIMCO ETF Trust, PIMCO Equity Series, PIMCO Equity Series VIT and PIMCO Capital Solutions BDC Corp. |
| | | |
| | Vice President | | Since January 2024 | | Senior Vice President, PIMCO. Vice President, PIMCO-Managed Funds, PIMCO Flexible Real Estate Income Fund, PIMCO Funds, PIMCO Variable Insurance Trust, PIMCO ETF Trust and PIMCO Equity Series, PIMCO Equity Series VIT. |
| | | |
| | Vice President | | Since January 2024 | | Senior Vice President, PIMCO. Vice President, PIMCO-Managed Funds, PIMCO Flexible Real Estate Income Fund, PIMCO Funds, PIMCO Variable Insurance Trust, PIMCO ETF Trust, PIMCO Equity Series, PIMCO Equity Series VIT and PIMCO Capital Solutions BDC Corp. |
| | | |
| | Vice President | | Since 2023 | | Senior Vice President, PIMCO. Vice President, PIMCO-Managed Funds, PIMCO Funds, PIMCO Variable Insurance Trust, PIMCO ETF Trust, PIMCO Equity Series and PIMCO Equity Series VIT. |
| | | |
| | Vice President | | Since 2022 | | Senior Vice President, PIMCO. Vice President, PIMCO-Managed Funds, PIMCO Flexible Real Estate Income Fund, PIMCO Funds, PIMCO Variable Insurance Trust, PIMCO ETF Trust, PIMCO Equity Series, PIMCO Equity Series VIT and PIMCO Capital Solutions BDC Corp. |
| | | |
| | Vice President | | Since 2023 | | Senior Vice President, PIMCO. Vice President, PIMCO-Managed Funds, PIMCO Flexible Real Estate Income Fund, PIMCO Funds, PIMCO Variable Insurance Trust, PIMCO ETF Trust, PIMCO Equity Series and PIMCO Equity Series VIT. |
| | | | | | |
Name, Address and
Year of Birth | | Position(s) Held
with Funds | | Term of Office and
Length of Time Served | | Principal Occupation(s) During the Past 5 Years |
| | | |
| | Vice President | | Since January 2024 | | Senior Vice President, PIMCO. Vice President, PIMCO-Managed Funds, PIMCO Flexible Real Estate Income Fund, PIMCO Funds, PIMCO Variable Insurance Trust, PIMCO ETF Trust, PIMCO Equity Series and PIMCO Equity Series VIT. |
| | | |
| | Vice President | | Since January 2024 | | Executive Vice President, PIMCO. Vice President, PIMCO-Managed Funds, PIMCO Flexible Real Estate Income Fund, PIMCO Funds, PIMCO Variable Insurance Trust, PIMCO ETF Trust, PIMCO Equity Series and PIMCO Equity Series VIT. |
| | | |
| | Vice President | | Since 2022 | | Executive Vice President, PIMCO. Vice President, PIMCO-Managed Funds, PIMCO Flexible Real Estate Income Fund, PIMCO Funds, PIMCO Variable Insurance Trust, PIMCO ETF Trust, PIMCO Equity Series, PIMCO Equity Series VIT and PIMCO Capital Solutions BDC Corp. |
| | | |
| | Vice President | | Since January 2024 | | Vice President, PIMCO. Vice President, PIMCO-Managed Funds, PIMCO Flexible Real Estate Income Fund, PIMCO Funds, PIMCO Variable Insurance Trust, PIMCO ETF Trust, PIMCO Equity Series and PIMCO Equity Series VIT. |
| | | |
| | Treasurer | | Since 2021 | | Executive Vice President, PIMCO. Treasurer, PIMCO-Managed Funds, PIMCO Flexible Real Estate Income Fund, PIMCO Funds, PIMCO Variable Insurance Trust, PIMCO ETF Trust, PIMCO Equity Series and PIMCO Equity Series VIT. |
| | | |
| | Deputy Treasurer | | Since 2022 | | Senior Vice President, PIMCO. Deputy Treasurer, PIMCO-Managed Funds. Assistant Treasurer, PIMCO Flexible Real Estate Income Fund, PIMCO Funds, PIMCO Variable Insurance Trust, PIMCO ETF Trust, PIMCO Equity Series and PIMCO Equity Series VIT. |
| | | |
| | Assistant Treasurer | | Since 2015 | | Executive Vice President, PIMCO. Assistant Treasurer, PIMCO-Managed Funds, PIMCO Flexible Real Estate Income Fund, PIMCO Funds, PIMCO Variable Insurance Trust, PIMCO ETF Trust, PIMCO Equity Series, PIMCO Equity Series VIT and PIMCO Capital Solutions BDC Corp. |
| | | |
| | Assistant Treasurer | | Since January 2024 | | Vice President, PIMCO. Assistant Treasurer, PIMCO-Managed Funds, PIMCO Flexible Real Estate Income Fund, PIMCO Funds, PIMCO Variable Insurance Trust, PIMCO ETF Trust, PIMCO Equity Series and PIMCO Equity Series VIT. |
| | | |
| | Assistant Treasurer | | Since January 2024 | | Vice President, PIMCO. Assistant Treasurer, PIMCO-Managed Funds, PIMCO Flexible Real Estate Income Fund, PIMCO Funds, PIMCO Variable Insurance Trust, PIMCO ETF Trust, PIMCO Equity Series and PIMCO Equity Series VIT. |
| | | |
| | Assistant Treasurer | | Since January 2024 | | Vice President, PIMCO. Assistant Treasurer, PIMCO-Managed Funds, PIMCO Flexible Real Estate Income Fund, PIMCO Funds, PIMCO Variable Insurance Trust, PIMCO ETF Trust, PIMCO Equity Series and PIMCO Equity Series VIT. |
| | | |
| | Assistant Treasurer | | Since January 2024 | | Vice President, PIMCO. Assistant Treasurer, PIMCO-Managed Funds, PIMCO Flexible Real Estate Income Fund, PIMCO Funds, PIMCO Variable Insurance Trust, PIMCO ETF Trust, PIMCO Equity Series and PIMCO Equity Series VIT. |
| The address of these officers is Pacific Investment Management Company LLC, 650 Newport Center Drive, Newport Beach, California 92660. |
| The address of these officers is Pacific Investment Management Company LLC, 401 Congress Ave., Austin, Texas 78701. |
The Funds
2,3
consider customer privacy to be a fundamental aspect of their relationships with shareholders and are committed to maintaining the confidentiality, integrity and security of their current, prospective and former shareholders’
non-public
personal information. The Funds have developed policies that are designed to protect this confidentiality, while allowing shareholder needs to be served.
OBTAINING
NON-PUBLIC
PERSONAL INFORMATION
In the course of providing shareholders with products and services, the Funds and certain service providers to the Funds, such as the Funds’ investment advisers or
sub-advisers
(“Advisers”), may obtain
non-public
personal information about shareholders, which may come from sources such as account applications and other forms, from other written, electronic or verbal correspondence, from shareholder transactions, from a shareholder’s brokerage or financial advisory firm, financial professional or consultant, and/or from information captured on applicable websites.
As a matter of policy, the Funds do not disclose any
non-public
personal information provided by shareholders or gathered by the Funds to
non-affiliated
third parties, except as required or permitted by law or as necessary for such third parties to perform their agreements with respect to the Funds. As is common in the industry,
non-affiliated
companies may from time to time be used to provide certain services, such as preparing and mailing prospectuses, reports, account statements and other information, conducting research on shareholder satisfaction and gathering shareholder proxies. The Funds or their affiliates may also retain
non-affiliated
companies to market Fund shares or products which use Fund shares and enter into joint marketing arrangements with them and other companies. These companies may have access to a shareholder’s personal and account information, but are permitted to use this information solely to provide the specific service or as otherwise permitted by law. In most cases, the shareholders will be clients of a third party, but the Funds may also provide a shareholder’s personal and account information to the shareholder’s respective brokerage or financial advisory firm and/or financial professional or consultant.
SHARING INFORMATION WITH THIRD PARTIES
The Funds reserve the right to disclose or report personal or account information to
non-affiliated
third parties in limited circumstances where the Funds believe in good faith that disclosure is required under law, to cooperate with regulators or law enforcement authorities, to protect their rights or property, or upon reasonable request by any Fund in which a shareholder has invested. In addition, the Funds may disclose information about a shareholder or a shareholder’s accounts to a
non-affiliated
third party at the shareholder’s request or with the consent of the shareholder.
SHARING INFORMATION WITH AFFILIATES
The Funds may share shareholder information with their affiliates in connection with servicing shareholders’ accounts, and subject to applicable law may provide shareholders with information about products and services that the Funds or their Advisers, distributors or their affiliates (“Service Affiliates”) believe may be of interest to such shareholders. The information that the Funds may share may include, for example, a shareholder’s participation in the Funds or in other investment programs sponsored by a Service Affiliate, a shareholder’s ownership of certain types of accounts (such as IRAs), information about the Funds’ experiences or transactions with a shareholder, information captured on applicable websites, or other data about a shareholder’s accounts, subject to applicable law. The Funds’ Service Affiliates, in turn, are not permitted to share shareholder information with
non-affiliated
entities, except as required or permitted by law.
PROCEDURES TO SAFEGUARD PRIVATE INFORMATION
The Funds take seriously the obligation to safeguard shareholder
non-public
personal information. In addition to this policy, the Funds have implemented procedures that are designed to restrict access to a shareholder’s
non-public
personal information to internal personnel who need to know that information to perform their jobs, such as servicing shareholder accounts or notifying shareholders of new products or services. Physical, electronic and procedural safeguards are in place to guard a shareholder’s
non-public
personal information.
INFORMATION COLLECTED FROM WEBSITES
The Funds or their service providers and partners may collect information from shareholders via websites they maintain. The information collected via websites maintained by the Funds or their service providers includes client
non-public
personal information.
CHANGES TO THE PRIVACY POLICY
From time to time, the Funds may update or revise this privacy policy. If there are changes to the terms of this privacy policy, documents containing the revised policy on the relevant website will be updated.
1
When distributing this Policy, a Fund may combine the distribution with any similar distribution of its investment adviser’s privacy policy. The distributed, combined, policy may be written in the first person (i.e. by using “we” instead of “the Funds”).
2
The listed entities which are open-end investment companies are known as the “Trusts,” the listed entities which are publicly-traded closed-end investment companies are known as the “Closed-End Funds,” the listed entities which are closed-end investment companies operating as “interval” funds pursuant to Rule 23c-3 under the 1940 Act are known as the “Interval Funds”, and the listed entities which are business development companies are known as the “BDCs.” The Trusts’ respective series, the Closed-End Funds, the Interval Funds and the BDC are referred to herein as the “Funds.” References to “Trustees” include Directors, as applicable.
3
PIMCO Investments LLC (“PI”) serves as the Funds’ distributor and does not provide brokerage services or any financial advice to investors in the Funds solely because it distributes the Funds. This Privacy Policy applies to the activities of PI to the extent that PI regularly effects or engages in transactions with or for a shareholder of a series of a Trust who is the record owner of such shares. For purposes of this Privacy Policy, references to “the Funds” shall include PI when acting in this capacity.
Pacific Investment Management Company LLC
650 Newport Center Drive,
State Street Bank and Trust Company
1100 Main Street, Suite 400
Transfer Agent, Dividend Paying Agent and Registrar for Common Shares
Equiniti Trust Company, LLC (“EQ”)
Auction Agent, Transfer Agent, Dividend Paying Agent and Registrar for Auction Rate Preferred Shares
Deutsche Bank Trust Company Americas
60 Wall Street, 16th Floor
Transfer Agent, Dividend Paying Agent and Registrar for Variable Rate MuniFund Term Preferred Shares
The Bank of New York Mellon
Independent Registered Public Accounting Firm
PricewaterhouseCoopers LLP
1100 Walnut Street, Suite 1300
This report is submitted for the general information of the shareholders of the Funds listed on the Report cover.
CEF3012AR_123123
As of the end of the period covered by this report, the Registrant has adopted a code of ethics (the “Code”) that applies to the Registrant’s principal executive officer and principal financial officer. The Registrant did not grant any waivers, including implicit waivers, from any provisions of the Code to the principal executive officer or principal financial officer during the period covered by this report.
A copy of the Code is included as an exhibit to this report.
| Item 3. | Audit Committee Financial Expert. |
The Board of Trustees has determined that Joseph B. Kittredge, Jr., who serves on the Board’s Audit Oversight Committee, qualifies as an “audit committee financial expert” as such term is defined in the instructions to this Item 3. The Board has also determined that Mr. Kittredge is “independent” as such term is interpreted under this Item 3.
| Item 4. | Principal Accountant Fees and Services. |
| | | | | | |
| (a) | | Fiscal Year Ended | | Audit Fees | | |
| | December 31, 2023 | | $ 56,772 |
| | December 31, 2022 | | $ 56,772 |
(b) | | Fiscal Year Ended | | Audit-Related Fees |
| | December 31, 2023 | | $ 11,528 |
| | December 31, 2022 | | $ 11,083 |
(c) | | Fiscal Year Ended | | Tax Fees (1) |
| | December 31, 2023 | | $ — |
| | December 31, 2022 | | $ — |
(d) | | Fiscal Year Ended | | All Other Fees (2) |
| | December 31, 2023 | | $ — |
| | December 31, 2022 | | $ — |
“Audit Fees” represents fees billed for each of the last two fiscal years for professional services rendered for the audit and review of the Registrant’s annual financial statements for those fiscal years or services that are normally provided by the accountant in connection with statutory or regulatory filings or engagements for those fiscal years.
“Audit-Related Fees” represents fees billed for each of the last two fiscal years for assurance and related services that are reasonably related to the performance of the audit or review of the Registrant’s financial statements, but not reported under “Audit Fees” above, and that include accounting consultations, agreed-upon procedure reports (inclusive of annual review of basic maintenance testing associated with the Preferred Shares), attestation reports and comfort letters for those fiscal years.
“Tax Fees” represents fees billed for each of the last two fiscal years for professional services related to tax compliance, tax advice and tax planning, including services relating to the filing or amendment of federal, state or local income tax returns, regulated investment company qualification reviews, and tax distribution and analysis reviews.
“All Other Fees” represents fees, if any, billed for other products and services rendered by the principal accountant to the Registrant other than those reported above under “Audit Fees,” “Audit-Related Fees” and “Tax Fees” for the last two fiscal years.
(1) There were no “Tax Fees” for the last two fiscal years.
(2) There were no “All Other Fees” for the last two fiscal years.
| | (e) | Pre-approval policies and procedures |
(1) The Registrant’s Audit Oversight Committee has adopted pre-approval policies and procedures (the “Procedures”) to govern the Audit Oversight Committee’s pre-approval of (i) all audit services and permissible non-audit services to be provided to the Registrant by its independent accountant, and (ii) all permissible non-audit services to be provided by such independent accountant to the Registrant’s investment adviser and to any entity controlling, controlled by, or under common control with the investment adviser that provides ongoing services to the Registrant (collectively, the “Service Affiliates”) if the services provided directly relate to the Registrant’s operations and financial reporting. In accordance with the Procedures, the Audit Oversight Committee is responsible for the engagement of the independent accountant to certify the Registrant’s financial statements for each fiscal year. With respect to the pre-approval of non-audit services provided to the Registrant and its Service Affiliates, the Procedures provide that the Audit Oversight Committee may annually pre-approve a list of types or categories of non-audit services that may be provided to the Registrant or its Service Affiliates, or the Audit Oversight Committee may pre-approve such services on a project-by-project basis as they arise. Unless a type of service has received general pre-approval, it will require specific pre-approval by the Audit Oversight Committee if it is to be provided by the independent accountant. The Procedures also permit the Audit Oversight Committee to delegate authority to one or more of its members to pre-approve any proposed non-audit services that have not been previously pre-approved by the Audit Oversight Committee, subject to the ratification by the full Audit Oversight Committee no later than its next scheduled meeting.
(2) With respect to the services described in paragraphs (b) through (d) of this Item 4, no amount was approved by the Audit Oversight Committee pursuant to paragraph (c)(7)(i)(C) of Rule 2-01 of Regulation S-X.
(g)
| | | | | | | | |
| | | Aggregate Non-Audit Fees Billed to Entity | |
Entity | | | December 31, 2023 | | | | December 31, 2022 | |
| | | | | |
PIMCO California Municipal Income Fund II | | $ | 11,528 | | | $ | 11,083 | |
Pacific Investment Management Company LLC (“PIMCO”) | | | 28,843,819 | | | | 16,740,682 | |
| | | | |
Totals | | $ | 28,855,347 | | | $ | 16,751,765 | |
| | | | | | | | |
| | (h) | The Registrant’s Audit Oversight Committee has considered whether the provision of non-audit services that were rendered to the Registrant’s investment adviser, and any entity controlling, controlled by, or under common control with the investment adviser that provides ongoing services to the Registrant which were not pre-approved (not requiring pre-approval) is compatible with maintaining the principal accountant’s independence. |
| Item 5. | Audit Committee of Listed Registrants. |
The Registrant has a separately-designated standing audit committee (known as the Audit Oversight Committee) established in accordance with Section 3(a)(58)(A) of the Securities Exchange Act of 1934, as amended. The Audit Oversight Committee is comprised of:
Sarah E. Cogan
Deborah A. DeCotis
Joseph B. Kittredge, Jr.
Kathleen A. McCartney
Alan Rappaport
E. Grace Vandecruze
| Item 6. | Schedule of Investments. |
The information required by this Item 6 is included as part of the annual report to shareholders filed under Item 1 of this Form N-CSR.
| Item 7. | Disclosure of Proxy Voting Policies and Procedures for Closed-End Management Investment Companies. |
Policy Statement: The proxy voting policy is intended to foster PIMCO’s compliance with its fiduciary obligations and applicable law; the policy applies to any voting or consent rights with respect to securities held in accounts over which PIMCO has discretionary voting authority. The Policy is designed in a manner reasonably expected to ensure that voting and consent rights are exercised in the best interests of PIMCO’s clients.
Overview: PIMCO has adopted a written proxy voting1 policy (“Proxy Policy”) as required by Rule 206(4)-6 under the Advisers Act. As a general matter, when PIMCO has proxy voting authority, PIMCO has a fiduciary obligation to monitor corporate events and to take appropriate action on client proxies that come to its attention. Each proxy is voted on a case-by-case basis, taking into account relevant facts and circumstances. When considering client proxies, PIMCO may determine not to vote a proxy in limited circumstances.
Equity Securities.2 PIMCO has retained an Industry Service Provider (“ISP”) to provide research and voting recommendations for proxies relating to equity securities in accordance with the ISP’s guidelines. By following the guidelines of an independent third party, PIMCO seeks to mitigate potential conflicts of interest PIMCO may have with respect to proxies covered by the ISP. PIMCO will follow the recommendations of the ISP unless: (i) the ISP does not provide a voting recommendation; or (ii) a portfolio manager decides to override the ISP’s voting recommendation. In either such case as described above, the Legal and Compliance department will review the proxy to determine whether a material conflict of interest, or the appearance of one, exists.
Fixed-Income Securities. Fixed income securities can be processed as proxy ballots or corporate action-consents3 at the discretion of the issuer/ custodian. When processed as proxy ballots, the ISP generally does not provide a voting recommendation and their role is limited to election processing and recordkeeping. When processed as corporate action-consents, the Legal and Compliance department will review all election forms to determine whether a conflict of interest, or the appearance of one, exists with respect to the PM’s consent election. PIMCO’s Credit Research and Portfolio Management Groups are responsible for issuing recommendations on how to vote proxy ballots and corporation action-consents with respect to fixed income securities.
Resolution of Potential Conflicts of Interest. The Proxy Policy permits PIMCO to seek to resolve material conflicts of interest by pursuing any one of several courses of action. With respect to material conflicts of interest between PIMCO and a client account, the Proxy Policy permits PIMCO to either: (i) convene a working group to assess and resolve the conflict (the “Proxy Working Group”); or (ii) vote in accordance with protocols previously established by the Proxy Policy, the Proxy Working Group and/or other relevant procedures approved by PIMCO’s Legal and Compliance department with respect to specific types of conflicts.
PIMCO will supervise and periodically review its proxy voting activities and the implementation of the Proxy Policy.
Sub-Adviser Engagement: As an investment manager, PIMCO may exercise its discretion to engage a Sub-Adviser to provide portfolio management services to the Fund. Consistent with its management responsibilities, the Sub-Adviser would assume the authority for voting proxies on behalf of PIMCO for the Fund. Sub-Advisers may utilize third parties to perform certain services related to their portfolio management responsibilities. As a fiduciary, PIMCO will maintain oversight of the investment management responsibilities (which may include proxy voting) performed by the Sub-Adviser and contracted third parties.
1 Proxies generally describe corporate action consent rights (relative to fixed income securities) and proxy voting ballots (relative to fixed income or equity securities) as determined by the issuer or custodian.
2 The term “Equity Securities” means common and preferred stock, including common and preferred shares issued by investment companies; it does not include debt securities convertible into equity securities.
3 Voting or consent rights shall not include matters which are primarily decisions to buy or sell investments, such as tender offers, exchange offers, conversions, put options, redemptions, and Dutch auctions.
| Item 8. | Portfolio Managers of Closed-End Management Investment Companies. |
(a)(1)
As of March 4, 2024, the following individuals have primary responsibility for the day-to-day management of PIMCO California Municipal Income Fund II (the “Fund”):
David Hammer
Mr. Hammer has been a portfolio manager of the Fund since August 2015. Mr. Hammer is a Managing Director and municipal bond portfolio manager in the Newport Beach office. He rejoined PIMCO in 2015 from Morgan Stanley, where he was managing director and head of municipal trading, risk management and research. Previously at PIMCO, he was a senior vice president and municipal bond portfolio manager, and prior to joining PIMCO in 2012, he was an executive director and head of the high yield and distressed municipal bond trading group at Morgan Stanley.
Kyle Christine
Mr. Christine has been a portfolio manager of the Fund since June 2023. Mr. Christine is a senior vice president and municipal bond portfolio manager in the Newport Beach office. He has previously served as a rotating member of PIMCO’s Americas portfolio committee. Prior to joining PIMCO in 2017, he was an institutional high yield and taxable municipal bond trader at Morgan Stanley. He has 11 years of investment and financial services experience and holds an undergraduate degree from Union College (NY).
(a)(2)
The following summarizes information regarding each of the accounts, excluding the Fund, managed by the Portfolio Managers as of December 31, 2023, including accounts managed by a team, committee, or other group that includes the Portfolio Managers. Unless mentioned otherwise, the advisory fee charged for managing each of the accounts listed below is not based on performance.
| | | | | | | | | | | | | | |
| | | Registered Investment
Companies | | Other Pooled Investment
Vehicles | | Other Accounts | | |
Portfolio Manager | | # | | AUM($million) | | # | | AUM($million) | | # | | AUM($million) |
David Hammer | | 28 | | $15,901.87 | | 111 | | $30,894.00 | | 184 | | $15,359.72 |
Kyle Christine | | 22 | | $13,535.88 | | 0 | | $0.00 | | 4 | | $57,399.96 |
1 Of these Other Pooled Investment Vehicles, 1 account(s) totaling $201.60 million in assets pay(s) an advisory fee that is based in part on the performance of the accounts.
From time to time, potential and actual conflicts of interest may arise between a portfolio manager’s management of the investments of the Fund, on the one hand, and the management of other accounts, on the other. Potential and actual conflicts of interest may also arise as a result of PIMCO’s other business activities and PIMCO’s possession of material non-public information (“MNPI”) about an issuer. Other accounts managed by a portfolio manager might have similar investment objectives or strategies as the Fund, track the same index the Fund tracks or otherwise hold, purchase, or sell securities that are eligible to be held, purchased or sold by the Fund. The other accounts might also have different investment objectives or strategies than the Fund. Investors should be aware that investments made by the Fund and the results achieved by the Fund at any given time are not expected to be the same as those made by other funds for which PIMCO acts as investment adviser, including funds with names, investment objectives and policies, and/or portfolio management teams, similar to the Fund. This may be attributable to a wide variety of factors, including, but not limited to, the use of a different strategy or portfolio management team, when a particular fund commenced operations or the size of a particular fund, in each case as compared to other similar funds. Potential and actual conflicts of interest may also arise as a result of PIMCO serving as investment adviser to accounts that invest in the Fund or to accounts in which the Fund
invests. In this case, such conflicts of interest could in theory give rise to incentives for PIMCO to, among other things, vote proxies, purchase or redeem shares of the underlying account, or take other actions with respect to the underlying account, in a manner beneficial to the investing account and/or PIMCO but detrimental to the underlying account. Such conflicts of interest could similarly in theory give rise to incentives for PIMCO to, among other things, vote proxies or purchase or redeem shares of the underlying account, or take other actions with respect to the underlying account, in a manner beneficial to the underlying account and/or PIMCO and that may or may not be detrimental to the investing account. For example, even if there is a fee waiver or reimbursement in place relating to the Fund’s investment in an underlying account, or relating to an investing account’s investment in the Fund, this will not necessarily eliminate all conflicts of interest, as PIMCO could nevertheless have a financial incentive to favor investments in PIMCO-affiliated funds and managers (for example, to increase the assets under management of PIMCO or a fund, product or line of business, or otherwise provide support to, certain funds, products or lines of business), which could also impact the manner in which certain transaction fees are set. Conversely, PIMCO’s duties to the Fund, as well as regulatory or other limitations applicable to the Fund, may affect the courses of action available to PIMCO-advised accounts (including the Fund) that invest in the Fund in a manner that is detrimental to such investing accounts. In addition, regulatory restrictions, actual or potential conflicts of interest or other considerations may cause PIMCO to restrict or prohibit participation in certain investments.
Because PIMCO is affiliated with Allianz SE, a large multi-national financial institution (together with its affiliates, “Allianz”), conflicts similar to those described below may occur between the Fund or other accounts managed by PIMCO and PIMCO’s affiliates or accounts managed by those affiliates. Those affiliates (or their clients), which generally operate autonomously from PIMCO, may take actions that are adverse to the Fund or other accounts managed by PIMCO. In many cases, PIMCO will not be in a position to mitigate those actions or address those conflicts, which could adversely affect the performance of the Fund or other accounts managed by PIMCO (each, a “Client,” and collectively, the “Clients”). In addition, because certain Clients are affiliates of PIMCO or have investors who are affiliates or employees of PIMCO, PIMCO may have incentives to resolve conflicts of interest in favor of these Clients over other Clients.
Knowledge and Timing of Fund Trades. A potential conflict of interest may arise as a result of a portfolio manager’s day-to-day management of the Fund. Because of their positions with the Fund, the portfolio managers know the size, timing and possible market impact of the Fund’s trades. It is theoretically possible that the portfolio managers could use this information to the advantage of other accounts they manage and to the possible detriment of the Fund.
Cross Trades. A potential conflict of interest may arise in instances where the Fund buys an instrument from a Client or sells an instrument to a Client (each, a “cross trade”). Such conflicts of interest may arise, among other reasons, as a result of PIMCO representing the interests of both the buying party and the selling party in the cross trade or because the price at which the instrument is bought or sold through a cross trade may not be as favorable as the price that might have been obtained had the trade been executed in the open market. PIMCO effects cross trades when appropriate pursuant to procedures adopted under applicable rules and SEC guidance. Among other things, such procedures require that the cross trade is consistent with the respective investment policies and investment restrictions of both parties and is in the best interests of both the buying and selling accounts.
Investment Opportunities. A potential conflict of interest may arise as a result of a portfolio manager’s management of a number of accounts with varying investment guidelines. Often, an investment opportunity may be suitable for one or more Clients, but may not be available in sufficient quantities for all accounts to participate fully. In addition, regulatory issues applicable to PIMCO or the Fund or other accounts may result in the Fund not receiving securities that may otherwise be appropriate for them. Similarly, there may be limited opportunity to sell an investment held by the Fund and another Client. In addition, regulatory issues applicable to PIMCO or the Fund or other accounts may result in the Fund not receiving securities that may otherwise be appropriate for it. Similarly, there may be limited opportunity to sell an investment held by the Fund and another Client. PIMCO has adopted policies and procedures reasonably designed to allocate investment opportunities on a fair and equitable basis over time. In addition, regulatory issues applicable to PIMCO or one or more Clients may result in certain Clients not receiving securities that may otherwise be appropriate for them.
PIMCO seeks to allocate orders across eligible Client accounts with similar investment guidelines and investment styles fairly and equitably, taking into consideration relevant factors including, among others, applicable investment restrictions and guidelines, including regulatory restrictions; Client account-specific investment objectives, restrictions and other Client instructions, as applicable; risk tolerances; amounts of available cash; the need to rebalance a Client account’s portfolio (e.g., due to investor contributions and redemptions); whether the allocation would result in a Client account receiving a trivial amount or an amount below the established minimum quantity; regulatory requirements; the origin of
the investment; the bases for an issuer’s allocation to PIMCO; and other Client account-specific factors. As part of PIMCO’s trade allocation process, portions of new fixed income investment opportunities are distributed among Client account categories where the relevant portfolio managers seek to participate in the investment. Those portions are then further allocated among the Client accounts within such categories pursuant to PIMCO’s trade allocation policy. Portfolio managers managing quantitative strategies and specialized accounts, such as those focused on international securities, mortgage-backed securities, bank loans, or other specialized asset classes, will likely receive an increased distribution of new fixed income investment opportunities where the investment involves a quantitative strategy or specialized asset class that matches the investment objective or focus of the Client account category. PIMCO seeks to allocate fixed income investments to Client accounts with the general purpose of maintaining consistent concentrations across similar accounts and achieving, as nearly as possible, portfolio characteristic parity among such accounts. Client accounts furthest from achieving portfolio characteristic parity typically receive priority in allocations. With respect to an order to buy or sell an equity security in the secondary market, PIMCO seeks to allocate the order across Client accounts with similar investment guidelines and investment styles fairly and equitably over time, taking into consideration the relevant factors discussed above.
Any particular allocation decision among Client accounts may be more or less advantageous to any one Client or group of Clients, and certain allocations will, to the extent consistent with PIMCO’s fiduciary obligations, deviate from a pro rata basis among Clients in order to address for example, differences in legal, tax, regulatory, risk management, concentration, exposure, Client guideline limitations and/or mandate or strategy considerations for the relevant Clients. PIMCO may determine that an investment opportunity or particular purchases or sales are appropriate for one or more Clients, but not appropriate for other Clients, or are appropriate or suitable for, or available to, Clients but in different sizes, terms, or timing than is appropriate or suitable for other Clients. For example, some Clients have higher risk tolerances than other Clients, such as private funds, which, in turn, allows PIMCO to allocate a wider variety and/or greater percentage of certain types of investments (which may or may not outperform other types of investments) to such Clients. Further, the respective risk tolerances of different types of Clients may change over time as market conditions change. Those Clients receiving an increased allocation as a result of the effect of their respective risk tolerance may be Clients that pay higher investment management fees or that pay incentive fees. In addition, certain Client account categories focusing on certain types of investments or asset classes will be given priority in new issue distribution and allocation with respect to the investments or asset classes that are the focus of their investment mandate. PIMCO may also take into account the bases for an issuer’s allocation to PIMCO, for example, by giving priority allocations to Client accounts holding existing positions in the issuer’s debt if the issuer’s allocation to PIMCO is based on such holdings. PIMCO also may determine not to allocate to or purchase or sell for certain Clients all investments for which all Clients may be eligible. Legal, contractual, or regulatory issues and/or related expenses applicable to PIMCO or one or more Clients may result in certain Clients not receiving securities that may otherwise be appropriate for them or may result in PIMCO selling securities out of Client accounts even if it might otherwise be beneficial to continue to hold them. Additional factors that are taken into account in the distribution and allocation of investment opportunities to Client accounts include, without limitation: ability to utilize leverage and risk tolerance of the Client account; the amount of discretion and trade authority given to PIMCO by the Client; availability of other similar investment opportunities; the Client account’s investment horizon and objectives; hedging, cash and liquidity needs of the portfolio; minimum increments and lot sizes; and underlying benchmark factors. Given all of the foregoing factors, the amount, timing, structuring, or terms of an investment by a Client, including the Fund, may differ from, and performance may be lower than, investments and performance of other Clients, including those that may provide greater fees or other compensation (including performance-based fees or allocations) to PIMCO. PIMCO has also adopted additional procedures to complement the general trade allocation policy that are designed to address potential conflicts of interest due to the side-by-side management of the Fund and certain pooled investment vehicles, including investment opportunity allocation issues.
From time to time, PIMCO may take an investment position or action for one or more Clients that may be different from, or inconsistent with, an action or position taken for one or more other Clients having similar or differing investment objectives. These positions and actions may adversely impact, or in some instances may benefit, one or more affected Clients (including Clients that are PIMCO affiliates) in which PIMCO has an interest, or which pays PIMCO higher fees or a performance fee. For example, a Client may buy a security and another Client may establish a short position in that same security. The subsequent short sale may result in a decrease in the price of the security that the other Client holds. Similarly, transactions or investments by one or more Clients may have the effect of diluting or otherwise disadvantaging the values, prices or investment strategies of another Client.
When PIMCO implements for one Client a portfolio decision or strategy ahead of, or contemporaneously with, similar portfolio decisions or strategies of another Client, market impact, liquidity constraints or other factors could result in one
or more Clients receiving less favorable trading results, the costs of implementing such portfolio decisions or strategies could be increased or such Clients could otherwise be disadvantaged. On the other hand, potential conflicts may also arise because portfolio decisions regarding a Client may benefit other Clients. For example, the sale of a long position or establishment of a short position for a Client may decrease the price of the same security sold short by (and therefore benefit) other Clients, and the purchase of a security or covering of a short position in a security for a Client may increase the price of the same security held by (and therefore benefit) other Clients.
Under certain circumstances, a Client may invest in a transaction in which one or more other Clients are expected to participate, or already have made or will seek to make, an investment. In addition, to the extent permitted by applicable law, a Client may also engage in investment transactions that may result in other Clients being relieved of obligations, or that may cause other Clients to divest certain investments (e.g., a Client may make a loan to, or directly or indirectly acquire securities or indebtedness of, a company that uses the proceeds to refinance or reorganize its capital structure, which could result in repayment of debt held by another Client). Such Clients (or groups of Clients) may have conflicting interests and objectives in connection with such investments, including with respect to views on the operations or activities of the issuer involved, the targeted returns from the investment and the timeframe for, and method of, exiting the investment. When making such investments, PIMCO may do so in a way that favors one Client over another Client, even if both Clients are investing in the same security at the same time. Certain Clients may invest on a “parallel” basis (i.e., proportionately in all transactions at substantially the same time and on substantially the same terms and conditions). In addition, other accounts may expect to invest in many of the same types of investments as another account. However, there may be investments in which one or more of such accounts does not invest (or invests on different terms or on a non-pro rata basis) due to factors such as legal, tax, regulatory, business, contractual or other similar considerations or due to the provisions of a Client’s governing documents. Decisions as to the allocation of investment opportunities among such Clients present numerous conflicts of interest, which may not be resolved in a manner that is favorable to a Client’s interests. To the extent an investment is not allocated pro rata among such entities, a Client could incur a disproportionate amount of income or loss related to such investment relative to such other Client.
In addition, Clients may invest alongside one another in the same underlying investments or otherwise pursuant to a substantially similar investment strategy as one or more other Clients. In such cases, certain Clients may have preferential liquidity and information rights relative to other Clients holding the same investments, with the result that such Clients will be able to withdraw/redeem their interests in underlying investments in priority to Clients who may have more limited access to information or more restrictive withdrawal/redemption rights. Clients with more limited information rights or more restrictive liquidity may therefore be adversely affected in the event of a downturn in the markets.
Further, potential conflicts may be inherent in PIMCO’s use of multiple strategies. For example, conflicts will arise in cases where different Clients invest in different parts of an issuer’s capital structure, including circumstances in which one or more Clients may own private securities or obligations of an issuer and other Clients may own or seek to acquire private securities of the same issuer. For example, a Client may acquire a loan, loan participation or a loan assignment of a particular borrower in which one or more other Clients have an equity investment, or may invest in senior debt obligations of an issuer for one Client and junior debt obligations or equity of the same issuer for another Client.
PIMCO may also, for example, direct a Client to invest in a tranche of a structured finance vehicle, such as a CLO or CDO, where PIMCO is also, at the same or different time, directing another Client to make investments in a different tranche of the same vehicle, which tranche’s interests may be adverse to other tranches. PIMCO may also cause a Client to purchase from, or sell assets to, an entity, such as a structured finance vehicle, in which other Clients may have an interest, potentially in a manner that will have an adverse effect on the other Clients. There may also be conflicts where, for example, a Client holds certain debt or equity securities of an issuer, and that same issuer has issued other debt, equity or other instruments that are owned by other Clients or by an entity, such as a structured finance vehicle, in which other Clients have an interest.
In each of the situations described above, PIMCO may take actions with respect to the assets held by one Client that are adverse to the other Clients, for example, by foreclosing on loans, by putting an issuer into default, or by exercising rights to purchase or sell to an issuer, causing an issuer to take actions adverse to certain classes of securities, or otherwise. In negotiating the terms and conditions of any such investments, or any subsequent amendments or waivers or taking any other actions, PIMCO may find that the interests of a Client and the interests of one or more other Clients could conflict. In these situations, decisions over items such as whether to make the investment or take an action, proxy voting, corporate reorganization, how to exit an investment, or bankruptcy or similar matters (including, for example, whether to trigger an event of default or the terms of any workout) may result in conflicts of interest. Similarly, if an issuer in which a Client and one or more other Clients directly or indirectly hold different classes of securities (or other assets, instruments or
obligations issued by such issuer or underlying investments of such issuer) encounters financial problems, decisions over the terms of any workout will raise conflicts of interests (including, for example, conflicts over proposed waivers and amendments to debt covenants). For example, a debt holder may be better served by a liquidation of the issuer in which it may be paid in full, whereas an equity or junior bond holder might prefer a reorganization that holds the potential to create value for the equity holders. In some cases PIMCO may refrain from taking certain actions or making certain investments on behalf of Clients in order to avoid or mitigate certain conflicts of interest or to prevent adverse regulatory or other effects on PIMCO, or may sell investments for certain Clients (in each case potentially disadvantaging the Clients on whose behalf the actions are not taken, investments not made, or investments sold). In other cases, PIMCO may not refrain from taking actions or making investments on behalf of certain Clients that have the potential to disadvantage other Clients. In addition, PIMCO may take actions or refrain from taking actions in order to mitigate legal risks to PIMCO or its affiliates or its Clients even if disadvantageous to a Client’s account. Moreover, a Client may invest in a transaction in which one or more other Clients are expected to participate, or already have made or will seek to make, an investment.
Additionally, certain conflicts may exist with respect to portfolio managers who make investment decisions on behalf of several different types of Clients. Such portfolio managers may have an incentive to allocate trades, time or resources to certain Clients, including those Clients who pay higher investment management fees or that pay incentive fees or allocations, over other Clients. These conflicts may be heightened with respect to portfolio managers who are eligible to receive a performance allocation under certain circumstances as part of their compensation.
From time to time, PIMCO personnel may come into possession of MNPI which, if disclosed, might affect an investor’s decision to buy, sell or hold a security. Should a PIMCO employee come into possession of MNPI with respect to an issuer, he or she generally will be prohibited from communicating such information to, or using such information for the benefit of, Clients, which could limit the ability of Clients to buy, sell or hold certain investments, thereby limiting the investment opportunities or exit strategies available to Clients. In addition, holdings in the securities or other instruments of an issuer by PIMCO or its affiliates may affect the ability of a Client to make certain acquisitions of or enter into certain transactions with such issuer. PIMCO has no obligation or responsibility to disclose such information to, or use such information for the benefit of, any person (including Clients).
PIMCO maintains one or more restricted lists of companies whose securities are subject to certain trading prohibitions due to PIMCO’s business activities. PIMCO may restrict trading in an issuer’s securities if the issuer is on a restricted list or if PIMCO has MNPI about that issuer. In some situations, PIMCO may restrict Clients from trading in a particular issuer’s securities in order to allow PIMCO to receive MNPI on behalf of other Clients. A Client may be unable to buy or sell certain securities until the restriction is lifted, which could disadvantage the Client. PIMCO may also be restricted from making (or divesting of) investments in respect of some Clients but not others. In some cases PIMCO may not initiate or recommend certain types of transactions, or may otherwise restrict or limit its advice relating to certain securities if a security is restricted due to MNPI or if PIMCO is seeking to limit receipt of MNPI.
PIMCO may conduct litigation or engage in other legal actions on behalf of one or more Clients. In such cases, Clients may be required to bear certain fees, costs, expenses and liabilities associated with the litigation. Other Clients that are or were investors in, or otherwise involved with, the subject investments may or may not (depending on the circumstances) be parties to such litigation actions, with the result that certain Clients may participate in litigation actions in which not all Clients with similar investments may participate, and such non-participating Clients may benefit from the results of such litigation actions without bearing or otherwise being subject to the associated fees, costs, expenses and liabilities. PIMCO, for example, typically does not pursue legal claims on behalf of its separate accounts. Furthermore, in certain situations, litigation or other legal actions pursued by PIMCO on behalf of a Client may be brought against or be otherwise adverse to a portfolio company or other investment held by a Client.
Co-Investments. The 1940 Act imposes significant limits on co-investment with affiliates of the Fund. The Fund has received exemptive relief from the SEC that, to the extent the Fund relies on such relief, permits it to (among other things) co-invest with certain other persons, including certain affiliates of the Investment Manager and certain public or private funds managed by the Investment Manager and its affiliates, subject to certain terms and conditions. Co-investment transactions may give rise to conflicts of interest or perceived conflicts of interest among the Fund and its affiliates. The exemptive relief from the SEC with respect to co-investments imposes extensive conditions on any co-investments made in reliance on such relief that may limit or restrict the Fund’s ability to participate in an investment or participate in an investment to a lesser extent. An inability to receive the desired allocation to potential investments may affect the Fund’s ability to achieve the desired investment returns. In the event investment opportunities are allocated among the Fund and its affiliates pursuant to co-investment exemptive relief, the Fund may not be able to structure its investment portfolio in the manner desired. Although PIMCO will endeavor to allocate investment opportunities in a fair and equitable manner,
the Fund will generally not be permitted to co-invest in any issuer in which a fund managed by PIMCO or any of its downstream affiliates (other than the Fund and its downstream affiliates) currently has an investment. However, the Fund would be able to co-invest with funds managed by PIMCO or any of its downstream affiliates, subject to compliance with existing regulatory guidance, applicable regulations and its allocation procedures. Pursuant to co-investment exemptive relief, the Fund will be able to invest in opportunities in which PIMCO and/or its affiliates has an investment, and PIMCO and/or its affiliates will be able to invest in opportunities in which the Fund has made an investment. From time to time, the Fund and its affiliates may make investments at different levels of an issuer’s capital structure or otherwise in different classes of an issuer’s securities. Such investments inherently give rise to conflicts of interest or perceived conflicts of interest between or among the various classes of securities that may be held by such entities. PIMCO has adopted procedures governing the co-investment in securities acquired in private placements with certain clients of PIMCO.
The foregoing is not a complete list of conflicts to which PIMCO or Clients may be subject. PIMCO seeks to review conflicts on a case-by-case basis as they arise. Any review will take into consideration the interests of the relevant Clients, the circumstances giving rise to the conflict, applicable PIMCO policies and procedures, and applicable laws. Clients (and investors in the Fund) should be aware that conflicts will not necessarily be resolved in favor of their interests and may in fact be resolved in a manner adverse to their interests. PIMCO will attempt to resolve such matters fairly, but even so, matters may be resolved in favor of other Clients which pay PIMCO higher fees or performance fees or in which PIMCO or its affiliates have a significant proprietary interest. There can be no assurance that any actual or potential conflicts of interest will not result in a particular Client or group of Clients receiving less favorable investment terms in or returns from certain investments than if such conflicts of interest did not exist.
Conflicts like those described above may also occur between Clients, on the one hand, and PIMCO or its affiliates, on the other. These conflicts will not always be resolved in favor of the Client. In addition, because PIMCO is affiliated with Allianz, a large multi-national financial institution, conflicts similar to those described above may occur between clients of PIMCO and PIMCO’s affiliates or accounts managed by those affiliates. Those affiliates (or their clients), which generally operate autonomously from PIMCO, may take actions that are adverse to PIMCO’s Clients. In many cases, PIMCO will have limited or no ability to mitigate those actions or address those conflicts, which could adversely affect Client performance. In addition, certain regulatory or internal restrictions may prohibit PIMCO from using certain brokers or investing in certain companies (even if such companies are not affiliated with Allianz) because of the applicability of certain laws and regulations or internal Allianz policies applicable to PIMCO, Allianz SE or their affiliates. An account’s willingness to negotiate terms or take actions with respect to an investment may also be, directly or indirectly, constrained or otherwise impacted to the extent Allianz SE, PIMCO, and/or their affiliates, directors, partners, managers, members, officers or personnel are also invested therein or otherwise have a connection to the subject investment (e.g., serving as a trustee or board member thereof).
Performance Fees. A portfolio manager may advise certain accounts with respect to which the advisory fee is based entirely or partially on performance. Performance fee arrangements may create a conflict of interest for the portfolio manager in that the portfolio manager may have an incentive to allocate the investment opportunities that he or she believes might be the most profitable to such other accounts instead of allocating them to the Fund. PIMCO has adopted policies and procedures reasonably designed to allocate investment opportunities between the Fund and such other accounts on a fair and equitable basis over time.
Certain service providers to the Fund are expected to be owned by or otherwise related to or affiliated with a Client, and in certain cases, such service providers are expected to be, or are owned by, employed by, or otherwise related to, PIMCO, Allianz SE, their affiliates and/or their respective employees, consultants and other personnel. PIMCO may, in its sole discretion, determine to provide, or engage or recommend an affiliate of PIMCO to provide, certain services to the Fund, instead of engaging or recommending one or more third parties to provide such services. Subject to the governance requirements of a particular fund and applicable law, PIMCO or its affiliates, as applicable, will receive compensation in connection with the provision of such services. As a result, PIMCO faces a conflict of interest when selecting or recommending service providers for the Fund. Fees paid to an affiliated service provider will be determined in PIMCO’s commercially reasonable discretion, taking into account the relevant facts and circumstances, and consistent with PIMCO’s responsibilities. Although PIMCO has adopted various policies and procedures intended to mitigate or otherwise manage conflicts of interest with respect to affiliated service providers, there can be no guarantee that such policies and procedures (which may be modified or terminated at any time in PIMCO’s sole discretion) will be successful.
(a)(3)
As of December 31, 2023, the following explains the compensation structure of the individuals who have primary responsibility for day-to-day portfolio management of the Fund:
Portfolio Manager Compensation
PIMCO and its affiliates approach to compensation seeks to provide professionals with a compensation process that is driven by values of collaboration, openness, responsibility and excellence.
Generally, compensation packages consist of three components. The compensation program for portfolio managers is designed to align with clients’ interests, emphasizing each portfolio manager’s ability to generate long-term investment success for clients, among other factors. A portfolio manager’s compensation is not based solely on the performance of the Fund or any other account managed by that portfolio manager:
Base Salary – Base salary is determined based on core job responsibilities, positions/levels and market factors. Base salary levels are reviewed annually, when there is a significant change in job responsibilities or position, or a significant change in market levels.
Variable Compensation – In addition to a base salary, portfolio managers have a variable component of their compensation, which is based on a combination of individual and company performance and includes both qualitative and quantitative factors. The following non-exhaustive list of qualitative and quantitative factors is considered when determining total compensation for portfolio managers:
| | ● | | Performance measured over a variety of longer- and shorter-term periods, including 5-year, 4-year, 3-year, 2-year and 1-year dollar-weighted and account-weighted, pre-tax total and risk-adjusted investment performance as judged against the applicable benchmarks (which may include internal investment performance-related benchmarks) for each account managed by a portfolio manager (including the Fund) and relative to applicable industry peer groups and; |
| | ● | | Amount and nature of assets managed by the portfolio manager. |
The variable compensation component of an employee’s compensation may include a deferred component. The deferred portion will generally be subject to vesting and may appreciate or depreciate based on the performance of PIMCO and/or its affiliates. PIMCO’s Long-Term Incentive Plan provides participants with deferred cash awards that appreciate or depreciate based on PIMCO’s operating earnings over a rolling three-year period.
Portfolio managers who are Managing Directors of PIMCO receive compensation from a non-qualified profit sharing plan consisting of a portion of PIMCO’s net profits. Portfolio managers who are Managing Directors receive an amount determined by the Compensation Committee, based upon an individual’s overall contribution to the firm.
(a)(4)
The following summarizes the dollar range of securities of the Fund each Portfolio Manager beneficially owned as of December 31, 2023:
| | | | |
| | | Portfolio Manager | | Dollar Range of Equity Securities of the Fund Owned as of December 31, 2023 |
| | David Hammer | | None |
| | Kyle Christine | | None |
| Item 9. | Purchases of Equity Securities by Closed-End Management Investment Company and Affiliated Purchasers. |
None.
| Item 10. | Submission of Matters to a Vote of Security Holders. |
There have been no material changes to the procedures by which shareholders may recommend nominees to the Fund’s Board of Trustees since the Fund last provided disclosure in response to this item.
| Item 11. | Controls and Procedures. |
| | (a) | The principal executive officer and principal financial & accounting officer have concluded as of a date within 90 days of the filing date of this report, based on their evaluation of the Registrant’s disclosure controls and procedures (as defined in Rule 30a-3(c) under the 1940 Act), that the design of such procedures is effective to provide reasonable assurance that material information required to be disclosed by the Registrant on Form N-CSR is recorded, processed, summarized and reported within the time periods specified in the Commission’s rules and forms. |
| | (b) | There were no changes in the Registrant’s internal control over financial reporting (as defined in Rule 30a-3(d) under the 1940 Act (17 CFR 270.30a-3(d))) that occurred during the period covered by this report that have materially affected, or are reasonably likely to materially affect, the Registrant’s internal control over financial reporting. |
| Item 12. | Disclosure of Securities Lending Activities for Closed-End Management Investment Companies. |
None.
Signatures
Pursuant to the requirements of the Securities Exchange Act of 1934 and the Investment Company Act of 1940, the registrant has duly caused this report to be signed on its behalf by the undersigned, thereunto duly authorized.
| | | | |
| | PIMCO California Municipal Income Fund II |
| | |
| | By: | | /s/ Joshua D. Ratner |
| | | | |
| | | | Joshua D. Ratner |
| | | | President (Principal Executive Officer) |
| |
| | Date: March 4, 2024 |
|
| Pursuant to the requirements of the Securities Exchange Act of 1934 and the Investment Company Act of 1940, this report has been signed below by the following persons on behalf of the registrant and in the capacities and on the dates indicated. |
| | |
| | By: | | /s/ Joshua D. Ratner |
| | | | |
| | | | Joshua D. Ratner |
| | | | President (Principal Executive Officer) |
| |
| | Date: March 4, 2024 |
| | |
| | By: | | /s/ Bijal Y. Parikh |
| | | | |
| | | | Bijal Y. Parikh |
| | | | Treasurer (Principal Financial & Accounting Officer) |
| |
| | Date: March 4, 2024 |