UNITED STATES
SECURITIES AND EXCHANGE COMMISSION
Washington, D.C. 20549
FORM N-CSR
CERTIFIED SHAREHOLDER REPORT OF REGISTERED
MANAGEMENT INVESTMENT COMPANIES
Investment Company Act file number: 811-21073
BRAGG CAPITAL TRUST
(Exact name of registrant as specified in charter)
11601 WILSHIRE BLVD., STE. 1200
LOS ANGELES, CALIFORNIA 90025
(Address of principal executive offices)(Zip code)
| (Name and Address of Agent for Service) | Copy to: |
| J. RICHARD ATWOOD, PRESIDENT | MARK D. PERLOW, ESQ. |
| BRAGG CAPITAL TRUST | DECHERT LLP |
| 11601 WILSHIRE BLVD., STE. 1200 | ONE BUSH STREET, STE. 1600 |
| LOS ANGELES, CALIFORNIA 90025 | SAN FRANCISCO, CA 94104 |
Registrant’s telephone number, including area code: (310) 473-0225
Date of fiscal year end: May 31
Date of reporting period: May 31, 2022
* Explanatory Note
The Registrant is filing this amendment to its Form N-CSR for the period ended May 31, 2022, originally filed with the Securities and Exchange Commission on August 5, 2022 (Accession Number 0001104659- 22-086583) to amend Item 1, Item 11 and Item 13.
The purpose of this amendment is to amend and update the Registrant’s Annual Reports to Shareholders to add disclosure relating the the Funds’ Liquidity Risk Management Program and update the certifications in Items 11 and 13 to reference the period covered by the report.
| Item 1: | Report to Shareholders. |
| (a) | The Report to Shareholders is attached herewith. |

Distributor:
UMB DISTRIBUTION SERVICES, LLC
235 West Galena Street
Milwaukee, Wisconsin 53212
Annual Report
May 31, 2022
FPA Queens Road Small Cap Value Fund
FPA QUEENS ROAD SMALL CAP VALUE FUND
LETTER TO SHAREHOLDERS
Dear Shareholders:
FPA Queens Road Small Cap Value Fund ("Fund") Investor Class returned -2.52% in fiscal year 2022 (June 1, 2021 to May 31, 2022). This compares to a -7.67% return for the Russell 2000 Value Index in the same period. The Fund's top five performing positions contributed 5.06% to the Fund's return while the bottom five detracted 4.09%.1
Fiscal Year 2022 Contributors and Detractors1
Identifier | Name | Average Weights | Contribution | GICS Sector | |||||||||||||||
Top 5 | |||||||||||||||||||
SYNA-US | Synaptics | 4.43 | % | 1.54 | % | Information Technology | |||||||||||||
AEL-US | American Equity Investment Life | 4.18 | % | 1.22 | % | Financials | |||||||||||||
| SFBS-US | ServisFirst Bancshares | 4.76 | % | 0.92 | % | Financials | |||||||||||||
SJI-US | South Jersey Industries | 2.33 | % | 0.70 | % | Utilities | |||||||||||||
CSGS-US | CSG Systems International | 1.92 | % | 0.69 | % | Information Technology | |||||||||||||
5.06 | % | ||||||||||||||||||
Bottom 5 | |||||||||||||||||||
MTZ-US | MasTec | 3.02 | % | -0.96 | % | Industrials | |||||||||||||
MATV-US | Schweitzer-Mauduit International | 2.45 | % | -0.94 | % | Materials | |||||||||||||
PVH-US | PVH | 2.06 | % | -0.82 | % | Consumer Discretionary | |||||||||||||
OSK-US | Oshkosh | 2.21 | % | -0.69 | % | Industrials | |||||||||||||
IDCC-US | InterDigital | 3.26 | % | -0.68 | % | Information Technology | |||||||||||||
-4.09 | % | ||||||||||||||||||
Comparing the Fund's performance for the first half of the year to the second, the -2.52% return for the full fiscal year was made up of a +1.10% return for the first half of the fiscal year (June 1, 2021 to November 30, 2021) and a -3.58% return for the second half (December 1, 2021 to May 31, 2022). This compares to the benchmark Russell 2000 Value's return of -3.31% for the first half of the fiscal year and -4.50% for the second half, making up the full fiscal year performance of -7.67%. Further, three of the Fund's top five performing positions noted in the November 30, 2021 Semi-Annual Report remain in the top five for the full fiscal year — Synaptics, American Equity and ServisFirst Bancshares. Similarly, three of the Fund's bottom five positions noted in the Semi-Annual Report remain in the bottom five for the entire fiscal year — MasTec, Schwietzer-Maudit, and InterDigital.
1 Reflects the top five contributors and detractors to the Fund's performance based on contribution to return for the quarter. Contribution is presented gross of investment management fees, transactions costs, and Fund operating expenses, which if included, would reduce the returns presented. The information provided does not reflect all positions purchased, sold or recommended by FPA during the quarter. A copy of the methodology used and a list of every holding's contribution to the overall Fund's performance during the quarter is available by contacting FPA Client Service at crm@fpa.com. It should not be assumed that recommendations made in the future will be profitable or will equal the performance of the securities listed. GICS is Global Industry Classification Standard.
Past performance is no guarantee, nor is it indicative, of future results.
1
FPA QUEENS ROAD SMALL CAP VALUE FUND
LETTER TO SHAREHOLDERS
(Continued)
One sector that we avoided during the fiscal year 2022 was the energy sector. While we maintain an allocation to companies servicing the oil and gas industry, we do not currently have any direct energy holdings. With the Russell 2000 Value energy sector up about 68% over the period, this has detracted from the Fund's performance. We typically seek to avoid commodity exposure as we have little ability to predict commodity prices. Furthermore, we think the energy industry historically has had low returns on capital and poor shareholder economics. With the environmental debate over fossil fuels underway we think the long-term economics of the industry are going to deteriorate, despite the recent runup in oil price which we think is due mostly to geopolitical issues. We prefer to look for high quality franchises with differentiated products that have pricing power.
Positioning and Outlook
As broad markets have fallen, valuations have come down. We believe small cap valuations are more compelling than their large cap peers. The chart below shows the relative valuation of small cap vs large cap stocks over the last 40 years. Over that period, small cap stocks traded at a median Price-to-Earnings (P/E) roughly equal to the P/E of large caps. As of March 31st, small caps traded at a 20% discount to the P/E of large caps. This is only the third time in the last 40 years that this discount has been this great. As a result, we are slowly putting cash to work.
Small Cap to Large Cap Historical P/E Ratio (x100)
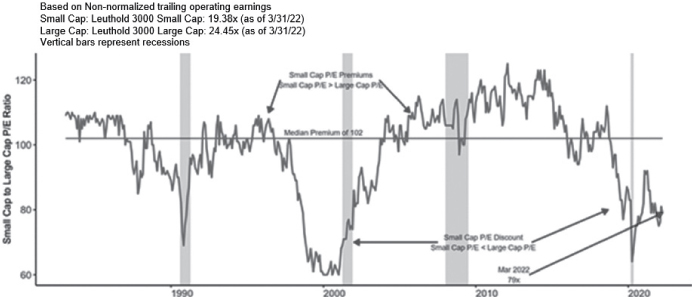
Source: The Leuthold Group, 1/1/1983 to 3/31/2022. The Leuthold 3000 Universe is defined as the largest 3,000 securities traded on U.S. exchanges. Universe was segregated into large- and small-cap tiers. Blue vertical bars identify recessionary periods of July 1990 to March 1991, March 2001 to November 2001, December 2007 to June 2009, March 2020 to April 2020. Price/Earnings Ratio (P/E).
2
FPA QUEENS ROAD SMALL CAP VALUE FUND
LETTER TO SHAREHOLDERS
(Continued)
We will continue to diligently seek attractively priced small-cap companies that are in sound financial condition, led by strong management teams, and operating in growing industries, while remaining mindful of our long-term focus of limiting the permanent impairment of capital.
Respectfully,

Steve Scruggs
Portfolio Manager
July 14, 2022
Important Disclosures
This update is for informational and discussion purposes only and does not constitute, and should not be construed as, an offer or solicitation for the purchase or sale of any securities, products or services discussed, and neither does it provide investment advice. Any such offer or solicitation shall only be made pursuant to the respective FPA Queens Road Fund's ("QR Funds") Prospectus, which supersedes the information contained herein in its entirety. This Commentary does not constitute an investment management agreement or offering circular.
The statements contained herein reflect the opinions and views of the portfolio managers as of the date written, is subject to change without notice, and may be forward-looking and/or based on current expectations, projections, and/or information currently available. Such information may not be accurate over the long-term. These views may differ from other portfolio managers and analysts of the firm as a whole, and are not intended to be a forecast of future events, a guarantee of future results or investment advice.
Portfolio composition will change due to ongoing management of the QR Funds. References to individual securities or sectors are for informational purposes only and should not be construed as recommendations by the QR Funds, the portfolio manager, the Adviser, the Sub-Adviser or the distributor. It should not be assumed that future investments will be profitable or will equal the performance of the security or sector examples discussed. The portfolio holdings as of the most recent quarter-end may be obtained at www.fpa.com.
Future events or results may vary significantly from those expressed and are subject to change at any time in response to changing circumstances and industry developments. The information and data contained herein has been prepared from sources believed reliable, but the accuracy and completeness of the information cannot be guaranteed and is not a complete summary or statement of all available data.
The information contained herein is not complete, may change, and is subject to, and is qualified in its entirety by, the more complete disclosures, risk factors, and other information contained in the respective QR Fund's Prospectus and Statement of Additional Information. The information is furnished as of the date shown. No representation is made with respect to its completeness or timeliness. The information is not intended to be, nor shall it be construed as, investment advice or a recommendation of any kind.
Certain statements contained in this presentation may be forward-looking and/or based on current expectations, projections, and information currently available. Actual events or results may differ from materially those we anticipate, or the actual performance of any investments described herein may differ from those reflected
3
FPA QUEENS ROAD SMALL CAP VALUE FUND
LETTER TO SHAREHOLDERS
(Continued)
or contemplated in such forward-looking statements, due to various risks and uncertainties. We cannot assure future results and disclaim any obligation to update or alter any forward-looking statements, whether as a result of new information, future events, or otherwise. Such statements may or may not be accurate over the long-term. Statistical data or references thereto were taken from sources which we deem to be reliable, but their accuracy cannot be guaranteed.
The reader is advised that the QR Funds' investment strategies include active management with corresponding changes in allocations from one period of time to the next. Therefore, any data with respect to investment allocations as of a given date is of limited use and may not be reflective of the portfolio manager's more general views with respect to proper geographic, instrument and /or sector allocations. The data is presented for indicative purposes only and, as a result, may not be relied upon for any purposes whatsoever.
In making any investment decision, you must rely on your own examination of the QR Funds, including the risks involved in an investment. Investments mentioned herein may not be suitable for all recipients and in each case, potential investors are advised not to make any investment decision unless they have taken independent advice from an appropriately authorized advisor. An investment in any security mentioned herein does not guarantee a positive return as securities are subject to market risks, including the potential loss of principal. You should not construe the contents of this document as legal, tax, investment or other advice or recommendations.
QR Funds performance presented is calculated on a total return basis, which includes the reinvestment of all income, plus realized and unrealized gains/losses, if applicable. Unless otherwise indicated, performance results are presented on a net of fees basis and reflect the deduction of, among other things: management fees, brokerage commissions, operating and administrative expenses, and accrued performance fee/allocation, if applicable.
From inception of the QR Funds to December 31, 2004, BFA and its affiliates voluntarily absorbed certain expenses of the QR Funds and voluntarily waived its management fee. Had BFA not done this, returns would have been lower during that period. Effective January 1, 2005 through October 31, 2020, BFA charged a single unitary management fee and contractually agreed to pay all operating expenses of the QR Funds except for brokerage, taxes, interest, litigation expenses, and other extraordinary expenses.
The information provided in this presentation is based upon data existing as of the date(s) of the report and has not been audited or reviewed. While we believe the information to be accurate, it is subject in all respects to adjustments that may be made after proper review and reconciliation.
Investments, including mutual fund investments, carry risks and investors may lose principal value. Capital markets are volatile and can decline significantly in response to adverse issuer, political, regulatory, market, or economic developments. Small and mid-cap stocks involve greater risks and they can fluctuate in price more than larger company stocks. Short-selling involves increased risks and transaction costs. You risk paying more for a security than you received from its sale. Groups of stocks, such as value and growth, go in and out of favor which may cause certain funds to underperform other equity funds. The value of an individual security can be more volatile than the market as a whole and can perform differently than the value of the market as a whole.
The FPA Queens Road Small Cap Value Fund primarily invests in equity securities (common stocks, preferred stocks and convertible securities) of small-capitalization U.S. companies, defined as those with market capitalization, at the time of purchase, that is no greater than the largest market capitalization of any company included in the Russell 2000 Value Index. Investing in small companies involves special risks including, but not limited to, the following: smaller companies typically have more risk and their company stock prices are more volatile than that of large companies; their securities may be less liquid and may be thinly traded which makes it
4
FPA QUEENS ROAD SMALL CAP VALUE FUND
LETTER TO SHAREHOLDERS
(Continued)
more difficult to dispose of them at prevailing market prices; these companies may be more adversely affected by poor economic or market conditions; they may have limited product lines, limited access to financial resources, and may be dependent on a limited management group; and small cap stocks may fluctuate independently of large cap stocks.
The prices of securities held by the QR Funds may decline in response to certain events taking place around the world, including those directly involving the companies whose securities are owned by the QR Funds. Securities in the QR Fund's portfolio may underperform due to inflation (or expectations for inflation), interest rates, global demand for particular products or resources, natural disasters, pandemics, epidemics, terrorism, regulatory events and governmental or quasi-governmental actions. There is a risk that you may lose money by investing in the QR Funds.
Value style investing presents the risk that the holdings or securities may never reach their full market value because the market fails to recognize what the portfolio management team considers the true business value or because the portfolio management team has misjudged those values. In addition, value style investing may fall out of favor and underperform growth or other styles of investing during given periods.
Please refer to the respective QR Fund's Prospectus for a complete overview of the primary risks associated with each fund.
The FPA Funds are distributed by UMB Distribution Services, LLC, 235 W. Galena Street, Milwaukee, WI, 53212.
Index / Benchmark / Category Definitions
Comparison to any index should not be relied upon as a fully accurate measure of comparison. The Fund will be less diversified than the indices noted herein and may hold non-index securities or securities that are not comparable to those contained in an index. Indices will hold positions that are not within the Fund's investment strategy. Indices are unmanaged and do not reflect any commissions or other fees and expenses which would be incurred by an investor purchasing the underlying securities and would reduce performance for an investor. An investor cannot invest directly in an index.
The Russell 2000 Value Index is a subset of the Russell 2000 Index, and tracks the stocks of small domestic companies, based on total market capitalization. The Russell 2000 Value Index represents those stocks of the Russell 2000 with lower price-to-book ratios and lower relative forecasted growth rates. A total return index computes the index value based on capital gains plus cash payments such as dividends and interest.
The Global Industries Classification Standards, or GICS®, is a common global classification standard developed by S&P Dow Jones Indices and MSCI. The GICS structure consists of 11 Sectors, 24 Industry groups, 69 Industries and 158 sub-industries.
5
FPA QUEENS ROAD SMALL CAP VALUE FUND
LETTER TO SHAREHOLDERS
(Continued)
The discussions of Fund investments represent the views of the Fund's managers at the time of this report and are subject to change without notice. References to individual securities are for informational purposes only and should not be construed as recommendations to purchase or sell individual securities. While the Fund's managers believe that the Fund's holdings are value stocks, there can be no assurance that others will consider them as such. Further, investing in value stocks presents the risk that value stocks may fall out of favor with investors and underperform growth stocks during given periods.
FORWARD LOOKING STATEMENT DISCLOSURE
As mutual fund managers, one of our responsibilities is to communicate with shareholders in an open and direct manner. Insofar as some of our opinions and comments in our letters to shareholders are based on our current expectations, they are considered "forward-looking statements" which may or may not prove to be accurate over the long term. While we believe we have a reasonable basis for our comments and we have confidence in our opinions, actual results may differ materially from those we anticipate. You can identify forward-looking statements by words such as "believe," "expect," "may," "anticipate," and other similar expressions when discussing prospects for particular portfolio holdings and/or the markets, generally. We cannot, however, assure future results and disclaim any obligation to update or alter any forward-looking statements, whether as a result of new information, future events, or otherwise. Further, information provided in this report should not be construed as a recommendation to purchase or sell any particular security.
6
FPA QUEENS ROAD SMALL CAP VALUE FUND
HISTORICAL PERFORMANCE
May 31, 2022 (Unaudited)
This graph illustrates the hypothetical investment of $10,000 in the Fund from May 31, 2012 to May 31, 2022. The Average Annual Total Return table and Growth of Assumed $10,000 Investment graph do not reflect the deduction of taxes that a shareholder would pay on Fund distributions or the redemption of Fund shares.
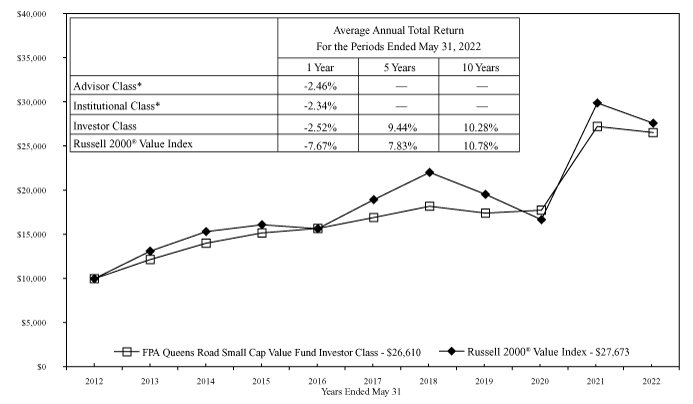
* The Small Cap Value Fund Advisor Class and Institutional Class shares commenced operations on December 1, 2020.
The Russell 2000 Value Index is a subset of the Russell 2000 Index, which tracks the stocks of small domestic companies, based on total market capitalization. The Russell 2000 Value Index represents those stocks of the Russell 2000 with lower price-to-book ratios and lower relative forecasted growth rates. The index does not reflect any commissions, fees or other expenses of investing which would be incurred by an investor purchasing the stocks it represents. The performance of the Fund and of the Index is computed on a total return basis which includes reinvestment of all distributions. It is not possible to invest directly in an index.
Past performance is no guarantee of future results and current performance may be higher or lower than the performance shown. The principal value and investment return of an investment will fluctuate so that your shares, when redeemed, may be worth more or less than their original cost. The returns shown do not reflect the deduction of taxes that a shareholder would pay on Fund distributions or on the redemptions of Fund shares. Returns greater than 1 year are annualized. The Fund's total annual operating expenses, per its current Prospectus, dated September 28, 2021, are 0.96%, 0.89% and 1.04% for the Advisor Class, Institutional Class and Investor Class, respectively. Prior to December 1, 2020, the Fund's total annual operating expenses were 1.04%. Prior to November 1, 2020, the Fund's total annual operating expenses were 1.18%. Current month-end performance data can be obtained by visiting the website at www.fpa.com or by calling toll-free, 1-800-982-4372. Information regarding the Fund's expense ratio and redemption fees can be found in the Financial Highlights section of this report. The Prospectus details the Fund's objective and policies, sales charges, and other matters of interest to prospective investors. Please read the Prospectus carefully before investing. The Prospectus may be obtained by visiting the website at www.fpa.com, by email at crm@fpa.com, toll-free by calling 1-800-982-4372 or by contacting the Fund in writing.
7
FPA QUEENS ROAD SMALL CAP VALUE FUND
PORTFOLIO SUMMARY
May 31, 2022
Common Stocks | 85.5 | % | |||||||||
Life Science Equipment | 7.4 | % | |||||||||
Banks | 6.7 | % | |||||||||
Information Technology Services | 6.6 | % | |||||||||
P&C Insurance | 6.4 | % | |||||||||
Oil & Gas Services & Equipment | 6.3 | % | |||||||||
Industrials | 6.2 | % | |||||||||
Semiconductor Devices | 6.1 | % | |||||||||
Apparel, Footwear & Accessory Design | 5.8 | % | |||||||||
Technology Distributors | 5.2 | % | |||||||||
Communications Equipment | 3.2 | % | |||||||||
Industrial Distribution & Rental | 3.0 | % | |||||||||
Packaged Food | 2.7 | % | |||||||||
Cement & Aggregates | 2.5 | % | |||||||||
Application Software | 2.0 | % | |||||||||
Other Wholesalers | 1.5 | % | |||||||||
Aircraft & Parts | 1.5 | % | |||||||||
Publishing & Broadcasting | 1.5 | % | |||||||||
Financials | 1.4 | % | |||||||||
Agricultural Machinery | 1.4 | % | |||||||||
Health Care Supply Chain | 1.4 | % | |||||||||
Flow Control Equipment | 1.2 | % | |||||||||
Basic & Diversified Chemicals | 1.1 | % | |||||||||
Real Estate Services | 1.1 | % | |||||||||
Containers & Packaging | 1.0 | % | |||||||||
Retailing | 0.9 | % | |||||||||
Electrical Components | 0.7 | % | |||||||||
Other Commercial Services | 0.4 | % | |||||||||
Internet Media | 0.3 | % | |||||||||
Insurance Brokers | 0.0 | % | |||||||||
Preferred Stocks | 0.1 | % | |||||||||
Short-Term Investments | 14.6 | % | |||||||||
Other Assets And Liabilities, Net | (0.2 | )% | |||||||||
Net Assets | 100.0 | % | |||||||||
8
FPA QUEENS ROAD SMALL CAP VALUE FUND
PORTFOLIO OF INVESTMENTS
May 31, 2022
COMMON STOCKS | Shares | Fair Value | |||||||||
LIFE SCIENCE EQUIPMENT — 7.4% | |||||||||||
American Equity Investment Life Holding Co. | 593,598 | $ | 23,898,256 | ||||||||
CNO Financial Group, Inc. | 629,934 | 12,957,742 | |||||||||
$ | 36,855,998 | ||||||||||
BANKS — 6.7% | |||||||||||
Axos Financial, Inc.(a) | 145,622 | $ | 5,628,290 | ||||||||
Citizens Financial Group, Inc. | 77,454 | 3,205,047 | |||||||||
ServisFirst Bancshares, Inc. | 296,364 | 24,704,903 | |||||||||
$ | 33,538,240 | ||||||||||
INFORMATION TECHNOLOGY SERVICES — 6.6% | |||||||||||
CSG Systems International, Inc. | 179,166 | $ | 11,142,333 | ||||||||
Fabrinet (Thailand)(a) | 169,272 | 14,704,659 | |||||||||
Science Applications International Corp. | 82,975 | 7,182,316 | |||||||||
$ | 33,029,308 | ||||||||||
P&C INSURANCE — 6.4% | |||||||||||
Horace Mann Educators Corp. | 404,378 | $ | 16,361,134 | ||||||||
RLI Corp. | 129,811 | 15,722,708 | |||||||||
$ | 32,083,842 | ||||||||||
OIL & GAS SERVICES & EQUIPMENT — 6.3% | |||||||||||
New Jersey Resources Corp. | 272,460 | $ | 12,511,363 | ||||||||
South Jersey Industries, Inc. | 377,898 | 13,169,746 | |||||||||
UGI Corp. | 136,011 | 5,813,110 | |||||||||
$ | 31,494,219 | ||||||||||
INDUSTRIALS — 6.2% | |||||||||||
CSW Industrials, Inc. | 68,777 | $ | 7,298,615 | ||||||||
Enovis Corp.(a) | 16,974 | 1,126,055 | |||||||||
Esab Corp.(a) | 16,974 | 848,700 | |||||||||
Kimball International, Inc. Class B | 242,750 | 2,073,085 | |||||||||
L B Foster Co. Class A(a) | 112,678 | 1,479,462 | |||||||||
MasTec, Inc.(a) | 217,484 | 18,179,488 | |||||||||
$ | 31,005,405 | ||||||||||
SEMICONDUCTOR DEVICES — 6.1% | |||||||||||
Qorvo, Inc.(a) | 43,080 | $ | 4,814,190 | ||||||||
Synaptics, Inc.(a) | 111,911 | 16,576,258 | |||||||||
Vishay Intertechnology, Inc. | 436,307 | 8,918,115 | |||||||||
$ | 30,308,563 | ||||||||||
APPAREL, FOOTWEAR & ACCESSORY DESIGN — 5.8% | |||||||||||
Carter's, Inc. | 58,772 | $ | 4,528,383 | ||||||||
Deckers Outdoor Corp.(a) | 27,860 | 7,482,082 | |||||||||
9
FPA QUEENS ROAD SMALL CAP VALUE FUND
PORTFOLIO OF INVESTMENTS (Continued)
May 31, 2022
COMMON STOCKS — Continued | Shares | Fair Value | |||||||||
G-III Apparel Group Ltd.(a) | 291,416 | $ | 7,302,885 | ||||||||
PVH Corp. | 138,166 | 9,791,824 | |||||||||
$ | 29,105,174 | ||||||||||
TECHNOLOGY DISTRIBUTORS — 5.2% | |||||||||||
Arrow Electronics, Inc.(a) | 31,199 | $ | 3,764,160 | ||||||||
TD SYNNEX Corp. | 213,712 | 22,193,991 | |||||||||
$ | 25,958,151 | ||||||||||
COMMUNICATIONS EQUIPMENT — 3.2% | |||||||||||
InterDigital, Inc. | 240,918 | $ | 15,729,536 | ||||||||
$ | 15,729,536 | ||||||||||
INDUSTRIAL DISTRIBUTION & RENTAL — 3.0% | |||||||||||
MSC Industrial Direct Co., Inc. Class A | 152,439 | $ | 12,946,644 | ||||||||
VSE Corp. | 47,401 | 1,842,003 | |||||||||
$ | 14,788,647 | ||||||||||
PACKAGED FOOD — 2.7% | |||||||||||
TreeHouse Foods, Inc.(a) | 106,948 | $ | 4,397,702 | ||||||||
United Natural Foods, Inc.(a) | 212,121 | 8,996,051 | |||||||||
$ | 13,393,753 | ||||||||||
CEMENT & AGGREGATES — 2.5% | |||||||||||
Oshkosh Corp. | 135,597 | $ | 12,598,317 | ||||||||
$ | 12,598,317 | ||||||||||
APPLICATION SOFTWARE — 2.0% | |||||||||||
Concentrix Corp. | 65,895 | $ | 10,206,477 | ||||||||
$ | 10,206,477 | ||||||||||
OTHER WHOLESALERS — 1.5% | |||||||||||
Schweitzer-Mauduit International, Inc. | 282,385 | $ | 7,658,281 | ||||||||
$ | 7,658,281 | ||||||||||
AIRCRAFT & PARTS — 1.5% | |||||||||||
Atlas Air Worldwide Holdings, Inc.(a) | 60,295 | $ | 4,203,164 | ||||||||
Ducommun, Inc.(a) | 73,372 | 3,349,432 | |||||||||
$ | 7,552,596 | ||||||||||
PUBLISHING & BROADCASTING — 1.5% | |||||||||||
Scholastic Corp. | 194,109 | $ | 7,284,911 | ||||||||
$ | 7,284,911 | ||||||||||
FINANCIALS — 1.4% | |||||||||||
MGIC Investment Corp. | 495,000 | $ | 6,895,350 | ||||||||
$ | 6,895,350 | ||||||||||
10
FPA QUEENS ROAD SMALL CAP VALUE FUND
PORTFOLIO OF INVESTMENTS (Continued)
May 31, 2022
COMMON STOCKS — Continued | Shares | Fair Value | |||||||||
AGRICULTURAL MACHINERY — 1.4% | |||||||||||
AGCO Corp. | 12,587 | $ | 1,612,772 | ||||||||
Darling Ingredients, Inc.(a) | 65,838 | 5,271,649 | |||||||||
$ | 6,884,421 | ||||||||||
HEALTH CARE SUPPLY CHAIN — 1.4% | |||||||||||
Owens & Minor, Inc. | 193,165 | $ | 6,737,595 | ||||||||
$ | 6,737,595 | ||||||||||
FLOW CONTROL EQUIPMENT — 1.2% | |||||||||||
Graco, Inc. | 94,946 | $ | 6,010,082 | ||||||||
$ | 6,010,082 | ||||||||||
BASIC & DIVERSIFIED CHEMICALS — 1.1% | |||||||||||
Livent Corp.(a) | 169,440 | $ | 5,386,498 | ||||||||
$ | 5,386,498 | ||||||||||
REAL ESTATE SERVICES — 1.1% | |||||||||||
Equity Commonwealth(a) | 196,306 | $ | 5,349,339 | ||||||||
$ | 5,349,339 | ||||||||||
CONTAINERS & PACKAGING — 1.0% | |||||||||||
Graphic Packaging Holding Co. | 231,077 | $ | 5,143,774 | ||||||||
$ | 5,143,774 | ||||||||||
RETAILING — 0.9% | |||||||||||
Sprouts Farmers Market, Inc.(a) | 162,980 | $ | 4,415,128 | ||||||||
$ | 4,415,128 | ||||||||||
ELECTRICAL COMPONENTS — 0.7% | |||||||||||
Chase Corp. | 14,303 | $ | 1,155,539 | ||||||||
Littelfuse, Inc. | 8,195 | 2,214,289 | |||||||||
$ | 3,369,828 | ||||||||||
OTHER COMMERCIAL SERVICES — 0.4% | |||||||||||
UniFirst Corp. | 10,760 | $ | 1,758,614 | ||||||||
$ | 1,758,614 | ||||||||||
INTERNET MEDIA — 0.3% | |||||||||||
IAC/InterActiveCorp(a) | 15,154 | $ | 1,292,636 | ||||||||
$ | 1,292,636 | ||||||||||
INSURANCE BROKERS — 0.0% | |||||||||||
Crawford & Co. Class B | 4,051 | $ | 30,423 | ||||||||
$ | 30,423 | ||||||||||
| TOTAL COMMON STOCKS — 85.5% (Cost $307,768,852) | $ | 425,865,106 | |||||||||
11
FPA QUEENS ROAD SMALL CAP VALUE FUND
PORTFOLIO OF INVESTMENTS (Continued)
May 31, 2022
PREFERRED STOCKS | Shares | Fair Value | |||||||||
INDUSTRIALS — 0.1% | |||||||||||
WESCO International, Inc. — 10.625% | 6,085 | $ | 170,806 | ||||||||
| TOTAL PREFERRED STOCKS — 0.1% (Cost $161,253) | $ | 170,806 | |||||||||
| TOTAL INVESTMENT SECURITIES — 85.6% (Cost $307,930,105) | $ | 426,035,912 | |||||||||
SHORT-TERM INVESTMENTS — 14.6% | |||||||||||
State Street Institutional Treasury Plus Money Market Fund, 0.72%(b) | 72,743,206 | $ | 72,743,206 | ||||||||
| TOTAL SHORT-TERM INVESTMENTS (Cost $72,743,206) | $ | 72,743,206 | |||||||||
| TOTAL INVESTMENTS — 100.2% (Cost $380,673,311) | $ | 498,779,118 | |||||||||
Other Assets and Liabilities, net — (0.2)% | (877,931 | ) | |||||||||
NET ASSETS — 100.0% | $ | 497,901,187 | |||||||||
(a) Non-income producing security.
(b) Represents the 7-day effective yield as of May 31, 2022.
See accompanying Notes to Financial Statements.
12
FPA QUEENS ROAD SMALL CAP VALUE FUND
STATEMENT OF ASSETS AND LIABILITIES
May 31, 2022
ASSETS | |||||||
Investment securities — at fair value (identified cost $307,930,105) | $ | 426,035,912 | |||||
Short-term investments — at amortized cost (maturities 60 days or less) | 72,743,206 | ||||||
Receivable for: | |||||||
Investment securities sold | 2,315,794 | ||||||
Capital Stock sold | 627,312 | ||||||
Dividends and interest | 361,485 | ||||||
Prepaid expenses and other assets | 7,321 | ||||||
Total assets | 502,091,030 | ||||||
LIABILITIES | |||||||
Payable for: | |||||||
Investment securities purchased | 2,589,570 | ||||||
Capital Stock repurchased | 1,125,969 | ||||||
Advisory fees | 271,280 | ||||||
Accrued expenses and other liabilities | 203,024 | ||||||
Total liabilities | 4,189,843 | ||||||
NET ASSETS | $ | 497,901,187 | |||||
SUMMARY OF SHAREHOLDERS' EQUITY | |||||||
| Capital Stock — par value $0.01 per share; unlimited authorized shares; 14,647,557 outstanding shares | $ | 146,476 | |||||
Additional Paid-in Capital | 369,253,519 | ||||||
Distributable earnings | 128,501,192 | ||||||
NET ASSETS | $ | 497,901,187 | |||||
Advisor Class: | |||||||
Net Assets | $ | 39,219,306 | |||||
Shares outstanding, par value $0.01 per share; unlimited authorized shares | 1,155,562 | ||||||
Offering and redemption price per share | $ | 33.94 | |||||
Institutional Class: | |||||||
Net Assets | $ | 376,221,071 | |||||
Shares outstanding, par value $0.01 per share; unlimited authorized shares | 11,068,859 | ||||||
Offering and redemption price per share | $ | 33.99 | |||||
Investor Class: | |||||||
Net Assets | $ | 82,460,810 | |||||
Shares outstanding, par value $0.01 per share; unlimited authorized shares | 2,423,136 | ||||||
Offering and redemption price per share | $ | 34.03 | |||||
See accompanying Notes to Financial Statements.
13
FPA QUEENS ROAD SMALL CAP VALUE FUND
STATEMENT OF OPERATIONS
For the Year Ended May 31, 2022
INVESTMENT INCOME | |||||||
Dividends | $ | 6,011,301 | |||||
Interest | 75,834 | ||||||
Total investment income | 6,087,135 | ||||||
EXPENSES | |||||||
Advisory fees | 3,321,323 | ||||||
Shareholder Servicing fees: | |||||||
Advisor Class | 48,967 | ||||||
Institutional Class | 158,551 | ||||||
Investor Class | 208,157 | ||||||
Filing fees | 164,640 | ||||||
Legal fees | 113,588 | ||||||
Trustee fees and expenses | 105,117 | ||||||
Reports to shareholders | 86,779 | ||||||
Transfer agent fees and expenses | 77,226 | ||||||
Custodian fees | 41,875 | ||||||
Administrative services fees | 20,774 | ||||||
Other professional fees | 5,704 | ||||||
Audit and tax services fees | 2,565 | ||||||
Other | 16,568 | ||||||
Total expenses | 4,371,834 | ||||||
Net investment income | 1,715,301 | ||||||
NET REALIZED AND UNREALIZED GAIN (LOSS) | |||||||
Net realized gain on: | |||||||
Investments | 11,326,130 | ||||||
Net change in unrealized appreciation (depreciation) of: | |||||||
Investments | (25,829,932 | ) | |||||
Net realized and unrealized loss | (14,503,802 | ) | |||||
NET DECREASE IN NET ASSETS RESULTING FROM OPERATIONS | $ | (12,788,501 | ) | ||||
See accompanying Notes to Financial Statements.
14
FPA QUEENS ROAD SMALL CAP VALUE FUND
STATEMENTS OF CHANGES IN NET ASSETS
| Year Ended May 31, 2022 | Year Ended May 31, 2021 | ||||||||||
INCREASE (DECREASE) IN NET ASSETS | |||||||||||
Operations: | |||||||||||
Net investment income | $ | 1,715,301 | $ | 474,777 | |||||||
Net realized gain | 11,326,130 | 12,945,691 | |||||||||
Net change in unrealized appreciation (depreciation) | (25,829,932 | ) | 114,541,567 | ||||||||
| Net increase (decrease) in net assets resulting from operations | (12,788,501 | ) | 127,962,035 | ||||||||
Distributions to shareholders — Advisor Class | (887,512 | ) | (93 | )(a) | |||||||
Distributions to shareholders — Institutional Class | (7,484,461 | ) | (272 | )(a) | |||||||
Distributions to shareholders — Investor Class | (1,507,183 | ) | (660,742 | ) | |||||||
Total distributions to shareholders | (9,879,156 | ) | (661,107 | ) | |||||||
Capital Stock transactions:(b) | |||||||||||
Proceeds from Capital Stock sold | 204,174,367 | 342,773,053 | |||||||||
| Proceeds from shares issued to shareholders upon reinvestment of dividends and distributions | 8,926,912 | 444,498 | |||||||||
Cost of Capital Stock repurchased | (189,118,949 | ) | (100,969,032 | ) | |||||||
Net increase from Capital Stock transactions | 23,982,330 | 242,248,519 | |||||||||
Total change in net assets | 1,314,673 | 369,549,447 | |||||||||
NET ASSETS | |||||||||||
Beginning of Year | 496,586,514 | 127,037,067 | |||||||||
End of Year | $ | 497,901,187 | $ | 496,586,514 | |||||||
(a) The Advisor Class and Institutional Class commenced operations on December 1, 2020. The data shown reflects operations for the period December 1, 2020 to May 31, 2021.
(b) See Note 7, Capital Stock, in the Notes to Financial Statements.
See accompanying Notes to Financial Statements.
15
FPA QUEENS ROAD SMALL CAP VALUE FUND
FINANCIAL HIGHLIGHTS
Selected Data for Each Share of Capital Stock Outstanding Throughout Each Year
| Year Ended May 31, 2022 | Period Ended May 31, 2021(a) | ||||||||||
Advisor Class | |||||||||||
Per share operating performance: | |||||||||||
Net asset value at beginning of period | $ | 35.52 | $ | 28.16 | |||||||
Income from investment operations: | |||||||||||
Net investment income(b) | 0.10 | 0.02 | |||||||||
Net realized and unrealized gain (loss) on investment securities | (0.95 | ) | 7.44 | ||||||||
Total from investment operations | (0.85 | ) | 7.46 | ||||||||
Less distributions: | |||||||||||
Dividends from net investment income | (0.12 | ) | (0.09 | ) | |||||||
Distributions from net realized capital gains | (0.61 | ) | (0.01 | ) | |||||||
Total distributions | (0.73 | ) | (0.10 | ) | |||||||
Net asset value at end of period | $ | 33.94 | $ | 35.52 | |||||||
Total investment return(c) | (2.46 | )% | 26.58 | % | |||||||
Ratios/supplemental data: | |||||||||||
Net assets, end of period (in 000's) | $ | 39,219 | $ | 724 | |||||||
Ratio of expenses to average net assets: | |||||||||||
Before reimbursement from Adviser | 0.93 | % | 0.90 | %(d) | |||||||
After reimbursement from Adviser | 0.93 | % | 0.90 | %(d) | |||||||
Ratio of net investment income to average net assets: | |||||||||||
Before reimbursement from Adviser | 0.28 | % | 0.10 | %(d) | |||||||
After reimbursement from Adviser | 0.28 | % | 0.10 | %(d) | |||||||
Portfolio turnover rate | 10 | % | 15 | % | |||||||
(a) The Advisor Class commenced operations on December 1, 2020. The data shown reflects operations for the period December 1, 2020 to May 31, 2021.
(b) Per share amount is based on average shares outstanding.
(c) Return is based on net asset value per share, adjusted for reinvestment of distributions, and does not reflect deduction of the sales charge.
(d) Annualized.
See accompanying Notes to Financial Statements.
16
FPA QUEENS ROAD SMALL CAP VALUE FUND
FINANCIAL HIGHLIGHTS
Selected Data for Each Share of Capital Stock Outstanding Throughout Each Year
| Year Ended May 31, 2022 | Period Ended May 31, 2021(a) | ||||||||||
Institutional Class | |||||||||||
Per share operating performance: | |||||||||||
Net asset value at beginning of period | $ | 35.52 | $ | 28.16 | |||||||
Income from investment operations: | |||||||||||
Net investment income(b) | 0.13 | 0.02 | |||||||||
Net realized and unrealized gain (loss) on investment securities | (0.94 | ) | 7.44 | ||||||||
Total from investment operations | (0.81 | ) | 7.46 | ||||||||
Less distributions: | |||||||||||
Dividends from net investment income | (0.11 | ) | (0.09 | ) | |||||||
Distributions from net realized capital gains | (0.61 | ) | (0.01 | ) | |||||||
Total distributions | (0.72 | ) | (0.10 | ) | |||||||
Net asset value at end of period | $ | 33.99 | $ | 35.52 | |||||||
Total investment return(c) | (2.34 | )% | 26.59 | % | |||||||
Ratios/supplemental data: | |||||||||||
Net assets, end of period (in 000's) | $ | 376,221 | $ | 301,941 | |||||||
Ratio of expenses to average net assets: | |||||||||||
Before reimbursement from Adviser | 0.83 | % | 0.91 | %(d) | |||||||
After reimbursement from Adviser | 0.83 | % | 0.89 | %(d) | |||||||
Ratio of net investment income to average net assets: | |||||||||||
Before reimbursement from Adviser | 0.38 | % | 0.08 | %(d) | |||||||
After reimbursement from Adviser | 0.38 | % | 0.10 | %(d) | |||||||
Portfolio turnover rate | 10 | % | 15 | % | |||||||
(a) The Institutional Class commenced operations on December 1, 2020. The data shown reflects operations for the period December 1, 2020 to May 31, 2021.
(b) Per share amount is based on average shares outstanding.
(c) Return is based on net asset value per share, adjusted for reinvestment of distributions, and does not reflect deduction of the sales charge.
(d) Annualized.
See accompanying Notes to Financial Statements.
17
FPA QUEENS ROAD SMALL CAP VALUE FUND
FINANCIAL HIGHLIGHTS
Selected Data for Each Share of Capital Stock Outstanding Throughout Each Year
Year Ended May 31, | |||||||||||||||||||||||
2022 | 2021 | 2020(a) | 2019(a) | 2018(a) | |||||||||||||||||||
Investor Class | |||||||||||||||||||||||
Per share operating performance: | |||||||||||||||||||||||
Net asset value at beginning of year | $ | 35.52 | $ | 23.22 | $ | 23.61 | $ | 27.32 | $ | 25.93 | |||||||||||||
Income from investment operations: | |||||||||||||||||||||||
Net investment income(b) | 0.07 | 0.06 | 0.03 | 0.05 | 0.02 | ||||||||||||||||||
| Net realized and unrealized gain (loss) on investment securities | (0.95 | ) | 12.34 | 0.55 | (1.28 | ) | 1.94 | ||||||||||||||||
Total from investment operations | (0.88 | ) | 12.40 | 0.58 | (1.23 | ) | 1.96 | ||||||||||||||||
Less distributions: | |||||||||||||||||||||||
Dividends from net investment income | — | (0.09 | ) | (0.01 | ) | (0.03 | ) | — | |||||||||||||||
| Distributions from net realized capital gains | (0.61 | ) | (0.01 | ) | (0.96 | ) | (2.45 | ) | (0.57 | ) | |||||||||||||
Total distributions | (0.61 | ) | (0.10 | ) | (0.97 | ) | (2.48 | ) | (0.57 | ) | |||||||||||||
Net asset value at end of year | $ | 34.03 | $ | 35.52 | $ | 23.22 | $ | 23.61 | $ | 27.32 | |||||||||||||
Total investment return(c) | (2.52 | )% | 53.51 | % | 1.89 | % | (4.26 | )% | 7.55 | % | |||||||||||||
Ratios/supplemental data: | |||||||||||||||||||||||
Net assets, end of year (in 000's) | $ | 82,461 | $ | 193,922 | $ | 127,037 | $ | 118,454 | $ | 133,630 | |||||||||||||
Ratio of expenses to average net assets: | |||||||||||||||||||||||
Before reimbursement from Adviser | 1.00 | % | 1.11 | % | 1.18 | % | 1.18 | % | 1.22 | % | |||||||||||||
After reimbursement from Adviser | 1.00 | % | 1.09 | %(d) | 1.18 | % | 1.18 | % | 1.22 | % | |||||||||||||
| Ratio of net investment income to average net assets: | |||||||||||||||||||||||
Before reimbursement from Adviser | 0.21 | % | 0.22 | % | 0.10 | % | 0.20 | % | 0.08 | % | |||||||||||||
After reimbursement from Adviser | 0.21 | % | 0.20 | % | 0.10 | % | 0.20 | % | 0.08 | % | |||||||||||||
Portfolio turnover rate | 10 | % | 15 | % | 24 | % | 27 | % | 6 | % | |||||||||||||
(a) Audits performed for the fiscal years indicated by the Fund's previous auditor, Cohen & Company, Ltd.
(b) Per share amount is based on average shares outstanding.
(c) Return is based on net asset value per share, adjusted for reinvestment of distributions, and does not reflect deduction of the sales charge.
(d) Effective November 1, 2020, the Adviser has contractually agreed to limit the annual fund operating expenses to 1.04%. Prior to November 1, 2020, the Fund had a unitized fee structure that limited annual operating expenses to 1.18%.
See accompanying Notes to Financial Statements.
18
FPA QUEENS ROAD SMALL CAP VALUE FUND
NOTES TO FINANCIAL STATEMENTS
May 31, 2022
NOTE 1 — Significant Accounting Policies
The FPA Queens Road Small Cap Value Fund (the "Fund"), is a diversified managed portfolio of Bragg Capital Trust (the "Trust"), which is registered under the Investment Company Act of 1940, as amended (the "1940 Act"), as an open-end management company. The Fund's investment objective is to seek long-term capital growth. The Fund invests primarily in common stocks which are believed by First Pacific Advisors, L.P. (the "Adviser") and Bragg Financial Advisors, Inc. (the "Sub-Adviser") to be undervalued and have good prospects for capital appreciation. Under normal circumstances, the Fund invests at least 80% of its assets in equity securities of companies with small market capitalization. The Fund currently defines a small market capitalization company as one whose market capitalization, at the time of purchase, is no greater than the largest market capitalization of any company included in the Russell 2000 Value Index. The following is a summary of significant accounting policies consistently followed by the Fund in the preparation of its financial statements.
A. Security Valuation
The Fund's investments are reported at fair value as defined by accounting principles generally accepted in the United States of America, ("U.S. GAAP"). The Fund generally determines its net asset value as of approximately 4:00 p.m. New York time each day the New York Stock Exchange is open. Further discussion of valuation methods, inputs and classifications can be found under Disclosure of Fair Value Measurements.
B. Securities Transactions and Related Investment Income
Securities transactions are accounted for on the date the securities are purchased or sold. Dividend income and distributions to shareholders are recorded on the ex-dividend date. Interest income and expenses are recorded on an accrual basis. Market discounts and premiums on fixed income securities are amortized over the expected life of the securities using effective interest rate method. Realized gains or losses are based on the specific identification method. The books and records of the Fund are maintained in U.S. dollars as follows: (1) the foreign currency fair value of investment securities, and other assets and liabilities stated in foreign currencies, are translated using the daily spot rate; and (2) purchases, sales, income and expenses are translated at the rate of exchange prevailing on the respective dates of such transactions. The resultant exchange gains and losses are included in net realized or net unrealized gain (loss) in the statement of operations.
C. Use of Estimates
The preparation of the financial statements in accordance with U.S. GAAP requires management to make estimates and assumptions that affect the amounts reported. Actual results could differ from those estimates.
NOTE 2 — Risk Considerations
Investing in the Fund may involve certain risks including, but not limited to, those described below.
Market Risk: Because the values of the Fund's investments will fluctuate with market conditions, so will the value of your investment in the Fund. You could lose money on your investment in the Fund or the Fund could underperform other investments.
Common Stocks and Other Securities: The prices of common stocks and other securities held by the Fund may decline in response to certain events taking place around the world, including; those directly involving companies whose securities are owned by the Fund; conditions affecting the general economy; overall market changes; local, regional or global political, social or economic instability; and currency, interest rate and commodity price fluctuations. In addition, the emphasis on a value-oriented investment approach by the
19
FPA QUEENS ROAD SMALL CAP VALUE FUND
NOTES TO FINANCIAL STATEMENTS (Continued)
Sub-Adviser generally results in the Fund's portfolio being invested primarily in medium or smaller sized companies. Smaller companies may be subject to a greater degree of change in earnings and business prospects than larger, more established companies, and smaller companies are often more reliant on key products or personnel than larger companies. Also, securities of smaller companies are traded in lower volumes than those issued by larger companies and may be more volatile than those of larger companies. The Fund's foreign investments are subject to additional risks such as, foreign markets could go down or prices of the Fund's foreign investments could go down because of unfavorable changes in foreign currency exchange rates, foreign government actions, social, economic or political instability or other factors that can adversely affect investments in foreign countries. These factors can also make foreign securities less liquid, more volatile and harder to value than U.S. securities. In light of these characteristics of smaller companies and their securities, the Fund may be subjected to greater risk than that assumed when investing in the equity securities of larger companies.
Many countries have experienced outbreaks of infectious illnesses in recent decades, including swine flu, avian influenza, SARS and, more recently, COVID-19. The global outbreak of COVID-19 in early 2020 has resulted in various disruptions, including travel and border restrictions, quarantines, supply chain disruptions, lower consumer demand and general market uncertainty. The full effects, duration and costs of the COVID-19 pandemic are impossible to predict, and the circumstances surrounding the COVID-19 pandemic will continue to evolve, including the risk of future increased rates of infection due to low vaccination rates and/or the lack of effectiveness of current vaccines against new variants. Similar consequences could arise as a result of the spread of other infectious diseases. Management will continue to monitor the impact COVID-19 has on the Fund and reflect the consequences as appropriate in the Fund's accounting and financial reporting.
NOTE 3 — Purchases and Sales of Investment Securities
Cost of purchases of investment securities (excluding short-term investments) aggregated $67,571,437 for the year ended May 31, 2022. The proceeds and cost of securities sold resulting in net realized gains of $11,326,130 aggregated $40,403,877 and $ 29,077,747, respectively, for the year ended May 31, 2022.
NOTE 4 — Federal Income Tax
No provision for federal income tax is required because the Fund has elected to be taxed as a "regulated investment company" under the Internal Revenue Code (the "Code") and intends to maintain this qualification and to distribute each year to its shareholders, in accordance with the minimum distribution requirements of the Code, its taxable net investment income and taxable net realized gains on investments.
Distributions paid to shareholders are based on net investment income and net realized gains determined on a tax reporting basis, which may differ from financial reporting. For federal income tax purposes, the Fund had the following components of distributable earnings at May 31, 2022:
Undistributed ordinary income | $ | 443,774 | |||||
Undistributed long-term capital gains | 10,199,484 | ||||||
Unrealized appreciation | 117,857,934 | ||||||
The tax status of distributions paid during the fiscal years ended May 31, 2022 and 2021 were as follows:
2022 | 2021 | ||||||||||
Dividends from ordinary income | $ | 2,705,357 | $ | 588,423 | |||||||
Distributions from long-term capital gains | 7,173,799 | 72,684 | |||||||||
20
FPA QUEENS ROAD SMALL CAP VALUE FUND
NOTES TO FINANCIAL STATEMENTS (Continued)
The Fund utilizes the provisions of federal income tax laws that provide for the carryforward of capital losses for prior years, offsetting such losses against any future realized capital gains. The Fund did not generate or utilize capital losses during the current tax year.
The cost of investment securities held at May 31, 2022 was $380,921,184 for federal income tax purposes. Gross unrealized appreciation and depreciation for all investments at May 31, 2022, for federal income tax purposes was $124,580,926 and $6,722,992, respectively resulting in net unrealized appreciation of $117,857,934. As of and during the year ended May 31, 2022, the Fund did not have any liability for unrecognized tax benefits. The Fund recognizes interest and penalties, if any, related to unrecognized tax benefits as income tax expense in the Statement of Operations. During the year, the Fund did not incur any interest or penalties. The statute of limitations remains open for the last 3 years, once a return is filed. No examinations are in progress at this time.
During the year ended May 31, 2022, the Fund reclassified $2,807,876 from Distributable Earnings to Paid in Capital to align financial reporting to tax reporting. These permanent differences are primarily due to distributions made in connection with redemption of fund shares. Net assets were not affected by these reclassifications.
NOTE 5 — Advisory Fees and Other Affiliated Transactions
Pursuant to an investment advisory agreement (the "Advisory Agreement") with the Fund, investment advisory services are provided to the Fund by the Adviser. Effective November 1, 2020, under terms of the Advisory Agreement, the Fund pays a fee, computed daily and payable monthly at the annual rate of 0.75% of the Fund's first $50,000,000 of average daily net assets, and 0.65% of the Fund's average daily net assets over $50,000,000. The amount due to the Adviser at May 31, 2022, in the form of Accrued Advisory Fees, was $271,280.
Pursuant to a written contract (the "Expense Limitation Agreement"), effective November 1, 2020, the Adviser has agreed to reimburse the Fund for operating expenses in excess of 0.99%, 0.89% and 1.04% of average net assets for the Advisor Class, Institutional Class and Investor Class shares, respectively, of the Fund, excluding interest, taxes, brokerage fees and commissions payable by the Fund in connection with the purchase or sale of portfolio securities, fees and expenses of other funds in which the Fund invests, and extraordinary expenses, including litigation expenses, not incurred in the Fund's ordinary course of business, through February 1, 2024.
In consideration of the Adviser's agreement to limit each Fund's expenses, the Adviser may recoup amounts waived or reimbursed for a period not to exceed three years from the time in which they were waived or reimbursed. Recoupment will be made only to the extent it does not cause the Fund's ordinary operating expenses to exceed: (1) the expense limitation in effect at the time the expense was paid or absorbed; and (2) the expense limitation in effect at the time of recapture.
For the year ended May 31, 2022, the Adviser did not waive or reimburse expenses of the Fund. As of May 31, 2022 there are no expenses subject to recapture.
Sub-Advisory Agreement — Effective November 1, 2020, the Adviser and the Trust engaged the Sub-Adviser. For its services, the Sub-Adviser receives a sub-advisory fee from the Adviser. The Sub-Adviser served as the investment adviser to the Fund until November 1, 2020.
For the year ended May 31, 2022, the Fund paid aggregate fees and expenses of $105,117, to all Trustees who are not affiliated persons of the Adviser. Certain officers of the Fund are also officers of the Adviser.
21
FPA QUEENS ROAD SMALL CAP VALUE FUND
NOTES TO FINANCIAL STATEMENTS (Continued)
NOTE 6 — Disclosure of Fair Value Measurements
The Fund uses the following methods and inputs to establish the fair value of its assets and liabilities. Use of particular methods and inputs may vary over time based on availability and relevance as market and economic conditions evolve.
Equity securities are generally valued each day at the official closing price of, or the last reported sale price on, the exchange or market on which such securities principally are traded, as of the close of business on that day. If there have been no sales that day, equity securities are generally valued at the last available bid price. Securities that are unlisted and fixed-income and convertible securities listed on a national securities exchange for which the over-the-counter ("OTC") market more accurately reflects the securities' value in the judgment of the Fund's officers, are valued at the most recent bid price. Short-term corporate notes with maturities of 60 days or less at the time of purchase are valued at amortized cost.
Securities for which representative market quotations are not readily available or are considered unreliable by the Adviser are valued as determined in good faith under procedures adopted by the authority of the Fund's Board of Trustees. Various inputs may be reviewed in order to make a good faith determination of a security's value. These inputs include, but are not limited to, the type and cost of the security; contractual or legal restrictions on resale of the security; relevant financial or business developments of the issuer; actively traded similar or related securities; conversion or exchange rights on the security; related corporate actions; significant events occurring after the close of trading in the security; and changes in overall market conditions. Fair valuations and valuations of investments that are not actively trading involve judgment and may differ materially from valuations of investments that would have been used had greater market activity occurred.
The Fund classifies its assets based on three valuation methodologies. Level 1 values are based on quoted market prices in active markets for identical assets. Level 2 values are based on significant observable market inputs, such as quoted prices for similar assets and quoted prices in inactive markets or other market observable inputs as noted above including spreads, cash flows, financial performance, prepayments, defaults, collateral, credit enhancements, and interest rate volatility. Level 3 values are based on significant unobservable inputs that reflect the Fund's determination of assumptions that market participants might reasonably use in valuing the assets. The valuation levels are not necessarily an indication of the risk associated with investing in those securities. The following table presents the valuation levels of the Fund's investments as of May 31, 2022:
Investments | Level 1 | Level 2 | Level 3 | Total | |||||||||||||||
Common Stocks | |||||||||||||||||||
Life Science Equipment | $ | 36,855,998 | — | — | $ | 36,855,998 | |||||||||||||
Banks | 33,538,240 | — | — | 33,538,240 | |||||||||||||||
Information Technology Services | 33,029,308 | — | — | 33,029,308 | |||||||||||||||
P&C Insurance | 32,083,842 | — | — | 32,083,842 | |||||||||||||||
Oil & Gas Services & Equipment | 31,494,219 | — | — | 31,494,219 | |||||||||||||||
Industrials | 31,005,405 | — | — | 31,005,405 | |||||||||||||||
Semiconductor Devices | 30,308,563 | — | — | 30,308,563 | |||||||||||||||
Apparel, Footwear & Accessory Design | 29,105,174 | — | — | 29,105,174 | |||||||||||||||
Technology Distributors | 25,958,151 | — | — | 25,958,151 | |||||||||||||||
Communications Equipment | 15,729,536 | — | — | 15,729,536 | |||||||||||||||
22
FPA QUEENS ROAD SMALL CAP VALUE FUND
NOTES TO FINANCIAL STATEMENTS (Continued)
Investments | Level 1 | Level 2 | Level 3 | Total | |||||||||||||||
Industrial Distribution & Rental | $ | 14,788,647 | — | — | $ | 14,788,647 | |||||||||||||
Packaged Food | 13,393,753 | — | — | 13,393,753 | |||||||||||||||
Cement & Aggregates | 12,598,317 | — | — | 12,598,317 | |||||||||||||||
Application Software | 10,206,477 | — | — | 10,206,477 | |||||||||||||||
Other Wholesalers | 7,658,281 | — | — | 7,658,281 | |||||||||||||||
Aircraft & Parts | 7,552,596 | — | — | 7,552,596 | |||||||||||||||
Publishing & Broadcasting | 7,284,911 | — | — | 7,284,911 | |||||||||||||||
Financials | 6,895,350 | — | — | 6,895,350 | |||||||||||||||
Agricultural Machinery | 6,884,421 | — | — | 6,884,421 | |||||||||||||||
Health Care Supply Chain | 6,737,595 | — | — | 6,737,595 | |||||||||||||||
Flow Control Equipment | 6,010,082 | — | — | 6,010,082 | |||||||||||||||
Basic & Diversified Chemicals | 5,386,498 | — | — | 5,386,498 | |||||||||||||||
Real Estate Services | 5,349,339 | — | — | 5,349,339 | |||||||||||||||
Containers & Packaging | 5,143,774 | — | — | 5,143,774 | |||||||||||||||
Retailing | 4,415,128 | — | — | 4,415,128 | |||||||||||||||
Electrical Components | 3,369,828 | — | — | 3,369,828 | |||||||||||||||
Other Commercial Services | 1,758,614 | — | — | 1,758,614 | |||||||||||||||
Internet Media | 1,292,636 | — | — | 1,292,636 | |||||||||||||||
Insurance Brokers | 30,423 | — | — | 30,423 | |||||||||||||||
Preferred Stocks | |||||||||||||||||||
Industrials | 170,806 | — | — | 170,806 | |||||||||||||||
Short-Term Investments | — | $ | 72,743,206 | — | 72,743,206 | ||||||||||||||
$ | 426,035,912 | $ | 72,743,206 | — | $ | 498,779,118 | |||||||||||||
Transfers of investments between different levels of the fair value hierarchy are recorded at fair value as of the end of the reporting period. There were no significant transfers into or out of Level 3 during the year ended May 31, 2022.
The Fund did not hold derivatives as of May 31, 2022.
NOTE 7 — Capital Stock
| Year Ended May 31, 2022 | Year Ended May 31, 2021 | ||||||||||||||||||
Shares | Amount | Shares | Amount | ||||||||||||||||
Capital Stock sold | |||||||||||||||||||
Advisor Class | 1,511,191 | $ | 53,586,768 | 21,443 | (a) | $ | 732,456 | (a) | |||||||||||
Institutional Class | 3,449,230 | 123,162,592 | 8,838,853 | (a)(b) | 258,878,817 | (a)(b) | |||||||||||||
Investor Class | 778,313 | 27,425,007 | 2,807,550 | 83,161,780 | |||||||||||||||
23
FPA QUEENS ROAD SMALL CAP VALUE FUND
NOTES TO FINANCIAL STATEMENTS (Continued)
| Year Ended May 31, 2022 | Year Ended May 31, 2021 | ||||||||||||||||||
Shares | Amount | Shares | Amount | ||||||||||||||||
| Issued to shareholders upon reinvestment of dividends and distributions | |||||||||||||||||||
Advisor Class | 25,116 | $ | 878,550 | 3 | (a) | $ | 93 | (a) | |||||||||||
Institutional Class | 186,968 | 6,543,877 | 9 | (a) | 272 | (a) | |||||||||||||
Investor Class | 42,924 | 1,504,485 | 15,010 | 444,133 | |||||||||||||||
Capital Stock repurchased | |||||||||||||||||||
Advisor Class | (401,111 | ) | (14,066,184 | ) | (1,080 | )(a) | (37,889 | )(a) | |||||||||||
Institutional Class | (1,067,545 | ) | (37,705,116 | ) | (338,656 | )(a) | (11,616,122 | )(a) | |||||||||||
Investor Class | (3,858,286 | ) | (137,347,649 | ) | (2,832,937 | ) | (89,315,021 | ) | |||||||||||
Change in Capital Stock outstanding | 666,800 | $ | 23,982,330 | 8,510,195 | $ | 242,248,519 | |||||||||||||
(a) The Advisor Class and Institutional Class commenced operations on December 1, 2020. The data shown reflects operations for the period December 1, 2020 to May 31, 2021.
(b) Includes $213,011,178 of paid-in-capital received from a transfer of an affiliated equity fund effective as of the close of business on January 29, 2021. The total value received of $213,011,178 from this non-taxable event represented $198,375,281 in securities cost, $14,795,613 in net unrealized appreciation, and $159,716 in liabilities less other assets in exchange for 6,977,887 Institutional Class shares at the time of the transfer.
24
FPA QUEENS ROAD SMALL CAP VALUE FUND
REPORT OF INDEPENDENT REGISTERED
PUBLIC ACCOUNTING FIRM
TO THE SHAREHOLDERS AND
BOARD OF TRUSTEES OF FPA QUEENS ROAD SMALL CAP VALUE FUND
Opinion on the Financial Statements
We have audited the accompanying statements of assets and liabilities of FPA Queens Road Small Cap Value Fund (the "Fund") (one of the funds constituting Bragg Capital Trust (the "Trust")), including the schedule of investments, as of May 31, 2022, the related statement of operations for the year then ended, the statement of changes in net assets and financial highlights for each of the two years in the period then ended, and the related notes (collectively referred to as the "financial statements"). The financial highlights for the years ended May 31, 2018, May 31, 2019 and May 31, 2020 were audited by another independent registered public accounting firm whose report, dated July 30, 2020, expressed an unqualified opinion on those financial highlights. In our opinion, the financial statements present fairly, in all material respects, the financial position of the Fund (one of the funds constituting Bragg Capital Trust) at May 31, 2022, the results of their operations for the year then ended, and changes in net assets and financial highlights for each of the two years in the period then ended, in conformity with U.S. generally accepted accounting principles.
Basis for Opinion
These financial statements are the responsibility of the Trust's management. Our responsibility is to express an opinion on the Fund's financial statements based on our audits. We are a public accounting firm registered with the Public Company Accounting Oversight Board (United States) ("PCAOB") and are required to be independent with respect to the Trust in accordance with the U.S. federal securities laws and the applicable rules and regulations of the Securities and Exchange Commission and the PCAOB.
We conducted our audits in accordance with the standards of the PCAOB. Those standards require that we plan and perform the audit to obtain reasonable assurance about whether the financial statements are free of material misstatement, whether due to error or fraud. The Trust is not required to have, nor were we engaged to perform, an audit of the Trust's internal control over financial reporting. As part of our audits, we are required to obtain an understanding of internal control over financial reporting, but not for the purpose of expressing an opinion on the effectiveness of the Trust's internal control over financial reporting. Accordingly, we express no such opinion.
Our audits included performing procedures to assess the risks of material misstatement of the financial statements, whether due to error or fraud, and performing procedures that respond to those risks. Such procedures included examining, on a test basis, evidence regarding the amounts and disclosures in the financial statements. Our procedures included confirmation of securities owned as of May 31, 2022, by correspondence with the custodian and brokers. Our audits also included evaluating the accounting principles used and significant estimates made by management, as well as evaluating the overall presentation of the financial statements. We believe that our audits provide a reasonable basis for our opinion.

We have served as the auditor of one or more FPA investment companies since 2018.
Los Angeles, CA
July 28, 2022
25
FPA QUEENS ROAD SMALL CAP VALUE FUND
SHAREHOLDER EXPENSE EXAMPLE
May 31, 2022 (Unaudited)
Fund Expenses
Mutual fund shareholders generally incur two types of costs: (1) transaction costs, and (2) ongoing costs, including advisory and administrative fees; shareholder service fees; and other Fund expenses. The Example is intended to help you understand your ongoing costs (in dollars) of investing in the Fund and to compare these costs with the ongoing costs of investing in other mutual funds. The Example is based on an investment of $1,000 invested at the beginning of the year and held for the entire year.
Actual Expenses
The information in the table under the heading "Actual Performance" provides information about actual account values and actual expenses. You may use the information in this column, together with the amount you invested, to estimate the expenses that you paid over the period. Simply divide your account value by $1,000 (for example, an $8,600 account value divided by $1,000 = 8.6), then multiply the result by the number in the first column in the row entitled "Expenses Paid During Period" to estimate the expenses you paid on your account during this period.
Hypothetical Example for Comparison Purposes
The information in the table under the heading "Hypothetical Performance (5% return before expenses)" provides information about hypothetical account values and hypothetical expenses based on the Fund's actual expense ratio and an assumed rate of return of 5% per year before expenses, which is not the Fund's actual return. The hypothetical account values and expenses may not be used to estimate the actual ending account balance or expenses you paid for the period. You may use this information to compare the ongoing costs of investing in the Fund and other funds. To do so, compare this 5% hypothetical example with the 5% hypothetical examples that appear in the shareholder reports of other funds.
Please note that the expenses shown in the table are meant to highlight your ongoing costs only and do not reflect any transactional costs. Therefore, the information under the heading "Hypothetical Performance (5% return before expenses)" is useful in comparing ongoing costs only, and will not help you determine the relative total costs of owning different funds. In addition, if these transactional costs were included, your costs would have been higher. Even though the Fund does not charge transaction fees, if you purchase shares through a broker, the broker may charge you a fee. You should evaluate other mutual funds' transaction fees and any applicable broker fees to assess the total cost of ownership for comparison purposes.
Actual Performance | Hypothetical Performance (5% return before expenses) | ||||||||||
Advisor Class | |||||||||||
Beginning Account Value November 30, 2021 | $ | 1,000.00 | $ | 1,000.00 | |||||||
Ending Account Value May 31, 2022 | $ | 963.50 | $ | 1,019.90 | |||||||
Expenses Paid During Period(a) | $ | 4.94 | $ | 5.09 | |||||||
Institutional Class | |||||||||||
Beginning Account Value November 30, 2021 | $ | 1,000.00 | $ | 1,000.00 | |||||||
Ending Account Value May 31, 2022 | $ | 964.70 | $ | 1,020.79 | |||||||
Expenses Paid During Period(b) | $ | 4.07 | $ | 4.18 | |||||||
26
FPA QUEENS ROAD SMALL CAP VALUE FUND
SHAREHOLDER EXPENSE EXAMPLE (Continued)
May 31, 2022 (Unaudited)
Actual Performance | Hypothetical Performance (5% return before expenses) | ||||||||||
Investor Class | |||||||||||
Beginning Account Value November 30, 2021 | $ | 1,000.00 | $ | 1,000.00 | |||||||
Ending Account Value May 31, 2022 | $ | 964.20 | $ | 1,020.29 | |||||||
Expenses Paid During Period(c) | $ | 4.55 | $ | 4.68 | |||||||
(a) Expenses are equal to the class's annualized expense ratio of 1.01%, multiplied by the average account value over the period and prorated for the six-months ended May 31, 2022 (182/365 days).
(b) Expenses are equal to the class's annualized expense ratio of 0.83%, multiplied by the average account value over the period and prorated for the six-months ended May 31, 2022 (182/365 days).
(c) Expenses are equal to the class's annualized expense ratio of 0.93%, multiplied by the average account value over the period and prorated for the six-months ended May 31, 2022 (182/365 days).
27
FPA QUEENS ROAD SMALL CAP VALUE FUND
LIQUIDITY RISK MANAGEMENT PROGRAM
(Unaudited)
In compliance with SEC Rule 22e-4 under the U.S. Investment Company Act of 1940 (the "Liquidity Rule"), the Fund has adopted and implemented a written liquidity risk management program (the "Program"). The Fund's Board of Trustees have also designated the Adviser to serve as the administrator of the Program.
The Liquidity Rule requires that the Program be reasonably designed to assess and manage each Fund's liquidity risk. A Fund's "liquidity risk" is the risk that the Fund could not meet requests to redeem shares issued by the Fund without significant dilution of the remaining investors' interests in the Fund. The Program includes a number of elements that support the assessment, management and review of liquidity risk. In accordance with the Program, each Fund's liquidity risk is assessed no less frequently than annually taking into consideration a variety of factors, including, as applicable, the Fund's investment strategy and liquidity of portfolio investments, cash flow projections, and holdings of cash and cash equivalents, as well as borrowing arrangements and other funding sources. Certain factors are considered under both normal and reasonably foreseeable stressed conditions. There is no guarantee that the Program will achieve its objective under all circumstances.
Under the Program, each Fund portfolio investment is classified into one of four liquidity categories based on a determination of the number of days it is reasonably expected to take to convert the investment to cash, or sell or dispose of the investment, in current market conditions without significantly changing the investment's market value. The Program is reasonably designed to meet Liquidity Rule requirements relating to "highly liquid investment minimums" (i.e., the minimum amount of Fund net assets to be invested in highly liquid investments that are assets) and to monitor compliance with the Liquidity Rule's limitations on a Fund's investments in illiquid investments. Under the Liquidity Rule, a Fund is prohibited from acquiring any illiquid investment if, immediately after the acquisition, the Fund would have invested more than 15% of its net assets in illiquid investments that are assets.
During the period covered by this shareholder report, the Fund's Board of Trustees received reports prepared by the Adviser addressing the Program's operation and assessing the adequacy and effectiveness of its implementation for the period from November 1, 2020 to September 30, 2021. The reports concluded that the Program operated effectively, the Program had been and continued to be reasonably designed to assess and manage each Fund's liquidity risk, and the Program has been adequately and effectively implemented to monitor and respond to the Funds' liquidity developments, as applicable.
28
FPA QUEENS ROAD SMALL CAP VALUE FUND
PRIVACY POLICY
(Unaudited)
The following is the privacy notice of the mutual funds managed by First Pacific Advisors, LP ("FPA", and the mutual funds, the "FPA Funds"). A complete list of funds is provided below.
The FPA Funds take privacy seriously and consider privacy to be a fundamental aspect of its relationships with its former, prospective, and current investors. The FPA Funds are committed to maintaining the confidentiality, integrity and security of its former, current, and prospective investors' non-public personal information and other personal information. This privacy policy describes our privacy practices surrounding the collection and sharing of non-public personal information of current, former, and prospective investors.
Sources and Collection of Non-Public Personal Information
While providing investors and/or prospective investors (collectively, "investors") with products and services, the FPA Funds, and certain service providers, such as the FPA Fund's Transfer Agents and/or Administrators, may obtain non-public personal information about such investors, which may come directly from the investor or their intermediaries from sources such as: (i) account applications, subscription agreements and other forms, (ii) written, electronic or verbal correspondence, (iii) investor transactions, (iv) an investor's brokerage or financial advisory firm, financial advisor or consultant, and/or (v) from information captured on applicable websites, including information you may voluntarily provide when you subscribe to receive FPA's quarterly updates or request us to mail you information about the FPA Funds. In addition, the FPA Funds may collect additional non-public personal information from different sources, such as: (i) affiliates or their service providers; (ii) public websites or other publicly available sources such as government records; and/or (iii) from credit reporting agencies, sanctions screening databases, or from sources designed to detect and prevent fraud.
The non-public personal information collected about an investor may include: (i) identifiers and similar information such as the investor's name, address, tax identification number, birth date, driver's license number, and potentially email address and phone number (if provided); (ii) commercial information like an investment selection, beneficiary information, or transaction and account history with the FPA Funds; (iii) internet or other electronic network activity like interactions with the FPA website; and (iv) professional or employment-related information like an investor's occupation and job title.
Purpose for Collecting Non-Public Personal Information
We may collect or use all or a few of these categories of non-public personal information listed above for the following business or commercial purposes: (i) performing services on behalf of FPA or the FPA Funds, including, for example, maintaining or servicing accounts, providing customer service, processing transactions, verifying information, processing payments, or providing similar services; (ii) performing our contractual obligations, including providing updates on FPA Funds performance and other operational matters; (iii) detecting security incidents, protecting against malicious, deceptive, fraudulent, or illegal activity, including, preventing fraud and conducting "Know Your Client," anti-money laundering, terrorist financing, and conflict checks; or (iv) enabling or effecting commercial transactions, including, using bank account details to remit funds and process distributions.
Disclosure of Non-Public Personal Information
The FPA Funds do not disclose any non-public personal information provided by investors or gathered by the FPA Funds to third parties, except as required or permitted by law or as necessary for such third parties to perform their agreements with respect to the FPA Funds. Non-affiliated companies may from time to time be used to provide certain services, such as maintaining investor accounts, preparing and mailing prospectuses, reports, account statements and other information, conducting Know Your Client reviews, performing checks
29
FPA QUEENS ROAD SMALL CAP VALUE FUND
PRIVACY POLICY (Continued)
(Unaudited)
against sanctions lists, and gathering shareholder proxies. In many instances, the investor will be a client of a third party, but the FPA Funds may also provide an investor's non-public personal information and account information to the investor's respective custodian, brokerage or financial advisory firm and/or financial advisor or consultant.
Sharing Information with Third Parties
The FPA Funds reserve the right to report or disclose non-public personal information or account information to third parties in circumstances where the FPA Funds believe in good faith that disclosure is required or permitted under law, to cooperate with regulators or law enforcement authorities, to protect their rights or property, or upon reasonable request by the FPA Funds in which an investor has invested. In addition, the FPA Funds may disclose information about an investor or an investor's accounts to a third party at the investor's request or direction or with the consent of the investor.
Rights to Limited Sharing
Federal law gives you the right to limit some but not all sharing of your nonpublic personal information. We do not: (i) share non-public personal information with non-affiliates to market to you; (ii) engage in joint marketing with non-affiliates; (iii) share non-public personal information with affiliates to market to you; or (iv) share non-public personal information about your creditworthiness with affiliates.
Procedures to Safeguard Private Information
The FPA Funds will take reasonable steps and use security measures appropriate to the nature of the information and that comply with applicable laws to protect investors' non-public personal information against unauthorized access and exfiltration, acquisition, theft, or disclosure. In addition to this policy, the FPA Funds have implemented internal procedures that are designed to help guard investors' personal data. Given the nature of information security, there is no guarantee that such safeguards will always be successful.
Changes to the Privacy Policy
From time to time, the FPA Funds may update or revise this privacy policy. If there are changes to the terms of this privacy policy, documents containing the revised policy will be updated.
FPA Funds
FPA Crescent Fund, FPA New Income, Inc., FPA Flexible Fixed Income Fund, FPA U.S. Core Equity Fund, Inc., FPA Queens Road Value Fund, FPA Queens Road Small Cap Value Fund, Source Capital, Inc.
Contact Us
Questions, comments, and requests regarding this privacy policy are welcomed and should be addressed to dataprotection@fpa.com.
Revised: January 2022
30
FPA QUEENS ROAD SMALL CAP VALUE FUND
TRUSTEE AND OFFICER INFORMATION
(Unaudited)
Sandra Brown, Mark L. Lipson, Alfred E. Osborne, Jr., and Robert F. Goldrich are all Trustees of the Fund who are not "interested persons" of the Fund, as that term is defined in the 1940 Act (collectively, the "Independent Trustees"). Trustees serve until their resignation, removal or retirement. The Statement of Additional Information includes additional information about the Trustees and is available, without charge, upon request by calling (800) 982-4372.
| Name, Address(1) and Year of Birth | Position(s) Held with the Fund | Year First Elected as Trustee of the Fund | Principal Occupation(s) During the Past Five Years | Number of FPA Funds Overseen by Trustee | Other Directorships Held by Trustee During the Past Five Years | ||||||||||||||||||
Independent Trustees | |||||||||||||||||||||||
| Sandra Brown, 1955 | Trustee | 2020 | Consultant (since 2009). Formerly, CEO and President of Transamerica Financial Advisers, Inc. (1999-2009); President, Transamerica Securities Sales Corp. (1998-2009); Vice President, Bank of America Mutual Fund Administration (1990-1998). Director/Trustee of each FPA Fund (Bragg Capital Trust since 2020). | 7 | None | ||||||||||||||||||
| Robert F. Goldrich, 1962 | Trustee | 2022 | President/CFO of the Leon Levy Foundation. Director/Trustee of each FPA Fund (since 2022). | 7 | Uluru, Inc. (2015-2017) | ||||||||||||||||||
| Mark L. Lipson, 1949 | Trustee & Chairman | 2020 | Managing Member, ML2 Advisors, LLC (since 2014). Formerly Managing Director, Bessemer Trust (2007-2014) and US Trust (2003-2006); Chairman and CEO of the Northstar Mutual Funds (1993-2001); and President and CEO of the National Mutual Funds (1988-1993). Director/Trustee of each FPA Fund (Bragg Capital Trust since 2020). | 7 | None | ||||||||||||||||||
| Alfred E. Osborne, Jr., 1944 | Trustee | 2020 | Senior Associate Dean, (since July 2003), Interim Dean (July 2018-June 2019), Professor and Faculty Director, Price Center for Entrepreneurship and Innovation at the John E. Anderson School of Management at UCLA. Dr. Osborne has been at UCLA since 1972. Director/Trustee of each FPA Fund (Bragg Capital Trust since 2020). | 7 | Kaiser Aluminum, Wedbush Capital, and Waverley Capital Acquisition Corporation | ||||||||||||||||||
"Interested" Trustee(2) | |||||||||||||||||||||||
| J. Richard Atwood, 1960 | Trustee | 2020 | Director and President of FPA GP, Inc., the General Partner of the Adviser (since October 2018). Director/Trustee of each FPA Fund (Bragg Capital Trust since 2020). President of each FPA Fund (since 2015). Formerly, Managing Partner of FPA (2006-2018). | 7 | None | ||||||||||||||||||
(1) The address of each Trustee is 11601 Wilshire Boulevard, Suite 1200, Los Angeles, California 90025.
(2) "Interested person" within the meaning of the 1940 Act by virtue of their affiliation with the Fund's Adviser.
31
FPA QUEENS ROAD SMALL CAP VALUE FUND
TRUSTEE AND OFFICER INFORMATION (Continued)
(Unaudited)
Officers of the Fund. Officers of the Fund are elected annually by the Board.
| Name, Address(1) and Year of Birth | Position with Fund | Year First Elected as Officer of the Fund | Principal Occupation(s) During the Past Five Years | ||||||||||||
| J. Richard Atwood, 1960 | President | 2020 | Director and President of FPA GP, Inc., the General Partner of FPA (since 2018). Director/Trustee of each FPA Fund. (Bragg Capital Trust since 2020). Formerly, Managing Partner of FPA. | ||||||||||||
| Karen E. Richards, 1969 | Chief Compliance Officer | 2020 | Chief Compliance Officer of FPA (since 2018); and Chief Compliance Officer of each FPA Fund (since 2019, except Bragg Capital Trust since 2020). Formerly, Deputy Chief Compliance Officer of First Republic Investment Management, LLC (from 2016 to 2018), and Vice President, Senior Compliance Officer of Pacific Investment Management Company (from 2010 to 2016). | ||||||||||||
| E. Lake Setzler III, 1967 | Treasurer | 2020 | Managing Director and CFO (since 2022) of FPA. Treasurer of each FPA Fund. Formerly, Senior Vice President and Controller of the Adviser. | ||||||||||||
| Rebecca D. Gilding, 1979 | Secretary | 2021 | Vice President and Counsel, State Street Bank and Trust Company (since 2016); and Secretary of each FPA Fund (since 2019, except Bragg Capital Trust since 2020). Formerly, Assistant Vice President and Associate Counsel, Brown Brothers Harriman & Co. (2013 to 2016). | ||||||||||||
(1) The address for each Officer (except Ms. Gilding) is 11601 Wilshire Boulevard, Suite 1200, Los Angeles, California 90025. Ms. Gilding's address is State Street Bank and Trust Company, One Lincoln Street, Boston, Massachusetts 02111.
32
FPA QUEENS ROAD SMALL CAP VALUE FUND
(Unaudited)
INVESTMENT ADVISER
First Pacific Advisors, LP
11601 Wilshire Boulevard, Suite 1200
Los Angeles, CA 90025
INVESTMENT SUB-ADVISER
Bragg Financial Advisors, Inc.
1031 Caldwell Street, Suite 200
Charlotte, NC 28203
TRANSFER & SHAREHOLDER SERVICE AGENT
UMB Fund Services, Inc.
P.O. Box 2175
Milwaukee, WI 53201-2175
or
235 West Galena Street
Milwaukee, WI 53212-3948
(800) 638-3060
Advisor Class:
TICKER SYMBOL: QRSAX
CUSIP: 104826300
Institutional Class:
TICKER SYMBOL: QRSIX
CUSIP: 104826409
CUSTODIAN AND ADMINISTRATOR
State Street Bank and Trust Company
One Lincoln Street
Boston, Massachusetts 02111
DISTRIBUTOR
UMB Distribution Services, LLC
235 West Galena Street
Milwaukee, Wisconsin 53212-3948
LEGAL COUNSEL
Dechert LLP
One Bush Street, Suite 1600
San Francisco, California 94104
INDEPENDENT REGISTERED PUBLIC ACCOUNTING FIRM
Ernst & Young LLP
725 South Figueroa Street
Los Angeles, California 90017
Investor Class:
TICKER SYMBOL: QRSVX
CUSIP: 104826201
This report has been prepared for the information of shareholders of FPA QUEENS ROAD SMALL CAP VALUE FUND, and is not authorized for distribution to prospective investors unless preceded or accompanied by an effective prospectus.
A description of the policies and procedures that the Adviser uses to vote proxies related to the Fund's portfolio securities is set forth in the Fund's Statement of Additional Information which is available without charge, upon request, on the Fund's website at www.fpa.com or by calling (800) 982-4372 and on the Securities and Exchange Commission's website at www.sec.gov.
The Fund's complete proxy voting record for the 12 months ended June 30, 2021 is available without charge, upon request by calling (800) 982-4372 and on the SEC's website at www.sec.gov.
The Fund's schedule of portfolio holdings, filed the first and third quarter of the Fund's fiscal year on Form N-PORT with the SEC, is available on the SEC's website at www.sec.gov.
Additional information about the Fund is available online at www.fpa.com. This information includes, among other things, holdings, top sectors, and performance, and is updated on or about the 15th business day after the end of each quarter.

Distributor:
UMB DISTRIBUTION SERVICES, LLC
235 West Galena Street
Milwaukee, Wisconsin 53212
Annual Report
May 31, 2022
FPA Queens Road Value Fund
FPA QUEENS ROAD VALUE FUND
LETTER TO SHAREHOLDERS
Dear Shareholders:
FPA Queens Road Value Fund ("QRV Fund") returned -2.19% in fiscal year 2022 (June 1, 2021 to May 31, 2022). This compares to a 2.46% return for the S&P 500 Value Index in the same period. The QRV Fund's top five performing positions contributed 4.97% to the QRV Fund's return while the bottom five detracted 4.99%.
Fiscal Year 2022 Contributors and Detractors1
Identifier | Name | Average Weights | Contribution | GICS Sector | |||||||||||||||
Top 5 | |||||||||||||||||||
ELV-US | Anthem | 5.92 | % | 1.63 | % | Health Care | |||||||||||||
PFE-US | Pfizer | 3.83 | % | 1.21 | % | Health Care | |||||||||||||
GD-US | General Dynamics | 4.30 | % | 0.86 | % | Industrials | |||||||||||||
MRK-US | Merck | 2.82 | % | 0.77 | % | Health Care | |||||||||||||
AXP-US | American Express | 5.48 | % | 0.50 | % | Financials | |||||||||||||
4.97 | % |
| |||||||||||||||||
Bottom 5 | |||||||||||||||||||
TT-US | Trane Technologies | 4.53 | % | -1.31 | % | Industrials | |||||||||||||
TROW-US | T. Rowe Price | 3.60 | % | -1.29 | % | Financials | |||||||||||||
DIS-US | Walt Disney | 2.03 | % | -0.95 | % | Communication Services | |||||||||||||
INTC-US | Intel | 3.37 | % | -0.77 | % | Information Technology | |||||||||||||
JPM-US | JPMorgan Chase | 3.46 | % | -0.68 | % | Financials | |||||||||||||
-4.99 | % |
| |||||||||||||||||
The QRV Fund outperformed the S&P 500 Value Index, the QRV Fund's primary benchmark, for the first half of the year but underperformed in the second. Specifically, the -2.19% return for the full fiscal year was made up of a +2.74% return for the first half of the fiscal year (June 1, 2021 to November 30, 2021) and a -4.80% for the second half (December 1, 2021 to May 31, 2022). This compares to the benchmark S&P 500 Value's return of -0.85% for the first half of the fiscal year and a +3.33% for the second half, making up the full fiscal year performance of 2.46%.
Persistently high inflation, rising interest rates, and the ongoing Russia/Ukraine war weighed heavily across the markets during the first half of 2022. Over the last 6 months through June 30, 2022, the S&P 500 Value has held up considerably better than the S&P 500 Growth, outperforming by over 15%.
1 Reflects the top five contributors and detractors to the Fund's performance based on contribution to return for the quarter. Contribution is presented gross of investment management fees, transactions costs, and Fund operating expenses, which if included, would reduce the returns presented. The information provided does not reflect all positions purchased, sold or recommended by FPA during the quarter. A copy of the methodology used and a list of every holding's contribution to the overall Fund's performance during the quarter is available by contacting FPA Client Service at crm@fpa.com. It should not be assumed that recommendations made in the future will be profitable or will equal the performance of the securities listed.
Past performance is no guarantee, nor is it indicative, of future results.
1
FPA QUEENS ROAD VALUE FUND
LETTER TO SHAREHOLDERS
(Continued)
Value vs. Growth in 2022

Source: Factset. Data is as of June 30, 2022.
Despite the recent out performance of value companies, we believe large cap value stocks still remain more attractive than their growth counterparts.
The QRV Fund's performance versus the S&P 500 Value Index was negatively impacted by not having exposure to the energy sector, which was up about 70% during the fiscal year. We typically seek to avoid commodity exposure as we have little ability to predict commodity prices. Furthermore, we think the energy sector typically lacks pricing power and has a poor capital allocation track record. In addition, the Fund's industrial securities hurt performance, most notably as Trane Technologies, our largest negative contributor for the year, fell sharply.
We will continue to diligently seek attractively priced larger-cap companies that are in sound financial condition, led by strong management teams, and operating in growing industries, while remaining mindful of our long-term focus of limiting the permanent impairment of capital.
Respectfully,

Steve Scruggs
Portfolio Manager
July 14, 2022
2
FPA QUEENS ROAD VALUE FUND
LETTER TO SHAREHOLDERS
(Continued)
Important Disclosures
This update is for informational and discussion purposes only and does not constitute, and should not be construed as, an offer or solicitation for the purchase or sale of any securities, products or services discussed, and neither does it provide investment advice. Any such offer or solicitation shall only be made pursuant to the respective FPA Queens Road Fund's ("QR Funds") Prospectus, which supersedes the information contained herein in its entirety. This Commentary does not constitute an investment management agreement or offering circular.
The statements contained herein reflect the opinions and views of the portfolio managers as of the date written, is subject to change without notice, and may be forward-looking and/or based on current expectations, projections, and/or information currently available. Such information may not be accurate over the long-term. These views may differ from other portfolio managers and analysts of the firm as a whole, and are not intended to be a forecast of future events, a guarantee of future results or investment advice.
Portfolio composition will change due to ongoing management of the QR Funds. References to individual securities or sectors are for informational purposes only and should not be construed as recommendations by the QR Funds, the portfolio manager, the Adviser, the Sub-Adviser or the distributor. It should not be assumed that future investments will be profitable or will equal the performance of the security or sector examples discussed. The portfolio holdings as of the most recent quarter-end may be obtained at www.fpa.com.
Future events or results may vary significantly from those expressed and are subject to change at any time in response to changing circumstances and industry developments. The information and data contained herein has been prepared from sources believed reliable, but the accuracy and completeness of the information cannot be guaranteed and is not a complete summary or statement of all available data.
The information contained herein is not complete, may change, and is subject to, and is qualified in its entirety by, the more complete disclosures, risk factors, and other information contained in the respective QR Fund's Prospectus and Statement of Additional Information. The information is furnished as of the date shown. No representation is made with respect to its completeness or timeliness. The information is not intended to be, nor shall it be construed as, investment advice or a recommendation of any kind.
Certain statements contained in this presentation may be forward-looking and/or based on current expectations, projections, and information currently available. Actual events or results may differ from materially those we anticipate, or the actual performance of any investments described herein may differ from those reflected or contemplated in such forward-looking statements, due to various risks and uncertainties. We cannot assure future results and disclaim any obligation to update or alter any forward-looking statements, whether as a result of new information, future events, or otherwise. Such statements may or may not be accurate over the long-term. Statistical data or references thereto were taken from sources which we deem to be reliable, but their accuracy cannot be guaranteed.
The reader is advised that the QR Funds' investment strategies include active management with corresponding changes in allocations from one period of time to the next. Therefore, any data with respect to investment allocations as of a given date is of limited use and may not be reflective of the portfolio manager's more general views with respect to proper geographic, instrument and /or sector allocations. The data is presented for indicative purposes only and, as a result, may not be relied upon for any purposes whatsoever.
3
FPA QUEENS ROAD VALUE FUND
LETTER TO SHAREHOLDERS
(Continued)
In making any investment decision, you must rely on your own examination of the QR Funds, including the risks involved in an investment. Investments mentioned herein may not be suitable for all recipients and in each case, potential investors are advised not to make any investment decision unless they have taken independent advice from an appropriately authorized advisor. An investment in any security mentioned herein does not guarantee a positive return as securities are subject to market risks, including the potential loss of principal. You should not construe the contents of this document as legal, tax, investment or other advice or recommendations.
QR Funds performance presented is calculated on a total return basis, which includes the reinvestment of all income, plus realized and unrealized gains/losses, if applicable. Unless otherwise indicated, performance results are presented on a net of fees basis and reflect the deduction of, among other things: management fees, brokerage commissions, operating and administrative expenses, and accrued performance fee/allocation, if applicable.
From inception of the QR Funds to December 31, 2004, BFA and its affiliates voluntarily absorbed certain expenses of the QR Funds and voluntarily waived its management fee. Had BFA not done this, returns would have been lower during that period. Effective January 1, 2005 through October 31, 2020, BFA charged a single unitary management fee and contractually agreed to pay all operating expenses of the QR Funds except for brokerage, taxes, interest, litigation expenses, and other extraordinary expenses.
The information provided in this presentation is based upon data existing as of the date(s) of the report and has not been audited or reviewed. While we believe the information to be accurate, it is subject in all respects to adjustments that may be made after proper review and reconciliation.
Investments, including mutual fund investments, carry risks and investors may lose principal value. Capital markets are volatile and can decline significantly in response to adverse issuer, political, regulatory, market, or economic developments. Small and mid-cap stocks involve greater risks and they can fluctuate in price more than larger company stocks. Short-selling involves increased risks and transaction costs. You risk paying more for a security than you received from its sale. Groups of stocks, such as value and growth, go in and out of favor which may cause certain funds to underperform other equity funds. The value of an individual security can be more volatile than the market as a whole and can perform differently than the value of the market as a whole.
The prices of securities held by the QR Funds may decline in response to certain events taking place around the world, including those directly involving the companies whose securities are owned by the QR Funds. Securities in the QR Fund's portfolio may underperform due to inflation (or expectations for inflation), interest rates, global demand for particular products or resources, natural disasters, pandemics, epidemics, terrorism, regulatory events and governmental or quasi-governmental actions. There is a risk that you may lose money by investing in the QR Funds.
Value style investing presents the risk that the holdings or securities may never reach their full market value because the market fails to recognize what the portfolio management team considers the true business value or because the portfolio management team has misjudged those values. In addition, value style investing may fall out of favor and underperform growth or other styles of investing during given periods.
Please refer to the respective QR Fund's Prospectus for a complete overview of the primary risks associated with each fund.
The FPA Funds are distributed by UMB Distribution Services, LLC, 235 W. Galena Street, Milwaukee, WI, 53212.
4
FPA QUEENS ROAD VALUE FUND
LETTER TO SHAREHOLDERS
(Continued)
Index / Benchmark / Category Definitions
Comparison to any index should not be relied upon as a fully accurate measure of comparison. The Fund will be less diversified than the indices noted herein and may hold non-index securities or securities that are not comparable to those contained in an index. Indices will hold positions that are not within the Fund's investment strategy. Indices are unmanaged and do not reflect any commissions or other fees and expenses which would be incurred by an investor purchasing the underlying securities and would reduce performance for an investor. An investor cannot invest directly in an index.
The S&P 500 Value Index measures value stocks using ratios of book value, earnings, and sales to price.
The Global Industries Classification Standards, or GICS®, is a common global classification standard developed by S&P Dow Jones Indices and MSCI. The GICS structure consists of 11 Sectors, 24 Industry groups, 69 Industries and 158 sub-industries.
5
FPA QUEENS ROAD VALUE FUND
LETTER TO SHAREHOLDERS
(Continued)
The discussions of Fund investments represent the views of the Fund's managers at the time of this report and are subject to change without notice. References to individual securities are for informational purposes only and should not be construed as recommendations to purchase or sell individual securities. While the Fund's managers believe that the Fund's holdings are value stocks, there can be no assurance that others will consider them as such. Further, investing in value stocks presents the risk that value stocks may fall out of favor with investors and underperform growth stocks during given periods.
FORWARD LOOKING STATEMENT DISCLOSURE
As mutual fund managers, one of our responsibilities is to communicate with shareholders in an open and direct manner. Insofar as some of our opinions and comments in our letters to shareholders are based on our current expectations, they are considered "forward-looking statements" which may or may not prove to be accurate over the long term. While we believe we have a reasonable basis for our comments and we have confidence in our opinions, actual results may differ materially from those we anticipate. You can identify forward-looking statements by words such as "believe," "expect," "may," "anticipate," and other similar expressions when discussing prospects for particular portfolio holdings and/or the markets, generally. We cannot, however, assure future results and disclaim any obligation to update or alter any forward-looking statements, whether as a result of new information, future events, or otherwise. Further, information provided in this report should not be construed as a recommendation to purchase or sell any particular security.
6
FPA QUEENS ROAD VALUE FUND
HISTORICAL PERFORMANCE
May 31, 2022 (Unaudited)
This graph illustrates the hypothetical investment of $10,000 in the Fund from May 31, 2012 to May 31, 2022. The Average Annual Total Return table and Growth of Assumed $10,000 Investment graph do not reflect the deduction of taxes that a shareholder would pay on Fund distributions or the redemption of Fund shares.
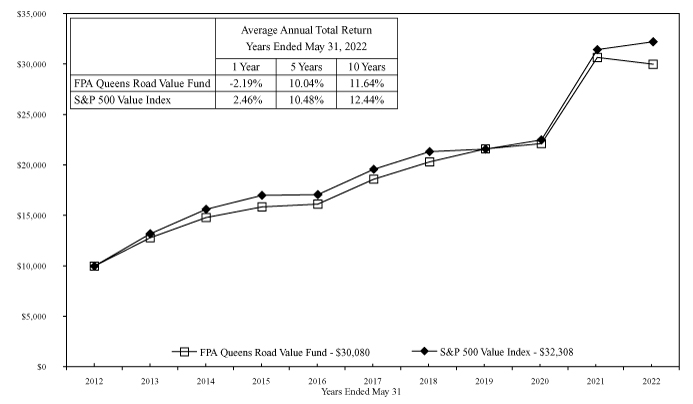
The S&P 500 Value Index measures the value stock segment of the broader S&P 500 Index using three factors: the ratios of book value, earnings, and sales to price. The indexes do not reflect any commissions, fees or other expenses of investing which would be incurred by an investor purchasing the stocks it represents. The performance of the Fund and of the Indexes is computed on a total return basis which includes reinvestment of all distributions. It is not possible to invest directly in an index.
Past performance is no guarantee of future results and current performance may be higher or lower than the performance shown. The principal value and investment return of an investment will fluctuate so that your shares, when redeemed, may be worth more or less than their original cost. The returns shown do not reflect the deduction of taxes that a shareholder would pay on Fund distributions or on the redemptions of Fund shares. Returns greater than 1 year are annualized. The Fund's total annual operating expenses are 0.65% per its current Prospectus, dated September 28, 2021. Prior to November 1, 2020, the Fund's total annual operating expenses were 0.95%. Current month-end performance data can be obtained by visiting the website at www.fpa.com or by calling toll-free, 1-800-982-4372. Information regarding the Fund's expense ratio and redemption fees can be found in the Financial Highlights section of this report. The Prospectus details the Fund's objective and policies, sales charges, and other matters of interest to prospective investors. Please read the Prospectus carefully before investing. The Prospectus may be obtained by visiting the website at www.fpa.com, by email at crm@fpa.com, toll-free by calling 1-800-982-4372 or by contacting the Fund in writing.
7
FPA QUEENS ROAD VALUE FUND
PORTFOLIO SUMMARY
May 31, 2022
Common Stocks | 94.4 | % | |||||||||
Wealth Management | 8.6 | % | |||||||||
Industrials | 8.0 | % | |||||||||
P&C Insurance | 7.2 | % | |||||||||
Managed Care | 6.7 | % | |||||||||
Communications Equipment | 5.5 | % | |||||||||
Consumer Finance | 5.4 | % | |||||||||
Electrical Components | 5.2 | % | |||||||||
Homebuilders | 5.2 | % | |||||||||
Infrastructure Software | 4.9 | % | |||||||||
Life Science Equipment | 4.8 | % | |||||||||
Large Pharmaceuticals | 4.8 | % | |||||||||
Specialty Pharmaceuticals | 3.7 | % | |||||||||
Application Software | 3.5 | % | |||||||||
Diversified Banks | 3.5 | % | |||||||||
Semiconductor Devices | 3.4 | % | |||||||||
Restaurants | 3.1 | % | |||||||||
Institutional Trust Fiduciary & Custody | 2.0 | % | |||||||||
Rail Freight | 1.9 | % | |||||||||
Industrial Distribution & Rental | 1.8 | % | |||||||||
Packaged Food | 1.7 | % | |||||||||
Entertainment Content | 1.7 | % | |||||||||
Apparel, Footwear & Accessory Design | 1.3 | % | |||||||||
Household Products | 0.5 | % | |||||||||
Short-Term Investments | 5.4 | % | |||||||||
Other Assets And Liabilities, Net | 0.2 | % | |||||||||
Net Assets | 100.0 | % | |||||||||
8
FPA QUEENS ROAD VALUE FUND
PORTFOLIO OF INVESTMENTS
May 31, 2022
COMMON STOCKS | Shares | Fair Value | |||||||||
WEALTH MANAGEMENT — 8.6% | |||||||||||
Ameriprise Financial, Inc. | 7,000 | $ | 1,933,890 | ||||||||
T Rowe Price Group, Inc. | 7,900 | 1,004,011 | |||||||||
$ | 2,937,901 | ||||||||||
INDUSTRIALS — 8.0% | |||||||||||
3M Co. | 3,600 | $ | 537,444 | ||||||||
General Dynamics Corp. | 8,000 | 1,799,280 | |||||||||
Ingersoll Rand, Inc. | 9,000 | 424,350 | |||||||||
$ | 2,761,074 | ||||||||||
P&C INSURANCE — 7.2% | |||||||||||
Berkshire Hathaway, Inc. Class A(a) | 3 | $ | 1,422,150 | ||||||||
Prudential Financial, Inc. | 10,000 | 1,062,500 | |||||||||
$ | 2,484,650 | ||||||||||
MANAGED CARE — 6.7% | |||||||||||
Anthem, Inc. | 4,500 | $ | 2,293,245 | ||||||||
$ | 2,293,245 | ||||||||||
COMMUNICATIONS EQUIPMENT — 5.5% | |||||||||||
Cisco Systems, Inc. | 30,700 | $ | 1,383,035 | ||||||||
Verizon Communications, Inc. | 10,000 | 512,900 | |||||||||
$ | 1,895,935 | ||||||||||
CONSUMER FINANCE — 5.4% | |||||||||||
American Express Co. | 11,000 | $ | 1,857,020 | ||||||||
$ | 1,857,020 | ||||||||||
ELECTRICAL COMPONENTS — 5.2% | |||||||||||
Eaton Corp. PLC | 13,000 | $ | 1,801,800 | ||||||||
$ | 1,801,800 | ||||||||||
HOMEBUILDERS — 5.2% | |||||||||||
Allegion PLC (Ireland) | 3,400 | $ | 379,610 | ||||||||
Trane Technologies PLC (Ireland) | 10,200 | 1,408,212 | |||||||||
$ | 1,787,822 | ||||||||||
INFRASTRUCTURE SOFTWARE — 4.9% | |||||||||||
Oracle Corp. | 23,395 | $ | 1,682,568 | ||||||||
$ | 1,682,568 | ||||||||||
LIFE SCIENCE EQUIPMENT — 4.8% | |||||||||||
Danaher Corp. | 6,300 | $ | 1,662,066 | ||||||||
$ | 1,662,066 | ||||||||||
LARGE PHARMACEUTICALS — 4.8% | |||||||||||
Pfizer, Inc. | 31,000 | $ | 1,644,240 | ||||||||
$ | 1,644,240 | ||||||||||
9
FPA QUEENS ROAD VALUE FUND
PORTFOLIO OF INVESTMENTS (Continued)
May 31, 2022
COMMON STOCKS — Continued | Shares | Fair Value | |||||||||
SPECIALTY PHARMACEUTICALS — 3.7% | |||||||||||
Merck & Co., Inc. | 13,820 | $ | 1,271,855 | ||||||||
$ | 1,271,855 | ||||||||||
APPLICATION SOFTWARE — 3.5% | |||||||||||
Fiserv, Inc.(a) | 12,000 | $ | 1,202,160 | ||||||||
$ | 1,202,160 | ||||||||||
DIVERSIFIED BANKS — 3.5% | |||||||||||
JPMorgan Chase & Co. | 9,000 | $ | 1,190,070 | ||||||||
$ | 1,190,070 | ||||||||||
SEMICONDUCTOR DEVICES — 3.4% | |||||||||||
Intel Corp. | 26,000 | $ | 1,154,920 | ||||||||
$ | 1,154,920 | ||||||||||
RESTAURANTS — 3.1% | |||||||||||
McDonald's Corp. | 4,225 | $ | 1,065,587 | ||||||||
$ | 1,065,587 | ||||||||||
INSTITUTIONAL TRUST FIDUCIARY & CUSTODY — 2.0% | |||||||||||
Bank of New York Mellon Corp. | 14,500 | $ | 675,845 | ||||||||
$ | 675,845 | ||||||||||
RAIL FREIGHT — 1.9% | |||||||||||
Union Pacific Corp. | 3,000 | $ | 659,340 | ||||||||
$ | 659,340 | ||||||||||
INDUSTRIAL DISTRIBUTION & RENTAL — 1.8% | |||||||||||
Raytheon Technologies Corp. | 6,600 | $ | 627,792 | ||||||||
$ | 627,792 | ||||||||||
PACKAGED FOOD — 1.7% | |||||||||||
Mondelez International, Inc. Class A | 9,000 | $ | 572,040 | ||||||||
$ | 572,040 | ||||||||||
ENTERTAINMENT CONTENT — 1.7% | |||||||||||
Walt Disney Co.(a) | 5,151 | $ | 568,877 | ||||||||
$ | 568,877 | ||||||||||
APPAREL, FOOTWEAR & ACCESSORY DESIGN — 1.3% | |||||||||||
VF Corp. | 8,500 | $ | 428,910 | ||||||||
$ | 428,910 | ||||||||||
HOUSEHOLD PRODUCTS — 0.5% | |||||||||||
Clorox Co. | 1,200 | $ | 174,432 | ||||||||
$ | 174,432 | ||||||||||
| TOTAL COMMON STOCKS — 94.4% (Cost $11,531,514) | $ | 32,400,149 | |||||||||
10
FPA QUEENS ROAD VALUE FUND
PORTFOLIO OF INVESTMENTS (Continued)
May 31, 2022
SHORT-TERM INVESTMENTS — 5.4% | Shares | Fair Value | |||||||||
State Street Institutional Treasury Plus Money Market Fund, 0.72%(b) | 1,854,654 | $ | 1,854,654 | ||||||||
| TOTAL SHORT-TERM INVESTMENTS (Cost $1,854,654) | $ | 1,854,654 | |||||||||
| TOTAL INVESTMENTS — 99.8% (Cost $13,386,168) | $ | 34,254,803 | |||||||||
Other Assets and Liabilities, net — 0.2% | 80,556 | ||||||||||
NET ASSETS — 100.0% | $ | 34,335,359 | |||||||||
(a) Non-income producing security.
(b) Represents the 7-day effective yield as of May 31, 2022.
See accompanying Notes to Financial Statements.
11
FPA QUEENS ROAD VALUE FUND
STATEMENT OF ASSETS AND LIABILITIES
May 31, 2022
ASSETS | |||||||
Investment securities — at fair value (identified cost $11,531,514) | $ | 32,400,149 | |||||
Short-term investments — at amortized cost (maturities 60 days or less) | 1,854,654 | ||||||
Receivable for: | |||||||
Due from Advisor | 73,304 | ||||||
Dividends and interest | 48,117 | ||||||
Capital Stock sold | 27,675 | ||||||
Prepaid expenses and other assets | 4,232 | ||||||
Total assets | 34,408,131 | ||||||
LIABILITIES | |||||||
Payable for: | |||||||
Capital Stock repurchased | 3,947 | ||||||
Accrued expenses and other liabilities | 68,825 | ||||||
Total liabilities | 72,772 | ||||||
NET ASSETS | $ | 34,335,359 | |||||
SUMMARY OF SHAREHOLDERS' EQUITY | |||||||
| Capital Stock — par value $0.01 per share; unlimited authorized shares; 1,408,714 outstanding shares | $ | 14,087 | |||||
Additional Paid-in Capital | 12,932,582 | ||||||
Distributable earnings | 21,388,690 | ||||||
NET ASSETS | $ | 34,335,359 | |||||
NET ASSET VALUE | |||||||
Offering and redemption price per share | $ | 24.37 | |||||
See accompanying Notes to Financial Statements.
12
FPA QUEENS ROAD VALUE FUND
STATEMENT OF OPERATIONS
For the Year Ended May 31, 2022
INVESTMENT INCOME | |||||||
Dividends | $ | 695,812 | |||||
Interest | 2,172 | ||||||
Total investment income | 697,984 | ||||||
EXPENSES | |||||||
Advisory fees | 373,991 | ||||||
Legal fees | 105,316 | ||||||
Trustee fees and expenses | 81,701 | ||||||
Transfer agent fees and expenses | 57,494 | ||||||
Filing fees | 52,545 | ||||||
Reports to shareholders | 39,194 | ||||||
Audit and tax services fees | 18,680 | ||||||
Administrative services fees | 18,304 | ||||||
Other professional fees | 5,246 | ||||||
Custodian fees | 3,512 | ||||||
Other | 11,797 | ||||||
Total expenses | 767,780 | ||||||
Reimbursement from Adviser | (511,891 | ) | |||||
Net expenses | 255,889 | ||||||
Net investment income | 442,095 | ||||||
NET REALIZED AND UNREALIZED GAIN (LOSS) | |||||||
Net realized gain on: | |||||||
Investments | 4,037,407 | ||||||
Net change in unrealized appreciation (depreciation) of: | |||||||
Investments | (5,068,156 | ) | |||||
Net realized and unrealized loss | (1,030,749 | ) | |||||
NET DECREASE IN NET ASSETS RESULTING FROM OPERATIONS | $ | (588,654 | ) | ||||
See accompanying Notes to Financial Statements.
13
FPA QUEENS ROAD VALUE FUND
STATEMENTS OF CHANGES IN NET ASSETS
| Year Ended May 31, 2022 | Year Ended May 31, 2021 | ||||||||||
INCREASE (DECREASE) IN NET ASSETS | |||||||||||
Operations: | |||||||||||
Net investment income | $ | 442,095 | $ | 584,817 | |||||||
Net realized gain | 4,037,407 | 3,917,499 | |||||||||
Net change in unrealized appreciation (depreciation) | (5,068,156 | ) | 7,967,599 | ||||||||
| Net increase (decrease) in net assets resulting from operations | (588,654 | ) | 12,469,915 | ||||||||
Distributions to shareholders | (6,393,788 | ) | (2,406,390 | ) | |||||||
Capital Stock transactions: | |||||||||||
Proceeds from Capital Stock sold | 4,030,264 | 1,795,576 | |||||||||
| Proceeds from shares issued to shareholders upon reinvestment of dividends and distributions | 6,327,612 | 158,999 | |||||||||
Cost of Capital Stock repurchased | (10,974,978 | ) | (4,662,855 | ) | |||||||
Net decrease from Capital Stock transactions | (617,102 | ) | (2,708,280 | ) | |||||||
Total change in net assets | (7,599,544 | ) | 7,355,245 | ||||||||
NET ASSETS | |||||||||||
Beginning of Year | 41,934,903 | 34,579,658 | |||||||||
End of Year | $ | 34,335,359 | $ | 41,934,903 | |||||||
CHANGE IN CAPITAL STOCK OUTSTANDING | |||||||||||
Shares of Capital Stock sold | 133,385 | 69,863 | |||||||||
| Shares issued to shareholders upon reinvestment of dividends and distributions | 240,502 | 6,430 | |||||||||
Shares of Capital Stock repurchased | (400,933 | ) | (181,032 | ) | |||||||
Change in Capital Stock outstanding | (27,046 | ) | (104,739 | ) | |||||||
See accompanying Notes to Financial Statements.
14
FPA QUEENS ROAD VALUE FUND
FINANCIAL HIGHLIGHTS
Selected Data for Each Share of Capital Stock Outstanding Throughout Each Year
Year Ended May 31, | |||||||||||||||||||||||
2022 | 2021 | 2020(a) | 2019(a) | 2018(a) | |||||||||||||||||||
Per share operating performance: | |||||||||||||||||||||||
Net asset value at beginning of year | $ | 29.21 | $ | 22.45 | $ | 22.67 | $ | 22.79 | $ | 21.69 | |||||||||||||
Income from investment operations: | |||||||||||||||||||||||
Net investment income(b) | 0.32 | 0.39 | 0.43 | 0.35 | 0.33 | ||||||||||||||||||
| Net realized and unrealized gain (loss) on investment securities | (0.63 | ) | 7.99 | 0.20 | 0.94 | 1.70 | |||||||||||||||||
Total from investment operations | (0.31 | ) | 8.38 | 0.63 | 1.29 | 2.03 | |||||||||||||||||
Less distributions: | |||||||||||||||||||||||
Dividends from net investment income | (0.37 | ) | (0.48 | ) | (0.37 | ) | (0.34 | ) | (0.29 | ) | |||||||||||||
| Distributions from net realized capital gains | (4.16 | ) | (1.14 | ) | (0.48 | ) | (1.07 | ) | (0.64 | ) | |||||||||||||
Total distributions | (4.53 | ) | (1.62 | ) | (0.85 | ) | (1.41 | ) | (0.93 | ) | |||||||||||||
Net asset value at end of year | $ | 24.37 | $ | 29.21 | $ | 22.45 | $ | 22.67 | $ | 22.79 | |||||||||||||
Total investment return(c) | (2.19 | )% | 38.62 | % | 2.41 | % | 6.36 | % | 9.25 | % | |||||||||||||
Ratios/supplemental data: | |||||||||||||||||||||||
Net assets, end of year (in 000's) | $ | 34,335 | $ | 41,935 | $ | 34,580 | $ | 39,423 | $ | 42,780 | |||||||||||||
Ratio of expenses to average net assets: | |||||||||||||||||||||||
Before reimbursement from Adviser | 1.95 | % | 1.43 | % | 0.95 | % | 0.95 | % | 0.95 | % | |||||||||||||
After reimbursement from Adviser | 0.65 | % | 0.77 | %(d) | 0.95 | % | 0.95 | % | 0.95 | % | |||||||||||||
| Ratio of net investment income to average net assets: | |||||||||||||||||||||||
Before reimbursement from Adviser | (0.18 | )% | 0.89 | % | 1.84 | % | 1.52 | % | 1.43 | % | |||||||||||||
After reimbursement from Adviser | 1.12 | % | 1.55 | % | 1.84 | % | 1.52 | % | 1.43 | % | |||||||||||||
Portfolio turnover rate | 4 | % | — | 1 | % | 1 | % | — | |||||||||||||||
(a) Audits performed for the fiscal years indicated by the Fund's previous auditor, Cohen & Company, Ltd.
(b) Per share amount is based on average shares outstanding.
(c) Return is based on net asset value per share, adjusted for reinvestment of distributions, and does not reflect deduction of the sales charge.
(d) Effective November 1, 2020, the Adviser has contractually agreed to limit the annual fund operating expenses to 0.65%. Prior to November 1, 2020, the Fund had a unitary fee structure that limited annual operating expenses to 0.95%.
See accompanying Notes to Financial Statements.
15
FPA QUEENS ROAD VALUE FUND
NOTES TO FINANCIAL STATEMENTS
May 31, 2022
NOTE 1 — Significant Accounting Policies
The FPA Queens Road Value Fund (the "Fund"), is a diversified managed portfolio of Bragg Capital Trust (the "Trust"), which is registered under the Investment Company Act of 1940, as amended (the "1940 Act"), as an open-end management company. The Fund's investment objective is to seek long-term capital growth. The Fund invests primarily in common stocks which are believed by First Pacific Advisors, L.P. (the "Adviser") and Bragg Financial Advisors, Inc. (the "Sub-Adviser") to be undervalued and have good prospects for capital appreciation. The following is a summary of significant accounting policies consistently followed by the Fund in the preparation of its financial statements.
A. Security Valuation
The Fund's investments are reported at fair value as defined by accounting principles generally accepted in the United States of America, ("U.S. GAAP"). The Fund generally determines its net asset value as of approximately 4:00 p.m. New York time each day the New York Stock Exchange is open. Further discussion of valuation methods, inputs and classifications can be found under Disclosure of Fair Value Measurements.
B. Securities Transactions and Related Investment Income
Securities transactions are accounted for on the date the securities are purchased or sold. Dividend income and distributions to shareholders are recorded on the ex-dividend date. Interest income and expenses are recorded on an accrual basis. Market discounts and premiums on fixed income securities are amortized over the expected life of the securities using effective interest rate method. Realized gains or losses are based on the specific identification method. The books and records of the Fund are maintained in U.S. dollars as follows: (1) the foreign currency fair value of investment securities, and other assets and liabilities stated in foreign currencies, are translated using the daily spot rate; and (2) purchases, sales, income and expenses are translated at the rate of exchange prevailing on the respective dates of such transactions. The resultant exchange gains and losses are included in net realized or net unrealized gain (loss) in the statement of operations.
C. Use of Estimates
The preparation of the financial statements in accordance with U.S. GAAP requires management to make estimates and assumptions that affect the amounts reported. Actual results could differ from those estimates.
NOTE 2 — Risk Considerations
Investing in the Fund may involve certain risks including, but not limited to, those described below.
Market Risk: Because the values of the Fund's investments will fluctuate with market conditions, so will the value of your investment in the Fund. You could lose money on your investment in the Fund or the Fund could underperform other investments.
Common Stocks and Other Securities: The prices of common stocks and other securities held by the Fund may decline in response to certain events taking place around the world, including; those directly involving companies whose securities are owned by the Fund; conditions affecting the general economy; overall market changes; local, regional or global political, social or economic instability; and currency, interest rate and commodity price fluctuations. In addition, the emphasis on a value-oriented investment approach by the Fund's Sub-Adviser generally results in the Fund's portfolio being invested primarily in medium or smaller sized companies. Smaller companies may be subject to a greater degree of change in earnings and business prospects than larger, more established companies, and smaller companies are often more reliant on key products or
16
FPA QUEENS ROAD VALUE FUND
NOTES TO FINANCIAL STATEMENTS (Continued)
personnel than larger companies. Also, securities of smaller companies are traded in lower volumes than those issued by larger companies and may be more volatile than those of larger companies. The Fund's foreign investments are subject to additional risks such as, foreign markets could go down or prices of the Fund's foreign investments could go down because of unfavorable changes in foreign currency exchange rates, foreign government actions, social, economic or political instability or other factors that can adversely affect investments in foreign countries. These factors can also make foreign securities less liquid, more volatile and harder to value than U.S. securities. In light of these characteristics of smaller companies and their securities, the Fund may be subjected to greater risk than that assumed when investing in the equity securities of larger companies.
Many countries have experienced outbreaks of infectious illnesses in recent decades, including swine flu, avian influenza, SARS and, more recently, COVID-19. The global outbreak of COVID-19 in early 2020 has resulted in various disruptions, including travel and border restrictions, quarantines, supply chain disruptions, lower consumer demand and general market uncertainty. The full effects, duration and costs of the COVID-19 pandemic are impossible to predict, and the circumstances surrounding the COVID-19 pandemic will continue to evolve, including the risk of future increased rates of infection due to low vaccination rates and/or the lack of effectiveness of current vaccines against new variants. Similar consequences could arise as a result of the spread of other infectious diseases. Management will continue to monitor the impact COVID-19 has on the Fund and reflect the consequences as appropriate in the Fund's accounting and financial reporting.
NOTE 3 — Purchases and Sales of Investment Securities
Cost of purchases of investment securities (excluding short-term investments) aggregated $1,306,919 for the year ended May 31, 2022. The proceeds and cost of securities sold resulting in net realized gains of $4,037,407 aggregated $7,284,958 and $3,247,551, respectively, for the year ended May 31, 2022.
NOTE 4 — Federal Income Tax
No provision for federal income tax is required because the Fund has elected to be taxed as a "regulated investment company" under the Internal Revenue Code (the "Code") and intends to maintain this qualification and to distribute each year to its shareholders, in accordance with the minimum distribution requirements of the Code, its taxable net investment income and taxable net realized gains on investments.
Distributions paid to shareholders are based on net investment income and net realized gains determined on a tax reporting basis, which may differ from financial reporting. For federal income tax purposes, the Fund had the following components of distributable earnings at May 31, 2022:
Undistributed ordinary income | $ | 194,138 | |||||
Undistributed long-term capital gains | 334,151 | ||||||
Unrealized appreciation | 20,860,401 | ||||||
The tax status of distributions paid during the fiscal years ended May 31, 2022 and 2021 were as follows:
2022 | 2021 | ||||||||||
Dividends from ordinary income | $ | 524,274 | $ | 712,321 | |||||||
Distributions from long-term capital gains | 5,869,514 | 1,694,069 | |||||||||
17
FPA QUEENS ROAD VALUE FUND
NOTES TO FINANCIAL STATEMENTS (Continued)
The Fund utilizes the provisions of federal income tax laws that provide for the carryforward of capital losses for prior years, offsetting such losses against any future realized capital gains. The Fund did not generate or utilize capital losses during the current tax year.
The cost of investment securities held at May 31, 2022 was $13,394,402 for federal income tax purposes. Gross unrealized appreciation and depreciation for all investments at May 31, 2022, for federal income tax purposes was $20,965,159 and $104,758, respectively resulting in net unrealized appreciation of $20,860,401. As of and during the year ended May 31, 2022, the Fund did not have any liability for unrecognized tax benefits. The Fund recognizes interest and penalties, if any, related to unrecognized tax benefits as income tax expense in the Statement of Operations. During the year, the Fund did not incur any interest or penalties. The statute of limitations remains open for the last 3 years, once a return is filed. No examinations are in progress at this time.
During the year ended May 31, 2022, the Fund reclassified $1,217,945 from Distributable Earnings to Paid in Capital to align financial reporting to tax reporting. These permanent differences are primarily due to distributions made in connection with redemption of fund shares. Net assets were not affected by these reclassifications.
NOTE 5 — Advisory Fees and Other Affiliated Transactions
Pursuant to an investment advisory agreement (the "Advisory Agreement") with the Fund, investment advisory services are provided to the Fund by the Adviser. Effective November 1, 2020, under terms of the Advisory Agreement, the Fund pays a fee, computed daily and payable monthly at the annual rate of 0.95% of the Fund's average daily net assets. The amount due from the Adviser at May 31, 2022, in the form of Accrued Advisory Fees, was $73,304.
Pursuant to a written contract (the "Expense Limitation Agreement"), effective November 1, 2020, the Adviser has agreed to reimburse the Fund for operating expenses in excess of 0.65% of average net assets of the Fund, excluding interest, taxes, brokerage fees and commissions payable by the Fund in connection with the purchase or sale of portfolio securities, fees and expenses of other funds in which the Fund invests, and extraordinary expenses, including litigation expenses, not incurred in the Fund's ordinary course of business, through October 31, 2023.
In consideration of the Adviser's agreement to limit the Fund's expenses, the Adviser may recoup amounts waived or reimbursed for a period not to exceed three years from the time in which they were waived or reimbursed. Recoupment will be made only to the extent it does not cause the Fund's ordinary operating expenses to exceed: (1) the expense limitation in effect at the time the expense was paid or absorbed; and (2) the expense limitation in effect at the time of recapture. For the years ended May 31, 2021 and May 31, 2022, the Adviser waived fees/reimbursed expenses of $249,095 and $511,891, respectively. These amounts are subject to recapture by May 31, 2024 and May 31, 2025, respectively.
Sub-Advisory Agreement — Effective November 1, 2020, the Adviser and the Trust engaged the Sub- Adviser. For its services, the Sub-Adviser receives a sub-advisory fee from the Adviser. The Sub-Adviser served as the investment adviser to the Fund until November 1, 2020.
For the year ended May 31, 2022, the Fund paid aggregate fees and expenses of $81,701, to all Trustees who are not affiliated persons of the Adviser. Certain officers of the Fund are also officers of the Adviser.
NOTE 6 — Disclosure of Fair Value Measurements
The Fund uses the following methods and inputs to establish the fair value of its assets and liabilities. Use of particular methods and inputs may vary over time based on availability and relevance as market and economic conditions evolve.
18
FPA QUEENS ROAD VALUE FUND
NOTES TO FINANCIAL STATEMENTS (Continued)
Equity securities are generally valued each day at the official closing price of, or the last reported sale price on, the exchange or market on which such securities principally are traded, as of the close of business on that day. If there have been no sales that day, equity securities are generally valued at the last available bid price. Securities that are unlisted and fixed-income and convertible securities listed on a national securities exchange for which the over-the-counter ("OTC") market more accurately reflects the securities' value in the judgment of the Fund's officers, are valued at the most recent bid price. Short-term corporate notes with maturities of 60 days or less at the time of purchase are valued at amortized cost.
Securities for which representative market quotations are not readily available or are considered unreliable by the Adviser are valued as determined in good faith under procedures adopted by the authority of the Fund's Board of Trustees. Various inputs may be reviewed in order to make a good faith determination of a security's value. These inputs include, but are not limited to, the type and cost of the security; contractual or legal restrictions on resale of the security; relevant financial or business developments of the issuer; actively traded similar or related securities; conversion or exchange rights on the security; related corporate actions; significant events occurring after the close of trading in the security; and changes in overall market conditions. Fair valuations and valuations of investments that are not actively trading involve judgment and may differ materially from valuations of investments that would have been used had greater market activity occurred.
The Fund classifies its assets based on three valuation methodologies. Level 1 values are based on quoted market prices in active markets for identical assets. Level 2 values are based on significant observable market inputs, such as quoted prices for similar assets and quoted prices in inactive markets or other market observable inputs as noted above including spreads, cash flows, financial performance, prepayments, defaults, collateral, credit enhancements, and interest rate volatility. Level 3 values are based on significant unobservable inputs that reflect the Fund's determination of assumptions that market participants might reasonably use in valuing the assets. The valuation levels are not necessarily an indication of the risk associated with investing in those securities. The following table presents the valuation levels of the Fund's investments as of May 31, 2022:
Investments | Level 1 | Level 2 | Level 3 | Total | |||||||||||||||
Common Stocks | |||||||||||||||||||
Wealth Management | $ | 2,937,901 | — | — | $ | 2,937,901 | |||||||||||||
Industrials | 2,761,074 | — | — | 2,761,074 | |||||||||||||||
P&C Insurance | 2,484,650 | — | — | 2,484,650 | |||||||||||||||
Managed Care | 2,293,245 | — | — | 2,293,245 | |||||||||||||||
Communications Equipment | 1,895,935 | — | — | 1,895,935 | |||||||||||||||
Consumer Finance | 1,857,020 | — | — | 1,857,020 | |||||||||||||||
Electrical Components | 1,801,800 | — | — | 1,801,800 | |||||||||||||||
Homebuilders | 1,787,822 | — | — | 1,787,822 | |||||||||||||||
Infrastructure Software | 1,682,568 | — | — | 1,682,568 | |||||||||||||||
Life Science Equipment | 1,662,066 | — | — | 1,662,066 | |||||||||||||||
Large Pharmaceuticals | 1,644,240 | — | — | 1,644,240 | |||||||||||||||
Specialty Pharmaceuticals | 1,271,855 | — | — | 1,271,855 | |||||||||||||||
Application Software | 1,202,160 | — | — | 1,202,160 | |||||||||||||||
Diversified Banks | 1,190,070 | — | — | 1,190,070 | |||||||||||||||
19
FPA QUEENS ROAD VALUE FUND
NOTES TO FINANCIAL STATEMENTS (Continued)
Investments | Level 1 | Level 2 | Level 3 | Total | |||||||||||||||
Semiconductor Devices | $ | 1,154,920 | — | — | $ | 1,154,920 | |||||||||||||
Restaurants | 1,065,587 | — | — | 1,065,587 | |||||||||||||||
Institutional Trust Fiduciary & Custody | 675,845 | — | — | 675,845 | |||||||||||||||
Rail Freight | 659,340 | — | — | 659,340 | |||||||||||||||
Industrial Distribution & Rental | 627,792 | — | — | 627,792 | |||||||||||||||
Packaged Food | 572,040 | — | — | 572,040 | |||||||||||||||
Entertainment Content | 568,877 | — | — | 568,877 | |||||||||||||||
Apparel, Footwear & Accessory Design | 428,910 | — | — | 428,910 | |||||||||||||||
Household Products | 174,432 | — | — | 174,432 | |||||||||||||||
Short-Term Investments | — | $ | 1,854,654 | — | 1,854,654 | ||||||||||||||
$ | 32,400,149 | $ | 1,854,654 | — | $ | 34,254,803 | |||||||||||||
Transfers of investments between different levels of the fair value hierarchy are recorded at fair value as of the end of the reporting period. There were no significant transfers into or out of Level 3 during the year ended May 31, 2022.
The Fund did not hold derivatives as of May 31, 2022.
20
FPA QUEENS ROAD VALUE FUND
REPORT OF INDEPENDENT REGISTERED
PUBLIC ACCOUNTING FIRM
TO THE SHAREHOLDERS AND
BOARD OF TRUSTEES OF FPA QUEENS ROAD VALUE FUND
Opinion on the Financial Statements
We have audited the accompanying statements of assets and liabilities of FPA Queens Road Value Fund (the "Fund") (one of the funds constituting Bragg Capital Trust (the "Trust")), including the schedule of investments, as of May 31, 2022, the related statement of operations for the year then ended, the statement of changes in net assets and financial highlights for each of the two years in the period then ended, and the related notes (collectively referred to as the "financial statements"). The financial highlights for the years ended May 31, 2018, May 31, 2019 and May 31, 2020 were audited by another independent registered public accounting firm whose report, dated July 30, 2020, expressed an unqualified opinion on those financial highlights. In our opinion, the financial statements present fairly, in all material respects, the financial position of the Fund (one of the funds constituting Bragg Capital Trust) at May 31, 2022, the results of their operations for the year then ended, and changes in net assets and financial highlights for each of the two years in the period then ended, in conformity with U.S. generally accepted accounting principles.
Basis for Opinion
These financial statements are the responsibility of the Trust's management. Our responsibility is to express an opinion on the Fund's financial statements based on our audits. We are a public accounting firm registered with the Public Company Accounting Oversight Board (United States) ("PCAOB") and are required to be independent with respect to the Trust in accordance with the U.S. federal securities laws and the applicable rules and regulations of the Securities and Exchange Commission and the PCAOB.
We conducted our audits in accordance with the standards of the PCAOB. Those standards require that we plan and perform the audit to obtain reasonable assurance about whether the financial statements are free of material misstatement, whether due to error or fraud. The Trust is not required to have, nor were we engaged to perform, an audit of the Trust's internal control over financial reporting. As part of our audits, we are required to obtain an understanding of internal control over financial reporting, but not for the purpose of expressing an opinion on the effectiveness of the Trust's internal control over financial reporting. Accordingly, we express no such opinion.
Our audits included performing procedures to assess the risks of material misstatement of the financial statements, whether due to error or fraud, and performing procedures that respond to those risks. Such procedures included examining, on a test basis, evidence regarding the amounts and disclosures in the financial statements. Our procedures included confirmation of securities owned as of May 31, 2022, by correspondence with the custodian and brokers. Our audits also included evaluating the accounting principles used and significant estimates made by management, as well as evaluating the overall presentation of the financial statements. We believe that our audits provide a reasonable basis for our opinion.

We have served as the auditor of one or more FPA investment companies since 2018.
Los Angeles, CA
July 28, 2022
21
FPA QUEENS ROAD VALUE FUND
SHAREHOLDER EXPENSE EXAMPLE
May 31, 2022 (Unaudited)
Fund Expenses
Mutual fund shareholders generally incur two types of costs: (1) transaction costs, and (2) ongoing costs, including advisory and administrative fees; shareholder service fees; and other Fund expenses. The Example is intended to help you understand your ongoing costs (in dollars) of investing in the Fund and to compare these costs with the ongoing costs of investing in other mutual funds. The Example is based on an investment of $1,000 invested at the beginning of the year and held for the entire year.
Actual Expenses
The information in the table under the heading "Actual Performance" provides information about actual account values and actual expenses. You may use the information in this column, together with the amount you invested, to estimate the expenses that you paid over the period. Simply divide your account value by $1,000 (for example, an $8,600 account value divided by $1,000 = 8.6), then multiply the result by the number in the first column in the row entitled "Expenses Paid During Period" to estimate the expenses you paid on your account during this period.
Hypothetical Example for Comparison Purposes
The information in the table under the heading "Hypothetical Performance (5% return before expenses)" provides information about hypothetical account values and hypothetical expenses based on the Fund's actual expense ratio and an assumed rate of return of 5% per year before expenses, which is not the Fund's actual return. The hypothetical account values and expenses may not be used to estimate the actual ending account balance or expenses you paid for the period. You may use this information to compare the ongoing costs of investing in the Fund and other funds. To do so, compare this 5% hypothetical example with the 5% hypothetical examples that appear in the shareholder reports of other funds.
Please note that the expenses shown in the table are meant to highlight your ongoing costs only and do not reflect any transactional costs. Therefore, the information under the heading "Hypothetical Performance (5% return before expenses)" is useful in comparing ongoing costs only, and will not help you determine the relative total costs of owning different funds. In addition, if these transactional costs were included, your costs would have been higher. Even though the Fund does not charge transaction fees, if you purchase shares through a broker, the broker may charge you a fee. You should evaluate other mutual funds' transaction fees and any applicable broker fees to assess the total cost of ownership for comparison purposes.
Actual Performance | Hypothetical Performance (5% return before expenses) | ||||||||||
Beginning Account Value November 30, 2021 | $ | 1,000.00 | $ | 1,000.00 | |||||||
Ending Account Value May 31, 2022 | $ | 952.10 | $ | 1,021.69 | |||||||
Expenses Paid During Period(a) | $ | 3.16 | $ | 3.28 | |||||||
(a) Expenses are equal to the Fund's annualized expense ratio of 0.65%, multiplied by the average account value over the period and prorated for the six-months ended May 31, 2022 (182/365 days).
22
FPA QUEENS ROAD VALUE FUND
LIQUIDITY RISK MANAGEMENT PROGRAM
(Unaudited)
In compliance with SEC Rule 22e-4 under the U.S. Investment Company Act of 1940 (the "Liquidity Rule"), the Fund has adopted and implemented a written liquidity risk management program (the "Program"). The Fund's Board of Trustees have also designated the Adviser to serve as the administrator of the Program.
The Liquidity Rule requires that the Program be reasonably designed to assess and manage each Fund's liquidity risk. A Fund's "liquidity risk" is the risk that the Fund could not meet requests to redeem shares issued by the Fund without significant dilution of the remaining investors' interests in the Fund. The Program includes a number of elements that support the assessment, management and review of liquidity risk. In accordance with the Program, each Fund's liquidity risk is assessed no less frequently than annually taking into consideration a variety of factors, including, as applicable, the Fund's investment strategy and liquidity of portfolio investments, cash flow projections, and holdings of cash and cash equivalents, as well as borrowing arrangements and other funding sources. Certain factors are considered under both normal and reasonably foreseeable stressed conditions. There is no guarantee that the Program will achieve its objective under all circumstances.
Under the Program, each Fund portfolio investment is classified into one of four liquidity categories based on a determination of the number of days it is reasonably expected to take to convert the investment to cash, or sell or dispose of the investment, in current market conditions without significantly changing the investment's market value. The Program is reasonably designed to meet Liquidity Rule requirements relating to "highly liquid investment minimums" (i.e., the minimum amount of Fund net assets to be invested in highly liquid investments that are assets) and to monitor compliance with the Liquidity Rule's limitations on a Fund's investments in illiquid investments. Under the Liquidity Rule, a Fund is prohibited from acquiring any illiquid investment if, immediately after the acquisition, the Fund would have invested more than 15% of its net assets in illiquid investments that are assets.
During the period covered by this shareholder report, the Fund's Board of Trustees received reports prepared by the Adviser addressing the Program's operation and assessing the adequacy and effectiveness of its implementation for the period from November 1, 2020 to September 30, 2021. The reports concluded that the Program operated effectively, the Program had been and continued to be reasonably designed to assess and manage each Fund's liquidity risk, and the Program has been adequately and effectively implemented to monitor and respond to the Funds' liquidity developments, as applicable.
23
FPA QUEENS ROAD VALUE FUND
PRIVACY POLICY
(Unaudited)
The following is the privacy notice of the mutual funds managed by First Pacific Advisors, LP ("FPA", and the mutual funds, the "FPA Funds"). A complete list of funds is provided below.
The FPA Funds take privacy seriously and consider privacy to be a fundamental aspect of its relationships with its former, prospective, and current investors. The FPA Funds are committed to maintaining the confidentiality, integrity and security of its former, current, and prospective investors' non-public personal information and other personal information. This privacy policy describes our privacy practices surrounding the collection and sharing of non-public personal information of current, former, and prospective investors.
Sources and Collection of Non-Public Personal Information
While providing investors and/or prospective investors (collectively, "investors") with products and services, the FPA Funds, and certain service providers, such as the FPA Fund's Transfer Agents and/or Administrators, may obtain non-public personal information about such investors, which may come directly from the investor or their intermediaries from sources such as: (i) account applications, subscription agreements and other forms, (ii) written, electronic or verbal correspondence, (iii) investor transactions, (iv) an investor's brokerage or financial advisory firm, financial advisor or consultant, and/or (v) from information captured on applicable websites, including information you may voluntarily provide when you subscribe to receive FPA's quarterly updates or request us to mail you information about the FPA Funds. In addition, the FPA Funds may collect additional non-public personal information from different sources, such as: (i) affiliates or their service providers; (ii) public websites or other publicly available sources such as government records; and/or (iii) from credit reporting agencies, sanctions screening databases, or from sources designed to detect and prevent fraud.
The non-public personal information collected about an investor may include: (i) identifiers and similar information such as the investor's name, address, tax identification number, birth date, driver's license number, and potentially email address and phone number (if provided); (ii) commercial information like an investment selection, beneficiary information, or transaction and account history with the FPA Funds; (iii) internet or other electronic network activity like interactions with the FPA website; and (iv) professional or employment-related information like an investor's occupation and job title.
Purpose for Collecting Non-Public Personal Information
We may collect or use all or a few of these categories of non-public personal information listed above for the following business or commercial purposes: (i) performing services on behalf of FPA or the FPA Funds, including, for example, maintaining or servicing accounts, providing customer service, processing transactions, verifying information, processing payments, or providing similar services; (ii) performing our contractual obligations, including providing updates on FPA Funds performance and other operational matters; (iii) detecting security incidents, protecting against malicious, deceptive, fraudulent, or illegal activity, including, preventing fraud and conducting "Know Your Client," anti-money laundering, terrorist financing, and conflict checks; or (iv) enabling or effecting commercial transactions, including, using bank account details to remit funds and process distributions.
Disclosure of Non-Public Personal Information
The FPA Funds do not disclose any non-public personal information provided by investors or gathered by the FPA Funds to third parties, except as required or permitted by law or as necessary for such third parties to perform their agreements with respect to the FPA Funds. Non-affiliated companies may from time to time be used to provide certain services, such as maintaining investor accounts, preparing and mailing prospectuses, reports, account statements and other information, conducting Know Your Client reviews, performing checks
24
FPA QUEENS ROAD VALUE FUND
PRIVACY POLICY (Continued)
(Unaudited)
against sanctions lists, and gathering shareholder proxies. In many instances, the investor will be a client of a third party, but the FPA Funds may also provide an investor's non-public personal information and account information to the investor's respective custodian, brokerage or financial advisory firm and/or financial advisor or consultant.
Sharing Information with Third Parties
The FPA Funds reserve the right to report or disclose non-public personal information or account information to third parties in circumstances where the FPA Funds believe in good faith that disclosure is required or permitted under law, to cooperate with regulators or law enforcement authorities, to protect their rights or property, or upon reasonable request by the FPA Funds in which an investor has invested. In addition, the FPA Funds may disclose information about an investor or an investor's accounts to a third party at the investor's request or direction or with the consent of the investor.
Rights to Limited Sharing
Federal law gives you the right to limit some but not all sharing of your nonpublic personal information. We do not: (i) share non-public personal information with non-affiliates to market to you; (ii) engage in joint marketing with non-affiliates; (iii) share non-public personal information with affiliates to market to you; or (iv) share non-public personal information about your creditworthiness with affiliates.
Procedures to Safeguard Private Information
The FPA Funds will take reasonable steps and use security measures appropriate to the nature of the information and that comply with applicable laws to protect investors' non-public personal information against unauthorized access and exfiltration, acquisition, theft, or disclosure. In addition to this policy, the FPA Funds have implemented internal procedures that are designed to help guard investors' personal data. Given the nature of information security, there is no guarantee that such safeguards will always be successful.
Changes to the Privacy Policy
From time to time, the FPA Funds may update or revise this privacy policy. If there are changes to the terms of this privacy policy, documents containing the revised policy will be updated.
FPA Funds
FPA Crescent Fund, FPA New Income, Inc., FPA Flexible Fixed Income Fund, FPA U.S. Core Equity Fund, Inc., FPA Queens Road Value Fund, FPA Queens Road Small Cap Value Fund, Source Capital, Inc.
Contact Us
Questions, comments, and requests regarding this privacy policy are welcomed and should be addressed to dataprotection@fpa.com.
Revised: January 2022
25
FPA QUEENS ROAD VALUE FUND
TRUSTEE AND OFFICER INFORMATION
(Unaudited)
Sandra Brown, Mark L. Lipson, Alfred E. Osborne, Jr., and Robert F. Goldrich are all Trustees of the Fund who are not "interested persons" of the Fund, as that term is defined in the 1940 Act (collectively, the "Independent Trustees"). Trustees serve until their resignation, removal or retirement. The Statement of Additional Information includes additional information about the Trustees and is available, without charge, upon request by calling (800) 982-4372.
| Name, Address(1) and Year of Birth | Position(s) Held with the Fund | Year First Elected as Trustee of the Fund | Principal Occupation(s) During the Past Five Years | Number of FPA Funds Overseen by Trustee | Other Directorships Held by Trustee During the Past Five Years | ||||||||||||||||||
Independent Trustees | |||||||||||||||||||||||
| Sandra Brown, 1955 | Trustee | 2020 | Consultant (since 2009). Formerly, CEO and President of Transamerica Financial Advisers, Inc. (1999-2009); President, Transamerica Securities Sales Corp. (1998-2009); Vice President, Bank of America Mutual Fund Administration (1990-1998). Director/Trustee of each FPA Fund (Bragg Capital Trust since 2020). | 7 | None | ||||||||||||||||||
| Robert F. Goldrich, 1962 | Trustee | 2022 | President/CFO of the Leon Levy Foundation. Director/Trustee of each FPA Fund (since 2022). | 7 | Uluru, Inc. (2015-2017) | ||||||||||||||||||
| Mark L. Lipson, 1949 | Trustee & Chairman | 2020 | Managing Member, ML2 Advisors, LLC (since 2014). Formerly Managing Director, Bessemer Trust (2007-2014) and US Trust (2003-2006); Chairman and CEO of the Northstar Mutual Funds (1993-2001); and President and CEO of the National Mutual Funds (1988-1993). Director/Trustee of each FPA Fund (Bragg Capital Trust since 2020). | 7 | None | ||||||||||||||||||
| Alfred E. Osborne, Jr., 1944 | Trustee | 2020 | Senior Associate Dean, (since July 2003), Interim Dean (July 2018-June 2019), Professor and Faculty Director, Price Center for Entrepreneurship and Innovation at the John E. Anderson School of Management at UCLA. Dr. Osborne has been at UCLA since 1972. Director/Trustee of each FPA Fund (Bragg Capital Trust since 2020). | 7 | Kaiser Aluminum, Wedbush Capital, and Waverley Capital Acquisition Corporation | ||||||||||||||||||
26
FPA QUEENS ROAD VALUE FUND
TRUSTEE AND OFFICER INFORMATION (Continued)
(Unaudited)
| Name, Address(1) and Year of Birth | Position(s) Held with the Fund | Year First Elected as Trustee of the Fund | Principal Occupation(s) During the Past Five Years | Number of FPA Funds Overseen by Trustee | Other Directorships Held by Trustee During the Past Five Years | ||||||||||||||||||
"Interested" Trustee(2) | |||||||||||||||||||||||
| J. Richard Atwood, 1960 | Trustee | 2020 | Director and President of FPA GP, Inc., the General Partner of the Adviser (since October 2018). Director/Trustee of each FPA Fund (Bragg Capital Trust since 2020). President of each FPA Fund (since 2015). Formerly, Managing Partner of FPA (2006-2018). | 7 | None | ||||||||||||||||||
(1) The address of each Trustee is 11601 Wilshire Boulevard, Suite 1200, Los Angeles, California 90025.
(2) "Interested person" within the meaning of the 1940 Act by virtue of their affiliation with the Fund's Adviser.
27
FPA QUEENS ROAD VALUE FUND
TRUSTEE AND OFFICER INFORMATION (Continued)
(Unaudited)
Officers of the Fund. Officers of the Fund are elected annually by the Board.
| Name, Address(1) and Year of Birth | Position with Fund | Year First Elected as Officer of the Fund | Principal Occupation(s) During the Past Five Years | ||||||||||||
| J. Richard Atwood, 1960 | President | 2020 | Director and President of FPA GP, Inc., the General Partner of FPA (since 2018). Director/Trustee of each FPA Fund. (Bragg Capital Trust since 2020). Formerly, Managing Partner of FPA (2006-2018). | ||||||||||||
| Karen E. Richards, 1969 | Chief Compliance Officer | 2020 | Chief Compliance Officer of FPA (since 2018); and Chief Compliance Officer of each FPA Fund (since 2019, except Bragg Capital Trust since 2020). Formerly, Deputy Chief Compliance Officer of First Republic Investment Management, LLC (from 2016 to 2018), and Vice President, Senior Compliance Officer of Pacific Investment Management Company (from 2010 to 2016). | ||||||||||||
| E. Lake Setzler III, 1967 | Treasurer | 2020 | Managing Director and CFO (since 2022) of FPA. Treasurer of each FPA Fund. Formerly, Senior Vice President and Controller of the Adviser. | ||||||||||||
| Rebecca D. Gilding, 1979 | Secretary | 2021 | Vice President and Counsel, State Street Bank and Trust Company (since 2016); and Secretary of each FPA Fund (since 2019, except Bragg Capital Trust since 2020). Formerly, Assistant Vice President and Associate Counsel, Brown Brothers Harriman & Co. (2013 to 2016). | ||||||||||||
(1) The address for each Officer (except Ms. Gilding) is 11601 Wilshire Boulevard, Suite 1200, Los Angeles, California 90025. Ms. Gilding's address is State Street Bank and Trust Company, One Lincoln Street, Boston, Massachusetts 02111.
28
FPA QUEENS ROAD VALUE FUND
(Unaudited)
INVESTMENT ADVISER
First Pacific Advisors, LP
11601 Wilshire Boulevard, Suite 1200
Los Angeles, CA 90025
INVESTMENT SUB-ADVISER
Bragg Financial Advisors, Inc.
1031 Caldwell Street, Suite 200
Charlotte, NC 28203
TRANSFER & SHAREHOLDER SERVICE AGENT
UMB Fund Services, Inc.
P.O. Box 2175
Milwaukee, WI 53201-2175
or
235 West Galena Street
Milwaukee, WI 53212-3948
(800) 638-3060
CUSTODIAN AND ADMINISTRATOR
State Street Bank and Trust Company
One Lincoln Street
Boston, Massachusetts 02111
DISTRIBUTOR
UMB Distribution Services, LLC
235 West Galena Street
Milwaukee, Wisconsin 53212-3948
LEGAL COUNSEL
Dechert LLP
One Bush Street, Suite 1600
San Francisco, California 94104
INDEPENDENT REGISTERED PUBLIC ACCOUNTING FIRM
Ernst & Young LLP
725 South Figueroa Street
Los Angeles, California 90017
This report has been prepared for the information of shareholders of FPA QUEENS ROAD VALUE FUND, and is not authorized for distribution to prospective investors unless preceded or accompanied by an effective prospectus.
A description of the policies and procedures that the Adviser uses to vote proxies related to the Fund's portfolio securities is set forth in the Fund's Statement of Additional Information which is available without charge, upon request, on the Fund's website at www.fpa.com or by calling (800) 982-4372 and on the Securities and Exchange Commission's website at www.sec.gov.
The Fund's complete proxy voting record for the 12 months ended June 30, 2021 is available without charge, upon request by calling (800) 982-4372 and on the SEC's website at www.sec.gov.
The Fund's schedule of portfolio holdings, filed the first and third quarter of the Fund's fiscal year on Form N-PORT with the SEC, is available on the SEC's website at www.sec.gov.
Additional information about the Fund is available online at www.fpa.com. This information includes, among other things, holdings, top sectors, and performance, and is updated on or about the 15th business day after the end of each quarter.
| (b) | Not Applicable. |
| Item 2. | Code of Ethics. |
| (a) | The registrant has adopted a code of ethics that applies to the registrant’s principal executive and financial officers. |
| (b) | Not applicable. |
| (c) | During the period covered by this report, there were no amendments to the provisions of the code of ethics adopted in 2(a) above. |
| (d) | During the period covered by this report, there were not any implicit or explicit waivers to the provisions of the code of ethics adopted in 2(a). |
| (e) | Not Applicable |
| (f) | A copy of the registrant’s code of ethics is filed as an exhibit to this Form N-CSR. |
| Item 3. | Audit Committee Financial Expert. |
The registrant’s board of directors has determined that Sandra Brown, who is a member of the registrant’s audit committee and board of directors, is an “audit committee financial expert” and is “independent,” as those terms are defined in this Item. This designation will not increase the designee’s duties, obligations or liability as compared to her duties, obligations or liability as a member of the audit committee and of the board of directors. This designation does not affect the duties, obligations or liability of any other member of the audit committee or the board of directors.
| Item 4. | Principal Accountant Fees and Services. |
| 2021 | 2022 | |||||||
| (a) Audit Fees | $ | 50,000 | $ | 54,500 | ||||
| (b) Audit Related Fees | $ | -0- | $ | -0- | ||||
| (c) Tax Fees1 | $ | 10,400 | $ | 12,600 | ||||
| (d) All Other Fees | $ | -0- | $ | 1,538 | ||||
| (1) | Tax fees are for the preparation of the registrant’s tax return(s). |
| (e)(1) | The audit committee shall pre-approve all audit and permissible non-audit services that the committee considers compatible with maintaining the independent auditors’ independence. The pre-approval requirement will extend to all non-audit services provided to the registrant, the adviser, and any entity controlling, controlled by, or under common control with the adviser that provides ongoing services to the registrant, if the engagement relates directly to the operations and financial reporting of the registrant; provided, however, that an engagement of the registrant’s independent auditors to perform attest services for the registrant, the adviser or its affiliates required by generally accepted auditing standards to complete the examination of the registrant’s financial statements (such as an examination conducted in accordance with Statement on Standards for Attestation Engagements Number 16, or a Successor Statement, issued by the American Institute of Certified Public Accountants), will be deem pre-approved if: |
| (i) | the registrant’s independent auditors inform the audit committee of the engagement, |
| (ii) | the registrant’s independent auditors advise the audit committee at least annually that the performance of this engagement will not impair the independent auditor’s independence with respect to the registrant, and |
| (iii) | the audit committee receives a copy of the independent auditor’s report prepared in connection with such services. The committee may delegate to one or more committee members the authority to review and pre-approve audit and permissible non-audit services. Actions taken under any such delegation will be reported to the full committee at its next meeting. |
| (e)(2) | 0% of the services provided to the registrant described in paragraphs b-d of this Item were approved by the Audit Committee pursuant to paragraph (c)(7)(i)(C) of Rule 2-01 of Regulation S-X. There were no services provided to the investment adviser or any entity controlling, controlled by or under common control with the adviser described in paragraphs (b) — (d) of this Item that were required to be pre-approved by the audit committee. |
| (f) | For the fiscal year ended May 31, 2022, if greater than 50%, specify the percentage of hours spent on the audit of the registrant’s financial statements for the most recent fiscal year that were attributed to work performed by persons who are not full-time, permanent employees of the principal accountant Ernst & Young LLP (“EY”). According to EY, such amount was below 50%; therefore disclosure item not applicable to this filing. |
| (g) | For the fiscal years ended May 31, 2022 and May 31, 2021,the aggregate non-audit fees billed by EY for services rendered to the investment advisor were $25,900 and $31,200, respectively. |
| (h) | The registrant’s Audit Committee has considered whether the provision of non-audit services that were rendered to the registrant’s investment advisor, which were not pre-approved (not requiring pre-approval), is compatible with maintaining EY’s independence. |
| (i) | Not applicable. |
| (j) | Not applicable. |
| Item 5. | Audit Committee of Listed Registrants. |
Not applicable.
| Item 6. | Investments. |
| (a) | Schedule of Investments is included as a part of the report to shareholders filed under Item 1 of this Form N-CSR. |
| (b) | Not applicable. |
| Item 7. | Disclosure of Proxy Voting Policies and Procedures for Closed-End Management Investment Companies. |
Not applicable.
| Item 8. | Portfolio Managers of Closed-End Management Investment Companies. |
Not applicable.
| Item 9. | Purchases of Equity Securities by Closed-End Management Investment Company and Affiliated Purchasers. |
Not applicable.
| Item 10. | Submission of Matters to a Vote of Security Holders. |
There have been no material changes to the procedures by which the shareholders may recommend nominees to the registrant’s board of directors.
| Item 11. | Controls and Procedures. |
| (a) | The principal executive officer and principal financial officer of the registrant have concluded that the registrant’s disclosure controls and procedures (as defined in Rule 30a-3(c) under the Investment Company Act of 1940) are effective based on their evaluation of the disclosure controls and procedures as of a date within 90 days of the filing date of this report. |
| (b) | There have been no significant changes in the registrant’s internal controls over financial reporting (as defined in Rule 30a-3(d) under the Investment Company Act of 1940) that occurred during the period covered by this report that have materially affected, or is reasonably likely to materially affect, the registrant’s internal controls over financial reporting. |
| Item 12. | Disclosure of Securities Lending Activities for Closed-End Management Investment Companies |
Not applicable.
| Item 13. | Exhibits. |
| (a)(1) | Code of ethics as applies to the registrant’s principal executive and financial officers is attached hereto. |
| (a)(2) | The certifications required by Rule 30a-2(a) under the Investment Company Act of 1940 are attached hereto. |
| (a)(3) | Not applicable. |
| (a)(4) | Not applicable. |
| (b) | The certifications required by Rule 30a-2(b) under the Investment Company Act of 1940 and Section 906 of the Sarbanes-Oxley Act of 2002 are attached hereto. |
SIGNATURES
Pursuant to the requirements of the Securities Exchange Act of 1934 and the Investment Company Act of 1940, the registrant has duly caused this report to be signed on its behalf by the undersigned, thereunto duly authorized.
| BRAGG CAPITAL TRUST | ||
| By: | /s/ J. Richard Atwood | |
| J. Richard Atwood | ||
| President (principal executive officer) | ||
| Date: September 21, 2022 | ||
Pursuant to the requirements of the Securities Exchange Act of 1934 and the Investment Company Act of 1940, this report has been signed below by the following persons on behalf of the registrant and in the capacities and on the dates indicated.
| By: | /s/ J. Richard Atwood | |
| J. Richard Atwood | ||
| President (principal executive officer) | ||
| Date: September 21, 2022 | ||
| By: | /s/ E. Lake Setzler III | |
| E. Lake Setzler III | ||
| Treasurer (principal financial officer) | ||
| Date: September 21, 2022 | ||