UNITED STATES
SECURITIES AND EXCHANGE COMMISSION
Washington, D.C. 20549
FORM N-CSR
CERTIFIED SHAREHOLDER REPORT OF REGISTERED MANAGEMENT INVESTMENT COMPANIES
Investment Company Act File Number 811-21073
Bragg Capital Trust
(Exact name of registrant as specified in charter)
1031 South Caldwell Street, Suite 200
Charlotte, NC 28203
(Address of principal executive offices) (Zip code)
1031 South Caldwell Street, Suite 200
Charlotte, NC 28203
(Name and address of agent for service)
Copies to:
JoAnn Strasser
Thompson Hine LLP
1919 M Street, NW, Suite 700
Washington DC 20036
Registrant's telephone number, including area code: (704) 714-7711
Date of fiscal year end: May 31
Date of reporting period: May 31, 2020
Item 1. Reports to Stockholders.
The following is a copy of the report transmitted to shareholders pursuant to Rule 30e-1 under the Investment Company Act of 1940, as amended.
ANNUAL REPORT
Queens Road Value Fund
Queens Road Small Cap Value Fund
Each a series of
May 31, 2020 |
Beginning on January 1, 2021, as permitted by regulations adopted by the Securities and Exchange Commission, paper copies of the Funds’ shareholder reports will no longer be sent by mail, unless you specifically request paper copies of the reports. Instead, the reports will be made available on the Funds’ website, www.queensroadfunds.com, and you will be notified by mail each time a report is posted and provided with a website link to access the report.
If you already elected to receive shareholder reports electronically, you will not be affected by this change and you need not take any action. You may elect to receive shareholder reports and other communications from the Funds’ electronically by contacting your financial intermediary (such as broker-dealer or bank) or, if you are a direct investor, by following the instructions included with paper Funds documents that have been mailed to you. You may also elect to receive all future reports in paper free of charge.
QUEENS ROAD FUNDS |
Table of Contents | |
Shareholder Letter | 2 |
Manager’s Commentary | 5 |
Performance Illustration | 8 |
Graphical Illustration | 10 |
Schedules of Investments | |
Queens Road Value Fund | 11 |
Queens Road Small Cap Value Fund | 13 |
Statements of Assets and Liabilities | 15 |
Statements of Operations | 16 |
Statements of Changes in Net Assets | 17 |
Financial Highlights | 18 |
Notes to Financial Statements | 20 |
Report of Independent Registered Public Accounting Firm | 25 |
Expense Illustration | 26 |
Additional Information | 27 |
Trustees Information | 28 |
QUEENS ROAD FUNDS
Shareholder Letter May 31, 2020 (Unaudited) |
Dear Queens Road Funds Shareholders:
After finishing 2019 with strong gains of over 31% for the S&P 500 Value Index and over 22% for the Russell 2000 Value Index, markets continued climbing higher as 2020 began. The market rout that began in late February caught everyone by surprise and was one of the most severe, fast, and unsettling in history. The pandemic caused by the coronavirus has created the most unusual circumstances of our generation with unprecedented restrictions on personal movement and economic activity. The fact that this crisis came out of the blue has contributed to the speed at which markets have reacted. Uncertainty about the health, economic and cultural impacts of the virus has contributed to its severity. Inundated by a constant deluge of doomsday headlines by the media, many investors were shellshocked as they rushed to shore up risky portfolios. As central banks and governments around the world responded with unprecedented fiscal and monetary policy actions, the market turned in late March and rallied almost as quickly as it had fallen. On the way down we saw some buying opportunities and took advantage of them; however, valuations never got broadly cheap as they had done in the 2008-2009 bear market. As we have experienced in past downturns our portfolios declined, but held up much better than our primary benchmarks and Morningstar peer groups.
As the world deals with the virus, we will continue to look for companies with strong balance sheets that are best equipped to make it through the challenges ahead and have a good chance to thrive on the other side of this crisis. We are doing so in a thoughtful, disciplined manner, adding companies with differing risk profiles to maintain an optimal level of risk in the overall portfolio.
It is hard not to worry about what might happen in terms of the spread of the virus. We all have family and friends who are older or have underlying health conditions that make them more vulnerable. It is helpful to remind ourselves that the most important thing we can do right now is so simple - keep our distance from each other and wash our hands.
It is also hard for investors to make good decisions during periods worry and uncertainty. As with our health, it is helpful to remind ourselves to keep it simple, focus on what we know, and remain disciplined in our investment process. While it is not as simple as washing our hands, we intend to remain true to our motto of being Diligent, Disciplined and Patient.
Economic Update
Five months into 2020, we are seeing record highs in daily new coronavirus cases and record highs in the NASDAQ. The effects of widespread efforts to contain the coronavirus are still reverberating throughout the economy. In late February, the US slipped into an almost instant recession as the country began to close down. Mandatory stay-at-home orders and business closures erased tens of millions of jobs in a matter of weeks. Not surprisingly, the stock market reacted negatively.
After hitting its all-time high on February 19, the S&P 500 had fallen 34% by March 23. On the news of the one-two punch of record-setting fiscal and monetary stimulus from Congress and the Fed respectively, the market turned and rallied just as dramatically. From the market bottom on March 23 through the end of May, the S&P 500 rose 36.5%. Year to date through May 31st, the S&P 500 was down 4.9%.
WHERE DO WE GO FROM HERE?
Given a spreading disease and widespread protests, it may be hard to imagine why stocks aren’t down more than they are, but the economy and stock prices are two different things. They rise and fall together over the long-term but can diverge widely over short-term periods. For investors, the question of why prices are where they are is always less important than where prices are going next. We have identified a few reasons why the market could fall again or continue to rise.
WHY STOCKS MIGHT FALL
Reason #1: Long, hard road to recovery
We are far from being out of the woods. COVID-19 cases are rising now, and some experts are saying next winter is going to be worse than what we’ve already seen. Even if we had a vaccine tomorrow, an effective treatment, or herd immunity, it would still take time to recover the economic activity and employment that we have lost year to date. The Federal Reserve Bank of Atlanta’s GDPNow estimate for the second quarter is for an economic contraction of -35.2% (seasonally adjusted annual rate) following a -5% fall in the first quarter. While May’s unemployment rate of 13.3% is down from April’s high of 14.7%, it is still above the 10% peak unemployment reached
2
QUEENS ROAD FUNDS
Shareholder Letter (Continued) |
during the financial crisis of 2008. There may be willingness in Congress to extend the additional unemployment benefits provided by the CARES Act that are set to expire at the end of July, but no final bills have been passed. If these benefits were to expire, millions of unemployed workers may struggle to meet their financial obligations, the effects of which would reverberate throughout the economy.
Reason #2: Stocks look pricey
We felt that stocks were a bit overvalued coming into 2020. Current prices for large-cap stocks are nearly back to pre-coronavirus levels and earnings will definitely be lower this year. For the full year 2020, FactSet is projecting S&P 500 earnings to fall 21.6% compared to 2019, and revenues to fall 3.9%. If stock valuations represent the sum of future expected earnings, one could argue that prices should be lower.
Reason #3: November’s election results
We had expected to spend most of 2020 talking about November’s elections, but COVID-19 and the nationwide protests about police brutality and racial inequality have stolen the spotlight. November is coming however, and media coverage will soon shift to putting virus news, racial inequality stories and any other reporting in the context of the impact on the election. If Democrats were to take control of the White House, the House of Representatives, and the Senate, we could see a roll-back of the business- and investor-friendly policies implemented by the current administration and would likely see an increase in government regulations and higher taxes.
WHY STOCKS MIGHT RISE
Reason #1: Willingness to act
Federal Reserve Chairman Jerome Powell has said the Fed will do whatever it takes to support the economy. In addition to bond purchases, the Fed created several lending facilities to support different areas of the economy. Since the end of February, the Fed’s balance sheet of bonds and loans has grown by over $3 trillion. By comparison, the Fed’s balance sheet rose by $3.6 trillion over the course of six-plus years in response to the 2008 financial crisis. Based on previous actions and statements by Fed governors, the Fed stands ready to continue to respond to any further bad economic data.
Congress also responded with record stimulus in March with the $2 trillion CARES Act. The US budget deficit likewise has grown by $1.9 trillion through May compared to $739 billion over the first five months of 2019. This enormous bill will need to be paid eventually, but the Treasury is meeting its interest payments and long-term fiscal problems have taken a back seat for now.
The $3 trillion HEROES Act has passed the House of Representatives but may get stalled in the Senate. It would include direct aid to individuals, state and local governments, and employers, as well as funding virus testing, expanding the moratorium on evictions, and other provisions.
The Fed and Congress are not likely finished in their responses to the pandemic and the resulting economic situation. Their stimulus should spur the economy throughout the recovery and beyond.
Reason #2: More effective stimulus
Compared to stimulus packages passed during the 2008 financial crisis, the recent CARES Act appears to have been more successful in terms of keeping the economy afloat. During the financial crisis, the Troubled Asset Relief Program (TARP) lent hundreds of billions of dollars to struggling banks. In turn, the banks were expected to lend the money to consumers. The only problem was that the banks were slow to do so. This time around, most of the stimulus provided by the CARES Act went directly to many of the households and businesses most in need. This allowed the money provided to enter the economy more quickly, lessening the depth of the economic decline.
Reason #3: Potential of cash on sidelines
There is another big difference between the financial crisis of 2008 and today. Coming out of the recession in 2009, the housing crisis left many homeowners saddled with mortgage balances that exceeded the value of their homes. Consumer balance sheets were in crisis. It took years for the housing market to right itself and for consumers to clean up their finances.
3
QUEENS ROAD FUNDS
SHAREHOLDER LETTER (Continued) |
Today, we do not have a similar issue of bad assets to sort out. Though more people are out of work today, the aggressive actions of Congress and the Fed have thus far provided enough support to keep consumers afloat and debt delinquencies have yet to rise dramatically. In fact, consumers are saving at above-average levels. As a result of the shut-down of the economy, consumers have been unable to go out and spend as they normally would. Bank deposits have quickly been rising. Through May, deposits at national banks rose by $2.6 trillion compared to a year earlier, a rise of over 20%. That is a lot of money sitting on the sidelines—money that could be invested, spent on travel, new cars or other consumption. If treatments or a vaccine prove to be effective for COVID-19, Americans collectively could go on an unprecedented spending spree. The Fed is unlikely to spoil the party by raising interest rates any time soon given the high level of unemployment, thus allowing the spending bonanza to last longer.

THE ANSWER: SOMEWHERE IN BETWEEN
The worst of the health crisis of the Covid-19 virus may not be over, but the worst of its economic effects may be. For starters, there probably is not enough political will to shut down the entire economy again (though sentiment could change). Additionally, we know more about the virus now than we did four months ago. We’ve learned how the virus spreads and the importance of protecting vulnerable populations. We’ve learned about the effectiveness of safe behavior including wearing masks, washing our hands and maintaining social distance—although clearly not all Americans are putting these behaviors into practice. We think we’ll see more limited and targeted shut-downs in hot spots and certainly some parts of the economy will continue to operate at well-below normal capacity. Clearly, there is a lot to worry about. The virus is very much with us and will impact the economy and markets for a long time yet. And still, people are getting back to work, companies are figuring out how to survive and prosper, and the economy is expanding again.
We are confident that companies, governments and individuals will adapt and find solutions to the problems that confront us, and things will return to normal at some point. As we continue to think about what we do and don’t know in this time of uncertainty, we are finding it helpful to turn to our disciplined investment process. We look at individual companies on a fundamental, bottom-up basis, searching for investment opportunities that provide a reasonable expected return and an adequate margin of safety. Taking a long-term view in these times of great uncertainty is certainly a challenge. Normalization of the long-term economic earnings potential of prospective investments is more difficult than ever. Sticking to our four-step process will continue to serve our shareholders well regardless of the road ahead.
We thank you for joining us as shareholders in the Queens Road Funds. As the largest shareholders in the funds, our investment committee, independent board, employees and family members are thoroughly enjoying eating our own cooking right alongside you.
Steve Scruggs, CFA | Matt DeVries, CFA |
President, Portfolio Manager | Analyst |
4
QUEENS ROAD FUNDS
Manager’s Commentary May 31, 2020 (Unaudited) |
Queens Road Value Fund Update:
For the fiscal year ended May 31, 2020, the Queens Road Value Fund returned 2.41% compared to 4.2% for the S&P500/Citigroup Value Index.
Holdings that Helped Performance
Intel Corporation (4.73% of net assets) was up 46% during the fiscal year ending 5/31/2020. The world’s largest chipmaker by revenue performed well in the face of increased competition from Advanced Micro Device and the loss of Apple’s PC chip business to Taiwan Semiconductor (approximately 5% of Intel revenue.) Growth in the company’s cloud, Internet of Things (IOT), and Artificial Intelligence markets has offset softness in its PC business. Although we are concerned with the company’s technology position relative to Taiwan Semiconductor, given the company’s customer relationships, balance sheet strength, valuation and returns on invested capital, we believe Intel remains a very attractive long-term investment.
The Clorox Company (4.52% of net assets) rose 42% during the year. This long-time holding and maker of household cleaning products, charcoal, and salad dressing benefited from increased demand and investor attention due to the Corona virus pandemic. The company, whose products can be found in 90% of US homes, competes in mature markets with its dominant brands and has been successful in steadily growing earnings (albeit slowly) though sales innovation and cost savings. Management has been successful with its focus on Return on Invested Capital and Free Cash Flow generation; however, at current price levels, the valuation given the company’s growth prospects are very close to our estimate of fair value.
Bristol-Myers Squib, Company (.86% of net assets) climbed 36% for the period. During the year, the company completed its acquisition of Celgene Corporation, positioning the company as #1 in oncology and cardiovascular medications and extending its in reach immunology and inflammation remedies. We are typically skeptical of mergers this size and this one looks attractive given the pros and cons of each company’s portfolios and pipelines assuming management can deliver with the oft-promised synergies. Management’s confidence in the future inspired them to raise the dividend by 10% during the year. We share their optimism in the prospects of the combined company.
Holdings that Hurt Performance
Prudential Financial, Inc. (1.76% of net assets) fell 30% for the year. As an investment manager and insurer with over $1.5 trillion under management, lower interest rates have negatively impacted the company’s interest rate spread, which will reduce net income. The company has worked quickly to reprice products to counter this. Management is traditionally very conservative and entered the year with a very strong balance sheet. Since the Covid virus pandemic, the company has raised additional cash, giving us extreme confidence that they will be able to manage through the current environment. Trading at less than half of book value and offering a 6.8% yield, we feel despite the adverse interest rate environment, the company remains a compelling investment opportunity.
V.F. Corporation (1.38% of net assets) was down 30% during the period. V.F. Corp. owns a portfolio of some of the world’s most well-known clothing brands, including The North Face, Vans, Timberland, and Nautica. The company has been heavily impacted by the coronavirus pandemic and expects 2nd quarter 2020 revenues to be down, yet despite this the company expects to generate over $600 million in free cash flow for the full year. Though we expect continued turbulence in the apparel industry, the company’s solid balance sheet should allow it to weather this storm and maintain its leading position.
Hewlett Packard Enterprise Company (1.30% of net assets) declined 27% for the year. This is the enterprise and storage business which was spun out of HP in 2015. The company has experienced relatively flat revenues since being spun off. We like the company’s recurring revenue model and solid balance sheet with $10 billion of liquidity. We think the company’s recent purchase of Cray, one of the world leaders in supercomputing, is a smart strategic move to increase its market share in the high-end supercomputing segment. The company has initiated a plan to right size itself and plans to invest $1.2 billion to eliminate $800 million in annual expenses by the end of 2022. We are cautiously optimistic that the company is on its way to sustainable, profitable, long-term growth.
5
QUEENS ROAD FUNDS
Manager’s Commentary (Continued) |
Queens Road Small Cap Value Fund Update:
For the fiscal year ended May 31, 2020, the Queens Road Small Cap Value Fund returned 1.89% compared to -14.69% for the Russell 2000 Value Index. As share prices dropped during the first quarter, we added to several existing portfolio holdings as valuations became attractive enough to increase their position size in the portfolio. These companies are in a broad variety of industries including utilities, industrials, health care, technology, and financials. The sharp sell-off created prices which we think will provide us with a reasonable expected return and a margin of safety in these very uncertain times.
In addition to adding broadly to existing positions, we added several new positions to the portfolio. Two companies that are worth noting are MSC Industrial, Inc. and MasTec, Inc.
MSC Industrial Direct Co, Inc. fell from $78/ share to $47 during the quarter. MSC provides industrial products and inventory management services for its clients. While economically sensitive, the highly fragmented industrial supply market is inherently broadly diversified. Although the company has a concentration in the metalworking industry, we are comfortable with the company’s broad customer base. MSC has an excellent management, a great business model, high client satisfaction, and an impressive track record. With the company’s strong balance sheet and a track record of doing a great job managing through the financial crisis of 2008-2009, we are confident it can weather this storm and thrive as the economy rebounds on the other side.
We have followed this value-added industrial distribution company for some time and used the recent market volatility to initiate an overweight position. We feel that we made an investment that has very attractive return potential while also providing us with an ample margin of safety.
MasTec, Inc. fell from $64 to $23.50 over the course of the quarter. MasTec is an infrastructure construction company with roots in the communication industry. The business has expanded and diversified over the last 13 years through organic growth and acquisitions to include oil and gas, electrical transmission, and power generation. The diversification across industries and its $8 billion backlog provides revenue visibility during this current crisis which gives us confidence that the company will be worth considerably more in three to five years than it is today. We also believe that the infrastructure bill currently being negotiated in Congress will pass and provide additional support for the company’s revenue base.
Holdings that Helped Performance
Synaptics, Inc. (3.83% of net assets) rose 141% during the year. After struggling with declining sales and profits for the previous two years, the company delivered on its strategic plan, and our patience was rewarded. Adoption of its on-cell touch solution continues to increase with the company winning more major phone programs. This higher margin business coupled with the divestiture of its Touch and Display chip business for LCD phones, which is a low-margin business, resulted in gross margin improvements for the year. Additionally, the company’s new CFO is very effectively implementing a cost rationalization program that is delivering significant savings, with more expected. The company had a disappointing two years, but we have confidence in its business model in the hands of the new management that joined last year.
Fabrinet (4.49% of net assets) gained 50% over the last 12 months. This manufacturer of complex optical components was founded in 2000 by Seagate Technologies co-founder Tom Mitchell and went public in 2010. As the 5G buildout continues to gather steam, demand for Fabrinet’s advanced manufacturing expertise continues to grow. We like the company’s focus on high-mix/low-volume components as opposed to simpler, commodity products and its expertise in design and engineering which results in long-term, profitable customer relationships. With $400 million in net cash on the balance sheet and high returns on invested capital, we remain confident in the company’s prospects.
Synnex Corp. (3.40% of net assets) returned 24% for the period. Synnex is a technology company with two segments: Technology Solutions and Concentrix. The Technology Solutions segment is a distributor of IT products and Concentrix is a customer engagement services provider. During the year, the company announced it would spin off the Concentrix segment to shareholders. We think this makes a lot of sense. Concentrix evolved out of Synnex’s acquisition of IBM’s CRM business in 2013 and was supplemented with Synnex’s acquisition of Convergys in 2018. Concentrix is a higher-margin, faster-growing services company, while the Technology Solutions is a slower-growing, thinner-margin business. Both have attractive business models with a history of creating shareholder value. The spinoff, initially scheduled for late 2020, has been delayed due to the uncertainty from the coronavirus pandemic. Currently, we anticipate holding shares of both companies after the transaction.
6
QUEENS ROAD FUNDS
Manager’s Commentary (Continued) |
Holdings that Hurt Performance
American Equity Investment Life Insurance Holding Co. (2.28% of net assets) declined 23%. The company is a leading fixed index annuity insurance company focused on selling through independent agents. The company has been battered like most life insurers due to falling interest rates and tightening net interest margins. We think the company’s conservative investment portfolio, strong balance sheet and innovative annuity products position it for long-term profitable growth. Demographic trends and recent regulatory changes also contribute to our opinion that this is an attractive long-term investment.
L. B. Foster Company (.92% of net assets) fell 49%. This transportation and energy infrastructure provider has been significantly impacted by both the coronavirus pandemic and the steep decline in oil prices. The company has made significant progress in deleveraging following its poorly timed acquisition of Inspection Oilfield Services in 2015. Although trading at about a 20% normalized free cash flow yield, L. B. Foster’s small size and leveraged balance sheet make it one of the riskiest holdings in the portfolio.
7
QUEENS ROAD FUNDS
Performance Illustration May 31, 2020 (Unaudited) |
Queens Road Value Fund
Average Annual Total Return | |||
Queens Road Value Fund | S&P 500/Citigroup Value Index | ||
1 Year | 2.41% | 4.20% | |
5 Year | 6.90% | 5.76% | |
10 Year | 9.82% | 10.34% | |
The performance data quoted is historical. Past performance is no guarantee of future results. Current performance may be higher or lower than the performance data quoted. The principal value and return of an investment will fluctuate so that your shares, when redeemed, may be worth more or less than their original cost. The returns shown do not reflect the deduction of taxes that a shareholder would pay on Fund distributions or on the redemptions of Fund shares. Returns greater than 1 year are annualized. The Fund’s total annual operating expenses are 0.95% per its October 1, 2019 Prospectus. This material must be proceeded or accompanied by a Prospectus. Please read it carefully before investing. For performance information current to the most recent month-end, please call the Fund at 1-800-595-3088. | |||
The S&P 500/Citigroup Value Index along with its counterpart the S&P 500/Citigroup Growth Index were introduced in December 2005. These Indices are created by dividing the S&P 500 Index based upon seven different factors, four to determine value characteristics and three to determine growth characteristics. The companies are allocated to each index according to their growth or value characteristics, with about one-third allocated to both the growth and value index. It is not possible to invest directly in the S&P 500/Citigroup Value Index. The S&P 500/Citigroup Growth Index and S&P 500/Citigroup Value Index are the exclusive property of Standard & Poors.
Growth of Assumed $10,000 Investment
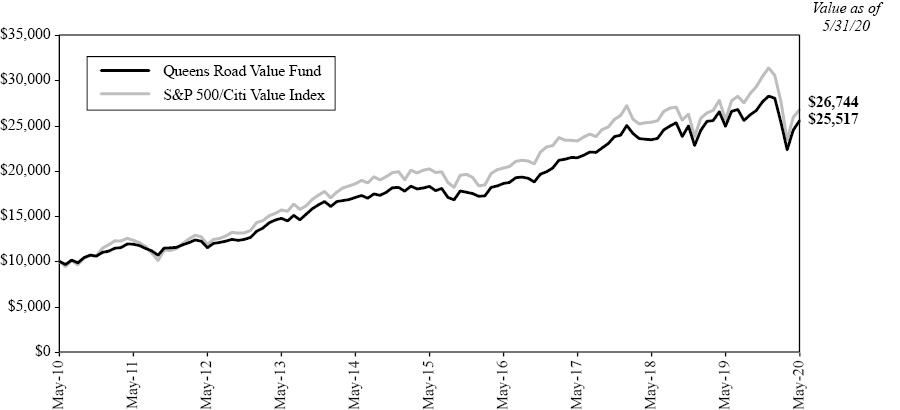
This graph illustrates the hypothetical investment of $10,000 in the Fund from May 31, 2010 to May 31, 2020. The Average Annual Total Return table and Growth of Assumed $10,000 Investment graph do not reflect the deduction of taxes that a shareholder would pay on Fund distributions or the redemption of Fund shares.
8
QUEENS ROAD FUNDS
Performance Illustration (Continued) |
Queens Road Small Cap Value Fund
Average Annual Total Return | |||
Queens Road Small Cap Value Fund | Russell 2000 Value Index | ||
1 Year | 1.89% | -14.69% | |
5 Year | 3.19% | 0.71% | |
10 Year | 6.75% | 6.54% | |
The performance data quoted is historical. Past performance is no guarantee of future results. Current performance may be higher or lower than the performance data quoted. The principal value and return of an investment will fluctuate so that your shares, when redeemed, may be worth more or less than their original cost. The returns shown do not reflect the deduction of taxes that a shareholder would pay on Fund distributions or on the redemptions of Fund shares. Returns greater than 1 year are annualized. The Fund’s total annual operating expenses are 1.18% per its October 1, 2019 Prospectus. This material must be proceeded or accompanied by a Prospectus. Please read it carefully before investing. For performance information current to the most recent month-end, please call the Fund at 1-800-595-3088. | |||
The Russell 2000 Value Index is a subset of the Russell 2000 Index, which tracks the stocks of small domestic companies, based on total market capitalization. The Russell 2000 Value Index represents those stocks of the Russell 2000 with lower price-to-book ratios and lower relative forecasted growth rates. You cannot invest directly in these indices.
Growth of Assumed $10,000 Investment
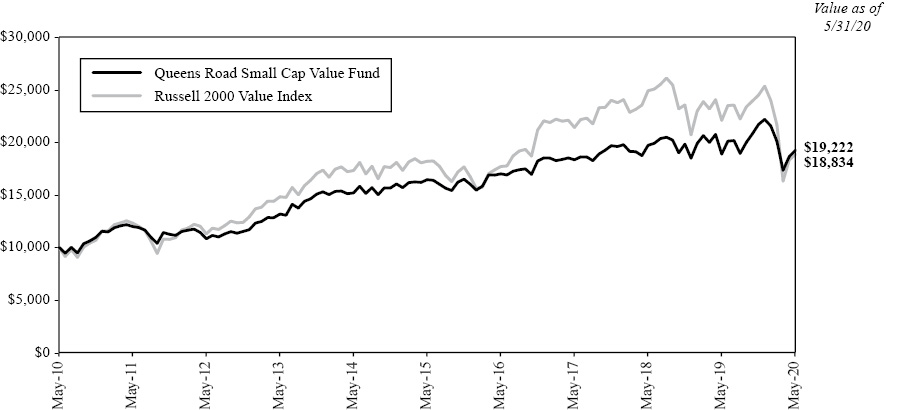
This graph illustrates the hypothetical investment of $10,000 in the Fund from May 31, 2010 to May 31, 2020. The Average Annual Total Return table and Growth of Assumed $10,000 Investment graph do not reflect the deduction of taxes that a shareholder would pay on Fund distributions or the redemption of Fund shares.
9
QUEENS ROAD FUNDS
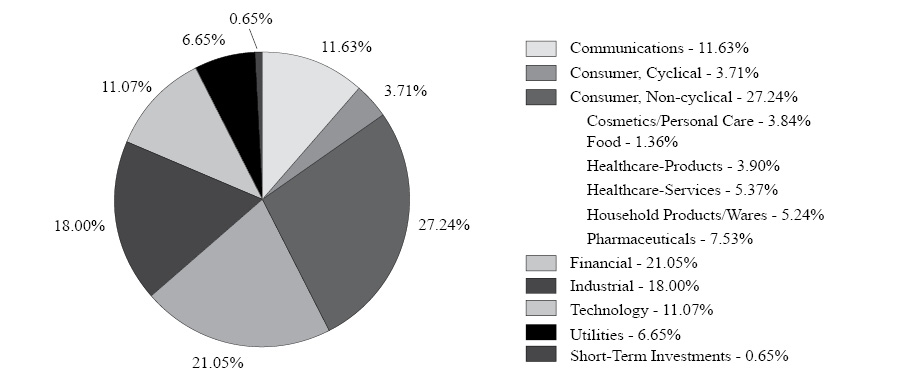
Graphical Illustration May 31, 2020 (Unaudited) |
The following charts provide a visual breakdown of the Funds by the industry sectors that the underlying securities represent, as a percentage of the total investments held by each Fund, as of May 31, 2020. Please see the Schedules of Investments on the following pages for a detailed list of each Fund’s holdings.
Queens Road Value Fund(1)
Queens Road Small Cap Value Fund(1)
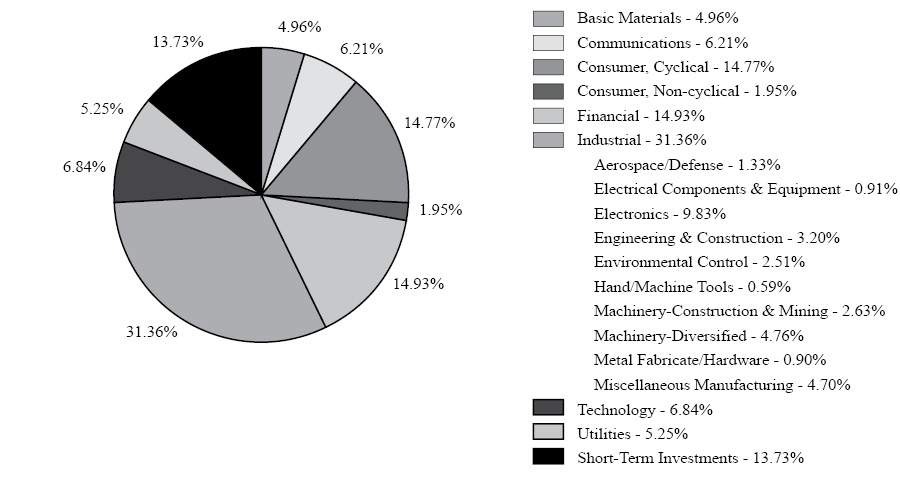
(1) | Sector weightings represent the percentage of a Fund’s investments in certain general sectors. These sectors may include more than one industry. A Fund’s portfolio composition is subject to change at any time. |
10
QUEENS ROAD VALUE FUND
Schedule of Investments |
NUMBER | VALUE | |||||||
COMMON STOCKS — 99.2% | ||||||||
AEROSPACE/DEFENSE — 4.6% | ||||||||
| 8,000 | General Dynamics Corp. | $ | 1,174,640 | |||||
| 6,600 | Raytheon Technologies Corp. | 425,832 | ||||||
| 1,600,472 | ||||||||
APPAREL — 1.4% | ||||||||
| 1,214 | Kontoor Brands, Inc. | 17,749 | ||||||
| 8,500 | VF Corp. | 476,850 | ||||||
| 494,599 | ||||||||
BANKS — 6.0% | ||||||||
| 14,500 | Bank of New York Mellon Corp. | 538,965 | ||||||
| 9,000 | JPMorgan Chase & Co. | 875,790 | ||||||
| 11,000 | State Street Corp. | 670,560 | ||||||
| 2,085,315 | ||||||||
BUILDING MATERIALS — 0.4% | ||||||||
| 6,600 | Carrier Global Corp.1 | 135,102 | ||||||
COMPUTERS — 1.3% | ||||||||
| 46,378 | Hewlett Packard Enterprise Co. | 450,330 | ||||||
COSMETICS/PERSONAL CARE — 3.8% | ||||||||
| 3,800 | Procter & Gamble Co. | 440,496 | ||||||
| 16,400 | Unilever PLC ADR | 886,420 | ||||||
| 1,326,916 | ||||||||
DIVERSIFIED FINANCIAL SERVICES — 10.8% | ||||||||
| 16,000 | American Express Co. | 1,521,120 | ||||||
| 9,000 | Ameriprise Financial, Inc. | 1,260,630 | ||||||
| 7,900 | T. Rowe Price Group, Inc. | 955,110 | ||||||
| 3,736,860 | ||||||||
ELECTRIC — 6.7% | ||||||||
| 13,000 | American Electric Power Co., Inc. | 1,108,250 | ||||||
| 8,284 | Duke Energy Corp. | 709,359 | ||||||
| 8,400 | Southern Co. | 479,388 | ||||||
| 2,296,997 | ||||||||
ELECTRONICS — 1.5% | ||||||||
| 3,400 | Allegion PLC | 338,980 | ||||||
| 3,150 | Fortive Corp. | 192,087 | ||||||
| 531,067 | ||||||||
FOOD — 1.4% | ||||||||
| 9,000 | Mondelez International, Inc., Class A | 469,080 | ||||||
HEALTHCARE-PRODUCTS — 3.9% | ||||||||
| 6,300 | Danaher Corp. | 1,049,643 | ||||||
| 3,022 | Medtronic PLC | 297,909 | ||||||
| 1,347,552 | ||||||||
HEALTHCARE-SERVICES — 5.4% | ||||||||
| 6,300 | Anthem, Inc. | 1,852,893 | ||||||
HOUSEHOLD PRODUCTS/WARES — 5.2% | ||||||||
| 7,586 | Clorox Co. | 1,564,613 | ||||||
| 1,717 | Kimberly-Clark Corp. | 242,852 | ||||||
| 1,807,465 | ||||||||
INSURANCE — 4.2% | ||||||||
| 3 | Berkshire Hathaway, Inc., Class A1 | 835,920 | ||||||
| 10,000 | Prudential Financial, Inc. | 609,600 | ||||||
| 1,445,520 | ||||||||
MACHINERY-DIVERSIFIED — 1.2% | ||||||||
| 9,000 | Ingersoll-Rand PLC1 | 253,800 | ||||||
| 3,300 | Otis Worldwide Corp. | 173,745 | ||||||
| 427,545 | ||||||||
MEDIA — 3.5% | ||||||||
| 10,151 | Walt Disney Co. | 1,190,712 | ||||||
MISCELLANEOUS MANUFACTURING — 8.7% | ||||||||
| 3,600 | 3M Co. | 563,184 | ||||||
| 18,000 | Eaton Corp. PLC | 1,528,200 | ||||||
| 10,200 | Trane Technologies PLC | 920,142 | ||||||
| 3,011,526 | ||||||||
PHARMACEUTICALS — 7.5% | ||||||||
| 5,000 | Bristol-Myers Squibb Co. | 298,600 | ||||||
| 13,820 | Merck & Co., Inc. | 1,115,550 | ||||||
| 31,000 | Pfizer, Inc. | 1,183,890 | ||||||
| 2,598,040 | ||||||||
RETAIL — 2.3% | ||||||||
| 4,225 | McDonald’s Corp. | 787,202 | ||||||
SEMICONDUCTORS — 4.7% | ||||||||
| 26,000 | Intel Corp. | 1,636,180 | ||||||
SOFTWARE — 5.0% | ||||||||
| 25,000 | Oracle Corp. | 1,344,250 | ||||||
| 2,500 | VMware, Inc., Class A1 | 390,675 | ||||||
| 1,734,925 | ||||||||
TELECOMMUNICATIONS — 8.2% | ||||||||
| 37,500 | Cisco Systems, Inc. | 1,793,250 | ||||||
| 20,000 | Corning, Inc. | 455,800 | ||||||
| 10,000 | Verizon Communications, Inc. | 573,800 | ||||||
| 2,822,850 | ||||||||
TRANSPORTATION — 1.5% | ||||||||
| 3,000 | Union Pacific Corp. | 509,580 | ||||||
TOTAL COMMON STOCKS | ||||||||
(Cost $16,329,536) | 34,298,728 | |||||||
See accompanying Notes to Financial Statements.
11
QUEENS ROAD VALUE FUND
Schedule of Investments (Continued) |
PRINCIPAL | VALUE | |||||||
SHORT-TERM INVESTMENTS — 0.6% | ||||||||
DEMAND DEPOSIT — 0.6% | ||||||||
| $ | 224,344 | U.S. Bank Money Market Deposit Account, 0.00%2 | $ | 224,344 | ||||
TOTAL SHORT-TERM INVESTMENTS | ||||||||
(Cost $224,344) | 224,344 | |||||||
TOTAL INVESTMENTS — 99.8% | ||||||||
(Cost $16,553,880) | 34,523,072 | |||||||
Other Assets in Excess of Liabilities — 0.2% | 56,586 | |||||||
TOTAL NET ASSETS — 100.0% | $ | 34,579,658 | ||||||
ADR | – American Depositary Receipt |
PLC | – Public Limited Company |
1 | Non-income Producing. |
2 | The Money Market Deposit Account (the “MMDA”) is a short-term investment vehicle in which the Fund holds cash balances. The MMDA will bear interest at a variable rate that is determined based on market conditions and may change daily and by any amount. The rate shown is as of May 31, 2020. |
See accompanying Notes to Financial Statements.
12
QUEENS ROAD SMALL CAP VALUE FUND
Schedule of Investments |
NUMBER | VALUE | |||||||
COMMON STOCKS — 87.9% | ||||||||
AEROSPACE/DEFENSE — 1.4% | ||||||||
| 44,809 | Astronics Corp.1 | $ | 409,106 | |||||
| 7,009 | Astronics Corp., Class B1 | 63,361 | ||||||
| 38,829 | Ducommun, Inc.1 | 1,250,294 | ||||||
| 1,722,761 | ||||||||
AGRICULTURE — 1.1% | ||||||||
| 57,879 | Darling Ingredients, Inc.1 | 1,349,160 | ||||||
APPAREL — 7.5% | ||||||||
| 38,360 | Deckers Outdoor Corp.1 | 7,001,851 | ||||||
| 11,149 | Delta Apparel, Inc.1 | 137,244 | ||||||
| 53,000 | PVH Corp. | 2,409,910 | ||||||
| 9,549,005 | ||||||||
BANKS — 1.3% | ||||||||
| 48,772 | ServisFirst Bancshares, Inc. | 1,701,167 | ||||||
COMMERCIAL SERVICES — 0.4% | ||||||||
| 12,171 | Cass Information Systems, Inc. | 490,978 | ||||||
DISTRIBUTION/WHOLESALE — 2.3% | ||||||||
| 9,574 | Anixter International, Inc.1 | 916,327 | ||||||
| 193,617 | G-III Apparel Group Ltd.1 | 2,000,064 | ||||||
| 2,916,391 | ||||||||
ELECTRICAL COMPONENTS & EQUIPMENT — 0.9% | ||||||||
| 17,600 | Graham Corp. | 201,344 | ||||||
| 2,394 | Littelfuse, Inc. | 389,001 | ||||||
| 22,325 | Powell Industries, Inc. | 593,845 | ||||||
| 1,184,190 | ||||||||
ELECTRONICS — 10.0% | ||||||||
| 40,434 | SYNNEX Corp. | 4,312,286 | ||||||
| 33,252 | Tech Data Corp.1 | 4,530,253 | ||||||
| 222,337 | Vishay Intertechnology, Inc. | 3,615,200 | ||||||
| 10,989 | Vishay Precision Group, Inc.1 | 259,560 | ||||||
| 12,717,299 | ||||||||
ENGINEERING & CONSTRUCTION — 3.3% | ||||||||
| 80,300 | MasTec, Inc.1 | 3,143,745 | ||||||
| 38,554 | VSE Corp. | 1,002,404 | ||||||
| 4,146,149 | ||||||||
ENVIRONMENTAL CONTROL — 2.6% | ||||||||
| 59,286 | Stericycle, Inc.1 | 3,250,651 | ||||||
FOREST PRODUCTS & PAPER — 4.0% | ||||||||
| 168,023 | Schweitzer-Mauduit International, Inc. | 5,106,219 | ||||||
GAS — 5.4% | ||||||||
| 96,439 | New Jersey Resources Corp. | 3,386,938 | ||||||
| 120,241 | South Jersey Industries, Inc. | 3,410,035 | ||||||
| 6,796,973 | ||||||||
HAND/MACHINE TOOLS — 0.6% | ||||||||
| 27,156 | Colfax Corp.1 | 761,997 | ||||||
INSURANCE — 12.2% | ||||||||
| 133,266 | American Equity Investment Life Holding Co. | 2,890,539 | ||||||
| 30,551 | American National Insurance Co. | 2,295,908 | ||||||
| 117,291 | CNO Financial Group, Inc. | 1,683,126 | ||||||
| 26,226 | Crawford & Co., Class B | 150,537 | ||||||
| 111,182 | Horace Mann Educators Corp. | 4,060,367 | ||||||
| 56,217 | RLI Corp. | 4,438,894 | ||||||
| 15,519,371 | ||||||||
INTERNET — 0.4% | ||||||||
| 28,000 | TripAdvisor, Inc. | 539,840 | ||||||
MACHINERY-CONSTRUCTION & MINING — 2.7% | ||||||||
| 47,326 | Oshkosh Corp. | 3,398,953 | ||||||
MACHINERY-DIVERSIFIED — 4.9% | ||||||||
| 51,381 | CSW Industrials, Inc. | 3,676,824 | ||||||
| 51,678 | Graco, Inc. | 2,491,397 | ||||||
| 6,168,221 | ||||||||
MEDIA — 2.7% | ||||||||
| 44,378 | Meredith Corp. | 663,007 | ||||||
| 94,712 | Scholastic Corp. | 2,784,533 | ||||||
| 3,447,540 | ||||||||
METAL FABRICATE/HARDWARE — 0.9% | ||||||||
| 95,715 | LB Foster Co.1 | 1,169,637 | ||||||
MINING — 1.0% | ||||||||
| 195,000 | Livent Corp.1 | 1,314,300 | ||||||
MISCELLANEOUS MANUFACTURING — 4.8% | ||||||||
| 3,900 | Chase Corp. | 388,635 | ||||||
| 89,029 | Fabrinet1 | 5,692,514 | ||||||
| 6,081,149 | ||||||||
PHARMACEUTICALS — 0.5% | ||||||||
| 86,693 | Owens & Minor, Inc. | 687,476 | ||||||
RETAIL — 3.0% | ||||||||
| 55,638 | MSC Industrial Direct Co., Inc., Class A | 3,857,939 | ||||||
SAVINGS & LOANS — 1.7% | ||||||||
| 96,367 | Axos Financial, Inc.1 | 2,100,801 | ||||||
See accompanying Notes to Financial Statements.
13
QUEENS ROAD SMALL CAP VALUE FUND
Schedule of Investments (Continued) |
NUMBER | VALUE | |||||||
SEMICONDUCTORS — 3.8% | ||||||||
| 76,267 | Synaptics, Inc.1 | $ | 4,859,733 | |||||
SOFTWARE — 3.1% | ||||||||
| 84,414 | CSG Systems International, Inc. | 3,997,003 | ||||||
TELECOMMUNICATIONS — 3.2% | ||||||||
| 39,896 | ADTRAN, Inc. | 454,814 | ||||||
| 65,442 | InterDigital, Inc. | 3,597,347 | ||||||
| 4,052,161 | ||||||||
TEXTILES — 2.2% | ||||||||
| 15,529 | UniFirst Corp. | 2,792,114 | ||||||
TOTAL COMMON STOCKS | ||||||||
(Cost $82,285,006) | 111,679,178 | |||||||
PRINCIPAL | ||||||||
SHORT-TERM INVESTMENTS — 14.0% | ||||||||
DEMAND DEPOSIT — 14.0% | ||||||||
| $ | 17,771,200 | U.S. Bank Money Market Deposit Account, 0.00%2 | 17,771,200 | |||||
TOTAL SHORT-TERM INVESTMENTS | ||||||||
(Cost $17,771,200) | 17,771,200 | |||||||
TOTAL INVESTMENTS — 101.9% | ||||||||
(Cost $100,056,206) | 129,450,378 | |||||||
| �� | ||||||||
Liabilities in Excess of Other Assets — (1.9)% | (2,413,311 | ) | ||||||
TOTAL NET ASSETS — 100.0% | $ | 127,037,067 | ||||||
1 | Non-income Producing. |
2 | The Money Market Deposit Account (the “MMDA”) is a short-term investment vehicle in which the Fund holds cash balances. The MMDA will bear interest at a variable rate that is determined based on market conditions and may change daily and by any amount. The rate shown is as of May 31, 2020. |
See accompanying Notes to Financial Statements.
14
QUEENS ROAD FUNDS
Statements of Assets and Liabilities As of May 31, 2020 |
Value Fund | Small Cap | |||||||
Assets: | ||||||||
Investments, at Value (cost $16,553,880, $100,056,206) | $ | 34,523,072 | $ | 129,450,378 | ||||
Receivables: | ||||||||
Shareholder Subscriptions | 250 | 198,531 | ||||||
Dividends and Interest | 82,858 | 96,111 | ||||||
Total Assets | 34,606,180 | 129,745,020 | ||||||
Liabilities: | ||||||||
Payables: | ||||||||
Investment Securities Purchased | — | 2,549,633 | ||||||
Shareholder Redemptions | — | 38,669 | ||||||
Accrued Advisory Fees (Note 3) | 26,522 | 119,651 | ||||||
Total Liabilities | 26,522 | 2,707,953 | ||||||
Net Assets | $ | 34,579,658 | $ | 127,037,067 | ||||
Components of Net Assets: | ||||||||
Paid-in Capital (par value $0.001 per share with an unlimited number of shares authorized) | $ | 15,054,106 | $ | 101,589,706 | ||||
Total Distributable Earnings | 19,525,552 | 25,447,361 | ||||||
Net Assets | $ | 34,579,658 | $ | 127,037,067 | ||||
Shares of Beneficial Interest Issued and Outstanding | 1,540,499 | 5,470,562 | ||||||
Net Asset Value, Offering and Redemption Price Per Share | $ | 22.45 | $ | 23.22 | ||||
See accompanying Notes to Financial Statements.
15
QUEENS ROAD FUNDS
Statements of Operations For the year ended May 31, 2020 |
Value Fund | Small Cap | |||||||
Investment Income: | ||||||||
Dividends | $ | 1,077,332 | $ | 1,529,000 | ||||
Interest | 927 | 53,261 | ||||||
Total Investment Income | 1,078,259 | 1,582,261 | ||||||
Expenses: | ||||||||
Advisory Fees (Note 3) | 366,695 | 1,456,348 | ||||||
Total Expenses | 366,695 | 1,456,348 | ||||||
Net Investment Income | 711,564 | 125,913 | ||||||
Realized and Unrealized Gain on Investments: | ||||||||
Net Realized Gain (Loss) on Investments | 1,381,880 | (4,057,973 | ) | |||||
Net Change in Unrealized Appreciation (Depreciation) on Investments | (802,433 | ) | 7,184,929 | |||||
Net Realized and Unrealized Gain on Investments | 579,447 | 3,126,956 | ||||||
Net Increase in Net Assets from Operations | $ | 1,291,011 | $ | 3,252,869 | ||||
See accompanying Notes to Financial Statements.
16
QUEENS ROAD FUNDS
Statements of Changes in Net Assets |
Value Fund | Small Cap Value Fund | |||||||||||||||
For the | For the | For the | For the | |||||||||||||
Increase (Decrease) in Net Assets From: | ||||||||||||||||
Operations: | ||||||||||||||||
Net Investment Income | $ | 711,564 | $ | 646,406 | $ | 125,913 | $ | 254,140 | ||||||||
Net Realized Gain (Loss) on Investments | 1,381,880 | 1,272,565 | (4,057,973 | ) | 11,185,675 | |||||||||||
Net Change in Unrealized Appreciation (Depreciation) on Investments | (802,433 | ) | 547,493 | 7,184,929 | (17,482,132 | ) | ||||||||||
Net Increase (Decrease) in Net Assets from Operations | 1,291,011 | 2,466,464 | 3,252,869 | (6,042,317 | ) | |||||||||||
Distributions to Shareholders: | ||||||||||||||||
Distributions | (1,381,312 | ) | (2,548,616 | ) | (4,754,912 | ) | (11,660,415 | ) | ||||||||
Net Change in Net Assets from Distributions | (1,381,312 | ) | (2,548,616 | ) | (4,754,912 | ) | (11,660,415 | ) | ||||||||
Capital Transactions: | ||||||||||||||||
Proceeds from Sale of Shares | 728,854 | 1,406,759 | 28,987,358 | 18,362,211 | ||||||||||||
Net Asset Value of Shares Issued on Reinvestment of Dividends | 73,071 | 518,840 | 2,623,269 | 7,371,415 | ||||||||||||
Cost of Shares Redeemed | (5,555,162 | ) | (5,199,937 | ) | (21,525,718 | ) | (23,206,927 | ) | ||||||||
Net Increase (Decrease) in Net Assets from Capital Transactions | (4,753,237 | ) | (3,274,338 | ) | 10,084,909 | 2,526,699 | ||||||||||
Total Increase (Decrease) in Net Assets | (4,843,538 | ) | (3,356,490 | ) | 8,582,866 | (15,176,033 | ) | |||||||||
Net Assets: | ||||||||||||||||
Beginning of Year | 39,423,196 | 42,779,686 | 118,454,201 | 133,630,234 | ||||||||||||
End of Year | $ | 34,579,658 | $ | 39,423,196 | $ | 127,037,067 | $ | 118,454,201 | ||||||||
Capital Share Transactions: | ||||||||||||||||
Shares Sold | 37,862 | 60,117 | 1,263,015 | 711,549 | ||||||||||||
Shares Issued on Reinvestment of Dividends | 2,956 | 25,384 | 97,411 | 320,915 | ||||||||||||
Shares Redeemed | (239,327 | ) | (223,895 | ) | (907,777 | ) | (905,533 | ) | ||||||||
Net Increase (Decrease) in Shares | (198,509 | ) | (138,394 | ) | 452,649 | 126,931 | ||||||||||
See accompanying Notes to Financial Statements.
17
QUEENS ROAD VALUE FUND
Financial Highlights |
Per share operating performance
For a capital share outstanding throughout each year
Year | Year | Year | Year | Year | ||||||||||||||||
Net Asset Value, Beginning of Year | $ | 22.67 | $ | 22.79 | $ | 21.69 | $ | 19.83 | $ | 20.10 | ||||||||||
Income from Investment Operations: | ||||||||||||||||||||
Net Investment Income1 | 0.43 | 0.35 | 0.33 | 0.30 | 0.31 | |||||||||||||||
Net Realized and Unrealized Gain on Investments | 0.20 | 0.94 | 1.70 | 2.66 | 0.00 | 2 | ||||||||||||||
Total from Investment Operations | 0.63 | 1.29 | 2.03 | 2.96 | 0.31 | |||||||||||||||
Less Distributions: | ||||||||||||||||||||
Net Investment Income | (0.37 | ) | (0.34 | ) | (0.29 | ) | (0.33 | ) | (0.22 | ) | ||||||||||
Net Realized Gains | (0.48 | ) | (1.07 | ) | (0.64 | ) | (0.77 | ) | (0.36 | ) | ||||||||||
Total Distributions | (0.85 | ) | (1.41 | ) | (0.93 | ) | (1.10 | ) | (0.58 | ) | ||||||||||
Net Asset Value, End of Year | $ | 22.45 | $ | 22.67 | $ | 22.79 | $ | 21.69 | $ | 19.83 | ||||||||||
Total Return | 2.41 | % | 6.36 | % | 9.25 | % | 15.31 | % | 1.74 | % | ||||||||||
Ratios and Supplemental Data: | ||||||||||||||||||||
Net Assets, End of Year (in thousands) | $ | 34,580 | $ | 39,423 | $ | 42,780 | $ | 42,820 | $ | 39,249 | ||||||||||
Ratio of Expenses to Average Net Assets | 0.95 | % | 0.95 | % | 0.95 | % | 0.95 | % | 0.95 | % | ||||||||||
Ratio of Net Investment Income to Average Net Assets | 1.84 | % | 1.52 | % | 1.43 | % | 1.44 | % | 1.61 | % | ||||||||||
Portfolio Turnover Rate | 1 | % | 1 | % | — | % | 8 | % | 14 | % | ||||||||||
1 | Computed using average shares method. |
2 | Amount is less than $0.005 per share. |
See accompanying Notes to Financial Statements.
18
QUEENS ROAD SMALL CAP VALUE FUND
Financial Highlights |
Per share operating performance
For a capital share outstanding throughout each year
Year | Year | Year | Year | Year | ||||||||||||||||
Net Asset Value, Beginning of Year | $ | 23.61 | $ | 27.32 | $ | 25.93 | $ | 25.26 | $ | 24.52 | ||||||||||
Income from Investment Operations: | ||||||||||||||||||||
Net Investment Income (Loss)1 | 0.03 | 0.05 | 0.02 | (0.00 | )2 | (0.02 | ) | |||||||||||||
Net Realized and Unrealized Gain (Loss) on Investments | 0.55 | (1.28 | ) | 1.94 | 2.01 | 0.84 | ||||||||||||||
Total from Investment Operations | 0.58 | (1.23 | ) | 1.96 | 2.01 | 0.82 | ||||||||||||||
Less Distributions: | ||||||||||||||||||||
Net Investment Income | (0.01 | ) | (0.03 | ) | — | — | — | |||||||||||||
Net Realized Gains | (0.96 | ) | (2.45 | ) | (0.57 | ) | (1.34 | ) | (0.08 | ) | ||||||||||
Total Distributions | (0.97 | ) | (2.48 | ) | (0.57 | ) | (1.34 | ) | (0.08 | ) | ||||||||||
Net Asset Value, End of Year | $ | 23.22 | $ | 23.61 | $ | 27.32 | $ | 25.93 | $ | 25.26 | ||||||||||
Total Return | 1.89 | % | (4.26 | )% | 7.55 | % | 7.87 | % | 3.37 | % | ||||||||||
Ratios and Supplemental Data: | ||||||||||||||||||||
Net Assets, End of Year (in thousands) | $ | 127,037 | $ | 118,454 | $ | 133,630 | $ | 140,683 | $ | 143,376 | ||||||||||
Ratio of Expenses to Average Net Assets | 1.18 | % | 1.18 | % | 1.22 | % | 1.24 | % | 1.24 | % | ||||||||||
Ratio of Net Investment Income to Average Net Assets | 0.10 | % | 0.20 | % | 0.08 | % | (0.02 | )% | (0.07 | )% | ||||||||||
Portfolio Turnover Rate | 24 | % | 27 | % | 6 | % | 27 | % | 23 | % | ||||||||||
1 | Computed using average shares method. |
2 | Amount is less than $0.005 per share. |
See accompanying Notes to Financial Statements.
19
QUEENS ROAD FUNDS
Notes to Financial Statements May 31, 2020 |
Note 1. Organization
The Queens Road Value Fund and the Queens Road Small Cap Value Fund (individually referred to as the “Value Fund” and “Small Cap Value Fund”, respectively, or collectively as the “Funds”), are diversified managed portfolios of Bragg Capital Trust (the “Trust”), which is registered under the Investment Company Act of 1940, as amended (the “1940 Act”), as an open-end management company. Each Fund’s investment objective is to seek long-term capital growth. The Funds invest primarily in common stocks which are believed by Bragg Financial Advisors (the “Advisor”) to be undervalued and have good prospects for capital appreciation. Under normal circumstances, the Small Cap Value Fund invests at least 80% of its assets in equity securities of companies with small market capitalization. The Small Cap Value Fund defines a small capitalization (small cap) company as one whose market capitalization, at the time of purchase, is $5 billion or less. The Funds’ registration statement was declared effective on June 13, 2002, and operations began on that date.
Note 2. Significant Accounting Policies
The following is a summary of accounting policies followed by the Funds in the preparation of their financial statements. The Funds are investment companies and, as such, these financial statements have applied the guidance set forth in the Financial Accounting Standards Board (“FASB”) Accounting Standards Codification (“ASC”) Topic 946 “Financial Services – Investment Companies.”
Federal Income Taxes: Each Fund intends to comply with the requirements of Subchapter M of the Internal Revenue Code of 1986, as amended, that are applicable to regulated investment companies and to distribute substantially all of its net investment income and any net realized gains to its shareholders. Therefore, no provision is made for federal income or excise taxes.
Accounting for Uncertainty in Income Taxes (the “Income Tax Statement”) requires an evaluation of tax positions taken (or expected to be taken) in the course of preparing a Fund’s tax returns to determine whether these positions meet a “more-likely-than-not” standard that, based on the technical merits, have a more than fifty percent likelihood of being sustained by a taxing authority upon examination. A tax position that meets the “more-likely-than-not” recognition threshold is measured to determine the amount of benefit to recognize in the financial statements. The Funds recognize interest and penalties, if any, related to unrecognized tax benefits as income tax expense in the Statements of Operations.
The Income Tax Statement requires management of the Funds to analyze all open tax years 2017 – 2019, as defined by IRS statute of limitations for all major jurisdictions, including federal tax authorities and certain state tax authorities. As of and during the year ended May 31, 2020, the Funds did not have a liability for any unrecognized tax benefits. The Funds have no examination in progress and are not aware of any tax positions for which it is reasonably possible that the total amounts of unrecognized tax benefits will significantly change in the next twelve months.
Distributions to Shareholders: The Funds distributes net investment income and net realized gains (net of any capital loss carryovers), if any, annually. Distributions to shareholders, which are determined in accordance with income tax regulations, are recorded on the ex-dividend date. The character of distributions made during the year from net investment income or net realized gain may differ from the characterization for federal income tax purposes due to differences in the recognition of income, expense and gain/ (loss) items for financial statement and tax purposes. Where appropriate, reclassifications between net asset accounts are made for such differences that are permanent in nature.
Use of Estimates: The financial statements are prepared in conformity with accounting principles generally accepted in the United States of America (“GAAP”), which requires management to make estimates and assumptions that affect the reported amounts of assets and liabilities, and disclosure of contingent assets and liabilities at the date of the financial statements and the reported amounts of increases and decreases in net assets from operations during the reporting period. Actual results could differ from those estimates.
Other: The Funds follow industry practice and record security transactions on the trade date. The specific identification method is used for determining gains or losses for financial statement and income tax purposes. Dividend income is recorded on the ex-dividend date, except that certain dividends from foreign securities are recorded as soon as information is available to the Funds. Withholding taxes on foreign dividends have been provided for in accordance with the Funds’ understanding of the applicable country’s tax rules and regulations. Interest income is recorded on an accrual basis. Discounts and premiums on fixed income securities purchased are accreted and amortized over the life of the respective securities using the effective interest method.
20
QUEENS ROAD FUNDS
Notes to Financial Statements (Continued) |
Security Valuation: Securities, including common stocks and closed-end funds, which are traded on a national securities exchange are valued at the last quoted sales price, and are generally classified as a Level 1 investment. Investments in mutual funds, including money market funds, are valued at the ending net asset value provided by the Funds, and are generally classified as a Level 1 investment. If there are no sales reported, the Fund’s common stock securities will be valued using the last reported bid price. The money market demand account is priced at cost and is generally classified as a Level 1 investment. Fixed income are priced by an independent pricing service. The pricing service may use one or more pricing models. Securities for which market quotations are not readily available are valued at fair value as determined in good faith by and under the direction of the Trust’s Board of Trustees, and are generally classified as a Level 3 investment.
In accordance with GAAP, fair value is defined as the price that the Funds would receive to sell an asset or pay to transfer a liability in an orderly transaction between market participants at the measurement date. GAAP also establishes a framework for measuring fair value, and a three-level hierarchy for fair value measurements based upon the transparency of inputs to the valuation of an asset or liability. The three-tier hierarchy of inputs is summarized below.
● | Level 1 – Unadjusted quoted prices in active markets for identical assets or liabilities that the company has the ability to access. An active market for the security is a market in which transactions occur with sufficient frequency and volume to provide pricing information on an ongoing basis. Common stocks, closed-end funds, demand deposits and mutual funds are generally categorized as Level 1. |
● | Level 2 – Observable inputs other than quoted prices included in Level 1 that are observable for the asset or liability, either directly or indirectly. These inputs may include quoted prices for the identical instrument on an inactive market, prices for similar instruments, interest rates, prepayment speeds, credit risk, yield curves, default rates and similar data. Fixed income securities, repurchase agreements, and securities valued by an independent fair value pricing service are generally categorized as Level 2. |
● | Level 3 – Unobservable inputs for the asset or liability, to the extent relevant observable inputs are not available, representing the company’s own assumptions about the assumptions a market participant would use in valuing the asset or liability, and would be based on the best information available. |
The availability of observable inputs can vary from security to security and is affected by a wide variety of factors, including, for example, the type of security, whether the security is new and not yet established in the marketplace, the liquidity of markets, and other characteristics particular to the security. To the extent that valuation is based on models or inputs that are less observable or unobservable in the market, the determination of fair value requires more judgment. Accordingly, the degree of judgment exercised in determining fair value is greatest for instruments categorized in Level 3.
As of May 31, 2020, the Funds did not hold any Level 3 securities. There were no transfers into or out of level 3 during the current year.
The following is a summary of the inputs used to value the Funds’ securities by level within the fair value hierarchy as of May 31, 2020.
Value Fund | ||||||||||||||||
| Level 1 - | Level 2 - | Level 3 - | Total | ||||||||||||
Common Stocks* | $ | 34,298,728 | $ | — | $ | — | $ | 34,298,728 | ||||||||
Short-Term Investments | 224,344 | — | — | 224,344 | ||||||||||||
Total | $ | 34,523,072 | $ | — | $ | — | $ | 34,523,072 | ||||||||
21
QUEENS ROAD FUNDS
Notes to Financial Statements (Continued) |
Small Cap Value Fund | ||||||||||||||||
| Level 1 - | Level 2 - | Level 3 - | Total | ||||||||||||
Common Stocks* | $ | 111,679,178 | $ | — | $ | — | $ | 111,679,178 | ||||||||
Short-Term Investments | 17,771,200 | — | — | 17,771,200 | ||||||||||||
Total | $ | 129,450,378 | $ | — | $ | — | $ | 129,450,378 | ||||||||
* | All sub-categories within common stocks represent Level 1 investments. See Schedules of Investments for industry categories. |
Note 3. Investment Advisory Fee and Other Transactions with Affiliates
The Funds retain Bragg Financial Advisors, Inc. as their investment advisor. Under the terms of the management agreement, the Advisor provides investment management and administrative services for the Funds. For its services as Advisor, the Value Fund and Small Cap Value Fund pay a fee, computed daily and payable monthly at the annual rate of 0.95% and 1.18% of each Fund’s first $250,000,000 of average daily net assets, 0.85% and 1.18% of each Fund’s next $250,000,000 of average daily net assets, and 0.80% and 1.15% of each Fund’s average daily net assets over $500,000,000, respectively. For the year ended May 31, 2020, the Advisor earned $366,695 and $1,456,348 from the Value Fund and Small Cap Value Fund, respectively. From these fees and its own resources, the Advisor is contractually obligated to pay other operating expenses of the Funds including transfer agent fees, fund accountant fees, administrator fees, registration fees, custodial fees, and other ordinary expenses of the Funds. However, the agreement does not require the Advisor to pay interest, taxes, brokerage commissions, and extraordinary expenses of the Funds. The amounts due to the Advisor at May 31, 2020, from the Value Fund and Small Cap Value Fund, were $26,522 and $119,651, respectively.
Certain employees and officers of the Advisor are also “interested persons” (as defined in the 1940 Act) of the Trust. Each “noninterested” Trustee is entitled to receive a fee of $500 per Fund, for each Board of Trustees Meeting for services relating to the Trust, which is paid by the Advisor.
Queens Road Securities, LLC (“QRS”) acts as the principal underwriter in the continuous public offering of the Funds’ shares. Certain officers of the Trust are also officers of QRS. QRS did not execute any purchases or sales of the Funds’ portfolio investments, nor collect any brokerage fees during the year ended May 31, 2020.
Note 4. Investment Transactions
For the year ended May 31, 2020, the cost of purchases and the proceeds from sales of portfolio securities, other than short-term investments, amounted to $432,941 and $5,310,125, respectively, for the Value Fund, and $35,862,427 and $24,090,413, respectively, for the Small Cap Value Fund.
Note 5. Federal Income Taxes
At May 31, 2020, gross unrealized appreciation and depreciation of investments based on cost for federal income tax purposes were as follows:
| Value Fund | Small Cap | ||||||
Cost of investments | $ | 16,562,515 | $ | 100,078,378 | ||||
Gross unrealized appreciation | $ | 18,101,706 | $ | 36,433,658 | ||||
Gross unrealized depreciation | (141,149 | ) | (7,061,657 | ) | ||||
Net unrealized appreciation on investments | $ | 17,960,557 | $ | 29,372,001 | ||||
22
QUEENS ROAD FUNDS
Notes to Financial Statements (Continued) |
The difference between cost amounts for financial statement and federal income tax purposes is due primarily to wash sale loss deferrals.
GAAP requires that certain components of net assets be reclassified between financial and tax reporting. These reclassifications have no effect on net assets or net asset value per share. For the year ended May 31, 2020, permanent differences in book and tax accounting resulting primarily from differing treatments for distribution reclassifications and return of capital items that have been reclassified between paid-in capital and total distributable earnings as follows:
Increase (Decrease) | ||||||||
Paid in | Total Distributable | |||||||
Queens Road Value Fund | $ | 165,734 | $ | (165,734 | ) | |||
Queens Road Small Cap Value Fund | $ | — | $ | — | ||||
As of May 31, 2020, the components of distributable earnings on a tax basis were as follows:
| Value Fund | Small Cap | ||||||
Undistributed ordinary income | $ | 377,541 | $ | 125,366 | ||||
Undistributed long-term capital gains | 1,187,454 | — | ||||||
Accumulated capital and other losses | — | (4,050,006 | ) | |||||
Net unrealized appreciation | 17,960,557 | 29,372,001 | ||||||
Total distributable earnings | $ | 19,525,552 | $ | 25,447,361 | ||||
The tax character of distributions paid during the fiscal years ended, May 31, 2020 and May 31, 2019 were as follows:
| Value Fund | Small Cap Value Fund | ||||||||||||||
Distributions Paid from: | 2020 | 2019 | 2020 | 2019 | ||||||||||||
Ordinary Income | $ | 602,127 | $ | 611,747 | $ | 60,666 | $ | 1,165,132 | ||||||||
Net Long Term Capital Gains | 779,185 | 1,936,869 | 4,694,246 | 10,495,283 | ||||||||||||
Total Taxable Distributions Paid | $ | 1,381,312 | $ | 2,548,616 | $ | 4,754,912 | $ | 11,660,415 | ||||||||
The net capital loss carryforwards as of May 31, 2020, which may be used to offset future net capital gains, if any, to the extent provided by treasury regulations were as follows:
Not Subject to Expiration | ||||||||
| Short-Term | Long-Term | ||||||
Value Fund | $ | — | $ | — | ||||
Small Cap Value Fund | $ | 2,802,504 | $ | 1,247,502 | ||||
23
QUEENS ROAD FUNDS
Notes to Financial Statements (Continued) |
Note 6. Control
The beneficial ownership, either directly or indirectly, of more than 25% of the voting securities of a fund creates a presumption of control of the fund, under section 2 (a)(9) of the 1940 Act. As of May 31, 2020, Pershing, LLC, for the benefit of its customers, owned 94.63% and 39.67% of the Value Fund and Small Cap Value Fund, respectively. As a result, Pershing, LLC may be deemed to control each Fund. As of May 31, 2020, Charles Schwab & Co., Inc., for the benefit of its customers, owned 41.09% of the Small Cap Value Fund. As a result, Charles Schwab & Co., Inc. may be deemed to control the Small Cap Value Fund.
Note 7. Guarantees and Indemnifications
In the normal course of business, the Funds enter into contracts with service providers that contain general indemnification clauses. The Funds’ maximum exposure under these arrangements is unknown as this would involve future claims that may be against the Funds that have not yet occurred. However, based on experience, the Funds expect the risk of loss to be remote.
Note 8. Subsequent Event Disclosure
The Funds have adopted financial reporting rules regarding subsequent events which require an entity to recognize or disclose in the financial statements the effects of all subsequent events that provide additional evidence about conditions that existed at the date of the balance sheet. Management has evaluated the Funds’ related events and transactions that occurred through the date of issuance of the Funds’ financial statements.
At the regular quarterly meeting of the Board of Trustees held on July 23, 2020, a resolution to engage UMB Distribution Services, LLC, beginning September 1, 2020, as the Funds’ Distributor, was approved and passed unanimously by the Board of Trustees.
In early 2020, an outbreak of a novel strain of coronavirus (COVID-19) emerged globally. This coronavirus has resulted in closing international borders, enhanced health screenings, healthcare service preparation and delivery, quarantines, cancellations, disruptions to supply chains and customer activity, as well as general public concern and uncertainty. The impact of this outbreak has negatively affected the worldwide economy, as well as the economies of individual countries, the financial health of individual companies and the market in general in significant and unforeseen ways. The future impact of COVID-19 is currently unknown, and it may exacerbate other risks that apply to the Funds, including political, social and economic risks. Any such impact could adversely affect the Funds’ performance, the performance of the securities in which the Funds invest and may lead to losses on your investment in the Funds. The ultimate impact of COVID-19 on the financial performance of the Funds’ investments is not reasonably estimable at this time.
There were no other events or transactions that occurred during this period that materially impacted the amounts or disclosures in the Funds’ financial statements.
24
QUEENS ROAD FUNDS
Report of Independent Registered Public Accounting Firm |
To the Shareholders and Board of Trustees of
Bragg Capital Trust
Opinion on the Financial Statements
We have audited the accompanying statements of assets and liabilities, including the schedules of investments, of Bragg Capital Trust comprising Queens Road Value Fund and Queens Road Small Cap Value Fund (the “Funds”) as of May 31, 2020, the related statements of operations for the year then ended, the statements of changes in net assets for each of the two years in the period then ended, including the related notes, and the financial highlights for each of the five years in the period then ended (collectively referred to as the “financial statements”). In our opinion, the financial statements present fairly, in all material respects, the financial position of the each of the Funds as of May 31, 2020, the results of their operations for the year then ended, the changes in their net assets for each of the two years in the period then ended, and the financial highlights for each of the five years in the period then ended, in conformity with accounting principles generally accepted in the United States of America.
Basis for Opinion
These financial statements are the responsibility of the Funds’ management. Our responsibility is to express an opinion on the Funds’ financial statements based on our audits. We are a public accounting firm registered with the Public Company Accounting Oversight Board (United States) (“PCAOB”) and are required to be independent with respect to the Funds in accordance with the U.S. federal securities laws and the applicable rules and regulations of the Securities and Exchange Commission and the PCAOB.
We conducted our audits in accordance with the standards of the PCAOB. Those standards require that we plan and perform the audit to obtain reasonable assurance about whether the financial statements are free of material misstatement whether due to error or fraud.
Our audits included performing procedures to assess the risks of material misstatement of the financial statements, whether due to error or fraud, and performing procedures that respond to those risks. Such procedures included examining, on a test basis, evidence regarding the amounts and disclosures in the financial statements. Our procedures included confirmation of securities owned as of May 31, 2020, by correspondence with the custodian and brokers. Our audits also included evaluating the accounting principles used and significant estimates made by management, as well as evaluating the overall presentation of the financial statements. We believe that our audits provide a reasonable basis for our opinion.
We have served as the Funds’ auditor since 2004.

COHEN & COMPANY, LTD.
Milwaukee, Wisconsin
July 30, 2020
25
QUEENS ROAD FUNDS
Expense Illustration May 31, 2020 (Unaudited) |
ABOUT YOUR FUND’S EXPENSES
Expense Example
As a shareholder of the Funds, you incur ongoing costs which typically consist of management fees and other Fund expenses. This Example is intended to help you understand your ongoing costs (in dollars) of investing in the Funds and to compare these costs with the ongoing costs of investing in other mutual funds.
The Example is based on an investment of $1,000 invested at the beginning of the period and held for the entire period, December 1, 2019 through May 31, 2020.
Actual Expenses
The first line of the table below provides information about actual account values and actual expenses. You may use the information in this line, together with the amount you invested, to estimate the expenses that you paid over the period. Simply divide your account value by $1,000 (for example, an $8,600 account value divided by $1,000 = 8.6), then multiply the result by the number in the first line under the heading entitled “Expenses Paid During Period” to estimate the expenses you paid on your account during this period.
Hypothetical Example for Comparison Purposes
The second line of the table below provides information about hypothetical account values and hypothetical expenses based on the Fund’s actual expense ratio and an assumed rate of return of 5% per year before expenses, which is not the Fund’s actual return. The hypothetical account values and expenses may not be used to estimate the actual ending account balance or expenses you paid for the period. You may use this information to compare the ongoing costs of investing in this Fund and other funds. To do so, compare this 5% hypothetical example with the 5% hypothetical examples that appear in the shareholder reports of the other funds.
| Beginning | Ending | Expenses Paid |
Value Fund | |||
Actual | $1,000.00 | $ 924.30 | $4.57 |
Hypothetical (5% Annual Return before expenses) | $1,000.00 | $ 1,020.20 | $4.80 |
Small Cap Value Fund | |||
Actual | $1,000.00 | $ 886.40 | $5.56 |
Hypothetical (5% Annual Return before expenses) | $1,000.00 | $ 1,019.10 | $5.96 |
* | Expenses are equal to the Funds’ annualized expense ratio of 0.95% and 1.18%, respectively, multiplied by the average account value over the period, multiplied by 183/366 (to reflect the one-half year period). |
26
QUEENS ROAD FUNDS
Additional Information May 31, 2020 (Unaudited) |
Proxy Voting – A description of the policies and procedures that the Funds use to determine how to vote proxies relating to portfolio securities and information regarding how the Funds voted proxies during the most recent 12 month period ended June 30, are available without charge upon request by (1) calling the Funds at 1-800-595-3088 and (2) from Fund documents filed with the Securities and Exchange Commission (“SEC”) on the SEC’s website at www.sec.gov.
Portfolio Holdings – The Funds file a complete schedule of investments with the SEC for the first and third quarter of each fiscal year on Form N-PORT. The Funds’ Form N-PORT is available on the website of the SEC at http://sec.gov.
Long Term Capital Gains Designation – Pursuant to IRC 852(b)(3) of the Internal Revenue Code, the Value Fund and Small Cap Value Fund hereby designates $779,185 and $4,694,246, respectively, as long-term capital gains distributed during the year ended, May 31, 2020.
Qualified Dividend Income – For the year ended May 31, 2020, 100% and 100% of the dividends paid from net investment income, including short-term capital gains (if any), are designated as qualified dividend income for the Value Fund and Small Cap Value Fund, respectively.
Corporate Dividends Received Deduction – For the year ended May 31, 2020, 100% and 100% of the dividends paid from net investment income, including short-term capital gains (if any), qualify for the dividends received deduction available to corporate shareholders for the Value Fund and Small Cap Value Fund, respectively.
27
QUEENS ROAD FUNDS
Trustees Information May 31, 2020 (Unaudited) |
Information about Trustees who are “interested persons” of the Trust as defined under the 1940 Act, and each Trustee of the Trust, including their principal occupations during the past five years, is as follows:
Interested Trustees | |||||
Name, Address, | Position(s) | Term of Office | Principal Occupations | Number of | Other |
Steven H. Scruggs | CCO, | Unlimited; | Bragg Financial Advisors, Portfolio Manager/CCO (2000-present) | Two | None |
Benton S. Bragg | Trustee, Chairman, Treasurer | Unlimited; | Bragg Financial Advisors, President, CEO (1996-present) | Two | None |
Steve Scruggs and Benton Bragg are Interested Trustees of the Funds (as that term is defined in Section 2(a)(19) of the 1940 Act) by reason of their affiliation with the Funds’ advisor, Bragg Financial Advisors, Inc. and their affiliation as registered principals with the Funds’ underwriter, QRS. Steven H. Scruggs and Benton S. Bragg are brothers-in-law.
The Funds’ Statement of Additional Information includes additional information about the Trustees and is available, without charge and upon request, by calling 1-800-595-3088.
28
QUEENS ROAD FUNDS
Trustees Information (Continued) |
Information about Trustees who are not “interested persons” of the Trust as defined under the 1940 Act, including their principal occupations during the past five years, is as follows:
Independent Trustees | |||||
Name, Address, | Position | Term of Office | Principal Occupations | Number of | Other |
Philip C. Blount III | Trustee | Unlimited; | Icons, Inc., President (2001-present) Marketing Merchandise | Two | None |
Christopher B. Brady | Trustee | Unlimited; | Private Investor (2017 – present); Brady Distributing, Vice President (1995-2009, 2012-2017) Machinery Distribution; Resort Capital Partners, Vice President (2009-2012) Hospitality Financial Advisory | Two | None |
Harold J. Smith | Trustee | Unlimited; | Raftelis Financial, Vice President (1996-present) Public Finance Consulting | Two | None |
Timothy J. Ignasher | Trustee | Unlimited; | New Dominion Bank, President (2017-present); NewBridge Bank, Exec. Vice President and Head of Commercial Banking (2012-2017); Citizens South Bank, Exec Vice President (2008-2012) | Two | None |
The Funds’ Statement of Additional Information includes additional information about the Trustees and is available, without charge and upon request, by calling 1-800-595-3088.
(1) | Member of the Audit Committee of the Board of Trustees, which makes recommendations regarding the selection of the Funds’ independent registered public accountant (the “accountants”) and meets with representatives of the accountants to determine the scope of and review the results of each audit. |
(2) | Member of the Nominating Committee of the Board of Trustees, which identifies qualified candidates and recommends nominees for the election as Trustees. |
29
QUEENS ROAD FUNDS |
Notes |
THIS PAGE INTENTIONALLY LEFT BLANK
THIS PAGE INTENTIONALLY LEFT BLANK
THIS PAGE INTENTIONALLY LEFT BLANK
QUEENS ROAD FUNDS |
Board of Trustees
Benton S. Bragg
Steven H. Scruggs
Philip C. Blount, III
Timothy J. Ignasher
Christopher B. Brady
Harold J. Smith
Investment Advisor
Bragg Financial Advisors, Inc.
1031 Caldwell Street, Suite 200
Charlotte, NC 28203
Dividend Paying Agent,
Shareholders’ Servicing Agent,
Transfer Agent
UMB Fund Services
235 West Galena Street
Milwaukee, WI 53212
Custodian
US Bank, NA
425 Walnut Street
P.O. Box 1118
Cincinnati, OH 45201
Independent Registered Public Accounting Firm
Cohen & Company, Ltd.
342 North Water Street, Suite 830
Milwaukee, WI 53202
Shares of Queens Road Value Fund and Queens Road Small Cap Value Fund are distributed by Queens Road Securities, LLC, an affiliate of the Advisor. This report has been prepared for the general information of the shareholders. It is not authorized for distribution to prospective investors unless preceded or accompanied by a current prospectus. The Funds’ prospectus contains more complete information about the objectives, policies, expenses and risks of the Funds. The Funds are not bank deposits, not FDIC insured and may lose value. Please read the prospectus carefully before investing or sending money.
This report contains certain forward looking statements which are subject to known and unknown risks and uncertainties that could cause actual results to differ materially from those expressed or implied by such statements. Forward looking statements generally include words such as “believes”, “expects”, “anticipates” and other words of similar import. Such risks and uncertainties include, among other things, the Risk Factors noted in the Funds’ filings with the Securities and Exchange Commission. The Funds undertake no obligation to update any forward looking statement.
Item 2. Code of Ethics.
| (a) | The Registrant has adopted a code of ethics (the “Code”) that applies to the Registrant’s principal executive officer, principal financial officer, principal accounting officer or controller, or persons performing similar functions. Code of Ethics for the Principal Executive and Principal Financial officer is incorporated by reference to the Registrant’s Form N-CSR filed on August 3, 2017. (SEC Accession No. 0001398344-17-009598) |
| (b) | As of the end of the period covered by the report, with respect to the Registrant’s Code that applies to its principal executive officer, principal financial officer, principal accounting officer or controller, or persons performing similar functions; there have been no amendments to, nor any waivers granted from, a provision that relates to any element of the Code definition enumerated in paragraph (b) of this Item 2. |
Item 3. Audit Committee Financial Expert.
| (a) | The board did not identify a member of the audit committee that had all of the required technical attributes to qualify as an “audit committee financial expert.” At this time, the board believes the experience provided by each member of the audit committee collectively offers the fund adequate oversight by its audit committee given the fund’s level of financial complexity. The board will from time to time reexamine such belief. |
Item 4. Principal Accountant Fees and Services.
(a) Audit Fees
| Registrant | |
| FY 2019 | $23,000 |
| FY 2020 | $23,000 |
(b) Audit-Related Fees
| Registrant | |
| FY 2019 | $0 |
| FY 2020 | $0 |
| Nature of the fees: | Not applicable. |
(c) Tax Fees
| Registrant | |
| FY 2019 | $5,000 |
| FY 2020 | $5,000 |
| Nature of the fees: | 1120-RIC & Excise Tax Return |
(d) All Other Fees
| Registrant | |
| FY 2019 | $644 |
| FY 2020 | $730 |
| Nature of the fees: | Out of pocket expenses and consents |
(e) (1) Audit Committee’s Pre-Approval Policies and Procedures
The Audit Committee has adopted pre-approval policies and procedures that require the Audit Committee to pre-approve all audit and non-audit services of the Registrant, including services provided to the Registrant’s investment adviser or any entity controlling, controlled by or under common control with the Registrant’s investment adviser that provides ongoing services to the Registrant with respect to any engagement that directly relates to the operations and financial reporting of the Registrant.
(2) Percentages of Services Approved by the Audit Committee
| Registrant | |
| Audit-Related Fees | 0.00% |
| Tax Fees: | 0.00% |
| All Other Fees: | 0.00% |
(f) None of the hours expended on the principal accountant's engagement to audit the registrant's financial statements for the most recent fiscal year were attributed to work performed by persons other than the principal account's full-time, permanent employees.
(g) The aggregate non-audit fees billed by the registrant's accountant for services rendered to the registrant, and rendered to the registrant's investment adviser (not including any sub-adviser whose role is primarily portfolio management and is subcontracted with or overseen by another investment adviser), and any entity controlling, controlled by, or under common control with the adviser that provides ongoing services to the registrant:
| Registrant | |
| FY 2019 | $0 |
| FY 2020 | $0 |
(h) The registrant's audit committee has considered whether the provision of non-audit services to the registrant's investment adviser (not including any sub-adviser whose role is primarily portfolio management and is subcontracted with or overseen by another investment adviser), and any entity controlling, controlled by, or under common control with the investment adviser that provides ongoing services to the registrant, that were not pre-approved pursuant to paragraph (c)(7)(ii) of Rule 2-01 of Regulation S-X, is compatible with maintaining the principal accountant's independence.
Item 5. Audit Committee of Listed Registrants.
Not applicable.
Item 6. Schedule of Investments.
Included as part of the report to shareholders filed under Item 1 of this Form N-CSR.
Item 7. Disclosure of Proxy Voting Policies and Procedures for Closed-End Management Investment Companies.
Not applicable to open-end management investment companies.
Item 8. Portfolio Managers of Closed-End Management Investment Companies.
Not applicable to open-end management investment companies.
Item 9. Purchases of Equity Securities by Closed-End Management Investment Company and Affiliated Purchasers.
Not applicable to open-end management investment companies.
Item 10. Submission of Matters to a Vote of Security Holders.
Not applicable.
Item 11. Controls and Procedures.
| (a) | The Registrant’s principal executive officer and principal financial officer have reviewed the Registrant's disclosure controls and procedures (as defined in Rule 30a-3(c) under the Investment Company Act of 1940, as amended, (the “Act”)) as of a date within 90 days of the filing of this report, as required by Rule 30a-3(b) under the Act. Based on their review, such officers have concluded that the disclosure controls and procedures were effective in ensuring that information required to be disclosed in this report was appropriately recorded, processed, summarized and reported and made known to them by others within the Registrant and by the Registrant’s service providers. |
| (b) | There were no changes in the Registrant’s internal control over financial reporting (as defined in Rule 30a-3(d) under the Act (17 CFR 270.30a-3(d)) that occurred during the period covered by this report that materially affected, or were reasonably likely to materially affect, the Registrant’s internal control over financial reporting. |
Item 12. Disclosure of Securities Lending Activities for Closed-End Management Companies.
Not applicable to open-end management investment companies.
Item 13. Exhibits.
| (a)(2) | Certifications required pursuant to Section 302 of the Sarbanes-Oxley Act of 2002. Filed herewith. |
| (a)(3) | Not applicable to open-end management investment companies. |
| (a)(4) | Change in the registrant’s independent public accountant. Not applicable. |
| (b) | Certification pursuant to Section 906 of the Sarbanes-Oxley Act of 2002. Filed herewith. |
SIGNATURES
Pursuant to the requirements of the Securities Exchange Act of 1934 and the Investment Company Act of 1940, the Registrant has duly caused this report to be signed on its behalf by the undersigned, thereunto duly authorized.
Bragg Capital Trust
| /s/ Steven H. Scruggs |
By: Steven H. Scruggs
President
August 10, 2020
Pursuant to the requirements of the Securities Exchange Act of 1934 and the Investment Company Act of 1940, this report has been signed below by the following persons on behalf of the Registrant and in the capacities and on the dates indicated.
| /s/ Steven H. Scruggs |
By: Steven H. Scruggs
President
(Principal Executive Officer)
August 10, 2020
| /s/ Benton S. Bragg |
By: Benton S. Bragg
Treasurer
(Principal Financial Officer)
August 10, 2020