UNITED STATES
SECURITIES AND EXCHANGE COMMISSION
Washington, D.C. 20549
FORM N-CSR
CERTIFIED SHAREHOLDER REPORT OF REGISTERED
MANAGEMENT INVESTMENT COMPANIES
Investment Company Act File Number811-21073
Bragg Capital Trust
(Exact name of registrant as specified in charter)
1031 South Caldwell Street, Suite 200
Charlotte, NC 28203
(Address of principal executive offices) (Zip code)
1031 South Caldwell Street, Suite 200
Charlotte, NC 28203
(Name and address of agent for service)
Copies to:
JoAnn Strasser
Thompson Hine LLP
1919 M Street, NW, Suite 700
Washington DC 20036
Registrant's telephone number, including area code:(704) 714-7711
Date of fiscal year end:May 31
Date of reporting period:May 31, 2019
Item 1. Reports to Stockholders.
The following is a copy of the report transmitted to shareholders pursuant to Rule 30e-1 under the Investment Company Act of 1940, as amended.
ANNUAL REPORT
Queens Road Value Fund
Queens Road Small Cap Value Fund
Each a series of
May 31, 2019 |
Beginning on January 1, 2021, as permitted by regulations adopted by the Securities and Exchange Commission, paper copies of the Funds’ shareholder reports will no longer be sent by mail, unless you specifically request paper copies of the reports. Instead, the reports will be made available on the Funds’ website, www.queensroadfunds.com, and you will be notified by mail each time a report is posted and provided with a website link to access the report.
If you already elected to receive shareholder reports electronically, you will not be affected by this change and you need not take any action. You may elect to receive shareholder reports and other communications from the Funds’ electronically by contacting your financial intermediary (such as broker-dealer or bank) or, if you are a direct investor, by following the instructions included with paper Funds documents that have been mailed to you. You may also elect to receive all future reports in paper free of charge.
QUEENS ROAD FUNDS |
Table of Contents | |
Shareholder Letter | 2 |
Manager’s Commentary | 5 |
Performance Illustration | 7 |
Graphical Illustration | 9 |
Schedules of Investments | |
Queens Road Value Fund | 10 |
Queens Road Small Cap Value Fund | 12 |
Statements of Assets and Liabilities | 14 |
Statements of Operations | 15 |
Statements of Changes in Net Assets | 16 |
Financial Highlights | 17 |
Notes to Financial Statements | 19 |
Report of Independent Registered Public Accounting Firm | 24 |
Expense Illustration | 25 |
Additional Information | 26 |
Trustees Information | 27 |
QUEENS ROAD FUNDS
Shareholder Letter May 31, 2019 (Unaudited) |
Dear Fellow Shareholder:
For investors, the volatility of the last 18 months has been especially frustrating. Like Sisyphus endlessly pushing his boulder to the top of the hill, only to watch it tumble down again, we have seen the stock market reach a new peak three times, only to drop back sharply. Yet, looking at just the first six months of 2019, this has been a good year overall for stocks and indeed all asset classes, even bonds.
Large company stocks, as measured by the S&P 500 Index, are up 18.5% for the first half of the year, albeit rising off a relative low at the end of 2018. Small cap stocks have also performed well, with the Russell 2000 Index up 17% year-to-date. May’s sell-off of 6.6% was not nearly as sharp as the 20% fourth quarter plunge in 2018, or the 10% drop earlier in that year. The drop-off in May reflected concerns over trade tensions with China; when those eased in June the market recovered to score all-time highs, just above levels seen in January 2018, September 2018 and early May 2019.
Bonds have also done well in the first half of 2019. It is speculated that the Federal Reserve will lower short-term interest rates in 2019, reversing course after a series of quarter-point increases which began in late 2015 and which took the Fed Funds target rate from approximately zero to the current target range of 2.25% to 2.50%. At the end of June the Barclays U.S. Aggregate Bond Index was up 6.11% for the year. If that return holds through year end, it would rank as the best year for the major bond index since 2011.
TEN-YEAR ANNIVERSARIES
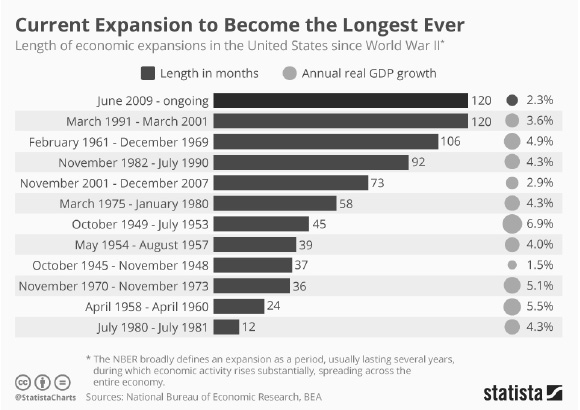
The current bull market was ten years old in March, and we are now also celebrating the tenth anniversary since the end of the last recession. As of this month, this current expansion is tied with 1991-2001 for the title of the longest enjoyed by the U.S. in the last 75 years (see chart below). However, even though the current expansion will soon be the longest in recent history, the expansion lags behind most others in terms of the rate of growth, with just 2.3% annual GDP growth. This slower rate of growth may explain why we haven’t seen the types of excessive risk taking by investors typically seen at the end of a bull market.
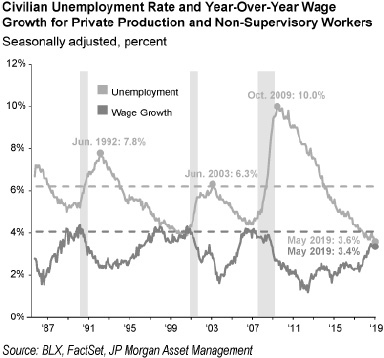
Several factors support continuing economic growth. Most estimates for 2019 GDP growth range from 2% to 3%, in line with annual growth over the past decade. U.S. unemployment has continued falling and is currently at a very low 3.6%, boosting consumer optimism. Despite the lowest unemployment rate since 1969, wage growth has remained subdued. There are pockets of the labor market that are seeing pay increases but overall, managers aren’t yet being forced to pay more to hire workers. We typically see wages rise over 4% year-over-year as the economy overheats late in the market cycle. June’s robust job creation figure of 224,000 further signals economic health.
2
QUEENS ROAD FUNDS
Shareholder Letter (Continued) |
Furthermore, trade issues that sparked May’s selloff have calmed for now, with a temporary trade truce in place with China as talks continue. The U.S. is postponing tariffs on an additional $300 billion in Chinese imports.
Moreover, the Federal Reserve seems to be standing ready to support the economy with further rate cuts if it deems it necessary. Though it’s hard to understand why the Fed would lower rates if the economy were not in immediate danger of recession, one guess is that the Fed governors saw the market’s negative reaction to its December rate hike as a misstep they do not want to repeat.
FACTORS TO WATCH
On the other hand, periods of economic expansion do not go on forever, and there are several factors to keep an eye on. Trade issues are not going away any time soon. It is hard to envision a permanent trade deal while China competes to overtake the U.S. as the premier global superpower. While China relies on the U.S. to buy its goods, there is a limit to how heavy-handed the U.S. can be in its negotiations.
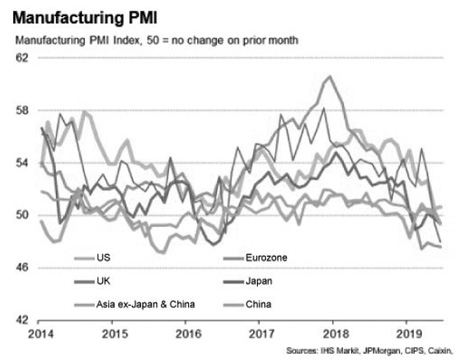
Meanwhile, manufacturing is slowing around the globe. The Purchasing Managers Index (PMI), which indicates manufacturing trends for national economies, is showing that manufacturing outputs for most major economies are now in, or approaching, the contraction zone (see chart below).
3
QUEENS ROAD FUNDS
Shareholder Letter (Continued) |
In Europe, Brexit remains an ongoing puzzle with no happy resolution in sight. British officials appear to be increasingly likely not to reach a deal before the UK’s official exit from the European Union. Failure to reach a deal would mean border checks would be introduced, transport of people and goods would be disrupted, and EU tariffs would be introduced. The deadline for the official Brexit is now scheduled for October.
Meanwhile, here in the U.S., the micro-economics of individual companies are beginning to reveal internal pressures on margins. Top line revenue growth appears scarce for many companies due to the weaker global economy and the uncertainty created by the trade war. 2019 earnings growth will likely be meager compared to the outstanding numbers posted in 2018. Juiced by the 2017 tax cuts, S&P 500 earnings grew by more than 20% in 2018. The comparisons will be trickier in 2019. This brings into question the sustainability of indefinite rosy market expectations. One sign that stock market sentiment is still quite high is the number of high-profile IPOs of Silicon Valley “unicorns” such as Uber, Lyft and Pinterest—companies that have grown to $1 billion+ valuations. A significant earnings recession will let some of the air out of the balloon…hopefully this can be avoided.
Volatility appears set to continue. Treasury bond yields once again inverted in the second quarter, with the ten-year bond paying less interest than the three-month bill—frequently an indication of a coming economic slow-down. We live in a world where a 140-character tweet can send the market up or down by 2%. It’s easy to imagine the negative event that could push us lower—military conflict with Iran, trade interruptions with China, a terrorist act. Positive events could also surprise us, with a positive effect.
We are navigating through a challenging time for investing. We’ve faced uncertainty over the past several years and investors have been rewarded for patience. With the economy on stable footing, we’ll continue to use these short-term bouts of volatility as rebalancing opportunities to buy at lower prices or take profits on price jumps. Through these actions, we hope to be well prepared for whatever lies ahead.
Sincerely,
Steven H. Scruggs, CFA | Matt Devries, CFA |
President/Portfolio Manager | Analyst |
4
QUEENS ROAD FUNDS
Manager’s Commentary May 31, 2019 (Unaudited) |
Queens Road Value Fund
For the fiscal year ended May 31, 2019, the Queens Road Value Fund returned 6.36% versus 1.15% for the S&P 500/Citigroup Value Index.
Companies that Helped Performance
● | Proctor & Gamble (PG) rose 45% during the fiscal year. The well-known consumer products company is in the midst of a long-term strategic brand re-alignment that has begun to show positive results. Organic revenue growth has expanded to mid-single digits after remaining relatively flat for the previous several years. While we are pleased with management’s progress, the company’s current valuation appears to be approaching our estimate of fair value. |
● | Ingersol Rand (IR) returned 38% for the fiscal year. The global manufacturer announced during the year that it would spin-off its Industrial business and focus on its climate control segment. The climate control business has been performing above expectations as both commercial and residential construction markets remain healthy. As we model the valuation of the remaining business after the spinoff of the Industrial business, the company appears to be near fair value. |
● | Merck (MRK)gained 37% for the fiscal year. Over the last five years, this global pharmaceutical manufacturer has continued to increase spending on research and development while cutting selling expenses. This focus on science over marketing is having positive impacts on the company’s financial statements. Return on Invested Capital continues to increase as operating margins expand. The company has proven to be a good allocator of capital through bolt-on acquisitions and strategic partnerships. With a strong pipeline and increasing global opportunities, we like Merck’s long-term prospects. |
Companies that Hurt Performance
● | State Street Corporation (STT)fell 41% during the period. One of the oldest and largest banks in the U.S., STT has been recently plagued by scandals resulting from overcharging some of its commercial clients. The company has stated that the $380 million in overcharges were accidental, but the investigation continues. Looking at the long term performance of its underlying businesses, things look much better. Although they are a provider in the competitively priced custody business, the competition is spread among only a few rational companies. Earnings continue to steadily grow and the balance sheet remains conservative. We believe STT’s current valuation provides an opportunity for the long-term investor. |
● | Lyondell Bassell Industries (LBY) declined 19% during the year. One of the largest chemical manufacturers in the world, LBY is one of the most efficient producers of plastics. The company has expanded through acquisitions, acquiring bolt-on and complimentary businesses as well as expanding its own manufacturing capabilities. While the company’s valuation appears very cheap at first glance, LYB faces cyclical challenges and near-term global production growth in excess of demand growth. These factors and its vulnerability to ethane price fluctuations have pushed down the share price. While we are cognizant of these and other risk factors, we feel the company’s balance sheet strength and position as a low cost producer provide a good investment opportunity. |
● | Bank of New York Mellon (BK) dropped 20% for the year. A competitor of portfolio holding State Street Corporation, BK faces the same price competition for their global custody services. In spite of this competition, the company continues to slowly but steadily increase its earnings and does so while maintaining a strong balance sheet. BK remains one of the fund’s core holding. |
5
QUEENS ROAD FUNDS
Manager’s Commentary (Continued) |
Queens Road Small Cap Value Fund
For the fiscal year ended May 31, 2019, the Queens Road Small Cap Value Fund returned -4.26% compared to -11.32% for the Russell 2000 Value Index.
Companies that Helped Performance
● | RLI Corp (RLI) rose 34% over the last 12 months. Well-managed specialty insurer, RLI Corp. continued its 44-year dividend growth streak. As a long-time holding of the fund, we hold the RLI management in very high regard as we have watched them manage their unique business model through various market environments. However, the company’s current valuation is trading very near our estimate of fair value. |
● | Deckers Outdoor, Corp. (DECK) rose 34% during the last 12 months. Best known as the makers of Ugg, Teva and Hoka One One footwear, the company has continued to perform well, posting strong earnings, and increasing guidance. In the face of a very challenging retail environment, management continues to execute its strategic plan as revenues and margins continue to grow. While the Ugg brand (80% of sales) performed well, growing according to plan, the Hoka One One brand continues to exceed plans. DECK remains one of our top holdings. |
Companies that Hurt Performance
● | Tenneco, Inc. (TEN)dropped 77% over the last year. Tenneco is a manufacturer and distributor of automotive parts for new vehicles and the repair/replacement market. Primarily, it makes ride suspension systems including shocks and struts, and clean air systems like catalytic converters and emission control systems. During the year, Tenneco acquired auto parts manufacturer Federal Mogul from Carl Icahn for $5.4 billion. Prior to the transaction the company announced that they planned to split into two separate companies in a tax free spin-off. One company will be a pure-play ride control and after-market parts company, and the other will be a pure-play powertrain company. The separation is scheduled to occur during the second half of 2019. The debt load resulting from the Federal Mogul acquisition is substantial. The separation plan the company announced makes a lot of sense and we believe the two separate companies will be worth more than the combined company. Carl Icahn seems to agree as he has indicated he plans on holding on to his significant stake that he received in the buyout. |
● | Greenbrier (GBX) fell 44% during the last 12 months. The maker of railcars appears to be making some process on improving production inefficiencies at its manufacturing facilities but still faces a concerning global economic growth forecast. The company’s international and product diversification efforts combined with its substantial backlog and pristine balance sheet is reassuring and we remain cautiously optimistic. |
● | Synaptics (SYNA) fell 37% during the year. Synaptics continues to struggle as it transitions from its heavy reliance on smart phones (primarily touch screen sensors and controllers) towards a more diversified revenue mix by expanding its presence in the Internet of Things (IoT) market (touch, voice and audio sensors). The IoT revenue is not growing quickly enough to offset declines in Mobile revenue, resulting in decreasing revenues, profits and cash flow. In the face of this poor performance, the company lost both its CEO and CFO during the year. Our patience has been tested with this long-term holding. The company has maintained profitability and a relatively strong balance sheet, but we are closely monitoring the new CEO hire to determine our continued investment. |
6
QUEENS ROAD FUNDS
Performance Illustration May 31, 2019 (Unaudited) |
Queens Road Value Fund
Average Annual Total Return | |||
Queens Road Value Fund | S&P 500/Citigroup Value Index | ||
1 Year | 6.36% | 1.15% | |
5 Year | 7.87% | 6.69% | |
10 Year | 11.38% | 12.17% | |
The performance data quoted is historical. Past performance is no guarantee of future results. Current performance may be higher or lower than the performance data quoted. The principal value and investment return of an investment will fluctuate so that your shares, when redeemed, may be worth more or less than their original cost. The returns shown do not reflect the deduction of taxes that a shareholder would pay on Fund distributions or on the redemptions of Fund shares. Returns greater than 1 year are annualized. The Fund’s total annual operating expenses are 0.95% per the October 1, 2018 Prospectus. This material must be proceeded or accompanied by a Prospectus. Please read it carefully before investing. For performance information current to the most recent month-end, please call the Fund at 1-800-595-3088. | |||
The S&P 500/Citigroup Value Index along with its counterpart the S&P 500/Citigroup Growth Index were introduced in December 2005. These Indices are created by dividing the S&P 500 Index based upon seven different factors, four to determine value characteristics and three to determine growth characteristics. The companies are allocated to each index according to their growth or value characteristics, with about one-third allocated to both the growth and value index. It is not possible to invest directly in the S&P 500/Citigroup Value Index. The S&P 500/Citigroup Growth Index and S&P 500/Citigroup Value Index are the exclusive property of Standard & Poors.
Growth of Assumed $10,000 Investment
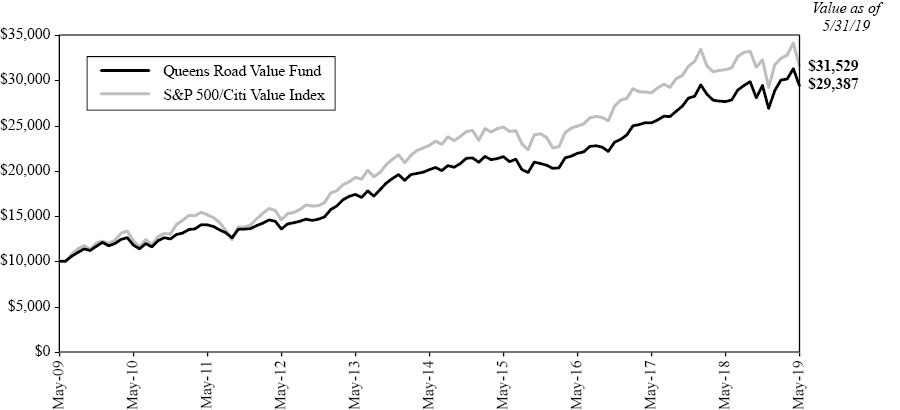
This graph illustrates the hypothetical investment of $10,000 in the Fund from May 31, 2009 to May 31, 2019. The Average Annual Total Return table and Growth of Assumed $10,000 Investment graph do not reflect the deduction of taxes that a shareholder would pay on Fund distributions or the redemption of Fund shares.
7
QUEENS ROAD FUNDS
Performance Illustration (Continued) |
Queens Road Small Cap Value Fund
Average Annual Total Return | |||
Queens Road Small Cap Value Fund | Russell 2000 Value Index | ||
1 Year | -4.26% | -11.32% | |
5 Year | 4.46% | 5.00% | |
10 Year | 9.18% | 11.67% | |
The performance data quoted is historical. Past performance is no guarantee of future results. Current performance may be higher or lower than the performance data quoted. The principal value and investment return of an investment will fluctuate so that your shares, when redeemed, may be worth more or less than their original cost. The returns shown do not reflect the deduction of taxes that a shareholder would pay on Fund distributions or on the redemptions of Fund shares. Returns greater than 1 year are annualized. The Fund’s total annual operating expenses are 1.18% per the October 1, 2018 Prospectus. This material must be proceeded or accompanied by a Prospectus. Please read it carefully before investing. For performance information current to the most recent month-end, please call the Fund at 1-800-595-3088. | |||
The Russell 2000 Value Index is a subset of the Russell 2000 Index, which tracks the stocks of small domestic companies, based on total market capitalization. The Russell 2000 Value Index represents those stocks of the Russell 2000 with lower price-to-book ratios and lower relative forecasted growth rates. You cannot invest directly in these indices.
Growth of Assumed $10,000 Investment
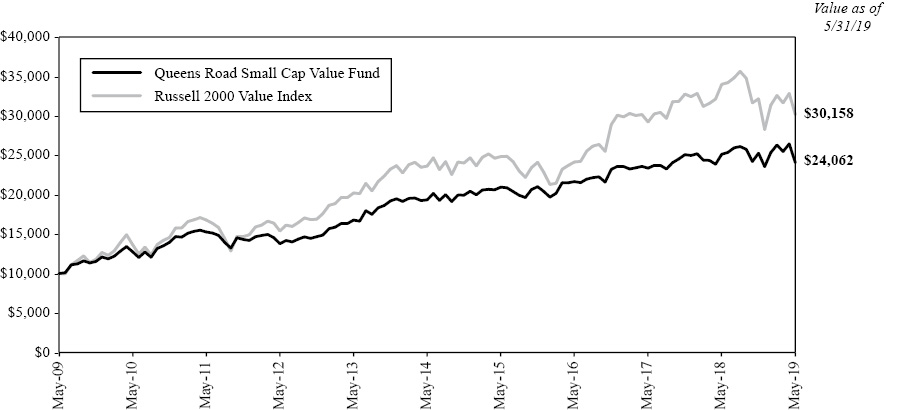
This graph illustrates the hypothetical investment of $10,000 in the Fund from May 31, 2009 to May 31, 2019. The Average Annual Total Return table and Growth of Assumed $10,000 Investment graph do not reflect the deduction of taxes that a shareholder would pay on Fund distributions or the redemption of Fund shares.
8
QUEENS ROAD FUNDS
Graphical Illustration May 31, 2019 (Unaudited) |
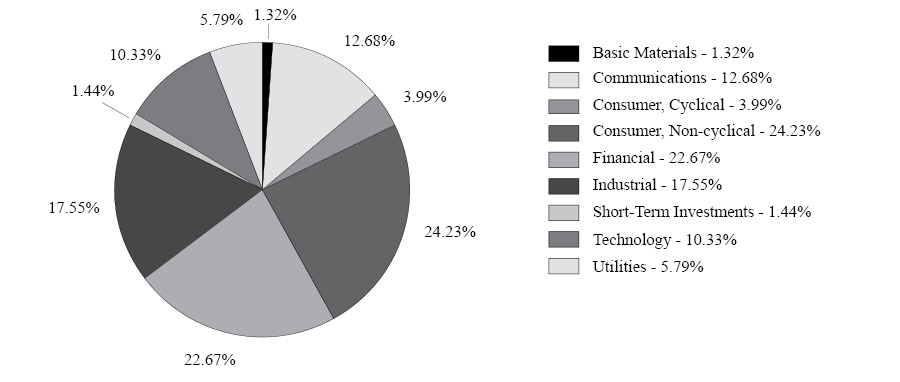
The following charts provide a visual breakdown of the Funds by the industry sectors that the underlying securities represent, as a percentage of the total investments held by each Fund, as of May 31, 2019. Please see the Schedules of Investments on the following pages for a detailed list of each Fund’s holdings.
Queens Road Value Fund(1)
Queens Road Small Cap Value Fund(1)
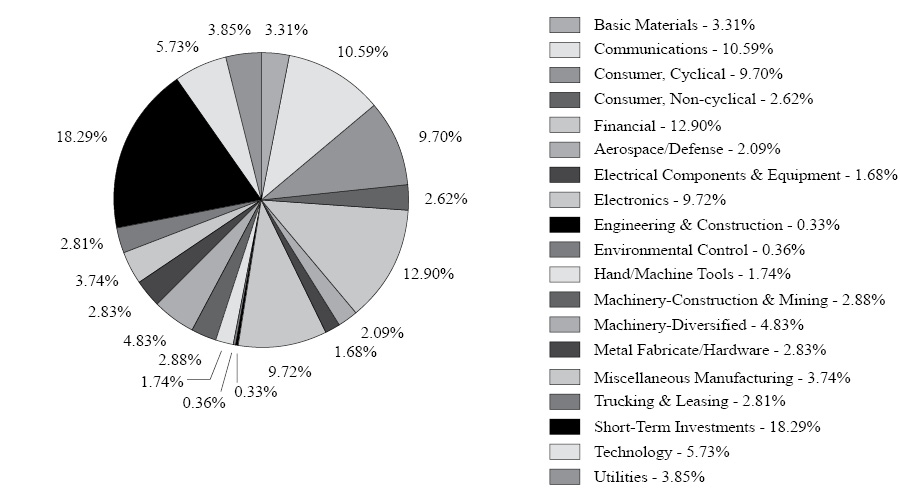
(1) | Sector weightings represent the percentage of a Fund’s investments in certain general sectors. These sectors may include more than one industry. A Fund’s portfolio composition is subject to change at any time. |
9
QUEENS ROAD VALUE FUND
Schedules of Investments |
NUMBER | VALUE | |||||||
COMMON STOCKS — 98.5% | ||||||||
AEROSPACE/DEFENSE — 5.4% | ||||||||
| 8,000 | General Dynamics Corp. | $ | 1,286,560 | |||||
| 6,600 | United Technologies Corp. | 833,580 | ||||||
| 2,120,140 | |||||||
APPAREL — 1.9% | ||||||||
| 1,214 | Kontoor Brands, Inc.1 | 35,579 | ||||||
| 8,500 | VF Corp. | 695,980 | ||||||
| 731,559 | ||||||||
BANKS — 5.5% | ||||||||
| 14,500 | Bank of New York Mellon Corp. | 619,005 | ||||||
| 9,000 | JPMorgan Chase & Co. | 953,640 | ||||||
| 11,000 | State Street Corp. | 607,750 | ||||||
| 2,180,395 | |||||||
CHEMICALS — 1.3% | ||||||||
| 7,000 | LyondellBasell Industries NV, Class A | 519,750 | ||||||
COMPUTERS — 2.2% | ||||||||
| 3,984 | DXC Technology Co. | 189,400 | ||||||
| 46,378 | Hewlett Packard Enterprise Co. | 636,306 | ||||||
| 1,234 | Perspecta, Inc. | 26,790 | ||||||
| 852,496 | ||||||||
COSMETICS/PERSONAL CARE — 4.8% | ||||||||
| 8,800 | Procter & Gamble Co. | 905,608 | ||||||
| 16,400 | Unilever PLC ADR | 998,924 | ||||||
| 1,904,532 | |||||||
DIVERSIFIED FINANCIAL SERVICES — 12.5% | ||||||||
| 18,000 | American Express Co. | 2,064,780 | ||||||
| 9,000 | Ameriprise Financial, Inc. | 1,244,070 | ||||||
| 10,000 | Franklin Resources, Inc. | 318,200 | ||||||
| 28,800 | Jefferies Financial Group, Inc. | 508,896 | ||||||
| 7,900 | T Rowe Price Group, Inc. | 799,006 | ||||||
| 4,934,952 | |||||||
ELECTRIC — 5.8% | ||||||||
| 13,000 | American Electric Power Co., Inc. | 1,119,560 | ||||||
| 8,284 | Duke Energy Corp. | 709,193 | ||||||
| 8,400 | Southern Co. | 449,400 | ||||||
| 2,278,153 | |||||||
ELECTRONICS — 1.4% | ||||||||
| 3,400 | Allegion PLC | 329,970 | ||||||
| 3,150 | Fortive Corp. | 239,873 | ||||||
| 569,843 | ||||||||
ENVIRONMENTAL CONTROL — 0.8% | ||||||||
| 9,076 | Pentair PLC | 316,026 | ||||||
FOOD — 1.4% | ||||||||
| 3,000 | Kraft Heinz Co. | 82,950 | ||||||
| 9,000 | Mondelez International, Inc., Class A | 457,650 | ||||||
| 540,600 | ||||||||
HEALTHCARE-PRODUCTS — 2.8% | ||||||||
| 6,300 | Danaher Corp. | 831,663 | ||||||
| 3,022 | Medtronic PLC | 279,777 | ||||||
| 1,111,440 | |||||||
HEALTHCARE-SERVICES — 5.2% | ||||||||
| 7,300 | Anthem, Inc. | 2,029,254 | ||||||
HOUSEHOLD PRODUCTS/WARES — 3.4% | ||||||||
| 7,586 | Clorox Co. | 1,128,873 | ||||||
| 1,717 | Kimberly-Clark Corp. | 219,587 | ||||||
| 1,348,460 | ||||||||
INSURANCE — 4.6% | ||||||||
| 3 | Berkshire Hathaway, Inc., Class A1 | 891,180 | ||||||
| 10,000 | Prudential Financial, Inc. | 923,800 | ||||||
| 1,814,980 | |||||||
INTERNET — 0.6% | ||||||||
| 12,000 | Symantec Corp. | 224,760 | ||||||
MEDIA — 4.3% | ||||||||
| 10,166 | Fox Corp., Class A | 358,148 | ||||||
| 10,151 | Walt Disney Co. | 1,340,338 | ||||||
| 1,698,486 | ||||||||
MISCELLANEOUS MANUFACTURING — 8.6% | ||||||||
| 3,600 | 3M Co. | 575,100 | ||||||
| 18,000 | Eaton Corp. PLC | 1,340,820 | ||||||
| 30,000 | General Electric Co. | 283,200 | ||||||
| 10,200 | Ingersoll-Rand PLC | 1,207,068 | ||||||
| 3,406,188 | |||||||
PHARMACEUTICALS — 6.6% | ||||||||
| 5,000 | Bristol-Myers Squibb Co. | 226,850 | ||||||
| 13,820 | Merck & Co., Inc. | 1,094,682 | ||||||
| 31,000 | Pfizer, Inc. | 1,287,120 | ||||||
| 2,608,652 | |||||||
RETAIL — 2.1% | ||||||||
| 4,225 | McDonald’s Corp. | 837,691 | ||||||
SEMICONDUCTORS — 2.9% | ||||||||
| 26,000 | Intel Corp. | 1,145,040 | ||||||
SOFTWARE — 5.3% | ||||||||
| 6,500 | Microsoft Corp. | 803,920 | ||||||
| 25,000 | Oracle Corp. | 1,265,000 | ||||||
| 2,068,920 | ||||||||
TELECOMMUNICATIONS — 7.8% | ||||||||
| 37,500 | Cisco Systems, Inc. | 1,951,125 | ||||||
| 20,000 | Corning, Inc. | 576,800 | ||||||
| 10,000 | Verizon Communications, Inc. | 543,500 | ||||||
| 3,071,425 | ||||||||
See accompanying Notes to Financial Statements.
10
QUEENS ROAD VALUE FUND
Schedules of Investments (Continued) |
NUMBER | VALUE | |||||||
TRANSPORTATION — 1.3% | ||||||||
| 3,000 | Union Pacific Corp. | $ | 500,340 | |||||
TOTAL COMMON STOCKS | ||||||||
(Cost $20,042,457) | 38,814,082 | |||||||
| ||||||||
PRINCIPAL | ||||||||
SHORT-TERM INVESTMENTS — 1.4% | ||||||||
DEMAND DEPOSIT — 1.4% | ||||||||
| $ | 555,010 | U.S. Bank Money Market Deposit Account, 0.30%2 | 555,010 | |||||
TOTAL SHORT-TERM INVESTMENTS | ||||||||
(Cost $555,010) | 555,010 | |||||||
TOTAL INVESTMENTS — 99.9% | ||||||||
(Cost $20,597,467) | 39,369,092 | |||||||
Other Assets in Excess of Liabilities — 0.1% | 54,104 | |||||||
TOTAL NET ASSETS — 100.0% | $ | 39,423,196 | ||||||
ADR – American Depositary Receipt
PLC – Public Limited Company
1 | Non-income Producing. |
2 | The Money Market Deposit Account (the “MMDA”) is a short-term investment vehicle in which the Fund holds cash balances. The MMDA will bear interest at a variable rate that is determined based on market conditions and may change daily and by any amount. The rate shown is as of May 31, 2019. |
See accompanying Notes to Financial Statements.
11
QUEENS ROAD SMALL CAP VALUE FUND
Schedules of Investments |
NUMBER | VALUE | |||||||
COMMON STOCKS — 81.7% | ||||||||
AEROSPACE/DEFENSE — 2.1% | ||||||||
| 9,484 | Astronics Corp.1 | $ | 385,714 | |||||
| 7,009 | Astronics Corp., Class B1 | 283,865 | ||||||
| 39,931 | Ducommun, Inc.1 | 1,802,086 | ||||||
| 2,471,665 | |||||||
AGRICULTURE — 0.9% | ||||||||
| 57,879 | Darling Ingredients, Inc.1 | 1,093,913 | ||||||
APPAREL — 5.4% | ||||||||
| 32,912 | Deckers Outdoor Corp.1 | 5,005,915 | ||||||
| 63,839 | Delta Apparel, Inc.1 | 1,376,369 | ||||||
| 6,382,284 | ||||||||
AUTO PARTS & EQUIPMENT — 0.7% | ||||||||
| 80,600 | Tenneco, Inc. | 801,164 | ||||||
COMPUTERS — 0.0% | ||||||||
| 115 | Cubic Corp. | 6,488 | ||||||
DISTRIBUTION/WHOLESALE — 1.6% | ||||||||
| 34,574 | Anixter International, Inc.1 | 1,844,869 | ||||||
DIVERSIFIED FINANCIAL SERVICES — 0.4% | ||||||||
| 13,214 | Deluxe Corp. | 491,561 | ||||||
ELECTRICAL COMPONENTS & EQUIPMENT — 1.7% | ||||||||
| 17,600 | Graham Corp. | 359,216 | ||||||
| 10,000 | Littelfuse, Inc. | 1,632,100 | ||||||
| 1,991,316 | |||||||
ELECTRONICS — 9.7% | ||||||||
| 47,610 | SYNNEX Corp. | 4,128,263 | ||||||
| 48,252 | Tech Data Corp.1 | 4,374,044 | ||||||
| 197,337 | Vishay Intertechnology, Inc. | 3,007,416 | ||||||
| 11,509,723 | |||||||
ENGINEERING & CONSTRUCTION — 0.3% | ||||||||
| 16,414 | VSE Corp. | 395,742 | ||||||
ENVIRONMENTAL CONTROL — 0.4% | ||||||||
| 9,286 | Stericycle, Inc.1 | 430,685 | ||||||
FOREST PRODUCTS & PAPER — 2.7% | ||||||||
| 104,012 | Schweitzer-Mauduit International, Inc. | 3,254,535 | ||||||
GAS — 3.9% | ||||||||
| 36,193 | New Jersey Resources Corp. | 1,717,358 | ||||||
| 90,241 | South Jersey Industries, Inc. | 2,847,103 | ||||||
| 4,564,461 | ||||||||
HAND/MACHINE TOOLS — 1.7% | ||||||||
| 82,156 | Colfax Corp.1 | 2,062,116 | ||||||
HOUSEHOLD PRODUCTS/WARES — 0.0% | ||||||||
| 11,288 | CSS Industries, Inc. | 53,618 | ||||||
INSURANCE — 11.1% | ||||||||
| 35,266 | American Equity Investment Life Holding Co. | 998,380 | ||||||
| 29,195 | American National Insurance Co. | 3,309,837 | ||||||
| 48,932 | CNO Financial Group, Inc. | 768,722 | ||||||
| 26,226 | Crawford & Co., Class B | 218,200 | ||||||
| 5,410 | EMC Insurance Group, Inc. | 195,193 | ||||||
| 71,182 | Horace Mann Educators Corp. | 2,883,583 | ||||||
| 56,217 | RLI Corp. | 4,827,916 | ||||||
| 13,201,831 | |||||||
MACHINERY-CONSTRUCTION & MINING — 2.9% | ||||||||
| 47,942 | Oshkosh Corp. | 3,412,991 | ||||||
MACHINERY-DIVERSIFIED — 4.8% | ||||||||
| 51,381 | CSW Industrials, Inc. | 3,284,787 | ||||||
| 51,678 | Graco, Inc. | 2,440,235 | ||||||
| 5,725,022 | |||||||
MEDIA — 5.9% | ||||||||
| 87,021 | Meredith Corp. | 4,505,077 | ||||||
| 74,712 | Scholastic Corp. | 2,472,220 | ||||||
| 6,977,297 | |||||||
METAL FABRICATE/HARDWARE — 2.8% | ||||||||
| 93,220 | LB Foster Co.1 | 2,253,127 | ||||||
| 25,000 | Timken Co. | 1,100,250 | ||||||
| 3,353,377 | |||||||
MINING — 0.6% | ||||||||
| 105,000 | Livent Corp.1 | 663,600 | ||||||
MISCELLANEOUS MANUFACTURING — 3.7% | ||||||||
| 3,900 | Chase Corp. | 396,591 | ||||||
| 94,479 | Fabrinet1 | 4,028,585 | ||||||
| 4,425,176 | |||||||
PHARMACEUTICALS — 1.7% | ||||||||
| 60,000 | Owens & Minor, Inc. | 161,400 | ||||||
| 61,967 | Prestige Consumer Healthcare, Inc.1 | 1,798,902 | ||||||
| 1,960,302 | ||||||||
SAVINGS & LOANS — 1.4% | ||||||||
| 58,460 | Axos Financial, Inc.1 | 1,596,543 | ||||||
SEMICONDUCTORS — 2.5% | ||||||||
| 113,026 | Synaptics, Inc.1 | 2,989,538 | ||||||
See accompanying Notes to Financial Statements.
12
QUEENS ROAD SMALL CAP VALUE FUND
Schedules of Investments (Continued) |
NUMBER | VALUE | |||||||
SOFTWARE — 3.2% | ||||||||
| 84,414 | CSG Systems International, Inc. | $ | 3,785,968 | |||||
TELECOMMUNICATIONS — 4.7% | ||||||||
| 41,142 | InterDigital, Inc. | 2,613,340 | ||||||
| 71,879 | Plantronics, Inc. | 2,952,070 | ||||||
| 5,565,410 | ||||||||
TEXTILES — 2.1% | ||||||||
| 15,529 | UniFirst Corp. | 2,465,695 | ||||||
TRUCKING & LEASING — 2.8% | ||||||||
| 122,145 | Greenbrier Cos., Inc. | 3,323,565 | ||||||
TOTAL COMMON STOCKS | ||||||||
(Cost $74,591,212) | 96,800,455 | |||||||
PRINCIPAL | ||||||||
SHORT-TERM INVESTMENTS — 18.3% | ||||||||
DEMAND DEPOSIT — 18.3% | ||||||||
| $ | 21,640,038 | U.S. Bank Money Market Deposit Account, 0.30%2 | 21,640,038 | |||||
| ||||||||
TOTAL SHORT-TERM INVESTMENTS | ||||||||
(Cost $21,640,038) | 21,640,038 | |||||||
TOTAL INVESTMENTS — 100.0% | ||||||||
(Cost $96,231,250) | 118,440,493 | |||||||
Other Assets in Excess of Liabilities — 0.0% | 13,708 | |||||||
TOTAL NET ASSETS — 100.0% | $ | 118,454,201 | ||||||
1 | Non-income Producing. |
2 | The Money Market Deposit Account (the “MMDA”) is a short-term investment vehicle in which the Fund holds cash balances. The MMDA will bear interest at a variable rate that is determined based on market conditions and may change daily and by any amount. The rate shown is as of May 31, 2019. |
See accompanying Notes to Financial Statements.
13
QUEENS ROAD FUNDS
Statements of Assets and Liabilities As of May 31, 2019 |
Value Fund | Small Cap | |||||||
Assets: | ||||||||
Investments, at Value (cost $20,597,467, $96,231,250) | $ | 39,369,092 | $ | 118,440,493 | ||||
Receivables: | ||||||||
Shareholder Subscriptions | 50 | 12,727 | ||||||
Dividends and Interest | 87,035 | 156,342 | ||||||
Total Assets | 39,456,177 | 118,609,562 | ||||||
Liabilities: | ||||||||
Payables: | ||||||||
Shareholder Redemptions | — | 29,308 | ||||||
Accrued Advisory Fees (Note 3) | 32,981 | 126,053 | ||||||
Total Liabilities | 32,981 | 155,361 | ||||||
Net Assets | $ | 39,423,196 | $ | 118,454,201 | ||||
Components of Net Assets: | ||||||||
Paid-in Capital (par value $0.001 per share with an unlimited number of shares authorized) | $ | 19,641,609 | $ | 91,504,797 | ||||
Total Distributable Earnings | 19,781,587 | 26,949,404 | ||||||
Net Assets | $ | 39,423,196 | $ | 118,454,201 | ||||
Shares of Beneficial Interest Issued and Outstanding | 1,739,008 | 5,017,913 | ||||||
Net Asset Value, Offering and Redemption Price Per Share | $ | 22.67 | $ | 23.61 | ||||
See accompanying Notes to Financial Statements.
14
QUEENS ROAD FUNDS
Statements of Operations For the year ended May 31, 2019 |
Value Fund | Small Cap | |||||||
Investment Income: | ||||||||
Dividends | $ | 1,045,420 | $ | 1,444,347 | ||||
Interest | 3,945 | 335,301 | ||||||
Total Investment Income | 1,049,365 | 1,779,648 | ||||||
Expenses: | ||||||||
Advisory Fees (Note 3) | 402,959 | 1,525,508 | ||||||
Total Expenses | 402,959 | 1,525,508 | ||||||
Net Investment Income | 646,406 | 254,140 | ||||||
Realized and Unrealized Gain (Loss) on Investments: | ||||||||
Net Realized Gain on Investments | 1,272,565 | 11,185,675 | ||||||
Net Change in Unrealized Appreciation (Depreciation) on Investments | 547,493 | (17,482,132 | ) | |||||
Net Realized and Unrealized Gain (Loss) on Investments | 1,820,058 | (6,296,457 | ) | |||||
Net Increase (Decrease) in Net Assets From Operations | $ | 2,466,464 | $ | (6,042,317 | ) | |||
See accompanying Notes to Financial Statements.
15
QUEENS ROAD FUNDS
Statements of Changes in Net Assets |
Value Fund | Small Cap Value Fund | |||||||||||||||
For the | For the | For the | For the | |||||||||||||
Increase (Decrease) in Net Assets from: | ||||||||||||||||
Operations: | ||||||||||||||||
Net Investment Income | $ | 646,406 | $ | 633,090 | $ | 254,140 | $ | 111,467 | ||||||||
Net Realized Gain on Investments | 1,272,565 | 1,418,777 | 11,185,675 | 6,813,801 | ||||||||||||
Net Change in Unrealized Appreciation (Depreciation) on Investments | 547,493 | 1,975,174 | (17,482,132 | ) | 3,092,197 | |||||||||||
Net Increase (Decrease) in Net Assets from Operations | 2,466,464 | 4,027,041 | (6,042,317 | ) | 10,017,465 | |||||||||||
| ||||||||||||||||
Distributions to Shareholders: | ||||||||||||||||
Distributions | (2,548,616 | ) | (1,780,875 | )1 | (11,660,415 | ) | (2,899,450 | )2 | ||||||||
Net Change in Net Assets | (2,548,616 | ) | (1,780,875 | ) | (11,660,415 | ) | (2,899,450 | ) | ||||||||
Capital Transactions: | ||||||||||||||||
Proceeds from Sale of Shares | 1,406,759 | 3,174,088 | 18,362,211 | 18,767,503 | ||||||||||||
Net Asset Value of Shares Issued on Reinvestment of Dividends | 518,840 | 384,841 | 7,371,415 | 1,985,175 | ||||||||||||
Cost of Shares Redeemed | (5,199,937 | ) | (5,844,929 | ) | (23,206,927 | ) | (34,923,359 | ) | ||||||||
Net Increase (Decrease) in Net Assets from Capital Transactions | (3,274,338 | ) | (2,286,000 | ) | 2,526,699 | (14,170,681 | ) | |||||||||
Total Decrease in Net Assets | (3,356,490 | ) | (39,834 | ) | (15,176,033 | ) | (7,052,666 | ) | ||||||||
Net Assets: | ||||||||||||||||
Beginning of Year | 42,779,686 | 42,819,520 | 133,630,234 | 140,682,900 | ||||||||||||
End of Year | $ | 39,423,196 | $ | 42,779,686 | 3 | $ | 118,454,201 | $ | 133,630,234 | 4 | ||||||
Capital Share Transactions: | ||||||||||||||||
Shares Sold | 60,117 | 137,816 | 711,549 | 704,107 | ||||||||||||
Shares Issued on Reinvestment of Dividends | 25,384 | 16,474 | 320,915 | 72,824 | ||||||||||||
Shares Redeemed | (223,895 | ) | (251,496 | ) | (905,533 | ) | (1,312,127 | ) | ||||||||
Net Increase (Decrease) in Shares | (138,394 | ) | (97,206 | ) | 126,931 | (535,196 | ) | |||||||||
1 | Includes net investment income distributions of $549,243 and net realized gain distributions of $1,231,632. |
2 | Includes net realized gain distributions of $2,899,450. |
3 | Net Assets – End of Year includes accumulated undistributed net investment income of $282,765 for the year ended May 31, 2018. The SEC eliminated this disclosure requirement effective November 2018. |
4 | Net Assets – End of Year includes accumulated distributions in excess of net investment income of $54,713 for the year ended May 31, 2018. The SEC eliminated this disclosure requirement effective November 2018. |
See accompanying Notes to Financial Statements.
16
QUEENS ROAD VALUE FUND
Financial Highlights |
Per share operating performance
For a capital share outstanding throughout each year
Year | Year | Year | Year | Year | ||||||||||||||||
Net Asset Value, Beginning of Year | $ | 22.79 | $ | 21.69 | $ | 19.83 | $ | 20.10 | $ | 19.65 | ||||||||||
Income from Investment Operations: | ||||||||||||||||||||
Net Investment Income1 | 0.35 | 0.33 | 0.30 | 0.31 | 0.23 | |||||||||||||||
Net Realized and Unrealized Gain on Investments | 0.94 | 1.70 | 2.66 | 0.00 | 2 | 1.17 | ||||||||||||||
Total from Investment Operations | 1.29 | 2.03 | 2.96 | 0.31 | 1.40 | |||||||||||||||
Less Distributions: | ||||||||||||||||||||
Net Investment Income | (0.34 | ) | (0.29 | ) | (0.33 | ) | (0.22 | ) | (0.22 | ) | ||||||||||
Net Realized Gains | (1.07 | ) | (0.64 | ) | (0.77 | ) | (0.36 | ) | (0.73 | ) | ||||||||||
Total Distributions | (1.41 | ) | (0.93 | ) | (1.10 | ) | (0.58 | ) | (0.95 | ) | ||||||||||
Net Asset Value, End of Year | $ | 22.67 | $ | 22.79 | $ | 21.69 | $ | 19.83 | $ | 20.10 | ||||||||||
Total Return | 6.36 | % | 9.25 | % | 15.31 | % | 1.74 | % | 7.15 | % | ||||||||||
Ratios and Supplemental Data: | ||||||||||||||||||||
Net Assets, End of Year (in thousands) | $ | 39,423 | $ | 42,780 | $ | 42,820 | $ | 39,249 | $ | 38,185 | ||||||||||
Ratio of Expenses to Average Net Assets | 0.95 | % | 0.95 | % | 0.95 | % | 0.95 | % | 0.95 | % | ||||||||||
Ratio of Net Investment Income to Average Net Assets | 1.52 | % | 1.43 | % | 1.44 | % | 1.61 | % | 1.14 | % | ||||||||||
Portfolio Turnover Rate | 1 | % | — | % | 8 | % | 14 | % | 4 | % | ||||||||||
1 | Computed using average shares method. |
2 | Amount is less than $0.005 per share. |
See accompanying Notes to Financial Statements.
17
QUEENS ROAD SMALL CAP VALUE FUND
Financial Highlights |
Per share operating performance
For a capital share outstanding throughout each year
Year | Year | Year | Year | Year | ||||||||||||||||
Net Asset Value, Beginning of Year | $ | 27.32 | $ | 25.93 | $ | 25.26 | $ | 24.52 | $ | 23.27 | ||||||||||
Income from Investment Operations: | ||||||||||||||||||||
Net Investment Income (Loss)1 | 0.05 | 0.02 | (0.00 | )2 | (0.02 | ) | 0.01 | |||||||||||||
Net Realized and Unrealized Gain (Loss) on Investments | (1.28 | ) | 1.94 | 2.01 | 0.84 | 1.90 | ||||||||||||||
Total from Investment Operations | (1.23 | ) | 1.96 | 2.01 | 0.82 | 1.91 | ||||||||||||||
Less Distributions: | ||||||||||||||||||||
Net Investment Income | (0.03 | ) | — | — | — | — | ||||||||||||||
Net Realized Gains | (2.45 | ) | (0.57 | ) | (1.34 | ) | (0.08 | ) | (0.66 | ) | ||||||||||
Total Distributions | (2.48 | ) | (0.57 | ) | (1.34 | ) | (0.08 | ) | (0.66 | ) | ||||||||||
Net Asset Value, End of Year | $ | 23.61 | $ | 27.32 | $ | 25.93 | $ | 25.26 | $ | 24.52 | ||||||||||
Total Return | (4.26 | )% | 7.55 | % | 7.87 | % | 3.37 | % | 8.33 | % | ||||||||||
Ratios and Supplemental Data: | ||||||||||||||||||||
Net Assets, End of Year (in thousands) | $ | 118,454 | $ | 133,630 | $ | 140,683 | $ | 143,376 | $ | 79,266 | ||||||||||
Ratio of Expenses to Average Net Assets | 1.18 | % | 1.22 | % | 1.24 | % | 1.24 | % | 1.24 | % | ||||||||||
Ratio of Net Investment Income to Average Net Assets | 0.20 | % | 0.08 | % | (0.02 | )% | (0.07 | )% | 0.02 | % | ||||||||||
Portfolio Turnover Rate | 27 | % | 6 | % | 27 | % | 23 | % | 2 | % | ||||||||||
1 | Computed using average shares method. |
2 | Amount is less than $0.005 per share. |
See accompanying Notes to Financial Statements.
18
QUEENS ROAD FUNDS
Notes to Financial Statements May 31, 2019 |
Note 1. Organization
The Queens Road Value Fund and the Queens Road Small Cap Value Fund (individually referred to as the “Value Fund” and “Small Cap Value Fund”, respectively, or collectively as the “Funds”), are diversified managed portfolios of Bragg Capital Trust (the “Trust”), which is registered under the Investment Company Act of 1940, as amended (the “1940 Act”), as an open-end management company. Each Fund’s investment objective is to seek long-term capital growth. The Funds invest primarily in common stocks which are believed by Bragg Financial Advisors (the “Advisor”) to be undervalued and have good prospects for capital appreciation. Under normal circumstances, the Small Cap Value Fund invests at least 80% of its assets in equity securities of companies with small market capitalization. The Small Cap Value Fund defines a small capitalization (small cap) company as one whose market capitalization, at the time of purchase, is $5 billion or less. The Funds’ registration statement was declared effective on June 13, 2002, and operations began on that date.
Note 2. Significant Accounting Policies
The following is a summary of accounting policies followed by the Funds in the preparation of their financial statements. The Funds are investment companies, as such, these financial statements have applied the guidance set forth in the Financial Accounting Standards Board (“FASB”) Accounting Standards Codification (“ASC”) Topic 946 “Financial Services - Investment Companies.”
Federal Income Taxes: Each Fund intends to continue to comply with the requirements of Subchapter M of the Internal Revenue Code applicable to regulated investment companies and to distribute substantially all of its net investment income and any net realized gains to its shareholders. Therefore, no provision is made for federal income or excise taxes.
Accounting for Uncertainty in Income Taxes (the “Income Tax Statement”) requires an evaluation of tax positions taken (or expected to be taken) in the course of preparing a Fund’s tax returns to determine whether these positions meet a “more-likely-than-not” standard that, based on the technical merits, have a more than fifty percent likelihood of being sustained by a taxing authority upon examination. A tax position that meets the “more-likely-than-not” recognition threshold is measured to determine the amount of benefit to recognize in the financial statements. The Funds recognize interest and penalties, if any, related to unrecognized tax benefits as income tax expense in the Statements of Operations.
The Income Tax Statement requires management of the Funds to analyze all open tax years 2015 – 2018, as defined by IRS statute of limitations for all major jurisdictions, including federal tax authorities and certain state tax authorities. As of and during the year ended May 31, 2019, the Funds did not have a liability for any unrecognized tax benefits. The Funds have no examination in progress and are not aware of any tax positions for which it is reasonably possible that the total amounts of unrecognized tax benefits will significantly change in the next twelve months.
Distributions to Shareholders: Distributions to shareholders, which are determined in accordance with income tax regulations, are recorded on the ex-dividend date. The character of distributions made during the year from net investment income or net realized gain may differ from the characterization for federal income tax purposes due to differences in the recognition of income, expense and gain/(loss) items for financial statement and tax purposes. Where appropriate, reclassifications between net asset accounts are made for such differences that are permanent in nature.
Use of Estimates: The financial statements are prepared in conformity with accounting principles generally accepted in the United States of America (“GAAP”), which requires management to make estimates and assumptions that affect the reported amounts of assets and liabilities, and disclosure of contingent assets and liabilities at the date of the financial statements and the reported amounts of increases and decreases in net assets from operations during the reporting period. Actual results could differ from those estimates.
Other:The Funds follow industry practice and record security transactions on the trade date. The specific identification method is used for determining gains or losses for financial statement and income tax purposes. Dividend income is recorded on the ex-dividend date, except that certain dividends from foreign securities are recorded as soon as information is available to the Funds. Withholding taxes on foreign dividends have been provided for in accordance with the Funds’ understanding of the applicable country’s tax rules and regulations. Interest income is recorded on an accrual basis. Discounts and premiums on securities purchased are accreted and amortized over the life of the respective securities using the effective interest method.
19
QUEENS ROAD FUNDS
Notes to Financial Statements (Continued) |
Security Valuation:Securities, including common stocks and closed-end funds, which are traded on a national securities exchange are valued at the last quoted sales price, and are generally classified as a Level 1 investment. Investments in mutual funds, including money market funds, are valued at the ending net asset value provided by the funds, and are generally classified as a Level 1 investment. If there are no sales reported, the Fund’s portfolio securities will be valued using the last reported bid price. The Money Market Demand Account is priced at cost and is generally classified as a Level 1 Investment. Debt securities are priced by an independent pricing service. The pricing service may use one or more pricing models. Securities for which market quotations are not readily available are valued at fair value as determined in good faith by and under the direction of the Trust’s Board of Trustees, and are generally classified as a Level 3 investment.
In accordance with GAAP, fair value is defined as the price that the Funds would receive to sell an asset or pay to transfer a liability in an orderly transaction between market participants at the measurement date. GAAP also establishes a framework for measuring fair value, and a three-level hierarchy for fair value measurements based upon the transparency of inputs to the valuation of an asset or liability. The three-tier hierarchy of inputs is summarized below.
● | Level 1 – Unadjusted quoted prices in active markets for identical assets or liabilities that the company has the ability to access. An active market for the security is a market in which transactions occur with sufficient frequency and volume to provide pricing information on an ongoing basis. Common stocks, closed-end funds, demand deposits and mutual funds are generally categorized as Level 1. |
● | Level 2 – Observable inputs other than quoted prices included in Level 1 that are observable for the asset or liability, either directly or indirectly. These inputs may include quoted prices for the identical instrument on an inactive market, prices for similar instruments, interest rates, prepayment speeds, credit risk, yield curves, default rates and similar data. Fixed income securities, repurchase agreements, and securities valued by an independent fair value pricing service are generally categorized as Level 2. |
● | Level 3 – Unobservable inputs for the asset or liability, to the extent relevant observable inputs are not available, representing the company’s own assumptions about the assumptions a market participant would use in valuing the asset or liability, and would be based on the best information available. |
The availability of observable inputs can vary from security to security and is affected by a wide variety of factors, including, for example, the type of security, whether the security is new and not yet established in the marketplace, the liquidity of markets, and other characteristics particular to the security. To the extent that valuation is based on models or inputs that are less observable or unobservable in the market, the determination of fair value requires more judgment. Accordingly, the degree of judgment exercised in determining fair value is greatest for instruments categorized in Level 3.
As of May 31, 2019, the Funds did not hold any Level 3 securities. There were no transfers into or out of level 3 during the current year.
The following is a summary of the inputs used to value the Funds’ securities by level within the fair value hierarchy as of May 31, 2019.
Value Fund | ||||||||||||||||
| Level 1 - | Level 2 - | Level 3 - | Total | ||||||||||||
Common Stocks* | $ | 38,814,082 | $ | — | $ | — | $ | 38,814,082 | ||||||||
Short-Term Investments | 555,010 | — | — | 555,010 | ||||||||||||
Total | $ | 39,369,092 | $ | — | $ | — | $ | 39,369,092 | ||||||||
20
QUEENS ROAD FUNDS
Notes to Financial Statements (Continued) |
Small Cap Value Fund | ||||||||||||||||
| Level 1 - | Level 2 - | Level 3 - | Total | ||||||||||||
Common Stocks* | $ | 96,800,455 | $ | — | $ | — | $ | 96,800,455 | ||||||||
Short-Term Investments | 21,640,038 | — | — | 21,640,038 | ||||||||||||
Total | $ | 118,440,493 | $ | — | $ | — | $ | 118,440,493 | ||||||||
* | All sub-categories within common stocks represent Level 1 investments. See Schedules of Investments for industry categories. |
Note 3. Investment Advisory Fee and Other Transactions with Affiliates
The Funds retain Bragg Financial Advisors, Inc. as their investment advisor. Under the terms of the management agreement, the Advisor provides investment management and administrative services for the Funds. For its services as Advisor, the Value Fund and Small Cap Value Fund pay a fee, computed daily and payable monthly at the annual rate of 0.95% and 1.18% of each Fund’s first $250,000,000 of average daily net assets, 0.85% and 1.18% of each Fund’s next $250,000,000 of average daily net assets, and 0.80% and 1.15% of each Fund’s average daily net assets over $500,000,000, respectively. For the year ended May 31, 2019, the Advisor earned $402,959 and $1,525,508 from the Value Fund and Small Cap Value Fund, respectively. From these fees and its own resources, the Advisor is contractually obligated to pay other operating expenses of the Funds including transfer agent fees, fund accountant fees, administrator fees, registration fees, custodial fees, and other ordinary expenses of the Funds. However, the agreement does not require the Advisor to pay interest, taxes, brokerage commissions, and extraordinary expenses of the Funds. The amounts due to the Advisor at May 31, 2019, from the Value Fund and Small Cap Value Fund, were $32,981 and $126,053, respectively.
Certain employees and officers of the Advisor are also “interested persons” (as defined in the 1940 Act) of the Trust. Each “noninterested” Trustee is entitled to receive a fee of $500 per Fund, for each Board of Trustees Meeting for services relating to the Trust, which is paid by the Advisor.
Queens Road Securities, LLC (“QRS”) acts as the principal underwriter in the continuous public offering of the Funds’ shares. Certain officers of the Trust are also officers of QRS. QRS did not execute any purchases and sales of the Funds’ portfolio investments, nor collect any brokerage fees during the year ended May 31, 2019.
Note 4. Investment Transactions
For the year ended May 31, 2019, the cost of purchases and the proceeds from sales of portfolio securities, other than short-term investments, amounted to $492,638 and $4,280,975, respectively, for the Value Fund, and $27,991,436 and $26,406,322 respectively, for the Small Cap Value Fund.
Note 5. Federal Income Taxes
At May 31, 2019, gross unrealized appreciation and depreciation of investments based on cost for federal income tax purposes were as follows:
| Value Fund | Small Cap | ||||||
Cost of investments | $ | 20,440,368 | $ | 96,245,454 | ||||
Gross unrealized appreciation | $ | 19,404,155 | $ | 30,126,321 | ||||
Gross unrealized depreciation | (475,431 | ) | (7,931,282 | ) | ||||
Net unrealized appreciation on investments | $ | 18,928,724 | $ | 22,195,039 | ||||
21
QUEENS ROAD FUNDS
Notes to Financial Statements(Continued) |
The difference between cost amounts for financial statement and federal income tax purposes is due primarily to wash sale loss deferrals and timing differences in recognizing certain gains and losses in security transactions.
GAAP requires that certain components of net assets be reclassified between financial and tax reporting. These reclassifications have no effect on net assets or net asset value per share. For the year ended May 31, 2019, there were no reclassifications.
As of May 31, 2019, the components of distributable earnings on a tax basis were as follows:
| Value Fund | Small Cap | ||||||
Undistributed ordinary income | $ | 268,104 | $ | 60,119 | ||||
Undistributed long-term capital gains | 584,759 | 4,694,246 | ||||||
Accumulated capital and other losses | — | — | ||||||
Net unrealized appreciation | 18,928,724 | 22,195,039 | ||||||
Total distributable earnings | $ | 19,781,587 | $ | 26,949,404 | ||||
The tax character of distributions paid during the fiscal years ended, May 31, 2019 and May 31, 2018 were as follows:
| Value Fund | Small Cap Value Fund | ||||||||||||||
Distributions Paid from: | 2019 | 2018 | 2019 | 2018 | ||||||||||||
Ordinary Income | $ | 611,747 | $ | 549,243 | $ | 1,165,132 | $ | — | ||||||||
Net Long Term Capital Gains | 1,936,869 | 1,231,632 | 10,495,283 | 2,899,450 | ||||||||||||
Total Taxable Distributions Paid | $ | 2,548,616 | $ | 1,780,875 | $ | 11,660,415 | $ | 2,899,450 | ||||||||
Note 6. Control
The beneficial ownership, either directly or indirectly, of more than 25% of the voting securities of a fund creates a presumption of control of the fund, under section 2 (a) (9) of the 1940 Act. As of May 31, 2019, Pershing, LLC, for the benefit of its customers, owned 94.32% and 46.08% of the Value Fund and Small Cap Value Fund, respectively. As a result, Pershing, LLC, may be deemed to control each Fund. As of May 31, 2019, Charles Schwab & Co., Inc., for the benefit of its customers, owned 34.49% of the Small Cap Value Fund. As a result, Charles Schwab & Co., Inc. may be deemed to control the Small Cap Value Fund.
Note 7. Guarantees and Indemnifications
In the normal course of business, the Funds enter into contracts with service providers that contain general indemnification clauses. The Funds’ maximum exposure under these arrangements is unknown as this would involve future claims that may be against the Funds that have not yet occurred. However, based on experience, the Funds expect the risk of loss to be remote.
22
QUEENS ROAD FUNDS
Notes to Financial Statements (Continued) |
Note 8. Recent Accounting Pronouncements
The Securities and Exchange Commission adopted amendments to Regulation S-X, for the presentation of distributable earnings and distributions to align with GAAP. The compliance date of the amendments to Regulation S-X was November 5, 2018. This report incorporates the amendments to Regulation S-X.
On August 28, 2018, the FASB issued Accounting Standards Update No. 2018-13 (“ASU 2018-13”), Fair Value Measurement (Topic 820): Disclosure Framework – Changes to the Disclosure Requirements for Fair Value Measurement, which changes the fair value measurement disclosure requirements of ASC Topic 820. ASU 2018-13’s amendments are effective for annual periods beginning after December 15, 2019. Early adoption is permitted. Management has adopted certain disclosures of ASU 2018-13 as permitted by the standard.
Note 9. Subsequent Event Disclosure
Management has evaluated the impact of all subsequent events on the Funds through the date the financial statements were issued, and has determined that there were no subsequent events requiring recognition or disclosure in the financial statements.
23
QUEENS ROAD FUNDS
Report of Independent Registered Public Accounting Firm |
To the Shareholders and Board of Trustees of
Bragg Capital Trust
Opinion on the Financial Statements
We have audited the accompanying statements of assets and liabilities, including the schedules of investments, of Bragg Capital Trust comprising Queens Road Value Fund and Queens Road Small Cap Value Fund (the “Funds”) as of May 31, 2019, and the related statements of operations for the year then ended, the statements of changes in net assets for each of the two years in the period then ended, including the related notes, and the financial highlights for each of the five years in the period then ended (collectively referred to as the “financial statements”). In our opinion, the financial statements present fairly, in all material respects, the financial position of each of the Funds as of May 31, 2019, the results of their operations for the year then ended, the changes in their net assets for each of the two years in the period then ended, and the financial highlights for each of the five years in the period then ended, in conformity with accounting principles generally accepted in the United States of America.
Basis for Opinion
These financial statements are the responsibility of the Funds’ management. Our responsibility is to express an opinion on the Funds’ financial statements based on our audits. We are a public accounting firm registered with the Public Company Accounting Oversight Board (United States) (“PCAOB”) and are required to be independent with respect to the Funds in accordance with the U.S. federal securities laws and the applicable rules and regulations of the Securities and Exchange Commission and the PCAOB.
We conducted our audits in accordance with the standards of the PCAOB. Those standards require that we plan and perform the audit to obtain reasonable assurance about whether the financial statements are free of material misstatement, whether due to error or fraud.
Our audits included performing procedures to assess the risks of material misstatement of the financial statements, whether due to error or fraud, and performing procedures that respond to those risks. Such procedures included examining, on a test basis, evidence regarding the amounts and disclosures in the financial statements and confirmation of securities owned as of May 31, 2019, by correspondence with the custodian. Our audits also included evaluating the accounting principles used and significant estimates made by management, as well as evaluating the overall presentation of the financial statements. We believe that our audits provide a reasonable basis for our opinion.
We have served as the Funds’ auditor since 2004.

COHEN & COMPANY, LTD.
Milwaukee, Wisconsin
July 26, 2019
24
QUEENS ROAD FUNDS
Expense Illustration May 31, 2019 (Unaudited) |
ABOUT YOUR FUND’S EXPENSES
Expense Example
As a shareholder of the Funds, you incur ongoing costs which typically consist of management fees and other Fund expenses. This Example is intended to help you understand your ongoing costs (in dollars) of investing in the Funds and to compare these costs with the ongoing costs of investing in other mutual funds.
The Example is based on an investment of $1,000 invested at the beginning of the period and held for the entire period, December 1, 2018 through May 31, 2019.
Actual Expenses
The first line of the table below provides information about actual account values and actual expenses. You may use the information in this line, together with the amount you invested, to estimate the expenses that you paid over the period. Simply divide your account value by $1,000 (for example, an $8,600 account value divided by $1,000 = 8.6), then multiply the result by the number in the first line under the heading entitled “Expenses Paid During Period” to estimate the expenses you paid on your account during this period.
Hypothetical Example for Comparison Purposes
The second line of the table below provides information about hypothetical account values and hypothetical expenses based on the Fund’s actual expense ratio and an assumed rate of return of 5% per year before expenses, which is not the Fund’s actual return. The hypothetical account values and expenses may not be used to estimate the actual ending account balance or expenses you paid for the period. You may use this information to compare the ongoing costs of investing in this Fund and other funds. To do so, compare this 5% hypothetical example with the 5% hypothetical examples that appear in the shareholder reports of the other funds.
| Beginning | Ending | Expenses Paid |
Value Fund | |||
Actual | $1,000.00 | $ 998.70 | $4.73 |
Hypothetical (5% Annual Return before expenses) | $1,000.00 | $ 1,020.30 | $4.79 |
Small Cap Value Fund | |||
Actual | $1,000.00 | $ 952.20 | $5.74 |
Hypothetical (5% Annual Return before expenses) | $1,000.00 | $ 1,019.10 | $5.94 |
* | Expenses are equal to the Funds’ annualized expense ratio of 0.95% and 1.18%, respectively, multiplied by the average account value over the period, multiplied by 182/365 (to reflect the one-half year period). |
25
QUEENS ROAD FUNDS
Additional Information May 31, 2019 (Unaudited) |
Proxy Voting – A description of the policies and procedures that the Funds use to determine how to vote proxies relating to portfolio securities and information regarding how the Funds voted proxies during the most recent 12 month period ended June 30, are available without charge upon request by (1) calling the Funds at 1-800-595-3088 and (2) from Fund documents filed with the Securities and Exchange Commission (“SEC”) on the SEC’s website at www.sec.gov.
Portfolio Holdings – The Funds file a complete schedule of investments with the SEC for the first and third quarter of each fiscal year on Form N-Q. The Funds’ first and third fiscal quarters end on August 31 and February 28. The Form N-Q filing must be made within 60 days of the end of the quarter, and the Funds’ first Form N-Q was filed with the SEC on October 8, 2004. The Funds’ Form N-Qs are available on the SEC’s website at www.sec.gov. You may also obtain copies by calling the Funds at 1-800-595-3088.
Long Term Capital Gains Designation – Pursuant to IRC 852(b)(3) of the Internal Revenue Code, the Value Fund and Small Cap Value Fund hereby designates $1,936,869 and $10,495,283, respectively, as long-term capital gains distributed during the year ended, May 31, 2019.
Qualified Dividend Income – For the year ended May 31, 2019, 100% and 100% of the dividends paid from net investment income, including short-term capital gains (if any), are designated as qualified dividend income for the Value Fund and Small Cap Value Fund, respectively.
Corporate Dividends Received Deduction – For the year ended May 31, 2019, 100% and 100% of the dividends paid from net investment income, including short-term capital gains (if any), qualify for the dividends received deduction available to corporate shareholders for the Value Fund and Small Cap Value Fund, respectively.
26
QUEENS ROAD FUNDS
Trustees Information May 31, 2019 (Unaudited) |
Information about Trustees who are “interested persons” of the Trust as defined under the 1940 Act, and each Trustee of the Trust, including their principal occupations during the past five years, is as follows:
Interested Trustees | |||||
Name, Address, | Position(s) | Term of Office | Principal Occupations | Number of | Other |
Steven H. Scruggs | CCO, | Unlimited; | Bragg Financial Advisors, Portfolio Manager/CCO (2000-present) | Two | None |
Benton S. Bragg | Trustee, Chairman, Treasurer | Unlimited; | Bragg Financial Advisors, President, CEO (1996-present) | Two | None |
Steve Scruggs and Benton Bragg are Interested Trustees of the Funds (as that term is defined in Section 2(a)(19) of the 1940 Act) by reason of their affiliation with the Funds’ advisor, Bragg Financial Advisors, Inc. and their affiliation as registered principals with the Funds’ underwriter, QRS. Steven H. Scruggs and Benton S. Bragg are brothers-in-law.
The Funds’ Statement of Additional Information includes additional information about the Trustees and is available, without charge and upon request, by calling 1-800-595-3088.
27
QUEENS ROAD FUNDS
Trustees Information (Continued) |
Information about Trustees who are not “interested persons” of the Trust as defined under the 1940 Act, including their principal occupations during the past five years, is as follows:
Independent Trustees | |||||
Name, Address, | Position | Term of Office | Principal Occupations | Number of | Other |
Philip C. Blount III | Trustee | Unlimited; | Icons, Inc., President (2001-present) Marketing Merchandise | Two | None |
Christopher B. Brady | Trustee | Unlimited; | Private Investor (2017 – present); Brady Distributing, Vice President (1995-2009, 2012-2017) Machinery Distribution; Resort Capital Partners, Vice President (2009-2012) Hospitality Financial Advisory | Two | None |
Harold J. Smith | Trustee | Unlimited; | Raftelis Financial, Vice President (1996-present) Public Finance Consulting | Two | None |
Timothy J. Ignasher | Trustee | Unlimited; | New Dominion Bank, President (2017-present); NewBridge Bank, Exec. Vice President and Head of Commercial Banking (2012-2017); Citizens South Bank, Exec Vice President (2008-2012) | Two | None |
The Funds’ Statement of Additional Information includes additional information about the Trustees and is available, without charge and upon request, by calling 1-800-595-3088.
(1) | Member of the Audit Committee of the Board of Trustees, which makes recommendations regarding the selection of the Funds’ independent registered public accountant (the “accountants”) and meets with representatives of the accountants to determine the scope of and review the results of each audit. |
(2) | Member of the Nominating Committee of the Board of Trustees, which identifies qualified candidates and recommends nominees for the election as Trustees. |
28
QUEENS ROAD FUNDS |
Notes |
QUEENS ROAD FUNDS |
Board of Trustees
Benton S. Bragg
Steven H. Scruggs
Philip C. Blount, III
Timothy J. Ignasher
Christopher B. Brady
Harold J. Smith
Investment Advisor
Bragg Financial Advisors, Inc.
1031 Caldwell Street, Suite 200
Charlotte, NC 28203
Dividend Paying Agent,
Shareholders’ Servicing Agent,
Transfer Agent
UMB Fund Services
235 West Galena Street
Milwaukee, WI 53212
Custodian
US Bank, NA
425 Walnut Street
P.O. Box 1118
Cincinnati, OH 45201
Independent Registered Public Accounting Firm
Cohen & Company, Ltd.
342 North Water Street, Suite 830
Milwaukee, WI 53202
Shares of Queens Road Value Fund and Queens Road Small Cap Value Fund are distributed by Queens Road Securities, LLC, an affiliate of the Investment Advisor. This report has been prepared for the general information of the shareholders. It is not authorized for distribution to prospective investors unless preceded or accompanied by a current prospectus. The Funds’ prospectus contains more complete information about the objectives, policies, expenses and risks of the Funds. The Funds are not bank deposits, not FDIC insured and may lose value. Please read the prospectus carefully before investing or sending money.
This report contains certain forward looking statements which are subject to known and unknown risks and uncertainties that could cause actual results to differ materially from those expressed or implied by such statements. Forward looking statements generally include words such as “believes”, “expects”, “anticipates” and other words of similar import. Such risks and uncertainties include, among other things, the Risk Factors noted in the Funds’ filings with the Securities and Exchange Commission. The Funds undertake no obligation to update any forward looking statement.
Item 2. Code of Ethics.
| (a) | The Registrant has adopted a code of ethics (the “Code”) that applies to the Registrant’s principal executive officer, principal financial officer, principal accounting officer or controller, or persons performing similar functions. Code of Ethics for the Principal Executive and Principal Financial officer is incorporated by reference to the Registrant’s Form N-CSR filed on August 3, 2017. (SEC Accession No. 0001398344-17-009598) |
| (b) | During the period covered by the report, with respect to the Registrant’s Code that applies to its principal executive officer, principal financial officer, principal accounting officer or controller, or persons performing similar functions; there have been no amendments to, nor any waivers granted from, a provision that relates to any element of the Code definition enumerated in paragraph (b) of this Item 2. |
Item 3. Audit Committee Financial Expert.
| (a) | The board did not identify a member of the audit committee that had all of the required technical attributes to qualify as an “audit committee financial expert.” At this time, the board believes the experience provided by each member of the audit committee collectively offers the fund adequate oversight by its audit committee given the fund’s level of financial complexity. The board will from time to time reexamine such belief. |
Item 4. Principal Accountant Fees and Services.
(a)Audit Fees
| Registrant | |
| FY 2018 | $22,300 |
| FY 2019 | $23,000 |
(b)Audit-Related Fees
| Registrant | |
| FY 2018 | $0 |
| FY 2019 | $0 |
| Nature of the fees: | Not applicable. |
(c)Tax Fees
| Registrant | |
| FY 2018 | $5,000 |
| FY 2019 | $5,000 |
| Nature of the fees: | 1120-RIC & Excise Tax Return |
(d)All Other Fees
| Registrant | |
| FY 2018 | $900 |
| FY 2019 | $644 |
| Nature of the fees: | Out of pocket expenses and consents |
(e) (1)Audit Committee’s Pre-Approval Policies and Procedures
The Audit Committee has adopted pre-approval policies and procedures that require the Audit Committee to pre-approve all audit and non-audit services of the Registrant, including services provided to the Registrant’s investment adviser or any entity controlling, controlled by or under common control with the Registrant’s investment adviser that provides ongoing services to the Registrant with respect to any engagement that directly relates to the operations and financial reporting of the Registrant.
(2)Percentages of Services Approved by the Audit Committee
| Registrant | |
| Audit-Related Fees | 0.00% |
| Tax Fees: | 0.00% |
| All Other Fees: | 0.00% |
(f)None of the hours expended on the principal accountant's engagement to audit the registrant's financial statements for the most recent fiscal year were attributed to work performed by persons other than the principal account's full-time, permanent employees.
(g) The aggregate non-audit fees billed by the registrant's accountant for services rendered to the registrant, and rendered to the registrant's investment adviser (not including any sub-adviser whose role is primarily portfolio management and is subcontracted with or overseen by another investment adviser), and any entity controlling, controlled by, or under common control with the adviser that provides ongoing services to the registrant:
| Registrant | |
| FY 2018 | $0 |
| FY 2019 | $0 |
(h) The registrant's audit committee has considered whether the provision of non-audit services to the registrant's investment adviser (not including any sub-adviser whose role is primarily portfolio management and is subcontracted with or overseen by another investment adviser), and any entity controlling, controlled by, or under common control with the investment adviser that provides ongoing services to the registrant, that were not pre-approved pursuant to paragraph (c)(7)(ii) of Rule 2-01 of Regulation S-X, is compatible with maintaining the principal accountant's independence.
Item 5. Audit Committee of Listed Registrants.
Not applicable.
Item 6. Schedule of Investments.
Included as part of the report to shareholders filed under Item 1 of this Form N-CSR.
Item 7. Disclosure of Proxy Voting Policies and Procedures for Closed-End Management Investment Companies.
Not applicable to open-end management investment companies.
Item 8. Portfolio Managers of Closed-End Management Investment Companies.
Not applicable to open-end management investment companies.
Item 9. Purchases of Equity Securities by Closed-End Management Investment Company and Affiliated Purchasers.
Not applicable to open-end management investment companies.
Item 10. Submission of Matters to a Vote of Security Holders.
Not applicable.
Item 11. Controls and Procedures.
| (a) | The Registrant’s principal executive officer and principal financial officer have reviewed the Registrant's disclosure controls and procedures (as defined in Rule 30a-3(c) under the Investment Company Act of 1940, as amended, (the “Act”)) as of a date within 90 days of the filing of this report, as required by Rule 30a-3(b) under the Act. Based on their review, such officers have concluded that the disclosure controls and procedures were effective in ensuring that information required to be disclosed in this report was appropriately recorded, processed, summarized and reported and made known to them by others within the Registrant and by the Registrant’s service providers. |
| (b) | There were no changes in the Registrant’s internal control over financial reporting (as defined in Rule 30a-3(d) under the Act (17 CFR 270.30a-3(d)) that occurred during the period covered by this report that materially affected, or were reasonably likely to materially affect, the Registrant’s internal control over financial reporting. |
Item 12. Disclosure of Securities Lending Activities for Closed-End Management Companies.
Not applicable to open-end management investment companies.
Item 13. Exhibits.
| (a) (1) | Code of Ethics for the Principal Executive and Principal Financial Officer is incorporated by reference to the Registrant’s Form N-CSR filed on August 3, 2017. (SEC Accession No. 0001398344-17-009598) |
| (a) (2) | Certifications required pursuant to Section 302 of the Sarbanes-Oxley Act of 2002. Filed herewith. |
| (a) (3) | Not applicable to open-end management investment companies. |
| (a) (4) | Change in the registrant’s independent public accountant.Not applicable. |
| (b) | Certification pursuant to Section 906 of the Sarbanes-Oxley Act of 2002. Filed herewith. |
SIGNATURES
Pursuant to the requirements of the Securities Exchange Act of 1934 and the Investment Company Act of 1940, the Registrant has duly caused this report to be signed on its behalf by the undersigned, thereunto duly authorized.
Bragg Capital Trust
| /s/ Steven H. Scruggs |
By: Steven H. Scruggs
President
August 5, 2019
Pursuant to the requirements of the Securities Exchange Act of 1934 and the Investment Company Act of 1940, this report has been signed below by the following persons on behalf of the Registrant and in the capacities and on the dates indicated.
| /s/ Steven H. Scruggs |
By: Steven H. Scruggs
President
(Principal Executive Officer)
August 5, 2019
| /s/ Benton S. Bragg |
By: Benton S. Bragg
Treasurer
(Principal Financial Officer)
August 5, 2019