SECURITIES AND EXCHANGE COMMISSION
Washington, D.C. 20549

ANNUAL REPORT
Queens Road Value Fund
Queens Road Small Cap Value Fund
Each a series of
May 31, 2016
|
QUEENS ROAD FUNDS
|
Table of Contents |
|
|
|
Shareholder Letter | 2 |
Manager’s Commentary | 3 |
Performance Illustration | 5 |
Graphical Illustration | 7 |
Schedules of Investments | |
Queens Road Value Fund | 8 |
Queens Road Small Cap Value Fund | 10 |
Statements of Assets and Liabilities | 12 |
Statements of Operations | 13 |
Statements of Changes in Net Assets | 14 |
Financial Highlights | 15 |
Notes to Financial Statements | 17 |
Report of Independent Registered Public Accounting Firm | 22 |
Expense Illustration | 23 |
Additional Information | 24 |
Trustee Information | 25 |
QUEENS ROAD FUNDS
SHAREHOLDER LETTER |
“There cannot be a crisis next week. My schedule is already full.”
-Henry Kissinger
Dear Fellow Shareholders:
Three main factors created uncertainty for investors during the first part of 2016. We began the year with worries over the falling price of oil. This was followed by the historic vote by the British to leave the European Union. The third factor creating uncertainty was our ongoing presidential election process as Democrats and Republicans completed their primaries and narrowed the field to two candidates. This uncertainty will continue into the fall with what promises to be an ugly campaign season. One might compare it to passing a car wreck on the highway. We tell ourselves to keep both hands on the wheel and our eyes on the road ahead, but we can’t help but look.
● | Falling Oil Prices: Just a few short months ago, oil dominated the news with headlines of doom and gloom about crashing oil prices and the impact they were going to have on the world economy. Fortunately, a global economic crisis did not materialize as a result of low oil prices. As soon as oil began moving up, other bogeymen quickly appeared to take the place as the crisis du jour. |
● | Brexit: The UK vote to leave the European Union is undoubtedly an important issue, but it is not likely to be the nightmare that some have predicted. If the UK does leave the EU, it will be done over a long period of time and in as orderly a fashion as possible. There will certainly be some dislocations (e.g. many finance jobs moving from London to the Continent), and perhaps a temporary economic slowdown, but it should not present structural problems to either the UK economy or the remaining countries in the European Union. |
● | U.S. Presidential Election: As the U.S. presidential election heats up, some say that a Donald Trump presidency will send the world into a global depression. Others have predicted a booming economy fueled by increased government borrowing, similar to the period in the 1980s. As independent investors we don’t take sides in these debates, which happens to be very convenient in this election. We are confident that whether Trump or Clinton wins the presidency (or an unlikely dark-horse candidate), it will not cause the world economy to fall into a depression. There will be much rhetoric and hand-wringing as both sides throw mud during their nominating conventions in July as they attempt to motivate their folks to get out and vote. The market will likely gyrate a bit in the short-term, but over the longer term, the global economy will continue its slow but steady growth. |
Earnings Pressure: As the global economy continues its slow expansion, operating margins are finally starting to feel pressure. The cost-cutting and rationalization that have been going on for the last several years appear to have reached their limits, broadly speaking. Companies and analysts alike are projecting tepid earnings growth for the near future. Additionally, we are seeing an increased reliance (and increased creativity) in “adjusting” GAAP earnings to ones that “management feels better represent the financial performance of the company”. We also see continued record share repurchases that provide immediate benefits to earnings per share numbers by reducing the outstanding share count. These share repurchases are often undertaken instead of increasing capital purchases, such as buying new plants and machinery. While the share buybacks provide the one-time pop of increased earnings per share due to a lower share count, we prefer to see companies that make capital investments that have the potential to provide sustainable long-term profit growth.
Late-Stage Bull Market? While these are worrisome signs, they aren’t unusual in the later stages of a bull market. Lest that sound like a call on the market, we think it is important to note that this bull could keep running for a while. Likewise, it may not. As bottom-up investors, we try to avoid making predictions about near-term equity market performance. Instead we focus on the portfolio. Currently we see pressure on earnings and above average valuations, but our portfolios are made up of companies that we believe have sound risk/reward prospects over the next three to five years. Our bottom-up analysis focuses on the individual companies, their business models, their managements, and the attractiveness of the industries in which they compete. Relative to the amount of risk that we are taking, we feel confident that collectively, the companies we own will prove to be a good investment over the long-term despite the uncertainty we face.
Thank you for entrusting your and your client’s money to Queens Road. Please call us if you have any questions about the portfolio or our investment philosophy and process.
Sincerely,
Steven Scruggs, CFA | Benton Bragg, CFA |
President | Chairman |
2
QUEENS ROAD FUNDS
MANAGER’S COMMENTARY |
Queens Road Value Fund
For our fiscal year ending May 31, 2016, the Queens Road Value Fund returned 1.74% compared to a return of 0.44% for the S&P 500 Citigroup Value Index, the fund’s primary benchmark.
Investments that Helped Performance
● | Constellation Brands Inc. (2.32% of the Fund) rose 29% during the fiscal year. The third-largest producer and marketer of beer in the U.S. continued its recent strong performance with its marquee brands Corona and Modelo and expanded its presence in the craft brew marketplace with the acquisition of Ballast Point Brewing. This year marks the fifth straight year in which the company’s beer brands gained market share in the U.S. The company’s other segment, wine and spirits, continues to show lackluster growth. This well-managed company has demographic trends in its favor for its major brands and remains one of the fund’s largest holdings. |
● | McDonald’s Corp. (1.31% of the Fund) advanced 30% during the period. The company has benefited greatly from its all-day breakfast menu, its reorganized discount menu (the McPick 2 platform) and its global refranchising initiative. We believe that management’s recent initiatives will continue to benefit the company’s bottom line. |
Investments that Hurt Performance
● | Anthem, Inc. (2.46% of the Fund) fell 20% for the year. The health benefits company formerly known as Wellpoint announced last July that it would acquire health insurer Cigna in a stock and cash deal. The deal has yet to close, but Anthem has continued to slide. Higher revenues were not enough to offset higher claims and costs and profits suffered. Although we think the merger with Cigna is positive, the current health insurance market is very uncertain. Anthem announced that it would remain in the Obamacare exchanges; however, we think there is a strong likelihood that this may change after the Cigna merger is consummated. |
● | Leucadia National Corp. (1.33% of the Fund) tumbled more than 25% as the company continues to transform itself after the retirement of its two founders. Current CEO Richard Handler, who also serves as CEO of the Leucadia subsidiary Jefferies, has evolved the company’s business model towards more merchant banking. The company engages in uniquely structured and often opaque transactions that take more time to pan out. Under prior management, the firm’s track record was impeccable. We are closely watching to see if the current management is capable of similar results. |
3
QUEENS ROAD FUNDS
MANAGER’S COMMENTARY (Continued) |
Queens Road Small Cap Value Fund
For our fiscal year ending May 31, 2016, the Queens Road Small Cap Value Fund returned 3.37% compared to a return of -2.75% for the Russell 2000 Value Index.
Investments that Helped Performance
● | Fabrinet (2.04% of the Fund) was up 94% for the period. This manufacturer of complex optical components was founded in 2000 by Seagate Technologies co-founder Tom Mitchell and went public in 2010. The company continues to increase utilization rates at its new manufacturing facility while gaining new customers. Demand for its technology and highly specialized manufacturing processes is increasing, and it is finding new applications for this technology as well. |
● | Piedmont Natural Gas Co. (0.00% of the Fund) increased 56% during the period. On October 26, 2015, the company announced it had reached an agreement with Duke Energy to be acquired for $4.9 billion in cash. This amounted to an approximate 40% premium above Piedmont’s previous closing price. |
● | RLI Corp. (1.97% of the Fund) returned 42% in fiscal 2016. RLI is an A+ rated specialty insurer that focuses on unique and hard-to-place risks. The company continued its streak of consecutive dividend increases, which now stands at 40 years. This conservatively-run, well-managed insurer remains one of the fund’s top holdings and we are very confident in its long-term prospects. |
Investments that Hurt Performance
● | Ducommun Inc. (0.81% of the Fund) fell 28% for the period. A California-based manufacturer of aerospace structures and electronic and mechanical assemblies, Ducommun is a key supplier to OEMs in many of the world’s most advanced aeronautical programs. Significant revenue reductions due to changing U.S. defense spending priorities hit the company hard, resulting in significant decreases in operating income. In addition, the company took a charge to refinance outstanding debt, which will reduce debt levels and future interest expenses. Management does not appear to be very confident that demand will pick up in the near term and is focusing on cost control. We also have demand concerns and have been reducing our exposure. |
● | Synaptics Inc. (2.13% of the Fund) fell 32% during the year. The company believes it is the leader in human interface technology for smartphones, tablets and touchscreen applications. The company posted weak earnings and guidance during the period, as it faced headwinds from slowing smartphone sales growth. Though the company had been reported to be in buyout talks with a Chinese firm, it was later reported that these talks have broken down. In spite of the recent underperformance, we are confident in the company’s products and long-term prospects. |
The Fund continues to be invested in a defensive position, and holds 25.78% in cash equivalents as of May 31, 2016.
4
QUEENS ROAD FUNDS
PERFORMANCE ILLUSTRATION |
Queens Road Value Fund
Average Annual Total Return | ||
Queens Road Value Fund | S&P 500/Citigroup Value Index | |
Six Month | 5.47% | 3.54% |
1 Year | 1.74% | 0.44% |
3 Year | 8.04% | 9.00% |
5 Year | 9.35% | 10.51% |
10 Year | 5.52% | 5.71% |
Since Inception* | 7.33% | 7.10% |
Gross Annual Operating Expense is 0.96% as disclosed in the most recent Prospectus effective October 1, 2015. | ||
* | The Queens Road Value Fund commenced operations on June 13, 2002. Past performance is not predictive of future performance. The value of shares will fluctuate and will be worth more or less than their original cost at the time of redemption. |
The S&P 500/Citigroup Value Index along with its counterpart the S&P 500/Citigroup Growth Index were introduced in December 2005. Previously, these indices were known as the S&P 500/Barra Growth and Value Indices. These Indices are created by dividing the S&P 500 Index based upon seven different factors, four to determine value characteristics and three to determine growth characteristics. The companies are allocated to each index according to their growth or value characteristics, with about one-third being allocated to both the growth and value index. It is not possible to invest directly in the S&P 500/Citigroup Value Index. The S&P 500/Citigroup Growth Index and S&P 500/Citigroup Value Index are the exclusive property of Standards & Poors.
Growth of Assumed $10,000 Investment

This graph illustrates the hypothetical investment of $10,000 in the Fund from May 31, 2006 to May 31, 2016. The Average Annual Total Return table and Growth of Assumed $10,000 Investment graph do not reflect the deduction of taxes that a shareholder would pay on fund distributions or the redemption of fund shares.
5
QUEENS ROAD FUNDS
PERFORMANCE ILLUSTRATION (Continued) |
Queens Road Small Cap Value Fund
Average Annual Total Return | ||
Queens Road Small Cap Value Fund | Russell 2000 Value Index | |
Six Month | 3.08% | 0.19% |
1 Year | 3.37% | (2.75)% |
3 Year | 8.88% | 6.10% |
5 Year | 7.25% | 7.55% |
10 Year | 6.86% | 5.25% |
Since Inception* | 9.62% | 7.90% |
Gross Annual Operating Expenses is 1.26% as disclosed in the most recent Prospectus effective October 1, 2015. | ||
* | The Queens Road Small Cap Value Fund commenced operations on June 13, 2002. Past performance is not predictive of future performance. The value of shares will fluctuate and will be worth more or less than their original cost at the time of redemption. |
The Russell 2000 Value Index is a subset of the Russell 2000 Index, which tracks the stocks of small domestic companies, based on total market capitalization. The Russell 2000 Value Index represents those stocks of the Russell 2000 with lower price-to book ratios and lower relative forecasted growth rates. You cannot invest directly in these indices.
Growth of Assumed $10,000 Investment
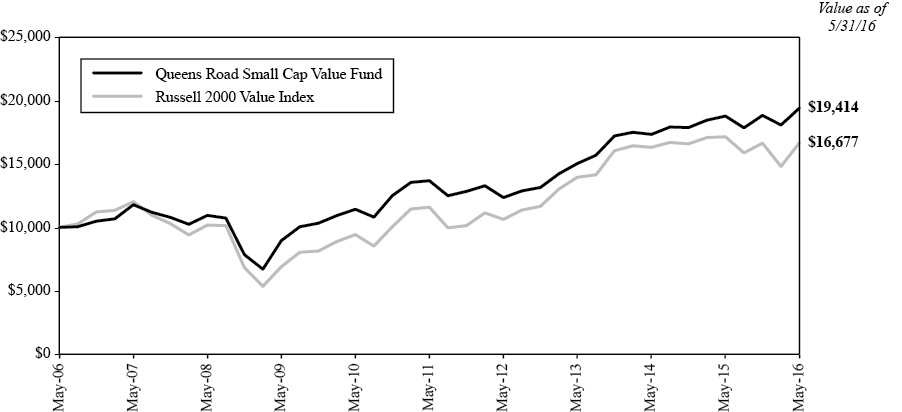
This graph illustrates the hypothetical investment of $10,000 in the Fund from May 31, 2006 to May 31, 2016. The Average Annual Total Return table and Growth of Assumed $10,000 Investment graph do not reflect the deduction of taxes that a shareholder would pay on fund distributions or the redemption of fund shares.
6
QUEENS ROAD FUNDS
GRAPHICAL ILLUSTRATION |
The following charts provide a visual breakdown of the Funds by the industry sectors that the underlying securities represent as a percentage of the total investments.
Queens Road Value Fund
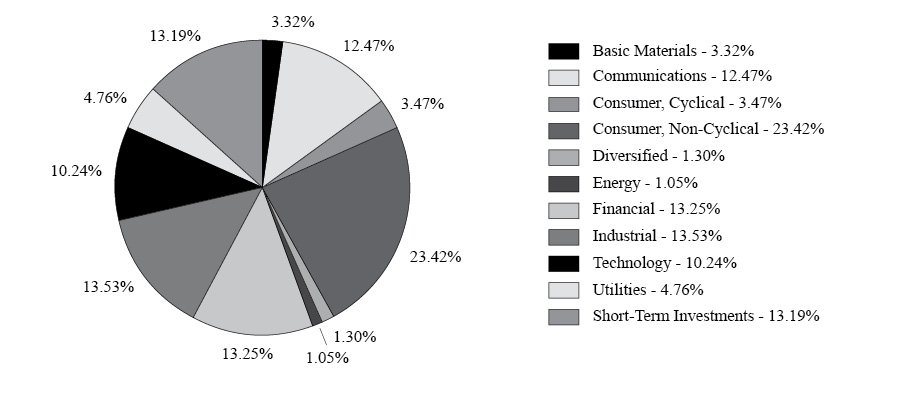
Queens Road Small Cap Value Fund

7
QUEENS ROAD VALUE FUND
SCHEDULES OF INVESTMENTS |
NUMBER OF SHARES | VALUE | ||||||
COMMON STOCKS — 87.6% | |||||||
AEROSPACE/DEFENSE — 4.6% | |||||||
8,000 | General Dynamics Corp. | $ | 1,134,960 | ||||
6,600 | United Technologies Corp. | 663,828 | |||||
1,798,788 | |||||||
APPAREL — 2.2% | |||||||
14,000 | VF Corp. | 872,480 | |||||
BANKS — 4.0% | |||||||
14,500 | Bank of New York Mellon Corp. | 609,870 | |||||
9,000 | JPMorgan Chase & Co. | 587,430 | |||||
6,000 | State Street Corp. | 378,360 | |||||
1,575,660 | |||||||
BEVERAGES — 2.3% | |||||||
5,937 | Constellation Brands, Inc., Class A | 909,251 | |||||
BUILDING MATERIALS — 1.0% | |||||||
6,380 | Fortune Brands Home & Security, Inc. | 374,315 | |||||
CHEMICALS — 2.5% | |||||||
12,000 | LyondellBasell Industries NV, Class A | 976,320 | |||||
COMPUTERS — 3.2% | |||||||
21,378 | Hewlett Packard Enterprise Co. | 394,852 | |||||
5,500 | International Business Machines Corp. | 845,570 | |||||
1,240,422 | |||||||
COSMETICS/PERSONAL CARE — 3.7% | |||||||
8,800 | Procter & Gamble Co. | 713,152 | |||||
16,400 | Unilever PLC ADR | 747,184 | |||||
1,460,336 | |||||||
DIVERSIFIED FINANCIAL SERVICES — 5.9% | |||||||
18,000 | American Express Co. | 1,183,680 | |||||
5,000 | Ameriprise Financial, Inc. | 508,350 | |||||
7,900 | T Rowe Price Group, Inc. | 608,774 | |||||
2,300,804 | |||||||
ELECTRIC — 4.8% | |||||||
13,000 | American Electric Power Co., Inc. | 841,490 | |||||
8,284 | Duke Energy Corp. | 648,057 | |||||
8,400 | Southern Co. | 415,296 | |||||
1,904,843 | |||||||
ELECTRONICS — 1.6% | |||||||
3,400 | Allegion PLC | 229,976 | |||||
20,000 | Corning, Inc. | 417,800 | |||||
647,776 | |||||||
FOOD — 1.7% | |||||||
3,000 | Kraft Heinz Co. | 249,570 | |||||
9,000 | Mondelez International, Inc., Class A | 400,410 | |||||
649,980 | |||||||
HEALTHCARE-PRODUCTS — 1.2% | |||||||
2,300 | Danaher Corp. |
| 226,228 | ||||
3,022 | Medtronic PLC | 243,211 | |||||
469,439 | |||||||
HEALTHCARE-SERVICES — 2.5% | |||||||
7,300 | Anthem, Inc. | 964,768 | |||||
HOLDING COMPANIES-DIVERSIFIED — 1.3% | |||||||
28,800 | Leucadia National Corp. | 521,280 | |||||
HOUSEHOLD PRODUCTS/WARES — 3.0% | |||||||
7,586 | Clorox Co. | 975,104 | |||||
1,717 | Kimberly-Clark Corp. | 218,128 | |||||
1,193,232 | |||||||
INSURANCE — 3.6% | |||||||
3 | Berkshire Hathaway, Inc., Class A* | 635,085 | |||||
10,000 | Prudential Financial, Inc. | 792,500 | |||||
1,427,585 | |||||||
INTERNET — 1.1% | |||||||
24,000 | Symantec Corp. | 416,640 | |||||
MEDIA — 5.1% | |||||||
5,490 | CBS Corp., Class B | 303,048 | |||||
5,166 | Time Warner, Inc. | 390,860 | |||||
30,500 | Twenty-First Century Fox, Inc. | 880,840 | |||||
10,000 | Viacom, Inc., Class B | 443,700 | |||||
2,018,448 | |||||||
MISCELLANEOUS MANUFACTURING — 6.0% | |||||||
5,100 | 3M Co. | 858,432 | |||||
10,000 | Eaton Corp. PLC | 616,300 | |||||
10,200 | Ingersoll-Rand PLC | 681,462 | |||||
3,076 | Pentair PLC | 185,298 | |||||
2,341,492 | |||||||
OIL & GAS — 1.1% | |||||||
4,700 | Exxon Mobil Corp. | 418,394 | |||||
PHARMACEUTICALS — 9.5% | |||||||
5,000 | Bristol-Myers Squibb Co. | 358,500 | |||||
9,000 | GlaxoSmithKline PLC ADR | 381,330 | |||||
10,050 | Johnson & Johnson | 1,132,535 | |||||
13,820 | Merck & Co., Inc. | 777,513 | |||||
31,000 | Pfizer, Inc. | 1,075,700 | |||||
3,725,578 | |||||||
RETAIL — 1.3% | |||||||
4,225 | McDonald's Corp. | 515,703 | |||||
SEMICONDUCTORS — 2.1% | |||||||
26,000 | Intel Corp. | 821,340 | |||||
See accompanying Notes to Financial Statements.
8
QUEENS ROAD VALUE FUND
SCHEDULES OF INVESTMENTS (Continued) |
NUMBER OF SHARES | VALUE | ||||||
SOFTWARE — 5.2% | |||||||
19,500 | Microsoft Corp. | $ | 1,033,500 | ||||
25,000 | Oracle Corp. | 1,005,000 | |||||
2,038,500 | |||||||
TELECOMMUNICATIONS — 6.5% | |||||||
30,020 | AT&T, Inc. | 1,175,283 | |||||
30,000 | Cisco Systems, Inc. | 871,500 | |||||
10,000 | Verizon Communications, Inc. | 509,000 | |||||
2,555,783 | |||||||
TRANSPORTATION — 0.6% | |||||||
3,000 | Union Pacific Corp. | 252,570 | |||||
TOTAL COMMON STOCKS (Cost $21,558,915) | 34,391,727 | ||||||
EXCHANGE-TRADED FUNDS — 0.9% | |||||||
COMMODITY FUND — 0.9% | |||||||
30,000 | iShares Gold Trust* | 351,600 | |||||
TOTAL EXCHANGE-TRADED FUNDS (Cost $295,770) | 351,600 | ||||||
SHORT-TERM INVESTMENTS — 13.5% | |||||||
5,279,456 | Invesco Short Term Investment Prime Portfolio - Institutional Class, 0.36%** | 5,279,456 | |||||
TOTAL SHORT-TERM INVESTMENTS (Cost $5,279,456) | 5,279,456 | ||||||
TOTAL INVESTMENTS — 102.0% (Cost $27,134,141) | 40,022,783 | ||||||
Liabilities in Excess of Other Assets — (2.0)% | (773,335 | ) | |||||
TOTAL NET ASSETS —100.0% | $ | 39,249,448 | |||||
ADR – American Depositary Receipt
PLC – Public Limited Company
* | Non-income Producing. |
** | Variable rate security; the coupon rate shown represents the yield at May 31, 2016. |
See accompanying Notes to Financial Statements.
9
QUEENS ROAD SMALL CAP VALUE FUND
SCHEDULES OF INVESTMENTS |
NUMBER OF SHARES | VALUE | ||||||
COMMON STOCKS — 76.1% | |||||||
AEROSPACE/DEFENSE — 5.9% | |||||||
50,398 | Astronics Corp.* | $ | 1,940,323 | ||||
47,315 | Cubic Corp. | 1,930,452 | |||||
68,412 | Ducommun, Inc.* | 1,156,163 | |||||
39,879 | Orbital ATK, Inc. | 3,470,669 | |||||
8,497,607 | |||||||
APPAREL — 2.5% | |||||||
17,912 | Deckers Outdoor Corp.* | 941,992 | |||||
63,839 | Delta Apparel, Inc.* | 1,311,253 | |||||
180,034 | Iconix Brand Group, Inc.* | 1,388,062 | |||||
3,641,307 | |||||||
BANKS — 2.1% | |||||||
144,363 | Hilltop Holdings, Inc.* | 2,950,780 | |||||
CHEMICALS — 1.9% | |||||||
71,091 | CSW Industrials, Inc.* | 2,377,283 | |||||
31,400 | CVR Partners LP | 281,030 | |||||
2,658,313 | |||||||
COMMERCIAL SERVICES — 1.2% | |||||||
170,487 | RPX Corp.* | 1,713,394 | |||||
COMPUTERS — 1.4% | |||||||
21,658 | Digimarc Corp.* | 599,060 | |||||
11,000 | DST Systems, Inc. | 1,330,120 | |||||
1,929,180 | |||||||
DISTRIBUTION/WHOLESALE — 1.4% | |||||||
64,530 | Essendant, Inc. | 1,986,879 | |||||
DIVERSIFIED FINANCIAL SERVICES — 0.6% | |||||||
62,162 | Santander Consumer USA Holdings, Inc.* | 799,403 | |||||
ELECTRIC — 0.3% | |||||||
8,508 | MGE Energy, Inc. | 431,441 | |||||
ELECTRICAL COMPONENTS & EQUIPMENT — 0.2% | |||||||
12,800 | Graham Corp. | 231,168 | |||||
ELECTRONICS — 4.5% | |||||||
53,552 | Tech Data Corp.* | 4,046,925 | |||||
188,752 | Vishay Intertechnology, Inc. | 2,446,226 | |||||
6,493,151 | |||||||
FOOD — 3.8% | |||||||
151,900 | Darling Ingredients, Inc.* | 2,331,665 | |||||
35,022 | Sanderson Farms, Inc. | 3,141,824 | |||||
5,473,489 | |||||||
FOREST PRODUCTS & PAPER — 1.9% | |||||||
78,981 | Schweitzer-Mauduit International, Inc. |
| 2,716,946 | ||||
GAS — 3.9% | |||||||
57,040 | New Jersey Resources Corp. | 2,004,956 | |||||
21,641 | South Jersey Industries, Inc. | 625,209 | |||||
68,600 | UGI Corp. | 2,944,312 | |||||
5,574,477 | |||||||
HEALTHCARE-PRODUCTS — 0.7% | |||||||
15,000 | STERIS PLC | 1,041,450 | |||||
HOME FURNISHINGS — 0.6% | |||||||
11,469 | Harman International Industries, Inc. | 897,335 | |||||
INSURANCE — 7.2% | |||||||
12,145 | American National Insurance Co. | 1,451,449 | |||||
25,315 | Crawford & Co., Class B | 216,950 | |||||
600 | EMC Insurance Group, Inc. | 16,032 | |||||
41,330 | Endurance Specialty Holdings Ltd. | 2,807,134 | |||||
88,909 | Horace Mann Educators Corp. | 3,028,240 | |||||
42,800 | RLI Corp. | 2,829,508 | |||||
10,349,313 | |||||||
MACHINERY-CONSTRUCTION & MINING — 2.3% | |||||||
71,942 | Oshkosh Corp. | 3,302,857 | |||||
MACHINERY-DIVERSIFIED — 2.8% | |||||||
32,813 | Graco, Inc. | 2,633,899 | |||||
43,733 | Hurco Cos., Inc. | 1,409,515 | |||||
4,043,414 | |||||||
MEDIA — 4.0% | |||||||
68,521 | Meredith Corp. | 3,391,789 | |||||
59,712 | Scholastic Corp. | 2,331,754 | |||||
5,723,543 | |||||||
METAL FABRICATE/HARDWARE — 0.4% | |||||||
51,365 | LB Foster Co. | 592,238 | |||||
MISCELLANEOUS MANUFACTURING — 3.7% | |||||||
7,300 | Chase Corp. | 428,802 | |||||
34,600 | Crane Co. | 1,986,040 | |||||
82,438 | Fabrinet* | 2,926,549 | |||||
5,341,391 | |||||||
OIL & GAS — 1.3% | |||||||
175,000 | Atwood Oceanics, Inc. | 1,867,250 | |||||
PHARMACEUTICALS — 2.8% | |||||||
69,916 | Owens & Minor, Inc. | 2,607,168 | |||||
27,012 | Prestige Brands Holdings, Inc.* | 1,459,728 | |||||
4,066,896 | |||||||
See accompanying Notes to Financial Statements.
10
QUEENS ROAD SMALL CAP VALUE FUND
SCHEDULES OF INVESTMENTS (Continued) |
NUMBER OF SHARES | VALUE | ||||||
RETAIL — 4.7% | |||||||
60,149 | Cato Corp., Class A | $ | 2,276,640 | ||||
67,600 | Pier 1 Imports, Inc. | 378,560 | |||||
50,883 | Urban Outfitters, Inc.* | 1,451,692 | |||||
51,600 | Vista Outdoor, Inc.* | 2,589,288 | |||||
6,696,180 | |||||||
SEMICONDUCTORS — 2.1% | |||||||
45,000 | Synaptics, Inc.* | 3,052,350 | |||||
SOFTWARE — 3.4% | |||||||
56,088 | CSG Systems International, Inc. | 2,384,301 | |||||
26,722 | SYNNEX Corp. | 2,434,374 | |||||
4,818,675 | |||||||
TELECOMMUNICATIONS — 5.8% | |||||||
49,533 | Anixter International, Inc.* | 2,981,887 | |||||
27,300 | Black Box Corp. | 342,615 | |||||
92,300 | CalAmp Corp.* | 1,387,269 | |||||
81,078 | Plantronics, Inc. | 3,609,592 | |||||
8,321,363 | |||||||
TEXTILES — 2.0% | |||||||
24,712 | UniFirst Corp. | 2,858,437 | |||||
TRUCKING & LEASING — 0.7% | |||||||
36,673 | Greenbrier Cos., Inc. | 1,052,515 | |||||
TOTAL COMMON STOCKS (Cost $79,938,443) | 109,122,742 | ||||||
EXCHANGE-TRADED FUNDS — 0.9% | |||||||
EQUITY FUND — 0.9% | |||||||
13,100 | iShares Russell 2000 Value Fund | 1,269,652 | |||||
TOTAL EXCHANGE-TRADED FUNDS (Cost $1,224,399) | 1,269,652 | ||||||
MUTUAL FUNDS — 0.9% | |||||||
106,846 | Central Fund of Canada Ltd., Class A** | 1,331,301 | |||||
TOTAL MUTUAL FUNDS (Cost $1,318,331) | 1,331,301 | ||||||
SHORT-TERM INVESTMENTS — 25.8% | |||||||
36,966,421 | Invesco Short Term Investment Prime Portfolio - Institutional Class, 0.36%*** |
| 36,966,421 | ||||
TOTAL SHORT-TERM INVESTMENTS (Cost $36,966,421) | 36,966,421 | ||||||
TOTAL INVESTMENTS — 103.7% (Cost $119,447,594) | 148,690,116 | ||||||
Liabilities in Excess of Other Assets — (3.7)% | (5,314,601 | ) | |||||
TOTAL NET ASSETS —100.0% | $ | 143,375,515 | |||||
* | Non-income Producing. |
** | Passive foreign investment company. |
*** | Variable rate security; the coupon rate shown represents the yield at May 31, 2016. |
See accompanying Notes to Financial Statements.
11
QUEENS ROAD FUNDS
STATEMENTS OF ASSETS AND LIABILITIES |
Value Fund | Small Cap Value Fund | |||||||
Assets: | ||||||||
Investments, at Value (cost $27,134,141, $119,447,594) | $ | 40,022,783 | $ | 148,690,116 | ||||
Receivables: | ||||||||
Shareholder Subscriptions | — | 482,265 | ||||||
Dividends and Interest | 105,596 | 123,526 | ||||||
Investment Securities Sold | 370,761 | 1,048,599 | ||||||
Total Assets | 40,499,140 | 150,344,506 | ||||||
Liabilities: | ||||||||
Payables: | ||||||||
Investment Securities Purchased | 1,189,939 | 6,698,001 | ||||||
Shareholder Redemptions | 28,501 | 124,617 | ||||||
Accrued Advisory Fees (Note 3) | 31,252 | 146,373 | ||||||
Total Liabilities | 1,249,692 | 6,968,991 | ||||||
Net Assets | $ | 39,249,448 | $ | 143,375,515 | ||||
Components of Net Assets: | ||||||||
Capital (par value of $0.001 per share with an unlimited number of shares authorized) | $ | 25,324,863 | $ | 109,674,129 | ||||
Accumulated Undistributed Net Investment Income | 358,530 | (119,263 | ) | |||||
Accumulated Undistributed Net Realized Gain on Investments | 677,413 | 4,578,127 | ||||||
Net Unrealized Appreciation on Investments | 12,888,642 | 29,242,522 | ||||||
Net Assets | $ | 39,249,448 | $ | 143,375,515 | ||||
Shares of Beneficial Interest Issued and Outstanding | 1,978,901 | 5,676,310 | ||||||
Net Asset Value, Offering and Redemption Price Per Share | $ | 19.83 | $ | 25.26 | ||||
See accompanying Notes to Financial Statements.
12
QUEENS ROAD FUNDS
STATEMENTS OF OPERATIONS |
Value Fund | Small Cap Value Fund | |||||||
Investment Income: | ||||||||
Dividends (net of foreign withholding taxes of $1,266, $142) | $ | 938,079 | $ | 1,045,442 | ||||
Interest | 10,459 | 46,644 | ||||||
Total Investment Income | 948,538 | 1,092,086 | ||||||
Expenses: | ||||||||
Advisory Fees (Note 3) | 352,106 | 1,161,009 | ||||||
Total Expenses | 352,106 | 1,161,009 | ||||||
Net Investment Income (Loss) | 596,432 | (68,923 | ) | |||||
Realized and Unrealized Gain (Loss) on Investments: | ||||||||
Net Realized Gain on Investments | 1,093,754 | 4,485,007 | ||||||
Net Change in Unrealized Appreciation (Depreciation) on Investments | (931,873 | ) | 1,569,952 | |||||
Net Realized and Unrealized Gain on Investments | 161,881 | 6,054,959 | ||||||
Net Increase in Net Assets from Operations | $ | 758,313 | $ | 5,986,036 | ||||
See accompanying Notes to Financial Statements.
13
QUEENS ROAD FUNDS
STATEMENTS OF CHANGES IN NET ASSETS |
Value Fund | Small Cap Value Fund | |||||||||||||||
For the | For the | For the | For the | |||||||||||||
Increase in Net Assets From: | ||||||||||||||||
Operations: | ||||||||||||||||
Net Investment Income (Loss) | $ | 596,432 | $ | 427,148 | $ | (68,923 | ) | $ | 18,847 | |||||||
Net Realized Gain on Investments | 1,093,754 | 503,116 | 4,485,007 | 1,329,045 | ||||||||||||
Net Change in Unrealized Appreciation (Depreciation) on Investments | (931,873 | ) | 1,683,331 | 1,569,952 | 4,804,996 | |||||||||||
Net Increase in Net Assets from Operations | 758,313 | 2,613,595 | 5,986,036 | 6,152,888 | ||||||||||||
Distributions to Shareholders From: | ||||||||||||||||
Net Investment Income | (424,769 | ) | (410,251 | ) | — | — | ||||||||||
Net Realized Gains | (682,181 | ) | (1,341,837 | ) | (302,677 | ) | (2,079,604 | ) | ||||||||
Net Change in Net Assets from Distributions | (1,106,950 | ) | (1,752,088 | ) | (302,677 | ) | (2,079,604 | ) | ||||||||
Capital Transactions: | ||||||||||||||||
Proceeds from Sale of Shares | 3,546,365 | 3,311,395 | 67,522,410 | 11,601,034 | ||||||||||||
Net Asset Value of Shares Issued on Reinvestment of Dividends | 577,112 | 956,713 | 219,896 | 1,467,200 | ||||||||||||
Cost of Shares Redeemed | (2,710,492 | ) | (3,878,038 | ) | (9,316,533 | ) | (12,087,527 | ) | ||||||||
Net Increase in Net Assets from Capital Transactions | 1,412,985 | 390,070 | 58,425,773 | 980,707 | ||||||||||||
Total Increase in Net Assets | 1,064,348 | 1,251,577 | 64,109,132 | 5,053,991 | ||||||||||||
Net Assets: | ||||||||||||||||
Beginning of Year | 38,185,100 | 36,933,523 | 79,266,383 | 74,212,392 | ||||||||||||
End of Year | $ | 39,249,448 | $ | 38,185,100 | $ | 143,375,515 | $ | 79,266,383 | ||||||||
Accumulated Undistributed Net Investment Income (Distributions in Excess of Net Investment Income) | $ | 358,530 | $ | 194,662 | $ | (119,263 | ) | $ | (137,694 | ) | ||||||
Capital Share Transactions: | ||||||||||||||||
Shares Sold | 188,888 | 166,037 | 2,819,818 | 486,257 | ||||||||||||
Shares Issued on Reinvestment of Dividends | 31,028 | 47,764 | 9,294 | 62,196 | ||||||||||||
Shares Redeemed | (140,816 | ) | (193,785 | ) | (385,083 | ) | (505,794 | ) | ||||||||
Net Increase in Shares | 79,100 | 20,016 | 2,444,029 | 42,659 | ||||||||||||
See accompanying Notes to Financial Statements.
14
QUEENS ROAD VALUE FUND
FINANCIAL HIGHLIGHTS |
Per share operating performance
For a capital share outstanding throughout each year
Year | Year | Year | Year | Year | ||||||||||||||||
Net Asset Value, Beginning of Year | $ | 20.10 | $ | 19.65 | $ | 17.15 | $ | 13.58 | $ | 14.20 | ||||||||||
Income from Investment Operations: | ||||||||||||||||||||
Net Investment Income* | 0.31 | 0.23 | 0.20 | 0.20 | 0.20 | |||||||||||||||
Net Realized and Unrealized Gain (Loss) on Investments | 0.00 | ** | 1.17 | 2.49 | 3.59 | (0.66 | ) | |||||||||||||
Total from Investment Operations | 0.31 | 1.40 | 2.69 | 3.79 | (0.46 | ) | ||||||||||||||
Less Distributions: | ||||||||||||||||||||
Net Investment Income | (0.22 | ) | (0.22 | ) | (0.19 | ) | (0.22 | ) | (0.16 | ) | ||||||||||
Net Realized Gains | (0.36 | ) | (0.73 | ) | — | — | — | |||||||||||||
Total Distributions | (0.58 | ) | (0.95 | ) | (0.19 | ) | (0.22 | ) | (0.16 | ) | ||||||||||
Net Asset Value, End of Year | $ | 19.83 | $ | 20.10 | $ | 19.65 | $ | 17.15 | $ | 13.58 | ||||||||||
Total Return | 1.74 | % | 7.15 | % | 15.69 | % | 28.19 | % | (3.28 | )% | ||||||||||
Ratios and Supplemental Data: | ||||||||||||||||||||
Net Assets, End of Year (in thousands) | $ | 39,249 | $ | 38,185 | $ | 36,934 | $ | 33,709 | $ | 27,003 | ||||||||||
Ratio of Expenses to Average Net Assets | 0.95 | % | 0.95 | % | 0.95 | % | 0.95 | % | 0.95 | % | ||||||||||
Ratio of Net Investment Income to Average Net Assets | 1.61 | % | 1.14 | % | 1.10 | % | 1.29 | % | 1.44 | % | ||||||||||
Portfolio Turnover Rate | 14 | % | 4 | % | — | % | 4 | % | 5 | % | ||||||||||
* | Computed using average shares method. |
** | Amount is less than $0.005 per share. |
See accompanying Notes to Financial Statements.
15
QUEENS ROAD SMALL CAP VALUE FUND
FINANCIAL HIGHLIGHTS |
Per share operating performance
For a capital share outstanding throughout each year
Year | Year | Year | Year | Year | ||||||||||||||||
Net Asset Value, Beginning of Year | $ | 24.52 | $ | 23.27 | $ | 20.84 | $ | 17.40 | $ | 20.67 | ||||||||||
Income from Investment Operations: | ||||||||||||||||||||
Net Investment Income (Loss)* | (0.02 | ) | 0.01 | 0.00 | ** | 0.05 | 0.00 | ** | ||||||||||||
Net Realized and Unrealized Gain (Loss) on Investments | 0.84 | 1.90 | 3.18 | 3.69 | (1.96 | ) | ||||||||||||||
Total from Investment Operations | 0.82 | 1.91 | 3.18 | 3.74 | (1.96 | ) | ||||||||||||||
Less Distributions: | ||||||||||||||||||||
Net Investment Income | — | — | — | (0.05 | ) | (0.08 | ) | |||||||||||||
Net Realized Gains | (0.08 | ) | (0.66 | ) | (0.75 | ) | (0.25 | ) | (1.23 | ) | ||||||||||
Return of Capital | — | — | — | (0.00 | )** | — | ||||||||||||||
Total Distributions | (0.08 | ) | (0.66 | ) | (0.75 | ) | (0.30 | ) | (1.31 | ) | ||||||||||
Net Asset Value, End of Year | $ | 25.26 | $ | 24.52 | $ | 23.27 | $ | 20.84 | $ | 17.40 | ||||||||||
Total Return | 3.37 | % | 8.33 | % | 15.26 | % | 21.75 | % | (9.71 | )% | ||||||||||
Ratios and Supplemental Data: | ||||||||||||||||||||
Net Assets, End of Year (in thousands) | $ | 143,376 | $ | 79,266 | $ | 74,212 | $ | 79,421 | $ | 65,219 | ||||||||||
Ratio of Expenses to Average Net Assets | 1.24 | % | 1.24 | % | 1.24 | % | 1.24 | % | 1.24 | % | ||||||||||
Ratio of Net Investment Income to Average Net Assets | (0.07 | )% | 0.02 | % | 0.01 | % | 0.27 | % | 0.01 | % | ||||||||||
Portfolio Turnover Rate | 23 | % | 2 | % | 0 | %*** | 10 | % | 14 | % | ||||||||||
* | Computed using average shares method. |
** | Amount is less than $0.005 per share. |
*** | Amount is less than 0.5%. |
See accompanying Notes to Financial Statements.
16
QUEENS ROAD FUNDS
NOTES TO FINANCIAL STATEMENTS |
Note 1. Organization
The Queens Road Value Fund and the Queens Road Small Cap Value Fund (individually referred to as the “Value Fund” and “Small Cap Value Fund”, respectively, or collectively as the “Funds”), are managed portfolios of the Bragg Capital Trust (the “Trust”), which are registered under the Investment Company Act of 1940, as amended, as non-diversified, open-end management companies. The Funds’ investment objective is to seek growth of capital. The Funds invest primarily in common stocks which are believed by the Advisor to be undervalued and have good prospects for capital appreciation. Under normal circumstances, the Small Cap Value Fund invests at least 80% of its assets in equity securities of companies with small market capitalization. The Fund defines a small capitalization (small cap) company as one whose market capitalization, at the time of purchase, is generally less than that of a company with the largest capitalization included in the Russell 2000 Value Index, which as of May 31, 2016, was $3.8 billion. The Funds’ registration statement was declared effective on June 13, 2002, and operations began on that date.
Note 2. Significant Accounting Policies
The following is a summary of accounting policies followed by the Funds in the preparation of their financial statements. The Funds are investment companies, as such, these financial statements have applied the guidance set forth in the Financial Accounting Standards Board (“FASB”) Accounting Standards Codification (ASC) 946, Financial Services-Investment Companies.
Federal Income Taxes: Each Fund intends to comply with the requirements of Subchapter M of the Internal Revenue Code applicable to regulated investment companies and to distribute substantially all of its net investment income and any net realized gains to its shareholders. Therefore, no provision is made for federal income or excise taxes.
Accounting for Uncertainty in Income Taxes (the “Income Tax Statement”) requires an evaluation of tax positions taken (or expected to be taken) in the course of preparing a Fund’s tax returns to determine whether these positions meet a “more-likely-than-not” standard that, based on the technical merits, have a more than fifty percent likelihood of being sustained by a taxing authority upon examination. A tax position that meets the “more-likely-than-not” recognition threshold is measured to determine the amount of benefit to recognize in the financial statements. The Funds recognize interest and penalties, if any, related to unrecognized tax benefits as income tax expense in the Statements of Operations.
The Income Tax Statement requires management of the Funds to analyze all open tax years 2012 – 2015, as defined by IRS statute of limitations for all major jurisdictions, including federal tax authorities and certain state tax authorities. As of and during the year ended May 31, 2016, the Funds did not have a liability for any unrecognized tax benefits. The Funds have no examination in progress and are not aware of any tax positions for which it is reasonably possible that the total amounts of unrecognized tax benefits will significantly change in the next twelve months.
Distributions to Shareholders: Distributions to shareholders, which are determined in accordance with income tax regulations, are recorded on the ex-dividend date. The character of distributions made during the year from net investment income or net realized gain may differ from the characterization for federal income tax purposes due to differences in the recognition of income, expense and gain/(loss) items for financial statement and tax purposes. Where appropriate, reclassifications between net asset accounts are made for such differences that are permanent in nature.
Use of Estimates: The preparation of financial statements in conformity with accounting principles generally accepted in the United States of America (“GAAP”) requires management to make estimates and assumptions that affect the reported amounts of assets and liabilities, and disclosure of contingent assets and liabilities at the date of the financial statements and the reported amounts of increases and decreases in net assets from operations during the reporting period. Actual results could differ from those estimates.
Other: The Funds follow industry practice and record security transactions on the trade date. The specific identification method is used for determining gains or losses for financial statement and income tax purposes. Dividend income is recorded on the ex-dividend date, except that certain dividends from foreign securities are recorded as soon as information is available to the Funds. Interest income is recorded on an accrual basis. Discounts and premiums on securities purchased are amortized over the life of the respective securities.
Security Valuation: Securities, including common stocks and exchange-traded funds, which are traded on a national securities exchange are valued at the last quoted sales price, and generally classified as a Level 1 investment. Investments in mutual funds, including money market funds, are valued at the ending net asset value provided by the funds, and generally classified as a Level 1 investment. If there are no sales reported, the Fund’s portfolio securities will be valued using the last reported bid price. Short-term obligations may be valued using
17
QUEENS ROAD FUNDS
NOTES TO FINANCIAL STATEMENTS (Continued) |
amortized cost, which approximates fair value, and are generally classified as a Level 2 investment. Securities for which market quotations are not readily available are valued at fair value as determined in good faith by and under the direction of the Trust’s Board of Trustees, and generally classified as a Level 3 investment.
In accordance with GAAP, fair value is defined as the price that the Funds would receive to sell an asset or pay to transfer a liability in an orderly transaction between market participants at the measurement date. GAAP also establishes a framework for measuring fair value, and a three-level hierarchy for fair value measurements based upon the transparency of inputs to the valuation of an asset or liability. The three-tier hierarchy of inputs is summarized below.
● | Level 1 – Unadjusted quoted prices in active markets for identical assets or liabilities that the company has the ability to access. An active market for the security is a market in which transactions occur with sufficient frequency and volume to provide pricing information on an ongoing basis. Common Stocks, Exchange-Traded Funds and Mutual Funds are generally categorized as Level 1. |
● | Level 2 – Observable inputs other than quoted prices included in Level 1 that are observable for the asset or liability, either directly or indirectly. These inputs may include quoted prices for the identical instrument on an inactive market, prices for similar instruments, interest rates, prepayment speeds, credit risk, yield curves, default rates and similar data. Fixed income securities, repurchase agreements, and securities valued by an independent fair value pricing service are generally categorized as Level 2. |
● | Level 3 – Unobservable inputs for the asset or liability, to the extent relevant observable inputs are not available, representing the company’s own assumptions about the assumptions a market participant would use in valuing the asset or liability, and would be based on the best information available. |
The availability of observable inputs can vary from security to security and is affected by a wide variety of factors, including, for example, the type of security, whether the security is new and not yet established in the marketplace, the liquidity of markets, and other characteristics particular to the security. To the extent that valuation is based on models or inputs that are less observable or unobservable in the market, the determination of fair value requires more judgment. Accordingly, the degree of judgment exercised in determining fair value is greatest for instruments categorized in Level 3.
The Funds did not hold any Level 2 or Level 3 securities during the year ended May 31, 2016. There were no transfers into and out of any level during the current year. It is the Funds’ policy to recognize transfers into and out of all levels at the end of the reporting period.
Value Fund | ||||||||||||||||
Level 1 - | Level 2 - | Level 3 - | Total | |||||||||||||
Common Stocks* | $ | 34,391,727 | $ | — | $ | — | $ | 34,391,727 | ||||||||
Exchange-Traded Funds | 351,600 | — | — | 351,600 | ||||||||||||
Short-Term Investments | 5,279,456 | — | — | 5,279,456 | ||||||||||||
Total | $ | 40,022,783 | $ | — | $ | — | $ | 40,022,783 | ||||||||
Small Cap Value Fund | ||||||||||||||||
Level 1 - | Level 2 - | Level 3 - | Total | |||||||||||||
Common Stocks* | $ | 109,122,742 | $ | — | $ | — | $ | 109,122,742 | ||||||||
Exchange-Traded Funds | 1,269,652 | — | — | 1,269,652 | ||||||||||||
Mutual Funds | 1,331,301 | — | — | 1,331,301 | ||||||||||||
Short-Term Investments | 36,966,421 | — | — | 36,966,421 | ||||||||||||
Total | $ | 148,690,116 | $ | — | $ | — | $ | 148,690,116 | ||||||||
* | All sub-categories within common stocks represent Level 1 investments. See Schedules of Investments for industry categories. |
18
QUEENS ROAD FUNDS
NOTES TO FINANCIAL STATEMENTS (Continued) |
Note 3. Investment Advisory Fee and Other Transactions with Affiliates
The Funds retain Bragg Financial Advisors, Inc. (the “Advisor”) as their investment advisor. Under the terms of the management agreement, the Advisor provides investment management and administrative services for the Funds. For its services as Advisor, the Value Fund and Small Cap Value Fund pay a fee, computed daily and payable monthly at the annual rate of 0.95% and 1.24% of each Fund’s first $250,000,000 of average daily net assets, 0.85% and 1.24% of each Fund’s next $250,000,000 of average daily net assets, and 0.80% and 1.15% of each Fund’s average daily net assets over $500,000,000, respectively. For the year ended May 31, 2016, the Advisor earned $352,106 and $1,161,009 from the Value Fund and Small Cap Value Fund, respectively. From these fees and its own resources, the Advisor agreed to pay other operating expenses of the Funds including transfer agent fees, fund accountant fees, administrator fees, registration fees, custodial fees, and other ordinary expenses of the Funds. However, the agreement does not require the Advisor to pay interest, taxes, brokerage commissions, and extraordinary expenses of the Funds. The amounts due to the Advisor at May 31, 2016, from the Value Fund and Small Cap Value Fund were $31,252 and $146,373, respectively.
Certain employees and officers of the Advisor are also “interested persons” (as defined in the Investment Company Act of 1940) of the Trust. Each “non- interested” Trustee is entitled to receive an annual fee of $7,500 plus expenses for services relating to the Trust which is paid by the Advisor.
Queens Road Securities (“QRS”) acts as the principal underwriter in the continuous public offering of the Funds’ shares. Certain officers of the Trust are also officers of QRS. QRS did not receive or waive any brokerage fees on executions of purchases and sales of the Funds’ portfolio investments during the year ended May 31, 2016.
Note 4. Investment Transactions
For the year ended May 31, 2016, the cost of purchases and the proceeds from sales of portfolio securities, other than short-term investments, amounted to $5,856,159 and $4,372,892, respectively, for the Value Fund, and $62,313,602 and $16,666,057, respectively, for the Small Cap Value Fund.
Note 5. Federal Income Taxes
At May 31, 2016, gross unrealized appreciation and depreciation of investments based on cost for federal income tax purposes were as follows:
| Value Fund | Small Cap | ||||||
Cost of investments | $ | 27,120,203 | $ | 119,484,033 | ||||
Gross unrealized appreciation | $ | 13,268,092 | $ | 30,042,338 | ||||
Gross unrealized depreciation | (365,512 | ) | (836,255 | ) | ||||
Net unrealized appreciation on investments | $ | 12,902,580 | $ | 29,206,083 | ||||
The difference between cost amounts for financial statement and federal income tax purposes is due primarily to wash sale loss deferrals and timing differences in recognizing certain gains and losses in security transactions.
19
QUEENS ROAD FUNDS
NOTES TO FINANCIAL STATEMENTS (Continued) |
GAAP requires that certain components of net assets be reclassified between financial and tax reporting. These reclassifications have no effect on net assets or net asset value per share. For the year ended May 31, 2016, permanent differences in book and tax accounting resulting primarily from differing treatments for net operating losses and return of capital items have been reclassified to paid-in capital, undistributed net investment income (loss) and accumulated realized gain (loss) as follows:
Increase (Decrease) | ||||||||||||
Paid-in Capital | Undistributed Net Investment Income (Loss) | Accumulated | ||||||||||
Queens Road Value Fund | $ | — | $ | (7,795 | ) | $ | 7,795 | |||||
Queens Road Small Cap Value Fund | (84,814 | ) | 87,354 | (2,540 | ) | |||||||
As of May 31, 2016, the components of accumulated earnings on a tax basis were as follows:
| Value Fund | Small Cap | ||||||
Undistributed ordinary income | $ | 358,530 | $ | — | ||||
Undistributed long-term capital gains | 663,475 | 4,587,566 | ||||||
Tax accumulated earnings | 1,022,005 | 4,587,566 | ||||||
Accumulated capital and other losses | — | (92,263 | ) | |||||
Net unrealized appreciation | 12,902,580 | 29,206,083 | ||||||
Total accumulated earnings | $ | 13,924,585 | $ | 33,701,386 | ||||
Post-October capital losses and late-year ordinary losses incurred after October 31 and within the taxable year are deemed to arise on the first business day of the Funds’ next taxable year. As of May 31, 2016, the following Funds had the following post-October capital-losses and late-year ordinary losses:
| Value Fund | Small Cap | ||||||
Post-October capital losses | $ | — | $ | — | ||||
Late-year ordinary losses | — | 92,263 | ||||||
The tax character of distributions paid during the fiscal years ended, May 31, 2016 and May 31, 2015 were as follows:
| Value Fund | Small Cap Value Fund | ||||||||||||||
Distributions paid from: | 2016 | 2015 | 2016 | 2015 | ||||||||||||
Ordinary Income | $ | 426,863 | $ | 410,251 | $ | — | $ | — | ||||||||
Net Long Term Capital Gains | 680,087 | 1,341,837 | 302,677 | 2,079,604 | ||||||||||||
Total Taxable Distributions Paid | $ | 1,106,950 | $ | 1,752,088 | $ | 302,677 | $ | 2,079,604 | ||||||||
20
QUEENS ROAD FUNDS
NOTES TO FINANCIAL STATEMENTS (Continued) |
Note 6. Control
The beneficial ownership, either directly or indirectly, of more than 25% of the voting securities of a fund creates a presumption of control of the fund, under section 2 (a) (9) of the Investment Company Act of 1940. As of May 31, 2016, Pershing, L.L.C., for the benefit of its customers, owned 97.13% and 38.37% of the Value Fund and Small Cap Value Fund, respectively. As of May 31, 2016, Charles Schwab & Co., Inc. owned 28.20% of the Small Cap Value Fund.
Note 7. Recently Issued Accounting Pronouncements
In May 2015, the FASB issued Accounting Standards Update (“ASU”) No. 2015-07 (“ASU 2015-07”) eliminating the requirement for investments measured at net asset value to be categorized within the fair value hierarchy under GAAP and requiring the disclosure of sufficient information to reconcile the fair value of the remaining assets categorized within the fair value hierarchy to the financial statements. ASU 2015-07 is effective for interim and annual reporting periods beginning after December 15, 2015. Management has reviewed the requirements and believes the adoption of ASU 2015-07 will not have a material impact on the financial statements.
Note 8. Subsequent Event Disclosure
Management has evaluated the impact of all subsequent events on the Funds through the date the financial statements were issued, and has determined that there were no subsequent events requiring recognition or disclosure in the financial statements.
21
QUEENS ROAD FUNDS
REPORT OF INDEPENDENT REGISTERED PUBLIC ACCOUNTING FIRM |
To the Shareholders and Board of Trustees of
Bragg Capital Trust
We have audited the accompanying statements of assets and liabilities, including the schedules of investments, of Bragg Capital Trust, comprising Queens Road Value Fund and Queens Road Small Cap Value Fund (the “Funds”) as of May 31, 2016, and the related statements of operations for the year then ended, the statements of changes in net assets for each of the two years in the period then ended, and the financial highlights for each of the five years in the period then ended. These financial statements and financial highlights are the responsibility of the Funds’ management. Our responsibility is to express an opinion on these financial statements and financial highlights based on our audits.
We conducted our audits in accordance with the standards of the Public Company Accounting Oversight Board (United States). Those standards require that we plan and perform the audit to obtain reasonable assurance about whether the financial statements and financial highlights are free of material misstatement. An audit includes examining, on a test basis, evidence supporting the amounts and disclosures in the financial statements. Our procedures included confirmation of securities owned as of May 31, 2016, by correspondence with the custodian and brokers or by other appropriate auditing procedures where replies from brokers were not received. An audit also includes assessing the accounting principles used and significant estimates made by management, as well as evaluating the overall financial statement presentation. We believe that our audits provide a reasonable basis for our opinion.
In our opinion, the financial statements and financial highlights referred to above present fairly, in all material respects, the financial position of each of the Funds constituting Bragg Capital Trust as of May 31, 2016, the results of their operations for the year then ended, the changes in their net assets for each of the two years in the period then ended, and the financial highlights for each of the five years in the period then ended, in conformity with accounting principles generally accepted in the United States of America.

COHEN FUND AUDIT SERVICES, LTD.
Cleveland, Ohio
July 29, 2016
22
QUEENS ROAD FUNDS
EXPENSE ILLUSTRATION |
ABOUT YOUR FUND’S EXPENSES
Expense Example
As a shareholder of the Funds, you incur ongoing costs which typically consist of management fees and other Fund expenses. This Example is intended to help you understand your ongoing costs (in dollars) of investing in the Funds and to compare these costs with the ongoing costs of investing in other mutual funds.
The Example is based on an investment of $1,000 invested at the beginning of the period and held for the entire period, December 1, 2015 through May 31, 2016.
Actual Expenses
The first line of the table below provides information about actual account values and actual expenses. You may use the information in this line, together with the amount you invested, to estimate the expenses that you paid over the period. Simply divide your account value by $1,000 (for example, an $8,600 account value divided by $1,000 = 8.6), then multiply the result by the number in the first line under the heading entitled “Expenses Paid During Period” to estimate the expenses you paid on your account during this period.
Hypothetical Example for Comparison Purposes
The second line of the table below provides information about hypothetical account values and hypothetical expenses based on the Fund’s actual expense ratio and an assumed rate of return of 5% per year before expenses, which is not the Fund’s actual return. The hypothetical account values and expenses may not be used to estimate the actual ending account balance or expenses you paid for the period. You may use this information to compare the ongoing costs of investing in this Fund and other funds. To do so, compare this 5% hypothetical example with the 5% hypothetical examples that appear in the shareholder reports of the other funds.
Beginning | Ending | Expenses Paid | |
Value Fund | |||
Actual | $1,000.00 | $1,054.70 | $4.88 |
Hypothetical (5% Annual Return before expenses) | $1,000.00 | $1,020.25 | $4.80 |
Small Cap Fund | |||
Actual | $1,000.00 | $1,030.80 | $6.29 |
Hypothetical (5% Annual Return before expenses) | $1,000.00 | $1,018.80 | $6.26 |
* | Expenses are equal to the Funds’ annualized expense ratio of 0.95% and 1.24%, respectively, multiplied by the average account value over the period, multiplied by 183/366 (to reflect the one-half year period). |
23
QUEENS ROAD FUNDS
ADDITIONAL INFORMATION |
Proxy Voting - A description of the policies and procedures that the Fund uses to determine how to vote proxies relating to portfolio securities and information regarding how the Fund voted proxies during the most recent 12 month period ended June 30, are available without charge upon request by (1) calling the Fund at 1-800-595-3088 and (2) from Fund documents filed with the Securities and Exchange Commission (“SEC”) on the SEC’s website at www.sec.gov.
Portfolio Holdings - The Funds file a complete schedule of investments with the SEC for the first and third quarter of each fiscal year on Form N-Q. The Funds’ first and third fiscal quarters end on August 31 and February 28. The Form N-Q filing must be made within 60 days of the end of the quarter, and the Funds’ first Form N-Q was filed with the SEC on October 8, 2004. The Funds’ Form N-Qs are available on the SEC’s website at http://sec.gov, or they may be reviewed and copied at the SEC’s Public Reference Room in Washington, DC (call 1-800-732-0330 for information on the operation of the Public Reference Room). You may also obtain copies by calling the Fund at 1-800-595-3088.
Qualified Dividend Income and Dividend Received Deduction Designations -
Long-Term Capital Gains Designation
Pursuant to IRC 852(b)(3) of the Internal Revenue Code, the Queens Road Value and Queens Road Small Cap Value Fund hereby designates $680,087 and $302,677, respectively, as long-term capital gains distributed during the year ended, May 31, 2016.
Qualified Dividend Income
For the year ended May 31, 2016, 100.00% of the dividends paid from net investment income, including short-term capital gains (if any), is designated as qualified dividend income for the Queens Road Value Fund.
Corporate Dividends Received Deduction
For the year ended May 31, 2016, 100.00% of the dividends paid from net investment income, including short-term capital gains (if any), qualifies for the dividends received deduction available to corporate shareholders for the Queens Road Value Fund.
24
QUEENS ROAD FUNDS
TRUSTEE INFORMATION |
Information about Trustees who are “interested persons” of the Trust as defined under the 1940 Act, and each Trustee of the Trust, including their principal occupations during the past five years, is as follows:
Interested Trustees | |||||
Name, Address, | Position with Fund | Term of Office and Length of Time Served | Principal Occupations | Number of Portfolios in Fund Complex Overseen | Other Directorships Held By Trustee |
Steven H. Scruggs | CCO, | Unlimited; | Bragg Financial Advisors, Portfolio Manager/CCO (2000-present) | Two | None |
Benton S. Bragg | Trustee, Chairman, Treasurer | Unlimited; | Bragg Financial Advisors, President, CEO (1996-present) | Two | None |
Steve Scruggs and Benton Bragg are Interested Trustees of the Funds (as that term is defined in Section 2(a)(19) of the Investment Company Act of 1940) by reason of their affiliation with the Funds’ Advisor, Bragg Financial Advisors, Inc. and their affiliation as registered principals with the Funds’ underwriter, Queens Road Securities, L.L.C., Benton S. Bragg and Steven H. Scruggs are brothers-in-law.
The Funds’ Statement of Additional Information includes additional information about the trustees and is available, without charge and upon request, by calling 1-800-595-3088.
25
QUEENS ROAD FUNDS
TRUSTEE INFORMATION (Continued) |
Information about Trustees who are not “interested persons” of the Trust as defined under the 1940 Act, including their principal occupations during the past five years, is as follows:
Independent Trustees | |||||
Name, Address, and Age | Position with Fund | Term of Office and Length of Time Served | Principal Occupations | Number of Portfolios in Fund Complex Overseen | Other Directorships Held By Trustee |
Philip C. Blount III | Trustee | Unlimited; | Icons, Inc., President (2001-present) Marketing Merchandise | Two | None |
Christopher B. Brady | Trustee | Unlimited; | Brady Distributing, Vice President (1995-2009, 2012-present) Machinery Distribution; Resort Capital Partners, Vice President (2009-2012) Hospitality Financial Advisory | Two | None |
Harold J. Smith | Trustee | Unlimited; | Raftelis Financial, Vice President (1996-present) Public Finance Consulting | Two | None |
Timothy J. Ignasher | Trustee | Unlimited; | NewBridge Bank, Exec. Vice President and Head of Commercial Banking (2012-Present); Citizens South Bank, Exec. Vice President (2008-present) | Two | None |
The Funds’ Statement of Additional Information includes additional information about the trustees and is available, without charge and upon request, by calling 1-800-595-3088.
(1) | Member of the Audit Committee of the Board of Trustees, which makes recommendations regarding the selection of the Fund’s independent public accountant and meets with representatives of the accountants to determine the scope of and review the results of each audit. |
(2) | Member of the Nominating Committee of the Board of Trustees, which identifies qualified candidates and recommends nominees for the election as Trustees. |
26
QUEENS ROAD FUNDS
|
Notes |
THIS PAGE INTENTIONALLY LEFT BLANK
THIS PAGE INTENTIONALLY LEFT BLANK
QUEENS ROAD FUNDS
|
Board of Trustees
Benton S. Bragg
Steven H. Scruggs
Philip C. Blount, III
Timothy J. Ignasher
Christopher B. Brady
Harold J. Smith
Investment Adviser
Bragg Financial Advisors, Inc.
1031 Caldwell Street, Suite 200
Charlotte, NC 28203
Dividend Paying Agent,
Shareholders’ Servicing Agent,
Transfer Agent
UMB Fund Services
235 West Galena Street
Milwaukee, WI 53212
Custodian
US Bank, NA
425 Walnut Street
P.O. Box 1118
Cincinnati, OH 45201
Independent Registered Public Accounting Firm
Cohen Fund Audit Services, Ltd.
1350 Euclid Avenue, Suite 800
Cleveland, OH 44115
Shares of Queens Road Value and Queens Road Small Cap Value Fund are distributed by Queens Road Securities, L.L.C., an affiliate of the Investment Adviser. This report has been prepared for the general information of the shareholders. It is not authorized for distribution to prospective investors unless preceded or accompanied by a current prospectus. The Funds’ prospectus contains more complete information about the objectives, policies, expenses and risks of the Funds. The Funds are not bank deposits, not FDIC insured and may lose value. Please read the prospectus carefully before investing or sending money.
This report contains certain forward looking statements which are subject to known and unknown risks and uncertainties that could cause actual results to differ materially from those expressed or implied by such statements. Forward looking statements generally include words such as “believes”, “expects”, “anticipates” and other words of similar import. Such risks and uncertainties include, among other things, the Risk Factors noted in the Funds’ filings with the Securities and Exchange Commission. The Funds undertake no obligation to update any forward looking statement.
| (a) | The Registrant has adopted a code of ethics (the “Code”) that applies to the Registrant’s principal executive officer, principal financial officer, principal accounting officer or controller, or persons performing similar functions. Code of Ethics for the Principal Executive and Principal Financial officer is incorporated by reference to the Registrant’s Form N-CSR filed on August 6, 2012. (SEC Accession No. 0001398344-12-002461) |
| (b) | During the period covered by the report, with respect to the Registrant’s Code that applies to its principal executive officer, principal financial officer, principal accounting officer or controller, or persons performing similar functions; there have been no amendments to, nor any waivers granted from, a provision that relates to any element of the Code definition enumerated in paragraph (b) of this Item 2. |
| (a) | The board did not identify a member of the audit committee that had all of the required technical attributes to qualify as an “audit committee financial expert.” At this time, the board believes the experience provided by each member of the audit committee collectively offers the fund adequate oversight by its audit committee given the fund’s level of financial complexity. The board will from time to time reexamine such belief. |
| Registrant | ||||
| FY 2015 | $ | 21,500 | ||
| FY 2016 | $ | 22,300 | ||
| Registrant | ||||
| FY 2015 | $ | 0 | ||
| FY 2016 | $ | 0 | ||
| Nature of the fees: | Not applicable. | |||
| Registrant | ||||
| FY 2015 | $ | 5,000 | ||
| FY 2016 | $ | 5,000 | ||
| Nature of the fees: | 1120-RIC & Excise Tax Return | |||
| Registrant | ||||
| FY 2015 | $ | 1,100 | ||
| FY 2016 | $ | 1,000 | ||
| Nature of the fees: | Out of pocket expenses and consents | |||
| (e) | (1) Audit Committee’s Pre-Approval Policies and Procedures |
| Registrant | |
| Audit Related Fees | 0.00% |
| Tax Fees: | 0.00% |
| All Other Fees: | 0.00% |
| Registrant | |
| FY 2015 | $0 |
| FY 2016 | $0 |
| (a) | The Registrant’s principal executive officer and principal financial officer have reviewed the Registrant's disclosure controls and procedures (as defined in Rule 30a-3(c) under the Investment Company Act of 1940, as amended, (the “Act”)) as of a date within 90 days of the filing of this report, as required by Rule 30a-3(b) under the Act. Based on their review, such officers have concluded that the disclosure controls and procedures were effective in ensuring that information required to be disclosed in this report was appropriately recorded, processed, summarized and reported and made known to them by others within the Registrant and by the Registrant’s service providers. |
| (b) | There were no changes in the Registrant’s internal control over financial reporting (as defined in Rule 30a-3(d) under the Act (17 CFR 270.30a-3(d)) that occurred during the Registrant’s second fiscal quarter of the period covered by this report that materially affected, or were reasonably likely to materially affect, the Registrant’s internal control over financial reporting. |
| (a) (1) | Code of Ethics for the Principal Executive and Principal Financial officer is incorporated by reference to the Registrant’s Form N-CSR filed on August 6, 2012. (SEC Accession No. 0001398344-12-002461) |
| (a) (2) | Certifications required pursuant to Section 302 of the Sarbanes-Oxley Act of 2002. Filed herewith. |
| (a) (3) | Not applicable to open-end management investment companies. |
| (b) | Certification pursuant to Section 906 of the Sarbanes-Oxley Act of 2002. Filed herewith. |
Bragg Capital Trust | |
| /s/ Steven H. Scruggs | |
| By: Steven H. Scruggs | |
| President | |
| July 28, 2016 | |
| Pursuant to the requirements of the Securities Exchange Act of 1934 and the Investment Company Act of 1940, this report has been signed below by the following persons on behalf of the Registrant and in the capacities and on the dates indicated. | |
| /s/ Steven H. Scruggs | |
| By: Steven H. Scruggs | |
| President | |
| (Principal Executive Officer) | |
| July 28, 2016 | |
| /s/ Benton S. Bragg | |
| By: Benton S. Bragg | |
| Treasurer | |
| (Principal Financial Officer) | |
| July 28, 2016 | |