UNITED STATES
SECURITIES AND EXCHANGE COMMISSION
Washington, D.C. 20549
FORM N-CSR
CERTIFIED SHAREHOLDER REPORT OF REGISTERED
MANAGEMENT INVESTMENT COMPANIES
Investment Company Act File Number 811-21073
Bragg Capital Trust
(Exact name of registrant as specified in charter)
1031 South Caldwell Street, Suite 200
Charlotte, NC 28203_______
(Address of principal executive offices) (Zip code)
1031 South Caldwell Street, Suite 200
Charlotte, NC 28203_______
(Name and address of agent for service)
Copies to:
Terrence Davis
Thompson Hine LLP
1919 M Street, NW, Suite 700
Washington DC 20036
Registrant's telephone number, including area code: (704) 714-7711
Date of fiscal year end: May 31
Date of reporting period: May 31, 2012
Item 1. Reports to Stockholders.
The following is a copy of the report transmitted to shareholders pursuant to Rule 30e-1 under the Investment Company Act of 1940, as amended.

ANNUAL REPORT
Queens Road Value Fund
Queens Road Small Cap Value Fund
Each a series of
Bragg Capital Trust
May 31, 2012
QUEENS ROAD FUNDS |
| Table of Contents | |
| Shareholder Letter | 2 |
| Manager’s Commentary | 4 |
| Performance Illustration | 6 |
| Graphical Illustration | 8 |
| Schedules of Investments | |
| Queens Road Value Fund | 9 |
| Queens Road Small Cap Value Fund | 11 |
| Statements of Assets and Liabilities | 13 |
| Statements of Operations | 14 |
| Statements of Changes in Net Assets | 15 |
| Financial Highlights | 16 |
| Notes to the Financial Statements | 18 |
| Report of Independent Registered Public Accounting Firm | 23 |
| Expense Illustration | 24 |
| Additional Information | 25 |
| Trustee Information | 26 |
QUEENS ROAD FUNDS SHAREHOLDER LETTER May 31, 2012 (Unaudited) |
Dear Fellow Shareholders:
Economic growth has been sluggish over the last twelve months and recent reports indicate that the pace of growth is slowing. The pace of the recovery that began three years ago has been far slower than the typical pace of recoveries following major recessions. If not for deficit spending by the US government, GDP growth would have been negative. The various stimulus programs have done little to stimulate lasting economic growth. Interestingly, in this environment corporate profit margins have reached all-time highs. The combination of record profits and sluggish growth may seem paradoxical, but a closer look at how companies are increasing profits makes this phenomenon understandable. Cost-cutting through job eliminations and product re-engineering, combined with record-low effective corporate tax rates and record-low interest rates have pushed corporate profit margins to their highest levels in history.
Profit Margins at Record Levels
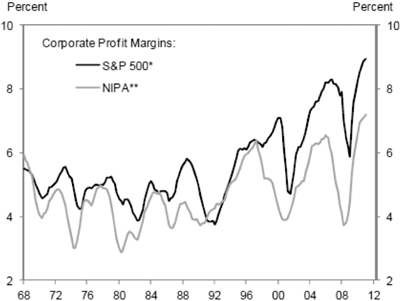
| * | Excluding financials and utilities. |
| ** | After-tex adjusted profits as percent of GDP. |
| Source: Department of Commerce, Standard & Poor’s. | |
Many argue that structural changes in the US economy (simply put, moving to a service economy from a manufacturing economy) will lead to sustainable higher aggregate corporate profit margins compared to historical ones. While there is some evidence to support this assertion, we believe the current levels are unsustainably high. Although structural changes may have an upward impact on margins, peak profit margins in 2007 were caused primarily by a credit bubble, and the peak margins today are caused by unsustainable corporate cost cutting.
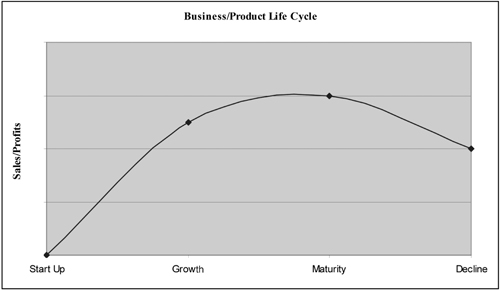
The following simple graph from Business Management 101 helps illustrate our view of the actions and philosophy currently dominating the thinking of corporate management. While this simple graph is typically used to describe the life cycle of a specific business or product, we believe that today it can be applied generally.
2
QUEENS ROAD FUNDS SHAREHOLDER LETTER (Continued) May 31, 2012 (Unaudited) |
Corporations, in general, are being managed like a business or product in the mature phase of the life cycle. Profits over growth are the emphasis due to the unprecedented uncertainty in the global economy and global sovereign fiscal crisis. This illustration in no way is a prediction that our country is headed toward a structural decline, rather it simply implies that corporations today are more focused on milking profits from mature businesses than in hiring, expanding and growing, which would crimp short-term profits. Thankfully, the flexibility of the US economy will allow corporations to change as the macro environment changes. We’ve been through similar periods in the past, but those periods didn’t involve zero percent fed funds rates and trillion dollar deficits. Unprecedented government intervention has allowed the current no-growth/high profits anomaly to emerge.
In summary, we believe companies can continue to generate unusually high profits, but at the cost of growth. When growth comes, we believe it will temporarily hurt margins. We’d prefer an innovative, growing economy with more normal profit margins over a no-growth/high-margin economy. In the long run, it will make us all better off.
Like everyone else, we can’t predict macro or policy events, so we don’t try. We remain focused on our bottom-up investment process. Our investment research focuses on four main factors:
| • | A company’s balance sheet strength |
| • | Our estimate of its intrinsic value based primarily on discounted cash flows |
| • | Our assessment of the quality of its management |
| • | Our analysis of the sector and industry in which it competes |
We focus on making investments in companies with staying power (strong balance sheets), at reasonable valuations (below our estimate of intrinsic value), with capable, proven managements, and that compete in industries with favorable economics. Using this process the companies in which we invest are the ones most likely to prosper, regardless of the uncertainties of future events.
We appreciate the confidence you place in us to invest your capital wisely. We stand beside you as investors in our funds and are confident in the investments we hold. If you have any questions about our philosophy or process please feel free to contact us.
Sincerely,
| Steven Scruggs, CFA | Benton Bragg, CFA |
| President | Chairman |
3
QUEENS ROAD VALUE FUND MANAGER’S COMMENTARY May 31, 2012 (Unaudited) |
For our fiscal year ended May 31, 2012 the Queens Road Value Fund declined 3.28% vs a 3.71% decline for our benchmark the S&P 500/Citi Value Index.
Investments that Hurt Performance
Leucadia National was down 42% during the fiscal year. The company is a mid-sized conglomerate run by Ian Cumming and Joseph Steinberg with one of the most enviable track records of any company over the last 30-plus years. During that period the value of the company’s stock has been quite volatile but with a significant upward trend, due to the investment prowess of Cumming and Steinberg. Although the recent down trend is unpleasant we have complete confidence in management. Cumming will be stepping down as chairman in 2015 but the company has created a long-term succession plan which we are very comfortable with.
Thomson Reuters fell 26% during the year. Thomson Reuters has assembled arguably the biggest name in business and professional information services. Its business model focuses on high-margin, recurring-revenue business segments, which allows it to fund growth as well as pay a healthy dividend and buy back shares. It dominates most of the business lines in which it competes and we are confident that it will continue to do so.
Investments that Helped Performance
One of our best performers, Duke Energy was up 23% during fiscal 2012. Price appreciation and its purchase of another fund holding, Progress Energy, make it the fund’s largest position. The merger also makes it the largest electric power company in the United States, with a focus primarily in the Southeast and Midwest. We think the combined companies operate in a favorable regulatory environment with good demographics for utilities, and that the cost reduction expected from the merger will come to fruition.
Bristol Myers was up 21% for the fiscal year. Bristol Myers is a research-based pharmaceutical company with a track record of getting innovative pharmaceuticals to market. Using a selectively integrated business model, it has introduced 14 new developed products in the last nine years. Its entrepreneurial model fosters co-development and co-commercialization of products and it has a promising pipeline that we expect will provide future growth.
4
QUEENS ROAD SMALL CAP VALUE FUND MANAGER’S COMMENTARY May 31, 2012 (Unaudited) |
For the fiscal year ending 5/31/2012, the Queens Road Small Cap Value Fund lost 9.71% compared to a decline of 8.28% for the Russell 2000 Value Index.
Investments that Hurt Performance
USEC was down 82% for the fiscal year. USEC is the only domestically owned enricher of uranium for power generation. It is currently in the midst of a fundamental change in the process it uses to refine uranium for electricity production. It has faced many challenges and is currently awaiting word on a Department of Energy loan guarantee to complete the development of a centrifuge refining plant. The economics of the new plant will radically change the profitability of its business model. We assumed it would have received the guarantee by now and begun the commercialization of its enrichment technology; however, the decision has been postponed for a number of reasons. We believe that the company will receive the loan guarantee which will allow it to complete the project. This is by far the most speculative position we own.
K-Swiss declined 72% for the year. Long-term holding K-Swiss has continued to struggle. Demand for the K-Swiss Classic, its flagship shoe, has continued to wane and marketing efforts to energize the brand and launch new products have fallen flat. Long-time CEO Steven Nichols has resurrected this company more than once in the past, and we are confident he will do it again. We remain convinced that, with a sizable cash position, no debt, and a strong brand this company will eventually reward our patience.
RadioShack was down 66% in fiscal 2012. The long-expected turn-around at Radio Shack has not materialized. Management continues to move in the right direction, but the pace is much slower than we expected. This is a company we are following extremely closely. It is either a text-book value trap that can’t be turned around or an extraordinary opportunity. At this valuation, we believe the latter and if the current management can’t get the company growing, it could be an extremely attractive takeover target.
Investments that Helped Performance
Chart Industries was up 29% for the year. Chart Industries is a provider of highly engineered cryogenic equipment in the energy and biomedical markets. Its ticker “GTLS” helps describe what it does: Gas to Liquid Systems. The company has benefited from the increased global demand for natural gas. Management has a strong record of successful execution and the company competes in a growing industry in which it is a leader.
Sanderson Farms gained 27% in fiscal 2012. Sanderson Farms is the third-largest producer of poultry in the United States. While cyclical, its business model, which integrates internally-owned hatcheries and feed mills with contracted independent growers, has proven to be an effective long-term model.
RLI rose 21% for the year. We believe RLI, a diversified insurer focusing on excess and surplus markets and hard-to-place admitted risks, is one of the best-managed insurers in the world. Management has shown over long periods that it can underwrite and insure hard-to-place coverages profitably. While it is willing to write coverage on riskier policies, its long-term performance shows it is conservative in its pricing, requiring more in premiums than the cost of the risk it is insuring. The strong balance sheet, attractive valuation, and management’s long-term track record of success, in an industry that continues to grow, leads us to make RLI the largest investment in the fund.
The Fund continues to be invested in a defensive position holding 27.2% in cash equivalents. As we compute our estimates of intrinsic value, we are having difficulty finding investments with expected returns large enough to compensate us for downside risk.
5
QUEENS ROAD FUNDS PERFORMANCE ILLUSTRATION May 31, 2012 (Unaudited) |
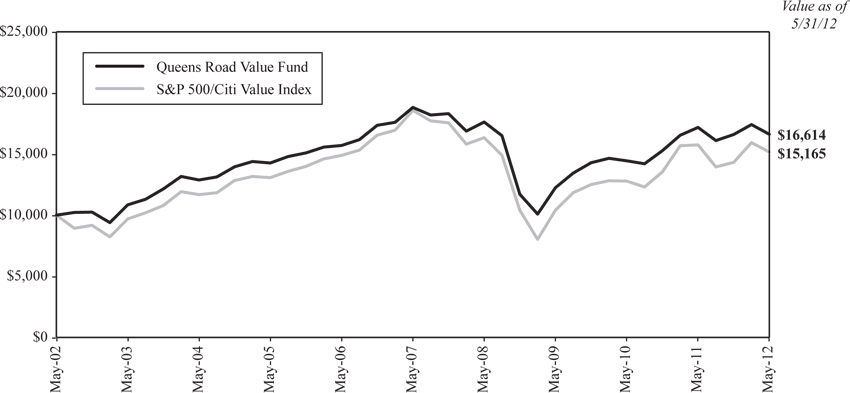
Queens Road Value Fund
Average Annual Total Return For the Years Ended May 31, 2012 | ||||
Queens Road Value Fund | S&P 500/Citi Value Index | |||
| Six Month | 0.10% | 5.92% | ||
| 1 Year | (3.28)% | (3.71)% | ||
| 3 Year | 10.70% | 13.37% | ||
| 5 Year | (2.45)% | (3.97)% | ||
| Since Inception* | 5.23% | 4.27% | ||
| Gross Annual Operating Expense 0.98% ** | ||||
| * | The Queens Road Value Fund commenced operations on June 13, 2002. Past performance is not predictive of future performance. The value of shares will fluctuate and will be worth more or less than their original cost at the time of redemption. |
| ** | As disclosed in the most recent Prospectus, effective September 28, 2011. |
6
QUEENS ROAD FUNDS PERFORMANCE ILLUSTRATION (Continued) May 31, 2012 (Unaudited) |
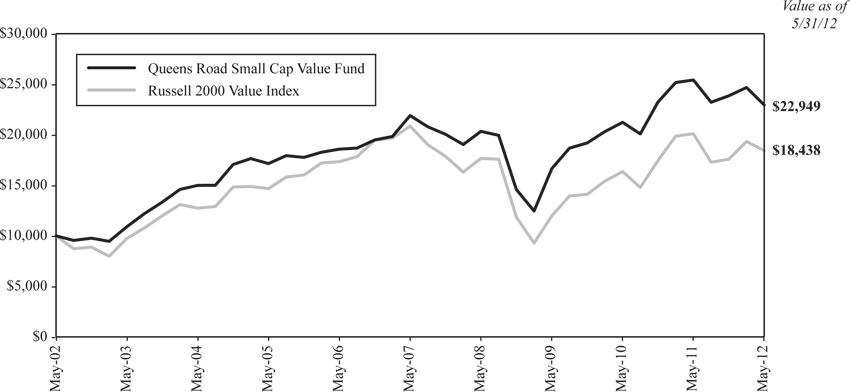
Queens Road Small Cap Value Fund
Average Annual Total Return For the Years Ended May 31, 2012 | ||||
Queens Road Small Cap Value Fund | Russell 2000 Value Index | |||
| Six Month | (3.80)% | 4.87% | ||
| 1 Year | (9.71)% | (8.28)% | ||
| 3 Year | 11.30% | 15.48% | ||
| 5 Year | 0.94% | (2.44)% | ||
| Since Inception* | 8.69% | 6.33% | ||
| Gross Annual Operating Expenses 1.28% ** | ||||
| * | The Queens Road Small Cap Value Fund commenced operations on June 13, 2002. Past performance is not predictive of future performance. The value of shares will fluctuate and will be worth more or less than their original cost at the time of redemption. |
| ** | As disclosed in the most recent Prospectus, effective September 28, 2011. |
7
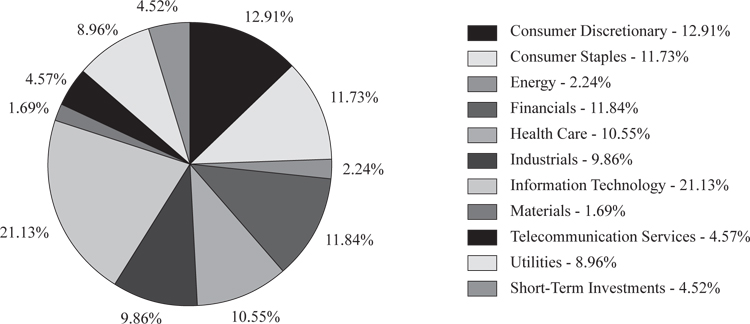
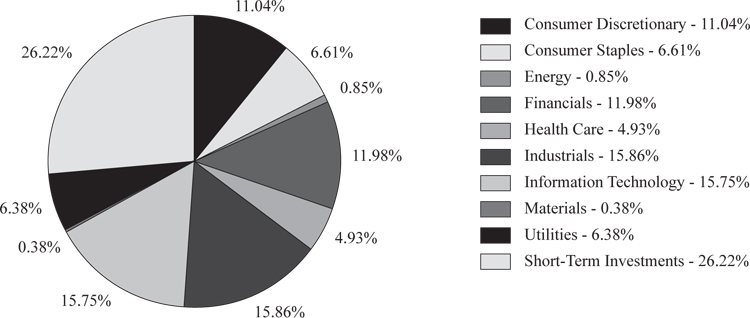
QUEENS ROAD FUNDS GRAPHICAL ILLUSTRATION May 31, 2012 (Unaudited) |
The following charts provide a visual breakdown of the Funds by the industry sectors that the underlying securities represent as a percentage of the portfolio of investments.
Queens Road Value Fund
Queens Road Small Cap Value Fund
8
QUEENS ROAD VALUE FUND SCHEDULE OF INVESTMENTS As of May 31, 2012 |
NUMBER OF SHARES | VALUE | ||||||
| COMMON STOCKS – 93.5% | |||||||
| AEROSPACE & DEFENSE – 3.7% | |||||||
| 8,000 | General Dynamics Corp. | $ | 512,080 | ||||
| 6,600 | United Technologies Corp. | 489,126 | |||||
| 1,001,206 | |||||||
| APPAREL, ACCESSORIES & LUXURY GOODS – 1.8% | |||||||
| 3,500 | VF Corp. | 493,640 | |||||
| ASSET MANAGEMENT & CUSTODY BANKS – 2.8% | |||||||
| 14,500 | Bank of New York Mellon Corp./The | 295,220 | |||||
| 6,000 | State Street Corp. | 247,260 | |||||
| 3,900 | T. Rowe Price Group, Inc. | 224,601 | |||||
| 767,081 | |||||||
| BROADCASTING – 2.4% | |||||||
| 20,490 | CBS Corp., Class B | 654,041 | |||||
| BUILDING PRODUCTS – 0.5% | |||||||
| 6,380 | Fortune Brands Home & Security, Inc.* | 144,316 | |||||
| COAL & CONSUMABLE FUELS – 0.9% | |||||||
| 10,000 | Peabody Energy Corp. | 233,600 | |||||
| COMMUNICATIONS EQUIPMENT – 3.0% | |||||||
| 30,000 | Cisco Systems, Inc. | 489,900 | |||||
| 120,000 | Nokia OYJ ADR | 320,400 | |||||
| 810,300 | |||||||
| COMPUTER HARDWARE – 3.9% | |||||||
| 72,000 | Dell, Inc.* | 887,760 | |||||
| 7,000 | Hewlett-Packard Co. | 158,760 | |||||
| 1,046,520 | |||||||
| COMPUTER STORAGE & PERIPHERALS – 1.7% | |||||||
| 15,000 | NetApp, Inc.* | 446,400 | |||||
| CONSUMER FINANCE – 1.7% | |||||||
| 8,000 | American Express Co. | 446,640 | |||||
| DISTILLERS & VINTNERS – 2.9% | |||||||
| 6,380 | Beam, Inc. | 386,373 | |||||
| 20,000 | Constellation Brands, Inc., Class A* | 385,800 | |||||
| 772,173 | |||||||
| ELECTRIC UTILITIES – 8.9% | |||||||
| 13,000 | American Electric Power Co., Inc. | $ | 500,630 | ||||
| 20,900 | Duke Energy Corp. | 459,382 | |||||
| 13,000 | Exelon Corp. | 480,740 | |||||
| 10,700 | Progress Energy, Inc. | 586,574 | |||||
| 8,400 | Southern Co./The | 385,644 | |||||
| 2,412,970 | |||||||
| ELECTRONIC COMPONENTS – 1.0% | |||||||
| 20,000 | Corning, Inc. | 259,800 | |||||
| ENVIRONMENTAL & FACILITIES SERVICES – 1.2% | |||||||
| 10,000 | Waste Management, Inc. | 324,400 | |||||
| HEALTH CARE EQUIPMENT – 0.6% | |||||||
| 3,162 | Covidien PLC | 163,728 | |||||
| HOUSEHOLD PRODUCTS – 5.6% | |||||||
| 8,400 | Clorox Co./The | 577,920 | |||||
| 5,000 | Kimberly-Clark Corp. | 396,750 | |||||
| 8,800 | Procter & Gamble Co./The | 548,152 | |||||
| 1,522,822 | |||||||
INDUSTRIAL CONGLOMERATES – 2.8% | |||||||
| 5,100 | 3M Co. | 430,491 | |||||
| 2,300 | Danaher Corp. | 119,531 | |||||
| 4,000 | Tyco International Ltd. | 212,640 | |||||
| 762,662 | |||||||
| INDUSTRIAL MACHINERY – 1.6% | |||||||
| 10,200 | Ingersoll-Rand PLC | 421,362 | |||||
| INTEGRATED OIL & GAS – 1.4% | |||||||
| 4,700 | Exxon Mobil Corp. | 369,561 | |||||
| INTEGRATED TELECOMMUNICATION SERVICES – 4.6% | |||||||
| 21,100 | AT&T, Inc. | 720,987 | |||||
| 10,000 | Verizon Communications, Inc. | 416,400 | |||||
| 10,000 | Windstream Corp. | 93,600 | |||||
| 1,230,987 | |||||||
| INTERNET SOFTWARE & SERVICES – 2.5% | |||||||
| 45,000 | Yahoo!, Inc.* | 685,800 | |||||
See accompanying Notes to Financial Statements.
9
QUEENS ROAD VALUE FUND SCHEDULE OF INVESTMENTS (Continued) As of May 31, 2012 |
| NUMBER OF SHARES | VALUE | ||||||
| IT CONSULTING & OTHER SERVICES – 2.5% | |||||||
| 3,500 | International Business Machines Corp. | $ | 675,150 | ||||
| MANAGED HEALTH CARE – 1.1% | |||||||
| 4,300 | WellPoint, Inc. | 289,777 | |||||
| MOVIES & ENTERTAINMENT – 3.8% | |||||||
| 44,500 | News Corp., Class A | 854,400 | |||||
| 5,166 | Time Warner, Inc. | 178,072 | |||||
| 1,032,472 | |||||||
| MULTI-SECTOR HOLDINGS – 2.2% | |||||||
| 28,800 | Leucadia National Corp. | 585,216 | |||||
| OTHER DIVERSIFIED FINANCIAL SERVICES – 1.1% | |||||||
| 9,000 | JPMorgan Chase & Co. | 298,350 | |||||
| PACKAGED FOODS & MEATS – 3.2% | |||||||
| 9,000 | Kraft Foods, Inc., Class A | 344,430 | |||||
| 16,400 | Unilever PLC ADR | 517,912 | |||||
| 862,342 | |||||||
| PHARMACEUTICALS – 8.8% | |||||||
| 5,000 | Bristol-Myers Squibb Co. | 166,700 | |||||
| 9,000 | GlaxoSmithKline PLC ADR | 396,990 | |||||
| 10,050 | Johnson & Johnson | 627,421 | |||||
| 13,820 | Merck & Co., Inc. | 519,356 | |||||
| 31,000 | Pfizer, Inc. | 677,970 | |||||
| 2,388,437 | |||||||
| PROPERTY & CASUALTY INSURANCE – 4.0% | |||||||
| 3 | Berkshire Hathaway, Inc., Class A* | 356,550 | |||||
| 21,400 | Progressive Corp./The | 465,022 | |||||
| 4,300 | Travelers Cos., Inc./The | 268,707 | |||||
| 1,090,279 | |||||||
| PUBLISHING – 1.2% | |||||||
| 11,900 | Thomson Reuters Corp. | 326,893 | |||||
| RESTAURANTS – 1.4% | |||||||
| 4,225 | McDonald's Corp. | 377,461 | |||||
| SEMICONDUCTORS – 1.5% | |||||||
| 16,000 | Intel Corp. | 413,440 | |||||
| SPECIALTY STORES – 2.2% | |||||||
| 45,000 | Staples, Inc. | $ | 591,300 | ||||
| SYSTEMS SOFTWARE – 5.0% | |||||||
| 11,500 | Microsoft Corp. | 335,685 | |||||
| 25,000 | Oracle Corp. | 661,750 | |||||
| 24,000 | Symantec Corp.* | 356,160 | |||||
| 1,353,595 | |||||||
TOTAL COMMON STOCKS (Cost $22,669,982) | 25,254,721 | ||||||
| EXCHANGE-TRADED FUNDS – 1.7% | |||||||
| GOLD – 1.7% | |||||||
| 30,000 | iShares Gold Trust* | 456,300 | |||||
TOTAL EXCHANGE-TRADED FUNDS (Cost $295,770) | 456,300 | ||||||
| SHORT-TERM INVESTMENTS – 4.5% | |||||||
| 1,217,117 | Invesco Short Term Investment Prime Portfolio, 0.08%** | 1,217,117 | |||||
TOTAL SHORT-TERM INVESTMENTS (Cost $1,217,117) | 1,217,117 | ||||||
TOTAL INVESTMENTS – 99.7% (Cost $24,182,869) | 26,928,138 | ||||||
Other Assets in Excess of Liabilities – 0.3% | 74,552 | ||||||
TOTAL NET ASSETS – 100.0% | $ | 27,002,690 |
ADR – American Depositary Receipt
PLC – Public Limited Company
| * | Non-income Producing. |
| ** | Variable rate security; the coupon rate shown represents the yield at May 31, 2012. |
See accompanying Notes to Financial Statements.
10
QUEENS ROAD SMALL CAP VALUE FUND SCHEDULE OF INVESTMENTS As of May 31, 2012 |
NUMBER OF SHARES | VALUE | ||||||
| COMMON STOCKS – 75.0% | |||||||
| AEROSPACE & DEFENSE – 4.5% | |||||||
| 15,700 | Alliant Techsystems, Inc. | $ | 768,515 | ||||
| 32,315 | Cubic Corp. | 1,402,471 | |||||
| 81,620 | Ducommun, Inc.* | 737,029 | |||||
| 2,908,015 | |||||||
| AGRICULTURAL PRODUCTS – 1.3% | |||||||
| 61,700 | Darling International, Inc.* | 864,417 | |||||
| APPAREL RETAIL – 2.1% | |||||||
| 48,000 | Cato Corp./The, Class A | 1,377,600 | |||||
| APPAREL, ACCESSORIES & LUXURY GOODS – 2.2% | |||||||
| 67,026 | Delta Apparel, Inc.* | 949,758 | |||||
| 20,000 | G-III Apparel Group Ltd.* | 494,200 | |||||
| 1,443,958 | |||||||
| APPLICATION SOFTWARE – 1.2% | |||||||
| 85,593 | Compuware Corp.* | 770,337 | |||||
| ASSET MANAGEMENT & CUSTODY BANKS – 0.9% | |||||||
| 76,400 | Janus Capital Group, Inc. | 557,720 | |||||
| COAL & CONSUMABLE FUELS – 0.6% | |||||||
| 560,592 | USEC, Inc.* | 404,860 | |||||
| COMMUNICATIONS EQUIPMENT – 3.7% | |||||||
| 12,850 | Bel Fuse, Inc., Class B | 209,198 | |||||
| 38,400 | Plantronics, Inc. | 1,155,456 | |||||
| 278,000 | Tellabs, Inc. | 1,017,480 | |||||
| 2,382,134 | |||||||
| COMPUTER & ELECTRONICS RETAIL – 1.1% | |||||||
| 153,500 | RadioShack Corp. | 712,240 | |||||
| COMPUTER STORAGE & PERIPHERALS – 1.3% | |||||||
| 43,514 | Imation Corp.* | 247,159 | |||||
| 22,000 | Synaptics, Inc.* | 590,040 | |||||
| 837,199 | |||||||
| CONSTRUCTION & ENGINEERING – 1.6% | |||||||
| 28,919 | URS Corp. | 1,046,000 | |||||
| CONSTRUCTION & FARM MACHINERY & HEAVY TRUCKS – 1.6% | |||||||
| 52,626 | Oshkosh Corp.* | $ | 1,077,254 | ||||
| DATA PROCESSING & OUTSOURCED SERVICES – 2.3% | |||||||
| 29,000 | DST Systems, Inc. | 1,481,900 | |||||
| DIVERSIFIED METALS & MINING – 0.4% | |||||||
| 29,100 | Horsehead Holding Corp.* | 257,826 | |||||
| DIVERSIFIED SUPPORT SERVICES – 2.1% | |||||||
| 23,864 | Unifirst Corp. | 1,365,498 | |||||
| ELECTRIC UTILITIES – 0.9% | |||||||
| 12,350 | MGE Energy, Inc. | 557,355 | |||||
| ELECTRONIC COMPONENTS – 0.9% | |||||||
| 56,856 | Vishay Intertechnology, Inc.* | 603,811 | |||||
| ELECTRONIC MANUFACTURING SERVICES – 3.0% | |||||||
| 25,400 | Park Electrochemical Corp. | 595,884 | |||||
| 69,477 | Radisys Corp.* | 405,746 | |||||
| 105,100 | TTM Technologies, Inc.* | 971,124 | |||||
| 1,972,754 | |||||||
| FOOD RETAIL – 0.4% | |||||||
| 3,317 | Arden Group, Inc., Class A | 273,752 | |||||
| FOOTWEAR – 1.2% | |||||||
| 262,841 | K-Swiss, Inc., Class A* | 785,895 | |||||
| GAS UTILITIES – 5.8% | |||||||
| 28,520 | New Jersey Resources Corp. | 1,197,270 | |||||
| 33,900 | Piedmont Natural Gas Co., Inc. | 1,027,848 | |||||
| 20,000 | South Jersey Industries, Inc. | 968,200 | |||||
| 20,000 | UGI Corp. | 573,600 | |||||
| 3,766,918 | |||||||
| HEALTH CARE DISTRIBUTORS – 2.2% | |||||||
| 51,080 | Owens & Minor, Inc. | 1,454,248 | |||||
| HEALTH CARE EQUIPMENT – 2.1% | |||||||
| 45,000 | STERIS Corp. | 1,343,700 | |||||
See accompanying Notes to Financial Statements.
11
QUEENS ROAD SMALL CAP VALUE FUND SCHEDULE OF INVESTMENTS (Continued) As of May 31, 2012 |
NUMBER OF SHARES | VALUE | ||||||
| HEALTH CARE SUPPLIES – 0.8% | |||||||
| 2,703 | Atrion Corp. | $ | 542,952 | ||||
| INDUSTRIAL MACHINERY – 5.6% | |||||||
| 14,978 | Chart Industries, Inc.* | 935,526 | |||||
| 25,875 | Graco, Inc. | 1,246,399 | |||||
| 43,202 | Hurco Cos., Inc.* | 953,036 | |||||
| 11,900 | Robbins & Myers, Inc. | 542,521 | |||||
| 3,677,482 | |||||||
| IT CONSULTING & OTHER SERVICES – 0.7% | |||||||
| 29,400 | Unisys Corp.* | 461,874 | |||||
| MULTI-LINE INSURANCE – 2.2% | |||||||
| 82,600 | Horace Mann Educators Corp. | 1,413,286 | |||||
| OFFICE SERVICES & SUPPLIES – 1.0% | |||||||
| 26,718 | United Stationers, Inc. | 674,629 | |||||
| OIL & GAS EXPLORATION & PRODUCTION – 0.3% | |||||||
| 20,000 | Vaalco Energy, Inc.* | 170,600 | |||||
| PACKAGED FOODS & MEATS – 2.3% | |||||||
| 21,030 | Imperial Sugar Co. | 132,699 | |||||
| 25,000 | Sanderson Farms, Inc. | 1,373,500 | |||||
| 1,506,199 | |||||||
| PERSONAL PRODUCTS – 2.8% | |||||||
| 31,700 | Inter Parfums, Inc. | 497,690 | |||||
| 97,600 | Prestige Brands Holdings, Inc.* | 1,340,048 | |||||
| 1,837,738 | |||||||
| PROPERTY & CASUALTY INSURANCE – 6.9% | |||||||
| 45,889 | American Safety Insurance Holdings Ltd.* | 824,166 | |||||
| 78,687 | Hilltop Holdings, Inc.* | 818,345 | |||||
| 12,500 | ProAssurance Corp. | 1,101,750 | |||||
| 25,900 | RLI Corp. | 1,725,976 | |||||
| 4,470,237 | |||||||
| PUBLISHING – 4.3% | |||||||
| 18,061 | Meredith Corp. | 534,425 | |||||
| 35,545 | Scholastic Corp. | 957,938 | |||||
| 66,717 | Valassis Communications, Inc.* | 1,328,335 | |||||
| 2,820,698 | |||||||
| REINSURANCE – 0.9% | |||||||
| 15,456 | Endurance Specialty Holdings Ltd. | 603,711 | |||||
| SEMICONDUCTORS – 0.0% | |||||||
| 801 | Micrel, Inc. | $ | 7,842 | ||||
| SPECIALTY STORES – 0.5% | |||||||
| 107,100 | Books-A-Million, Inc.* | 340,578 | |||||
| SYSTEMS SOFTWARE – 0.9% | |||||||
| 81,903 | Pervasive Software, Inc.* | 581,511 | |||||
| TECHNOLOGY DISTRIBUTORS – 2.4% | |||||||
| 33,000 | Tech Data Corp.* | 1,571,130 | |||||
TOTAL COMMON STOCKS (Cost $46,259,125) | 48,925,858 | ||||||
| MUTUAL FUNDS – 1.7% | |||||||
| 56,846 | Central Fund of Canada Ltd., Class A*** | 1,071,547 | |||||
TOTAL MUTUAL FUNDS (Cost $811,601) | 1,071,547 | ||||||
| SHORT-TERM INVESTMENTS – 27.2% | |||||||
| 17,766,220 | Invesco Short Term Investment Prime Portfolio, 0.08%** | 17,766,220 | |||||
TOTAL SHORT-TERM INVESTMENTS (Cost $17,766,220) | 17,766,220 | ||||||
TOTAL INVESTMENTS – 103.9% (Cost $64,836,946) | 67,763,625 | ||||||
Liabilities in Excess of Other Assets – (3.9)% | (2,544,600 | ) | |||||
TOTAL NET ASSETS – 100.0% | $ | 65,219,025 |
| * | Non-income Producing |
| ** | Variable rate security; the coupon rate shown represents the yield at May 31, 2012. |
| *** | Passive foreign investment company. |
See accompanying Notes to Financial Statements.
12
QUEENS ROAD FUNDS STATEMENTS OF ASSETS AND LIABILITIES As of May 31, 2012 |
Value Fund | Small Cap Value Fund | |||||||
| Assets: | ||||||||
Investments, at Fair Value (cost $24,182,869, $64,836,946) | $ | 26,928,138 | $ | 67,763,625 | ||||
| Receivables: | ||||||||
Shareholder Subscriptions | 26,356 | 27,337 | ||||||
Dividends and Interest | 78,010 | 46,977 | ||||||
Investment securities sold | — | 502,087 | ||||||
Total Assets | 27,032,504 | 68,340,026 | ||||||
| Liabilities: | ||||||||
| Payables: | ||||||||
Investment Securities Purchased | — | 3,012,523 | ||||||
Shareholder Redemptions | 7,855 | 39,567 | ||||||
Accrued Management Fees (Note 3) | 21,959 | 68,911 | ||||||
Total Liabilities | 29,814 | 3,121,001 | ||||||
Net Assets | $ | 27,002,690 | $ | 65,219,025 | ||||
| Components of Net Assets: | ||||||||
| Capital (par value of $0.001 per share with an unlimited number of shares authorized) | $ | 25,461,536 | $ | 62,600,127 | ||||
Accumulated Undistributed Net Investment Income (Loss) | 197,891 | (521,897 | ) | |||||
Accumulated Undistributed Net Realized Gain (Loss) on Investments | (1,402,006 | ) | 214,116 | |||||
Net Unrealized Appreciation on Investments | 2,745,269 | 2,926,679 | ||||||
Net Assets | $ | 27,002,690 | $ | 65,219,025 | ||||
Shares of Beneficial Interest Issued and Outstanding | 1,988,846 | 3,749,046 | ||||||
Net Asset Value, Offering and Redemption Price Per Share | $ | 13.58 | $ | 17.40 | ||||
See accompanying Notes to Financial Statements.
13
QUEENS ROAD FUNDS STATEMENTS OF OPERATIONS For the year ended May 31, 2012 |
Value Fund | Small Cap Value Fund | |||||||
| Investment Income: | ||||||||
Dividends (net of foreign withholding taxes of $5,509, $0) | $ | 614,806 | $ | 746,147 | ||||
Interest | 2,437 | 13,120 | ||||||
Total investment income | 617,243 | 759,267 | ||||||
| Expenses: | ||||||||
Advisory Fees (Note 3) | 245,297 | 751,913 | ||||||
Total Expenses | 245,297 | 751,913 | ||||||
Net Investment Income | 371,946 | 7,354 | ||||||
| Realized and Unrealized Gain (Loss) on Investments: | ||||||||
Net Realized Gain on Investments | 274,176 | 901,200 | ||||||
Net Change in Unrealized Depreciation on Investments | (1,550,850 | ) | (6,918,496 | ) | ||||
Net Realized and Unrealized Loss on Investments | (1,276,674 | ) | (6,017,296 | ) | ||||
Net Decrease in Net Assets from Operations | $ | (904,728 | ) | $ | (6,009,942 | ) | ||
See accompanying Notes to Financial Statements.
14
QUEENS ROAD FUNDS STATEMENTS OF CHANGES IN NET ASSETS |
Value Fund | Small Cap Value Fund | |||||||||||||||
For the year ended May 31, 2012 | For the year ended May 31, 2011 | For the year ended May 31, 2012 | For the year ended May 31, 2011 | |||||||||||||
| Increase in Net Assets From: | ||||||||||||||||
| Operations: | ||||||||||||||||
Net Investment Income (Loss) | $ | 371,946 | $ | 260,994 | $ | 7,354 | $ | (190,464 | ) | |||||||
Net Realized Gain on Investments | 274,176 | 184,462 | 901,200 | 4,524,695 | ||||||||||||
Net Change in Unrealized Appreciation (Depreciation) on Investments | (1,550,850 | ) | 3,423,612 | (6,918,496 | ) | 3,815,968 | ||||||||||
Net Increase/(Decrease) in Net Assets Resulting from Operations | (904,728 | ) | 3,869,068 | (6,009,942 | ) | 8,150,199 | ||||||||||
| Distributions to Shareholders From: | ||||||||||||||||
Net Investment Income | (293,821 | ) | (207,168 | ) | (256,311 | ) | — | |||||||||
Net Realized Gains | — | — | (4,002,745 | ) | (1,361,671 | ) | ||||||||||
Net Change in Net Assets from Distributions | (293,821 | ) | (207,168 | ) | (4,259,056 | ) | (1,361,671 | ) | ||||||||
| Capital Transactions: | ||||||||||||||||
Proceeds from Sale of Shares | 5,234,607 | 5,640,267 | 25,030,099 | 16,998,730 | ||||||||||||
Net Asset Value of Shares Issued on Reinvestment of Dividends | 196,137 | 147,855 | 3,380,784 | 987,070 | ||||||||||||
Cost of Shares Redeemed | (3,060,407 | ) | (1,401,855 | ) | (9,685,204 | ) | (5,381,561 | ) | ||||||||
Net Increase in Net Assets from Capital Transactions | 2,370,337 | 4,386,267 | 18,725,679 | 12,604,239 | ||||||||||||
Total Increase in Net Assets | 1,171,788 | 8,048,167 | 8,456,681 | 19,392,767 | ||||||||||||
| Net Assets: | ||||||||||||||||
Beginning of Year | 25,830,902 | 17,782,735 | 56,762,344 | 37,369,577 | ||||||||||||
End of Year | $ | 27,002,690 | $ | 25,830,902 | $ | 65,219,025 | $ | 56,762,344 | ||||||||
Accumulated Undistributed Net Investment Income (Loss) | $ | 197,891 | $ | 124,577 | $ | (521,897 | ) | $ | (272,940 | ) | ||||||
| Capital Share Transactions: | ||||||||||||||||
Shares Sold | 381,432 | 438,999 | 1,335,395 | 873,116 | ||||||||||||
Shares Issued on Reinvestment of Dividends | 14,338 | 11,244 | 187,509 | 49,354 | ||||||||||||
Shares Redeemed | (226,112 | ) | (106,976 | ) | (520,104 | ) | (278,656 | ) | ||||||||
Net Increase in Shares | 169,658 | 343,267 | 1,002,800 | 643,814 | ||||||||||||
See accompanying Notes to Financial Statements.
15
QUEENS ROAD VALUE FUND FINANCIAL HIGHLIGHTS |
Per share operating performance
For a capital share outstanding throughout each year
Year Ended May 31, 2012 | Year Ended May 31, 2011 | Year Ended May 31, 2010 | Year Ended May 31, 2009 | Year Ended May 31, 2008 | |||||||||||||||
| Net Asset Value, Beginning of Year | $ | 14.20 | $ | 12.05 | $ | 10.26 | $ | 15.13 | $ | 16.65 | |||||||||
| Income from Investment Operations: | |||||||||||||||||||
| Net Investment Income* | 0.20 | 0.16 | 0.13 | 0.20 | 0.27 | ||||||||||||||
| Net Realized and Unrealized Gain (Loss) on Investments | (0.66 | ) | 2.11 | 1.79 | (4.88 | ) | (1.30 | ) | |||||||||||
| Total from Investment Operations | (0.46 | ) | 2.27 | 1.92 | (4.68 | ) | (1.03 | ) | |||||||||||
| Less Distributions: | |||||||||||||||||||
| Net Investment Income | (0.16 | ) | (0.12 | ) | (0.13 | ) | (0.19 | ) | (0.27 | ) | |||||||||
| Net Realized Gains | — | — | — | (0.00 | )** | (0.22 | ) | ||||||||||||
| Total Distributions | (0.16 | ) | (0.12 | ) | (0.13 | ) | (0.19 | ) | (0.49 | ) | |||||||||
| Net Asset Value, End of Year | $ | 13.58 | $ | 14.20 | $ | 12.05 | $ | 10.26 | $ | 15.13 | |||||||||
| Total Return | (3.28 | )% | 18.92 | % | 18.64 | % | (30.90 | )% | (6.34 | )% | |||||||||
| Ratios and Supplemental Data: | |||||||||||||||||||
| Net Assets, End of Year (in thousands) | $ | 27,003 | $ | 25,831 | $ | 17,783 | $ | 12,424 | $ | 11,524 | |||||||||
| Ratio of Expenses to Average Net Assets | 0.95 | % | 0.95 | % | 0.95 | % | 0.95 | % | 0.95 | % | |||||||||
| Ratio of Net Investment Income to Average Net Assets | 1.44 | % | 1.20 | % | 1.08 | % | 1.83 | % | 1.75 | % | |||||||||
| Portfolio turnover rate | 5 | % | 15 | % | 6 | % | 38 | % | 14 | % | |||||||||
| * | Computed using average shares method. |
| ** | Amount is less than $0.005 per share. |
See accompanying Notes to Financial Statements.
16
QUEENS ROAD SMALL CAP VALUE FUND FINANCIAL HIGHLIGHTS |
Per share operating performance
For a capital share outstanding throughout each year
Year Ended May 31, 2012 | Year Ended May 31, 2011 | Year Ended May 31, 2010 | Year Ended May 31, 2009 | Year Ended May 31, 2008 | ||||||||||||||||
| Net Asset Value, Beginning of Year | $ | 20.67 | $ | 17.77 | $ | 13.94 | $ | 17.16 | $ | 19.47 | ||||||||||
| Income from Investment Operations: | ||||||||||||||||||||
| Net Investment Income (Loss)* | 0.00 | ** | (0.08 | ) | (0.06 | ) | 0.05 | 0.12 | ||||||||||||
| Net Realized and Unrealized Gain (Loss) on Investments | (1.96 | ) | 3.57 | 3.89 | (3.18 | ) | (1.53 | ) | ||||||||||||
| Total from Investment Operations | (1.96 | ) | 3.49 | 3.83 | (3.13 | ) | (1.41 | ) | ||||||||||||
| Less Distributions: | ||||||||||||||||||||
| Net Investment Income | (0.08 | ) | — | — | (0.07 | ) | (0.10 | ) | ||||||||||||
| Net Realized Gains | (1.23 | ) | (0.59 | ) | — | (0.00 | )** | (0.80 | ) | |||||||||||
| Return of Capital | — | — | — | (0.02 | ) | — | ||||||||||||||
| Total Distributions | (1.31 | ) | (0.59 | ) | — | (0.09 | ) | (0.90 | ) | |||||||||||
| Net Asset Value, End of Year | $ | 17.40 | $ | 20.67 | $ | 17.77 | $ | 13.94 | $ | 17.16 | ||||||||||
| Total Return | (9.71 | )% | 19.78 | % | 27.47 | % | (18.14 | )% | (7.15 | )% | ||||||||||
| Ratios and Supplemental Data: | ||||||||||||||||||||
| Net Assets, End of Year (in thousands) | $ | 65,219 | $ | 56,762 | $ | 37,370 | $ | 20,678 | $ | 12,975 | ||||||||||
| Ratio of Expenses to Average Net Assets | 1.24 | % | 1.24 | % | 1.24 | % | 1.35 | % | 1.35 | % | ||||||||||
| Ratio of Net Investment Income to Average Net Assets | 0.01 | % | (0.42 | )% | (0.38 | )% | 0.41 | % | 0.69 | % | ||||||||||
| Portfolio turnover rate | 14 | % | 38 | % | 31 | % | 36 | % | 25 | % | ||||||||||
| * | Computed using average shares method. |
| ** | Amount is less than $0.005 per share. |
See accompanying Notes to Financial Statements.
17
QUEENS ROAD FUNDS NOTES TO THE FINANCIAL STATEMENTS (Continued) May 31, 2012 |
| Note 1. | Organization |
The Queens Road Value Fund and the Queens Road Small Cap Value Fund (individually referred to as the “Value Fund” and “Small Cap Value Fund”, respectively, or collectively as the “Funds”), are managed portfolios of the Bragg Capital Trust (the “Trust”), which are registered under the Investment Company Act of 1940, as amended, as a non-diversified, open-end management company. The Funds’ investment objective is to seek growth of capital. The Funds invest primarily in common stocks which are believed by the Advisor to be undervalued and have good prospects for capital appreciation. The Small Cap Value Fund invests (under normal market conditions), at least 80% of its total assets in small capitalization (less than $2 billion market cap at the time of purchase) common stocks. The Funds’ registration statement was declared effective on June 13, 2002, and operations began on that date.
| Note 2. | Significant Accounting Policies |
The following is a summary of accounting policies followed by the Funds in the preparation of their financial statements.
Federal Income Taxes: Each Fund intends to comply with the requirements of Subchapter M of the Internal Revenue Code applicable to regulated investment companies and to distribute substantially all of its net investment income and any net realized gains to its shareholders. Therefore, no provision is made for federal income or excise taxes.
The Regulated Investment Company Modernization Act of 2010 (the “Act”) was signed into law on December 22, 2010. The Act makes changes to a number of the federal income and excise tax provisions impacting regulated investment companies (“RICs”), including simplification provisions on asset diversification and qualifying income tests, provisions aimed at preserving the character of the distributions made by the RIC and coordination of the income and excise tax distribution requirements, and provisions for allowing unlimited years carryforward for capital losses. In general, the provisions of the Act will be effective for taxable years beginning after December 22, 2010, the date of enactment.
Accounting for Uncertainty in Income Taxes (the “Income Tax Statement”) requires an evaluation of tax positions taken (or expected to be taken) in the course of preparing a Fund’s tax returns to determine whether these positions meet a “more-likely-than-not” standard that, based on the technical merits, have a more than fifty percent likelihood of being sustained by a taxing authority upon examination. A tax position that meets the “more-likely-than-not” recognition threshold is measured to determine the amount of benefit to recognize in the financial statements. The Funds recognize interest and penalties, if any, related to unrecognized tax benefits as income tax expense in the Statements of Operations.
The Income Tax Statement requires management of the Funds to analyze all open tax years 2008-2011, as defined by IRS statute of limitations for all major jurisdictions, including federal tax authorities and certain state tax authorities. As of and during the year ended May 31, 2012, the Funds did not have a liability for any unrecognized tax benefits. The Funds have no examination in progress and are not aware of any tax positions for which it is reasonably possible that the total amounts of unrecognized tax benefits will significantly change in the next twelve months.
Distributions to Shareholders: Distributions to shareholders, which are determined in accordance with income tax regulations, are recorded on the ex-dividend date. The character of distributions made during the year from net investment income or net realized gain may differ from the characterization for federal income tax purposes due to differences in the recognition of income, expense and gain/(loss) items for financial statement and tax purposes. Where appropriate, reclassifications between net asset accounts are made for such differences that are permanent in nature.
Use of Estimates: The preparation of financial statements in conformity with accounting principles generally accepted in the United States of America (“GAAP”) requires management to make estimates and assumptions that affect the reported amounts of assets and liabilities, and disclosure of contingent assets and liabilities at the date of the financial statements and the reported amounts of increases and decreases in net assets from operations during the reporting period. Actual results could differ from those estimates.
Other: The Funds follow industry practice and record security transactions on the trade date. The specific identification method is used for determining gains or losses for financial statement and income tax purposes. Dividend income is recorded on the ex-dividend date, except that certain dividends from foreign securities are recorded as soon as information is available to the Funds. Interest income is recorded on an accrual basis. Discounts and premiums on securities purchased are amortized over the life of the respective securities.
18
QUEENS ROAD FUNDS NOTES TO THE FINANCIAL STATEMENTS (Continued) May 31, 2012 |
Security Valuation: Securities, including common stocks and exchange traded funds, which are traded on a national securities exchange are valued at the last quoted sales price, and generally classified as a Level 1 investment. Investments in mutual funds, including money market funds, are valued at the ending net asset value provided by the funds, and generally classified as a Level 1 investment. If there are no sales reported, the Fund’s portfolio securities will be valued using the last reported bid price. Short-term obligations having remaining maturities of 60 days or less are valued at amortized cost, and generally classified as a Level 2 investment. Securities for which market quotations are not readily available are valued at fair value as determined in good faith by and under the direction of the Trust’s Board of Trustees, and generally classified as a Level 3 investment.
In accordance with GAAP, fair value is defined as the price that the Funds would receive to sell an asset or pay to transfer a liability in an orderly transaction between market participants at the measurement date. GAAP also establishes a framework for measuring fair value, and a three-level hierarchy for fair value measurements based upon the transparency of inputs to the valuation of an asset or liability. The three-tier hierarchy of inputs is summarized below.
| • | Level 1 – Unadjusted quoted prices in active markets for identical assets or liabilities that the company has the ability to access. An active market for the security is a market in which transactions occur with sufficient frequency and volume to provide pricing information on an ongoing basis. Common Stocks, Exchange-Traded Funds and Mutual Funds are generally categorized as Level 1. |
| • | Level 2 – Observable inputs other than quoted prices included in Level 1 that are observable for the asset or liability, either directly or indirectly. These inputs may include quoted prices for the identical instrument on an inactive market, prices for similar instruments, interest rates, prepayment speeds, credit risk, yield curves, default rates and similar data. Fixed income securities, repurchase agreements, and securities valued by an independent fair value pricing service are generally categorized as Level 2. |
| • | Level 3 – Unobservable inputs for the asset or liability, to the extent relevant observable inputs are not available, representing the company’s own assumptions about the assumptions a market participant would use in valuing the asset or liability, and would be based on the best information available. |
The availability of observable inputs can vary from security to security and is affected by a wide variety of factors, including, for example, the type of security, whether the security is new and not yet established in the marketplace, the liquidity of markets, and other characteristics particular to the security. To the extent that valuation is based on models or inputs that are less observable or unobservable in the market, the determination of fair value requires more judgment. Accordingly, the degree of judgment exercised in determining fair value is greatest for instruments categorized in Level 3.
The Funds did not hold any Level 2 or Level 3 securities during the year ended May 31, 2012. There were no transfers into and out of any level during the current year. It is the Funds’ policy to recognize transfers into and out of all levels at the end of the reporting period.
Value Fund | ||||||||||||||||
Level 1 - Quoted Prices | Level 2 – Other Significant Observable Inputs | Level 3 – Significant Unobservable Inputs | Total | |||||||||||||
Common Stocks* | $ | 25,254,721 | $ | — | $ | — | $ | 25,254,721 | ||||||||
Exchange-Traded Funds | 456,300 | — | — | 456,300 | ||||||||||||
Short-Term Investments | 1,217,117 | — | — | 1,217,117 | ||||||||||||
Total | $ | 26,928,138 | $ | — | $ | — | $ | 26,928,138 | ||||||||
19
QUEENS ROAD FUNDS NOTES TO THE FINANCIAL STATEMENTS (Continued) May 31, 2012 |
Small Cap Value Fund | ||||||||||||||||
Level 1 - Quoted Prices | Level 2 - Other Significant Observable Inputs | Level 3 – Significant Unobservable Inputs | Total | |||||||||||||
Common Stocks* | $ | 48,925,858 | $ | — | $ | — | $ | 48,925,858 | ||||||||
Mutual Funds | 1,071,547 | — | — | 1,071,547 | ||||||||||||
Short-Term Investments | 17,766,220 | — | — | 17,766,220 | ||||||||||||
Total | $ | 67,763,625 | $ | — | $ | — | $ | 67,763,625 | ||||||||
| * | All sub-categories within common stocks represent Level 1 evaluation status. See Schedules of Investments for industry categories. |
In May 2011, the Financial Accounting Standards Board (“FASB”) issued Accounting Standards Update (“ASU”) No. 2011-04, “Fair Value Measurements (Topic 820) - Amendments to Achieve Common Fair Value Measurement and Disclosure Requirements in U.S. GAAP and International Financial Reporting Standards (“IFRSs”)” (“ASU No. 2011-04”). ASU No. 2011-04 requires additional disclosures regarding fair value measurements in financial statements of interim and annual periods beginning after December 15, 2011. The Funds adopted the FASB amendments to authoritative guidance which require the Funds to disclose details of transfers in and out of Level 1 and Level 2 measurements and Level 2 and Level 3 measurements and the reasons for the transfers. The above disclosures reflect the requirements of ASU No. 2011-04.
| Note 3. | Investment Advisory Fee and Other Transactions with Affiliates |
The Funds retain Bragg Financial Advisors, Inc. (the “Advisor”) as their investment advisor. Under the terms of the management agreement, the Advisor provides investment management and administrative services for the Funds. For its services as Advisor, the Value Fund and Small Cap Value Fund pay a fee, computed daily and payable monthly at the annual rate of 0.95% and 1.24% of each Fund’s first $250,000,000 of net assets, 0.85% and 1.24% of each Fund’s next $250,000,000 of net assets, and 0.80% and 1.15% of each Fund’s net assets over $500,000,000, respectively. For the year ended May 31, 2012, the Advisor earned $245,297 and $751,913 from the Value Fund and Small Cap Value Fund, respectively. From these fees and its own resources the Advisor agreed to pay other operating expenses of the Funds including transfer agent fees, fund accountant fees, administrator fees, registration fees, custodial fees, and other ordinary expenses of the Funds. However, the agreement does not require the Advisor to pay interest, taxes, brokerage commissions, and extraordinary expenses of the Funds. The amount due to the Advisor at May 31, 2012, from the Value Fund and Small Cap Value Fund was $21,959 and $68,911, respectively.
Certain employees and officers of the Advisor are also “interested persons” (as defined in the Investment Company Act of 1940) of the Trust. Each “non- interested” Trustee is entitled to receive an annual fee of $1,000 plus expenses for services relating to the Trust which is paid by the Advisor.
Queens Road Securities (“QRS”) acts as the principal underwriter in the continuous public offering of the Funds’ shares. Certain officers of the Trust are also officers of QRS. QRS did not receive or waive any brokerage fees on executions of purchases and sales of the Funds’ portfolio investments during the year ended May 31, 2012.
| Note 4. | Capital Stock |
The Articles of Incorporation permit the Trustees to issue an indefinite number of full and fractional shares of common stock, each with a par value of $0.001. At May 31, 2012, there were 1,988,846 and 3,749,046 of shares outstanding in the Value Fund and Small Cap Value Fund, respectively.
20
QUEENS ROAD FUNDS NOTES TO THE FINANCIAL STATEMENTS (Continued) May 31, 2012 |
| Note 5. | Investment Transactions |
For the year ended May 31, 2012, the cost of purchases and the proceeds from sales of portfolio securities, other than short-term investments, amounted to $7,290,559 and $1,226,744, respectively, for the Value Fund, and $17,674,567 and $6,550,498, respectively, for the Small Cap Value Fund.
| Note 6. | Federal Income Taxes |
At May 31, 2012, gross unrealized appreciation and depreciation of investments based on cost for federal income tax purposes were as follows:
Value Fund | Small Cap Value Fund | |||||||
Cost of Investments | $ | 24,185,116 | $ | 65,098,111 | ||||
Gross Unrealized Appreciation | $ | 4,453,318 | $ | 8,591,201 | ||||
Gross Unrealized Depreciation | (1,710,296 | ) | (5,925,687 | ) | ||||
Net Unrealized Appreciation on Investments | $ | 2,743,022 | $ | 2,665,514 | ||||
The difference between cost amounts for financial statement and federal income tax purposes is due primarily to wash sale loss deferrals and passive foreign investment companies (“PFICs”).
GAAP requires that certain components of net assets be reclassified between financial and tax reporting. These reclassifications have no effect on net assets or net asset value per share. For the year ended May 31, 2012, permanent differences in book and tax accounting have been reclassified to paid-in capital, undistributed net investment income (loss) and accumulated realized gain (loss) as follows:
Increase (Decrease) | ||||||||||||
Paid-in Capital | Undistributed Net Investment Income (Loss) | Accumulated Net Realized Gain (Loss) | ||||||||||
Value Fund | $ | — | $ | (4,811 | ) | $ | 4,811 | |||||
Small Cap Value Fund | — | — | — | |||||||||
As of May 31, 2012, the components of accumulated earnings on a tax basis were as follows:
Value Fund | Small Cap Value Fund | |||||||
Undistributed Ordinary Income | $ | 197,891 | $ | 966,165 | ||||
Undistributed Long-Term Capital Gains | — | — | ||||||
Tax Accumulated Earnings | 197,891 | 966,165 | ||||||
Accumulated Capital and Other Losses | (1,399,759 | ) | (1,012,781 | ) | ||||
Net Unrealized Appreciation | 2,743,022 | 2,665,514 | ||||||
Total Accumulated Earnings | $ | 1,541,154 | $ | 2,618,898 | ||||
21
QUEENS ROAD FUNDS NOTES TO THE FINANCIAL STATEMENTS (Continued) May 31, 2012 |
At May 31, 2012, the Funds had accumulated capital loss carryforwards as follows:
Value Fund | Small Cap Value Fund | |||||||
| For losses expiring May 31, | ||||||||
2017 | $ | 191,688 | $ | — | ||||
2018 | 1,208,071 | — | ||||||
| $ | 1,399,759 | $ | — | |||||
The Queens Road Value Fund utilized $274,591 of its capital loss carryforwards during the year ended May 31, 2012.
To the extent that a fund may realize future net capital gains, those gains will be offset by any of its unused capital loss carryforward. Future loss carryforward utilization in any given year may be subject to Internal Revenue Code limitations.
Under the recently enacted Act, the Funds will be permitted to carryforward capital losses incurred in taxable years beginning after December 22, 2010, the date of enactment of the Act, for an unlimited period. However, any losses incurred during those future taxable years will be required to be utilized prior to the losses incurred in pre-enactment taxable years. As a result of this ordering rule, pre-enactment capital loss carryforwards may be more likely to expire unused. Additionally, post-enactment capital loss that are carried forward will retain their character as either short-term or long-term capital losses rather than being considered all short-term as under previous law.
Post-October capital losses and late-year ordinary losses incurred after October 31 and within the taxable year are deemed to arise on the first business day of the Funds’ taxable year. As of December 31, 2011, the following Funds had the following post-October capital-losses and late-year ordinary losses:
Post-October capital losses | Late-year ordinary losses | |||||||
Value Fund | $ | — | $ | — | ||||
Small Cap Value Fund | 752,049 | 260,732 | ||||||
The tax character of distributions paid during the fiscal years ended May 31, 2012, and May 31, 2011, were as follows:
Fund | Value Fund | Small Cap Value Fund | ||||||||||||||
| Distributions paid from: | May 31, 2012 | May 31, 2011 | May 31, 2012 | May 31, 2011 | ||||||||||||
Ordinary Income | $ | 293,821 | $ | 207,168 | $ | 1,307,576 | $ | 233,195 | ||||||||
Net Long-Term Capital Gains | — | — | 2,951,480 | 1,128,476 | ||||||||||||
Total Taxable Distributions Paid | $ | 293,821 | $ | 207,168 | $ | 4,259,056 | $ | 1,361,671 | ||||||||
| Note 7. | Control |
The beneficial ownership, either directly or indirectly, of more than 25% of the voting securities of a fund creates a presumption of control of the fund, under section 2 (a) (9) of the Investment Company Act of 1940. As of May 31, 2012, Pershing, LLC., for the benefit of its customers, owned 97.18% and 49.27% of the Value Fund and Small Cap Value Fund, respectively, and Charles Schwab & Co., Inc., for the benefit of its customers, owned 33.47% of the Small Cap Value Fund.
22
QUEENS ROAD FUNDS REPORT OF INDEPENDENT REGISTERED PUBLIC ACCOUNTING FIRM |
To the Shareholders and Board of Trustees of
Bragg Capital Trust
We have audited the accompanying statements of assets and liabilities, including the schedules of investments, of Bragg Capital Trust (the “Trust”), comprising Queens Road Value Fund and Queens Road Small Cap Value Fund (the “Funds”), as of May 31, 2012, and the related statements of operations for the year then ended, the statements of changes in net assets for each of the two years in the period then ended, and the financial highlights for each of the five years in the period then ended. These financial statements and financial highlights are the responsibility of Fund management. Our responsibility is to express an opinion on these financial statements and financial highlights based on our audits.
We conducted our audits in accordance with the standards of the Public Company Accounting Oversight Board (United States). Those standards require that we plan and perform the audit to obtain reasonable assurance about whether the financial statements and financial highlights are free of material misstatement. An audit includes examining, on a test basis, evidence supporting the amounts and disclosures in the financial statements. Our procedures included confirmation of securities owned as of May 31, 2012, by correspondence with the custodian and brokers or by other appropriate auditing procedures where replies from brokers were not received. An audit also includes assessing the accounting principles used and significant estimates made by management, as well as evaluating the overall financial statement presentation. We believe that our audits provide a reasonable basis for our opinion.
In our opinion, the financial statements and financial highlights referred to above present fairly, in all material respects, the financial position of each of the Funds constituting Bragg Capital Trust, the results of their operations for the year then ended, the changes in their net assets for each of the two years in the period then ended, and the financial highlights for each of the five years in the period then ended, in conformity with accounting principles generally accepted in the United States of America.
COHEN FUND AUDIT SERVICES, LTD.
Westlake, Ohio
July 27, 2012
23
QUEENS ROAD FUNDS EXPENSE ILLUSTRATION May 31, 2012 (Unaudited) |
ABOUT YOUR FUND’S EXPENSES
Expense Example
As a shareholder of the Funds, you incur ongoing costs which typically consist of management fees and other Fund expenses. This Example is intended to help you understand your ongoing costs (in dollars) of investing in the Funds and to compare these costs with the ongoing costs of investing in other mutual funds.
The Example is based on an investment of $1,000 invested at the beginning of the period and held for the entire period, December 1, 2011 through May 31, 2012.
Actual Expenses
The first line of the table below provides information about actual account values and actual expenses. You may use the information in this line, together with the amount you invested, to estimate the expenses that you paid over the period. Simply divide your account value by $1,000 (for example, an $8,600 account value divided by $1,000 = 8.6), then multiply the result by the number in the first line under the heading entitled “Expenses Paid During Period” to estimate the expenses you paid on your account during this period.
Hypothetical Example for Comparison Purposes
The second line of the table below provides information about hypothetical account values and hypothetical expenses based on the Fund’s actual expense ratio and an assumed rate of return of 5% per year before expenses, which is not the Fund’s actual return. The hypothetical account values and expenses may not be used to estimate the actual ending account balance or expenses you paid for the period. You may use this information to compare the ongoing costs of investing in this Fund and other funds. To do so, compare this 5% hypothetical example with the 5% hypothetical examples that appear in the shareholder reports of the other funds.
Beginning Account Value December 1, 2011 | Ending Account Value May 31, 2012 | Expenses Paid During the Period* December 1, 2011 to May 31,2012 | |||||||
| Value Fund | |||||||||
Actual | $1,000.00 | $1,001.00 | $4.74 | ||||||
Hypothetical (5% Annual Return before expenses) | $1,000.00 | $1,020.26 | $4.79 |
| Small Cap Fund | ||||||||||||
Actual | $1,000.00 | $962.00 | $6.07 | |||||||||
Hypothetical (5% Annual Return before expenses) | $1,000.00 | $1,018.81 | $6.25 | |||||||||
| * | Expenses are equal to the Funds’ annualized expense ratio of 0.95 and 1.24%, respectively, multiplied by the average account value over the period, multiplied by 183/366 (to reflect the one-half year period). |
24
QUEENS ROAD FUNDS ADDITIONAL INFORMATION May 31, 2012 (Unaudited) |
Proxy Voting – A description of the policies and procedures that the Fund uses to determine how to vote proxies relating to portfolio securities and information regarding how the Fund voted proxies during the most recent 12 month period, are available without charge upon request by (1) calling the Fund at 1-800-595-3088 and (2) from Fund documents filed with the Securities and Exchange Commission (“SEC”) on the SEC’s website at www.sec.gov.
Portfolio Holdings – The Funds file a complete schedule of investments with the SEC for the first and third quarter of each fiscal year on Form N-Q. The Funds’ first and third fiscal quarters end on August 31 and February 28. The Form N-Q filing must be made within 60 days of the end of the quarter, and the Funds’ first Form N-Q was filed with the SEC on October 8, 2004. The Funds’ Form N-Qs are available on the SEC’s website at http://sec.gov, or they may be reviewed and copied at the SEC’s Public Reference Room in Washington, DC (call 1-800-732-0330 for information on the operation of the Public Reference Room). You may also obtain copies by calling the Fund at 1-800-595-3088.
Long-Term Capital Gains Designation – Pursuant to IRC 852(b)(3) of the Internal Revenue Code, the Queens Road Small Cap Value Fund hereby designates $2,951,480 as long-term capital gains distributed during the year ended, May 31, 2012.
For the year ended May 31, 2012, 100.00% and 57.01% of the dividends paid from net investment income, including short-term capital gains (if any), are designated as qualified dividend income for the Queens Road Value and Queens Road Small Cap Value Funds, respectively.
For the year ended May 31, 2012, 100.00% and 56.51% of the dividends paid from net investment income, including short-term capital gains (if any), qualifies for the dividends received deduction available to corporate shareholders for the Queens Road Value and Queens Road Small Cap Value Funds, respectively.
25
QUEENS ROAD FUNDS TRUSTEES INFORMATION May 31, 2012 (Unaudited) |
Information about Trustees who are “interested persons” of the Trust as defined under the 1940 Act, and each Trustees of the Trust, including their principal occupations during the past five years, is as follows:
| Interested Trustees | |||||
| Name (Age) | Position with Fund | Term of Office and Length of Time Served | Principal Occupations During Past Five Years | Number of Portfolios in Fund Complex Overseen By Trustee | Other Directorships Held By Trustee |
Steve Scruggs, 43 | Trustee, President Secretary | Unlimited; 9 years | Bragg Financial Advisors, Portfolio Manager/CCO (2000-present) | Two | None |
Benton Bragg, 44 | Trustee, Chairman Treasurer | Unlimited; 9 years | Bragg Financial Advisors, President, CEO (1996-present) | Two | None |
Steve Scruggs and Benton Bragg are Interested Trustees of the Fund (as that term is defined in Section 2(a)(19) of the Investment Company Act of 1940) by reason of their affiliation with the Fund’s Advisor, Bragg Financial Advisors, Inc. and their affiliation as registered principals with the Fund’s underwriter, Queens Road Securities, LLC. Benton Bragg and Steve Scruggs are brothers-in-law.
26
QUEENS ROAD FUNDS TRUSTEES INFORMATION (Continued) May 31, 2012 (Unaudited) |
Information about Trustees who are not “interested persons” of the Trust as defined under the 1940 Act, including their principal occupations during the past five years, is as follows:
| Independent Trustees | |||||
| Name (Age) | Position with Fund | Term of Office and Length of Time Served | Principal Occupations During Past Five Years | Number of Portfolios in Fund Complex Overseen By Trustee | Other Directorships Held By Trustee |
Philip Blount, 582 | Trustee | Unlimited; 9 years | Icons, Inc., President (2001- present) Marketing Merchandise | Two | None |
Christopher Brady, 421,2 | Trustee | Unlimited; 9 years | Brady Distributing, Vice President (1995-2009, 2012-present) Machinery Distribution; Resort Capital Partners, Vice President (2009-2012) Hospitality Financial Advisory | Two | None |
Harold Smith, 472 | Trustee | Unlimited; 9 years | Raftelis Financial, Vice President (1996-present) Public Finance Consulting | Two | None |
Timothy Ignasher, 511 | Trustee | Unlimited; 9 years | Citizens South Bank, Exec Vice President (2008-present); Colony Signature Bank, Exec. Vice President (2007-2008); Scottish Bank, Vice President (1998-2007) Commercial Loan Officer | Two | None |
| (1) | Member of the Audit Committee of the Board of Trustees, which makes recommendations regarding the selection of the Fund’s independent public accountant and meets with representatives of the accountants to determine the scope of and review the results of each audit. |
| (2) | Member of the Nominating Committee of the Board of Trustees, which identifies qualified candidates and recommends nominees for the election as Trustees. |
27
QUEENS ROAD FUNDS |
| Notes |
THIS PAGE INTENTIONALLY LEFT BLANK
QUEENS ROAD FUNDS |
Board of Trustees
Benton Bragg
Steve Scruggs
Phil Blount
Tim Ignasher
Chris Brady
Harold Smith
Investment Adviser
Bragg Financial Advisors, Inc.
1031 Caldwell Street, Suite 200
Charlotte, NC 28203
Dividend Paying Agent,
Shareholders’ Servicing Agent,
Transfer Agent
UMB Fund Services
803 West Michigan Street
Milwaukee, WI 53233
Custodian
US Bank, NA
425 Walnut Street
P.O. Box 1118
Cincinnati, OH 45201
Independent Auditors
Cohen Fund Audit Services, Ltd.
800 Westpoint Parkway, Suite 1100
Westlake, OH 44145
Shares of Queens Road Value and Queens Road Small Cap Value Fund are distributed by Queens Road Securities, L.L.C, an affiliate of the Investment Adviser. This report has been prepared for the general information of the shareholders. It is not authorized for distribution to prospective investors unless preceded or accompanied by a current prospectus. The Funds’ prospectus contains more complete information about the objectives, policies, expenses and risks of the Funds. The Funds are not bank deposits, not FDIC insured and may lose value. Please read the prospectus carefully before investing or sending money.
This report contains certain forward looking statements which are subject to known and unknown risks and uncertainties that could cause actual results 0to differ materially from those expressed or implied by such statements. Forward looking statements generally include words such as “believes”, “expects”, “anticipates” and other words of similar import. Such risks and uncertainties include, among other things, the Risk Factors noted in the Funds’ filings with the Securities and Exchange Commission. The Funds undertake no obligation to update any forward looking statement.
| Item 2. | Code of Ethics. |
| (a) | The Registrant has adopted a code of ethics (the “Code”) that applies to the Registrant’s principal executive officer, principal financial officer, principal accounting officer or controller, or persons performing similar functions. This Code is included as an Exhibit. |
| (b) | During the period covered by the report, with respect to the Registrant’s Code that applies to its principal executive officer, principal financial officer, principal accounting officer or controller, or persons performing similar functions; there have been no amendments to, nor any waivers granted from, a provision that relates to any element of the Code definition enumerated in paragraph (b) of this Item 2. |
| Item 3. | Audit Committee Financial Expert. |
| (a) | The registrant’s board of trustees has determined that the registrant does not have an audit committee financial expert. This is because no one on the board of trustees is deemed to be a financial expert. |
| Item 4. | Principal Accountant Fees and Services. |
(a) Audit Fees | |
| FY 2011 | $24,150 |
| FY 2012 | $23,800 |
(b) Audit-Related Fees | |
| Registrant | |
| FY 2011 | $0 |
| FY 2012 | $0 |
| Nature of the fees: | Not applicable. |
(c) Tax Fees | |
| Registrant | |
| FY 2011 | $5,000 |
| FY 2012 | $5,000 |
| Nature of the fees: | 1120-RIC & Excise Tax Return |
(d) All Other Fees | |
| Registrant | |
| FY 2011 | $0 |
| FY 2012 | $1,125 |
| Nature of the fees: | Out of pocket expenses and consents |
| (e) | (1) Audit Committee’s Pre-Approval Policies |
The Audit Committee reviews the auditor engagement letter and recommends to the Board of Trustees whether or not to adopt the engagement letter and appoint the independent auditor to perform the services described in the engagement letter.
(2) Percentages of Services Approved by the Audit Committee
| Registrant | |
| Audit-Related Fees: | 100 % |
| Tax Fees: | 100 % |
| All Other Fees: | 0 % |
(f) During audit of registrant's financial statements for the most recent fiscal year, less than 50 percent of the hours expended on the principal accountant's engagement were attributed to work performed by persons other than the principal accountant's full-time, permanent employees.
(g) The aggregate non-audit fees billed by the registrant's accountant for services rendered to the registrant, and rendered to the registrant's investment adviser (not including any sub-adviser whose role is primarily portfolio management and is subcontracted with or overseen by another investment adviser), and any entity controlling, controlled by, or under common control with the adviser that provides ongoing services to the registrant:
| Registrant | |
| FY2011 | $0 |
| FY2012 | $0 |
(h) The registrant's audit committee has considered whether the provision of non-audit services to the registrant's investment adviser (not including any sub-adviser whose role is primarily portfolio management and is subcontracted with or overseen by another investment adviser), and any entity controlling, controlled by, or under common control with the investment adviser that provides ongoing services to the registrant, that were not pre-approved pursuant to paragraph (c)(7)(ii) of Rule 2-01 of Regulation S-X, is compatible with maintaining the principal accountant's independence.
| Item 5. | Audit Committee of Listed Registrants. |
Not applicable.
| Item 6. | Schedule of Investments. |
Included as part of the report to shareholders filed under Item 1 of this Form N-CSR.
| Item 7. | Disclosure of Proxy Voting Policies and Procedures for Closed-End Management Investment Companies. |
Not applicable to open-end management investment companies.
| Item 8. | Portfolio Managers of Closed-End Management Investment Companies. |
Not applicable to open-end management investment companies.
| Item 9. | Purchases of Equity Securities by Closed-End Management Investment Company and Affiliated Purchasers. |
Not applicable to open-end management investment companies.
| Item 10. | Submission of Matters to a Vote of Security Holders. |
Not applicable.
| Item 11. | Controls and Procedures. |
| (a) | The Registrant’s principal executive officer and principal financial officer have reviewed the Registrant's disclosure controls and procedures (as defined in Rule 30a-3(c) under the Investment Company Act of 1940, as amended, (the “Act”)) as of a date within 90 days of the filing of this report, as required by Rule 30a-3(b) under the Act. Based on their review, such officers have concluded that the disclosure controls and procedures were effective in ensuring that information required to be disclosed in this report was appropriately recorded, processed, summarized and reported and made known to them by others within the Registrant and by the Registrant’s service providers. |
| (b) | There were no changes in the Registrant’s internal control over financial reporting (as defined in Rule 30a-3(d) under the Act (17 CFR 270.30a-3(d)) that occurred during the Registrant’s second fiscal quarter of the period covered by this report that materially affected, or were reasonably likely to materially affect, the Registrant’s internal control over financial reporting. |
| Item 12. | Exhibits. |
| (a) (1) | Code of Ethics. The code of ethics that is the subject of the disclosure required by Item 2 is attached herewith. |
| (a) (2) | Certifications required pursuant to Section 302 of the Sarbanes-Oxley Act of 2002. |
Filed herewith.
| (a) (3) | Not applicable to open-end management investment companies. |
| (b) | Certification pursuant to Section 906 of the Sarbanes-Oxley Act of 2002. Filed herewith. |
SIGNATURES
Pursuant to the requirements of the Securities Exchange Act of 1934 and the Investment Company Act of 1940, the Registrant has duly caused this report to be signed on its behalf by the undersigned, thereunto duly authorized.
Bragg Capital Trust
/s/ Steven H. Scruggs |
By: Steven H. Scruggs
President
August 1, 2012
Pursuant to the requirements of the Securities Exchange Act of 1934 and the Investment Company Act of 1940, this report has been signed below by the following persons on behalf of the Registrant and in the capacities and on the dates indicated.
/s/ Steven H. Scruggs |
By: Steven H. Scruggs
President
(Principal Executive Officer)
August 1, 2012
/s/ Benton S. Bragg |
By: Benton S. Bragg
Treasurer
(Principal Financial Officer)
August 1, 2012