UNITED STATES
SECURITIES AND EXCHANGE COMMISSION
Washington, D.C. 20549
FORM N-CSR
CERTIFIED SHAREHOLDER REPORT OF REGISTERED
MANAGEMENT INVESTMENT COMPANIES
Investment Company Act File Number 811-21073
Bragg Capital Trust
(Exact name of registrant as specified in charter)
1031 South Caldwell Street, Suite 200
Charlotte, NC 28203
(Address of principal executive offices) (Zip code)
(Address of principal executive offices) (Zip code)
1031 South Caldwell Street, Suite 200
Charlotte, NC 28203
(Name and address of agent for service)
Copies to:
Tanya L. Goins
Thompson Hine LLP
1919 M Street, NW, Suite 700
Washington DC 20036
Registrant's telephone number, including area code: (704) 714-7711
Date of fiscal year end: May 31
Date of reporting period: May 31, 2013
| Item 1. | Reports to Stockholders. |
The following is a copy of the report transmitted to shareholders pursuant to Rule 30e-1 under the Investment Company Act of 1940, as amended.

ANNUAL REPORT Queens Road Value Fund Queens Road Small Cap Value Fund Each a series of Bragg Capital Trust May 31, 2013 |
QUEENS ROAD FUNDS |
| Table of Contents | |
| Shareholder Letter | 2 |
| Manager’s Commentary | 3 |
| Performance Illustration | 5 |
| Graphical Illustration | 7 |
| Schedules of Investments | |
| Queens Road Value Fund | 8 |
| Queens Road Small Cap Value Fund | 10 |
| Statements of Assets and Liabilities | 12 |
| Statements of Operations | 13 |
| Statements of Changes in Net Assets | 14 |
| Financial Highlights | 15 |
| Notes to Financial Statements | 17 |
| Report of Independent Registered Public Accounting Firm | 22 |
| Expense Illustration | 23 |
| Additional Information | 24 |
| Trustee Information | 25 |
QUEENS ROAD FUNDS SHAREHOLDER LETTER May 31, 2013 (Unaudited) |
Dear Fellow Shareholders:
Equity markets continued to climb “the wall of worry” throughout our recent fiscal year ending on May 31. In the face of an anemic economy, political gridlock and global tension, every major U.S. equity index posted healthy gains. There was some good news: corporate profits continued to grow and policymakers continued their unprecedentedly accommodative monetary policy. Yet major problems remain. Unemployment remains stubbornly high, GDP growth tepid, and international geopolitical concerns abound.
So how does one explain the soaring stock prices in the U.S. markets? We think there are three primary drivers. One is that there is simply not a good alternative to owning stocks. The actions of the Fed have driven fixed income yields down to historic lows. A ten-year treasury bond yields 2.16% today. The Fed’s goal is to stimulate the economy by keeping money “cheap,” prompting borrowing and investment in riskier assets like stocks, real estate and capital equipment. The hope is that rising prices will instill confidence and confidence will lead to more investment and the economy will grow. Part of the plan is working ... prices have risen dramatically. We are still waiting for the economic growth. If history is any guide, it will come.
Second, U.S. stocks have fared well because investing is a relative game. The U.S. economy, weak as it is, is performing better than much of the rest of the world. In particular, housing continues to show strength. Much of Europe is in recession and the emerging economies, including China, Brazil and India, have cooled considerably.
And finally, we think stocks are doing well because investors are human. The passage of time heals wounds and we forget how bad things were just a few short years ago. Investors who have been on the sidelines are coming back into the market. At the end of the day, we humans are risk- takers. And thank goodness for this human characteristic; without it we likely would have never emerged from the cave after our first fight with the mighty mastodon. Instead, we emerged from the cave and we tried again, and look where we are today. This belief in inevitable human progress leaves us optimistic about the future.
As long-term value investors, we follow the barrage of economic and financial news with a blind eye. Our focus remains on the companies we are invested in and their prospects for creating value for their owners. It can seem boring and mundane. (They don’t talk about these things on CNBC very much and if they did it surely wouldn’t help their ratings.) But these are the things that matter over the long term; return on investment, strong balance sheets, and prudent capital allocation are more important than Fed minutes, gridlock in Washington or weekly jobs reports.
We appreciate the confidence you place in us to invest your capital wisely. We stand beside you as investors in our funds and are confident in the prospects of the companies we are invested in. If you have any questions about our philosophy or process please feel free to contact us.
Sincerely,
| Steven Scruggs, CFA | Benton Bragg, CFA |
| President | Chairman |
2
QUEENS ROAD VALUE FUND MANAGER’S COMMENTARY May 31, 2013 (Unaudited) |
For the fiscal year ended May 31, 2013, the Queens Road Value Fund returned 28.19% compared to a return of 32.14% for the S&P 500/Citigroup Value Index.
Investments that Helped Performance
Yahoo!, Inc.’s (3.5% of the Fund) stock price was up 76% during fiscal year 2013. As one of the world’s most recognized brands, Yahoo has over 700 million users worldwide. Newly-hired CEO Marissa Mayer has the company focused on innovation and building a more successful mobile presence. The company’s Asian investments and its advertising pact with Microsoft appear to be paying off. The board shake-up from the spring of 2012 has proven to be very positive and we think the company is well on its way in expanding its franchise.
JPMorgan Chase & Co. (1.5% of the Fund) rose 71% during fiscal year 2013. JP Morgan appears to have emerged from the recent financial crisis in much stronger shape than most of its competitors. It has capitalized on this by expanding its core businesses during the recent recovery. Although net interest income has fallen slightly, the company has performed strongly in investment banking, trading, and mortgage banking. Meanwhile, it continues its extensive cost-cutting to drive profit growth. Although the recent increase in mortgage interest rates could provide a headwind for its mortgage banking business, we believe the company is poised for above-average growth in its core businesses.
Investments that Hurt Performance
Intel Corp. (1.2% of the Fund) was down 3.4% during fiscal year 2013. Intel continues to suffer from the slowdown in the worldwide PC market. While the PC market should stabilize, we believe the key to the company’s future success lies in growth areas particularly mobile, foundry, and data centers. To that end, the company is refocusing its capital expenditures in these areas. We believe Intel’s new mobile chip sets, its lithography partnership with ASML Holdings and its increased focus on data center and cloud computing microprocessors will drive earnings growth and provide shareholders meaningful returns.
Southern Co. (1.1% of the Fund) and Exelon Corp. (1.2% of the Fund) were down 4.6% and 14.6%, respectively, for fiscal year 2013. Mild weather and an anemic economy have put downward pressure on power consumption which in turn affected the financial performance of utilities. Additionally, the specter of increased interest rates and a possible change in dividend tax policy make these dividend-paying stocks less attractive. Regardless, these companies are extremely well-managed utilities operating primarily in areas that have favorable demographics and regulatory environments. For these reasons, they remain core positions in the portfolio.
3
QUEENS ROAD SMALL CAP VALUE FUND MANAGER’S COMMENTARY (Continued) May 31, 2013 (Unaudited) |
For the fiscal year ended May 31, 2013, the Queens Road Small Cap Value Fund returned 21.75% compared to a return of 31.31% for the Russell 2000 Value Index.
Investments that Helped Performance
Ducommun, Inc. (2.2% of the Fund) was up 119% for fiscal year 2013. A California-based manufacturer of aerospace structures and electronic and mechanical assemblies, Ducommun is a key supplier to original equipment manufacturers on many of the world’s most advanced aeronautical programs. As a key supplier to Boeing, Airbus, and defense platforms, Ducommun maintains a healthy backlog which provides financial visibility and consistent cash flows.
Prestige Brands Holdings, Inc. (1.9% of the Fund) returned 118.3% for fiscal year 2013. Prestige owns a diversified portfolio of well-known niche over-the-counter brands including Goody’s, BC Powders, Dramamine, Chloraseptic, Clear Eyes, Efferdent, Compound W, and Ludens. In many of these niche markets they own the top position. Although organic growth is relatively low, expanding product offerings and strategic acquisitions has grown Prestige into a $600 million branded consumer products company with healthy free cash-flow margins and a strong balance sheet. We have confidence in this well-managed company but acknowledge valuations are getting a bit stretched.
Oshkosh Corp. (2.6% of the Fund) was up 105% in fiscal year 2013. A manufacturer of both defense and commercial vehicles, Oshkosh maintains a dominant share in the major segments in which it competes. Although highly reliant on defense spending, we believe the company is poised to take advantage of an upswing in construction with its JLG division, which leads the market in construction access equipment. We think management’s focus on growth, innovation, and fiscal responsibility will continue to drive operating margin expansion and increased free cash-flow.
Investments that Hurt Performance
Imation Corp. (0.1% of the Fund) declined 27% in fiscal year 2013. Imation’s strategic transformation remains elusive. As the company continues its transition to grow its security business and regain relevance in enterprise storage, the losses continue. Fortunately, it is a smaller holding in the portfolio. We have lost confidence that management can gain any traction in the highly competitive markets in which it focuses. We are currently considering selling this position.
USEC, Inc. (0.3% of the Fund) fell 49% for fiscal year 2013. USEC continues to work towards receiving a Department of Energy approval for a loan guarantee relating to the commercialization of the American Centrifuge Project. While the process has taken considerably longer than we expected, we believe USEC will ultimately receive the guarantee under reasonable terms which will allow it to continue development of the project. We believe upon its completion it will be the most efficient uranium enrichment facility in North America and perhaps the world. This continues to be the most speculative holding in the portfolio.
The fund continues to be invested in a defensive position, holding 25% in cash equivalents. As we compute our estimates of intrinsic value, we are having difficulty finding investments with expected returns large enough to compensate us for the amount of risk we would take investing in them.
4
QUEENS ROAD FUNDS PERFORMANCE ILLUSTRATION May 31, 2013 (Unaudited) |
Queens Road Value Fund
Average Annual Total Return For the Year Ended May 31, 2013 | ||||
Queens Road Value Fund | S&P 500/Citigroup Value Index | |||
| Six Month | 18.66% | 19.34% | ||
| 1 Year | 28.19% | 32.14% | ||
| 3 Year | 13.82% | 16.16% | ||
| 5 Year | 3.86% | 4.16% | ||
| 10 Year | 6.98% | 7.54% | ||
| Since Inception* | 7.14% | 6.54% | ||
| Gross Annual Operating Expense is 0.97% as disclosed in the most recent Prospectus effective September 28, 2012. | ||||
| * | The Queens Road Value Fund commenced operations on June 13, 2002. Past performance is not predictive of future performance. The value of shares will fluctuate and will be worth more or less than their original cost at the time of redemption. |
The S&P 500/Citigroup Value Index along with its counterpart the S&P 500/Citigroup Growth Index were introduced in December 2005. Previously, these indices were known as the S&P 500/Barra Growth and Value Indices. These Indices are created by dividing the S&P 500 Index based upon seven different factors, four to determine value characteristics and three to determine growth characteristics. The companies are allocated to each index according to their growth or value characteristics, with about one-third being allocated to both the growth and value index. It is not possible to invest directly in the S&P 500/Citigroup Value Index. The S&P 500/Citigroup Growth Index and S&P 500/Citigroup Value Index are the exclusive property of Standards & Poors.
Growth of Assumed $10,000 Investment
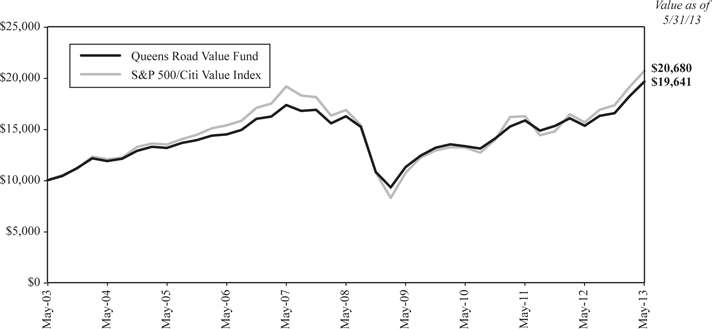
| This graph illustrates the hypothetical investment of $10,000 in the Fund from May 31, 2003 to May 31, 2013. |
5
QUEENS ROAD FUNDS PERFORMANCE ILLUSTRATION (Continued) May 31, 2013 (Unaudited) |
Queens Road Small Cap Value Fund
Average Annual Total Return For the Year Ended May 31, 2013 | ||||
Queens Road Small Cap Value Fund | Russell 2000 Value Index | |||
| Six Month | 14.39% | 19.69% | ||
| 1 Year | 21.75% | 31.31% | ||
| 3 Year | 9.58% | 13.97% | ||
| 5 Year | 6.56% | 6.51% | ||
| 10 Year | 9.87% | 9.53% | ||
| Since Inception* | 9.82% | 8.40% | ||
| Gross Annual Operating Expenses is 1.27% as disclosed in the most recent Prospectus effective September 28, 2012. | ||||
| * | The Queens Road Small Cap Value Fund commenced operations on June 13, 2002. Past performance is not predictive of future performance. The value of shares will fluctuate and will be worth more or less than their original cost at the time of redemption. |
The Russell 2000 Value Index is a subset of the Russell 2000 Index, which tracks the stocks of small domestic companies, based on total market capitalization. The Russell 2000 Value Index represents those stocks of the Russell 2000 with lower price-to book ratios and lower relative forecasted growth rates. You cannot invest directly in these indexes.
Growth of Assumed $10,000 Investment
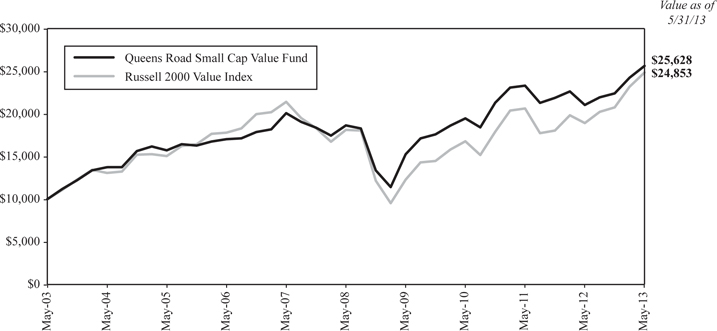
| This graph illustrates the hypothetical investment of $10,000 in the Fund from May 31, 2003 to May 31, 2013. |
6
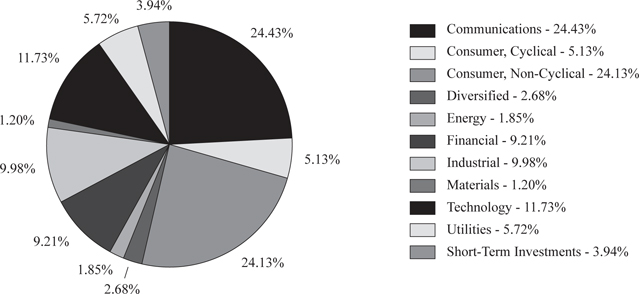
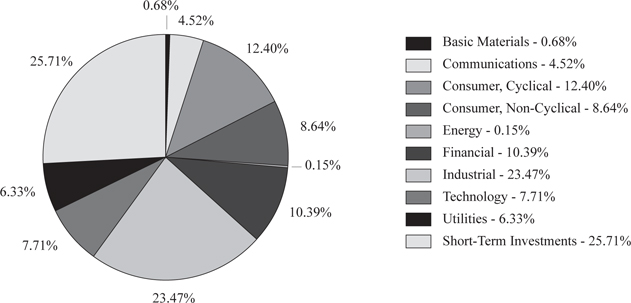
QUEENS ROAD FUNDS GRAPHICAL ILLUSTRATION May 31, 2013 (Unaudited) |
The following charts provide a visual breakdown of the Funds by the industry sectors that the underlying securities represent as a percentage of the portfolio of investments.
Queens Road Value Fund
Queens Road Small Cap Value Fund
7
QUEENS ROAD VALUE FUND SCHEDULES OF INVESTMENTS As of May 31, 2013 |
NUMBER OF SHARES | VALUE | ||||||
| COMMON STOCKS – 94.7% | |||||||
| AEROSPACE/DEFENSE – 3.7% | |||||||
| 8,000 | General Dynamics Corp. | $ | 616,800 | ||||
| 6,600 | United Technologies Corp. | 626,340 | |||||
| 1,243,140 | |||||||
| APPAREL – 1.9% | |||||||
| 3,500 | VF Corp. | 643,510 | |||||
| BANKS – 3.9% | |||||||
| 14,500 | Bank of New York Mellon Corp. | 435,870 | |||||
| 9,000 | JPMorgan Chase & Co. | 491,310 | |||||
| 6,000 | State Street Corp. | 397,080 | |||||
| 1,324,260 | |||||||
| BEVERAGES – 4.5% | |||||||
| 6,380 | Beam, Inc. | 413,679 | |||||
| 20,000 | Constellation Brands, Inc., Class A* | 1,060,200 | |||||
| 2,880 | Crimson Wine Group Ltd.* | 25,258 | |||||
| 1,499,137 | |||||||
| BUILDING MATERIALS – 0.8% | |||||||
| 6,380 | Fortune Brands Home & Security, Inc. | 269,746 | |||||
| COAL – 0.6% | |||||||
| 10,000 | Peabody Energy Corp. | 196,700 | |||||
| COMMERCIAL SERVICES – 0.2% | |||||||
| 2,000 | ADT Corp. | 81,180 | |||||
| COMPUTERS – 6.9% | |||||||
| 29,500 | Dell, Inc. | 393,825 | |||||
| 3,500 | International Business Machines Corp. | 728,070 | |||||
| 15,000 | NetApp, Inc.* | 562,950 | |||||
| 45,000 | Research In Motion Ltd.* | 627,750 | |||||
| 2,312,595 | |||||||
| COSMETICS/PERSONAL CARE – 2.0% | |||||||
| 8,800 | Procter & Gamble Co. | 675,488 | |||||
| DIVERSIFIED FINANCIAL SERVICES – 2.7% | |||||||
| 8,000 | American Express Co. | 605,680 | |||||
| 3,900 | T. Rowe Price Group, Inc. | 295,854 | |||||
| 901,534 | |||||||
| ELECTRIC – 5.7% | |||||||
| 13,000 | American Electric Power Co., Inc. | 595,660 | |||||
| 8,284 | Duke Energy Corp. | 554,448 | |||||
| 13,000 | Exelon Corp. | 407,420 | |||||
| 8,400 | Southern Co. | 368,760 | |||||
| 1,926,288 | |||||||
| ELECTRONICS – 0.4% | |||||||
| 4,000 | Tyco International Ltd. | $ | 135,240 | ||||
| ENVIRONMENTAL CONTROL – 1.2% | |||||||
| 10,000 | Waste Management, Inc. | 419,300 | |||||
| FOOD – 3.3% | |||||||
| 3,000 | Kraft Foods Group, Inc. | 165,390 | |||||
| 9,000 | Mondelez International, Inc., Class A | 265,140 | |||||
| 16,400 | Unilever PLC ADR | 688,964 | |||||
| 1,119,494 | |||||||
| HEALTHCARE-PRODUCTS – 0.6% | |||||||
| 3,162 | Covidien PLC | 201,103 | |||||
| HEALTHCARE-SERVICES – 1.0% | |||||||
| 4,300 | WellPoint, Inc. | 330,971 | |||||
| HOLDING COMPANIES-DIVERSIFIED – 2.7% | |||||||
| 28,800 | Leucadia National Corp. | 903,744 | |||||
| HOUSEHOLD PRODUCTS/WARES – 3.5% | |||||||
| 8,400 | Clorox Co. | 697,872 | |||||
| 5,000 | Kimberly-Clark Corp. | 484,150 | |||||
| 1,182,022 | |||||||
| INSURANCE – 2.6% | |||||||
| 3 | Berkshire Hathaway, Inc., Class A* | 513,900 | |||||
| 4,300 | Travelers Cos., Inc. | 359,996 | |||||
| 873,896 | |||||||
| INTERNET – 5.1% | |||||||
| 24,000 | Symantec Corp.* | 537,360 | |||||
| 45,000 | Yahoo!, Inc.* | 1,183,500 | |||||
| 1,720,860 | |||||||
| MEDIA – 11.1% | |||||||
| 20,490 | CBS Corp., Class B | 1,014,255 | |||||
| 10,000 | DIRECTV* | 611,300 | |||||
| 44,500 | News Corp., Class A | 1,428,895 | |||||
| 11,900 | Thomson Reuters Corp. | 397,460 | |||||
| 5,166 | Time Warner, Inc. | 301,540 | |||||
| 3,753,450 | |||||||
| MISCELLANEOUS MANUFACTURING – 3.8% | |||||||
| 5,100 | 3M Co. | 562,377 | |||||
| 2,300 | Danaher Corp. | 142,186 | |||||
| 10,200 | Ingersoll-Rand PLC | 586,806 | |||||
| 1,291,369 | |||||||
See accompanying Notes to Financial Statements.
8
QUEENS ROAD VALUE FUND SCHEDULES OF INVESTMENTS (Continued) As of May 31, 2013 |
| NUMBER OF SHARES | VALUE | ||||||
| OIL & GAS – 1.3% | |||||||
| 4,700 | Exxon Mobil Corp. | $ | 425,209 | ||||
| PHARMACEUTICALS – 9.0% | |||||||
| 5,000 | Bristol-Myers Squibb Co. | 230,050 | |||||
| 9,000 | GlaxoSmithKline PLC ADR | 465,930 | |||||
| 10,050 | Johnson & Johnson | 846,009 | |||||
| 13,820 | Merck & Co., Inc. | 645,394 | |||||
| 31,000 | Pfizer, Inc. | 844,130 | |||||
| 3,031,513 | |||||||
| RETAIL – 3.2% | |||||||
| 4,225 | McDonald's Corp. | 408,008 | |||||
| 45,000 | Staples, Inc. | 675,000 | |||||
| 1,083,008 | |||||||
| SEMICONDUCTORS – 1.2% | |||||||
| 16,000 | Intel Corp. | 388,480 | |||||
| SOFTWARE – 3.7% | |||||||
| 11,500 | Microsoft Corp. | 401,120 | |||||
| 25,000 | Oracle Corp. | 844,000 | |||||
| 1,245,120 | |||||||
| TELECOMMUNICATIONS – 8.1% | |||||||
| 21,100 | AT&T, Inc. | 738,289 | |||||
| 30,000 | Cisco Systems, Inc. | 722,400 | |||||
| 20,000 | Corning, Inc. | 307,400 | |||||
| 120,000 | Nokia OYJ ADR* | 412,800 | |||||
| 10,000 | Verizon Communications, Inc. | 484,800 | |||||
| 10,000 | Windstream Corp. | 80,300 | |||||
| 2,745,989 | |||||||
| TOTAL COMMON STOCKS | |||||||
| (Cost $21,843,842) | 31,924,346 | ||||||
| EXCHANGE-TRADED FUNDS – 1.2% | |||||||
| COMMODITY FUND – 1.2% | |||||||
| 30,000 | iShares Gold Trust* | 403,800 | |||||
| TOTAL EXCHANGE-TRADED FUNDS | |||||||
| (Cost $295,770) | 403,800 | ||||||
| SHORT-TERM INVESTMENTS – 3.9% | |||||||
| 1,324,732 | Invesco Short Term Investment Prime Portfolio, 0.03%** | $ | 1,324,732 | ||||
| TOTAL SHORT-TERM INVESTMENTS | |||||||
| (Cost $1,324,732) | 1,324,732 | ||||||
| TOTAL INVESTMENTS – 99.8% | |||||||
| (Cost $23,464,344) | 33,652,878 | ||||||
| Other Assets in Excess of Liabilities – 0.2% | 55,960 | ||||||
| TOTAL NET ASSETS – 100.0% | $ | 33,708,838 | |||||
| ADR – American Depositary Receipt |
| PLC – Public Limited Company |
| * | Non-income Producing. |
| ** | Variable rate security; the coupon rate shown represents the yield at May 31, 2013. |
See accompanying Notes to Financial Statements.
9
QUEENS ROAD SMALL CAP VALUE FUND SCHEDULES OF INVESTMENTS As of May 31, 2013 |
NUMBER OF SHARES | VALUE | ||||||
| COMMON STOCKS – 73.2% | |||||||
| AEROSPACE/DEFENSE – 7.7% | |||||||
| 35,700 | Alliant Techsystems, Inc. | $ | 2,803,164 | ||||
| 32,315 | Cubic Corp. | 1,538,194 | |||||
| 91,620 | Ducommun, Inc.* | 1,780,177 | |||||
| 6,121,535 | |||||||
| APPAREL – 1.2% | |||||||
| 67,026 | Delta Apparel, Inc.* | 983,942 | |||||
| AUTO MANUFACTURERS – 2.6% | |||||||
| 52,626 | Oshkosh Corp.* | 2,095,567 | |||||
| COMMERCIAL SERVICES – 2.2% | |||||||
| 66,717 | Valassis Communications, Inc. | 1,733,975 | |||||
| COMPUTERS – 6.5% | |||||||
| 20,000 | Digimarc Corp. | 460,200 | |||||
| 29,000 | DST Systems, Inc. | 1,977,220 | |||||
| 26,555 | Imation Corp.* | 108,875 | |||||
| 60,832 | Radisys Corp.* | 304,160 | |||||
| 42,000 | Synaptics, Inc.* | 1,732,920 | |||||
| 29,400 | Unisys Corp.* | 607,110 | |||||
| 5,190,485 | |||||||
| COSMETICS/PERSONAL CARE – 1.2% | |||||||
| 31,700 | Inter Parfums, Inc. | 950,366 | |||||
| DISTRIBUTION/WHOLESALE – 4.0% | |||||||
| 51,080 | Owens & Minor, Inc. | 1,745,914 | |||||
| 40,555 | United Stationers, Inc. | 1,399,553 | |||||
| 3,145,467 | |||||||
| DIVERSIFIED FINANCIAL SERVICES – 0.8% | |||||||
| 76,400 | Janus Capital Group, Inc. | 670,028 | |||||
| ELECTRIC – 0.8% | |||||||
| 12,350 | MGE Energy, Inc. | 659,120 | |||||
| ELECTRONICS – 7.3% | |||||||
| 9,384 | Bel Fuse, Inc., Class B | 149,393 | |||||
| 25,400 | Park Electrochemical Corp. | 613,410 | |||||
| 33,000 | Tech Data Corp.* | 1,653,960 | |||||
| 145,100 | TTM Technologies, Inc.* | 1,172,408 | |||||
| 151,408 | Vishay Intertechnology, Inc.* | 2,204,501 | |||||
| 5,793,672 | |||||||
| ENGINEERING & CONSTRUCTION – 1.8% | |||||||
| 28,919 | URS Corp. | 1,400,836 | |||||
| ENVIRONMENTAL CONTROL – 3.0% | |||||||
| 121,700 | Darling International, Inc.* | $ | 2,386,537 | ||||
| GAS – 5.5% | |||||||
| 28,520 | New Jersey Resources Corp. | 1,294,238 | |||||
| 33,900 | Piedmont Natural Gas Co., Inc. | 1,145,481 | |||||
| 20,000 | South Jersey Industries, Inc. | 1,168,400 | |||||
| 20,000 | UGI Corp. | 763,800 | |||||
| 4,371,919 | |||||||
| HEALTHCARE-PRODUCTS – 3.3% | |||||||
| 2,703 | Atrion Corp. | 595,957 | |||||
| 45,000 | STERIS Corp. | 2,040,300 | |||||
| 2,636,257 | |||||||
| HOUSEHOLD PRODUCTS/WARES – 2.0% | |||||||
| 52,600 | Prestige Brands Holdings, Inc.* | 1,545,914 | |||||
| INSURANCE – 8.4% | |||||||
| 28,888 | American Safety Insurance Holdings Ltd.* | 692,156 | |||||
| 15,456 | Endurance Specialty Holdings Ltd. | 777,901 | |||||
| 78,687 | Hilltop Holdings, Inc.* | 1,258,992 | |||||
| 82,600 | Horace Mann Educators Corp. | 2,007,180 | |||||
| 25,900 | RLI Corp. | 1,944,572 | |||||
| 6,680,801 | |||||||
| MACHINERY-DIVERSIFIED – 3.7% | |||||||
| 25,875 | Graco, Inc. | 1,667,644 | |||||
| 44,502 | Hurco Cos., Inc.* | 1,277,207 | |||||
| 2,944,851 | |||||||
| MEDIA – 2.3% | |||||||
| 18,061 | Meredith Corp. | 740,140 | |||||
| 35,545 | Scholastic Corp. | 1,074,881 | |||||
| 1,815,021 | |||||||
| MINING – 0.7% | |||||||
| 29,100 | Horsehead Holding Corp.* | 334,941 | |||||
| 560,592 | USEC, Inc.* | 207,139 | |||||
| 542,080 | |||||||
| OIL & GAS – 0.2% | |||||||
| 20,000 | Vaalco Energy, Inc.* | 122,400 | |||||
| RETAIL – 1.7% | |||||||
| 22,952 | Books-A-Million, Inc.* | 69,085 | |||||
| 48,000 | Cato Corp., Class A | 1,195,200 | |||||
| 26,221 | RadioShack Corp. | 97,018 | |||||
| 1,361,303 | |||||||
| SOFTWARE – 1.2% | |||||||
| 7,192 | CSG Systems International, Inc.* | 155,419 | |||||
| 19,222 | SYNNEX Corp.* | 779,452 | |||||
| 934,871 | |||||||
See accompanying Notes to Financial Statements.
10
QUEENS ROAD SMALL CAP VALUE FUND SCHEDULES OF INVESTMENTS (Continued) As of May 31, 2013 |
| NUMBER OF SHARES | VALUE | ||||||
| TELECOMMUNICATIONS – 2.2% | |||||||
| 38,400 | Plantronics, Inc. | $ | 1,774,080 | ||||
| TEXTILES – 2.9% | |||||||
| 23,864 | UniFirst Corp. | 2,264,694 | |||||
| TOTAL COMMON STOCKS | |||||||
| (Cost $41,623,895) | 58,125,721 | ||||||
| MUTUAL FUNDS – 1.2% | |||||||
| 56,846 | Central Fund of Canada Ltd., Class A*** | 907,262 | |||||
| TOTAL MUTUAL FUNDS | |||||||
| (Cost $811,601) | 907,262 | ||||||
| SHORT-TERM INVESTMENTS – 25.7% | |||||||
| 20,427,999 | Invesco Short Term Investment Prime Portfolio, 0.03%** | 20,427,999 | |||||
| TOTAL SHORT-TERM INVESTMENTS | |||||||
| (Cost $20,427,999) | 20,427,999 | ||||||
| TOTAL INVESTMENTS – 100.1% | |||||||
| (Cost $62,863,495) | 79,460,982 | ||||||
| Liabilities in Excess of Other Assets – (0.1)% | (40,086 | ) | |||||
| TOTAL NET ASSETS – 100.0% | $ | 79,420,896 | |||||
| * | Non-income Producing. |
| ** | Variable rate security; the coupon rate shown represents the yield at May 31, 2013. |
| *** | Passive foreign investment company. |
See accompanying Notes to Financial Statements.
11
QUEENS ROAD FUNDS STATEMENTS OF ASSETS AND LIABILITIES As of May 31, 2013 |
Value Fund | Small Cap Value Fund | |||||||
| Assets: | ||||||||
Investments, at Value (cost $23,464,344, $62,863,495) | $ | 33,652,878 | $ | 79,460,982 | ||||
| Receivables: | ||||||||
Shareholder Subscriptions | 6,586 | 7,853 | ||||||
Dividends and Interest | 77,010 | 56,801 | ||||||
Total Assets | 33,736,474 | 79,525,636 | ||||||
| Liabilities: | ||||||||
| Payables: | ||||||||
Shareholder Redemptions | — | 21,456 | ||||||
Accrued Management Fees (Note 3) | 27,636 | 83,284 | ||||||
Total Liabilities | 27,636 | 104,740 | ||||||
Net Assets | $ | 33,708,838 | $ | 79,420,896 | ||||
| Components of Net Assets: | ||||||||
| Capital (par value of $0.001 per share with an unlimited number of shares authorized) | $ | 25,084,312 | $ | 63,534,718 | ||||
Accumulated Undistributed Net Investment Income (Distributions in Excess of Net Investment Income) | 144,590 | (582,578 | ) | |||||
Accumulated Undistributed Net Realized Loss on Investments | (1,708,598 | ) | (128,731 | ) | ||||
Net Unrealized Appreciation on Investments | 10,188,534 | 16,597,487 | ||||||
Net Assets | $ | 33,708,838 | $ | 79,420,896 | ||||
Shares of Beneficial Interest Issued and Outstanding | 1,965,540 | 3,810,405 | ||||||
Net Asset Value, Offering and Redemption Price Per Share | $ | 17.15 | $ | 20.84 | ||||
See accompanying Notes to Financial Statements.
12
QUEENS ROAD FUNDS STATEMENTS OF OPERATIONS For the year ended May 31, 2013 |
Value Fund | Small Cap Value Fund | |||||||
| Investment Income: | ||||||||
Dividends (net of foreign withholding taxes of $2,074, $85) | $ | 669,325 | $ | 1,088,522 | ||||
Interest | 1,498 | 14,902 | ||||||
Total investment income | 670,823 | 1,103,424 | ||||||
| Expenses: | ||||||||
Advisory Fees (Note 3) | 284,360 | 904,323 | ||||||
Total Expenses | 284,360 | 904,323 | ||||||
Net Investment Income | 386,463 | 199,101 | ||||||
| Realized and Unrealized Gain (Loss) on Investments: | ||||||||
Net Realized Gain (Loss) on Investments | (317,218 | ) | 550,414 | |||||
Net Change in Unrealized Appreciation on Investments | 7,443,265 | 13,670,808 | ||||||
Net Realized and Unrealized Gain on Investments | 7,126,047 | 14,221,222 | ||||||
Net Increase in Net Assets from Operations | $ | 7,512,510 | $ | 14,420,323 | ||||
See accompanying Notes to Financial Statements.
13
QUEENS ROAD FUNDS STATEMENTS OF CHANGES IN NET ASSETS |
Value Fund | Small Cap Value Fund | |||||||||||||||
For the year ended May 31, 2013 | For the year ended May 31, 2012 | For the year ended May 31, 2013 | For the year ended May 31, 2012 | |||||||||||||
| Increase in Net Assets From: | ||||||||||||||||
| Operations: | ||||||||||||||||
Net Investment Income | $ | 386,463 | $ | 371,946 | $ | 199,101 | $ | 7,354 | ||||||||
Net Realized Gain (Loss) on Investments | (317,218 | ) | 274,176 | 550,414 | 901,200 | |||||||||||
Net Change in Unrealized Appreciation (Depreciation) on Investments | 7,443,265 | (1,550,850 | ) | 13,670,808 | (6,918,496 | ) | ||||||||||
Net Increase/(Decrease) in Net Assets Resulting from Operations | 7,512,510 | (904,728 | ) | 14,420,323 | (6,009,942 | ) | ||||||||||
| Distributions to Shareholders From: | ||||||||||||||||
Net Investment Income | (429,138 | ) | (293,821 | ) | (190,758 | ) | (256,311 | ) | ||||||||
Net Realized Gains | — | — | (966,403 | ) | (4,002,745 | ) | ||||||||||
Net Change in Net Assets from Distributions | (429,138 | ) | (293,821 | ) | (1,157,161 | ) | (4,259,056 | ) | ||||||||
| Capital Transactions: | ||||||||||||||||
Proceeds from Sale of Shares | 2,542,040 | 5,234,607 | 16,017,867 | 25,030,099 | ||||||||||||
Net Asset Value of Shares Issued on Reinvestment of Dividends | 265,618 | 196,137 | 920,710 | 3,380,784 | ||||||||||||
Cost of Shares Redeemed | (3,184,882 | ) | (3,060,407 | ) | (15,999,868 | ) | (9,685,204 | ) | ||||||||
Net Increase (Decrease) in Net Assets from Capital Transactions | (377,224 | ) | 2,370,337 | 938,709 | 18,725,679 | |||||||||||
Total Increase in Net Assets | 6,706,148 | 1,171,788 | 14,201,871 | 8,456,681 | ||||||||||||
| Net Assets: | ||||||||||||||||
Beginning of Year | 27,002,690 | 25,830,902 | 65,219,025 | 56,762,344 | ||||||||||||
End of Year | $ | 33,708,838 | $ | 27,002,690 | $ | 79,420,896 | $ | 65,219,025 | ||||||||
| Accumulated Undistributed Net Investment Income (Distributions in Excess of Net Investment Income) | $ | 144,590 | $ | 197,891 | $ | (582,578 | ) | $ | (521,897 | ) | ||||||
| Capital Share Transactions: | ||||||||||||||||
Shares Sold | 165,515 | 381,432 | 862,022 | 1,335,395 | ||||||||||||
Shares Issued on Reinvestment of Dividends | 18,156 | 14,338 | 50,230 | 187,509 | ||||||||||||
Shares Redeemed | (206,977 | ) | (226,112 | ) | (850,893 | ) | (520,104 | ) | ||||||||
Net Increase/(Decrease) in Shares | (23,306 | ) | 169,658 | 61,359 | 1,002,800 | |||||||||||
See accompanying Notes to Financial Statements.
14
QUEENS ROAD VALUE FUND FINANCIAL HIGHLIGHTS |
Per share operating performance
For a capital share outstanding throughout each year
Year Ended May 31, 2013 | Year Ended May 31, 2012 | Year Ended May 31, 2011 | Year Ended May 31, 2010 | Year Ended May 31, 2009 | ||||||||||||||||
| Net Asset Value, Beginning of Year | $ | 13.58 | $ | 14.20 | $ | 12.05 | $ | 10.26 | $ | 15.13 | ||||||||||
| Income from Investment Operations: | ||||||||||||||||||||
| Net Investment Income* | 0.20 | 0.20 | 0.16 | 0.13 | 0.20 | |||||||||||||||
| Net Realized and Unrealized Gain (Loss) on Investments | 3.59 | (0.66 | ) | 2.11 | 1.79 | (4.88 | ) | |||||||||||||
| Total from Investment Operations | 3.79 | (0.46 | ) | 2.27 | 1.92 | (4.68 | ) | |||||||||||||
| Less Distributions: | ||||||||||||||||||||
| Net Investment Income | (0.22 | ) | (0.16 | ) | (0.12 | ) | (0.13 | ) | (0.19 | ) | ||||||||||
| Net Realized Gains | — | — | — | — | (0.00 | )** | ||||||||||||||
| Total Distributions | (0.22 | ) | (0.16 | ) | (0.12 | ) | (0.13 | ) | (0.19 | ) | ||||||||||
| Net Asset Value, End of Year | $ | 17.15 | $ | 13.58 | $ | 14.20 | $ | 12.05 | $ | 10.26 | ||||||||||
| �� | ||||||||||||||||||||
| Total Return | 28.19 | % | (3.28 | )% | 18.92 | % | 18.64 | % | (30.90 | )% | ||||||||||
| Ratios and Supplemental Data: | ||||||||||||||||||||
| Net Assets, End of Year (in thousands) | $ | 33,709 | $ | 27,003 | $ | 25,831 | $ | 17,783 | $ | 12,424 | ||||||||||
| Ratio of Expenses to Average Net Assets | 0.95 | % | 0.95 | % | 0.95 | % | 0.95 | % | 0.95 | % | ||||||||||
| Ratio of Net Investment Income to Average Net Assets | 1.29 | % | 1.44 | % | 1.20 | % | 1.08 | % | 1.83 | % | ||||||||||
| Portfolio turnover rate | 4 | % | 5 | % | 15 | % | 6 | % | 38 | % | ||||||||||
| * | Computed using average shares method. |
| ** | Amount is less than $0.005 per share. |
See accompanying Notes to Financial Statements.
15
QUEENS ROAD SMALL CAP VALUE FUND FINANCIAL HIGHLIGHTS |
Per share operating performance
For a capital share outstanding throughout each year
Year Ended May 31, 2013 | Year Ended May 31, 2012 | Year Ended May 31, 2011 | Year Ended May 31, 2010 | Year Ended May 31, 2009 | ||||||||||||||||
| Net Asset Value, Beginning of Year | $ | 17.40 | $ | 20.67 | $ | 17.77 | $ | 13.94 | $ | 17.16 | ||||||||||
| Income from Investment Operations: | ||||||||||||||||||||
| Net Investment Income (Loss)* | 0.05 | 0.00 | ** | (0.08 | ) | (0.06 | ) | 0.05 | ||||||||||||
| Net Realized and Unrealized Gain (Loss) on Investments | 3.69 | (1.96 | ) | 3.57 | 3.89 | (3.18 | ) | |||||||||||||
| Total from Investment Operations | 3.74 | (1.96 | ) | 3.49 | 3.83 | (3.13 | ) | |||||||||||||
| Less Distributions: | ||||||||||||||||||||
| Net Investment Income | (0.05 | ) | (0.08 | ) | — | — | (0.07 | ) | ||||||||||||
| Net Realized Gains | (0.25 | ) | (1.23 | ) | (0.59 | ) | — | (0.00 | )** | |||||||||||
| Return of Capital | — | — | — | — | (0.02 | ) | ||||||||||||||
| Total Distributions | (0.30 | ) | (1.31 | ) | (0.59 | ) | — | (0.09 | ) | |||||||||||
| Net Asset Value, End of Year | $ | 20.84 | $ | 17.40 | $ | 20.67 | $ | 17.77 | $ | 13.94 | ||||||||||
| Total Return | 21.75 | % | (9.71 | )% | 19.78 | % | 27.47 | % | (18.14 | )% | ||||||||||
| Ratios and Supplemental Data: | ||||||||||||||||||||
| Net Assets, End of Year (in thousands) | $ | 79,421 | $ | 65,219 | $ | 56,762 | $ | 37,370 | $ | 20,678 | ||||||||||
| Ratio of Expenses to Average Net Assets | 1.24 | % | 1.24 | % | 1.24 | % | 1.24 | % | 1.35 | % | ||||||||||
| Ratio of Net Investment Income to Average Net Assets | 0.27 | % | 0.01 | % | (0.42 | )% | (0.38 | )% | 0.41 | % | ||||||||||
| Portfolio turnover rate | 10 | % | 14 | % | 38 | % | 31 | % | 36 | % | ||||||||||
| * | Computed using average shares method. |
| ** | Amount is less than $0.005 per share. |
See accompanying Notes to Financial Statements.
16
QUEENS ROAD FUNDS NOTES TO THE FINANCIAL STATEMENTS May 31, 2013 |
| Note 1. Organization |
The Queens Road Value Fund and the Queens Road Small Cap Value Fund (individually referred to as the “Value Fund” and “Small Cap Value Fund”, respectively, or collectively as the “Funds”), are managed portfolios of the Bragg Capital Trust (the “Trust”), which are registered under the Investment Company Act of 1940, as amended, as a non-diversified, open-end management company. The Funds’ investment objective is to seek growth of capital. The Funds invest primarily in common stocks which are believed by the Advisor to be undervalued and have good prospects for capital appreciation. The Small Cap Value Fund invests (under normal market conditions), at least 80% of its total assets in small capitalization (less than $2 billion market cap at the time of purchase) common stocks. The Funds’ registration statement was declared effective on June 13, 2002, and operations began on that date.
| Note 2. Significant Accounting Policies |
The following is a summary of accounting policies followed by the Funds in the preparation of their financial statements.
Federal Income Taxes: Each Fund intends to comply with the requirements of Subchapter M of the Internal Revenue Code applicable to regulated investment companies and to distribute substantially all of its net investment income and any net realized gains to its shareholders. Therefore, no provision is made for federal income or excise taxes.
Accounting for Uncertainty in Income Taxes (the “Income Tax Statement”) requires an evaluation of tax positions taken (or expected to be taken) in the course of preparing a Fund’s tax returns to determine whether these positions meet a “more-likely-than-not” standard that, based on the technical merits, have a more than fifty percent likelihood of being sustained by a taxing authority upon examination. A tax position that meets the “more-likely-than-not” recognition threshold is measured to determine the amount of benefit to recognize in the financial statements. The Funds recognize interest and penalties, if any, related to unrecognized tax benefits as income tax expense in the Statements of Operations.
The Income Tax Statement requires management of the Funds to analyze all open tax years 2009 – 2012, as defined by IRS statute of limitations for all major jurisdictions, including federal tax authorities and certain state tax authorities. As of and during the year ended May 31, 2013, the Funds did not have a liability for any unrecognized tax benefits. The Funds have no examination in progress and are not aware of any tax positions for which it is reasonably possible that the total amounts of unrecognized tax benefits will significantly change in the next twelve months.
Distributions to Shareholders: Distributions to shareholders, which are determined in accordance with income tax regulations, are recorded on the ex-dividend date. The character of distributions made during the year from net investment income or net realized gain may differ from the characterization for federal income tax purposes due to differences in the recognition of income, expense and gain/(loss) items for financial statement and tax purposes. Where appropriate, reclassifications between net asset accounts are made for such differences that are permanent in nature.
Use of Estimates: The preparation of financial statements in conformity with generally accepted accounting principles (“GAAP”) requires management to make estimates and assumptions that affect the reported amounts of assets and liabilities, and disclosure of contingent assets and liabilities at the date of the financial statements and the reported amounts of increases and decreases in net assets from operations during the reporting period. Actual results could differ from those estimates.
Other: The Funds follow industry practice and record security transactions on the trade date. The specific identification method is used for determining gains or losses for financial statement and income tax purposes. Dividend income is recorded on the ex-dividend date, except that certain dividends from foreign securities are recorded as soon as information is available to the Funds. Interest income is recorded on an accrual basis. Discounts and premiums on securities purchased are amortized over the life of the respective securities.
17
QUEENS ROAD FUNDS NOTES TO THE FINANCIAL STATEMENTS (Continued) May 31, 2013 |
Security Valuation: Securities, including common stocks and exchange traded funds, which are traded on a national securities exchange are valued at the last quoted sales price, and generally classified as a Level 1 investment. Investments in mutual funds, including money market funds, are valued at the ending net asset value provided by the funds, and generally classified as a Level 1 investment. If there are no sales reported, the Fund’s portfolio securities will be valued using the last reported bid price. Short-term obligations having remaining maturities of 60 days or less are valued at amortized cost, and generally classified as a Level 2 investment. Securities for which market quotations are not readily available are valued at fair value as determined in good faith by and under the direction of the Trust’s Board of Trustees, and generally classified as a Level 3 investment.
In accordance with GAAP, fair value is defined as the price that the Funds would receive to sell an asset or pay to transfer a liability in an orderly transaction between market participants at the measurement date. GAAP also establishes a framework for measuring fair value, and a three-level hierarchy for fair value measurements based upon the transparency of inputs to the valuation of an asset or liability. The three-tier hierarchy of inputs is summarized below.
| • | Level 1 – Unadjusted quoted prices in active markets for identical assets or liabilities that the company has the ability to access. An active market for the security is a market in which transactions occur with sufficient frequency and volume to provide pricing information on an ongoing basis. Common Stocks, Exchange-Traded Funds and Mutual Funds are generally categorized as Level 1. |
| • | Level 2 – Observable inputs other than quoted prices included in Level 1 that are observable for the asset or liability, either directly or indirectly. These inputs may include quoted prices for the identical instrument on an inactive market, prices for similar instruments, interest rates, prepayment speeds, credit risk, yield curves, default rates and similar data. Fixed income securities, repurchase agreements, and securities valued by an independent fair value pricing service are generally categorized as Level 2. |
| • | Level 3 – Unobservable inputs for the asset or liability, to the extent relevant observable inputs are not available, representing the company’s own assumptions about the assumptions a market participant would use in valuing the asset or liability, and would be based on the best information available. |
The availability of observable inputs can vary from security to security and is affected by a wide variety of factors, including, for example, the type of security, whether the security is new and not yet established in the marketplace, the liquidity of markets, and other characteristics particular to the security. To the extent that valuation is based on models or inputs that are less observable or unobservable in the market, the determination of fair value requires more judgment. Accordingly, the degree of judgment exercised in determining fair value is greatest for instruments categorized in Level 3.
The Funds did not hold any Level 2 or Level 3 securities during the year ended May 31, 2013. There were no transfers into and out of any level during the current year. It is the Funds’ policy to recognize transfers into and out of all levels at the end of the reporting period.
Value Fund | ||||||||||||||||
Level 1 – Quoted Prices | Level 2 – Other Significant Observable Inputs | Level 3 – Significant Unobservable Inputs | Total | |||||||||||||
Common Stocks* | $ | 31,924,346 | $ | — | $ | — | $ | 31,924,346 | ||||||||
Exchange-Traded Funds | 403,800 | — | — | 403,800 | ||||||||||||
Short-Term Investments | 1,324,732 | — | — | 1,324,732 | ||||||||||||
Total | $ | 33,652,878 | $ | — | $ | — | $ | 33,652,878 | ||||||||
18
QUEENS ROAD FUNDS NOTES TO THE FINANCIAL STATEMENTS (Continued) May 31, 2013 |
Small Cap Value Fund | ||||||||||||||||
Level 1 – Quoted Prices | Level 2 – Other Significant Observable Inputs | Level 3 – Significant Unobservable Inputs | Total | |||||||||||||
Common Stocks* | $ | 58,125,721 | $ | — | $ | — | $ | 58,125,721 | ||||||||
Mutual Funds | 907,262 | — | — | 907,262 | ||||||||||||
Short-Term Investments | 20,427,999 | — | — | 20,427,999 | ||||||||||||
Total | $ | 79,460,982 | $ | — | $ | — | $ | 79,460,982 | ||||||||
| * | All sub-categories within common stocks represent Level 1 evaluation status. See Schedules of Investments for industry categories. |
The Funds have adopted Amendments to Achieve Common Fair Value Measurement and Disclosure Requirements in U.S. GAAP and International Financial Reporting Standards (“IFRS”) which amends Fair Value Measurements and Disclosures to establish common requirements for measuring fair value and for disclosing information about fair value measurements in accordance with U.S. GAAP and IFRS. Enhanced disclosure is required to detail any transfers into and out of Level 1 and Level 2 measurements and Level 2 and Level 3 measurements and the reasons for the transfers.
| Note 3. Investment Advisory Fee and Other Transactions with Affiliates |
The Funds retain Bragg Financial Advisors, Inc. (the “Advisor”) as their investment advisor. Under the terms of the management agreement, the Advisor provides investment management and administrative services for the Funds. For its services as Advisor, the Value Fund and Small Cap Value Fund pay a fee, computed daily and payable monthly at the annual rate of 0.95% and 1.24% of each Fund’s first $250,000,000 of net assets, 0.85% and 1.24% of each Fund’s next $250,000,000 of net assets, and 0.80% and 1.15% of each Fund’s net assets over $500,000,000, respectively. For the year ended May 31, 2013, the Advisor earned $284,360 and $904,323 from the Value Fund and Small Cap Value Fund, respectively. From these fees and its own resources the Advisor agreed to pay other operating expenses of the Funds including transfer agent fees, fund accountant fees, administrator fees, registration fees, custodial fees, and other ordinary expenses of the Funds. However, the agreement does not require the Advisor to pay interest, taxes, brokerage commissions, and extraordinary expenses of the Funds. The amount due to the Advisor at May 31, 2013, from the Value Fund and Small Cap Value Fund was $27,636 and $83,284, respectively.
Certain employees and officers of the Advisor are also “interested persons” (as defined in the Investment Company Act of 1940) of the Trust. Each “non- interested” Trustee is entitled to receive an annual fee of $1,000 plus expenses for services relating to the Trust which is paid by the Advisor.
Queens Road Securities (“QRS”) acts as the principal underwriter in the continuous public offering of the Funds’ shares. Certain officers of the Trust are also officers of QRS. QRS did not receive or waive any brokerage fees on executions of purchases and sales of the Funds’ portfolio investments during the year ended May 31, 2013.
| Note 4. Capital Stock |
The Articles of Incorporation permit the Trustees to issue an indefinite number of full and fractional shares of common stock, each with a par value of $0.001. At May 31, 2013, there were 1,965,540 and 3,810,405 of shares outstanding in the Value Fund and Small Cap Value Fund, respectively.
19
QUEENS ROAD FUNDS NOTES TO THE FINANCIAL STATEMENTS (Continued) May 31, 2013 |
| Note 5. Investment Transactions |
For the year ended May 31, 2013, the cost of purchases and the proceeds from sales of portfolio securities, other than short-term investments, amounted to $1,165,612 and $1,674,506, respectively, for the Value Fund, and $5,506,914 and $10,692,558, respectively, for the Small Cap Value Fund.
| Note 6. Federal Income Taxes |
At May 31, 2013, gross unrealized appreciation and depreciation of investments based on cost for federal income tax purposes were as follows:
Value Fund | Small Cap Value Fund | |||||||
Cost of Investments | $ | 23,456,453 | $ | 62,916,215 | ||||
Gross Unrealized Appreciation | $ | 10,741,098 | $ | 18,205,099 | ||||
Gross Unrealized Depreciation | (544,673 | ) | (1,660,332 | ) | ||||
Net Unrealized Appreciation on Investments | $ | 10,196,425 | $ | 16,544,767 | ||||
The difference between cost amounts for financial statement and federal income tax purposes is due primarily to wash sale loss deferrals and passive foreign investment companies (“PFICs”).
GAAP requires that certain components of net assets be reclassified between financial and tax reporting. These reclassifications have no effect on net assets or net asset value per share. For the year ended May 31, 2013, permanent differences in book and tax accounting have been reclassified to paid-in capital, undistributed net investment income (loss) and accumulated realized gain (loss) as follows:
Increase (Decrease) | ||||||||||||
Paid-in Capital | Undistributed Net Investment Income (Loss) | Accumulated Net Realized Gain (Loss) | ||||||||||
Value Fund | $ | — | $ | (10,626 | ) | $ | 10,626 | |||||
Small Cap Value Fund | (4,118 | ) | (69,024 | ) | 73,142 | |||||||
As of May 31, 2013, the components of accumulated earnings on a tax basis were as follows:
Value Fund | Small Cap Value Fund | |||||||
Undistributed Ordinary Income | $ | 144,590 | $ | — | ||||
Undistributed Long-Term Capital Gains | — | — | ||||||
Tax Accumulated Earnings | 144,590 | — | ||||||
Accumulated Capital and Other Losses | (1,716,489 | ) | (658,589 | ) | ||||
Net Unrealized Appreciation | 10,196,425 | 16,544,767 | ||||||
Total Accumulated Earnings | $ | 8,624,526 | $ | 15,886,178 | ||||
20
QUEENS ROAD FUNDS NOTES TO THE FINANCIAL STATEMENTS (Continued) May 31, 2013 |
At May 31, 2013, the Funds had accumulated capital loss carryforwards as follows:
Value Fund | Small Cap Value Fund | |||||||
| For losses expiring May 31, | ||||||||
2017 | $ | 191,688 | $ | — | ||||
2018 | 1,208,071 | — | ||||||
Non-expiring short-term capital loss carryforward | 17,543 | 201,635 | ||||||
| $ | 1,417,302 | $ | 201,635 | |||||
To the extent that a fund may realize future net capital gains, those gains will be offset by any of its unused capital loss carryforward. Future loss carryforward utilization in any given year may be subject to Internal Revenue Code limitations.
Under The Registered Investment Company Modernization Act of 2010 (the “Modernization Act”), capital losses incurred during the fiscal years beginning after the enactment date of the Modernization Act (December 22, 2010) are carried forward indefinitely and retain the character of the original loss. However, any remaining pre-enactment capital loss carryovers may expire unused, since the post-enactment capital losses are utilized before pre-enactment capital loss carryovers according to the Modernization Act.
Post-October capital losses and late-year ordinary losses incurred after October 31 and within the taxable year are deemed to arise on the first business day of the Funds’ next taxable year. As of May 31, 2013, the following Funds had the following post-October capital-losses and late-year ordinary losses:
Value Fund | Small Cap Value Fund | |||||||
Post-October capital losses | $ | 299,187 | $ | — | ||||
Late-year ordinary losses | — | 456,954 | ||||||
The tax character of distributions paid during the fiscal years ended May 31, 2013, and May 31, 2012, were as follows:
Fund | Value Fund | Small Cap Value Fund | ||||||||||||||
| Distributions paid from: | May 31, 2013 | May 31, 2012 | May 31, 2013 | May 31, 2012 | ||||||||||||
Ordinary Income | $ | 429,138 | $ | 293,821 | $ | 1,153,043 | $ | 1,307,576 | ||||||||
Return of Capital | — | — | 4,118 | — | ||||||||||||
Net Long-Term Capital Gains | — | — | — | 2,951,480 | ||||||||||||
Total Taxable Distributions Paid | $ | 429,138 | $ | 293,821 | $ | 1,157,161 | $ | 4,259,056 | ||||||||
| Note 7. Control |
The beneficial ownership, either directly or indirectly, of more than 25% of the voting securities of a fund creates a presumption of control of the fund, under section 2 (a) (9) of the Investment Company Act of 1940. As of May 31, 2013, Pershing, LLC., for the benefit of its customers, owned 97.56% and 50.56% of the Value Fund and Small Cap Value Fund, respectively, and Charles Schwab & Co., Inc., for the benefit of its customers, owned 32.90% of the Small Cap Value Fund.
21
QUEENS ROAD FUNDS REPORT OF INDEPENDENT REGISTERED PUBLIC ACCOUNTING FIRM |
To the Shareholders and Board of Trustees of
Bragg Capital Trust
We have audited the accompanying statements of assets and liabilities, including the schedules of investments of Bragg Capital Trust (the “Trust”), comprising Queens Road Value Fund and Queens Road Small Cap Value Fund (the “Funds”), as of May 31, 2013, and the related statements of operations for the year then ended, the statements of changes in net assets for each of the two years in the period then ended, and the financial highlights for each of the five years in the period then ended. These financial statements and financial highlights are the responsibility of Fund management. Our responsibility is to express an opinion on these financial statements and financial highlights based on our audits.
We conducted our audits in accordance with the standards of the Public Company Accounting Oversight Board (United States). Those standards require that we plan and perform the audit to obtain reasonable assurance about whether the financial statements and financial highlights are free of material misstatement. An audit includes examining, on a test basis, evidence supporting the amounts and disclosures in the financial statements. Our procedures included confirmation of securities owned as of May 31, 2013, by correspondence with the custodian. An audit also includes assessing the accounting principles used and significant estimates made by management, as well as evaluating the overall financial statement presentation. We believe that our audits provide a reasonable basis for our opinion.
In our opinion, the financial statements and financial highlights referred to above present fairly, in all material respects, the financial position of each of the Funds constituting Bragg Capital Trust as of May 31, 2013, the results of their operations for the year then ended, the changes in their net assets for each of the two years in the period then ended, and the financial highlights for each of the five years in the period then ended, in conformity with accounting principles generally accepted in the United States of America.
COHEN FUND AUDIT SERVICES, LTD.
Cleveland, Ohio
July 30, 2013
22
QUEENS ROAD FUNDS EXPENSE ILLUSTRATION May 31, 2013 (Unaudited) |
ABOUT YOUR FUND’S EXPENSES
Expense Example
As a shareholder of the Funds, you incur ongoing costs which typically consist of management fees and other Fund expenses. This Example is intended to help you understand your ongoing costs (in dollars) of investing in the Funds and to compare these costs with the ongoing costs of investing in other mutual funds.
The Example is based on an investment of $1,000 invested at the beginning of the period and held for the entire period, December 1, 2012 through May 31, 2013.
Actual Expenses
The first line of the table below provides information about actual account values and actual expenses. You may use the information in this line, together with the amount you invested, to estimate the expenses that you paid over the period. Simply divide your account value by $1,000 (for example, an $8,600 account value divided by $1,000 = 8.6), then multiply the result by the number in the first line under the heading entitled “Expenses Paid During Period” to estimate the expenses you paid on your account during this period.
Hypothetical Example for Comparison Purposes
The second line of the table below provides information about hypothetical account values and hypothetical expenses based on the Fund’s actual expense ratio and an assumed rate of return of 5% per year before expenses, which is not the Fund’s actual return. The hypothetical account values and expenses may not be used to estimate the actual ending account balance or expenses you paid for the period. You may use this information to compare the ongoing costs of investing in this Fund and other funds. To do so, compare this 5% hypothetical example with the 5% hypothetical examples that appear in the shareholder reports of the other funds.
Beginning Account Value December 1, 2012 | Ending Account Value May 31, 2013 | Expenses Paid During the Period* December 1,2012 to May 31,2013 | |
| Value Fund | |||
Actual | $1,000.00 | $1,186.60 | $5.18 |
Hypothetical (5% Annual Return before expenses) | $1,000.00 | $1,020.26 | $4.79 |
| Small Cap Fund | |||
Actual | $1,000.00 | $1,143.90 | $6.63 |
Hypothetical (5% Annual Return before expenses) | $1,000.00 | $1,018.82 | $6.24 |
| * | Expenses are equal to the Funds’ annualized expense ratio of 0.95 and 1.24%, respectively, multiplied by the average account value over the period, multiplied by 182/365 (to reflect the one-half year period). |
23
QUEENS ROAD FUNDS ADDITIONAL INFORMATION May 31, 2013 (Unaudited) |
Proxy Voting - A description of the policies and procedures that the Fund uses to determine how to vote proxies relating to portfolio securities and information regarding how the Fund voted proxies during the most recent 12 month period, are available without charge upon request by (1) calling the Fund at 1-800-595-3088 and (2) from Fund documents filed with the Securities and Exchange Commission (“SEC”) on the SEC’s website at www.sec.gov.
Portfolio Holdings - The Funds file a complete schedule of investments with the SEC for the first and third quarter of each fiscal year on Form N-Q. The Funds’ first and third fiscal quarters end on August 31 and February 28. The Form N-Q filing must be made within 60 days of the end of the quarter, and the Funds’ first Form N-Q was filed with the SEC on October 8, 2004. The Funds’ Form N-Qs are available on the SEC’s website at http://sec.gov, or they may be reviewed and copied at the SEC’s Public Reference Room in Washington, DC (call 1-800-732-0330 for information on the operation of the Public Reference Room). You may also obtain copies by calling the Fund at 1-800-595-3088.
Qualified Dividend Income and Dividend Received Deduction Designations - For the year ended May 31, 2013, 100.00% and 100.00% of the dividends paid from net investment income are designated as qualified dividend income for the Queens Road Value and Queens Road Small Cap Value Funds, respectively, while 57.01% of the dividends paid from short-term capital gains are designated as qualified dividend income for the Queens Road Small Cap Value Fund.
For the year ended May 31, 2013, 100.00% and 100.00% of the dividends paid from net investment income qualifies for the dividends received deduction available to corporate shareholders for the Queens Road Value and Queens Road Small Cap Value Funds, respectively, while 56.51% of the dividends paid from short-term capital gains qualifies for the dividends received deduction available to corporate shareholders for the Queens Road Small Cap Value Fund.
24
QUEENS ROAD FUNDS TRUSTEES INFORMATION May 31, 2013 (Unaudited) |
Information about Trustees who are “interested persons” of the Trust as defined under the 1940 Act, and each Trustees of the Trust, including their principal occupations during the past five years, is as follows:
| Interested Trustees | |||||
| Name (Age) | Position with Fund | Term of Office and Length of Time Served | Principal Occupations During Past Five Years | Number of Portfolios in Fund Complex Overseen By Trustee | Other Directorships Held By Trustee |
Steven H. Scruggs, 44 | Trustee, President Secretary | Unlimited; 10 years | Bragg Financial Advisors, Portfolio Manager/CCO (2000-present) | Two | None |
Benton S. Bragg, 45 | Trustee, Chairman Treasurer | Unlimited; 10 years | Bragg Financial Advisors, President, CEO (1996-present) | Two | None |
Steve Scruggs and Benton Bragg are Interested Trustees of the Fund (as that term is defined in Section 2(a)(19) of the Investment Company Act of 1940) by reason of their affiliation with the Fund’s Advisor, Bragg Financial Advisors, Inc. and their affiliation as registered principals with the Fund’s underwriter, Queens Road Securities, LLC. Benton S. Bragg and Steven H. Scruggs are brothers-in-law.
25
QUEENS ROAD FUNDS TRUSTEES INFORMATION (Continued) May 31, 2013 (Unaudited) |
Information about Trustees who are not “interested persons” of the Trust as defined under the 1940 Act, including their principal occupations during the past five years, is as follows:
| Independent Trustees | |||||
| Name (Age) | Position with Fund | Term of Office and Length of Time Served | Principal Occupations During Past Five Years | Number of Portfolios in Fund Complex Overseen By Trustee | Other Directorships Held By Trustee |
Philip C. Blount III, 59 2 | Trustee | Unlimited; 10 years | Icons, Inc., President (2001-present) Marketing Merchandise | Two | None |
Christopher B. Brady, 43 1,2 | Trustee | Unlimited; 10 years | Brady Distributing, Vice President (1995-2009, 2012-present) Machinery Distribution; Resort Capital Partners, Vice President (2009-2012) Hospitality Financial Advisory | Two | None |
Harold J. Smith, 48 2 | Trustee | Unlimited; 10 years | Raftelis Financial, Vice President (1996-present) Public Finance Consulting | Two | None |
Timothy J. Ignasher, 52 1 | Trustee | Unlimited; 10 years | Citizens South Bank, Exec Vice President (2008-present); Colony Signature Bank, Exec. Vice President (2007-2008) | Two | None |
| (1) | Member of the Audit Committee of the Board of Trustees, which makes recommendations regarding the selection of the Fund’s independent public accountant and meets with representatives of the accountants to determine the scope of and review the results of each audit. |
| (2) | Member of the Nominating Committee of the Board of Trustees, which identifies qualified candidates and recommends nominees for the election as Trustees. |
26
QUEENS ROAD FUNDS |
| Notes |
THIS PAGE INTENTIONALLY LEFT BLANK
THIS PAGE INTENTIONALLY LEFT BLANK
QUEENS ROAD FUNDS |
Board of Trustees
Benton S. Bragg
Steven H. Scruggs
Philip C. Blount, III
Timothy J. Ignasher
Christopher B. Brady
Harold J. Smith
Investment Adviser
Bragg Financial Advisors, Inc.
1031 Caldwell Street, Suite 200
Charlotte, NC 28203
Dividend Paying Agent,
Shareholders’ Servicing Agent,
Transfer Agent
UMB Fund Services
803 West Michigan Street
Milwaukee, WI 53233
Custodian
US Bank, NA
425 Walnut Street
P.O. Box 1118
Cincinnati, OH 45201
Independent Auditors
Cohen Fund Audit Services, Ltd.
1350 Euclid Avenue, Suite 800
Cleveland, OH 44115
Shares of Queens Road Value and Queens Road Small Cap Value Fund are distributed by Queens Road Securities, LLC, an affiliate of the Investment Adviser. This report has been prepared for the general information of the shareholders. It is not authorized for distribution to prospective investors unless preceded or accompanied by a current prospectus. The Funds’ prospectus contains more complete information about the objectives, policies, expenses and risks of the Funds. The Funds are not bank deposits, not FDIC insured and may lose value. Please read the prospectus carefully before investing or sending money.
This report contains certain forward looking statements which are subject to known and unknown risks and uncertainties that could cause actual results to differ materially from those expressed or implied by such statements. Forward looking statements generally include words such as “believes”, “expects”, “anticipates” and other words of similar import. Such risks and uncertainties include, among other things, the Risk Factors noted in the Funds’ filings with the Securities and Exchange Commission. The Funds undertake no obligation to update any forward looking statement.
| Item 2. | Code of Ethics. |
| (a) | The Registrant has adopted a code of ethics (the “Code”) that applies to the Registrant’s principal executive officer, principal financial officer, principal accounting officer or controller, or persons performing similar functions. Code of Ethics for the Principal Executive and Principal Financial officer is incorporated by reference to the Registrant’s Form N-CSR filed on August 6, 2012. (SEC Accession No. 0001398344-12-002461) |
| (b) | During the period covered by the report, with respect to the Registrant’s Code that applies to its principal executive officer, principal financial officer, principal accounting officer or controller, or persons performing similar functions; there have been no amendments to, nor any waivers granted from, a provision that relates to any element of the Code definition enumerated in paragraph (b) of this Item 2. |
| Item 3. | Audit Committee Financial Expert. |
| (a) | The registrant’s board of trustees has determined that the registrant does not have an audit committee financial expert. This is because no one on the board of trustees is deemed to be a financial expert. |
| Item 4. | Principal Accountant Fees and Services. |
(a) Audit Fees | |
| FY 2012 | $23,800 |
| FY 2013 | $21,500 |
(b) Audit-Related Fees | |
| Registrant | |
| FY 2012 | $0 |
| FY 2013 | $0 |
| Nature of the fees: | Not applicable. |
(c) Tax Fees | |
| Registrant | |
| FY 2012 | $5,000 |
| FY 2013 | $5,000 |
| Nature of the fees: | 1120-RIC & Excise Tax Return |
(d) All Other Fees | |
| Registrant | |
| FY 2012 | $1,125 |
| FY 2013 | $1,100 |
| Nature of the fees: | Out of pocket expenses and consents |
| (e) | (1) Audit Committee’s Pre-Approval Policies |
The Audit Committee reviews the auditor engagement letter and recommends to the Board of Trustees whether or not to adopt the engagement letter and appoint the independent auditor to perform the services described in the engagement letter.
(2) Percentages of Services Approved by the Audit Committee
| Registrant | |
| Audit-Related Fees: | 100 % |
| Tax Fees: | 100 % |
| All Other Fees: | 0 % |
(f) During audit of registrant's financial statements for the most recent fiscal year, less than 50 percent of the hours expended on the principal accountant's engagement were attributed to work performed by persons other than the principal accountant's full-time, permanent employees.
(g) The aggregate non-audit fees billed by the registrant's accountant for services rendered to the registrant, and rendered to the registrant's investment adviser (not including any sub-adviser whose role is primarily portfolio management and is subcontracted with or overseen by another investment adviser), and any entity controlling, controlled by, or under common control with the adviser that provides ongoing services to the registrant:
| Registrant | |
| FY 2012 | $0 |
| FY 2013 | $0 |
(h) The registrant's audit committee has considered whether the provision of non-audit services to the registrant's investment adviser (not including any sub-adviser whose role is primarily portfolio management and is subcontracted with or overseen by another investment adviser), and any entity controlling, controlled by, or under common control with the investment adviser that provides ongoing services to the registrant, that were not pre-approved pursuant to paragraph (c)(7)(ii) of Rule 2-01 of Regulation S-X, is compatible with maintaining the principal accountant's independence.
| Item 5. | Audit Committee of Listed Registrants. |
Not applicable.
| Item 6. | Schedule of Investments. |
Included as part of the report to shareholders filed under Item 1 of this Form N-CSR.
| Item 7. | Disclosure of Proxy Voting Policies and Procedures for Closed-End Management Investment Companies. |
Not applicable to open-end management investment companies.
| Item 8. | Portfolio Managers of Closed-End Management Investment Companies. |
Not applicable to open-end management investment companies.
| Item 9. | Purchases of Equity Securities by Closed-End Management Investment Company and Affiliated Purchasers. |
Not applicable to open-end management investment companies.
| Item 10. | Submission of Matters to a Vote of Security Holders. |
Not applicable.
| Item 11. | Controls and Procedures. |
| (a) | The Registrant’s principal executive officer and principal financial officer have reviewed the Registrant's disclosure controls and procedures (as defined in Rule 30a-3(c) under the Investment Company Act of 1940, as amended, (the “Act”)) as of a date within 90 days of the filing of this report, as required by Rule 30a-3(b) under the Act. Based on their review, such officers have concluded that the disclosure controls and procedures were effective in ensuring that information required to be disclosed in this report was appropriately recorded, processed, summarized and reported and made known to them by others within the Registrant and by the Registrant’s service providers. |
| (b) | There were no changes in the Registrant’s internal control over financial reporting (as defined in Rule 30a-3(d) under the Act (17 CFR 270.30a-3(d)) that occurred during the Registrant’s second fiscal quarter of the period covered by this report that materially affected, or were reasonably likely to materially affect, the Registrant’s internal control over financial reporting. |
| Item 12. | Exhibits. |
| (a) (1) | Code of Ethics for the Principal Executive and Principal Financial officer is incorporated by reference to the Registrant’s Form N-CSR filed on August 6, 2012. (SEC Accession No. 0001398344-12-002461) |
| (a) (2) | Certifications required pursuant to Section 302 of the Sarbanes-Oxley Act of 2002. Filed herewith. |
| (a) (3) | Not applicable to open-end management investment companies. |
| (b) | Certification pursuant to Section 906 of the Sarbanes-Oxley Act of 2002. Filed herewith. |
SIGNATURES
Pursuant to the requirements of the Securities Exchange Act of 1934 and the Investment Company Act of 1940, the Registrant has duly caused this report to be signed on its behalf by the undersigned, thereunto duly authorized.
Bragg Capital Trust
| /s/ Steven H. Scruggs |
By: Steven H. Scruggs
President
July 26, 2013
Pursuant to the requirements of the Securities Exchange Act of 1934 and the Investment Company Act of 1940, this report has been signed below by the following persons on behalf of the Registrant and in the capacities and on the dates indicated.
| /s/ Steven H. Scruggs |
By: Steven H. Scruggs
President
(Principal Executive Officer)
July 26, 2013
| /s/ Benton S. Bragg |
By: Benton S. Bragg
Treasurer
(Principal Financial Officer)
July 26, 2013