UNITED STATES
SECURITIES AND EXCHANGE COMMISSION
Washington, D.C. 20549
FORM N-CSR
CERTIFIED SHAREHOLDER REPORT OF REGISTERED
MANAGEMENT INVESTMENT COMPANIES
INVESTMENT COMPANY ACT FILE NUMBER: 811-21080
| | |
| EXACT NAME OF REGISTRANT AS SPECIFIED IN CHARTER: | | Calamos Convertible Opportunities and Income Fund |
| |
| ADDRESS OF PRINCIPAL EXECUTIVE OFFICES: | | 2020 Calamos Court, Naperville, |
| | Illinois 60563-2787 |
| |
| NAME AND ADDRESS OF AGENT FOR SERVICE: | | John P. Calamos, Sr., President, |
| | Calamos Advisors LLC |
| | 2020 Calamos Court |
| | Naperville, Illinois |
| | 60563-2787 |
REGISTRANT’S TELEPHONE NUMBER, INCLUDING AREA CODE: (630) 245-7200
DATE OF FISCAL YEAR END: October 31, 2016
DATE OF REPORTING PERIOD: November 1, 2015 through April 30, 2016
Item 1. Report to Shareholders

Experience and Foresight
About Calamos Investments
For over 35 years, we have helped investors like you manage and build wealth to meet their long-term individual objectives by working to capitalize on the opportunities of the evolving global marketplace. We launched our first mutual fund in 1985 and our first closed-end fund in 2002. Today, we manage six closed-end funds. Three are income-oriented total return offerings, which seek current income, with increased emphasis on capital gains potential. Three are enhanced fixed income offerings, which pursue high current income and capital gains. Calamos Convertible Opportunities and Income Fund (CHI) falls into this latter category. Please see page 4 for a more detailed overview of our closed-end offerings.
We are dedicated to helping our clients build and protect wealth. We understand when you entrust us with your assets, you also entrust us with your achievements, goals and aspirations. We believe we best honor this trust by making investment decisions guided by integrity, by discipline, and by our conscientious research.
We believe an active, risk-conscious approach is essential for wealth creation. In the 1970s, we pioneered strategies that seek to participate in equity market upside and mitigate some of the potential risks of equity market volatility. Our investment process seeks to manage risk at multiple levels and draws upon our experience investing through multiple market cycles.
We have a global perspective. We believe globalization offers tremendous opportunities for countries and companies all over the world. In our view, this creates significant opportunities for investors. In our U.S., global and international portfolios, we are seeking to capitalize on the potential growth of the global economy.
We believe there are opportunities in all markets. Our history traces back to the 1970s, a period of significant volatility and economic concerns. We have invested through multiple market cycles, each with its own challenges. Out of this experience comes our belief that the flipside of volatility is opportunity.
Letter to Shareholders

John P. Calamos, Sr.
Founder, Chairman and Global Chief Investment Officer
Dear Fellow Shareholder:
Welcome to your semiannual report for the six-month period ended April 30, 2016. In this report, you will find commentary from the management teams of the Calamos Funds, as well as a listing of portfolio holdings, financial statements and highlights and detailed information about the Fund’s performance and positioning. I invite you to review not only the commentary for this Fund, but also to discuss with your financial advisor if there are other Calamos Funds that could be suitable for your asset allocation.
Calamos Convertible Opportunities and Income Fund (CHI) is an enhanced fixed income fund. We utilize dynamic asset allocation to pursue high current income with a less rate sensitive approach, while also maintaining a focus on capital gains. We believe the flexibility to invest in high yield corporate bonds and convertible securities is an important differentiator, especially given the speculation surrounding the Federal Reserve’s fiscal activities and the potential impact on interest rates and the fixed income markets.
Distributions
During the period, the Fund provided a compelling monthly distribution of $0.0950 per share. We believe the Fund’s current annualized distribution rate, which was 11.81%* on a market price basis as of April 30, 2016, was very competitive, given the low interest rates in many segments of the bond market. In our view, the Fund’s distributions illustrate the benefits of a multi-asset class approach and flexible allocation strategy.
We understand that many closed-end fund investors seek steady, predictable distributions instead of distributions that fluctuate. Therefore, this Fund has a level rate distribution policy. As part of this policy, we aim to keep distributions consistent from month to month, and at a level that we believe can be sustained over the long term. In setting the Fund’s distribution rate, the investment management team and the Fund’s
| * | Current Annualized Distribution Rate is the Fund’s most recent distribution, expressed as an annualized percentage of the Fund’s current market price per share. The Fund’s 4/15/16 distribution was $0.0950 per share. Based on our current estimates, we anticipate that approximately $0.0372 is paid from ordinary income or capital gains and that approximately $0.0578 represents a return of capital. Estimates are calculated on a tax basis rather than on a generally accepted accounting principles (GAAP) basis, but should not be used for tax reporting purposes. Distributions are subject to re-characterization for tax purposes after the end of the fiscal year. This information is not legal or tax advice. Consult a professional regarding your specific legal or tax matters. Under the Fund’s level rate distribution policy, distributions paid to common shareholders may include net investment income, net realized short-term capital gains and return of capital. When the net investment income and net realized short-term capital gains are not sufficient, a portion of the level rate distribution will be a return of capital. In addition, a limited number of distributions per calendar year may include net realized long-term capital gains. Distribution rate may vary. |
| | | | | | |
| | CALAMOS CONVERTIBLE OPPORTUNITIES AND INCOME FUND SEMIANNUAL REPORT | | | 1 | |
Letter to Shareholders
Board of Trustees consider the interest rate, market and economic environment. We also factor in our assessment of individual securities and asset classes. (For additional information on our level rate distribution policy, please see “The Calamos Closed-End Funds: An Overview” on page 4 and “Level Rate Distribution Policy” on page 29.)
Market Review
The reporting period proved to be an extremely turbulent time in the financial markets, as changing sentiment fueled volatility and market rotation. During the final months of 2015, investors appeared to show concern about low commodity prices, global economic growth forecasts, and the implications of central bank policies—including the Federal Reserve’s move to raise short-term interest rates for the first time since 2006.
As 2016 began, markets fell sharply as investor apprehension increased. By mid-February, investors appeared more confident about the health of the U.S. economy and the likelihood of fewer Fed increases, while commodity prices stabilized. This increased optimism drove a rally in emerging markets, high yield bonds, and value and cyclical stocks. (A stronger economic environment can provide tailwinds for cyclically oriented companies and fewer hurdles for companies with less robust growth prospects.)
In this challenging environment, the S&P 500 Index gained 0.43% for the semiannual period. As for convertibles, the BofA Merrill Lynch All U.S. Convertibles Index fell 2.88%. The Credit Suisse High Yield Index returned 1.73%.
Our Use of Leverage**
We have the flexibility to utilize leverage in this Fund. Over the long term, we believe that the judicious use of leverage provides us with opportunities to enhance total return and support the Fund’s distribution rate. Leverage strategies typically entail borrowing at short-term interest rates and investing the proceeds at higher rates of return. During the reporting period, we believed the prudent use of leverage would be advantageous given the economic environment, specifically the low borrowing costs we were able to secure. Overall, we believe the use of leverage will contribute favorably to the returns of the Fund, as we anticipate that the performance of the Fund’s holdings will exceed the cost of borrowing.
| ** | Leverage creates risks that may adversely affect return, including the likelihood of greater volatility of net asset value and market price of common shares, and fluctuations in the variable rates of the leverage financing. The Fund has a non-fundamental policy that it will not issue preferred shares, borrow money, or issue debt securities with an aggregate liquidation preference and aggregate principal amount exceeding 38% of the Fund’s managed assets as measured immediately after the issuance of any preferred shares or debt. Prior to May 22, 2015, this leverage limitation was measured according to the Fund’s total assets. |
| | | | |
| 2 | | CALAMOS CONVERTIBLE OPPORTUNITIES AND INCOME FUND SEMIANNUAL REPORT | | |
Letter to Shareholders
Outlook
We do not believe a U.S. recession is imminent but the pace of expansion is likely to be measured in 2016. Similarly, we expect that the global economy will grow, but not at a robust pace overall. Around the world, fiscal policy remains an overarching cause of concern, as a lack of clarity on key regulatory issues casts a shadow over a number of sectors. We believe investors will be challenged by a host of uncertainties, including global growth concerns, the policies of the Fed and other central banks, the U.S. presidential election, commodity prices, and geopolitical uncertainties.
Our teams continue to identify opportunities in this slower growth environment, but they recognize that selectivity and risk management remain crucial. We believe investment opportunities exist across many asset classes, but selectivity remains paramount. Our portfolio management teams are holding to their long-term discipline, seeking to capitalize on short-term investor emotion as they position the funds for longer-term opportunities.
Conclusion
The market environment is always changing. To keep up-to-date on our views of the global financial markets and the opportunities that are emerging, I encourage you to visit our website on an ongoing basis. You’ll find our blog and videos from our team, as well as a variety of pieces designed to help you and your financial advisor make sound asset allocation decisions that align with your long-term goals and risk tolerance.
As always, we thank you for your continued trust. All of us at Calamos Investments are honored that you have chosen us to help you achieve your financial goals.
Sincerely,

John P. Calamos, Sr.
Founder, Chairman and Global Chief Investment Officer
Before investing, carefully consider a Fund’s investment objectives, risks, charges and expenses. Please see the prospectus containing this and other information or call 800.582.6959. Please read the prospectus carefully. Performance data represents past performance, which is no guarantee of future results. Current performance may be lower or higher than the performance quoted.
The S&P 500 Index represents the U.S. stock market. The BofA ML All U.S. Convertibles Index is representative of the U.S. convertible market. The Credit Suisse High Yield Index is considered generally representative of the U.S. market for high yield bonds. Source: Lipper
Unmanaged index returns assume reinvestment of any and all distributions and, unlike fund returns, do not reflect fees, expenses or sales charges. Investors cannot invest directly in an index. Investments in overseas markets pose special risks, including currency fluctuation and political risks. These risks are generally intensified for investments in emerging markets. Countries, regions, and sectors mentioned are presented to illustrate countries, regions, and sectors in which a fund may invest. Fund holdings are subject to change daily. The Fund is actively managed. The information contained herein is based on internal research derived from various sources and does not purport to be statements of all material facts relating to the securities mentioned. The information contained herein, while not guaranteed as to the accuracy or completeness, has been obtained from sources we believe to be reliable. There are certain risks involved with investing in convertible securities in addition to market risk, such as call risk, dividend risk, liquidity risk and default risk, that should be carefully considered prior to investing. This information is being provided for informational purposes only and should not be considered investment advice or an offer to buy or sell any security in the portfolio.
| | | | | | |
| | CALAMOS CONVERTIBLE OPPORTUNITIES AND INCOME FUND SEMIANNUAL REPORT | | | 3 | |
The Calamos Closed-End Funds: An Overview
In our closed-end funds, we draw upon decades of investment experience, including a long history of opportunistically blending asset classes in an attempt to capture upside potential while seeking to manage downside risk. We launched our first closed-end fund in 2002.
Closed-end funds are long-term investments. Most focus on providing monthly distributions, but there are important differences among individual closed-end funds. Calamos closed-end funds can be grouped into multiple categories that seek to produce income while offering exposure to various asset classes and sectors.
| | |
Portfolios Positioned to Pursue High Current Income from Income and Capital Gains | | Portfolios Positioned to Seek Current Income, with Increased Emphasis on Capital Gains Potential |
| |
| OBJECTIVE: U.S. ENHANCED FIXED INCOME | | OBJECTIVE: GLOBAL TOTAL RETURN |
Calamos Convertible Opportunities and Income Fund (Ticker: CHI) Invests in high yield and convertible securities, primarily in U.S. markets Calamos Convertible and High Income Fund (Ticker CHY) Invests in high yield and convertible securities, primarily in U.S. markets OBJECTIVE: GLOBAL ENHANCED FIXED INCOME Calamos Global Dynamic Income Fund (Ticker: CHW) Invests in global fixed income securities, alternative investments and equities | | Calamos Global Total Return Fund (Ticker: CGO) Invests in equities and higher-yielding convertible securities and corporate bonds, in both U.S. and non-U.S. markets OBJECTIVE: U.S. TOTAL RETURN Calamos Strategic Total Return Fund (Ticker: CSQ) Invests in equities and higher-yielding convertible securities and corporate bonds, primarily in U.S. markets Calamos Dynamic Convertible and Income Fund (Ticker: CCD) Invests in convertibles and other fixed income securities |
| |
| |
| |
| |
Our Level Rate Distribution Policy
Closed-end fund investors often look for a steady stream of income. Recognizing this, Calamos closed-end funds have a level rate distribution policy in which we aim to keep monthly income consistent through the disbursement of net investment income, net realized short-term capital gains and, if necessary, return of capital. We set distributions at levels that we believe are sustainable for the long term. Our team is focused on delivering an attractive monthly distribution, while maintaining a long-term focus on risk management. The level of the funds’ distributions can be greatly influenced by market conditions, including the interest rate environment. The funds’ distributions will depend on the individual performance of positions the funds hold, our view of the benefits of retaining leverage, fund tax considerations, and maintaining regulatory requirements.
For more information about any of these funds, we encourage you to contact your financial advisor or Calamos Investments at 800.582.6959 (Monday through Friday from 8:00 a.m. to 6:00 p.m., Central Time). You can also visit us at www.calamos.com.
For more information on our level rate distribution policy, please see page 29.
| | | | |
| 4 | | CALAMOS CONVERTIBLE OPPORTUNITIES AND INCOME FUND SEMIANNUAL REPORT | | |
Investment Team Discussion
CONVERTIBLE OPPORTUNITIES AND INCOME FUND (CHI)
INVESTMENT TEAM DISCUSSION
Please discuss the Fund’s strategy and role within an asset allocation.
Calamos Convertible Opportunities and Income Fund (CHI) is an enhanced fixed income offering that seeks total return through a combination of capital appreciation and current income. It provides an alternative to funds investing exclusively in investment-grade fixed income instruments and seeks to be less sensitive to interest rates. Like all six Calamos closed-end funds, the Fund seeks to provide a steady stream of distributions paid out monthly and invests in multiple asset classes.
We invest in a diversified portfolio of convertible securities and high yield securities. The allocation to each asset class is dynamic and reflects our view of the economic landscape as well as the potential of individual securities. By combining these asset classes, we believe that the Fund is well positioned to generate capital gains and income. The broader range of security types also provides what we believe to be increased opportunities to manage the risk and reward characteristics of the portfolio over full market cycles. During the six months ended April 30, 2016, the Fund maintained a high proportional exposure to convertible assets. We believe such exposure, which constituted over half the portfolio at the end of the period, positions us well to participate in the equity markets in a risk-managed manner in 2016.
We seek companies with respectable balance sheets, reliable debt servicing and good prospects for sustainable growth. While we invest primarily in securities of U.S. issuers, we favor companies that are actively participating in globalization with geographically diversified revenue streams and global-scale business strategies.
How did the Fund perform over the reporting period?
The Fund declined 3.36% on a net asset value (NAV) basis and retreated 1.57% on a market price basis for the six-month period ended April 30, 2016 versus the 1.73% gain for Credit Suisse High Yield Index and 2.88% loss for the BofA ML All U.S. Convertibles Index for the same period.
At the end of the reporting period, the Fund’s shares traded at a 9.22% discount to net asset value.
The six-month period included significant bouts of volatility as investors grappled with a myriad of concerns including commodity price and dollar volatility, U.S. recessionary fears, and central bank monetary policy shifts. The convertible market was not immune to the pressures that hindered equities and other risk assets during this environment. Also, because small- and mid-cap growth-oriented stocks are well represented within the convertible index, the convertible market shared in the added headwinds that these securities encountered.
| | | | | | | | | | | | |
| TOTAL RETURN* AS OF 4/30/16 | |
Common Shares – Inception 6/26/02 | |
| | | 6 Months | | | 1 Year | | | Since
Inception** | |
On Market Price | | | -1.57% | | | | -17.21% | | | | 7.67% | |
On NAV | | | -3.36% | | | | -8.87% | | | | 8.78% | |
*Total return measures net investment income and net realized gain or loss from Fund investments, and change in net unrealized appreciation and depreciation, assuming reinvestment of income and net realized gains distributions. **Annualized since inception. | |
| | | | |
| SECTOR WEIGHTINGS | | | |
Information Technology | | | 21.9 | % |
Consumer Discretionary | | | 19.6 | |
Health Care | | | 15.2 | |
Financials | | | 10.9 | |
Energy | | | 7.2 | |
Industrials | | | 6.3 | |
Consumer Staples | | | 4.2 | |
Telecommunication Services | | | 4.1 | |
Materials | | | 3.4 | |
Utilities | | | 3.4 | |
Sector Weightings are based on managed assets and may vary over time. Sector Weightings exclude any government/sovereign bonds or options on broad market indexes the Fund may hold.
| | | | | | |
| | CALAMOS CONVERTIBLE OPPORTUNITIES AND INCOME FUND SEMIANNUAL REPORT | | | 5 | |
Investment Team Discussion
ASSET ALLOCATION AS OF 4/30/16
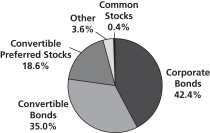
Fund asset allocations are based on total investments and may vary over time.
SINCE INCEPTION MARKET PRICE AND NAV HISTORY THROUGH 4/30/16
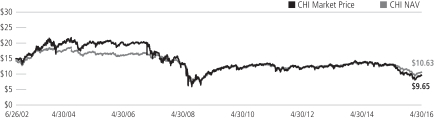
Performance data quoted represents past performance, which is no guarantee of future results. Current performance may be lower or higher than the performance quoted. The principal value of an investment will fluctuate so that your shares, when sold, may be worth more or less than their original cost. Returns at NAV reflect the deduction of the Fund’s management fee, debt leverage costs and all other applicable fees and expenses. You can obtain performance data current to the most recent month end by visiting www.calamos.com.
How do NAV and market price return differ?
Closed-end funds trade on exchanges, where the price of shares may be driven by factors other than the value of the underlying securities. The price of a share in the market is called market value. Market price may be influenced by factors unrelated to the performance of the fund’s holdings, such as general market sentiment or future expectations. A fund’s NAV return measures the actual return of the individual securities in the portfolio, less fund expenses. It also measures how a manager was able to capitalize on market opportunities. Because we believe closed-end funds are best utilized as a long-term holding within asset allocations, we believe that NAV return is the better measure of a fund’s performance. However, when managing the fund, we strongly consider actions and policies that we believe will optimize its overall price performance and returns based on market value.
Please discuss the Fund’s distributions during the period.
We employ a level rate distribution policy within this Fund with the goal of providing shareholders with a consistent distribution stream. In each month of the period, the Fund distributed $0.0950 per share, resulting in a current annualized distribution rate of 11.81% of market price as of April 30, 2016.
We believe that both the Fund’s distribution rate and level remained attractive and competitive, as low interest rates limited yield opportunities in much of the marketplace. For example, as of April 30, 2016, the dividend yield of S&P 500 Index stocks averaged approximately 2.19%. Yields also were low within the U.S. government bond market, with the 10-year U.S. Treasury and 30-year U.S. Treasury yielding 1.83% and 2.68%, respectively.
What factors influenced performance over the reporting period?
A downturn in the convertible market detracted from the Fund’s performance, but improvement in the high yield market served to mitigate the impact.
From an economic sector perspective, selection in utilities aided performance, especially holdings in electric utilities. In addition, our selection in consumer staples contributed, particularly in the packaged foods and meats industry and housewares and specialties industry.
| | | | |
| 6 | | CALAMOS CONVERTIBLE OPPORTUNITIES AND INCOME FUND SEMIANNUAL REPORT | | |
Investment Team Discussion
Our selection in and overweight to health care, particularly in biotechnology, hindered performance. Also, our selection in energy, including the oil and gas exploration industry, lagged.
How is the Fund positioned?
Our heaviest exposures are in the information technology, health care and consumer discretionary sectors. We believe that these sectors can outperform because of demographic trends and our outlook for a slow-growth economy. We continue to maintain significant positions in convertible securities, which we believe can provide income, benefit from a rising equity market and help manage portfolio risk. More than half of the Fund was invested in convertible securities at the end of the period. We believe this will enable our shareholders to take advantage of opportunities in the general markets even with recent equity volatility. Long-term, we believe patient investors will be rewarded for an allocation to convertibles and high yield at current levels.
The average credit quality of the portfolio is higher than that of the BofA ML All U.S. Convertibles Index. This is typical for the Fund, as our credit process tends to guide us away from the most speculative corporate securities. We view the lowest credit tiers of the market as less attractive because of valuations and our outlook for a slower-growth global economy. That said, we selectively invest in lower-rated securities when we believe the risk/return dynamics are favorable for our investors.
We are investing in global businesses that we believe can capitalize on the best opportunities around the world and diversify their revenue streams. We believe the companies in the Fund are performing well fundamentally, earning attractive cash flow and improving their credit profiles while utilizing reasonable debt levels to fund their operations.
What are your closing thoughts for Fund shareholders?
We believe that investing in convertibles provides a means to participate in a portion of the equity market upside and to achieve a measured degree of downside protection. We expect markets to remain turbulent, which we see as a positive for convertibles. In this respect, we believe returns are best viewed over a full market cycle. We are focused on the more balanced convertibles, which can be beneficial in a volatile market as they are more likely to limit losses in down markets and participate in up markets. We are also encouraged by the issuance of convertibles, which should provide broad investment opportunities throughout the space. Our dynamic allocation mandate allows us to deploy assets over different asset classes to benefit our shareholders. Accordingly, we believe that active management in the convertible and high yield asset classes is essential to achieving desirable risk-managed results over time.
| | | | | | |
| | CALAMOS CONVERTIBLE OPPORTUNITIES AND INCOME FUND SEMIANNUAL REPORT | | | 7 | |
Schedule of Investments April 30, 2016 (Unaudited)
| | | | | | | | | | |
PRINCIPAL
AMOUNT | | | | | | | VALUE | |
| | CORPORATE BONDS (59.7%) | | | | |
| | | | | | Consumer Discretionary (15.0%) | |
| | 1,400,000 | | | | | Altice Luxembourg, SA*^m
7.750%, 05/15/22 | | $ | 1,401,750 | |
| | 550,000 | | | | | Argos Merger Sub, Inc.*m
7.125%, 03/15/23 | | | 562,031 | |
| | | | | | CalAtlantic Group, Inc.m | | | | |
| | 5,500,000 | | | | | 6.625%, 05/01/20^ | | | 6,094,687 | |
| | 1,490,000 | | | | | 5.375%, 10/01/22 | | | 1,535,631 | |
| | 2,827,000 | | | | | CCO Holdings, LLC / CCO Holdings Capital Corp.
6.625%, 01/31/22 | | | 3,003,687 | |
| | 2,450,000 | | | | | CCO Safari II, LLC*m
4.908%, 07/23/25 | | | 2,639,875 | |
| | 1,359,000 | | | | | Century Communities, Inc.m
6.875%, 05/15/22 | | | 1,326,724 | |
| | 6,111,000 | | | | | Cooper Tire & Rubber Company^m
8.000%, 12/15/19 | | | 6,989,456 | |
| | 4,526,000 | | | | | Dana Holding Corp.^m
6.750%, 02/15/21 | | | 4,692,896 | |
| | | | | | DISH DBS Corp.m | | | | |
| | 5,460,000 | | | | | 7.875%, 09/01/19 | | | 6,040,125 | |
| | 3,625,000 | | | | | 6.750%, 06/01/21 | | | 3,765,469 | |
| | 3,135,000 | | | | | 5.125%, 05/01/20 | | | 3,166,350 | |
| | 4,000,000 | | | | | Dufry Finance, SCA*m
5.500%, 10/15/20 | | | 4,165,000 | |
| | | | | | GameStop Corp.* | | | | |
| | 1,500,000 | | | | | 5.500%, 10/01/19^m | | | 1,462,500 | |
| | 1,450,000 | | | | | 6.750%, 03/15/21 | | | 1,426,438 | |
| | 2,334,000 | | | | | Golden Nugget Escrow, Inc.*
8.500%, 12/01/21 | | | 2,424,442 | |
| | 610,000 | | | | | Goodyear Tire & Rubber Companym
5.125%, 11/15/23 | | | 633,256 | |
| | 2,370,000 | | | | | Hasbro, Inc.^m
6.600%, 07/15/28 | | | 2,731,176 | |
| | | | | | L Brands, Inc. | | | | |
| | 3,000,000 | | | | | 7.600%, 07/15/37m | | | 3,255,000 | |
| | 1,200,000 | | | | | 6.875%, 11/01/35 | | | 1,320,000 | |
| | 850,000 | | | | | 5.625%, 02/15/22m | | | 937,125 | |
| | 680,000 | | | | | 6.950%, 03/01/33^m | | | 709,325 | |
| | 1,409,000 | | | | | Liberty Interactive, LLCm
8.250%, 02/01/30 | | | 1,479,450 | |
| | | | | | Meritage Homes Corp.m | | | | |
| | 3,400,000 | | | | | 7.150%, 04/15/20^ | | | 3,672,000 | |
| | 1,908,000 | | | | | 7.000%, 04/01/22 | | | 2,059,448 | |
| | 2,825,000 | | | | | Netflix, Inc.^m
5.375%, 02/01/21 | | | 2,994,500 | |
| | | | | | Numericable-SFR, SA* | | | | |
| | 2,800,000 | | | | | 6.000%, 05/15/22^m | | | 2,821,000 | |
| | 1,600,000 | | | | | 7.375%, 05/01/26 | | | 1,628,000 | |
| | 2,300,000 | | | | | Penske Automotive Group, Inc.m
5.375%, 12/01/24 | | | 2,321,563 | |
| | 1,900,000 | | | | | Reliance Intermediate Holdings, LP*m
6.500%, 04/01/23 | | | 1,989,063 | |
| | | | | | | | | | |
PRINCIPAL
AMOUNT | | | | | | | VALUE | |
| | 3,865,000 | | | | | Royal Caribbean Cruises, Ltd.m
7.500%, 10/15/27 | | $ | 4,459,244 | |
| | 1,352,000 | | | | | Sally Holdings, LLC / Sally Capital, Inc.m
5.625%, 12/01/25 | | | 1,450,865 | |
| | 3,500,000 | | | | | Service Corp. International^m
7.500%, 04/01/27 | | | 4,136,562 | |
| | 3,450,000 | | | | | Sirius XM Radio, Inc.*
6.000%, 07/15/24 | | | 3,652,687 | |
| | 2,920,000 | | | | | Six Flags Entertainment Corp.*m
5.250%, 01/15/21 | | | 3,027,675 | |
| | 2,998,000 | | | | | Taylor Morrison Communities, Inc.*m
5.250%, 04/15/21 | | | 2,998,000 | |
| | 3,000,000 | | | | | Time, Inc.*m
5.750%, 04/15/22 | | | 2,885,625 | |
| | | | | | Toll Brothers Finance Corp.m | | | | |
| | 4,249,000 | | | | | 5.625%, 01/15/24 | | | 4,461,450 | |
| | 1,150,000 | | | | | 4.000%, 12/31/18 | | | 1,193,844 | |
| | | | | | ZF North America Capital, Inc.*m | | | | |
| | 2,350,000 | | | | | 4.750%, 04/29/25 | | | 2,380,844 | |
| | 1,426,000 | | | | | 4.500%, 04/29/22 | | | 1,460,759 | |
| | | | | | | | | | |
| | | | | | | | | 111,355,522 | |
| | | | | | | | | | |
| | | | | | Consumer Staples (3.5%) | |
| | 2,150,000 | | | | | Alphabet Holding Company, Inc.
7.750%, 11/01/17 | | | 2,175,725 | |
| | 3,650,000 | | | | | Fidelity & Guaranty Life Holdings, Inc.*m
6.375%, 04/01/21 | | | 3,675,094 | |
| | 2,200,000 | | | | | Fresh Market, Inc.*^
9.750%, 05/01/23 | | | 2,171,125 | |
| | 4,968,000 | | | | | JBS USA, LLC*m
7.250%, 06/01/21 | | | 5,113,935 | |
| | 5,400,000 | | | | | Land O’Lakes, Inc.*m
6.000%, 11/15/22 | | | 5,751,000 | |
| | 1,127,000 | | | | | NBTY, Inc.*
7.625%, 05/15/21 | | | 1,146,722 | |
| | | | | | Post Holdings, Inc. | | | | |
| | 1,832,000 | | | | | 7.375%, 02/15/22m | | | 1,933,905 | |
| | 670,000 | | | | | 7.750%, 03/15/24* | | | 731,556 | |
| | 3,150,000 | | | | | Smithfield Foods, Inc.m
6.625%, 08/15/22 | | | 3,325,219 | |
| | | | | | | | | | |
| | | | | | | | | 26,024,281 | |
| | | | | | | | | | |
| | | | | | Energy (8.2%) | |
| | 3,341,000 | | | | | Atwood Oceanics, Inc.m
6.500%, 02/01/20 | | | 2,215,501 | |
| | 1,200,000 | | | | | Bill Barrett Corp.
7.000%, 10/15/22 | | | 880,500 | |
| | 2,050,000 | | | | | Blue Racer Midstream, LLC / Blue Racer Finance Corp.*m
6.125%, 11/15/22 | | | 1,809,125 | |
| | 2,500,000 | | | | | Bonanza Creek Energy, Inc.
6.750%, 04/15/21 | | | 984,375 | |
| | 2,250,000 | | | | | Calfrac Holdings, LP*m
7.500%, 12/01/20 | | | 1,125,000 | |
| | | | |
| 8 | | CALAMOS CONVERTIBLE OPPORTUNITIES AND INCOME FUND SEMIANNUAL REPORT | | See accompanying Notes to Schedule of Investments |
Schedule of Investments April 30, 2016 (Unaudited)
| | | | | | | | | | |
PRINCIPAL
AMOUNT | | | | | | | VALUE | |
| | | | | | Calumet Specialty Products Partners, LP | |
| | 2,300,000 | | | | | 7.625%, 01/15/22 | | $ | 1,546,750 | |
| | 819,000 | | | | | 6.500%, 04/15/21 | | | 568,181 | |
| | | | | | Carrizo Oil & Gas, Inc.m | | | | |
| | 4,420,000 | | | | | 7.500%, 09/15/20 | | | 4,480,775 | |
| | 1,350,000 | | | | | 6.250%, 04/15/23 | | | 1,306,125 | |
| | 5,693,000 | | | | | Cimarex Energy Company^m
5.875%, 05/01/22 | | | 6,005,147 | |
| | 5,466,000 | | | | | Drill Rigs Holdings, Inc.*^m
6.500%, 10/01/17 | | | 3,388,920 | |
| | | | | | Energy Transfer Equity, LPm | | | | |
| | 1,900,000 | | | | | 5.875%, 01/15/24 | | | 1,777,688 | |
| | 875,000 | | | | | 5.500%, 06/01/27 | | | 755,234 | |
| | 4,750,000 | | | | | Gulfmark Offshore, Inc.
6.375%, 03/15/22 | | | 2,173,125 | |
| | 2,520,000 | | | | | Gulfport Energy Corp.^m
7.750%, 11/01/20 | | | 2,556,225 | |
| | 5,500,000 | | | | | Laredo Petroleum, Inc.^
7.375%, 05/01/22 | | | 5,407,187 | |
| | 3,100,000 | | | | | MPLX, LP*
4.875%, 06/01/25 | | | 3,000,536 | |
| | | | | | Oasis Petroleum, Inc.m | | | | |
| | 4,190,000 | | | | | 6.500%, 11/01/21 | | | 3,831,231 | |
| | 1,250,000 | | | | | 6.875%, 01/15/23^ | | | 1,123,438 | |
| | 2,270,000 | | | | | Pacific Drilling, SA*^m
5.375%, 06/01/20 | | | 692,350 | |
| | 2,749,000 | | | | | Petroleum Geo-Services, ASA*m
7.375%, 12/15/18 | | | 2,077,213 | |
| | 752,000 | | | | | Rice Energy, Inc.
7.250%, 05/01/23 | | | 760,930 | |
| | 5,000,000 | | | | | SEACOR Holdings, Inc.^m
7.375%, 10/01/19 | | | 4,650,000 | |
| | 1,382,000 | | | | | SM Energy Companym
6.500%, 11/15/21 | | | 1,278,350 | |
| | 3,600,000 | | | | | Trinidad Drilling, Ltd.*m
7.875%, 01/15/19 | | | 2,938,500 | |
| | 6,450,000 | | | | | W&T Offshore, Inc.
8.500%, 06/15/19 | | | 1,060,219 | |
| | 2,780,000 | | | | | Western Refining, Inc.m
6.250%, 04/01/21 | | | 2,587,138 | |
| | | | | | | | | | |
| | | | | | | | | 60,979,763 | |
| | | | | | | | | | |
| | | | | | Financials (4.3%) | |
| | | | | | Ally Financial, Inc. | | | | |
| | 1,400,000 | | | | | 7.500%, 09/15/20 | | | 1,579,375 | |
| | 680,000 | | | | | 8.000%, 11/01/31 | | | 817,275 | |
| | 2,401,000 | | | | | AON Corp.m
8.205%, 01/01/27 | | | 3,061,275 | |
| | 3,731,000 | | | | | Black Knight InfoServ, LLCm
5.750%, 04/15/23 | | | 3,897,552 | |
| | 2,057,000 | | | | | Brookfield Residential Properties, Inc.*m
6.375%, 05/15/25 | | | 1,853,871 | |
| | | | | | DuPont Fabros Technology, LPµ | | | | |
| | 1,300,000 | | | | | 5.875%, 09/15/21 | | | 1,366,625 | |
| | 925,000 | | | | | 5.625%, 06/15/23 | | | 957,953 | |
| | | | | | | | | | |
PRINCIPAL
AMOUNT | | | | | | | VALUE | |
| | 2,000,000 | | | | | Equinix, Inc.m
5.375%, 04/01/23 | | $ | 2,093,750 | |
| | 3,503,000 | | | | | First Cash Financial Services, Inc.
6.750%, 04/01/21 | | | 3,457,023 | |
| | 290,000 | | | | | Iron Mountain, Inc.*
6.000%, 10/01/20 | | | 307,038 | |
| | 2,850,000 | | | | | Jefferies Finance, LLC*m
7.375%, 04/01/20 | | | 2,643,375 | |
| | 2,290,000 | | | | | Nationstar Mortgage, LLC / Nationstar Capital Corp.m
6.500%, 07/01/21 | | | 2,023,788 | |
| | 5,500,000 | | | | | Neuberger Berman Group, LLC*m
5.875%, 03/15/22 | | | 5,733,365 | |
| | 2,700,000 | | | | | Quicken Loans, Inc.*^m
5.750%, 05/01/25 | | | 2,543,062 | |
| | | | | | | | | | |
| | | | | | | | | 32,335,327 | |
| | | | | | | | | | |
| | | | | | Health Care (5.5%) | |
| | 4,000,000 | | | | | Acadia Healthcare Company, Inc.m
5.625%, 02/15/23 | | | 4,107,500 | |
| | 3,225,000 | | | | | Alere, Inc.
6.500%, 06/15/20 | | | 3,200,812 | |
| | 3,755,000 | | | | | Community Health Systems, Inc.m
7.125%, 07/15/20 | | | 3,635,309 | |
| | 3,100,000 | | | | | DaVita HealthCare Partners, Inc.m
5.125%, 07/15/24 | | | 3,167,812 | |
| | 678,000 | | | | | Endo International, PLC*‡
7.750%, 01/15/22 | | | 705,120 | |
| | | | | | HCA Holdings, Inc.µ | | | | |
| | 8,000,000 | | | | | 5.875%, 05/01/23 | | | 8,450,000 | |
| | 1,940,000 | | | | | 6.250%, 02/15/21 | | | 2,110,963 | |
| | 1,070,000 | | | | | Hologic, Inc.*m
5.250%, 07/15/22 | | | 1,128,181 | |
| | 1,810,000 | | | | | Jaguar Holding Company II / Pharmaceutical Product Development, LLC*
6.375%, 08/01/23 | | | 1,891,450 | |
| | 1,250,000 | | | | | Mallinckrodt International Finance, SA / Mallinckrodt CB, LLC*m
5.625%, 10/15/23 | | | 1,175,000 | |
| | 898,000 | | | | | Surgical Care Affiliates, Inc.*
6.000%, 04/01/23 | | | 919,889 | |
| | 6,150,000 | | | | | Tenet Healthcare Corp.
6.750%, 02/01/20 | | | 6,242,250 | |
| | | | | | Valeant Pharmaceuticals International, Inc.* | | | | |
| | 3,100,000 | | | | | 7.000%, 10/01/20^m | | | 2,875,250 | |
| | 370,000 | | | | | 5.500%, 03/01/23 | | | 314,269 | |
| | 950,000 | | | | | VPII Escrow Corp.*^m
6.750%, 08/15/18 | | | 920,313 | |
| | | | | | | | | | |
| | | | | | | | | 40,844,118 | |
| | | | | | | | | | |
| | | | | | Industrials (7.2%) | |
| | 4,700,000 | | | | | ACCO Brands Corp.m
6.750%, 04/30/20 | | | 4,993,750 | |
| | | | | | |
| See accompanying Notes to Schedule of Investments | | CALAMOS CONVERTIBLE OPPORTUNITIES AND INCOME FUND SEMIANNUAL REPORT | | | 9 | |
Schedule of Investments April 30, 2016 (Unaudited)
| | | | | | | | | | |
PRINCIPAL
AMOUNT | | | | | | | VALUE | |
| | 6,200,000 | | | | | Deluxe Corp.m
6.000%, 11/15/20 | | $ | 6,475,125 | |
| | 2,205,000 | | | | | Garda World Security Corp.*
7.250%, 11/15/21 | | | 1,805,344 | |
| | 2,825,000 | | | | | GrafTech International, Ltd.
6.375%, 11/15/20 | | | 1,825,656 | |
| | 4,555,000 | | | | | H&E Equipment Services, Inc.m
7.000%, 09/01/22 | | | 4,597,703 | |
| | | | | | Icahn Enterprises, LPm | | | | |
| | 3,116,000 | | | | | 5.875%, 02/01/22^ | | | 2,989,413 | |
| | 2,360,000 | | | | | 6.000%, 08/01/20^ | | | 2,355,575 | |
| | 545,000 | | | | | 4.875%, 03/15/19 | | | 543,978 | |
| | | | | | Meritor, Inc.m | | | | |
| | 2,053,000 | | | | | 6.250%, 02/15/24 | | | 1,834,869 | |
| | 1,605,000 | | | | | 6.750%, 06/15/21 | | | 1,503,684 | |
| | | | | | Michael Baker International, LLC*m | | | | |
| | 2,084,000 | | | | | 8.250%, 10/15/18 | | | 2,003,245 | |
| | 1,625,877 | | | | | 8.875%, 04/15/19 | | | 1,174,696 | |
| | 2,985,000 | | | | | Navistar International Corp.^
8.250%, 11/01/21 | | | 2,167,856 | |
| | 1,804,000 | | | | | Nortek, Inc.m
8.500%, 04/15/21 | | | 1,878,415 | |
| | 3,300,000 | | | | | Terex Corp.m
6.000%, 05/15/21 | | | 3,281,437 | |
| | 2,025,000 | | | | | Titan International, Inc.m
6.875%, 10/01/20 | | | 1,756,688 | |
| | 2,350,000 | | | | | TransDigm, Inc.
5.500%, 10/15/20 | | | 2,394,063 | |
| | 2,300,000 | | | | | United Continental Holdings, Inc.m
6.375%, 06/01/18 | | | 2,426,500 | |
| | | | | | United Rentals North America, Inc.m | | | | |
| | 5,500,000 | | | | | 7.625%, 04/15/22 | | | 5,885,000 | |
| | 1,400,000 | | | | | 6.125%, 06/15/23 | | | 1,459,500 | |
| | | | | | | | | | |
| | | | | | | | | 53,352,497 | |
| | | | | | | | | | |
| | | | | | Information Technology (7.0%) | |
| | 3,200,000 | | | | | Activision Blizzard, Inc.*m
5.625%, 09/15/21 | | | 3,368,000 | |
| | 3,000,000 | | | | | Alliance Data Systems Corp.*
6.375%, 04/01/20 | | | 3,082,500 | |
| | | | | | Amkor Technology, Inc.m | | | | |
| | 3,290,000 | | | | | 6.375%, 10/01/22^ | | | 3,133,725 | |
| | 939,000 | | | | | 6.625%, 06/01/21 | | | 914,938 | |
| | 1,150,000 | | | | | Anixter, Inc.*m
5.500%, 03/01/23 | | | 1,178,031 | |
| | 8,000,000 | | | | | Belden, Inc.*m
5.500%, 09/01/22 | | | 8,155,000 | |
| | 3,425,000 | | | | | Cardtronics, Inc.m
5.125%, 08/01/22 | | | 3,439,984 | |
| | | | | | CDW, LLC / CDW Finance Corp. | | | | |
| | 1,200,000 | | | | | 6.000%, 08/15/22 | | | 1,284,750 | |
| | 845,000 | | | | | 5.000%, 09/01/23µ | | | 865,597 | |
| | 2,800,000 | | | | | CommScope Technologies Finance, LLC*m
6.000%, 06/15/25 | | | 2,880,500 | |
| | | | | | | | | | |
PRINCIPAL
AMOUNT | | | | | | | VALUE | |
| | 3,400,000 | | | | | First Data Corp.*
7.000%, 12/01/23 | | $ | 3,510,500 | |
| | 6,500,000 | | | | | Hughes Satellite Systems Corp.m
7.625%, 06/15/21 | | | 7,255,625 | |
| | 4,000,000 | | | | | J2 Global, Inc.m
8.000%, 08/01/20 | | | 4,190,000 | |
| | 3,010,000 | | | | | Nuance Communications, Inc.*^m
5.375%, 08/15/20 | | | 3,096,538 | |
| | 2,000,000 | | | | | NXP Semiconductors, NV*m
5.750%, 02/15/21 | | | 2,102,500 | |
| | 3,400,000 | | | | | ViaSat, Inc.m
6.875%, 06/15/20 | | | 3,525,375 | |
| | | | | | | | | | |
| | | | | | | | | 51,983,563 | |
| | | | | | | | | | |
| | | | | | Materials (4.0%) | |
| | 2,350,000 | | | | | Alcoa, Inc.^m
5.125%, 10/01/24 | | | 2,298,594 | |
| | 3,300,000 | | | | | ArcelorMittal, SA^m
6.125%, 06/01/25 | | | 3,240,187 | |
| | 1,435,000 | | | | | Chemtura Corp.m
5.750%, 07/15/21 | | | 1,436,794 | |
| | | | | | First Quantum Minerals, Ltd.* | | | | |
| | 748,000 | | | | | 7.000%, 02/15/21 | | | 606,815 | |
| | 738,000 | | | | | 6.750%, 02/15/20 | | | 615,769 | |
| | 4,410,000 | | | | | Greif, Inc.m
7.750%, 08/01/19 | | | 4,975,031 | |
| | | | | | INEOS Group Holdings, SA*^ | | | | |
| | 2,200,000 | | | | | 6.125%, 08/15/18 | | | 2,241,250 | |
| | 1,200,000 | | | | | 5.875%, 02/15/19 | | | 1,223,250 | |
| | 3,715,000 | | | | | New Gold, Inc.*m
7.000%, 04/15/20 | | | 3,626,769 | |
| | 2,350,000 | | | | | PH Glatfelter Companym
5.375%, 10/15/20 | | | 2,373,500 | |
| | | | | | Sealed Air Corp.*m | | | | |
| | 2,055,000 | | | | | 6.500%, 12/01/20 | | | 2,340,131 | |
| | 900,000 | | | | | 5.250%, 04/01/23 | | | 962,438 | |
| | 4,000,000 | | | | | Trinseo Materials Operating, SCA*m
6.750%, 05/01/22 | | | 4,140,000 | |
| | | | | | | | | | |
| | | | | | | | | 30,080,528 | |
| | | | | | | | | | |
| | | | | | Telecommunication Services (3.8%) | |
| | | | | | CenturyLink, Inc. | | | | |
| | 2,036,000 | | | | | 6.750%, 12/01/23m | | | 2,019,457 | |
| | 425,000 | | | | | 7.500%, 04/01/24 | | | 426,328 | |
| | | | | | Frontier Communications Corp.m | | | | |
| | 2,782,000 | | | | | 7.625%, 04/15/24 | | | 2,484,674 | |
| | 1,975,000 | | | | | 11.000%, 09/15/25* | | | 2,002,156 | |
| | 1,580,000 | | | | | 10.500%, 09/15/22* | | | 1,631,350 | |
| | 286,000 | | | | | 6.875%, 01/15/25 | | | 239,168 | |
| | 1,050,000 | | | | | Intelsat Jackson Holdings, SA*
8.000%, 02/15/24 | | | 1,084,781 | |
| | 200,000 | | | | | Neptune Finco Corp.*
10.125%, 01/15/23 | | | 220,125 | |
| | 2,350,000 | | | | | SBA Communications Corp.m
5.625%, 10/01/19 | | | 2,444,000 | |
| | | | |
| 10 | | CALAMOS CONVERTIBLE OPPORTUNITIES AND INCOME FUND SEMIANNUAL REPORT | | See accompanying Notes to Schedule of Investments |
Schedule of Investments April 30, 2016 (Unaudited)
| | | | | | | | | | |
PRINCIPAL
AMOUNT | | | | | | | VALUE | |
| | | | | | Sprint Corp.µ | | | | |
| | 11,220,000 | | | | | 7.875%, 09/15/23 | | $ | 8,765,625 | |
| | 1,480,000 | | | | | 7.125%, 06/15/24 | | | 1,113,700 | |
| | 1,035,000 | | | | | 7.250%, 09/15/21 | | | 833,175 | |
| | 4,700,000 | | | | | T-Mobile USA, Inc.m
6.625%, 04/01/23 | | | 5,029,000 | |
| | | | | | | | | | |
| | | | | | | | | 28,293,539 | |
| | | | | | | | | | |
| | | | | | Utilities (1.2%) | |
| | 3,000,000 | | | | | AES Corp.^
7.375%, 07/01/21 | | | 3,436,875 | |
| | 4,960,000 | | | | | AmeriGas Finance Corp.m
7.000%, 05/20/22 | | | 5,254,500 | |
| | | | | | | | | | |
| | | | | | | | | 8,691,375 | |
| | | | | | | | | | |
| | | | | | TOTAL CORPORATE BONDS
(Cost $461,024,914) | | | 443,940,513 | |
| | | | | | | | | | |
| | | | | | | | | | |
| | CONVERTIBLE BONDS (49.3%) | |
| | | | | | Consumer Discretionary (11.8%) | |
| | 7,100,000 | | | | | CalAtlantic Group, Inc.m
1.250%, 08/01/32 | | | 7,443,143 | |
| | 3,200,000 | | | | | Ctrip.com International, Ltd.*
1.000%, 07/01/20 | | | 3,519,616 | |
| | | | | | Jarden Corp. | | | | |
| | 8,015,000 | | | | | 1.125%, 03/15/34 | | | 10,377,902 | |
| | 6,000,000 | | | | | 1.500%, 06/15/19 | | | 9,444,000 | |
| | 6,506,000 | | | | | Liberty Interactive, LLC (Time Warner Cable, Inc., Time Warner, Inc.)^m§
0.750%, 03/30/43 | | | 11,218,784 | |
| | 8,550,000 | | | | | Liberty Media Corp.^
1.375%, 10/15/23 | | | 8,609,251 | |
| | | | | | Priceline Group, Inc.^m | | | | |
| | 12,800,000 | | | | | 0.350%, 06/15/20 | | | 15,656,128 | |
| | 3,350,000 | | | | | 0.900%, 09/15/21 | | | 3,462,560 | |
| | 19,850,000 | | | | | Tesla Motors, Inc.^m
1.250%, 03/01/21 | | | 18,256,343 | |
| | | | | | | | | | |
| | | | | | | | | 87,987,727 | |
| | | | | | | | | | |
| | | | | | Financials (3.6%) | |
| | 7,300,000 | | | | | Ares Capital Corp.m
4.750%, 01/15/18 | | | 7,607,950 | |
| | 1,600,000 | | | EUR | | Azimut Holding, S.p.A.m
2.125%, 11/25/20 | | | 2,130,891 | |
| | 3,600,000 | | | | | Colony Starwood Homes
3.000%, 07/01/19 | | | 3,598,614 | |
| | 2,050,000 | | | | | Extra Space Storage, LP*^
3.125%, 10/01/35 | | | 2,267,700 | |
| | 3,500,000 | | | | | IAS Operating Partnership, LP*m
5.000%, 03/15/18 | | | 3,374,157 | |
| | 4,200,000 | | | | | Spirit Realty Capital, Inc.^m
2.875%, 05/15/19 | | | 4,408,152 | |
| | 2,900,000 | | | | | Starwood Property Trust, Inc.^m
4.550%, 03/01/18 | | | 2,954,970 | |
| | | | | | | | | | |
| | | | | | | | | 26,342,434 | |
| | | | | | | | | | |
| | | | | | | | | | |
PRINCIPAL
AMOUNT | | | | | | | VALUE | |
| | | | | | | | | | |
| | | | | | Health Care (9.2%) | |
| | 2,515,000 | | | | | Anacor Pharmaceuticals, Inc.*
2.000%, 04/15/23 | | $ | 2,888,377 | |
| | 5,711,000 | | | | | BioMarin Pharmaceutical, Inc.m
1.500%, 10/15/20 | | | 6,958,368 | |
| | 5,900,000 | | | | | Cepheid
1.250%, 02/01/21 | | | 5,115,507 | |
| | 5,950,000 | | | | | Emergent Biosolutions, Inc.
2.875%, 01/15/21 | | | 8,126,629 | |
| | 1,200,000 | | | | | Gilead Sciences, Inc.^m
1.625%, 05/01/16 | | | 4,752,372 | |
| | 8,300,000 | | | | | Hologic, Inc.‡
0.000%, 12/15/43 | | | 10,284,571 | |
| | 6,400,000 | | | | | Illumina, Inc.^m
0.500%, 06/15/21 | | | 6,610,656 | |
| | 1,435,000 | | | | | Incyte Corp.
1.250%, 11/15/20 | | | 2,264,595 | |
| | 5,400,000 | | | | | Ionis Pharmaceuticals, Inc.^m
1.000%, 11/15/21 | | | 5,013,873 | |
| | 3,489,000 | | | | | Medidata Solutions, Inc.^
1.000%, 08/01/18 | | | 3,694,432 | |
| | 7,442,000 | | | | | Molina Healthcare, Inc.^m
1.625%, 08/15/44 | | | 8,339,245 | |
| | 4,050,000 | | | | | NuVasive, Inc.*
2.250%, 03/15/21 | | | 4,567,104 | |
| | | | | | | | | | |
| | | | | | | | | 68,615,729 | |
| | | | | | | | | | |
| | | | | | Industrials (0.4%) | |
| | 2,022,000 | | | | | Air Lease Corp.^m
3.875%, 12/01/18 | | | 2,670,203 | |
| | | | | | | | | | |
| | | | | | Information Technology (23.9%) | |
| | 3,300,000 | | | | | Citrix Systems, Inc.^m
0.500%, 04/15/19 | | | 3,719,974 | |
| | 5,150,000 | | | | | Euronet Worldwide, Inc.^m
1.500%, 10/01/44 | | | 6,310,630 | |
| | 2,700,000 | | | | | Finisar Corp.
0.500%, 12/15/33 | | | 2,591,771 | |
| | | | | | FireEye, Inc.* | | | | |
| | 5,300,000 | | | | | 1.000%, 06/01/35 | | | 4,598,280 | |
| | 4,826,000 | | | | | 1.625%, 06/01/35 | | | 3,986,928 | |
| | 2,900,000 | | | | | Inphi Corp.*
1.125%, 12/01/20 | | | 3,042,666 | |
| | 11,350,000 | | | | | Intel Corp.m
3.250%, 08/01/39 | | | 17,242,977 | |
| | 3,900,000 | | | | | Knowles Corp.*
3.250%, 11/01/21 | | | 3,968,250 | |
| | 7,850,000 | | | | | LinkedIn Corp.m
0.500%, 11/01/19 | | | 7,334,451 | |
| | 9,400,000 | | | | | Microchip Technology, Inc.^m
1.625%, 02/15/25 | | | 9,785,165 | |
| | 6,225,000 | | | | | Micron Technology, Inc.
2.125%, 02/15/33 | | | 7,581,801 | |
| | 3,450,000 | | | | | Novellus Systems, Inc.^m
2.625%, 05/15/41 | | | 7,842,298 | |
| | | | | | |
| See accompanying Notes to Schedule of Investments | | CALAMOS CONVERTIBLE OPPORTUNITIES AND INCOME FUND SEMIANNUAL REPORT | | | 11 | |
Schedule of Investments April 30, 2016 (Unaudited)
| | | | | | | | | | |
PRINCIPAL
AMOUNT | | | | | | | VALUE | |
| | 5,700,000 | | | | | NVIDIA Corp.
1.000%, 12/01/18 | | $ | 10,160,791 | |
| | 9,300,000 | | | | | NXP Semiconductors, NV^
1.000%, 12/01/19 | | | 10,552,012 | |
| | | | | | ON Semiconductor Corp.m | | | | |
| | 6,400,000 | | | | | 1.000%, 12/01/20*^ | | | 5,811,104 | |
| | 4,900,000 | | | | | 2.625%, 12/15/26 | | | 5,223,498 | |
| | 1,550,000 | | | | | Palo Alto Networks, Inc.
0.000%, 07/01/19 | | | 2,277,555 | |
| | 3,100,000 | | | | | Proofpoint, Inc.*
0.750%, 06/15/20 | | | 3,173,114 | |
| | 2,700,000 | | | | | Red Hat, Inc.^
0.250%, 10/01/19 | | | 3,320,771 | |
| | 8,800,000 | | | | | Salesforce.com, Inc.^m
0.250%, 04/01/18 | | | 11,098,032 | |
| | 3,759,000 | | | | | ServiceNow, Inc.^m
0.000%, 11/01/18 | | | 4,350,610 | |
| | | | | | SunEdison, Inc.m@ | | | | |
| | 9,411,000 | | | | | 0.250%, 01/15/20* | | | 374,511 | |
| | 898,000 | | | | | 2.000%, 10/01/18 | | | 35,381 | |
| | | | | | SunPower Corp. | | | | |
| | 5,125,000 | | | | | 0.750%, 06/01/18^m | | | 5,427,477 | |
| | 3,100,000 | | | | | 4.000%, 01/15/23* | | | 2,991,221 | |
| | 3,200,000 | | | | | Synchronoss Technologies, Inc.m
0.750%, 08/15/19 | | | 3,110,192 | |
| | | | | | Take-Two Interactive Software, Inc. | | | | |
| | 2,600,000 | | | | | 1.000%, 07/01/18 | | | 4,262,661 | |
| | 625,000 | | | | | 1.750%, 12/01/16 | | | 1,120,975 | |
| | 7,325,000 | | | | | Twitter, Inc.
1.000%, 09/15/21 | | | 6,140,621 | |
| | 4,000,000 | | | | | Verint Systems, Inc.
1.500%, 06/01/21 | | | 3,607,560 | |
| | 2,375,000 | | | | | WebMD Health Corp.
2.500%, 01/31/18 | | | 2,724,873 | |
| | | | | | Workday, Inc. | | | | |
| | 5,125,000 | | | | | 0.750%, 07/15/18^m | | | 5,752,659 | |
| | 1,950,000 | | | | | 1.500%, 07/15/20 | | | 2,282,309 | |
| | 5,950,000 | | | | | Yahoo!, Inc.^m
0.000%, 12/01/18 | | | 5,981,386 | |
| | | | | | | | | | |
| | | | | | | | | 177,784,504 | |
| | | | | | | | | | |
| | | | | | Materials (0.4%) | |
| | 2,800,000 | | | | | RTI International Metals, Inc.^m
1.625%, 10/15/19 | | | 3,212,006 | |
| | | | | | | | | | |
| | | | | | TOTAL CONVERTIBLE BONDS
(Cost $386,015,810) | | | 366,612,603 | |
| | | | | | | | | | |
| | | | | | | | | | |
| | U.S. GOVERNMENT AND AGENCY SECURITY (0.1%) | |
| | 700,000 | | | | | United States Treasury Note~
0.875%, 11/30/16
(Cost $700,499) | | | 701,682 | |
| | | | | | | | | | |
| | | | | | | | | | |
NUMBER OF
SHARES | | | | | | | VALUE | |
| | CONVERTIBLE PREFERRED STOCKS (26.2%) | |
| | | | | | Consumer Discretionary (0.9%) | |
| | 91,550 | | | | | Fiat Chrysler Automobiles, NV
7.875% | | $ | 6,620,392 | |
| | | | | | | | | | |
| | | | | | Consumer Staples (2.5%) | |
| | 54,000 | | | | | Bunge, Ltd.m
4.875% | | | 4,968,000 | |
| | 30,800 | | | | | Post Holdings, Inc.m
5.250% | | | 4,032,182 | |
| | 130,000 | | | | | Tyson Foods, Inc.m
4.750% | | | 9,482,200 | |
| | | | | | | | | | |
| | | | | | | | | 18,482,382 | |
| | | | | | | | | | |
| | | | | | Energy (2.0%) | |
| | 117,800 | | | | | Hess Corp.^
8.000% | | | 8,955,156 | |
| | 69,300 | | | | | Southwestern Energy Companym
6.250% | | | 2,196,117 | |
| | 73,500 | | | | | WPX Energy, Inc.
6.250% | | | 3,474,345 | |
| | | | | | | | | | |
| | | | | | | | | 14,625,618 | |
| | | | | | | | | | |
| | | | | | Financials (7.3%) | |
| | 207,200 | | | | | Affiliated Managers Group, Inc.^m
5.150% | | | 11,978,750 | |
| | | | | | American Tower Corp. | | | | |
| | 64,000 | | | | | 5.250%m | | | 6,792,960 | |
| | 16,650 | | | | | 5.500%^ | | | 1,726,272 | |
| | 4,600 | | | | | Bank of America Corp.
7.250% | | | 5,420,180 | |
| | 93,000 | | | | | Crown Castle International Corp.m
4.500% | | | 9,877,995 | |
| | 4,375 | | | | | Wells Fargo & Company
7.500% | | | 5,451,250 | |
| | 130,225 | | | | | Welltower, Inc.
6.500% | | | 8,038,789 | |
| | 103,333 | | | | | Weyerhaeuser Companym
6.375% | | | 5,322,683 | |
| | | | | | | | | | |
| | | | | | | | | 54,608,879 | |
| | | | | | | | | | |
| | | | | | Health Care (6.7%) | |
| | 24,950 | | | | | Allergan, PLC
5.500% | | | 20,246,675 | |
| | 49,750 | | | | | Amsurg Corp.m
5.250% | | | 7,556,030 | |
| | 302,500 | | | | | Anthem, Inc.^
5.250% | | | 14,020,875 | |
| | 9,200 | | | | | Teva Pharmaceutical Industries, Ltd.
7.000% | | | 8,289,200 | |
| | | | | | | | | | |
| | | | | | | | | 50,112,780 | |
| | | | | | | | | | |
| | | | | | Industrials (0.9%) | |
| | 57,750 | | | | | Stanley Black & Decker, Inc.m
6.250% | | | 6,838,755 | |
| | | | | | | | | | |
| | | | |
| 12 | | CALAMOS CONVERTIBLE OPPORTUNITIES AND INCOME FUND SEMIANNUAL REPORT | | See accompanying Notes to Schedule of Investments |
Schedule of Investments April 30, 2016 (Unaudited)
| | | | | | | | | | |
NUMBER OF
SHARES | | | | | | | VALUE | |
| | | | | | | | | | |
| | | | | | Materials (0.3%) | |
| | 70,000 | | | | | Alcoa, Inc.^
5.375% | | $ | 2,665,600 | |
| | | | | | | | | | |
| | | | | | Telecommunication Services (2.0%) | |
| | 58,870 | | | | | Frontier Communications Corp.
11.125% | | | 6,140,141 | |
| | 125,650 | | | | | T-Mobile USA, Inc.^
5.500% | | | 8,520,327 | |
| | | | | | | | | | |
| | | | | | | | | 14,660,468 | |
| | | | | | | | | | |
| | | | | | Utilities (3.6%) | |
| | 170,000 | | | | | Dominion Resources, Inc.m
6.375% | | | 8,386,100 | |
| | 270,000 | | | | | Exelon Corp.m
6.500% | | | 13,084,200 | |
| | 86,000 | | | | | NextEra Energy, Inc.^m
6.371% | | | 5,142,800 | |
| | | | | | | | | | |
| | | | | | | | | 26,613,100 | |
| | | | | | | | | | |
| | | | | | TOTAL CONVERTIBLE PREFERRED STOCKS
(Cost $192,455,390) | | | 195,227,974 | |
| | | | | | | | | | |
| | | | | | | | | | |
| | COMMON STOCKS (0.5%) | |
| | | | | | Financials (0.1%) | |
| | 13,850 | | | | | American International Group, Inc.^m | | | 773,107 | |
| | | | | | | | | | |
| | | | | | Industrials (0.4%) | |
| | 30,780 | | | | | United Technologies Corp.^m | | | 3,212,509 | |
| | | | | | | | | | |
| | | | | | TOTAL COMMON STOCKS
(Cost $4,277,454) | | | 3,985,616 | |
| | | | | | | | | | |
| | | | | | | | | | |
| | | | | | | | | | |
NUMBER OF
SHARES | | | | | | | VALUE | |
| | SHORT TERM INVESTMENT (5.0%) | |
| | 36,783,240 | | | | | Fidelity Prime Money Market Fund - Institutional Class
(Cost $36,783,240) | | $ | 36,783,240 | |
| | | | | | | | | | |
| | | | | | TOTAL INVESTMENTS (140.8%)
(Cost $1,081,257,307) | | | 1,047,251,628 | |
| | | | | | | | | | |
| |
| | LIABILITIES, LESS OTHER ASSETS (-40.8%) | | | (303,257,855 | ) |
| | | | | | | | | | |
| |
| | NET ASSETS (100.0%) | | $ | 743,993,773 | |
| | | | | | | | | | |
NOTES TO SCHEDULE OF INVESTMENTS
| * | Securities issued and sold pursuant to a Rule 144A transaction are excepted from the registration requirement of the Securities Act of 1933, as amended. These securities may only be sold to qualified institutional buyers (“QIBs”), such as the Fund. Any resale of these securities must generally be effected through a sale that is registered under the Act or otherwise exempted from such registration requirements. |
| ^ | Security, or portion of security, is on loan. |
| m | Security, or portion of security, is held in a segregated account as collateral for note payable aggregating a total value of $588,719,177. $135,168,691 of the collateral has been re-registered by one of the counterparties, BNP (see Note 7 - Borrowings). |
| ‡ | Variable rate or step bond security. The rate shown is the rate in effect at April 30, 2016. |
| § | Securities exchangeable or convertible into securities of one or more entities that are different than the issuer. Each entity is identified in the parenthetical. |
| @ | In default status and considered non-income producing. |
| ~ | Security, or portion of security, is segregated as collateral (or potential collateral for future transactions) for swaps. The aggregate value of such securities is $701,682. |
FOREIGN CURRENCY ABBREVIATION
| | |
| EUR | | European Monetary Unit |
Note: Value for securities denominated in foreign currencies is shown in U.S. dollars. The principal amount for such securities is shown in the respective foreign currency.
INTEREST RATE SWAPS
| | | | | | | | | | | | | | |
| COUNTERPARTY | | FIXED RATE
(FUND PAYS) | | FLOATING RATE
(FUND RECEIVES) | | TERMINATION
DATE | | NOTIONAL
AMOUNT | | | UNREALIZED
APPRECIATION/
(DEPRECIATION) | |
| BNP Paribas, SA | | 1.160% quarterly | | 3 month LIBOR | | 04/19/17 | | $ | 55,000,000 | | | $ | (223,428 | ) |
| BNP Paribas, SA | | 1.140% quarterly | | 3 month LIBOR | | 03/14/17 | | | 40,000,000 | | | | (165,375 | ) |
| | | | | | | | | | | | | | |
| | | $ | (388,803 | ) |
| | | | | | | | | | | | | | |
| | | | | | |
| See accompanying Notes to Financial Statements | | CALAMOS CONVERTIBLE OPPORTUNITIES AND INCOME FUND SEMIANNUAL REPORT | | | 13 | |
Statement of Assets and Liabilities April 30, 2016 (Unaudited)
| | | | |
ASSETS | |
Investments in securities, at value (cost $1,081,257,307) | | $ | 1,047,251,628 | |
Receivables: | | | | |
Accrued interest and dividends | | | 9,583,034 | |
Investments sold | | | 5,534,999 | |
Prepaid expenses | | | 59,845 | |
Other assets | | | 173,179 | |
Total assets | | | 1,062,602,685 | |
LIABILITIES | | | | |
Unrealized depreciation on interest rate swaps | | | 388,803 | |
Payables: | | | | |
Notes payable | | | 306,000,000 | |
Investments purchased | | | 11,042,885 | |
Affiliates: | | | | |
Investment advisory fees | | | 683,423 | |
Deferred compensation to trustees | | | 173,179 | |
Financial accounting fees | | | 9,957 | |
Trustees’ fees and officer compensation | | | 12,616 | |
Other accounts payable and accrued liabilities | | | 298,049 | |
Total liabilities | | | 318,608,912 | |
NET ASSETS | | $ | 743,993,773 | |
COMPOSITION OF NET ASSETS | | | | |
Common stock, no par value, unlimited shares authorized 69,997,487 shares issued and outstanding | | $ | 852,063,443 | |
Undistributed net investment income (loss) | | | (28,966,183 | ) |
Accumulated net realized gain (loss) on investments, foreign currency transactions and interest rate swaps | | | (44,709,593 | ) |
Unrealized appreciation (depreciation) of investments, foreign currency translations and interest rate swaps | | | (34,393,894 | ) |
NET ASSETS | | $ | 743,993,773 | |
Net asset value per common shares based upon 69,997,487 shares issued and outstanding | | $ | 10.63 | |
| | | | |
| 14 | | CALAMOS CONVERTIBLE OPPORTUNITIES AND INCOME FUND SEMIANNUAL REPORT | | See accompanying Notes to Financial Statements |
Statement of Operations Six Months Ended April 30, 2016 (Unaudited)
| | | | |
INVESTMENT INCOME | |
Interest | | $ | 22,650,076 | |
Dividends | | | 4,919,112 | |
Securities lending income | | | 85,749 | |
Dividend taxes withheld | | | (12,503 | ) |
Total investment income | | | 27,642,434 | |
| |
EXPENSES | | | | |
Investment advisory fees | | | 4,260,419 | |
Interest expense and related fees | | | 1,916,865 | |
Legal fees | | | 82,120 | |
Printing and mailing fees | | | 73,428 | |
Financial accounting fees | | | 61,818 | |
Accounting fees | | | 37,396 | |
Audit fees | | | 36,995 | |
Trustees’ fees and officer compensation | | | 32,989 | |
Custodian fees | | | 14,968 | |
Transfer agent fees | | | 12,288 | |
Registration fees | | | 7,284 | |
Other | | | 74,067 | |
Total expenses | | | 6,610,637 | |
NET INVESTMENT INCOME (LOSS) | | | 21,031,797 | |
| |
REALIZED AND UNREALIZED GAIN (LOSS) | | | | |
Net realized gain (loss) from: | | | | |
Investments, excluding purchased options | | | (48,603,810 | ) |
Purchased options | | | (1,877,271 | ) |
Foreign currency transactions | | | (5,641 | ) |
Interest rate swaps | | | (339,681 | ) |
Change in net unrealized appreciation/(depreciation) on: | | | | |
Investments, excluding purchased options | | | (4,474,859 | ) |
Purchased options | | | 391,259 | |
Foreign currency translations | | | 820 | |
Interest rate swaps | | | 332,190 | |
NET GAIN (LOSS) | | | (54,576,993 | ) |
NET INCREASE (DECREASE) IN NET ASSETS RESULTING FROM OPERATIONS | | $ | (33,545,196 | ) |
| | | | | | |
| See accompanying Notes to Financial Statements | | CALAMOS CONVERTIBLE OPPORTUNITIES AND INCOME FUND SEMIANNUAL REPORT | | | 15 | |
Statements of Changes in Net Assets
| | | | | | | | |
| | | (UNAUDITED)
SIX MONTHS ENDED
APRIL 30, 2016 | | | YEAR ENDED
OCTOBER 31, 2015 | |
OPERATIONS | | | | | | | | |
Net investment income (loss) | | $ | 21,031,797 | | | $ | 43,548,636 | |
Net realized gain (loss) | | | (50,826,403 | ) | | | 14,279,438 | |
Change in unrealized appreciation/(depreciation) | | | (3,750,590 | ) | | | (101,817,001 | ) |
Net increase (decrease) in net assets applicable to shareholders resulting from operations | | | (33,545,196 | ) | | | (43,988,927 | ) |
| | |
DISTRIBUTIONS FROM | | | | | | | | |
Net investment income | | | (39,898,568 | ) | | | (56,919,151 | ) |
Net realized gains | | | — | | | | (1,309,468 | ) |
Return of capital | | | — | | | | (21,388,022 | ) |
Net decrease in net assets from distributions | | | (39,898,568 | ) | | | (79,616,641 | ) |
| | |
CAPITAL STOCK TRANSACTIONS | | | | | | | | |
Proceeds from shares sold | | | — | | | | 6,895,228 | |
Offering costs on shares | | | (53,060 | ) | | | (311,846 | ) |
Reinvestment of distributions resulting in the issuance of stock | | | — | | | | 2,810,011 | |
Net increase (decrease) in net assets from capital stock transactions | | | (53,060 | ) | | | 9,393,393 | |
TOTAL INCREASE (DECREASE) IN NET ASSETS | | | (73,496,824 | ) | | | (114,212,175 | ) |
| | |
NET ASSETS | | | | | | | | |
Beginning of period | | $ | 817,490,597 | | | $ | 931,702,772 | |
End of period | | | 743,993,773 | | | | 817,490,597 | |
Undistributed net investment income (loss) | | $ | (28,966,183 | ) | | $ | (10,099,412 | ) |
| | | | |
| 16 | | CALAMOS CONVERTIBLE OPPORTUNITIES AND INCOME FUND SEMIANNUAL REPORT | | See accompanying Notes to Financial Statements |
Statement of Cash Flows Six Months Ended April 30, 2016 (Unaudited)
| | | | |
CASH FLOWS FROM OPERATING ACTIVITIES: | |
Net increase/(decrease) in net assets from operations | | $ | (33,545,196 | ) |
Adjustments to reconcile net increase/(decrease) in net assets from operations to net cash provided by operating activities: | | | | |
Purchases of investment securities | | | (163,137,379 | ) |
Net proceeds from disposition of short term investments | | | 23,745,110 | |
Proceeds from disposition of investment securities | | | 208,485,820 | |
Amortization and accretion of fixed-income securities | | | (4,000,576 | ) |
Net realized gains/losses from investments, excluding purchased options | | | 48,603,810 | |
Net realized gains/losses from purchased options | | | 1,877,271 | |
Change in unrealized appreciation or depreciation on investments, excluding purchased options | | | 4,474,859 | |
Change in unrealized appreciation or depreciation on purchased options | | | (391,259 | ) |
Change in unrealized appreciation or depreciation on interest rate swaps | | | (332,190 | ) |
Net change in assets and liabilities: | | | | |
(Increase)/decrease in assets: | | | | |
Accrued interest and dividends receivable | | | 1,274,111 | |
Prepaid expenses | | | (39,635 | ) |
Other assets | | | 23,195 | |
Increase/(decrease) in liabilities: | | | | |
Payables to affiliates | | | (132,222 | ) |
Other accounts payable and accrued liabilities | | | 45,909 | |
Net cash provided by/(used in) operating activities | | $ | 86,951,628 | |
| |
CASH FLOWS FROM FINANCING ACTIVITIES: | | | | |
Offering costs related to shares sold | | | (53,060 | ) |
Distributions to shareholders | | | (39,898,568 | ) |
Repayment of note payable | | | (47,000,000 | ) |
Net cash provided by/(used in) financing activities | | $ | (86,951,628 | ) |
Net increase/(decrease) in cash | | $ | — | |
Cash at beginning of period | | $ | — | |
Cash at end of period | | $ | — | |
Supplemental disclosure | | | | |
Cash paid for interest and related fees | | $ | 1,888,098 | |
| | | | | | |
| See accompanying Notes to Financial Statements | | CALAMOS CONVERTIBLE OPPORTUNITIES AND INCOME FUND SEMIANNUAL REPORT | | | 17 | |
Notes to Financial Statements (Unaudited)
Note 1 – Organization and Significant Accounting Policies
Organization. Calamos Convertible Opportunities and Income Fund (the “Fund”) was organized as a Delaware statutory trust on April 17, 2002 and is registered under the Investment Company Act of 1940 (the “1940 Act”) as a diversified, closed-end management investment company. The Fund commenced operations on June 26, 2002. The Fund’s investment strategy is to provide total return through a combination of capital appreciation and current income. Under normal circumstances, the Fund will invest at least 80% of its managed assets in a diversified portfolio of convertibles and non-convertible income securities and under normal circumstances, the Fund will invest at least 35% of its managed assets in convertible securities. “Managed assets” means the Fund’s total assets (including any assets attributable to any leverage that may be outstanding) minus total liabilities (other than debt representing financial leverage).
Significant Accounting Policies. The financial statements have been prepared in conformity with accounting principles generally accepted in the United States of America (GAAP), which require management to make certain estimates and assumptions at the date of the financial statements. Actual results may differ from those estimates. Subsequent events, if any, through the date that the financial statements were issued have been evaluated in the preparation of the financial statements. The following summarizes the significant accounting policies of the Fund:
Fund Valuation. The valuation of the Fund’s investments is in accordance with policies and procedures adopted by and under the ultimate supervision of the board of trustees.
Fund securities that are traded on U.S. securities exchanges, except option securities, are valued at the official closing price, which is the last current reported sales price on its principal exchange at the time each Fund determines its net asset value (“NAV”). Securities traded in the over-the-counter market and quoted on The NASDAQ Stock Market are valued at the NASDAQ Official Closing Price, as determined by NASDAQ, or lacking a NASDAQ Official Closing Price, the last current reported sale price on NASDAQ at the time a Fund determines its NAV. When a last sale or closing price is not available, equity securities, other than option securities, that are traded on a U.S. securities exchange and other equity securities traded in the over-the-counter market are valued at the mean between the most recent bid and asked quotations on its principal exchange in accordance with guidelines adopted by the board of trustees. Each option security traded on a U.S. securities exchange is valued at the mid-point of the consolidated bid/ask quote for the option security, also in accordance with guidelines adopted by the board of trustees. Each over-the-counter option that is not traded through the Options Clearing Corporation is valued based on a quotation provided by the counterparty to such option under the ultimate supervision of the board of trustees.
Fixed income securities, certain convertible preferred securities, and non-exchange traded derivatives are normally valued by independent pricing services or by dealers or brokers who make markets in such securities. Valuations of such fixed income securities, certain convertible preferred securities, and non-exchange traded derivatives consider yield or price of equivalent securities of comparable quality, coupon rate, maturity, type of issue, trading characteristics and other market data and do not rely exclusively upon exchange or over-the-counter prices.
Trading on European and Far Eastern exchanges and over-the-counter markets is typically completed at various times before the close of business on each day on which the New York Stock Exchange (“NYSE”) is open. Each security trading on these exchanges or in over-the-counter markets may be valued utilizing a systematic fair valuation model provided by an independent pricing service approved by the board of trustees. The valuation of each security that meets certain criteria in relation to the valuation model is systematically adjusted to reflect the impact of movement in the U.S. market after the foreign markets close. Securities that do not meet the criteria, or that are principally traded in other foreign markets, are valued as of the last reported sale price at the time the Fund determines its NAV, or when reliable market prices or quotations are not readily available, at the mean between the most recent bid and asked quotations as of the close of the appropriate exchange or other designated time. Trading of foreign securities may not take place on every NYSE business day. In addition, trading may take place in various foreign markets on Saturdays or on other days when the NYSE is not open and on which the Fund’s NAV is not calculated.
If the pricing committee determines that the valuation of a security in accordance with the methods described above is not reflective of a fair value for such security, the security is valued at a fair value by the pricing committee, under the ultimate supervision of the board of trustees, following the guidelines and/or procedures adopted by the board of trustees.
The Fund also may use fair value pricing, pursuant to guidelines adopted by the board of trustees and under the ultimate supervision of the board of trustees, if trading in the security is halted or if the value of a security it holds is materially affected by events
| | | | |
| 18 | | CALAMOS CONVERTIBLE OPPORTUNITIES AND INCOME FUND SEMIANNUAL REPORT | | |
Notes to Financial Statements (Unaudited)
occurring before the Fund’s pricing time but after the close of the primary market or exchange on which the security is listed. Those procedures may utilize valuations furnished by pricing services approved by the board of trustees, which may be based on market transactions for comparable securities and various relationships between securities that are generally recognized by institutional traders, a computerized matrix system, or appraisals derived from information concerning the securities or similar securities received from recognized dealers in those securities.
When fair value pricing of securities is employed, the prices of securities used by a Fund to calculate its NAV may differ from market quotations or official closing prices. In light of the judgment involved in fair valuations, there can be no assurance that a fair value assigned to a particular security is accurate.
Investment Transactions. Investment transactions are recorded on a trade date basis as of April 30, 2016. Net realized gains and losses from investment transactions are reported on an identified cost basis. Interest income is recognized using the accrual method and includes accretion of original issue and market discount and amortization of premium. Dividend income is recognized on the ex-dividend date, except that certain dividends from foreign securities are recorded as soon as the information becomes available after the ex-dividend date.
Foreign Currency Translation. Values of investments and other assets and liabilities denominated in foreign currencies are translated into U.S. dollars using a rate quoted by a major bank or dealer in the particular currency market, as reported by a recognized quotation dissemination service.
The Fund does not isolate that portion of the results of operations resulting from changes in foreign exchange rates on investments from the fluctuations arising from changes in market prices of securities held. Such fluctuations are included with the net realized and unrealized gain or loss from investments.
Reported net realized foreign currency gains or losses arise from disposition of foreign currency, the difference in the foreign exchange rates between the trade and settlement dates on securities transactions, and the difference between the amounts of dividends, interest and foreign withholding taxes recorded on the ex-date or accrual date and the U.S. dollar equivalent of the amounts actually received or paid. Net unrealized foreign exchange gains and losses arise from changes (due to the changes in the exchange rate) in the value of foreign currency and other assets and liabilities denominated in foreign currencies held at period end.
Allocation of Expenses Among Funds. Expenses directly attributable to the Fund are charged to the Fund; certain other common expenses of Calamos Advisors Trust, Calamos Investment Trust, Calamos ETF Trust, Calamos Convertible Opportunities and Income Fund, Calamos Convertible and High Income Fund, Calamos Strategic Total Return Fund, Calamos Global Total Return Fund, Calamos Global Dynamic Income Fund and Calamos Dynamic Convertible and Income Fund are allocated proportionately among each Fund to which the expenses relate in relation to the net assets of each Fund or on another reasonable basis.
Income Taxes. No provision has been made for U.S. income taxes because the Fund’s policy is to continue to qualify as a regulated investment company under the Internal Revenue Code of 1986, as amended, and distribute to shareholders substantially all of the Fund’s taxable income and net realized gains.
Dividends and distributions paid to shareholders are recorded on the ex-dividend date. The amount of dividends and distributions from net investment income and net realized capital gains is determined in accordance with federal income tax regulations, which may differ from U.S. generally accepted accounting principles. To the extent these “book/tax” differences are permanent in nature, such amounts are reclassified within the capital accounts based on their federal tax-basis treatment. These differences are primarily due to differing treatments for foreign currency transactions, contingent payment debt instruments and methods of amortizing and accreting for fixed income securities. The financial statements are not adjusted for temporary differences.
The Fund recognized no liability for uncertain tax positions. A reconciliation is not provided as the beginning and ending amounts of unrecognized benefits are zero, with no interim additions, reductions or settlements. Tax years 2011 and forward remain subject to examination by U.S. and State tax jurisdictions.
Indemnifications. Under the Fund’s organizational documents, the Fund is obligated to indemnify its officers and trustees against certain liabilities incurred by them by reason of having been an officer or trustee of the Fund. In addition, in the normal course of business, the Fund may enter into contracts that provide general indemnifications to other parties. The Fund’s maximum exposure
| | | | | | |
| | CALAMOS CONVERTIBLE OPPORTUNITIES AND INCOME FUND SEMIANNUAL REPORT | | | 19 | |
Notes to Financial Statements (Unaudited)
under these arrangements is unknown as this would involve future claims that may be made against the Fund that have not yet occurred. Currently, the Fund’s management expects the risk of material loss in connection to a potential claim to be remote.
Note 2 – Investment Adviser and Transactions With Affiliates Or Certain Other Parties
Pursuant to an investment advisory agreement with Calamos Advisors LLC (“Calamos Advisors”), the Fund pays an annual fee, payable monthly, equal to 0.80% based on the average weekly managed assets.
Pursuant to a financial accounting services agreement, during the period the Fund paid Calamos Advisors a fee for financial accounting services payable monthly at the annual rate of 0.0175% on the first $1 billion of combined assets, 0.0150% on the next $1 billion of combined assets and 0.0110% on combined assets above $2 billion (for purposes of this calculation “combined assets” means the sum of the total average daily net assets of Calamos Advisors Trust, Calamos Investment Trust, Calamos ETF Trust and the total average weekly managed assets of Calamos Convertible and High Income Fund, Calamos Strategic Total Return Fund, Calamos Convertible Opportunities and Income Fund, Calamos Global Total Return Fund, Calamos Global Dynamic Income Fund and Calamos Dynamic Convertible and Income Fund). Financial accounting services include, but are not limited to, the following: managing expenses and expense payment processing; monitoring the calculation of expense accrual amounts; calculating, tracking and reporting tax adjustments on all assets; and monitoring trustee deferred compensation plan accruals and valuations. The Fund pays its pro rata share of the financial accounting services fee payable to Calamos Advisors based on its relative portion of combined assets used in calculating the fee.
The Fund reimburses Calamos Advisors for a portion of compensation paid to the Fund’s Chief Compliance Officer. This compensation is reported as part of the “Trustees’ fees and officer compensation” expense on the Statement of Operations.
A trustee and certain officers of the Fund are also officers and directors of Calamos Advisors. Such trustee and officers serve without direct compensation from the Fund.
The Fund has adopted a deferred compensation plan (the “Plan”). Under the Plan, a trustee who is not an “interested person” (as defined in the 1940 Act) and has elected to participate in the Plan (a “participating trustee”) may defer receipt of all or a portion of their compensation from the Fund. The deferred compensation payable to the participating trustee is credited to the trustee’s deferral account as of the business day such compensation would have been paid to the participating trustee. The value of amounts deferred for a participating trustee is determined by reference to the change in value of Class I shares of one or more funds of Calamos Investment Trust designated by the participant. The value of the account increases with contributions to the account or with increases in the value of the measuring shares, and the value of the account decreases with withdrawals from the account or with declines in the value of the measuring shares. Deferred compensation of $173,179 is included in “Other assets” on the Statement of Assets and Liabilities at April 30, 2016. The Fund obligation to make payments under the Plan is a general obligation of the Fund and is included in “Payable for deferred compensation to trustees” on the Statement of Assets and Liabilities at April 30, 2016.
Note 3 – Investments
The cost of purchases and proceeds from sale of long-term investments for the period ended April 30, 2016 were as follows:
| | | | |
| Cost of purchases | | $ | 140,205,408 | |
| Proceeds from sales | | | 198,635,296 | |
The following information is presented on a federal income tax basis as of April 30, 2016. Differences between the cost basis under U.S. generally accepted accounting principles and federal income tax purposes are primarily due to temporary differences.
The cost basis of investments for federal income tax purposes at April 30, 2016 was as follows:
| | | | |
| Cost basis of investments | | $ | 1,088,131,250 | |
| | | | |
| Gross unrealized appreciation | | | 54,742,229 | |
| Gross unrealized depreciation | | | (95,621,851 | ) |
| | | | |
| Net unrealized appreciation (depreciation) | | $ | (40,879,622 | ) |
| | | | |
| | | | |
| 20 | | CALAMOS CONVERTIBLE OPPORTUNITIES AND INCOME FUND SEMIANNUAL REPORT | | |
Notes to Financial Statements (Unaudited)
Note 4 – Income Taxes
The Fund intends to make monthly distributions from its income available for distribution, which consists of the Fund’s dividends and interest income after payment of Fund expenses, and net realized gains on stock investments. At least annually, the Fund intends to distribute all or substantially all of its net realized capital gains, if any. Distributions are recorded on the ex-dividend date. The Fund distinguishes between distributions on a tax basis and a financial reporting basis. Accounting principles generally accepted in the United States of America require that only distributions in excess of tax basis earnings and profits be reported in the financial statements as a return of capital. Permanent differences between book and tax accounting relating to distributions are reclassified to paid-in-capital. For tax purposes, distributions from short-term capital gains are considered to be from ordinary income. Distributions in any year may include a return of capital component.
The tax character of distributions for the period ended April 30, 2016 will be determined at the end of the Fund’s current fiscal year.
Distributions for the year ended October 31, 2015 were characterized for federal income tax purposes as follows:
| | | | |
| | | YEAR ENDED OCTOBER 31, 2015 | |
| Distributions paid from: | | | | |
| Ordinary income | | $ | 56,919,151 | |
| Long-term capital gains | | | 1,309,468 | |
| Return of capital | | | 21,388,022 | |
As of October 31, 2015, the components of accumulated earnings/(loss) on a tax basis were as follows:
| | | | |
| Undistributed ordinary income | | $ | — | |
| Undistributed capital gains | | | 8,143,867 | |
| | | | |
| Total undistributed earnings | | | 8,143,867 | |
| Accumulated capital and other losses | | | — | |
| Net unrealized gains/(losses) | | | (42,599,066 | ) |
| | | | |
| Total accumulated earnings/(losses) | | | (34,455,199 | ) |
| Other | | | (170,707 | ) |
| Paid-in-capital | | | 852,116,503 | |
| | | | |
| Total | | $ | 817,490,597 | |
| | | | |
The Regulated Investment Company Modernization Act of 2010 (the “Act”) modernized various tax rules for regulated investment companies, and was effective for taxable years beginning after the enactment date of December 22, 2010. One significant change is to the treatment of capital loss carryforwards. Now, any capital losses recognized will retain their character as either short-term or long-term capital losses, will be utilized before the pre-Act capital loss carryforwards, and will be carried forward indefinitely, until applied in offsetting future capital gains.
Note 5 – Common Shares
There are unlimited common shares of beneficial interest authorized and 69,997,487 shares outstanding at April 30, 2016. Calamos Advisors owned 25,738 of the outstanding shares at April 30, 2016. Transactions in common shares were as follows:
| | | | | | | | |
| | | PERIOD ENDED
APRIL 30, 2016 | | | YEAR ENDED
OCTOBER 31, 2015 | |
| Beginning shares | | | 69,997,487 | | | | 69,263,034 | |
| Shares sold | | | — | | | | 517,519 | |
| Shares issued through reinvestment of distributions | | | — | | | | 216,934 | |
| | | | |
| Ending shares | | | 69,997,487 | | | | 69,997,487 | |
| | | | |
Notice is hereby given in accordance with Section 23(c) of the 1940 Act that the Fund may from time to time purchase its shares of common stock in the open market.
| | | | | | |
| | CALAMOS CONVERTIBLE OPPORTUNITIES AND INCOME FUND SEMIANNUAL REPORT | | | 21 | |
Notes to Financial Statements (Unaudited)
The Fund also may offer and sell common shares from time to time at an offering price equal to or in excess of the net asset value per share of the Fund’s common shares at the time such common shares are initially sold.
Note 6 – Derivative Instruments
Foreign Currency Risk. The Fund may engage in portfolio hedging with respect to changes in currency exchange rates by entering into forward foreign currency contracts to purchase or sell currencies. A forward foreign currency contract is a commitment to purchase or sell a foreign currency at a future date at a negotiated forward rate. Risks associated with such contracts include, among other things, movement in the value of the foreign currency relative to the U.S. dollar and the ability of the counterparty to perform. To mitigate the counterparty risk, the Fund may enter into an International Swaps and Derivatives Association, Inc. Master Agreement (“ISDA Master Agreement”) or similar agreement with its derivative contract counterparties. An ISDA Master Agreement is a bilateral agreement between the Fund and a counterparty that governs over-the-counter derivatives and foreign exchange contracts and typically contains, among other things, collateral posting terms and netting provisions in the event of a default and/or termination event. Under an ISDA Master Agreement, the Fund may, under certain circumstances, offset with the counterparty certain derivative financial instrument’s payables and/or receivables with collateral held and/or posted and create one single net payment. The provisions of the ISDA Master Agreement typically permit a single net payment in the event of default (close-out netting), including the bankruptcy or insolvency of the counterparty. Generally, collateral is exchanged between the Fund and the counterparty and the amount of collateral due from the Fund or to a counterparty has to exceed a minimum transfer amount threshold before a transfer has to be made. To the extent amounts due to the Fund from its counterparties are not fully collateralized, contractually or otherwise, the Fund bears the risk of loss from counterparty nonperformance. For financial reporting purposes, the Fund does not offset derivative assets and derivative liabilities that are subject to netting arrangements in the Statement of Assets and Liabilities. The Fund’s net counterparty exposure is reflected in the counterparty table below. The net unrealized gain, if any, represents the credit risk to the Fund on a forward foreign currency contract. The contracts are valued daily at forward foreign exchange rates. The Fund realizes a gain or loss when a position is closed or upon settlement of the contracts. There were no open forward foreign currency contracts at April 30, 2016.
Equity Risk. The Fund may engage in option transactions and in doing so achieves similar objectives to what it would achieve through the sale or purchase of individual securities. A call option, upon payment of a premium, gives the purchaser of the option the right to buy, and the seller of the option the obligation to sell, the underlying security, index or other instrument at the exercise price. A put option gives the purchaser of the option, upon payment of a premium, the right to sell, and the seller the obligation to buy, the underlying security, index, or other instrument at the exercise price.
To seek to offset some of the risk of a potential decline in value of certain long positions, the Fund may also purchase put options on individual securities, broad-based securities indexes or certain exchange-traded funds (“ETFs”). The Fund may also seek to generate income from option premiums by writing (selling) options on a portion of the equity securities (including securities that are convertible into equity securities) in the Fund’s portfolio, on broad-based securities indexes, or certain ETFs.
When a Fund purchases an option, it pays a premium and an amount equal to that premium is recorded as an asset. When a Fund writes an option, it receives a premium and an amount equal to that premium is recorded as a liability. The asset or liability is adjusted daily to reflect the current market value of the option. If an option expires unexercised, the Fund realizes a gain or loss to the extent of the premium received or paid. If an option is exercised, the premium received or paid is recorded as an adjustment to the proceeds from the sale or the cost basis of the purchase. The difference between the premium and the amount received or paid on a closing purchase or sale transaction is also treated as a realized gain or loss. The cost of securities acquired through the exercise of call options is increased by premiums paid. The proceeds from securities sold through the exercise of put options are decreased by the premiums paid. Gain or loss on written options and purchased options is presented separately as net realized gain or loss on written options and net realized gain or loss on purchased options, respectively.
Options written by the Fund do not typically give rise to counterparty credit risk since options written obligate the Fund and not the counterparty to perform. Exchange traded purchased options have minimal counterparty credit risk to the Fund since the exchange’s clearinghouse, as counterparty to such instruments, guarantees against a possible default.
| | | | |
| 22 | | CALAMOS CONVERTIBLE OPPORTUNITIES AND INCOME FUND SEMIANNUAL REPORT | | |
Notes to Financial Statements (Unaudited)
As of April 30, 2016, the Fund had no outstanding purchased options listed on the Schedule of Investments.
Interest Rate Risk. The Fund engages in interest rate swaps primarily to hedge the interest rate risk on the Fund’s borrowings (see Note 7 – Borrowings). An interest rate swap is a contract that involves the exchange of one type of interest rate for another type of interest rate. If interest rates rise, resulting in a diminution in the value of the Fund’s portfolio, the Fund would receive payments under the swap that would offset, in whole or in part, such diminution in value; if interest rates fall, the Fund would likely lose money on the swap transaction. Unrealized gains are reported as an asset, and unrealized losses are reported as a liability on the Statement of Assets and Liabilities. The change in value of swaps, including accruals of periodic amounts of interest to be paid or received on swaps, is reported as change in net unrealized appreciation/depreciation on interest rate swaps in the Statement of Operations. A realized gain or loss is recorded in net realized gain (loss) on interest rate swaps in the Statement of Operations upon payment or receipt of a periodic payment or termination of the swap agreements. Swap agreements are stated at fair value. Notional principal amounts are used to express the extent of involvement in these transactions, but the amounts potentially subject to credit risk are much smaller. In connection with these contracts, securities may be identified as collateral in accordance with the terms of the respective swap contracts in the event of default or bankruptcy of the Fund.
Premiums paid to or by a Fund are accrued daily and included in realized gain (loss) when paid on swaps in the accompanying Statement of Operations. The contracts are marked-to-market daily based upon third party vendor valuations and changes in value are recorded as unrealized appreciation (depreciation). Gains or losses are realized upon early termination of the contract. Risks may exceed amounts recognized in the Statement of Assets and Liabilities. These risks include changes in the returns of the underlying instruments, failure of the counterparties to perform under the contracts’ terms, counterparty’s creditworthiness, and the possible lack of liquidity with respect to the contracts.
As of April 30, 2016, the Fund had outstanding interest rate swap agreements as listed on the Schedule of Investments.
As of April 30, 2016, the Fund had outstanding derivative contracts which are reflected on the Statement of Asset and Liabilities as follows:
| | | | | | | | |
| | | ASSET
DERIVATIVES | | | LIABILITY
DERIVATIVES | |
| Gross amounts at fair value: | | | | | | | | |
| Interest Rate Swaps(1) | | $ | — | | | $ | 388,803 | |
| | | | |
| | $ | — | | | $ | 388,803 | |
| | | | |
The following table presents the outstanding derivative contracts, organized by counterparty, that are subject to enforceable master netting agreements as of April 30, 2016:
| | | | | | | | | | | | | | | | | | | | | | |
| | | GROSS AMOUNTS NOT OFFSET IN THE STATEMENT OF ASSETS AND LIABILITIES | |
| | | GROSS AMOUNTS PRESENTED IN THE
STATEMENT OF ASSETS AND LIABILITIES | | | COLLATERAL PLEDGED | | | NET AMOUNT
RECEIVABLE
IN THE EVENT OF DEFAULT | | | NET AMOUNT
PAYABLE IN
THE EVENT OF DEFAULT | |
| Counterparty | | | | ASSETS | | | LIABILITIES | | | | |
| BNP Paribas, SA | | ISDA | | $ | — | | | $ | 388,803 | | | $ | (388,803 | ) | | $ | — | | | $ | — | |
| | | | | | |
| | | | $ | — | | | $ | 388,803 | | | $ | (388,803 | ) | | $ | — | | | $ | — | |
| | | | | | |
| (1) | Generally, the Statement of Assets and Liabilities location for ‘Interest rate swaps” is “Unrealized appreciation (depreciation) on interest rate swaps.” |
Note 7 – Borrowings
The Fund, with the approval of its board of trustees, including its independent trustees, has entered into a financing package that includes a Committed Facility Agreement (the “BNP Agreement”) with BNP Paribas Prime Brokerage International Ltd. (“BNP”) that allows the Fund to borrow up to $215.0 million and a lending agreement, “Lending Agreement” as defined below. In addition, the financing package also includes a Credit Agreement (the “SSB Agreement”, together with the BNP Agreement, “Agreements”) with State Street Bank and Trust Company (“SSB”) that allows the Fund to borrow up to a limit of $215.0 million, and a related securities lending authorization agreement (“Authorized Agreement”). Borrowings under the BNP Agreement and the SSB Agreement are secured by assets of the Fund that are held with the Fund’s custodian in a separate account (the “pledged collateral”). BNP and
| | | | | | |
| | CALAMOS CONVERTIBLE OPPORTUNITIES AND INCOME FUND SEMIANNUAL REPORT | | | 23 | |
Notes to Financial Statements (Unaudited)
SSB share an equal claim on the pledged collateral, subject to any adjustment that may be agreed upon between the lenders. Interest on the BNP Agreement is charged at the three month LIBOR (London Inter-bank Offered Rate) plus .65% on the amount borrowed and .55% on the undrawn balance. Interest on the SSB Agreement is charged on the drawn amount at the rate of Overnight LIBOR plus .80% and .10% on the undrawn balance (if the undrawn amount is more than 75% of the borrowing limit, the commitment fee is .20%). For the period ended April 30, 2016, the average borrowings under the Agreements were $316.5 million. For the period ended April 30, 2016, the average interest rate was 1.12%. As of April 30, 2016, the amount of total outstanding borrowings was $306.0 million ($153.0 million under the BNP Agreement and $153.0 million under the SSB Agreement), which approximates fair value. The interest rate applicable to the borrowings on April 30, 2016 was 1.15%.
The Lending Agreement with BNP is a separate side-agreement between the Fund and BNP pursuant to which BNP may borrow a portion of the pledged collateral (the “Lent Securities”) in an amount not to exceed the outstanding borrowings owed by the Fund to BNP under the BNP Agreement. The Lending Agreement is intended to permit the Fund to significantly reduce the cost of its borrowings under the BNP Agreement. BNP may re-register the Lent Securities in its own name or in another name other than the Fund, and may pledge, re-pledge, sell, lend or otherwise transfer or use the Lent Securities with all attendant rights of ownership. (It is the Fund’s understanding that BNP will perform due diligence to determine the creditworthiness of any party that borrows Lent Securities from BNP.) The Fund may designate any security within the pledged collateral as ineligible to be a Lent Security, provided there are eligible securities within the pledged collateral in an amount equal to the outstanding borrowing owed by the Fund. During the period in which the Lent Securities are outstanding, BNP must remit payment to the Fund equal to the amount of all dividends, interest or other distributions earned or made by the Lent Securities.
Under the terms of the Lending Agreement with BNP, the Lent Securities are marked to market daily, and if the value of the Lent Securities exceeds the value of the then-outstanding borrowings owed by the Fund to BNP under the Agreement (the “Current Borrowings”), BNP must, on that day, either (1) return Lent Securities to the Fund’s custodian in an amount sufficient to cause the value of the outstanding Lent Securities to equal the Current Borrowings; or (2) post cash collateral with the Fund’s custodian equal to the difference between the value of the Lent Securities and the value of the Current Borrowings. If BNP fails to perform either of these actions as required, the Fund will recall securities, as discussed below, in an amount sufficient to cause the value of the outstanding Lent Securities to equal the Current Borrowings. The Fund can recall any of the Lent Securities and BNP shall, to the extent commercially possible, return such security or equivalent security to the Fund’s custodian no later than three business days after such request. If the Fund recalls a Lent Security pursuant to the Lending Agreement, and BNP fails to return the Lent Securities or equivalent securities in a timely fashion, BNP shall remain liable for the ultimate delivery of such Lent Securities, or equivalent securities, to be made to the Fund’s custodian, and for any buy-in costs that the executing broker for the sales transaction may impose with respect to the failure to deliver. The Fund shall also have the right to apply and set-off an amount equal to one hundred percent (100%) of the then-current fair market value of such Lent Securities against the Current Borrowings.
Under the terms of the Authorized Agreement with SSB, all securities lent through SSB must be secured continuously by collateral received in cash, cash equivalents, or U.S. Treasury bills and maintained on a current basis at an amount at least equal to the market value of the securities loaned. Cash collateral held by SSB on behalf of the Fund may be credited against the amounts borrowed under the SSB Agreement. Any amounts credited against the SSB Agreement would count against the Fund’s leverage limitations under the 1940 Act, unless otherwise covered in accordance with SEC Release IC-10666. Under the terms of the Authorized Agreement with SSB, SSB will return the value of the collateral to the borrower upon the return of the lent securities, which will eliminate the credit against the SSB Agreement and will cause the amount drawn under the SSB Agreement to increase in an amount equal to the returned collateral. Under the terms of the Authorized Agreement with SSB, the Fund will make a variable “net income” payment related to any collateral credited against the SSB Agreement which will be paid to the securities borrower, less any payments due to the Fund or SSB under the terms of the Authorized Agreement. The Fund has the right to call a loan and obtain the securities loaned at any time. As of April 30, 2016, the Fund used approximately $59.9 million of its cash collateral to offset the SSB Agreement, representing 5.7% of managed assets, and was required to pay a “net income” payment equal to an annualized interest rate of 0.59%, which can fluctuate depending on interest rates. As of April 30, 2016, approximately $58.5 million of securities were on loan ($50.0 million of fixed income securities and $8.5 million of equity securities) which are reflected in the Investment in securities, at value on the Statement of Assets and Liabilities.
| | | | |
| 24 | | CALAMOS CONVERTIBLE OPPORTUNITIES AND INCOME FUND SEMIANNUAL REPORT | | |
Notes to Financial Statements (Unaudited)
On May 22, 2015, the Fund’s board of trustees amended the Fund’s non-fundamental policy with respect to borrowings to be measured based on managed assets rather than total assets. The policy, as amended, is as follows:
As a non-fundamental policy, the Fund may not issue debt securities, borrow money or issue preferred shares in an aggregate amount exceeding 38% of the Fund’s managed assets measured at the time of issuance of the new securities.
For purposes of this non-fundamental policy, “managed assets” shall mean the total assets of the Fund (including any assets attributable to any leverage that may be outstanding) minus the sum of liabilities (other than debt representing financial leverage). The policy is measured at each incurrence of the debt, and is not a maintenance test.
Note 8 – Fair Value Measurements
Various inputs are used to determine the value of the Fund’s investments. These inputs are categorized into three broad levels as follows:
| | • | | Level 1 – Prices are determined using inputs from unadjusted quoted prices from active markets (including securities actively traded on a securities exchange) for identical assets. |
| | • | | Level 2 – Prices are determined using significant observable market inputs other than unadjusted quoted prices, including quoted prices of similar securities, fair value adjustments to quoted foreign securities, interest rates, credit risk, prepayment speeds, and other relevant data. |
| | • | | Level 3 – Prices reflect unobservable market inputs (including the Fund’s own judgments about assumptions market participants would use in determining fair value) when observable inputs are unavailable. |
Debt securities are valued based upon evaluated prices received from an independent pricing service or from a dealer or broker who makes markets in such securities. Pricing services utilize various observable market data and as such, debt securities are generally categorized as Level 2. The levels are not necessarily an indication of the risk or liquidity of the Fund’s investments. Transfers between the levels for investment securities or other financial instruments are measured at the end of the reporting period.
The following is a summary of the inputs used in valuing the Fund’s holdings at fair value:
| | | | | | | | | | | | | | | | |
| | | LEVEL 1 | | | LEVEL 2 | | | LEVEL 3 | | | TOTAL | |
| Assets: | | | | | | | | | | | | | | | | |
Corporate Bonds | | $ | — | | | $ | 443,940,513 | | | $ | — | | | $ | 443,940,513 | |
Convertible Bonds | | | — | | | | 366,612,603 | | | | — | | | | 366,612,603 | |
U.S. Government and Agency Security | | | — | | | | 701,682 | | | | — | | | | 701,682 | |
Convertible Preferred Stocks | | | 167,628,650 | | | | 27,599,324 | | | | — | | | | 195,227,974 | |
Common Stocks U.S. | | | 3,985,616 | | | | — | | | | — | | | | 3,985,616 | |
Short Term Investment | | | 36,783,240 | | | | — | | | | — | | | | 36,783,240 | |
| | | | |
| Total | | $ | 208,397,506 | | | $ | 838,854,122 | | | $ | — | | | $ | 1,047,251,628 | |
| | | | |
| Liabilities: | | | | | | | | | | | | | | | | |
Interest Rate Swaps | | $ | — | | | $ | 388,803 | | | $ | — | | | $ | 388,803 | |
| | | | |
| Total | | $ | — | | | $ | 388,803 | | | $ | — | | | $ | 388,803 | |
| | | | |
| | | | | | |
| | CALAMOS CONVERTIBLE OPPORTUNITIES AND INCOME FUND SEMIANNUAL REPORT | | | 25 | |
Financial Highlights
Selected data for a share outstanding throughout each period were as follows:
| | | | | | | | | | | | | | | | | | | | | | | | |
| | | (Unaudited)
Six Months
Ended
April 30, | | | Year Ended October 31, | |
| | | 2016 | | | 2015 | | | 2014 | | | 2013 | | | 2012 | | | 2011 | |
Net asset value, beginning of period | | | $11.68 | | | | $13.45 | | | | $13.20 | | | | $12.45 | | | | $12.31 | | | | $12.84 | |
Income from investment operations: | | | | | | | | | | | | | | | | | | | | | | | | |
Net investment income (loss)* | | | 0.30 | | | | 0.62 | | | | 0.72 | | | | 0.75 | | | | 0.81 | | | | 0.83 | |
Net realized and unrealized gain (loss) | | | (0.78 | ) | | | (1.25 | ) | | | 0.67 | | | | 1.14 | | | | 0.47 | | | | (0.23 | ) |
Total from investment operations | | | (0.48 | ) | | | (0.63 | ) | | | 1.39 | | | | 1.89 | | | | 1.28 | | | | 0.60 | |
Less distributions to common shareholders from: | | | | | | | | | | | | | | | | | | | | | | | | |
Net investment income | | | (0.57 | ) | | | (0.81 | ) | | | (0.95 | ) | | | (1.14 | ) | | | (1.14 | ) | | | (0.84 | ) |
Net realized gains | | | — | | | | (0.02 | ) | | | (0.19 | ) | | | — | | | | — | | | | — | |
Return of capital | | | — | | | | (0.31 | ) | | | — | | | | — | | | | — | | | | (0.30 | ) |
Total distributions | | | (0.57 | ) | | | (1.14 | ) | | | (1.14 | ) | | | (1.14 | ) | | | (1.14 | ) | | | (1.14 | ) |
Premiums from shares sold in at the market offerings | | | — | | | | — | (a) | | | — | (a) | | | — | | | | — | (a) | | | 0.01 | |
Net asset value, end of period | | | $10.63 | | | | $11.68 | | | | $13.45 | | | | $13.20 | | | | $12.45 | | | | $12.31 | |
Market value, end of period | | | $9.65 | | | | $10.41 | | | | $13.69 | | | | $13.09 | | | | $12.51 | | | | $12.09 | |
Total investment return based on:(b) | | | | | | | | | | | | | | | | | | | | | | | | |
Net asset value | | | (3.36% | ) | | | (4.69% | ) | | | 10.90% | | | | 16.08% | | | | 11.05% | | | | 4.92% | |
Market value | | | (1.57% | ) | | | (16.54% | ) | | | 13.83% | | | | 14.56% | | | | 13.62% | | | | 1.08% | |
Net assets, end of period (000) | | | $743,994 | | | | $817,491 | | | | $931,703 | | | | $891,350 | | | | $840,737 | | | | $827,339 | |
Ratios to average net assets applicable to common shareholders: | | | | | | | | | | | | | | | | | | | | | | | | |
Net expenses | | | 1.79% | (c) | | | 1.84% | | | | 1.47% | | | | 1.49% | | | | 1.57% | | | | 1.55% | |
Gross expenses prior to expense reductions and earnings credits | | | 1.79% | (c) | | | 1.84% | | | | 1.47% | | | | 1.49% | | | | 1.57% | | | | 1.55% | |
Net expenses, excluding interest expense | | | 1.27% | (c) | | | 1.50% | | | | 1.18% | | | | 1.17% | | | | 1.17% | | | | 1.19% | |
Net investment income (loss) | | | 5.68% | (c) | | | 4.90% | | | | 5.38% | | | | 5.92% | | | | 6.60% | | | | 6.56% | |
Net investment income (loss), net of preferred share distributions from net investment income | | | 5.68% | | | | 4.90% | | | | 5.38% | | | | 5.92% | | | | 6.60% | | | | 6.56% | |
Portfolio turnover rate | | | 14% | | | | 36% | | | | 40% | | | | 62% | | | | 56% | | | | 44% | |
Average commission rate paid | | | $0.0334 | | | | $0.0303 | | | | $0.0294 | | | | $0.0295 | | | | $0.0230 | | | | $0.0222 | |
Asset coverage per $1,000 of loan outstanding(d) | | | $3,431 | | | | $3,316 | | | | $3,588 | | | | $3,547 | | | | $3,950 | | | | $3,903 | |
| * | Net investment income allocated based on average shares method. |
| (a) | Amount equated to less than $0.005 per common share. |
| (b) | Total investment return is calculated assuming a purchase of common stock on the opening of the first day and a sale on the closing of the last day of the period reported. Dividends and distributions are assumed, for purposes of this calculation, to be reinvested at prices obtained under the Fund’s dividend reinvestment plan. Total return is not annualized for periods less than one year. Brokerage commissions are not reflected. NAV per share is determined by dividing the value of the Fund’s portfolio securities, cash and other assets, less all liabilities, by the total number of common shares outstanding. The common share market price is the price the market is willing to pay for shares of the Fund at a given time. Common share market price is influenced by a range of factors, including supply and demand and market conditions. |
| (d) | Calculated by subtracting the Fund’s total liabilities (not including Notes payable) from the Fund’s total assets and dividing this by the amount of notes payable outstanding, and by multiplying the result by 1,000. |
| | | | |
| 26 | | CALAMOS CONVERTIBLE OPPORTUNITIES AND INCOME FUND SEMIANNUAL REPORT | | |
Report of Independent Registered Public Accounting Firm
To the Board of Trustees and Shareholders of Calamos Convertible Opportunities and Income Fund
We have reviewed the accompanying statement of assets and liabilities, including the schedule of investments, for Calamos Convertible Opportunities and Income Fund (the “Fund”) as of April 30, 2016, and the related statements of operations, changes in net assets and cash flows, and the financial highlights for the six month period then ended. These financial statements and financial highlights are the responsibility of the Fund’s management.
We conducted our review in accordance with standards of the Public Company Accounting Oversight Board (United States). A review of financial information consists principally of applying analytical procedures and making inquiries of persons responsible for financial and accounting matters. It is substantially less in scope than an audit conducted in accordance with standards of the Public Company Accounting Oversight Board (United States), the objective of which is the expression of an opinion regarding the financial statements and financial highlights taken as a whole. Accordingly, we do not express such an opinion.
Based on our review, we are not aware of any material modifications that should be made to such financial statements and financial highlights for them to be in conformity with accounting principles generally accepted in the United States of America.
We have previously audited, in accordance with the standards of the Public Company Accounting Oversight Board (United States), the statement of changes in net assets of the Fund for the year ended October 31, 2015 and the financial highlights for each of the five years in the period then ended; and in our report dated December 16, 2015, we expressed an unqualified opinion on such statement of changes in net assets and financial highlights.

Chicago, Illinois
June 15, 2016
| | | | | | |
| | CALAMOS CONVERTIBLE OPPORTUNITIES AND INCOME FUND SEMIANNUAL REPORT | | | 27 | |
About Closed-End Funds
What is a Closed-End Fund?
A closed-end fund is a publicly traded investment company that raises its initial investment capital through the issuance of a fixed number of shares to investors in a public offering. Shares of a closed-end fund are listed on a stock exchange or traded in the over-the-counter market. Like all investment companies, a closed-end fund is professionally managed and offers investors a unique investment solution based on its investment objective approved by the fund’s Board of Directors.
Potential Advantages of Closed-End Fund Investing
| • | | Defined Asset Pool Allows Efficient Portfolio Management—Although closed-end fund shares trade actively on a securities exchange, this doesn’t affect the closed-end fund manager because there are no new investors buying into or selling out of the fund’s portfolio. |
| • | | More Flexibility in the Timing and Price of Trades—Investors can purchase and sell shares of closed-end funds throughout the trading day, just like the shares of other publicly traded securities. |
| • | | Lower Expense Ratios—The expense ratios of closed-end funds are oftentimes less than those of mutual funds. Over time, a lower expense ratio could enhance investment performance. |
| • | | Closed-End Structure Makes Sense for Less-Liquid Asset Classes—A closed-end structure makes sense for investors considering less-liquid asset classes, such as high-yield bonds or micro-cap stocks. |
| • | | Ability to Put Leverage to Work—Closed-end funds may issue senior securities (such as preferred shares or debentures) or borrow money to “leverage” their investment positions. |
| • | | No Minimum Investment Requirements |
OPEN-END MUTUAL FUNDS VERSUS CLOSED-END FUNDS
| | |
| OPEN-END FUND | | CLOSED-END FUND |
| Issues new shares on an ongoing basis | | Generally issues a fixed number of shares |
| Issues common equity shares | | Can issue common equity shares and senior securities such as preferred shares and bonds |
| Sold at NAV plus any sales charge | | Price determined by the marketplace |
| Sold through the fund’s distributor | | Traded in the secondary market |
| Fund redeems shares at NAV calculated at the close of business day | | Fund does not redeem shares |
| | | |
You can purchase or sell common shares of closed-end funds daily. Like any other stock, market price will fluctuate with the market. Upon sale, your shares may have a market price that is above or below net asset value and may be worth more or less than your original investment. Shares of closed-end funds frequently trade at a discount, which is a market price that is below their net asset value.
Leverage creates risks which may adversely affect return, including the likelihood of greater volatility of net asset value and market price of common shares and fluctuations in the variable rates of the leverage financing.
Each open-end or closed-end fund should be evaluated individually. Before investing carefully consider the fund’s investment objectives, risks, charges and expenses.
| | | | |
| 28 | | CALAMOS CONVERTIBLE OPPORTUNITIES AND INCOME FUND SEMIANNUAL REPORT | | |
Level Rate Distribution Policy
Using a Level Rate Distribution Policy to Promote Dependable Income and Total Return
The goal of the level rate distribution policy is to provide investors a predictable, though not assured, level of cash flow, which can either serve as a stable income stream or, through reinvestment, may contribute significantly to long-term total return.
We understand the importance that investors place on the stability of dividends and their ability to contribute to long-term total return, which is why we have instituted a level rate distribution policy for the Fund. Under the policy, monthly distributions paid may include net investment income, net realized short-term capital gains and, if necessary, return of capital. In addition, a limited number of distributions per calendar year may include net realized long-term capital gains. There is no guarantee that the Fund will realize capital gains in any given year. Distributions are subject to re-characterization for tax purposes after the end of the fiscal year. All shareholders with taxable accounts will receive written notification regarding the components and tax treatment for distributions via Form 1099-DIV.
Distributions from the Fund are generally subject to Federal income taxes. For purposes of maintaining the level rate distribution policy, the Fund may realize short-term capital gains on securities that, if sold at a later date, would have resulted in long-term capital gains. Maintenance of a level rate distribution policy may increase transaction and tax costs associated with the Fund.
Automatic Dividend Reinvestment Plan
Maximizing Investment with an Automatic Dividend Reinvestment Plan
The Automatic Dividend Reinvestment Plan offers a simple, cost-efficient and convenient way to reinvest your dividends and capital gains distributions in additional shares of the Fund, allowing you to increase your investment in the Fund.
Potential Benefits
| • | | Compounded Growth: By automatically reinvesting with the Plan, you gain the potential to allow your dividends and capital gains to compound over time. |
| • | | Potential for Lower Commission Costs: Additional shares are purchased in large blocks, with brokerage commissions shared among all plan participants. There is no cost to enroll in the Plan. |
| • | | Convenience: After enrollment, the Plan is automatic and includes detailed statements for participants. Participants can terminate their enrollment at any time. |
Pursuant to the Plan, unless a shareholder is ineligible or elects otherwise, all dividend and capital gains on common shares distributions are automatically reinvested by Computershare, as agent for shareholders in administering the Plan (“Plan Agent”), in additional common shares of the Fund. Shareholders who elect not to participate in the Plan will receive all dividends and distributions payable in cash paid by check mailed directly to the shareholder of record (or, if the shares are held in street or other nominee name, then to such nominee) by Plan Agent, as dividend paying agent. Shareholders may elect not to participate in the Plan and to receive all dividends and distributions in cash by sending written instructions to the Plan Agent, as dividend paying agent, at: Dividend Reinvestment Department, P.O. Box 358016, Pittsburgh, PA 15252. Participation in the Plan is completely voluntary and may be terminated or resumed at any time without penalty by giving notice in writing to the Plan Agent; such termination will be effective with respect to a particular dividend or distribution if notice is received prior to the record date for the applicable distribution.
The shares are acquired by the Plan Agent for the participant’s account either (i) through receipt of additional common shares from the Fund (“newly issued shares”) or (ii) by purchase of outstanding common shares on the
| | | | | | |
| | CALAMOS CONVERTIBLE OPPORTUNITIES AND INCOME FUND SEMIANNUAL REPORT | | | 29 | |
Automatic Dividend Reinvestment Plan
open market (“open-market purchases”) on the NASDAQ or elsewhere. If, on the payment date, the net asset value per share of the common shares is equal to or less than the market price per common share plus estimated brokerage commissions (a “market premium”), the Plan Agent will receive newly issued shares from the Fund for each participant’s account. The number of newly issued common shares to be credited to the participant’s account will be determined by dividing the dollar amount of the dividend or distribution by the greater of (i) the net asset value per common share on the payment date, or (ii) 95% of the market price per common share on the payment date.
If, on the payment date, the net asset value per common share exceeds the market price plus estimated brokerage commissions (a “market discount”), the Plan Agent has a limited period of time to invest the dividend or distribution amount in shares acquired in open-market purchases. The weighted average price (including brokerage commissions) of all common shares purchased by the Plan Agent as Plan Agent will be the price per common share allocable to each participant. If the Plan Agent is unable to invest the full dividend amount in open-market purchases during the purchase period or if the market discount shifts to a market premium during the purchase period, the Plan Agent will cease making open-market purchases and will invest the uninvested portion of the dividend or distribution amount in newly issued shares at the close of business on the last purchase date.
The automatic reinvestment of dividends and distributions will not relieve participants of any federal, state or local income tax that may be payable (or required to be withheld) on such dividends even though no cash is received by participants.
There are no brokerage charges with respect to shares issued directly by the Fund as a result of dividends or distributions payable either in shares or in cash. However, each participant will pay a pro rata share of brokerage commissions incurred with respect to the Plan Agent’s open-market purchases in connection with the reinvestment of dividends or distributions. If a participant elects to have the Plan Agent sell part or all of his or her common shares and remit the proceeds, such participant will be charged his or her pro rata share of brokerage commissions on the shares sold, plus a $15 transaction fee. There is no direct service charge to participants in the Plan; however, the Fund reserves the right to amend the Plan to include a service charge payable by the participants.
A participant may request the sale of all of the common shares held by the Plan Agent in his or her Plan account in order to terminate participation in the Plan. If such participant elects in advance of such termination to have the Plan Agent sell part or all of his shares, the Plan Agent is authorized to deduct from the proceeds a $15.00 fee plus the brokerage commissions incurred for the transaction. A participant may re-enroll in the Plan in limited circumstances.
The terms and conditions of the Plan may be amended by the Plan Agent or the Fund at any time upon notice as required by the Plan.
This discussion of the Plan is only summary, and is qualified in its entirety by the Terms and Conditions of the Dividend Reinvestment Plan filed as part of the Fund’s registration statement.
For additional information about the Plan, please contact the Plan Agent, Computershare, at 866.226.8016. If you wish to participate in the Plan and your shares are held in your own name, simply call the Plan Agent. If your shares are not held in your name, please contact your brokerage firm, bank, or other nominee to request that they participate in the Plan on your behalf. If your brokerage firm, bank, or other nominee is unable to participate on your behalf, you may request that your shares be re-registered in your own name.
We’re pleased to provide our shareholders with the additional benefit of the Fund’s Dividend Reinvestment Plan and hope that it may serve your financial plan.
| | | | |
| 30 | | CALAMOS CONVERTIBLE OPPORTUNITIES AND INCOME FUND SEMIANNUAL REPORT | | |
MANAGING YOUR CALAMOS FUNDS INVESTMENTS
Calamos Investments offers several convenient means to monitor, manage and feel confident about your Calamos investment choice.
PERSONAL ASSISTANCE: 800.582.6959
Dial this toll-free number to speak with a knowledgeable Client Services Representative who can help answer questions or address issues concerning your Calamos Fund.
YOUR FINANCIAL ADVISOR
We encourage you to talk to your financial advisor to determine how the Calamos Funds can benefit your investment portfolio based on your financial goals, risk tolerance, time horizon and income needs.
| | |

| | STAY CONNECTED www.calamos.com |
|
Visit our Web site for timely fund performance, detailed fund profiles, fund news and insightful market commentary. |
A description of the Calamos Proxy Voting Policies and Procedures and the Fund’s proxy voting record for the 12-month period ended June 30, 2015, are available free of charge upon request by calling 800.582.6959, by visiting the Calamos Web site at www.calamos.com, by writing Calamos at: Calamos Investments, Attn: Client Services, 2020 Calamos Court, Naperville, IL 60563. The Fund’s proxy voting record is also available free of charge by visiting the SEC Web site at www.sec.gov.
The Fund files its complete list of portfolio holdings with the SEC for the first and third quarters each fiscal year on Form N-Q . The Forms N-Q are available free of charge, upon request, by calling or writing Calamos Investments at the phone number or address provided above or by visiting the SEC Web site at www.sec.gov. You may also review or, for a fee, copy the forms at the SEC’s Public Reference Room in Washington, D.C. Information on the operation of the Public Reference Room may be obtained by calling 800.732.0330.
The Fund’s report to the SEC on Form N-CSR contains certifications by the fund’s principal executive officer and principal financial officer as required by Rule 30a-2(a) under the 1940 Act, relating to, among other things, the quality of the Fund’s disclosure controls and procedures and internal control over financial reporting.
FOR 24-HOUR AUTOMATED SHAREHOLDER ASSISTANCE: 866.226.8016
TO OBTAIN INFORMATION ABOUT YOUR INVESTMENTS: 800.582.6959
VISIT OUR WEB SITE: www.calamos.com
INVESTMENT ADVISER:
Calamos Advisors LLC
2020 Calamos Court
Naperville, IL 60563-2787
CUSTODIAN AND FUND ACCOUNTING AGENT:
State Street Bank and Trust Company
Boston, MA
TRANSFER AGENT:
Computershare
P.O. Box 30170
College Station, TX 77842-3170
866.226.8016
INDEPENDENT REGISTERED PUBLIC ACCOUNTING FIRM:
Deloitte & Touche LLP
Chicago, IL
LEGAL COUNSEL:
Ropes & Gray LLP
Chicago, IL

2020 Calamos Court
Naperville, IL 60563-2787
800.582.6959
www.calamos.com
© 2016 Calamos investments LLC. All Rights Reserved.
Calamos® and Calamos Investments® are registered
trademarks of Calamos investments LLC.
CHISAN 1790 2016
ITEM 2. CODE OF ETHICS.
Not applicable.
ITEM 3. AUDIT COMMITTEE FINANCIAL EXPERT.
Not applicable.
ITEM 4. PRINCIPAL ACCOUNTANT FEES AND SERVICES.
Not applicable.
ITEM 5. AUDIT COMMITTEE OF LISTED REGISTRANTS.
Not applicable.
ITEM 6. SCHEDULE OF INVESTMENTS
Included in the Report to Shareholders in Item 1.
ITEM 7. DISCLOSURE OF PROXY VOTING POLICIES AND PROCEDURES FOR CLOSED-END MANAGEMENT INVESTMENT COMPANIES.
Not applicable.
ITEM 8. PORTFOLIO MANAGERS OF CLOSED-END MANAGEMENT INVESTMENT COMPANIES.
(a) Not applicable.
ITEM 9. PURCHASES OF EQUITY SECURITIES BY CLOSED-END MANAGEMENT INVESTMENT COMPANY AND AFFILIATED PURCHASERS.
Not applicable.
ITEM 10. SUBMISSION OF MATTERS TO A VOTE OF SECURITY HOLDERS.
No material changes.
ITEM 11. CONTROLS AND PROCEDURES.
a) The registrant’s principal executive officer and principal financial officer have evaluated the registrant’s disclosure controls and procedures within 90 days of this filing and have concluded that the registrant’s disclosure controls and procedures were effective, as of that date, in ensuring that information required to be disclosed by the registrant in this Form N-CSR was recorded, processed, summarized, and timely reported.
b) There were no changes in the registrant’s internal controls over financial reporting (as defined in Rule 30a-3(d) under the Investment Company Act of 1940) that occurred during the second fiscal quarter of the period covered by this report that has materially affected, or is reasonably likely to materially affect, the registrant’s internal control over financial reporting.
ITEM 12. EXHIBITS.
(a)(1) Code of Ethics - Not applicable.
(a)(2)(i) Certification of Principal Executive Officer.
(a)(2)(ii) Certification of Principal Financial Officer.
SIGNATURES
Pursuant to the requirements of the Securities Exchange Act of 1934 and the Investment Company Act of 1940, the registrant has duly caused this report to be signed on its behalf by the undersigned, thereunto duly authorized.
| | |
|
| Calamos Convertible Opportunities and Income Fund |
| |
| By: | | /s/ John P. Calamos, Sr. |
| | |
| Name: | | John P. Calamos, Sr. |
| Title: | | Principal Executive Officer |
| Date: | | June 21, 2016 |
| | |
| By: | | /s/ Nimish S. Bhatt |
| | |
| Name: | | Nimish S. Bhatt |
| Title: | | Principal Financial Officer |
| Date: | | June 21, 2016 |
Pursuant to the requirements of the Securities Exchange Act of 1934 and the Investment Company Act of 1940, this report has been signed by the following persons on behalf of the registrant and in the capacities and on the dates indicated.
| | |
| By: | | /s/ John P. Calamos, Sr. |
| | |
| Name: | | John P. Calamos, Sr. |
| Title: | | Principal Executive Officer |
| Date: | | June 21, 2016 |
| | |
| By: | | /s/ Nimish S. Bhatt |
| | |
| Name: | | Nimish S. Bhatt |
| Title: | | Principal Financial Officer |
| Date: | | June 21, 2016 |