EXHIBIT 99.2
| |
 |  |
2011 AMERICAN FINANCIAL SERVICES
ASSOCIATION CONFERENCE Glenn Votek, Executive Vice President and Treasurer June 8, 2011 |
Important Notices
This presentation contains forward-looking statements within the meaning of applicable federal securities laws that are based upon our current expectations and assumptions concerning future events, which are subject to a number of risks and uncertainties that could cause actual results to differ materially from those anticipated. The words “expect,” “anticipate,” “estimate,” “forecast,” “initiative,” “objective,” “plan,” “goal,” “project,” “outlook,” “priorities,” “target,” “intend,” “evaluate,” “pursue,” “commence,” “seek,” “may,” “would,” “could,” “should,” “believe,” “potential,” “continue,” or the negative of any of those words or similar expressions is intended to identify forward-looking statements. All statements contained in this presentation, other than statements of historical fact, including without limitation, statements about our plans, strategies, prospects and expectations regarding future events and our financial performance, are forward-looking statements that involve certain risks and uncertainties. While these statements represent our current judgment on what the future may hold, and we believe these judgments are reasonable, these statements are not guarantees of any events or financial results, and our actual results may differ materially. Important factors that could cause our actual results to be materially different from our expectations include, among others, the risk that CIT is unsuccessful in refining and implementing its strategy and business plan, the risk that CIT’s changes in its management team affects CIT’s ability to react to and address key business and regulatory issues, the risk that CIT is delayed in transitioning certain business platforms to CIT Bank and may not succeed in developing a stable, long-term source of funding, and the risk that CIT continues to be subject to liquidity constraints and higher funding costs. Further, there is a risk that the valuations resulting from our fresh start accounting analysis, which are inherently uncertain, will differ significantly from the actual values realized, due to the complexity of the valuation process, the degree of judgment required, and changes in market conditions and economic environment. We describe these and other risks that could affect our results in Item 1A, “Risk Factors,” of our latest Annual Report on Form 10-K filed with the Securities and Exchange Commission. Accordingly, you should not place undue reliance on the forward-looking statements contained in this presentation. These forward-looking statements speak only as of the date on which the statements were made. CIT undertakes no obligation to update publicly or otherwise revise any forward-looking statements, except where expressly required by law.
This presentation is to be used solely as part of CIT management's continuing investor communications program. This presentation shall not constitute an offer or solicitation in connection with any securities.
|
 |
2 |
Key Messages
Strong franchise
Aggressively restructuring the liability profile
Bank strategy is well underway
Improved risk management and controls
Strong capital and liquidity position
|
|
3 |
CIT Overview
| Bank Holding Company With Over 100 Years Commercial Lending Experience |
| Focused on Small Businesses and Middle-Market Companies |
| Solid Business Operating Within Attractive Markets Generating High-yielding Assets |
| $51 Billion in Assets and Market Capitalization Over $8 Billion |
|
|
4 |
Financial Solutions for Small Business and Middle Market Companies
Corporate
Finance | Lending, leasing, advisory and other financial services to small and middle market companies |
Trade
Finance | Factoring, lending, receivables management and trade finance to companies in retail supply chain |
Transportation
Finance | Lending, leasing and advisory services to the transportation industry, principally aerospace and rail |
Vendor
Finance | Financing and leasing solutions to manufacturers and distributors around the globe |
| Consumer | Liquidating pool of largely government-guaranteed student loans |
Finance and Leasing Assets (1)
Total $36 Billion
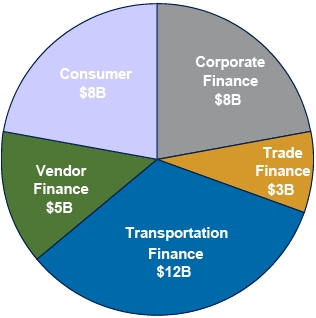
(1) Finance and Leasing assets include loans, operating leases and assets held for sale; data as of 3/31/2011
|
|
5 |
Significant Progress Since the Beginning of 2010
Hire and Retain Key
Personnel | |
Restructure and Refine
Business Model | |
Develop and Implement Plan
to Reduce Funding Costs | |
Continue to Build Hybrid
Funding Model | |
Improve Bank Holding
Company Capabilities | |
|
|
6 |
Financial Performance Reflects Strategic Initiatives
| | | |
| | | 2010 | 1Q11 |
|
| Pre-Tax Income | | $768 Million | $136 Million |
|
| Net Income | | $517 Million | $66 Million |
|
| EPS(diluted) | | $2.58 | $0.33 |
|
| | | |
| | 12/31/09 | 12/31/10 | 3/31/11 |
|
| Total Assets | $60 Billion | $51 Billion | $51 Billion |
|
| Total Capital Ratio | 14.3% | 19.9% | 21.0% |
|
| Book Value | $8.4 Billion | $8.9 Billion | $9.0 Billion |
| $41.99 per share | $44.48 per share | $44.85 per share |
|
| Tangible Book Value | $7.9 Billion | $8.5 Billion | $8.6 Billion |
| $39.48 per share | $42.50 per share | $42.97 per share |
|
|
|
7 |
Operational Progress: Business Update and Priorities
| | | |
| | Update | | Priorities |
| | | | |
Corporate
Finance | - CIT Bank originating US volume
- Pipeline for new deals growing
| | - Return to lead positions in the middle market
- Defend lead agency roles and stem portfolio shrinkage
- Advance international strategy
|
| |
|
Trade
Finance | - Client base has stabilized
- Overall health of retail sector improving
- Funding costs continue to impact results
| | - Retain and grow existing clients
- Focus on traditional notification factoring transactions
- Access low-cost funding sources for ABL and factoring
|
| |
|
Transportation
Finance | - Utilization strong in Air and Rail
- 2011 Air order book fully placed
- Ordered 3,500 railcars during Q1 2011
| | - Manage lease expirations and renewal terms
- Further diversify funding sources
|
| |
|
Vendor
Finance | - Continued strong new business yields
- Growth in Asia and Latin America
- Success accessing lower-cost funding
| | - Transfer US platform to CIT Bank 2H 2011
- Expand existing relationships and add new vendors
- Increase global operating efficiencies
|
|
|
8 |
2011 Business Objectives
| 1 | Focus on growth in our commercial businesses, domestically and internationally |
| 2 | Improve profitability, including reducing our cost of capital and operating expenses |
| 3 | Expand the role of CIT Bank, both asset origination and funding capabilities |
| 4 | Advance our risk management, compliance and control functions |
| 5 | Substantially satisfy the open items in the Written Agreement |
|
|
9 |
Strategic Principles
| Controlled asset growth with strong risk management oversight |
| Balanced combination of Bank and Holding Company funding |
| Generate attractive ROA and ROE with moderate leverage |
| Attain investment grade ratings |
|
|
10 |
Long-term Target: Normalized Profit Model
| Key Metrics | Long-Term
Target (1) | Drivers / Assumptions |
| Finance Margin | 3.00% - 4.00% | - Market dynamics and source/cost of funding
|
| Credit Provision | (0.75%) - (1.00%) | |
| Other Income | 1.50% - 2.00% | - Agent roles and fee-based services
|
| Operating Expense | (2.00%) - (2.25%) | - Rationalize infrastructure
|
| Pre-Tax Earnings | 2.00% - 2.50% | |
| Taxes | (0.25%) - (0.75%) | - Utilize NOL carry-forwards
|
| Net Income (ROAEA) | 1.50% - 2.00% | - EPS growth exceeds asset growth
|
| ROE (Common Equity) | 10% - 15% | - Maintain prudent levels of capital
|
Long-term Target reflects “steady state” performance objectives
(1) Expressed as percentages of average earning assets, except ROE
|
|
11 |
Financial Operating Models Vary by Segment
| Key Metrics (1) | Corporate
Finance | Trade
Finance | Transportation
Finance | Vendor
Finance |
| Finance Margin | Medium | Low | Medium | High |
| Credit Provision | Medium | Low | Low | High |
| Other Income | Medium | High | Low | Medium |
| Operating Expenses | Medium | High | Low | High |
| ROA | Medium | Medium | High | Medium |
| Capital Required | Medium | Low | High | Low |
| Return on Economic Capital | All Segments Capable of Generating Double-Digit Risk-Adjusted ROEs |
| |
Key Performance
Drivers | | | | |
(1) High, Medium and Low classifications are relative to Long-Term Target ranges
|
|
12 |
Portfolio Mix Evolving
Finance and Leasing Assets by Segment
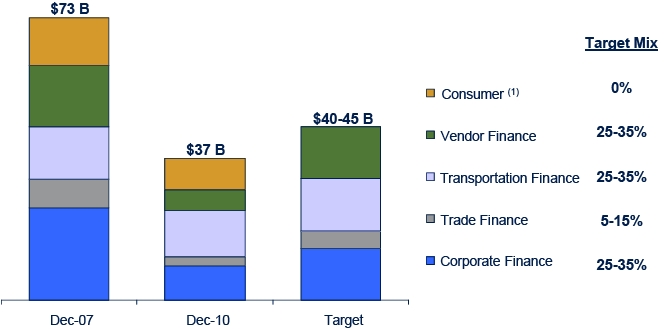
Over $7 billion assets sold since January 2010 (pre-FSA)
Commercial portfolio optimization efforts near complete
Returning focus to growth in core commercial franchises
(1) Consumer consists of a liquidating pool of largely government-guaranteed student loans
|
|
13 |
Factors Impacting Economic Margin
Total Assets - $51 billion(1)
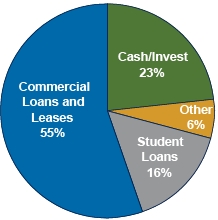
(1) Data as of March 31, 2011
|
|
14 |
Credit Trends
25-Year Net Charge-off History(1)

(1) Excludes credit related losses on discontinued operations (including home lending) which were significant in 2008 Data may not be comparable due to changes in portfolio mix and reporting
|
|
15 |
Credit Underwriting Framework
| Modeling & Scenario Analysis |
|
|
16 |
Capital Position is Strong
- Capital ratios(1)well above regulatory commitments and economic requirements
| | | |
| | CIT | CIT-Bank | Peers(2) |
|
| Tier 1 Capital | 20.1% | 56.1% | 10-15% |
| Total Capital | 21.0% | 56.5% | 13-18% |
| Leverage Ratio | 17.2% | 25.6% | 9-13% |
|
- Implemented new economic capital framework in January
Allocations commenced 1Q 2011
“Excess” capital held at corporate
Ongoing review/refinement of models
| |
|
| Capital Allocations by Segment(1) (3) |
|
| Corporate Finance | 12% |
| Trade Finance | 9% |
| Transportation Finance | 15% |
| Vendor Finance | 10% |
| Consumer | 6% |
| |
|
| Total Requirement (inc Corporate) | ~12% |
|
(1) Data as of March 31, 2011
(2) Peers consist of over a dozen banks and specialty finance companies
(3) Capital expressed as a percentage of Risk-weighted assets and is subject to change
|
|
17 |
Liquidity
Cash serves as key source ofliquidity
Satisfies funding and otheroperating obligations
Protects against severe stressscenarios
Lack of access to capitalmarkets or other fundingsources
Customer line draws
Market volatility impactingcollateral postingrequirements
Other unanticipated fundingobligations
| |
|
| ($US MM) | Cash at
3/31/11 |
|
| Bank Holding Company | $6.2 |
| CIT Bank | 1.2 |
| Operating Subsidiaries | 1.1 |
| Restricted | 3.3 |
| |
|
| Total Cash and Investments | $11.8 |
| |
| Percentage of Total Assets | 23.3% |
| Bank Holding Company Cash to Total | |
| Assets | 12.2% |
|
|
18 |
Extended Liquidity Horizon and Improved Debt Composition
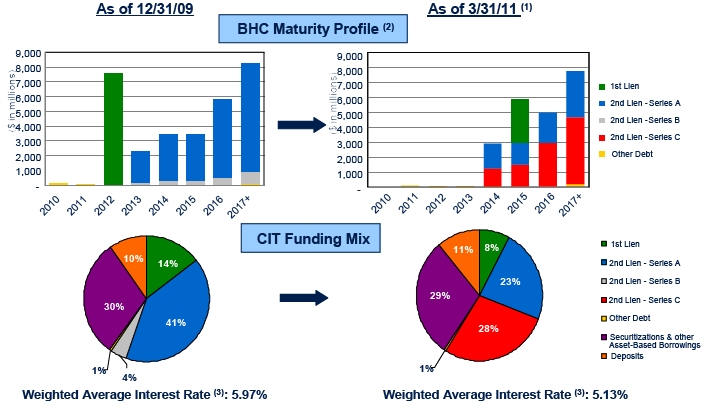
(1) Pro forma for $2.5 billion Series A redemption in May 2011 and $8.8 billion Series A to C Exchange expected to close in June 2011
(2) BHC maturity profiles exclude secured debt that is primarily repaid with pledged collateral cash flows
(3) Excludes all FSA adjustments and amortization of fees and expenses
|
|
19 |
Summary
Strong franchise
Aggressively restructuring the liability profile
Bank strategy is well underway
Improved risk management and controls
Strong capital and liquidity position
|
|
20 |
| |
| |
Questions? |