EXHIBIT 99.1
| |
 |  |
KBW INVESTMENT
MANAGEMENT & SPECIALTY
FINANCE CONFERENCE John Thain, Chairman & CEO
Scott Parker, CFO June 8, 2011 |
Important Notices
This presentation contains forward-looking statements within the meaning of applicable federal securities laws that are based upon our current expectations and assumptions concerning future events, which are subject to a number of risks and uncertainties that could cause actual results to differ materially from those anticipated. The words “expect,” “anticipate,” “estimate,” “forecast,” “initiative,” “objective,” “plan,” “goal,” “project,” “outlook,” “priorities,” “target,” “intend,” “evaluate,” “pursue,” “commence,” “seek,” “may,” “would,” “could,” “should,” “believe,” “potential,” “continue,” or the negative of any of those words or similar expressions is intended to identify forward-looking statements. All statements contained in this presentation, other than statements of historical fact, including without limitation, statements about our plans, strategies, prospects and expectations regarding future events and our financial performance, are forward-looking statements that involve certain risks and uncertainties. While these statements represent our current judgment on what the future may hold, and we believe these judgments are reasonable, these statements are not guarantees of any events or financial results, and our actual results may differ materially. Important factors that could cause our actual results to be materially different from our expectations include, among others, the risk that CIT is unsuccessful in refining and implementing its strategy and business plan, the risk that CIT’s changes in its management team affects CIT’s ability to react to and address key business and regulatory issues, the risk that CIT is delayed in transitioning certain business platforms to CIT Bank and may not succeed in developing a stable, long-term source of funding, and the risk that CIT continues to be subject to liquidity constraints and higher funding costs. Further, there is a risk that the valuations resulting from our fresh start accounting analysis, which are inherently uncertain, will differ significantly from the actual values realized, due to the complexity of the valuation process, the degree of judgment required, and changes in market conditions and economic environment. We describe these and other risks that could affect our results in Item 1A, “Risk Factors,” of our latest Annual Report on Form 10-K filed with the Securities and Exchange Commission. Accordingly, you should not place undue reliance on the forward-looking statements contained in this presentation. These forward-looking statements speak only as of the date on which the statements were made. CIT undertakes no obligation to update publicly or otherwise revise any forward-looking statements, except where expressly required by law.
This presentation is to be used solely as part of CIT management's continuing investor communications program. This presentation shall not constitute an offer or solicitation in connection with any securities.
|

|
| 2 |
Key Messages
Strong franchise
Aggressively restructuring the liability profile
Bank strategy is well underway
Improved risk management and controls
Well positioned for value creation
|
|
| 3 |
CIT Overview
| Bank Holding Company With Over 100 Years Commercial Lending Experience |
| Focused on Small Businesses and Middle-Market Companies |
| Solid Business Operating Within Attractive Markets Generating High-yielding Assets |
| $51 Billion in Assets and Market Capitalization Over $8 Billion |
|
|
| 4 |
Financial Solutions for Small Business and Middle Market Companies
Corporate
Finance | Lending, leasing, advisory and other financial services to small and middle market companies |
Trade
Finance | Factoring, lending, receivables management and trade finance to companies in retail supply chain |
Transportation
Finance | Lending, leasing and advisory services to the transportation industry, principally aerospace and rail |
Vendor
Finance | Financing and leasing solutions to manufacturers and distributors around the globe |
| Consumer | Liquidating pool of largely government-guaranteed student loans |
Finance and Leasing Assets(1)
Total $36 Billion

(1) Finance and Leasing assets include loans, operating leases and assets held for sale; data as of 3/31/2011
|
|
| 5 |
Significant Progress Since the Beginning of 2010
Hire and Retain Key
Personnel | - Completed build out of the senior management team
|
Restructure and Refine
Business Model | - Divested non-core operations
- Sold over $7 billion of loan and lease assets (pre-FSA)
|
Develop and Implement Plan
to Reduce Funding Costs | - Redeemed or refinanced $13 billion of high cost debt
- Closed over $5 billion in new financings at attractive rates & terms
|
Continue to Build Hybrid
Funding Model | - Originating US Corporate Finance business in CIT Bank
- Transferred SBL platform to CIT Bank; US Vendor in progress
- Maintain strong cash and capital position
|
Improve Bank Holding
Company Capabilities | - Significant progress building out risk and control functions
- Cease & Desist Orders on CIT Bank lifted April 2011
|
|
|
| 6 |
Financial Performance Reflects Strategic Initiatives
| | | |
| | | 2010 | 1Q11 |
|
| Pre-Tax Income | | $768 Million | $136 Million |
|
| Net Income | | $517 Million | $66 Million |
|
| EPS (diluted) | | $2.58 | $0.33 |
|
| | | |
| | 12/31/09 | 12/31/10 | 3/31/11 |
|
| Total Assets | $60 Billion | $51 Billion | $51 Billion |
|
| Total Capital Ratio | 14.3% | 19.9% | 21.0% |
|
| Book Value | $8.4 Billion
$41.99 per share | $8.9 Billion
$44.48 per share | $9.0 Billion
$44.85 per share |
|
| Tangible Book Value | $7.9 Billion
$39.48 per share | $8.5 Billion
$42.50 per share | $8.6 Billion
$42.97 per share |
|
|
|
| 7 |
Operational Progress: Business Update and Priorities
| | | |
| | Update | | Priorities |
| | | | |
Corporate
Finance | - CIT Bank originating US volume
- Pipeline for new deals growing
| | - Return to lead positions in the middle market
- Defend lead agency roles and stem portfolio shrinkage
- Advance international strategy
|
| |
|
Trade
Finance | - Client base has stabilized
- Overall health of retail sector improving
- Funding costs continue to impact results
| | - Retain and grow existing clients
- Focus on traditional notification factoring transactions
- Access low-cost funding sources for ABL and factoring
|
| |
|
Transportation
Finance | - Utilization strong in Air and Rail
- 2011 Air order book fully placed
- Ordered 3,500 railcars during Q1 2011
| | - Manage lease expirations and renewal terms
- Further diversify funding sources
|
| |
|
Vendor
Finance | - Continued strong new business yields
- Growth in Asia and Latin America
- Success accessing lower-cost funding
| | - Transfer US platform to CIT Bank 2H 2011
- Expand existing relationships and add new vendors
- Increase global operating efficiencies
|
|
|
| 8 |
2011 Business Objectives
| 1 | Focus on growth in our commercial businesses, domestically and internationally |
| 2 | Improve profitability, including reducing our cost of capital and operating expenses |
| 3 | Expand the role of CIT Bank, both asset origination and funding capabilities |
| 4 | Advance our risk management, compliance and control functions |
| 5 | Substantially satisfy the open items in the Written Agreement |
|
|
| 9 |
Strategic Principles
| Controlled asset growth with strong risk management oversight |
| Balanced combination of Bank and Holding Company funding |
| Generate attractive ROA and ROE with moderate leverage |
| Attain investment grade ratings |
|
|
| 10 |
Long-term Target: Normalized Profit Model
| Key Metrics | Long-Term
Target (1) | Drivers / Assumptions |
| Finance Margin | 3.00% - 4.00% | - Market dynamics and source/cost of funding
|
| Credit Provision | (0.75%) - (1.00%) | |
| Other Income | 1.50% - 2.00% | - Agent roles and fee-based services
|
| Operating Expense | (2.00%) - (2.25%) | - Rationalize infrastructure
|
| Pre-Tax Earnings | 2.00% - 2.50% | |
| Taxes | (0.25%) - (0.75%) | - Utilize NOL carry-forwards
|
| Net Income (ROAEA) | 1.50% - 2.00% | - EPS growth exceeds asset growth
|
| ROE (Common Equity) | 10% - 15% | - Maintain prudent levels of capital
|
| Key Assumptions | - Operations scaled to efficiency
- Return to investment grade ratings
- Optimal capital structure
- ~13% Total Capital ratio; ~7 times debt-to-equity
- “Normal” economic / operating environment
|
Long-term Target reflects “steady state” performance objectives
(1) Expressed as percentages of average earning assets, except ROE
|
|
| 11 |
Q1 2011 Financial Results vs. Long-term Targets
| Key Metrics | 1Q 2011 Actual | Long-Term Target |
| Finance Margin | 2.24% | 3.00% - 4.00% |
| Credit Provision | (1.40%) | (0.75%) - (1.00%) |
| Other Income | 3.16% | 1.50% - 2.00% |
| Operating Expense | (2.46%) | (2.00%) - (2.25%) |
| Pre-Tax Earnings | 1.54% | 2.00% - 2.50% |
| Taxes & Non-controlling Interest | (0.79%) | (0.25%) - (0.75%) |
| Net Income(ROAEA) | 0.75% | 1.50% - 2.00% |
| ROE(Common Equity) | 3% | 10% - 15% |
Margin– Impacted by high cost debt, balance sheet composition and other factors
Provision– Coming off bottom of credit cycle; Building post-emergence reserves
Other Income– Minimal capital markets activity offset by strong gains on asset sales
Operating Expenses– Considerable operating leverage exists
Taxes– No current benefit from existing NOLs
ROE– Negligible operating earnings; Considerable excess capital
|
|
| 13 |
Financial Operating Models Vary by Segment
| Key Metrics (1) | Corporate
Finance | Trade
Finance | Transportation
Finance | Vendor
Finance |
| Finance Margin | Medium | Low | Medium | High |
| Credit Provision | Medium | Low | Low | High |
| Other Income | Medium | High | Low | Medium |
| Operating Expenses | Medium | High | Low | High |
| ROA | Medium | Medium | High | Medium |
| Capital Required | Medium | Low | High | Low |
| Return on Economic Capital | All Segments Capable of Generating Double-Digit Risk-Adjusted ROEs |
| |
Key Performance
Drivers | | | | - Residual realization / end of lease
|
(1) High, Medium and Low classifications are relative to Long-Term Target ranges
|
|
| 14 |
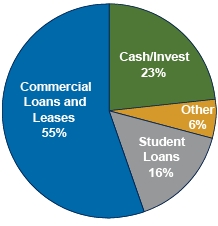
Portfolio Mix Evolving
Finance and Leasing Assets by Segment

Over $7 billion assets sold since January 2010 (pre-FSA)
Commercial portfolio optimization efforts near complete
Returning focus to growth in core commercial franchises
(1) Consumer consists of a liquidating pool of largely government-guaranteed student loans
|
|
| 15 |
Factors Impacting Economic Margin
Total Assets - $51 billion(1)
(1) Data as of March 31, 2011
|
|
| 16 |
Credit Trends
25-Year Net Charge-off History(1)
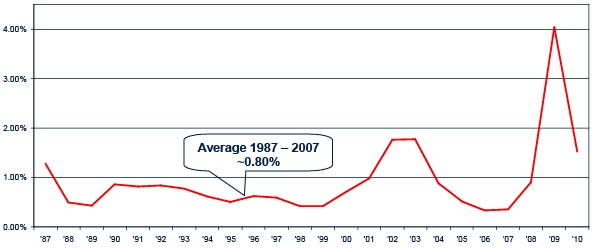
(1) Excludes credit related losses on discontinued operations (including home lending) which were significant in 2008 Data may not be comparable due to changes in portfolio mix and reporting
|
|
| 17 |
Capital Position is Strong
- Capital ratios(1)well above regulatory commitments and economic requirements
| | | |
| | CIT | CIT-Bank | Peers(2) |
|
| Tier 1 Capital | 20.1% | 56.1% | 10-15% |
| Total Capital | 21.0% | 56.5% | 13-18% |
| Leverage Ratio | 17.2% | 25.6% | 9-13% |
|
- Implemented new economic capital framework in January
Allocations commenced 1Q 2011
“Excess” capital held at corporate
Ongoing review/refinement of models
| |
|
| Capital Allocations by Segment(1)(3) |
|
| Corporate Finance | 12% |
| Trade Finance | 9% |
| Transportation Finance | 15% |
| Vendor Finance | 10% |
| Consumer | 6% |
| |
|
| Total Requirement (inc Corporate) | ~12% |
|
(1) Data as of March 31, 2011
(2) Peers consist of over a dozen banks and specialty finance companies
(3) Capital expressed as a percentage of Risk-weighted assets and is subject to change
|
|
| 18 |
Extended Liquidity Horizon and Improved Debt Composition
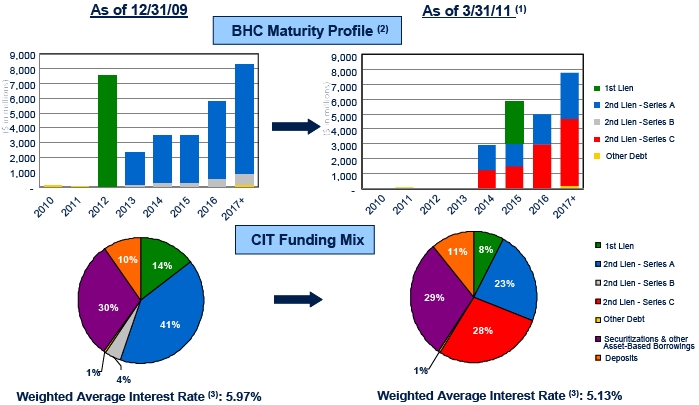
(1) Pro forma for $2.5 billion Series A redemption in May 2011 and $8.8 billion Series A to C Exchange expected to close in June 2011
(2) BHC maturity profiles exclude secured debt that is primarily repaid with pledged collateral cash flows
(3) Excludes all FSA adjustments and amortization of fees and expenses
|
|
| 19 |
Summary
Strong franchise
Leadership positions intact
Commercial portfolio optimization near completion
Focus on prudent growth returning
Aggressively restructuring the liability profile
Bank strategy is well underway
Successful transfer of SBL platform to be followed with transfer of Vendor platform (pendingregulatory approvals)
Increased loan origination at CIT Bank with volume from all segments
Expansion and diversification of deposit funding
Improved risk management and controls
Well positioned for value creation
|
|
| 20 |
| |
| |
Questions? |
| |
| |  |
| | Financial Solutions for Small and
Middle Market Businesses
|
Founded in 1908, CIT (NYSE: CIT) is a bank holding company with more than $35 billion in finance and leasing assets. It provides financing and leasing capital to its more than one million small business and middle market clients and their customers across more than 30 industries. CIT maintains leadership positions in small business and middle market lending, factoring, retail finance, aerospace, equipment and rail leasing, and global vendor finance.
www.cit.com
Corporate Finance - $8.1 billion in financing and leasing assets*
We provide lending, leasing and other financial and advisory services to the small business and middle market sectors, with a focus on specific industries, including Communications, Energy, Entertainment, Healthcare, Industrials, Information Services & Technology, Restaurants, Retail, and Sports & Gaming.
Trade Finance - $2.6 billion in financing and leasing assets*
We are the number one provider of factoring services for companies that sell into retail channels of distribution. We provide credit protection, accounts receivable management and asset-based lending to manufacturers and importers.
Transportation Finance - $12.1 billion in financing and leasing assets*
We are a leading global aircraft lessor and the third largest U.S. railcar lessor. We provide lending and leasing services to the transportation industry, principally aerospace and rail.
Vendor Finance - $5.2 billion in financing and leasing assets*
We are a global leader in providing financing programs for manufacturers, distributors, product resellers and other intermediaries that enable their customers to acquire product now and finance payments over time. We maintain relationships with leading companies primarily in the information technology, telecommunications and office equipment industries while providing equipment leasing and financing to small and middle market businesses that lease products from these industries.
Consumer - $7.9 billion in financing and leasing assets*
Our Consumer segment includes student lending and consumer portfolios held by CIT Bank. The existing student loan portfolio is running off as we ceased offering government-guaranteed loans in 2008 and private loans during 2007.
* Financing and leasing assets as of March 31, 2011 and include finance receivables (loans and leases), operating lease equipment and assets held for sale.
Contacts | |
| Investor Relations: | Media Relations: |
| Ken Brause | C. Curtis Ritter |
| Executive Vice President | Director of Corporate Communications |
| 212-771-9650 | 973-740-5390 |
| Ken.Brause@cit.com | Curt.Ritter@cit.com |
| |
| Products | Services |
- Debtor-in-possession / turnaround financing
| |
Securities and investment banking services offered through CIT Capital Securities LLC, an affiliate of CIT.
Portfolio Assets by Industry1

Portfolio Assets by Geography1
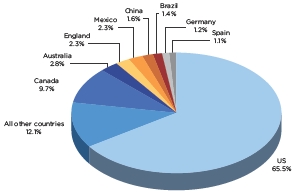
1As of 3/31/11.
2Ceased originating all student loans by April 2008.
3No industry greater than 2%.
 © 2011 CIT Group Inc., CIT and the CIT logo are registered service marks of CIT Group Inc. 5/18/11