 Management Discussion & Analysis
Management of Algonquin Power & Utilities Corp. (“AQN” or the “Company” or the “Corporation”) has prepared the following discussion and analysis to provide information to assist its shareholders’ understanding of the financial results for the three and six months ended June 30, 2021. This Management Discussion & Analysis (“MD&A”) should be read in conjunction with AQN’s unaudited interim consolidated financial statements for the three and six months ended June 30, 2021 and 2020. This MD&A should also be read in conjunction with AQN's annual consolidated financial statements for the years ended December 31, 2020 and 2019. This material is available on SEDAR at www.sedar.com, on EDGAR at www.sec.gov/edgar, and on the AQN website at www.AlgonquinPowerandUtilities.com. Additional information about AQN, including the most recent Annual Information Form (“AIF”), can be found on SEDAR at www.sedar.com and on EDGAR at www.sec.gov/edgar.
Unless otherwise indicated, financial information provided for the three and six months ended June 30, 2021 and 2020 has been prepared in accordance with generally accepted accounting principles in the United States (“U.S. GAAP”). As a result, the Company's financial information may not be comparable with financial information of other Canadian companies that provide financial information on another basis.
All monetary amounts are in U.S. dollars, except where otherwise noted. We denote any amounts denominated in Canadian dollars with "C$" immediately prior to the stated amount.
Capitalized terms used herein and not otherwise defined will have the meanings assigned to them in the Company's most recent AIF.
This MD&A is based on information available to management as of August 12, 2021.
Contents
| | | | | |
| Caution Concerning Forward-Looking Statements, Forward-Looking Information and non-GAAP Measures | |
| Overview and Business Strategy | |
| Significant Updates | |
| 2021 Second Quarter Results From Operations | |
| 2021 Year-to-Date Results from Operations | |
| 2021 Adjusted EBITDA Summary | |
| Regulated Services Group | |
| Renewable Energy Group | |
| AQN: Corporate and Other Expenses | |
| Non-GAAP Financial Measures | |
| Corporate Development Activities | |
| Summary of Property, Plant and Equipment Expenditures | |
| Liquidity and Capital Reserves | |
| Share-Based Compensation Plans | |
| Related Party Transactions | |
| Enterprise Risk Management | |
| Quarterly Financial Information | |
| Disclosure Controls and Internal Controls Over Financial Reporting | |
| Critical Accounting Estimates and Policies | |
| | | | | |
| |
| Algonquin Power & Utilities Corp. - Management Discussion & Analysis | 1 |
Caution Concerning Forward-Looking Statements, Forward-Looking Information and Non-GAAP Measures
Forward-Looking Statements and Forward-Looking Information
This document may contain statements that constitute "forward-looking information" within the meaning of applicable securities laws in each of the provinces of Canada and the respective policies, regulations and rules under such laws or "forward-looking statements" within the meaning of the U.S. Private Securities Litigation Reform Act of 1995 (collectively, “forward-looking information”). The words “anticipates”, “believes”, “budget”, “could”, “estimates”, “expects”, “forecasts”, “intends”, “may”, “might”, “plans”, “projects”, “schedule”, “should”, “will”, “would” and similar expressions are often intended to identify forward-looking information, although not all forward-looking information contains these identifying words. Specific forward-looking information in this document includes, but is not limited to, statements relating to: expected future growth, earnings and results of operations; liquidity, capital resources and operational requirements; rate reviews, including resulting decisions and rates and expected impacts and timing; sources of funding, including adequacy and availability of credit facilities, debt maturation and future borrowings; expectations regarding the impact of the 2019 novel coronavirus (“COVID-19”) on the Company; expectations regarding the use of proceeds from financings, including the offering of Green Equity Units (as defined herein); ongoing and planned acquisitions, projects and initiatives, including expectations regarding costs, financing, results, ownership structures, power purchase arrangements, regulatory matters, in-service dates and completion dates; the estimated impact of the February 2021 extreme winter storm conditions experienced in Texas and parts of the central U.S. (the "Midwest Extreme Weather Event") and as a result of the Midwest Extreme Weather Event, the significantly elevated pricing that persisted in the Electric Reliability Council of Texas (ERCOT) market over several days (the "Market Disruption Event") on the Company, its operations, its facilities and its financial results; expectations regarding the anticipated closing of AQN's acquisition of New York American Water (as defined herein); expectations regarding the Company's corporate development activities and the results thereof, including the expected business mix between the Regulated Services Group and Renewable Energy Group; expectations regarding the Company's development pipeline; the potential impacts of interconnection study results on the Neosho Ridge Wind Facility, and the expected timing for the next interconnection study results for the North Fork Ridge, Kings Point and Neosho Ridge Wind Facilities; expectations regarding regulatory hearings, motions, filings and approvals; expectations regarding the cost of operations, capital spending and maintenance, and the variability of those costs; expected future generation of the Company’s energy facilities; expected future capital investments, including expected timing, investment plans, sources of funds and impacts; expectations regarding future "greening the fleet" initiatives; expectations regarding generation availability, capacity and production; expectations regarding the sale of renewable energy credits; expectations regarding the outcome of existing or potential legal and contractual claims and disputes; expectations regarding the ability to access the capital market on reasonable terms; strategy and goals; expectations regarding the impacts of a failed restructuring by the subsidiary of Abengoa S.A ("Abengoa") that holds the interest in AAGES (as defined herein); expectations regarding the timing for completion of, and apportionment of liability for, the blade remediation work at the Sugar Creek Wind Facility; contractual obligations and other commercial commitments; environmental liabilities; dividends to shareholders; expectations regarding the maturity and redemption of AQN's outstanding subordinated notes; expectations regarding the maturity and settlement of AQN's outstanding Green Equity Units; expectations regarding the impact of tax reforms; credit ratings; anticipated growth and emerging opportunities in AQN’s target markets; anticipated customer benefits; the future impact on the Company of actual or proposed laws, regulations and rules; accounting estimates; interest rates; currency exchange rates; and commodity prices. All forward-looking information is given pursuant to the “safe harbor” provisions of applicable securities legislation.
The forecasts and projections that make up the forward-looking information contained herein are based on certain factors or assumptions which include, but are not limited to: the receipt of applicable regulatory approvals and requested rate decisions; the absence of material adverse regulatory decisions being received and the expectation of regulatory stability; the absence of any material equipment breakdown or failure; availability of financing (including tax equity financing and self-monetization transactions for U.S. federal tax credits) on commercially reasonable terms and the stability of credit ratings of the Corporation and its subsidiaries; the absence of unexpected material liabilities or uninsured losses; the continued availability of commodity supplies and stability of commodity prices; the absence of sustained interest rate increases or significant currency exchange rate fluctuations; the absence of significant operational, financial or supply chain disruptions or liability due to natural disasters, diseases or other force majeure events; the continued ability to maintain systems and facilities to ensure their continued performance; the absence of a severe and prolonged downturn in general economic, credit, social and market conditions; the successful and timely development and construction of new projects; the closing of pending acquisitions substantially in accordance with the expected timing for such acquisitions; the absence of material capital project or financing cost overruns; sufficient liquidity and capital resources; the continuation of long term weather patterns and trends; the absence of significant counterparty defaults; the continued competitiveness of electricity pricing when compared with alternative sources of energy; the realization of the anticipated benefits of the Corporation’s acquisitions and joint ventures; the absence of a change in applicable laws, political conditions, public policies and directions by governments, materially negatively affecting the Corporation; the ability to obtain and maintain licenses and permits; maintenance of adequate insurance coverage; the absence of a material decrease in market energy prices; the absence of material disputes with taxation authorities or changes to applicable tax laws; continued maintenance of information technology infrastructure and the absence of a material breach of cybersecurity; favourable relations with
| | | | | |
| |
| Algonquin Power & Utilities Corp. - Management Discussion & Analysis | 2 |
external stakeholders; and favourable labour relations. Given the continued uncertainty and evolving circumstances surrounding the COVID-19 pandemic and related response from governments, regulatory authorities, businesses, suppliers and customers, there is more uncertainty associated with the Corporation’s assumptions and expectations as compared to periods prior to the onset of COVID-19.
The forward-looking information contained herein is subject to risks, uncertainties and other factors that could cause actual results to differ materially from historical results or results anticipated by the forward-looking information. Factors which could cause results or events to differ materially from current expectations include, but are not limited to: changes in general economic, credit, social and market conditions; changes in customer energy usage patterns and energy demand; global climate change; the incurrence of environmental liabilities; natural disasters, diseases, pandemics and other force majeure events; critical equipment breakdown or failure; the failure of information technology infrastructure and cybersecurity; physical security breach; the loss of key personnel and/or labour disruptions; seasonal fluctuations and variability in weather conditions and natural resource availability; reductions in demand for electricity, gas and water due to developments in technology; reliance on transmission systems owned and operated by third parties; issues arising with respect to land use rights and access to the Corporation’s facilities; terrorist attacks; fluctuations in commodity prices; capital expenditures; reliance on subsidiaries; the incurrence of an uninsured loss; a credit rating downgrade; an increase in financing costs or limits on access to credit and capital markets; sustained increases in interest rates; currency exchange rate fluctuations; restricted financial flexibility due to covenants in existing credit agreements; an inability to refinance maturing debt on commercially reasonable terms; disputes with taxation authorities or changes to applicable tax laws; failure to identify, acquire, develop or timely place in service projects to maximize the value of production tax credit qualified equipment; requirement for greater than expected contributions to post-employment benefit plans; default by a counterparty; inaccurate assumptions, judgments and/or estimates with respect to asset retirement obligations; failure to maintain required regulatory authorizations; changes to health and safety laws, regulations or permit requirements; failure to comply with and/or changes to environmental laws, regulations and other standards; changes in laws and regulations; compliance with foreign laws or regulations; failure of compliance programs; failure to identify attractive acquisition or development candidates necessary to pursue the Corporation’s growth strategy; delays and cost overruns in the design and construction of projects, including as a result of COVID-19; loss of key customers; failure to realize the anticipated benefits of acquisitions or joint ventures, including Atlantica (as defined herein) or Abengoa-Algonquin Global Energy Solutions ("AAGES") acting in a manner contrary to the Corporation’s interests; a drop in the market value of Atlantica's ordinary shares; facilities being condemned or otherwise taken by governmental entities; increased external-stakeholder activism adverse to the Corporation’s interests; fluctuations in the price and liquidity of the Corporation’s common shares and the Corporation's other securities; and the severity and duration of the COVID-19 pandemic and its collateral consequences, including the disruption of economic activity, volatility in capital and credit markets and legislative and regulatory responses. Although the Corporation has attempted to identify important factors that could cause actual actions, events or results to differ materially from those described in forward-looking information, there may be other factors that cause actions, events or results not to be as anticipated, estimated or intended. Some of these and other factors are discussed in more detail under the heading Enterprise Risk Management in this MD&A and in the Corporation's management discussion and analysis for the three and twelve months ended December 31, 2020 (the "Annual MD&A"), and under the heading Enterprise Risk Factors in the Corporation's most recent AIF.
Forward-looking information contained herein (including any financial outlook) is provided for the purposes of assisting the reader in understanding the Corporation and its business, operations, risks, financial performance, financial position and cash flows as at and for the periods indicated and to present information about management’s current expectations and plans relating to the future and the reader is cautioned that such information may not be appropriate for other purposes. Forward-looking information contained herein is made as of the date of this document and based on the plans, beliefs, estimates, projections, expectations, opinions and assumptions of management on the date hereof. There can be no assurance that forward-looking information will prove to be accurate, as actual results and future events could differ materially from those anticipated in such forward-looking information. Accordingly, readers should not place undue reliance on forward-looking information. While subsequent events and developments may cause the Corporation’s views to change, the Corporation disclaims any obligation to update any forward-looking information or to explain any material difference between subsequent actual events and such forward-looking information, except to the extent required by law. All forward-looking information contained herein is qualified by these cautionary statements.
| | | | | |
| |
| Algonquin Power & Utilities Corp. - Management Discussion & Analysis | |
Non-GAAP Financial Measures
The terms “Adjusted Net Earnings”, “Adjusted Earnings Before Interest, Taxes, Depreciation and Amortization” (“Adjusted EBITDA”), “Adjusted Funds from Operations”, "Net Energy Sales", "Net Utility Sales" and "Divisional Operating Profit" are used throughout this MD&A. The terms “Adjusted Net Earnings”, “Adjusted Funds from Operations”, "Adjusted EBITDA", "Net Energy Sales", "Net Utility Sales" and "Divisional Operating Profit" are not recognized measures under U.S. GAAP. There is no standardized measure of “Adjusted Net Earnings”, "Adjusted EBITDA", “Adjusted Funds from Operations”, "Net Energy Sales", "Net Utility Sales", and "Divisional Operating Profit"; consequently, AQN’s method of calculating these measures may differ from methods used by other companies and therefore may not be comparable to similar measures presented by other companies. An explanation, calculation and analysis of “Adjusted Net Earnings”, "Adjusted EBITDA", “Adjusted Funds from Operations”, "Net Energy Sales", "Net Utility Sales", and "Divisional Operating Profit", including a reconciliation to the most directly comparable U.S. GAAP measure, where applicable, can be found in this MD&A.
Adjusted EBITDA
Adjusted EBITDA is a non-GAAP measure used by many investors to compare companies on the basis of ability to generate cash from operations. AQN uses these calculations to monitor the amount of cash generated by AQN. AQN uses Adjusted EBITDA to assess the operating performance of AQN without the effects of (as applicable): depreciation and amortization expense, income tax expense or recoveries, acquisition costs, certain litigation expenses, interest expense, gain or loss on derivative financial instruments, write down of intangibles and property, plant and equipment, earnings attributable to non-controlling interests, non-service pension and post-employment costs, cost related to tax equity financing, costs related to management succession and executive retirement, costs related to prior period adjustments due to the Tax Cuts and Jobs Act ("U.S. Tax Reform"), costs related to condemnation proceedings, financial impacts from the Market Disruption Event on the Company's Senate Wind Facility, gain or loss on foreign exchange, earnings or loss from discontinued operations, changes in value of investments carried at fair value, and other typically non-recurring or unusual items. AQN adjusts for these factors as they may be non-cash, unusual in nature and are not factors used by management for evaluating the operating performance of the Company. AQN believes that presentation of this measure will enhance an investor’s understanding of AQN’s operating performance. Adjusted EBITDA is not intended to be representative of cash provided by operating activities or results of operations determined in accordance with U.S. GAAP, and can be impacted positively or negatively by these items.
Adjusted Net Earnings
Adjusted Net Earnings is a non-GAAP measure used by many investors to compare net earnings from operations without the effects of certain volatile primarily non-cash items that generally have no current economic impact or items such as acquisition expenses or certain litigation expenses that are viewed as not directly related to a company’s operating performance. AQN uses Adjusted Net Earnings to assess its performance without the effects of (as applicable): gains or losses on foreign exchange, foreign exchange forward contracts, interest rate swaps, acquisition costs, one-time costs of arranging tax equity financing, certain litigation expenses and write down of intangibles and property, plant and equipment, earnings or loss from discontinued operations, unrealized mark-to-market revaluation impacts (other than those realized in connection with the sales of development assets), costs related to management succession and executive retirement, costs related to prior period adjustments due to U.S. Tax Reform, costs related to condemnation proceedings, financial impacts from the Market Disruption Event on the Company's Senate Wind Facility, changes in value of investments carried at fair value, and other typically non-recurring or unusual items as these are not reflective of the performance of the underlying business of AQN. The non-cash accounting charge related to the revaluation of U.S. deferred income tax assets and liabilities as a result of implementation of the effects of U.S. Tax Reform is adjusted as it is also considered a non-recurring item not reflective of the performance of the underlying business of AQN. AQN believes that analysis and presentation of net earnings or loss on this basis will enhance an investor’s understanding of the operating performance of its businesses. Adjusted Net Earnings is not intended to be representative of net earnings or loss determined in accordance with U.S. GAAP, and can be impacted positively or negatively by these items.
Adjusted Funds from Operations
Adjusted Funds from Operations is a non-GAAP measure used by investors to compare cash flows from operating activities without the effects of certain volatile items that generally have no current economic impact or items such as acquisition expenses that are viewed as not directly related to a company’s operating performance. AQN uses Adjusted Funds from Operations to assess its performance without the effects of (as applicable): changes in working capital balances, acquisition expenses, certain litigation expenses, cash provided by or used in discontinued operations, financial impacts from the Market Disruption Event on the Company's Senate Wind Facility, and other typically non-recurring items affecting cash from operations as these are not reflective of the long-term performance of the underlying businesses of AQN. AQN believes that analysis and presentation of funds from operations on this basis will enhance an investor’s understanding of the operating performance of its businesses. Adjusted Funds from Operations is not intended to be representative of cash flows from operating activities as determined in accordance with U.S. GAAP, and can be impacted positively or negatively by these items.
| | | | | |
| |
| Algonquin Power & Utilities Corp. - Management Discussion & Analysis | |
Net Energy Sales
Net Energy Sales is a non-GAAP measure used by investors to identify revenue after commodity costs used to generate revenue where such revenue generally increases or decreases in response to increases or decreases in the cost of the commodity used to produce that revenue. AQN uses Net Energy Sales to assess its revenues without the effects of fluctuating commodity costs as such costs are predominantly passed through either directly or indirectly in the rates that are charged to customers. AQN believes that analysis and presentation of Net Energy Sales on this basis will enhance an investor’s understanding of the revenue generation of its businesses. It is not intended to be representative of revenue as determined in accordance with U.S. GAAP.
Net Utility Sales
Net Utility Sales is a non-GAAP measure used by investors to identify utility revenue after commodity costs, either natural gas or electricity, where these commodity costs are generally included as a pass through in rates to its utility customers. AQN uses Net Utility Sales to assess its utility revenues without the effects of fluctuating commodity costs as such costs are predominantly passed through and paid for by utility customers. AQN believes that analysis and presentation of Net Utility Sales on this basis will enhance an investor’s understanding of the revenue generation of its utility businesses. It is not intended to be representative of revenue as determined in accordance with U.S. GAAP.
Divisional Operating Profit
Divisional Operating Profit is a non-GAAP measure. AQN uses Divisional Operating Profit to assess the operating performance of its business groups without the effects of (as applicable): depreciation and amortization expense, corporate administrative expenses, income tax expense or recoveries, acquisition costs, certain litigation expenses, interest expense, gain or loss on derivative financial instruments, write down of intangibles and property, plant and equipment, gain or loss on foreign exchange, earnings or loss from discontinued operations, non-service pension and post-employment costs, financial impacts from the Market Disruption Event on the Company's Senate Wind Facility, and other typically non-recurring items. AQN adjusts for these factors as they may be non-cash, unusual in nature and are not factors used by management for evaluating the operating performance of the divisional units. Divisional Operating Profit is calculated inclusive of interest, dividend and equity income earned from indirect investments, and Hypothetical Liquidation at Book Value (“HLBV”) income, which represents the value of net tax attributes earned in the period from electricity generated by certain of its U.S. wind power and U.S. solar generation facilities. AQN believes that presentation of this measure will enhance an investor’s understanding of AQN’s divisional operating performance. Divisional Operating Profit is not intended to be representative of cash provided by operating activities or results of operations determined in accordance with U.S. GAAP.
Overview and Business Strategy
AQN is incorporated under the Canada Business Corporations Act. AQN owns and operates a diversified portfolio of regulated and non-regulated generation, distribution, and transmission utility assets which are expected to deliver predictable earnings and cash flows. AQN seeks to maximize total shareholder value through real per share growth in earnings and cash flows to support a growing dividend and share price appreciation. AQN strives to achieve these results while also seeking to maintain a business risk profile consistent with its BBB flat investment grade credit ratings and a strong focus on Environmental, Social and Governance factors.
AQN’s current quarterly dividend to shareholders is $0.1706 per common share or $0.6824 per common share per annum. Based on the Bank of Canada exchange rate on August 11, 2021, the quarterly dividend is equivalent to C$0.2134 per common share or C$0.8536 per common share per annum. AQN believes its annual dividend payout allows for both an immediate return on investment for shareholders and retention of sufficient cash within AQN to fund growth opportunities. Changes in the level of dividends paid by AQN are at the discretion of the AQN Board of Directors (the “Board”), with dividend levels being reviewed periodically by the Board in the context of AQN's financial performance and growth prospects.
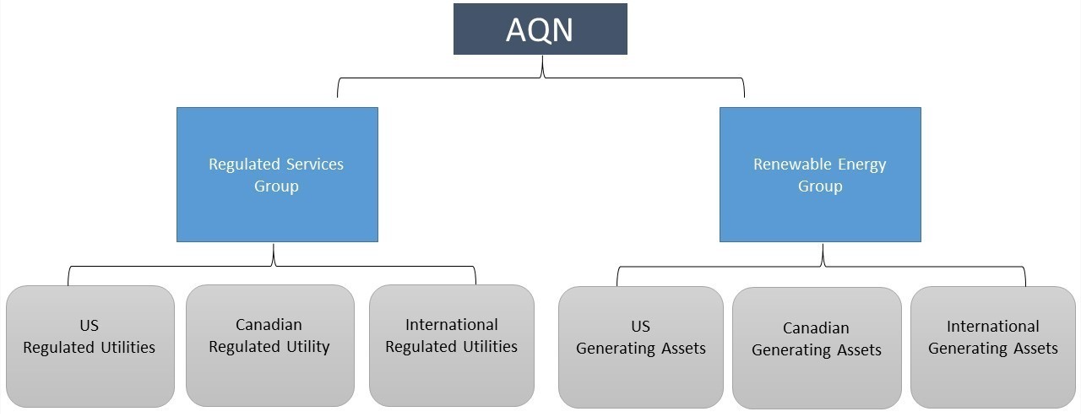
AQN's operations are organized across two primary business units consisting of: the Regulated Services Group, which primarily owns and operates a portfolio of regulated assets in the United States, Canada, Chile and Bermuda, and the Renewable Energy Group, which primarily owns and operates a diversified portfolio of renewable generation assets.
AQN pursues investment opportunities with an objective of maintaining the current business mix between its Regulated Services Group and Renewable Energy Group and with leverage consistent with its current credit ratings1. The business mix target may from time to time require AQN to grow its Regulated Services Group or implement other strategies in order to pursue investment opportunities within its Renewable Energy Group.
1 See Treasury Risk Management -Downgrade in the Company's Credit Rating Risk in the Company's Annual MD&A.
| | | | | |
| |
| Algonquin Power & Utilities Corp. - Management Discussion & Analysis | |
The Company also undertakes development activities for both business units, working with a global reach to identify, develop, acquire, or invest in renewable power generating facilities, regulated utilities and other complementary infrastructure projects. See additional discussion in Corporate Development Activities.
Summary Structure of the Business
The following chart depicts, in summary form, AQN's key businesses. A more detailed description of AQN's organizational structure can be found in the most recent AIF.
Regulated Services Group
The Regulated Services Group operates a diversified portfolio of regulated utility systems throughout the United States, Canada, Chile and Bermuda serving approximately 1,093,000 customer connections (using an average of 2.5 customers per household, this translates into approximately 2,733,000 customers). The Regulated Services Group seeks to provide safe, high quality, and reliable services to its customers and to deliver stable and predictable earnings to AQN. In addition to encouraging and supporting organic growth within its service territories, the Regulated Services Group seeks to deliver continued growth in earnings through accretive acquisitions of additional utility systems.
The Regulated Services Group's regulated electrical distribution utility systems and related generation assets are located in the U.S. States of California, New Hampshire, Missouri, Kansas, Oklahoma, and Arkansas, as well as in Bermuda, which together serve approximately 306,000 electric customer connections. The group also owns and operates generating assets with a gross capacity of approximately 2.0 GW and has investments in generating assets with approximately 0.3 GW of net generation capacity.
The Regulated Services Group's regulated natural gas distribution utility systems are located in the U.S. States of Georgia, Illinois, Iowa, Massachusetts, New Hampshire, Missouri, and New York, and in the Canadian Province of New Brunswick, which together serve approximately 371,000 natural gas customer connections.
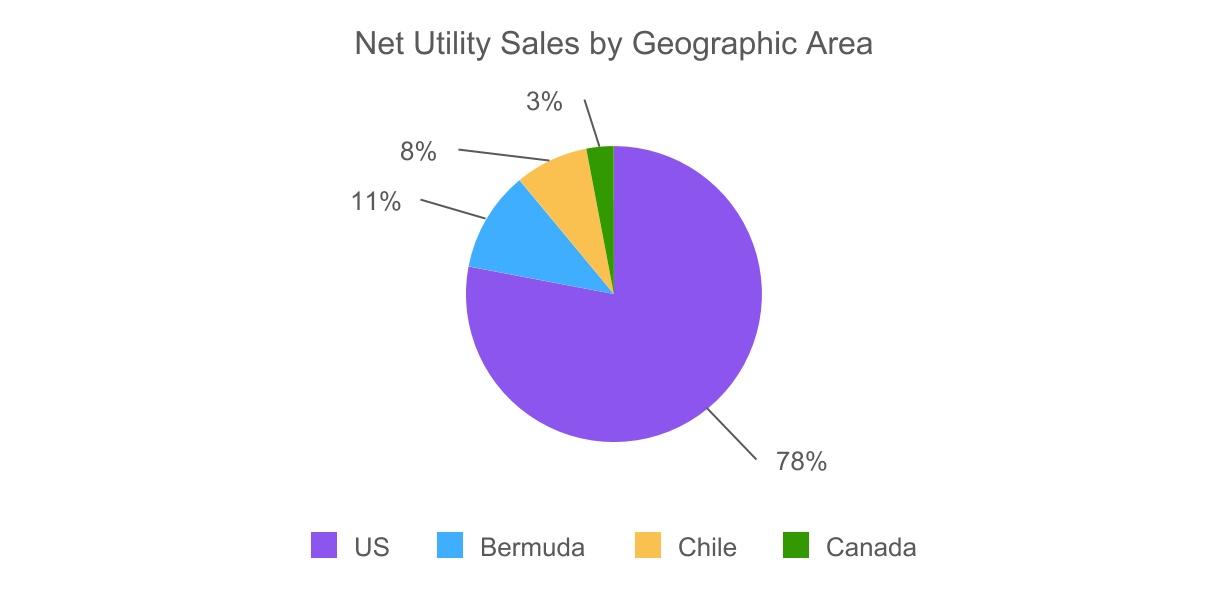
The Regulated Services Group's regulated water distribution and wastewater collection utility systems are located in the U.S. States of Arizona, Arkansas, California, Illinois, Missouri, and Texas as well as in Chile which together serve approximately 416,000 customer connections.
Below is a breakdown of the Regulated Services Group's Net Utility Sales by geographic area for the six months ended June 30, 2021 (see Non-GAAP Financial Measures).
| | | | | |
| |
| Algonquin Power & Utilities Corp. - Management Discussion & Analysis | 6 |
Renewable Energy Group
The Renewable Energy Group generates and sells electrical energy produced by its diverse portfolio of renewable power generation and clean power generation facilities primarily located across the United States and Canada. The Renewable Energy Group seeks to deliver continuing growth through development of new power generation projects and accretive acquisitions of additional electrical energy generation facilities.
The Renewable Energy Group directly owns and operates hydroelectric, wind, solar, and thermal facilities with a combined gross generating capacity of approximately 2.3 GW. Approximately 81% of the electrical output is sold pursuant to long term contractual arrangements which as of June 30, 2021 had a production-weighted average remaining contract life of approximately 13 years.
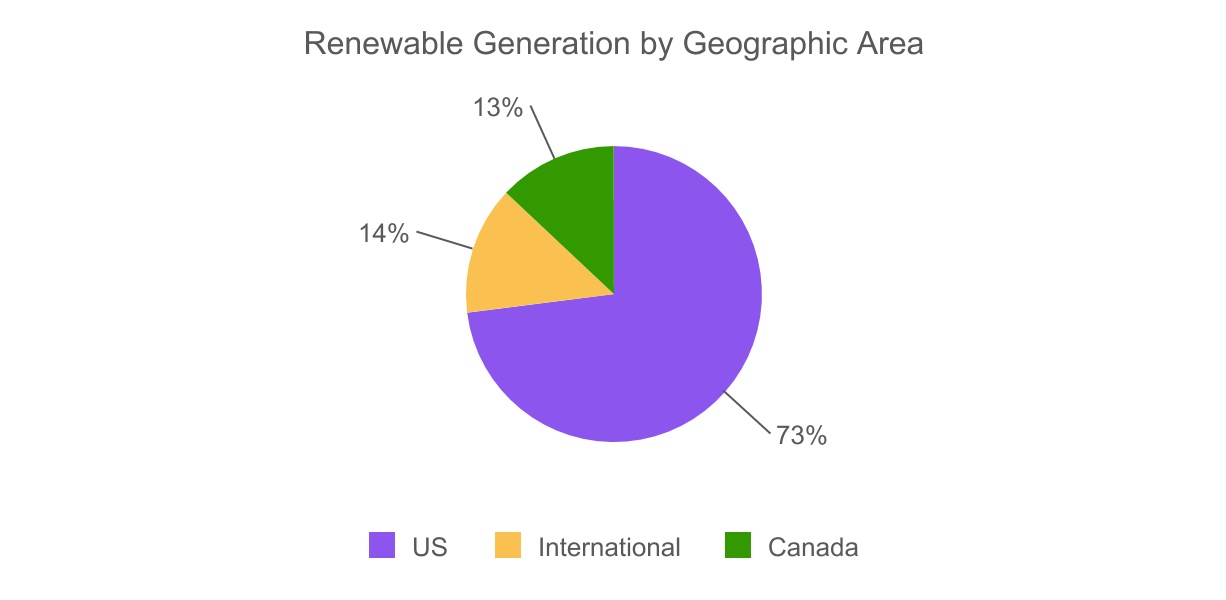
In addition to directly owned and operated assets, the Renewable Energy Group has investments in generating assets with approximately 1.5 GW of net generating capacity which includes the Company's 44.2% interest in Atlantica Sustainable Infrastructure PLC ("Atlantica"). Atlantica owns and operates a portfolio of international clean energy and water infrastructure assets under long term contracts with a Cash Available for Distribution (CAFD) weighted average remaining contract life of approximately 16 years as of June 30, 2021.
Below is a breakdown of the Renewable Energy Group's generating capacity by geographic area as of June 30, 2021, which is comprised of gross generating capacity of facilities owned and operated and net generating capacity of investments (including the Company's 44.2% interest in Atlantica).
| | | | | |
| |
| Algonquin Power & Utilities Corp. - Management Discussion & Analysis | |
Significant Updates
Operating Results
AQN operating results relative to the same period last year are as follows:
| | | | | | | | | | | | | | | | | | | | | | | | | | | | | |
| (all dollar amounts in $ millions except per share information) | Three Months Ended June 30 | | | | |
| 2021 | | 2020 | | Change | | | | | | | | | | | | |
| Net earnings attributable to shareholders | $103.2 | | $286.2 | | (64)% | | | | | | | | | | | | |
Adjusted Net Earnings1 | $91.7 | | $47.4 | | 93% | | | | | | | | | | | | |
Adjusted EBITDA1 | $244.9 | | $176.3 | | 39% | | | | | | | | | | | | |
| Net earnings per common share | $0.16 | | $0.54 | | (70)% | | | | | | | | | | | | |
Adjusted Net Earnings per common share1 | $0.15 | | $0.09 | | 67% | | | | | | | | | | | | |
| | | | | |
| 1 | See Non-GAAP Financial Measures. |
Declaration of 2021 Third Quarter Dividend of $0.1706 (C$0.2134) per Common Share
AQN currently targets annual growth in dividends payable to shareholders underpinned by increases in earnings and cash flow. In setting the appropriate dividend level, the Board considers the Company’s current and expected growth in earnings per share as well as a dividend payout ratio as a percentage of earnings per share and cash flow per share.
On August 12, 2021, AQN announced that the Board declared a third quarter 2021 dividend of $0.1706 per common share payable on October 15, 2021 to shareholders of record on September 30, 2021.
Based on the Bank of Canada exchange rate on August 11, 2021, the Canadian dollar equivalent for the third quarter 2021 dividend is C$0.2134 per common share.
The previous four quarter U.S and Canadian dollar equivalent dividends per common share have been as follows:
| | | | | | | | | | | | | | | | | |
| Q4 2020 | Q1
2021 | Q2
2021 | Q3 2021 | Total |
| U.S. dollar dividend | $ | 0.1551 | | $ | 0.1551 | | $ | 0.1706 | | $ | 0.1706 | | $0.6514 |
| Canadian dollar equivalent | $ | 0.2019 | | $ | 0.1959 | | $ | 0.2094 | | $ | 0.2134 | | $0.8206 |
Inaugural Issuance of Green Equity UnitsOn June 23, 2021, the Company closed an underwritten marketed public offering of 20,000,000 equity units (the "Green Equity Units") for total gross proceeds of $1.0 billion (the "Offering"). The underwriters subsequently exercised their option to purchase an additional 3,000,000 Green Equity Units on the same terms as the Offering, bringing total gross proceeds including the over-allotment to $1.15 billion.
Each Green Equity Unit consists of a 1/20 or 5% undivided beneficial interest in a $1,000 principal amount remarketable senior note of the Company due June 15, 2026, and a contract to purchase AQN common shares on June 15, 2024 based on a reference price determined by the volume-weighted average AQN common share price over the preceding 20 day trading period. Total annual distributions on the Green Equity Units will be at the rate of 7.75%. The net proceeds from the Offering have been or will be, as applicable, used to finance or refinance investments in renewable energy generation or facilities or other clean energy technologies in accordance with the Company's Green Financing Framework. See additional discussion in Long Term Debt.
Progress on Renewable Construction Projects
To date the Company has completed approximately 1,400 MW of its 1,600 MW pipeline of renewable energy generation construction projects that were under construction in 2020, with the remainder expected to be completed before the end of 2021. This 1,600 MW pipeline of new projects is expected to approximately double the size of the Company's portfolio of renewable energy generation facilities that it owns and operates, providing renewable energy to an equivalent of 500,000 homes each year. In the second quarter of 2021, significant milestones were achieved:
Completion of Midwest Greening the Fleet Initiative
The Regulated Services Group successfully completed the construction and acquisition of all the wind facilities related to its inaugural 'greening the fleet' initiative. The initiative consists of 600 MWs of new strategically located wind energy generation which is expected to provide benefits to the Regulated Services Group's electric customers in Missouri, Arkansas, Oklahoma and Kansas. The initiative also resulted in the early retirement of the 200 MW Asbury Coal Facility ("Asbury") on March 1, 2020, approximately 15 years ahead of its original retirement schedule.
| | | | | |
| |
| Algonquin Power & Utilities Corp. - Management Discussion & Analysis | 8 |
The early retirement of Asbury has reduced the Company's CO2e emissions by more than 900,000 metric tons, bringing the Company's total reduction of greenhouse gas ("GHG") emissions to over 1 million metric tons since 2017. With the drive to responsibly minimize CO2e emissions, AQN's commitment to 'greening the fleet' supports important growth and sustainability levers. The early retirement has also contributed to the reduction in the Company’s total Scope 1 GHG emissions as well as reductions in emission intensity per dollar of revenue since 2017, the year in which the Company acquired The Empire District Electric Company ("Empire"), which owns Asbury.
On January 27, 2021, Empire closed its acquisition of the North Fork Ridge Wind Facility and on May 5, 2021, Empire closed the acquisitions of the Kings Point and Neosho Ridge Wind Facilities (collectively, the "Empire Wind Facilities"). Since 2017, Empire has seen an approximately 26% reduction in emission intensity per dollar of revenue, an attestation to the Company’s responsible stewardship of energy infrastructure. AQN was an early pioneer in building renewables into rate base to promote customer savings and minimize CO2e emissions, and maintains a commitment to further "greening the fleet" initiatives congruent with its sustainability and growth strategies.
Completion of the Altavista Solar Project
On June 1, 2021, the Renewable Energy Group achieved full commercial operations ("COD") at its 80 MW Altavista Solar Facility, located in Campbell County, Virginia. The Altavista Solar Facility is the Renewable Energy Group's sixth solar powered electric generating facility and is expected to generate approximately 174 GW-hrs of energy per year with the majority of output being sold to Facebook Operations, LLC, a wholly-owned subsidiary of Facebook, Inc., pursuant to a power purchase agreement ("PPA").
Acquisition of Majority Interest in Fourth Texas Coastal Wind Facility
On August 12, 2021, the Renewable Energy Group closed the acquisition of a 51% interest in the West Raymond Wind Facility that it had previously agreed to purchase from RWE Renewables Americas, LLC, a subsidiary of RWE AG. The West Raymond Wind Facility is located in the coastal region of south Texas, achieved COD in the third quarter of 2021 and has a generating capacity of approximately 240 MW. With the acquisition of the West Raymond Wind Facility and the three wind facilities that were acquired in the first quarter of 2021 (Stella, Cranell, and East Raymond) (collectively the "Texas Coastal Wind Facilities"), the Renewable Energy Group now owns a 51% interest in the portfolio of four wind facilities that have a total generating capacity of approximately 861 MW.
Impact of COVID-19 on Operating Results
For the three months ended June 30, 2021, the Company's operating results were not materially impacted by the COVID-19 pandemic. Approximately 60% of the Company's workforce continues to work remotely and the Company continues to employ operational measures intended to protect the health and safety of its employees and customers. Over the coming months the Company is planning a return to base operations as the impacts of the pandemic further diminish.
The Company’s business, financial condition, cash flows and results of operations continue to be subject to actual and potential future impacts resulting from COVID-19, the full extent of which are not currently known. The extent of the future impact of the COVID-19 pandemic on the Company will depend on, among other things, the duration of the pandemic, the extent of the related public health measures taken in response to the pandemic and the Company's efforts to mitigate the impact on its operations.
For a discussion of the risks the Company faces related to COVID-19 please refer to Enterprise Risk Management.
| | | | | |
| |
| Algonquin Power & Utilities Corp. - Management Discussion & Analysis | |
2021 Second Quarter Results From Operations
| | | | | | | | | | | |
| Key Financial Information | Three Months Ended June 30 |
| (all dollar amounts in $ millions except per share information) | 2021 | | 2020 |
| Revenue | $ | 527.5 | | | $ | 343.6 | |
| | | |
| Net earnings attributable to shareholders | 103.2 | | | 286.2 | |
| Cash provided by operating activities | 103.3 | | | 142.9 | |
Adjusted Net Earnings1 | 91.7 | | | 47.4 | |
Adjusted EBITDA1 | 244.9 | | | 176.3 | |
Adjusted Funds from Operations1 | 161.3 | | | 93.4 | |
| Dividends declared to common shareholders | 105.7 | | | 83.8 | |
| Weighted average number of common shares outstanding | 614,013,963 | | | 529,440,246 | |
| Per share | | | |
| | | |
| Basic net earnings | $ | 0.16 | | | $ | 0.54 | |
| Diluted net earnings | $ | 0.16 | | | $ | 0.53 | |
Adjusted Net Earnings1,2 | $ | 0.15 | | | $ | 0.09 | |
| Dividends declared to common shareholders | $ | 0.17 | | | $ | 0.16 | |
| | | | | |
| 1 | See Non-GAAP Financial Measures. |
| 2 | AQN uses per share Adjusted Net Earnings to enhance assessment and understanding of the performance of AQN. |
For the three months ended June 30, 2021, AQN experienced an average exchange rate of Canadian to U.S. dollars of approximately 0.8143 as compared to 0.7216 in the same period in 2020. As such, any quarter over quarter variance in revenue or expenses, in local currency, at any of AQN’s Canadian entities is affected by a change in the average exchange rate upon conversion to AQN’s reporting currency.
For the three months ended June 30, 2021, AQN reported total revenue of $527.5 million as compared to $343.6 million during the same period in 2020, an increase of $183.9 million or 53.5%. The major factors impacting AQN's revenue in the three months ended June 30, 2021 as compared to the same period in 2020 are set out as follows:
| | | | | |
| |
| Algonquin Power & Utilities Corp. - Management Discussion & Analysis | 10 |
| | | | | |
| (all dollar amounts in $ millions) | Three Months Ended June 30 |
| Comparative Prior Period Revenue | $ | 343.6 | |
| REGULATED SERVICES GROUP | |
| Existing Facilities | |
| Electricity: Increase is primarily due to higher pass through commodity costs and out of period resettlement adjustments at the Empire Electric System, reflecting residual impacts as a result of the Midwest Extreme Weather Event. | 54.1 | |
| Gas: Increase is primarily due to higher pass through commodity costs at the EnergyNorth and New England Gas Systems as well as increased commercial and industrial consumption at the Midstates Gas System. | 12.0 | |
| Water: Increase is primarily due to growth in connections at the Midstates, Beardsley and Arkansas Water Systems. | 1.1 | |
| |
| 67.2 | |
| New Facilities | |
| Electricity: Acquisition of Liberty Group Limited (formerly Ascendant Group Limited ("Ascendant")) (November 2020) and the Empire Wind Facilities (2021). | 60.4 | |
| |
| Water: Acquisition of Empresa de Servicios Sanitarios de Los Lagos S.A.("ESSAL") (October 2020). | 23.1 | |
| |
| 83.5 | |
| Rate Reviews | |
| Electricity: Increase is due to the implementation of a Post-Test Year Adjustment Mechanism effective January 2021 at the CalPeco Electric System as well as the implementation of new rates at the Granite State Electric System. | 2.9 | |
| Gas: Increase is primarily due to the implementation of new rates at the EnergyNorth and Peach State Gas Systems. | 1.3 | |
| |
| 4.2 | |
| |
| |
Estimated Impact of COVID-19 on comparative period results1 | 10.8 | |
| |
| RENEWABLE ENERGY GROUP | |
| Existing Facilities | |
| Hydro: Decrease is primarily due to lower production in the Ontario Region, partially offset by favourable pricing in the Western Region. | (0.1) | |
| Wind Canada: Decrease is primarily due to lower production. | (0.8) | |
Wind U.S.: Decrease is primarily due to lower production and unfavourable pricing at the Senate Wind Facility as well as unfavourable pricing at the Shady Oaks Wind Facility.
| (1.4) | |
| Solar: Increase is primarily due to higher production at the Bakersfield Solar Facilities. | 0.3 | |
| |
| Thermal: Increase is primarily due to higher production at the Sanger Thermal Facility as well as favourable pricing at the Windsor Locks Thermal Facility. | 1.3 | |
| Other | (0.6) | |
| (1.3) | |
| New Facilities | |
| Wind U.S.: Sugar Creek Wind Facility (full COD in November 2020) and Maverick Creek Wind Facility (full COD in April 2021). | 13.7 | |
| Solar: Great Bay II Solar Facility (full COD in August 2020) and Altavista Solar Facility (full COD in June 2021) | 2.5 | |
| 16.2 | |
| Foreign Exchange | 3.3 | |
| Current Period Revenue | $ | 527.5 | |
| | | | | |
| |
| Algonquin Power & Utilities Corp. - Management Discussion & Analysis | |
| | | | | |
| 1 | The impacts of COVID-19 were estimated by normalizing sales in both periods for changes in weather and attributing the remaining variances to COVID-19. |
A more detailed discussion of these factors is presented within the business unit analysis.For the three months ended June 30, 2021, net earnings attributable to shareholders totaled $103.2 million as compared to net earnings of $286.2 million during the same period in 2020, a decrease of $183.0 million or 63.9%. The decrease was due to a $282.5 million change in fair value of investments carried at fair value, a $13.4 million increase in interest expense, a $22.5 million increase in depreciation and amortization expenses, a $2.8 million increase in losses from derivative instruments, a $0.3 million increase in administrative expenses, a $1.3 million increase in foreign exchange loss, and a $0.3 million increase in pension and post-employment non-service costs. These items were partially offset by a $50.6 million increase in earnings from operating facilities, an $8.2 million increase in interest, dividend, equity and other income, a $25.1 million decrease in other net losses, a $51.1 million decrease in income tax expense (tax explanations are discussed in AQN: Corporate and Other Expenses), and a $5.1 million increase in net effect of non-controlling interests as compared to the same period in 2020.
During the three months ended June 30, 2021, cash provided by operating activities totaled $103.3 million as compared to $142.9 million during the same period in 2020, a decrease of $39.6 million. During the three months ended June 30, 2021, Adjusted Funds from Operations totaled $161.3 million as compared to Adjusted Funds from Operations of $93.4 million during the same period in 2020, an increase of $67.9 million (see Non-GAAP Financial Measures).
During the three months ended June 30, 2021, Adjusted EBITDA totaled $244.9 million as compared to $176.3 million during the same period in 2020, an increase of $68.6 million or 38.9%. A more detailed analysis of these factors is presented within the reconciliation of Adjusted EBITDA to net earnings set out below (see Non-GAAP Financial Measures).
2021 Year-to-Date Results From Operations
| | | | | | | | | | | | | | | |
| Key Financial Information | Six Months Ended June 30 |
| (all dollar amounts in $ millions except per share information) | 2021 | | 2020 | | | | |
| Revenue | $ | 1,162.1 | | | $ | 808.5 | | | | | |
| | | | | | | |
| Net earnings attributable to shareholders | 117.2 | | | 222.4 | | | | | |
| Cash provided by (used in) operating activities | (140.2) | | | 209.8 | | | | | |
Adjusted Net Earnings1 | 216.2 | | | 150.7 | | | | | |
Adjusted EBITDA1 | 527.7 | | | 418.5 | | | | | |
Adjusted Funds from Operations1 | 366.6 | | | 272.9 | | | | | |
| Dividends declared to common shareholders | 200.3 | | | 158.5 | | | | | |
| Weighted average number of common shares outstanding | 606,876,299 | | | 527,634,250 | | | | | |
| Per share | | | | | | | |
| | | | | | | |
| Basic net earnings | $ | 0.19 | | | $ | 0.41 | | | | | |
| Diluted net earnings | $ | 0.18 | | | $ | 0.41 | | | | | |
Adjusted Net Earnings1,2 | $ | 0.35 | | | $ | 0.28 | | | | | |
| Dividends declared to common shareholders | $ | 0.33 | | | $ | 0.30 | | | | | |
| | | | | | | |
| | | | | | | |
| | | | | |
| 1 | See Non-GAAP Financial Measures. |
| 2 | AQN uses per share Adjusted Net Earnings to enhance assessment and understanding of the performance of AQN. |
For the six months ended June 30, 2021, AQN experienced an average exchange rate of Canadian to U.S. dollars of approximately 0.8017 as compared to 0.7325 in the same period in 2020. As such, any year-over-year variance in revenue or expenses, in local currency, at any of AQN’s Canadian entities is affected by a change in the average exchange rate upon conversion to AQN’s reporting currency.
For the six months ended June 30, 2021, AQN reported total revenue of $1,162.1 million as compared to $808.5 million during the same period in 2020, an increase of $353.6 million or 43.7%. The major factors resulting in the increase in AQN revenue for the six months ended June 30, 2021 as compared to the same period in 2020 are set out as follows:
| | | | | |
| |
| Algonquin Power & Utilities Corp. - Management Discussion & Analysis | |
| | | | | |
| (all dollar amounts in $ millions) | Six Months Ended June 30 |
| Comparative Prior Period Revenue | $ | 808.5 | |
| REGULATED SERVICES GROUP | |
| Existing Facilities | |
| Electricity: Increase is primarily due to higher consumption and pass through commodity costs at the Empire Electric System as a result of the Midwest Extreme Weather Event. | 153.3 | |
| Gas: Increase is due to higher pass through commodity costs in the New England, EnergyNorth and Georgia Gas Systems as well as increased consumption at the Midstates Gas System. | 21.2 | |
| Water: Increase is primarily due to growth in connections at the Litchfield Park, Midstates and Beardsley Water Systems. | 3.0 | |
| Other | 0.6 | |
| 178.1 | |
| New Facilities | |
| Electricity: Acquisition of Ascendant (November 2020) and the Empire Wind Facilities (2021). | 118.2 | |
| |
| Water: Acquisition of ESSAL (October 2020). | 48.5 | |
| |
| 166.7 | |
| Rate Reviews | |
| Electricity: Increase is due to the implementation of a Post-Test Year Adjustment Mechanism effective January 2021 at the CalPeco Electric System as well as the implementation of new rates at the Granite State Electric System. | 6.3 | |
| Gas: Increase is primarily due to the implementation of new rates at the EnergyNorth and Peach State Gas Systems, | 6.3 | |
| |
| 12.6 | |
| |
| |
Estimated Impact of COVID-19 on comparative period results1 | 11.0 | |
| |
| RENEWABLE ENERGY GROUP | |
| Existing Facilities | |
| Hydro: Increase is primarily due to favourable pricing in the Western Region, partially offset by lower production in the Ontario Region. | 0.4 | |
| Wind Canada: Decrease is primarily due to lower production. | (1.1) | |
| Wind U.S.: Decrease is primarily due to the impacts from the Market Disruption Event at the Senate Wind Facility. | (53.5) | |
| Solar: Increase is primarily due to higher production at the Bakersfield Solar Facilities. | 0.3 | |
| |
| Thermal: Increase is primarily due to higher production at the Sanger Thermal Facility as well as favourable pricing at the Windsor Locks Thermal Facility. | 3.5 | |
| Other | (0.3) | |
| (50.7) | |
| New Facilities | |
| |
| Wind U.S.: Sugar Creek Wind Facility (full COD in November 2020) and Maverick Creek Wind Facility (full COD in April 2021). | 26.9 | |
| Solar: Great Bay II Solar Facility (achieved COD in August 2020) and Altavista Solar Facility (full COD in June 2021). | 4.1 | |
| 31.0 | |
| Foreign Exchange | 4.9 | |
| |
| Current Period Revenue | $ | 1,162.1 | |
| | | | | |
| 1 | The impacts of COVID-19 were estimated by normalizing sales in both periods for changes in weather and attributing the remaining variances to COVID-19. |
| | | | | |
| |
| Algonquin Power & Utilities Corp. - Management Discussion & Analysis | 13 |
A more detailed discussion of these factors is presented within the business unit analysis.
For the six months ended June 30, 2021, net earnings attributable to shareholders totaled $117.2 million as compared to $222.4 million during the same period in 2020, a decrease of $105.2 million or 47.3%. The decrease was due to a $163.5 million change in fair value of investments carried at fair value, a $41.1 million increase in depreciation and amortization expenses, a $16.7 million increase in interest expense, a $6.8 million decrease in foreign exchange gains, a $1.7 million decrease in gains from derivative instruments, and a $0.5 million increase in pension and post-employment non-service costs. These items were partially offset by a $39.3 million increase in earnings from operating facilities, a $17.6 million decrease in other net losses, a $0.9 million decrease in administration charges, a $1.3 million increase in interest, dividend, equity and other income, a $59.0 million decrease in income tax expense (tax explanations are discussed in AQN: Corporate and Other Expenses), and a $6.8 million increase in net effect of non-controlling interests as compared to the same period in 2020.
During the six months ended June 30, 2021, cash provided by (used in) operating activities totaled $(140.2) million as compared to $209.8 million during the same period in 2020. During the six months ended June 30, 2021, Adjusted Funds from Operations totaled $366.6 million as compared to $272.9 million the same period in 2020, an increase of $93.7 million (see Non-GAAP Financial Measures).
During the six months ended June 30, 2021, Adjusted EBITDA totaled $527.7 million as compared to $418.5 million during the same period in 2020, an increase of $109.2 million or 26.1%. A detailed analysis of this variance is presented within the reconciliation of Adjusted EBITDA to net earnings set out below (see Non-GAAP Financial Measures).
| | | | | |
| |
| Algonquin Power & Utilities Corp. - Management Discussion & Analysis | |
2021 Second Quarter and Year-to-Date Adjusted EBITDA Summary
Adjusted EBITDA (see Non-GAAP Financial Measures) for the three months ended June 30, 2021 totaled $244.9 million as compared to $176.3 million during the same period in 2020, an increase of $68.6 million or 38.9%. Adjusted EBITDA for the six months ended June 30, 2021 totaled $527.7 million as compared to $418.5 million during the same period in 2020, an increase of $109.2 million or 26.1%. The breakdown of Adjusted EBITDA by the Company's main business units and a summary of changes are shown below.
| | | | | | | | | | | | | | | | | | | | | | | |
| Adjusted EBITDA by business units | Three Months Ended June 30 | | Six Months Ended June 30 |
| (all dollar amounts in $ millions) | 2021 | | 2020 | | 2021 | | 2020 |
| Regulated Services Group Operating Profit | $ | 165.9 | | | $ | 114.5 | | | $ | 372.8 | | | $ | 285.2 | |
| Renewable Energy Group Operating Profit | 97.9 | | | 82.7 | | | 192.8 | | | 170.7 | |
| Administrative Expenses | (18.2) | | | (17.9) | | | (33.8) | | | (34.7) | |
| Other Income & Expenses | (0.7) | | | (3.0) | | | (4.1) | | | (2.7) | |
| Total AQN Adjusted EBITDA | $ | 244.9 | | | $ | 176.3 | | | $ | 527.7 | | | $ | 418.5 | |
| Change in Adjusted EBITDA ($) | $ | 68.6 | | | | | $ | 109.2 | | | |
| Change in Adjusted EBITDA (%) | 38.9 | % | | | | 26.1 | % | | |
| | | | | | | | | | | | | | |
| Change in Adjusted EBITDA | Three Months Ended June 30, 2021 |
| (all dollar amounts in $ millions) | Regulated Services | Renewable Energy | Corporate | Total |
| Prior period balances | $ | 114.5 | | $ | 82.7 | | $ | (20.9) | | $ | 176.3 | |
| Existing Facilities and Investments | 5.6 | | (2.4) | | 2.3 | | 5.5 | |
| New Facilities and Investments | 32.1 | | 15.0 | | — | | 47.1 | |
| Rate Reviews | 4.1 | | — | | — | | 4.1 | |
Estimated Impact of COVID-19 on comparative period results1 | 9.6 | | — | | — | | 9.6 | |
| Foreign Exchange Impact | — | | 2.6 | | — | | 2.6 | |
| Administrative Expenses | — | | — | | (0.3) | | (0.3) | |
| Total change during the period | $ | 51.4 | | $ | 15.2 | | $ | 2.0 | | $ | 68.6 | |
| Current period balances | $ | 165.9 | | $ | 97.9 | | $ | (18.9) | | $ | 244.9 | |
| | | | | | | | | | | | | | |
| Change in Adjusted EBITDA | Six Months Ended June 30, 2021 |
| (all dollar amounts in $ millions) | Regulated Services | Renewable Energy | Corporate | Total |
| Prior period balances | $ | 285.2 | | $ | 170.7 | | $ | (37.4) | | $ | 418.5 | |
| Existing Facilities and Investments | (0.7) | | (0.6) | | (1.5) | | (2.8) | |
| New Facilities and Investments | 65.9 | | 18.7 | | — | | 84.6 | |
| Rate Reviews | 12.6 | | — | | — | | 12.6 | |
Estimated Impact of COVID-19 on comparative period results1 | 9.8 | | — | | — | | 9.8 | |
| Foreign Exchange Impact | — | | 4.0 | | — | | 4.0 | |
| Administrative Expenses | — | | — | | 1.0 | | 1.0 | |
| Total change during the period | $ | 87.6 | | $ | 22.1 | | $ | (0.5) | | $ | 109.2 | |
| Current period balances | $ | 372.8 | | $ | 192.8 | | $ | (37.9) | | $ | 527.7 | |
| | | | | |
| 1 | The impacts of COVID-19 were estimated by normalizing sales in both periods for changes in weather and attributing the remaining variances to COVID-19. |
| | | | | |
| |
| Algonquin Power & Utilities Corp. - Management Discussion & Analysis | 15 |
REGULATED SERVICES GROUP
The Regulated Services Group operates rate-regulated utilities that as of June 30, 2021 provided distribution services to approximately 1,093,000 customer connections in the electric, natural gas, and water and wastewater sectors which is an increase of approximately 286,000 customer connections as compared to the prior year. The increase is primarily due to the acquisitions in the second half of 2020 of a majority interest in the ESSAL water utility in Chile and Ascendant in Bermuda.
The Regulated Services Group's strategy is to grow its business organically and through business development activities while using prudent acquisition criteria. The Regulated Services Group believes that its business results are maximized by building constructive regulatory and customer relationships, and enhancing customer connections in the communities in which it operates.
| | | | | | | | | | | | | | | | | | | | | | | |
| Utility System Type | As at June 30 |
| 2021 | | 2020 |
| (all dollar amounts in $ millions) | Assets | Net Utility Sales1 | Total Customer Connections2 | | Assets | Net Utility Sales1 | Total Customer Connections2 |
| Electricity | 5,109.1 | | 325.7 | | 306,000 | | | 2,646.0 | | 244.3 | | 267,000 | |
| Natural Gas | 900.2 | | 169.5 | | 371,000 | | | 1,412.3 | | 158.8 | | 370,000 | |
| Water and Wastewater | 846.1 | | 106.4 | | 416,000 | | | 531.7 | | 57.2 | | 170,000 | |
| | | | | | | |
| | | | | | | |
| Other | 230.1 | | 47.9 | | | | 105.3 | | 26.8 | | |
| Total | $ | 7,085.5 | | $ | 649.5 | | 1,093,000 | | | $ | 4,695.3 | | $ | 487.1 | | 807,000 | |
| | | | | | | |
| Accumulated Deferred Income Taxes Liability | $ | 554.6 | | | | | $ | 484.8 | | | |
| | | | | |
| 1 | Net Utility Sales for the six months ended June 30, 2020 and 2021. See Non-GAAP Financial Measures. |
| 2 | Total Customer Connections represents the sum of all active and vacant customer connections. |
The Regulated Services Group aggregates the performance of its utility operations by utility system type – electricity, natural gas, and water and wastewater systems.
The electric distribution systems are comprised of regulated electrical distribution utility systems and serve approximately 306,000 customer connections in the U.S. States of California, New Hampshire, Missouri, Kansas, Oklahoma and Arkansas and in Bermuda.
The natural gas distribution systems are comprised of regulated natural gas distribution utility systems and serve approximately 371,000 customer connections located in the U.S. States of New Hampshire, Illinois, Iowa, Missouri, Georgia, Massachusetts and New York and in the Canadian Province of New Brunswick.
The water and wastewater distribution systems are comprised of regulated water distribution and wastewater collection utility systems and serve approximately 416,000 customer connections located in the U.S. States of Arkansas, Arizona, California, Illinois, Missouri and Texas and in Chile.
| | | | | |
| |
| Algonquin Power & Utilities Corp. - Management Discussion & Analysis | 16 |
2021 Second Quarter and Year-to-Date Usage Results
| | | | | | | | | | | | | | | | | | | | | | | |
| Electric Distribution Systems | Three Months Ended June 30 | | Six Months Ended June 30 |
| | 2021 | | 2020 | | 2021 | | 2020 |
| Average Active Electric Customer Connections For The Period | | | | | | | |
| Residential | 261,200 | | | 227,900 | | | 261,100 | | | 227,800 | |
| Commercial and industrial | 41,900 | | | 38,200 | | | 41,900 | | | 38,100 | |
| Total Average Active Electric Customer Connections For The Period | 303,100 | | | 266,100 | | | 303,000 | | | 265,900 | |
| | | | | | | |
| Customer Usage (GW-hrs) | | | | | | | |
| Residential | 572.3 | | | 512.5 | | | 1,416.2 | | | 1,169.8 | |
| Commercial and industrial | 890.9 | | | 770.2 | | | 1,791.9 | | | 1,593.0 | |
| Total Customer Usage (GW-hrs) | 1,463.2 | | | 1,282.7 | | | 3,208.1 | | | 2,762.8 | |
For the three months ended June 30, 2021, the electric distribution systems' usage totaled 1,463.2 GW-hrs as compared to 1,282.7 GW-hrs for the same period in 2020, an increase of 180.5 GW-hrs or 14.1%. The increase in electricity consumption is primarily due to the acquisition of Ascendant in the fourth quarter of 2020, which contributed 117.9 GW-hrs, increased consumption due to favorable weather at the Granite State and CalPeco Electric Systems, as well as customer growth at the Empire Electric System.
For the six months ended June 30, 2021, the electric distribution systems' usage totaled 3,208.1 GW-hrs as compared to 2,762.8 GW-hrs for the same period in 2020, an increase of 445.3 GW-hrs or 16.1%. The increase in electricity consumption is primarily due to the acquisition of Ascendant in the fourth quarter of 2020, which contributed 234.8 GW-hrs.
| | | | | | | | | | | | | | | | | | | | | | | |
| Natural Gas Distribution Systems | Three Months Ended June 30 | | Six Months Ended June 30 |
| 2021 | | 2020 | | 2021 | | 2020 |
| Average Active Natural Gas Customer Connections For The Period | | | | | | | |
| Residential | 319,600 | | | 317,800 | | | 320,100 | | | 317,900 | |
| Commercial and industrial | 38,100 | | | 37,800 | | | 38,100 | | | 38,000 | |
| Total Average Active Natural Gas Customer Connections For The Period | 357,700 | | | 355,600 | | | 358,200 | | | 355,900 | |
| | | | | | | |
| Customer Usage (One Million British Thermal Units("MMBTU")) | | | | | | | |
| Residential | 2,955,000 | | | 3,391,000 | | | 13,667,000 | | | 13,970,000 | |
| Commercial and industrial | 3,418,000 | | | 4,217,000 | | | 11,720,000 | | | 13,464,000 | |
| Total Customer Usage (MMBTU) | 6,373,000 | | | 7,608,000 | | | 25,387,000 | | | 27,434,000 | |
For the three months ended June 30, 2021, usage at the natural gas distribution systems totaled 6,373,000 MMBTU as compared to 7,608,000 MMBTU during the same period in 2020, a decrease of 1,235,000 MMBTU, or 16.2%. This was primarily due to lower sales driven by warmer weather at the New Brunswick, EnergyNorth, New England and Midstates Gas Systems.
For the six months ended June 30, 2021, usage at the natural gas distribution systems totaled 25,387,000 MMBTU as compared to 27,434,000 MMBTU during the same period in 2020, a decrease of 2,047,000 MMBTU, or 7.5%. This was primarily due to lower sales driven by warmer weather at the New Brunswick, Energy North and New England Gas Systems, as well as lower commercial and industrial customer usage at the Midstates Gas System as a result of the Midwest Extreme Weather Event.
| | | | | |
| |
| Algonquin Power & Utilities Corp. - Management Discussion & Analysis | 17 |
| | | | | | | | | | | | | | | | | | | | | | | |
| Water and Wastewater Distribution Systems | Three Months Ended June 30 | | Six Months Ended June 30 |
| 2021 | | 2020 | | 2021 | | 2020 |
| Average Active Customer Connections For The Period | | | | | | | |
| Wastewater customer connections | 46,500 | | | 45,100 | | | 46,300 | | | 44,900 | |
| Water distribution customer connections | 360,400 | | | 116,600 | | | 358,900 | | | 116,400 | |
| Total Average Active Customer Connections For The Period | 406,900 | | | 161,700 | | | 405,200 | | | 161,300 | |
| | | | | | | |
| Gallons Provided (millions of gallons) | | | | | | | |
| Wastewater treated | 677 | | | 614 | | | 1,340 | | | 1,263 | |
| Water provided | 6,915 | | | 3,796 | | | 13,053 | | | 6,852 | |
| Total Gallons Provided (millions of gallons) | 7,592 | | | 4,410 | | | 14,393 | | | 8,115 | |
For the three months ended June 30, 2021, the water and wastewater distribution systems provided approximately 6,915 million gallons of water to customers and treated approximately 677 million gallons of wastewater. This is compared to 3,796 million gallons of water provided and 614 million gallons of wastewater treated during the same period in 2020, an increase in total gallons provided of 3,182 million, or 72.2%. The increase is primarily due to the acquisition of ESSAL in the fourth quarter of 2020, which contributed 2,705 million gallons of water provided.
For the six months ended June 30, 2021, the water and wastewater distribution systems provided approximately 13,053 million gallons of water to customers and treated approximately 1,340 million gallons of wastewater. This is compared to 6,852 million gallons of water provided and 1,263 million gallons of wastewater treated during the same period in 2020, an increase in total gallons provided of 6,278 million, or 77.4%. The increase is primarily due to the acquisition of ESSAL in the fourth quarter of 2020, which contributed 5,612 million gallons of water provided.
2021 Second Quarter and Year-to-Date Regulated Services Group Operating Results
| | | | | | | | | | | | | | | | | | | | | | | |
| Three Months Ended June 30 | | Six Months Ended June 30 |
| (all dollar amounts in $ millions) | 2021 | | 2020 | | 2021 | | 2020 |
| Revenue | | | | | | | |
| Utility electricity sales and distribution | $ | 280.0 | | | $ | 163.6 | | | $ | 614.0 | | | $ | 344.3 | |
| Less: cost of sales – electricity | (118.9) | | | (42.8) | | | (288.3) | | | (100.0) | |
Net Utility Sales - electricity1 | 161.1 | | | 120.8 | | | 325.7 | | | 244.3 | |
| Utility natural gas sales and distribution | 84.5 | | | 71.0 | | | 269.0 | | | 241.7 | |
| Less: cost of sales – natural gas | (26.1) | | | (19.3) | | | (99.5) | | | (82.9) | |
Net Utility Sales - natural gas1 | 58.4 | | | 51.7 | | | 169.5 | | | 158.8 | |
| Utility water distribution & wastewater treatment sales and distribution | 58.1 | | | 34.9 | | | 112.5 | | | 62.7 | |
| Less: cost of sales – water | (3.4) | | | (3.2) | | | (6.1) | | | (5.5) | |
Net Utility Sales - water distribution & wastewater treatment1 | 54.7 | | | 31.7 | | | 106.4 | | | 57.2 | |
| Gas transportation | 8.3 | | | 6.9 | | | 22.3 | | | 20.9 | |
| Other revenue | 14.0 | | | 3.0 | | | 25.6 | | | 5.9 | |
Net Utility Sales1 | 296.5 | | | 214.1 | | | 649.5 | | | 487.1 | |
| Operating expenses | (144.8) | | | (105.1) | | | (297.9) | | | (213.4) | |
| Other income | 8.4 | | | 3.7 | | | 11.0 | | | 8.0 | |
HLBV2 | 5.8 | | | 1.8 | | | 10.2 | | | 3.5 | |
Divisional Operating Profit1,3 | $ | 165.9 | | | $ | 114.5 | | | $ | 372.8 | | | $ | 285.2 | |
| | | | | |
| 1 | See Non-GAAP Financial Measures. |
| 2 | HLBV income represents the value of net tax attributes monetized by the Regulated Services Group in the period at the Luning and Turquoise Solar Facilities and the Empire Wind Facilities. |
| 3 | Certain prior year items have been reclassified to conform with current year presentation. |
| | | | | |
| |
| Algonquin Power & Utilities Corp. - Management Discussion & Analysis | |
2021 Second Quarter Operating Results
For the three months ended June 30, 2021, the Regulated Services Group reported an operating profit (excluding corporate administration expenses) of $165.9 million as compared to $114.5 million for the comparable period in the prior year.
Highlights of the changes are summarized in the following table:
| | | | | |
| (all dollar amounts in $ millions) | Three Months Ended June 30 |
Prior Period Divisional Operating Profit1 | $ | 114.5 | |
| Existing Facilities | |
| Electricity: Decrease is due to out of period resettlements related to the Midwest Extreme Weather Event, higher non-pass through fuel costs as well as decreased net sales associated with milder temperatures. | (5.7) | |
| Gas: Increase is primarily due to favourable property tax adjustments at the EnergyNorth and Midstates Gas Systems. | 4.8 | |
| Water | 0.1 | |
| Other: Increase is primarily due to higher earnings from the San Antonio Water System investment and recoverable amounts related to the Midwest Extreme Weather Event. | 6.4 | |
| 5.6 | |
| New Facilities | |
| Electricity: Acquisition of Ascendant (November 2020) and the Empire Wind Facilities (2021). | 23.3 | |
| |
| Water: Acquisition of ESSAL (October 2020). | 8.8 | |
| |
| 32.1 | |
| Rate Reviews | |
| Electricity: Increase is primarily due to the implementation of a Post-Test Year Adjustment Mechanism effective January 2021 at the CalPeco Electric System as well as the implementation of new rates at the Granite State Electric System. | 2.9 | |
| Gas: Increase is primarily due to implementation of new rates at the EnergyNorth and Peach State Gas Systems. | 1.2 | |
| |
| 4.1 | |
| |
Estimated Impact of COVID-19 on comparative period results2 | 9.6 | |
| |
| |
Current Period Divisional Operating Profit1 | $ | 165.9 | |
| | | | | |
| 1 | See Non-GAAP Financial Measures. |
| 2 | The impacts of COVID-19 were estimated by normalizing sales in both periods for changes in weather and attributing the remaining variances to COVID-19. |
| | | | | |
| |
| Algonquin Power & Utilities Corp. - Management Discussion & Analysis | 19 |
2021 Year-to-Date Operating Results
For the six months ended June 30, 2021, the Regulated Services Group reported an operating profit (excluding corporate administration expenses) of $372.8 million as compared to $285.2 million for the comparable period in the prior year.
Highlights of the changes are summarized in the following table:
| | | | | |
| (all dollar amounts in $ millions) | Six Months Ended June 30 |
Prior Period Divisional Operating Profit1 | $ | 285.2 | |
| Existing Facilities | |
| Electricity: Decrease is primarily due to higher non-pass through fuel costs as well as higher maintenance and operating expenses. | (13.3) | |
| Gas: Increase is primarily due to favourable property tax adjustments at the EnergyNorth and Midstates Gas Systems. | 6.8 | |
| Water: Increase is primarily due to increased consumption and growth at the Arizona Water Systems and lower operating expenses at the Park Water System. | 2.2 | |
| |
| Other: Increase is primarily due to higher earnings from the San Antonio Water System investment and recoverable amounts related to the Midwest Extreme Weather Event. | 3.6 | |
| (0.7) | |
| New Facilities | |
| Electricity: Acquisition of Ascendant (November 2020) and the Empire Wind Facilities (2021). | 46.1 | |
| |
| Water: Acquisition of ESSAL (October 2020). | 19.8 | |
| |
| 65.9 | |
| Rate Reviews | |
| Electricity: Increase is due to the implementation of a Post-Test Year Adjustment Mechanism effective January 2021 at the CalPeco Electric System as well as the implementation of new rates at the Granite State Electric System. | 6.3 | |
| Gas: Increase is primarily due to the implementation of new rates at the EnergyNorth and Peach State Gas Systems. | 6.3 | |
| |
| 12.6 | |
| |
Estimated Impact of COVID-19 on comparative period results2 | 9.8 | |
| |
| |
Current Period Divisional Operating Profit1 | $ | 372.8 | |
| | | | | |
| 1 | See Non-GAAP Financial Measures. |
| 2 | The impacts of COVID-19 were estimated by normalizing sales in both periods for changes in weather and attributing the remaining variances to COVID-19. |
| | | | | |
| |
| Algonquin Power & Utilities Corp. - Management Discussion & Analysis | 20 |
Regulatory Proceedings
The following table summarizes the major regulatory proceedings currently underway within the Regulated Services Group:
| | | | | | | | | | | | | | |
| Utility | Jurisdiction | Regulatory Proceeding Type | Rate Request
(millions) | Current Status |
| Completed Rate Reviews | | | | |
| BELCO | Bermuda | GRC | $5.9 | On November 17, 2020, filed its initial revenue allowance application and, in consultation with the Regulatory Authority of Bermuda ("RA"), provided updates to this filing on January 18, 2021 and February 25, 2021. On April 27, 2021, BELCO submitted a revised application to establish an overall revenue requirement of $215.5 million for 2021, increasing authorized revenues by $5.9 million. Additionally, BELCO offered to defer a portion of its revenues from both 2021 and 2022, to be collected over a period of 10 years, beginning in 2022, while maintaining its weighted average cost of capital ("WACC") at 8%. On May 7, 2021, the RA issued a final decision, approving a WACC of 7.5% and authorizing $211.4 million in revenue with $13.4 million in deferred earned revenue to be collected over 5 years at a minimum WACC of 7.5%. The revenue requirement included $71.2 million for fuel and purchased power costs for the period from January 1, 2021 through December 31, 2021. The new rates were effective June 1, 2021. |
| EnergyNorth Gas System | New Hampshire | GRC | $13.5 | EnergyNorth reached a settlement in principle regarding its application filed in July 2020 requesting a permanent increase in annual revenues. The settlement provides for an increase of $1.3 million in distribution revenues effective August 1, 2021 in excess of the previously authorized temporary increase (authorized rates yield an increase of $7.6 million), a step adjustment of $4.0 million also effective August 1, 2021, a second step increase of $3.2 million effective August 1, 2022, and a property tax reconciliation mechanism. Recovery of Granite Bridge feasibility costs, which were included in a supplemental filing in November 2020, were separately litigated in hearings in June 2021. The settlement on all other issues in the rate review was filed by the parties and a hearing was held on July 13, 2021. An order on the settlement agreement was received on July 30, 2021. The order approved the settlement agreement, pending the submission of additional information and a hearing to be submitted as part of the $4.0 million step adjustment for 2021. As a result of the order, the rate increases were implemented on August 1, 2021, with the exception of the 2021 step adjustment, which is expected to be implemented in the fourth quarter of 2021 upon approval by the New Hampshire Public Utilities Commission. A separate order on recovery of litigated Granite Bridge costs is expected by October 2021. |
| Various | Various | GRC | $0.9 | Approval of approximately $0.3 million in rate increases for a wastewater utility. |
| Pending Rate Reviews | | | | |
| ESSAL | Chile | VII Tariff Process | N/A | ESSAL’s VII tariff process began in April 2020 to set rates for the five-year period from September 2021 to September 2026. A tariff decision is expected from the Superintendence of Sanitation Services in the fourth quarter of 2021. |
| | | | | |
| |
| Algonquin Power & Utilities Corp. - Management Discussion & Analysis | 21 |
| | | | | | | | | | | | | | |
| Utility | Jurisdiction | Regulatory Proceeding Type | Rate Request
(millions) | Current Status |
| Empire | Missouri | GRC | $79.9 | On May 28, 2021, filed a rate review based on a 12 month historical test year ending September 30, 2020, with an update period through June 30, 2021, seeking to recover an annual revenue deficiency of $50.0 million, or a 7.61% increase in total base rate operating revenue, based on a rate base of $2.6 billion, which includes the recently completed Empire Wind Facilities. Empire requested a return on equity ("ROE") of 10% and a 52% equity capital structure. In addition, Empire is seeking an incremental annual increase of $29.9 million related to the impact of the Midwest Extreme Weather Event. Empire indicated in its direct testimony that it is aware of legislation enabling securitization of the Midwest Extreme Weather Event costs. On July 6, 2021, the bill was signed into law, with an effective date of August 28, 2021. Empire will request to update its filing through an isolated adjustment outside of its test year and update period to reflect the securitization of these costs. |
| Empire | Kansas | GRC | $4.5 | On May 27, 2021, submitted an abbreviated rate review seeking to recover a revenue deficiency of $4.5 million associated with the addition of the Neosho Ridge Wind Facility, the retirement of Asbury and non-growth related plant investments since the 2019 rate review. |
| CalPeco Electric System | California | GRC | $35.7 | On May 28, 2021, filed an application requesting a revenue increase of $35.7 million for 2022 based on an ROE of 10.5% and on a 54% equity capital structure. |
| Apple Valley Ranchos Water System | California | GRC | $2.9 | On July 2, 2021, filed an application requesting revenue increases of $2.9 million for 2022, $2.1 million for 2023, and $2.3 million for 2024 based on an ROE of 9.4% and on a 57% equity capital structure. |
| Park Water System | California | GRC | $5.5 | On July 2, 2021, filed an application requesting revenue increases of $5.5 million for 2022, $1.8 million for 2023, and $1.8 million for 2024 based on an ROE of 9.4% and on a 57% equity capital structure. |
| Various | Various | Various | $0.6 | Other pending rate review requests across one wastewater utility and one natural gas utility. |
Regulatory Proceedings related to Acquisitions:
New York American Water
On November 20, 2019, a subsidiary of the Company entered into a stock purchase agreement (the "SPA") with American Water Works Company Inc. ("American Water") and New York American Water Company, Inc. (“New York American Water”) to purchase all of the outstanding shares of New York American Water. The Company assigned the SPA to its subsidiary Liberty Utilities (Eastern Water Holdings) Corp. (“Liberty Eastern”) in February 2021. New York American Water is a regulated water and wastewater utility serving customers across seven counties in southeastern New York. On June 29, 2021, American Water, New York American Water and Liberty Eastern signed a letter extending the closing end date for the SPA to January 3, 2022.
On February 28, 2020, Liberty Eastern and American Water filed a joint petition with the New York State Public Service Commission for approval of the acquisition. A revised procedural schedule is expected to be issued shortly. The Company currently expects the transaction to close within the timelines set out in the amended SPA.
| | | | | |
| |
| Algonquin Power & Utilities Corp. - Management Discussion & Analysis | |
RENEWABLE ENERGY GROUP
| | | | | | | | | | | | | | | | | | | | | | | | | | | | | | | | | | | |
| 2021 Second Quarter and Year-to-Date Electricity Generation Performance |
| Long Term Average Resource | | Three Months Ended June 30 | | Long Term Average Resource | | Six Months Ended June 30 |
| (Performance in GW-hrs sold) | | 2021 | | 2020 | | | 2021 | | 2020 |
| Hydro Facilities: | | | | | | | | | | | |
| Maritime Region | 62.4 | | | 47.0 | | | 46.0 | | | 89.9 | | | 71.9 | | | 70.5 | |
| Quebec Region | 82.4 | | | 76.9 | | | 84.0 | | | 138.4 | | | 138.1 | | | 141.6 | |
| Ontario Region | 29.0 | | | 17.1 | | | 28.6 | | | 67.3 | | | 48.4 | | | 50.9 | |
| Western Region | 19.0 | | | 17.4 | | | 22.4 | | | 28.6 | | | 23.4 | | | 31.8 | |
| 192.8 | | | 158.4 | | | 181.0 | | | 324.2 | | | 281.8 | | | 294.8 | |
| Canadian Wind Facilities: | | | | | | | | | | | |
| St. Damase | 16.4 | | | 15.7 | | | 17.3 | | | 37.3 | | | 37.6 | | | 38.2 | |
| St. Leon | 99.5 | | | 98.7 | | | 105.0 | | | 220.9 | | | 206.8 | | | 218.8 | |
Red Lily1 | 20.8 | | | 21.1 | | | 23.2 | | | 44.0 | | | 45.4 | | | 45.9 | |
| Morse | 25.2 | | | 24.5 | | | 26.7 | | | 55.7 | | | 53.7 | | | 55.0 | |
| Amherst | 53.4 | | | 46.9 | | | 48.6 | | | 118.7 | | | 104.5 | | | 107.5 | |
| 215.3 | | | 206.9 | | | 220.8 | | | 476.6 | | | 448.0 | | | 465.4 | |
| U.S. Wind Facilities: | | | | | | | | | | | |
| Sandy Ridge | 37.7 | | | 32.8 | | | 38.2 | | | 84.8 | | | 70.0 | | | 80.9 | |
| Minonk | 167.8 | | | 150.6 | | | 154.2 | | | 355.2 | | | 335.5 | | | 338.9 | |
| Senate | 137.4 | | | 111.0 | | | 133.9 | | | 288.7 | | | 247.5 | | | 268.1 | |
| Shady Oaks | 92.4 | | | 71.0 | | | 67.2 | | | 200.6 | | | 177.2 | | | 166.9 | |
| Odell | 208.2 | | | 183.3 | | | 205.3 | | | 438.7 | | | 377.1 | | | 420.5 | |
| Deerfield | 121.1 | | | 116.4 | | | 111.5 | | | 281.5 | | | 281.6 | | | 278.2 | |
Sugar Creek2 | 86.4 | | | 75.0 | | | — | | | 179.3 | | | 159.4 | | | — | |
Maverick Creek3 | 447.1 | | | 393.4 | | | — | | | 836.3 | | | 684.9 | | | — | |
| 1,298.1 | | | 1,133.5 | | | 710.3 | | | 2,665.1 | | | 2,333.2 | | | 1,553.5 | |
| Solar Facilities: | | | | | | | | | | | |
| Cornwall | 5.1 | | | 5.4 | | | 5.3 | | | 7.7 | | | 7.7 | | | 7.7 | |
| Bakersfield | 26.3 | | | 22.6 | | | 19.3 | | | 39.2 | | | 36.8 | | | 32.6 | |
Great Bay4 | 65.2 | | | 64.5 | | | 51.8 | | | 111.9 | | | 108.2 | | | 79.1 | |
Altavista5 | 54.1 | | | 40.3 | | | — | | | 66.1 | | | 44.7 | | | — | |
| 150.7 | | | 132.8 | | | 76.4 | | | 224.9 | | | 197.4 | | | 119.4 | |
| Renewable Energy Performance | 1,856.9 | | | 1,631.6 | | | 1,188.5 | | | 3,690.8 | | | 3,260.4 | | | 2,433.1 | |
| | | | | | | | | | | |
| Thermal Facilities: | | | | | | | | | | | |
| Windsor Locks | N/A6 | | 31.4 | | | 29.2 | | | N/A2 | | 64.4 | | | 60.4 | |
| Sanger | N/A6 | | 26.1 | | | 3.1 | | | N/A2 | | 37.5 | | | 4.8 | |
| | | 57.5 | | | 32.3 | | | | | 101.9 | | | 65.2 | |
| Total Performance | | | 1,689.1 | | | 1,220.8 | | | | | 3,362.3 | | | 2,498.3 | |
| | | | | |
| |
| Algonquin Power & Utilities Corp. - Management Discussion & Analysis | 23 |
| | | | | |
| 1 | AQN owns a 75% equity interest but accounts for the facility using the equity method. Figures show full energy produced by the facility. |
| 2 | Achieved COD on November 9, 2020. As a result of a blade manufacturing error 26 of 40 turbines were initially shut down. Operating agreement contains customary liquidated damage protections in favour of the Company for revenue loss due to operating down time (see Corporate Development for further information). Long-term average resources ("LTAR") for the three and six months ended June 30, 2021 have been adjusted to reflect turbines that were operational during these periods. |
| 3 | Achieved partial completion on November 6, 2020 and COD on April 21, 2021. As a result of a blade manufacturing error 26 of 73 turbines were initially shut down. Operating agreement contains customary liquidated damage protections in favour of the Company for revenue loss due to operating down time (see Corporate Development for further information). LTARs for the three and six months ended June 30, 2021 have been adjusted to reflect turbines that were operational during these periods. |
| 4 | The Great Bay II Solar Facility achieved partial completion on April 15, 2020 and COD on August 13, 2020. |
| 5 | Achieved partial completion on March 8, 2021 and COD on June 1, 2021. Prior to April 9, 2021, AQN owned a 50% equity interest in the facility. On April 9, 2021, AQN acquired the remaining 50% equity interest that it did not previously own. Figures show full energy produced by the facility. |
| 6 | Natural gas fired co-generation facility. |
2021 Second Quarter Renewable Energy Group Performance
For the three months ended June 30, 2021, the Renewable Energy Group generated 1,689.1 GW-hrs of electricity as compared to 1,220.8 GW-hrs during the same period of 2020.
For the three months ended June 30, 2021, the hydro facilities generated 158.4 GW-hrs of electricity as compared to 181.0 GW-hrs produced in the same period in 2020, a decrease of 12.5%. Electricity generated represented 82.2% of LTAR as compared to 93.9% during the same period in 2020. During the quarter, all regions were below their respective LTAR.
For the three months ended June 30, 2021, the wind facilities produced 1,340.4 GW-hrs of electricity as compared to 931.1 GW-hrs produced in the same period in 2020, an increase of 44.0%. The increase in production is primarily due to the addition of the Sugar Creek Wind Facility which achieved COD on November 9, 2020, and the Maverick Creek Wind Facility which achieved COD on April 21, 2021. The wind facilities (excluding Sugar Creek and Maverick Creek) generated electricity equal to 89.0% of LTAR as compared to 95.0% during the same period in 2020.
For the three months ended June 30, 2021, the solar facilities generated 132.8 GW-hrs of electricity as compared to 76.4 GW-hrs of electricity in the same period in 2020, an increase of 73.8%. The increase in production is primarily due to the addition of the Great Bay II Solar Facility which achieved partial completion on April 15, 2020 and COD on August 13, 2020, and the Altavista Solar Facility which achieved partial completion on March 8, 2021 and COD on June 1, 2021. The solar facilities (excluding Great Bay II and Altavista) generated electricity equal to 91.2% of LTAR as compared to 87.7% in the same period in 2020.
For the three months ended June 30, 2021, the thermal facilities generated 57.5 GW-hrs of electricity as compared to 32.3 GW-hrs of electricity during the same period in 2020. During the same period, the Windsor Locks Thermal Facility generated 102.9 billion lbs of steam as compared to 147.8 billion lbs of steam during the same period in 2020.
2021 Year-to-Date Renewable Energy Group Performance
For the six months ended June 30, 2021, the Renewable Energy Group generated 3,362.3 GW-hrs of electricity as compared to 2,498.3 GW-hrs during the same period in 2020.
For the six months ended June 30, 2021, the hydro facilities generated 281.8 GW-hrs of electricity as compared to 294.8 GW-hrs produced in the same period in 2020, a decrease of 4.4%. Electricity generated represented 86.9% of LTAR as compared to 90.9% during the same period in 2020.
For the six months ended June 30, 2021, the wind facilities produced 2,781.2 GW-hrs of electricity as compared to 2,018.9 GW-hrs produced in the same period in 2020, an increase of 37.8%. The increase in production is primarily due to the addition of the Sugar Creek Wind Facility which achieved COD on November 9, 2020, and the Maverick Creek Wind Facility which achieved COD on April 21, 2021. The wind facilities (excluding Sugar Creek and Maverick Creek Wind Facility) generated electricity equal to 91.1% of LTAR as compared to 95.0% during the same period in 2020.
For the six months ended June 30, 2021, the solar facilities generated 197.4 GW-hrs of electricity as compared to 119.4 GW-hrs of electricity produced in the same period in 2020, an increase of 65.3%. The increase in production is primarily due to the addition of the Great Bay II Solar Facility which achieved partial completion on April 15, 2020 and COD on August 13, 2020, and the Altavista Solar Facility which achieved partial completion on March 8, 2021 and COD on June 1, 2021. The solar facilities (excluding Great Bay II and Altavista) generated electricity equal to 92.8% of LTAR as compared to 89.4% in the same period in 2020.
| | | | | |
| |
| Algonquin Power & Utilities Corp. - Management Discussion & Analysis | 24 |
For the six months ended June 30, 2021, the thermal facilities generated 101.9 GW-hrs of electricity as compared to 65.2 GW-hrs of electricity during the same period in 2020. For the six months ended June 30, 2021, the Windsor Locks Thermal Facility generated 279.6 billion lbs of steam as compared to 328.1 billion lbs of steam during the same period in 2020.
| | | | | | | | | | | | | | | | | | | | | | | |
| 2021 Second Quarter and Year-to-Date Renewable Energy Group Operating Results |
| Three Months Ended June 30 | | Six Months Ended June 30 |
| (all dollar amounts in $ millions) | 2021 | | 2020 | | 2021 | | 2020 |
Revenue1 | | | | | | | |
| Hydro | $ | 10.9 | | | $ | 10.0 | | | $ | 21.7 | | | $ | 19.8 | |
| Wind | 51.4 | | | 38.2 | | | 59.0 | | | 84.8 | |
| Solar | 8.2 | | | 6.0 | | | 12.0 | | | 9.4 | |
| Thermal | 7.4 | | | 5.9 | | | 16.0 | | | 12.3 | |
| Total Revenue | $ | 77.9 | | | $ | 60.1 | | | $ | 108.7 | | | $ | 126.3 | |
| Less: | | | | | | | |
Cost of Sales - Energy2 | (2.4) | | | (0.8) | | | (5.6) | | | (2.0) | |
| Cost of Sales - Thermal | (3.7) | | | (1.9) | | | (8.3) | | | (4.7) | |
Realized gain (loss) on hedges3 | 0.2 | | | (0.5) | | | 0.4 | | | (0.7) | |
Net Energy Sales7 | $ | 72.0 | | | $ | 56.9 | | | $ | 95.2 | | | $ | 118.9 | |
Renewable Energy Credits4 | 4.4 | | | 3.7 | | | 8.6 | | | 5.7 | |
| Other Revenue | — | | | 0.7 | | | 0.7 | | | 1.0 | |
| Total Net Revenue | $ | 76.4 | | | $ | 61.3 | | | $ | 104.5 | | | $ | 125.6 | |
| Expenses & Other Income | | | | | | | |
| Operating expenses | (25.2) | | | (17.9) | | | (53.2) | | | (36.2) | |
Dividend, interest, equity and other income5 | 26.0 | | | 23.8 | | | 48.1 | | | 47.6 | |
| Impacts from the Market Disruption Event on the Senate Wind Facility | — | | | — | | | 53.4 | | | — | |
HLBV income8 | 20.7 | | | 15.5 | | | 40.0 | | | 33.7 | |
Divisional Operating Profit6,7 | $ | 97.9 | | | $ | 82.7 | | | $ | 192.8 | | | $ | 170.7 | |
| | | | | |
| 1 | Many of the Renewable Energy Group's PPAs include annual rate increases. However, a change to the weighted average production levels resulting from higher average production from facilities that earn lower energy rates can result in a lower weighted average energy rate earned by the division as compared to the same period in the prior year. Includes the impacts from the Market Disruption Event on the Senate Wind Facility. |
| 2 | Cost of Sales - Energy consists of energy purchases in the Maritime Region to manage the energy sales from the Tinker Hydro Facility which is sold to retail and industrial customers under multi-year contracts. |
| 3 | See Note 21(b)(iv) in the unaudited interim consolidated financial statements. |
| 4 | Qualifying renewable energy projects receive renewable energy certificates ("RECs") for the generation and delivery of renewable energy to the power grid. The RECs represent proof that 1 MW-hr of electricity was generated from an eligible energy source. |
| 5 | Includes dividends received from Atlantica and related parties (see Note 6 and 13 in the unaudited interim consolidated financial statements) as well as the equity investment in the Texas Coastal Wind Facilities (Stella, Cranell and East Raymond). |
| 6 | Certain prior year items have been reclassified to conform to current year presentation. |
| 7 | See Non-GAAP Financial Measures. |
8 HLBV Income and PTCs
HLBV income represents the value of net tax attributes earned by the Renewable Energy Group in the period primarily from electricity generated by certain of its U.S. wind and U.S. solar generation facilities.
Production tax credits ("PTCs") are earned as wind energy is generated based on a dollar per kW-hr rate prescribed in applicable federal and state statutes. For the three and six months ended June 30, 2021, the Renewable Energy Group's eligible facilities generated 1,062.5 and 2,156.0 GW-hrs representing approximately $26.6 million and $53.9 million in PTCs earned as compared to 643.1 and 1,386.6 GW-hrs representing $16.1 million and $34.7 million in PTCs earned during the same period in 2020. The majority of the PTCs have been allocated to tax equity investors to monetize the value to AQN of the PTCs and other tax attributes which are being recognized as HLBV income.
| | | | | |
| |
| Algonquin Power & Utilities Corp. - Management Discussion & Analysis | 25 |
2021 Second Quarter Operating Results
For the three months ended June 30, 2021, the Renewable Energy Group's facilities generated $97.9 million of operating profit as compared to $82.7 million during the same period in 2020, which represents an increase of $15.2 million or 18.4%, excluding corporate administration expenses.
Highlights of the changes are summarized in the following table:
| | | | | |
| (all dollar amounts in $ millions) | Three Months Ended June 30 |
Prior Period Divisional Operating Profit1 | $ | 82.7 | |
| Existing Facilities and Investments | |
| Hydro: Decrease is primarily due to lower production in the Ontario Region and higher operating expenses in the Maritime Region, partially offset by favourable pricing in the Western Region. | (0.4) | |
| Wind Canada: Decrease is primarily due to lower production. | (1.2) | |
| Wind U.S.: Decrease is primarily due to lower production and unfavourable pricing at the Senate and Shady Oaks Wind Facilities. | (2.4) | |
| |
| Solar: Increase is primarily due to higher production at the Bakersfield Solar Facilities and lower overall operating expenses. | 0.4 | |
| |
| Thermal: Decrease is primarily due to the higher operating expenses and unfavourable REC pricing at the Windsor Locks Thermal Facility, partially offset by higher overall production. | (0.9) | |
Investments: Increase is primarily due to higher dividends from AQN's investment in Atlantica.2 | 2.1 | |
| |
| (2.4) | |
| New Facilities and Investments | |
| |
| |
| Wind U.S.: Sugar Creek Wind Facility (full COD in November 2020) and Maverick Creek Wind Facility (full COD April 2021). | 13.3 | |
| |
| Solar: Great Bay II Solar Facility (full COD in August 2020) and Altavista Solar Facility (full COD in June 2021). | 2.1 | |
| |
| Other: Decrease is primarily due to an equity loss from the investment in the Texas Coastal Wind Facilities (Stella, Cranell and East Raymond). | (0.4) | |
| 15.0 | |
| Foreign Exchange | 2.6 | |
Current Period Divisional Operating Profit1 | $ | 97.9 | |
| | | | | |
| 1 | See Non-GAAP Financial Measures. |
| 2 | See Note 6 and 13 in the unaudited interim consolidated financial statements. |
| | | | | |
| |
| Algonquin Power & Utilities Corp. - Management Discussion & Analysis | 26 |
2021 Year-to-Date Operating Results
For the six months ended June 30, 2021, the Renewable Energy Group's facilities generated $192.8 million of operating profit as compared to $170.7 million during the same period in 2020, which represents an increase of $22.1 million or 12.9%, excluding corporate administration expenses.
Highlights of the changes are summarized in the following table:
| | | | | |
| (all dollar amounts in $ millions) | Six Months Ended June 30 |
Prior Period Divisional Operating Profit1 | $ | 170.7 | |
| Existing Facilities | |
| Hydro: Decrease is primarily due to lower production in the Ontario Region and higher operating expenses in the Quebec and Maritime Region, partially offset by favourable pricing in the Western Region. | (1.9) | |
| Wind Canada: Decrease is primarily due to lower production. | (1.4) | |
| Wind U.S.: Decrease is primarily due to lower production at the Minonk, Sandy Ridge, Senate and Odell Wind Facilities. | (0.8) | |
| |
| Solar: Increase is primarily due to higher production at the Bakersfield II Solar Facility and favourable REC pricing at the Great Bay I Solar Facility. | 0.2 | |
| |
| Thermal: Decrease is primarily due to the higher operating expenses and unfavourable REC pricing at the Windsor Locks Thermal Facility, partially offset by higher overall production. | (1.0) | |
Investments: Increase is primarily due to higher dividends from AQN's investment in Atlantica.2 | 4.7 | |
| Other | (0.4) | |
| (0.6) | |
| New Facilities and Investments | |
| |
| |
| Wind U.S.: Sugar Creek Wind Facility (full COD in November 2020) and Maverick Creek Wind Facility (full COD in April 2021). | 19.2 | |
| |
| Solar: Great Bay II Solar Facility (full COD in August 2020) and Altavista Solar Facility (full COD June 2021). | 3.2 | |
| |
| Other: Decrease is due to an equity loss from the investment in the Texas Coastal Wind Facilities (Stella, Cranell and East Raymond) primarily as a result of the Midwest Extreme Weather Event. | (3.7) | |
| 18.7 | |
| |
| Foreign Exchange | 4.0 | |
Current Period Divisional Operating Profit1 | $ | 192.8 | |
| | | | | |
| 1 | See Non-GAAP Financial Measures. |
| 2 | See Note 6 and 13 in the annual consolidated financial statements. |
| | | | | |
| |
| Algonquin Power & Utilities Corp. - Management Discussion & Analysis | 27 |
AQN: CORPORATE AND OTHER EXPENSES
| | | | | | | | | | | | | | | | | | | | | | | |
| Three Months Ended June 30 | | Six Months Ended June 30 |
| (all dollar amounts in $ millions) | 2021 | | 2020 | | 2021 | | 2020 |
| Corporate and other expenses: | | | | | | | |
| Administrative expenses | $ | 18.2 | | | $ | 17.9 | | | $ | 33.8 | | | $ | 34.7 | |
| Loss (gain) on foreign exchange | 1.3 | | | — | | | 2.1 | | | (4.7) | |
| | | | | | | |
| Interest expense | 58.2 | | | 44.8 | | | 107.8 | | | 91.1 | |
| Depreciation and amortization | 98.2 | | | 75.7 | | | 195.6 | | | 154.5 | |
| Change in value of investments carried at fair value | (27.3) | | | (309.8) | | | 44.4 | | | (119.1) | |
Interest, dividend, equity, and other loss (income)1 | 2.4 | | | (0.7) | | | 2.4 | | | (1.1) | |
| Pension and post-employment non-service costs | 3.9 | | | 3.6 | | | 7.5 | | | 7.0 | |
| Other net losses | 1.8 | | | 26.9 | | | 10.2 | | | 27.8 | |
| | | | | | | |
| Loss (gain) on derivative financial instruments | 1.4 | | | (1.4) | | | 0.3 | | | (1.4) | |
| Income tax expense (recovery) | (4.2) | | | 46.9 | | | (25.8) | | | 33.2 | |
| | | | | |
| 1 | Excludes income directly pertaining to the Regulated Services and Renewable Energy Groups (disclosed in the relevant sections). |
2021 Second Quarter Corporate and Other Expenses
For the three months ended June 30, 2021, administrative expenses totaled $18.2 million as compared to $17.9 million in the same period in 2020.
For the three months ended June 30, 2021, interest expense totaled $58.2 million as compared to $44.8 million in the same period in 2020. The increase was primarily due to the acquisitions of Ascendant and ESSAL as well as the funding of capital deployed during the three months ended June 30, 2021, primarily related to renewable energy projects that have reached COD.
For the three months ended June 30, 2021, depreciation expense totaled $98.2 million as compared to $75.7 million in the same period in 2020. The increase was primarily due to higher overall property, plant and equipment, and the acquisitions of Ascendant and ESSAL.
For the three months ended June 30, 2021, change in investments carried at fair value totaled a gain of $27.3 million as compared to a gain of $309.8 million in 2020. The Company records certain of its investments, including Atlantica, using the fair value method and accordingly any change in the fair value of the investment is recorded in the Statement of Operations (see Note 6 in the unaudited interim consolidated financial statements).
For the three months ended June 30, 2021, pension and post-employment non-service costs totaled $3.9 million as compared to $3.6 million in 2020. The increase was primarily due to higher amortization of regulatory accounts and net actuarial losses, partially offset by a higher than expected return on pension plan assets.
For the three months ended June 30, 2021, other net losses were $1.8 million as compared to $26.9 million in the same period in 2020. The net losses in 2021 were primarily due to a regulatory asset write down and acquisition and transition-related costs. The net losses in 2020 were primarily due to adjustments related to U.S. Tax Reform, management succession and retirement expenses. See Note 16 in the unaudited interim consolidated financial statements for further details.
For the three months ended June 30, 2021, the loss on derivative financial instruments totaled $1.4 million as compared to a gain of $1.4 million in the same period in 2020. Both the losses and gains in 2021 and 2020 respectively were primarily related to mark-to-markets on energy derivatives.
For the three months ended June 30, 2021, an income tax recovery of $4.2 million was recorded as compared to an income tax expense of $46.9 million during the same period in 2020. The decrease in income tax expense was primarily due to the tax impact associated with the change in fair value of the investment in Atlantica, tax credits accrued, and a one-time income tax expense related to U.S. Tax Reform recorded in 2020. For the three months ended June 30, 2021, the Company accrued $14.9 million of investment tax credits ("ITCs") and PTCs associated with renewable energy projects that have either been placed in service or are expected to be placed in service by the end of 2021. On April 8, 2020, the IRS issued final regulations with respect to rules regarding certain hybrid arrangements as a result of U.S. Tax Reform. As a result of the final regulations, the Company recorded a one-time income tax expense of $9.3 million in the three months ended June 30, 2020, to reverse the benefit of deductions taken in a prior year.
| | | | | |
| |
| Algonquin Power & Utilities Corp. - Management Discussion & Analysis | 28 |
2021 Year-to-Date Corporate and Other Expenses
During the six months ended June 30, 2021, administrative expenses totaled $33.8 million as compared to $34.7 million in the same period in 2020. The decrease was primarily due to lower travel cost and other administrative expenses, partially offset by increase in payroll, employee benefits and professional expenses.
For the six months ended June 30, 2021, interest expense totaled $107.8 million as compared to $91.1 million in the same period in 2020. The increase was primarily due to the acquisitions of Ascendant and ESSAL as well as the funding of capital deployed in the first half of 2021 primarily related to renewable energy projects that have reached COD.
For the six months ended June 30, 2021, depreciation expense totaled $195.6 million as compared to $154.5 million in the same period in 2020. The increase was primarily due to higher overall property, plant and equipment, and the acquisitions of Ascendant and ESSAL.
For the six months ended June 30, 2021, change in investments carried at fair value totaled a loss of $44.4 million as compared to a gain of $119.1 million in the same period in 2020. The Company records certain of its investments, including Atlantica, using the fair value method and accordingly any change in the fair value of the investment is recorded in the Statement of Operations (see Note 8 in the annual consolidated financial statements).
For the six months ended June 30, 2021, pension and post-employment non-service costs totaled $7.5 million as compared to $7.0 million in the same period in 2020. The increase in 2021 was primarily due to higher amortization of regulatory accounts and net actuarial losses, partially offset by a higher than expected return on pension plan assets.
For the six months ended June 30, 2021, other net losses were $10.2 million as compared to $27.8 million in the same period in 2020. The net losses in 2021 were primarily due to a regulatory asset write down and acquisition and transition-related costs. The net losses in 2020 were primarily due to adjustments related to U.S. Tax Reform and management succession and retirement expenses. See Note 16 in the unaudited interim consolidated financial statements for further details.
For the six months ended June 30, 2021, the loss on derivative financial instruments totaled $0.3 million as compared to a gain of $1.4 million in the same period in 2020. Both the losses and gains in 2021 and 2020 respectively were primarily related to mark-to-markets on energy derivatives.
An income tax recovery of $25.8 million was recorded in the six months ended June 30, 2021, as compared to an income tax expense of $33.2 million during the same period in 2020. The decrease in income tax expense was primarily due to the tax impact associated with the change in fair value of the investment in Atlantica, tax credits accrued, the tax benefits associated with the impact of the Midwest Extreme Weather Event earlier in 2021, and a one-time income tax expense related to U.S. Tax Reform recorded in 2020. For the six months ended June 30, 2021, the Company has accrued $26.5 million of ITCs and PTCs associated with renewable energy projects that have either been placed in service or are expected to be placed in service by the end of 2021. On April 8, 2020, the IRS issued final regulations with respect to rules regarding certain hybrid arrangements as a result of U.S. Tax Reform. As a result of the final regulations, the Company recorded a one-time income tax expense of $9.3 million in the six months ended June 30 2020, to reverse the benefit of deductions taken in a prior year.
| | | | | |
| |
| Algonquin Power & Utilities Corp. - Management Discussion & Analysis | 29 |
NON-GAAP FINANCIAL MEASURES
Reconciliation of Adjusted EBITDA to Net Earnings
The following table is derived from and should be read in conjunction with the consolidated statement of operations. This supplementary disclosure is intended to more fully explain disclosures related to Adjusted EBITDA and provides additional information related to the operating performance of AQN. Investors are cautioned that this measure should not be construed as an alternative to U.S. GAAP consolidated net earnings.
| | | | | | | | | | | | | | | | | | | | | | | |
| Three Months Ended June 30 | | Six Months Ended June 30 |
| (all dollar amounts in $ millions) | 2021 | | 2020 | | 2021 | | 2020 |
| Net earnings attributable to shareholders | $ | 103.2 | | | $ | 286.2 | | | $ | 117.2 | | | $ | 222.4 | |
| Add (deduct): | | | | | | | |
Net earnings attributable to the non-controlling interest, exclusive of HLBV1 | 2.9 | | | 4.0 | | | 9.3 | | | 8.4 | |
| | | | | | | |
| Income tax expense (recovery) | (4.2) | | | 46.9 | | | (25.8) | | | 33.2 | |
| | | | | | | |
| Interest expense | 58.2 | | | 44.8 | | | 107.8 | | | 91.1 | |
Other net losses3 | 1.8 | | | 26.9 | | | 10.2 | | | 27.8 | |
| | | | | | | |
| Pension and post-employment non-service costs | 3.9 | | | 3.6 | | | 7.5 | | | 7.0 | |
| | | | | | | |
Change in value of investments carried at fair value2 | (27.3) | | | (309.8) | | | 44.4 | | | (119.1) | |
| Impacts from the Market Disruption Event on the Senate Wind Facility | — | | | — | | | 53.4 | | | — | |
| Costs related to tax equity financing | 5.3 | | | — | | | 5.3 | | | — | |
| Loss (gain) on derivative financial instruments | 1.4 | | | (1.4) | | | 0.3 | | | (1.4) | |
| Realized gain (loss) on energy derivative contracts | 0.2 | | | (0.6) | | | 0.4 | | | (0.7) | |
| Loss (gain) on foreign exchange | 1.3 | | | — | | | 2.1 | | | (4.7) | |
| Depreciation and amortization | 98.2 | | | 75.7 | | | 195.6 | | | 154.5 | |
| Adjusted EBITDA | $ | 244.9 | | | $ | 176.3 | | | $ | 527.7 | | | $ | 418.5 | |
| | | | | |
| 1 | HLBV represents the value of net tax attributes earned during the period primarily from electricity generated by certain U.S. wind power and U.S. solar generation facilities. HLBV earned in the three and six months ended June 30, 2021 amounted to $21.3 million and $44.9 million as compared to $17.3 million and $37.2 million during the same period in 2020. |
| 2 | See Note 6 in the unaudited interim consolidated financial statements. |
| 3 | See Note 16 in the unaudited interim consolidated financial statements. |
| | | | | |
| |
| Algonquin Power & Utilities Corp. - Management Discussion & Analysis | 30 |
Reconciliation of Adjusted Net Earnings to Net Earnings
The following table is derived from and should be read in conjunction with the consolidated statement of operations. This supplementary disclosure is intended to more fully explain disclosures related to Adjusted Net Earnings and provides additional information related to the operating performance of AQN. Investors are cautioned that this measure should not be construed as an alternative to consolidated net earnings in accordance with U.S. GAAP.
The following table shows the reconciliation of net earnings to Adjusted Net Earnings exclusive of these items:
| | | | | | | | | | | | | | | | | | | | | | | |
| Three Months Ended June 30 | | Six Months Ended June 30 |
| (all dollar amounts in $ millions except per share information) | 2021 | | 2020 | | 2021 | | 2020 |
| Net earnings attributable to shareholders | $ | 103.2 | | | $ | 286.2 | | | $ | 117.2 | | | $ | 222.4 | |
| Add (deduct): | | | | | | | |
| | | | | | | |
| Loss (gain) on derivative financial instruments | 1.4 | | | (1.4) | | | 0.3 | | | (1.4) | |
Realized gain (loss) on energy derivative contracts
| 0.2 | | | (0.6) | | | 0.4 | | | (0.7) | |
Other net losses2 | 1.8 | | | 26.9 | | | 10.2 | | | 27.8 | |
| Loss (gain) on foreign exchange | 1.3 | | | — | | | 2.1 | | | (4.7) | |
| | | | | | | |
| | | | | | | |
Change in value of investments carried at fair value1 | (27.3) | | | (309.8) | | | 44.4 | | | (119.1) | |
| Impacts from the Market Disruption Event on the Senate Wind Facility | — | | | — | | | 53.4 | | | — | |
| Costs related to tax equity financing and other non-recurring adjustments | 5.3 | | | — | | | 5.3 | | | 1.0 | |
| | | | | | | |
| Adjustment for taxes related to above | 5.8 | | | 46.1 | | | (17.1) | | | 25.4 | |
| Adjusted Net Earnings | $ | 91.7 | | | $ | 47.4 | | | $ | 216.2 | | | $ | 150.7 | |
| Adjusted Net Earnings per share | $ | 0.15 | | | $ | 0.09 | | | $ | 0.35 | | | $ | 0.28 | |
| | | | | |
| 1 | See Note 6 in the unaudited interim consolidated financial statements. |
| 2 | See Note 16 in the unaudited interim consolidated financial statements. |
For the three months ended June 30, 2021, Adjusted Net Earnings totaled $91.7 million as compared to Adjusted Net Earnings of $47.4 million for the same period in 2020, an increase of $44.3 million.
For the six months ended June 30, 2021, Adjusted Net earnings totaled $216.2 million as compared to Adjusted Net Earnings of $150.7 million for the same period in 2020, an increase of $65.5 million.
| | | | | |
| |
| Algonquin Power & Utilities Corp. - Management Discussion & Analysis | 31 |
Reconciliation of Adjusted Funds from Operations to Cash Flows from Operating Activities
The following table is derived from and should be read in conjunction with the consolidated statement of operations and consolidated statement of cash flows. This supplementary disclosure is intended to more fully explain disclosures related to Adjusted Funds from Operations and provides additional information related to the operating performance of AQN. Investors are cautioned that this measure should not be construed as an alternative to cash flows from operating activities in accordance with U.S GAAP.
The following table shows the reconciliation of cash flows from (used in) operating activities to Adjusted Funds from Operations exclusive of these items:
| | | | | | | | | | | | | | | | | | | | | | | |
| Three Months Ended June 30 | | Six Months Ended June 30 |
| (all dollar amounts in $ millions) | 2021 | | 2020 | | 2021 | | 2020 |
| Cash flows from (used in) operating activities | $ | 103.3 | | | $ | 142.9 | | | $ | (140.2) | | | $ | 209.8 | |
| Add (deduct): | | | | | | | |
| Changes in non-cash operating items | 51.8 | | | (52.6) | | | 440.3 | | | 56.6 | |
| | | | | | | |
| Production based cash contributions from non-controlling interests | — | | | — | | | 4.8 | | | 3.4 | |
| | | | | | | |
| Impacts from the Market Disruption Event on the Senate Wind Facility | — | | | — | | | 53.4 | | | — | |
| Costs related to tax equity financing | 5.3 | | | — | | | 5.3 | | | — | |
| Acquisition-related costs | 0.9 | | | 3.1 | | | 3.0 | | | 3.1 | |
| | | | | | | |
| Adjusted Funds from Operations | $ | 161.3 | | | $ | 93.4 | | | $ | 366.6 | | | $ | 272.9 | |
For the three months ended June 30, 2021, Adjusted Funds from Operations totaled $161.3 million as compared to Adjusted Funds from Operations of $93.4 million for the same period in 2020, an increase of $67.9 million.
For the six months ended June 30, 2021, Adjusted Funds from Operations totaled $366.6 million as compared to Adjusted Funds from Operations of $272.9 million for the same period in 2020, an increase of $93.7 million.
CORPORATE DEVELOPMENT ACTIVITIES
The Company undertakes development activities working with a global reach to identify, develop, and construct both regulated and non-regulated renewable power generating facilities, power transmission lines, water infrastructure assets, and other complementary infrastructure projects as well as to invest in local utility electric, natural gas and water distribution systems.
The Company has identified a development pipeline of approximately $9.4 billion consisting of approximately $6.3 billion of investments in its Regulated Services Group and approximately $3.1 billion of investments in its Renewable Energy Group from 2021 through the end of 2025.
AQN pursues investment opportunities with an objective to maintain its business mix in approximately the same proportion as currently exists between its Regulated Services Group and Renewable Energy Group and within credit metrics expected to maintain its current credit ratings. The business mix target may from time to time require AQN to grow its Regulated Services Group or implement other strategies in order to pursue investment opportunities within its Renewable Energy Group.
On January 27, 2021, Empire closed its acquisition of the North Fork Ridge Wind Facility, and closed the acquisition of the Neosho Ridge and Kings Point Wind Facilities on May 5, 2021. Construction of the Kings Point and Neosho Ridge Wind Facilities is complete with the exception of civil remediation. All three Wind Facilities are currently operating under interim interconnection agreements. The most recent interconnection study results published by the transmission provider for the three Wind Facilities confirmed no required network upgrades for the Kings Point and North Fork Ridge Wind Facilities, but identified certain required network upgrades for the Neosho Ridge Wind Facility, which may result in future curtailment of some of the energy produced by the Neosho Ridge Wind Facility prior to completion of the required network upgrades. The Company continues to evaluate this issue. The next interconnection study results are expected in the second half of 2021. Empire filed rate reviews in Missouri and Kansas in May 2021 seeking cost recovery of the North Fork Ridge, Kings Point, and Neosho Ridge Wind Facilities (see Regulatory Proceedings).
As a result of a blade manufacturing error, the Renewable Energy Group was instructed by its turbine supplier on November 24, 2020 to shut down 26 turbines at the Maverick Creek Wind Facility and 26 turbines at the Sugar Creek Wind Facility. Correction of this issue required remediating 45 affected blades at the Maverick Creek Wind Facility and 38 affected blades at the Sugar Creek Wind Facility. Remediation work is now complete at the Maverick Creek Wind Facility, with all
| | | | | |
| |
| Algonquin Power & Utilities Corp. - Management Discussion & Analysis | 32 |
26 affected turbines returned to service. The remediation work at the Sugar Creek Wind Facility has started, with six of 26 turbines now returned to service, and with the remaining units expected to be completed prior to the end of 2021. The relevant turbine supply and operating agreements contain customary warranty and liquidated damage protections in favour of the Company relating to the remediation of the affected blades and revenue loss due to operating down time.
SUMMARY OF PROPERTY, PLANT, AND EQUIPMENT EXPENDITURES
| | | | | | | | | | | | | | | | | | | | | | | |
| | Three Months Ended June 30 | | Six Months Ended June 30 |
| (all dollar amounts in $ millions) | 2021 | | 2020 | | 2021 | | 2020 |
| Regulated Services Group | | | | | | | |
| Rate Base Maintenance | $ | 67.3 | | | $ | 52.2 | | | $ | 134.6 | | | $ | 104.9 | |
| Rate Base Growth | 952.2 | | | 95.0 | | | 1,371.3 | | | 152.2 | |
| | | | | | | |
| $ | 1,019.5 | | | $ | 147.2 | | | $ | 1,505.9 | | | $ | 257.1 | |
| | | | | | | |
| Renewable Energy Group | | | | | | | |
| Maintenance | $ | 15.8 | | | $ | 1.5 | | | $ | 22.6 | | | $ | 11.3 | |
Investment in Capital Projects1 | 170.1 | | | 64.5 | | | 1,472.1 | | | 126.2 | |
| International Investments | 2.2 | | | 3.4 | | | 136.8 | | | 3.9 | |
| $ | 188.1 | | | $ | 69.4 | | | $ | 1,631.5 | | | $ | 141.4 | |
| | | | | | | |
| | | | | | | |
| Total Capital Expenditures | $ | 1,207.6 | | | $ | 216.6 | | | $ | 3,137.4 | | | $ | 398.5 | |
| | | | | | | | |
| 1 | Includes expenditures on Property Plant & Equipment, equity-method investees, and acquisitions of operating entities that may have been jointly developed by the Company with another third party developer. |
2021 Second Quarter Property Plant and Equipment Expenditures
During the three months ended June 30, 2021, the Regulated Services Group invested $1,019.5 million in capital expenditures as compared to $147.2 million during the same period in 2020. The Regulated Services Group's investment was primarily related to the acquisition of the Neosho Ridge and Kings Point Wind Facilities ($847.2 million), construction of transmission and distribution main replacements, work on new and existing substation assets, and initiatives relating to the safety and reliability of the electric and gas systems.
During the three months ended June 30, 2021, the Renewable Energy Group incurred capital expenditures of $188.1 million as compared to $69.4 million during the same period in 2020. The Renewable Energy Group's investment was primarily related to the acquisition of the previously unowned portion of the Altavista Solar Project from its joint venture partner, to advance the development and/or construction of the Dimension and Carvers Creek Solar Projects, and Shady Oaks II Wind Project, and ongoing maintenance capital at existing operating sites.
2021 Year-to-Date Property Plant and Equipment Expenditures
During the six months ended June 30, 2021, the Regulated Services Group invested $1,505.9 million in capital expenditures as compared to $257.1 million during the same period in 2020. The Regulated Services Group's investment was primarily related to the acquisition of the North Fork Ridge, Neosho Ridge, and Kings Point Wind Facilities ($1,095.3 million), construction of transmission and distribution main replacements, the completion and start of work on new and existing substation assets, and initiatives relating to the safety and reliability of the electric and gas systems.
During the six months ended June 30, 2021, the Renewable Energy Group incurred capital expenditures of $1,631.5 million as compared to $141.4 million during the same period in 2020. The Renewable Energy Group's investment was primarily related to the acquisitions of the previously unowned portions of the Maverick Creek and Sugar Creek Wind Projects and Altavista Solar Project from its joint venture partners, the acquisition of a 51% interest in the Texas Coastal Wind Facilities (Stella, Cranell and East Raymond), to advance the development and/or construction of the Dimension and Carvers Creek Solar Projects, and ongoing sustaining capital at existing operating sites. During the six months ended June 30, 2021, the Company also made an investment of approximately $132.7 million of additional ordinary shares of Atlantica purchased through a subscription agreement that was completed in early 2021 (see Note 6 (a) in the unaudited interim consolidated financial statements).
| | | | | |
| |
| Algonquin Power & Utilities Corp. - Management Discussion & Analysis | 33 |
2021 Capital Investments
The following discussion should be read in conjunction with the Forward-Looking Statements and Forward-Looking Information section of this MD&A.
Over the course of the 2021 financial year, the Company expects to spend between $4.0 billion to $4.5 billion on capital investment opportunities. Actual expenditures in 2021 may vary due to, among other things, the impacts of COVID-19 and related response measures, the timing of various project investments and acquisitions, and the realized foreign exchange rates.
Ranges of expected capital investment in the 2021 financial year are as follows:
| | | | | | | | | | | |
| (all dollar amounts in $ millions) | | | |
| Regulated Services Group: | | | |
| Rate Base Maintenance | $ | 250.0 | | - | $ | 300.0 | |
| Rate Base Growth | 1,750.0 | | - | 1,825.0 | |
| Rate Base Acquisitions | 600.0 | | - | 625.0 | |
| Total Regulated Services Group: | $ | 2,600.0 | | - | $ | 2,750.0 | |
| | | |
| Renewable Energy Group: | | | |
| Maintenance | $ | 25.0 | | - | $ | 50.0 | |
| Investment in Capital Projects | 1,250.0 | | - | 1,550.0 | |
| International Investments | 125.0 | | - | 150.0 | |
| Total Renewable Energy Group: | $ | 1,400.0 | | - | $ | 1,750.0 | |
| | | |
| Total 2021 Capital Investments | $ | 4,000.0 | | - | $ | 4,500.0 | |
The Regulated Services Group expects to spend between $2,600.0 million to $2,750.0 million over the course of 2021 in an effort to expand operations, improve the reliability of the utility systems and broaden the technologies used to better serve its service areas. Project spending includes capital for structural improvements, specifically in relation to refurbishing substations, replacing poles and wires, drilling and equipping aquifers, main replacements, and reservoir pumping stations. The Regulated Services Group closed the acquisitions of the North Fork Ridge, Neosho Ridge and Kings Point Wind Facilities in the first half of 2021.
The Renewable Energy Group expects to spend between $1,400.0 million to $1,750.0 million over the course of 2021 to develop or further invest in capital projects, primarily in relation to: (i) the acquisition of its joint venture partners' interest in the Maverick Creek and Sugar Creek Wind Projects and the Altavista Solar Project, and acquisition of a 51% interest in the Texas Coastal Wind Facilities, (ii) development and construction (as applicable) of the Renewable Energy Group's wind and solar projects, and (iii) incremental international investments which includes an investment of approximately $132.7 million of additional ordinary shares of Atlantica purchased through a subscription agreement that was completed in early 2021 (see Note 6 (a) in the unaudited interim consolidated financial statements). Furthermore, the Renewable Energy Group plans to spend $25.0 million to $50.0 million on various operational solar, thermal, and wind assets to maintain safety, regulatory, and operational efficiencies.
The Company expects to fund its 2021 capital plan through a combination of retained cash, tax equity funding, senior notes, bank revolving and term credit facilities, and common equity or equity linked instruments.
| | | | | |
| |
| Algonquin Power & Utilities Corp. - Management Discussion & Analysis | 34 |
LIQUIDITY AND CAPITAL RESERVES
AQN has revolving credit and letter of credit facilities as well as separate credit facilities for the Regulated Services Group and the Renewable Energy Group to manage the liquidity and working capital requirements of each division (collectively the “Bank Credit Facilities”).
Bank Credit Facilities
The following table sets out the Bank Credit Facilities available to AQN and its operating groups as at June 30, 2021:
| | | | | | | | | | | | | | | | | | | | | | | | | | | | | |
| | As at June 30, 2021 | | As at Dec 31, 2020 |
| (all dollar amounts in $ millions) | Corporate | | Regulated Services Group | | Renewable Energy Group | | Total | | Total |
| Credit facilities | $ | 1,550.0 | | 1 | $ | 1,175.0 | | | $ | 850.0 | | 2 | $ | 3,575.0 | | | $ | 3,575.0 | |
| Funds drawn on facilities/ Commercial paper issued | (3.0) | | | (816.8) | | | (247.0) | | | (1,066.8) | | | (345.5) | |
| Letters of credit issued | (19.1) | | | (73.0) | | | (257.0) | | | (349.1) | | | (441.4) | |
| Liquidity available under the facilities | 1,527.9 | | | 285.2 | | | 346.0 | | | 2,159.1 | | | 2,788.1 | |
| Undrawn Portion of Uncommitted Letter of Credit Facilities | (34.7) | | | — | | | (145.2) | | | (179.9) | | | (105.8) | |
| Cash on hand | | | | | | | 203.5 | | | 101.6 | |
| Total Liquidity and Capital Reserves | $ | 1,493.2 | | | $ | 285.2 | | | $ | 200.8 | | | $ | 2,182.7 | | | $ | 2,783.9 | |
| | | | | | | | | |
1 Includes a $50 million uncommitted standalone letter of credit facility. |
2 Includes a $350 million uncommitted standalone letter of credit facility. |
Corporate
As at June 30, 2021, the Company's $500.0 million senior unsecured syndicated revolving credit facility (the "Corporate Credit Facility") had no amounts drawn and had $3.8 million of outstanding letters of credit. The Corporate Credit Facility matures on July 12, 2024.
As at June 30, 2021, the Company's $1.0 billion senior unsecured syndicated revolving credit facility (the "Corporate Liquidity Facility") had $3.0 million drawn. The Corporate Liquidity Facility matures on December 31, 2021.
As at June 30, 2021, the Company had also issued $15.3 million of letters of credit from its $50 million uncommitted bi-lateral letter of credit facility.
Regulated Services Group
As at June 30, 2021, the Regulated Services Group's $500.0 million senior unsecured syndicated revolving credit facility (the "Regulated Services Credit Facility") had $243.0 million drawn and had $73.0 million of outstanding letters of credit. The Regulated Services Credit Facility matures on February 23, 2023. As at June 30, 2021, $499.0 million of commercial paper was issued and outstanding.
As at June 30, 2021, the Regulated Services Group's $600.0 million senior unsecured syndicated revolving credit facility (the "Regulated Services Liquidity Facility") had no amounts drawn. The Regulated Services Liquidity Facility matures on December 31, 2021.
Through the acquisition of Ascendant in the fourth quarter of 2020, the Regulated Services Group acquired a $75.0 million senior unsecured revolving credit facility (the "BELCO Credit Facility"). As at June 30, 2021, the BELCO Credit Facility had $74.8 million drawn. The BELCO Credit Facility was amended to extend the maturity to December 31, 2021. The Company expects to refinance the credit facility before maturity.
Renewable Energy Group
As at June 30, 2021, the Renewable Energy Group's bank lines consisted of a $500.0 million senior unsecured syndicated revolving credit facility (the "Renewable Energy Credit Facility") maturing on October 6, 2023 and a $350.0 million letter of credit facility ("Renewable Energy LC Facility") that was amended to extend the maturity to June 30, 2023. As at June 30, 2021, the Renewable Energy Credit Facility had $247.0 million drawn and had $52.1 million in outstanding letters of credit. As at June 30, 2021, the Renewable Energy LC Facility had $204.8 million in outstanding letters of credit.
| | | | | |
| |
| Algonquin Power & Utilities Corp. - Management Discussion & Analysis | 35 |
Long Term Debt
Issuance of $1.15 Billion of Green Equity Units
On June 23, 2021, the Company closed an underwritten marketed public offering of 20,000,000 Green Equity Units for total gross proceeds of $1.0 billion. The underwriters subsequently exercised their option to purchase an additional 3,000,000 Green Equity Units on the same terms as the Offering, bringing total gross proceeds including the over-allotment to $1.15 billion.
Each Green Equity Unit was issued in a stated amount of $50 and, at issuance, consisted of a contract to purchase common shares of the Company and a 1/20, or 5%, undivided beneficial ownership interest in a $1,000 principal amount remarketable senior note of the Company due June 15, 2026. Pursuant to the purchase contracts, holders are required to purchase common shares of the Company on June 15, 2024.
Total annual distributions on the Green Equity Units will be at the rate of 7.75%, consisting of quarterly interest payments on the remarketable senior notes at a rate of 1.18% per year and, subject to any permitted deferral, quarterly contract adjustment payments on the purchase contracts at a rate of 6.57% per year. The reference price for the Green Equity Units is $15.00 per AQN common share. The minimum settlement rate under the purchase contracts is 2.7778 common shares, which is approximately equal to the $50 stated amount per Green Equity Unit, divided by the threshold appreciation price of $18.00 per common share, which represents a premium of 20% over the reference price. The maximum settlement rate under the purchase contracts is 3.3333 common shares, which is approximately equal to the $50 stated amount per Green Equity Unit, divided by the reference price. Each of the settlement rates is subject to adjustment in certain circumstances.
The Green Equity Units are expected to receive 100% equity credit from S&P as of the issuance date and 100% equity credit from Fitch and DBRS upon conversion.
The Green Equity Units are being accounted for using the treasury stock method of accounting (see Note 7(a) in the unaudited interim consolidated financial statements).
The net proceeds of the Offering were approximately $1.12 billion in the aggregate (including the over-allotment), after deducting underwriting discounts and commissions but before deducting estimated expenses of the Offering. The net proceeds of the Offering have been or will be, as applicable, used to finance or refinance investments in renewable energy generation projects or facilities or other clean energy technologies in accordance with the Company's Green Financing Framework. This is the fourth "green" offering by the Company or its subsidiaries and aligns with AQN's commitment to advancing a sustainable energy and water future.
The Green Equity Units (that are in the form of "corporate units") are listed on the New York Stock Exchange ("NYSE") under the ticker symbol "AQNU".
Credit Ratings
AQN has a long term consolidated corporate credit rating of BBB from S&P, a BBB rating from DBRS and a BBB issuer rating from Fitch.
Liberty Utilities Co., the parent company for the U.S. regulated utilities under the Regulated Services Group, has a corporate credit rating of BBB from S&P and a BBB issuer rating from Fitch. Debt issued by Liberty Utilities Finance GP1, has a rating of BBB (high) from DBRS, BBB+ from Fitch and BBB from S&P. Empire has an issuer rating of BBB from S&P and a Baa1 rating from Moody's Investors Service, Inc.
Liberty Utilities (Canada) LP, the parent company for the Canadian regulated utilities under the Regulated Services Group, has an issuer rating of BBB from DBRS.
Algonquin Power Co. has a BBB issuer rating from S&P, a BBB issuer rating from DBRS and a BBB issuer rating from Fitch.
| | | | | |
| |
| Algonquin Power & Utilities Corp. - Management Discussion & Analysis | 36 |
Contractual Obligations
Information concerning contractual obligations as of June 30, 2021 is shown below:
| | | | | | | | | | | | | | | | | | | | | | | | | | | | | |
| (all dollar amounts in $ millions) | Total | | Due in less
than 1 year | | Due in 1
to 3 years | | Due in 4
to 5 years | | Due after
5 years |
Principal repayments on debt obligations1,2 | $ | 6,634.7 | | | $ | 888.2 | | | $ | 1,110.1 | | | $ | 1,211.0 | | | $ | 3,425.4 | |
| | | | | | | | | |
| Advances in aid of construction | 89.5 | | | 1.4 | | | — | | | — | | | 88.1 | |
Interest on long-term debt obligations2 | 1,982.8 | | | 303.4 | | | 361.9 | | | 237.9 | | | 1,079.6 | |
| Purchase obligations | 506.0 | | | 506.0 | | | — | | | — | | | — | |
| Environmental obligations | 60.5 | | | 10.4 | | | 26.8 | | | 2.0 | | | 21.3 | |
| Derivative financial instruments: | | | | | | | | | |
| Cross currency interest rate swaps | 60.9 | | | 25.1 | | | 4.0 | | | 28.5 | | | 3.3 | |
| Interest rate swaps | 9.6 | | | 2.6 | | | 3.4 | | | 2.0 | | | 1.6 | |
| | | | | | | | | |
| Energy derivative and commodity contracts | 17.9 | | | 4.2 | | | 3.2 | | | 3.4 | | | 7.1 | |
| Purchased power | 311.4 | | | 48.2 | | | 54.9 | | | 47.0 | | | 161.3 | |
| Gas delivery, service and supply agreements | 403.9 | | | 78.9 | | | 105.5 | | | 73.5 | | | 146.0 | |
| Service agreements | 657.5 | | | 62.1 | | | 116.2 | | | 109.9 | | | 369.3 | |
| Capital projects | 107.0 | | | 107.0 | | | — | | | — | | | — | |
| Land easements | 545.6 | | | 12.9 | | | 26.2 | | | 26.9 | | | 479.6 | |
| Contract adjustment payments on Green Equity Units | 226.7 | | | 75.6 | | | 151.1 | | | — | | | — | |
| Other obligations | 289.9 | | | 59.6 | | | 4.3 | | | 18.8 | | | 207.2 | |
| Total Obligations | $ | 11,903.9 | | | $ | 2,185.6 | | | $ | 1,967.6 | | | $ | 1,760.9 | | | $ | 5,989.8 | |
| | | | | |
| 1 | Exclusive of deferred financing costs, bond premium/discount, fair value adjustments at the time of issuance or acquisition. |
| 2 | The Company's subordinated unsecured notes have a maturity in 2078 and 2079, respectively. However, the Company currently anticipates repaying in 2023 and 2029 upon exercising its redemption right. |
Equity
The common shares of AQN are publicly traded on the Toronto Stock Exchange ("TSX") and the NYSE under the trading symbol "AQN". As at August 11, 2021, AQN had 619,263,309 issued and outstanding common shares.
AQN may issue an unlimited number of common shares. The holders of common shares are entitled to dividends, if and when declared; to one vote for each share at meetings of the holders of common shares; and to receive a pro rata share of any remaining property and assets of AQN upon liquidation, dissolution or winding up of AQN. All shares are of the same class and with equal rights and privileges and are not subject to future calls or assessments.
AQN is also authorized to issue an unlimited number of preferred shares, issuable in one or more series, containing terms and conditions as approved by the Board. As at June 30, 2021, AQN had outstanding:
•4,800,000 cumulative rate reset Series A preferred shares, yielding 5.162% annually for the five-year period ending on December 31, 2023;
•100 Series C preferred shares that were issued in exchange for 100 Class B limited partnership units by St. Leon Wind Energy LP; and
•4,000,000 cumulative rate reset Series D preferred shares, yielding 5.091% annually for the five year period ending on March 31, 2024.
In addition, AQN’s Green Equity Units are listed on the NYSE under the ticker symbol "AQNU". As at August 11, 2021, there were 23,000,000 Green Equity Units outstanding. Pursuant to the purchase contract forming part of each Green Equity Unit, holders are required to purchase AQN common shares on June 15, 2024. The minimum settlement rate under each purchase contract is 2.7778 common shares and the maximum settlement rate is 3.3333 common shares, resulting in a minimum of 63,889,400 common shares and a maximum of 76,665,900 common shares issuable on settlement of the purchase contracts.
| | | | | |
| |
| Algonquin Power & Utilities Corp. - Management Discussion & Analysis | 37 |
At-The-Market Equity Program
On March 15, 2020, AQN re-established its at-the-market equity program ("ATM program") that allows the Company to issue up to $500 million of common shares from treasury to the public from time to time, at the Company's discretion, at the prevailing market price when issued on the TSX, the NYSE, or any other existing trading market for the common shares of the Company in Canada or the United States.
During the three months ended June 30, 2021, under its ATM program AQN issued approximately 8.6 million of its common shares at an average price of $15.68 per common share for total gross proceeds of $134.8 million ($133.1 million net of commissions). Other costs were $0.4 million.
As at August 12, 2021, the Company has issued since the inception of the ATM program in 2019 a cumulative total of 27,211,284 common shares under the ATM program at an average price of $14.95 per share for gross proceeds of approximately $406.8 million ($401.6 million net of commissions). Other related costs, primarily related to the establishment and subsequent re-establishments of the ATM program, were $4.0 million.
Dividend Reinvestment Plan
AQN has a shareholder dividend reinvestment plan (the “Reinvestment Plan”) for registered holders of common shares of AQN. As at June 30, 2021, 136,501,762 common shares representing approximately 22% of total common shares outstanding had been registered with the Reinvestment Plan. During the three months ended June 30, 2021, 1,522,859 common shares were issued under the Reinvestment Plan, and subsequent to quarter-end, on July 15, 2021, an additional 1,633,962 common shares were issued under the Reinvestment Plan.
SHARE-BASED COMPENSATION PLANS
For the six months ended June 30, 2021, AQN recorded $4.4 million in total share-based compensation expense as compared to $11.6 million for the same period in 2020. The compensation expense is recorded as part of administrative expenses in the consolidated statement of operations, except for $7.0 million in 2020 related to management succession and executive retirement expenses recorded in other net losses. The portion of share-based compensation costs capitalized as cost of construction is insignificant.
As at June 30, 2021, total unrecognized compensation costs related to non-vested share-based awards was $19.7 million and is expected to be recognized over a period of 1.95 years.
Stock Option Plan
AQN has a stock option plan that permits the grant of share options to key officers, directors, employees and selected service providers. Except in certain circumstances, the term of an option shall not exceed ten (10) years from the date of the grant of the option.
AQN determines the fair value of options granted using the Black-Scholes option-pricing model. The estimated fair value of options, including the effect of estimated forfeitures, is recognized as an expense on a straight-line basis over the options’ vesting periods while ensuring that the cumulative amount of compensation cost recognized at least equals the value of the vested portion of the award at that date. During the six months ended June 30, 2021, the Company granted 437,006 options to executives of the Company. The options allow for the purchase of common shares at a weighted average price of C$19.64, the market price of the underlying common share at the date of grant. During the six months ended June 30, 2021, executives of the Company exercised 61,225 stock options at a weighted average exercise price of C$14.75 in exchange for 12,021 common shares issued from treasury and 49,204 options were settled at their cash value as payment for the exercise price and tax withholdings related to the exercise of the options.
As at June 30, 2021, a total of 2,486,229 options were issued and outstanding under the stock option plan.
Performance and Restricted Share Units
AQN issues performance share units (“PSUs”) and restricted share units ("RSUs") to certain employees as part of AQN’s long-term incentive program. During the six months ended June 30, 2021, the Company granted (including dividends and performance adjustments) a combined total of 703,620 PSUs and RSUs to employees of the Company. During the six months ended June 30, 2021, the Company settled 709,853 PSUs, of which 373,314 PSUs were exchanged for common shares issued from treasury and 336,539 PSUs were settled at their cash value as payment for tax withholdings related to the settlement of the PSUs. Additionally, during the six months ended June 30, 2021, a total of 34,981 PSUs were forfeited.
As at June 30, 2021, a combined total of 2,679,993 PSUs and RSUs were granted and outstanding under the PSU and RSU plans.
| | | | | |
| |
| Algonquin Power & Utilities Corp. - Management Discussion & Analysis | 38 |
Directors' Deferred Share Units
AQN has a Directors' Deferred Share Unit Plan. Under the plan, non-employee directors of AQN receive all or any portion of their annual compensation in deferred share units (“DSUs”) and may elect to receive any portion of their remaining compensation in DSUs. The DSUs provide for settlement in cash or shares at the election of AQN. As AQN does not expect to settle the DSUs in cash, these DSUs are accounted for as equity awards. During the six months ended June 30, 2021, the Company issued 35,549 DSUs (including DSUs in lieu of dividends) to the directors of the Company. During the six months ended June 30, 2021, the Company settled 85,210 DSUs, of which 39,719 DSUs were exchanged for common shares issued from treasury and 45,491 DSUs were settled at their cash value as payment for tax withholdings related to the settlement of DSUs.
As at June 30, 2021, a total of 494,832 DSUs were outstanding under the DSU plan.
Bonus Deferral Restricted Share Units
The Company has a bonus deferral RSU program that is available to certain employees. The eligible employees have the option to receive a portion or all of their annual bonus payment in RSUs in lieu of cash. The RSUs provide for settlement in shares, and therefore these RSUs are accounted for as equity awards. During the six months ended June 30, 2021, 50,302 RSUs were issued (including RSUs in lieu of dividends) to employees of the Company. During the six months ended June 30, 2021, the Company settled 148,459 bonus RSUs, of which 68,841 were exchanged for common shares issued from treasury and 79,618 RSUs were settled at their cash value as payment for tax withholdings related to the settlement of the RSUs.
Employee Share Purchase Plan
AQN has an Employee Share Purchase Plan (the “ESPP”) which allows eligible employees to use a portion of their earnings to purchase common shares of AQN. The aggregate number of common shares reserved for issuance from treasury by AQN under this plan shall not exceed 4,000,000 shares. During the six months ended June 30, 2021, the Company issued 185,940 common shares to employees under the ESPP.
As at June 30, 2021, a total of 1,774,456 shares had been issued under the ESPP.
RELATED PARTY TRANSACTIONS
Equity-method investments
The Company entered into a number of transactions with equity-method investees in 2021 and 2020 (see Note 6 in the unaudited interim consolidated financial statements).
The Company provides administrative and development services to its equity-method investees and is reimbursed for incurred costs. To that effect, the Company charged its equity-method investees $6.0 million and $12.3 million during the three and six months ended June 30, 2021, as compared to $5.7 million and $10.2 million during the same period in 2020. Additionally, one of the equity-method investees provides development services to the Company on specified projects, for which it earns a development fee upon reaching certain milestones. During the three and six months ended June 30, 2021, the development fees charged to the Company were $nil and $0.7 million as compared to $0.5 million and $0.5 million during the same period in 2020. See Note 6(b) in the unaudited interim consolidated financial statements.
In 2020, a subsidiary of the Company made a tax equity investment into Altavista Solar Subco, LLC, an equity investee of the Company (prior to April 9, 2021) and indirect owner of the Altavista Solar Project. Following the closing of the construction financing facility for the Altavista Solar Project, certain excess funds were distributed to the Company and in return the Company issued a promissory note of $30.5 million payable to Altavista Solar Subco, LLC with an original maturity date of March 31, 2021, that was amended and extended to June 30, 2021. On April 9, 2021, the Company acquired the remaining 50% equity interest in the Altavista Solar Project that it did not previously own and repaid the $30.5 million promissory note to Altavista Solar Subco, LLC, upon consolidation of the entity. See Note 3(b) in the unaudited interim consolidated financial statements.
Redeemable non-controlling interest held by related party
Redeemable non-controlling interest held by related party represents a preference share in a consolidated subsidiary of the Company acquired by AAGES in 2018 for $305.0 million (see Note 13 in the unaudited interim consolidated financial statements). Redemption is not considered probable as at June 30, 2021. During the three and six months ended June 30, 2021, the Company incurred non-controlling interest attributable to AAGES of $2.6 million and $5.3 million as compared to $3.4 million and $7.2 million during the same period in 2020 and recorded distributions of $2.5 million and $5.0 million as compared to $3.6 million and $6.9 million during the same period in 2020 (see Note 14 in the unaudited
| | | | | |
| |
| Algonquin Power & Utilities Corp. - Management Discussion & Analysis | 39 |
interim consolidated financial statements). The subsidiary of Abengoa that currently holds the interest in AAGES has taken steps towards executing a restructuring plan which is subject to final creditor approval. In the event this restructuring is not successful, AQN would consolidate its interest in the preference share held by AAGES and the 3-year secured credit facility in the amount of $306.5 million.
On October 21, 2020, the Company paid $1.5 million to Abengoa for a twelve month exclusive, transferable, and irrevocable option to purchase all of Abengoa's interests in AAGES. On August 6, 2021, the Company exercised the option. Closing of the transaction is anticipated prior to the end of the third quarter of 2021. Pursuant to an agreement between AQN and funds managed by the Infrastructure and Power strategy of Ares Management LLC (“Ares”), Ares is expected to become AQN’s new partner in its non-regulated development platform for renewable energy, water and other sectors.
Non-controlling interest held by related party
Non-controlling interest held by related party represents interest in a consolidated subsidiary of the Company acquired by a subsidiary of Atlantica in May 2019 for $96.8 million. During the three and six months ended June 30, 2021, the Company recorded distributions of $4.5 million and $8.9 million as compared to $4.8 million and $9.0 million during the same period in 2020.
The above related party transactions have been recorded at the exchange amounts agreed to by the parties to the transactions.
ENTERPRISE RISK MANAGEMENT
The Corporation is subject to a number of risks and uncertainties, certain of which are described below. A risk is the possibility that an event might happen in the future that could have a negative effect on the financial condition, financial performance or business of the Corporation. The actual effect of any event on the Corporation’s business could be materially different from what is anticipated or described below. The description of risks below does not include all possible risks.
Led by the Chief Compliance and Risk Officer, the Corporation has an established enterprise risk management ("ERM") framework. The Corporation’s ERM framework follows the guidance of ISO 31000 and the Committee of Sponsoring Organizations of the Treadway Commission ("COSO") Enterprise Risk Management - Integrated Framework. The Corporation’s Board oversees the Corporation's risk policies, including the ERM policy which describes the Corporation’s risk management processes, risk appetite, and risk governance structure.
As part of the risk management process, risk registers have been developed across the organization through ongoing risk identification and risk assessment exercises facilitated by the Corporation’s internal ERM team. Key risks and associated mitigation strategies are reviewed by the executive-level Enterprise Risk Management Council and are presented to the Board’s Risk Committee periodically.
Risks are evaluated across the Corporation using a risk scoring matrix to assess impact and likelihood. Financial, strategic, reputational and safety implications are among those considered when determining the impact of a potential risk. Risk treatment priorities are established based upon these risk assessments and incorporated into the development of the Corporation’s strategic and business plans. However, there can be no assurance that the Corporation's risk management activities will be successful in identifying, assessing, or mitigating the risks to which the Corporation is subject.
The risks discussed below are not intended as a complete list of all risks that AQN, its subsidiaries and affiliates are encountering or may encounter. Please see the Company's most recent AIF and Annual MD&A available on SEDAR and EDGAR for a more detailed discussion of risk factors to which the Company is subject. To the extent of any inconsistency, the risks discussed below are intended to provide an update on those that were previously disclosed.
Risks Related to COVID-19
The COVID-19 situation remains fluid and its full impact on the Company’s business, financial condition, cash flows and results of operations is not fully known at this time. In addition to the risks and impacts described elsewhere in this MD&A, the COVID-19 pandemic and efforts to contain the virus could result in:
•operating, supply chain and project development and construction delays, disruptions and cost overruns;
•delayed collection of accounts receivable and increased levels of bad debt expense;
•delayed placed-in-service dates for the Company's renewable energy projects, which may give rise to, among other things, lower than anticipated revenue, delay-related liabilities to contractual counterparties and increased amounts of interest payable to construction lenders;
•reduced availability of funding under construction loans and tax equity financing, which may require the Company to initially increase its funding and, if possible, directly realize the tax benefits;
| | | | | |
| |
| Algonquin Power & Utilities Corp. - Management Discussion & Analysis | 40 |
•lower revenue from the Company’s utility operations, including as a result of decreased consumption by customers not covered by rate decoupling;
•negative impacts to the Company's existing and planned rate reviews, including non-recovery of certain costs incurred directly or indirectly as a result of the COVID-19 pandemic and delays in filing, processing and settlement of the reviews;
•introduction of new legislation, policies, rules or regulations that adversely impact the Company;
•labour shortages and shutdowns (including as a result of government regulation and prevention measures), reduced employee and/or contractor productivity, and loss of key personnel;
•inability to implement the Company’s growth strategy, including sourcing new acquisitions and completing previously-announced acquisitions;
•inability to carry out the Company’s capital expenditure plans on previously anticipated timelines;
•lower earnings from unhedged power generation as a result of lower wholesale commodity prices in energy markets;
•losses or liabilities resulting from default, delays or non-performance by either the Company or its counterparties under the Company’s contracts, including joint venture agreements, supply agreements, construction agreements, services agreements and power purchase and other offtake agreements;
•lower revenue from the Company's power generation facilities as a result of system load reduction and related system directed curtailments;
•delay in the permitting process of certain development projects, affecting the timing of final investment decisions and start of construction dates;
•reduced ability of the Company and its employees to effectively respond to, or mitigate the effects of, another force majeure or other significant event;
•increased operating costs for emergency supplies, personal protective equipment, cleaning services, enabling technology and other specific needs in response to COVID-19, some of which may not be recovered through future rates;
•increased market volatility and lower pension plan returns which could adversely impact the valuation of pension plan assets and future funding requirements for the Company's pension plans;
•deterioration in financial metrics and other factors that impact the Company’s credit ratings;
•inability to meet the requirements of the covenants in existing credit facilities;
•inability to access credit and capital markets on acceptable terms or at all, including to refinance maturing indebtedness;
•IT and operational technology system interruptions, loss of critical data and increased cybersecurity and privacy breaches due to “work from home” arrangements implemented by the Company;
•business disruptions and costs as "work from home" arrangements are reduced and a greater number of employees return to the office;
•losses to the Company caused by fluctuations and volatility in the trading price of Atlantica’s ordinary shares or reduction of the dividend paid to holders of Atlantica’s ordinary shares; and
•fluctuations and volatility in the trading price of the Company’s common shares and other securities, which could result in losses for the Company’s security holders.
The COVID-19 pandemic may also have the effect of heightening the other risks described herein, under the heading Enterprise Risk Management in the Company’s Annual MD&A, and under the heading Enterprise Risk Factors in the Company's most recent AIF. The adverse impacts of COVID-19 on the Company can be expected to increase the longer the pandemic and the related response measures persist.
Change in customer demand due to the COVID-19 Pandemic
The Company operates utility systems across 16 regulatory jurisdictions delivering electric, natural gas, water and waste water services to residential, commercial and industrial customers in the areas it serves. The COVID-19 pandemic and resulting business suspensions and shutdowns have changed consumption patterns of residential, commercial and industrial customers across all three modalities of utility services, including potential decreased consumption among certain commercial and industrial customers. Further, different regulatory jurisdictions provide different mechanisms to
| | | | | |
| |
| Algonquin Power & Utilities Corp. - Management Discussion & Analysis | 41 |
allow utilities to adapt to changes in demand including decoupling on a total revenue basis, decoupling on a weather adjusted basis, and fixed fee components in rates.
The Company has seen the impacts on consumption patterns reduce from their early peaks as the economy has started to re-open.
Since the length of the pandemic, any longer term economic impacts, and how these may change consumption for residential, commercial and industrial customers is not known, the actual impacts on the Company’s operations for the remainder of 2021 are not known at this time.
Treasury Risk Management
Interest Rate Risk
The majority of debt outstanding in AQN and its subsidiaries is subject to a fixed rate of interest and as such is not subject to significant interest rate risk in the short to medium term time horizon.
Borrowings subject to variable interest rates can vary significantly from month to month, quarter to quarter and year to year. AQN does not actively manage interest rate risk on its variable interest rate borrowings due to the primarily short term and revolving nature of the amounts drawn.
Based on amounts outstanding as at June 30, 2021, the impact to interest expense from changes in interest rates are as follows:
•the Corporate Credit Facility is subject to a variable interest rate and had no amounts outstanding as at June 30, 2021. As a result, a 100 basis point change in the variable rate charged would not impact interest expense;
•the Corporate Liquidity Facility is subject to a variable interest rate and had $3.0 million outstanding as at June 30, 2021. As a result, a 100 basis point change in the variable rate charged would impact interest expense by $0.03 million annually;
•the Regulated Services Credit Facility is subject to a variable interest rate and had $243.0 million outstanding as at June 30, 2021. As a result, a 100 basis point change in the variable rate charged would impact interest expense by $2.4 million annually;
•the Regulated Services Liquidity Facility is subject to a variable interest rate and had no amounts outstanding as at June 30, 2021. As a result, a 100 basis point change in the variable rate charged would not impact interest expense;
•the BELCO Credit Facility is subject to a variable interest rate and had $74.8 million outstanding as at June 30, 2021. As a result, a 100 basis point change in the variable rate charged would impact interest expense by $0.7 million annually;
•the Regulated Services Group's commercial paper program is subject to a variable interest rate and had $499.0 million outstanding as at June 30, 2021. As a result, a 100 basis point change in the variable rate charged would impact interest expense by $5.0 million annually;
•the Renewable Energy Credit Facility is subject to a variable interest rate and had $247.0 million outstanding as at June 30, 2021. As a result, a 100 basis point change in the variable rate charged would impact interest expense by $2.5 million annually; and
•term facilities at BELCO and ESSAL that are subject to variable interest rates had $157.7 million outstanding as at June 30, 2021. As a result, a 100 basis point change in the variable rate charged would impact interest expense by $1.6 million annually.
Tax Risk and Uncertainty
The Company is subject to income and other taxes primarily in the United States and Canada. Changes in tax laws or interpretations thereof in the jurisdictions in which it does business could adversely affect the Company's results from operations, returns to shareholders and cash flow. While management believes it is in compliance with current prevailing laws, one or more taxing jurisdictions could seek to impose incremental or new taxes on the Company.
•As a result of the most recent presidential and congressional elections in the United States, there could be significant changes in tax laws and regulations;
•On April 19, 2021, the Canadian federal government delivered its 2021 budget. The budget contains proposed measures related to limits on interest deductibility. Draft legislative proposals are expected to be released at a future date;
•As a consequence of the Organization for Economic Cooperation and Development’s project on “Base Erosion and Profit Shifting” (BEPS), there could be a focus by taxing authorities to pursue common international principles for the entitlement to taxation of global corporate profits and minimum global tax rates.
| | | | | |
| |
| Algonquin Power & Utilities Corp. - Management Discussion & Analysis | |
The timing or impacts of any future changes in tax laws, including the impacts of proposed regulations, cannot be predicted. Any adverse developments in these laws or regulations, including legislative changes, judicial holdings or administrative interpretations, could have a material and adverse effect on the results of operations, financial condition and cash flows of the Company.
OPERATIONAL RISK MANAGEMENT
Litigation Risks and Other Contingencies
AQN and certain of its subsidiaries are involved in various litigation, claims and other legal and regulatory proceedings that arise from time to time in the ordinary course of business. Any accruals for contingencies related to these items are recorded in the financial statements at the time it is concluded that a material financial loss is likely and the related liability is estimable. Anticipated recoveries under existing insurance policies are recorded when reasonably assured of recovery.
Claim by Gaia Power Inc.
On October 30, 2018, Gaia Power Inc. (“Gaia”) commenced an action in the Ontario Superior Court of Justice against AQN and certain of its subsidiaries, claiming damages and punitive damages. The action arose from Gaia’s 2010 sale, to a subsidiary of AQN, of Gaia’s interest in certain proposed wind farm projects in Canada. Pursuant to a 2010 royalty agreement, Gaia is entitled to royalty payments if the projects are developed and achieve certain agreed targets.
The parties agreed to arbitrate the dispute and concluded hearings on March 17, 2021. The arbitrator released his decision on August 6, 2021, dismissing Gaia's damages claims for oppression and conspiracy, and also dismissing Gaia's punitive damages claim. The arbitrator confirmed that development fees and royalties, calculated as a sliding percentage of the facility's EBITDA (as argued for by the Company), are payable to Gaia in connection with the Company's 74 MW Amherst Island Wind Facility in Ontario. The arbitrator also found that development fees and royalties, calculated on substantially the same basis as the royalties for the Amherst Island Wind Facility, are payable to Gaia in connection with the Company's 175 MW Blue Hill Wind Project in Saskatchewan. Although the Company argued that no such fees or royalties should be payable to Gaia for the Blue Hill Wind Project, the Company factored in the possibility of these payments when internally evaluating and approving the development and construction of the Blue Hill Wind Project. The Company is taking steps to determine its immediate and ongoing obligations to Gaia in light of the arbitrator's award.
Mountain View Fire
On November 17, 2020, a wildfire now known as the Mountain View fire occurred in the territory of Liberty Utilities (CalPeco Electric) LLC ("Liberty CalPeco"). The cause of the fire is undetermined at this time, and CAL FIRE has not yet issued a report. There are currently five active lawsuits that name the Company and/or certain of its subsidiaries as defendants in connection with the Mountain View fire. Three of these lawsuits are brought by groups of individual plaintiffs alleging causes of action including negligence, inverse condemnation, nuisance, trespass, and violations of Cal. Pub. Util. Code 2106 and Cal. Health and Safety Code 13007. In the fourth active lawsuit, County of Mono, Antelope Valley Fire Protection District, Toiyabe Indian Health Project, and Bridgeport Indian Colony allege similar causes of action and seek damages for fire suppression costs, law enforcement costs, property and infrastructure damage, and other costs. In the fifth active lawsuit, a group of insurance companies alleges inverse condemnation and negligence and seek recovery of amounts paid and to be paid to their insureds. The likelihood of success in these lawsuits cannot be reasonably predicted. Liberty CalPeco intends to vigorously defend them. The Company has wildfire liability insurance that is expected to apply up to applicable policy limits.
Apple Valley Condemnation Proceedings
Liberty Utilities (Apple Valley Ranchos Water) Corp ("Liberty Apple Valley") was the subject of a condemnation lawsuit filed by the Town of Apple Valley (the "Town"). On May 7, 2021, the Court issued a Tentative Statement of Decision denying the Town’s attempt to take the Apple Valley Water System by eminent domain. The ruling confirmed that Liberty Apple Valley’s continued ownership and operation of the water system is in the best interest of the community. The Town filed objections to the Tentative Decision on June 1, 2021 and Liberty Apple Valley filed its response to the Town’s objections on June 18, 2021. The Court conducted a hearing on those objections on July 23, 2021. The Court is expected to issue a final Statement of Decision in August or September 2021. Upon entry of a Final Statement of Decision consistent with the Tentative Statement of Decision, the Town’s lawsuit would be dismissed, and the Town would be required to compensate Liberty Apple Valley for litigation expenses. The Court’s ruling is subject to appeal by the Town.
| | | | | |
| |
| Algonquin Power & Utilities Corp. - Management Discussion & Analysis | 43 |
QUARTERLY FINANCIAL INFORMATION
The following is a summary of unaudited quarterly financial information for the eight quarters ended June 30, 2021:
| | | | | | | | | | | | | | | | | | | | | | | |
| (all dollar amounts in $ millions except per share information) | 3rd Quarter
2020 | | 4th Quarter
2020 | | 1st Quarter 2021 | | 2nd Quarter 2021 |
| Revenue | $ | 376.1 | | | $ | 492.4 | | | $ | 634.5 | | | $ | 527.5 | |
| | | | | | | |
| Net earnings attributable to shareholders | 55.9 | | | 504.2 | | | 13.9 | | | 103.2 | |
| | | | | | | |
| Net earnings per share | 0.09 | | | 0.84 | | | 0.02 | | | 0.16 | |
| Diluted net earnings per share | 0.09 | | | 0.83 | | | 0.02 | | | 0.16 | |
Adjusted Net Earnings1 | 88.1 | | | 127.0 | | | 124.5 | | | 91.7 | |
Adjusted Net Earnings per share1 | 0.15 | | | 0.21 | | | 0.20 | | | 0.15 | |
Adjusted EBITDA1 | 197.9 | | | 253.1 | | | 282.9 | | | 244.9 | |
| Total assets | 11,739.9 | | | 13,224.1 | | | 15,286.1 | | | 16,453.7 | |
Long term debt2 | 3,978.0 | | | 4,538.8 | | | 6,353.7 | | | 6,622.6 | |
| Dividend declared per common share | $ | 0.16 | | | $ | 0.16 | | | $ | 0.16 | | | $ | 0.17 | |
| | | | | | | |
| 3rd Quarter
2019 | | 4th Quarter
2019 | | 1st Quarter 2020 | | 2nd Quarter 2020 |
| Revenue | $ | 365.6 | | | $ | 440.0 | | | $ | 465.0 | | | $ | 343.6 | |
| | | | | | | |
| Net earnings (loss) attributable to shareholders | 115.8 | | | 172.1 | | | (63.8) | | | 286.2 | |
| | | | | | | |
| Net earnings (loss) per share | 0.23 | | | 0.34 | | | (0.13) | | | 0.54 | |
| Diluted net earnings (loss) per share | 0.23 | | | 0.33 | | | (0.13) | | | 0.53 | |
Adjusted Net Earnings1 | 69.2 | | | 103.6 | | | 103.3 | | | 47.4 | |
Adjusted Net Earnings per share1 | 0.14 | | | 0.20 | | | 0.19 | | | 0.09 | |
Adjusted EBITDA1 | 186.9 | | | 230.4 | | | 242.2 | | | 176.3 | |
| Total assets | 10,618.9 | | | 10,920.8 | | | 10,900.6 | | | 11,188.0 | |
Long term debt2 | 4,276.6 | | | 3,932.2 | | | 4,205.1 | | | 4,155.1 | |
| Dividend declared per common share | $ | 0.14 | | | $ | 0.14 | | | $ | 0.14 | | | $ | 0.16 | |
| | | | | |
| 1 | See Non-GAAP Financial Measures. |
| 2 | Includes current portion of long-term debt, long-term debt and convertible debentures. |
The quarterly results are impacted by various factors including seasonal fluctuations and acquisitions of facilities as noted in this MD&A.
Quarterly revenues have fluctuated between $343.6 million and $634.5 million over the prior two year period. A number of factors impact quarterly results including acquisitions, seasonal fluctuations, and winter and summer rates built into the PPAs. In addition, a factor impacting revenues year over year is the fluctuation in the strength of the Canadian dollar relative to the U.S. dollar which can result in significant changes in reported revenue from Canadian operations.
Quarterly net earnings attributable to shareholders have fluctuated between a loss of $63.8 million and earnings of $504.2 million over the prior two year period. Earnings have been significantly impacted by non-cash factors such as deferred tax recovery and expense, impairment of intangibles, property, plant and equipment and mark-to-market gains and losses on financial instruments.
DISCLOSURE CONTROLS AND PROCEDURES
AQN's management carried out an evaluation as of June 30, 2021, under the supervision of and with the participation of AQN’s Chief Executive Officer ("CEO") and Chief Financial Officer ("CFO"), of the effectiveness of the design and operations of AQN’s disclosure controls and procedures (as defined in Rule 13a-15(e) and Rule 15d-15 (e) under the Securities Exchange Act of 1934, as amended (the “Exchange Act”)). Based on that evaluation, the CEO and the CFO have concluded that as of June 30, 2021, AQN’s disclosure controls and procedures are effective to provide reasonable assurance that information required to be disclosed by AQN in reports that it files or submits under the Exchange Act is recorded, processed, summarized, and reported within the time periods specified in SEC rules and forms, and is accumulated and communicated to management, including the CEO and CFO, as appropriate, to allow timely decisions regarding required disclosure.
| | | | | |
| |
| Algonquin Power & Utilities Corp. - Management Discussion & Analysis | 44 |
MANAGEMENT REPORT ON INTERNAL CONTROLS OVER FINANCIAL REPORTING
Management, including the CEO and the CFO, is responsible for establishing and maintaining internal control over financial reporting. Management, as at the end of the period covered by this interim filing, designed internal controls over financial reporting to provide reasonable, but not absolute, assurance regarding the reliability of financial reporting and the preparation of financial statements for external purposes in accordance with U.S. GAAP. The control framework management used to design the issuer's internal control over financial reporting is that established in Internal Control - Integrated Framework (2013) issued by the COSO.
CHANGES IN INTERNAL CONTROLS OVER FINANCIAL REPORTING
For the six months ended June 30, 2021, there has been no change in the Company’s internal controls over financial reporting that has materially affected, or is reasonably likely to materially affect, the Company’s internal controls over financial reporting.
INHERENT LIMITATIONS ON EFFECTIVENESS OF CONTROLS
Due to its inherent limitations, disclosure controls and procedures or internal control over financial reporting may not prevent or detect all misstatements based on error or fraud. Further, the effectiveness of internal control is subject to the risk that controls may become inadequate because of changes in conditions, or that the degree of compliance with policies or procedures may change.
CRITICAL ACCOUNTING ESTIMATES AND POLICIES
AQN prepared its unaudited interim consolidated financial statements in accordance with U.S. GAAP. The preparation of the unaudited interim consolidated financial statements requires management to make estimates and assumptions that affect the reported amounts of assets and liabilities, related amounts of revenues and expenses, and disclosure of contingent assets and liabilities. Significant areas requiring the use of management judgment relate to the scope of consolidated entities, useful lives and recoverability of depreciable assets, the measurement of deferred taxes and the recoverability of deferred tax assets, rate-regulation, unbilled revenue, pension and post-employment benefits, fair value of derivatives and fair value of assets and liabilities acquired in a business combination. Actual results may differ from these estimates.
AQN’s significant accounting policies and new accounting standards are discussed in Notes 1 and 2 in the unaudited interim consolidated financial statements, respectively.
| | | | | |
| |
| Algonquin Power & Utilities Corp. - Management Discussion & Analysis | 45 |