Pioneer Multi-Asset
Ultrashort Income Fund
| | |
| Annual Report | March 31, 2020 |
|
| Ticker Symbols: |
Class A | MAFRX |
Class C | MCFRX |
Class C2 | MAUCX |
Class K | MAUKX |
Class Y | MYFRX |
Beginning in March 2021, as permitted by regulations adopted by the Securities and Exchange Commission, paper copies of the Fund’s shareholder reports like this one will no longer be sent by mail, unless you specifically request paper copies of the reports from the Fund or from your financial intermediary, such as a broker-dealer, bank or insurance company. Instead, the reports will be made available on the Fund’s website, and you will be notified by mail each time a report is posted and provided with a website link to access the report.
If you already elected to receive shareholder reports electronically, you will not be affected by this change and you need not take any action. You may elect to receive shareholder reports and other communications electronically by contacting your financial intermediary or, if you invest directly with the Fund, by calling 1-800-225-6292.
You may elect to receive all future reports in paper free of charge. If you invest directly with the Fund, you can inform the Fund that you wish to continue receiving paper copies of your shareholder reports by calling 1-800-225-6292. If you invest through a financial intermediary, you can contact your financial intermediary to request that you continue to receive paper copies of your shareholder reports. Your election to receive reports in paper will apply to all funds held in your account if you invest through your financial intermediary or all funds held within the Pioneer Fund complex if you invest directly.
visit us: www.amundipioneer.com/us
Pioneer Multi-Asset Ultrashort Income Fund | Annual Report | 3/31/20 1
Dear Shareholders,
The new decade has arrived delivering a first quarter that will go down in the history books. The beginning of the year seemed to extend the positive market environment of 2019 and then, March roared in like a lion and the COVID-19 pandemic became a global crisis impacting lives and life as we know it. The impact on the global economy from the COVID-19 virus pandemic, while currently unknown, is likely to be considerable. It is clear that several industries have already felt greater effects than others. And the markets, which do not thrive on uncertainty, have been volatile. Our business continuity plan was implemented given the new COVID-19 guidelines, and most of our employees are working remotely. To date, our operating environment has faced no interruption. I am proud of the careful planning that has taken place and confident we can maintain this environment for as long as is prudent. History in the making for a company that first opened its doors way back in 1928.
Since 1928, Amundi Pioneer’s investment process has been built on a foundation of fundamental research and active management, principles which have guided our investment decisions for more than 90 years. We believe active management – that is, making active investment decisions – can help mitigate the potential risks during periods of market volatility. As the early days of 2020 have reminded us, in today’s global economy, investment risk can materialize from a number of factors, including a slowing economy, changing U.S. Federal Reserve policy, oil price shocks, political and geopolitical factors and, unfortunately, major public health concerns such as a viral pandemic.
At Amundi Pioneer, active management begins with our own fundamental, bottom-up research process. Our team of dedicated research analysts and portfolio managers analyze each security under consideration, communicating directly with the management teams of the companies issuing the securities and working together to identify those securities that best meet our investment criteria for our family of funds. Our risk management approach begins with each and every security, as we strive to carefully understand the potential opportunity, while considering any and all risk factors.
2 Pioneer Multi-Asset Ultrashort Income Fund | Annual Report | 3/31/20
Today, as investors, we have many options. It is our view that active management can serve shareholders well, not only when markets are thriving, but also during periods of market stress. As you consider your long-term investment goals, we encourage you to work with your financial advisor to develop an investment plan that paves the way for you to pursue both your short-term and long-term goals.
We remain confident that the current crisis, like others in human history, will pass, and we greatly appreciate the trust you have placed in us and look forward to continuing to serve you in the future.
Sincerely,
Lisa M. Jones
Head of the Americas, President and CEO of U.S.
Amundi Pioneer Asset Management USA, Inc.
March 31, 2020
Any information in this shareowner report regarding market or economic trends or the factors influencing the Fund’s historical or future performance are statements of opinion as of the date of this report. Past performance is no guarantee of future results.
Pioneer Multi-Asset Ultrashort Income Fund | Annual Report | 3/31/20 3
Portfolio Management Discussion |
3/31/20 In the following interview, portfolio managers Seth Roman, Jonathan Sharkey, Noah Funderburk, and Nicolas Pauwels discuss the factors that influenced the performance of Pioneer Multi-Asset Ultrashort Income Fund during the 12-month period ended March 31, 2020. Mr. Roman, a vice president and a portfolio manager at Amundi Pioneer Asset Management, Inc. (Amundi Pioneer); Mr. Sharkey, a senior vice president and a portfolio manager at Amundi Pioneer; Mr. Funderburk, a vice president and a portfolio manager at Amundi Pioneer; and Mr. Pauwels, a vice president and a portfolio manager at Amundi Pioneer, are responsible for the day-to-day management of the Fund.
Q How did the Fund perform during the 12-month period ended March 31, 2020?
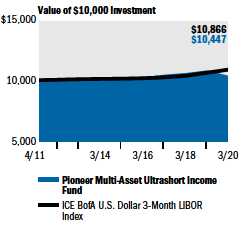
A Pioneer Multi-Asset Ultrashort Income Fund’s Class A shares returned -4.02% at net asset value (NAV) during the 12-month period ended March 31, 2020, while the Fund’s benchmark, the ICE Bank of America 3-Month U.S. Dollar LIBOR Index (the ICE BofA Index), returned 2.38%.
During the same period, the average return of the 204 mutual funds in Morningstar’s Ultrashort Bond category was 0.28%.
Q Can you describe the market environment for fixed-income investors over the 12-month period ended March 31, 2020?
A Entering the 12-month period, deteriorating global economic growth driven in part by the ongoing U.S.-China trade war was counterbalanced by the continued easing of global monetary policy. U.S. economic growth had held up better than growth in other developed markets during that timeframe, due to healthy consumer confidence data and continued strong employment figures. However, the plummeting manufacturing purchasing managers’ index (PMI) numbers, increased tariffs due to the U.S.-China trade dispute, and a downward trend in non-farm payrolls increased concerns about a U.S. recession. In particular, the on-again, off-again trade negotiations increased market volatility. Responding to those concerns, the U.S. Federal Reserve (Fed) followed up on its July 2019 rate cut with another quarter-point reduction in September. U.S. Treasury yields subsequently declined across the curve and fixed-income returns were buoyed by falling rates.
As the 12-month period drew to a close, the spread to pandemic levels of the COVID-19 virus from China to the rest of the world began to drive performance in the financial markets dramatically downward. Global economies ground to a near halt during March as public health concerns
4 Pioneer Multi-Asset Ultrashort Income Fund | Annual Report | 3/31/20
led to the rapid implementation by governments and companies of extreme measures focused on virus containment, including the shuttering of businesses deemed non-essential. Compounding the extreme market volatility and economic distress was the plummeting of oil prices to 20-year lows in response to slumping global demand resulting not only from the spread of COVID-19, but also from a supply shock spurred by a price war launched on March 8 between Saudi Arabia and Russia.
Uncertainty over the scope and duration of the pandemic crisis and the need for cash drove wholesale liquidations across most asset classes and a “flight-to-safety” trade that resulted in U.S. Treasury yields hitting historic lows. Significant selling in U.S. dollar (USD) fixed-income markets eventually stressed markets and led to price dislocations in all segments, even Treasury bonds.
Social-distancing and shelter-in-place measures enacted to help curb the spread of COVID-19 had profound economic effects and resulted in significant reductions in services consumption, manufacturing activity, construction, and labor demand. The unprecedented shutting down of much of the U.S. economy due to COVID-19 spurred extraordinary monetary and fiscal policy responses. The Fed jumped into action by dusting off its 2008/2009 policy “playbook” and rapidly rolling out a raft of programs aimed at restoring market liquidity, facilitating credit availability, and boosting investors’ confidence. The measures included reducing the benchmark federal funds rate to zero and committing to making unlimited purchases of U.S. Treasuries and agency mortgage-backed securities (MBS), if necessary, as well as providing support for commercial paper issuance, mutual fund liquidity needs, and the issuance of asset-backed securities (ABS). Additionally, the Fed entered uncharted waters with the announcement on March 23 of purchasing programs in support of investment-grade corporate bonds in both the new-issue and secondary markets. For its part, the U.S. government took steps to backstop the domestic economy with the passage of a stimulus bill in excess of $2 trillion, with the goal of assisting both individuals and businesses. Congressional leaders and the White House also were in discussions about possible further stimulus legislation as the 12-month period ended.
Selling pressures were most pronounced in the short-term markets relevant to most of the Fund’s investments. With “cash as king” in the latter part of the 12-month period, asset managers seeking to meet redemptions or redeploy capital into more deeply discounted securities flooded the market with short-term instruments. At its peak, the liquidity crisis witnessed the inversion of credit curves, with short-term corporates having higher
Pioneer Multi-Asset Ultrashort Income Fund | Annual Report | 3/31/20 5
spreads than longer-term corporates. (Credit spreads are commonly defined as the differences in yield between Treasuries and other types of fixed-income securities with similar maturities.)
Certain mutual funds began to receive large cash injections from their parents as they faced massive redemptions against the backdrop of a frozen commercial paper market. In turn, banks and broker/dealer balance sheets lacked the capacity to position the flood of assets, and so liquidity started to come at an increasingly high cost. Only the massive, $4 trillion (estimated) monetary stimulus by the Fed helped to restore confidence and liquidity to the market.
Among the U.S. bond market sectors, the liquidity stress was greatest in securitized credit, including ABS, commercial MBS (CMBS), and nonagency MBS, which have typically had a narrower buyer base than corporate bonds. Notably, while post-2008 crisis regulations have caused securitized sectors to offer compelling fundamental value, the same regulations have limited banks' ability to position those securities on their balance sheets, which has greatly exacerbated the price dislocations within the asset class. During the first calendar quarter of 2020, the ABS, MBS, and CMBS markets had to deal with forced selling by real estate investment trusts (REITs), other leveraged investors, and certain mutual funds, not to mention concerns about the impact of COVID-19 on employment and the corresponding ability of homeowners and businesses to pay their residential and commercial obligations.
Q Can you review the Fund’s principal investment strategies during the 12-month period ended March 31, 2020, and how they affected benchmark-relative performance?
A Investments in securitized sectors, where the portfolio is overweight compared to its peers, accounted for the majority of the Fund’s underperformance relative to the ICE BofA Index during the 12-month period. Exposures to collateralized mortgage obligations (CMOs), ABS, and CMBS were the primary detractors from benchmark-relative returns.
Within CMOs, the Fund’s allocation to credit-risk-transfer (CRT) securities, which transfer some of the risk of non-payment on residential mortgages from government-sponsored entities to the private sector, had the greatest negative effect on benchmark-relative performance for the 12-month period. Despite the recent underperformance, we believe we would have to experience a significant fall in home prices, similar to the declines of 2008, for the CRTs held by the portfolio to suffer permanent impairment. As a sector within non-agency MBS that has typically been
6 Pioneer Multi-Asset Ultrashort Income Fund | Annual Report | 3/31/20
more liquid, CRTs may have experienced greater price volatility from forced sellers over the month of March, compared with other segments of the non-agency MBS market.
Underperformance of the Fund’s CMBS holdings primarily reflected the struggles of the portfolio’s allocation to single-asset/single-borrower (SASB) investments. Each SASB securitization represents exposure to a single large property, or to the assets of a single borrower, and can include exposure to collateral such as office towers, suburban office parks, apartment buildings, refrigerated warehouses, and hotels. Because of the concentrated risk, SASBs have tended to feature conservative loan-to-value ratios compared to traditional CMBS instruments. In addition, equity owners of those properties have tended to be well-capitalized firms. The portfolio’s allocation to commercial real estate collateralized loan obligations (CLOs) also detracted from the Fund’s benchmark-relative returns during the 12-month period.
Another detractor from the Fund’s relative returns were its ABS positions backed by consumer loans – where the portfolio’s investments have resided primarily in the most senior tranches – and AAA-rated credit card collateral. At the peak of March's distress and volatility, credit card ABS spreads had widened to historical extremes due to market illiquidity and concerns about consumer delinquencies in the wake of the COVID-19 crisis. We believe the launch of the Fed’s Term Asset-Backed Securities Loan Facility (TALF), expected in early May, could enable purchases of new-issue AAA-rated ABS, and thereby help to restore liquidity to the market.
Other portfolio allocations that had negative effects on the Fund’s benchmark-relative performance during the 12-month period included corporate credit holdings within the financials and industrials sectors, and holdings of bank loans.
Positive contributions to the Fund’s benchmark-relative returns during the 12-month period were led by an allocation to insurance-linked securities (ILS), which are sponsored by property-and-casualty insurers seeking to mitigate the effects of having to pay claims in the wake of natural disasters. The ostensibly exotic ILS market, which has typically had little or no correlation to other financial markets, proved to have relatively resilient liquidity during the extremely volatile market environment we experienced during the first calendar quarter of 2020. ILS had also displayed similar resiliency during the global financial crisis almost 12 years ago.
Pioneer Multi-Asset Ultrashort Income Fund | Annual Report | 3/31/20 7
Q Can you discuss the factors that affected the Fund’s income-generation/ distributions* to shareholders, either positively or negatively, during the 12-month period ended March 31, 2020?
A Throughout the period, we had invested the Fund in floating-rate issues with interest rates tied to London Interbank Offered Rates (LIBOR), or other short-term reference rates. The Fund’s income remained quite steady over the 12-month period, despite a decline in short-term LIBOR rates.
Historically, changes to the Fund’s dividend yield have tended to lag changes in LIBOR rates.
Q Did the Fund have any exposure to derivatives during the 12-month period ended March 31, 2020?
A No, the Fund had no derivatives exposure during the 12-month period.
Q What is your assessment of the current investment environment in the fixed-income markets, and how have you positioned the portfolio for that environment?
A Entering the Fund’s new fiscal year, we have continued to hold significant exposure to securitized credit within the portfolio. As noted previously, the sector suffered late in the 12-month period due to concerns about liquidity and fundamentals, with the latter focused on the ability of U.S. consumers to remain current on their credit card, auto, and home payments, and of businesses to pay their rents. With that said, on the consumer side, we believe securitized credit may benefit from consumers’ markedly higher aggregate savings rates, record levels of total wealth, and significantly lower levels of leverage compared with 2008. In general, relative to 2008, we believe the securitized credit market reflects much stronger underwriting standards, with greater risk-retention by issuers, more stringent rating-agency standards, and much higher levels of credit protection. In recalibrating credit protections, the rating agencies have sought to ensure that investment-grade-rated MBS issues would not suffer permanent impairment when facing a downside scenario such as occurred in 2008. It is important to note that, in the overvalued market of 2008, home prices eventually declined by approximately 30%, and commercial real estate prices declined by approximately 40%. We believe that both residential and commercial real estate valuations are much more reasonable than they were in those days and that, while there are no guarantees, neither housing nor commercial real estate should suffer the dramatic declines experienced during the 2008/09 financial crisis.
* Distributions and dividend yields are not guaranteed.
8 Pioneer Multi-Asset Ultrashort Income Fund | Annual Report | 3/31/20
Given currently wide credit spreads, we believe that corporate credit offers attractive investment opportunities. We believe the wider spreads for investment-grade corporates have resulted primarily from the aforementioned liquidity squeeze, rather than from fundamental factors. In addition, the Fund’s management team believes the financial sector, particularly U.S. and European banks, has continued to offer value. Banks have significantly improved their balance sheets and capital positions over the past several years, and have been subject to increased regulatory oversight.
The Fund’s current positioning is designed to allow it to possibly benefit from any potential recovery in credit markets. With investment-grade corporate spreads well above their long-term average, we believe investors have been receiving fair compensation for taking on credit risk. As the year progresses, we think we could see further spread compression should the global economy begin to recover.
Importantly, we do not believe the Fund faces any material, permanent impairment of capital in the current difficult environment. Given the greater credit sensitivity of the portfolio relative to the benchmark ICE BofA Index, we believe the Fund has the potential to generate solid benchmark-relative performance over the longer term.
Please refer to the Schedule of Investments on pages 21–89 for a full listing of Fund securities.
All investments are subject to risk, including the possible loss of principal. In the past several years, financial markets have experienced increased volatility and heightened uncertainty. The market prices of securities may go up or down, sometimes rapidly or unpredictably, due to general market conditions, such as real or perceived adverse economic, political, or regulatory conditions, recessions, inflation, changes in interest or currency rates, lack of liquidity in the bond markets, the spread of infectious illness or other public health issues or adverse investor sentiment. These conditions may continue, recur, worsen or spread.
The Fund has the ability to invest in a wide variety of debt securities.
The Fund may invest in underlying funds (including ETFs). In addition to the Fund’s operating expenses, you will indirectly bear the operating expenses of investments in any underlying funds.
The Fund and some of the underlying funds may utilize strategies that have a leveraging effect on the Fund, which increases the volatility of investment returns and subjects the Fund to magnified losses if the Fund’s or an underlying fund’s investments decline in value.
Pioneer Multi-Asset Ultrashort Income Fund | Annual Report | 3/31/20 9
The Fund and some of the underlying funds may use derivatives, such as options and futures, which can be illiquid, may disproportionately increase losses, and have a potentially large impact on Fund performance.
The Fund may invest in inflation-linked securities. As inflationary expectations increase, inflation-linked securities may become more attractive, because they protect future interest payments against inflation. Conversely, as inflationary concerns decrease, inflation-linked securities will become less attractive and less valuable.
The Fund may invest in credit default swaps, which may in some cases be illiquid, and they increase credit risk since the Fund has exposure to both the issuer of the referenced obligation and the counterparty to the credit default swap.
The Fund may invest in subordinated securities which may be disproportionately adversely affected by a default or even a perceived decline in creditworthiness of the issuer.
The Fund may invest in floating-rate loans. The value of collateral, if any, securing a floating-rate loan can decline or may be insufficient to meet the issuer’s obligations or may be difficult to liquidate.
The Fund may invest in insurance-linked securities. The return of principal and the payment of interest and/or dividends on insurance-linked securities are contingent on the non-occurrence of a pre-defined “trigger” event, such as a hurricane or an earthquake of a specific magnitude.
The Fund may invest in zero-coupon bonds and payment-in-kind securities, which may be more speculative and fluctuate more in value than other fixed income securities. The accrual of income from these securities are payable as taxable annual dividends to shareholders.
Investments in equity securities are subject to price fluctuation.
International investments are subject to special risks including currency fluctuations, social, economic and political uncertainties, which could increase volatility. These risks are magnified in emerging markets.
Investments in fixed-income securities involve interest rate, credit, inflation, and reinvestment risks. As interest rates rise, the value of fixed income securities generally falls.
The Fund may invest in mortgage-backed securities, which during times of fluctuating interest rates may increase or decrease more than other fixed-income securities. Mortgage-backed securities are also subject to pre-payments.
10 Pioneer Multi-Asset Ultrashort Income Fund | Annual Report | 3/31/20
Prepayment risk is the chance that an issuer may exercise its right to prepay its security, if falling interest rates prompt the issuer to do so. Forced to reinvest the unanticipated proceeds at lower interest rates, the Fund would experience a decline in income and lose the opportunity for additional price appreciation.
High yield bonds possess greater price volatility, illiquidity, and possibility of default.
There may be insufficient or illiquid collateral securing the floating rate loans held within the Fund. This may reduce the future redemption or recovery value of such loans.
The Fund may have disadvantaged access to confidential information that could be used to assess a loan issuer, as Amundi Pioneer normally seeks to avoid receiving material, non-public information.
The Fund is not a money market fund.
These risks may increase share price volatility.
There is no assurance that these and other strategies used by the Fund or underlying funds will be successful.
Please see the prospectus for a more complete discussion of the Fund’s risks.
Before investing, consider the product’s investment objectives, risks, charges and expenses. Contact your advisor or Amundi Pioneer Asset Management, Inc., for a prospectus or summary prospectus containing this information. Read it carefully.
Any information in this shareholder report regarding market or economic trends or the factors influencing the Fund’s historical or future performance are statements of opinion as of the date of this report. Past performance is no guarantee of future results.
Pioneer Multi-Asset Ultrashort Income Fund | Annual Report | 3/31/20 11
Portfolio Summary |
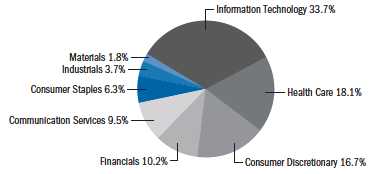
3/31/20Portfolio Diversification
(As a percentage of total investments)*
† Amount rounds to less than 0.1%.
10 Largest Holdings
(As a percentage of total investments)*
| | | |
| 1. | U.S. Treasury Floating Rate Notes, 0.385% (3 Month U.S. Treasury Bill Money | |
| Market Yield + 30 bps), 10/31/21 | 10.99% |
| 2. | Tidewater Auto Receivables Trust, Series 2020-AA, Class A2, 1.39%, 8/15/24 (144A) | 0.65 |
| 3. | PFS Financing Corp., Series 2019-B, Class A, 1.255% (1 Month USD LIBOR + | |
| 55 bps), 9/15/23 (144A) | 0.62 |
| 4. | First Investors Auto Owner Trust, Series 2020-1A, Class A, 1.49%, 1/15/25 (144A) | 0.58 |
| 5. | Verizon Owner Trust, Series 2020-A, Class A1B, 1.043% (1 Month USD LIBOR + | |
| 27 bps), 7/22/24 | 0.55 |
| 6. | Veros Automobile Receivables Trust, Series 2020-1, Class A, 1.67%, 9/15/23 (144A)
| 0.55 |
| 7. | Upstart Securitization Trust, Series 2020-1, Class A, 2.322%, 4/22/30 (144A) | 0.55 |
| 8. | LSTAR Securities Investment, Ltd., Series 2019-4, Class A1, 3.081% (1 Month | |
| USD LIBOR + 150 bps), 5/1/24 (144A) | 0.54 |
| 9. | Federal National Mortgage Association, 0.23% (SOFRRATE + 22 bps), 3/16/22 | 0.53 |
| 10. | Consumer Loan Underlying Bond Club Certificate Issuer Trust, Series 2019-HP1, | |
| Class A, 2.59%, 12/15/26 (144A) | 0.50 |
* Excludes temporary cash investments and all derivative contracts except for options purchased. The Fund is actively managed, and current holdings may be different. The holdings listed should not be considered recommendations to buy or sell any securities.
12 Pioneer Multi-Asset Ultrashort Income Fund | Annual Report | 3/31/20
Prices and Distributions |
3/31/20Net Asset Value per Share
| | | |
| Class | 3/31/20 | 3/31/19 |
| A | $9.26 | $9.92 |
| C | $9.26 | $9.91 |
| C2 | $9.27 | $9.91 |
| K | $9.29 | $9.93 |
| Y | $9.27 | $9.92 |
Distributions per Share:* 4/1/19 – 3/31/20
| | | | |
| Net Investment | Short-Term | Long-Term |
| Class | Income | Capital Gains | Capital Gains |
| A | $0.2734 | $ — | $ — |
| C | $0.2410 | $ — | $ — |
| C2 | $0.2418 | $ — | $ — |
| K | $0.2950 | $ — | $ — |
| Y | $0.2881 | $ — | $ — |
* The amount of distributions made to shareowners during the year was in excess of the net investment income earned by the Fund during the year.
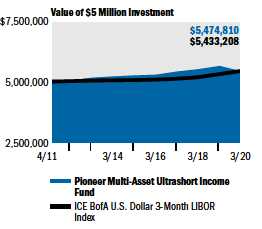
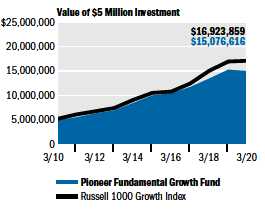
The ICE Bank of America U.S. Dollar 3-Month LIBOR Index is an unmanaged index that tracks the performance of a synthetic asset paying the London Interbank Offered Rate (LIBOR), with a constant 3-month average maturity. The index is based on the assumed purchase at par value of a synthetic instrument having exactly its stated maturity and with a coupon equal to that day’s 3-month LIBOR rate. Index returns assume reinvestment of dividends and, unlike Fund returns, do not reflect any fees, expenses or sales charges. It is not possible to invest directly in an index.
The index defined here pertains to the “Value of $10,000 Investment” and “Value of $5 Million Investment” charts on pages 14–18.
Pioneer Multi-Asset Ultrashort Income Fund | Annual Report | 3/31/20 13
| | |
Performance Update | 3/31/20 | Class A Shares |
Investment Returns
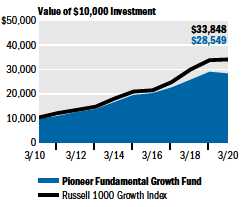
The mountain chart on the right shows the change in value of a $10,000 investment made in Class A shares of Pioneer Multi-Asset Ultrashort Income Fund at public offering price during the periods shown, compared to that of the ICE Bank of America (BofA) U.S. Dollar 3-Month LIBOR Index.
| | | | |
| Average Annual Total Returns | |
(As of March 31, 2020) | | |
| | | ICE BofA |
| | | U.S. |
| Net | Public | Dollar |
| Asset | Offering | 3-Month |
| Value | Price | LIBOR |
| Period | (NAV) | (POP)* | Index |
Life-of-Class | | | |
(4/29/11) | 0.85% | 0.57% | 0.94% |
5 years | 0.50 | -0.01 | 1.42 |
1 year | -4.02 | -4.02 | 2.38 |
|
|
| Expense Ratio | | |
(Per prospectus dated August 1, 2019) |
|
| Gross | | | |
0.59% | | | |
Call 1-800-225-6292 or visit www.amundipioneer.com/us for the most recent month-end performance results. Current performance may be lower or higher than the performance data quoted.
The performance data quoted represents past performance, which is no guarantee of future results. Investment return and principal value will fluctuate, and shares, when redeemed, may be worth more or less than their original cost.
NAV results represent the percent change in net asset value per share.
*POP returns shown above reflect the deduction of the maximum 2.50% front-end sales charge on Class A shares purchased prior to February 5, 2018.
All results are historical and assume the reinvestment of dividends and capital gains. Other share classes are available for which performance and expenses will differ.
Performance results reflect any applicable expense waivers in effect during the periods shown. Without such waivers Fund performance would be lower. Waivers may not be in effect for all funds. Certain fee waivers are contractual through a specified period. Otherwise, fee waivers can be rescinded at any time. See the prospectus and financial statements for more information.
The performance table and graph do not reflect the deduction of fees and taxes that a shareowner would pay on Fund distributions or the redemption of Fund shares.
Please refer to the financial highlights for a more current expense ratio.
14 Pioneer Multi-Asset Ultrashort Income Fund | Annual Report | 3/31/20
| | |
Performance Update | 3/31/20 | Class C Shares |
Investment Returns
The mountain chart on the right shows the change in value of a $10,000 investment made in Class C shares of Pioneer Multi-Asset Ultrashort Income Fund during the periods shown, compared to that of the ICE Bank of America (BofA) U.S. Dollar 3-Month LIBOR Index.
| | | |
| Average Annual Total Returns | |
(As of March 31, 2020) | |
| | ICE BofA |
| | U.S. |
| Net | Dollar |
| Asset | 3-Month |
| Value | LIBOR |
| Period | (NAV) | Index |
Life-of-Class | | |
(4/29/11) | 0.48% | 0.94% |
5 years | 0.20 | 1.42 |
1 year | -4.24 | 2.38 |
|
|
| Expense Ratio | | |
(Per prospectus dated August 1, 2019) |
|
| Gross | | |
0.91% | | |
Call 1-800-225-6292 or visit www.amundipioneer.com/us for the most recent month-end performance results. Current performance may be lower or higher than the performance data quoted.
The performance data quoted represents past performance, which is no guarantee of future results. Investment return and principal value will fluctuate, and shares, when redeemed, may be worth more or less than their original cost.
NAV results represent the percent change in net asset value per share. All results are historical and assume the reinvestment of dividends and capital gains. Other share classes are available for which performance and expenses will differ.
Performance results reflect any applicable expense waivers in effect during the periods shown. Without such waivers Fund performance would be lower. Waivers may not be in effect for all funds. Certain fee waivers are contractual through a specified period. Otherwise, fee waivers can be rescinded at any time. See the prospectus and financial statements for more information.
The performance table and graph do not reflect the deduction of fees and taxes that a shareowner would pay on Fund distributions or the redemption of Fund shares.
Please refer to the financial highlights for a more current expense ratio.
Pioneer Multi-Asset Ultrashort Income Fund | Annual Report | 3/31/20 15
| | |
Performance Update | 3/31/20 | Class C2 Shares |
Investment Returns
The mountain chart on the right shows the change in value of a $10,000 investment made in Class C2 shares of Pioneer Multi-Asset Ultrashort Income Fund during the periods shown, compared to that of the ICE Bank of America (BofA) U.S. Dollar 3-Month LIBOR Index.
| | | | |
| Average Annual Total Returns | |
(As of March 31, 2020) | |
| | | ICE BofA |
| | | U.S. |
| | | Dollar |
| | | 3-Month |
| If | If | LIBOR |
| Period | Held | Redeemed | Index |
Life-of-Fund
| | | |
(4/29/11) | 0.49% | 0.49% | 0.94% |
5 years | 0.22 | 0.22 | 1.42 |
1 year | -4.13 | -4.13 | 2.38 |
|
|
| Expense Ratio | | |
(Per prospectus dated August 1, 2019) |
|
| Gross | | | |
0.91% | | | |
Call 1-800-225-6292 or visit www.amundipioneer.com/us for the most recent month-end performance results. Current performance may be lower or higher than the performance data quoted.
The performance data quoted represents past performance, which is no guarantee of future results. Investment return and principal value will fluctuate, and shares, when redeemed, may be worth more or less than their original cost.
Class C2 shares held for less than 1 year are subject to a 1% contingent deferred sales charge (CDSC). “If Held” results represent the percentage change in net asset value per share. “If Redeemed” returns would have been lower had sales charges been reflected. All results are historical and assume the reinvestment of dividends and capital gains. Other share classes are available for which performance and expenses will differ.
The performance shown for periods prior to the commencement of operations of Class C2 shares on August 1, 2013, is the net asset value performance of the Fund’s Class C shares, which has not been restated to reflect any differences in expenses. For the period beginning August 1, 2013, the actual performance of Class C2 shares is reflected.
Performance results reflect any applicable expense waivers in effect during the periods shown. Without such waivers Fund performance would be lower. Waivers may not be in effect for all funds. Certain fee waivers are contractual through a specified period. Otherwise, fee waivers can be rescinded at any time. See the prospectus and financial statements for more information.
The performance table and graph do not reflect the deduction of fees and taxes that a shareowner would pay on Fund distributions or the redemption of Fund shares.
Please refer to the financial highlights for a more current expense ratio.
16 Pioneer Multi-Asset Ultrashort Income Fund | Annual Report | 3/31/20
| | |
Performance Update | 3/31/20 | Class K Shares |
Investment Returns
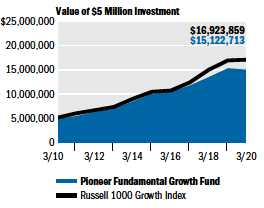
The mountain chart on the right shows the change in value of a $5 million investment made in Class K shares of Pioneer Multi-Asset Ultrashort Income Fund during the periods shown, compared to that of the ICE Bank of America (BofA) U.S. Dollar 3-Month LIBOR Index.
| | | |
| Average Annual Total Returns | |
(As of March 31, 2020) | |
| | ICE BofA |
| | U.S. |
| Net | Dollar |
| Asset | 3-Month |
| Value | LIBOR |
| Period | (NAV) | Index |
Life-of-Fund
| | |
(4/29/11) | 1.07% | 0.94% |
5 years | 0.77 | 1.42 |
1 year | -3.60 | 2.38 |
|
|
| Expense Ratio | | |
(Per prospectus dated August 1, 2019) |
|
| Gross | | |
0.37% | | |
Call 1-800-225-6292 or visit www.amundipioneer.com/us for the most recent month-end performance results. Current performance may be lower or higher than the performance data quoted.
The performance data quoted represents past performance, which is no guarantee of future results. Investment return and principal value will fluctuate, and shares, when redeemed, may be worth more or less than their original cost.
The performance shown for Class K shares for the period prior to the commencement of operations of Class K shares on December 20, 2012, is the net asset value performance of the Fund’s Class A shares, which has not been restated to reflect any differences in expenses, including Rule 12b-1 fees applicable to Class A shares. Since fees for Class A shares generally are higher than those of Class K shares, the performance of Class K shares prior to their inception would have been higher than the performance shown. For the period beginning on December 20, 2012, the actual performance of Class K shares is reflected. Class K shares are not subject to sales charges and are available for limited groups of eligible investors, including institutional investors. All results are historical and assume the reinvestment of dividends and capital gains. Other share classes are available for which performance and expenses will differ.
Performance results reflect any applicable expense waivers in effect during the periods shown. Without such waivers Fund performance would be lower. Waivers may not be in effect for all funds. Certain fee waivers are contractual through a specified period. Otherwise, fee waivers can be rescinded at any time. See the prospectus and financial statements for more information.
The performance table and graph do not reflect the deduction of fees and taxes that a shareowner would pay on Fund distributions or the redemption of Fund shares.
Please refer to the financial highlights for a more current expense ratio.
Pioneer Multi-Asset Ultrashort Income Fund | Annual Report | 3/31/20 17
| | |
Performance Update | 3/31/20 | Class Y Shares |
Investment Returns
The mountain chart on the right shows the change in value of a $5 million investment made in Class Y shares of Pioneer Multi-Asset Ultrashort Income Fund during the periods shown, compared to that of the ICE Bank of America (BofA) U.S. Dollar 3-Month LIBOR Index.
| | | |
| Average Annual Total Returns | |
(As of March 31, 2020) | |
| | ICE BofA |
| | U.S. |
| Net | Dollar |
| Asset | 3-Month |
| Value | LIBOR |
| Period | (NAV) | Index |
Life-of-Class | | |
(4/29/11) | 1.02% | 0.94% |
5 years | 0.64 | 1.42 |
1 year | -3.78 | 2.38 |
|
|
| Expense Ratio | | |
(Per prospectus dated August 1, 2019) |
|
| Gross | | |
0.45% | | |
Call 1-800-225-6292 or visit www.amundipioneer.com/us for the most recent month-end performance results. Current performance may be lower or higher than the performance data quoted.
The performance data quoted represents past performance, which is no guarantee of future results. Investment return and principal value will fluctuate, and shares, when redeemed, may be worth more or less than their original cost.
Class Y shares are not subject to sales charges and are available for limited groups of eligible investors, including institutional investors. All results are historical and assume the reinvestment of dividends and capital gains. Other share classes are available for which performance and expenses will differ.
Performance results reflect any applicable expense waivers in effect during the periods shown. Without such waivers Fund performance would be lower. Waivers may not be in effect for all funds. Certain fee waivers are contractual through a specified period. Otherwise, fee waivers can be rescinded at any time. See the prospectus and financial statements for more information.
The performance table and graph do not reflect the deduction of fees and taxes that a shareowner would pay on Fund distributions or the redemption of Fund shares.
Please refer to the financial highlights for a more current expense ratio.
18 Pioneer Multi-Asset Ultrashort Income Fund | Annual Report | 3/31/20
Comparing Ongoing Fund Expenses
As a shareowner in the Fund, you incur two types of costs:
(1) ongoing costs, including management fees, distribution and/or service (12b-1) fees, and other Fund expenses; and
(2) transaction costs, including sales charges (loads) on purchase payments.
This example is intended to help you understand your ongoing expenses (in dollars) of investing in the Fund and to compare these costs with the ongoing costs of investing in other mutual funds. The example is based on an investment of $1,000 at the beginning of the Fund’s latest six-month period and held throughout the six months.
Using the Tables
Actual Expenses
The first table below provides information about actual account values and actual expenses. You may use the information in this table, together with the amount you invested, to estimate the expenses that you paid over the period as follows:
(1) Divide your account value by $1,000
Example: an $8,600 account value ÷ $1,000 = 8.6
(2) Multiply the result in (1) above by the corresponding share class’s number in the third row under the heading entitled “Expenses Paid During Period” to estimate the expenses you paid on your account during this period.
Expenses Paid on a $1,000 Investment in Pioneer Multi-Asset Ultrashort Income Fund
Based on actual returns from October 1, 2019 through March 31, 2020.
| | | | | | |
| Share Class | A | C | C2 | K | Y |
Beginning Account | $1,000.00 | $1,000.00 | $1,000.00 | $1,000.00 | $1,000.00 |
Value on 10/1/19 | | | | | |
Ending Account Value | $945.15 | $944.47 | $945.56 | $948.26 | $945.84 |
(after expenses) | | | | | |
on 3/31/20 | | | | | |
Expenses Paid | $2.82 | $4.33 | $4.28 | $1.75 | $2.14 |
During Period* | | | | | |
* Expenses are equal to the Fund's annualized expense ratio of 0.58%, 0.89%, 0.88%, 0.36% and 0.44% for class A, C, C2, K, and Y shares, respectively, multiplied by the average account value over the period, multiplied by 183/366 (to reflect the partial year period).
Pioneer Multi-Asset Ultrashort Income Fund | Annual Report | 3/31/20 19
Hypothetical Example for Comparison Purposes
The table below provides information about hypothetical account values and hypothetical expenses based on the Fund’s actual expense ratio and an assumed rate of return of 5% per year before expenses, which is not the Fund’s actual return. The hypothetical account values and expenses may not be used to estimate the actual ending account balance or expenses you paid for the period.
You may use this information to compare the ongoing costs of investing in the Fund and other funds. To do so, compare this 5% hypothetical example with the 5% hypothetical examples that appear in the shareholder reports of the other funds.
Please note that the expenses shown in the tables are meant to highlight your ongoing costs only and do not reflect any transaction costs, such as sales charges (loads) that are charged at the time of the transaction. Therefore, the table below is useful in comparing ongoing costs only and will not help you determine the relative total costs of owning different funds. In addition, if these transaction costs were included, your costs would have been higher.
Expenses Paid on a $1,000 Investment in Pioneer Multi-Asset Ultrashort Income Fund
Based on a hypothetical 5% return per year before expenses, reflecting the period from October 1, 2019 through March 31, 2020.
| | | | | | |
| Share Class | A | C | C2 | K | Y |
Beginning Account | $1,000.00 | $1,000.00 | $1,000.00 | $1,000.00 | $1,000.00 |
Value on 10/1/19 | | | | | |
Ending Account Value | $1,022.10 | $1,020.55 | $1,020.60 | $1,023.20 | $1,022.80 |
(after expenses) | | | | | |
on 3/31/20 | | | | | |
Expenses Paid | $2.93 | $4.50 | $4.45 | $1.82 | $2.23 |
During Period* | | | | | |
* Expenses are equal to the Fund's annualized expense ratio of 0.58%, 0.89%, 0.88%, 0.36% and 0.44% for class A, C, C2, K, and Y shares, respectively, multiplied by the average account value over the period, multiplied by 183/366 (to reflect the partial year period).
20 Pioneer Multi-Asset Ultrashort Income Fund | Annual Report | 3/31/20
Schedule of Investments |
3/31/20 | | | | |
| Shares | | | Value |
| | UNAFFILIATED ISSUERS — 96.2% | |
| | COMMON STOCK — 0.0%† of Net Assets | |
| | Transportation Infrastructure — 0.0%† | |
| 2,377(a) | | Syncreon Group | $ 12,678 |
| | Total Transportation Infrastructure | $ 12,678 |
| | TOTAL COMMON STOCK | |
| | (Cost $33,278) | $ 12,678 |
| Principal | | | |
| Amount | | | |
| USD ($) | | | |
| | ASSET BACKED SECURITIES — 33.5% | |
| | of Net Assets | |
| 244,936(b) | | 321 Henderson Receivables I LLC, Series 2004-A, | |
| | Class A1, 1.055% (1 Month USD LIBOR + | |
| | 35 bps), 9/15/45 (144A) | $ 233,344 |
| 2,045,570(b) | | 321 Henderson Receivables I LLC, Series 2005-1A, | |
| | Class A1, 0.935% (1 Month USD LIBOR + | |
| | 23 bps), 11/15/40 (144A) | 1,883,304 |
| 377,753(b) | | 321 Henderson Receivables I LLC, Series 2006-1A, | |
| | Class A1, 0.905% (1 Month USD LIBOR + | |
| | 20 bps), 3/15/41 (144A) | 363,783 |
| 926,402(b) | | 321 Henderson Receivables I LLC, Series 2006-2A, | |
| | Class A1, 0.905% (1 Month USD LIBOR + | |
| | 20 bps), 6/15/41 (144A) | 865,057 |
| 1,355,680(b) | | 321 Henderson Receivables I LLC, Series 2006-4A, | |
| | Class A1, 0.905% (1 Month USD LIBOR + | |
| | 20 bps), 12/15/41 (144A) | 1,317,248 |
| 379,474(b) | | 321 Henderson Receivables I LLC, Series 2007-1A, | |
| | Class A1, 0.905% (1 Month USD LIBOR + | |
| | 20 bps), 3/15/42 (144A) | 336,655 |
| 1,310,785(b) | | 321 Henderson Receivables II LLC, Series 2006-3A, | |
| | Class A1, 0.905% (1 Month USD LIBOR + | |
| | 20 bps), 9/15/41 (144A) | 1,217,030 |
| 1,893,415(b) | | ABFC Trust, Series 2004-OPT2, Class M1, 1.772% | |
| | (1 Month USD LIBOR + 83 bps), 8/25/33 | 1,778,367 |
| 568,708(b) | | ABFC Trust, Series 2005-WMC1, Class M2, 1.622% | |
| | (1 Month USD LIBOR + 68 bps), 6/25/35 | 563,610 |
| 7,756,469 | | ACC Trust, Series 2019-2, Class A, 2.82%, | |
| | 2/21/23 (144A) | 7,729,154 |
| 842,005(b) | | ACE Securities Corp. Home Equity Loan Trust, Series | |
| | 2005-WF1, Class M2, 1.607% (1 Month USD LIBOR | |
| | + 66 bps), 5/25/35 | 847,818 |
| 1,585,645(b) | | Aegis Asset Backed Securities Trust Mortgage Pass-Through | |
| | Ctfs, Series 2004-3, Class M1, 1.847% | |
| | (1 Month USD LIBOR + 90 bps), 9/25/34 | 1,480,821 |
| 2,540,509(b) | | Aegis Asset Backed Securities Trust Mortgage Pass-Through | |
| | Ctfs, Series 2004-4, Class M1, 1.847% | |
| | (1 Month USD LIBOR + 90 bps), 10/25/34 | 2,388,077 |
The accompanying notes are an integral part of these financial statements.
Pioneer Multi-Asset Ultrashort Income Fund | Annual Report | 3/31/20 21
Schedule of Investments | 3/31/20 (continued)
| | | | |
| Principal | | | |
| Amount | | | |
| USD ($) | | | Value |
| | Asset Backed Securities — (continued) | |
| 4,854 | | American Credit Acceptance Receivables Trust, | |
| | Series 2017-2, Class C, 2.86%, 6/12/23 (144A) | $ 4,851 |
| 308,418 | | American Credit Acceptance Receivables Trust, | |
| | Series 2018-3, Class B, 3.49%, 6/13/22 (144A) | 308,243 |
| 8,000,000 | | American Credit Acceptance Receivables Trust, | |
| | Series 2020-1, Class B, 2.08%, 12/13/23 (144A) | 7,721,058 |
| 806,501(b) | | Ameriquest Mortgage Securities, Inc. Asset-Backed | |
| | Pass-Through Ctfs, Series 2005-R3, Class M2, | |
| | 1.652% (1 Month USD LIBOR + 71 bps), 5/25/35 | 804,550 |
| 21,851(b) | | Ameriquest Mortgage Securities, Inc. Asset-Backed | |
| | Pass-Through Ctfs, Series 2005-R10, Class M1, | |
| | 1.357% (1 Month USD LIBOR + 41 bps), 1/25/36 | 21,764 |
| 68,915(b) | | Amortizing Residential Collateral Trust, Series 2002-BC5, | |
| | Class M1, 1.982% (1 Month USD LIBOR + | |
| | 104 bps), 7/25/32 | 65,010 |
| 6,695,120 | | Amur Equipment Finance Receivables V LLC, | |
| | Series 2018-1A, Class A2, 3.24%, 12/20/23 (144A) | 6,685,276 |
| 6,422,003 | | Amur Equipment Finance Receivables VI LLC, | |
| | Series 2018-2A, Class A2, 3.89%, 7/20/22 (144A) | 6,543,879 |
| 4,000,000 | | Amur Equipment Finance Receivables VII LLC, | |
| | Series 2019-1A, Class B, 2.8%, 3/20/25 (144A) | 3,943,272 |
| 618,750(b) | | Annisa CLO, Ltd., Series 2016-2A, Class X, 2.419% | |
| | (3 Month USD LIBOR + 60 bps), 7/20/31 (144A) | 618,723 |
| 375,000(b) | | Apidos CLO XV, Series 2013-15A, Class XRR, 2.419% | |
| | (3 Month USD LIBOR + 60 bps), 4/20/31 (144A) | 374,996 |
| 964,286(b) | | Apidos CLO XXIX, Series 2018-29A, Class X, 2.344% | |
| | (3 Month USD LIBOR + 55 bps), 7/25/30 (144A) | 964,278 |
| 2,600,000(b) | | Apidos CLO XXXII, Series 2019-32A, Class X, 2.333% | |
| | (3 Month USD LIBOR + 65 bps), 1/20/33 (144A) | 2,599,943 |
| 13,978,209 | | Aqua Finance Trust, Series 2019-A, Class A, 3.14%, | |
| | 7/16/40 (144A) | 13,922,423 |
| 146,875(b) | | Ares XXXVIII CLO, Ltd., Series 2015-38A, Class X, 2.319% | |
| | (3 Month USD LIBOR + 50 bps), 4/20/30 (144A) | 146,874 |
| 225,000(b) | | Ares XXXVR CLO, Ltd., Series 2015-35RA, Class X, 2.481% | |
| | (3 Month USD LIBOR + 65 bps), 7/15/30 (144A) | 224,999 |
| 1,021,875(b) | | Argent Securities, Inc. Asset-Backed Pass-Through | |
| | Certificates, Series 2004-W11, Class M2, | |
| | 1.997% (1 Month USD LIBOR + | |
| | 105 bps), 11/25/34 | 998,290 |
| 29,745(b) | | Argent Securities, Inc. Asset-Backed Pass-Through | |
| | Certificates, Series 2005-W2, Class A1, | |
| | 1.207% (1 Month USD LIBOR + | |
| | 26 bps), 10/25/35 | 29,700 |
| 95,106(b) | | Argent Securities, Inc. Asset-Backed Pass-Through | |
| | Certificates, Series 2005-W3, Class A2D, | |
| | 1.287% (1 Month USD LIBOR + | |
| | 34 bps), 11/25/35 | 93,191 |
The accompanying notes are an integral part of these financial statements.
22 Pioneer Multi-Asset Ultrashort Income Fund | Annual Report | 3/31/20
| | | | |
| Principal | | | |
| Amount | | | |
| USD ($) | | | Value |
| | Asset Backed Securities — (continued) | |
| 320,491 | | ARI Fleet Lease Trust, Series 2016-A, Class A3, 2.11%, | |
| | 7/15/24 (144A) | $ 320,075 |
| 284,642 | | ARI Fleet Lease Trust, Series 2017-A, Class A2, 1.91%, | |
| | 4/15/26 (144A) | 284,077 |
| 9,044,762 | | Arivo Acceptance Auto Loan Receivables Trust, | |
| | Series 2019-1, Class A, 2.99%, 7/15/24 (144A) | 8,872,622 |
| 5,229,405 | | Ascentium Equipment Receivables, Series 2019-1A, | |
| | Class A2, 2.84%, 6/10/22 (144A) | 5,216,683 |
| 20,000,000 | | Ascentium Equipment Receivables, Series 2019-2A, | |
| | Class A2, 2.24%, 6/10/22 (144A) | 20,202,394 |
| 307,767(b) | | Asset Backed Securities Corp. Home Equity Loan Trust, | |
| | Series 2005-HE4, Class M4, 1.892% (1 Month | |
| | USD LIBOR + 95 bps), 5/25/35 | 305,312 |
| 75,493(b) | | Asset Backed Securities Corp. Home Equity Loan Trust, | |
| | Series 2006-HE1, Class A3, 1.147% (1 Month | |
| | USD LIBOR + 20 bps), 1/25/36 | 74,970 |
| 22,302(b) | | Asset-Backed Pass-Through Certificates, Series 2004-R2, | |
| | Class A1A, 1.637% (1 Month USD LIBOR + | |
| | 69 bps), 4/25/34 | 21,936 |
| 234,816(b) | | Asset-Backed Pass-Through Certificates, Series 2004-R2, | |
| | Class A1B, 1.567% (1 Month USD LIBOR + | |
| | 62 bps), 4/25/34 | 230,803 |
| 1,658,571(b) | | ASSURANT CLO III, Ltd., Series 2018-2A, Class X, 2.519% | |
| | (3 Month USD LIBOR + 70 bps), 10/20/31 (144A) | 1,658,560 |
| 16,422,533(b) | | Atlas Senior Loan Fund III, Ltd., Series 2013-1A, | |
| | Class AR, 2.522% (3 Month USD LIBOR + | |
| | 83 bps), 11/17/27 (144A) | 15,435,440 |
| 959,751(b) | | Atlas Senior Loan Fund XII, Ltd., Series 2018-12A, | |
| | Class X, 2.551% (3 Month USD LIBOR + | |
| | 75 bps), 10/24/31 (144A) | 959,742 |
| 880,147 | | Avant Loans Funding Trust, Series 2018-B, Class A, | |
| | 3.42%, 1/18/22 (144A) | 866,825 |
| 4,223,271 | | Avant Loans Funding Trust, Series 2019-A, Class A, | |
| | 3.48%, 7/15/22 (144A) | 4,108,857 |
| 6,183,482 | | Avant Loans Funding Trust, Series 2019-B, Class A, | |
| | 2.72%, 10/15/26 (144A) | 6,017,557 |
| 1,015,589 | | Avid Automobile Receivables Trust, Series 2018-1, | |
| | Class A, 2.84%, 8/15/23 (144A) | 1,009,924 |
| 6,935,780 | | Avid Automobile Receivables Trust, Series 2019-1, | |
| | Class A, 2.62%, 2/15/24 (144A) | 6,773,511 |
| 1,266,667(b) | | Babson CLO, Ltd., Series 2015-IA, Class XR, 2.369% | |
| | (3 Month USD LIBOR + 55 bps), 1/20/31 (144A) | 1,266,653 |
| 150,000(b) | | Barings CLO, Ltd., Series 2018-2A, Class X, 2.431% | |
| | (3 Month USD LIBOR + 60 bps), 4/15/30 (144A) | 149,999 |
| 642,857(b) | | Barings CLO, Ltd., Series 2018-3A, Class X, 2.319% | |
| | (3 Month USD LIBOR + 50 bps), 7/20/29 (144A) | 642,853 |
The accompanying notes are an integral part of these financial statements.
Pioneer Multi-Asset Ultrashort Income Fund | Annual Report | 3/31/20 23
Schedule of Investments | 3/31/20 (continued)
| | | | |
| Principal | | | |
| Amount | | | |
| USD ($) | | | Value |
| | Asset Backed Securities — (continued) | |
| 1,666,666(b) | | Barings CLO, Ltd., Series 2019-1A, Class X, 2.581% | |
| | (3 Month USD LIBOR + 75 bps), 4/15/31 (144A) | $ 1,666,656 |
| 6,250,000(b) | | Barings Middle Market CLO, Ltd., Series 2018-IA, | |
| | Class A1, 3.361% (3 Month USD LIBOR + | |
| | 153 bps), 1/15/31 (144A) | 5,842,269 |
| 1,500,000(b) | | Battery Park CLO, Ltd., Series 2019-1A, Class X, 2.481% | |
| | (3 Month USD LIBOR + 65 bps), 7/15/32 (144A) | 1,499,991 |
| 519(c) | | Bayview Financial Acquisition Trust, Series 2007-A, | |
| | Class 1A2, 6.205%, 5/28/37 | 519 |
| 10,274,301 | | BCC Funding Corp. XVI LLC, Series 2019-1A, Class A1, | |
| | 2.3%, 10/20/20 (144A) | 10,228,244 |
| 6,476,379 | | BCC Funding XIV LLC, Series 2018-1A, Class A2, 2.96%, | |
| | 6/20/23 (144A) | 6,462,694 |
| 2,500,000(b) | | BDS, Ltd., Series 2020-FL5, Class C, 2.662% (1 Month | |
| | USD LIBOR + 205 bps), 2/16/37 (144A) | 2,020,665 |
| 1,546,875(b) | | Bean Creek CLO, Ltd., Series 2015-1A, Class XR, 2.419% | |
| | (3 Month USD LIBOR + 60 bps), 4/20/31 (144A) | 1,546,836 |
| 257,997(b) | | Bear Stearns Asset Backed Securities I Trust, Series | |
| | 2005-TC1, Class M1, 1.607% (1 Month USD LIBOR | |
| | + 66 bps), 5/25/35 | 255,501 |
| 342,297(b) | | Bear Stearns Asset Backed Securities Trust, Series 2001-3, | |
| | Class A1, 1.847% (1 Month USD LIBOR + | |
| | 90 bps), 10/27/32 | 311,657 |
| 565,343(b) | | Bear Stearns Asset Backed Securities Trust, Series | |
| | 2006-SD1, Class A, 1.317% (1 Month USD LIBOR + | |
| | 37 bps), 4/25/36 | 563,027 |
| 1,187,500(b) | | BlueMountain CLO, Ltd., Series 2013-2A, Class X, 2.452% | |
| | (3 Month USD LIBOR + 65 bps), 10/22/30 (144A) | 1,187,417 |
| 771,429(b) | | BlueMountain CLO, Ltd., Series 2018-2A, Class X, 2.342% | |
| | (3 Month USD LIBOR + 65 bps), 8/15/31 (144A) | 771,422 |
| 2,750,000(b) | | California Street CLO IX LP, Series 2012-9A, Class XR2, | |
| | 2.543% (3 Month USD LIBOR + 70 bps), | |
| | 7/16/32 (144A) | 2,749,725 |
| 4,151,002(b) | | Canadian Pacer Auto Receivables Trust, Series 2018-2A, | |
| | Class A2B, 0.93% (1 Month USD LIBOR + | |
| | 18 bps), 6/21/21 (144A) | 4,139,859 |
| 850,000(b) | | Carlyle US CLO, Ltd., Series 2019-4A, Class M, 2.528% | |
| | (3 Month USD LIBOR + 65 bps), 1/15/33 (144A) | 849,963 |
| 2,366,276 | | Carnow Auto Receivables Trust, Series 2018-1A, Class A, | |
| | 3.61%, 10/15/21 (144A) | 2,349,850 |
| 12,211,385 | | Carnow Auto Receivables Trust, Series 2019-1A, Class A, | |
| | 2.72%, 11/15/22 (144A) | 12,079,148 |
| 3,000,000 | | Carvana Auto Receivables Trust, Series 2019-4A, | |
| | Class A2, 2.2%, 7/15/22 (144A) | 2,973,699 |
| 8,000,000 | | Carvana Auto Receivables Trust, Series 2020-N1A, | |
| | Class B, 2.01%, 3/17/25 (144A) | 7,840,000 |
| 5,000,000 | | Carvana Auto Receivables Trust, Series 2020-N1A, | |
| | Class D, 3.43%, 1/15/26 (144A) | 4,855,000 |
The accompanying notes are an integral part of these financial statements.
24 Pioneer Multi-Asset Ultrashort Income Fund | Annual Report | 3/31/20
| | | | |
| Principal | | | |
| Amount | | | |
| USD ($) | | | Value |
| | Asset Backed Securities — (continued) | |
| 466,645(b) | | Catamaran CLO, Ltd., Series 2013-1A, Class X, 2.344% | |
| | (3 Month USD LIBOR + 55 bps), 1/27/28 (144A) | $ 466,631 |
| 866,949 | | Cazenovia Creek Funding II LLC, Series 2018-1A, | |
| | Class B, 3.984%, 7/15/30 (144A) | 821,483 |
| 814,285(b) | | CBAM, Ltd., Series 2018-5A, Class X, 2.386% (3 Month | |
| | USD LIBOR + 55 bps), 4/17/31 (144A) | 814,280 |
| 2,062,500(b) | | Cent CLO 21, Ltd., Series 2014-21A, Class XR2, 2.444% | |
| | (3 Month USD LIBOR + 65 bps), 7/27/30 (144A) | 2,062,483 |
| 70,355(d) | | Centex Home Equity Loan Trust, Series 2003-A, Class AF6, | |
| | 3.654%, 3/25/33 | 69,025 |
| 281,250(b) | | CFIP CLO, Ltd., Series 2018-1A, Class X, 2.569% (3 Month | |
| | USD LIBOR + 75 bps), 7/18/31 (144A) | 281,248 |
| 778,346 | | Chesapeake Funding II LLC, Series 2017-2A, Class A1, | |
| | 1.99%, 5/15/29 (144A) | 772,095 |
| 1,704,578(b) | | Chesapeake Funding II LLC, Series 2017-2A, Class A2, | |
| | 1.155% (1 Month USD LIBOR + 45 bps), | |
| | 5/15/29 (144A) | 1,689,174 |
| 2,769,675(b) | | Chesapeake Funding II LLC, Series 2017-3A, Class A2, | |
| | 1.045% (1 Month USD LIBOR + 34 bps), | |
| | 8/15/29 (144A) | 2,746,326 |
| 3,850,787(b) | | Chesapeake Funding II LLC, Series 2018-1A, Class A2, | |
| | 1.155% (1 Month USD LIBOR + 45 bps), | |
| | 4/15/30 (144A) | 3,770,841 |
| 1,125,000(b) | | CIFC Funding, Ltd., Series 2013-4A, Class XRR, 2.344% | |
| | (3 Month USD LIBOR + 55 bps), 4/27/31 (144A) | 1,124,991 |
| 2,142,857(b) | | CIFC Funding, Ltd., Series 2014-4RA, Class X, 2.386% | |
| | (3 Month USD LIBOR + 55 bps), 10/17/30 (144A) | 2,142,844 |
| 533,729 | | CIG Auto Receivables Trust, Series 2017-1A, Class A, | |
| | 2.71%, 5/15/23 (144A) | 532,024 |
| 7,746,368 | | CIG Auto Receivables Trust, Series 2019-1A, Class A, | |
| | 3.33%, 8/15/24 (144A) | 7,643,567 |
| 2,832,404(b) | | CIM Small Business Loan Trust, Series 2018-1A, Class A, | |
| | 2.173% (1 Month USD LIBOR + 140 bps), | |
| | 3/20/43 (144A) | 2,699,691 |
| 1,824,420(b) | | Citigroup Mortgage Loan Trust, Inc., Series 2006-WFH1, | |
| | Class M3, 1.547% (1 Month USD LIBOR + | |
| | 60 bps), 1/25/36 | 1,803,972 |
| 437,500(b) | | Clear Creek CLO, Series 2015-1A, Class X, 2.819% | |
| | (3 Month USD LIBOR + 100 bps), 10/20/30 (144A) | 437,486 |
| 1,750,000(b) | | Columbia Cent CLO 28, Ltd., Series 2018-28A, Class X, | |
| | 2.392% (3 Month USD LIBOR + 65 bps), | |
| | 11/7/30 (144A) | 1,749,984 |
| 1,831,869 | | Commonbond Student Loan Trust, Series 2016-B, | |
| | Class A1, 2.73%, 10/25/40 (144A) | 1,858,435 |
| 244,524(b) | | Commonbond Student Loan Trust, Series 2016-B, | |
| | Class A2, 2.397% (1 Month USD LIBOR + 145 bps), | |
| | 10/25/40 (144A) | 242,025 |
The accompanying notes are an integral part of these financial statements.
Pioneer Multi-Asset Ultrashort Income Fund | Annual Report | 3/31/20 25
Schedule of Investments | 3/31/20 (continued)
| | | | |
| Principal | | | |
| Amount | | | |
| USD ($) | | | Value |
| | | Asset Backed Securities — (continued) | |
| 2,213,233(b) | | Commonbond Student Loan Trust, Series 2017-AGS, | |
| | | Class A2, 1.797% (1 Month USD LIBOR + | |
| | | 85 bps), 5/25/41 (144A) | $ 2,175,280 |
| 4,597,111(b) | | Commonbond Student Loan Trust, Series 2017-BGS, | |
| | | Class A2, 1.597% (1 Month USD LIBOR + | |
| | | 65 bps), 9/25/42 (144A) | 4,506,099 |
| 3,738,609(b) | | Commonbond Student Loan Trust, Series 2018-AGS, | |
| | | Class A2, 1.447% (1 Month USD LIBOR + | |
| | | 50 bps), 2/25/44 (144A) | 3,638,608 |
| 7,865,714(b) | | Commonbond Student Loan Trust, Series 2018-BGS, | |
| | | Class A2, 1.517% (1 Month USD LIBOR + | |
| | | 57 bps), 9/25/45 (144A) | 7,496,946 |
| 6,090,104(b) | | Commonbond Student Loan Trust, Series 2018-CGS, | |
| | | Class A2, 1.747% (1 Month USD LIBOR + | |
| | | 80 bps), 2/25/46 (144A) | 6,006,618 |
| 8,591,168(b) | | Commonbond Student Loan Trust, Series 2019-AGS, | |
| | | Class A2, 1.847% (1 Month USD LIBOR + | |
| | | 90 bps), 1/25/47 (144A) | 8,437,270 |
| 749,674 | | Conn’s Receivables Funding LLC, Series 2018-A, Class A, | |
| | | 3.25%, 1/15/23 (144A) | 731,917 |
| 508,560 | | Conn’s Receivables Funding LLC, Series 2018-A, Class B, | |
| | | 4.65%, 1/15/23 (144A) | 487,194 |
| 1,663,916 | | Conn’s Receivables Funding LLC, Series 2019-A, Class A, | |
| | | 3.4%, 10/16/23 (144A) | 1,616,300 |
| 5,200,000 | | Conn’s Receivables Funding LLC, Series 2019-A, Class B, | |
| | | 4.36%, 10/16/23 (144A) | 4,926,334 |
| 9,216,102 | | Conn’s Receivables Funding LLC, Series 2019-B, Class A, | |
| | | 2.66%, 6/17/24 (144A) | 8,733,415 |
| 106,647(b) | | Conseco Finance Home Equity Loan Trust, Series 2002-C, | |
| | | Class MV1, 2.205% (1 Month USD LIBOR + | |
| | | 150 bps), 5/15/32 | 105,127 |
| 3,603,615 | | Consumer Lending Receivables Trust, Series 2019-A, | |
| | | Class A, 3.52%, 4/15/26 (144A) | 3,488,286 |
| 24,991,948 | | Consumer Loan Underlying Bond Club Certificate Issuer | |
| | | Trust, Series 2019-HP1, Class A, 2.59%, | |
| | | 12/15/26 (144A) | 23,350,072 |
| 14,651,165 | | Consumer Loan Underlying Bond CLUB Credit Trust , | |
| | | Series 2020-P1, Class A, 2.26%, 3/15/28 (144A) | 14,050,126 |
| 1,718,644 | | Consumer Loan Underlying Bond Credit Trust, Series | |
| | | 2018-P2, Class A, 3.47%, 10/15/25 (144A) | 1,695,093 |
| 3,838,738 | | Consumer Loan Underlying Bond Credit Trust, Series | |
| | | 2019-P1, Class A, 2.94%, 7/15/26 (144A) | 3,707,875 |
| 30,225(b) | | Countrywide Asset-Backed Certificates, Series 2004-8, | |
| | | Class M1, 1.997% (1 Month USD LIBOR + | |
| | | 105 bps), 1/25/35 | 30,177 |
| 153,916(b) | | Countrywide Asset-Backed Certificates, Series 2005-9, | |
| | | Class M1, 1.467% (1 Month USD LIBOR + | |
| | | 52 bps), 1/25/36 | 151,814 |
The accompanying notes are an integral part of these financial statements.
26 Pioneer Multi-Asset Ultrashort Income Fund | Annual Report | 3/31/20
| | | | |
| Principal | | | |
| Amount | | | |
| USD ($) | | | Value |
| | Asset Backed Securities — (continued) | |
| 125,368(b) | | Countrywide Asset-Backed Certificates, Series 2005-BC1, | |
| | Class M4, 1.847% (1 Month USD LIBOR + | |
| | 90 bps), 5/25/35 | $ 125,086 |
| 231,718(b) | | Countrywide Asset-Backed Certificates, Series 2006-3, | |
| | Class 2A3, 1.237% (1 Month USD LIBOR + | |
| | 29 bps), 6/25/36 | 229,023 |
| 3,760,525(b) | | Countrywide Asset-Backed Certificates, Series 2006-4, | |
| | Class 2A3, 1.237% (1 Month USD LIBOR + | |
| | 29 bps), 7/25/36 | 3,634,308 |
| 195,984 | | CPS Auto Receivables Trust, Series 2015-A, Class C, | |
| | 4.0%, 2/16/21 (144A) | 195,914 |
| 742,448 | | CPS Auto Receivables Trust, Series 2018-D, Class A, | |
| | 3.06%, 1/18/22 (144A) | 741,469 |
| 5,000,000 | | Credit Acceptance Auto Loan Trust , Series 2020-1A, | |
| | Class C, 2.59%, 6/15/29 (144A) | 4,180,372 |
| 1,280,505(b) | | Credit Suisse Seasoned Loan Trust, Series 2006-1, | |
| | Class A, 1.187% (1 Month USD LIBOR + | |
| | 24 bps), 10/25/34 (144A) | 1,272,263 |
| 153,870(b) | | Credit-Based Asset Servicing & Securitization LLC, Series | |
| | 2005-CB3, Class M2, 1.877% (1 Month USD LIBOR | |
| | + 93 bps), 5/25/35 | 151,776 |
| 1,061,239(b) | | CSFB Mortgage-Backed Pass-Through Certificates, Series | |
| | 2005-AGE1, Class M3, 1.597% (1 Month USD | |
| | LIBOR + 65 bps), 2/25/32 | 1,054,287 |
| 175,608(b) | | CWABS Asset-Backed Certificates Trust, Series 2005-17, | |
| | Class 3AV2, 1.287% (1 Month USD LIBOR + | |
| | 34 bps), 5/25/36 | 173,743 |
| 703,506(b) | | CWABS Asset-Backed Certificates Trust, Series 2005-AB1, | |
| | Class M1, 1.577% (1 Month USD LIBOR + | |
| | 63 bps), 8/25/35 | 696,890 |
| 2,496,618(b) | | CWHEQ Revolving Home Equity Loan Resuritization Trust, | |
| | Series 2006-RES, Class 4M1A, 0.985% (1 Month | |
| | USD LIBOR + 28 bps), 2/15/34 (144A) | 2,437,385 |
| 3,018,082(b) | | CWHEQ Revolving Home Equity Loan Resuritization Trust, | |
| | Series 2006-RES, Class 4N1A, 0.985% (1 Month | |
| | USD LIBOR + 28 bps), 2/15/34 (144A) | 2,933,096 |
| 1,073,331(b) | | Deer Creek CLO, Ltd., Series 2017-1A, Class X, 2.819% | |
| | (3 Month USD LIBOR + 100 bps), 10/20/30 (144A) | 1,073,310 |
| 1,370,260 | | Dell Equipment Finance Trust, Series 2018-2, Class A2, | |
| | 3.16%, 2/22/21 (144A) | 1,369,718 |
| 195,000 | | Dell Equipment Finance Trust, Series 2018-2, Class A3, | |
| | 3.37%, 10/22/23 (144A) | 195,907 |
| 128 | | Delta Funding Home Equity Loan Trust, Series 1997-2, | |
| | Class A6, 7.04%, 6/25/27 | 118 |
| 3,681,666 | | Diamond Resorts Owner Trust, Series 2016-1, Class B, | |
| | 3.37%, 11/20/28 (144A) | 3,656,866 |
| 11,798,782 | | DLL LLC, Series 2018-ST2, Class A3, 3.46%, | |
| | 1/20/22 (144A) | 11,815,918 |
The accompanying notes are an integral part of these financial statements.
Pioneer Multi-Asset Ultrashort Income Fund | Annual Report | 3/31/20 27
Schedule of Investments | 3/31/20 (continued)
| | | | |
| Principal | | | |
| Amount | | | |
| USD ($) | | | Value |
| | Asset Backed Securities — (continued) | |
| 6,277,164 | | DLL LLC, Series 2019-MT3, Class A1, 2.062%, | |
| | 10/20/20 (144A) | $ 6,255,582 |
| 590,709(b) | | DRB Prime Student Loan Trust, Series 2015-D, Class A1, | |
| | 2.647% (1 Month USD LIBOR + 170 bps), | |
| | 1/25/40 (144A) | 590,563 |
| 386,141(b) | | DRB Prime Student Loan Trust, Series 2016-B, Class A1, | |
| | 2.747% (1 Month USD LIBOR + 180 bps), | |
| | 6/25/40 (144A) | 385,219 |
| 352,735 | | DRB Prime Student Loan Trust, Series 2016-B, Class A3, | |
| | 2.23%, 6/25/36 (144A) | 351,774 |
| 1,808,312(b) | | DRB Prime Student Loan Trust, Series 2017-A, Class A1, | |
| | 1.797% (1 Month USD LIBOR + 85 bps), | |
| | 5/27/42 (144A) | 1,791,358 |
| 15,785(b) | | Drive Auto Receivables Trust, Series 2019-2, Class A2B, | |
| | 0.985% (1 Month USD LIBOR + 28 bps), 3/15/22 | 15,778 |
| 2,978,048(b) | | Drug Royalty III LP 1, Series 2017-1A, Class A1, 4.331% | |
| | (3 Month USD LIBOR + 250 bps), 4/15/27 (144A) | 2,956,362 |
| 2,030,130(b) | | Drug Royalty III LP 1, Series 2018-1A, Class A1, 3.431% | |
| | (3 Month USD LIBOR + 160 bps), 10/15/31 (144A) | 1,959,135 |
| 1,500,000(b) | | Dryden 80 CLO, Ltd., Series 2019-80A, Class X, 2.784% | |
| | (3 Month USD LIBOR + 90 bps), 1/17/33 (144A) | 1,499,893 |
| 8,392,151 | | DT Auto Owner Trust , Series 2020-1A, Class A, 1.94%, | |
| | 9/15/23 (144A) | 8,292,543 |
| 322,087(b) | | Earnest Student Loan Program LLC, Series 2016-C, | |
| | Class A1, 2.797% (1 Month USD LIBOR + 185 bps), | |
| | 10/27/36 (144A) | 322,854 |
| 303,393(b) | | Earnest Student Loan Program LLC, Series 2016-D, | |
| | Class A1, 2.347% (1 Month USD LIBOR + | |
| | 140 bps), 1/25/41 (144A) | 302,462 |
| 994,182(b) | | Earnest Student Loan Program LLC, Series 2017-A, | |
| | Class A1, 1.947% (1 Month USD LIBOR + | |
| | 100 bps), 1/25/41 (144A) | 985,048 |
| 15,950,000(b) | | Elevation CLO, Ltd., Series 2015-4A, Class CR, 4.019% | |
| | (3 Month USD LIBOR + 220 bps), 4/18/27 (144A) | 14,851,396 |
| 2,000,000(b) | | Elmwood CLO IV, Ltd., Series 2020-1A, Class X, 0.0% | |
| | (3 Month USD LIBOR + 70 bps), 4/15/33 (144A) | 1,859,998 |
| 240,673 | | Engs Commercial Finance Trust, Series 2016-1A, | |
| | Class A2, 2.63%, 2/22/22 (144A) | 240,272 |
| 36,728(b) | | EquiFirst Mortgage Loan Trust, Series 2004-2, Class M1, | |
| | 1.772% (1 Month USD LIBOR + 83 bps), 10/25/34 | 36,672 |
| 1,000,000(b) | | Evergreen Credit Card Trust, Series 2019-1, Class A, | |
| | 1.185% (1 Month USD LIBOR + 48 bps), | |
| | 1/15/23 (144A) | 948,632 |
| 2,349,333 | | FCI Funding LLC, Series 2019-1A, Class A, 3.63%, | |
| | 2/18/31 (144A) | 2,345,394 |
| 21,345,954(d) | | Finance of America HECM Buyout , Series 2020-HB1, | |
| | Class A, 2.012%, 2/25/30 (144A) | 21,597,494 |
| 7,907,976(d) | | Finance of America Structured Securities Trust, Series | |
| | 2019-HB1, Class A, 3.279%, 4/25/29 (144A) | 7,851,468 |
The accompanying notes are an integral part of these financial statements.
28 Pioneer Multi-Asset Ultrashort Income Fund | Annual Report | 3/31/20
| | | | |
| Principal | | | |
| Amount | | | |
| USD ($) | | | Value |
| | | Asset Backed Securities — (continued) | |
| 1,331,000(d) | | Finance of America Structured Securities Trust, Series | |
| | | 2019-HB1, Class M1, 3.396%, 4/25/29 (144A) | $ 1,311,124 |
| 42,081(b) | | First Franklin Mortgage Loan Trust, Series 2004-FF4, | |
| | | Class M1, 1.802% (1 Month USD LIBOR + | |
| | | 86 bps), 6/25/34 | 40,788 |
| 208,114(b) | | First Franklin Mortgage Loan Trust, Series 2005-FFH2, | |
| | | Class M2, 1.757% (1 Month USD LIBOR + | |
| | | 81 bps), 4/25/35 (144A) | 206,056 |
| 3,839,182 | | First Investors Auto Owner Trust, Series 2019-1A, | |
| | | Class A, 2.89%, 3/15/24 (144A) | 3,808,414 |
| 27,000,000 | | First Investors Auto Owner Trust, Series 2020-1A, | |
| | | Class A, 1.49%, 1/15/25 (144A) | 27,028,193 |
| 6,510,000 | | First Investors Auto Owner Trust, Series 2020-1A, | |
| | | Class B, 1.85%, 2/17/26 (144A) | 6,706,939 |
| 9,000,000(b) | | First National Master Note Trust, Series 2017-2, | |
| | | Class A, 1.145% (1 Month USD LIBOR + | |
| | | 44 bps), 10/16/23 | 8,985,271 |
| 301,871 | | Flagship Credit Auto Trust, Series 2017-4, Class A, | |
| | | 2.07%, 4/15/22 (144A) | 300,950 |
| 12,975,000(b) | | Fort CRE LLC, Series 2018-1A, Class A1, 2.274% | |
| | | (1 Month USD LIBOR + 135 bps), 11/16/35 (144A) | 12,367,424 |
| 2,750,000(b) | | Fortress Credit Opportunities IX CLO, Ltd., Series 2015-6A, | |
| | Class A1TR, 3.194% (3 Month USD LIBOR + |
| | | 136 bps), 7/10/30 (144A) | 2,574,539 |
| 3,500,000(b) | | Fortress Credit Opportunities IX CLO, Ltd., Series 2017-9A, | |
| | | Class A1T, 3.242% (3 Month USD LIBOR + | |
| | | 155 bps), 11/15/29 (144A) | 3,347,060 |
| 8,762 | | Foursight Capital Automobile Receivables Trust, Series | |
| | | 2016-1, Class A2, 2.87%, 10/15/21 (144A) | 8,757 |
| 1,056,882 | | Foursight Capital Automobile Receivables Trust, Series | |
| | | 2017-1, Class A, 2.37%, 4/15/22 (144A) | 1,053,965 |
| 802,749 | | Foursight Capital Automobile Receivables Trust, Series | |
| | | 2018-2, Class A2, 3.32%, 4/15/22 (144A) | 800,998 |
| 5,731,691 | | Foursight Capital Automobile Receivables Trust, Series | |
| | | 2019-1, Class A2, 2.58%, 3/15/23 (144A) | 5,704,366 |
| 7,000,000 | | Foursight Capital Automobile Receivables Trust, Series | |
| | | 2020-1, Class A2, 1.97%, 9/15/23 (144A) | 6,869,421 |
| 2,500,000 | | Foursight Capital Automobile Receivables Trust, Series | |
| | | 2020-1, Class B, 2.27%, 2/18/25 (144A) | 2,368,750 |
| 7,237,649 | | FREED ABS Trust, Series 2020-FP1, Class A, 2.52%, | |
| | | 3/18/27 (144A) | 6,875,749 |
| 2,771,839(b) | | Fremont Home Loan Trust, Series 2005-E, Class 1A1, | |
| | | 1.177% (1 Month USD LIBOR + 23 bps), 1/25/36 | 2,719,218 |
| 6,100,131(b) | | Fremont Home Loan Trust, Series 2006-2, Class 1A1, | |
| | | 1.107% (1 Month USD LIBOR + 16 bps), 2/25/36 | 5,846,708 |
The accompanying notes are an integral part of these financial statements.
Pioneer Multi-Asset Ultrashort Income Fund | Annual Report | 3/31/20 29
Schedule of Investments | 3/31/20 (continued)
| | | | |
| Principal | | | |
| Amount | | | |
| USD ($) | | | Value |
| | | Asset Backed Securities — (continued) | |
| 1,206,802(b) | | GE-WMC Asset-Backed Pass-Through Certificates, | |
| | Series 2005-2, Class A1, 1.172% (1 Month USD | |
| | | LIBOR + 23 bps), 12/25/35 | $ 1,197,127 |
| 3,407,667 | | GLS Auto Receivables Issuer Trust, Series 2019-1A, | |
| | | Class A, 3.37%, 1/17/23 (144A) | 3,393,278 |
| 8,850,415 | | GLS Auto Receivables Issuer Trust, Series 2019-3A, | |
| | | Class A, 2.58%, 7/17/23 (144A) | 8,761,293 |
| 3,000,000 | | GLS Auto Receivables Issuer Trust, Series 2019-3A, | |
| | | Class B, 2.72%, 6/17/24 (144A) | 2,958,934 |
| 7,946,996 | | GLS Auto Receivables Issuer Trust, Series 2019-4A, | |
| | | Class A, 2.47%, 11/15/23 (144A) | 7,432,370 |
| 800,000 | | GLS Auto Receivables Trust, Series 2018-1A, Class B, | |
| | | 3.52%, 8/15/23 (144A) | 756,898 |
| 920,224 | | GLS Auto Receivables Trust, Series 2018-2A, Class A, | |
| | | 3.25%, 4/18/22 (144A) | 912,873 |
| 2,361,265 | | GLS Auto Receivables Trust, Series 2018-3A, Class A, | |
| | | 3.35%, 8/15/22 (144A) | 2,347,085 |
| 7,944,436(b) | | GM Financial Automobile Leasing Trust, Series 2019-3, | |
| | | Class A2B, 1.043% (1 Month USD LIBOR + | |
| | | 27 bps), 10/20/21 | 7,895,788 |
| 3,595,499 | | Gold Key Resorts LLC, Series 2014-A, Class B, 3.72%, | |
| | | 3/17/31 (144A) | 3,593,295 |
| 937,500(b) | | Goldentree Loan Management US CLO 3, Ltd., | |
| | | Series 2018-3A, Class X, 2.369% (3 Month USD LIBOR + | |
| | | 55 bps), 4/20/30 (144A) | 937,493 |
| 1,400,000(b) | | Goldentree Loan Management US CLO 5, Ltd., | |
| | | Series 2019-5A, Class X, 2.319% (3 Month USD LIBOR + | |
| | | 50 bps), 10/20/32 (144A) | 1,399,992 |
| 799,133(b) | | Golub Capital BDC CLO LLC, Series 2014-1A, Class A1R, | |
| | | 2.744% (3 Month USD LIBOR + 95 bps), | |
| | | 4/25/26 (144A) | 787,984 |
| 3,000,000(b) | | Golub Capital Partners CLO 24M-R, Ltd., Series 2015-24A, | |
| | | Class AR, 3.341% (3 Month USD LIBOR + | |
| | | 160 bps), 11/5/29 (144A) | 2,730,156 |
| 1,821,000(b) | | Golub Capital Partners CLO 25M, Ltd., Series 2015-25A, | |
| | | Class AR, 3.121% (3 Month USD LIBOR + | |
| | | 138 bps), 5/5/30 (144A) | 1,705,197 |
| 10,000,000(b) | | Golub Capital Partners CLO 34M, Ltd., Series 2017-34A, | |
| | | Class AR, 3.441% (3 Month USD LIBOR + | |
| | | 170 bps), 3/14/31 (144A) | 9,389,790 |
| 5,000,000(b) | | Golub Capital Partners CLO 46M, Ltd., Series 2019-46A, | |
| | | Class A1A, 3.565% (3 Month USD LIBOR + | |
| | | 180 bps), 4/20/32 (144A) | 4,662,510 |
| 5,244,920 | | Great American Auto Leasing, Inc., Series 2019-1, | |
| | | Class A2, 2.97%, 6/15/21 (144A) | 5,238,631 |
| 2,350,000(b) | | Greywolf CLO III, Ltd., Series 2020-3RA, Class XR, | |
| | | 2.302% (3 Month USD LIBOR + 50 bps), | |
| | | 4/15/33 (144A) | 2,325,001 |
The accompanying notes are an integral part of these financial statements.
30 Pioneer Multi-Asset Ultrashort Income Fund | Annual Report | 3/31/20
| | | | |
| Principal | | | |
| Amount | | | |
| USD ($) | | | Value |
| | Asset Backed Securities — (continued) | |
| 1,174,056(b) | | GSAA Home Equity Trust, Series 2005-6, Class A3, | |
| | 1.317% (1 Month USD LIBOR + 37 bps), 6/25/35 | $ 1,169,031 |
| 228,852(b) | | GSRPM Mortgage Loan Trust, Series 2006-1, Class A1, | |
| | 1.247% (1 Month USD LIBOR + 30 bps), | |
| | 3/25/35 (144A) | 225,336 |
| 4,419,237(b) | | HANA SBA LOAN TRUST, Series 2019-1, Class A, 4.04% | |
| | (1 Month USD LIBOR + 200 bps), 8/25/45 (144A) | 4,237,818 |
| 1,000,000(b) | | Harbor Park CLO, Ltd., Series 2018-1A, Class X, 2.719% | |
| | (3 Month USD LIBOR + 90 bps), 1/20/31 (144A) | 999,992 |
| 237,442 | | Hero Residual Funding, Series 2016-1R, Class A1, 4.5%, | |
| | 9/21/42 (144A) | 238,016 |
| 1,176,773(b) | | Hertz Fleet Lease Funding LP, Series 2017-1, Class A1, | |
| | 1.513% (1 Month USD LIBOR + 65 bps), | |
| | 4/10/31 (144A) | 1,173,258 |
| 4,865,886(b) | | Hertz Fleet Lease Funding LP, Series 2018-1, Class A1, | |
| | 1.363% (1 Month USD LIBOR + 50 bps), | |
| | 5/10/32 (144A) | 4,829,174 |
| 388,250(b) | | Hertz Fleet Lease Funding LP, Series 2019-1, Class A1, | |
| | 1.333% (1 Month USD LIBOR + 47 bps), | |
| | 1/10/33 (144A) | 383,997 |
| 45,777 | | Hilton Grand Vacations Trust, Series 2014-AA, Class B, | |
| | 2.07%, 11/25/26 (144A) | 45,340 |
| 4,000,000 | | HOA Funding LLC, Series 2015-1A, Class B, 9.0%, | |
| | 8/20/44 (144A) | 3,909,450 |
| 147,004(b) | | Home Equity Asset Trust, Series 2004-8, Class M1, 1.817% | |
| | (1 Month USD LIBOR + 87 bps), 3/25/35 | 145,222 |
| 2,417,581(b) | | Home Equity Asset Trust, Series 2005-3, Class M4, 1.587% | |
| | (1 Month USD LIBOR + 64 bps), 8/25/35 | 2,374,407 |
| 474,075(b) | | Home Equity Asset Trust, Series 2005-6, Class M2, 1.437% | |
| | (1 Month USD LIBOR + 49 bps), 12/25/35 | 472,628 |
| 105,586(b) | | Home Equity Asset Trust, Series 2005-7, Class M1, 1.397% | |
| | (1 Month USD LIBOR + 45 bps), 1/25/36 | 102,254 |
| 3,807,355(b) | | Home Equity Asset Trust, Series 2006-3, Class 2A4, | |
| | 1.257% (1 Month USD LIBOR + 31 bps), 7/25/36 | 3,761,669 |
| 2,000,000(b) | | Home Partners of America Trust, Series 2018-1, Class C, | |
| | 2.05% (1 Month USD LIBOR + 125 bps), | |
| | 7/17/37 (144A) | 1,775,649 |
| 3,000,000(b) | | Home Partners of America Trust, Series 2017-1, Class C, | |
| | 2.35% (1 Month USD LIBOR + 155 bps), | |
| | 7/17/34 (144A) | 2,742,123 |
| 2,500,000(b) | | Home Partners of America Trust, Series 2017-1, Class D, | |
| | 2.7% (1 Month USD LIBOR + 190 bps), | |
| | 7/17/34 (144A) | 2,250,266 |
| 11,000,000 | | HPEFS Equipment Trust, Series 2019-1A, Class A2, 2.19%, | |
| | 9/20/29 (144A) | 10,907,340 |
| 1,097,931(b) | | HSI Asset Securitization Corp. Trust, Series 2006-OPT1, | |
| | Class 2A4, 1.247% (1 Month USD LIBOR + | |
| | 30 bps), 12/25/35 | 1,085,254 |
The accompanying notes are an integral part of these financial statements.
Pioneer Multi-Asset Ultrashort Income Fund | Annual Report | 3/31/20 31
Schedule of Investments | 3/31/20 (continued)
| | | | |
| Principal | | | |
| Amount | | | |
| USD ($) | | | Value |
| | Asset Backed Securities — (continued) | |
| 375,689(b) | | HSI Asset Securitization Corp. Trust, Series 2006-OPT2, | |
| | Class M1, 1.317% (1 Month USD LIBOR + | |
| | 37 bps), 1/25/36 | $ 373,129 |
| 2,067,000(b) | | Invitation Homes Trust, Series 2017-SFR2, Class C, | |
| | 2.25% (1 Month USD LIBOR + 145 bps), | |
| | 12/17/36 (144A) | 1,785,055 |
| 11,250,311(b) | | Invitation Homes Trust, Series 2018-SFR1, Class A, 1.5% | |
| | (1 Month USD LIBOR + 70 bps), 3/17/37 (144A) | 10,268,219 |
| 4,000,000(b) | | Invitation Homes Trust, Series 2018-SFR1, Class B, 1.75% | |
| | (1 Month USD LIBOR + 95 bps), 3/17/37 (144A) | 3,512,861 |
| 7,165,000(b) | | Invitation Homes Trust, Series 2018-SFR1, Class D, 2.25% | |
| | (1 Month USD LIBOR + 145 bps), 3/17/37 (144A) | 5,978,310 |
| 5,479,251(b) | | Invitation Homes Trust, Series 2018-SFR1, Class E, 2.8% | |
| | (1 Month USD LIBOR + 200 bps), 3/17/37 (144A) | 4,267,649 |
| 1,750,000(b) | | Invitation Homes Trust, Series 2018-SFR2, Class C, | |
| | 1.985% (1 Month USD LIBOR + 128 bps), | |
| | 6/17/37 (144A) | 1,538,556 |
| 10,000,000(b) | | Invitation Homes Trust, Series 2018-SFR2, Class D, | |
| | 2.155% (1 Month USD LIBOR + 145 bps), | |
| | 6/17/37 (144A) | 8,496,563 |
| 6,856,743(b) | | Invitation Homes Trust, Series 2018-SFR3, Class E, 2.8% | |
| | (1 Month USD LIBOR + 200 bps), 7/17/37 (144A) | 5,541,752 |
| 13,821,000(b) | | Invitation Homes Trust, Series 2018-SFR4, Class E, 2.75% | |
| | (1 Month USD LIBOR + 195 bps), 1/17/38 (144A) | 11,402,246 |
| 5,900,000(b) | | Ivy Hill Middle Market Credit Fund X, Ltd., Series 10A, | |
| | | Class A1AR, 3.069% (3 Month USD LIBOR + | |
| | 125 bps), 7/18/30 (144A) | 5,553,505 |
| 214,286(b) | | Jefferson Mill CLO, Ltd., Series 2015-1I, Class XR, | |
| | 2.419% (3 Month USD LIBOR + 60 bps), 10/20/31 | 214,274 |
| 22,600,000 | | Kabbage Funding LLC, Series 2019-1, Class A, 3.825%, | |
| | 3/15/24 (144A) | 21,978,520 |
| 1,400,000 | | Kabbage Funding LLC, Series 2019-1, Class C, 4.611%, | |
| | 3/15/24 (144A) | 1,354,661 |
| 500,000(b) | | KVK CLO, Ltd., Series 2018-1A, Class A, 2.625% | |
| | (3 Month USD LIBOR + 93 bps), 5/20/29 (144A) | 483,181 |
| 15,000,000(b) | | KVK CLO, Ltd., Series 2018-1A, Class B, 3.345% (3 Month | |
| | USD LIBOR + 165 bps), 5/20/29 (144A) | 13,712,520 |
| 4,331,552(b) | | Laurel Road Prime Student Loan Trust, Series 2017-C, | |
| | Class A1, 1.497% (1 Month USD LIBOR + | |
| | 55 bps), 11/25/42 (144A) | 4,266,148 |
| 400,000(b) | | LCM 28, Ltd., Series 28A, Class X, 2.719% (3 Month USD | |
| | LIBOR + 90 bps), 10/20/30 (144A) | 399,997 |
| 814,233(b) | | Lehman XS Trust, Series 2005-4, Class 1A3, 1.747% | |
| | (1 Month USD LIBOR + 80 bps), 10/25/35 | 793,928 |
| 9,291,048 | | Lendingpoint Asset Securitization Trust, Series 2019-1, | |
| | Class A, 3.154%, 8/15/25 (144A) | 9,108,402 |
| 2,500,000 | | Lendingpoint Asset Securitization Trust, Series 2019-1, | |
| | Class B, 3.613%, 8/15/25 (144A) | 2,323,399 |
The accompanying notes are an integral part of these financial statements.
32 Pioneer Multi-Asset Ultrashort Income Fund | Annual Report | 3/31/20
| | | | |
| Principal | | | |
| Amount | | | |
| USD ($) | | | Value |
| | | Asset Backed Securities — (continued) | |
| 13,903,472 | | Lendingpoint Asset Securitization Trust, Series 2020-1, | |
| | | Class A, 2.512%, 2/10/26 (144A) | $ 13,095,119 |
| 10,547,044 | | LL ABS Trust, Series 2019-1A, Class A, 2.87%, | |
| | | 3/15/27 (144A) | 10,145,964 |
| 7,500,000(b) | | LoanCore Issuer, Ltd., Series 2019-CRE2, Class A, 1.835% | |
| | | (1 Month USD LIBOR + 113 bps), 5/15/36 (144A) | 7,020,810 |
| 8,300,000(b) | | M360 LLC, Series 2019-CRE2, Class A, 2.105% | |
| | | (1 Month USD LIBOR + 140 bps), 9/15/34 (144A) | 7,661,364 |
| 1,000,000(b) | | Madison Park Funding XII, Ltd., Series 2014-12A, | |
| | | Class CR, 4.169% (3 Month USD LIBOR + | |
| | | 235 bps), 7/20/26 (144A) | 960,102 |
| 3,714,494 | | Marlette Funding Trust, Series 2017-1A, Class C, 6.658%, | |
| | | 3/15/24 (144A) | 3,633,560 |
| 1,236,102 | | Marlette Funding Trust, Series 2018-3A, Class A, 3.2%, | |
| | | 9/15/28 (144A) | 1,227,791 |
| 9,177,089 | | Marlette Funding Trust , Series 2020-1A, Class A, 2.24%, | |
| | | 3/15/30 (144A) | 8,896,769 |
| 22,614,401 | | Marlin Receivables LLC, Series 2018-1A, Class A3, 3.36%, | |
| | | 4/20/23 (144A) | 22,593,650 |
| 15,500,000(b) | | Master Credit Card Trust, Series 2019-1A, Class A, | |
| | | 1.404% (1 Month USD LIBOR + 48 bps), | |
| | | 7/21/22 (144A) | 15,279,091 |
| 9,300,000(b) | | Master Credit Card Trust II, Series 2018-3A, Class A, | |
| | | 1.264% (1 Month USD LIBOR + 34 bps), | |
| | | 1/21/22 (144A) | 9,248,379 |
| 12,000,000(b) | | Master Credit Card Trust II, Series 2019-2A, Class A, | |
| | | 1.314% (1 Month USD LIBOR + 39 bps), | |
| | | 1/21/23 (144A) | 11,743,277 |
| 300,567(b) | | Merrill Lynch Mortgage Investors Trust, Series 2004-OPT1, | |
| | | Class A1B, 1.807% (1 Month USD LIBOR + | |
| | | 86 bps), 6/25/35 | 287,668 |
| 2,148,798(b) | | Merrill Lynch Mortgage Investors Trust, Series 2005-AR1, | |
| | | Class M1, 1.697% (1 Month USD LIBOR + | |
| | | 75 bps), 6/25/36 | 2,098,400 |
| 5,726,310(c) | | MFA LLC, Series 2017-NPL1, Class A1, 3.352%, | |
| | | 11/25/47 (144A) | 5,831,797 |
| 5,750,000 | | MMAF Equipment Finance LLC, Series 2019-B, Class A2, | |
| | | 2.07%, 10/12/22 (144A) | 5,700,915 |
| 4,500,000(b) | | Monroe Capital Mml CLO, Ltd., Series 2017-1A, Class A, | |
| | | 3.402% (3 Month USD LIBOR + 160 bps), | |
| | | 4/22/29 (144A) | 4,274,978 |
| 1,848,563(b) | | Morgan Stanley Capital I, Inc. Trust, Series 2006-NC2, | |
| | | Class A2D, 1.237% (1 Month USD LIBOR + | |
| | | 29 bps), 2/25/36 | 1,694,722 |
| 596,426(b) | | Morgan Stanley Home Equity Loan Trust, Series 2006-2, | |
| | | Class A4, 1.227% (1 Month USD LIBOR + | |
| | | 28 bps), 2/25/36 | 559,597 |
The accompanying notes are an integral part of these financial statements.
Pioneer Multi-Asset Ultrashort Income Fund | Annual Report | 3/31/20 33
Schedule of Investments | 3/31/20 (continued)
| | | | |
| Principal | | | |
| Amount | | | |
| USD ($) | | | Value |
| | Asset Backed Securities — (continued) | |
| 568,750(b) | | Motor Plc, Series 2017-1A, Class A1, 1.477% | |
| | (1 Month USD LIBOR + 53 bps), 9/25/24 (144A) | $ 567,120 |
| 2,779,260(b) | | National Collegiate Trust, Series 2007-A, Class A, | |
| | 1.242% (1 Month USD LIBOR + 30 bps), | |
| | 5/25/31 (144A) | 2,615,574 |
| 7,028,020(d) | | Nationstar HECM Loan Trust, Series 2019-1A, Class A, | |
| | 2.651%, 6/25/29 (144A) | 6,964,931 |
| 7,062,270(b) | | Nationstar Home Equity Loan Trust, Series 2006-B, | |
| | Class AV4, 1.227% (1 Month USD LIBOR + | |
| | 28 bps), 9/25/36 | 6,806,262 |
| 17,734,762(b) | | Navient Student Loan Trust, Series 2019-4A, Class A1, | |
| | 1.227% (1 Month USD LIBOR + 28 bps), | |
| | 7/25/68 (144A) | 17,499,145 |
| 1,100,000(b) | | Navistar Financial Dealer Note Master Owner Trust II, | |
| | Series 2018-1, Class C, 1.997% (1 Month USD LIBOR + | |
| | 105 bps), 9/25/23 (144A) | 1,064,463 |
| 2,730,806 | | Nelnet Private Education Loan Trust, Series 2016-A, | |
| | Class A1B, 3.6%, 12/26/40 (144A) | 2,765,425 |
| 8,881,595(b) | | Nelnet Student Loan Trust, Series 2005-2, Class A5, | |
| | 1.295% (3 Month USD LIBOR + 10 bps), 3/23/37 | 8,346,387 |
| 7,256,000(b) | | Neuberger Berman CLO XX, Ltd., Series 2015-20A, | |
| | Class AR, 2.631% (3 Month USD LIBOR + | |
| | 80 bps), 1/15/28 (144A) | 6,955,290 |
| 2,750,000(b) | | Neuberger Berman CLO XXII, Ltd., Series 2016-22A, | |
| | Class XR, 2.736% (3 Month USD LIBOR + | |
| | 90 bps), 10/17/30 (144A) | 2,749,978 |
| 969,619(b) | | New Century Home Equity Loan Trust, Series 2005-2, | |
| | Class M2, 1.622% (1 Month USD LIBOR + | |
| | 68 bps), 6/25/35 | 966,739 |
| 820,093(b) | | Newtek Small Business Loan Trust, Series 2016-1A, | |
| | Class A, 3.947% (1 Month USD LIBOR + | |
| | 300 bps), 2/25/42 (144A) | 809,487 |
| 4,299,906(b) | | Newtek Small Business Loan Trust, Series 2017-1, | |
| | Class A, 2.947% (1 Month USD LIBOR + | |
| | 200 bps), 2/15/43 (144A) | 4,140,296 |
| 5,031,929(b) | | Newtek Small Business Loan Trust, Series 2018-1, | |
| | Class A, 2.647% (1 Month USD LIBOR + | |
| | 170 bps), 2/25/44 (144A) | 4,856,739 |
| 3,870,715(b) | | Newtek Small Business Loan Trust, Series 2018-1, | |
| | Class B, 3.947% (1 Month USD LIBOR + | |
| | 300 bps), 2/25/44 (144A) | 3,752,000 |
| 12,135,684(b) | | Newtek Small Business Loan Trust, Series 2019-1, | |
| | | Class A, 2.35% (PRIME + 90 bps), 12/25/44 | |
| | (144A) | 11,702,108 |
| 2,588,946(b) | | Newtek Small Business Loan Trust, Series 2019-1, | |
| | Class B, 3.447% (1 Month USD LIBOR + | |
| | 250 bps), 12/25/44 (144A) | 2,497,547 |
The accompanying notes are an integral part of these financial statements.
34 Pioneer Multi-Asset Ultrashort Income Fund | Annual Report | 3/31/20
| | | | |
| Principal | | | |
| Amount | | | |
| USD ($) | | | Value |
| | Asset Backed Securities — (continued) | |
| 18,300,000(b) | | NextGear Floorplan Master Owner Trust, Series 2019-2A, | |
| | Class A1, 1.405% (1 Month USD LIBOR + | |
| | 70 bps), 10/15/24 (144A) | $ 16,693,802 |
| 19,500,000(b) | | NextGear Floorplan Master Owner Trust, Series 2020-1A, | |
| | Class A1, 2.056% (1 Month USD LIBOR + | |
| | 80 bps), 2/18/25 (144A) | 18,739,874 |
| 12,554,270 | | NMEF Funding 2015-A LLC, Series 2019-A, Class A, | |
| | 2.73%, 8/17/26 (144A) | 12,437,292 |
| 159,286(b) | | NovaStar Mortgage Funding Trust, Series 2003-1, | |
| | Class A2, 1.727% (1 Month USD LIBOR + | |
| | 78 bps), 5/25/33 | 147,281 |
| 1,500,000(b) | | Octagon Investment Partners XVI, Ltd., Series 2013-1A, | |
| | Class XR, 2.386% (3 Month USD LIBOR + | |
| | 55 bps), 7/17/30 (144A) | 1,499,955 |
| 3,375,000(b) | | Octagon Investment Partners XXI, Ltd., Series 2014-1A, | |
| | Class XRR, 2.454% (3 Month USD LIBOR + | |
| | 75 bps), 2/14/31 (144A) | 3,374,605 |
| 3,656,250(b) | | Octagon Investment Partners XXII, Ltd., Series 2014-1A, | |
| | Class XRR, 2.452% (3 Month USD LIBOR + | |
| | 65 bps), 1/22/30 (144A) | 3,656,148 |
| 8,500,000 | | Ocwen Master Advance Receivables Trust, Series 2019-T1, | |
| | Class AT1, 2.514%, 8/15/50 (144A) | 8,475,659 |
| 1,250,000 | | Ocwen Master Advance Receivables Trust, Series 2019-T1, | |
| | Class DT1, 3.107%, 8/15/50 (144A) | 1,242,596 |
| 2,250,000(b) | | OHA Credit Funding 3, Ltd., Series 2019-3A, Class X, | |
| | 2.469% (3 Month USD LIBOR + 65 bps), | |
| | 7/20/32 (144A) | 2,249,984 |
| 2,750,000(b) | | OHA Credit Funding 5, Ltd., Series 2020-5A, Class X, | |
| | 1.856% (3 Month USD LIBOR + 55 bps), | |
| | 4/18/33 (144A) | 2,747,195 |
| 4,070,663(b) | | OneMain Financial Issuance Trust, Series 2017-1A, | |
| | Class A2, 1.505% (1 Month USD LIBOR + | |
| | 80 bps), 9/14/32 (144A) | 3,971,988 |
| 1,475,000 | | OneMain Financial Issuance Trust, Series 2019-1A, | |
| | Class A, 3.48%, 2/14/31 (144A) | 1,386,991 |
| 170,000 | | OneMain Financial Issuance Trust, Series 2019-1A, | |
| | Class B, 3.79%, 2/14/31 (144A) | 153,421 |
| 6,046,099(b) | | Option One Mortgage Loan Trust, Series 2005-3, Class M2, | |
| | 1.682% (1 Month USD LIBOR + 74 bps), 8/25/35 | 5,876,555 |
| 1,807,578(b) | | Option One Mortgage Loan Trust, Series 2005-4, Class M1, | |
| | 1.387% (1 Month USD LIBOR + 44 bps), 11/25/35 | 1,778,705 |
| 2,830(c) | | Option One Mortgage Loan Trust, Series 2007-FXD2, | |
| | Class 2A1, 5.9%, 3/25/37 | 2,232 |
| 12,950,000(b) | | Orec, Ltd., Series 2018-CRE1, Class A, 1.885% (1 Month | |
| | USD LIBOR + 118 bps), 6/15/36 (144A) | 11,848,186 |
| 1,624,382 | | Oscar US Funding Trust IX LLC, Series 2018-2A, | |
| | Class A2A, 3.15%, 8/10/21 (144A) | 1,627,275 |
The accompanying notes are an integral part of these financial statements.
Pioneer Multi-Asset Ultrashort Income Fund | Annual Report | 3/31/20 35
Schedule of Investments | 3/31/20 (continued)
| | | | |
| Principal | | | |
| Amount | | | |
| USD ($) | | | Value |
| | Asset Backed Securities — (continued) | |
| 13,500,000(b) | | Owl Rock CLO II, Ltd., Series 2019-2A, Class A1L, | |
| | 3.636% (3 Month USD LIBOR + 175 bps), | |
| | 1/20/31 (144A) | $ 12,849,948 |
| 30,861 | | Oxford Finance Funding LLC, Series 2016-1A, Class A, |
| | 3.968%, 6/17/24 (144A) | 30,786 |
| 1,750,000(b) | | OZLM VIII, Ltd., Series 2014-8A, Class XRR, 2.536% | |
| | (3 Month USD LIBOR + 70 bps), 10/17/29 (144A) | 1,749,988 |
| 500,000(b) | | OZLM XXII, Ltd., Series 2018-22A, Class X, 2.386% | |
| | (3 Month USD LIBOR + 55 bps), 1/17/31 (144A) | 499,966 |
| 4,250,000(b) | | Palmer Square Loan Funding, Ltd., Series 2018-1A, | |
| | Class A2, 2.881% (3 Month USD LIBOR + | |
| | 105 bps), 4/15/26 (144A) | 3,867,054 |
| 1,000,000(b) | | Palmer Square Loan Funding, Ltd., Series 2018-2A, | |
| | Class D, 5.781% (3 Month USD LIBOR + | |
| | 395 bps), 7/15/26 (144A) | 645,823 |
| 1,611,035(b) | | PARTS Student Loan Trust , Series 2007-CT1, Class A, |
| | 2.1% (3 Month USD LIBOR + 19 bps), | |
| | 2/25/33 (144A) | 1,530,703 |
| 817,128 | | Pawnee Equipment Receivables LLC, Series 2019-1, | |
| | Class A1, 2.294%, 10/15/20 (144A) | 813,488 |
| 10,000,000 | | Pawnee Equipment Receivables LLC, Series 2019-1, | |
| | Class A2, 2.29%, 10/15/24 (144A) | 9,864,494 |
| 30,000,000(b) | | PFS Financing Corp., Series 2019-B, Class A, 1.255% |
| | (1 Month USD LIBOR + 55 bps), 9/15/23 (144A) | 28,863,237 |
| 84,547(b) | | Popular ABS Mortgage Pass-Through Trust, Series 2005-A, |
| | Class M1, 1.377% (1 Month USD LIBOR + | |
| | 43 bps), 6/25/35 | 84,051 |
| 996,459 | | Prosper Marketplace Issuance Trust, Series 2019-1A, |
| | Class A, 3.54%, 4/15/25 (144A) | 985,896 |
| 5,067,403 | | Prosper Marketplace Issuance Trust, Series 2019-4A, |
| | Class A, 2.48%, 2/17/26 (144A) | 4,813,967 |
| 8,200,000 | | Purchasing Power Funding LLC, Series 2018-A, Class A, |
| | 3.34%, 8/15/22 (144A) | 8,176,590 |
| 2,600,000 | | Purchasing Power Funding LLC, Series 2018-A, Class B, |
| | 3.58%, 8/15/22 (144A) | 2,592,345 |
| 7,020,075(b) | | RAAC Trust, Series 2006-RP1, Class M2, 2.147% (1 Month |
| | USD LIBOR + 120 bps), 10/25/45 (144A) | 6,703,511 |
| 686,273(b) | | RAMP Trust, Series 2005-EFC6, Class M2, 1.592% (1 Month |
| | USD LIBOR + 65 bps), 11/25/35 | 669,225 |
| 75,017(b) | | RAMP Trust, Series 2006-EFC2, Class A3, 1.107% (1 Month |
| | USD LIBOR + 16 bps), 12/25/36 | 74,433 |
| 13,382(b) | | RAMP Trust, Series 2006-RZ3, Class A3, 1.237% (1 Month |
| | USD LIBOR + 29 bps), 8/25/36 | 13,284 |
| 3,390,261(b) | | RAMP Trust, Series 2006-RZ4, Class A3, 1.217% (1 Month |
| | USD LIBOR + 27 bps), 10/25/36 | 3,255,806 |
| 771,529(b) | | RASC Trust, Series 2005-EMX4, Class M2, 1.607% (1 Month |
| | USD LIBOR + 66 bps), 11/25/35 | 763,866 |
The accompanying notes are an integral part of these financial statements.
36 Pioneer Multi-Asset Ultrashort Income Fund | Annual Report | 3/31/20
| | | | |
| Principal | | | |
| Amount | | | |
| USD ($) | | | Value |
| | Asset Backed Securities — (continued) | |
| 1,209,145(b) | | RASC Trust, Series 2005-KS1, Class M1, 1.622% | |
| | (1 Month USD LIBOR + 68 bps), 2/25/35 | $ 1,176,007 |
| 645,584(b) | | RASC Trust, Series 2005-KS7, Class M4, 1.817% | |
| | (1 Month USD LIBOR + 87 bps), 8/25/35 | 640,789�� |
| 613,638(b) | | RASC Trust, Series 2005-KS8, Class M3, 1.427% | |
| | (1 Month USD LIBOR + 48 bps), 8/25/35 | 608,288 |
| 121,100(b) | | RASC Trust, Series 2005-KS11, Class M1, 1.347% | |
| | (1 Month USD LIBOR + 40 bps), 12/25/35 | 120,594 |
| 1,591,224(b) | | Ready Capital Mortgage Financing LLC, Series 2018-FL2, | |
| | Class A, 1.797% (1 Month USD LIBOR + | |
| | 85 bps), 6/25/35 (144A) | 1,584,228 |
| 10,970,901(b) | | ReadyCap Lending Small Business Loan Trust, | |
| | Series 2019-2, Class A, 2.75% (PRIME + 50 bps), | |
| | 12/27/44 (144A) | 9,739,855 |
| 6,400,000 | | Republic FInance Issuance Trust, Series 2019-A, Class A, | |
| | 3.43%, 11/22/27 (144A) | 5,579,985 |
| 2,433,173(d) | | RMF Buyout Issuance Trust, Series 2018-1, Class A, | |
| | 3.436%, 11/25/28 (144A) | 2,429,002 |
| 2,000,000(d) | | RMF Buyout Issuance Trust, Series 2018-1, Class M1, | |
| | 3.912%, 11/25/28 (144A) | 1,989,020 |
| 1,000,000(d) | | RMF Buyout Issuance Trust , Series 2019-1, Class M1, | |
| | 2.521%, 7/25/29 (144A) | 901,989 |
| 7,500,000(b) | | Rosy, Series 2018-1, Class A2, 4.99% (1 Month USD LIBOR | |
| | + 325 bps), 12/15/25 (144A) | 7,125,000 |
| 38,912(b) | | Salomon Mortgage Loan Trust, Series 2001-CB4, Class 1A1, | |
| | 1.847% (1 Month USD LIBOR + 90 bps), 11/25/33 | 36,748 |
| 2,856,937(b) | | Saxon Asset Securities Trust, Series 2006-2, Class A3C, | |
| | 1.097% (1 Month USD LIBOR + 15 bps), 9/25/36 | 2,805,761 |
| 560,936 | | SCF Equipment Leasing LLC, Series 2017-1A, Class A, | |
| | 3.77%, 1/20/23 (144A) | 561,774 |
| 2,726,913 | | SCF Equipment Leasing LLC, Series 2017-2A, Class A, | |
| | 3.41%, 12/20/23 (144A) | 2,707,235 |
| 9,509,446 | | SCF Equipment Leasing LLC, Series 2019-1A, Class A1, | |
| | 3.04%, 3/20/23 (144A) | 9,459,614 |
| 14,010,905 | | SCF Equipment Leasing LLC, Series 2019-2A, Class A1, | |
| | 2.22%, 6/20/24 (144A) | 13,906,354 |
| 20,943(b) | | Securitized Asset Backed Receivables LLC Trust, Series | |
| | 2005-OP2, Class M1, 1.377% (1 Month USD LIBOR | |
| | + 43 bps), 10/25/35 | 20,284 |
| 2,594,644 | | Securitized Term Auto Receivables Trust, Series 2019-1A, | |
| | Class A2, 2.862%, 5/25/21 (144A) | 2,598,413 |
| 633,539(b) | | Security National Mortgage Loan Trust, Series 2007-1A, | |
| | Class 2A, 1.297% (1 Month USD LIBOR + | |
| | 35 bps), 4/25/37 (144A) | 618,562 |
| 2,604,603(b) | | SG Mortgage Securities Trust, Series 2005-OPT1, | |
| | Class M1, 1.377% (1 Month USD LIBOR + | |
| | 43 bps), 10/25/35 | 2,545,992 |
The accompanying notes are an integral part of these financial statements.
Pioneer Multi-Asset Ultrashort Income Fund | Annual Report | 3/31/20 37
Schedule of Investments | 3/31/20 (continued)
| | | | |
| Principal | | | |
| Amount | | | |
| USD ($) | | | Value |
| | Asset Backed Securities — (continued) | |
| 8,295,186(b) | | SLM Private Credit Student Loan Trust, Series 2007-A, | |
| | Class A4A, 0.981% (3 Month USD LIBOR + | |
| | 24 bps), 12/16/41 | $ 7,311,948 |
| 14,000,000(b) | | SLM Student Loan Trust, Series 2006-10, Class A6, | |
| | 1.944% (3 Month USD LIBOR + 15 bps), 3/25/44 | 12,448,554 |
| 7,492,856 | | Small Business Lending Trust, Series 2019-A, Class A, | |
| | 2.85%, 7/15/26 (144A) | 7,342,998 |
| 10,828,716 | | Small Business Lending Trust, Series 2020-A, Class A, | |
| | 2.62%, 12/15/26 (144A) | 10,549,727 |
| 1,000,000 | | Small Business Lending Trust, Series 2020-A, Class C, | |
| | 5.01%, 12/15/26 (144A) | 921,668 |
| 4,300,000 | | Sofi Consumer Loan Program Trust, Series 2018-1, | |
| | Class B, 3.65%, 2/25/27 (144A) | 3,602,921 |
| 9,220,571 | | Sofi Consumer Loan Program LLC, Series 2016-1, Class A, | |
| | 3.26%, 8/25/25 (144A) | 8,918,188 |
| 445,403 | | Sofi Consumer Loan Program LLC, Series 2016-2, Class A, | |
| | 3.09%, 10/27/25 (144A) | 437,175 |
| 200,119 | | Sofi Consumer Loan Program LLC, Series 2016-3, Class A, | |
| | 3.05%, 12/26/25 (144A) | 198,187 |
| 905,210 | | Sofi Consumer Loan Program LLC, Series 2016-4, Class A, | |
| | 3.18%, 11/25/25 (144A) | 885,347 |
| 2,621,620 | | Sofi Consumer Loan Program LLC, Series 2017-1, Class A, | |
| | 3.28%, 1/26/26 (144A) | 2,574,413 |
| 124,152 | | Sofi Consumer Loan Program LLC, Series 2017-3, Class A, | |
| | 2.77%, 5/25/26 (144A) | 123,073 |
| 4,434,307 | | Sofi Consumer Loan Program Trust, Series 2019-1, | |
| | Class A, 3.24%, 2/25/28 (144A) | 4,297,403 |
| 2,186,156 | | Sofi Consumer Loan Program Trust, Series 2019-2, | |
| | Class A, 3.01%, 4/25/28 (144A) | 2,120,614 |
| 694,232(b) | | Sofi Professional Loan Program LLC, Series 2015-B, | |
| | Class A1, 1.997% (1 Month USD LIBOR + | |
| | 105 bps), 4/25/35 (144A) | 691,875 |
| 766,143(b) | | Sofi Professional Loan Program LLC, Series 2015-C, | |
| | Class A1, 1.997% (1 Month USD LIBOR + | |
| | 105 bps), 8/27/35 (144A) | 760,256 |
| 1,313,140(b) | | Sofi Professional Loan Program LLC, Series 2015-D, | |
| | Class A1, 2.447% (1 Month USD LIBOR + | |
| | 150 bps), 10/27/36 (144A) | 1,295,728 |
| 1,330,753(b) | | Sofi Professional Loan Program LLC, Series 2016-A, | |
| | Class A1, 2.697% (1 Month USD LIBOR + | |
| | 175 bps), 8/25/36 (144A) | 1,333,816 |
| 961,022(b) | | Sofi Professional Loan Program LLC, Series 2016-B, | |
| | Class A1, 2.147% (1 Month USD LIBOR + | |
| | 120 bps), 6/25/33 (144A) | 956,601 |
| 2,644,988(b) | | Sofi Professional Loan Program LLC, Series 2016-C, | |
| | Class A1, 2.047% (1 Month USD LIBOR + | |
| | 110 bps), 10/27/36 (144A) | 2,616,202 |
The accompanying notes are an integral part of these financial statements.
38 Pioneer Multi-Asset Ultrashort Income Fund | Annual Report | 3/31/20
| | | | |
| Principal | | | |
| Amount | | | |
| USD ($) | | | Value |
| | Asset Backed Securities — (continued) | |
| 689,035(b) | | Sofi Professional Loan Program LLC, Series 2016-D, | |
| | Class A1, 1.897% (1 Month USD LIBOR + | |
| | 95 bps), 1/25/39 (144A) | $ 685,701 |
| 1,786,762(b) | | Sofi Professional Loan Program LLC, Series 2016-E, | |
| | Class A1, 1.797% (1 Month USD LIBOR + | |
| | 85 bps), 7/25/39 (144A) | 1,769,040 |
| 467,217(b) | | Sofi Professional Loan Program LLC, Series 2017-A, | |
| | Class A1, 1.647% (1 Month USD LIBOR + | |
| | 70 bps), 3/26/40 (144A) | 446,832 |
| 585,824(b) | | Sofi Professional Loan Program LLC, Series 2017-C, | |
| | Class A1, 1.547% (1 Month USD LIBOR + | |
| | 60 bps), 7/25/40 (144A) | 567,583 |
| 1,020,083(b) | | Sofi Professional Loan Program LLC, Series 2017-E, | |
| | Class A1, 1.447% (1 Month USD LIBOR + | |
| | 50 bps), 11/26/40 (144A) | 1,007,961 |
| 151,335 | | Sofi Professional Loan Program LLC, Series 2017-F, | |
| | Class A1FX, 2.05%, 1/25/41 (144A) | 151,170 |
| 1,392,921(b) | | Sofi Professional Loan Program LLC, Series 2018-A, | |
| | Class A1, 1.297% (1 Month USD LIBOR + | |
| | 35 bps), 2/25/42 (144A) | 1,373,654 |
| 779,078 | | Sofi Professional Loan Program LLC, Series 2018-A, | |
| | Class A2A, 2.39%, 2/25/42 (144A) | 779,146 |
| 8,485,522 | | Sofi Professional Loan Program LLC, Series 2019-C, | |
| | Class A1FX, 2.13%, 11/16/48 (144A) | 8,459,070 |
| 3,522,734 | | Sofi Professional Loan Program Trust, Series 2018-B, | |
| | Class A1FX, 2.64%, 8/25/47 (144A) | 3,501,763 |
| 2,000,000(b) | | Sound Point CLO XXV, Ltd., Series 2019-4A, Class X, | |
| | 2.481% (3 Month USD LIBOR + 65 bps), | |
| | 1/15/33 (144A) | 1,999,922 |
| 18,500,000 | | Springleaf Funding Trust, Series 2015-BA, Class A, | |
| | 3.48%, 5/15/28 (144A) | 17,922,965 |
| 4,500,000(b) | | Starwood Waypoint Homes Trust, Series 2017-1, Class E, | |
| | 3.305% (1 Month USD LIBOR + 260 bps), | |
| | 1/17/35 (144A) | 4,217,003 |
| 687,500(b) | | Stewart Park CLO, Ltd., Series 2015-1A, Class X, 2.431% | |
| | (3 Month USD LIBOR + 60 bps), 1/15/30 (144A) | 687,494 |
| 28,612(b) | | Structured Asset Investment Loan Trust, Series 2004-10, | |
| | Class A7, 2.007% (1 Month USD LIBOR + | |
| | 106 bps), 11/25/34 | 28,547 |
| 176,249(b) | | Structured Asset Investment Loan Trust, Series 2005-HE1, | |
| | Class M1, 1.417% (1 Month USD LIBOR + | |
| | 47 bps), 7/25/35 | 174,755 |
| 3,221,714(b) | | Structured Asset Investment Loan Trust, Series 2005-HE3, | |
| | Class M1, 1.667% (1 Month USD LIBOR + | |
| | 72 bps), 9/25/35 | 3,068,300 |
| 90,035(b) | | Structured Asset Securities Corp. Mortgage Loan Trust, | |
| | | Series 2005-NC2, Class M4, 1.652% (1 Month | |
| | USD LIBOR + 71 bps), 5/25/35 | 86,730 |
The accompanying notes are an integral part of these financial statements.
Pioneer Multi-Asset Ultrashort Income Fund | Annual Report | 3/31/20 39
Schedule of Investments | 3/31/20 (continued)
| | | | |
| Principal | | | |
| Amount | | | |
| USD ($) | | | Value |
| | Asset Backed Securities — (continued) | |
| 4,121,691(b) | | Structured Asset Securities Corp. Mortgage Loan Trust, | |
| | Series 2006-OPT1, Class A1, 1.127% (1 Month | |
| | USD LIBOR + 18 bps), 4/25/36 | $ 3,835,956 |
| 1,739,326(b) | | Structured Asset Securities Corp. Mortgage Loan Trust, | |
| | Series 2007-TC1, Class A, 1.247% (1 Month USD | |
| | LIBOR + 30 bps), 4/25/31 (144A) | 1,690,891 |
| 445,582(b) | | Structured Asset Securities Corp. Trust, Series 2005-AR1, | |
| | Class M1, 1.377% (1 Month USD LIBOR + | |
| | 43 bps), 9/25/35 | 443,500 |
| 500,000(b) | | Symphony CLO XIX, Ltd., Series 2018-19A, Class X, 2.343% | |
| | (3 Month USD LIBOR + 50 bps), 4/16/31 (144A) | 499,997 |
| 1,535,967 | | Tax Ease Funding LLC, Series 2016-1A, Class A, 3.131%, | |
| | 6/15/28 (144A) | 1,527,977 |
| 538,001 | | TCF Auto Receivables Owner Trust, Series 2016-PT1A, | |
| | Class A, 1.93%, 6/15/22 (144A) | 534,192 |
| 158,900(b) | | Terwin Mortgage Trust, Series 2006-1, Class 1A3, 1.327% | |
| | (1 Month USD LIBOR + 38 bps), 1/25/37 (144A) | 158,615 |
| 4,632,892(b) | | Terwin Mortgage Trust, Series 2006-3, Class 1A2, 1.177% | |
| | (1 Month USD LIBOR + 23 bps), 4/25/37 (144A) | 4,494,548 |
| 625,000(b) | | THL Credit Wind River CLO, Ltd., Series 2015-1A, | |
| | Class X, 2.469% (3 Month USD LIBOR + | |
| | 65 bps), 10/20/30 (144A) | 621,898 |
| 407,936 | | Tidewater Auto Receivables Trust, Series 2018-AA, | |
| | Class A2, 3.12%, 7/15/22 (144A) | 407,263 |
| 31,182,000 | | Tidewater Auto Receivables Trust, Series 2020-AA, | |
| | Class A2, 1.39%, 8/15/24 (144A) | 30,187,753 |
| 2,750,000 | | Tidewater Auto Receivables Trust, Series 2020-AA, | |
| | Class E, 3.35%, 7/17/28 (144A) | 2,467,630 |
| 2,889,159 | | TLF National Tax Lien Trust, Series 2017-1A, Class A, | |
| | 3.09%, 12/15/29 (144A) | 2,879,453 |
| 13,359,594(b) | | Towd Point Asset Trust, Series 2018-SL1, Class A, 2.227% | |
| | (1 Month USD LIBOR + 60 bps), 1/25/46 (144A) | 13,116,160 |
| 11,000,000(b) | | Towd Point Asset Trust, Series 2018-SL1, Class B, 2.677% | |
| | (1 Month USD LIBOR + 105 bps), 1/25/46 (144A) | 10,103,917 |
| 528,932(d) | | Towd Point Mortgage Trust, Series 2015-4, Class A1, | |
| | 3.5%, 4/25/55 (144A) | 528,402 |
| 2,541,076(d) | | Towd Point Mortgage Trust, Series 2015-5, Class A1B, | |
| | 2.75%, 5/25/55 (144A) | 2,520,233 |
| 1,510,253(d) | | Towd Point Mortgage Trust, Series 2017-5, Class XA, | |
| | 3.5%, 2/25/57 (144A) | 1,501,838 |
| 7,289,079(d) | | Towd Point Mortgage Trust, Series 2018-SJ1, Class XA, | |
| | 5.0%, 10/25/58 (144A) | 7,186,998 |
| 4,785,536(d) | | Towd Point Mortgage Trust, Series 2019-HY2, Class XA, | |
| | 5.0%, 5/25/58 (144A) | 4,744,758 |
| 5,318,000(b) | | Towd Point Mortgage Trust, Series 2019-HY3, Class A1B, | |
| | 1.947% (1 Month USD LIBOR + 100 bps), | |
| | 10/25/59 (144A) | 4,707,645 |
The accompanying notes are an integral part of these financial statements.
40 Pioneer Multi-Asset Ultrashort Income Fund | Annual Report | 3/31/20
| | | | |
| Principal | | | |
| Amount | | | |
| USD ($) | | | Value |
| | Asset Backed Securities — (continued) | |
| 12,289,656 | | Towd Point Mortgage Trust, Series 2019-HY3, Class XA, | |
| | 4.5%, 10/25/59 (144A) | $ 12,151,853 |
| 15,908,289(d) | | Towd Point Mortgage Trust, Series 2019-SJ3, Class A1, | |
| | 3.0%, 11/25/59 (144A) | 15,780,224 |
| 13,394,999(d) | | Towd Point Mortgage Trust, Series 2019-SJ3, Class XA, | |
| | 4.5%, 11/25/59 (144A) | 12,725,249 |
| 8,000,000(b) | | Trafigura Securitisation Finance Plc, Series 2017-1A, | |
| | Class A1, 1.555% (1 Month USD LIBOR + | |
| | 85 bps), 12/15/20 (144A) | 7,976,256 |
| 2,000,000(b) | | Trafigura Securitisation Finance Plc, Series 2017-1A, | |
| | Class B, 2.405% (1 Month USD LIBOR + | |
| | 170 bps), 12/15/20 (144A) | 1,987,760 |
| 13,750,000(b) | | Trafigura Securitisation Finance Plc, Series 2018-1A, | |
| | Class A1, 1.435% (1 Month USD LIBOR + | |
| | 73 bps), 3/15/22 (144A) | 13,693,914 |
| 2,500,000 | | Trafigura Securitisation Finance Plc, Series 2018-1A, | |
| | Class B, 4.29%, 3/15/22 (144A) | 2,487,335 |
| 2,423,077(b) | | Tralee CLO V, Ltd., Series 2018-5A, Class AX, 2.519% | |
| | (3 Month USD LIBOR + 70 bps), 10/20/28 (144A) | 2,423,060 |
| 16,400,000(b) | | TRTX Issuer, Ltd., Series 2019-FL3, Class C, 2.9% | |
| | (1 Month USD LIBOR + 210 bps), 9/15/34 (144A) | 13,284,253 |
| 12,000,000 | | United Auto Credit Securitization Trust, Series 2018-1, | |
| | Class E, 4.84%, 8/10/23 (144A) | 11,967,016 |
| 8,680,000 | | United Auto Credit Securitization Trust, Series 2019-1, | |
| | Class B, 3.03%, 4/10/24 (144A) | 8,581,209 |
| 1,372,427 | | Upstart Pass-Through Trust, Series 2020-ST2, Class A, | |
| | 3.5%, 3/20/28 (144A) | 1,097,942 |
| 4,650,000 | | Upstart Pass-Through Trust, Series 2020-ST3, Class A, | |
| | 3.35%, 4/20/28 (144A) | 3,720,000 |
| 437,571 | | Upstart Securitization Trust, Series 2019-1, Class A, | |
| | 3.45%, 4/20/26 (144A) | 434,192 |
| 12,228,863 | | Upstart Securitization Trust, Series 2019-2, Class A, | |
| | 2.897%, 9/20/29 (144A) | 11,328,202 |
| 17,328,174 | | Upstart Securitization Trust, Series 2019-3, Class A, | |
| | 2.684%, 1/21/30 (144A) | 17,206,905 |
| 27,000,000 | | Upstart Securitization Trust, Series 2020-1, Class A, | |
| | 2.322%, 4/22/30 (144A) | 25,473,366 |
| 9,338,087 | | US Auto Funding LLC, Series 2019-1A, Class A, 3.61%, | |
| | 4/15/22 (144A) | 9,113,132 |
| 184,211(b) | | Venture 32 CLO, Ltd., Series 2018-32RR, Class AX, 2.569% | |
| | (3 Month USD LIBOR + 75 bps), 7/19/31 (144A) | 184,209 |
| 1,396,838(b) | | Venture XXI CLO, Ltd., Series 2015-21A, Class AR, 2.711% | |
| | (3 Month USD LIBOR + 88 bps), 7/15/27 (144A) | 1,331,464 |
| 2,293,979(b) | | Verizon Owner Trust, Series 2017-3A, Class A1B, 1.043% | |
| | (1 Month USD LIBOR + 27 bps), 4/20/22 (144A) | 2,284,919 |
| 10,000,000(b) | | Verizon Owner Trust, Series 2019-A, Class A1B, 1.103% | |
| | (1 Month USD LIBOR + 33 bps), 9/20/23 | 9,830,997 |
The accompanying notes are an integral part of these financial statements.
Pioneer Multi-Asset Ultrashort Income Fund | Annual Report | 3/31/20 41
Schedule of Investments | 3/31/20 (continued)
| | | | |
| Principal | | | |
| Amount | | | |
| USD ($) | | | Value |
| | Asset Backed Securities — (continued) | |
| 23,500,000(b) | | Verizon Owner Trust, Series 2019-C, Class A1B, 1.193% | |
| | (1 Month USD LIBOR + 42 bps), 4/22/24 | $ 22,398,931 |
| 27,000,000(b) | | Verizon Owner Trust, Series 2020-A, Class A1B, 1.043% | |
| | (1 Month USD LIBOR + 27 bps), 7/22/24 | 25,699,667 |
| 2,260,460 | | Veros Automobile Receivables Trust, Series 2018-1, | |
| | Class A, 3.63%, 5/15/23 (144A) | 2,256,195 |
| 26,000,000 | | Veros Automobile Receivables Trust, Series 2020-1, | |
| | Class A, 1.67%, 9/15/23 (144A) | 25,609,654 |
| 2,000,000 | | Veros Automobile Receivables Trust, Series 2020-1, | |
| | Class B, 2.19%, 6/16/25 (144A) | 1,924,520 |
| 6,500,000 | | Volvo Financial Equipment LLC, Series 2019-2A, Class A2, | |
| | 2.02%, 8/15/22 (144A) | 6,475,555 |
| 11,250,000(b) | | Volvo Financial Equipment Master Owner Trust, | |
| | Series 2018-A, Class A, 1.225% (1 Month USD LIBOR + | |
| | 52 bps), 7/17/23 (144A) | 11,120,142 |
| 16,015(b) | | Wells Fargo Home Equity Asset-Backed Securities Trust, | |
| | Series 2006-2, Class A4, 1.197% (1 Month USD | |
| | LIBOR + 25 bps), 7/25/36 | 15,986 |
| 127,586 | | Westgate Resorts LLC, Series 2016-1A, Class A, 3.5%, | |
| | 12/20/28 (144A) | 126,912 |
| 3,376,831 | | Westgate Resorts LLC, Series 2017-1A, Class A, 3.05%, | |
| | 12/20/30 (144A) | 3,200,086 |
| 1,582,889 | | Westgate Resorts LLC, Series 2017-1A, Class B, 4.05%, | |
| | 12/20/30 (144A) | 1,488,516 |
| 3,469,662 | | Westgate Resorts LLC, Series 2018-1A, Class B, 3.58%, | |
| | 12/20/31 (144A) | 3,448,298 |
| 537,932 | | Westgate Resorts LLC, Series 2018-1A, Class C, 4.1%, | |
| | 12/20/31 (144A) | 534,422 |
| 11,462 | | Wheels SPV 2 LLC, Series 2017-1A, Class A2, 1.88%, | |
| | 4/20/26 (144A) | 11,451 |
| 9,888(b) | | Wilshire Mortgage Loan Trust, Series 1997-2, Class A6, | |
| | 1.227% (1 Month USD LIBOR + 28 bps), 5/25/28 | 9,527 |
| 444,589 | | World Omni Select Auto Trust, Series 2018-1A, Class A2, | |
| | 3.24%, 4/15/22 (144A) | 444,225 |
| | TOTAL ASSET BACKED SECURITIES | |
| | (Cost $1,811,498,721) | $1,746,889,150
|
| | COLLATERALIZED MORTGAGE OBLIGATIONS — | |
| | 15.2% of Net Assets | |
| 160,515(d) | | Agate Bay Mortgage Trust, Series 2014-3, Class A4, | |
| | 3.0%, 11/25/44 (144A) | $ 159,608 |
| 105,479(b) | | Alternative Loan Trust, Series 2004-6CB, Class A, | |
| | 1.527% (1 Month USD LIBOR + 58 bps), 5/25/34 | 103,505 |
| 3,435,445 | | Amur Equipment Finance Receivables VII LLC, | |
| | Series 2019-1A, Class A1, 2.45%, 7/20/20 (144A) | 3,432,108 |
| 376,852(b) | | Bear Stearns ALT-A Trust, Series 2004-12, Class 1A2, | |
| | 1.787% (1 Month USD LIBOR + 84 bps), 1/25/35 | 365,406 |
The accompanying notes are an integral part of these financial statements.
42 Pioneer Multi-Asset Ultrashort Income Fund | Annual Report | 3/31/20
| | | | |
| Principal | | | |
| Amount | | | |
| USD ($) | | | Value |
| | Collateralized Mortgage Obligations — (continued) | |
| 665,945(b) | | Bear Stearns ALT-A Trust, Series 2004-12, Class 1A3, | |
| | 1.647% (1 Month USD LIBOR + 70 bps), 1/25/35 | $ 638,300 |
| 328,498(b) | | Bear Stearns ALT-A Trust, Series 2004-12, Class 1A4, | |
| | 1.787% (1 Month USD LIBOR + 84 bps), 1/25/35 | 314,713 |
| 101,013(d) | | Bear Stearns Mortgage Securities, Inc., Series 1997-6, | |
| | Class 3B1, 3.992%, 6/25/30 | 98,135 |
| 791,433(b) | | Bellemeade Re, Ltd., Series 2017-1, Class M1, 2.647% | |
| | (1 Month USD LIBOR + 170 bps), 10/25/27 (144A) | 790,100 |
| 4,200,000(b) | | Bellemeade Re, Ltd., Series 2017-1, Class M2, 4.297% | |
| | (1 Month USD LIBOR + 335 bps), 10/25/27 (144A) | 3,652,789 |
| 10,926,324(b) | | Bellemeade Re, Ltd., Series 2018-1A, Class M1B, 2.547% | |
| | (1 Month USD LIBOR + 160 bps), 4/25/28 (144A) | 10,843,246 |
| 3,943,258(b) | | Bellemeade Re, Ltd., Series 2018-3A, Class M1B, 2.797% | |
| | (1 Month USD LIBOR + 185 bps), 10/25/28 (144A) | 3,919,884 |
| 6,125,000(b) | | Bellemeade Re, Ltd., Series 2018-3A, Class M2, 3.697% | |
| | (1 Month USD LIBOR + 275 bps), 10/25/28 (144A) | 4,561,950 |
| 23,980(b) | | Bellemeade Re, Ltd., Series 2019-1A, Class M1A, 2.247% | |
| | (1 Month USD LIBOR + 130 bps), 3/25/29 (144A) | 23,859 |
| 5,140,000(b) | | Bellemeade Re, Ltd., Series 2019-1A, Class M1B, 2.697% | |
| | (1 Month USD LIBOR + 175 bps), 3/25/29 (144A) | 4,528,948 |
| 2,800,000(b) | | Bellemeade Re, Ltd., Series 2019-3A, Class B1, 3.447% | |
| | (1 Month USD LIBOR + 250 bps), 7/25/29 (144A) | 1,981,972 |
| 10,671,000(b) | | Bellemeade Re, Ltd., Series 2019-3A, Class M1B, 2.547% | |
| | (1 Month USD LIBOR + 160 bps), 7/25/29 (144A) | 9,129,669 |
| 10,150,000(b) | | Bellemeade Re, Ltd., Series 2019-4A, Class M1B, 2.947% | |
| | (1 Month USD LIBOR + 200 bps), 10/25/29 (144A) | 9,693,063 |
| 7,301,013(b) | | Brass NO 8 Plc, Series 8A, Class A1, 2.392% (3 Month | |
| | USD LIBOR + 70 bps), 11/16/66 (144A) | 7,032,614 |
| 88,052(b) | | CHL Mortgage Pass-Through Trust, Series 2003-15, | |
| | Class 1A1, 1.447% (1 Month USD LIBOR + | |
| | 50 bps), 6/25/18 | 88,052 |
| 671 | | Citicorp Mortgage Securities REMIC Pass-Through | |
| | Certificates Trust, Series 2005-4, Class 2A1, | |
| | 5.0%, 7/25/20 | 656 |
| 23,326,941(b) | | Connecticut Avenue Securities Trust, Series 2019-HRP1, | |
| | Class M2, 3.811% (1 Month USD LIBOR + | |
| | 215 bps), 11/25/39 (144A) | 20,606,865 |
| 17,682,347(b) | | Connecticut Avenue Securities Trust, Series 2019-R01, | |
| | Class 2M2, 3.397% (1 Month USD LIBOR + | |
| | 245 bps), 7/25/31 (144A) | 14,653,794 |
| 5,491,954(b) | | Connecticut Avenue Securities Trust, Series 2020-R01, | |
| | Class 1M1, 1.747% (1 Month USD LIBOR + | |
| | 80 bps), 1/25/40 (144A) | 5,251,151 |
| 877,428(b) | | Connecticut Avenue Securities Trust, Series 2020-R02, | |
| | Class 2M1, 1.697% (1 Month USD LIBOR + | |
| | 75 bps), 1/25/40 (144A) | 842,237 |
The accompanying notes are an integral part of these financial statements.
Pioneer Multi-Asset Ultrashort Income Fund | Annual Report | 3/31/20 43
Schedule of Investments | 3/31/20 (continued)
| | | | |
| Principal | | | |
| Amount | | | |
| USD ($) | | | Value |
| | | Collateralized Mortgage Obligations — (continued) | |
| 69,956(b) | | CSFB Mortgage-Backed Pass-Through Certificates, Series | |
| | 2004-AR5, Class 11A2, 1.687% (1 Month USD | |
| | | LIBOR + 74 bps), 6/25/34 | $ 66,253 |
| 236,835(d) | | CSMC Trust, Series 2014-SAF1, Class A12, 4.0%, | |
| | | 3/25/44 (144A) | 235,763 |
| 5,160,204(b) | | Eagle Re, Ltd., Series 2018-1, Class M1, 2.647% | |
| | (1 Month USD LIBOR + 170 bps), 11/25/28 (144A) | 5,135,938 |
| 10,050,029(b) | | Eagle Re, Ltd., Series 2019-1, Class M1B, 2.747% | |
| | (1 Month USD LIBOR + 180 bps), 4/25/29 (144A) | 10,004,725 |
| 11,364,000(b) | | Eagle Re, Ltd., Series 2020-1, Class M1A, 1.847% | |
| | (1 Month USD LIBOR + 90 bps), 1/25/30 (144A) | 10,835,165 |
| 8,770,087(b) | | Fannie Mae Connecticut Avenue Securities, Series | |
| | 2014-C02, Class 1M2, 3.547% (1 Month USD LIBOR + | |
| | 260 bps), 5/25/24 | 7,868,826 |
| 6,439,391(b) | | Fannie Mae Connecticut Avenue Securities, Series | |
| | 2016-C02, Class 1M2, 6.947% (1 Month USD LIBOR + | |
| | 600 bps), 9/25/28 | 6,283,458 |
| 13,987,820(b) | | Fannie Mae Connecticut Avenue Securities, Series | |
| | 2016-C03, Class 2M2, 6.847% (1 Month USD LIBOR + | |
| | 590 bps), 10/25/28 | 13,638,115 |
| 6,477,040(b) | | Fannie Mae Connecticut Avenue Securities, Series | |
| | 2017-C01, Class 1M2, 4.497% (1 Month USD LIBOR + | |
| | 355 bps), 7/25/29 | 5,925,252 |
| 57,372(b) | | Fannie Mae Connecticut Avenue Securities, Series | |
| | 2017-C02, Class 2M1, 2.097% (1 Month USD LIBOR + | |
| | 115 bps), 9/25/29 | 57,102 |
| 3,850,000(b) | | Fannie Mae Connecticut Avenue Securities, Series | |
| | 2017-C02, Class 2M2, 4.597% (1 Month USD LIBOR + | |
| | 365 bps), 9/25/29 | 2,778,813 |
| 409,604(b) | | Fannie Mae Connecticut Avenue Securities, Series | |
| | 2017-C04, Class 2M1, 1.797% (1 Month USD LIBOR + | |
| | 85 bps), 11/25/29 | 405,849 |
| 4,722,952(b) | | Fannie Mae Connecticut Avenue Securities, Series | |
| | 2017-C05, Class 1M2, 3.147% (1 Month USD LIBOR + | |
| | 220 bps), 1/25/30 | 4,173,099 |
| 10,526,604(b) | | Fannie Mae Connecticut Avenue Securities, Series | |
| | 2017-C05, Class 1M2B, 3.147% (1 Month USD LIBOR + | |
| | 220 bps), 1/25/30 | 9,071,716 |
| 8,871,668(b) | | Fannie Mae Connecticut Avenue Securities, Series | |
| | 2017-C06, Class 2M2, 3.747% (1 Month USD LIBOR + | |
| | 280 bps), 2/25/30 | 7,400,476 |
| 3,940,785(b) | | Fannie Mae Connecticut Avenue Securities, Series | |
| | 2017-C06, Class 2M2A, 3.747% (1 Month USD LIBOR + | |
| | 280 bps), 2/25/30 | 3,757,892 |
The accompanying notes are an integral part of these financial statements.
44 Pioneer Multi-Asset Ultrashort Income Fund | Annual Report | 3/31/20
| | | | |
| Principal | | | |
| Amount | | | |
| USD ($) | | | Value |
| | Collateralized Mortgage Obligations — (continued) | |
| 9,873,392(b) | | Fannie Mae Connecticut Avenue Securities, Series | |
| | 2017-C07, Class 1M2A, 3.347% (1 Month USD LIBOR + | |
| | 240 bps), 5/25/30 | $ 9,246,175 |
| 823,287(b) | | Fannie Mae Connecticut Avenue Securities, Series | |
| | 2018-C03, Class 1M1, 1.627% (1 Month USD LIBOR + | |
| | 68 bps), 10/25/30 | 809,032 |
| 22,379,694(b) | | Fannie Mae Connecticut Avenue Securities, Series | |
| | 2018-C04, Class 2M2, 3.497% (1 Month USD LIBOR + | |
| | 255 bps), 12/25/30 | 18,343,948 |
| 19,530,000(b) | | Fannie Mae Connecticut Avenue Securities, Series | |
| | 2018-C05, Class 1M2, 3.297% (1 Month USD LIBOR + | |
| | 235 bps), 1/25/31 | 16,401,358 |
| 7,583,513(b) | | Fannie Mae Connecticut Avenue Securities, Series | |
| | 2018-C06, Class 1M2, 2.947% (1 Month USD LIBOR + | |
| | 200 bps), 3/25/31 | 6,671,519 |
| 307,909(b) | | Federal Home Loan Mortgage Corp. REMICS, Series | |
| | 1695, Class EG, 2.709% (1 Month USD LIBOR + |
| | 105 bps), 3/15/24 | 312,265 |
| 161,016(b) | | Federal Home Loan Mortgage Corp. REMICS, Series | |
| | | 2106, Class F, 1.155% (1 Month USD LIBOR + | |
| | 45 bps), 12/15/28 | 160,564 |
| 95,344(b) | | Federal Home Loan Mortgage Corp. REMICS, Series | |
| | 2122, Class FD, 1.055% (1 Month USD LIBOR + |
| | 35 bps), 2/15/29 | 94,908 |
| 35,520(b) | | Federal Home Loan Mortgage Corp. REMICS, Series | |
| | | 2156, Class FQ, 1.055% (1 Month USD LIBOR + | |
| | 35 bps), 5/15/29 | 35,632 |
| 186,109(b) | | Federal Home Loan Mortgage Corp. REMICS, Series | |
| | 2186, Class FY, 1.305% (1 Month USD LIBOR + |
| | 60 bps), 4/15/28 | 186,336 |
| 39,090(b) | | Federal Home Loan Mortgage Corp. REMICS, Series | |
| | | 2368, Class AF, 1.655% (1 Month USD LIBOR + | |
| | 95 bps), 10/15/31 | 39,876 |
| 43,062(b) | | Federal Home Loan Mortgage Corp. REMICS, Series | |
| | 2377, Class FE, 1.305% (1 Month USD LIBOR + |
| | 60 bps), 11/15/31 | 43,364 |
| 114,569(b) | | Federal Home Loan Mortgage Corp. REMICS, Series | |
| | | 2411, Class FR, 1.305% (1 Month USD LIBOR + | |
| | 60 bps), 6/15/31 | 114,732 |
| 80,038(b) | | Federal Home Loan Mortgage Corp. REMICS, Series 2432, | |
| | Class FH, 1.405% (1 Month USD LIBOR + | |
| | 70 bps), 3/15/32 | 78,955 |
| 243,473(b) | | Federal Home Loan Mortgage Corp. REMICS, Series 2439, | |
| | Class F, 1.705% (1 Month USD LIBOR + | |
| | 100 bps), 3/15/32 | 247,622 |
| 341,703(b) | | Federal Home Loan Mortgage Corp. REMICS, Series 2470, | |
| | Class AF, 1.705% (1 Month USD LIBOR + | |
| | 100 bps), 3/15/32 | 347,632 |
The accompanying notes are an integral part of these financial statements.
Pioneer Multi-Asset Ultrashort Income Fund | Annual Report | 3/31/20 45
Schedule of Investments | 3/31/20 (continued)
| | | | |
| Principal | | | |
| Amount | | | |
| USD ($) | | | Value |
| | Collateralized Mortgage Obligations — (continued) | |
| 205,707(b) | | Federal Home Loan Mortgage Corp. REMICS, Series 2471, | |
| | Class FD, 1.705% (1 Month USD LIBOR + | |
| | 100 bps), 3/15/32 | $ 209,212 |
| 52,336(b) | | Federal Home Loan Mortgage Corp. REMICS, Series 2498, | |
| | Class FQ, 1.305% (1 Month USD LIBOR + | |
| | 60 bps), 9/15/32 | 52,709 |
| 87,574(b) | | Federal Home Loan Mortgage Corp. REMICS, Series 2543, | |
| | Class EF, 1.055% (1 Month USD LIBOR + | |
| | 35 bps), 12/15/32 | 86,986 |
| 393,851(b) | | Federal Home Loan Mortgage Corp. REMICS, Series 2551, | |
| | Class FD, 1.105% (1 Month USD LIBOR + | |
| | 40 bps), 1/15/33 | 391,574 |
| 231,263(b) | | Federal Home Loan Mortgage Corp. REMICS, Series 2567, | |
| | Class FJ, 1.105% (1 Month USD LIBOR + | |
| | 40 bps), 2/15/33 | 229,873 |
| 113,990(b) | | Federal Home Loan Mortgage Corp. REMICS, Series 2577, | |
| | Class FA, 1.255% (1 Month USD LIBOR + | |
| | 55 bps), 2/15/33 | 113,741 |
| 9,211(b) | | Federal Home Loan Mortgage Corp. REMICS, Series 2585, | |
| | Class FD, 1.205% (1 Month USD LIBOR + | |
| | 50 bps), 12/15/32 | 9,193 |
| 136,456(b) | | Federal Home Loan Mortgage Corp. REMICS, Series 2614, | |
| | Class FV, 2.856% (1 Month USD LIBOR + | |
| | 150 bps), 5/15/33 | 139,246 |
| 186,581(b) | | Federal Home Loan Mortgage Corp. REMICS, Series 2631, | |
| | Class FC, 1.105% (1 Month USD LIBOR + | |
| | 40 bps), 6/15/33 | 185,472 |
| 204(b) | | Federal Home Loan Mortgage Corp. REMICS, Series 2647, | |
| | Class XF, 0.955% (1 Month USD LIBOR + | |
| | 25 bps), 7/15/21 | 204 |
| 115,255(b) | | Federal Home Loan Mortgage Corp. REMICS, Series 2711, | |
| | Class FA, 1.705% (1 Month USD LIBOR + | |
| | 100 bps), 11/15/33 | 118,112 |
| 215,122(b) | | Federal Home Loan Mortgage Corp. REMICS, Series 2916, | |
| | Class NF, 0.955% (1 Month USD LIBOR + | |
| | 25 bps), 1/15/35 | 212,563 |
| 368,494(b) | | Federal Home Loan Mortgage Corp. REMICS, Series 2976, | |
| | Class LF, 1.045% (1 Month USD LIBOR + | |
| | 34 bps), 5/15/35 | 363,122 |
| 192,732(b) | | Federal Home Loan Mortgage Corp. REMICS, Series 3012, | |
| | Class FE, 0.955% (1 Month USD LIBOR + | |
| | 25 bps), 8/15/35 | 191,882 |
| 122,983(b) | | Federal Home Loan Mortgage Corp. REMICS, Series 3042, | |
| | Class PF, 0.955% (1 Month USD LIBOR + | |
| | 25 bps), 8/15/35 | 121,568 |
| 69,656(b) | | Federal Home Loan Mortgage Corp. REMICS, Series 3067, | |
| | Class FA, 1.055% (1 Month USD LIBOR + | |
| | 35 bps), 11/15/35 | 68,670 |
The accompanying notes are an integral part of these financial statements.
46 Pioneer Multi-Asset Ultrashort Income Fund | Annual Report | 3/31/20
| | | | |
| Principal | | | |
| Amount | | | |
| USD ($) | | | Value |
| | Collateralized Mortgage Obligations — (continued) | |
| 83,658(b) | | Federal Home Loan Mortgage Corp. REMICS, Series 3102, | |
| | Class FG, 1.005% (1 Month USD LIBOR + | |
| | 30 bps), 1/15/36 | $ 82,550 |
| 101,717(b) | | Federal Home Loan Mortgage Corp. REMICS, Series 3117, | |
| | Class EF, 1.055% (1 Month USD LIBOR + | |
| | 35 bps), 2/15/36 | 100,308 |
| 327,097(b) | | Federal Home Loan Mortgage Corp. REMICS, Series 3117, | |
| | Class FE, 1.005% (1 Month USD LIBOR + | |
| | 30 bps), 2/15/36 | 321,810 |
| 228,677(b) | | Federal Home Loan Mortgage Corp. REMICS, Series 3122, | |
| | Class FP, 1.005% (1 Month USD LIBOR + | |
| | 30 bps), 3/15/36 | 226,424 |
| 144,332(b) | | Federal Home Loan Mortgage Corp. REMICS, Series 3147, | |
| | Class PF, 1.005% (1 Month USD LIBOR + | |
| | 30 bps), 4/15/36 | 143,260 |
| 323,069(b) | | Federal Home Loan Mortgage Corp. REMICS, Series 3173, | |
| | Class FC, 1.125% (1 Month USD LIBOR + | |
| | 42 bps), 6/15/36 | 321,616 |
| 720,295(b) | | Federal Home Loan Mortgage Corp. REMICS, Series 3175, | |
| | Class FE, 1.015% (1 Month USD LIBOR + | |
| | 31 bps), 6/15/36 | 720,676 |
| 381,946(b) | | Federal Home Loan Mortgage Corp. REMICS, Series 3181, | |
| | Class HF, 1.205% (1 Month USD LIBOR + | |
| | 50 bps), 7/15/36 | 379,520 |
| 18,226(b) | | Federal Home Loan Mortgage Corp. REMICS, Series 3191, | |
| | Class FE, 1.105% (1 Month USD LIBOR + | |
| | 40 bps), 7/15/36 | 18,119 |
| 266,727(b) | | Federal Home Loan Mortgage Corp. REMICS, Series 3221, | |
| | Class FW, 1.125% (1 Month USD LIBOR + | |
| | 42 bps), 9/15/36 | 264,011 |
| 78,135(b) | | Federal Home Loan Mortgage Corp. REMICS, Series 3222, | |
| | Class FN, 1.105% (1 Month USD LIBOR + | |
| | 40 bps), 9/15/36 | 77,545 |
| 279,856(b) | | Federal Home Loan Mortgage Corp. REMICS, Series 3239, | |
| | Class EF, 1.055% (1 Month USD LIBOR + | |
| | 35 bps), 11/15/36 | 276,313 |
| 148,648(b) | | Federal Home Loan Mortgage Corp. REMICS, Series 3239, | |
| | Class FB, 1.055% (1 Month USD LIBOR + | |
| | 35 bps), 11/15/36 | 146,794 |
| 239,026(b) | | Federal Home Loan Mortgage Corp. REMICS, Series 3247, | |
| | Class FA, 0.955% (1 Month USD LIBOR + | |
| | 25 bps), 8/15/36 | 235,015 |
| 632,014(b) | | Federal Home Loan Mortgage Corp. REMICS, Series 3266, | |
| | Class F, 1.005% (1 Month USD LIBOR + | |
| | 30 bps), 1/15/37 | 624,210 |
| 207,866(b) | | Federal Home Loan Mortgage Corp. REMICS, Series 3307, | |
| | Class FT, 0.945% (1 Month USD LIBOR + | |
| | 24 bps), 7/15/34 | 203,848 |
The accompanying notes are an integral part of these financial statements.
Pioneer Multi-Asset Ultrashort Income Fund | Annual Report | 3/31/20 47
Schedule of Investments | 3/31/20 (continued)
| | | | |
| Principal | | | |
| Amount | | | |
| USD ($) | | | Value |
| | Collateralized Mortgage Obligations — (continued) | |
| 34,022(b) | | Federal Home Loan Mortgage Corp. REMICS, Series 3315, | |
| | Class F, 1.045% (1 Month USD LIBOR + | |
| | 34 bps), 5/15/37 | $ 33,592 |
| 472,965(b) | | Federal Home Loan Mortgage Corp. REMICS, Series 3373, | |
| | Class FB, 1.285% (1 Month USD LIBOR + | |
| | 58 bps), 10/15/37 | 471,136 |
| 85,436(b) | | Federal Home Loan Mortgage Corp. REMICS, Series 3376, | |
| | Class FM, 1.325% (1 Month USD LIBOR + | |
| | 62 bps), 10/15/37 | 85,266 |
| 8,521 | | Federal Home Loan Mortgage Corp. REMICS, Series 3455, | |
| | Class BD, 4.5%, 6/15/23 | 8,533 |
| 22,936(b) | | Federal Home Loan Mortgage Corp. REMICS, Series 3560, | |
| | Class FA, 1.955% (1 Month USD LIBOR + | |
| | 125 bps), 5/15/37 | 22,981 |
| 266,199(b) | | Federal Home Loan Mortgage Corp. REMICS, Series 3610, | |
| | Class FA, 1.405% (1 Month USD LIBOR + | |
| | 70 bps), 12/15/39 | 267,634 |
| 101,051 | | Federal Home Loan Mortgage Corp. REMICS, Series 3706, | |
| | Class C, 2.0%, 8/15/20 | 101,286 |
| 152,695(b) | | Federal Home Loan Mortgage Corp. REMICS, Series 3708, | |
| | Class PF, 1.055% (1 Month USD LIBOR + | |
| | 35 bps), 7/15/40 | 151,291 |
| 40,850 | | Federal Home Loan Mortgage Corp. REMICS, Series 3760, | |
| | Class KH, 2.0%, 11/15/20 | 40,941 |
| 67,170(b) | | Federal Home Loan Mortgage Corp. REMICS, Series 3767, | |
| | Class JF, 1.005% (1 Month USD LIBOR + | |
| | 30 bps), 2/15/39 | 67,137 |
| 316,940 | | Federal Home Loan Mortgage Corp. REMICS, Series 3778, | |
| | Class D, 3.5%, 3/15/25 | 318,046 |
| 4,743(b) | | Federal Home Loan Mortgage Corp. REMICS, Series 3780, | |
| | Class FE, 1.105% (1 Month USD LIBOR + | |
| | 40 bps), 12/15/20 | 4,744 |
| 95,421(b) | | Federal Home Loan Mortgage Corp. REMICS, Series 3784, | |
| | Class F, 1.105% (1 Month USD LIBOR + | |
| | 40 bps), 7/15/23 | 95,051 |
| 24,869(b) | | Federal Home Loan Mortgage Corp. REMICS, Series 3792, | |
| | Class DF, 1.105% (1 Month USD LIBOR + | |
| | 40 bps), 11/15/40 | 24,882 |
| 32,317(b) | | Federal Home Loan Mortgage Corp. REMICS, Series 3867, | |
| | Class FD, 1.055% (1 Month USD LIBOR + | |
| | 35 bps), 5/15/41 | 31,917 |
| 101,829(b) | | Federal Home Loan Mortgage Corp. REMICS, Series 3914, | |
| | Class LF, 0.905% (1 Month USD LIBOR + | |
| | 20 bps), 8/15/26 | 101,441 |
| 123,351(b) | | Federal Home Loan Mortgage Corp. REMICS, Series 3960, | |
| | Class FB, 1.005% (1 Month USD LIBOR + | |
| | 30 bps), 2/15/30 | 123,162 |
The accompanying notes are an integral part of these financial statements.
48 Pioneer Multi-Asset Ultrashort Income Fund | Annual Report | 3/31/20
| | | | |
| Principal | | | |
| Amount | | | |
| USD ($) | | | Value |
| | Collateralized Mortgage Obligations — (continued) | |
| 219,774(b) | | Federal Home Loan Mortgage Corp. REMICS, Series 3970, | |
| | Class GF, 1.005% (1 Month USD LIBOR + | |
| | 30 bps), 9/15/26 | $ 219,315 |
| 448,349(b) | | Federal Home Loan Mortgage Corp. REMICS, Series 3982, | |
| | Class FL, 1.255% (1 Month USD LIBOR + | |
| | 55 bps), 12/15/39 | 448,116 |
| 174,432(b) | | Federal Home Loan Mortgage Corp. REMICS, Series 4056, | |
| | Class QF, 1.055% (1 Month USD LIBOR + | |
| | 35 bps), 12/15/41 | 173,119 |
| 152,178(b) | | Federal Home Loan Mortgage Corp. Strips, Series 237, | |
| | Class F14, 1.105% (1 Month USD LIBOR + | |
| | 40 bps), 5/15/36 | 152,053 |
| 132,206(b) | | Federal Home Loan Mortgage Corp. Strips, Series 239, | |
| | Class F29, 0.955% (1 Month USD LIBOR + | |
| | 25 bps), 8/15/36 | 132,004 |
| 571,531(b) | | Federal Home Loan Mortgage Corp. Strips, Series 239, | |
| | Class F30, 1.005% (1 Month USD LIBOR + | |
| | 30 bps), 8/15/36 | 568,031 |
| 170,638(b) | | Federal Home Loan Mortgage Corp. Strips, Series 244, | |
| | Class F22, 1.055% (1 Month USD LIBOR + | |
| | 35 bps), 12/15/36 | 171,006 |
| 11,898(b) | | Federal National Mortgage Association REMICS, Series | |
| | 1991-124, Class FA, 1.847% (1 Month USD LIBOR | |
| | + 90 bps), 9/25/21 | 11,944 |
| 26,491(b) | | Federal National Mortgage Association REMICS, Series | |
| | 1993-230, Class FA, 2.227% (1 Month USD LIBOR | |
| | + 60 bps), 12/25/23 | 26,303 |
| 70,170(b) | | Federal National Mortgage Association REMICS, Series | |
| | 1993-247, Class FA, 2.436% (11th District | |
| | Cost of Funds Index + 140 bps), 12/25/23 | 71,185 |
| 70,170(b) | | Federal National Mortgage Association REMICS, Series | |
| | 1993-247, Class FE, 1.947% (1 Month USD LIBOR | |
| | + 100 bps), 12/25/23 | 70,584 |
| 138,119(b) | | Federal National Mortgage Association REMICS, Series | |
| | | 1994-40, Class FC, 1.447% (1 Month USD LIBOR | |
| | + 50 bps), 3/25/24 | 139,058 |
| 19,088(b) | | Federal National Mortgage Association REMICS, Series | |
| | | 1997-46, Class FA, 1.112% (1 Month USD LIBOR | |
| | + 50 bps), 7/18/27 | 19,249 |
| 65,443(b) | | Federal National Mortgage Association REMICS, Series | |
| | | 1998-21, Class F, 1.9% (1 Year CMT Index + | |
| | 35 bps), 3/25/28 | 65,675 |
| 4,750(b) | | Federal National Mortgage Association REMICS, Series | |
| | | 1999-49, Class FB, 1.447% (1 Month USD LIBOR | |
| | + 50 bps), 3/25/23 | 4,749 |
| 38,081(b) | | Federal National Mortgage Association REMICS, Series | |
| | | 2000-47, Class FD, 1.497% (1 Month USD LIBOR | |
| | + 55 bps), 12/25/30 | 38,073 |
The accompanying notes are an integral part of these financial statements.
Pioneer Multi-Asset Ultrashort Income Fund | Annual Report | 3/31/20 49
Schedule of Investments | 3/31/20 (continued)
| | | | |
| Principal | | | |
| Amount | | | |
| USD ($) | | | Value |
| | Collateralized Mortgage Obligations — (continued) | |
| 155,733(b) | | Federal National Mortgage Association REMICS, Series | |
| | 2001-35, Class F, 1.547% (1 Month USD LIBOR + | |
| | 60 bps), 7/25/31 | $ 155,902 |
| 62,868(b) | | Federal National Mortgage Association REMICS, Series | |
| | 2001-37, Class F, 1.447% (1 Month USD LIBOR + | |
| | 50 bps), 8/25/31 | 63,064 |
| 321,823(b) | | Federal National Mortgage Association REMICS, Series | |
| | 2001-50, Class FQ, 1.547% (1 Month USD LIBOR | |
| | + 60 bps), 11/25/31 | 322,172 |
| 141,602(b) | | Federal National Mortgage Association REMICS, Series | |
| | 2001-65, Class F, 1.547% (1 Month USD LIBOR + | |
| | 60 bps), 11/25/31 | 141,756 |
| 102,391(b) | | Federal National Mortgage Association REMICS, Series | |
| | 2001-69, Class FA, 1.547% (1 Month USD LIBOR | |
| | + 60 bps), 7/25/31 | 102,578 |
| 283,993(b) | | Federal National Mortgage Association REMICS, Series | |
| | 2001-72, Class FB, 1.847% (1 Month USD LIBOR | |
| | + 90 bps), 12/25/31 | 287,522 |
| 78,342(b) | | Federal National Mortgage Association REMICS, Series | |
| | 2001-81, Class FL, 1.262% (1 Month USD LIBOR | |
| | + 65 bps), 1/18/32 | 78,574 |
| 127,680(b) | | Federal National Mortgage Association REMICS, | |
| | Series 2002-1, Class FC, 1.647% (1 Month USD LIBOR + | |
| | 70 bps), 1/25/32 | 128,361 |
| 410,545(b) | | Federal National Mortgage Association REMICS, Series | |
| | 2002-13, Class FD, 1.847% (1 Month USD LIBOR | |
| | + 90 bps), 3/25/32 | 414,740 |
| 278,852(b) | | Federal National Mortgage Association REMICS, Series | |
| | 2002-34, Class FA, 1.112% (1 Month USD LIBOR | |
| | + 50 bps), 5/18/32 | 278,919 |
| 201,794(b) | | Federal National Mortgage Association REMICS, Series | |
| | 2002-56, Class FN, 1.947% (1 Month USD LIBOR | |
| | + 100 bps), 7/25/32 | 205,298 |
| 28,374(b) | | Federal National Mortgage Association REMICS, Series | |
| | 2002-58, Class FD, 1.547% (1 Month USD LIBOR | |
| | + 60 bps), 8/25/32 | 28,425 |
| 131,914(b) | | Federal National Mortgage Association REMICS, Series | |
| | 2002-77, Class F, 1.547% (1 Month USD LIBOR + | |
| | 60 bps), 12/25/32 | 132,153 |
| 96,916(b) | | Federal National Mortgage Association REMICS, Series | |
| | 2002-82, Class FB, 1.447% (1 Month USD LIBOR | |
| | + 50 bps), 12/25/32 | 96,740 |
| 123,099(b) | | Federal National Mortgage Association REMICS, Series | |
| | 2002-90, Class FH, 1.447% (1 Month USD LIBOR | |
| | + 50 bps), 9/25/32 | 122,882 |
| 61,434(b) | | Federal National Mortgage Association REMICS, Series | |
| | 2002-92, Class FB, 1.597% (1 Month USD LIBOR | |
| | + 65 bps), 4/25/30 | 61,507 |
The accompanying notes are an integral part of these financial statements.
50 Pioneer Multi-Asset Ultrashort Income Fund | Annual Report | 3/31/20
| | | | |
| Principal | | | |
| Amount | | | |
| USD ($) | | | Value |
| | Collateralized Mortgage Obligations — (continued) | |
| 139,113(b) | | Federal National Mortgage Association REMICS, Series | |
| | 2002-93, Class FH, 1.447% (1 Month USD LIBOR | |
| | + 50 bps), 1/25/33 | $ 138,849 |
| 113,554(b) | | Federal National Mortgage Association REMICS, | |
| | Series 2003-7, Class FA, 1.697% (1 Month USD LIBOR + | |
| | 75 bps), 2/25/33 | 114,380 |
| 229,012(b) | | Federal National Mortgage Association REMICS, | |
| | Series 2003-8, Class FJ, 1.297% (1 Month USD LIBOR + | |
| | 35 bps), 2/25/33 | 228,581 |
| 339,418(b) | | Federal National Mortgage Association REMICS, Series | |
| | 2003-31, Class FM, 1.447% (1 Month USD LIBOR | |
| | + 50 bps), 4/25/33 | 338,755 |
| 155,861(b) | | Federal National Mortgage Association REMICS, Series | |
| | 2003-42, Class JF, 1.447% (1 Month USD LIBOR | |
| | + 50 bps), 5/25/33 | 155,195 |
| 101,903(b) | | Federal National Mortgage Association REMICS, Series | |
| | 2003-49, Class FY, 1.347% (1 Month USD LIBOR | |
| | + 40 bps), 6/25/23 | 101,830 |
| 241,645(b) | | Federal National Mortgage Association REMICS, Series | |
| | 2003-107, Class FD, 1.447% (1 Month USD LIBOR | |
| | + 50 bps), 11/25/33 | 240,451 |
| 198,438(b) | | Federal National Mortgage Association REMICS, Series | |
| | 2004-52, Class FW, 1.347% (1 Month USD LIBOR | |
| | + 40 bps), 7/25/34 | 196,593 |
| 58,247(b) | | Federal National Mortgage Association REMICS, Series | |
| | 2004-54, Class FN, 1.397% (1 Month USD LIBOR | |
| | + 45 bps), 7/25/34 | 57,561 |
| 526,487(b) | | Federal National Mortgage Association REMICS, Series | |
| | 2004-79, Class FM, 1.247% (1 Month USD LIBOR | |
| | + 30 bps), 11/25/24 | 525,609 |
| 61,653(b) | | Federal National Mortgage Association REMICS, Series | |
| | 2004-91, Class HF, 1.247% (1 Month USD LIBOR | |
| | + 30 bps), 11/25/34 | 61,618 |
| 212,559(b) | | Federal National Mortgage Association REMICS, Series | |
| | 2005-83, Class KT, 1.247% (1 Month USD LIBOR | |
| | + 30 bps), 10/25/35 | 209,376 |
| 276,550(b) | | Federal National Mortgage Association REMICS, Series | |
| | 2005-83, Class LF, 1.257% (1 Month USD LIBOR | |
| | + 31 bps), 2/25/35 | 275,055 |
| 42,669(b) | | Federal National Mortgage Association REMICS, Series | |
| | 2006-11, Class FB, 1.247% (1 Month USD LIBOR | |
| | + 30 bps), 3/25/36 | 42,107 |
| 117,659(b) | | Federal National Mortgage Association REMICS, Series | |
| | 2006-33, Class FH, 1.297% (1 Month USD LIBOR | |
| | + 35 bps), 5/25/36 | 116,490 |
| 361,277(b) | | Federal National Mortgage Association REMICS, Series | |
| | 2006-34, Class FA, 1.257% (1 Month USD LIBOR | |
| | + 31 bps), 5/25/36 | 356,836 |
The accompanying notes are an integral part of these financial statements.
Pioneer Multi-Asset Ultrashort Income Fund | Annual Report | 3/31/20 51
Schedule of Investments | 3/31/20 (continued)
| | | | |
| Principal | | | |
| Amount | | | |
| USD ($) | | | Value |
| | Collateralized Mortgage Obligations — (continued) | |
| 255,004(b) | | Federal National Mortgage Association REMICS, Series | |
| | 2006-42, Class CF, 1.397% (1 Month USD LIBOR | |
| | + 45 bps), 6/25/36 | $ 252,643 |
| 99,611(b) | | Federal National Mortgage Association REMICS, Series | |
| | 2006-56, Class FC, 1.237% (1 Month USD LIBOR | |
| | + 29 bps), 7/25/36 | 98,314 |
| 38,610(b) | | Federal National Mortgage Association REMICS, Series | |
| | 2006-70, Class BF, 1.497% (1 Month USD LIBOR | |
| | + 55 bps), 8/25/36 | 38,543 |
| 79,432(b) | | Federal National Mortgage Association REMICS, Series | |
| | 2006-82, Class F, 1.517% (1 Month USD LIBOR + | |
| | 57 bps), 9/25/36 | 79,090 |
| 121,607(b) | | Federal National Mortgage Association REMICS, Series | |
| | 2006-104, Class GF, 1.267% (1 Month USD LIBOR | |
| | + 32 bps), 11/25/36 | 119,798 |
| 45,769(b) | | Federal National Mortgage Association REMICS, Series | |
| | 2006-115, Class BF, 1.187% (1 Month USD LIBOR | |
| | + 24 bps), 12/25/36 | 45,206 |
| 147,152(b) | | Federal National Mortgage Association REMICS, | |
| | Series 2007-2, Class FT, 1.197% (1 Month USD LIBOR + | |
| | 25 bps), 2/25/37 | 144,432 |
| 176,115(b) | | Federal National Mortgage Association REMICS, | |
| | Series 2007-7, Class FJ, 1.147% (1 Month USD LIBOR + | |
| | 20 bps), 2/25/37 | 173,627 |
| 64,925(b) | | Federal National Mortgage Association REMICS, Series | |
| | 2007-13, Class FA, 1.197% (1 Month USD LIBOR | |
| | + 25 bps), 3/25/37 | 63,938 |
| 179,945(b) | | Federal National Mortgage Association REMICS, Series | |
| | 2007-41, Class FA, 1.347% (1 Month USD LIBOR | |
| | + 40 bps), 5/25/37 | 178,621 |
| 302,668(b) | | Federal National Mortgage Association REMICS, Series | |
| | 2007-50, Class FN, 1.187% (1 Month USD LIBOR | |
| | + 24 bps), 6/25/37 | 296,672 |
| 27,841(b) | | Federal National Mortgage Association REMICS, Series | |
| | 2007-57, Class FA, 1.177% (1 Month USD LIBOR | |
| | + 23 bps), 6/25/37 | 27,371 |
| 87,217(b) | | Federal National Mortgage Association REMICS, Series | |
| | 2007-58, Class FA, 1.197% (1 Month USD LIBOR | |
| | + 25 bps), 6/25/37 | 86,187 |
| 82,503(b) | | Federal National Mortgage Association REMICS, Series | |
| | 2007-66, Class FB, 1.347% (1 Month USD LIBOR | |
| | + 40 bps), 7/25/37 | 81,461 |
| 255,688(b) | | Federal National Mortgage Association REMICS, Series | |
| | 2007-85, Class FG, 1.447% (1 Month USD LIBOR | |
| | + 50 bps), 9/25/37 | 253,894 |
| 309,748(b) | | Federal National Mortgage Association REMICS, Series | |
| | 2007-91, Class FB, 1.547% (1 Month USD LIBOR | |
| | + 60 bps), 10/25/37 | 308,805 |
The accompanying notes are an integral part of these financial statements.
52 Pioneer Multi-Asset Ultrashort Income Fund | Annual Report | 3/31/20
| | | | |
| Principal | | | |
| Amount | | | |
| USD ($) | | | Value |
| | Collateralized Mortgage Obligations — (continued) | |
| 126,549(b) | | Federal National Mortgage Association REMICS, Series | |
| | 2007-92, Class OF, 1.517% (1 Month USD LIBOR | |
| | + 57 bps), 9/25/37 | $ 125,865 |
| 70,787(b) | | Federal National Mortgage Association REMICS, Series | |
| | 2007-93, Class FD, 1.497% (1 Month USD LIBOR | |
| | + 55 bps), 9/25/37 | 69,095 |
| 31,538(b) | | Federal National Mortgage Association REMICS, Series | |
| | 2007-98, Class FD, 1.397% (1 Month USD LIBOR | |
| | + 45 bps), 6/25/37 | 31,402 |
| 42,932(b) | | Federal National Mortgage Association REMICS, Series | |
| | 2007-100, Class YF, 1.497% (1 Month USD LIBOR | |
| | + 55 bps), 10/25/37 | 42,702 |
| 52,788(b) | | Federal National Mortgage Association REMICS, Series | |
| | 2007-103, Class AF, 1.947% (1 Month USD LIBOR | |
| | + 100 bps), 3/25/37 | 53,557 |
| 55,024(b) | | Federal National Mortgage Association REMICS, Series | |
| | 2007-110, Class FA, 1.567% (1 Month USD LIBOR | |
| | + 62 bps), 12/25/37 | 54,671 |
| 43,831(b) | | Federal National Mortgage Association REMICS, | |
| | Series 2008-6, Class FA, 1.647% (1 Month USD LIBOR + | |
| | 70 bps), 2/25/38 | 44,059 |
| 197,188(b) | | Federal National Mortgage Association REMICS, Series | |
| | 2008-88, Class FA, 2.167% (1 Month USD LIBOR | |
| | + 122 bps), 10/25/38 | 199,880 |
| 64,476(b) | | Federal National Mortgage Association REMICS, Series | |
| | 2009-113, Class FB, 1.497% (1 Month USD LIBOR | |
| | + 55 bps), 1/25/40 | 64,455 |
| 967 | | Federal National Mortgage Association REMICS, Series | |
| | 2010-17, Class DE, 3.5%, 6/25/21 | 967 |
| 120,611(b) | | Federal National Mortgage Association REMICS, Series | |
| | 2010-32, Class FD, 2.047% (1 Month USD LIBOR | |
| | + 110 bps), 4/25/40 | 122,185 |
| 2,079(b) | | Federal National Mortgage Association REMICS, Series | |
| | 2010-38, Class F, 1.247% (1 Month USD LIBOR + | |
| | 30 bps), 4/25/25 | 2,078 |
| 75,938(b) | | Federal National Mortgage Association REMICS, Series | |
| | 2010-43, Class FD, 1.547% (1 Month USD LIBOR | |
| | + 60 bps), 5/25/40 | 75,722 |
| 121,890(b) | | Federal National Mortgage Association REMICS, Series | |
| | 2010-43, Class IF, 1.447% (1 Month USD LIBOR | |
| | + 50 bps), 5/25/40 | 122,167 |
| 15,097 | | Federal National Mortgage Association REMICS, Series | |
| | 2010-112, Class AE, 2.0%, 10/25/25 | 15,110 |
| 214,464(b) | | Federal National Mortgage Association REMICS, Series | |
| | 2011-19, Class FM, 1.497% (1 Month USD LIBOR | |
| | + 55 bps), 5/25/40 | 214,618 |
| 196,123(b) | | Federal National Mortgage Association REMICS, Series | |
| | 2012-40, Class PF, 1.447% (1 Month USD LIBOR | |
| | + 50 bps), 4/25/42 | 194,369 |
The accompanying notes are an integral part of these financial statements.
Pioneer Multi-Asset Ultrashort Income Fund | Annual Report | 3/31/20 53
Schedule of Investments | 3/31/20 (continued)
| | | | |
| Principal | | | |
| Amount | | | |
| USD ($) | | | Value |
| | Collateralized Mortgage Obligations — (continued) | |
| 1,566,889(b) | | Federal National Mortgage Association Trust, | |
| | Series 2003-W6, Class F, 1.977% (1 Month USD | |
| | LIBOR + 35 bps), 9/25/42 | $ 1,546,167 |
| 696,877(b) | | Federal National Mortgage Association Trust, | |
| | Series 2005-W3, Class 2AF, 1.167% (1 Month USD | |
| | LIBOR + 22 bps), 3/25/45 | 694,199 |
| 53,548(d) | | Federal National Mortgage Association Trust, | |
| | Series 2005-W3, Class 3A, 4.083%, 4/25/45 | 58,372 |
| 85,375(d) | | Federal National Mortgage Association Trust, | |
| | Series 2005-W4, Class 3A, 4.005%, 6/25/45 | 91,644 |
| 658,589(b) | | Federal National Mortgage Association Whole Loan, | |
| | Series 2007-W1, Class 1AF1, 1.207% (1 Month USD | |
| | LIBOR + 26 bps), 11/25/46 | 648,867 |
| 185,411(d) | | FirstKey Mortgage Trust, Series 2014-1, Class A2, 3.0%, | |
| | 11/25/44 (144A) | 184,838 |
| 10,100,000(b) | | Freddie Mac Stacr Remic Trust, Series 2020-HQA2, | |
| | Class M1, 1.911% (1 Month USD LIBOR + | |
| | 110 bps), 3/25/50 (144A) | 9,749,763 |
| 8,470,000(b) | | Freddie Mac Stacr Remic Trust, Series 2020-HQA2, | |
| | Class M2, 3.911% (1 Month USD LIBOR + | |
| | 310 bps), 3/25/50 (144A) | 5,450,304 |
| 2,838,533(b) | | Freddie Mac Stacr Trust, Series 2018-HQA2, Class M1, | |
| | 1.697% (1 Month USD LIBOR + 75 bps), | |
| | 10/25/48 (144A) | 2,758,545 |
| 14,300,000(b) | | Freddie Mac Stacr Trust, Series 2019-HRP1, Class M2, | |
| | 2.347% (1 Month USD LIBOR + 140 bps), | |
| | 2/25/49 (144A) | 12,028,315 |
| 13,891,266(b) | | Freddie Mac Structured Agency Credit Risk Debt Notes, | |
| | Series 2015-DNA3, Class M3, 5.647% (1 Month USD | |
| | LIBOR + 470 bps), 4/25/28 | 12,733,817 |
| 1,104,314(b) | | Freddie Mac Structured Agency Credit Risk Debt Notes, | |
| | Series 2015-HQA2, Class M2, 3.747% (1 Month USD | |
| | LIBOR + 280 bps), 5/25/28 | 1,092,229 |
| 344,715(b) | | Freddie Mac Structured Agency Credit Risk Debt Notes, | |
| | Series 2016-DNA1, Class M2, 3.847% (1 Month USD | |
| | LIBOR + 290 bps), 7/25/28 | 342,592 |
| 17,450,000(b) | | Freddie Mac Structured Agency Credit Risk Debt Notes, | |
| | Series 2016-DNA1, Class M3, 6.497% (1 Month USD | |
| | LIBOR + 555 bps), 7/25/28 | 16,795,609 |
| 11,862,981(b) | | Freddie Mac Structured Agency Credit Risk Debt Notes, | |
| | Series 2016-DNA2, Class M3, 5.597% (1 Month USD | |
| | LIBOR + 465 bps), 10/25/28 | 11,269,826 |
| 17,304,709(b) | | Freddie Mac Structured Agency Credit Risk Debt Notes, | |
| | Series 2016-DNA3, Class M3, 5.947% (1 Month USD | |
| | LIBOR + 500 bps), 12/25/28 | 16,437,648 |
| 198,843(b) | | Freddie Mac Structured Agency Credit Risk Debt Notes, | |
| | Series 2016-DNA4, Class M2, 2.247% (1 Month USD | |
| | LIBOR + 130 bps), 3/25/29 | 196,037 |
The accompanying notes are an integral part of these financial statements.
54 Pioneer Multi-Asset Ultrashort Income Fund | Annual Report | 3/31/20
| | | | |
| Principal | | | |
| Amount | | | |
| USD ($) | | | Value |
| | Collateralized Mortgage Obligations — (continued) | |
| 14,967,126(b) | | Freddie Mac Structured Agency Credit Risk Debt Notes, | |
| | Series 2016-DNA4, Class M3, 4.747% (1 Month USD | |
| | LIBOR + 380 bps), 3/25/29 | $ 13,880,122 |
| 1,750,759(b) | | Freddie Mac Structured Agency Credit Risk Debt Notes, | |
| | Series 2016-HQA3, Class M2, 2.297% (1 Month USD | |
| | LIBOR + 135 bps), 3/25/29 | 1,677,073 |
| 387,036(b) | | Freddie Mac Structured Agency Credit Risk Debt Notes, | |
| | Series 2017-DNA1, Class M1, 2.147% (1 Month USD | |
| | LIBOR + 120 bps), 7/25/29 | 384,828 |
| 1,400,000(b) | | Freddie Mac Structured Agency Credit Risk Debt Notes, | |
| | Series 2017-DNA2, Class M2, 4.397% (1 Month USD | |
| | LIBOR + 345 bps), 10/25/29 | 1,245,868 |
| 3,360,000(b) | | Freddie Mac Structured Agency Credit Risk Debt Notes, | |
| | Series 2017-DNA3, Class M2, 3.447% (1 Month USD | |
| | LIBOR + 250 bps), 3/25/30 | 2,892,427 |
| 17,483(b) | | Freddie Mac Structured Agency Credit Risk Debt Notes, | |
| | Series 2017-HQA1, Class M1, 2.147% (1 Month USD | |
| | LIBOR + 120 bps), 8/25/29 | 17,401 |
| 5,000,000(b) | | Freddie Mac Structured Agency Credit Risk Debt Notes, | |
| | Series 2017-HQA1, Class M2, 4.497% (1 Month USD | |
| | LIBOR + 355 bps), 8/25/29 | 3,927,109 |
| 214,857(b) | | Freddie Mac Structured Agency Credit Risk Debt Notes, | |
| | Series 2017-HQA2, Class M1, 1.747% (1 Month USD | |
| | LIBOR + 80 bps), 12/25/29 | 212,212 |
| 3,201,162(b) | | Freddie Mac Structured Agency Credit Risk Debt Notes, | |
| | Series 2017-HQA2, Class M2, 3.597% (1 Month USD | |
| | LIBOR + 265 bps), 12/25/29 | 2,771,420 |
| 9,410,954(b) | | Freddie Mac Structured Agency Credit Risk Debt Notes, | |
| | Series 2017-HRP1, Class M2, 3.397% (1 Month USD | |
| | LIBOR + 245 bps), 12/25/42 | 8,733,838 |
| 1,221,157(b) | | Freddie Mac Structured Agency Credit Risk Debt Notes, | |
| | Series 2017-HRP1, Class M2D, 2.197% (1 Month USD | |
| | LIBOR + 125 bps), 12/25/42 | 1,088,656 |
| 15,660,992(b) | | Freddie Mac Structured Agency Credit Risk Debt Notes, | |
| | Series 2018-HQA1, Class M2, 3.247% (1 Month USD | |
| | LIBOR + 230 bps), 9/25/30 | 13,189,680 |
| 4,617,062(d) | | Freddie Mac Structured Agency Credit Risk Debt Notes, | |
| | Series 2018-SPI2, Class M1, 3.811%, 5/25/48 (144A) | 4,466,518 |
| 352,458(d) | | Freddie Mac Whole Loan Securities Trust, Series | |
| | 2015-SC02, Class M1, 3.668%, 9/25/45 | 351,284 |
| 3,835,508(b) | | Gosforth Funding Plc, Series 2018-1A, Class A1, 2.129% | |
| | (3 Month USD LIBOR + 45 bps), 8/25/60 (144A) | 3,750,267 |
| 131,540(b) | | Government National Mortgage Association, Series 2003-7, | |
| | Class FB, 0.905% (1 Month USD LIBOR + | |
| | 20 bps), 1/16/33 | 130,945 |
| 466,968(b) | | Government National Mortgage Association, Series 2005-3, | |
| | Class FC, 0.955% (1 Month USD LIBOR + | |
| | 25 bps), 1/16/35 | 461,641 |
The accompanying notes are an integral part of these financial statements.
Pioneer Multi-Asset Ultrashort Income Fund | Annual Report | 3/31/20 55
Schedule of Investments | 3/31/20 (continued)
| | | | |
| Principal | | | |
| Amount | | | |
| USD ($) | | | Value |
| | Collateralized Mortgage Obligations — (continued) | |
| 437,751(b) | | Government National Mortgage Association, | |
| | Series 2005-16, Class FA, 1.023% (1 Month USD | |
| | LIBOR + 25 bps), 2/20/35 | $ 429,821 |
| 148,369(b) | | Government National Mortgage Association, | |
| | Series 2008-69, Class FA, 1.273% (1 Month USD | |
| | LIBOR + 50 bps), 8/20/38 | 147,627 |
| 149,454(b) | | Government National Mortgage Association, Series | |
| | 2009-66, Class UF, 1.705% (1 Month USD LIBOR + | |
| | 100 bps), 8/16/39 | 150,379 |
| 658,123(b) | | Government National Mortgage Association, Series | |
| | 2009-88, Class MF, 1.373% (1 Month USD LIBOR + | |
| | 60 bps), 7/20/39 | 658,264 |
| 118,890(b) | | Government National Mortgage Association, Series | |
| | 2009-92, Class FJ, 1.385% (1 Month USD LIBOR + | |
| | 68 bps), 10/16/39 | 118,778 |
| 15,006(b) | | Government National Mortgage Association, Series | |
| | 2010-17, Class AF, 1.173% (1 Month USD LIBOR + | |
| | 40 bps), 10/20/38 | 15,004 |
| 152,517 | | Government National Mortgage Association, Series | |
| | 2010-138, Class PE, 3.0%, 8/20/38 | 154,016 |
| 3,389,186(b) | | Holmes Master Issuer Plc, Series 2018-2A, Class A2, | |
| | 2.251% (3 Month USD LIBOR + 42 bps), | |
| | 10/15/54 (144A) | 3,374,029 |
| 14,404,870(b) | | Home Partners of America Trust, Series 2017-1, Class A, | |
| | 1.617% (1 Month USD LIBOR + 82 bps), | |
| | 7/17/34 (144A) | 13,265,913 |
| 7,200,000(b) | | Home Partners of America Trust, Series 2017-1, Class B, | |
| | 2.15% (1 Month USD LIBOR + 135 bps), | |
| | 7/17/34 (144A) | 6,696,419 |
| 5,920,353(b) | | Home Re, Ltd., Series 2018-1, Class M1, 2.547% | |
| | (1 Month USD LIBOR + 160 bps), 10/25/28 (144A) | 5,897,799 |
| 8,726,260(b) | | Home Re, Ltd., Series 2019-1, Class M1, 2.597% | |
| | (1 Month USD LIBOR + 165 bps), 5/25/29 (144A) | 8,683,146 |
| 1,579,377(b) | | HomeBanc Mortgage Trust, Series 2005-3, Class A1, | |
| | 1.187% (1 Month USD LIBOR + 24 bps), 7/25/35 | 1,540,688 |
| 2,784,341(b) | | JP Morgan Mortgage Trust, Series 2018-7FRB, Class A3, | |
| | 2.377% (1 Month USD LIBOR + 75 bps), | |
| | 4/25/46 (144A) | 2,564,367 |
| 8,432,054(d) | | JP Morgan Mortgage Trust, Series 2018-7FRB, Class B1, | |
| | 3.045%, 4/25/46 (144A) | 7,116,106 |
| 7,975,237(d) | | JP Morgan Mortgage Trust, Series 2018-7FRB, Class B2, | |
| | 3.045%, 4/25/46 (144A) | 6,710,455 |
| 1,978,568(b) | | JP Morgan Seasoned Mortgage Trust, Series 2014-1, | |
| | Class AM, 1.447% (1 Month USD LIBOR + | |
| | 50 bps), 5/25/33 (144A) | 1,829,229 |
| 4,992,729(d) | | JP Morgan Seasoned Mortgage Trust, Series 2014-1, | |
| | Class B1, 2.473%, 5/25/33 (144A) | 4,647,912 |
The accompanying notes are an integral part of these financial statements.
56 Pioneer Multi-Asset Ultrashort Income Fund | Annual Report | 3/31/20
| | | | |
| Principal | | | |
| Amount | | | |
| USD ($) | | | Value |
| | Collateralized Mortgage Obligations — (continued) | |
| 6,729,054(d) | | JP Morgan Seasoned Mortgage Trust, Series 2014-1, | |
| | Class B2, 2.473%, 5/25/33 (144A) | $ 6,264,320 |
| 5,187,509(d) | | JP Morgan Seasoned Mortgage Trust, Series 2014-1, | |
| | Class B3, 2.473%, 5/25/33 (144A) | 4,829,240 |
| 541,282(b) | | JP Morgan Trust, Series 2015-1, Class 1A14, 3.083% | |
| | (1 Month USD LIBOR + 125 bps), 12/25/44 (144A) | 481,252 |
| 2,800,000(b) | | Lanark Master Issuer Plc, Series 2018-1A, Class 1A, | |
| | 2.103% (3 Month USD LIBOR + 42 bps), | |
| | 12/22/69 (144A) | 2,764,115 |
| 813,450(b) | | LMREC, Inc., Series 2016-CRE2, Class A, 3.329% | |
| | (1 Month USD LIBOR + 170 bps), 11/24/31 (144A) | 801,921 |
| 23,102,465(b) | | LSTAR Securities Investment Trust, Series 2019-2, | |
| | Class A1, 3.081% (1 Month USD LIBOR + | |
| | 150 bps), 4/1/24 (144A) | 22,200,616 |
| 9,774,084(b) | | LSTAR Securities Investment, Ltd., Series 2019-3, | |
| | Class A1, 3.081% (1 Month USD LIBOR + | |
| | 150 bps), 4/1/24 (144A) | 9,038,069 |
| 26,986,377(b) | | LSTAR Securities Investment, Ltd., Series 2019-4, | |
| | Class A1, 3.081% (1 Month USD LIBOR + | |
| | 150 bps), 5/1/24 (144A) | 25,324,051 |
| 13,714,910(b) | | LSTAR Securities Investment, Ltd., Series 2019-5, | |
| | Class A1, 3.081% (1 Month USD LIBOR + | |
| | 150 bps), 11/1/24 (144A) | 13,397,846 |
| 13,050(d) | | Merrill Lynch Mortgage Investors Trust, Series 2003-G, | |
| | Class A3, 3.565%, 1/25/29 | 11,868 |
| 678,826(b) | | Merrill Lynch Mortgage Investors Trust, Series 2003-H, | |
| | Class A1, 1.587% (1 Month USD LIBOR + | |
| | 64 bps), 1/25/29 | 619,127 |
| 468,096(b) | | Merrill Lynch Mortgage Investors Trust, Series 2004-B, | |
| | Class A2, 2.434% (6 Month USD LIBOR + | |
| | 54 bps), 5/25/29 | 417,384 |
| 32,025(b) | | Merrill Lynch Mortgage Investors Trust, Series 2004-C, | |
| | Class A2B, 2.924% (6 Month USD LIBOR + | |
| | 100 bps), 7/25/29 | 28,587 |
| 104,834(d) | | Merrill Lynch Mortgage Investors Trust, Series 2004-D, | |
| | Class A3, 3.646%, 9/25/29 | 94,217 |
| 146,756(b) | | Merrill Lynch Mortgage Investors Trust, Series 2004-G, | |
| | Class A2, 2.524% (6 Month USD LIBOR + | |
| | 60 bps), 1/25/30 | 130,844 |
| 145,574(d) | | Mill City Mortgage Loan Trust, Series 2018-4, Class A1A, | |
| | 3.5%, 4/25/66 (144A) | 145,213 |
| 4,338,467(d) | | Morgan Stanley Residential Mortgage Loan Trust, Series | |
| | 2014-1A, Class A1, 3.017%, 6/25/44 (144A) | 4,267,998 |
| 6,000,000(b) | | Mortgage Insurance-Linked Notes Series , Series 2020-1, | |
| | | Class M1A, 1.897% (1 Month USD LIBOR + | |
| | 95 bps), 2/25/30 (144A) | 5,752,394 |
| 10,722,384(b) | | Oaktown Re II, Ltd., Series 2018-1A, Class M1, 2.497% | |
| | (1 Month USD LIBOR + 155 bps), 7/25/28 (144A) | 10,666,020 |
The accompanying notes are an integral part of these financial statements.
Pioneer Multi-Asset Ultrashort Income Fund | Annual Report | 3/31/20 57
Schedule of Investments | 3/31/20 (continued)
| | | | |
| Principal | | | |
| Amount | | | |
| USD ($) | | | Value |
| | Collateralized Mortgage Obligations — (continued) | |
| 3,620,000(b) | | Oaktown Re III, Ltd., Series 2019-1A, Class B1A, | |
| | 4.447% (1 Month USD LIBOR + 350 bps), | |
| | 7/25/29 (144A) | $ 2,451,826 |
| 13,573,000(b) | | Oaktown Re III, Ltd., Series 2019-1A, Class M1B, | |
| | 2.897% (1 Month USD LIBOR + 195 bps), | |
| | 7/25/29 (144A) | 12,150,722 |
| 13,750,000(b) | | OBX Trust, Series 2019-EXP2, Class 2A1B, 1.847% | |
| | (1 Month USD LIBOR + 90 bps), 6/25/59 (144A) | 12,076,103 |
| 9,871,607(c) | | OSAT Trust, Series 2020-RPL1, Class A1, 3.072%, | |
| | 12/26/59 (144A) | 9,898,860 |
| 7,950,000(b) | | Pepper I-Prime Trust, Series 2018-2A, Class A1U2, | |
| | 1.277% (1 Month USD LIBOR + 48 bps), | |
| | 10/13/20 (144A) | 7,955,347 |
| 317,404(b) | | Pepper Residential Securities Trust No. 18, Series 18A, | |
| | Class A1UA, 1.761% (1 Month USD LIBOR + | |
| | 95 bps), 3/12/47 (144A) | 317,163 |
| 2,824,866(b) | | Pepper Residential Securities Trust No. 21, Series 21A, | |
| | Class A1U, 1.585% (1 Month USD LIBOR + | |
| | 88 bps), 1/16/60 (144A) | 2,794,683 |
| 6,507,843(b) | | Pepper Residential Securities Trust No. 22, Series 22A, | |
| | Class A1U, 1.773% (1 Month USD LIBOR + | |
| | 100 bps), 6/20/60 (144A) | 6,506,689 |
| 10,956,410(b) | | Pepper Residential Securities Trust No. 25, Series 25A, | |
| | Class A1U, 1.741% (1 Month USD LIBOR + | |
| | 93 bps), 3/12/61 (144A) | 10,853,595 |
| 5,437,500 | | Permanent Master Issuer Plc, Series 2018-1A, Class 1A1, | |
| | 2.211% (3 Month USD LIBOR + 38 bps), | |
| | 7/15/58 (144A) | 5,423,640 |
| 4,530,468(b) | | Radnor Re, Ltd., Series 2018-1, Class M1, 2.347% | |
| | (1 Month USD LIBOR + 140 bps), 3/25/28 (144A) | 4,520,371 |
| 7,284,042(b) | | Radnor Re, Ltd., Series 2019-1, Class M1B, 2.897% | |
| | (1 Month USD LIBOR + 195 bps), 2/25/29 (144A) | 7,257,791 |
| 17,250,000(b) | | Radnor Re, Ltd., Series 2019-2, Class M1B, 2.697% | |
| | (1 Month USD LIBOR + 175 bps), 6/25/29 (144A) | 16,136,785 |
| 2,063,759(b) | | RESI Finance LP, Series 2003-CB1, Class B3, 2.313% | |
| | (1 Month USD LIBOR + 145 bps), 6/10/35 (144A) | 1,859,756 |
| 5,709,224(b) | | Resimac MBS Trust, Series 2018-2A, Class A1A, 1.713% | |
| | (1 Month USD LIBOR + 85 bps), 4/10/50 (144A) | 5,693,353 |
| 1,464,578(b) | | Resimac Premier, Series 2017-1A, Class A1A, 1.675% | |
| | (1 Month USD LIBOR + 95 bps), 9/11/48 (144A) | 1,457,138 |
| 2,667,773(b) | | Resimac Premier, Series 2018-1A, Class A1, 1.663% | |
| | (1 Month USD LIBOR + 80 bps), 11/10/49 (144A) | 2,643,827 |
| 11,321,420(b) | | Resimac Premier, Series 2019-2A, Class A1, 1.813% | |
| | (1 Month USD LIBOR + 95 bps), 2/10/51 (144A) | 11,212,531 |
| 10,118,469(d) | | RMF Buyout Issuance Trust, Series 2019-1, Class A, | |
| | 2.475%, 7/25/29 (144A) | 10,055,729 |
| 4,500,000(d) | | RMF Buyout Issuance Trust, Series 2019-1, Class M2, | |
| | 2.872%, 7/25/29 (144A) | 4,296,960 |
The accompanying notes are an integral part of these financial statements.
58 Pioneer Multi-Asset Ultrashort Income Fund | Annual Report | 3/31/20
| | | | |
| Principal | | | |
| Amount | | | |
| USD ($) | | | Value |
| | Collateralized Mortgage Obligations — (continued) | |
| 6,306,043(d) | | RMF Buyout Issuance Trust , Series 2020-1, Class A, | |
| | 2.158%, 2/25/30 (144A) | $ 6,234,109 |
| 2,000,000(d) | | RMF Buyout Issuance Trust , Series 2020-1, Class M1, | |
| | 2.332%, 2/25/30 (144A) | 1,913,500 |
| 6,689,317(b) | | STACR Trust, Series 2018-HRP1, Class M2, 2.597% | |
| | (1 Month USD LIBOR + 165 bps), 4/25/43 (144A) | 6,259,250 |
| 194,444(b) | | STACR Trust, Series 2018-HRP1, Class M2A, 2.597% | |
| | (1 Month USD LIBOR + 165 bps), 4/25/43 (144A) | 193,319 |
| 6,238,600(b) | | STACR Trust, Series 2018-HRP2, Class M2, 2.197% | |
| | (1 Month USD LIBOR + 125 bps), 2/25/47 (144A) | 5,915,053 |
| 17,605,000(b) | | STACR Trust, Series 2018-HRP2, Class M3, 3.347% | |
| | (1 Month USD LIBOR + 240 bps), 2/25/47 (144A) | 15,088,779 |
| 7,247,796(b) | | STACR Trust , Series 2018-HRP1, Class B1, 4.697% | |
| | (1 Month USD LIBOR + 375 bps), 4/25/43 (144A) | 4,462,914 |
| 7,500,000(b) | | Starwood Waypoint Homes Trust, Series 2017-1, Class B, | |
| | 1.875% (1 Month USD LIBOR + 117 bps), | |
| | 1/17/35 (144A) | 6,917,233 |
| 12,978,431(b) | | Towd Point HE Trust, Series 2019-HE1, Class A1, 1.847% | |
| | (1 Month USD LIBOR + 90 bps), 4/25/48 (144A) | 12,589,069 |
| 8,180,168(b) | | Towd Point HE Trust, Series 2019-HE1, Class M1, 2.047% | |
| | (1 Month USD LIBOR + 110 bps), 4/25/48 (144A) | 7,903,099 |
| 206,116(d) | | Verus Securitization Trust , Series 2018-1, Class A3, | |
| | 3.205%, 2/25/48 (144A) | 196,044 |
| | TOTAL COLLATERALIZED MORTGAGE OBLIGATIONS | |
| | (Cost $870,064,354) | $ 789,572,350
|
| | COMMERCIAL MORTGAGE-BACKED | |
| | SECURITIES — 11.6% of Net Assets | |
| 12,500,000(b) | | Austin Fairmont Hotel Trust, Series 2019-FAIR, Class E, | |
| | 2.955% (1 Month USD LIBOR + 225 bps), | |
| | 9/15/32 (144A) | $ 9,788,552 |
| 15,635,000(b) | | BAMLL Commercial Mortgage Securities Trust, Series | |
| | 2019-RLJ, Class C, 2.305% (1 Month USD LIBOR + | |
| | 160 bps), 4/15/36 (144A) | 12,142,000 |
| 3,480,910(b) | | Bancorp Commercial Mortgage Trust, Series 2018-CRE4, | |
| | Class A, 1.605% (1 Month USD LIBOR + | |
| | 90 bps), 9/15/35 (144A) | 3,022,345 |
| 13,500,000(b) | | BHP Trust, Series 2019-BXHP, Class D, 2.476% (1 Month | |
| | USD LIBOR + 177 bps), 8/15/36 (144A) | 10,986,220 |
| 7,750,000(b) | | BTH-13 Mortgage Backed Securities Trust, Series 2018-13, | |
| | Class A, 4.081% (1 Month USD LIBOR + | |
| | 250 bps), 8/18/21 (144A) | 7,727,042 |
| 5,700,000(b) | | BTH-16 Mortgage-Backed Securities Trust, Series 2018-16, | |
| | Class A, 4.081% (1 Month USD LIBOR + | |
| | 250 bps), 8/4/21 (144A) | 5,482,967 |
| 5,700,000(b) | | BTH-20 Mortgage-Backed Securities Trust, Series 2018-20, | |
| | Class A, 4.081% (1 Month USD LIBOR + | |
| | 250 bps), 9/24/20 (144A) | 5,650,683 |
The accompanying notes are an integral part of these financial statements.
Pioneer Multi-Asset Ultrashort Income Fund | Annual Report | 3/31/20 59
Schedule of Investments | 3/31/20 (continued)
| | | | |
| Principal | | | |
| Amount | | | |
| USD ($) | | | Value |
| | Commercial Mortgage-Backed Securities — (continued) | |
| 7,625,000(b) | | BTH-21 Mortgage-Backed Securities Trust, Series | |
| | 2018-21, Class A, 4.081% (1 Month USD LIBOR + | |
| | 250 bps), 10/7/21 (144A) | $ 7,582,657 |
| 14,500,000(b) | | BTH-25 Mortgage-Backed Securities Trust, Series | |
| | 2019-25, Class A, 4.015% (1 Month USD LIBOR + | |
| | 250 bps), 2/18/21 (144A) | 14,337,909 |
| 12,300,000(b) | | BTH-3 Mortgage-Backed Securities Trust, Series 2018-3, | |
| | Class A, 4.081% (1 Month USD LIBOR + | |
| | 250 bps), 7/6/20 | 11,985,878 |
| 5,810,000(b) | | BX Commercial Mortgage Trust, Series 2018-IND, Class D, | |
| | 2.005% (1 Month USD LIBOR + 130 bps), | |
| | 11/15/35 (144A) | 5,329,763 |
| 15,582,583(b) | | BX Commercial Mortgage Trust, Series 2019-XL, Class G, | |
| | 3.005% (1 Month USD LIBOR + 230 bps), | |
| | 10/15/36 (144A) | 13,086,333 |
| 9,300,000(b) | | BX Trust, Series 2019-ATL, Class B, 2.091% (1 Month USD | |
| | LIBOR + 139 bps), 10/15/36 (144A) | 7,466,758 |
| 8,000,000(b) | | BXP Trust, Series 2017-CQHP, Class B, 1.805% (1 Month | |
| | USD LIBOR + 110 bps), 11/15/34 (144A) | 6,680,403 |
| 2,171,167(b) | | CG-CCRE Commercial Mortgage Trust, Series 2014-FL1, | |
| | Class B, 1.855% (1 Month USD LIBOR + | |
| | 115 bps), 6/15/31 (144A) | 2,171,274 |
| 722,572(b) | | CG-CCRE Commercial Mortgage Trust, Series 2014-FL2, | |
| | Class A, 2.559% (1 Month USD LIBOR + | |
| | 185 bps), 11/15/31 (144A) | 687,413 |
| 10,000,000(b) | | CGDB Commercial Mortgage Trust, Series 2019-MOB, | |
| | Class C, 2.155% (1 Month USD LIBOR + | |
| | 145 bps), 11/15/36 (144A) | 8,273,669 |
| 5,700,000(b) | | CGMS Commercial Mortgage Trust, Series 2017-MDRC, | |
| | Class C, 2.005% (1 Month USD LIBOR + | |
| | 130 bps), 7/15/30 (144A) | 5,335,816 |
| 14,935,551(b) | | CHC Commercial Mortgage Trust, Series 2019-CHC, | |
| | Class C, 2.455% (1 Month USD LIBOR + 175 bps), | |
| | 6/15/34 (144A) | 14,169,798 |
| 9,500,000(b) | | CHT Mortgage Trust, Series 2017-CSMO, Class C, 2.205% | |
| | (1 Month USD LIBOR + 150 bps), 11/15/36 (144A) | 8,148,699 |
| 8,750,000(b) | | Citigroup Commercial Mortgage Trust, Series 2019-SST2, | |
| | Class B, 1.805% (1 Month USD LIBOR + | |
| | 110 bps), 12/15/36 (144A) | 8,344,739 |
| 5,500,000(b) | | Citigroup Commercial Mortgage Trust, Series 2019-SST2, | |
| | Class C, 2.005% (1 Month USD LIBOR + | |
| | 130 bps), 12/15/36 (144A) | 5,226,502 |
| 15,000,000(b) | | CLNY Trust, Series 2019-IKPR, Class B, 2.183% (1 Month | |
| | USD LIBOR + 148 bps), 11/15/38 (144A) | 12,676,538 |
| 5,000,000(b) | | CLNY Trust, Series 2019-IKPR, Class E, 3.426% (1 Month | |
| | USD LIBOR + 272 bps), 11/15/38 (144A) | 3,389,931 |
The accompanying notes are an integral part of these financial statements.
60 Pioneer Multi-Asset Ultrashort Income Fund | Annual Report | 3/31/20
| | | | |
| Principal | | | |
| Amount | | | |
| USD ($) | | | Value |
| | Commercial Mortgage-Backed Securities — (continued) | |
| 6,750,000(b) | | Credit Suisse Commercial Mortgage Securities Corp., | |
| | Series 2019-SKLZ, Class B, 2.605% (1 Month USD | |
| | LIBOR + 190 bps), 1/15/34 (144A) | $ 5,889,751 |
| 10,000,000(b) | | Credit Suisse Mortgage Capital Certificates, Series | |
| | 2019-ICE4, Class E, 2.855% (1 Month USD LIBOR | |
| | + 215 bps), 5/15/36 (144A) | 8,397,714 |
| 10,380,000(b) | | CSMC Trust, Series 2017-HD, Class B, 2.055% (1 Month | |
| | USD LIBOR + 135 bps), 2/15/31 (144A) | 9,986,699 |
| 19,750,000(b) | | Exantas Capital Corp., Series 2020-RSO8, Class A, 2.85% | |
| | (1 Month USD LIBOR + 115 bps), 3/15/35 (144A) | 17,027,711 |
| 5,042,070(b) | | FREMF Mortgage Trust, Series 2014-KF03, Class B, | |
| | 6.015% (1 Month USD LIBOR + 450 bps), | |
| | 1/25/21 (144A) | 4,961,737 |
| 1,715,812(b) | | FREMF Mortgage Trust, Series 2014-KF05, Class B, | |
| | 5.515% (1 Month USD LIBOR + 400 bps), | |
| | 9/25/22 (144A) | 1,653,666 |
| 2,930,828(b) | | FREMF Mortgage Trust, Series 2014-KS02, Class B, | |
| | 6.515% (1 Month USD LIBOR + 500 bps), | |
| | 8/25/23 (144A) | 2,865,732 |
| 3,907,816(b) | | FREMF Mortgage Trust, Series 2018-KI01, Class B, 3.965% | |
| | (1 Month USD LIBOR + 245 bps), 9/25/22 (144A) | 3,762,519 |
| 5,009,151(b) | | GPMT, Ltd., Series 2018-FL1, Class A, 1.673% (1 Month | |
| | USD LIBOR + 90 bps), 11/21/35 (144A) | 4,842,010 |
| 3,250,000(b) | | GPMT, Ltd., Series 2018-FL1, Class AS, 1.973% (1 Month | |
| | USD LIBOR + 120 bps), 11/21/35 (144A) | 3,125,911 |
| 18,000,000(b) | | Great Wolf Trust, Series 2019-WOLF, Class D, 2.638% | |
| | (1 Month USD LIBOR + 193 bps), 12/15/36 (144A) | 14,936,362 |
| 9,400,000(d) | | GS Mortgage Securities Corp. Trust, Series 2016-RENT, | |
| | Class E, 4.067%, 2/10/29 (144A) | 9,093,506 |
| 3,500,000(b) | | GS Mortgage Securities Corp. Trust, Series 2017-STAY, | |
| | Class B, 1.805% (1 Month USD LIBOR + | |
| | 110 bps), 7/15/32 (144A) | 3,130,866 |
| 10,900,000(b) | | GS Mortgage Securities Corp. Trust, Series 2018-TWR, | |
| | Class A, 1.605% (1 Month USD LIBOR + | |
| | 90 bps), 7/15/31 (144A) | 9,235,379 |
| 11,000,000(b) | | GS Mortgage Securities Corp. Trust, Series 2019-70P, | |
| | Class D, 2.455% (1 Month USD LIBOR + | |
| | 175 bps), 10/15/36 (144A) | 9,072,575 |
| 7,400,000(b) | | GS Mortgage Securities Corp. Trust, Series 2019-SMP, | |
| | Class D, 2.655% (1 Month USD LIBOR + | |
| | 195 bps), 8/15/32 (144A) | 5,685,345 |
| 10,000,000(b) | | GS Mortgage Securities Corp. Trust, Series 2020-DUNE, | |
| | Class A, 1.805% (1 Month USD LIBOR + | |
| | 110 bps), 12/15/36 (144A) | 8,110,090 |
| 9,000,000(b) | | GS Mortgage Securities Corp. Trust, Series 2020-DUNE, | |
| | Class E, 3.205% (1 Month USD LIBOR + | |
| | 250 bps), 12/15/36 (144A) | 6,959,524 |
The accompanying notes are an integral part of these financial statements.
Pioneer Multi-Asset Ultrashort Income Fund | Annual Report | 3/31/20 61
Schedule of Investments | 3/31/20 (continued)
| | | | |
| Principal | | | |
| Amount | | | |
| USD ($) | | | Value |
| | Commercial Mortgage-Backed Securities — (continued) | |
| 4,300,000(b) | | GS Mortgage Securities Trust, Series 2018-HART, Class A, | |
| | 1.795% (1 Month USD LIBOR + 109 bps), | |
| | 10/15/31 (144A) | $ 4,115,802 |
| 9,729,000(b) | | GS Mortgage Securities Trust, Series 2018-HART, Class B, | |
| | 2.005% (1 Month USD LIBOR + 130 bps), | |
| | 10/15/31 (144A) | 9,284,876 |
| 8,652,895(b) | | HPLY Trust, Series 2019-HIT, Class C, 2.305% (1 Month | |
| | USD LIBOR + 160 bps), 11/15/36 (144A) | 6,710,929 |
| 8,300,000(b) | | Hudsons Bay Simon JV Trust, Series 2015-HBFL, | |
| | Class AFL, 3.498% (1 Month USD LIBOR + 183 bps), | |
| | 8/5/34 (144A) | 7,697,277 |
| 8,665,000(b) | | InTown Hotel Portfolio Trust, Series 2018-STAY, Class A, | |
| | 1.405% (1 Month USD LIBOR + 70 bps), | |
| | 1/15/33 (144A) | 7,883,494 |
| 4,230,000(b) | | InTown Hotel Portfolio Trust, Series 2018-STAY, Class B, | |
| | 1.755% (1 Month USD LIBOR + 105 bps), | |
| | 1/15/33 (144A) | 3,782,301 |
| 2,078,000(d) | | JP Morgan Chase Commercial Mortgage Securities Trust, | |
| | Series 2015-UES, Class C, 3.621%, 9/5/32 (144A) | 2,051,675 |
| 11,900,000(b) | | JP Morgan Chase Commercial Mortgage Securities Trust, | |
| | Series 2017-FL11, Class B, 1.805% (1 Month USD LIBOR | |
| | + 110 bps), 10/15/32 (144A) | 11,676,889 |
| 7,300,000(b) | | JP Morgan Chase Commercial Mortgage Securities Trust, | |
| | Series 2018-PHH, Class B, 1.865% (1 Month USD LIBOR | |
| | + 116 bps), 6/15/35 (144A) | 6,366,161 |
| 2,800,000(b) | | JP Morgan Chase Commercial Mortgage Securities Trust, | |
| | Series 2018-WPT, Class BFL, 2.627% (1 Month USD | |
| | LIBOR + 125 bps), 7/5/33 (144A) | 2,548,633 |
| 4,000,000(b) | | JP Morgan Chase Commercial Mortgage Securities Trust, | |
| | Series 2018-WPT, Class CFL, 3.027% (1 Month USD | |
| | LIBOR + 165 bps), 7/5/33 (144A) | 3,525,933 |
| 3,600,000(b) | | JP Morgan Chase Commercial Mortgage Securities Trust, | |
| | Series 2019-BKWD, Class C, 2.305% (1 Month USD LIBOR | |
| | + 160 bps), 9/15/29 (144A) | 3,306,243 |
| 1,650,000(b) | | JP Morgan Chase Commercial Mortgage Securities Trust, | |
| | Series 2019-BKWD, Class E, 3.305% (1 Month USD LIBOR | |
| | + 260 bps), 9/15/29 (144A) | 1,566,483 |
| 10,300,000(b) | | JP Morgan Chase Commercial Mortgage Securities Trust, | |
| | Series 2019-MFP, Class E, 2.865% (1 Month USD LIBOR | |
| | + 216 bps), 7/15/36 (144A) | 8,569,453 |
| 194,615 | | JPMBB Commercial Mortgage Securities Trust, Series | |
| | 2014-C19, Class A2, 3.046%, 4/15/47 | 195,467 |
| 18,050,000(b) | | MBRT, Series 2019-MBR, Class B, 1.855% (1 Month USD | |
| | LIBOR + 115 bps), 11/15/36 (144A) | 15,437,181 |
| 20,000,000(b) | | MF1, Ltd., Series 2019-FL2, Class A, 2.077% (1 Month | |
| | USD LIBOR + 113 bps), 12/25/34 (144A) | 17,040,114 |
| 10,313,648(b) | | MMFL Re-REMIC Trust, Series 2019-1, Class A, 2.347% | |
| | (1 Month USD LIBOR + 140 bps), 1/28/24 (144A) | 9,950,362 |
The accompanying notes are an integral part of these financial statements.
62 Pioneer Multi-Asset Ultrashort Income Fund | Annual Report | 3/31/20
| | | | |
| Principal | | | |
| Amount | | | |
| USD ($) | | | Value |
| | Commercial Mortgage-Backed Securities — (continued) | |
| 1,780,419(d) | | Morgan Stanley Capital I Trust, Series 2007-T25, | |
| | Class AJ, 5.574%, 11/12/49 | $ 1,782,194 |
| 8,500,000(b) | | Morgan Stanley Capital I Trust, Series 2017-ASHF, | |
| | Class B, 1.955% (1 Month USD LIBOR + | |
| | 125 bps), 11/15/34 (144A) | 6,891,516 |
| 8,250,000(b) | | Morgan Stanley Capital I Trust, Series 2017-CLS, | |
| | Class C, 1.705% (1 Month USD LIBOR + | |
| | 100 bps), 11/15/34 (144A) | 7,741,199 |
| 9,975,000(b) | | Morgan Stanley Capital I Trust, Series 2018-BOP, | |
| | Class B, 1.955% (1 Month USD LIBOR + | |
| | 125 bps), 8/15/33 (144A) | 9,352,538 |
| 9,280,000(b) | | Morgan Stanley Capital I Trust, Series 2019-AGLN, | |
| | Class C, 2.155% (1 Month USD LIBOR + | |
| | 145 bps), 3/15/34 (144A) | 7,928,139 |
| 7,275,000(b) | | Morgan Stanley Capital I Trust, Series 2019-NUGS, | |
| | Class D, 3.3% (1 Month USD LIBOR + | |
| | 180 bps), 12/15/36 (144A) | 6,877,208 |
| 14,300,000(b) | | Morgan Stanley Capital I Trust, Series 2019-PLND, | |
| | Class C, 2.205% (1 Month USD LIBOR + | |
| | 150 bps), 5/15/36 (144A) | 11,560,486 |
| 9,709,619(b) | | Motel 6 Trust, Series 2017-MTL6, Class C, 2.105% | |
| | (1 Month USD LIBOR + 140 bps), 8/15/34 (144A) | 8,205,731 |
| 5,220,000(b) | | MTRO Commercial Mortgage Trust, Series 2019-TECH, | |
| | Class C, 2.005% (1 Month USD LIBOR + | |
| | 130 bps), 12/15/33 (144A) | 4,800,638 |
| 3,662,523(b) | | Natixis Commercial Mortgage Securities Trust, Series | |
| | 2018-FL1, Class MCR1, 4.009% (1 Month USD | |
| | LIBOR + 235 bps), 6/15/35 (144A) | 3,361,899 |
| 11,500,000(b) | | Natixis Commercial Mortgage Securities Trust, Series | |
| | 2019-MILE, Class B, 2.505% (1 Month USD LIBOR | |
| | + 180 bps), 7/15/36 (144A) | 10,811,126 |
| 321,083(b) | | NCUA Guaranteed Notes Trust, Series 2011-C1, Class 2A, | |
| | 1.546% (1 Month USD LIBOR + 53 bps), 3/9/21 | 320,721 |
| 2,039,294(b) | | RETL, Series 2019-RVP, Class A, 1.855% (1 Month USD | |
| | LIBOR + 115 bps), 3/15/36 (144A) | 1,863,496 |
| 7,006,040(b) | | SLIDE, Series 2018-FUN, Class B, 1.955% (1 Month USD | |
| | LIBOR + 125 bps), 6/15/31 (144A) | 6,371,917 |
| 2,020,108(d) | | Sutherland Commercial Mortgage Loans, Series | |
| | 2017-SBC6, Class A, 3.192%, 5/25/37 (144A) | 1,873,695 |
| 4,236,828(d) | | Sutherland Commercial Mortgage Loans, Series | |
| | 2018-SBC7, Class A, 4.72%, 5/25/39 (144A) | 3,556,802 |
| 4,374,433(b) | | Tharaldson Hotel Portfolio Trust, Series 2018-THL, | |
| | Class C, 2.355% (1 Month USD LIBOR + | |
| | 135 bps), 11/11/34 (144A) | 3,930,757 |
| 7,400,000(b) | | VMC Finance LLC, Series 2018-FL2, Class B, 2.15% | |
| | (1 Month USD LIBOR + 135 bps), 10/15/35 (144A) | 6,530,003 |
| 3,166,400(d) | | WaMu Commercial Mortgage Securities Trust, | |
| | Series 2006-SL1, Class C, 3.717%, 11/23/43 (144A) | 3,192,175 |
The accompanying notes are an integral part of these financial statements.
Pioneer Multi-Asset Ultrashort Income Fund | Annual Report | 3/31/20 63
Schedule of Investments | 3/31/20 (continued)
| | | | |
| Principal | | | |
| Amount | | | |
| USD ($) | | | Value |
| | Commercial Mortgage-Backed Securities — (continued) | |
| 12,800,000(b) | | Wells Fargo Commercial Mortgage Trust, Series | |
| | 2017-SMP, Class C, 1.905% (1 Month USD LIBOR + | |
| | 120 bps), 12/15/34 (144A) | $ 10,527,260 |
| 17,500,000(b) | | XCAL Mortgage Trust, Series 2019-1, Class A, 4.4% | |
| | (1 Month USD LIBOR + 225 bps), 11/6/21 (144A) | 17,408,496 |
| 14,200,000(b) | | XCALI Mortgage Trust, Series 2020-1, Class A, 4.05% | |
| | (1 Month USD LIBOR + 240 bps), 1/22/23 (144A) | 14,264,467 |
| 13,500,000(b) | | XCALI Mortgage Trust, Series 2020-2, Class A, 4.05% | |
| | (1 Month USD LIBOR + 200 bps), 2/7/23 (144A) | 13,552,578 |
| | TOTAL COMMERCIAL MORTGAGE-BACKED SECURITIES | |
| | (Cost $676,529,073) | $ 602,845,300 |
| | CORPORATE BONDS — 14.0% of Net Assets | |
| | Auto Manufacturers — 1.1% | |
| 2,850,000(b) | | American Honda Finance Corp., 1.807% (3 Month | |
| | USD LIBOR + 54 bps), 6/27/22 | $ 2,648,961 |
| 4,275,000(b) | | American Honda Finance Corp., 1.923% (3 Month | |
| | USD LIBOR + 21 bps), 2/12/21 | 4,168,785 |
| 7,500,000(b) | | BMW US Capital LLC, 2.074% (3 Month USD LIBOR + | |
| | 37 bps), 8/14/20 (144A) | 7,432,076 |
| 2,015,000(b) | | Ford Motor Credit Co. LLC, 2.728% (3 Month USD LIBOR + | |
| | 88 bps), 10/12/21 | 1,852,785 |
| 6,750,000(b) | | Nissan Motor Acceptance Corp., 1.261% (3 Month | |
| | USD LIBOR + 52 bps), 3/15/21 (144A) | 6,625,247 |
| 6,020,000 | | Nissan Motor Acceptance Corp., 2.55%, 3/8/21 (144A) | 5,795,291 |
| 8,889,000(b) | | PACCAR Financial Corp., 1.994% (3 Month USD LIBOR + | |
| | 26 bps), 5/10/21 | 8,526,765 |
| 14,245,000(b) | | Volkswagen Group of America Finance LLC, 2.064% | |
| | (3 Month USD LIBOR + 86 bps), 9/24/21 (144A) | 13,046,260 |
| 5,550,000(b) | | Volkswagen Group of America Finance LLC, 2.653% | |
| | (3 Month USD LIBOR + 94 bps), 11/12/21 (144A) | 5,431,225 |
| | Total Auto Manufacturers | $ 55,527,395 |
| | Banks — 6.7% | |
| 15,262,000(d) | | Bank of America Corp., 2.369%, 7/21/21 | $ 15,251,692 |
| 2,082,000(b) | | Bank of America Corp., 3.239% (3 Month USD LIBOR + | |
| | 142 bps), 4/19/21 | 2,061,596 |
| 2,675,000(b) | | Bank of Nova Scotia, 2.259% (3 Month USD LIBOR + | |
| | 44 bps), 4/20/21 | 2,621,386 |
| 6,210,000(b) | | Banque Federative du Credit Mutuel SA, 2.549% | |
| | (3 Month USD LIBOR + 73 bps), 7/20/22 (144A) | 6,127,437 |
| 17,185,000(b) | | Barclays Plc, 3.122% (3 Month USD LIBOR + | |
| | 143 bps), 2/15/23 | 16,178,371 |
| 1,200,000(b) | | Barclays Plc, 3.459% (3 Month USD LIBOR + | |
| | 163 bps), 1/10/23 | 1,153,812 |
| 16,311,000(b) | | BPCE SA, 2.903% (3 Month USD LIBOR + 122 bps), | |
| | 5/22/22 (144A) | 15,669,325 |
The accompanying notes are an integral part of these financial statements.
64 Pioneer Multi-Asset Ultrashort Income Fund | Annual Report | 3/31/20
| | | | |
| Principal | | | |
| Amount | | | |
| USD ($) | | | Value |
| | | Banks — (continued) | |
| 4,550,000(b) | | Capital One NA, 2.554%, 8/8/22 | $ 4,452,361 |
| 5,890,000 | | Capital One NA, 2.95%, 7/23/21 | 5,907,290 |
| 9,095,000(b) | | Citibank NA, 2.063%, 2/12/21 | 9,011,353 |
| 6,831,000(b) | | Citigroup, Inc., 2.069% (3 Month USD LIBOR + | |
| | | 107 bps), 12/8/21 | 6,718,542 |
| 10,771,000 | | Citigroup, Inc., 2.7%, 3/30/21 | 10,815,781 |
| 12,500,000(b) | | Citigroup, Inc., 2.754% (3 Month USD LIBOR + | |
| | | 96 bps), 4/25/22 | 12,238,688 |
| 970,000(b) | | Citigroup, Inc., 2.953% (3 Month USD LIBOR + | |
| | | 119 bps), 8/2/21 | 963,611 |
| 2,320,000(b) | | Credit Suisse Group AG, 1.941% (3 Month USD LIBOR + | |
| | | 120 bps), 12/14/23 (144A) | 2,030,292 |
| 1,000,000(b) | | Credit Suisse Group Funding Guernsey, Ltd., | |
| | | 4.109%, 4/16/21 | 1,000,597 |
| 4,400,000(b) | | DNB Bank ASA, 2.2% (3 Month USD LIBOR + 62 bps), | |
| | | 12/2/22 (144A) | 4,191,371 |
| 8,505,000(b) | | Federation des Caisses Desjardins du Quebec, 2.1% | |
| | | (3 Month USD LIBOR + 33 bps), 10/30/20 (144A) | 8,397,342 |
| 2,995,000(b) | | Goldman Sachs Group, Inc., 1.941% (3 Month USD | |
| | | LIBOR + 120 bps), 9/15/20 | 2,992,837 |
| 1,000,000(b) | | Goldman Sachs Group, Inc., 2.862%, 11/15/21 | 980,000 |
| 13,530,000(b) | | JPMorgan Chase & Co., 2.099%, 6/7/21 | 13,477,639 |
| 2,215,000 | | JPMorgan Chase & Co., 2.55%, 3/1/21 | 2,220,297 |
| 2,905,000(b) | | KeyBank NA, 2.423% (3 Month USD LIBOR + | |
| | | 66 bps), 2/1/22 | 2,731,014 |
| 8,000,000(b) | | Macquarie Bank, Ltd., 2.187% (3 Month USD LIBOR + | |
| | | 45 bps), 8/6/21 (144A) | 7,758,472 |
| 2,968,000(b) | | Mitsubishi UFJ Financial Group, Inc., 2.444% | |
| | | (3 Month USD LIBOR + 65 bps), 7/26/21 | 2,844,492 |
| 3,735,000(b) | | Mitsubishi UFJ Financial Group, Inc., 2.584% | |
| | | (3 Month USD LIBOR + 79 bps), 7/25/22 | 3,574,221 |
| 6,500,000(b) | | Mizuho Financial Group, Inc., 1.623% (3 Month | |
| | | USD LIBOR + 85 bps), 9/13/23 | 5,955,939 |
| 250,000(b) | | Mizuho Financial Group, Inc., 1.648% (3 Month | |
| | | USD LIBOR + 88 bps), 9/11/22 | 240,203 |
| 12,195,000(b) | | Mizuho Financial Group, Inc., 2.553% (3 Month | |
| | | USD LIBOR + 94 bps), 2/28/22 | 11,739,125 |
| 2,425,000 | | PNC Bank NA, 2.0%, 5/19/20 | 2,421,776 |
| 4,114,000(b) | | PNC Bank NA, 2.252% (3 Month USD LIBOR + | |
| | | 45 bps), 7/22/22 | 3,988,112 |
| 2,914,000(b) | | PNC Bank NA, 2.294% (3 Month USD LIBOR + | |
| | | 50 bps), 7/27/22 | 2,816,192 |
| 7,825,000 | | PNC Bank NA, 2.3%, 6/1/20 | 7,825,391 |
| 3,175,000 | | PNC Bank NA, 2.45%, 11/5/20 | 3,180,628 |
| 3,878,000 | | PNC Bank NA, 2.5%, 1/22/21 | 3,885,696 |
| 5,502,000 | | Royal Bank of Canada, 2.15%, 10/26/20 | 5,499,227 |
The accompanying notes are an integral part of these financial statements.
Pioneer Multi-Asset Ultrashort Income Fund | Annual Report | 3/31/20 65
Schedule of Investments | 3/31/20 (continued)
| | | | |
| Principal | | | |
| Amount | | | |
| USD ($) | | | Value |
| | | Banks — (continued) | |
| 445,000(b) | | Royal Bank of Canada, 2.16% (3 Month USD LIBOR + | |
| | | 39 bps), 4/30/21 | $ 435,016 |
| 9,000,000(b) | | Royal Bank of Canada, 2.194% (3 Month USD LIBOR + | |
| | | 40 bps), 1/25/21 | 8,851,828 |
| 2,310,000(b) | | Royal Bank of Canada, 2.245% (3 Month USD LIBOR + | |
| | | 47 bps), 4/29/22 | 2,217,296 |
| 681,000 | | Royal Bank of Canada, 2.35%, 10/30/20 | 682,311 |
| 14,715,000(b) | | Skandinaviska Enskilda Banken AB, 1.429% (3 Month | |
| | | USD LIBOR + 65 bps), 12/12/22 (144A) | 13,641,151 |
| 4,232,000(b) | | Sumitomo Mitsui Financial Group, Inc., 2.559% | |
| | | (3 Month USD LIBOR + 74 bps), 10/18/22 | 4,192,565 |
| 15,919,000(b) | | Sumitomo Mitsui Financial Group, Inc., 2.618% | |
| | | (3 Month USD LIBOR + 78 bps), 7/12/22 | 15,150,563 |
| 3,600,000 | | Toronto-Dominion Bank, 1.85%, 9/11/20 | 3,595,371 |
| 1,165,000(b) | | Toronto-Dominion Bank, 2.11% (3 Month USD LIBOR + | |
| | | 53 bps), 12/1/22 | 1,102,381 |
| 1,000,000(b) | | Toronto-Dominion Bank, 2.459% (3 Month USD LIBOR + | |
| | | 64 bps), 7/19/23 | 924,227 |
| 8,195,000 | | Toronto-Dominion Bank, 2.5%, 12/14/20 | 8,228,767 |
| 1,035,000(b) | | Toronto-Dominion Bank, 2.874%, 4/7/21 | 1,028,720 |
| 8,847,000(b) | | Truist Bank, 2.282% (3 Month USD LIBOR + | |
| | | 59 bps), 5/17/22 | 8,627,278 |
| 3,970,000(b) | | Truist Financial Corp., 1.983% (3 Month USD LIBOR + | |
| | | 22 bps), 2/1/21 | 3,841,429 |
| 9,095,000(b) | | US Bank NA, 0.0% (3 Month USD LIBOR + | |
| | | 31 bps), 2/4/21 | 9,007,732 |
| 1,204,000(b) | | US Bank NA, 1.986%, 5/21/21 | 1,183,699 |
| 1,315,000(b) | | US Bank NA, 2.114% (3 Month USD LIBOR + | |
| | | 32 bps), 4/26/21 | 1,295,018 |
| 12,490,000(b) | | US Bank NA, 2.123% (3 Month USD LIBOR + | |
| | | 44 bps), 5/23/22 | 12,091,210 |
| 9,451,000 | | Wells Fargo & Co., 2.5%, 3/4/21 | 9,452,643 |
| 3,350,000(b) | | Wells Fargo & Co., 2.594% (3 Month USD LIBOR + | |
| | | 134 bps), 3/4/21 | 3,291,682 |
| 9,754,000(b) | | Wells Fargo & Co., 2.661% (3 Month USD LIBOR + | |
| | | 93 bps), 2/11/22 | 9,566,304 |
| 7,325,000(b) | | Wells Fargo & Co., 2.819% (3 Month USD LIBOR + | |
| | | 103 bps), 7/26/21 | 7,261,181 |
| 3,776,000 | | Wells Fargo & Co., 3.0%, 1/22/21 | 3,810,823 |
| 4,849,000 | | Wells Fargo & Co., 4.6%, 4/1/21 | 4,954,268 |
| 6,430,000(b) | | Wells Fargo Bank NA, 2.258% (3 Month USD LIBOR + | |
| | | 62 bps), 5/27/22 | 6,338,396 |
| | | Total Banks | $ 349,693,967 |
The accompanying notes are an integral part of these financial statements.
66 Pioneer Multi-Asset Ultrashort Income Fund | Annual Report | 3/31/20
| | | | |
| Principal | | | |
| Amount | | | |
| USD ($) | | | Value |
| | | Beverages — 0.2% | |
| 2,753,000 | | Constellation Brands, Inc., 3.75%, 5/1/21 | $ 2,756,407 |
| 3,814,000 | | Pernod Ricard SA, 5.75%, 4/7/21 (144A) | 3,924,397 |
| | | Total Beverages | $ 6,680,804 |
| | | Chemicals — 0.6% | |
| 13,788,000(b) | | Albemarle Corp., 2.742% (3 Month USD LIBOR + | |
| | | 105 bps), 11/15/22 (144A) | $ 13,129,451 |
| 15,830,000(b) | | DuPont de Nemours, Inc., 2.402% (3 Month USD | |
| | | LIBOR + 71 bps), 11/15/20 | 15,716,895 |
| | | Total Chemicals | $ 28,846,346 |
| | | Commercial Services — 0.0%† | |
| 1,510,000 | | ERAC USA Finance LLC, 5.25%, 10/1/20 (144A) | $ 1,534,105 |
| | | Total Commercial Services | $ 1,534,105 |
| | | Diversified Financial Services — 0.5% | |
| 7,510,000(b) | | AIG Global Funding, 1.931% (3 Month USD LIBOR + | |
| | | 48 bps), 7/2/20 (144A) | $ 7,457,272 |
| 1,855,000(b) | | American Express Co., 2.373% (3 Month USD LIBOR + | |
| | | 61 bps), 8/1/22 | 1,796,263 |
| 4,005,000(b) | | Capital One Financial Corp., 2.22% (3 Month USD | |
| | | LIBOR + 45 bps), 10/30/20 | 3,943,758 |
| 15,850,000(b) | | Capital One Financial Corp., 2.49% (3 Month USD | |
| | | LIBOR + 72 bps), 1/30/23 | 14,813,742 |
| | | Total Diversified Financial Services | $ 28,011,035 |
| | | Electric — 0.0%† | |
| 2,460,000(b) | | Duke Energy Corp., 2.204% (3 Month USD LIBOR + | |
| | | 50 bps), 5/14/21 (144A) | $ 2,434,241 |
| | | Total Electric | $ 2,434,241 |
| | | Food — 0.0%† | |
| 1,465,000(b) | | Conagra Brands, Inc., 2.552% (3 Month USD LIBOR + | |
| | | 75 bps), 10/22/20 | $ 1,449,496 |
| 900,000(b) | | Tyson Foods, Inc., 2.13% (3 Month USD LIBOR + | |
| | | 55 bps), 6/2/20 | 897,737 |
| | | Total Food | $ 2,347,233 |
| | | Gas — 0.1% | |
| 6,225,000(b) | | Dominion Energy Gas Holdings LLC, 1.341% (3 Month | |
| | | USD LIBOR + 60 bps), 6/15/21 | $ 5,983,719 |
| | | Total Gas | $ 5,983,719 |
The accompanying notes are an integral part of these financial statements.
Pioneer Multi-Asset Ultrashort Income Fund | Annual Report | 3/31/20 67
Schedule of Investments | 3/31/20 (continued)
| | | | |
| Principal | | | |
| Amount | | | |
| USD ($) | | | Value |
| | | Healthcare – Services — 0.4% | |
| 5,945,000(b) | | UnitedHealth Group, Inc., 1.901% (3 Month USD LIBOR + | |
| | | 7 bps), 10/15/20 | $ 5,856,250 |
| 13,650,000 | | UnitedHealth Group, Inc., 1.95%, 10/15/20 | 13,647,625 |
| | | Total Healthcare – Services | $ 19,503,875 |
| | | Insurance — 0.5% | |
| 3,129,000(b) | | Allstate Corp., 2.005%, 3/29/23 | $ 2,959,215 |
| 1 | | Ambac Assurance Corp., 5.1%, 6/7/20 (144A) | 1 |
| 2(b) | | Ambac LSNI LLC, 6.45% (3 Month USD LIBOR + | |
| | | 500 bps), 2/12/23 (144A) | 2 |
| 2,152,000 | | Aon Corp., 5.0%, 9/30/20 | 2,173,653 |
| 4,380,000(b) | | Metropolitan Life Global Funding I, 1.695% (SOFRRATE + | |
| | | 57 bps), 1/13/23 (144A) | 3,828,360 |
| 6,190,000 | | Metropolitan Life Global Funding I, 2.4%, 1/8/21 (144A) | 6,168,239 |
| 4,531,000(b) | | New York Life Global Funding, 2.057% (3 Month | |
| | | USD LIBOR + 32 bps), 8/6/21 (144A) | 4,403,312 |
| 4,185,000 | | Protective Life Global Funding, 2.161%, 9/25/20 (144A) | 4,157,576 |
| | | Total Insurance | $ 23,690,358 |
| | Machinery – Construction & Mining — 0.1% | |
| 2,600,000(b) | | Caterpillar Financial Services Corp., 1.279% (3 Month | |
| | | USD LIBOR + 28 bps), 9/7/21 | $ 2,503,863 |
| | | Total Machinery – Construction & Mining | $ 2,503,863 |
| | | Machinery – Diversified — 0.3% | |
| 5,997,000(b) | | John Deere Capital Corp., 1.156% (3 Month USD | |
| | | LIBOR + 26 bps), 9/10/21 | $ 5,802,226 |
| 5,512,000(b) | | John Deere Capital Corp., 1.379% (3 Month USD | |
| | | LIBOR + 38 bps), 3/7/22 | 5,329,123 |
| 4,500,000(b) | | John Deere Capital Corp., 1.399% (3 Month USD | |
| | | LIBOR + 40 bps), 6/7/21 | 4,416,465 |
| | | Total Machinery – Diversified | $ 15,547,814 |
| | | Media — 0.1% | |
| 6,499,000(b) | | NBCUniversal Enterprise, Inc., 1.833% (3 Month | |
| | | USD LIBOR + 40 bps), 4/1/21 (144A) | $ 6,412,433 |
| | | Total Media | $ 6,412,433 |
| | | Oil & Gas — 0.7% | |
| 5,766,000(b) | | BP Capital Markets Plc, 1.611% (3 Month USD LIBOR + | |
| | | 87 bps), 9/16/21 | $ 5,673,695 |
| 2,775,000(b) | | BP Capital Markets Plc, 1.702% (3 Month USD LIBOR + | |
| | | 65 bps), 9/19/22 | 2,770,062 |
| 7,045,000 | | Canadian Natural Resources, Ltd., 3.45%, 11/15/21 | 6,576,520 |
| 2,295,000(b) | | Chevron Corp., 1.993% (3 Month USD LIBOR + | |
| | | 53 bps), 3/3/22 | 2,236,053 |
The accompanying notes are an integral part of these financial statements.
68 Pioneer Multi-Asset Ultrashort Income Fund | Annual Report | 3/31/20
| | | | |
| Principal | | | |
| Amount | | | |
| USD ($) | | | Value |
| | Oil & Gas — (continued) | |
| 10,913,000(b) | | Exxon Mobil Corp., 2.022% (3 Month USD LIBOR + | |
| | 33 bps), 8/16/22 | $ 10,010,913 |
| 8,710,000(b) | | Phillips 66, 2.247% (3 Month USD LIBOR + 60 | |
| | bps), 2/26/21 | 8,147,613 |
| | Total Oil & Gas | $ 35,414,856 |
| | Pharmaceuticals — 0.8% | |
| 7,636,000(b) | | AbbVie, Inc., 2.346% (3 Month USD LIBOR + | |
| | 65 bps), 11/21/22 (144A) | $ 7,143,715 |
| 4,670,000(b) | | Bayer US Finance II LLC, 1.846% (3 Month USD | |
| | LIBOR + 63 bps), 6/25/21 (144A) | 4,634,844 |
| 12,890,000(b) | | Becton Dickinson & Co., 2.031% (3 Month USD | |
| | LIBOR + 103 bps), 6/6/22 | 12,055,876 |
| 2,990,000(b) | | Becton Dickinson & Co., 2.25% (3 Month USD LIBOR + | |
| | 88 bps), 12/29/20 | 2,889,088 |
| 6,730,000(b) | | Cigna Corp., 1.493% (3 Month USD LIBOR + 65 | |
| | bps), 9/17/21 | 6,460,800 |
| 11,060,000(b) | | Zoetis, Inc., 2.135% (3 Month USD LIBOR + | |
| | 44 bps), 8/20/21 | 10,148,691 |
| | Total Pharmaceuticals | $ 43,333,014 |
| | Pipelines — 1.2% | |
| 9,000,000 | | Enterprise Products Operating LLC, 2.8%, 2/15/21 | $ 8,987,542 |
| 3,750,000 | | Enterprise Products Operating LLC, 2.85%, 4/15/21 | 3,705,860 |
| 3,453,000 | | Kinder Morgan, Inc., 5.0%, 2/15/21 (144A) | 3,434,445 |
| 15,605,000(b) | | MPLX LP, 2.099% (3 Month USD LIBOR + 110 | |
| | bps), 9/9/22 | 14,518,553 |
| 13,330,000 | | Sabine Pass Liquefaction LLC, 5.625%, 2/1/21 | 12,930,601 |
| 15,900,000(b) | | Spectra Energy Partners LP, 2.014% (3 Month USD | |
| | LIBOR + 70 bps), 6/5/20 | 15,730,308 |
| 1,380,000 | | Sunoco Logistics Partners Operations LP, 4.4%, 4/1/21 | 1,375,601 |
| | Total Pipelines | $ 60,682,910 |
| | REITS — 0.2% | |
| 7,910,000 | | Essex Portfolio LP, 5.2%, 3/15/21 | $ 8,039,324 |
| | Total REITS | $ 8,039,324 |
| | Semiconductors — 0.4% | |
| 23,276,000 | | Broadcom Corp./Broadcom Cayman Finance, Ltd., | |
| | 2.2%, 1/15/21 | $ 22,967,763 |
| | Total Semiconductors | $ 22,967,763 |
| | Trucking & Leasing — 0.1% | |
| 1,400,000(b) | | Aviation Capital Group LLC, 2.44% (3 Month USD | |
| | LIBOR + 67 bps), 7/30/21 (144A) | $ 1,323,779 |
| 5,010,000(b) | | GATX Corp., 2.461% (3 Month USD LIBOR + | |
| | 72 bps), 11/5/21 | 4,911,069 |
The accompanying notes are an integral part of these financial statements.
Pioneer Multi-Asset Ultrashort Income Fund | Annual Report | 3/31/20 69
Schedule of Investments | 3/31/20 (continued)
| | | | |
| Principal | | | |
| Amount | | | |
| USD ($) | | | Value |
| | Trucking & Leasing — (continued) | |
| 1,320,000 | | Penske Truck Leasing Co. LP/PTL Finance Corp., 3.65%, | |
| | 7/29/21 (144A) | $ 1,336,388 |
| | Total Trucking & Leasing | $ 7,571,236 |
| | TOTAL CORPORATE BONDS | |
| | (Cost $750,425,808) | $ 726,726,291 |
| | FOREIGN GOVERNMENT BOND — 0.5% of | |
| | Net Assets | |
| | United States — 0.5% | |
| 25,000,000(b) | | Federal National Mortgage Association, 0.23% | |
| | (SOFRRATE + 22 bps), 3/16/22 | $ 24,950,475 |
| | Total United States | $ 24,950,475 |
| | TOTAL FOREIGN GOVERNMENT BOND | |
| | (Cost $24,970,291) | $ 24,950,475 |
| | INSURANCE-LINKED SECURITIES — 2.2% of | |
| | Net Assets(e) | |
| | Event Linked Bonds — 1.0% | |
| | Earthquakes – California — 0.1% | |
| 600,000(b) | | Ursa Re, 4.173% (3 Month U.S. Treasury Bill + | |
| | 414 bps), 12/10/20 (144A) | $ 587,400 |
| 750,000(b) | | Ursa Re, 5.273% (3 Month U.S. Treasury Bill + | |
| | 524 bps), 9/24/21 (144A) | 730,500 |
| 500,000(b) | | Ursa Re, 5.783% (3 Month U.S. Treasury Bill + | |
| | 575 bps), 12/10/22 (144A) | 485,000 |
| | | $ 1,802,900 |
| | Earthquakes – Chile — 0.0%† | |
| 1,800,000(b) | | International Bank for Reconstruction & Development, | |
| | 3.992% (3 Month USD LIBOR + 250 bps), | |
| | 2/15/21 (144A) | $ 1,755,720 |
| | Earthquakes – Colombia — 0.0%† | |
| 1,300,000(b) | | International Bank for Reconstruction & Development, | |
| | 4.492% (3 Month USD LIBOR + 300 bps), | |
| | 2/15/21 (144A) | $ 1,259,050 |
| | Earthquakes – Japan — 0.0%† | |
| 500,000(b) | | Kizuna Re II, 1.908% (3 Month U.S. Treasury Bill + | |
| | 188 bps), 4/11/23 (144A) | $ 494,450 |
| 450,000(b) | | Nakama Re, 2.912% (6 Month USD LIBOR + 220 | |
| | bps), 10/13/21 (144A) | 435,600 |
| | | $ 930,050 |
| | Earthquakes – Mexico — 0.0%† | |
| 500,000(b) | | International Bank for Reconstruction & Development, | |
| | 4.421% (3 Month USD LIBOR + 350 bps), | |
| | 3/13/24 (144A) | $ 499,950 |
The accompanying notes are an integral part of these financial statements.
70 Pioneer Multi-Asset Ultrashort Income Fund | Annual Report | 3/31/20
| | | | |
| Principal | | | |
| Amount | | | |
| USD ($) | | | Value |
| | Earthquakes – Peru — 0.0%† | |
| 700,000(b) | | International Bank for Reconstruction & Development, | |
| | 7.492% (3 Month USD LIBOR + 600 bps), | |
| | 2/15/21 (144A) | $ 676,270 |
| | Health – U.S. — 0.1% | |
| 250,000(b) | | Vitality Re VIII, 1.783% (3 Month U.S. Treasury Bill + | |
| | 175 bps), 1/8/21 (144A) | $ 212,500 |
| 1,000,000(b) | | Vitality Re VIII, 2.033% (3 Month U.S. Treasury Bill + | |
| | 200 bps), 1/8/21 (144A) | 800,000 |
| 3,500,000(b) | | Vitality Re X, 1.783% (3 Month U.S. Treasury Bill + | |
| | 175 bps), 1/10/23 (144A) | 2,975,000 |
| 1,750,000(b) | | Vitality Re X, 2.033% (3 Month U.S. Treasury Bill + | |
| | 200 bps), 1/10/23 (144A) | 1,400,000 |
| | | $ 5,387,500 |
| | Inland Flood – U.S. — 0.0%† | |
| 500,000(b) | | FloodSmart Re, 11.278% (3 Month U.S. Treasury Bill + | |
| | 1,125 bps), 3/7/22 (144A) | $ 474,750 |
| | Multiperil – Japan — 0.0%† | |
| 250,000(b) | | Akibare Re, 3.323% (3 Month USD LIBOR + 190 | |
| | bps), 4/7/22 (144A) | $ 241,750 |
| 500,000(b) | | Akibare Re, 3.323% (3 Month USD LIBOR + 190 | |
| | bps), 4/7/22 (144A) | 479,500 |
| | | $ 721,250 |
| | Multiperil – U.S. — 0.4% | |
| 1,500,000(b) | | Bonanza RE, 4.783% (3 Month U.S. Treasury Bill + | |
| | 475 bps), 2/20/24 (144A) | $ 1,450,050 |
| 1,250,000(b) | | Caelus Re V, 0.533% (1 Month U.S. Treasury Bill + | |
| | 50 bps), 6/5/20 (144A) | 1,087,500 |
| 1,000,000(b) | | Caelus Re V, 3.163% (3 Month U.S. Treasury Bill + | |
| | 313 bps), 6/5/20 (144A) | 951,000 |
| 500,000(b) | | Caelus Re V, 3.963% (3 Month U.S. Treasury Bill + | |
| | 393 bps), 6/7/21 (144A) | 477,900 |
| 750,000(b) | | Caelus Re V, 4.673% (3 Month U.S. Treasury Bill + | |
| | 464 bps), 6/7/21 (144A) | 698,625 |
| 750,000(b) | | Caelus Re VI, 5.533% (3 Month U.S. Treasury Bill + | |
| | 550 bps), 6/7/24 (144A) | 720,075 |
| 500,000(b) | | Fortius Re II, 4.913% (6 Month USD LIBOR + | |
| | 342 bps), 7/7/21 (144A) | 495,200 |
| 1,700,000(b) | | Kilimanjaro II Re, 8.722% (6 Month USD LIBOR + | |
| | 791 bps), 4/21/22 (144A) | 1,646,280 |
| 1,000,000(b) | | Northshore Re II, 7.563% (3 Month U.S. Treasury Bill + | |
| | 753 bps), 7/6/20 (144A) | 996,000 |
| 2,350,000(b) | | Residential Reinsurance 2016, 4.003% (3 Month | |
| | U.S. Treasury Bill + 397 bps), 12/6/20 (144A) | 2,313,105 |
| 2,100,000(b) | | Residential Reinsurance 2017, 3.203% (3 Month | |
| | U.S. Treasury Bill + 317 bps), 6/6/21 (144A) | 2,042,040 |
The accompanying notes are an integral part of these financial statements.
Pioneer Multi-Asset Ultrashort Income Fund | Annual Report | 3/31/20 71
Schedule of Investments | 3/31/20 (continued)
| | | | |
| Principal | | | |
| Amount | | | |
| USD ($) | | | Value |
| | Multiperil – U.S. — (continued) | |
| 2,900,000(b) | | Residential Reinsurance 2017, 5.793% (3 Month | |
| | U.S. Treasury Bill + 576 bps), 12/6/21 (144A) | $ 2,745,140 |
| 1,250,000(b) | | Residential Reinsurance 2018, 3.283% (3 Month | |
| | U.S. Treasury Bill + 325 bps), 6/6/22 (144A) | 1,196,375 |
| 500,000(b) | | Residential Reinsurance 2019, 4.533% (3 Month | |
| | U.S. Treasury Bill + 450 bps), 6/6/23 (144A) | 489,000 |
| 3,350,000(b) | | Tailwind Re, 7.393% (3 Month U.S. Treasury Bill + | |
| | 736 bps), 1/8/22 (144A) | 3,268,930 |
| | | $ 20,577,220 |
| | Multiperil – U.S. Regional — 0.0%† | |
| 1,250,000(b) | | Long Point Re III, 2.783% (3 Month U.S. Treasury Bill + | |
| | 275 bps), 6/1/22 (144A) | $ 1,211,000 |
| | Multiperil – Worldwide — 0.1% | |
| 1,250,000(b) | | Galilei Re, 6.704% (6 Month USD LIBOR + 513 | |
| | bps), 1/8/21 (144A) | $ 1,237,000 |
| 550,000(b) | | Galilei Re, 7.254% (6 Month USD LIBOR + 568 | |
| | bps), 1/8/21 (144A) | 543,675 |
| 2,300,000(b) | | Galilei Re, 7.454% (6 Month USD LIBOR + 588 | |
| | bps), 1/8/21 (144A) | 2,273,320 |
| | | $ 4,053,995 |
| | Pandemic – U.S. — 0.1% | |
| 1,250,000(b) | | Vitality Re XI, 1.833% (3 Month U.S. Treasury Bill + | |
| | 180 bps), 1/9/24 (144A) | $ 1,000,000 |
| 3,000,000(b) | | Vitality Re XI, 1.533% (3 Month U.S. Treasury Bill + | |
| | 150 bps), 1/9/24 (144A) | 2,550,000 |
| | | $ 3,550,000 |
| | Pandemic – Worldwide — 0.0%† | |
| 1,250,000(b) | | International Bank for Reconstruction & Development, | |
| | 8.373% (6 Month USD LIBOR + 690 bps), | |
| | 7/15/20 (144A) | $ 1,000,000 |
| 1,750,000(b) | | Vita Capital VI, Ltd., 4.614% (6 Month USD LIBOR + | |
| | 290 bps), 1/8/21 (144A) | 1,645,000 |
| | | $ 2,645,000 |
| | Windstorm – Florida — 0.1% | |
| 2,500,000(b) | | Casablanca Re, 4.808% (6 Month USD LIBOR + | |
| | 402 bps), 6/4/20 (144A) | $ 2,500,000 |
| 2,500,000(b) | | Integrity Re, 5.564% (3 Month USD LIBOR + | |
| | 401 bps), 6/10/22 (144A) | 2,372,250 |
| | | $ 4,872,250 |
| | Windstorm – Japan — 0.0%† | |
| 1,500,000(b) | | Aozora Re, 3.593% (6 Month USD LIBOR + 200 | |
| | bps), 4/7/21 (144A) | $ 1,474,050 |
| | Windstorm – Mexico — 0.0%† | |
| 500,000 | | International Bank for Reconstruction & Development, | |
| | 7.421%, 3/13/24 | $ 480,750 |
The accompanying notes are an integral part of these financial statements.
72 Pioneer Multi-Asset Ultrashort Income Fund | Annual Report | 3/31/20
| | | | |
| Principal | | | |
| Amount | | | |
| USD ($) | | | Value |
| | | Windstorm – U.S. — 0.0%† | |
| 250,000(b) | | Bowline Re, 8.85% (3 Month U.S. Treasury Bill + | |
| | | 885 bps), 3/20/23 (144A) | $ 243,250 |
| | | Windstorm – U.S. Multistate — 0.0%† | |
| 3,475,000(b) | | Citrus Re, 0.533% (1 Month U.S. Treasury Bill + | |
| | | 50 bps), 4/9/20 (144A) | $ 173,750 |
| | | Windstorm – U.S. Regional — 0.1% | |
| 500,000(f) | | Matterhorn Re 2019-1, 12/7/22 (144A) | $ 480,650 |
| 2,000,000(b) | | Matterhorn Re 2020-1, 7.5% (3 Month U.S. Treasury | |
| | | Bill + 750 bps), 12/7/21 (144A) | 1,928,000 |
| 1,250,000(b) | | Matterhorn Re 2020-2, 6.278% (3 Month U.S. | |
| | | Treasury Bill + 625 bps), 1/8/24 (144A) | 1,204,750 |
| | | | $ 3,613,400 |
| | | Total Event Linked Bonds | $ 56,402,105 |
| Face | | | |
| Amount | | | |
| USD ($) | | | |
| | | Collateralized Reinsurance — 0.6% | |
| | | Earthquakes – California — 0.1% | |
| 2,500,000(a)(g) | | Adare Re 2020, 1/31/21 | $ 2,532,512 |
| | | Multiperil – Massachusetts — 0.1% | |
| 3,000,000(a)(g) | | Denning Re 2019, 7/31/20 | $ 3,048,046 |
| | | Multiperil – U.S. — 0.1% | |
| 500,000(a)(g) | | Dingle Re 2019, 2/1/21 | $ 510,263 |
| 250,000(a)(g) | | Dingle Re 2020, 1/31/21 | 240,252 |
| 1,500,000(a)(g) | | Kingsbarns Re 2017, 5/19/20 | 1,500 |
| 4,000,000(a)(g) | | Port Royal Re 2019, 5/31/20 | 4,105,534 |
| 2,000,000(a)(g) | | Riviera Re 2019, 5/31/20 | 2,044,000 |
| | | | $ 6,901,549 |
| | | Multiperil – U.S. & Canada — 0.1% | |
| 3,250,000(a)(g) | | Leven Re 2020, 1/31/21 | $ 3,180,633 |
| | | Multiperil – U.S. Regional — 0.1% | |
| 1,563,421(a)(g) | | Ailsa Re 2018, 6/15/20 | $ 75,670 |
| 2,750,000(a)(g) | | Ailsa Re 2019, 6/30/20 | 2,904,505 |
| 2,500,000(a)(g) | | Ocean View Re 2019, 6/30/20 | 2,560,414 |
| | | | $ 5,540,589 |
| | | Multiperil – Worldwide — 0.1% | |
| 1,000,000(a)(g) | | Cypress Re 2017, 1/10/21 | $ 18,200 |
| 3,688,762(a)(g) | | Kilarney Re 2018, 5/31/20 | 1,862,087 |
| 24,000(g) | | Limestone Re 2016-1, 8/31/21 | 18,890 |
| 40,000(g) | | Limestone Re 2016-1, 8/31/21 | 31,484 |
The accompanying notes are an integral part of these financial statements.
Pioneer Multi-Asset Ultrashort Income Fund | Annual Report | 3/31/20 73
Schedule of Investments | 3/31/20 (continued)
| | | | |
| Face | | | |
| Amount | | | |
| USD ($) | | | Value |
| | Multiperil – Worldwide — (continued) | |
| 2,000,000(a)(g) | | Limestone Re 2019-2, 3/1/24 (144A) | $ 2,077,000 |
| 1,500,000(a)(g) | | Mid Ocean Re 2019, 7/31/20 | 1,508,059 |
| 2,500,000(a)(g) | | Resilience Re, 5/1/20 | 250 |
| 2,000,000(a)(g) | | Resilience Re, 4/6/21 | 200 |
| | | $ 5,516,170 |
| | Windstorm – Florida — 0.0%† | |
| 2,000,000(a)(g) | | Formby Re 2018, 2/28/21 | $ 377,042 |
| 800,000(a)(g) | | Portrush Re 2017, 6/15/20 | 510,480 |
| | | $ 887,522 |
| | Windstorm – North Carolina — 0.0%† | |
| 1,998,900(g) | | Lahinch Re 2019, 5/31/20 | $ 29,151 |
| | Windstorm – U.S. Regional — 0.0%† | |
| 500,000(a)(g) | | Oakmont Re 2017, 4/15/20 | $ 14,700 |
| 2,500,000(a)(g) | | Oakmont Re 2019, 4/30/21 | 1,730,780 |
| 1,500,000(g) | | Resilience Re, 6/8/20 | 727,500 |
| | | $ 2,472,980 |
| | Total Collateralized Reinsurance | $ 30,109,152 |
| | Industry Loss Warranties — 0.0%† | |
| | Multiperil – U.S. — 0.0%† | |
| 2,250,000(a)(g) | | Scotscraig Re 2020, 1/31/21 | $ 2,105,050 |
| | Total Industry Loss Warranties | $ 2,105,050 |
| | Reinsurance Sidecars — 0.6% | |
| | Multiperil – U.S. — 0.1% | |
| 750,000(a)(g) | | Carnoustie Re 2016, 11/30/20 | $ 20,250 |
| 2,000,000(a)(g) | | Carnoustie Re 2017, 11/30/21 | 271,700 |
| 1,500,000(g) | | Carnoustie Re 2018, 12/31/21 | 16,800 |
| 1,100,000(a)(g) | | Carnoustie Re 2019, 12/31/22 | 1,275,450 |
| 1,500,000(a)(g) | | Castle Stuart Re 2018, 12/1/21 | 430,820 |
| 2,000,000(a)(h) | | Harambee Re 2018, 12/31/21 | 130,000 |
| 4,000,000(h) | | Harambee Re 2019, 12/31/22 | 382,000 |
| 625,004(a)(g) | | Sector Re V, Series 7, Class G, 3/1/22 (144A) | 89,437 |
| | | $ 2,616,457 |
| | Multiperil – Worldwide — 0.5% | |
| 2,000(a)(g) | | Alturas Re 2019-1, 6/3/20 | $ 72,743 |
| 36,448(a)(g) | | Alturas Re 2019-2, 3/10/22 | 317,553 |
| 500,000(a)(g) | | Arlington Re 2015, 2/1/21 | 24,300 |
| 2,500,000(a)(g) | | Bantry Re 2016, 3/31/21 | 201,500 |
| 2,000,000(a)(g) | | Bantry Re 2017, 3/31/21 | 472,200 |
| 2,000,000(a)(g) | | Bantry Re 2018, 12/31/21 | 22,800 |
The accompanying notes are an integral part of these financial statements.
74 Pioneer Multi-Asset Ultrashort Income Fund | Annual Report | 3/31/20
| | | | |
| Face | | | |
| Amount | | | |
| USD ($) | | | Value |
| | | Multiperil – Worldwide — (continued) | |
| 4,000,000(g) | | Bantry Re 2019, 12/31/22 | $ 136,000 |
| 1,250,000(a)(g) | | Berwick Re 2017-1, 2/1/21 | 41,375 |
| 5,120,164(a)(g) | | Berwick Re 2018-1, 12/31/21 | 623,124 |
| 3,658,035(a)(g) | | Berwick Re 2019-1, 12/31/22 | 3,947,803 |
| 1,500,000(h) | | Blue Lotus Re 2018, 12/31/21 | 93,300 |
| 75,000(g) | | Eden Re II, 3/22/22 (144A) | 100,434 |
| 113,405(g) | | Eden Re II, 3/22/22 (144A) | 130,763 |
| 4,000(a)(g) | | Eden Re II, 3/22/23 (144A) | 34,170 |
| 35,797(a)(g) | | Eden Re II, 3/22/23 (144A) | 314,230 |
| 1,300,000(g) | | Gleneagles Re 2016, 11/30/20 | 40,560 |
| 2,118,314(a)(g) | | Gullane Re 2018, 12/31/21 | 1,994,625 |
| 2,000(g) | | Limestone Re 2018, 3/1/22 | 4,385 |
| 500,000(g) | | Lion Rock Re 2019, 1/31/21 | 46,150 |
| 4,000,000(a)(h) | | Lorenz Re 2018, 7/1/21 | 286,800 |
| 2,744,544(a)(h) | | Lorenz Re 2019, 6/30/22 | 2,481,891 |
| 3,000,000(a)(g) | | Merion Re 2018-2, 12/31/21 | 3,268,200 |
| 977,820(a)(h) | | NCM Re 2019, 12/31/22 | 216,489 |
| 2,500,000(g) | | Pangaea Re 2015-1, 2/28/21 | 3,270 |
| 2,800,000(g) | | Pangaea Re 2015-2, 5/29/20 | 4,175 |
| 2,500,000(g) | | Pangaea Re 2016-1, 11/30/20 | 5,549 |
| 1,500,000(g) | | Pangaea Re 2016-2, 11/30/20 | 4,464 |
| 2,000,000(a)(g) | | Pangaea Re 2017-1, 11/30/21 | 32,200 |
| 1,500,000(a)(g) | | Pangaea Re 2017-3, 5/31/22 | 76,486 |
| 2,000,000(a)(g) | | Pangaea Re 2018-1, 12/31/21 | 117,600 |
| 4,000,000(a)(g) | | Pangaea Re 2018-3, 7/1/22 | 82,974 |
| 2,800,000(a)(g) | | Pangaea Re 2019-1, 2/1/23 | 58,345 |
| 2,941,254(a)(g) | | Pangaea Re 2019-3, 7/1/23 | 2,958,492 |
| 2,400,000(a)(g) | | Sector Re V, 12/1/23 (144A) | 1,715,301 |
| 379(g) | | Sector Re V, Series 8, Class F, 3/1/23 (144A) | 22,253 |
| 1,331(g) | | Sector Re V, Series 8, Class G, 3/1/23 (144A) | 56,311 |
| 2,000,000(a)(g) | | Sector Re V, Series 9, Class A, 3/1/24 (144A) | 1,733,347 |
| 1,600,000(a)(g) | | Sector Re V, Series 9, Class D, 12/1/24 (144A) | 1,671,632 |
| 874,996(a)(g) | | Sector Re V, Series 9, Class G, 3/1/24 (144A) | 1,022,631 |
| 1,250,000(a)(g) | | St. Andrews Re 2017-1, 2/1/21 | 84,750 |
| 1,737,984(a)(g) | | St. Andrews Re 2017-4, 6/1/20 | 171,018 |
| 750,000(a)(h) | | Thopas Re 2018, 12/31/21 | 15,975 |
| 3,000,000(a)(h) | | Thopas Re 2019, 12/31/22 | 570,000 |
| 2,600,000(a)(g) | | Versutus Re 2017, 11/30/21 | 20,280 |
| 2,000,000(a)(g) | | Versutus Re 2018, 12/31/21 | — |
| 1,765,095(g) | | Versutus Re 2019-A, 12/31/21 | 151,975 |
| 1,434,906(g) | | Versutus Re 2019-B, 12/31/21 | 123,545 |
| 750,000(a)(h) | | Viribus Re 2018, 12/31/21 | 41,475 |
The accompanying notes are an integral part of these financial statements.
Pioneer Multi-Asset Ultrashort Income Fund | Annual Report | 3/31/20 75
Schedule of Investments | 3/31/20 (continued)
| | | | |
| Face | | | |
| Amount | | | |
| USD ($) | | | Value |
| | Multiperil – Worldwide — (continued) | |
| 2,500,000(h) | | Viribus Re 2019, 12/31/22 | $ 45,250 |
| 1,724,784(a)(g) | | Woburn Re 2018, 12/31/21 | 230,776 |
| 809,418(a)(g) | | Woburn Re 2019, 12/31/22 | 473,348 |
| | | $ 26,364,817 |
| | Total Reinsurance Sidecars | $ 28,981,274 |
| | TOTAL INSURANCE-LINKED SECURITIES | |
| | (Cost $126,144,688) | $ 117,597,581 |
| Principal | | | |
| Amount | | | |
| USD ($) | | | |
| | MUNICIPAL BOND — 0.0%† of Net Assets(i) | |
| | Municipal Student Loan — 0.0%† | |
| 116,620(b) | | Louisiana Public Facilities Authority, Student Loan Backed, | |
| | Series A, 2.694% (3 Month USD LIBOR + | |
| | 90 bps), 4/26/27 | $ 116,590 |
| | Total Municipal Student Loan | $ 116,590 |
| | TOTAL MUNICIPAL BOND | |
| | (Cost $117,090) | $ 116,590 |
| | SENIOR SECURED FLOATING RATE LOAN | |
| | INTERESTS — 2.7% of Net Assets*(b) | |
| | Aerospace & Defense — 0.1% | |
| 2,424,514 | | American Airlines, Inc., 2018 Replacement Term Loan, | |
| | 2.709% (LIBOR + 175 bps), 6/27/25 | $ 2,008,710 |
| 744,375 | | MRO Holdings, Inc., Initial Term Loan, 6.45% (LIBOR + | |
| | 500 bps), 6/4/26 | 595,500 |
| 86,135 | | United Airlines, Inc., Refinanced Term Loan, 2.739% | |
| | (LIBOR + 175 bps), 4/1/24 | 78,382 |
| | Total Aerospace & Defense | $ 2,682,592 |
| | Automobile — 0.0%† | |
| 1,433,905 | | Cooper-Standard Automotive, Inc., Additional Term B-1 | |
| | Loan, 2.989% (LIBOR + 200 bps), 11/2/23 | $ 982,225 |
| 468,015 | | CWGS Group LLC (aka Camping World, Inc.), Term | |
| | Loan, 3.766% (LIBOR + 275 bps), 11/8/23 | 312,789 |
| 291,667 | | Visteon Corp., New Term Loan, 2.787% (LIBOR + | |
| | 175 bps), 3/25/24 | 255,208 |
| | Total Automobile | $ 1,550,222 |
| | Beverage, Food & Tobacco — 0.0%† | |
| 995,000 | | US Foods, Inc. (aka U.S. Foodservice, Inc.), Incremental | |
| | B-2019 Term Loan, 3.072% (LIBOR + | |
| | 200 bps), 9/13/26 | $ 927,009 |
| | Total Beverage, Food & Tobacco | $ 927,009 |
The accompanying notes are an integral part of these financial statements.
76 Pioneer Multi-Asset Ultrashort Income Fund | Annual Report | 3/31/20
| | | | |
| Principal | | | |
| Amount | | | |
| USD ($) | | | Value |
| | Broadcasting & Entertainment — 0.1% | |
| 1,087,297 | | Gray Television, Inc., Term B-2 Loan, 3.765% (LIBOR + | |
| | 225 bps), 2/7/24 | $ 1,030,214 |
| 2,000,001 | | Gray Television, Inc., Term C Loan, 4.015% (LIBOR + | |
| | 250 bps), 1/2/26 | 1,930,001 |
| | Total Broadcasting & Entertainment | $ 2,960,215 |
| | Building Materials — 0.1% | |
| 1,091,190 | | Circor International, Inc., New Term Loan, 4.061% | |
| | (LIBOR + 325 bps), 12/11/24 | $ 889,320 |
| 2,739,962 | | Summit Materials LLC, New Term Loan, 2.989% (LIBOR + | |
| | 200 bps), 11/21/24 | 2,428,292 |
| | Total Building Materials | $ 3,317,612 |
| | Buildings & Real Estate — 0.2% | |
| 2,429,860 | | Beacon Roofing Supply, Inc., Initial Term Loan, 3.239% | |
| | (LIBOR + 225 bps), 1/2/25 | $ 2,211,172 |
| 1,012,188 | | Cushman & Wakefield US Borrower LLC, Replacement | |
| | Term Loan, 3.739% (LIBOR + 275 bps), 8/21/25 | 910,969 |
| 1,277,250 | | Southwire Co. LLC (f.k.a Southwire Co.), Initial Term Loan, | |
| | 2.739% (LIBOR + 175 bps), 5/19/25 | 1,168,684 |
| 2,100,000 | | VICI Properties 1 LLC, Term B Loan, 2.674% (LIBOR + | |
| | 175 bps), 12/20/24 | 1,940,751 |
| 643,435 | | WireCo WorldGroup, Inc. (WireCo WorldGroup Finance LP), | |
| | First Lien Initial Term Loan, 6.072% (LIBOR + | |
| | 500 bps), 9/29/23 | 517,965 |
| | Total Buildings & Real Estate | $ 6,749,541 |
| | Chemicals, Plastics & Rubber — 0.2% | |
| 2,411,014 | | Axalta Coating Systems Dutch Holding B BV (Axalta | |
| | Coating Systems U.S. Holdings, Inc.), Term B-3 Dollar | |
| | Loan, 3.2% (LIBOR + 175 bps), 6/1/24 | $ 2,278,408 |
| 4,466,250 | | Berry Global, Inc. (fka Berry Plastics Corp.), Term Y Loan, | |
| | 2.863% (LIBOR + 200 bps), 7/1/26 | 4,229,539 |
| 1,897,792 | | PQ Corp., Third Amendment Tranche B-1 Term Loan, | |
| | 4.027% (LIBOR + 225 bps), 2/7/27 | 1,726,991 |
| 965,072 | | Reynolds Group Holdings, Inc., Incremental US Term Loan, | |
| | 3.739% (LIBOR + 275 bps), 2/5/23 | 920,437 |
| 4,471,317 | | Tronox Finance LLC, First Lien Initial Dollar Term Loan, | |
| | 3.93% (LIBOR + 275 bps), 9/23/24 | 4,020,460 |
| 292,530 | | Twist Beauty International Holdings SA, Facility B2, | |
| | 4.907% (LIBOR + 300 bps), 4/22/24 | 237,681 |
| | Total Chemicals, Plastics & Rubber | $ 13,413,516 |
| | Computers & Electronics — 0.1% | |
| 750,000 | | Celestica, Inc., Incremental Term B–2 Loan, 3.459% | |
| | (LIBOR + 250 bps), 6/27/25 | $ 667,500 |
| 1,990,000 | | NCR Corp., Initial Term Loan, 3.49% (LIBOR + | |
| | 250 bps), 8/28/26 | 1,820,850 |
| | Total Computers & Electronics | $ 2,488,350 |
The accompanying notes are an integral part of these financial statements.
Pioneer Multi-Asset Ultrashort Income Fund | Annual Report | 3/31/20 77
Schedule of Investments | 3/31/20 (continued)
| | | | |
| Principal | | | |
| Amount | | | |
| USD ($) | | | Value |
| | Consumer Services — 0.0%† | |
| 1,036,174 | | Prime Security Services Borrower LLC (aka Protection 1 | |
| | Security Solutions), First Lien 2019 Refinancing | |
| | Term B-1 Loan, 4.606% (LIBOR + | |
| | 325 bps), 9/23/26 | $ 942,919 |
| | Total Consumer Services | $ 942,919 |
| | Diversified & Conglomerate Manufacturing — 0.0%† | |
| 904,422 | | Delos Finance S.a r.l., New Term Loan, 3.2% (LIBOR + | |
| | 175 bps), 10/6/23 | $ 807,762 |
| | Total Diversified & Conglomerate Manufacturing | $ 807,762 |
| | Diversified & Conglomerate Service — 0.1% | |
| 2,000,828 | | Avis Budget Car Rental LLC, New Tranche B Term Loan, | |
| | 2.74% (LIBOR + 175 bps), 8/6/27 | $ 1,730,716 |
| 102,875 | | AVSC Holding Corp. (aka PSAV, Inc.), First Lien Initial Term | |
| | Loan, 4.888% (LIBOR + 325 bps), 3/3/25 | 64,297 |
| 1,867,900 | | Bright Horizons Family Solutions LLC (fka Bright Horizons | |
| | Family Solutions, Inc.), Term B Loan, 2.739% | |
| | (LIBOR + 175 bps), 11/7/23 | 1,811,863 |
| 1,038,015 | | Change Healthcare Holdings, Inc. (fka Emdeon, Inc.), | |
| | Closing Date Term Loan, 3.498% (LIBOR + | |
| | 250 bps), 3/1/24 | 958,434 |
| 490,205 | | DG Investment Intermediate Holdings 2, Inc. (aka | |
| | Convergint Technologies Holdings LLC), First Lien Initial | |
| | Term Loan, 3.989% (LIBOR + 300 bps), 2/3/25 | 424,027 |
| 466,109 | | DTI Holdco, Inc., Replacement B-1 Term Loan, 6.527% | |
| | (LIBOR + 475 bps), 9/29/23 | 335,598 |
| 1,950,000 | | DynCorp International, Inc., Term Loan, 7.0% (LIBOR + | |
| | 600 bps), 8/18/25 | 1,759,875 |
| 1,950,000 | | Iqvia, Inc. (Quintiles IMS), Incremental Term B-2 Dollar | |
| | Loan, 2.739% (LIBOR + 175 bps), 1/17/25 | 1,820,812 |
| 869,156 | | Jaguar Holding Co. I LLC (fka Jaguar Holding Co. I) (aka | |
| | Pharmaceutical Product Development LLC), 2018 | |
| | Term Loan, 3.5% (LIBOR + 250 bps), 8/18/22 | 838,012 |
| 1,475,298 | | Outfront Media Capital LLC (Outfront Media Capital Corp.), | |
| | Extended Term Loan, 2.547% (LIBOR + | |
| | 175 bps), 11/18/26 | 1,276,133 |
| 682,456 | | Tempo Acquisition LLC, Initial Term Loan, 3.739% (LIBOR + | |
| | 275 bps), 5/1/24 | 613,073 |
| 410,803 | | West Corp., Initial Term B Loan, 5.45% (LIBOR + | |
| | 400 bps), 10/10/24 | 316,318 |
| | Total Diversified & Conglomerate Service | $ 11,949,158 |
| | Electric & Electrical — 0.0%† | |
| 391,870 | | Rackspace Hosting, Inc., First Lien Term B Loan, 4.763% | |
| | (LIBOR + 300 bps), 11/3/23 | $ 355,622 |
| | Total Electric & Electrical | $ 355,622 |
The accompanying notes are an integral part of these financial statements.
78 Pioneer Multi-Asset Ultrashort Income Fund | Annual Report | 3/31/20
| | | | |
| Principal | | | |
| Amount | | | |
| USD ($) | | | Value |
| | Electronics — 0.1% | |
| 2,364,023 | | Scientific Games International, Inc., Initial Term B-5 | |
| | Loan, 4.246% (LIBOR + 275 bps), 8/14/24 | $ 1,920,769 |
| 1,418,024 | | Western Digital Corp., US Term B-4 Loan, 3.353% | |
| | (LIBOR + 175 bps), 4/29/23 | 1,371,939 |
| | Total Electronics | $ 3,292,708 |
| | Environmental Services — 0.0%† | |
| 2,085,246 | | GFL Environmental, Inc., Effective Date Incremental Term | |
| | Loan, 3.991% (LIBOR + 300 bps), 5/30/25 | $ 2,034,418 |
| | Total Environmental Services | $ 2,034,418 |
| | Healthcare — 0.0%† | |
| 525,287 | | Grifols Worldwide Operations, Ltd., Dollar Tranche B Term | |
| | Loan, 2.684% (LIBOR + 200 bps), 11/15/27 | $ 503,400 |
| 358,343 | | Horizon Therapeutics USA, Inc., Seventh Amendment | |
| | Refinancing Term Loan, 3.313% (LIBOR + | |
| | 225 bps), 5/22/26 | 339,530 |
| | Total Healthcare | $ 842,930 |
| | Healthcare & Pharmaceuticals — 0.0%† | |
| 1,266,363 | | Acadia Healthcare Co., Inc., Tranche B-4 Term Loan, | |
| | 3.5% (LIBOR + 250 bps), 2/16/23 | $ 1,139,727 |
| 1,069,236 | | Alkermes, Inc., 2023 Term Loan, 2.87% (LIBOR + | |
| | 225 bps), 3/27/23 | 951,620 |
| 975,000 | | Alphabet Holding Co., Inc. (aka Nature’s Bounty), | |
| | First Lien Initial Term Loan, 4.489% (LIBOR + | |
| | 350 bps), 9/26/24 | 790,725 |
| 1,508,370 | | NMN Holdings III Corp., First Lien Closing Date Term Loan, | |
| | 4.739% (LIBOR + 375 bps), 11/13/25 | 1,248,176 |
| 299,466 | | Prestige Brands, Inc., Term B-4 Loan, 2.989% (LIBOR + | |
| | 200 bps), 1/26/24 | 280,999 |
| 1,430,000 | | Sotera Health Holdings LLC, First Lien Initial Term Loan, | |
| | 5.5% (LIBOR + 450 bps), 12/11/26 | 1,275,084 |
| | Total Healthcare & Pharmaceuticals | $ 5,686,331 |
| | Healthcare, Education & Childcare — 0.3% | |
| 1,030,158 | | ATI Holdings Acquisition, Inc., First Lien Initial Term | |
| | Loan, 4.572% (LIBOR + 350 bps), 5/10/23 | $ 785,495 |
| 2,337,500 | | Bausch Health Cos., Inc. (fka Valeant Pharmaceuticals | |
| | International, Inc.), First Incremental Term | |
| | Loan, 3.362% (LIBOR + 275 bps), 11/27/25 | 2,228,416 |
| 2,663,590 | | Bausch Health Cos., Inc. (fka Valeant Pharmaceuticals | |
| | International, Inc.), Initial Term Loan, 3.612% | |
| | (LIBOR + 300 bps), 6/2/25 | 2,552,606 |
| 4,844,922 | | LifePoint Health, Inc. (fka Regionalcare Hospital Partners | |
| | Holdings, Inc.), First Lien Term B Loan, 4.739% | |
| | (LIBOR + 375 bps), 11/16/25 | 4,457,329 |
The accompanying notes are an integral part of these financial statements.
Pioneer Multi-Asset Ultrashort Income Fund | Annual Report | 3/31/20 79
Schedule of Investments | 3/31/20 (continued)
| | | | |
| Principal | | | |
| Amount | | | |
| USD ($) | | | Value |
| | Healthcare, Education & Childcare — (continued) | |
| 1,485,000 | | Vizient, Inc., Term B-6 Loan, 2.989% (LIBOR + | |
| | 200 bps), 5/6/26 | $ 1,410,750 |
| | Total Healthcare, Education & Childcare | $ 11,434,596 |
| | Hotel, Gaming & Leisure — 0.1% | |
| 1,209,192 | | 1011778 B.C. Unlimited Liability Co. (New Red | |
| | Finance, Inc.) (aka Burger King/Tim Hortons), Term B-4 | |
| | Loan, 2.739% (LIBOR + 175 bps), 11/19/26 | $ 1,121,525 |
| 2,008,901 | | Boyd Gaming Corp., Refinancing Term B Loan, 2.934% | |
| | (LIBOR + 225 bps), 9/15/23 | 1,771,182 |
| 1,000,000 | | Hanjin International Corp. (aka Wilshire Grand Center), | |
| | Initial Term Loan, 3.489% (LIBOR + | |
| | 250 bps), 10/19/20 | 800,000 |
| | Total Hotel, Gaming & Leisure | $ 3,692,707 |
| | Insurance — 0.1% | |
| 992,500 | | Alliant Holdings Intermediate LLC, 2019 New Term Loan, | |
| | 3.862% (LIBOR + 325 bps), 5/9/25 | $ 920,544 |
| 69,262 | | Alliant Holdings Intermediate LLC, Initial Term Loan, | |
| | 3.989% (LIBOR + 300 bps), 5/9/25 | 64,356 |
| 4,267,798 | | Asurion LLC (fka Asurion Corp.), New B-7 Term Loan, | |
| | 3.989% (LIBOR + 300 bps), 11/3/24 | 4,018,845 |
| 552,946 | | Confie Seguros Holding II Co., Term B Loan, 6.363% | |
| | (LIBOR + 475 bps), 4/19/22 | 429,086 |
| 495,168 | | Integro Parent, Inc., First Lien Initial Term Loan, 6.75% | |
| | (LIBOR + 575 bps), 10/31/22 | 487,740 |
| 341,250 | | USI, Inc. (fka Compass Investors, Inc.), 2017 New Term | |
| | Loan, 3.989% (LIBOR + 300 bps), 5/16/24 | 311,391 |
| | Total Insurance | $ 6,231,962 |
| | Leasing — 0.2% | |
| 1,144,959 | | Avolon TLB Borrower 1 (US) LLC, Term B-3 Loan, | |
| | 2.523% (LIBOR + 175 bps), 1/15/25 | $ 1,032,375 |
| 1,385,491 | | Avolon TLB Borrower 1 (US) LLC, Term B-4 Loan, | |
| | 2.273% (LIBOR + 150 bps), 2/12/27 | 1,246,942 |
| 2,536,757 | | Fly Funding II S.a.r.l., Replacement Loan, 3.48% (LIBOR + | |
| | 175 bps), 8/11/25 | 2,219,662 |
| 2,906,977 | | Hertz Corp., Tranche Term B-1 Loan, 3.74% (LIBOR + | |
| | 275 bps), 6/30/23 | 2,083,334 |
| 980,000 | | IBC Capital I, Ltd. (aka Goodpack, Ltd.), First Lien | |
| | Tranche B-1 Term Loan, 4.639% (LIBOR + | |
| | 375 bps), 9/11/23 | 830,550 |
| | Total Leasing | $ 7,412,863 |
| | Leisure & Entertainment — 0.1% | |
| 982,500 | | 24 Hour Fitness Worldwide, Inc., Term Loan, 4.95% | |
| | (LIBOR + 350 bps), 5/30/25 | $ 243,987 |
The accompanying notes are an integral part of these financial statements.
80 Pioneer Multi-Asset Ultrashort Income Fund | Annual Report | 3/31/20
| | | | |
| Principal | | | |
| Amount | | | |
| USD ($) | | | Value |
| | Leisure & Entertainment — (continued) | |
| 2,351,137 | | AMC Entertainment Holdings, Inc. (fka AMC | |
| | Entertainment, Inc.), Term B-1 Loan, 4.08% (LIBOR + | |
| | 300 bps), 4/22/26 | $ 1,771,189 |
| 729,375 | | CityCenter Holdings LLC, Term B Loan, 3.239% (LIBOR + | |
| | 225 bps), 4/18/24 | 646,408 |
| 1,220,288 | | Fitness International LLC, Term B Loan, 4.322% (LIBOR + | |
| | 325 bps), 4/18/25 | 925,385 |
| 951,871 | | Six Flags Theme Parks, Inc., Tranche B Term Loan, 2.74% | |
| | (LIBOR + 175 bps), 4/17/26 | 844,547 |
| | Total Leisure & Entertainment | $ 4,431,516 |
| | Machinery — 0.1% | |
| 97,197 | | Clark Equipment Co. (aka Doosan Bobcat, Inc.), | |
| | Repriced 2019 Term Loan, 3.2% (LIBOR + 175
| |
| | bps), 5/18/24 | $ 88,611 |
| 1,234,571 | | CTC AcquiCo GmbH, Facility B2, 4.363% (LIBOR + | |
| | 275 bps), 3/7/25 | 1,120,374 |
| 140,772 | | Gardner Denver, Inc., 2020 GDI Tranche B-2 Dollar | |
| | Term Loan, 2.739% (LIBOR + 175 bps), 3/1/27 | 132,326 |
| 246,125 | | NN, Inc., Tranche B Term Loan, 6.689% (LIBOR + | |
| | 575 bps), 10/19/22 | 183,363 |
| 2,108,942 | | Shape Technologies Group, Inc., Initial Term Loan, 4.806% | |
| | (LIBOR + 300 bps), 4/21/25 | 1,528,983 |
| 1,732,500 | | Terex Corp., 2019 US Term Loan Commitments, 3.739% | |
| | (LIBOR + 275 bps), 1/31/24 | 1,624,219 |
| 293,513 | | Terex Corp., Incremental US Term Loan, 3.45% (LIBOR + | |
| | 200 bps), 1/31/24 | 270,032 |
| | Total Machinery | $ 4,947,908 |
| | Media — 0.1% | |
| 1,352,384 | | CSC Holdings LLC (fka CSC Holdings, Inc. (Cablevision)), | |
| | October 2018 Incremental Term Loan, 2.862% (LIBOR | |
| | + 225 bps), 1/15/26 | $ 1,308,431 |
| 2,175,000 | | Ziggo Financing Partnership, Term Loan I Facility, 3.205% | |
| | (LIBOR + 250 bps), 4/30/28 | 2,030,906 |
| | Total Media | $ 3,339,337 |
| | Metals & Mining — 0.1% | |
| 949,352 | | Atkore International, Inc., First Lien Initial Incremental | |
| | Term Loan, 4.02% (LIBOR + 275 bps), 12/22/23 | $ 822,775 |
| 984,810 | | BWay Holding Co., Initial Term Loan, 5.084% (LIBOR + | |
| | 325 bps), 4/3/24 | 817,392 |
| 221,875 | | Oxbow Carbon LLC, First Lien Tranche B Term Loan, | |
| | 4.739% (LIBOR + 375 bps), 1/4/23 | 194,141 |
| 1,836,148 | | Phoenix Guarantor, Inc. (aka Brightspring), First Lien | |
| | Tranche B-1 Term Loan, 4.113% (LIBOR + | |
| | 325 bps), 3/5/26 | 1,689,256 |
| | Total Metals & Mining | $ 3,523,564 |
The accompanying notes are an integral part of these financial statements.
Pioneer Multi-Asset Ultrashort Income Fund | Annual Report | 3/31/20 81
Schedule of Investments | 3/31/20 (continued)
| | | | |
| Principal | | | |
| Amount | | | |
| USD ($) | | | Value |
| | Oil & Gas — 0.1% | |
| 496,250 | | BCP Raptor II LLC, Initial Term Loan, 5.739% (LIBOR + | |
| | 475 bps), 11/3/25 | $ 270,456 |
| 4,937,500 | | Centurion Pipeline Co. LLC (fka Lotus Midstream LLC), | |
| | Initial Term Loan, 4.239% (LIBOR + | |
| | 325 bps), 9/29/25 | 3,703,125 |
| 692,954 | | Delek US Holdings, Inc., Initial Term Loan, 3.239% | |
| | (LIBOR + 225 bps), 3/31/25 | 513,941 |
| 194,116 | | Encino Acquisition Partners Holdings LLC, Second Lien | |
| | Initial Term Loan, 7.75% (LIBOR + | |
| | 675 bps), 10/29/25 | 92,205 |
| 246,673 | | Gulf Finance LLC, Tranche B Term Loan, 6.791% (LIBOR + | |
| | 525 bps), 8/25/23 | 127,448 |
| 553,680 | | St. Joseph Energy Center LLC, Term B Advance, 4.5% | |
| | (LIBOR + 350 bps), 4/10/25 | 498,312 |
| | Total Oil & Gas | $ 5,205,487 |
| | Personal, Food & Miscellaneous Services — 0.0%† | |
| 1,221,938 | | Option Care Health, Inc., Term B Loan, 5.489% (LIBOR + | |
| | 450 bps), 8/6/26 | $ 1,038,647 |
| | Total Personal, Food & Miscellaneous Services | $ 1,038,647 |
| | Printing & Publishing — 0.0%† | |
| 1,207,856 | | Red Ventures LLC (New Imagitas, Inc.), First Lien Tranche | |
| | B-2 Term Loan, 3.489% (LIBOR + | |
| | 250 bps), 11/8/24 | $ 1,018,625 |
| | Total Printing & Publishing | $ 1,018,625 |
| | Professional & Business Services — 0.1% | |
| 995,000 | | Clear Channel Outdoor Holdings, Inc., Term B Loan, | |
| | 4.489% (LIBOR + 350 bps), 8/21/26 | $ 901,719 |
| 3,000,000(j) | | Elanco Animal Health, Inc., Term Loan B, 2/4/27 | 2,878,125 |
| 761,947(j) | | Gbt US LLC, Cov-Lite Term Loan, 2/26/27 | 666,704 |
| 1,240,625 | | MYOB US Borrower LLC, First Lien Initial US Term Loan, | |
| | 4.989% (LIBOR + 400 bps), 5/6/26 | 1,116,563 |
| | Total Professional & Business Services | $ 5,563,111 |
| | Retail — 0.1% | |
| 2,000,000 | | Aramark Intermediate HoldCo Corp., US Term B-4 | |
| | Loan, 2.739% (LIBOR + 175 bps), 1/15/27 | $ 1,870,000 |
| 731,250 | | Bass Pro Group LLC, Initial Term Loan, 6.072% (LIBOR + | |
| | 500 bps), 9/25/24 | 621,563 |
| 2,462,500 | | HD Supply, Inc., Term B-5 Loan, 2.739% (LIBOR + | |
| | 175 bps), 10/17/23 | 2,327,063 |
| 2,384,681 | | KFC Holding Co. (aka Yum! Brands), 2018 Term B Loan, | |
| | 2.362% (LIBOR + 175 bps), 4/3/25 | 2,270,216 |
| | Total Retail | $ 7,088,842 |
The accompanying notes are an integral part of these financial statements.
82 Pioneer Multi-Asset Ultrashort Income Fund | Annual Report | 3/31/20
| | | | |
| Principal | | | |
| Amount | | | |
| USD ($) | | | Value |
| | Securities & Trusts — 0.0%† | |
| 1,546,534 | | RPI 2019 Intermediate Finance Trust, Term Loan B, | |
| | 2.739% (LIBOR + 175 bps), 2/11/27 | $ 1,443,431 |
| 382,757 | | RPI Intermediate Finance Trust, Term B-1 Term Facility, | |
| | 2.739% (LIBOR + 175 bps), 2/11/27 | 357,240 |
| | Total Securities & Trusts | $ 1,800,671 |
| | Telecommunications — 0.2% | |
| 3,042,375 | | CenturyLink, Inc., Term B Loan, 3.239% (LIBOR + | |
| | 225 bps), 3/15/27 | $ 2,827,507 |
| 2,499,750 | | Ciena Corp., Refinancing Term Loan, 2.523% (LIBOR + | |
| | 175 bps), 9/26/25 | 2,374,763 |
| 2,448,748 | | Go Daddy Operating Co. LLC (GD Finance Co., Inc.), | |
| | Tranche B-2 Term Loan, 2.739% (LIBOR + | |
| | 175 bps), 2/15/24 | 2,356,920 |
| 1,990,234 | | Level 3 Financing, Inc., Tranche B 2027 Term Loan, | |
| | 2.739% (LIBOR + 175 bps), 3/1/27 | 1,880,771 |
| 1,484,673 | | Virgin Media Bristol LLC, N Facility, 3.205% (LIBOR + | |
| | 250 bps), 1/31/28 | 1,414,151 |
| 680,541 | | Windstream Services LLC (fka Windstream Corp.), | |
| | Tranche B-7 Term Loan, 7.5% (PRIME + 425
| |
| | bps), 2/17/24 | 421,935 |
| | Total Telecommunications | $ 11,276,047 |
| | Transportation — 0.0%† | |
| 2,419,375 | | Envision Healthcare Corp., Initial Term Loan, 4.739% | |
| | (LIBOR + 375 bps), 10/10/25 | $ 1,296,785 |
| 62,461 | | Syncreon Group BV, Second Out Term Loan, 7.45% | |
| | (LIBOR + 600 bps), 4/1/25 | 44,581 |
| | Total Transportation | $ 1,341,366 |
| | Utilities — 0.1% | |
| 1,209,216 | | APLP Holdings, Ltd. Partnership, Term Loan, 3.5% | |
| | (LIBOR + 250 bps), 4/14/25 | $ 1,178,986 |
| 757,563 | | Calpine Construction Finance Co., LP, Term B Loan, | |
| | 2.989% (LIBOR + 200 bps), 1/15/25 | 715,897 |
| 497,500 | | Calpine Corp., Term Loan, 2.989% (LIBOR + | |
| | 200 bps), 8/12/26 | 468,894 |
| 489,940 | | Eastern Power LLC (Eastern Covert Midco LLC) (aka | |
| | TPF II LC LLC), Term Loan, 4.75% (LIBOR + | |
| | 375 bps), 10/2/25 | 429,716 |
| 568,884 | | Vistra Operations Co. LLC (fka Tex Operations Co. LLC), | |
| | 2018 Incremental Term Loan, 2.703% (LIBOR + | |
| | 175 bps), 12/31/25 | 545,417 |
| | Total Utilities | $ 3,338,910 |
| | TOTAL SENIOR SECURED FLOATING RATE | |
| | LOAN INTERESTS | |
| | (Cost $161,561,695) | $ 142,687,064 |
The accompanying notes are an integral part of these financial statements.
Pioneer Multi-Asset Ultrashort Income Fund | Annual Report | 3/31/20 83
Schedule of Investments | 3/31/20 (continued)
| | | | |
| Principal | | | |
| Amount | | | |
| USD ($) | | | Value |
| | U.S. GOVERNMENT AND AGENCY | |
| | OBLIGATIONS — 9.9% of Net Assets | |
| 7,199(b) | | Fannie Mae, 3.723% (2 Month USD LIBOR + | |
| | 168 bps), 1/1/48 | $ 7,380 |
| 6,299(b) | | Fannie Mae, 3.795% (1 Year CMT Index + | |
| | 217 bps), 2/1/34 | 6,312 |
| 8,133(b) | | Fannie Mae, 4.106% (1 Year CMT Index + | |
| | 211 bps), 9/1/32 | 8,349 |
| 250(b) | | Fannie Mae, 4.301% (1 Year CMT Index + | |
| | 232 bps), 11/1/23 | 253 |
| 7,181(b) | | Fannie Mae, 4.559% (1 Year CMT Index + | |
| | 219 bps), 10/1/32 | 7,244 |
| 10,042(b) | | Federal Home Loan Mortgage Corp., 4.125% (2 Month | |
| | USD LIBOR + 200 bps), 11/1/33 | 10,138 |
| 1,152(b) | | Federal Home Loan Mortgage Corp., 4.371% (3 Year | |
| | CMT Index + 212 bps), 6/1/35 | 1,166 |
| 686(b) | | Federal Home Loan Mortgage Corp., 4.499% (1 Year | |
| | CMT Index + 230 bps), 10/1/23 | 691 |
| 1,716(b) | | Government National Mortgage Association II, 4.0% | |
| | (1 Year CMT Index + 150 bps), 1/20/22 | 1,732 |
| 511,160,000(b) | | U.S. Treasury Floating Rate Notes, 0.385% (3 Month U.S. | |
| | Treasury Bill Money Market Yield + | |
| | 30 bps), 10/31/21 | 512,634,415 |
| | TOTAL U.S. GOVERNMENT AND AGENCY OBLIGATIONS | |
| | (Cost $512,996,375) | $ 512,677,680 |
| | TEMPORARY CASH INVESTMENTS — 6.6% of | |
| | Net Assets | |
| | CERTIFICATES OF DEPOSIT — 0.6% | |
| 6,200,000 | | Bank of Montreal, 1.8%, 4/3/20 | $ 6,200,823 |
| 6,100,000(b) | | Lloyds Bank Corporate Markets Plc, 2.369% (3 Month | |
| | USD LIBOR + 55 bps), 7/19/21 | 6,037,897 |
| 13,700,000 | | Norinchukin Bank, 1.94%, 4/9/20 | 13,705,379 |
| 6,000,000(b) | | Svenska Handelsbanken AB, 1.567% (1 Month USD | |
| | LIBOR + 19 bps), 5/5/20 | 6,002,424 |
| 1,135,000(b) | | Swedbank AB, 2.003% (3 Month USD LIBOR + 32 | |
| | bps), 8/24/20 | 1,133,734 |
| | | $ 33,080,257 |
| | COMMERCIAL PAPERS — 4.1% | |
| 9,000,000 | | Anthem, Inc., 1.724%, 4/20/20 | $ 8,992,915 |
| 397,000 | | Aon Corp., 1.352%, 4/6/20 | 396,818 |
| 25,000,000 | | BASF SE, 2.001%, 4/8/20 | 24,992,467 |
| 7,000,000 | | Boeing Co., 1.956%, 4/7/20 | 6,995,236 |
| 7,030,000 | | Boeing Co., 2.029%, 5/14/20 | 6,997,633 |
| 10,000,000 | | Boeing Co., 2.03%, 5/20/20 | 9,946,986 |
| 25,000,000 | | DNB Bank ASA, 0.08%, 4/7/20 | 24,999,222 |
The accompanying notes are an integral part of these financial statements.
84 Pioneer Multi-Asset Ultrashort Income Fund | Annual Report | 3/31/20
| | | | |
| Principal | | | |
| Amount | | | |
| USD ($) | | | Value |
| | Commercial Papers — (continued) | |
| 8,500,000 | | Eni Finance USA, Inc., 1.808%, 5/28/20 | $ 8,478,815 |
| 4,200,000 | | Eni Finance USA, Inc., 1.882%, 4/2/20 | 4,199,892 |
| 25,000,000 | | Federation des Caisses Desjardins du Quebec, | |
| | 0.07%, 4/1/20 | 24,999,990 |
| 25,000,000 | | LVMH Moet Hennessy Louis Vuitton SE, 0.5%, 4/7/20 | 24,997,520 |
| 25,000,000 | | Nordea Bank Abp, 0.01%, 4/1/20 | 25,000,043 |
| 4,550,000 | | Puget Sound Energy, Inc., 2.001%, 4/8/20 | 4,547,112 |
| 25,000,000 | | Societe Generale North America, Inc., 0.005%, 4/1/20 | 25,000,043 |
| 9,700,000 | | TransCanada PipeLines, Ltd., 1.849%, 4/27/20 | 9,676,233 |
| | | $ 210,220,925 |
| | REPURCHASE AGREEMENTS — 1.9% | |
| 20,880,000 | | $20,880,000 Merrill Lynch, Pierce, Fenner & Smith, Inc., | |
| | 0.01%, dated 3/31/20 plus accrued interest on | |
| | 4/1/20 collateralized by $21,297,600 U.S. | |
| | Treasury Notes, 1.8%-2.0%, 5/15/22-1/15/26. | $ 20,880,000 |
| 28,000,000 | | $28,000,000 RBC Capital Markets LLC, 0.01%, | |
| | dated 3/31/20 plus accrued interest on 4/1/20 | |
| | collateralized by the following: | |
| | $19,484,325 Federal National Mortgage Association, | |
| | 4.0%-4.5%, 10/1/48-2/1/49 | |
| | $7,685,399 Freddie Mac Giant, 3.5%, 7/1/48 | |
| | $1,390,285 Government National Mortgage | |
| | Association, 4.0%, 3/20/50. | 28,000,000 |
| 26,020,000 | | $26,020,000 TD Securities USA LLC, 0.01%, dated | |
| | 3/31/20 plus accrued interest on 4/1/20 collateralized | |
| | by the following: | |
| | $13,270,201 Federal National Mortgage Association, | |
| | 3.0%, 3/1/50 | |
| | $13,270,262 U.S. Treasury Notes, 0.0%-0.8%, | |
| | 7/31/20-2/15/50. | 26,020,000 |
| 25,880,000 | | $25,880,000 ScotiaBank, 0.01%, dated 3/31/20 plus | |
| | accrued interest on 4/1/20 collateralized by | |
| | $26,397,648 U.S. Treasury Notes, 2.8%-2.9%, | |
| | 11/5/23-2/15/28. | 25,880,000 |
| | | $ 100,780,000 |
| | TOTAL TEMPORARY CASH INVESTMENTS | |
| | (Cost $344,185,515) | $ 344,081,182 |
| | TOTAL INVESTMENTS IN UNAFFILIATED | |
| | ISSUERS — 96.2% | |
| | (Cost $5,279,526,888) | $5,008,156,341 |
| | OTHER ASSETS AND LIABILITIES — 3.8% | $ 196,232,942 |
| | NET ASSETS — 100.0% | $5,204,389,283 |
The accompanying notes are an integral part of these financial statements.
Pioneer Multi-Asset Ultrashort Income Fund | Annual Report | 3/31/20 85
Schedule of Investments | 3/31/20 (continued)
| | |
bps | Basis Points. |
CMT | Constant Maturity Treasury. |
FREMF | Freddie Mac Multifamily Fixed-Rate Mortgage Loans. |
LIBOR | London Interbank Offered Rate. |
PRIME | U.S. Federal Funds Rate. |
REIT | Real Estate Investment Trust. |
REMICS | Real Estate Mortgage Investment Conduits. |
SOFRRATE | Secured Overnight Financing Rate. |
Strips | Separate trading of Registered interest and principal of securities. |
(144A) | Security is exempt from registration under Rule 144A of the Securities Act of 1933. Such securities may be resold normally to qualified institutional buyers in a transaction exempt from registration. At March 31, 2020, the value of these securities amounted to$2,920,442,280, or 56.1% of net assets. |
† | Amount rounds to less than 0.1%. |
* | Senior secured floating rate loan interests in which the Fund invests generally pay interest at rates that are periodically redetermined by reference to a base lending rate plus a premium. These base lending rates are generally (i) the lending rate offered by one or more major European banks, such as LIBOR, (ii) the prime rate offered by one or more major United States banks, (iii) the rate of a certificate of deposit or (iv) other base lending rates used by commercial lenders. The interest rate shown is the rate accruing at March 31, 2020. |
+ | Security that used significant unobservable inputs to determine its value. |
(a) | Non-income producing security. |
(b) | Floating rate note. Coupon rate, reference index and spread shown at March 31, 2020. |
(c) | Debt obligation initially issued at one coupon which converts to a higher coupon at a specific date. The rate shown is the rate at March 31, 2020. |
(d) | The interest rate is subject to change periodically. The interest rate and/or reference index and spread shown at March 31, 2020. |
(e) | Securities are restricted as to resale. |
(f) | Security issued with a zero coupon. Income is recognized through accretion of discount. |
(g) | Issued as participation notes. |
(h) | Issued as preference shares. |
(i) | Consists of Revenue Bonds unless otherwise indicated. |
(j) | This term loan will settle after March 31, 2020, at which time the interest rate will be determined. |
Principal amounts are denominated in U.S. dollars (“USD”) unless otherwise noted.
The accompanying notes are an integral part of these financial statements.
86 Pioneer Multi-Asset Ultrashort Income Fund | Annual Report | 3/31/20
Purchases and sales of securities (excluding temporary cash investments) for the year ended March 31, 2020 were as follows:
| | | | | | | |
| | Purchases | | | Sales | |
Long-Term U.S. Government Securities | | $ | 990,350,036 | | | $ | 716,965,967 | |
Other Long-Term Securities | | $ | 4,595,711,694 | | | $ | 5,462,947,682 | |
The Fund is permitted to engage in purchase and sale transactions (“cross trades”) with certain funds and accounts for which Amundi Pioneer Asset Management, Inc. (the “Adviser”) serves as the Fund’s investment adviser, as set forth in Rule 17a-7 under the Investment Company Act of 1940, pursuant to procedures adopted by the Board of Trustees. Under these procedures, cross trades are effected at current market prices. During the year ended March 31, 2020, the Fund engaged in purchases of $6,349,102 and sales of $4,490,383 pursuant to these procedures, which resulted in a net realized gain/(loss) of $(3,960).
At March 31, 2020, the net unrealized depreciation on investments based on cost for federal tax purposes of $5,291,958,192 was as follows:
| | | | |
| Aggregate gross unrealized appreciation for all investments in which | | | |
| there is an excess of value over tax cost | | $ | 6,418,466 | |
| Aggregate gross unrealized depreciation for all investments in which | | | | |
| there is an excess of tax cost over value | | | (290,220,317 | ) |
| Net unrealized depreciation | | $ | (283,801,851 | ) |
Various inputs are used in determining the value of the Fund’s investments. These inputs are summarized in the three broad levels below.
Level 1 – quoted prices in active markets for identical securities.
Level 2 – other significant observable inputs (including quoted prices for similar securities, interest rates, prepayment speeds, credit risks, etc.). See Notes to Financial Statements — Note 1A.
Level 3 – significant unobservable inputs (including the Fund’s own assumptions in determining fair value of investments). See Notes to Financial Statements — Note 1A.
The accompanying notes are an integral part of these financial statements.
Pioneer Multi-Asset Ultrashort Income Fund | Annual Report | 3/31/20 87
Schedule of Investments | 3/31/20 (continued)
The following is a summary of the inputs used as of March 31, 2020, in valuing the Fund’s investments:
| | | | | | | | | | | | | |
| | Level 1 | | | Level 2 | | | Level 3 | | | Total | |
Common Stock | | | | | | | | | | | | |
| Transportation Infrastructure | | $ | — | | | $ | 12,678 | | | $ | — | | | $ | 12,678 | |
Asset Backed Securities | | | — | | | | 1,746,889,150 | | | | — | | | | 1,746,889,150 | |
Collateralized Mortgage | | | | | | | | | | | | | | | | |
| Obligations | | | — | | | | 789,572,350 | | | | — | | | | 789,572,350 | |
Commercial Mortgage-Backed | | | | | | | | | | | | | | | | |
| Securities | | | — | | | | 602,845,300 | | | | — | | | | 602,845,300 | |
Corporate Bonds | | | — | | | | 726,726,291 | | | | — | | | | 726,726,291 | |
Foreign Government Bond | | | — | | | | 24,950,475 | | | | — | | | | 24,950,475 | |
Insurance-Linked Securities | | | | | | | | | | | | | | | | |
| Event Linked Bonds | | | | | | | | | | | | | | | | |
| Windstorm - Mexico | | | — | | | | — | | | | 480,750 | | | | 480,750 | |
| Collateralized Reinsurance | | | | | | | | | | | | | | | | |
| Earthquakes - California | | | — | | | | — | | | | 2,532,512 | | | | 2,532,512 | |
| Multiperil - Massachusetts | | | — | | | | — | | | | 3,048,046 | | | | 3,048,046 | |
| Multiperil - U.S. | | | — | | | | — | | | | 6,901,549 | | | | 6,901,549 | |
| Multiperil - U.S. & Canada | | | — | | | | — | | | | 3,180,633 | | | | 3,180,633 | |
| Multiperil - U.S. Regional | | | — | | | | — | | | | 5,540,589 | | | | 5,540,589 | |
| Multiperil - Worldwide | | | — | | | | — | | | | 5,516,170 | | | | 5,516,170 | |
| Windstorm - Florida | | | — | | | | — | | | | 887,522 | | | | 887,522 | |
| Windstorm - North Carolina | | | — | | | | — | | | | 29,151 | | | | 29,151 | |
| Windstorm - U.S. Regional | | | — | | | | — | | | | 2,472,980 | | | | 2,472,980 | |
| Industry Loss Warranties | | | | | | | | | | | | | | | | |
| Multiperil - U.S. | | | — | | | | — | | | | 2,105,050 | | | | 2,105,050 | |
| Reinsurance Sidecars | | | | | | | | | | | | | | | | |
| Multiperil - U.S. | | | — | | | | — | | | | 2,616,457 | | | | 2,616,457 | |
| Multiperil - Worldwide | | | — | | | | — | | | | 26,364,817 | | | | 26,364,817 | |
| All Other Insurance-Linked | | | | | | | | | | | | | | | | |
| Securities | | | — | | | | 55,921,355 | | | | — | | | | 55,921,355 | |
Municipal Bond | | | — | | | | 116,590 | | | | — | | | | 116,590 | |
Senior Secured Floating | | | | | | | | | | | | | | | | |
| Rate Loan Interests | | | — | | | | 142,687,064 | | | | — | | | | 142,687,064 | |
U.S. Government and | | | | | | | | | | | | | | | | |
| Agency Obligations | | | — | | | | 512,677,680 | | | | — | | | | 512,677,680 | |
Certificates of Deposit | | | — | | | | 33,080,257 | | | | — | | | | 33,080,257 | |
Commercial Papers | | | — | | | | 210,220,925 | | | | — | | | | 210,220,925 | |
| | |
Repurchase Agreements | | | — | | | | 100,780,000 | | | | — | | | | 100,780,000 | |
| Total Investments in Securities | | $ | — | | | $ | 4,946,480,115 | | | $ | 61,676,226 | | | $ | 5,008,156,341 | |
The accompanying notes are an integral part of these financial statements.
88 Pioneer Multi-Asset Ultrashort Income Fund | Annual Report | 3/31/20
The following is a reconciliation of assets valued using significant unobservable inputs (Level 3):
| | | | |
| | Insurance- | |
| | Linked | |
| | Securities | |
Balance as of 3/31/19 | | $ | 90,513,904 | |
Realized gain (loss)(1) | | | (384,569 | ) |
Change in unrealized appreciation(2) | | | 1,015,179 | |
Accrued discounts/premiums | | | — | |
Purchases | | | 43,039,024 | |
Sales | | | (72,507,312 | ) |
Transfers in to Level 3* | �� | | — | |
Transfers out of Level 3* | | | — | |
| Balance as of 3/31/20 | | $ | 61,676,226 | |
| | | |
(1)
| Realized gain (loss) on these securities is included in the realized gain (loss) from investments on the Statement of Operations. | |
(2)
| Unrealized appreciation (depreciation) on these securities is included in the change in unrealized appreciation (depreciation) from investments on the Statement of Operations. | |
* | Transfers are calculated on the beginning of period value. For the year ended March 31, 2020, there were no transfers between Levels 1, 2 and 3.
| |
| Net change in unrealized appreciation (depreciation) of Level 3 investments still held and considered |
| Level 3 at March 31, 2020: | $2,002,682 |
The accompanying notes are an integral part of these financial statements.
Pioneer Multi-Asset Ultrashort Income Fund | Annual Report | 3/31/20 89
Statement of Assets and Liabilities |
3/31/20 | | | | |
| ASSETS: | | | |
| Investments in unaffiliated issuers, at value (cost $5,279,526,888) | | $ | 5,008,156,341 | |
| Cash | | | 581,290,354 | |
| Receivables — | | | | |
| Investment securities sold | | | 117,327,165 | |
| Fund shares sold | | | 46,361,578 | |
| Interest | | | 9,594,235 | |
| Other assets | | | 232,943 | |
| Total assets | | $ | 5,762,962,616 | |
| LIABILITIES: | | | | |
| Payables — | | | | |
| Investment securities purchased | | $ | 509,747,591 | |
| Fund shares repurchased | | | 46,146,524 | |
| Distributions | | | 1,141,032 | |
| Trustees’ fees | | | 4,523 | |
| Unrealized depreciation on unfunded loan commitments | | | 122,329 | |
| Due to affiliates | | | 295,877 | |
| Accrued expenses | | | 1,115,457 | |
| Total liabilities | | $ | 558,573,333 | |
| NET ASSETS: | | | | |
| Paid-in capital | | $ | 5,691,436,283 | |
| Distributable earnings (loss) | | | (487,047,000 | ) |
| Net assets | | $ | 5,204,389,283 | |
| NET ASSET VALUE PER SHARE: | | | | |
| No par value (unlimited number of shares authorized) | | | | |
| Class A (based on $1,628,082,307/175,843,458 shares) | | $ | 9.26 | |
| Class C (based on $300,129,408/32,402,694 shares) | | $ | 9.26 | |
| Class C2 (based on $20,982,095/2,264,362 shares) | | $ | 9.27 | |
| Class K (based on $264,405,157/28,474,598 shares) | | $ | 9.29 | |
| Class Y (based on $2,990,790,316/322,506,747 shares) | | $ | 9.27 | |
The accompanying notes are an integral part of these financial statements.
90 Pioneer Multi-Asset Ultrashort Income Fund | Annual Report | 3/31/20
Statement of Operations
FOR THE YEAR ENDED 3/31/20
| | | | | | | |
| INVESTMENT INCOME: | | | | | | |
| Interest from unaffiliated issuers | | $ | 189,338,728 | | | | |
| Dividends from unaffiliated issuers | | | 3,387,079 | | | | |
| Total investment income | | | | | | $ | 192,725,807 | |
| EXPENSES: | | | | | | | | |
| Management fees | | $ | 18,452,386 | | | | | |
| Administrative expense | | | 1,507,789 | | | | | |
| Transfer agent fees | | | | | | | | |
| Class A | | | 416,062 | | | | | |
| Class C | | | 136,028 | | | | | |
| Class C2 | | | 3,323 | | | | | |
| Class K | | | 536 | | | | | |
| Class Y | | | 2,842,027 | | | | | |
| Distribution fees | | | | | | | | |
| Class A | | | 3,543,223 | | | | | |
| Class C | | | 1,916,747 | | | | | |
| Class C2 | | | 61,671 | | | | | |
| Shareowner communications expense | | | 161,251 | | | | | |
| Custodian fees | | | 257,123 | | | | | |
| Registration fees | | | 401,180 | | | | | |
| Professional fees | | | 333,617 | | | | | |
| Printing expense | | | 80,828 | | | | | |
| Pricing fees | | | 310,497 | | | | | |
| Trustees’ fees | | | 329,367 | | | | | |
| Insurance expense | | | 70,534 | | | | | |
| Miscellaneous | | | 228,287 | | | | | |
| Total expenses | | | | | | $ | 31,052,476 | |
| Net investment income | | | | | | $ | 161,673,331 | |
| REALIZED AND UNREALIZED GAIN (LOSS) ON INVESTMENTS: | | | | | | | | |
| Net realized gain (loss) on: | | | | | | | | |
| Investments in unaffiliated issuers | | | | | | $ | (167,329,917 | ) |
| Change in net unrealized appreciation (depreciation) on: | | | | | | | | |
| Investments in unaffiliated issuers | | $ | (254,042,856 | ) | | | | |
| Unfunded loan commitments | | | (118,596 | ) | | | | |
| Other assets and liabilities denominated in | | | | | | | | |
| foreign currencies | | | 217 | | | $ | (254,161,235 | ) |
| Net realized and unrealized gain (loss) on investments | | | | | | $ | (421,491,152 | ) |
| Net decrease in net assets resulting from operations | | | | | | $ | (259,817,821 | ) |
The accompanying notes are an integral part of these financial statements.
Pioneer Multi-Asset Ultrashort Income Fund | Annual Report | 3/31/20 91
Statements of Changes in Net Assets
| | | | | | | |
| | Year | | | Year | |
| | Ended | | | Ended | |
| | 3/31/20 | | | 3/31/19 | |
| FROM OPERATIONS: | | | | | | |
Net investment income (loss) | | $ | 161,673,331 | | | $ | 139,593,455 | |
Net realized gain (loss) on investments | | | (167,329,917 | ) | | | (1,981,291 | ) |
Change in net unrealized appreciation (depreciation) | | | | | | | | |
| on investments | | | (254,161,235 | ) | | | (15,456,309 | ) |
| Net increase (decrease) in net assets resulting | | | | | | | | |
| from operations | | $ | (259,817,821 | ) | | $ | 122,155,855 | |
| DISTRIBUTIONS TO SHAREOWNERS: | | | | | | | | |
| Class A ($0.27 and $0.26 per share, respectively) | | $ | (48,393,422 | ) | | $ | (36,341,184 | ) |
| Class C ($0.24 and $0.23 per share, respectively) | | | (9,350,830 | ) | | | (11,382,084 | ) |
| Class C2 ($0.24 and $0.23 per share, respectively) | | | (292,948 | ) | | | (189,452 | ) |
| Class K ($0.30 and $0.28 per share, respectively) | | | (10,737,706 | ) | | | (5,789,037 | ) |
| Class Y ($0.29 and $0.27 per share, respectively) | | | (105,798,339 | ) | | | (88,207,485 | ) |
| Total distributions to shareowners | | $ | (174,573,245 | ) | | $ | (141,909,242 | ) |
| FROM FUND SHARE TRANSACTIONS: | | | | | | | | |
Net proceeds from sales of shares | | $ | 5,510,392,928 | | | $ | 5,435,371,909 | |
Reinvestment of distributions | | | 158,619,800 | | | | 123,987,280 | |
Cost of shares repurchased | | | (5,915,746,371 | ) | | | (4,163,986,271 | ) |
| Net increase (decrease) in net assets resulting from | | | | | | | | |
| Fund share transactions | | $ | (246,733,643 | ) | | $ | 1,395,372,918 | |
| Net increase (decrease) in net assets | | $ | (681,124,709 | ) | | $ | 1,375,619,531 | |
| NET ASSETS: | | | | | | | | |
Beginning of year | | $ | 5,885,513,992 | | | $ | 4,509,894,461 | |
End of year | | $ | 5,204,389,283 | | | $ | 5,885,513,992 | |
The accompanying notes are an integral part of these financial statements.
92 Pioneer Multi-Asset Ultrashort Income Fund | Annual Report | 3/31/20
| | | | | | | | | | | | | |
| | Year Ended | | | Year Ended | | | Year Ended | | | Year Ended | |
| | 3/31/20 | | | 3/31/20 | | | 3/31/19 | | | 3/31/19 | |
| | Shares | | | Amount | | | Shares | | | Amount | |
| Class A | | | | | | | | | | | | |
Shares sold | | | 207,659,616 | | | $ | 2,059,762,141 | | | | 150,053,164 | | | $ | 1,492,141,016 | |
Reinvestment of distributions | | | 4,724,639 | | | | 46,618,899 | | | | 3,447,856 | | | | 34,237,849 | |
Less shares repurchased | | | (188,391,509 | ) | | | (1,839,757,207 | ) | | | (123,191,698 | ) | | | (1,224,211,031 | ) |
| Net increase | | | 23,992,746 | | | $ | 266,623,833 | | | | 30,309,322 | | | $ | 302,167,834 | |
| Class C | | | | | | | | | | | | | | | | |
Shares sold | | | 11,059,054 | | | $ | 109,569,322 | | | | 9,449,781 | | | $ | 93,876,062 | |
Reinvestment of distributions | | | 945,924 | | | | 9,341,514 | | | | 1,139,347 | | | | 11,304,487 | |
Less shares repurchased | | | (22,585,668 | ) | | | (221,897,172 | ) | | | (30,337,629 | ) | | | (301,269,304 | ) |
| Net decrease | | | (10,580,690 | ) | | $ | (102,986,336 | ) | | | (19,748,501 | ) | | $ | (196,088,755 | ) |
| Class C2 | | | | | | | | | | | | | | | | |
Shares sold | | | 1,697,084 | | | $ | 16,812,541 | | | | 304,143 | | | $ | 3,017,620 | |
Reinvestment of distributions | | | 7,983 | | | | 78,821 | | | | 10,421 | | | | 103,386 | |
Less shares repurchased | | | (309,176 | ) | | | (2,999,390 | ) | | | (344,484 | ) | | | (3,418,732 | ) |
| Net increase/ | | | | | | | | | | | | | | | | |
| (decrease) | | | 1,395,891 | | | $ | 13,891,972 | | | | (29,920 | ) | | $ | (297,726 | ) |
| Class K | | | | | | | | | | | | | | | | |
Shares sold | | | 16,044,359 | | | $ | 159,364,345 | | | | 26,908,751 | | | $ | 267,357,993 | |
Reinvestment of distributions | | | 1,078,075 | | | | 10,665,224 | | | | 461,075 | | | | 4,581,504 | |
Less shares repurchased | | | (16,312,518 | ) | | | (159,929,239 | ) | | | (15,608,370 | ) | | | (155,221,276 | ) |
| Net increase | | | 809,916 | | | $ | 10,100,330 | | | | 11,761,456 | | | $ | 116,718,221 | |
| Class Y | | | | | | | | | | | | | | | | |
Shares sold | | | 319,898,241 | | | $ | 3,164,884,579 | | | | 359,915,914 | | | $ | 3,578,979,218 | |
Reinvestment of distributions | | | 9,300,699 | | | | 91,915,342 | | | | 7,424,296 | | | | 73,760,054 | |
Less shares repurchased | | | (376,494,340 | ) | | | (3,691,163,363 | ) | | | (249,523,007 | ) | | | (2,479,865,928 | ) |
| Net increase/ | | | | | | | | | | | | | | | | |
| (decrease) | | | (47,295,400 | ) | | $ | (434,363,442 | ) | | | 117,817,203 | | | $ | 1,172,873,344 | |
The accompanying notes are an integral part of these financial statements.
Pioneer Multi-Asset Ultrashort Income Fund | Annual Report | 3/31/20 93
Financial Highlights
| | | | | | | | | | | | | | | | |
| | Year | | | Year | | | Year | | | Year | | | Year | |
| | Ended | | | Ended | | | Ended | | | Ended | | | Ended | |
| | 3/31/20 | | | 3/31/19 | | | 3/31/18 | | | 3/31/17* | | | 3/31/16* | |
| Class A | | | | | | | | | | | | | | | |
Net asset value, beginning of period | | $ | 9.92 | | | $ | 9.95 | | | $ | 9.99 | | | $ | 9.92 | | | $ | 10.00 | |
Increase (decrease) from investment operations: | | | | | | | | | | | | | | | | | | | | |
| Net investment income (loss)(a) | | $ | 0.25 | | | $ | 0.26 | | | $ | 0.18 | | | $ | 0.16 | | | $ | 0.10 | |
| Net realized and unrealized gain (loss) on investments | | | (0.64 | ) | | | (0.03 | ) | | | (0.03 | ) | | | 0.08 | | | | (0.06 | ) |
Net increase (decrease) from investment operations | | $ | (0.39 | ) | | $ | 0.23 | | | $ | 0.15 | | | $ | 0.24 | | | $ | 0.04 | |
Distributions to shareowners: | | | | | | | | | | | | | | | | | | | | |
| Net investment income | | $ | (0.27 | ) | | $ | (0.26 | ) | | $ | (0.19 | ) | | $ | (0.17 | ) | | $ | (0.12 | ) |
Net increase (decrease) in net asset value | | $ | (0.66 | ) | | $ | (0.03 | ) | | $ | (0.04 | ) | | $ | 0.07 | | | $ | (0.08 | ) |
Net asset value, end of period | | $ | 9.26 | | | $ | 9.92 | | | $ | 9.95 | | | $ | 9.99 | | | $ | 9.92 | |
Total return(b) | | | (4.02 | )% | | | 2.32 | % | | | 1.51 | % | | | 2.43 | % | | | 0.41 | % |
Ratio of net expenses to average net assets | | | 0.58 | % | | | 0.59 | % | | | 0.60 | % | | | 0.61 | % | | | 0.63 | % |
Ratio of net investment income (loss) to average net assets | | | 2.52 | % | | | 2.58 | % | | | 1.81 | % | | | 1.59 | % | | | 1.01 | % |
Portfolio turnover rate | | | 100 | % | | | 61 | % | | | 54 | % | | | 69 | % | | | 58 | % |
Net assets, end of period (in thousands) | | $ | 1,628,082 | | | $ | 1,506,433 | | | $ | 1,209,820 | | | $ | 759,455 | | | $ | 673,352 | |
| | |
* | The Fund was audited by an independent registered public accounting firm other than Ernst & Young LLP. |
(a) | The per share data presented above is based on the average shares outstanding for the period presented. |
(b) | Assumes initial investment at net asset value at the beginning of each period, reinvestment of all distributions, the complete redemption of the investment at net asset value at the end of each period and no sales charges. Total return would be reduced if sales charges were taken into account. |
The accompanying notes are an integral part of these financial statements.
94 Pioneer Multi-Asset Ultrashort Income Fund | Annual Report | 3/31/20
| | | | | | | | | | | | | | | | |
| | Year | | | Year | | | Year | | | Year | | | Year | |
| | Ended | | | Ended | | | Ended | | | Ended | | | Ended | |
| | 3/31/20 | | | 3/31/19 | | | 3/31/18 | | | 3/31/17* | | | 3/31/16* | |
| Class C | | | | | | | | | | | | | | | |
Net asset value, beginning of period | | $ | 9.91 | | | $ | 9.94 | | | $ | 9.97 | | | $ | 9.91 | | | $ | 9.99 | |
Increase (decrease) from investment operations: | | | | | | | | | | | | | | | | | | | | |
| Net investment income (loss)(a) | | $ | 0.22 | | | $ | 0.22 | | | $ | 0.15 | | | $ | 0.13 | | | $ | 0.07 | |
| Net realized and unrealized gain (loss) on investments | | | (0.63 | ) | | | (0.02 | ) | | | (0.02 | ) | | | 0.07 | | | | (0.06 | ) |
Net increase (decrease) from investment operations | | $ | (0.41 | ) | | $ | 0.20 | | | $ | 0.13 | | | $ | 0.20 | | | $ | 0.01 | |
Distributions to shareowners: | | | | | | | | | | | | | | | | | | | | |
| Net investment income | | $ | (0.24 | ) | | $ | (0.23 | ) | | $ | (0.16 | ) | | $ | (0.14 | ) | | $ | (0.09 | ) |
Net increase (decrease) in net asset value | | $ | (0.65 | ) | | $ | (0.03 | ) | | $ | (0.03 | ) | | $ | 0.06 | | | $ | (0.08 | ) |
Net asset value, end of period | | $ | 9.26 | | | $ | 9.91 | | | $ | 9.94 | | | $ | 9.97 | | | $ | 9.91 | |
Total return(b) | | | (4.24 | )% | | | 1.99 | % | | | 1.28 | % | | | 2.00 | % | | | 0.11 | % |
Ratio of net expenses to average net assets | | | 0.89 | % | | | 0.91 | % | | | 0.92 | % | | | 0.93 | % | | | 0.94 | % |
Ratio of net investment income (loss) to average net assets | | | 2.25 | % | | | 2.22 | % | | | 1.48 | % | | | 1.27 | % | | | 0.70 | % |
Portfolio turnover rate | | | 100 | % | | | 61 | % | | | 54 | % | | | 69 | % | | | 58 | % |
Net assets, end of period (in thousands) | | $ | 300,129 | | | $ | 425,928 | | | $ | 623,642 | | | $ | 568,840 | | | $ | 524,030 | |
| | |
* | The Fund was audited by an independent registered public accounting firm other than Ernst & Young LLP. |
(a) | The per share data presented above is based on the average shares outstanding for the period presented. |
(b) | Assumes initial investment at net asset value at the beginning of each period, reinvestment of all distributions, the complete redemption of the investment at net asset value at the end of each period and no sales charges. Total return would be reduced if sales charges were taken into account. |
The accompanying notes are an integral part of these financial statements.
Pioneer Multi-Asset Ultrashort Income Fund | Annual Report | 3/31/20 95
Financial Highlights (continued)
| | | | | | | | | | | | | | | | |
| | Year | | | Year | | | Year | | | Year | | | Year | |
| | Ended | | | Ended | | | Ended | | | Ended | | | Ended | |
| | 3/31/20 | | | 3/31/19 | | | 3/31/18 | | | 3/31/17* | | | 3/31/16* | |
| Class C2 | | | | | | | | | | | | | | | |
Net asset value, beginning of period | | $ | 9.91 | | | $ | 9.94 | | | $ | 9.97 | | | $ | 9.91 | | | $ | 9.99 | |
Increase (decrease) from investment operations: | | | | | | | | | | | | | | | | | | | | |
| Net investment income (loss)(a) | | $ | 0.21 | | | $ | 0.22 | | | $ | 0.15 | | | $ | 0.13 | | | $ | 0.07 | |
| Net realized and unrealized gain (loss) on investments | | | (0.61 | ) | | | (0.02 | ) | | | (0.02 | ) | | | 0.07 | | | | (0.06 | ) |
Net increase (decrease) from investment operations | | $ | (0.40 | ) | | $ | 0.20 | | | $ | 0.13 | | | $ | 0.20 | | | $ | 0.01 | |
Distributions to shareowners: | | | | | | | | | | | | | | | | | | | | |
| Net investment income | | $ | (0.24 | ) | | $ | (0.23 | ) | | $ | (0.16 | ) | | $ | (0.14 | ) | | $ | (0.09 | ) |
Net increase (decrease) in net asset value | | $ | (0.64 | ) | | $ | (0.03 | ) | | $ | (0.03 | ) | | $ | 0.06 | | | $ | (0.08 | ) |
Net asset value, end of period | | $ | 9.27 | | | $ | 9.91 | | | $ | 9.94 | | | $ | 9.97 | | | $ | 9.91 | |
Total return(b) | | | (4.13 | )% | | | 1.98 | % | | | 1.29 | % | | | 2.00 | % | | | 0.11 | % |
Ratio of net expenses to average net assets | | | 0.88 | % | | | 0.91 | % | | | 0.92 | % | | | 0.93 | % | | | 0.94 | % |
Ratio of net investment income (loss) to average net assets | | | 2.17 | % | | | 2.25 | % | | | 1.47 | % | | | 1.27 | % | | | 0.69 | % |
Portfolio turnover rate | | | 100 | % | | | 61 | % | | | 54 | % | | | 69 | % | | | 58 | % |
Net assets, end of period (in thousands) | | $ | 20,982 | | | $ | 8,604 | | | $ | 8,929 | | | $ | 9,834 | | | $ | 10,292 | |
| | |
* | The Fund was audited by an independent registered public accounting firm other than Ernst & Young LLP. |
(a) | The per share data presented above is based on the average shares outstanding for the period presented. |
(b) | Assumes initial investment at net asset value at the beginning of each period, reinvestment of all distributions, the complete redemption of the investment at net asset value at the end of each period and no sales charges. Total return would be reduced if sales charges were taken into account. |
The accompanying notes are an integral part of these financial statements.
96 Pioneer Multi-Asset Ultrashort Income Fund | Annual Report | 3/31/20
| | | | | | | | | | | | | | | | |
| | Year | | | Year | | | Year | | | Year | | | Year | |
| | Ended | | | Ended | | | Ended | | | Ended | | | Ended | |
| | 3/31/20 | | | 3/31/19 | | | 3/31/18 | | | 3/31/17* | | | 3/31/16* | |
| Class K | | | | | | | | | | | | | | | |
Net asset value, beginning of period | | $ | 9.93 | | | $ | 9.96 | | | $ | 9.99 | | | $ | 9.93 | | | $ | 10.01 | |
Increase (decrease) from investment operations: | | | | | | | | | | | | | | | | | | | | |
| Net investment income (loss)(a) | | $ | 0.28 | | | $ | 0.28 | | | $ | 0.20 | | | $ | 0.19 | | | $ | 0.12 | |
| Net realized and unrealized gain (loss) on investments | | | (0.62 | ) | | | (0.03 | ) | | | (0.02 | ) | | | 0.06 | | | | (0.06 | ) |
Net increase (decrease) from investment operations | | $ | (0.34 | ) | | $ | 0.25 | | | $ | 0.18 | | | $ | 0.25 | | | $ | 0.06 | |
Distributions to shareowners: | | | | | | | | | | | | | | | | | | | | |
| Net investment income | | $ | (0.30 | ) | | $ | (0.28 | ) | | $ | (0.21 | ) | | $ | (0.19 | ) | | $ | (0.14 | ) |
Net increase (decrease) in net asset value | | $ | (0.64 | ) | | $ | (0.03 | ) | | $ | (0.03 | ) | | $ | 0.06 | | | $ | (0.08 | ) |
Net asset value, end of period | | $ | 9.29 | | | $ | 9.93 | | | $ | 9.96 | | | $ | 9.99 | | | $ | 9.93 | |
Total return(b) | | | (3.60 | )% | | | 2.54 | % | | | 1.83 | % | | | 2.55 | % | | | 0.64 | % |
Ratio of net expenses to average net assets | | | 0.36 | % | | | 0.37 | % | | | 0.38 | % | | | 0.42 | % | | | 0.42 | % |
Ratio of net investment income (loss) to average net assets | | | 2.79 | % | | | 2.82 | % | | | 2.03 | % | | | 1.92 | % | | | 1.24 | % |
Portfolio turnover rate | | | 100 | % | | | 61 | % | | | 54 | % | | | 69 | % | | | 58 | % |
Net assets, end of period (in thousands) | | $ | 264,405 | | | $ | 274,682 | | | $ | 158,443 | | | $ | 91,666 | | | $ | 5,026 | |
| | |
* | The Fund was audited by an independent registered public accounting firm other than Ernst & Young LLP. |
(a) | The per share data presented above is based on the average shares outstanding for the period presented. |
(b) | Assumes initial investment at net asset value at the beginning of each period, reinvestment of all distributions and the complete redemption of the investment at net asset value at the end of each period. |
The accompanying notes are an integral part of these financial statements.
Pioneer Multi-Asset Ultrashort Income Fund | Annual Report | 3/31/20 97
Financial Highlights (continued)
| | | | | | | | | | | | | | | | |
| | Year | | | Year | | | Year | | | Year | | | Year | |
| | Ended | | | Ended | | | Ended | | | Ended | | | Ended | |
| | 3/31/20 | | | 3/31/19 | | | 3/31/18 | | | 3/31/17* | | | 3/31/16* | |
| Class Y | | | | | | | | | | | | | | | |
Net asset value, beginning of period | | $ | 9.92 | | | $ | 9.96 | | | $ | 9.99 | | | $ | 9.93 | | | $ | 10.01 | |
Increase (decrease) from investment operations: | | | | | | | | | | | | | | | | | | | | |
| Net investment income (loss)(a) | | $ | 0.27 | | | $ | 0.27 | | | $ | 0.19 | | | $ | 0.17 | | | $ | 0.11 | |
| Net realized and unrealized gain (loss) on investments | | | (0.63 | ) | | | (0.04 | ) | | | (0.01 | ) | | | 0.07 | | | | (0.06 | ) |
Net increase (decrease) from investment operations | | $ | (0.36 | ) | | $ | 0.23 | | | $ | 0.18 | | | $ | 0.24 | | | $ | 0.05 | |
Distributions to shareowners: | | | | | | | | | | | | | | | | | | | | |
| Net investment income | | $ | (0.29 | ) | | $ | (0.27 | ) | | $ | (0.21 | ) | | $ | (0.18 | ) | | $ | (0.13 | ) |
Net increase (decrease) in net asset value | | $ | (0.65 | ) | | $ | (0.04 | ) | | $ | (0.03 | ) | | $ | 0.06 | | | $ | (0.08 | ) |
Net asset value, end of period | | $ | 9.27 | | | $ | 9.92 | | | $ | 9.96 | | | $ | 9.99 | | | $ | 9.93 | |
Total return(b) | | | (3.78 | )% | | | 2.37 | % | | | 1.76 | % | | | 2.46 | % | | | 0.54 | % |
Ratio of net expenses to average net assets | | | 0.44 | % | | | 0.45 | % | | | 0.46 | % | | | 0.50 | % | | | 0.51 | % |
Ratio of net investment income (loss) to average net assets | | | 2.69 | % | | | 2.74 | % | | | 1.94 | % | | | 1.70 | % | | | 1.15 | % |
Portfolio turnover rate | | | 100 | % | | | 61 | % | | | 54 | % | | | 69 | % | | | 58 | % |
Net assets, end of period (in thousands) | | $ | 2,990,790 | | | $ | 3,669,866 | | | $ | 2,509,061 | | | $ | 1,768,502 | | | $ | 1,418,468 | |
| | |
* | The Fund was audited by an independent registered public accounting firm other than Ernst & Young LLP. |
(a) | The per share data presented above is based on the average shares outstanding for the period presented. |
(b) | Assumes initial investment at net asset value at the beginning of each period, reinvestment of all distributions and the complete redemption of the investment at net asset value at the end of each period. |
The accompanying notes are an integral part of these financial statements.
98 Pioneer Multi-Asset Ultrashort Income Fund | Annual Report | 3/31/20
Notes to Financial Statements |
3/31/20 1. Organization and Significant Accounting Policies
Pioneer Multi-Asset Ultrashort Income Fund (the “Fund”) is one of three portfolios comprising Pioneer Series Trust X, a Delaware statutory trust. The Fund is registered under the Investment Company Act of 1940 as a diversified, open-end management investment company. The investment objective of the Fund is to seek a high level of current income to the extent consistent with a relatively high level of stability of principal.
The Fund offers five classes of shares designated as Class A, Class C, Class C2, Class K and Class Y shares. Each class of shares represents an interest in the same portfolio of investments of the Fund and has identical rights (based on relative net asset values) to assets and liquidation proceeds. Share classes can bear different rates of class-specific fees and expenses, such as transfer agent and distribution fees. Differences in class-specific fees and expenses will result in differences in net investment income and, therefore, the payment of different dividends from net investment income earned by each class. The Amended and Restated Declaration of Trust of the Fund gives the Board of Trustees the flexibility to specify either per-share voting or dollar-weighted voting when submitting matters for shareholder approval. Under per-share voting, each share of a class of the Fund is entitled to one vote. Under dollar-weighted voting, a shareowner’s voting power is determined not by the number of shares owned, but by the dollar value of the shares on the record date. Each share class has exclusive voting rights with respect to matters affecting only that class, including with respect to the distribution plan for that class. There is no distribution plan for Class K or Class Y shares.
Amundi Pioneer Asset Management, Inc., an indirect, wholly owned subsidiary of Amundi and Amundi’s wholly owned subsidiary, Amundi USA, Inc., serves as the Fund’s investment adviser (the “Adviser”). Amundi Pioneer Distributor, Inc., an affiliate of Amundi Pioneer Asset Management, Inc., serves as the Fund’s distributor (the “Distributor”).
In August 2018, the Securities and Exchange Commission (“SEC”) released a Disclosure Update and Simplification Final Rule. The Final Rule amends Regulation S-X disclosures requirements to conform them to U.S. Generally Accepted Accounting Principles (“U.S. GAAP”) for investment companies. The Fund’s financial statements were prepared in compliance with the new amendments to Regulation S-X.
During March 2017, the Financial Accounting Standards Board (FASB) issued an Accounting Standard Update, ASU 2017-08, Receivables-Nonrefundable Fees and Other Costs (Subtopic 310-20), Premium Amortization on Purchased
Pioneer Multi-Asset Ultrashort Income Fund | Annual Report | 3/31/20 99
Callable Debt Securities (“ASU 2017-08”), which shortens the amortization period for purchased non-contingently callable debt securities held at a premium. ASU 2017-08 specifies that the premium amortization period ends at the earliest call date, for certain purchased non-contingently callable debt securities. ASU 2017-08 is effective for fiscal years, and interim periods within those fiscal years, beginning after December 15, 2018. The Fund has adopted ASU 2017-08 as of March 31, 2020. The implementation of ASU 2017-08 did not have a material impact on the Fund’s financial statements.
The Fund is an investment company and follows investment company accounting and reporting guidance under U.S. GAAP. U.S. GAAP requires the management of the Fund to make estimates and assumptions that affect the reported amounts of assets and liabilities, the disclosure of contingent assets and liabilities at the date of the financial statements, and the reported amounts of income, expenses and gain or loss on investments during the reporting period. Actual results could differ from those estimates.
The following is a summary of significant accounting policies followed by the Fund in the preparation of its financial statements:
A. Security Valuation
The net asset value of the Fund is computed once daily, on each day the New York Stock Exchange (“NYSE”) is open, as of the close of regular trading on the NYSE.
Fixed-income securities are valued by using prices supplied by independent pricing services, which consider such factors as market prices, market events, quotations from one or more brokers, Treasury spreads, yields, maturities and ratings, or may use a pricing matrix or other fair value methods or techniques to provide an estimated value of the security or instrument. A pricing matrix is a means of valuing a debt security on the basis of current market prices for other debt securities, historical trading patterns in the market for fixed-income securities and/or other factors. Non-U.S. debt securities that are listed on an exchange will be valued at the bid price obtained from an independent third party pricing service. When independent third party pricing services are unable to supply prices, or when prices or market quotations are considered to be unreliable, the value of that security may be determined using quotations from one or more broker-dealers.
Loan interests are valued in accordance with guidelines established by the Board of Trustees at the mean between the last available bid and asked prices from one or more brokers or dealers as obtained from Loan Pricing Corporation, an independent third party pricing service. If price information is not available from Loan Pricing Corporation, or if the price information is deemed to be unreliable, price information will be obtained from an
100 Pioneer Multi-Asset Ultrashort Income Fund | Annual Report | 3/31/20
alternative loan interest pricing service. If no reliable price quotes are available from either the primary or alternative pricing service, broker quotes will be solicited.
Event-linked bonds are valued at the bid price obtained from an independent third party pricing service. Other insurance-linked securities (including reinsurance sidecars, collateralized reinsurance and industry loss warranties) may be valued at the bid price obtained from an independent pricing service, or through a third party using a pricing matrix, insurance industry valuation models, or other fair value methods or techniques to provide an estimated value of the instrument.
Equity securities that have traded on an exchange are valued by using the last sale price on the principal exchange where they are traded. Equity securities that have not traded on the date of valuation, or securities for which sale prices are not available, generally are valued using the mean between the last bid and asked prices or, if both last bid and asked prices are not available, at the last quoted bid price. Last sale and bid and asked prices are provided by independent third party pricing services. In the case of equity securities not traded on an exchange, prices are typically determined by independent third party pricing services using a variety of techniques and methods.
The value of foreign securities is translated into U.S. dollars based on foreign currency exchange rate quotations supplied by a third party pricing source. Trading in non-U.S. equity securities is substantially completed each day at various times prior to the close of the NYSE. The values of such securities used in computing the net asset value of the Fund’s shares are determined as of such times. The Fund may use a fair value model developed by an independent pricing service to value non-U.S. equity securities.
Repurchase agreements are valued at par. Cash may include overnight time deposits at approved financial institutions.
Securities or loan interests for which independent pricing services or broker-dealers are unable to supply prices or for which market prices and/or quotations are not readily available or are considered to be unreliable are valued by a fair valuation team comprised of certain personnel of the Adviser pursuant to procedures adopted by the Fund’s Board of Trustees. The Adviser’s fair valuation team uses fair value methods approved by the Valuation Committee of the Board of Trustees. The Adviser’s fair valuation team is responsible for monitoring developments that may impact fair valued securities and for discussing and assessing fair values on an ongoing basis, and at least quarterly, with the Valuation Committee of the Board of Trustees.
Pioneer Multi-Asset Ultrashort Income Fund | Annual Report | 3/31/20 101
Inputs used when applying fair value methods to value a security may include credit ratings, the financial condition of the company, current market conditions and comparable securities. The Fund may use fair value methods if it is determined that a significant event has occurred after the close of the exchange or market on which the security trades and prior to the determination of the Fund’s net asset value. Examples of a significant event might include political or economic news, corporate restructurings, natural disasters, terrorist activity or trading halts. Thus, the valuation of the Fund’s securities may differ significantly from exchange prices, and such differences could be material.
At March 31, 2020, no securities were valued using fair value methods (other than securities valued using prices supplied by independent pricing services, broker-dealers or using a third party insurance industry pricing model).
B. Investment Income and Transactions
Interest income, including interest on income-bearing cash accounts, is recorded on the accrual basis. Dividend and interest income are reported net of unrecoverable foreign taxes withheld at the applicable country rates and net of income accrued on defaulted securities.
Dividend income is recorded on the ex-dividend date, except that certain dividends from foreign securities where the ex-dividend date may have passed are recorded as soon as the Fund becomes aware of the ex-dividend data in the exercise of reasonable diligence.
Interest and dividend income payable by delivery of additional shares is reclassified as PIK (payment-in-kind) income upon receipt and is included in interest and dividend income, respectively.
Principal amounts of mortgage-backed securities are adjusted for monthly paydowns. Premiums and discounts related to certain mortgage-backed securities are amortized or accreted in proportion to the monthly paydowns. All discounts/premiums on purchase prices of debt securities are accreted/amortized for financial reporting purposes over the life of the respective securities, and such accretion/amortization is included in interest income.
Security transactions are recorded as of trade date. Gains and losses on sales of investments are calculated on the identified cost method for both financial reporting and federal income tax purposes.
102 Pioneer Multi-Asset Ultrashort Income Fund | Annual Report | 3/31/20
C. Foreign Currency Translation
The books and records of the Fund are maintained in U.S. dollars. Amounts denominated in foreign currencies are translated into U.S. dollars using current exchange rates.
Net realized gains and losses on foreign currency transactions, if any, represent, among other things, the net realized gains and losses on foreign currency exchange contracts, disposition of foreign currencies and the difference between the amount of income accrued and the U.S. dollars actually received. Further, the effects of changes in foreign currency exchange rates on investments are not segregated on the Statement of Operations from the effects of changes in the market prices of those securities, but are included with the net realized and unrealized gain or loss on investments.
D. Federal Income Taxes
It is the Fund’s policy to comply with the requirements of the Internal Revenue Code applicable to regulated investment companies and to distribute all of its net taxable income and net realized capital gains, if any, to its shareowners. Therefore, no provision for federal income taxes is required. As of March 31, 2020, the Fund did not accrue any interest or penalties with respect to uncertain tax positions, which, if applicable, would be recorded as an income tax expense on the Statement of Operations. Tax returns filed within the prior three years remain subject to examination by federal and state tax authorities.
The amount and character of income and capital gain distributions to shareowners are determined in accordance with federal income tax rules, which may differ from U.S. GAAP. Distributions in excess of net investment income or net realized gains are temporary over distributions for financial statement purposes resulting from differences in the recognition or classification of income or distributions for financial statement and tax purposes. Capital accounts within the financial statements are adjusted for permanent book/tax differences to reflect tax character, but are not adjusted for temporary differences.
At March 31, 2020, the Fund reclassified $1,260,555 to increase distributable earnings and $1,260,555 to decrease paid-in capital to reflect permanent book/tax differences. These adjustments have no impact on net assets or the results of operations.
At March 31, 2020, the Fund was permitted to carry forward indefinitely $127,268,187 of short-term losses and $75,764,035 of long-term losses.
Pioneer Multi-Asset Ultrashort Income Fund | Annual Report | 3/31/20 103
The tax character of distributions paid during the years ended March 31, 2020 and March 31, 2019, were as follows:
| | | | | | | |
| | 2020 | | | 2019 | |
| Distributions paid from: | | | | | | |
Ordinary income | | $ | 174,573,245 | | | $ | 141,909,242 | |
| Total | | $ | 174,573,245 | | | $ | 141,909,242 | |
The following shows the components of distributable earnings (losses) on a federal income tax basis at March 31, 2020:
| | | | |
| | 2020 | |
| Distributable earnings (losses): | | | |
Undistributed ordinary income | | $ | 1,050,217 | |
Capital loss carryforward | | | (203,032,222 | ) |
Current year dividend payable | | | (1,141,032 | ) |
Unrealized depreciation | | | (283,923,963 | ) |
| Total | | $ | (487,047,000 | ) |
The difference between book-basis and tax-basis unrealized depreciation is attributable to the tax deferral of losses on wash sales, adjustments relating to event-linked bonds, insurance-linked securities, and the tax treatment of premium and amortization.
E. Fund Shares
The Fund records sales and repurchases of its shares as of trade date. The Distributor earned $0 in underwriting commissions on the sale of Class A shares during the year ended March 31, 2020.
F. Class Allocations
Income, common expenses and realized and unrealized gains and losses are calculated at the Fund level and allocated daily to each class of shares based on its respective percentage of adjusted net assets at the beginning of the day.
Distribution fees are calculated based on the average daily net asset value attributable to Class A, Class C and Class C2 shares of the Fund, respectively (see Note 4). Class K and Class Y shares do not pay distribution fees. All expenses and fees paid to the Fund’s transfer agent, for its services are allocated among the classes of shares based on the number of accounts in each class and the ratable allocation of related out-of-pocket expenses (see Note 3).
The Fund declares as daily dividends substantially all of its net investment income. All dividends are paid on a monthly basis. Short-term capital gain distributions, if any, may be declared with the daily dividends. Distributions to shareowners are recorded as of the ex-dividend date. Distributions paid by the Fund with respect to each class of shares are calculated in the same
104 Pioneer Multi-Asset Ultrashort Income Fund | Annual Report | 3/31/20
manner and at the same time except that net investment income dividends to Class A, Class C, Class C2, Class K and Class Y shares can reflect different transfer agent and distribution expense rates.
G. Risks
The value of securities held by the Fund may go up or down, sometimes rapidly or unpredictably, due to general market conditions, such as real or perceived adverse economic, political or regulatory conditions, recessions, the spread of infectious illness or other public health issues, inflation, changes in interest rates, lack of liquidity in the bond markets or adverse investor sentiment. In the past several years, financial markets have experienced increased volatility, depressed valuations, decreased liquidity and heightened uncertainty. These conditions may continue, recur, worsen or spread.
At times, the Fund’s investments may represent industries or industry sectors that are interrelated or have common risks, making the Fund more susceptible to any economic, political, or regulatory developments or other risks affecting those industries and sectors. The Fund’s investments in foreign markets and countries with limited developing markets may subject the Fund to a greater degree of risk than investments in a developed market. These risks include disruptive political or economic conditions and the imposition of adverse governmental laws or currency exchange restrictions.
The Fund invests in below-investment-grade (high-yield) debt securities and preferred stocks. Some of these high-yield securities may be convertible into equity securities of the issuer. Debt securities rated below-investment-grade are commonly referred to as “junk bonds” and are considered speculative. These securities involve greater risk of loss, are subject to greater price volatility, and are less liquid, especially during periods of economic uncertainty or change, than higher rated debt securities.
With the increased use of technologies such as the Internet to conduct business, the Fund is susceptible to operational, information security and related risks. While the Fund’s Adviser has established business continuity plans in the event of, and risk management systems to prevent, limit or mitigate, such cyber-attacks, there are inherent limitations in such plans and systems, including the possibility that certain risks have not been identified. Furthermore, the Fund cannot control the cybersecurity plans and systems put in place by service providers to the Fund such as Brown Brothers Harriman & Co., the Fund’s custodian and accounting agent, and DST Asset Manager Solutions, Inc., the Fund’s transfer agent. In addition, many beneficial owners of Fund shares hold them through accounts at broker-dealers, retirement platforms and other financial market participants over which neither the Fund nor Amundi Pioneer exercises control. Each of these may in turn rely on service providers to them, which are also subject to the
Pioneer Multi-Asset Ultrashort Income Fund | Annual Report | 3/31/20 105
risk of cyber-attacks. Cybersecurity failures or breaches at Amundi Pioneer or the Fund’s service providers or intermediaries have the ability to cause disruptions and impact business operations, potentially resulting in financial losses, interference with the Fund’s ability to calculate its net asset value, impediments to trading, the inability of Fund shareowners to effect share purchases, redemptions or exchanges or receive distributions, loss of or unauthorized access to private shareowner information and violations of applicable privacy and other laws, regulatory fines, penalties, reputational damage, or additional compliance costs. Such costs and losses may not be covered under any insurance. In addition, maintaining vigilance against cyber-attacks may involve substantial costs over time, and system enhancements may themselves be subject to cyber-attacks.
The Fund’s prospectus contains unaudited information regarding the Fund’s principal risks. Please refer to that document when considering the Fund’s principal risks.
H. Insurance-Linked Securities (“ILS”)
The Fund invests in ILS. The Fund could lose a portion or all of the principal it has invested in an ILS, and the right to additional interest or dividend payments with respect to the security, upon the occurrence of one or more trigger events, as defined within the terms of an insurance-linked security. Trigger events, generally, are hurricanes, earthquakes, or other natural events of a specific size or magnitude that occur in a designated geographic region during a specified time period, and/or that involve losses or other metrics that exceed a specific amount. There is no way to accurately predict whether a trigger event will occur, and accordingly, ILS carry significant risk. The Fund is entitled to receive principal, and interest and/or dividend payments so long as no trigger event occurs of the description and magnitude specified by the instrument. In addition to the specified trigger events, ILS may expose the Fund to other risks, including but not limited to issuer (credit) default, adverse regulatory or jurisdictional interpretations and adverse tax consequences.
The Fund’s investments in ILS may include event-linked bonds. ILS also may include special purpose vehicles (“SPVs”) or similar instruments structured to comprise a portion of a reinsurer’s catastrophe-oriented business, known as quota share instruments (sometimes referred to as reinsurance sidecars), or to provide reinsurance relating to specific risks to insurance or reinsurance companies through a collateralized instrument, known as collateralized reinsurance. Structured reinsurance investments also may include industry loss warranties (“ILWs”). A traditional ILW takes the form of a bilateral reinsurance contract, but there are also products that take the form of derivatives, collateralized structures, or exchange-traded instruments.
106 Pioneer Multi-Asset Ultrashort Income Fund | Annual Report | 3/31/20
Where the ILS are based on the performance of underlying reinsurance contracts, the Fund has limited transparency into the individual underlying contracts, and therefore must rely upon the risk assessment and sound underwriting practices of the issuer. Accordingly, it may be more difficult for the Adviser to fully evaluate the underlying risk profile of the Fund’s structured reinsurance investments, and therefore the Fund’s assets are placed at greater risk of loss than if the Adviser had more complete information. Structured reinsurance instruments generally will be considered illiquid securities by the Fund. These securities may be difficult to purchase, sell or unwind. Illiquid securities also may be difficult to value. If the Fund is forced to sell an illiquid asset, the Fund may be forced to sell at a loss.
I. Repurchase Agreements
Repurchase agreements are arrangements under which the Fund purchases securities from a broker-dealer or a bank, called the counterparty, upon the agreement of the counterparty to repurchase the securities from the Fund at a later date, and at a specific price, which is typically higher than the purchase price paid by the Fund. The securities purchased serve as the Fund’s collateral for the obligation of the counterparty to repurchase the securities. The value of the collateral, including accrued interest, is required to be equal to or in excess of the repurchase price. The collateral for all repurchase agreements is held in safekeeping in the customer-only account of the Fund’s custodian or a sub-custodian of the Fund. The Adviser is responsible for determining that the value of the collateral remains at least equal to the repurchase price. In the event of a default by the counterparty, the Fund is entitled to sell the securities, but the Fund may not be able to sell them for the price at which they were purchased, thus causing a loss to the Fund. Additionally, if the counterparty becomes insolvent, there is some risk that the Fund will not have a right to the securities, or the immediate right to sell the securities.
Open repurchase agreements at March 31, 2020, are disclosed in the Schedule of Investments.
2. Management Agreement
The Adviser manages the Fund’s portfolio. Management fees are paid monthly and are calculated daily at the annual rate of 0.35% of the Fund’s average daily net assets up to $1 billion, 0.30% of the next $4 billion of the Fund’s average daily net assets, 0.25% of the next $2.5 billion of the Fund’s average daily net assets and 0.20% of the Fund’s average daily net assets over $7.5 billion. For the year ended March 31, 2020, the effective management fee was equivalent to 0.30% of the Fund’s average daily net assets.
Pioneer Multi-Asset Ultrashort Income Fund | Annual Report | 3/31/20 107
In addition, under the management and administration agreements, certain other services and costs, including accounting, regulatory reporting and insurance premiums, are paid by the Fund as administrative reimbursements. Included in “Due to affiliates” reflected on the Statement of Assets and Liabilities is $229,942 in management fees, administrative costs and certain other reimbursements payable to the Adviser at March 31, 2020.
3. Transfer Agent
DST Asset Manager Solutions, Inc. serves as the transfer agent to the Fund at negotiated rates. Transfer agent fees and payables shown on the Statement of Operations and the Statement of Assets and Liabilities, respectively, include sub-transfer agent expenses incurred through the Fund’s omnibus relationship contracts.
In addition, the Fund reimbursed the transfer agent for out-of-pocket expenses incurred by the transfer agent related to shareowner communications activities such as proxy and statement mailings, and outgoing phone calls. For the year ended March 31, 2020, such out-of-pocket expenses by class of shares were as follows:
| | | | |
| Shareowner Communications: | | | |
Class A | | $ | 25,257 | |
Class C | | | 12,343 | |
Class C2 | | | 244 | |
Class K | | | 508 | |
Class Y | | | 122,899 | |
| Total | | $ | 161,251 | |
4. Distribution Plan
The Fund has adopted a distribution plan (the “Plan”) pursuant to Rule 12b-1 of the Investment Company Act of 1940 with respect to its Class A, Class C and Class C2 shares. Pursuant to the Plan, the Fund pays the Distributor 0.20% of the average daily net assets attributable to Class A shares as compensation for personal services and/or account maintenance services or distribution services with regard to Class A shares. Pursuant to the Plan, the Fund also pays the Distributor 0.50% of the average daily net assets attributable to Class C and Class C2 shares. The fee for Class C and Class C2 shares consists of a 0.25% service fee and a 0.25% distribution fee paid as compensation for personal services and/or account maintenance services or distribution services with regard to Class C and Class C2 shares. Included in “Due to affiliates” reflected on the Statement of Assets and Liabilities is $65,935 in distribution fees payable to the Distributor at March 31, 2020.
108 Pioneer Multi-Asset Ultrashort Income Fund | Annual Report | 3/31/20
In addition, redemptions of Class A and Class C2 shares may be subject to a contingent deferred sales charge (“CDSC”). A CDSC of 1.00% may be imposed on redemptions of certain net asset value purchases of Class A shares within 12 months of purchase. Redemptions of Class C2 shares redemptions of shares within 12 months of purchase are subject to a CDSC of 1.00%, based on the lower of cost or market value of shares being redeemed. Shares purchased as part of an exchange remain subject to any CDSC that applied to the original purchase of those shares. There is no CDSC for Class C, Class K and Class Y shares. Proceeds from the CDSCs are paid to the Distributor. For the year ended March 31, 2020, CDSCs in the amount of $10,115 were paid to the Distributor.
5. Line of Credit Facility
The Fund, along with certain other funds in the Pioneer Family of Funds (the “Funds”), participates in a committed, unsecured revolving line of credit facility. Borrowings are used solely for temporary or emergency purposes. The Fund may borrow up to the lesser of the amount available under the credit facility or the limits set for borrowing by the Fund’s prospectus and the 1940 Act. Effective March 11, 2020, the Fund participates in a facility that is in the amount of $300 million. Prior to March 11, 2020, the Fund participated in a facility in the amount of $250 million. Under such facility, depending on the type of loan, interest on borrowings is payable at the London Interbank Offered Rate (“LIBOR”) plus a credit spread. The Fund also pays an annual commitment fee to participate in a credit facility. The commitment fee is allocated among participating Funds based on an allocation schedule set forth in the credit agreement. For the year ended March 31, 2020, the Fund had no borrowings under the credit facility.
6. Unfunded Loan Commitments
The Fund may enter into unfunded loan commitments. Unfunded loan commitments may be partially or wholly unfunded. During the contractual period, the Fund is obliged to provide funding to the borrower upon demand. A fee is earned by the Fund on the unfunded commitment and is recorded as interest income on the Statement of Operations.
As of March 31, 2020, the Fund had the following unfunded loan commitments outstanding:
| | | | | | | | | | | | | |
| | | | | | | | | | | Unrealized | |
| | | | | | | | | | | Appreciation/ | |
| Loan | | Principal | | | Cost | | | Value | | | (Depreciation) | |
Gbt US LLC | | $ | 638,053 | | | $ | 625,403 | | | $ | 558,296 | | | $ | (67,107 | ) |
NMN Holdings III Corp. | | | 323,878 | | | | 323,231 | | | | 268,009 | | | | (55,222 | ) |
| Total Value | | $ | 961,931 | | | $ | 948,634 | | | $ | 826,305 | | | $ | (122,329 | ) |
Pioneer Multi-Asset Ultrashort Income Fund | Annual Report | 3/31/20 109
7. Subsequent Event
COVID-19
The respiratory illness COVID-19 caused by a novel coronavirus has resulted in a global pandemic and major disruption to economies and markets around the world, including the United States. Global financial markets have experienced extreme volatility and severe losses, and trading in many instruments has been disrupted. Liquidity for many instruments has been greatly reduced for periods of time. Some interest rates are very low and in some cases yields are negative. Some sectors of the economy and individual issuers have experienced particularly large losses. These circumstances may continue for an extended period of time, and may continue to affect adversely the value and liquidity of the Fund’s investments. The ultimate economic fallout from the pandemic, and the long-term impact on economies, markets, industries and individual issuers, are not known. Governments and central banks, including the Federal Reserve in the U.S., have taken extraordinary and unprecedented actions to support local and global economies and the financial markets. These actions have resulted in significant expansion of public debt, including in the U.S. The impact of these measures, and whether they will be effective to mitigate the economic and market disruption, will not be known for some time. The consequences of high public debt, including its future impact on the economy and securities markets, likewise may not be known for some time.
110 Pioneer Multi-Asset Ultrashort Income Fund | Annual Report | 3/31/20
Report of Independent Registered Public Accounting FirmTo the Board of Trustees of Pioneer Series Trust X and the Shareholders of
Pioneer Multi-Asset Ultrashort Income Fund:
Opinion on the Financial Statements
We have audited the accompanying statement of assets and liabilities of Pioneer Multi-Asset Ultrashort Income Fund (the “Fund”) (one of the funds constituting Pioneer Series Trust X (the “Trust”)), including the schedule of investments, as of March 31, 2020, and the related statement of operations for the year then ended, the statements of changes in net assets for each of the two years in the period then ended, the financial highlights for each of the three years in the period then ended and the related notes (collectively referred to as the “financial statements”). The financial highlights for the periods ended March 31, 2016 and March 31, 2017 were audited by another independent registered public accounting firm whose report, dated May 26, 2017, expressed an unqualified opinion on those financial highlights. In our opinion, the financial statements present fairly, in all material respects, the financial position of Pioneer Multi-Asset Ultrashort Income Fund (one of the funds constituting Pioneer Series Trust X) at March 31, 2020, the results of its operations for the year then ended, the changes in its net assets for each of the two years in the period then ended, and its financial highlights for each of the three years in the period then ended in conformity with U.S. generally accepted accounting principles.
Basis for Opinion
These financial statements are the responsibility of the Trust’s management. Our responsibility is to express an opinion on the Fund’s financial statements based on our audits. We are a public accounting firm registered with the Public Company Accounting Oversight Board (United States) (“PCAOB”) and are required to be independent with respect to the Trust in accordance with the U.S. federal securities laws and the applicable rules and regulations of the Securities and Exchange Commission and the PCAOB.
We conducted our audits in accordance with the standards of the PCAOB. Those standards require that we plan and perform the audit to obtain reasonable assurance about whether the financial statements are free of material misstatement, whether due to error or fraud. The Trust is not required to have, nor were we engaged to perform, an audit of the Trust’s internal control over financial reporting. As part of our audits, we are required to obtain an understanding of internal control over financial reporting, but not for the purpose of expressing an opinion on the effectiveness of the Trust’s internal control over financial reporting. Accordingly, we express no such opinion.
Pioneer Multi-Asset Ultrashort Income Fund | Annual Report | 3/31/20 111
Our audits included performing procedures to assess the risks of material misstatement of the financial statements, whether due to error or fraud, and performing procedures that respond to those risks. Such procedures included examining, on a test basis, evidence regarding the amounts and disclosures in the financial statements. Our procedures included confirmation of securities owned as of March 31, 2020, by correspondence with the custodian and brokers. Our audits also included evaluating the accounting principles used and significant estimates made by management, as well as evaluating the overall presentation of the financial statements. We believe that our audits provide a reasonable basis for our opinion.
We have served as the auditor of one or more Amundi Pioneer investment companies since 2017.
Boston, Massachusetts
May 29, 2020
112 Pioneer Multi-Asset Ultrashort Income Fund | Annual Report | 3/31/20
ADDITIONAL INFORMATION (unaudited)
Qualified interest income is exempt from nonresident alien (NRA) tax withholding. The percentage of the Fund’s ordinary income distributions derived from qualified interest income was 76.89%.
Pioneer Multi-Asset Ultrashort Income Fund | Annual Report | 3/31/20 113
Trustees, Officers and Service ProvidersInvestment Adviser and AdministratorAmundi Pioneer Asset Management, Inc.
Custodian and Sub-AdministratorBrown Brothers Harriman & Co.
Independent Registered Public Accounting FirmErnst & Young LLP
Principal UnderwriterAmundi Pioneer Distributor, Inc.
Legal CounselMorgan, Lewis & Bockius LLP
Transfer AgentDST Asset Manager Solutions, Inc.
Proxy Voting Policies and Procedures of the Fund are available without charge, upon request, by calling our toll free number (1-800-225-6292). Information regarding how the Fund voted proxies relating to portfolio securities during the most recent 12-month period ended June 30 is publicly available to shareowners at www.amundipioneer.com/us. This information is also available on the Securities and Exchange Commission’s web site at www.sec.gov.
Trustees and Officers
The Fund’s Trustees and officers are listed below, together with their principal occupations and other directorships they have held during at least the past five years. Trustees who are interested persons of the Fund within the meaning of the 1940 Act are referred to as Interested Trustees. Trustees who are not interested persons of the Fund are referred to as Independent Trustees. Each of the Trustees serves as a Trustee of each of the 45 U.S. registered investment portfolios for which Amundi Pioneer serves as investment adviser (the “Pioneer Funds”). The address for all Trustees and all officers of the Fund is 60 State Street, Boston, Massachusetts 02109.
The Statement of Additional Information of the Fund includes additional information about the Trustees and is available, without charge, upon request, by calling 1-800-225-6292.
114 Pioneer Multi-Asset Ultrashort Income Fund | Annual Report | 3/31/20
Independent Trustees
| | | | |
| Name, Age and Position | Term of Office and | | Other Directorships |
| Held With the Fund | Length of Service | Principal Occupation | Held by Trustee |
Thomas J. Perna (68) Chairman of the Board and Trustee
| Trustee since 2011. Serves until a successor trustee is elected or earlier retirement or removal.
| Private investor (2004 – 2008 and 2013 – present); Chairman (2008 – 2013) and Chief Executive Officer (2008 – 2012), Quadriserv, Inc. (technology products for securities lending industry); and Senior Executive Vice President, The Bank of New York (financial and securities services) (1986 – 2004) | Director, Broadridge Financial Solutions, Inc. (investor communications and securities processing provider for financial services industry) (2009 – present); Director, Quadriserv, Inc. (2005 – 2013); and Commissioner, New Jersey State Civil Service Commission (2011 – 2015) |
John E. Baumgardner, Jr. (68) Trustee
| Trustee since 2019. Serves until a successor trustee is elected or earlier retirement or removal. | Of Counsel (2019 – present), Partner (1983-2018), Sullivan & Cromwell LLP (law firm).
| Chairman, The Lakeville Journal Company, LLC, (privately-held community newspaper group) (2015-present) |
Diane Durnin (63) Trustee
| Trustee since 2019. Serves until a successor trustee is elected or earlier retirement or removal. | Managing Director - Head of Product Strategy and Development, BNY Mellon Investment Management (2012-2018); Vice Chairman – The Dreyfus Corporation (2005 – 2018): Executive Vice President Head of Product, BNY Mellon Investment Management (2007-2012); Executive Director- Product Strategy, Mellon Asset Management (2005-2007); Executive Vice President Head of Products, Marketing and Client Service, Dreyfus Corporation (2000-2005); and Senior Vice President Strategic Product and Business Development, Dreyfus Corporation (1994-2000) | None
|
Benjamin M. Friedman (75) Trustee
| Trustee since 2011. Serves until a successor trustee is elected or earlier retirement or removal. | William Joseph Maier Professor of Political Economy, Harvard University (1972 – present) | Trustee, Mellon Institutional Funds Investment Trust and Mellon Institutional Funds Master Portfolio (oversaw 17 portfolios in fund complex) (1989 - 2008) |
Pioneer Multi-Asset Ultrashort Income Fund | Annual Report | 3/31/2 115
Independent Trustees (continued)
| | | | |
| Name, Age and Position | Term of Office and | | Other Directorships |
| Held With the Fund | Length of Service | Principal Occupation | Held by Trustee |
Lorraine H. Monchak (64) Trustee | Trustee since 2017. (Advisory Trustee from 2014 - 2017). Serves until a successor trustee is elected or earlier retirement or removal. | Chief Investment Officer, 1199 SEIU Funds (healthcare workers union pension funds) (2001 – present); Vice President – International Investments Group, American International Group, Inc. (insurance company) (1993 – 2001); Vice President – Corporate Finance and Treasury Group, Citibank, N.A. (1980 – 1986 and 1990 – 1993); Vice President – Asset/Liability Management Group, Federal Farm Funding Corporation (government-sponsored issuer of debt securities) (1988 – 1990); Mortgage Strategies Group, Shearson Lehman Hutton, Inc. (investment bank) (1987 – 1988); and Mortgage Strategies Group, Drexel Burnham Lambert, Ltd. (investment bank) (1986 – 1987) | None |
Marguerite A. Piret (71) Trustee | Trustee since 2011. Serves until a successor trustee is elected or earlier retirement or removal. | Chief Financial Officer, American Ag Energy, Inc. (controlled environment and agriculture company) (2016 – present); and President and Chief Executive Officer, Metric Financial Inc. (formerly known as Newbury Piret Company) (investment banking firm) (1981 – 2019) | Director ofNew America High Income Fund, Inc. (closed-end investment company) (2004 – present); and Member, Board of Governors, Investment Company Institute (2000 – 2006) |
Fred J. Ricciardi (73) Trustee | Trustee since 2014. Serves until a successor trustee is elected or earlier retirement or removal. | Consultant (investment company services) (2012 – present); Executive Vice President, BNY Mellon (financial and investment company services) (1969 – 2012); Director, BNY International Financing Corp. (financial services) (2002 – 2012); Director, Mellon Overseas Investment Corp. (financial services) (2009 – 2012); Director, Financial Models (technology) (2005-2007); Director, BNY Hamilton Funds, Ireland (offshore investment companies) (2004-2007); Chairman/Director, AIB/BNY Securities Services, Ltd., Ireland (financial services) (1999-2006); and Chairman, BNY Alternative Investment Services, Inc. (financial services) (2005-2007) | None |
116 Pioneer Multi-Asset Ultrashort Income Fund | Annual Report | 3/31/20
Interested Trustees
| | | | |
| Name, Age and Position | Term of Office and | | Other Directorships |
| Held With the Fund | Length of Service | Principal Occupation | Held by Trustee |
Lisa M. Jones (58)* Trustee, President and Chief Executive Officer | Trustee since 2017. Serves until a successor trustee is elected or earlier retirement or removal | Director, CEO and President of Amundi Pioneer Asset Management USA, Inc. (since September 2014); Director, CEO and President of Amundi Pioneer Asset Management, Inc. (since September 2014); Director, CEO and President of Amundi Pioneer Distributor, Inc. (since September 2014); Director, CEO and President of Amundi Pioneer Institutional Asset Management, Inc. (since September 2014); Chair, Amundi Pioneer Asset Management USA, Inc., Amundi Pioneer Distributor, Inc. and Amundi Pioneer Institutional Asset Management, Inc. (September 2014 – 2018); Managing Director, Morgan Stanley Investment Management (2010 – 2013); Director of Institutional Business, CEO of International, Eaton Vance Management (2005 – 2010); and Director of Amundi USA, Inc. (since 2017) | None |
Kenneth J. Taubes (62)* Trustee | Trustee since 2014. Serves until a successor trustee is elected or earlier retirement or removal | Director and Executive Vice President (since 2008) and Chief Investment Officer, U.S. (since 2010) of Amundi Pioneer Asset Management USA, Inc.; Director and Executive Vice President and Chief Investment Officer, U.S. of Amundi Pioneer (since 2008); Executive Vice President and Chief Investment Officer, U.S. of Amundi Pioneer Institutional Asset Management, Inc. (since 2009); Portfolio Manager of Amundi Pioneer (since 1999); and Director of Amundi USA, Inc. (since 2017) | None |
* Ms. Jones and Mr. Taubes are Interested Trustees because they are officers or directors of the Fund’s investment adviser and certain of its affiliates.
Pioneer Multi-Asset Ultrashort Income Fund | Annual Report | 3/31/20 117
Fund Officers
| | | | |
| Name, Age and Position | Term of Office and | | Other Directorships |
| Held With the Fund | Length of Service | Principal Occupation | Held by Officer |
Christopher J. Kelley (55) Secretary and Chief Legal Officer | Since 2011. Serves at the discretion of the Board | Vice President and Associate General Counsel of Amundi Pioneer since January 2008; Secretary and Chief Legal Officer of all of the Pioneer Funds since June 2010; Assistant Secretary of all of the Pioneer Funds from September 2003 to May 2010; and Vice President and Senior Counsel of Amundi Pioneer from July 2002 to December 2007 | None |
Carol B. Hannigan (59) Assistant Secretary | Since 2011. Serves at the discretion of the Board | Fund Governance Director of Amundi Pioneer since December 2006 and Assistant Secretary of all the Pioneer Funds since June 2010; Manager – Fund Governance of Amundi Pioneer from December 2003 to November 2006; and Senior Paralegal of Amundi Pioneer from January 2000 to November 2003 | None
|
Thomas Reyes (57) Assistant Secretary | Since 2011. Serves at the discretion of the Board | Assistant General Counsel of Amundi Pioneer since May 2013 and Assistant Secretary of all the Pioneer Funds since June 2010; and Counsel of Amundi Pioneer from June 2007 to May 2013 | None |
Mark E. Bradley (60) Treasurer and Chief Financial and Accounting Officer | Since 2011. Serves at the discretion of the Board | Vice President – Fund Treasury of Amundi Pioneer; Treasurer of all of the Pioneer Funds since March 2008; Deputy Treasurer of Amundi Pioneer from March 2004 to February 2008; and Assistant Treasurer of all of the Pioneer Funds from March 2004 to February 2008 | None |
Luis I. Presutti (55) Assistant Treasurer | Since 2011. Serves at the discretion of the Board | Director – Fund Treasury of Amundi Pioneer; and Assistant Treasurer of all of the Pioneer Funds | None |
Gary Sullivan (62) Assistant Treasurer | Since 2011. Serves at the discretion of the Board | Senior Manager – Fund Treasury of Amundi Pioneer; and Assistant Treasurer of all of the Pioneer Funds | None |
118 Pioneer Multi-Asset Ultrashort Income Fund | Annual Report | 3/31/20
| | | | |
| Name, Age and Position | Term of Office and | | Other Directorships |
| Held With the Fund | Length of Service | Principal Occupation | Held by Officer |
Antonio Furtado (38) Assistant Treasurer | Since 2020. Serves at the discretion of the Board | Fund Oversight Manager – Fund Treasury of Amundi Pioneer; and Assistant Treasurer of all of the Pioneer Funds | None |
John Malone (48) Chief Compliance Officer | Since 2018. Serves at the discretion of the Board | Managing Director, Chief Compliance Officer of Amundi Pioneer Asset Management; Amundi Pioneer Institutional Asset Management, Inc.; and the Pioneer Funds since September 2018; and Chief Compliance Officer of Amundi Pioneer Distributor, Inc. since January 2014. | None |
Kelly O’Donnell (49) Anti-Money Laundering Officer | Since 2011. Serves at the discretion of the Board | Vice President – Amundi Pioneer Asset Management; and Anti-Money Laundering Officer of all the Pioneer Funds since 2006 | None |
Pioneer Multi-Asset Ultrashort Income Fund | Annual Report | 3/31/20 119
This page was intentionally left blank.
120 Pioneer Multi-Asset Ultrashort Income Fund | Annual Report | 3/31/20
This page was intentionally left blank.
Pioneer Multi-Asset Ultrashort Income Fund | Annual Report | 3/31/20 121
This page was intentionally left blank.
122 Pioneer Multi-Asset Ultrashort Income Fund | Annual Report | 3/31/20
This page was intentionally left blank.
Pioneer Multi-Asset Ultrashort Income Fund | Annual Report | 3/31/20 123
This page was intentionally left blank.
124 Pioneer Multi-Asset Ultrashort Income Fund | Annual Report | 3/31/20
How to Contact Amundi Pioneer
We are pleased to offer a variety of convenient ways for you to contact us for assistance or information.
| | | |
| Call us for: | | |
Account Information, including existing accounts, | |
new accounts, prospectuses, applications | |
and service forms | | 1-800-225-6292 |
| | | |
FactFoneSM for automated fund yields, prices, | |
account information and transactions | 1-800-225-4321 |
| | |
| Retirement plans information | 1-800-622-0176 |
|
| Write to us: | | |
Amundi Pioneer | | |
P.O. Box 219427 | | |
Kansas City, MO 64121-9427 | | |
| | | |
| Our toll-free fax | | 1-800-225-4240 |
| | | |
| Our internet e-mail address | us.askamundipioneer@amundipioneer.com |
(for general questions about Amundi Pioneer only) | |
|
| Visit our web site: www.amundipioneer.com/us | |
This report must be preceded or accompanied by a prospectus.
The Fund files a complete schedule of portfolio holdings with the Securities and Exchange Commission for the first and third quarters of each fiscal year as an exhibit to its reports on Form N-PORT. Shareholders may view the filed Form N-PORT by visiting the Commission’s web site at https://www.sec.gov.
Amundi Pioneer Asset Management, Inc.
60 State Street
Boston, MA 02109
www.amundipioneer.com/us
Securities offered through Amundi Pioneer Funds Distributor, Inc.
60 State Street, Boston, MA 02109
Underwriter of Pioneer Mutual Funds, Member SIPC
© 2020 Amundi Pioneer Asset Management 25671-08-0520
Pioneer Fundamental
Growth Fund
Annual Report | March 31, 2020
| | |
| Ticker Symbols: |
Class A | PIGFX |
Class C | FUNCX |
Class K | PFGKX |
Class R | PFGRX |
Class Y | FUNYX |
Beginning in March 2021, as permitted by regulations adopted by the Securities and Exchange Commission, paper copies of the Fund’s shareholder reports like this one will no longer be sent by mail, unless you specifically request paper copies of the reports from the Fund or from your financial intermediary, such as a broker-dealer, bank or insurance company. Instead, the reports will be made available on the Fund’s website, and you will be notified by mail each time a report is posted and provided with a website link to access the report.
If you already elected to receive shareholder reports electronically, you will not be affected by this change and you need not take any action. You may elect to receive shareholder reports and other communications electronically by contacting your financial intermediary or, if you invest directly with the Fund, by calling 1-800-225-6292.
You may elect to receive all future reports in paper free of charge. If you invest directly with the Fund, you can inform the Fund that you wish to continue receiving paper copies of your shareholder reports by calling 1-800-225-6292. If you invest through a financial intermediary, you can contact your financial intermediary to request that you continue to receive paper copies of your shareholder reports. Your election to receive reports in paper will apply to all funds held in your account if you invest through your financial intermediary or all funds held within the Pioneer Fund complex if you invest directly.
visit us: www.amundipioneer.com/us
Pioneer Fundamental Growth Fund | Annual Report | 3/31/20 1
Dear Shareholders,
The new decade has arrived delivering a first quarter that will go down in the history books. The beginning of the year seemed to extend the positive market environment of 2019 and then, March roared in like a lion and the COVID-19 pandemic became a global crisis impacting lives and life as we know it. The impact on the global economy from the COVID-19 virus pandemic, while currently unknown, is likely to be considerable. It is clear that several industries have already felt greater effects than others. And the markets, which do not thrive on uncertainty, have been volatile. Our business continuity plan was implemented given the new COVID-19 guidelines, and most of our employees are working remotely. To date, our operating environment has faced no interruption. I am proud of the careful planning that has taken place and confident we can maintain this environment for as long as is prudent. History in the making for a company that first opened its doors way back in 1928.
Since 1928, Amundi Pioneer’s investment process has been built on a foundation of fundamental research and active management, principles which have guided our investment decisions for more than 90 years. We believe active management – that is, making active investment decisions – can help mitigate the potential risks during periods of market volatility. As the early days of 2020 have reminded us, in today’s global economy, investment risk can materialize from a number of factors, including a slowing economy, changing U.S. Federal Reserve policy, oil price shocks, political and geopolitical factors and, unfortunately, major public health concerns such as a viral pandemic.
At Amundi Pioneer, active management begins with our own fundamental, bottom-up research process. Our team of dedicated research analysts and portfolio managers analyze each security under consideration, communicating directly with the management teams of the companies issuing the securities and working together to identify those securities that best meet our investment criteria for our family of funds. Our risk management approach begins with each and every security, as we strive to carefully understand the potential opportunity, while considering any and all risk factors.
2 Pioneer Fundamental Growth Fund | Annual Report | 3/31/20
Today, as investors, we have many options. It is our view that active management can serve shareholders well, not only when markets are thriving, but also during periods of market stress. As you consider your long-term investment goals, we encourage you to work with your financial advisor to develop an investment plan that paves the way for you to pursue both your short-term and long-term goals.
We remain confident that the current crisis, like others in human history, will pass, and we greatly appreciate the trust you have placed in us and look forward to continuing to serve you in the future.
Sincerely,
Lisa M. Jones
Head of the Americas, President and CEO of U.S.
Amundi Pioneer Asset Management USA, Inc.
March 31, 2020
Any information in this shareowner report regarding market or economic trends or the factors influencing the Fund’s historical or future performance are statements of opinion as of the date of this report. Past performance is no guarantee of future results.
Pioneer Fundamental Growth Fund | Annual Report | 3/31/20 3
Portfolio Management Discussion |
3/31/20 The decade-long bull market for U.S. equities drew to a close late in the 12-month period ended March 31, 2020, as the COVID-19 virus pandemic caused much of the global economy to shut down and sent stocks into a bear-market decline. However, markets recovered sharply at the end of the period from their worst levels, offsetting some of the losses for the full fiscal year. In the following interview, Andrew Acheson and Paul Cloonan discuss the factors that affected the performance of Pioneer Fundamental Growth Fund during the 12-month period. Mr. Acheson, Managing Director, Director of Growth, U.S., and a portfolio manager at Amundi Pioneer Asset Management, Inc. (Amundi Pioneer), and Mr. Cloonan, a senior vice president and a portfolio manager at Amundi Pioneer, are responsible for the day-to-day management of the Fund.
Q How did the Fund perform during the 12-month period ended March 31, 2020?
A Pioneer Fundamental Growth Fund’s Class A shares returned -2.17% at net asset value during the 12-month period ended March 31, 2020, while the Fund’s benchmark, the Russell 1000 Growth Index (the Russell Index), returned 0.91%. During the same period, the average return of the 1,358 mutual funds in Morningstar’s Large Growth Funds category was -3.72%.
Q How would you describe the investment environment for domestic equity stocks during the 12-month period ended March 31, 2020?
A The 12-month period was extremely volatile for U.S. equities. Throughout the early part of the period, trade tensions between the U.S. and China increased dramatically, leading to higher tariffs and heightened uncertainty about the global economic growth outlook. The U.S. Federal Reserve (Fed) responded to a less-robust growth outlook in July 2019 with its first interest-rate reduction in a decade, but stock markets remained choppy as trade negotiations started and stopped throughout much of 2019. By December, however, the U.S. and China had announced a “phase one” trade deal, sending domestic equities to record highs. The market rally proved short-lived, however, as the growing COVID-19 pandemic led to virus-containment measures that essentially brought the global economy to a halt.
Stocks began moving sharply lower in mid-February 2020 as investors fled riskier assets for so-called “safe haven” alternatives such as Treasuries. The Fed responded by cutting its benchmark short-term interest rate to zero and reviving 2008/2009 financial crisis-era asset purchase and credit-support
4 Pioneer Fundamental Growth Fund | Annual Report | 3/31/20
programs. Meanwhile, the U.S. government passed a $2.2 trillion stimulus package. Those aggressive fiscal and monetary policy measures allowed stocks to recover, to a certain degree, and move up from their worst levels as the 12-month period drew to a close.
Somewhat counterintuitively, the best-performing sector during the 12-month period was information technology, as many tech companies once again showed the ability to prosper without broad-based economic growth. Meanwhile, cyclical stocks performed poorly, with the industrials and materials sectors declining the most.
Q How would you characterize the Fund’s positioning and how the positioning affected benchmark-relative performance during the 12-month period ended March 31, 2020?
A During the 12-month period, we maintained our traditional discipline of focusing the Fund’s investments on shares of what we believe to be higher-quality corporations with stable businesses, sustainable competitive advantages, secular growth opportunities, reasonable valuations, and steady earnings. Given our focus on trying to mitigate risk in the portfolio, the Fund’s performance has typically lagged the benchmark’s performance during periods of strong market appreciation. That was especially the case in the fourth quarter of 2019 and early in 2020, as investors favored high-growth, high-valuation stocks in which the Fund was underweight due to our valuation discipline in managing the portfolio.
Conversely, the Fund has typically outperformed the benchmark during market declines. However, during the market’s drop from late February to late March of this year, the Fund performed only roughly in line with the Russell Index. The nature of the recent market decline was far different from the typical sell-off. In the past, when weakening economic conditions have caused stock markets to fall, the Fund’s strict quality requirements have typically led to less volatile performance. In addition, our portfolio construction process attempts to limit risk at the security, sector, and Fund levels. The result is a portfolio containing stocks of companies that have tended to be profitable on average and that have had lower-than-average debt levels, which are the stocks investors have often turned to during uncertain times, due to their more predictable nature. During the most recent market slump in the wake of COVID-19, that was not uniformly the case, as some stocks that have historically been defensive - meaning that they have declined much less than the overall equity markets during past downturns - actually fell much more sharply than the Russell Index toward the end of the 12-month period.
Pioneer Fundamental Growth Fund | Annual Report | 3/31/20 5
Q Which individual portfolio positions detracted from the Fund’s performance relative to the benchmark Russell Index during the 12-month period ended March 31, 2020?
A To illustrate the points we made earlier, three portfolio holdings in particular that have traditionally behaved defensively, but underperformed during the recent market decline and detracted from the Fund’s benchmark-relative returns over the 12-month period, were Ecolab, O’Reilly Auto Parts, and Ross Stores.
Ecolab provides cleaning and sanitizing solutions as well as water treatment equipment. The business has historically generated steady growth over time and often has proved resilient during recessions. The stock outperformed the Russell Index by 15 percentage points during the last major recession in 2008/2009, and by 9 percentage points during the late-2018 market correction. During the pandemic-induced decline towards the end of the 12-month period, however, Ecolab actually underperformed the Russell Index by nearly 9 percentage points, primarily due to the market’s concerns about declining sales to the struggling restaurant and hotel industries that use the company’s products. We do not believe the decline in the stock price was warranted, as we view Ecolab as exceptionally well positioned to potentially benefit from society’s increased focus on sanitization going forward as a result of the COVID-19 virus.
O’Reilly, a leading auto parts retailer, has been generating high returns on capital and has had a competitive advantage based on parts availability that has been difficult for its peers to replicate. Consumers have typically purchased fewer new cars during recessions, instead opting to spend more money to repair older cars. During the past two major market corrections, O’Reilly’s often recession-resistant business model has translated into good relative performance for the company’s shares. However, the stock slightly underperformed the Russell Index (-2%) during this most recent market slump, as the number of miles driven in the U.S. has plummeted due to COVID-19 stay-at-home orders, and consumers have been avoiding any unnecessary contact with stores and repair shops. We believe that once non-essential businesses reopen, miles driven will increase, and so could the need for auto repairs.
Another example of a “defensive” stock that underperformed during this market correction is Ross Stores, an off-price apparel retailer that was also one of the top 10 detractors from the Fund’s benchmark-relative performance during the first quarter of 2020. The stock outperformed the market during the 2008/2009 recession, despite the fact that customers spent less on apparel overall, because a greater percentage of the spending went toward purchases of off-price merchandise. Similar to the situation with
6 Pioneer Fundamental Growth Fund | Annual Report | 3/31/20
O’Reilly, in the current COVID-19 environment, consumers have been avoiding shopping at stores, and Ross has temporarily closed the vast majority of its physical locations. That dynamic has put near-term pressure on the stock, but it has not altered our long-term investment case that Ross could be a prime beneficiary of the shift away from full-price apparel department stores to off-price stores. We believe that shift is likely to accelerate once people go back to work, as they may be more budget-conscious than they were prior to the COVID-19 crisis. Moreover, we believe Ross could have an opportunity to purchase excess apparel inventory from manufacturers and full-price retailers at greatly discounted prices.
Other portfolio holdings that notably lagged and detracted from the Fund’s benchmark-relative returns throughout the 12-month period included defense contractor Raytheon. One factor driving the stock’s underperformance was investors’ concerns about the company’s pending merger with United Technologies (not a Fund holding), a major producer of aircraft engines and other aerospace products. We had based our investment case for Raytheon on its historically strong returns on capital, competitive advantages in military technology, and exposure to U.S. defense spending. However, we exited the Fund’s position before the end of the 12-month period, as it was not clear to us how Raytheon’s shareholders would benefit from the impending merger, especially with the weak outlook for aircraft demand in light of travel restrictions resulting from COVID-19.
A position in semiconductor solutions specialist Broadcom also detracted from the Fund’s relative returns during the 12-month period. Broadcom’s strategy of acquiring businesses and subsequently cutting costs through workforce reductions and other measures has given the company’s profits a short-term boost, but those acquisitions have also significantly changed Broadcom’s business mix and added substantial leverage to its balance sheet. We sold the position before period-end, as it remained unclear to us how the company could sustain competitiveness and growth over the long run.
Finally, tool/equipment maker Stanley Black & Decker was a notable laggard in the portfolio during the 12-month period. The shares had performed well throughout much of the period, as the pre-pandemic economic expansion had built confidence about customer demand for the company’s core products. However, the stock price fell dramatically during the first quarter of 2020 as Stanley Black & Decker cut back on non-essential staffing and temporarily suspended acquisition activity to focus on securing its supply chain and conserving its capital in the wake of
Pioneer Fundamental Growth Fund | Annual Report | 3/31/20 7
the COVID-19 pandemic. We increased the Fund’s exposure to the company during the decline, as we believe its business could bounce back once the current crisis passes or at least subsides.
Q Which investments contributed positively to the Fund’s benchmark-relative performance during the 12-month period ended March 31, 2020?
A In addition to seeing traditionally defensive stocks underperform in the falling market during March, the 12-month period was also noteworthy in that other stocks not typically seen as being defensive in nature actually outperformed.
Individual portfolio holdings that benefited the Fund’s benchmark-relative returns during the 12-month period included Amazon.com. After consolidating previous gains throughout much of 2019, the e-commerce giant saw its stock gain momentum going into 2020. During the downturn over the final month of the period, Amazon benefited from rising demand for its online shopping and cloud-computing services.
Animal health company Zoetis was also a strong contributor to the Fund’s relative returns. We believe Zoetis has a strong competitive advantage with its global distribution network and its broad and innovative product line.
Another positive contributor to the Fund’s benchmark-relative results over the 12-month period was Adobe, as the digital-marketing company built momentum in the fourth quarter of 2019. Adobe’s competitive advantage stems from its integrated digital-marketing platform, which has helped the company earn solid returns on capital that have been far higher than Adobe’s cost of capital. We believe a secular shift toward digital marketing could support further growth for the company.
Finally, the Fund’s position in IntercontinentalExchange (ICE) was one of the top positive contributors to benchmark-relative performance during the 12-month period. The return of significant market volatility over the final weeks of the period caused trading volumes to rise, which benefited the company’s derivatives business. We also see continued strength from ICE’s information and data analytics business, which represents more than half of total sales and potentially brings some stability to ICE’s earnings.
Q Did the Fund invest in any derivative securities during the 12-month period ended March 31, 2020?
A No, the Fund did not hold any derivatives during the period.
8 Pioneer Fundamental Growth Fund | Annual Report | 3/31/20
Q What were some of the Fund’s most notable purchases during the 12-month period ended March 31, 2020?
A We added to the Fund’s position in medical-device maker Zimmer Biomet, taking advantage of the market decline late in the 12-month period. The company’s products include implants for knee and hip replacements as well as surgical robotics to aid surgeons during knee, spine, and brain procedures. In January, we also invested in Motorola Solutions, which has been generating strong returns on capital with its end-to-end public safety solutions business. We believe Motorola’s stable business model, recurring revenues, and attractive valuation could help sustain growth over time.
Late in the 12-month period, we added positions in Rockwell Automation and Salesforce.com. Rockwell’s process-automation business has been producing high returns on capital, and we believe that with its competitive advantages in technology innovation, distribution network infrastructure, and large installed base, the returns are potentially sustainable. We also believe that the secular trend toward factory automation could help Rockwell. Salesforce.com has been growing its market share in enterprise software, expanding its scope beyond customer-relationship management software to generate impressive gains in recurring revenues. The recent market volatility allowed us to establish portfolio stakes in both Rockwell and Salesforce at attractive valuations.
Q What were some of the noteworthy positions sold from the Fund’s portfolio during the 12-month period ended March 31, 2020?
A As noted earlier, during the 12-month period we liquidated the Fund’s positions in Raytheon and Broadcom. We also sold the Fund’s shares of Emerson Electric. Emerson has typically derived a substantial amount of its business from the oil and gas industry, and we believe that, weak oil prices have worsened the outlook for future capital spending. Finally, we eliminated the Fund’s position in International Flavors and Fragrances (IFF), based on our concerns that the company’s recent acquisition of Frutarom (not a Fund holding), a manufacturer of natural food colorings and food protection, may significantly reduce IFF’s returns on capital.
Q What is your outlook heading into the Fund’s new fiscal year, and how has the outlook affected the Fund’s positioning?
A As we look ahead to the remainder of 2020, we expect that the economic damage from the COVID-19 pandemic will be severe. The extent of the damage will depend on how long mitigation and containment measures remain in place and how effective aggressive fiscal and monetary stimulus packages are in cushioning the blow to the U.S. economy.
Pioneer Fundamental Growth Fund | Annual Report | 3/31/20 9
The situation could play out in several possible scenarios. The most optimistic view is that containment efforts will be successful relatively quickly, thus potentially resulting in a “V-shaped,” or sharp recovery. More pessimistic views anticipate a prolonged global recession. We believe that a lopsided V-shaped recovery is most likely to occur at some point, but that the slope of the recovery will not be as steep as the decline and could include some setbacks should further waves of COVID-19 infections recur.
We anticipate that markets will almost certainly remain volatile, and trying to anticipate the exact time when the market reaches its low remains a futile task. And yet, equity valuations have become increasingly attractive in our view, thus providing opportunities for investors with a long-term investment horizon.
We strongly believe that the best approach to equity investing is to seek to acquire shares of companies that are highly profitable and have strong balance sheets and sustainable business models. In our view, such companies must be capable of surviving a prolonged and deep recession and emerging from the recession with the financial firepower to invest and thrive during the subsequent recovery. The Fund has had a proven long-term record of delivering solid risk-adjusted returns in good times and bad. We believe the portfolio’s current positioning may potentially mitigate risk going forward, while providing the Fund with the potential to participate in the upside if and when U.S. equities recover fully.
The Fund has remained overweight in the non-spread (interest-rate sensitive) financials sector, featuring holdings such as insurance brokerage companies and financial exchanges that have typically been less susceptible to narrowing interest-rate spreads, and in the health care sector. Those two sectors feature holdings of a number of companies that meet our investment criteria related to profitability, competitive advantages, secular growth, and valuation.
The Fund’s biggest underweight relative to the benchmark Russell Index is in the information technology sector, due to relatively high valuations and increased corporate earnings risk deriving from a potentially severe global economic downturn.
10 Pioneer Fundamental Growth Fund | Annual Report | 3/31/20
Please refer to the Schedule of Investments on pages 21–24 for a full listing of Fund securities.
All investments are subject to risk, including the possible loss of principal. In the past several years, financial markets have experienced increased volatility and heightened uncertainty. The market prices of securities may go up or down, sometimes rapidly or unpredictably, due to general market conditions, such as real or perceived adverse economic, political, or regulatory conditions, recessions, inflation, changes in interest or currency rates, lack of liquidity in the bond markets, the spread of infectious illness or other public health issues or adverse investor sentiment. These conditions may continue, recur, worsen or spread.
Investing in foreign and/or emerging markets securities involves risks relating to interest rates, currency exchange rates, economic, and political conditions.
The Fund invests in a limited number of securities and, as a result, the Fund’s performance may be more volatile than the performance of other funds holding more securities.
At times, the Fund’s investments may represent industries or industry sectors that are interrelated or have common risks, making the Fund more susceptible to any economic, political, or regulatory developments or other risks affecting those industries and sectors.
These risks may increase share price volatility.
Before investing, consider the product’s investment objectives, risks, charges and expenses. Contact your advisor or Amundi Pioneer Asset Management, Inc., for a prospectus or summary prospectus containing this information. Read it carefully.
Any information in this shareholder report regarding market or economic trends or the factors influencing the Fund’s historical or future performance are statements of opinion as of the date of this report. Past performance is no guarantee of future results.
Pioneer Fundamental Growth Fund | Annual Report | 3/31/20 11
Portfolio Summary |
3/31/20Sector Distribution
(As a percentage of total investments)*
10 Largest Holdings
(As a percentage of total investments)*| | | |
| 1. | Microsoft Corp. | 7.52% |
| 2. | Amazon.com, Inc. | 7.29 |
| 3. | Alphabet, Inc., Class C | 6.63 |
| 4. | Apple, Inc. | 4.70 |
| 5. | Mastercard, Inc. | 4.61 |
| 6. | PepsiCo., Inc. | 4.18 |
| 7. | Progressive Corp. | 3.61 |
| 8. | Adobe, Inc. | 3.34 |
| 9. | Intercontinental Exchange, Inc. | 3.20 |
| 10. | Thermo Fisher Scientific, Inc. | 3.17 |
* Excludes temporary cash investments and all derivative contracts except for options purchased. The Fund is actively managed, and current holdings may be different. The holdings listed should not be considered recommendations to buy or sell any securities.
12 Pioneer Fundamental Growth Fund | Annual Report | 3/31/20
Prices and Distributions |
3/31/20Net Asset Value per Share
| | | |
| Class | 3/31/20 | 3/31/19 |
| A | $22.43 | $24.21 |
| C | $20.07 | $21.93 |
| K | $22.43 | $24.21 |
| R | $21.95 | $23.79 |
| Y | $22.63 | $24.42 |
Distributions per Share: 4/1/19–3/31/20
| | | | |
| Net Investment | Short-Term | Long-Term |
| Class | Income | Capital Gains | Capital Gains |
| A | $0.0095 | $ — | $1.4465 |
| C | $ — | $ — | $1.4465 |
| K | $0.1214 | $ — | $1.4465 |
| R | $ — | $ — | $1.4465 |
| Y | $0.0975 | $ — | $1.4465 |
The Russell 1000 Growth Index is an unmanaged index that measures the performance of large-cap U.S. growth stocks. Index returns assume reinvestment of dividends and, unlike Fund returns, do not reflect any fees, expenses or sales charges. It is not possible to invest directly in an index.
The index defined here pertains to the “Value of $10,000 Investment” and “Value of $5 Million Investment” charts on pages 14–18.
Pioneer Fundamental Growth Fund | Annual Report | 3/31/20 13
| | |
Performance Update | 3/31/20 | Class A Shares |
Investment Returns
The mountain chart on the right shows the change in value of a $10,000 investment made in Class A shares of Pioneer Fundamental Growth Fund at public offering price during the periods shown, compared to that of the Russell 1000 Growth Index.
| | | | |
| Average Annual Total Returns | |
(As of March 31, 2020) | |
| Net | Public | Russell |
| Asset | Offering | 1000 |
| Value | Price | Growth |
| Period | (NAV) | (POP) | Index |
10 years | 11.33% | 10.67% | 12.97% |
5 years | 7.95 | 6.68 | 10.36 |
1 year | -2.17 | -7.79 | 0.91 |
|
|
| Expense Ratio | | |
(Per prospectus dated August 1, 2019) |
| Gross | | | |
1.09% | | | |
Call 1-800-225-6292 or visit www.amundipioneer.com/us for the most recent month-end performance results. Current performance may be lower or higher than the performance data quoted.
The performance data quoted represents past performance, which is no guarantee of future results. Investment return and principal value will fluctuate, and shares, when redeemed, may be worth more or less than their original cost.
NAV results represent the percent change in net asset value per share. NAV returns would have been lower had sales charges been reflected. POP returns reflect deduction of maximum 5.75% sales charge. All results are historical and assume the reinvestment of dividends and capital gains. Other share classes are available for which performance and expenses will differ.
Performance results reflect any applicable expense waivers in effect during the periods shown. Without such waivers Fund performance would be lower. Waivers may not be in effect for all funds. Certain fee waivers are contractual through a specified period. Otherwise, fee waivers can be rescinded at any time. See the prospectus and financial statements for more information.
The performance table and graph do not reflect the deduction of fees and taxes that a shareowner would pay on Fund distributions or the redemption of Fund shares.
Please refer to the financial highlights for a more current expense ratio.
14 Pioneer Fundamental Growth Fund | Annual Report | 3/31/20
| | |
Performance Update | 3/31/20 | Class C Shares |
Investment Returns
The mountain chart on the right shows the change in value of a $10,000 investment made in Class C shares of Pioneer Fundamental Growth Fund during the periods shown, compared to that of the Russell 1000 Growth Index.
| | | | |
| Average Annual Total Returns | |
(As of March 31, 2020) | |
| | | Russell |
| | | 1000 |
| If | If | Growth |
| Period | Held | Redeemed | Index |
10 years | 10.54% | 10.54% | 12.97% |
5 years | 7.22 | 7.22 | 10.36 |
1 year | -2.81 | -2.81 | 0.91 |
|
|
| Expense Ratio | | |
(Per prospectus dated August 1, 2019) |
| Gross | | | |
1.73% | | | |
Call 1-800-225-6292 or visit www.amundipioneer.com/us for the most recent month-end performance results. Current performance may be lower or higher than the performance data quoted.
The performance data quoted represents past performance, which is no guarantee of future results. Investment return and principal value will fluctuate, and shares, when redeemed, may be worth more or less than their original cost.
Class C shares held for less than one year are also subject to a 1% contingent deferred sales charge (CDSC). “If Held” results represent the percent change in net asset value per share. “If Redeemed” returns would have been lower had sales charges been reflected. All results are historical and assume the reinvestment of dividends and capital gains. Other share classes are available for which performance and expenses will differ.
Performance results reflect any applicable expense waivers in effect during the periods shown. Without such waivers Fund performance would be lower. Waivers may not be in effect for all funds. Certain fee waivers are contractual through a specified period. Otherwise, fee waivers can be rescinded at any time. See the prospectus and financial statements for more information.
The performance table and graph do not reflect the deduction of fees and taxes that a shareowner would pay on Fund distributions or the redemption of Fund shares.
Please refer to the financial highlights for a more current expense ratio.
Pioneer Fundamental Growth Fund | Annual Report | 3/31/20 15
| | |
Performance Update | 3/31/20 | Class K Shares |
Investment Returns
The mountain chart on the right shows the change in value of a $5 million investment made in Class K shares of Pioneer Fundamental Growth Fund during the periods shown, compared to that of the Russell 1000 Growth Index.
| | | |
| Average Annual Total Returns | |
(As of March 31, 2020) | |
| Net | Russell |
| Asset | 1000 |
| Value | Growth |
| Period | (NAV) | Index |
10 years | 11.67% | 12.97% |
5 years | 8.40 | 10.36 |
1 year | -1.78 | 0.91 |
|
|
| Expense Ratio | | |
(Per prospectus dated August 1, 2019) |
| Gross | | |
0.66% | | |
Call 1-800-225-6292 or visit www.amundipioneer.com/us for the most recent month-end performance results. Current performance may be lower or higher than the performance data quoted.
The performance data quoted represents past performance, which is no guarantee of future results. Investment return and principal value will fluctuate, and shares, when redeemed, may be worth more or less than their original cost.
The performance shown for Class K shares for the period prior to the commencement of operations of Class K shares on December 20, 2012, is the net asset value performance of the Fund’s Class A shares, which has not been restated to reflect any differences in expenses, including Rule 12b-1 fees applicable to Class A shares. Since fees for Class A shares generally are higher than those of Class K shares, the performance of Class K shares prior to their inception would have been higher than the performance shown. For the period beginning December 20, 2012, the actual performance of Class K shares is reflected. Class K shares are not subject to sales charges and are available for limited groups of eligible investors, including institutional investors. All results are historical and assume the reinvestment of dividends and capital gains. Other share classes are available for which performance and expenses will differ.
Performance results reflect any applicable expense waivers in effect during the periods shown. Without such waivers Fund performance would be lower. Waivers may not be in effect for all funds. Certain fee waivers are contractual through a specified period. Otherwise, fee waivers can be rescinded at any time. See the prospectus and financial statements for more information.
The performance table and graph do not reflect the deduction of fees and taxes that a shareowner would pay on Fund distributions or the redemption of Fund shares.
Please refer to the financial highlights for a more current expense ratio.
16 Pioneer Fundamental Growth Fund | Annual Report | 3/31/20
| | |
Performance Update | 3/31/20 | Class R Shares |
Investment Returns
The mountain chart on the right shows the change in value of a $10,000 investment made in Class R shares of Pioneer Fundamental Growth Fund during the periods shown, compared to that of the Russell 1000 Growth Index.
| | | |
| Average Annual Total Returns | |
(As of March 31, 2020) | |
| Net | Russell |
| Asset | 1000 |
| Value | Growth |
| Period | (NAV) | Index |
10 years | 11.06% | 12.97% |
5 years | 7.61 | 10.36 |
1 year | -2.50 | 0.91 |
|
|
| Expense Ratio | | |
(Per prospectus dated August 1, 2019) |
| Gross | | |
1.39% | | |
Call 1-800-225-6292 or visit www.amundipioneer.com/us for the most recent month-end performance results. Current performance may be lower or higher than the performance data quoted.
The performance data quoted represents past performance, which is no guarantee of future results. Investment return and principal value will fluctuate, and shares, when redeemed, may be worth more or less than their original cost.
The performance shown for Class R shares for the period prior to the commencement of operations of Class R shares on April 2, 2012, is based on the performance of Class A shares, reduced to reflect the higher distribution and service fees of Class R shares. For the period beginning April 2, 2012, the actual performance of Class R shares is reflected. Class R shares are not subject to sales charges and are available for limited groups of eligible investors, including institutional investors. All results are historical and assume the reinvestment of dividends and capital gains. Other share classes are available for which performance and expenses will differ.
Performance results reflect any applicable expense waivers in effect during the periods shown. Without such waivers Fund performance would be lower. Waivers may not be in effect for all funds. Certain fee waivers are contractual through a specified period. Otherwise, fee waivers can be rescinded at any time. See the prospectus and financial statements for more information.
The performance table and graph do not reflect the deduction of fees and taxes that a shareowner would pay on Fund distributions or the redemption of Fund shares.
Please refer to the financial highlights for a more current expense ratio.
Pioneer Fundamental Growth Fund | Annual Report | 3/31/20 17
| | |
Performance Update | 3/31/20 | Class Y Shares |
Investment Returns
The mountain chart on the right shows the change in value of a $5 million investment made in Class Y shares of Pioneer Fundamental Growth Fund during the periods shown, compared to that of the Russell 1000 Growth Index.
| | | |
| Average Annual Total Returns | |
(As of March 31, 2020) | |
| Net | Russell |
| Asset | 1000 |
| Value | Growth |
| Period | (NAV) | Index |
10 years | 11.70% | 12.97% |
5 years | 8.28 | 10.36 |
1 year | -1.89 | 0.91 |
|
|
| Expense Ratio | | |
(Per prospectus dated August 1, 2019) |
| Gross | | |
0.77% | | |
Call 1-800-225-6292 or visit www.amundipioneer.com/us for the most recent month-end performance results. Current performance may be lower or higher than the performance data quoted.
The performance data quoted represents past performance, which is no guarantee of future results. Investment return and principal value will fluctuate, and shares, when redeemed, may be worth more or less than their original cost.
Class Y shares are not subject to sales charges and are available for limited groups of eligible investors, including institutional investors. All results are historical and assume the reinvestment of dividends and capital gains. Other share classes are available for which performance and expenses will differ.
Performance results reflect any applicable expense waivers in effect during the periods shown. Without such waivers Fund performance would be lower. Waivers may not be in effect for all funds. Certain fee waivers are contractual through a specified period. Otherwise, fee waivers can be rescinded at any time. See the prospectus and financial statements for more information.
The performance table and graph do not reflect the deduction of fees and taxes that a shareowner would pay on Fund distributions or the redemption of Fund shares.
Please refer to the financial highlights for a more current expense ratio.
18 Pioneer Fundamental Growth Fund | Annual Report | 3/31/20
Comparing Ongoing Fund Expenses
As a shareowner in the Fund, you incur two types of costs:
(1) ongoing costs, including management fees, distribution and/or service (12b-1) fees, and other Fund expenses; and
(2) transaction costs, including sales charges (loads) on purchase payments.
This example is intended to help you understand your ongoing expenses (in dollars) of investing in the Fund and to compare these costs with the ongoing costs of investing in other mutual funds. The example is based on an investment of $1,000 at the beginning of the Fund’s latest six-month period and held throughout the six months.
Using the Tables
Actual Expenses
The first table below provides information about actual account values and actual expenses. You may use the information in this table, together with the amount you invested, to estimate the expenses that you paid over the period as follows:
(1) Divide your account value by $1,000
Example: an $8,600 account value ÷ $1,000 = 8.6
(2) Multiply the result in (1) above by the corresponding share class’s number in the third row under the heading entitled “Expenses Paid During Period” to estimate the expenses you paid on your account during this period.
Expenses Paid on a $1,000 Investment in Pioneer Fundamental Growth Fund
Based on actual returns from October 1, 2019 through March 31, 2020.
| | | | | | |
| Share Class | A | C | K | R | Y |
Beginning Account | $1,000.00 | $1,000.00 | $1,000.00 | $1,000.00 | $1,000.00 |
Value on 10/1/19 | | | | | |
Ending Account | $856.33 | $905.44 | $910.37 | $906.81 | $909.61 |
Value (after expenses) | | | | | |
on 3/31/20 | | | | | |
Expenses Paid | $4.97 | $8.29 | $3.15 | $6.67 | $3.63 |
During Period* | | | | | |
* Expenses are equal to the Fund’s annualized expense ratio of 1.07%, 1.74%, 0.66%, 1.40% and 0.76%, for Class A, Class C, Class K, Class R and Class Y respectively, multiplied by the average account value over the period, multiplied by 183/366 (to reflect the partial year period).
Pioneer Fundamental Growth Fund | Annual Report | 3/31/20 19
Hypothetical Example for Comparison Purposes
The table below provides information about hypothetical account values and hypothetical expenses based on the Fund’s actual expense ratio and an assumed rate of return of 5% per year before expenses, which is not the Fund’s actual return. The hypothetical account values and expenses may not be used to estimate the actual ending account balance or expenses you paid for the period.
You may use this information to compare the ongoing costs of investing in the Fund and other funds. To do so, compare this 5% hypothetical example with the 5% hypothetical examples that appear in the shareholder reports of the other funds.
Please note that the expenses shown in the tables are meant to highlight your ongoing costs only and do not reflect any transaction costs, such as sales charges (loads) that are charged at the time of the transaction. Therefore, the table below is useful in comparing ongoing costs only and will not help you determine the relative total costs of owning different funds. In addition, if these transaction costs were included, your costs would have been higher.
Expenses Paid on a $1,000 Investment in Pioneer Fundamental Growth Fund
Based on a hypothetical 5% per year return before expenses, reflecting the period from October 1, 2019 through March 31, 2020.
| | | | | | |
| Share Class | A | C | K | R | Y |
Beginning Account | $1,000.00 | $1,000.00 | $1,000.00 | $1,000.00 | $1,000.00 |
Value on 10/1/19 | | | | | |
Ending Account | $1,019.65 | $1,016.30 | $1,021.70 | $1,018.00 | $1,021.20 |
Value (after expenses) | | | | | |
on 3/31/20 | | | | | |
Expenses Paid | $5.40 | $8.77 | $3.34 | $7.06 | $3.84 |
During Period* | | | | | |
* Expenses are equal to the Fund’s annualized expense ratio of 1.07%, 1.74%, 0.66%, 1.40% and 0.76%, for Class A, Class C, Class K, Class R and Class Y respectively, multiplied by the average account value over the period, multiplied by 183/366 (to reflect the partial year period).
20 Pioneer Fundamental Growth Fund | Annual Report | 3/31/20
Schedule of Investments |
3/31/20 | | | | |
| Shares | | | Value |
| | | UNAFFILIATED ISSUERS — 97.9% | |
| | | COMMON STOCKS — 97.9% of Net Assets | |
| | | Beverages — 4.1% | |
| 1,750,817 | | PepsiCo., Inc. | $ 210,273,122 |
| | | Total Beverages | $ 210,273,122 |
| | | Capital Goods — 0.7% | |
| 231,494 | | Rockwell Automation, Inc. | $ 34,934,760 |
| | | Total Capital Goods | $ 34,934,760 |
| | | Capital Markets — 4.7% | |
| 2,381,790 | | Charles Schwab Corp. | $ 80,075,780 |
| 1,993,913 | | Intercontinental Exchange, Inc. | 161,008,474 |
| | | Total Capital Markets | $ 241,084,254 |
| | | Chemicals — 1.8% | |
| 585,543 | | Ecolab, Inc. | $ 91,245,166 |
| | | Total Chemicals | $ 91,245,166 |
| | | Communications Equipment — 1.4% | |
| 556,312 | | Motorola Solutions, Inc. | $ 73,944,991 |
| | | Total Communications Equipment | $ 73,944,991 |
| | Electronic Equipment, Instruments & Components — 3.3% | |
| 898,650 | | Amphenol Corp. | $ 65,493,612 |
| 1,097,308 | | CDW Corp. | 102,345,917 |
| | | Total Electronic Equipment, Instruments & Components | $ 167,839,529 |
| | | Entertainment — 2.8% | |
| 1,429,652(a) | | Electronic Arts, Inc. | $ 143,208,241 |
| | | Total Entertainment | $ 143,208,241 |
| | | Food & Staples Retailing — 2.1% | |
| 933,264 | | Walmart, Inc. | $ 106,037,456 |
| | | Total Food & Staples Retailing | $ 106,037,456 |
| | | Health Care Equipment & Supplies — 6.8% | |
| 297,491 | | Cooper Cos., Inc. | $ 82,009,344 |
| 380,084(a) | | Edwards Lifesciences Corp. | 71,691,444 |
| 1,123,180 | | Medtronic Plc | 101,288,372 |
| 910,988 | | Zimmer Biomet Holdings, Inc. | 92,082,667 |
| | | Total Health Care Equipment & Supplies | $ 347,071,827 |
| | | Insurance — 5.2% | |
| 1,028,614 | | Marsh & McLennan Cos., Inc. | $ 88,933,966 |
| 2,461,678 | | Progressive Corp. | 181,770,304 |
| | | Total Insurance | $ 270,704,270 |
The accompanying notes are an integral part of these financial statements.
Pioneer Fundamental Growth Fund | Annual Report | 3/31/20 21
Schedule of Investments | 3/31/20 (continued)
| | | | |
| Shares | | | Value |
| | | Interactive Media & Services — 6.5% | |
| 286,937(a) | | Alphabet, Inc., Class C | $ 333,653,213 |
| | | Total Interactive Media & Services | $ 333,653,213 |
| | | Internet & Direct Marketing Retail — 8.8% | |
| 188,008(a) | | Amazon.com, Inc. | $ 366,562,958 |
| 65,846(a) | | Booking Holdings, Inc. | 88,583,941 |
| | | Total Internet & Direct Marketing Retail | $ 455,146,899 |
| | | IT Services — 11.6% | |
| 829,203 | | Accenture Plc | $ 135,375,682 |
| 661,098 | | Fidelity National Information Services, Inc. | 80,415,961 |
| 958,971 | | Mastercard, Inc. | 231,649,035 |
| 1,571,791(a) | | PayPal Holdings, Inc. | 150,483,270 |
| | | Total IT Services | $ 597,923,948 |
| | | Life Sciences Tools & Services — 3.1% | |
| 561,593 | | Thermo Fisher Scientific, Inc. | $ 159,267,775 |
| | | Total Life Sciences Tools & Services | $ 159,267,775 |
| | | Machinery — 2.9% | |
| 277,545 | | Illinois Tool Works, Inc. | $ 39,444,695 |
| 1,106,103 | | Stanley Black & Decker, Inc. | 110,610,300 |
| | | Total Machinery | $ 150,054,995 |
| | | Pharmaceuticals — 7.9% | |
| 1,833,906(a) | | Elanco Animal Health, Inc. | $ 41,061,155 |
| 857,052 | | Eli Lilly & Co. | 118,890,253 |
| 663,643 | | Johnson & Johnson | 87,023,507 |
| 1,288,730 | | Roche Holding AG (A.D.R.) | 52,283,776 |
| 915,683 | | Zoetis, Inc. | 107,766,732 |
| | | Total Pharmaceuticals | $ 407,025,423 |
| | | Software — 10.7% | |
| 527,607(a) | | Adobe, Inc. | $ 167,905,651 |
| 2,398,866 | | Microsoft Corp. | 378,325,157 |
| | | Total Software | $ 546,230,808 |
| | | Software & Services — 1.4% | |
| 507,584(a) | | salesforce.com, Inc. | $ 73,081,944 |
| | | Total Software & Services | $ 73,081,944 |
The accompanying notes are an integral part of these financial statements.
22 Pioneer Fundamental Growth Fund | Annual Report | 3/31/20
| | | | |
| Shares | | | Value |
| | Specialty Retail — 7.5% | |
| 841,578 | | Home Depot, Inc. | $ 157,131,028 |
| 293,267(a) | | O’Reilly Automotive, Inc. | 88,288,030 |
| 1,597,117 | | Ross Stores, Inc. | 138,901,266 |
| | | Total Specialty Retail | $ 384,320,324 |
| | | Technology Hardware, Storage & Peripherals — 4.6% | |
| 930,106 | | Apple, Inc. | $ 236,516,655 |
| | Total Technology Hardware, Storage & Peripherals | $ 236,516,655 |
| | TOTAL COMMON STOCKS | |
| | (Cost $3,590,028,488) | $5,029,565,600 |
| | TOTAL INVESTMENTS IN UNAFFILIATED ISSUERS — 97.9% | |
| | (Cost $3,590,028,488) | $5,029,565,600 |
| | OTHER ASSETS AND LIABILITIES — 2.1% | $ 105,856,879 |
| | NET ASSETS — 100.0% | $5,135,422,479 |
| | |
(A.D.R.) | American Depositary Receipts. |
(a) | Non-income producing security. |
Purchases and sales of securities (excluding temporary cash investments and in-kind redemptions) for the year ended March 31, 2020, aggregated $1,347,833,842 and $1,922,679,114, respectively.
The Fund is permitted to engage in purchase and sale transactions (“cross trades”) with certain funds and accounts for which Amundi Pioneer Asset Management, Inc. (the “Adviser”) serves as the Fund’s investment adviser, as set forth in Rule 17a-7 under the Investment Company Act of 1940, pursuant to procedures adopted by the Board of Trustees. Under these procedures, cross trades are effected at current market prices. During the year ended March 31, 2020, the Fund did not engage in any cross trade activity.
At March 31, 2020, the net unrealized appreciation on investments based on cost for federal tax purposes of $3,608,149,876 was as follows:
| | | | |
| Aggregate gross unrealized appreciation for all investments in which | | | |
| there is an excess of value over tax cost | | $ | 1,646,791,191 | |
| Aggregate gross unrealized depreciation for all investments in which | | | | |
| there is an excess of tax cost over value | | | (225,375,467 | ) |
| Net unrealized appreciation | | $ | 1,421,415,724 | |
Various inputs are used in determining the value of the Fund’s investments. These inputs are summarized in the three broad levels below.
Level 1 – quoted prices in active markets for identical securities.
Level 2 – other significant observable inputs (including quoted prices for similar securities, interest rates, prepayment speeds, credit risks, etc.). See Notes to Financial Statements — Note 1A.
Level 3 – significant unobservable inputs (including the Fund’s own assumptions in determining fair value of investments). See Notes to Financial Statements — Note 1A.
The accompanying notes are an integral part of these financial statements.
Pioneer Fundamental Growth Fund | Annual Report | 3/31/20 23
Schedule of Investments | 3/31/20 (continued)
The following is a summary of the inputs used as of March 31, 2020, in valuing the Fund’s investments:
| | | | | | | | | | | | | |
| | Level 1 | | | Level 2 | | | Level 3 | | | Total | |
Common Stocks | | $ | 5,029,565,600 | | | $ | — | | | $ | — | | | $ | 5,029,565,600 | |
| Total Investments in | | | | | | | | | | | | | | | | |
| Securities | | $ | 5,029,565,600 | | | $ | — | | | $ | — | | | $ | 5,029,565,600 | |
During the year ended March 31, 2020, there were no transfers between Levels 1, 2 and 3.
The accompanying notes are an integral part of these financial statements.
24 Pioneer Fundamental Growth Fund | Annual Report | 3/31/20
Statement of Assets and Liabilities |
3/31/20 | | | | |
| ASSETS: | | | |
| Investments in unaffiliated issuers, at value (cost $3,590,028,488) | | $ | 5,029,565,600 | |
| Cash | | | 87,451,792 | |
| Receivables — | | | | |
| Investment securities sold | | | 25,108,601 | |
| Fund shares sold | | | 34,495,907 | |
| Dividends | | | 2,628,250 | |
| Interest | | | 2,218 | |
| Due from the Adviser | | | 441 | |
| Other assets | | | 80,358 | |
| Total assets | | $ | 5,179,333,167 | |
| LIABILITIES: | | | | |
| Payables — | | | | |
| Investment securities purchased | | $ | 25,970,743 | |
| Fund shares repurchased | | | 16,094,686 | |
| Trustees’ fees | | | 7,748 | |
| Due to affiliates | | | 521,644 | |
| Accrued expenses | | | 1,315,867 | |
| Total liabilities | | $ | 43,910,688 | |
| NET ASSETS: | | | | |
| Paid-in capital | | $ | 3,503,398,855 | |
| Distributable earnings | | | 1,632,023,624 | |
| Net assets | | $ | 5,135,422,479 | |
| NET ASSET VALUE PER SHARE: | | | | |
No par value (unlimited number of shares authorized) | | | | |
| Class A (based on $805,102,040/35,898,021 shares) | | $ | 22.43 | |
| Class C (based on $372,488,160/18,557,931 shares) | | $ | 20.07 | |
| Class K (based on $639,430,050/28,505,253 shares) | | $ | 22.43 | |
| Class R (based on $85,892,080/3,912,458 shares) | | $ | 21.95 | |
| Class Y (based on $3,232,510,149/142,817,645 shares) | | $ | 22.63 | |
| MAXIMUM OFFERING PRICE PER SHARE: | | | | |
| Class A (based on $22.43 net asset value per share/100%-5.75% | | | | |
| maximum sales charge) | | $ | 23.80 | |
The accompanying notes are an integral part of these financial statements.
Pioneer Fundamental Growth Fund | Annual Report | 3/31/20 25
Statement of Operations
FOR THE YEAR ENDED 3/31/20
| | | | | | | |
| INVESTMENT INCOME: | | | | | | |
| Interest from unaffiliated issuers | | $ | 1,305,972 | | | | |
| Dividends from unaffiliated issuers (net of foreign taxes | | | | | | | |
| withheld $102,656) | | | 73,628,730 | | | | |
| Total investment income | | | | | | $ | 74,934,702 | |
| EXPENSES: | | | | | | | | |
| Management fees | | $ | 36,870,492 | | | | | |
| Administrative expense | | | 1,521,632 | | | | | |
| Transfer agent fees | | | | | | | | |
| Class A | | | 1,655,323 | | | | | |
| Class C | | | 355,883 | | | | | |
| Class K | | | 11,738 | | | | | |
| Class R | | | 290,965 | | | | | |
| Class Y | | | 4,098,373 | | | | | |
| Distribution fees | | | | | | | | |
| Class A | | | 2,524,633 | | | | | |
| Class C | | | 4,463,456 | | | | | |
| Class R | | | 550,329 | | | | | |
| Shareowner communications expense | | | 255,234 | | | | | |
| Custodian fees | | | 64,864 | | | | | |
| Registration fees | | | 161,648 | | | | | |
| Professional fees | | | 292,027 | | | | | |
| Printing expense | | | 59,429 | | | | | |
| Pricing fees | | | 265 | | | | | |
| Trustees’ fees | | | 319,776 | | | | | |
| Insurance expense | | | 81,576 | | | | | |
| Miscellaneous | | | 143,246 | | | | | |
| Total expenses | | | | | | $ | 53,720,889 | |
| Less fees waived and expenses reimbursed by the Adviser | | | | | | | (24,637 | ) |
| Net expenses | | | | | | $ | 53,696,252 | |
| Net investment income | | | | | | $ | 21,238,450 | |
| REALIZED AND UNREALIZED GAIN (LOSS) ON INVESTMENTS: | | | | | | | | |
| Net realized gain (loss) on: | | | | | | | | |
| Investments in unaffiliated issuers | | $ | 414,986,310 | | | | | |
| In-kind redemptions | | | 26,554,900 | | | $ | 441,541,210 | |
| Change in net unrealized appreciation (depreciation) on: | | | | | | | | |
| Investments in unaffiliated issuers | | | | | | $ | (522,764,617 | ) |
| Net realized and unrealized gain (loss) on investments | | | | | | $ | (81,223,407 | ) |
| Net decrease in net assets resulting from operations | | | | | | $ | (59,984,957 | ) |
The accompanying notes are an integral part of these financial statements.
26 Pioneer Fundamental Growth Fund | Annual Report | 3/31/20
Statements of Changes in Net Assets
| | | | | | | |
| | Year | | | Year | |
| | Ended | | | Ended | |
| | 3/31/20 | | | 3/31/19 | |
| FROM OPERATIONS: | | | | | | |
Net investment income (loss) | | $ | 21,238,450 | | | $ | 26,841,828 | |
Net realized gain (loss) on investments | | | 441,541,210 | | | | 366,395,202 | |
Change in net unrealized appreciation (depreciation) | | | | | | | | |
| on investments | | | (522,764,617 | ) | | | 334,424,633 | |
| Net increase (decrease) in net assets resulting | | | | | | | | |
| from operations | | $ | (59,984,957 | ) | | $ | 727,661,663 | |
| DISTRIBUTIONS TO SHAREOWNERS: | | | | | | | | |
| Class A ($1.46 and $1.28 per share, respectively) | | $ | (52,971,897 | ) | | $ | (56,885,056 | ) |
| Class C ($1.45 and $1.23 per share, respectively) | | | (26,521,714 | ) | | | (25,144,609 | ) |
| Class K ($1.57 and $1.39 per share, respectively) | | | (41,746,809 | ) | | | (37,601,659 | ) |
| Class R ($1.45 and $1.23 per share, respectively) | | | (5,828,998 | ) | | | (6,194,708 | ) |
| Class Y ($1.55 and $1.37 per share, respectively) | | | (223,328,693 | ) | | | (206,490,287 | ) |
| Total distributions to shareowners | | | (350,398,111 | ) | | $ | (332,316,319 | ) |
| FROM FUND SHARE TRANSACTIONS: | | | | | | | | |
Net proceeds from sales of shares | | $ | 1,400,061,586 | | | $ | 1,335,053,456 | |
Reinvestment of distributions | | | 315,072,293 | | | | 301,535,270 | |
Cost of shares repurchased | | | (1,888,437,080 | ) | | | (2,364,978,703 | ) |
In-kind redemptions | | | (125,892,667 | ) | | | — | |
| Net decrease in net assets resulting from Fund share | | | | | | | | |
| transactions | | $ | (299,195,868 | ) | | $ | (728,389,977 | ) |
| Net decrease in net assets | | $ | (709,578,936 | ) | | $ | (333,044,633 | ) |
| NET ASSETS: | | | | | | | | |
Beginning of year | | $ | 5,845,001,415 | | | $ | 6,178,046,048 | |
End of year | | $ | 5,135,422,479 | | | $ | 5,845,001,415 | |
The accompanying notes are an integral part of these financial statements.
Pioneer Fundamental Growth Fund | Annual Report | 3/31/20 27
Statements of Changes in Net Assets (continued)
| | | | | | | | | | | | | |
| | Year Ended | | | Year Ended | | | Year Ended | | | Year Ended | |
| | 3/31/20 | | | 3/31/20 | | | 3/31/19 | | | 3/31/19 | |
| | Shares | | | Amount | | | Shares | | | Amount | |
| Class A | | | | | | | | | | | | |
Shares sold | | | 6,780,506 | | | $ | 173,685,723 | | | | 7,464,963 | | | $ | 174,656,891 | |
Reinvestment of | | | | | | | | | | | | | | | | |
| distributions | | | 1,745,050 | | | | 45,416,499 | | | | 2,147,773 | | | | 48,760,985 | |
Less shares repurchased | | | (15,681,904 | ) | | | (401,715,645 | ) | | | (19,319,758 | ) | | | (454,252,301 | ) |
| Net decrease | | | (7,156,348 | ) | | $ | (182,613,423 | ) | | | (9,707,022 | ) | | $ | (230,834,425 | ) |
| Class C | | | | | | | | | | | | | | | | |
Shares sold | | | 2,176,616 | | | $ | 50,178, 207 | | | | 2,716,493 | | | $ | 57,846,329 | |
Reinvestment of | | | | | | | | | | | | | | | | |
| distributions | | | 974,000 | | | | 22,723,445 | | | | 1,059,825 | | | | 21,874,816 | |
Less shares repurchased | | | (4,872,206 | ) | | | (111,162,851 | ) | | | (6,325,451 | ) | | | (135,733,801 | ) |
| Net decrease | | | (1,721,590 | ) | | $ | (38,261,199 | ) | | | (2,549,133 | ) | | $ | (56,012,656 | ) |
| Class K | | | | | | | | | | | | | | | | |
Shares sold | | | 7,791,751 | | | $ | 199,976,460 | | | | 10,787,886 | | | $ | 253,736,943 | |
Reinvestment of | | | | | | | | | | | | | | | | |
| distributions | | | 1,530,890 | | | | 40,054,332 | | | | 1,635,138 | | | | 36,995,323 | |
Less shares repurchased | | | (8,913,964 | ) | | | (226,677,667 | ) | | | (11,429,160 | ) | | | (271,777,022 | ) |
| Net increase | | | 408,677 | | | $ | 13,353,125 | | | | 993,864 | | | $ | 18,955,244 | |
| Class R | | | | | | | | | | | | | | | | |
Shares sold | | | 798,200 | | | $ | 20,090,041 | | | | 1,085,802 | | | $ | 24,580,239 | |
Reinvestment of | | | | | | | | | | | | | | | | |
| distributions | | | 211,646 | | | | 5,394,855 | | | | 230,179 | | | | 5,146,817 | |
Less shares repurchased | | | (1,922,327 | ) | | | (48,170,595 | ) | | | (2,077,742 | ) | | | (47,159,442 | ) |
| Net increase | | | | | | | | | | | | | | | | |
| (decrease) | | | (912,481 | ) | | $ | (22,685,699 | ) | | | (761,761 | ) | | $ | (17,432,386 | ) |
| Class Y | | | | | | | | | | | | | | | | |
Shares sold | | | 37,154,018 | | | $ | 956,131,155 | | | | 34,937,476 | | | $ | 824,233,054 | |
Reinvestment | | | | | | | | | | | | | | | | |
| of distributions | | | 7,640,100 | | | | 201,483,162 | | | | 8,263,070 | | | | 188,757,329 | |
Less shares repurchased | | | (42,812,259 | ) | | | (1,100,710,322 | ) | | | (62,145,940 | ) | | | (1,456,056,137 | ) |
In-kind redemptions | | | (5,096,895 | ) | | | (125,892,667 | ) | | | — | | | | — | |
| Net decrease | | | (3,115,036 | ) | | $ | (68,988,672 | ) | | | (18,945,394 | ) | | $ | (443,065,754 | ) |
The accompanying notes are an integral part of these financial statements.
28 Pioneer Fundamental Growth Fund | Annual Report | 3/31/20
Financial Highlights
| | | | | | | | | | | | | | | | |
| | Year | | | Year | | | Year | | | Year | | | Year | |
| | Ended | | | Ended | | | Ended | | | Ended | | | Ended | |
| | 3/31/20 | | | 3/31/19 | | | 3/31/18 | | | 3/31/17* | | | 3/31/16* | |
| Class A | | | | | | | | | | | | | | | |
Net asset value, beginning of period | | $ | 24.21 | | | $ | 22.66 | | | $ | 20.78 | | | $ | 19.00 | | | $ | 19.06 | |
Increase (decrease) from investment operations: | | | | | | | | | | | | | | | | | | | | |
| Net investment income (loss) (a) | | $ | 0.04 | | | $ | 0.06 | | | $ | 0.06 | | | $ | 0.08 | | | $ | 0.07 | |
| Net realized and unrealized gain (loss) on investments | | | (0.36 | ) | | | 2.77 | | | | 2.87 | | | | 2.13 | | | | 0.70 | |
| Net increase (decrease) from investment operations | | $ | (0.32 | ) | | $ | 2.83 | | | $ | 2.93 | | | $ | 2.21 | | | $ | 0.77 | |
Distributions to shareowners: | | | | | | | | | | | | | | | | | | | | |
| Net investment income | | $ | (0.01 | ) | | $ | (0.05 | ) | | $ | (0.04 | ) | | $ | (0.06 | ) | | $ | (0.05 | ) |
| Net realized gain | | | (1.45 | ) | | | (1.23 | ) | | | (1.01 | ) | | | (0.37 | ) | | | (0.78 | ) |
| Total distributions | | $ | (1.46 | ) | | $ | (1.28 | ) | | $ | (1.05 | ) | | $ | (0.43 | ) | | $ | (0.83 | ) |
| Net increase (decrease) in net asset value | | $ | (1.78 | ) | | $ | 1.55 | | | $ | 1.88 | | | $ | 1.78 | | | $ | (0.06 | ) |
Net asset value, end of period | | $ | 22.43 | | | $ | 24.21 | | | $ | 22.66 | | | $ | 20.78 | | | $ | 19.00 | |
| Total return (b) | | | (2.17 | )% | | | 12.90 | % | | | 14.16 | % | | | 11.78 | % | | | 4.00 | % |
Ratio of net expenses to average net assets | | | 1.07 | % | | | 1.09 | % | | | 1.09 | % | | | 1.09 | % | | | 1.09 | % |
Ratio of net investment income (loss) to average net assets | | | 0.16 | % | | | 0.25 | % | | | 0.25 | % | | | 0.39 | % | | | 0.38 | % |
Portfolio turnover rate | | | 23 | %(c) | | | 26 | % | | | 38 | % | | | 23 | % | | | 13 | % |
Net assets, end of period (in thousands) | | $ | 805,102 | | | $ | 1,042,168 | | | $ | 1,195,674 | | | $ | 1,205,124 | | | $ | 992,927 | |
Ratios with no waiver of fees and assumption of expenses by | | | | | | | | | | | | | | | | | | | | |
| the Adviser and no reduction for fees paid indirectly: | | | | | | | | | | | | | | | | | | | | |
| Total expenses to average net assets | | | 1.07 | % | | | 1.09 | % | | | 1.10 | % | | | 1.09 | % | | | 1.11 | % |
| Net investment income (loss) to average net assets | | | 0.16 | % | | | 0.25 | % | | | 0.24 | % | | | 0.39 | % | | | 0.36 | % |
* The Fund was audited by an independent registered public accounting firm other than Ernst & Young LLP.
(a) The per-share data presented above is based upon the average shares outstanding for the periods presented.
(b) Assumes initial investment at net asset value at the beginning of each period, reinvestment of all distributions, the complete redemption of the investment at net asset value at the end of each period and no sales charges. Total return would be reduced if sales charges were taken into account.
(c) Portfolio turnover excludes the value of portfolio securities received or delivered as a result of in-kind fund share transactions.
The accompanying notes are an integral part of these financial statements.
Pioneer Fundamental Growth Fund | Annual Report | 3/31/20 29
Financial Highlights (continued)
| | | | | | | | | | | | | | | | |
| | Year | | | Year | | | Year | | | Year | | | Year | |
| | Ended | | | Ended | | | Ended | | | Ended | | | Ended | |
| | 3/31/20 | | | 3/31/19 | | | 3/31/18 | | | 3/31/17* | | | 3/31/16* | |
| Class C | | | | | | | | | | | | | | | |
Net asset value, beginning of period | | $ | 21.93 | | | $ | 20.73 | | | $ | 19.17 | | | $ | 17.63 | | | $ | 17.81 | |
Increase (decrease) from investment operations: | | | | | | | | | | | | | | | | | | | | |
| Net investment income (loss) (a)(b) | | $ | (0.12 | ) | | $ | (0.08 | ) | | $ | (0.08 | ) | | $ | (0.05 | ) | | $ | (0.05 | ) |
| Net realized and unrealized gain (loss) on investments | | | (0.29 | ) | | | 2.51 | | | | 2.65 | | | | 1.96 | | | | 0.65 | |
| Net increase (decrease) from investment operations | | $ | (0.41 | ) | | $ | 2.43 | | | $ | 2.57 | | | $ | 1.91 | | | $ | 0.60 | |
Distributions to shareowners: | | | | | | | | | | | | | | | | | | | | |
| Net realized gain | | | (1.45 | ) | | | (1.23 | ) | | | (1.01 | ) | | | (0.37 | ) | | | (0.78 | ) |
| Total distributions | | $ | (1.45 | ) | | $ | (1.23 | ) | | $ | (1.01 | ) | | $ | (0.37 | ) | | $ | (0.78 | ) |
| Net increase (decrease) in net asset value | | $ | (1.86 | ) | | $ | 1.20 | | | $ | 1.56 | | | $ | 1.54 | | | $ | (0.18 | ) |
Net asset value, end of period | | $ | 20.07 | | | $ | 21.93 | | | $ | 20.73 | | | $ | 19.17 | | | $ | 17.63 | |
| Total return (c) | | | (2.81 | )% | | | 12.12 | % | | | 13.46 | % | | | 10.98 | % | | | 3.29 | % |
Ratio of net expenses to average net assets | | | 1.74 | % | | | 1.73 | % | | | 1.74 | % | | | 1.77 | % | | | 1.77 | % |
Ratio of net investment income (loss) to average net assets | | | (0.51 | )% | | | (0.39 | )% | | | (0.40 | )% | | | (0.30 | )% | | | (0.29 | )% |
Portfolio turnover rate | | | 23 | %(d) | | | 26 | % | | | 38 | % | | | 23 | % | | | 13 | % |
Net assets, end of period (in thousands) | | $ | 372,488 | | | $ | 444,786 | | | $ | 473,154 | | | $ | 465,545 | | | $ | 356,675 | |
* The Fund was audited by an independent registered public accounting firm other than Ernst & Young LLP.
(a) The per-share data presented above is based upon the average shares outstanding for the periods presented.
(b) The amount shown for a share outstanding does not correspond with net investment income on the Statement of Operations for the period due to timing of the sales and repurchase of shares.
(c) Assumes initial investment at net asset value at the beginning of each period, reinvestment of all distributions, the complete redemption of the investment at net asset value at the end of each period and no sales charges. Total return would be reduced if sales charges were taken into account.
(d) Portfolio turnover excludes the value of portfolio securities received or delivered as a result of in-kind fund share transactions.
The accompanying notes are an integral part of these financial statements.
30 Pioneer Fundamental Growth Fund | Annual Report | 3/31/20
| | | | | | | | | | | | | | | | |
| | Year | | | Year | | | Year | | | Year | | | Year | |
| | Ended | | | Ended | | | Ended | | | Ended | | | Ended | |
| | 3/31/20 | | | 3/31/19 | | | 3/31/18 | | | 3/31/17* | | | 3/31/16* | |
| Class K | | | | | | | | | | | | | | | |
Net asset value, beginning of period | | $ | 24.21 | | | $ | 22.68 | | | $ | 20.79 | | | $ | 19.00 | | | $ | 19.05 | |
Increase (decrease) from investment operations: | | | | | | | | | | | | | | | | | | | | |
| Net investment income (loss) (a) | | $ | 0.15 | | | $ | 0.16 | | | $ | 0.16 | | | $ | 0.16 | | | $ | 0.15 | |
| Net realized and unrealized gain (loss) on investments | | | (0.36 | ) | | | 2.76 | | | | 2.88 | | | | 2.13 | | | | 0.70 | |
| Net increase (decrease) from investment operations | | $ | (0.21 | ) | | $ | 2.92 | | | $ | 3.04 | | | $ | 2.29 | | | $ | 0.85 | |
Distributions to shareowners: | | | | | | | | | | | | | | | | | | | | |
| Net investment income | | $ | (0.12 | ) | | $ | (0.16 | ) | | $ | (0.14 | ) | | $ | (0.13 | ) | | $ | (0.12 | ) |
| Net realized gain | | | (1.45 | ) | | | (1.23 | ) | | | (1.01 | ) | | | (0.37 | ) | | | (0.78 | ) |
| Total distributions | | $ | (1.57 | ) | | $ | (1.39 | ) | | $ | (1.15 | ) | | $ | (0.50 | ) | | $ | (0.90 | ) |
| Net increase (decrease) in net asset value | | $ | (1.78 | ) | | $ | 1.53 | | | $ | 1.89 | | | $ | 1.79 | | | $ | (0.05 | ) |
Net asset value, end of period | | $ | 22.43 | | | $ | 24.21 | | | $ | 22.68 | | | $ | 20.79 | | | $ | 19.00 | |
| Total return (b) | | | (1.78 | )% | | | 13.39 | % | | | 14.68 | % | | | 12.24 | % | | | 4.43 | %
|
Ratio of net expenses to average net assets | | | 0.66 | % | | | 0.66 | % | | | 0.66 | % | | | 0.67 | % | | | 0.67 | % |
Ratio of net investment income (loss) to average net assets | | | 0.58 | % | | | 0.68 | % | | | 0.69 | % | | | 0.81 | % | | | 0.80 | % |
Portfolio turnover rate | | | 23 | %(c) | | | 26 | % | | | 38 | % | | | 23 | % | | | 13 | % |
Net assets, end of period (in thousands) | | $ | 639,430 | | | $ | 680,094 | | | $ | 614,710 | | | $ | 376,708 | | | $ | 131,813 | |
Ratios with no waiver of fees and assumption of expenses by | | | | | | | | | | | | | | | | | | | | |
| the Adviser and no reduction for fees paid indirectly: | | | | | | | | | | | | | | | | | | | | |
| Total expenses to average net assets | | | 0.66 | % | | | 0.66 | % | | | 0.66 | % | | | 0.67 | % | | | 0.67 | % |
| Net investment income (loss) to average net assets | | | 0.58 | % | | | 0.68 | % | | | 0.69 | % | | | 0.81 | % | | | 0.80 | % |
* The Fund was audited by an independent registered public accounting firm other than Ernst & Young LLP.
(a) The per-share data presented above is based upon the average shares outstanding for the periods presented.
(b) Assumes initial investment at net asset value at the beginning of each period, reinvestment of all distributions and the complete redemption of the investment at net asset value at the end of each period.
(c) Portfolio turnover excludes the value of portfolio securities received or delivered as a result of in-kind fund share transactions.
The accompanying notes are an integral part of these financial statements.
Pioneer Fundamental Growth Fund | Annual Report | 3/31/20 31
Financial Highlights (continued)
| | | | | | | | | | | | | | | | |
| | Year | | | Year | | | Year | | | Year | | | Year | |
| | Ended | | | Ended | | | Ended | | | Ended | | | Ended | |
| | 3/31/20 | | | 3/31/19 | | | 3/31/18 | | | 3/31/17* | | | 3/31/16* | |
| Class R | | | | | | | | | | | | | | | |
Net asset value, beginning of period | | $ | 23.79 | | | $ | 22.31 | | | $ | 20.49 | | | $ | 18.76 | | | $ | 18.86 | |
Increase (decrease) from investment operations: | | | | | | | | | | | | | | | | | | | | |
| Net investment income (loss) (a) | | $ | (0.04)( | b) | | $ | (0.01)( | b) | | $ | (0.01)( | b) | | $ | 0.01 | | | $ | 0.02 | |
| Net realized and unrealized gain (loss) on investments | | | (0.35 | ) | | | 2.72 | | | | 2.84 | | | | 2.10 | | | | 0.69 | |
| Net increase (decrease) from investment operations | | $ | (0.39 | ) | | $ | 2.71 | | | $ | 2.83 | | | $ | 2.11 | | | $ | 0.71 | |
Distributions to shareowners: | | | | | | | | | | | | | | | | | | | | |
| Net investment income | | $ | — | | | $ | — | | | $ | — | | | $ | (0.01 | ) | | $ | (0.03 | ) |
| Net realized gain | | | (1.45 | ) | | | (1.23 | ) | | | (1.01 | ) | | | (0.37 | ) | | | (0.78 | ) |
| Total distributions | | $ | (1.45 | ) | | $ | (1.23 | ) | | $ | (1.01 | ) | | $ | (0.38 | ) | | $ | (0.81 | ) |
| Net increase (decrease) in net asset value | | $ | (1.84 | ) | | $ | 1.48 | | | $ | 1.82 | | | $ | 1.73 | | | $ | (0.10 | ) |
Net asset value, end of period | | $ | 21.95 | | | $ | 23.79 | | | $ | 22.31 | | | $ | 20.49 | | | $ | 18.76 | |
| Total return (c) | | | (2.50 | )% | | | 12.52 | % | | | 13.87 | % | | | 11.41 | % | | | 3.70 | % |
Ratio of net expenses to average net assets | | | 1.40 | % | | | 1.39 | % | | | 1.40 | % | | | 1.40 | % | | | 1.40 | % |
Ratio of net investment income (loss) to average net assets | | | (0.17 | )% | | | (0.04 | )% | | | (0.05 | )% | | | 0.08 | % | | | 0.10 | % |
Portfolio turnover rate | | | 23 | %(d) | | | 26 | % | | | 38 | % | | | 23 | % | | | 13 | % |
Net assets, end of period (in thousands) | | $ | 85,892 | | | $ | 114,781 | | | $ | 124,614 | | | $ | 117,931 | | | $ | 79,519 | |
Ratios with no waiver of fees and assumption of expenses by | | | | | | | | | | | | | | | | | | | | |
| the Adviser and no reduction for fees paid indirectly: | | | | | | | | | | | | | | | | | | | | |
| Total expenses to average net assets | | | 1.42 | % | | | 1.39 | % | | | 1.42 | % | | | 1.41 | % | | | 1.43 | % |
| Net investment income (loss) to average net assets | | | (0.19 | )% | | | (0.04 | )% | | | (0.07 | )% | | | 0.07 | % | | | 0.07 | % |
* The Fund was audited by an independent registered public accounting firm other than Ernst & Young LLP.
(a) The per-share data presented above is based upon the average shares outstanding for the periods presented.
(b) The amount shown for a share outstanding does not correspond with net investment income on the Statement of Operations for the period due to timing of the sales and repurchase of shares.
(c) Assumes initial investment at net asset value at the beginning of each period, reinvestment of all distributions and the complete redemption of the investment at net asset value at the end of each period. (d) Portfolio turnover excludes the value of portfolio securities received or delivered as a result of in-kind fund share transactions.
The accompanying notes are an integral part of these financial statements.
32 Pioneer Fundamental Growth Fund | Annual Report | 3/31/20
| | | | | | | | | | | | | | | | |
| | Year | | | Year | | | Year | | | Year | | | Year | |
| | Ended | | | Ended | | | Ended | | | Ended | | | Ended | |
| | 3/31/20 | | | 3/31/19 | | | 3/31/18 | | | 3/31/17* | | | 3/31/16* | |
| Class Y | | | | | | | | | | | | | | | |
Net asset value, beginning of period | | $ | 24.42 | | | $ | 22.86 | | | $ | 20.95 | | | $ | 19.15 | | | $ | 19.20 | |
Increase (decrease) from investment operations: | | | | | | | | | | | | | | | | | | | | |
| Net investment income (loss) (a) | | $ | 0.12 | | | $ | 0.14 | | | $ | 0.13 | | | $ | 0.14 | | | $ | 0.13 | |
| Net realized and unrealized gain (loss) on investments | | | (0.36 | ) | | | 2.79 | | | | 2.90 | | | | 2.14 | | | | 0.71 | |
| Net increase (decrease) from investment operations | | $ | (0.24 | ) | | $ | 2.93 | | | $ | 3.03 | | | $ | 2.28 | | | $ | 0.84 | |
Distributions to shareowners: | | | | | | | | | | | | | | | | | | | | |
| Net investment income | | $ | (0.10 | ) | | $ | (0.14 | ) | | $ | (0.11 | ) | | $ | (0.11 | ) | | $ | (0.11 | ) |
| Net realized gain | | | (1.45 | ) | | | (1.23 | ) | | | (1.01 | ) | | | (0.37 | ) | | | (0.78 | ) |
| Total distributions | | $ | (1.55 | ) | | $ | (1.37 | ) | | $ | (1.12 | ) | | $ | (0.48 | ) | | $ | (0.89 | ) |
| Net increase (decrease) in net asset value | | $ | (1.79 | ) | | $ | 1.56 | | | $ | 1.91 | | | $ | 1.80 | | | $ | (0.05 | ) |
Net asset value, end of period | | $ | 22.63 | | | $ | 24.42 | | | $ | 22.86 | | | $ | 20.95 | | | $ | 19.15 | |
| Total return (b) | | | (1.89 | )% | | | 13.28 | % | | | 14.54 | % | | | 12.11 | % | | | 4.29 | % |
Ratio of net expenses to average net assets | | | 0.76 | % | | | 0.77 | % | | | 0.77 | % | | | 0.77 | % | | | 0.79 | % |
Ratio of net investment income (loss) to average net assets | | | 0.47 | % | | | 0.58 | % | | | 0.58 | % | | | 0.71 | % | | | 0.70 | % |
Portfolio turnover rate | | | 23 | %(c) | | | 26 | % | | | 38 | % | | | 23 | % | | | 13 | % |
Net assets, end of period (in thousands) | | $ | 3,232,510 | | | $ | 3,563,173 | | | $ | 3,769,893 | | | $ | 3,198,861 | | | $ | 2,001,002 | |
Ratios with no waiver of fees and assumption of expenses by | | | | | | | | | | | | | | | | | | | | |
| the Adviser and no reduction for fees paid indirectly: | | | | | | | | | | | | | | | | | | | | |
| Total expenses to average net assets | | | 0.76 | % | | | 0.77 | % | | | 0.77 | % | | | 0.77 | % | | | 0.79 | % |
| Net investment income (loss) to average net assets | | | 0.47 | % | | | 0.58 | % | | | 0.58 | % | | | 0.71 | % | | | 0.70 | % |
* The Fund was audited by an independent registered public accounting firm other than Ernst & Young LLP.
(a) The per-share data presented above is based upon the average shares outstanding for the periods presented.
(b) Assumes initial investment at net asset value at the beginning of each period, reinvestment of all distributions and the complete redemption of the investment at net asset value at the end of each period.
(c) Portfolio turnover excludes the value of portfolio securities received or delivered as a result of in-kind fund share transactions.
The accompanying notes are an integral part of these financial statements.
Pioneer Fundamental Growth Fund | Annual Report | 3/31/20 33
Notes to Financial Statements |
3/31/20 1. Organization and Significant Accounting Policies
Pioneer Fundamental Growth Fund (the “Fund”) is one of three portfolios comprising Pioneer Series Trust X, a Delaware statutory trust. The Fund is registered under the Investment Company Act of 1940 as a diversified, open-end management investment company. The Fund’s investment objective is to seek long-term capital growth.
The Fund offers five classes of shares designated as Class A, Class C, Class K, Class R and Class Y shares. Each class of shares represents an interest in the same portfolio of investments of the Fund and has identical rights (based on relative net asset values) to assets and liquidation proceeds. Share classes can bear different rates of class-specific fees and expenses, such as transfer agent and distribution fees. Differences in class-specific fees and expenses will result in differences in net investment income and, therefore, the payment of different dividends from net investment income earned by each class. The Amended and Restated Declaration of Trust of the Fund gives the Board of Trustees the flexibility to specify either per-share voting or dollar-weighted voting when submitting matters for shareowner approval. Under per-share voting, each share of a class of the Fund is entitled to one vote. Under dollar-weighted voting, a shareowner’s voting power is determined not by the number of shares owned, but by the dollar value of the shares on the record date. Each share class has exclusive voting rights with respect to matters affecting only that class, including with respect to the distribution plan for that class. There is no distribution plan for Class K or Class Y shares.
Amundi Pioneer Asset Management, Inc., an indirect, wholly owned subsidiary of Amundi and Amundi’s wholly owned subsidiary, Amundi USA, Inc., serves as the Fund’s investment adviser (the “Adviser”). Amundi Pioneer Distributor, Inc., an affiliate of Amundi Pioneer Asset Management, Inc., serves as the Fund’s distributor (the “Distributor”).
In August 2018, the Securities and Exchange Commission (“SEC”) released a Disclosure Update and Simplification Final Rule. The Final Rule amends Regulation S-X disclosure requirements to conform them to U.S. Generally Accepted Accounting Principles (“U.S. GAAP”) for investment companies. The Fund’s financial statements were prepared in compliance with the new amendments to Regulation S-X.
The Fund is an investment company and follows investment company accounting and reporting guidance under U.S. GAAP. U.S. GAAP requires the management of the Fund to make estimates and assumptions that affect the reported amounts of assets and liabilities, the disclosure of contingent assets
34 Pioneer Fundamental Growth Fund | Annual Report | 3/31/20
and liabilities at the date of the financial statements, and the reported amounts of income, expenses and gain or loss on investments during the reporting period. Actual results could differ from those estimates.
The following is a summary of significant accounting policies followed by the Fund in the preparation of its financial statements:
A. Security Valuation
The net asset value of the Fund is computed once daily, on each day the New York Stock Exchange (“NYSE”) is open, as of the close of regular trading on the NYSE.
Equity securities that have traded on an exchange are valued by using the last sale price on the principal exchange where they are traded. Equity securities that have not traded on the date of valuation, or securities for which sale prices are not available, generally are valued using the mean between the last bid and asked prices or, if both last bid and asked prices are not available, at the last quoted bid price. Last sale and bid and asked prices are provided by independent third party pricing services. In the case of equity securities not traded on an exchange, prices are typically determined by independent third party pricing services using a variety of techniques and methods.
The value of foreign securities is translated into U.S. dollars based on foreign currency exchange rate quotations supplied by a third party pricing source. Trading in non-U.S. equity securities is substantially completed each day at various times prior to the close of the NYSE. The values of such securities used in computing the net asset value of the Fund’s shares are determined as of such times. The Fund may use a fair value model developed by an independent pricing service to value non-U.S. equity securities.
Securities for which independent pricing services or broker-dealers are unable to supply prices or for which market prices and/or quotations are not readily available or are considered to be unreliable are valued by a fair valuation team comprised of certain personnel of the Adviser pursuant to procedures adopted by the Fund’s Board of Trustees. The Adviser’s fair valuation team uses fair value methods approved by the Valuation Committee of the Board of Trustees. The Adviser’s fair valuation team is responsible for monitoring developments that may impact fair valued securities and for discussing and assessing fair values on an ongoing basis, and at least quarterly, with the Valuation Committee of the Board of Trustees.
Pioneer Fundamental Growth Fund | Annual Report | 3/31/20 35
Fixed-income securities are valued by using prices supplied by independent pricing services, which consider such factors as market prices, market events, quotations from one or more brokers, Treasury spreads, yields, maturities and ratings, or may use a pricing matrix or other fair value methods or techniques to provide an estimated value of the security or instrument. A pricing matrix is a means of valuing a debt security on the basis of current market prices for other debt securities, historical trading patterns in the market for fixed income securities and/or other factors. Non-U.S. debt securities that are listed on an exchange will be valued at the bid price obtained from an independent third party pricing service. When independent third party pricing services are unable to supply prices, or when prices or market quotations are considered to be unreliable, the value of that security may be determined using quotations from one or more broker-dealers.
Inputs used when applying fair value methods to value a security may include credit ratings, the financial condition of the company, current market conditions and comparable securities. The Fund may use fair value methods if it is determined that a significant event has occurred after the close of the exchange or market on which the security trades and prior to the determination of the Fund’s net asset value. Examples of a significant event might include political or economic news, corporate restructurings, natural disasters, terrorist activity or trading halts. Thus, the valuation of the Fund’s securities may differ significantly from exchange prices, and such differences could be material.
At March 31, 2020, no securities were valued using fair value methods (other than securities valued using prices supplied by independent pricing services, broker-dealers or using a third party insurance industry pricing model).
B. Investment Income and Transactions
Dividend income is recorded on the ex-dividend date, except that certain dividends from foreign securities where the ex-dividend date may have passed are recorded as soon as the Fund becomes aware of the ex-dividend data in the exercise of reasonable diligence.
Interest income, including interest on income-bearing cash accounts, is recorded on the accrual basis. Dividend and interest income are reported net of unrecoverable foreign taxes withheld at the applicable country rates and net of income accrued on defaulted securities.
Interest and dividend income payable by delivery of additional shares is reclassified as PIK (payment-in-kind) income upon receipt and is included in interest and dividend income, respectively.
36 Pioneer Fundamental Growth Fund | Annual Report | 3/31/20
Security transactions are recorded as of trade date. Gains and losses on sales of investments are calculated on the identified cost method for both financial reporting and federal income tax purposes.
C. Federal Income Taxes
It is the Fund’s policy to comply with the requirements of the Internal Revenue Code applicable to regulated investment companies and to distribute all of its net taxable income and net realized capital gains, if any, to its shareowners. Therefore, no provision for federal income taxes is required. As of March 31, 2020, the Fund did not accrue any interest or penalties with respect to uncertain tax positions, which, if applicable, would be recorded as an income tax expense on the Statement of Operations. Tax returns filed within the prior three years remain subject to examination by federal and state tax authorities.
The amount and character of income and capital gain distributions to shareowners are determined in accordance with federal income tax rules, which may differ from U.S. GAAP. Distributions in excess of net investment income or net realized gains are temporary over distributions for financial statement purposes resulting from differences in the recognition or classification of income or distributions for financial statement and tax purposes. Capital accounts within the financial statements are adjusted for permanent book/tax differences to reflect tax character, but are not adjusted for temporary differences.
At March 31, 2020, the Fund reclassified $26,469,330 to decrease distributable earnings and $26,469,330 to increase paid-in capital to reflect permanent book/tax differences. These adjustments have no impact on net assets or the results of operations.
The tax character of distributions paid during the years ended March 31, 2020 and March 31, 2019, was as follows:
| | | | | | | |
| | 2020 | | | 2019 | |
| Distributions paid from: | | | | | | |
| Ordinary income | | $ | 18,163,279 | | | $ | 34,716,252 | |
Long-term capital gain | | | 332,234,832 | | | | 297,600,067 | |
| Total | | $ | 350,398,111 | | | $ | 332,316,319 | |
Pioneer Fundamental Growth Fund | Annual Report | 3/31/20 37
The following shows the components of distributable earnings on a federal income tax basis at March 31, 2020:
| | | | |
| | 2020 | |
| Distributable earnings: | | | |
| Undistributed ordinary income | | $ | 7,478,226 | |
| Undistributed long-term capital gain | | | 203,129,674 | |
Unrealized appreciation | | | 1,421,415,724 | |
| Total | | $ | 1,632,023,624 | |
The difference between book-basis and tax-basis unrealized appreciation is attributable to the tax deferral of losses on wash sales and tax basis adjustments on common stock.
D. Fund Shares
The Fund records sales and repurchases of its shares as of trade date. The Distributor earned $154,466 in underwriting commissions on the sale of Class A shares during the year ended March 31, 2020.
E. Class Allocations
Income, common expenses and realized and unrealized gains and losses are calculated at the Fund level and allocated daily to each class of shares based on its respective percentage of adjusted net assets at the beginning of the day.
Distribution fees are calculated based on the average daily net asset value attributable to Class A, Class C and Class R shares of the Fund, respectively (see Note 4). Class K and Class Y shares do not pay distribution fees. All expenses and fees paid to the Fund’s transfer agent for its services are allocated among the classes of shares based on the number of accounts in each class and the ratable allocation of related out-of-pocket expenses (see Note 3).
Distributions to shareowners are recorded as of the ex-dividend date. Distributions paid by the Fund with respect to each class of shares are calculated in the same manner and at the same time, except that net investment income dividends to Class A, Class C, Class K, Class R and Class Y shares can reflect different transfer agent and distribution expense rates.
F. Risks
The value of securities held by the Fund may go up or down, sometimes rapidly or unpredictably, due to general market conditions, such as real or perceived adverse economic, political or regulatory conditions, recessions, the spread of infectious illness or other public health issues, inflation, changes
38 Pioneer Fundamental Growth Fund | Annual Report | 3/31/20
in interest rates, lack of liquidity in the bond markets or adverse investor sentiment. In the past several years, financial markets have experienced increased volatility, depressed valuations, decreased liquidity and heightened uncertainty. These conditions may continue, recur, worsen or spread.
At times, the Fund’s investments may represent industries or industry sectors that are interrelated or have common risks, making the Fund more susceptible to any economic, political, or regulatory developments or other risks affecting those industries and sectors. The Fund’s investments in foreign markets and countries with limited developing markets may subject the Fund to a greater degree of risk than investments in a developed market. These risks include disruptive political or economic conditions and the imposition of adverse governmental laws or currency exchange restrictions.
With the increased use of technologies such as the Internet to conduct business, the Fund is susceptible to operational, information security and related risks. While the Fund’s Adviser has established business continuity plans in the event of, and risk management systems to prevent, limit or mitigate, such cyber-attacks, there are inherent limitations in such plans and systems, including the possibility that certain risks have not been identified. Furthermore, the Fund cannot control the cybersecurity plans and systems put in place by service providers to the Fund such as Brown Brothers Harriman & Co., the Fund’s custodian and accounting agent, and DST Asset Manager Solutions, Inc., the Fund’s transfer agent. In addition, many beneficial owners of Fund shares hold them through accounts at broker-dealers, retirement platforms and other financial market participants over which neither the Fund nor Amundi Pioneer exercises control. Each of these may in turn rely on service providers to them, which are also subject to the risk of cyber-attacks. Cybersecurity failures or breaches at Amundi Pioneer or the Fund’s service providers or intermediaries have the ability to cause disruptions and impact business operations, potentially resulting in financial losses, interference with the Fund’s ability to calculate its net asset value, impediments to trading, the inability of Fund shareowners to effect share purchases, redemptions or exchanges or receive distributions, loss of or unauthorized access to private shareowner information and violations of applicable privacy and other laws, regulatory fines, penalties, reputational damage, or additional compliance costs. Such costs and losses may not be covered under any insurance. In addition, maintaining vigilance against cyber-attacks may involve substantial costs over time, and system enhancements may themselves be subject to cyber-attacks.
The Fund’s prospectus contains unaudited information regarding the Fund’s principal risks. Please refer to that document when considering the Fund’s principal risks.
Pioneer Fundamental Growth Fund | Annual Report | 3/31/20 39
2. Management Agreement
The Adviser manages the Fund’s portfolio. Management fees are paid monthly and are calculated daily at the annual rate of 0.65% of the Fund’s average daily net assets up to $1 billion, 0.60% of the next $6.5 billion and 0.55% on assets over $7.5 billion. For the year ended March 31, 2020, the effective management fee (excluding waivers and/or assumption of expenses) was equivalent to 0.61% of the Fund’s average daily net assets.
The Adviser has contractually agreed to limit ordinary operating expenses (ordinary operating expenses means all fund expenses other than extraordinary expenses, such as litigation, taxes, brokerage commissions and acquired fund fees and expenses) of the Fund to the extent required to reduce Fund expenses to 1.09%, 1.40% and 0.83% of the average daily net assets attributable to Class A, Class R, and Class Y shares, respectively. Class C and Class K shares do not have an expense limitation. These expense limitations are in effect through August 1, 2020. Fees waived and expenses reimbursed during the year ended March 31, 2020 are reflected on the Statement of Operations.
In addition, under the management and administration agreements, certain other services and costs, including accounting, regulatory reporting and insurance premiums, are paid by the Fund as administrative reimbursements. Included in “Due to affiliates” reflected on the Statement of Assets and Liabilities is $437,561 in management fees, administrative costs and certain other reimbursements payable to the Adviser at March 31, 2020.
3. Transfer Agent
DST Asset Manager Solutions, Inc. serves as the transfer agent to the Fund at negotiated rates. Transfer agent fees and payables shown on the Statement of Operations and the Statement of Assets and Liabilities, respectively, include sub-transfer agent expenses incurred through the Fund’s omnibus relationship contracts.
In addition, the Fund reimbursed the transfer agent for out-of-pocket expenses incurred by the transfer agent related to shareowner communications activities such as proxy and statement mailings, and outgoing phone calls. For the year ended March 31, 2020, such out-of-pocket expenses by class of shares were as follows:
| | | | |
| Shareowner Communications: | | | |
Class A | | $ | 85,144 | |
Class C | | | 40,131 | |
Class K | | | 20,216 | |
Class R | | | 7,714 | |
Class Y | | | 102,029 | |
| Total | | $ | 255,234 | |
40 Pioneer Fundamental Growth Fund | Annual Report | 3/31/20
4. Distribution and Service Plans
The Fund has adopted a distribution plan (the “Plan”) pursuant to Rule 12b-1 of the Investment Company Act of 1940 with respect to its Class A, Class C and Class R shares. Pursuant to the Plan, the Fund pays the Distributor 0.25% of the average daily net assets attributable to Class A shares as compensation for personal services and/or account maintenance services or distribution services with regard to Class A shares. Pursuant to the Plan, the Fund also pays the Distributor 1.00% of the average daily net assets attributable to Class C shares. The fee for Class C shares consists of a 0.25% service fee and a 0.75% distribution fee paid as compensation for personal services and/or account maintenance services or distribution services with regard to Class C shares. Pursuant to the Plan, the Fund further pays the Distributor 0.50% of the average daily net assets attributable to Class R shares for distribution services. Included in “Due to affiliates” reflected on the Statement of Assets and Liabilities is $84,083 in distribution fees payable to the Distributor at March 31, 2020.
The Fund also has adopted a separate service plan for Class R shares (“Service Plan”). The Service Plan authorizes the Fund to pay securities dealers, plan administrators or other service organizations that agree to provide certain services to retirement plans or plan participants holding shares of the Fund a service fee of up to 0.25% of the Fund’s average daily net assets attributable to Class R shares held by such plans.
In addition, redemptions of Class A and Class C shares may be subject to a contingent deferred sales charge (“CDSC”). A CDSC of 1.00% may be imposed on redemptions of certain net asset value purchases of Class A shares within 12 months of purchase. Redemptions of Class C shares within 12 months of purchase are subject to a CDSC of 1.00%, based on the lower of cost or market value of shares being redeemed. Shares purchased as part of an exchange remain subject to any CDSC that applied to the original purchase of those shares. There is no CDSC for Class K, Class R or Class Y shares. Proceeds from the CDSCs are paid to the Distributor. For the year ended March 31, 2020, CDSCs in the amount of $23,513 were paid to the Distributor.
5. In-Kind Redemption
In accordance with guidelines described in a Fund’s prospectus and in accordance with procedures adopted by the Board, a Fund may distribute portfolio securities rather than cash as payment for a redemption of Fund shares (“in-kind redemption”). For financial reporting purposes, the Fund recognizes a gain on in-kind redemptions to the extent the value of the distributed securities on the date of redemption exceeds the cost of those securities. Gains and losses realized on in-kind redemptions are not
Pioneer Fundamental Growth Fund | Annual Report | 3/31/20 41
recognized for tax purposes and are reclassified from undistributed realized gain/(loss) to paid-in capital. During the year ended March 31, 2020, the fund realized net gains of $26,554,900 on $125,892,667, of in-kind redemptions.
6. Line of Credit Facility
The Fund, along with certain other funds in the Pioneer Family of Funds (the “Funds”), participates in a committed, unsecured revolving line of credit facility. Borrowings are used solely for temporary or emergency purposes. The Fund may borrow up to the lesser of the amount available under the credit facility or the limits set for borrowing by the Fund’s prospectus and the 1940 Act. Effective March 11, 2020, the Fund participates in a facility that is in the amount of $300 million. Prior to March 11, 2020, the Fund participated in a facility in the amount of $250 million. Under such facility, depending on the type of loan, interest on borrowings is payable at the London Interbank Offered Rate (“LIBOR”) plus a credit spread. The Fund also pays an annual commitment fee to participate in a credit facility. The commitment fee is allocated among participating Funds based on an allocation schedule set forth in the credit agreement. For the year ended March 31, 2020, the Fund had no borrowings under the credit facility.
6. Subsequent Event
COVID-19
The respiratory illness COVID-19 caused by a novel coronavirus has resulted in a global pandemic and major disruption to economies and markets around the world, including the United States. Global financial markets have experienced extreme volatility and severe losses, and trading in many instruments has been disrupted. Liquidity for many instruments has been greatly reduced for periods of time. Some interest rates are very low and in some cases yields are negative. Some sectors of the economy and individual issuers have experienced particularly large losses. These circumstances may continue for an extended period of time, and may continue to affect adversely the value and liquidity of the fund’s investments. The ultimate economic fallout from the pandemic, and the long-term impact on economies, markets, industries and individual issuers, are not known. Governments and central banks, including the Federal Reserve in the U.S., have taken extraordinary and unprecedented actions to support local and global economies and the financial markets. These actions have resulted in significant expansion of public debt, including in the U.S. The impact of these measures, and whether they will be effective to mitigate the economic and market disruption, will not be known for some time. The consequences of high public debt, including its future impact on the economy and securities markets, likewise may not be known for some time.
42 Pioneer Fundamental Growth Fund | Annual Report | 3/31/20
Report of Independent Registered Public Accounting FirmTo the Board of Trustees of Pioneer Series Trust X and the Shareholders of
Pioneer Fundamental Growth Fund:
Opinion on the Financial Statements
We have audited the accompanying statement of assets and liabilities of Pioneer Fundamental Growth Fund (the “Fund”) (one of the funds constituting Pioneer Series Trust X (the “Trust”)), including the schedule of investments, as of March 31, 2020, and the related statement of operations for the year then ended, the statements of changes in net assets for each of the two years in the period then ended, the financial highlights for each of the three years in the period then ended and the related notes (collectively referred to as the “financial statements”). The financial highlights for the periods ended March 31, 2016 and March 31, 2017 were audited by another independent registered public accounting firm whose report, dated May 26, 2017, expressed an unqualified opinion on those financial highlights. In our opinion, the financial statements present fairly, in all material respects, the financial position of Pioneer Fundamental Growth Fund (one of the funds constituting Pioneer Series Trust X) at March 31, 2020, the results of its operations for the year then ended, the changes in its net assets for each of the two years in the period then ended, and its financial highlights for each of the three years in the period then ended in conformity with U.S. generally accepted accounting principles.
Basis for Opinion
These financial statements are the responsibility of the Trust’s management. Our responsibility is to express an opinion on the Fund’s financial statements based on our audits. We are a public accounting firm registered with the Public Company Accounting Oversight Board (United States) (“PCAOB”) and are required to be independent with respect to the Trust in accordance with the U.S. federal securities laws and the applicable rules and regulations of the Securities and Exchange Commission and the PCAOB.
We conducted our audits in accordance with the standards of the PCAOB. Those standards require that we plan and perform the audit to obtain reasonable assurance about whether the financial statements are free of material misstatement, whether due to error or fraud. The Trust is not required to have, nor were we engaged to perform, an audit of the Trust’s internal control over financial reporting. As part of our audits, we are required to obtain an understanding of internal control over financial reporting, but not for the purpose of expressing an opinion on the effectiveness of the Trust’s internal control over financial reporting. Accordingly, we express no such opinion.
Pioneer Fundamental Growth Fund | Annual Report | 3/31/20 43
Our audits included performing procedures to assess the risks of material misstatement of the financial statements, whether due to error or fraud, and performing procedures that respond to those risks. Such procedures included examining, on a test basis, evidence regarding the amounts and disclosures in the financial statements. Our procedures included confirmation of securities owned as of March 31, 2020, by correspondence with the custodian and brokers. Our audits also included evaluating the accounting principles used and significant estimates made by management, as well as evaluating the overall presentation of the financial statements. We believe that our audits provide a reasonable basis for our opinion.
We have served as the auditor of one or more Amundi Pioneer investment companies since 2017.
Boston, Massachusetts
May 29, 2020
44 Pioneer Fundamental Growth Fund | Annual Report | 3/31/20
For the year ended March 31, 2020, certain dividends paid by the Fund may be subject to a maximum tax rate of 20%. The Fund intends to designate up to the maximum amount of such dividends allowable as taxed at a maximum rate of 20%. Complete information will be computed and reported in conjunction with your 2020 Form 1099-DIV.
The qualifying percentage of the Fund’s ordinary income dividends for the purpose of the corporate dividends received deduction was 100.00%.
Pioneer Fundamental Growth Fund | Annual Report | 3/31/20 45
Trustees, Officers and Service ProvidersInvestment Adviser and AdministratorAmundi Pioneer Asset Management, Inc.
Custodian and Sub-AdministratorBrown Brothers Harriman & Co.
Independent Registered Public Accounting FirmErnst & Young LLP
Principal UnderwriterAmundi Pioneer Distributor, Inc.
Legal CounselMorgan, Lewis & Bockius LLP
Transfer AgentDST Asset Manager Solutions, Inc.
Proxy Voting Policies and Procedures of the Fund are available without charge, upon request, by calling our toll free number (1-800-225-6292). Information regarding how the Fund voted proxies relating to portfolio securities during the most recent 12-month period ended June 30 is publicly available to shareowners at www.amundipioneer.com/us. This information is also available on the Securities and Exchange Commission’s web site at www.sec.gov.
Trustees and Officers
The Fund’s Trustees and officers are listed below, together with their principal occupations and other directorships they have held during at least the past five years. Trustees who are interested persons of the Fund within the meaning of the 1940 Act are referred to as Interested Trustees. Trustees who are not interested persons of the Fund are referred to as Independent Trustees. Each of the Trustees serves as a Trustee of each of the 45 U.S. registered investment portfolios for which Amundi Pioneer serves as investment adviser (the “Pioneer Funds”). The address for all Trustees and all officers of the Fund is 60 State Street, Boston, Massachusetts 02109.
The Statement of Additional Information of the Fund includes additional information about the Trustees and is available, without charge, upon request, by calling 1-800-225-6292.
46 Pioneer Fundamental Growth Fund | Annual Report | 3/31/20
Independent Trustees
| | | | |
| Name, Age and Position | Term of Office and | | Other Directorships |
| Held With the Fund | Length of Service | Principal Occupation | Held by Trustee |
Thomas J. Perna (68) Chairman of the Board and Trustee | Trustee since 2006. Serves until a successor trustee is elected or earlier retirement or removal. | Private investor (2004 – 2008 and 2013 – present); Chairman (2008 – 2013) and Chief Executive Officer (2008 – 2012), Quadriserv, Inc. (technology products for securities lending industry); and Senior Executive Vice President, The Bank of New York (financial and securities services) (1986 – 2004) | Director, Broadridge Financial Solutions, Inc. (investor communications and securities processing provider for financial services industry) (2009 – present); Director, Quadriserv, Inc. (2005 – 2013); and Commissioner, New Jersey State Civil Service Commission (2011 – 2015) |
John E. Baumgardner, Jr. (68) Trustee | Trustee since 2019. Serves until a successor trustee is elected or earlier retirement or removal. | Of Counsel (2019 – present), Partner (1983-2018), Sullivan & Cromwell LLP (law firm). | Chairman, The Lakeville Journal Company, LLC, (privately-held community newspaper group) (2015-present) |
Diane Durnin (63) Trustee | Trustee since 2019. Serves until a successor trustee is elected or earlier retirement or removal. | Managing Director - Head of Product Strategy and Development, BNY Mellon Investment Management (2012-2018); Vice Chairman – The Dreyfus Corporation (2005 – 2018): Executive Vice President Head of Product, BNY Mellon Investment Management (2007-2012); Executive Director- Product Strategy, Mellon Asset Management (2005-2007); Executive Vice President Head of Products, Marketing and Client Service, Dreyfus Corporation (2000-2005); and Senior Vice President Strategic Product and Business Development, Dreyfus Corporation (1994-2000) | None |
Benjamin M. Friedman (75) Trustee | Trustee since 2008. Serves until a successor trustee is elected or earlier retirement or removal. | William Joseph Maier Professor of Political Economy, Harvard University (1972 – present) | Trustee, Mellon Institutional Funds Investment Trust and Mellon Institutional Funds Master Portfolio (oversaw 17 portfolios in fund complex) (1989 - 2008) |
Pioneer Fundamental Growth Fund | Annual Report | 3/31/20 47
Independent Trustees (continued)
| | | | |
| Name, Age and Position | Term of Office and | | Other Directorships |
| Held With the Fund | Length of Service | Principal Occupation | Held by Trustee |
Lorraine H. Monchak (64) Trustee | Trustee since 2017. (Advisory Trustee from 2014 - 2017). Serves until a successor trustee is elected or earlier retirement or removal.
| Chief Investment Officer, 1199 SEIU Funds (healthcare workers union pension funds) (2001 – present); Vice President – International Investments Group, American International Group, Inc. (insurance company) (1993 – 2001); Vice President – Corporate Finance and Treasury Group, Citibank, N.A. (1980 – 1986 and 1990 – 1993); Vice President – Asset/Liability Management Group, Federal Farm Funding Corporation (government-sponsored issuer of debt securities) (1988 – 1990); Mortgage Strategies Group, Shearson Lehman Hutton, Inc. (investment bank) (1987 – 1988); and Mortgage Strategies Group, Drexel Burnham Lambert, Ltd. (investment bank) (1986 – 1987) | None |
Marguerite A. Piret (71) Trustee | Trustee since 2002. Serves until a successor trustee is elected or earlier retirement or removal. | Chief Financial Officer, American Ag Energy, Inc. (controlled environment and agriculture company) (2016 – present); and President and Chief Executive Officer, Metric Financial Inc. (formerly known as Newbury Piret Company) (investment banking firm) (1981 – 2019) | Director of New America High Income Fund, Inc. (closed-end investment company) (2004 – present); and Member, Board of Governors, Investment Company Institute (2000 – 2006) |
Fred J. Ricciardi (73) Trustee | Trustee since 2014. Serves until a successor trustee is elected or earlier retirement or removal. | Consultant (investment company services) (2012 – present); Executive Vice President, BNY Mellon (financial and investment company services) (1969 – 2012); Director, BNY International Financing Corp. (financial services) (2002 – 2012); Director, Mellon Overseas Investment Corp. (financial services) (2009 – 2012); Director, Financial Models (technology) (2005-2007); Director, BNY Hamilton Funds, Ireland (offshore investment companies) (2004-2007); Chairman/Director, AIB/BNY Securities Services, Ltd., Ireland (financial services) (1999-2006); and Chairman, BNY Alternative Investment Services, Inc. (financial services) (2005-2007) | None |
48 Pioneer Fundamental Growth Fund | Annual Report | 3/31/20
Interested Trustees
| | | | |
| Name, Age and Position | Term of Office and | | Other Directorships |
| Held With the Fund | Length of Service | Principal Occupation | Held by Trustee |
Lisa M. Jones (58)* Trustee, President and Chief Executive Officer | Trustee since 2017. Serves until a successor trustee is elected or earlier retirement or removal | Director, CEO and President of Amundi Pioneer Asset Management USA, Inc. (since September 2014); Director, CEO and President of Amundi Pioneer Asset Management, Inc. (since September 2014); Director, CEO and President of Amundi Pioneer Distributor, Inc. (since September 2014); Director, CEO and President of Amundi Pioneer Institutional Asset Management, Inc. (since September 2014); Chair, Amundi Pioneer Asset Management USA, Inc., Amundi Pioneer Distributor, Inc. and Amundi Pioneer Institutional Asset Management, Inc. (September 2014 – 2018); Managing Director, Morgan Stanley Investment Management (2010 – 2013); Director of Institutional Business, CEO of International, Eaton Vance Management (2005 – 2010); and Director of Amundi USA, Inc. (since 2017) | None |
Kenneth J. Taubes (62)* Trustee | Trustee since 2014. Serves until a successor trustee is elected or earlier retirement or removal | Director and Executive Vice President (since 2008) and Chief Investment Officer, U.S. (since 2010) of Amundi Pioneer Asset Management USA, Inc.; Director and Executive Vice President and Chief Investment Officer, U.S. of Amundi Pioneer (since 2008); Executive Vice President and Chief Investment Officer, U.S. of Amundi Pioneer Institutional Asset Management, Inc. (since 2009); Portfolio Manager of Amundi Pioneer (since 1999); and Director of Amundi USA, Inc. (since 2017) | None |
* Ms. Jones and Mr. Taubes are Interested Trustees because they are officers or directors of the Fund’s investment adviser and certain of its affiliates.
Pioneer Fundamental Growth Fund | Annual Report | 3/31/20 49
Fund Officers
| | | | |
| Name, Age and Position | Term of Office and | | Other Directorships |
| Held With the Fund | Length of Service | Principal Occupation | Held by Officer |
Christopher J. Kelley (55) Secretary and Chief Legal Officer | Since 2003. Serves at the discretion of the Board | Vice President and Associate General Counsel of Amundi Pioneer since January 2008; Secretary and Chief Legal Officer of all of the Pioneer Funds since June 2010; Assistant Secretary of all of the Pioneer Funds from September 2003 to May 2010; and Vice President and Senior Counsel of Amundi Pioneer from July 2002 to December 2007 | None |
Carol B. Hannigan (59) Assistant Secretary | Since 2010. Serves at the discretion of the Board | Fund Governance Director of Amundi Pioneer since December 2006 and Assistant Secretary of all the Pioneer Funds since June 2010; Manager – Fund Governance of Amundi Pioneer from December 2003 to November 2006; and Senior Paralegal of Amundi Pioneer from January 2000 to November 2003 | None |
Thomas Reyes (57) Assistant Secretary | Since 2010. Serves at the discretion of the Board | Assistant General Counsel of Amundi Pioneer since May 2013 and Assistant Secretary of all the Pioneer Funds since June 2010; and Counsel of Amundi Pioneer from June 2007 to May 2013 | None |
Mark E. Bradley (60) Treasurer and Chief Financial and Accounting Officer | Since 2008. Serves at the discretion of the Board | Vice President – Fund Treasury of Amundi Pioneer; Treasurer of all of the Pioneer Funds since March 2008; Deputy Treasurer of Amundi Pioneer from March 2004 to February 2008; and Assistant Treasurer of all of the Pioneer Funds from March 2004 to February 2008 | None |
Luis I. Presutti (55) Assistant Treasurer | Since 2002. Serves at the discretion of the Board | Director – Fund Treasury of Amundi Pioneer; and Assistant Treasurer of all of the Pioneer Funds | None |
Gary Sullivan (62) Assistant Treasurer | Since 2002. Serves at the discretion of the Board | Senior Manager – Fund Treasury of Amundi Pioneer; and Assistant Treasurer of all of the Pioneer Funds | None |
50 Pioneer Fundamental Growth Fund | Annual Report | 3/31/20
| | | | |
| Name, Age and Position | Term of Office and | | Other Directorships |
| Held With the Fund | Length of Service | Principal Occupation | Held by Officer |
Antonio Furtado (38) Assistant Treasurer | Since 2020. Serves at the discretion of the Board | Fund Oversight Manager – Fund Treasury of Amundi Pioneer; and Assistant Treasurer of all of the Pioneer Funds | None |
John Malone (48) Chief Compliance Officer | Since 2018. Serves at the discretion of the Board | Managing Director, Chief Compliance Officer of Amundi Pioneer Asset Management; Amundi Pioneer Institutional Asset Management, Inc.; and the Pioneer Funds since September 2018; and Chief Compliance Officer of Amundi Pioneer Distributor, Inc. since January 2014. | None |
Kelly O’Donnell (49) Anti-Money Laundering Officer | Since 2006. Serves at the discretion of the Board | Vice President – Amundi Pioneer Asset Management; and Anti-Money Laundering Officer of all the Pioneer Funds since 2006 | None |
Pioneer Fundamental Growth Fund | Annual Report | 3/31/20 51
This page was intentionally left blank.
52 Pioneer Fundamental Growth Fund | Annual Report | 3/31/20
How to Contact Amundi Pioneer
We are pleased to offer a variety of convenient ways for you to contact us for assistance or information.
| | | |
| Call us for: | | |
Account Information, including existing accounts, | |
new accounts, prospectuses, applications | |
and service forms | | 1-800-225-6292 |
| | | |
FactFoneSM for automated fund yields, prices, | |
account information and transactions | 1-800-225-4321 |
| | |
| Retirement plans information | 1-800-622-0176 |
|
| Write to us: | | |
Amundi Pioneer | | |
P.O. Box 219427 | | |
Kansas City, MO 64121-9427 | | |
| | | |
| Our toll-free fax | | 1-800-225-4240 |
| | | |
| Our internet e-mail address | us.askamundipioneer@amundipioneer.com |
(for general questions about Amundi Pioneer only) | |
Visit our web site: www.amundipioneer.com/us
This report must be preceded or accompanied by a prospectus.
The Fund files a complete schedule of portfolio holdings with the Securities and Exchange Commission for the first and third quarters of each fiscal year as an exhibit to its reports on Form N-PORT. Shareholders may view the filed Form N-PORT by visiting the Commission’s web site at https://www.sec.gov.
Amundi Pioneer Asset Management, Inc.
60 State Street
Boston, MA 02109
www.amundipioneer.com/us
Securities offered through Amundi Pioneer Funds Distributor, Inc.
60 State Street, Boston, MA 02109
Underwriter of Pioneer Mutual Funds, Member SIPC
© 2020 Amundi Pioneer Asset Management 19341-14-0520
Pioneer Dynamic
Credit Fund
Annual Report | March 31, 2020
| | |
| Ticker Symbols: |
Class A | RCRAX |
Class C | RCRCX |
Class Y | RCRYX |
Beginning in March 2021, as permitted by regulations adopted by the Securities and Exchange Commission, paper copies of the Fund’s shareholder reports like this one will no longer be sent by mail, unless you specifically request paper copies of the reports from the Fund or from your financial intermediary, such as a broker-dealer, bank or insurance company. Instead, the reports will be made available on the Fund’s website, and you will be notified by mail each time a report is posted and provided with a website link to access the report.
If you already elected to receive shareholder reports electronically, you will not be affected by this change and you need not take any action. You may elect to receive shareholder reports and other communications electronically by contacting your financial intermediary or, if you invest directly with the Fund, by calling 1-800-225-6292.
You may elect to receive all future reports in paper free of charge. If you invest directly with the Fund, you can inform the Fund that you wish to continue receiving paper copies of your shareholder reports by calling 1-800-225-6292. If you invest through a financial intermediary, you can contact your financial intermediary to request that you continue to receive paper copies of your shareholder reports. Your election to receive reports in paper will apply to all funds held in your account if you invest through your financial intermediary or all funds held within the Pioneer Fund complex if you invest directly.
visit us: www.amundipioneer.com/us
| | |
| |
|
| 2 |
| 4 |
| 10 |
| 11 |
| 12 |
| 15 |
| 17 |
| 32 |
| 39 |
| 57 |
| 59 |
| 60 |
Pioneer Dynamic Credit Fund | Annual Report | 3/31/20 1
Dear Shareholders,
The new decade has arrived delivering a first quarter that will go down in the history books. The beginning of the year seemed to extend the positive market environment of 2019 and then, March roared in like a lion and the COVID-19 pandemic became a global crisis impacting lives and life as we know it. The impact on the global economy from the COVID-19 virus pandemic, while currently unknown, is likely to be considerable. It is clear that several industries have already felt greater effects than others. And the markets, which do not thrive on uncertainty, have been volatile. Our business continuity plan was implemented given the new COVID-19 guidelines, and most of our employees are working remotely. To date, our operating environment has faced no interruption. I am proud of the careful planning that has taken place and confident we can maintain this environment for as long as is prudent. History in the making for a company that first opened its doors way back in 1928.
Since 1928, Amundi Pioneer’s investment process has been built on a foundation of fundamental research and active management, principles which have guided our investment decisions for more than 90 years. We believe active management – that is, making active investment decisions – can help mitigate the potential risks during periods of market volatility. As the early days of 2020 have reminded us, in today’s global economy, investment risk can materialize from a number of factors, including a slowing economy, changing U.S. Federal Reserve policy, oil price shocks, political and geopolitical factors and, unfortunately, major public health concerns such as a viral pandemic.
At Amundi Pioneer, active management begins with our own fundamental, bottom-up research process. Our team of dedicated research analysts and portfolio managers analyze each security under consideration, communicating directly with the management teams of the companies issuing the securities and working together to identify those securities that best meet our investment criteria for our family of funds. Our risk management approach begins with each and every security, as we strive to carefully understand the potential opportunity, while considering any and all risk factors.
2 Pioneer Dynamic Credit Fund | Annual Report | 3/31/20
Today, as investors, we have many options. It is our view that active management can serve shareholders well, not only when markets are thriving, but also during periods of market stress. As you consider your long-term investment goals, we encourage you to work with your financial advisor to develop an investment plan that paves the way for you to pursue both your short-term and long-term goals.
We remain confident that the current crisis, like others in human history, will pass, and we greatly appreciate the trust you have placed in us and look forward to continuing to serve you in the future.
Sincerely,
Lisa M. Jones
Head of the Americas, President and CEO of U.S.
Amundi Pioneer Asset Management USA, Inc.
March 31, 2020
Any information in this shareowner report regarding market or economic trends or the factors influencing the Fund’s historical or future performance are statements of opinion as of the date of this report. Past performance is no guarantee of future results.
Pioneer Dynamic Credit Fund | Annual Report | 3/31/20 3
Portfolio Management Discussion |
3/31/20 In the following interview, Michael Temple and Kevin Choy discuss the principal factors that affected the performance of Pioneer Dynamic Credit Fund during the 12-month period ended March 31, 2020, Mr. Temple, Managing Director, Director of Corporate Credit Research, U.S., and a portfolio manager at Amundi Pioneer Asset Management, Inc. (Amundi Pioneer), and Mr. Choy, a vice president and a portfolio manager at Amundi Pioneer, are responsible for the day-to-day management of the Fund.
Q How did the Fund perform during the 12-month period ended March 31, 2020?
A Pioneer Dynamic Credit Fund’s Class A shares returned -10.59% at net asset value during the 12-month period ended March 31, 2020, while the Fund’s benchmark, the ICE Bank of America U.S. Dollar 3-Month LIBOR Index (the ICE BofA Index), returned 2.38%. During the same period, the average return of the 316 mutual funds in Morningstar’s Multisector Bond Funds category was -4.16%.
Q How would you describe the investment backdrop in the fixed-income markets during the 12-month period ended March 31, 2020?
A The 12-month period was unusual in that it encompassed two distinct parts. The first part, which ran from April 2019 through mid-February of 2020, was a generally favorable time for the markets. Amid signs that a slowing global economy could begin to have a negative effect on the U.S. economy, the U.S. Federal Reserve (Fed) moved to an accommodative policy stance and enacted three 0.25% interest-rate cuts over the second half of the 2019 calendar year. In combination with a backdrop of steady domestic economic growth and positive investor sentiment, the Fed’s actions contributed to broad-based gains across the fixed-income market and robust relative performance for credit-sensitive investments.
Those favorable conditions changed abruptly in the middle of February 2020, however, when it became clear that the highly contagious COVID-19 virus had begun to spread beyond China and throughout the globe, eventually becoming a pandemic. As world governments shut down large swaths of their economies to help contain the spread of the virus, the outlook for both gross domestic product (GDP) and for corporate earnings deteriorated dramatically. Market participants responded by moving out of riskier positions and into so-called “safe havens,” such as U.S. Treasuries. In
4 Pioneer Dynamic Credit Fund | Annual Report | 3/31/20
the bond market, the imbalance of sellers and buyers led to a sharp, dramatic downturn in the prices of credit-sensitive assets such as investment-grade corporates, high-yield bonds, and senior loans. Conversely, U.S. Treasuries staged a strong rally in the ensuing “flight to quality” over the final weeks of the 12-month period.
Global governments and central banks responded with massive stimulus programs in an attempt to help offset the effects of the virus-related shutdowns on both economies and the markets for riskier assets, which had sold off dramatically. In the United States, for instance, the Fed cut short-term interest rates to zero and announced a wide range of lending and asset-purchase facilities, while the U.S. government passed an estimated $2 trillion financial aid bill for both workers and businesses. Credit-sensitive markets had a positive response to those initiatives and staged an impressive rally in the final week of March, but the various credit-sensitive asset classes nonetheless finished the full 12-month period in negative territory.
Q What were the principal factors that affected the Fund’s benchmark-relative performance during the 12-month period ended March 31, 2020?
A Our preference for investing the Fund in the credit-sensitive sectors was a key detractor from benchmark-relative performance over the full 12-month period, even though the positions had fared reasonably well for most of the fiscal year before declining sharply in the market sell-off spawned by COVID-19. Specifically, the Fund’s allocations to high-yield bonds and investment-grade corporates detracted from relative returns, as did portfolio positions in senior loans and securitized assets. We gradually reduced the portfolio’s risk exposure over the course of the 12-month period by decreasing the Fund’s weightings in loans and high-yield bonds. At the same time, we rotated the portfolio into higher-quality segments of the credit sectors, including asset-backed securities (ABS). While the shift helped to cushion some of the negative performance effects of the late-period market sell-off, the Fund nonetheless underperformed the benchmark given that all of the asset categories in which it was invested lagged the ICE BofA Index, which is concentrated in non-credit-sensitive issues.
On the plus side, our efforts to manage tail risk – that is, the chance that unexpected developments could lead to a sharp sell-off across the markets - contributed positively to the Fund’s returns by helping to ease some of the pain inflicted by the market downturn during February and March. The
Pioneer Dynamic Credit Fund | Annual Report | 3/31/20 5
Fund also benefited from its weightings in cash and U.S. Treasuries during the 12-month period. In addition, an allocation to insurance-linked securities (ILS), which are issued by property-and-casualty insurers to help mitigate the risk of having to payout claims in the wake of natural disasters, contributed modestly to the Fund’s benchmark-relative results. ILS have typically had little or no correlation to the performance of financial markets, a characteristic that helped the asset class outperform most other riskier assets over the 12-month period. We opted to gradually reduce the Fund’s exposure to ILS as the period progressed.
Q Did the Fund have exposure to derivative securities during the 12-month period ended March 31, 2020? If so, how did the derivatives affect the Fund’s performance?
A The Fund had investments in several types of derivatives during the 12-month period. We used credit default swaps to manage the portfolio’s exposure to credit-linked securities. In addition, we invested the portfolio in interest-rate futures to help manage duration risk, and we used forward foreign currency contracts to take directional views on underlying economies as well as to manage the risks associated with investments denominated in foreign currencies. (Duration is a measure of the sensitivity of the price, or the value of principal, of a fixed-income investment to a change in interest rates, expressed as a number of years.)
Our credit-linked derivative strategies detracted from the Fund’s performance, while the interest-rate strategies contributed positively to performance. As mentioned earlier, our attempts to manage tail risk, which involved the use of derivatives, also contributed positively to relative returns. The currency forwards had little effect on the Fund’s results.
Q Were there any changes to the Fund’s yield, or distributions* to shareholders, during the 12-month period ended March 31, 2020?
A The Fund’s yield rose compared to its level on March 31, 2019, primarily as a result of the general increase in prevailing market yields over the majority of the 12-month period.
Please see the Notes to Financial Statements for more information about how the Fund distributes income to shareholders.
* Distributions are not guaranteed.
6 Pioneer Dynamic Credit Fund | Annual Report | 3/31/20
Q How would you characterize broader fixed-income market conditions in the wake of the recent sell-off, and your investment approach as the Fund enters a new fiscal year?
A The markets were mired in a great deal of uncertainty as the 12-month period drew to a close, and volatility remained very high as investors struggled to assess the economic outlook. We believe we are unlikely to see a return to the previous, more positive environment for quite some time, and we have been preparing for that eventuality. With that said, we made few major changes to the portfolio as prices turned lower towards the end of the period, given that the Fund had already been positioned in a defensive fashion.
We did reduce the Fund’s duration exposure to a certain degree, as we believe a lower duration could potentially help mitigate portfolio volatility, and we see the positioning as appropriate given the extent to which yields have already fallen. We also have maintained above-average Fund weightings in cash and short-term securities to provide us with the flexibility to capitalize on additional market fluctuations in the months ahead. Not least, we have continued to emphasize portfolio investments in corporate bonds issued by companies with robust, sustainable cash flows and strong balance sheets, over issuers that are potentially exposed to greater financial risk. In our view, the possibility of a protracted economic downturn will result in clear winners and losers emerging on the other side, which makes intensive, bottom-up security analysis even more essential.
As always, we believe flexibility remains a key part of our investment process in managing the Fund. We have the ability to manage the portfolio similarly to the way an unconstrained fund might be managed, which means we can increase or decrease credit- or interest-rate risk depending on our economic outlook and assessments of current valuations. We view that degree of flexibility as being crucial in helping us to potentially navigate the Fund through what is currently an unprecedented set of circumstances affecting the global economy.
Note to shareholders: The Fund’s Board of Trustees has approved the reorganization of Pioneer Dynamic Credit Fund with Pioneer Corporate High Yield Fund. It is expected that the reorganization will be completed sometime during the third calendar quarter of 2020. The reorganization does not require shareholder approval. The combined fund will have the same investment strategies and policies and the same portfolio management team as Pioneer Corporate High Yield Fund. It is anticipated that the performance history of the combined fund will be that of Pioneer Corporate High Yield Fund, and the combined fund will be named Pioneer Corporate High Yield Fund.
Pioneer Dynamic Credit Fund | Annual Report | 3/31/20 7
Please refer to the Schedule of Investments on pages 17–31 for a full listing of Fund securities.
All investments are subject to risk, including the possible loss of principal. In the past several years, financial markets have experienced increased volatility and heightened uncertainty. The market prices of securities may go up or down, sometimes rapidly or unpredictably, due to general market conditions, such as real or perceived adverse economic, political, or regulatory conditions, recessions, inflation, changes in interest or currency rates, lack of liquidity in the bond markets, the spread of infectious illness or other public health issues or adverse investor sentiment. These conditions may continue, recur, worsen or spread.
The Fund has the ability to invest in a wide variety of debt securities.
The Fund may invest in underlying funds, including ETFs. In addition to the Fund’s operating expenses, you will indirectly bear the operating expenses of investments in any underlying funds.
The Fund and some of the underlying funds utilize strategies that have a leveraging effect on the Fund, which increases the volatility of investment returns and subjects the Fund to magnified losses if the Fund’s or an underlying fund’s investments decline in value.
The Fund and some of the underlying funds may use derivatives, such as options and futures, which can be illiquid, may disproportionately increase losses, and have a potentially large impact on Fund performance.
The Fund may invest in inflation-linked securities. As inflationary expectations increase, inflation-linked securities may become more attractive, because they protect future interest payments against inflation. Conversely, as inflationary concerns decrease, inflation-linked securities will become less attractive and less valuable.
The Fund may invest in credit default swaps, which may in some cases be illiquid, and they increase credit risk since the Fund has exposure to both the issuer of the referenced obligation and the counterparty to the credit default swap.
The Fund may invest in floating-rate loans. The value of collateral, if any, securing a floating-rate loan can decline or may be insufficient to meet the issuer’s obligations or may be difficult to liquidate.
8 Pioneer Dynamic Credit Fund | Annual Report | 3/31/20
The Fund may invest in insurance-linked securities. The return of principal and the payment of interest and/or dividends on insurance linked securities are contingent on the non-occurrence of a pre-defined “trigger” event, such as a hurricane or an earthquake of a specific magnitude.
The Fund may invest in zero coupon bonds and payment-in-kind securities, which may be more speculative and fluctuate more in value than other fixed income securities. The accrual of income from these securities are payable as taxable annual dividends to shareholders.
Investments in equity securities are subject to price fluctuation.
Investments in fixed-income securities involve interest rate, credit, inflation, and reinvestment risks. As interest rates rise, the value of fixed-income securities generally falls.
The Fund may invest in mortgage-backed securities, which during times of fluctuating interest rates may increase or decrease more than other fixed-income securities. Mortgage-backed securities are also subject to pre-payments.
Prepayment risk is the chance that an issuer may exercise its right to prepay its security, if falling interest rates prompt the issuer to do so. Forced to reinvest the unanticipated proceeds at lower interest rates, the Fund would experience a decline in income and lose the opportunity for additional price appreciation.
High-yield bonds possess greater price volatility, illiquidity, and possibility of default.
There is no assurance that these and other strategies used by the Fund or underlying funds will be successful.
The Fund is not intended to outperform stocks and bonds during strong market rallies.
These risks may increase share price volatility.
Please see the prospectus for a more complete discussion of the Fund’s risks.
Before investing, consider the product’s investment objectives, risks, charges and expenses. Contact your advisor or Amundi Pioneer Asset Management, Inc., for a prospectus or summary prospectus containing this information. Read it carefully.
Any information in this shareholder report regarding market or economic trends or the factors influencing the Fund’s historical or future performance are statements of opinion as of the date of this report. Past performance is no guarantee of future results.
Pioneer Dynamic Credit Fund | Annual Report | 3/31/20 9
Portfolio Summary |
3/31/20
| | | |
| 10 Largest Holdings | |
(As a percentage of total investments)* | |
| 1. | U.S. Treasury Notes, 2.125%, 12/31/22 | 6.50% |
| 2. | U.S. Treasury Floating Rate Notes, 0.239% (3 Month U.S. Treasury Bill | |
| Money Market Yield + 15 bps), 1/31/22 | 3.48 |
| 3. | Westlake Automobile Receivables Trust, Series 2018-3A, Class E, 4.9%, 12/15/23 (144A) | 2.12 |
| 4. | Iron Mountain, Inc., 4.875%, 9/15/27 (144A) | 1.76 |
| 5. | Progress Residential Trust, Series 2018-SFR2, Class E, 4.656%, 8/17/35 (144A) | 1.74 |
| 6. | Progress Residential Trust, Series 2018-SFR3, Class F, 5.368%, 10/17/35 (144A) | 1.72 |
| 7. | Aramark Services, Inc., 5.0%, 2/1/28 (144A) | 1.66 |
| 8. | Charter Communications Operating LLC/Charter Communications | |
| Operating Capital, 4.8%, 3/1/50 | 1.49 |
| 9. | Cascade Funding Mortgage Trust, Series 2018-RM2, Class D, 4.0%, 10/25/68 (144A) | 1.46 |
| 10. | Allergan Funding SCS, 4.75%, 3/15/45 | 1.46 |
* | Excludes temporary cash investments and all derivative contracts except for options purchased. The Fund is actively managed, and current holdings may be different. The holdings listed should not be considered recommendations to buy or sell any securities. |
10 Pioneer Dynamic Credit Fund | Annual Report | 3/31/20
| | | |
Prices and Distributions | 3/31/20 | |
|
| Net Asset Value per Share | | |
|
| Class | 3/31/20 | 3/31/19 |
| A | $7.75 | $9.04 |
| C | $7.73 | $9.00 |
| Y | $7.79 | $9.07 |
| | | | | | |
| Distributions per Share: 4/1/19–3/31/20 | | | |
|
| Net Investment | Short-Term | Long-Term | Tax Return |
| Class | Income | Capital Gains | Capital Gains | Of Capital |
| A | $0.3545 | $ — | $ — | $0.0234 |
| C | $0.2817 | $ — | $ — | $0.0234 |
| Y | $0.3862 | $ — | $ — | $0.0234 |
The ICE Bank of America U.S. Dollar 3-Month LIBOR Index is an unmanaged index that tracks the performance of a synthetic asset paying the London Interbank Offered Rate (LIBOR), with a constant 3-month average maturity. The index is based on the assumed purchase at par value of a synthetic instrument having exactly its stated maturity and with a coupon equal to that day’s 3-month LIBOR rate. Index returns assume reinvestment of dividends and, unlike Fund returns, do not reflect any fees, expenses or sales charges. It is not possible to invest directly in an index.
The index defined here pertains to the “Value of $10,000 Investment” and “Value of $5 Million Investment” charts on pages 12–14.
Pioneer Dynamic Credit Fund | Annual Report | 3/31/20 11
| | |
Performance Update | 3/31/20 | Class A Shares |
Investment Returns
The mountain chart on the right shows the change in value of a $10,000 investment made in Class A shares of Pioneer Dynamic Credit Fund at public offering price during the periods shown, compared to that of the ICE Bank of America (BofA) U.S. Dollar 3-Month LIBOR Index.
| Average Annual Total Returns | |
(As of March 31, 2020) | |
|
| | | ICE |
| | | BofA |
| Net | Public | U.S. Dollar |
| Asset | Offering | 3-Month |
| Value | Price | LIBOR |
| Period | (NAV) | (POP) | Index |
|
Life-of-Class | | | |
(4/29/11) | 1.66% | 1.14% | 0.94% |
5 years | 0.48 | -0.45 | 1.42 |
1 year | -10.59 | -14.62 | 2.38 |
|
|
| Expense Ratio | | |
(Per prospectus dated August 1, 2019) |
|
| Gross | Net | | |
|
1.28% | 1.27% | | |
Call 1-800-225-6292 or visit www.amundipioneer.com/us for the most recent month-end performance results. Current performance may be lower or higher than the performance data quoted.
The performance data quoted represents past performance, which is no guarantee of future results. Investment return and principal value will fluctuate, and shares, when redeemed, may be worth more or less than their original cost.
NAV results represent the percent change in net asset value per share. NAV returns would have been lower had sales charges been reflected. POP returns reflect deduction of maximum 4.50% sales charge. All results are historical and assume the reinvestment of dividends and capital gains. Other share classes are available for which performance and expenses will differ.
Performance results reflect any applicable expense waivers in effect during the periods shown. Without such waivers Fund performance would be lower. Waivers may not be in effect for all funds. Certain fee waivers are contractual through a specified period. Otherwise, fee waivers can be rescinded at any time. See the prospectus and financial statements for more information.
The net expense ratio reflects the contractual expense limitation currently in effect through August 1, 2020, for Class A shares. There can be no assurance that Amundi Pioneer will extend the expense limitation beyond such time. Please see the prospectus for more information.
The performance table and graph do not reflect the deduction of fees and taxes that a shareowner would pay on Fund distributions or the redemption of Fund shares.
Please refer to the financial highlights for more current expense ratios.
12 Pioneer Dynamic Credit Fund | Annual Report | 3/31/20
| | |
Performance Update | 3/31/20 | Class C Shares |
Investment Returns
The mountain chart on the right shows the change in value of a $10,000 investment made in Class C shares of Pioneer Dynamic Credit Fund during the periods shown, compared to that of the ICE Bank of America (BofA) U.S. Dollar 3-Month LIBOR Index.
| | | | |
| Average Annual Total Returns | |
(As of March 31, 2020) | |
|
| | | ICE |
| | | BofA |
| | | U.S. Dollar |
| | | 3-Month |
| If | If | LIBOR |
| Period | Held | Redeemed | Index
|
|
Life-of-Class | | | |
(4/29/11) | 0.88% | 0.88% | 0.94% |
5 years | -0.27 | -0.27 | 1.42 |
1 year | -11.14 | -11.14 | 2.38 |
|
|
| Expense Ratio | | |
(Per prospectus dated August 1, 2019) |
|
| Gross | | | |
|
2.07% | | | |
Call 1-800-225-6292 or visit www.amundipioneer.com/us for the most recent month-end performance results. Current performance may be lower or higher than the performance data quoted.
The performance data quoted represents past performance, which is no guarantee of future results. Investment return and principal value will fluctuate, and shares, when redeemed, may be worth more or less than their original cost.
Class C shares held for less than one year are subject to a 1% contingent deferred sales charge (CDSC). “If Held” results represent the percent change in net asset value per share. “If Redeemed” returns would have been lower had sales charges been reflected. All results are historical and assume the reinvestment of dividends and capital gains. Other share classes are available for which performance and expenses will differ.
Performance results reflect any applicable expense waivers in effect during the periods shown. Without such waivers Fund performance would be lower. Waivers may not be in effect for all funds. Certain fee waivers are contractual through a specified period. Otherwise, fee waivers can be rescinded at any time. See the prospectus and financial statements for more information.
The performance table and graph do not reflect the deduction of fees and taxes that a shareowner would pay on Fund distributions or the redemption of Fund shares.
Please refer to the financial highlights for a more current expense ratio.
Pioneer Dynamic Credit Fund | Annual Report | 3/31/20 13
| | |
Performance Update | 3/31/20 | Class Y Shares |
Investment Returns
The mountain chart on the right shows the change in value of a $5 million investment made in Class Y shares of Pioneer Dynamic Credit Fund during the periods shown, compared to that of the ICE Bank of America (BofA) U.S. Dollar 3-Month LIBOR Index.
| Average Annual Total Returns | |
(As of March 31, 2020) | |
|
| | ICE |
| | BofA |
| Net | U.S. Dollar |
| Asset | 3-Month |
| Value | LIBOR |
| Period | (NAV) | Index |
|
Life-of-Class | | |
(4/29/11) | 2.03% | 0.94% |
5 years | 0.81 | 1.42 |
1 year | -10.13 | 2.38 |
|
|
| Expense Ratio | |
(Per prospectus dated August 1, 2019) |
|
| Gross | Net | |
|
1.06% | 0.92% | |
Call 1-800-225-6292 or visit www.amundipioneer.com/us for the most recent month-end performance results. Current performance may be lower or higher than the performance data quoted.
The performance data quoted represents past performance, which is no guarantee of future results. Investment return and principal value will fluctuate, and shares, when redeemed, may be worth more or less than their original cost.
Class Y shares are not subject to sales charges and are available for limited groups of eligible investors, including institutional investors. All results are historical and assume the reinvestment of dividends and capital gains. Other share classes are available for which performance and expenses will differ.
Performance results reflect any applicable expense waivers in effect during the periods shown. Without such waivers Fund performance would be lower. Waivers may not be in effect for all funds. Certain fee waivers are contractual through a specified period. Otherwise, fee waivers can be rescinded at any time. See the prospectus and financial statements for more information.
The net expense ratio reflects the contractual expense limitation currently in effect through August 1, 2020, for Class Y shares. There can be no assurance that Amundi Pioneer will extend the expense limitation beyond such time. Please see the prospectus for more information.
The performance table and graph do not reflect the deduction of fees and taxes that a shareowner would pay on Fund distributions or the redemption of Fund shares.
Please refer to the financial highlights for more current expense ratios.
14 Pioneer Dynamic Credit Fund | Annual Report | 3/31/20
Comparing Ongoing Fund Expenses
As a shareowner in the Fund, you incur two types of costs:
(1) | ongoing costs, including management fees, distribution and/or service (12b-1) fees, and other Fund expenses; and |
(2) | transaction costs, including sales charges (loads) on purchase payments. |
This example is intended to help you understand your ongoing expenses (in dollars) of investing in the Fund and to compare these costs with the ongoing costs of investing in other mutual funds. The example is based on an investment of $1,000 at the beginning of the Fund’s latest six-month period and held throughout the six months.
Using the Tables
Actual Expenses
The first table below provides information about actual account values and actual expenses. You may use the information in this table, together with the amount you invested, to estimate the expenses that you paid over the period as follows:
(1) | Divide your account value by $1,000 |
| Example: an $8,600 account value ÷ $1,000 = 8.6 |
(2) | Multiply the result in (1) above by the corresponding share class’s number in the third row under the heading entitled “Expenses Paid During Period” to estimate the expenses you paid on your account during this period. |
Expenses Paid on a $1,000 Investment in Pioneer Dynamic Credit Fund
Based on actual returns from October 1, 2019 through March 31, 2020.
| Share Class | A | C | Y |
Beginning Account | $1,000.00 | $1,000.00 | $1,000.00 |
Value on 10/1/19 | | | |
Ending Account Value | $859.96 | $857.89 | $862.15 |
(after expenses) on 3/31/20 | | | |
Expenses Paid | $5.49 | $9.15 | $3.96 |
During Period* | | | |
* | Expenses are equal to the Fund’s annualized expense ratio of 1.18%, 1.97%, and 0.85% for Class A, Class C, and Class Y, respectively, multiplied by the average account value over the period, multiplied by 183/366 (to reflect the partial year period). |
Pioneer Dynamic Credit Fund | Annual Report | 3/31/20 15
Hypothetical Example for Comparison Purposes
The table below provides information about hypothetical account values and hypothetical expenses based on the Fund’s actual expense ratio and an assumed rate of return of 5% per year before expenses, which is not the Fund’s actual return. The hypothetical account values and expenses may not be used to estimate the actual ending account balance or expenses you paid for the period.
You may use this information to compare the ongoing costs of investing in the Fund and other funds. To do so, compare this 5% hypothetical example with the 5% hypothetical examples that appear in the shareholder reports of the other funds.
Please note that the expenses shown in the tables are meant to highlight your ongoing costs only and do not reflect any transaction costs, such as sales charges (loads) that are charged at the time of the transaction. Therefore, the table below is useful in comparing ongoing costs only and will not help you determine the relative total costs of owning different funds. In addition, if these transaction costs were included, your costs would have been higher.
Expenses Paid on a $1,000 Investment in Pioneer Dynamic Credit Fund
Based on a hypothetical 5% return per year before expenses, reflecting the period from October 1, 2019 through March 31, 2020.
| Share Class | A | C | Y |
Beginning Account | $1,000.00 | $1,000.00 | $1,000.00 |
Value on 10/1/19 | | | |
Ending Account Value | $1,019.10 | $1,015.00 | $1,020.75 |
(after expenses) on 3/31/20 | | | |
Expenses Paid | $5.96 | $9.92 | $4.29 |
During Period* | | | |
* | Expenses are equal to the Fund’s annualized expense ratio of 1.18%, 1.97%, and 0.85% for Class A, Class C, and Class Y, respectively, multiplied by the average account value over the period, multiplied by 183/366 (to reflect the partial year period). |
16 Pioneer Dynamic Credit Fund | Annual Report | 3/31/20
Schedule of Investments |
3/31/20| | | | |
| Principal | | | |
| Amount | | | |
| USD ($) | | | Value |
|
| | UNAFFILIATED ISSUERS — 94.7% | |
| | ASSET BACKED SECURITIES — 22.5% | |
| | of Net Assets | |
| 250,000(a) | | 522 Funding CLO I, Ltd., Series 2019-1A, Class E, 0.0% | |
| | | (3 Month USD LIBOR + 734 bps), 1/15/33 (144A) | $ 145,056 |
| 718,207 | | Access Point Funding I LLC, Series 2017-A, Class B, | |
| | | 3.97%, 4/15/29 (144A) | 716,589 |
| 250,000(a) | | AIG CLO, Ltd., Series 2019-2A, Class E, 9.12% (3 Month | |
| | | USD LIBOR + 725 bps), 10/25/32 (144A) | 143,011 |
| 250,000(a) | | Allegany Park CLO, Ltd., Series 2019-1A, Class E, 8.609% | |
| | | (3 Month USD LIBOR + 678 bps), 1/20/33 (144A) | 140,456 |
| 1,667,000 | | Amur Equipment Finance Receivables VI LLC, Series | |
| | | 2018-2A, Class F, 7.39%, 6/22/26 (144A) | 1,697,218 |
| 250,000(a) | | Apidos CLO XXXII, Series 2019-32A, Class E, 8.433% | |
| | | (3 Month USD LIBOR + 675 bps), 1/20/33 (144A) | 140,522 |
| 250,000(a) | | Battalion CLO IX, Ltd., Series 2015-9A, Class ER, 8.081% | |
| | | (3 Month USD LIBOR + 625 bps), 7/15/31 (144A) | 142,792 |
| 500,000(a) | | Benefit Street Partners CLO XIX, Ltd., Series 2019-19A, | |
| | | Class D, 5.678% (3 Month USD LIBOR + | |
| | | 380 bps), 1/15/33 (144A) | 362,327 |
| 500,000(a) | | Benefit Street Partners CLO XIX, Ltd., Series 2019-19A, | |
| | | Class E, 8.898% (3 Month USD LIBOR + | |
| | | 702 bps), 1/15/33 (144A) | 283,371 |
| 366,466 | | BXG Receivables Note Trust, Series 2018-A, Class C, | |
| | | 4.44%, 2/2/34 (144A) | 364,773 |
| 250,000(a) | | Carlyle US CLO, Ltd., Series 2019-4A, Class C, 5.878% | |
| | | (3 Month USD LIBOR + 400 bps), 1/15/33 (144A) | 186,524 |
| 1,000,000 | | Cig Auto Receivables Trust, Series 2019-1A, Class D, | |
| | | 4.85%, 5/15/26 (144A) | 711,199 |
| 1,000,000 | | Conn’s Receivables Funding LLC, Series 2019-A, Class C, | |
| | | 5.29%, 10/16/23 (144A) | 947,921 |
| 250,000(a) | | Dryden 78 CLO, Ltd., Series 2020-78A, Class E, 6.6% | |
| | | (3 Month USD LIBOR + 660 bps), 4/17/33 (144A) | 137,500 |
| 1,500,000 | | Elm Trust, Series 2018-2A, Class B, 5.584%, | |
| | | 10/20/27 (144A) | 1,502,625 |
| 800,000 | | Engs Commercial Finance Trust, Series 2016-1A, Class D, | |
| | | 5.22%, 1/22/24 (144A) | 797,750 |
| 250,000(a) | | First Eagle BSL CLO, Ltd., Series 2019-1A, Class C, | |
| | | 6.225% (3 Month USD LIBOR + 435 bps), 1/20/33 (144A) | 184,515 |
| 250,000(a) | | First Eagle BSL CLO, Ltd., Series 2019-1A, Class D, | |
| | | 9.575% (3 Month USD LIBOR + 770 bps), 1/20/33 (144A) | 144,215 |
| 250,000(a) | | First Eagle Commercial Loan Funding LLC, Series 2016-1A, | |
| | | Class CR, 6.794% (3 Month USD LIBOR + 500 bps), | |
| | | 1/25/32 (144A) | 236,399 |
| 250,000(a) | | Fort Washington CLO, Series 2019-1A, Class E, 9.158% (3 | |
| | | Month USD LIBOR + 725 bps), 10/20/32 (144A) | 142,956 |
| 1,800,000 | | Four Seas LP, Series 2017-1A, Class A2, 5.927%, | |
| | | 8/28/27 (144A) | 1,629,000 |
The accompanying notes are an integral part of these financial statements.
Pioneer Dynamic Credit Fund | Annual Report | 3/31/20 17
| | | |
Schedule of Investments | 3/31/20 (continued) | |
|
| Principal | | | |
| Amount | | | |
| USD ($) | | | Value |
|
| | ASSET BACKED SECURITIES — (continued) | |
| 1,500,000 | | Foursight Capital Automobile Receivables Trust, Series | |
| | | 2018-2, Class E, 5.5%, 10/15/24 (144A) | $ 1,464,289 |
| 500,000 | | Foursight Capital Automobile Receivables Trust, Series | |
| | | 2018-2, Class F, 6.48%, 6/15/26 (144A) | 413,611 |
| 500,000 | | Foursight Capital Automobile Receivables Trust, Series | |
| | | 2019-1, Class F, 5.57%, 11/16/26 (144A) | 384,470 |
| 103,768(b) | | GE Mortgage Services LLC, Series 1997-HE1, Class A4, | |
| | | 7.78%, 3/25/27 | 20,531 |
| 440,000(a) | | Goldentree Loan Management US CLO 6, Ltd., Series | |
| | | 2019-6A, Class D, 5.607% (3 Month USD LIBOR + | |
| | | 385 bps), 1/20/33 (144A) | 325,461 |
| 500,000 | | Hercules Capital Funding Trust, Series 2018-1A, Class A, | |
| | | 4.605%, 11/22/27 (144A) | 497,687 |
| 890,000 | | HOA Funding LLC, Series 2014-1A, Class A2, 4.846%, | |
| | | 8/20/44 (144A) | 848,855 |
| 200,000 | | InSite Issuer LLC, Series 2016-1A, Class C, 6.414%, | |
| | | 11/15/46 (144A) | 165,484 |
| 700,000 | | Kabbage Funding LLC, Series 2019-1, Class C, 4.611%, | |
| | | 3/15/24 (144A) | 677,330 |
| 250,000(a) | | Madison Park Funding XXII, Ltd., Series 2016-22A, | |
| | | Class ER, 8.358% (3 Month USD LIBOR + | |
| | | 670 bps), 1/15/33 (144A) | 149,962 |
| 250,000(a) | | Madison Park Funding XXXVI, Ltd., Series 2019-36A, | |
| | | Class D, 5.692% (3 Month USD LIBOR + | |
| | | 375 bps), 1/15/33 (144A) | 182,554 |
| 500,000(a) | | Madison Park Funding XXXVI, Ltd., Series 2019-36A, | |
| | | Class E, 9.192% (3 Month USD LIBOR + | |
| | | 725 bps), 1/15/33 (144A) | 301,155 |
| 774,143(a) | | Newtek Small Business Loan Trust, Series 2018-1, | |
| | | Class B, 3.947% (1 Month USD LIBOR + | |
| | | 300 bps), 2/25/44 (144A) | 750,400 |
| 250,000(a) | | Octagon Investment Partners XXI, Ltd., Series 2014-1A, | |
| | | Class DRR, 8.704% (3 Month USD LIBOR + | |
| | | 700 bps), 2/14/31 (144A) | 164,667 |
| 650,000(a) | | Palmer Square Loan Funding, Ltd., Series 2018-1A, | |
| | | Class C, 3.681% (3 Month USD LIBOR + | |
| | | 185 bps), 4/15/26 (144A) | 513,508 |
| 650,000(a) | | Palmer Square Loan Funding, Ltd., Series 2018-1A, | |
| | | Class D, 5.781% (3 Month USD LIBOR + | |
| | | 395 bps), 4/15/26 (144A) | 431,798 |
| 1,675,000 | | Progress Residential Trust, Series 2018-SFR1, Class E, | |
| | | 4.38%, 3/17/35 (144A) | 1,562,668 |
| 2,500,000 | | Progress Residential Trust, Series 2018-SFR2, Class E, | |
| | | 4.656%, 8/17/35 (144A) | 2,249,081 |
| 2,510,000 | | Progress Residential Trust, Series 2018-SFR3, Class F, | |
| | | 5.368%, 10/17/35 (144A) | 2,227,298 |
| 500,000 | | Rosy, Series 2018-1, Class A1, 6.25%, 12/15/25 (144A) | 475,000 |
The accompanying notes are an integral part of these financial statements.
18 Pioneer Dynamic Credit Fund | Annual Report | 3/31/20
| | | | | |
| Principal | | | | |
| Amount | | | | |
| USD ($) | | | Value |
|
| | ASSET BACKED SECURITIES — (continued) | |
| 834,337 | | SCF Equipment Leasing LLC, Series 2019-1A, Class E, | |
| | 5.49%, 4/20/30 (144A) | $ 798,061 |
| 848,472 | | Solarcity Lmc Series VI LLC, Series 2016-A, Class A, | |
| | 4.8%, 9/20/48 (144A) | | 821,195 |
| 300,000(a) | | Sound Point CLO XXV, Ltd., Series 2019-4A, Class E, | |
| | 9.451% (3 Month USD LIBOR + 762 bps), | | |
| | 1/15/33 (144A) | | 176,711 |
| 250,000(a) | | Symphony CLO XXII, Ltd., Series 2020-22A, Class D, 0.0% | |
| | (3 Month USD LIBOR + 315 bps), 4/18/33 (144A) | 171,736 |
| 500,000 | | United Auto Credit Securitization Trust, Series 2019-1, | |
| | Class F, 6.05%, 1/12/26 (144A) | | 347,544 |
| 750,000 | | Veros Automobile Receivables Trust, Series 2018-1, | |
| | Class C, 4.65%, 2/15/24 (144A) | | 749,925 |
| 500,000(a) | | Westcott Park CLO, Ltd., Series 2016-1A, Class ER, | |
| | 8.219% (3 Month USD LIBOR + 640 bps), | | |
| | 7/20/28 (144A) | | 320,452 |
| 2,750,000 | | Westlake Automobile Receivables Trust, Series 2018-3A, | |
| | Class E, 4.9%, 12/15/23 (144A) | | 2,735,790 |
| | TOTAL ASSET BACKED SECURITIES | | |
| | (Cost $35,119,023) | $ 30,683,942 |
| | | COLLATERALIZED MORTGAGE OBLIGATIONS — | | |
| | 10.1% of Net Assets | | |
| 17,880(b) | | Bear Stearns ALT-A Trust, Series 2003-3, Class 1A, | |
| | 4.544%, 10/25/33 | $ 15,587 |
| 235,000(a) | | Bellemeade Re, Ltd., Series 2018-2A, Class B1, 3.597% | |
| | (1 Month USD LIBOR + 265 bps), 8/25/28 (144A) | 184,151 |
| 380,000(a) | | Bellemeade Re, Ltd., Series 2019-1A, Class M1B, 2.697% | |
| | (1 Month USD LIBOR + 175 bps), 3/25/29 (144A) | 334,825 |
| 2,113,125(b) | | Cascade Funding Mortgage Trust, Series 2018-RM2, | |
| | Class D, 4.0%, 10/25/68 (144A) | | 1,893,098 |
| 1,000,000(a) | | Connecticut Avenue Securities Trust, Series 2018-R07, | |
| | Class 1B1, 5.297% (1 Month USD LIBOR + | | |
| | 435 bps), 4/25/31 (144A) | | 471,825 |
| 818,142(a) | | Connecticut Avenue Securities Trust, Series 2018-R07, | |
| | Class 1M2, 3.347% (1 Month USD LIBOR + | |
| | 240 bps), 4/25/31 (144A) | | 699,456 |
| 871,407(a) | | Connecticut Avenue Securities Trust, Series 2019-R02, | |
| | Class 1M2, 3.247% (1 Month USD LIBOR + | |
| | 230 bps), 8/25/31 (144A) | | 721,136 |
| 1,000,000(a) | | Connecticut Avenue Securities Trust, Series 2019-R03, | |
| | Class 1B1, 5.047% (1 Month USD LIBOR + | | |
| | 410 bps), 9/25/31 (144A) | | 450,943 |
| 1,250,000(b) | | Deephaven Residential Mortgage Trust, Series 2018-3A, | |
| | Class B1, 5.007%, 8/25/58 (144A) | | 1,158,080 |
| 890,000(a) | | Fannie Mae Connecticut Avenue Securities, Series 2017-C02, | |
| | Class 2B1, 6.447% (1 Month USD LIBOR + | | |
| | 550 bps), 9/25/29 | | 552,563 |
|
The accompanying notes are an integral part of these financial statements. | |
Pioneer Dynamic Credit Fund | Annual Report | 3/31/20 19
| | | |
Schedule of Investments | 3/31/20 (continued) | |
|
| Principal | | | |
| Amount | | | |
| USD ($) | | | Value |
| | | COLLATERALIZED MORTGAGE OBLIGATIONS — | |
| | (continued) | |
| 952,152(a) | | Fannie Mae Connecticut Avenue Securities, Series 2018-C06, | |
| | | Class 1M2, 2.947% (1 Month USD LIBOR + | |
| | | 200 bps), 3/25/31 | $ 837,646 |
| 2,510,000(a) | | Freddie Mac Stacr Trust, Series 2018-HQA2, Class B2, | |
| | | 11.947% (1 Month USD LIBOR + | |
| | | 1,100 bps), 10/25/48 (144A) | 1,503,674 |
| 1,240,906(a) | | Freddie Mac Stacr Trust, Series 2019-HQA1, Class M2, | |
| | | 3.297% (1 Month USD LIBOR + 235 bps), | |
| | | 2/25/49 (144A) | 1,047,533 |
| 180,000(a) | | Freddie Mac Stacr Trust, Series 2019-HQA2, Class B1, | |
| | | 5.047% (1 Month USD LIBOR + 410 bps), | |
| | | 4/25/49 (144A) | 77,810 |
| 140,000(a) | | Freddie Mac Stacr Trust, Series 2019-HQA2, Class B2, | |
| | | 12.197% (1 Month USD LIBOR + 1,125 bps), | |
| | | 4/25/49 (144A) | 83,277 |
| 150,000(a) | | Freddie Mac Stacr Trust, Series 2019-HQA2, Class M2, | |
| | | 2.997% (1 Month USD LIBOR + 205 bps), | |
| | | 4/25/49 (144A) | 124,461�� |
| 177,728 | | Global Mortgage Securitization, Ltd., Series 2004-A, | |
| | | Class B2, 5.25%, 11/25/32 (144A) | 8,881 |
| 84,162 | | Global Mortgage Securitization, Ltd., Series 2004-A, | |
| | | Class B3, 5.25%, 11/25/32 (144A) | 1 |
| 208,001 | | Global Mortgage Securitization, Ltd., Series 2005-A, | |
| | | Class B2, 5.25%, 4/25/32 (144A) | 154,016 |
| 326,152(a) | | La Hipotecaria Panamanian Mortgage Trust, Series 2007-1GA, | |
| | | Class A, 4.5% (Panamanian Mortgage Reference | |
| | | Rate - 125 bps), 12/23/36 (144A) | 333,083 |
| 1,525,000(a) | | Starwood Waypoint Homes Trust, Series 2017-1, Class E, | |
| | | 3.305% (1 Month USD LIBOR + 260 bps), | |
| | | 1/17/35 (144A) | 1,429,096 |
| 1,000,000 | | Tricon American Homes Trust, Series 2017-SFR1, Class F, | |
| | | 5.151%, 9/17/34 (144A) | 903,786 |
| 900,000 | | Tricon American Homes Trust, Series 2017-SFR2, Class F, | |
| | | 5.104%, 1/17/36 (144A) | 759,821 |
| | | TOTAL COLLATERALIZED MORTGAGE OBLIGATIONS | |
| | | (Cost $17,823,460) | $ 13,744,749 |
| | | COMMERCIAL MORTGAGE-BACKED SECURITIES — | |
| | | 3.4% of Net Assets | |
| 500,000(a) | | BTH-25 Mortgage-Backed Securities Trust, Series 2019-25, | |
| | | Class A, 4.015% (1 Month USD LIBOR + | |
| | | 250 bps), 2/18/21 (144A) | $ 494,411 |
| 350,000(a) | | BX Commercial Mortgage Trust, Series 2018-IND, Class D, | |
| | | 2.005% (1 Month USD LIBOR + 130 bps), | |
| | | 11/15/35 (144A) | 321,070 |
| 500,000(b) | | CSAIL Commercial Mortgage Trust, Series 2015-C4, | |
| | | Class D, 3.58%, 11/15/48 | 374,393 |
The accompanying notes are an integral part of these financial statements.
20 Pioneer Dynamic Credit Fund | Annual Report | 3/31/20
| | | | |
| Principal | | | |
| Amount | | | |
| USD ($) | | | Value |
| | | COMMERCIAL MORTGAGE-BACKED SECURITIES — | |
| | (continued) | |
| 500,000(a) | | GS Mortgage Securities Trust, Series 2018-HART, Class B, | |
| | 2.005% (1 Month USD LIBOR + 130 bps), | |
| | 10/15/31 (144A) | $ 477,175 |
| 300,000(b) | | JPMDB Commercial Mortgage Securities Trust, | |
| | Series 2016-C4, Class D, 3.09%, 12/15/49 (144A) | 209,439 |
| 260,000 | | Morgan Stanley Capital I Trust, Series 2016-UBS9, | |
| | Class D, 3.0%, 3/15/49 (144A) | 185,007 |
| 426,222(a) | | Natixis Commercial Mortgage Securities Trust, Series | |
| | 2018-FL1, Class MCR1, 4.009% (1 Month USD | |
| | LIBOR + 235 bps), 6/15/35 (144A) | 391,237 |
| 1,439,597(a) | | SLIDE, Series 2018-FUN, Class B, 1.955% (1 Month | |
| | USD LIBOR + 125 bps), 6/15/31 (144A) | 1,309,298 |
| 416,381(a) | | Tharaldson Hotel Portfolio Trust, Series 2018-THL, | |
| | Class C, 2.355% (1 Month USD LIBOR + | |
| | 135 bps), 11/11/34 (144A) | 374,150 |
| 750,000 | | Wells Fargo Commercial Mortgage Trust, Series 2016-BNK1, | |
| | Class D, 3.0%, 8/15/49 (144A) | 519,585 |
| | TOTAL COMMERCIAL MORTGAGE-BACKED SECURITIES | |
| | (Cost $5,119,463) | $ 4,655,765 |
| | | CORPORATE BONDS — 37.9% of Net Assets | |
| | Advertising — 0.9% | |
| 1,300,000 | | Lamar Media Corp., 3.75%, 2/15/28 (144A) | $ 1,218,594 |
| 85,000 | | Lamar Media Corp., 4.0%, 2/15/30 (144A) | 79,050 |
| | Total Advertising | $ 1,297,644 |
| | Banks — 10.3% | |
| 1,400,000(b)(c) | | Bank of America Corp., 4.3% (3 Month USD LIBOR + | |
| | 266 bps) | $ 1,204,000 |
| 850,000(b)(c) | | Barclays Plc, 7.75% (5 Year USD Swap Rate + 484 bps) | 745,450 |
| 900,000(b)(c) | | BNP Paribas SA, 6.625% (5 Year USD Swap Rate + | |
| | 415 bps) (144A) | 794,250 |
| 1,880,000(b)(c) | | Citigroup, Inc., 4.7% (SOFRRATE + 323 bps) | 1,610,407 |
| 1,700,000(b)(c) | | Credit Suisse Group AG, 6.375% (5 Year CMT | |
| | Index + 482 bps) | 1,492,090 |
| 1,423,000 | | Freedom Mortgage Corp., 8.25%, 4/15/25 (144A) | 1,117,055 |
| 1,700,000(b)(c) | | ING Groep NV, 6.5% (5 Year USD Swap Rate + 445 bps) | 1,422,815 |
| 850,000(b)(c) | | Intesa Sanpaolo S.p.A., 7.7% (5 Year USD Swap | |
| | Rate + 546 bps) (144A) | 722,500 |
| 1,875,000(b)(c) | | JPMorgan Chase & Co., 4.6% (SOFRRATE + 313 bps) | 1,641,000 |
| 850,000(b)(c) | | Lloyds Banking Group Plc, 7.5% (5 Year USD Swap | |
| | Rate + 450 bps) | 763,980 |
| 1,000,000(b)(c) | | Royal Bank of Scotland Group Plc, 8.625% (5 Year USD | |
| | Swap Rate + 760 bps) | 975,000 |
| 1,650,000(b)(c) | | UBS Group AG, 7.0% (5 Year USD Swap Rate + | |
| | 434 bps) (144A) | 1,551,000 |
| | Total Banks | $ 14,039,547 |
The accompanying notes are an integral part of these financial statements.
Pioneer Dynamic Credit Fund | Annual Report | 3/31/20 21
| | | |
Schedule of Investments | 3/31/20 (continued) | |
|
| Principal | | | |
| Amount | | | |
| USD ($) | | | Value |
| | Building Materials — 1.1% | |
| 1,520,000 | | Standard Industries, Inc., 5.375%, 11/15/24 (144A) | $ 1,466,800 |
| | | Total Building Materials | $ 1,466,800 |
| | | Chemicals — 0.9% | |
| 1,415,000 | | OCI NV, 5.25%, 11/1/24 (144A) | $ 1,216,900 |
| | | Total Chemicals | $ 1,216,900 |
| | | Commercial Services — 3.0% | |
| 1,100,000 | | ADT Security Corp., 4.875%, 7/15/32 (144A) | $ 934,670 |
| 275,000 | | Allied Universal Holdco LLC/Allied Universal Finance Corp., | |
| | | 6.625%, 7/15/26 (144A) | 270,187 |
| 1,904,000 | | Brink’s Co., 4.625%, 10/15/27 (144A) | 1,756,440 |
| 1,240,000 | | Garda World Security Corp., 4.625%, 2/15/27 (144A) | 1,109,800 |
| | | Total Commercial Services | $ 4,071,097 |
| | | Diversified Financial Services — 1.4% | |
| 1,000,000(d) | | Fixed Income Trust Series 2013-A, 7.697%, | |
| | | (Liberty Mutual 7.697%) 10/15/97 (144A) | $ 1,421,835 |
| 490,000 | | Nationstar Mortgage Holdings, Inc., 6.0%, 1/15/27 (144A) | 416,500 |
| | | Total Diversified Financial Services | $ 1,838,335 |
| | | Electric — 3.0% | |
| 1,443,000 | | Clearway Energy Operating LLC, 5.75%, 10/15/25 | $ 1,428,570 |
| 1,300,000 | | NRG Energy, Inc., 5.25%, 6/15/29 (144A) | 1,339,000 |
| 1,345,000 | | Vistra Operations Co. LLC, 5.625%, 2/15/27 (144A) | 1,387,031 |
| | | Total Electric | $ 4,154,601 |
| | | Entertainment — 0.8% | |
| 1,270,000 | | International Game Technology Plc, 6.25%, 1/15/27 (144A) | $ 1,104,900 |
| | | Total Entertainment | $ 1,104,900 |
| | | Environmental Control — 0.6% | |
| 1,200,000 | | Tervita Corp., 7.625%, 12/1/21 (144A) | $ 840,000 |
| | | Total Environmental Control | $ 840,000 |
| | | Food Service — 1.6% | |
| 2,300,000 | | Aramark Services, Inc., 5.0%, 2/1/28 (144A) | $ 2,140,426 |
| | | Total Food Service | $ 2,140,426 |
| | | Healthcare-Services — 1.0% | |
| 1,190,000 | | Centene Corp., 5.25%, 4/1/25 (144A) | $ 1,195,950 |
| 200,000 | | Centene Corp., 5.375%, 6/1/26 (144A) | 206,022 |
| | | Total Healthcare-Services | $ 1,401,972 |
| | | Insurance — 0.1% | |
| 100,000 | | Liberty Mutual Insurance Co., 7.697%, 10/15/97 (144A) | $ 142,184 |
| | | Total Insurance | $ 142,184 |
The accompanying notes are an integral part of these financial statements.
22 Pioneer Dynamic Credit Fund | Annual Report | 3/31/20
| | | | |
| Principal | | | |
| Amount | | | |
| USD ($) | | | Value |
| | Internet — 0.7% | |
| 1,000,000 | | Netflix, Inc., 4.375%, 11/15/26 | $ 1,015,000 |
| | Total Internet | $ 1,015,000 |
| | Media — 2.1% | |
| 1,850,000 | | Charter Communications Operating LLC/Charter | |
| | Communications Operating Capital, 4.8%, 3/1/50 | $ 1,925,061 |
| 1,434,000 | | Diamond Sports Group LLC/Diamond Sports Finance Co., | |
| | 6.625%, 8/15/27 (144A) | 958,988 |
| | Total Media | $ 2,884,049 |
| | Oil & Gas — 0.2% | |
| 540,000 | | MEG Energy Corp., 7.0%, 3/31/24 (144A) | $ 249,075 |
| | Total Oil & Gas | $ 249,075 |
| | Pharmaceuticals — 3.0% | |
| 1,750,000 | | Allergan Funding SCS, 4.75%, 3/15/45 | $ 1,886,204 |
| 900,000 | | Bausch Health Cos., Inc., 6.5%, 3/15/22 (144A) | 909,000 |
| 1,250,000 | | Bausch Health Cos., Inc., 7.0%, 3/15/24 (144A) | 1,273,425 |
| | Total Pharmaceuticals | $ 4,068,629 |
| | Pipelines — 4.2% | |
| 900,000 | | American Midstream Partners LP/American Midstream | |
| | Finance Corp., 9.5%, 12/15/21 (144A) | $ 846,000 |
| 1,400,000 | | Enable Midstream Partners LP, 4.95%, 5/15/28 | 844,167 |
| 2,065,000 | | EnLink Midstream Partners LP, 4.15%, 6/1/25 | 1,000,905 |
| 357,000 | | Genesis Energy LP/Genesis Energy Finance Corp., | |
| | 6.25%, 5/15/26 | 249,900 |
| 1,450,000 | | ONEOK, Inc., 6.875%, 9/30/28 | 1,396,789 |
| 1,475,000 | | Targa Resources Partners LP/Targa Resources Partners | |
| | Finance Corp., 5.875%, 4/15/26 | 1,224,250 |
| 327,000 | | Targa Resources Partners LP/Targa Resources Partners | |
| | Finance Corp., 6.5%, 7/15/27 | 278,768 |
| | Total Pipelines | $ 5,840,779 |
| | REITs — 1.7% | |
| 2,350,000 | | Iron Mountain, Inc., 4.875%, 9/15/27 (144A) | $ 2,279,500 |
| | Total REITs | $ 2,279,500 |
| | Telecommunications — 1.3% | |
| 833,000 | | CenturyLink, Inc., 4.0%, 2/15/27 (144A) | $ 808,010 |
| 950,000 | | CenturyLink, Inc., 7.6%, 9/15/39 | 921,500 |
| | Total Telecommunications | $ 1,729,510 |
| | TOTAL CORPORATE BONDS | |
| | (Cost $58,464,128) | $ 51,780,948 |
The accompanying notes are an integral part of these financial statements.
Pioneer Dynamic Credit Fund | Annual Report | 3/31/20 23
| | | | |
Schedule of Investments | 3/31/20 (continued) |
|
|
|
| Principal | | | |
| Amount | | | |
| USD ($) | | | Value |
| | | INSURANCE-LINKED SECURITIES — 1.2% | |
| | of Net Assets(e) | |
| | Event-Linked Bonds — 0.9% | |
| | Earthquakes – California — 0.5% | |
| 250,000(a) | | Ursa Re, 3.533% (3 Month U.S. Treasury Bill + | |
| | | 350 bps), 5/27/20 (144A) | $ 247,550 |
| 250,000(a) | | Ursa Re, 4.173% (3 Month U.S. Treasury Bill + | |
| | | 414 bps), 12/10/20 (144A) | 244,750 |
| 250,000(a) | | Ursa Re, 5.503% (3 Month U.S. Treasury Bill + | |
| | | 547 bps), 12/10/20 (144A) | 242,500 |
| | | | $ 734,800 |
| | | Multiperil – U.S. — 0.4% | |
| 250,000(a) | | Residential Reinsurance 2016, 5.463% (3 Month U.S. | |
| | | Treasury Bill + 543 bps), 12/6/20 (144A) | $ 245,100 |
| 250,000(a) | | Residential Reinsurance 2017, 5.793% (3 Month U.S. | |
| | Treasury Bill + 576 bps), 12/6/21 (144A) | 236,650 |
| | | $ 481,750 |
| | Total Event-Linked Bonds | $ 1,216,550 |
| Face | | | |
| Amount | | | |
| USD ($) | | | |
|
| | Collateralized Reinsurance — 0.0%† | |
| | Multiperil – Worldwide — 0.0%† | |
| 250,000+(f)(g) | | Cypress Re 2017, 1/10/21 | $ 4,550 |
| 12,000+(f) | | Limestone Re 2016-1, 8/31/21 | 9,445 |
| 250,000+(f)(g) | | Resilience Re, 5/1/20 | 25 |
| | | Total Collateralized Reinsurance | $ 14,020 |
| | | Reinsurance Sidecars — 0.3% | |
| | | Multiperil – U.S. — 0.1% | |
| 1,500,000+(f)(g) | | Carnoustie Re 2015, 7/1/20 | $ 4,800 |
| 500,000+(f)(g) | | Carnoustie Re 2016, 11/30/20 | 13,500 |
| 500,000+(f)(g) | | Carnoustie Re 2017, 11/30/21 | 67,925 |
| 250,000+(f) | | Carnoustie Re 2018, 12/31/21 | 2,800 |
| 1,500,000+(g)(h) | | Harambee Re 2018, 12/31/21 | 97,500 |
| | | | $ 186,525 |
| | | Multiperil – Worldwide — 0.2% | |
| 500,000+(f)(g) | | Arlington Re 2015, 2/1/21 | $ 24,300 |
| 41,791+(f)(g) | | Berwick Re 2018-1, 12/31/21 | 5,086 |
| 29,857+(f)(g) | | Berwick Re 2019-1, 12/31/22 | 32,222 |
| 250,000+(h) | | Blue Lotus Re 2018, 12/31/21 | 15,550 |
| 25,000+(f) | | Eden Re II, 3/22/22 (144A) | 33,478 |
| 2,000,000+(f) | | Pangaea Re 2015-1, 2/28/21 | 2,616 |
The accompanying notes are an integral part of these financial statements.
24 Pioneer Dynamic Credit Fund | Annual Report | 3/31/20
| | | | |
| Face | | | |
| Amount | | | |
| USD ($) | | | Value |
| | Multiperil – Worldwide — (continued) | |
| 2,000,000+(f) | | Pangaea Re 2015-2, 5/29/20 | $ 2,982 |
| 1,000,000+(f) | | Pangaea Re 2016-1, 11/30/20 | 2,220 |
| 1,000,000+(f)(g) | | Pangaea Re 2017-1, 11/30/21 | 16,100 |
| 217,248+(f)(g) | | St. Andrews Re 2017-4, 6/1/20 | 21,377 |
| 250,000+(g)(h) | | Thopas Re 2018, 12/31/21 | 5,325 |
| 1,500,000+(f)(g) | | Versutus Re 2017, 11/30/21 | 11,700 |
| 1,500,000+(f)(g) | | Versutus Re 2018, 12/31/21 | — |
| 250,000+(g)(h) | | Viribus Re 2018, 12/31/21 | 13,825 |
| 106,153+(h) | | Viribus Re 2019, 12/31/22 | 1,921 |
| | | $ 188,702 |
| | Total Reinsurance Sidecars | $ 375,227 |
| | TOTAL INSURANCE-LINKED SECURITIES | |
| | (Cost $2,083,122) | $ 1,605,797 |
| Principal | | | |
| Amount | | | |
| USD ($) | | | |
| | SENIOR SECURED FLOATING RATE LOAN | |
| | INTERESTS — 8.2% of Net Assets*(a) | |
| | Automobile — 0.2% | |
| 295,375 | | KAR Auction Services, Inc., Tranche B-6 Term Loan, | |
| | | 3.188% (LIBOR + 225 bps), 9/19/26 | $ 274,699 |
| | | Total Automobile | $ 274,699 |
| | | Buildings & Real Estate — 0.3% | |
| 294,000 | | Beacon Roofing Supply, Inc., Initial Term Loan, 3.239% | |
| | | (LIBOR + 225 bps), 1/2/25 | $ 267,540 |
| 100,681 | | Builders FirstSource, Inc., Refinancing Term Loan, 4.613% | |
| | | (LIBOR + 300 bps), 2/29/24 | 91,619 |
| | | Total Buildings & Real Estate | $ 359,159 |
| | | Chemicals, Plastics & Rubber — 0.5% | |
| 724,343 | | Univar Solutions USA, Inc., Term B-3 Loan, 3.7% | |
| | | (LIBOR + 225 bps), 7/1/24 | $ 679,072 |
| | | Total Chemicals, Plastics & Rubber | $ 679,072 |
| | | Computers & Electronics — 0.6% | |
| 789,573 | | Applied Systems, Inc., First Lien Closing Date Term Loan, | |
| | | 4.7% (LIBOR + 325 bps), 9/19/24 | $ 726,971 |
| 94,050 | | Energizer Holdings, Inc., Term B Loan, 3.875% (LIBOR + | |
| | | 225 bps), 12/17/25 | 90,523 |
| 205,020 | | Energy Acquisition LP (aka Electrical Components | |
| | | International), First Lien Initial Term Loan, | |
| | 5.239% (LIBOR + 425 bps), 6/26/25 | 154,790 |
| | Total Computers & Electronics | $ 972,284 |
The accompanying notes are an integral part of these financial statements.
Pioneer Dynamic Credit Fund | Annual Report | 3/31/20 25
| | | |
Schedule of Investments | 3/31/20 (continued) | |
|
| Principal | | | |
| Amount | | | |
| USD ($) | | | Value |
| | Diversified & Conglomerate Service — 2.0% | |
| 975,000 | | Albany Molecular Research, Inc., First Lien Initial Term | |
| | Loan, 4.25% (LIBOR + 325 bps), 8/30/24 | $ 872,625 |
| 477,705 | | Filtration Group Corp., Initial Dollar Term Loan, 3.989% | |
| | (LIBOR + 300 bps), 3/31/25 | 422,172 |
| 462,687 | | Outfront Media Capital LLC (Outfront Media Capital Corp.), | |
| | Extended Term Loan, 2.547% (LIBOR + | |
| | 175 bps), 11/18/26 | 400,224 |
| 1,236,562 | | WEX, Inc., Term B-3 Loan, 3.239% (LIBOR + | |
| | 225 bps), 5/15/26 | 1,081,992 |
| | Total Diversified & Conglomerate Service | $ 2,777,013 |
| | Electric & Electrical — 0.3% | |
| 413,770 | | Rackspace Hosting, Inc., First Lien Term B Loan, 4.763% | |
| | (LIBOR + 300 bps), 11/3/23 | $ 375,496 |
| | Total Electric & Electrical | $ 375,496 |
| | Electronics — 0.2% | |
| 253,575 | | Avast Software BV, 2018 Refinancing Dollar Term Loan, | |
| | 3.7% (LIBOR + 225 bps), 9/29/23 | $ 231,546 |
| | Total Electronics | $ 231,546 |
| | Healthcare & Pharmaceuticals — 0.9% | |
| 467,337 | | Acadia Healthcare Co., Inc., Tranche B-3 Term Loan, 3.5% | |
| | (LIBOR + 250 bps), 2/11/22 | $ 434,624 |
| 975,000 | | Alphabet Holding Co., Inc. (aka Nature’s Bounty), First | |
| | Lien Initial Term Loan, 4.489% (LIBOR + | |
| | 350 bps), 9/26/24 | 790,725 |
| | Total Healthcare & Pharmaceuticals | $ 1,225,349 |
| | Healthcare, Education & Childcare — 0.0%† | |
| 17,637 | | Select Medical Corp., Tranche B Term Loan, 3.43% | |
| | (LIBOR + 250 bps), 3/6/25 | $ 16,843 |
| | Total Healthcare, Education & Childcare | $ 16,843 |
| | Hotel, Gaming & Leisure — 0.2% | |
| 252,802 | | Eldorado Resorts, Inc., Term Loan, 3.25% (LIBOR + | |
| | 225 bps), 4/17/24 | $ 247,746 |
| | Total Hotel, Gaming & Leisure | $ 247,746 |
| | Insurance — 0.7% | |
| 975,000 | | USI, Inc. (fka Compass Investors, Inc.), 2017 New Term Loan, | |
| | 3.989% (LIBOR + 300 bps), 5/16/24 | $ 889,687 |
| | Total Insurance | $ 889,687 |
| | Leisure & Entertainment — 0.2% | |
| 424,925 | | Fitness International LLC, Term B Loan, 4.322% (LIBOR + | |
| | 325 bps), 4/18/25 | $ 322,234 |
| | Total Leisure & Entertainment | $ 322,234 |
The accompanying notes are an integral part of these financial statements.
26 Pioneer Dynamic Credit Fund | Annual Report | 3/31/20
| | | | |
| Principal | | | |
| Amount | | | |
| USD ($) | | | Value |
| | Machinery — 0.2% | |
| 438,107 | | NN, Inc., Tranche B Term Loan, 6.689% (LIBOR + | |
| | | 575 bps), 10/19/22 | $ 326,390 |
| | | Total Machinery | $ 326,390 |
| | | Printing & Publishing — 0.4% | |
| 687,389 | | Trader Corp., First Lien 2017 Refinancing Term Loan, | |
| | | 3.941% (LIBOR + 300 bps), 9/28/23 | $ 587,718 |
| | | Total Printing & Publishing | $ 587,718 |
| | | Securities & Trusts — 0.6% | |
| 908,400 | | Spectacle Gary Holdings LLC, Closing Date Term Loan, | |
| | | 11.0% (LIBOR + 900 bps), 12/23/25 | $ 776,682 |
| | | Total Securities & Trusts | $ 776,682 |
| | | Utilities — 0.9% | |
| 439,116 | | APLP Holdings, Ltd. Partnership, 2020 Term Loan, 3.5% | |
| | | (LIBOR + 250 bps), 4/14/25 | $ 428,138 |
| 541,784 | | Eastern Power LLC (Eastern Covert Midco LLC) (aka | |
| | | TPF II LC LLC), Term Loan, 4.75% (LIBOR + | |
| | | 375 bps), 10/2/25 | 475,188 |
| 279,891 | | Vistra Operations Co. LLC (fka Tex Operations Co. LLC), | |
| | | 2018 Incremental Term Loan, 2.703% (LIBOR + | |
| | | 175 bps), 12/31/25 | 268,345 |
| | | Total Utilities | $ 1,171,671 |
| | | TOTAL SENIOR SECURED FLOATING RATE LOAN INTERESTS | |
| | | (Cost $12,727,049) | $ 11,233,589 |
| | | U.S. GOVERNMENT AND AGENCY OBLIGATIONS — | |
| | | 10.6% of Net Assets | |
| 1,500,000(a) | | U.S. Treasury Floating Rate Notes, 0.13% (3 Month | |
| | | U.S. Treasury Bill Money Market Yield + | |
| | | 5 bps), 10/31/20 | $ 1,499,778 |
| 4,500,000(a) | | U.S. Treasury Floating Rate Notes, 0.239% (3 Month | |
| | | U.S. Treasury Bill Money Market Yield + | |
| | | 15 bps), 1/31/22 | 4,499,499 |
| 8,000,000 | | U.S. Treasury Notes, 2.125%, 12/31/22 | 8,405,625 |
| | | TOTAL U.S. GOVERNMENT AND AGENCY OBLIGATIONS | |
| | (Cost $13,894,682) | $ 14,404,902 |
The accompanying notes are an integral part of these financial statements.
Pioneer Dynamic Credit Fund | Annual Report | 3/31/20 27
| | | | | | |
Schedule of Investments | 3/31/20 (continued) | | |
|
|
| Number of | | | Strike | Expiration | |
| Contracts | Description | Counterparty | Notional
| Price | Date | Value |
| EXCHANGE-TRADED PUT OPTION PURCHASED — 0.8% | | |
18
| S&P 500 Index
| Citigroup Global Markets, Inc. | USD 81,720
| USD 3,225 | 5/15/20
| $ 1,128,060
|
| TOTAL EXCHANGE-TRADED PUT OPTION PURCHASED | | |
| (Premiums paid $81,720) | | | $ 1,128,060 |
| TOTAL OPTIONS PURCHASED | | | |
| (Premiums paid $81,720) | | | $ 1,128,060 |
| TOTAL INVESTMENTS IN UNAFFILIATED ISSUERS — 94.7% | | |
| (Cost $145,312,647) | | | $129,237,752 |
| OTHER ASSETS AND LIABILITIES — 5.3% | | | $ 7,231,418 |
| NET ASSETS — 100.0% | | | $136,469,170 |
bps Basis Points.
CMT Constant Maturity Treasury Index.
LIBOR London Interbank Offered Rate.
REIT Real Estate Investment Trust.
SOFRRATE Secured Overnight Financing Rate.
(144A) Security is exempt from registration under Rule 144A of the Securities Act of 1933. Such securities may be resold normally to qualified institutional buyers in a transaction exempt from registration. At March 31, 2020, the value of these securities amounted to $78,288,856, or 57.4% of net assets.
† Amount rounds to less than 0.1%.
* Senior secured floating rate loan interests in which the Fund invests generally pay interest at rates that are periodically redetermined by reference to a base lending rate plus a premium. These base lending rates are generally (i) the lending rate offered by one or more major European banks, such as LIBOR, (ii) the prime rate offered by one or more major United States banks, (iii) the rate of a certificate of deposit or (iv) other base lending rates used by commercial lenders. The interest rate shown is the rate accruing at March 31, 2020.
+ Security that used significant unobservable inputs to determine its value.
(a) Floating rate note. Coupon rate, reference index and spread shown at March 31, 2020.
(b) The interest rate is subject to change periodically. The interest rate and/or reference index and spread shown at March 31, 2020.
(c) Security is perpetual in nature and has no stated maturity date.
(d) Debt obligation initially issued at one coupon which converts to a higher coupon at a specific date. The rate shown is the rate at March 31, 2020.
(e) Securities are restricted as to resale.
(f) Issued as participation notes.
(g) Non-income producing security.
(h) Issued as preference shares.
The accompanying notes are an integral part of these financial statements.
28 Pioneer Dynamic Credit Fund | Annual Report | 3/31/20
Purchases and sales of securities (excluding temporary cash investments) for the year ended March 31, 2020 were as follows:
| Purchases | Sales |
Long-Term U.S. Government Securities | $14,055,519 | $ 11,908,828 |
Other Long-Term Securities | $70,363,687 | $107,817,012 |
The Fund is permitted to engage in purchase and sale transactions (“cross trades”) with certain funds and accounts for which Amundi Pioneer Asset Management, Inc. (the “Adviser”) serves as the Fund’s investment adviser, as set forth in Rule 17a-7 under the Investment Company Act of 1940, pursuant to procedures adopted by the Board of Trustees. Under these procedures, cross trades are effected at current market prices. During the year ended March 31, 2020, the Fund did not engage in any cross trade activity.
At March 31, 2020, the net unrealized depreciation on investments based on cost for federal tax purposes of $146,506,817 was as follows:
| Aggregate gross unrealized appreciation for all investments in which | |
| there is an excess of value over tax cost | $ 2,817,896 |
| Aggregate gross unrealized depreciation for all investments in which | |
| there is an excess of tax cost over value | (20,086,961) |
| Net unrealized depreciation | $(17,269,065) |
Various inputs are used in determining the value of the Fund’s investments. These inputs are summarized in the three broad levels below.
Level 1 – quoted prices in active markets for identical securities.
Level 2 – other significant observable inputs (including quoted prices for similar securities, interest rates, prepayment speeds, credit risks, etc.). See Notes to Financial Statements — Note 1A.
Level 3 – significant unobservable inputs (including the Fund’s own assumptions in determining fair value of investments). See Notes to Financial Statements — Note 1A.
The accompanying notes are an integral part of these financial statements.
Pioneer Dynamic Credit Fund | Annual Report | 3/31/20 29
Schedule of Investments | 3/31/20 (continued)
The following is a summary of the inputs used as of March 31, 2020, in valuing the Fund’s investments:
| | Level 1 | | | Level 2 | | | Level 3 | | | Total | |
Asset Backed Securities | | $ | — | | | $ | 30,683,942 | | | $ | — | | | $ | 30,683,942 | |
Collateralized Mortgage Obligations | | | — | | | | 13,744,749 | | | | — | | | | 13,744,749 | |
Commercial Mortgage-Backed Securities | | | — | | | | 4,655,765 | | | | — | | | | 4,655,765 | |
Corporate Bonds | | | — | | | | 51,780,948 | | | | — | | | | 51,780,948 | |
Insurance-Linked Securities | | | | | | | | | | | | | | | | |
| Collateralized Reinsurance | | | | | | | | | | | | | | | | |
| Multiperil – Worldwide | | | — | | | | — | | | | 14,020 | | | | 14,020 | |
| Reinsurance Sidecars | | | | | | | | | | | | | | | | |
| Multiperil – U.S. | | | — | | | | — | | | | 186,525 | | | | 186,525 | |
| Multiperil – Worldwide | | | — | | | | — | | | | 188,702 | | | | 188,702 | |
| All Other Insurance-Linked Securities | | | — | | | | 1,216,550 | | | | — | | | | 1,216,550 | |
Senior Secured Floating Rate | | | | | | | | | | | | | | | | |
| Loan Interests | | | — | | | | 11,233,589 | | | | — | | | | 11,233,589 | |
U.S. Government and | | | | | | | | | | | | | | | | |
| Agency Obligations | | | — | | | | 14,404,902 | | | | — | | | | 14,404,902 | |
Exchange-Traded Put | | | | | | | | | | | | | | | | |
Option Purchased | | | 1,128,060 | | | | — | | | | — | | | | 1,128,060 | |
| Total Investments in Securities | | $ | 1,128,060 | | | $ | 127,720,445 | | | $ | 389,247 | | | $ | 129,237,752 | |
The accompanying notes are an integral part of these financial statements.
30 Pioneer Dynamic Credit Fund | Annual Report | 3/31/20
The following is a reconciliation of assets valued using significant unobservable inputs (Level 3):
| | | | | Insurance- | | | | |
| | Corporate | | | Linked | | | | |
| | Bonds | | | Securities | | | Total | |
Balance as of 3/31/19 | | $ | 1,316,208 | | | $ | 2,403,621 | | | $ | 3,719,829 | |
Realized gain (loss) | | | — | | | | (955 | ) | | | (955 | ) |
Change in unrealized | | | | | | | | | | | | |
| appreciation (depreciation) | | | — | | | | 74,688 | | | | 74,688 | |
Accrued discounts/premiums | | | — | | | | — | | | | — | |
Purchases | | | — | | | | 25,124 | | | | 25,124 | |
Sales | | | — | | | | (2,113,231 | ) | | | (2,113,231 | ) |
Transfers in to Level 3* | | | — | | | | — | | | | — | |
Transfers out of Level 3* | | | (1,316,208 | ) | | | — | | | | (1,316,208 | ) |
| Balance as of 3/31/20 | | $ | — | | | $ | 389,247 | | | $ | 389,247 | |
* | Transfers are calculated on the beginning of period values. For the year ended March 31, 2020, investments having a value of $1,316,208 were transferred out of Level 3 to Level 2, as there were observable inputs available to determine their value. There were no other transfers between Levels 1, 2 and 3. |
| | | |
| Net change in unrealized appreciation (depreciation) of Level 3 investments still | | |
| held and considered Level 3 at March 31, 2020: | $118,002 | |
The accompanying notes are an integral part of these financial statements.
Pioneer Dynamic Credit Fund | Annual Report | 3/31/20 31
| | | | |
Statement of Assets and Liabilities | 3/31/20 | | | |
| | |
| | |
| ASSETS: | | | |
| Investments in unaffiliated issuers, at value (cost $145,312,647) | | $ | 129,237,752 | |
| Cash | | | 5,763,585 | |
| Foreign currencies, at value (cost $7,198) | | | 5,502 | |
| Due from broker for futures | | | 45 | |
| Receivables — | | | | |
| Investment securities sold | | | 8,633 | |
| Fund shares sold | | | 1,109,660 | |
| Interest | | | 1,119,792 | |
| Due from the Adviser | | | 29,765 | |
| Other assets | | | 43,788 | |
| Total assets | | $ | 137,318,522 | |
| LIABILITIES: | | | | |
| Payables — | | | | |
| Fund shares repurchased | | $ | 558,634 | |
| Distributions | | | 108,401 | |
| Trustees’ fees | | | 325 | |
| Professional fees | | | 56,720 | |
| Transfer agent fees | | | 38,913 | |
| Registration fees | | | 11,583 | |
| Variation margin for centrally cleared swap contracts | | | 950 | |
| Unrealized depreciation on unfunded loan commitments | | | 7,689 | |
| Due to affiliates | | | 30,132 | |
| Accrued expenses | | | 36,005 | |
| Total liabilities | | $ | 849,352 | |
| NET ASSETS: | | | | |
| Paid-in capital | | $ | 217,714,751 | |
| Distributable earnings (loss) | | | (81,245,581 | ) |
| Net assets | | $ | 136,469,170 | |
| NET ASSET VALUE PER SHARE: | | | | |
No par value (unlimited number of shares authorized) | | | | |
| Class A (based on $19,028,324/2,454,360 shares) | | $ | 7.75 | |
| Class C (based on $13,300,061/1,720,946 shares) | | $ | 7.73 | |
| Class Y (based on $104,140,785/13,364,289 shares) | | $ | 7.79 | |
| MAXIMUM OFFERING PRICE PER SHARE: | | | | |
| Class A (based on $7.75 net asset value per share/100%-4.50% | | | | |
| maximum sales charge) | | $ | 8.12 | |
The accompanying notes are an integral part of these financial statements.
32 Pioneer Dynamic Credit Fund | Annual Report | 3/31/20
| | | | |
Statement of Operations
| | | |
| FOR THE YEAR ENDED 3/31/20 | | | |
|
| INVESTMENT INCOME: | | | |
| Interest from unaffiliated issuers | $ 9,024,155 | | |
| Dividends from unaffiliated issuers | 91,838 | | |
| Total investment income | | $ 9,115,993 |
| EXPENSES: | | | |
| Management fees | $ 1,334,534 | | |
| Administrative expense | 97,667 | | |
| Transfer agent fees | | | |
| Class A | 20,185 | | |
| Class C | 19,096 | | |
| Class Y | 174,471 | | |
| Distribution fees | | | |
| Class A | 67,107 | | |
| Class C | 192,684 | | |
| Shareowner communications expense | 13,456 | | |
| Custodian fees | 19,136 | | |
| Registration fees | 96,196 | | |
| Professional fees | 75,402 | | |
| Printing expense | 50,399 | | |
| Pricing fees | 24,182 | | |
| Trustees’ fees | 8,847 | | |
| Insurance expense | 2,476 | | |
| Miscellaneous | 37,863 | | |
| Total expenses | | $ 2,233,701 |
| Less fees waived and expenses reimbursed by the Adviser | | | (306,994) |
| Net expenses | | $ 1,926,707 |
| Net investment income | | $ 7,189,286 |
| REALIZED AND UNREALIZED GAIN (LOSS) ON INVESTMENTS: | | | |
| Net realized gain (loss) on: | | | |
| Investments in unaffiliated issuers | $ (1,352,781) | | |
| Forward foreign currency exchange contracts | (18,188) | | |
| Futures contracts | 922,660 | | |
| Swap contracts | (6,911,007) | | |
| Other assets and liabilities denominated in foreign currencies | (52,621) | $ (7,411,937) |
| Change in net unrealized appreciation (depreciation) on: | | | |
| Investments in unaffiliated issuers | $(15,801,163)
| |
| Forward foreign currency exchange contracts | 5,675 | | |
| Futures contracts | (277,109) | | |
| Swap contracts | (29,531) | | |
| Unfunded loan commitments | (7,689) | | |
| Other assets and liabilities denominated in foreign currencies | 15,674 | $(16,094,143) |
Net realized and unrealized gain (loss) on investments | | $(23,506,080) |
Net decrease in net assets resulting from operations | | $(16,316,794) |
The accompanying notes are an integral part of these financial statements.
Pioneer Dynamic Credit Fund | Annual Report | 3/31/20 33
Statements of Changes in Net Assets
| | | |
| Year Ended | Year Ended |
| 3/31/20 | 3/31/19 |
| FROM OPERATIONS: | | |
Net investment income (loss) | $ 7,189,286 | $ 10,108,541 |
Net realized gain (loss) on investments | (7,411,937) | (7,856,429) |
Change in net unrealized appreciation (depreciation) | | |
| on investments | (16,094,143) | 2,217,556 |
| Net increase (decrease) in net assets resulting | | |
| from operations | $ (16,316,794) | $ 4,469,668 |
| DISTRIBUTIONS TO SHAREOWNERS: | | |
| Class A ($0.36 and $0.27 per share, respectively) | $ (1,044,774) | $ (942,711) |
| Class C ($0.29 and $0.22 per share, respectively) | (604,876) | (693,951) |
| Class Y ($0.39 and $0.28 per share, respectively) | (6,115,718) | (6,862,964) |
Tax return of capital: | | |
| Class A ($0.02 and $0.10 per share, respectively) | (67,732) | (311,815) |
| Class C ($0.02 and $0.08 per share, respectively) | (44,321) | (213,174) |
| Class Y ($0.02 and $0.11 per share, respectively) | (347,545) | (1,921,221) |
| Total distributions to shareowners | $ (8,224,966) | $ (10,945,836) |
| FROM FUND SHARE TRANSACTIONS: | | |
Net proceeds from sales of shares | $ 43,084,319 | $ 65,851,989 |
Reinvestment of distributions | 6,571,328 | 8,926,110 |
Cost of shares repurchased | (93,149,196) | (171,790,151) |
| Net decrease in net assets resulting from Fund | | |
| share transactions | $ (43,493,549) | $ (97,012,052) |
| Net decrease in net assets | $ (68,035,309) | $(103,488,220) |
| NET ASSETS: | | |
Beginning of year | $204,504,479 | $ 307,992,699 |
End of year | $136,469,170 | $ 204,504,479 |
The accompanying notes are an integral part of these financial statements.
34 Pioneer Dynamic Credit Fund | Annual Report | 3/31/20
| | | | | |
| Year Ended | Year Ended | Year Ended | Year Ended |
| 3/31/20 | 3/31/20 | 3/31/19 | 3/31/19 |
| Shares | Amount | Shares | Amount |
| Class A | | | | |
Shares sold | 983,511 | $ 8,999,716 | 1,168,099 | $ 10,608,335 |
Reinvestment of distributions | 118,707 | 1,073,735 | 131,743 | 1,189,927 |
Less shares repurchased | (1,741,834) | (15,289,182) | (1,958,195) | (17,706,029) |
| Net decrease | (639,616) | $ (5,215,731) | (658,353) | $ (5,907,767) |
| Class C | | | | |
Shares sold | 206,917 | $ 1,880,828 | 254,349 | $ 2,308,677 |
Reinvestment of distributions | 62,972 | 568,186 | 90,083 | 810,845 |
Less shares repurchased | (959,485) | (8,632,014) | (1,621,670) | (14,576,084) |
| Net decrease | (689,596) | $ (6,183,000) | (1,277,238) | $ (11,456,562) |
| Class Y | | | | |
Shares sold | 3,560,356 | $ 32,203,775 | 5,797,248 | $ 52,934,977 |
Reinvestment of distributions | 542,473 | 4,929,407 | 763,624 | 6,925,338 |
Less shares repurchased | (7,801,653) | (69,228,000) | (15,431,991) | (139,508,038) |
| Net decrease | (3,698,824) | $(32,094,818) | (8,871,119) | $ (79,647,723) |
The accompanying notes are an integral part of these financial statements.
Pioneer Dynamic Credit Fund | Annual Report | 3/31/20 35
| | | | | | | | | | | |
| Financial Highlights | | | | | | | | | | |
|
|
| Year | | Year | | Year | | Year | | Year | |
| Ended | Ended | Ended | Ended | Ended |
| 3/31/20 | 3/31/19 | 3/31/18 | 3/31/17* | 3/31/16* |
| Class A | | | | | | | | | | |
Net asset value, beginning of period | $ 9.04 | $ 9.20 | $ 9.39 | $ 8.99 | $ 9.54 |
Increase (decrease) from investment operations: | | | | | | | | | | |
| Net investment income (loss) (a) | $ 0.29 | $ 0.33 | $ 0.34 | $ 0.44 | $ 0.42 |
| Net realized and unrealized gain (loss) on investments | (1.20) | (0.12) | (0.12) | | 0.54 | (0.58) |
| Net increase (decrease) from investment operations | $ (0.91) | $ 0.21 | $ 0.22 | $ 0.98 | $ (0.16) |
Distributions to shareowners: | | | | | | | | | | |
| Net investment income | $ (0.36) | $ (0.27) | $ (0.41) | $ (0.58) | $ (0.39) |
| Tax return of capital | (0.02) | (0.10) | — | — | — |
| Total distributions | $ (0.38) | $ (0.37) | $ (0.41) | $ (0.58) | $ (0.39) |
| Net increase (decrease) in net asset value | $ (1.29) | $ (0.16) | $ (0.19) | $ 0.40 | $ (0.55) |
Net asset value, end of period | $ 7.75 | $ 9.04 | $ 9.20 | $ 9.39 | $ 8.99 |
| Total return (b) | (10.59)% | |
| 2.37%
|
| 11.13% | (1.62)% |
Ratio of net expenses to average net assets | |
| |
| 1.14%
|
| |
| |
|
Ratio of net investment income (loss) to average net assets | |
| |
| |
| |
| |
|
Portfolio turnover rate | |
| |
| |
| |
| |
|
Net assets, end of period (in thousands) | $19,028 | $27,960 | | | $35,375 | $47,311 |
Ratios with no waiver of fees and assumption of expenses by | | | | | | | | | | |
| the Adviser and no reduction for fees paid indirectly: | | | | | | | | | | |
| Total expenses to average net assets | |
| |
| |
| |
| |
|
| Net investment income (loss) to average net assets | |
| |
| |
| |
| |
|
* | The Fund was audited by an independent registered public accounting firm other than Ernst & Young LLP. |
(a) | The per-share data presented above is based on the average shares outstanding for the period presented. |
(b) | Assumes initial investment at net asset value at the beginning of each period, reinvestment of all distributions, the complete redemption of the investment at net asset value at the end of each period and no sales charges. Total return would be reduced if sales charges were taken into account. |
The accompanying notes are an integral part of these financial statements.
36 Pioneer Dynamic Credit Fund | Annual Report | 3/31/20
| | | | | | | | | | | |
| Year | | Year | | Year | | Year | | Year | |
| Ended | Ended | Ended | Ended | Ended |
| 3/31/20 | 3/31/19 | 3/31/18 | 3/31/17* | 3/31/16* |
| Class C | | | | | | | | | | |
Net asset value, beginning of period | $ 9.00 | $ 9.17 | $ 9.36 | $ 8.97 | $ 9.51 |
Increase (decrease) from investment operations: | | | | | | | | | | |
| Net investment income (loss) (a) | $ 0.22 | $ 0.26 | $ 0.27 | $ 0.36 | $ 0.36 |
| Net realized and unrealized gain (loss) on investments | (1.18) | (0.13) | (0.12) | |
| (0.58) |
| Net increase (decrease) from investment operations | $ (0.96) | $ 0.13 | $ 0.15 | $ 0.90 | $ (0.22) |
Distributions to shareowners: | | | | | | | | | | |
| Net investment income | $ (0.29) | $ (0.22) | $ (0.34) | $ (0.51) | $ (0.32) |
| Tax return of capital | (0.02) | (0.08) | — |
| — |
| — |
|
| Total distributions | $ (0.31) | $ (0.30) | $ (0.34) | $ (0.51) | $ (0.32) |
| Net increase (decrease) in net asset value | $ (1.27) | $ (0.17) | $ (0.19) | $ 0.39 | $ (0.54) |
Net asset value, end of period | $ 7.73 | $ 9.00 | $ 9.17 | $ 9.36 | $ 8.97 |
| Total return (b) | (11.14)% | |
| |
| 10.18% | (2.25)% |
Ratio of net expenses to average net assets | |
| |
| |
| |
| |
|
Ratio of net investment income (loss) to average net assets | |
| |
| |
| |
| |
|
Portfolio turnover rate | |
| |
| |
| |
| |
|
Net assets, end of period (in thousands) | $13,300 | $21,702 | $33,824 | $37,510 | $44,207 |
Ratios with no waiver of fees and assumption of expenses by | | | | | | | | | | |
| the Adviser and no reduction for fees paid indirectly: | | | | | | | | | | |
| Total expenses to average net assets | |
| |
| |
| |
| |
|
| Net investment income (loss) to average net assets | |
| |
| |
| |
| |
|
* | The Fund was audited by an independent registered public accounting firm other than Ernst & Young LLP. |
(a) | The per-share data presented above is based on the average shares outstanding for the period presented. |
(b) | Assumes initial investment at net asset value at the beginning of each period, reinvestment of all distributions, the complete redemption of the investment at net asset value at the end of each period and no sales charges. Total return would be reduced if sales charges were taken into account. |
The accompanying notes are an integral part of these financial statements.
Pioneer Dynamic Credit Fund | Annual Report | 3/31/20 37
| | | | | | | | | | | |
Financial Highlights (continued) | | | | | | | | | | |
|
|
| Year | | Year | | Year | | Year | | Year | |
| Ended | Ended | Ended | Ended | Ended |
| 3/31/20 | 3/31/19 | 3/31/18 | 3/31/17* | 3/31/16* |
|
| Class Y | | | | | | | | | | |
Net asset value, beginning of period | $ 9.07 | $ 9.24 | $ 9.42 | $ 9.03 | $ 9.58 |
Increase (decrease) from investment operations: | | | | | | | | | | |
| Net investment income (loss) (a) | $ 0.37 | $ 0.36 | $ 0.37 | $ 0.47 | $ 0.46 |
| Net realized and unrealized gain (loss) on investments | |
| (0.14)
|
| |
| |
| |
|
| Net increase (decrease) from investment operations | $ (0.87) | $ 0.22 | $ 0.26 | $ 1.00 | $ (0.12) |
Distributions to shareowners: | | | | | | | | | | |
| Net investment income | $ (0.39) | $ (0.28) | $ (0.44) | $ (0.61) | $ (0.43) |
| Tax return of capital | |
| |
| — |
| — |
| — |
|
| Total distributions | $ (0.41) | $ (0.39) | $ (0.44) | $ (0.61) | $ (0.43) |
| Net increase (decrease) in net asset value | $ (1.28) | $ (0.17) | $ (0.18) | $ 0.39 | $ (0.55) |
Net asset value, end of period | $ 7.79 | $ 9.07 | $ 9.24 | $ 9.42 | $ 9.03 |
| Total return (b) | (10.13)% | |
| |
| 11.35% | |
|
Ratio of net expenses to average net assets | |
| |
| |
| 0.85%
|
| |
|
Ratio of net investment income (loss) to average net assets | |
| |
| |
| 5.01%
|
| |
|
Portfolio turnover rate | |
| |
| 76%
|
| 114%
|
| |
|
Net assets, end of period (in thousands) | $104,141 | $154,842 | $239,630 | $198,398 | $203,736 |
Ratios with no waiver of fees and assumption of expenses by | | | | | | | | | | |
| the Adviser and no reduction for fees paid indirectly: | | | | | | | | | | |
| Total expenses to average net assets | |
| |
| |
| 0.96%
|
| |
|
| Net investment income (loss) to average net assets | |
| |
| |
| 4.90%
|
| |
|
* | The Fund was audited by an independent registered public accounting firm other than Ernst & Young LLP. |
(a) | The per-share data presented above is based on the average shares outstanding for the period presented. |
(b) | Assumes initial investment at net asset value at the beginning of each period, reinvestment of all distributions and the complete redemption of the investment at net asset value at the end of each period. |
The accompanying notes are an integral part of these financial statements.
38 Pioneer Dynamic Credit Fund | Annual Report | 3/31/20
Notes to Financial Statements |
3/31/20 1. Organization and Significant Accounting Policies
Pioneer Dynamic Credit Fund (the “Fund”) is one of three portfolios comprising Pioneer Series Trust X, a Delaware statutory trust. The Fund is registered under the Investment Company Act of 1940 as a diversified, open-end management investment company. The investment objective of the Fund is to seek a high level of current income. Capital appreciation is a secondary objective.
The Fund offers four classes of shares designated as Class A, Class C, Class K and Class Y shares. Class K shares had not commenced operations as of March 31, 2020. Each class of shares represents an interest in the same portfolio of investments of the Fund and has identical rights (based on relative net asset values) to assets and liquidation proceeds. Share classes can bear different rates of class-specific fees and expenses, such as transfer agent and distribution fees. Differences in class-specific fees and expenses will result in differences in net investment income and, therefore, the payment of different dividends from net investment income earned by each class. The Amended and Restated Declaration of Trust of the Fund gives the Board of Trustees the flexibility to specify either per-share voting or dollar-weighted voting when submitting matters for shareowner approval. Under per-share voting, each share of a class of the Fund is entitled to one vote. Under dollar-weighted voting, a shareowner’s voting power is determined not by the number of shares owned, but by the dollar value of the shares on the record date. Each share class has exclusive voting rights with respect to matters affecting only that class, including with respect to the distribution plan for that class. There is no distribution plan for Class Y shares.
Amundi Pioneer Asset Management, Inc., an indirect, wholly owned subsidiary of Amundi and Amundi’s wholly owned subsidiary, Amundi USA, Inc., serves as the Fund’s investment adviser (the “Adviser”). Amundi Pioneer Distributor, Inc., an affiliate of Amundi Pioneer Asset Management, Inc., serves as the Fund’s distributor (the “Distributor”).
In August 2018, the Securities and Exchange Commission (“SEC”) released a Disclosure Update and Simplification Final Rule. The Final Rule amends Regulation S-X disclosures requirements to conform them to U.S. Generally Accepted Accounting Principles (“U.S. GAAP”) for investment companies. The Fund’s financial statements were prepared in compliance with the new amendments to Regulation S-X.
During March 2017, the Financial Accounting Standards Board (FASB) issued an Accounting Standard Update, ASU 2017-08, Receivables-Nonrefundable Fees and Other Costs (Subtopic 310-20), Premium Amortization on Purchased
Pioneer Dynamic Credit Fund | Annual Report | 3/31/20 39
Callable Debt Securities (“ASU 2017-08”), which shortens the amortization period for purchased non-contingently callable debt securities held at a premium. ASU 2017-08 specifies that the premium amortization period ends at the earliest call date, for certain purchased non-contingently callable debt securities. ASU 2017-08 is effective for fiscal years, and interim periods within those fiscal years, beginning after December 15, 2018. The Fund has adopted ASU 2017-08 as of March 31, 2020. The implementation of ASU 2017-08 did not have a material impact on the Fund’s financial statements.
The Fund is an investment company and follows investment company accounting and reporting guidance under U.S. GAAP. U.S. GAAP requires the management of the Fund to make estimates and assumptions that affect the reported amounts of assets and liabilities, the disclosure of contingent assets and liabilities at the date of the financial statements, and the reported amounts of income, expenses and gain or loss on investments during the reporting period. Actual results could differ from those estimates.
The following is a summary of significant accounting policies followed by the Fund in the preparation of its financial statements:
A. Security Valuation
The net asset value of the Fund is computed once daily, on each day the New York Stock Exchange (“NYSE”) is open, as of the close of regular trading on the NYSE.
Fixed-income securities are valued by using prices supplied by independent pricing services, which consider such factors as market prices, market events, quotations from one or more brokers, Treasury spreads, yields, maturities and ratings, or may use a pricing matrix or other fair value methods or techniques to provide an estimated value of the security or instrument. A pricing matrix is a means of valuing a debt security on the basis of current market prices for other debt securities, historical trading patterns in the market for fixed-income securities and/or other factors. Non-U.S. debt securities that are listed on an exchange will be valued at the bid price obtained from an independent third party pricing service. When independent third party pricing services are unable to supply prices, or when prices or market quotations are considered to be unreliable, the value of that security may be determined using quotations from one or more broker-dealers.
Loan interests are valued in accordance with guidelines established by the Board of Trustees at the mean between the last available bid and asked prices from one or more brokers or dealers as obtained from Loan Pricing Corporation, an independent third party pricing service. If price information is not available from Loan Pricing Corporation, or if the price information is deemed to be unreliable, price information will be obtained from an
40 Pioneer Dynamic Credit Fund | Annual Report | 3/31/20
alternative loan interest pricing service. If no reliable price quotes are available from either the primary or alternative pricing service, broker quotes will be solicited.
Event-linked bonds are valued at the bid price obtained from an independent third party pricing service. Other insurance-linked securities (including reinsurance sidecars, collateralized reinsurance and industry loss warranties) may be valued at the bid price obtained from an independent pricing service, or through a third party using a pricing matrix, insurance industry valuation models, or other fair value methods or techniques to provide an estimated value of the instrument.
Options contracts are generally valued at the mean between the last bid and ask prices on the principal exchange where they are traded. Over-the-counter (“OTC”) options and options on swaps (“swaptions”) are valued using prices supplied by independent pricing services, which consider such factors as market prices, market events, quotations from one or more brokers, Treasury spreads, yields, maturities and ratings, or may use a pricing matrix or other fair value methods or techniques to provide an estimated value of the security or instrument.
Shares of exchange-listed closed-end funds are valued by using the last sale price on the principal exchange where they are traded.
Forward foreign currency exchange contracts are valued daily using the foreign exchange rate or, for longer term forward contract positions, the spot currency rate and the forward points on a daily basis, in each case provided by a third party pricing service. Contracts whose forward settlement date falls between two quoted days are valued by interpolation.
Futures contracts are generally valued at the closing settlement price established by the exchange on which they are traded.
Swap contracts, including interest rate swaps, caps and floors (other than centrally cleared swap contracts), are valued at the dealer quotations obtained from reputable International Swap Dealers Association members. Centrally cleared swaps are valued at the daily settlement price provided by the central clearing counterparty.
Securities or loan interests for which independent pricing services or broker-dealers are unable to supply prices or for which market prices and/or quotations are not readily available or are considered to be unreliable are valued by a fair valuation team comprised of certain personnel of the Adviser pursuant to procedures adopted by the Fund’s Board of Trustees. The Adviser’s fair valuation team uses fair value methods approved by the Valuation Committee of the Board of Trustees. The Adviser’s fair valuation
Pioneer Dynamic Credit Fund | Annual Report | 3/31/20 41
team is responsible for monitoring developments that may impact fair valued securities and for discussing and assessing fair values on an ongoing basis, and at least quarterly, with the Valuation Committee of the Board of Trustees.
Inputs used when applying fair value methods to value a security may include credit ratings, the financial condition of the company, current market conditions and comparable securities. The Fund may use fair value methods if it is determined that a significant event has occurred after the close of the exchange or market on which the security trades and prior to the determination of the Fund’s net asset value. Examples of a significant event might include political or economic news, corporate restructurings, natural disasters, terrorist activity or trading halts. Thus, the valuation of the Fund’s securities may differ significantly from exchange prices, and such differences could be material.
At March 31, 2020, no securities were valued using fair value methods (other than securities valued using prices supplied by independent pricing services, broker-dealers or using a third party insurance industry pricing model).
B. Investment Income and Transactions
Dividend income is recorded on the ex-dividend date, except that certain dividends from foreign securities where the ex-dividend date may have passed are recorded as soon as the Fund becomes aware of the ex-dividend data in the exercise of reasonable diligence.
Interest income, including interest on income-bearing cash accounts, is recorded on the accrual basis. Dividend and interest income are reported net of unrecoverable foreign taxes withheld at the applicable country rates and net of income accrued on defaulted securities.
Interest and dividend income payable by delivery of additional shares is reclassified as PIK (payment-in-kind) income upon receipt and is included in interest and dividend income, respectively.
Principal amounts of mortgage-backed securities are adjusted for monthly paydowns. Premiums and discounts related to certain mortgage-backed securities are amortized or accreted in proportion to the monthly paydowns. All discounts/premiums on purchase prices of debt securities are accreted/amortized for financial reporting purposes over the life of the respective securities, and such accretion/amortization is included in interest income.
Security transactions are recorded as of trade date. Gains and losses on sales of investments are calculated on the identified cost method for both financial reporting and federal income tax purposes.
42 Pioneer Dynamic Credit Fund | Annual Report | 3/31/20
C. Foreign Currency Translation
The books and records of the Fund are maintained in U.S. dollars. Amounts denominated in foreign currencies are translated into U.S. dollars using current exchange rates.
Net realized gains and losses on foreign currency transactions, if any, represent, among other things, the net realized gains and losses on foreign currency exchange contracts, disposition of foreign currencies and the difference between the amount of income accrued and the U.S. dollars actually received. Further, the effects of changes in foreign currency exchange rates on investments are not segregated on the Statement of Operations from the effects of changes in the market prices of those securities, but are included with the net realized and unrealized gain or loss on investments.
D. Federal Income Taxes
It is the Fund’s policy to comply with the requirements of the Internal Revenue Code applicable to regulated investment companies and to distribute all of its net taxable income and net realized capital gains, if any, to its shareowners. Therefore, no provision for federal income taxes is required. As of March 31, 2020, the Fund did not accrue any interest or penalties with respect to uncertain tax positions, which, if applicable, would be recorded as an income tax expense on the Statement of Operations. Tax returns filed within the prior three years remain subject to examination by federal and state tax authorities.
The Fund does not consider the effect of foreign currency gain/loss when calculating its monthly distribution due to its unpredictable nature over the course of a year and differing treatment for book and tax purposes. As a result, the Fund may report a distribution in excess of its earnings and profits or a tax return of capital at its fiscal year end.
The amount and character of income and capital gain distributions to shareowners are determined in accordance with federal income tax rules, which may differ from U.S. GAAP. Distributions in excess of net investment income or net realized gains are temporary over distributions for financial statement purposes resulting from differences in the recognition or classification of income or distributions for financial statement and tax purposes. Capital accounts within the financial statements are adjusted for permanent book/tax differences to reflect tax character, but are not adjusted for temporary differences.
At March 31, 2020, the Fund reclassified $459,598 to increase distributable earnings and $459,598 to decrease paid-in capital to reflect permanent book/tax differences. These adjustments have no impact on net assets or the results of operations.
Pioneer Dynamic Credit Fund | Annual Report | 3/31/20 43
At March 31, 2020, the Fund was permitted to carry forward indefinitely $31,031,239 of short-term losses and $32,797,789 of long-term losses.
The Fund has elected to defer $29,699 of ordinary losses recognized between November 1, 2018 and March 31, 2020 to its fiscal year ending March 31, 2021.
The tax character of distributions paid during the years ended March 31, 2020 and March 31, 2019, were as follows:
| 2020 | 2019 |
| Distributions paid from: | | |
| Ordinary income | $7,765,368 | $ 8,499,626 |
| Return of capital | 459,598 | 2,446,210 |
| Total | $8,224,966 | $10,945,836 |
The following shows the components of distributable earnings (losses) on a federal income tax basis at March 31, 2020:
| 2020 |
| Distributable earnings: | |
| Capital loss carryforward | $(63,829,028) |
| Current year late year loss | (29,699) |
| Current year dividend payable | (108,401) |
| Unrealized depreciation | (17,278,453) |
| Total | $(81,245,581) |
The difference between book basis and tax basis unrealized depreciation is attributable to the tax deferral of losses on wash sales, adjustments relating to insurance-linked securities, the tax treatment of premium and amortization, the mark to market of forward and futures contracts, tax basis adjustments on Real Estate Investment Trust (REIT) holdings, interest accruals on preferred stock, partnerships and other holdings.
E. Fund Shares
The Fund records sales and repurchases of its shares as of trade date. The Distributor earned $1,490 in underwriting commissions on the sale of Class A shares during the year ended March 31, 2020.
F. Class Allocations
Income, common expenses and realized and unrealized gains and losses are calculated at the Fund level and allocated daily to each class of shares based on its respective percentage of adjusted net assets at the beginning of the day.
Distribution fees are calculated based on the average daily net asset value attributable to Class A and Class C shares of the Fund, respectively (see Note 4). Class Y shares do not pay distribution fees. All expenses and fees
44 Pioneer Dynamic Credit Fund | Annual Report | 3/31/20
paid to the Fund’s transfer agent for its services are allocated among the classes of shares based on the number of accounts in each class and the ratable allocation of related out-of-pocket expenses (see Note 3).
The Fund declares as daily dividends substantially all of its net investment income. All dividends are paid on a monthly basis. Short-term capital gain distributions, if any, may be declared with the daily dividends. Distributions to shareowners are recorded as of the ex-dividend date. Distributions paid by the Fund with respect to each class of shares are calculated in the same manner and at the same time, except that net investment income dividends to Class A, Class C and Class Y shares can reflect different transfer agent and distribution expense rates.
G. Risks
The value of securities held by the Fund may go up or down, sometimes rapidly or unpredictably, due to general market conditions, such as real or perceived adverse economic, political or regulatory conditions, recessions, the spread of infectious illness or other public health issues, inflation, changes in interest rates, lack of liquidity in the bond markets or adverse investor sentiment. In the past several years, financial markets have experienced increased volatility, depressed valuations, decreased liquidity and heightened uncertainty. These conditions may continue, recur, worsen or spread.
At times, the Fund’s investments may represent industries or industry sectors that are interrelated or have common risks, making the Fund more susceptible to any economic, political, or regulatory developments or other risks affecting those industries and sectors. The Fund’s investments in foreign markets and countries with limited developing markets may subject the Fund to a greater degree of risk than investments in a developed market. These risks include disruptive political or economic conditions and the imposition of adverse governmental laws or currency exchange restrictions.
The Fund invests in below-investment-grade (high-yield) debt securities and preferred stocks. Some of these high-yield securities may be convertible into equity securities of the issuer. Debt securities rated below-investment-grade are commonly referred to as “junk bonds” and are considered speculative. These securities involve greater risk of loss, are subject to greater price volatility, and are less liquid, especially during periods of economic uncertainty or change, than higher rated debt securities.
With the increased use of technologies such as the Internet to conduct business, the Fund is susceptible to operational, information security and related risks. While the Fund’s Adviser has established business continuity plans in the event of, and risk management systems to prevent, limit or
Pioneer Dynamic Credit Fund | Annual Report | 3/31/20 45
mitigate, such cyber-attacks, there are inherent limitations in such plans and systems, including the possibility that certain risks have not been identified. Furthermore, the Fund cannot control the cybersecurity plans and systems put in place by service providers to the Fund such as Brown Brothers Harriman & Co., the Fund’s custodian and accounting agent, and DST Asset Manager Solutions, Inc., the Fund’s transfer agent. In addition, many beneficial owners of Fund shares hold them through accounts at broker-dealers, retirement platforms and other financial market participants over which neither the Fund nor Amundi Pioneer exercises control. Each of these may in turn rely on service providers to them, which are also subject to the risk of cyber-attacks. Cybersecurity failures or breaches at Amundi Pioneer or the Fund’s service providers or intermediaries have the ability to cause disruptions and impact business operations, potentially resulting in financial losses, interference with the Fund’s ability to calculate its net asset value, impediments to trading, the inability of Fund shareowners to effect share purchases, redemptions or exchanges or receive distributions, loss of or unauthorized access to private shareowner information and violations of applicable privacy and other laws, regulatory fines, penalties, reputational damage, or additional compliance costs. Such costs and losses may not be covered under any insurance. In addition, maintaining vigilance against cyber-attacks may involve substantial costs over time, and system enhancements may themselves be subject to cyber-attacks.
The Fund’s prospectus contains unaudited information regarding the Fund’s principal risks. Please refer to that document when considering the Fund’s principal risks.
H. Insurance-Linked Securities (“ILS”)
The Fund invests in ILS. The Fund could lose a portion or all of the principal it has invested in an ILS, and the right to additional interest or dividend payments with respect to the security, upon the occurrence of one or more trigger events, as defined within the terms of an insurance-linked security. Trigger events, generally, are hurricanes, earthquakes, or other natural events of a specific size or magnitude that occur in a designated geographic region during a specified time period, and/or that involve losses or other metrics that exceed a specific amount. There is no way to accurately predict whether a trigger event will occur, and accordingly, ILS carry significant risk. The Fund is entitled to receive principal, and interest and/or dividend payments so long as no trigger event occurs of the description and magnitude specified by the instrument. In addition to the specified trigger events, ILS may expose the Fund to other risks, including but not limited to issuer (credit) default, adverse regulatory or jurisdictional interpretations and adverse tax consequences.
46 Pioneer Dynamic Credit Fund | Annual Report | 3/31/20
The Fund’s investments in ILS may include event-linked bonds. ILS also may include special purpose vehicles (“SPVs”) or similar instruments structured to comprise a portion of a reinsurer’s catastrophe-oriented business, known as quota share instruments (sometimes referred to as reinsurance sidecars), or to provide reinsurance relating to specific risks to insurance or reinsurance companies through a collateralized instrument, known as collateralized reinsurance. Structured reinsurance investments also may include industry loss warranties (“ILWs”). A traditional ILW takes the form of a bilateral reinsurance contract, but there are also products that take the form of derivatives, collateralized structures, or exchange-traded instruments.
Where the ILS are based on the performance of underlying reinsurance contracts, the Fund has limited transparency into the individual underlying contracts, and therefore must rely upon the risk assessment and sound underwriting practices of the issuer. Accordingly, it may be more difficult for the Adviser to fully evaluate the underlying risk profile of the Fund’s structured reinsurance investments, and therefore the Fund’s assets are placed at greater risk of loss than if the Adviser had more complete information. Structured reinsurance instruments generally will be considered illiquid securities by the Fund. These securities may be difficult to purchase, sell or unwind. Illiquid securities also may be difficult to value. If the Fund is forced to sell an illiquid asset, the Fund may be forced to sell at a loss.
I. Purchased Options
The Fund may purchase put and call options to seek to increase total return. Purchased call and put options entitle the Fund to buy and sell a specified number of shares or units of a particular security, currency or index at a specified price at a specific date or within a specific period of time. Upon the purchase of a call or put option, the premium paid by the Fund is included on the Statement of Assets and Liabilities as an investment. All premiums are marked-to-market daily, and any unrealized appreciation or depreciation is recorded on the Fund’s Statement of Operations. As the purchaser of an index option, the Fund has the right to receive a cash payment equal to any depreciation in the value of the index below the strike price of the option (in the case of a put) or equal to any appreciation in the value of the index over the strike price of the option (in the case of a call) as of the valuation date of the option. Premiums paid for purchased call and put options which have expired are treated as realized losses on investments on the Statement of Operations. Upon the exercise or closing of a purchased put option, the premium is offset against the proceeds on the sale of the underlying security or financial instrument in order to determine the realized gain or loss on investments. Upon the exercise or closing of a purchased call option, the premium is added to the cost of the security or financial instrument. The risk associated with purchasing options is limited to the premium originally paid.
Pioneer Dynamic Credit Fund | Annual Report | 3/31/20 47
The average market value of purchased options contracts open during the year ended March 31, 2020, was $261,514. Open purchased options at March 31, 2020, are listed in the Schedule of Investments.
J. Forward Foreign Currency Exchange Contracts
The Fund may enter into forward foreign currency exchange contracts (“contracts”) for the purchase or sale of a specific foreign currency at a fixed price on a future date. All contracts are marked-to-market daily at the applicable exchange rates, and any resulting unrealized appreciation or depreciation is recorded in the Fund’s financial statements. The Fund records realized gains and losses at the time a contract is offset by entry into a closing transaction or extinguished by delivery of the currency. Risks may arise upon entering into these contracts from the potential inability of counterparties to meet the terms of the contract and from unanticipated movements in the value of foreign currencies relative to the U.S. dollar (see Note 6).
During the year ended March 31, 2020, the Fund had entered into various forward foreign currency exchange contracts that obligated the Fund to deliver or take delivery of currencies at specified future maturity dates. Alternatively, prior to the settlement date of a forward foreign currency exchange contract, the Fund may close out such contract by entering into an offsetting contract.
The average market value of forward foreign currency exchange contracts open during the year ended March 31, 2020, was $170,123. There were no open forward foreign currency exchange contracts at March 31, 2020.
K. Futures Contracts
The Fund may enter into futures transactions in order to attempt to hedge against changes in interest rates, securities prices and currency exchange rates or to seek to increase total return. Futures contracts are types of derivatives. All futures contracts entered into by the Fund are traded on a futures exchange. Upon entering into a futures contract, the Fund is required to deposit with a broker an amount of cash or securities equal to the minimum “initial margin” requirements of the associated futures exchange. The amount of cash deposited with the broker as collateral at March 31, 2020, is recorded as “Futures collateral” on the Statement of Assets and Liabilities.
Subsequent payments for futures contracts (“variation margin”) are paid or received by the Fund, depending on the daily fluctuation in the value of the contracts, and are recorded by the Fund as unrealized appreciation or depreciation. Cash received from or paid to the broker related to previous margin movement is held in a segregated account at the broker and is recorded as either “Due from broker for futures” or “Due to broker for futures” on the Statement of Assets and Liabilities. When the contract is
48 Pioneer Dynamic Credit Fund | Annual Report | 3/31/20
closed, the Fund realizes a gain or loss equal to the difference between the opening and closing value of the contract as well as any fluctuation in foreign currency exchange rates where applicable. Futures contracts are subject to market risk, interest rate risk and currency exchange rate risk. Changes in value of the contracts may not directly correlate to the changes in value of the underlying securities. With futures, there is reduced counterparty credit risk to the Fund since futures are exchange-traded and the exchange’s clearinghouse, as counterparty to all exchange-traded futures, guarantees the futures against default.
The average market value of futures contracts open during the year ended March 31, 2020, was $22,401,567. There were no open futures contracts at March 31, 2020.
L. Credit Default Swap Contracts
A credit default swap is a contract between a buyer of protection and a seller of protection against a pre-defined credit event or an underlying reference obligation, which may be a single security or a basket or index of securities. The Fund may buy or sell credit default swap contracts to seek to increase the Fund’s income, or to attempt to hedge the risk of default on portfolio securities. A credit default swap index is used to hedge risk or take a position on a basket of credit entities or indices.
As a seller of protection, the Fund would be required to pay the notional (or other agreed-upon) value of the referenced debt obligation to the counterparty in the event of a default by a U.S. or foreign corporate issuer of a debt obligation, which would likely result in a loss to the Fund. In return, the Fund would receive from the counterparty a periodic stream of payments during the term of the contract, provided that no event of default occurred. The maximum exposure of loss to the seller would be the notional value of the credit default swaps outstanding. If no default occurs, the Fund would keep the stream of payments and would have no payment obligation. The Fund may also buy credit default swap contracts in order to hedge against the risk of default of debt securities, in which case the Fund would function as the counterparty referenced above.
As a buyer of protection, the Fund makes an upfront or periodic payment to the protection seller in exchange for the right to receive a contingent payment. An upfront payment made by the Fund, as the protection buyer, is recorded within the “Swap contracts, at value” line item on the Statement of Assets and Liabilities. Periodic payments received or paid by the Fund are recorded as realized gains or losses on the Statement of Operations.
Pioneer Dynamic Credit Fund | Annual Report | 3/31/20 49
Credit default swap contracts are marked-to-market daily using valuations supplied by independent sources, and the change in value, if any, is recorded within the “Swap contracts, at value” line item on the Statement of Assets and Liabilities. Payments received or made as a result of a credit event or upon termination of the contract are recognized, net of the appropriate amount of the upfront payment, as realized gains or losses on the Statement of Operations.
Credit default swap contracts involving the sale of protection may involve greater risks than if the Fund had invested in the referenced debt instrument directly. Credit default swap contracts are subject to general market risk, liquidity risk, counterparty risk and credit risk. If the Fund is a protection buyer and no credit event occurs, it will lose its investment. If the Fund is a protection seller and a credit event occurs, the value of the referenced debt instrument received by the Fund, together with the periodic payments received, may be less than the amount the Fund pays to the protection buyer, resulting in a loss to the Fund. In addition, obligations under sell protection credit default swaps may be partially offset by net amounts received from settlement of buy protection credit default swaps entered into by the Fund for the same reference obligation with the same counterparty.
Certain swap contracts that are cleared through a central clearinghouse are referred to as centrally cleared swaps. All payments made or received by the Fund are pursuant to a centrally cleared swap contract with the central clearing party rather than the original counterparty. Upon entering into a centrally cleared swap contract, the Fund is required to make an initial margin deposit, either in cash or in securities. The daily change in value on open centrally cleared contracts is recorded as “Variation margin for centrally cleared swap contracts” on the Statement of Assets and Liabilities. Cash received from or paid to the broker related to previous margin movement is held in a segregated account at the broker and is recorded as either “Due from broker for swaps” or “Due to broker for swaps” on the Statement of Assets and Liabilities. The amount of cash deposited with a broker as collateral at March 31, 2020, is recorded as “Swaps collateral” on the Statement of Assets and Liabilities.
The average market value of credit default swap contracts open during the year ended March 31, 2020, was $1,357,175. There were no open credit default swap contracts at March 31, 2020.
50 Pioneer Dynamic Credit Fund | Annual Report | 3/31/20
2. Management Agreement
The Adviser manages the Fund’s portfolio. Management fees are paid monthly and are calculated daily at the annual rate equal to 0.70% of the Fund’s average daily net assets up to $1 billion and 0.65% of the Fund’s average daily net assets $1 billion. For the year ended March 31, 2020, the effective management fee (excluding waivers and/or assumption of expenses) was equivalent to 0.70% of the Fund’s average daily net assets.
The Adviser has contractually agreed to limit ordinary operating expenses (ordinary operating expenses means all fund expenses other than extraordinary expenses, such as litigation, taxes, brokerage commissions and acquired fund fees and expenses) of the Fund to the extent required to reduce Fund expenses to 1.20% and 0.85% of the average daily net assets attributable to Class A and Class Y shares, respectively. These expense limitations are in effect through August 1, 2020. Fees waived and expenses reimbursed during the year ended March 31, 2020 are reflected on the Statement of Operations. There can be no assurance that the Adviser will extend the expense limitation agreement for a class of shares beyond the date referred to above.
In addition, under the management and administration agreements, certain other services and costs, including accounting, regulatory reporting and insurance premiums, are paid by the Fund as administrative reimbursements. Included in “Due to affiliates” reflected on the Statement of Assets and Liabilities is $27,695 in management fees, administrative costs and certain other reimbursements payable to the Adviser at March 31, 2020.
3. Transfer Agent
DST Asset Manager Solutions, Inc. serves as the transfer agent to the Fund at negotiated rates. Transfer agent fees and payables shown on the Statement of Operations and the Statement of Assets and Liabilities, respectively, include sub-transfer agent expenses incurred through the Fund’s omnibus relationship contracts.
In addition, the Fund reimbursed the transfer agent for out-of-pocket expenses incurred by the transfer agent related to shareowner communications activities such as proxy and statement mailings, and outgoing phone calls. For the year ended March 31, 2020, such out-of-pocket expenses by class of shares were as follows:
| Shareowner Communications: | |
Class A | $ 2,519 |
Class C | 3,770 |
Class Y | 7,167 |
| Total | $13,456 |
Pioneer Dynamic Credit Fund | Annual Report | 3/31/20 51
4. Distribution and Service Plans
The Fund has adopted a distribution plan (the “Plan”) pursuant to Rule 12b-1 of the Investment Company Act of 1940 with respect to its Class A and Class C shares. Pursuant to the Plan, the Fund pays the Distributor 0.25% of the average daily net assets attributable to Class A shares as compensation for personal services and/or account maintenance services or distribution services with regard to Class A shares. Pursuant to the Plan, the Fund also pays the Distributor 1.00% of the average daily net assets attributable to Class C shares. The fee for Class C shares consists of a 0.25% service fee and a 0.75% distribution fee paid as compensation for personal services and/or account maintenance services or distribution services with regard to Class C shares. Included in “Due to affiliates” reflected on the Statement of Assets and Liabilities is $2,437 in distribution fees payable to the Distributor at March 31, 2020.
In addition, redemptions of Class A and Class C shares may be subject to a contingent deferred sales charge (“CDSC”). A CDSC of 1.00% may be imposed on redemptions of certain net asset value purchases of Class A shares within 12 months of purchase. Redemptions of Class C shares within 12 months of purchase are subject to a CDSC of 1.00%, based on the lower of cost or market value of shares being redeemed. Shares purchased as part of an exchange remain subject to any CDSC that applied to the original purchase of those shares. There is no CDSC for Class Y shares. Proceeds from the CDSCs are paid to the Distributor. For the year ended March 31, 2020, CDSCs in the amount of $1,856 were paid to the Distributor.
5. Line of Credit Facility
The Fund, along with certain other funds in the Pioneer Family of Funds (the “Funds”), participates in a committed, unsecured revolving line of credit facility. Borrowings are used solely for temporary or emergency purposes. The Fund may borrow up to the lesser of the amount available under the credit facility or the limits set for borrowing by the Fund’s prospectus and the 1940 Act. Effective March 11, 2020, the Fund participates in a facility in the amount of $300 million. Prior to March 11, 2020, the Fund participated in a facility in the amount of $25 million. Under such facility, depending on the type of loan, interest on borrowings is payable at the London Interbank Offered Rate (“LIBOR”) plus a credit spread. The Funds pay an annual commitment fee to participate in a credit facility. The commitment fee is allocated among participating Funds based on an allocation schedule set forth in the credit agreement. For the year ended March 31, 2020, the Fund had no borrowings under the credit facility.
52 Pioneer Dynamic Credit Fund | Annual Report | 3/31/20
6. Additional Disclosures about Derivative Instruments and Hedging Activities
The Fund’s use of derivatives may enhance or mitigate the Fund’s exposure to the following risks:
Interest rate risk relates to the fluctuations in the value of interest-bearing securities due to changes in the prevailing levels of market interest rates.
Credit risk relates to the ability of the issuer of a financial instrument to make further principal or interest payments on an obligation or commitment that it has to the Fund.
Foreign exchange rate risk relates to fluctuations in the value of an asset or liability due to changes in currency exchange rates.
Equity risk relates to the fluctuations in the value of financial instruments as a result of changes in market prices (other than those arising from interest rate risk or foreign exchange rate risk), whether caused by factors specific to an individual investment, its issuer, or all factors affecting all instruments traded in a market or market segment.
Commodity risk relates to the risk that the value of a commodity or commodity index will fluctuate based on increases or decreases in the commodities market and factors specific to a particular industry or commodity.
The fair value of open derivative instruments (not considered to be hedging instruments for accounting disclosure purposes) by risk exposure at March 31, 2020, was as follows:
| | | Foreign | | |
| Statement of | Interest | Credit | Exchange | Equity | Commodity |
| Assets and Liabilities | Rate Risk | Risk | Rate Risk | Risk | Risk |
| Assets: | | | | | |
Options purchased* | $ — | $ — | $ — | $1,128,060 | $ — |
| Total Value | $ — | $ — | $ — | $1,128,060 | $ — |
* | Reflects the market value of purchased option contracts (see Note 1I.). These amounts are included in investments in unaffiliated issuers, at value, on the Statement of Assets and Liabilities. |
Pioneer Dynamic Credit Fund | Annual Report | 3/31/20 53
The effect of derivative instruments (not considered to be hedging instruments for accounting disclosure purposes) on the Statement of Operations by risk exposure at March 31, 2020 was as follows:
| | | | | | | | Foreign | | | | | | | |
| | Interest | | | Credit | | | Exchange | | | Equity | | | Commodity | |
| Statement of Operations | | Rate Risk | | | Risk | | | Rate Risk | | | Risk | | | Risk | |
| Net realized gain | | | | | | | | | | | | | | | |
| (loss) on: | | | | | | | | | | | | | | | |
| Options purchased* | | $ | — | | | $ | — | | | $ | — | | | $ | (881,995 | ) | | $ | — | |
| Forward foreign | | | | | | | | | | | | | | | | | | | | |
| currency exchange | | | | | | | | | | | | | | | | | | | | |
| contracts | | | — | | | | — | | | | (18,188 | ) | | | — | | | | — | |
| Futures contracts | | | 922,639 | | | | — | | | | — | | | | — | | | | — | |
Swap contracts | | | — | | | | (6,911,007 | ) | | | — | | | | — | | | | — | |
| Total Value | | $ | 922,639 | | | $ | (6,911,007 | ) | | $ | (18,188 | ) | | $ | (881,995 | ) | | $ | — | |
| Change in net unrealized | | | | | | | | | | | | | | | | | | | | |
| appreciation | | | | | | | | | | | | | | | | | | | | |
| (depreciation) on: | | | | | | | | | | | | | | | | | | | | |
| Options purchased** | | $ | — | | | $ | — | | | $ | — | | | $ | 1,822,546 | | | $ | — | |
| Forward foreign | | | | | | | | | | | | | | | | | | | | |
| currency exchange | | | | | | | | | | | | | | | | | | | | |
| contracts | | | — | | | | — | | | | 5,675 | | | | — | | | | — | |
| Futures contracts | | | (277,109 | ) | | | — | | | | — | | | | — | | | | — | |
Swap contracts | | | — | | | | (29,531 | ) | | | — | | | | — | | | | — | |
| Total Value | | $ | (277,109 | ) | | $ | (29,531 | ) | | $ | 5,675 | | | $ | 1,822,546 | | | $ | — | |
* | Reflects the net realized gain (loss) on purchased option contracts (see Note 1I). These amounts are included in net realized gain (loss) on investments in unaffiliated issuers, on the Statement of Operations. |
** | Reflects the change in net unrealized appreciation (depreciation) on purchased option contracts (see Note 1I.). These amounts are included in change in net unrealized appreciation (depreciation) on Investments in unaffiliated issuers, on the Statement of Operations. |
7. Unfunded Loan Commitments
The Fund may enter into unfunded loan commitments. Unfunded loan commitments may be partially or wholly unfunded. During the contractual period, the Fund is obliged to provide funding to the borrower upon demand. A fee is earned by the Fund on the unfunded commitment and is recorded as interest income on the Statement of Operations.
As of March 31, 2020, the Fund had the following unfunded loan commitments outstanding:
| | | | Unrealized |
| Loan | Principal | Cost | Value | Depreciation |
Spectacle Gary | | | | |
| Holdings LLC | $65,800 | $63,948 | $56,259 | $(7,689) |
54 Pioneer Dynamic Credit Fund | Annual Report | 3/31/20
8. Subsequent Event
The respiratory illness COVID-19 caused by a novel coronavirus has resulted in a global pandemic and major disruption to economies and markets around the world, including the United States. Global financial markets have experienced extreme volatility and severe losses, and trading in many instruments has been disrupted. Liquidity for many instruments has been greatly reduced for periods of time. Some interest rates are very low and in some cases yields are negative. Some sectors of the economy and individual issuers have experienced particularly large losses. These circumstances may continue for an extended period of time, and may continue to affect adversely the value and liquidity of the fund’s investments. The ultimate economic fallout from the pandemic, and the long-term impact on economies, markets, industries and individual issuers, are not known. Governments and central banks, including the Federal Reserve in the U.S., have taken extraordinary and unprecedented actions to support local and global economies and the financial markets. These actions have resulted in significant expansion of public debt, including in the U.S. The impact of these measures, and whether they will be effective to mitigate the economic and market disruption, will not be known for some time. The consequences of high public debt, including its future impact on the economy and securities markets, likewise may not be known for some time.
9. The Reorganization
The Board of Trustees of the Fund has approved the reorganization of the Fund with Pioneer Corporate High Yield Fund (the “Reorganization”). Each fund is managed by Amundi Pioneer Asset Management, Inc. The Reorganization is expected to occur in the third quarter of 2020. The Reorganization does not require shareholder approval. Following is a brief description of certain aspects of the Reorganization:
— Pioneer Corporate High Yield Fund will reorganize with Pioneer Dynamic Credit Fund, resulting in the “Combined Fund.” The Combined Fund will be named “Pioneer Corporate High Yield Fund.”
— Pioneer Corporate High Yield Fund’s investment team will manage the Combined Fund.
— The Combined Fund will have the same investment objective, investment strategies and investment policies as Pioneer Corporate High Yield Fund.
— The Combined Fund’s investment objective will be to seek a high level of current income and long-term capital appreciation. The Combined Fund normally will invest at least 80% of its net assets (plus the amount of borrowings, if any, for investment purposes) in below investment grade (high yield) debt of corporate issuers. Pioneer Dynamic Credit Fund’s investment objective is to seek a high level of current income. Capital
Pioneer Dynamic Credit Fund | Annual Report | 3/31/20 55
appreciation is a secondary objective. Pioneer Dynamic Credit Fund normally invests at least 80% of its net assets (plus the amount of borrowings, if any, for investment purposes) in debt securities.
— The management fee payable by the Combined Fund will be equal to 0.50% of the Fund’s average daily net assets up to $1 billion and 0.45% of the Fund’s average daily net assets over $1 billion. The management fee payable by Pioneer Dynamic Credit Fund is equal to 0.70% of the Fund’s average daily net assets up to $1 billion and 0.65% of the Fund’s average daily net assets over $1 billion. Thus, the management fee payable by the Combined Fund will be less than the management fee payable by Pioneer Dynamic Credit Fund.
— It is currently anticipated that the historical performance of Pioneer Corporate High Yield Fund will become the Combined Fund’s historical performance.
— The Reorganization is expected to qualify as a tax-free reorganization, which generally means that the Reorganization will result in no income gain or loss being recognized for federal income tax purposes by either fund or its shareholders as a direct result of the Reorganization.
Shareholders of Pioneer Dynamic Credit Fund will not receive an information statement. Additional information about the Reorganization and the Combined Fund will be provided to shareholders prior to the consummation of the Reorganization.
56 Pioneer Dynamic Credit Fund | Annual Report | 3/31/20
Report of Independent Registered Public Accounting Firm
To the Board of Trustees of Pioneer Series Trust X and the Shareholders of Pioneer Dynamic Credit Fund:
Opinion on the Financial Statements
We have audited the accompanying statement of assets and liabilities of Pioneer Dynamic Credit Fund (the “Fund”) (one of the funds constituting Pioneer Series Trust X (the “Trust”)), including the schedule of investments, as of March 31, 2020, and the related statement of operations for the year then ended, the statements of changes in net assets for each of the two years in the period then ended, the financial highlights for each of the three years in the period then ended and the related notes (collectively referred to as the “financial statements”). The financial highlights for the periods ended March 31, 2016 and March 31, 2017 were audited by another independent registered public accounting firm whose report, dated May 26, 2017, expressed an unqualified opinion on those financial highlights. In our opinion, the financial statements present fairly, in all material respects, the financial position of Pioneer Dynamic Credit Fund (one of the funds constituting Pioneer Series Trust X) at March 31, 2020, the results of its operations for the year then ended, the changes in its net assets for each of the two years in the period then ended, and its financial highlights for each of the three years in the period then ended in conformity with U.S. generally accepted accounting principles.
Basis for Opinion
These financial statements are the responsibility of the Trust’s management. Our responsibility is to express an opinion on the Fund’s financial statements based on our audits. We are a public accounting firm registered with the Public Company Accounting Oversight Board (United States) (“PCAOB”) and are required to be independent with respect to the Trust in accordance with the U.S. federal securities laws and the applicable rules and regulations of the Securities and Exchange Commission and the PCAOB.
We conducted our audits in accordance with the standards of the PCAOB. Those standards require that we plan and perform the audit to obtain reasonable assurance about whether the financial statements are free of material misstatement, whether due to error or fraud. The Trust is not required to have, nor were we engaged to perform, an audit of the Trust’s internal control over financial reporting. As part of our audits, we are required to obtain an understanding of internal control over financial reporting, but not for the purpose of expressing an opinion on the effectiveness of the Trust’s internal control over financial reporting. Accordingly, we express no such opinion.
Pioneer Dynamic Credit Fund | Annual Report | 3/31/20 57
Our audits included performing procedures to assess the risks of material misstatement of the financial statements, whether due to error or fraud, and performing procedures that respond to those risks. Such procedures included examining, on a test basis, evidence regarding the amounts and disclosures in the financial statements. Our procedures included confirmation of securities owned as of March 31, 2020, by correspondence with the custodian and brokers. Our audits also included evaluating the accounting principles used and significant estimates made by management, as well as evaluating the overall presentation of the financial statements. We believe that our audits provide a reasonable basis for our opinion.
We have served as the auditor of one or more Amundi Pioneer investment companies since 2017.
Boston, Massachusetts
May 29, 2020
58 Pioneer Dynamic Credit Fund | Annual Report | 3/31/20
ADDITIONAL INFORMATION
(unaudited)
The percentages of the Fund’s ordinary income distributions that are exempt from nonresident alien (NRA) tax withholding resulting from qualified interest income was 88.60%.
Pioneer Dynamic Credit Fund | Annual Report | 3/31/20 59
Trustees, Officers and Service Providers
Investment Adviser and Administrator
Amundi Pioneer Asset Management, Inc.
Custodian and Sub-Administrator
Brown Brothers Harriman & Co.
Independent Registered Public Accounting Firm
Ernst & Young LLP
Principal Underwriter
Amundi Pioneer Distributor, Inc.
Legal Counsel
Morgan, Lewis & Bockius LLP
Transfer Agent
DST Asset Manager Solutions, Inc.
Proxy Voting Policies and Procedures of the Fund are available without charge, upon request, by calling our toll free number (1-800-225-6292). Information regarding how the Fund voted proxies relating to portfolio securities during the most recent 12-month period ended June 30 is publicly available to shareowners at www.amundipioneer.com/us. This information is also available on the Securities and Exchange Commission’s web site at www.sec.gov.
Trustees and Officers
The Fund’s Trustees and officers are listed below, together with their principal occupations and other directorships they have held during at least the past five years. Trustees who are interested persons of the Fund within the meaning of the 1940 Act are referred to as Interested Trustees. Trustees who are not interested persons of the Fund are referred to as Independent Trustees. Each of the Trustees serves as a Trustee of each of the 45 U.S. registered investment portfolios for which Amundi Pioneer serves as investment adviser (the “Pioneer Funds”). The address for all Trustees and all officers of the Fund is 60 State Street, Boston, Massachusetts 02109.
The Statement of Additional Information of the Fund includes additional information about the Trustees and is available, without charge, upon request, by calling 1-800-225-6292.
60 Pioneer Dynamic Credit Fund | Annual Report | 3/31/20
Independent Trustees
| Name, Age and Position | Term of Office and | | Other Directorships |
| Held With the Fund | Length of Service | Principal Occupation | Held by Trustee |
| Thomas J. Perna (68) | Trustee since 2011. Serves | Private investor (2004 – 2008 and 2013 – present); Chairman (2008 – 2013) | Director, Broadridge Financial Solutions, |
Chairman of the Board | until a successor trustee is | and Chief Executive Officer (2008 – 2012), Quadriserv, Inc. (technology products | Inc. (investor communications and |
and Trustee | elected or earlier retirement | for securities lending industry); and Senior Executive Vice President, The Bank of | securities processing provider for financial |
| or removal. | New York (financial and securities services) (1986 – 2004) | services industry) (2009 – present); |
| | | Director, Quadriserv, Inc. (2005 – 2013); |
| | | and Commissioner, New Jersey State Civil |
| | | Service Commission (2011 – 2015) |
| John E. Baumgardner, Jr. (68) | Trustee since 2019. Serves | Of Counsel (2019 – present), Partner (1983-2018), Sullivan & Cromwell LLP | Chairman, The Lakeville Journal Company, |
Trustee | until a successor trustee is | (law firm). | LLC, (privately-held community |
| elected or earlier retirement | | newspaper group) (2015-present) |
| or removal. | | |
| Diane Durnin (63) | Trustee since 2019. Serves | Managing Director - Head of Product Strategy and Development, BNY Mellon | None |
Trustee | until a successor trustee is | Investment Management (2012-2018); Vice Chairman – The Dreyfus Corporation | |
| elected or earlier retirement | (2005 – 2018): Executive Vice President Head of Product, BNY Mellon Investment | |
| or removal. | Management (2007-2012); Executive Director- Product Strategy, Mellon Asset | |
| | Management (2005-2007); Executive Vice President Head of Products, Marketing | |
| | and Client Service, Dreyfus Corporation (2000-2005); and Senior Vice President | |
| | Strategic Product and Business Development, Dreyfus Corporation (1994-2000) | |
| Benjamin M. Friedman (75) | Trustee since 2011. Serves | William Joseph Maier Professor of Political Economy, Harvard University | Trustee, Mellon Institutional Funds |
Trustee | until a successor trustee is | (1972 – present) | Investment Trust and Mellon Institutional |
| elected or earlier retirement | | Funds Master Portfolio (oversaw 17 |
| or removal. | | portfolios in fund complex) (1989 - 2008) |
Pioneer Dynamic Credit Fund | Annual Report | 3/31/20 61
Independent Trustees (continued)
| Name, Age and Position | Term of Office and | | Other Directorships |
| Held With the Fund | Length of Service | Principal Occupation | Held by Trustee |
| Lorraine H. Monchak (64) | Trustee since 2017. | Chief Investment Officer, 1199 SEIU Funds (healthcare workers union pension | None |
Trustee | (Advisory Trustee from | funds) (2001 – present); Vice President – International Investments Group, American | |
| 2014 - 2017). Serves until | International Group, Inc. (insurance company) (1993 – 2001); Vice President – | |
| a successor trustee is elected | Corporate Finance and Treasury Group, Citibank, N.A. (1980 – 1986 and | |
| or earlier retirement or removal. | 1990 – 1993); Vice President – Asset/Liability Management Group, Federal Farm | |
| | Funding Corporation (government-sponsored issuer of debt securities) | |
| | (1988 – 1990); Mortgage Strategies Group, Shearson Lehman Hutton, Inc. | |
| | (investment bank) (1987 – 1988); and Mortgage Strategies Group, Drexel | |
| | | Burnham Lambert, Ltd. (investment bank) (1986 – 1987) | |
| Marguerite A. Piret (71) | Trustee since 2011. Serves | Chief Financial Officer, American Ag Energy, Inc. (controlled environment and | Director of New America High Income |
Trustee | until a successor trustee is | agriculture company) (2016 – present); and President and Chief Executive Officer, | Fund, Inc. (closed-end investment |
| elected or earlier retirement | Metric Financial Inc. (formerly known as Newbury Piret Company) (investment | company) (2004 – present); and Member, |
| or removal. | banking firm) (1981 – 2019) | Board of Governors, Investment Company |
| | | Institute (2000 – 2006) |
| Fred J. Ricciardi (73) | Trustee since 2014. Serves | Consultant (investment company services) (2012 – present); Executive Vice | None |
Trustee | until a successor trustee is | President, BNY Mellon (financial and investment company services) (1969 – 2012); | |
| elected or earlier retirement | Director, BNY International Financing Corp. (financial services) (2002 – 2012); | |
| or removal. | Director, Mellon Overseas Investment Corp. (financial services) (2009 – 2012); | |
| | Director, Financial Models (technology) (2005-2007); Director, BNY Hamilton Funds, | |
| | Ireland (offshore investment companies) (2004-2007); Chairman/Director, AIB/BNY | |
| | Securities Services, Ltd., Ireland (financial services) (1999-2006); and Chairman, | |
| | BNY Alternative Investment Services, Inc. (financial services) (2005-2007) | |
62 Pioneer Dynamic Credit Fund | Annual Report | 3/31/20
Interested Trustees
| Name, Age and Position | Term of Office and | | Other Directorships |
| Held With the Fund | Length of Service | Principal Occupation | Held by Trustee |
| Lisa M. Jones (58)* | Trustee since 2017. Serves | Director, CEO and President of Amundi Pioneer Asset Management USA, Inc. | None |
Trustee, President and | until a successor trustee is | (since September 2014); Director, CEO and President of Amundi Pioneer Asset | |
Chief Executive Officer | elected or earlier retirement | Management, Inc. (since September 2014); Director, CEO and President of Amundi | |
| or removal | Pioneer Distributor, Inc. (since September 2014); Director, CEO and President of | |
| | Amundi Pioneer Institutional Asset Management, Inc. (since September 2014); | |
| | Chair, Amundi Pioneer Asset Management USA, Inc., Amundi Pioneer Distributor, Inc. | |
| | and Amundi Pioneer Institutional Asset Management, Inc. (September 2014 – 2018); | |
| | Managing Director, Morgan Stanley Investment Management (2010 – 2013); | |
| | Director of Institutional Business, CEO of International, Eaton Vance Management | |
| | (2005 – 2010); and Director of Amundi USA, Inc. (since 2017) | |
| Kenneth J. Taubes (62)* | Trustee since 2014. Serves | Director and Executive Vice President (since 2008) and Chief Investment Officer, | None |
Trustee | until a successor trustee is | U.S. (since 2010) of Amundi Pioneer Asset Management USA, Inc.; Director and | |
| elected or earlier retirement | Executive Vice President and Chief Investment Officer, U.S. of Amundi Pioneer (since | |
| or removal | 2008); Executive Vice President and Chief Investment Officer, U.S. of Amundi Pioneer | |
| | Institutional Asset Management, Inc. (since 2009); Portfolio Manager of Amundi | |
| | Pioneer (since 1999); and Director of Amundi USA, Inc. (since 2017) | |
| * Ms. Jones and Mr. Taubes are Interested Trustees because they are officers or directors of the Fund’s investment adviser and certain of its affiliates. |
Pioneer Dynamic Credit Fund | Annual Report | 3/31/20 63
| Name, Age and Position | Term of Office and | | Other Directorships |
| Held With the Fund | Length of Service | Principal Occupation | Held by Officer |
| Christopher J. Kelley (55) | Since 2011. Serves at the | Vice President and Associate General Counsel of Amundi Pioneer since January | None |
Secretary and Chief | discretion of the Board | 2008; Secretary and Chief Legal Officer of all of the Pioneer Funds since June 2010; | |
Legal Officer | | Assistant Secretary of all of the Pioneer Funds from September 2003 to May 2010; | |
| | and Vice President and Senior Counsel of Amundi Pioneer from July 2002 to | |
| | December 2007 | |
| Carol B. Hannigan (59) | Since 2011. Serves at the | Fund Governance Director of Amundi Pioneer since December 2006 and Assistant | None |
Assistant Secretary | discretion of the Board | Secretary of all the Pioneer Funds since June 2010; Manager – Fund Governance of | |
| | Amundi Pioneer from December 2003 to November 2006; and Senior Paralegal of | |
| | Amundi Pioneer from January 2000 to November 2003 | |
| Thomas Reyes (57) | Since 2011. Serves at the | Assistant General Counsel of Amundi Pioneer since May 2013 and Assistant | None |
Assistant Secretary | discretion of the Board | Secretary of all the Pioneer Funds since June 2010; and Counsel of Amundi | |
| | | Pioneer from June 2007 to May 2013 | |
| Mark E. Bradley (60) | Since 2011. Serves at the | Vice President – Fund Treasury of Amundi Pioneer; Treasurer of all of the Pioneer | None |
Treasurer and Chief | discretion of the Board | Funds since March 2008; Deputy Treasurer of Amundi Pioneer from March 2004 to | |
Financial and Accounting | | February 2008; and Assistant Treasurer of all of the Pioneer Funds from March 2004 | |
Officer | | to February 2008 | |
| Luis I. Presutti (55) | Since 2011. Serves at the | Director – Fund Treasury of Amundi Pioneer; and Assistant Treasurer of all of the | None |
Assistant Treasurer | discretion of the Board | Pioneer Funds | |
| Gary Sullivan (62) | Since 2011. Serves at the | Senior Manager – Fund Treasury of Amundi Pioneer; and Assistant Treasurer of all of | None |
Assistant Treasurer | discretion of the Board | the Pioneer Funds | |
64 Pioneer Dynamic Credit Fund | Annual Report | 3/31/20
| | | | |
| Name, Age and Position | Term of Office and | | Other Directorships |
| Held With the Fund | Length of Service | Principal Occupation | Held by Officer |
| Antonio Furtado (38) | Since 2020. Serves at the | Fund Oversight Manager – Fund Treasury of Amundi Pioneer; and Assistant Treasurer | None |
Assistant Treasurer | discretion of the Board | of all of the Pioneer Funds | |
| John Malone (48) | Since 2018. Serves at the | Managing Director, Chief Compliance Officer of Amundi Pioneer Asset Management; | None |
Chief Compliance Officer | discretion of the Board | Amundi Pioneer Institutional Asset Management, Inc.; and the Pioneer Funds since | |
| | September 2018; and Chief Compliance Officer of Amundi Pioneer Distributor, Inc. | |
| | since January 2014. | |
| Kelly O’Donnell (49) | Since 2011. Serves at the | Vice President – Amundi Pioneer Asset Management; and Anti-Money Laundering | None |
Anti-Money Laundering | discretion of the Board | Officer of all the Pioneer Funds since 2006 | |
Officer | | | |
Pioneer Dynamic Credit Fund | Annual Report | 3/31/20 65
This page was intentionally left blank.
66 Pioneer Dynamic Credit Fund | Annual Report | 3/31/20
This page was intentionally left blank.
Pioneer Dynamic Credit Fund | Annual Report | 3/31/20 67
This page was intentionally left blank.
68 Pioneer Dynamic Credit Fund | Annual Report | 3/31/20
How to Contact Amundi Pioneer
We are pleased to offer a variety of convenient ways for you to contact us for assistance or information.
| Call us for: | | |
Account Information, including existing accounts, | |
new accounts, prospectuses, applications | |
and service forms | | 1-800-225-6292 |
| | |
FactFoneSM for automated fund yields, prices, | |
account information and transactions | 1-800-225-4321 |
| | |
| Retirement plans information | 1-800-622-0176 |
|
| Write to us: | | |
Amundi Pioneer | | |
P.O. Box 219427 | | |
Kansas City, MO 64121-9427 | | |
| | | |
| Our toll-free fax | | 1-800-225-4240 |
| | | |
| Our internet e-mail address | us.askamundipioneer@amundipioneer.com |
(for general questions about Amundi Pioneer only) | |
|
| Visit our web site: www.amundipioneer.com/us | |
This report must be preceded or accompanied by a prospectus.
The Fund files a complete schedule of portfolio holdings with the Securities and Exchange Commission for the first and third quarters of each fiscal year as an exhibit to its reports on Form N-PORT. Shareholders may view the filed Form N-PORT by visiting the Commission’s web site at https://www.sec.gov.
Amundi Pioneer Asset Management, Inc. |
60 State Street |
Boston, MA 02109 |
| www.amundipioneer.com/us |
| |
Securities offered through Amundi Pioneer Distributor, Inc. |
60 State Street, Boston, MA 02109 |
Underwriter of Pioneer Mutual Funds, Member SIPC |
© 2020 Amundi Pioneer Asset Management 25667-08-0520 |
ITEM 2. CODE OF ETHICS.
(a) Disclose whether, as of the end of the period covered by the report, the registrant has adopted a code of ethics that applies to the registrant’s principal executive officer, principal financial officer, principal accounting officer or controller, or persons performing similar functions, regardless of whether these individuals are employed by the registrant or a third party. If the registrant has not adopted such a code of ethics, explain why it has not done so.
The registrant has adopted, as of the end of the period covered by this report, a code of ethics that applies to the registrant’s principal executive officer, principal financial officer, principal accounting officer and controller.
(b) For purposes of this Item, the term “code of ethics” means written standards that are reasonably designed to deter wrongdoing and to promote:
(1) Honest and ethical conduct, including the ethical handling of actual or apparent conflicts of interest between personal and professional relationships;
(2) Full, fair, accurate, timely, and understandable disclosure in reports and documents that a registrant files with, or submits to, the Commission and in other public communications made by the registrant;
(3) Compliance with applicable governmental laws, rules, and regulations;
(4) The prompt internal reporting of violations of the code to an appropriate person or persons identified in the code; and
(5) Accountability for adherence to the code.
(c) The registrant must briefly describe the nature of any amendment, during the period covered by the report, to a provision of its code of ethics that applies to the registrant’s principal executive officer, principal financial officer, principal accounting officer or controller, or persons performing similar functions, regardless of whether these individuals are employed by the registrant or a third party, and that relates to any element of the code of ethics definition enumerated in paragraph (b) of this Item. The registrant must file a copy of any such amendment as an exhibit pursuant to Item 10(a), unless the registrant has elected to satisfy paragraph (f) of this Item by posting its code of ethics on its website pursuant to paragraph (f)(2) of this Item, or by undertaking to provide its code of ethics to any person without charge, upon request, pursuant to paragraph (f)(3) of this Item.
The registrant has made no amendments to the code of ethics during the period covered by this report.
(d) If the registrant has, during the period covered by the report, granted a waiver, including an implicit waiver, from a provision of the code of ethics to the registrant’s principal executive officer, principal financial officer, principal accounting officer or controller, or persons performing similar functions, regardless of whether these individuals are employed by the registrant or a third party, that relates to one or more of the items set forth in paragraph (b) of this Item, the registrant must briefly describe the nature of the waiver, the name of the person to whom the waiver was granted, and the date of the waiver.
Not applicable.
(e) If the registrant intends to satisfy the disclosure requirement under paragraph (c) or (d) of this Item regarding an amendment to, or a waiver from, a provision of its code of ethics that applies to the registrant’s principal executive officer, principal financial officer, principal accounting officer or controller, or persons performing similar functions and that relates to any element of the code of ethics definition
enumerated in paragraph (b) of this Item by posting such information on its Internet website, disclose the registrant’s Internet address and such intention.
Not applicable.
(f) The registrant must:
(1) File with the Commission, pursuant to Item 12(a)(1), a copy of its code of ethics that applies to the registrant’s principal executive officer,principal financial officer, principal accounting officer or controller, or persons performing similar functions, as an exhibit to its annual report on this Form N-CSR (see attachment);
(2) Post the text of such code of ethics on its Internet website and disclose, in its most recent report on this Form N-CSR, its Internet address and the fact that it has posted such code of ethics on its Internet website; or
(3) Undertake in its most recent report on this Form N-CSR to provide to any person without charge, upon request, a copy of such code of ethics and explain the manner in which such request may be made. See Item 10(2)
ITEM 3. AUDIT COMMITTEE FINANCIAL EXPERT.
(a) (1) Disclose that the registrant’s board of trustees has determined that the registrant either:
(i) Has at least one audit committee financial expert serving on its audit committee; or
(ii) Does not have an audit committee financial expert serving on its audit committee.
The registrant’s Board of Trustees has determined that the registrant has at least one audit committee financial expert.
(2) If the registrant provides the disclosure required by paragraph (a)(1)(i) of this Item, it must disclose the name of the audit committee financial expert and whether that person is “independent.” In order to be considered “independent” for purposes of this Item, a member of an audit committee may not, other than in his or her capacity as a member of the audit committee, the board of trustees, or any other board committee:
(i) Accept directly or indirectly any consulting, advisory, or other compensatory fee from the issuer; or
(ii) Be an “interested person” of the investment company as defined in Section 2(a)(19) of the Act (15 U.S.C. 80a-2(a)(19)).
Mr. Fred J. Ricciardi, an independent trustee, is such an audit committee financial expert.
(3) If the registrant provides the disclosure required by paragraph (a)(1) (ii) of this Item, it must explain why it does not have an audit committee financial expert.
Not applicable.
ITEM 4. PRINCIPAL ACCOUNTANT FEES AND SERVICES.
(a) Disclose, under the caption AUDIT FEES, the aggregate fees billed for each of the last two fiscal years for professional services rendered by the principal accountant for the audit of the registrant’s annual financial statements or services that are normally provided by the accountant in connection with statutory and regulatory filings or engagements for those fiscal years.
The audit fees for the Trust were $122,500 payable to Ernst & Young LLP for the year ended March 31, 2020 and $122,500 for the year ended March 31, 2019.
(b) Disclose, under the caption AUDIT-RELATED FEES, the aggregate fees billed in each of the last two fiscal years for assurance and related services by the principal accountant that are reasonably related to the performance of the audit of the registrant’s financial statements and are not reported under paragraph (a) of this Item. Registrants shall describe the nature of the services comprising the fees disclosed under this category.
There were no audit-related services in 2020 or 2019.
(c) Disclose, under the caption TAX FEES, the aggregate fees billed in each of the last two fiscal years for professional services rendered by the principal accountant for tax compliance, tax advice, and tax planning. Registrants shall describe the nature of the services comprising the fees disclosed under this category.
The tax fees for the Trust were $28,258 payable to Ernst & Young LLP for the year ended March 31, 2020 and $28,258 for the year ended March 31, 2019.
(d) Disclose, under the caption ALL OTHER FEES, the aggregate fees billed in each of the last two fiscal years for products and services provided by the principal accountant, other than the services reported in paragraphs (a) through (c) of this Item. Registrants shall describe the nature of the services comprising the fees disclosed under this category.
There were no other fees in 2020 or 2019.
(e) (1) Disclose the audit committee’s pre-approval policies and procedures described in paragraph (c)(7) of Rule 2-01 of Regulation S-X.
PIONEER FUNDS
APPROVAL OF AUDIT, AUDIT-RELATED, TAX AND OTHER SERVICES
PROVIDED BY THE INDEPENDENT AUDITOR
SECTION I - POLICY PURPOSE AND APPLICABILITY
The Pioneer Funds recognize the importance of maintaining the independence of their outside auditors. Maintaining independence is a shared responsibility involving Amundi Pioneer Asset Management, Inc, the audit committee and the independent auditors.
The Funds recognize that a Fund’s independent auditors: 1) possess knowledge of the Funds, 2) are able to incorporate certain services into the scope of the audit, thereby avoiding redundant work, cost and disruption of Fund personnel and processes, and 3) have expertise that has value to the Funds. As a result, there are situations where it is desirable to use the Fund’s independent auditors for services in addition to the annual audit and where the potential for conflicts of interests are minimal. Consequently, this policy, which is intended to comply with Rule 210.2-01(C)(7), sets forth guidelines and procedures to be followed by the Funds when retaining the independent audit firm to perform audit, audit-related tax and
other services under those circumstances, while also maintaining independence.
Approval of a service in accordance with this policy for a Fund shall also constitute approval for any other Fund whose pre-approval is required pursuant to Rule 210.2-01(c)(7)(ii).
In addition to the procedures set forth in this policy, any non-audit services that may be provided consistently with Rule 210.2-01 may be approved by the Audit Committee itself and any pre-approval that may be waived in accordance with Rule 210.2-01(c)(7)(i)(C) is hereby waived.
Selection of a Fund’s independent auditors and their compensation shall be determined by the Audit Committee and shall not be subject to this policy.
| | | |
| SECTION II - POLICY |
| |
SERVICE CATEGORY | SERVICE CATEGORY DESCRIPTION | SPECIFIC PRE-APPROVED SERVICE SUBCATEGORIES |
| | | |
I. AUDIT SERVICES | Services that are directly | o Accounting research assistance |
| | related to performing the | o SEC consultation, registration |
| | independent audit of the Funds | statements, and reporting |
| | | o Tax accrual related matters |
| | | o Implementation of new accounting standards |
| | | o Compliance letters (e.g. rating agency letters) |
| | | o Regulatory reviews and assistance |
| | | regarding financial matters |
| | | o Semi-annual reviews (if requested) |
| | | o Comfort letters for closed end offerings |
II. AUDIT-RELATED | Services which are not | o AICPA attest and agreed-upon procedures |
SERVICES | prohibited under Rule | o Technology control assessments |
| | 210.2-01(C)(4) (the “Rule”) | o Financial reporting control assessments |
| | and are related extensions of | o Enterprise security architecture |
| | the audit services support the | assessment |
| | audit, or use the knowledge/expertise | |
| | gained from the audit procedures as a | |
| | foundation to complete the project. | |
| | In most cases, if the Audit-Related | |
| | Services are not performed by the | |
| | Audit firm, the scope of the Audit | |
| | Services would likely increase. | |
| | The Services are typically well-defined | |
| | and governed by accounting | |
| | professional standards (AICPA, | |
| | SEC, etc.) | |
| | |
AUDIT COMMITTEE APPROVAL POLICY | AUDIT COMMITTEE REPORTING POLICY |
| o “One-time” pre-approval | o A summary of all such |
| for the audit period for all | services and related fees |
| pre-approved specific service | reported at each regularly |
| subcategories. Approval of the | scheduled Audit Committee |
| independent auditors as | meeting. |
| auditors for a Fund shall | |
| constitute pre approval for | |
| these services. | |
| |
| o “One-time” pre-approval | o A summary of all such |
| for the fund fiscal year within | services and related fees |
| a specified dollar limit | (including comparison to |
| for all pre-approved | specified dollar limits) |
| specific service subcategories | reported quarterly. |
| |
| o Specific approval is | |
| needed to exceed the | |
| pre-approved dollar limit for | |
| these services (see general | |
| Audit Committee approval policy | |
| below for details on obtaining | |
| specific approvals) | |
| |
| o Specific approval is | |
| needed to use the Fund’s | |
| auditors for Audit-Related | |
| Services not denoted as | |
| “pre-approved”, or | |
| to add a specific service | |
| subcategory as “pre-approved” | |
SECTION III - POLICY DETAIL, CONTINUED
| | |
SERVICE CATEGORY | SERVICE CATEGORY DESCRIPTION | SPECIFIC PRE-APPROVED SERVICE |
| | | SUBCATEGORIES |
III. TAX SERVICES | Services which are not | o Tax planning and support |
| | prohibited by the Rule, | o Tax controversy assistance |
| | if an officer of the Fund | o Tax compliance, tax returns, excise |
| | determines that using the | tax returns and support |
| | Fund’s auditor to provide | o Tax opinions |
| | these services creates | |
| | significant synergy in | |
| | the form of efficiency, | |
| | minimized disruption, or | |
| | the ability to maintain a | |
| | desired level of | |
| | confidentiality. | |
| | |
| AUDIT COMMITTEE APPROVAL POLICY | AUDIT COMMITTEE REPORTING POLICY |
o “One-time” pre-approval | o A summary of |
for the fund fiscal year | all such services and |
within a specified dollar limit | related fees |
| | (including comparison |
| | to specified dollar |
| | limits) reported |
| | quarterly. |
| |
o Specific approval is | |
| needed to exceed the | |
| pre-approved dollar limits for | |
| these services (see general | |
| Audit Committee approval policy | |
| below for details on obtaining | |
| specific approvals) | |
| |
o Specific approval is | |
| needed to use the Fund’s | |
| auditors for tax services not | |
| denoted as pre-approved, or to | |
| add a specific service subcategory as | |
| “pre-approved” | |
SECTION III - POLICY DETAIL, CONTINUED
| |
SERVICE CATEGORY | SERVICE CATEGORY DESCRIPTION | SPECIFIC PRE-APPROVED SERVICE |
| | | SUBCATEGORIES |
IV. OTHER SERVICES | Services which are not | o Business Risk Management support |
| | prohibited by the Rule, | o Other control and regulatory |
A. SYNERGISTIC, | if an officer of the Fund | compliance projects |
UNIQUE QUALIFICATIONS | determines that using the | |
| | Fund’s auditor to provide | |
| | these services creates | |
| | significant synergy in | |
| | the form of efficiency, | |
| | minimized disruption, | |
| | the ability to maintain a | |
| | desired level of | |
| | confidentiality, or where | |
| | the Fund’s auditors | |
| | posses unique or superior | |
| | qualifications to provide | |
| | these services, resulting | |
| | in superior value and | |
| | results for the Fund. | |
| | |
AUDIT COMMITTEE APPROVAL POLICY | AUDIT COMMITTEE REPORTING POLICY |
o “One-time” pre-approval | o A summary of |
| for the fund fiscal year within | all such services and |
| a specified dollar limit | related fees |
| | (including comparison |
| | to specified dollar |
| | limits) reported |
| | quarterly. |
o Specific approval is | |
| needed to exceed the | |
| pre-approved dollar limits for | |
| these services (see general | |
| Audit Committee approval policy | |
| below for details on obtaining | |
| specific approvals) | |
| |
o Specific approval is | |
| needed to use the Fund’s | |
| auditors for “Synergistic” or | |
| “Unique Qualifications” Other | |
| Services not denoted as | |
| pre-approved to the left, or to | |
| add a specific service | |
| subcategory as “pre-approved” | |
SECTION III - POLICY DETAIL, CONTINUED
| |
SERVICE CATEGORY | SERVICE CATEGORY DESCRIPTION | SPECIFIC PROHIBITED SERVICE |
| | | SUBCATEGORIES |
PROHIBITED SERVICES | Services which result | 1. Bookkeeping or other services |
| | in the auditors losing | related to the accounting records or |
| | independence status | financial statements of the audit |
| | under the Rule. | client* |
| | | 2. Financial information systems design |
| | | and implementation* |
| | | 3. Appraisal or valuation services, |
| | | fairness* opinions, or |
| | | contribution-in-kind reports |
| | | 4. Actuarial services (i.e., setting |
| | | actuarial reserves versus actuarial |
| | | audit work)* |
| | | 5. Internal audit outsourcing services* |
| | | 6. Management functions or human |
| | | resources |
| | | 7. Broker or dealer, investment |
| | | advisor, or investment banking services |
| | | 8. Legal services and expert services |
| | | unrelated to the audit |
| | | 9. Any other service that the Public |
| | | Company Accounting Oversight Board |
| | | determines, by regulation, is |
| | | impermissible |
| | |
AUDIT COMMITTEE APPROVAL POLICY | AUDIT COMMITTEE REPORTING POLICY |
o These services are not to be | o A summary of all |
| performed with the exception of the(*) | services and related |
| services that may be permitted | fees reported at each |
| if they would not be subject to audit | regularly scheduled |
| procedures at the audit client (as | Audit Committee meeting |
| defined in rule 2-01(f)(4)) level | will serve as continual |
| the firm providing the service. | confirmation that has |
| | not provided any |
| | restricted services. |
GENERAL AUDIT COMMITTEE APPROVAL POLICY:
o For all projects, the officers of the Funds and the Fund’s auditors will each make an assessment to determine that any proposed projects will not impair independence.
o Potential services will be classified into the four non-restricted service categories and the “Approval of Audit, Audit-Related, Tax and Other Services” Policy above will be applied. Any services outside the specific pre-approved service subcategories set forth above must be specifically approved by the Audit Committee.
o At least quarterly, the Audit Committee shall review a report summarizing the services by service category, including fees, provided by the Audit firm as set forth in the above policy.
(2) Disclose the percentage of services described in each of paragraphs (b) through (d) of this Item that were approved by the audit committee pursuant to paragraph (c)(7)(i)(C) of Rule 2-01 of Regulation S-X.
Non-Audit Services
Beginning with non-audit service contracts entered into on or after May 6, 2003, the effective date of the
new SEC pre-approval rules, the Trust's audit committee is required to pre-approve services to affiliates defined by SEC rules to the extent that the services are determined to have a direct impact on the operations or financial reporting of the Trust. For the years ended March 31 2020 and 2019, there were no services provided to an affiliate that required the Trust's audit committee pre-approval.
(f) If greater than 50 percent, disclose the percentage of hours expended on the principal accountants engagement to audit the registrant’s financial statements for the most recent fiscal year that were attributed to work performed by persons other than the principal accountant’s full-time, permanent employees.
N/A
(g) Disclose the aggregate non-audit fees billed by the registrants accountant for services rendered to the registrant, and rendered to the registrants investment adviser (not including any sub-adviser whose role is primarily portfolio management and is subcontracted with or overseen by another investment adviser), and any entity controlling, controlled by, or under common control with the adviser that provides ongoing services to the registrant for each of the last two fiscal years of the registrant.
The aggregate non-audit fees for the Trust were $28,258 payable to Ernst & Young LLP for the year ended March 31, 2020 and $28,258 for the year ended March 31, 2019.
(h) Disclose whether the registrants audit committee of the board of trustees has considered whether the provision of non-audit services that were rendered to the registrants investment adviser (not including any subadviser whose role is primarily portfolio management and is subcontracted with or overseen by another investment adviser), and any entity controlling, controlled by, or under common control with the investment adviser that provides ongoing services to the registrant that were not pre-approved pursuant to paragraph (c)(7)(ii) of Rule 2-01 of Regulation S-X is compatible with maintaining the principal accountant’s independence.
The Fund’s audit committee of the Board of Trustees has considered whether the provision of non-audit services that were rendered to the Affiliates (as defined) that were not pre- approved pursuant to paragraph (c)(7)(ii) of Rule 2-01 of Regulation S-X is compatible with maintaining the principal accountant’s independence.
ITEM 5. AUDIT COMMITTEE OF LISTED REGISTRANTS
(a) If the registrant is a listed issuer as defined in Rule 10A-3 under the Exchange Act (17 CFR 240.10A-3), state whether or not the registrant has a separately-designated standing audit committee established in accordance with Section 3(a)(58)(A) of the Exchange Act (15 U.S.C. 78c(a)(58)(A)). If the registrant has such a committee, however designated, identify each committee member. If the entire board of directors is acting as the registrant’s audit committee as specified in Section 3(a)(58)(B) of the Exchange Act (15 U.S.C. 78c(a)(58)(B)), so state.
N/A
(b) If applicable, provide the disclosure required by Rule 10A-3(d) under the Exchange Act (17 CFR 240.10A-3(d)) regarding an exemption from the listing standards for audit committees.
N/A
ITEM 6. SCHEDULE OF INVESTMENTS.
File Schedule of Investments in securities of unaffiliated issuers as of the close of the reporting period as set forth in 210.1212 of Regulation S-X [17 CFR 210.12-12], unless the schedule is included as part of the report to shareholders filed under Item 1 of this Form.
Included in Item 1
ITEM 7. DISCLOSURE OF PROXY VOTING POLICIES AND PROCEDURES FOR CLOSED-END MANAGEMENT INVESTMENT COMPANIES.
A closed-end management investment company that is filing an annual report on this Form N-CSR must, unless it invests exclusively in non-voting securities, describe the policies and procedures that it uses to determine how to vote proxies relating to portfolio securities, including the procedures that the company uses when a vote presents a conflict between the interests of its shareholders, on the one hand, and those of the company’s investment adviser; principal underwriter; or any affiliated person (as defined in Section 2(a)(3) of the Investment Company Act of 1940 (15 U.S.C. 80a-2(a)(3)) and the rules thereunder) of the company, its investment adviser, or its principal underwriter, on the other. Include any policies and procedures of the company’s investment adviser, or any other third party, that the company uses, or that are used on the company’s behalf, to determine how to vote proxies relating to portfolio securities.
Not applicable to open-end management investment companies.
ITEM 8. PORTFOLIO MANAGERS OF CLOSED-END MANAGEMENT INVESTMENT COMPANIES.
(a) If the registrant is a closed-end management investment company that is filing an annual report on this Form N-CSR, provide the following information:
(1) State the name, title, and length of service of the person or persons employed by or associated with the registrant or an investment adviser of the registrant who are primarily responsible for the day-to-day management of the registrant’s portfolio (“Portfolio Manager”). Also state each Portfolio Manager’s business experience during the past 5 years.
Not applicable to open-end management investment companies.
ITEM 9. PURCHASES OF EQUITY SECURITIES BY CLOSED-END MANAGEMENT INVESTMENT COMPANY AND AFFILIATED PURCHASERS.
(a) If the registrant is a closed-end management investment company, in the following tabular format, provide the information specified in paragraph (b) of this Item with respect to any purchase made by or on behalf of the registrant or any affiliated purchaser, as defined in Rule 10b-18(a)(3) under the Exchange Act (17 CFR 240.10b-18(a)(3)), of shares or other units of any class of the registrant’s equity securities that is registered by the registrant pursuant to Section 12 of the Exchange Act (15 U.S.C. 781).
Not applicable to open-end management investment companies.
ITEM 10. SUBMISSION OF MATTERS TO A VOTE OF SECURITY HOLDERS.
Describe any material changes to the procedures by which shareholders may recommend nominees to the registrant’s board of directors, where those changes were implemented after the registrant last provided disclosure in response to the requirements of Item 407(c)(2)(iv) of Regulation S-R(17 CFR 229.407)(as required by Item 22(b)(15)) of Schedule 14A (17 CFR 240.14a-101), or this Item.
There have been no material changes to the procedures by which the shareholders may recommend nominees to the registrant’s board of directors since the registrant last provided disclosure in response to the requirements of Item 407(c)(2)(iv) of Regulation S-R of Schedule 14(A) in its definitive proxy statement, or this item.
ITEM 11. CONTROLS AND PROCEDURES.
(a) Disclose the conclusions of the registrant’s principal executive and principal financials officers, or persons performing similar functions, regarding the effectiveness of the registrant’s disclosure controls and procedures (as defined in Rule 30a-3(c) under the Act (17 CFR 270.30a-3(c))) as of a date within 90 days of the filing date of the report that includes the disclosure required by this paragraph, based on the evaluation of these controls and procedures required by Rule 30a-3(b) under the Act (17 CFR 270.30(a)-3(b) and Rules 13a-15(b) or 15d-15(b) under the Exchange Act (17 CFR 240.13a-15(b) or 240.15d-15(b)).
The registrant’s principal executive officer and principal financial officer have concluded that the registrant’s disclosure controls and procedures are effective based on the evaluation of these controls and procedures as of a date within 90 days of the filing date of this report.
(b) Disclose any change in the registrant’s internal control over financial reporting (as defined in Rule 30a-3(d) under the Act (17CFR 270.30a-3(d)) that occured during the second fiscal quarter of the period covered by this report that has materially affected, or is reasonably likely to materially affect, the registrant’s internal control over financial reporting.
There were no significant changes in the registrant’s internal control over financial reporting that occurred during the second fiscal quarter of the period covered by this report that have materially affected, or are reasonably likely to materially affect, the registrant’s internal control over financial reporting.
Item 12. Disclosure of Securities Lending Activities for Closed-End Management Investment Companies.
(a) If the registrant is a closed-end management investment company, provide the following dollar amounts of income and compensation related to the securities lending activities of the registrant during its most recent fiscal year:
N/A
(1) Gross income from securities lending activities;
N/A
(2) All fees and/or compensation for each of the following securities lending activities and related services: any share of revenue generated by the securities lending program paid to the securities lending agent(s) (revenue split); fees paid for cash collateral management services (including fees deducted from a pooled cash collateral reinvestment vehicle) that are not included in the revenue split; administrative fees that are not included in the revenue split; fees for indemnification that are not included in the revenue split; rebates paid to borrowers; and any other fees relating to the securities lending program that are not included in the revenue split, including a description of those other fees;
N/A
(3) The aggregate fees/compensation disclosed pursuant to paragraph (2); and
N/A
(4) Net income from securities lending activities (i.e., the dollar amount in paragraph (1) minus the dollar amount in paragraph (3)).
If a fee for a service is included in the revenue split, state that the fee is included in the revenue split.
N/A
(b) If the registrant is a closed-end management investment company, describe the services provided to the registrant by the securities lending agent in the registrants most recent fiscal year.
N/A
ITEM 13. EXHIBITS.
(a) File the exhibits listed below as part of this Form. Letter or number the exhibits in the sequence indicated.
Filed herewith.
SIGNATURES
[See General Instruction F]
Pursuant to the requirements of the Securities Exchange Act of 1934 and the Investment Company Act of 1940, the registrant has duly caused this report to be signed on its behalf by the undersigned, thereunto duly authorized.
(Registrant) Pioneer Series Trust X
By (Signature and Title)* /s/ Lisa M. Jones
Lisa M. Jones, President & Chief Executive Officer
Date June 5, 2020
Pursuant to the requirements of the Securities Exchange Act of 1934 and the Investment Company Act of 1940, this report has been signed below by the following persons on behalf of the registrant and in the capacities and on the dates indicated.
By (Signature and Title)* /s/ Lisa M. Jones
Lisa M. Jones, President & Chief Executive Officer
Date June 5, 2020
By (Signature and Title)* /s/ Mark E. Bradley
Mark E. Bradley, Treasurer & Chief Accounting & Financial Officer
Date June 5, 2020
* Print the name and title of each signing officer under his or her signature.