Pioneer Fundamental Growth Fund
Annual Report | March 31, 2021
| | | | | |
| A: PIGFX | C: FUNCX | K: PFGKX | R: PFGRX | Y: FUNYX |
Paper copies of the Fund’s shareholder reports are no longer sent by mail, unless you specifically request paper copies of the reports from the Fund or from your financial intermediary, such as a broker-dealer, bank or insurance company. Instead, the reports are available on the Fund’s website, and you will be notified by mail each time a report is posted and provided with a website link to access the report.
You may elect to receive all future reports in paper free of charge. If you invest directly with the Fund, you can inform the Fund that you wish to continue receiving paper copies of your shareholder reports by calling 1-800-225-6292.
If you invest through a financial intermediary, you can contact your financial intermediary to request that you continue to receive paper copies of your shareholder reports. Your election to receive reports in paper will apply to all funds held in your account if you invest through your financial intermediary or all funds held within the Pioneer Fund complex if you invest directly.
visit us: www.amundi.com/us
Pioneer Fundamental Growth Fund | Annual Report | 3/31/21 1
President’s LetterDear Shareholders,
The first few months of 2021 have brought some better news on the COVID-19 global pandemic front, as the deployment of the first approved COVID-19 vaccines is well underway, with expectations for widespread vaccine distribution by the middle of the year. In general, COVID-19 cases and related hospitalizations have been on the decline in the US, despite a few problematic “hot spots” in some states, and that has had a positive effect on overall market sentiment.
While there may finally be a light visible at the end of the pandemic tunnel, the long-term impact on the global economy from COVID-19, while currently unknown, is likely to be considerable. It is clear that several industries have already felt greater effects than others, and the markets, which do not thrive on uncertainty, have been volatile. With that said, in the first few months of 2021, equity markets and other so-called “riskier” assets, such as high-yield bonds, have outperformed investments regarded as less risky, such as government debt. In addition, we’ve witnessed the long-awaited rebound in the performance of cyclical stocks, or stocks of companies with greater exposure to the ebbs and flows of the economic cycle, as investors have appeared to embrace the potential for a more widespread reopening of the economy in the coming months. Additional fiscal stimulus from the US government in recent months has also helped provide some market momentum.
However, despite the dramatic market rebound since its March 2020 low point, volatility has remained elevated, with momentum rising and falling on seemingly every bit of positive or negative news about the virus. In addition, the recent US Presidential and Congressional elections have resulted in a power shift in Washington, DC, and that most likely portends some changes in fiscal policy above and beyond just additional pandemic-related stimulus. That, too, could lead to increased market volatility as investors analyze the various tax and spending plans, and wait to see what proposed policy alterations actually become law.
With the advent of COVID-19 in early 2020, we implemented our business continuity plan according to the new COVID-19 guidelines, and most of our employees have been working remotely since March 2020. To date, our operating environment has faced no interruption. I am proud of the careful planning that has taken place and confident we can maintain this environment for as long as is prudent. History in the making for a company that first opened its doors way back in 1928.
2 Pioneer Fundamental Growth Fund | Annual Report | 3/31/21
Since 1928, Amundi US’s investment process has been built on a foundation of fundamental research and active management, principles which have guided our investment decisions for more than 90 years. We believe active management – that is, making active investment decisions – can help mitigate the risks during periods of market volatility. As 2020 has reminded us, investment risk can arise from a number of factors in today’s global economy, including slower or stagnating growth, changing U.S. Federal Reserve policy, oil price shocks, political and geopolitical factors and, unfortunately, major public health concerns such as a viral pandemic.
At Amundi US, active management begins with our own fundamental, bottom-up research process. Our team of dedicated research analysts and portfolio managers analyzes each security under consideration, communicating directly with the management teams of the companies issuing the securities and working together to identify those securities that best meet our investment criteria for our family of funds. Our risk management approach begins with each and every security, as we strive to carefully understand the potential opportunity, while considering any and all risk factors.
Today, as investors, we have many options. It is our view that active management can serve shareholders well, not only when markets are thriving, but also during periods of market stress.
As you consider your long-term investment goals, we encourage you to work with your financial professional to develop an investment plan that paves the way for you to pursue both your short-term and long-term goals.
We remain confident that the current crisis, like others in human history, will pass, and we greatly appreciate the trust you have placed in us and look forward to continuing to serve you in the future.
Sincerely,
Lisa M. Jones
Head of the Americas, President and CEO of US
Amundi Asset Management US, Inc.
May 2021
Any information in this shareowner report regarding market or economic trends or the factors influencing the Fund’s historical or future performance are statements of opinion as of the date of this report. Past performance is no guarantee of future results.
Pioneer Fundamental Growth Fund | Annual Report | 3/31/21 3
Portfolio Management Discussion
| 3 / 31/ 21
US equity markets rebounded sharply during the 12-month period ended March 31, 2021, as investors regained confidence following the bear market sell-off driven by the onset of the COVID-19 pandemic in early 2020. In the following interview, Andrew Acheson and Paul Cloonan discuss the factors that affected the performance of Pioneer Fundamental Growth Fund during the 12-month period. Mr. Acheson, Managing Director, Director of Growth, US, and a portfolio manager at Amundi Asset Management US, Inc. (Amundi US), and Mr. Cloonan*, a senior vice president and a portfolio manager at Amundi US, are responsible for the day-to-day management of the Fund.
Q How did the Fund perform during the 12-month period ended March 31, 2021?
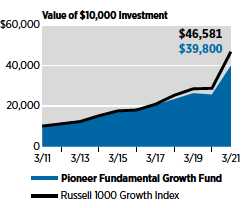
A Pioneer Fundamental Growth Fund’s Class A shares returned 55.55% at net asset value during the 12-month period ended March 31, 2021, while the Fund’s benchmark, the Russell 1000 Growth Index, returned 62.74%.During the same period, the average return of the 1,282 mutual funds in Morningstar’s Large Growth Funds category was 63.57%.
Q How would you describe the investment environment for domestic equity investors during the 12-month period ended March 31, 2021?
A While markets endured bouts of volatility, the 12-month period saw equities generally trend higher and finish with notable gains. In the wake of COVID-19-driven shutdowns in the spring of 2020, unprecedented levels of monetary and fiscal stimulus from the US Federal Reserve (Fed) and the US government boosted liquidity in the financial system and quickly generated a sense of optimism that the economic effects of the pandemic, though severe, would be short-lived. Corporate earnings results added to investors’ upbeat outlook, with second-quarter 2020 earnings surpassing consensus estimates by an unprecedented margin of more than 20%.
Markets continued to rally during the summer of 2020, as many US businesses reopened after the initial shutdowns aimed at curbing the spread of the COVID-19 virus. The economy at that time showed several signs of strength, with a surge in consumer spending and housing sales.
* Effective June 30, 2021, Mr. Cloonan will no longer be a portfolio manager on the Fund. Mr. Acheson will become lead portfolio manager and will continue to be responsible for the day-to-day management of the Fund, along with Yves Raymond, a vice president and portfolio manager at Amundi US, and David Chamberlain, a vice president and portfolio manager at Amundi US, both of whom became portfolio managers on the Fund in April 2021.
4 Pioneer Fundamental Growth Fund | Annual Report | 3/31/21
The Fed, which had lowered the target range of the federal funds rate effectively to zero at the height of the pandemic-induced market slump, signaled that interest rates would likely remain low for several years, lending support to equity valuations and making fixed-income alternatives far less attractive to investors. However, after reaching new highs in early September 2020, markets became choppier as an uptick in COVID-19 case counts and uncertainty about the November US presidential election combined to prompt a pullback.
Markets for riskier assets, including equities, once again surged higher following the election, and additional stimulus approved by US lawmakers near the end of 2020 further boosted investors’ confidence, as did the emergency-use approval of the first COVID-19 vaccines and the accompanying rollout of vaccine distributions, which market participants viewed as a possible “light at the end of the tunnel” with regard to the pandemic.
The first quarter of 2021 saw markets continue to rally, as the accelerated pace of COVID-19 vaccine distributions, the passage of another $1.9 trillion fiscal stimulus package by the US government, and further supportive messaging from the Fed helped investors gain confidence in the prospects for a sharp economic recovery later in the calendar year.
Growth stocks outperformed value stocks by a wide margin during the 12-month period, extending a streak of outperformance for growth over value that has lasted for several years. Early in the period, high-valuation growth stocks posted the best returns, especially within the information technology sector. As the rally continued, the consumer discretionary sector overtook information technology to lead performance within the Fund’s benchmark, the Russell 1000 Growth Index, for the first half of the 12-month period. However, a market rotation towards value stocks began in earnest during the fourth quarter of 2020 and gained momentum over the final months of the period. In fact, value stocks, as measured by the Russell 1000 Value Index, outperformed growth stocks, as measured by the Russell 1000 Growth Index (the Russell Index), by more than 10 percentage points during the first quarter of 2021 (January through March), which represented the most dramatic quarterly outperformance by value over growth in 20 years.
Pioneer Fundamental Growth Fund | Annual Report | 3/31/21 5
Q What factors detracted from the Fund’s performance relative to the benchmark Russell Index during the 12-month period ended March 31, 2021?
A During the 12-month period, we maintained our traditional discipline of focusing the Fund’s investments on shares of what we viewed as higher-quality corporations with stable businesses and steady earnings. Given our focus on trying to mitigate risk, the Fund’s performance has typically lagged the return of the benchmark when markets have appreciated significantly, particularly when more-speculative stocks drove the market’s momentum, which was the case for most of the 12-month period.
Three key factors were the biggest detractors from the Fund’s benchmark-relative performance over the 12-month period. First, investors have largely favored high-growth, high-valuation stocks ever since the market began rebounding from the pandemic-induced sell-off of one year ago, and the returns of stocks with the highest price-to-earnings ratios within the Russell Index have far exceeded the overall return of the Fund’s benchmark. We have maintained portfolio underweights to those types of stocks, due to our concerns about the sustainability of their valuations. While many of the stocks started to underperform in the latter part of the 12-month period, we believe there is still a very significant downside risk to owning shares in what we view as those more-speculative equities.
The second factor was the unique nature of the COVID-19 economic contraction, which had a negative effect on some Fund holdings that have historically acted more defensively during recessionary periods. For instance, the off-price retail industry has typically been resistant to recessionary conditions over time. However, store closures due to COVID-19 restrictions caused sales and profits of such retailers to decline sharply, and the slow return to more “normal” business conditions has continued to weigh on the performance of those companies.
Finally, the weighting of the largest five stocks within the Russell Index has grown to record levels. The benchmark’s concentration in a handful of stocks has raised risk-management concerns, in our view, especially as the concentration has also resulted in unprecedented exposure to a single sector within the Russell Index: information technology. In seeking to manage portfolio risk, we have deliberately maintained below-benchmark exposure to those largest five stocks, even as they have outperformed and thus detracted from the Fund’s relative returns.
6 Pioneer Fundamental Growth Fund | Annual Report | 3/31/21
Q Which individual stocks detracted from the Fund’s benchmark-relative performance during the 12-month period ended March 31, 2021?
A The two biggest individual detractors from the Fund’s benchmark-relative returns during the 12-month period were the portfolio’s lack of exposure to Tesla, the manufacturer of electric vehicles, and an underweight position in technology giant Apple, as both stocks climbed sharply over the past year. Tesla’s stock valuation has become excessive, in our view, and Apple’s weighting in the Russell Index at times exceeded 11% during the period.
Portfolio overweights that notably detracted from the Fund’s benchmark-relative returns for the 12-month period included a position in snack-and-beverage company PepsiCo. Cost pressures weighed on the company’s earnings throughout 2020 as investments in its marketing and production capacities led PepsiCo to divert capital away from stock repurchases. However, signs toward the end of the period pointed to a potential recovery and rising market shares in key segments of the company’s business.
An overweight position in insurance giant Progressive also detracted from the Fund’s benchmark-relative performance for the 12-month period. Progressive’s profits have tended to be more resilient during economic downturns, as auto insurance coverage is mandatory in nearly all US states. Moreover, auto accidents and resulting insurance claims have typically declined during times of rising unemployment, due to fewer miles being driven by the company’s customers. However, as the economy reopened and driving behavior began returning to pre-pandemic levels, investors’ sentiment towards Progressive waned. We have retained the Fund’s position, as we still believe Progressive’s long-term outlook is positive, given its market-share gains and general profitability.
Q Which investments contributed positively to the Fund’s benchmark-relative performance during the 12-month period ended March 31, 2021?
A The largest individual contributor to the Fund’s performance relative to the benchmark for the period was a position in PayPal. PayPal’s large-scale technology platform for digital and mobile payments has benefited from the gradual, secular shift towards a cashless society, and the COVID-19 pandemic has helped accelerate the adoption of electronic
Pioneer Fundamental Growth Fund | Annual Report | 3/31/21 7
payments across the globe. The introduction of cryptocurrency services also contributed to growth in the latter part of the 12-month period. We believe that PayPal could continue to do well if the economy recovers from the pandemic and consumers eventually increase spending in response. The company has featured high returns on capital and a wide “moat” around its business, with a network of more than 375 million users and 29 million merchants. (A wide moat is defined as a type of sustainable competitive advantage possessed by a business that makes it difficult for rivals to wear down its market share.)
Shares of tool-and-hardware manufacturer Stanley Black & Decker also strongly contributed positively to the Fund’s benchmark-relative returns for the 12-month period. The home-improvement industry has been resilient during the pandemic, as individuals working from home have looked to make renovations to accommodate their changing needs. In response, home-improvement retailers have overcome uncertainty about the broader economy and restocked their inventories, which has helped boost Stanley Black & Decker’s revenues. We believe the company’s strong brands, innovation, and global distribution capabilities give it competitive advantages that could sustain solid returns on capital.
Finally, online search and cloud-infrastructure company Alphabet was a notable positive contributor to the Fund’s relative performance. Alphabet for a time had lagged behind many of its peers among large technology companies, but the company saw its search-based advertising business recover during the 12-month period, and pandemic-driven digital investments also boosted demand in the cloud-computing market. We believe those favorable trends may continue for the foreseeable future.
Q Did the Fund have any exposure to derivative securities during the 12-month period ended March 31, 2021?
A No, the Fund had no exposure to derivatives during the 12-month period.
Q What were some of the notable additions you made to the Fund’s portfolio during the 12-month period ended March 31, 2021?
A Early in the period, we initiated a position in auto-auction firm Copart, which provides auction services to insurance companies related to the salvage of damaged vehicles. The company has consistently generated solid returns on growth capital, driven by its scale and efficiency advantages, and the increase in the number of vehicles considered to be “total losses” in accidents has been another key factor in an increase in the amount of cars sold through auction providers.
8 Pioneer Fundamental Growth Fund | Annual Report | 3/31/21
Later in 2020, we added shares of semiconductor chip-maker Qualcomm to the portfolio. Qualcomm owns numerous patents for the technologies that make up the backbone of 3G, 4G, and coming 5G networks. The company recently reported better-than-expected quarterly earnings results, and we believe that Qualcomm’s intellectual property represents a large and sustainable competitive advantage that could result in profitable growth for the foreseeable future. Other new positions added to the Fund during the period were health insurer Humana and off-price retailer TJX. Humana has benefited from the aging population’s positive effects on the sales of its Medicare Advantage products, which are supplemental insurance plans for Medicare recipients, while TJX has participated in the home-goods boom and has featured a higher-income customer base than fellow Fund holding and industry peer Ross Stores.
Toward the end of the period, we added life-science toolmaker and diagnostic specialist Danaher to the portfolio. The company has generated strong organic growth and returns on capital as its research-and-development activities and pharmaceutical pipeline work have grown. We also have seen opportunities for growth in Danaher’s environment solutions segment. Finally, we added shares of oilfield-services company Schlumberger to the portfolio during the period, as the energy market has shown signs of recovery after a significant slump in the early months of 2020, particularly in the first quarter. Schlumberger has shifted toward higher-margin technological and intellectual property-based services, and we believe its position as one of the market leaders in its industry potentially gives the company competitive advantages over its peers.
Q What were some of the noteworthy positions sold from the Fund’s portfolio during the 12-month period ended March 31, 2021?
A During the period, we exited the Fund’s position in Elanco Animal Health. The company has significantly increased its debt level in order to purchase Bayer’s animal health division. (Bayer is not a Fund holding.) We believe that the increased leverage has raised the company’s risk profile to a degree inconsistent with our focus on quality when picking stocks for the Fund’s portfolio. Moreover, challenges involved in executing a major merger integration during the pandemic have created additional risks for Elanco. Later in the period, we also sold the Fund’s position in Elanco’s industry peer Zoetis, once the stock reached a valuation that no longer seemed justifiable to us, even given a positive outlook for the company’s business.
Pioneer Fundamental Growth Fund | Annual Report | 3/31/21 9
We also sold the Fund’s position in Walmart early in the second half of the 12-month period, primarily due to valuation. Walmart’s successful omni-channel strategy has helped it gain meaningful market share in e-commerce, but the industry has remained fiercely competitive, which could weigh on the company’s returns on capital. Similarly, we closed the Fund’s position in consumer-products company Colgate-Palmolive after having bought shares earlier in the 12-month period. We had made the purchase at what we believed was an opportune moment, but we now think Colgate-Palmolive will have to invest more heavily in its business, which could hurt the company’s profit margins.
We sold the Fund’s shares of materials and chemical company Ecolab during the first quarter of 2021. The stock has traded above our estimate of fair value, and we believe it could take longer for earnings to recover from pandemic-related factors, despite Ecolab’s high levels of service quality and business efficiency.
Finally, we exited the Fund’s out-of-benchmark position in pharmaceutical company Roche, as investors reacted negatively to larger-than-expected declines in sales of some of Roche’s key blockbuster drugs, due to competition from biosimilar treatments. Meanwhile, the pandemic’s impact on clinical-trial activity has limited Roche’s ability to move drug candidates through its pipeline. We also foresaw further challenges from biosimilar competition that could prove difficult for Roche to overcome.
Q What is your outlook heading into the coming fiscal year for the Fund, and how is the outlook reflected in the Fund’s positioning?
A As we look ahead to the remainder of 2021, we believe that the ongoing rollout of COVID-19 vaccinations and the most recent round of economic stimulus from the US government could lead to sharp growth in the US economy during the second half of the calendar year. The yield curve may continue to steepen and, in our view, corporate earnings growth could be strongest for those companies with greater cyclical exposure — or exposure to the ebbs and flows of the economy. The resulting shift in market leadership towards cyclical stocks and away from high-valuation stocks that benefited from historically low interest rates in 2020 could be favorable for the Fund’s holdings. (A yield curve is a line that plots the interest rates, at a set point in time, of bonds having equal credit quality but differing maturity dates.)
10 Pioneer Fundamental Growth Fund | Annual Report | 3/31/21
We believe the Fund’s current holdings are well-suited to benefit from a full reopening of the US and global economies should the vaccine rollouts bring the US and the rest of the world closer to COVID-19 herd immunity. The portfolio currently consists of holdings of what we view as attractively valued, high-quality secular growth stocks, many of which have cyclical economic exposure. By contrast, many of 2020’s strongest performers among high-valuation stocks have already started to underperform in 2021, and we believe owning those more-speculative stocks in the coming year may still present significant downside potential for investors.
Regardless of the macroeconomic backdrop, we have remained committed to investing the Fund in companies that we see as highly profitable and that have strong balance sheets as well as sustainable business models. We seek to hold companies capable of surviving recessions and then emerging with the financial firepower to both invest and thrive during the subsequent recovery.
In sector terms, the Fund remains overweight versus the Russell Index to industrials and financials. Companies in the industrials sector have benefited both from a cyclical economic recovery and from secular growth in industrial automation. Among financials, we have invested the portfolio in what we believe are high-quality firms, which have remained a good fit with our overall approach.
The information technology sector has remained the Fund’s biggest underweight relative to the benchmark heading into the new fiscal year. We continue to have concerns about high valuations and the extreme concentration of the sector within the Russell Index, and have maintained the Fund’s underweight as part of our goal of seeking to manage portfolio risk.
Please refer to the Schedule of Investments on pages 22–25 for a full listing of Fund securities.
All investments are subject to risk, including the possible loss of principal. In the past several years, financial markets have experienced increased volatility and heightened uncertainty. The market prices of securities may go up or down, sometimes rapidly or unpredictably, due to general market conditions, such as real or perceived adverse economic, political, or regulatory conditions,
Pioneer Fundamental Growth Fund | Annual Report | 3/31/21 11
recessions, inflation, changes in interest or currency rates, lack of liquidity in the bond markets, the spread of infectious illness or other public health issues or adverse investor sentiment. These conditions may continue, recur, worsen or spread.
Investing in foreign and/or emerging markets securities involves risks relating to interest rates, currency exchange rates, economic, and political conditions.
The Fund invests in a limited number of securities and, as a result, the Fund’s performance may be more volatile than the performance of other funds holding more securities.
At times, the Fund’s investments may represent industries or industry sectors that are interrelated or have common risks, making the Fund more susceptible to any economic, political, or regulatory developments or other risks affecting those industries and sectors.
These risks may increase share price volatility.
Before investing, consider the product’s investment objectives, risks, charges and expenses. Contact your financial professional or Amundi Asset Management US, Inc., for a prospectus or summary prospectus containing this information. Read it carefully.
Any information in this shareholder report regarding market or economic trends or the factors influencing the Fund’s historical or future performance are statements of opinion as of the date of this report. Past performance is no guarantee of future results.
12 Pioneer Fundamental Growth Fund | Annual Report | 3/31/21
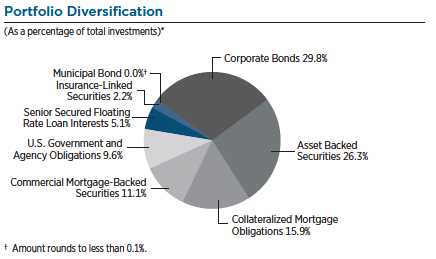
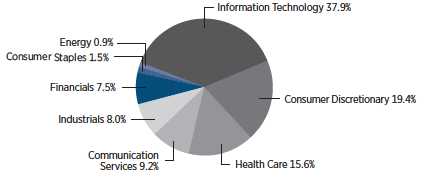
Portfolio Summary |
3/31/21 Sector Distribution
(As a percentage of total investments)*
| 10 Largest Holdings | |
(As a percentage of total investments)* | |
| 1. | Alphabet, Inc., Class C | 7.71% |
| 2. | Microsoft Corp. | 7.58 |
| 3. | Amazon.com, Inc. | 6.83 |
| 4. | Mastercard, Inc. | 4.55 |
| 5. | QUALCOMM, Inc. | 4.14 |
| 6. | Stanley Black & Decker, Inc. | 3.75 |
| 7. | Apple, Inc. | 3.71 |
| 8. | PayPal Holdings, Inc. | 3.47 |
| 9. | Booking Holdings, Inc. | 3.39 |
| 10. | Charles Schwab Corp. | 3.37 |
| * Excludes temporary cash investments and all derivative contracts except for options purchased. The Fund is actively managed, and current holdings may be different. The holdings listed should not be considered recommendations to buy or sell any securities. |
Pioneer Fundamental Growth Fund | Annual Report | 3/31/21 13
Prices and Distributions |
3/31/21 Net Asset Value per Share
| | | |
| Class | 3/31/21 | 3/31/20 |
A | $31.88 | $22.43 |
C | $28.01 | $20.07 |
K | $31.94 | $22.43 |
R | $31.03 | $21.95 |
Y | $32.25 | $22.63 |
Distributions per Share: 4/1/20–3/31/21
| | | | | |
| Net Investment | Short-Term | Long-Term |
| Class | Income | Capital Gains | Capital Gains |
A | $
| —
| $0.0024 | $2.8231 |
C | $
| — | $0.0024 | $2.8231 |
K | $
| 0.0806 | $0.0024 | $2.8231 |
R | $
| — | $0.0024 | $2.8231 |
Y | $
| 0.0500 | $0.0024 | $2.8231 |
Index Definitions
The Russell 1000 Growth Index is an unmanaged index that measures the performance of large-cap U.S. growth stocks. Index returns assume reinvestment of dividends and, unlike Fund returns, do not reflect any fees, expenses or sales charges. It is not possible to invest directly in an index.
The index defined here pertains to the “Value of $10,000 Investment” and “Value of $5 Million Investment” charts on pages 15–19.
14 Pioneer Fundamental Growth Fund | Annual Report | 3/31/21
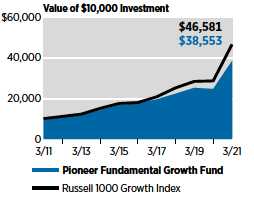
Performance Update | 3/31/21 | Class A Shares |
Investment Returns
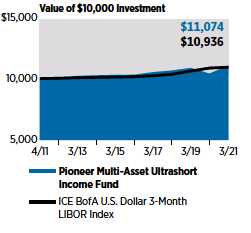
The mountain chart on the right shows the change in value of a $10,000 investment made in Class A shares of Pioneer Fundamental Growth Fund at public offering price during the periods shown, compared to that of the Russell 1000 Growth Index.
| Average Annual Total Returns | |
(As of March 31, 2021) | |
| Net | Public | Russell |
| Asset | Offering | 1000 |
| Value | Price | Growth |
| Period | (NAV) | (POP) | Index |
10 years | 15.13% | 14.45% | 16.63% |
5 years | 17.00 | 15.62 | 21.05 |
1 year | 55.55 | 46.61 | 62.74 |
| Expense Ratio |
(Per prospectus dated August 1, 2020) |
| Gross |
1.07% |
Call 1-800-225-6292 or visit www.amundi.com/us for the most recent month-end performance results. Current performance may be lower or higher than the performance data quoted.
The performance data quoted represents past performance, which is no guarantee of future results. Investment return and principal value will fluctuate, and shares, when redeemed, may be worth more or less than their original cost.
NAV results represent the percent change in net asset value per share. NAV returns would have been lower had sales charges been reflected. POP returns reflect deduction of maximum 5.75% sales charge. All results are historical and assume the reinvestment of dividends and capital gains. Other share classes are available for which performance and expenses will differ.
Performance results reflect any applicable expense waivers in effect during the periods shown. Without such waivers Fund performance would be lower. Waivers may not be in effect for all funds. Certain fee waivers are contractual through a specified period. Otherwise, fee waivers can be rescinded at any time. See the prospectus and financial statements for more information.
The performance table and graph do not reflect the deduction of fees and taxes that a shareowner would pay on Fund distributions or the redemption of Fund shares.
Please refer to the financial highlights for a more current expense ratio.
Pioneer Fundamental Growth Fund | Annual Report | 3/31/21 15
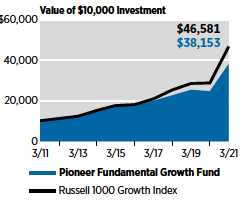
Performance Update | 3/31/21 | Class C Shares |
Investment Returns
The mountain chart on the right shows the change in value of a $10,000 investment made in Class C shares of Pioneer Fundamental Growth Fund during the periods shown, compared to that of the Russell 1000 Growth Index.
| Average Annual Total Returns | |
(As of March 31, 2021) | |
| | | Russell |
| | | 1000 |
| If | If | Growth |
| Period | Held | Redeemed | Index |
10 years | 14.33% | 14.33% | 16.63% |
5 years | 16.22 | 16.22 | 21.05 |
1 year | 54.53 | 54.53 | 62.74 |
| Expense Ratio |
(Per prospectus dated August 1, 2020) |
| Gross |
1.74% |
Call 1-800-225-6292 or visit www.amundi.com/us for the most recent month-end performance results. Current performance may be lower or higher than the performance data quoted.
The performance data quoted represents past performance, which is no guarantee of future results. Investment return and principal value will fluctuate, and shares, when redeemed, may be worth more or less than their original cost.
Class C shares held for less than one year are also subject to a 1% contingent deferred sales charge (CDSC). “If Held” results represent the percent change in net asset value per share. “If Redeemed” returns would have been lower had sales charges been reflected. All results are historical and assume the reinvestment of dividends and capital gains. Other share classes are available for which performance and expenses will differ.
Performance results reflect any applicable expense waivers in effect during the periods shown. Without such waivers Fund performance would be lower. Waivers may not be in effect for all funds. Certain fee waivers are contractual through a specified period. Otherwise, fee waivers can be rescinded at any time. See the prospectus and financial statements for more information.
The performance table and graph do not reflect the deduction of fees and taxes that a shareowner would pay on Fund distributions or the redemption of Fund shares.
Please refer to the financial highlights for a more current expense ratio.
16 Pioneer Fundamental Growth Fund | Annual Report | 3/31/21
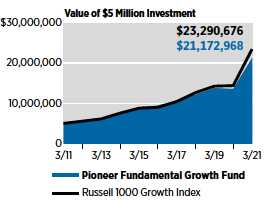
Performance Update | 3/31/21 | Class K Shares |
Investment Returns
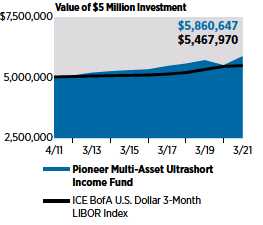
The mountain chart on the right shows the change in value of a $5 million investment made in Class K shares of Pioneer Fundamental Growth Fund during the periods shown, compared to that of the Russell 1000 Growth Index.
| Average Annual Total Returns |
(As of March 31, 2021) | |
| Net | Russell |
| Asset | 1000 |
| Value | Growth |
| Period | (NAV) | Index |
10 years | 15.53% | 16.63% |
5 years | 17.50 | 21.05 |
1 year | 56.21 | 62.74 |
| Expense Ratio |
(Per prospectus dated August 1, 2020) |
| Gross |
0.66% |
Call 1-800-225-6292 or visit www.amundi.com/us for the most recent month-end performance results. Current performance may be lower or higher than the performance data quoted.
The performance data quoted represents past performance, which is no guarantee of future results. Investment return and principal value will fluctuate, and shares, when redeemed, may be worth more or less than their original cost.
The performance shown for Class K shares for the period prior to the commencement of operations of Class K shares on December 20, 2012, is the net asset value performance of the Fund’s Class A shares, which has not been restated to reflect any differences in expenses, including Rule 12b-1 fees applicable to Class A shares. Since fees for Class A shares generally are higher than those of Class K shares, the performance of Class K shares prior to their inception would have been higher than the performance shown. For the period beginning December 20, 2012, the actual performance of Class K shares is reflected. Class K shares are not subject to sales charges and are available for limited groups of eligible investors, including institutional investors. All results are historical and assume the reinvestment of dividends and capital gains. Other share classes are available for which performance and expenses will differ.
Performance results reflect any applicable expense waivers in effect during the periods shown. Without such waivers Fund performance would be lower. Waivers may not be in effect for all funds. Certain fee waivers are contractual through a specified period. Otherwise, fee waivers can be rescinded at any time. See the prospectus and financial statements for more information.
The performance table and graph do not reflect the deduction of fees and taxes that a shareowner would pay on Fund distributions or the redemption of Fund shares.
Please refer to the financial highlights for a more current expense ratio.
Pioneer Fundamental Growth Fund | Annual Report | 3/31/21 17
Performance Update | 3/31/21 | Class R Shares |
Investment Returns
The mountain chart on the right shows the change in value of a $10,000 investment made in Class R shares of Pioneer Fundamental Growth Fund during the periods shown, compared to that of the Russell 1000 Growth Index.
| Average Annual Total Returns |
(As of March 31, 2021) | |
| Net | Russell |
| Asset | 1000 |
| Value | Growth |
| Period | (NAV) | Index |
10 years | 14.81% | 16.63% |
5 years | 16.63 | 21.05 |
1 year | 55.07 | 62.74 |
| Expense Ratio | |
(Per prospectus dated August 1, 2020) |
| Gross | Net |
1.42% | 1.40% |
Call 1-800-225-6292 or visit www.amundi.com/us for the most recent month-end performance results. Current performance may be lower or higher than the performance data quoted.
The performance data quoted represents past performance, which is no guarantee of future results. Investment return and principal value will fluctuate, and shares, when redeemed, may be worth more or less than their original cost.
The performance shown for Class R shares for the period prior to the commencement of operations of Class R shares on April 2, 2012, is based on the performance of Class A shares, reduced to reflect the higher distribution and service fees of Class R shares. For the period beginning April 2, 2012, the actual performance of Class R shares is reflected. Class R shares are not subject to sales charges and are available for limited groups of eligible investors, including institutional investors. All results are historical and assume the reinvestment of dividends and capital gains. Other share classes are available for which performance and expenses will differ.
The net expense ratios reflect the contractual expense limitations currently in effect through August 1, 2021 for Class R shares. There can be no assurance that Amundi US will extend the expense limitations beyond such time. Please see the prospectus and financial statements for more information.
Performance results reflect any applicable expense waivers in effect during the periods shown. Without such waivers Fund performance would be lower. Waivers may not be in effect for all funds. Certain fee waivers are contractual through a specified period. Otherwise, fee waivers can be rescinded at any time. See the prospectus and financial statements for more information.
The performance table and graph do not reflect the deduction of fees and taxes that a shareowner would pay on Fund distributions or the redemption of Fund shares.
Please refer to the financial highlights for more current expense ratios.
18 Pioneer Fundamental Growth Fund | Annual Report | 3/31/21
Performance Update | 3/31/21 | Class Y Shares |
Investment Returns
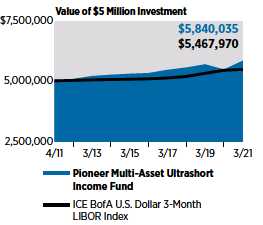
The mountain chart on the right shows the change in value of a $5 million investment made in Class Y shares of Pioneer Fundamental Growth Fund during the periods shown, compared to that of the Russell 1000 Growth Index.
| | | |
| Average Annual Total Returns |
(As of March 31, 2021) | |
| Net | Russell |
| Asset | 1000 |
| Value | Growth |
| Period | (NAV) | Index |
10 years | 15.49% | 16.63% |
5 years | 17.37 | 21.05 |
1 year | 56.06 | 62.74 |
| |
| Expense Ratio |
(Per prospectus dated August 1, 2020) |
| Gross |
0.76% |
Call 1-800-225-6292 or visit www.amundi.com/us for the most recent month-end performance results. Current performance may be lower or higher than the performance data quoted.
The performance data quoted represents past performance, which is no guarantee of future results. Investment return and principal value will fluctuate, and shares, when redeemed, may be worth more or less than their original cost.
Class Y shares are not subject to sales charges and are available for limited groups of eligible investors, including institutional investors. All results are historical and assume the reinvestment of dividends and capital gains. Other share classes are available for which performance and expenses will differ.
Performance results reflect any applicable expense waivers in effect during the periods shown. Without such waivers Fund performance would be lower. Waivers may not be in effect for all funds. Certain fee waivers are contractual through a specified period. Otherwise, fee waivers can be rescinded at any time. See the prospectus and financial statements for more information.
The performance table and graph do not reflect the deduction of fees and taxes that a shareowner would pay on Fund distributions or the redemption of Fund shares.
Please refer to the financial highlights for a more current expense ratio.
Pioneer Fundamental Growth Fund | Annual Report | 3/31/21 19
Comparing Ongoing Fund Expenses
As a shareowner in the Fund, you incur two types of costs:
(1) | ongoing costs, including management fees, distribution and/or service (12b-1) fees, and other Fund expenses; and
|
|
(2) | transaction costs, including sales charges (loads) on purchase payments.
|
This example is intended to help you understand your ongoing expenses (in dollars) of investing in the Fund and to compare these costs with the ongoing costs of investing in other mutual funds. The example is based on an investment of $1,000 at the beginning of the Fund’s latest six-month period and held throughout the six months.
Using the Tables
Actual Expenses
The first table below provides information about actual account values and actual expenses. You may use the information in this table, together with the amount you invested, to estimate the expenses that you paid over the period as follows:
| | |
(1) | Divide your account value by $1,000 |
| Example: an $8,600 account value ÷ $1,000 = 8.6 |
|
(2) | Multiply the result in (1) above by the corresponding share class’s number in the third row under the heading entitled “Expenses Paid During Period” to estimate the expenses you paid on your account during this period. |
Expenses Paid on a $1,000 Investment in Pioneer Fundamental Growth Fund
Based on actual returns from October 1, 2020 through March 31, 2021.
| Share Class | A
| C
| K
| R
| Y
|
Beginning Account | $1,000.00 | $1,000.00 | $1,000.00 | $1,000.00 | $1,000.00 |
Value on 10/1/20 | | | | | |
Ending Account Value | $1,132.01 | $1,128.20 | $1,134.26 | $1,130.08 | $1,133.75 |
(after expenses) | | | | | |
on 3/31/21 | | | | | |
Expenses Paid | $5.53 | $10.22 | $3.87 | $8.21 | $4.47 |
During Period* | | | | | |
*
| Expenses are equal to the Fund’s annualized expense ratio of 1.04%, 1.72%, 0.65%, 1.39% and 0.76% for Class A, Class C, Class K, Class R and Class Y respectively, multiplied by the average account value over the period, multiplied by 182/365 (to reflect the partial year period). |
20 Pioneer Fundamental Growth Fund | Annual Report | 3/31/21
Hypothetical Example for Comparison Purposes
The table below provides information about hypothetical account values and hypothetical expenses based on the Fund’s actual expense ratio and an assumed rate of return of 5% per year before expenses, which is not the Fund’s actual return. The hypothetical account values and expenses may not be used to estimate the actual ending account balance or expenses you paid for the period.
You may use this information to compare the ongoing costs of investing in the Fund and other funds. To do so, compare this 5% hypothetical example with the 5% hypothetical examples that appear in the shareholder reports of the other funds.
Please note that the expenses shown in the tables are meant to highlight your ongoing costs only and do not reflect any transaction costs, such as sales charges (loads) that are charged at the time of the transaction. Therefore, the table below is useful in comparing ongoing costs only and will not help you determine the relative total costs of owning different funds. In addition, if these transaction costs were included, your costs would have been higher.
Expenses Paid on a $1,000 Investment in Pioneer Fundamental Growth Fund
Based on a hypothetical 5% per year return before expenses, reflecting the period from October 1, 2020 through March 31, 2021.
| Share Class | A
| C
| K
| R
| Y
|
Beginning Account | $1,000.00 | $1,000.00 | $1,000.00 | $1,000.00 | $1,000.00 |
Value on 10/1/20 | | | | | |
Ending Account | $1,019.75 | $1,016.36 | $1,021.69 | $1,018.00 | $1,021.14 |
Value (after expenses) | | | | | |
on 3/31/21 | | | | | |
Expenses Paid | $5.24 | $8.65 | $3.28 | $6.99 | $3.83 |
During Period* | | | | | |
*
| Expenses are equal to the Fund’s annualized expense ratio of 1.04%, 1.72%, 0.65%, 1.39% and 0.76% for Class A, Class C, Class K, Class R and Class Y respectively, multiplied by the average account value over the period, multiplied by 182/365 (to reflect the partial year period). |
Pioneer Fundamental Growth Fund | Annual Report | 3/31/21 21
Schedule of Investments |
3/31/21
| | | | |
| Shares | | | Value |
| | UNAFFILIATED ISSUERS — 99.2% | |
| | COMMON STOCKS — 99.2% of Net Assets | |
| | Beverages — 1.5% | |
| 705,031 | | PepsiCo., Inc. | $ 99,726,635 |
| | Total Beverages | $ 99,726,635 |
| | Capital Goods — 1.1% | |
| 297,661 | | Rockwell Automation, Inc. | $ 79,011,136 |
| | Total Capital Goods | $ 79,011,136 |
| | Capital Markets — 5.7% | |
| 3,489,105 | | Charles Schwab Corp. | $ 227,419,864 |
| 1,448,507 | | Intercontinental Exchange, Inc. | 161,769,262 |
| | Total Capital Markets | $ 389,189,126 |
| | Commercial Services & Supplies — 1.3% | |
| 804,271(a) | | Copart, Inc. | $ 87,351,873 |
| | Total Commercial Services & Supplies | $ 87,351,873 |
| | Communications Equipment — 1.2% | |
| 435,009 | | Motorola Solutions, Inc. | $ 81,803,442 |
| | Total Communications Equipment | $ 81,803,442 |
| | Electronic Equipment, Instruments & | |
| | Components — 4.6% | |
| 2,144,658 | | Amphenol Corp. | $ 141,483,088 |
| 1,018,523 | | CDW Corp. | 168,820,187 |
| Total Electronic Equipment, Instruments &
|
| | Components | $ 310,303,275 |
| | Energy Equipment & Services — 1.0% | |
| 2,409,370 | | Schlumberger, Ltd. | $ 65,510,770 |
| | Total Energy Equipment & Services | $ 65,510,770 |
| | Entertainment — 1.5% | |
| 737,245 | | Electronic Arts, Inc. | $ 99,800,856 |
| | Total Entertainment | $ 99,800,856 |
| Health Care Equipment & Supplies — 7.8%
|
| 239,197 | | Cooper Cos., Inc. | $ 91,873,176 |
| 566,967 | | Danaher Corp. | 127,612,932 |
1,033,531
| (a) | Edwards Lifesciences Corp. | 86,444,533 |
| 657,192 | | Medtronic Plc | 77,634,091 |
| 913,427 | | Zimmer Biomet Holdings, Inc. | 146,221,394 |
| | Total Health Care Equipment & Supplies | $ 529,786,126 |
| | Health Care Providers & Services — 1.3% | |
| 210,378 | | Humana, Inc. | $ 88,200,976 |
| | Total Health Care Providers & Services | $ 88,200,976 |
The accompanying notes are an integral part of these financial statements.
22 Pioneer Fundamental Growth Fund | Annual Report | 3/31/21
| | | | |
| Shares | | | Value |
| | | Insurance — 1.7% | |
| 315,191 |
| Marsh & McLennan Cos., Inc. | $ 38,390,264 |
| 802,313 |
| Progressive Corp. | 76,709,146 |
|
| Total Insurance | $ 115,099,410 |
|
| Interactive Media & Services — 7.6% | |
251,358
| (a) | Alphabet, Inc., Class C | $ 519,966,700 |
|
| Total Interactive Media & Services | $ 519,966,700 |
| Internet & Direct Marketing Retail — 10.1%
|
148,866
| (a) | Amazon.com, Inc. | $ 460,603,313 |
98,177
| (a) | Booking Holdings, Inc. | 228,736,702 |
|
| Total Internet & Direct Marketing Retail | $ 689,340,015 |
|
| IT Services — 11.9% | |
| 639,817 |
| Accenture Plc | $ 176,749,446 |
| 643,177 |
| Fidelity National Information Services, Inc. | 90,437,118 |
| 861,260 |
| Mastercard, Inc. | 306,651,623 |
963,818
| (a) | PayPal Holdings, Inc. | 234,053,563 |
|
| Total IT Services | $ 807,891,750 |
|
| Life Sciences Tools & Services — 3.0% | |
| 452,615 |
| Thermo Fisher Scientific, Inc. | $ 206,564,434 |
|
| Total Life Sciences Tools & Services | $ 206,564,434 |
|
| Machinery — 5.5% | |
| 536,785 |
| Illinois Tool Works, Inc. | $ 118,908,613 |
| 1,267,414 |
| Stanley Black & Decker, Inc. | 253,064,554 |
|
| Total Machinery | $ 371,973,167 |
|
| Pharmaceuticals — 3.4% | |
| 665,306 |
| Eli Lilly & Co. | $ 124,292,467 |
| 641,597 |
| Johnson & Johnson | 105,446,467 |
|
| Total Pharmaceuticals | $ 229,738,934 |
|
| Semiconductors & Semiconductor Equipment — 4.1% | |
| 2,106,399 |
| QUALCOMM, Inc. | $ 279,287,443 |
|
| Total Semiconductors & Semiconductor Equipment | $ 279,287,443 |
|
| Software — 9.9% | |
345,564
| (a)
| Adobe, Inc. | $ 164,270,759 |
| 2,167,459 |
| Microsoft Corp. | 511,021,808 |
|
| Total Software | $ 675,292,567 |
|
| Software & Services — 2.2% | |
707,032
| (a)
| salesforce.com, Inc. | $ 149,798,870 |
| | Total Software & Services | $ 149,798,870 |
The accompanying notes are an integral part of these financial statements.
Pioneer Fundamental Growth Fund | Annual Report | 3/31/21 23
Schedule of Investments | 3/31/21 (continued)
| Shares | | | Value |
|
| Specialty Retail — 9.1% | |
| 527,937 |
| Home Depot, Inc. | $ 161,152,769 |
280,470
| (a) | O’Reilly Automotive, Inc. | 142,268,408 |
| 1,509,108 |
| Ross Stores, Inc. | 180,957,140 |
| 2,041,178 |
| TJX Cos., Inc. | 135,023,925 |
|
| Total Specialty Retail | $ 619,402,242 |
|
| Technology Hardware, Storage & Peripherals — 3.7% | |
| 2,049,197 |
| Apple, Inc. | $ 250,309,414 |
|
| Total Technology Hardware, Storage & Peripherals | $ 250,309,414 |
| | TOTAL COMMON STOCKS | |
| | (Cost $3,543,418,178) | $ 6,745,349,161 |
| | TOTAL INVESTMENTS IN UNAFFILIATED ISSUERS — 99.2% | |
| | (Cost $3,543,418,178) | $ 6,745,349,161 |
| | OTHER ASSETS AND LIABILITIES — 0.8% | $ 54,583,438 |
| | NET ASSETS — 100.0% | $ 6,799,932,599 |
(a) | Non-income producing security. |
Purchases and sales of securities (excluding temporary cash investments) for the year ended March 31, 2021, aggregated $1,559,087,363 and $2,575,891,972, respectively.
The Fund is permitted to engage in purchase and sale transactions (“cross trades”) with certain funds and accounts for which Amundi Asset Management US, Inc. (the “Adviser”) serves as the Fund’s investment adviser, as set forth in Rule 17a-7 under the Investment Company Act of 1940, pursuant to procedures adopted by the Board of Trustees. Under these procedures, cross trades are effected at current market prices. During the year ended March 31, 2021, the Fund did not engage in any cross trade activity.
At March 31, 2021, the net unrealized appreciation on investments based on cost for federal tax purposes of $3,562,335,879 was as follows:
Aggregate gross unrealized appreciation for all investments in which | |
| there is an excess of value over tax cost | $ 3,216,558,738 |
Aggregate gross unrealized depreciation for all investments in which | |
| there is an excess of tax cost over value | (33,545,456) |
Net unrealized appreciation | $ 3,183,013,282 |
Various inputs are used in determining the value of the Fund’s investments. These inputs are summarized in the three broad levels below.
Level 1 -
| unadjusted quoted prices in active markets for identical securities.
|
Level 2 -
| other significant observable inputs (including quoted prices for similar securities, interest rates, prepayment speeds, credit risks, etc.). See Notes to Financial Statements — Note 1A. |
Level 3 -
| significant unobservable inputs (including the Fund’s own assumptions in determining fair value of investments). See Notes to Financial Statements — Note 1A. |
The accompanying notes are an integral part of these financial statements.
24 Pioneer Fundamental Growth Fund | Annual Report | 3/31/21
The following is a summary of the inputs used as of March 31, 2021, in valuing the Fund’s investments:
| Level 1 | Level 2 | Level 3 | Total |
Common Stocks | $6,745,349,161 | $ — | $ — | $6,745,349,161 |
| Total Investments | | | | |
| in Securities | $6,745,349,161 | $ — | $ — | $6,745,349,161 |
During the year ended March 31, 2021, there were no transfers in or out of Level 3.
The accompanying notes are an integral part of these financial statements.
Pioneer Fundamental Growth Fund | Annual Report | 3/31/21 25
Statement of Assets and Liabilities |
3/31/21 | ASSETS: | |
| Investments in unaffiliated issuers, at value (cost $3,543,418,178) | $6,745,349,161 |
| Cash | 60,967,569 |
| Receivables — | |
| Fund shares sold | 6,878,843 |
| Dividends | 2,482,471 |
| Other assets | 253,869 |
| Total assets | $6,815,931,913 |
| LIABILITIES: | |
| Payables — | |
| Fund shares repurchased | $ 13,717,003 |
| Transfer agent fees | 1,268,624 |
| Due to affiliates | 685,931 |
| Accrued expenses | 327,756 |
| Total liabilities | $ 15,999,314 |
| NET ASSETS: | |
| Paid-in capital | $3,027,514,783 |
| Distributable earnings | 3,772,417,816 |
| Net assets | $6,799,932,599 |
| NET ASSET VALUE PER SHARE: | |
No par value (unlimited number of shares authorized) | |
| Class A (based on $1,143,970,481/35,878,446 shares) | $ 31.88 |
| Class C (based on $432,821,706/15,450,563 shares) | $ 28.01 |
| Class K (based on $846,019,333/26,488,029 shares) | $ 31.94 |
| Class R (based on $108,568,388/3,499,254 shares) | $ 31.03 |
| Class Y (based on $4,268,552,691/132,357,024 shares) | $ 32.25 |
| MAXIMUM OFFERING PRICE PER SHARE: | |
| Class A (based on $31.88 net asset value per share/100%-5.75% | |
| maximum sales charge) | $ 33.82 |
The accompanying notes are an integral part of these financial statements.
26 Pioneer Fundamental Growth Fund | Annual Report | 3/31/21
Statement of Operations
FOR THE YEAR ENDED 3/31/21
| INVESTMENT INCOME: | | |
| Dividends from unaffiliated issuers | $ 60,834,640 | |
| Interest from unaffiliated issuers | 9,505 | |
| Total investment income | | $ 60,844,145 |
| EXPENSES: | | |
| Management fees | $ 39,407,638 | |
| Administrative expense | 1,600,900 | |
| Transfer agent fees | | |
| Class A | 1,370,184 | |
| Class C | 295,069 | |
| Class K | 13,627 | |
| Class R | 253,410 | |
| Class Y | 4,330,962 | |
| Distribution fees | | |
| Class A | 2,603,858 | |
| Class C | 4,465,894 | |
| Class R | 523,046 | |
| Shareowner communications expense | 283,744 | |
| Custodian fees | 81,820 | |
| Registration fees | 161,521 | |
| Professional fees | 290,867 | |
| Printing expense | 69,778 | |
| Trustees’ fees | 338,584 | |
| Insurance expense | 29,798 | |
| Miscellaneous | 74,264 | |
| Total expenses | | $ 56,194,964 |
| Net investment income | | $ 4,649,181 |
| REALIZED AND UNREALIZED GAIN (LOSS) | | |
| ON INVESTMENTS: | | |
| Net realized gain (loss) on: | | |
| Investments in unaffiliated issuers | | $ 970,134,700 |
| Change in net unrealized appreciation (depreciation) on: | | |
| Investments in unaffiliated issuers | | $1,762,393,871 |
| Net realized and unrealized gain (loss) on investments | | $2,732,528,571 |
| Net increase in net assets resulting from operations | | $2,737,177,752 |
The accompanying notes are an integral part of these financial statements.
Pioneer Fundamental Growth Fund | Annual Report | 3/31/21 27
Statements of Changes in Net Assets
| | | |
| Year | Year |
| Ended | Ended |
| 3/31/21 | 3/31/20 |
| FROM OPERATIONS: | | |
Net investment income (loss) | $ 4,649,181 | $ 21,238,450 |
Net realized gain (loss) on investments | 970,134,700 | 441,541,210 |
Change in net unrealized appreciation (depreciation) | | |
| on investments | 1,762,393,871 | (522,764,617) |
| Net increase (decrease) in net assets resulting | | |
| from operations | $ 2,737,177,752 | $ (59,984,957) |
| DISTRIBUTIONS TO SHAREOWNERS: | | |
| Class A ($2.83 and $1.46 per share, respectively) | $ (94,466,550) | $ (52,971,897) |
| Class C ($2.83 and $1.45 per share, respectively) | (45,098,174) | (26,521,714) |
| Class K ($2.91 and $1.57 per share, respectively) | (77,636,740) | (41,746,809) |
| Class R ($2.83 and $1.45 per share, respectively) | (9,663,029) | (5,828,998) |
| Class Y ($2.88 and $1.55 per share, respectively) | (369,919,067) | (223,328,693) |
| Total distributions to shareowners | $ (596,783,560) | $ (350,398,111) |
| FROM FUND SHARE TRANSACTIONS: | | |
Net proceeds from sales of shares | $ 1,234,749,738 | $ 1,400,061,586 |
Reinvestment of distributions | 535,831,760 | 315,072,293 |
Cost of shares repurchased | (2,246,465,570) | (1,888,437,080) |
In-kind redemptions | — | (125,892,667) |
| Net decrease in net assets resulting from | | |
| Fund share transactions | $ (475,884,072) | $ (299,195,868) |
| Net increase (decrease) in net assets | $ 1,664,510,120 | $ (709,578,936) |
| NET ASSETS: | | |
Beginning of year | $ 5,135,422,479 | $ 5,845,001,415 |
End of year | $ 6,799,932,599 | $ 5,135,422,479 |
The accompanying notes are an integral part of these financial statements.
28 Pioneer Fundamental Growth Fund | Annual Report | 3/31/21
| Year | Year | Year | Year |
| Ended | Ended | Ended | Ended |
| 3/31/21 | 3/31/21 | 3/31/20 | 3/31/20 |
| Shares | Amount | Shares | Amount |
| Class A | | | | |
Shares sold | 7,407,994 | $ 219,461,981 | 6,780,506 | $ 173,685,723 |
Reinvestment of | | | | |
| distributions | 2,715,972 | 81,261,884 | 1,745,050 | 45,416,499 |
Less shares repurchased | (10,143,541) | (299,316,735) | (15,681,904) | (401,715,645) |
| Net increase | | | | |
| (decrease) | (19,575) | $ 1,407,130 | (7,156,348) | $ (182,613,423) |
| Class C | | | | |
Shares sold | 1,558,051 | $ 40,271,983 | 2,176,616 | $ 50,178, 207 |
Reinvestment of | | | | |
| distributions | 1,556,931 | 41,025,186 | 974,000 | 22,723,445 |
Less shares repurchased | (6,222,350) | (164,763,329) | (4,872,206) | (111,162,851) |
| Net decrease | (3,107,368) | $ (83,466,160) | (1,721,590) | $ (38,261,199) |
| Class K | | | | |
Shares sold | 6,834,011 | $ 201,878,300 | 7,791,751 | $ 199,976,460 |
Reinvestment of | | | | |
| distributions | 2,441,135 | 73,323,605 | 1,530,890 | 40,054,332 |
Less shares repurchased | (11,292,370) | (339,878,863) | (8,913,964) | (226,677,667) |
| Net increase | | | | |
| (decrease) | (2,017,224) | $ (64,676,958) | 408,677 | $ 13,353,125 |
| Class R | | | | |
Shares sold | 536,207 | $ 15,380,122 | 798,200 | $ 20,090,041 |
Reinvestment of | | | | |
| distributions | 324,682 | 9,464,372 | 211,646 | 5,394,855 |
Less shares repurchased | (1,274,093) | (36,244,726) | (1,922,327) | (48,170,595) |
| Net decrease | (413,204) | $ (11,400,232) | (912,481) | $ (22,685,699) |
| Class Y | | | | |
Shares sold | 25,747,914 | $ 757,757,352 | 37,154,018 | $ 956,131,155 |
Reinvestment of | | | | |
| distributions | 10,916,939 | 330,756,713 | 7,640,100 | 201,483,162 |
Less shares repurchased | (47,125,474) | (1,406,261,917) | (42,812,259) | (1,100,710,322) |
In-kind redemptions | — | — | (5,096,895) | (125,892,667) |
| Net decrease | (10,460,621) | $ (317,747,852) | (3,115,036) | $ (68,988,672) |
The accompanying notes are an integral part of these financial statements.
Pioneer Fundamental Growth Fund | Annual Report | 3/31/21 29
Financial Highlights
| Year | Year | Year | Year | Year |
| Ended | Ended | Ended | Ended | Ended |
| 3/31/21 | 3/31/20 | 3/31/19 | 3/31/18 | 3/31/17* |
| Class A | | | | | |
Net asset value, beginning of period | $ 22.43 | $ 24.21 | $22.36
| $ 20.78 | $ 19.00 |
Increase (decrease) from investment operations: |
|
|
|
| |
| Net investment income (loss) (a) | $ (0.03)(b) | $ 0.04 | $ 0.06 | $ 0.06 | $ 0.08 |
| Net realized and unrealized gain (loss) on investments | 12.31 | (0.36) | 2.77
| 2.87 | 2.13 |
| Net increase (decrease) from investment operations | $ 12.28 | $ (0.32) | $ 2.83 | $ 2.93 | $ 2.21 |
Distributions to shareowners: |
|
|
|
| |
| Net investment income | $ — | $ (0.01) | $ (0.05) | $ (0.04) | $ (0.06) |
| Net realized gain | (2.83)
| (1.45) | (1.23)
| (1.01) | (0.37) |
| Total distributions | $ (2.83) | $ (1.46) | $ (1.28) | $ (1.05) | $ (0.43)
|
| Net increase (decrease) in net asset value | $ 9.45 | $ (1.78) | $ 1.55 | $ 1.88
| $ 1.78
|
Net asset value, end of period | $ 31.88 | $ 22.43 | $ 24.21 | $ 22.66
| $ 20.78
|
| Total return (c) | 55.55% | (2.17)% | 12.90%
| 14.16% | 11.78% |
Ratio of net expenses to average net assets | 1.04%
| 1.07% | 1.09%
| 1.09% | 1.09% |
Ratio of net investment income (loss) to average net assets | (0.10)%
| 0.16% | 0.25%
| 0.25% | 0.39% |
Portfolio turnover rate | 24% | 23%(d) | 26%
| 38% | 23% |
Net assets, end of period (in thousands) | $1,143,970 | $805,102 | $1,042,168 | $1,195,674
| $1,205,124 |
Ratios with no waiver of fees and assumption of expenses by |
|
|
|
| |
| the Adviser and no reduction for fees paid indirectly: |
|
|
|
| |
| Total expenses to average net assets | 1.04% | 1.07% | 1.09%
| 1.10% | 1.09% |
| Net investment income (loss) to average net assets | (0.10)% | 0.16% | 0.25%
| 0.24% | 0.39% |
* | The Fund was audited by an independent registered public accounting firm other than Ernst & Young LLP. |
(a) | The per-share data presented above is based upon the average shares outstanding for the periods presented. |
(b) | The amount shown for a share outstanding does not correspond with net investment income on the Statement of Operations for the period due to timing of the sales and repurchase of shares. |
(c) | Assumes initial investment at net asset value at the beginning of each period, reinvestment of all distributions, the complete redemption of the investment at net asset value at the
|
| end of each period and no sales charges. Total return would be reduced if sales charges were taken into account. |
(d) | Portfolio turnover excludes the value of portfolio securities received or delivered as a result of in-kind fund share transactions. |
The accompanying notes are an integral part of these financial statements.
30 Pioneer Fundamental Growth Fund | Annual Report | 3/31/21
| Year | Year | Year | Year | Year |
| Ended | Ended | Ended | Ended | Ended |
| 3/31/21 | 3/31/20 | 3/31/19 | 3/31/18 | 3/31/17* |
| Class C | | | | | |
Net asset value, beginning of period | $ 20.07 | $ 21.93 | $ 20.73 | $ 19.17 | $ 17.63 |
Increase (decrease) from investment operations: |
|
|
|
|
|
| Net investment income (loss) (a)(b) | $ (0.21) | $ (0.12) | $ (0.08) | $ (0.08) | $ (0.05) |
| Net realized and unrealized gain (loss) on investments | 10.98 | (0.29) | 2.51 | 2.65 | 1.96 |
| Net increase (decrease) from investment operations | $ 10.77 | $ (0.41) | $ 2.43 | $ 2.57 | $ 1.91 |
Distributions to shareowners: |
|
|
|
|
|
| Net realized gain | (2.83) | (1.45) | (1.23) | (1.01) | (0.37) |
| Total distributions | $ (2.83) | $ (1.45) | $ (1.23) | $ (1.01) | $ (0.37) |
| Net increase (decrease) in net asset value | $ 7.94 | $ (1.86) | $ 1.20 | $ 1.56 | $ 1.54 |
Net asset value, end of period | $ 28.01 | $ 20.07 | $ 21.93 | $ 20.73 | $ 19.17 |
| Total return (c) | 54.53% | (2.81)% | 12.12% | 13.46% | 10.98% |
Ratio of net expenses to average net assets | 1.72% | 1.74% | 1.73% | 1.74% | 1.77% |
Ratio of net investment income (loss) to average net assets | (0.79)% | (0.51)% | (0.39)% | (0.40)% | (0.30)% |
Portfolio turnover rate | 24% | 23%(d) | 26% | 38% | 23% |
Net assets, end of period (in thousands) | $432,822 | $372,488 | $444,786 | $473,154 | $465,545 |
* | The Fund was audited by an independent registered public accounting firm other than Ernst & Young LLP. |
(a) | The per-share data presented above is based upon the average shares outstanding for the periods presented. |
(b) | The amount shown for a share outstanding does not correspond with net investment income on the Statement of Operations for the period due to timing of the sales and repurchase of shares. |
(c) | Assumes initial investment at net asset value at the beginning of each period, reinvestment of all distributions, the complete redemption of the investment at net asset value at the
|
| end of each period and no sales charges. Total return would be reduced if sales charges were taken into account. |
(d) | Portfolio turnover excludes the value of portfolio securities received or delivered as a result of in-kind fund share transactions. |
The accompanying notes are an integral part of these financial statements.
Pioneer Fundamental Growth Fund | Annual Report | 3/31/21 31
Financial Highlights (continued)
| Year | Year | Year | Year | Year |
| Ended | Ended | Ended | Ended | Ended |
| 3/31/21 | 3/31/20 | 3/31/19 | 3/31/18 | 3/31/17* |
| Class K | | | | | |
Net asset value, beginning of period | $ 22.43 | $ 24.21 | $ 22.68 | $ 20.79 | $ 19.00 |
Increase (decrease) from investment operations: | | | | | |
| Net investment income (loss) (a) | $ 0.08 | $ 0.15 | $ 0.16 | $ 0.16 | $ 0.16 |
| Net realized and unrealized gain (loss) on investments | 12.34 | (0.36) | 2.76 | 2.88 | 2.13 |
| Net increase (decrease) from investment operations | $ 12.42 | $ (0.21) | $ 2.92 | $ 3.04 | $ 2.29 |
Distributions to shareowners: | | | | | |
| Net investment income | $ (0.08) | $ (0.12) | $ (0.16) | $ (0.14) | $ (0.13) |
| Net realized gain | (2.83) | (1.45) | (1.23) | (1.01) | (0.37) |
| Total distributions | $ (2.91) | $ (1.57) | $ (1.39) | $ (1.15) | $ (0.50) |
| Net increase (decrease) in net asset value | $ 9.51 | $ (1.78) | $ 1.53 | $ 1.89 | $ 1.79 |
Net asset value, end of period | $ 31.94 | $ 22.43 | $ 24.21 | $ 22.68 | $ 20.79 |
| Total return (b) | 56.21% | (1.78)% | 13.39% | 14.68% | 12.24% |
Ratio of net expenses to average net assets | 0.65% | 0.66% | 0.66% | 0.66% | 0.67% |
Ratio of net investment income (loss) to average net assets | 0.28% | 0.58% | 0.68% | 0.69% | 0.81% |
Portfolio turnover rate | 24% | 23%(c) | 26% | 38% | 23% |
Net assets, end of period (in thousands) | $846,019 | $639,430 | $680,094 | $614,710 | $376,708 |
* | The Fund was audited by an independent registered public accounting firm other than Ernst & Young LLP. |
(a) | The per-share data presented above is based upon the average shares outstanding for the periods presented. |
(b) | Assumes initial investment at net asset value at the beginning of each period, reinvestment of all distributions and the complete redemption of the investment at net asset value at the end of each period. |
(c) | Portfolio turnover excludes the value of portfolio securities received or delivered as a result of in-kind fund share transactions. |
The accompanying notes are an integral part of these financial statements.
32 Pioneer Fundamental Growth Fund | Annual Report | 3/31/21
| Year | Year | Year | Year | Year |
| Ended | Ended | Ended | Ended | Ended |
| 3/31/21 | 3/31/20 | 3/31/19 | 3/31/18 | 3/31/17* |
| Class R |
|
|
|
|
|
Net asset value, beginning of period | $ 21.95 | $ 23.79 | $ 22.31 | $ 20.49 | $ 18.76 |
Increase (decrease) from investment operations: |
|
|
|
|
|
| Net investment income (loss) (a) | $ (0.13)(b) | $ (0.04)(b) | $ (0.01)(b) | $ (0.01)(b) | $ 0.01 |
| Net realized and unrealized gain (loss) on investments | 12.04 | (0.35) | 2.72 | 2.84 | 2.10 |
| Net increase (decrease) from investment operations | $ 11.91 | $ (0.39) | $ 2.71 | $ 2.83 | $ 2.11 |
Distributions to shareowners: |
|
|
|
|
|
| Net investment income | $ — | $ — | $ — | $ — | $ (0.01) |
| Net realized gain | (2.83) | (1.45) | (1.23) | (1.01) | (0.37) |
| Total distributions | $ (2.83) | $ (1.45) | $ (1.23) | $ (1.01) | $ (0.38) |
| Net increase (decrease) in net asset value | $ 9.08 | $ (1.84) | $ 1.48 | $ 1.82 | $ 1.73 |
Net asset value, end of period | $ 31.03 | $ 21.95 | $ 23.79 | $ 22.31 | $ 20.49 |
| Total return (c) | 55.07% | (2.50)% | 12.52% | 13.87% | 11.41% |
Ratio of net expenses to average net assets | 1.39% | 1.40% | 1.39% | 1.40% | 1.40% |
Ratio of net investment income (loss) to average net assets | (0.46)% | (0.17)% | (0.04)% | (0.05)% | 0.08% |
Portfolio turnover rate | 24% | 23%(d) | 26% | 38% | 23% |
Net assets, end of period (in thousands) | $108,568 | $85,892 | $114,781 | $124,614 | $117,931 |
Ratios with no waiver of fees and assumption of expenses by |
|
|
|
|
|
| the Adviser and no reduction for fees paid indirectly: |
|
|
|
|
|
| Total expenses to average net assets | 1.39% | 1.42% | 1.39% | 1.42% | 1.41% |
| Net investment income (loss) to average net assets | (0.46)% | (0.19)% | (0.04)% | (0.07)% | 0.07% |
* | The Fund was audited by an independent registered public accounting firm other than Ernst & Young LLP. |
(a) | The per-share data presented above is based upon the average shares outstanding for the periods presented. |
(b) | The amount shown for a share outstanding does not correspond with net investment income on the Statement of Operations for the period due to timing of the sales and repurchase of shares. |
(c) | Assumes initial investment at net asset value at the beginning of each period, reinvestment of all distributions and the complete redemption of the investment at net asset value at the
|
| end of each period. |
(d) | Portfolio turnover excludes the value of portfolio securities received or delivered as a result of in-kind fund share transactions. |
The accompanying notes are an integral part of these financial statements.
Pioneer Fundamental Growth Fund | Annual Report | 3/31/21 33
Financial Highlights (continued)
| Year | Year | Year | Year | Year |
| Ended | Ended | Ended | Ended | Ended |
| 3/31/21 | 3/31/20 | 3/31/19 | 3/31/18 | 3/31/17* |
| Class Y |
|
|
|
|
|
Net asset value, beginning of period | $ 22.63 | $ 24.42 | $ 22.86 | $ 20.95 | $ 19.15 |
Increase (decrease) from investment operations: |
|
|
|
|
|
| Net investment income (loss) (a) | $ 0.05 | $ 0.12 | $ 0.14 | $ 0.13 | $ 0.14 |
| Net realized and unrealized gain (loss) on investments | 12.45 | (0.36) | 2.79 | 2.90 | 2.14 |
| Net increase (decrease) from investment operations | $ 12.50 | $ (0.24) | $ 2.93 | $ 3.03 | $ 2.28 |
Distributions to shareowners: |
|
|
|
|
|
| Net investment income | $ (0.05) | $ (0.10) | $ (0.14) | $ (0.11) | $ (0.11) |
| Net realized gain | (2.83) | (1.45) | (1.23) | (1.01) | (0.37) |
| Total distributions | $ (2.88) | $ (1.55) | $ (1.37) | $ (1.12) | $ (0.48) |
| Net increase (decrease) in net asset value | $ 9.62 | $ (1.79) | $ 1.56 | $ 1.91 | $ 1.80 |
Net asset value, end of period | $ 32.25 | $ 22.63 | $ 24.42 | $ 22.86 | $ 20.95 |
| Total return (b) | 56.06% | (1.89)% | 13.28% | 14.54% | 12.11% |
Ratio of net expenses to average net assets | 0.76% | 0.76% | 0.77% | 0.77% | 0.77% |
Ratio of net investment income (loss) to average net assets | 0.18% | 0.47% | 0.58% | 0.58% | 0.71% |
Portfolio turnover rate | 24% | 23%(c) | 26% | 38% | 23% |
Net assets, end of period (in thousands) | $4,268,553 | $3,232,510 | $3,563,173 | $3,769,893 | $3,198,861 |
* | The Fund was audited by an independent registered public accounting firm other than Ernst & Young LLP. |
(a) | The per-share data presented above is based upon the average shares outstanding for the periods presented. |
(b) | Assumes initial investment at net asset value at the beginning of each period, reinvestment of all distributions and the complete redemption of the investment at net asset value at the end of each period.
|
(c) | Portfolio turnover excludes the value of portfolio securities received or delivered as a result of in-kind fund share transactions. |
The accompanying notes are an integral part of these financial statements.
34 Pioneer Fundamental Growth Fund | Annual Report | 3/31/21
Notes to Financial Statements |
3/31/21 1. Organization and Significant Accounting Policies
Pioneer Fundamental Growth Fund (the “Fund”) is one of three portfolios comprising Pioneer Series Trust X, a Delaware statutory trust. The Fund is registered under the Investment Company Act of 1940 as a diversified, open-end management investment company. The Fund’s investment objective is to seek long-term capital growth.
The Fund offers five classes of shares designated as Class A, Class C, Class K, Class R and Class Y shares. Each class of shares represents an interest in the same portfolio of investments of the Fund and has identical rights (based on relative net asset values) to assets and liquidation proceeds. Share classes can bear different rates of class-specific fees and expenses, such as transfer agent and distribution fees. Differences in class-specific fees and expenses will result in differences in net investment income and, therefore, the payment of different dividends from net investment income earned by each class. The Amended and Restated Declaration of Trust of the Fund gives the Board of Trustees the flexibility to specify either per-share voting or dollar-weighted voting when submitting matters for shareowner approval. Under per-share voting, each share of a class of the Fund is entitled to one vote. Under dollar-weighted voting, a shareowner’s voting power is determined not by the number of shares owned, but by the dollar value of the shares on the record date. Each share class has exclusive voting rights with respect to matters affecting only that class, including with respect to the distribution plan for that class. There is no distribution plan for Class K or Class Y shares.
Amundi Asset Management US, Inc., an indirect, wholly owned subsidiary of Amundi and Amundi’s wholly owned subsidiary, Amundi USA, Inc., serves as the Fund’s investment adviser (the “Adviser”). Prior to January 1, 2021, the Adviser was named Amundi Pioneer Asset Management, Inc. Amundi Distributor US, Inc., an affiliate of Amundi Asset Management US, Inc., serves as the Fund’s distributor (the “Distributor”).
In August 2018, the Financial Accounting Standards Board (FASB) issued Accounting Standards Update 2018-13 “Disclosure Framework - Changes to the Disclosure Requirements for Fair Value Measurement” (“ASU 2018-13”) which modifies disclosure requirements for fair value measurements, principally for Level 3 securities and transfers between levels of the fair value hierarchy. ASU 2018-13 is effective for fiscal years beginning after December 15, 2019 and for interim periods within those fiscal years. The Fund has adopted ASU 2018-13 for the year ended March 31, 2021. The impact to the Fund’s adoption was limited to changes in the Fund’s
Pioneer Fundamental Growth Fund | Annual Report | 3/31/21 35
disclosures regarding fair value, primarily those disclosures related to transfers between levels of the fair value hierarchy and disclosure of the range and weighted average used to develop significant unobservable inputs for Level 3 fair value investments, when applicable.
In March 2020, FASB issued an Accounting Standard Update, ASU 2020-04, Reference Rate Reform (Topic 848) — Facilitation of the Effects of Reference Rate Reform on Financial Reporting (“ASU 2020-04”), which provides optional, temporary relief with respect to the financial reporting of contracts subject to certain types of modifications due to the planned discontinuation of the London Interbank Offered Rate (“LIBOR”) and other LIBOR-based reference rates at the end of 2021. The temporary relief provided by ASU 2020-04 is effective for certain reference rate-related contract modifications that occur during the period from March 12, 2020 through December 31, 2022. Management is evaluating the impact of ASU 2020-04 on the Fund’s investments, derivatives, debt and other contracts, if applicable, that will undergo reference rate-related modifications as a result of the reference rate reform.
The Fund is an investment company and follows investment company accounting and reporting guidance under U.S. Generally Accepted Accounting Principles (“U.S. GAAP”). U.S. GAAP requires the management of the Fund to make estimates and assumptions that affect the reported amounts of assets and liabilities, the disclosure of contingent assets and liabilities at the date of the financial statements, and the reported amounts of income, expenses and gain or loss on investments during the reporting period. Actual results could differ from those estimates.
The following is a summary of significant accounting policies followed by the Fund in the preparation of its financial statements:
A. Security Valuation
The net asset value of the Fund is computed once daily, on each day the New York Stock Exchange (“NYSE”) is open, as of the close of regular trading on the NYSE.
Equity securities that have traded on an exchange are valued by using the last sale price on the principal exchange where they are traded. Equity securities that have not traded on the date of valuation, or securities for which sale prices are not available, generally are valued using the mean between the last bid and asked prices or, if both last bid and asked prices are not available, at the last quoted bid price. Last sale and bid and asked prices are provided by independent third party pricing services. In the case
36 Pioneer Fundamental Growth Fund | Annual Report | 3/31/21
of equity securities not traded on an exchange, prices are typically determined by independent third party pricing services using a variety of techniques and methods.
The value of foreign securities is translated into U.S. dollars based on foreign currency exchange rate quotations supplied by a third party pricing source. Trading in non-U.S. equity securities is substantially completed each day at various times prior to the close of the NYSE. The values of such securities used in computing the net asset value of the Fund’s shares are determined as of such times. The Fund may use a fair value model developed by an independent pricing service to value non-U.S. equity securities.
Securities for which independent pricing services or broker-dealers are unable to supply prices or for which market prices and/or quotations are not readily available or are considered to be unreliable are valued by a fair valuation team comprised of certain personnel of the Adviser pursuant to procedures adopted by the Fund’s Board of Trustees. The Adviser’s fair valuation team uses fair value methods approved by the Valuation Committee of the Board of Trustees. The Adviser’s fair valuation team is responsible for monitoring developments that may impact fair valued securities and for discussing and assessing fair values on an ongoing basis, and at least quarterly, with the Valuation Committee of the Board of Trustees.
Inputs used when applying fair value methods to value a security may include credit ratings, the financial condition of the company, current market conditions and comparable securities. The Fund may use fair value methods if it is determined that a significant event has occurred after the close of the exchange or market on which the security trades and prior to the determination of the Fund’s net asset value. Examples of a significant event might include political or economic news, corporate restructurings, natural disasters, terrorist activity or trading halts. Thus, the valuation of the Fund’s securities may differ significantly from exchange prices, and such differences could be material.
At March 31, 2021, no securities were valued using fair value methods (other than securities valued using prices supplied by independent pricing services, broker-dealers or using a third party insurance industry pricing model).
B. Investment Income and Transactions
Dividend income is recorded on the ex-dividend date, except that certain dividends from foreign securities where the ex-dividend date may have passed are recorded as soon as the Fund becomes aware of the ex-dividend data in the exercise of reasonable diligence.
Pioneer Fundamental Growth Fund | Annual Report | 3/31/21 37
Interest income, including interest on income-bearing cash accounts, is recorded on the accrual basis. Dividend and interest income are reported net of unrecoverable foreign taxes withheld at the applicable country rates and net of income accrued on defaulted securities.
Interest and dividend income payable by delivery of additional shares is reclassified as PIK (payment-in-kind) income upon receipt and is included in interest and dividend income, respectively.
Security transactions are recorded as of trade date. Gains and losses on sales of investments are calculated on the identified cost method for both financial reporting and federal income tax purposes.
C. Federal Income Taxes
It is the Fund’s policy to comply with the requirements of the Internal Revenue Code applicable to regulated investment companies and to distribute all of its net taxable income and net realized capital gains, if any, to its shareowners. Therefore, no provision for federal income taxes is required. As of March 31, 2021, the Fund did not accrue any interest or penalties with respect to uncertain tax positions, which, if applicable, would be recorded as an income tax expense on the Statement of Operations. Tax returns filed within the prior three years remain subject to examination by federal and state tax authorities.
The amount and character of income and capital gain distributions to shareowners are determined in accordance with federal income tax rules, which may differ from U.S. GAAP. Distributions in excess of net investment income or net realized gains are temporary over distributions for financial statement purposes resulting from differences in the recognition or classification of income or distributions for financial statement and tax purposes. Capital accounts within the financial statements are adjusted for permanent book/tax differences to reflect tax character, but are not adjusted for temporary differences.
The tax character of distributions paid during the years ended March 31, 2021 and March 31, 2020, were as follows:
| 2021 | 2020 |
| Distributions paid from: | | |
Ordinary income | $ 9,677,539 | $ 18,163,279 |
Long-term capital gain | 587,106,021 | 332,234,832 |
| Total | $596,783,560 | $350,398,111 |
38 Pioneer Fundamental Growth Fund | Annual Report | 3/31/21
The following shows the components of distributable earnings (losses) on a federal income tax basis at March 31, 2021:
| 2021 |
| Distributable earnings/(losses): | |
Undistributed ordinary income | $ 25,699,620 |
Undistributed long-term capital gain | 563,704,914 |
Unrealized appreciation | 3,183,013,282 |
| Total | $3,772,417,816 |
The difference between book-basis and tax-basis unrealized appreciation is attributable to the tax deferral of losses on wash sales and tax basis adjustments on common stock.
D. Fund Shares
The Fund records sales and repurchases of its shares as of trade date. The Distributor earned $113,211 in underwriting commissions on the sale of Class A shares during the year ended March 31, 2021.
E. Class Allocations
Income, common expenses and realized and unrealized gains and losses are calculated at the Fund level and allocated daily to each class of shares based on its respective percentage of adjusted net assets at the beginning of the day.
Distribution fees are calculated based on the average daily net asset value attributable to Class A, Class C and Class R shares of the Fund, respectively (see Note 5). Class K and Class Y shares do not pay distribution fees. All expenses and fees paid to the Fund’s transfer agent for its services are allocated among the classes of shares based on the number of accounts in each class and the ratable allocation of related out-of-pocket expenses (see Note 4).
Distributions to shareowners are recorded as of the ex-dividend date. Distributions paid by the Fund with respect to each class of shares are calculated in the same manner and at the same time, except that net investment income dividends to Class A, Class C, Class K, Class R and Class Y shares can reflect different transfer agent and distribution expense rates.
Pioneer Fundamental Growth Fund | Annual Report | 3/31/21 39
F. Risks
The value of securities held by the Fund may go up or down, sometimes rapidly or unpredictably, due to general market conditions, such as real or perceived adverse economic, political or regulatory conditions, recessions, the spread of infectious illness or other public health issues, inflation, changes in interest rates, lack of liquidity in the bond markets or adverse investor sentiment. In the past several years, financial markets have experienced increased volatility, depressed valuations, decreased liquidity and heightened uncertainty. These conditions may continue, recur, worsen or spread. A general rise in interest rates could adversely affect the price and liquidity of fixed-income securities and could also result in increased redemptions from the Fund.
At times, the Fund’s investments may represent industries or industry sectors that are interrelated or have common risks, making the Fund more susceptible to any economic, political, or regulatory developments or other risks affecting those industries and sectors. The Fund’s investments in foreign markets and countries with limited developing markets may subject the Fund to a greater degree of risk than investments in a developed market. These risks include disruptive political or economic conditions and the imposition of adverse governmental laws or currency exchange restrictions.
With the increased use of technologies such as the Internet to conduct business, the Fund is susceptible to operational, information security and related risks. While the Fund’s Adviser has established business continuity plans in the event of, and risk management systems to prevent, limit or mitigate, such cyber-attacks, there are inherent limitations in such plans and systems, including the possibility that certain risks have not been identified. Furthermore, the Fund cannot control the cybersecurity plans and systems put in place by service providers to the Fund such as Brown Brothers Harriman & Co., the Fund’s custodian and accounting agent, and DST Asset Manager Solutions, Inc., the Fund’s transfer agent. In addition, many beneficial owners of Fund shares hold them through accounts at broker-dealers, retirement platforms and other financial market participants over which neither the Fund nor the Adviser exercises control. Each of these may in turn rely on service providers to them, which are also subject to the risk of cyber-attacks. Cybersecurity failures or breaches at the Adviser or the Fund’s service providers or intermediaries have the ability to cause disruptions and impact business operations, potentially resulting in financial losses, interference with the Fund’s ability to calculate its net asset value, impediments to trading, the inability of Fund
40 Pioneer Fundamental Growth Fund | Annual Report | 3/31/21
shareowners to effect share purchases, redemptions or exchanges or receive distributions, loss of or unauthorized access to private shareowner information and violations of applicable privacy and other laws, regulatory fines, penalties, reputational damage, or additional compliance costs. Such costs and losses may not be covered under any insurance. In addition, maintaining vigilance against cyber-attacks may involve substantial costs over time, and system enhancements may themselves be subject to cyber-attacks.
COVID-19
The respiratory illness COVID-19 caused by a novel coronavirus has resulted in a global pandemic and major disruption to economies and markets around the world, including the United States. Global financial markets have experienced extreme volatility and severe losses, and trading in many instruments has been disrupted. Liquidity for many instruments has been greatly reduced for periods of time. Some interest rates are very low and in some cases yields are negative. Some sectors of the economy and individual issuers have experienced particularly large losses. These circumstances may continue for an extended period of time, and may continue to affect adversely the value and liquidity of the Fund’s investments. The ultimate economic fallout from the pandemic, and the long-term impact on economies, markets, industries and individual issuers, are not known. Governments and central banks, including the Federal Reserve in the U.S., have taken extraordinary and unprecedented actions to support local and global economies and the financial markets. These actions have resulted in significant expansion of public debt, including in the U.S. The impact of these measures, and whether they will be effective to mitigate the economic and market disruption, will not be known for some time. The consequences of high public debt, including its future impact on the economy and securities markets, likewise may not be known for some time.
The Fund’s prospectus contains unaudited information regarding the Fund’s principal risks. Please refer to that document when considering the Fund’s principal risks.
2. Management Agreement
The Adviser manages the Fund’s portfolio. Management fees are calculated daily and paid monthly at the annual rate of 0.65% of the Fund’s average daily net assets up to $1 billion, 0.60% of the next $6.5 billion of the Fund’s average daily net assets and 0.55% of the Fund’s average daily net assets over $7.5 billion. For the year ended March 31, 2021, the effective management fee was equivalent to 0.61% of the Fund’s average daily net assets.
Pioneer Fundamental Growth Fund | Annual Report | 3/31/21 41
The Adviser has contractually agreed to limit ordinary operating expenses (ordinary operating expenses means all fund expenses other than extraordinary expenses, such as litigation, taxes, brokerage commissions and acquired fund fees and expenses) of the Fund to the extent required to reduce Fund expenses to 1.09%, 1.40% and 0.83% of the average daily net assets attributable to Class A, Class R and Class Y respectively. These expense limitations is in effect through August 1, 2021. There can be no assurance that the Adviser will extend the expense limitation agreement for a class of shares beyond the date referred to above. There are no fees waived and expenses reimbursed during the year ended March 31, 2021. Class C and Class K did not have an expense limitation.
In addition, under the management and administration agreements, certain other services and costs, including accounting, regulatory reporting and insurance premiums, are paid by the Fund as administrative reimbursements. Included in “Due to affiliates” reflected on the Statement of Assets and Liabilities is $579,575 in management fees, administrative costs and certain other reimbursements payable to the Adviser at March 31, 2021.
3. Compensation of Trustees and Officers
The Fund pays an annual fee to its Trustees. The Adviser reimburses the Fund for fees paid to the Interested Trustees. The Fund does not pay any salary or other compensation to its officers. For the year ended March 31, 2021, the Fund paid $338,584 in Trustees’ compensation, which is reflected on the Statement of Operations as Trustees’ fees. At March 31, 2021, the Fund had a payable for Trustees’ fees on its Statement of Assets and Liabilities of $0.
4. Transfer Agent
DST Asset Manager Solutions, Inc. serves as the transfer agent to the Fund at negotiated rates. Transfer agent fees and payables shown on the Statement of Operations and the Statement of Assets and Liabilities, respectively, include sub-transfer agent expenses incurred through the Fund’s omnibus relationship contracts.
42 Pioneer Fundamental Growth Fund | Annual Report | 3/31/21
In addition, the Fund reimbursed the transfer agent for out-of-pocket expenses incurred by the transfer agent related to shareowner communications activities such as proxy and statement mailings, and outgoing phone calls. For the year ended March 31, 2021, such out-of-pocket expenses by class of shares were as follows:
| Shareowner Communications: | |
Class A | $ 98,476 |
Class C | 38,426 |
Class K | 29,735 |
Class R | 3,862 |
Class Y | 113,245 |
| Total | $283,744 |
5. Distribution and Service Plans
The Fund has adopted a distribution plan (the “Plan”) pursuant to Rule 12b-1 of the Investment Company Act of 1940 with respect to its Class A, Class C and Class R shares. Pursuant to the Plan, the Fund pays the Distributor 0.25% of the average daily net assets attributable to Class A shares as compensation for personal services and/or account maintenance services or distribution services with regard to Class A shares. Pursuant to the Plan, the Fund also pays the Distributor 1.00% of the average daily net assets attributable to Class C shares. The fee for Class C shares consists of a 0.25% service fee and a 0.75% distribution fee paid as compensation for personal services and/or account maintenance services or distribution services with regard to Class C shares. Pursuant to the Plan, the Fund further pays the Distributor 0.50% of the average daily net assets attributable to Class R shares for distribution services. Included in “Due to affiliates” reflected on the Statement of Assets and Liabilities is $106,356 in distribution fees payable to the Distributor at March 31, 2021.
The Fund also has adopted a separate service plan for Class R shares (“Service Plan”). The Service Plan authorizes the Fund to pay securities dealers, plan administrators or other service organizations that agree to provide certain services to retirement plans or plan participants holding shares of the Fund a service fee of up to 0.25% of the Fund’s average daily net assets attributable to Class R shares held by such plans.
In addition, redemptions of Class A and Class C shares may be subject to a contingent deferred sales charge (“CDSC”). A CDSC of 1.00% may be imposed on redemptions of certain net asset value purchases of Class A shares within 12 months of purchase. Redemptions of Class C shares within
Pioneer Fundamental Growth Fund | Annual Report | 3/31/21 43
12 months of purchase are subject to a CDSC of 1.00%, based on the lower of cost or market value of shares being redeemed. Shares purchased as part of an exchange remain subject to any CDSC that applied to the original purchase of those shares. There is no CDSC for Class K, Class R or Class Y shares. Proceeds from the CDSCs are paid to the Distributor. For the year ended March 31, 2021, CDSCs in the amount of $56,461 were paid to the Distributor.
6. In-Kind Redemption
In accordance with guidelines described in a Fund’s prospectus and in accordance with procedures adopted by the Board, a Fund may distribute portfolio securities rather than cash as payment for a redemption of Fund shares (“in-kind redemption”). For financial reporting purposes, the Fund recognizes a gain on in-kind redemptions to the extent the value of the distributed securities on the date of redemption exceeds the cost of those securities. Gains and losses realized on in-kind redemptions are not recognized for tax purposes and are reclassified from undistributed realized gain/(loss) to paid-in capital. During the year ended March 31, 2021, there were no in-kind redemptions.
7. Line of Credit Facility
The Fund, along with certain other funds in the Pioneer Family of Funds (the “Funds”), participates in a committed, unsecured revolving line of credit (“credit facility”). Borrowings are used solely for temporary or emergency purposes. The Fund may borrow up to the lesser of the amount available under the credit facility or the limits set for borrowing by the Fund’s prospectus and the 1940 Act. Effective February 4, 2021, the Fund participates in a facility in the amount of $450 million. Prior to February 4, 2021, the Fund participated in a facility in the amount of $300 million. Under such facility, depending on the type of loan, interest on borrowings is payable at the London Interbank Offered Rate (“LIBOR”) plus a credit spread. The Fund also pays an annual commitment fee to participate in a credit facility. The Fund also pays both an upfront fee and an annual commitment fee to participate in a credit facility. The upfront fee in the amount 0.10% of the total credit facility is allocated among the participating Funds based on an allocation schedule set forth in the credit agreement. The commitment fee in the amount of 0.25% of the daily unused portion of each lenders commitment is allocated among participating Funds based on an allocation schedule set forth in the credit agreement. For the year ended March 31, 2021, the Fund had no borrowings under the credit facility.
44 Pioneer Fundamental Growth Fund | Annual Report | 3/31/21
Report of Independent Registered Public Accounting Firm
To the Board of Trustees of Pioneer Series Trust X and the Shareholders of Pioneer Fundamental Growth Fund:
Opinion on the Financial Statements
We have audited the accompanying statement of assets and liabilities of Pioneer Fundamental Growth Fund (the “Fund”) (one of the funds constituting Pioneer Series Trust X (the “Trust”)), including the schedule of investments, as of March 31, 2021, and the related statement of operations for the year then ended, the statements of changes in net assets for each of the two years in the period then ended, the financial highlights for each of the four years in the period then ended and the related notes (collectively referred to as the “financial statements”). The financial highlights for the period ended March 31, 2017 were audited by another independent registered public accounting firm whose report, dated May 26, 2017, expressed an unqualified opinion on those financial highlights. In our opinion, the financial statements present fairly, in all material respects, the financial position of Pioneer Fundamental Growth Fund (one of the funds constituting Pioneer Series Trust X) at March 31, 2021, the results of its operations for the year then ended, the changes in its net assets for each of the two years in the period then ended, and its financial highlights for each of the four years in the period then ended in conformity with U.S. generally accepted accounting principles.
Basis for Opinion
These financial statements are the responsibility of the Trust’s management. Our responsibility is to express an opinion on the Fund’s financial statements based on our audits. We are a public accounting firm registered with the Public Company Accounting Oversight Board (United States) (“PCAOB”) and are required to be independent with respect to the Trust in accordance with the U.S. federal securities laws and the applicable rules and regulations of the Securities and Exchange Commission and the PCAOB.
We conducted our audits in accordance with the standards of the PCAOB. Those standards require that we plan and perform the audit to obtain reasonable assurance about whether the financial statements are free of material misstatement, whether due to error or fraud. The Trust is not required to have, nor were we engaged to perform, an audit of the Trust’s internal control over financial reporting. As part of our audits, we are required to obtain an understanding of internal control over financial reporting, but not for the purpose of expressing an opinion on the effectiveness of the Trust’s internal control over financial reporting. Accordingly, we express no such opinion.
Pioneer Fundamental Growth Fund | Annual Report | 3/31/21 45
Our audits included performing procedures to assess the risks of material misstatement of the financial statements, whether due to error or fraud, and performing procedures that respond to those risks. Such procedures included examining, on a test basis, evidence regarding the amounts and disclosures in the financial statements. Our procedures included confirmation of securities owned as of March 31, 2021, by correspondence with the custodian and brokers or by other appropriate auditing procedures where replies from brokers were not received. Our audits also included evaluating the accounting principles used and significant estimates made by management, as well as evaluating the overall presentation of the financial statements. We believe that our audits provide a reasonable basis for our opinion.
We have served as the auditor of one or more Amundi Pioneer investment companies since 2017.
Boston, Massachusetts
May 27, 2021
46 Pioneer Fundamental Growth Fund | Annual Report | 3/31/21
Additional Information
(unaudited)
For the year ended March 31, 2021, certain dividends paid by the Fund may be subject to a maximum tax rate of 20%. The Fund intends to designate up to the maximum amount of such dividends allowable, as at a maximum rate of 20%. Complete information will be computed and reported in conjunction with your 2021 Form 1099-DIV. The qualifying percentage of the Fund’s ordinary income dividends for the purpose of the corporate dividends received deduction was 100%.
Pioneer Fundamental Growth Fund | Annual Report | 3/31/21 47
Trustees, Officers
and Service Providers
Investment Adviser and Administrator
Amundi Asset Management US, Inc.
Custodian and Sub-Administrator
Brown Brothers Harriman & Co.
Independent Registered Public Accounting Firm
Ernst & Young LLP
Principal Underwriter
Amundi Distributor US, Inc.
Legal Counsel
Morgan, Lewis & Bockius LLP
Transfer Agent
DST Asset Manager Solutions, Inc.
Proxy Voting Policies and Procedures of the Fund are available without charge, upon request, by calling our toll free number (1-800-225-6292). Information regarding how the Fund voted proxies relating to portfolio securities during the most recent 12-month period ended June 30 is publicly available to shareowners at www.amundi.com/us. This information is also available on the Securities and Exchange Commission’s web site at www.sec.gov.
Trustees and Officers
The Fund’s Trustees and officers are listed below, together with their principal occupations and other directorships they have held during at least the past five years. Trustees who are interested persons of the Fund within the meaning of the 1940 Act are referred to as Interested Trustees. Trustees who are not interested persons of the Fund are referred to as Independent Trustees. Each of the Trustees serves as a Trustee of each of the 45 U.S. registered investment portfolios for which Amundi US serves as investment adviser (the “Pioneer Funds”). The address for all Trustees and all officers of the Fund is 60 State Street, Boston, Massachusetts 02109.
The Statement of Additional Information of the Fund includes additional information about the Trustees and is available, without charge, upon request, by calling 1-800-225-6292.
48 Pioneer Fundamental Growth Fund | Annual Report | 3/31/21
Independent Trustees
| Name, Age and Position | Term of Office and | | Other Directorships |
| Held With the Fund | Length of Service | Principal Occupation | Held by Trustee |
| Thomas J. Perna (70) | Trustee since 2006. | Private investor (2004 – 2008 and 2013 – present); Chairman (2008 – 2013) | Director, Broadridge Financial |
Chairman of the Board | Serves until a successor | and Chief Executive Officer (2008 – 2012), Quadriserv, Inc. (technology | Solutions, Inc. (investor |
and Trustee | trustee is elected | products for securities lending industry); and Senior Executive Vice | communications and securities |
| or earlier retirement | President, The Bank of New York (financial and securities services) | processing provider for financial |
| or removal. | (1986 – 2004) | services industry) (2009 – present); |
| | | Director, Quadriserv, Inc. (2005 – |
| | | 2013); and Commissioner, New |
| | | Jersey State Civil Service |
| | | Commission (2011 – 2015) |
| John E. Baumgardner, | Trustee since 2019. | Of Counsel (2019 – present), Partner (1983-2018), Sullivan & | Chairman, The Lakeville Journal |
| Jr. (70) | Serves until a successor | Cromwell LLP (law firm). | Company, LLC, (privately-held |
Trustee | trustee is elected | | community newspaper group) |
| or earlier retirement | | (2015-present) |
| or removal. | | |
| Diane Durnin (64) | Trustee since 2019. | Managing Director - Head of Product Strategy and Development, BNY | None |
Trustee | Serves until a successor | Mellon Investment Management (investment management firm) | |
| trustee is elected | (2012-2018); Vice Chairman – The Dreyfus Corporation (2005 – 2018): | |
| or earlier retirement | Executive Vice President Head of Product, BNY Mellon Investment | |
| or removal. | Management (2007-2012); Executive Director- Product Strategy, Mellon | |
| | Asset Management (2005-2007); Executive Vice President Head of Products, | |
| | Marketing and Client Service, Dreyfus Corporation (investment management | |
| | firm) (2000-2005); and Senior Vice President Strategic Product and | |
| Business Development, Dreyfus Corporation (1994-2000)
| |
Pioneer Fundamental Growth Fund | Annual Report | 3/31/21 49
Independent Trustees (continued)
| Name, Age and Position | Term of Office and | | Other Directorships |
| Held With the Fund | Length of Service | Principal Occupation | Held by Trustee |
| Benjamin M. Friedman (76) | Trustee since 2008. | William Joseph Maier Professor of Political Economy, Harvard University | Trustee, Mellon Institutional Funds |
Trustee | Serves until a successor | (1972 – present) | Investment Trust and Mellon |
| trustee is elected | | Institutional Funds Master Portfolio |
| or earlier retirement | | (oversaw 17 portfolios in fund |
| or removal. | | complex) (1989 - 2008) |
| Craig C. MacKay (58)* | Trustee since 2021. | Partner, England & Company, LLC (advisory firm) (2012 – present); | Board Member of Carver Bancorp, |
Trustee | Serves until a successor | Group Head – Leveraged Finance Distribution, Oppenheimer & Company | Inc. (holding company) and Carver |
| trustee is elected | (investment bank) (2006 – 2012); Group Head – Private Finance & High | Federal Savings Bank, NA (2017 – |
| or earlier retirement | Yield Capital Markets Origination, SunTrust Robinson Humphrey | present); Advisory Council Member, |
| or removal. | (investment bank) (2003 – 2006); and Founder and Chief Executive | MasterShares ETF (2016 – 2017); |
| | Officer, HNY Associates, LLC (investment bank) (1996 – 2003) | Advisory Council Member, The Deal |
| | | (financial market information |
| | | publisher) (2015 – 2016); Board |
| | | Co-Chairman and Chief Executive |
| | | Officer, Danis Transportation |
| | | Company (privately-owned |
| | | commercial carrier) (2000 – 2003); |
| | | Board Member and Chief Financial |
| | | Officer, Customer Access Resources |
| | | (privately-owned teleservices |
| | | company) (1998 – 2000); Board |
| | | Member, Federation of Protestant |
| | | Welfare Agencies (human services |
| | | agency) (1993 – present); and |
| | | Board Treasurer, Harlem Dowling |
| | | Westside Center (foster care |
| | | agency) (1999 – 2018) |
* | Mr. MacKay was appointed as a Trustee effective March 22, 2021. |
50 Pioneer Fundamental Growth Fund | Annual Report | 3/31/21
| Name, Age and Position | Term of Office and | | Other Directorships |
| Held With the Fund | Length of Service | Principal Occupation | Held by Trustee |
| Lorraine H. Monchak (64) | Trustee since 2017. | Chief Investment Officer, 1199 SEIU Funds (healthcare workers union | None |
Trustee | (Advisory Trustee from | pension funds) (2001 – present); Vice President – International Investments | |
| 2014 - 2017). Serves | Group, American International Group, Inc. (insurance company) | |
| until a successor trustee | (1993 – 2001); Vice President – Corporate Finance and Treasury Group, | |
| is elected or earlier | Citibank, N.A. (1980 – 1986 and 1990 – 1993); Vice President – | |
| retirement or removal. | Asset/Liability Management Group, Federal Farm Funding Corporation | |
| | (government-sponsored issuer of debt securities) (1988 – 1990); Mortgage | |
| | Strategies Group, Shearson Lehman Hutton, Inc. (investment bank) | |
| | (1987 – 1988); and Mortgage Strategies Group, Drexel Burnham Lambert, | |
| | Ltd. (investment bank) (1986 – 1987) | |
| Marguerite A. Piret (72) | Trustee since 2002. | Chief Financial Officer, American Ag Energy, Inc. (controlled environment | Director of New America High |
Trustee | Serves until a successor | and agriculture company) (2016 – present); and President and Chief | Income Fund, Inc. (closed-end |
| trustee is elected | Executive Officer, Metric Financial Inc. (formerly known as Newbury Piret | investment company) (2004 – |
| or earlier retirement | Company) (investment banking firm) (1981 – 2019) | present); and Member, Board of |
| or removal. | | Governors, Investment Company |
| | | Institute (2000 – 2006) |
| Fred J. Ricciardi (74) | Trustee since 2014. | Private investor (2020 – present); Consultant (investment company | None |
Trustee | Serves until a successor | services) (2012 – 2020); Executive Vice President, BNY Mellon (financial and | |
| trustee is elected | investment company services) (1969 – 2012); Director, BNY International | |
| or earlier retirement | Financing Corp. (financial services) (2002 – 2012); Director, Mellon Overseas | |
| or removal. | Investment Corp. (financial services) (2009 – 2012); Director, Financial Models | |
| | (technology) (2005-2007); Director, BNY Hamilton Funds, Ireland (offshore | |
| | investment companies) (2004-2007); Chairman/Director, AIB/BNY Securities | |
| | Services, Ltd., Ireland (financial services) (1999-2006); and Chairman, BNY | |
| | Alternative Investment Services, Inc. (financial services) (2005-2007) | |
Pioneer Fundamental Growth Fund | Annual Report | 3/31/21 51
Interested Trustees
| Name, Age and Position | Term of Office and | | Other Directorships |
| Held With the Fund | Length of Service | Principal Occupation | Held by Trustee |
| Lisa M. Jones (59)** | Trustee since 2017. | Director, CEO and President of Amundi US, Inc. (investment management | None |
Trustee, President and | Serves until a successor | firm) (since September 2014); Director, CEO and President of Amundi Asset | |
Chief Executive Officer | trustee is elected | Management US, Inc. (since September 2014); Director, CEO and President of | |
| or earlier retirement | Amundi Distributor US, Inc. (since September 2014); Director, CEO and | |
| or removal | President of Amundi Asset Management US, Inc. (since September 2014); | |
| | Chair, Amundi US, Inc., Amundi Distributor US, Inc. and Amundi Asset | |
| | Management US, Inc. (September 2014 – 2018); Managing Director, Morgan | |
| | Stanley Investment Management (investment management firm) | |
| | (2010 – 2013); Director of Institutional Business, CEO of International, | |
| | Eaton Vance Management (investment management firm) (2005 – 2010); and | |
| | Director of Amundi Holdings US, Inc. (since 2017) | |
| Kenneth J. Taubes (62)** | Trustee since 2014. | Director and Executive Vice President (since 2008) and Chief Investment | None |
Trustee | Serves until a successor | Officer, U.S. (since 2010) of Amundi US, Inc. (investment management firm); | |
| trustee is elected | Director and Executive Vice President and Chief Investment Officer, U.S. of | |
| or earlier retirement | Amundi US (since 2008); Executive Vice President and Chief Investment | |
| or removal | Officer, U.S. of Amundi Asset Management US, Inc. (since 2009); Portfolio | |
| | Manager of Amundi US (since 1999); and Director of Amundi Holdings | |
| | US, Inc. (since 2017) | |
** | Ms. Jones and Mr. Taubes are Interested Trustees because they are officers or directors of the Fund’s investment adviser and certain of its affiliates. |
52 Pioneer Fundamental Growth Fund | Annual Report | 3/31/21
Fund Officers*
| Name, Age and Position | Term of Office and | | Other Directorships |
| Held With the Fund | Length of Service | Principal Occupation | Held by Officer |
| Christopher J. Kelley (56) | Since 2003. Serves | Vice President and Associate General Counsel of Amundi US since | None |
Secretary and Chief | at the discretion of | January 2008; Secretary and Chief Legal Officer of all of the Pioneer Funds | |
Legal Officer | the Board | since June 2010; Assistant Secretary of all of the Pioneer Funds from | |
| | September 2003 to May 2010; and Vice President and Senior Counsel of | |
| | Amundi US from July 2002 to December 2007 | |
| Carol B. Hannigan (60) | Since 2010. Serves | Fund Governance Director of Amundi US since December 2006 and | None |
Assistant Secretary | at the discretion of | Assistant Secretary of all the Pioneer Funds since June 2010; Manager – | |
| the Board | Fund Governance of Amundi US from December 2003 to November 2006; | |
| | and Senior Paralegal of Amundi US from January 2000 to November 2003 | |
| Thomas Reyes (58) | Since 2010. Serves | Assistant General Counsel of Amundi US since May 2013 and Assistant | None |
Assistant Secretary | at the discretion of | Secretary of all the Pioneer Funds since June 2010; and Counsel of Amundi | |
| the Board | US from June 2007 to May 2013 | |
| Anthony J. Koenig, Jr. (57) | Since 2021. Serves | Senior Vice President – Fund Treasury of Amundi US; Treasurer of all of | None |
Treasurer and Chief | at the discretion of | the Pioneer Funds since May 2021; Assistant Treasurer of all of the Pioneer | |
Financial and | the Board | Funds from January 2021 to May 2021; and Chief of Staff, US Investment | |
Accounting Officer | | Management of Amundi US from May 2008 to January 2021 | |
| Luis I. Presutti (55) | Since 2002. Serves | Director – Fund Treasury of Amundi US since 1999; and Assistant | None |
Assistant Treasurer | at the discretion of | Treasurer of all of the Pioneer Funds since 1999 | |
| the Board | | |
| Gary Sullivan (62) | Since 2002. Serves | Senior Manager – Fund Treasury of Amundi US since 2012; and Assistant | None |
Assistant Treasurer | at the discretion of | Treasurer of all of the Pioneer Funds since 2002 | |
| the Board | | |
* | Effective April 30, 2021, Mark E. Bradley is no longer Treasurer of the Fund. |
Pioneer Fundamental Growth Fund | Annual Report | 3/31/21 53
Fund Officers* (continued)
| | | | |
| Name, Age and Position | Term of Office and | | Other Directorships |
| Held With the Fund | Length of Service | Principal Occupation | Held by Officer |
| Antonio Furtado (38) | Since 2020. Serves | Fund Oversight Manager – Fund Treasury of Amundi US since 2020; | None |
Assistant Treasurer | at the discretion of | Assistant Treasurer of all of the Pioneer Funds since 2020; and Senior Fund | |
| the Board | Treasury Analyst from 2012 - 2020 | |
| John Malone (50) | Since 2018. Serves | Managing Director, Chief Compliance Officer of Amundi US Asset | None |
Chief Compliance Officer | at the discretion of | Management; Amundi Asset Management US, Inc.; and the Pioneer | |
| the Board | Funds since September 2018; and Chief Compliance Officer of Amundi | |
| | | Distributor US, Inc. since January 2014. | |
| Kelly O’Donnell (50) | Since 2006. Serves | Vice President – Amundi Asset Management; and Anti-Money Laundering | None |
Anti-Money | at the discretion of | Officer of all the Pioneer Funds since 2006 | |
Laundering Officer | the Board | | |
54 Pioneer Fundamental Growth Fund | Annual Report | 3/31/21
This page was intentionally left blank.
Pioneer Fundamental Growth Fund | Annual Report | 3/31/21 55
This page was intentionally left blank.
56 Pioneer Fundamental Growth Fund | Annual Report | 3/31/21
This page was intentionally left blank.
Pioneer Fundamental Growth Fund | Annual Report | 3/31/21 57
This page was intentionally left blank.
58 Pioneer Fundamental Growth Fund | Annual Report | 3/31/21
This page was intentionally left blank.
Pioneer Fundamental Growth Fund | Annual Report | 3/31/21 59
This page was intentionally left blank.
60 Pioneer Fundamental Growth Fund | Annual Report | 3/31/21
How to Contact Amundi
We are pleased to offer a variety of convenient ways for you to contact us for assistance or information.
| Call us for: | |
Account Information, including existing accounts, | |
new accounts, prospectuses, applications | |
and service forms | 1-800-225-6292 |
FactFoneSM for automated fund yields, prices, | |
account information and transactions | 1-800-225-4321 |
| Retirement plans information | 1-800-622-0176 |
Write to us:
Amundi
P.O. Box 219427
Kansas City, MO 64121-9427
| Our toll-free fax | 1-800-225-4240 |
| Our internet e-mail address | us.askamundi@amundi.com/us |
(for general questions about Amundi only) | |
|
| Visit our web site: www.amundi.com/us. | |
This report must be preceded or accompanied by a prospectus.
The Fund files a complete schedule of portfolio holdings with the Securities and Exchange Commission for the first and third quarters of each fiscal year as an exhibit to its reports on Form N-PORT. Shareholders may view the filed Form N-PORT by visiting the Commission’s web site at https://www.sec.gov.
Amundi Asset Management US, Inc.
60 State Street
Boston, MA 02109
www.amundi.com/us
Securities offered through Amundi Distributor US, Inc.,
60 State Street, Boston, MA 02109
Underwriter of Pioneer Mutual Funds, Member SIPC
© 2021 Amundi Asset Management US, Inc. 19341-15-0521
ITEM 2. CODE OF ETHICS.
(a) Disclose whether, as of the end of the period covered by the report, the registrant has adopted a code of ethics that applies to the registrant’s principal executive officer, principal financial officer, principal accounting officer or controller, or persons performing similar functions, regardless of whether these individuals are employed by the registrant or a third party. If the registrant has not adopted such a code of ethics, explain why it has not done so.
The registrant has adopted, as of the end of the period covered by this report, a code of ethics that applies to the registrant’s principal executive officer, principal financial officer, principal accounting officer and controller.
(b) For purposes of this Item, the term “code of ethics” means written standards that are reasonably designed to deter wrongdoing and to promote:
(1) Honest and ethical conduct, including the ethical handling of actual or apparent conflicts of interest between personal and professional relationships;
(2) Full, fair, accurate, timely, and understandable disclosure in reports and documents that a registrant files with, or submits to, the Commission and in other public communications made by the registrant;
(3) Compliance with applicable governmental laws, rules, and regulations;
(4) The prompt internal reporting of violations of the code to an appropriate person or persons identified in the code; and
(5) Accountability for adherence to the code.
(c) The registrant must briefly describe the nature of any amendment, during the period covered by the report, to a provision of its code of ethics that applies to the registrant’s principal executive officer, principal financial officer, principal accounting officer or controller, or persons performing similar functions, regardless of whether these individuals are employed by the registrant or a third party, and that relates to any element of the code of ethics definition enumerated in paragraph (b) of this Item. The registrant must file a copy of any such amendment as an exhibit pursuant to Item 10(a), unless the registrant has elected to satisfy paragraph (f) of this Item by posting its code of ethics on its website pursuant to paragraph (f)(2) of this Item, or by undertaking to provide its code of ethics to any person without charge, upon request, pursuant to paragraph (f)(3) of this Item.
The registrant has made no amendments to the code of ethics during the period covered by this report.
(d) If the registrant has, during the period covered by the report, granted a waiver, including an implicit waiver, from a provision of the code of ethics to the registrant’s principal executive officer, principal financial officer, principal accounting officer or controller, or persons performing similar functions, regardless of whether these individuals are employed by the registrant or a third party, that relates to one or more of the items set forth in paragraph (b) of this Item, the registrant must briefly describe the nature of the waiver, the name of the person to whom the waiver was granted, and the date of the waiver.
Not applicable.
(e) If the registrant intends to satisfy the disclosure requirement under paragraph (c) or (d) of this Item regarding an amendment to, or a waiver from, a provision of its code of ethics that applies to the registrant’s principal executive officer, principal financial officer, principal accounting officer or controller, or persons performing similar functions and that relates to any element of the code of ethics definition
enumerated in paragraph (b) of this Item by posting such information on its Internet website, disclose the registrant’s Internet address and such intention.
Not applicable.
(f) The registrant must:
(1) File with the Commission, pursuant to Item 12(a)(1), a copy of its code of ethics that applies to the registrant’s principal executive officer, principal financial officer, principal accounting officer or controller, or persons performing similar functions, as an exhibit to its annual report on this Form N-CSR (see attachment);
(2) Post the text of such code of ethics on its Internet website and disclose, in its most recent report on this Form N-CSR, its Internet address and the fact that it has posted such code of ethics on its Internet website; or
(3) Undertake in its most recent report on this Form N-CSR to provide to any person without charge, upon request, a copy of such code of ethics and explain the manner in which such request may be made. See Item 10(2)
ITEM 3. AUDIT COMMITTEE FINANCIAL EXPERT.
(a) (1) Disclose that the registrant’s board of trustees has determined that the registrant either:
(i) Has at least one audit committee financial expert serving on its audit committee; or
(ii) Does not have an audit committee financial expert serving on its audit committee.
The registrant’s Board of Trustees has determined that the registrant has at least one audit committee financial expert.
(2) If the registrant provides the disclosure required by paragraph (a)(1)(i) of this Item, it must disclose the name of the audit committee financial expert and whether that person is “independent.” In order to be considered “independent” for purposes of this Item, a member of an audit committee may not, other than in his or her capacity as a member of the audit committee, the board of trustees, or any other board committee:
(i) Accept directly or indirectly any consulting, advisory, or other compensatory fee from the issuer; or
(ii) Be an “interested person” of the investment company as defined in Section 2(a)(19) of the Act (15 U.S.C. 80a-2(a)(19)).
Mr. Fred J. Ricciardi, an independent trustee, is such an audit committee financial expert.
(3) If the registrant provides the disclosure required by paragraph (a)(1) (ii) of this Item, it must explain why it does not have an audit committee financial expert.
Not applicable.
ITEM 4. PRINCIPAL ACCOUNTANT FEES AND SERVICES.
(a) Disclose, under the caption AUDIT FEES, the aggregate fees billed for each of the last two fiscal years for professional services rendered by the principal accountant for the audit of the registrant’s annual financial statements or services that are normally provided by the accountant in connection with statutory and regulatory filings or engagements for those fiscal years.
The audit fees for the Trust were $91,150 payable to Ernst & Young LLP for the year ended March 31, 2021 and $85,000 for the year ended March 31, 2020.
(b) Disclose, under the caption AUDIT-RELATED FEES, the aggregate fees billed in each of the last two fiscal years for assurance and related services by the principal accountant that are reasonably related to the performance of the audit of the registrant’s financial statements and are not reported under paragraph (a) of this Item. Registrants shall describe the nature of the services comprising the fees disclosed under this category.
There were no audit-related services in 2021 or 2020.
(c) Disclose, under the caption TAX FEES, the aggregate fees billed in each of the last two fiscal years for professional services rendered by the principal accountant for tax compliance, tax advice, and tax planning. Registrants shall describe the nature of the services comprising the fees disclosed under this category.
The Trust paid aggregate non-audit fees to Ernst & Young LLP for tax services of $26,447 and $18,143 during the fiscal years ended March 31, 2021 and 2020, respectively.
(d) Disclose, under the caption ALL OTHER FEES, the aggregate fees billed in each of the last two fiscal years for products and services provided by the principal accountant, other than the services reported in paragraphs (a) through (c) of this Item. Registrants shall describe the nature of the services comprising the fees disclosed under this category.
There were no other fees in 2021 or 2020.
(e) (1) Disclose the audit committee’s pre-approval policies and procedures described in paragraph (c)(7) of Rule 2-01 of Regulation S-X.
PIONEER FUNDS
APPROVAL OF AUDIT, AUDIT-RELATED, TAX AND OTHER SERVICES
PROVIDED BY THE INDEPENDENT AUDITOR
SECTION I - POLICY PURPOSE AND APPLICABILITY
The Pioneer Funds recognize the importance of maintaining the independence of their outside auditors. Maintaining independence is a shared responsibility involving Amundi Asset Management, Inc, the audit committee and the independent auditors.
The Funds recognize that a Fund’s independent auditors: 1) possess knowledge of the Funds, 2) are able to incorporate certain services into the scope of the audit, thereby avoiding redundant work, cost and disruption of Fund personnel and processes, and 3) have expertise that has value to the Funds. As a result, there are situations where it is desirable to use the Fund’s independent auditors for services in addition to the annual audit and where the potential for conflicts of interests are minimal. Consequently, this policy, which is intended to comply with Rule 210.2-01(C)(7), sets forth guidelines and procedures to be followed by the Funds when retaining the independent audit firm to perform audit, audit-related tax and other services under those circumstances, while also maintaining independence.
Approval of a service in accordance with this policy for a Fund shall also constitute approval for any other Fund whose pre-approval is required pursuant to Rule 210.2-01(c)(7)(ii).
In addition to the procedures set forth in this policy, any non-audit services that may be provided consistently with Rule 210.2-01 may be approved by the Audit Committee itself and any pre-approval that may be waived in accordance with Rule 210.2-01(c)(7)(i)(C) is hereby waived.
Selection of a Fund’s independent auditors and their compensation shall be determined by the Audit Committee and shall not be subject to this policy.
| | | |
| SECTION II - POLICY |
| |
SERVICE CATEGORY | SERVICE CATEGORY DESCRIPTION | SPECIFIC PRE-APPROVED SERVICE SUBCATEGORIES |
| | | |
I. AUDIT SERVICES | Services that are directly | o Accounting research assistance |
| | related to performing the | o SEC consultation, registration |
| | independent audit of the Funds | statements, and reporting |
| | | o Tax accrual related matters |
| | | o Implementation of new accounting standards |
| | | o Compliance letters (e.g. rating agency letters) |
| | | o Regulatory reviews and assistance |
| | | regarding financial matters |
| | | o Semi-annual reviews (if requested) |
| | | o Comfort letters for closed end offerings |
II. AUDIT-RELATED | Services which are not | o AICPA attest and agreed-upon procedures |
SERVICES | prohibited under Rule | o Technology control assessments |
| | 210.2-01(C)(4) (the “Rule”) | o Financial reporting control assessments |
| | and are related extensions of | o Enterprise security architecture |
| | the audit services support the | assessment |
| | audit, or use the knowledge/expertise | |
| | gained from the audit procedures as a | |
| | foundation to complete the project. | |
| | In most cases, if the Audit-Related | |
| | Services are not performed by the | |
| | Audit firm, the scope of the Audit | |
| | Services would likely increase. | |
| | The Services are typically well-defined | |
| | and governed by accounting | |
| | professional standards (AICPA, | |
| | SEC, etc.) | |
| | |
AUDIT COMMITTEE APPROVAL POLICY | AUDIT COMMITTEE REPORTING POLICY |
| o “One-time” pre-approval | o A summary of all such |
| for the audit period for all | services and related fees |
| pre-approved specific service | reported at each regularly |
| subcategories. Approval of the | scheduled Audit Committee |
| independent auditors as | meeting. |
| auditors for a Fund shall | |
| constitute pre approval for | |
| these services. | |
| |
| o “One-time” pre-approval | o A summary of all such |
| for the fund fiscal year within | services and related fees |
| a specified dollar limit | (including comparison to |
| for all pre-approved | specified dollar limits) |
| specific service subcategories | reported quarterly. |
| |
| o Specific approval is | |
| needed to exceed the | |
| pre-approved dollar limit for | |
| these services (see general | |
| Audit Committee approval policy | |
| below for details on obtaining | |
| specific approvals) | |
| |
| o Specific approval is | |
| needed to use the Fund’s | |
| auditors for Audit-Related | |
| Services not denoted as | |
| “pre-approved”, or | |
| to add a specific service | |
| subcategory as “pre-approved” | |
SECTION III - POLICY DETAIL, CONTINUED
| | |
SERVICE CATEGORY | SERVICE CATEGORY DESCRIPTION | SPECIFIC PRE-APPROVED SERVICE |
| | | SUBCATEGORIES |
III. TAX SERVICES | Services which are not | o Tax planning and support |
| | prohibited by the Rule, | o Tax controversy assistance |
| | if an officer of the Fund | o Tax compliance, tax returns, excise |
| | determines that using the | tax returns and support |
| | Fund’s auditor to provide | o Tax opinions |
| | these services creates | |
| | significant synergy in | |
| | the form of efficiency, | |
| | minimized disruption, or | |
| | the ability to maintain a | |
| | desired level of | |
| | confidentiality. | |
| | |
| AUDIT COMMITTEE APPROVAL POLICY | AUDIT COMMITTEE REPORTING POLICY |
o “One-time” pre-approval | o A summary of |
for the fund fiscal year | all such services and |
within a specified dollar limit | related fees |
| | (including comparison |
| | to specified dollar |
| | limits) reported |
| | quarterly. |
| |
o Specific approval is | |
| needed to exceed the | |
| pre-approved dollar limits for | |
| these services (see general | |
| Audit Committee approval policy | |
| below for details on obtaining | |
| specific approvals) | |
| |
o Specific approval is | |
| needed to use the Fund’s | |
| auditors for tax services not | |
| denoted as pre-approved, or to | |
| add a specific service subcategory as | |
| “pre-approved” | |
SECTION III - POLICY DETAIL, CONTINUED
| |
SERVICE CATEGORY | SERVICE CATEGORY DESCRIPTION | SPECIFIC PRE-APPROVED SERVICE |
| | | SUBCATEGORIES |
IV. OTHER SERVICES | Services which are not | o Business Risk Management support |
| | prohibited by the Rule, | o Other control and regulatory |
A. SYNERGISTIC, | if an officer of the Fund | compliance projects |
UNIQUE QUALIFICATIONS | determines that using the | |
| | Fund’s auditor to provide | |
| | these services creates | |
| | significant synergy in | |
| | the form of efficiency, | |
| | minimized disruption, | |
| | the ability to maintain a | |
| | desired level of | |
| | confidentiality, or where | |
| | the Fund’s auditors | |
| | posses unique or superior | |
| | qualifications to provide | |
| | these services, resulting | |
| | in superior value and | |
| | results for the Fund. | |
| | |
AUDIT COMMITTEE APPROVAL POLICY | AUDIT COMMITTEE REPORTING POLICY |
o “One-time” pre-approval | o A summary of |
| for the fund fiscal year within | all such services and |
| a specified dollar limit | related fees |
| | (including comparison |
| | to specified dollar |
| | limits) reported |
| | quarterly. |
o Specific approval is | |
| needed to exceed the | |
| pre-approved dollar limits for | |
| these services (see general | |
| Audit Committee approval policy | |
| below for details on obtaining | |
| specific approvals) | |
| |
o Specific approval is | |
| needed to use the Fund’s | |
| auditors for “Synergistic” or | |
| “Unique Qualifications” Other | |
| Services not denoted as | |
| pre-approved to the left, or to | |
| add a specific service | |
| subcategory as “pre-approved” | |
SECTION III - POLICY DETAIL, CONTINUED
| |
SERVICE CATEGORY | SERVICE CATEGORY DESCRIPTION | SPECIFIC PROHIBITED SERVICE |
| | | SUBCATEGORIES |
PROHIBITED SERVICES | Services which result | 1. Bookkeeping or other services |
| | in the auditors losing | related to the accounting records or |
| | independence status | financial statements of the audit |
| | under the Rule. | client* |
| | | 2. Financial information systems design |
| | | and implementation* |
| | | 3. Appraisal or valuation services, |
| | | fairness* opinions, or |
| | | contribution-in-kind reports |
| | | 4. Actuarial services (i.e., setting |
| | | actuarial reserves versus actuarial |
| | | audit work)* |
| | | 5. Internal audit outsourcing services* |
| | | 6. Management functions or human |
| | | resources |
| | | 7. Broker or dealer, investment |
| | | advisor, or investment banking services |
| | | 8. Legal services and expert services |
| | | unrelated to the audit |
| | | 9. Any other service that the Public |
| | | Company Accounting Oversight Board |
| | | determines, by regulation, is |
| | | impermissible |
| | |
AUDIT COMMITTEE APPROVAL POLICY | AUDIT COMMITTEE REPORTING POLICY |
o These services are not to be | o A summary of all |
| performed with the exception of the(*) | services and related |
| services that may be permitted | fees reported at each |
| if they would not be subject to audit | regularly scheduled |
| procedures at the audit client (as | Audit Committee meeting |
| defined in rule 2-01(f)(4)) level | will serve as continual |
| the firm providing the service. | confirmation that has |
| | not provided any |
| | restricted services. |
GENERAL AUDIT COMMITTEE APPROVAL POLICY:
o For all projects, the officers of the Funds and the Fund’s auditors will each make an assessment to determine that any proposed projects will not impair independence.
o Potential services will be classified into the four non-restricted service categories and the “Approval of Audit, Audit-Related, Tax and Other Services” Policy above will be applied. Any services outside the specific pre-approved service subcategories set forth above must be specifically approved by the Audit Committee.
o At least quarterly, the Audit Committee shall review a report summarizing the services by service category, including fees, provided by the Audit firm as set forth in the above policy.
(2) Disclose the percentage of services described in each of paragraphs (b) through (d) of this Item that were approved by the audit committee pursuant to paragraph (c)(7)(i)(C) of Rule 2-01 of Regulation S-X.
Non-Audit Services
Beginning with non-audit service contracts entered into on or after May 6, 2003, the effective date of the
new SEC pre-approval rules, the Trust’s audit committee is required to pre-approve services to
affiliates defined by SEC rules to the extent that the services are determined to have a direct impact on the operations or financial reporting of the Trust. For the years ended March 31, 2021 and 2020, there were no services provided to an affiliate that required the Trust’s audit committee pre-approval.
(f) If greater than 50 percent, disclose the percentage of hours expended on the principal accountants engagement to audit the registrant’s financial statements for the most recent fiscal year that were attributed to work performed by persons other than the principal accountant’s full-time, permanent employees.
N/A
(g) Disclose the aggregate non-audit fees billed by the registrants accountant for services rendered to the registrant, and rendered to the registrants investment adviser (not including any sub-adviser whose role is primarily portfolio management and is subcontracted with or overseen by another investment adviser), and any entity controlling, controlled by, or under common control with the adviser that provides ongoing services to the registrant for each of the last two fiscal years of the registrant.
The Trust paid aggregate non-audit fees to Ernst & Young LLP for tax services of $26,447 and $18,143 during the fiscal years ended March 31, 2021 and 2020, respectively.
(h) Disclose whether the registrants audit committee of the board of trustees has considered whether the provision of non-audit services that were rendered to the registrants investment adviser (not including any subadviser whose role is primarily portfolio management and is subcontracted with or overseen by another investment adviser), and any entity controlling, controlled by, or under common control with the investment adviser that provides ongoing services to the registrant that were not pre-approved pursuant to paragraph (c)(7)(ii) of Rule 2-01 of Regulation S-X is compatible with maintaining the principal accountant’s independence.
The Fund’s audit committee of the Board of Trustees has considered whether the provision of non-audit services that were rendered to the Affiliates (as defined) that were not pre- approved pursuant to paragraph (c)(7)(ii) of Rule 2-01 of Regulation S-X is compatible with maintaining the principal accountant’s independence.
ITEM 5. AUDIT COMMITTEE OF LISTED REGISTRANTS
(a) If the registrant is a listed issuer as defined in Rule 10A-3 under the Exchange Act (17 CFR 240.10A-3), state whether or not the registrant has a separately-designated standing audit committee established in accordance with Section 3(a)(58)(A) of the Exchange Act (15 U.S.C. 78c(a)(58)(A)). If the registrant has such a committee, however designated, identify each committee member. If the entire board of directors is acting as the registrant’s audit committee as specified in Section 3(a)(58)(B) of the Exchange Act (15 U.S.C. 78c(a)(58)(B)), so state.
N/A
(b) If applicable, provide the disclosure required by Rule 10A-3(d) under the Exchange Act (17 CFR 240.10A-3(d)) regarding an exemption from the listing standards for audit committees.
N/A
ITEM 6. SCHEDULE OF INVESTMENTS.
File Schedule of Investments in securities of unaffiliated issuers as of the close of the reporting period as set forth in 210.1212 of Regulation S-X [17 CFR 210.12-12], unless the schedule is included as part of the report to shareholders filed under Item 1 of this Form.
Included in Item 1
ITEM 7. DISCLOSURE OF PROXY VOTING POLICIES AND PROCEDURES FOR CLOSED-END MANAGEMENT INVESTMENT COMPANIES.
A closed-end management investment company that is filing an annual report on this Form N-CSR must, unless it invests exclusively in non-voting securities, describe the policies and procedures that it uses to determine how to vote proxies relating to portfolio securities, including the procedures that the company uses when a vote presents a conflict between the interests of its shareholders, on the one hand, and those of the company’s investment adviser; principal underwriter; or any affiliated person (as defined in Section 2(a)(3) of the Investment Company Act of 1940 (15 U.S.C. 80a-2(a)(3)) and the rules thereunder) of the company, its investment adviser, or its principal underwriter, on the other. Include any policies and procedures of the company’s investment adviser, or any other third party, that the company uses, or that are used on the company’s behalf, to determine how to vote proxies relating to portfolio securities.
Not applicable to open-end management investment companies.
ITEM 8. PORTFOLIO MANAGERS OF CLOSED-END MANAGEMENT INVESTMENT COMPANIES.
(a) If the registrant is a closed-end management investment company that is filing an annual report on this Form N-CSR, provide the following information:
(1) State the name, title, and length of service of the person or persons employed by or associated with the registrant or an investment adviser of the registrant who are primarily responsible for the day-to-day management of the registrant’s portfolio (“Portfolio Manager”). Also state each Portfolio Manager’s business experience during the past 5 years.
Not applicable to open-end management investment companies.
ITEM 9. PURCHASES OF EQUITY SECURITIES BY CLOSED-END MANAGEMENT INVESTMENT COMPANY AND AFFILIATED PURCHASERS.
(a) If the registrant is a closed-end management investment company, in the following tabular format, provide the information specified in paragraph (b) of this Item with respect to any purchase made by or on behalf of the registrant or any affiliated purchaser, as defined in Rule 10b-18(a)(3) under the Exchange Act (17 CFR 240.10b-18(a)(3)), of shares or other units of any class of the registrant’s equity securities that is registered by the registrant pursuant to Section 12 of the Exchange Act (15 U.S.C. 781).
Not applicable to open-end management investment companies.
ITEM 10. SUBMISSION OF MATTERS TO A VOTE OF SECURITY HOLDERS.
Describe any material changes to the procedures by which shareholders may recommend nominees to the registrant’s board of directors, where those changes were implemented after the registrant last provided disclosure in response to the requirements of Item 407(c)(2)(iv) of Regulation S-R(17 CFR 229.407)(as required by Item 22(b)(15)) of Schedule 14A (17 CFR 240.14a-101), or this Item.
There have been no material changes to the procedures by which the shareholders may recommend nominees to the registrant’s board of directors since the registrant last provided disclosure in response to the requirements of Item 407(c)(2)(iv) of Regulation S-R of Schedule 14(A) in its definitive proxy statement, or this item.
ITEM 11. CONTROLS AND PROCEDURES.
(a) Disclose the conclusions of the registrant’s principal executive and principal financials officers, or persons performing similar functions, regarding the effectiveness of the registrant’s disclosure controls and procedures (as defined in Rule 30a-3(c) under the Act (17 CFR 270.30a-3(c))) as of a date within 90 days of the filing date of the report that includes the disclosure required by this paragraph, based on the evaluation of these controls and procedures required by Rule 30a-3(b) under the Act (17 CFR 270.30(a)-3(b) and Rules 13a-15(b) or 15d-15(b) under the Exchange Act (17 CFR 240.13a-15(b) or 240.15d-15(b)).
The registrant’s principal executive officer and principal financial officer have concluded that the registrant’s disclosure controls and procedures are effective based on the evaluation of these controls and procedures as of a date within 90 days of the filing date of this report.
(b) Disclose any change in the registrant’s internal control over financial reporting (as defined in Rule 30a-3(d) under the Act (17CFR 270.30a-3(d)) that occured during the second fiscal quarter of the period covered by this report that has materially affected, or is reasonably likely to materially affect, the registrant’s internal control over financial reporting.
There were no significant changes in the registrant’s internal control over financial reporting that occurred during the second fiscal quarter of the period covered by this report that have materially affected, or are reasonably likely to materially affect, the registrant’s internal control over financial reporting.
Item 12. Disclosure of Securities Lending Activities for Closed-End Management Investment Companies.
(a) If the registrant is a closed-end management investment company, provide the following dollar amounts of income and compensation related to the securities lending activities of the registrant during its most recent fiscal year:
N/A
(1) Gross income from securities lending activities;
N/A
(2) All fees and/or compensation for each of the following securities lending activities and related services: any share of revenue generated by the securities lending program paid to the securities lending agent(s) (revenue split); fees paid for cash collateral management services (including fees deducted from a pooled cash collateral reinvestment vehicle) that are not included in the revenue split; administrative fees that are not included in the revenue split; fees for indemnification that are not included in the revenue split; rebates paid to borrowers; and any other fees relating to the securities lending program that are not included in the revenue split, including a description of those other fees;
N/A
(3) The aggregate fees/compensation disclosed pursuant to paragraph (2); and
N/A
(4) Net income from securities lending activities (i.e., the dollar amount in paragraph (1) minus the dollar amount in paragraph (3)).
If a fee for a service is included in the revenue split, state that the fee is included in the revenue split.
N/A
(b) If the registrant is a closed-end management investment company, describe the services provided to the registrant by the securities lending agent in the registrants most recent fiscal year.
N/A
ITEM 13. EXHIBITS.
(a) File the exhibits listed below as part of this Form. Letter or number the exhibits in the sequence indicated.
SIGNATURES
[See General Instruction F]
Pursuant to the requirements of the Securities Exchange Act of 1934 and the Investment Company Act of 1940, the registrant has duly caused this report to be signed on its behalf by the undersigned, thereunto duly authorized.
(Registrant) Pioneer Series Trust X
By (Signature and Title)* /s/ Lisa M. Jones
Lisa M. Jones, President & Chief Executive Officer
Date June 4, 2021
Pursuant to the requirements of the Securities Exchange Act of 1934 and the Investment Company Act of 1940, this report has been signed below by the following persons on behalf of the registrant and in the capacities and on the dates indicated.
By (Signature and Title)* /s/ Lisa M. Jones
Lisa M. Jones, President & Chief Executive Officer
Date June 4, 2021
By (Signature and Title)* /s/ Anthony J. Koenig
Anthony J. Koenig, Jr., Managing Director, Chief Operations Officer & Treasurer of the Funds
Date June 4, 2021
* Print the name and title of each signing officer under his or her signature.