| | |
| Ticker Symbols: |
| |
| Class A | | HYCAX |
| |
| Class C | | HYCCX |
| |
| Class Y | | HYCYX |
Beginning in February 2021, as permitted by regulations adopted by the Securities and Exchange Commission, paper copies of the Fund’s shareholder reports like this one will no longer be sent by mail, unless you specifically request paper copies of the reports from the Fund or from your financial intermediary, such as a broker-dealer, bank or insurance company. Instead, the reports will be made available on the Fund’s website, and you will be notified by mail each time a report is posted and provided with a website link to access the report.
If you already elected to receive shareholder reports electronically, you will not be affected by this change and you need not take any action. You may elect to receive shareholder reports and other communications electronically by contacting your financial intermediary or, if you invest directly with the Fund, by calling 1-800-225-6292.
You may elect to receive all future reports in paper free of charge. If you invest directly with the Fund, you can inform the Fund that you wish to continue receiving paper copies of your shareholder reports by calling 1-800-225-6292. If you invest through a financial intermediary, you can contact your financial intermediary to request that you continue to receive paper copies of your shareholder reports. Your election to receive reports in paper will apply to all funds held in your account if you invest through your financial intermediary or all funds held within the Pioneer Fund complex if you invest directly.

visit us: www.amundipioneer.com/us
| | | | |
| Table of Contents | | | | |
| |
President’s Letter | | | 2 | |
| |
Portfolio Management Discussion | | | 4 | |
| |
Portfolio Summary | | | 11 | |
| |
Prices and Distributions | | | 12 | |
| |
Performance Update | | | 13 | |
| |
Comparing Ongoing Fund Expenses | | | 16 | |
| |
Schedule of Investments | | | 18 | |
| |
Financial Statements | | | 29 | |
| |
Notes to Financial Statements | | | 36 | |
| |
Report of Independent Registered Public Accounting Firm | | | 47 | |
| |
Additional Information | | | 49 | |
| |
Trustees, Officers and Service Providers | | | 50 | |
| | |
| Pioneer Corporate High Yield Fund | Annual Report | 8/31/19 | | 1 |
President’s Letter
Since 1928, active portfolio management based on in-depth, fundamental research, has been the foundation of Amundi Pioneer’s investment approach. We believe an active management investment strategy is a prudent approach to investing, especially during periods of market volatility, which can result from any number of risk factors, including slow U.S. economic growth, rising interest rates, and geopolitical factors. Of course, in today’s global economy, risk factors extend well beyond U.S. borders. In fact, it’s not unusual for political and economic issues on the international front to cause or contribute to volatility in U.S. markets.
At Amundi Pioneer, each security under consideration is researched by our team of experienced investment professionals, who communicate directly with the management teams of those companies. At the end of this research process, if we have conviction in a company’s business model and management team, and regard the security as a potentially solid investment opportunity, an Amundi Pioneer portfolio manager makes an active decision to invest in that security. The portfolio resulting from these decisions represents an expression of his or her convictions, and strives to balance overall risk and return opportunity.
As an example, the Standard & Poor’s 500 Index – the predominant benchmark for many U.S. Large-Cap Core Equity funds – has 500 stocks. An Amundi Pioneer portfolio manager chooses to invest in only those companies that he or she believes can offer the most attractive opportunities to pursue the fund’s investment objective, thus potentially benefiting the fund’s shareowners. This process results in a portfolio that does not own all 500 stocks, but a much narrower universe.
The same active decision to invest in a company is also applied when we decide to sell a security, due to changing fundamentals, valuation concerns, or market risks. We apply this active decision-making across all of our equity, fixed-income, and global portfolios.
Today, as investors, we have many options. It is our view that active management can serve shareholders well not only when markets are thriving, but also during periods of market volatility and uncertainty, thus making it a compelling investment choice. As you consider the many choices today, we encourage you to work with your financial advisor to develop an overall investment plan that addresses both your short- and long-term goals, and to implement such a plan in a disciplined manner.
| | | | |
| 2 | | Pioneer Corporate High Yield Fund | Annual Report | 8/31/19 | | |
We greatly appreciate the trust you have placed in us and look forward to continuing to serve you in the future.
Sincerely,

Lisa M. Jones
Head of the Americas, President and CEO of U.S.
Amundi Pioneer Asset Management USA, Inc.
August 31, 2019
Any information in this shareowner report regarding market or economic trends or the factors influencing the Fund’s historical or future performance are statements of opinion as of the date of this report. Past performance is no guarantee of future results.
| | |
| Pioneer Corporate High Yield Fund | Annual Report | 8/31/19 | | 3 |
Portfolio Management Discussion | 8/31/19
In the following interview, Matthew Shulkin discusses the factors that influenced the performance of Pioneer Corporate High Yield Fund during the 12-month period ended August 31, 2019. Mr. Shulkin, a vice president and a portfolio manager at Amundi Pioneer Asset Management, Inc. (Amundi Pioneer), and Andrew Feltus, Co-Director of High Yield and a portfolio manager at Amundi Pioneer, are responsible for the day-to-day management of the Fund, along with Kenneth Monaghan, Co-Director of High Yield and a portfolio manager at Amundi Pioneer*.
| Q | How did the Fund perform during the 12-month period ended August 31, 2019? |
| A | Pioneer Corporate High Yield Fund’s Class A shares returned 7.13% at net asset value during the 12-month period ended August 31, 2019, while the Fund’s benchmark, the ICE Bank of America Merrill Lynch U.S. High Yield Index (the ICE BofA ML Index), returned 6.58%. During the same period, the average return of the 712 mutual funds in Morningstar’s High Yield Bond Funds category was 5.34%. |
| Q | Could you please describe the market environment for high-yield corporate bonds during the 12-month period ended August 31, 2019? |
| A | Entering the period, robust economic data and corporate earnings results boosted market sentiment for riskier assets, outweighing concerns over increasingly protectionist U.S. trade policy. The markets continued to focus heavily on economic growth and inflation indicators in an effort to predict likely U.S. Federal Reserve (Fed) policy, as the Fed was in the process of tightening monetary conditions by raising interest rates, having done so twice in the first half of 2018. At that time, the general expectation among market participants was for two additional quarter-point federal funds rate increases by year-end, for a total of four in 2018. Treasury yields rose in advance of the Fed’s September 25, 2018, meeting, the result of which was an increase to the upper band for the benchmark overnight lending rate from 2.00% to 2.25%. Meanwhile, equities continued to grind higher, and credit-oriented segments of the bond market performed well through September of 2018. |
| * | Mr. Monaghan became a portfolio manager on the Fund effective September 30, 2019. |
| | | | |
| 4 | | Pioneer Corporate High Yield Fund | Annual Report | 8/31/19 | | |
Conditions reversed in the fourth quarter of 2018, however, and it proved to be one of the most challenging three-month periods for investors since the end of the financial crisis in March of 2009. A number of issues converged to produce exceptionally poor returns for riskier assets heading into the end of the calendar year. Escalating trade tensions between the U.S. and some of its key trading partners, especially China, with associated implications for economic growth and corporate profit margins, was perhaps the biggest issue. Another concern was that the Fed would “overshoot” and raise interest rates too high after doing so again in December, the fourth rate increase in 2018, which had the potential to produce an inverted yield curve and raise recession fears. (An inverted yield curve occurs when longer-term rates dip below shorter-term rates.) Finally, the prospect of a looming U.S. government shutdown also concerned the markets towards the end of 2018. (A shutdown did occur, but it proved relatively short-lived.)
After the difficult fourth quarter, capped by December’s rout in the credit and equity markets, investor sentiment rebounded in January 2019 as Fed Chairman Powell indicated that interest-rate policy was not on a fixed course. Powell’s words led market participants to conclude that the Fed was unlikely to raise its benchmark rate again in 2019. The view received further support from the Fed’s statement at the end of January that it was prepared to be “patient” on further rate hikes, given “muted inflation pressures.” In addition, positive readouts from employment and manufacturing data helped boost risk sentiment at the beginning of the new calendar year.
Despite some interim volatility, credit-sensitive and other riskier assets generally maintained a firm tone through the end of April 2019. In May, however, President Trump’s announcement of plans to institute a 25% tariff on some $200 billion worth of Chinese goods – an indication that a trade deal between the two countries was not going to be as easy to achieve as the market initially believed – led to another brief market downturn. At that point, the Fed signaled a willingness to implement one or more cuts in the federal funds rate before the end of 2019, and later implemented a 0.25% rate reduction in July 2019, prior to period-end. The Fed’s continued softer tone on monetary policy spurred a strong rally in bonds over the final weeks of the 12-month period.
The Treasury yield curve finished the 12-month period significantly lower along its length, boosting returns for fixed-income assets in general.
| | |
| Pioneer Corporate High Yield Fund | Annual Report | 8/31/19 | | 5 |
| Q | Can you review the Fund’s principal strategies during the 12-month period ended August 31, 2019, and the degree to which they added to or detracted from benchmark-relative performance? |
| A | Security selection results drove the Fund’s strong performance relative to the benchmark during the 12-month period, led by portfolio holdings within the energy, health care, and basic industry sectors. In energy for example, our overall focus on holding higher-quality issues in the portfolio helped bolster the Fund’s benchmark-relative performance during the sell-off of riskier assets we witnessed in late 2018. |
With regard to individual securities, the Fund’s lack of exposure to the debt of Weatherford International was the top positive contributor to benchmark-relative performance for the period. The over-levered oil & gas services firm had entered into a restructuring support agreement with bondholders in May of 2019, but ultimately filed Chapter 11 bankruptcy in July. Another positive contributor to the Fund’s benchmark-relative results was a portfolio overweight to the long-term debt of CF Industries. CF, an agricultural fertilizer company, experienced improved operating results during the period; meanwhile, the prices of CF’s bonds benefited from declining Treasury yields. Finally, a portfolio overweight position in bonds financing the construction of a new Hard Rock hotel/casino in Sacramento, California, also aided the Fund’s relative performance for the period. The Fund participated in structuring the bonds’ terms and pricing after performing significant due diligence on the casino project, which has surpassed construction targets in terms of both cost and timing.
On the negative side, the Fund’s sector weightings and duration positioning versus the benchmark detracted modestly from relative performance. (Duration is a measure of the sensitivity of the price, or the value of principal, of a fixed-income investment to changes in interest rates, expressed as a number of years.)
Individual investments that detracted from the Fund’s benchmark-relative returns during the 12-month period included an overweight portfolio position in the bonds of Halcon Resources. The highly levered exploration & production company burned through its free cash as it experienced ongoing production misses and weak natural gas realizations. Those developments led Halcon to file for reorganization under Chapter 11 bankruptcy. An overweight position in agricultural tire manufacturer Titan Tire also weighed on the Fund’s benchmark-relative returns as tariffs, soft farm prices, and higher commodity input costs led to weaker operating results. The Fund’s overweight holdings of the bonds of network infrastructure
| | | | |
| 6 | | Pioneer Corporate High Yield Fund | Annual Report | 8/31/19 | | |
company CommScope was another detractor from benchmark-relative performance. Lower-than-expected spending on cable networks and some integration issues with a recent acquisition constrained CommScope’s results over the 12-month period.
| Q | Can you discuss the factors that affected the Fund’s income-generation, or distributions** to shareholders, either positively or negatively, during the 12-month period ended August 31, 2019? |
| A | The Fund’s income generation and distributions to shareholders remained relatively stable over the period. Even though our more “up-in-quality” and higher-rated bias with regard to the Fund’s holdings resulted in a marginally lower yield versus the benchmark BofA ML Index, we view the portfolio’s positioning as appropriate given where we are in the current credit cycle. |
| Q | What role did derivatives play in the Fund’s investment process and results during the 12-month period ended August 31, 2019? |
| A | We have the ability to utilize derivatives from time to time in order to maintain the desired level of portfolio exposure to the high-yield market, while also seeking to maintain sufficient liquidity to make opportunistic purchases and help meet any unanticipated shareholder redemptions. During the 12-month period, the Fund had light exposure to credit default swap index contracts, which had no material impact on performance. |
| Q | What is your assessment of the current climate for high-yield investing? |
| A | Based on historical averages, high-yield valuations are relatively tight. That said, we do not view current valuations as extreme, given our expectations for a continued low default rate and a strong technical backdrop in the high-yield market. |
We believe the greatest threat to high-yield returns is a recession that increases economic stress on leveraged issuers, which could then lead to a spike in defaults. Those who anticipate a near-term recession frequently note that economic expansions do not last forever and point to possible contagion from the global manufacturing recession triggered by the U.S. trade war with China. From our perspective, we are less concerned with the age of the economic expansion than with the potential spreading of manufacturing weakness into the broader U.S. economy. The length of any particular economic expansion is always unpredictable, and alarmists have been claiming for years that we are “in the 9th inning” of the current expansion.
| ** | Distributions are not guaranteed. |
| | |
| Pioneer Corporate High Yield Fund | Annual Report | 8/31/19 | | 7 |
As for the impact of trade disputes on manufacturing, we assess data related to the topic as part of our top-down evaluation process, while asking our fundamental investment analysts if the companies they cover have been feeling the effects of the trade uncertainty. So far, the manufacturing weakness and whatever effect it has had on the service sector has not weighed on employment. However, if the trade war expands, that situation will likely change quickly.
We believe the coupon (interest) component of returns as opposed to further spread tightening will most likely drive near-term high-yield market performance. (Credit spreads are commonly defined as the differences in yield between Treasuries and other types of fixed-income securities with similar maturities.) We believe issuers of high-yield securities are of a much better quality than usually seen at the end of other economic expansions. While there have been some aggressive financings, they are nowhere near as widespread as in 2008.
We feel that geopolitics and the upcoming U.S. election cycle will likely trigger periods of high market volatility, but we believe the Fund is well positioned to take advantage of any market dislocations. Our intent is to attempt to generate positive performance relative to the Fund’s benchmark through both security selection and sector allocations, while maintaining the portfolio’s risk level at close to that of the benchmark ICE BofA ML Index. If spreads do happen to widen because of market volatility not rooted in real economic weakness, we may then take the opportunity to increase the portfolio’s risk profile.
| | | | |
| 8 | | Pioneer Corporate High Yield Fund | Annual Report | 8/31/19 | | |
Please refer to the Schedule of Investments on pages 18–28 for a full listing of Fund securities.
All investments are subject to risk, including the possible loss of principal. In the past several years, financial markets have experienced increased volatility, depressed valuations, decreased liquidity and heightened uncertainty. These conditions may continue, recur, worsen or spread.
Investments in high-yield or lower rated securities are subject to greater-than-average price volatility, illiquidity and possibility of default.
When interest rates rise, the prices of fixed income securities held by the Fund will generally fall. Conversely, when interest rates fall, the prices of fixed income securities held by the Fund will generally rise.
Investments in the Fund are subject to possible loss due to the financial failure of issuers of underlying securities and their inability to meet their debt obligations.
Prepayment risk is the chance that an issuer may exercise its right to prepay its security, if falling interest rates prompt the issuer to do so. Forced to reinvest the unanticipated proceeds at lower interest rates, the Fund would experience a decline in income and lose the opportunity for additional price appreciation.
The portfolio may invest in mortgage-backed securities, which during times of fluctuating interest rates may increase or decrease more than other fixed-income securities. Mortgage-backed securities are also subject to prepayments.
Investing in foreign and/or emerging market securities involves risks relating to interest rates, currency exchange rates, economic, and political conditions.
The Fund may use derivatives, such as options, futures, inverse floating rate obligations, swaps, and others, which can be illiquid, may disproportionately increase losses, and have a potentially large impact on Fund performance. Derivatives may have a leveraging effect on the Fund.
At times, the Fund’s investments may represent industries or sectors that are interrelated or have common risks, making them more susceptible to any economic, political, or regulatory developments or other risks affecting those industries and sectors.
These risks may increase share price volatility.
| | |
| Pioneer Corporate High Yield Fund | Annual Report | 8/31/19 | | 9 |
Before investing, consider the product’s investment objectives, risks, charges and expenses. Contact your advisor or Amundi Pioneer Asset Management, Inc., for a prospectus or summary prospectus containing this information. Read it carefully.
Any information in this shareholder report regarding market or economic trends or the factors influencing the Fund’s historical or future performance are statements of opinion as of the date of this report. Past performance is no guarantee of future results.
| | | | |
| 10 | | Pioneer Corporate High Yield Fund | Annual Report | 8/31/19 | | |
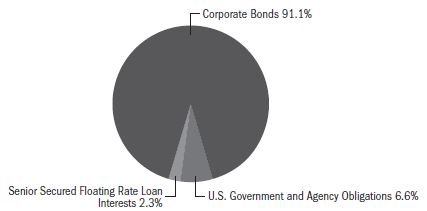
Portfolio Summary | 8/31/19
Portfolio Diversification
(As a percentage of total investments)*
10 Largest Holdings
(As a percentage of total investments)*
| | | | |
1. U.S. Treasury Bills, 9/17/19 | | | 4.42 | % |
2. U.S. Treasury Bills, 9/10/19 | | | 1.47 | |
3. Scientific Games International, Inc., 8.25%, 3/15/26 (144A) | | | 1.09 | |
4. Altice Luxembourg SA, 10.5%, 5/15/27 (144A) | | | 1.07 | |
5. CSC Holdings LLC, 5.5%, 4/15/27 (144A) | | | 1.05 | |
6. UBS Group Funding Switzerland AG, 7.0% (5 Year USD Swap Rate + 434 bps) (144A) | | | 1.04 | |
7. CSC Holdings LLC, 5.5%, 5/15/26 (144A) | | | 1.04 | |
8. OCI NV, 6.625%, 4/15/23 (144A) | | | 1.04 | |
9. Ardagh Packaging Finance Plc/Ardagh Holdings USA, Inc., 6.0%, 2/15/25 (144A) | | | 1.03 | |
10. Horizon Pharma USA, Inc., 5.5%, 8/1/27 (144A) | | | 1.02 | |
| * | Excludes temporary cash investments and all derivative contracts except for options purchased. The Fund is actively managed, and current holdings may be different. The holdings listed should not be considered recommendations to buy or sell any securities. |
| | |
| Pioneer Corporate High Yield Fund | Annual Report | 8/31/19 | | 11 |
Prices and Distributions | 8/31/19
Net Asset Value per Share
| | | | | | | | |
| Class | | 8/31/19 | | | 8/31/18 | |
A | | $ | 10.15 | | | $ | 9.97 | |
C | | $ | 10.14 | | | $ | 9.96 | |
Y | | $ | 10.15 | | | $ | 9.97 | |
Distributions per Share: 9/1/18–8/31/19
| | | | | | | | | | | | |
| Class | | Net Investment Income | | | Short-Term Capital Gains | | | Long-Term Capital Gains | |
A | | $ | 0.5046 | | | $ | — | | | $ | — | |
C | | $ | 0.4309 | | | $ | — | | | $ | — | |
Y | | $ | 0.5306 | | | $ | — | | | $ | — | |
Index Definition
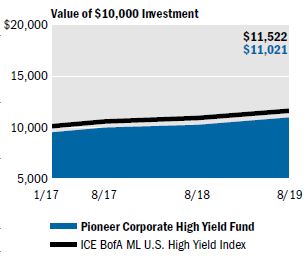
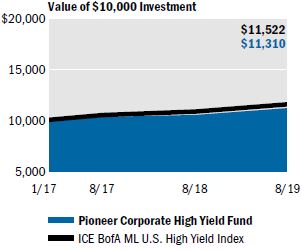
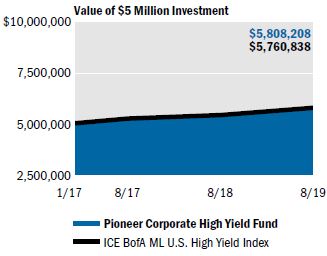
The ICE BofA ML U.S. High Yield Index is an unmanaged, commonly accepted measure of the performance of high-yield securities. Index returns are calculated monthly, assume reinvestment of dividends and, unlike Fund returns, do not reflect any fees, expenses or sales charges. It is not possible to invest directly in an index.
The index defined here pertains to the “Value of $10,000 Investment” and “Value of $5 Million Investment” charts on pages 13–15.
| | | | |
| 12 | | Pioneer Corporate High Yield Fund | Annual Report | 8/31/19 | | |
| | |
| Performance Update | 8/31/19 | | Class A Shares |
Investment Returns
The mountain chart on the right shows the change in value of a $10,000 investment made in Class A shares of Pioneer Corporate High Yield Fund at public offering price during the periods shown, compared to that of the ICE BofA ML U.S. High Yield Index.
| | | | | | | | | | | | |
| Average Annual Total Returns | | | | | |
| (As of August 31, 2019) | |
| | | |
| | | Net | | | Public | | | ICE BofA | |
| | | Asset | | | Offering | | | ML U.S. | |
| | | Value | | | Price | | | High Yield | |
Period | | (NAV) | | | (POP) | | | Index | |
Life of Class (1/3/17) | | | 5.54 | % | | | 3.73 | % | | | 5.90 | % |
1 year | | | 7.13 | | | | 2.31 | | | | 6.58 | |
|
| Expense Ratio | |
| (Per prospectus dated December 31, 2018) | |
| | | |
Gross | | Net | | | | | | | |
1.91% | | | 1.05 | % | | | | | | | | |
Call 1-800-225-6292 or visit www.amundipioneer.com/us for the most recent month-end performance results. Current performance may be lower or higher than the performance data quoted.
The performance data quoted represents past performance, which is no guarantee of future results. Investment return and principal value will fluctuate, and shares, when redeemed, may be worth more or less than their original cost.
NAV results represent the percent change in net asset value per share. NAV returns would have been lower had sales charges been reflected. POP returns reflect deduction of maximum 4.50% sales charge. All results are historical and assume the reinvestment of dividends and capital gains. Other share classes are available for which performance and expenses will differ.
Performance results reflect any applicable expense waivers in effect during the periods shown. Without such waivers Fund performance would be lower. Waivers may not be in effect for all funds. Certain fee waivers are contractual through a specified period. Otherwise, fee waivers can be rescinded at any time. See the prospectus and financial statements for more information.
The net expense ratio reflects the contractual expense limitation currently in effect through January 1, 2020, for Class A shares. There can be no assurance that Amundi Pioneer will extend the expense limitation beyond such time. Please see the prospectus and financial statements for more information.
The performance table and graph do not reflect the deduction of fees and taxes that a shareowner would pay on Fund distributions or the redemption of Fund shares.
Please refer to the financial highlights for a more current expense ratio.
| | |
| Pioneer Corporate High Yield Fund | Annual Report | 8/31/19 | | 13 |
| | |
| Performance Update | 8/31/19 | | Class C Shares |
Investment Returns
The mountain chart on the right shows the change in value of a $10,000 investment made in Class C shares of Pioneer Corporate High Yield Fund during the periods shown, compared to that of the ICE BofA ML U.S. High Yield Index.
| | | | | | | | | | | | |
| Average Annual Total Returns | | | | | |
| (As of August 31, 2019) | |
| | | |
| | | | | | | | | ICE BofA | |
| | | | | | | | | ML U.S. | |
| | | If | | | If | | | High Yield | |
Period | | Held | | | Redeemed | | | Index | |
Life of Class (1/3/17) | | | 4.74 | % | | | 4.74 | % | | | 5.90 | % |
1 year | | | 6.34 | | | | 6.34 | | | | 6.58 | |
| | |
| Expense Ratio | | | | | | | | | |
| (Per prospectus dated December 31, 2018) | |
| | | |
Gross | | Net | | | | | | | |
2.65% | | | 1.80 | % | | | | | | | | |
Call 1-800-225-6292 or visit www.amundipioneer.com/us for the most recent month-end performance results. Current performance may be lower or higher than the performance data quoted.
The performance data quoted represents past performance, which is no guarantee of future results. Investment return and principal value will fluctuate, and shares, when redeemed, may be worth more or less than their original cost.
Class C shares held for less than one year are also subject to a 1% contingent deferred sales charge (CDSC). If you paid a 1% sales charge, your returns would be lower than those shown above. “If Held” results represent the percent change in net asset value per share. “If Redeemed” returns would have been lower had sales charges been reflected. All results are historical and assume the reinvestment of dividends and capital gains. Other share classes are available for which performance and expenses will differ.
Performance results reflect any applicable expense waivers in effect during the periods shown. Without such waivers Fund performance would be lower. Waivers may not be in effect for all funds. Certain fee waivers are contractual through a specified period. Otherwise, fee waivers can be rescinded at any time. See the prospectus and financial statements for more information.
The net expense ratio reflects the contractual expense limitation currently in effect through January 1, 2020, for Class C shares. There can be no assurance that Amundi Pioneer will extend the expense limitation beyond such time. Please see the prospectus and financial statements for more information.
The performance table and graph do not reflect the deduction of fees and taxes that a shareowner would pay on Fund distributions or the redemption of Fund shares.
Please refer to the financial highlights for a more current expense ratio.
| | | | |
| 14 | | Pioneer Corporate High Yield Fund | Annual Report | 8/31/19 | | |
| | |
| Performance Update | 8/31/19 | | Class Y Shares |
Investment Returns
The mountain chart on the right shows the change in value of a $5 million investment made in Class Y shares of Pioneer Corporate High Yield Fund during the periods shown, compared to that of the ICE BofA ML U.S. High Yield Index.
| | | | | | | | |
| Average Annual Total Returns | | | | | |
| (As of August 31, 2019) | |
| | |
| | | Net | | | ICE BofA | |
| | | Asset | | | ML U.S. | |
| | | Value | | | High Yield | |
Period | | (NAV) | | | Index | |
Life of Class (1/3/17) | | | 5.80 | % | | | 5.90 | % |
1 year | | | 7.41 | | | | 6.58 | |
| | |
| Expense Ratio | | | | | | | | |
| (Per prospectus dated December 31, 2018) | |
| | |
Gross | | Net | | | | |
1.66% | | | 0.75 | % | | | | |
Call 1-800-225-6292 or visit www.amundipioneer.com/us for the most recent month-end performance results. Current performance may be lower or higher than the performance data quoted.
The performance data quoted represents past performance, which is no guarantee of future results. Investment return and principal value will fluctuate, and shares, when redeemed, may be worth more or less than their original cost.
Class Y shares are not subject to sales charges and are available for limited groups of eligible investors, including institutional investors. All results are historical and assume the reinvestment of dividends and capital gains. Other share classes are available for which performance and expenses will differ.
Performance results reflect any applicable expense waivers in effect during the periods shown. Without such waivers Fund performance would be lower. Waivers may not be in effect for all funds. Certain fee waivers are contractual through a specified period. Otherwise, fee waivers can be rescinded at any time. See the prospectus and financial statements for more information.
The net expense ratio reflects the contractual expense limitation currently in effect through January 1, 2020, for Class Y shares. There can be no assurance that Amundi Pioneer will extend the expense limitation beyond such time. Please see the prospectus and financial statements for more information.
The performance table and graph do not reflect the deduction of fees and taxes that a shareowner would pay on Fund distributions or the redemption of Fund shares.
Please refer to the financial highlights for a more current expense ratio.
| | |
| Pioneer Corporate High Yield Fund | Annual Report | 8/31/19 | | 15 |
Comparing Ongoing Fund Expenses
As a shareowner in the Fund, you incur two types of costs:
| (1) | ongoing costs, including management fees, distribution and/or service (12b-1) fees, and other Fund expenses; and |
| (2) | transaction costs, including sales charges (loads) on purchase payments. |
This example is intended to help you understand your ongoing expenses (in dollars) of investing in the Fund and to compare these costs with the ongoing costs of investing in other mutual funds. The example is based on an investment of $1,000 at the beginning of the Fund’s latest six-month period and held throughout the six months.
Using the Tables
Actual Expenses
The first table below provides information about actual account values and actual expenses. You may use the information in this table, together with the amount you invested, to estimate the expenses that you paid over the period as follows:
| (1) | Divide your account value by $1,000 |
Example: an $8,600 account value ÷ $1,000 = 8.6
| (2) | Multiply the result in (1) above by the corresponding share class’s number in the third row under the heading entitled “Expenses Paid During Period” to estimate the expenses you paid on your account during this period. |
Expenses Paid on a $1,000 Investment in Pioneer Corporate High Yield Fund
Based on actual returns from March 1, 2019 through August 31, 2019.
| | | | | | | | | | | | |
| Share Class | | A | | | C | | | Y | |
Beginning Account Value on 3/1/19 | | $ | 1,000.00 | | | $ | 1,000.00 | | | $ | 1,000.00 | |
Ending Account Value (after expenses) 8/31/19 | | $ | 1,050.91 | | | $ | 1,047.07 | | | $ | 1,052.32 | |
Expenses Paid During Period* | | $ | 5.17 | | | $ | 9.03 | | | $ | 3.88 | |
| * | Expenses are equal to the Fund’s annualized net expense ratio of 1.00%, 1.75% and 0.75% for Class A, Class C and Class Y shares, respectively, multiplied by the average account value over the period, multiplied by 184/365, (to reflect the one-half year period). |
| | | | |
| 16 | | Pioneer Corporate High Yield Fund | Annual Report | 8/31/19 | | |
Hypothetical Example for Comparison Purposes
The table below provides information about hypothetical account values and hypothetical expenses based on the Fund’s actual expense ratio and an assumed rate of return of 5% per year before expenses, which is not the Fund’s actual return. The hypothetical account values and expenses may not be used to estimate the actual ending account balance or expenses you paid for the period.
You may use this information to compare the ongoing costs of investing in the Fund and other funds. To do so, compare this 5% hypothetical example with the 5% hypothetical examples that appear in the shareholder reports of the other funds.
Please note that the expenses shown in the tables are meant to highlight your ongoing costs only and do not reflect any transaction costs, such as sales charges (loads) that are charged at the time of the transaction. Therefore, the table below is useful in comparing ongoing costs only and will not help you determine the relative total costs of owning different funds. In addition, if these transaction costs were included, your costs would have been higher.
Expenses Paid on a $1,000 Investment in Pioneer Corporate High Yield Fund
Based on a hypothetical 5% per year return before expenses, reflecting the period from March 1, 2019 through August 31, 2019.
| | | | | | | | | | | | |
| Share Class | | A | | | C | | | Y | |
Beginning Account Value on 3/1/19 | | $ | 1,000.00 | | | $ | 1,000.00 | | | $ | 1,000.00 | |
Ending Account Value (after expenses) 8/31/19 | | $ | 1,020.16 | | | $ | 1,016.38 | | | $ | 1,021.42 | |
Expenses Paid During Period* | | $ | 5.09 | | | $ | 8.89 | | | $ | 3.82 | |
| * | Expenses are equal to the Fund’s annualized net expense ratio of 1.00%, 1.75% and 0.75% for Class A, Class C and Class Y shares, respectively, multiplied by the average account value over the period, multiplied by 184/365, (to reflect the one-half year period). |
| | |
| Pioneer Corporate High Yield Fund | Annual Report | 8/31/19 | | 17 |
Schedule of Investments | 8/31/19
| | | | | | | | |
Principal Amount USD ($) | | | | | Value | |
| | | | UNAFFILIATED ISSUERS — 98.7% | | | | |
| | | | CORPORATE BONDS — 89.9% of Net Assets | | | | |
| | | | Advertising — 0.7% | | | | |
| | 168,000 | | | MDC Partners, Inc., 6.5%, 5/1/24 (144A) | | $ | 152,880 | |
| | | | | | | | |
| | | | Total Advertising | | $ | 152,880 | |
| | | | | | | | |
| | | | Aerospace & Defense — 1.0% | | | | |
| | 100,000 | | | Bombardier, Inc., 6.0%, 10/15/22 (144A) | | $ | 99,250 | |
| | 38,000 | | | Bombardier, Inc., 7.5%, 3/15/25 (144A) | | | 37,002 | |
| | 61,000 | | | Bombardier, Inc., 7.875%, 4/15/27 (144A) | | | 59,094 | |
| | | | | | | | |
| | | | Total Aerospace & Defense | | $ | 195,346 | |
| | | | | | | | |
| | | | Agriculture — 0.2% | | | | |
| | 45,000 | | | Darling Ingredients, Inc., 5.25%, 4/15/27 (144A) | | $ | 47,925 | |
| | | | | | | | |
| | | | Total Agriculture | | $ | 47,925 | |
| | | | | | | | |
| | | | Auto Manufacturers — 0.5% | | | | |
| | 104,000 | | | JB Poindexter & Co., Inc., 7.125%, 4/15/26 (144A) | | $ | 106,340 | |
| | | | | | | | |
| | | | Total Auto Manufacturers | | $ | 106,340 | |
| | | | | | | | |
| | | | Auto Parts & Equipment — 1.4% | | | | |
| | 204,000 | | | American Axle & Manufacturing, Inc., 6.25%, 3/15/26 | | $ | 189,210 | |
| | 129,000 | | | Titan International, Inc., 6.5%, 11/30/23 | | | 102,878 | |
| | | | | | | | |
| | | | Total Auto Parts & Equipment | | $ | 292,088 | |
| | | | | | | | |
| | | | Banks — 3.4% | | | | |
| | 200,000 | (a)(b) | | Barclays Plc, 7.75% (5 Year USD Swap Rate + 484 bps) | | $ | 204,250 | |
| | 95,000 | | | Freedom Mortgage Corp., 8.125%, 11/15/24 (144A) | | | 82,650 | |
| | 90,000 | | | Freedom Mortgage Corp., 8.25%, 4/15/25 (144A) | | | 78,300 | |
| | 121,000 | | | Provident Funding Associates LP/PFG Finance Corp., 6.375%, 6/15/25 (144A) | | | 117,672 | |
| | 200,000 | (a)(b) | | UBS Group Funding Switzerland AG, 7.0% (5 Year USD Swap Rate + 434 bps) (144A) | | | 212,000 | |
| | | | | | | | |
| | | | Total Banks | | $ | 694,872 | |
| | | | | | | | |
| | | | Building Materials — 2.0% | | | | |
| | 41,000 | | | American Woodmark Corp., 4.875%, 3/15/26 (144A) | | $ | 41,205 | |
| | 60,000 | | | Builders FirstSource, Inc., 5.625%, 9/1/24 (144A) | | | 62,475 | |
| | 90,000 | | | Builders FirstSource, Inc., 6.75%, 6/1/27 (144A) | | | 98,325 | |
| | 99,000 | | | Standard Industries, Inc., 5.375%, 11/15/24 (144A) | | | 101,846 | |
| | 94,000 | | | Summit Material LLC/Summit Materials Finance Corp., 6.5%, 3/15/27 (144A) | | | 101,050 | |
| | | | | | | | |
| | | | Total Building Materials | | $ | 404,901 | |
| | | | | | | | |
| | | | Chemicals — 4.5% | | | | |
| | 150,000 | | | CF Industries, Inc., 5.375%, 3/15/44 | | $ | 151,587 | |
| | 156,000 | | | Chemours Co., 7.0%, 5/15/25 | | | 154,050 | |
The accompanying notes are an integral part of these financial statements.
| | | | |
| 18 | | Pioneer Corporate High Yield Fund | Annual Report | 8/31/19 | | |
| | | | | | | | |
Principal Amount USD ($) | | | | | Value | |
| | | | Chemicals — (continued) | | | | |
| | 103,000 | | | Hexion, Inc., 7.875%, 7/15/27 (144A) | | $ | 99,652 | |
| | 88,000 | | | NOVA Chemicals Corp., 5.0%, 5/1/25 (144A) | | | 89,980 | |
| | 200,000 | | | OCI NV, 6.625%, 4/15/23 (144A) | | | 211,000 | |
| | 100,000 | | | Olin Corp., 5.0%, 2/1/30 | | | 99,875 | |
| | 28,000 | | | Olin Corp., 5.625%, 8/1/29 | | | 29,085 | |
| | 106,000 | | | Trinseo Materials Operating SCA/Trinseo Materials Finance, Inc., 5.375%, 9/1/25 (144A) | | | 99,640 | |
| | | | | | | | |
| | | | Total Chemicals | | $ | 934,869 | |
| | | | | | | | |
| | | | Coal — 0.5% | | | | |
| | 116,000 | | | SunCoke Energy Partners LP/SunCoke Energy Partners Finance Corp., 7.5%, 6/15/25 (144A) | | $ | 109,838 | |
| | | | | | | | |
| | | | Total Coal | | $ | 109,838 | |
| | | | | | | | |
| | | | Commercial Services — 4.7% | | | | |
| | 101,000 | | | Brink’s Co., 4.625%, 10/15/27 (144A) | | $ | 102,767 | |
| | 144,000 | | | Cardtronics, Inc./Cardtronics USA, Inc., 5.5%, 5/1/25 (144A) | | | 144,000 | |
| | 50,000 | | | Carriage Services, Inc., 6.625%, 6/1/26 (144A) | | | 51,125 | |
| | 83,000 | | | Garda World Security Corp., 8.75%, 5/15/25 (144A) | | | 85,618 | |
| | 106,000 | | | Herc Holdings, Inc., 5.5%, 7/15/27 (144A) | | | 109,710 | |
| | 53,000 | | | Hertz Corp., 7.125%, 8/1/26 (144A) | | | 54,087 | |
| | 35,000 | | | Prime Security Services Borrower LLC/Prime Finance, Inc., 5.25%, 4/15/24 (144A) | | | 36,152 | |
| | 35,000 | | | Prime Security Services Borrower LLC/Prime Finance, Inc., 5.75%, 4/15/26 (144A) | | | 36,487 | |
| | 93,000 | | | Prime Security Services Borrower LLC/Prime Finance, Inc., 9.25%, 5/15/23 (144A) | | | 97,799 | |
| | 44,000 | | | United Rentals North America, Inc., 5.25%, 1/15/30 | | | 47,025 | |
| | 94,000 | | | United Rentals North America, Inc., 6.5%, 12/15/26 | | | 102,225 | |
| | 96,000 | | | Verscend Escrow Corp., 9.75%, 8/15/26 (144A) | | | 102,776 | |
| | | | | | | | |
| | | | Total Commercial Services | | $ | 969,771 | |
| | | | | | | | |
| | | | Computers — 0.7% | | | | |
| | 150,000 | | | Western Digital Corp., 4.75%, 2/15/26 | | $ | 153,518 | |
| | | | | | | | |
| | | | Total Computers | | $ | 153,518 | |
| | | | | | | | |
| | | | Diversified Financial Services — 1.9% | | | | |
| | 17,000 | | | Nationstar Mortgage Holdings, Inc., 8.125%, 7/15/23 (144A) | | $ | 17,605 | |
| | 98,000 | | | Nationstar Mortgage Holdings, Inc., 9.125%, 7/15/26 (144A) | | | 103,635 | |
| | 89,000 | | | Nationstar Mortgage LLC/Nationstar Capital Corp., 6.5%, 7/1/21 | | | 89,111 | |
| | 185,000 | | | Oxford Finance LLC/Oxford Finance Co-Issuer II, Inc., 6.375%, 12/15/22 (144A) | | | 192,632 | |
| | | | | | | | |
| | | | Total Diversified Financial Services | | $ | 402,983 | |
| | | | | | | | |
The accompanying notes are an integral part of these financial statements.
| | |
| Pioneer Corporate High Yield Fund | Annual Report | 8/31/19 | | 19 |
Schedule of Investments | 8/31/19 (continued)
| | | | | | | | |
Principal Amount USD ($) | | | | | Value | |
| | | | Electric — 1.7% | | | | |
| | 60,000 | | | Clearway Energy Operating LLC, 5.75%, 10/15/25 (144A) | | $ | 62,551 | |
| | 145,185 | | | NSG Holdings LLC/NSG Holdings, Inc., 7.75%, 12/15/25 (144A) | | | 155,711 | |
| | 40,000 | | | Talen Energy Supply LLC, 6.625%, 1/15/28 (144A) | | | 38,700 | |
| | 31,000 | | | Talen Energy Supply LLC, 7.25%, 5/15/27 (144A) | | | 30,768 | |
| | 72,000 | | | Vistra Operations Co. LLC, 5.625%, 2/15/27 (144A) | | | 76,230 | |
| | | | | | | | |
| | | | Total Electric | | $ | 363,960 | |
| | | | | | | | |
| | | | Electrical Components & Equipment — 0.1% | | | | |
| | 14,000 | | | Energizer Holdings, Inc., 6.375%, 7/15/26 (144A) | | $ | 14,752 | |
| | | | | | | | |
| | | | Total Electrical Components & Equipment | | $ | 14,752 | |
| | | | | | | | |
| | | | Entertainment — 2.5% | | | | |
| | 101,000 | | | Caesars Resort Collection LLC/CRC Finco, Inc., 5.25%, 10/15/25 (144A) | | $ | 102,767 | |
| | 101,000 | | | Enterprise Development Authority, 12.0%, 7/15/24 (144A) | | | 113,191 | |
| | 15,000 | | | Penn National Gaming, Inc., 5.625%, 1/15/27 (144A) | | | 15,395 | |
| | 210,000 | | | Scientific Games International, Inc., 8.25%, 3/15/26 (144A) | | | 222,600 | |
| | 51,000 | | | Scientific Games International, Inc., 10.0%, 12/1/22 | | | 52,912 | |
| | | | | | | | |
| | | | Total Entertainment | | $ | 506,865 | |
| | | | | | | | |
| | | | Environmental Control — 2.2% | | | | |
| | 100,000 | | | Covanta Holding Corp., 6.0%, 1/1/27 | | $ | 104,000 | |
| | 143,000 | | | GFL Environmental, Inc., 5.375%, 3/1/23 (144A) | | | 143,715 | |
| | 55,000 | | | GFL Environmental, Inc., 8.5%, 5/1/27 (144A) | | | 60,225 | |
| | 142,000 | | | Tervita Corp., 7.625%, 12/1/21 (144A) | | | 144,130 | |
| | | | | | | | |
| | | | Total Environmental Control | | $ | 452,070 | |
| | | | | | | | |
| | | | Food — 4.5% | | | | |
| | 54,000 | | | Albertsons Cos LLC / Safeway, Inc. / New Albertsons LP / Albertson’s LLC,
5.875%, 2/15/28 (144A) | | $ | 56,908 | |
| | 98,000 | | | Albertsons Cos. LLC/Safeway, Inc./New Albertsons LP/Albertson’s LLC, 5.75%, 3/15/25 | | | 100,450 | |
| | 30,000 | | | Albertsons Cos. LLC/Safeway, Inc./New Albertsons LP/Albertson’s LLC,
7.5%, 3/15/26 (144A) | | | 33,375 | |
| | 200,000 | | | FAGE International SA/FAGE USA Dairy Industry, Inc., 5.625%, 8/15/26 (144A) | | | 175,625 | |
| | 148,000 | | | Ingles Markets, Inc., 5.75%, 6/15/23 | | | 150,960 | |
| | 96,000 | | | JBS USA LUX SA/JBS USA Finance, Inc., 6.75%, 2/15/28 (144A) | | | 107,040 | |
| | 65,000 | | | JBS USA LUX SA/JBS USA Food Co./JBS USA Finance, Inc., 5.5%, 1/15/30 (144A) | | | 68,900 | |
| | 30,000 | | | JBS USA LUX SA/JBS USA Food Co./JBS USA Finance, Inc., 6.5%, 4/15/29 (144A) | | | 33,225 | |
| | 60,000 | | | Pilgrim’s Pride Corp., 5.875%, 9/30/27 (144A) | | | 64,650 | |
| | 135,000 | | | Simmons Foods, Inc., 5.75%, 11/1/24 (144A) | | | 127,913 | |
| | | | | | | | |
| | | | Total Food | | $ | 919,046 | |
| | | | | | | | |
The accompanying notes are an integral part of these financial statements.
| | | | |
| 20 | | Pioneer Corporate High Yield Fund | Annual Report | 8/31/19 | | |
| | | | | | | | |
Principal Amount USD ($) | | | | | Value | |
| | | | Forest Products & Paper — 0.5% | | | | |
| | 110,000 | | | Schweitzer-Mauduit International, Inc., 6.875%, 10/1/26 (144A) | | $ | 113,300 | |
| | | | | | | | |
| | | | Total Forest Products & Paper | | $ | 113,300 | |
| | | | | | | | |
| | | | Healthcare-Services — 5.1% | | | | |
| | 120,000 | | | BCPE Cycle Merger Sub II, Inc., 10.625%, 7/15/27 (144A) | | $ | 117,000 | |
| | 115,000 | | | Centene Corp., 5.375%, 6/1/26 (144A) | | | 122,941 | |
| | 55,000 | | | CHS/Community Health Systems, Inc., 6.25%, 3/31/23 | | | 53,218 | |
| | 150,000 | | | HCA, Inc., 5.375%, 2/1/25 | | | 166,500 | |
| | 29,000 | | | HCA, Inc., 5.625%, 9/1/28 | | | 32,997 | |
| | 19,000 | | | HCA, Inc., 5.875%, 2/1/29 | | | 21,874 | |
| | 100,000 | | | Molina Healthcare, Inc., 5.375%, 11/15/22 | | | 106,879 | |
| | 73,000 | | | RegionalCare Hospital Partners Holdings, Inc., 8.25%, 5/1/23 (144A) | | | 78,041 | |
| | 119,000 | | | Surgery Centre Holdings, Inc., 10.0%, 4/15/27 (144A) | | | 113,943 | |
| | 60,000 | | | Tenet Healthcare Corp., 4.875%, 1/1/26 (144A) | | | 61,656 | |
| | 50,000 | | | Tenet Healthcare Corp., 5.125%, 11/1/27 (144A) | | | 51,688 | |
| | 98,000 | | | WellCare Health Plans, Inc., 5.25%, 4/1/25 | | | 102,611 | |
| | | | | | | | |
| | | | Total Healthcare-Services | | $ | 1,029,348 | |
| | | | | | | | |
| | | | Holding Companies-Diversified — 0.4% | | | | |
| | 80,000 | | | VistaJet Malta Finance Plc/XO Management Holding, Inc., 10.5%, 6/1/24 (144A) | | $ | 78,600 | |
| | | | | | | | |
| | | | Total Holding Companies-Diversified | | $ | 78,600 | |
| | | | | | | | |
| | | | Home Builders — 3.8% | | | | |
| | 190,000 | | | Beazer Homes USA, Inc., 6.75%, 3/15/25 | | $ | 191,425 | |
| | 140,000 | | | KB Home, 6.875%, 6/15/27 | | | 157,500 | |
| | 192,000 | | | Lennar Corp., 4.75%, 11/15/22 | | | 202,560 | |
| | 25,000 | | | Meritage Homes Corp., 6.0%, 6/1/25 | | | 27,594 | |
| | 189,000 | | | Taylor Morrison Communities, Inc./Taylor Morrison Holdings II, Inc., 5.875%, 4/15/23 (144A) | | | 201,285 | |
| | | | | | | | |
| | | | Total Home Builders | | $ | 780,364 | |
| | | | | | | | |
| | | | Home Furnishings — 0.7% | | | | |
| | 134,000 | | | Tempur Sealy International, Inc., 5.5%, 6/15/26 | | $ | 140,030 | |
| | | | | | | | |
| | | | Total Home Furnishings | | $ | 140,030 | |
| | | | | | | | |
| | | | Insurance — 0.4% | | | | |
| | 70,000 | | | CNO Financial Group, Inc., 5.25%, 5/30/29 | | $ | 77,350 | |
| | | | | | | | |
| | | | Total Insurance | | $ | 77,350 | |
| | | | | | | | |
| | | | Internet — 0.7% | | | | |
| | 136,000 | | | Netflix, Inc., 5.375%, 11/15/29 (144A) | | $ | 147,900 | |
| | | | | | | | |
| | | | Total Internet | | $ | 147,900 | |
| | | | | | | | |
The accompanying notes are an integral part of these financial statements.
| | |
| Pioneer Corporate High Yield Fund | Annual Report | 8/31/19 | | 21 |
Schedule of Investments | 8/31/19 (continued)
| | | | | | | | |
Principal Amount USD ($) | | | | | Value | |
| | | | Iron & Steel — 0.6% | | | | |
| | 100,000 | | | Commercial Metals Co., 5.375%, 7/15/27 | | $ | 99,750 | |
| | 30,000 | | | Commercial Metals Co., 5.75%, 4/15/26 | | | 30,750 | |
| | | | | | | | |
| | | | Total Iron & Steel | | $ | 130,500 | |
| | | | | | | | |
| | | | Leisure Time — 0.8% | | | | |
| | 96,000 | | | Viking Cruises, Ltd., 6.25%, 5/15/25 (144A) | | $ | 99,360 | |
| | 50,000 | | | VOC Escrow, Ltd., 5.0%, 2/15/28 (144A) | | | 51,250 | |
| | | | | | | | |
| | | | Total Leisure Time | | $ | 150,610 | |
| | | | | | | | |
| | | | Lodging — 0.3% | | | | |
| | 65,000 | | | MGM Resorts International, 5.5%, 4/15/27 | | $ | 70,444 | |
| | | | | | | | |
| | | | Total Lodging | | $ | 70,444 | |
| | | | | | | | |
| | | | Machinery-Diversified — 0.6% | | | | |
| | 111,000 | | | Cloud Crane LLC, 10.125%, 8/1/24 (144A) | | $ | 119,325 | |
| | | | | | | | |
| | | | Total Machinery-Diversified | | $ | 119,325 | |
| | | | | | | | |
| | | | Media — 7.3% | | | | |
| | 200,000 | | | Altice Luxembourg SA, 10.5%, 5/15/27 (144A) | | $ | 217,500 | |
| | 194,000 | | | CCO Holdings LLC/CCO Holdings Capital Corp., 5.5%, 5/1/26 (144A) | | | 204,427 | |
| | 137,000 | | | Clear Channel Worldwide Holdings, Inc., 9.25%, 2/15/24 (144A) | | | 150,186 | |
| | 200,000 | | | CSC Holdings LLC, 5.5%, 5/15/26 (144A) | | | 211,500 | |
| | 200,000 | | | CSC Holdings LLC, 5.5%, 4/15/27 (144A) | | | 214,000 | |
| | 24,000 | | | Diamond Sports Group LLC/Diamond Sports Finance Co., 5.375%, 8/15/26 (144A) | | | 25,200 | |
| | 103,000 | | | Diamond Sports Group LLC/Diamond Sports Finance Co., 6.625%, 8/15/27 (144A) | | | 107,892 | |
| | 93,000 | | | Gray Television, Inc., 7.0%, 5/15/27 (144A) | | | 101,691 | |
| | 100,000 | | | Sinclair Television Group, Inc., 5.875%, 3/15/26 (144A) | | | 104,750 | |
| | 35,000 | | | Sirius XM Radio, Inc., 4.625%, 7/15/24 (144A) | | | 36,531 | |
| | 100,000 | | | Sirius XM Radio, Inc., 5.375%, 7/15/26 (144A) | | | 105,625 | |
| | 30,000 | | | Sirius XM Radio, Inc., 5.5%, 7/1/29 (144A) | | | 32,691 | |
| | | | | | | | |
| | | | Total Media | | $ | 1,511,993 | |
| | | | | | | | |
| | | | Mining — 2.7% | | | | |
| | 200,000 | | | Century Aluminum Co., 7.5%, 6/1/21 (144A) | | $ | 199,000 | |
| | 50,000 | | | Coeur Mining, Inc., 5.875%, 6/1/24 | | | 49,857 | |
| | 104,000 | | | Freeport-McMoRan, Inc., 5.25%, 9/1/29 | | | 103,117 | |
| | 98,000 | | | Hudbay Minerals, Inc., 7.25%, 1/15/23 (144A) | | | 101,170 | |
| | 100,000 | | | Novelis Corp., 5.875%, 9/30/26 (144A) | | | 105,625 | |
| | | | | | | | |
| | | | Total Mining | | $ | 558,769 | |
| | | | | | | | |
The accompanying notes are an integral part of these financial statements.
| | | | |
| 22 | | Pioneer Corporate High Yield Fund | Annual Report | 8/31/19 | | |
| | | | | | | | |
Principal
Amount USD ($) | | | | | Value | |
| | | | Miscellaneous Manufacturers — 1.6% | | | | |
| | 193,000 | | | Amsted Industries, Inc., 5.375%, 9/15/24 (144A) | | $ | 198,307 | |
| | 120,000 | | | EnPro Industries, Inc., 5.75%, 10/15/26 | | | 125,700 | |
| | | | | | | | |
| | | | Total Miscellaneous Manufacturers | | $ | 324,007 | |
| | | | | | | | |
| | | | Oil & Gas — 8.2% | | | | |
| | 85,000 | | | Ensign Drilling, Inc., 9.25%, 4/15/24 (144A) | | $ | 79,475 | |
| | 122,000 | | | Great Western Petroleum LLC/Great Western Finance Corp., 9.0%, 9/30/21 (144A) | | | 107,055 | |
| | 170,000 | | | Indigo Natural Resources LLC, 6.875%, 2/15/26 (144A) | | | 140,250 | |
| | 70,000 | | | Jagged Peak Energy LLC, 5.875%, 5/1/26 | | | 70,245 | |
| | 86,000 | | | MEG Energy Corp., 7.0%, 3/31/24 (144A) | | | 81,807 | |
| | 200,000 | | | Neptune Energy Bondco Plc, 6.625%, 5/15/25 (144A) | | | 200,100 | |
| | 142,000 | | | Oasis Petroleum, Inc., 6.875%, 3/15/22 | | | 132,060 | |
| | 48,000 | | | Parkland Fuel Corp., 5.875%, 7/15/27 (144A) | | | 50,400 | |
| | 150,000 | | | Parsley Energy LLC/Parsley Finance Corp., 5.625%, 10/15/27 (144A) | | | 154,500 | |
| | 202,000 | | | PBF Holding Co. LLC/PBF Finance Corp., 7.0%, 11/15/23 | | | 207,555 | |
| | 144,000 | | | Shelf Drilling Holdings, Ltd., 8.25%, 2/15/25 (144A) | | | 128,160 | |
| | 80,000 | | | SM Energy Co., 6.125%, 11/15/22 | | | 74,400 | |
| | 56,000 | | | SM Energy Co., 6.75%, 9/15/26 | | | 47,600 | |
| | 62,000 | | | Transocean Sentry, Ltd., 5.375%, 5/15/23 (144A) | | | 61,380 | |
| | 65,000 | | | Transocean, Inc., 7.25%, 11/1/25 (144A) | | | 59,150 | |
| | 160,000 | | | Whiting Petroleum Corp., 6.25%, 4/1/23 | | | 125,600 | |
| | | | | | | | |
| | | | Total Oil & Gas | | $ | 1,719,737 | |
| | | | | | | | |
| | | | Oil & Gas Services — 1.8% | | | | |
| | 100,000 | | | Archrock Partners LP/Archrock Partners Finance Corp., 6.875%, 4/1/27 (144A) | | $ | 104,750 | |
| | 70,000 | | | Exterran Energy Solutions LP/EES Finance Corp., 8.125%, 5/1/25 | | | 70,306 | |
| | 194,000 | | | FTS International, Inc., 6.25%, 5/1/22 | | | 161,384 | |
| | 34,000 | | | USA Compression Partners LP/USA Compression Finance Corp., 6.875%, 9/1/27 (144A) | | | 34,972 | |
| | | | | | | | |
| | | | Total Oil & Gas Services | | $ | 371,412 | |
| | | | | | | | |
| | | | Packaging & Containers — 2.8% | | | | |
| | 200,000 | | | Ardagh Packaging Finance Plc/Ardagh Holdings USA, Inc., 6.0%, 2/15/25 (144A) | | $ | 208,875 | |
| | 125,000 | | | Crown Cork & Seal Co., Inc., 7.375%, 12/15/26 | | | 151,875 | |
| | 117,000 | | | Greif, Inc., 6.5%, 3/1/27 (144A) | | | 122,850 | |
| | 100,000 | | | Plastipak Holdings, Inc., 6.25%, 10/15/25 (144A) | | | 91,000 | |
| | | | | | | | |
| | | | Total Packaging & Containers | | $ | 574,600 | |
| | | | | | | | |
The accompanying notes are an integral part of these financial statements.
| | |
| Pioneer Corporate High Yield Fund | Annual Report | 8/31/19 | | 23 |
Schedule of Investments | 8/31/19 (continued)
| | | | | | | | |
Principal
Amount USD ($) | | | | | Value | |
| | | | Pharmaceuticals — 3.4% | | | | |
| | 91,000 | | | Bausch Health Americas, Inc., 8.5%, 1/31/27 (144A) | | $ | 101,008 | |
| | 70,000 | | | Bausch Health Cos., Inc., 5.5%, 11/1/25 (144A) | | | 73,411 | |
| | 67,000 | | | Bausch Health Cos., Inc., 5.875%, 5/15/23 (144A) | | | 67,838 | |
| | 36,000 | | | Bausch Health Cos., Inc., 7.0%, 1/15/28 (144A) | | | 37,725 | |
| | 36,000 | | | Bausch Health Cos., Inc., 7.25%, 5/30/29 (144A) | | | 38,070 | |
| | 200,000 | | | Horizon Pharma USA, Inc., 5.5%, 8/1/27 (144A) | | | 208,500 | |
| | 80,000 | | | Par Pharmaceutical, Inc., 7.5%, 4/1/27 (144A) | | | 74,600 | |
| | 105,000 | | | Teva Pharmaceutical Finance Netherlands III BV, 2.8%, 7/21/23 | | | 88,463 | |
| | | | | | | | |
| | | | Total Pharmaceuticals | | $ | 689,615 | |
| | | | | | | | |
| | | | Pipelines — 5.5% | | | | |
| | 109,000 | | | American Midstream Partners LP/American Midstream Finance Corp., 9.5%, 12/15/21 (144A) | | $ | 105,185 | |
| | 95,000 | | | Cheniere Corpus Christi Holdings LLC, 5.875%, 3/31/25 | | | 105,925 | |
| | 95,000 | | | Cheniere Energy Partners LP, 5.625%, 10/1/26 | | | 100,225 | |
| | 101,000 | | | DCP Midstream Operating LP, 3.875%, 3/15/23 | | | 102,263 | |
| | 20,000 | | | DCP Midstream Operating LP, 5.375%, 7/15/25 | | | 21,150 | |
| | 6,000 | | | EnLink Midstream LLC, 5.375%, 6/1/29 | | | 5,871 | |
| | 100,000 | | | Genesis Energy LP/Genesis Energy Finance Corp., 6.5%, 10/1/25 | | | 97,375 | |
| | 167,000 | | | Global Partners LP/GLP Finance Corp., 7.0%, 6/15/23 | | | 168,670 | |
| | 29,000 | | | Global Partners LP/GLP Finance Corp., 7.0%, 8/1/27 (144A) | | | 29,362 | |
| | 75,000 | | | Hess Infrastructure Partners LP/Hess Infrastructure Partners Finance Corp., 5.625%, 2/15/26 (144A) | | | 77,625 | |
| | 200,000 | | | PBF Logistics LP/PBF Logistics Finance Corp., 6.875%, 5/15/23 | | | 205,500 | |
| | 100,000 | | | Targa Resources Partners LP/Targa Resources Partners Finance Corp., 5.0%, 1/15/28 | | | 100,500 | |
| | 27,000 | | | Targa Resources Partners LP/Targa Resources Partners Finance Corp., 6.5%, 7/15/27 (144A) | | | 29,295 | |
| | | | | | | | |
| | | | Total Pipelines | | $ | 1,148,946 | |
| | | | | | | | |
| | | | REITs — 1.3% | | | | |
| | 100,000 | | | Iron Mountain, Inc., 4.875%, 9/15/27 (144A) | | $ | 102,688 | |
| | 100,000 | | | Iron Mountain, Inc., 5.75%, 8/15/24 | | | 101,250 | |
| | 66,000 | | | MPT Operating Partnership LP/MPT Finance Corp., 4.625%, 8/1/29 | | | 68,640 | |
| | | | | | | | |
| | | | Total REITs | | $ | 272,578 | |
| | | | | | | | |
The accompanying notes are an integral part of these financial statements.
| | | | |
| 24 | | Pioneer Corporate High Yield Fund | Annual Report | 8/31/19 | | |
| | | | | | | | |
Principal
Amount USD ($) | | | | | Value | |
| | | | Retail — 1.4% | | | | |
| | 70,000 | | | AAG FH LP/AAG FH Finco, Inc., 9.75%, 7/15/24 (144A) | | $ | 64,750 | |
| | 93,000 | | | Golden Nugget, Inc., 8.75%, 10/1/25 (144A) | | | 97,534 | |
| | 140,000 | | | Michaels Stores, Inc., 8.0%, 7/15/27 (144A) | | | 134,081 | |
| | | | | | | | |
| | | | Total Retail | | $ | 296,365 | |
| | | | | | | | |
| | | | Software — 0.1% | | | | |
| | 19,000 | | | Rackspace Hosting, Inc., 8.625%, 11/15/24 (144A) | | $ | 17,432 | |
| | | | | | | | |
| | | | Total Software | | $ | 17,432 | |
| | | | | | | | |
| | | | Telecommunications — 7.4% | | | | |
| | 100,000 | | | CenturyLink, Inc., 6.45%, 6/15/21 | | $ | 105,375 | |
| | 138,000 | | | CommScope Technologies LLC, 6.0%, 6/15/25 (144A) | | | 123,165 | |
| | 35,000 | | | CommScope, Inc., 8.25%, 3/1/27 (144A) | | | 34,300 | |
| | 100,000 | | | Frontier Communications Corp., 8.5%, 4/1/26 (144A) | | | 97,250 | |
| | 75,000 | | | Frontier Communications Corp., 11.0%, 9/15/25 | | | 38,062 | |
| | 150,000 | | | Hughes Satellite Systems Corp., 5.25%, 8/1/26 | | | 159,000 | |
| | 150,000 | | | Level 3 Financing, Inc., 5.375%, 5/1/25 | | | 156,000 | |
| | 185,000 | | | Sprint Corp., 7.125%, 6/15/24 | | | 204,510 | |
| | 192,000 | | | Sprint Corp., 7.25%, 9/15/21 | | | 206,534 | |
| | 50,000 | | | Sprint Corp., 7.625%, 2/15/25 | | | 55,938 | |
| | 50,000 | | | Sprint Corp., 7.625%, 3/1/26 | | | 56,188 | |
| | 100,000 | | | T-Mobile USA, Inc., 4.75%, 2/1/28 | | | 105,248 | |
| | 155,000 | | | Windstream Services LLC/Windstream Finance Corp., 8.625%, 10/31/25 (144A) | | | 155,775 | |
| | | | | | | | |
| | | | Total Telecommunications | | $ | 1,497,345 | |
| | | | | | | | |
| | | | TOTAL CORPORATE BONDS
(Cost $18,311,786) | | $ | 18,542,594 | |
| | | | | | | | |
| | | | SENIOR SECURED FLOATING RATE LOAN INTERESTS — 2.3% of Net Assets*(c) | | | | |
| | | | Diversified & Conglomerate Service — 0.5% | | | | |
| | 112,343 | | | Filtration Group Corp., Initial Dollar Term Loan, 5.112% (LIBOR + 300 bps), 3/29/25 | | $ | 112,484 | |
| | | | | | | | |
| | | | Total Diversified & Conglomerate Service | | $ | 112,484 | |
| | | | | | | | |
| | | | Healthcare, Education & Childcare — 0.4% | | | | |
| | 91,580 | | | Regionalcare Hospital Partners Holdings, Inc., First Lien Term B Loan, 6.645% (LIBOR + 450 bps), 11/16/25 | | $ | 91,030 | |
| | | | | | | | |
| | | | Total Healthcare, Education & Childcare | | $ | 91,030 | |
| | | | | | | | |
The accompanying notes are an integral part of these financial statements.
| | |
| Pioneer Corporate High Yield Fund | Annual Report | 8/31/19 | | 25 |
Schedule of Investments | 8/31/19 (continued)
| | | | | | | | |
Principal
Amount USD ($) | | | | | Value | |
| | | | Metals & Mining — 0.3% | | | | |
| | 54,450 | | | Aleris International, Inc., Initial Term Loan, 6.862% (LIBOR + 475 bps), 2/27/23 | | $ | 54,563 | |
| | | | | | | | |
| | | | Total Metals & Mining | | $ | 54,563 | |
| | | | | | | | |
| | | | Oil & Gas — 0.4% | | | | |
| | 95,000 | | | Encino Acquisition Partners Holdings LLC, Second Lien Initial Term Loan, 8.862%
(LIBOR + 675 bps), 10/29/25 | | $ | 71,250 | |
| | | | | | | | |
| | | | Total Oil & Gas | | $ | 71,250 | |
| | | | | | | | |
| | | | Personal, Food & Miscellaneous Services — 0.4% | | | | |
| | 97,923 | | | Revlon Consumer Products Corp., Initial Term B Loan, 5.624% (LIBOR + 350 bps), 9/7/23 | | $ | 78,257 | |
| | | | | | | | |
| | | | Total Personal, Food & Miscellaneous Services | | $ | 78,257 | |
| | | | | | | | |
| | | | Retail — 0.3% | | | | |
| | 79,023 | | | Neiman Marcus Group Ltd. LLC, Cash Pay Extended Term Loan, 8.229%
(LIBOR + 600 bps), 10/25/23 | | $ | 64,848 | |
| | | | | | | | |
| | | | Total Retail | | $ | 64,848 | |
| | | | | | | | |
| | | | TOTAL SENIOR SECURED FLOATING RATE LOAN INTERESTS
(Cost $516,051) | | $ | 472,432 | |
| | | | | | | | |
| | | | U.S. GOVERNMENT AND AGENCY OBLIGATIONS — 6.5% of Net Assets | | | | |
| | 300,000 | (d) | | U.S. Treasury Bills, 9/10/19 | | $ | 299,883 | |
| | 900,000 | (d) | | U.S. Treasury Bills, 9/17/19 | | | 899,291 | |
| | 150,000 | (d) | | U.S. Treasury Bills, 9/24/19 | | | 149,821 | |
| | | | | | | | |
| | | | TOTAL U.S. GOVERNMENT AND AGENCY OBLIGATIONS
(Cost $1,348,839) | | $ | 1,348,995 | |
| | | | | | | | |
| | | | TOTAL INVESTMENTS IN UNAFFILIATED ISSUERS — 98.7%
(Cost $20,176,676) | | $ | 20,364,021 | |
| | | | | | | | |
| | | | OTHER ASSETS AND LIABILITIES — 1.3% | | $ | 261,910 | |
| | | | | | | | |
| | | | NET ASSETS — 100.0% | | $ | 20,625,931 | |
| | | | | | | | |
| | |
| bps | | Basis Points. |
| LIBOR | | London Interbank Offered Rate. |
| REIT | | Real Estate Investment Trust. |
| (144A) | | Security is exempt from registration under Rule 144A of the Securities Act of 1933. Such securities may be resold normally to qualified institutional buyers in a transaction exempt from registration. At August 31, 2019, the value of these securities amounted to $11,757,590, or 57.0% of net assets. |
The accompanying notes are an integral part of these financial statements.
| | | | |
| 26 | | Pioneer Corporate High Yield Fund | Annual Report | 8/31/19 | | |
| * | Senior secured floating rate loan interests in which the Fund invests generally pay interest at rates that are periodically redetermined by reference to a base lending rate plus a premium. These base lending rates are generally (i) the lending rate offered by one or more major European banks, such as LIBOR, (ii) the prime rate offered by one or more major United States banks, (iii) the rate of a certificate of deposit or (iv) other base lending rates used by commercial lenders. The interest rate shown is the rate accruing at August 31, 2019. |
| (a) | The interest rate is subject to change periodically. The interest rate and/or reference index and spread is shown at August 31, 2019. |
| (b) | Security is perpetual in nature and has no stated maturity date. |
| (c) | Floating rate note. Coupon rate, reference index and spread shown at August 31, 2019. |
| (d) | Security issued with a zero coupon. Income is recognized through accretion of discount. |
SWAP CONTRACT
CENTRALLY CLEARED CREDIT DEFAULT SWAP CONTRACT — SELL PROTECTION
| | | | | | | | | | | | | | | | | | | | | | | | | | |
| | | | | | | | Annual | | | | | | | | | | | | | |
| Notional | | Reference | | Pay/ | | | Fixed | | | Expiration | | | Premiums | | | Unrealized | | | Market | |
| Amount ($)(1) | | Obligation/Index | | Receive(2) | | | Rate | | | Date | | | Paid | | | Appreciation | | | Value | |
504,900 | | Markit CDX North America
High Yield Index Series 32 | | | Receive | | | | 5.00 | % | | | 6/20/24 | | | $ | 26,045 | | | $ | 12,678 | | | $ | 38,723 | |
| (1) | The notional amount is the maximum amount that a seller of credit protection would be obligated to pay upon occurrence of a credit event. |
Purchases and sales of securities (excluding temporary cash investments) for the year ended August 31, 2019, aggregated $11,408,018 and $11,992,422, respectively.
The Fund is permitted to engage in purchase and sale transactions (“cross trades”) with certain funds and accounts for which Amundi Pioneer Asset Management, Inc. (the “Adviser”) serves as the Fund’s investment adviser, as set forth in Rule 17a-7 under the Investment Company Act of 1940, pursuant to procedures adopted by the Board of Trustees. Under these procedures, cross trades are effected at current market prices. During the year ended August 31, 2019, the Fund engaged in sales of $28,902 which resulted in a net realized gain/(loss) of $175. During the year ended August 31, 2019, the Fund did not engage in purchases pursuant to these procedures.
At August 31, 2019, the net unrealized appreciation on investments based on cost for federal tax purposes of $20,218,495 was as follows:
| | | | |
Aggregate gross unrealized appreciation for all investments in which there is an excess of value over tax cost | | $ | 583,646 | |
Aggregate gross unrealized depreciation for all investments in which there is an excess of tax cost over value | | | (399,397 | ) |
| | | | |
Net unrealized appreciation | | $ | 184,249 | |
| | | | |
Various inputs are used in determining the value of the Fund’s investments. These inputs are summarized in the three broad levels below.
| | | | |
| Level 1 | | – | | quoted prices in active markets for identical securities. |
| | |
| Level 2 | | – | | other significant observable inputs (including quoted prices for similar securities, interest rates, prepayment speeds, credit risks, etc.). See Notes to Financial Statements — Note 1A. |
| | |
| Level 3 | | – | | significant unobservable inputs (including the Fund’s own assumptions in determining fair value of investments). See Notes to Financial Statements — Note 1A. |
The accompanying notes are an integral part of these financial statements.
| | |
| Pioneer Corporate High Yield Fund | Annual Report | 8/31/19 | | 27 |
Schedule of Investments | 8/31/19 (continued)
The following is a summary of the inputs used as of August 31, 2019, in valuing the Fund’s investments:
| | | | | | | | | | | | | | | | |
| | | Level 1 | | | Level 2 | | | Level 3 | | | Total | |
Corporate Bonds | | $ | — | | | $ | 18,542,594 | | | $ | — | | | $ | 18,542,594 | |
Senior Secured Floating Rate Loan Interests | | | — | | | | 472,432 | | | | — | | | | 472,432 | |
U.S. Government and Agency Obligations | | | — | | | | 1,348,995 | | | | — | | | | 1,348,995 | |
| | | | | | | | | | | | | | | | |
Total Investments in Securities | | $ | — | | | $ | 20,364,021 | | | $ | — | | | $ | 20,364,021 | |
| | | | | | | | | | | | | | | | |
Other Financial Instruments | | | | | | | | | | | | | | | | |
Swap contracts, at value | | $ | — | | | $ | 38,723 | | | $ | — | | | $ | 38,723 | |
| | | | | | | | | | | | | | | | |
Total Other Financial Instruments | | $ | — | | | $ | 38,723 | | | $ | — | | | $ | 38,723 | |
| | | | | | | | | | | | | | | | |
During the year ended August 31, 2019, there were no transfers between Levels 1, 2 and 3.
The accompanying notes are an integral part of these financial statements.
| | | | |
| 28 | | Pioneer Corporate High Yield Fund | Annual Report | 8/31/19 | | |
Statement of Assets and Liabilities | 8/31/19
| | | | |
ASSETS: | | | | |
Investments in unaffiliated issuers, at value (cost $20,176,676) | | $ | 20,364,021 | |
Cash | | | 25,144 | |
Swaps collateral | | | 27,805 | |
Variation margin for centrally cleared swap contracts | | | 100 | |
Swap contracts, at value (net premiums paid $26,045) | | | 38,723 | |
Receivables — | | | | |
Interest | | | 329,285 | |
Due from the Adviser | | | 28,787 | |
Other assets | | | 10,917 | |
| | | | |
Total assets | | $ | 20,824,782 | |
| | | | |
LIABILITIES: | | | | |
Payables — | | | | |
Fund shares repurchased | | $ | 1,088 | |
Distributions | | | 82,023 | |
Trustees’ fees | | | 1,380 | |
Administrative fees | | | 8,230 | |
Professional fees | | | 48,242 | |
Due to broker for swaps | | | 38,906 | |
Due to affiliates — | | | | |
Management fees | | | 12,074 | |
Others due to affiliates | | | 719 | |
Accrued expenses | | | 6,189 | |
| | | | |
Total liabilities | | $ | 198,851 | |
| | | | |
NET ASSETS: | | | | |
Paid-in capital | | $ | 20,759,856 | |
Distributable earnings (loss) | | | (133,925 | ) |
| | | | |
Net assets | | $ | 20,625,931 | |
| | | | |
NET ASSET VALUE PER SHARE: | | | | |
No par value (unlimited number of shares authorized) | | | | |
Class A (based on $8,373,728/825,224 shares) | | $ | 10.15 | |
Class C (based on $4,088,782/403,291 shares) | | $ | 10.14 | |
Class Y (based on $8,163,421/804,474 shares) | | $ | 10.15 | |
MAXIMUM OFFERING PRICE PER SHARE: | | | | |
Class A (based on $10.15 net asset value per share/100%-4.50% maximum sales charge) | | $ | 10.63 | |
The accompanying notes are an integral part of these financial statements.
| | |
| Pioneer Corporate High Yield Fund | Annual Report | 8/31/19 | | 29 |
Statement of Operations
For the Year Ended 8/31/19
| | | | | | | | |
INVESTMENT INCOME: | | | | | | | | |
Interest from unaffiliated issuers | | $ | 1,203,579 | | | | | |
Dividends from unaffiliated issuers | | | 12,194 | | | | | |
| | | | | | | | |
Total investment income | | | | | | $ | 1,215,773 | |
| | | | | | | | |
EXPENSES: | | | | | | | | |
Management fees | | $ | 119,573 | | | | | |
Administrative expense | | | 70,631 | | | | | |
Transfer agent fees | | | | | | | | |
Class A | | | 86 | | | | | |
Class C | | | 59 | | | | | |
Class Y | | | 26 | | | | | |
Distribution fees | | | | | | | | |
Class A | | | 19,953 | | | | | |
Class C | | | 39,918 | | | | | |
Shareowner communications expense | | | 359 | | | | | |
Custodian fees | | | 5,830 | | | | | |
Registration fees | | | 56,192 | | | | | |
Professional fees | | | 63,121 | | | | | |
Printing expense | | | 36,202 | | | | | |
Pricing fees | | | 10,775 | | | | | |
Trustees’ fees | | | 7,307 | | | | | |
Miscellaneous | | | 2,729 | | | | | |
| | | | | | | | |
Total expenses | | | | | | $ | 432,761 | |
Less fees waived and expenses reimbursed by the Adviser | | | | | | | (222,891 | ) |
| | | | | | | | |
Net expenses | | | | | | $ | 209,870 | |
| | | | | | | | |
Net investment income | | | | | | $ | 1,005,903 | |
| | | | | | | | |
REALIZED AND UNREALIZED GAIN (LOSS) ON INVESTMENTS: | | | | | | | | |
Net realized gain (loss) on: | | | | | | | | |
Investments in unaffiliated issuers | | $ | (239,320 | ) | | | | |
Swap contracts | | | (2,964 | ) | | $ | (242,284 | ) |
| | | | | | | | |
Change in net unrealized appreciation (depreciation) on: | | | | | | | | |
Investments in unaffiliated issuers | | $ | 588,903 | | | | | |
Swap contracts | | | 12,678 | | | $ | 601,581 | |
| | | | | | | | |
Net realized and unrealized gain (loss) on investments | | | | | | $ | 359,297 | |
| | | | | | | | |
Net increase in net assets resulting from operations | | | | | | $ | 1,365,200 | |
The accompanying notes are an integral part of these financial statements.
| | | | |
| 30 | | Pioneer Corporate High Yield Fund | Annual Report | 8/31/19 | | |
Statements of Changes in Net Assets
| | | | | | | | |
| | | Year | | | Year | |
| | | Ended | | | Ended | |
| | | 8/31/19 | | | 8/31/18 | |
FROM OPERATIONS: | | | | | | | | |
Net investment income (loss) | | $ | 1,005,903 | | | $ | 937,578 | |
Net realized gain (loss) on investments | | | (242,284 | ) | | | (86,017 | ) |
Change in net unrealized appreciation (depreciation) on investments | | | 601,581 | | | | (341,816 | ) |
| | | | | | | | |
Net increase (decrease) in net assets resulting from operations | | $ | 1,365,200 | | | $ | 509,745 | |
| | | | | | | | |
DISTRIBUTIONS TO SHAREOWNERS: | | | | | | | | |
Class A ($0.50 and $0.51 per share, respectively) | | $ | (407,169 | ) | | $ | (408,315 | )* |
Class C ($0.43 and $0.43 per share, respectively) | | | (174,094 | ) | | | (173,360 | )* |
Class Y ($0.53 and $0.53 per share, respectively) | | | (426,817 | ) | | | (429,473 | )* |
| | | | | | | | |
Total distributions to shareowners | | $ | (1,008,080 | ) | | $ | (1,011,148 | ) |
| | | | | | | | |
FROM FUND SHARE TRANSACTIONS: | | | | | | | | |
Net proceeds from sales of shares | | $ | 322,953 | | | $ | 20,516,902 | |
Reinvestment of distributions | | | 3,515 | | | | 327,726 | |
Cost of shares repurchased | | | (71,105 | ) | | | (20,519,096 | ) |
| | | | | | | | |
Net increase in net assets resulting from Fund share transactions | | $ | 255,363 | | | $ | 325,532 | |
| | | | | | | | |
Net increase (decrease) in net assets | | $ | 612,483 | | | $ | (175,871 | ) |
NET ASSETS: | | | | | | | | |
Beginning of year | | $ | 20,013,448 | | | $ | 20,189,319 | |
| | | | | | | | |
End of year** | | $ | 20,625,931 | | | $ | 20,013,448 | |
| | | | | | | | |
* For the year ended August 31, 2018, distributions to shareowners were presented as follows: | | | | |
Net investment income: | | | | | | | | |
Class A ($0.46 per share) | | | | | | $ | (365,959 | ) |
Class C ($0.38 per share) | | | | | | | (152,224 | ) |
Class Y ($0.48 per share) | | | | | | | (387,078 | ) |
Net realized gain: | | | | | | | | |
Class A ($0.05 per share) | | | | | | $ | (42,356 | ) |
Class C ($0.05 per share) | | | | | | | (21,136 | ) |
Class Y ($0.05 per share) | | | | | | | (42,395 | ) |
| ** | For the year ended August 31, 2018, undistributed net investment income was presented as follows: $43,630. |
The accompanying notes are an integral part of these financial statements.
| | |
| Pioneer Corporate High Yield Fund | Annual Report | 8/31/19 | | 31 |
Statements of Changes in Net Assets (continued)
| | | | | | | | | | | | | | | | |
| | | Year | | | Year | | | Year | | | Year | |
| | | Ended | | | Ended | | | Ended | | | Ended | |
| | | 8/31/19 | | | 8/31/19 | | | 8/31/18 | | | 8/31/18 | |
| | | Shares | | | Amount | | | Shares | | | Amount | |
Class A | | | | | | | | | | | | | | | | |
Shares sold | | | 27,056 | | | $ | 271,209 | | | | 803,296 | | | $ | 8,201,723 | |
Reinvestment of distributions | | | 180 | | | | 1,815 | | | | 12,871 | | | | 132,015 | |
Less shares repurchased | | | (5,310 | ) | | | (52,361 | ) | | | (803,196 | ) | | | (8,200,629 | ) |
| | | | | | | | | | | | | | | | |
Net increase | | | 21,926 | | | $ | 220,663 | | | | 12,971 | | | $ | 133,109 | |
| | | | | | | | | | | | | | | | |
Class C | | | | | | | | | | | | | | | | |
Shares sold | | | 5,155 | | | $ | 51,744 | | | | 402,165 | | | $ | 4,101,707 | |
Reinvestment of distributions | | | 154 | | | | 1,508 | | | | 5,698 | | | | 58,368 | |
Less shares repurchased | | | (1,878 | ) | | | (18,744 | ) | | | (402,861 | ) | | | (4,108,583 | ) |
| | | | | | | | | | | | | | | | |
Net increase | | | 3,431 | | | $ | 34,508 | | | | 5,002 | | | $ | 51,492 | |
| | | | | | | | | | | | | | | | |
Class Y | | | | | | | | | | | | | | | | |
Shares sold | | | — | | | $ | — | | | | 804,453 | | | $ | 8,213,472 | |
Reinvestment of distributions | | | 20 | | | | 192 | | | | 13,389 | | | | 137,343 | |
Less shares repurchased | | | — | | | | — | | | | (804,102 | ) | | | (8,209,884 | ) |
| | | | | | | | | | | | | | | | |
Net increase | | | 20 | | | $ | 192 | | | | 13,740 | | | $ | 140,931 | |
| | | | | | | | | | | | | | | | |
The accompanying notes are an integral part of these financial statements.
| | | | |
| 32 | | Pioneer Corporate High Yield Fund | Annual Report | 8/31/19 | | |
Financial Highlights
| | | | | | | | | | | | |
| | | Year | | | Year | | | | |
| | | Ended | | | Ended | | | 1/3/17* to | |
| | | 8/31/19 | | | 8/31/18 | | | 8/31/17 | |
Class A | | | | | | | | | | | | |
Net asset value, beginning of period | | $ | 9.97 | | | $ | 10.22 | | | $ | 10.00 | |
| | | | | | | | | | | | |
Increase (decrease) from investment operations: | | | | | | | | | | | | |
Net investment income (loss) | | $ | 0.50 | (a) | | $ | 0.47 | (a) | | $ | 0.29 | (a) |
Net realized and unrealized gain (loss) on investments | | | 0.18 | | | | (0.21 | ) | | | 0.21 | |
| | | | | | | | | | | | |
Net increase (decrease) from investment operations | | $ | 0.68 | | | $ | 0.26 | | | $ | 0.50 | |
| | | | | | | | | | | | |
Distributions to shareowners: | | | | | | | | | | | | |
Net investment income | | $ | (0.50 | ) | | $ | (0.46 | ) | | $ | (0.28 | ) |
Net realized gain | | | — | | | | (0.05 | ) | | | — | |
| | | | | | | | | | | | |
Total distributions | | $ | (0.50 | ) | | $ | (0.51 | ) | | $ | (0.28 | ) |
| | | | | | | | | | | | |
Net increase (decrease) in net asset value | | $ | 0.18 | | | $ | (0.25 | ) | | $ | 0.22 | |
| | | | | | | | | | | | |
Net asset value, end of period | | $ | 10.15 | | | $ | 9.97 | | | $ | 10.22 | |
| | | | | | | | | | | | |
Total return(b) | | | 7.13 | % | | | 2.60 | % | | | 5.00 | %(c) |
Ratio of net expenses to average net assets | | | 1.00 | % | | | 1.01 | % | | | 1.02 | %(d) |
Ratio of net investment income (loss) to average net assets | | | 5.10 | % | | | 4.68 | % | | | 4.40 | %(d) |
Portfolio turnover rate | | | 60 | % | | | 114 | % | | | 113 | %(c) |
Net assets, end of period (in thousands) | | $ | 8,374 | | | $ | 8,009 | | | $ | 8,076 | |
Ratios with no waiver of fees and assumption of expenses by the Adviser and no reduction for fees paid indirectly: | | | | | | | | | | | | |
Total expenses to average net assets | | | 2.12 | % | | | 1.91 | % | | | 3.89 | %(d) |
Net investment income (loss) to average net assets | | | 3.98 | % | | | 3.78 | % | | | 1.53 | %(d) |
| * | Class A shares commenced operations on January 3, 2017. |
| (a) | The per-share data presented above is based on the average shares outstanding for the period presented. |
| (b) | Assumes initial investment at net asset value at the beginning of each period, reinvestment of all distributions, the complete redemption of the investment at net asset value at the end of each period and no sales charges. Total return would be reduced if sales charges were taken into account. |
The accompanying notes are an integral part of these financial statements.
| | |
| Pioneer Corporate High Yield Fund | Annual Report | 8/31/19 | | 33 |
Financial Highlights (continued)
| | | | | | | | | | | | |
| | | Year | | | Year | | | | |
| | | Ended | | | Ended | | | 1/3/17* to | |
| | | 8/31/19 | | | 8/31/18 | | | 8/31/17 | |
Class C | | | | | | | | | | | | |
Net asset value, beginning of period | | $ | 9.96 | | | $ | 10.21 | | | $ | 10.00 | |
| | | | | | | | | | | | |
Increase (decrease) from investment operations: | | | | | | | | | | | | |
Net investment income (loss) | | $ | 0.43 | (a) | | $ | 0.40 | (a) | | $ | 0.24 | (a) |
Net realized and unrealized gain (loss) on investments | | | 0.18 | | | | (0.22 | ) | | | 0.20 | |
| | | | | | | | | | | | |
Net increase (decrease) from investment operations | | $ | 0.61 | | | $ | 0.18 | | | $ | 0.44 | |
| | | | | | | | | | | | |
Distributions to shareowners: | | | | | | | | | | | | |
Net investment income | | $ | (0.43 | ) | | $ | (0.38 | ) | | $ | (0.23 | ) |
Net realized gain | | | — | | | | (0.05 | ) | | | — | |
| | | | | | | | | | | | |
Total distributions | | $ | (0.43 | ) | | $ | (0.43 | ) | | $ | (0.23 | ) |
| | | | | | | | | | | | |
Net increase (decrease) in net asset value | | $ | 0.18 | | | $ | (0.25 | ) | | $ | 0.21 | |
| | | | | | | | | | | | |
Net asset value, end of period | | $ | 10.14 | | | $ | 9.96 | | | $ | 10.21 | |
| | | | | | | | | | | | |
Total return(b) | | | 6.34 | % | | | 1.84 | % | | | 4.44 | %(c) |
Ratio of net expenses to average net assets | | | 1.75 | % | | | 1.75 | % | | | 1.75 | %(d) |
Ratio of net investment income (loss) to average net assets | | | 4.35 | % | | | 3.94 | % | | | 3.67 | %(d) |
Portfolio turnover rate | | | 60 | % | | | 114 | % | | | 113 | %(c) |
Net assets, end of period (in thousands) | | $ | 4,089 | | | $ | 3,983 | | | $ | 4,032 | |
Ratios with no waiver of fees and assumption of expenses by the Adviser and no reduction for fees paid indirectly: | | | | | | | | | | | | |
Total expenses to average net assets | | | 2.87 | % | | | 2.65 | % | | | 4.63 | %(d) |
Net investment income (loss) to average net assets | | | 3.23 | % | | | 3.04 | % | | | 0.79 | %(d) |
| * | Class C shares commenced operations on January 3, 2017. |
| (a) | The per-share data presented above is based on the average shares outstanding for the period presented. |
| (b) | Assumes initial investment at net asset value at the beginning of each period, reinvestment of all distributions, the complete redemption of the investment at net asset value at the end of each period and no sales charges. Total return would be reduced if sales charges were taken into account. |
The accompanying notes are an integral part of these financial statements.
| | | | |
| 34 | | Pioneer Corporate High Yield Fund | Annual Report | 8/31/19 | | |
| | | | | | | | | | | | |
| | | Year | | | Year | | | | |
| | | Ended | | | Ended | | | 1/3/17* to | |
| | | 8/31/19 | | | 8/31/18 | | | 8/31/17 | |
Class Y | | | | | | | | | | | | |
Net asset value, beginning of period | | $ | 9.97 | | | $ | 10.22 | | | $ | 10.00 | |
| | | | | | | | | | | | |
Increase (decrease) from investment operations: | | | | | | | | | | | | |
Net investment income (loss) | | $ | 0.53 | (a) | | $ | 0.50 | (a) | | $ | 0.31 | (a) |
Net realized and unrealized gain (loss) on investments | | | 0.18 | | | | (0.22 | ) | | | 0.20 | |
| | | | | | | | | | | | |
Net increase (decrease) from investment operations | | $ | 0.71 | | | $ | 0.28 | | | $ | 0.51 | |
| | | | | | | | | | | | |
Distributions to shareowners: | | | | | | | | | | | | |
Net investment income | | $ | (0.53 | ) | | $ | (0.48 | ) | | $ | (0.29 | ) |
Net realized gain | | | — | | | | (0.05 | ) | | | — | |
| | | | | | | | | | | | |
Total distributions | | $ | (0.53 | ) | | $ | (0.53 | ) | | $ | (0.29 | ) |
| | | | | | | | | | | | |
Net increase (decrease) in net asset value | | $ | 0.18 | | | $ | (0.25 | ) | | $ | 0.22 | |
| | | | | | | | | | | | |
Net asset value, end of period | | $ | 10.15 | | | $ | 9.97 | | | $ | 10.22 | |
| | | | | | | | | | | | |
Total return(b) | | | 7.41 | % | | | 2.86 | % | | | 5.14 | %(c) |
Ratio of net expenses to average net assets | | | 0.75 | % | | | 0.75 | % | | | 0.75 | %(d) |
Ratio of net investment income (loss) to average net assets | | | 5.35 | % | | | 4.94 | % | | | 4.67 | %(d) |
Portfolio turnover rate | | | 60 | % | | | 114 | % | | | 113 | %(c) |
Net assets, end of period (in thousands) | | $ | 8,163 | | | $ | 8,021 | | | $ | 8,081 | |
Ratios with no waiver of fees and assumption of expenses by the Adviser and no reduction for fees paid indirectly: | | | | | | | | | | | | |
Total expenses to average net assets | | | 1.87 | % | | | 1.66 | % | | | 3.63 | %(d) |
Net investment income (loss) to average net assets | | | 4.23 | % | | | 4.03 | % | | | 1.79 | %(d) |
| * | Class Y shares commenced operations on January 3, 2017. |
| (a) | The per-share data presented above is based on the average shares outstanding for the period presented. |
| (b) | Assumes initial investment at net asset value at the beginning of each period, reinvestment of all distributions and the complete redemption of the investment at net asset value at the end of each period. |
The accompanying notes are an integral part of these financial statements.
| | |
| Pioneer Corporate High Yield Fund | Annual Report | 8/31/19 | | 35 |
Notes to Financial Statements | 8/31/19
1. Organization and Significant Accounting Policies
Pioneer Corporate High Yield Fund (formerly Pioneer U.S. Corporate High Yield Fund) (the “Fund”) is one of three portfolios comprising Pioneer Series Trust V, a Delaware statutory trust. The Fund is registered under the Investment Company Act of 1940 as a diversified, open-end management investment company. The investment objective of the Fund is to achieve a high level of current income and long-term capital appreciation.
The Fund offers four classes of shares designated as Class A, Class C, Class K and Class Y shares. Class K shares had not commenced operations as of August 31, 2019. Each class of shares represents an interest in the same portfolio of investments of the Fund and has identical rights (based on relative net asset values) to assets and liquidation proceeds. Share classes can bear different rates of class-specific fees and expenses, such as transfer agent and distribution fees. Differences in class-specific fees and expenses will result in differences in net investment income and, therefore, the payment of different dividends from net investment income earned by each class. The Amended and Restated Declaration of Trust of the Fund gives the Board of Trustees the flexibility to specify either per-share voting or dollar-weighted voting when submitting matters for shareholder approval. Under per-share voting, each share of a class of the Fund is entitled to one vote. Under dollar-weighted voting, a shareholder’s voting power is determined not by the number of shares owned, but by the dollar value of the shares on the record date. Each share class has exclusive voting rights with respect to matters affecting only that class, including with respect to the distribution plan for that class. There is no distribution plan for Class Y shares.
Amundi Pioneer Asset Management, Inc., an indirect, wholly owned subsidiary of Amundi and Amundi’s wholly owned subsidiary, Amundi USA, Inc., serves as the Fund’s investment adviser (the “Adviser”). Amundi Pioneer Distributor, Inc., an affiliate of Amundi Pioneer Asset Management, Inc., serves as the Fund’s distributor (the “Distributor”).
In August 2018, the Securities and Exchange Commission (“SEC”) released a Disclosure Update and Simplification Final Rule. The Final Rule amends Regulation S-X disclosures requirements to conform them to U.S. Generally Accepted Accounting Principles (“U.S. GAAP”) for investment companies. The Fund’s financial statements were prepared in compliance with the new amendments to Regulation S-X.
| | | | |
| 36 | | Pioneer Corporate High Yield Fund | Annual Report | 8/31/19 | | |
The Fund is an investment company and follows investment company accounting and reporting guidance under U.S. GAAP. U.S. GAAP requires the management of the Fund to make estimates and assumptions that affect the reported amounts of assets and liabilities, the disclosure of contingent assets and liabilities at the date of the financial statements, and the reported amounts of income, expenses and gain or loss on investments during the reporting period. Actual results could differ from those estimates.
The following is a summary of significant accounting policies followed by the Fund in the preparation of its financial statements:
The net asset value of the Fund is computed once daily, on each day the New York Stock Exchange (“NYSE”) is open, as of the close of regular trading on the NYSE.
Fixed-income securities are valued by using prices supplied by independent pricing services, which consider such factors as market prices, market events, quotations from one or more brokers, Treasury spreads, yields, maturities and ratings, or may use a pricing matrix or other fair value methods or techniques to provide an estimated value of the security or instrument. A pricing matrix is a means of valuing a debt security on the basis of current market prices for other debt securities, historical trading patterns in the market for fixed-income securities and/or other factors. Non-U.S. debt securities that are listed on an exchange will be valued at the bid price obtained from an independent third party pricing service. When independent third party pricing services are unable to supply prices, or when prices or market quotations are considered to be unreliable, the value of that security may be determined using quotations from one or more broker-dealers.
Loan interests are valued in accordance with guidelines established by the Board of Trustees at the mean between the last available bid and asked prices from one or more brokers or dealers as obtained from Loan Pricing Corporation, an independent third party pricing service. If price information is not available from Loan Pricing Corporation, or if the price information is deemed to be unreliable, price information will be obtained from an alternative loan interest pricing service. If no reliable price quotes are available from either the primary or alternative pricing service, broker quotes will be solicited.
Equity securities that have traded on an exchange are valued by using the last sale price on the principal exchange where they are traded. Equity securities that have not traded on the date of valuation, or securities for which sale prices are not available, generally are valued using the mean between the last bid and asked prices or, if both last bid and asked prices are not available, at
| | |
| Pioneer Corporate High Yield Fund | Annual Report | 8/31/19 | | 37 |
the last quoted bid price. Last sale and bid and asked prices are provided by independent third party pricing services. In the case of equity securities not traded on an exchange, prices are typically determined by independent third party pricing services using a variety of techniques and methods.
Swap contracts, including interest rate swaps, caps and floors (other than centrally cleared swap contracts), are valued at the dealer quotations obtained from reputable International Swap Dealers Association members. Centrally cleared swaps are valued at the daily settlement price provided by the central clearing counterparty.
Securities or loan interests for which independent pricing services or broker-dealers are unable to supply prices or for which market prices and/or quotations are not readily available or are considered to be unreliable are valued by a fair valuation team comprised of certain personnel of the Adviser pursuant to procedures adopted by the Fund’s Board of Trustees. The Adviser’s fair valuation team uses fair value methods approved by the Valuation Committee of the Board of Trustees. The Adviser’s fair valuation team is responsible for monitoring developments that may impact fair valued securities and for discussing and assessing fair values on an ongoing basis, and at least quarterly, with the Valuation Committee of the Board of Trustees.
Inputs used when applying fair value methods to value a security may include credit ratings, the financial condition of the company, current market conditions and comparable securities. The Fund may use fair value methods if it is determined that a significant event has occurred after the close of the exchange or market on which the security trades and prior to the determination of the Fund’s net asset value. Examples of a significant event might include political or economic news, corporate restructurings, natural disasters, terrorist activity or trading halts. Thus, the valuation of the Fund’s securities may differ significantly from exchange prices, and such differences could be material.
At August 31, 2019, no securities were valued using fair value methods (other than securities valued using prices supplied by independent pricing services, broker-dealers or using a third party insurance industry pricing model).
| B. | Investment Income and Transactions |
Dividend income is recorded on the ex-dividend date, except that certain dividends from foreign securities where the ex-dividend date may have passed are recorded as soon as the Fund becomes aware of the ex-dividend data in the exercise of reasonable diligence.
| | | | |
| 38 | | Pioneer Corporate High Yield Fund | Annual Report | 8/31/19 | | |
Interest income, including interest on income-bearing cash accounts, is recorded on the accrual basis. Dividend and interest income are reported net of unrecoverable foreign taxes withheld at the applicable country rates and net of income accrued on defaulted securities.
Interest and dividend income payable by delivery of additional shares is reclassified as PIK (payment-in-kind) income upon receipt and is included in interest and dividend income, respectively.
Security transactions are recorded as of trade date. Gains and losses on sales of investments are calculated on the identified cost method for both financial reporting and federal income tax purposes.
It is the Fund’s policy to comply with the requirements of the Internal Revenue Code applicable to regulated investment companies and to distribute all of its net taxable income and net realized capital gains, if any, to its shareowners. Therefore, no provision for federal income taxes is required. As of August 31, 2019, the Fund did not accrue any interest or penalties with respect to uncertain tax positions, which, if applicable, would be recorded as an income tax expense on the Statement of Operations. Tax returns filed within the prior three years remain subject to examination by federal and state tax authorities.
The amount and character of income and capital gain distributions to shareowners are determined in accordance with federal income tax rules, which may differ from U.S. GAAP. Distributions in excess of net investment income or net realized gains are temporary over distributions for financial statement purposes resulting from differences in the recognition or classification of income or distributions for financial statement and tax purposes. Capital accounts within the financial statements are adjusted for permanent book/tax differences to reflect tax character, but are not adjusted for temporary differences.
At August 31, 2019, the Fund was permitted to carry forward indefinitely $120,111 of short-term losses and $249,870 of long-term losses under the Regulated Investment Company Modernization Act of 2010 without limitation.
The tax character of distributions paid during the years ended August 31, 2019 and August 31, 2018, were as follows:
| | | | | | | | |
| | | 2019 | | | 2018 | |
Distributions paid from: | | | | | | | | |
Ordinary income | | $ | 1,008,080 | | | $ | 1,011,148 | |
| | | | | | | | |
Total | | $ | 1,008,080 | | | $ | 1,011,148 | |
| | | | | | | | |
| | |
| Pioneer Corporate High Yield Fund | Annual Report | 8/31/19 | | 39 |
The following shows the components of distributable earnings on a federal income tax-basis at August 31, 2019:
| | | | |
| | | 2019 | |
Distributable earnings: | | | | |
Undistributed ordinary income | | $ | 133,829 | |
Capital loss carryforward | | | (369,981 | ) |
Current year dividend payable | | | (82,023 | ) |
Net unrealized appreciation | | | 184,250 | |
| | | | |
Total | | $ | (133,925 | ) |
| | | | |
The difference between book basis and tax basis unrealized appreciation is attributable to the tax deferral of losses on wash sales, the mark to market of swaps and adjustments relating to credit default swaps.
The Fund records sales and repurchases of its shares as of trade date. The Distributor earned no in underwriting commissions on the sale of Class A shares during the year ended August 31, 2019.
Income, common expenses and realized and unrealized gains and losses are calculated at the Fund level and allocated daily to each class of shares based on its respective percentage of adjusted net assets at the beginning of the day.
Distribution fees are calculated based on the average daily net asset value attributable to Class A and Class C shares of the Fund, respectively (see Note 4). Class Y shares do not pay distribution fees. All expenses and fees paid to the Fund’s transfer agent for its services are allocated among the classes of shares based on the number of accounts in each class and the ratable allocation of related out-of-pocket expenses (see Note 3).
The Fund declares as daily dividends substantially all of its net investment income. All dividends are paid on a monthly basis. Short-term capital gain distributions, if any, may be declared with the daily dividends. Distributions to shareowners are recorded as of the ex-dividend date. Distributions paid by the Fund with respect to each class of shares are calculated in the same manner and at the same time, except that net investment income dividends to Class A, Class C and Class Y shares can reflect different transfer agent and distribution expense rates.
The value of securities held by the Fund may go up or down, sometimes rapidly or unpredictably, due to general market conditions, such as real or perceived adverse economic, political or regulatory conditions, inflation,
| | | | |
| 40 | | Pioneer Corporate High Yield Fund | Annual Report | 8/31/19 | | |
changes in interest rates, lack of liquidity in the bond markets or adverse investor sentiment. In the past several years, financial markets have experienced increased volatility, depressed valuations, decreased liquidity and heightened uncertainty. These conditions may continue, recur, worsen or spread. A general rise in interest rates could adversely affect the price and liquidity of fixed-income securities and could also result in increased redemptions from the Fund.
At times, the Fund’s investments may represent industries or industry sectors that are interrelated or have common risks, making the Fund more susceptible to any economic, political, or regulatory developments or other risks affecting those industries and sectors. The Fund’s investments in foreign markets and countries with limited developing markets may subject the Fund to a greater degree of risk than investments in a developed market. These risks include disruptive political or economic conditions and the imposition of adverse governmental laws or currency exchange restrictions.
The Fund invests in below-investment-grade (high-yield) debt securities and preferred stocks. Some of these high-yield securities may be convertible into equity securities of the issuer. Debt securities rated below-investment-grade are commonly referred to as “junk bonds” and are considered speculative. These securities involve greater risk of loss, are subject to greater price volatility, and are less liquid, especially during periods of economic uncertainty or change, than higher rated debt securities.
With the increased use of technologies such as the Internet to conduct business, the Fund is susceptible to operational, information security and related risks. While the Fund’s Adviser has established business continuity plans in the event of, and risk management systems to prevent, limit or mitigate, such cyber-attacks, there are inherent limitations in such plans and systems, including the possibility that certain risks have not been identified. Furthermore, the Fund cannot control the cybersecurity plans and systems put in place by service providers to the Fund such as Brown Brothers Harriman & Co., the Fund’s custodian and accounting agent, and DST Asset Manager Solutions, Inc., the Fund’s transfer agent. In addition, many beneficial owners of Fund shares hold them through accounts at broker-dealers, retirement platforms and other financial market participants over which neither the Fund nor Amundi Pioneer exercises control. Each of these may in turn rely on service providers to them, which are also subject to the risk of cyber-attacks. Cybersecurity failures or breaches at Amundi Pioneer or the Fund’s service providers or intermediaries have the ability to cause disruptions and impact business operations, potentially resulting in financial losses, interference with the Fund’s ability to calculate its net asset value, impediments to trading, the inability of Fund shareowners to effect share
| | |
| Pioneer Corporate High Yield Fund | Annual Report | 8/31/19 | | 41 |
purchases, redemptions or exchanges or receive distributions, loss of or unauthorized access to private shareowner information and violations of applicable privacy and other laws, regulatory fines, penalties, reputational damage, or additional compliance costs. Such costs and losses may not be covered under any insurance. In addition, maintaining vigilance against cyber-attacks may involve substantial costs over time, and system enhancements may themselves be subject to cyber-attacks.
The Fund’s prospectus contains unaudited information regarding the Fund’s principal risks. Please refer to that document when considering the Fund’s principal risks.
| G. | Credit Default Swap Contracts |
A credit default swap is a contract between a buyer of protection and a seller of protection against a pre-defined credit event or an underlying reference obligation, which may be a single security or a basket or index of securities. The Fund may buy or sell credit default swap contracts to seek to increase the Fund’s income, or to attempt to hedge the risk of default on portfolio securities. A credit default swap index is used to hedge risk or take a position on a basket of credit entities or indices.
As a seller of protection, the Fund would be required to pay the notional (or other agreed-upon) value of the referenced debt obligation to the counterparty in the event of a default by a U.S. or foreign corporate issuer of a debt obligation, which would likely result in a loss to the Fund. In return, the Fund would receive from the counterparty a periodic stream of payments during the term of the contract, provided that no event of default occurred. The maximum exposure of loss to the seller would be the notional value of the credit default swaps outstanding. If no default occurs, the Fund would keep the stream of payments and would have no payment obligation. The Fund may also buy credit default swap contracts in order to hedge against the risk of default of debt securities, in which case the Fund would function as the counterparty referenced above.
As a buyer of protection, the Fund makes an upfront or periodic payment to the protection seller in exchange for the right to receive a contingent payment. An upfront payment made by the Fund, as the protection buyer, is recorded within the “Swap contracts, at value” line item on the Statement of Assets and Liabilities. Periodic payments received or paid by the Fund are recorded as realized gains or losses on the Statement of Operations.
Credit default swap contracts are marked-to-market daily using valuations supplied by independent sources, and the change in value, if any, is recorded within the “Swap contracts, at value” line item on the Statement of Assets and Liabilities. Payments received or made as a result of a credit event or upon termination of the contract are recognized, net of the appropriate amount of the upfront payment, as realized gains or losses on the Statement of Operations.
| | | | |
| 42 | | Pioneer Corporate High Yield Fund | Annual Report | 8/31/19 | | |
Credit default swap contracts involving the sale of protection may involve greater risks than if the Fund had invested in the referenced debt instrument directly. Credit default swap contracts are subject to general market risk, liquidity risk, counterparty risk and credit risk. If the Fund is a protection buyer and no credit event occurs, it will lose its investment. If the Fund is a protection seller and a credit event occurs, the value of the referenced debt instrument received by the Fund, together with the periodic payments received, may be less than the amount the Fund pays to the protection buyer, resulting in a loss to the Fund. In addition, obligations under sell protection credit default swaps may be partially offset by net amounts received from settlement of buy protection credit default swaps entered into by the Fund for the same reference obligation with the same counterparty.
Certain swap contracts that are cleared through a central clearinghouse are referred to as centrally cleared swaps. All payments made or received by the Fund are pursuant to a centrally cleared swap contract with the central clearing party rather than the original counterparty. Upon entering into a centrally cleared swap contract, the Fund is required to make an initial margin deposit, either in cash or in securities. The daily change in value on open centrally cleared contracts is recorded as “Variation margin for centrally cleared swaps” on the Statement of Assets and Liabilities. Cash received from or paid to the broker related to previous margin movement is held in a segregated account at the broker and is recorded as either “Due from broker for swaps” or “Due to broker for swaps” on the Statement of Assets and Liabilities. The amount of cash deposited with a broker as collateral at August 31, 2019, is recorded as “Swaps collateral” on the Statement of Assets and Liabilities.
The average market value of credit default swap contracts open during the year ended August 31, 2019, was $8,413. Open credit default swap contracts at August 31, 2019, are listed in the Schedule of Investments.
2. Management Agreement
The Adviser manages the Fund’s portfolio. Management fees are calculated daily at the annual rate of 0.60% of the Fund’s average daily net assets up to $1 billion and 0.55% of the Fund’s average daily net assets over $1 billion. For the year ended August 31, 2019, the effective management fee (excluding waivers and/or assumption of expenses) was equivalent to 0.60% of the Fund’s average daily net assets.
| | |
| Pioneer Corporate High Yield Fund | Annual Report | 8/31/19 | | 43 |
The Adviser has contractually agreed to limit ordinary operating expenses (ordinary operating expenses means all fund expenses other than extraordinary expenses, such as litigation, taxes, brokerage commissions and acquired fund fees and expenses) of the Fund to the extent required to reduce Fund expenses to 1.05%, 1.80% and 0.75% of the average daily net assets attributable to Class A, Class C, and Class Y shares, respectively. Fees waived and expenses reimbursed during the year ended August 31, 2019 are reflected on the Statement of Operations. These expense limitations are in effect through January 1, 2020. There can be no assurance that the Adviser will extend the expense limitation agreement for a class of shares beyond the date referred to above.
In addition, under the management and administration agreements, certain other services and costs, including accounting, regulatory reporting and insurance premiums, are paid by the Fund as administrative reimbursements. Included in “Due to affiliates” reflected on the Statement of Assets and Liabilities is $12,117 in management fees, administrative costs and certain other reimbursements payable to the Adviser at August 31, 2019.
3. Transfer Agent
DST Asset Manager Solutions, Inc. serves as the transfer agent to the Fund at negotiated rates. Transfer agent fees and payables shown on the Statement of Operations and the Statement of Assets and Liabilities, respectively, include sub-transfer agent expenses incurred through the Fund’s omnibus relationship contracts.
In addition, the Fund reimbursed the transfer agent for out-of-pocket expenses incurred by the transfer agent related to shareowner communications activities such as proxy and statement mailings, and outgoing phone calls. For the year ended August 31, 2019, such out-of-pocket expenses by class of shares were as follows:
| | | | |
| Shareowner Communications: | | | |
Class A | | $ | 233 | |
Class C | | | 47 | |
Class Y | | | 79 | |
| | | | |
Total | | $ | 359 | |
| | | | |
| | | | |
| 44 | | Pioneer Corporate High Yield Fund | Annual Report | 8/31/19 | | |
4. Distribution and Service Plans
The Fund has adopted a distribution plan (the “Plan”) pursuant to Rule 12b-1 of the Investment Company Act of 1940 with respect to its Class A and Class C shares. Pursuant to the Plan, the Fund pays the Distributor 0.25% of the average daily net assets attributable to Class A shares as compensation for personal services and/or account maintenance services or distribution services with regard to Class A shares. Pursuant to the Plan, the Fund also pays the Distributor 1.00% of the average daily net assets attributable to Class C shares. The fee for Class C shares consists of a 0.25% service fee and a 0.75% distribution fee paid as compensation for personal services and/or account maintenance services or distribution services with regard to Class C shares. Included in “Due to affiliates” reflected on the Statement of Assets and Liabilities is $676 in distribution fees payable to the Distributor at August 31, 2019.
In addition, Class A and Class C shares may be subject to a contingent deferred sales charge (“CDSC”). A CDSC of 1.00% may be imposed on redemptions of certain net asset value purchases of Class A shares within 12 months of purchase. Redemptions of Class C shares within 12 months of purchase are subject to a CDSC of 1.00% based on the lower of cost or market value of shares being redeemed. Shares purchased as part of an exchange remain subject to any CDSC that applied to the original purchase of those shares. There is no CDSC for Class Y shares. Proceeds from the CDSCs are paid to the Distributor. For the year ended August 31, 2019, no CDSCs were paid to the Distributor.
5. Additional Disclosures about Derivative Instruments and Hedging Activities
The Fund’s use of derivatives may enhance or mitigate the Fund’s exposure to the following risks:
Interest rate risk relates to the fluctuations in the value of interest-bearing securities due to changes in the prevailing levels of market interest rates.
Credit risk relates to the ability of the issuer of a financial instrument to make further principal or interest payments on an obligation or commitment that it has to the Fund.
Foreign exchange rate risk relates to fluctuations in the value of an asset or liability due to changes in currency exchange rates.
| | |
| Pioneer Corporate High Yield Fund | Annual Report | 8/31/19 | | 45 |
Equity risk relates to the fluctuations in the value of financial instruments as a result of changes in market prices (other than those arising from interest rate risk or foreign exchange rate risk), whether caused by factors specific to an individual investment, its issuer, or all factors affecting all instruments traded in a market or market segment.
Commodity risk relates to the risk that the value of a commodity or commodity index will fluctuate based on increases or decreases in the commodities market and factors specific to a particular industry or commodity.
The fair value of open derivative instruments (not considered to be hedging instruments for accounting disclosure purposes) by risk exposure at August 31, 2019, was as follows:
| | | | | | | | | | | | | | | | | | | | |
| | | | | | | | | Foreign | | | | | | | |
| Statement of Assets | | Interest | | | Credit | | | Exchange | | | Equity | | | Commodity | |
| and Liabilities | | Rate Risk | | | Risk | | | Rate Risk | | | Risk | | | Risk | |
Assets: | | | | | | | | | | | | | | | | | | | | |
Swap contracts, at value | | $ | — | | | $ | 38,723 | | | $ | — | | | $ | — | | | $ | — | |
| | | | | | | | | | | | | | | | | | | | |
Total Value | | $ | — | | | $ | 38,723 | | | $ | — | | | $ | — | | | $ | — | |
| | | | | | | | | | | | | | | | | | | | |
The effect of derivative instruments (not considered to be hedging instruments for accounting disclosure purposes) on the Statement of Operations by risk exposure at August 31, 2019, was as follows:
| | | | | | | | | | | | | | | | | | | | |
| | | | | | | | | Foreign | | | | | | | |
| | | Interest | | | Credit | | | Exchange | | | Equity | | | Commodity | |
| Statement of Operations | | Rate Risk | | | Risk | | | Rate Risk | | | Risk | | | Risk | |
Net realized gain (loss) on: | | | | | | | | | | | | | | | | | | | | |
Swap contracts | | $ | — | | | $ | (2,964 | ) | | $ | — | | | $ | — | | | $ | — | |
| | | | | | | | | | | | | | | | | | | | |
Total Value | | $ | — | | | $ | (2,964 | ) | | $ | — | | | $ | — | | | $ | — | |
| | | | | | | | | | | | | | | | | | | | |
Change in net unrealized appreciation (depreciation) on: | | | | | | | | | | | | | | | | | | | | |
Swap contracts | | $ | — | | | $ | 12,678 | | | $ | — | | | $ | — | | | $ | — | |
| | | | | | | | | | | | | | | | | | | | |
Total Value | | $ | — | | | $ | 12,678 | | | $ | — | | | $ | — | | | $ | — | |
| | | | | | | | | | | | | | | | | | | | |
| | | | |
| 46 | | Pioneer Corporate High Yield Fund | Annual Report | 8/31/19 | | |
Report of Independent Registered Public Accounting Firm
To the Board of Trustees of Pioneer Series Trust V and the Shareowners of Pioneer Corporate High Yield Fund:
Opinion on the Financial Statements
We have audited the accompanying statement of assets and liabilities of Pioneer Corporate High Yield Fund (the “Fund”), one of the funds constituting Pioneer Series Trust V (the “Trust”) including the schedule of investments, as of August 31, 2019, and the related statement of operations for the year then ended, the statements changes in net assets for each of the two years in the period then ended and the financial highlights for each of the three years in the period then ended (collectively referred to as the “financial statements”). The financial highlights for the periods ended August 31, 2015 and August 31, 2016 were audited by another independent registered public accounting firm whose report, dated October 24, 2016, expressed an unqualified opinion on those financial highlights. In our opinion, the financial statements present fairly, in all material respects, the financial position of the Fund at August 31, 2019, the results of its operations for the year then ended, the changes in its net assets for each of the two years in the period then ended, and the financial highlights for each of the three years in the period then ended, in conformity with U.S. generally accepted accounting principles.
Basis for Opinion
These financial statements are the responsibility of the Fund’s management. Our responsibility is to express an opinion on the Fund’s financial statements based on our audits. We are a public accounting firm registered with the Public Company Accounting Oversight Board (United States) (“PCAOB”) and are required to be independent with respect to the Fund in accordance with the U.S. federal securities laws and the applicable rules and regulations of the Securities and Exchange Commission and the PCAOB.
We conducted our audits in accordance with the standards of the PCAOB. Those standards require that we plan and perform the audit to obtain reasonable assurance about whether the financial statements are free of material misstatement, whether due to error or fraud. The Fund is not required to have, nor were we engaged to perform, an audit of the Fund’s internal control over financial reporting. As part of our audits, we are required to obtain an understanding of internal control over financial reporting, but not for the purpose of expressing an opinion on the effectiveness of the Fund’s internal control over financial reporting. Accordingly, we express no such opinion.
| | |
| Pioneer Corporate High Yield Fund | Annual Report | 8/31/19 | | 47 |
Our audits included performing procedures to assess the risks of material misstatement of the financial statements, whether due to error or fraud, and performing procedures that respond to those risks. Such procedures included examining, on a test basis, evidence regarding the amounts and disclosures in the financial statements. Our procedures included confirmation of securities owned as of August 31, 2019, by correspondence with the custodian and brokers. Our audits also included evaluating the accounting principles used and significant estimates made by management, as well as evaluating the overall presentation of the financial statements. We believe that our audits provide a reasonable basis for our opinion.

We have served as the Fund’s auditor since 2017.
Boston, Massachusetts
October 29, 2019
| | | | |
| 48 | | Pioneer Corporate High Yield Fund | Annual Report | 8/31/19 | | |
ADDITIONAL INFORMATION (unaudited)
Qualified interest income is exempt from nonresident alien (NRA) tax withholding. The percentage of the Fund’s ordinary income distributions derived from qualified interest income was 77.44%.
| | |
| Pioneer Corporate High Yield Fund | Annual Report | 8/31/19 | | 49 |
Trustees, Officers and Service Providers
Investment Adviser and Administrator
Amundi Pioneer Asset Management, Inc.
Custodian and Sub-Administrator
Brown Brothers Harriman & Co.
Independent Registered Public Accounting Firm
Ernst & Young LLP
Principal Underwriter
Amundi Pioneer Distributor, Inc.
Legal Counsel
Morgan, Lewis & Bockius LLP
Transfer Agent
DST Asset Manager Solutions, Inc.
Proxy Voting Policies and Procedures of the Fund are available without charge, upon request, by calling our toll free number (1-800-225-6292). Information regarding how the Fund voted proxies relating to portfolio securities during the most recent 12-month period ended June 30 is publicly available to shareowners at www.amundipioneer.com/us. This information is also available on the Securities and Exchange Commission’s web site at www.sec.gov.
Trustees and Officers
The Fund’s Trustees and officers are listed below, together with their principal occupations and other directorships they have held during at least the past five years. Trustees who are interested persons of the Fund within the meaning of the 1940 Act are referred to as Interested Trustees. Trustees who are not interested persons of the Fund are referred to as Independent Trustees. Each of the Trustees, except Mr. Bock and Ms. Durnin, serve as Trustees of each of the 44 U.S. registered investment portfolios for which Amundi Pioneer serves as investment adviser (the “Pioneer Funds”). Mr. Bock and Ms. Durnin serve as a Trustee of 37 Pioneer Funds. The address for all Trustees and all officers of the Fund is 60 State Street, Boston, Massachusetts 02109.
The Statement of Additional Information of the Fund includes additional information about the Trustees and is available, without charge, upon request, by calling 1-800-225-6292.
| | | | |
| 50 | | Pioneer Corporate High Yield Fund | Annual Report | 8/31/19 | | |
Independent Trustees
| | | | | | |
| Name, Age and Position | | Term of Office and | | | | Other Directorships |
| Held With the Fund | | Length of Service | | Principal Occupation | | Held by Trustee |
Thomas J. Perna (68) Chairman of the Board and Trustee | | Trustee since 2016.
Serves until a successor trustee is elected or earlier retirement or removal. | | Private investor (2004 – 2008 and 2013 –present); Chairman (2008 – 2013) and Chief Executive Officer (2008 – 2012), Quadriserv, Inc. (technology products for securities lending industry); and Senior Executive Vice President, The Bank of New York (financial and securities services) (1986 – 2004) | | Director, Broadridge Financial Solutions, Inc. (investor communications and securities processing provider for financial services industry) (2009 – present); Director, Quadriserv, Inc. (2005 – 2013); and Commissioner, New Jersey State Civil Service Commission (2011 – 2015) |
| | | |
John E. Baumgardner, Jr. (68) Trustee | | Trustee since 2019.
Serves until a successor trustee is elected or earlier retirement or removal. | | Of Counsel (2019 – present), Partner (1983-2018), Sullivan & Cromwell LLP (law firm). | | Chairman, The Lakeville Journal Company, LLC, (privately-held community newspaper group) (2015-present) |
| | | |
David R. Bock (75) Trustee | | Trustee since 2016.
Serves until a successor trustee is elected or earlier retirement or removal. | | Managing Partner, Federal City Capital Advisors (corporate advisory services company) (1997 – 2004 and 2008 – present); Interim Chief Executive Officer, Oxford Analytica, Inc. (privately held research and consulting company) (2010); Executive Vice President and Chief Financial Officer, I-trax, Inc. (publicly traded health care services company) (2004 – 2007); and Executive Vice President and Chief Financial Officer, Pedestal Inc. (internet-based mortgage trading company) (2000 – 2002); Private Consultant (1995 – 1997); Managing Director, Lehman Brothers (1992 – 1995); and Executive, The World Bank (1979 – 1992) | | Director of New York Mortgage Trust (publicly-traded mortgage REIT) (2004 – 2009, 2012 - present); Director of The Swiss Helvetia Fund, Inc. (closed-end fund) (2010 – 2017); Director of Oxford Analytica, Inc. (2008 – 2015); and Director of Enterprise Community Investment, Inc. (privately-held affordable housing finance company) (1985 – 2010) |
| | |
| Pioneer Corporate High Yield Fund | Annual Report | 8/31/19 | | 51 |
Independent Trustees (continued)
| | | | | | |
| Name, Age and Position | | Term of Office and | | | | Other Directorships |
| Held With the Fund | | Length of Service | | Principal Occupation | | Held by Trustee |
Diane Durnin (62) Trustee | | Trustee since 2019.
Serves until a successor trustee is elected or earlier retirement or removal. | | Managing Director - Head of Product Strategy and Development, BNY Mellon Investment Management (2012-2018); Vice Chairman – The Dreyfus Corporation (2005 – 2018): Executive Vice President Head of Product, BNY Mellon Investment Management (2007-2012); Executive Director- Product Strategy, Mellon Asset Management (2005-2007); Executive Vice President Head of Products, Marketing and Client Service, Dreyfus Corporation (2000-2005); and Senior Vice President Strategic Product and Business Development, Dreyfus Corporation (1994-2000) | | None |
| | | |
Benjamin M. Friedman (75) Trustee | | Trustee since 2016.
Serves until a successor trustee is elected or earlier retirement or removal. | | William Joseph Maier Professor of Political Economy, Harvard University (1972 – present) | | Trustee, Mellon Institutional Funds Investment Trust and Mellon Institutional Funds Master Portfolio (oversaw 17 portfolios in fund complex) (1989 - 2008) |
| | | |
Margaret B.W. Graham (72) Trustee | | Trustee since 2016.
Serves until a successor trustee is elected or earlier retirement or removal. | | Founding Director, Vice-President and Corporate Secretary, The Winthrop Group, Inc. (consulting firm) (1982 – present); Desautels Faculty of Management, McGill University (1999 – 2017); and Manager of Research Operations and Organizational Learning, Xerox PARC, Xerox’s advance research center (1990-1994) | | None |
| | | |
Lorraine H. Monchak (62) Trustee | | Trustee since 2017.
(Advisory Trustee from 2014 - 2017) Serves until a successor trustee is elected or earlier retirement or removal. | | Chief Investment Officer, 1199 SEIU Funds (healthcare workers union pension funds) (2001 – present); Vice President – International Investments Group, American International Group, Inc. (insurance company) (1993 – 2001); Vice President – Corporate Finance and Treasury Group, Citibank, N.A. (1980 – 1986 and 1990 – 1993); Vice President – Asset/Liability Management Group, Federal Farm Funding Corporation (government-sponsored issuer of debt securities) (1988 – 1990); Mortgage Strategies Group, Shearson Lehman Hutton, Inc. (investment bank) (1987 – 1988); and Mortgage Strategies Group, Drexel Burnham Lambert, Ltd. (investment bank) (1986 – 1987) | | None |
| | | | |
| 52 | | Pioneer Corporate High Yield Fund | Annual Report | 8/31/19 | | |
| | | | | | |
| Name, Age and Position | | Term of Office and | | | | Other Directorships |
| Held With the Fund | | Length of Service | | Principal Occupation | | Held by Trustee |
Marguerite A. Piret (71) Trustee | | Trustee since 2016.
Serves until a successor trustee is elected or earlier retirement or removal. | | President and Chief Executive Officer, Metric Financial Inc. (formerly known as Newbury Piret Company) (investment banking firm) (1981 – present) | | Director of New America High Income Fund, Inc. (closed-end investment company) (2004 – present); and Member, Board of Governors, Investment Company Institute (2000 – 2006) |
| | | |
Fred J. Ricciardi (72) Trustee | | Trustee since 2016.
Serves until a successor trustee is elected or earlier retirement or removal. | | Consultant (investment company services) (2012 – present); Executive Vice President, BNY Mellon (financial and investment company services) (1969 – 2012); Director, BNY International Financing Corp. (financial services) (2002 – 2012); Director, Mellon Overseas Investment Corp. (financial services) (2009 – 2012); Director, Financial Models (technology) (2005-2007); Director, BNY Hamilton Funds, Ireland (offshore investment companies) (2004-2007); Chairman/Director, AIB/BNY Securities Services, Ltd., Ireland (financial services) (1999-2006); and Chairman, BNY Alternative Investment Services, Inc. (financial services) (2005-2007) | | None |
| | |
| Pioneer Corporate High Yield Fund | Annual Report | 8/31/19 | | 53 |
Interested Trustees
| | | | | | |
| Name, Age and Position | | Term of Office and | | | | Other Directorships |
| Held With the Fund | | Length of Service | | Principal Occupation | | Held by Trustee |
Lisa M. Jones (57)* Trustee, President and Chief Executive Officer | | Trustee since 2017. Serves until a successor trustee is elected or earlier retirement or removal | | Director, CEO and President of Amundi Pioneer Asset Management USA, Inc. (since September 2014); Director, CEO and President of Amundi Pioneer Asset Management, Inc. (since September 2014); Director, CEO and President of Amundi Pioneer Distributor, Inc. (since September 2014); Director, CEO and President of Amundi Pioneer Institutional Asset Management, Inc. (since September 2014); Chair, Amundi Pioneer Asset Management USA, Inc., Amundi Pioneer Distributor, Inc. and Amundi Pioneer Institutional Asset Management, Inc. (September 2014 – 2018); Managing Director, Morgan Stanley Investment Management (2010 – 2013); Director of Institutional Business, CEO of International, Eaton Vance Management (2005 – 2010); and Director of Amundi USA, Inc. (since 2017) | | None |
| | | |
Kenneth J. Taubes (61)* Trustee | | Trustee since 2016. Serves until a successor trustee is elected or earlier retirement or removal | | Director and Executive Vice President (since 2008) and Chief Investment Officer, U.S. (since 2010) of Amundi Pioneer Asset Management USA, Inc.; Director and Executive Vice President and Chief Investment Officer, U.S. of Amundi Pioneer (since 2008); Executive Vice President and Chief Investment Officer, U.S. of Amundi Pioneer Institutional Asset Management, Inc. (since 2009); Portfolio Manager of Amundi Pioneer (since 1999); and Director of Amundi USA, Inc. (since 2017) | | None |
| * | Ms. Jones and Mr. Taubes are Interested Trustees because they are officers or directors of the Fund’s investment adviser and certain of its affiliates. |
| | | | |
| 54 | | Pioneer Corporate High Yield Fund | Annual Report | 8/31/19 | | |
Fund Officers
| | | | | | |
| Name, Age and Position | | Term of Office and | | | | Other Directorships |
| Held With the Fund | | Length of Service | | Principal Occupation | | Held by Officer |
Christopher J. Kelley (54) Secretary and Chief Legal Officer | | Since 2016. Serves at the discretion of the Board | | Vice President and Associate General Counsel of Amundi Pioneer since January 2008; Secretary and Chief Legal Officer of all of the Pioneer Funds since June 2010; Assistant Secretary of all of the Pioneer Funds from September 2003 to May 2010; and Vice President and Senior Counsel of Amundi Pioneer from July 2002 to December 2007 | | None |
| | | |
Carol B. Hannigan (58) Assistant Secretary | | Since 2016. Serves at the discretion of the Board | | Fund Governance Director of Amundi Pioneer since December 2006 and Assistant Secretary of all the Pioneer Funds since June 2010; Manager – Fund Governance of Amundi Pioneer from December 2003 to November 2006; and Senior Paralegal of Amundi Pioneer from January 2000 to November 2003 | | None |
| | | |
Thomas Reyes (56) Assistant Secretary | | Since 2016. Serves at the discretion of the Board | | Senior Counsel of Amundi Pioneer since May 2013 and Assistant Secretary of all the Pioneer Funds since June 2010; and Counsel of Amundi Pioneer from June 2007 to May 2013 | | None |
| | | |
Mark E. Bradley (59) Treasurer and Chief Financial and Accounting Officer | | Since 2016. Serves at the discretion of the Board | | Vice President – Fund Treasury of Amundi Pioneer; Treasurer of all of the Pioneer Funds since March 2008; Deputy Treasurer of Amundi Pioneer from March 2004 to February 2008; and Assistant Treasurer of all of the Pioneer Funds from March 2004 to February 2008 | | None |
| | | |
Luis I. Presutti (54) Assistant Treasurer | | Since 2016. Serves at the discretion of the Board | | Director – Fund Treasury of Amundi Pioneer; and Assistant Treasurer of all of the Pioneer Funds | | None |
| | | |
Gary Sullivan (61) Assistant Treasurer | | Since 2016. Serves at the discretion of the Board | | Senior Manager – Fund Treasury of Amundi Pioneer; and Assistant Treasurer of all of the Pioneer Funds | | None |
| | | |
David F. Johnson (39) Assistant Treasurer | | Since 2016. Serves at the discretion of the Board | | Senior Manager – Fund Treasury of Amundi Pioneer since November 2008; Assistant Treasurer of all of the Pioneer Funds since January 2009; and Client Service Manager – Institutional Investor Services at State Street Bank from March 2003 to March 2007 | | None |
| | |
| Pioneer Corporate High Yield Fund | Annual Report | 8/31/19 | | 55 |
Fund Officers (continued)
| | | | | | |
| Name, Age and Position | | Term of Office and | | | | Other Directorships |
| Held With the Fund | | Length of Service | | Principal Occupation | | Held by Officer |
John Malone (48) Chief Compliance Officer | | Since 2018. Serves at the discretion of the Board | | Managing Director, Chief Compliance Officer of Amundi Pioneer Asset Management; Amundi Pioneer Institutional Asset Management, Inc.; and the Pioneer Funds since September 2018; and Chief Compliance Officer of Amundi Pioneer Distributor, Inc. since January 2014 | | None |
| | | |
Kelly O’Donnell (48) Anti-Money Laundering Officer | | Since 2016. Serves at the discretion of the Board | | Vice President – Amundi Pioneer Asset Management; and Anti-Money Laundering Officer of all the Pioneer Funds since 2006 | | None |
| | | | |
| 56 | | Pioneer Corporate High Yield Fund | Annual Report | 8/31/19 | | |
This page is for your notes.
| | |
| Pioneer Corporate High Yield Fund | Annual Report | 8/31/19 | | 57 |
This page is for your notes.
| | | | |
| 58 | | Pioneer Corporate High Yield Fund | Annual Report | 8/31/19 | | |
This page is for your notes.
| | |
| Pioneer Corporate High Yield Fund | Annual Report | 8/31/19 | | 59 |
This page is for your notes.
| | | | |
| 60 | | Pioneer Corporate High Yield Fund | Annual Report | 8/31/19 | | |
How to Contact Amundi Pioneer
We are pleased to offer a variety of convenient ways for you to contact us for assistance or information.
| | |
Call us for: | | |
Account Information, including existing accounts, new accounts, prospectuses, applications and service forms | | 1-800-225-6292 |
| |
FactFoneSM for automated fund yields, prices, account information and transactions | | 1-800-225-4321 |
| |
Retirement plans information | | 1-800-622-0176 |
| |
Write to us: | | |
Amundi Pioneer | | |
P.O. Box 219427 | | |
Kansas City, MO 64121-9427 | | |
| |
Our toll-free fax | | 1-800-225-4240 |
| |
Our internet e-mail address | | us.askamundipioneer@amundipioneer.com |
(for general questions about Amundi Pioneer only) | | |
Visit our web site: www.amundipioneer.com/us
This report must be preceded or accompanied by a prospectus.
The Fund files a complete schedule of portfolio holdings with the Securities and Exchange Commission for the first and third quarters of each fiscal year as an exhibit to its reports on Form N-PORT. Shareholders may view the filed Form N-PORT by visiting the Commission’s web site at https://www.sec.gov.
Amundi Pioneer Asset Management, Inc.
60 State Street
Boston, MA 02109
www.amundipioneer.com/us
Securities offered through Amundi Pioneer Distributor, Inc.
60 State Street, Boston, MA 02109
Underwriter of Pioneer Mutual Funds, Member SIPC
© 2019 Amundi Pioneer Asset Management 30494-02-1019