| | | | |
| | | Ticker Symbols: |
| | |
| | | Class A | | RCRAX |
| | Class C | | RCRCX |
| | Class Y | | RCRYX |
Beginning in March 2021, as permitted by regulations adopted by the Securities and Exchange Commission, paper copies of the Fund’s shareholder reports like this one will no longer be sent by mail, unless you specifically request paper copies of the reports from the Fund or from your financial intermediary, such as a broker-dealer, bank or insurance company. Instead, the reports will be made available on the Fund’s website, and you will be notified by mail each time a report is posted and provided with a website link to access the report.
If you already elected to receive shareholder reports electronically, you will not be affected by this change and you need not take any action. You may elect to receive shareholder reports and other communications electronically by contacting your financial intermediary or, if you invest directly with the Fund, by calling 1-800-225-6292.
You may elect to receive all future reports in paper free of charge. If you invest directly with the Fund, you can inform the Fund that you wish to continue receiving paper copies of your shareholder reports by calling 1-800-225-6292. If you invest through a financial intermediary, you can contact your financial intermediary to request that you continue to receive paper copies of your shareholder reports. Your election to receive reports in paper will apply to all funds held in your account if you invest through your financial intermediary or all funds held within the Pioneer Fund complex if you invest directly.

visit us: www.amundipioneer.com/us
Table of Contents
| | | | |
President’s Letter | | | 2 | |
| |
Portfolio Management Discussion | | | 4 | |
| |
Portfolio Summary | | | 10 | |
| |
Prices and Distributions | | | 11 | |
| |
Performance Update | | | 12 | |
| |
Comparing Ongoing Fund Expenses | | | 15 | |
| |
Schedule of Investments | | | 17 | |
| |
Financial Statements | | | 32 | |
| |
Notes to Financial Statements | | | 39 | |
| |
Report of Independent Registered Public Accounting Firm | | | 57 | |
| |
Additional Information | | | 59 | |
| |
Trustees, Officers and Service Providers | | | 60 | |
| | |
| Pioneer Dynamic Credit Fund | Annual Report | 3/31/20 | | 1 |
President’s Letter
Dear Shareholders,
The new decade has arrived delivering a first quarter that will go down in the history books. The beginning of the year seemed to extend the positive market environment of 2019 and then, March roared in like a lion and the COVID-19 pandemic became a global crisis impacting lives and life as we know it. The impact on the global economy from the COVID-19 virus pandemic, while currently unknown, is likely to be considerable. It is clear that several industries have already felt greater effects than others. And the markets, which do not thrive on uncertainty, have been volatile. Our business continuity plan was implemented given the new COVID-19 guidelines, and most of our employees are working remotely. To date, our operating environment has faced no interruption. I am proud of the careful planning that has taken place and confident we can maintain this environment for as long as is prudent. History in the making for a company that first opened its doors way back in 1928.
Since 1928, Amundi Pioneer’s investment process has been built on a foundation of fundamental research and active management, principles which have guided our investment decisions for more than 90 years. We believe active management – that is, making active investment decisions – can help mitigate the potential risks during periods of market volatility. As the early days of 2020 have reminded us, in today’s global economy, investment risk can materialize from a number of factors, including a slowing economy, changing U.S. Federal Reserve policy, oil price shocks, political and geopolitical factors and, unfortunately, major public health concerns such as a viral pandemic.
At Amundi Pioneer, active management begins with our own fundamental, bottom-up research process. Our team of dedicated research analysts and portfolio managers analyze each security under consideration, communicating directly with the management teams of the companies issuing the securities and working together to identify those securities that best meet our investment criteria for our family of funds. Our risk management approach begins with each and every security, as we strive to carefully understand the potential opportunity, while considering any and all risk factors.
| | |
| 2 | | Pioneer Dynamic Credit Fund | Annual Report | 3/31/20 |
Today, as investors, we have many options. It is our view that active management can serve shareholders well, not only when markets are thriving, but also during periods of market stress. As you consider your long-term investment goals, we encourage you to work with your financial advisor to develop an investment plan that paves the way for you to pursue both your short-term and long-term goals.
We remain confident that the current crisis, like others in human history, will pass, and we greatly appreciate the trust you have placed in us and look forward to continuing to serve you in the future.
Sincerely,

Lisa M. Jones
Head of the Americas, President and CEO of U.S.
Amundi Pioneer Asset Management USA, Inc.
March 31, 2020
Any information in this shareowner report regarding market or economic trends or the factors influencing the Fund’s historical or future performance are statements of opinion as of the date of this report. Past performance is no guarantee of future results.
| | |
| Pioneer Dynamic Credit Fund | Annual Report | 3/31/20 | | 3 |
Portfolio Management Discussion | 3/31/20
In the following interview, Michael Temple and Kevin Choy discuss the principal factors that affected the performance of Pioneer Dynamic Credit Fund during the 12-month period ended March 31, 2020, Mr. Temple, Managing Director, Director of Corporate Credit Research, U.S., and a portfolio manager at Amundi Pioneer Asset Management, Inc. (Amundi Pioneer), and Mr. Choy, a vice president and a portfolio manager at Amundi Pioneer, are responsible for the day-to-day management of the Fund.
| Q | How did the Fund perform during the 12-month period ended March 31, 2020? |
| A | Pioneer Dynamic Credit Fund’s Class A shares returned -10.59% at net asset value during the 12-month period ended March 31, 2020, while the Fund’s benchmark, the ICE Bank of America U.S. Dollar 3-Month LIBOR Index (the ICE BofA Index), returned 2.38%. During the same period, the average return of the 316 mutual funds in Morningstar’s Multisector Bond Funds category was -4.16%. |
| Q | How would you describe the investment backdrop in the fixed-income markets during the 12-month period ended March 31, 2020? |
| A | The 12-month period was unusual in that it encompassed two distinct parts. The first part, which ran from April 2019 through mid-February of 2020, was a generally favorable time for the markets. Amid signs that a slowing global economy could begin to have a negative effect on the U.S. economy, the U.S. Federal Reserve (Fed) moved to an accommodative policy stance and enacted three 0.25% interest-rate cuts over the second half of the 2019 calendar year. In combination with a backdrop of steady domestic economic growth and positive investor sentiment, the Fed’s actions contributed to broad-based gains across the fixed-income market and robust relative performance for credit-sensitive investments. |
Those favorable conditions changed abruptly in the middle of February 2020, however, when it became clear that the highly contagious COVID-19 virus had begun to spread beyond China and throughout the globe, eventually becoming a pandemic. As world governments shut down large swaths of their economies to help contain the spread of the virus, the outlook for both gross domestic product (GDP) and for corporate earnings deteriorated dramatically. Market participants responded by moving out of riskier positions and into so-called “safe havens,” such as U.S. Treasuries. In
| | |
| 4 | | Pioneer Dynamic Credit Fund | Annual Report | 3/31/20 |
the bond market, the imbalance of sellers and buyers led to a sharp, dramatic downturn in the prices of credit-sensitive assets such as investment-grade corporates, high-yield bonds, and senior loans. Conversely, U.S. Treasuries staged a strong rally in the ensuing “flight to quality” over the final weeks of the 12-month period.
Global governments and central banks responded with massive stimulus programs in an attempt to help offset the effects of the virus-related shutdowns on both economies and the markets for riskier assets, which had sold off dramatically. In the United States, for instance, the Fed cut short-term interest rates to zero and announced a wide range of lending and asset-purchase facilities, while the U.S. government passed an estimated $2 trillion financial aid bill for both workers and businesses. Credit-sensitive markets had a positive response to those initiatives and staged an impressive rally in the final week of March, but the various credit-sensitive asset classes nonetheless finished the full 12-month period in negative territory.
| Q | What were the principal factors that affected the Fund’s benchmark-relative performance during the 12-month period ended March 31, 2020? |
| A | Our preference for investing the Fund in the credit-sensitive sectors was a key detractor from benchmark-relative performance over the full 12-month period, even though the positions had fared reasonably well for most of the fiscal year before declining sharply in the market sell-off spawned by COVID-19. Specifically, the Fund’s allocations to high-yield bonds and investment-grade corporates detracted from relative returns, as did portfolio positions in senior loans and securitized assets. We gradually reduced the portfolio’s risk exposure over the course of the 12-month period by decreasing the Fund’s weightings in loans and high-yield bonds. At the same time, we rotated the portfolio into higher-quality segments of the credit sectors, including asset-backed securities (ABS). While the shift helped to cushion some of the negative performance effects of the late-period market sell-off, the Fund nonetheless underperformed the benchmark given that all of the asset categories in which it was invested lagged the ICE BofA Index, which is concentrated in non-credit-sensitive issues. |
On the plus side, our efforts to manage tail risk – that is, the chance that unexpected developments could lead to a sharp sell-off across the markets – contributed positively to the Fund’s returns by helping to ease some of the pain inflicted by the market downturn during February and March. The
| | |
| Pioneer Dynamic Credit Fund | Annual Report | 3/31/20 | | 5 |
Fund also benefited from its weightings in cash and U.S. Treasuries during the 12-month period. In addition, an allocation to insurance-linked securities (ILS), which are issued by property-and-casualty insurers to help mitigate the risk of having to payout claims in the wake of natural disasters, contributed modestly to the Fund’s benchmark-relative results. ILS have typically had little or no correlation to the performance of financial markets, a characteristic that helped the asset class outperform most other riskier assets over the 12-month period. We opted to gradually reduce the Fund’s exposure to ILS as the period progressed.
| Q | Did the Fund have exposure to derivative securities during the 12-month period ended March 31, 2020? If so, how did the derivatives affect the Fund’s performance? |
| A | The Fund had investments in several types of derivatives during the 12-month period. We used credit default swaps to manage the portfolio’s exposure to credit-linked securities. In addition, we invested the portfolio in interest-rate futures to help manage duration risk, and we used forward foreign currency contracts to take directional views on underlying economies as well as to manage the risks associated with investments denominated in foreign currencies. (Duration is a measure of the sensitivity of the price, or the value of principal, of a fixed-income investment to a change in interest rates, expressed as a number of years.) |
Our credit-linked derivative strategies detracted from the Fund’s performance, while the interest-rate strategies contributed positively to performance. As mentioned earlier, our attempts to manage tail risk, which involved the use of derivatives, also contributed positively to relative returns. The currency forwards had little effect on the Fund’s results.
| Q | Were there any changes to the Fund’s yield, or distributions* to shareholders, during the 12-month period ended March 31, 2020? |
| A | The Fund’s yield rose compared to its level on March 31, 2019, primarily as a result of the general increase in prevailing market yields over the majority of the 12-month period. |
Please see the Notes to Financial Statements for more information about how the Fund distributes income to shareholders.
| * | Distributions are not guaranteed. |
| | |
| 6 | | Pioneer Dynamic Credit Fund | Annual Report | 3/31/20 |
| Q | How would you characterize broader fixed-income market conditions in the wake of the recent sell-off, and your investment approach as the Fund enters a new fiscal year? |
| A | The markets were mired in a great deal of uncertainty as the 12-month period drew to a close, and volatility remained very high as investors struggled to assess the economic outlook. We believe we are unlikely to see a return to the previous, more positive environment for quite some time, and we have been preparing for that eventuality. With that said, we made few major changes to the portfolio as prices turned lower towards the end of the period, given that the Fund had already been positioned in a defensive fashion. |
We did reduce the Fund’s duration exposure to a certain degree, as we believe a lower duration could potentially help mitigate portfolio volatility, and we see the positioning as appropriate given the extent to which yields have already fallen. We also have maintained above-average Fund weightings in cash and short-term securities to provide us with the flexibility to capitalize on additional market fluctuations in the months ahead. Not least, we have continued to emphasize portfolio investments in corporate bonds issued by companies with robust, sustainable cash flows and strong balance sheets, over issuers that are potentially exposed to greater financial risk. In our view, the possibility of a protracted economic downturn will result in clear winners and losers emerging on the other side, which makes intensive, bottom-up security analysis even more essential.
As always, we believe flexibility remains a key part of our investment process in managing the Fund. We have the ability to manage the portfolio similarly to the way an unconstrained fund might be managed, which means we can increase or decrease credit- or interest-rate risk depending on our economic outlook and assessments of current valuations. We view that degree of flexibility as being crucial in helping us to potentially navigate the Fund through what is currently an unprecedented set of circumstances affecting the global economy.
Note to shareholders: The Fund’s Board of Trustees has approved the reorganization of Pioneer Dynamic Credit Fund with Pioneer Corporate High Yield Fund. It is expected that the reorganization will be completed sometime during the third calendar quarter of 2020. The reorganization does not require shareholder approval. The combined fund will have the same investment strategies and policies and the same portfolio management team as Pioneer Corporate High Yield Fund. It is anticipated that the performance history of the combined fund will be that of Pioneer Corporate High Yield Fund, and the combined fund will be named Pioneer Corporate High Yield Fund.
| | |
| Pioneer Dynamic Credit Fund | Annual Report | 3/31/20 | | 7 |
Please refer to the Schedule of Investments on pages 17–31 for a full listing of Fund securities.
All investments are subject to risk, including the possible loss of principal. In the past several years, financial markets have experienced increased volatility and heightened uncertainty. The market prices of securities may go up or down, sometimes rapidly or unpredictably, due to general market conditions, such as real or perceived adverse economic, political, or regulatory conditions, recessions, inflation, changes in interest or currency rates, lack of liquidity in the bond markets, the spread of infectious illness or other public health issues or adverse investor sentiment. These conditions may continue, recur, worsen or spread.
The Fund has the ability to invest in a wide variety of debt securities.
The Fund may invest in underlying funds, including ETFs. In addition to the Fund’s operating expenses, you will indirectly bear the operating expenses of investments in any underlying funds.
The Fund and some of the underlying funds utilize strategies that have a leveraging effect on the Fund, which increases the volatility of investment returns and subjects the Fund to magnified losses if the Fund’s or an underlying fund’s investments decline in value.
The Fund and some of the underlying funds may use derivatives, such as options and futures, which can be illiquid, may disproportionately increase losses, and have a potentially large impact on Fund performance.
The Fund may invest in inflation-linked securities. As inflationary expectations increase, inflation-linked securities may become more attractive, because they protect future interest payments against inflation. Conversely, as inflationary concerns decrease, inflation-linked securities will become less attractive and less valuable.
The Fund may invest in credit default swaps, which may in some cases be illiquid, and they increase credit risk since the Fund has exposure to both the issuer of the referenced obligation and the counterparty to the credit default swap.
The Fund may invest in floating-rate loans. The value of collateral, if any, securing a floating-rate loan can decline or may be insufficient to meet the issuer’s obligations or may be difficult to liquidate.
| | |
| 8 | | Pioneer Dynamic Credit Fund | Annual Report | 3/31/20 |
The Fund may invest in insurance-linked securities. The return of principal and the payment of interest and/or dividends on insurance linked securities are contingent on the non-occurrence of a pre-defined “trigger” event, such as a hurricane or an earthquake of a specific magnitude.
The Fund may invest in zero coupon bonds and payment-in-kind securities, which may be more speculative and fluctuate more in value than other fixed income securities. The accrual of income from these securities are payable as taxable annual dividends to shareholders.
Investments in equity securities are subject to price fluctuation.
Investments in fixed-income securities involve interest rate, credit, inflation, and reinvestment risks. As interest rates rise, the value of fixed-income securities generally falls.
The Fund may invest in mortgage-backed securities, which during times of fluctuating interest rates may increase or decrease more than other fixed-income securities. Mortgage-backed securities are also subject to pre-payments.
Prepayment risk is the chance that an issuer may exercise its right to prepay its security, if falling interest rates prompt the issuer to do so. Forced to reinvest the unanticipated proceeds at lower interest rates, the Fund would experience a decline in income and lose the opportunity for additional price appreciation.
High-yield bonds possess greater price volatility, illiquidity, and possibility of default.
There is no assurance that these and other strategies used by the Fund or underlying funds will be successful.
The Fund is not intended to outperform stocks and bonds during strong market rallies.
These risks may increase share price volatility.
Please see the prospectus for a more complete discussion of the Fund’s risks.
Before investing, consider the product’s investment objectives, risks, charges and expenses. Contact your advisor or Amundi Pioneer Asset Management, Inc., for a prospectus or summary prospectus containing this information. Read it carefully.
Any information in this shareholder report regarding market or economic trends or the factors influencing the Fund’s historical or future performance are statements of opinion as of the date of this report. Past performance is no guarantee of future results.
| | |
| Pioneer Dynamic Credit Fund | Annual Report | 3/31/20 | | 9 |
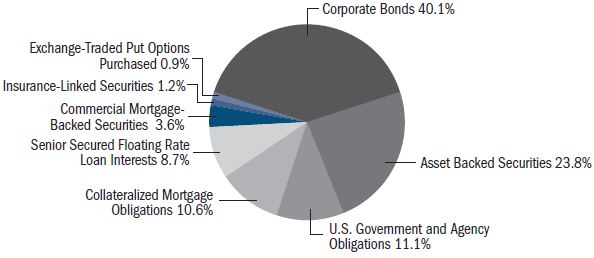
Portfolio Summary | 3/31/20
Portfolio Diversification
(As a percentage of total investments)*
10 Largest Holdings
(As a percentage of total investments)*
| | | | | | |
1. | | U.S. Treasury Notes, 2.125%, 12/31/22 | | | 6.50 | % |
2. | | U.S. Treasury Floating Rate Notes, 0.239% (3 Month U.S. Treasury Bill Money Market Yield + 15 bps), 1/31/22 | | | 3.48 | |
3. | | Westlake Automobile Receivables Trust, Series 2018-3A, Class E, 4.9%, 12/15/23 (144A) | | | 2.12 | |
4. | | Iron Mountain, Inc., 4.875%, 9/15/27 (144A) | | | 1.76 | |
5. | | Progress Residential Trust, Series 2018-SFR2, Class E, 4.656%, 8/17/35 (144A) | | | 1.74 | |
6. | | Progress Residential Trust, Series 2018-SFR3, Class F, 5.368%, 10/17/35 (144A) | | | 1.72 | |
7. | | Aramark Services, Inc., 5.0%, 2/1/28 (144A) | | | 1.66 | |
8. | | Charter Communications Operating LLC/Charter Communications Operating Capital, 4.8%, 3/1/50 | | | 1.49 | |
9. | | Cascade Funding Mortgage Trust, Series 2018-RM2, Class D, 4.0%, 10/25/68 (144A) | | | 1.46 | |
10. | | Allergan Funding SCS, 4.75%, 3/15/45 | | | 1.46 | |
| * | Excludes temporary cash investments and all derivative contracts except for options purchased. The Fund is actively managed, and current holdings may be different. The holdings listed should not be considered recommendations to buy or sell any securities. |
| | |
| 10 | | Pioneer Dynamic Credit Fund | Annual Report | 3/31/20 |
Prices and Distributions | 3/31/20
Net Asset Value per Share
| | | | | | | | |
| Class | | 3/31/20 | | | 3/31/19 | |
| A | | $ | 7.75 | | | $ | 9.04 | |
| C | | $ | 7.73 | | | $ | 9.00 | |
| Y | | $ | 7.79 | | | $ | 9.07 | |
Distributions per Share: 4/1/19–3/31/20
| | | | | | | | | | | | | | | | |
| | | Net Investment | | | Short-Term | | | Long-Term | | | Tax Return | |
| Class | | Income | | | Capital Gains | | | Capital Gains | | | Of Capital | |
| A | | $ | 0.3545 | | | $ | — | | | $ | — | | | $ | 0.0234 | |
| C | | $ | 0.2817 | | | $ | — | | | $ | — | | | $ | 0.0234 | |
| Y | | $ | 0.3862 | | | $ | — | | | $ | — | | | $ | 0.0234 | |
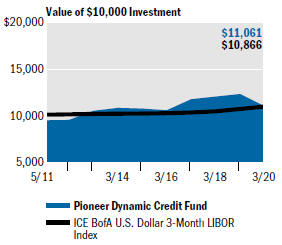
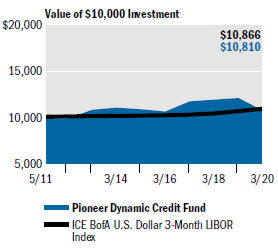
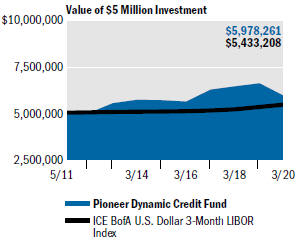
The ICE Bank of America U.S. Dollar 3-Month LIBOR Index is an unmanaged index that tracks the performance of a synthetic asset paying the London Interbank Offered Rate (LIBOR), with a constant 3-month average maturity. The index is based on the assumed purchase at par value of a synthetic instrument having exactly its stated maturity and with a coupon equal to that day’s 3-month LIBOR rate. Index returns assume reinvestment of dividends and, unlike Fund returns, do not reflect any fees, expenses or sales charges. It is not possible to invest directly in an index.
The index defined here pertains to the “Value of $10,000 Investment” and “Value of $5 Million Investment” charts on pages 12–14.
| | |
| Pioneer Dynamic Credit Fund | Annual Report | 3/31/20 | | 11 |
| | |
| Performance Update | 3/31/20 | | Class A Shares |
Investment Returns
The mountain chart on the right shows the change in value of a $10,000 investment made in Class A shares of Pioneer Dynamic Credit Fund at public offering price during the periods shown, compared to that of the ICE Bank of America (BofA) U.S. Dollar 3-Month LIBOR Index.
Average Annual Total Returns
(As of March 31, 2020)
| | | | | | | | | | | | |
Period | | Net
Asset
Value
(NAV) | | | Public
Offering
Price
(POP) | | | ICE
BofA
U.S. Dollar
3-Month
LIBOR
Index | |
Life-of-Class
(4/29/11) | | | 1.66 | % | | | 1.14 | % | | | 0.94 | % |
5 years | | | 0.48 | | | | -0.45 | | | | 1.42 | |
1 year | | | -10.59 | | | | -14.62 | | | | 2.38 | |
| | | | |
Expense Ratio | |
(Per prospectus dated August 1, 2019) | |
| |
Gross | | Net | |
1.28% | | | 1.27 | % |
Call 1-800-225-6292 or visit www.amundipioneer.com/us for the most recent month-end performance results. Current performance may be lower or higher than the performance data quoted.
The performance data quoted represents past performance, which is no guarantee of future results. Investment return and principal value will fluctuate, and shares, when redeemed, may be worth more or less than their original cost.
NAV results represent the percent change in net asset value per share. NAV returns would have been lower had sales charges been reflected. POP returns reflect deduction of maximum 4.50% sales charge. All results are historical and assume the reinvestment of dividends and capital gains. Other share classes are available for which performance and expenses will differ.
Performance results reflect any applicable expense waivers in effect during the periods shown. Without such waivers Fund performance would be lower. Waivers may not be in effect for all funds. Certain fee waivers are contractual through a specified period. Otherwise, fee waivers can be rescinded at any time. See the prospectus and financial statements for more information.
The net expense ratio reflects the contractual expense limitation currently in effect through August 1, 2020, for Class A shares. There can be no assurance that Amundi Pioneer will extend the expense limitation beyond such time. Please see the prospectus for more information.
The performance table and graph do not reflect the deduction of fees and taxes that a shareowner would pay on Fund distributions or the redemption of Fund shares.
Please refer to the financial highlights for more current expense ratios.
| | |
| 12 | | Pioneer Dynamic Credit Fund | Annual Report | 3/31/20 |
| | |
| Performance Update | 3/31/20 | | Class C Shares |
Investment Returns
The mountain chart on the right shows the change in value of a $10,000 investment made in Class C shares of Pioneer Dynamic Credit Fund during the periods shown, compared to that of the ICE Bank of America (BofA) U.S. Dollar 3-Month LIBOR Index.
Average Annual Total Returns
(As of March 31, 2020)
| | | | | | | | | | | | |
Period | | If
Held | | | If
Redeemed | | | ICE
BofA
U.S. Dollar
3-Month
LIBOR
Index | |
Life-of-Class
(4/29/11) | | | 0.88 | % | | | 0.88 | % | | | 0.94 | % |
5 years | | | -0.27 | | | | -0.27 | | | | 1.42 | |
1 year | | | -11.14 | | | | -11.14 | | | | 2.38 | |
|
| Expense Ratio |
(Per prospectus dated August 1, 2019) |
|
Gross |
2.07% |
Call 1-800-225-6292 or visit www.amundipioneer.com/us for the most recent month-end performance results. Current performance may be lower or higher than the performance data quoted.
The performance data quoted represents past performance, which is no guarantee of future results. Investment return and principal value will fluctuate, and shares, when redeemed, may be worth more or less than their original cost.
Class C shares held for less than one year are subject to a 1% contingent deferred sales charge (CDSC). “If Held” results represent the percent change in net asset value per share. “If Redeemed” returns would have been lower had sales charges been reflected. All results are historical and assume the reinvestment of dividends and capital gains. Other share classes are available for which performance and expenses will differ.
Performance results reflect any applicable expense waivers in effect during the periods shown. Without such waivers Fund performance would be lower. Waivers may not be in effect for all funds. Certain fee waivers are contractual through a specified period. Otherwise, fee waivers can be rescinded at any time. See the prospectus and financial statements for more information.
The performance table and graph do not reflect the deduction of fees and taxes that a shareowner would pay on Fund distributions or the redemption of Fund shares.
Please refer to the financial highlights for a more current expense ratio.
| | |
| Pioneer Dynamic Credit Fund | Annual Report | 3/31/20 | | 13 |
| | |
| Performance Update | 3/31/20 | | Class Y Shares |
Investment Returns
The mountain chart on the right shows the change in value of a $5 million investment made in Class Y shares of Pioneer Dynamic Credit Fund during the periods shown, compared to that of the ICE Bank of America (BofA) U.S. Dollar 3-Month LIBOR Index.
Average Annual Total Returns
(As of March 31, 2020)
| | | | | | | | |
Period | | Net
Asset
Value
(NAV) | | | ICE
BofA
U.S. Dollar
3-Month
LIBOR
Index | |
Life-of-Class
(4/29/11) | | | 2.03 | % | | | 0.94 | % |
5 years | | | 0.81 | | | | 1.42 | |
1 year | | | -10.13 | | | | 2.38 | |
| | | | |
| Expense Ratio | |
(Per prospectus dated August 1, 2019) | |
| |
Gross | | Net | |
1.06% | | | 0.92 | % |
Call 1-800-225-6292 or visit www.amundipioneer.com/us for the most recent month-end performance results. Current performance may be lower or higher than the performance data quoted.
The performance data quoted represents past performance, which is no guarantee of future results. Investment return and principal value will fluctuate, and shares, when redeemed, may be worth more or less than their original cost.
Class Y shares are not subject to sales charges and are available for limited groups of eligible investors, including institutional investors. All results are historical and assume the reinvestment of dividends and capital gains. Other share classes are available for which performance and expenses will differ.
Performance results reflect any applicable expense waivers in effect during the periods shown. Without such waivers Fund performance would be lower. Waivers may not be in effect for all funds. Certain fee waivers are contractual through a specified period. Otherwise, fee waivers can be rescinded at any time. See the prospectus and financial statements for more information.
The net expense ratio reflects the contractual expense limitation currently in effect through August 1, 2020, for Class Y shares. There can be no assurance that Amundi Pioneer will extend the expense limitation beyond such time. Please see the prospectus for more information.
The performance table and graph do not reflect the deduction of fees and taxes that a shareowner would pay on Fund distributions or the redemption of Fund shares.
Please refer to the financial highlights for more current expense ratios.
| | |
| 14 | | Pioneer Dynamic Credit Fund | Annual Report | 3/31/20 |
Comparing Ongoing Fund Expenses
As a shareowner in the Fund, you incur two types of costs:
| (1) | ongoing costs, including management fees, distribution and/or service (12b-1) fees, and other Fund expenses; and |
| (2) | transaction costs, including sales charges (loads) on purchase payments. |
This example is intended to help you understand your ongoing expenses (in dollars) of investing in the Fund and to compare these costs with the ongoing costs of investing in other mutual funds. The example is based on an investment of $1,000 at the beginning of the Fund’s latest six-month period and held throughout the six months.
Using the Tables
Actual Expenses
The first table below provides information about actual account values and actual expenses. You may use the information in this table, together with the amount you invested, to estimate the expenses that you paid over the period as follows:
| (1) | Divide your account value by $1,000 |
Example: an $8,600 account value ÷ $1,000 = 8.6
| (2) | Multiply the result in (1) above by the corresponding share class’s number in the third row under the heading entitled “Expenses Paid During Period” to estimate the expenses you paid on your account during this period. |
Expenses Paid on a $1,000 Investment in Pioneer Dynamic Credit Fund
Based on actual returns from October 1, 2019 through March 31, 2020.
| | | | | | | | | | | | |
| Share Class | | A | | | C | | | Y | |
Beginning Account Value on 10/1/19 | | $ | 1,000.00 | | | $ | 1,000.00 | | | $ | 1,000.00 | |
Ending Account Value
(after expenses) on 3/31/20 | | $ | 859.96 | | | $ | 857.89 | | | $ | 862.15 | |
Expenses Paid During Period* | | $ | 5.49 | | | $ | 9.15 | | | $ | 3.96 | |
| * | Expenses are equal to the Fund’s annualized expense ratio of 1.18%, 1.97%, and 0.85% for Class A, Class C, and Class Y, respectively, multiplied by the average account value over the period, multiplied by 183/366 (to reflect the partial year period). |
| | |
| Pioneer Dynamic Credit Fund | Annual Report | 3/31/20 | | 15 |
Hypothetical Example for Comparison Purposes
The table below provides information about hypothetical account values and hypothetical expenses based on the Fund’s actual expense ratio and an assumed rate of return of 5% per year before expenses, which is not the Fund’s actual return. The hypothetical account values and expenses may not be used to estimate the actual ending account balance or expenses you paid for the period.
You may use this information to compare the ongoing costs of investing in the Fund and other funds. To do so, compare this 5% hypothetical example with the 5% hypothetical examples that appear in the shareholder reports of the other funds.
Please note that the expenses shown in the tables are meant to highlight your ongoing costs only and do not reflect any transaction costs, such as sales charges (loads) that are charged at the time of the transaction. Therefore, the table below is useful in comparing ongoing costs only and will not help you determine the relative total costs of owning different funds. In addition, if these transaction costs were included, your costs would have been higher.
Expenses Paid on a $1,000 Investment in Pioneer Dynamic Credit Fund
Based on a hypothetical 5% return per year before expenses, reflecting the period from October 1, 2019 through March 31, 2020.
| | | | | | | | | | | | |
| Share Class | | A | | | C | | | Y | |
Beginning Account Value on 10/1/19 | | $ | 1,000.00 | | | $ | 1,000.00 | | | $ | 1,000.00 | |
Ending Account Value
(after expenses) on 3/31/20 | | $ | 1,019.10 | | | $ | 1,015.00 | | | $ | 1,020.75 | |
Expenses Paid During Period* | | $ | 5.96 | | | $ | 9.92 | | | $ | 4.29 | |
| * | Expenses are equal to the Fund’s annualized expense ratio of 1.18%, 1.97%, and 0.85% for Class A, Class C, and Class Y, respectively, multiplied by the average account value over the period, multiplied by 183/366 (to reflect the partial year period). |
| | |
| 16 | | Pioneer Dynamic Credit Fund | Annual Report | 3/31/20 |
Schedule of Investments | 3/31/20
| | | | | | | | |
Principal
Amount
USD ($) | | | | | Value | |
| | | | UNAFFILIATED ISSUERS — 94.7% | | | | |
| | | | ASSET BACKED SECURITIES — 22.5% of Net Assets | | | | |
| | 250,000 | (a) | | 522 Funding CLO I, Ltd., Series 2019-1A, Class E, 0.0% (3 Month USD LIBOR + 734 bps), 1/15/33 (144A) | | $ | 145,056 | |
| | 718,207 | | | Access Point Funding I LLC, Series 2017-A, Class B, 3.97%, 4/15/29 (144A) | | | 716,589 | |
| | 250,000 | (a) | | AIG CLO, Ltd., Series 2019-2A, Class E, 9.12% (3 Month USD LIBOR + 725 bps), 10/25/32 (144A) | | | 143,011 | |
| | 250,000 | (a) | | Allegany Park CLO, Ltd., Series 2019-1A, Class E, 8.609% (3 Month USD LIBOR + 678 bps), 1/20/33 (144A) | | | 140,456 | |
| | 1,667,000 | | | Amur Equipment Finance Receivables VI LLC, Series 2018-2A, Class F, 7.39%, 6/22/26 (144A) | | | 1,697,218 | |
| | 250,000 | (a) | | Apidos CLO XXXII, Series 2019-32A, Class E, 8.433% (3 Month USD LIBOR + 675 bps), 1/20/33 (144A) | | | 140,522 | |
| | 250,000 | (a) | | Battalion CLO IX, Ltd., Series 2015-9A, Class ER, 8.081% (3 Month USD LIBOR + 625 bps), 7/15/31 (144A) | | | 142,792 | |
| | 500,000 | (a) | | Benefit Street Partners CLO XIX, Ltd., Series 2019-19A, Class D, 5.678% (3 Month USD LIBOR + 380 bps), 1/15/33 (144A) | | | 362,327 | |
| | 500,000 | (a) | | Benefit Street Partners CLO XIX, Ltd., Series 2019-19A, Class E, 8.898% (3 Month USD LIBOR + 702 bps), 1/15/33 (144A) | | | 283,371 | |
| | 366,466 | | | BXG Receivables Note Trust, Series 2018-A, Class C, 4.44%, 2/2/34 (144A) | | | 364,773 | |
| | 250,000 | (a) | | Carlyle US CLO, Ltd., Series 2019-4A, Class C, 5.878% (3 Month USD LIBOR + 400 bps), 1/15/33 (144A) | | | 186,524 | |
| | 1,000,000 | | | Cig Auto Receivables Trust, Series 2019-1A, Class D, 4.85%, 5/15/26 (144A) | | | 711,199 | |
| | 1,000,000 | | | Conn’s Receivables Funding LLC, Series 2019-A, Class C, 5.29%, 10/16/23 (144A) | | | 947,921 | |
| | 250,000 | (a) | | Dryden 78 CLO, Ltd., Series 2020-78A, Class E, 6.6% (3 Month USD LIBOR + 660 bps), 4/17/33 (144A) | | | 137,500 | |
| | 1,500,000 | | | Elm Trust, Series 2018-2A, Class B, 5.584%, 10/20/27 (144A) | | | 1,502,625 | |
| | 800,000 | | | Engs Commercial Finance Trust, Series 2016-1A, Class D, 5.22%, 1/22/24 (144A) | | | 797,750 | |
| | 250,000 | (a) | | First Eagle BSL CLO, Ltd., Series 2019-1A, Class C, 6.225% (3 Month USD LIBOR + 435 bps), 1/20/33 (144A) | | | 184,515 | |
| | 250,000 | (a) | | First Eagle BSL CLO, Ltd., Series 2019-1A, Class D, 9.575% (3 Month USD LIBOR + 770 bps), 1/20/33 (144A) | | | 144,215 | |
| | 250,000 | (a) | | First Eagle Commercial Loan Funding LLC, Series 2016-1A, Class CR, 6.794% (3 Month USD LIBOR + 500 bps), 1/25/32 (144A) | | | 236,399 | |
| | 250,000 | (a) | | Fort Washington CLO, Series 2019-1A, Class E, 9.158% (3 Month USD LIBOR + 725 bps), 10/20/32 (144A) | | | 142,956 | |
| | 1,800,000 | | | Four Seas LP, Series 2017-1A, Class A2, 5.927%, 8/28/27 (144A) | | | 1,629,000 | |
The accompanying notes are an integral part of these financial statements.
| | |
| Pioneer Dynamic Credit Fund | Annual Report | 3/31/20 | | 17 |
Schedule of Investments | 3/31/20 (continued)
| | | | | | | | |
Principal
Amount
USD ($) | | | | | Value | |
| | | | ASSET BACKED SECURITIES — (continued) | | | | |
| | 1,500,000 | | | Foursight Capital Automobile Receivables Trust, Series 2018-2, Class E, 5.5%, 10/15/24 (144A) | | $ | 1,464,289 | |
| | 500,000 | | | Foursight Capital Automobile Receivables Trust, Series 2018-2, Class F, 6.48%, 6/15/26 (144A) | | | 413,611 | |
| | 500,000 | | | Foursight Capital Automobile Receivables Trust, Series 2019-1, Class F, 5.57%, 11/16/26 (144A) | | | 384,470 | |
| | 103,768 | (b) | | GE Mortgage Services LLC, Series 1997-HE1, Class A4, 7.78%, 3/25/27 | | | 20,531 | |
| | 440,000 | (a) | | Goldentree Loan Management US CLO 6, Ltd., Series 2019-6A, Class D, 5.607% (3 Month USD LIBOR + 385 bps), 1/20/33 (144A) | | | 325,461 | |
| | 500,000 | | | Hercules Capital Funding Trust, Series 2018-1A, Class A, 4.605%, 11/22/27 (144A) | | | 497,687 | |
| | 890,000 | | | HOA Funding LLC, Series 2014-1A, Class A2, 4.846%, 8/20/44 (144A) | | | 848,855 | |
| | 200,000 | | | InSite Issuer LLC, Series 2016-1A, Class C, 6.414%, 11/15/46 (144A) | | | 165,484 | |
| | 700,000 | | | Kabbage Funding LLC, Series 2019-1, Class C, 4.611%, 3/15/24 (144A) | | | 677,330 | |
| | 250,000 | (a) | | Madison Park Funding XXII, Ltd., Series 2016-22A, Class ER, 8.358% (3 Month USD LIBOR + 670 bps), 1/15/33 (144A) | | | 149,962 | |
| | 250,000 | (a) | | Madison Park Funding XXXVI, Ltd., Series 2019-36A, Class D, 5.692% (3 Month USD LIBOR + 375 bps), 1/15/33 (144A) | | | 182,554 | |
| | 500,000 | (a) | | Madison Park Funding XXXVI, Ltd., Series 2019-36A, Class E, 9.192% (3 Month USD LIBOR + 725 bps), 1/15/33 (144A) | | | 301,155 | |
| | 774,143 | (a) | | Newtek Small Business Loan Trust, Series 2018-1, Class B, 3.947% (1 Month USD LIBOR + 300 bps), 2/25/44 (144A) | | | 750,400 | |
| | 250,000 | (a) | | Octagon Investment Partners XXI, Ltd., Series 2014-1A, Class DRR, 8.704% (3 Month USD LIBOR + 700 bps), 2/14/31 (144A) | | | 164,667 | |
| | 650,000 | (a) | | Palmer Square Loan Funding, Ltd., Series 2018-1A, Class C, 3.681% (3 Month USD LIBOR + 185 bps), 4/15/26 (144A) | | | 513,508 | |
| | 650,000 | (a) | | Palmer Square Loan Funding, Ltd., Series 2018-1A, Class D, 5.781% (3 Month USD LIBOR + 395 bps), 4/15/26 (144A) | | | 431,798 | |
| | 1,675,000 | | | Progress Residential Trust, Series 2018-SFR1, Class E, 4.38%, 3/17/35 (144A) | | | 1,562,668 | |
| | 2,500,000 | | | Progress Residential Trust, Series 2018-SFR2, Class E, 4.656%, 8/17/35 (144A) | | | 2,249,081 | |
| | 2,510,000 | | | Progress Residential Trust, Series 2018-SFR3, Class F, 5.368%, 10/17/35 (144A) | | | 2,227,298 | |
| | 500,000 | | | Rosy, Series 2018-1, Class A1, 6.25%, 12/15/25 (144A) | | | 475,000 | |
The accompanying notes are an integral part of these financial statements.
| | |
| 18 | | Pioneer Dynamic Credit Fund | Annual Report | 3/31/20 |
| | | | | | | | |
Principal
Amount USD ($) | | | | | Value | |
| | | | ASSET BACKED SECURITIES — (continued) | | | | |
| | 834,337 | | | SCF Equipment Leasing LLC, Series 2019-1A, Class E, 5.49%, 4/20/30 (144A) | | $ | 798,061 | |
| | 848,472 | | | Solarcity Lmc Series VI LLC, Series 2016-A, Class A, 4.8%, 9/20/48 (144A) | | | 821,195 | |
| | 300,000 | (a) | | Sound Point CLO XXV, Ltd., Series 2019-4A, Class E, 9.451% (3 Month USD LIBOR + 762 bps), 1/15/33 (144A) | | | 176,711 | |
| | 250,000 | (a) | | Symphony CLO XXII, Ltd., Series 2020-22A, Class D, 0.0% (3 Month USD LIBOR + 315 bps), 4/18/33 (144A) | | | 171,736 | |
| | 500,000 | | | United Auto Credit Securitization Trust, Series 2019-1, Class F, 6.05%, 1/12/26 (144A) | | | 347,544 | |
| | 750,000 | | | Veros Automobile Receivables Trust, Series 2018-1, Class C, 4.65%, 2/15/24 (144A) | | | 749,925 | |
| | 500,000 | (a) | | Westcott Park CLO, Ltd., Series 2016-1A, Class ER, 8.219% (3 Month USD LIBOR + 640 bps), 7/20/28 (144A) | | | 320,452 | |
| | 2,750,000 | | | Westlake Automobile Receivables Trust, Series 2018-3A, Class E, 4.9%, 12/15/23 (144A) | | | 2,735,790 | |
| | | | | | | | |
| | | | TOTAL ASSET BACKED SECURITIES
(Cost $35,119,023) | | $ | 30,683,942 | |
| | | | | | | | |
| | | | COLLATERALIZED MORTGAGE OBLIGATIONS — 10.1% of Net Assets | | | | |
| | 17,880 | (b) | | Bear Stearns ALT-A Trust, Series 2003-3, Class 1A, 4.544%, 10/25/33 | | $ | 15,587 | |
| | 235,000 | (a) | | Bellemeade Re, Ltd., Series 2018-2A, Class B1, 3.597% (1 Month USD LIBOR + 265 bps), 8/25/28 (144A) 184,151 | | | | |
| | 380,000 | (a) | | Bellemeade Re, Ltd., Series 2019-1A, Class M1B, 2.697% (1 Month USD LIBOR + 175 bps), 3/25/29 (144A) 334,825 | | | | |
| | 2,113,125 | (b) | | Cascade Funding Mortgage Trust, Series 2018-RM2, Class D, 4.0%, 10/25/68 (144A) | | | 1,893,098 | |
| | 1,000,000 | (a) | | Connecticut Avenue Securities Trust, Series 2018-R07, Class 1B1, 5.297% (1 Month USD LIBOR + 435 bps), 4/25/31 (144A) | | | 471,825 | |
| | 818,142 | (a) | | Connecticut Avenue Securities Trust, Series 2018-R07, Class 1M2, 3.347% (1 Month USD LIBOR + 240 bps), 4/25/31 (144A) | | | 699,456 | |
| | 871,407 | (a) | | Connecticut Avenue Securities Trust, Series 2019-R02, Class 1M2, 3.247% (1 Month USD LIBOR + 230 bps), 8/25/31 (144A) | | | 721,136 | |
| | 1,000,000 | (a) | | Connecticut Avenue Securities Trust, Series 2019-R03, Class 1B1, 5.047% (1 Month USD LIBOR + 410 bps), 9/25/31 (144A) | | | 450,943 | |
| | 1,250,000 | (b) | | Deephaven Residential Mortgage Trust, Series 2018-3A, Class B1, 5.007%, 8/25/58 (144A) | | | 1,158,080 | |
| | 890,000 | (a) | | Fannie Mae Connecticut Avenue Securities, Series 2017-C02, Class 2B1, 6.447% (1 Month USD LIBOR + 550 bps), 9/25/29 | | | 552,563 | |
The accompanying notes are an integral part of these financial statements.
| | |
| Pioneer Dynamic Credit Fund | Annual Report | 3/31/20 | | 19 |
Schedule of Investments | 3/31/20 (continued)
| | | | | | | | |
Principal
Amount USD ($) | | | | | Value | |
| | | | COLLATERALIZED MORTGAGE OBLIGATIONS — (continued) | | | | |
| | 952,152 | (a) | | Fannie Mae Connecticut Avenue Securities, Series 2018-C06, Class 1M2, 2.947% (1 Month USD LIBOR + 200 bps), 3/25/31 | | $ | 837,646 | |
| | 2,510,000 | (a) | | Freddie Mac Stacr Trust, Series 2018-HQA2, Class B2, 11.947% (1 Month USD LIBOR + 1,100 bps), 10/25/48 (144A) | | | 1,503,674 | |
| | 1,240,906 | (a) | | Freddie Mac Stacr Trust, Series 2019-HQA1, Class M2, 3.297% (1 Month USD LIBOR + 235 bps), 2/25/49 (144A) | | | 1,047,533 | |
| | 180,000 | (a) | | Freddie Mac Stacr Trust, Series 2019-HQA2, Class B1, 5.047% (1 Month USD LIBOR + 410 bps), 4/25/49 (144A) | | | 77,810 | |
| | 140,000 | (a) | | Freddie Mac Stacr Trust, Series 2019-HQA2, Class B2, 12.197% (1 Month USD LIBOR + 1,125 bps), 4/25/49 (144A) | | | 83,277 | |
| | 150,000 | (a) | | Freddie Mac Stacr Trust, Series 2019-HQA2, Class M2, 2.997% (1 Month USD LIBOR + 205 bps), 4/25/49 (144A) | | | 124,461 | |
| | 177,728 | | | Global Mortgage Securitization, Ltd., Series 2004-A, Class B2, 5.25%, 11/25/32 (144A) | | | 8,881 | |
| | 84,162 | | | Global Mortgage Securitization, Ltd., Series 2004-A, Class B3, 5.25%, 11/25/32 (144A) | | | 1 | |
| | 208,001 | | | Global Mortgage Securitization, Ltd., Series 2005-A, Class B2, 5.25%, 4/25/32 (144A) | | | 154,016 | |
| | 326,152 | (a) | | La Hipotecaria Panamanian Mortgage Trust, Series 2007-1GA, Class A, 4.5% (Panamanian Mortgage Reference Rate - 125 bps), 12/23/36 (144A) | | | 333,083 | |
| | 1,525,000 | (a) | | Starwood Waypoint Homes Trust, Series 2017-1, Class E, 3.305% (1 Month USD LIBOR + 260 bps), 1/17/35 (144A) | | | 1,429,096 | |
| | 1,000,000 | | | Tricon American Homes Trust, Series 2017-SFR1, Class F, 5.151%, 9/17/34 (144A) | | | 903,786 | |
| | 900,000 | | | Tricon American Homes Trust, Series 2017-SFR2, Class F, 5.104%, 1/17/36 (144A) | | | 759,821 | |
| | | | | | | | |
| | | | TOTAL COLLATERALIZED MORTGAGE OBLIGATIONS
(Cost $17,823,460) | | $ | 13,744,749 | |
| | | | | | | | |
| | | | COMMERCIAL MORTGAGE-BACKED SECURITIES — 3.4% of Net Assets | | | | |
| | 500,000 | (a) | | BTH-25 Mortgage-Backed Securities Trust, Series 2019-25, Class A, 4.015% (1 Month USD LIBOR + 250 bps), 2/18/21 (144A) | | $ | 494,411 | |
| | 350,000 | (a) | | BX Commercial Mortgage Trust, Series 2018-IND, Class D, 2.005% (1 Month USD LIBOR + 130 bps), 11/15/35 (144A) | | | 321,070 | |
| | 500,000 | (b) | | CSAIL Commercial Mortgage Trust, Series 2015-C4, Class D, 3.58%, 11/15/48 | | | 374,393 | |
The accompanying notes are an integral part of these financial statements.
| | |
| 20 | | Pioneer Dynamic Credit Fund | Annual Report | 3/31/20 |
| | | | | | | | |
Principal Amount USD ($) | | | | | Value | |
| | | | COMMERCIAL MORTGAGE-BACKED SECURITIES — (continued) | | | | |
| | 500,000 | (a) | | GS Mortgage Securities Trust, Series 2018-HART, Class B, 2.005% (1 Month USD LIBOR + 130 bps), 10/15/31 (144A) | | $ | 477,175 | |
| | 300,000 | (b) | | JPMDB Commercial Mortgage Securities Trust, Series 2016-C4, Class D, 3.09%, 12/15/49 (144A) | | | 209,439 | |
| | 260,000 | | | Morgan Stanley Capital I Trust, Series 2016-UBS9, Class D, 3.0%, 3/15/49 (144A) | | | 185,007 | |
| | 426,222 | (a) | | Natixis Commercial Mortgage Securities Trust, Series 2018-FL1, Class MCR1, 4.009% (1 Month USD LIBOR + 235 bps), 6/15/35 (144A) | | | 391,237 | |
| | 1,439,597 | (a) | | SLIDE, Series 2018-FUN, Class B, 1.955% (1 Month USD LIBOR + 125 bps), 6/15/31 (144A) | | | 1,309,298 | |
| | 416,381 | (a) | | Tharaldson Hotel Portfolio Trust, Series 2018-THL, Class C, 2.355% (1 Month USD LIBOR + 135 bps), 11/11/34 (144A) | | | 374,150 | |
| | 750,000 | | | Wells Fargo Commercial Mortgage Trust, Series 2016-BNK1, Class D, 3.0%, 8/15/49 (144A) | | | 519,585 | |
| | | | | | | | |
| | | | TOTAL COMMERCIAL MORTGAGE-BACKED SECURITIES
(Cost $5,119,463) | | $ | 4,655,765 | |
| | | | | | | | |
| | | | CORPORATE BONDS — 37.9% of Net Assets | | | | |
| | | | Advertising — 0.9% | | | | |
| | 1,300,000 | | | Lamar Media Corp., 3.75%, 2/15/28 (144A) | | $ | 1,218,594 | |
| | 85,000 | | | Lamar Media Corp., 4.0%, 2/15/30 (144A) | | | 79,050 | |
| | | | | | | | |
| | | | Total Advertising | | $ | 1,297,644 | |
| | | | | | | | |
| | | | Banks — 10.3% | | | | |
| | 1,400,000 | (b)(c) | | Bank of America Corp., 4.3% (3 Month USD LIBOR + 266 bps) | | $ | 1,204,000 | |
| | 850,000 | (b)(c) | | Barclays Plc, 7.75% (5 Year USD Swap Rate + 484 bps) | | | 745,450 | |
| | 900,000 | (b)(c) | | BNP Paribas SA, 6.625% (5 Year USD Swap Rate + 415 bps) (144A) | | | 794,250 | |
| | 1,880,000 | (b)(c) | | Citigroup, Inc., 4.7% (SOFRRATE + 323 bps) | | | 1,610,407 | |
| | 1,700,000 | (b)(c) | | Credit Suisse Group AG, 6.375% (5 Year CMT Index + 482 bps) | | | 1,492,090 | |
| | 1,423,000 | | | Freedom Mortgage Corp., 8.25%, 4/15/25 (144A) | | | 1,117,055 | |
| | 1,700,000 | (b)(c) | | ING Groep NV, 6.5% (5 Year USD Swap Rate + 445 bps) | | | 1,422,815 | |
| | 850,000 | (b)(c) | | Intesa Sanpaolo S.p.A., 7.7% (5 Year USD Swap Rate + 546 bps) (144A) | | | 722,500 | |
| | 1,875,000 | (b)(c) | | JPMorgan Chase & Co., 4.6% (SOFRRATE + 313 bps) | | | 1,641,000 | |
| | 850,000 | (b)(c) | | Lloyds Banking Group Plc, 7.5% (5 Year USD Swap Rate + 450 bps) | | | 763,980 | |
| | 1,000,000 | (b)(c) | | Royal Bank of Scotland Group Plc, 8.625% (5 Year USD Swap Rate + 760 bps) | | | 975,000 | |
| | 1,650,000 | (b)(c) | | UBS Group AG, 7.0% (5 Year USD Swap Rate + 434 bps) (144A) | | | 1,551,000 | |
| | | | | | | | |
| | | | Total Banks | | $ | 14,039,547 | |
| | | | | | | | |
The accompanying notes are an integral part of these financial statements.
| | |
| Pioneer Dynamic Credit Fund | Annual Report | 3/31/20 | | 21 |
Schedule of Investments | 3/31/20 (continued)
| | | | | | | | |
Principal
Amount
USD ($) | | | | | Value | |
| | | | Building Materials — 1.1% | | | | |
| | 1,520,000 | | | Standard Industries, Inc., 5.375%, 11/15/24 (144A) | | $ | 1,466,800 | |
| | | | | | | | |
| | | | Total Building Materials | | $ | 1,466,800 | |
| | | | | | | | |
| | | | Chemicals — 0.9% | | | | |
| | 1,415,000 | | | OCI NV, 5.25%, 11/1/24 (144A) | | $ | 1,216,900 | |
| | | | | | | | |
| | | | Total Chemicals | | $ | 1,216,900 | |
| | | | | | | | |
| | | | Commercial Services — 3.0% | | | | |
| | 1,100,000 | | | ADT Security Corp., 4.875%, 7/15/32 (144A) | | $ | 934,670 | |
| | 275,000 | | | Allied Universal Holdco LLC/Allied Universal Finance Corp., 6.625%, 7/15/26 (144A) | | | 270,187 | |
| | 1,904,000 | | | Brink’s Co., 4.625%, 10/15/27 (144A) | | | 1,756,440 | |
| | 1,240,000 | | | Garda World Security Corp., 4.625%, 2/15/27 (144A) | | | 1,109,800 | |
| | | | | | | | |
| | | | Total Commercial Services | | $ | 4,071,097 | |
| | | | | | | | |
| | | | Diversified Financial Services — 1.4% | | | | |
| | 1,000,000 | (d) | | Fixed Income Trust Series 2013-A, 7.697%, (Liberty Mutual 7.697%) 10/15/97 (144A) | | $ | 1,421,835 | |
| | 490,000 | | | Nationstar Mortgage Holdings, Inc., 6.0%, 1/15/27 (144A) | | | 416,500 | |
| | | | | | | | |
| | | | Total Diversified Financial Services | | $ | 1,838,335 | |
| | | | | | | | |
| | | | Electric — 3.0% | | | | |
| | 1,443,000 | | | Clearway Energy Operating LLC, 5.75%, 10/15/25 | | $ | 1,428,570 | |
| | 1,300,000 | | | NRG Energy, Inc., 5.25%, 6/15/29 (144A) | | | 1,339,000 | |
| | 1,345,000 | | | Vistra Operations Co. LLC, 5.625%, 2/15/27 (144A) | | | 1,387,031 | |
| | | | | | | | |
| | | | Total Electric | | $ | 4,154,601 | |
| | | | | | | | |
| | | | Entertainment — 0.8% | | | | |
| | 1,270,000 | | | International Game Technology Plc, 6.25%, 1/15/27 (144A) | | $ | 1,104,900 | |
| | | | | | | | |
| | | | Total Entertainment | | $ | 1,104,900 | |
| | | | | | | | |
| | | | Environmental Control — 0.6% | | | | |
| | 1,200,000 | | | Tervita Corp., 7.625%, 12/1/21 (144A) | | $ | 840,000 | |
| | | | | | | | |
| | | | Total Environmental Control | | $ | 840,000 | |
| | | | | | | | |
| | | | Food Service — 1.6% | | | | |
| | 2,300,000 | | | Aramark Services, Inc., 5.0%, 2/1/28 (144A) | | $ | 2,140,426 | |
| | | | | | | | |
| | | | Total Food Service | | $ | 2,140,426 | |
| | | | | | | | |
| | | | Healthcare-Services — 1.0% | | | | |
| | 1,190,000 | | | Centene Corp., 5.25%, 4/1/25 (144A) | | $ | 1,195,950 | |
| | 200,000 | | | Centene Corp., 5.375%, 6/1/26 (144A) | | | 206,022 | |
| | | | | | | | |
| | | | Total Healthcare-Services | | $ | 1,401,972 | |
| | | | | | | | |
| | | | Insurance — 0.1% | | | | |
| | 100,000 | | | Liberty Mutual Insurance Co., 7.697%, 10/15/97 (144A) | | $ | 142,184 | |
| | | | | | | | |
| | | | Total Insurance | | $ | 142,184 | |
| | | | | | | | |
The accompanying notes are an integral part of these financial statements.
| | |
| 22 | | Pioneer Dynamic Credit Fund | Annual Report | 3/31/20 |
| | | | | | | | |
Principal
Amount
USD ($) | | | | | Value | |
| | | | Internet — 0.7% | | | | |
| | 1,000,000 | | | Netflix, Inc., 4.375%, 11/15/26 | | $ | 1,015,000 | |
| | | | | | | | |
| | | | Total Internet | | $ | 1,015,000 | |
| | | | | | | | |
| | | | Media — 2.1% | | | | |
| | 1,850,000 | | | Charter Communications Operating LLC/Charter Communications Operating Capital, 4.8%, 3/1/50 | | $ | 1,925,061 | |
| | 1,434,000 | | | Diamond Sports Group LLC/Diamond Sports Finance Co., 6.625%, 8/15/27 (144A) | | | 958,988 | |
| | | | | | | | |
| | | | Total Media | | $ | 2,884,049 | |
| | | | | | | | |
| | | | Oil & Gas — 0.2% | | | | |
| | 540,000 | | | MEG Energy Corp., 7.0%, 3/31/24 (144A) | | $ | 249,075 | |
| | | | | | | | |
| | | | Total Oil & Gas | | $ | 249,075 | |
| | | | | | | | |
| | | | Pharmaceuticals — 3.0% | | | | |
| | 1,750,000 | | | Allergan Funding SCS, 4.75%, 3/15/45 | | $ | 1,886,204 | |
| | 900,000 | | | Bausch Health Cos., Inc., 6.5%, 3/15/22 (144A) | | | 909,000 | |
| | 1,250,000 | | | Bausch Health Cos., Inc., 7.0%, 3/15/24 (144A) | | | 1,273,425 | |
| | | | | | | | |
| | | | Total Pharmaceuticals | | $ | 4,068,629 | |
| | | | | | | | |
| | | | Pipelines — 4.2% | | | | |
| | 900,000 | | | American Midstream Partners LP/American Midstream Finance Corp., 9.5%, 12/15/21 (144A) | | $ | 846,000 | |
| | 1,400,000 | | | Enable Midstream Partners LP, 4.95%, 5/15/28 | | | 844,167 | |
| | 2,065,000 | | | EnLink Midstream Partners LP, 4.15%, 6/1/25 | | | 1,000,905 | |
| | 357,000 | | | Genesis Energy LP/Genesis Energy Finance Corp., 6.25%, 5/15/26 | | | 249,900 | |
| | 1,450,000 | | | ONEOK, Inc., 6.875%, 9/30/28 | | | 1,396,789 | |
| | 1,475,000 | | | Targa Resources Partners LP/Targa Resources Partners Finance Corp., 5.875%, 4/15/26 | | | 1,224,250 | |
| | 327,000 | | | Targa Resources Partners LP/Targa Resources Partners Finance Corp., 6.5%, 7/15/27 | | | 278,768 | |
| | | | | | | | |
| | | | Total Pipelines | | $ | 5,840,779 | |
| | | | | | | | |
| | | | REITs — 1.7% | | | | |
| | 2,350,000 | | | Iron Mountain, Inc., 4.875%, 9/15/27 (144A) | | $ | 2,279,500 | |
| | | | | | | | |
| | | | Total REITs | | $ | 2,279,500 | |
| | | | | | | | |
| | | | Telecommunications — 1.3% | | | | |
| | 833,000 | | | CenturyLink, Inc., 4.0%, 2/15/27 (144A) | | $ | 808,010 | |
| | 950,000 | | | CenturyLink, Inc., 7.6%, 9/15/39 | | | 921,500 | |
| | | | | | | | |
| | | | Total Telecommunications | | $ | 1,729,510 | |
| | | | | | | | |
| | | | TOTAL CORPORATE BONDS
(Cost $58,464,128) | | $ | 51,780,948 | |
| | | | | | | | |
The accompanying notes are an integral part of these financial statements.
| | |
| Pioneer Dynamic Credit Fund | Annual Report | 3/31/20 | | 23 |
Schedule of Investments | 3/31/20 (continued)
| | | | | | | | |
Principal Amount USD ($) | | | | | Value | |
| | | | INSURANCE-LINKED SECURITIES — 1.2% of Net Assets(e) | | | | |
| | | | Event-Linked Bonds — 0.9% | | | | |
| | | | Earthquakes – California — 0.5% | | | | |
| | 250,000 | (a) | | Ursa Re, 3.533% (3 Month U.S. Treasury Bill + 350 bps), 5/27/20 (144A) | | $ | 247,550 | |
| | 250,000 | (a) | | Ursa Re, 4.173% (3 Month U.S. Treasury Bill + 414 bps), 12/10/20 (144A) | | | 244,750 | |
| | 250,000 | (a) | | Ursa Re, 5.503% (3 Month U.S. Treasury Bill + 547 bps), 12/10/20 (144A) | | | 242,500 | |
| | | | | | | | |
| | | | | | $ | 734,800 | |
| | | | | | | | |
| | | | Multiperil – U.S. — 0.4% | | | | |
| | 250,000 | (a) | | Residential Reinsurance 2016, 5.463% (3 Month U.S. Treasury Bill + 543 bps), 12/6/20 (144A) | | $ | 245,100 | |
| | 250,000 | (a) | | Residential Reinsurance 2017, 5.793% (3 Month U.S. Treasury Bill + 576 bps), 12/6/21 (144A) | | | 236,650 | |
| | | | | | | | |
| | | | | | $ | 481,750 | |
| | | | | | | | |
| | | | Total Event-Linked Bonds | | $ | 1,216,550 | |
| | | | | | | | |
| | |
Face Amount USD ($) | | | | | | |
| | | | Collateralized Reinsurance — 0.0%† | | | | |
| | | | Multiperil – Worldwide — 0.0%† | | | | |
| | 250,000 | +(f)(g) | | Cypress Re 2017, 1/10/21 | | $ | 4,550 | |
| | 12,000 | +(f) | | Limestone Re 2016-1, 8/31/21 | | | 9,445 | |
| | 250,000 | +(f)(g) | | Resilience Re, 5/1/20 | | | 25 | |
| | | | | | | | |
| | | | Total Collateralized Reinsurance | | $ | 14,020 | |
| | | | | | | | |
| | | | Reinsurance Sidecars — 0.3% | | | | |
| | | | Multiperil – U.S. — 0.1% | | | | |
| | 1,500,000 | +(f)(g) | | Carnoustie Re 2015, 7/1/20 | | $ | 4,800 | |
| | 500,000 | +(f)(g) | | Carnoustie Re 2016, 11/30/20 | | | 13,500 | |
| | 500,000 | +(f)(g) | | Carnoustie Re 2017, 11/30/21 | | | 67,925 | |
| | 250,000 | +(f) | | Carnoustie Re 2018, 12/31/21 | | | 2,800 | |
| | 1,500,000 | +(g)(h) | | Harambee Re 2018, 12/31/21 | | | 97,500 | |
| | | | | | | | |
| | | | | | $ | 186,525 | |
| | | | | | | | |
| | | | Multiperil – Worldwide — 0.2% | | | | |
| | 500,000 | +(f)(g) | | Arlington Re 2015, 2/1/21 | | $ | 24,300 | |
| | 41,791 | +(f)(g) | | Berwick Re 2018-1, 12/31/21 | | | 5,086 | |
| | 29,857 | +(f)(g) | | Berwick Re 2019-1, 12/31/22 | | | 32,222 | |
| | 250,000 | +(h) | | Blue Lotus Re 2018, 12/31/21 | | | 15,550 | |
| | 25,000 | +(f) | | Eden Re II, 3/22/22 (144A) | | | 33,478 | |
| | 2,000,000 | +(f) | | Pangaea Re 2015-1, 2/28/21 | | | 2,616 | |
The accompanying notes are an integral part of these financial statements.
| | |
| 24 | | Pioneer Dynamic Credit Fund | Annual Report | 3/31/20 |
| | | | | | | | |
Face Amount USD ($) | | | | | Value | |
| | | | Multiperil – Worldwide — (continued) | | | | |
| | 2,000,000 | +(f) | | Pangaea Re 2015-2, 5/29/20 | | $ | 2,982 | |
| | 1,000,000 | +(f) | | Pangaea Re 2016-1, 11/30/20 | | | 2,220 | |
| | 1,000,000 | +(f)(g) | | Pangaea Re 2017-1, 11/30/21 | | | 16,100 | |
| | 217,248 | +(f)(g) | | St. Andrews Re 2017-4, 6/1/20 | | | 21,377 | |
| | 250,000 | +(g)(h) | | Thopas Re 2018, 12/31/21 | | | 5,325 | |
| | 1,500,000 | +(f)(g) | | Versutus Re 2017, 11/30/21 | | | 11,700 | |
| | 1,500,000 | +(f)(g) | | Versutus Re 2018, 12/31/21 | | | — | |
| | 250,000 | +(g)(h) | | Viribus Re 2018, 12/31/21 | | | 13,825 | |
| | 106,153 | +(h) | | Viribus Re 2019, 12/31/22 | | | 1,921 | |
| | | | | | | | |
| | | | | | $ | 188,702 | |
| | | | | | | | |
| | | | Total Reinsurance Sidecars | | $ | 375,227 | |
| | | | | | | | |
| | | | TOTAL INSURANCE-LINKED SECURITIES
(Cost $2,083,122) | | $ | 1,605,797 | |
| | | | | | | | |
| | |
Principal Amount USD ($) | | | | | | |
| | | | SENIOR SECURED FLOATING RATE LOAN INTERESTS — 8.2% of Net Assets*(a) | | | | |
| | | | Automobile — 0.2% | | | | |
| | 295,375 | | | KAR Auction Services, Inc., Tranche B-6 Term Loan, 3.188% (LIBOR + 225 bps), 9/19/26 | | $ | 274,699 | |
| | | | | | | | |
| | | | Total Automobile | | $ | 274,699 | |
| | | | | | | | |
| | | | Buildings & Real Estate — 0.3% | | | | |
| | 294,000 | | | Beacon Roofing Supply, Inc., Initial Term Loan, 3.239% (LIBOR + 225 bps), 1/2/25 | | $ | 267,540 | |
| | 100,681 | | | Builders FirstSource, Inc., Refinancing Term Loan, 4.613% (LIBOR + 300 bps), 2/29/24 | | | 91,619 | |
| | | | | | | | |
| | | | Total Buildings & Real Estate | | $ | 359,159 | |
| | | | | | | | |
| | | | Chemicals, Plastics & Rubber — 0.5% | | | | |
| | 724,343 | | | Univar Solutions USA, Inc., Term B-3 Loan, 3.7% (LIBOR + 225 bps), 7/1/24 | | $ | 679,072 | |
| | | | | | | | |
| | | | Total Chemicals, Plastics & Rubber | | $ | 679,072 | |
| | | | | | | | |
| | | | Computers & Electronics — 0.6% | | | | |
| | 789,573 | | | Applied Systems, Inc., First Lien Closing Date Term Loan, 4.7% (LIBOR + 325 bps), 9/19/24 | | $ | 726,971 | |
| | 94,050 | | | Energizer Holdings, Inc., Term B Loan, 3.875% (LIBOR + 225 bps), 12/17/25 | | | 90,523 | |
| | 205,020 | | | Energy Acquisition LP (aka Electrical Components International), First Lien Initial Term Loan, 5.239% (LIBOR + 425 bps), 6/26/25 | | | 154,790 | |
| | | | | | | | |
| | | | Total Computers & Electronics | | $ | 972,284 | |
| | | | | | | | |
The accompanying notes are an integral part of these financial statements.
| | |
| Pioneer Dynamic Credit Fund | Annual Report | 3/31/20 | | 25 |
Schedule of Investments | 3/31/20 (continued)
| | | | | | | | |
Principal Amount USD ($) | | | | | Value | |
| | | | Diversified & Conglomerate Service — 2.0% | | | | |
| | 975,000 | | | Albany Molecular Research, Inc., First Lien Initial Term Loan, 4.25% (LIBOR + 325 bps), 8/30/24 | | $ | 872,625 | |
| | 477,705 | | | Filtration Group Corp., Initial Dollar Term Loan, 3.989% (LIBOR + 300 bps), 3/31/25 | | | 422,172 | |
| | 462,687 | | | Outfront Media Capital LLC (Outfront Media Capital Corp.), Extended Term Loan, 2.547% (LIBOR + 175 bps), 11/18/26 | | | 400,224 | |
| | 1,236,562 | | | WEX, Inc., Term B-3 Loan, 3.239% (LIBOR + 225 bps), 5/15/26 | | | 1,081,992 | |
| | | | | | | | |
| | | | Total Diversified & Conglomerate Service | | $ | 2,777,013 | |
| | | | | | | | |
| | | | Electric & Electrical — 0.3% | | | | |
| | 413,770 | | | Rackspace Hosting, Inc., First Lien Term B Loan, 4.763% (LIBOR + 300 bps), 11/3/23 | | $ | 375,496 | |
| | | | | | | | |
| | | | Total Electric & Electrical | | $ | 375,496 | |
| | | | | | | | |
| | | | Electronics — 0.2% | | | | |
| | 253,575 | | | Avast Software BV, 2018 Refinancing Dollar Term Loan, 3.7% (LIBOR + 225 bps), 9/29/23 | | $ | 231,546 | |
| | | | | | | | |
| | | | Total Electronics | | $ | 231,546 | |
| | | | | | | | |
| | | | Healthcare & Pharmaceuticals — 0.9% | | | | |
| | 467,337 | | | Acadia Healthcare Co., Inc., Tranche B-3 Term Loan, 3.5% (LIBOR + 250 bps), 2/11/22 | | $ | 434,624 | |
| | 975,000 | | | Alphabet Holding Co., Inc. (aka Nature’s Bounty), First Lien Initial Term Loan, 4.489% (LIBOR + 350 bps), 9/26/24 | | | 790,725 | |
| | | | | | | | |
| | | | Total Healthcare & Pharmaceuticals | | $ | 1,225,349 | |
| | | | | | | | |
| | | | Healthcare, Education & Childcare — 0.0%† | | | | |
| | 17,637 | | | Select Medical Corp., Tranche B Term Loan, 3.43% (LIBOR + 250 bps), 3/6/25 | | $ | 16,843 | |
| | | | | | | | |
| | | | Total Healthcare, Education & Childcare | | $ | 16,843 | |
| | | | | | | | |
| | | | Hotel, Gaming & Leisure — 0.2% | | | | |
| | 252,802 | | | Eldorado Resorts, Inc., Term Loan, 3.25% (LIBOR + 225 bps), 4/17/24 | | $ | 247,746 | |
| | | | | | | | |
| | | | Total Hotel, Gaming & Leisure | | $ | 247,746 | |
| | | | | | | | |
| | | | Insurance — 0.7% | | | | |
| | 975,000 | | | USI, Inc. (fka Compass Investors, Inc.), 2017 New Term Loan, 3.989% (LIBOR + 300 bps), 5/16/24 | | $ | 889,687 | |
| | | | | | | | |
| | | | Total Insurance | | $ | 889,687 | |
| | | | | | | | |
| | | | Leisure & Entertainment — 0.2% | | | | |
| | 424,925 | | | Fitness International LLC, Term B Loan, 4.322% (LIBOR + 325 bps), 4/18/25 | | $ | 322,234 | |
| | | | | | | | |
| | | | Total Leisure & Entertainment | | $ | 322,234 | |
| | | | | | | | |
The accompanying notes are an integral part of these financial statements.
| | |
| 26 | | Pioneer Dynamic Credit Fund | Annual Report | 3/31/20 |
| | | | | | | | |
Principal Amount USD ($) | | | | | Value | |
| | | | Machinery — 0.2% | | | | |
| | 438,107 | | | NN, Inc., Tranche B Term Loan, 6.689% (LIBOR + 575 bps), 10/19/22 | | $ | 326,390 | |
| | | | | | | | |
| | | | Total Machinery | | $ | 326,390 | |
| | | | | | | | |
| | | | Printing & Publishing — 0.4% | | | | |
| | 687,389 | | | Trader Corp., First Lien 2017 Refinancing Term Loan, 3.941% (LIBOR + 300 bps), 9/28/23 | | $ | 587,718 | |
| | | | | | | | |
| | | | Total Printing & Publishing | | $ | 587,718 | |
| | | | | | | | |
| | | | Securities & Trusts — 0.6% | | | | |
| | 908,400 | | | Spectacle Gary Holdings LLC, Closing Date Term Loan, 11.0% (LIBOR + 900 bps), 12/23/25 | | $ | 776,682 | |
| | | | | | | | |
| | | | Total Securities & Trusts | | $ | 776,682 | |
| | | | | | | | |
| | | | Utilities — 0.9% | | | | |
| | 439,116 | | | APLP Holdings, Ltd. Partnership, 2020 Term Loan, 3.5% (LIBOR + 250 bps), 4/14/25 | | $ | 428,138 | |
| | 541,784 | | | Eastern Power LLC (Eastern Covert Midco LLC) (aka TPF II LC LLC), Term Loan, 4.75% (LIBOR + 375 bps), 10/2/25 | | | 475,188 | |
| | 279,891 | | | Vistra Operations Co. LLC (fka Tex Operations Co. LLC), 2018 Incremental Term Loan, 2.703% (LIBOR + 175 bps), 12/31/25 | | | 268,345 | |
| | | | | | | | |
| | | | Total Utilities | | $ | 1,171,671 | |
| | | | | | | | |
| | | | TOTAL SENIOR SECURED FLOATING RATE LOAN INTERESTS
(Cost $12,727,049) | | $ | 11,233,589 | |
| | | | | | | | |
| | | | U.S. GOVERNMENT AND AGENCY OBLIGATIONS — 10.6% of Net Assets | | | | |
| | 1,500,000 | (a) | | U.S. Treasury Floating Rate Notes, 0.13% (3 Month U.S. Treasury Bill Money Market Yield + 5 bps), 10/31/20 | | $ | 1,499,778 | |
| | 4,500,000 | (a) | | U.S. Treasury Floating Rate Notes, 0.239% (3 Month U.S. Treasury Bill Money Market Yield + 15 bps), 1/31/22 | | | 4,499,499 | |
| | 8,000,000 | | | U.S. Treasury Notes, 2.125%, 12/31/22 | | | 8,405,625 | |
| | | | | | | | |
| | | | TOTAL U.S. GOVERNMENT AND AGENCY OBLIGATIONS
(Cost $13,894,682) | | $ | 14,404,902 | |
| | | | | | | | |
The accompanying notes are an integral part of these financial statements.
| | |
| Pioneer Dynamic Credit Fund | Annual Report | 3/31/20 | | 27 |
Schedule of Investments | 3/31/20 (continued)
| | | | | | | | | | | | | | | | | | | | |
Number of Contracts | | Description | | Counterparty | | Notional | | | Strike Price | | | Expiration Date | | | Value | |
| | EXCHANGE-TRADED PUT OPTION PURCHASED — 0.8% | | | | | | | | | |
| 18 | | S&P 500 Index | | Citigroup Global Markets, Inc. | | | USD 81,720 | | | | USD 3,225 | | | | 5/15/20 | | | $ | 1,128,060 | |
| | | | | | | | | | | | | | | | | | | | |
| | TOTAL EXCHANGE-TRADED PUT OPTION PURCHASED
(Premiums paid $81,720) | | | | | | | | | | | | | | | | $ | 1,128,060 | |
| | | | | | | | | | | | | | | | | | | | |
| | TOTAL OPTIONS PURCHASED
(Premiums paid $81,720) | | | | | | | | | | | | | | | | $ | 1,128,060 | |
| | | | | | | | | | | | | | | | | | | | |
| | TOTAL INVESTMENTS IN UNAFFILIATED
ISSUERS — 94.7%
(Cost $145,312,647) | | | | | | | | | | | | | | | | $ | 129,237,752 | |
| | | | | | | | | | | | | | | | | | | | |
| | OTHER ASSETS AND LIABILITIES — 5.3% | | | | | | | | | | | | | | | | $ | 7,231,418 | |
| | | | | | | | | | | | | | | | | | | | |
| | NET ASSETS — 100.0% | | | | | | | | | | | | | | | | $ | 136,469,170 | |
| | | | | | | | | | | | | | | | | | | | |
| CMT | Constant Maturity Treasury Index. |
| LIBOR | London Interbank Offered Rate. |
| REIT | Real Estate Investment Trust. |
| SOFRRATE | Secured Overnight Financing Rate. |
| (144A) | Security is exempt from registration under Rule 144A of the Securities Act of 1933. Such securities may be resold normally to qualified institutional buyers in a transaction exempt from registration. At March 31, 2020, the value of these securities amounted to $78,288,856, or 57.4% of net assets. |
| † | Amount rounds to less than 0.1%. |
| * | Senior secured floating rate loan interests in which the Fund invests generally pay interest at rates that are periodically redetermined by reference to a base lending rate plus a premium. These base lending rates are generally (i) the lending rate offered by one or more major European banks, such as LIBOR, (ii) the prime rate offered by one or more major United States banks, (iii) the rate of a certificate of deposit or (iv) other base lending rates used by commercial lenders. The interest rate shown is the rate accruing at March 31, 2020. |
| + | Security that used significant unobservable inputs to determine its value. |
| (a) | Floating rate note. Coupon rate, reference index and spread shown at March 31, 2020. |
| (b) | The interest rate is subject to change periodically. The interest rate and/or reference index and spread shown at March 31, 2020. |
| (c) | Security is perpetual in nature and has no stated maturity date. |
| (d) | Debt obligation initially issued at one coupon which converts to a higher coupon at a specific date. The rate shown is the rate at March 31, 2020. |
| (e) | Securities are restricted as to resale. |
| (f) | Issued as participation notes. |
| (g) | Non-income producing security. |
| (h) | Issued as preference shares. |
The accompanying notes are an integral part of these financial statements.
| | |
| 28 | | Pioneer Dynamic Credit Fund | Annual Report | 3/31/20 |
Purchases and sales of securities (excluding temporary cash investments) for the year ended March 31, 2020 were as follows:
| | | | | | | | |
| | | Purchases | | | Sales | |
Long-Term U.S. Government Securities | | $ | 14,055,519 | | | $ | 11,908,828 | |
Other Long-Term Securities | | $ | 70,363,687 | | | $ | 107,817,012 | |
The Fund is permitted to engage in purchase and sale transactions (“cross trades”) with certain funds and accounts for which Amundi Pioneer Asset Management, Inc. (the “Adviser”) serves as the Fund’s investment adviser, as set forth in Rule 17a-7 under the Investment Company Act of 1940, pursuant to procedures adopted by the Board of Trustees. Under these procedures, cross trades are effected at current market prices. During the year ended March 31, 2020, the Fund did not engage in any cross trade activity.
At March 31, 2020, the net unrealized depreciation on investments based on cost for federal tax purposes of $146,506,817 was as follows:
| | | | |
Aggregate gross unrealized appreciation for all investments in which there is an excess of value over tax cost | | $ | 2,817,896 | |
Aggregate gross unrealized depreciation for all investments in which there is an excess of tax cost over value | | | (20,086,961 | ) |
| | | | |
Net unrealized depreciation | | $ | (17,269,065 | ) |
| | | | |
Various inputs are used in determining the value of the Fund’s investments. These inputs are summarized in the three broad levels below.
| | | | |
| Level 1 | | – | | quoted prices in active markets for identical securities. |
| | |
| Level 2 | | – | | other significant observable inputs (including quoted prices for similar securities, interest rates, prepayment speeds, credit risks, etc.). See Notes to Financial Statements — Note 1A. |
| | |
| Level 3 | | – | | significant unobservable inputs (including the Fund’s own assumptions in determining fair value of investments). See Notes to Financial Statements — Note 1A. |
The accompanying notes are an integral part of these financial statements.
| | |
| Pioneer Dynamic Credit Fund | Annual Report | 3/31/20 | | 29 |
Schedule of Investments | 3/31/20 (continued)
The following is a summary of the inputs used as of March 31, 2020, in valuing the Fund’s investments:
| | | | | | | | | | | | | | | | |
| | | Level 1 | | | Level 2 | | | Level 3 | | | Total | |
Asset Backed Securities | | $ | — | | | $ | 30,683,942 | | | $ | — | | | $ | 30,683,942 | |
Collateralized Mortgage Obligations | | | — | | | | 13,744,749 | | | | — | | | | 13,744,749 | |
Commercial Mortgage-Backed Securities | | | — | | | | 4,655,765 | | | | — | | | | 4,655,765 | |
Corporate Bonds | | | — | | | | 51,780,948 | | | | — | | | | 51,780,948 | |
Insurance-Linked Securities | | | | | | | | | | | | | | | | |
Collateralized Reinsurance | | | | | | | | | | | | | | | | |
Multiperil – Worldwide | | | — | | | | — | | | | 14,020 | | | | 14,020 | |
Reinsurance Sidecars | | | | | | | | | | | | | | | | |
Multiperil – U.S. | | | — | | | | — | | | | 186,525 | | | | 186,525 | |
Multiperil – Worldwide | | | — | | | | — | | | | 188,702 | | | | 188,702 | |
All Other Insurance-Linked Securities | | | — | | | | 1,216,550 | | | | — | | | | 1,216,550 | |
Senior Secured Floating Rate Loan Interests | | | — | | | | 11,233,589 | | | | — | | | | 11,233,589 | |
U.S. Government and Agency Obligations | | | — | | | | 14,404,902 | | | | — | | | | 14,404,902 | |
Exchange-Traded Put Option Purchased | | | 1,128,060 | | | | — | | | | — | | | | 1,128,060 | |
| | | | | | | | | | | | | | | | |
Total Investments in Securities | | $ | 1,128,060 | | | $ | 127,720,445 | | | $ | 389,247 | | | $ | 129,237,752 | |
| | | | | | | | | | | | | | | | |
The accompanying notes are an integral part of these financial statements.
| | |
| 30 | | Pioneer Dynamic Credit Fund | Annual Report | 3/31/20 |
The following is a reconciliation of assets valued using significant unobservable inputs (Level 3):
| | | | | | | | | | | | |
| | | Corporate
Bonds | | | Insurance-
Linked
Securities | | | Total | |
Balance as of 3/31/19 | | $ | 1,316,208 | | | $ | 2,403,621 | | | $ | 3,719,829 | |
Realized gain (loss) | | | — | | | | (955 | ) | | | (955 | ) |
Change in unrealized appreciation (depreciation) | | | — | | | | 74,688 | | | | 74,688 | |
Accrued discounts/premiums | | | — | | | | — | | | | — | |
Purchases | | | — | | | | 25,124 | | | | 25,124 | |
Sales | | | — | | | | (2,113,231 | ) | | | (2,113,231 | ) |
Transfers in to Level 3* | | | — | | | | — | | | | — | |
Transfers out of Level 3* | | | (1,316,208 | ) | | | — | | | | (1,316,208 | ) |
| | | | | | | | | | | | |
Balance as of 3/31/20 | | $ | — | | | $ | 389,247 | | | $ | 389,247 | |
| | | | | | | | | | | | |
| * | Transfers are calculated on the beginning of period values. For the year ended March 31, 2020, investments having a value of $1,316,208 were transferred out of Level 3 to Level 2, as there were observable inputs available to determine their value. There were no other transfers between Levels 1, 2 and 3. |
| | | | |
Net change in unrealized appreciation (depreciation) of Level 3 investments still held and considered Level 3 at March 31, 2020: | | $ | 118,002 | |
| | | | |
The accompanying notes are an integral part of these financial statements.
| | |
| Pioneer Dynamic Credit Fund | Annual Report | 3/31/20 | | 31 |
Statement of Assets and Liabilities | 3/31/20
| | | | |
ASSETS: | | | | |
Investments in unaffiliated issuers, at value (cost $145,312,647) | | $ | 129,237,752 | |
Cash | | | 5,763,585 | |
Foreign currencies, at value (cost $7,198) | | | 5,502 | |
Due from broker for futures | | | 45 | |
Receivables — | | | | |
Investment securities sold | | | 8,633 | |
Fund shares sold | | | 1,109,660 | |
Interest | | | 1,119,792 | |
Due from the Adviser | | | 29,765 | |
Other assets | | | 43,788 | |
| | | | |
Total assets | | $ | 137,318,522 | |
| | | | |
LIABILITIES: | | | | |
Payables — | | | | |
Fund shares repurchased | | $ | 558,634 | |
Distributions | | | 108,401 | |
Trustees’ fees | | | 325 | |
Professional fees | | | 56,720 | |
Transfer agent fees | | | 38,913 | |
Registration fees | | | 11,583 | |
Variation margin for centrally cleared swap contracts | | | 950 | |
Unrealized depreciation on unfunded loan commitments | | | 7,689 | |
Due to affiliates | | | 30,132 | |
Accrued expenses | | | 36,005 | |
| | | | |
Total liabilities | | $ | 849,352 | |
| | | | |
NET ASSETS: | | | | |
Paid-in capital | | $ | 217,714,751 | |
Distributable earnings (loss) | | | (81,245,581 | ) |
| | | | |
Net assets | | $ | 136,469,170 | |
| | | | |
NET ASSET VALUE PER SHARE: | | | | |
No par value (unlimited number of shares authorized) | | | | |
Class A (based on $19,028,324/2,454,360 shares) | | $ | 7.75 | |
Class C (based on $13,300,061/1,720,946 shares) | | $ | 7.73 | |
Class Y (based on $104,140,785/13,364,289 shares) | | $ | 7.79 | |
MAXIMUM OFFERING PRICE PER SHARE: | | | | |
Class A (based on $7.75 net asset value per share/100%-4.50% maximum sales charge) | | $ | 8.12 | |
| | | | |
The accompanying notes are an integral part of these financial statements.
| | |
| 32 | | Pioneer Dynamic Credit Fund | Annual Report | 3/31/20 |
Statement of Operations
FOR THE YEAR ENDED 3/31/20
| | | | | | | | |
INVESTMENT INCOME: | | | | | | | | |
Interest from unaffiliated issuers | | $ | 9,024,155 | | | | | |
Dividends from unaffiliated issuers | | | 91,838 | | | | | |
| | | | | | | | |
Total investment income | | | | | | $ | 9,115,993 | |
| | | | | | | | |
EXPENSES: | | | | | | | | |
Management fees | | $ | 1,334,534 | | | | | |
Administrative expense | | | 97,667 | | | | | |
Transfer agent fees | | | | | | | | |
Class A | | | 20,185 | | | | | |
Class C | | | 19,096 | | | | | |
Class Y | | | 174,471 | | | | | |
Distribution fees | | | | | | | | |
Class A | | | 67,107 | | | | | |
Class C | | | 192,684 | | | | | |
Shareowner communications expense | | | 13,456 | | | | | |
Custodian fees | | | 19,136 | | | | | |
Registration fees | | | 96,196 | | | | | |
Professional fees | | | 75,402 | | | | | |
Printing expense | | | 50,399 | | | | | |
Pricing fees | | | 24,182 | | | | | |
Trustees’ fees | | | 8,847 | | | | | |
Insurance expense | | | 2,476 | | | | | |
Miscellaneous | | | 37,863 | | | | | |
| | | | | | | | |
Total expenses | | | | | | $ | 2,233,701 | |
Less fees waived and expenses reimbursed by the Adviser | | | | | | | (306,994 | ) |
| | | | | | | | |
Net expenses | | | | | | $ | 1,926,707 | |
| | | | | | | | |
Net investment income | | | | | | $ | 7,189,286 | |
| | | | | | | | |
REALIZED AND UNREALIZED GAIN (LOSS) ON INVESTMENTS: | | | | | | | | |
Net realized gain (loss) on: | | | | | | | | |
Investments in unaffiliated issuers | | $ | (1,352,781 | ) | | | | |
Forward foreign currency exchange contracts | | | (18,188 | ) | | | | |
Futures contracts | | | 922,660 | | | | | |
Swap contracts | | | (6,911,007 | ) | | | | |
Other assets and liabilities denominated in foreign currencies | | | (52,621 | ) | | $ | (7,411,937 | ) |
| | | | | | | | |
Change in net unrealized appreciation (depreciation) on: | | | | | | | | |
Investments in unaffiliated issuers | | $ | (15,801,163 | ) | | | | |
Forward foreign currency exchange contracts | | | 5,675 | | | | | |
Futures contracts | | | (277,109 | ) | | | | |
Swap contracts | | | (29,531 | ) | | | | |
Unfunded loan commitments | | | (7,689 | ) | | | | |
Other assets and liabilities denominated in foreign currencies | | | 15,674 | | | $ | (16,094,143 | ) |
| | | | | | | | |
Net realized and unrealized gain (loss) on investments | | | | | | $ | (23,506,080 | ) |
| | | | | | | | |
Net decrease in net assets resulting from operations | | | | | | $ | (16,316,794 | ) |
| | | | | | | | |
The accompanying notes are an integral part of these financial statements.
| | |
| Pioneer Dynamic Credit Fund | Annual Report | 3/31/20 | | 33 |
Statements of Changes in Net Assets
| | | | | | | | |
| | | Year Ended | | | Year Ended | |
| | | 3/31/20 | | | 3/31/19 | |
FROM OPERATIONS: | | | | | | | | |
Net investment income (loss) | | $ | 7,189,286 | | | $ | 10,108,541 | |
Net realized gain (loss) on investments | | | (7,411,937 | ) | | | (7,856,429 | ) |
Change in net unrealized appreciation (depreciation) on investments | | | (16,094,143 | ) | | | 2,217,556 | |
| | | | | | | | |
Net increase (decrease) in net assets resulting from operations | | $ | (16,316,794 | ) | | $ | 4,469,668 | |
| | | | | | | | |
DISTRIBUTIONS TO SHAREOWNERS: | | | | | | | | |
Class A ($0.36 and $0.27 per share, respectively) | | $ | (1,044,774 | ) | | $ | (942,711 | ) |
Class C ($0.29 and $0.22 per share, respectively) | | | (604,876 | ) | | | (693,951 | ) |
Class Y ($0.39 and $0.28 per share, respectively) | | | (6,115,718 | ) | | | (6,862,964 | ) |
Tax return of capital: | | | | | | | | |
Class A ($0.02 and $0.10 per share, respectively) | | | (67,732 | ) | | | (311,815 | ) |
Class C ($0.02 and $0.08 per share, respectively) | | | (44,321 | ) | | | (213,174 | ) |
Class Y ($0.02 and $0.11 per share, respectively) | | | (347,545 | ) | | | (1,921,221 | ) |
| | | | | | | | |
Total distributions to shareowners | | $ | (8,224,966 | ) | | $ | (10,945,836 | ) |
| | | | | | | | |
FROM FUND SHARE TRANSACTIONS: | | | | | | | | |
Net proceeds from sales of shares | | $ | 43,084,319 | | | $ | 65,851,989 | |
Reinvestment of distributions | | | 6,571,328 | | | | 8,926,110 | |
Cost of shares repurchased | | | (93,149,196 | ) | | | (171,790,151 | ) |
| | | | | | | | |
Net decrease in net assets resulting from Fund share transactions | | $ | (43,493,549 | ) | | $ | (97,012,052 | ) |
| | | | | | | | |
Net decrease in net assets | | $ | (68,035,309 | ) | | $ | (103,488,220 | ) |
NET ASSETS: | | | | | | | | |
Beginning of year | | $ | 204,504,479 | | | $ | 307,992,699 | |
| | | | | | | | |
End of year | | $ | 136,469,170 | | | $ | 204,504,479 | |
| | | | | | | | |
The accompanying notes are an integral part of these financial statements.
| | |
| 34 | | Pioneer Dynamic Credit Fund | Annual Report | 3/31/20 |
| | | | | | | | | | | | | | | | |
| | | Year Ended | | | Year Ended | | | Year Ended | | | Year Ended | |
| | | 3/31/20 | | | 3/31/20 | | | 3/31/19 | | | 3/31/19 | |
| | | Shares | | | Amount | | | Shares | | | Amount | |
Class A | | | | | | | | | | | | | | | | |
Shares sold | | | 983,511 | | | $ | 8,999,716 | | | | 1,168,099 | | | $ | 10,608,335 | |
Reinvestment of distributions | | | 118,707 | | | | 1,073,735 | | | | 131,743 | | | | 1,189,927 | |
Less shares repurchased | | | (1,741,834 | ) | | | (15,289,182 | ) | | | (1,958,195 | ) | | | (17,706,029 | ) |
| | | | | | | | | | | | | | | | |
Net decrease | | | (639,616 | ) | | $ | (5,215,731 | ) | | | (658,353 | ) | | $ | (5,907,767 | ) |
| | | | | | | | | | | | | | | | |
Class C | | | | | | | | | | | | | | | | |
Shares sold | | | 206,917 | | | $ | 1,880,828 | | | | 254,349 | | | $ | 2,308,677 | |
Reinvestment of distributions | | | 62,972 | | | | 568,186 | | | | 90,083 | | | | 810,845 | |
Less shares repurchased | | | (959,485 | ) | | | (8,632,014 | ) | | | (1,621,670 | ) | | | (14,576,084 | ) |
| | | | | | | | | | | | | | | | |
Net decrease | | | (689,596 | ) | | $ | (6,183,000 | ) | | | (1,277,238 | ) | | $ | (11,456,562 | ) |
| | | | | | | | | | | | | | | | |
Class Y | | | | | | | | | | | | | | | | |
Shares sold | | | 3,560,356 | | | $ | 32,203,775 | | | | 5,797,248 | | | $ | 52,934,977 | |
Reinvestment of distributions | | | 542,473 | | | | 4,929,407 | | | | 763,624 | | | | 6,925,338 | |
Less shares repurchased | | | (7,801,653 | ) | | | (69,228,000 | ) | | | (15,431,991 | ) | | | (139,508,038 | ) |
| | | | | | | | | | | | | | | | |
Net decrease | | | (3,698,824 | ) | | $ | (32,094,818 | ) | | | (8,871,119 | ) | | $ | (79,647,723 | ) |
| | | | | | | | | | | | | | | | |
The accompanying notes are an integral part of these financial statements.
| | |
| Pioneer Dynamic Credit Fund | Annual Report | 3/31/20 | | 35 |
Financial Highlights
| | | | | | | | | | | | | | | | | | | | |
| | | Year
Ended
3/31/20 | | | Year
Ended
3/31/19 | | | Year
Ended
3/31/18 | | | Year
Ended
3/31/17* | | | Year
Ended
3/31/16* | |
Class A | | | | | | | | | | | | | | | | | | | | |
Net asset value, beginning of period | | $ | 9.04 | | | $ | 9.20 | | | $ | 9.39 | | | $ | 8.99 | | | $ | 9.54 | |
| | | | | | | | | | | | | | | | | | | | |
Increase (decrease) from investment operations: | | | | | | | | | | | | | | | | | | | | |
Net investment income (loss) (a) | | $ | 0.29 | | | $ | 0.33 | | | $ | 0.34 | | | $ | 0.44 | | | $ | 0.42 | |
Net realized and unrealized gain (loss) on investments | | | (1.20 | ) | | | (0.12 | ) | | | (0.12 | ) | | | 0.54 | | | | (0.58 | ) |
| | | | | | | | | | | | | | | | | | | | |
Net increase (decrease) from investment operations | | $ | (0.91 | ) | | $ | 0.21 | | | $ | 0.22 | | | $ | 0.98 | | | $ | (0.16 | ) |
| | | | | | | | | | | | | | | | | | | | |
Distributions to shareowners: | | | | | | | | | | | | | | | | | | | | |
Net investment income | | $ | (0.36 | ) | | $ | (0.27 | ) | | $ | (0.41 | ) | | $ | (0.58 | ) | | $ | (0.39 | ) |
Tax return of capital | | | (0.02 | ) | | | (0.10 | ) | | | — | | | | — | | | | — | |
| | | | | | | | | | | | | | | | | | | | |
Total distributions | | $ | (0.38 | ) | | $ | (0.37 | ) | | $ | (0.41 | ) | | $ | (0.58 | ) | | $ | (0.39 | ) |
| | | | | | | | | | | | | | | | | | | | |
Net increase (decrease) in net asset value | | $ | (1.29 | ) | | $ | (0.16 | ) | | $ | (0.19 | ) | | $ | 0.40 | | | $ | (0.55 | ) |
| | | | | | | | | | | | | | | | | | | | |
Net asset value, end of period | | $ | 7.75 | | | $ | 9.04 | | | $ | 9.20 | | | $ | 9.39 | | | $ | 8.99 | |
| | | | | | | | | | | | | | | | | | | | |
Total return (b) | | | (10.59 | )% | | | 2.33 | % | | | 2.37 | % | | | 11.13 | % | | | (1.62 | )% |
Ratio of net expenses to average net assets | | | 1.18 | % | | | 1.15 | % | | | 1.14 | % | | | 1.18 | % | | | 1.19 | % |
Ratio of net investment income (loss) to average net assets | | | 3.23 | % | | | 3.69 | % | | | 3.61 | % | | | 4.71 | % | | | 4.52 | % |
Portfolio turnover rate | | | 49 | % | | | 65 | % | | | 76 | % | | | 114 | % | | | 56 | % |
Net assets, end of period (in thousands) | | $ | 19,028 | | | $ | 27,960 | | | $ | 34,538 | | | $ | 35,375 | | | $ | 47,311 | |
Ratios with no waiver of fees and assumption of expenses by the Adviser and no reduction for fees paid indirectly: | | | | | | | | | | | | | | | | | | | | |
Total expenses to average net assets | | | 1.25 | % | | | 1.21 | % | | | 1.14 | % | | | 1.19 | % | | | 1.19 | % |
Net investment income (loss) to average net assets | | | 3.16 | % | | | 3.63 | % | | | 3.61 | % | | | 4.70 | % | | | 4.52 | % |
| * | The Fund was audited by an independent registered public accounting firm other than Ernst & Young LLP. |
| (a) | The per-share data presented above is based on the average shares outstanding for the period presented. |
| (b) | Assumes initial investment at net asset value at the beginning of each period, reinvestment of all distributions, the complete redemption of the investment at net asset value at the end of each period and no sales charges. Total return would be reduced if sales charges were taken into account. |
The accompanying notes are an integral part of these financial statements.
| | |
| 36 | | Pioneer Dynamic Credit Fund | Annual Report | 3/31/20 |
| | | | | | | | | | | | | | | | | | | | |
| | | Year
Ended
3/31/20 | | | Year
Ended
3/31/19 | | | Year
Ended
3/31/18 | | | Year
Ended
3/31/17* | | | Year
Ended
3/31/16* | |
Class C | | | | | | | | | | | | | | | | | | | | |
Net asset value, beginning of period | | $ | 9.00 | | | $ | 9.17 | | | $ | 9.36 | | | $ | 8.97 | | | $ | 9.51 | |
| | | | | | | | | | | | | | | | | | | | |
Increase (decrease) from investment operations: | | | | | | | | | | | | | | | | | | | | |
Net investment income (loss) (a) | | $ | 0.22 | | | $ | 0.26 | | | $ | 0.27 | | | $ | 0.36 | | | $ | 0.36 | |
Net realized and unrealized gain (loss) on investments | | | (1.18 | ) | | | (0.13 | ) | | | (0.12 | ) | | | 0.54 | | | | (0.58 | ) |
| | | | | | | | | | | | | | | | | | | | |
Net increase (decrease) from investment operations | | $ | (0.96 | ) | | $ | 0.13 | | | $ | 0.15 | | | $ | 0.90 | | | $ | (0.22 | ) |
| | | | | | | | | | | | | | | | | | | | |
Distributions to shareowners: | | | | | | | | | | | | | | | | | | | | |
Net investment income | | $ | (0.29 | ) | | $ | (0.22 | ) | | $ | (0.34 | ) | | $ | (0.51 | ) | | $ | (0.32 | ) |
Tax return of capital | | | (0.02 | ) | | | (0.08 | ) | | | — | | | | — | | | | — | |
| | | | | | | | | | | | | | | | | | | | |
Total distributions | | $ | (0.31 | ) | | $ | (0.30 | ) | | $ | (0.34 | ) | | $ | (0.51 | ) | | $ | (0.32 | ) |
| | | | | | | | | | | | | | | | | | | | |
Net increase (decrease) in net asset value | | $ | (1.27 | ) | | $ | (0.17 | ) | | $ | (0.19 | ) | | $ | 0.39 | | | $ | (0.54 | ) |
| | | | | | | | | | | | | | | | | | | | |
Net asset value, end of period | | $ | 7.73 | | | $ | 9.00 | | | $ | 9.17 | | | $ | 9.36 | | | $ | 8.97 | |
| | | | | | | | | | | | | | | | | | | | |
Total return (b) | | | (11.14 | )% | | | 1.44 | % | | | 1.61 | % | | | 10.18 | % | | | (2.25 | )% |
Ratio of net expenses to average net assets | | | 1.97 | % | | | 1.93 | % | | | 1.90 | % | | | 1.94 | % | | | 1.95 | % |
Ratio of net investment income (loss) to average net assets | | | 2.44 | % | | | 2.91 | % | | | 2.86 | % | | | 3.94 | % | | | 3.86 | % |
Portfolio turnover rate | | | 49 | % | | | 65 | % | | | 76 | % | | | 114 | % | | | 56 | % |
Net assets, end of period (in thousands) | | $ | 13,300 | | | $ | 21,702 | | | $ | 33,824 | | | $ | 37,510 | | | $ | 44,207 | |
Ratios with no waiver of fees and assumption of expenses by the Adviser and no reduction for fees paid indirectly: | | | | | | | | | | | | | | | | | | | | |
Total expenses to average net assets | | | 2.03 | % | | | 2.00 | % | | | 1.90 | % | | | 1.95 | % | | | 1.95 | % |
Net investment income (loss) to average net assets | | | 2.38 | % | | | 2.84 | % | | | 2.86 | % | | | 3.93 | % | | | 3.86 | % |
| * | The Fund was audited by an independent registered public accounting firm other than Ernst & Young LLP. |
| (a) | The per-share data presented above is based on the average shares outstanding for the period presented. |
| (b) | Assumes initial investment at net asset value at the beginning of each period, reinvestment of all distributions, the complete redemption of the investment at net asset value at the end of each period and no sales charges. Total return would be reduced if sales charges were taken into account. |
The accompanying notes are an integral part of these financial statements.
| | |
| Pioneer Dynamic Credit Fund | Annual Report | 3/31/20 | | 37 |
Financial Highlights (continued)
| | | | | | | | | | | | | | | | | | | | |
| | | Year
Ended
3/31/20 | | | Year
Ended
3/31/19 | | | Year
Ended
3/31/18 | | | Year
Ended
3/31/17* | | | Year
Ended
3/31/16* | |
Class Y | | | | | | | | | | | | | | | | | | | | |
Net asset value, beginning of period | | $ | 9.07 | | | $ | 9.24 | | | $ | 9.42 | | | $ | 9.03 | | | $ | 9.58 | |
| | | | | | | | | | | | | | | | | | | | |
Increase (decrease) from investment operations: | | | | | | | | | | | | | | | | | | | | |
Net investment income (loss) (a) | | $ | 0.37 | | | $ | 0.36 | | | $ | 0.37 | | | $ | 0.47 | | | $ | 0.46 | |
Net realized and unrealized gain (loss) on investments | | | (1.24 | ) | | | (0.14 | ) | | | (0.11 | ) | | | 0.53 | | | | (0.58 | ) |
| | | | | | | | | | | | | | | | | | | | |
Net increase (decrease) from investment operations | | $ | (0.87 | ) | | $ | 0.22 | | | $ | 0.26 | | | $ | 1.00 | | | $ | (0.12 | ) |
| | | | | | | | | | | | | | | | | | | | |
Distributions to shareowners: | | | | | | | | | | | | | | | | | | | | |
Net investment income | | $ | (0.39 | ) | | $ | (0.28 | ) | | $ | (0.44 | ) | | $ | (0.61 | ) | | $ | (0.43 | ) |
Tax return of capital | | | (0.02 | ) | | | (0.11 | ) | | | — | | | | — | | | | — | |
| | | | | | | | | | | | | | | | | | | | |
Total distributions | | $ | (0.41 | ) | | $ | (0.39 | ) | | $ | (0.44 | ) | | $ | (0.61 | ) | | $ | (0.43 | ) |
| | | | | | | | | | | | | | | | | | | | |
Net increase (decrease) in net asset value | | $ | (1.28 | ) | | $ | (0.17 | ) | | $ | (0.18 | ) | | $ | 0.39 | | | $ | (0.55 | ) |
| | | | | | | | | | | | | | | | | | | | |
Net asset value, end of period | | $ | 7.79 | | | $ | 9.07 | | | $ | 9.24 | | | $ | 9.42 | | | $ | 9.03 | |
| | | | | | | | | | | | | | | | | | | | |
Total return (b) | | | (10.13 | )% | | | 2.50 | % | | | 2.77 | % | | | 11.35 | % | | | (1.26 | )% |
Ratio of net expenses to average net assets | | | 0.85 | % | | | 0.85 | % | | | 0.85 | % | | | 0.85 | % | | | 0.85 | % |
Ratio of net investment income (loss) to average net assets | | | 4.05 | % | | | 3.98 | % | | | 3.90 | % | | | 5.01 | % | | | 4.90 | % |
Portfolio turnover rate | | | 49 | % | | | 65 | % | | | 76 | % | | | 114 | % | | | 56 | % |
Net assets, end of period (in thousands) | | $ | 104,141 | | | $ | 154,842 | | | $ | 239,630 | | | $ | 198,398 | | | $ | 203,736 | |
Ratios with no waiver of fees and assumption of expenses by the Adviser and no reduction for fees paid indirectly: | | | | | | | | | | | | | | | | | | | | |
Total expenses to average net assets | | | 1.04 | % | | | 0.99 | % | | | 0.90 | % | | | 0.96 | % | | | 0.96 | % |
Net investment income (loss) to average net assets | | | 3.86 | % | | | 3.84 | % | | | 3.85 | % | | | 4.90 | % | | | 4.79 | % |
| * | The Fund was audited by an independent registered public accounting firm other than Ernst & Young LLP. |
| (a) | The per-share data presented above is based on the average shares outstanding for the period presented. |
| (b) | Assumes initial investment at net asset value at the beginning of each period, reinvestment of all distributions and the complete redemption of the investment at net asset value at the end of each period. |
The accompanying notes are an integral part of these financial statements.
| | |
| 38 | | Pioneer Dynamic Credit Fund | Annual Report | 3/31/20 |
Notes to Financial Statements | 3/31/20
1. Organization and Significant Accounting Policies
Pioneer Dynamic Credit Fund (the “Fund”) is one of three portfolios comprising Pioneer Series Trust X, a Delaware statutory trust. The Fund is registered under the Investment Company Act of 1940 as a diversified, open-end management investment company. The investment objective of the Fund is to seek a high level of current income. Capital appreciation is a secondary objective.
The Fund offers four classes of shares designated as Class A, Class C, Class K and Class Y shares. Class K shares had not commenced operations as of March 31, 2020. Each class of shares represents an interest in the same portfolio of investments of the Fund and has identical rights (based on relative net asset values) to assets and liquidation proceeds. Share classes can bear different rates of class-specific fees and expenses, such as transfer agent and distribution fees. Differences in class-specific fees and expenses will result in differences in net investment income and, therefore, the payment of different dividends from net investment income earned by each class. The Amended and Restated Declaration of Trust of the Fund gives the Board of Trustees the flexibility to specify either per-share voting or dollar-weighted voting when submitting matters for shareowner approval. Under per-share voting, each share of a class of the Fund is entitled to one vote. Under dollar-weighted voting, a shareowner’s voting power is determined not by the number of shares owned, but by the dollar value of the shares on the record date. Each share class has exclusive voting rights with respect to matters affecting only that class, including with respect to the distribution plan for that class. There is no distribution plan for Class Y shares.
Amundi Pioneer Asset Management, Inc., an indirect, wholly owned subsidiary of Amundi and Amundi’s wholly owned subsidiary, Amundi USA, Inc., serves as the Fund’s investment adviser (the “Adviser”). Amundi Pioneer Distributor, Inc., an affiliate of Amundi Pioneer Asset Management, Inc., serves as the Fund’s distributor (the “Distributor”).
In August 2018, the Securities and Exchange Commission (“SEC”) released a Disclosure Update and Simplification Final Rule. The Final Rule amends Regulation S-X disclosures requirements to conform them to U.S. Generally Accepted Accounting Principles (“U.S. GAAP”) for investment companies. The Fund’s financial statements were prepared in compliance with the new amendments to Regulation S-X.
During March 2017, the Financial Accounting Standards Board (FASB) issued an Accounting Standard Update, ASU 2017-08, Receivables-Nonrefundable Fees and Other Costs (Subtopic 310-20), Premium Amortization on Purchased
| | |
| Pioneer Dynamic Credit Fund | Annual Report | 3/31/20 | | 39 |
Callable Debt Securities (“ASU 2017-08”), which shortens the amortization period for purchased non-contingently callable debt securities held at a premium. ASU 2017-08 specifies that the premium amortization period ends at the earliest call date, for certain purchased non-contingently callable debt securities. ASU 2017-08 is effective for fiscal years, and interim periods within those fiscal years, beginning after December 15, 2018. The Fund has adopted ASU 2017-08 as of March 31, 2020. The implementation of ASU 2017-08 did not have a material impact on the Fund’s financial statements.
The Fund is an investment company and follows investment company accounting and reporting guidance under U.S. GAAP. U.S. GAAP requires the management of the Fund to make estimates and assumptions that affect the reported amounts of assets and liabilities, the disclosure of contingent assets and liabilities at the date of the financial statements, and the reported amounts of income, expenses and gain or loss on investments during the reporting period. Actual results could differ from those estimates.
The following is a summary of significant accounting policies followed by the Fund in the preparation of its financial statements:
The net asset value of the Fund is computed once daily, on each day the New York Stock Exchange (“NYSE”) is open, as of the close of regular trading on the NYSE.
Fixed-income securities are valued by using prices supplied by independent pricing services, which consider such factors as market prices, market events, quotations from one or more brokers, Treasury spreads, yields, maturities and ratings, or may use a pricing matrix or other fair value methods or techniques to provide an estimated value of the security or instrument. A pricing matrix is a means of valuing a debt security on the basis of current market prices for other debt securities, historical trading patterns in the market for fixed-income securities and/or other factors. Non-U.S. debt securities that are listed on an exchange will be valued at the bid price obtained from an independent third party pricing service. When independent third party pricing services are unable to supply prices, or when prices or market quotations are considered to be unreliable, the value of that security may be determined using quotations from one or more broker-dealers.
Loan interests are valued in accordance with guidelines established by the Board of Trustees at the mean between the last available bid and asked prices from one or more brokers or dealers as obtained from Loan Pricing Corporation, an independent third party pricing service. If price information is not available from Loan Pricing Corporation, or if the price information is deemed to be unreliable, price information will be obtained from an
| | |
| 40 | | Pioneer Dynamic Credit Fund | Annual Report | 3/31/20 |
alternative loan interest pricing service. If no reliable price quotes are available from either the primary or alternative pricing service, broker quotes will be solicited.
Event-linked bonds are valued at the bid price obtained from an independent third party pricing service. Other insurance-linked securities (including reinsurance sidecars, collateralized reinsurance and industry loss warranties) may be valued at the bid price obtained from an independent pricing service, or through a third party using a pricing matrix, insurance industry valuation models, or other fair value methods or techniques to provide an estimated value of the instrument.
Options contracts are generally valued at the mean between the last bid and ask prices on the principal exchange where they are traded. Over-the-counter (“OTC”) options and options on swaps (“swaptions”) are valued using prices supplied by independent pricing services, which consider such factors as market prices, market events, quotations from one or more brokers, Treasury spreads, yields, maturities and ratings, or may use a pricing matrix or other fair value methods or techniques to provide an estimated value of the security or instrument.
Shares of exchange-listed closed-end funds are valued by using the last sale price on the principal exchange where they are traded.
Forward foreign currency exchange contracts are valued daily using the foreign exchange rate or, for longer term forward contract positions, the spot currency rate and the forward points on a daily basis, in each case provided by a third party pricing service. Contracts whose forward settlement date falls between two quoted days are valued by interpolation.
Futures contracts are generally valued at the closing settlement price established by the exchange on which they are traded.
Swap contracts, including interest rate swaps, caps and floors (other than centrally cleared swap contracts), are valued at the dealer quotations obtained from reputable International Swap Dealers Association members. Centrally cleared swaps are valued at the daily settlement price provided by the central clearing counterparty.
Securities or loan interests for which independent pricing services or broker-dealers are unable to supply prices or for which market prices and/or quotations are not readily available or are considered to be unreliable are valued by a fair valuation team comprised of certain personnel of the Adviser pursuant to procedures adopted by the Fund’s Board of Trustees. The Adviser’s fair valuation team uses fair value methods approved by the Valuation Committee of the Board of Trustees. The Adviser’s fair valuation
| | |
| Pioneer Dynamic Credit Fund | Annual Report | 3/31/20 | | 41 |
team is responsible for monitoring developments that may impact fair valued securities and for discussing and assessing fair values on an ongoing basis, and at least quarterly, with the Valuation Committee of the Board of Trustees.
Inputs used when applying fair value methods to value a security may include credit ratings, the financial condition of the company, current market conditions and comparable securities. The Fund may use fair value methods if it is determined that a significant event has occurred after the close of the exchange or market on which the security trades and prior to the determination of the Fund’s net asset value. Examples of a significant event might include political or economic news, corporate restructurings, natural disasters, terrorist activity or trading halts. Thus, the valuation of the Fund’s securities may differ significantly from exchange prices, and such differences could be material.
At March 31, 2020, no securities were valued using fair value methods (other than securities valued using prices supplied by independent pricing services, broker-dealers or using a third party insurance industry pricing model).
| B. | Investment Income and Transactions |
Dividend income is recorded on the ex-dividend date, except that certain dividends from foreign securities where the ex-dividend date may have passed are recorded as soon as the Fund becomes aware of the ex-dividend data in the exercise of reasonable diligence.
Interest income, including interest on income-bearing cash accounts, is recorded on the accrual basis. Dividend and interest income are reported net of unrecoverable foreign taxes withheld at the applicable country rates and net of income accrued on defaulted securities.
Interest and dividend income payable by delivery of additional shares is reclassified as PIK (payment-in-kind) income upon receipt and is included in interest and dividend income, respectively.
Principal amounts of mortgage-backed securities are adjusted for monthly paydowns. Premiums and discounts related to certain mortgage-backed securities are amortized or accreted in proportion to the monthly paydowns. All discounts/premiums on purchase prices of debt securities are accreted/amortized for financial reporting purposes over the life of the respective securities, and such accretion/amortization is included in interest income.
Security transactions are recorded as of trade date. Gains and losses on sales of investments are calculated on the identified cost method for both financial reporting and federal income tax purposes.
| | |
| 42 | | Pioneer Dynamic Credit Fund | Annual Report | 3/31/20 |
| C. | Foreign Currency Translation |
The books and records of the Fund are maintained in U.S. dollars. Amounts denominated in foreign currencies are translated into U.S. dollars using current exchange rates.
Net realized gains and losses on foreign currency transactions, if any, represent, among other things, the net realized gains and losses on foreign currency exchange contracts, disposition of foreign currencies and the difference between the amount of income accrued and the U.S. dollars actually received. Further, the effects of changes in foreign currency exchange rates on investments are not segregated on the Statement of Operations from the effects of changes in the market prices of those securities, but are included with the net realized and unrealized gain or loss on investments.
It is the Fund’s policy to comply with the requirements of the Internal Revenue Code applicable to regulated investment companies and to distribute all of its net taxable income and net realized capital gains, if any, to its shareowners. Therefore, no provision for federal income taxes is required. As of March 31, 2020, the Fund did not accrue any interest or penalties with respect to uncertain tax positions, which, if applicable, would be recorded as an income tax expense on the Statement of Operations. Tax returns filed within the prior three years remain subject to examination by federal and state tax authorities.
The Fund does not consider the effect of foreign currency gain/loss when calculating its monthly distribution due to its unpredictable nature over the course of a year and differing treatment for book and tax purposes. As a result, the Fund may report a distribution in excess of its earnings and profits or a tax return of capital at its fiscal year end.
The amount and character of income and capital gain distributions to shareowners are determined in accordance with federal income tax rules, which may differ from U.S. GAAP. Distributions in excess of net investment income or net realized gains are temporary over distributions for financial statement purposes resulting from differences in the recognition or classification of income or distributions for financial statement and tax purposes. Capital accounts within the financial statements are adjusted for permanent book/tax differences to reflect tax character, but are not adjusted for temporary differences.
At March 31, 2020, the Fund reclassified $459,598 to increase distributable earnings and $459,598 to decrease paid-in capital to reflect permanent book/tax differences. These adjustments have no impact on net assets or the results of operations.
| | |
| Pioneer Dynamic Credit Fund | Annual Report | 3/31/20 | | 43 |
At March 31, 2020, the Fund was permitted to carry forward indefinitely $31,031,239 of short-term losses and $32,797,789 of long-term losses.
The Fund has elected to defer $29,699 of ordinary losses recognized between November 1, 2018 and March 31, 2020 to its fiscal year ending March 31, 2021.
The tax character of distributions paid during the years ended March 31, 2020 and March 31, 2019, were as follows:
| | | | | | | | |
| | | 2020 | | | 2019 | |
Distributions paid from: | | | | | | | | |
Ordinary income | | $ | 7,765,368 | | | $ | 8,499,626 | |
Return of capital | | | 459,598 | | | | 2,446,210 | |
| | | | | | | | |
Total | | $ | 8,224,966 | | | $ | 10,945,836 | |
| | | | | | | | |
The following shows the components of distributable earnings (losses) on a federal income tax basis at March 31, 2020:
| | | | |
| | | 2020 | |
Distributable earnings: | | | | |
Capital loss carryforward | | $ | (63,829,028 | ) |
Current year late year loss | | | (29,699 | ) |
Current year dividend payable | | | (108,401 | ) |
Unrealized depreciation | | | (17,278,453 | ) |
| | | | |
Total | | $ | (81,245,581 | ) |
| | | | |
The difference between book basis and tax basis unrealized depreciation is attributable to the tax deferral of losses on wash sales, adjustments relating to insurance-linked securities, the tax treatment of premium and amortization, the mark to market of forward and futures contracts, tax basis adjustments on Real Estate Investment Trust (REIT) holdings, interest accruals on preferred stock, partnerships and other holdings.
The Fund records sales and repurchases of its shares as of trade date. The Distributor earned $1,490 in underwriting commissions on the sale of Class A shares during the year ended March 31, 2020.
Income, common expenses and realized and unrealized gains and losses are calculated at the Fund level and allocated daily to each class of shares based on its respective percentage of adjusted net assets at the beginning of the day.
Distribution fees are calculated based on the average daily net asset value attributable to Class A and Class C shares of the Fund, respectively (see Note 4). Class Y shares do not pay distribution fees. All expenses and fees
| | |
| 44 | | Pioneer Dynamic Credit Fund | Annual Report | 3/31/20 |
paid to the Fund’s transfer agent for its services are allocated among the classes of shares based on the number of accounts in each class and the ratable allocation of related out-of-pocket expenses (see Note 3).
The Fund declares as daily dividends substantially all of its net investment income. All dividends are paid on a monthly basis. Short-term capital gain distributions, if any, may be declared with the daily dividends. Distributions to shareowners are recorded as of the ex-dividend date. Distributions paid by the Fund with respect to each class of shares are calculated in the same manner and at the same time, except that net investment income dividends to Class A, Class C and Class Y shares can reflect different transfer agent and distribution expense rates.
The value of securities held by the Fund may go up or down, sometimes rapidly or unpredictably, due to general market conditions, such as real or perceived adverse economic, political or regulatory conditions, recessions, the spread of infectious illness or other public health issues, inflation, changes in interest rates, lack of liquidity in the bond markets or adverse investor sentiment. In the past several years, financial markets have experienced increased volatility, depressed valuations, decreased liquidity and heightened uncertainty. These conditions may continue, recur, worsen or spread.
At times, the Fund’s investments may represent industries or industry sectors that are interrelated or have common risks, making the Fund more susceptible to any economic, political, or regulatory developments or other risks affecting those industries and sectors. The Fund’s investments in foreign markets and countries with limited developing markets may subject the Fund to a greater degree of risk than investments in a developed market. These risks include disruptive political or economic conditions and the imposition of adverse governmental laws or currency exchange restrictions.
The Fund invests in below-investment-grade (high-yield) debt securities and preferred stocks. Some of these high-yield securities may be convertible into equity securities of the issuer. Debt securities rated below-investment-grade are commonly referred to as “junk bonds” and are considered speculative. These securities involve greater risk of loss, are subject to greater price volatility, and are less liquid, especially during periods of economic uncertainty or change, than higher rated debt securities.
With the increased use of technologies such as the Internet to conduct business, the Fund is susceptible to operational, information security and related risks. While the Fund’s Adviser has established business continuity plans in the event of, and risk management systems to prevent, limit or
| | |
| Pioneer Dynamic Credit Fund | Annual Report | 3/31/20 | | 45 |
mitigate, such cyber-attacks, there are inherent limitations in such plans and systems, including the possibility that certain risks have not been identified. Furthermore, the Fund cannot control the cybersecurity plans and systems put in place by service providers to the Fund such as Brown Brothers Harriman & Co., the Fund’s custodian and accounting agent, and DST Asset Manager Solutions, Inc., the Fund’s transfer agent. In addition, many beneficial owners of Fund shares hold them through accounts at broker-dealers, retirement platforms and other financial market participants over which neither the Fund nor Amundi Pioneer exercises control. Each of these may in turn rely on service providers to them, which are also subject to the risk of cyber-attacks. Cybersecurity failures or breaches at Amundi Pioneer or the Fund’s service providers or intermediaries have the ability to cause disruptions and impact business operations, potentially resulting in financial losses, interference with the Fund’s ability to calculate its net asset value, impediments to trading, the inability of Fund shareowners to effect share purchases, redemptions or exchanges or receive distributions, loss of or unauthorized access to private shareowner information and violations of applicable privacy and other laws, regulatory fines, penalties, reputational damage, or additional compliance costs. Such costs and losses may not be covered under any insurance. In addition, maintaining vigilance against cyber-attacks may involve substantial costs over time, and system enhancements may themselves be subject to cyber-attacks.
The Fund’s prospectus contains unaudited information regarding the Fund’s principal risks. Please refer to that document when considering the Fund’s principal risks.
| H. | Insurance-Linked Securities (“ILS”) |
The Fund invests in ILS. The Fund could lose a portion or all of the principal it has invested in an ILS, and the right to additional interest or dividend payments with respect to the security, upon the occurrence of one or more trigger events, as defined within the terms of an insurance-linked security. Trigger events, generally, are hurricanes, earthquakes, or other natural events of a specific size or magnitude that occur in a designated geographic region during a specified time period, and/or that involve losses or other metrics that exceed a specific amount. There is no way to accurately predict whether a trigger event will occur, and accordingly, ILS carry significant risk. The Fund is entitled to receive principal, and interest and/or dividend payments so long as no trigger event occurs of the description and magnitude specified by the instrument. In addition to the specified trigger events, ILS may expose the Fund to other risks, including but not limited to issuer (credit) default, adverse regulatory or jurisdictional interpretations and adverse tax consequences.
| | |
| 46 | | Pioneer Dynamic Credit Fund | Annual Report | 3/31/20 |
The Fund’s investments in ILS may include event-linked bonds. ILS also may include special purpose vehicles (“SPVs”) or similar instruments structured to comprise a portion of a reinsurer’s catastrophe-oriented business, known as quota share instruments (sometimes referred to as reinsurance sidecars), or to provide reinsurance relating to specific risks to insurance or reinsurance companies through a collateralized instrument, known as collateralized reinsurance. Structured reinsurance investments also may include industry loss warranties (“ILWs”). A traditional ILW takes the form of a bilateral reinsurance contract, but there are also products that take the form of derivatives, collateralized structures, or exchange-traded instruments.
Where the ILS are based on the performance of underlying reinsurance contracts, the Fund has limited transparency into the individual underlying contracts, and therefore must rely upon the risk assessment and sound underwriting practices of the issuer. Accordingly, it may be more difficult for the Adviser to fully evaluate the underlying risk profile of the Fund’s structured reinsurance investments, and therefore the Fund’s assets are placed at greater risk of loss than if the Adviser had more complete information. Structured reinsurance instruments generally will be considered illiquid securities by the Fund. These securities may be difficult to purchase, sell or unwind. Illiquid securities also may be difficult to value. If the Fund is forced to sell an illiquid asset, the Fund may be forced to sell at a loss.
The Fund may purchase put and call options to seek to increase total return. Purchased call and put options entitle the Fund to buy and sell a specified number of shares or units of a particular security, currency or index at a specified price at a specific date or within a specific period of time. Upon the purchase of a call or put option, the premium paid by the Fund is included on the Statement of Assets and Liabilities as an investment. All premiums are marked-to-market daily, and any unrealized appreciation or depreciation is recorded on the Fund’s Statement of Operations. As the purchaser of an index option, the Fund has the right to receive a cash payment equal to any depreciation in the value of the index below the strike price of the option (in the case of a put) or equal to any appreciation in the value of the index over the strike price of the option (in the case of a call) as of the valuation date of the option. Premiums paid for purchased call and put options which have expired are treated as realized losses on investments on the Statement of Operations. Upon the exercise or closing of a purchased put option, the premium is offset against the proceeds on the sale of the underlying security or financial instrument in order to determine the realized gain or loss on investments. Upon the exercise or closing of a purchased call option, the premium is added to the cost of the security or financial instrument. The risk associated with purchasing options is limited to the premium originally paid.
| | |
| Pioneer Dynamic Credit Fund | Annual Report | 3/31/20 | | 47 |
The average market value of purchased options contracts open during the year ended March 31, 2020, was $261,514. Open purchased options at March 31, 2020, are listed in the Schedule of Investments.
| J. | Forward Foreign Currency Exchange Contracts |
The Fund may enter into forward foreign currency exchange contracts (“contracts”) for the purchase or sale of a specific foreign currency at a fixed price on a future date. All contracts are marked-to-market daily at the applicable exchange rates, and any resulting unrealized appreciation or depreciation is recorded in the Fund’s financial statements. The Fund records realized gains and losses at the time a contract is offset by entry into a closing transaction or extinguished by delivery of the currency. Risks may arise upon entering into these contracts from the potential inability of counterparties to meet the terms of the contract and from unanticipated movements in the value of foreign currencies relative to the U.S. dollar (see Note 6).
During the year ended March 31, 2020, the Fund had entered into various forward foreign currency exchange contracts that obligated the Fund to deliver or take delivery of currencies at specified future maturity dates. Alternatively, prior to the settlement date of a forward foreign currency exchange contract, the Fund may close out such contract by entering into an offsetting contract.
The average market value of forward foreign currency exchange contracts open during the year ended March 31, 2020, was $170,123. There were no open forward foreign currency exchange contracts at March 31, 2020.
The Fund may enter into futures transactions in order to attempt to hedge against changes in interest rates, securities prices and currency exchange rates or to seek to increase total return. Futures contracts are types of derivatives. All futures contracts entered into by the Fund are traded on a futures exchange. Upon entering into a futures contract, the Fund is required to deposit with a broker an amount of cash or securities equal to the minimum “initial margin” requirements of the associated futures exchange. The amount of cash deposited with the broker as collateral at March 31, 2020, is recorded as “Futures collateral” on the Statement of Assets and Liabilities.
Subsequent payments for futures contracts (“variation margin”) are paid or received by the Fund, depending on the daily fluctuation in the value of the contracts, and are recorded by the Fund as unrealized appreciation or depreciation. Cash received from or paid to the broker related to previous margin movement is held in a segregated account at the broker and is recorded as either “Due from broker for futures�� or “Due to broker for futures” on the Statement of Assets and Liabilities. When the contract is
| | |
| 48 | | Pioneer Dynamic Credit Fund | Annual Report | 3/31/20 |
closed, the Fund realizes a gain or loss equal to the difference between the opening and closing value of the contract as well as any fluctuation in foreign currency exchange rates where applicable. Futures contracts are subject to market risk, interest rate risk and currency exchange rate risk. Changes in value of the contracts may not directly correlate to the changes in value of the underlying securities. With futures, there is reduced counterparty credit risk to the Fund since futures are exchange-traded and the exchange’s clearinghouse, as counterparty to all exchange-traded futures, guarantees the futures against default.
The average market value of futures contracts open during the year ended March 31, 2020, was $22,401,567. There were no open futures contracts at March 31, 2020.
| L. | Credit Default Swap Contracts |
A credit default swap is a contract between a buyer of protection and a seller of protection against a pre-defined credit event or an underlying reference obligation, which may be a single security or a basket or index of securities. The Fund may buy or sell credit default swap contracts to seek to increase the Fund’s income, or to attempt to hedge the risk of default on portfolio securities. A credit default swap index is used to hedge risk or take a position on a basket of credit entities or indices.
As a seller of protection, the Fund would be required to pay the notional (or other agreed-upon) value of the referenced debt obligation to the counterparty in the event of a default by a U.S. or foreign corporate issuer of a debt obligation, which would likely result in a loss to the Fund. In return, the Fund would receive from the counterparty a periodic stream of payments during the term of the contract, provided that no event of default occurred. The maximum exposure of loss to the seller would be the notional value of the credit default swaps outstanding. If no default occurs, the Fund would keep the stream of payments and would have no payment obligation. The Fund may also buy credit default swap contracts in order to hedge against the risk of default of debt securities, in which case the Fund would function as the counterparty referenced above.
As a buyer of protection, the Fund makes an upfront or periodic payment to the protection seller in exchange for the right to receive a contingent payment. An upfront payment made by the Fund, as the protection buyer, is recorded within the “Swap contracts, at value” line item on the Statement of Assets and Liabilities. Periodic payments received or paid by the Fund are recorded as realized gains or losses on the Statement of Operations.
| | |
| Pioneer Dynamic Credit Fund | Annual Report | 3/31/20 | | 49 |
Credit default swap contracts are marked-to-market daily using valuations supplied by independent sources, and the change in value, if any, is recorded within the “Swap contracts, at value” line item on the Statement of Assets and Liabilities. Payments received or made as a result of a credit event or upon termination of the contract are recognized, net of the appropriate amount of the upfront payment, as realized gains or losses on the Statement of Operations.
Credit default swap contracts involving the sale of protection may involve greater risks than if the Fund had invested in the referenced debt instrument directly. Credit default swap contracts are subject to general market risk, liquidity risk, counterparty risk and credit risk. If the Fund is a protection buyer and no credit event occurs, it will lose its investment. If the Fund is a protection seller and a credit event occurs, the value of the referenced debt instrument received by the Fund, together with the periodic payments received, may be less than the amount the Fund pays to the protection buyer, resulting in a loss to the Fund. In addition, obligations under sell protection credit default swaps may be partially offset by net amounts received from settlement of buy protection credit default swaps entered into by the Fund for the same reference obligation with the same counterparty.
Certain swap contracts that are cleared through a central clearinghouse are referred to as centrally cleared swaps. All payments made or received by the Fund are pursuant to a centrally cleared swap contract with the central clearing party rather than the original counterparty. Upon entering into a centrally cleared swap contract, the Fund is required to make an initial margin deposit, either in cash or in securities. The daily change in value on open centrally cleared contracts is recorded as “Variation margin for centrally cleared swap contracts” on the Statement of Assets and Liabilities. Cash received from or paid to the broker related to previous margin movement is held in a segregated account at the broker and is recorded as either “Due from broker for swaps” or “Due to broker for swaps” on the Statement of Assets and Liabilities. The amount of cash deposited with a broker as collateral at March 31, 2020, is recorded as “Swaps collateral” on the Statement of Assets and Liabilities.
The average market value of credit default swap contracts open during the year ended March 31, 2020, was $1,357,175. There were no open credit default swap contracts at March 31, 2020.
| | |
| 50 | | Pioneer Dynamic Credit Fund | Annual Report | 3/31/20 |
2. Management Agreement
The Adviser manages the Fund’s portfolio. Management fees are paid monthly and are calculated daily at the annual rate equal to 0.70% of the Fund’s average daily net assets up to $1 billion and 0.65% of the Fund’s average daily net assets $1 billion. For the year ended March 31, 2020, the effective management fee (excluding waivers and/or assumption of expenses) was equivalent to 0.70% of the Fund’s average daily net assets.
The Adviser has contractually agreed to limit ordinary operating expenses (ordinary operating expenses means all fund expenses other than extraordinary expenses, such as litigation, taxes, brokerage commissions and acquired fund fees and expenses) of the Fund to the extent required to reduce Fund expenses to 1.20% and 0.85% of the average daily net assets attributable to Class A and Class Y shares, respectively. These expense limitations are in effect through August 1, 2020. Fees waived and expenses reimbursed during the year ended March 31, 2020 are reflected on the Statement of Operations. There can be no assurance that the Adviser will extend the expense limitation agreement for a class of shares beyond the date referred to above.
In addition, under the management and administration agreements, certain other services and costs, including accounting, regulatory reporting and insurance premiums, are paid by the Fund as administrative reimbursements. Included in “Due to affiliates” reflected on the Statement of Assets and Liabilities is $27,695 in management fees, administrative costs and certain other reimbursements payable to the Adviser at March 31, 2020.
3. Transfer Agent
DST Asset Manager Solutions, Inc. serves as the transfer agent to the Fund at negotiated rates. Transfer agent fees and payables shown on the Statement of Operations and the Statement of Assets and Liabilities, respectively, include sub-transfer agent expenses incurred through the Fund’s omnibus relationship contracts.
In addition, the Fund reimbursed the transfer agent for out-of-pocket expenses incurred by the transfer agent related to shareowner communications activities such as proxy and statement mailings, and outgoing phone calls. For the year ended March 31, 2020, such out-of-pocket expenses by class of shares were as follows:
| | | | |
| Shareowner Communications: | | | |
Class A | | $ | 2,519 | |
Class C | | | 3,770 | |
Class Y | | | 7,167 | |
| | | | |
Total | | $ | 13,456 | |
| | | | |
| | |
| Pioneer Dynamic Credit Fund | Annual Report | 3/31/20 | | 51 |
4. Distribution and Service Plans
The Fund has adopted a distribution plan (the “Plan”) pursuant to Rule 12b-1 of the Investment Company Act of 1940 with respect to its Class A and Class C shares. Pursuant to the Plan, the Fund pays the Distributor 0.25% of the average daily net assets attributable to Class A shares as compensation for personal services and/or account maintenance services or distribution services with regard to Class A shares. Pursuant to the Plan, the Fund also pays the Distributor 1.00% of the average daily net assets attributable to Class C shares. The fee for Class C shares consists of a 0.25% service fee and a 0.75% distribution fee paid as compensation for personal services and/or account maintenance services or distribution services with regard to Class C shares. Included in “Due to affiliates” reflected on the Statement of Assets and Liabilities is $2,437 in distribution fees payable to the Distributor at March 31, 2020.
In addition, redemptions of Class A and Class C shares may be subject to a contingent deferred sales charge (“CDSC”). A CDSC of 1.00% may be imposed on redemptions of certain net asset value purchases of Class A shares within 12 months of purchase. Redemptions of Class C shares within 12 months of purchase are subject to a CDSC of 1.00%, based on the lower of cost or market value of shares being redeemed. Shares purchased as part of an exchange remain subject to any CDSC that applied to the original purchase of those shares. There is no CDSC for Class Y shares. Proceeds from the CDSCs are paid to the Distributor. For the year ended March 31, 2020, CDSCs in the amount of $1,856 were paid to the Distributor.
5. Line of Credit Facility
The Fund, along with certain other funds in the Pioneer Family of Funds (the “Funds”), participates in a committed, unsecured revolving line of credit facility. Borrowings are used solely for temporary or emergency purposes. The Fund may borrow up to the lesser of the amount available under the credit facility or the limits set for borrowing by the Fund’s prospectus and the 1940 Act. Effective March 11, 2020, the Fund participates in a facility in the amount of $300 million. Prior to March 11, 2020, the Fund participated in a facility in the amount of $25 million. Under such facility, depending on the type of loan, interest on borrowings is payable at the London Interbank Offered Rate (“LIBOR”) plus a credit spread. The Funds pay an annual commitment fee to participate in a credit facility. The commitment fee is allocated among participating Funds based on an allocation schedule set forth in the credit agreement. For the year ended March 31, 2020, the Fund had no borrowings under the credit facility.
| | |
| 52 | | Pioneer Dynamic Credit Fund | Annual Report | 3/31/20 |
6. Additional Disclosures about Derivative Instruments and Hedging Activities
The Fund’s use of derivatives may enhance or mitigate the Fund’s exposure to the following risks:
Interest rate risk relates to the fluctuations in the value of interest-bearing securities due to changes in the prevailing levels of market interest rates.
Credit risk relates to the ability of the issuer of a financial instrument to make further principal or interest payments on an obligation or commitment that it has to the Fund.
Foreign exchange rate risk relates to fluctuations in the value of an asset or liability due to changes in currency exchange rates.
Equity risk relates to the fluctuations in the value of financial instruments as a result of changes in market prices (other than those arising from interest rate risk or foreign exchange rate risk), whether caused by factors specific to an individual investment, its issuer, or all factors affecting all instruments traded in a market or market segment.
Commodity risk relates to the risk that the value of a commodity or commodity index will fluctuate based on increases or decreases in the commodities market and factors specific to a particular industry or commodity.
The fair value of open derivative instruments (not considered to be hedging instruments for accounting disclosure purposes) by risk exposure at March 31, 2020, was as follows:
| | | | | | | | | | | | | | | | | | | | |
Statement of Assets and Liabilities | | Interest Rate Risk | | | Credit Risk | | | Foreign Exchange Rate Risk | | | Equity Risk | | | Commodity Risk | |
Assets: | | | | | | | | | | | | | | | | | | | | |
Options purchased* | | $ | — | | | $ | — | | | $ | — | | | $ | 1,128,060 | | | $ | — | |
| | | | | | | | | | | | | | | | | | | | |
Total Value | | $ | — | | | $ | — | | | $ | — | | | $ | 1,128,060 | | | $ | — | |
| | | | | | | | | | | | | | | | | | | | |
| * | Reflects the market value of purchased option contracts (see Note 1I.). These amounts are included in investments in unaffiliated issuers, at value, on the Statement of Assets and Liabilities. |
| | |
| Pioneer Dynamic Credit Fund | Annual Report | 3/31/20 | | 53 |
The effect of derivative instruments (not considered to be hedging instruments for accounting disclosure purposes) on the Statement of Operations by risk exposure at March 31, 2020 was as follows:
| | | | | | | | | | | | | | | | | | | | |
| Statement of Operations | | Interest Rate Risk | | | Credit Risk | | | Foreign Exchange Rate Risk | | | Equity Risk | | | Commodity Risk | |
Net realized gain (loss) on: | | | | | | | | | | | | | | | | | | | | |
Options purchased* | | $ | — | | | $ | — | | | $ | — | | | $ | (881,995 | ) | | $ | — | |
Forward foreign currency exchange contracts | | | — | | | | — | | | | (18,188 | ) | | | — | | | | — | |
Futures contracts | | | 922,639 | | | | — | | | | — | | | | — | | | | — | |
Swap contracts | | | — | | | | (6,911,007 | ) | | | — | | | | — | | | | — | |
| | | | | | | | | | | | | | | | | | | | |
Total Value | | $ | 922,639 | | | $ | (6,911,007 | ) | | $ | (18,188 | ) | | $ | (881,995 | ) | | $ | — | |
| | | | | | | | | | | | | | | | | | | | |
Change in net unrealized appreciation (depreciation) on: | | | | | | | | | | | | | | | | | | | | |
Options purchased** | | $ | — | | | $ | — | | | $ | — | | | $ | 1,822,546 | | | $ | — | |
Forward foreign currency exchange contracts | | | — | | | | — | | | | 5,675 | | | | — | | | | — | |
Futures contracts | | | (277,109 | ) | | | — | | | | — | | | | — | | | | — | |
Swap contracts | | | — | | | | (29,531 | ) | | | — | | | | — | | | | — | |
| | | | | | | | | | | | | | | | | | | | |
Total Value | | $ | (277,109 | ) | | $ | (29,531 | ) | | $ | 5,675 | | | $ | 1,822,546 | | | $ | — | |
| | | | | | | | | | | | | | | | | | | | |
| * | Reflects the net realized gain (loss) on purchased option contracts (see Note 1I). These amounts are included in net realized gain (loss) on investments in unaffiliated issuers, on the Statement of Operations. |
| ** | Reflects the change in net unrealized appreciation (depreciation) on purchased option contracts (see Note 1I.). These amounts are included in change in net unrealized appreciation (depreciation) on Investments in unaffiliated issuers, on the Statement of Operations. |
7. Unfunded Loan Commitments
The Fund may enter into unfunded loan commitments. Unfunded loan commitments may be partially or wholly unfunded. During the contractual period, the Fund is obliged to provide funding to the borrower upon demand. A fee is earned by the Fund on the unfunded commitment and is recorded as interest income on the Statement of Operations.
As of March 31, 2020, the Fund had the following unfunded loan commitments outstanding:
| | | | | | | | | | | | | | | | |
| Loan | | Principal | | | Cost | | | Value | | | Unrealized Depreciation | |
Spectacle Gary Holdings LLC | | $ | 65,800 | | | $ | 63,948 | | | $ | 56,259 | | | $ | (7,689 | ) |
| | |
| 54 | | Pioneer Dynamic Credit Fund | Annual Report | 3/31/20 |
8. Subsequent Event
The respiratory illness COVID-19 caused by a novel coronavirus has resulted in a global pandemic and major disruption to economies and markets around the world, including the United States. Global financial markets have experienced extreme volatility and severe losses, and trading in many instruments has been disrupted. Liquidity for many instruments has been greatly reduced for periods of time. Some interest rates are very low and in some cases yields are negative. Some sectors of the economy and individual issuers have experienced particularly large losses. These circumstances may continue for an extended period of time, and may continue to affect adversely the value and liquidity of the fund’s investments. The ultimate economic fallout from the pandemic, and the long-term impact on economies, markets, industries and individual issuers, are not known. Governments and central banks, including the Federal Reserve in the U.S., have taken extraordinary and unprecedented actions to support local and global economies and the financial markets. These actions have resulted in significant expansion of public debt, including in the U.S. The impact of these measures, and whether they will be effective to mitigate the economic and market disruption, will not be known for some time. The consequences of high public debt, including its future impact on the economy and securities markets, likewise may not be known for some time.
9. The Reorganization
The Board of Trustees of the Fund has approved the reorganization of the Fund with Pioneer Corporate High Yield Fund (the “Reorganization”). Each fund is managed by Amundi Pioneer Asset Management, Inc. The Reorganization is expected to occur in the third quarter of 2020. The Reorganization does not require shareholder approval. Following is a brief description of certain aspects of the Reorganization:
| | • | | Pioneer Corporate High Yield Fund will reorganize with Pioneer Dynamic Credit Fund, resulting in the “Combined Fund.” The Combined Fund will be named “Pioneer Corporate High Yield Fund.” |
| | • | | Pioneer Corporate High Yield Fund’s investment team will manage the Combined Fund. |
| | • | | The Combined Fund will have the same investment objective, investment strategies and investment policies as Pioneer Corporate High Yield Fund. |
| | • | | The Combined Fund’s investment objective will be to seek a high level of current income and long-term capital appreciation. The Combined Fund normally will invest at least 80% of its net assets (plus the amount of borrowings, if any, for investment purposes) in below investment grade (high yield) debt of corporate issuers. Pioneer Dynamic Credit Fund’s investment objective is to seek a high level of current income. Capital |
| | |
| Pioneer Dynamic Credit Fund | Annual Report | 3/31/20 | | 55 |
| | appreciation is a secondary objective. Pioneer Dynamic Credit Fund normally invests at least 80% of its net assets (plus the amount of borrowings, if any, for investment purposes) in debt securities. |
| | • | | The management fee payable by the Combined Fund will be equal to 0.50% of the Fund’s average daily net assets up to $1 billion and 0.45% of the Fund’s average daily net assets over $1 billion. The management fee payable by Pioneer Dynamic Credit Fund is equal to 0.70% of the Fund’s average daily net assets up to $1 billion and 0.65% of the Fund’s average daily net assets over $1 billion. Thus, the management fee payable by the Combined Fund will be less than the management fee payable by Pioneer Dynamic Credit Fund. |
| | • | | It is currently anticipated that the historical performance of Pioneer Corporate High Yield Fund will become the Combined Fund’s historical performance. |
| | • | | The Reorganization is expected to qualify as a tax-free reorganization, which generally means that the Reorganization will result in no income gain or loss being recognized for federal income tax purposes by either fund or its shareholders as a direct result of the Reorganization. |
Shareholders of Pioneer Dynamic Credit Fund will not receive an information statement. Additional information about the Reorganization and the Combined Fund will be provided to shareholders prior to the consummation of the Reorganization.
| | |
| 56 | | Pioneer Dynamic Credit Fund | Annual Report | 3/31/20 |
Report of Independent Registered Public Accounting Firm
To the Board of Trustees of Pioneer Series Trust X and the Shareholders of Pioneer Dynamic Credit Fund:
Opinion on the Financial Statements
We have audited the accompanying statement of assets and liabilities of Pioneer Dynamic Credit Fund (the “Fund”) (one of the funds constituting Pioneer Series Trust X (the “Trust”)), including the schedule of investments, as of March 31, 2020, and the related statement of operations for the year then ended, the statements of changes in net assets for each of the two years in the period then ended, the financial highlights for each of the three years in the period then ended and the related notes (collectively referred to as the “financial statements”). The financial highlights for the periods ended March 31, 2016 and March 31, 2017 were audited by another independent registered public accounting firm whose report, dated May 26, 2017, expressed an unqualified opinion on those financial highlights. In our opinion, the financial statements present fairly, in all material respects, the financial position of Pioneer Dynamic Credit Fund (one of the funds constituting Pioneer Series Trust X) at March 31, 2020, the results of its operations for the year then ended, the changes in its net assets for each of the two years in the period then ended, and its financial highlights for each of the three years in the period then ended in conformity with U.S. generally accepted accounting principles.
Basis for Opinion
These financial statements are the responsibility of the Trust’s management. Our responsibility is to express an opinion on the Fund’s financial statements based on our audits. We are a public accounting firm registered with the Public Company Accounting Oversight Board (United States) (“PCAOB”) and are required to be independent with respect to the Trust in accordance with the U.S. federal securities laws and the applicable rules and regulations of the Securities and Exchange Commission and the PCAOB.
We conducted our audits in accordance with the standards of the PCAOB. Those standards require that we plan and perform the audit to obtain reasonable assurance about whether the financial statements are free of material misstatement, whether due to error or fraud. The Trust is not required to have, nor were we engaged to perform, an audit of the Trust’s internal control over financial reporting. As part of our audits, we are required to obtain an understanding of internal control over financial reporting, but not for the purpose of expressing an opinion on the effectiveness of the Trust’s internal control over financial reporting. Accordingly, we express no such opinion.
| | |
| Pioneer Dynamic Credit Fund | Annual Report | 3/31/20 | | 57 |
Our audits included performing procedures to assess the risks of material misstatement of the financial statements, whether due to error or fraud, and performing procedures that respond to those risks. Such procedures included examining, on a test basis, evidence regarding the amounts and disclosures in the financial statements. Our procedures included confirmation of securities owned as of March 31, 2020, by correspondence with the custodian and brokers. Our audits also included evaluating the accounting principles used and significant estimates made by management, as well as evaluating the overall presentation of the financial statements. We believe that our audits provide a reasonable basis for our opinion.

We have served as the auditor of one or more Amundi Pioneer investment companies since 2017.
Boston, Massachusetts
May 29, 2020
| | |
| 58 | | Pioneer Dynamic Credit Fund | Annual Report | 3/31/20 |
ADDITIONAL INFORMATION (unaudited)
The percentages of the Fund’s ordinary income distributions that are exempt from nonresident alien (NRA) tax withholding resulting from qualified interest income was 88.60%.
| | |
| Pioneer Dynamic Credit Fund | Annual Report | 3/31/20 | | 59 |
Trustees, Officers and Service Providers
Investment Adviser and Administrator
Amundi Pioneer Asset Management, Inc.
Custodian and Sub-Administrator
Brown Brothers Harriman & Co.
Independent Registered Public Accounting Firm
Ernst & Young LLP
Principal Underwriter
Amundi Pioneer Distributor, Inc.
Legal Counsel
Morgan, Lewis & Bockius LLP
Transfer Agent
DST Asset Manager Solutions, Inc.
Proxy Voting Policies and Procedures of the Fund are available without charge, upon request, by calling our toll free number (1-800-225-6292). Information regarding how the Fund voted proxies relating to portfolio securities during the most recent 12-month period ended June 30 is publicly available to shareowners at www.amundipioneer.com/us. This information is also available on the Securities and Exchange Commission’s web site at www.sec.gov.
Trustees and Officers
The Fund’s Trustees and officers are listed below, together with their principal occupations and other directorships they have held during at least the past five years. Trustees who are interested persons of the Fund within the meaning of the 1940 Act are referred to as Interested Trustees. Trustees who are not interested persons of the Fund are referred to as Independent Trustees. Each of the Trustees serves as a Trustee of each of the 45 U.S. registered investment portfolios for which Amundi Pioneer serves as investment adviser (the “Pioneer Funds”). The address for all Trustees and all officers of the Fund is 60 State Street, Boston, Massachusetts 02109.
The Statement of Additional Information of the Fund includes additional information about the Trustees and is available, without charge, upon request, by calling 1-800-225-6292.
| | |
| 60 | | Pioneer Dynamic Credit Fund | Annual Report | 3/31/20 |
Independent Trustees
| | | | | | |
Name, Age and Position Held With the Fund | | Term of Office and Length of Service | | Principal Occupation | | Other Directorships Held by Trustee |
Thomas J. Perna (68) Chairman of the Board and Trustee | | Trustee since 2011. Serves until a successor trustee is elected or earlier retirement or removal. | | Private investor (2004 – 2008 and 2013 – present); Chairman (2008 – 2013) and Chief Executive Officer (2008 – 2012), Quadriserv, Inc. (technology products for securities lending industry); and Senior Executive Vice President, The Bank of New York (financial and securities services) (1986 – 2004) | | Director, Broadridge Financial Solutions, Inc. (investor communications and securities processing provider for financial services industry) (2009 – present); Director, Quadriserv, Inc. (2005 – 2013); and Commissioner, New Jersey State Civil Service Commission (2011 – 2015) |
| | | |
John E. Baumgardner, Jr. (68) Trustee | | Trustee since 2019. Serves until a successor trustee is elected or earlier retirement or removal. | | Of Counsel (2019 – present), Partner (1983-2018), Sullivan & Cromwell LLP (law firm). | | Chairman, The Lakeville Journal Company, LLC, (privately-held community newspaper group) (2015-present) |
| | | |
Diane Durnin (63) Trustee | | Trustee since 2019. Serves until a successor trustee is elected or earlier retirement or removal. | | Managing Director - Head of Product Strategy and Development, BNY Mellon Investment Management (2012-2018); Vice Chairman – The Dreyfus Corporation (2005 – 2018): Executive Vice President Head of Product, BNY Mellon Investment Management (2007-2012); Executive Director- Product Strategy, Mellon Asset Management (2005-2007); Executive Vice President Head of Products, Marketing and Client Service, Dreyfus Corporation (2000-2005); and Senior Vice President Strategic Product and Business Development, Dreyfus Corporation (1994-2000) | | None |
| | | |
Benjamin M. Friedman (75) Trustee | | Trustee since 2011. Serves until a successor trustee is elected or earlier retirement or removal. | | William Joseph Maier Professor of Political Economy, Harvard University (1972 – present) | | Trustee, Mellon Institutional Funds Investment Trust and Mellon Institutional Funds Master Portfolio (oversaw 17 portfolios in fund complex) (1989 - 2008) |
| | |
| Pioneer Dynamic Credit Fund | Annual Report | 3/31/20 | | 61 |
Independent Trustees (continued)
| | | | | | |
Name, Age and Position Held With the Fund | | Term of Office and Length of Service | | Principal Occupation | | Other Directorships Held by Trustee |
Lorraine H. Monchak (64) Trustee | | Trustee since 2017. (Advisory Trustee from 2014 - 2017). Serves until a successor trustee is elected or earlier retirement or removal. | | Chief Investment Officer, 1199 SEIU Funds (healthcare workers union pension funds) (2001 – present); Vice President – International Investments Group, American International Group, Inc. (insurance company) (1993 – 2001); Vice President – Corporate Finance and Treasury Group, Citibank, N.A. (1980 – 1986 and 1990 – 1993); Vice President – Asset/Liability Management Group, Federal Farm Funding Corporation (government-sponsored issuer of debt securities) (1988 – 1990); Mortgage Strategies Group, Shearson Lehman Hutton, Inc. (investment bank) (1987 – 1988); and Mortgage Strategies Group, Drexel Burnham Lambert, Ltd. (investment bank) (1986 – 1987) | | None |
| | | |
Marguerite A. Piret (71) Trustee | | Trustee since 2011. Serves until a successor trustee is elected or earlier retirement or removal. | | Chief Financial Officer, American Ag Energy, Inc. (controlled environment and agriculture company) (2016 – present); and President and Chief Executive Officer, Metric Financial Inc. (formerly known as Newbury Piret Company) (investment banking firm) (1981 – 2019) | | Director of New America High Income Fund, Inc. (closed-end investment company) (2004 – present); and Member, Board of Governors, Investment Company Institute (2000 – 2006) |
| | | |
Fred J. Ricciardi (73) Trustee | | Trustee since 2014. Serves until a successor trustee is elected or earlier retirement or removal. | | Consultant (investment company services) (2012 – present); Executive Vice President, BNY Mellon (financial and investment company services) (1969 – 2012); Director, BNY International Financing Corp. (financial services) (2002 – 2012); Director, Mellon Overseas Investment Corp. (financial services) (2009 – 2012); Director, Financial Models (technology) (2005-2007); Director, BNY Hamilton Funds, Ireland (offshore investment companies) (2004-2007); Chairman/Director, AIB/BNY Securities Services, Ltd., Ireland (financial services) (1999-2006); and Chairman, BNY Alternative Investment Services, Inc. (financial services) (2005-2007) | | None |
| | |
| 62 | | Pioneer Dynamic Credit Fund | Annual Report | 3/31/20 |
Interested Trustees
| | | | | | |
Name, Age and Position Held With the Fund | | Term of Office and Length of Service | | Principal Occupation | | Other Directorships Held by Trustee |
Lisa M. Jones (58)* Trustee, President and Chief Executive Officer | | Trustee since 2017. Serves until a successor trustee is elected or earlier retirement or removal | | Director, CEO and President of Amundi Pioneer Asset Management USA, Inc. (since September 2014); Director, CEO and President of Amundi Pioneer Asset Management, Inc. (since September 2014); Director, CEO and President of Amundi Pioneer Distributor, Inc. (since September 2014); Director, CEO and President of Amundi Pioneer Institutional Asset Management, Inc. (since September 2014); Chair, Amundi Pioneer Asset Management USA, Inc., Amundi Pioneer Distributor, Inc. and Amundi Pioneer Institutional Asset Management, Inc. (September 2014 – 2018); Managing Director, Morgan Stanley Investment Management (2010 – 2013); Director of Institutional Business, CEO of International, Eaton Vance Management (2005 – 2010); and Director of Amundi USA, Inc. (since 2017) | | None |
| | | |
Kenneth J. Taubes (62)* Trustee | | Trustee since 2014. Serves until a successor trustee is elected or earlier retirement or removal | | Director and Executive Vice President (since 2008) and Chief Investment Officer, U.S. (since 2010) of Amundi Pioneer Asset Management USA, Inc.; Director and Executive Vice President and Chief Investment Officer, U.S. of Amundi Pioneer (since 2008); Executive Vice President and Chief Investment Officer, U.S. of Amundi Pioneer Institutional Asset Management, Inc. (since 2009); Portfolio Manager of Amundi Pioneer (since 1999); and Director of Amundi USA, Inc. (since 2017) | | None |
| * | Ms. Jones and Mr. Taubes are Interested Trustees because they are officers or directors of the Fund’s investment adviser and certain of its affiliates. |
| | |
| Pioneer Dynamic Credit Fund | Annual Report | 3/31/20 | | 63 |
Fund Officers
| | | | | | |
Name, Age and Position Held With the Fund | | Term of Office and Length of Service | | Principal Occupation | | Other Directorships Held by Officer |
Christopher J. Kelley (55) Secretary and Chief Legal Officer | | Since 2011. Serves at the discretion of the Board | | Vice President and Associate General Counsel of Amundi Pioneer since January 2008; Secretary and Chief Legal Officer of all of the Pioneer Funds since June 2010; Assistant Secretary of all of the Pioneer Funds from September 2003 to May 2010; and Vice President and Senior Counsel of Amundi Pioneer from July 2002 to December 2007 | | None |
| | | |
Carol B. Hannigan (59) Assistant Secretary | | Since 2011. Serves at the discretion of the Board | | Fund Governance Director of Amundi Pioneer since December 2006 and Assistant Secretary of all the Pioneer Funds since June 2010; Manager – Fund Governance of Amundi Pioneer from December 2003 to November 2006; and Senior Paralegal of Amundi Pioneer from January 2000 to November 2003 | | None |
| | | |
Thomas Reyes (57) Assistant Secretary | | Since 2011. Serves at the discretion of the Board | | Assistant General Counsel of Amundi Pioneer since May 2013 and Assistant Secretary of all the Pioneer Funds since June 2010; and Counsel of Amundi Pioneer from June 2007 to May 2013 | | None |
| | | |
Mark E. Bradley (60) Treasurer and Chief Financial and Accounting Officer | | Since 2011. Serves at the discretion of the Board | �� | Vice President – Fund Treasury of Amundi Pioneer; Treasurer of all of the Pioneer Funds since March 2008; Deputy Treasurer of Amundi Pioneer from March 2004 to February 2008; and Assistant Treasurer of all of the Pioneer Funds from March 2004 to February 2008 | | None |
| | | |
Luis I. Presutti (55) Assistant Treasurer | | Since 2011. Serves at the discretion of the Board | | Director – Fund Treasury of Amundi Pioneer; and Assistant Treasurer of all of the Pioneer Funds | | None |
| | | |
Gary Sullivan (62) Assistant Treasurer | | Since 2011. Serves at the discretion of the Board | | Senior Manager – Fund Treasury of Amundi Pioneer; and Assistant Treasurer of all of the Pioneer Funds | | None |
| | |
| 64 | | Pioneer Dynamic Credit Fund | Annual Report | 3/31/20 |
| | | | | | |
Name, Age and Position Held With the Fund | | Term of Office and Length of Service | | Principal Occupation | | Other Directorships Held by Officer |
Antonio Furtado (38) Assistant Treasurer | | Since 2020. Serves at the discretion of the Board | | Fund Oversight Manager – Fund Treasury of Amundi Pioneer; and Assistant Treasurer of all of the Pioneer Funds | | None |
| | | |
John Malone (48) Chief Compliance Officer | | Since 2018. Serves at the discretion of the Board | | Managing Director, Chief Compliance Officer of Amundi Pioneer Asset Management; Amundi Pioneer Institutional Asset Management, Inc.; and the Pioneer Funds since September 2018; and Chief Compliance Officer of Amundi Pioneer Distributor, Inc. since January 2014. | | None |
| | | |
Kelly O’Donnell (49) Anti-Money Laundering Officer | | Since 2011. Serves at the discretion of the Board | | Vice President – Amundi Pioneer Asset Management; and Anti-Money Laundering Officer of all the Pioneer Funds since 2006 | | None |
| | |
| Pioneer Dynamic Credit Fund | Annual Report | 3/31/20 | | 65 |
This page was intentionally left blank.
| | |
| 66 | | Pioneer Dynamic Credit Fund | Annual Report | 3/31/20 |
This page was intentionally left blank.
| | |
| Pioneer Dynamic Credit Fund | Annual Report | 3/31/20 | | 67 |
This page was intentionally left blank.
| | |
| 68 | | Pioneer Dynamic Credit Fund | Annual Report | 3/31/20 |
How to Contact Amundi Pioneer
We are pleased to offer a variety of convenient ways for you to contact us for assistance or information.
| | | | |
| Call us for: | | | |
| |
| Account Information, including existing accounts, new accounts, prospectuses, applications and service forms | | | 1-800-225-6292 | |
| |
| FactFoneSM for automated fund yields, prices, account information and transactions | | | 1-800-225-4321 | |
| |
| Retirement plans information | | | 1-800-622-0176 | |
| | | | |
| Write to us: | | | | |
| |
| Amundi Pioneer | | | | |
| P.O. Box 219427 | | | | |
| Kansas City, MO 64121-9427 | | | | |
| |
| Our toll-free fax | | | 1-800-225-4240 | |
| | |
| Our internet e-mail address | | us.askamundipioneer@amundipioneer.com |
(for general questions about Amundi Pioneer only)
Visit our web site: www.amundipioneer.com/us
This report must be preceded or accompanied by a prospectus.
The Fund files a complete schedule of portfolio holdings with the Securities and Exchange Commission for the first and third quarters of each fiscal year as an exhibit to its reports on Form N-PORT. Shareholders may view the filed Form N-PORT by visiting the Commission’s web site at https://www.sec.gov.

Amundi Pioneer Asset Management, Inc.
60 State Street
Boston, MA 02109
www.amundipioneer.com/us
Securities offered through Amundi Pioneer Distributor, Inc.
60 State Street, Boston, MA 02109
Underwriter of Pioneer Mutual Funds, Member SIPC
© 2020 Amundi Pioneer Asset Management 25667-08-0520