UNITED STATES
SECURITIES AND EXCHANGE COMMISSION
Washington, D.C. 20549
FORM N-CSR
CERTIFIED SHAREHOLDER REPORT OF REGISTERED
MANAGEMENT INVESTMENT COMPANIES
Investment Company Act file number 811-21108
Pioneer Series Trust X
(Exact name of registrant as specified in charter)
60 State Street, Boston, MA 02109
(Address of principal executive offices) (ZIP code)
Christopher J. Kelley, Amundi Asset Management, Inc.,
60 State Street, Boston, MA 02109
(Name and address of agent for service)
Registrant’s telephone number, including area code: (617) 742-7825
Date of fiscal year end: March 31, 2024
Date of reporting period: April 1, 2023 through September 30, 2023
Form N-CSR is to be used by management investment companies to file reports with the Commission not later than 10 days after the transmission to stockholders of any report that is required to be transmitted to stockholders under Rule 30e-1 under the Investment Company Act of 1940 (17 CFR 270.30e-1). The Commission may use the information provided on Form N-CSR in its regulatory, disclosure review, inspection, and policymaking roles.
A registrant is required to disclose the information specified by Form N-CSR, and the Commission will make this information public. A registrant is not required to respond to the collection of information contained in Form N-CSR unless the Form displays a currently valid Office of Management and Budget (“OMB”) control number. Please direct comments concerning the accuracy of the information collection burden estimate and any suggestions for reducing the burden to Secretary, Securities and Exchange Commission, 450 Fifth Street, NW, Washington, DC 20549-0609. The OMB has reviewed this collection of information under the clearance requirements of 44 U.S.C. ss. 3507.
ITEM 1. REPORTS TO STOCKHOLDERS.
Pioneer Fundamental Growth Fund
Semiannual Report | September 30, 2023
| | | | | |
| A: PIGFX | C: FUNCX | K: PFGKX | R: PFGRX | Y: FUNYX |
visit us: www.amundi.com/us
Pioneer Fundamental Growth Fund | Semiannual Report | 9/30/231
President’s Letter
Dear Shareholders,
On February 13, 2023, Amundi US celebrated the 95th anniversary of Pioneer Fund, the second-oldest mutual fund in the United States. We recognized the anniversary with ringing of the closing bell at the New York Stock Exchange, which seemed fitting for this special milestone.
Pioneer Fund was launched on February 13, 1928 by Phil Carret, one of the earliest proponents of value investing and a leading innovator in the asset management industry. Mr. Carret began investing in the 1920s and founded Pioneer Investments (now Amundi US) in 1928, and was one of the first investors to realize he could uncover value through rigorous, innovative, fundamental research techniques.
Consistent with Mr. Carret’s investment approach and employing many of the same techniques utilized in the 1920s, Amundi US's portfolio managers have adapted Mr. Carret’s philosophy to a new age of “active” investing.
The last few years have seen investors face some unprecedented challenges, from a global pandemic that shuttered much of the world’s economy for months, to geopolitical strife, to rising inflation that has reached levels not seen in decades. Now, more than ever, Amundi US believes active management – that is, making active investment decisions across all of our portfolios – can help mitigate risk during periods of market volatility.
At Amundi US, active management begins with our own fundamental, bottom-up research process. Our team of dedicated research analysts and portfolio managers analyzes each security under consideration, communicating frequently with the management teams of the companies and other entities issuing the securities, and working together to identify those securities that we believe best meet our investment criteria for our family of funds. Our risk management approach begins with each security under consideration, as we strive to develop a deep understanding of the potential opportunity, while considering any potential risk factors.
Today, as shareholders, we have many options. It is our view that active management can serve shareholders well, not only when markets are thriving, but also during periods of market stress. As you consider your long-term investment goals, we encourage you to work with your financial professional to develop an investment plan that paves the way for you to pursue both your short-term and long-term goals.
2Pioneer Fundamental Growth Fund | Semiannual Report | 9/30/23
We greatly appreciate the trust you have placed in us and look forward to continuing to serve you in the future.
Lisa M. Jones
Head of the Americas, President and CEO of US
Amundi Asset Management US, Inc.
November 2023
Any information in this shareowner report regarding market or economic trends or the factors influencing the Fund’s historical or future performance are statements of opinion as of the date of this report. Past performance is no guarantee of future results.
Pioneer Fundamental Growth Fund | Semiannual Report | 9/30/233
Portfolio Management Discussion | 9/30/23
In the following interview, Yves Raymond, David Chamberlain, and Andrew Acheson discuss the factors that affected the performance of Pioneer Fundamental Growth Fund during the six-month period ended September 30, 2023. Mr. Raymond, a senior vice president and a portfolio manager at Amundi Asset Management US (Amundi US); Mr. Chamberlain, a senior vice president and a portfolio manager at Amundi US; Matthew Gormley, an associate portfolio manager at Amundi US; and Mr. Acheson, Managing Director, Director of Growth, US, and a portfolio manager at Amundi UK, are responsible for the day-to-day management of the Fund.
| Q | How did the Fund perform during the six-month period ended September 30, 2023? |
| A | Pioneer Fundamental Growth Fund’s Class A shares returned 8.69% at net asset value during the six-month period ended September 30, 2023, while the Fund’s benchmark, the Russell 1000 Growth Index, returned 9.28%. During the same period, the average return of the 1,229 mutual funds in Morningstar’s Large Growth Funds category was 7.04%. |
| Q | How would you describe the investment backdrop for equities during the six-month period ended September 30, 2023? |
| A | Stocks performed well through the first four months of the reporting period, as cooling inflation prompted the US Federal Reserve (Fed) to slow the pace of its interest-rate increases. In addition, the markets appeared to grow confident that the Fed will have largely completed its tightening of monetary policy by 2024. Investor sentiment was further boosted by the fact that both economic growth and corporate profits held up well, compared to the depressed expectations seen in late 2022. |
| | The investment backdrop became less favorable in September and October of 2023, causing the market to finish below its previous highs. Renewed strength in crude oil prices fueled fears that inflation would reaccelerate and the Fed would have to keep rates elevated for longer than the markets had been anticipating. In addition, investors appeared to grow concerned that the US economy was finally beginning to slow. Despite the late sell-off, equities closed the six-month period firmly in positive territory, thanks to their earlier advance. |
4Pioneer Fundamental Growth Fund | Semiannual Report | 9/30/23
| | During the period, growth stocks outpaced the broader market, as measured by the 5.16% return for the Russell 1000 Index. The Fund’s benchmark, Russell 1000 Growth Index (the Russell Index), returned 9.28% for the six-month period, as the growth category performed very well in the second calendar quarter, driven by the strong showing for mega-cap technology stocks, particularly stocks of companies that seemed poised to benefit from the advancements in artificial intelligence (AI). |
| Q | What factors contributed to and detracted from the Fund’s benchmark-relative performance during the six-month period ended September 30, 2023? |
| A | The Fund generated a positive return for the six-month period, but underperformed the Russell Index. Underweights in some of the mega-cap tech companies mentioned earlier detracted from benchmark-relative performance. Most notably, an underweight Fund position in NVIDIA, shares of which surged on excitement surrounding the company’s ability to become one of the largest winners of the developments related to AI, was a key detractor from relative returns. The portfolio’s below-benchmark weightings in Tesla and Meta Platforms were additional lags on the Fund’s relative performance in the mega-cap tech segment. |
| | In addition, two of the Fund’s holdings in the health care sector were sizable detractors from benchmark-relative results. Edwards Lifesciences, a leader in transcatheter heart valve replacement, which is a minimally invasive alternative to open heart surgery, lagged its sector peers by a wide margin during the six-month period. The company’s stock price fell after Edwards reported slightly lower-than-expected profit margins due to investments in clinical trials to generate future growth. A position in life sciences tools company Thermo Fisher Scientific was another key detractor from the Fund’s relative performance in the health care sector. The stock price came under pressure during the period on concerns about unsteady macroeconomic conditions, a decline in Thermo Fisher’s revenues from COVID-related products and services, and destocking by its customers. |
| | Outside of information technology and health care, a position in PepsiCo was a key detractor from the Fund’s relative performance. The shares lost ground during the period on worries |
Pioneer Fundamental Growth Fund | Semiannual Report | 9/30/235
| | that the company would be unable to continue passing on rising costs to consumers in the form of higher prices. |
| | On the positive side, the Fund’s position in Eli Lilly surged in price and contributed to benchmark-relative performance, based on growing optimism about the potential addressable market for the company’s weight-loss treatment. The company also reported better-than-expected sales for its diabetes product, and raised earnings guidance. The Fund further benefited from having no exposure to a number of health care companies that specialize in diabetes treatments and are expected to see their sales slow due to the rollout of Eli Lilly’s diabetes drug. |
| | The industrials sector was an additional source of outperformance for the Fund versus the Russell Index. Within the sector, a position in Verisk Analytics, the leading provider of data and analytics tools for the US property-and-casualty insurance industry, was a top positive contributor to the Fund's relative returns during the six-month period, thanks in part to the company’s decision to refocus on its core business. Positions in Eaton and United Parcel Service (UPS) also contributed positively to the Fund’s relative results in the industrials sector. Stock selection results in the energy sector also aided the Fund’s benchmark-relative performance, due largely to the portfolio’s position in oil services company Schlumberger, as rising crude oil prices led to an improved outlook for spending by the large, integrated producers, and boosted the earnings prospects of services companies. |
| | Finally, an underweight portfolio position in Apple, which lagged its mega-cap peers on concerns about its future sales growth and elevated valuation, also contributed positively to the Fund’s relative performance. |
| Q | Did the Fund have any exposure to derivative securities during the six-month period ended September 30, 2023? |
| A | No. The Fund had no derivatives exposure during the reporting period. |
6Pioneer Fundamental Growth Fund | Semiannual Report | 9/30/23
| Q | How would you characterize the Fund’s overall positioning as of September 30, 2023? |
| A | Our goal is to seek to generate long-term capital growth by investing primarily in US large-cap companies. We believe risk mitigation is a critical component in meeting this goal. Our approach to managing portfolio risk is to invest in what we view as attractively valued equities of companies that have high returns on capital, that we think possess sustainable competitive advantages, and could be positioned to capitalize on secular growth opportunities. |
| | We continue to expect that economic growth will slow over the next several months, due to the effects of higher interest rates, depleted excess savings among consumers, and a resumption of student loan payments, among other factors. The continuing impact of prior fiscal stimulus, such as the Inflation Reduction Act, may offset some of those headwinds. |
| | We believe the Fed will stay hawkish with regard to monetary policy as long as inflation remains sticky, providing there are no unforeseen, adverse events. Hopes of interest-rate cuts later in the year or early in 2024 may prove to be premature, in our view, given rising wages. If the Fed does cut interest rates in the next six to nine months, we think it would likely be a response to greater-than-expected economic weakness, which could be detrimental to corporate earnings. Potential rate cuts, therefore, aren’t necessarily a positive for the markets. |
| | Corporate profit margins have remained relatively high, though well off their peaks of a year ago. We believe further contraction is likely to occur for the majority of companies, and we think that earnings estimates for the next several quarters are overly optimistic. A mild recession, in our view, is more likely than a “soft landing,” in which economic growth slows but remains positive while inflation is brought under control. In either scenario, we believe profit estimates may decline as companies take a more cautious approach due to economic uncertainty. However, if the stock market begins to discount a potential recession, we would anticipate becoming more constructive. |
| | We have been highly selective with regard to the stocks we add to the Fund, and have been seeking to avoid what we believe are |
Pioneer Fundamental Growth Fund | Semiannual Report | 9/30/237
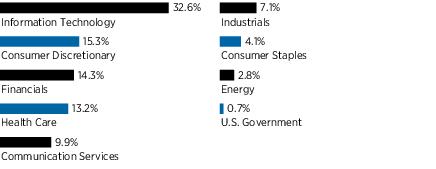
speculative and unprofitable companies that could easily fall out of favor again. At the sector level, the Fund is overweight versus the Russell Index to financials and health care companies, and underweight to information technology. The underweight to the technology sector is primarily due to the aforementioned below-benchmark weighting in Apple, which reflects both position-size limits and our view on the stock’s valuation.
8Pioneer Fundamental Growth Fund | Semiannual Report | 9/30/23
Please refer to the Schedule of Investments on pages 19 - 23 for a full listing of Fund securities.
All investments are subject to risk, including the possible loss of principal. In the past several years, financial markets have experienced increased volatility and heightened uncertainty. The market prices of securities may go up or down, sometimes rapidly or unpredictably, due to general market conditions, such as real or perceived adverse economic, political, or regulatory conditions, recessions, inflation, changes in interest or currency rates, lack of liquidity in the bond markets, the spread of infectious illness or other public health issues, armed conflict including Russia's military invasion of Ukraine, sanctions against Russia, other nations or individuals or companies and possible countermeasures, market disruptions caused by tariffs, trade disputes or other government actions, or adverse investor sentiment. These conditions may continue, recur, worsen or spread.
The Fund may invest in fewer than 40 securities and, as a result, its performance may be more volatile than the performance of other funds holding more securities.
Investing in foreign and/or emerging markets securities involves risks relating to interest rates, currency exchange rates, economic, and political conditions.
For more information on this or any Pioneer fund, please visit amundi.com/usinvestors or call 1-800-622-9876. This material must be preceded or accompanied by the Fund's current prospectus or summary prospectus.
Any information in this shareholder report regarding market or economic trends or the factors influencing the Fund’s historical or future performance are statements of opinion as of the date of this report. Past performance is no guarantee of future results.
Pioneer Fundamental Growth Fund | Semiannual Report | 9/30/239
Portfolio Summary | 9/30/23
Sector Distribution
(As a percentage of total investments)*
10 Largest Holdings
| (As a percentage of total investments)* |
| 1. | Alphabet, Inc., Class C | 8.01% |
| 2. | Microsoft Corp. | 7.11 |
| 3. | Amazon.com, Inc. | 6.15 |
| 4. | Mastercard, Inc., Class A | 4.87 |
| 5. | Eli Lilly & Co. | 4.63 |
| 6. | Apple, Inc. | 4.33 |
| 7. | Adobe, Inc. | 3.17 |
| 8. | PepsiCo., Inc. | 3.02 |
| 9. | Thermo Fisher Scientific, Inc. | 2.99 |
| 10. | Visa, Inc., Class A | 2.89 |
| | |
| * | Excludes short-term investments and all derivative contracts except for options purchased. The Fund is actively managed, and current holdings may be different. The holdings listed should not be considered recommendations to buy or sell any securities. |
10Pioneer Fundamental Growth Fund | Semiannual Report | 9/30/23
Prices and Distributions | 9/30/23
Net Asset Value per Share
| Class | 9/30/23 | 3/31/23 |
| A | $28.52 | $26.24 |
| C | $23.69 | $21.88 |
| K | $28.81 | $26.46 |
| R | $27.27 | $25.13 |
| Y | $29.12 | $26.76 |
| | | |
Distributions per Share: 4/1/23 - 9/30/23
| Class | Net
Investment
Income | Short-Term
Capital Gains | Long-Term
Capital Gains |
| A | $— | $— | $— |
| C | $— | $— | $— |
| K | $— | $— | $— |
| R | $— | $— | $— |
| Y | $— | $— | $— |
Index Definitions
The Russell 1000 Growth Index is an unmanaged index that measures the performance of large-cap U.S. growth stocks. Indices are unmanaged and their returns assume reinvestment of dividends and do not reflect any fees or expenses. It is not possible to invest directly in an index.
The index defined here pertains to the “Value of $10,000 Investment” and “Value of $5 Million Investment” charts on pages 16-20.
Pioneer Fundamental Growth Fund | Semiannual Report | 9/30/2311
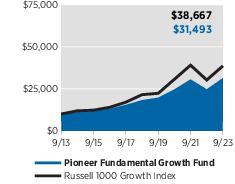
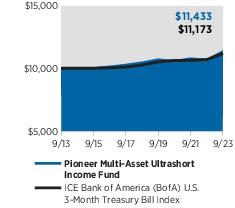
| Performance Update | 9/30/23 | Class A Shares |
Investment Returns
The mountain chart on the right shows the change in value of a $10,000 investment made in Class A shares of Pioneer Fundamental Growth Fund at public offering price during the periods shown, compared to that of the Russell 1000 Growth Index.
Average Annual Total Returns
(As of September 30, 2023) |
| Period | Net
Asset
Value
(NAV) | Public
Offering
Price
(POP) | Russell
1000
Growth
Index |
| 10 Years | 12.82% | 12.16% | 14.48% |
| 5 Years | 11.45 | 10.13 | 12.42 |
| 1 Year | 27.11 | 19.79 | 27.72 |
Expense Ratio
(Per prospectus dated August 1, 2023) |
| Gross |
| 1.02% |
Value of $10,000 Investment
Call 1-800-225-6292 or visit www.amundi.com/us for the most recent month-end performance results. Current performance may be lower or higher than the performance data quoted.
The performance data quoted represents past performance, which is no guarantee of future results. Investment return and principal value will fluctuate, and shares, when redeemed, may be worth more or less than their original cost.
NAV results represent the percent change in net asset value per share. NAV returns would have been lower had sales charges been reflected. POP returns reflect deduction of maximum 5.75% sales charge. All results are historical and assume the reinvestment of dividends and capital gains. Other share classes are available for which performance and expenses will differ.
Performance results reflect any applicable expense waivers in effect during the periods shown. Without such waivers Fund performance would be lower. Waivers may not be in effect for all funds. Certain fee waivers are contractual through a specified period. Otherwise, fee waivers can be rescinded at any time. See the prospectus and financial statements for more information.
The performance table and graph do not reflect the deduction of fees and taxes that a shareowner would pay on Fund distributions or the redemption of Fund shares.
Please refer to the financial highlights for a more current expense ratio.
12Pioneer Fundamental Growth Fund | Semiannual Report | 9/30/23
| Performance Update | 9/30/23 | Class C Shares |
Investment Returns
The mountain chart on the right shows the change in value of a $10,000 investment made in Class C shares of Pioneer Fundamental Growth Fund during the periods shown, compared to that of the Russell 1000 Growth Index.
Average Annual Total Returns
(As of September 30, 2023) |
| Period | If
Held | If
Redeemed | Russell
1000
Growth
Index |
| 10 Years | 12.05% | 12.05% | 14.48% |
| 5 Years | 10.68 | 10.68 | 12.42 |
| 1 Year | 26.24 | 25.24 | 27.72 |
Expense Ratio
(Per prospectus dated August 1, 2023) |
| Gross |
| 1.74% |
Value of $10,000 Investment
Call 1-800-225-6292 or visit www.amundi.com/us for the most recent month-end performance results. Current performance may be lower or higher than the performance data quoted.
The performance data quoted represents past performance, which is no guarantee of future results. Investment return and principal value will fluctuate, and shares, when redeemed, may be worth more or less than their original cost.
Class C shares held for less than one year are also subject to a 1% contingent deferred sales charge (CDSC). “If Held” results represent the percent change in net asset value per share. “If Redeemed” returns reflect deduction of the CDSC for the one-year period, assuming a complete redemption of shares at the last price calculated on the last business day of the period, and no CDSC for the five- and 10-year periods. All results are historical and assume the reinvestment of dividends and capital gains. Other share classes are available for which performance and expenses will differ.
Performance results reflect any applicable expense waivers in effect during the periods shown. Without such waivers Fund performance would be lower. Waivers may not be in effect for all funds. Certain fee waivers are contractual through a specified period. Otherwise, fee waivers can be rescinded at any time. See the prospectus and financial statements for more information.
The performance table and graph do not reflect the deduction of fees and taxes that a shareowner would pay on Fund distributions or the redemption of Fund shares.
Please refer to the financial highlights for a more current expense ratio.
Pioneer Fundamental Growth Fund | Semiannual Report | 9/30/2313
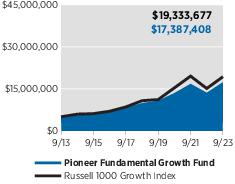
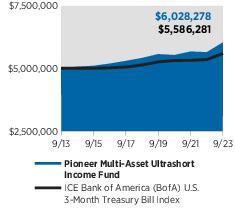
| Performance Update | 9/30/23 | Class K Shares |
Investment Returns
The mountain chart on the right shows the change in value of a $5 million investment made in Class K shares of Pioneer Fundamental Growth Fund during the periods shown, compared to that of the Russell 1000 Growth Index.
Average Annual Total Returns
(As of September 30, 2023) |
| Period | Net
Asset
Value
(NAV) | Russell
1000
Growth
Index |
| 10 Years | 13.27% | 14.48% |
| 5 Years | 11.87 | 12.42 |
| 1 Year | 27.55 | 27.72 |
Expense Ratio
(Per prospectus dated August 1, 2023) |
| Gross |
| 0.67% |
Value of $5 Million Investment
Call 1-800-225-6292 or visit www.amundi.com/us for the most recent month-end performance results. Current performance may be lower or higher than the performance data quoted.
The performance data quoted represents past performance, which is no guarantee of future results. Investment return and principal value will fluctuate, and shares, when redeemed, may be worth more or less than their original cost.
Class K shares are not subject to sales charges and are available for limited groups of eligible investors, including institutional investors. All results are historical and assume the reinvestment of dividends and capital gains. Other share classes are available for which performance and expenses will differ.
Performance results reflect any applicable expense waivers in effect during the periods shown. Without such waivers Fund performance would be lower. Waivers may not be in effect for all funds. Certain fee waivers are contractual through a specified period. Otherwise, fee waivers can be rescinded at any time. See the prospectus and financial statements for more information.
The performance table and graph do not reflect the deduction of fees and taxes that a shareowner would pay on Fund distributions or the redemption of Fund shares.
Please refer to the financial highlights for a more current expense ratio.
14Pioneer Fundamental Growth Fund | Semiannual Report | 9/30/23
| Performance Update | 9/30/23 | Class R Shares |
Investment Returns
The mountain chart on the right shows the change in value of a $10,000 investment made in Class R shares of Pioneer Fundamental Growth Fund during the periods shown, compared to that of the Russell 1000 Growth Index.
Average Annual Total Returns
(As of September 30, 2023) |
| Period | Net
Asset
Value
(NAV) | Russell
1000
Growth
Index |
| 10 Years | 12.45% | 14.48% |
| 5 Years | 11.05 | 12.42 |
| 1 Year | 26.68 | 27.72 |
Expense Ratio
(Per prospectus dated August 1, 2023) |
| Gross | Net |
| 1.43% | 1.40% |
Value of $10,000 Investment
Call 1-800-225-6292 or visit www.amundi.com/us for the most recent month-end performance results. Current performance may be lower or higher than the performance data quoted.
The performance data quoted represents past performance, which is no guarantee of future results. Investment return and principal value will fluctuate, and shares, when redeemed, may be worth more or less than their original cost.
Class R shares are not subject to sales charges and are available for limited groups of eligible investors, including institutional investors. All results are historical and assume the reinvestment of dividends and capital gains. Other share classes are available for which performance and expenses will differ.
Performance results reflect any applicable expense waivers in effect during the periods shown. Without such waivers Fund performance would be lower. Waivers may not be in effect for all funds. Certain fee waivers are contractual through a specified period. Otherwise, fee waivers can be rescinded at any time. See the prospectus and financial statements for more information.
The net expense ratio reflects the contractual expense limitation in effect through August 1, 2024 for Class R shares. There can be no assurance that Amundi US will extend the expense limitation beyond such time. Please see the prospectus for more information.
The performance table and graph do not reflect the deduction of fees and taxes that a shareowner would pay on Fund distributions or the redemption of Fund shares.
Please refer to the financial highlights for more current expense ratios.
Pioneer Fundamental Growth Fund | Semiannual Report | 9/30/2315
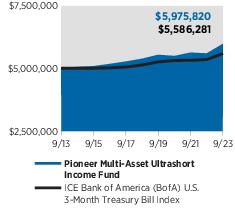
| Performance Update | 9/30/23 | Class Y Shares |
Investment Returns
The mountain chart on the right shows the change in value of a $5 million investment made in Class Y shares of Pioneer Fundamental Growth Fund during the periods shown, compared to that of the Russell 1000 Growth Index.
Average Annual Total Returns
(As of September 30, 2023) |
| Period | Net
Asset
Value
(NAV) | Russell
1000
Growth
Index |
| 10 Years | 13.16% | 14.48% |
| 5 Years | 11.76 | 12.42 |
| 1 Year | 27.45 | 27.72 |
Expense Ratio
(Per prospectus dated August 1, 2023) |
| Gross |
| 0.76% |
Value of $5 Million Investment
Call 1-800-225-6292 or visit www.amundi.com/us for the most recent month-end performance results. Current performance may be lower or higher than the performance data quoted.
The performance data quoted represents past performance, which is no guarantee of future results. Investment return and principal value will fluctuate, and shares, when redeemed, may be worth more or less than their original cost.
Class Y shares are not subject to sales charges and are available for limited groups of eligible investors, including institutional investors. All results are historical and assume the reinvestment of dividends and capital gains. Other share classes are available for which performance and expenses will differ.
Performance results reflect any applicable expense waivers in effect during the periods shown. Without such waivers Fund performance would be lower. Waivers may not be in effect for all funds. Certain fee waivers are contractual through a specified period. Otherwise, fee waivers can be rescinded at any time. See the prospectus and financial statements for more information.
The performance table and graph do not reflect the deduction of fees and taxes that a shareowner would pay on Fund distributions or the redemption of Fund shares.
Please refer to the financial highlights for a more current expense ratio.
16Pioneer Fundamental Growth Fund | Semiannual Report | 9/30/23
Comparing Ongoing Fund Expenses
As a shareowner in the Fund, you incur two types of costs:
| (1) | ongoing costs, including management fees, distribution and/or service (12b-1) fees, and other Fund expenses; and |
| (2) | transaction costs, including sales charges (loads) on purchase payments. |
This example is intended to help you understand your ongoing expenses (in dollars) of investing in the Fund and to compare these costs with the ongoing costs of investing in other mutual funds. The example is based on an investment of $1,000 at the beginning of the Fund’s latest six-month period and held throughout the six months.
Using the Tables
Actual Expenses
The first table below provides information about actual account values and actual expenses. You may use the information in this table, together with the amount you invested, to estimate the expenses that you paid over the period as follows:
| (1) | Divide your account value by $1,000
Example: an $8,600 account value ÷ $1,000 = 8.6 |
| (2) | Multiply the result in (1) above by the corresponding share class’s number in the third row under the heading entitled “Expenses Paid During Period” to estimate the expenses you paid on your account during this period. |
Expenses Paid on a $1,000 Investment in Pioneer Fundamental Growth Fund
Based on actual returns from April 1, 2023 through September 30, 2023.
| Share Class | A | C | K | R | Y |
Beginning Account
Value on 4/1/23 | $1,000.00 | $1,000.00 | $1,000.00 | $1,000.00 | $1,000.00 |
Ending Account Value
(after expenses) on 9/30/23 | $1,086.90 | $1,082.70 | $1,088.80 | $1,085.20 | $1,088.20 |
Expenses Paid
During Period* | $5.22 | $9.06 | $3.45 | $7.09 | $3.97 |
| | |
| * | Expenses are equal to the Fund’s annualized expense ratio of 1.00%, 1.74%, 0.66%, 1.36%, and 0.76% for Class A, Class C, Class K, Class R, and Class Y shares, respectively, multiplied by the average account value over the period, multiplied by 183/366 (to reflect the one-half year period). |
Pioneer Fundamental Growth Fund | Semiannual Report | 9/30/2317
Comparing Ongoing Fund Expenses (continued)
Hypothetical Example for Comparison Purposes
The table below provides information about hypothetical account values and hypothetical expenses based on the Fund’s actual expense ratio and an assumed rate of return of 5% per year before expenses, which is not the Fund’s actual return. The hypothetical account values and expenses may not be used to estimate the actual ending account balance or expenses you paid for the period.
You may use this information to compare the ongoing costs of investing in the Fund and other funds. To do so, compare this 5% hypothetical example with the 5% hypothetical examples that appear in the shareholder reports of the other funds.
Please note that the expenses shown in the tables are meant to highlight your ongoing costs only and do not reflect any transaction costs, such as sales charges (loads) that are charged at the time of the transaction. Therefore, the table below is useful in comparing ongoing costs only and will not help you determine the relative total costs of owning different funds. In addition, if these transaction costs were included, your costs would have been higher.
Expenses Paid on a $1,000 Investment in Pioneer Fundamental Growth Fund
Based on a hypothetical 5% return per year before expenses, reflecting the period from April 1, 2023 through September 30, 2023.
| Share Class | A | C | K | R | Y |
Beginning Account
Value on 4/1/23 | $1,000.00 | $1,000.00 | $1,000.00 | $1,000.00 | $1,000.00 |
Ending Account Value
(after expenses) on 9/30/23 | $1,020.00 | $1,016.30 | $1,021.70 | $1,018.20 | $1,021.20 |
Expenses Paid
During Period* | $5.05 | $8.77 | $3.34 | $6.86 | $3.84 |
| | |
| * | Expenses are equal to the Fund’s annualized expense ratio of 1.00%, 1.74%, 0.66%, 1.36%, and 0.76% for Class A, Class C, Class K, Class R, and Class Y shares, respectively, multiplied by the average account value over the period, multiplied by 183/366 (to reflect the one-half year period). |
18Pioneer Fundamental Growth Fund | Semiannual Report | 9/30/23
Schedule of Investments | 9/30/23
(unaudited)
| Shares | | | | | | Value |
| | UNAFFILIATED ISSUERS — 100.0% | |
| | Common Stocks — 97.2% of Net Assets | |
| | Beverages — 3.0% | |
| 1,038,325 | PepsiCo., Inc. | $ 175,933,788 |
| | Total Beverages | $175,933,788 |
|
|
| | Broadline Retail — 6.0% | |
| 2,817,410(a) | Amazon.com, Inc. | $ 358,149,159 |
| | Total Broadline Retail | $358,149,159 |
|
|
| | Capital Markets — 3.6% | |
| 178,987 | FactSet Research Systems, Inc. | $ 78,263,855 |
| 1,222,541 | Intercontinental Exchange, Inc. | 134,503,961 |
| | Total Capital Markets | $212,767,816 |
|
|
| | Commercial Services & Supplies — 1.0% | |
| 1,371,464(a) | Copart, Inc. | $ 59,096,384 |
| | Total Commercial Services & Supplies | $59,096,384 |
|
|
| | Communications Equipment — 2.3% | |
| 514,327 | Motorola Solutions, Inc. | $ 140,020,382 |
| | Total Communications Equipment | $140,020,382 |
|
|
| | Electrical Equipment — 1.9% | |
| 352,813 | Eaton Corp. Plc | $ 75,247,957 |
| 143,830 | Rockwell Automation, Inc. | 41,116,682 |
| | Total Electrical Equipment | $116,364,639 |
|
|
| | Electronic Equipment, Instruments & Components
— 5.1% | |
| 1,991,394 | Amphenol Corp., Class A | $ 167,257,182 |
| 677,515 | CDW Corp. | 136,695,426 |
| | Total Electronic Equipment, Instruments & Components | $303,952,608 |
|
|
| | Energy Equipment & Services — 2.7% | |
| 2,805,994 | Schlumberger, NV | $ 163,589,450 |
| | Total Energy Equipment & Services | $163,589,450 |
|
|
| | Entertainment — 1.9% | |
| 436,589 | Electronic Arts, Inc. | $ 52,565,315 |
| 717,394(a) | Walt Disney Co. | 58,144,784 |
| | Total Entertainment | $110,710,099 |
|
|
The accompanying notes are an integral part of these financial statements.
Pioneer Fundamental Growth Fund | Semiannual Report | 9/30/2319
Schedule of Investments | 9/30/23
(unaudited) (continued)
| Shares | | | | | | Value |
| | Financial Services — 7.6% | |
| 716,976 | Mastercard, Inc., Class A | $ 283,857,968 |
| 731,282 | Visa, Inc., Class A | 168,202,173 |
| | Total Financial Services | $452,060,141 |
|
|
| | Ground Transportation — 1.1% | |
| 1,471,961(a) | Uber Technologies, Inc. | $ 67,695,486 |
| | Total Ground Transportation | $67,695,486 |
|
|
| | Health Care Equipment & Supplies — 3.1% | |
| 1,031,768(a) | Edwards Lifesciences Corp. | $ 71,480,887 |
| 385,975(a) | Intuitive Surgical, Inc. | 112,816,633 |
| | Total Health Care Equipment & Supplies | $184,297,520 |
|
|
| | Hotels, Restaurants & Leisure — 2.5% | |
| 38,932(a) | Booking Holdings, Inc. | $ 120,064,342 |
| 193,134 | Hilton Worldwide Holdings, Inc. | 29,004,864 |
| | Total Hotels, Restaurants & Leisure | $149,069,206 |
|
|
| | Household Products — 1.1% | |
| 910,977 | Colgate-Palmolive Co. | $ 64,779,574 |
| | Total Household Products | $64,779,574 |
|
|
| | Insurance — 2.8% | |
| 1,192,238 | Progressive Corp. | $ 166,078,753 |
| | Total Insurance | $166,078,753 |
|
|
| | Interactive Media & Services — 7.8% | |
| 3,539,494(a) | Alphabet, Inc., Class C | $ 466,682,284 |
| | Total Interactive Media & Services | $466,682,284 |
|
|
| | Life Sciences Tools & Services — 5.3% | |
| 561,960 | Danaher Corp. | $ 139,422,276 |
| 343,657 | Thermo Fisher Scientific, Inc. | 173,948,864 |
| | Total Life Sciences Tools & Services | $313,371,140 |
|
|
| | Machinery — 1.1% | |
| 277,199 | Illinois Tool Works, Inc. | $ 63,841,702 |
| | Total Machinery | $63,841,702 |
|
|
| | Pharmaceuticals — 4.5% | |
| 502,191 | Eli Lilly & Co. | $ 269,741,852 |
| | Total Pharmaceuticals | $269,741,852 |
|
|
| | Professional Services — 1.8% | |
| 443,095 | Verisk Analytics, Inc. | $ 104,676,763 |
| | Total Professional Services | $104,676,763 |
|
|
The accompanying notes are an integral part of these financial statements.
20Pioneer Fundamental Growth Fund | Semiannual Report | 9/30/23
| Shares | | | | | | Value |
| | Semiconductors & Semiconductor Equipment —
5.9% | |
| 851,833(a) | Advanced Micro Devices, Inc. | $ 87,585,469 |
| 695,367 | Microchip Technology, Inc. | 54,273,394 |
| 152,923 | NVIDIA Corp. | 66,519,976 |
| 1,272,073 | QUALCOMM, Inc. | 141,276,428 |
| | Total Semiconductors & Semiconductor Equipment | $349,655,267 |
|
|
| | Software — 14.4% | |
| 362,698(a) | Adobe, Inc. | $ 184,939,710 |
| 277,136 | Intuit, Inc. | 141,599,868 |
| 1,311,965 | Microsoft Corp. | 414,252,949 |
| 562,518(a) | Salesforce, Inc. | 114,067,400 |
| | Total Software | $854,859,927 |
|
|
| | Specialty Retail — 6.5% | |
| 147,878(a) | O'Reilly Automotive, Inc. | $ 134,400,399 |
| 1,077,823 | Ross Stores, Inc. | 121,740,108 |
| 1,470,459 | TJX Cos., Inc. | 130,694,396 |
| | Total Specialty Retail | $386,834,903 |
|
|
| | Technology Hardware, Storage & Peripherals —
4.2% | |
| 1,474,878 | Apple, Inc. | $ 252,513,862 |
| | Total Technology Hardware, Storage & Peripherals | $252,513,862 |
|
|
| | Total Common Stocks
(Cost $2,878,822,180) | $5,786,742,705 |
|
|
Principal
Amount
USD ($) | | | | | | |
| | U.S. Government and Agency
Obligations — 0.7% of Net Assets | |
| 40,000,000(b) | U.S. Treasury Bills, 10/24/23 | $ 39,871,025 |
| | Total U.S. Government and Agency Obligations
(Cost $39,865,120) | $39,871,025 |
|
|
The accompanying notes are an integral part of these financial statements.
Pioneer Fundamental Growth Fund | Semiannual Report | 9/30/2321
Schedule of Investments | 9/30/23
(unaudited) (continued)
Principal
Amount
USD ($) | | | | | | Value |
|
| | SHORT TERM INVESTMENTS — 2.1% of Net
Assets | |
| | Repurchase Agreements — 0.7% | |
| 42,000,000 | Bank of America, 5.3%, dated 9/29/23,
to be purchased on 10/2/23 for $42,018,550,
collateralized by $42,840,078 U.S. Treasury Note,
3.75%-4.00%, 4/15/26-2/28/30 | $ 42,000,000 |
| | | | | | | $ 42,000,000 |
|
|
| Shares | | | | | | |
| | Open-End Fund — 1.4% | |
| 81,020,043(c) | Dreyfus Government Cash Management,
Institutional Shares, 5.22% | $ 81,020,043 |
| | | | | | | $ 81,020,043 |
|
|
| | TOTAL SHORT TERM INVESTMENTS
(Cost $123,020,043) | $123,020,043 |
|
|
| | TOTAL INVESTMENTS IN UNAFFILIATED ISSUERS — 100.0%
(Cost $3,041,707,343) | $5,949,633,773 |
| | OTHER ASSETS AND LIABILITIES — 0.0%† | $ 2,671,121 |
| | net assets — 100.0% | $5,952,304,894 |
| | | | | | | |
| (a) | Non-income producing security. |
| (b) | Security issued with a zero coupon. Income is recognized through accretion of discount. |
| (c) | Rate periodically changes. Rate disclosed is the 7-day yield at September 30, 2023. |
| † | Amount rounds to less than 0.1%. |
Purchases and sales of securities (excluding short-term investments) for the six months ended September 30, 2023, aggregated $494,368,992 and $534,459,092, respectively.
At September 30, 2023, the net unrealized appreciation on investments based on cost for federal tax purposes of $3,053,988,856 was as follows:
| Aggregate gross unrealized appreciation for all investments in which there is an excess of value over tax cost | $2,935,411,126 |
| Aggregate gross unrealized depreciation for all investments in which there is an excess of tax cost over value | (39,766,209) |
| Net unrealized appreciation | $2,895,644,917 |
The accompanying notes are an integral part of these financial statements.
22Pioneer Fundamental Growth Fund | Semiannual Report | 9/30/23
Various inputs are used in determining the value of the Fund's investments. These inputs are summarized in the three broad levels below.
| Level 1 | – | unadjusted quoted prices in active markets for identical securities. |
| Level 2 | – | other significant observable inputs (including quoted prices for similar securities, interest rates, prepayment speeds, credit risks, etc.). See Notes to Financial Statements — Note 1A. |
| Level 3 | – | significant unobservable inputs (including the Adviser's own assumptions in determining fair value of investments). See Notes to Financial Statements — Note 1A. |
The following is a summary of the inputs used as of September 30, 2023, in valuing the Fund's investments:
| | Level 1 | Level 2 | Level 3 | Total |
| Common Stocks | $5,786,742,705 | $ — | $— | $5,786,742,705 |
| U.S. Government and Agency Obligations | — | 39,871,025 | — | 39,871,025 |
| Repurchase Agreements | — | 42,000,000 | — | 42,000,000 |
| Open-End Fund | 81,020,043 | — | — | 81,020,043 |
| Total Investments in Securities | $ 5,867,762,748 | $ 81,871,025 | $ — | $ 5,949,633,773 |
During the period ended September 30, 2023, there were no transfers in or out of Level 3.
The accompanying notes are an integral part of these financial statements.
Pioneer Fundamental Growth Fund | Semiannual Report | 9/30/2323
Statement of Assets and Liabilities | 9/30/23 (unaudited)
| ASSETS: | |
| Investments in unaffiliated issuers, at value (cost $3,041,707,343) | $5,949,633,773 |
| Receivables — | |
| Fund shares sold | 8,942,050 |
| Dividends | 2,033,197 |
| Interest | 235,489 |
| Due from the Adviser | 27 |
| Other assets | 223,255 |
| Total assets | $ 5,961,067,791 |
| LIABILITIES: | |
| Payables — | |
| Fund shares repurchased | $ 6,857,310 |
| Transfer agent fees | 984,131 |
| Management fees | 395,353 |
| Administrative expenses | 169,706 |
| Distribution fees | 60,017 |
| Accrued expenses | 296,380 |
| Total liabilities | $ 8,762,897 |
| NET ASSETS: | |
| Paid-in capital | $2,853,243,361 |
| Distributable earnings | 3,099,061,533 |
| Net assets | $5,952,304,894 |
| NET ASSET VALUE PER SHARE: | |
| No par value (unlimited number of shares authorized) | |
| Class A (based on $1,152,581,202/40,412,194 shares) | $ 28.52 |
| Class C (based on $209,936,436/8,862,388 shares) | $ 23.69 |
| Class K (based on $839,506,578/29,137,770 shares) | $ 28.81 |
| Class R (based on $103,654,718/3,801,562 shares) | $ 27.27 |
| Class Y (based on $3,646,625,960/125,248,089 shares) | $ 29.12 |
| MAXIMUM OFFERING PRICE PER SHARE: | |
| Class A (based on $28.52 net asset value per share/100%-5.75% maximum sales charge) | $ 30.26 |
The accompanying notes are an integral part of these financial statements.
24Pioneer Fundamental Growth Fund | Semiannual Report | 9/30/23
Statement of Operations (unaudited)
FOR THE SIX MONTHS ENDED 9/30/23
| INVESTMENT INCOME: | | |
| Dividends from unaffiliated issuers | $23,175,622 | |
| Interest from unaffiliated issuers | 2,093,339 | |
| Total Investment Income | | $ 25,268,961 |
| EXPENSES: | | |
| Management fees | $17,782,278 | |
| Administrative expenses | 770,411 | |
| Transfer agent fees | | |
| Class A | 457,750 | |
| Class C | 78,358 | |
| Class K | 901 | |
| Class R | 103,083 | |
| Class Y | 1,693,013 | |
| Distribution fees | | |
| Class A | 1,380,284 | |
| Class C | 1,109,193 | |
| Class R | 258,650 | |
| Shareowner communications expense | 130,729 | |
| Custodian fees | 31,918 | |
| Registration fees | 60,793 | |
| Professional fees | 192,843 | |
| Printing expense | 12,913 | |
| Officers' and Trustees' fees | 187,171 | |
| Miscellaneous | 208,089 | |
| Total expenses | | $ 24,458,377 |
| Net investment income | | $ 810,584 |
| REALIZED AND UNREALIZED GAIN (LOSS) ON INVESTMENTS: | | |
| Net realized gain (loss) on: | | |
| Investments in unaffiliated issuers | | $202,947,823 |
| Change in net unrealized appreciation (depreciation) on: | | |
| Investments in unaffiliated issuers | | $273,605,775 |
| Net realized and unrealized gain (loss) on investments | | $476,553,598 |
| Net increase in net assets resulting from operations | | $477,364,182 |
The accompanying notes are an integral part of these financial statements.
Pioneer Fundamental Growth Fund | Semiannual Report | 9/30/2325
Statements of Changes in Net Assets
| | Six Months
Ended
9/30/23
(unaudited) | Year
Ended
3/31/23 |
| FROM OPERATIONS: | | |
| Net investment income (loss) | $ 810,584 | $ 1,702,215 |
| Net realized gain (loss) on investments | 202,947,823 | 4,379,884 |
| Change in net unrealized appreciation (depreciation) on investments | 273,605,775 | (430,738,196) |
| Net increase (decrease) in net assets resulting from operations | $ 477,364,182 | $ (424,656,097) |
| DISTRIBUTIONS TO SHAREOWNERS: | | |
| Class A ($— and $1.06 per share, respectively) | $ — | $ (40,524,950) |
| Class C ($— and $1.06 per share, respectively) | — | (12,076,330) |
| Class K ($— and $1.06 per share, respectively) | — | (28,722,503) |
| Class R ($— and $1.06 per share, respectively) | — | (4,002,407) |
| Class Y ($— and $1.06 per share, respectively) | — | (127,942,583) |
| Total distributions to shareowners | $ — | $ (213,268,773) |
| FROM FUND SHARE TRANSACTIONS: | | |
| Net proceeds from sales of shares | $ 714,617,386 | $ 1,286,919,419 |
| Reinvestment of distributions | — | 190,150,893 |
| Cost of shares repurchased | (708,247,877) | (1,641,920,640) |
| Net increase (decrease) in net assets resulting from Fund share transactions | $ 6,369,509 | $ (164,850,328) |
| Net increase (decrease) in net assets | $ 483,733,691 | $ (802,775,198) |
| NET ASSETS: | | |
| Beginning of period | $5,468,571,203 | $ 6,271,346,401 |
| End of period | $5,952,304,894 | $ 5,468,571,203 |
The accompanying notes are an integral part of these financial statements.
26Pioneer Fundamental Growth Fund | Semiannual Report | 9/30/23
| | Six Months
Ended
9/30/23
Shares
(unaudited) | Six Months
Ended
9/30/23
Amount
(unaudited) | Year
Ended
3/31/23
Shares | Year
Ended
3/31/23
Amount |
| Class A | | | | |
| Shares sold | 6,075,289 | $ 173,066,440 | 5,572,757 | $ 141,439,708 |
| Reinvestment of distributions | — | — | 1,426,771 | 35,355,376 |
| Less shares repurchased | (4,024,503) | (113,676,356) | (8,270,446) | (210,553,850) |
Net increase
(decrease) | 2,050,786 | $ 59,390,084 | (1,270,918) | $ (33,758,766) |
| Class C | | | | |
| Shares sold | 347,155 | $ 8,169,311 | 777,200 | $ 16,585,707 |
| Reinvestment of distributions | — | — | 551,991 | 11,431,724 |
| Less shares repurchased | (1,730,074) | (40,344,727) | (5,499,084) | (117,360,748) |
| Net decrease | (1,382,919) | $ (32,175,416) | (4,169,893) | $ (89,343,317) |
| Class K | | | | |
| Shares sold | 3,774,982 | $ 108,572,867 | 6,058,204 | $ 154,002,209 |
| Reinvestment of distributions | — | — | 1,081,116 | 26,984,664 |
| Less shares repurchased | (2,264,254) | (64,530,420) | (8,262,193) | (215,969,328) |
Net increase
(decrease) | 1,510,728 | $ 44,042,447 | (1,122,873) | $ (34,982,455) |
| Class R | | | | |
| Shares sold | 309,852 | $ 8,210,949 | 454,486 | $ 11,063,987 |
| Reinvestment of distributions | — | — | 152,300 | 3,620,180 |
| Less shares repurchased | (334,943) | (9,039,010) | (747,578) | (18,143,975) |
| Net decrease | (25,091) | $ (828,061) | (140,792) | $ (3,459,808) |
| Class Y | | | | |
| Shares sold | 14,475,005 | $ 416,597,819 | 37,242,069 | $ 963,827,808 |
| Reinvestment of distributions | — | — | 4,467,470 | 112,758,949 |
| Less shares repurchased | (16,694,542) | (480,657,364) | (42,011,533) | (1,079,892,739) |
| Net decrease | (2,219,537) | $ (64,059,545) | (301,994) | $ (3,305,982) |
The accompanying notes are an integral part of these financial statements.
Pioneer Fundamental Growth Fund | Semiannual Report | 9/30/2327
| | Six Months
Ended
9/30/23
(unaudited) | Year
Ended
3/31/23 | Year
Ended
3/31/22 | Year
Ended
3/31/21 | Year
Ended
3/31/20 | Year
Ended
3/31/19 |
| Class A | | | | | | |
| Net asset value, beginning of period | $ 26.24 | $ 29.25 | $ 31.88 | $ 22.43 | $ 24.21 | $ 22.66 |
| Increase (decrease) from investment operations: | | | | | | |
| Net investment income (loss) (a) | $ (0.02) | $ (0.03) | $ (0.09) | $ (0.03)(b) | $ 0.04 | $ 0.06 |
| Net realized and unrealized gain (loss) on investments | 2.30 | (1.92) | 3.87 | 12.31 | (0.36) | 2.77 |
| Net increase (decrease) from investment operations | $ 2.28 | $ (1.95) | $ 3.78 | $ 12.28 | $ (0.32) | $ 2.83 |
| Distributions to shareowners: | | | | | | |
| Net investment income | $ — | $ — | $ — | $ — | $ (0.01) | $ (0.05) |
| Net realized gain | — | (1.06) | (6.41) | (2.83) | (1.45) | (1.23) |
| Total distributions | $ — | $ (1.06) | $ (6.41) | $ (2.83) | $ (1.46) | $ (1.28) |
| Net increase (decrease) in net asset value | $ 2.28 | $ (3.01) | $ (2.63) | $ 9.45 | $ (1.78) | $ 1.55 |
| Net asset value, end of period | $ 28.52 | $ 26.24 | $ 29.25 | $ 31.88 | $ 22.43 | $ 24.21 |
| Total return (c) | 8.69%(d) | (6.44)% | 10.70% | 55.55% | (2.17)% | 12.90% |
| Ratio of net expenses to average net assets | 1.00%(e) | 1.02% | 1.00% | 1.04% | 1.07% | 1.09% |
| Ratio of net investment income (loss) to average net assets | (0.13)%(e) | (0.13)% | (0.26)% | (0.10)% | 0.16% | 0.25% |
| Portfolio turnover rate | 9%(d) | 12% | 18%(f) | 24% | 23%(f) | 26% |
| Net assets, end of period (in thousands) | $1,152,581 | $1,006,630 | $1,159,356 | $1,143,970 | $805,102 | $1,042,168 |
| (a) | The per-share data presented above is based on the average shares outstanding for the period presented. |
| (b) | The amount shown for a share outstanding does not correspond with net investment income on the Statement of Operations for the period due to timing of the sales and repurchase of shares. |
| (c) | Assumes initial investment at net asset value at the beginning of each period, reinvestment of all distributions, the complete redemption of the investment at net asset value at the end of each period and no sales charges. Total return would be reduced if sales charges were taken into account. |
| (d) | Not annualized. |
| (e) | Annualized. |
| (f) | Portfolio turnover excludes the value of portfolio securities received or delivered as a result of in-kind fund share transactions. |
The accompanying notes are an integral part of these financial statements.
28Pioneer Fundamental Growth Fund | Semiannual Report | 9/30/23
| | Six Months
Ended
9/30/23
(unaudited) | Year
Ended
3/31/23 | Year
Ended
3/31/22 | Year
Ended
3/31/21 | Year
Ended
3/31/20 | Year
Ended
3/31/19 |
| Class C | | | | | | |
| Net asset value, beginning of period | $ 21.88 | $ 24.76 | $ 28.01 | $ 20.07 | $ 21.93 | $ 20.73 |
| Increase (decrease) from investment operations: | | | | | | |
| Net investment income (loss) (a) | $ (0.10) | $ (0.18) | $ (0.28) | $ (0.21)(b) | $ (0.12)(b) | $ (0.08)(b) |
| Net realized and unrealized gain (loss) on investments | 1.91 | (1.64) | 3.44 | 10.98 | (0.29) | 2.51 |
| Net increase (decrease) from investment operations | $ 1.81 | $ (1.82) | $ 3.16 | $ 10.77 | $ (0.41) | $ 2.43 |
| Distributions to shareowners: | | | | | | |
| Net realized gain | $ — | $ (1.06) | $ (6.41) | $ (2.83) | $ (1.45) | $ (1.23) |
| Total distributions | $ — | $ (1.06) | $ (6.41) | $ (2.83) | $ (1.45) | $ (1.23) |
| Net increase (decrease) in net asset value | $ 1.81 | $ (2.88) | $ (3.25) | $ 7.94 | $ (1.86) | $ 1.20 |
| Net asset value, end of period | $ 23.69 | $ 21.88 | $ 24.76 | $ 28.01 | $ 20.07 | $ 21.93 |
| Total return (c) | 8.27%(d) | (7.10)% | 9.91% | 54.53% | (2.81)% | 12.12% |
| Ratio of net expenses to average net assets | 1.74%(e) | 1.74% | 1.71% | 1.72% | 1.74% | 1.73% |
| Ratio of net investment income (loss) to average net assets | (0.88)%(e) | (0.86)% | (0.98)% | (0.79)% | (0.51)% | (0.39)% |
| Portfolio turnover rate | 9%(d) | 12% | 18%(f) | 24% | 23%(f) | 26% |
| Net assets, end of period (in thousands) | $209,936 | $224,126 | $356,963 | $432,822 | $372,488 | $444,786 |
| (a) | The per-share data presented above is based on the average shares outstanding for the period presented. |
| (b) | The amount shown for a share outstanding does not correspond with net investment income on the Statement of Operations for the period due to timing of the sales and repurchase of shares. |
| (c) | Assumes initial investment at net asset value at the beginning of each period, reinvestment of all distributions, the complete redemption of the investment at net asset value at the end of each period and no sales charges. Total return would be reduced if sales charges were taken into account. |
| (d) | Not annualized. |
| (e) | Annualized. |
| (f) | Portfolio turnover excludes the value of portfolio securities received or delivered as a result of in-kind fund share transactions. |
The accompanying notes are an integral part of these financial statements.
Pioneer Fundamental Growth Fund | Semiannual Report | 9/30/2329
Financial Highlights (continued)
| | Six Months
Ended
9/30/23
(unaudited) | Year
Ended
3/31/23 | Year
Ended
3/31/22 | Year
Ended
3/31/21 | Year
Ended
3/31/20 | Year
Ended
3/31/19 |
| Class K | | | | | | |
| Net asset value, beginning of period | $ 26.46 | $ 29.39 | $ 31.94 | $ 22.43 | $ 24.21 | $ 22.68 |
| Increase (decrease) from investment operations: | | | | | | |
| Net investment income (loss) (a) | $ 0.03 | $ 0.06 | $ 0.03(b) | $ 0.08 | $ 0.15 | $ 0.16 |
| Net realized and unrealized gain (loss) on investments | 2.32 | (1.93) | 3.87 | 12.34 | (0.36) | 2.76 |
| Net increase (decrease) from investment operations | $ 2.35 | $ (1.87) | $ 3.90 | $ 12.42 | $ (0.21) | $ 2.92 |
| Distributions to shareowners: | | | | | | |
| Net investment income | $ — | $ — | $ (0.04) | $ (0.08) | $ (0.12) | $ (0.16) |
| Net realized gain | — | (1.06) | (6.41) | (2.83) | (1.45) | (1.23) |
| Total distributions | $ — | $ (1.06) | $ (6.45) | $ (2.91) | $ (1.57) | $ (1.39) |
| Net increase (decrease) in net asset value | $ 2.35 | $ (2.93) | $ (2.55) | $ 9.51 | $ (1.78) | $ 1.53 |
| Net asset value, end of period | $ 28.81 | $ 26.46 | $ 29.39 | $ 31.94 | $ 22.43 | $ 24.21 |
| Total return (c) | 8.88%(d) | (6.14)% | 11.08% | 56.21% | (1.78)% | 13.39% |
| Ratio of net expenses to average net assets | 0.66%(e) | 0.67% | 0.66% | 0.65% | 0.66% | 0.66% |
| Ratio of net investment income (loss) to average net assets | 0.20%(e) | 0.22% | 0.09% | 0.28% | 0.58% | 0.68% |
| Portfolio turnover rate | 9%(d) | 12% | 18%(f) | 24% | 23%(f) | 26% |
| Net assets, end of period (in thousands) | $839,507 | $731,131 | $844,949 | $846,019 | $639,430 | $680,094 |
| (a) | The per-share data presented above is based on the average shares outstanding for the period presented. |
| (b) | The amount shown for a share outstanding does not correspond with net investment income on the Statement of Operations for the period due to timing of the sales and repurchase of shares. |
| (c) | Assumes initial investment at net asset value at the beginning of each period, reinvestment of all distributions and the complete redemption of the investment at net asset value at the end of each period. |
| (d) | Not annualized. |
| (e) | Annualized. |
| (f) | Portfolio turnover excludes the value of portfolio securities received or delivered as a result of in-kind fund share transactions. |
The accompanying notes are an integral part of these financial statements.
30Pioneer Fundamental Growth Fund | Semiannual Report | 9/30/23
| | Six Months
Ended
9/30/23
(unaudited) | Year
Ended
3/31/23 | Year
Ended
3/31/22 | Year
Ended
3/31/21 | Year
Ended
3/31/20 | Year
Ended
3/31/19 |
| Class R | | | | | | |
| Net asset value, beginning of period | $ 25.13 | $ 28.17 | $ 31.03 | $ 21.95 | $ 23.79 | $ 22.31 |
| Increase (decrease) from investment operations: | | | | | | |
| Net investment income (loss) (a) | $ (0.07) | $ (0.13) | $ (0.21) | $ (0.13)(b) | $ (0.04)(b) | $ (0.01)(b) |
| Net realized and unrealized gain (loss) on investments | 2.21 | (1.85) | 3.76 | 12.04 | (0.35) | 2.72 |
| Net increase (decrease) from investment operations | $ 2.14 | $ (1.98) | $ 3.55 | $ 11.91 | $ (0.39) | $ 2.71 |
| Distributions to shareowners: | | | | | | |
| Net realized gain | $ — | $ (1.06) | $ (6.41) | $ (2.83) | $ (1.45) | $ (1.23) |
| Total distributions | $ — | $ (1.06) | $ (6.41) | $ (2.83) | $ (1.45) | $ (1.23) |
| Net increase (decrease) in net asset value | $ 2.14 | $ (3.04) | $ (2.86) | $ 9.08 | $ (1.84) | $ 1.48 |
| Net asset value, end of period | $ 27.27 | $ 25.13 | $ 28.17 | $ 31.03 | $ 21.95 | $ 23.79 |
| Total return (c) | 8.52%(d) | (6.80)% | 10.22% | 55.07% | (2.50)% | 12.52% |
| Ratio of net expenses to average net assets | 1.36%(e) | 1.40% | 1.40% | 1.39% | 1.40% | 1.39% |
| Ratio of net investment income (loss) to average net assets | (0.49)%(e) | (0.51)% | (0.66)% | (0.46)% | (0.17)% | (0.04)% |
| Portfolio turnover rate | 9%(d) | 12% | 18%(f) | 24% | 23%(f) | 26% |
| Net assets, end of period (in thousands) | $103,655 | $96,175 | $111,781 | $108,568 | $85,892 | $114,781 |
| Ratios with no waiver of fees and assumption of expenses by the Adviser and no reduction for fees paid indirectly: | | | | | | |
| Total expenses to average net assets | 1.36%(e) | 1.43% | 1.40% | 1.39% | 1.42% | 1.39% |
| Net investment income (loss) to average net assets | (0.49)%(e) | (0.54)% | (0.66)% | (0.46)% | (0.19)% | (0.04)% |
| (a) | The per-share data presented above is based on the average shares outstanding for the period presented. |
| (b) | The amount shown for a share outstanding does not correspond with net investment income on the Statement of Operations for the period due to timing of the sales and repurchase of shares. |
| (c) | Assumes initial investment at net asset value at the beginning of each period, reinvestment of all distributions and the complete redemption of the investment at net asset value at the end of each period. |
| (d) | Not annualized. |
| (e) | Annualized. |
| (f) | Portfolio turnover excludes the value of portfolio securities received or delivered as a result of in-kind fund share transactions. |
The accompanying notes are an integral part of these financial statements.
Pioneer Fundamental Growth Fund | Semiannual Report | 9/30/2331
Financial Highlights (continued)
| | Six Months
Ended
9/30/23
(unaudited) | Year
Ended
3/31/23 | Year
Ended
3/31/22 | Year
Ended
3/31/21 | Year
Ended
3/31/20 | Year
Ended
3/31/19 |
| Class Y | | | | | | |
| Net asset value, beginning of period | $ 26.76 | $ 29.73 | $ 32.25 | $ 22.63 | $ 24.42 | $ 22.86 |
| Increase (decrease) from investment operations: | | | | | | |
| Net investment income (loss) (a) | $ 0.02 | $ 0.03 | $ (0.01) | $ 0.05 | $ 0.12 | $ 0.14 |
| Net realized and unrealized gain (loss) on investments | 2.34 | (1.94) | 3.91 | 12.45 | (0.36) | 2.79 |
| Net increase (decrease) from investment operations | $ 2.36 | $ (1.91) | $ 3.90 | $ 12.50 | $ (0.24) | $ 2.93 |
| Distributions to shareowners: | | | | | | |
| Net investment income | $ — | $ — | $ (0.01) | $ (0.05) | $ (0.10) | $ (0.14) |
| Net realized gain | — | (1.06) | (6.41) | (2.83) | (1.45) | (1.23) |
| Total distributions | $ — | $ (1.06) | $ (6.42) | $ (2.88) | $ (1.55) | $ (1.37) |
| Net increase (decrease) in net asset value | $ 2.36 | $ (2.97) | $ (2.52) | $ 9.62 | $ (1.79) | $ 1.56 |
| Net asset value, end of period | $ 29.12 | $ 26.76 | $ 29.73 | $ 32.25 | $ 22.63 | $ 24.42 |
| Total return (b) | 8.82%(c) | (6.20)% | 10.97% | 56.06% | (1.89)% | 13.28% |
| Ratio of net expenses to average net assets | 0.76%(d) | 0.76% | 0.76% | 0.76% | 0.76% | 0.77% |
| Ratio of net investment income (loss) to average net assets | 0.11%(d) | 0.13% | (0.03)% | 0.18% | 0.47% | 0.58% |
| Portfolio turnover rate | 9%(c) | 12% | 18%(e) | 24% | 23%(e) | 26% |
| Net assets, end of period (in thousands) | $3,646,626 | $3,410,508 | $3,798,296 | $4,268,553 | $3,232,510 | $3,563,173 |
| (a) | The per-share data presented above is based on the average shares outstanding for the period presented. |
| (b) | Assumes initial investment at net asset value at the beginning of each period, reinvestment of all distributions and the complete redemption of the investment at net asset value at the end of each period. |
| (c) | Not annualized. |
| (d) | Annualized. |
| (e) | Portfolio turnover excludes the value of portfolio securities received or delivered as a result of in-kind fund share transactions. |
The accompanying notes are an integral part of these financial statements.
32Pioneer Fundamental Growth Fund | Semiannual Report | 9/30/23
Notes to Financial Statements | 9/30/23
(unaudited)
1. Organization and Significant Accounting Policies
Pioneer Fundamental Growth Fund (the “Fund”) is one of three portfolios comprising Pioneer Series Trust X (the “Trust”), a Delaware statutory trust. The Fund is registered under the Investment Company Act of 1940, as ammended (the "1940 Act") as a diversified, open-end management investment company. The Fund’s investment objective is to seek long-term capital growth.
The Fund offers five classes of shares designated as Class A, Class C, Class K, Class R and Class Y shares. Each class of shares represents an interest in the same portfolio of investments of the Fund and has identical rights (based on relative net asset values) to assets and liquidation proceeds. Share classes can bear different rates of class-specific fees and expenses, such as transfer agent and distribution fees. Differences in class-specific fees and expenses will result in differences in net investment income and, therefore, the payment of different dividends from net investment income earned by each class. The Amended and Restated Declaration of Trust of the Trust gives the Board of Trustees the flexibility to specify either per-share voting or dollar-weighted voting when submitting matters for shareowner approval. Under per-share voting, each share of a class of the Fund is entitled to one vote. Under dollarweighted voting, a shareowner’s voting power is determined not by the number of shares owned, but by the dollar value of the shares on the record date.
Each share class has exclusive voting rights with respect to matters affecting only that class, including with respect to the distribution plan for that class. There is no distribution plan for Class K or Class Y shares.
Amundi Asset Management US, Inc., an indirect, wholly owned subsidiary of Amundi and Amundi’s wholly owned subsidiary, Amundi USA, Inc., serves as the Fund’s investment adviser (the “Adviser”).
Amundi Distributor US, Inc., an affiliate of the Adviser, serves as the Fund’s distributor (the “Distributor”).
In March 2020, FASB issued an Accounting Standard Update, ASU 2020-04, Reference Rate Reform (Topic 848) — Facilitation of the Effects of Reference Rate Reform on Financial Reporting (“ASU 2020-04”), which provides optional, temporary relief with respect to the financial reporting of contracts subject to certain types of modifications due to the planned discontinuation of the London Interbank Offered Rate (“LIBOR”) and other LIBOR-based reference rates at the end of 2021. The temporary relief
Pioneer Fundamental Growth Fund | Semiannual Report | 9/30/2333
provided by ASU 2020-04 is effective for certain reference rate-related contract modifications that occur during the period from March 12, 2020 through December 31, 2023. Management is evaluating the impact of ASU 2020-04 on the Fund's investments, derivatives, debt and other contracts, if applicable, that will undergo reference rate-related modifications as a result of the reference rate reform.
The Fund is required to comply with Rule 18f-4 under the 1940 Act, which governs the use of derivatives by registered investment companies. Rule 18f-4 permits funds to enter into derivatives transactions (as defined in Rule 18f-4) and certain other transactions notwithstanding the restrictions on the issuance of “senior securities” under Section 18 of the 1940 Act. Rule 18f-4 requires a fund to establish and maintain a comprehensive derivatives risk management program, appoint a derivatives risk manager and comply with a relative or absolute limit on fund leverage risk calculated based on value-at-risk (“VaR”), unless the fund uses derivatives in only a limited manner (a "limited derivatives user"). The Fund is currently a limited derivatives user for purposes of Rule 18f-4.
The Fund is an investment company and follows investment company accounting and reporting guidance under U.S. Generally Accepted Accounting Principles (“U.S. GAAP”). U.S. GAAP requires the management of the Fund to make estimates and assumptions that affect the reported amounts of assets and liabilities, the disclosure of contingent assets and liabilities at the date of the financial statements, and the reported amounts of income, expenses and gain or loss on investments during the reporting period. Actual results could differ from those estimates.
The following is a summary of significant accounting policies followed by the Fund in the preparation of its financial statements:
| A. | Security Valuation |
| | The net asset value of the Fund is computed once daily, on each day the New York Stock Exchange (“NYSE”) is open, as of the close of regular trading on the NYSE. |
| | Equity securities that have traded on an exchange are valued by using the last sale price on the principal exchange where they are traded. Equity securities that have not traded on the date of valuation, or securities for which sale prices are not available, generally are valued using the mean between the last bid and asked prices or, if both last bid and asked prices are not available, at the last quoted bid price. Last sale and bid and asked prices are provided by independent third party pricing services. In the case of equity securities not traded on an exchange, |
34Pioneer Fundamental Growth Fund | Semiannual Report | 9/30/23
| | prices are typically determined by independent third party pricing services using a variety of techniques and methods. |
| | The value of foreign securities is translated into U.S. dollars based on foreign currency exchange rate quotations supplied by a third party pricing source. Trading in non-U.S. equity securities is substantially completed each day at various times prior to the close of the NYSE. The values of such securities used in computing the net asset value of the Fund's shares are determined as of such times. The Adviser may use a fair value model developed by an independent pricing service to value non-U.S. equity securities. |
| | Shares of open-end registered investment companies (including money market mutual funds) are valued at such funds’ net asset value. |
| | Securities for which independent pricing services or broker-dealers are unable to supply prices or for which market prices and/or quotations are not readily available or are considered to be unreliable are valued by a fair valuation team comprised of certain personnel of the Adviser. The Adviser is designated as the valuation designee for the Fund pursuant to Rule 2a-5 under the 1940 Act. The Adviser’s fair valuation team is responsible for monitoring developments that may impact fair valued securities. |
| | Inputs used when applying fair value methods to value a security may include credit ratings, the financial condition of the company, current market conditions and comparable securities. The Adviser may use fair value methods if it is determined that a significant event has occurred after the close of the exchange or market on which the security trades and prior to the determination of the Fund's net asset value. Examples of a significant event might include political or economic news, corporate restructurings, natural disasters, terrorist activity or trading halts. Thus, the valuation of the Fund's securities may differ significantly from exchange prices, and such differences could be material. |
| | Repurchase agreements are valued at par. Cash may include overnight time deposits at approved financial institutions. |
| B. | Investment Income and Transactions |
| | Dividend income is recorded on the ex-dividend date, except that certain dividends from foreign securities where the ex-dividend date may have passed are recorded as soon as the Fund becomes aware of the ex-dividend data in the exercise of reasonable diligence. |
Pioneer Fundamental Growth Fund | Semiannual Report | 9/30/2335
| | Interest income, including interest on income-bearing cash accounts, is recorded on the accrual basis. Dividend and interest income are reported net of unrecoverable foreign taxes withheld at the applicable country rates and net of income accrued on defaulted securities. |
| | Interest and dividend income payable by delivery of additional shares is reclassified as PIK (payment-in-kind) income upon receipt and is included in interest and dividend income, respectively. |
| | Security transactions are recorded as of trade date. Gains and losses on sales of investments are calculated on the identified cost method for both financial reporting and federal income tax purposes. |
| C. | Federal Income Taxes |
| | It is the Fund's policy to comply with the requirements of the Internal Revenue Code applicable to regulated investment companies and to distribute all of its net taxable income and net realized capital gains, if any, to its shareowners. Therefore, no provision for federal income taxes is required. As of September 30, 2023, the Fund did not accrue any interest or penalties with respect to uncertain tax positions, which, if applicable, would be recorded as an income tax expense on the Statement of Operations. Tax returns filed within the prior three years remain subject to examination by federal and state tax authorities. |
| | The amount and character of income and capital gain distributions to shareowners are determined in accordance with federal income tax rules, which may differ from U.S. GAAP. Distributions in excess of net investment income or net realized gains are temporary over distributions for financial statement purposes resulting from differences in the recognition or classification of income or distributions for financial statement and tax purposes. Capital accounts within the financial statements are adjusted for permanent book/tax differences to reflect tax character, but are not adjusted for temporary differences. |
| | The tax character of current year distributions payable will be determined at the end of the current taxable year. The tax character of distributions paid during the year ended March 31, 2023 was as follows: |
| | 2023 |
| Distributions paid from: | |
| Ordinary income | $ 11,767,976 |
| Long-term capital gains | 201,500,797 |
| Total | $213,268,773 |
36Pioneer Fundamental Growth Fund | Semiannual Report | 9/30/23
The following shows the components of distributable earnings (losses) on a federal income tax basis at March 31, 2023:
| | 2023 |
| Distributable earnings/(losses): | |
| Undistributed ordinary income | $ 1,675,538 |
| Capital loss carryforward | (2,017,329) |
| Net unrealized appreciation | 2,622,039,142 |
| Total | $2,621,697,351 |
The difference between book-basis and tax-basis unrealized appreciation is attributable to the tax deferral of losses on wash sales.
| D. | Fund Shares |
| | The Fund records sales and repurchases of its shares as of trade date. The Distributor earned $34,567 in underwriting commissions on the sale of Class A shares during the six months ended September 30, 2023. |
| E. | Class Allocations |
| | Income, common expenses and realized and unrealized gains and losses are calculated at the Fund level and allocated daily to each class of shares based on its respective percentage of adjusted net assets at the beginning of the day. |
| | Distribution fees are calculated based on the average daily net asset value attributable to Class A, Class C and Class R shares of the Fund, respectively (see Note 5). Class K and Class Y shares do not pay distribution fees. All expenses and fees paid to the Fund's transfer agent for its services are allocated among the classes of shares based on the number of accounts in each class and the ratable allocation of related out-of-pocket expenses (see Note 4). |
| | Distributions to shareowners are recorded as of the ex-dividend date. Distributions paid by the Fund with respect to each class of shares are calculated in the same manner and at the same time, except that net investment income dividends to Class A, Class C, Class K, Class R and Class Y shares can reflect different transfer agent and distribution expense rates. |
| F. | Risks |
| | The value of securities held by the Fund may go up or down, sometimes rapidly or unpredictably, due to general market conditions, such as real or perceived adverse economic, political or regulatory conditions, recessions, the spread of infectious illness or other public health issues, inflation, changes in interest rates, armed conflict including Russia's |
Pioneer Fundamental Growth Fund | Semiannual Report | 9/30/2337
| | military invasion of Ukraine, sanctions against Russia, other nations or individuals or companies and possible countermeasures, lack of liquidity in the bond markets or adverse investor sentiment. In the past several years, financial markets have experienced increased volatility, depressed valuations, decreased liquidity and heightened uncertainty. These conditions may continue, recur, worsen or spread. Inflation and interest rates have increased and may rise further. These circumstances could adversely affect the value and liquidity of the Fund's investments and negatively impact the Fund's performance. |
| | The long-term impact of the COVID-19 pandemic and its subsequent variants on economies, markets, industries and individual issuers, are not known. Some sectors of the economy and individual issuers have experienced or may experience particularly large losses. Periods of extreme volatility in the financial markets, reduced liquidity of many instruments, increased government debt, inflation, and disruptions to supply chains, consumer demand and employee availability, may continue for some time. Following Russia's invasion of Ukraine, Russian securities lost all, or nearly all, their market value. Other securities or markets could be similarly affected by past or future political, geopolitical or other events or conditions. |
| | Governments and central banks, including the U.S. Federal Reserve, have taken extraordinary and unprecedented actions to support local and global economies and the financial markets. These actions have resulted in significant expansion of public debt, including in the U.S. The consequences of high public debt, including its future impact on the economy and securities markets, may not be known for some time. |
| | The U.S. and other countries are periodically involved in disputes over trade and other matters, which may result in tariffs, investment restrictions and adverse impacts on affected companies and securities. For example, the U.S. has imposed tariffs and other trade barriers on Chinese exports, has restricted sales of certain categories of goods to China, and has established barriers to investments in China. Trade disputes may adversely affect the economies of the U.S. and its trading partners, as well as companies directly or indirectly affected and financial markets generally. If the political climate between the U.S. and China does not improve or continues to deteriorate, if China were to attempt unification of Taiwan by force, or if other geopolitical conflicts develop or get worse, economies, markets and individual securities may be severely affected both regionally and globally, and the value of the Fund's assets may go down. |
38Pioneer Fundamental Growth Fund | Semiannual Report | 9/30/23
| | At times, the Fund’s investments may represent industries or industry sectors that are interrelated or have common risks, making the Fund more susceptible to any economic, political, or regulatory developments or other risks affecting those industries and sectors. |
| | Normally, the Fund invests at least 80% of its net assets in equity securities of large companies. Large companies may fall out of favor with investors and underperform the overall equity market. |
| | Russia launched a large-scale invasion of Ukraine on February 24, 2022. In response to the military action by Russia, various countries, including the U.S., the United Kingdom, and European Union issued broad-ranging economic sanctions against Russia and Belarus and certain companies and individuals. Since then, Russian securities have lost all, or nearly all, their market value, and many other issuers, securities and markets have been adversely affected. The United States and other countries may impose sanctions on other countries, companies and individuals in light of Russia’s military invasion. The extent and duration of the military action or future escalation of such hostilities, the extent and impact of existing and future sanctions, market disruptions and volatility, and the result of any diplomatic negotiations cannot be predicted. These and any related events could have a significant impact on the value and liquidity of certain Fund investments, on Fund performance and the value of an investment in the Fund, particularly with respect to securities and commodities, such as oil, natural gas and food commodities, as well as other sectors with exposure to Russian issuers or issuers in other countries affected by the invasion, and are likely to have collateral impacts on market sectors globally. |
| | With the increased use of technologies such as the Internet to conduct business, the Fund is susceptible to operational, information security and related risks. While the Fund’s Adviser has established business continuity plans in the event of, and risk management systems to prevent, limit or mitigate, such cyber-attacks, there are inherent limitations in such plans and systems, including the possibility that certain risks have not been identified. Furthermore, the Fund cannot control the cybersecurity plans and systems put in place by service providers to the Fund such as the Fund's custodian and accounting agent, and the Fund’s transfer agent. In addition, many beneficial owners of Fund shares hold them through accounts at broker-dealers, retirement platforms and other financial market participants over which neither the Fund nor the Adviser exercises control. Each of these may in turn rely on service providers to them, which are also subject to the risk of cyber-attacks. Cybersecurity failures or breaches at the Adviser or the Fund’s service providers or intermediaries have the ability to cause |
Pioneer Fundamental Growth Fund | Semiannual Report | 9/30/2339
| | disruptions and impact business operations, potentially resulting in financial losses, interference with the Fund’s ability to calculate its net asset value, impediments to trading, the inability of Fund shareowners to effect share purchases, redemptions or exchanges or receive distributions, loss of or unauthorized access to private shareowner information and violations of applicable privacy and other laws, regulatory fines, penalties, reputational damage, or additional compliance costs. Such costs and losses may not be covered under any insurance. In addition, maintaining vigilance against cyber-attacks may involve substantial costs over time, and system enhancements may themselves be subject to cyber-attacks. |
| | As of the date of this report, a significant portion of the Fund’s net asset value is attributable to net unrealized capital gains on portfolio securities. If the Fund realizes capital gains in excess of realized capital losses and any available capital loss carryforwards in any fiscal year, it generally will be required to distribute that excess to shareholders. You may receive distributions that are attributable to appreciation that was present in the Fund’s portfolio securities at the time you made your investment but had not been realized at that time, or that are attributable to capital gains or other income that, although realized by the Fund, had not yet been distributed at the time you made your investment. Unless you purchase shares through a tax-advantaged account (such as an IRA or 401(k) plan), these distributions will be taxable to you. You should consult your tax adviser about the tax consequences of your investment in the Fund. |
| | The Fund’s prospectus contains unaudited information regarding the Fund’s principal risks. Please refer to that document when considering the Fund’s principal risks. |
| G. | Repurchase Agreements |
| | Repurchase agreements are arrangements under which the Fund purchases securities from a broker-dealer or a bank, called the counterparty, upon the agreement of the counterparty to repurchase the securities from the Fund at a later date, and at a specific price, which is typically higher than the purchase price paid by the Fund. The securities purchased serve as the Fund's collateral for the obligation of the counterparty to repurchase the securities. The value of the collateral, including accrued interest, is required to be equal to or in excess of the repurchase price. The collateral for all repurchase agreements is held in safekeeping in the customer-only account of the Fund's custodian or a sub-custodian of the Fund. The Adviser is responsible for determining that the value of the collateral remains at least equal to the repurchase |
40Pioneer Fundamental Growth Fund | Semiannual Report | 9/30/23
| | price. In the event of a default by the counterparty, the Fund is entitled to sell the securities, but the Fund may not be able to sell them for the price at which they were purchased, thus causing a loss to the Fund. Additionally, if the counterparty becomes insolvent, there is some risk that the Fund will not have a right to the securities, or the immediate right to sell the securities. Open repurchase agreements at September 30, 2023 are disclosed in the Schedule of Investments. |
2. Management Agreement
The Adviser manages the Fund’s portfolio. Management fees payable under the Fund’s Investment Management Agreement with the Adviser are calculated daily and paid monthly at the annual rate of 0.65% of the Fund’s average daily net assets up to $1 billion, 0.60% of the next $6.5 billion of the Fund’s average daily net assets and 0.55% of the Fund’s average daily net assets over $7.5 billion. For the six months ended September 30, 2023, the effective management fee was equivalent to 0.61% (annualized) of the Fund’s average daily net assets.
The Adviser has contractually agreed to limit ordinary operating expenses (ordinary operating expenses means all fund expenses other than taxes, brokerage commissions and acquired fund fees and expenses, and extraordinary expenses, such as litigation) of the Fund to the extent required to reduce Fund expenses to 1.40% of the average daily net assets attributable to Class R. This expense limitation is in effect through August 1, 2024. There can be no assurance that the Adviser will extend the expense limitation agreement beyond the date referred to above. Fees waived and expenses reimbursed during the six months ended September 30, 2023 are reflected on the Statement of Operations. There is no expense limitation arrangement for Class A, Class C, Class K or Class Y shares.
In addition, under the management and administration agreements, certain other services and costs, including accounting, regulatory reporting and insurance premiums, are paid by the Fund as administrative reimbursements. Reflected on the Statement of Assets and Liabilities is $395,353 in management fees payable to the Adviser at September 30, 2023.
3. Compensation of Officers and Trustees
The Fund pays an annual fee to its Trustees. The Adviser reimburses the Fund for fees paid to the Interested Trustees. Except for the chief compliance officer, the Fund does not pay any salary or other compensation to its officers. The Fund pays a portion of the chief compliance officer's compensation for his services as the Fund's chief compliance officer.
Pioneer Fundamental Growth Fund | Semiannual Report | 9/30/2341
Amundi US pays the remaining portion of the chief compliance officer's compensation. For the six months ended September 30, 2023, the Fund paid $187,171 in Officers' and Trustees' compensation, which is reflected on the Statement of Operations as Officers' and Trustees' fees. At September 30, 2023, on its Statement of Assets and Liabilities, the Fund did not have a payable for Trustees' fees and had a payable for administrative expenses of $169,706, which includes the payable for Officers' compensation.
4. Transfer Agent
BNY Mellon Investment Servicing (US) Inc. serves as the transfer agent to the Fund at negotiated rates. Transfer agent fees and payables shown on the Statement of Operations and the Statement of Assets and Liabilities, respectively, include sub-transfer agent expenses incurred through the Fund’s omnibus relationship contracts.
In addition, the Fund reimbursed the transfer agent for out-of-pocket expenses incurred by the transfer agent related to shareowner communications activities such as proxy and statement mailings, and outgoing phone calls. For the six months ended September 30, 2023, such out-of-pocket expenses by class of shares were as follows:
| Shareowner Communications: | |
| Class A | $ 31,479 |
| Class C | 8,563 |
| Class K | 12,083 |
| Class R | 1,651 |
| Class Y | 76,953 |
| Total | $130,729 |
5. Distribution and Service Plans
The Fund has adopted a distribution plan (the “Plan”) pursuant to Rule 12b-1 of the Investment Company Act of 1940 with respect to its Class A, Class C and Class R shares. Pursuant to the Plan, the Fund pays the Distributor 0.25% of the average daily net assets attributable to Class A shares as compensation for personal services and/or account maintenance services or distribution services with regard to Class A shares. Pursuant to the Plan, the Fund also pays the Distributor 1.00% of the average daily net assets attributable to Class C shares. The fee for Class C shares consists of a 0.25% service fee and a 0.75% distribution fee paid as compensation for personal services and/or account maintenance services or distribution services with regard to Class C shares. Pursuant to the Plan, the Fund further pays the Distributor 0.50% of the average daily net assets attributable to Class R shares for distribution services. Reflected on the Statement of Assets and Liabilities is $60,017 in distribution fees payable to the Distributor at September 30, 2023.
42Pioneer Fundamental Growth Fund | Semiannual Report | 9/30/23
The Fund also has adopted a separate service plan for Class R shares (“Service Plan”). The Service Plan authorizes the Fund to pay securities dealers, plan administrators or other service organizations that agree to provide certain services to retirement plans or plan participants holding shares of the Fund a service fee of up to 0.25% of the Fund’s average daily net assets attributable to Class R shares held by such plans.
In addition, redemptions of Class A and Class C shares may be subject to a contingent deferred sales charge (“CDSC”). A CDSC of 1.00% may be imposed on redemptions of certain net asset value purchases of Class A shares within 12 months of purchase. Redemptions of Class C shares within 12 months of purchase are subject to a CDSC of 1.00%, based on the lower of cost or market value of shares being redeemed. Shares purchased as part of an exchange remain subject to any CDSC that applied to the original purchase of those shares. There is no CDSC for Class K, Class R or Class Y shares. Proceeds from the CDSCs are paid to the Distributor. For the six months ended September 30, 2023, CDSCs in the amount of $4,652 were paid to the Distributor.
6. Line of Credit Facility
The Fund, along with certain other funds in the Pioneer Family of Funds, participates in a committed, unsecured revolving line of credit (“credit facility”). Borrowings are used solely for temporary or emergency purposes. The Fund may borrow up to the lesser of the amount available under the credit facility or the limits set for borrowing by the Fund’s prospectus and the 1940 Act. The Fund participates in a credit facility in the amount of $380 million. Under such credit facility, depending on the type of loan, interest on borrowings is payable at the Secured Overnight Financing Rate ("SOFR") plus a credit spread. The Fund also pays both an upfront fee and an annual commitment fee to participate in the credit facility. The upfront fee in the amount of 0.15% of the total credit facility and the commitment fee in the amount of 0.30% of the daily unused portion of each lender's commitment are allocated among participating funds based on an allocation schedule set forth in the credit agreement. For the six months ended September 30, 2023, the Fund had no borrowings under the credit facility.
Pioneer Fundamental Growth Fund | Semiannual Report | 9/30/2343
Approval of Renewal of Investment Management Agreement
Amundi Asset Management US, Inc. (“Amundi US”) serves as the investment adviser to Pioneer Fundamental Growth Fund (the “Fund”) pursuant to an investment management agreement between Amundi US and the Fund. In order for Amundi US to remain the investment adviser of the Fund, the Trustees of the Fund, including a majority of the Fund’s Independent Trustees, must determine annually whether to renew the investment management agreement for the Fund.
The contract review process began in January 2023 as the Trustees of the Fund agreed on, among other things, an overall approach and timeline for the process. Contract review materials were provided to the Trustees in March 2023, July 2023 and September 2023. In addition, the Trustees reviewed and discussed the Fund’s performance at regularly scheduled meetings throughout the year, and took into account other information related to the Fund provided to the Trustees at regularly scheduled meetings, in connection with the review of the Fund’s investment management agreement.
In March 2023, the Trustees, among other things, discussed the memorandum provided by Fund counsel that summarized the legal standards and other considerations that are relevant to the Trustees in their deliberations regarding the renewal of the investment management agreement, and reviewed and discussed the qualifications of the investment management teams for the Fund, as well as the level of investment by the Fund’s portfolio managers in the Fund. In July 2023, the Trustees, among other things, reviewed the Fund’s management fees and total expense ratios, the financial statements of Amundi US and its parent companies, profitability analyses provided by Amundi US, and analyses from Amundi US as to possible economies of scale. The Trustees also reviewed the profitability of the institutional business of Amundi US as compared to that of Amundi US’s fund management business, and considered the differences between the fees and expenses of the Fund and the fees and expenses of Amundi US’s institutional accounts, as well as the different services provided by Amundi US to the Fund and to the institutional accounts. The Trustees further considered contract review materials, including additional materials received in response to the Trustees’ request, in September 2023.
At a meeting held on September 19, 2023, based on their evaluation of the information provided by Amundi US and third parties, the Trustees of the Fund, including the Independent Trustees voting separately advised by independent counsel, unanimously approved the renewal of the investment
44Pioneer Fundamental Growth Fund | Semiannual Report | 9/30/23
management agreement for another year. In approving the renewal of the investment management agreement, the Trustees considered various factors that they determined were relevant, including the factors described below. The Trustees did not identify any single factor as the controlling factor in determining to approve the renewal of the agreement.
Nature, Extent and Quality of Services
The Trustees considered the nature, extent and quality of the services that had been provided by Amundi US to the Fund, taking into account the investment objective and strategy of the Fund. The Trustees also reviewed Amundi US’s investment approach for the Fund and its research process. The Trustees considered Amundi US’ integration of environmental, social and governance (ESG) considerations into its investment research process. The Trustees considered the resources of Amundi US and the personnel of Amundi US who provide investment management services to the Fund. They also reviewed the amount of non-Fund assets managed by the portfolio managers of the Fund. They considered the non-investment resources and personnel of Amundi US that are involved in Amundi US’s services to the Fund, including Amundi US’s compliance, risk management, and legal resources and personnel. The Trustees considered the compliance services being provided to the Fund by Amundi US and how Amundi US has addressed any compliance issues during the past year. The Trustees noted the substantial attention and high priority given by Amundi US’s senior management to the Pioneer Fund complex, including with respect to the increasing regulation to which the Pioneer Funds are subject.
The Trustees considered that Amundi US supervises and monitors the performance of the Fund’s service providers and provides the Fund with personnel (including Fund officers) and other resources that are necessary for the Fund’s business management and operations. The Trustees also considered that, as administrator, Amundi US is responsible for the administration of the Fund’s business and other affairs. The Trustees considered that the Fund reimburses Amundi US its pro rata share of Amundi US’s costs of providing administration services to the Pioneer Funds.
Based on these considerations, the Trustees concluded that the nature, extent and quality of services that had been provided by Amundi US to the Fund were satisfactory and consistent with the terms of the investment management agreement.
Performance of the Fund
In considering the Fund’s performance, the Trustees regularly review and discuss throughout the year data prepared by Amundi US and information
Pioneer Fundamental Growth Fund | Semiannual Report | 9/30/2345
comparing the Fund’s performance with the performance of its peer group of funds, as classified by Morningstar, Inc. (Morningstar), and with the performance of the Fund’s benchmark index. They also discuss the Fund’s performance with Amundi US on a regular basis. The Trustees’ regular reviews and discussions were factored into the Trustees’ deliberations concerning the renewal of the investment management agreement.
Management Fee and Expenses
The Trustees considered information showing the fees and expenses of the Fund in comparison to the management fees of its peer group of funds as classified by Morningstar and also to the expense ratios of a peer group of funds selected on the basis of criteria determined by the Independent Trustees for this purpose using data provided by Strategic Insight Mutual Fund Research and Consulting, LLC (Strategic Insight), an independent third party. The peer group comparisons referred to below are organized in quintiles. Each quintile represents one-fifth of the peer group. In all peer group comparisons referred to below, first quintile is most favorable to the Fund’s shareowners. The Trustees noted that they separately review and consider the impact of the Fund’s transfer agency and Fund- and Amundi US-paid expenses for sub-transfer agency and intermediary arrangements, and that the results of the most recent such review were considered in the consideration of the Fund’s expense ratio.
The Trustees considered that the Fund’s management fee for the most recent fiscal year was in the second quintile relative to the management fees paid by other funds in its Morningstar category for the comparable period. The Trustees also considered the breakpoints in the management fee schedule and the reduced fee rates above certain asset levels. The Trustees considered that the expense ratio of the Fund’s Class Y shares for the most recent fiscal year was in the fourth quintile relative to its Strategic Insight peer group for the comparable period. The Trustees noted Amundi US’s explanation of the reasons that the expense ratio of the Fund’s Class Y shares was in the fourth quintile relative to its Strategic Insight peer group.
The Trustees reviewed management fees charged by Amundi US to institutional and other clients, including publicly offered European funds sponsored by Amundi US’s affiliates, unaffiliated U.S. registered investment companies (in a sub-advisory capacity), and unaffiliated foreign and domestic separate accounts. The Trustees also considered Amundi US’s costs in providing services to the Fund and Amundi US’s costs in providing services to the other clients and considered the differences in management fees and profit margins for fund and non-fund services. In evaluating the fees associated with Amundi US’s client accounts, the Trustees took into
46Pioneer Fundamental Growth Fund | Semiannual Report | 9/30/23
account the respective demands, resources and complexity associated with the Fund and other client accounts. The Trustees noted that, in some instances, the fee rates for those clients were lower than the management fee for the Fund and considered that, under the investment management and administration agreements with the Fund, Amundi US performs additional services for the Fund that it does not provide to those other clients or services that are broader in scope, including oversight of the Fund’s other service providers and activities related to compliance and the extensive regulatory and tax regimes to which the Fund is subject. The Trustees also considered the entrepreneurial risks associated with Amundi US’s management of the Fund.
The Trustees concluded that the management fee payable by the Fund to Amundi US was reasonable in relation to the nature and quality of the services provided by Amundi US.
Profitability
The Trustees considered information provided by Amundi US regarding the profitability of Amundi US with respect to the advisory services provided by Amundi US to the Fund, including the methodology used by Amundi US in allocating certain of its costs to the management of the Fund. The Trustees also considered Amundi US’s profit margin in connection with the overall operation of the Fund. They further reviewed the financial results, including the profit margins, realized by Amundi US from non-fund businesses. The Trustees considered Amundi US’s profit margins in comparison to the limited industry data available and noted that the profitability of any adviser was affected by numerous factors, including its organizational structure and method for allocating expenses. The Trustees concluded that Amundi US’s profitability with respect to the management of the Fund was not unreasonable.
Economies of Scale
The Trustees considered Amundi US’s views relating to economies of scale in connection with the Pioneer Funds as fund assets grow and the extent to which any such economies of scale are shared with the Fund and Fund shareholders. The Trustees noted the breakpoints in the management fee schedule. The Trustees recognize that economies of scale are difficult to identify and quantify, and that, among other factors that may be relevant, are the following: fee levels, expense subsidization, investment by Amundi US in research and analytical capabilities and Amundi US’s commitment and resource allocation to the Fund. The Trustees noted that profitability also may be an indicator of the availability of any economies of scale, although profitability may vary for other reasons including due to
Pioneer Fundamental Growth Fund | Semiannual Report | 9/30/2347
reductions in expenses. The Trustees concluded that economies of scale, if any, were being appropriately shared with the Fund.
Other Benefits
TThe Trustees considered the other benefits that Amundi US enjoys from its relationship with the Fund. The Trustees considered the character and amount of fees paid or to be paid by the Fund, other than under the investment management agreement, for services provided by Amundi US and its affiliates. The Trustees further considered the revenues and profitability of Amundi US’s businesses other than the Fund business. To the extent applicable, the Trustees also considered the benefits to the Fund and to Amundi US and its affiliates from the use of “soft” commission dollars generated by the Fund to pay for research and brokerage services.
The Trustees considered that Amundi US is the principal U.S. asset management business of Amundi, which is one of the largest asset managers globally. Amundi’s worldwide asset management business manages over $2.1 trillion in assets (including the Pioneer Funds). The Trustees considered that Amundi US’s relationship with Amundi creates potential opportunities for Amundi US and Amundi that derive from Amundi US’s relationships with the Fund, including Amundi’s ability to market the services of Amundi US globally. The Trustees noted that Amundi US has access to additional research and portfolio management capabilities as a result of its relationship with Amundi and Amundi’s enhanced global presence that may contribute to an increase in the resources available to Amundi US. The Trustees considered that Amundi US and the Fund receive reciprocal intangible benefits from the relationship, including mutual brand recognition and, for the Fund, direct and indirect access to the resources of a large global asset manager. The Trustees concluded that any such benefits received by Amundi US as a result of its relationship with the Fund were reasonable.
Conclusion
After consideration of the factors described above as well as other factors, the Trustees, including the Independent Trustees, concluded that the investment management agreement for the Fund, including the fees payable thereunder, was fair and reasonable and voted to approve the proposed renewal of the investment management agreement.
48Pioneer Fundamental Growth Fund | Semiannual Report | 9/30/23
Statement Regarding Liquidity Risk Management Program
As required by law, the Fund has adopted and implemented a liquidity risk management program (the “Program”) that is designed to assess and manage liquidity risk. Liquidity risk is the risk that the Fund could not meet requests to redeem its shares without significant dilution of remaining investors’ interests in the Fund. The Fund’s Board of Trustees designated a liquidity risk management committee (the “Committee”) consisting of employees of Amundi Asset Management US, Inc. (the “Adviser”) to administer the Program.
The Committee provided the Board of Trustees with a report that addressed the operation of the Program and assessed its adequacy and effectiveness of implementation (the “Report”). The Report covered the period from January 1, 2022 through December 31, 2022 (the “Reporting Period”).
The Report confirmed that, throughout the Reporting Period, the Committee had monitored the Fund’s portfolio liquidity and liquidity risk on an ongoing basis, as described in the Program and in Board reporting throughout the Reporting Period.
The Report discussed the Committee’s annual review of the Program, which addressed, among other things, the following elements of the Program:
The Committee reviewed the Fund’s investment strategy and liquidity of portfolio investments during both normal and reasonably foreseeable stressed conditions. The Committee noted that the Fund’s investment strategy continues to be appropriate for an open-end fund, taking into account, among other things, whether and to what extent the Fund held less liquid and illiquid assets and the extent to which any such investments affected the Fund’s ability to meet redemption requests. In managing and reviewing the Fund’s liquidity risk, the Committee also considered the extent to which the Fund’s investment strategy involves a relatively concentrated portfolio or large positions in particular issuers, the extent to which the Fund uses borrowing for investment purposes, and the extent to which the Fund uses derivatives (including for hedging purposes). The Committee also reviewed the Fund’s short-term and long-term cash flow projections during both normal and reasonably foreseeable stressed conditions. In assessing the Fund’s cash flow projections, the Committee considered, among other factors, historical net redemption activity, redemption policies, ownership concentration, distribution channels, and the degree of certainty associated with the Fund’s short-term and long-term cash flow projections. The Committee also considered the Fund’s holdings of cash and cash equivalents, as well as borrowing arrangements
Pioneer Fundamental Growth Fund | Semiannual Report | 9/30/23 49
and other funding sources, including, if applicable, the Fund’s participation in a credit facility, as components of the Fund’s ability to meet redemption requests. The Fund has adopted an in-kind redemption policy which may be utilized to meet larger redemption requests.
The Committee reviewed the Program’s liquidity classification methodology for categorizing the Fund’s investments into one of four liquidity buckets. In reviewing the Fund’s investments, the Committee considered, among other factors, whether trading varying portions of a position in a particular portfolio investment or asset class in sizes the Fund would reasonably anticipate trading, would be reasonably expected to significantly affect liquidity.
The Committee performed an analysis to determine whether the Fund is required to maintain a Highly Liquid Investment Minimum, and determined that no such minimum is required because the Fund primarily holds highly liquid investments.
The Report stated that the Committee concluded the Program operates adequately and effectively, in all material respects, to assess and manage the Fund’s liquidity risk throughout the Reporting Period.
50Pioneer Fundamental Growth Fund | Semiannual Report | 9/30/23
Trustees, Officers and Service Providers
Trustees
Thomas J. Perna, Chairman
John E. Baumgardner, Jr.
Diane Durnin
Benjamin M. Friedman
Lisa M. Jones
Craig C. MacKay
Lorraine H. Monchak
Marguerite A. Piret
Fred J. Ricciardi
Kenneth J. Taubes
Officers
Lisa M. Jones, President and
Chief Executive Officer
Anthony J. Koenig, Jr., Treasurer
and Chief Financial and
Accounting Officer
Christopher J. Kelley, Secretary and
Chief Legal Officer
Investment Adviser and Administrator
Amundi Asset Management US, Inc.
Custodian and Sub-Administrator
The Bank of New York Mellon Corporation
Independent Registered Public Accounting Firm
Ernst & Young LLP
Principal Underwriter
Amundi Distributor US, Inc.
Legal Counsel
Morgan, Lewis & Bockius LLP
Transfer Agent
BNY Mellon Investment Servicing (US) Inc.
Proxy Voting Policies and Procedures of the Fund are available without charge, upon request, by calling our toll free number (1-800-225-6292). Information regarding how the Fund voted proxies relating to portfolio securities during the most recent 12-month period ended June 30 is publicly available to shareowners at www.amundi.com/us. This information is also available on the Securities and Exchange Commission’s web site at www.sec.gov.
Pioneer Fundamental Growth Fund | Semiannual Report | 9/30/2351
How to Contact Amundi
We are pleased to offer a variety of convenient ways for you to contact us for assistance or information.
Call us for:
Account Information, including existing accounts,
new accounts, prospectuses, applications
and service forms
1-800-225-6292
FactFoneSM for automated fund yields, prices,
account information and transactions
1-800-225-4321
| Retirement plans information | 1-800-622-0176 |
Write to us:
Amundi
P.O. Box 534427
Pittsburgh, PA 15253-4427
| Our toll-free fax | 1-800-225-4240 |
| Our internet e-mail address | us.askamundi@amundi.com
(for general questions about Amundi only) |
Visit our web site: www.amundi.com/us
This report must be preceded or accompanied by a prospectus.
The Fund files a complete schedule of portfolio holdings with the Securities and Exchange Commission for the first and third quarters of each fiscal year as an exhibit to its reports on Form N-PORT. Shareholders may view the filed Form N-PORT by visiting the Commission’s web site at https://www.sec.gov.
Amundi Asset Management US, Inc.
60 State Street
Boston, MA 02109
www.amundi.com/us
Securities offered through Amundi Distributor US, Inc.
60 State Street, Boston, MA 02109
Underwriter of Pioneer Mutual Funds, Member SIPC
© 2023 Amundi Asset Management US, Inc. 19434-17-1123
Pioneer Multi-Asset Ultrashort Income Fund
Semiannual Report | September 30, 2023
| | | | | |
| A: MAFRX | C: MCFRX | C2: MAUCX | K: MAUKX | Y: MYFRX |
visit us: www.amundi.com/us
Pioneer Multi-Asset Ultrashort Income Fund | Semiannual Report | 9/30/231
President’s Letter
Dear Shareholders,
On February 13, 2023, Amundi US celebrated the 95th anniversary of Pioneer Fund, the second-oldest mutual fund in the United States. We recognized the anniversary with ringing of the closing bell at the New York Stock Exchange, which seemed fitting for this special milestone.
Pioneer Fund was launched on February 13, 1928 by Phil Carret, one of the earliest proponents of value investing and a leading innovator in the asset management industry. Mr. Carret began investing in the 1920s and founded Pioneer Investments (now Amundi US) in 1928, and was one of the first investors to realize he could uncover value through rigorous, innovative, fundamental research techniques.
Consistent with Mr. Carret’s investment approach and employing many of the same techniques utilized in the 1920s, Amundi US's portfolio managers have adapted Mr. Carret’s philosophy to a new age of “active” investing.
The last few years have seen investors face some unprecedented challenges, from a global pandemic that shuttered much of the world’s economy for months, to geopolitical strife, to rising inflation that has reached levels not seen in decades. Now, more than ever, Amundi US believes active management – that is, making active investment decisions across all of our portfolios – can help mitigate risk during periods of market volatility.
At Amundi US, active management begins with our own fundamental, bottom-up research process. Our team of dedicated research analysts and portfolio managers analyzes each security under consideration, communicating frequently with the management teams of the companies and other entities issuing the securities, and working together to identify those securities that we believe best meet our investment criteria for our family of funds. Our risk management approach begins with each security under consideration, as we strive to develop a deep understanding of the potential opportunity, while considering any potential risk factors.
Today, as shareholders, we have many options. It is our view that active management can serve shareholders well, not only when markets are thriving, but also during periods of market stress. As you consider your long-term investment goals, we encourage you to work with your financial professional to develop an investment plan that paves the way for you to pursue both your short-term and long-term goals.
2Pioneer Multi-Asset Ultrashort Income Fund | Semiannual Report | 9/30/23
We greatly appreciate the trust you have placed in us and look forward to continuing to serve you in the future.
Lisa M. Jones
Head of the Americas, President and CEO of US
Amundi Asset Management US, Inc.
November 2023
Any information in this shareowner report regarding market or economic trends or the factors influencing the Fund’s historical or future performance are statements of opinion as of the date of this report. Past performance is no guarantee of future results.
Pioneer Multi-Asset Ultrashort Income Fund | Semiannual Report | 9/30/233
Portfolio Management Discussion | 9/30/23
In the following interview, portfolio managers Jonathan Sharkey, Noah Funderburk, and Nicolas Pauwels discuss the factors that influenced the performance of Pioneer Multi-Asset Ultrashort Income Fund during the six-month period ended September 30, 2023. Mr. Sharkey, a senior vice president and a portfolio manager at Amundi Asset Management US, Inc. (Amundi US); Mr. Funderburk, a senior vice president, Director of Securitized Credit, and a portfolio manager at Amundi US; and Mr. Pauwels, a vice president, Deputy Director of Securitized Credit, and a portfolio manager at Amundi US, are responsible for the day-to-day management of the Fund.
| Q | How did the Fund perform during the six-month period ended September 30, 2023? |
| A | Pioneer Multi-Asset Ultrashort Income Fund’s Class A shares returned 3.64% at net asset value (NAV) during the six-month period ended September 30, 2023, while the Fund’s benchmark, the ICE Bank of America (ICE BofA) US 3-Month Treasury Bill Index, returned 2.50%. During the same period, the average return of the 242 mutual funds in Morningstar’s Ultrashort Bond category was 2.72%. |
| Q | Can you describe the market environment for fixed-income investors during the six-month period ended September 30, 2023? |
| A | The period opened in the wake of the March 2023 failures of a pair of regional US banks, along with the collapse of European lender Credit Suisse, which raised fears of a financial crisis. The US Federal Reserve (Fed) followed up by enacting measures to backstop the banking system, while also implementing another modest quarter-point increase to the federal funds rate target range, which brought the target to 4.75% – 5.00%. The Fed’s rate increase was largely well received by financial markets as an indication that any systemic risks from the bank failures had been contained. |
| | With the unemployment rate hovering around record lows, in April the markets welcomed news of 2% first quarter gross domestic product (GDP) growth, driven by continued consumer strength. While high inflation and the strong labor market resulted in the Fed's signaling a higher terminal (ending) federal funds rate of 5.6%, markets were encouraged that the central bank was possibly nearing the end of its rate-hiking cycle. |
4Pioneer Multi-Asset Ultrashort Income Fund | Semiannual Report | 9/30/23
| | Corporate profits posted declines for both the first and second quarters of 2023, but investors embraced the very high percentage of earnings reports that came in above expectations. |
| | The Fed increased the federal funds target range by 25 bps in early May, bringing the range to 5.00% ‒ 5.25%, before taking a pause at its June meeting. On July 26, 2023, the Fed once again raised the federal funds target range by 25 bps, then the Fed took another pause at its September meeting, leaving the range at 5.25% ‒ 5.50% as of period-end. |
| | Most asset classes sold off in the third quarter of 2023, most notably in September, as US bond yields rose dramatically, driven by the Fed’s “higher for longer” monetary policy, coupled with the negative impact of higher Treasury issuance and increasing concerns about the US government’s budget deficit. In addition, weaker economic growth in China and Europe weighed on market sentiment. |
| | As of September 30, 2023, the yield on the one-year Treasury note closed at 5.46%, versus 4.64% six months earlier. |
| Q | Can you review your principal investment strategies during the six-month period ended September 30, 2023, and how the strategies affected the Fund’s benchmark-relative performance? |
| A | The largest positive contributors to the Fund’s benchmark-relative performance during the six-month period were the portfolio’s exposures to securitized assets, including credit-risk transfer issues within the residential mortgage-backed securities (RMBS) segment, asset-backed securities (ABS), collateralized loan obligations (CLOs), and commercial mortgage-backed securities (CMBS). Securitized assets, particularly those with floating-rate structures, have historically outperformed corporate and government securities during periods of rising interest rates. Credit spreads on securitized credit assets tightened during the six-month period, due to increasing investor demand and better-than-expected fundamental strength. (Credit spreads are commonly defined as the differences in yield between Treasuries and other types of fixed-income securities with similar maturities.) |
Pioneer Multi-Asset Ultrashort Income Fund | Semiannual Report | 9/30/235
| | The next most significant positive contribution to the Fund’s relative returns came from the portfolio’s exposure to financial issues within the investment-grade corporate bond segment. In the banking sector, we have heavily favored investing the Fund in shorter-maturity bonds issued by large, diversified, multinational institutions. Additional positive contributors to the Fund’s relative results came from holdings of industrial and utility issues within investment-grade corporates. Finally, the Fund’s modest positions in insurance-linked securities and bank loans proved additive for benchmark-relative performance. |
| | During a period of solid outperformance by the Fund versus its benchmark, the one key detractor from relative performance for the six-month period was the portfolio’s yield-curve positioning, as overall portfolio carry lagged that of the benchmark, given an inverted yield curve. (Carry represents the cost or benefit of holding an asset. A yield curve is a line that plots the interest rates, at a set point in time, of bonds having equal credit quality but differing maturity dates. An inverted yield curve means that longer-term rates are lower than shorter-term rates.) |
| Q | Can you discuss the factors that affected the Fund’s yield, or distributions* to shareholders, during the six-month period ended September 30, 2023? |
| A | While credit spreads modestly tightened over the six-month period, the Fund’s monthly distribution rate increased, due mostly to the portfolio’s exposures to floating-rate securities. We believe the income-generation of the Fund relative to alternative investment options has remained attractive. |
| Q | Did the Fund have any exposure to derivative securities during the six-month period ended September 30, 2023? |
| A | We have invested the Fund in certain derivative instruments as a potential hedge against interest-rate risk on some of the portfolio’s positions, such as agency mortgage-backed securities (MBS) and ABS, but the investments have typically amounted to a very small portion of the Fund’s invested assets/notional |
| * | Distributions are not guaranteed. |
6Pioneer Multi-Asset Ultrashort Income Fund | Semiannual Report | 9/30/23
| | value. During the six-month period, the Fund had a small allocation to US Treasury futures, which had no material effect on performance. |
| Q | What is your assessment of the current investment climate for the Fund? |
| A | While recent economic data may show signs consistent with a domestic “soft landing,” in which growth slows but remains positive while inflation is brought under control, we are wary of extrapolating the current growth signals too far into the future. Consumer spending has been waning after a summer boost, business sentiment has been softening, and the still-tight US labor market has been cooling. In addition, higher interest rates and tighter lending conditions are just starting to take their toll on businesses. In a “higher for longer” interest-rate environment, businesses may encounter increasing difficulty with regard to carrying higher interest expenses and eventually rolling over maturing loans. We expect economic growth will slow in the coming quarters, and while it may take into early 2024 to know if the economy has a soft or hard landing, we continue to view the odds of a soft landing as relatively low. |
| | The recent rise in yields has been rapid and significant. Since the Fed’s last rate increase on July 26, 10-year Treasury yields have moved from 3.86% to 4.58%. The rise in long-term Treasury rates is likely not due to higher expected inflation, in our view. Rather, it appears the bond market is currently discounting a “higher for forever” scenario, in which the Fed’s “neutral” rate has increased substantially. |
| | We think longer-term interest rates are fundamentally attractive and well above fair value, but recognize that rates could move higher in the short term as investors reposition in response to recent volatility. |
Pioneer Multi-Asset Ultrashort Income Fund | Semiannual Report | 9/30/237
Please refer to the Schedule of Investments on pages 20 - 85 for a full listing of Fund securities.
All investments are subject to risk, including the possible loss of principal. In the past several years, financial markets have experienced increased volatility and heightened uncertainty. The market prices of securities may go up or down, sometimes rapidly or unpredictably, due to general market conditions, such as real or perceived adverse economic, political, or regulatory conditions, recessions, inflation, changes in interest or currency rates, lack of liquidity in the bond markets, the spread of infectious illness or other public health issues, armed conflict including Russia's military invasion of Ukraine, sanctions against Russia, other nations or individuals or companies and possible countermeasures, market disruptions caused by tariffs, trade disputes or other government actions, or adverse investor sentiment. These conditions may continue, recur, worsen or spread.
Pioneer Multi-Asset Ultrashort Income (“MAUI”) Fund has the ability to invest in a wide variety of debt securities.
Until recently, a commonly used reference rate for floating rate securities was LIBOR (London Interbank Offered Rate). Publication of most LIBOR settings has ceased on a representative basis. The impact of the transition from LIBOR on the Fund's transactions and financial markets generally cannot yet be determined.
The Fund may invest in underlying funds, including ETFs. In addition to the Fund’s operating expenses, you will indirectly bear the operating expenses of investments in any underlying funds.
The Fund and some of the underlying funds employ leverage, which increases the volatility of investment returns and subjects the Fund to magnified losses if an underlying fund’s investments decline in value.
The Fund may use derivatives, such as options, futures, inverse-floating-rate obligations, swaps, and others, which can be illiquid, may disproportionately increase losses, and have a potentially large impact on Fund performance.
The Fund may invest in credit default swaps, which may in some cases be illiquid, and they increase credit risk since the Fund has exposure to both the issuer of the referenced obligation and the counterparty to the credit default swap.
The Fund may invest in subordinated securities, which may be proportionately adversely affected by a default or even a perceived decline creditworthiness of the issuer.
8Pioneer Multi-Asset Ultrashort Income Fund | Semiannual Report | 9/30/23
The Fund may invest in floating-rate loans. The value of collateral, if any, securing a floating-rate loan can decline or may be insufficient to meet the Issuer’s obligations or may be difficult to liquidate.
The Fund may invest in insurance-linked securities (ILS). The Fund could lose a portion or all of the principal it has invested in an ILS, and the right to additional interest and/or dividend payments with respect to the security, upon the occurrence of a trigger event that leads to physical or economic loss. ILS may expose the Fund to issuer (credit) default, liquidity, and other risks.
The Fund may invest in zero-coupon bonds and payment-in-kind securities, which may be more speculative and fluctuate more in value than other fixed-income securities. The accrual of income from these securities are payable as taxable annual dividends to shareowners.
Investments in equity securities are subject to price fluctuation.
International investments are subject to special risks including currency fluctuations, social, economic and political uncertainties, which could increase volatility. These risks are magnified in emerging markets.
Investments in fixed-income securities involve interest rate, credit, inflation, and reinvestment risks. As interest rates rise, the value of fixed-income securities falls.
The Fund may invest in mortgage-backed securities, which during times of fluctuating interest rates may increase or decrease more than other fixed-income securities. Mortgage-backed securities are also subject to pre-payments.
Prepayment risk is the chance that an issuer may exercise its right to prepay its security, if falling interest rates prompt the issuer to do so. Forced to reinvest the unanticipated proceeds at lower interest rates, the Fund would experience a decline in income and lose the opportunity for additional price appreciation.
High-yield bonds possess greater price volatility, illiquidity, and possibility of default.
There may be insufficient or illiquid collateral securing the floating-rate loans held within the Fund. This may reduce the future redemption or recovery value of such loans.
The Fund may have disadvantaged access to confidential information that could be used to assess a loan issuer, as Amundi US normally seeks to avoid receiving material, non-public information.
Multi-Asset Ultrashort Income Fund is not a money market fund. These risks may increase share price volatility.
Pioneer Multi-Asset Ultrashort Income Fund | Semiannual Report | 9/30/239
There is no assurance that these and other strategies used by the Fund or underlying funds will be successful.
Please see the prospectus for a more complete discussion of the Fund’s risks.
For more information on this or any Pioneer fund, please visit amundi.com/usinvestors or call 1-800-622-9876. This material must be preceded or accompanied by the Fund's current prospectus or summary prospectus.
Any information in this shareowner report regarding market or economic trends or the factors influencing the Fund’s historical or future performance are statements of opinion as of the date of this report. Past performance is not a guarantee of future results.
10Pioneer Multi-Asset Ultrashort Income Fund | Semiannual Report | 9/30/23
Portfolio Summary | 9/30/23
Portfolio Diversification
(As a percentage of total investments)*
10 Largest Holdings
| (As a percentage of total investments)* |
| 1. | Federal National Mortgage Association, 6.50%, 10/15/53 (TBA) | 0.83% |
| 2. | Standard Chartered Plc, 7.085% (SOFR + 174 bps), 3/30/26 (144A) | 0.60 |
| 3. | Federal National Mortgage Association, 5.50%, 10/15/38 (TBA) | 0.58 |
| 4. | Svenska Handelsbanken AB, 6.594% (SOFR + 125 bps), 6/15/26 (144A) | 0.56 |
| 5. | Toyota Motor Credit Corp., 5.994% (SOFR + 65 bps), 9/11/25 | 0.56 |
| 6. | Goldman Sachs Group, Inc., 5.844% (SOFR + 50 bps), 9/10/24 | 0.53 |
| 7. | Daimler Trucks Finance North America LLC, 6.27% (SOFR + 100 bps), 4/5/24 (144A) | 0.51 |
| 8. | ING Groep NV, 6.905% (SOFR + 156 bps), 9/11/27 | 0.51 |
| 9. | Volkswagen Group of America Finance LLC, 6.274% (SOFR + 93 bps), 9/12/25 (144A) | 0.51 |
| 10. | Pagaya AI Debt Trust, Series 2023-3, Class A, 7.60%, 12/16/30 (144A) | 0.51 |
| | |
| * | Excludes short-term investments and all derivative contracts except for options purchased. The Fund is actively managed, and current holdings may be different. The holdings listed should not be considered recommendations to buy or sell any securities. |
Pioneer Multi-Asset Ultrashort Income Fund | Semiannual Report | 9/30/2311
Prices and Distributions | 9/30/23
Net Asset Value per Share
| Class | 9/30/23 | 3/31/23 |
| A | $9.60 | $9.53 |
| C | $9.61 | $9.53 |
| C2 | $9.61 | $9.53 |
| K | $9.63 | $9.56 |
| Y | $9.62 | $9.54 |
| | | |
Distributions per Share: 4/1/23 - 9/30/23
| Class | Net
Investment
Income | Short-Term
Capital Gains | Long-Term
Capital Gains |
| A | $0.2731 | $— | $— |
| C | $0.2578 | $— | $— |
| C2 | $0.2591 | $— | $— |
| K | $0.2854 | $— | $— |
| Y | $0.2813 | $— | $— |
The ICE Bank of America U.S. 3-Month Treasury Bill Index measures the performance of a single issue of outstanding Treasury bills which mature closest to, but not beyond, three months from the rebalancing date. The issue is purchased at the beginning of the month and held for a full month; at the end of the month, that issue is sold and rolled into a newly selected issue. Indices are unmanaged and their returns assume reinvestment of dividends and do not reflect any fees or expenses. It is not possible to invest directly in an index.
The index defined here pertains to the “Value of $10,000 Investment” and “Value of $5 Million Investment” charts on pages 13 - 17.
12Pioneer Multi-Asset Ultrashort Income Fund | Semiannual Report | 9/30/23
| Performance Update | 9/30/23 | Class A Shares |
Investment Returns
The mountain chart on the right shows the change in value of a $10,000 investment made in Class A shares of Pioneer Multi-Asset Ultrashort Income Fund during the periods shown, compared to that of the ICE Bank of America (BofA) U.S. 3-Month Treasury Bill Index.
Average Annual Total Returns
(As of September 30, 2023) |
| Period | Net
Asset
Value
(NAV) | ICE BofA
U.S.
3-Month
Treasury
Bill
Index |
| 10 Years | 1.64% | 1.11% |
| 5 Years | 1.92 | 1.72 |
| 1 Year | 6.64 | 4.47 |
Expense Ratio
(Per prospectus dated August 1, 2023) |
| Gross |
| 0.60% |
Value of $10,000 Investment
Call 1-800-225-6292 or visit www.amundi.com/us for the most recent month-end performance results. Current performance may be lower or higher than the performance data quoted.
The performance data quoted represents past performance, which is no guarantee of future results. Investment return and principal value will fluctuate, and shares, when redeemed, may be worth more or less than their original cost.
NAV results represent the percent change in net asset value per share.
All results are historical and assume the reinvestment of dividends and capital gains. Other share classes are available for which performance and expenses will differ.
Performance results reflect any applicable expense waivers in effect during the periods shown. Without such waivers Fund performance would be lower. Waivers may not be in effect for all funds. Certain fee waivers are contractual through a specified period. Otherwise, fee waivers can be rescinded at any time. See the prospectus and financial statements for more information.
The performance table and graph do not reflect the deduction of fees and taxes that a shareowner would pay on Fund distributions or the redemption of Fund shares.
Please refer to the financial highlights for a more current expense ratio.
Pioneer Multi-Asset Ultrashort Income Fund | Semiannual Report | 9/30/2313
| Performance Update | 9/30/23 | Class C Shares |
Investment Returns
The mountain chart on the right shows the change in value of a $10,000 investment made in Class C shares of Pioneer Multi-Asset Ultrashort Income Fund during the periods shown, compared to that of the ICE Bank of America (BofA) U.S. 3-Month Treasury Bill Index.
Average Annual Total Returns
(As of September 30, 2023) |
| Period | Net
Asset
Value
(NAV) | ICE BofA
U.S.
3-Month
Treasury
Bill
Index |
| 10 Years | 1.34% | 1.11% |
| 5 Years | 1.63 | 1.72 |
| 1 Year | 6.30 | 4.47 |
Expense Ratio
(Per prospectus dated August 1, 2023) |
| Gross |
| 0.92% |
Value of $10,000 Investment
Call 1-800-225-6292 or visit www.amundi.com/us for the most recent month-end performance results. Current performance may be lower or higher than the performance data quoted.
The performance data quoted represents past performance, which is no guarantee of future results. Investment return and principal value will fluctuate, and shares, when redeemed, may be worth more or less than their original cost.
NAV results represent the percent change in net asset value per share. All results are historical and assume the reinvestment of dividends and capital gains. Other share classes are available for which performance and expenses will differ.
Performance results reflect any applicable expense waivers in effect during the periods shown. Without such waivers Fund performance would be lower. Waivers may not be in effect for all funds. Certain fee waivers are contractual through a specified period. Otherwise, fee waivers can be rescinded at any time. See the prospectus and financial statements for more information.
The performance table and graph do not reflect the deduction of fees and taxes that a shareowner would pay on Fund distributions or the redemption of Fund shares.
Please refer to the financial highlights for a more current expense ratio.
14Pioneer Multi-Asset Ultrashort Income Fund | Semiannual Report | 9/30/23
| Performance Update | 9/30/23 | Class C2 Shares |
Investment Returns
The mountain chart on the right shows the change in value of a $10,000 investment made in Class C2 shares of Pioneer Multi-Asset Ultrashort Income Fund during the periods shown, compared to that of the ICE Bank of America (BofA) U.S. 3-Month Treasury Bill Index.
Average Annual Total Returns
(As of September 30, 2023) |
| Period | If
Held | If
Redeemed | ICE BofA
U.S.
3-Month
Treasury
Bill
Index |
| 10 Years | 1.35% | 1.35% | 1.11% |
| 5 Years | 1.65 | 1.65 | 1.72 |
| 1 Year | 6.32 | 5.32 | 4.47 |
Expense Ratio
(Per prospectus dated August 1, 2023) |
| Gross |
| 0.91% |
Value of $10,000 Investment
Call 1-800-225-6292 or visit www.amundi.com/us for the most recent month-end performance results. Current performance may be lower or higher than the performance data quoted.
The performance data quoted represents past performance, which is no guarantee of future results. Investment return and principal value will fluctuate, and shares, when redeemed, may be worth more or less than their original cost.
Class C2 shares held for less than 1 year are subject to a 1% contingent deferred sales charge (CDSC). “If Held” results represent the percentage change in net asset value per share. “If Redeemed” returns reflect deduction of the CDSC for the one-year period, assuming a complete redemption of shares at the last price calculated on the last business day of the period, and no CDSC for the five- and 10-year periods. All results are historical and assume the reinvestment of dividends and capital gains. Other share classes are available for which performance and expenses will differ.
Performance results reflect any applicable expense waivers in effect during the periods shown. Without such waivers Fund performance would be lower. Waivers may not be in effect for all funds. Certain fee waivers are contractual through a specified period. Otherwise, fee waivers can be rescinded at any time. See the prospectus and financial statements for more information.
The performance table and graph do not reflect the deduction of fees and taxes that a shareowner would pay on Fund distributions or the redemption of Fund shares.
Please refer to the financial highlights for a more current expense ratio.
Pioneer Multi-Asset Ultrashort Income Fund | Semiannual Report | 9/30/2315
| Performance Update | 9/30/23 | Class K Shares |
Investment Returns
The mountain chart on the right shows the change in value of a $5 million investment made in Class K shares of Pioneer Multi-Asset Ultrashort Income Fund during the periods shown, compared to that of the ICE Bank of America (BofA) U.S. 3-Month Treasury Bill Index.
Average Annual Total Returns
(As of September 30, 2023) |
| Period | Net
Asset
Value
(NAV) | ICE BofA
U.S.
3-Month
Treasury
Bill
Index |
| 10 Years | 1.89% | 1.11% |
| 5 Years | 2.19 | 1.72 |
| 1 Year | 6.88 | 4.47 |
Expense Ratio
(Per prospectus dated August 1, 2023) |
| Gross |
| 0.38% |
Value of $5 Million Investment
Call 1-800-225-6292 or visit www.amundi.com/us for the most recent month-end performance results. Current performance may be lower or higher than the performance data quoted.
The performance data quoted represents past performance, which is no guarantee of future results. Investment return and principal value will fluctuate, and shares, when redeemed, may be worth more or less than their original cost.
Class K shares are not subject to sales charges and are available for limited groups of eligible investors, including institutional investors. All results are historical and assume the reinvestment of dividends and capital gains. Other share classes are available for which performance and expenses will differ.
Performance results reflect any applicable expense waivers in effect during the periods shown. Without such waivers Fund performance would be lower. Waivers may not be in effect for all funds. Certain fee waivers are contractual through a specified period. Otherwise, fee waivers can be rescinded at any time. See the prospectus and financial statements for more information.
The performance table and graph do not reflect the deduction of fees and taxes that a shareowner would pay on Fund distributions or the redemption of Fund shares.
Please refer to the financial highlights for a more current expense ratio.
16Pioneer Multi-Asset Ultrashort Income Fund | Semiannual Report | 9/30/23
| Performance Update | 9/30/23 | Class Y Shares |
Investment Returns
The mountain chart on the right shows the change in value of a $5 million investment made in Class Y shares of Pioneer Multi-Asset Ultrashort Income Fund during the periods shown, compared to that of the ICE Bank of America (BofA) U.S. 3-Month Treasury Bill Index.
Average Annual Total Returns
(As of September 30, 2023) |
| Period | Net
Asset
Value
(NAV) | ICE BofA
U.S.
3-Month
Treasury
Bill
Index |
| 10 Years | 1.80% | 1.11% |
| 5 Years | 2.11 | 1.72 |
| 1 Year | 6.81 | 4.47 |
Expense Ratio
(Per prospectus dated August 1, 2023) |
| Gross |
| 0.45% |
Value of $5 Million Investment
Call 1-800-225-6292 or visit www.amundi.com/us for the most recent month-end performance results. Current performance may be lower or higher than the performance data quoted.
The performance data quoted represents past performance, which is no guarantee of future results. Investment return and principal value will fluctuate, and shares, when redeemed, may be worth more or less than their original cost.
Class Y shares are not subject to sales charges and are available for limited groups of eligible investors, including institutional investors. All results are historical and assume the reinvestment of dividends and capital gains. Other share classes are available for which performance and expenses will differ.
Performance results reflect any applicable expense waivers in effect during the periods shown. Without such waivers Fund performance would be lower. Waivers may not be in effect for all funds. Certain fee waivers are contractual through a specified period. Otherwise, fee waivers can be rescinded at any time. See the prospectus and financial statements for more information.
The performance table and graph do not reflect the deduction of fees and taxes that a shareowner would pay on Fund distributions or the redemption of Fund shares.
Please refer to the financial highlights for a more current expense ratio.
Pioneer Multi-Asset Ultrashort Income Fund | Semiannual Report | 9/30/2317
Comparing Ongoing Fund Expenses
As a shareowner in the Fund, you incur two types of costs:
| (1) | ongoing costs, including management fees, distribution and/or service (12b-1) fees, and other Fund expenses; and |
| (2) | transaction costs, including sales charges (loads) on purchase payments. |
This example is intended to help you understand your ongoing expenses (in dollars) of investing in the Fund and to compare these costs with the ongoing costs of investing in other mutual funds. The example is based on an investment of $1,000 at the beginning of the Fund’s latest six-month period and held throughout the six months.
Using the Tables
Actual Expenses
The first table below provides information about actual account values and actual expenses. You may use the information in this table, together with the amount you invested, to estimate the expenses that you paid over the period as follows:
| (1) | Divide your account value by $1,000
Example: an $8,600 account value ÷ $1,000 = 8.6 |
| (2) | Multiply the result in (1) above by the corresponding share class’s number in the third row under the heading entitled “Expenses Paid During Period” to estimate the expenses you paid on your account during this period. |
Expenses Paid on a $1,000 Investment in Pioneer Multi-Asset Ultrashort Income Fund
Based on actual returns from April 1, 2023 through September 30, 2023.
| Share Class | A | C | C2 | K | Y |
Beginning Account
Value on 4/1/23 | $1,000.00 | $1,000.00 | $1,000.00 | $1,000.00 | $1,000.00 |
Ending Account Value
(after expenses) on 9/30/23 | $1,036.40 | $1,035.80 | $1,036.00 | $1,037.60 | $1,038.30 |
Expenses Paid
During Period* | $3.05 | $4.63 | $4.53 | $1.83 | $2.29 |
| | |
| * | Expenses are equal to the Fund’s annualized expense ratio of 0.60%, 0.91%, 0.89%, 0.36%, and 0.45% for Class A, Class C, Class C2, Class K, and Class Y shares, respectively, multiplied by the average account value over the period, multiplied by 183/366 (to reflect the one-half year period). |
18Pioneer Multi-Asset Ultrashort Income Fund | Semiannual Report | 9/30/23
Hypothetical Example for Comparison Purposes
The table below provides information about hypothetical account values and hypothetical expenses based on the Fund’s actual expense ratio and an assumed rate of return of 5% per year before expenses, which is not the Fund’s actual return. The hypothetical account values and expenses may not be used to estimate the actual ending account balance or expenses you paid for the period.
You may use this information to compare the ongoing costs of investing in the Fund and other funds. To do so, compare this 5% hypothetical example with the 5% hypothetical examples that appear in the shareholder reports of the other funds.
Please note that the expenses shown in the tables are meant to highlight your ongoing costs only and do not reflect any transaction costs, such as sales charges (loads) that are charged at the time of the transaction. Therefore, the table below is useful in comparing ongoing costs only and will not help you determine the relative total costs of owning different funds. In addition, if these transaction costs were included, your costs would have been higher.
Expenses Paid on a $1,000 Investment in Pioneer Multi-Asset Ultrashort Income Fund
Based on a hypothetical 5% return per year before expenses, reflecting the period from April 1, 2023 through September 30, 2023.
| Share Class | A | C | C2 | K | Y |
Beginning Account
Value on 4/1/23 | $1,000.00 | $1,000.00 | $1,000.00 | $1,000.00 | $1,000.00 |
Ending Account Value
(after expenses) on 9/30/23 | $1,022.00 | $1,020.45 | $1,020.55 | $1,023.20 | $1,022.75 |
Expenses Paid
During Period* | $3.03 | $4.60 | $4.50 | $1.82 | $2.28 |
| | |
| * | Expenses are equal to the Fund’s annualized expense ratio of 0.60%, 0.91%, 0.89%, 0.36%, and 0.45% for Class A, Class C, Class C2, Class K, and Class Y shares, respectively, multiplied by the average account value over the period, multiplied by 183/366 (to reflect the one-half year period). |
Pioneer Multi-Asset Ultrashort Income Fund | Semiannual Report | 9/30/2319
Schedule of Investments | 9/30/23
(unaudited)
Principal
Amount
USD ($) | | | | | | Value |
| | UNAFFILIATED ISSUERS — 102.7% | |
| | Senior Secured Floating Rate Loan
Interests — 2.1% of Net Assets*(a) | |
| | Advertising Sales — 0.1% | |
| 962,500 | Clear Channel Outdoor Holdings, Inc., Term B Loan, 9.131% (Term SOFR + 350 bps), 8/21/26 | $ 937,100 |
| 1,475,298 | Outfront Media Capital LLC (Outfront Media Capital Corporation), Extended Term Loan, 7.066% (Term SOFR + 175 bps), 11/18/26 | 1,466,308 |
| | Total Advertising Sales | $2,403,408 |
|
|
| | Advertising Services — 0.0%† | |
| 736,875 | Dotdash Meredith, Inc., Term B Loan, 9.43% (Term SOFR + 400 bps), 12/1/28 | $ 712,006 |
| | Total Advertising Services | $712,006 |
|
|
| | Aerospace & Defense — 0.0%† | |
| 1,421,875 | ADS Tactical, Inc., Initial Term Loan, 11.181% (Term SOFR + 575 bps), 3/19/26 | $ 1,396,992 |
| | Total Aerospace & Defense | $1,396,992 |
|
|
| | Auto Parts & Equipment — 0.0%† | |
| 485,794 | IXS Holdings, Inc., Initial Term Loan, 9.851% (Term SOFR + 425 bps), 3/5/27 | $ 400,477 |
| | Total Auto Parts & Equipment | $400,477 |
|
|
| | Auto-Truck Trailers — 0.0%† | |
| 1,477,500 | Novae LLC, Tranche B Term Loan, 10.338% (Term SOFR + 500 bps), 12/22/28 | $ 1,374,075 |
| | Total Auto-Truck Trailers | $1,374,075 |
|
|
| | Batteries/Battery Systems — 0.0%† | |
| 613,750 | Energizer Holdings, Inc., 2020 Term Loan, 7.688% (Term SOFR + 225 bps), 12/22/27 | $ 613,494 |
| | Total Batteries/Battery Systems | $613,494 |
|
|
| | Building & Construction — 0.0%† | |
| 1,220,551 | Service Logic Acquisition, Inc., First Lien Closing Date Initial Term Loan, 9.631% (Term SOFR + 400 bps), 10/29/27 | $ 1,218,262 |
| | Total Building & Construction | $1,218,262 |
|
|
The accompanying notes are an integral part of these financial statements.
20Pioneer Multi-Asset Ultrashort Income Fund | Semiannual Report | 9/30/23
Principal
Amount
USD ($) | | | | | | Value |
| | Building & Construction Products — 0.0%† | |
| 488,750 | Cornerstone Building Brands, Inc., Tranche B Term Loan, 8.682% (Term SOFR + 325 bps), 4/12/28 | $ 476,990 |
| | Total Building & Construction Products | $476,990 |
|
|
| | Building Production — 0.0%† | |
| 498,750 | Koppers Inc., Initial Term Loan, 9.44% (Term SOFR + 400 bps), 4/10/30 | $ 500,620 |
| | Total Building Production | $500,620 |
|
|
| | Cable & Satellite Television — 0.1% | |
| 2,923,858 | Charter Communications Operating LLC, Term B-2 Loan, 7.116% (Term SOFR + 175 bps), 2/1/27 | $ 2,924,024 |
| 982,500 | Radiate Holdco LLC, Amendment No. 6 Term B Loan, 8.681% (Term SOFR + 325 bps), 9/25/26 | 806,572 |
| 1,025,000 | Virgin Media Bristol LLC, Facility Q, 8.697% (Term SOFR + 325 bps), 1/31/29 | 1,003,459 |
| | Total Cable & Satellite Television | $4,734,055 |
|
|
| | Casino Services — 0.1% | |
| 1,592,819 | Flutter Entertainment Plc, USD Term Loan, 7.902% (Term SOFR + 225 bps), 7/21/26 | $ 1,593,925 |
| | Total Casino Services | $1,593,925 |
|
|
| | Cellular Telecom — 0.0%† | |
| 1,225,000 | Xplore Inc., First Lien Refinancing Term Loan, 9.652% (Term SOFR + 400 bps), 10/2/28 | $ 967,750 |
| | Total Cellular Telecom | $967,750 |
|
|
| | Chemicals-Specialty — 0.2% | |
| 977,500 | INEOS Quattro Holdings UK Ltd., 2026 Tranche B Dollar Term Loan, 8.181% (Term SOFR + 275 bps), 1/29/26 | $ 975,667 |
| 2,541,500 | Mativ Holdings, Inc., Term B Loan, 9.181% (Term SOFR + 375 bps), 4/20/28 | 2,517,674 |
| 400,000 | Olympus Water US Holding Corp., 2023 Incremental Term Loan, 10.39% (Term SOFR + 500 bps), 11/9/28 | 399,900 |
| 982,500 | Olympus Water US Holding Corp., Initial Dollar Term Loan, 9.402% (Term SOFR + 375 bps), 11/9/28 | 971,575 |
| 1,719,380 | Tronox Finance LLC, First Lien Refinancing Term Loan, 7.931% (Term SOFR + 250 bps), 3/10/28 | 1,692,157 |
| | Total Chemicals-Specialty | $6,556,973 |
|
|
The accompanying notes are an integral part of these financial statements.
Pioneer Multi-Asset Ultrashort Income Fund | Semiannual Report | 9/30/2321
Schedule of Investments | 9/30/23
(unaudited) (continued)
Principal
Amount
USD ($) | | | | | | Value |
| | Commercial Services — 0.1% | |
| 502,918 | CoreLogic, Inc. (fka First American Corporation), First Lien Initial Term Loan, 8.931% (Term SOFR + 350 bps), 6/2/28 | $ 465,932 |
| 467,875 | Pre-Paid Legal Services, Inc., First Lien Initial Term Loan, 8.931% (Term SOFR + 350 bps), 12/15/28 | 464,025 |
| 1,750,150 | Trans Union LLC, 2019 Replacement Term B-5 Loan, 7.166% (Term SOFR + 175 bps), 11/16/26 | 1,750,241 |
| | Total Commercial Services | $2,680,198 |
|
|
| | Computer Data Security — 0.0%† | |
| 1,228,125 | Magenta Buyer LLC, First Lien Initial Term Loan, 10.631% (Term SOFR + 500 bps), 7/27/28 | $ 921,971 |
| 687,719 | Precisely Software Inc., First Lien Third Amendment Term Loan, 9.613% (Term SOFR + 400 bps), 4/24/28 | 669,237 |
| | Total Computer Data Security | $1,591,208 |
|
|
| | Computer Services — 0.0%† | |
| 918,400 | MAG DS Corp., Initial Term Loan, 10.99% (Term SOFR + 550 bps), 4/1/27 | $ 844,928 |
| | Total Computer Services | $844,928 |
|
|
| | Computer Software — 0.0%† | |
| 492,500 | Cornerstone OnDemand, Inc., First Lien Initial Term Loan, 9.181% (Term SOFR + 375 bps), 10/16/28 | $ 469,722 |
| | Total Computer Software | $469,722 |
|
|
| | Containers-Paper & Plastic — 0.1% | |
| 2,577,193 | Berry Global, Inc., Term Z Loan, 7.293% (Term SOFR + 175 bps), 7/1/26 | $ 2,580,012 |
| 1,465,100 | ProAmpac PG Borrower LLC, First Lien 2020-1 Term Loan, 9.258% (Term SOFR + 375 bps), 11/3/25 | 1,459,301 |
| | Total Containers-Paper & Plastic | $4,039,313 |
|
|
| | Cruise Lines — 0.0%† | |
| 1,057,350 | Carnival Corp., Initial Advance, 8.327% (Term SOFR + 300 bps), 8/9/27 | $ 1,056,909 |
| | Total Cruise Lines | $1,056,909 |
|
|
| | Diagnostic Equipment — 0.0%† | |
| 1,461,363 | Curia Global, Inc., First Lien 2021 Term Loan, 9.169% (Term SOFR + 375 bps), 8/30/26 | $ 1,216,584 |
| | Total Diagnostic Equipment | $1,216,584 |
|
|
The accompanying notes are an integral part of these financial statements.
22Pioneer Multi-Asset Ultrashort Income Fund | Semiannual Report | 9/30/23
Principal
Amount
USD ($) | | | | | | Value |
| | Direct Marketing — 0.0%† | |
| 579,812 | Red Ventures, LLC (New Imagitas, Inc.), First Lien Term B-4 Loan, 8.316% (Term SOFR + 300 bps), 3/3/30 | $ 576,430 |
| | Total Direct Marketing | $576,430 |
|
|
| | Disposable Medical Products — 0.1% | |
| 985,000 | Medline Borrower, LP, Initial Dollar Term Loan, 8.681% (Term SOFR + 325 bps), 10/23/28 | $ 983,769 |
| 900,000 | Sotera Health Holdings LLC, First Lien Refinancing Loan, 8.181% (Term SOFR + 275 bps), 12/11/26 | 895,359 |
| | Total Disposable Medical Products | $1,879,128 |
|
|
| | Distribution & Wholesale — 0.0%† | |
| 937,500 | Windsor Holdings III LLC, Dollar Term B Loan, 9.83% (Term SOFR + 450 bps), 8/1/30 | $ 934,375 |
| | Total Distribution & Wholesale | $934,375 |
|
|
| | E-Commerce — 0.0%† | |
| 487,500 | CNT Holdings I Corp., First Lien Initial Term Loan, 8.80% (Term SOFR + 350 bps), 11/8/27 | $ 486,803 |
| | Total E-Commerce | $486,803 |
|
|
| | Electric-Generation — 0.1% | |
| 885,955 | Eastern Power LLC (Eastern Covert Midco LLC), Term Loan, 9.181% (Term SOFR + 375 bps), 10/2/25 | $ 857,162 |
| 440,000 | Generation Bridge Northeast LLC, Term Loan B, 9.566% (Term SOFR + 425 bps), 8/22/29 | 440,550 |
| 547,009 | Vistra Operations Company LLC (fka Tex Operations Company LLC), 2018 Incremental Term Loan, 7.181% (Term SOFR + 175 bps), 12/31/25 | 547,464 |
| | Total Electric-Generation | $1,845,176 |
|
|
| | Electric-Integrated — 0.0%† | |
| 479,452 | Pike Corp., 2028 Initial Term Loan, 8.431% (Term SOFR + 300 bps), 1/21/28 | $ 479,702 |
| | Total Electric-Integrated | $479,702 |
|
|
| | Entertainment Software — 0.0%† | |
| 828,750 | Playtika Holding Corp., Term B-1 Loan, 8.181% (Term SOFR + 275 bps), 3/13/28 | $ 828,906 |
| | Total Entertainment Software | $828,906 |
|
|
The accompanying notes are an integral part of these financial statements.
Pioneer Multi-Asset Ultrashort Income Fund | Semiannual Report | 9/30/2323
Schedule of Investments | 9/30/23
(unaudited) (continued)
Principal
Amount
USD ($) | | | | | | Value |
| | Finance-Investment Banker — 0.1% | |
| 1,450,242 | Citadel Securities LP, 2023 Term Loan, 7.931% (Term SOFR + 250 bps), 7/29/30 | $ 1,449,109 |
| 926,250 | Hudson River Trading LLC, Term Loan, 8.631% (Term SOFR + 300 bps), 3/20/28 | 922,005 |
| | Total Finance-Investment Banker | $2,371,114 |
|
|
| | Finance-Leasing Company — 0.1% | |
| 1,219,290 | Avolon TLB Borrower 1 (US) LLC, 2021 Term B-5 Loan, 7.675% (Term SOFR + 225 bps), 12/1/27 | $ 1,220,662 |
| 1,336,999 | Avolon TLB Borrower 1 (US) LLC, Term B-4 Loan, 6.925% (Term SOFR + 150 bps), 2/12/27 | 1,337,378 |
| 1,509,791 | Castlelake Aviation One Designated Activity Company, 2023 Incremental Term Loan, 8.421% (Term SOFR + 275 bps), 10/22/27 | 1,509,791 |
| | Total Finance-Leasing Company | $4,067,831 |
|
|
| | Food-Wholesale & Distributions — 0.0%† | |
| 746,667 | US Foods, Inc. (aka U.S. Foodservice, Inc.), Incremental B-2019 Term Loan, 7.431% (Term SOFR + 200 bps), 9/13/26 | $ 747,734 |
| | Total Food-Wholesale & Distributions | $747,734 |
|
|
| | Footwear & Related Apparel — 0.1% | |
| 1,635,000 | Crocs, Inc., 2023 Refinancing Term Loan, 8.54% (Term SOFR + 300 bps), 2/20/29 | $ 1,642,040 |
| | Total Footwear & Related Apparel | $1,642,040 |
|
|
| | Gambling (Non-Hotel) — 0.0%† | |
| 982,500 | Bally's Corp., Term B Facility Loan, 8.838% (Term SOFR + 325 bps), 10/2/28 | $ 965,070 |
| | Total Gambling (Non-Hotel) | $965,070 |
|
|
| | Independent Power Producer — 0.0%† | |
| 732,375 | Calpine Construction Finance Company, L.P., Refinancing Term Loan, 7.566% (Term SOFR + 225 bps), 7/31/30 | $ 729,247 |
| 465,750 | EFS Cogen Holdings I LLC, Term B Advance, 9.16% (Term SOFR + 350 bps), 10/1/27 | 464,258 |
| | Total Independent Power Producer | $1,193,505 |
|
|
The accompanying notes are an integral part of these financial statements.
24Pioneer Multi-Asset Ultrashort Income Fund | Semiannual Report | 9/30/23
Principal
Amount
USD ($) | | | | | | Value |
| | Internet Content — 0.0%† | |
| 498,750 | MH Sub I LLC (Micro Holding Corp.), 2023 May Incremental First Lien Term Loan, 9.566% (Term SOFR + 425 bps), 5/3/28 | $ 483,271 |
| | Total Internet Content | $483,271 |
|
|
| | Internet Security — 0.0%† | |
| 884,099 | Gen Digital Inc., Initial Tranche B Term Loan, 7.416% (Term SOFR + 200 bps), 9/12/29 | $ 882,372 |
| | Total Internet Security | $882,372 |
|
|
| | Investment Management & Advisory Services —
0.1% | |
| 977,500 | Edelman Financial Engines Center LLC, First Lien 2021 Initial Term Loan, 8.931% (Term SOFR + 350 bps), 4/7/28 | $ 969,130 |
| 492,460 | LHS Borrower LLC, Initial Term Loan, 10.166% (Term SOFR + 475 bps), 2/16/29 | 451,216 |
| 1,464,150 | Russell Investments US Institutional Holdco, Inc., 2025 Term Loan, 8.818% (Term SOFR + 350 bps), 5/30/25 | 1,398,995 |
| 743,302 | Victory Capital Holdings, Inc., Tranche B-2 Term Loan, 7.619% (Term SOFR + 225 bps), 7/1/26 | 743,767 |
| | Total Investment Management & Advisory Services | $3,563,108 |
|
|
| | Lasers-System & Components — 0.1% | |
| 2,285,380 | Coherent Corp., Initial Term B Loan, 8.181% (Term SOFR + 275 bps), 7/2/29 | $ 2,286,808 |
| | Total Lasers-Syst/Components | $2,286,808 |
|
|
| | Machinery-Pumps — 0.0%† | |
| 979,684 | Circor International, Inc., Initial Term Loan, 10.916% (Term SOFR + 550 bps), 12/20/28 | $ 981,072 |
| | Total Machinery-Pumps | $981,072 |
|
|
| | Medical Information Systems — 0.0%† | |
| 660,257 | athenahealth Group, Inc., Initial Term Loan, 8.568% (Term SOFR + 325 bps), 2/15/29 | $ 649,253 |
| | Total Medical Information Systems | $649,253 |
|
|
| | Medical Labs & Testing Services — 0.1% | |
| 1,558,500(b) | Envision Healthcare Corp., 2018 Third Out Term Loan, 9.121% (Term SOFR + 375 bps), 3/31/27 | $ 23,378 |
| 1,771,722 | Phoenix Guarantor Inc., First Lien Tranche B-1 Term Loan, 8.681% (Term SOFR + 325 bps), 3/5/26 | 1,763,180 |
The accompanying notes are an integral part of these financial statements.
Pioneer Multi-Asset Ultrashort Income Fund | Semiannual Report | 9/30/2325
Schedule of Investments | 9/30/23
(unaudited) (continued)
Principal
Amount
USD ($) | | | | | | Value |
| | Medical Labs & Testing Services — (continued) | |
| 1,218,750 | Phoenix Guarantor Inc., First Lien Tranche B-3 Term Loan, 8.931% (Term SOFR + 350 bps), 3/5/26 | $ 1,212,874 |
| 1,323,000 | U.S. Anesthesia Partners, Inc., First Lien Initial Term Loan, 9.694% (Term SOFR + 425 bps), 10/1/28 | 1,218,318 |
| | Total Medical Labs & Testing Services | $4,217,750 |
|
|
| | Medical Products — 0.1% | |
| 1,459,006 | NMN Holdings III Corp., First Lien Closing Date Term Loan, 9.181% (Term SOFR + 375 bps), 11/13/25 | $ 1,394,263 |
| 313,397 | NMN Holdings III Corp., First Lien Delayed Draw Term Loan, 9.181% (Term SOFR + 375 bps), 11/13/25 | 299,490 |
| | Total Medical Products | $1,693,753 |
|
|
| | Medical-Drugs — 0.0%† | |
| 800,000 | Padagis LLC, Term B Loan, 10.28% (Term SOFR + 475 bps), 7/6/28 | $ 779,666 |
| | Total Medical-Drugs | $779,666 |
|
|
| | Medical-Hospitals — 0.0%† | |
| 1,280,500 | EyeCare Partners LLC, First Lien Amendment No. 1 Term Loan, 9.181% (Term SOFR + 375 bps), 11/15/28 | $ 898,911 |
| 982,500 | Knight Health Holdings LLC, Term B Loan, 10.681% (Term SOFR + 525 bps), 12/23/28 | 249,309 |
| | Total Medical-Hospitals | $1,148,220 |
|
|
| | Metal Processors & Fabrication — 0.0%† | |
| 316,805 | WireCo WorldGroup, Inc., Initial Term Loan, 9.695% (Term SOFR + 425 bps), 11/13/28 | $ 317,003 |
| | Total Metal Processors & Fabrication | $317,003 |
|
|
| | Office Automation & Equipment — 0.0%† | |
| 1,062,750 | Pitney Bowes, Inc., Refinancing Tranche B Term Loan, 9.431% (Term SOFR + 400 bps), 3/17/28 | $ 1,028,211 |
| | Total Office Automation & Equipment | $1,028,211 |
|
|
| | Physical Practice Management — 0.0%† | |
| 867,392 | Team Health Holdings, Inc., Extended Term Loan, 10.566% (Term SOFR + 525 bps), 3/2/27 | $ 663,314 |
| | Total Physical Practice Management | $663,314 |
|
|
| | Property & Casualty Insurance — 0.1% | |
| 2,635,142 | Asurion LLC, New B-11 Term Loan, 9.666% (Term SOFR + 425 bps), 8/19/28 | $ 2,578,047 |
The accompanying notes are an integral part of these financial statements.
26Pioneer Multi-Asset Ultrashort Income Fund | Semiannual Report | 9/30/23
Principal
Amount
USD ($) | | | | | | Value |
| | Property & Casualty Insurance — (continued) | |
| 1,164,417 | Asurion LLC, New B-8 Term Loan, 8.681% (Term SOFR + 325 bps), 12/23/26 | $ 1,144,929 |
| 975,000 | Asurion LLC, New B-9 Term Loan, 8.681% (Term SOFR + 325 bps), 7/31/27 | 949,482 |
| | Total Property & Casualty Insurance | $4,672,458 |
|
|
| | Protection-Safety — 0.0%† | |
| 907,250 | Prime Security Services Borrower LLC, First Lien 2021 Refinancing Term B-1 Loan, 8.192% (Term SOFR + 275 bps), 9/23/26 | $ 907,147 |
| | Total Protection-Safety | $907,147 |
|
|
| | Publishing — 0.0%† | |
| 990,000 | Houghton Mifflin Harcourt Co., First Lien Term B Loan, 10.666% (Term SOFR + 525 bps), 4/9/29 | $ 941,119 |
| | Total Publishing | $941,119 |
|
|
| | Racetracks — 0.0%† | |
| 487,500 | Churchill Downs Inc., 2021 Incremental Term B Loan, 7.416% (Term SOFR + 200 bps), 3/17/28 | $ 486,433 |
| | Total Racetracks | $486,433 |
|
|
| | Recreational Centers — 0.0%† | |
| 1,220,288 | Fitness International LLC, Term B Loan, 8.769% (Term SOFR + 325 bps), 4/18/25 | $ 1,215,331 |
| | Total Recreational Centers | $1,215,331 |
|
|
| | Rental Auto & Equipment — 0.1% | |
| 1,930,623 | Avis Budget Car Rental LLC, New Tranche B Term Loan, 7.181% (Term SOFR + 175 bps), 8/6/27 | $ 1,925,797 |
| | Total Rental Auto & Equipment | $1,925,797 |
|
|
| | Retail — 0.1% | |
| 1,137,500 | Highline Aftermarket Acquisition LLC, First Lien Initial Term Loan, 9.916% (Term SOFR + 450 bps), 11/9/27 | $ 1,127,547 |
| 938,382 | Petco Health & Wellness Co., Inc., First Lien Initial Term Loan, 8.902% (Term SOFR + 325 bps), 3/3/28 | 929,879 |
| 735,000 | PetSmart LLC, Initial Term Loan, 9.166% (Term SOFR + 375 bps), 2/11/28 | 734,005 |
| 733,591 | RVR Dealership Holdings LLC, Term Loan, 9.246% (Term SOFR + 375 bps), 2/8/28 | 660,690 |
| | Total Retail | $3,452,121 |
|
|
The accompanying notes are an integral part of these financial statements.
Pioneer Multi-Asset Ultrashort Income Fund | Semiannual Report | 9/30/2327
Schedule of Investments | 9/30/23
(unaudited) (continued)
Principal
Amount
USD ($) | | | | | | Value |
| | Security Services — 0.1% | |
| 1,960,000 | Allied Universal Holdco LLC (f/k/a USAGM Holdco LLC), Initial U.S. Dollar Term Loan, 9.166% (Term SOFR + 375 bps), 5/12/28 | $ 1,897,302 |
| 1,400,000 | Allied Universal Holdco LLC, (f/k/a USAGM Holdco LLC), Amendment No. 3 Term Loan, 10.091% (Term SOFR + 475 bps), 5/12/28 | 1,380,750 |
| 1,500,000 | Garda World Security Corp., Term B-2 Loan, 9.746% (Term SOFR + 425 bps), 10/30/26 | 1,502,437 |
| | Total Security Services | $4,780,489 |
|
|
| | Telephone-Integrated — 0.1% | |
| 1,867,211 | Level 3 Financing, Inc., Tranche B 2027 Term Loan, 7.181% (Term SOFR + 175 bps), 3/1/27 | $ 1,767,664 |
| | Total Telephone-Integrated | $1,767,664 |
|
|
| | Textile-Home Furnishings — 0.0%† | |
| 1,773,000 | Runner Buyer, Inc., Initial Term Loan, 11.037% (Term SOFR + 550 bps), 10/20/28 | $ 1,411,751 |
| | Total Textile-Home Furnishings | $1,411,751 |
|
|
| | Transportation - Trucks — 0.0%† | |
| 1,470,000 | Carriage Purchaser, Inc., Term B Loan, 9.681% (Term SOFR + 425 bps), 9/30/28 | $ 1,442,989 |
| | Total Transportation - Trucks | $1,442,989 |
|
|
| | Total Senior Secured Floating Rate Loan Interests
(Cost $99,522,111) | $94,562,803 |
|
|
| | Asset Backed Securities — 30.1% of Net
Assets | |
| 44,645(a) | 321 Henderson Receivables I LLC, Series 2004-A, Class A1, 5.797% (1 Month Term SOFR + 46 bps), 9/15/45 (144A) | $ 44,208 |
| 362,499(a) | 321 Henderson Receivables I LLC, Series 2006-2A, Class A1, 5.647% (1 Month Term SOFR + 31 bps), 6/15/41 (144A) | 353,579 |
| 434,026(a) | 321 Henderson Receivables I LLC, Series 2006-3A, Class A1, 5.647% (1 Month Term SOFR + 31 bps), 9/15/41 (144A) | 416,965 |
| 844,299(a) | 321 Henderson Receivables LLC, Series 2005-1A, Class A1, 5.677% (1 Month Term SOFR + 34 bps), 11/15/40 (144A) | 826,928 |
| 3,550,000(a) | 522 Funding CLO, Ltd., Series 2020-6A, Class X, 6.707% (3 Month Term SOFR + 136 bps), 10/23/34 (144A) | 3,548,055 |
The accompanying notes are an integral part of these financial statements.
28Pioneer Multi-Asset Ultrashort Income Fund | Semiannual Report | 9/30/23
Principal
Amount
USD ($) | | | | | | Value |
| | Asset Backed Securities — (continued) | |
| 3,000,000(a) | ABPCI Direct Lending Fund CLO V Ltd., Series 2019-5A, Class CR, 9.788% (3 Month Term SOFR + 446 bps), 4/20/31 (144A) | $ 2,789,970 |
| 5,000,000(a) | ABPCI Direct Lending Fund CLO X LP, Series 2020-10A, Class A1A, 7.538% (3 Month Term SOFR + 221 bps), 1/20/32 (144A) | 4,988,070 |
| 8,451,562 | ACC Auto Trust, Series 2021-A, Class B, 1.79%, 4/15/27 (144A) | 8,388,231 |
| 1,181,704 | ACC Auto Trust, Series 2022-A, Class A, 4.58%, 7/15/26 (144A) | 1,168,243 |
| 2,000,000 | ACC Auto Trust, Series 2022-A, Class D, 10.07%, 3/15/29 (144A) | 1,929,159 |
| 310,504 | ACHV ABS Trust, Series 2023-1PL, Class A, 6.42%, 3/18/30 (144A) | 310,590 |
| 1,798,898 | ACHV ABS Trust, Series 2023-2PL, Class A, 6.42%, 5/20/30 (144A) | 1,799,575 |
| 5,500,000 | ACHV ABS Trust, Series 2023-2PL, Class B, 6.88%, 5/20/30 (144A) | 5,500,723 |
| 1,571,527 | ACHV ABS Trust, Series 2023-3PL, Class A, 6.60%, 8/19/30 (144A) | 1,572,472 |
| 1,250,000 | ACHV ABS Trust, Series 2023-3PL, Class B, 7.17%, 8/19/30 (144A) | 1,255,460 |
| 378,991 | ACM Auto Trust, Series 2022-1A, Class C, 5.48%, 4/20/29 (144A) | 378,536 |
| 4,562,000 | ACM Auto Trust, Series 2022-1A, Class D, 8.58%, 4/20/29 (144A) | 4,549,166 |
| 3,542,748 | ACM Auto Trust, Series 2023-1A, Class A, 6.61%, 1/22/30 (144A) | 3,539,281 |
| 7,750,000 | ACM Auto Trust, Series 2023-1A, Class C, 8.59%, 1/22/30 (144A) | 7,730,605 |
| 7,397,322(a) | ACREC, Ltd., Series 2021-FL1, Class A, 6.595% (1 Month Term SOFR + 126 bps), 10/16/36 (144A) | 7,294,440 |
| 12,900,000(a) | ACRES Commercial Realty, Ltd., Series 2021-FL2, Class A, 6.847% (1 Month Term SOFR + 151 bps), 1/15/37 (144A) | 12,771,881 |
| 2,216,668(a) | Allegro CLO XIII, Ltd., Series 2021-1A, Class X, 6.588% (3 Month Term SOFR + 126 bps), 7/20/34 (144A) | 2,207,411 |
| 2,220,833(a) | Allegro CLO XIV, Ltd., Series 2021-2A, Class X, 6.57% (3 Month Term SOFR + 126 bps), 10/15/34 (144A) | 2,219,736 |
| 8,570,000 | AM Capital Funding LLC, Series 2018-1, Class A, 4.98%, 12/15/23 (144A) | 8,562,359 |
| 3,035,000 | American Credit Acceptance Receivables Trust, Series 2020-3, Class E, 3.88%, 8/13/26 (144A) | 3,004,324 |
The accompanying notes are an integral part of these financial statements.
Pioneer Multi-Asset Ultrashort Income Fund | Semiannual Report | 9/30/2329
Schedule of Investments | 9/30/23
(unaudited) (continued)
Principal
Amount
USD ($) | | | | | | Value |
| | Asset Backed Securities — (continued) | |
| 6,242,873 | American Credit Acceptance Receivables Trust, Series 2023-1, Class A, 5.45%, 9/14/26 (144A) | $ 6,226,750 |
| 3,780,000 | American Homes 4 Rent Trust, Series 2014-SFR2, Class D, 5.149%, 10/17/36 (144A) | 3,712,550 |
| 5,778,000 | American Homes 4 Rent Trust, Series 2015-SFR1, Class F, 5.885%, 4/17/52 (144A) | 5,685,521 |
| 5,857,497(a) | Americredit Automobile Receivables Trust, Series 2023-1, Class A2B, 6.043% (SOFR30A + 73 bps), 10/19/26 | 5,863,888 |
| 9,587(a) | Amortizing Residential Collateral Trust, Series 2002-BC5, Class M1, 6.469% (1 Month Term SOFR + 115 bps), 7/25/32 | 9,608 |
| 1,750,000 | Amur Equipment Finance Receivables IX LLC, Series 2021-1A, Class D, 2.30%, 11/22/27 (144A) | 1,648,019 |
| 2,300,000(a) | Antares CLO LTD, Series 2019-2A, Class D, 10.357% (3 Month Term SOFR + 501 bps), 1/23/32 (144A) | 2,162,423 |
| 1,095,457(a) | Apres Static CLO, Ltd., Series 2019-1A, Class A1R, 6.64% (3 Month Term SOFR + 133 bps), 10/15/28 (144A) | 1,093,833 |
| 2,080,500 | Aqua Finance Trust, Series 2019-A, Class A, 3.14%, 7/16/40 (144A) | 1,926,092 |
| 3,365,012 | Aqua Finance Trust, Series 2020-AA, Class A, 1.90%, 7/17/46 (144A) | 3,111,209 |
| 4,472,127 | Aqua Finance Trust, Series 2021-A, Class A, 1.54%, 7/17/46 (144A) | 3,930,473 |
| 1,000,000(a) | Arbor Realty Commercial Real Estate Notes, Ltd., Series 2021-FL3, Class D, 7.647% (1 Month Term SOFR + 231 bps), 8/15/34 (144A) | 934,245 |
| 2,500,000(a) | Arbor Realty Commercial Real Estate Notes, Ltd., Series 2021-FL4, Class E, 8.847% (1 Month Term SOFR + 351 bps), 11/15/36 (144A) | 2,290,630 |
| 1,500,000(a) | Arbor Realty Commercial Real Estate Notes, Ltd., Series 2022-FL1, Class E, 9.063% (SOFR30A + 375 bps), 1/15/37 (144A) | 1,406,634 |
| 4,000,000(a) | Ares LVII CLO, Ltd., Series 2020-57A, Class XR, 6.613% (3 Month USD LIBOR + 100 bps), 1/25/35 (144A) | 3,999,800 |
| 1,000,000(a) | Ares XXXVR CLO, Ltd., Series 2015-35RA, Class C, 7.47% (3 Month Term SOFR + 216 bps), 7/15/30 (144A) | 977,255 |
| 3,779,622 | Arivo Acceptance Auto Loan Receivables Trust, Series 2022-1A, Class A, 3.93%, 5/15/28 (144A) | 3,697,156 |
| 1,500,000 | Arm Master Trust LLC, Series 2023-T1, Class A, 6.562%, 2/17/25 (144A) | 1,497,723 |
The accompanying notes are an integral part of these financial statements.
30Pioneer Multi-Asset Ultrashort Income Fund | Semiannual Report | 9/30/23
Principal
Amount
USD ($) | | | | | | Value |
| | Asset Backed Securities — (continued) | |
| 250,000(a) | ASSURANT CLO Ltd., Series 2018-2A, Class D, 8.438% (3 Month Term SOFR + 311 bps), 4/20/31 (144A) | $ 239,147 |
| 739,456 | Atalaya Equipment Leasing Trust, Series 2021-1A, Class A2, 1.23%, 5/15/26 (144A) | 728,443 |
| 340,948(a) | Atlas Senior Loan Fund III, Ltd., Series 2013-1A, Class AR, 6.468% (3 Month Term SOFR + 109 bps), 11/17/27 (144A) | 340,537 |
| 8,964,229(a) | AUF Funding LLC, Series 2022-1A, Class A1LN, 7.826% (3 Month Term SOFR + 250 bps), 1/20/31 (144A) | 8,977,084 |
| 1,600,000 | Avid Automobile Receivables Trust, Series 2021-1, Class F, 5.16%, 10/16/28 (144A) | 1,464,752 |
| 4,452,884 | Avid Automobile Receivables Trust, Series 2023-1, Class A, 6.63%, 7/15/26 (144A) | 4,442,520 |
| 3,000,000 | Avid Automobile Receivables Trust, Series 2023-1, Class B, 7.12%, 3/15/27 (144A) | 2,994,090 |
| 5,500,000(c) | B2R Mortgage Trust, Series 2015-2, Class E, 6.009%, 11/15/48 (144A) | 5,308,827 |
| 5,704,038(a) | Barings Middle Market CLO, Ltd., Series 2018-IA, Class A1, 7.10% (3 Month Term SOFR + 179 bps), 1/15/31 (144A) | 5,674,588 |
| 148,315(a) | Bear Stearns Asset Backed Securities Trust, Series 2001-3, Class A1, 6.334% (1 Month Term SOFR + 101 bps), 10/27/32 | 145,693 |
| 1,011,753 | BHG Securitization Trust, Series 2021-B, Class A, 0.90%, 10/17/34 (144A) | 972,895 |
| 2,748,659 | BHG Securitization Trust, Series 2022-C, Class A, 5.32%, 10/17/35 (144A) | 2,728,379 |
| 1,511,887(a) | Black Diamond CLO, Ltd., Series 2017-1A, Class A1AR, 6.657% (3 Month Term SOFR + 131 bps), 4/24/29 (144A) | 1,509,706 |
| 3,130,085 | Blackbird Capital Aircraft, Series 2021-1A, Class A, 2.443%, 7/15/46 (144A) | 2,672,210 |
| 974,337 | BOF URSA VI Funding Trust I, Series 2023-CAR1, Class A2, 5.542%, 10/27/31 (144A) | 960,699 |
| 2,137,128 | BOF URSA VI Funding Trust I, Series 2023-CAR2, Class A2, 5.542%, 10/27/31 (144A) | 2,107,222 |
| 4,401,763 | BOF VII AL Funding Trust I, Series 2023-CAR3, Class A2, 6.291%, 7/26/32 (144A) | 4,377,337 |
| 5,500,000(a) | Brightwood Capital MM CLO, Ltd., Series 2020-1A, Class B1R, 9.058% (3 Month Term SOFR + 375 bps), 1/15/31 (144A) | 5,473,737 |
The accompanying notes are an integral part of these financial statements.
Pioneer Multi-Asset Ultrashort Income Fund | Semiannual Report | 9/30/2331
Schedule of Investments | 9/30/23
(unaudited) (continued)
Principal
Amount
USD ($) | | | | | | Value |
| | Asset Backed Securities — (continued) | |
| 1,500,000(a) | Brightwood Capital MM CLO, Ltd., Series 2020-1A, Class C1R, 10.808% (3 Month Term SOFR + 550 bps), 1/15/31 (144A) | $ 1,494,956 |
| 5,900,000(a) | Brightwood Capital MM CLO, Ltd., Series 2020-1A, Class DR, 11.558% (3 Month Term SOFR + 625 bps), 1/15/31 (144A) | 5,718,333 |
| 3,260,000(a) | Brightwood Capital MM CLO, Ltd., Series 2023-1A, Class X, 7.651% (3 Month Term SOFR + 225 bps), 10/15/35 (144A) | 3,260,228 |
| 9,825,000(a) | BRSP, Ltd., Series 2021-FL1, Class A, 6.592% (1 Month Term SOFR + 126 bps), 8/19/38 (144A) | 9,589,564 |
| 2,000,000(a) | BSPRT Issuer, Ltd., Series 2021-FL7, Class D, 8.197% (1 Month Term SOFR + 286 bps), 12/15/38 (144A) | 1,884,596 |
| 325,501 | BXG Receivables Note Trust, Series 2020-A, Class B, 2.49%, 2/28/36 (144A) | 294,872 |
| 8,000,000(a) | CAL Receivables LLC, Series 2022-1, Class B, 9.663% (SOFR30A + 435 bps), 10/15/26 (144A) | 7,901,538 |
| 1,400,000(a) | Carlyle Direct Lending CLO LLC, Series 2015-1A, Class A2R, 7.77% (3 Month Term SOFR + 246 bps), 10/15/31 (144A) | 1,363,237 |
| 1,094,703 | CarNow Auto Receivables Trust, Series 2022-1A, Class B, 4.89%, 3/16/26 (144A) | 1,088,606 |
| 540,540 | CarNow Auto Receivables Trust, Series 2023-1A, Class A, 6.62%, 12/16/24 (144A) | 540,499 |
| 2,000,000 | CarNow Auto Receivables Trust, Series 2023-1A, Class D, 7.99%, 2/15/28 (144A) | 1,963,473 |
| 1,838,261 | Cartiga Asset Finance Trust LLC, Series 2023-1, Class A, 7.00%, 3/15/35 (144A) | 1,824,896 |
| 2,886,442 | Carvana Auto Receivables Trust, Series 2019-1A, Class E, 5.64%, 1/15/26 (144A) | 2,880,821 |
| 9,555,255 | Carvana Auto Receivables Trust, Series 2019-2A, Class E, 5.01%, 4/15/26 (144A) | 9,504,082 |
| 875,590 | Carvana Auto Receivables Trust, Series 2019-4A, Class D, 3.07%, 7/15/25 (144A) | 871,528 |
| 2,141,538 | Carvana Auto Receivables Trust, Series 2020-N1A, Class D, 3.43%, 1/15/26 (144A) | 2,126,468 |
| 1,428,687 | Carvana Auto Receivables Trust, Series 2021-N3, Class A1, 0.35%, 6/12/28 | 1,414,120 |
| 1,000,000 | Carvana Auto Receivables Trust, Series 2021-P2, Class D, 2.02%, 5/10/28 | 861,497 |
| 9,622,558 | Carvana Auto Receivables Trust, Series 2023-N1, Class A, 6.36%, 4/12/27 (144A) | 9,635,417 |
| 3,000,000 | Carvana Auto Receivables Trust, Series 2023-N3, Class A, 6.41%, 9/10/27 (144A) | 2,999,462 |
The accompanying notes are an integral part of these financial statements.
32Pioneer Multi-Asset Ultrashort Income Fund | Semiannual Report | 9/30/23
Principal
Amount
USD ($) | | | | | | Value |
| | Asset Backed Securities — (continued) | |
| 7,415,031(c) | Cascade Funding Mortgage Trust, Series 2021-HB6, Class A, 0.898%, 6/25/36 (144A) | $ 7,183,429 |
| 4(c) | Centex Home Equity Loan Trust, Series 2003-A, Class AF6, 3.654%, 3/25/33 | 4 |
| 887,014(a) | Cerberus Loan Funding XXVIII LP, Series 2020-1A, Class A, 7.42% (3 Month Term SOFR + 211 bps), 10/15/31 (144A) | 884,334 |
| 3,300,000(c) | CFMT LLC, Series 2021-HB5, Class M3, 2.91%, 2/25/31 (144A) | 3,054,201 |
| 6,201,054(c) | CFMT LLC, Series 2021-HB7, Class A, 1.151%, 10/27/31 (144A) | 5,915,299 |
| 9,000,000(c) | CFMT LLC, Series 2021-HB7, Class M2, 2.679%, 10/27/31 (144A) | 8,254,125 |
| 6,450,000(c) | CFMT LLC, Series 2021-HB7, Class M4, 5.072%, 10/27/31 (144A) | 5,807,310 |
| 6,610,328(c) | CFMT LLC, Series 2023-HB12, Class A, 4.25%, 4/25/33 (144A) | 6,327,460 |
| 1,242,285(a) | Chesapeake Funding II LLC, Series 2020-1A, Class A2, 6.078% (SOFR30A + 76 bps), 8/15/32 (144A) | 1,242,277 |
| 3,799,441(a) | Chesapeake Funding II LLC, Series 2023-1A, Class A2, 6.563% (SOFR30A + 125 bps), 5/15/35 (144A) | 3,806,684 |
| 6,500,000(a) | Chesapeake Funding II LLC, Series 2023-2A, Class A2, 6.40% (SOFR30A + 115 bps), 10/15/35 (144A) | 6,507,150 |
| 1,500,000(a) | Churchill Middle Market CLO III, Ltd., Series 2021-1A, Class C, 8.207% (3 Month Term SOFR + 286 bps), 10/24/33 (144A) | 1,387,830 |
| 5,000,000(a) | Churchill Middle Market CLO III, Ltd., Series 2021-1A, Class E, 13.767% (3 Month Term SOFR + 842 bps), 10/24/33 (144A) | 4,437,795 |
| 4,200,000(a) | CIFC Funding, Ltd., Series 2021-7A, Class X, 6.507% (3 Month Term SOFR + 116 bps), 1/23/35 (144A) | 4,197,715 |
| 4,654,864(a) | College Ave Student Loans LLC, Series 2019-A, Class A1, 6.834% (1 Month Term SOFR + 151 bps), 12/28/48 (144A) | 4,634,668 |
| 2,625,912 | Commercial Equipment Finance LLC, Series 2021-A, Class A, 2.05%, 2/16/27 (144A) | 2,551,091 |
| 299,690 | Commonbond Student Loan Trust, Series 2016-B, Class A1, 2.73%, 10/25/40 (144A) | 282,844 |
| 75,149(a) | Commonbond Student Loan Trust, Series 2016-B, Class A2, 6.884% (1 Month Term SOFR + 156 bps), 10/25/40 (144A) | 74,477 |
The accompanying notes are an integral part of these financial statements.
Pioneer Multi-Asset Ultrashort Income Fund | Semiannual Report | 9/30/2333
Schedule of Investments | 9/30/23
(unaudited) (continued)
Principal
Amount
USD ($) | | | | | | Value |
| | Asset Backed Securities — (continued) | |
| 783,116(a) | Commonbond Student Loan Trust, Series 2017-AGS, Class A2, 6.284% (1 Month Term SOFR + 96 bps), 5/25/41 (144A) | $ 768,883 |
| 1,084,876(a) | Commonbond Student Loan Trust, Series 2017-BGS, Class A2, 6.084% (1 Month Term SOFR + 76 bps), 9/25/42 (144A) | 1,056,593 |
| 70,511 | Commonbond Student Loan Trust, Series 2017-BGS, Class C, 4.44%, 9/25/42 (144A) | 56,920 |
| 825,592(a) | Commonbond Student Loan Trust, Series 2018-AGS, Class A2, 5.934% (1 Month Term SOFR + 61 bps), 2/25/44 (144A) | 804,133 |
| 1,644,219(a) | Commonbond Student Loan Trust, Series 2018-BGS, Class A2, 6.004% (1 Month Term SOFR + 68 bps), 9/25/45 (144A) | 1,605,220 |
| 782,180(a) | Commonbond Student Loan Trust, Series 2018-CGS, Class A2, 6.234% (1 Month Term SOFR + 91 bps), 2/25/46 (144A) | 767,775 |
| 1,395,085(a) | Commonbond Student Loan Trust, Series 2019-AGS, Class A2, 6.334% (1 Month Term SOFR + 101 bps), 1/25/47 (144A) | 1,370,370 |
| 1,110,283 | Conn's Receivables Funding LLC, Series 2021-A, Class C, 4.59%, 5/15/26 (144A) | 1,107,693 |
| 2,658,341 | Conn's Receivables Funding LLC, Series 2023-A, Class A, 8.01%, 1/17/28 (144A) | 2,661,871 |
| 4,181,747 | Continental Credit Card ABS LLC, Series 2019-1A, Class B, 4.95%, 8/15/26 (144A) | 4,143,325 |
| 4,398,000 | Continental Credit Card ABS LLC, Series 2019-1A, Class C, 6.16%, 8/15/26 (144A) | 4,238,820 |
| 518,466 | Credito Real USA Auto Receivables Trust, Series 2021-1A, Class A, 1.35%, 2/16/27 (144A) | 514,124 |
| 7,870,000 | Credito Real USA Auto Receivables Trust, Series 2021-1A, Class B, 2.87%, 2/16/27 (144A) | 7,640,590 |
| 500,000 | Crossroads Asset Trust, Series 2021-A, Class D, 2.52%, 1/20/26 (144A) | 483,967 |
| 78 | Delta Funding Home Equity Loan Trust, Series 1997-2, Class A6, 7.04%, 6/25/27 | 36 |
| 2,500,000 | Dext ABS LLC, Series 2021-1, Class B, 1.76%, 2/15/28 (144A) | 2,302,231 |
| 3,127,257 | Dext ABS LLC, Series 2023-1, Class A1, 5.68%, 4/15/24 (144A) | 3,124,621 |
| 2,000,000 | Dext ABS LLC, Series 2023-1, Class A2, 5.99%, 3/15/32 (144A) | 1,969,186 |
The accompanying notes are an integral part of these financial statements.
34Pioneer Multi-Asset Ultrashort Income Fund | Semiannual Report | 9/30/23
Principal
Amount
USD ($) | | | | | | Value |
| | Asset Backed Securities — (continued) | |
| 2,302,538(a) | Donlen Fleet Lease Funding 2 LLC, Series 2021-2, Class A1, 5.757% (1 Month USD LIBOR + 33 bps), 12/11/34 (144A) | $ 2,298,803 |
| 4,900,000(a) | Ellington CLO III, Ltd., Series 2018-3A, Class B, 7.588% (3 Month Term SOFR + 226 bps), 7/20/30 (144A) | 4,806,822 |
| 6,500,000(a) | Ellington CLO III, Ltd., Series 2018-3A, Class C, 7.838% (3 Month Term SOFR + 251 bps), 7/20/30 (144A) | 6,463,853 |
| 858,187(a) | Ellington CLO IV, Ltd., Series 2019-4A, Class AR, 7.15% (3 Month Term SOFR + 184 bps), 4/15/29 (144A) | 857,829 |
| 7,000,000(a) | Ellington CLO IV, Ltd., Series 2019-4A, Class BR, 7.57% (3 Month Term SOFR + 226 bps), 4/15/29 (144A) | 6,958,588 |
| 3,362,500(a) | Ellington CLO IV, Ltd., Series 2019-4A, Class CR, 8.32% (3 Month Term SOFR + 301 bps), 4/15/29 (144A) | 3,346,733 |
| 500,000(a) | Elmwood CLO IV, Ltd., Series 2020-1A, Class X, 6.27% (3 Month Term SOFR + 96 bps), 4/15/33 (144A) | 499,975 |
| 6,486,467 | Exeter Automobile Receivables Trust, Series 2020-2A, Class D, 4.73%, 4/15/26 (144A) | 6,450,821 |
| 2,500,000 | Exeter Automobile Receivables Trust, Series 2023-1A, Class A3, 5.58%, 4/15/26 | 2,492,550 |
| 1,723,539 | Exeter Automobile Receivables Trust, Series 2023-2A, Class A2, 5.87%, 11/17/25 | 1,722,565 |
| 1,209,014 | FCI Funding LLC, Series 2021-1A, Class A, 1.13%, 4/15/33 (144A) | 1,173,276 |
| 906,760 | FCI Funding LLC, Series 2021-1A, Class B, 1.53%, 4/15/33 (144A) | 876,003 |
| 2,429,118 | FHF Trust, Series 2021-1A, Class A, 1.27%, 3/15/27 (144A) | 2,346,907 |
| 1,442,193 | FHF Trust, Series 2021-2A, Class A, 0.83%, 12/15/26 (144A) | 1,382,266 |
| 6,238,037 | FHF Trust, Series 2023-1A, Class A2, 6.57%, 6/15/28 (144A) | 6,172,572 |
| 3,621,224 | First Investors Auto Owner Trust, Series 2022-2A, Class A, 6.26%, 7/15/27 (144A) | 3,626,015 |
| 5,873,443 | Flagship Credit Auto Trust, Series 2023-1, Class A2, 5.38%, 12/15/26 (144A) | 5,844,351 |
| 2,923,425(a) | Ford Credit Auto Owner Trust, Series 2023-A, Class A2B, 6.033% (SOFR30A + 72 bps), 3/15/26 | 2,927,588 |
The accompanying notes are an integral part of these financial statements.
Pioneer Multi-Asset Ultrashort Income Fund | Semiannual Report | 9/30/2335
Schedule of Investments | 9/30/23
(unaudited) (continued)
Principal
Amount
USD ($) | | | | | | Value |
| | Asset Backed Securities — (continued) | |
| 4,100,000(a) | Ford Credit Floorplan Master Owner Trust, Series 2023-1, Class A2, 6.563% (SOFR30A + 125 bps), 5/15/28 (144A) | $ 4,127,051 |
| 1,000,000 | Ford Credit Floorplan Master Owner Trust, Series 2023-1, Class B, 5.31%, 5/15/28 (144A) | 982,618 |
| 5,000,000(a) | Fort Washington CLO, Series 2019-1A, Class AR, 6.718% (3 Month Term SOFR + 139 bps), 10/20/32 (144A) | 4,974,495 |
| 8,250,000(a) | Fortress Credit Opportunities IX CLO, Ltd., Series 2017-9A, Class A1TR, 7.12% (3 Month Term SOFR + 181 bps), 10/15/33 (144A) | 8,067,073 |
| 1,844,476(a) | Fortress Credit Opportunities VI CLO, Ltd., Series 2015-6A, Class A1TR, 6.903% (3 Month Term SOFR + 162 bps), 7/10/30 (144A) | 1,833,736 |
| 5,429,490(a) | Fortress Credit Opportunities XVII CLO, Ltd., Series 2022-17A, Class A, 6.678% (3 Month Term SOFR + 137 bps), 1/15/30 (144A) | 5,411,295 |
| 7,000,000(a) | Fortress Credit Opportunities XVII CLO, Ltd., Series 2022-17A, Class C, 7.958% (3 Month Term SOFR + 265 bps), 1/15/30 (144A) | 6,761,524 |
| 4,163,298 | Foundation Finance Trust, Series 2021-1A, Class A, 1.27%, 5/15/41 (144A) | 3,671,053 |
| 2,480,505 | Foundation Finance Trust, Series 2021-2A, Class A, 2.19%, 1/15/42 (144A) | 2,209,384 |
| 2,656,408 | Foursight Capital Automobile Receivables Trust, Series 2023-1, Class A2, 5.43%, 10/15/26 (144A) | 2,643,099 |
| 593,395 | Freed ABS Trust, Series 2021-1CP, Class C, 2.83%, 3/20/28 (144A) | 587,243 |
| 1,000,000 | Freed ABS Trust, Series 2021-3FP, Class D, 2.37%, 11/20/28 (144A) | 944,140 |
| 153,433 | Freed ABS Trust, Series 2022-3FP, Class B, 5.79%, 8/20/29 (144A) | 153,158 |
| 7,690,000(a) | FS Rialto, Series 2021-FL3, Class A, 6.695% (1 Month Term SOFR + 136 bps), 11/16/36 (144A) | 7,547,193 |
| 12,000,000 | Genesis Sales Finance Master Trust, Series 2021-AA, Class A, 1.20%, 12/21/26 (144A) | 11,394,857 |
| 1,000,000 | Genesis Sales Finance Master Trust, Series 2021-AA, Class D, 2.09%, 12/21/26 (144A) | 881,679 |
| 858,051 | GLS Auto Receivables Issuer Trust, Series 2020-2A, Class C, 4.57%, 4/15/26 (144A) | 851,490 |
| 2,100,000 | GLS Auto Receivables Issuer Trust, Series 2022-3A, Class D, 6.42%, 6/15/28 (144A) | 2,073,544 |
| 9,439,396 | GLS Auto Receivables Issuer Trust, Series 2023-1A, Class A2, 5.98%, 8/17/26 (144A) | 9,431,820 |
The accompanying notes are an integral part of these financial statements.
36Pioneer Multi-Asset Ultrashort Income Fund | Semiannual Report | 9/30/23
Principal
Amount
USD ($) | | | | | | Value |
| | Asset Backed Securities — (continued) | |
| 2,695,000 | GLS Auto Receivables Issuer Trust, Series 2023-1A, Class D, 7.01%, 1/16/29 (144A) | $ 2,704,379 |
| 7,600,000 | GLS Auto Receivables Issuer Trust, Series 2023-2A, Class A2, 5.70%, 1/15/27 (144A) | 7,570,952 |
| 5,000,000 | GLS Auto Select Receivables Trust, Series 2023-1A, Class A2, 6.27%, 8/16/27 (144A) | 4,987,807 |
| 5,500,000(a) | GMF Floorplan Owner Revolving Trust, Series 2023-1, Class A2, 6.463% (SOFR30A + 115 bps), 6/15/28 (144A) | 5,516,571 |
| 86,096 | Gold Key Resorts LLC, Series 2014-A, Class B, 3.72%, 3/17/31 (144A) | 85,597 |
| 500,000(a) | Goldentree Loan Management US CLO 1, Ltd., Series 2017-1A, Class ER2, 12.088% (3 Month Term SOFR + 676 bps), 4/20/34 (144A) | 484,791 |
| 5,414,426(a) | Golub Capital Partners CLO 24M-R, Ltd., Series 2015-24A, Class AR, 7.231% (3 Month Term SOFR + 186 bps), 11/5/29 (144A) | 5,394,805 |
| 7,072,570(a) | Golub Capital Partners CLO 25M, Ltd., Series 2015-25A, Class AR, 7.011% (3 Month Term SOFR + 164 bps), 5/5/30 (144A) | 7,049,980 |
| 8,398,058 | Golub Capital Partners CLO 31M, Ltd., 7.051%, 8/5/30 | 8,307,620 |
| 9,262,646(a) | Golub Capital Partners CLO 34M, Ltd., Series 2017-34A, Class AR, 7.331% (3 Month Term SOFR + 196 bps), 3/14/31 (144A) | 9,234,219 |
| 5,000,000(a) | Golub Capital Partners CLO 46M, Ltd., Series 2019-46A, Class A1A, 7.388% (3 Month Term SOFR + 206 bps), 4/20/32 (144A) | 5,001,400 |
| 12,774,414(a) | Golub Capital Partners TALF LLC, Series 2020-1A, Class A, 7.538% (3 Month Term SOFR + 221 bps), 10/20/29 (144A) | 12,739,770 |
| 9,643,737(a) | Gracie Point International Funding, Series 2022-1A, Class A, 7.562% (SOFR30A + 225 bps), 4/1/24 (144A) | 9,674,771 |
| 1,405,000(a) | Gracie Point International Funding, Series 2022-1A, Class D, 9.812% (SOFR30A + 450 bps), 4/1/24 (144A) | 1,413,654 |
| 3,486,421(a) | Gracie Point International Funding, Series 2022-2A, Class A, 8.067% (SOFR30A + 275 bps), 7/1/24 (144A) | 3,503,013 |
| 500,000(a) | Gracie Point International Funding, Series 2022-2A, Class D, 10.817% (SOFR30A + 550 bps), 7/1/24 (144A) | 505,449 |
The accompanying notes are an integral part of these financial statements.
Pioneer Multi-Asset Ultrashort Income Fund | Semiannual Report | 9/30/2337
Schedule of Investments | 9/30/23
(unaudited) (continued)
Principal
Amount
USD ($) | | | | | | Value |
| | Asset Backed Securities — (continued) | |
| 2,500,000(a) | Gracie Point International Funding, Series 2022-2A, Class E, 12.317% (SOFR30A + 700 bps), 7/1/24 (144A) | $ 2,518,008 |
| 3,863,468(a) | Gracie Point International Funding, Series 2022-3A, Class A, 8.562% (SOFR30A + 325 bps), 11/1/24 (144A) | 3,869,938 |
| 3,000,000(a) | Gracie Point International Funding, Series 2022-3A, Class C, 9.812% (SOFR30A + 450 bps), 11/1/24 (144A) | 3,002,713 |
| 1,000,000(a) | Gracie Point International Funding, Series 2022-3A, Class D, 11.062% (SOFR30A + 575 bps), 11/1/24 (144A) | 1,000,674 |
| 6,000,000(a) | Gracie Point International Funding, Series 2023-1A, Class A, 7.174% (SOFR90A + 195 bps), 9/1/26 (144A) | 6,010,704 |
| 5,163,000(a) | Gracie Point International Funding, Series 2023-1A, Class C, 8.324% (SOFR90A + 310 bps), 9/1/26 (144A) | 5,162,814 |
| 3,163,000(a) | Gracie Point International Funding, Series 2023-1A, Class D, 9.723% (SOFR90A + 450 bps), 9/1/26 (144A) | 3,162,844 |
| 2,933,333(a) | Great Lakes CLO VI LLC, Series 2021-6A, Class AX, 6.77% (3 Month Term SOFR + 146 bps), 1/15/34 (144A) | 2,904,956 |
| 2,556,856(a) | HGI CRE CLO, Ltd., Series 2021-FL2, Class A, 6.445% (1 Month Term SOFR + 111 bps), 9/17/36 (144A) | 2,499,304 |
| 5,194,000 | HOA Funding LLC - HOA, Series 2021-1A, Class A2, 4.723%, 8/20/51 (144A) | 4,253,419 |
| 2,050,000 | HOA Funding LLC - HOA, Series 2021-1A, Class B, 7.432%, 8/20/51 (144A) | 1,576,423 |
| 4,000,000(a) | ICG US CLO, Ltd., Series 2017-1A, Class ERR, 12.987% (3 Month Term SOFR + 762 bps), 7/28/34 (144A) | 3,190,864 |
| 2,812,500(a) | Ivy Hill Middle Market Credit Fund IX, Ltd., Series 9A, Class XRR, 6.546% (3 Month Term SOFR + 120 bps), 4/23/34 (144A) | 2,805,337 |
| 7,000,000(a) | Ivy Hill Middle Market Credit Fund XII, Ltd., Series 12A, Class A1TR, 7.188% (3 Month Term SOFR + 186 bps), 7/20/33 (144A) | 6,867,966 |
| 10,303,843(a) | JP Morgan Mortgage Trust, Series 2023-HE1, Class A1, 7.064% (SOFR30A + 175 bps), 11/25/53 (144A) | 10,329,603 |
| 25,297 | JPMorgan Chase Bank N.A. - CACLN, Series 2020-2, Class B, 0.84%, 2/25/28 (144A) | 25,053 |
The accompanying notes are an integral part of these financial statements.
38Pioneer Multi-Asset Ultrashort Income Fund | Semiannual Report | 9/30/23
Principal
Amount
USD ($) | | | | | | Value |
| | Asset Backed Securities — (continued) | |
| 1,503,534 | JPMorgan Chase Bank N.A. - CACLN, Series 2021-1, Class B, 0.875%, 9/25/28 (144A) | $ 1,466,896 |
| 345,479 | JPMorgan Chase Bank N.A. - CACLN, Series 2021-1, Class C, 1.024%, 9/25/28 (144A) | 337,003 |
| 334,119 | JPMorgan Chase Bank N.A. - CACLN, Series 2021-1, Class D, 1.174%, 9/25/28 (144A) | 325,791 |
| 4,000,000 | JPMorgan Chase Bank N.A. - CACLN, Series 2021-1, Class F, 4.28%, 9/25/28 (144A) | 3,791,737 |
| 1,903,455 | JPMorgan Chase Bank N.A. - CACLN, Series 2021-2, Class B, 0.889%, 12/26/28 (144A) | 1,848,444 |
| 171,311 | JPMorgan Chase Bank N.A. - CACLN, Series 2021-2, Class C, 0.969%, 12/26/28 (144A) | 166,359 |
| 338,392 | JPMorgan Chase Bank N.A. - CACLN, Series 2021-2, Class D, 1.138%, 12/26/28 (144A) | 328,306 |
| 495,887 | JPMorgan Chase Bank N.A. - CACLN, Series 2021-3, Class B, 0.76%, 2/26/29 (144A) | 474,182 |
| 11,300,000 | Kubota Credit Owner Trust, Series 2023-1A, Class A2, 5.40%, 2/17/26 (144A) | 11,239,824 |
| 4,152,521 | LAD Auto Receivables Trust, Series 2023-1A, Class A2, 5.68%, 10/15/26 (144A) | 4,142,215 |
| 1,448,558(a) | Laurel Road Prime Student Loan Trust, Series 2017-C, Class A1, 5.984% (1 Month Term SOFR + 66 bps), 11/25/42 (144A) | 1,440,669 |
| 50,000(a) | LCM 28, Ltd., Series 28A, Class X, 6.488% (3 Month Term SOFR + 116 bps), 10/20/30 (144A) | 49,998 |
| 7,409,544(a) | LCM XVIII LP, Series 18A, Class A1R, 6.608% (3 Month Term SOFR + 128 bps), 4/20/31 (144A) | 7,382,099 |
| 8,974,189 | Lendingpoint Asset Securitization Trust, Series 2022-C, Class A, 6.56%, 2/15/30 (144A) | 8,961,718 |
| 9,000,000 | LendingPoint Asset Securitization Trust, Series 2020-REV1, Class B, 4.494%, 10/15/28 (144A) | 8,922,992 |
| 839,052 | LendingPoint Pass-Through Trust Series, Series 2022-ST1, Class A, 2.50%, 3/15/28 (144A) | 818,728 |
| 2,798,397 | LFS LLC, Series 2021-A, Class A, 2.46%, 4/15/33 (144A) | 2,688,739 |
| 6,952,246 | LFS LLC, Series 2023-A, Class A, 7.173%, 7/15/35 (144A) | 6,899,857 |
| 4,078,176 | Libra Solutions LLC, Series 2022-1A, Class A, 4.75%, 5/15/34 (144A) | 4,038,480 |
| 8,778,892 | Libra Solutions LLC, Series 2023-1A, Class A, 7.00%, 2/15/35 (144A) | 8,734,790 |
| 3,950,501 | Libra Solutions LLC, Series 2023-1A, Class B, 10.25%, 2/15/35 (144A) | 3,946,551 |
The accompanying notes are an integral part of these financial statements.
Pioneer Multi-Asset Ultrashort Income Fund | Semiannual Report | 9/30/2339
Schedule of Investments | 9/30/23
(unaudited) (continued)
Principal
Amount
USD ($) | | | | | | Value |
| | Asset Backed Securities — (continued) | |
| 6,572,228 | Lobel Automobile Receivables Trust, Series 2023-1, Class A, 6.97%, 7/15/26 (144A) | $ 6,572,571 |
| 1,404,901 | Lunar Structured Aircraft Portfolio Notes, Series 2021-1, Class A, 2.636%, 10/15/46 (144A) | 1,204,351 |
| 944,949(a) | Madison Park Funding XXX LTD, Series 2018-30A, Class A, 6.32% (3 Month Term SOFR + 101 bps), 4/15/29 (144A) | 940,110 |
| 4,942,417(a) | Magnetite VII, Ltd., Series 2012-7A, Class A1R2, 6.37% (3 Month Term SOFR + 106 bps), 1/15/28 (144A) | 4,925,435 |
| 1,105,445 | Marlette Funding Trust, Series 2022-3A, Class A, 5.18%, 11/15/32 (144A) | 1,101,028 |
| 16,243,219 | Marlette Funding Trust, Series 2023-2A, Class A, 6.04%, 6/15/33 (144A) | 16,188,653 |
| 4,294,302 | Marlette Funding Trust, Series 2023-3A, Class A, 6.49%, 9/15/33 (144A) | 4,294,927 |
| 2,000,000(a) | MCF CLO IX, Ltd., Series 2019-1A, Class A2R, 7.058% (3 Month Term SOFR + 175 bps), 7/17/31 (144A) | 1,936,570 |
| 6,930,000(a) | MCF CLO IX, Ltd., Series 2019-1A, Class CR, 8.008% (3 Month Term SOFR + 270 bps), 7/17/31 (144A) | 6,681,054 |
| 2,500,000(a) | MCF CLO VII LLC, Series 2017-3A, Class ER, 14.738% (3 Month Term SOFR + 941 bps), 7/20/33 (144A) | 2,374,395 |
| 4,621,866(a) | MCF CLO VIII, Ltd., Series 2018-1A, Class A2AR, 7.972% (3 Month Term SOFR + 266 bps), 7/18/30 (144A) | 4,616,611 |
| 10,000,000 | Mercury Financial Credit Card Master Trust, Series 2022-1A, Class A, 2.50%, 9/21/26 (144A) | 9,572,461 |
| 7,000,000 | Mercury Financial Credit Card Master Trust, Series 2022-1A, Class B, 3.20%, 9/21/26 (144A) | 6,707,229 |
| 3,000,000 | Mercury Financial Credit Card Master Trust, Series 2022-2A, Class C, 10.83%, 3/22/27 (144A) | 2,938,423 |
| 12,000,000 | Mercury Financial Credit Card Master Trust, Series 2023-1A, Class A, 8.04%, 9/20/27 (144A) | 12,043,108 |
| 4,673,208(a) | MF1, Ltd., Series 2020-FL4, Class A, 7.147% (1 Month Term SOFR + 181 bps), 11/15/35 (144A) | 4,663,776 |
| 9,000,000(a) | MF1, Ltd., Series 2021-FL6, Class E, 8.395% (1 Month Term SOFR + 306 bps), 7/16/36 (144A) | 8,239,018 |
| 2,300,000(a) | MF1, Ltd., Series 2021-FL7, Class D, 7.995% (1 Month Term SOFR + 266 bps), 10/16/36 (144A) | 2,206,629 |
| 3,300,000(a) | MF1, Ltd., Series 2021-FL7, Class E, 8.245% (1 Month Term SOFR + 291 bps), 10/16/36 (144A) | 3,114,751 |
| 9,500,000 | Mission Lane Credit Card Master Trust, Series 2023-A, Class A, 7.23%, 7/17/28 (144A) | 9,420,785 |
The accompanying notes are an integral part of these financial statements.
40Pioneer Multi-Asset Ultrashort Income Fund | Semiannual Report | 9/30/23
Principal
Amount
USD ($) | | | | | | Value |
| | Asset Backed Securities — (continued) | |
| 2,500,000 | Mission Lane Credit Card Master Trust, Series 2023-A, Class C, 10.03%, 7/17/28 (144A) | $ 2,500,198 |
| 7,590,000(d) | Mission Lane Credit Card Master Trust, Series 2023-B, Class A, 7.79%, 11/15/28 (144A) | 7,588,916 |
| 6,175,480(a) | MJX Venture Management II LLC, Series 2014-18RR, Class A, 6.79% (3 Month USD LIBOR + 122 bps), 10/16/29 (144A) | 6,167,613 |
| 1,100,000(a) | Monroe Capital MML CLO VII, Ltd., Series 2018-2A, Class D, 9.695% (3 Month Term SOFR + 431 bps), 11/22/30 (144A) | 1,029,603 |
| 102,289(a) | Morgan Stanley Home Equity Loan Trust, Series 2006-2, Class A4, 5.994% (1 Month Term SOFR + 67 bps), 2/25/36 | 100,396 |
| 1,000,000(a) | Mountain View CLO XVII, Ltd., Series 2023-1A, Class X, 7.13% (3 Month Term SOFR + 170 bps), 9/14/36 (144A) | 999,818 |
| 1,710,562 | MVW LLC, Series 2021-1WA, Class A, 1.14%, 1/22/41 (144A) | 1,552,868 |
| 819,925 | MVW Owner Trust, Series 2019-1A, Class A, 2.89%, 11/20/36 (144A) | 785,103 |
| 1,205,689(a) | National Collegiate Trust, Series 2007-A, Class A, 5.729% (1 Month USD LIBOR + 30 bps), 5/25/31 (144A) | 1,167,552 |
| 751,656 | Navient Private Education Refi Loan Trust, Series 2021-CA, Class A, 1.06%, 10/15/69 (144A) | 638,525 |
| 3,261,034(a) | Navient Student Loan Trust, Series 2021-1A, Class A1B, 6.029% (SOFR30A + 71 bps), 12/26/69 (144A) | 3,222,438 |
| 3,798,239(a) | Nelnet Student Loan Trust, Series 2005-2, Class A5, 5.603% (SOFR90A + 36 bps), 3/23/37 | 3,720,945 |
| 871,217 | Nelnet Student Loan Trust, Series 2021-A, Class APT2, 1.36%, 4/20/62 (144A) | 776,502 |
| 4,460,937(a) | Nelnet Student Loan Trust, Series 2021-DA, Class AFL, 6.129% (1 Month Term SOFR + 80 bps), 4/20/62 (144A) | 4,389,618 |
| 2,750,000(a) | Neuberger Berman CLO XXI, Ltd., Series 2016-21A, Class XR2, 6.488% (3 Month Term SOFR + 116 bps), 4/20/34 (144A) | 2,748,782 |
| 1,660,055(a) | Newtek Small Business Loan Trust, Series 2018-1, Class A, 7.95% (PRIME - 55 bps), 2/25/44 (144A) | 1,644,380 |
| 1,660,055(a) | Newtek Small Business Loan Trust, Series 2018-1, Class B, 9.25% (PRIME + 75 bps), 2/25/44 (144A) | 1,648,303 |
| 3,698,458(a) | Newtek Small Business Loan Trust, Series 2019-1, Class A, 7.60% (PRIME - 90 bps), 12/25/44 (144A) | 3,653,518 |
The accompanying notes are an integral part of these financial statements.
Pioneer Multi-Asset Ultrashort Income Fund | Semiannual Report | 9/30/2341
Schedule of Investments | 9/30/23
(unaudited) (continued)
Principal
Amount
USD ($) | | | | | | Value |
| | Asset Backed Securities — (continued) | |
| 789,004(a) | Newtek Small Business Loan Trust, Series 2019-1, Class B, 8.75% (PRIME + 25 bps), 12/25/44 (144A) | $ 776,384 |
| 3,170,923(a) | Newtek Small Business Loan Trust, Series 2021-1, Class A, 8.25% (PRIME - 25 bps), 12/25/48 (144A) | 3,112,889 |
| 4,245,935(a) | Newtek Small Business Loan Trust, Series 2023-1, Class A, 8.00% (PRIME - 50 bps), 7/25/50 (144A) | 4,235,530 |
| 244,006 | NMEF Funding LLC, Series 2021-A, Class B, 1.85%, 12/15/27 (144A) | 240,228 |
| 3,807,000 | NMEF Funding LLC, Series 2021-A, Class D, 5.78%, 12/15/27 (144A) | 3,711,814 |
| 7,000,000 | NMEF Funding LLC, Series 2023-A, Class A2, 6.57%, 6/17/30 (144A) | 7,002,227 |
| 86,148(a) | NovaStar Mortgage Funding Trust Series, Series 2003-1, Class A2, 6.214% (1 Month Term SOFR + 89 bps), 5/25/33 | 82,977 |
| 2,466,230 | Oasis Securitization Funding LLC, Series 2021-2A, Class A, 2.143%, 10/15/33 (144A) | 2,457,691 |
| 1,214,860 | Oasis Securitization Funding LLC, Series 2021-2A, Class B, 5.147%, 10/15/33 (144A) | 1,211,199 |
| 1,500,000(a) | Ocean Trails CLO XII, Ltd., Series 2022-12A, Class E, 13.436% (3 Month Term SOFR + 811 bps), 7/20/35 (144A) | 1,380,492 |
| 1,828,790 | Octane Receivables Trust, Series 2021-1A, Class A, 0.93%, 3/22/27 (144A) | 1,790,667 |
| 2,750,000 | Octane Receivables Trust, Series 2021-1A, Class C, 2.23%, 11/20/28 (144A) | 2,540,191 |
| 395,527 | Octane Receivables Trust, Series 2021-2A, Class A, 1.21%, 9/20/28 (144A) | 382,631 |
| 49,642 | Octane Receivables Trust, Series 2022-1A, Class A2, 4.18%, 3/20/28 (144A) | 48,899 |
| 2,813,000 | Octane Receivables Trust, Series 2022-1A, Class D, 5.54%, 2/20/29 (144A) | 2,672,360 |
| 3,363,939 | Octane Receivables Trust, Series 2023-1A, Class A, 5.87%, 5/21/29 (144A) | 3,350,593 |
| 10,326,000 | Octane Receivables Trust, Series 2023-2A, Class A2, 5.88%, 6/20/31 (144A) | 10,287,132 |
| 8,000,000 | Octane Receivables Trust, Series 2023-3A, Class A2, 6.44%, 3/20/29 (144A) | 7,995,128 |
| 1,290,104 | Oportun Funding LLC, Series 2022-1, Class A, 3.25%, 6/15/29 (144A) | 1,278,040 |
| 3,886,057 | Oportun Funding XIV LLC, Series 2021-A, Class B, 1.76%, 3/8/28 (144A) | 3,720,707 |
| 1,943,029 | Oportun Funding XIV LLC, Series 2021-A, Class D, 5.40%, 3/8/28 (144A) | 1,882,399 |
The accompanying notes are an integral part of these financial statements.
42Pioneer Multi-Asset Ultrashort Income Fund | Semiannual Report | 9/30/23
Principal
Amount
USD ($) | | | | | | Value |
| | Asset Backed Securities — (continued) | |
| 10,000,000 | Oportun Issuance Trust, Series 2021-C, Class A, 2.18%, 10/8/31 (144A) | $ 9,094,399 |
| 433,026 | Oscar US Funding X LLC, Series 2019-1A, Class A4, 3.27%, 5/10/26 (144A) | 431,431 |
| 4,000,000(a) | OSD CLO, Ltd., Series 2021-23A, Class D, 8.52% (3 Month Term SOFR + 321 bps), 4/17/31 (144A) | 3,869,928 |
| 5,000,000(a) | Owl Rock CLO I, Ltd., Series 2019-1A, Class B, 8.341% (3 Month Term SOFR + 296 bps), 5/20/31 (144A) | 4,852,565 |
| 11,000,000(a) | Owl Rock CLO II, Ltd., Series 2019-2A, Class ALR, 7.138% (3 Month Term SOFR + 181 bps), 4/20/33 (144A) | 10,793,926 |
| 2,600,000(a) | Owl Rock CLO IV, Ltd., Series 2020-4A, Class A1R, 7.241% (3 Month Term SOFR + 186 bps), 8/20/33 (144A) | 2,538,648 |
| 119,936 | Pagaya AI Debt Selection Trust, Series 2021-5, Class A, 1.53%, 8/15/29 (144A) | 118,338 |
| 8,437,198 | Pagaya AI Debt Trust, Series 2022-1, Class A, 2.03%, 10/15/29 (144A) | 8,260,720 |
| 9,634,506 | Pagaya AI Debt Trust, Series 2022-5, Class A, 8.096%, 6/17/30 (144A) | 9,718,297 |
| 16,289,898 | Pagaya AI Debt Trust, Series 2023-1, Class A, 7.556%, 7/15/30 (144A) | 16,356,294 |
| 19,691,171 | Pagaya AI Debt Trust, Series 2023-3, Class A, 7.60%, 12/16/30 (144A) | 19,787,388 |
| 10,065,000 | Pagaya AI Debt Trust, Series 2023-5, Class A, 7.179%, 4/15/31 (144A) | 10,080,501 |
| 2,250,000 | Pagaya AI Debt Trust, Series 2023-5, Class B, 7.625%, 4/15/31 (144A) | 2,256,650 |
| 4,000,000(a) | Palmer Square Loan Funding, Ltd., Series 2020-4A, Class C, 9.253% (3 Month Term SOFR + 386 bps), 11/25/28 (144A) | 3,984,172 |
| 1,250,000(a) | Palmer Square Loan Funding, Ltd., Series 2021-2A, Class D, 10.641% (3 Month Term SOFR + 526 bps), 5/20/29 (144A) | 1,232,935 |
| 14,705,621(a) | Palmer Square Loan Funding, Ltd., Series 2022-1A, Class A1, 6.358% (3 Month Term SOFR + 105 bps), 4/15/30 (144A) | 14,617,020 |
| 3,250,000 | Pawneee Equipment Receivables Series LLC, Series 2021-1, Class D, 2.75%, 7/15/27 (144A) | 2,950,374 |
| 2,605,723 | PEAR LLC, Series 2021-1, Class A, 2.60%, 1/15/34 (144A) | 2,479,887 |
| 3,000,000 | PEAR LLC, Series 2021-1, Class B, 0.000%, 1/15/34 (144A) | 2,101,320 |
The accompanying notes are an integral part of these financial statements.
Pioneer Multi-Asset Ultrashort Income Fund | Semiannual Report | 9/30/2343
Schedule of Investments | 9/30/23
(unaudited) (continued)
Principal
Amount
USD ($) | | | | | | Value |
| | Asset Backed Securities — (continued) | |
| 5,271,540 | PEAR LLC, Series 2023-1, Class A, 7.42%, 7/15/35 (144A) | $ 5,238,554 |
| 2,500,000 | PFS Financing Corp., Series 2021-A, Class A, 0.71%, 4/15/26 (144A) | 2,427,626 |
| 6,500,000 | Prestige Auto Receivables Trust, Series 2023-1A, Class A2, 5.88%, 3/16/26 (144A) | 6,489,322 |
| 3,522,406(a) | Prodigy Finance CMDAC, Series 2021-1A, Class A, 6.684% (1 Month Term SOFR + 136 bps), 7/25/51 (144A) | 3,487,218 |
| 1,300,000 | Prosper Marketplace Issuance Trust, Series 2023-1A, Class A, 7.06%, 7/16/29 (144A) | 1,301,184 |
| 2,339,264 | Purchasing Power Funding LLC, Series 2021-A, Class A, 1.57%, 10/15/25 (144A) | 2,331,107 |
| 4,860,000 | Purchasing Power Funding LLC, Series 2021-A, Class C, 2.53%, 10/15/25 (144A) | 4,753,908 |
| 2,310,000 | Purchasing Power Funding LLC, Series 2021-A, Class D, 4.37%, 10/15/25 (144A) | 2,213,378 |
| 301,741(a) | RAAC Series Trust, Series 2006-RP1, Class M2, 6.634% (1 Month USD LIBOR + 120 bps), 10/25/45 (144A) | 300,879 |
| 5,751,585 | Reach ABS Trust, Series 2023-1A, Class A, 7.05%, 2/18/31 (144A) | 5,764,932 |
| 939,875 | Reach Financial LLC, Series 2022-1A, Class A, 3.76%, 11/15/29 (144A) | 931,445 |
| 4,685,077(a) | ReadyCap Lending Small Business Loan Trust, Series 2019-2, Class A, 8.00% (PRIME - 50 bps), 12/27/44 (144A) | 4,505,103 |
| 11,936,648(a) | ReadyCap Lending Small Business Loan Trust, Series 2023-3, Class A, 8.57% (PRIME + 7 bps), 4/25/48 (144A) | 11,936,248 |
| 2,191,764(a) | Regatta VI Funding, Ltd., Series 2016-1A, Class XR, 6.388% (3 Month Term SOFR + 106 bps), 4/20/34 (144A) | 2,190,933 |
| 2,911,765(a) | Regatta VII Funding, Ltd., Series 2016-1A, Class X, 6.509% (3 Month Term SOFR + 111 bps), 6/20/34 (144A) | 2,900,004 |
| 3,500,000(a) | Regatta XXIII Funding, Ltd., Series 2021-4A, Class X, 6.538% (3 Month Term SOFR + 121 bps), 1/20/35 (144A) | 3,499,825 |
| 1,110,000 | Republic Finance Issuance Trust, Series 2020-A, Class A, 2.47%, 11/20/30 (144A) | 1,079,385 |
| 1,105,755(c) | RMF Buyout Issuance Trust, Series 2021-HB1, Class A, 1.259%, 11/25/31 (144A) | 1,057,328 |
The accompanying notes are an integral part of these financial statements.
44Pioneer Multi-Asset Ultrashort Income Fund | Semiannual Report | 9/30/23
Principal
Amount
USD ($) | | | | | | Value |
| | Asset Backed Securities — (continued) | |
| 7,500,000(a) | Rosy Blue Carat SCS, Series 2018-1, Class A2R, 5.319% (1 Month Term SOFR + 411 bps), 3/15/30 (144A) | $ 7,586,250 |
| 4,696,496 | Santander Bank Auto Credit-Linked Notes, Series 2022-B, Class B, 5.721%, 8/16/32 (144A) | 4,668,091 |
| 3,287,547 | Santander Bank Auto Credit-Linked Notes, Series 2022-B, Class D, 6.793%, 8/16/32 (144A) | 3,274,436 |
| 2,728,759 | Santander Bank Auto Credit-Linked Notes Series, Series 2022-A, Class B, 5.281%, 5/15/32 (144A) | 2,695,559 |
| 1,197,530 | Santander Bank NA - SBCLN, Series 2021-1A, Class B, 1.833%, 12/15/31 (144A) | 1,167,250 |
| 630,280 | Santander Consumer Auto Receivables Trust, Series 2021-BA, Class B, 1.45%, 10/16/28 (144A) | 623,983 |
| 1,091,764 | Santander Consumer Auto Receivables Trust, Series 2021-CA, Class C, 2.97%, 6/15/28 (144A) | 1,052,795 |
| 2,500,000 | Santander Drive Auto Receivables Trust, Series 2022-2, Class B, 3.44%, 9/15/27 | 2,426,172 |
| 1,784,528 | Santander Drive Auto Receivables Trust, Series 2022-4, Class A3, 4.14%, 2/16/27 | 1,768,373 |
| 618,521 | SCF Equipment Leasing LLC, Series 2021-1A, Class A3, 0.83%, 8/21/28 (144A) | 606,660 |
| 396,880 | Sierra Timeshare Receivables Funding LLC, Series 2021-1A, Class A, 0.99%, 11/20/37 (144A) | 370,539 |
| 1,600,000(a) | Silver Rock CLO II, Ltd., Series 2021-2A, Class X, 6.638% (3 Month Term SOFR + 131 bps), 1/20/35 (144A) | 1,599,387 |
| 3,699,080(a) | SLM Private Credit Student Loan Trust, Series 2007-A, Class A4A, 5.911% (3 Month Term SOFR + 50 bps), 12/16/41 | 3,571,102 |
| 2,628,891(a) | SMB Private Education Loan Trust, Series 2018-B, Class A2B, 6.167% (1 Month Term SOFR + 83 bps), 1/15/37 (144A) | 2,597,823 |
| 5,270,931(a) | SMB Private Education Loan Trust, Series 2023-B, Class A1B, 7.113% (SOFR30A + 180 bps), 10/16/56 (144A) | 5,303,706 |
| 7,390,000(a) | SMB Private Education Loan Trust, Series 2023-C, Class A1B, 0.000% (SOFR30A + 155 bps), 11/15/52 (144A) | 7,403,091 |
| 760,038 | SoFi Consumer Loan Program Trust, Series 2023-1S, Class A, 5.81%, 5/15/31 (144A) | 758,150 |
| 3,000,000(a) | Sound Point CLO XVI, Ltd., Series 2017-2A, Class D, 9.213% (3 Month Term SOFR + 386 bps), 7/25/30 (144A) | 2,792,016 |
The accompanying notes are an integral part of these financial statements.
Pioneer Multi-Asset Ultrashort Income Fund | Semiannual Report | 9/30/2345
Schedule of Investments | 9/30/23
(unaudited) (continued)
Principal
Amount
USD ($) | | | | | | Value |
| | Asset Backed Securities — (continued) | |
| 1,853,440 | SpringCastle America Funding LLC, Series 2020-AA, Class A, 1.97%, 9/25/37 (144A) | $ 1,681,893 |
| 4,755,054(a) | STAR Trust, Series 2021-SFR2, Class A, 6.397% (1 Month Term SOFR + 106 bps), 1/17/24 (144A) | 4,635,691 |
| 6,250,000(a) | STAR Trust, Series 2021-SFR2, Class E, 7.447% (1 Month Term SOFR + 211 bps), 1/17/24 (144A) | 6,047,629 |
| 2,012,147 | Stonepeak ABS, Series 2021-1A, Class AA, 2.301%, 2/28/33 (144A) | 1,819,653 |
| 9,000,000(a) | STWD, Ltd., Series 2021-FL2, Class A, 6.645% (1 Month Term SOFR + 131 bps), 4/18/38 (144A) | 8,761,489 |
| 6,000,000(a) | STWD, Ltd., Series 2021-SIF1, Class A, 7.07% (3 Month Term SOFR + 176 bps), 4/15/32 (144A) | 5,973,306 |
| 3,320,000(a) | STWD, Ltd., Series 2021-SIF1, Class C, 7.92% (3 Month Term SOFR + 261 bps), 4/15/32 (144A) | 3,258,268 |
| 12,000,000(a) | STWD, Ltd., Series 2021-SIF2A, Class A1, 6.858% (3 Month Term SOFR + 155 bps), 1/15/33 (144A) | 11,920,776 |
| 6,000,000(a) | STWD, Ltd., Series 2021-SIF2A, Class D, 9.158% (3 Month Term SOFR + 385 bps), 1/15/33 (144A) | 5,990,090 |
| 1,986,471(a) | Symphony CLO XIX, Ltd., Series 2018-19A, Class A, 6.53% (3 Month Term SOFR + 122 bps), 4/16/31 (144A) | 1,981,720 |
| 2,750,000 | Tesla Auto Lease Trust, Series 2021-A, Class B, 1.02%, 3/20/25 (144A) | 2,729,844 |
| 319,687 | Theorem Funding Trust, Series 2022-1A, Class A, 1.85%, 2/15/28 (144A) | 316,853 |
| 3,000,000(a) | THL Credit Wind River CLO, Ltd., Series 2019-1A, Class XR, 6.538% (3 Month Term SOFR + 121 bps), 7/20/34 (144A) | 2,998,575 |
| 679,647 | Tidewater Auto Receivables Trust, Series 2018-AA, Class E, 5.48%, 10/15/26 (144A) | 678,137 |
| 2,750,000 | Tidewater Auto Receivables Trust, Series 2020-AA, Class E, 3.35%, 7/17/28 (144A) | 2,734,099 |
| 1,427,518(a) | Towd Point Asset Trust, Series 2018-SL1, Class A, 6.034% (1 Month Term SOFR + 71 bps), 1/25/46 (144A) | 1,423,141 |
| 11,000,000(a) | Towd Point Asset Trust, Series 2018-SL1, Class B, 6.484% (1 Month Term SOFR + 116 bps), 1/25/46 (144A) | 10,701,055 |
| 11,500,000(a) | Trafigura Securitisation Finance Plc, Series 2021-1A, Class A1, 5.977% (1 Month USD LIBOR + 53 bps), 1/15/25 (144A) | 11,305,949 |
| 3,250,000 | Tricolor Auto Securitization Trust, Series 2021-1A, Class E, 3.23%, 9/15/26 (144A) | 3,185,388 |
The accompanying notes are an integral part of these financial statements.
46Pioneer Multi-Asset Ultrashort Income Fund | Semiannual Report | 9/30/23
Principal
Amount
USD ($) | | | | | | Value |
| | Asset Backed Securities — (continued) | |
| 239,012 | Tricolor Auto Securitization Trust, Series 2022-1A, Class A, 3.30%, 2/18/25 (144A) | $ 238,324 |
| 5,000,000 | Tricolor Auto Securitization Trust, Series 2022-1A, Class E, 7.79%, 8/16/27 (144A) | 4,814,975 |
| 4,798,064 | Tricolor Auto Securitization Trust, Series 2023-1A, Class A, 6.48%, 8/17/26 (144A) | 4,787,558 |
| 4,018,000 | Tricon American Homes Trust, Series 2017-SFR2, Class F, 5.104%, 1/17/36 (144A) | 3,987,971 |
| 4,140,000(a) | Trinitas CLO XI, Ltd., Series 2019-11A, Class X, 6.50% (3 Month Term SOFR + 119 bps), 7/15/34 (144A) | 4,113,881 |
| 978,092 | TVEST LLC, Series 2021-A, Class A, 2.35%, 9/15/33 (144A) | 967,992 |
| 4,700,000 | United Auto Credit Securitization Trust, Series 2021-1, Class F, 4.30%, 9/10/27 (144A) | 4,600,058 |
| 2,500,000 | United Auto Credit Securitization Trust, Series 2022-2, Class B, 5.41%, 12/10/25 (144A) | 2,492,593 |
| 990,713 | United Auto Credit Securitization Trust, Series 2023-1, Class A, 5.57%, 7/10/25 (144A) | 989,212 |
| 23,169 | Upstart Pass-Through Trust Series, Series 2020-ST2, Class A, 3.50%, 3/20/28 (144A) | 22,867 |
| 444,194 | Upstart Pass-Through Trust Series, Series 2021-ST4, Class A, 2.00%, 7/20/27 (144A) | 424,831 |
| 1,901,184 | Upstart Pass-Through Trust Series, Series 2021-ST5, Class A, 2.00%, 7/20/27 (144A) | 1,818,919 |
| 3,016,649 | Upstart Pass-Through Trust Series, Series 2022-ST2, Class A, 3.80%, 4/20/30 (144A) | 2,895,038 |
| 127,758 | Upstart Securitization Trust, Series 2021-1, Class B, 1.89%, 3/20/31 (144A) | 127,374 |
| 1,234,720 | Upstart Securitization Trust, Series 2021-5, Class A, 1.31%, 11/20/31 (144A) | 1,215,943 |
| 4,900,000 | Verdant Receivables LLC, Series 2023-1A, Class A2, 6.24%, 1/13/31 (144A) | 4,874,201 |
| 2,000,000 | Veros Auto Receivables Trust, Series 2021-1, Class C, 3.64%, 8/15/28 (144A) | 1,881,950 |
| 4,971,246 | Veros Auto Receivables Trust, Series 2023-1, Class A, 7.12%, 11/15/28 (144A) | 4,979,470 |
| 3,000,000 | Veros Auto Receivables Trust, Series 2023-1, Class C, 8.32%, 11/15/28 (144A) | 2,955,588 |
| 2,135,124 | VFI ABS LLC, Series 2022-1A, Class A, 2.23%, 3/24/28 (144A) | 2,082,233 |
| 2,330,628(a) | Voya CLO, Ltd., Series 2018-1A, Class A1, 6.532% (3 Month Term SOFR + 121 bps), 4/19/31 (144A) | 2,320,996 |
| 460,234 | Westgate Resorts LLC, Series 2020-1A, Class A, 2.713%, 3/20/34 (144A) | 451,585 |
The accompanying notes are an integral part of these financial statements.
Pioneer Multi-Asset Ultrashort Income Fund | Semiannual Report | 9/30/2347
Schedule of Investments | 9/30/23
(unaudited) (continued)
Principal
Amount
USD ($) | | | | | | Value |
| | Asset Backed Securities — (continued) | |
| 552,281 | Westgate Resorts LLC, Series 2020-1A, Class C, 6.213%, 3/20/34 (144A) | $ 545,538 |
| 3,849,835 | Westgate Resorts LLC, Series 2022-1A, Class C, 2.488%, 8/20/36 (144A) | 3,616,165 |
| 4,641,109 | Westgate Resorts LLC, Series 2023-1A, Class C, 7.49%, 12/20/37 (144A) | 4,547,545 |
| 6,923,783(a) | Westlake Automobile Receivables Trust, Series 2023-1A, Class A2B, 6.163% (SOFR30A + 85 bps), 6/15/26 (144A) | 6,920,272 |
| 8,979,378(a) | Westlake Automobile Receivables Trust, Series 2023-2A, Class A2B, 6.063% (SOFR30A + 75 bps), 7/15/26 (144A) | 8,981,458 |
| 6,643,805 | Willis Engine Structured Trust VI, Series 2021-A, Class B, 5.438%, 5/15/46 (144A) | 4,906,457 |
| 4,150(a) | Wilshire Mortgage Loan Trust, Series 1997-2, Class A6, 5.714% (1 Month Term SOFR + 39 bps), 5/25/28 | 4,134 |
| 5,000,000(a) | Woodmont Trust, Series 2020-7A, Class A1A, 7.47% (3 Month Term SOFR + 216 bps), 1/15/32 (144A) | 4,971,340 |
| 11,000,000(a) | Woodmont Trust, Series 2023-12A, Class A1A, 7.62% (3 Month Term SOFR + 250 bps), 7/25/31 (144A) | 11,010,142 |
| 4,743,247(a) | World Omni Select Auto Trust, Series 2023-A, Class A2B, 6.163% (SOFR30A + 85 bps), 3/15/27 | 4,749,557 |
| 6,500,000(a) | Z Capital Credit Partners CLO, Ltd., Series 2019-1A, Class BR, 7.57% (3 Month Term SOFR + 226 bps), 7/16/31 (144A) | 6,451,497 |
| 6,000,000(a) | Z Capital Credit Partners CLO, Ltd., Series 2019-1A, Class DR, 10.57% (3 Month Term SOFR + 526 bps), 7/16/31 (144A) | 5,890,176 |
| | Total Asset Backed Securities
(Cost $1,393,268,645) | $1,369,196,723 |
|
|
| | Collateralized Mortgage
Obligations—11.9% of Net Assets | |
| 27,037(c) | Bear Stearns Mortgage Securities, Inc., Series 1997-6, Class 3B1, 4.503%, 6/25/30 | $ 26,787 |
| 7,768,220(a) | Bellemeade Re, Ltd., Series 2018-3A, Class M2, 8.184% (1 Month USD LIBOR + 275 bps), 10/25/28 (144A) | 7,806,114 |
| 3,242,547(a) | Bellemeade Re, Ltd., Series 2019-1A, Class M2, 8.134% (1 Month USD LIBOR + 270 bps), 3/25/29 (144A) | 3,264,708 |
The accompanying notes are an integral part of these financial statements.
48Pioneer Multi-Asset Ultrashort Income Fund | Semiannual Report | 9/30/23
Principal
Amount
USD ($) | | | | | | Value |
| | Collateralized Mortgage
Obligations—(continued) | |
| 2,800,000(a) | Bellemeade Re, Ltd., Series 2019-3A, Class B1, 7.934% (1 Month USD LIBOR + 250 bps), 7/25/29 (144A) | $ 2,812,617 |
| 2,527,176(a) | Bellemeade Re, Ltd., Series 2019-4A, Class M1C, 7.934% (1 Month USD LIBOR + 250 bps), 10/25/29 (144A) | 2,533,455 |
| 3,179,624(a) | Bellemeade Re, Ltd., Series 2020-3A, Class M1C, 9.134% (SOFR30A + 381 bps), 10/25/30 (144A) | 3,209,956 |
| 5,000,000(a) | Bellemeade Re, Ltd., Series 2020-4A, Class B1, 10.434% (1 Month USD LIBOR + 500 bps), 6/25/30 (144A) | 5,102,404 |
| 1,024,013(a) | Bellemeade Re, Ltd., Series 2020-4A, Class M2B, 9.034% (1 Month USD LIBOR + 360 bps), 6/25/30 (144A) | 1,030,448 |
| 2,900,000(a) | Bellemeade Re, Ltd., Series 2021-1A, Class M1B, 7.515% (SOFR30A + 220 bps), 3/25/31 (144A) | 2,908,546 |
| 415,815(a) | Bellemeade Re, Ltd., Series 2021-2A, Class M1A, 6.515% (SOFR30A + 120 bps), 6/25/31 (144A) | 414,949 |
| 6,613,208(a) | Bellemeade Re, Ltd., Series 2021-3A, Class A2, 6.315% (SOFR30A + 100 bps), 9/25/31 (144A) | 6,542,545 |
| 15,000,000(a) | Bellemeade Re, Ltd., Series 2021-3A, Class M1C, 6.865% (SOFR30A + 155 bps), 9/25/31 (144A) | 14,785,446 |
| 15,964,000(a) | Bellemeade Re, Ltd., Series 2022-1, Class M1C, 9.015% (SOFR30A + 370 bps), 1/26/32 (144A) | 16,112,772 |
| 493,185(c) | BRAVO Residential Funding Trust, Series 2021-NQM2, Class A2, 1.28%, 3/25/60 (144A) | 445,714 |
| 45,001(c) | Cascade Funding Mortgage Trust, Series 2019-RM3, Class A, 2.80%, 6/25/69 (144A) | 43,643 |
| 2,462,778(c) | CFMT LLC, Series 2022-HB8, Class A, 3.75%, 4/25/25 (144A) | 2,408,400 |
| 8,000,000(c) | CFMT LLC, Series 2022-HB8, Class M3, 3.75%, 4/25/25 (144A) | 6,725,040 |
| 7,504,051(a) | Chase Mortgage Finance Corp., Series 2021-CL1, Class M1, 6.515% (SOFR30A + 120 bps), 2/25/50 (144A) | 7,099,780 |
| 1,942,225(a) | Chase Mortgage Finance Corp., Series 2021-CL1, Class M2, 6.665% (SOFR30A + 135 bps), 2/25/50 (144A) | 1,814,917 |
| 1,118,251(a) | Chase Mortgage Finance Corp., Series 2021-CL1, Class M3, 6.865% (SOFR30A + 155 bps), 2/25/50 (144A) | 1,009,739 |
The accompanying notes are an integral part of these financial statements.
Pioneer Multi-Asset Ultrashort Income Fund | Semiannual Report | 9/30/2349
Schedule of Investments | 9/30/23
(unaudited) (continued)
Principal
Amount
USD ($) | | | | | | Value |
| | Collateralized Mortgage
Obligations—(continued) | |
| 12,412,899(a) | Connecticut Avenue Securities Trust, Series 2019-HRP1, Class M2, 7.579% (SOFR30A + 226 bps), 11/25/39 (144A) | $ 12,412,858 |
| 562,051(a) | Connecticut Avenue Securities Trust, Series 2021-R03, Class 1M1, 6.165% (SOFR30A + 85 bps), 12/25/41 (144A) | 557,506 |
| 8,797,658(a) | Connecticut Avenue Securities Trust, Series 2022-R01, Class 1M1, 6.315% (SOFR30A + 100 bps), 12/25/41 (144A) | 8,745,421 |
| 2,515,000(a) | Connecticut Avenue Securities Trust, Series 2022-R01, Class 1M2, 7.215% (SOFR30A + 190 bps), 12/25/41 (144A) | 2,467,844 |
| 5,892,367(a) | Connecticut Avenue Securities Trust, Series 2022-R02, Class 2M1, 6.515% (SOFR30A + 120 bps), 1/25/42 (144A) | 5,853,868 |
| 7,309,465(a) | Connecticut Avenue Securities Trust, Series 2022-R04, Class 1M1, 7.315% (SOFR30A + 200 bps), 3/25/42 (144A) | 7,359,632 |
| 2,825,929(a) | Connecticut Avenue Securities Trust, Series 2022-R09, Class 2M1, 7.815% (SOFR30A + 250 bps), 9/25/42 (144A) | 2,858,335 |
| 8,699,345(a) | Connecticut Avenue Securities Trust, Series 2023-R01, Class 1M1, 7.715% (SOFR30A + 240 bps), 12/25/42 (144A) | 8,846,190 |
| 4,298,674(a) | Connecticut Avenue Securities Trust, Series 2023-R02, Class 1M1, 7.615% (SOFR30A + 230 bps), 1/25/43 (144A) | 4,355,116 |
| 3,490,704(a) | Connecticut Avenue Securities Trust, Series 2023-R03, Class 2M1, 7.815% (SOFR30A + 250 bps), 4/25/43 (144A) | 3,530,942 |
| 5,376,289(a) | Connecticut Avenue Securities Trust, Series 2023-R06, Class 1M1, 7.015% (SOFR30A + 170 bps), 7/25/43 (144A) | 5,376,289 |
| 4,410,148(a) | Eagle Re, Ltd., Series 2018-1, Class M1, 7.129% (1 Month USD LIBOR + 170 bps), 11/25/28 (144A) | 4,413,538 |
| 1,779,640(a) | Eagle Re, Ltd., Series 2020-1, Class M1B, 6.884% (1 Month USD LIBOR + 145 bps), 1/25/30 (144A) | 1,778,333 |
| 3,360,000(a) | Eagle Re, Ltd., Series 2021-2, Class M1C, 8.765% (SOFR30A + 345 bps), 4/25/34 (144A) | 3,393,258 |
| 6,860,000(a)(d) | Eagle Re, Ltd., Series 2023-1, Class M1A, 7.315% (SOFR30A + 200 bps), 9/26/33 (144A) | 6,860,000 |
| 6,770,000(a)(d) | Eagle Re, Ltd., Series 2023-1, Class M1B, 9.265% (SOFR30A + 395 bps), 9/26/33 (144A) | 6,770,000 |
The accompanying notes are an integral part of these financial statements.
50Pioneer Multi-Asset Ultrashort Income Fund | Semiannual Report | 9/30/23
Principal
Amount
USD ($) | | | | | | Value |
| | Collateralized Mortgage
Obligations—(continued) | |
| 2,150,527(a) | Fannie Mae Connecticut Avenue Securities, Series 2018-C01, Class 1EB1, 5.879% (SOFR30A + 56 bps), 7/25/30 | $ 2,148,960 |
| 3,069,815(a) | Fannie Mae Connecticut Avenue Securities, Series 2018-C04, Class 2M2, 7.979% (SOFR30A + 266 bps), 12/25/30 | 3,147,347 |
| 911,682(a) | Fannie Mae Trust, Series 2003-W6, Class F, 5.779% (SOFR30A + 46 bps), 9/25/42 | 903,657 |
| 328,522(a) | Fannie Mae Trust, Series 2005-W3, Class 2AF, 5.649% (SOFR30A + 33 bps), 3/25/45 | 325,178 |
| 27,479(c) | Fannie Mae Trust, Series 2005-W3, Class 3A, 4.053%, 4/25/45 | 25,890 |
| 32,224(c) | Fannie Mae Trust, Series 2005-W4, Class 3A, 3.706%, 6/25/45 | 30,861 |
| 297,955(a) | Fannie Mae Whole Loan, Series 2007-W1, Class 1AF1, 5.689% (SOFR30A + 37 bps), 11/25/46 | 294,789 |
| 10,974(a) | Federal Home Loan Mortgage Corp. REMICs, Series 1695, Class EG, 6.478% (SOFR30A + 116 bps), 3/15/24 | 10,984 |
| 64,154(a) | Federal Home Loan Mortgage Corp. REMICs, Series 2106, Class F, 5.878% (SOFR30A + 56 bps), 12/15/28 | 63,694 |
| 34,722(a) | Federal Home Loan Mortgage Corp. REMICs, Series 2122, Class FD, 5.778% (SOFR30A + 46 bps), 2/15/29 | 34,411 |
| 6,709(a) | Federal Home Loan Mortgage Corp. REMICs, Series 2156, Class FQ, 5.778% (SOFR30A + 46 bps), 5/15/29 | 6,692 |
| 58,837(a) | Federal Home Loan Mortgage Corp. REMICs, Series 2186, Class FY, 6.028% (SOFR30A + 71 bps), 4/15/28 | 58,785 |
| 19,649(a) | Federal Home Loan Mortgage Corp. REMICs, Series 2368, Class AF, 6.378% (SOFR30A + 106 bps), 10/15/31 | 19,731 |
| 19,332(a) | Federal Home Loan Mortgage Corp. REMICs, Series 2377, Class FE, 6.028% (SOFR30A + 71 bps), 11/15/31 | 19,208 |
| 49,531(a) | Federal Home Loan Mortgage Corp. REMICs, Series 2411, Class FR, 6.028% (SOFR30A + 71 bps), 6/15/31 | 49,235 |
| 42,719(a) | Federal Home Loan Mortgage Corp. REMICs, Series 2432, Class FH, 6.128% (SOFR30A + 81 bps), 3/15/32 | 42,665 |
The accompanying notes are an integral part of these financial statements.
Pioneer Multi-Asset Ultrashort Income Fund | Semiannual Report | 9/30/2351
Schedule of Investments | 9/30/23
(unaudited) (continued)
Principal
Amount
USD ($) | | | | | | Value |
| | Collateralized Mortgage
Obligations—(continued) | |
| 112,720(a) | Federal Home Loan Mortgage Corp. REMICs, Series 2439, Class F, 6.428% (SOFR30A + 111 bps), 3/15/32 | $ 113,627 |
| 153,163(a) | Federal Home Loan Mortgage Corp. REMICs, Series 2470, Class AF, 6.428% (SOFR30A + 111 bps), 3/15/32 | 154,370 |
| 95,236(a) | Federal Home Loan Mortgage Corp. REMICs, Series 2471, Class FD, 6.428% (SOFR30A + 111 bps), 3/15/32 | 96,002 |
| 29,830(a) | Federal Home Loan Mortgage Corp. REMICs, Series 2498, Class FQ, 6.028% (SOFR30A + 71 bps), 9/15/32 | 29,608 |
| 33,812(a) | Federal Home Loan Mortgage Corp. REMICs, Series 2543, Class EF, 5.778% (SOFR30A + 46 bps), 12/15/32 | 33,445 |
| 174,652(a) | Federal Home Loan Mortgage Corp. REMICs, Series 2551, Class FD, 5.828% (SOFR30A + 51 bps), 1/15/33 | 173,201 |
| 107,998(a) | Federal Home Loan Mortgage Corp. REMICs, Series 2567, Class FJ, 5.828% (SOFR30A + 51 bps), 2/15/33 | 106,878 |
| 47,224(a) | Federal Home Loan Mortgage Corp. REMICs, Series 2577, Class FA, 5.978% (SOFR30A + 66 bps), 2/15/33 | 46,802 |
| 3,944(a) | Federal Home Loan Mortgage Corp. REMICs, Series 2585, Class FD, 5.928% (SOFR30A + 61 bps), 12/15/32 | 3,901 |
| 58,269(a) | Federal Home Loan Mortgage Corp. REMICs, Series 2614, Class FV, 6.926% (SOFR30A + 161 bps), 5/15/33 | 58,368 |
| 81,902(a) | Federal Home Loan Mortgage Corp. REMICs, Series 2631, Class FC, 5.828% (SOFR30A + 51 bps), 6/15/33 | 81,159 |
| 46,161(a) | Federal Home Loan Mortgage Corp. REMICs, Series 2711, Class FA, 6.428% (SOFR30A + 111 bps), 11/15/33 | 46,664 |
| 53,404(a) | Federal Home Loan Mortgage Corp. REMICs, Series 2916, Class NF, 5.678% (SOFR30A + 36 bps), 1/15/35 | 52,724 |
| 189,853(a) | Federal Home Loan Mortgage Corp. REMICs, Series 2976, Class LF, 5.768% (SOFR30A + 45 bps), 5/15/35 | 186,018 |
The accompanying notes are an integral part of these financial statements.
52Pioneer Multi-Asset Ultrashort Income Fund | Semiannual Report | 9/30/23
Principal
Amount
USD ($) | | | | | | Value |
| | Collateralized Mortgage
Obligations—(continued) | |
| 39,850(a) | Federal Home Loan Mortgage Corp. REMICs, Series 3012, Class FE, 5.678% (SOFR30A + 36 bps), 8/15/35 | $ 39,578 |
| 45,963(a) | Federal Home Loan Mortgage Corp. REMICs, Series 3042, Class PF, 5.678% (SOFR30A + 36 bps), 8/15/35 | 45,468 |
| 35,174(a) | Federal Home Loan Mortgage Corp. REMICs, Series 3067, Class FA, 5.778% (SOFR30A + 46 bps), 11/15/35 | 34,447 |
| 23,665(a) | Federal Home Loan Mortgage Corp. REMICs, Series 3102, Class FG, 5.728% (SOFR30A + 41 bps), 1/15/36 | 23,301 |
| 70,753(a) | Federal Home Loan Mortgage Corp. REMICs, Series 3117, Class EF, 5.778% (SOFR30A + 46 bps), 2/15/36 | 69,753 |
| 147,485(a) | Federal Home Loan Mortgage Corp. REMICs, Series 3117, Class FE, 5.728% (SOFR30A + 41 bps), 2/15/36 | 144,412 |
| 74,897(a) | Federal Home Loan Mortgage Corp. REMICs, Series 3122, Class FP, 5.728% (SOFR30A + 41 bps), 3/15/36 | 73,944 |
| 45,659(a) | Federal Home Loan Mortgage Corp. REMICs, Series 3147, Class PF, 5.728% (SOFR30A + 41 bps), 4/15/36 | 45,076 |
| 125,458(a) | Federal Home Loan Mortgage Corp. REMICs, Series 3173, Class FC, 5.848% (SOFR30A + 53 bps), 6/15/36 | 122,611 |
| 288,423(a) | Federal Home Loan Mortgage Corp. REMICs, Series 3175, Class FE, 5.738% (SOFR30A + 42 bps), 6/15/36 | 283,159 |
| 167,359(a) | Federal Home Loan Mortgage Corp. REMICs, Series 3181, Class HF, 5.928% (SOFR30A + 61 bps), 7/15/36 | 164,698 |
| 14,945(a) | Federal Home Loan Mortgage Corp. REMICs, Series 3191, Class FE, 5.828% (SOFR30A + 51 bps), 7/15/36 | 14,755 |
| 129,187(a) | Federal Home Loan Mortgage Corp. REMICs, Series 3221, Class FW, 5.848% (SOFR30A + 53 bps), 9/15/36 | 126,663 |
| 41,697(a) | Federal Home Loan Mortgage Corp. REMICs, Series 3222, Class FN, 5.828% (SOFR30A + 51 bps), 9/15/36 | 40,863 |
The accompanying notes are an integral part of these financial statements.
Pioneer Multi-Asset Ultrashort Income Fund | Semiannual Report | 9/30/2353
Schedule of Investments | 9/30/23
(unaudited) (continued)
Principal
Amount
USD ($) | | | | | | Value |
| | Collateralized Mortgage
Obligations—(continued) | |
| 140,926(a) | Federal Home Loan Mortgage Corp. REMICs, Series 3239, Class EF, 5.778% (SOFR30A + 46 bps), 11/15/36 | $ 137,752 |
| 66,968(a) | Federal Home Loan Mortgage Corp. REMICs, Series 3239, Class FB, 5.778% (SOFR30A + 46 bps), 11/15/36 | 65,488 |
| 111,015(a) | Federal Home Loan Mortgage Corp. REMICs, Series 3247, Class FA, 5.678% (SOFR30A + 36 bps), 8/15/36 | 107,584 |
| 174,533(a) | Federal Home Loan Mortgage Corp. REMICs, Series 3266, Class F, 5.728% (SOFR30A + 41 bps), 1/15/37 | 169,113 |
| 96,229(a) | Federal Home Loan Mortgage Corp. REMICs, Series 3307, Class FT, 5.668% (SOFR30A + 35 bps), 7/15/34 | 93,823 |
| 10,646(a) | Federal Home Loan Mortgage Corp. REMICs, Series 3315, Class F, 5.768% (SOFR30A + 45 bps), 5/15/37 | 10,344 |
| 278,272(a) | Federal Home Loan Mortgage Corp. REMICs, Series 3373, Class FB, 6.008% (SOFR30A + 69 bps), 10/15/37 | 274,394 |
| 31,262(a) | Federal Home Loan Mortgage Corp. REMICs, Series 3376, Class FM, 6.048% (SOFR30A + 73 bps), 10/15/37 | 30,888 |
| 99,425(a) | Federal Home Loan Mortgage Corp. REMICs, Series 3560, Class FA, 6.50% (SOFR30A + 136 bps), 5/15/37 | 99,097 |
| 166,615(a) | Federal Home Loan Mortgage Corp. REMICs, Series 3610, Class FA, 6.128% (SOFR30A + 81 bps), 12/15/39 | 165,421 |
| 49,683(a) | Federal Home Loan Mortgage Corp. REMICs, Series 3708, Class PF, 5.778% (SOFR30A + 46 bps), 7/15/40 | 49,200 |
| 695(a) | Federal Home Loan Mortgage Corp. REMICs, Series 3792, Class DF, 5.828% (SOFR30A + 51 bps), 11/15/40 | 695 |
| 14,395(a) | Federal Home Loan Mortgage Corp. REMICs, Series 3867, Class FD, 5.778% (SOFR30A + 46 bps), 5/15/41 | 14,150 |
| 15,484(a) | Federal Home Loan Mortgage Corp. REMICs, Series 3914, Class LF, 5.628% (SOFR30A + 31 bps), 8/15/26 | 15,454 |
The accompanying notes are an integral part of these financial statements.
54Pioneer Multi-Asset Ultrashort Income Fund | Semiannual Report | 9/30/23
Principal
Amount
USD ($) | | | | | | Value |
| | Collateralized Mortgage
Obligations—(continued) | |
| 12,661(a) | Federal Home Loan Mortgage Corp. REMICs, Series 3970, Class GF, 5.728% (SOFR30A + 41 bps), 9/15/26 | $ 12,659 |
| 23,666(a) | Federal Home Loan Mortgage Corp. REMICs, Series 3982, Class FL, 5.978% (SOFR30A + 66 bps), 12/15/39 | 23,624 |
| 27,085(a) | Federal Home Loan Mortgage Corp. REMICs, Series 4056, Class QF, 5.778% (SOFR30A + 46 bps), 12/15/41 | 26,642 |
| 323(a) | Federal National Mortgage Association REMICs, Series 1993-230, Class FA, 6.029% (SOFR30A + 71 bps), 12/25/23 | 323 |
| 532(a) | Federal National Mortgage Association REMICs, Series 1993-247, Class FA, 7.427% (SOFR30A + 212 bps), 12/25/23 | 530 |
| 532(a) | Federal National Mortgage Association REMICs, Series 1993-247, Class FE, 6.429% (SOFR30A + 111 bps), 12/25/23 | 532 |
| 5,718(a) | Federal National Mortgage Association REMICs, Series 1994-40, Class FC, 5.929% (SOFR30A + 61 bps), 3/25/24 | 5,717 |
| 4,287(a) | Federal National Mortgage Association REMICs, Series 1997-46, Class FA, 5.928% (SOFR30A + 61 bps), 7/18/27 | 4,241 |
| 2,717(a) | Federal National Mortgage Association REMICs, Series 1998-21, Class F, 4.578% (1 Year CMT Index + 35 bps), 3/25/28 | 2,697 |
| 20,737(a) | Federal National Mortgage Association REMICs, Series 2000-47, Class FD, 5.979% (SOFR30A + 66 bps), 12/25/30 | 20,587 |
| 75,400(a) | Federal National Mortgage Association REMICs, Series 2001-35, Class F, 6.029% (SOFR30A + 71 bps), 7/25/31 | 74,923 |
| 26,378(a) | Federal National Mortgage Association REMICs, Series 2001-37, Class F, 5.929% (SOFR30A + 61 bps), 8/25/31 | 26,199 |
| 155,816(a) | Federal National Mortgage Association REMICs, Series 2001-50, Class FQ, 6.029% (SOFR30A + 71 bps), 11/25/31 | 154,829 |
| 68,559(a) | Federal National Mortgage Association REMICs, Series 2001-65, Class F, 6.029% (SOFR30A + 71 bps), 11/25/31 | 68,312 |
The accompanying notes are an integral part of these financial statements.
Pioneer Multi-Asset Ultrashort Income Fund | Semiannual Report | 9/30/2355
Schedule of Investments | 9/30/23
(unaudited) (continued)
Principal
Amount
USD ($) | | | | | | Value |
| | Collateralized Mortgage
Obligations—(continued) | |
| 43,870(a) | Federal National Mortgage Association REMICs, Series 2001-69, Class FA, 6.029% (SOFR30A + 71 bps), 7/25/31 | $ 43,584 |
| 97,695(a) | Federal National Mortgage Association REMICs, Series 2001-72, Class FB, 6.329% (SOFR30A + 101 bps), 12/25/31 | 97,975 |
| 30,617(a) | Federal National Mortgage Association REMICs, Series 2001-81, Class FL, 6.078% (SOFR30A + 76 bps), 1/18/32 | 30,520 |
| 55,873(a) | Federal National Mortgage Association REMICs, Series 2002-1, Class FC, 6.129% (SOFR30A + 81 bps), 1/25/32 | 55,819 |
| 133,307(a) | Federal National Mortgage Association REMICs, Series 2002-13, Class FD, 6.329% (SOFR30A + 101 bps), 3/25/32 | 133,663 |
| 89,843(a) | Federal National Mortgage Association REMICs, Series 2002-34, Class FA, 5.928% (SOFR30A + 61 bps), 5/18/32 | 89,565 |
| 89,148(a) | Federal National Mortgage Association REMICs, Series 2002-56, Class FN, 6.429% (SOFR30A + 111 bps), 7/25/32 | 89,868 |
| 31,519(a) | Federal National Mortgage Association REMICs, Series 2002-58, Class FD, 6.029% (SOFR30A + 71 bps), 8/25/32 | 31,386 |
| 59,638(a) | Federal National Mortgage Association REMICs, Series 2002-77, Class F, 6.029% (SOFR30A + 71 bps), 12/25/32 | 59,491 |
| 41,732(a) | Federal National Mortgage Association REMICs, Series 2002-82, Class FB, 5.929% (SOFR30A + 61 bps), 12/25/32 | 41,420 |
| 55,438(a) | Federal National Mortgage Association REMICs, Series 2002-90, Class FH, 5.929% (SOFR30A + 61 bps), 9/25/32 | 54,875 |
| 30,625(a) | Federal National Mortgage Association REMICs, Series 2002-92, Class FB, 6.079% (SOFR30A + 76 bps), 4/25/30 | 30,575 |
| 60,114(a) | Federal National Mortgage Association REMICs, Series 2002-93, Class FH, 5.929% (SOFR30A + 61 bps), 1/25/33 | 59,777 |
| 101,512(a) | Federal National Mortgage Association REMICs, Series 2003-107, Class FD, 5.929% (SOFR30A + 61 bps), 11/25/33 | 100,881 |
The accompanying notes are an integral part of these financial statements.
56Pioneer Multi-Asset Ultrashort Income Fund | Semiannual Report | 9/30/23
Principal
Amount
USD ($) | | | | | | Value |
| | Collateralized Mortgage
Obligations—(continued) | |
| 148,692(a) | Federal National Mortgage Association REMICs, Series 2003-31, Class FM, 5.929% (SOFR30A + 61 bps), 4/25/33 | $ 147,808 |
| 61,863(a) | Federal National Mortgage Association REMICs, Series 2003-42, Class JF, 5.929% (SOFR30A + 61 bps), 5/25/33 | 61,228 |
| 49,070(a) | Federal National Mortgage Association REMICs, Series 2003-7, Class FA, 6.179% (SOFR30A + 86 bps), 2/25/33 | 49,087 |
| 82,961(a) | Federal National Mortgage Association REMICs, Series 2003-8, Class FJ, 5.779% (SOFR30A + 46 bps), 2/25/33 | 82,582 |
| 104,748(a) | Federal National Mortgage Association REMICs, Series 2004-52, Class FW, 5.829% (SOFR30A + 51 bps), 7/25/34 | 103,873 |
| 27,403(a) | Federal National Mortgage Association REMICs, Series 2004-54, Class FN, 5.879% (SOFR30A + 56 bps), 7/25/34 | 27,230 |
| 51,376(a) | Federal National Mortgage Association REMICs, Series 2004-79, Class FM, 5.729% (SOFR30A + 41 bps), 11/25/24 | 51,321 |
| 98,151(a) | Federal National Mortgage Association REMICs, Series 2005-83, Class KT, 5.729% (SOFR30A + 41 bps), 10/25/35 | 96,317 |
| 108,522(a) | Federal National Mortgage Association REMICs, Series 2005-83, Class LF, 5.739% (SOFR30A + 42 bps), 2/25/35 | 107,524 |
| 61,425(a) | Federal National Mortgage Association REMICs, Series 2006-104, Class GF, 5.749% (SOFR30A + 43 bps), 11/25/36 | 60,191 |
| 20,590(a) | Federal National Mortgage Association REMICs, Series 2006-11, Class FB, 5.729% (SOFR30A + 41 bps), 3/25/36 | 20,190 |
| 30,968(a) | Federal National Mortgage Association REMICs, Series 2006-115, Class BF, 5.669% (SOFR30A + 35 bps), 12/25/36 | 30,364 |
| 65,873(a) | Federal National Mortgage Association REMICs, Series 2006-34, Class FA, 5.739% (SOFR30A + 42 bps), 5/25/36 | 64,615 |
| 115,346(a) | Federal National Mortgage Association REMICs, Series 2006-42, Class CF, 5.879% (SOFR30A + 56 bps), 6/25/36 | 113,606 |
The accompanying notes are an integral part of these financial statements.
Pioneer Multi-Asset Ultrashort Income Fund | Semiannual Report | 9/30/2357
Schedule of Investments | 9/30/23
(unaudited) (continued)
Principal
Amount
USD ($) | | | | | | Value |
| | Collateralized Mortgage
Obligations—(continued) | |
| 45,967(a) | Federal National Mortgage Association REMICs, Series 2006-56, Class FC, 5.719% (SOFR30A + 40 bps), 7/25/36 | $ 45,430 |
| 11,406(a) | Federal National Mortgage Association REMICs, Series 2006-70, Class BF, 5.979% (SOFR30A + 66 bps), 8/25/36 | 11,190 |
| 23,199(a) | Federal National Mortgage Association REMICs, Series 2006-82, Class F, 5.999% (SOFR30A + 68 bps), 9/25/36 | 22,892 |
| 21,918(a) | Federal National Mortgage Association REMICs, Series 2007-100, Class YF, 5.979% (SOFR30A + 66 bps), 10/25/37 | 21,577 |
| 32,897(a) | Federal National Mortgage Association REMICs, Series 2007-103, Class AF, 6.429% (SOFR30A + 111 bps), 3/25/37 | 33,328 |
| 33,145(a) | Federal National Mortgage Association REMICs, Series 2007-110, Class FA, 6.049% (SOFR30A + 73 bps), 12/25/37 | 32,655 |
| 57,492(a) | Federal National Mortgage Association REMICs, Series 2007-13, Class FA, 5.679% (SOFR30A + 36 bps), 3/25/37 | 55,521 |
| 68,099(a) | Federal National Mortgage Association REMICs, Series 2007-2, Class FT, 5.679% (SOFR30A + 36 bps), 2/25/37 | 65,937 |
| 41,756(a) | Federal National Mortgage Association REMICs, Series 2007-41, Class FA, 5.829% (SOFR30A + 51 bps), 5/25/37 | 40,768 |
| 139,178(a) | Federal National Mortgage Association REMICs, Series 2007-50, Class FN, 5.669% (SOFR30A + 35 bps), 6/25/37 | 135,884 |
| 12,753(a) | Federal National Mortgage Association REMICs, Series 2007-57, Class FA, 5.659% (SOFR30A + 34 bps), 6/25/37 | 12,503 |
| 37,297(a) | Federal National Mortgage Association REMICs, Series 2007-58, Class FA, 5.679% (SOFR30A + 36 bps), 6/25/37 | 36,226 |
| 27,609(a) | Federal National Mortgage Association REMICs, Series 2007-66, Class FB, 5.829% (SOFR30A + 51 bps), 7/25/37 | 27,393 |
| 84,358(a) | Federal National Mortgage Association REMICs, Series 2007-7, Class FJ, 5.629% (SOFR30A + 31 bps), 2/25/37 | 82,534 |
The accompanying notes are an integral part of these financial statements.
58Pioneer Multi-Asset Ultrashort Income Fund | Semiannual Report | 9/30/23
Principal
Amount
USD ($) | | | | | | Value |
| | Collateralized Mortgage
Obligations—(continued) | |
| 123,693(a) | Federal National Mortgage Association REMICs, Series 2007-85, Class FG, 5.929% (SOFR30A + 61 bps), 9/25/37 | $ 121,521 |
| 170,393(a) | Federal National Mortgage Association REMICs, Series 2007-91, Class FB, 6.029% (SOFR30A + 71 bps), 10/25/37 | 168,200 |
| 54,899(a) | Federal National Mortgage Association REMICs, Series 2007-92, Class OF, 5.999% (SOFR30A + 68 bps), 9/25/37 | 54,286 |
| 31,306(a) | Federal National Mortgage Association REMICs, Series 2007-93, Class FD, 5.979% (SOFR30A + 66 bps), 9/25/37 | 30,758 |
| 16,698(a) | Federal National Mortgage Association REMICs, Series 2007-98, Class FD, 5.879% (SOFR30A + 56 bps), 6/25/37 | 16,373 |
| 17,733(a) | Federal National Mortgage Association REMICs, Series 2008-6, Class FA, 6.129% (SOFR30A + 81 bps), 2/25/38 | 17,566 |
| 92,990(a) | Federal National Mortgage Association REMICs, Series 2008-88, Class FA, 6.649% (SOFR30A + 133 bps), 10/25/38 | 94,307 |
| 47,310(a) | Federal National Mortgage Association REMICs, Series 2009-113, Class FB, 5.979% (SOFR30A + 66 bps), 1/25/40 | 46,814 |
| 24,110(a) | Federal National Mortgage Association REMICs, Series 2010-43, Class FD, 6.029% (SOFR30A + 71 bps), 5/25/40 | 23,785 |
| 87,845(a) | Federal National Mortgage Association REMICs, Series 2010-43, Class IF, 5.929% (SOFR30A + 61 bps), 5/25/40 | 86,464 |
| 86,168(a) | Federal National Mortgage Association REMICs, Series 2012-40, Class PF, 5.929% (SOFR30A + 61 bps), 4/25/42 | 84,381 |
| 992,795(a) | Freddie Mac STACR REMIC Trust, Series 2020-HQA2, Class M2, 8.529% (SOFR30A + 321 bps), 3/25/50 (144A) | 1,023,881 |
| 928,853(a) | Freddie Mac STACR REMIC Trust, Series 2021-DNA3, Class M1, 6.065% (SOFR30A + 75 bps), 10/25/33 (144A) | 924,545 |
| 5,539,854(a) | Freddie Mac STACR REMIC Trust, Series 2021-DNA5, Class M2, 6.965% (SOFR30A + 165 bps), 1/25/34 (144A) | 5,534,667 |
The accompanying notes are an integral part of these financial statements.
Pioneer Multi-Asset Ultrashort Income Fund | Semiannual Report | 9/30/2359
Schedule of Investments | 9/30/23
(unaudited) (continued)
Principal
Amount
USD ($) | | | | | | Value |
| | Collateralized Mortgage
Obligations—(continued) | |
| 4,251,131(a) | Freddie Mac STACR REMIC Trust, Series 2021-DNA6, Class M1, 6.115% (SOFR30A + 80 bps), 10/25/41 (144A) | $ 4,243,309 |
| 3,250,000(a) | Freddie Mac STACR REMIC Trust, Series 2021-DNA6, Class M2, 6.815% (SOFR30A + 150 bps), 10/25/41 (144A) | 3,203,298 |
| 2,950,313(a) | Freddie Mac STACR REMIC Trust, Series 2021-DNA7, Class M1, 6.165% (SOFR30A + 85 bps), 11/25/41 (144A) | 2,920,104 |
| 6,190,000(a) | Freddie Mac STACR REMIC Trust, Series 2021-DNA7, Class M2, 7.115% (SOFR30A + 180 bps), 11/25/41 (144A) | 6,044,906 |
| 6,932,067(a) | Freddie Mac STACR REMIC Trust, Series 2021-HQA1, Class M2, 7.565% (SOFR30A + 225 bps), 8/25/33 (144A) | 6,890,970 |
| 4,700,000(a) | Freddie Mac STACR REMIC Trust, Series 2021-HQA3, Class M2, 7.415% (SOFR30A + 210 bps), 9/25/41 (144A) | 4,606,658 |
| 9,037,219(a) | Freddie Mac STACR REMIC Trust, Series 2021-HQA4, Class M1, 6.265% (SOFR30A + 95 bps), 12/25/41 (144A) | 8,868,710 |
| 12,380,000(a) | Freddie Mac STACR REMIC Trust, Series 2022-DNA1, Class M2, 7.815% (SOFR30A + 250 bps), 1/25/42 (144A) | 12,101,450 |
| 2,193,170(a) | Freddie Mac STACR REMIC Trust, Series 2022-DNA6, Class M1A, 7.465% (SOFR30A + 215 bps), 9/25/42 (144A) | 2,215,297 |
| 4,738,399(a) | Freddie Mac STACR REMIC Trust, Series 2022-HQA1, Class M1A, 7.415% (SOFR30A + 210 bps), 3/25/42 (144A) | 4,776,922 |
| 2,810,269(a) | Freddie Mac STACR REMIC Trust, Series 2022-HQA3, Class M1A, 7.615% (SOFR30A + 230 bps), 8/25/42 (144A) | 2,853,972 |
| 9,424,084(a) | Freddie Mac STACR REMIC Trust, Series 2023-DNA1, Class M1A, 7.415% (SOFR30A + 210 bps), 3/25/43 (144A) | 9,510,636 |
| 2,698,890(a) | Freddie Mac STACR REMIC Trust, Series 2023-HQA1, Class M1A, 7.315% (SOFR30A + 200 bps), 5/25/43 (144A) | 2,715,673 |
| 316,219(a) | Freddie Mac STACR Trust, Series 2019-FTR2, Class M1, 6.379% (SOFR30A + 106 bps), 11/25/48 (144A) | 315,146 |
The accompanying notes are an integral part of these financial statements.
60Pioneer Multi-Asset Ultrashort Income Fund | Semiannual Report | 9/30/23
Principal
Amount
USD ($) | | | | | | Value |
| | Collateralized Mortgage
Obligations—(continued) | |
| 9,040,000(a) | Freddie Mac STACR Trust, Series 2019-FTR2, Class M2, 7.579% (SOFR30A + 226 bps), 11/25/48 (144A) | $ 9,130,400 |
| 65,576(a) | Freddie Mac STRIPS, Series 237, Class F14, 5.828% (SOFR30A + 51 bps), 5/15/36 | 64,309 |
| 61,403(a) | Freddie Mac STRIPS, Series 239, Class F29, 5.678% (SOFR30A + 36 bps), 8/15/36 | 60,238 |
| 265,446(a) | Freddie Mac STRIPS, Series 239, Class F30, 5.728% (SOFR30A + 41 bps), 8/15/36 | 260,969 |
| 76,853(a) | Freddie Mac STRIPS, Series 244, Class F22, 5.778% (SOFR30A + 46 bps), 12/15/36 | 75,711 |
| 16,145,550(a) | Freddie Mac Structured Agency Credit Risk Debt Notes, Series 2013-DN2, Class M2, 9.679% (SOFR30A + 436 bps), 11/25/23 | 16,219,990 |
| 4,845,000(a) | Freddie Mac Structured Agency Credit Risk Debt Notes, Series 2017-HQA2, Class M2B, 8.079% (SOFR30A + 276 bps), 12/25/29 | 4,971,345 |
| 500,000(a) | Freddie Mac Structured Agency Credit Risk Debt Notes, Series 2017-HRP1, Class B1, 10.029% (SOFR30A + 471 bps), 12/25/42 | 547,486 |
| 3,190,470(a) | Freddie Mac Structured Agency Credit Risk Debt Notes, Series 2017-HRP1, Class M2, 7.879% (SOFR30A + 256 bps), 12/25/42 | 3,235,593 |
| 493,113(a) | Freddie Mac Structured Agency Credit Risk Debt Notes, Series 2017-HRP1, Class M2D, 6.679% (SOFR30A + 136 bps), 12/25/42 | 494,662 |
| 3,330,370(a) | Freddie Mac Structured Agency Credit Risk Debt Notes, Series 2021-DNA2, Class M2, 7.615% (SOFR30A + 230 bps), 8/25/33 (144A) | 3,356,287 |
| 6,208,569(a) | Freddie Mac Structured Agency Credit Risk Debt Notes, Series 2023-HQA2, Class M1A, 7.315% (SOFR30A + 200 bps), 6/25/43 (144A) | 6,238,747 |
| 23,733(a) | Government National Mortgage Association, Series 2003-7, Class FB, 5.645% (1 Month Term SOFR + 31 bps), 1/16/33 | 23,696 |
| 206,247(a) | Government National Mortgage Association, Series 2005-16, Class FA, 5.689% (1 Month Term SOFR + 36 bps), 2/20/35 | 203,120 |
| 216,647(a) | Government National Mortgage Association, Series 2005-3, Class FC, 5.695% (1 Month Term SOFR + 36 bps), 1/16/35 | 213,989 |
The accompanying notes are an integral part of these financial statements.
Pioneer Multi-Asset Ultrashort Income Fund | Semiannual Report | 9/30/2361
Schedule of Investments | 9/30/23
(unaudited) (continued)
Principal
Amount
USD ($) | | | | | | Value |
| | Collateralized Mortgage
Obligations—(continued) | |
| 71,949(a) | Government National Mortgage Association, Series 2008-69, Class FA, 5.939% (1 Month Term SOFR + 61 bps), 8/20/38 | $ 71,687 |
| 69,687(a) | Government National Mortgage Association, Series 2009-66, Class UF, 6.445% (1 Month Term SOFR + 111 bps), 8/16/39 | 70,095 |
| 50,584(a) | Government National Mortgage Association, Series 2009-92, Class FJ, 6.125% (1 Month Term SOFR + 79 bps), 10/16/39 | 50,322 |
| 5,347,200(a) | Home Re, Ltd., Series 2019-1, Class M1, 7.084% (1 Month USD LIBOR + 165 bps), 5/25/29 (144A) | 5,347,232 |
| 7,360,000(a) | Home Re, Ltd., Series 2021-1, Class M2, 8.284% (SOFR30A + 296 bps), 7/25/33 (144A) | 7,379,304 |
| 14,283,000(a) | Home Re, Ltd., Series 2021-2, Class M1C, 8.115% (SOFR30A + 280 bps), 1/25/34 (144A) | 14,403,926 |
| 2,650,276(a) | Home Re, Ltd., Series 2022-1, Class M1A, 8.165% (SOFR30A + 285 bps), 10/25/34 (144A) | 2,670,120 |
| 4,219,383 | IMS Ecuadorian Mortgage Trust, Series 2021-1, Class GA, 3.40%, 8/18/43 (144A) | 3,860,736 |
| 1,867,435(c) | JP Morgan Mortgage Trust, Series 2014-IVR3, Class B4, 4.854%, 9/25/44 (144A) | 1,766,609 |
| 7,894,307(a) | JP Morgan Mortgage Trust, Series 2018-7FRB, Class A2, 6.184% (1 Month Term SOFR + 86 bps), 4/25/46 (144A) | 7,584,585 |
| 1,293,751(a) | JP Morgan Mortgage Trust, Series 2018-7FRB, Class A3, 6.184% (1 Month Term SOFR + 86 bps), 4/25/46 (144A) | 1,239,063 |
| 7,418,123(c) | JP Morgan Mortgage Trust, Series 2018-7FRB, Class B1, 6.644%, 4/25/46 (144A) | 6,897,856 |
| 7,016,236(c) | JP Morgan Mortgage Trust, Series 2018-7FRB, Class B2, 6.644%, 4/25/46 (144A) | 6,501,679 |
| 11,260,000(a) | JP Morgan Mortgage Trust, Series 2023-HE2, Class A1, 7.016% (SOFR30A + 170 bps), 3/25/54 (144A) | 11,260,000 |
| 770,523(a) | JP Morgan Seasoned Mortgage Trust, Series 2014-1, Class AM, 5.934% (1 Month Term SOFR + 61 bps), 5/25/33 (144A) | 741,827 |
| 2,866,217(c) | JP Morgan Seasoned Mortgage Trust, Series 2014-1, Class B1, 5.864%, 5/25/33 (144A) | 2,759,542 |
| 2,671,769(c) | JP Morgan Seasoned Mortgage Trust, Series 2014-1, Class B2, 5.864%, 5/25/33 (144A) | 2,569,120 |
| 2,059,699(c) | JP Morgan Seasoned Mortgage Trust, Series 2014-1, Class B3, 5.864%, 5/25/33 (144A) | 1,971,034 |
The accompanying notes are an integral part of these financial statements.
62Pioneer Multi-Asset Ultrashort Income Fund | Semiannual Report | 9/30/23
Principal
Amount
USD ($) | | | | | | Value |
| | Collateralized Mortgage
Obligations—(continued) | |
| 114,895(c) | JP Morgan Trust, Series 2015-1, Class 1A14, 6.647%, 12/25/44 (144A) | $ 110,986 |
| 3,067,628(a) | JPMorgan Chase Bank N.A. - CHASE, Series 2019-CL1, Class M1, 6.784% (1 Month Term SOFR + 146 bps), 4/25/47 (144A) | 3,001,883 |
| 7,484,858(a) | LSTAR Securities Investment, Ltd., Series 2021-1, Class A, 8.229% (1 Month Term SOFR + 291 bps), 2/1/26 (144A) | 7,404,055 |
| 3,844(c) | Merrill Lynch Mortgage Investors Trust Series MLCC, Series 2003-G, Class A3, 7.125%, 1/25/29 | 3,709 |
| 326,703(a) | Merrill Lynch Mortgage Investors Trust Series MLCC, Series 2003-H, Class A1, 6.074% (1 Month Term SOFR + 75 bps), 1/25/29 | 288,730 |
| 115,479(a) | Merrill Lynch Mortgage Investors Trust Series MLCC, Series 2004-B, Class A2, 6.044% (6 Month USD LIBOR + 54 bps), 5/25/29 | 108,777 |
| 10,949(a) | Merrill Lynch Mortgage Investors Trust Series MLCC, Series 2004-C, Class A2B, 6.683% (6 Month USD LIBOR + 100 bps), 7/25/29 | 10,519 |
| 59,590(c) | Merrill Lynch Mortgage Investors Trust Series MLCC, Series 2004-D, Class A3, 7.272%, 9/25/29 | 56,278 |
| 2,564,000(c) | Morgan Stanley Residential Mortgage Loan Trust, Series 2014-1A, Class B4, 6.815%, 6/25/44 (144A) | 2,371,982 |
| 6,911,667(a) | NewRez Warehouse Securitization Trust, Series 2021-1, Class E, 8.684% (1 Month Term SOFR + 336 bps), 5/25/55 (144A) | 6,894,053 |
| 4,970,000(a) | Oaktown Re III, Ltd., Series 2019-1A, Class B1A, 8.929% (SOFR30A + 361 bps), 7/25/29 (144A) | 5,041,131 |
| 1,631,000(a) | Oaktown Re III, Ltd., Series 2019-1A, Class B1B, 9.779% (SOFR30A + 446 bps), 7/25/29 (144A) | 1,662,124 |
| 5,521,365(a) | Oaktown Re III, Ltd., Series 2019-1A, Class M1B, 7.379% (SOFR30A + 206 bps), 7/25/29 (144A) | 5,535,113 |
| 4,006,058(a) | Oaktown Re VI, Ltd., Series 2021-1A, Class M1B, 7.365% (SOFR30A + 205 bps), 10/25/33 (144A) | 4,012,899 |
| 3,500,000(a) | Oaktown Re VII, Ltd., Series 2021-2, Class M1B, 8.215% (SOFR30A + 290 bps), 4/25/34 (144A) | 3,534,558 |
| 117,302(a) | Pepper Residential Securities Trust No. 22, Series 22A, Class A1U, 6.433% (SOFR + 111 bps), 6/20/60 (144A) | 117,284 |
| 621,167(a) | Pepper Residential Securities Trust No. 25, Series 25A, Class A1U, 6.374% (1 Month Term SOFR + 104 bps), 3/12/61 (144A) | 620,818 |
The accompanying notes are an integral part of these financial statements.
Pioneer Multi-Asset Ultrashort Income Fund | Semiannual Report | 9/30/2363
Schedule of Investments | 9/30/23
(unaudited) (continued)
Principal
Amount
USD ($) | | | | | | Value |
| | Collateralized Mortgage
Obligations—(continued) | |
| 16,117,000(a) | PNMAC GMSR Issuer Trust, Series 2018-GT2, Class A, 8.084% (1 Month USD LIBOR + 265 bps), 8/25/25 (144A) | $ 16,113,777 |
| 7,664,895(a) | Radnor Re, Ltd., Series 2019-1, Class M1B, 7.384% (1 Month USD LIBOR + 195 bps), 2/25/29 (144A) | 7,667,502 |
| 7,197,207(a) | Radnor Re, Ltd., Series 2020-1, Class M1B, 6.884% (1 Month USD LIBOR + 145 bps), 1/25/30 (144A) | 7,188,268 |
| 7,400,000(a) | Radnor Re, Ltd., Series 2020-1, Class M1C, 7.184% (1 Month USD LIBOR + 175 bps), 1/25/30 (144A) | 7,400,033 |
| 15,516,000(a) | Radnor Re, Ltd., Series 2021-1, Class M1C, 8.015% (SOFR30A + 270 bps), 12/27/33 (144A) | 15,671,596 |
| 1,790,000(a) | Radnor Re, Ltd., Series 2021-1, Class M2, 8.465% (SOFR30A + 315 bps), 12/27/33 (144A) | 1,801,026 |
| 12,590,000(a) | Radnor Re, Ltd., Series 2021-2, Class M1B, 9.015% (SOFR30A + 370 bps), 11/25/31 (144A) | 12,898,480 |
| 7,210,000(a) | Radnor Re, Ltd., Series 2023-1, Class M1A, 8.015% (SOFR30A + 270 bps), 7/25/33 (144A) | 7,245,775 |
| 1,000,000(a) | Radnor RE, Ltd., Series 2022-1, Class M1A, 9.065% (SOFR30A + 375 bps), 9/25/32 (144A) | 1,012,891 |
| 965,556(a) | RESI Finance LP, Series 2003-CB1, Class B3, 6.894% (1 Month Term SOFR + 156 bps), 6/10/35 (144A) | 797,874 |
| 727,316(a) | RESIMAC Premier Series, Series 2020-1A, Class A1A, 6.492% (1 Month Term SOFR + 116 bps), 2/7/52 (144A) | 727,680 |
| 3,681,786(c) | Seasoned Credit Risk Transfer Trust, Series 2018-1, Class M, 4.75%, 5/25/57 | 3,391,707 |
| 2,855,000(c) | Seasoned Credit Risk Transfer Trust, Series 2019-3, Class M, 4.75%, 10/25/58 | 2,576,734 |
| 7,086,497(a) | STACR Trust, Series 2018-HRP1, Class B1, 9.179% (SOFR30A + 386 bps), 4/25/43 (144A) | 7,281,146 |
| 3,281,170(a) | Towd Point Mortgage Trust, Series 2017-5, Class A1, 5.28% (1 Month Term SOFR + 71 bps), 2/25/57 (144A) | 3,294,309 |
| 5,846,900 | Towd Point Mortgage Trust, Series 2020-4, Class XA, 3.25%, 10/25/60 (144A) | 5,378,315 |
| 4,017,384(a) | Triangle Re, Ltd., Series 2021-1, Class M2, 9.334% (1 Month USD LIBOR + 390 bps), 8/25/33 (144A) | 4,036,885 |
The accompanying notes are an integral part of these financial statements.
64Pioneer Multi-Asset Ultrashort Income Fund | Semiannual Report | 9/30/23
Principal
Amount
USD ($) | | | | | | Value |
| | Collateralized Mortgage
Obligations—(continued) | |
| 1,451,267(a) | Triangle Re, Ltd., Series 2021-2, Class M1B, 8.034% (1 Month USD LIBOR + 260 bps), 10/25/33 (144A) | $ 1,454,778 |
| 7,880,000(a) | Triangle Re, Ltd., Series 2021-3, Class M1B, 8.215% (SOFR30A + 290 bps), 2/25/34 (144A) | 7,908,131 |
| | Total Collateralized Mortgage Obligations
(Cost $544,651,284) | $541,842,767 |
|
|
| | Commercial Mortgage-Backed
Securities—5.6% of Net Assets | |
| 8,000,000(a) | BAMLL Commercial Mortgage Securities Trust, Series 2019-RLJ, Class C, 6.98% (1 Month Term SOFR + 165 bps), 4/15/36 (144A) | $ 7,905,661 |
| 2,713,826(a) | BDS, Series 2021-FL8, Class A, 6.365% (1 Month Term SOFR + 103 bps), 1/18/36 (144A) | 2,678,432 |
| 3,500,000(a) | BDS, Ltd., Series 2020-FL5, Class C, 7.495% (1 Month Term SOFR + 216 bps), 2/16/37 (144A) | 3,398,213 |
| 1,150,000(a) | BFLD Trust, Series 2020-OBRK, Class A, 7.496% (1 Month Term SOFR + 216 bps), 11/15/28 (144A) | 1,147,940 |
| 12,000,000(a) | BX Commercial Mortgage Trust, Series 2021-CIP, Class B, 6.717% (1 Month Term SOFR + 139 bps), 12/15/38 (144A) | 11,698,872 |
| 3,909,651(a) | BX Commercial Mortgage Trust, Series 2021-XL2, Class D, 6.843% (1 Month Term SOFR + 151 bps), 10/15/38 (144A) | 3,791,895 |
| 9,300,000(a) | BX Trust, Series 2019-ATL, Class B, 6.834% (1 Month Term SOFR + 150 bps), 10/15/36 (144A) | 9,017,481 |
| 8,000,000(a) | BXP Trust, Series 2017-CQHP, Class B, 6.48% (1 Month Term SOFR + 115 bps), 11/15/34 (144A) | 7,399,718 |
| 2,171,167(a) | CG-CCRE Commercial Mortgage Trust, Series 2014-FL1, Class B, 6.597% (1 Month Term SOFR + 126 bps), 6/15/31 (144A) | 2,166,004 |
| 1,109,562(a) | CG-CCRE Commercial Mortgage Trust, Series 2014-FL2, Class A, 7.301% (1 Month Term SOFR + 197 bps), 11/15/31 (144A) | 1,104,333 |
| 6,000,000(a) | CLNY Trust, Series 2019-IKPR, Class B, 6.921% (1 Month Term SOFR + 159 bps), 11/15/38 (144A) | 5,629,511 |
| 9,975,183(a) | Credit Suisse Mortgage Capital Certificates, Series 2019-ICE4, Class E, 7.53% (1 Month Term SOFR + 220 bps), 5/15/36 (144A) | 9,905,383 |
| 794,623(a) | Freddie Mac Multifamily Structured Credit Risk, Series 2021-MN1, Class M1, 7.315% (SOFR30A + 200 bps), 1/25/51 (144A) | 769,867 |
The accompanying notes are an integral part of these financial statements.
Pioneer Multi-Asset Ultrashort Income Fund | Semiannual Report | 9/30/2365
Schedule of Investments | 9/30/23
(unaudited) (continued)
Principal
Amount
USD ($) | | | | | | Value |
| | Commercial Mortgage-Backed
Securities—(continued) | |
| 8,000,000(a) | Great Wolf Trust, Series 2019-WOLF, Class D, 7.379% (1 Month Term SOFR + 205 bps), 12/15/36 (144A) | $ 7,888,622 |
| 2,978,409(a) | GS Mortgage Securities Corp. Trust, Series 2018-HART, Class A, 6.483% (1 Month Term SOFR + 114 bps), 10/15/31 (144A) | 2,953,958 |
| 9,729,000(a) | GS Mortgage Securities Corp. Trust, Series 2018-HART, Class B, 6.693% (1 Month Term SOFR + 135 bps), 10/15/31 (144A) | 9,627,022 |
| 8,720,000(a) | GS Mortgage Securities Corp. Trust, Series 2018-TWR, Class A, 6.53% (1 Month Term SOFR + 120 bps), 7/15/31 (144A) | 7,281,200 |
| 5,500,000(a) | GS Mortgage Securities Corp. Trust, Series 2019-70P, Class D, 7.197% (1 Month Term SOFR + 186 bps), 10/15/36 (144A) | 4,971,871 |
| 7,400,000(a) | GS Mortgage Securities Corp. Trust, Series 2019-SMP, Class D, 7.647% (1 Month Term SOFR + 231 bps), 8/15/32 (144A) | 7,099,560 |
| 10,000,000(a) | GS Mortgage Securities Corp. Trust, Series 2020-DUNE, Class A, 6.554% (1 Month Term SOFR + 121 bps), 12/15/36 (144A) | 9,848,866 |
| 5,000,000(a) | GS Mortgage Securities Corp. Trust, Series 2020-DUNE, Class E, 7.954% (1 Month Term SOFR + 261 bps), 12/15/36 (144A) | 4,736,215 |
| 1,100,000(a) | GS Mortgage Securities Corp. Trust, Series 2021-IP, Class E, 8.997% (1 Month Term SOFR + 366 bps), 10/15/36 (144A) | 992,947 |
| 7,656,826(a) | HPLY Trust, Series 2019-HIT, Class C, 7.043% (1 Month Term SOFR + 171 bps), 11/15/36 (144A) | 7,521,264 |
| 4,000,000(a) | JP Morgan Chase Commercial Mortgage Securities Trust, Series 2018-WPT, Class CFL, 7.466% (1 Month Term SOFR + 214 bps), 7/5/33 (144A) | 3,343,605 |
| 3,600,000(a) | JP Morgan Chase Commercial Mortgage Securities Trust, Series 2019-BKWD, Class C, 7.547% (1 Month Term SOFR + 196 bps), 9/15/29 (144A) | 2,823,784 |
| 5,700,000(a) | JP Morgan Chase Commercial Mortgage Securities Trust, Series 2019-MFP, Class E, 7.54% (1 Month Term SOFR + 221 bps), 7/15/36 (144A) | 5,478,142 |
| 6,735,000(a) | JP Morgan Chase Commercial Mortgage Securities Trust, Series 2020-609M, Class A, 6.817% (1 Month Term SOFR + 148 bps), 10/15/33 (144A) | 6,294,658 |
| 5,204,393(a) | MF1 Multifamily Housing Mortgage Loan Trust, Series 2021-FL5, Class A, 6.297% (1 Month Term SOFR + 96 bps), 7/15/36 (144A) | 5,146,822 |
The accompanying notes are an integral part of these financial statements.
66Pioneer Multi-Asset Ultrashort Income Fund | Semiannual Report | 9/30/23
Principal
Amount
USD ($) | | | | | | Value |
| | Commercial Mortgage-Backed
Securities—(continued) | |
| 8,500,000(a) | Morgan Stanley Capital I Trust, Series 2017-ASHF, Class B, 6.755% (1 Month Term SOFR + 142 bps), 11/15/34 (144A) | $ 8,357,769 |
| 7,980,000(a) | Morgan Stanley Capital I Trust, Series 2018-BOP, Class B, 6.63% (1 Month Term SOFR + 130 bps), 8/15/33 (144A) | 6,242,356 |
| 6,300,000(a) | Natixis Commercial Mortgage Securities Trust, Series 2019-MILE, Class B, 7.212% (1 Month Term SOFR + 188 bps), 7/15/36 (144A) | 5,370,123 |
| 3,181,160(a) | Ready Capital Mortgage Financing LLC, Series 2021-FL6, Class A, 6.384% (1 Month Term SOFR + 106 bps), 7/25/36 (144A) | 3,122,803 |
| 2,175,000(a) | Ready Capital Mortgage Financing LLC, Series 2021-FL6, Class D, 7.834% (1 Month Term SOFR + 251 bps), 7/25/36 (144A) | 2,025,480 |
| 1,519,000(a) | Ready Capital Mortgage Financing LLC, Series 2021-FL6, Class E, 8.334% (1 Month Term SOFR + 301 bps), 7/25/36 (144A) | 1,407,829 |
| 4,825,000(a) | Ready Capital Mortgage Financing LLC, Series 2021-FL7, Class D, 8.384% (1 Month Term SOFR + 306 bps), 11/25/36 (144A) | 4,535,985 |
| 4,374,433(a) | Tharaldson Hotel Portfolio Trust, Series 2018-THL, Class C, 7.092% (1 Month Term SOFR + 176 bps), 11/11/34 (144A) | 4,287,114 |
| 16,400,000(a) | TRTX Issuer, Ltd., Series 2019-FL3, Class C, 7.547% (1 Month Term SOFR + 221 bps), 10/15/34 (144A) | 15,638,543 |
| 2,512,179(c) | Velocity Commercial Capital Loan Trust, Series 2023-1, Class A, 6.47%, 1/25/53 (144A) | 2,429,680 |
| 12,800,000(a) | Wells Fargo Commercial Mortgage Trust, Series 2017-SMP, Class C, 6.704% (1 Month Term SOFR + 137 bps), 12/15/34 (144A) | 11,913,020 |
| 11,316,024(a) | XCALI Mortgage Trust, Series 2019-1, Class A, 9.194% (1 Month Term SOFR + 386 bps), 11/6/23 (144A) | 11,269,000 |
| 10,318,224(a) | XCALI Mortgage Trust, Series 2020-1, Class A, 7.844% (1 Month Term SOFR + 251 bps), 2/6/24 (144A) | 10,257,097 |
The accompanying notes are an integral part of these financial statements.
Pioneer Multi-Asset Ultrashort Income Fund | Semiannual Report | 9/30/2367
Schedule of Investments | 9/30/23
(unaudited) (continued)
Principal
Amount
USD ($) | | | | | | Value |
| | Commercial Mortgage-Backed
Securities—(continued) | |
| 13,048,418(a) | XCALI Mortgage Trust, Series 2020-2, Class A, 7.444% (1 Month USD LIBOR + 200 bps), 3/15/24 (144A) | $ 12,927,596 |
| 2,008,164(a) | XCALI Mortgage Trust, Series 2020-5, Class A, 8.70% (1 Month Term SOFR + 337 bps), 10/15/23 (144A) | 2,000,863 |
| | Total Commercial Mortgage-Backed Securities
(Cost $267,026,444) | $254,407,104 |
|
|
| | Corporate Bonds — 32.1% of Net Assets | |
| | Auto Manufacturers — 3.5% | |
| 18,480,000(a) | American Honda Finance Corp., 6.213% (SOFR + 92 bps), 1/12/26 | $ 18,596,698 |
| 12,030,000(a) | BMW US Capital LLC, 5.721% (SOFR + 38 bps), 8/12/24 (144A) | 12,020,329 |
| 20,000,000(a) | Daimler Trucks Finance North America LLC, 6.27% (SOFR + 100 bps), 4/5/24 (144A) | 20,032,555 |
| 18,670,000(a) | General Motors Financial Co., Inc., 5.92% (SOFR + 62 bps), 10/15/24 | 18,613,218 |
| 6,360,000(a) | General Motors Financial Co., Inc., 6.104% (SOFR + 76 bps), 3/8/24 | 6,358,345 |
| 6,215,000(a) | General Motors Financial Co., Inc., 6.579% (SOFR + 130 bps), 4/7/25 | 6,228,196 |
| 5,520,000 | Hyundai Capital America, 5.80%, 6/26/25 (144A) | 5,496,705 |
| 9,500,000 | Hyundai Capital America, 6.00%, 7/11/25 (144A) | 9,467,665 |
| 11,000,000(a) | Nissan Motor Acceptance Co. LLC, 6.299% (3 Month Term SOFR + 90 bps), 3/8/24 (144A) | 10,962,253 |
| 9,255,000(a) | Toyota Motor Credit Corp., 5.841% (SOFR + 56 bps), 1/10/25 | 9,253,810 |
| 21,650,000(a) | Toyota Motor Credit Corp., 5.994% (SOFR + 65 bps), 9/11/25 | 21,685,441 |
| 19,820,000(a) | Volkswagen Group of America Finance LLC, 6.274% (SOFR + 93 bps), 9/12/25 (144A) | 19,842,610 |
| | Total Auto Manufacturers | $158,557,825 |
|
|
| | Banks — 23.3% | |
| 17,800,000(a) | ABN AMRO Bank NV, 7.124% (SOFR + 178 bps), 9/18/27 (144A) | $ 17,831,862 |
| 10,000,000(a) | ANZ New Zealand Int'l, Ltd., 5.942% (SOFR + 60 bps), 2/18/25 (144A) | 9,988,137 |
| 13,530,000(a)(d) | Australia & New Zealand Banking Group, Ltd., 5.985% (SOFR + 64 bps), 10/3/25 (144A) | 13,535,818 |
The accompanying notes are an integral part of these financial statements.
68Pioneer Multi-Asset Ultrashort Income Fund | Semiannual Report | 9/30/23
Principal
Amount
USD ($) | | | | | | Value |
| | Banks — (continued) | |
| 8,730,000(a) | Australia & New Zealand Banking Group, Ltd., 6.095% (SOFR + 75 bps), 7/3/25 (144A) | $ 8,766,531 |
| 12,400,000(a) | Banco Santander SA, 6.582% (SOFR + 124 bps), 5/24/24 | 12,456,949 |
| 3,643,000(a) | Bank of America Corp., 6.002% (SOFR + 66 bps), 2/4/25 | 3,639,113 |
| 5,000,000(a) | Bank of America Corp., 6.022% (SOFR + 69 bps), 4/22/25 | 4,993,805 |
| 9,450,000(a) | Bank of America Corp., 6.062% (SOFR + 73 bps), 10/24/24 | 9,452,268 |
| 2,811,000(a) | Bank of America Corp., 6.29% (SOFR + 97 bps), 7/22/27 | 2,801,873 |
| 13,300,000(a) | Bank of America Corp., 6.694% (SOFR + 135 bps), 9/15/27 | 13,297,340 |
| 15,450,000(a) | Bank of America NA, 6.362% (SOFR + 102 bps), 8/18/26 | 15,512,163 |
| 8,100,000(a) | Bank of Montreal, 5.964% (SOFR + 62 bps), 9/15/26 | 8,003,758 |
| 7,500,000(a) | Bank of Montreal, 6.674% (SOFR + 133 bps), 6/5/26 | 7,580,982 |
| 9,910,000(c) | Bank of New York Mellon, 5.148% (SOFR + 107 bps), 5/22/26 | 9,816,892 |
| 2,500,000 | Bank of New York Mellon Corp., 0.50%, 4/26/24 | 2,426,090 |
| 15,100,000(a) | Bank of Nova Scotia, 6.434% (SOFR + 109 bps), 6/12/25 | 15,132,285 |
| 13,630,000(a) | Banque Federative du Credit Mutuel S.A., 6.696% (SOFR + 140 bps), 7/13/26 (144A) | 13,685,638 |
| 13,700,000 | Banque Federative du Credit Mutuel SA, 0.65%, 2/27/24 (144A) | 13,408,972 |
| 6,500,000(a) | Banque Federative du Credit Mutuel SA, 5.751% (SOFR + 41 bps), 2/4/25 (144A) | 6,468,791 |
| 10,669,000(c) | Barclays Plc, 3.932% (3 Month USD LIBOR + 161 bps), 5/7/25 | 10,505,990 |
| 12,316,000(a) | Barclays Plc, 7.224% (SOFR + 188 bps), 9/13/27 | 12,362,431 |
| 4,355,000 | BNP Paribas S.A., 3.375%, 1/9/25 (144A) | 4,202,969 |
| 12,519,000 | BNP Paribas S.A., 3.80%, 1/10/24 (144A) | 12,437,554 |
| 5,970,000 | Canadian Imperial Bank of Commerce, 5.144%, 4/28/25 | 5,892,151 |
| 18,400,000(a) | Canadian Imperial Bank of Commerce, 5.744% (SOFR + 40 bps), 12/14/23 | 18,400,951 |
| 15,790,000(a) | Citibank NA, 6.15% (SOFR + 81 bps), 9/29/25 | 15,790,489 |
| 11,083,000(a) | Citigroup, Inc., 6.019% (SOFR + 69 bps), 1/25/26 | 11,038,335 |
| 3,760,000(a) | Citigroup, Inc., 6.114% (SOFR + 77 bps), 6/9/27 | 3,694,284 |
| 12,550,000(a) | Citigroup, Inc., 6.715% (SOFR + 137 bps), 5/24/25 | 12,601,416 |
| 1,575,000(a) | Citigroup, Inc., 6.873% (SOFR + 153 bps), 3/17/26 | 1,589,931 |
The accompanying notes are an integral part of these financial statements.
Pioneer Multi-Asset Ultrashort Income Fund | Semiannual Report | 9/30/2369
Schedule of Investments | 9/30/23
(unaudited) (continued)
Principal
Amount
USD ($) | | | | | | Value |
| | Banks — (continued) | |
| 15,000,000(a) | Cooperatieve Rabobank UA, 5.661% (SOFR + 38 bps), 1/10/25 | $ 14,965,266 |
| 15,790,000(a)(d) | Cooperatieve Rabobank UA, 6.245% (SOFR + 90 bps), 10/5/26 | 15,792,637 |
| 10,000,000(a) | Credit Suisse AG, 5.731% (SOFR + 39 bps), 2/2/24 | 9,979,786 |
| 17,960,000(a) | DNB Bank ASA, 6.175% (SOFR + 83 bps), 3/28/25 (144A) | 17,962,213 |
| 7,000,000(a) | Federation des Caisses Desjardins du Quebec, 5.772% (SOFR + 43 bps), 5/21/24 (144A) | 6,991,781 |
| 4,600,000 | Goldman Sachs Group, Inc., 1.217%, 12/6/23 | 4,561,878 |
| 13,880,000(a) | Goldman Sachs Group, Inc., 5.808% (SOFR + 49 bps), 10/21/24 | 13,842,993 |
| 20,725,000(a) | Goldman Sachs Group, Inc., 5.844% (SOFR + 50 bps), 9/10/24 | 20,683,618 |
| 1,576,000(a) | Goldman Sachs Group, Inc., 6.134% (SOFR + 79 bps), 12/9/26 | 1,565,079 |
| 7,084,000(a) | Goldman Sachs Group, Inc., 6.154% (SOFR + 81 bps), 3/9/27 | 7,003,149 |
| 5,000,000(a) | HSBC Holdings Plc, 5.923% (SOFR + 58 bps), 11/22/24 | 4,999,422 |
| 7,750,000(a) | HSBC Holdings Plc, 6.775% (SOFR + 143 bps), 3/10/26 | 7,788,362 |
| 8,700,000(a) | HSBC Holdings Plc, 6.911% (SOFR + 157 bps), 8/14/27 | 8,747,850 |
| 11,000,000 | HSBC USA, Inc., 5.625%, 3/17/25 | 10,934,871 |
| 15,270,000(a) | Huntington National Bank, 6.532% (SOFR + 119 bps), 5/16/25 | 14,911,236 |
| 8,309,000(a) | ING Groep NV, 6.354% (SOFR + 101 bps), 4/1/27 | 8,218,541 |
| 19,850,000(a) | ING Groep NV, 6.905% (SOFR + 156 bps), 9/11/27 | 19,910,741 |
| 10,300,000(a) | ING Groep NV, 6.985% (SOFR + 164 bps), 3/28/26 | 10,392,021 |
| 8,000,000(a) | JPMorgan Chase & Co., 5.879% (SOFR + 54 bps), 6/1/25 | 7,976,354 |
| 5,922,000(a) | JPMorgan Chase & Co., 5.944% (SOFR + 60 bps), 12/10/25 | 5,888,090 |
| 14,000,000(a) | JPMorgan Chase & Co., 6.11% (SOFR + 77 bps), 9/22/27 | 13,749,687 |
| 12,270,000(a) | JPMorgan Chase & Co., 6.314% (SOFR + 97 bps), 6/14/25 | 12,293,357 |
| 8,667,000(a) | JPMorgan Chase & Co., 6.652% (SOFR + 132 bps), 4/26/26 | 8,723,856 |
| 6,200,000(c) | KeyBank NA/Cleveland OH, 5.664% (SOFR + 32 bps), 6/14/24 | 6,100,538 |
The accompanying notes are an integral part of these financial statements.
70Pioneer Multi-Asset Ultrashort Income Fund | Semiannual Report | 9/30/23
Principal
Amount
USD ($) | | | | | | Value |
| | Banks — (continued) | |
| 11,294,000(a) | KeyBank NA/Cleveland OH, 5.685% (SOFR + 34 bps), 1/3/24 | $ 11,241,778 |
| 12,000,000(a) | Lloyds Banking Group Plc, 6.901% (SOFR + 156 bps), 8/7/27 | 12,047,694 |
| 7,140,000(a) | Macquarie Bank, Ltd., 6.655% (SOFR + 131 bps), 3/21/25 (144A) | 7,186,751 |
| 17,816,000(a) | Macquarie Group, Ltd., 6.008% (SOFR + 71 bps), 10/14/25 (144A) | 17,716,587 |
| 6,925,000(a) | Mitsubishi UFJ Financial Group, Inc., 6.282% (SOFR + 94 bps), 2/20/26 | 6,928,850 |
| 9,512,000(a) | Mitsubishi UFJ Financial Group, Inc., 6.733% (SOFR + 144 bps), 4/17/26 | 9,580,377 |
| 16,600,000(a) | Mitsubishi UFJ Financial Group, Inc., 6.956% (SOFR + 165 bps), 7/18/25 | 16,687,874 |
| 16,000,000(a) | Mizuho Financial Group, Inc., 6.302% (SOFR + 96 bps), 5/22/26 | 15,996,286 |
| 7,055,000(a) | Morgan Stanley, 5.957% (SOFR + 63 bps), 1/24/25 | 7,042,202 |
| 16,703,000(a) | Morgan Stanley, 6.293% (SOFR + 95 bps), 2/18/26 | 16,719,630 |
| 5,700,000(a) | Morgan Stanley, 6.466% (SOFR + 117 bps), 4/17/25 | 5,709,727 |
| 15,000,000(a) | National Bank of Canada, 5.831% (SOFR + 49 bps), 8/6/24 | 14,937,373 |
| 6,400,000 | National Securities Clearing Corp., 5.15%, 5/30/25 (144A) | 6,348,599 |
| 4,200,000(a) | NatWest Markets Plc, 5.871% (SOFR + 53 bps), 8/12/24 (144A) | 4,186,564 |
| 17,240,000(a) | NatWest Markets Plc, 6.795% (SOFR + 145 bps), 3/22/25 (144A) | 17,350,690 |
| 17,200,000(a) | Royal Bank of Canada, 5.612% (SOFR + 30 bps), 1/19/24 | 17,197,454 |
| 4,620,000(a) | Royal Bank of Canada, 5.905% (SOFR + 57 bps), 4/27/26 | 4,569,271 |
| 4,800,000(a) | Royal Bank of Canada, 5.931% (SOFR + 59 bps), 11/2/26 | 4,729,755 |
| 15,380,000(a) | Royal Bank of Canada, 6.138% (SOFR + 84 bps), 4/14/25 | 15,363,875 |
| 17,880,000 | Santander Holdings USA, Inc., 3.50%, 6/7/24 | 17,506,180 |
| 17,000,000(a) | Societe Generale S.A., 6.368% (SOFR + 105 bps), 1/21/26 (144A) | 16,889,466 |
| 8,880,000(a) | Standard Chartered Plc, 6.273% (SOFR + 93 bps), 11/23/25 (144A) | 8,846,162 |
| 23,250,000(a) | Standard Chartered Plc, 7.085% (SOFR + 174 bps), 3/30/26 (144A) | 23,391,207 |
The accompanying notes are an integral part of these financial statements.
Pioneer Multi-Asset Ultrashort Income Fund | Semiannual Report | 9/30/2371
Schedule of Investments | 9/30/23
(unaudited) (continued)
Principal
Amount
USD ($) | | | | | | Value |
| | Banks — (continued) | |
| 17,300,000(c) | State Street Corp., 5.104% (SOFR + 113 bps), 5/18/26 | $ 17,081,355 |
| 8,910,000(a) | Sumitomo Mitsui Financial Group, Inc., 6.596% (SOFR + 130 bps), 7/13/26 | 8,966,907 |
| 15,085,000(a) | Sumitomo Mitsui Financial Group, Inc., 6.711% (SOFR + 143 bps), 1/13/26 | 15,225,592 |
| 12,700,000(a) | Sumitomo Mitsui Trust Bank, Ltd., 5.784% (SOFR + 44 bps), 9/16/24 (144A) | 12,668,295 |
| 18,540,000(a) | Sumitomo Mitsui Trust Bank, Ltd., 6.465% (SOFR + 112 bps), 3/9/26 (144A) | 18,620,288 |
| 3,835,000(a) | Sumitomo Mitsui Trust Bank, Ltd., 6.494% (SOFR + 115 bps), 9/14/26 (144A) | 3,861,040 |
| 21,600,000(a) | Svenska Handelsbanken AB, 6.594% (SOFR + 125 bps), 6/15/26 (144A) | 21,752,286 |
| 8,500,000(a) | Swedbank AB, 6.179% (SOFR + 91 bps), 4/4/25 (144A) | 8,510,370 |
| 8,840,000(a) | Swedbank AB, 6.724% (SOFR + 138 bps), 6/15/26 (144A) | 8,915,389 |
| 11,667,000(a) | Toronto-Dominion Bank, 5.934% (SOFR + 59 bps), 9/10/26 | 11,521,496 |
| 10,780,000(a) | Toronto-Dominion Bank, 6.381% (SOFR + 108 bps), 7/17/26 | 10,793,876 |
| 9,000,000(a) | Truist Bank, 5.501% (SOFR + 20 bps), 1/17/24 | 8,970,617 |
| 4,000,000 | Truist Financial Corp., 2.50%, 8/1/24 | 3,877,691 |
| 10,150,000 | U.S. Bancorp., 2.40%, 7/30/24 | 9,859,241 |
| 7,500,000(a) | UBS AG, 5.791% (SOFR + 45 bps), 8/9/24 (144A) | 7,486,875 |
| 18,700,000(a) | UBS AG, 6.274% (SOFR + 93 bps), 9/11/25 | 18,706,508 |
| 14,110,000(a) | UBS Group AG, 6.921% (SOFR + 158 bps), 5/12/26 (144A) | 14,192,387 |
| 19,340,000(a) | Wells Fargo & Co., 6.645% (SOFR + 132 bps), 4/25/26 | 19,450,301 |
| 12,760,000(a) | Wells Fargo Bank NA, 6.40% (SOFR + 106 bps), 8/7/26 | 12,816,855 |
| | Total Banks | $1,062,750,815 |
|
|
| | Diversified Financial Services — 2.0% | |
| 14,000,000 | Ally Financial, Inc., 3.875%, 5/21/24 | $ 13,739,021 |
| 7,421,000 | Ally Financial, Inc., 4.625%, 3/30/25 | 7,165,415 |
| 17,600,000(a) | American Express Co., 6.308% (SOFR + 97 bps), 7/28/27 | 17,462,050 |
| 750,000 | Avolon Holdings Funding, Ltd., 3.95%, 7/1/24 (144A) | 734,097 |
| 1,000,000 | Avolon Holdings Funding, Ltd., 5.25%, 5/15/24 (144A) | 990,382 |
The accompanying notes are an integral part of these financial statements.
72Pioneer Multi-Asset Ultrashort Income Fund | Semiannual Report | 9/30/23
Principal
Amount
USD ($) | | | | | | Value |
| | Diversified Financial Services — (continued) | |
| 9,873,000(c) | Capital One Financial Corp., 1.343% (SOFR + 69 bps), 12/6/24 | $ 9,753,758 |
| 18,200,000(a) | Capital One Financial Corp., 6.034% (SOFR + 69 bps), 12/6/24 | 17,995,426 |
| 15,250,000(a) | Capital One Financial Corp., 6.692% (SOFR + 135 bps), 5/9/25 | 15,161,377 |
| 3,350,000 | Charles Schwab Corp., 4.20%, 3/24/25 | 3,266,083 |
| 6,646,000(a) | Charles Schwab Corp., 6.394% (SOFR + 105 bps), 3/3/27 | 6,576,724 |
| | Total Diversified Financial Services | $92,844,333 |
|
|
| | Electric — 1.1% | |
| 7,600,000(a) | CenterPoint Energy, Inc., 5.991% (SOFR + 65 bps), 5/13/24 | $ 7,598,603 |
| 8,660,000 | EDP Finance BV, 3.625%, 7/15/24 (144A) | 8,483,582 |
| 9,090,000 | NextEra Energy Capital Holdings, Inc., 5.749%, 9/1/25 | 9,064,474 |
| 4,485,000 | NextEra Energy Capital Holdings, Inc., 6.051%, 3/1/25 | 4,491,787 |
| 13,575,000(a) | NextEra Energy Capital Holdings, Inc., 6.365% (SOFR + 102 bps), 3/21/24 | 13,580,559 |
| 6,545,000 | Public Service Enterprise Group, Inc., 0.841%, 11/8/23 | 6,508,931 |
| | Total Electric | $49,727,936 |
|
|
| | Insurance — 1.1% | |
| 13,700,000(a) | Athene Global Funding, 5.902% (SOFR + 56 bps), 8/19/24 (144A) | $ 13,565,735 |
| 6,250,000(a) | Metropolitan Life Global Funding I, 6.255% (SOFR + 91 bps), 3/21/25 (144A) | 6,277,798 |
| 5,400,000(a) | Principal Life Global Funding II, 5.723% (SOFR + 38 bps), 8/23/24 (144A) | 5,385,000 |
| 6,500,000(a) | Principal Life Global Funding II, 5.743% (SOFR + 45 bps), 4/12/24 (144A) | 6,492,362 |
| 9,030,000(a) | Protective Life Global Funding, 6.325% (SOFR + 98 bps), 3/28/25 (144A) | 9,059,084 |
| 8,115,000(a) | Protective Life Global Funding, 6.394% (SOFR + 105 bps), 12/11/24 (144A) | 8,148,181 |
| | Total Insurance | $48,928,160 |
|
|
| | Machinery-Diversified — 0.2% | |
| 8,820,000 | John Deere Capital Corp., 5.30%, 9/8/25 | $ 8,799,050 |
| | Total Machinery-Diversified | $8,799,050 |
|
|
The accompanying notes are an integral part of these financial statements.
Pioneer Multi-Asset Ultrashort Income Fund | Semiannual Report | 9/30/2373
Schedule of Investments | 9/30/23
(unaudited) (continued)
Principal
Amount
USD ($) | | | | | | Value |
| | Pipelines — 0.5% | |
| 7,553,000 | Sabine Pass Liquefaction LLC, 5.625%, 3/1/25 | $ 7,505,400 |
| 15,000,000 | Williams Cos, Inc., 4.30%, 3/4/24 | 14,886,400 |
| | Total Pipelines | $22,391,800 |
|
|
| | Semiconductors — 0.3% | |
| 9,147,000 | Broadcom Corp./Broadcom Cayman Finance, Ltd., 3.625%, 1/15/24 | $ 9,079,971 |
| 4,010,000 | Microchip Technology, Inc., 0.983%, 9/1/24 | 3,827,992 |
| | Total Semiconductors | $12,907,963 |
|
|
| | Telecommunications — 0.0%† | |
| 2,162,000 | T-Mobile USA, Inc., 3.50%, 4/15/25 | $ 2,086,132 |
| | Total Telecommunications | $2,086,132 |
|
|
| | Trucking & Leasing — 0.1% | |
| 5,645,000 | Penske Truck Leasing Co. LP/PTL Finance Corp., 5.75%, 5/24/26 (144A) | $ 5,561,931 |
| | Total Trucking & Leasing | $5,561,931 |
|
|
| | Total Corporate Bonds
(Cost $1,465,264,824) | $1,464,555,945 |
|
|
| | Insurance-Linked Securities — 2.1%# of
Net Assets | |
| | Event Linked Bonds — 1.7% | |
| | Earthquakes – California — 0.1% | |
| 2,000,000(a) | Phoenician Re, 8.344%, (3 Month U.S. Treasury Bill + 290 bps), 12/14/24 (144A) | $ 1,967,000 |
| 4,000,000(a) | Ursa Re II, 9.386%, (3 Month U.S. Treasury Bill + 394 bps), 12/7/23 (144A) | 3,986,000 |
| | | | | | | $ 5,953,000 |
|
|
| | Earthquakes – Mexico — 0.0%† | |
| 500,000(a) | International Bank for Reconstruction & Development, 9.087%, (3 Month USD LIBOR + 350 bps), 3/13/24 (144A) | $ 498,650 |
| | Earthquakes – U.S. — 0.0%† | |
| 1,000,000(a) | Torrey Pines Re Pte, 9.626%, (3 Month U.S. Treasury Bill + 418 bps), 6/7/24 (144A) | $ 971,400 |
| | Earthquakes – U.S. & Canada — 0.1% | |
| 2,500,000(a) | Acorn Re, 7.946%, (3 Month U.S. Treasury Bill + 250 bps), 11/7/24 (144A) | $ 2,446,250 |
The accompanying notes are an integral part of these financial statements.
74Pioneer Multi-Asset Ultrashort Income Fund | Semiannual Report | 9/30/23
Principal
Amount
USD ($) | | | | | | Value |
| | Flood – U.S. — 0.0%† | |
| 1,500,000(a) | FloodSmart Re, 17.276%, (3 Month U.S. Treasury Bill + 1,183 bps), 2/25/25 (144A) | $ 1,434,750 |
| | Multiperil – U.S. — 0.7% | |
| 1,500,000(a) | Bonanza Re, 10.316%, (3 Month U.S. Treasury Bill + 487 bps), 2/20/24 (144A) | $ 1,417,650 |
| 125,000(a) | Caelus Re V, 5.546%, (1 Month U.S. Treasury Bill + 10 bps), 6/5/24 (144A) | 100,000 |
| 750,000(a) | Caelus Re V, 5.546%, (3 Month U.S. Treasury Bill + 10 bps), 6/9/25 (144A) | 75 |
| 500,000(a) | Caelus Re V, 5.946%, (3 Month U.S. Treasury Bill + 50 bps), 6/9/25 (144A) | 350,000 |
| 750,000(a) | Caelus Re VI, 10.826%, (3 Month U.S. Treasury Bill + 538 bps), 6/7/24 (144A) | 729,675 |
| 4,500,000(a) | Easton Re Pte, 9.976%, (3 Month U.S. Treasury Bill + 453 bps), 1/8/24 (144A) | 4,506,750 |
| 2,000,000(a) | Four Lakes Re, 9.716%, (3 Month U.S. Treasury Bill + 427 bps), 1/7/25 (144A) | 1,934,600 |
| 1,750,000(a) | Four Lakes Re, 12.746%, (3 Month U.S. Treasury Bill + 730 bps), 1/5/24 (144A) | 1,711,500 |
| 500,000(a) | Herbie Re, 12.176%, (3 Month U.S. Treasury Bill + 673 bps), 1/8/25 (144A) | 486,550 |
| 5,000,000(a) | Matterhorn Re, 10.595%, (SOFR + 525 bps), 3/24/25 (144A) | 4,872,000 |
| 2,000,000(a) | Matterhorn Re, 13.095%, (SOFR + 775 bps), 3/24/25 (144A) | 1,972,000 |
| 5,000,000(a) | Residential Re, 10.626%, (3 Month U.S. Treasury Bill + 518 bps), 12/6/25 (144A) | 4,677,000 |
| 1,500,000(a) | Residential Re, 11.956%, (3 Month U.S. Treasury Bill + 651 bps), 12/6/24 (144A) | 1,474,350 |
| 2,750,000(a) | Sanders Re II, 8.496%, (3 Month U.S. Treasury Bill + 305 bps), 4/7/25 (144A) | 2,604,800 |
| 3,000,000(a) | Sanders Re II, 8.696%, (3 Month U.S. Treasury Bill + 325 bps), 4/7/25 (144A) | 2,879,100 |
| 3,000,000(a) | Sanders Re III, 8.946%, (3 Month U.S. Treasury Bill + 350 bps), 4/7/26 (144A) | 2,839,800 |
| 1,000,000(a) | Sussex Re, 13.826%, (3 Month U.S. Treasury Bill + 838 bps), 1/8/25 (144A) | 961,600 |
| | | | | | | $ 33,517,450 |
|
|
| | Multiperil – U.S. & Canada — 0.1% | |
| 250,000(a) | Matterhorn Re, 11.094%, (SOFR + 575 bps), 12/8/25 (144A) | $ 226,575 |
The accompanying notes are an integral part of these financial statements.
Pioneer Multi-Asset Ultrashort Income Fund | Semiannual Report | 9/30/2375
Schedule of Investments | 9/30/23
(unaudited) (continued)
Principal
Amount
USD ($) | | | | | | Value |
| | Multiperil – U.S. & Canada — (continued) | |
| 1,000,000(a) | Mona Lisa Re, 12.446%, (3 Month U.S. Treasury Bill + 700 bps), 7/8/25 (144A) | $ 974,800 |
| 4,000,000(a) | Mystic Re IV, 11.576%, (3 Month U.S. Treasury Bill + 613 bps), 1/8/25 (144A) | 3,853,200 |
| | | | | | | $ 5,054,575 |
|
|
| | Multiperil – U.S. Regional — 0.1% | |
| 1,000,000(a) | Kilimanjaro III Re, 5.25%, (3 Month U.S. Treasury Bill + 525 bps), 6/25/25 (144A) | $ 996,500 |
| 3,500,000(a) | Long Point Re IV, 9.696%, (3 Month U.S. Treasury Bill + 425 bps), 6/1/26 (144A) | 3,479,000 |
| 400,000(a) | Matterhorn Re, 10.446%, (3 Month U.S. Treasury Bill + 500 bps), 1/8/24 (144A) | 328,000 |
| | | | | | | $ 4,803,500 |
|
|
| | Multiperil – Worldwide — 0.0%† | |
| 1,500,000(a) | Northshore Re II, 11.196%, (3 Month U.S. Treasury Bill + 575 bps), 1/8/24 (144A) | $ 1,495,050 |
| | Pandemic – U.S — 0.1% | |
| 3,000,000(a) | Vitality Re XI, 6.946%, (3 Month U.S. Treasury Bill + 150 bps), 1/9/24 (144A) | $ 2,990,700 |
| 1,250,000(a) | Vitality Re XI, 7.246%, (3 Month U.S. Treasury Bill + 180 bps), 1/9/24 (144A) | 1,240,375 |
| | | | | | | $ 4,231,075 |
|
|
| | Windstorm – Florida — 0.1% | |
| 2,000,000(a) | Integrity Re, 12.516%, (3 Month U.S. Treasury Bill + 707 bps), 6/6/25 (144A) | $ 1,800,000 |
| 2,200,000(a) | Merna Re II, 10.946%, (3 Month U.S. Treasury Bill + 550 bps), 7/8/24 (144A) | 2,139,500 |
| | | | | | | $ 3,939,500 |
|
|
| | Windstorm – Jamaica — 0.1% | |
| 4,000,000(a) | International Bank for Reconstruction & Development, 9.721%, (SOFR + 440 bps), 12/29/23 (144A) | $ 4,002,400 |
| | Windstorm – Mexico — 0.0%† | |
| 500,000(a) | International Bank for Reconstruction & Development, 12.167%, (3 Month USD LIBOR + 650 bps), 3/13/24 (144A) | $ 491,750 |
| | Windstorm – North Carolina — 0.1% | |
| 3,000,000(a) | Cape Lookout Re, 10.796%, (3 Month U.S. Treasury Bill + 535 bps), 3/28/25 (144A) | $ 2,903,400 |
The accompanying notes are an integral part of these financial statements.
76Pioneer Multi-Asset Ultrashort Income Fund | Semiannual Report | 9/30/23
Principal
Amount
USD ($) | | | | | | Value |
| | Windstorm – U.S. — 0.1% | |
| 2,000,000(a) | Bonanza Re, 10.316%, (3 Month U.S. Treasury Bill + 487 bps), 12/23/24 (144A) | $ 1,786,600 |
| 250,000(a) | Bonanza Re, 11.196%, (3 Month U.S. Treasury Bill + 575 bps), 3/16/25 (144A) | 175,000 |
| | | | | | | $ 1,961,600 |
| |
| |
| | Windstorm – U.S. Regional — 0.1% | | |
| 2,500,000(a) | Citrus Re, 10.546%, (3 Month U.S. Treasury Bill + 510 bps), 6/7/25 (144A) | $ 2,468,500 | |
| 1,000,000(a) | Commonwealth Re, 8.946%, (3 Month U.S. Treasury Bill + 350 bps), 7/8/25 (144A) | 1,004,300 | |
| | | | | | | $ 3,472,800 | |
| |
| |
| | Total Event Linked Bonds | $ 77,177,150 | |
| |
| |
Face
Amount
USD ($) | | | | | | |
| | Collateralized Reinsurance — 0.1% | |
| | Earthquakes – California — 0.1% | |
| 2,980,000(e)(f) + | Adare Re 2022-2, 9/30/28 | $ 3,290,727 |
| | Multiperil – Massachusetts — 0.0%† | |
| 3,000,000(e)(f) + | Denning Re 2022, 6/30/28 | $ 2,507,717 |
| | Multiperil – U.S. — 0.0%† | |
| 2,088,182(e)(f) + | Ballybunion Re 2022, 12/31/27 | $ 39,572 |
| 1,053,082(e)(f) + | Ballybunion Re 2022-2, 5/31/28 | 1,069,415 |
| | | | | | | $ 1,108,987 |
|
|
| | Multiperil – Worldwide — 0.0%† | |
| 1,000,000(e)(f) + | Cypress Re 2017, 1/31/24 | $ 100 |
| 223,000(f) + | Limestone Re 2019-2B, 10/1/23 (144A) | 1,890 |
| 2,500,000(e)(f) + | Resilience Re, 5/1/24 | — |
| | | | | | | $ 1,990 |
|
|
| | Windstorm – Florida — 0.0%† | |
| 2,000,000(e)(f) + | Formby Re 2018, 2/29/24 | $ — |
| 800,000(e)(f) + | Portrush Re 2017, 6/15/24 | 80 |
| | | | | | | $ 80 |
|
|
| | Windstorm – U.S. Regional — 0.0%† | |
| 1,500,000(e)(f) + | Oakmont Re 2022, 4/1/28 | $ 471,758 |
| | Total Collateralized Reinsurance | $7,381,259 |
|
|
The accompanying notes are an integral part of these financial statements.
Pioneer Multi-Asset Ultrashort Income Fund | Semiannual Report | 9/30/2377
Schedule of Investments | 9/30/23
(unaudited) (continued)
Face
Amount
USD ($) | | | | | | Value |
|
| | Reinsurance Sidecars — 0.3% | |
| | Multiperil – U.S. — 0.0%† | |
| 2,000,000(e)(g) + | Harambee Re 2018, 12/31/24 | $ — |
| 4,000,000(g) + | Harambee Re 2019, 12/31/24 | 4,800 |
| | | | | | | $ 4,800 |
|
|
| | Multiperil – Worldwide — 0.3% | |
| 4,000,000(e)(g) + | Alturas Re 2021-3, 7/31/25 | $ 349,200 |
| 421,041(e)(g) + | Alturas Re 2022-2, 12/31/27 | 95,913 |
| 3,000,000(e)(f) + | Bantry Re 2022, 12/31/27 | 350,583 |
| 3,658,035(e)(f) + | Berwick Re 2019-1, 12/31/24 | 583,457 |
| 4,500,000(e)(f) + | Berwick Re 2022, 12/31/27 | 86,757 |
| 3,000,000(e)(f) + | Gleneagles Re 2022, 12/31/27 | 1,482,972 |
| 2,118,314(e)(f) + | Gullane Re 2018, 12/31/24 | 100,036 |
| 2,744,544(e)(g) + | Lorenz Re 2019, 6/30/24 | 26,896 |
| 3,000,000(f) + | Merion Re 2018-2, 12/31/24 | 149,952 |
| 4,000,000(e)(f) + | Merion Re 2022-2, 12/31/27 | 3,792,446 |
| 4,000,000(f) + | Pangaea Re 2021-3, 7/1/25 | 97,497 |
| 4,000,000(e)(f) + | RosaPenna Re 2021, 7/31/25 | 160,000 |
| 3,500,000(e)(f) + | RosaPenna Re 2022, 6/30/28 | 3,365,619 |
| 800,000(e)(f) + | Sector Re V, 3/1/24 (144A) | 410,080 |
| 1,861(e)(f) + | Sector Re V, 3/1/24 (144A) | 44,602 |
| 160,000(e)(f) + | Sector Re V, 12/1/24 (144A) | 279,360 |
| 50,000(a)(f) + | Sector Re V, 12/1/26 (144A) | 233,460 |
| 3,000,000(e)(g) + | Thopas Re 2019, 12/31/24 | 23,400 |
| 3,500,000(g) + | Thopas Re 2022, 12/31/27 | — |
| 4,000,000(g) + | Torricelli Re 2021, 7/31/25 | 172,800 |
| 4,000,000(g) + | Torricelli Re 2022, 6/30/28 | 59,612 |
| 750,000(e)(g) + | Viribus Re 2018, 12/31/24 | — |
| 2,500,000(e)(g) + | Viribus Re 2019, 12/31/24 | 17,750 |
| 1,724,784(e)(f) + | Woburn Re 2018, 12/31/24 | 34,209 |
| 809,418(e)(f) + | Woburn Re 2019, 12/31/24 | 140,095 |
| | | | | | | $ 12,056,696 |
|
|
| | Total Reinsurance Sidecars | $12,061,496 |
|
|
| | Total Insurance-Linked Securities
(Cost $99,634,564) | $96,619,905 |
|
|
The accompanying notes are an integral part of these financial statements.
78Pioneer Multi-Asset Ultrashort Income Fund | Semiannual Report | 9/30/23
Principal
Amount
USD ($) | | | | | | Value |
| | U.S. Government and Agency
Obligations — 1.6% of Net Assets | |
| 1,187(a) | Federal Home Loan Mortgage Corp., 4.250%, (1 year Refinitiv USD IBOR Consumer Cash Fallbacks + 200 bps), 11/1/33 | $ 1,169 |
| 2,157,720 | Federal National Mortgage Association, 3.000%, 3/1/47 | 1,829,710 |
| 3,274(a) | Federal National Mortgage Association, 3.954%, (1 year Refinitiv USD IBOR Consumer Cash Fallbacks + 167 bps), 1/1/48 | 3,223 |
| 1,331(a) | Federal National Mortgage Association, 4.230%, (1 Year CMT Index + 211 bps), 10/1/32 | 1,299 |
| 4,987(a) | Federal National Mortgage Association, 4.295%, (1 Year CMT Index + 217 bps), 2/1/34 | 4,874 |
| 3,636(a) | Federal National Mortgage Association, 4.727%, (1 Year CMT Index + 210 bps), 9/1/32 | 3,571 |
| 23,000,000 | Federal National Mortgage Association, 5.500%, 10/15/38 (TBA) | 22,752,930 |
| 15,000,000 | Federal National Mortgage Association, 6.000%, 10/1/53 (TBA) | 14,803,125 |
| 32,000,000 | Federal National Mortgage Association, 6.500%, 10/15/53 (TBA) | 32,145,000 |
| | Total U.S. Government and Agency Obligations
(Cost $71,990,236) | $71,544,901 |
|
|
| | SHORT TERM INVESTMENTS — 17.2% of Net
Assets | |
| | Repurchase Agreements — 5.7% | |
| 90,000,000 | Bank of America, 5.3%, dated 9/29/23,
to be purchased on 10/2/23 for $90,039,750,
collateralized by $91,800,000 Government National
Mortgage Association, 4.5%, 6/20/50 | $ 90,000,000 |
| 50,000,000 | Scotia Capital Inc., 5.29%, dated 9/29/23,
to be purchased on 10/2/23 for $50,022,042,
collateralized by the following:
$623,721 Federal Home Loan Mortgage Corporation,
5.0%, 7/1/53,
$22,502,617 Federal National Mortgage Association,
3.0%-6.5%, 7/1/39-9/1/53,
$27,896,192 U.S. Treasury Bill, 12/28/23 | 50,000,000 |
The accompanying notes are an integral part of these financial statements.
Pioneer Multi-Asset Ultrashort Income Fund | Semiannual Report | 9/30/2379
Schedule of Investments | 9/30/23
(unaudited) (continued)
Principal
Amount
USD ($) | | | | | | Value |
| | Repurchase Agreements — (continued) | |
| 50,000,000 | RBC Dominion Securities Inc., 5.3%, dated 9/29/23,
to be purchased on 10/2/23 for $50,022,083,
collateralized by the following:
$5,595,211 U.S. Treasury Bill, 12/28/23-2/22/24,
$5,437,443 U.S. Treasury Floating Rate Note,
5.440%-5.543%, 7/31/24-10/31/24,
$39,989,940 U.S. Treasury Note, 0.5%-2.625%, 4/15/25-2/28/26 | $ 50,000,000 |
| 35,000,000 | Toronto-Dominion Bank, 5.3%, dated 9/29/23,
to be purchased on 10/2/23 for $35,015,458,
collateralized by $35,700,051 U.S. Treasury Note,
0.25%-4.125%, 4/30/25-11/15/32 | 35,000,000 |
| 35,000,000 | Toronto-Dominion Bank, 5.31%, dated 9/29/23,
to be purchased on 10/2/23 for $35,015,488,
collateralized by $35,700,000 Federal National
Mortgage Association, 6.0%, 8/1/53 | 35,000,000 |
| | | | | | | $ 260,000,000 |
|
|
| | Commercial Paper — 5.7% of Net Assets | |
| 22,000,000(h) | Avalonbay Communities, Inc., 5.402%, 10/2/23 | $ 21,989,964 |
| 19,800,000(h) | Consolidated Edison Company of New York, Inc., 5.416%, 10/5/23 | 19,782,084 |
| 19,800,000(h) | DCAT LLC, 5.404%, 10/4/23 | 19,785,277 |
| 11,400,000(h) | Duke Energy Corp., 5.353%, 10/3/23 | 11,393,127 |
| 8,400,000(h) | Duke Energy Corp., 5.332%, 10/2/23 | 8,396,203 |
| 18,000,000(h) | Energy Transfer Operating LP, 5.753%, 10/2/23 | 17,991,426 |
| 22,000,000(h) | Enterprise Products Operating LLC, 5.402%, 10/2/23 | 21,990,056 |
| 20,800,000(h) | ERP Operating LP, 5.462%, 10/2/23 | 20,790,598 |
| 18,000,000(h) | FMC Corp., 5.903%, 10/2/23 | 17,990,927 |
| 22,000,000(h) | Healthpeak Properties Interim, Inc., 5.551%, 10/4/23 | 21,983,335 |
| 18,000,000(h) | Jabil, Inc., 6.054%, 10/3/23 | 17,987,752 |
| 13,000,000(h) | Penske Truck Leasing Co. LP, 5.512%, 10/6/23 | 12,986,072 |
| 25,000,000(h) | Prudential Funding Corp., 5.316%, 10/4/23 | 24,981,549 |
| 12,900,000(h) | WEC Energy Group, Inc., 5.402%, 10/2/23 | 12,894,169 |
| 9,100,000(h) | WEC Energy Group, Inc., 5.446%, 10/5/23 | 9,091,766 |
| | Total Commercial Paper
(Cost $260,114,347) | $260,034,305 |
|
|
The accompanying notes are an integral part of these financial statements.
80Pioneer Multi-Asset Ultrashort Income Fund | Semiannual Report | 9/30/23
| Shares | | | | | | Value |
| | Open-End Fund — 5.8% | |
| 261,794,851(i) | Dreyfus Government Cash Management,
Institutional Shares, 5.22% | $ 261,794,851 |
| | | | | | | $ 261,794,851 |
|
|
| | TOTAL SHORT TERM INVESTMENTS
(Cost $781,909,198) | $781,829,156 |
|
|
| | TOTAL INVESTMENTS IN UNAFFILIATED ISSUERS — 102.7%
(Cost $4,723,267,306) | $4,674,559,304 |
| | OTHER ASSETS AND LIABILITIES — (2.7)% | $ (122,149,930) |
| | net assets — 100.0% | $4,552,409,374 |
| | | | | | | |
| (TBA) | “To Be Announced” Securities. |
| bps | Basis Points. |
| CMT | Constant Maturity Treasury Index. |
| IBOR | Interbank Offered Rate. |
| LIBOR | London Interbank Offered Rate. |
| PRIME | U.S. Federal Funds Rate. |
| REMICs | Real Estate Mortgage Investment Conduits. |
| SOFR | Secured Overnight Financing Rate. |
| SOFR30A | Secured Overnight Financing Rate 30 Day Average. |
| STRIPS | Separate Trading of Registered Interest and Principal of Securities. |
| (144A) | The resale of such security is exempt from registration under Rule 144A of the Securities Act of 1933. Such securities may be resold normally to qualified institutional buyers. At September 30, 2023, the value of these securities amounted to $2,621,568,921, or 57.6% of net assets. |
| (a) | Floating rate note. Coupon rate, reference index and spread shown at September 30, 2023. |
| (b) | Security is in default. |
| (c) | The interest rate is subject to change periodically. The interest rate and/or reference index and spread shown at September 30, 2023. |
| (d) | Securities purchased on a when-issued basis. Rates do not take effect until settlement date. |
| (e) | Non-income producing security. |
| (f) | Issued as participation notes. |
| (g) | Issued as preference shares. |
| (h) | Rate shown represents yield-to-maturity. |
| (i) | Rate periodically changes. Rate disclosed is the 7-day yield at September 30, 2023. |
The accompanying notes are an integral part of these financial statements.
Pioneer Multi-Asset Ultrashort Income Fund | Semiannual Report | 9/30/2381
Schedule of Investments | 9/30/23
(unaudited) (continued)
| * | Senior secured floating rate loan interests in which the Fund invests generally pay interest at rates that are periodically re-determined by reference to a base lending rate plus a premium. These base lending rates are generally (i) the lending rate offered by one or more major European banks, such as LIBOR or SOFR, (ii) the prime rate offered by one or more major United States banks, (iii) the rate of a certificate of deposit or (iv) other base lending rates used by commercial lenders. The interest rate shown is the rate accruing at September 30, 2023. |
| + | Security is valued using significant unobservable inputs (Level 3). |
| † | Amount rounds to less than 0.1%. |
| # | Securities are restricted as to resale. |
| Restricted Securities | Acquisition date | Cost | Value |
| Acorn Re | 10/25/2021 | $2,500,000 | $ 2,446,250 |
| Adare Re 2022-2 | 10/20/2022 | 2,980,000 | 3,290,727 |
| Alturas Re 2021-3 | 7/1/2021 | 746,372 | 349,200 |
| Alturas Re 2022-2 | 1/6/2022 | 93,527 | 95,913 |
| Ballybunion Re 2022 | 3/9/2022 | 3,338 | 39,572 |
| Ballybunion Re 2022-2 | 8/9/2022 | 1,053,082 | 1,069,415 |
| Bantry Re 2022 | 1/28/2022 | 222,536 | 350,583 |
| Berwick Re 2019-1 | 12/31/2018 | 437,104 | 583,457 |
| Berwick Re 2022 | 12/28/2021 | 80,457 | 86,757 |
| Bonanza Re | 2/13/2020 | 1,500,000 | 1,417,650 |
| Bonanza Re | 12/15/2020 | 2,000,000 | 1,786,600 |
| Bonanza Re | 3/11/2022 | 250,000 | 175,000 |
| Caelus Re V | 4/27/2017 | 125,000 | 100,000 |
| Caelus Re V | 5/4/2018 | 500,000 | 350,000 |
| Caelus Re V | 5/4/2018 | 750,000 | 75 |
| Caelus Re VI | 2/20/2020 | 750,000 | 729,675 |
| Cape Lookout Re | 3/16/2022 | 3,000,000 | 2,903,400 |
| Citrus Re | 4/11/2022 | 2,500,000 | 2,468,500 |
| Commonwealth Re | 6/15/2022 | 1,000,000 | 1,004,300 |
| Cypress Re 2017 | 1/24/2017 | 3,361 | 100 |
| Denning Re 2022 | 7/11/2022 | 2,333,769 | 2,507,717 |
| Easton Re Pte | 12/15/2020 | 4,500,000 | 4,506,750 |
| FloodSmart Re | 2/14/2022 | 1,500,000 | 1,434,750 |
| Formby Re 2018 | 7/9/2018 | 6,214 | — |
| Four Lakes Re | 11/5/2020 | 1,750,000 | 1,711,500 |
| Four Lakes Re | 12/15/2021 | 2,000,000 | 1,934,600 |
| Gleneagles Re 2022 | 1/18/2022 | 1,389,222 | 1,482,972 |
| Gullane Re 2018 | 3/26/2018 | — | 100,036 |
| Harambee Re 2018 | 12/19/2017 | 42,461 | — |
| Harambee Re 2019 | 12/20/2018 | — | 4,800 |
| Herbie Re | 10/19/2020 | 500,000 | 486,550 |
| Integrity Re | 5/9/2022 | 2,000,000 | 1,800,000 |
The accompanying notes are an integral part of these financial statements.
82Pioneer Multi-Asset Ultrashort Income Fund | Semiannual Report | 9/30/23
| Restricted Securities | Acquisition date | Cost | Value |
| International Bank for Reconstruction & Development | 2/28/2020 | $ 500,000 | $ 498,650 |
| International Bank for Reconstruction & Development | 2/28/2020 | 500,000 | 491,750 |
| International Bank for Reconstruction & Development | 7/19/2021 | 4,000,000 | 4,002,400 |
| Kilimanjaro III Re | 6/15/2022 | 1,000,000 | 996,500 |
| Limestone Re 2019-2B | 6/20/2018 | 1,771 | 1,890 |
| Long Point Re IV | 5/13/2022 | 3,500,000 | 3,479,000 |
| Lorenz Re 2019 | 6/26/2019 | 456,730 | 26,896 |
| Matterhorn Re | 6/5/2020 | 399,270 | 328,000 |
| Matterhorn Re | 12/15/2021 | 250,000 | 226,575 |
| Matterhorn Re | 3/10/2022 | 5,000,000 | 4,872,000 |
| Matterhorn Re | 3/10/2022 | 2,000,000 | 1,972,000 |
| Merion Re 2018-2 | 12/28/2017 | — | 149,952 |
| Merion Re 2022-2 | 2/22/2022 | 4,000,000 | 3,792,446 |
| Merna Re II | 6/8/2021 | 2,200,000 | 2,139,500 |
| Mona Lisa Re | 6/22/2021 | 1,000,000 | 974,800 |
| Mystic Re IV | 6/9/2021 | 4,000,000 | 3,853,200 |
| Northshore Re II | 12/2/2020 | 1,500,000 | 1,495,050 |
| Oakmont Re 2022 | 5/4/2022 | 345,066 | 471,758 |
| Pangaea Re 2021-3 | 6/17/2021 | — | 97,497 |
| Phoenician Re | 12/1/2021 | 2,000,000 | 1,967,000 |
| Portrush Re 2017 | 6/12/2017 | 613,588 | 80 |
| Residential Re | 10/30/2020 | 1,500,000 | 1,474,350 |
| Residential Re | 10/28/2021 | 5,000,000 | 4,677,000 |
| Resilience Re | 2/8/2017 | 1,209 | — |
| RosaPenna Re 2021 | 7/16/2021 | — | 160,000 |
| RosaPenna Re 2022 | 9/6/2022 | 3,153,869 | 3,365,619 |
| Sanders Re II | 5/24/2021 | 3,000,000 | 2,879,100 |
| Sanders Re II | 11/23/2021 | 2,752,500 | 2,604,800 |
| Sanders Re III | 3/22/2022 | 3,000,000 | 2,839,800 |
| Sector Re V | 4/23/2019 | 543,357 | 410,080 |
| Sector Re V | 5/1/2019 | 1,861 | 44,602 |
| Sector Re V | 1/1/2020 | 3,775 | 279,360 |
| Sector Re V | 12/6/2021 | — | 233,460 |
| Sussex Re | 12/7/2020 | 1,000,000 | 961,600 |
| Thopas Re 2019 | 12/21/2018 | — | 23,400 |
| Thopas Re 2022 | 2/7/2022 | — | — |
| Torrey Pines Re Pte | 3/12/2021 | 1,000,000 | 971,400 |
| Torricelli Re 2021 | 7/1/2021 | — | 172,800 |
| Torricelli Re 2022 | 7/26/2022 | — | 59,612 |
| Ursa Re II | 10/8/2020 | 4,000,000 | 3,986,000 |
| Viribus Re 2018 | 12/22/2017 | 15,839 | — |
| Viribus Re 2019 | 12/27/2018 | — | 17,750 |
The accompanying notes are an integral part of these financial statements.
Pioneer Multi-Asset Ultrashort Income Fund | Semiannual Report | 9/30/2383
Schedule of Investments | 9/30/23
(unaudited) (continued)
| Restricted Securities | Acquisition date | Cost | Value |
| Vitality Re XI | 1/23/2020 | $3,000,000 | $ 2,990,700 |
| Vitality Re XI | 1/23/2020 | 1,249,090 | 1,240,375 |
| Woburn Re 2018 | 3/20/2018 | 518,057 | 34,209 |
| Woburn Re 2019 | 1/30/2019 | 112,139 | 140,095 |
| Total Restricted Securities | | | $96,619,905 |
| % of Net assets | | | 2.1% |
Principal amounts are denominated in U.S. dollars (“USD”) unless otherwise noted.
Purchases and sales of securities (excluding short-term investments) for the six months ended September 30, 2023, aggregated $1,137,326,569 and $931,231,228, respectively.
At September 30, 2023, the net unrealized depreciation on investments based on cost for federal tax purposes of $4,725,194,986 was as follows:
| Aggregate gross unrealized appreciation for all investments in which there is an excess of value over tax cost | $ 10,161,142 |
| Aggregate gross unrealized depreciation for all investments in which there is an excess of tax cost over value | (60,796,824) |
| Net unrealized depreciation | $(50,635,682) |
Various inputs are used in determining the value of the Fund's investments. These inputs are summarized in the three broad levels below.
| Level 1 | – | unadjusted quoted prices in active markets for identical securities. |
| Level 2 | – | other significant observable inputs (including quoted prices for similar securities, interest rates, prepayment speeds, credit risks, etc.). See Notes to Financial Statements — Note 1A. |
| Level 3 | – | significant unobservable inputs (including the Adviser's own assumptions in determining fair value of investments). See Notes to Financial Statements — Note 1A. |
The accompanying notes are an integral part of these financial statements.
84Pioneer Multi-Asset Ultrashort Income Fund | Semiannual Report | 9/30/23
The following is a summary of the inputs used as of September 30, 2023, in valuing the Fund's investments:
| | Level 1 | Level 2 | Level 3 | Total |
| Senior Secured Floating Rate Loan Interests | $ — | $ 94,562,803 | $ — | $ 94,562,803 |
| Asset Backed Securities | — | 1,369,196,723 | — | 1,369,196,723 |
| Collateralized Mortgage Obligations | — | 541,842,767 | — | 541,842,767 |
| Commercial Mortgage-Backed Securities | — | 254,407,104 | — | 254,407,104 |
| Corporate Bonds | — | 1,464,555,945 | — | 1,464,555,945 |
| Insurance-Linked Securities | | | | |
| Collateralized Reinsurance | | | | |
| Earthquakes – California | — | — | 3,290,727 | 3,290,727 |
| Multiperil – Massachusetts | — | — | 2,507,717 | 2,507,717 |
| Multiperil – U.S. | — | — | 1,108,987 | 1,108,987 |
| Multiperil – Worldwide | — | — | 1,990 | 1,990 |
| Windstorm – Florida | — | — | 80 | 80 |
| Windstorm – U.S. Regional | — | — | 471,758 | 471,758 |
| Reinsurance Sidecars | | | | |
| Multiperil – U.S. | — | — | 4,800 | 4,800 |
| Multiperil – Worldwide | — | — | 12,056,696 | 12,056,696 |
| All Other Insurance-Linked Securities | — | 77,177,150 | — | 77,177,150 |
| U.S. Government and Agency Obligations | — | 71,544,901 | — | 71,544,901 |
| Repurchase Agreements | — | 260,000,000 | — | 260,000,000 |
| Commercial Paper | — | 260,034,305 | — | 260,034,305 |
| Open-End Fund | 261,794,851 | — | — | 261,794,851 |
| Total Investments in Securities | $ 261,794,851 | $ 4,393,321,698 | $ 19,442,755 | $ 4,674,559,304 |
During the period ended September 30, 2023, there were no significant transfers in or out of Level 3.
The accompanying notes are an integral part of these financial statements.
Pioneer Multi-Asset Ultrashort Income Fund | Semiannual Report | 9/30/2385
Statement of Assets and Liabilities | 9/30/23 (unaudited)
| ASSETS: | |
| Investments in unaffiliated issuers, at value (cost $4,723,267,306) | $4,674,559,304 |
| Cash | 321,808 |
| Futures collateral | 1,249 |
| Receivables — | |
| Investment securities sold | 44,940,964 |
| Fund shares sold | 27,783,641 |
| Interest | 22,722,977 |
| Other assets | 160,382 |
| Total assets | $ 4,770,490,325 |
| LIABILITIES: | |
| Payables — | |
| Investment securities purchased | $ 188,651,664 |
| Fund shares repurchased | 25,552,175 |
| Distributions | 2,768,663 |
| Trustees' fees | 5,448 |
| Management fees | 152,770 |
| Administrative expenses | 123,032 |
| Distribution fees | 30,348 |
| Accrued expenses | 796,851 |
| Total liabilities | $ 218,080,951 |
| NET ASSETS: | |
| Paid-in capital | $4,873,185,094 |
| Distributable earnings (loss) | (320,775,720) |
| Net assets | $4,552,409,374 |
| NET ASSET VALUE PER SHARE: | |
| No par value (unlimited number of shares authorized) | |
| Class A (based on $1,205,257,902/125,554,714 shares) | $ 9.60 |
| Class C (based on $68,438,050/7,124,322 shares) | $ 9.61 |
| Class C2 (based on $7,804,840/812,280 shares) | $ 9.61 |
| Class K (based on $455,287,357/47,285,050 shares) | $ 9.63 |
| Class Y (based on $2,815,621,225/292,790,545 shares) | $ 9.62 |
The accompanying notes are an integral part of these financial statements.
86Pioneer Multi-Asset Ultrashort Income Fund | Semiannual Report | 9/30/23
Statement of Operations (unaudited)
FOR THE SIX MONTHS ENDED 9/30/23
| INVESTMENT INCOME: | | |
| Interest from unaffiliated issuers (net of foreign taxes withheld $78,946) | $135,003,291 | |
| Dividends from unaffiliated issuers | 3,819,258 | |
| Total Investment Income | | $138,822,549 |
| EXPENSES: | | |
| Management fees | $ 6,761,290 | |
| Administrative expenses | 551,315 | |
| Transfer agent fees | | |
| Class A | 169,840 | |
| Class C | 14,952 | |
| Class C2 | 861 | |
| Class Y | 1,177,410 | |
| Distribution fees | | |
| Class A | 1,132,008 | |
| Class C | 186,011 | |
| Class C2 | 20,402 | |
| Shareowner communications expense | 66,175 | |
| Custodian fees | 24,430 | |
| Registration fees | 83,664 | |
| Professional fees | 135,110 | |
| Printing expense | 22,088 | |
| Officers' and Trustees' fees | 110,440 | |
| Miscellaneous | 179,247 | |
| Total expenses | | $ 10,635,243 |
| Net investment income | | $128,187,306 |
| REALIZED AND UNREALIZED GAIN (LOSS) ON INVESTMENTS: | | |
| Net realized gain (loss) on: | | |
| Investments in unaffiliated issuers | $ (6,750,775) | |
| Futures contracts | (1,770,247) | |
| Other assets and liabilities denominated in foreign currencies | 49 | $ (8,520,973) |
| Change in net unrealized appreciation (depreciation) on: | | |
| Investments in unaffiliated issuers | $ 37,336,324 | |
| Futures contracts | 2,519,317 | |
| Unfunded loan commitments | 5,462 | $ 39,861,103 |
| Net realized and unrealized gain (loss) on investments | | $ 31,340,130 |
| Net increase in net assets resulting from operations | | $159,527,436 |
The accompanying notes are an integral part of these financial statements.
Pioneer Multi-Asset Ultrashort Income Fund | Semiannual Report | 9/30/2387
Statements of Changes in Net Assets
| | Six Months
Ended
9/30/23
(unaudited) | Year
Ended
3/31/23 |
| FROM OPERATIONS: | | |
| Net investment income (loss) | $ 128,187,306 | $ 156,299,476 |
| Net realized gain (loss) on investments | (8,520,973) | (677,151) |
| Change in net unrealized appreciation (depreciation) on investments | 39,861,103 | (42,796,102) |
| Net increase in net assets resulting from operations | $ 159,527,436 | $ 112,826,223 |
| DISTRIBUTIONS TO SHAREOWNERS: | | |
| Class A ($0.27 and $0.33 per share, respectively) | $ (32,346,825) | $ (45,177,410) |
| Class C ($0.26 and $0.30 per share, respectively) | (1,991,501) | (3,171,931) |
| Class C2 ($0.26 and $0.30 per share, respectively) | (220,186) | (304,605) |
| Class K ($0.29 and $0.35 per share, respectively) | (13,500,680) | (14,837,824) |
| Class Y ($0.28 and $0.34 per share, respectively) | (78,470,327) | (93,891,768) |
| Total distributions to shareowners | $ (126,529,519) | $ (157,383,538) |
| FROM FUND SHARE TRANSACTIONS: | | |
| Net proceeds from sales of shares | $ 1,173,771,235 | $ 2,526,795,632 |
| Reinvestment of distributions | 114,871,043 | 143,378,011 |
| Cost of shares repurchased | (1,112,669,496) | (3,367,262,456) |
| Net increase (decrease) in net assets resulting from Fund share transactions | $ 175,972,782 | $ (697,088,813) |
| Net increase (decrease) in net assets | $ 208,970,699 | $ (741,646,128) |
| NET ASSETS: | | |
| Beginning of period | $ 4,343,438,675 | $ 5,085,084,803 |
| End of period | $ 4,552,409,374 | $ 4,343,438,675 |
The accompanying notes are an integral part of these financial statements.
88Pioneer Multi-Asset Ultrashort Income Fund | Semiannual Report | 9/30/23
| | Six Months
Ended
9/30/23
Shares
(unaudited) | Six Months
Ended
9/30/23
Amount
(unaudited) | Year
Ended
3/31/23
Shares | Year
Ended
3/31/23
Amount |
| Class A | | | | |
| Shares sold | 31,613,901 | $ 302,789,794 | 51,546,875 | $ 491,379,155 |
| Reinvestment of distributions | 3,267,640 | 31,298,818 | 4,633,351 | 44,082,938 |
| Less shares repurchased | (27,614,388) | (264,250,315) | (127,741,729) | (1,217,403,060) |
Net increase
(decrease) | 7,267,153 | $ 69,838,297 | (71,561,503) | $ (681,940,967) |
| Class C | | | | |
| Shares sold | 475,560 | $ 4,557,829 | 888,298 | $ 8,462,519 |
| Reinvestment of distributions | 205,654 | 1,971,197 | 330,923 | 3,150,518 |
| Less shares repurchased | (2,338,075) | (22,381,646) | (6,655,032) | (63,442,174) |
| Net decrease | (1,656,861) | $ (15,852,620) | (5,435,811) | $ (51,829,137) |
| Class C2 | | | | |
| Shares sold | 36,156 | $ 346,341 | 68,056 | $ 648,782 |
| Reinvestment of distributions | 2,159 | 20,691 | 3,410 | 32,472 |
| Less shares repurchased | (113,656) | (1,089,297) | (832,791) | (7,952,273) |
| Net decrease | (75,341) | $ (722,265) | (761,325) | $ (7,271,019) |
| Class K | | | | |
| Shares sold | 1,321,713 | $ 12,716,686 | 14,966,722 | $ 143,123,150 |
| Reinvestment of distributions | 1,394,482 | 13,397,852 | 1,553,923 | 14,832,180 |
| Less shares repurchased | (4,121,780) | (39,555,070) | (7,490,765) | (71,627,487) |
Net increase
(decrease) | (1,405,585) | $ (13,440,532) | 9,029,880 | $ 86,327,843 |
| Class Y | | | | |
| Shares sold | 88,941,139 | $ 853,360,585 | 197,282,641 | $ 1,883,182,026 |
| Reinvestment of distributions | 7,104,822 | 68,182,485 | 8,525,407 | 81,279,903 |
| Less shares repurchased | (81,901,458) | (785,393,168) | (210,298,894) | (2,006,837,462) |
Net increase
(decrease) | 14,144,503 | $ 136,149,902 | (4,490,846) | $ (42,375,533) |
The accompanying notes are an integral part of these financial statements.
Pioneer Multi-Asset Ultrashort Income Fund | Semiannual Report | 9/30/2389
| | Six Months
Ended
9/30/23
(unaudited) | Year
Ended
3/31/23 | Year
Ended
3/31/22 | Year
Ended
3/31/21 | Year
Ended
3/31/20 | Year
Ended
3/31/19 |
| Class A | | | | | | |
| Net asset value, beginning of period | $ 9.53 | $ 9.61 | $ 9.71 | $ 9.26 | $ 9.92 | $ 9.95 |
| Increase (decrease) from investment operations: | | | | | | |
| Net investment income (loss) (a) | $ 0.28 | $ 0.31 | $ 0.09 | $ 0.12 | $ 0.25 | $ 0.26 |
| Net realized and unrealized gain (loss) on investments | 0.06 | (0.06) | (0.07) | 0.47 | (0.64) | (0.03) |
| Net increase (decrease) from investment operations | $ 0.34 | $ 0.25 | $ 0.02 | $ 0.59 | $ (0.39) | $ 0.23 |
| Distributions to shareowners: | | | | | | |
| Net investment income | $ (0.27) | $ (0.33) | $ (0.12) | $ (0.14) | $ (0.27) | $ (0.26) |
| Total distributions | $ (0.27) | $ (0.33) | $ (0.12) | $ (0.14) | $ (0.27) | $ (0.26) |
| Net increase (decrease) in net asset value | $ 0.07 | $ (0.08) | $ (0.10) | $ 0.45 | $ (0.66) | $ (0.03) |
| Net asset value, end of period | $ 9.60 | $ 9.53 | $ 9.61 | $ 9.71 | $ 9.26 | $ 9.92 |
| Total return (b) | 3.64%(c) | 2.62% | 0.16% | 6.42% | (4.02)% | 2.32% |
| Ratio of net expenses to average net assets | 0.60%(d) | 0.60% | 0.59% | 0.60% | 0.58% | 0.59% |
| Ratio of net investment income (loss) to average net assets | 5.80%(d) | 3.21% | 0.96% | 1.29% | 2.52% | 2.58% |
| Portfolio turnover rate | 26%(c) | 34% | 52% | 51% | 100% | 61% |
| Net assets, end of period (in thousands) | $1,205,258 | $1,126,767 | $1,824,401 | $1,561,042 | $1,628,082 | $1,506,433 |
| (a) | The per-share data presented above is based on the average shares outstanding for the period presented. |
| (b) | Assumes initial investment at net asset value at the beginning of each period, reinvestment of all distributions, the complete redemption of the investment at net asset value at the end of each period and no sales charges. Total return would be reduced if sales charges were taken into account. |
| (c) | Not annualized. |
| (d) | Annualized. |
The accompanying notes are an integral part of these financial statements.
90Pioneer Multi-Asset Ultrashort Income Fund | Semiannual Report | 9/30/23
| | Six Months
Ended
9/30/23
(unaudited) | Year
Ended
3/31/23 | Year
Ended
3/31/22 | Year
Ended
3/31/21 | Year
Ended
3/31/20 | Year
Ended
3/31/19 |
| Class C | | | | | | |
| Net asset value, beginning of period | $ 9.53 | $ 9.61 | $ 9.71 | $ 9.26 | $ 9.91 | $ 9.94 |
| Increase (decrease) from investment operations: | | | | | | |
| Net investment income (loss) (a) | $ 0.26 | $ 0.28 | $ 0.06 | $ 0.10 | $ 0.22 | $ 0.22 |
| Net realized and unrealized gain (loss) on investments | 0.08 | (0.06) | (0.08) | 0.46 | (0.63) | (0.02) |
| Net increase (decrease) from investment operations | $ 0.34 | $ 0.22 | $ (0.02) | $ 0.56 | $ (0.41) | $ 0.20 |
| Distributions to shareowners: | | | | | | |
| Net investment income | $ (0.26) | $ (0.30) | $ (0.08) | $ (0.11) | $ (0.24) | $ (0.23) |
| Total distributions | $ (0.26) | $ (0.30) | $ (0.08) | $ (0.11) | $ (0.24) | $ (0.23) |
| Net increase (decrease) in net asset value | $ 0.08 | $ (0.08) | $ (0.10) | $ 0.45 | $ (0.65) | $ (0.03) |
| Net asset value, end of period | $ 9.61 | $ 9.53 | $ 9.61 | $ 9.71 | $ 9.26 | $ 9.91 |
| Total return (b) | 3.58%(c) | 2.29% | (0.17)% | 6.09% | (4.24)% | 1.99% |
| Ratio of net expenses to average net assets | 0.91%(d) | 0.92% | 0.91% | 0.91% | 0.89% | 0.91% |
| Ratio of net investment income (loss) to average net assets | 5.47%(d) | 2.90% | 0.66% | 1.00% | 2.25% | 2.22% |
| Portfolio turnover rate | 26%(c) | 34% | 52% | 51% | 100% | 61% |
| Net assets, end of period (in thousands) | $68,438 | $83,703 | $136,692 | $213,396 | $300,129 | $425,928 |
| (a) | The per-share data presented above is based on the average shares outstanding for the period presented. |
| (b) | Assumes initial investment at net asset value at the beginning of each period, reinvestment of all distributions and the complete redemption of the investment at net asset value at the end of each period. |
| (c) | Not annualized. |
| (d) | Annualized. |
The accompanying notes are an integral part of these financial statements.
Pioneer Multi-Asset Ultrashort Income Fund | Semiannual Report | 9/30/2391
Financial Highlights (continued)
| | Six Months
Ended
9/30/23
(unaudited) | Year
Ended
3/31/23 | Year
Ended
3/31/22 | Year
Ended
3/31/21 | Year
Ended
3/31/20 | Year
Ended
3/31/19 |
| Class C2 | | | | | | |
| Net asset value, beginning of period | $ 9.53 | $ 9.62 | $ 9.72 | $ 9.27 | $ 9.91 | $ 9.94 |
| Increase (decrease) from investment operations: | | | | | | |
| Net investment income (loss) (a) | $ 0.26 | $ 0.27 | $ 0.07 | $ 0.10 | $ 0.21 | $ 0.22 |
| Net realized and unrealized gain (loss) on investments | 0.08 | (0.06) | (0.08) | 0.46 | (0.61) | (0.02) |
| Net increase (decrease) from investment operations | $ 0.34 | $ 0.21 | $ (0.01) | $ 0.56 | $ (0.40) | $ 0.20 |
| Distributions to shareowners: | | | | | | |
| Net investment income | $ (0.26) | $ (0.30) | $ (0.09) | $ (0.11) | $ (0.24) | $ (0.23) |
| Total distributions | $ (0.26) | $ (0.30) | $ (0.09) | $ (0.11) | $ (0.24) | $ (0.23) |
| Net increase (decrease) in net asset value | $ 0.08 | $ (0.09) | $ (0.10) | $ 0.45 | $ (0.64) | $ (0.03) |
| Net asset value, end of period | $ 9.61 | $ 9.53 | $ 9.62 | $ 9.72 | $ 9.27 | $ 9.91 |
| Total return (b) | 3.60%(c) | 2.21% | (0.14)% | 6.09% | (4.13)% | 1.98% |
| Ratio of net expenses to average net assets | 0.89%(d) | 0.91% | 0.88% | 0.90% | 0.88% | 0.91% |
| Ratio of net investment income (loss) to average net assets | 5.51%(d) | 2.85% | 0.69% | 1.00% | 2.17% | 2.25% |
| Portfolio turnover rate | 26%(c) | 34% | 52% | 51% | 100% | 61% |
| Net assets, end of period (in thousands) | $7,805 | $8,463 | $15,861 | $19,432 | $20,982 | $8,604 |
| (a) | The per-share data presented above is based on the average shares outstanding for the period presented. |
| (b) | Assumes initial investment at net asset value at the beginning of each period, reinvestment of all distributions, the complete redemption of the investment at net asset value at the end of each period and no sales charges. Total return would be reduced if sales charges were taken into account. |
| (c) | Not annualized. |
| (d) | Annualized. |
The accompanying notes are an integral part of these financial statements.
92Pioneer Multi-Asset Ultrashort Income Fund | Semiannual Report | 9/30/23
| | Six Months
Ended
9/30/23
(unaudited) | Year
Ended
3/31/23 | Year
Ended
3/31/22 | Year
Ended
3/31/21 | Year
Ended
3/31/20 | Year
Ended
3/31/19 |
| Class K | | | | | | |
| Net asset value, beginning of period | $ 9.56 | $ 9.64 | $ 9.74 | $ 9.29 | $ 9.93 | $ 9.96 |
| Increase (decrease) from investment operations: | | | | | | |
| Net investment income (loss) (a) | $ 0.29 | $ 0.35 | $ 0.12 | $ 0.15 | $ 0.28 | $ 0.28 |
| Net realized and unrealized gain (loss) on investments | 0.07 | (0.08) | (0.08) | 0.46 | (0.62) | (0.03) |
| Net increase (decrease) from investment operations | $ 0.36 | $ 0.27 | $ 0.04 | $ 0.61 | $ (0.34) | $ 0.25 |
| Distributions to shareowners: | | | | | | |
| Net investment income | $ (0.29) | $ (0.35) | $ (0.14) | $ (0.16) | $ (0.30) | $ (0.28) |
| Total distributions | $ (0.29) | $ (0.35) | $ (0.14) | $ (0.16) | $ (0.30) | $ (0.28) |
| Net increase (decrease) in net asset value | $ 0.07 | $ (0.08) | $ (0.10) | $ 0.45 | $ (0.64) | $ (0.03) |
| Net asset value, end of period | $ 9.63 | $ 9.56 | $ 9.64 | $ 9.74 | $ 9.29 | $ 9.93 |
| Total return (b) | 3.76%(c) | 2.86% | 0.39% | 6.64% | (3.60)% | 2.54% |
| Ratio of net expenses to average net assets | 0.36%(d) | 0.38% | 0.36% | 0.37% | 0.36% | 0.37% |
| Ratio of net investment income (loss) to average net assets | 6.03%(d) | 3.71% | 1.20% | 1.52% | 2.79% | 2.82% |
| Portfolio turnover rate | 26%(c) | 34% | 52% | 51% | 100% | 61% |
| Net assets, end of period (in thousands) | $455,287 | $465,248 | $382,288 | $332,949 | $264,405 | $274,682 |
| (a) | The per-share data presented above is based on the average shares outstanding for the period presented. |
| (b) | Assumes initial investment at net asset value at the beginning of each period, reinvestment of all distributions and the complete redemption of the investment at net asset value at the end of each period. |
| (c) | Not annualized. |
| (d) | Annualized. |
The accompanying notes are an integral part of these financial statements.
Pioneer Multi-Asset Ultrashort Income Fund | Semiannual Report | 9/30/2393
Financial Highlights (continued)
| | Six Months
Ended
9/30/23
(unaudited) | Year
Ended
3/31/23 | Year
Ended
3/31/22 | Year
Ended
3/31/21 | Year
Ended
3/31/20 | Year
Ended
3/31/19 |
| Class Y | | | | | | |
| Net asset value, beginning of period | $ 9.54 | $ 9.63 | $ 9.73 | $ 9.27 | $ 9.92 | $ 9.96 |
| Increase (decrease) from investment operations: | | | | | | |
| Net investment income (loss) (a) | $ 0.28 | $ 0.34 | $ 0.11 | $ 0.14 | $ 0.27 | $ 0.27 |
| Net realized and unrealized gain (loss) on investments | 0.08 | (0.09) | (0.08) | 0.48 | (0.63) | (0.04) |
| Net increase (decrease) from investment operations | $ 0.36 | $ 0.25 | $ 0.03 | $ 0.62 | $ (0.36) | $ 0.23 |
| Distributions to shareowners: | | | | | | |
| Net investment income | $ (0.28) | $ (0.34) | $ (0.13) | $ (0.16) | $ (0.29) | $ (0.27) |
| Total distributions | $ (0.28) | $ (0.34) | $ (0.13) | $ (0.16) | $ (0.29) | $ (0.27) |
| Net increase (decrease) in net asset value | $ 0.08 | $ (0.09) | $ (0.10) | $ 0.46 | $ (0.65) | $ (0.04) |
| Net asset value, end of period | $ 9.62 | $ 9.54 | $ 9.63 | $ 9.73 | $ 9.27 | $ 9.92 |
| Total return (b) | 3.83%(c) | 2.67% | 0.30% | 6.67% | (3.78)% | 2.37% |
| Ratio of net expenses to average net assets | 0.45%(d) | 0.45% | 0.44% | 0.45% | 0.44% | 0.45% |
| Ratio of net investment income (loss) to average net assets | 5.94%(d) | 3.53% | 1.12% | 1.45% | 2.69% | 2.74% |
| Portfolio turnover rate | 26%(c) | 34% | 52% | 51% | 100% | 61% |
| Net assets, end of period (in thousands) | $2,815,621 | $2,659,258 | $2,725,842 | $2,335,355 | $2,990,790 | $3,669,866 |
| (a) | The per-share data presented above is based on the average shares outstanding for the period presented. |
| (b) | Assumes initial investment at net asset value at the beginning of each period, reinvestment of all distributions and the complete redemption of the investment at net asset value at the end of each period. |
| (c) | Not annualized. |
| (d) | Annualized. |
The accompanying notes are an integral part of these financial statements.
94Pioneer Multi-Asset Ultrashort Income Fund | Semiannual Report | 9/30/23
Notes to Financial Statements | 9/30/23
(unaudited)
1. Organization and Significant Accounting Policies
Pioneer Multi-Asset Ultrashort Income Fund (the “Fund”) is one of three portfolios comprising Pioneer Series Trust X (the "Trust"), a Delaware statutory trust. The Fund is registered under the Investment Company Act of 1940, as amended (the "1940 Act"), as a diversified, open-end management investment company. The investment objective of the Fund is to seek a high level of current income to the extent consistent with a relatively high level of stability of principal.
The Fund offers five classes of shares designated as Class A, Class C, Class C2, Class K and Class Y shares. Each class of shares represents an interest in the same portfolio of investments of the Fund and has identical rights (based on relative net asset values) to assets and liquidation proceeds. Share classes can bear different rates of class-specific fees and expenses, such as transfer agent and distribution fees. Differences in class-specific fees and expenses will result in differences in net investment income and, therefore, the payment of different dividends from net investment income earned by each class. The Amended and Restated Declaration of Trust of the Trust gives the Board of Trustees the flexibility to specify either per-share voting or dollar-weighted voting when submitting matters for shareowner approval. Under per-share voting, each share of a class of the Fund is entitled to one vote. Under dollar-weighted voting, a shareowner’s voting power is determined not by the number of shares owned, but by the dollar value of the shares on the record date. Each share class has exclusive voting rights with respect to matters affecting only that class, including with respect to the distribution plan for that class. There is no distribution plan for Class K or Class Y shares.
Amundi Asset Management US, Inc., an indirect, wholly owned subsidiary of Amundi and Amundi’s wholly owned subsidiary, Amundi USA, Inc., serves as the Fund’s investment adviser (the “Adviser”). Amundi Distributor US, Inc., an affiliate of the Adviser, serves as the Fund’s distributor (the “Distributor”).
In March 2020, FASB issued an Accounting Standard Update, ASU 2020-04, Reference Rate Reform (Topic 848) — Facilitation of the Effects of Reference Rate Reform on Financial Reporting (“ASU 2020-04”), which provides optional, temporary relief with respect to the financial reporting of contracts subject to certain types of modifications due to the planned discontinuation of the London Interbank Offered Rate (“LIBOR”) and other LIBOR-based reference rates at the end of 2021. The temporary relief
Pioneer Multi-Asset Ultrashort Income Fund | Semiannual Report | 9/30/2395
provided by ASU 2020-04 is effective for certain reference rate-related contract modifications that occur during the period from March 12, 2020 through December 31, 2023. Management is evaluating the impact of ASU 2020-04 on the Fund's investments, derivatives, debt and other contracts, if applicable, that will undergo reference rate-related modifications as a result of the reference rate reform.
The Fund is required to comply with Rule 18f-4 under the 1940 Act, which governs the use of derivatives by registered investment companies. Rule 18f-4 permits funds to enter into derivatives transactions (as defined in Rule 18f-4) and certain other transactions notwithstanding the restrictions on the issuance of “senior securities” under Section 18 of the 1940 Act. In accordance with Rule 18f-4, the Fund has established and maintains a comprehensive derivatives risk management program, has appointed a derivatives risk manager and complies with a relative or absolute limit on fund leverage risk calculated based on value-at-risk (“VaR”).
The Fund is an investment company and follows investment company accounting and reporting guidance under U.S. Generally Accepted Accounting Principles (“U.S. GAAP”). U.S. GAAP requires the management of the Fund to make estimates and assumptions that affect the reported amounts of assets and liabilities, the disclosure of contingent assets and liabilities at the date of the financial statements, and the reported amounts of income, expenses and gain or loss on investments during the reporting period. Actual results could differ from those estimates.
The following is a summary of significant accounting policies followed by the Fund in the preparation of its financial statements:
| A. | Security Valuation |
| | The net asset value of the Fund is computed once daily, on each day the New York Stock Exchange (“NYSE”) is open, as of the close of regular trading on the NYSE. |
| | Fixed-income securities are valued by using prices supplied by independent pricing services, which consider such factors as market prices, market events, quotations from one or more brokers, Treasury spreads, yields, maturities and ratings, or may use a pricing matrix or other fair value methods or techniques to provide an estimated value of the security or instrument. A pricing matrix is a means of valuing a debt security on the basis of current market prices for other debt securities, historical trading patterns in the market for fixed-income securities and/or other factors. Non-U.S. debt securities that are listed on an exchange will be valued at the bid price obtained from an independent |
96Pioneer Multi-Asset Ultrashort Income Fund | Semiannual Report | 9/30/23
| | third party pricing service. When independent third party pricing services are unable to supply prices, or when prices or market quotations are considered to be unreliable, the value of that security may be determined using quotations from one or more broker-dealers. |
| | Loan interests are valued at the mean between the last available bid and asked prices from one or more brokers or dealers as obtained from Loan Pricing Corporation, an independent third party pricing service. If price information is not available from Loan Pricing Corporation, or if the price information is deemed to be unreliable, price information will be obtained from an alternative loan interest pricing service. If no reliable price quotes are available from either the primary or alternative pricing service, broker quotes will be solicited. |
| | Event-linked bonds are valued at the bid price obtained from an independent third party pricing service. Other insurance-linked securities (including reinsurance sidecars, collateralized reinsurance and industry loss warranties) may be valued at the bid price obtained from an independent pricing service, or through a third party using a pricing matrix, insurance industry valuation models, or other fair value methods or techniques to provide an estimated value of the instrument. |
| | Futures contracts are generally valued at the closing settlement price established by the exchange on which they are traded. |
| | The value of foreign securities is translated into U.S. dollars based on foreign currency exchange rate quotations supplied by a third party pricing source. Trading in non-U.S. equity securities is substantially completed each day at various times prior to the close of the NYSE. The values of such securities used in computing the net asset value of the Fund's shares are determined as of such times. The Adviser may use a fair value model developed by an independent pricing service to value non-U.S. equity securities. |
| | Repurchase agreements are valued at par. Cash may include overnight time deposits at approved financial institutions. |
| | Securities or loan interests for which independent pricing services or broker-dealers are unable to supply prices or for which market prices and/or quotations are not readily available or are considered to be unreliable are valued by a fair valuation team comprised of certain personnel of the Adviser. The Adviser is designated as the valuation designee for the Fund pursuant to Rule 2a-5 under the 1940 Act. The Adviser’s fair valuation team is responsible for monitoring developments that may impact fair valued securities. |
Pioneer Multi-Asset Ultrashort Income Fund | Semiannual Report | 9/30/2397
| | Inputs used when applying fair value methods to value a security may include credit ratings, the financial condition of the company, current market conditions and comparable securities. The Adviser may use fair value methods if it is determined that a significant event has occurred after the close of the exchange or market on which the security trades and prior to the determination of the Fund's net asset value. Examples of a significant event might include political or economic news, corporate restructurings, natural disasters, terrorist activity or trading halts. Thus, the valuation of the Fund's securities may differ significantly from exchange prices, and such differences could be material. |
| B. | Investment Income and Transactions |
| | Dividend income is recorded on the ex-dividend date, except that certain dividends from foreign securities where the ex-dividend date may have passed are recorded as soon as the Fund becomes aware of the ex-dividend data in the exercise of reasonable diligence. |
| | Interest income, including interest on income-bearing cash accounts, is recorded on the accrual basis. Dividend and interest income are reported net of unrecoverable foreign taxes withheld at the applicable country rates and net of income accrued on defaulted securities. |
| | Interest and dividend income payable by delivery of additional shares is reclassified as PIK (payment-in-kind) income upon receipt and is included in interest and dividend income, respectively. |
| | Principal amounts of mortgage-backed securities are adjusted for monthly paydowns. Premiums and discounts related to certain mortgage-backed securities are amortized or accreted in proportion to the monthly paydowns. All discounts/premiums on purchase prices of debt securities are accreted/amortized for financial reporting purposes over the life of the respective securities, and such accretion/amortization is included in interest income. |
| | Security transactions are recorded as of trade date. Gains and losses on sales of investments are calculated on the identified cost method for both financial reporting and federal income tax purposes. |
| C. | Federal Income Taxes |
| | It is the Fund's policy to comply with the requirements of the Internal Revenue Code applicable to regulated investment companies and to distribute all of its net taxable income and net realized capital gains, if any, to its shareowners. Therefore, no provision for federal income taxes is required. As of September 30, 2023, the Fund did not accrue any |
98Pioneer Multi-Asset Ultrashort Income Fund | Semiannual Report | 9/30/23
| | interest or penalties with respect to uncertain tax positions, which, if applicable, would be recorded as an income tax expense on the Statement of Operations. Tax returns filed within the prior three years remain subject to examination by federal and state tax authorities. |
| | The amount and character of income and capital gain distributions to shareowners are determined in accordance with federal income tax rules, which may differ from U.S. GAAP. Distributions in excess of net investment income or net realized gains are temporary over distributions for financial statement purposes resulting from differences in the recognition or classification of income or distributions for financial statement and tax purposes. Capital accounts within the financial statements are adjusted for permanent book/tax differences to reflect tax character, but are not adjusted for temporary differences. |
| | The tax character of current year distributions payable will be determined at the end of the current taxable year. The tax character of distributions paid during the year ended March 31, 2023 was as follows: |
| | 2023 |
| Distributions paid from: | |
| Ordinary income | $157,383,538 |
| Total | $157,383,538 |
The following shows the components of distributable earnings (losses) on a federal income tax basis at March 31, 2023:
| | 2023 |
| Distributable earnings/(losses): | |
| Undistributed ordinary income | $ 5,018,355 |
| Capital loss carryforward | (266,591,212) |
| Other book/tax temporary differences | (1,703,995) |
| Net unrealized depreciation | (90,496,785) |
| Total | $(353,773,637) |
The difference between book-basis and tax-basis unrealized depreciation is attributable to the tax deferral of losses on wash sales, adjustments relating to event-linked bonds, insurance-linked securities and the tax treatment of premium and amortization.
| D. | Fund Shares |
| | The Fund records sales and repurchases of its shares as of trade date. The Distributor earned $0 in underwriting commissions on the sale of Class A shares during the six months ended September 30, 2023. |
Pioneer Multi-Asset Ultrashort Income Fund | Semiannual Report | 9/30/2399
| E. | Class Allocations |
| | Income, common expenses and realized and unrealized gains and losses are calculated at the Fund level and allocated daily to each class of shares based on its respective percentage of adjusted net assets at the beginning of the day. |
| | Distribution fees are calculated based on the average daily net asset value attributable to Class A, Class C and Class C2 shares of the Fund, respectively (see Note 5). Class K and Class Y shares do not pay distribution fees. All expenses and fees paid to the Fund's transfer agent for its services are allocated among the classes of shares based on the number of accounts in each class and the ratable allocation of related out-of-pocket expenses (see Note 4). |
| | The Fund declares as daily dividends substantially all of its net investment income. All dividends are paid on a monthly basis. Short-term capital gain distributions, if any, may be declared with the daily dividends. Distributions to shareowners are recorded as of the ex-dividend date. Distributions paid by the Fund with respect to each class of shares are calculated in the same manner and at the same time, except that net investment income dividends to Class A, Class C, Class C2, Class K and Class Y shares can reflect different transfer agent and distribution expense rates. |
| F. | Risks |
| | The value of securities held by the Fund may go up or down, sometimes rapidly or unpredictably, due to general market conditions, such as real or perceived adverse economic, political or regulatory conditions, recessions, the spread of infectious illness or other public health issues, inflation, changes in interest rates, armed conflict including Russia's military invasion of Ukraine, sanctions against Russia, other nations or individuals or companies and possible countermeasures, lack of liquidity in the bond markets or adverse investor sentiment. In the past several years, financial markets have experienced increased volatility, depressed valuations, decreased liquidity and heightened uncertainty. These conditions may continue, recur, worsen or spread. Inflation and interest rates have increased and may rise further. These circumstances could adversely affect the value and liquidity of the Fund's investments and negatively impact the Fund's performance. |
| | The long-term impact of the COVID-19 pandemic and its subsequent variants on economies, markets, industries and individual issuers, are not known. Some sectors of the economy and individual issuers have experienced or may experience particularly large losses. Periods of |
100Pioneer Multi-Asset Ultrashort Income Fund | Semiannual Report | 9/30/23
| | extreme volatility in the financial markets, reduced liquidity of many instruments, increased government debt, inflation, and disruptions to supply chains, consumer demand and employee availability, may continue for some time. Following Russia's invasion of Ukraine, Russian securities lost all, or nearly all, their market value. Other securities or markets could be similarly affected by past or future political, geopolitical or other events or conditions. |
| | Governments and central banks, including the U.S. Federal Reserve, have taken extraordinary and unprecedented actions to support local and global economies and the financial markets. These actions have resulted in significant expansion of public debt, including in the U.S. The consequences of high public debt, including its future impact on the economy and securities markets, may not be known for some time. |
| | The U.S. and other countries are periodically involved in disputes over trade and other matters, which may result in tariffs, investment restrictions and adverse impacts on affected companies and securities. For example, the U.S. has imposed tariffs and other trade barriers on Chinese exports, has restricted sales of certain categories of goods to China, and has established barriers to investments in China. Trade disputes may adversely affect the economies of the U.S. and its trading partners, as well as companies directly or indirectly affected and financial markets generally. If the political climate between the U.S. and China does not improve or continues to deteriorate, if China were to attempt unification of Taiwan by force, or if other geopolitical conflicts develop or get worse, economies, markets and individual securities may be severely affected both regionally and globally, and the value of the Fund's assets may go down. |
| | At times, the Fund’s investments may represent industries or industry sectors that are interrelated or have common risks, making the Fund more susceptible to any economic, political, or regulatory developments or other risks affecting those industries and sectors. |
| | The Fund’s investments in foreign markets and countries with limited developing markets may subject the Fund to a greater degree of risk than investments in a developed market. These risks include disruptive political or economic conditions, military conflicts and sanctions, terrorism, sustained economic downturns, financial instability, less liquid trading markets, extreme price volatility, currency risks, reduction of government or central bank support, inadequate accounting standards, tariffs, tax disputes or other tax burdens, nationalization or expropriation of assets and the imposition of adverse governmental laws, arbitrary application of laws and regulations or lack of rule of law |
Pioneer Multi-Asset Ultrashort Income Fund | Semiannual Report | 9/30/23101
| | and investment and repatriation restrictions. Lack of information and less market regulation also may affect the value of these securities. Withholding and other non-U.S. taxes may decrease the Fund’s return. Non-U.S. issuers may be located in parts of the world that have historically been prone to natural disasters. Investing in depositary receipts is subject to many of the same risks as investing directly in non-U.S. issuers. Depositary receipts may involve higher expenses and may trade at a discount (or premium) to the underlying security. |
| | Russia launched a large-scale invasion of Ukraine on February 24, 2022. In response to the military action by Russia, various countries, including the U.S., the United Kingdom, and European Union issued broad-ranging economic sanctions against Russia and Belarus and certain companies and individuals. Since then, Russian securities have lost all, or nearly all, their market value, and many other issuers, securities and markets have been adversely affected. The United States and other countries may impose sanctions on other countries, companies and individuals in light of Russia’s military invasion. The extent and duration of the military action or future escalation of such hostilities, the extent and impact of existing and future sanctions, market disruptions and volatility, and the result of any diplomatic negotiations cannot be predicted. These and any related events could have a significant impact on the value and liquidity of certain Fund investments, on Fund performance and the value of an investment in the Fund, particularly with respect to securities and commodities, such as oil, natural gas and food commodities, as well as other sectors with exposure to Russian issuers or issuers in other countries affected by the invasion, and are likely to have collateral impacts on market sectors globally. |
| | The Fund may invest in mortgage-related and asset-backed securities. The value of mortgage-related and asset-backed securities will be influenced by factors affecting the assets underlying such securities. As a result, during periods of declining asset value, difficult or frozen credit markets, swings in interest rates, or deteriorating economic conditions, mortgage-related and asset-backed securities may decline in value, face valuation difficulties, become more volatile and/or become illiquid. Mortgage-backed securities tend to be more sensitive to changes in interest rate than other types of debt securities. These securities are also subject to prepayment and extension risks. Some of these securities may receive little or no collateral protection from the underlying assets and are thus subject to the risk of default. The risk of such defaults is generally higher in the case of mortgage-backed investments offered by non-governmental issuers and those that include so-called “sub-prime” mortgages. The structure of some of these securities may be complex |
102Pioneer Multi-Asset Ultrashort Income Fund | Semiannual Report | 9/30/23
| | and there may be less available information than for other types of debt securities. Upon the occurrence of certain triggering events or defaults, the Fund may become the holder of underlying assets at a time when those assets may be difficult to sell or may be sold only at a loss. |
| | The Fund may invest in credit risk transfer securities. Credit risk transfer securities are unguaranteed and unsecured debt securities issued by government sponsored enterprises and therefore are not directly linked to or backed by the underlying mortgage loans. As a result, in the event that a government sponsored enterprise fails to pay principal or interest on its credit risk transfer securities or goes through a bankruptcy, insolvency or similar proceeding, holders of such credit risk transfer securities have no direct recourse to the underlying mortgage loans and will generally receive recovery on par with other unsecured note holders in such a scenario. The risks associated with an investment in credit risk transfer securities are different than the risks associated with an investment in mortgage-backed securities issued by Fannie Mae and Freddie Mac, or other government sponsored enterprise or issued by a private issuer, because some or all of the mortgage default or credit risk associated with the underlying mortgage loans is transferred to investors. As a result, investors in these securities could lose some or all of their investment in these securities if the underlying mortgage loans default. |
| | The Fund invests in below-investment-grade (high-yield) debt securities and preferred stocks. Some of these high-yield securities may be convertible into equity securities of the issuer. Debt securities rated below-investment-grade are commonly referred to as “junk bonds” and are considered speculative with respect to the issuer’s capacity to pay interest and repay principal. These securities involve greater risk of loss, are subject to greater price volatility, and may be less liquid and more difficult to value, especially during periods of economic uncertainty or change, than higher rated debt securities. |
| | The market prices of the Fund's fixed income securities may fluctuate significantly when interest rates change. The value of your investment will generally go down when interest rates rise. A rise in rates tends to have a greater impact on the prices of longer term or duration securities. For example, if interest rates increase by 1%, the value of a Fund's portfolio with a portfolio duration of ten years would be expected to decrease by 10%, all other things being equal. In recent years interest rates and credit spreads in the U.S. have been at historic lows. The U.S. Federal Reserve has raised certain interest rates, and interest rates may continue to go up. A general rise in interest rates could adversely affect the price and liquidity of fixed income securities. The maturity of |
Pioneer Multi-Asset Ultrashort Income Fund | Semiannual Report | 9/30/23103
| | a security may be significantly longer than its effective duration. A security's maturity and other features may be more relevant than its effective duration in determining the security's sensitivity to other factors affecting the issuer or markets generally, such as changes in credit quality or in the yield premium that the market may establish for certain types of securities (sometimes called "credit spread"). In general, the longer its maturity the more a security may be susceptible to these factors. When the credit spread for a fixed income security goes up, or "widens," the value of the security will generally go down. |
| | If an issuer or guarantor of a security held by the Fund or a counterparty to a financial contract with the Fund defaults on its obligation to pay principal and/or interest, has its credit rating downgraded or is perceived to be less creditworthy, or the credit quality or value of any underlying assets declines, the value of your investment will typically decline. Changes in actual or perceived creditworthiness may occur quickly. The Fund could be delayed or hindered in its enforcement of rights against an issuer, guarantor or counterparty. |
| | The Fund's investments, payment obligations and financing terms may be based on floating rates, such as LIBOR (London Interbank Offered Rate) or SOFR (Secured Overnight Financing Rate). ICE Benchmark Administration, the administrator of LIBOR, has ceased publication of most LIBOR settings on a representative basis. Actions by regulators have resulted in the establishment of alternative reference rates to LIBOR in most major currencies. In the U.S., a common benchmark replacement is based on the SOFR published by the Federal Reserve Bank of New York, including certain spread adjustments and benchmark replacement conforming changes, although other benchmark replacements (without or without spread adjustments) may be used in certain transactions. The impact of the transition from LIBOR on the Fund's transactions and financial markets generally cannot yet be determined. The transition away from LIBOR may lead to increased volatility and illiquidity in markets for instruments that have relied on LIBOR and may adversely affect the Fund's performance. |
| | With the increased use of technologies such as the Internet to conduct business, the Fund is susceptible to operational, information security and related risks. While the Fund’s Adviser has established business continuity plans in the event of, and risk management systems to prevent, limit or mitigate, such cyber-attacks, there are inherent limitations in such plans and systems, including the possibility that certain risks have not been identified. Furthermore, the Fund cannot control the cybersecurity plans and systems put in place by service providers to the Fund such as the Fund's custodian and accounting |
104Pioneer Multi-Asset Ultrashort Income Fund | Semiannual Report | 9/30/23
| | agent, and the Fund’s transfer agent. In addition, many beneficial owners of Fund shares hold them through accounts at broker-dealers, retirement platforms and other financial market participants over which neither the Fund nor the Adviser exercises control. Each of these may in turn rely on service providers to them, which are also subject to the risk of cyber-attacks. Cybersecurity failures or breaches at the Adviser or the Fund’s service providers or intermediaries have the ability to cause disruptions and impact business operations, potentially resulting in financial losses, interference with the Fund’s ability to calculate its net asset value, impediments to trading, the inability of Fund shareowners to effect share purchases, redemptions or exchanges or receive distributions, loss of or unauthorized access to private shareowner information and violations of applicable privacy and other laws, regulatory fines, penalties, reputational damage, or additional compliance costs. Such costs and losses may not be covered under any insurance. In addition, maintaining vigilance against cyber-attacks may involve substantial costs over time, and system enhancements may themselves be subject to cyber-attacks. |
| | The Fund’s prospectus contains unaudited information regarding the Fund’s principal risks. Please refer to that document when considering the Fund’s principal risks. |
| G. | Restricted Securities |
| | Restricted Securities are subject to legal or contractual restrictions on resale. Restricted securities generally are resold in transactions exempt from registration under the Securities Act of 1933. Private placement securities are generally considered to be restricted except for those securities traded between qualified institutional investors under the provisions of Rule 144A of the Securities Act of 1933. |
| | Disposal of restricted investments may involve negotiations and expenses, and prompt sale at an acceptable price may be difficult to achieve. Restricted investments held by the Fund at September 30, 2023 are listed in the Schedule of Investments. |
| H. | Insurance-Linked Securities (“ILS”) |
| | The Fund invests in ILS. The Fund could lose a portion or all of the principal it has invested in an ILS, and the right to additional interest or dividend payments with respect to the security, upon the occurrence of one or more trigger events, as defined within the terms of an insurance-linked security. Trigger events, generally, are hurricanes, earthquakes, or other natural events of a specific size or magnitude that occur in a designated geographic region during a specified time period, and/or that |
Pioneer Multi-Asset Ultrashort Income Fund | Semiannual Report | 9/30/23105
| | involve losses or other metrics that exceed a specific amount. There is no way to accurately predict whether a trigger event will occur, and accordingly, ILS carry significant risk. The Fund is entitled to receive principal, and interest and/or dividend payments so long as no trigger event occurs of the description and magnitude specified by the instrument. In addition to the specified trigger events, ILS may expose the Fund to other risks, including but not limited to issuer (credit) default, adverse regulatory or jurisdictional interpretations and adverse tax consequences. |
| | The Fund’s investments in ILS may include event-linked bonds. ILS also may include special purpose vehicles (“SPVs”) or similar instruments structured to comprise a portion of a reinsurer’s catastrophe-oriented business, known as quota share instruments (sometimes referred to as reinsurance sidecars), or to provide reinsurance relating to specific risks to insurance or reinsurance companies through a collateralized instrument, known as collateralized reinsurance. Structured reinsurance investments also may include industry loss warranties (“ILWs”). A traditional ILW takes the form of a bilateral reinsurance contract, but there are also products that take the form of derivatives, collateralized structures, or exchange-traded instruments. |
| | Where the ILS are based on the performance of underlying reinsurance contracts, the Fund has limited transparency into the individual underlying contracts, and therefore must rely upon the risk assessment and sound underwriting practices of the issuer. Accordingly, it may be more difficult for the Adviser to fully evaluate the underlying risk profile of the Fund’s structured reinsurance investments, and therefore the Fund’s assets are placed at greater risk of loss than if the Adviser had more complete information. Structured reinsurance instruments generally will be considered illiquid securities by the Fund. These securities may be difficult to purchase, sell or unwind. Illiquid securities also may be difficult to value. If the Fund is forced to sell an illiquid asset, the Fund may be forced to sell at a loss. |
| I. | Repurchase Agreements |
| | Repurchase agreements are arrangements under which the Fund purchases securities from a broker-dealer or a bank, called the counterparty, upon the agreement of the counterparty to repurchase the securities from the Fund at a later date, and at a specific price, which is typically higher than the purchase price paid by the Fund. The securities purchased serve as the Fund's collateral for the obligation of the counterparty to repurchase the securities. The value of the collateral, including accrued interest, is required to be equal to or in excess of the |
106Pioneer Multi-Asset Ultrashort Income Fund | Semiannual Report | 9/30/23
| | repurchase price. The collateral for all repurchase agreements is held in safekeeping in the customer-only account of the Fund's custodian or a sub-custodian of the Fund. The Adviser is responsible for determining that the value of the collateral remains at least equal to the repurchase price. In the event of a default by the counterparty, the Fund is entitled to sell the securities, but the Fund may not be able to sell them for the price at which they were purchased, thus causing a loss to the Fund. Additionally, if the counterparty becomes insolvent, there is some risk that the Fund will not have a right to the securities, or the immediate right to sell the securities. |
| | Open repurchase agreements at September 30, 2023 are disclosed in the Schedule of Investments. |
| J. | Futures Contracts |
| | The Fund may enter into futures transactions in order to attempt to hedge against changes in interest rates, securities prices and currency exchange rates or to seek to increase total return. Futures contracts are types of derivatives. |
| | All futures contracts entered into by the Fund are traded on a futures exchange. Upon entering into a futures contract, the Fund is required to deposit with a broker an amount of cash or securities equal to the minimum "initial margin" requirements of the associated futures exchange. The amount of cash deposited with the broker as collateral at September 30, 2023 is recorded as "Futures collateral" on the Statement of Assets and Liabilities. |
| | Subsequent payments for futures contracts ("variation margin") are paid or received by the Fund, depending on the daily fluctuation in the value of the contracts, and are recorded by the Fund as unrealized appreciation or depreciation. Cash received from or paid to the broker related to previous margin movement is held in a segregated account at the broker and is recorded as either "Due from broker for futures" or "Due to broker for futures" on the Statement of Assets and Liabilities. When the contract is closed, the Fund realizes a gain or loss equal to the difference between the opening and closing value of the contract as well as any fluctuation in foreign currency exchange rates where applicable. Futures contracts are subject to market risk, interest rate risk and currency exchange rate risk. Changes in value of the contracts may not directly correlate to the changes in value of the underlying securities. With futures, there is reduced counterparty credit risk to the Fund since futures are exchange-traded and the exchange's clearinghouse, as counterparty to all exchange-traded futures, guarantees the futures against default. |
Pioneer Multi-Asset Ultrashort Income Fund | Semiannual Report | 9/30/23107
| | The average notional value of futures contracts short position during the six months ended September 30, 2023 was $69,666,494. There were no open futures contracts outstanding at September 30, 2023. |
2. Management Agreement
The Adviser manages the Fund’s portfolio. Management fees payable under the Fund's Investment Management Agreement with the Adviser are calculated daily and paid monthly at the annual rate of 0.35% of the Fund’s average daily net assets up to $1 billion, 0.30% of the next $4 billion of the Fund’s average daily net assets, 0.25% of the next $2.5 billion of the Fund’s average daily net assets and 0.20% of the Fund’s average daily net assets over $7.5 billion. For the six months ended September 30, 2023, the effective management fee was equivalent to 0.31% (annualized) of the Fund’s average daily net assets.
In addition, under the management and administration agreements, certain other services and costs, including accounting, regulatory reporting and insurance premiums, are paid by the Fund as administrative reimbursements. Reflected on the Statement of Assets and Liabilities is $152,770 in management fees payable to the Adviser at September 30, 2023.
3. Compensation of Officers and Trustees
The Fund pays an annual fee to its Trustees. The Adviser reimburses the Fund for fees paid to the Interested Trustees. Except for the chief compliance officer, the Fund does not pay any salary or other compensation to its officers. The Fund pays a portion of the chief compliance officer's compensation for his services as the Fund's chief compliance officer. Amundi US pays the remaining portion of the chief compliance officer's compensation. For the six months ended September 30, 2023, the Fund paid $110,440 in Officers' and Trustees' compensation, which is reflected on the Statement of Operations as Officers' and Trustees' fees. At September 30, 2023, on its Statement of Assets and Liabilities, the Fund had a payable for Trustees' fees of $5,448 and a payable for administrative expenses of $123,032, which includes the payable for Officers' compensation.
4. Transfer Agent
BNY Mellon Investment Servicing (US) Inc. serves as the transfer agent to the Fund at negotiated rates. Transfer agent fees and payables shown on the Statement of Operations and the Statement of Assets and Liabilities, respectively, include sub-transfer agent expenses incurred through the Fund’s omnibus relationship contracts.
108Pioneer Multi-Asset Ultrashort Income Fund | Semiannual Report | 9/30/23
In addition, the Fund reimbursed the transfer agent for out-of-pocket expenses incurred by the transfer agent related to shareowner communications activities such as proxy and statement mailings, and outgoing phone calls. For the six months ended September 30, 2023, such out-of-pocket expenses by class of shares were as follows:
| Shareowner Communications: | |
| Class A | $14,263 |
| Class C | 2,419 |
| Class C2 | 55 |
| Class K | 156 |
| Class Y | 49,282 |
| Total | $66,175 |
5. Distribution Plan
The Fund has adopted a distribution plan (the “Plan”) pursuant to Rule 12b-1 of the Investment Company Act of 1940 with respect to its Class A, Class C and Class C2 shares. Pursuant to the Plan, the Fund pays the Distributor 0.20% of the average daily net assets attributable to Class A shares as compensation for personal services and/or account maintenance services or distribution services with regard to Class A shares. Pursuant to the Plan, the Fund also pays the Distributor 0.50% of the average daily net assets attributable to Class C and Class C2 shares. The fee for Class C and Class C2 shares consists of a 0.25% service fee and a 0.25% distribution fee paid as compensation for personal services and/or account maintenance services or distribution services with regard to Class C and Class C2 shares. Reflected on the Statement of Assets and Liabilities is $30,348 in distribution fees payable to the Distributor at September 30, 2023.
In addition, redemptions of Class C2 shares may be subject to a contingent deferred sales charge (“CDSC”). Redemptions of Class C2 shares within 12 months of purchase are subject to a CDSC of 1.00%, based on the lower of cost or market value of shares being redeemed. Shares purchased as part of an exchange remain subject to any CDSC that applied to the original purchase of those shares. There is no CDSC for Class A, Class C, Class K and Class Y shares. Proceeds from the CDSCs are paid to the Distributor. For the six months ended September 30, 2023, CDSCs in the amount of $14 were paid to the Distributor.
6. Line of Credit Facility
The Fund, along with certain other funds in the Pioneer Family of Funds, participates in a committed, unsecured revolving line of credit (“credit facility”). Borrowings are used solely for temporary or emergency purposes. The Fund may borrow up to the lesser of the amount available under the credit facility or the limits set for borrowing by the Fund’s prospectus and
Pioneer Multi-Asset Ultrashort Income Fund | Semiannual Report | 9/30/23109
the 1940 Act. The Fund participates in a credit facility in the amount of $380 million. Under such credit facility, depending on the type of loan, interest on borrowings is payable at the Secured Overnight Financing Rate ("SOFR") plus a credit spread. The Fund also pays both an upfront fee and an annual commitment fee to participate in the credit facility. The upfront fee in the amount of 0.15% of the total credit facility and the commitment fee in the amount of 0.30% of the daily unused portion of each lender's commitment are allocated among participating funds based on an allocation schedule set forth in the credit facility. For the six months ended September 30, 2023, the Fund had no borrowings under the credit facility.
7. Additional Disclosures about Derivative Instruments and Hedging Activities
The Fund’s use of derivatives may enhance or mitigate the Fund’s exposure to the following risks:
Interest rate risk relates to the fluctuations in the value of interest-bearing securities due to changes in the prevailing levels of market interest rates.
Credit risk relates to the ability of the issuer of a financial instrument to make further principal or interest payments on an obligation or commitment that it has to the Fund.
Foreign exchange rate risk relates to fluctuations in the value of an asset or liability due to changes in currency exchange rates.
Equity risk relates to the fluctuations in the value of financial instruments as a result of changes in market prices (other than those arising from interest rate risk or foreign exchange rate risk), whether caused by factors specific to an individual investment, its issuer, or all factors affecting all instruments traded in a market or market segment.
Commodity risk relates to the risk that the value of a commodity or commodity index will fluctuate based on increases or decreases in the commodities market and factors specific to a particular industry or commodity.
110Pioneer Multi-Asset Ultrashort Income Fund | Semiannual Report | 9/30/23
The effect of derivative instruments (not considered to be hedging instruments for accounting disclosure purposes) on the Statement of Operations by risk exposure at September 30, 2023 was as follows:
| Statement of Operations | Interest
Rate Risk | Credit
Risk | Foreign
Exchange
Rate Risk | Equity
Risk | Commodity
Risk |
| Net Realized Gain (Loss) on | | | | | |
| Futures contracts | $ (1,770,247) | $ — | $ — | $ — | $ — |
| Total Value | $(1,770,247) | $— | $— | $— | $— |
| Change in Net Unrealized Appreciation (Depreciation) on | | | | | |
| Futures contracts | $ 2,519,317 | $ — | $ — | $ — | $ — |
| Total Value | $ 2,519,317 | $— | $— | $— | $— |
8. Unfunded Loan Commitments
The Fund may enter into unfunded loan commitments. Unfunded loan commitments may be partially or wholly unfunded. During the contractual period, the Fund is obliged to provide funding to the borrower upon demand. A fee is earned by the Fund on the unfunded loan commitment and is recorded as interest income on the Statement of Operations. Unfunded loan commitments are fair valued in accordance with the valuation policy described in Footnote 1A and unrealized appreciation or depreciation, if any, is recorded on the Statement of Assets and Liabilities.
As of September 30, 2023, the Fund had no unfunded loan commitments outstanding.
Pioneer Multi-Asset Ultrashort Income Fund | Semiannual Report | 9/30/23111
Approval of Renewal of Investment Management Agreement
Amundi Asset Management US, Inc. (“Amundi US”) serves as the investment adviser to Pioneer Multi-Asset Ultrashort Income Fund (the “Fund”) pursuant to an investment management agreement between Amundi US and the Fund. In order for Amundi US to remain the investment adviser of the Fund, the Trustees of the Fund, including a majority of the Fund’s Independent Trustees, must determine annually whether to renew the investment management agreement for the Fund.
The contract review process began in January 2023 as the Trustees of the Fund agreed on, among other things, an overall approach and timeline for the process. Contract review materials were provided to the Trustees in March 2023, July 2023 and September 2023. In addition, the Trustees reviewed and discussed the Fund’s performance at regularly scheduled meetings throughout the year, and took into account other information related to the Fund provided to the Trustees at regularly scheduled meetings, in connection with the review of the Fund’s investment management agreement.
In March 2023, the Trustees, among other things, discussed the memorandum provided by Fund counsel that summarized the legal standards and other considerations that are relevant to the Trustees in their deliberations regarding the renewal of the investment management agreement, and reviewed and discussed the qualifications of the investment management teams for the Fund, as well as the level of investment by the Fund’s portfolio managers in the Fund. In July 2023, the Trustees, among other things, reviewed the Fund’s management fees and total expense ratios, the financial statements of Amundi US and its parent companies, profitability analyses provided by Amundi US, and analyses from Amundi US as to possible economies of scale. The Trustees also reviewed the profitability of the institutional business of Amundi US as compared to that of Amundi US’s fund management business, and considered the differences between the fees and expenses of the Fund and the fees and expenses of Amundi US’s institutional accounts, as well as the different services provided by Amundi US to the Fund and to the institutional accounts. The Trustees further considered contract review materials, including additional materials received in response to the Trustees’ request, in September 2023.
At a meeting held on September 19, 2023, based on their evaluation of the information provided by Amundi US and third parties, the Trustees of the Fund, including the Independent Trustees voting separately advised by independent counsel, unanimously approved the renewal of the investment
112Pioneer Multi-Asset Ultrashort Income Fund | Semiannual Report | 9/30/23
management agreement for another year. In approving the renewal of the investment management agreement, the Trustees considered various factors that they determined were relevant, including the factors described below. The Trustees did not identify any single factor as the controlling factor in determining to approve the renewal of the agreement.
Nature, Extent and Quality of Services
The Trustees considered the nature, extent and quality of the services that had been provided by Amundi US to the Fund, taking into account the investment objective and strategy of the Fund. The Trustees also reviewed Amundi US’s investment approach for the Fund and its research process. The Trustees considered Amundi US’ integration of environmental, social and governance (ESG) considerations into its investment research process. The Trustees considered the resources of Amundi US and the personnel of Amundi US who provide investment management services to the Fund. They also reviewed the amount of non-Fund assets managed by the portfolio managers of the Fund. They considered the non-investment resources and personnel of Amundi US that are involved in Amundi US’s services to the Fund, including Amundi US’s compliance, risk management, and legal resources and personnel. The Trustees considered the compliance services being provided to the Fund by Amundi US and how Amundi US has addressed any compliance issues during the past year. The Trustees noted the substantial attention and high priority given by Amundi US’s senior management to the Pioneer Fund complex, including with respect to the increasing regulation to which the Pioneer Funds are subject.
The Trustees considered that Amundi US supervises and monitors the performance of the Fund’s service providers and provides the Fund with personnel (including Fund officers) and other resources that are necessary for the Fund’s business management and operations. The Trustees also considered that, as administrator, Amundi US is responsible for the administration of the Fund’s business and other affairs. The Trustees considered that the Fund reimburses Amundi US its pro rata share of Amundi US’s costs of providing administration services to the Pioneer Funds.
Based on these considerations, the Trustees concluded that the nature, extent and quality of services that had been provided by Amundi US to the Fund were satisfactory and consistent with the terms of the investment management agreement.
Performance of the Fund
In considering the Fund’s performance, the Trustees regularly review and discuss throughout the year data prepared by Amundi US and information
Pioneer Multi-Asset Ultrashort Income Fund | Semiannual Report | 9/30/23113
comparing the Fund’s performance with the performance of its peer group of funds, as classified by Morningstar, Inc. (Morningstar), and with the performance of the Fund’s benchmark index. They also discuss the Fund’s performance with Amundi US on a regular basis. The Trustees’ regular reviews and discussions were factored into the Trustees’ deliberations concerning the renewal of the investment management agreement.
Management Fee and Expenses
The Trustees considered information showing the fees and expenses of the Fund in comparison to the management fees of its peer group of funds as classified by Morningstar and also to the expense ratios of a peer group of funds selected on the basis of criteria determined by the Independent Trustees for this purpose using data provided by Strategic Insight Mutual Fund Research and Consulting, LLC (Strategic Insight), an independent third party. The peer group comparisons referred to below are organized in quintiles. Each quintile represents one-fifth of the peer group. In all peer group comparisons referred to below, first quintile is most favorable to the Fund’s shareowners. The Trustees noted that they separately review and consider the impact of the Fund’s transfer agency and Fund- and Amundi US-paid expenses for sub-transfer agency and intermediary arrangements, and that the results of the most recent such review were considered in the consideration of the Fund’s expense ratio.
The Trustees considered that the Fund’s management fee for the most recent fiscal year was in the fourth quintile relative to the management fees paid by other funds in its Morningstar category for the comparable period. The Trustees also considered the breakpoints in the management fee schedule and the reduced fee rates above certain asset levels. The Trustees noted Amundi US’s explanation of the reasons that the Fund’s management fee was in the fourth quintile relative to the management fees paid by other funds in its Morningstar category. The Trustees considered that the expense ratio of the Fund’s Class Y shares for the most recent fiscal year was in the fourth quintile relative to its Strategic Insight peer group for the comparable period. The Trustees noted Amundi US’s explanation of the reasons that the expense ratio of the Fund’s Class Y shares was in the fourth quintile relative to its Strategic Insight peer group.
The Trustees reviewed management fees charged by Amundi US to institutional and other clients, including publicly offered European funds sponsored by Amundi US’s affiliates, unaffiliated U.S. registered investment companies (in a sub-advisory capacity), and unaffiliated foreign and domestic separate accounts. The Trustees also considered Amundi US’s costs in providing services to the Fund and Amundi US’s costs in providing services to the other clients and considered the differences in management
114Pioneer Multi-Asset Ultrashort Income Fund | Semiannual Report | 9/30/23
fees and profit margins for fund and non-fund services. In evaluating the fees associated with Amundi US’s client accounts, the Trustees took into account the respective demands, resources and complexity associated with the Fund and other client accounts. The Trustees noted that, in some instances, the fee rates for those clients were lower than the management fee for the Fund and considered that, under the investment management and administration agreements with the Fund, Amundi US performs additional services for the Fund that it does not provide to those other clients or services that are broader in scope, including oversight of the Fund’s other service providers and activities related to compliance and the extensive regulatory and tax regimes to which the Fund is subject. The Trustees also considered the entrepreneurial risks associated with Amundi US’s management of the Fund.
The Trustees concluded that the management fee payable by the Fund to Amundi US was reasonable in relation to the nature and quality of the services provided by Amundi US.
Profitability
The Trustees considered information provided by Amundi US regarding the profitability of Amundi US with respect to the advisory services provided by Amundi US to the Fund, including the methodology used by Amundi US in allocating certain of its costs to the management of the Fund. The Trustees also considered Amundi US’s profit margin in connection with the overall operation of the Fund. They further reviewed the financial results, including the profit margins, realized by Amundi US from non-fund businesses. The Trustees considered Amundi US’s profit margins in comparison to the limited industry data available and noted that the profitability of any adviser was affected by numerous factors, including its organizational structure and method for allocating expenses. The Trustees concluded that Amundi US’s profitability with respect to the management of the Fund was not unreasonable.
Economies of Scale
The Trustees considered Amundi US’s views relating to economies of scale in connection with the Pioneer Funds as fund assets grow and the extent to which any such economies of scale are shared with the Fund and Fund shareholders. The Trustees noted the breakpoints in the management fee schedule. The Trustees recognize that economies of scale are difficult to identify and quantify, and that, among other factors that may be relevant, are the following: fee levels, expense subsidization, investment by Amundi US in research and analytical capabilities and Amundi US’s commitment and resource allocation to the Fund. The Trustees noted that profitability also may be an indicator of the availability of any economies of scale,
Pioneer Multi-Asset Ultrashort Income Fund | Semiannual Report | 9/30/23115
although profitability may vary for other reasons including due to reductions in expenses. The Trustees concluded that economies of scale, if any, were being appropriately shared with the Fund.
Other Benefits
The Trustees considered the other benefits that Amundi US enjoys from its relationship with the Fund. The Trustees considered the character and amount of fees paid or to be paid by the Fund, other than under the investment management agreement, for services provided by Amundi US and its affiliates. The Trustees further considered the revenues and profitability of Amundi US’s businesses other than the Fund business. To the extent applicable, the Trustees also considered the benefits to the Fund and to Amundi US and its affiliates from the use of “soft” commission dollars generated by the Fund to pay for research and brokerage services.
The Trustees considered that Amundi US is the principal U.S. asset management business of Amundi, which is one of the largest asset managers globally. Amundi’s worldwide asset management business manages over $2.1 trillion in assets (including the Pioneer Funds). The Trustees considered that Amundi US’s relationship with Amundi creates potential opportunities for Amundi US and Amundi that derive from Amundi US’s relationships with the Fund, including Amundi’s ability to market the services of Amundi US globally. The Trustees noted that Amundi US has access to additional research and portfolio management capabilities as a result of its relationship with Amundi and Amundi’s enhanced global presence that may contribute to an increase in the resources available to Amundi US. The Trustees considered that Amundi US and the Fund receive reciprocal intangible benefits from the relationship, including mutual brand recognition and, for the Fund, direct and indirect access to the resources of a large global asset manager. The Trustees concluded that any such benefits received by Amundi US as a result of its relationship with the Fund were reasonable.
Conclusion
After consideration of the factors described above as well as other factors, the Trustees, including the Independent Trustees, concluded that the investment management agreement for the Fund, including the fees payable thereunder, was fair and reasonable and voted to approve the proposed renewal of the investment management agreement.
116Pioneer Multi-Asset Ultrashort Income Fund | Semiannual Report | 9/30/23
Statement Regarding Liquidity Risk Management Program
As required by law, the Fund has adopted and implemented a liquidity risk management program (the “Program”) that is designed to assess and manage liquidity risk. Liquidity risk is the risk that the Fund could not meet requests to redeem its shares without significant dilution of remaining investors’ interests in the Fund. The Fund’s Board of Trustees designated a liquidity risk management committee (the “Committee”) consisting of employees of Amundi Asset Management US, Inc. (the “Adviser”) to administer the Program.
The Committee provided the Board of Trustees with a report that addressed the operation of the Program and assessed its adequacy and effectiveness of implementation (the “Report”). The Report covered the period from January 1, 2022 through December 31, 2022 (the “Reporting Period”).
The Report confirmed that, throughout the Reporting Period, the Committee had monitored the Fund’s portfolio liquidity and liquidity risk on an ongoing basis, as described in the Program and in Board reporting throughout the Reporting Period.
The Report discussed the Committee’s annual review of the Program, which addressed, among other things, the following elements of the Program:
The Committee reviewed the Fund’s investment strategy and liquidity of portfolio investments during both normal and reasonably foreseeable stressed conditions. The Committee noted that the Fund’s investment strategy continues to be appropriate for an open-end fund, taking into account, among other things, whether and to what extent the Fund held less liquid and illiquid assets and the extent to which any such investments affected the Fund’s ability to meet redemption requests. In managing and reviewing the Fund’s liquidity risk, the Committee also considered the extent to which the Fund’s investment strategy involves a relatively concentrated portfolio or large positions in particular issuers, the extent to which the Fund uses borrowing for investment purposes, and the extent to which the Fund uses derivatives (including for hedging purposes). The Committee also reviewed the Fund’s short-term and long-term cash flow projections during both normal and reasonably foreseeable stressed conditions. In assessing the Fund’s cash flow projections, the Committee considered, among other factors, historical net redemption activity, redemption policies, ownership concentration, distribution channels, and the degree of certainty associated with the Fund’s short-term and long-term cash flow projections. The Committee also considered the Fund’s holdings of cash and cash equivalents, as well as borrowing arrangements
Pioneer Multi-Asset Ultrashort Income Fund | Semiannual Report | 9/30/23 117
and other funding sources, including, if applicable, the Fund’s participation in a credit facility, as components of the Fund’s ability to meet redemption requests. The Fund has adopted an in-kind redemption policy which may be utilized to meet larger redemption requests.
The Committee reviewed the Program’s liquidity classification methodology for categorizing the Fund’s investments into one of four liquidity buckets. In reviewing the Fund’s investments, the Committee considered, among other factors, whether trading varying portions of a position in a particular portfolio investment or asset class in sizes the Fund would reasonably anticipate trading, would be reasonably expected to significantly affect liquidity.
The Committee performed an analysis to determine whether the Fund is required to maintain a Highly Liquid Investment Minimum, and determined that no such minimum is required because the Fund primarily holds highly liquid investments.
The Report stated that the Committee concluded the Program operates adequately and effectively, in all material respects, to assess and manage the Fund’s liquidity risk throughout the Reporting Period.
118Pioneer Multi-Asset Ultrashort Income Fund | Semiannual Report | 9/30/23
Trustees, Officers and Service Providers
Trustees
Thomas J. Perna, Chairman
John E. Baumgardner, Jr.
Diane Durnin
Benjamin M. Friedman
Lisa M. Jones
Craig C. MacKay
Lorraine H. Monchak
Marguerite A. Piret
Fred J. Ricciardi
Kenneth J. Taubes
Officers
Lisa M. Jones, President and
Chief Executive Officer
Anthony J. Koenig, Jr., Treasurer
and Chief Financial and
Accounting Officer
Christopher J. Kelley, Secretary and
Chief Legal Officer
Investment Adviser and Administrator
Amundi Asset Management US, Inc.
Custodian and Sub-Administrator
The Bank of New York Mellon Corporation
Independent Registered Public Accounting Firm
Ernst & Young LLP
Principal Underwriter
Amundi Distributor US, Inc.
Legal Counsel
Morgan, Lewis & Bockius LLP
Transfer Agent
BNY Mellon Investment Servicing (US) Inc.
Proxy Voting Policies and Procedures of the Fund are available without charge, upon request, by calling our toll free number (1-800-225-6292). Information regarding how the Fund voted proxies relating to portfolio securities during the most recent 12-month period ended June 30 is publicly available to shareowners at www.amundi.com/us. This information is also available on the Securities and Exchange Commission’s web site at www.sec.gov.
Pioneer Multi-Asset Ultrashort Income Fund | Semiannual Report | 9/30/23119
How to Contact Amundi
We are pleased to offer a variety of convenient ways for you to contact us for assistance or information.
Call us for:
Account Information, including existing accounts,
new accounts, prospectuses, applications
and service forms
1-800-225-6292
FactFoneSM for automated fund yields, prices,
account information and transactions
1-800-225-4321
| Retirement plans information | 1-800-622-0176 |
Write to us:
Amundi
P.O. Box 534427
Pittsburgh, PA 15253-4427
| Our toll-free fax | 1-800-225-4240 |
| Our internet e-mail address | us.askamundi@amundi.com
(for general questions about Amundi only) |
Visit our web site: www.amundi.com/us
This report must be preceded or accompanied by a prospectus.
The Fund files a complete schedule of portfolio holdings with the Securities and Exchange Commission for the first and third quarters of each fiscal year as an exhibit to its reports on Form N-PORT. Shareowners may view the filed Form N-PORT by visiting the Commission’s web site at https://www.sec.gov.
Amundi Asset Management US, Inc.
60 State Street
Boston, MA 02109
www.amundi.com/us
Securities offered through Amundi Distributor US, Inc.
60 State Street, Boston, MA 02109
Underwriter of Pioneer Mutual Funds, Member SIPC
© 2023 Amundi Asset Management US, Inc. 25249-12-1123
ITEM 2. CODE OF ETHICS.
(a) Disclose whether, as of the end of the period covered by the report, the registrant has adopted a code of ethics that applies to the registrant’s principal executive officer, principal financial officer, principal accounting officer or controller, or persons performing similar functions, regardless of whether these individuals are employed by the registrant or a third party. If the registrant has not adopted such a code of ethics, explain why it has not done so.
The registrant has adopted, as of the end of the period covered by this report, a code of ethics that applies to the registrant’s principal executive officer, principal financial officer, principal accounting officer and controller.
(b) For purposes of this Item, the term “code of ethics” means written standards that are reasonably designed to deter wrongdoing and to promote:
(1) Honest and ethical conduct, including the ethical handling of actual or apparent conflicts of interest between personal and professional relationships;
(2) Full, fair, accurate, timely, and understandable disclosure in reports and documents that a registrant files with, or submits to, the Commission and in other public communications made by the registrant;
(3) Compliance with applicable governmental laws, rules, and regulations;
(4) The prompt internal reporting of violations of the code to an appropriate person or persons identified in the code; and
(5) Accountability for adherence to the code.
(c) The registrant must briefly describe the nature of any amendment, during the period covered by the report, to a provision of its code of ethics that applies to the registrant’s principal executive officer, principal financial officer, principal accounting officer or controller, or persons performing similar functions, regardless of whether these individuals are employed by the registrant or a third party, and that relates to any element of the code of ethics definition enumerated in paragraph (b) of this Item. The registrant must file a copy of any such amendment as an exhibit pursuant to Item 10(a), unless the registrant has elected to satisfy paragraph (f) of this Item by posting its code of ethics on its website pursuant to paragraph (f)(2) of this Item, or by undertaking to provide its code of ethics to any person without charge, upon request, pursuant to paragraph (f)(3) of this Item.
The registrant has made no amendments to the code of ethics during the period covered by this report.
(d) If the registrant has, during the period covered by the report, granted a waiver, including an implicit waiver, from a provision of the code of ethics to the registrant’s principal executive officer, principal financial officer, principal accounting officer or controller, or persons performing similar functions, regardless of whether these individuals are employed by the registrant or a third party, that relates to one or more of the items set forth in paragraph (b) of this Item, the registrant must briefly describe the nature of the waiver, the name of the person to whom the waiver was granted, and the date of the waiver.
Not applicable.
(e) If the registrant intends to satisfy the disclosure requirement under paragraph (c) or (d) of this Item regarding an amendment to, or a waiver from, a provision of its code of ethics that applies to the registrant’s principal executive officer, principal financial officer, principal accounting officer or controller, or persons performing similar functions and that relates to any element of the code of ethics definition enumerated in paragraph (b) of this Item by posting such information on its Internet website, disclose the registrant’s Internet address and such intention.
Not applicable.
(f) The registrant must:
(1) File with the Commission, pursuant to Item 12(a)(1), a copy of its code of ethics that applies to the registrant’s principal executive officer, principal financial officer, principal accounting officer or controller, or persons performing similar functions, as an exhibit to its annual report on this Form N-CSR (see attachment);
(2) Post the text of such code of ethics on its Internet website and disclose, in its most recent report on this Form N-CSR, its Internet address and the fact that it has posted such code of ethics on its Internet website; or
(3) Undertake in its most recent report on this Form N-CSR to provide to any person without charge, upon request, a copy of such code of ethics and explain the manner in which such request may be made. See Item 10(2)
ITEM 3. AUDIT COMMITTEE FINANCIAL EXPERT.
(a) (1) Disclose that the registrant’s Board of Trustees has determined that the registrant either:
(i) Has at least one audit committee financial expert serving on its audit committee; or
(ii) Does not have an audit committee financial expert serving on its audit committee.
The registrant’s Board of Trustees has determined that the registrant has at least one audit committee financial expert.
(2) If the registrant provides the disclosure required by paragraph (a)(1)(i) of this Item, it must disclose the name of the audit committee financial expert and whether that person is “independent.” In order to be considered “independent” for purposes of this Item, a member of an audit committee may not, other than in his or her capacity as a member of the audit committee, the Board of Trustees, or any other board committee:
(i) Accept directly or indirectly any consulting, advisory, or other compensatory fee from the issuer; or
(ii) Be an “interested person” of the investment company as defined in Section 2(a)(19) of the Act (15 U.S.C. 80a-2(a)(19)).
Mr. Fred J. Ricciardi, an independent Trustee, is such an audit committee financial expert.
(3) If the registrant provides the disclosure required by paragraph (a)(1) (ii) of this Item, it must explain why it does not have an audit committee financial expert.
Not applicable.
ITEM 4. PRINCIPAL ACCOUNTANT FEES AND SERVICES.
(a) Disclose, under the caption AUDIT FEES, the aggregate fees billed for each of the last two fiscal years for professional services rendered by the principal accountant for the audit of the registrant’s annual financial statements or services that are normally provided by the accountant in connection with statutory and regulatory filings or engagements for those fiscal years.
N/A
(b) Disclose, under the caption AUDIT-RELATED FEES, the aggregate fees billed in each of the last two fiscal years for assurance and related services by the principal accountant that are reasonably related to the performance of the audit of the registrant’s financial statements and are not reported under paragraph (a) of this Item. Registrants shall describe the nature of the services comprising the fees disclosed under this category.
N/A
(c) Disclose, under the caption TAX FEES, the aggregate fees billed in each of the last two fiscal years for professional services rendered by the principal accountant for tax compliance, tax advice, and tax planning. Registrants shall describe the nature of the services comprising the fees disclosed under this category.
N/A
(d) Disclose, under the caption ALL OTHER FEES, the aggregate fees billed in each of the last two fiscal years for products and services provided by the principal accountant, other than the services reported in paragraphs (a) through (c) of this Item. Registrants shall describe the nature of the services comprising the fees disclosed under this category.
N/A
(e) (1) Disclose the audit committee’s pre-approval policies and procedures described in paragraph (c)(7) of Rule 2-01 of Regulation S-X.
PIONEER FUNDS
APPROVAL OF AUDIT, AUDIT-RELATED, TAX AND OTHER SERVICES
PROVIDED BY THE INDEPENDENT AUDITOR
SECTION I - POLICY PURPOSE AND APPLICABILITY
The Pioneer Funds recognize the importance of maintaining the independence of their outside auditors. Maintaining independence is a shared responsibility involving Amundi Asset Management US, Inc., the audit committee and the independent auditors.
The Funds recognize that a Fund’s independent auditors: 1) possess knowledge of the Funds, 2) are able to incorporate certain services into the scope of the audit, thereby avoiding redundant work, cost and disruption of Fund personnel and processes, and 3) have expertise that has value to the Funds. As a result, there are situations where it is desirable to use the Fund’s independent auditors for services in addition to the annual audit and where the potential for conflicts of interests are minimal. Consequently, this policy, which is intended to comply with Rule 210.2-01(C)(7), sets forth guidelines and procedures to be followed by the Funds when retaining the independent audit firm to perform audit, audit-related tax and other services under those circumstances, while also maintaining independence.
Approval of a service in accordance with this policy for a Fund shall also constitute approval for any other Fund whose pre-approval is required pursuant to Rule 210.2-01(c)(7)(ii).
In addition to the procedures set forth in this policy, any non-audit services that may be provided consistently with Rule 210.2-01 may be approved by the Audit Committee itself and any pre-approval that may be waived in accordance with Rule 210.2-01(c)(7)(i)(C) is hereby waived.
Selection of a Fund’s independent auditors and their compensation shall be determined by the Audit Committee and shall not be subject to this policy.
| | | | |
SECTION II - POLICY |
SERVICE CATEGORY | | SERVICE CATEGORY DESCRIPTION | | SPECIFIC PRE-APPROVED SERVICE SUBCATEGORIES |
| I. AUDIT SERVICES | | Services that are directly related to performing the independent audit of the Funds | | • Accounting research assistance • SEC consultation, registration statements, and reporting • Tax accrual related matters • Implementation of new accounting standards • Compliance letters (e.g. rating agency letters) • Regulatory reviews and assistance regarding financial matters • Semi-annual reviews (if requested) • Comfort letters for closed end offerings |
| | |
| II. AUDIT-RELATED SERVICES | | Services which are not prohibited under Rule 210.2-01(C)(4) (the “Rule”) and are related extensions of the audit services support the audit, or use the knowledge/expertise gained from the audit procedures as a foundation to complete the project. In most cases, if the Audit-Related Services are not performed by the Audit firm, the scope of the Audit Services would likely increase. The Services are typically well-defined and governed by accounting professional standards (AICPA, SEC, etc.) | | • AICPA attest and agreed-upon procedures • Technology control assessments • Financial reporting control assessments • Enterprise security architecture assessment |
| | |
AUDIT COMMITTEE APPROVAL POLICY | | AUDIT COMMITTEE REPORTING POLICY |
• “One-time” pre-approval for the audit period for all pre-approved specific service subcategories. Approval of the independent auditors as auditors for a Fund shall constitute pre approval for these services. | | • A summary of all such services and related fees reported at each regularly scheduled Audit Committee meeting. |
| |
• “One-time” pre-approval for the fund fiscal year within a specified dollar limit for all pre-approved specific service subcategories | | • A summary of all such services and related fees (including comparison to specified dollar limits) reported quarterly. |
| | |
| |
• Specific approval is needed to exceed the pre-approved dollar limit for these services (see general Audit Committee approval policy below for details on obtaining specific approvals) • Specific approval is needed to use the Fund’s auditors for Audit-Related Services not denoted as “pre-approved”, or to add a specific service subcategory as “pre-approved” | | |
SECTION III - POLICY DETAIL, CONTINUED
| | | | |
SERVICE CATEGORY | | SERVICE CATEGORY DESCRIPTION | | SPECIFIC PRE-APPROVED
SERVICE SUBCATEGORIES |
| III. TAX SERVICES | | Services which are not prohibited by the Rule, if an officer of the Fund determines that using the Fund’s auditor to provide these services creates significant synergy in the form of efficiency, minimized disruption, or the ability to maintain a desired level of confidentiality. | | • Tax planning and support • Tax controversy assistance • Tax compliance, tax returns, excise tax returns and support • Tax opinions |
| | |
AUDIT COMMITTEE APPROVAL POLICY | | AUDIT COMMITTEE REPORTING POLICY |
| |
• “One-time” pre-approval for the fund fiscal year within a specified dollar limit | | • A summary of all such services and related fees (including comparison to specified dollar limits) reported quarterly. |
| |
• Specific approval is needed to exceed the pre-approved dollar limits for these services (see general Audit Committee approval policy below for details on obtaining specific approvals) | | |
| |
• Specific approval is needed to use the Fund’s auditors for tax services not denoted as pre-approved, or to add a specific service subcategory as “pre-approved” | | |
SECTION III - POLICY DETAIL, CONTINUED
| | | | |
SERVICE CATEGORY | | SERVICE CATEGORY DESCRIPTION | | SPECIFIC PRE-APPROVED
SERVICE SUBCATEGORIES |
| IV. OTHER SERVICES | | Services which are not prohibited by the Rule, | | • Business Risk Management support |
| | |
| A. SYNERGISTIC, UNIQUE QUALIFICATIONS | | if an officer of the Fund determines that using the Fund’s auditor to provide these services creates significant synergy in the form of efficiency, minimized disruption, the ability to maintain a desired level of confidentiality, or where the Fund’s auditors posses unique or superior qualifications to provide these services, resulting in superior value and results for the Fund. | | • Other control and regulatory compliance projects |
| | |
AUDIT COMMITTEE APPROVAL POLICY | | AUDIT COMMITTEE REPORTING POLICY |
• “One-time” pre-approval for the fund fiscal year within a specified dollar limit | | • A summary of all such services and related fees (including comparison to specified dollar limits) reported quarterly. |
| |
• Specific approval is needed to exceed the pre-approved dollar limits for these services (see general Audit Committee approval policy below for details on obtaining specific approvals) | | |
| |
• Specific approval is needed to use the Fund’s auditors for “Synergistic” or “Unique Qualifications” Other Services not denoted as pre-approved to the left, or to add a specific service subcategory as “pre-approved” | | |
SECTION III - POLICY DETAIL, CONTINUED
| | | | |
SERVICE CATEGORY | | SERVICE CATEGORY DESCRIPTION | | SPECIFIC PROHIBITED SERVICE SUBCATEGORIES |
| PROHIBITED SERVICES | | Services which result in the auditors losing independence status under the Rule. | | 1. Bookkeeping or other services related to the accounting records or financial statements of the audit client* |
| | |
| | | | 2. Financial information systems design and implementation* |
| | |
| | | | 3. Appraisal or valuation services, fairness* opinions, or contribution-in-kind reports |
| | |
| | | | 4. Actuarial services (i.e., setting actuarial reserves versus actuarial audit work)* |
| | |
| | | | 5. Internal audit outsourcing services* |
| | |
| | | | 6. Management functions or human resources |
| | |
| | | | 7. Broker or dealer, investment advisor, or investment banking services |
| | |
| | | | 8. Legal services and expert services unrelated to the audit |
| | |
| | | | 9. Any other service that the Public Company Accounting Oversight Board determines, by regulation, is impermissible |
| | |
AUDIT COMMITTEE APPROVAL POLICY | | AUDIT COMMITTEE REPORTING POLICY |
• These services are not to be performed with the exception of the(*) services that may be permitted if they would not be subject to audit procedures at the audit client (as defined in rule 2-01(f)(4)) level the firm providing the service. | | • A summary of all services and related fees reported at each regularly scheduled Audit Committee meeting will serve as continual confirmation that has not provided any restricted services. |
GENERAL AUDIT COMMITTEE APPROVAL POLICY:
| | • | | For all projects, the officers of the Funds and the Fund’s auditors will each make an assessment to determine that any proposed projects will not impair independence. |
| | • | | Potential services will be classified into the four non-restricted service categories and the “Approval of Audit, Audit-Related, Tax and Other Services” Policy above will be applied. Any services outside the specific pre-approved service subcategories set forth above must be specifically approved by the Audit Committee. |
| | • | | At least quarterly, the Audit Committee shall review a report summarizing the services by service category, including fees, provided by the Audit firm as set forth in the above policy. |
(2) Disclose the percentage of services described in each of paragraphs (b) through (d) of this Item that were approved by the audit committee pursuant to paragraph (c)(7)(i)(C) of Rule 2-01 of Regulation S-X.
Non-Audit Services
N/A
(f) If greater than 50 percent, disclose the percentage of hours expended on the principal accountants engagement to audit the registrant’s financial statements for the most recent fiscal year that were attributed to work performed by persons other than the principal accountant’s full-time, permanent employees.
N/A
(g) Disclose the aggregate non-audit fees billed by the registrants accountant for services rendered to the registrant, and rendered to the registrants investment adviser (not including any sub-adviser whose role is primarily portfolio management and is subcontracted with or overseen by another investment adviser), and any entity controlling, controlled by, or under common control with the adviser that provides ongoing services to the registrant for each of the last two fiscal years of the registrant.
N/A
(h) Disclose whether the registrants audit committee of the Board of Trustees has considered whether the provision of non-audit services that were rendered to the registrants investment adviser (not including any subadviser whose role is primarily portfolio management and is subcontracted with or overseen by another investment adviser), and any entity controlling, controlled by, or under common control with the investment adviser that provides ongoing services to the registrant that were not pre-approved pursuant to paragraph (c)(7)(ii) of Rule 2-01 of Regulation S-X is compatible with maintaining the principal accountant’s independence.
The Fund’s audit committee of the Board of Trustees has considered whether the provision of non-audit services that were rendered to the Affiliates (as defined) that were not pre- approved pursuant to paragraph (c)(7)(ii) of Rule 2-01 of Regulation S-X is compatible with maintaining the principal accountant’s independence.
(i) A registrant identified by the Commission pursuant to Section 104(i)(2)(A) of the Sarbanes-Oxley Act of 2002 (15 U.S.C. 7214(i)(2)(A)), as having retained, for the preparation of the audit report on its financial statements included in the Form NCSR, a registered public accounting firm that has a branch or office that is located in a foreign jurisdiction and that the Public Company Accounting Oversight Board has determined it is unable to inspect or investigate completely because of a position taken by an authority in the foreign jurisdiction must electronically submit to the Commission on a supplemental basis documentation that establishes that the registrant is not owned or controlled by a governmental entity in the foreign jurisdiction. The registrant must submit this documentation on or before the due date for this form. A registrant that is owned or controlled by a foreign governmental entity is not required to submit such documentation.
N/A
(j) A registrant that is a foreign issuer, as defined in 17 CFR 240.3b-4, identified by the Commission pursuant to Section 104(i)(2)(A) of the Sarbanes-Oxley Act of 2002 (15 U.S.C. 7214(i)(2)(A)), as having retained, for the preparation of the audit report on its financial statements included in the Form N-CSR, a registered public accounting firm that has a branch or office that is located in a foreign jurisdiction and that the Public Company Accounting Oversight Board has determined it is unable to inspect or investigate completely because of a position taken by an authority in the foreign jurisdiction, for each year in which the registrant is so identified, must provide the below disclosures. Also, any such identified foreign issuer that uses a variable-interest entity or any similar structure that results in additional foreign entities being consolidated in the financial statements of the registrant is required to provide the below disclosures for itself and its consolidated foreign operating entity or entities. A registrant must disclose:
(1) That, for the immediately preceding annual financial statement period, a registered public accounting firm that the PCAOB was unable to inspect or investigate completely, because of a position taken by an authority in the foreign jurisdiction, issued an audit report for the registrant;
N/A
(2) The percentage of shares of the registrant owned by governmental entities in the foreign jurisdiction in which the registrant is incorporated or otherwise organized;
N/A
(3) Whether governmental entities in the applicable foreign jurisdiction with respect to that registered public accounting firm have a controlling financial interest with respect to the registrant; N/A
(4) The name of each official of the Chinese Communist Party who is a member of the board of directors of the registrant or the operating entity with respect to the registrant;
N/A
(5) Whether the articles of incorporation of the registrant (or equivalent organizing document) contains any charter of the Chinese Communist Party, including the text of any such charter.
N/A
ITEM 5. AUDIT COMMITTEE OF LISTED REGISTRANTS
(a) If the registrant is a listed issuer as defined in Rule 10A-3 under the Exchange Act (17 CFR 240.10A-3), state whether or not the registrant has a separately-designated standing audit committee established in accordance with Section 3(a)(58)(A) of the Exchange Act (15 U.S.C. 78c(a)(58)(A)). If the registrant has such a committee, however designated, identify each committee member. If the entire board of directors is acting as the registrant’s audit committee as specified in Section 3(a)(58)(B) of the Exchange Act (15 U.S.C. 78c(a)(58)(B)), so state.
N/A
(b) If applicable, provide the disclosure required by Rule 10A-3(d) under the Exchange Act (17 CFR 240.10A-3(d)) regarding an exemption from the listing standards for audit committees.
N/A
ITEM 6. SCHEDULE OF INVESTMENTS.
File Schedule of Investments in securities of unaffiliated issuers as of the close of the reporting period as set forth in 210.1212 of Regulation S-X [17 CFR 210.12-12], unless the schedule is included as part of the report to shareholders filed under Item 1 of this Form.
Included in Item 1
ITEM 7. DISCLOSURE OF PROXY VOTING POLICIES AND PROCEDURES FOR CLOSED-END MANAGEMENT INVESTMENT COMPANIES.
A closed-end management investment company that is filing an annual report on this Form N-CSR must, unless it invests exclusively in non-voting securities, describe the policies and procedures that it uses to determine how to vote proxies relating to portfolio securities, including the procedures that the company uses when a vote presents a conflict between the interests of its shareholders, on the one hand, and those of the company’s investment adviser; principal underwriter; or any affiliated person (as defined in Section 2(a)(3) of the Investment Company Act of 1940 (15 U.S.C. 80a-2(a)(3)) and the rules thereunder) of the company, its investment adviser, or its principal underwriter, on the other. Include any policies and procedures of the company’s investment adviser, or any other third party, that the company uses, or that are used on the company’s behalf, to determine how to vote proxies relating to portfolio securities.
N/A
ITEM 8. PORTFOLIO MANAGERS OF CLOSED-END MANAGEMENT INVESTMENT COMPANIES.
(a) If the registrant is a closed-end management investment company that is filing an annual report on this Form N-CSR, provide the following information:
(1) State the name, title, and length of service of the person or persons employed by or associated with the registrant or an investment adviser of the registrant who are primarily responsible for the day-to-day management of the registrant’s portfolio (“Portfolio Manager”). Also state each Portfolio Manager’s business experience during the past 5 years.
N/A
ITEM 9. PURCHASES OF EQUITY SECURITIES BY CLOSED-END MANAGEMENT INVESTMENT COMPANY AND AFFILIATED PURCHASERS.
(a) If the registrant is a closed-end management investment company, in the following tabular format, provide the information specified in paragraph (b) of this Item with respect to any purchase made by or on behalf of the registrant or any affiliated purchaser, as defined in Rule 10b-18(a)(3) under the Exchange Act (17 CFR 240.10b-18(a)(3)), of shares or other units of any class of the registrant’s equity securities that is registered by the registrant pursuant to Section 12 of the Exchange Act (15 U.S.C. 781).
N/A
ITEM 10. SUBMISSION OF MATTERS TO A VOTE OF SECURITY HOLDERS.
Describe any material changes to the procedures by which shareholders may recommend nominees to the registrant’s board of directors, where those changes were implemented after the registrant last provided disclosure in response to the requirements of Item 407(c)(2)(iv) of Regulation S-R(17 CFR 229.407)(as required by Item 22(b)(15)) of Schedule 14A (17 CFR 240.14a-101), or this Item.
There have been no material changes to the procedures by which the shareholders may recommend nominees to the registrant’s board of directors since the registrant last provided disclosure in response to the requirements of Item 407(c)(2)(iv) of Regulation S-R of Schedule 14(A) in its definitive proxy statement, or this item.
ITEM 11. CONTROLS AND PROCEDURES.
(a) Disclose the conclusions of the registrant’s principal executive and principal financials officers, or persons performing similar functions, regarding the effectiveness of the registrant’s disclosure controls and procedures (as defined in Rule 30a-3(c) under the Act (17 CFR 270.30a-3(c))) as of a date within 90 days of the filing date of the report that includes the disclosure required by this paragraph, based on the evaluation of these controls and procedures required by Rule 30a-3(b) under the Act (17 CFR 270.30(a)-3(b) and Rules 13a-15(b) or 15d-15(b) under the Exchange Act (17 CFR 240.13a-15(b) or 240.15d-15(b)).
The registrant’s principal executive officer and principal financial officer have concluded that the registrant’s disclosure controls and procedures are effective based on the evaluation of these controls and procedures as of a date within 90 days of the filing date of this report.
(b) Disclose any change in the registrant’s internal control over financial reporting (as defined in Rule 30a-3(d) under the Act (17CFR 270.30a-3(d)) that occurred during the period covered by this report that has materially affected, or is reasonably likely to materially affect, the registrant’s internal control over financial reporting.
There were no significant changes in the registrant’s internal control over financial reporting that occurred during the period covered by this report that have materially affected, or are reasonably likely to materially affect, the registrant’s internal control over financial reporting.
Item 12. Disclosure of Securities Lending Activities for Closed-End Management Investment Companies.
(a) If the registrant is a closed-end management investment company, provide the following dollar amounts of income and compensation related to the securities lending activities of the registrant during its most recent fiscal year:
N/A
(1) Gross income from securities lending activities;
N/A
(2) All fees and/or compensation for each of the following securities lending activities and related services: any share of revenue generated by the securities lending program paid to the securities lending agent(s) (revenue split); fees paid for cash collateral management services (including fees deducted from a pooled cash collateral reinvestment vehicle) that are not included in the revenue split; administrative fees that are not included in the revenue split; fees for indemnification that are not included in the revenue split; rebates paid to borrowers; and any other fees relating to the securities lending program that are not included in the revenue split, including a description of those other fees;
N/A
(3) The aggregate fees/compensation disclosed pursuant to paragraph (2); and
N/A
(4) Net income from securities lending activities (i.e., the dollar amount in paragraph (1) minus the dollar amount in paragraph (3)).
If a fee for a service is included in the revenue split, state that the fee is included in the revenue split.
N/A
(b) If the registrant is a closed-end management investment company, describe the services provided to the registrant by the securities lending agent in the registrants most recent fiscal year.
N/A
ITEM 13. EXHIBITS.
(a) File the exhibits listed below as part of this Form. Letter or number the exhibits in the sequence indicated.
(1) Any code of ethics, or amendment thereto, that is the subject of the disclosure required by Item 2, to the extent that the registrant intends to satisfy the Item 2 requirements through filing of an exhibit.
(2) A separate certification for each principal executive officer and principal financial officer of the registrant as required by Rule 30a-2(a) under the Act (17 CFR 270.30a-2(a)) , exactly as set forth below:
Filed herewith.
(b) Certifications pursuant to Rule 30a-2(b) under the 1940 Act and Section 906 of the Sarbanes-Oxley Act of 2002 are attached hereto.
SIGNATURES
[See General Instruction F]
Pursuant to the requirements of the Securities Exchange Act of 1934 and the Investment Company Act of 1940, the registrant has duly caused this report to be signed on its behalf by the undersigned, thereunto duly authorized.
(Registrant) Pioneer Series Trust X
|
By (Signature and Title)* /s/ Lisa M. Jones |
Lisa M. Jones, President and Chief Executive Officer |
Date December 7, 2023 |
Pursuant to the requirements of the Securities Exchange Act of 1934 and the Investment Company Act of 1940, this report has been signed below by the following persons on behalf of the registrant and in the capacities and on the dates indicated.
|
By (Signature and Title)* /s/ Lisa M. Jones |
Lisa M. Jones, President and Chief Executive Officer |
|
Date December 7, 2023 |
|
By (Signature and Title)* /s/ Anthony J. Koenig, Jr. |
Anthony J. Koenig, Jr., Managing Director, Chief Operations Officer & Treasurer of the Funds |
|
Date December 7, 2023 |
| * | Print the name and title of each signing officer under his or her signature. |