UNITED STATES
SECURITIES AND EXCHANGE COMMISSION
Washington, D.C. 20549
FORM N-CSR
CERTIFIED SHAREHOLDER REPORT OF REGISTERED
MANAGEMENT INVESTMENT COMPANIES
Investment Company Act file number 811-21128
Legg Mason Partners Variable Equity Trust
(Exact name of registrant as specified in charter)
620 Eighth Avenue, 49th Floor, New York, NY 10018
(Address of principal executive offices) (Zip code)
Robert I. Frenkel, Esq.
Legg Mason & Co., LLC
100 First Stamford Place
Stamford, CT 06902
(Name and address of agent for service)
Registrant’s telephone number, including area code: 1-877-721-1926
Date of fiscal year end: December 31
Date of reporting period: June 30, 2015
ITEM 1. REPORT TO STOCKHOLDERS.
The Semi-Annual Report to Stockholders is filed herewith.

| | |
| Semi-Annual Report | | June 30, 2015 |
PERMAL
ALTERNATIVE SELECT VIT PORTFOLIO

|
| INVESTMENT PRODUCTS: NOT FDIC INSURED • NO BANK GUARANTEE • MAY LOSE VALUE |
Portfolio objective
The Portfolio seeks to provide investors with long term capital appreciation.
Letter from the president

Dear Shareholder,
We are pleased to provide the semi-annual report of Permal Alternative Select VIT Portfolio for the six-month reporting period ended June 30, 2015. Please read on for Portfolio performance information and a detailed look at prevailing economic and market conditions during the Portfolio’s reporting period.
I am pleased to introduce myself as the new President and Chief Executive Officer of the Portfolio, succeeding Kenneth D. Fuller. I am honored to have been appointed to my new role. During my 27 year career with Legg Mason, I have seen the investment management industry evolve and expand. Throughout these changes, maintaining an unwavering focus on our shareholders and their needs has remained paramount.
As always, we remain committed to providing you with excellent service and a full spectrum of investment choices. We also remain committed to supplementing the support you receive from your financial advisor. One way we accomplish this is through our website, www.leggmason.com/individualinvestors. Here you can gain immediate access to market and investment information, including:
| • | | Market insights and commentaries from our portfolio managers, and |
| • | | A host of educational resources. |
We look forward to helping you meet your financial goals.
Sincerely,

Jane Trust, CFA
President and Chief Executive Officer
July 31, 2015
| | |
| II | | Permal Alternative Select VIT Portfolio |
Investment commentary
Economic review
After a tepid start, the pace of U.S. economic activity improved during the six months ended June 30, 2015 (the “reporting period”). Looking back, the U.S. Department of Commerce’s revised figures showed that fourth quarter 2014 U.S. gross domestic product (“GDP”)i growth was 2.1%. First quarter 2015 GDP growth then moderated to 0.6%. This was attributed to a number of factors, including a deceleration in personal consumption expenditures (“PCE”), along with negative contributions from exports, nonresidential fixed investment, and state and local government spending. However, the economy then gained some traction, as the U.S. Department of Commerce’s initial estimate for second quarter 2015 GDP growth — released after the reporting period ended — was 2.3%. The upturn was driven by an increase in exports, an acceleration in PCE, a deceleration in imports and increased state and local government spending.
Activity in the U.S. manufacturing sector initially moderated and then strengthened during the reporting period. Based on the Institute for Supply Management’s Purchasing Managers’ Index (“PMI”)ii, U.S. manufacturing expanded during all six months of the reporting period (a reading below 50 indicates a contraction, whereas a reading above 50 indicates an expansion).
The labor market was a tailwind for the economy during the reporting period. When the period began, unemployment was 5.7%, as reported by the U.S. Department of Labor. By June 2015, unemployment was 5.3%, its lowest level since April 2008.
Turning to the global economy, in its July 2015 World Economic Outlook Update, released after the reporting period ended, the International Monetary Fund (“IMF”) said “A setback to activity in the first quarter of 2015, mostly in North America, has resulted in a small downward revision to global growth for 2015 relative to the April 2015 World Economic Outlook Update. Nevertheless, the underlying drivers for a gradual acceleration in economic activity in advanced economies — easy financial conditions, more neutral fiscal policy in the euro area, lower fuel prices, and improving confidence and labor market conditions —remain intact.” From a regional perspective, the IMF projects that 2015 growth in the Eurozone will be 1.5%, versus 0.8% in 2014. Japan’s economy is expected to expand 0.8% in 2015, compared to -0.1% in 2014. Elsewhere, the IMF said that overall growth in emerging market countries will decelerate in 2015, with growth of 4.2% versus 4.6% in 2014.
| | |
| Permal Alternative Select VIT Portfolio | | III |
Investment commentary (cont’d)
Market review
Q. How did the Federal Reserve Board (“Fed”)iii respond to the economic environment?
A. The Fed took a number of actions as it sought to meet its dual mandate of fostering maximum employment and price stability. As it has since December 2008, the Fed maintained the federal funds rateiv at a historically low range between zero and 0.25%. However, in October 2014 the Fed ended its asset purchase program that was announced in December 2012. In December 2014, the Fed said that “it can be patient in beginning to normalize the stance of monetary policy.” At its meeting that ended on April 29, 2015, the Fed said, “…economic growth slowed during the winter months, in part reflecting transitory factors.” Finally, at its meeting that ended on July 29, 2015, after the reporting period ended, the Fed said, “The Committee currently anticipates that, even after employment and inflation are near mandate-consistent levels, economic conditions may, for some time, warrant keeping the target federal funds rate below levels the Committee views as normal in the longer run.”
Q. What actions did international central banks take during the reporting period?
A. Given the economic challenges in the Eurozone, the European Central Bank (“ECB”)v took a number of actions to stimulate growth and ward off deflation. The ECB reduced rates in June and September 2014, before the beginning of the reporting period. Then, in January 2015 the ECB announced that, beginning in March 2015, it would start a €60 billion-a-month bond buying program that is expected to run until September 2016. In other developed countries, the Bank of England kept rates on hold at 0.50% during the reporting period, as did Japan at a range of zero to 0.10%, its lowest level since 2006. At the end of October 2014, the Bank of Japan announced that it would increase its asset purchases between 10 trillion yen and 20 trillion yen ($90.7 billion to $181.3 billion) to approximately 80 trillion yen ($725 billion) annually, in an attempt to stimulate growth. Elsewhere, after holding rates steady at 6.0% since July 2012, the People’s Bank of China lowered rates four times during the reporting period. Its most recent cut in June 2015 dropped rates to 4.85%.
Q. What factors impacted the U.S. stock market during the reporting period?
A. The U.S. stock market rose modestly over the six months ended June 30, 2015 although with notable volatility. The market fell sharply in January 2015 due to concerns over global growth and geopolitical issues. The market then moved sharply higher in February given strong investor risk appetite. After another bout of weakness in March, the market rallied in April and May, only to again decline in June, as investor sentiment soured amid the mounting debt crisis in Greece. All told, for the six months ended June 30, 2015, the S&P 500 Indexvi gained 1.23%.
Looking at the U.S. stock market more closely, small-cap stocks generated the best returns, with the Russell 2000 Indexvii returning 4.75% during the reporting period. Large-cap stocks, as measured by the Russell 1000 Indexviii, gained 1.71% and mid-cap stocks, as measured by the Russell Midcap Indexix rose 2.35%. From an investment style perspective, growth stocks handily outperformed value. The Russell 3000 Growthx and Russell 3000 Valuexi Indices, returned 4.33% and -0.51%,
| | |
| IV | | Permal Alternative Select VIT Portfolio |
respectively, during the six months ended June 30, 2015.
Q. How did the international stock market perform during the reporting period?
A. Developed market equities, as measured by the MSCI EAFE Indexxii, gained 5.52% during the six months ended June 30, 2015. Emerging market equities produced relatively weaker results, as the MSCI Emerging Markets Indexxiii returned 2.95% during the reporting period. Emerging market equities were impacted by concerns about global growth, fluctuating oil and currency prices, and bouts of investor risk aversion.
Q. Did Treasury yields trend higher or lower during the six months ended June 30, 2015?
A. Short-term Treasury yields edged lower, whereas long-term Treasury yields increased during the reporting period. When the reporting period began, the yield on the two-year Treasury note was 0.67%. It peaked at 0.75% on June 10, 2015, and fell as low as 0.44% on January 15, 2015, before ending the period at 0.64%. The yield on the ten-year Treasury note began the period at 2.17% and its peak of 2.50% occurred on June 10, 2015. The yield on the ten-year Treasury note was as low as 1.68% in late January/early February 2015 and concluded the reporting period at 2.35%.
Q. What factors impacted the spread sectors (non-Treasuries) during the reporting period?
A. The spread sectors generally posted positive, albeit small gains, during the reporting period. Performance fluctuated with investor sentiment given the uncertainties regarding future Fed monetary policy, along with concerns over global growth and geopolitical issues. The broad U.S. bond market, as measured by the Barclays U.S. Aggregate Indexxiv, declined 0.10% during the six months ended June 30, 2015.
Q. How did the high-yield bond market perform over the six months ended June 30, 2015?
A. The U.S. high-yield bond market, as measured by the Barclays U.S. Corporate High Yield — 2% Issuer Cap Indexxv, returned 2.53% for the six months ended June 30, 2015. High yield bonds were volatile during the reporting period. While the underlying fundamentals in the high-yield market remained generally solid and default rates were well below their long-term average, the asset class posted negative returns in March and June 2015 when investor risk aversion increased.
Q. How did the emerging markets debt asset class perform over the reporting period?
A. The JPMorgan Emerging Markets Bond Index Global (“EMBI Global”)xvi returned 1.76% during the six months ended June 30, 2015. The asset class rose during the first four months of the reporting period, but those gains were partially offset by weakness in May and June 2015. These setbacks were triggered by a number of factors, including expectations for future Fed rate hikes and geopolitical issues.
| | |
| Permal Alternative Select VIT Portfolio | | V |
Investment commentary (cont’d)
Performance review
For the six months ended June 30, 2015, Class II shares of Permal Alternative Select VIT Portfolio1 returned 2.31%. The Portfolio’s unmanaged benchmarks, HFRX Global Hedge Fund Indexxvii and the Citigroup 3-Month U.S. Treasury Bill Indexxviii returned 1.27% and 0.01%, respectively, for the same period. The Lipper Variable Alternative Other Funds Category Average2 returned 0.65% over the same time frame.
| | | | |
Performance Snapshot as of June 30, 2015
(unaudited) | |
| | | 6 months | |
| Permal Alternative Select VIT Portfolio1: | | | | |
Class II | | | 2.31 | % |
| HFRX Global Hedge Fund Index | | | 1.27 | % |
| Citigroup 3-Month U.S. Treasury Bill Index | | | 0.01 | % |
Lipper Variable Alternative Other Funds
Category Average2 | | | 0.65 | % |
The performance shown represents past performance. Past performance is no guarantee of future results and current performance may be higher or lower than the performance shown above. Principal value, investment returns and yields will fluctuate and investors’ shares, when redeemed, may be worth more or less than their original cost.
Portfolio return assumes the reinvestment of all distributions, including returns of capital, if any, at net asset value and the deduction of all Portfolio expenses. Performance figures for periods shorter than one year represent cumulative figures and are not annualized.
Portfolio performance figures reflect fee waivers and/or expense reimbursements, without which the performance would have been lower.
|
| Total Annual Operating Expenses (unaudited) |
As of the Portfolio’s current prospectus dated May 1, 2015, the gross total annual operating expense ratio for Class II shares was 6.42%.
Actual expenses may be higher. For example, expenses may be higher than those shown if average net assets decrease. Net assets are more likely to decrease and Portfolio expense ratios are more likely to increase when markets are volatile.
As a result of an expense limitation arrangement, the ratio of expenses (other than taxes; interest; extraordinary expenses; brokerage commissions and expenses; fees, costs and expenses associated with any prime brokerage arrangement (including the costs of any securities borrowing arrangement); acquired fund fees and expenses; and dividend and interest expenses on securities sold short) to average net assets is not expected to exceed 2.70% for Class II shares. This expense limitation arrangement cannot be terminated prior to December 31, 2016 without the Board of Trustees’ consent.
The manager is permitted to recapture amounts waived and/or reimbursed to the class during the same fiscal year if the class’ total annual operating expenses have fallen to a level below the expense limitation (“expense cap”) in effect at the time
| 1 | The Portfolio is an underlying investment option of various variable annuity and variable life insurance products. The Portfolio’s performance returns do not reflect the deduction of expenses imposed in connection with investing in variable annuity or variable life insurance contracts, such as administrative fees, account charges and surrender charges, which, if reflected, would reduce the performance of the Portfolio. Past performance is no guarantee of future results. |
| 2 | Lipper, Inc., a wholly-owned subsidiary of Reuters, provides independent insight on global collective investments. Returns are based on the six-month period ended June 30, 2015,including the reinvestment of all distributions, including returns of capital, if any, calculated among the 78 funds in the Portfolio’s Lipper category. |
| | |
| VI | | Permal Alternative Select VIT Portfolio |
the fees were earned or the expenses incurred. In no case will the manager recapture any amount that would result, on any particular business day of the Portfolio, in the class’ total annual operating expenses exceeding the expense cap or any other lower limit then in effect.
As always, thank you for your confidence in our stewardship of your assets.
Sincerely,
Jane Trust, CFA
President and Chief Executive Officer
July 31, 2015
RISKS: The Portfolio utilizes alternative hedge strategies which involve highly speculative investments that employ aggressive investment strategies and carry substantial risk. These investments are generally illiquid, difficult to value and may carry significant restrictions for transferring assets. The Portfolio, and the sub-advised strategies, may employ leverage, which increases the volatility of investment returns and subjects the Portfolio to magnified losses if the Portfolio’s investments decline in value. The Portfolio and the subadvisers may use derivatives, such as options and futures, which can be illiquid, may disproportionately increase losses, and have a potentially large impact on Portfolio performance. The Portfolio, and some of the subadvisers may employ short selling, a speculative strategy. Unlike the possible loss on a security that is purchased, there is no limit on the amount of loss on an appreciating security that is sold short. The Portfolio and each subadviser may engage in active and frequent trading, resulting in higher portfolio turnover and transaction costs. There is no assurance strategies used by the Portfolio or sub-advised funds will be successful. Equity securities are subject to price fluctuation and loss of principal. International investments are subject to special risks including currency fluctuations, social, economic and political uncertainties, which could increase volatility. These risks are magnified in emerging markets. Small-and mid-cap stocks involve greater risks and volatility than large-cap stocks. Fixed income securities involve interest rate, credit, inflation, and reinvestment risks. As interest rates rise, the value of fixed income securities fall. High-yield bonds possess greater price volatility, illiquidity, and possibility of default. The Portfolio is classified as “non-diversified,” which means it may invest a larger percentage of its assets in a smaller number of issuers than a diversified fund. Please see the prospectus for a more complete discussion of these and other risks and the Portfolio’s investment strategies.
All investments are subject to risk including the possible loss of principal. Past performance is no guarantee of future results. All index performance reflects no deduction for fees, expenses or taxes. Please note that an investor cannot invest directly in an index.
The information provided is not intended to be a forecast of future events, a guarantee of future results or investment advice. Views expressed may differ from those of the firm as a whole. Forecasts and predictions are inherently limited and should not be relied upon as an indication of actual or future performance.
| | |
| Permal Alternative Select VIT Portfolio | | VII |
Investment commentary (cont’d)
| i | Gross domestic product (“GDP”) is the market value of all final goods and services produced within a country in a given period of time. |
| ii | The Institute for Supply Management’s PMI is based on a survey of purchasing executives who buy the raw materials for manufacturing at more than 350 companies. It offers an early reading on the health of the U.S. manufacturing sector. |
| iii | The Federal Reserve Board (“Fed”) is responsible for the formulation of policies designed to promote economic growth, full employment, stable prices and a sustainable pattern of international trade and payments. |
| iv | The federal funds rate is the rate charged by one depository institution on an overnight sale of immediately available funds (balances at the Federal Reserve) to another depository institution; the rate may vary from depository institution to depository institution and from day to day. |
| v | The European Central Bank (“ECB”) is responsible for the monetary system of the European Union and the euro currency. |
| vi | The S&P 500 Index is an unmanaged index of 500 stocks and is generally representative of the performance of larger companies in the U.S. |
| vii | The Russell 2000 Index measures the performance of the small-cap segment of the U.S. equity universe. The Russell 2000 is a subset of the Russell 3000 Index representing approximately 10% of the total market capitalization of that index. It includes approximately 2,000 of the smallest securities based on a combination of their market cap and current index membership. The Russell 3000 Index measures the performance of the 3,000 largest U.S. companies based on total market capitalization, which represents approximately 98% of the U.S. equity market. |
| viii | The Russell 1000 Index measures the performance of the large-cap segment of the U.S. equity universe. It is a subset of the Russell 3000 Index and includes approximately 1,000 of the largest securities based on a combination of their market cap and current index membership. The Russell 1000 represents approximately 92% of the U.S. market. |
| ix | The Russell Midcap Index measures the performance of the mid-cap segment of the U.S. equity universe. The Russell Midcap is a subset of the Russell 1000 Index. It includes approximately 800 of the smallest securities based on a combination of their market cap and current index membership. The Russell Midcap represents approximately 31% of the total market capitalization of the Russell 1000 companies. |
| x | The Russell 3000 Growth Index measures the performance of the broad growth segment of the U.S. equity universe. It includes those Russell 3000 Index companies with higher price-to-book ratios and higher forecasted growth values. (A price-to-book ratio is the price of a stock compared to the difference between a company’s assets and liabilities.) |
| xi | The Russell 3000 Value Index measures the performance of the broad value segment of the U.S. equity value universe. It includes those Russell 3000 Index companies with lower price-to-book ratios and lower forecasted growth values. |
| xii | The MSCI EAFE Index is a free float-adjusted market capitalization index designed to measure developed market equity performance, excluding the U.S. and Canada. |
| xiii | The MSCI Emerging Markets Index is a free float-adjusted market capitalization index that is designed to measure equity market performance in the global emerging markets. |
| xiv | The Barclays U.S. Aggregate Index is a broad-based bond index comprised of government, corporate, mortgage- and asset-backed issues, rated investment grade or higher, and having at least one year to maturity. |
| xv | The Barclays U.S. Corporate High Yield — 2% Issuer Cap Index is an index of the 2% Issuer Cap component of the Barclays U.S. Corporate High Yield Index, which covers the U.S. dollar-denominated, non-investment grade, fixed-rate, taxable corporate bond market. |
| xvi | The JPMorgan Emerging Markets Bond Index Global (“EMBI Global”) tracks total returns for U.S. dollar-denominated debt instruments issued by emerging market sovereign and quasi-sovereign entities: Brady bonds, loans, Eurobonds and local market instruments. |
| xvii | The HFRX Global Hedge Fund Index is designed to be representative of the overall composition of the hedge fund universe. It is comprised of all eligible hedge fund strategies; including but not limited to convertible arbitrage, distressed securities, equity hedge, equity market neutral, event-driven, macro, merger arbitrage, and relative value arbitrage. The strategies are asset weighted based on the distribution of assets in the hedge fund industry. |
| xviiiThe | Citigroup 3-Month U.S. Treasury Bill Index is an unmanaged index generally representative of the average yield of 3-month U.S. Treasury bills. |
| | |
| VIII | | Permal Alternative Select VIT Portfolio |
Portfolio at a glance (unaudited)
Investment breakdown† (%) as a percent of total investments
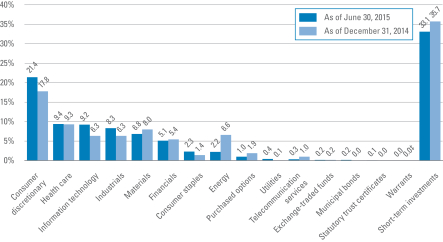
| † | The bar graph above represents the composition of the Portfolio’s investments as of June 30, 2015 and December 31, 2014 and does not include derivatives such as written options, futures contracts, swap contracts and forward foreign currency contracts. The Portfolio is actively managed. As a result, the composition of the Portfolio’s investments is subject to change at any time. |
| ‡ | Represents less than 0.1%. |
Securities sold short breakdown* (%) as a percent of total securities sold short
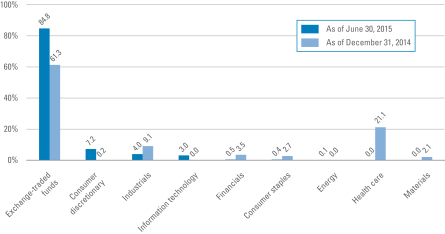
| * | The bar graph above represents the composition of the Portfolio’s securities sold short as of June 30, 2015 and December 31, 2014 and does not include derivatives. The Portfolio is actively managed. As a result, the composition of the Portfolio’s securities sold short is subject to change at any time. |
| | |
| Permal Alternative Select VIT Portfolio 2015 Semi-Annual Report | | 1 |
Portfolio expenses (unaudited)
Example
As a shareholder of the Portfolio, you may incur two types of costs: (1) transaction costs and (2) ongoing costs, including management fees; service and/or distribution (12b-1) fees; and other Portfolio expenses. This example is intended to help you understand your ongoing costs (in dollars) of investing in the Portfolio and to compare these costs with the ongoing costs of investing in other mutual funds.
This example is based on an investment of $1,000 invested on January 1, 2015 and held for the six months ended June 30, 2015.
Actual expenses
The table below titled “Based on Actual Total Return” provides information about actual account values and actual expenses. You may use the information provided in this table, together with the amount you invested, to estimate the expenses that you paid over the period. To estimate the expenses you paid on your account, divide your ending account value by $1,000 (for example, an $8,600 ending account value divided by $1,000 = 8.6), then multiply the result by the number under the heading entitled “Expenses Paid During the Period“.
Hypothetical example for comparison purposes
The table below titled “Based on Hypothetical Total Return” provides information about hypothetical account values and hypothetical expenses based on the actual expense ratio and an assumed rate of return of 5.00% per year before expenses, which is not the Portfolio’s actual return. The hypothetical account values and expenses may not be used to estimate the actual ending account balance or expenses you paid for the period. You may use the information provided in this table to compare the ongoing costs of investing in the Portfolio and other funds. To do so, compare the 5.00% hypothetical example relating to the Portfolio with the 5.00% hypothetical examples that appear in the shareholder reports of the other funds.
Please note that the expenses shown in the table below are meant to highlight your ongoing costs only and do not reflect any transactional costs. Therefore, the table is useful in comparing ongoing costs only, and will not help you determine the relative total costs of owning different funds. In addition, if these transaction costs were included, your costs would have been higher.
| | | | | | | | | | | | | | | | | | | | | | | | | | | | | | | | | | | | | | | | | | | | |
| Based on actual total return1 | | | | | Based on hypothetical total return1 | |
| | | Actual
Total
Return2 | | | Beginning
Account
Value | | | Ending
Account
Value | | | Annualized
Expense
Ratio | | | Expenses
Paid
During
the
Period3 | | | | | | | Hypothetical
Annualized
Total Return | | | Beginning
Account
Value | | | Ending
Account
Value | | | Annualized
Expense
Ratio | | | Expenses
Paid
During
the
Period3 | |
| Class II | | | 2.31 | % | | $ | 1,000.00 | | | $ | 1,023.10 | | | | 2.94 | % | | $ | 14.75 | | | | | Class II | | | 5.00 | % | | $ | 1,000.00 | | | $ | 1,010.22 | | | | 2.94 | % | | $ | 14.65 | |
| 1 | For the six months ended June 30, 2015. |
| 2 | Assumes the reinvestment of all distributions, including returns of capital, if any, at net asset value. Total return is not annualized, as it may not be representative of the total return for the year. Total return does not reflect expenses associated with separate accounts such as administrative fees, account charges and surrender charges, which, if reflected, would reduce the total return. Performance figures may reflect compensating balance arrangements, fee waivers and/or expense reimbursements. In the absence of compensating balance arrangements, fee waivers and/or expense reimbursements, the total return would have been lower. Past performance is no guarantee of future results. |
| 3 | Expenses (net of compensating balance arrangements, fee waivers and/or expense reimbursements) are equal to the class’ annualized expense ratio multiplied by the average account value over the period, multiplied by the number of days in the most recent fiscal half-year (181), then divided by 365. |
| | |
| 2 | | Permal Alternative Select VIT Portfolio 2015 Semi-Annual Report |
Consolidated schedule of investments (unaudited)
June 30, 2015
Permal Alternative Select VIT Portfolio
| | | | | | | | | | | | |
| Security | | | | | | Shares | | | Value | |
| Common Stocks — 36.4% | | | | | | | | | | | | |
| Consumer Discretionary — 11.5% | | | | | | | | | | | | |
Auto Components — 2.7% | | | | | | | | | | | | |
American Axle & Manufacturing Holdings Inc. | | | | | | | 3,851 | | | $ | 80,525 | * |
Compagnie Generale des Etablissements Michelin, Class B Shares | | | | | | | 1,164 | | | | 121,969 | |
Faurecia | | | | | | | 2,171 | | | | 89,286 | |
Goodyear Tire & Rubber Co. | | | | | | | 6,914 | | | | 208,457 | (a) |
Koito Manufacturing Co., Ltd. | | | | | | | 3,400 | | | | 132,655 | |
Lear Corp. | | | | | | | 792 | | | | 88,910 | |
Magna International Inc., Class A Shares | | | | | | | 1,586 | | | | 88,959 | |
Total Auto Components | | | | | | | | | | | 810,761 | |
Automobiles — 0.1% | | | | | | | | | | | | |
Motors Liquidation Co. GUC Trust | | | | | | | 1,463 | | | | 28,163 | |
Tata Motors Ltd., ADR | | | | | | | 13 | | | | 448 | |
Total Automobiles | | | | | | | | | | | 28,611 | |
Diversified Consumer Services — 0.6% | | | | | | | | | | | | |
Service Corporation International | | | | | | | 1,108 | | | | 32,608 | |
Sotheby’s Holdings Inc. | | | | | | | 3,240 | | | | 146,578 | |
Total Diversified Consumer Services | | | | | | | | | | | 179,186 | |
Hotels, Restaurants & Leisure — 1.0% | | | | | | | | | | | | |
Boyd Gaming Corp. | | | | | | | 72 | | | | 1,076 | * |
Caesars Acquisition Co., Class A Shares | | | | | | | 295 | | | | 2,030 | * |
Caesars Entertainment Corp. | | | | | | | 2,207 | | | | 13,507 | * |
ClubCorp Holdings Inc. | | | | | | | 659 | | | | 15,737 | |
MGM Resorts International | | | | | | | 6,196 | | | | 113,077 | * |
OPAP SA | | | | | | | 2,118 | | | | 15,737 | (b) |
Pinnacle Entertainment Inc. | | | | | | | 223 | | | | 8,313 | * |
Starwood Hotels & Resorts Worldwide Inc. | | | | | | | 450 | | | | 36,491 | |
Wynn Resorts Ltd. | | | | | | | 950 | | | | 93,736 | |
Total Hotels, Restaurants & Leisure | | | | | | | | | | | 299,704 | |
Internet & Catalog Retail — 2.2% | | | | | | | | | | | | |
Netflix Inc. | | | | | | | 1,000 | | | | 656,940 | *(c) |
Media — 1.1% | | | | | | | | | | | | |
Cablevision Systems Corp., New York Group, Class A Shares | | | | | | | 650 | | | | 15,561 | |
Clear Channel Outdoor Holdings Inc., Class A Shares | | | | | | | 75 | | | | 759 | |
Comcast Corp., Class A Shares | | | | | | | 3,427 | | | | 206,100 | |
Time Warner Cable Inc. | | | | | | | 505 | | | | 89,976 | |
Total Media | | | | | | | | | | | 312,396 | |
See Notes to Consolidated Financial Statements.
| | |
| Permal Alternative Select VIT Portfolio 2015 Semi-Annual Report | | 3 |
Consolidated schedule of investments (unaudited) (cont’d)
June 30, 2015
Permal Alternative Select VIT Portfolio
| | | | | | | | | | | | |
| Security | | | | | | Shares | | | Value | |
Multiline Retail — 0.3% | | | | | | | | | | | | |
Family Dollar Stores Inc. | | | | | | | 1,196 | | | $ | 94,257 | |
Specialty Retail — 2.4% | | | | | | | | | | | | |
Container Store Group Inc. | | | | | | | 12,600 | | | | 212,562 | *(c) |
Office Depot Inc. | | | | | | | 5,034 | | | | 43,595 | * |
Restoration Hardware Holdings Inc. | | | | | | | 1,300 | | | | 126,919 | * |
Tiffany & Co. | | | | | | | 2,000 | | | | 183,600 | |
Urban Outfitters Inc. | | | | | | | 3,400 | | | | 119,000 | *(c) |
Vitamin Shoppe Inc. | | | | | | | 856 | | | | 31,903 | * |
Total Specialty Retail | | | | | | | | | | | 717,579 | |
Textiles, Apparel & Luxury Goods — 1.1% | | | | | | | | | | | | |
Michael Kors Holdings Ltd. | | | | | | | 7,300 | | | | 307,257 | *(c) |
Total Consumer Discretionary | | | | | | | | | | | 3,406,691 | |
| Energy — 0.8% | | | | | | | | | | | | |
Energy Equipment & Services — 0.2% | | | | | | | | | | | | |
Baker Hughes Inc. | | | | | | | 43 | | | | 2,653 | |
Schlumberger Ltd. | | | | | | | 650 | | | | 56,023 | |
Total Energy Equipment & Services | | | | | | | | | | | 58,676 | |
Oil, Gas & Consumable Fuels — 0.6% | | | | | | | | | | | | |
Antero Resources Corp. | | | | | | | 3,000 | | | | 103,020 | * |
DHT Holdings Inc. | | | | | | | 337 | | | | 2,618 | |
Golar LNG Ltd. | | | | | | | 1,200 | | | | 56,160 | |
Marathon Petroleum Corp. | | | | | | | 228 | | | | 11,927 | |
PBF Energy Inc., Class A Shares | | | | | | | 14 | | | | 398 | |
PBF Logistics LP | | | | | | | 175 | | | | 4,188 | |
Tesoro Corp. | | | | | | | 11 | | | | 928 | |
Valero Energy Corp. | | | | | | | 116 | | | | 7,262 | |
Western Refining Inc. | | | | | | | 140 | | | | 6,107 | |
Total Oil, Gas & Consumable Fuels | | | | | | | | | | | 192,608 | |
Total Energy | | | | | | | | | | | 251,284 | |
| Exchange-traded Funds — 0.2% | | | | | | | | | | | | |
Market Vectors ETF Trust — Gold Miners ETF | | | | | | | 3,000 | | | | 53,280 | |
| Financials — 2.2% | | | | | | | | | | | | |
Banks — 0.1% | | | | | | | | | | | | |
HDFC Bank Ltd., ADR | | | | | | | 69 | | | | 4,177 | |
ICICI Bank Ltd., ADR | | | | | | | 1,472 | | | | 15,338 | |
Total Banks | | | | | | | | | | | 19,515 | |
Capital Markets — 0.9% | | | | | | | | | | | | |
Apollo Global Management LLC, Class A Shares | | | | | | | 5,276 | | | | 116,863 | (a) |
See Notes to Consolidated Financial Statements.
| | |
| 4 | | Permal Alternative Select VIT Portfolio 2015 Semi-Annual Report |
Permal Alternative Select VIT Portfolio
| | | | | | | | | | | | |
| Security | | | | | | Shares | | | Value | |
Capital Markets — continued | | | | | | | | | | | | |
Blackstone Group LP | | | | | | | 922 | | | $ | 37,682 | |
Fortress Investment Group LLC, Class A Shares | | | | | | | 10,192 | | | | 74,402 | |
Och-Ziff Capital Management Group LLC | | | | | | | 3,118 | | | | 38,102 | |
Total Capital Markets | | | | | | | | | | | 267,049 | |
Consumer Finance — 0.4% | | | | | | | | | | | | |
Ally Financial Inc. | | | | | | | 3,457 | | | | 77,540 | * |
Santander Consumer USA Holdings Inc. | | | | | | | 1,484 | | | | 37,946 | |
Total Consumer Finance | | | | | | | | | | | 115,486 | |
Insurance — 0.1% | | | | | | | | | | | | |
Ambac Financial Group Inc. | | | | | | | 1,350 | | | | 22,464 | * |
Real Estate Investment Trusts (REITs) — 0.7% | | | | | | | | | | | | |
Campus Crest Communities Inc. | | | | | | | 35,061 | | | | 194,238 | |
HCP Inc. | | | | | | | 649 | | | | 23,669 | |
Total Real Estate Investment Trusts (REITs) | | | | | | | | | | | 217,907 | |
Real Estate Management & Development — 0.0% | | | | | | | | | | | | |
Hispania Activos Inmobiliarios SA | | | | | | | 683 | | | | 10,021 | * |
Total Financials | | | | | | | | | | | 652,442 | |
| Health Care — 6.9% | | | | | | | | | | | | |
Biotechnology — 1.2% | | | | | | | | | | | | |
Alexion Pharmaceuticals Inc. | | | | | | | 700 | | | | 126,539 | * |
Dynavax Technologies Corp. | | | | | | | 1,500 | | | | 35,137 | * |
Gilead Sciences Inc. | | | | | | | 349 | | | | 40,861 | |
Sage Therapeutics Inc. | | | | | | | 1,200 | | | | 87,600 | * |
Sangamo BioSciences Inc. | | | | | | | 2,800 | | | | 31,052 | * |
Vertex Pharmaceuticals Inc. | | | | | | | 187 | | | | 23,091 | * |
Total Biotechnology | | | | | | | | | | | 344,280 | |
Health Care Equipment & Supplies — 0.9% | | | | | | | | | | | | |
Medtronic PLC | | | | | | | 572 | | | | 42,385 | |
Spectranetics Corp. | | | | | | | 4,600 | | | | 105,846 | * |
Wright Medical Group Inc. | | | | | | | 4,300 | | | | 112,918 | * |
Total Health Care Equipment & Supplies | | | | | | | | | | | 261,149 | |
Health Care Providers & Services — 1.9% | | | | | | | | | | | | |
Brookdale Senior Living Inc. | | | | | | | 9,884 | | | | 342,975 | * |
Kindred Healthcare Inc. | | | | | | | 4,500 | | | | 91,305 | |
McKesson Corp. | | | | | | | 600 | | | | 134,886 | |
Total Health Care Providers & Services | | | | | | | | | | | 569,166 | |
Pharmaceuticals — 2.9% | | | | | | | | | | | | |
Allergan PLC | | | | | | | 1,050 | | | | 318,633 | * |
See Notes to Consolidated Financial Statements.
| | |
| Permal Alternative Select VIT Portfolio 2015 Semi-Annual Report | | 5 |
Consolidated schedule of investments (unaudited) (cont’d)
June 30, 2015
Permal Alternative Select VIT Portfolio
| | | | | | | | | | | | |
| Security | | | | | | Shares | | | Value | |
Pharmaceuticals — continued | | | | | | | | | | | | |
Mylan NV | | | | | | | 143 | | | $ | 9,704 | * |
Perrigo Co. PLC | | | | | | | 166 | | | | 30,682 | |
Pfizer Inc. | | | | | | | 1,242 | | | | 41,644 | |
Shire PLC, ADR | | | | | | | 900 | | | | 217,341 | |
Teva Pharmaceutical Industries Ltd., ADR | | | | | | | 4,300 | | | | 254,130 | |
Total Pharmaceuticals | | | | | | | | | | | 872,134 | |
Total Health Care | | | | | | | | | | | 2,046,729 | |
| Industrials — 4.5% | | | | | | | | | | | | |
Aerospace & Defense — 0.7% | | | | | | | | | | | | |
Airbus Group SE | | | | | | | 287 | | | | 18,622 | |
Triumph Group Inc. | | | | | | | 2,976 | | | | 196,386 | (a) |
Total Aerospace & Defense | | | | | | | | | | | 215,008 | |
Airlines — 0.5% | | | | | | | | | | | | |
Alaska Air Group Inc. | | | | | | | 1 | | | | 64 | |
Virgin America Inc. | | | | | | | 5,100 | | | | 140,148 | * |
Total Airlines | | | | | | | | | | | 140,212 | |
Building Products — 0.0% | | | | | | | | | | | | |
Simpson Manufacturing Co. Inc. | | | | | | | 229 | | | | 7,786 | |
Commercial Services & Supplies — 0.3% | | | | | | | | | | | | |
De La Rue PLC | | | | | | | 10,947 | | | | 90,303 | |
Construction & Engineering — 0.4% | | | | | | | | | | | | |
AECOM | | | | | | | 2,953 | | | | 97,685 | * |
Electrical Equipment — 0.6% | | | | | | | | | | | | |
SolarCity Corp. | | | | | | | 3,293 | | | | 176,340 | * |
Machinery — 1.1% | | | | | | | | | | | | |
Kennametal Inc. | | | | | | | 307 | | | | 10,475 | |
Kurita Water Industries Ltd. | | | | | | | 4,000 | | | | 93,280 | |
Metso Corp. | | | | | | | 1,456 | | | | 39,996 | |
Sulzer AG | | | | | | | 915 | | | | 94,098 | |
Terex Corp. | | | | | | | 4,157 | | | | 96,650 | |
Total Machinery | | | | | | | | | | | 334,499 | |
Trading Companies & Distributors — 0.9% | | | | | | | | | | | | |
Air Lease Corp. | | | | | | | 3,700 | | | | 125,430 | |
WESCO International Inc. | | | | | | | 2,107 | | | | 144,625 | *(a) |
Total Trading Companies & Distributors | | | | | | | | | | | 270,055 | |
Total Industrials | | | | | | | | | | | 1,331,888 | |
See Notes to Consolidated Financial Statements.
| | |
| 6 | | Permal Alternative Select VIT Portfolio 2015 Semi-Annual Report |
Permal Alternative Select VIT Portfolio
| | | | | | | | | | | | |
| Security | | | | | | Shares | | | Value | |
| Information Technology — 7.0% | | | | | | | | | | | | |
Electronic Equipment, Instruments & Components — 0.8% | | | | | | | | | | | | |
Anixter International Inc. | | | | | | | 1,593 | | | $ | 103,784 | * |
CDW Corp. | | | | | | | 411 | | | | 14,089 | |
Ingram Micro Inc., Class A Shares | | | | | | | 4,997 | | | | 125,075 | * |
Total Electronic Equipment, Instruments & Components | | | | | | | | | | | 242,948 | |
Internet Software & Services — 3.2% | | | | | | | | | | | | |
Cornerstone OnDemand Inc. | | | | | | | 5,300 | | | | 184,440 | * |
Cvent Inc. | | | | | | | 2,500 | | | | 64,450 | * |
Google Inc., Class A Shares | | | | | | | 150 | | | | 81,006 | * |
LinkedIn Corp., Class A Shares | | | | | | | 850 | | | | 175,636 | * |
Xactly Corp. | | | | | | | 4,200 | | | | 36,078 | |
Yahoo! Inc. | | | | | | | 1,905 | | | | 74,847 | * |
Yelp Inc. | | | | | | | 7,800 | | | | 335,634 | *(c) |
Total Internet Software & Services | | | | | | | | | | | 952,091 | |
IT Services — 0.8% | | | | | | | | | | | | |
AtoS | | | | | | | 1,837 | | | | 137,174 | |
ITOCHU Techno-Solutions Corp. | | | | | | | 4,100 | | | | 102,177 | |
Total IT Services | | | | | | | | | | | 239,351 | |
Semiconductors & Semiconductor Equipment — 0.2% | | | | | | | | | | | | |
Canadian Solar Inc. | | | | | | | 128 | | | | 3,661 | * |
JinkoSolar Holding Co., Ltd., ADR | | | | | | | 424 | | | | 12,517 | * |
SunEdison Inc. | | | | | | | 1,451 | | | | 43,399 | * |
Total Semiconductors & Semiconductor Equipment | | | | | | | | | | | 59,577 | |
Software — 2.0% | | | | | | | | | | | | |
Autodesk Inc. | | | | | | | 1,300 | | | | 65,098 | * |
CDK Global Inc. | | | | | | | 1,979 | | | | 106,826 | |
Informatica Corp. | | | | | | | 211 | | | | 10,227 | * |
MicroStrategy Inc., Class A Shares | | | | | | | 1,500 | | | | 255,120 | *(c) |
Solarwinds Inc. | | | | | | | 3,000 | | | | 138,390 | * |
Total Software | | | | | | | | | | | 575,661 | |
Total Information Technology | | | | | | | | | | | 2,069,628 | |
| Materials — 2.8% | | | | | | | | | | | | |
Chemicals — 1.5% | | | | | | | | | | | | |
Arkema | | | | | | | 1,182 | | | | 85,166 | |
FMC Corp. | | | | | | | 4,970 | | | | 261,174 | (a) |
Kuraray Co., Ltd. | | | | | | | 8,500 | | | | 103,971 | |
Total Chemicals | | | | | | | | | | | 450,311 | |
See Notes to Consolidated Financial Statements.
| | |
| Permal Alternative Select VIT Portfolio 2015 Semi-Annual Report | | 7 |
Consolidated schedule of investments (unaudited) (cont’d)
June 30, 2015
Permal Alternative Select VIT Portfolio
| | | | | | | | | | | | | | |
| Security | | | | | | | Shares | | | Value | |
Containers & Packaging — 0.8% | | | | | | | | | | | | | | |
Owens-Illinois Inc. | | | | | | | | | 10,727 | | | $ | 246,077 | *(a) |
Metals & Mining — 0.5% | | | | | | | | | | | | | | |
Barrick Gold Corp. | | | | | | | | | 11,202 | | | | 119,413 | |
Freeport-McMoRan Inc. | | | | | | | | | 745 | | | | 13,872 | |
Total Metals & Mining | | | | | | | | | | | | | 133,285 | |
Total Materials | | | | | | | | | | | | | 829,673 | |
| Telecommunication Services — 0.2% | | | | | | | | | | | | | | |
Diversified Telecommunication Services — 0.1% | | | | | | | | | | | | | | |
Cellnex Telecom SAU | | | | | | | | | 1,484 | | | | 25,106 | *(d) |
Hellenic Telecommunications Organization SA | | | | | | | | | 1,009 | | | | 7,872 | (b) |
Total Diversified Telecommunication Services | | | | | | | | | | | | | 32,978 | |
Wireless Telecommunication Services — 0.1% | | | | | | | | | | | | | | |
China Mobile Ltd., ADR | | | | | | | | | 382 | | | | 24,482 | |
Total Telecommunication Services | | | | | | | | | | | | | 57,460 | |
| Utilities — 0.3% | | | | | | | | | | | | | | |
Independent Power and Renewable Electricity Producers — 0.3% | | | | | | | | | | | | | | |
TerraForm Power Inc., Class A | | | | | | | | | 1,240 | | | | 47,095 | |
Vivint Solar Inc. | | | | | | | | | 3,294 | | | | 40,088 | * |
Total Utilities | | | | | | | | | | | | | 87,183 | |
Total Common Stocks (Cost — $10,639,113) | | | | | | | | | | | | | 10,786,258 | |
| | | | |
| | | Rate | | | | | | | | | |
| Convertible Preferred Stocks — 0.2% | | | | | | | | | | | | | | |
| Financials — 0.2% | | | | | | | | | | | | | | |
Real Estate Investment Trusts (REITs) — 0.2% | | | | | | | | | | | | | | |
American Tower Corp. (Cost — $50,000) | | | 5.500 | % | | | | | 500 | | | | 50,000 | |
| Preferred Stocks — 0.1% | | | | | | | | | | | | | | |
| Financials — 0.1% | | | | | | | | | | | | | | |
Real Estate Investment Trusts (REITs) — 0.1% | | | | | | | | | | | | | | |
Campus Crest Communities Inc. | | | 8.000 | % | | | | | 700 | | | | 17,325 | |
Thrifts & Mortgage Finance — 0.0% | | | | | | | | | | | | | | |
Federal Home Loan Mortgage Corp. (FHLMC) | | | 5.570 | % | | | | | 129 | | | | 438 | * |
Federal Home Loan Mortgage Corp. (FHLMC) | | | 5.900 | % | | | | | 202 | | | | 721 | * |
Federal Home Loan Mortgage Corp. (FHLMC) | | | 8.375 | % | | | | | 575 | | | | 2,156 | *(e) |
Federal National Mortgage Association (FNMA) | | | 0.000 | % | | | | | 239 | | | | 841 | *(e) |
Federal National Mortgage Association (FNMA) | | | 8.250 | % | | | | | 625 | | | | 2,344 | *(e) |
Total Thrifts & Mortgage Finance | | | | | | | | | | | | | 6,500 | |
Total Preferred Stocks (Cost — $23,811) | | | | | | | | | | | | | 23,825 | |
See Notes to Consolidated Financial Statements.
| | |
| 8 | | Permal Alternative Select VIT Portfolio 2015 Semi-Annual Report |
Permal Alternative Select VIT Portfolio
| | | | | | | | | | | | | | | | |
| Security | | Rate | | | | | | Units | | | Value | |
| Statutory Trust Certificates — 0.1% | | | | | | | | | | | | | | | | |
Rescap Liquidating Trust (Cost — $25,491) | | | | | | | | | | | 2,445 | | | $ | 25,428 | |
| | | | |
| | | | | | Maturity
Date | | | Face
Amount | | | | |
| Convertible Bonds & Notes — 1.0% | | | | | | | | | | | | | | | | |
| Financials — 0.1% | | | | | | | | | | | | | | | | |
Real Estate Investment Trusts (REITs) — 0.1% | | | | | | | | | | | | | | | | |
Starwood Waypoint Residential Trust, Senior Notes | | | 4.500 | % | | | 10/15/17 | | | $ | 10,000 | | | | 9,913 | (d) |
Starwood Waypoint Residential Trust, Senior Notes | | | 3.000 | % | | | 7/1/19 | | | | 25,000 | | | | 23,047 | (d) |
Total Financials | | | | | | | | | | | | | | | 32,960 | |
| Industrials — 0.9% | | | | | | | | | | | | | | | | |
Electrical Equipment — 0.9% | | | | | | | | | | | | | | | | |
SolarCity Corp., Senior Notes | | | 1.625 | % | | | 11/1/19 | | | | 285,000 | | | | 262,200 | (a)(d) |
| Information Technology — 0.0% | | | | | | | | | | | | | | | | |
Semiconductors & Semiconductor Equipment — 0.0% | | | | | | | | | | | | | |
SunEdison Inc., Senior Notes | | | 2.375 | % | | | 4/15/22 | | | | 5,000 | | | | 6,672 | (d) |
Total Convertible Bonds & Notes (Cost — $303,222) | | | | | | | | | | | | | | | 301,832 | |
| Corporate Bonds & Notes — 12.6% | | | | | | | | | | | | | | | | |
| Consumer Discretionary — 4.9% | | | | | | | | | | | | | | | | |
Hotels, Restaurants & Leisure — 1.8% | | | | | | | | | | | | | | | | |
Caesars Entertainment Operating Co. Inc., Secured Bonds | | | 10.000 | % | | | 12/15/18 | | | | 4,967 | | | | 1,341 | (f) |
Caesars Entertainment Operating Co. Inc., Secured Notes | | | 10.000 | % | | | 12/15/18 | | | | 325,000 | | | | 89,375 | (f) |
Caesars Entertainment Operating Co. Inc., Senior Secured Notes | | | 11.250 | % | | | 6/1/17 | | | | 270,000 | | | | 213,300 | (f) |
Caesars Entertainment Operating Co. Inc., Senior Secured Notes | | | 9.000 | % | | | 2/15/20 | | | | 265,000 | | | | 215,975 | (f) |
Caesars Entertainment Operating Co. Inc., Senior Secured Notes | | | 9.000 | % | | | 2/15/20 | | | | 10,000 | | | | 8,200 | (f) |
Total Hotels, Restaurants & Leisure | | | | | | | | | | | | | | | 528,191 | |
Media — 2.0% | | | | | | | | | | | | | | | | |
iHeartCommunications Inc., Senior Secured Notes | | | 9.000 | % | | | 3/1/21 | | | | 15,000 | | | | 13,631 | |
iHeartCommunications Inc., Senior Secured Notes | | | 11.250 | % | | | 3/1/21 | | | | 75,000 | | | | 73,125 | |
iHeartCommunications Inc., Senior Secured Notes | | | 9.000 | % | | | 9/15/22 | | | | 175,000 | | | | 158,594 | (a) |
iHeartCommunications Inc., Senior Secured Notes | | | 10.625 | % | | | 3/15/23 | | | | 20,000 | | | | 19,000 | (d) |
Numericable-SFR, Senior Secured Bonds | | | 6.250 | % | | | 5/15/24 | | | | 200,000 | | | | 197,250 | (d) |
Radio One Inc., Senior Secured Notes | | | 7.375 | % | | | 4/15/22 | | | | 70,000 | | | | 68,863 | (d) |
Time Warner Cable Inc., Debentures | | | 7.300 | % | | | 7/1/38 | | | | 15,000 | | | | 16,950 | |
Time Warner Cable Inc., Senior Bonds | | | 6.550 | % | | | 5/1/37 | | | | 29,000 | | | | 30,278 | |
Time Warner Cable Inc., Senior Notes | | | 6.750 | % | | | 6/15/39 | | | | 14,000 | | | | 14,993 | |
Time Warner Entertainment Co., LP, Senior Notes | | | 8.375 | % | | | 7/15/33 | | | | 5,000 | | | | 6,153 | |
Total Media | | | | | | | | | | | | | | | 598,837 | |
See Notes to Consolidated Financial Statements.
| | |
| Permal Alternative Select VIT Portfolio 2015 Semi-Annual Report | | 9 |
Consolidated schedule of investments (unaudited) (cont’d)
June 30, 2015
Permal Alternative Select VIT Portfolio
| | | | | | | | | | | | | | | | |
| Security | | Rate | | | Maturity
Date | | | Face
Amount | | | Value | |
Specialty Retail — 0.4% | | | | | | | | | | | | | | | | |
Guitar Center Inc., Senior Secured Bonds | | | 6.500 | % | | | 4/15/19 | | | $ | 15,000 | | | $ | 13,800 | (d) |
PETCO Animal Supplies Inc., Senior Notes | | | 9.250 | % | | | 12/1/18 | | | | 100,000 | | | | 104,750 | (d) |
Total Specialty Retail | | | | | | | | | | | | | | | 118,550 | |
Textiles, Apparel & Luxury Goods — 0.7% | | | | | | | | | | | | | | | | |
Boardriders SA, Senior Notes | | | 8.875 | % | | | 12/15/17 | | | | 100,000 | | | | 98,469 | (g) |
Quiksilver Inc./QS Wholesale Inc., Senior Secured Notes | | | 7.875 | % | | | 8/1/18 | | | | 135,000 | | | | 116,100 | (d) |
Total Textiles, Apparel & Luxury Goods | | | | | | | | | | | | | | | 214,569 | |
Total Consumer Discretionary | | | | | | | | | | | | | | | 1,460,147 | |
| Consumer Staples — 1.7% | | | | | | | | | | | | | | | | |
Food & Staples Retailing — 1.7% | | | | | | | | | | | | | | | | |
New Albertsons Inc., Senior Bonds | | | 7.750 | % | | | 6/15/26 | | | | 150,000 | | | | 147,000 | |
New Albertsons Inc., Senior Bonds | | | 7.450 | % | | | 8/1/29 | | | | 40,000 | | | | 38,600 | |
New Albertsons Inc., Senior Bonds | | | 8.000 | % | | | 5/1/31 | | | | 25,000 | | | | 24,875 | |
New Albertsons Inc., Senior Notes | | | 7.110 | % | | | 7/22/27 | | | | 70,000 | | | | 62,781 | |
New Albertsons Inc., Senior Notes | | | 7.150 | % | | | 7/23/27 | | | | 5,000 | | | | 4,181 | |
New Albertsons Inc., Senior Notes | | | 6.570 | % | | | 2/23/28 | | | | 230,000 | | | | 196,075 | |
New Albertsons Inc., Senior Notes | | | 6.520 | % | | | 4/10/28 | | | | 40,000 | | | | 33,900 | |
New Albertsons Inc., Senior Notes | | | 6.625 | % | | | 6/1/28 | | | | 5,000 | | | | 4,275 | |
Total Consumer Staples | | | | | | | | | | | | | | | 511,687 | |
| Energy — 0.9% | | | | | | | | | | | | | | | | |
Oil, Gas & Consumable Fuels — 0.9% | | | | | | | | | | | | | | | | |
Ridgebury Crude Tankers LLC, Senior Secured Bonds | | | 7.625 | % | | | 3/20/17 | | | | 238,095 | | | | 247,619 | (g) |
| Financials — 1.4% | | | | | | | | | | | | | | | | |
Capital Markets — 0.6% | | | | | | | | | | | | | | | | |
Lehman Brothers Holdings Inc., Escrow Receipts | | | — | | | | — | | | | 1,750,000 | | | | 188,125 | * |
Insurance — 0.8% | | | | | | | | | | | | | | | | |
Ambac Assurance Corp., Subordinated Notes | | | 5.100 | % | | | 6/7/20 | | | | 206,574 | | | | 221,809 | (d) |
Total Financials | | | | | | | | | | | | | | | 409,934 | |
| Health Care — 0.3% | | | | | | | | | | | | | | | | |
Health Care Providers & Services — 0.3% | | | | | | | | | | | | | | | | |
Tenet Healthcare Corp., Senior Notes | | | 6.750 | % | | | 6/15/23 | | | | 75,000 | | | | 76,594 | (d) |
| Industrials — 1.0% | | | | | | | | | | | | | | | | |
Aerospace & Defense — 1.0% | | | | | | | | | | | | | | | | |
DynCorp International Inc., Senior Notes | | | 10.375 | % | | | 7/1/17 | | | | 400,000 | | | | 290,000 | |
| Information Technology — 0.0% | | | | | | | | | | | | | | | | |
Technology Hardware, Storage & Peripherals — 0.0% | | | | | | | | | | | | | | | | |
Project Homestake Merger Corp., Senior Notes | | | 8.875 | % | | | 3/1/23 | | | | 5,000 | | | | 4,863 | (d) |
See Notes to Consolidated Financial Statements.
| | |
| 10 | | Permal Alternative Select VIT Portfolio 2015 Semi-Annual Report |
Permal Alternative Select VIT Portfolio
| | | | | | | | | | | | | | | | |
| Security | | Rate | | | Maturity
Date | | | Face
Amount | | | Value | |
| Materials — 2.4% | | | | | | | | | | | | | | | | |
Metals & Mining — 2.4% | | | | | | | | | | | | | | | | |
Consolidated Minerals Ltd., Senior Secured Notes | | | 8.000 | % | | | 5/15/20 | | | $ | 200,000 | | | $ | 160,000 | (d) |
First Quantum Minerals Ltd., Senior Notes | | | 7.250 | % | | | 5/15/22 | | | | 230,000 | | | | 220,512 | (d) |
HudBay Minerals Inc., Senior Notes | | | 9.500 | % | | | 10/1/20 | | | | 240,000 | | | | 255,600 | (a) |
Thompson Creek Metals Co. Inc., Senior Notes | | | 7.375 | % | | | 6/1/18 | | | | 85,000 | | | | 70,125 | |
Thompson Creek Metals Co. Inc., Senior Notes | | | 12.500 | % | | | 5/1/19 | | | | 10,000 | | | | 9,300 | |
Total Materials | | | | | | | | | | | | | | | 715,537 | |
| Telecommunication Services — 0.0% | | | | | | | | | | | | | | | | |
Diversified Telecommunication Services — 0.0% | | | | | | | | | | | | | | | | |
Intelsat Luxembourg SA, Senior Bonds | | | 6.750 | % | | | 6/1/18 | | | | 10,000 | | | | 9,500 | |
Total Corporate Bonds & Notes (Cost — $3,842,299) | | | | | | | | | | | | | | | 3,725,881 | |
| Municipal Bonds — 0.1% | | | | | | | | | | | | | | | | |
Puerto Rico — 0.1% | | | | | | | | | | | | | | | | |
Puerto Rico Sales Tax Financing Corp., Sales Tax Revenue | | | 6.050 | % | | | 8/1/38 | | | | 35,000 | | | | 20,300 | (h) |
Puerto Rico Sales Tax Financing Corp., Sales Tax Revenue | | | 6.000 | % | | | 8/1/38 | | | | 5,000 | | | | 2,900 | (h) |
Puerto Rico Sales Tax Financing Corp., Sales Tax Revenue | | | 6.050 | % | | | 8/1/37 | | | | 5,000 | | | | 2,900 | (h) |
Puerto Rico Sales Tax Financing Corp., Sales Tax Revenue | | | 6.050 | % | | | 8/1/36 | | | | 10,000 | | | | 5,800 | (h) |
Puerto Rico Sales Tax Financing Corp., Sales Tax Revenue | | | 6.050 | % | | | 8/1/39 | | | | 10,000 | | | | 5,800 | (h) |
Total Municipal Bonds (Cost — $42,163) | | | | | | | | | | | | | | | 37,700 | |
| | | | |
| | | | | | Expiration
Date | | | Contracts | | | | |
| Purchased Options — 0.7% | | | | | | | | | | | | | | | | |
Allergan PLC, Call @ $270.00 | | | | | | | 1/15/16 | | | | 6 | | | | 26,400 | |
Concho Resources Inc., Call @ $95.00 | | | | | | | 1/15/16 | | | | 12 | | | | 28,200 | |
Ebay Inc., Call @ $60.00 | | | | | | | 1/15/16 | | | | 28 | | | | 12,432 | |
Golar LNG Ltd., Call @ $60.00 | | | | | | | 1/15/16 | | | | 9 | | | | 2,453 | |
Google Inc., Call @ $500.00 | | | | | | | 1/15/16 | | | | 4 | | | | 24,500 | |
MasterCard Inc., Call @ $72.00 | | | | | | | 1/15/16 | | | | 17 | | | | 37,442 | |
Michael Kors Holdings Ltd., Call @ $60.00 | | | | | | | 1/20/17 | | | | 24 | | | | 4,920 | |
Schlumberger Ltd., Call @ $115.00 | | | | | | | 1/15/16 | | | | 7 | | | | 179 | |
Starbucks Corp., Call @ $36.25 | | | | | | | 1/15/16 | | | | 37 | | | | 64,842 | |
Tiffany & Co., Call @ $87.50 | | | | | | | 1/15/16 | | | | 10 | | | | 8,400 | |
Tiffany & Co., Call @ $95.00 | | | | | | | 1/20/17 | | | | 14 | | | | 14,000 | |
U.S. Dollar/Euro, Put @ $1.05 | | | | | | | 7/24/15 | | | | 133,000 | | | | 209 | |
Yelp Inc., Call @ $65.00 | | | | | | | 8/21/15 | | | | 38 | | | | 1,710 | |
Total Purchased Options (Cost — $143,878) | | | | | | | | | | | | | | | 225,687 | |
Total Investments Before Short-Term Investments (Cost — $15,069,977) | | | | 15,176,611 | |
See Notes to Consolidated Financial Statements.
| | |
| Permal Alternative Select VIT Portfolio 2015 Semi-Annual Report | | 11 |
Consolidated schedule of investments (unaudited) (cont’d)
June 30, 2015
Permal Alternative Select VIT Portfolio
| | | | | | | | | | | | |
| Security | | Rate | | | Shares | | | Value | |
| Short-Term Investments — 25.4% | | | | | | | | | | | | |
State Street Institutional Liquid Reserves Fund, Premier Class | | | 0.103 | % | | | 418,817 | | | $ | 418,817 | |
State Street Institutional Investment Trust Treasury Plus Fund, Premier Class | | | 0.000 | % | | | 1,155,053 | | | | 1,155,053 | |
State Street Institutional Investment Trust Treasury Money Market Fund, Premier Class | | | 0.000 | % | | | 5,948,294 | | | | 5,948,294 | |
Total Short-Term Investments (Cost — $7,522,164) | | | | | | | | | | | 7,522,164 | |
Total Investments — 76.6% (Cost — $22,592,141#) | | | | | | | | | | | 22,698,775 | |
Other Assets in Excess of Liabilities — 23.4% | | | | | | | | | | | 6,951,368 | |
Total Net Assets — 100.0% | | | | | | | | | | $ | 29,650,143 | |
| * | Non-income producing security. |
| (a) | All or a portion of this security is held at the broker as collateral for open securities sold short. |
| (b) | Security is valued in good faith in accordance with procedures approved by the Board of Trustees (See Note 1). |
| (c) | All or a portion of this security is held by the custodian as collateral for open swap contracts. |
| (d) | Security is exempt from registration under Rule 144A of the Securities Act of 1933. This security may be resold in transactions that are exempt from registration, normally to qualified institutional buyers. This security has been deemed liquid pursuant to guidelines approved by the Board of Trustees, unless otherwise noted. |
| (e) | Variable rate security. Interest rate disclosed is as of the most recent information available. |
| (f) | The coupon payment on these securities is currently in default as of June 30, 2015. |
| (g) | Security is exempt from registration under Regulation S of the Securities Act of 1933. Regulation S applies to securities offerings that are made outside of the United States and do not involve direct selling efforts in the United States. This security has been deemed liquid pursuant to guidelines approved by the Board of Trustees, unless otherwise noted. |
| # | Aggregate cost for federal income tax purposes is substantially the same. |
| | |
Abbreviation used in this schedule: |
| ADR | | — American Depositary Receipt |
| | | | | | | | | | | | |
| Security | | | | | | Shares | | | Value | |
| Securities Sold Short‡ | | | | | | | | | | | | |
| Common Stocks — (5.5)% | | | | | | | | | | | | |
| Consumer Discretionary — (0.4)% | | | | | | | | | | | | |
Hotels, Restaurants & Leisure — (0.1)% | | | | | | | | | | | | |
Dominos Pizza Inc. | | | | | | | (54 | ) | | $ | (6,123 | ) |
Dunkin’ Brands Group Inc. | | | | | | | (112 | ) | | | (6,160 | ) |
Panera Bread Co., Class A Shares | | | | | | | (16 | ) | | | (2,796 | ) * |
Restaurant Brands International Inc. | | | | | | | (53 | ) | | | (2,025 | ) |
Starbucks Corp. | | | | | | | (115 | ) | | | (6,166 | ) |
Texas Roadhouse Inc., Class A Shares | | | | | | | (127 | ) | | | (4,754 | ) |
Total Hotels, Restaurants & Leisure | | | | | | | | | | | (28,024 | ) |
See Notes to Consolidated Financial Statements.
| | |
| 12 | | Permal Alternative Select VIT Portfolio 2015 Semi-Annual Report |
Permal Alternative Select VIT Portfolio
| | | | | | | | | | | | |
| Security | | | | | | Shares | | | Value | |
Multiline Retail — (0.1)% | | | | | | | | | | | | |
Burlington Stores Inc. | | | | | | | (79 | ) | | $ | (4,045 | ) * |
Dollar Tree Inc. | | | | | | | (296 | ) | | | (23,381 | ) * |
J.C. Penney Co. Inc. | | | | | | | (547 | ) | | | (4,633 | ) * |
Target Corp. | | | | | | | (75 | ) | | | (6,122 | ) |
Total Multiline Retail | | | | | | | | | | | (38,181 | ) |
Specialty Retail — (0.2)% | | | | | | | | | | | | |
Five Below Inc. | | | | | | | (173 | ) | | | (6,839 | ) * |
L Brands Inc. | | | | | | | (46 | ) | | | (3,944 | ) |
Michaels Cos. Inc. | | | | | | | (221 | ) | | | (5,947 | ) * |
Restoration Hardware Holdings Inc. | | | | | | | (65 | ) | | | (6,346 | ) * |
Ross Stores Inc. | | | | | | | (63 | ) | | | (3,062 | ) |
Staples Inc. | | | | | | | (1,098 | ) | | | (16,810 | ) |
TJX Cos. Inc. | | | | | | | (92 | ) | | | (6,088 | ) |
Total Specialty Retail | | | | | | | | | | | (49,036 | ) |
Textiles, Apparel & Luxury Goods — (0.0)% | | | | | | | | | | | | |
Lululemon Athletica Inc. | | | | | | | (38 | ) | | | (2,482 | ) * |
Total Consumer Discretionary | | | | | | | | | | | (117,723 | ) |
| Consumer Staples — (0.0)% | | | | | | | | | | | | |
Food & Staples Retailing — (0.0)% | | | | | | | | | | | | |
Kroger Co. | | | | | | | (82 | ) | | | (5,946 | ) |
| Energy — (0.0)% | | | | | | | | | | | | |
Energy Equipment & Services — (0.0)% | | | | | | | | | | | | |
Halliburton Co. | | | | | | | (48 | ) | | | (2,067 | ) |
| Exchange-traded Funds — (4.7)% | | | | | | | | | | | | |
iShares Inc. — iShares MSCI Japan Index Fund | | | | | | | (17,219 | ) | | | (220,575 | ) |
SPDR S&P 500 ETF Trust | | | | | | | (1,554 | ) | | | (319,891 | ) |
SPDR S&P Midcap 400 ETF Trust | | | | | | | (1,173 | ) | | | (320,464 | ) |
The Select Sector SPDR Trust — The Energy Select Sector SPDR Fund | | | | | | | (3,225 | ) | | | (242,391 | ) |
Vanguard FTSE Europe ETF | | | | | | | (5,242 | ) | | | (282,963 | ) |
Total Exchange-traded Funds | | | | | | | | | | | (1,386,284 | ) |
| Financials — (0.0)% | | | | | | | | | | | | |
Real Estate Investment Trusts (REITs) — (0.0)% | | | | | | | | | | | | |
Starwood Waypoint Residential Trust | | | | | | | (321 | ) | | | (7,627 | ) |
| Industrials — (0.2)% | | | | | | | | | | | | |
Electrical Equipment — (0.2)% | | | | | | | | | | | | |
SolarCity Corp. | | | | | | | (1,231 | ) | | | (65,920 | ) * |
See Notes to Consolidated Financial Statements.
| | |
| Permal Alternative Select VIT Portfolio 2015 Semi-Annual Report | | 13 |
Consolidated schedule of investments (unaudited) (cont’d)
June 30, 2015
Permal Alternative Select VIT Portfolio
| | | | | | | | | | | | |
| Security | | | | | | Shares | | | Value | |
| Information Technology — (0.2)% | | | | | | | | | | | | |
Internet Software & Services — (0.2)% | | | | | | | | | | | | |
Alibaba Group Holding Ltd., ADR | | | | | | | (595 | ) | | $ | (48,951 | ) * |
Total Securities Sold Short (Cost — $(1,681,796)) | | | | | | | | | | | (1,634,518 | ) |
| * | Non-income producing security. |
| ‡ | Percentages indicated are based on net assets. |
| | | | | | | | | | | | | | | | |
| Schedule of Written Options | | | | | | | | | | | | |
| Security | | Expiration
Date | | | Strike
Price | | | Contracts | | | Value | |
| Concho Resources Inc., Call | | | 1/15/16 | | | $ | 115.00 | | | | 12 | | | $ | 12,660 | |
| Concho Resources Inc., Put | | | 1/15/16 | | | | 70.00 | | | | 12 | | | | 1,140 | |
| Ebay Inc., Call | | | 1/15/16 | | | | 70.00 | | | | 28 | | | | 3,640 | |
| Ebay Inc., Put | | | 1/15/16 | | | | 50.00 | | | | 28 | | | | 2,604 | |
| Golar LNG Ltd., Put | | | 1/15/16 | | | | 40.00 | | | | 25 | | | | 10,125 | |
| Google Inc., Call | | | 1/15/16 | | | | 575.00 | | | | 4 | | | | 8,240 | |
| Google Inc., Put | | | 1/15/16 | | | | 450.00 | | | | 4 | | | | 2,560 | |
| L Brands Inc., Put | | | 1/15/16 | | | | 44.50 | | | | 18 | | | | 225 | |
| Mastercard Inc., Call | | | 1/15/16 | | | | 82.00 | | | | 17 | | | | 22,355 | |
| Mastercard Inc., Put | | | 1/15/16 | | | | 62.00 | | | | 17 | | | | 527 | |
| Schlumberger Ltd., Put | | | 1/15/16 | | | | 85.00 | | | | 7 | | | | 3,780 | |
| Starbucks Corp., Call | | | 1/15/16 | | | | 41.25 | | | | 37 | | | | 49,487 | |
| Starbucks Corp., Put | | | 1/15/16 | | | | 30.00 | | | | 37 | | | | 167 | |
| Tiffany & Co., Call | | | 1/15/16 | | | | 100.00 | | | | 10 | | | | 3,100 | |
| Tiffany & Co., Call | | | 1/20/17 | | | | 115.00 | | | | 14 | | | | 5,530 | |
| Tiffany & Co., Put | | | 1/15/16 | | | | 75.00 | | | | 10 | | | | 1,560 | |
| Tiffany & Co., Put | | | 1/20/17 | | | | 65.00 | | | | 14 | | | | 4,144 | |
| Wynn Resorts Ltd., Put | | | 1/15/16 | | | | 100.00 | | | | 13 | | | | 14,365 | |
| Yelp Inc., Put | | | 1/15/16 | | | | 50.00 | | | | 12 | | | | 12,780 | |
| Total Written Options (Premiums received — $143,717) | | | | | | | $ | 158,989 | |
See Notes to Consolidated Financial Statements.
| | |
| 14 | | Permal Alternative Select VIT Portfolio 2015 Semi-Annual Report |
Consolidated statement of assets and liabilities (unaudited)
June 30, 2015
| | | | |
| |
| Assets: | | | | |
Investments, at value (Cost — $22,592,141) | | $ | 22,698,775 | |
Foreign currency, at value (Cost — $194,627) | | | 193,867 | |
Cash | | | 6,735,330 | |
Deposits with brokers for securities sold short | | | 1,510,129 | |
Receivable for securities sold | | | 618,313 | |
Deposits with brokers for open written options | | | 300,000 | |
Deposits with brokers for forward foreign currency contracts | | | 286,000 | |
Deposits with brokers for open futures contracts | | | 256,402 | |
Foreign currency collateral for open futures contracts, at value (Cost — $207,345) | | | 209,332 | |
Interest and dividends receivable | | | 73,361 | |
Receivable for Portfolio shares sold | | | 40,981 | |
Unrealized appreciation on forward foreign currency contracts | | | 23,189 | |
Receivable from investment manager | | | 17,697 | |
OTC swaps, at value | | | 2,444 | |
Deferred offering costs | | | 53,125 | |
Total Assets | | | 33,018,945 | |
| |
| Liabilities: | | | | |
Investments sold short, at value (proceeds received — $1,681,796) | | | 1,634,518 | |
Payable for securities purchased | | | 1,024,548 | |
OTC swaps, at value | | | 197,448 | |
Written options, at value (premiums received — $143,717) | | | 158,989 | |
Deposits from brokers for open futures contracts (Cost — $59,720) | | | 59,540 | |
Unrealized depreciation on forward foreign currency contracts | | | 35,490 | |
Payable to broker — variation margin on open futures contracts | | | 32,910 | |
Service and/or distribution fees payable | | | 6,076 | |
Dividends payable on securities sold short | | | 420 | |
Payable for open OTC swap contracts | | | 238 | |
Trustees’ fees payable | | | 196 | |
Accrued expenses | | | 218,429 | |
Total Liabilities | | | 3,368,802 | |
| Total Net Assets | | $ | 29,650,143 | |
See Notes to Consolidated Financial Statements.
| | |
| Permal Alternative Select VIT Portfolio 2015 Semi-Annual Report | | 15 |
Consolidated statement of assets and liabilities (unaudited) (cont’d)
June 30, 2015
| | | | |
| |
| Net Assets: | | | | |
Par value (Note 5) | | $ | 29 | |
Paid-in capital in excess of par value | | | 29,332,792 | |
Overdistributed net investment income | | | (249,803) | |
Accumulated net realized gain on investments, futures contracts, written options, short sales, swap contracts and foreign currency transactions | | | 666,398 | |
Net unrealized depreciation on investments, futures contracts, written options, short sales, swap contracts and foreign currencies | | | (99,273) | |
| Total Net Assets | | $ | 29,650,143 | |
| |
| Shares Outstanding: | | | | |
Class II | | | 2,918,841 | |
| |
| Net Asset Value: | | | | |
Class II | | | $10.16 | |
See Notes to Consolidated Financial Statements.
| | |
| 16 | | Permal Alternative Select VIT Portfolio 2015 Semi-Annual Report |
Consolidated statement of operations (unaudited)
For the Six Months Ended June 30, 2015
| | | | |
| |
| Investment Income: | | | | |
Interest | | $ | 95,375 | |
Dividends | | | 44,136 | |
Less: Foreign taxes withheld | | | (1,998) | |
Total Investment Income | | | 137,513 | |
| |
| Expenses: | | | | |
Investment management fee (Note 2) | | | 250,329 | |
Custody fees | | | 173,540 | |
Offering costs (Note 1) | | | 82,610 | |
Legal fees | | | 63,970 | |
Compliance fees | | | 34,144 | |
Audit and tax fees | | | 33,885 | |
Service and/or distribution fees (Note 2) | | | 32,938 | |
Shareholder reports | | | 20,803 | |
Dividend expense on securities sold short | | | 19,200 | |
Commodity pool reports | | | 16,904 | |
Interest expense on securities sold short | | | 12,124 | |
Administration fees (Note 2) | | | 11,858 | |
Fund accounting fees | | | 10,644 | |
Trustees’ fees | | | 796 | |
Transfer agent fees | | | 533 | |
Miscellaneous expenses | | | 1,102 | |
Total Expenses | | | 765,380 | |
Less: Fee waivers and/or expense reimbursements (Note 2) | | | (378,324) | |
Net Expenses | | | 387,056 | |
| Net Investment Loss | | | (249,543) | |
|
Realized and Unrealized Gain (Loss) on Investments, Futures Contracts,
Written Options, Short Sales, Swap Contracts and Foreign Currency Transactions (Notes 1, 3 and 4): | |
Net Realized Gain (Loss) From: | | | | |
Investment transactions | | | 443,241 | |
Futures contracts | | | 149,444 | |
Written options | | | (13,960) | |
Securities sold short | | | (8,916) | |
Swap contracts | | | (62,659) | |
Foreign currency transactions | | | 167,185 | |
Net Realized Gain | | | 674,335 | |
See Notes to Consolidated Financial Statements.
| | |
| Permal Alternative Select VIT Portfolio 2015 Semi-Annual Report | | 17 |
Consolidated statement of operations (unaudited) (cont’d)
For the Six Months Ended June 30, 2015
| | | | |
Change in Net Unrealized Appreciation (Depreciation) From: | | | | |
Investments | | | 27,026 | |
Futures contracts | | | (96,247) | |
Written options | | | 58,331 | |
Securities sold short | | | 88,790 | |
Swap contracts | | | (20,575) | |
Foreign currencies | | | (55,250) | |
Change in Net Unrealized Appreciation (Depreciation) | | | 2,075 | |
| Net Gain on Investments, Futures Contracts, Written Options, Short Sales, Swap Contracts and Foreign Currency Transactions | | | 676,410 | |
| Increase in Net Assets from Operations | | $ | 426,867 | |
See Notes to Consolidated Financial Statements.
| | |
| 18 | | Permal Alternative Select VIT Portfolio 2015 Semi-Annual Report |
Consolidated statements of changes in net assets
| | | | | | | | |
For the Six Months Ended June 30, 2015 (unaudited)
and the Period Ended December 31, 2014 | | 2015 | | | 2014† | |
|
| Operations: | |
Net investment loss | | $ | (249,543) | | | $ | (66,749) | |
Net realized gain | | | 674,335 | | | | 295,004 | |
Change in net unrealized appreciation (depreciation) | | | 2,075 | | | | (101,348) | |
Increase in Net Assets from Operations | | | 426,867 | | | | 126,907 | |
| | |
| Distributions to Shareholders From (Note 1): | | | | | | | | |
Net investment income | | | (121,102) | | | | (55,000) | |
Net realized gains | | | (147,499) | | | | — | |
Decrease in Net Assets from Distributions to Shareholders | | | (268,601) | | | | (55,000) | |
| | |
| Portfolio Share Transactions (Note 5): | | | | | | | | |
Net proceeds from sale of shares | | | 5,933,037 | | | | 23,168,963 | |
Reinvestment of distributions | | | 268,601 | | | | 55,000 | |
Cost of shares repurchased | | | (5,629) | | | | (2) | |
Increase in Net Assets from Portfolio Share Transactions | | | 6,196,009 | | | | 23,223,961 | |
Increase in Net Assets | | | 6,354,275 | | | | 23,295,868 | |
| | |
| Net Assets: | | | | | | | | |
Beginning of period | | | 23,295,868 | | | | — | |
End of period* | | $ | 29,650,143 | | | $ | 23,295,868 | |
*Includes(overdistributed) undistributed net investment income, respectively, of: | | | $(249,803) | | | | $120,842 | |
| † | For the period October 6, 2014 (inception date) to December 31, 2014. |
See Notes to Consolidated Financial Statements.
| | |
| Permal Alternative Select VIT Portfolio 2015 Semi-Annual Report | | 19 |
Consolidated financial highlights
| | | | | | | | |
For a share of beneficial interest outstanding throughout each year ended December 31,
unless otherwise noted: | | | | |
| Class II Shares1 | | 20152 | | | 20143 | |
| | |
| Net asset value, beginning of period | | $ | 10.03 | | | $ | 10.00 | |
| | |
| Income (loss) from operations: | | | | | | | | |
Net investment loss | | | (0.10) | | | | (0.03) | |
Net realized and unrealized gain | | | 0.32 | | | | 0.08 | |
Total income from operations | | | 0.22 | | | | 0.05 | |
| | |
| Less distributions from: | | | | | | | | |
Net investment income | | | (0.04) | | | | (0.02) | |
Net realized gains | | | (0.05) | | | | — | |
Total distributions | | | (0.09) | | | | (0.02) | |
| | |
| Net asset value, end of period | | $ | 10.16 | | | $ | 10.03 | |
Total return4 | | | 2.31 | % | | | 0.44 | % |
| | |
| Net assets, end of period (000s) | | $ | 29,650 | | | $ | 23,296 | |
| | |
| Ratios to average net assets: | | | | | | | | |
Gross expenses5 | | | 5.81 | % | | | 13.02 | % |
Net expenses5,6,7 | | | 2.94 | | | | 2.85 | |
Net investment loss5 | | | (1.89) | | | | (1.26) | |
| | |
| Portfolio turnover rate | | | 117 | % | | | 77 | % |
| 1 | Per share amounts have been calculated using the average shares method. |
| 2 | For the six months ended June 30, 2015 (unaudited). |
| 3 | For the period October 6, 2014 (inception date) to December 31, 2014. |
| 4 | Performance figures may reflect compensating balance arrangements, fee waivers and/or expense reimbursements. In the absence of compensating balance arrangements, fee waivers and/or expense reimbursements, the total return would have been lower. Total return does not reflect expenses associated with separate accounts such as administrative fees, account charges and surrender charges which, if reflected, would reduce the total return for all periods shown. Past performance is no guarantee of future results. Total returns for periods of less than one year are not annualized. |
| 6 | As a result of an expense limitation arrangement, the ratio of expenses (other than taxes; interest; extraordinary expenses; brokerage commissions and expenses; fees, costs and expenses associated with any prime brokerage arrangement (including the costs of any securities borrowing arrangement); acquired fund fees and expenses; and dividend and interest expenses on securities sold short), to average net assets of Class II shares did not exceed 2.70%. Total annual fund operating expenses after waiving fees and/or reimbursing expenses exceed the expense cap as a result of dividend and interest expenses on securities sold short. This expense limitation arrangement cannot be terminated prior to December 31, 2016 without the Board of Trustees’ consent. |
| 7 | Reflects fee waivers and/or expense reimbursements. |
See Notes to Consolidated Financial Statements.
| | |
| 20 | | Permal Alternative Select VIT Portfolio 2015 Semi-Annual Report |
Notes to consolidated financial statements (unaudited)
1. Organization and significant accounting policies
Permal Alternative Select VIT Portfolio (the “Portfolio”) is a separate non-diversified investment series of Legg Mason Partners Variable Equity Trust (the “Trust”). The Trust, a Maryland statutory trust, is registered under the Investment Company Act of 1940, as amended (the “1940 Act”), as an open-end management investment company.
The Portfolio seeks to achieve its investment objective by implementing a tactical asset allocation program of alternative strategies overseen by the Portfolio’s manager, Permal Asset Management LLC (“Permal”), through which the Portfolio will allocate its assets among a number of alternative investment strategies implemented by multiple investment subadvisers. Permal may also manage Portfolio assets directly.
The Portfolio’s assets may be invested in wholly-owned and controlled subsidiaries, each of which will have the same investment objective as the Portfolio. The Portfolio intends to gain exposure to the commodities markets by investing a portion of its assets in a wholly-owned subsidiary, Alternative Select VIT Portfolio Ltd. (the “Subsidiary”), organized under the laws of the Cayman Islands. Among other investments, the Subsidiary is expected to invest, directly or indirectly through the use of derivatives, in securities and commodity interests, which include commodity futures (including futures on broad-based securities indexes or interest rate futures, options on commodity futures, certain swaps and other investments). These financial statements are consolidated financial statements of the Portfolio and the Subsidiary.
Shares of the Portfolio may only be purchased or redeemed through variable annuity contracts and variable life insurance policies offered by the separate accounts of participating insurance companies or through eligible pension or other qualified plans.
The following are significant accounting policies consistently followed by the Portfolio and are in conformity with U.S. generally accepted accounting principles (“GAAP”). Estimates and assumptions are required to be made regarding assets, liabilities and changes in net assets resulting from operations when financial statements are prepared. Changes in the economic environment, financial markets and any other parameters used in determining these estimates could cause actual results to differ. Subsequent events have been evaluated through the date the consolidated financial statements were issued.
(a) Investment valuation. Equity securities for which market quotations are available are valued at the last reported sales price or official closing price on the primary market or exchange on which they trade. The valuations for fixed income securities (which may include, but are not limited to, corporate, government, municipal, mortgage-backed, collateralized mortgage obligations and asset-backed securities) and certain derivative instruments are typically the prices supplied by independent third party pricing services, which may use market prices or broker/dealer quotations or a variety of valuation techniques and methodologies. The independent third party pricing services use inputs that are observable such as issuer details, interest rates, yield curves, prepayment speeds, credit risks/spreads, default rates and quoted prices for similar securities. Short-term fixed
| | |
| Permal Alternative Select VIT Portfolio 2015 Semi-Annual Report | | 21 |
Notes to consolidated financial statements (unaudited) (cont’d)
income securities that will mature in 60 days or less are valued at amortized cost, unless it is determined that using this method would not reflect an investment’s fair value. Investments in open-end funds are valued at the closing net asset value per share of each fund on the day of valuation. Futures contracts are valued daily at the settlement price established by the board of trade or exchange on which they are traded. When the Portfolio holds securities or other assets that are denominated in a foreign currency, the Portfolio will normally use the currency exchange rates as of 4:00 p.m. (Eastern Time). If independent third party pricing services are unable to supply prices for a portfolio investment, or if the prices supplied are deemed by the manager to be unreliable, the market price may be determined by the manager using quotations from one or more broker/dealers or at the transaction price if the security has recently been purchased and no value has yet been obtained from a pricing service or pricing broker. When reliable prices are not readily available, such as when the value of a security has been significantly affected by events after the close of the exchange or market on which the security is principally traded, but before the Portfolio calculates its net asset value, the Portfolio values these securities as determined in accordance with procedures approved by the Portfolio’s Board of Trustees.
The Board of Trustees is responsible for the valuation process and has delegated the supervision of the daily valuation process to the Legg Mason North Atlantic Fund Valuation Committee (formerly, Legg Mason North American Fund Valuation Committee) (the “Valuation Committee”). The Valuation Committee, pursuant to the policies adopted by the Board of Trustees, is responsible for making fair value determinations, evaluating the effectiveness of the Portfolio’s pricing policies, and reporting to the Board of Trustees. When determining the reliability of third party pricing information for investments owned by the Portfolio, the Valuation Committee, among other things, conducts due diligence reviews of pricing vendors, monitors the daily change in prices and reviews transactions among market participants.
The Valuation Committee will consider pricing methodologies it deems relevant and appropriate when making fair value determinations. Examples of possible methodologies include, but are not limited to, multiple of earnings; discount from market of a similar freely traded security; discounted cash-flow analysis; book value or a multiple thereof; risk premium/yield analysis; yield to maturity; and/or fundamental investment analysis. The Valuation Committee will also consider factors it deems relevant and appropriate in light of the facts and circumstances. Examples of possible factors include, but are not limited to, the type of security; the issuer’s financial statements; the purchase price of the security; the discount from market value of unrestricted securities of the same class at the time of purchase; analysts’ research and observations from financial institutions; information regarding any transactions or offers with respect to the security; the existence of merger proposals or tender offers affecting the security; the price and extent of public trading in similar securities of the issuer or comparable companies; and the existence of a shelf registration for restricted securities.
For each portfolio security that has been fair valued pursuant to the policies adopted by the Board of Trustees, the fair value price is compared against the last available and next avail-
| | |
| 22 | | Permal Alternative Select VIT Portfolio 2015 Semi-Annual Report |
able market quotations. The Valuation Committee reviews the results of such back testing monthly and fair valuation occurrences are reported to the Board of Trustees quarterly.
The Portfolio uses valuation techniques to measure fair value that are consistent with the market approach and/or income approach, depending on the type of security and the particular circumstance. The market approach uses prices and other relevant information generated by market transactions involving identical or comparable securities. The income approach uses valuation techniques to discount estimated future cash flows to present value.
GAAP establishes a disclosure hierarchy that categorizes the inputs to valuation techniques used to value assets and liabilities at measurement date. These inputs are summarized in the three broad levels listed below:
| • | | Level 1 — quoted prices in active markets for identical investments |
| • | | Level 2 — other significant observable inputs (including quoted prices for similar investments, interest rates, prepayment speeds, credit risk, etc.) |
| • | | Level 3 — significant unobservable inputs (including the Portfolio’s own assumptions in determining the fair value of investments) |
The inputs or methodologies used to value securities are not necessarily an indication of the risk associated with investing in those securities.
The following is a summary of the inputs used in valuing the Portfolio’s assets and liabilities carried at fair value:
| | | | | | | | | | | | | | | | |
| ASSETS | |
| Description | | Quoted Prices
(Level 1) | | | Other Significant
Observable Inputs
(Level 2) | | | Significant
Unobservable
Inputs
(Level 3) | | | Total | |
| Long-term investments†: | | | | | | | | | | | | | | | | |
Common stocks: | | | | | | | | | | | | | | | | |
Consumer discretionary | | $ | 3,390,954 | | | $ | 15,737 | | | | — | | | $ | 3,406,691 | |
Telecommunication services | | | 49,588 | | | | 7,872 | | | | — | | | | 57,460 | |
Other common stocks | | | 7,322,107 | | | | — | | | | — | | | | 7,322,107 | |
Convertible preferred stocks | | | 50,000 | | | | — | | | | — | | | | 50,000 | |
Preferred stocks | | | 23,825 | | | | — | | | | — | | | | 23,825 | |
Statutory trust certificates | | | 25,428 | | | | — | | | | — | | | | 25,428 | |
Convertible bonds & notes | | | — | | | | 301,832 | | | | — | | | | 301,832 | |
Corporate bonds & notes | | | — | | | | 3,725,881 | | | | — | | | | 3,725,881 | |
Municipal bonds | | | — | | | | 37,700 | | | | — | | | | 37,700 | |
Purchased options | | | 78,452 | | | | 147,235 | | | | — | | | | 225,687 | |
| Total long-term investments | | $ | 10,940,354 | | | $ | 4,236,257 | | | | — | | | $ | 15,176,611 | |
| Short-term investments† | | | 7,522,164 | | | | — | | | | — | | | | 7,522,164 | |
| Total investments | | $ | 18,462,518 | | | $ | 4,236,257 | | | | — | | | $ | 22,698,775 | |
| | |
| Permal Alternative Select VIT Portfolio 2015 Semi-Annual Report | | 23 |
Notes to consolidated financial statements (unaudited) (cont’d)
| | | | | | | | | | | | | | | | |
| ASSETS | |
| Description | | Quoted Prices
(Level 1) | | | Other Significant
Observable Inputs
(Level 2) | | | Significant
Unobservable
Inputs
(Level 3) | | | Total | |
| Other financial instruments: | | | | | | | | | | | | | | | | |
Futures contracts | | $ | 15,307 | | | | — | | | | — | | | $ | 15,307 | |
Forward foreign currency contracts | | | — | | | $ | 23,189 | | | | — | | | | 23,189 | |
OTC total return swaps‡ | | | — | | | | 2,444 | | | | — | | | | 2,444 | |
| Total other financial instruments | | $ | 15,307 | | | $ | 25,633 | | | | — | | | $ | 40,940 | |
| Total | | $ | 18,477,825 | | | $ | 4,261,890 | | | | — | | | $ | 22,739,715 | |
|
| LIABILITIES | |
| Description | | Quoted Prices
(Level 1) | | | Other Significant
Observable Inputs
(Level 2) | | | Significant
Unobservable
Inputs
(Level 3) | | | Total | |
| Other financial instruments: | | | | | | | | | | | | | | | | |
Securities sold short | | $ | 1,634,518 | | | | — | | | | — | | | $ | 1,634,518 | |
Written options | | | 58,635 | | | $ | 100,354 | | | | — | | | | 158,989 | |
Futures contracts | | | 45,671 | | | | — | | | | — | | | | 45,671 | |
Forward foreign currency contracts | | | — | | | | 35,490 | | | | — | | | | 35,490 | |
OTC total return swaps‡ | | | — | | | | 197,448 | | | | — | | | | 197,448 | |
| Total | | $ | 1,738,824 | | | $ | 333,292 | | | | — | | | $ | 2,072,116 | |
| † | See Schedule of Investments for additional detailed categorizations. |
| ‡ | Values include any premiums paid or received with respect to swap contracts. |
For the six months ended June 30, 2015, as a result of the fair value pricing procedures for international equities utilized by the Portfolio, certain securities have transferred in and out of Level 1 and Level 2 measurements during the period. The Portfolio’s policy is to recognize transfers between levels as of the end of the reporting period. At June 30, 2015, securities valued at $856,430 were transferred from Level 2 to Level 1 within the fair value hierarchy.
(b) Repurchase agreements. The Portfolio may enter into repurchase agreements with institutions that its investment adviser has determined are creditworthy. Each repurchase agreement is recorded at cost. Under the terms of a typical repurchase agreement, the Portfolio acquires a debt security subject to an obligation of the seller to repurchase, and of the Portfolio to resell, the security at an agreed-upon price and time, thereby determining the yield during the Portfolio’s holding period. When entering into repurchase agreements, it is the Portfolio’s policy that its custodian or a third party custodian, acting on the Portfolio’s behalf, take possession of the underlying collateral securities, the market value of which, at all times, at least equals the principal amount of the repurchase transaction, including accrued interest. To the extent that any repurchase transaction maturity exceeds one business day, the value of the collateral is marked-to-market and measured against the value of the agreement in an effort to ensure the adequacy of the collateral. If the counterparty defaults, the Portfolio generally has the right to use the collateral to satisfy the terms of the repurchase transaction. However, if the market value of the collateral declines during
| | |
| 24 | | Permal Alternative Select VIT Portfolio 2015 Semi-Annual Report |
the period in which the Portfolio seeks to assert its rights or if bankruptcy proceedings are commenced with respect to the seller of the security, realization of the collateral by the Portfolio may be delayed or limited.
(c) Futures contracts. The Portfolio uses futures contracts generally to gain exposure to, or hedge against, changes in interest rates or gain exposure to, or hedge against, changes in certain asset classes. A futures contract represents a commitment for the future purchase or sale of an asset at a specified price on a specified date.
Upon entering into a futures contract, the Portfolio is required to deposit cash or cash equivalents with a broker in an amount equal to a certain percentage of the contract amount. This is known as the ‘‘initial margin’’ and subsequent payments (‘‘variation margin’’) are made or received by the Portfolio each day, depending on the daily fluctuation in the value of the contract. For certain futures, including foreign denominated futures, variation margin is not settled daily, but is recorded as a net variation margin payable or receivable. The daily changes in contract value are recorded as unrealized gains or losses in the Consolidated Statement of Operations and the Portfolio recognizes a realized gain or loss when the contract is closed.
Futures contracts involve, to varying degrees, risk of loss in excess of the amounts reflected in the financial statements. In addition, there is the risk that the Portfolio may not be able to enter into a closing transaction because of an illiquid secondary market.
(d) Forward foreign currency contracts. The Portfolio enters into a forward foreign currency contract to hedge against foreign currency exchange rate risk on its non-U.S. dollar denominated securities or to facilitate settlement of a foreign currency denominated portfolio transaction. A forward foreign currency contract is an agreement between two parties to buy and sell a currency at a set price with delivery and settlement at a future date. The contract is marked-to-market daily and the change in value is recorded by the Portfolio as an unrealized gain or loss. When a forward foreign currency contract is closed, through either delivery or offset by entering into another forward foreign currency contract, the Portfolio recognizes a realized gain or loss equal to the difference between the value of the contract at the time it was opened and the value of the contract at the time it is closed.
Forward foreign currency contracts involve elements of market risk in excess of the amounts reflected on the Consolidated Statement of Assets and Liabilities. The Portfolio bears the risk of an unfavorable change in the foreign exchange rate underlying the forward foreign currency contract. Risks may also arise upon entering into these contracts from the potential inability of the counterparties to meet the terms of their contracts.
(e) Purchased options. When the Portfolio purchases an option, an amount equal to the premium paid by the Portfolio is recorded as an investment on the Consolidated Statement of Assets and Liabilities, the value of which is marked-to-market to reflect the current market value of the option purchased. If the purchased option expires, the Portfolio realizes a loss equal to the amount of premium paid. When an instrument is purchased or sold through the exercise of an option, the related premium paid is added to the basis of the
| | |
| Permal Alternative Select VIT Portfolio 2015 Semi-Annual Report | | 25 |
Notes to consolidated financial statements (unaudited) (cont’d)
instrument acquired or deducted from the proceeds of the instrument sold. The risk associated with purchasing put and call options is limited to the premium paid.
(f) Written options. When the Portfolio writes an option, an amount equal to the premium received by the Portfolio is recorded as a liability, the value of which is marked-to-market daily to reflect the current market value of the option written. If the option expires, the premium received is recorded as a realized gain. When a written call option is exercised, the difference between the premium received plus the option exercise price and the Portfolio’s basis in the underlying security (in the case of a covered written call option), or the cost to purchase the underlying security (in the case of an uncovered written call option), including brokerage commission, is recognized as a realized gain or loss. When a written put option is exercised, the amount of the premium received is subtracted from the cost of the security purchased by the Portfolio from the exercise of the written put option to form the Portfolio’s basis in the underlying security purchased. The writer or buyer of an option traded on an exchange can liquidate the position before the exercise of the option by entering into a closing transaction. The cost of a closing transaction is deducted from the original premium received resulting in a realized gain or loss to the Portfolio.
The risk in writing a covered call option is that the Portfolio may forego the opportunity of profit if the market price of the underlying security increases and the option is exercised. The risk in writing a put option is that the Portfolio may incur a loss if the market price of the underlying security decreases and the option is exercised. The risk in writing an uncovered call option is that the Portfolio is exposed to the risk of loss if the market price of the underlying security increases. In addition, there is the risk that the Portfolio may not be able to enter into a closing transaction because of an illiquid secondary market.
(g) Short sale transactions. Short sales are transactions in which the Portfolio sells a security it does not own in anticipation of a decline in the market value of that security. To complete such a transaction, a Portfolio must borrow the security to deliver to the buyer. The Portfolio is then obligated to replace the security borrowed by purchasing it in the open market at the time of replacement. The proceeds received by the Portfolio for the short sale are retained by the broker as collateral until the Portfolio replaces the borrowed security. The collateral required is determined daily by reference to the market value of the short positions. Liabilities for securities sold short are marked-to-market daily and reported at market value in the financial statements.
Short sale transactions may result in a risk of loss that may exceed the amount shown on the Consolidated Statement of Assets and Liabilities. A gain, limited to the price at which the Portfolio sold the security short, or a loss, potentially unlimited in size, will be recognized upon termination of a short sale. Dividends on short positions are recorded as a liability on the ex-dividend date and are shown in the Consolidated Statement of Operations as Dividend Expense because the Portfolio must pay the dividend to the lender of the security.
Short selling is a technique that may be considered speculative, involves risk beyond the amount of money used to secure each transaction and may represent a form of leverage.
| | |
| 26 | | Permal Alterative Select VIT Portfolio 2015 Semi-Annual Report |
(h) Foreign currency translation. Investment securities and other assets and liabilities denominated in foreign currencies are translated into U.S. dollar amounts based upon prevailing exchange rates on the date of valuation. Purchases and sales of investment securities and income and expense items denominated in foreign currencies are translated into U.S. dollar amounts based upon prevailing exchange rates on the respective dates of such transactions.
The Portfolio does not isolate that portion of the results of operations resulting from fluctuations in foreign exchange rates on investments from the fluctuations arising from changes in market prices of securities held. Such fluctuations are included with the net realized and unrealized gain or loss on investments.
Net realized foreign exchange gains or losses arise from sales of foreign currencies, including gains and losses on forward foreign currency contracts, currency gains or losses realized between the trade and settlement dates on securities transactions, and the difference between the amounts of dividends, interest, and foreign withholding taxes recorded on the Portfolio’s books and the U.S. dollar equivalent of the amounts actually received or paid. Net unrealized foreign exchange gains and losses arise from changes in the values of assets and liabilities, other than investments in securities, on the date of valuation, resulting from changes in exchange rates.
Foreign security and currency transactions may involve certain considerations and risks not typically associated with those of U.S. dollar denominated transactions as a result of, among other factors, the possibility of lower levels of governmental supervision and regulation of foreign securities markets and the possibility of political or economic instability.
(i) Swap agreements. The Portfolio invests in swaps for the purpose of managing its exposure to interest rate, credit or market risk, or for other purposes. The use of swaps involves risks that are different from those associated with other portfolio transactions. Swap agreements are privately negotiated in the over-the-counter market (“OTC Swaps”) or may be executed on a registered exchange (“Centrally Cleared Swaps”). Unlike Centrally Cleared Swaps, the Portfolio has credit exposure to the counterparties of OTC Swaps.
Swap contracts are marked-to-market daily and changes in value are recorded as unrealized appreciation (depreciation). The daily change in valuation of Centrally Cleared Swaps, if any, is recorded as a receivable or payable for variation margin on the Consolidated Statement of Assets and Liabilities. Gains or losses are realized upon termination of the swap agreement. Collateral, in the form of restricted cash or securities, may be required to be held in segregated accounts with the Portfolio’s custodian in compliance with the terms of the swap contracts. Securities posted as collateral for swap contracts are identified in the Consolidated Schedule of Investments and restricted cash, if any, is identified on the Consolidated Statement of Assets and Liabilities. Risks may exceed amounts recorded in the Consolidated Statement of Assets and Liabilities. These risks include changes in the returns of the underlying instruments, failure of the counterparties to perform under the contracts’ terms, and the possible lack of liquidity with respect to the swap agreements.
OTC swap payments received or made at the beginning of the measurement period are reflected as a premium or deposit, respectively, on the Consolidated Statement of Assets
| | |
| Permal Alternative Select VIT Portfolio 2015 Semi-Annual Report | | 27 |
Notes to consolidated financial statements (unaudited) (cont’d)
and Liabilities. These upfront payments are amortized over the life of the swap and are recognized as realized gain or loss in the Consolidated Statement of Operations. Net periodic payments received or paid by the Portfolio are recognized as a realized gain or loss in the Consolidated Statement of Operations.
The Portfolio’s maximum exposure in the event of a defined credit event on a credit default swap to sell protection is the notional amount. As of June 30, 2015, the Portfolio did not hold any credit default swaps to sell protection.
For average notional amounts of swaps held during the six months ended June 30, 2015, see Note 4.
Total return swaps
The Portfolio enters into total return swaps for investment purposes. Total return swaps are agreements to exchange the return generated by one instrument for the return generated by another instrument. For example, the agreement to pay a predetermined or fixed interest rate in exchange for a market-linked return based on a notional amount. To the extent the total return of a referenced index or instrument exceeds the offsetting interest obligation, the Portfolio will receive a payment from the counterparty. To the extent it is less, the Portfolio will make a payment to the counterparty.
(j) Options on futures contracts. An option on a futures contract gives the purchaser the right, in return for the premium paid, to assume a position in the underlying futures contract at the specified option exercise price at any time prior to the expiration date of the option. Upon exercise of an option, the delivery of the futures position by the writer of the option to the holder of the option will be accompanied by delivery of the accumulated balance in the writer’s futures margin account that represents the amount by which the market price of the futures contract exceeds (in the case of a call) or is less than (in the case of a put) the exercise price of the option on the futures contract. The potential for loss related to the purchase of an option on a futures contract is limited to the premium paid for the option plus transaction costs. Because the value of the option is fixed at the point of purchase, there are no daily cash payments by the purchaser to reflect changes in the value of the underlying contract; however, the value of the option changes daily and that change would be reflected in the net asset value of the Portfolio. The potential for loss related to writing call options is unlimited. The potential for loss related to writing put options is limited only by the aggregate strike price of the put option less the premium received.
(k) Credit and market risk. The Portfolio invests in high-yield instruments that are subject to certain credit and market risks. The yields of high-yield obligations reflect, among other things, perceived credit and market risks. The Portfolio’s investments in securities rated below investment grade typically involve risks not associated with higher rated securities including, among others, greater risk related to timely and ultimate payment of interest and principal, greater market price volatility and less liquid secondary market trading.
(l) Foreign investment risks. The Portfolio’s investments in foreign securities may involve risks not present in domestic investments. Since securities may be denominated in foreign currencies, may require settlement in foreign currencies or pay interest or dividends
| | |
| 28 | | Permal Alternative Select VIT Portfolio 2015 Semi-Annual Report |
in foreign currencies, changes in the relationship of these foreign currencies to the U.S. dollar can significantly affect the value of the investments and earnings of the Portfolio. Foreign investments may also subject the Portfolio to foreign government exchange restrictions, expropriation, taxation or other political, social or economic developments, all of which affect the market and/or credit risk of the investments.
(m) Counterparty risk and credit-risk-related contingent features of derivative instruments. The Portfolio may invest in certain securities or engage in other transactions, where the Portfolio is exposed to counterparty credit risk in addition to broader market risks. The Portfolio may invest in securities of issuers, which may also be considered counterparties as trading partners in other transactions. This may increase the risk of loss in the event of default or bankruptcy by the counterparty or if the counterparty otherwise fails to meet its contractual obligations. The Portfolio’s investment manager attempts to mitigate counterparty risk by (i) periodically assessing the creditworthiness of its trading partners, (ii) monitoring and/or limiting the amount of its net exposure to each individual counterparty based on its assessment and (iii) requiring collateral from the counterparty for certain transactions. Market events and changes in overall economic conditions may impact the assessment of such counterparty risk by the investment manager. In addition, declines in the values of underlying collateral received may expose the Portfolio to increased risk of loss.
The Portfolio has entered into master agreements with certain of its derivative counterparties that provide for general obligations, representations, agreements, collateral, events of default or termination and credit related contingent features. The credit related contingent features include, but are not limited to, a percentage decrease in the Portfolio’s net assets or NAV over a specified period of time. If these credit related contingent features were triggered, the derivatives counterparty could terminate the positions and demand payment or require additional collateral.
Collateral requirements differ by type of derivative. Collateral or margin requirements are set by the broker or exchange clearinghouse for exchange traded derivatives while collateral terms are contract specific for over-the-counter traded derivatives. Cash collateral that has been pledged to cover obligations of the Portfolio under derivative contracts, if any, will be reported separately in the Consolidated Statement of Assets and Liabilities. Securities pledged as collateral, if any, for the same purpose are noted in the Consolidated Schedule of Investments.
Absent an event of default by the counterparty or a termination of the agreement, the terms of the master agreements do not result in an offset of reported amounts of financial assets and financial liabilities in the Consolidated Statement of Assets and Liabilities across transactions between the Portfolio and the applicable counterparty. The enforceability of the right to offset may vary by jurisdiction.
As of June 30, 2015, the Portfolio held written options, forward foreign currency contracts and OTC total return swaps with credit related contingent features which had a liability position of $391,927. If a contingent feature in the master agreements would have been triggered, the Portfolio would have been required to pay this amount to its derivatives counterparties.
| | |
| Permal Alternative Select VIT Portfolio 2015 Semi-Annual Report | | 29 |
Notes to consolidated financial statements (unaudited) (cont’d)
(n) Security transactions and investment income. Security transactions are accounted for on a trade date basis. Interest income, adjusted for amortization of premium and accretion of discount, is recorded on the accrual basis. Dividend income is recorded on the ex-dividend date. Foreign dividend income is recorded on the ex-dividend date or as soon as practicable after the Portfolio determines the existence of a dividend declaration after exercising reasonable due diligence. The cost of investments sold is determined by use of the specific identification method. To the extent any issuer defaults or a credit event occurs that impacts the issuer, the Portfolio may halt any additional interest income accruals and consider the realizability of interest accrued up to the date of default or credit event.
(o) Distributions to shareholders. Distributions from net investment income and distributions of net realized gains, if any, are declared at least annually. Distributions to shareholders of the Portfolio are recorded on the ex-dividend date and are determined in accordance with income tax regulations, which may differ from GAAP.
(p) REIT distributions. The character of distributions received from Real Estate Investment Trusts (‘‘REITs’’) held by the Portfolio is generally comprised of net investment income, capital gains, and return of capital. It is the policy of the Portfolio to estimate the character of distributions received from underlying REITs based on historical data provided by the REITs. After each calendar year end, REITs report the actual tax character of these distributions. Differences between the estimated and actual amounts reported by the REITs are reflected in the Portfolio’s records in the year in which they are reported by the REITs by adjusting related investment cost basis, capital gains and income, as necessary.
(q) Compensating balance arrangements. The Portfolio has an arrangement with its custodian bank whereby a portion of the custodian’s fees is paid indirectly by credits earned on the Portfolio’s cash on deposit with the bank.
(r) Offering costs. Costs incurred by the Portfolio in connection with the commencement of the Portfolio’s operations are being amortized on a straight line basis over twelve months.
(s) Federal and other taxes. It is the Portfolio’s policy to comply with the federal income and excise tax requirements of the Internal Revenue Code of 1986 (the “Code”), as amended, applicable to regulated investment companies. Accordingly, the Portfolio intends to distribute its taxable income and net realized gains, if any, to shareholders in accordance with timing requirements imposed by the Code. Therefore, no federal or state income tax provision is required in the Portfolio’s financial statements.
Management has analyzed the Portfolio’s tax positions taken on income tax returns for all open tax years and has concluded that as of June 30, 2015, no provision for income tax is required in the Portfolio’s financial statements. The Portfolio’s federal and state income and federal excise tax returns for tax years for which the applicable statutes of limitations have not expired are subject to examination by the Internal Revenue Service and state departments of revenue.
| | |
| 30 | | Permal Alternative Select VIT Portfolio 2015 Semi-Annual Report |
Under the applicable foreign tax laws, a withholding tax may be imposed on interest, dividends and capital gains at various rates.
(t) Reclassification. GAAP requires that certain components of net assets be reclassified to reflect permanent differences between financial and tax reporting. These reclassifications have no effect on net assets or net asset value per share.
2. Investment management agreement and other transactions with affiliates
Permal Asset Management LLC (“Permal”) is the Portfolio’s investment manager. Apex Capital, LLC, Atlantic Investment Management, Inc., BH-DG Systematic Trading LLC (part of a joint venture arrangement between David Gorton and Brevan Howard Investment Holdings Limited) (trading advisor), River Canyon Fund Management LLC (a wholly-owned subsidiary of Canyon Capital Advisors LLC) and TT International are the Portfolio’s subadvisers. Legg Mason Partners Fund Advisor, LLC (“LMPFA”) serves as the administrator to the Portfolio. Permal and LMPFA are wholly-owned subsidiaries of Legg Mason, Inc. (“Legg Mason”).
Under the management agreement, the Portfolio pays Permal an investment management fee, calculated daily and paid monthly, at an annual rate of 1.90% of the Portfolio’s average daily net assets. The Portfolio pays LMPFA an administration fee at an annual rate of 0.09% of the Portfolio’s average daily net assets.
The investment manager has agreed to waive fees and/or reimburse operating expenses (other than taxes; interest; extraordinary expenses; brokerage commissions and expenses; fees, costs and expenses associated with any prime brokerage arrangement (including the costs of any securities borrowing arrangement); acquired fund fees and expenses; and dividend and interest expenses on securities sold short) so that total annual operating expenses are not expected to exceed 2.70% for Class II shares. This arrangement is expected to continue until December 31, 2016, may be terminated prior to that date by agreement of the manager and the Board of Trustees, and may be terminated at any time after that date by the manager. This arrangement, however, may be modified by the manager to decrease total annual operating expenses at any time. From time to time, LMPFA may also voluntarily waive some or all of its administration fee.
During the six months ended June 30, 2015, fees waived and/or expenses reimbursed amounted to $378,324, which includes administrative fees waived in the amount of $11,858.
The investment manager is permitted to recapture amounts waived and/or reimbursed to a class during the same fiscal year if the class’ total annual operating expenses have fallen to a level below the expense limitation (“expense cap”) in effect at the time the fees were earned or the expenses incurred. In no case will the investment manager recapture any amount that would result, on any particular business day of the Portfolio, in the class’ total annual operating expenses exceeding the expense cap or any other lower limit then in effect.
Legg Mason Investor Services, LLC, a wholly-owned broker-dealer subsidiary of Legg Mason, serves as the Portfolio’s sole and exclusive distributor. The Portfolio has adopted a
| | |
| Permal Alternative Select VIT Portfolio 2015 Semi-Annual Report | | 31 |
Notes to consolidated financial statements (unaudited) (cont’d)
Rule 12b-1 distribution plan and under that plan the Portfolio pays service and/or distribution fees with respect to its Class II shares calculated at the annual rate of 0.25% of the average daily net assets of the class. Service and distribution fees are accrued daily and paid monthly.
All officers and one Trustee of the Trust are employees of Legg Mason or its affiliates and do not receive compensation from the Trust.
As of June 30, 2015, Legg Mason and its affiliates owned 78% of the Portfolio.
3. Investments
During the six months ended June 30, 2015, the aggregate cost of purchases and proceeds from sales of investments (excluding short-term investments) and U.S Government & Agency Obligations were as follows:
| | | | | | | | |
| | | Investments | | | U.S. Government &
Agency Obligations | |
| Purchases | | $ | 16,956,950 | | | $ | 12,954 | |
| Sales | | | 13,127,737 | | | | 5,581 | |
At June 30, 2015, the aggregate gross unrealized appreciation and depreciation of investments for federal income tax purposes were substantially as follows:
| | | | |
| Gross unrealized appreciation | | $ | 864,189 | |
| Gross unrealized depreciation | | | (757,555) | |
| Net unrealized appreciation | | $ | 106,634 | |
During the six months ended June 30, 2015, written option transactions for the Portfolio were as follows:
| | | | | | | | |
| | | Number of
Contracts | | | Premiums | |
| Written options, outstanding as of December 31, 2014 | | | 325 | | | $ | 165,815 | |
| Options written | | | 11,857,145 | | | | 178,637 | |
| Options closed | | | (9,830,084) | | | | (173,979) | |
| Options exercised | | | (864,147) | | | | (20,348) | |
| Options expired | | | (1,162,920) | | | | (6,408) | |
| Written options, outstanding as of June 30, 2015 | | | 319 | | | $ | 143,717 | |
| | |
| 32 | | Permal Alternative Select VIT Portfolio 2015 Semi-Annual Report |
At June 30, 2015, the Portfolio had the following open futures contracts:
| | | | | | | | | | | | | | | | | | | | |
| | | Number of
Contracts | | | Expiration
Date | | | Basis
Value | | | Market
Value | | | Unrealized
Appreciation
(Depreciation) | |
| Contracts to Buy: | | | | | | | | | | | | | | | | | | | | |
| 3-Month Bankers Acceptance | | | 4 | | | | 6/16 | | | $ | 792,779 | | | $ | 793,955 | | | $ | 1,176 | |
| 90-Day Eurodollar | | | 7 | | | | 12/17 | | | | 1,714,033 | | | | 1,714,300 | | | | 267 | |
| CAC 40 10 Euro Index | | | 1 | | | | 7/15 | | | | 53,351 | | | | 53,362 | | | | 11 | |
| E-Mini NASDAQ 100 Index | | | 4 | | | | 9/15 | | | | 355,789 | | | | 351,220 | | | | (4,569) | |
| E-mini Nikkei 225 Index | | | 48 | | | | 9/15 | | | | 787,750 | | | | 794,397 | | | | 6,647 | |
| E-mini S&P 500 Index | | | 8 | | | | 9/15 | | | | 833,453 | | | | 821,760 | | | | (11,693) | |
| Euro Stoxx 50 | | | 51 | | | | 9/15 | | | | 1,958,272 | | | | 1,953,618 | | | | (4,654) | |
| FTSE 100 Index | | | 1 | | | | 9/15 | | | | 104,630 | | | | 102,037 | | | | (2,593) | |
| Hang Seng Index | | | 1 | | | | 7/15 | | | | 176,140 | | | | 169,024 | | | | (7,116) | |
| LME Price Aluminum | | | 1 | | | | 7/15 | �� | | | 45,416 | | | | 41,462 | | | | (3,954) | |
| LME Price Aluminum | | | 1 | | | | 9/15 | | | | 43,249 | | | | 42,119 | | | | (1,130) | |
| Russell 2000 Mini Index | | | 1 | | | | 9/15 | | | | 126,041 | | | | 125,040 | | | | (1,001) | |
| Topix Index | | | 2 | | | | 9/15 | | | | 269,497 | | | | 266,454 | | | | (3,043) | |
| | | | | | | | | | | | | | | | | | | | (31,652) | |
| Contracts to Sell: | | | | | | | | | | | | | | | | | | | | |
| 3-Month Euribor | | | 1 | | | | 12/17 | | | $ | 277,736 | | | $ | 277,820 | | | $ | (84) | |
| 90-Day Sterling | | | 12 | | | | 6/17 | | | | 2,317,506 | | | | 2,317,986 | | | | (480) | |
| Brent Crude | | | 1 | | | | 8/15 | | | | 63,169 | | | | 63,590 | | | | (421) | |
| CBOE Volatility Index | | | 1 | | | | 8/15 | | | | 16,699 | | | | 17,375 | | | | (676) | |
| Corn | | | 1 | | | | 12/15 | | | | 18,874 | | | | 21,575 | | | | (2,701) | |
| E-mini S&P 500 Index | | | 1 | | | | 9/15 | | | | 103,773 | | | | 102,720 | | | | 1,053 | |
| Gold 100 Ounce | | | 1 | | | | 8/15 | | | | 117,158 | | | | 117,180 | | | | (22) | |
| LME Price Aluminum | | | 1 | | | | 7/15 | | | | 44,113 | | | | 41,463 | | | | 2,650 | |
| LME Price Aluminum | | | 2 | | | | 9/15 | | | | 85,518 | | | | 84,238 | | | | 1,280 | |
| Natural Gas | | | 1 | | | | 8/15 | | | | 27,538 | | | | 28,320 | | | | (782) | |
| Silver | | | 1 | | | | 9/15 | | | | 78,950 | | | | 77,905 | | | | 1,045 | |
| Sugar No. 11 | | | 1 | | | | 10/15 | | | | 13,214 | | | | 13,966 | | | | (752) | |
| WTI Crude | | | 1 | | | | 8/15 | | | | 60,648 | | | | 59,470 | | | | 1,178 | |
| | | | | | | | | | | | | | | | | | | | 1,288 | |
| Net unrealized depreciation on open futures contracts | | | $ | (30,364) | |
At June 30, 2015, the Portfolio had the following open forward foreign currency contracts:
| | | | | | | | | | | | | | | | | | | | |
Currency
Purchased | | | Currency
Sold | | | Counterparty | | Settlement
Date | | | Unrealized
Appreciation
(Depreciation) | |
| EUR | | | 84,000 | | | NZD | | | 139,054 | | | Deutsche Bank AG | | | 7/2/15 | | | $ | (582) | |
| EUR | | | 97,000 | | | USD | | | 108,599 | | | Deutsche Bank AG | | | 7/2/15 | | | | (459) | |
| EUR | | | 140,000 | | | USD | | | 156,979 | | | Deutsche Bank AG | | | 7/2/15 | | | | (900) | |
| EUR | | | 84,000 | | | USD | | | 94,324 | | | Deutsche Bank AG | | | 7/2/15 | | | | (676) | |
| NZD | | | 137,889 | | | EUR | | | 84,000 | | | Deutsche Bank AG | | | 7/2/15 | | | | (207) | |
| | |
| Permal Alternative Select VIT Portfolio 2015 Semi-Annual Report | | 33 |
Notes to consolidated financial statements (unaudited) (cont’d)
| | | | | | | | | | | | | | | | | | | | |
Currency
Purchased | | | Currency
Sold | | | Counterparty | | Settlement
Date | | | Unrealized
Appreciation
(Depreciation) | |
| USD | | | 266,585 | | | EUR | | | 237,000 | | | Deutsche Bank AG | | | 7/2/15 | | | $ | 2,365 | |
| USD | | | 94,390 | | | EUR | | | 84,000 | | | Deutsche Bank AG | | | 7/2/15 | | | | 743 | |
| NZD | | | 137,492 | | | EUR | | | 83,000 | | | Deutsche Bank AG | | | 7/9/15 | | | | 572 | |
| USD | | | 93,208 | | | EUR | | | 83,000 | | | Deutsche Bank AG | | | 7/9/15 | | | | 666 | |
| AUD | | | 210,000 | | | JPY | | | 20,021,898 | | | Deutsche Bank AG | | | 7/10/15 | | | | (1,661) | |
| AUD | | | 90,000 | | | JPY | | | 8,609,594 | | | Deutsche Bank AG | | | 7/10/15 | | | | (947) | |
| AUD | | | 20,000 | | | JPY | | | 1,911,958 | | | Deutsche Bank AG | | | 7/10/15 | | | | (200) | |
| AUD | | | 10,000 | | | USD | | | 7,666 | | | Deutsche Bank AG | | | 7/10/15 | | | | 46 | |
| EUR | | | 40,000 | | | USD | | | 45,496 | | | Deutsche Bank AG | | | 7/10/15 | | | | (897) | |
| EUR | | | 110,000 | | | USD | | | 123,781 | | | Deutsche Bank AG | | | 7/10/15 | | | | (1,134) | |
| EUR | | | 130,000 | | | USD | | | 145,571 | | | Deutsche Bank AG | | | 7/10/15 | | | | (624) | |
| GBP | | | 30,000 | | | USD | | | 47,498 | | | Deutsche Bank AG | | | 7/10/15 | | | | (363) | |
| GBP | | | 280,000 | | | USD | | | 441,519 | | | Deutsche Bank AG | | | 7/10/15 | | | | (1,594) | |
| GBP | | | 10,000 | | | USD | | | 15,742 | | | Deutsche Bank AG | | | 7/10/15 | | | | (31) | |
| GBP | | | 30,000 | | | USD | | | 47,235 | | | Deutsche Bank AG | | | 7/10/15 | | | | (100) | |
| GBP | | | 10,000 | | | USD | | | 15,748 | | | Deutsche Bank AG | | | 7/10/15 | | | | (36) | |
| GBP | | | 30,000 | | | USD | | | 47,217 | | | Deutsche Bank AG | | | 7/10/15 | | | | (82) | |
| GBP | | | 20,000 | | | USD | | | 31,457 | | | Deutsche Bank AG | | | 7/10/15 | | | | (34) | |
| GBP | | | 20,000 | | | USD | | | 31,509 | | | Deutsche Bank AG | | | 7/10/15 | | | | (86) | |
| JPY | | | 8,557,434 | | | AUD | | | 90,000 | | | Deutsche Bank AG | | | 7/10/15 | | | | 521 | |
| JPY | | | 18,686,000 | | | AUD | | | 200,000 | | | Deutsche Bank AG | | | 7/10/15 | | | | (1,544) | |
| JPY | | | 2,813,547 | | | AUD | | | 30,000 | | | Deutsche Bank AG | | | 7/10/15 | | | | (145) | |
| JPY | | | 10,000,000 | | | USD | | | 81,087 | | | Deutsche Bank AG | | | 7/10/15 | | | | 630 | |
| JPY | | | 48,730,000 | | | USD | | | 398,092 | | | Deutsche Bank AG | | | 7/10/15 | | | | 115 | |
| JPY | | | 16,770,000 | | | USD | | | 137,084 | | | Deutsche Bank AG | | | 7/10/15 | | | | (45) | |
| SEK | | | 40,000 | | | USD | | | 4,850 | | | Deutsche Bank AG | | | 7/10/15 | | | | (25) | |
| TRY | | | 20,000 | | | USD | | | 7,422 | | | Deutsche Bank AG | | | 7/10/15 | | | | 21 | |
| TRY | | | 10,000 | | | USD | | | 3,723 | | | Deutsche Bank AG | | | 7/10/15 | | | | (1) | |
| TRY | | | 30,000 | | | USD | | | 11,257 | | | Deutsche Bank AG | | | 7/10/15 | | | | (93) | |
| TRY | | | 10,000 | | | USD | | | 3,725 | | | Deutsche Bank AG | | | 7/10/15 | | | | (4) | |
| USD | | | 130,903 | | | AUD | | | 170,000 | | | Deutsche Bank AG | | | 7/10/15 | | | | (201) | |
| USD | | | 254,439 | | | AUD | | | 330,000 | | | Deutsche Bank AG | | | 7/10/15 | | | | (56) | |
| USD | | | 15,429 | | | AUD | | | 20,000 | | | Deutsche Bank AG | | | 7/10/15 | | | | 5 | |
| USD | | | 15,471 | | | AUD | | | 20,000 | | | Deutsche Bank AG | | | 7/10/15 | | | | 47 | |
| USD | | | 30,840 | | | AUD | | | 40,000 | | | Deutsche Bank AG | | | 7/10/15 | | | | (8) | |
| USD | | | 137,362 | | | AUD | | | 180,000 | | | Deutsche Bank AG | | | 7/10/15 | | | | (1,454) | |
| USD | | | 24,264 | | | CAD | | | 30,000 | | | Deutsche Bank AG | | | 7/10/15 | | | | 247 | |
| USD | | | 242,967 | | | CAD | | | 300,000 | | | Deutsche Bank AG | | | 7/10/15 | | | | 2,801 | |
| USD | | | 40,434 | | | CAD | | | 50,000 | | | Deutsche Bank AG | | | 7/10/15 | | | | 406 | |
| USD | | | 8,101 | | | CAD | | | 10,000 | | | Deutsche Bank AG | | | 7/10/15 | | | | 96 | |
| USD | | | 16,174 | | | CAD | | | 20,000 | | | Deutsche Bank AG | | | 7/10/15 | | | | 163 | |
| USD | | | 32,169 | | | CAD | | | 40,000 | | | Deutsche Bank AG | | | 7/10/15 | | | | 147 | |
| | |
| 34 | | Permal Alternative Select VIT Portfolio 2015 Semi-Annual Report |
| | | | | | | | | | | | | | | | | | | | |
Currency
Purchased | | | Currency
Sold | | | Counterparty | | Settlement
Date | | | Unrealized
Appreciation
(Depreciation) | |
| USD | | | 345,964 | | | EUR | | | 310,000 | | | Deutsche Bank AG | | | 7/10/15 | | | $ | 322 | |
| USD | | | 156,651 | | | EUR | | | 140,000 | | | Deutsche Bank AG | | | 7/10/15 | | | | 554 | |
| USD | | | 33,595 | | | EUR | | | 30,000 | | | Deutsche Bank AG | | | 7/10/15 | | | | 146 | |
| USD | | | 78,255 | | | EUR | | | 70,000 | | | Deutsche Bank AG | | | 7/10/15 | | | | 207 | |
| USD | | | 133,506 | | | EUR | | | 120,000 | | | Deutsche Bank AG | | | 7/10/15 | | | | (291) | |
| USD | | | 207,804 | | | JPY | | | 25,700,000 | | | Deutsche Bank AG | | | 7/10/15 | | | | (2,209) | |
| USD | | | 1,344,291 | | | JPY | | | 166,220,000 | | | Deutsche Bank AG | | | 7/10/15 | | | | (14,006) | |
| USD | | | 182,921 | | | JPY | | | 22,680,000 | | | Deutsche Bank AG | | | 7/10/15 | | | | (2,413) | |
| USD | | | 51,382 | | | JPY | | | 6,350,000 | | | Deutsche Bank AG | | | 7/10/15 | | | | (508) | |
| USD | | | 151,783 | | | MXN | | | 2,330,000 | | | Deutsche Bank AG | | | 7/10/15 | | | | 3,625 | |
| USD | | | 19,426 | | | MXN | | | 300,000 | | | Deutsche Bank AG | | | 7/10/15 | | | | 350 | |
| USD | | | 14,218 | | | MXN | | | 220,000 | | | Deutsche Bank AG | | | 7/10/15 | | | | 229 | |
| USD | | | 16,049 | | | MXN | | | 250,000 | | | Deutsche Bank AG | | | 7/10/15 | | | | 152 | |
| USD | | | 9,567 | | | MXN | | | 150,000 | | | Deutsche Bank AG | | | 7/10/15 | | | | 29 | |
| USD | | | 11,491 | | | MXN | | | 180,000 | | | Deutsche Bank AG | | | 7/10/15 | | | | 45 | |
| USD | | | 6,372 | | | NOK | | | 50,000 | | | Deutsche Bank AG | | | 7/10/15 | | | | (4) | |
| USD | | | 71,903 | | | NOK | | | 560,000 | | | Deutsche Bank AG | | | 7/10/15 | | | | 492 | |
| USD | | | 15,261 | | | NOK | | | 120,000 | | | Deutsche Bank AG | | | 7/10/15 | | | | (41) | |
| USD | | | 10,214 | | | NOK | | | 80,000 | | | Deutsche Bank AG | | | 7/10/15 | | | | 13 | |
| USD | | | 10,121 | | | NOK | | | 80,000 | | | Deutsche Bank AG | | | 7/10/15 | | | | (81) | |
| USD | | | 5,098 | | | NOK | | | 40,000 | | | Deutsche Bank AG | | | 7/10/15 | | | | (3) | |
| USD | | | 6,843 | | | NZD | | | 10,000 | | | Deutsche Bank AG | | | 7/10/15 | | | | 71 | |
| USD | | | 348,768 | | | NZD | | | 510,000 | | | Deutsche Bank AG | | | 7/10/15 | | | | 3,411 | |
| USD | | | 13,693 | | | NZD | | | 20,000 | | | Deutsche Bank AG | | | 7/10/15 | | | | 150 | |
| USD | | | 20,715 | | | NZD | | | 30,000 | | | Deutsche Bank AG | | | 7/10/15 | | | | 400 | |
| USD | | | 13,760 | | | NZD | | | 20,000 | | | Deutsche Bank AG | | | 7/10/15 | | | | 216 | |
| USD | | | 6,800 | | | NZD | | | 10,000 | | | Deutsche Bank AG | | | 7/10/15 | | | | 28 | |
| USD | | | 5,346 | | | PLN | | | 20,000 | | | Deutsche Bank AG | | | 7/10/15 | | | | 27 | |
| USD | | | 2,701 | | | PLN | | | 10,000 | | | Deutsche Bank AG | | | 7/10/15 | | | | 42 | |
| USD | | | 2,683 | | | PLN | | | 10,000 | | | Deutsche Bank AG | | | 7/10/15 | | | | 24 | |
| USD | | | 2,678 | | | PLN | | | 10,000 | | | Deutsche Bank AG | | | 7/10/15 | | | | 19 | |
| USD | | | 2,654 | | | PLN | | | 10,000 | | | Deutsche Bank AG | | | 7/10/15 | | | | (5) | |
| USD | | | 2,673 | | | PLN | | | 10,000 | | | Deutsche Bank AG | | | 7/10/15 | | | | 14 | |
| USD | | | 3,661 | | | SEK | | | 30,000 | | | Deutsche Bank AG | | | 7/10/15 | | | | 42 | |
| USD | | | 2,422 | | | SEK | | | 20,000 | | | Deutsche Bank AG | | | 7/10/15 | | | | 9 | |
| USD | | | 3,643 | | | SEK | | | 30,000 | | | Deutsche Bank AG | | | 7/10/15 | | | | 24 | |
| USD | | | 3,636 | | | SEK | | | 30,000 | | | Deutsche Bank AG | | | 7/10/15 | | | | 16 | |
| USD | | | 4,821 | | | SEK | | | 40,000 | | | Deutsche Bank AG | | | 7/10/15 | | | | (5) | |
| USD | | | 3,619 | | | SEK | | | 30,000 | | | Deutsche Bank AG | | | 7/10/15 | | | | (1) | |
| USD | | | 66,951 | | | TRY | | | 180,000 | | | Deutsche Bank AG | | | 7/10/15 | | | | (35) | |
| USD | | | 3,706 | | | TRY | | | 10,000 | | | Deutsche Bank AG | | | 7/10/15 | | | | (15) | |
| USD | | | 58,241 | | | ZAR | | | 710,000 | | | Deutsche Bank AG | | | 7/10/15 | | | | (39) | |
| | |
| Permal Alternative Select VIT Portfolio 2015 Semi-Annual Report | | 35 |
Notes to consolidated financial statements (unaudited) (cont’d)
| | | | | | | | | | | | | | | | | | | | |
Currency
Purchased | | | Currency
Sold | | | Counterparty | | Settlement
Date | | | Unrealized
Appreciation
(Depreciation) | |
| USD | | | 1,638 | | | ZAR | | | 20,000 | | | Deutsche Bank AG | | | 7/10/15 | | | $ | (4) | |
| USD | | | 5,688 | | | ZAR | | | 70,000 | | | Deutsche Bank AG | | | 7/10/15 | | | | (58) | |
| ZAR | | | 50,000 | | | USD | | | 4,080 | | | Deutsche Bank AG | | | 7/10/15 | | | | 24 | |
| ZAR | | | 110,000 | | | USD | | | 9,096 | | | Deutsche Bank AG | | | 7/10/15 | | | | (67) | |
| ZAR | | | 70,000 | | | USD | | | 5,747 | | | Deutsche Bank AG | | | 7/10/15 | | | | (1) | |
| USD | | | 61,673 | | | EUR | | | 54,400 | | | Credit Suisse | | | 7/23/15 | | | | 1,009 | |
| USD | | | 100,219 | | | EUR | | | 88,400 | | | Credit Suisse | | | 7/23/15 | | | | 1,639 | |
| BRL | | | 30,000 | | | USD | | | 9,330 | | | Deutsche Bank AG | | | 9/16/15 | | | | 60 | |
| BRL | | | 10,000 | | | USD | | | 3,126 | | | Deutsche Bank AG | | | 9/16/15 | | | | 4 | |
| BRL | | | 40,000 | | | USD | | | 12,733 | | | Deutsche Bank AG | | | 9/16/15 | | | | (213) | |
| BRL | | | 10,000 | | | USD | | | 3,165 | | | Deutsche Bank AG | | | 9/16/15 | | | | (35) | |
| BRL | | | 10,000 | | | USD | | | 3,159 | | | Deutsche Bank AG | | | 9/16/15 | | | | (29) | |
| BRL | | | 30,000 | | | USD | | | 9,434 | | | Deutsche Bank AG | | | 9/16/15 | | | | (44) | |
| INR | | | 2,160,000 | | | USD | | | 33,338 | | | Deutsche Bank AG | | | 9/16/15 | | | | 82 | |
| INR | | | 1,850,000 | | | USD | | | 28,609 | | | Deutsche Bank AG | | | 9/16/15 | | | | 15 | |
| INR | | | 1,900,000 | | | USD | | | 29,526 | | | Deutsche Bank AG | | | 9/16/15 | | | | (129) | |
| INR | | | 670,000 | | | USD | | | 10,401 | | | Deutsche Bank AG | | | 9/16/15 | | | | (34) | |
| INR | | | 370,000 | | | USD | | | 5,735 | | | Deutsche Bank AG | | | 9/16/15 | | | | (11) | |
| INR | | | 960,000 | | | USD | | | 14,911 | | | Deutsche Bank AG | | | 9/16/15 | | | | (58) | |
| INR | | | 430,000 | | | USD | | | 6,678 | | | Deutsche Bank AG | | | 9/16/15 | | | | (25) | |
| INR | | | 900,000 | | | USD | | | 13,957 | | | Deutsche Bank AG | | | 9/16/15 | | | | (32) | |
| USD | | | 31,363 | | | BRL | | | 100,000 | | | Deutsche Bank AG | | | 9/16/15 | | | | 63 | |
| USD | | | 12,237 | | | BRL | | | 40,000 | | | Deutsche Bank AG | | | 9/16/15 | | | | (283) | |
| USD | | | 3,155 | | | BRL | | | 10,000 | | | Deutsche Bank AG | | | 9/16/15 | | | | 25 | |
| USD | | | 6,245 | | | BRL | | | 20,000 | | | Deutsche Bank AG | | | 9/16/15 | | | | (15) | |
| USD | | | 3,150 | | | BRL | | | 10,000 | | | Deutsche Bank AG | | | 9/16/15 | | | | 20 | |
| USD | | | 12,440 | | | BRL | | | 40,000 | | | Deutsche Bank AG | | | 9/16/15 | | | | (80) | |
| USD | | | 6,193 | | | BRL | | | 20,000 | | | Deutsche Bank AG | | | 9/16/15 | | | | (67) | |
| USD | | | 15,246 | | | INR | | | 990,000 | | | Deutsche Bank AG | | | 9/16/15 | | | | (72) | |
| USD | | | 19,972 | | | INR | | | 1,300,000 | | | Deutsche Bank AG | | | 9/16/15 | | | | (142) | |
| USD | | | 11,044 | | | INR | | | 720,000 | | | Deutsche Bank AG | | | 9/16/15 | | | | (96) | |
| USD | | | 8,288 | | | INR | | | 540,000 | | | Deutsche Bank AG | | | 9/16/15 | | | | (68) | |
| USD | | | 5,065 | | | INR | | | 330,000 | | | Deutsche Bank AG | | | 9/16/15 | | | | (41) | |
| USD | | | 23,941 | | | INR | | | 1,550,000 | | | Deutsche Bank AG | | | 9/16/15 | | | | (41) | |
| Total | | | $ | (12,301) | |
| | |
| 36 | | Permal Alternative Select VIT Portfolio 2015 Semi-Annual Report |
| | |
Abbreviations used in this table: |
| AUD | | — Australian Dollar |
| BRL | | — Brazilian Real |
| CAD | | — Canadian Dollar |
| EUR | | — Euro |
| GBP | | — British Pound |
| INR | | — Indian Rupee |
| JPY | | — Japanese Yen |
| MXN | | — Mexican Peso |
| NOK | | — Norwegian Krone |
| NZD | | — New Zealand Dollar |
| PLN | | — Polish Zloty |
| SEK | | — Swedish Krona |
| TRY | | — Turkish Lira |
| USD | | — United States Dollar |
| ZAR | | — South African Rand |
At June 30, 2015, the Portfolio had the following open swap contracts:
| | | | | | | | | | | | | | | | | | | | |
| OTC TOTAL RETURN SWAPS | |
| Swap Counterparty | | Notional
Amount* | | | Termination
Date | | | Periodic
Payments Made by the Portfolio | | Periodic
Payments
Received by the Portfolio | | Upfront
Premiums
Paid
(Received) | | | Unrealized
Appreciation
(Depreciation) | |
Credit Suisse Securities
(Europe) Ltd. | | | 799,232 | JPY | | | 12/15/16 | | | Yahoo Japan Corp. † | | 1-Month LIBOR plus
50 basis points | | | — | | | $ | 230 | |
| Credit Suisse Securities (Europe) Ltd. | | | 46,973 | | | | 11/30/15 | | | 1-Month LIBOR plus
30 basis points | | Chimera Investment
Corp.† | | | — | | | | (5,158) | |
| Credit Suisse Securities (Europe) Ltd. | | | 8,399 | GBP | | | 8/18/15 | | | 1-Month LIBOR plus
35 basis points | | Inmarsat PLC† | | | — | | | | (811) | |
| Credit Suisse Securities (Europe) Ltd. | | | 11,619 | EUR | | | 8/10/16 | | | 1-Month LIBOR plus
30 basis points | | Ryanair Holdings
PLC† | | | — | | | | 2,214 | |
| Credit Suisse Securities (Europe) Ltd. | | | 324 | | | | 11/30/15 | | | 1-Month LIBOR plus
55 basis points | | MarkWest Energy
Partners LP† | | | — | | | | (43) | |
| Credit Suisse Securities (Europe) Ltd. | | | 16,409 | GBP | | | 8/18/15 | | | 1-Month LIBOR plus
30 basis points | | Vodafone Group
PLC† | | | — | | | | (1,990) | |
| Morgan Stanley Capital Services LLC | | | 2,047,833 | | | | 10/13/16 | | | Apex R2 basket†‡ | | USD-Federal Funds-
H.15 | | | — | | | | (189,446) | |
| Total | | | | | | | | | | | | | | | | | | $ | (195,004) | |
| * | Notional amount denominated in U.S. dollars, unless otherwise noted. |
| † | Periodic payments made/received by the Portfolio are based on the total return of the referenced entity. |
| ‡ | Custom equity basket of securities intended to perform in correlation to the Russell 2000 Index. |
| | |
Abbreviations used in this table: |
| EUR | | — Euro |
| GBP | | — British Pound |
| JPY | | — Japanese Yen |
| | |
| Permal Alternative Select VIT Portfolio 2015 Semi-Annual Report | | 37 |
Notes to consolidated financial statements (unaudited) (cont’d)
4. Derivative instruments and hedging activities
Below is a table, grouped by derivative type, that provides information about the fair value and the location of derivatives within the Consolidated Statement of Assets and Liabilities at June 30, 2015.
| | | | | | | | | | | | | | | | | | | | |
| ASSET DERIVATIVES1 | |
| | | Interest Rate
Risk | | | Foreign Exchange
Risk | | | Commodity
Risk | | | Equity Risk | | | Total | |
| Purchased options2 | | | — | | | $ | 209 | | | | — | | | $ | 225,478 | | | $ | 225,687 | |
| Futures contracts3 | | $ | 1,443 | | | | — | | | $ | 6,153 | | | | 7,711 | | | | 15,307 | |
| OTC swap contracts4 | | | — | | | | — | | | | — | | | | 2,444 | | | | 2,444 | |
| Forward foreign currency contracts | | | — | | | | 23,189 | | | | — | | | | — | | | | 23,189 | |
| Total | | $ | 1,443 | | | $ | 23,398 | | | $ | 6,153 | | | $ | 235,633 | | | $ | 266,627 | |
| | | | | | | | | | | | | | | | | | | | |
| LIABILITY DERIVATIVES1 | |
| | | Interest Rate
Risk | | | Foreign Exchange
Risk | | | Commodity
Risk | | | Equity Risk | | | Total | |
| Written options | | | — | | | | — | | | | — | | | $ | 158,989 | | | $ | 158,989 | |
| Futures contracts3 | | $ | 564 | | | | — | | | $ | 9,762 | | | | 35,345 | | | | 45,671 | |
| OTC swap contracts4 | | | — | | | | — | | | | — | | | | 197,448 | | | | 197,448 | |
| Forward foreign currency contracts | | | — | | | $ | 35,490 | | | | — | | | | — | | | | 35,490 | |
| Total | | $ | 564 | | | $ | 35,490 | | | $ | 9,762 | | | $ | 391,782 | | | $ | 437,598 | |
| 1 | Generally, the balance sheet location for asset derivatives is receivables/net unrealized appreciation (depreciation) and for liability derivatives is payables/net unrealized appreciation (depreciation). |
| 2 | Market value of purchased options is reported in Investments at value in the Consolidated Statement of Assets and Liabilities. |
| 3 | Includes cumulative appreciation (depreciation) of futures contracts as reported in the footnotes. Only variation margin is reported within the receivables and/or payables on the Consolidated Statement of Assets and Liabilities. |
| 4 | Values include premiums paid (received) on swap contracts which are shown separately in the Consolidated Statement of Assets and Liabilities. |
| | |
| 38 | | Permal Alternative Select VIT Portfolio 2015 Semi-Annual Report |
The following tables provide information about the effect of derivatives and hedging activities on the Portfolio’s Consolidated Statement of Operations for the six months ended June 30, 2015. The first table provides additional detail about the amounts and sources of gains (losses) realized on derivatives during the period. The second table provides additional information about the change in unrealized appreciation (depreciation) resulting from the Portfolio’s derivatives and hedging activities during the period.
| | | | | | | | | | | | | | | | | | | | |
| AMOUNT OF REALIZED GAIN (LOSS) ON DERIVATIVES RECOGNIZED | |
| | | Interest Rate
Risk | | | Foreign Exchange
Risk | | | Commodity
Risk | | | Equity Risk | | | Total | |
| Purchased options1 | | $ | (3,562) | | | $ | 73,562 | | | $ | (4,024) | | | $ | 100,851 | | | $ | 166,827 | |
| Written options | | | (632) | | | | 4,634 | | | | (5,134) | | | | (12,828) | | | | (13,960) | |
| Futures contracts | | | (33,126) | | | | — | | | | 45,447 | | | | 137,123 | | | | 149,444 | |
| Swap contracts | | | — | | | | — | | | | — | | | | (62,659) | | | | (62,659) | |
| Forward foreign currency contracts2 | | | — | | | | 158,998 | | | | — | | | | — | | | | 158,998 | |
| Total | | $ | (37,320) | | | $ | 237,194 | | | $ | 36,289 | | | $ | 162,487 | | | $ | 398,650 | |
| 1 | Net realized gain (loss) from purchased options is reported in net realized gain (loss) from investment transactions in the Consolidated Statement of Operations. |
| 2 | Net realized gain (loss) from forward foreign currency contracts is reported in net realized gain (loss) from foreign currency transactions in the Consolidated Statement of Operations. |
| | | | | | | | | | | | | | | | | | | | |
| CHANGE IN UNREALIZED APPRECIATION (DEPRECIATION) ON DERIVATIVES RECOGNIZED | |
| | | Interest Rate
Risk | | | Foreign Exchange
Risk | | | Commodity
Risk | | | Equity
Risk | | | Total | |
| Purchased options1 | | $ | 13 | | | $ | (16,494) | | | | — | | | $ | 32,805 | | | $ | 16,324 | |
| Written options | | | — | | | | — | | | | — | | | | 58,331 | | | | 58,331 | |
| Futures contracts | | | (51,136) | | | | — | | | $ | (16,233) | | | | (28,878) | | | | (96,247) | |
| Swap contracts | | | — | | | | — | | | | — | | | | (20,575) | | | | (20,575) | |
| Forward foreign currency contracts2 | | | — | | | | (54,983) | | | | — | | | | — | | | | (54,983) | |
| Total | | $ | (51,123) | | | $ | (71,477) | | | $ | (16,233) | | | $ | 41,683 | | | $ | (97,150) | |
| 1 | The change in unrealized appreciation (depreciation) from purchased options is reported in the change in net unrealized appreciation (depreciation) from investments in the Consolidated Statement of Operations. |
| 2 | The change in unrealized appreciation (depreciation) from forward foreign currency contracts is reported in the change in net unrealized appreciation (depreciation) from foreign currencies in the Consolidated Statement of Operations. |
| | |
| Permal Alternative Select VIT Portfolio 2015 Semi-Annual Report | | 39 |
Notes to consolidated financial statements (unaudited) (cont’d)
During the six months ended June 30, 2015, the volume of derivative activity for the Portfolio was as follows:
| | | | |
| | | Average Market
Value | |
| Purchased options | | $ | 316,566 | |
| Written options | | | 238,050 | |
| Futures contracts (to buy) | | | 18,284,596 | |
| Futures contracts (to sell) | | | 4,252,742 | |
| Forward foreign currency contracts (to buy) | | | 4,331,475 | |
| Forward foreign currency contracts (to sell) | | | 8,791,455 | |
| | | Average Notional
Balance | |
| Total return swap contracts | | $ | 1,953,573 | |
The following table presents by financial instrument, the Portfolio’s derivative assets net of the related collateral received by the Portfolio at June 30, 2015:
| | | | | | | | | | | | |
| | | Gross Amount of Derivative
Assets in the Consolidated
Statement of Assets and
Liabilities1 | | | Collateral
Received | | | Net
Amount | |
| Purchased options2 | | $ | 225,687 | | | | – | | | $ | 225,687 | |
| OTC swap contracts | | | 2,444 | | | | – | | | | 2,444 | |
| Forward foreign currency contracts | | | 23,189 | | | | – | | | | 23,189 | |
| Total | | $ | 251,320 | | | | – | | | $ | 251,320 | |
The following table presents by financial instrument, the Portfolio’s derivative liabilities net of the related collateral pledged by the Portfolio at June 30, 2015:
| | | | | | | | | | | | |
| | | Gross Amount of Derivative
Liabilities in the Consolidated
Statement of Assets and
Liabilities1 | | | Collateral
Pledged3,4,5 | | | Net
Amount | |
| Written options | | $ | 158,989 | | | $ | (158,989) | | | | — | |
| Futures contracts6 | | | 32,910 | | | | (32,910) | | | | — | |
| OTC swap contracts | | | 197,448 | | | | (197,448) | | | | — | |
| Forward foreign currency contracts | | | 35,490 | | | | (35,490) | | | | — | |
| Total | | $ | 424,837 | | | $ | (424,837) | | | | — | |
| 1 | Absent an event of default or early termination, derivative assets and liabilities are presented gross and not offset in the Consolidated Statement of Assets and Liabilities. |
| 2 | Market value of purchased options is shown in Investments at value in the Consolidated Statement of Asset and Liabilities. |
| 3 | Gross amounts are not offset in the Consolidated Statement of Assets and Liabilities. |
| 4 | In some instances, the actual collateral received and/or pledged may be more than the amount shown here due to overcollateralization. |
| 5 | See the Consolidated Schedule of Investments for securities pledged as collateral. |
| 6 | Amount represents the current day’s variation margin as reported in the Consolidated Statement of Assets and Liabilities. It differs from the cumulative appreciation (depreciation) presented in the previous table. |
| | |
| 40 | | Permal Alternative Select VIT Portfolio 2015 Semi-Annual Report |
5. Shares of beneficial interest
At June 30, 2015, the Trust had an unlimited number of shares of beneficial interest authorized with a par value of $0.00001 per share.
Transactions in shares of the Portfolio were as follows:
| | | | | | | | |
| | | Six Months Ended
June 30, 2015 | | | Period Ended
December 31, 2014† | |
| Class II | | | | | | | | |
| Shares sold | | | 571,199 | | | | 2,316,730 | |
| Shares issued on reinvestment | | | 25,977 | | | | 5,473 | |
| Shares repurchased | | | (538) | | | | 0 | * |
| Net increase | | | 596,638 | | | | 2,322,203 | |
| † | For the period October 6, 2014 (inception date) to December 31, 2014. |
| * | Represents less than 1 share. |
| | |
| Permal Alternative Select VIT Portfolio 2015 Semi-Annual Report | | 41 |
Permal Alternative Select VIT Portfolio
Trustees
Paul R. Ades
Andrew L. Breech
Dwight B. Crane
Althea L. Duersten
Frank G. Hubbard
Howard J. Johnson Chairman
Jerome K. Miller
Ken Miller
John J. Murphy
Thomas F. Schlafly
Jane Trust* President
| * | Effective June 1, 2015, Ms. Trust became a Trustee, President and Chief Executive Officer. |
Investment manager
Permal Asset Management LLC
Subadvisers
Apex Capital, LLC
Atlantic Investment Management, Inc.
BH-DG Systematic Trading LLP
River Canyon Fund Management LLC
TT International
Distributor
Legg Mason Investor Services, LLC
Custodian
State Street Bank and Trust Company
Transfer agent
BNYMellon Investment Servicing (US) Inc.
4400 Computer Drive
Westborough, MA 01581
Independent registered public accounting firm
KPMG LLP
345 Park Avenue
New York, NY 10154
Permal Alternative Select VIT Portfolio
The Portfolio is a separate investment series of Legg Mason Partners Equity Variable Trust, a Maryland statutory trust.
Permal Alternative Select VIT Portfolio
Legg Mason Funds
620 Eighth Avenue, 49th Floor
New York, NY 10018
The Portfolio files its complete schedule of portfolio holdings with the Securities and Exchange Commission (“SEC”) for the first and third quarters of each fiscal year on Form N-Q. The Portfolio’s Forms N-Q are available on the SEC’s website at www.sec.gov. The Portfolio’s Forms N-Q may be reviewed and copied at the SEC’s Public Reference Room in Washington, D.C., and information on the operation of the Public Reference Room may be obtained by calling 1-800-SEC-0330. To obtain information on Form N-Q, shareholders can call the Portfolio at 1-877-721-1926.
Information on how the Portfolio voted proxies relating to portfolio securities during the prior 12-month period ended June 30th of each year and a description of the policies and procedures that the Portfolio uses to determine how to vote proxies related to portfolio transactions are available (1) without charge, upon request, by calling the Portfolio at 1-877-721-1926. (2) on the Portfolio’s website at www.leggmason.com/individualinvestors and (3) on the SEC’s website at www.sec.gov.
This report is submitted for the general information of the shareholders of Permal Alternative Select VIT Portfolio. This report is not authorized for distribution to prospective investors in the Portfolio unless preceded or accompanied by a current prospectus.
Investors should consider the Portfolio’s investment objectives, risks, charges and expenses carefully before investing. The prospectus contains this and other important information about the Portfolio. Please read the prospectus carefully before investing.
www.leggmason.com/individualinvestors
© 2015 Legg Mason Investor Services, LLC
Member FINRA, SIPC
Legg Mason Funds Privacy and Security Notice
Your Privacy and the Security of Your Personal Information is Very Important to the Legg Mason Funds
This Privacy and Security Notice (the “Privacy Notice”) addresses the Legg Mason Funds’ privacy and data protection practices with respect to nonpublic personal information the Funds receive. The Legg Mason Funds include any funds sold by the Funds’ distributor, Legg Mason Investor Services, LLC, as well as Legg Mason-sponsored closed-end funds and certain closed-end funds managed or sub-advised by Legg Mason or its affiliates. The provisions of this Privacy Notice apply to your information both while you are a shareholder and after you are no longer invested with the Funds.
The Type of Nonpublic Personal Information the Funds Collect About You
The Funds collect and maintain nonpublic personal information about you in connection with your shareholder account. Such information may include, but is not limited to:
| • | | Personal information included on applications or other forms; |
| • | | Account balances, transactions, and mutual fund holdings and positions; |
| • | | Online account access user IDs, passwords, security challenge question responses; and |
| • | | Information received from consumer reporting agencies regarding credit history and creditworthiness (such as the amount of an individual’s total debt, payment history, etc.). |
How the Funds Use Nonpublic Personal Information About You
The Funds do not sell or share your nonpublic personal information with third parties or with affiliates for their marketing purposes, or with other financial institutions or affiliates for joint marketing purposes, unless you have authorized the Funds to do so. The Funds do not disclose any nonpublic personal information about you except as may be required to perform transactions or services you have authorized or as permitted or required by law. The Funds may disclose information about you to:
| • | | Employees, agents, and affiliates on a “need to know” basis to enable the Funds to conduct ordinary business or comply with obligations to government regulators; |
| • | | Service providers, including the Funds’ affiliates, who assist the Funds as part of the ordinary course of business (such as printing, mailing services, or processing or servicing your account with us) or otherwise perform services on the Funds’ behalf, including companies that may perform marketing services solely for the Funds; |
| • | | The Funds’ representatives such as legal counsel, accountants and auditors; and |
| • | | Fiduciaries or representatives acting on your behalf, such as an IRA custodian or trustee of a grantor trust. |
|
| NOT PART OF THE SEMI-ANNUAL REPORT |
Legg Mason Funds Privacy and Security Notice (cont’d)
Except as otherwise permitted by applicable law, companies acting on the Funds’ behalf are contractually obligated to keep nonpublic personal information the Funds provide to them confidential and to use the information the Funds share only to provide the services the Funds ask them to perform.
The Funds may disclose nonpublic personal information about you when necessary to enforce their rights or protect against fraud, or as permitted or required by applicable law, such as in connection with a law enforcement or regulatory request, subpoena, or similar legal process. In the event of a corporate action or in the event a Fund service provider changes, the Funds may be required to disclose your nonpublic personal information to third parties. While it is the Funds’ practice to obtain protections for disclosed information in these types of transactions, the Funds cannot guarantee their privacy policy will remain unchanged.
Keeping You Informed of the Funds’ Privacy and Security Practices
The Funds will notify you annually of their privacy policy as required by federal law. While the Funds reserve the right to modify this policy at any time they will notify you promptly if this privacy policy changes.
The Funds’ Security Practices
The Funds maintain appropriate physical, electronic and procedural safeguards designed to guard your nonpublic personal information. The Funds’ internal data security policies restrict access to your nonpublic personal information to authorized employees, who may use your nonpublic personal information for Fund business purposes only.
Although the Funds strive to protect your nonpublic personal information, they cannot ensure or warrant the security of any information you provide or transmit to them, and you do so at your own risk. In the event of a breach of the confidentiality or security of your nonpublic personal information, the Funds will attempt to notify you as necessary so you can take appropriate protective steps. If you have consented to the Funds using electronic communications or electronic delivery of statements, they may notify you under such circumstances using the most current email address you have on record with them.
In order for the Funds to provide effective service to you, keeping your account information accurate is very important. If you believe that your account information is incomplete, not accurate or not current, or if you have questions about the Funds’ privacy practices, write the Funds using the contact information on your account statements, email the Funds by clicking on the Contact Us section of the Funds’ website at www.leggmason.com, or contact the Fund at 1-877-721-1926.
|
| NOT PART OF THE SEMI-ANNUAL REPORT |
www.leggmason.com/individualinvestors
© 2015 Legg Mason Investor Services, LLC Member FINRA, SIPC
PRML179487 8/15 SR15-2555
ITEM 2. CODE OF ETHICS.
Not applicable.
ITEM 3. AUDIT COMMITTEE FINANCIAL EXPERT.
Not applicable.
| ITEM 4. | PRINCIPAL ACCOUNTANT FEES AND SERVICES. |
Not applicable.
ITEM 5. AUDIT COMMITTEE OF LISTED REGISTRANTS.
Not applicable.
ITEM 6. SCHEDULE OF INVESTMENTS.
Included herein under Item 1.
| ITEM 7. | DISCLOSURE OF PROXY VOTING POLICIES AND PROCEDURES FOR CLOSED-END MANAGEMENT INVESTMENT COMPANIES. |
Not applicable.
| ITEM 8. | PORTFOLIO MANAGERS OF CLOSED-END MANAGEMENT INVESTMENT COMPANIES. |
Not applicable.
| ITEM 9. | PURCHASES OF EQUITY SECURITIES BY CLOSED-END MANAGEMENT INVESTMENT COMPANY AND AFFILIATED PURCHASERS. |
Not applicable.
| ITEM 10. | SUBMISSION OF MATTERS TO A VOTE OF SECURITY HOLDERS. |
Not applicable.
| ITEM 11. | CONTROLS AND PROCEDURES. |
| | (a) | The registrant’s principal executive officer and principal financial officer have concluded that the registrant’s disclosure controls and procedures (as defined in Rule 30a- 3(c) under the Investment Company Act of 1940, as amended (the “1940 Act”)) are effective as of a date within 90 days of the filing date of this report that includes the disclosure required by this paragraph, based on their evaluation of the disclosure controls and procedures required by Rule 30a-3(b) under the 1940 Act and 15d-15(b) under the Securities Exchange Act of 1934. |
| | (b) | There were no changes in the registrant’s internal control over financial reporting (as defined in Rule 30a-3(d) under the 1940 Act) that occurred during the second fiscal quarter of the period covered by this report that have materially affected, or are likely to materially affect the registrant’s internal control over financial reporting |
(a) (1) Not applicable.
Exhibit 99.CODE ETH
(a) (2) Certifications pursuant to section 302 of the Sarbanes-Oxley Act of 2002 attached hereto.
Exhibit 99.CERT
(b) Certifications pursuant to Section 906 of the Sarbanes-Oxley Act of 2002 attached hereto.
Exhibit 99.906CERT
SIGNATURES
Pursuant to the requirements of the Securities Exchange Act of 1934 and the Investment Company Act of 1940, the registrant has duly caused this Report to be signed on its behalf by the undersigned, there unto duly authorized.
| | |
| Legg Mason Partners Variable Equity Trust |
| |
| By: | | /s/ Jane Trust |
| | Jane Trust |
| | Chief Executive Officer |
| |
| Date: | | August 24, 2015 |
Pursuant to the requirements of the Securities Exchange Act of 1934 and the Investment Company Act of 1940, this report has been signed below by the following persons on behalf of the registrant and in the capacities and on the dates indicated.
| | |
| By: | | /s/ Jane Trust |
| | Jane Trust |
| | Chief Executive Officer |
| |
| Date: | | August 24, 2015 |
| |
| By: | | /s/ Richard F. Sennett |
| | Richard F. Sennett |
| | Principal Financial Officer |
| |
| Date: | | August 24, 2015 |