UNITED STATES
SECURITIES AND EXCHANGE COMMISSION
Washington, D.C. 20549
FORM N-CSR
CERTIFIED SHAREHOLDER REPORT OF REGISTERED
MANAGEMENT INVESTMENT COMPANIES
Investment Company Act file number 811-21128
Legg Mason Partners Variable Equity Trust
(Exact name of registrant as specified in charter)
620 Eighth Avenue, 49th Floor, New York, NY 10018
(Address of principal executive offices) (Zip code)
Robert I. Frenkel, Esq.
Legg Mason & Co., LLC
100 First Stamford Place
Stamford, CT 06902
(Name and address of agent for service)
Registrant’s telephone number, including area code: 1-877-721-1926
Date of fiscal year end: December 31
Date of reporting period: June 30, 2016
| ITEM 1. | REPORT TO STOCKHOLDERS. |
The Semi-Annual Report to Stockholders is filed herewith.

| | |
| Semi-Annual Report | | June 30, 2016 |
ENTRUSTPERMAL
ALTERNATIVE SELECT VIT PORTFOLIO

|
| INVESTMENT PRODUCTS: NOT FDIC INSURED • NO BANK GUARANTEE • MAY LOSE VALUE |
Portfolio objective
The Portfolio seeks to provide investors with long term capital appreciation.
Portfolio name change
Prior to July 22, 2016, the Portfolio was known as Permal Alternative Select VIT Portfolio. There was no change in the Portfolio’s investment objective, policies and strategy as a result of the name change.
Letter from the president

Dear Shareholder,
We are pleased to provide the semi-annual report of EnTrustPermal Alternative Select VIT Portfolio for the six-month reporting period ended June 30, 2016. Please read on for Portfolio performance information and a detailed look at prevailing economic and market conditions during the Portfolio’s reporting period.
Special shareholder notice
On January 22, 2016, certain affiliates of Legg Mason, Inc. (“Legg Mason”) entered into an agreement with Mr. Gregg S. Hymowitz, the Co-founder and Managing Partner of EnTrust Capital (“EnTrust”), and entities controlled by him, to combine the businesses of The Permal Group, of which Permal Asset Management LLC (“Permal”), the Portfolio’s investment manager was a member, and EnTrust (the “Combination”). On May 2, 2016, the Portfolio announced that the Combination of the businesses of The Permal Group and EnTrust became effective.
As a result of the Combination, a new combined entity, EnTrustPermal LLC, was formed with Legg Mason owning 65% and Mr. Hymowitz and entities controlled by him owning 35%. The name of Permal was changed to EnTrustPermal Management LLC (“EnTrustPermal”), and it is a subsidiary of EnTrustPermal LLC, a new holding company.
The Combination resulted in a “change in control” in the ultimate ownership of Permal for purposes of the Investment Company Act of 1940, thereby triggering the automatic termination provisions in the current management agreement between the Legg Mason Partners Variable Equity Trust (the “Trust”) and Permal and the subadvisory and trading agreements between Permal and the subadvisers and trading advisor, respectively, and each such agreement was terminated.
At a meeting of the Board of Trustees (the “Board”) of the Trust held on March 3, 2016, in anticipation of the Combination, the Board approved a new management agreement with
| | |
| II | | EnTrustPermal Alternative Select VIT Portfolio |
EnTrustPermal (the “New Management Agreement”), which is identical to the current management agreement, including the compensation paid thereunder, except for the dates and the names of the parties.
A proxy statement further describing the Combination and the New Management Agreement and requesting that shareholders vote to approve the New Management Agreement was mailed to shareholders on or about April 6, 2016. The Board fixed the close of business of March 21, 2016 as the record date for determining shareholders entitled to notice and to vote at the Special Meeting of Shareholders (the “Special Meeting”). The Special Meeting took place on May 20, 2016 at which shareholders approved the New Management Agreement between the Trust, on behalf of the Portfolio, and EnTrustPermal. The New Management Agreement became effective upon shareholder approval and supersedes an interim management agreement that went into effect with respect to the Portfolio on May 2, 2016, when the Combination became effective.
In addition, new subadvisory and trading agreements took effect on May 20, 2016. These agreements superseded the interim subadvisory and trading agreements that took effect on May 2, 2016.
Effective July 22, 2016, the Portfolio’s name changed from Permal Alternative Select VIT Portfolio to EnTrustPermal Alternative Select VIT Portfolio. For more information, please see the prospectus supplements dated May 2, 2016 and May 23, 2016.
As always, we remain committed to providing you with excellent service and a full spectrum of investment choices. We also remain committed to supplementing the support you receive from your financial advisor. One way we accomplish this is through our website, www.leggmason.com. Here you can gain immediate access to market and investment information, including:
| • | | Market insights and commentaries from our portfolio managers, and |
| • | | A host of educational resources. |
We look forward to helping you meet your financial goals.
Sincerely,

Jane Trust, CFA
President and Chief Executive Officer
July 29, 2016
| | |
| EnTrustPermal Alternative Select VIT Portfolio | | III |
Investment commentary
Economic review
The pace of U.S. economic activity fluctuated during the six months ended June 30, 2016 (the “reporting period”). Looking back, the U.S. Department of Commerce’s revised figures showed that fourth quarter 2015 U.S. gross domestic product (“GDP”)i growth was 0.9%. First quarter 2016 GDP growth then decelerated to 0.8%. The U.S. Department of Commerce’s initial reading for second quarter 2016 GDP growth — released after the reporting period ended — was 1.2%. The improvement in GDP growth in the second quarter reflected an acceleration in personal consumption expenditures (“PCE”), an upturn in exports and smaller decreases in nonresidential fixed investment and in federal government spending.
While there was a pocket of weakness in May 2016, job growth in the U.S. was solid overall and a tailwind for the economy during the reporting period. When the period ended in June 2016, unemployment was 4.9%, as reported by the U.S. Department of Labor. The percentage of longer-term unemployed also declined over the period. In June 2016, 25.8% of Americans looking for a job had been out of work for more than six months, versus 26.9% when the period began.
Turning to the global economy, in its July 2016 World Economic Outlook Update, released after the reporting period ended, the International Monetary Fund (“IMF”) said, “The outcome of the UK [Brexit] vote, which surprised global financial markets, implies the materialization of an important downside risk for the world economy. As a result, the global outlook for 2016-17 has worsened, despite the better-than-expected performance in early 2016.” From a regional perspective, the IMF currently estimates 2016 growth in the Eurozone will be 1.6%, versus 1.7% in 2015. Japan’s economy is expected to expand 0.3% in 2016, down from 0.5% in 2015. Elsewhere, the IMF projects that overall growth in emerging market countries will tick up to 4.1% in 2016, versus 4.0% in 2015.
| | |
| IV | | EnTrustPermal Alternative Select VIT Portfolio |
Market review
Q. How did the Federal Reserve Board (the “Fed”)ii respond to the economic environment?
A. Looking back, after an extended period of maintaining the federal funds rateiii at a historically low range between zero and 0.25%, the Fed increased the rate at its meeting on December 16, 2015. This marked the first rate hike since 2006. In particular, the U.S. central bank raised the federal funds rate to a range between 0.25% and 0.50%. In its official statement after the December 2015 meeting, the Fed said, “The stance of monetary policy remains accommodative after this increase, thereby supporting further improvement in labor market conditions and a return to 2 percent inflation….The Committee expects that economic conditions will evolve in a manner that will warrant only gradual increases in the federal funds rate; the federal funds rate is likely to remain, for some time, below levels that are expected to prevail in the longer run.” At its meetings that concluded on January 27, 2016, March 16, 2016, April 27, 2016, June 15, 2016 and July 27, 2016 (after the reporting period ended), the Fed kept rates on hold.
Q. What actions did international central banks take during the reporting period?
A. Given the economic challenges in the Eurozone, the European Central Bank (“ECB”)iv took a number of actions to stimulate growth and ward off deflation. In January 2015, before the reporting period began, the ECB announced that, beginning in March 2015, it would start a €60 billion-a-month bond buying program that is expected to run until September 2016. In December 2015, the ECB extended its monthly bond buying program until at least March 2017. Finally, in March 2016 the ECB announced that it would increase its bond purchasing program to €80 billion a month. It also cut its deposit rate to -0.4% and its main interest rate to 0%. In other developed countries, the Bank of England (“BoE”)v kept rates on hold at 0.50% during the reporting period, its lowest level since 2006. However, in the aftermath of the June 23, 2016 U.K. referendum to leave the European Union (“Brexit”), BoE’s Governor Carney said that further interest rate cuts would be needed. After holding rates steady at 0.10% for more than five years, in January 2016 the Bank of Japan announced that it cut the rate on current accounts that commercial banks hold with it to -0.10%. Elsewhere, the People’s Bank of China kept rates steady at 4.35%.
Q. What factors impacted the U.S. stock market during the reporting period?
A. The U.S. stock market was volatile over the six months ended June 30, 2016. The market declined during the first two months of the reporting period. This weakness was triggered by a number of factors, including concerns about the fallout from moderating economic growth in China, uncertainties surrounding future Fed actions and several geopolitical issues. However, the market then rallied over the next three months of the period. Investor sentiment improved as U.S. economic data was generally positive, oil prices moved higher and the Fed reduced its expectations for rate hikes in 2016. The market then gyrated in June 2016. After initially rising, the market fell sharply in the immediate wake of Brexit. However, the market largely recouped those losses at the end of the month. All told, for the six months ended June 30, 2016, the S&P 500 Indexvi gained 3.84%.
| | |
| EnTrustPermal Alternative Select VIT Portfolio | | V |
Investment commentary (cont’d)
Looking at the U.S. stock market more closely, mid-cap stocks, as measured by the Russell Midcap Indexvii, generated the strongest returns, as they gained 5.50% over the reporting period. In contrast, small-cap stocks generated the weakest results with the Russell 2000 Indexviii rising 2.22%, whereas large-cap stocks, as measured by the Russell 1000 Indexix, returned 3.74%. From an investment style perspective, growth and value stocks, as measured by the Russell 3000 Growthx and Russell 3000 Valuexi Indices, returned 1.14% and 6.29%, respectively, during the six months ended June 30, 2016.
Q. How did the international stock market perform during the reporting period?
A. International equities were also volatile during the reporting period. Developed market equities, as measured by the MSCI EAFE Indexxii, declined during the first two months of the period, rose over the next two months and then moved lower over the last two months. These fluctuations were partially driven by the uncertainties leading up to and following Brexit. All told, the MSCI EAFE Index declined 4.42% during the reporting period. Emerging market equities were not immune to the market’s gyrations. For the first five months of the reporting period, the MSCI Emerging Markets Indexxiii rose and fell in the same pattern as developed market equities. However, emerging market equities rallied in June 2016. For the six months ended June 30, 2016, the MSCI Emerging Markets Index gained 6.41%.
Q. Did Treasury yields trend higher or lower during the six months ended June 30, 2016?
A. Both short- and long-term Treasury yields moved sharply lower during the six months ended June 30, 2016. Two-year Treasury yields fell from a peak of 1.06% at the beginning of the period to a low of 0.58% at the end of the period. Ten-year Treasury yields began the reporting period at a peak of 2.27% and ended the period at 1.49%. Their low of 1.46% occurred on June 27 and June 28, 2016.
Q. What factors impacted the spread sectors (non-Treasuries) during the reporting period?
A. The spread sectors generally posted positive results during the reporting period. Performance fluctuated with investor sentiment given signs of moderating global growth, shifting expectations for future Fed monetary policy, Brexit and several geopolitical issues. The broad U.S. bond market, as measured by the Barclays U.S. Aggregate Indexxiv, gained 5.31% during the six months ended June 30, 2016. Higher risk segments of the market generated the best returns during the reporting period.
Q. How did the high-yield bond market perform over the six months ended June 30, 2016?
A. The U.S. high-yield bond market, as measured by the Barclays U.S. Corporate High Yield — 2% Issuer Cap Indexxv, gained 9.06% for the six months ended June 30, 2016. The high-yield market was weak during the first month of the reporting period, due to falling oil prices and poor investor demand. After stabilizing in February 2016, the high-yield market rallied sharply over the last four months of the reporting period. This turnaround occurred as oil prices rebounded and the Fed reduced its expectations for rate hikes in 2016.
| | |
| VI | | EnTrustPermal Alternative Select VIT Portfolio |
Q. How did the emerging markets debt asset class perform over the reporting period?
A. The JPMorgan Emerging Markets Bond Index Global (“EMBI Global”)xvi gained 10.90% during the six months ended June 30, 2016. The asset class declined during the first month of the reporting period given concerns over economic growth in China, falling commodity prices and expectations for future Fed rate hikes. While there were periods of weakness, the asset class rallied sharply over the last five months of the reporting period as a whole. This turnaround was driven by rising oil prices, accommodative global monetary policy and solid investor demand.
Performance review
For the six months ended June 30, 2016, Class II shares of EnTrustPermal Alternative Select VIT Portfolio1 returned
-4.33%. The Portfolio’s unmanaged benchmarks, HFRX Global Hedge Fund Indexxvii and the Citigroup 3-Month U.S. Treasury Bill Indexxviii returned -0.83% and 0.12%, respectively, for the same period. The Lipper Variable Alternative Other Funds Category Average2 returned 3.27% over the same time frame.
| | | | |
Performance Snapshot as of June 30, 2016
(unaudited) | |
| | | 6 months | |
| EnTrustPermal Alternative Select VIT Portfolio1: | | | | |
Class II | | | -4.33 | % |
| HFRX Global Hedge Fund Index | | | -0.83 | % |
| Citigroup 3-Month U.S. Treasury Bill Index | | | 0.12 | % |
| Lipper Variable Alternative Other Funds Category Average2 | | | 3.27 | % |
The performance shown represents past performance. Past performance is no guarantee of future results and current performance may be higher or lower than the performance shown above. Principal value, investment returns and yields will fluctuate and investors’ shares, when redeemed, may be worth more or less than their original cost.
Portfolio return assumes the reinvestment of all distributions, including returns of capital, if any, at net asset value and the deduction of all Portfolio expenses. Performance figures for periods shorter than one year represent cumulative figures and are not annualized.
Portfolio performance figures reflect fee waivers and/or expense reimbursements, without which the performance would have been lower.
|
| Total Annual Operating Expenses (unaudited) |
As of the Portfolio’s current prospectus dated May 1, 2016, the gross total annual operating expense ratio for Class II shares was 4.77%.
Actual expenses may be higher. For example, expenses may be higher than those shown if average net assets decrease. Net assets are more likely to decrease and Portfolio expense ratios are more likely to increase when markets are volatile.
As a result of an expense limitation arrangement, the ratio of expenses (other than taxes; interest; extraordinary expenses; brokerage commissions and expenses; fees, costs and expenses associated with any prime brokerage arrangement (including the costs of any securities borrowing
| 1 | The Portfolio is an underlying investment option of various variable annuity and variable life insurance products. The Portfolio’s performance returns do not reflect the deduction of expenses imposed in connection with investing in variable annuity or variable life insurance contracts, such as administrative fees, account charges and surrender charges, which, if reflected, would reduce the performance of the Portfolio. Past performance is no guarantee of future results. |
| 2 | Lipper, Inc., a wholly-owned subsidiary of Reuters, provides independent insight on global collective investments. Returns are based on the six-month period ended June 30, 2016, including the reinvestment of all distributions, including returns of capital, if any, calculated among the 101 funds in the Portfolio’s Lipper category. |
| | |
| EnTrustPermal Alternative Select VIT Portfolio | | VII |
Investment commentary (cont’d)
arrangement); acquired fund fees and expenses; and dividend and interest expenses on securities sold short) to average net assets will not exceed 2.70% for Class II shares. This expense limitation arrangement cannot be terminated prior to December 31, 2017 without the Board of Trustees’ consent.
The manager is permitted to recapture amounts waived and/or reimbursed to the class during the same fiscal year if the class’ total annual operating expenses have fallen to a level below the expense limitation (“expense cap”) in effect at the time the fees were earned or the expenses incurred. In no case will the manager recapture any amount that would result, on any particular business day of the Portfolio, in the class’ total annual operating expenses exceeding the expense cap or any other lower limit then in effect.
As always, thank you for your confidence in our stewardship of your assets.
Sincerely,
Jane Trust, CFA
President and Chief Executive Officer
July 29, 2016
RISKS: The Portfolio’s investment strategies and portfolio investments differ from those of many other mutual funds. The manager and the subadvisers may devote significant portions of the Portfolio’s assets to pursuing investment opportunities or strategies including through the use of derivatives that may create a form of investment leverage in the Portfolio. This approach to investing may make the Portfolio a more volatile investment than other mutual funds and cause the Portfolio to perform less favorably than other mutual funds under similar market or other conditions.
The Portfolio utilizes alternative hedge strategies which involve highly speculative investments that employ aggressive investment strategies and carry substantial risk. The Portfolio, and the subadvised strategies, may employ leverage, which increases the volatility of investment returns and subjects the Portfolio to magnified losses if the Portfolio’s investments decline in value. The Portfolio and the subadvisers may use derivatives, such as options and futures, which can be illiquid, may disproportionately increase losses, and have a potentially large impact on Portfolio performance. The Portfolio, and some of the subadvisers may employ short selling, a speculative strategy. Unlike the possible loss on a security that is purchased, there is no limit on the amount of loss on an appreciating security that is sold short. The Portfolio and each subadviser may engage in active and frequent trading, resulting in higher portfolio turnover and transaction costs. There is no assurance strategies used by the Portfolio or subadvised funds will be successful. Equity securities are subject to market and price fluctuations. International investments are subject to special risks including currency fluctuations, social, economic and political uncertainties, which could increase volatility. These risks are magnified in emerging markets.
Small- and mid-cap stocks involve greater risks and volatility than large-cap stocks. Fixed income securities involve interest rate, credit, inflation, and reinvestment risks. As interest rates rise, the value of fixed income securities fall. High-yield (“junk”) bonds possess greater price volatility, illiquidity, and possibility of default than higher-grade bonds. The Portfolio is classified as “non-diversified,” which means it may invest a larger percentage of its assets in a smaller number of issuers than a diversified fund. Please see the prospectus for a more complete discussion of these and other risks and the Portfolio’s investment strategies.
| | |
| VIII | | EnTrustPermal Alternative Select VIT Portfolio |
All investments are subject to risk including the possible loss of principal. Past performance is no guarantee of future results. All index performance reflects no deduction for fees, expenses or taxes. Please note that an investor cannot invest directly in an index.
The information provided is not intended to be a forecast of future events, a guarantee of future results or investment advice. Views expressed may differ from those of the firm as a whole. Forecasts and predictions are inherently limited and should not be relied upon as an indication of actual or future performance.
| i | Gross domestic product (“GDP”) is the market value of all final goods and services produced within a country in a given period of time. |
| ii | The Federal Reserve Board (the “Fed”) is responsible for the formulation of U.S. policies designed to promote economic growth, full employment, stable prices and a sustainable pattern of international trade and payments. |
| iii | The federal funds rate is the rate charged by one depository institution on an overnight sale of immediately available funds (balances at the Fed) to another depository institution; the rate may vary from depository institution to depository institution and from day to day. |
| iv | The European Central Bank (“ECB”) is responsible for the monetary system of the European Union and the euro currency. |
| v | The Bank of England (“BoE”), formally the Governor and Company of the Bank of England, is the central bank of the United Kingdom. The BoE’s purpose is to maintain monetary and financial stability. |
| vi | The S&P 500 Index is an unmanaged index of 500 stocks and is generally representative of the performance of larger companies in the U.S. |
| vii | The Russell Midcap Index measures the performance of the mid-cap segment of the U.S. equity universe. The Russell Midcap is a subset of the Russell 1000 Index. It includes approximately 800 of the smallest securities based on a combination of their market cap and current index membership. The Russell Midcap represents approximately 31% of the total market capitalization of the Russell 1000 companies. |
| viii | The Russell 2000 Index measures the performance of the small-cap segment of the U.S. equity universe. The Russell 2000 is a subset of the Russell 3000 Index representing approximately 10% of the total market capitalization of that index. It includes approximately 2,000 of the smallest securities based on a combination of their market cap and current index membership. The Russell 3000 Index measures the performance of the 3,000 largest U.S. companies based on total market capitalization, which represents approximately 98% of the U.S. equity market. |
| ix | The Russell 1000 Index measures the performance of the large-cap segment of the U.S. equity universe. It is a subset of the Russell 3000 Index and includes approximately 1,000 of the largest securities based on a combination of their market cap and current index membership. The Russell 1000 represents approximately 92% of the U.S. market. |
| x | The Russell 3000 Growth Index measures the performance of the broad growth segment of the U.S. equity universe. It includes those Russell 3000 Index companies with higher price-to-book ratios and higher forecasted growth values. (A price-to-book ratio is the price of a stock compared to the difference between a company’s assets and liabilities.) |
| xi | The Russell 3000 Value Index measures the performance of the broad value segment of the U.S. equity value universe. It includes those Russell 3000 Index companies with lower price-to-book ratios and lower forecasted growth values. |
| xii | The MSCI EAFE Index is a free float-adjusted market capitalization index designed to measure developed market equity performance, excluding the U.S. and Canada. |
| xiii | The MSCI Emerging Markets Index is a free float-adjusted market capitalization index that is designed to measure equity market performance in the global emerging markets. |
| xiv | The Barclays U.S. Aggregate Index is a broad-based bond index comprised of government, corporate, mortgage- and asset-backed issues, rated investment grade or higher, and having at least one year to maturity. |
| xv | The Barclays U.S. Corporate High Yield — 2% Issuer Cap Index is an index of the 2% Issuer Cap component of the Barclays U.S. Corporate High Yield Index, which covers the U.S. dollar-denominated, non-investment grade, fixed-rate, taxable corporate bond market. |
| xvi | The JPMorgan Emerging Markets Bond Index Global (“EMBI Global”) tracks total returns for U.S. dollar-denominated debt instruments issued by emerging market sovereign and quasi-sovereign entities: Brady bonds, loans, Eurobonds and local market instruments. |
| xvii | The HFRX Global Hedge Fund Index is designed to be representative of the overall composition of the hedge fund universe. It is comprised of all eligible hedge fund strategies; including but not limited to convertible arbitrage, distressed securities, equity hedge, equity market neutral, event-driven, macro, merger arbitrage, and relative value arbitrage. The strategies are asset weighted based on the distribution of assets in the hedge fund industry. |
| xviii | The Citigroup 3-Month U.S. Treasury Bill Index is an unmanaged index generally representative of the average yield of 3-month U.S. Treasury bills. |
| | |
| EnTrustPermal Alternative Select VIT Portfolio | | IX |
Portfolio at a glance (unaudited)
Investment breakdown† (%) as a percent of total investments
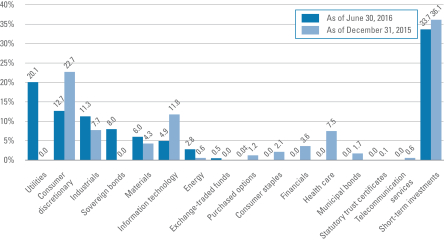
| † | The bar graph above represents the composition of the Portfolio’s investments as of June 30, 2016 and December 31, 2015 and does not include derivatives such as written options, futures contracts, swap contracts and forward foreign currency contracts. The Portfolio is actively managed. As a result, the composition of the Portfolio’s investments is subject to change at any time. |
| ‡ | Represents less than 0.1%. |
Securities sold short breakdown* (%) as a percent of total securities sold short
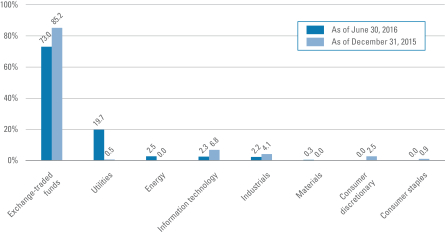
| * | The bar graph above represents the composition of the Portfolio’s securities sold short as of June 30, 2016 and December 31, 2015 and does not include derivatives. The Portfolio is actively managed. As a result, the composition of the Portfolio’s securities sold short is subject to change at any time. |
| | |
| EnTrustPermal Alternative Select VIT Portfolio 2016 Semi-Annual Report | | 1 |
Portfolio expenses (unaudited)
Example
As a shareholder of the Portfolio, you may incur two types of costs: (1) transaction costs and (2) ongoing costs, including management fees; service and/or distribution (12b-1) fees; and other Portfolio expenses. This example is intended to help you understand your ongoing costs (in dollars) of investing in the Portfolio and to compare these costs with the ongoing costs of investing in other mutual funds.
This example is based on an investment of $1,000 invested on January 1, 2016 and held for the six months ended June 30, 2016.
Actual expenses
The table below titled “Based on Actual Total Return” provides information about actual account values and actual expenses. You may use the information provided in this table, together with the amount you invested, to estimate the expenses that you paid over the period. To estimate the expenses you paid on your account, divide your ending account value by $1,000 (for example, an $8,600 ending account value divided by $1,000 = 8.6), then multiply the result by the number under the heading entitled “Expenses Paid During the Period“.
Hypothetical example for comparison purposes
The table below titled “Based on Hypothetical Total Return” provides information about hypothetical account values and hypothetical expenses based on the actual expense ratio and an assumed rate of return of 5.00% per year before expenses, which is not the Portfolio’s actual return. The hypothetical account values and expenses may not be used to estimate the actual ending account balance or expenses you paid for the period. You may use the information provided in this table to compare the ongoing costs of investing in the Portfolio and other funds. To do so, compare the 5.00% hypothetical example relating to the Portfolio with the 5.00% hypothetical examples that appear in the shareholder reports of the other funds.
Please note that the expenses shown in the table below are meant to highlight your ongoing costs only and do not reflect any transactional costs. Therefore, the table is useful in comparing ongoing costs only, and will not help you determine the relative total costs of owning different funds. In addition, if these transaction costs were included, your costs would have been higher.
| | | | | | | | | | | | | | | | | | | | | | | | | | | | | | | | | | | | | | | | | | | | | | |
| Based on actual total return1 | | | | | | Based on hypothetical total return1 | |
| | | Actual
Total Return2 | | | Beginning
Account
Value | | | Ending
Account
Value | | | Annualized
Expense
Ratio | | | Expenses
Paid
During
the
Period3 | | | | | | | | Hypothetical
Annualized
Total Return | | | Beginning
Account
Value | | | Ending
Account
Value | | | Annualized
Expense
Ratio | | | Expenses
Paid
During
the
Period3 | |
| Class II | | | -4.33 | % | | $ | 1,000.00 | | | $ | 956.70 | | | | 3.14 | % | | $ | 15.28 | | | | | | | Class II | | | 5.00 | % | | $ | 1,000.00 | | | $ | 1,009.25 | | | | 3.14 | % | | $ | 15.69 | |
| 1 | For the six months ended June 30, 2016. |
| 2 | Assumes the reinvestment of all distributions, including returns of capital, if any, at net asset value. Total return is not annualized, as it may not be representative of the total return for the year. Total return does not reflect expenses associated with separate accounts such as administrative fees, account charges and surrender charges, which, if reflected, would reduce the total return. Performance figures may reflect compensating balance arrangements, fee waivers and/or expense reimbursements. In the absence of compensating balance arrangements, fee waivers and/or expense reimbursements, the total return would have been lower. Past performance is no guarantee of future results. |
| 3 | Expenses (net of compensating balance arrangements, fee waivers and/or expense reimbursements) are equal to the class’ annualized expense ratio multiplied by the average account value over the period, multiplied by the number of days in the most recent fiscal half-year (182), then divided by 366. |
| | |
| 2 | | EnTrustPermal Alternative Select VIT Portfolio 2016 Semi-Annual Report |
Consolidated schedule of investments (unaudited)
June 30, 2016
EnTrustPermal Alternative Select VIT Portfolio
| | | | | | | | | | | | | | | | |
| Security | | | | | | | | Shares | | | Value | |
| Common Stocks — 34.5% | | | | | | | | | | | | | | | | |
| Consumer Discretionary — 6.8% | | | | | | | | | | | | | | | | |
Auto Components — 3.8% | | | | | | | | | | | | | | | | |
Cooper Tire & Rubber Co. | | | | | | | | | | | 5,710 | | | $ | 170,272 | |
GKN PLC | | | | | | | | | | | 75,621 | | | | 272,193 | (a) |
Goodyear Tire & Rubber Co. | | | | | | | | | | | 16,238 | | | | 416,667 | (b) |
Koito Manufacturing Co., Ltd. | | | | | | | | | | | 5,100 | | | | 233,408 | (a) |
NGK Spark Plug Co., Ltd. | | | | | | | | | | | 16,700 | | | | 251,276 | (a) |
Total Auto Components | | | | | | | | | | | | | | | 1,343,816 | |
Household Durables — 1.6% | | | | | | | | | | | | | | | | |
Harman International Industries Inc. | | | | | | | | | | | 7,540 | | | | 541,523 | (b) |
Specialty Retail — 1.4% | | | | | | | | | | | | | | | | |
Asbury Automotive Group Inc. | | | | | | | | | | | 3,558 | | | | 187,649 | * |
Group 1 Automotive Inc. | | | | | | | | | | | 2,339 | | | | 115,453 | |
Tiffany & Co. | | | | | | | | | | | 3,311 | | | | 200,779 | |
Total Specialty Retail | | | | | | | | | | | | | | | 503,881 | |
Total Consumer Discretionary | | | | | | | | | | | | | | | 2,389,220 | |
| Energy — 1.7% | | | | | | | | | | | | | | | | |
Oil, Gas & Consumable Fuels — 1.7% | | | | | | | | | | | | | | | | |
Cheniere Energy Inc. | | | | | | | | | | | 1,108 | | | | 41,605 | * |
China Coal Energy Co., Class H Shares | | | | | | | | | | | 154,566 | | | | 80,877 | *(a) |
Cosan Ltd., Class A Shares | | | | | | | | | | | 31,570 | | | | 205,521 | |
GasLog Ltd. | | | | | | | | | | | 1,560 | | | | 20,249 | |
Hoegh LNG Holdings Ltd. | | | | | | | | | | | 4,408 | | | | 43,616 | (a) |
Yanzhou Coal Mining Co., Ltd., Class H Shares | | | | | | | | | | | 329,884 | | | | 213,616 | (a) |
Total Energy | | | | | | | | | | | | | | | 605,484 | |
| Exchange-Traded Funds — 0.3% | | | | | | | | | | | | | | | | |
iShares Currency Hedged MSCI Japan ETF | | | | | | | | | | | 1,249 | | | | 29,189 | |
Nomura TOPIX ETF | | | | | | | | | | | 5,860 | | | | 74,248 | (a) |
Total Exchange-Traded Funds | | | | | | | | | | | | | | | 103,437 | |
| Industrials — 6.9% | | | | | | | | | | | | | | | | |
Aerospace & Defense — 1.7% | | | | | | | | | | | | | | | | |
Spirit AeroSystems Holdings Inc., Class A Shares | | | | | | | | | | | 4,981 | | | | 214,183 | * |
Triumph Group Inc. | | | | | | | | | | | 10,490 | | | | 372,395 | (b) |
Total Aerospace & Defense | | | | | | | | | | | | | | | 586,578 | |
Airlines — 0.6% | | | | | | | | | | | | | | | | |
Alaska Air Group Inc. | | | | | | | | | | | 3,735 | | | | 217,713 | |
Commercial Services & Supplies — 0.5% | | | | | | | | | | | | | | | | |
Mitie Group PLC | | | | | | | | | | | 56,991 | | | | 190,673 | (a) |
See Notes to Consolidated Financial Statements.
| | |
| EnTrustPermal Alternative Select VIT Portfolio 2016 Semi-Annual Report | | 3 |
Consolidated schedule of investments (unaudited) (cont’d)
June 30, 2016
EnTrustPermal Alternative Select VIT Portfolio
| | | | | | | | | | | | | | | | |
| Security | | | | | | | | Shares | | | Value | |
Construction & Engineering — 0.3% | | | | | | | | | | | | | | | | |
Beijing Urban Construction Design & Development Group Co., Ltd., Class H Shares | | | | | | | | | | | 174,031 | | | $ | 94,433 | (a)(c) |
Electrical Equipment — 0.1% | | | | | | | | | | | | | | | | |
Philips Lighting NV | | | | | | | | | | | 1,029 | | | | 23,695 | *(c) |
Industrial Conglomerates — 0.2% | | | | | | | | | | | | | | | | |
Beijing Enterprises Holdings Ltd. | | | | | | | | | | | 13,297 | | | | 75,910 | (a) |
Machinery — 2.3% | | | | | | | | | | | | | | | | |
ITT Inc. | | | | | | | | | | | 2,161 | | | | 69,109 | |
Kurita Water Industries Ltd. | | | | | | | | | | | 8,400 | | | | 186,893 | (a) |
Mueller Water Products Inc., Class A Shares | | | | | | | | | | | 11,404 | | | | 130,234 | |
SKF AB, Class B Shares | | | | | | | | | | | 13,186 | | | | 210,548 | (a) |
Xylem Inc. | | | | | | | | | | | 4,871 | | | | 217,490 | |
Total Machinery | | | | | | | | | | | | | | | 814,274 | |
Professional Services — 0.6% | | | | | | | | | | | | | | | | |
Robert Half International Inc. | | | | | | | | | | | 5,036 | | | | 192,174 | |
Transportation Infrastructure — 0.6% | | | | | | | | | | | | | | | | |
OHL Mexico SAB de CV | | | | | | | | | | | 182,110 | | | | 223,123 | * |
Total Industrials | | | | | | | | | | | | | | | 2,418,573 | |
| Information Technology — 3.0% | | | | | | | | | | | | | | | | |
Electronic Equipment, Instruments & Components — 0.8% | | | | | | | | | | | | | | | | |
Ingram Micro Inc., Class A Shares | | | | | | | | | | | 7,199 | | | | 250,381 | (b) |
Osaki Electric Co., Ltd. | | | | | | | | | | | 5,336 | | | | 40,970 | (a) |
Total Electronic Equipment, Instruments & Components | | | | | | | | | | | | | | | 291,351 | |
IT Services — 1.6% | | | | | | | | | | | | | | | | |
Atos SE | | | | | | | | | | | 3,880 | | | | 324,091 | (a) |
ITOCHU Techno-Solutions Corp. | | | | | | | | | | | 10,500 | | | | 225,668 | (a) |
Total IT Services | | | | | | | | | | | | | | | 549,759 | |
Software — 0.2% | | | | | | | | | | | | | | | | |
Silver Spring Networks Inc. | | | | | | | | | | | 5,979 | | | | 72,645 | * |
Technology Hardware, Storage & Peripherals — 0.4% | | | | | | | | | | | | | | | | |
Hewlett Packard Enterprise Co. | | | | | | | | | | | 8,060 | | | | 147,256 | |
Total Information Technology | | | | | | | | | | | | | | | 1,061,011 | |
| Materials — 3.6% | | | | | | | | | | | | | | | | |
Chemicals — 1.7% | | | | | | | | | | | | | | | | |
Arkema SA | | | | | | | | | | | 2,682 | | | | 206,968 | (a) |
Eastman Chemical Co. | | | | | | | | | | | 5,805 | | | | 394,159 | (b) |
Total Chemicals | | | | | | | | | | | | | | | 601,127 | |
Containers & Packaging — 1.9% | | | | | | | | | | | | | | | | |
Owens-Illinois Inc. | | | | | | | | | | | 37,578 | | | | 676,780 | *(b) |
Total Materials | | | | | | | | | | | | | | | 1,277,907 | |
See Notes to Consolidated Financial Statements.
| | |
| 4 | | EnTrustPermal Alternative Select VIT Portfolio 2016 Semi-Annual Report |
EnTrustPermal Alternative Select VIT Portfolio
| | | | | | | | | | | | | | | | |
| Security | | | | | | | | Shares | | | Value | |
| Utilities — 12.3% | | | | | | | | | | | | | | | | |
Electric Utilities — 6.3% | | | | | | | | | | | | | | | | |
Alliant Energy Corp. | | | | | | | | | | | 2,058 | | | $ | 81,703 | |
CLP Holdings Ltd. | | | | | | | | | | | 10,098 | | | | 103,369 | (a) |
Companhia Energetica de Minas Gerais, ADR | | | | | | | | | | | 17,116 | | | | 37,826 | |
Companhia Paranaense de Energia-Copel, ADR | | | | | | | | | | | 2,484 | | | | 22,306 | |
DONG Energy A/S | | | | | | | | | | | 1,717 | | | | 61,563 | *(c) |
Duke Energy Corp. | | | | | | | | | | | 5,668 | | | | 486,258 | |
Edison International | | | | | | | | | | | 1,065 | | | | 82,719 | |
Entergy Corp. | | | | | | | | | | | 2,933 | | | | 238,600 | |
Exelon Corp. | | | | | | | | | | | 4,433 | | | | 161,184 | |
Hawaiian Electric Industries Inc. | | | | | | | | | | | 14,204 | | | | 465,749 | |
PG&E Corp. | | | | | | | | | | | 4,390 | | | | 280,609 | |
Pinnacle West Capital Corp. | | | | | | | | | | | 952 | | | | 77,169 | |
Tenaga Nasional Berhad | | | | | | | | | | | 30,708 | | | | 107,424 | (a) |
Total Electric Utilities | | | | | | | | | | | | | | | 2,206,479 | |
Gas Utilities — 0.5% | | | | | | | | | | | | | | | | |
Spire Inc. | | | | | | | | | | | 1,380 | | | | 97,759 | |
WGL Holdings Inc. | | | | | | | | | | | 1,077 | | | | 76,241 | |
Total Gas Utilities | | | | | | | | | | | | | | | 174,000 | |
Independent Power and Renewable Electricity Producers — 1.7% | | | | | | | | | | | | | | | | |
China Longyuan Power Group Corp., Ltd., Class H Shares | | | | | | | | | | | 143,610 | | | | 119,088 | (a) |
Dynegy Inc. | | | | | | | | | | | 2,315 | | | | 39,747 | * |
Huadian Fuxin Energy Corp. Ltd., Class H Shares | | | | | | | | | | | 355,472 | | | | 79,004 | (a) |
Huaneng Renewables Corp., Ltd., Class H Shares | | | | | | | | | | | 289,144 | | | | 96,537 | (a) |
NRG Yield Inc., Class C Shares | | | | | | | | | | | 7,750 | | | | 120,822 | |
Pattern Energy Group Inc. | | | | | | | | | | | 4,486 | | | | 103,043 | |
Talen Energy Corp. | | | | | | | | | | | 3,683 | | | | 49,905 | * |
Total Independent Power and Renewable Electricity Producers | | | | | | | | | | | | | | | 608,146 | |
Multi-Utilities — 3.2% | | | | | | | | | | | | | | | | |
Ameren Corp. | | | | | | | | | | | 3,810 | | | | 204,140 | |
Avangrid Inc. | | | | | | | | | | | 4,153 | | | | 191,287 | |
Hera SpA | | | | | | | | | | | 110,764 | | | | 302,991 | (a) |
SCANA Corp. | | | | | | | | | | | 3,286 | | | | 248,619 | |
Sempra Energy | | | | | | | | | | | 1,531 | | | | 174,565 | |
Total Multi-Utilities | | | | | | | | | | | | | | | 1,121,602 | |
Water Utilities — 0.6% | | | | | | | | | | | | | | | | |
Beijing Enterprises Water Group Ltd. | | | | | | | | | | | 147,338 | | | | 89,528 | (a) |
CT Environmental Group Ltd. | | | | | | | | | | | 113,120 | | | | 33,199 | (a) |
See Notes to Consolidated Financial Statements.
| | |
| EnTrustPermal Alternative Select VIT Portfolio 2016 Semi-Annual Report | | 5 |
Consolidated schedule of investments (unaudited) (cont’d)
June 30, 2016
EnTrustPermal Alternative Select VIT Portfolio
| | | | | | | | | | | | | | | | |
| Security | | | | | | | | Shares | | | Value | |
Water Utilities — continued | | | | | | | | | | | | | | | | |
Guangdong Investment Ltd. | | | | | | | | | | | 48,960 | | | $ | 75,169 | (a) |
Total Water Utilities | | | | | | | | | | | | | | | 197,896 | |
Total Utilities | | | | | | | | | | | | | | | 4,308,123 | |
Total Common Stocks (Cost — $12,051,111) | | | | 12,163,755 | |
| | | | |
| | | Rate | | | | | | | | | | |
| Preferred Stocks — 0.9% | | | | | | | | | | | | | | | | |
| Consumer Discretionary — 0.9% | | | | | | | | | | | | | | | | |
Auto Components — 0.9% | | | | | | | | | | | | | | | | |
Schaeffler AG (Cost — $376,569) | | | 1.625 | % | | | | | | | 24,933 | | | | 330,545 | (a) |
| | | | |
| | | | | | Maturity
Date | | | Face
Amount | | | | |
| Sovereign Bonds — 4.9% | | | | | | | | | | | | | | | | |
| Canada — 2.0% | | | | | | | | | | | | | | | | |
Canada Treasury Bills | | | 0.483 | % | | | 8/25/16 | | | | 880,000 | CAD | | | 680,637 | (e) |
| Germany — 1.2% | | | | | | | | | | | | | | | | |
German Treasury Bills | | | -0.719 | % | | | 8/10/16 | | | | 386,000 | EUR | | | 428,657 | (d) (e) |
| United Kingdom — 1.7% | | | | | | | | | | | | | | | | |
United Kingdom Treasury Bills | | | 0.391 | % | | | 12/5/16 | | | | 450,000 | GBP | | | 597,803 | (e) |
Total Sovereign Bonds (Cost — $1,747,133) | | | | 1,707,097 | |
| | | | |
| | | | | | Expiration
Date | | | Contracts | | | | |
| Purchased Options — 0.0% | |
NASDAQ 100 Stock Index, Put @ $4,270.00 (Cost — $5,546) | | | | | | | 7/1/16 | | | | 2 | | | | 46 | |
Total Investments before Short-Term Investments (Cost — $14,180,359) | | | | 14,201,443 | |
| | | | |
| | | | | | Maturity
Date | | | Face
Amount | | | | |
| Short-Term Investments — 20.5% | |
| U.S. Treasury Bills — 2.0% | | | | | | | | | | | | | | | | |
U.S. Treasury Bills (Cost — $691,872) | | | 0.160-0.370 | % | | | 7/21/16 | | | $ | 692,000 | | | | 691,872 | (e) |
| | | | |
| | | | | | | | | Shares | | | | |
| Money Market Funds — 18.5% | | | | | | | | | | | | | | | | |
State Street Institutional Liquid Reserves Fund, Premier Class | | | 0.479 | % | | | | | | | 3,379,785 | | | | 3,379,785 | |
See Notes to Consolidated Financial Statements.
| | |
| 6 | | EnTrustPermal Alternative Select VIT Portfolio 2016 Semi-Annual Report |
EnTrustPermal Alternative Select VIT Portfolio
| | | | | | | | | | | | | | | | |
| Security | | Rate | | | | | | Shares | | | Value | |
| Money Market Funds — continued | | | | | | | | | | | | | | | | |
State Street Institutional Treasury Plus Money Market Fund, Premier Class | | | 0.163 | % | | | | | | | 3,135,131 | | | $ | 3,135,131 | |
Total Money Market Funds (Cost — $6,514,916) | | | | | | | | | | | | | | | 6,514,916 | |
Total Short-Term Investments (Cost — $7,206,788) | | | | 7,206,788 | |
Total Investments — 60.9% (Cost — $21,387,147#) | | | | 21,408,231 | |
Other Assets in Excess of Liabilities — 39.1% | | | | 13,768,737 | |
Total Net Assets — 100.0% | | | | | | | | | | | | | | $ | 35,176,968 | |
| * | Non-income producing security. |
| (a) | Security is valued in good faith in accordance with procedures approved by the Board of Trustees (See Note 1). |
| (b) | All or a portion of this security is held at the broker as collateral for open securities sold short. |
| (c) | Security is exempt from registration under Rule 144A of the Securities Act of 1933. This security may be resold in transactions that are exempt from registration, normally to qualified institutional buyers. This security has been deemed liquid pursuant to guidelines approved by the Board of Trustees, unless otherwise noted. |
| (d) | Security is exempt from registration under Regulation S of the Securities Act of 1933. Regulation S applies to securities offerings that are made outside of the United States and do not involve direct selling efforts in the United States. This security has been deemed liquid pursuant to guidelines approved by the Board of Trustees, unless otherwise noted. |
| (e) | Rate shown represents yield-to-maturity. |
| # | Aggregate cost for federal income tax purposes is substantially the same. |
| | |
Abbreviations used in this schedule: |
| ADR | | — American Depositary Receipts |
| ETF | | — Exchange-Traded Fund |
| SPDR | | — Standard & Poor’s Depositary Receipts |
| | | | | | | | | | | | | | | | |
| Security | | | | | | | | Shares | | | Value | |
| Securities Sold Short‡ | | | | | | | | | | | | | | | | |
| Common Stocks — (15.0)% | | | | | | | | | | | | | | | | |
| Energy — (0.4)% | | | | | | | | | | | | | | | | |
Oil, Gas & Consumable Fuels — (0.4)% | | | | | | | | | | | | | | | | |
Chevron Corp. | | | | | | | | | | | (220 | ) | | $ | (23,063 | ) |
Exxon Mobil Corp. | | | | | | | | | | | (240 | ) | | | (22,497 | ) |
Kinder Morgan Inc. | | | | | | | | | | | (4,528 | ) | | | (84,764 | ) |
Total Energy | | | | | | | | | | | | | | | (130,324 | ) |
| Exchange-Traded Funds — (11.0)% | | | | | | | | | | | | | | | | |
Guggenheim China Small Cap Index ETF | | | | | | | | | | | (872 | ) | | | (19,341 | ) |
iShares Trust — iShares Russell 2000 Index Fund | | | | | | | | | | | (1,453 | ) | | | (167,051 | ) |
iShares, Inc. — iShares MSCI Brazil Capped ETF | | | | | | | | | | | (5,502 | ) | | | (165,775 | ) |
iShares, Inc. — iShares MSCI Mexico Capped ETF | | | | | | | | | | | (1,830 | ) | | | (92,159 | ) |
Nomura TOPIX ETF | | | | | | | | | | | (37,300 | ) | | | (472,604 | ) (a) |
SPDR S&P 500 ETF Trust | | | | | | | | | | | (5,131 | ) | | | (1,075,098 | ) |
See Notes to Consolidated Financial Statements.
| | |
| EnTrustPermal Alternative Select VIT Portfolio 2016 Semi-Annual Report | | 7 |
Consolidated schedule of investments (unaudited) (cont’d)
June 30, 2016
EnTrustPermal Alternative Select VIT Portfolio
| | | | | | | | | | | | | | | | |
| Security | | | | | | | | Shares | | | Value | |
| Exchange-Traded Funds — continued | | | | | | | | | | | | | | | | |
SPDR S&P Midcap 400 ETF Trust | | | | | | | | | | | (2,634 | ) | | $ | (717,449 | ) |
The Select Sector SPDR Trust — The Energy Select Sector SPDR Fund | | | | | | | | | | | (7,903 | ) | | | (539,301 | ) |
Vanguard FTSE Europe ETF | | | | | | | | | | | (13,151 | ) | | | (613,626 | ) |
Total Exchange-Traded Funds | | | | | | | | | | | | | | | (3,862,404 | ) |
| Industrials — (0.3)% | | | | | | | | | | | | | | | | |
Electrical Equipment — (0.3)% | | | | | | | | | | | | | | | | |
Generac Holdings Inc. | | | | | | | | | | | (672 | ) | | | (23,493 | ) * |
Nordex SE | | | | | | | | | | | (492 | ) | | | (13,889 | ) *(a) |
Vestas Wind Systems A/S | | | | | | | | | | | (1,193 | ) | | | (80,963 | ) (a) |
Total Industrials | | | | | | | | | | | | | | | (118,345 | ) |
| Information Technology — (0.3)% | | | | | | | | | | | | | | | | |
Semiconductors & Semiconductor Equipment — (0.3)% | | | | | | | | | | | | | | | | |
Canadian Solar Inc. | | | | | | | | | | | (1,624 | ) | | | (24,555 | ) * |
Daqo New Energy Corp., ADR | | | | | | | | | | | (805 | ) | | | (18,169 | ) * |
JA Solar Holdings Co., Ltd., ADR | | | | | | | | | | | (3,501 | ) | | | (23,982 | ) * |
Renewable Energy Corp. ASA | | | | | | | | | | | (4,592 | ) | | | (821 | ) *(a) |
SolarEdge Technologies Inc. | | | | | | | | | | | (1,170 | ) | | | (22,932 | ) * |
Trina Solar Ltd., ADR | | | | | | | | | | | (4,005 | ) | | | (30,999 | ) * |
Total Information Technology | | | | | | | | | | | | | | | (121,458 | ) |
| Materials — (0.0)% | | | | | | | | | | | | | | | | |
Chemicals — (0.0)% | | | | | | | | | | | | | | | | |
Wacker Chemie AG | | | | | | | | | | | (188 | ) | | | (16,424 | ) (a) |
| Utilities — (3.0)% | | | | | | | | | | | | | | | | |
Electric Utilities — (0.9)% | | | | | | | | | | | | | | | | |
CEZ AS | | | | | | | | | | | (1,854 | ) | | | (31,668 | ) (a) |
FirstEnergy Corp. | | | | | | | | | | | (2,410 | ) | | | (84,133 | ) |
Fortum OYJ | | | | | | | | | | | (5,854 | ) | | | (93,790 | ) (a) |
Tokyo Electric Power Co. Holdings Inc. | | | | | | | | | | | (10,816 | ) | | | (45,610 | ) *(a) |
Xcel Energy Inc. | | | | | | | | | | | (1,274 | ) | | | (57,050 | ) |
Total Electric Utilities | | | | | | | | | | | | | | | (312,251 | ) |
Gas Utilities — (0.1)% | | | | | | | | | | | | | | | | |
Tokyo Gas Co., Ltd. | | | | | | | | | | | (8,690 | ) | | | (35,674 | ) (a) |
Independent Power and Renewable Electricity Producers — (0.2)% | | | | | | | | | | | | | | | | |
Calpine Corp. | | | | | | | | | | | (5,380 | ) | | | (79,355 | ) * |
Multi-Utilities — (1.2)% | | | | | | | | | | | | | | | | |
Consolidated Edison Inc. | | | | | | | | | | | (1,221 | ) | | | (98,217 | ) |
E.ON SE | | | | | | | | | | | (9,708 | ) | | | (97,125 | ) (a) |
Public Service Enterprise Group Inc. | | | | | | | | | | | (1,331 | ) | | | (62,038 | ) |
See Notes to Consolidated Financial Statements.
| | |
| 8 | | EnTrustPermal Alternative Select VIT Portfolio 2016 Semi-Annual Report |
EnTrustPermal Alternative Select VIT Portfolio
| | | | | | | | | | | | | | | | |
| Security | | | | | | | | Shares | | | Value | |
Multi-Utilities — continued | | | | | | | | | | | | | | | | |
RWE AG | | | | | | | | | | | (3,763 | ) | | $ | (59,464 | ) *(a) |
WEC Energy Group Inc. | | | | | | | | | | | (1,432 | ) | | | (93,510 | ) |
Total Multi-Utilities | | | | | | | | | | | | | | | (410,354 | ) |
Water Utilities — (0.6)% | | | | | | | | | | | | | | | | |
American Water Works Co. Inc. | | | | | | | | | | | (1,431 | ) | | | (120,934 | ) |
Aqua America Inc. | | | | | | | | | | | (2,350 | ) | | | (83,801 | ) |
Total Water Utilities | | | | | | | | | | | | | | | (204,735 | ) |
Total Utilities | | | | | | | | | | | | | | | (1,042,369 | ) |
Total Securities Sold Short (Proceeds — $(5,167,154)) | | | $ | (5,291,324 | ) |
| * | Non-income producing security. |
| ‡ | Percentages indicated are based on net assets. |
| (a) | Security is valued in good faith in accordance with procedures approved by the Board of Trustees (See Note 1). |
See Notes to Consolidated Financial Statements.
| | |
| EnTrustPermal Alternative Select VIT Portfolio 2016 Semi-Annual Report | | 9 |
Consolidated statement of assets and liabilities (unaudited)
June 30, 2016
| | | | |
| |
| Assets: | | | | |
Investments, at value (Cost — $21,387,147) | | $ | 21,408,231 | |
Foreign currency, at value (Cost — $389,596) | | | 392,120 | |
Cash | | | 12,083,790 | |
Deposits with brokers for securities sold short | | | 3,322,069 | |
Deposits with brokers for open OTC swap contracts | | | 1,685,000 | |
Unrealized appreciation on forward foreign currency contracts | | | 1,061,002 | |
Foreign currency collateral for securities sold short, at value (Cost — $1,017,800) | | | 1,060,614 | |
Deposits with brokers for forward foreign currency contracts | | | 865,000 | |
Receivable for securities sold | | | 814,880 | |
Receivable for open OTC swap contracts | | | 395,886 | |
OTC swaps, at value | | | 135,992 | |
Receivable from broker — variation margin on open futures contracts | | | 128,559 | |
Deposits with brokers for open futures contracts | | | 110,783 | |
Dividends and interest receivable | | | 29,631 | |
Foreign currency collateral for open futures contracts, at value (Cost — $402) | | | 403 | |
Prepaid expenses | | | 187 | |
Total Assets | | | 43,494,147 | |
| |
| Liabilities: | | | | |
Investments sold short, at value (proceeds received — $5,167,154) | | | 5,291,324 | |
Payable for securities purchased | | | 1,279,057 | |
Unrealized depreciation on forward foreign currency contracts | | | 995,415 | |
Payable for open OTC swap contracts | | | 398,960 | |
Foreign currency collateral due to brokers for open futures contracts, at value (Cost — $84,436) | | | 83,415 | |
OTC swaps, at value | | | 73,706 | |
Investment management fee payable | | | 18,984 | |
Dividends payable on securities sold short | | | 10,677 | |
Service and/or distribution fees payable | | | 7,211 | |
Swap dividend payable | | | 3,372 | |
Payable for Portfolio shares repurchased | | | 2,004 | |
Trustees’ fees payable | | | 290 | |
Accrued expenses | | | 152,764 | |
Total Liabilities | | | 8,317,179 | |
| Total Net Assets | | $ | 35,176,968 | |
See Notes to Consolidated Financial Statements.
| | |
| 10 | | EnTrustPermal Alternative Select VIT Portfolio 2016 Semi-Annual Report |
| | | | |
| |
| Net Assets: | | | | |
Par value (Note 5) | | $ | 39 | |
Paid-in capital in excess of par value | | | 38,796,112 | |
Overdistributed net investment income | | | (710,664) | |
Accumulated net realized loss on investments, futures contracts, written options, short sales,
swap contracts and foreign currency transactions | | | (3,106,755) | |
Net unrealized appreciation on investments, futures contracts, short sales, swap contracts
and foreign currencies | | | 198,236 | |
| Total Net Assets | | $ | 35,176,968 | |
| |
| Shares Outstanding: | | | | |
Class II | | | 3,917,925 | |
| |
| Net Asset Value: | | | | |
Class II | | | $8.98 | |
See Notes to Consolidated Financial Statements.
| | |
| EnTrustPermal Alternative Select VIT Portfolio 2016 Semi-Annual Report | | 11 |
Consolidated statement of operations (unaudited)
For the Six Months Ended June 30, 2016
| | | | |
|
| Investment Income: | |
Interest | | $ | 146,160 | |
Dividends | | | 112,077 | |
Less: Foreign taxes withheld | | | (6,227) | |
Total Investment Income | | | 252,010 | |
| |
| Expenses: | | | | |
Investment management fee (Note 2) | | | 322,165 | |
Custody fees | | | 170,477 | |
Dividend expense on securities sold short | | | 56,244 | |
Service and/or distribution fees (Note 2) | | | 42,390 | |
Compliance fees | | | 33,814 | |
Audit and tax fees | | | 33,399 | |
Legal fees | | | 32,295 | |
Interest expense on securities sold short | | | 18,275 | |
Commodity pool reports | | | 16,199 | |
Administration fees (Note 2) | | | 15,260 | |
Fund accounting fees | | | 12,102 | |
Shareholder reports | | | 10,590 | |
Trustees’ fees | | | 1,190 | |
Insurance | | | 550 | |
Transfer agent fees | | | 501 | |
Miscellaneous expenses | | | 2,661 | |
Total Expenses | | | 768,112 | |
Less: Fee waivers and/or expense reimbursements (Note 2) | | | (235,780) | |
Net Expenses | | | 532,332 | |
| Net Investment Loss | | | (280,322) | |
| |
Realized and Unrealized Gain (Loss) on Investments, Futures Contracts,
Written Options, Short Sales, Swap Contracts and Foreign Currency Transactions (Notes 1, 3 and 4): | | | | |
Net Realized Gain (Loss) From: | | | | |
Investment transactions | | | (2,102,923) | |
Futures contracts | | | (165,936) | |
Written options | | | (104,029) | |
Securities sold short | | | (41,959) | |
Swap contracts | | | 280,378 | |
Foreign currency transactions | | | (66,755) | |
Net Realized Loss | | | (2,201,224) | |
See Notes to Consolidated Financial Statements.
| | |
| 12 | | EnTrustPermal Alternative Select VIT Portfolio 2016 Semi-Annual Report |
| | | | |
Change in Net Unrealized Appreciation (Depreciation) From: | | | | |
Investments | | | 911,604 | |
Futures contracts | | | 145,552 | |
Written options | | | 40,825 | |
Securities sold short | | | (159,179) | |
Swap contracts | | | (42,775) | |
Foreign currencies | | | 98,328 | |
Change in Net Unrealized Appreciation (Depreciation) | | | 994,355 | |
Net Loss on Investments, Futures Contracts, Written Options, Short Sales,
Swap Contracts and Foreign Currency Transactions | | | (1,206,869) | |
| Decrease in Net Assets From Operations | | $ | (1,487,191) | |
See Notes to Consolidated Financial Statements.
| | |
| EnTrustPermal Alternative Select VIT Portfolio 2016 Semi-Annual Report | | 13 |
Consolidated statements of changes in net assets
| | | | | | | | |
For the Six Months Ended June 30, 2016 (unaudited)
and the Year Ended December 31, 2015 | | 2016 | | | 2015 | |
| | |
| Operations: | | | | | | | | |
Net investment loss | | $ | (280,322) | | | $ | (458,143) | |
Net realized loss | | | (2,201,224) | | | | (558,065) | |
Change in net unrealized appreciation (depreciation) | | | 994,355 | | | | (694,771) | |
Decrease in Net Assets From Operations | | | (1,487,191) | | | | (1,710,979) | |
| | |
| Distributions to Shareholders From (Note 1): | | | | | | | | |
Net investment income | | | (15,000) | | | | (311,103) | |
Net realized gains | | | — | | | | (329,804) | |
Decrease in Net Assets From Distributions to Shareholders | | | (15,000) | | | | (640,907) | |
| | |
| Portfolio Share Transactions (Note 5): | | | | | | | | |
Net proceeds from sale of shares | | | 3,356,216 | | | | 12,147,741 | |
Reinvestment of distributions | | | 15,000 | | | | 640,907 | |
Cost of shares repurchased | | | (369,455) | | | | (55,232) | |
Increase in Net Assets From Portfolio Share Transactions | | | 3,001,761 | | | | 12,733,416 | |
Increase in Net Assets | | | 1,499,570 | | | | 10,381,530 | |
| | |
| Net Assets: | | | | | | | | |
Beginning of period | | | 33,677,398 | | | | 23,295,868 | |
End of period* | | $ | 35,176,968 | | | $ | 33,677,398 | |
*Includes overdistributed net investment income of: | | | $(710,664) | | | | $(415,342) | |
See Notes to Consolidated Financial Statements.
| | |
| 14 | | EnTrustPermal Alternative Select VIT Portfolio 2016 Semi-Annual Report |
Consolidated financial highlights
| | | | | | | | | | | | |
For a share of beneficial interest outstanding throughout each year ended December 31, unless
otherwise noted: | |
| Class II Shares1 | | 20162 | | | 2015 | | | 20143 | |
| | | |
| Net asset value, beginning of period | | | $9.39 | | | | $10.03 | | | | $10.00 | |
| | | |
| Income (loss) from operations: | | | | | | | | | | | | |
Net investment loss | | | (0.07) | | | | (0.16) | | | | (0.03) | |
Net realized and unrealized gain (loss) | | | (0.34) | | | | (0.28) | | | | 0.08 | |
Total income (loss) from operations | | | (0.41) | | | | (0.44) | | | | 0.05 | |
| | | |
| Less distributions from: | | | | | | | | | | | | |
Net investment income | | | (0.00) | 4 | | | (0.10) | | | | (0.02) | |
Net realized gains | | | — | | | | (0.10) | | | | — | |
Total distributions | | | (0.00) | | | | (0.20) | | | | (0.02) | |
| | | |
| Net asset value, end of period | | | $8.98 | | | | $9.39 | | | | $10.03 | |
Total return5 | | | (4.33) | % | | | (4.37) | % | | | 0.44 | % |
| | | |
| Net assets, end of period (000s) | | | $35,177 | | | | $33,677 | | | | $23,296 | |
| | | |
| Ratios to average net assets: | | | | | | | | | | | | |
Gross expenses | | | 4.53 | %6 | | | 5.16 | % | | | 13.02 | %6 |
Net expenses7,8 | | | 3.14 | 6 | | | 2.91 | | | | 2.85 | 6 |
Net investment loss | | | (1.65) | 6 | | | (1.57) | | | | (1.26) | 6 |
| | | |
| Portfolio turnover rate9 | | | 188 | % | | | 118 | % | | | 32 | %10 |
| 1 | Per share amounts have been calculated using the average shares method. |
| 2 | For the six months ended June 30, 2016 (unaudited). |
| 3 | For the period October 6, 2014 (inception date) to December 31, 2014. |
| 4 | Amount represents less than $0.005 per share. |
| 5 | Performance figures may reflect compensating balance arrangements, fee waivers and/or expense reimbursements. In the absence of compensating balance arrangements, fee waivers and/or expense reimbursements, the total return would have been lower. Total return does not reflect expenses associated with separate accounts such as administrative fees, account charges and surrender charges which, if reflected, would reduce the total return for all periods shown. Past performance is no guarantee of future results. Total returns for periods of less than one year are not annualized. |
| 7 | As a result of an expense limitation arrangement, the ratio of expenses (other than taxes; interest; extraordinary expenses; brokerage commissions and expenses; fees, costs and expenses associated with any prime brokerage arrangement (including the costs of any securities borrowing arrangement); acquired fund fees and expenses; and dividend and interest expenses on securities sold short), to average net assets of Class II shares did not exceed 2.70%. Total annual fund operating expenses after waiving fees and/or reimbursing expenses exceed the expense cap as a result of dividend and interest expenses on securities sold short. This expense limitation arrangement cannot be terminated prior to December 31, 2017 without the Board of Trustees’ consent. |
| 8 | Reflects fee waivers and/or expense reimbursements. |
| 9 | Excluding short sale transactions. If short sale transactions had been included, the portfolio turnover rate would have been 256% for the six months ended June 30, 2016, 207% for the year ended December 31, 2015 and 77% for the period ended December 31, 2014, respectively. |
| 10 | Revised to conform to current period presentation. |
See Notes to Consolidated Financial Statements.
| | |
| EnTrustPermal Alternative Select VIT Portfolio 2016 Semi-Annual Report | | 15 |
Notes to consolidated financial statements (unaudited)
1. Organization and significant accounting policies
Permal Alternative Select VIT Portfolio (effective July 22, 2016, EnTrustPermal Alternative Select VIT Portfolio) (the “Portfolio”) is a separate non-diversified investment series of Legg Mason Partners Variable Equity Trust (the “Trust”). The Trust, a Maryland statutory trust, is registered under the Investment Company Act of 1940, as amended (the “1940 Act”), as an open-end management investment company.
The Portfolio seeks to achieve its investment objective by implementing a tactical asset allocation program of alternative strategies overseen by the Portfolio’s manager, EnTrustPermal Management LLC (“EnTrustPermal”), through which the Portfolio will allocate its assets among a number of alternative investment strategies implemented by multiple investment subadvisers. EnTrustPermal may also manage Portfolio assets directly.
The Portfolio’s assets may be invested in wholly-owned and controlled subsidiaries, each of which will have the same investment objective as the Portfolio. The Portfolio intends to gain exposure to the commodities markets by investing a portion of its assets in a wholly-owned subsidiary, Alternative Select VIT Portfolio Ltd. (the “Subsidiary”), organized under the laws of the Cayman Islands. Among other investments, the Subsidiary is expected to invest, directly or indirectly through the use of derivatives, in securities and commodity interests, which include commodity futures (including futures on broad-based securities indexes or interest rate futures, options on commodity futures, certain swaps and other investments). These financial statements are consolidated financial statements of the Portfolio and the Subsidiary.
Shares of the Portfolio may only be purchased or redeemed through variable annuity contracts and variable life insurance policies offered by the separate accounts of participating insurance companies or through eligible pension or other qualified plans.
The following are significant accounting policies consistently followed by the Portfolio and are in conformity with U.S. generally accepted accounting principles (“GAAP”). Estimates and assumptions are required to be made regarding assets, liabilities and changes in net assets resulting from operations when financial statements are prepared. Changes in the economic environment, financial markets and any other parameters used in determining these estimates could cause actual results to differ. Subsequent events have been evaluated through the date the consolidated financial statements were issued.
(a) Investment valuation. Equity securities for which market quotations are available are valued at the last reported sales price or official closing price on the primary market or exchange on which they trade. The valuations for fixed income securities (which may include, but are not limited to, corporate, government, municipal, mortgage-backed, collateralized mortgage obligations and asset-backed securities) and certain derivative instruments are typically the prices supplied by independent third party pricing services, which may use market prices or broker/dealer quotations or a variety of valuation techniques and methodologies. The independent third party pricing services use inputs that are observable such as issuer details, interest rates, yield curves, prepayment speeds, credit risks/spreads, default rates and quoted
| | |
| 16 | | EnTrustPermal Alternative Select VIT Portfolio 2016 Semi-Annual Report |
prices for similar securities. Short-term fixed income securities that will mature in 60 days or less are valued at amortized cost, unless it is determined that using this method would not reflect an investment’s fair value. Investments in open-end funds are valued at the closing net asset value per share of each fund on the day of valuation. Futures contracts are valued daily at the settlement price established by the board of trade or exchange on which they are traded. When the Portfolio holds securities or other assets that are denominated in a foreign currency, the Portfolio will normally use the currency exchange rates as of 4:00 p.m. (Eastern Time). If independent third party pricing services are unable to supply prices for a portfolio investment, or if the prices supplied are deemed by the manager to be unreliable, the market price may be determined by the manager using quotations from one or more broker/dealers or at the transaction price if the security has recently been purchased and no value has yet been obtained from a pricing service or pricing broker. When reliable prices are not readily available, such as when the value of a security has been significantly affected by events after the close of the exchange or market on which the security is principally traded, but before the Portfolio calculates its net asset value, the Portfolio values these securities as determined in accordance with procedures approved by the Portfolio’s Board of Trustees.
The Board of Trustees is responsible for the valuation process and has delegated the supervision of the daily valuation process to the Legg Mason North Atlantic Fund Valuation Committee (the “Valuation Committee”). The Valuation Committee, pursuant to the policies adopted by the Board of Trustees, is responsible for making fair value determinations, evaluating the effectiveness of the Portfolio’s pricing policies, and reporting to the Board of Trustees. When determining the reliability of third party pricing information for investments owned by the Portfolio, the Valuation Committee, among other things, conducts due diligence reviews of pricing vendors, monitors the daily change in prices and reviews transactions among market participants.
The Valuation Committee will consider pricing methodologies it deems relevant and appropriate when making fair value determinations. Examples of possible methodologies include, but are not limited to, multiple of earnings; discount from market of a similar freely traded security; discounted cash-flow analysis; book value or a multiple thereof; risk premium/yield analysis; yield to maturity; and/or fundamental investment analysis. The Valuation Committee will also consider factors it deems relevant and appropriate in light of the facts and circumstances. Examples of possible factors include, but are not limited to, the type of security; the issuer’s financial statements; the purchase price of the security; the discount from market value of unrestricted securities of the same class at the time of purchase; analysts’ research and observations from financial institutions; information regarding any transactions or offers with respect to the security; the existence of merger proposals or tender offers affecting the security; the price and extent of public trading in similar securities of the issuer or comparable companies; and the existence of a shelf registration for restricted securities.
For each portfolio security that has been fair valued pursuant to the policies adopted by the Board of Trustees, the fair value price is compared against the last available and next
| | |
| EnTrustPermal Alternative Select VIT Portfolio 2016 Semi-Annual Report | | 17 |
Notes to consolidated financial statements (unaudited) (cont’d)
available market quotations. The Valuation Committee reviews the results of such back testing monthly and fair valuation occurrences are reported to the Board of Trustees quarterly.
The Portfolio uses valuation techniques to measure fair value that are consistent with the market approach and/or income approach, depending on the type of security and the particular circumstance. The market approach uses prices and other relevant information generated by market transactions involving identical or comparable securities. The income approach uses valuation techniques to discount estimated future cash flows to present value.
GAAP establishes a disclosure hierarchy that categorizes the inputs to valuation techniques used to value assets and liabilities at measurement date. These inputs are summarized in the three broad levels listed below:
| • | | Level 1 — quoted prices in active markets for identical investments |
| • | | Level 2 — other significant observable inputs (including quoted prices for similar investments, interest rates, prepayment speeds, credit risk, etc.) |
| • | | Level 3 — significant unobservable inputs (including the Portfolio’s own assumptions in determining the fair value of investments) |
The inputs or methodologies used to value securities are not necessarily an indication of the risk associated with investing in those securities.
The following is a summary of the inputs used in valuing the Portfolio’s assets and liabilities carried at fair value:
| | | | | | | | | | | | | | | | |
| ASSETS | |
| Description | | Quoted Prices
(Level 1) | | | Other Significant
Observable Inputs
(Level 2) | | | Significant
Unobservable
Inputs
(Level 3) | | | Total | |
| Long-term investments†: | | | | | | | | | | | | | | | | |
Common stocks: | | | | | | | | | | | | | | | | |
Consumer discretionary | | $ | 1,632,343 | | | $ | 756,877 | | | | — | | | $ | 2,389,220 | |
Energy | | | 267,375 | | | | 338,109 | | | | — | | | | 605,484 | |
Exchange-traded funds | | | 29,189 | | | | 74,248 | | | | — | | | | 103,437 | |
Industrials | | | 1,660,116 | | | | 758,457 | | | | — | | | | 2,418,573 | |
Information technology | | | 470,282 | | | | 590,729 | | | | — | | | | 1,061,011 | |
Materials | | | 1,070,939 | | | | 206,968 | | | | — | | | | 1,277,907 | |
Utilities | | | 3,301,814 | | | | 1,006,309 | | | | — | | | | 4,308,123 | |
Preferred stocks: | | | | | | | | | | | | | | | | |
Consumer discretionary | | | — | | | | 330,545 | | | | — | | | | 330,545 | |
Sovereign bonds | | | — | | | | 1,707,097 | | | | — | | | | 1,707,097 | |
Purchased options | | | 46 | | | | — | | | | — | | | | 46 | |
| Total long-term investments | | $ | 8,432,104 | | | $ | 5,769,339 | | | | — | | | $ | 14,201,443 | |
| | |
| 18 | | EnTrustPermal Alternative Select VIT Portfolio 2016 Semi-Annual Report |
| | | | | | | | | | | | | | | | |
| ASSETS | |
| Description | | Quoted Prices
(Level 1) | | | Other Significant
Observable Inputs
(Level 2) | | | Significant
Unobservable
Inputs
(Level 3) | | | Total | |
| Short-term investments†: | | | | | | | | | | | | | | | | |
U.S. treasury bills | | | — | | | $ | 691,872 | | | | — | | | $ | 691,872 | |
Money market funds | | $ | 6,514,916 | | | | — | | | | — | | | | 6,514,916 | |
| Total short-term investments | | $ | 6,514,916 | | | $ | 691,872 | | | | — | | | $ | 7,206,788 | |
| Total investments | | $ | 14,947,020 | | | $ | 6,461,211 | | | | — | | | $ | 21,408,231 | |
| Other financial instruments: | | | | | | | | | | | | | | | | |
Futures contracts | | $ | 156,043 | | | | — | | | | — | | | $ | 156,043 | |
Forward foreign currency contracts | | | — | | | $ | 1,061,002 | | | | — | | | | 1,061,002 | |
OTC total return swaps‡ | | | — | | | | 135,992 | | | | — | | | | 135,992 | |
| Total other financial instruments | | $ | 156,043 | | | $ | 1,196,994 | | | | — | | | $ | 1,353,037 | |
| Total | | $ | 15,103,063 | | | $ | 7,658,205 | | | | — | | | $ | 22,761,268 | |
| | | | | | | | | | | | | | | | |
| LIABILITIES | |
| Description | | Quoted Prices
(Level 1) | | | Other Significant
Observable Inputs
(Level 2) | | | Significant
Unobservable
Inputs
(Level 3) | | | Total | |
| Other financial instruments: | | | | | | | | | | | | | | | | |
Securities sold short: | | | | | | | | | | | | | | | | |
Common stocks: | | | | | | | | | | | | | | | | |
Energy | | $ | 130,324 | | | | — | | | | — | | | $ | 130,324 | |
Exchange-traded funds | | | 3,389,800 | | | $ | 472,604 | | | | — | | | | 3,862,404 | |
Industrials | | | 23,493 | | | | 94,852 | | | | — | | | | 118,345 | |
Information technology | | | 120,637 | | | | 821 | | | | — | | | | 121,458 | |
Materials | | | — | | | | 16,424 | | | | — | | | | 16,424 | |
Utilities | | | 679,038 | | | | 363,331 | | | | — | | | | 1,042,369 | |
Futures contracts | | | 27,582 | | | | — | | | | — | | | | 27,582 | |
Forward foreign currency contracts | | | — | | | | 995,415 | | | | — | | | | 995,415 | |
OTC total return swaps‡ | | | — | | | | 73,706 | | | | — | | | | 73,706 | |
| Total | | $ | 4,370,874 | | | $ | 2,017,153 | | | | — | | | $ | 6,388,027 | |
| † | See Schedule of Investments for additional detailed categorizations. |
| ‡ | Value includes any premium paid or received with respect to swap contracts. |
For the six months ended June 30, 2016, as a result of the fair value pricing procedures for international equities utilized by the Portfolio, certain securities have transferred in and out of Level 1 and Level 2 measurements during the period. The Portfolio’s policy is to recognize transfers between levels as of the end of the reporting period. At June 30, 2016, securities valued at $4,062,242 and securities sold short valued at $948,032 were classified as Level 2 within the fair value hierarchy because fair value procedures were applied when the change in value of a domestic equity security index suggested that the closing prices on foreign exchanges may no longer have represented the value of those securities at the time of closing of the NYSE.
| | |
| EnTrustPermal Alternative Select VIT Portfolio 2016 Semi-Annual Report | | 19 |
Notes to consolidated financial statements (unaudited) (cont’d)
(b) Repurchase agreements. The Portfolio may enter into repurchase agreements with institutions that EnTrustPermal or a subadviser has determined are creditworthy. Each repurchase agreement is recorded at cost. Under the terms of a typical repurchase agreement, the Portfolio acquires a debt security subject to an obligation of the seller to repurchase, and of the Portfolio to resell, the security at an agreed-upon price and time, thereby determining the yield during the Portfolio’s holding period. When entering into repurchase agreements, it is the Portfolio’s policy that its custodian or a third party custodian, acting on the Portfolio’s behalf, take possession of the underlying collateral securities, the market value of which, at all times, at least equals the principal amount of the repurchase transaction, including accrued interest. To the extent that any repurchase transaction maturity exceeds one business day, the value of the collateral is marked-to-market and measured against the value of the agreement in an effort to ensure the adequacy of the collateral. If the counterparty defaults, the Portfolio generally has the right to use the collateral to satisfy the terms of the repurchase transaction. However, if the market value of the collateral declines during the period in which the Portfolio seeks to assert its rights or if bankruptcy proceedings are commenced with respect to the seller of the security, realization of the collateral by the Portfolio may be delayed or limited.
(c) Futures contracts. The Portfolio uses futures contracts generally to gain exposure to, or hedge against, changes in interest rates or gain exposure to, or hedge against, changes in certain asset classes. A futures contract represents a commitment for the future purchase or sale of an asset at a specified price on a specified date.
Upon entering into a futures contract, the Portfolio is required to deposit cash or cash equivalents with a broker in an amount equal to a certain percentage of the contract amount. This is known as the ‘‘initial margin’’ and subsequent payments (‘‘variation margin’’) are made or received by the Portfolio each day, depending on the daily fluctuation in the value of the contract. For certain futures, including foreign denominated futures, variation margin is not settled daily, but is recorded as a net variation margin payable or receivable. The daily changes in contract value are recorded as unrealized gains or losses in the Consolidated Statement of Operations and the Portfolio recognizes a realized gain or loss when the contract is closed.
Futures contracts involve, to varying degrees, risk of loss in excess of the amounts reflected in the financial statements. In addition, there is the risk that the Portfolio may not be able to enter into a closing transaction because of an illiquid secondary market.
(d) Forward foreign currency contracts. The Portfolio enters into a forward foreign currency contract to hedge against foreign currency exchange rate risk on its non-U.S. dollar denominated securities or to facilitate settlement of a foreign currency denominated portfolio transaction. A forward foreign currency contract is an agreement between two parties to buy and sell a currency at a set price with delivery and settlement at a future date. The contract is marked-to-market daily and the change in value is recorded by the Portfolio as an unrealized gain or loss. When a forward foreign currency contract is closed, through either delivery or offset by entering into another forward foreign currency contract, the
| | |
| 20 | | EnTrustPermal Alternative Select VIT Portfolio 2016 Semi-Annual Report |
Portfolio recognizes a realized gain or loss equal to the difference between the value of the contract at the time it was opened and the value of the contract at the time it is closed.
Non-deliverable forward foreign currency exchange contracts are settled with the counterparty in cash without the delivery of foreign currency.
Forward foreign currency contracts involve elements of market risk in excess of the amounts reflected on the Consolidated Statement of Assets and Liabilities. The Portfolio bears the risk of an unfavorable change in the foreign exchange rate underlying the forward foreign currency contract. Risks may also arise upon entering into these contracts from the potential inability of the counterparties to meet the terms of their contracts.
(e) Purchased options. When the Portfolio purchases an option, an amount equal to the premium paid by the Portfolio is recorded as an investment on the Consolidated Statement of Assets and Liabilities, the value of which is marked-to-market to reflect the current market value of the option purchased. If the purchased option expires, the Portfolio realizes a loss equal to the amount of premium paid. When an instrument is purchased or sold through the exercise of an option, the related premium paid is added to the basis of the instrument acquired or deducted from the proceeds of the instrument sold. The risk associated with purchasing put and call options is limited to the premium paid.
(f) Written options. When the Portfolio writes an option, an amount equal to the premium received by the Portfolio is recorded as a liability, the value of which is marked-to-market daily to reflect the current market value of the option written. If the option expires, the premium received is recorded as a realized gain. When a written call option is exercised, the difference between the premium received plus the option exercise price and the Portfolio’s basis in the underlying security (in the case of a covered written call option), or the cost to purchase the underlying security (in the case of an uncovered written call option), including brokerage commission, is recognized as a realized gain or loss. When a written put option is exercised, the amount of the premium received is subtracted from the cost of the security purchased by the Portfolio from the exercise of the written put option to form the Portfolio’s basis in the underlying security purchased. The writer or buyer of an option traded on an exchange can liquidate the position before the exercise of the option by entering into a closing transaction. The cost of a closing transaction is deducted from the original premium received resulting in a realized gain or loss to the Portfolio.
The risk in writing a covered call option is that the Portfolio may forego the opportunity of profit if the market price of the underlying security increases and the option is exercised. The risk in writing a put option is that the Portfolio may incur a loss if the market price of the underlying security decreases and the option is exercised. The risk in writing an uncovered call option is that the Portfolio is exposed to the risk of loss if the market price of the underlying security increases. In addition, there is the risk that the Portfolio may not be able to enter into a closing transaction because of an illiquid secondary market.
(g) Short sale transactions. Short sales are transactions in which the Portfolio sells a security it does not own in anticipation of a decline in the market value of that security. To
| | |
| EnTrustPermal Alternative Select VIT Portfolio 2016 Semi-Annual Report | | 21 |
Notes to consolidated financial statements (unaudited) (cont’d)
complete such a transaction, a Portfolio must borrow the security to deliver to the buyer. The Portfolio is then obligated to replace the security borrowed by purchasing it in the open market at the time of replacement. The proceeds received by the Portfolio for the short sale are retained by the broker as collateral until the Portfolio replaces the borrowed security. The collateral required is determined daily by reference to the market value of the short positions. Liabilities for securities sold short are marked-to-market daily and reported at market value in the financial statements.
Short sale transactions may result in a risk of loss that may exceed the amount shown on the Consolidated Statement of Assets and Liabilities. A gain, limited to the price at which the Portfolio sold the security short, or a loss, potentially unlimited in size, will be recognized upon termination of a short sale. Dividends on short positions are recorded as a liability on the ex-dividend date and are shown in the Consolidated Statement of Operations as Dividend Expense because the Portfolio must pay the dividend to the lender of the security.
Short selling is a technique that may be considered speculative, involves risk beyond the amount of money used to secure each transaction and may represent a form of leverage.
(h) Foreign currency translation. Investment securities and other assets and liabilities denominated in foreign currencies are translated into U.S. dollar amounts based upon prevailing exchange rates on the date of valuation. Purchases and sales of investment securities and income and expense items denominated in foreign currencies are translated into U.S. dollar amounts based upon prevailing exchange rates on the respective dates of such transactions.
The Portfolio does not isolate that portion of the results of operations resulting from fluctuations in foreign exchange rates on investments from the fluctuations arising from changes in market prices of securities held. Such fluctuations are included with the net realized and unrealized gain or loss on investments.
Net realized foreign exchange gains or losses arise from sales of foreign currencies, including gains and losses on forward foreign currency contracts, currency gains or losses realized between the trade and settlement dates on securities transactions, and the difference between the amounts of dividends, interest, and foreign withholding taxes recorded on the Portfolio’s books and the U.S. dollar equivalent of the amounts actually received or paid. Net unrealized foreign exchange gains and losses arise from changes in the values of assets and liabilities, other than investments in securities, on the date of valuation, resulting from changes in exchange rates.
Foreign security and currency transactions may involve certain considerations and risks not typically associated with those of U.S. dollar denominated transactions as a result of, among other factors, the possibility of lower levels of governmental supervision and regulation of foreign securities markets and the possibility of political or economic instability.
(i) Swap agreements. The Portfolio invests in swaps for the purpose of managing its exposure to interest rate, credit or market risk, or for other purposes. The use of swaps
| | |
| 22 | | EnTrustPermal Alternative Select VIT Portfolio 2016 Semi-Annual Report |
involves risks that are different from those associated with other portfolio transactions. Swap agreements are privately negotiated in the over-the-counter market and may be entered into as a bilateral contract (“OTC Swaps”) or centrally cleared (“Centrally Cleared Swaps”). Unlike Centrally Cleared Swaps, the Portfolio has credit exposure to the counterparties of OTC Swaps.
In a Centrally Cleared Swap, immediately following execution of the swap, the swap agreement is submitted to a clearinghouse or central counterparty (the “CCP”) and the CCP becomes the ultimate counterparty of the swap agreement. The Portfolio is required to interface with the CCP through a broker, acting in an agency capacity. All payments are settled with the CCP through the broker. Upon entering into a Centrally Cleared Swap, the Portfolio is required to deposit initial margin with the broker in the form of cash or securities.
Swap contracts are marked-to-market daily and changes in value are recorded as unrealized appreciation (depreciation). The daily change in valuation of Centrally Cleared Swaps, if any, is recorded as a receivable or payable for variation margin on the Consolidated Statement of Assets and Liabilities. Gains or losses are realized upon termination of the swap agreement. Collateral, in the form of restricted cash or securities, may be required to be held in segregated accounts with the Portfolio’s custodian in compliance with the terms of the swap contracts. Securities posted as collateral for swap contracts are identified in the Consolidated Schedule of Investments and restricted cash, if any, is identified on the Consolidated Statement of Assets and Liabilities. Risks may exceed amounts recorded in the Consolidated Statement of Assets and Liabilities. These risks include changes in the returns of the underlying instruments, failure of the counterparties to perform under the contracts’ terms, and the possible lack of liquidity with respect to the swap agreements.
OTC swap payments received or made at the beginning of the measurement period are reflected as a premium or deposit, respectively, on the Consolidated Statement of Assets and Liabilities. These upfront payments are amortized over the life of the swap and are recognized as realized gain or loss in the Consolidated Statement of Operations. Net periodic payments received or paid by the Portfolio are recognized as a realized gain or loss in the Consolidated Statement of Operations.
The Portfolio’s maximum exposure in the event of a defined credit event on a credit default swap to sell protection is the notional amount. As of June 30, 2016, the Portfolio did not hold any credit default swaps to sell protection.
For average notional amounts of swaps held during the six months ended June 30, 2016, see Note 4.
Credit default swaps
The Portfolio enters into credit default swap (“CDS”) contracts for investment purposes, to manage its credit risk or to add leverage. CDS agreements involve one party making a stream of payments to another party in exchange for the right to receive a specified return in the event of a default by a third party, typically corporate or sovereign issuers, on a
| | |
| EnTrustPermal Alternative Select VIT Portfolio 2016 Semi-Annual Report | | 23 |
Notes to consolidated financial statements (unaudited) (cont’d)
specified obligation, or in the event of a write-down, principal shortfall, interest shortfall or default of all or part of the referenced entities comprising a credit index. The Portfolio may use a CDS to provide protection against defaults of the issuers (i.e., to reduce risk where the Portfolio has exposure to an issuer) or to take an active long or short position with respect to the likelihood of a particular issuer’s default. As a seller of protection, the Portfolio generally receives an upfront payment or a stream of payments throughout the term of the swap provided that there is no credit event. If the Portfolio is a seller of protection and a credit event occurs, as defined under the terms of that particular swap agreement, the maximum potential amount of future payments (undiscounted) that the Portfolio could be required to make under a credit default swap agreement would be an amount equal to the notional amount of the agreement. These amounts of potential payments will be partially offset by any recovery of values from the respective referenced obligations. As a seller of protection, the Portfolio effectively adds leverage to its portfolio because, in addition to its total net assets, the Portfolio is subject to investment exposure on the notional amount of the swap. As a buyer of protection, the Portfolio generally receives an amount up to the notional value of the swap if a credit event occurs.
Implied spreads are the theoretical prices a lender receives for credit default protection. When spreads rise, market perceived credit risk rises and when spreads fall, market perceived credit risk falls. The implied credit spread of a particular referenced entity reflects the cost of buying/selling protection and may include upfront payments required to enter into the agreement. Wider credit spreads and decreasing market values, when compared to the notional amount of the swap, represent a deterioration of the referenced entity’s credit soundness and a greater likelihood or risk of default or other credit event occurring as defined under the terms of the agreement. Credit spreads utilized in determining the period end market value of credit default swap agreements on corporate or sovereign issues are disclosed in the Notes to Consolidated Financial Statements and serve as an indicator of the current status of the payment/performance risk and represent the likelihood or risk of default for credit derivatives. For credit default swap agreements on asset-backed securities and credit indices, the quoted market prices and resulting values, particularly in relation to the notional amount of the contract as well as the annual payment rate, serve as an indication of the current status of the payment/performance risk.
The Portfolio’s maximum risk of loss from counterparty risk, as the protection buyer, is the fair value of the contract (this risk is mitigated by the posting of collateral by the counterparty to the Portfolio to cover the Portfolio’s exposure to the counterparty). As the protection seller, the Portfolio’s maximum risk is the notional amount of the contract. Credit default swaps are considered to have credit risk-related contingent features since they require payment by the protection seller to the protection buyer upon the occurrence of a defined credit event.
Entering into a CDS agreement involves, to varying degrees, elements of credit, market and documentation risk in excess of the related amounts recognized on the Consolidated Statement of Assets and Liabilities. Such risks involve the possibility that there will be no
| | |
| 24 | | EnTrustPermal Alternative Select VIT Portfolio 2016 Semi-Annual Report |
liquid market for these agreements, that the counterparty to the agreement may default on its obligation to perform or disagree as to the meaning of the contractual terms in the agreement, and that there will be unfavorable changes in net interest rates.
Total return swaps
The Portfolio enters into total return swaps for investment purposes. Total return swaps are agreements to exchange the return generated by one instrument for the return generated by another instrument. For example, the agreement to pay a predetermined or fixed interest rate in exchange for a market-linked return based on a notional amount. To the extent the total return of a referenced index or instrument exceeds the offsetting interest obligation, the Portfolio will receive a payment from the counterparty. To the extent it is less, the Portfolio will make a payment to the counterparty.
(j) Credit and market risk. The Portfolio invests in high-yield instruments that are subject to certain credit and market risks. The yields of high-yield obligations reflect, among other things, perceived credit and market risks. The Portfolio’s investments in securities rated below investment grade typically involve risks not associated with higher rated securities including, among others, greater risk related to timely and ultimate payment of interest and principal, greater market price volatility and less liquid secondary market trading.
(k) Foreign investment risks. The Portfolio’s investments in foreign securities may involve risks not present in domestic investments. Since securities may be denominated in foreign currencies, may require settlement in foreign currencies or pay interest or dividends in foreign currencies, changes in the relationship of these foreign currencies to the U.S. dollar can significantly affect the value of the investments and earnings of the Portfolio. Foreign investments may also subject the Portfolio to foreign government exchange restrictions, expropriation, taxation or other political, social or economic developments, all of which affect the market and/or credit risk of the investments.
(l) Counterparty risk and credit-risk-related contingent features of derivative instruments. The Portfolio may invest in certain securities or engage in other transactions, where the Portfolio is exposed to counterparty credit risk in addition to broader market risks. The Portfolio may invest in securities of issuers, which may also be considered counterparties as trading partners in other transactions. This may increase the risk of loss in the event of default or bankruptcy by the counterparty or if the counterparty otherwise fails to meet its contractual obligations. The Portfolio’s investment manager and subadvisers attempt to mitigate counterparty risk by (i) periodically assessing the creditworthiness of its trading partners, (ii) monitoring and/or limiting the amount of its net exposure to each individual counterparty based on its assessment and (iii) requiring collateral from the counterparty for certain transactions. Market events and changes in overall economic conditions may impact the assessment of such counterparty risk by the investment manager and subadvisers. In addition, declines in the values of underlying collateral received may expose the Portfolio to increased risk of loss.
The Portfolio has entered into master agreements with certain of its derivative counterparties that provide for general obligations, representations, agreements, collateral, events
| | |
| EnTrustPermal Alternative Select VIT Portfolio 2016 Semi-Annual Report | | 25 |
Notes to consolidated financial statements (unaudited) (cont’d)
of default or termination and credit related contingent features. The credit related contingent features include, but are not limited to, a percentage decrease in the Portfolio’s net assets or NAV over a specified period of time. If these credit related contingent features were triggered, the derivatives counterparty could terminate the positions and demand payment or require additional collateral.
Collateral requirements differ by type of derivative. Collateral or margin requirements are set by the broker or exchange clearinghouse for exchange traded derivatives while collateral terms are contract specific for over-the-counter traded derivatives. Cash collateral that has been pledged to cover obligations of the Portfolio under derivative contracts, if any, will be reported separately in the Consolidated Statement of Assets and Liabilities. Securities pledged as collateral, if any, for the same purpose are noted in the Consolidated Schedule of Investments.
Absent an event of default by the counterparty or a termination of the agreement, the terms of the master agreements do not result in an offset of reported amounts of financial assets and financial liabilities in the Consolidated Statement of Assets and Liabilities across transactions between the Portfolio and the applicable counterparty. The enforceability of the right to offset may vary by jurisdiction.
As of June 30, 2016, the Portfolio held forward foreign currency contracts and OTC total return swaps with credit related contingent features which had a liability position of $1,069,121. If a contingent feature in the master agreements would have been triggered, the Portfolio would have been required to pay this amount to its derivatives counterparties. As of June 30, 2016, the Portfolio had posted with its counterparties cash and/or securities as collateral to cover the net liability of these derivatives amounting to $2,550,000, which could be used to reduce the required payment.
(m) Security transactions and investment income. Security transactions are accounted for on a trade date basis. Interest income, adjusted for amortization of premium and accretion of discount, is recorded on the accrual basis. Dividend income is recorded on the ex-dividend date. Foreign dividend income is recorded on the ex-dividend date or as soon as practicable after the Portfolio determines the existence of a dividend declaration after exercising reasonable due diligence. The cost of investments sold is determined by use of the specific identification method. To the extent any issuer defaults or a credit event occurs that impacts the issuer, the Portfolio may halt any additional interest income accruals and consider the realizability of interest accrued up to the date of default or credit event.
(n) Distributions to shareholders. Distributions from net investment income and distributions of net realized gains, if any, are declared at least annually. Distributions to shareholders of the Portfolio are recorded on the ex-dividend date and are determined in accordance with income tax regulations, which may differ from GAAP.
(o) REIT distributions. The character of distributions received from Real Estate Investment Trusts (‘‘REITs’’) held by the Portfolio is generally comprised of net investment income,
| | |
| 26 | | EnTrustPermal Alternative Select VIT Portfolio 2016 Semi-Annual Report |
capital gains, and return of capital. It is the policy of the Portfolio to estimate the character of distributions received from underlying REITs based on historical data provided by the REITs. After each calendar year end, REITs report the actual tax character of these distributions. Differences between the estimated and actual amounts reported by the REITs are reflected in the Portfolio’s records in the year in which they are reported by the REITs by adjusting related investment cost basis, capital gains and income, as necessary.
(p) Compensating balance arrangements. The Portfolio has an arrangement with its custodian bank whereby a portion of the custodian’s fees is paid indirectly by credits earned on the Portfolio’s cash on deposit with the bank.
(q) Federal and other taxes. It is the Portfolio’s policy to comply with the federal income and excise tax requirements of the Internal Revenue Code of 1986 (the “Code”), as amended, applicable to regulated investment companies. Accordingly, the Portfolio intends to distribute its taxable income and net realized gains, if any, to shareholders in accordance with timing requirements imposed by the Code. Therefore, no federal or state income tax provision is required in the Portfolio’s financial statements.
Management has analyzed the Portfolio’s tax positions taken on income tax returns for all open tax years and has concluded that as of December 31, 2015, no provision for income tax is required in the Portfolio’s financial statements. The Portfolio’s federal and state income and federal excise tax returns for tax years for which the applicable statutes of limitations have not expired are subject to examination by the Internal Revenue Service and state departments of revenue.
Under the applicable foreign tax laws, a withholding tax may be imposed on interest, dividends and capital gains at various rates.
(r) Reclassification. GAAP requires that certain components of net assets be reclassified to reflect permanent differences between financial and tax reporting. These reclassifications have no effect on net assets or net asset value per share.
2. Investment management agreement and other transactions with affiliates
EnTrustPermal Management LLC (“EnTrustPermal”) is the Portfolio’s investment manager. Prior to May 20, 2016, Permal Asset Management LLC (“Permal”) was the Portfolio’s subadviser. Atlantic Investment Management, Inc., BH-DG Systematic Trading LLP (part of a joint venture arrangement between David Gorton and Brevan Howard Investment Holdings Limited) (trading advisor), Electron Capital Partners, LLC (effective April 19, 2016) and First Quadrant, L.P. (effective March 6, 2016) are the Portfolio’s subadvisers. Apex Capital, LLC, TT International and River Canyon Fund Management LLC (a wholly-owned subsidiary of Canyon Capital Advisors LLC) no longer serve as subadvisers to the Portfolio effective February 29, 2016, June 5, 2016 and June 30, 2016, respectively. Legg Mason Partners Fund Advisor, LLC (“LMPFA”) serves as the administrator to the Portfolio. EnTrustPermal is a subsidiary of Legg Mason, Inc. (“Legg Mason”) and LMPFA is a wholly-owned subsidiary of Legg Mason. Permal was a wholly-owned subsidiary of Legg Mason.
| | |
| EnTrustPermal Alternative Select VIT Portfolio 2016 Semi-Annual Report | | 27 |
Notes to consolidated financial statements (unaudited) (cont’d)
Under the management agreement, the Portfolio pays EnTrustPermal (Permal prior to May 20, 2016) an investment management fee, calculated daily and paid monthly, at an annual rate of 1.90% of the Portfolio’s average daily net assets. The Portfolio pays LMPFA an administration fee at an annual rate of 0.09% of the Portfolio’s average daily net assets.
As a result of an expense limitation arrangement between the Portfolio and EnTrustPermal, the ratio of expenses (other than taxes; interest; extraordinary expenses; brokerage commissions and expenses; fees, costs and expenses associated with any prime brokerage arrangement (including the costs of any securities borrowing arrangement); acquired fund fees and expenses; and dividend and interest expenses on securities sold short) to average net assets of Class II shares did not exceed 2.70%. Total annual portfolio operating expenses after waiving fees and/or reimbursing expenses exceed the expense cap as a result of dividend and interest expenses on securities sold short. This expense limitation arrangement cannot be terminated prior to December 31, 2017 without the Board of Trustees’ consent. This arrangement, however, may be modified by the manager to decrease total annual operating expenses at any time. From time to time, LMPFA may also voluntarily waive some or all of its administration fee.
During the six months ended June 30, 2016, fees waived and/or expenses reimbursed amounted to $235,780, which includes administrative fees waived in the amount of $15,260.
EnTrustPermal is permitted to recapture amounts waived and/or reimbursed to a class during the same fiscal year if the class’ total annual operating expenses have fallen to a level below the expense limitation (“expense cap”) in effect at the time the fees were earned or the expenses incurred. In no case will EnTrustPermal recapture any amount that would result, on any particular business day of the Portfolio, in the class’ total annual operating expenses exceeding the expense cap or any other lower limit then in effect.
Legg Mason Investor Services, LLC, a wholly-owned broker-dealer subsidiary of Legg Mason, serves as the Portfolio’s sole and exclusive distributor. The Portfolio has adopted a Rule 12b-1 shareholder service and distribution plan and under that plan the Portfolio pays service and/or distribution fees with respect to its Class II shares calculated at the annual rate of 0.25% of the average daily net assets of the class. Service and/or distribution fees are accrued daily and paid monthly.
All officers and one Trustee of the Trust are employees of Legg Mason or its affiliates and do not receive compensation from the Trust.
As of June 30, 2016, Legg Mason and its affiliates owned 59% of the Portfolio.
| | |
| 28 | | EnTrustPermal Alternative Select VIT Portfolio 2016 Semi-Annual Report |
3. Investments
During the six months ended June 30, 2016, the aggregate cost of purchases and proceeds from sales of investments (excluding short-term investments) were as follows:
| | | | |
| | | Investments* | |
| Purchases | | $ | 23,864,952 | |
| Sales | | | 23,885,519 | |
| * | Excluding securities sold short and covers on securities sold short in the amounts of $10,853,211 and $8,634,210, respectively. |
At June 30, 2016, the aggregate gross unrealized appreciation and depreciation of investments for federal income tax purposes were substantially as follows:
| | | | |
| Gross unrealized appreciation | | $ | 588,983 | |
| Gross unrealized depreciation | | | (567,899) | |
| Net unrealized appreciation | | $ | 21,084 | |
During the six months ended June 30, 2016, written option transactions for the Portfolio were as follows:
| | | | | | | | |
| | | Number of Contracts/
Notional Amount | | | Premiums | |
| Written options, outstanding as of December 31, 2015 | | | 695,405 | | | $ | 153,616 | |
| Options written | | | 7,938,829 | | | | 47,488 | |
| Options closed | | | (8,634,074) | | | | (148,605) | |
| Options exercised | | | (22) | | | | (14,817) | |
| Options expired | | | (138) | | | | (37,682) | |
| Written options, outstanding as of June 30, 2016 | | | — | | | | — | |
At June 30, 2016, the Portfolio had the following open futures contracts:
| | | | | | | | | | | | | | | | | | | | |
| | | Number of
Contracts | | | Expiration
Date | | | Basis
Value | | | Market
Value | | | Unrealized
Appreciation
(Depreciation) | |
| Contracts to Buy: | | | | | | | | | | | | | | | | | | | | |
| 3-Month Bankers Acceptance | | | 5 | | | | 6/17 | | | $ | 959,296 | | | $ | 959,306 | | | $ | 10 | |
| 3-Month Euribor | | | 73 | | | | 12/18 | | | | 20,304,503 | | | | 20,323,819 | | | | 19,316 | |
| 90-Day Eurodollar | | | 36 | | | | 12/18 | | | | 8,890,463 | | | | 8,908,200 | | | | 17,737 | |
| 90-Day Sterling | | | 29 | | | | 6/18 | | | | 4,791,395 | | | | 4,808,407 | | | | 17,012 | |
| E-mini S&P 500 Index | | | 4 | | | | 9/16 | | | | 401,163 | | | | 418,040 | | | | 16,877 | |
| FTSE 100 Index | | | 1 | | | | 9/16 | | | | 78,464 | | | | 85,499 | | | | 7,035 | |
| Gold 100 Ounce | | | 2 | | | | 8/16 | | | | 251,442 | | | | 264,120 | | | | 12,678 | |
| LME Copper | | | 1 | | | | 8/16 | | | | 114,250 | | | | 121,175 | | | | 6,925 | |
| LME Copper | | | 1 | | | | 9/16 | | | | 116,016 | | | | 121,200 | | | | 5,184 | |
| LME Price Aluminum | | | 2 | | | | 7/16 | | | | 81,089 | | | | 82,288 | | | | 1,199 | |
| LME Price Aluminum | | | 1 | | | | 8/16 | | | | 38,750 | | | | 41,200 | | | | 2,450 | |
| LME Price Aluminum | | | 2 | | | | 9/16 | | | | 80,873 | | | | 82,562 | | | | 1,689 | |
| LME Zinc | | | 1 | | | | 9/16 | | | | 51,875 | | | | 52,656 | | | | 781 | |
| | |
| EnTrustPermal Alternative Select VIT Portfolio 2016 Semi-Annual Report | | 29 |
Notes to consolidated financial statements (unaudited) (cont’d)
| | | | | | | | | | | | | | | | | | | | |
| | | Number of
Contracts | | | Expiration
Date | | | Basis
Value | | | Market
Value | | | Unrealized
Appreciation
(Depreciation) | |
| Contracts to Buy: continued | | | | | | | | | | | | | | | | | | | | |
| Low Sulphur Gasoil | | | 1 | | | | 8/16 | | | $ | 43,654 | | | $ | 44,625 | | | $ | 971 | |
| MSCI Taiwan Index | | | 1 | | | | 7/16 | | | | 31,733 | | | | 31,750 | | | | 17 | |
| Natural Gas | | | 4 | | | | 7/16 | | | | 112,956 | | | | 116,960 | | | | 4,004 | |
| Silver | | | 1 | | | | 9/16 | | | | 89,277 | | | | 93,115 | | | | 3,838 | |
| Soybean | | | 1 | | | | 11/16 | | | | 55,615 | | | | 57,663 | | | | 2,048 | |
| Soybean Meal | | | 1 | | | | 12/16 | | | | 37,390 | | | | 40,100 | | | | 2,710 | |
| Sugar No. 11 | | | 1 | | | | 9/16 | | | | 22,142 | | | | 22,770 | | | | 628 | |
| U.S. Treasury Long-Term Bonds | | | 2 | | | | 9/16 | | | | 326,330 | | | | 344,687 | | | | 18,357 | |
| U.S. Treasury Ultra Long-Term Bonds | | | 2 | | | | 9/16 | | | | 361,634 | | | | 372,750 | | | | 11,116 | |
| WTI Crude | | | 1 | | | | 7/16 | | | | 48,932 | | | | 48,330 | | | | (602) | |
| | | | | | | | | | | | | | | | | | | | 151,980 | |
| Contracts to Sell: | | | | | | | | | | | | | | | | | | | | |
| E-Mini NASDAQ 100 Index | | | 1 | | | | 9/16 | | | | 87,620 | | | | 88,140 | | | | (520) | |
| E-mini Nikkei 225 Index | | | 12 | | | | 9/16 | | | | 183,619 | | | | 180,933 | | | | 2,686 | |
| Euro Stoxx 50 | | | 1 | | | | 9/16 | | | | 29,951 | | | | 31,683 | | | | (1,732) | |
| LME Copper | | | 1 | | | | 8/16 | | | | 113,959 | | | | 121,175 | | | | (7,216) | |
| LME Copper | | | 1 | | | | 9/16 | | | | 114,275 | | | | 121,200 | | | | (6,925) | |
| LME Price Aluminum | | | 2 | | | | 7/16 | | | | 79,134 | | | | 82,287 | | | | (3,153) | |
| LME Price Aluminum | | | 1 | | | | 8/16 | | | | 38,974 | | | | 41,200 | | | | (2,226) | |
| LME Price Aluminum | | | 2 | | | | 9/16 | | | | 79,309 | | | | 82,563 | | | | (3,254) | |
| LME Zinc | | | 1 | | | | 9/16 | | | | 50,702 | | | | 52,656 | | | | (1,954) | |
| Wheat | | | 1 | | | | 9/16 | | | | 23,050 | | | | 22,275 | | | | 775 | |
| | | | | | | | | | | | | | | | | | | | (23,519) | |
| Net unrealized appreciation on open futures contracts | | | $ | 128,461 | |
At June 30, 2016, the Portfolio had the following open forward foreign currency contracts:
| | | | | | | | | | | | | | | | | | | | |
Currency
Purchased | | | Currency
Sold | | | Counterparty | | Settlement
Date | | | Unrealized
Appreciation
(Depreciation) | |
| AUD | | | 10,000 | | | JPY | | | 781,556 | | | Deutsche Bank AG | | | 7/8/16 | | | $ | (112) | |
| AUD | | | 110,000 | | | JPY | | | 8,659,024 | | | Deutsche Bank AG | | | 7/8/16 | | | | (1,831) | |
| AUD | | | 120,000 | | | JPY | | | 9,064,836 | | | Deutsche Bank AG | | | 7/8/16 | | | | 1,696 | |
| AUD | | | 400,000 | | | USD | | | 298,025 | | | Deutsche Bank AG | | | 7/8/16 | | | | 261 | |
| AUD | | | 190,000 | | | USD | | | 141,308 | | | Deutsche Bank AG | | | 7/8/16 | | | | 378 | |
| AUD | | | 230,000 | | | USD | | | 172,203 | | | Deutsche Bank AG | | | 7/8/16 | | | | (689) | |
| AUD | | | 80,000 | | | USD | | | 59,699 | | | Deutsche Bank AG | | | 7/8/16 | | | | (42) | |
| AUD | | | 260,000 | | | USD | | | 196,110 | | | Deutsche Bank AG | | | 7/8/16 | | | | (2,224) | |
| AUD | | | 220,000 | | | USD | | | 163,116 | | | Deutsche Bank AG | | | 7/8/16 | | | | 941 | |
| AUD | | | 70,000 | | | USD | | | 52,004 | | | Deutsche Bank AG | | | 7/8/16 | | | | 196 | |
| AUD | | | 130,000 | | | USD | | | 96,503 | | | Deutsche Bank AG | | | 7/8/16 | | | | 440 | |
| CAD | | | 670,000 | | | USD | | | 522,214 | | | Deutsche Bank AG | | | 7/8/16 | | | | (3,611) | |
| CAD | | | 70,000 | | | USD | | | 54,614 | | | Deutsche Bank AG | | | 7/8/16 | | | | (432) | |
| | |
| 30 | | EnTrustPermal Alternative Select VIT Portfolio 2016 Semi-Annual Report |
| | | | | | | | | | | | | | | | | | | | |
Currency
Purchased | | | Currency
Sold | | | Counterparty | | Settlement
Date | | | Unrealized
Appreciation
(Depreciation) | |
| CAD | | | 50,000 | | | USD | | | 39,125 | | | Deutsche Bank AG | | | 7/8/16 | | | $ | (423) | |
| CAD | | | 50,000 | | | USD | | | 39,175 | | | Deutsche Bank AG | | | 7/8/16 | | | | (473) | |
| CAD | | | 10,000 | | | USD | | | 7,703 | | | Deutsche Bank AG | | | 7/8/16 | | | | 37 | |
| EUR | | | 310,000 | | | USD | | | 352,214 | | | Deutsche Bank AG | | | 7/8/16 | | | | (8,157) | |
| EUR | | | 540,000 | | | USD | | | 612,822 | | | Deutsche Bank AG | | | 7/8/16 | | | | (13,497) | |
| EUR | | | 390,000 | | | USD | | | 441,532 | | | Deutsche Bank AG | | | 7/8/16 | | | | (8,686) | |
| EUR | | | 280,000 | | | USD | | | 318,683 | | | Deutsche Bank AG | | | 7/8/16 | | | | (7,922) | |
| GBP | | | 210,000 | | | USD | | | 307,593 | | | Deutsche Bank AG | | | 7/8/16 | | | | (28,027) | |
| GBP | | | 60,000 | | | USD | | | 88,071 | | | Deutsche Bank AG | | | 7/8/16 | | | | (8,195) | |
| GBP | | | 40,000 | | | USD | | | 58,954 | | | Deutsche Bank AG | | | 7/8/16 | | | | (5,703) | |
| GBP | | | 40,000 | | | USD | | | 59,243 | | | Deutsche Bank AG | | | 7/8/16 | | | | (5,992) | |
| JPY | | | 35,829,046 | | | AUD | | | 460,000 | | | Deutsche Bank AG | | | 7/8/16 | | | | 3,964 | |
| JPY | | | 2,264,310 | | | AUD | | | 30,000 | | | Deutsche Bank AG | | | 7/8/16 | | | | (442) | |
| JPY | | | 756,759 | | | AUD | | | 10,000 | | | Deutsche Bank AG | | | 7/8/16 | | | | (128) | |
| JPY | | | 1,510,516 | | | AUD | | | 20,000 | | | Deutsche Bank AG | | | 7/8/16 | | | | (285) | |
| JPY | | | 215,600,000 | | | USD | | | 2,062,383 | | | Deutsche Bank AG | | | 7/8/16 | | | | 25,632 | |
| JPY | | | 5,460,000 | | | USD | | | 52,161 | | | Deutsche Bank AG | | | 7/8/16 | | | | 717 | |
| JPY | | | 9,550,000 | | | USD | | | 91,490 | | | Deutsche Bank AG | | | 7/8/16 | | | | 998 | |
| JPY | | | 6,490,000 | | | USD | | | 62,156 | | | Deutsche Bank AG | | | 7/8/16 | | | | 697 | |
| JPY | | | 5,930,000 | | | USD | | | 56,816 | | | Deutsche Bank AG | | | 7/8/16 | | | | 614 | |
| JPY | | | 7,710,000 | | | USD | | | 75,722 | | | Deutsche Bank AG | | | 7/8/16 | | | | (1,054) | |
| JPY | | | 5,430,000 | | | USD | | | 53,145 | | | Deutsche Bank AG | | | 7/8/16 | | | | (557) | |
| JPY | | | 2,230,000 | | | USD | | | 21,810 | | | Deutsche Bank AG | | | 7/8/16 | | | | (213) | |
| JPY | | | 5,670,000 | | | USD | | | 55,199 | | | Deutsche Bank AG | | | 7/8/16 | | | | (287) | |
| MXN | | | 90,000 | | | USD | | | 4,812 | | | Deutsche Bank AG | | | 7/8/16 | | | | 110 | |
| MXN | | | 3,020,000 | | | USD | | | 161,614 | | | Deutsche Bank AG | | | 7/8/16 | | | | 3,524 | |
| MXN | | | 70,000 | | | USD | | | 3,768 | | | Deutsche Bank AG | | | 7/8/16 | | | | 59 | |
| MXN | | | 550,000 | | | USD | | | 30,056 | | | Deutsche Bank AG | | | 7/8/16 | | | | 19 | |
| MXN | | | 400,000 | | | USD | | | 21,367 | | | Deutsche Bank AG | | | 7/8/16 | | | | 505 | |
| MXN | | | 100,000 | | | USD | | | 5,261 | | | Deutsche Bank AG | | | 7/8/16 | | | | 207 | |
| MXN | | | 40,000 | | | USD | | | 2,116 | | | Deutsche Bank AG | | | 7/8/16 | | | | 71 | |
| MXN | | | 170,000 | | | USD | | | 9,118 | | | Deutsche Bank AG | | | 7/8/16 | | | | 178 | |
| MXN | | | 170,000 | | | USD | | | 9,171 | | | Deutsche Bank AG | | | 7/8/16 | | | | 125 | |
| NOK | | | 100,000 | | | USD | | | 12,114 | | | Deutsche Bank AG | | | 7/8/16 | | | | (165) | |
| NOK | | | 560,000 | | | USD | | | 67,661 | | | Deutsche Bank AG | | | 7/8/16 | | | | (746) | |
| NOK | | | 160,000 | | | USD | | | 19,348 | | | Deutsche Bank AG | | | 7/8/16 | | | | (229) | |
| NOK | | | 200,000 | | | USD | | | 24,489 | | | Deutsche Bank AG | | | 7/8/16 | | | | (591) | |
| NZD | | | 710,000 | | | USD | | | 504,543 | | | Deutsche Bank AG | | | 7/8/16 | | | | 2,321 | |
| NZD | | | 10,000 | | | USD | | | 7,106 | | | Deutsche Bank AG | | | 7/8/16 | | | | 33 | |
| NZD | | | 50,000 | | | USD | | | 35,651 | | | Deutsche Bank AG | | | 7/8/16 | | | | 44 | |
| NZD | | | 40,000 | | | USD | | | 28,548 | | | Deutsche Bank AG | | | 7/8/16 | | | | 8 | |
| NZD | | | 20,000 | | | USD | | | 14,391 | | | Deutsche Bank AG | | | 7/8/16 | | | | (113) | |
| | |
| EnTrustPermal Alternative Select VIT Portfolio 2016 Semi-Annual Report | | 31 |
Notes to consolidated financial statements (unaudited) (cont’d)
| | | | | | | | | | | | | | | | | | | | |
Currency
Purchased | | | Currency
Sold | | | Counterparty | | Settlement
Date | | | Unrealized
Appreciation
(Depreciation) | |
| NZD | | | 160,000 | | | USD | | | 113,106 | | | Deutsche Bank AG | | | 7/8/16 | | | $ | 1,117 | |
| NZD | | | 20,000 | | | USD | | | 14,139 | | | Deutsche Bank AG | | | 7/8/16 | | | | 139 | |
| NZD | | | 10,000 | | | USD | | | 7,091 | | | Deutsche Bank AG | | | 7/8/16 | | | | 48 | |
| PLN | | | 40,000 | | | USD | | | 10,307 | | | Deutsche Bank AG | | | 7/8/16 | | | | (169) | |
| PLN | | | 30,000 | | | USD | | | 7,740 | | | Deutsche Bank AG | | | 7/8/16 | | | | (137) | |
| PLN | | | 20,000 | | | USD | | | 5,203 | | | Deutsche Bank AG | | | 7/8/16 | | | | (134) | |
| SEK | | | 40,000 | | | USD | | | 4,805 | | | Deutsche Bank AG | | | 7/8/16 | | | | (77) | |
| SEK | | | 20,000 | | | USD | | | 2,407 | | | Deutsche Bank AG | | | 7/8/16 | | | | (42) | |
| SEK | | | 60,000 | | | USD | | | 7,291 | | | Deutsche Bank AG | | | 7/8/16 | | | | (199) | |
| SEK | | | 50,000 | | | USD | | | 6,064 | | | Deutsche Bank AG | | | 7/8/16 | | | | (153) | |
| SEK | | | 100,000 | | | USD | | | 12,238 | | | Deutsche Bank AG | | | 7/8/16 | | | | (418) | |
| TRY | | | 180,000 | | | USD | | | 61,695 | | | Deutsche Bank AG | | | 7/8/16 | | | | 764 | |
| TRY | | | 70,000 | | | USD | | | 24,016 | | | Deutsche Bank AG | | | 7/8/16 | | | | 273 | |
| TRY | | | 30,000 | | | USD | | | 10,271 | | | Deutsche Bank AG | | | 7/8/16 | | | | 139 | |
| TRY | | | 30,000 | | | USD | | | 10,317 | | | Deutsche Bank AG | | | 7/8/16 | | | | 93 | |
| TRY | | | 50,000 | | | USD | | | 17,337 | | | Deutsche Bank AG | | | 7/8/16 | | | | 13 | |
| TRY | | | 30,000 | | | USD | | | 10,333 | | | Deutsche Bank AG | | | 7/8/16 | | | | 77 | |
| TRY | | | 30,000 | | | USD | | | 10,354 | | | Deutsche Bank AG | | | 7/8/16 | | | | 56 | |
| TRY | | | 20,000 | | | USD | | | 6,919 | | | Deutsche Bank AG | | | 7/8/16 | | | | 21 | |
| USD | | | 465,046 | | | AUD | | | 630,000 | | | Deutsche Bank AG | | | 7/8/16 | | | | (4,754) | |
| USD | | | 274,043 | | | AUD | | | 370,000 | | | Deutsche Bank AG | | | 7/8/16 | | | | (1,871) | |
| USD | | | 96,025 | | | AUD | | | 130,000 | | | Deutsche Bank AG | | | 7/8/16 | | | | (918) | |
| USD | | | 185,101 | | | CAD | | | 240,000 | | | Deutsche Bank AG | | | 7/8/16 | | | | (667) | |
| USD | | | 84,287 | | | CAD | | | 110,000 | | | Deutsche Bank AG | | | 7/8/16 | | | | (857) | |
| USD | | | 38,337 | | | CAD | | | 50,000 | | | Deutsche Bank AG | | | 7/8/16 | | | | (365) | |
| USD | | | 15,378 | | | CAD | | | 20,000 | | | Deutsche Bank AG | | | 7/8/16 | | | | (102) | |
| USD | | | 461,523 | | | EUR | | | 410,000 | | | Deutsche Bank AG | | | 7/8/16 | | | | 6,480 | |
| USD | | | 1,309,203 | | | EUR | | | 1,180,000 | | | Deutsche Bank AG | | | 7/8/16 | | | | (433) | |
| USD | | | 286,263 | | | EUR | | | 260,000 | | | Deutsche Bank AG | | | 7/8/16 | | | | (2,301) | |
| USD | | | 143,865 | | | EUR | | | 130,000 | | | Deutsche Bank AG | | | 7/8/16 | | | | (417) | |
| USD | | | 22,235 | | | EUR | | | 20,000 | | | Deutsche Bank AG | | | 7/8/16 | | | | 38 | |
| USD | | | 88,816 | | | EUR | | | 80,000 | | | Deutsche Bank AG | | | 7/8/16 | | | | 27 | |
| USD | | | 438,069 | | | GBP | | | 300,000 | | | Deutsche Bank AG | | | 7/8/16 | | | | 38,689 | |
| USD | | | 110,372 | | | GBP | | | 80,000 | | | Deutsche Bank AG | | | 7/8/16 | | | | 3,871 | |
| USD | | | 66,129 | | | GBP | | | 50,000 | | | Deutsche Bank AG | | | 7/8/16 | | | | (434) | |
| USD | | | 53,551 | | | GBP | | | 40,000 | | | Deutsche Bank AG | | | 7/8/16 | | | | 301 | |
| USD | | | 40,511 | | | GBP | | | 30,000 | | | Deutsche Bank AG | | | 7/8/16 | | | | 573 | |
| USD | | | 40,266 | | | GBP | | | 30,000 | | | Deutsche Bank AG | | | 7/8/16 | | | | 328 | |
| USD | | | 898,412 | | | JPY | | | 91,860,000 | | | Deutsche Bank AG | | | 7/8/16 | | | | 8,778 | |
| USD | | | 161,398 | | | MXN | | | 3,020,000 | | | Deutsche Bank AG | | | 7/8/16 | | | | (3,741) | |
| USD | | | 161,398 | | | MXN | | | 3,020,000 | | | Deutsche Bank AG | | | 7/8/16 | | | | (3,741) | |
| USD | | | 8,406 | | | NOK | | | 70,000 | | | Deutsche Bank AG | | | 7/8/16 | | | | 41 | |
| | |
| 32 | | EnTrustPermal Alternative Select VIT Portfolio 2016 Semi-Annual Report |
| | | | | | | | | | | | | | | | | | | | |
Currency
Purchased | | | Currency
Sold | | | Counterparty | | Settlement
Date | | | Unrealized
Appreciation
(Depreciation) | |
| USD | | | 74,511 | | | NOK | | | 630,000 | | | Deutsche Bank AG | | | 7/8/16 | | | $ | (769) | |
| USD | | | 18,690 | | | NOK | | | 160,000 | | | Deutsche Bank AG | | | 7/8/16 | | | | (429) | |
| USD | | | 12,982 | | | NOK | | | 110,000 | | | Deutsche Bank AG | | | 7/8/16 | | | | (162) | |
| USD | | | 2,383 | | | NOK | | | 20,000 | | | Deutsche Bank AG | | | 7/8/16 | | | | (6) | |
| USD | | | 197,565 | | | NZD | | | 280,000 | | | Deutsche Bank AG | | | 7/8/16 | | | | (2,325) | |
| USD | | | 56,628 | | | NZD | | | 80,000 | | | Deutsche Bank AG | | | 7/8/16 | | | | (484) | |
| USD | | | 12,870 | | | PLN | | | 50,000 | | | Deutsche Bank AG | | | 7/8/16 | | | | 198 | |
| USD | | | 2,549 | | | PLN | | | 10,000 | | | Deutsche Bank AG | | | 7/8/16 | | | | 14 | |
| USD | | | 12,531 | | | PLN | | | 50,000 | | | Deutsche Bank AG | | | 7/8/16 | | | | (141) | |
| USD | | | 4,950 | | | PLN | | | 20,000 | | | Deutsche Bank AG | | | 7/8/16 | | | | (119) | |
| USD | | | 2,500 | | | PLN | | | 10,000 | | | Deutsche Bank AG | | | 7/8/16 | | | | (35) | |
| USD | | | 2,511 | | | PLN | | | 10,000 | | | Deutsche Bank AG | | | 7/8/16 | | | | (24) | |
| USD | | | 29,518 | | | SEK | | | 250,000 | | | Deutsche Bank AG | | | 7/8/16 | | | | (34) | |
| USD | | | 12,918 | | | SEK | | | 110,000 | | | Deutsche Bank AG | | | 7/8/16 | | | | (85) | |
| USD | | | 10,549 | | | SEK | | | 90,000 | | | Deutsche Bank AG | | | 7/8/16 | | | | (89) | |
| USD | | | 5,890 | | | SEK | | | 50,000 | | | Deutsche Bank AG | | | 7/8/16 | | | | (20) | |
| USD | | | 5,886 | | | SEK | | | 50,000 | | | Deutsche Bank AG | | | 7/8/16 | | | | (24) | |
| USD | | | 54,563 | | | TRY | | | 160,000 | | | Deutsche Bank AG | | | 7/8/16 | | | | (956) | |
| USD | | | 20,403 | | | TRY | | | 60,000 | | | Deutsche Bank AG | | | 7/8/16 | | | | (417) | |
| USD | | | 2,667 | | | ZAR | | | 40,000 | | | Deutsche Bank AG | | | 7/8/16 | | | | (47) | |
| USD | | | 6,018 | | | ZAR | | | 90,000 | | | Deutsche Bank AG | | | 7/8/16 | | | | (89) | |
| USD | | | 11,071 | | | ZAR | | | 170,000 | | | Deutsche Bank AG | | | 7/8/16 | | | | (464) | |
| USD | | | 2,637 | | | ZAR | | | 40,000 | | | Deutsche Bank AG | | | 7/8/16 | | | | (77) | |
| ZAR | | | 150,000 | | | USD | | | 10,063 | | | Deutsche Bank AG | | | 7/8/16 | | | | 116 | |
| ZAR | | | 100,000 | | | USD | | | 6,745 | | | Deutsche Bank AG | | | 7/8/16 | | | | 41 | |
| ZAR | | | 110,000 | | | USD | | | 7,483 | | | Deutsche Bank AG | | | 7/8/16 | | | | (19) | |
| ZAR | | | 120,000 | | | USD | | | 8,284 | | | Deutsche Bank AG | | | 7/8/16 | | | | (141) | |
| ZAR | | | 30,000 | | | USD | | | 2,007 | | | Deutsche Bank AG | | | 7/8/16 | | | | 29 | |
| ZAR | | | 70,000 | | | USD | | | 4,755 | | | Deutsche Bank AG | | | 7/8/16 | | | | (5) | |
| AUD | | | 4,937,918 | | | USD | | | 3,539,376 | | | Deutsche Bank AG | | | 9/21/16 | | | | 132,987 | |
| BRL | | | 30,000 | | | USD | | | 8,293 | | | Deutsche Bank AG | | | 9/21/16 | | | | 828 | |
| BRL | | | 30,000 | | | USD | | | 8,380 | | | Deutsche Bank AG | | | 9/21/16 | | | | 742 | |
| BRL | | | 170,000 | | | USD | | | 47,557 | | | Deutsche Bank AG | | | 9/21/16 | | | | 4,132 | |
| BRL | | | 10,000 | | | USD | | | 2,815 | | | Deutsche Bank AG | | | 9/21/16 | | | | 225 | |
| BRL | | | 30,000 | | | USD | | | 8,486 | | | Deutsche Bank AG | | | 9/21/16 | | | | 635 | |
| BRL | | | 10,000 | | | USD | | | 2,875 | | | Deutsche Bank AG | | | 9/21/16 | | | | 166 | |
| BRL | | | 20,000 | | | USD | | | 5,760 | | | Deutsche Bank AG | | | 9/21/16 | | | | 321 | |
| CAD | | | 4,093,195 | | | USD | | | 3,148,953 | | | Deutsche Bank AG | | | 9/21/16 | | | | 19,780 | |
| CAD | | | 125,502 | | | USD | | | 95,757 | | | Deutsche Bank AG | | | 9/21/16 | | | | 1,400 | |
| CAD | | | 577,853 | | | USD | | | 447,424 | | | Deutsche Bank AG | | | 9/21/16 | | | | (81) | |
| EUR | | | 3,730,653 | | | USD | | | 4,174,668 | | | Deutsche Bank AG | | | 9/21/16 | | | | (22,853) | |
| EUR | | | 235,176 | | | USD | | | 263,047 | | | Deutsche Bank AG | | | 9/21/16 | | | | (1,322) | |
| | |
| EnTrustPermal Alternative Select VIT Portfolio 2016 Semi-Annual Report | | 33 |
Notes to consolidated financial statements (unaudited) (cont’d)
| | | | | | | | | | | | | | | | | | | | |
Currency
Purchased | | | Currency
Sold | | | Counterparty | | Settlement
Date | | | Unrealized
Appreciation
(Depreciation) | |
| EUR | | | 351,211 | | | USD | | | 396,472 | | | Deutsche Bank AG | | | 9/21/16 | | | $ | (5,612) | |
| EUR | | | 1,014,298 | | | USD | | | 1,125,486 | | | Deutsche Bank AG | | | 9/21/16 | | | | 3,318 | |
| EUR | | | 758,823 | | | USD | | | 845,152 | | | Deutsche Bank AG | | | 9/21/16 | | | | (664) | |
| GBP | | | 1,582,522 | | | USD | | | 2,319,302 | | | Deutsche Bank AG | | | 9/21/16 | | | | (211,006) | |
| GBP | | | 124,963 | | | USD | | | 167,668 | | | Deutsche Bank AG | | | 9/21/16 | | | | (1,187) | |
| GBP | | | 232,250 | | | USD | | | 310,864 | | | Deutsche Bank AG | | | 9/21/16 | | | | (1,451) | |
| INR | | | 2,590,000 | | | USD | | | 38,139 | | | Deutsche Bank AG | | | 9/21/16 | | | | (277) | |
| INR | | | 8,870,000 | | | USD | | | 130,864 | | | Deutsche Bank AG | | | 9/21/16 | | | | (1,199) | |
| INR | | | 2,500,000 | | | USD | | | 36,881 | | | Deutsche Bank AG | | | 9/21/16 | | | | (335) | |
| INR | | | 2,100,000 | | | USD | | | 31,048 | | | Deutsche Bank AG | | | 9/21/16 | | | | (350) | |
| INR | | | 520,000 | | | USD | | | 7,665 | | | Deutsche Bank AG | | | 9/21/16 | | | | (64) | |
| INR | | | 1,130,000 | | | USD | | | 16,525 | | | Deutsche Bank AG | | | 9/21/16 | | | | (6) | |
| INR | | | 1,410,000 | | | USD | | | 20,605 | | | Deutsche Bank AG | | | 9/21/16 | | | | 7 | |
| JPY | | | 19,887,920 | | | USD | | | 180,207 | | | Deutsche Bank AG | | | 9/21/16 | | | | 12,890 | |
| JPY | | | 24,550,228 | | | USD | | | 231,035 | | | Deutsche Bank AG | | | 9/21/16 | | | | 7,330 | |
| JPY | | | 36,892,103 | | | USD | | | 346,577 | | | Deutsche Bank AG | | | 9/21/16 | | | | 11,618 | |
| NOK | | | 1,436,141 | | | USD | | | 172,456 | | | Deutsche Bank AG | | | 9/21/16 | | | | (875) | |
| NOK | | | 1,142,075 | | | USD | | | 138,247 | | | Deutsche Bank AG | | | 9/21/16 | | | | (1,799) | |
| NOK | | | 3,654,517 | | | USD | | | 439,102 | | | Deutsche Bank AG | | | 9/21/16 | | | | (2,482) | |
| NOK | | | 5,138,436 | | | USD | | | 603,567 | | | Deutsche Bank AG | | | 9/21/16 | | | | 10,342 | |
| SEK | | | 1,205,104 | | | USD | | | 145,466 | | | Deutsche Bank AG | | | 9/21/16 | | | | (2,548) | |
| SEK | | | 1,450,415 | | | USD | | | 178,566 | | | Deutsche Bank AG | | | 9/21/16 | | | | (6,555) | |
| SEK | | | 2,703,000 | | | USD | | | 329,072 | | | Deutsche Bank AG | | | 9/21/16 | | | | (8,512) | |
| SEK | | | 356,448 | | | USD | | | 43,071 | | | Deutsche Bank AG | | | 9/21/16 | | | | (799) | |
| SEK | | | 6,296,423 | | | USD | | | 742,072 | | | Deutsche Bank AG | | | 9/21/16 | | | | 4,648 | |
| SGD | | | 667,534 | | | USD | | | 496,886 | | | Deutsche Bank AG | | | 9/21/16 | | | | (1,752) | |
| USD | | | 373,336 | | | AUD | | | 507,278 | | | Deutsche Bank AG | | | 9/21/16 | | | | (3,930) | |
| USD | | | 592,170 | | | AUD | | | 809,644 | | | Deutsche Bank AG | | | 9/21/16 | | | | (9,967) | |
| USD | | | 707,985 | | | AUD | | | 959,033 | | | Deutsche Bank AG | | | 9/21/16 | | | | (5,254) | |
| USD | | | 5,618 | | | BRL | | | 20,000 | | | Deutsche Bank AG | | | 9/21/16 | | | | (463) | |
| USD | | | 2,786 | | | BRL | | | 10,000 | | | Deutsche Bank AG | | | 9/21/16 | | | | (254) | |
| USD | | | 12,027 | | | BRL | | | 40,000 | | | Deutsche Bank AG | | | 9/21/16 | | | | (135) | |
| USD | | | 6,083 | | | BRL | | | 20,000 | | | Deutsche Bank AG | | | 9/21/16 | | | | 2 | |
| USD | | | 786,633 | | | CAD | | | 1,010,510 | | | Deutsche Bank AG | | | 9/21/16 | | | | 4,350 | |
| USD | | | 360,208 | | | CAD | | | 468,978 | | | Deutsche Bank AG | | | 9/21/16 | | | | (2,849) | |
| USD | | | 138,777 | | | CAD | | | 179,938 | | | Deutsche Bank AG | | | 9/21/16 | | | | (521) | |
| USD | | | 806,615 | | | EUR | | | 707,766 | | | Deutsche Bank AG | | | 9/21/16 | | | | 18,948 | |
| USD | | | 1,162,023 | | | EUR | | | 1,021,266 | | | Deutsche Bank AG | | | 9/21/16 | | | | 25,464 | |
| USD | | | 1,215,472 | | | EUR | | | 1,080,425 | | | Deutsche Bank AG | | | 9/21/16 | | | | 13,075 | |
| USD | | | 448,421 | | | EUR | | | 403,968 | | | Deutsche Bank AG | | | 9/21/16 | | | | (1,151) | |
| USD | | | 75,130 | | | GBP | | | 52,000 | | | Deutsche Bank AG | | | 9/21/16 | | | | 5,854 | |
| USD | | | 23,654 | | | INR | | | 1,610,000 | | | Deutsche Bank AG | | | 9/21/16 | | | | 119 | |
| | |
| 34 | | EnTrustPermal Alternative Select VIT Portfolio 2016 Semi-Annual Report |
| | | | | | | | | | | | | | | | | | | | |
Currency
Purchased | | | Currency
Sold | | | Counterparty | | Settlement
Date | | | Unrealized
Appreciation
(Depreciation) | |
| USD | | | 55,374 | | | INR | | | 3,780,000 | | | Deutsche Bank AG | | | 9/21/16 | | | $ | 117 | |
| USD | | | 21,250 | | | INR | | | 1,450,000 | | | Deutsche Bank AG | | | 9/21/16 | | | | 53 | |
| USD | | | 41,766 | | | INR | | | 2,860,000 | | | Deutsche Bank AG | | | 9/21/16 | | | | (42) | |
| USD | | | 18,076 | | | INR | | | 1,240,000 | | | Deutsche Bank AG | | | 9/21/16 | | | | (51) | |
| USD | | | 21,995 | | | INR | | | 1,510,000 | | | Deutsche Bank AG | | | 9/21/16 | | | | (78) | |
| USD | | | 65,978 | | | INR | | | 4,560,000 | | | Deutsche Bank AG | | | 9/21/16 | | | | (682) | |
| USD | | | 16,380 | | | INR | | | 1,130,000 | | | Deutsche Bank AG | | | 9/21/16 | | | | (139) | |
| USD | | | 9,578 | | | INR | | | 660,000 | | | Deutsche Bank AG | | | 9/21/16 | | | | (70) | |
| USD | | | 4,653 | | | INR | | | 320,000 | | | Deutsche Bank AG | | | 9/21/16 | | | | (25) | |
| USD | | | 454,713 | | | JPY | | | 49,817,028 | | | Deutsche Bank AG | | | 9/21/16 | | | | (28,973) | |
| USD | | | 530,491 | | | JPY | | | 54,012,778 | | | Deutsche Bank AG | | | 9/21/16 | | | | 6,067 | |
| USD | | | 120,258 | | | JPY | | | 12,259,941 | | | Deutsche Bank AG | | | 9/21/16 | | | | 1,223 | |
| USD | | | 110,766 | | | JPY | | | 11,354,835 | | | Deutsche Bank AG | | | 9/21/16 | | | | 519 | |
| USD | | | 366,093 | | | NOK | | | 3,040,034 | | | Deutsche Bank AG | | | 9/21/16 | | | | 2,888 | |
| USD | | | 89,265 | | | NOK | | | 739,568 | | | Deutsche Bank AG | | | 9/21/16 | | | | 906 | |
| USD | | | 62,751 | | | NOK | | | 534,120 | | | Deutsche Bank AG | | | 9/21/16 | | | | (1,063) | |
| USD | | | 151,343 | | | NZD | | | 225,959 | | | Deutsche Bank AG | | | 9/21/16 | | | | (9,360) | |
| USD | | | 844,623 | | | NZD | | | 1,270,418 | | | Deutsche Bank AG | | | 9/21/16 | | | | (58,901) | |
| USD | | | 826,345 | | | NZD | | | 1,173,946 | | | Deutsche Bank AG | | | 9/21/16 | | | | (8,568) | |
| USD | | | 477,043 | | | NZD | | | 676,895 | | | Deutsche Bank AG | | | 9/21/16 | | | | (4,366) | |
| USD | | | 504,639 | | | NZD | | | 713,406 | | | Deutsche Bank AG | | | 9/21/16 | | | | (2,737) | |
| USD | | | 125,781 | | | SEK | | | 1,041,730 | | | Deutsche Bank AG | | | 9/21/16 | | | | 2,238 | |
| USD | | | 179,186 | | | SEK | | | 1,450,553 | | | Deutsche Bank AG | | | 9/21/16 | | | | 7,159 | |
| USD | | | 479,092 | | | SEK | | | 4,061,878 | | | Deutsche Bank AG | | | 9/21/16 | | | | (2,624) | |
| USD | | | 12,000 | | | SGD | | | 16,605 | | | Deutsche Bank AG | | | 9/21/16 | | | | (317) | |
| USD | | | 268,834 | | | SGD | | | 363,650 | | | Deutsche Bank AG | | | 9/21/16 | | | | (898) | |
| USD | | | 180,154 | | | SGD | | | 243,255 | | | Deutsche Bank AG | | | 9/21/16 | | | | (277) | |
| AUD | | | 155,305 | | | USD | | | 115,542 | | | Morgan Stanley Capital Services, LLC | | | 9/21/16 | | | | (40) | |
| AUD | | | 77,277 | | | USD | | | 56,911 | | | Morgan Stanley Capital Services, LLC | | | 9/21/16 | | | | 561 | |
| AUD | | | 122,266 | | | USD | | | 90,905 | | | Morgan Stanley Capital Services, LLC | | | 9/21/16 | | | | 25 | |
| CAD | | | 175,480 | | | USD | | | 138,386 | | | Morgan Stanley Capital Services, LLC | | | 9/21/16 | | | | (2,539) | |
| CAD | | | 149,933 | | | USD | | | 117,576 | | | Morgan Stanley Capital Services, LLC | | | 9/21/16 | | | | (1,506) | |
| CAD | | | 304,719 | | | USD | | | 236,414 | | | Morgan Stanley Capital Services, LLC | | | 9/21/16 | | | | (517) | |
| CAD | | | 612,183 | | | USD | | | 469,486 | | | Morgan Stanley Capital Services, LLC | | | 9/21/16 | | | | 4,433 | |
| CAD | | | 1,030,997 | | | USD | | | 788,483 | | | Morgan Stanley Capital Services, LLC | | | 9/21/16 | | | | 9,660 | |
| EUR | | | 198,702 | | | USD | | | 222,799 | | | Morgan Stanley Capital Services, LLC | | | 9/21/16 | | | | (1,665) | |
| EUR | | | 569,894 | | | USD | | | 639,877 | | | Morgan Stanley Capital Services, LLC | | | 9/21/16 | | | | (5,647) | |
| EUR | | | 236,085 | | | USD | | | 268,867 | | | Morgan Stanley Capital Services, LLC | | | 9/21/16 | | | | (6,130) | |
| EUR | | | 379,151 | | | USD | | | 430,945 | | | Morgan Stanley Capital Services, LLC | | | 9/21/16 | | | | (8,991) | |
| GBP | | | 547,619 | | | USD | | | 806,603 | | | Morgan Stanley Capital Services, LLC | | | 9/21/16 | | | | (77,044) | |
| GBP | | | 150,186 | | | USD | | | 219,082 | | | Morgan Stanley Capital Services, LLC | | | 9/21/16 | | | | (18,998) | |
| GBP | | | 49,102 | | | USD | | | 69,705 | | | Morgan Stanley Capital Services, LLC | | | 9/21/16 | | | | (4,289) | |
| | |
| EnTrustPermal Alternative Select VIT Portfolio 2016 Semi-Annual Report | | 35 |
Notes to consolidated financial statements (unaudited) (cont’d)
| | | | | | | | | | | | | | | | | | | | |
Currency
Purchased | | | Currency
Sold | | | Counterparty | | Settlement
Date | | | Unrealized
Appreciation
(Depreciation) | |
| GBP | | | 617,903 | | | USD | | | 833,606 | | | Morgan Stanley Capital Services, LLC | | | 9/21/16 | | | $ | (10,412) | |
| GBP | | | 648,164 | | | USD | | | 871,218 | | | Morgan Stanley Capital Services, LLC | | | 9/21/16 | | | | (7,709) | |
| JPY | | | 214,050,279 | | | USD | | | 1,959,567 | | | Morgan Stanley Capital Services, LLC | | | 9/21/16 | | | | 118,701 | |
| JPY | | | 33,856,585 | | | USD | | | 310,929 | | | Morgan Stanley Capital Services, LLC | | | 9/21/16 | | | | 17,793 | |
| JPY | | | 36,910,261 | | | USD | | | 348,913 | | | Morgan Stanley Capital Services, LLC | | | 9/21/16 | | | | 9,458 | |
| JPY | | | 11,363,505 | | | USD | | | 108,980 | | | Morgan Stanley Capital Services, LLC | | | 9/21/16 | | | | 1,351 | |
| NOK | | | 1,391,356 | | | USD | | | 170,349 | | | Morgan Stanley Capital Services, LLC | | | 9/21/16 | | | | (4,118) | |
| NOK | | | 1,646,657 | | | USD | | | 199,586 | | | Morgan Stanley Capital Services, LLC | | | 9/21/16 | | | | (2,853) | |
| NOK | | | 739,458 | | | USD | | | 88,801 | | | Morgan Stanley Capital Services, LLC | | | 9/21/16 | | | | (455) | |
| NZD | | | 1,001,473 | | | USD | | | 669,975 | | | Morgan Stanley Capital Services, LLC | | | 9/21/16 | | | | 42,275 | |
| NZD | | | 373,384 | | | USD | | | 257,145 | | | Morgan Stanley Capital Services, LLC | | | 9/21/16 | | | | 8,407 | |
| NZD | | | 205,136 | | | USD | | | 145,635 | | | Morgan Stanley Capital Services, LLC | | | 9/21/16 | | | | 258 | |
| NZD | | | 565,746 | | | USD | | | 396,063 | | | Morgan Stanley Capital Services, LLC | | | 9/21/16 | | | | 6,297 | |
| NZD | | | 261,615 | | | USD | | | 183,977 | | | Morgan Stanley Capital Services, LLC | | | 9/21/16 | | | | 2,084 | |
| NZD | | | 310,286 | | | USD | | | 219,721 | | | Morgan Stanley Capital Services, LLC | | | 9/21/16 | | | | 955 | |
| SEK | | | 6,193,822 | | | USD | | | 749,937 | | | Morgan Stanley Capital Services, LLC | | | 9/21/16 | | | | (15,385) | |
| SEK | | | 1,895,083 | | | USD | | | 229,000 | | | Morgan Stanley Capital Services, LLC | | | 9/21/16 | | | | (4,253) | |
| SEK | | | 876,312 | | | USD | | | 103,238 | | | Morgan Stanley Capital Services, LLC | | | 9/21/16 | | | | 688 | |
| SGD | | | 354,962 | | | USD | | | 261,617 | | | Morgan Stanley Capital Services, LLC | | | 9/21/16 | | | | 1,671 | |
| SGD | | | 120,431 | | | USD | | | 88,477 | | | Morgan Stanley Capital Services, LLC | | | 9/21/16 | | | | 851 | |
| SGD | | | 106,374 | | | USD | | | 78,343 | | | Morgan Stanley Capital Services, LLC | | | 9/21/16 | | | | 558 | |
| USD | | | 322,722 | | | AUD | | | 449,981 | | | Morgan Stanley Capital Services, LLC | | | 9/21/16 | | | | (11,932) | |
| USD | | | 1,681,712 | | | AUD | | | 2,345,899 | | | Morgan Stanley Capital Services, LLC | | | 9/21/16 | | | | (62,949) | |
| USD | | | 208,800 | | | AUD | | | 292,491 | | | Morgan Stanley Capital Services, LLC | | | 9/21/16 | | | | (8,727) | |
| USD | | | 833,794 | | | AUD | | | 1,151,471 | | | Morgan Stanley Capital Services, LLC | | | 9/21/16 | | | | (22,563) | |
| USD | | | 121,591 | | | AUD | | | 168,619 | | | Morgan Stanley Capital Services, LLC | | | 9/21/16 | | | | (3,813) | |
| USD | | | 530,569 | | | AUD | | | 712,833 | | | Morgan Stanley Capital Services, LLC | | | 9/21/16 | | | | 430 | |
| USD | | | 271,637 | | | AUD | | | 368,902 | | | Morgan Stanley Capital Services, LLC | | | 9/21/16 | | | | (2,718) | |
| USD | | | 1,064,824 | | | AUD | | | 1,442,909 | | | Morgan Stanley Capital Services, LLC | | | 9/21/16 | | | | (8,277) | |
| USD | | | 100,666 | | | AUD | | | 136,350 | | | Morgan Stanley Capital Services, LLC | | | 9/21/16 | | | | (738) | |
| USD | | | 325,603 | | | AUD | | | 439,270 | | | Morgan Stanley Capital Services, LLC | | | 9/21/16 | | | | (1,085) | |
| USD | | | 3,051,158 | | | CAD | | | 3,965,529 | | | Morgan Stanley Capital Services, LLC | | | 9/21/16 | | | | (18,743) | |
| USD | | | 207,716 | | | CAD | | | 268,734 | | | Morgan Stanley Capital Services, LLC | | | 9/21/16 | | | | (324) | |
| USD | | | 250,260 | | | CAD | | | 327,097 | | | Morgan Stanley Capital Services, LLC | | | 9/21/16 | | | | (2,961) | |
| USD | | | 100,004 | | | CAD | | | 131,000 | | | Morgan Stanley Capital Services, LLC | | | 9/21/16 | | | | (1,409) | |
| USD | | | 249,897 | | | CAD | | | 323,309 | | | Morgan Stanley Capital Services, LLC | | | 9/21/16 | | | | (392) | |
| USD | | | 592,888 | | | CAD | | | 758,536 | | | Morgan Stanley Capital Services, LLC | | | 9/21/16 | | | | 5,670 | |
| USD | | | 203,075 | | | CAD | | | 260,624 | | | Morgan Stanley Capital Services, LLC | | | 9/21/16 | | | | 1,314 | |
| USD | | | 1,326,277 | | | EUR | | | 1,183,399 | | | Morgan Stanley Capital Services, LLC | | | 9/21/16 | | | | 9,281 | |
| USD | | | 50,407 | | | EUR | | | 45,000 | | | Morgan Stanley Capital Services, LLC | | | 9/21/16 | | | | 327 | |
| USD | | | 425,415 | | | EUR | | | 383,886 | | | Morgan Stanley Capital Services, LLC | | | 9/21/16 | | | | (1,808) | |
| USD | | | 4,044,394 | | | GBP | | | 2,791,451 | | | Morgan Stanley Capital Services, LLC | | | 9/21/16 | | | | 325,517 | |
| | |
| 36 | | EnTrustPermal Alternative Select VIT Portfolio 2016 Semi-Annual Report |
| | | | | | | | | | | | | | | | | | | | |
Currency
Purchased | | | Currency
Sold | | | Counterparty | | Settlement
Date | | | Unrealized
Appreciation
(Depreciation) | |
| USD | | | 146,170 | | | GBP | | | 101,101 | | | Morgan Stanley Capital Services, LLC | | | 9/21/16 | | | $ | 11,480 | |
| USD | | | 48,945 | | | GBP | | | 33,392 | | | Morgan Stanley Capital Services, LLC | | | 9/21/16 | | | | 4,459 | |
| USD | | | 245,228 | | | JPY | | | 27,194,641 | | | Morgan Stanley Capital Services, LLC | | | 9/21/16 | | | | (18,812) | |
| USD | | | 150,192 | | | JPY | | | 16,279,472 | | | Morgan Stanley Capital Services, LLC | | | 9/21/16 | | | | (7,870) | |
| USD | | | 273,577 | | | JPY | | | 29,246,055 | | | Morgan Stanley Capital Services, LLC | | | 9/21/16 | | | | (10,380) | |
| USD | | | 223,641 | | | JPY | | | 22,655,180 | | | Morgan Stanley Capital Services, LLC | | | 9/21/16 | | | | 3,676 | |
| USD | | | 403,263 | | | NOK | | | 3,360,109 | | | Morgan Stanley Capital Services, LLC | | | 9/21/16 | | | | 1,818 | |
| USD | | | 341,868 | | | NOK | | | 2,896,849 | | | Morgan Stanley Capital Services, LLC | | | 9/21/16 | | | | (4,230) | |
| USD | | | 501,631 | | | NOK | | | 4,202,775 | | | Morgan Stanley Capital Services, LLC | | | 9/21/16 | | | | (491) | |
| USD | | | 255,924 | | | NZD | | | 379,518 | | | Morgan Stanley Capital Services, LLC | | | 9/21/16 | | | | (13,990) | |
| USD | | | 99,116 | | | NZD | | | 146,414 | | | Morgan Stanley Capital Services, LLC | | | 9/21/16 | | | | (5,014) | |
| USD | | | 428,258 | | | NZD | | | 610,959 | | | Morgan Stanley Capital Services, LLC | | | 9/21/16 | | | | (6,257) | |
| USD | | | 197,761 | | | SEK | | | 1,631,605 | | | Morgan Stanley Capital Services, LLC | | | 9/21/16 | | | | 4,262 | |
| USD | | | 2,600,736 | | | SEK | | | 21,571,972 | | | Morgan Stanley Capital Services, LLC | | | 9/21/16 | | | | 42,422 | |
| USD | | | 393,852 | | | SEK | | | 3,194,693 | | | Morgan Stanley Capital Services, LLC | | | 9/21/16 | | | | 14,979 | |
| USD | | | 90,169 | | | SEK | | | 739,419 | | | Morgan Stanley Capital Services, LLC | | | 9/21/16 | | | | 2,478 | |
| USD | | | 192,760 | | | SEK | | | 1,632,901 | | | Morgan Stanley Capital Services, LLC | | | 9/21/16 | | | | (893) | |
| USD | | | 159,461 | | | SGD | | | 219,953 | | | Morgan Stanley Capital Services, LLC | | | 9/21/16 | | | | (3,686) | |
| USD | | | 1,329,923 | | | SGD | | | 1,832,501 | | | Morgan Stanley Capital Services, LLC | | | 9/21/16 | | | | (29,309) | |
| USD | | | 239,673 | | | SGD | | | 331,092 | | | Morgan Stanley Capital Services, LLC | | | 9/21/16 | | | | (5,910) | |
| USD | | | 355,659 | | | SGD | | | 490,071 | | | Morgan Stanley Capital Services, LLC | | | 9/21/16 | | | | (7,845) | |
| USD | | | 215,577 | | | SGD | | | 297,162 | | | Morgan Stanley Capital Services, LLC | | | 9/21/16 | | | | (4,839) | |
| USD | | | 292,220 | | | SGD | | | 398,582 | | | Morgan Stanley Capital Services, LLC | | | 9/21/16 | | | | (3,423) | |
| USD | | | 200,809 | | | SGD | | | 273,060 | | | Morgan Stanley Capital Services, LLC | | | 9/21/16 | | | | (1,730) | |
| USD | | | 485,795 | | | SGD | | | 659,152 | | | Morgan Stanley Capital Services, LLC | | | 9/21/16 | | | | (3,122) | |
| USD | | | 278,871 | | | SGD | | | 375,332 | | | Morgan Stanley Capital Services, LLC | | | 9/21/16 | | | | 473 | |
| USD | | | 415,171 | | | SGD | | | 561,729 | | | Morgan Stanley Capital Services, LLC | | | 9/21/16 | | | | (1,483) | |
| Total | | | | | | $ | 65,587 | |
| | |
Abbreviations used in this table: |
| AUD | | — Australian Dollar |
| BRL | | — Brazilian Real |
| CAD | | — Canadian Dollar |
| EUR | | — Euro |
| GBP | | — British Pound |
| INR | | — Indian Rupee |
| JPY | | — Japanese Yen |
| MXN | | — Mexican Peso |
| NOK | | — Norwegian Krone |
| NZD | | — New Zealand Dollar |
| PLN | | — Polish Zloty |
| SEK | | — Swedish Krona |
| SGD | | — Singapore Dollar |
| TRY | | — Turkish Lira |
| USD | | — United States Dollar |
| ZAR | | — South African Rand |
| | |
| EnTrustPermal Alternative Select VIT Portfolio 2016 Semi-Annual Report | | 37 |
Notes to consolidated financial statements (unaudited) (cont’d)
At June 30, 2016, the Portfolio had the following open swap contracts:
| | | | | | | | | | | | | | | | | | | | |
| OTC TOTAL RETURN SWAPS | |
Swap
Counterparty | | Notional
Amount* | | | Termination
Date | | | Periodic
Payments
Received by
the Portfolio | | Periodic
Payments
Made by
the Portfolio | | Upfront
Premiums
Paid
(Received) | | | Unrealized
Appreciation
(Depreciation) | |
| Deutsche Bank AG | | | 39,905 | EUR | | | 4/21/17 | | | ESTX 50 Price Index† | | 1-Month LIBOR plus
110 basis points | | | — | | | $ | 223 | |
| Deutsche Bank AG | | | 429,341 | HKD | | | 4/21/17 | | | Huaneng Power International Inc.† | | 1-Month LIBOR plus
55 basis points | | | — | | | | 10,161 | |
| Deutsche Bank AG | | | 519,318 | HKD | | | 4/21/17 | | | CGN Power Co., Ltd.† | | 1-Month LIBOR plus
55 basis points | | | — | | | | 9,594 | |
| Deutsche Bank AG | | | 51,751 | GBP | | | 4/21/17 | | | 1-Month LIBOR plus 45 basis points | | Pennon Group PLC† | | | — | | | | 7,685 | |
| Deutsche Bank AG | | | 49,776 | GBP | | | 4/21/17 | | | 1-Month LIBOR plus 45 basis points | | Centrica PLC† | | | — | | | | 7,209 | |
| Deutsche Bank AG | | | 50,930 | GBP | | | 4/21/17 | | | 1-Month LIBOR plus 45 basis points | | United Utilities
Group PLC† | | | — | | | | 6,617 | |
| Deutsche Bank AG | | | 51,316 | GBP | | | 4/21/17 | | | 1-Month LIBOR plus 45 basis points | | Severn Trent PLC† | | | — | | | | 5,821 | |
| Deutsche Bank AG | | | 92,683 | EUR | | | 4/21/17 | | | CAC 40 Index† | | 1-Month LIBOR plus
110 basis points | | | — | | | | 4,102 | |
| Deutsche Bank AG | | | 13,501 | EUR | | | 4/21/17 | | | CAC 40 Index† | | 1-Month LIBOR plus
110 basis points | | | — | | | | 875 | |
| Deutsche Bank AG | | | 184,230 | HKD | | | 4/21/17 | | | Shanghai Electric Group Co., Ltd.† | | 1-Month LIBOR plus
372 basis points | | | — | | | | 603 | |
| Deutsche Bank AG | | | 87,227 | EUR | | | 4/21/17 | | | Stoxx Europe 600 Utilities† | | 1-Month LIBOR plus
110 basis points | | | — | | | | (1,030) | |
| Deutsche Bank AG | | | 271,658 | HKD | | | 4/21/17 | | | HK Electric Investments and HK Electric Investments Ltd.† | | 1-Month LIBOR plus
55 basis points | | | — | | | | (1,578) | |
| Deutsche Bank AG | | | 43,053 | GBP | | | 4/21/17 | | | Drax Group PLC† | | 1-Month LIBOR plus
50 basis points | | | — | | | | (1,950) | |
| Deutsche Bank AG | | | 934,292 | HKD | | | 4/21/17 | | | China Shenhua Energy Co., Ltd.† | | 1-Month LIBOR plus
55 basis points | | | — | | | | (17,318) | |
| Deutsche Bank AG | | | 103,556 | EUR | | | 4/21/17 | | | ESTX 50 Price Index† | | 1-Month LIBOR plus
110 basis points | | | — | | | | (2,709) | |
| Deutsche Bank AG | | | 25,098 | GBP | | | 4/21/17 | | | National Grid PLC† | | 1-Month LIBOR plus
50 basis points | | | — | | | | 3,065 | |
| Deutsche Bank AG | | | 185,330 | HKD | | | 4/21/17 | | | Huadian Power International Corp., Ltd.† | | 1-Month LIBOR plus
55 basis points | | | — | | | | 1,874 | |
| Deutsche Bank AG | | | 129,799 | HKD | | | 4/21/17 | | | China Resources Power Holdings Co., Ltd.† | | 1-Month LIBOR plus
55 basis points | | | — | | | | 1,531 | |
| Deutsche Bank AG | | | 231,994 | EUR | | | 4/28/17 | | | 1-Month LIBOR plus 45 basis points | | Engie† | | | — | | | | 22,245 | |
| Deutsche Bank AG | | | 161,573 | EUR | | | 4/28/17 | | | 1-Month LIBOR plus 45 basis points | | Gamesa Corporacion
Tecnologica SA† | | | — | | | | 3,927 | |
| Deutsche Bank AG | | | 48,403 | EUR | | | 4/28/17 | | | Energias de Portugal SA† | | 1-Month LIBOR plus
50 basis points | | | — | | | | 3,132 | |
| | |
| 38 | | EnTrustPermal Alternative Select VIT Portfolio 2016 Semi-Annual Report |
| | | | | | | | | | | | | | | | | | | | |
| OTC TOTAL RETURN SWAPS | |
Swap
Counterparty | | Notional
Amount* | | | Termination
Date | | | Periodic
Payments
Received by
the Portfolio | | Periodic
Payments
Made by
the Portfolio | | Upfront
Premiums
Paid
(Received) | | | Unrealized
Appreciation
(Depreciation) | |
| Deutsche Bank AG | | | 20,238 | EUR | | | 4/28/17 | | | Abertis Infraestructuras SA† | | 1-Month LIBOR plus
50 basis points | | | — | | | $ | 486 | |
| Deutsche Bank AG | | | 67,312 | EUR | | | 4/28/17 | | | Iberdrola SA† | | 1-Month LIBOR plus
50 basis points | | | — | | | | 158 | |
| Deutsche Bank AG | | | 45,667 | EUR | | | 4/28/17 | | | Endesa SA† | | 1-Month LIBOR plus
50 basis points | | | — | | | | 36 | |
| Deutsche Bank AG | | | 216,979 | EUR | | | 4/28/17 | | | 1-Month LIBOR plus 45 basis points | | EDP Renovaveis SA† | | | — | | | | (142) | |
| Deutsche Bank AG | | | 87,833 | EUR | | | 4/28/17 | | | 1-Month LIBOR plus 45 basis points | | Aena SA† | | | — | | | | (1,282) | |
| Deutsche Bank AG | | | 12,569 | EUR | | | 4/28/17 | | | 1-Month LIBOR plus 90 basis points | | Public Power Corp.† | | | — | | | | (2,972) | |
| Deutsche Bank AG | | | 155,587 | EUR | | | 4/28/17 | | | 1-Month LIBOR plus 45 basis points | | Veolia Environnement
SA† | | | — | | | | (3,741) | |
| Deutsche Bank AG | | | 82,815 | EUR | | | 4/28/17 | | | 1-Month LIBOR plus 45 basis points | | Ferrovial SA† | | | — | | | | (4,623) | |
| Deutsche Bank AG | | | 44,414 | EUR | | | 4/28/17 | | | 1-Month LIBOR plus 45 basis points | | Suez Environnement
Co.† | | | — | | | | (4,772) | |
| Deutsche Bank AG | | | 93,075 | EUR | | | 4/28/17 | | | 1-Month LIBOR plus 45 basis points | | Philips Lighting NV† | | | — | | | | (5,838) | |
| Deutsche Bank AG | | | 106,809 | EUR | | | 4/28/17 | | | 1-Month LIBOR plus 45 basis points | | Electricite de France† | | | — | | | | (7,176) | |
| Deutsche Bank AG | | | 174,933 | EUR | | | 4/28/17 | | | 1-Month LIBOR plus 45 basis points | | Groupe
Eurotunnel SE† | | | — | | | | (18,575) | |
| Deutsche Bank AG | | | 28,671 | | | | 5/1/17 | | | S-Oil Corp.† | | 1-Month LIBOR plus
60 basis points | | | — | | | | 3,961 | |
| Deutsche Bank AG | | | 852,673 | MXN | | | 7/3/17 | | | 28 day TIIE plus 70 basis points | | OHL Mexico SAB de
CV† | | | — | | | | 107 | |
| Deutsche Bank AG | | | 269,795 | MXN | | | 7/3/17 | | | 28 day TIIE plus 70 basis points | | OHL Mexico SAB de
CV† | | | — | | | | 511 | |
| Deutsche Bank AG | | | 52,992 | | | | 4/24/18 | | | 1-Month LIBOR plus 50 basis points | | CCR SA† | | | — | | | | 10,368 | |
| Deutsche Bank AG | | | 36,217 | | | | 4/24/18 | | | 1-Month LIBOR plus 50 basis points | | Cia de Saneamento
Basico do Estado de
Sau Paulo† | | | — | | | | 7,199 | |
| Deutsche Bank AG | | | 37,035 | | | | 4/24/18 | | | 1-Month LIBOR plus 50 basis points | | Equatorial Energia
SA† | | | — | | | | 6,098 | |
| Deutsche Bank AG | | | 38,864 | | | | 4/24/18 | | | 1-Month LIBOR plus 50 basis points | | Companhia
de Transmissao de
Energia Eletrica
Paulista† | | | — | | | | 5,166 | |
| Deutsche Bank AG | | | 18,051 | | | | 4/24/18 | | | 1-Month LIBOR plus 50 basis points | | Ecorodovias
Infraestrutura e
Logistica SA† | | | — | | | | 4,398 | |
| Deutsche Bank AG | | | 25,911 | | | | 4/24/18 | | | 1-Month LIBOR plus 50 basis points | | CPFL Energia SA† | | | — | | | | 4,279 | |
| | |
| EnTrustPermal Alternative Select VIT Portfolio 2016 Semi-Annual Report | | 39 |
Notes to consolidated financial statements (unaudited) (cont’d)
| | | | | | | | | | | | | | | | | | | | | | |
| OTC TOTAL RETURN SWAPS | |
Swap
Counterparty | | Notional
Amount* | | | Termination
Date | | | Periodic
Payments
Received by
the Portfolio | | Periodic
Payments
Made by
the Portfolio | | | Upfront
Premiums
Paid
(Received) | | | Unrealized
Appreciation
(Depreciation) | |
| Deutsche Bank AG | | | 27,361 | | | | 4/24/18 | | | 1-Month LIBOR plus 50 basis points | |
| Companhia
Paranaense de
Energia-Copel† |
| | | — | | | $ | 3,348 | |
| Deutsche Bank AG | | | 28,783 | | | | 4/24/18 | | | 1-Month LIBOR plus 50 basis points | | | AES Tiete Energia SA† | | | | — | | | | 1,213 | |
| Total | | | | | | | | | | | | | | | | | — | | | $ | 62,286 | |
| * | Notional amount denominated in U.S. dollars, unless otherwise noted. |
| † | Periodic payments made/received by the Portfolio are based on the total return of the referenced entity. |
| | |
Abbreviations used in this table: |
| EUR | | — Euro |
| GBP | | — British Pound |
| HKD | | — Hong Kong Dollar |
| LIBOR | | — London Interbank Offered Rate |
| MXN | | — Mexican Peso |
| TIIE | | — Interbank Equilibrium Interest Rate |
4. Derivative instruments and hedging activities
Below is a table, grouped by derivative type, that provides information about the fair value and the location of derivatives within the Consolidated Statement of Assets and Liabilities at June 30, 2016.
| | | | | | | | | | | | | | | | | | | | |
| ASSET DERIVATIVES1 | |
| | | Interest
Rate Risk | | | Foreign
Exchange Risk | | | Equity
Risk | | | Commodity
Risk | | | Total | |
| Purchased options2 | | | — | | | | — | | | $ | 46 | | | | — | | | $ | 46 | |
| Futures contracts3 | | $ | 83,548 | | | | — | | | | 26,615 | | | $ | 45,880 | | | | 156,043 | |
| OTC swap contracts4 | | | — | | | | — | | | | 135,992 | | | | — | | | | 135,992 | |
| Forward foreign currency contracts | | | — | | | $ | 1,061,002 | | | | — | | | | — | | | | 1,061,002 | |
| Total | | $ | 83,548 | | | $ | 1,061,002 | | | $ | 162,653 | | | $ | 45,880 | | | $ | 1,353,083 | |
| | | | | | | | | | | | | | | | |
| LIABILITY DERIVATIVES1 | |
| | | Foreign
Exchange Risk | | | Equity
Risk | | | Commodity
Risk | | | Total | |
| Futures contracts3 | | | — | | | $ | 2,252 | | | $ | 25,330 | | | $ | 27,582 | |
| OTC swap contracts4 | | | — | | | | 73,706 | | | | — | | | | 73,706 | |
| Forward foreign currency contracts | | $ | 995,415 | | | | — | | | | — | | | | 995,415 | |
| Total | | $ | 995,415 | | | $ | 75,958 | | | $ | 25,330 | | | $ | 1,096,703 | |
| 1 | Generally, the balance sheet location for asset derivatives is receivables/net unrealized appreciation (depreciation) and for liability derivatives is payables/net unrealized appreciation (depreciation). |
| 2 | Market value of purchased options is reported in Investments at value in the Consolidated Statement of Assets and Liabilities. |
| 3 | Includes cumulative appreciation (depreciation) of futures contracts as reported in the footnotes. Only variation margin is reported within the receivables and/or payables on the Consolidated Statement of Assets and Liabilities. |
| 4 | Values include premiums paid (received) on swap contracts which are shown separately in the Consolidated Statement of Assets and Liabilities. |
| | |
| 40 | | EnTrustPermal Alternative Select VIT Portfolio 2016 Semi-Annual Report |
The following tables provide information about the effect of derivatives and hedging activities on the Portfolio’s Consolidated Statement of Operations for the six months ended June 30, 2016. The first table provides additional detail about the amounts and sources of gains (losses) realized on derivatives during the period. The second table provides additional information about the change in unrealized appreciation (depreciation) resulting from the Portfolio’s derivatives and hedging activities during the period.
| | | | | | | | | | | | | | | | | | | | | | | | |
| AMOUNT OF REALIZED GAIN (LOSS) ON DERIVATIVES RECOGNIZED | |
| | | Interest
Rate Risk | | | Foreign
Exchange Risk | | | Credit
Risk | | | Equity
Risk | | | Commodity
Risk | | | Total | |
| Purchased options1 | | | — | | | $ | (47,040) | | | | — | | | $ | 31,991 | | | | — | | | $ | (15,049) | |
| Written options | | | — | | | | (51,410) | | | | — | | | | (52,619) | | | | — | | | | (104,029) | |
| Futures contracts | | $ | 134,568 | | | | — | | | | — | | | | (262,200) | | | $ | (38,304) | | | | (165,936) | |
| Swap contracts | | | — | | | | — | | | $ | 171 | | | | 280,207 | | | | — | | | | 280,378 | |
| Forward foreign currency contracts2 | | | — | | | | (59,855) | | | | — | | | | — | | | | — | | | | (59,855) | |
| Total | | $ | 134,568 | | | $ | (158,305) | | | $ | 171 | | | $ | (2,621) | | | $ | (38,304) | | | $ | (64,491) | |
| 1 | Net realized gain (loss) from purchased options is reported in net realized gain (loss) from investment transactions in the Consolidated Statement of Operations. |
| 2 | Net realized gain (loss) from forward foreign currency contracts is reported in net realized gain (loss) from foreign currency transactions in the Consolidated Statement of Operations. |
| | | | | | | | | | | | | | | | | | | | | | | | |
| CHANGE IN UNREALIZED APPRECIATION (DEPRECIATION) ON DERIVATIVES RECOGNIZED | |
| | | Interest
Rate Risk | | | Foreign
Exchange Risk | | | Credit
Risk | | | Equity
Risk | | | Commodity
Risk | | | Total | |
| Purchased options1 | | | — | | | $ | 26,987 | | | | — | | | $ | (106,154) | | | | — | | | $ | (79,167) | |
| Written options | | | — | | | $ | (1,504) | | | | — | | | | 42,329 | | | | — | | | | 40,825 | |
| Futures contracts | | $ | 78,679 | | | | — | | | | — | | | | 49,728 | | | $ | 17,145 | | | | 145,552 | |
| Swap contracts | | | — | | | | — | | | | (130) | | | | (42,645) | | | | — | | | | (42,775) | |
| Forward foreign currency contracts2 | | | — | | | | 56,077 | | | | — | | | | — | | | | — | | | | 56,077 | |
| Total | | $ | 78,679 | | | $ | 81,560 | | | $ | (130) | | | $ | (56,742) | | | $ | 17,145 | | | $ | 120,512 | |
| 1 | The change in unrealized appreciation (depreciation) from purchased options is reported in the change in net unrealized appreciation (depreciation) from investments in the Consolidated Statement of Operations. |
| 2 | The change in unrealized appreciation (depreciation) from forward foreign currency contracts is reported in the change in net unrealized appreciation (depreciation) from foreign currencies in the Consolidated Statement of Operations. |
During the six months ended June 30, 2016, the volume of derivative activity for the Portfolio was as follows:
| | | | |
| | | Average Market
Value | |
| Purchased options | | $ | 53,231 | |
| Written options† | | | 43,138 | |
| Futures contracts (to buy) | | | 30,804,909 | |
| Futures contracts (to sell) | | | 2,502,230 | |
| Forward foreign currency contracts (to buy) | | | 31,849,078 | |
| Forward foreign currency contracts (to sell) | | | 34,537,220 | |
| | |
| EnTrustPermal Alternative Select VIT Portfolio 2016 Semi-Annual Report | | 41 |
Notes to consolidated financial statements (unaudited) (cont’d)
| | | | |
| | | Average Notional
Balance | |
| Credit default swap contracts (to sell protection)† | | $ | 4,286 | |
| Total return swap contracts | | | 1,702,517 | |
| † | At June 30, 2016, there were no open positions held in this derivative. |
The following table presents by financial instrument, the Portfolio’s derivative assets net of the related collateral received by the Portfolio at June 30, 2016:
| | | | | | | | | | | | |
| | | Gross Amount of Derivative
Assets in the Consolidated
Statement of Assets and
Liabilities1 | | | Collateral
Received | | | Net
Amount | |
| Purchased options2 | | $ | 46 | | | | — | | | $ | 46 | |
| Futures contracts3 | | | 128,559 | | | | — | | | | 128,559 | |
| OTC swap contracts | | | 135,992 | | | | — | | | | 135,992 | |
| Forward foreign currency contracts | | | 1,061,002 | | | | — | | | | 1,061,002 | |
| Total | | $ | 1,325,599 | | | | — | | | $ | 1,325,599 | |
The following table presents by financial instrument, the Portfolio’s derivative liabilities net of the related collateral pledged by the Portfolio at June 30, 2016:
| | | | | | | | | | | | |
| | | Gross Amount of Derivative
Liabilities in the Consolidated
Statement of Assets and
Liabilities1 | | | Collateral
Pledged4,5 | | | Net
Amount | |
| OTC swap contracts | | $ | 73,706 | | | $ | (73,706) | | | | — | |
| Forward foreign currency contracts | | | 995,415 | | | | (545,141) | | | $ | 450,274 | |
| Total | | $ | 1,069,121 | | | $ | (618,847) | | | $ | 450,274 | |
| 1 | Absent an event of default or early termination, derivative assets and liabilities are presented gross and not offset in the Consolidated Statement of Assets and Liabilities. |
| 2 | Market value of purchased options is shown in Investments at value in the Consolidated Statement of Assets and Liabilities. |
| 3 | Amount represents the current day’s variation margin as reported in the Consolidated Statement of Assets and Liabilities. It differs from the cumulative appreciation (depreciation) presented in the previous table. |
| 4 | Gross amounts are not offset in the Consolidated Statement of Assets and Liabilities. |
| 5 | In some instances, the actual collateral received and/or pledged may be more than the amount shown here due to overcollateralization. |
5. Shares of beneficial interest
At June 30, 2016, the Trust had an unlimited number of shares of beneficial interest authorized with a par value of $0.00001 per share.
| | |
| 42 | | EnTrustPermal Alternative Select VIT Portfolio 2016 Semi-Annual Report |
Transactions in shares of the Portfolio were as follows:
| | | | | | | | |
| | | Six Months Ended
June 30, 2016 | | | Year Ended
December 31, 2015 | |
| Class II | | | | | | | | |
| Shares sold | | | 371,291 | | | | 1,203,594 | |
| Shares issued on reinvestment | | | 1,643 | | | | 65,438 | |
| Shares repurchased | | | (40,763) | | | | (5,481) | |
| Net increase | | | 332,171 | | | | 1,263,551 | |
6. Deferred capital losses
As of December 31, 2015, the Portfolio had deferred capital losses of $757,719, which have no expiration date, that will be available to offset future taxable capital gains.
| | |
| EnTrustPermal Alternative Select VIT Portfolio 2016 Semi-Annual Report | | 43 |
Board approval of management and subadvisory agreements (unaudited)
At a meeting of the Trust’s Board of Trustees held in March 2016 (the “March Board Meeting”), the Board approved the Investment Management Agreement of EnTrustPermal Alternative Select VIT Portfolio (the “Fund”), pursuant to which EnTrustPermal Management LLC (“EnTrustPermal” or the “Manager”) serves as “manager of managers” for the Fund (the “EnTrustPermal Management Agreement”), and the separate Sub-Advisory Agreements between EnTrustPermal and Atlantic Investment Management, Inc., Electron Capital Partners, LLC, First Quadrant, L.P., River Canyon Fund Management LLC and TT International, and the Trading Agreement between the Manager and BH-DG Systematic Trading LLP (collectively with Atlantic Investment Management, Inc., Electron Capital Partners, LLC, First Quadrant, L.P., River Canyon Fund Management LLC and TT International, the “Sub-Advisers”), pursuant to which each Sub-Adviser provides day-to-day management of a percentage of the Fund’s portfolio allocated to it by the Manager. (The Sub-Advisory Agreements and Trading Agreement are collectively referred to as the “Sub-Advisory Agreements” and, together with the EnTrustPermal Management Agreement, as the “New Agreements.”) The Manager is a subsidiary of Legg Mason, Inc. (“Legg Mason”). Shareholders of the Fund approved the EnTrustPermal Management Agreement at a special meeting of shareholders on May 20, 2016.
The New Agreements replace the Investment Management Agreement of the Fund and Permal Asset Management LLC (“Permal” or the “Manager”), pursuant to which Permal served as “manager of managers” for the Fund (the “Permal Management Agreement”), and the separate Sub-Advisory Agreements between Permal and the Sub-Advisers, pursuant to which each Sub-Adviser provided day-to-day management of a percentage of the Fund’s portfolio allocated to it by the Manager (collectively with the Permal Management Agreement, the “Prior Agreements” and together with the New Agreements, the “Agreements”), which the Board approved at meetings held prior to the March Board Meeting (the “Prior Board Meeting”). At the Prior Board Meeting, the Trustees who are not “interested persons” (as defined in the Investment Company Act of 1940, as amended (the “Independent Trustees”)) of the Fund were assisted in their review by Fund counsel and independent legal counsel and met with independent legal counsel in executive sessions separate from representatives of the Manager and the Sub-Advisers. The Independent Trustees requested and received information from Permal and the Sub-Advisers they deemed reasonably necessary for their review of the Prior Agreements and the performance and services provided by Permal and the Sub-Advisers. Included was information about Permal, the Sub-Advisers and the Fund’s distributor, as well as the management, sub-advisory, administration and distribution arrangements for the Fund and other funds overseen by the Board. This information was initially reviewed, except in connection with the subsequent meeting held to approve the Sub-Advisory Agreement between Permal and Electron Capital Partners, LLC, by a special committee of the Independent Trustees and then by the full Board. The Prior Agreements terminated as a result of a “change in control” in the ultimate ownership of Permal, then a subsidiary of Legg Mason, when Legg Mason acquired a majority ownership interest in EnTrust Capital (“EnTrust”) and combined EnTrust with Permal (the “Combination”).
| | |
| 44 | | EnTrustPermal Alternative Select VIT Portfolio |
At the March Board Meeting, management represented to the Independent Trustees that there were no material changes to the information presented at the Prior Board Meeting relevant to the Board’s consideration of the New Agreements, other than the information about EnTrustPermal and the Combination. Based on management’s representation that the Combination was not expected to have a material impact on the nature, extent or quality of the investment management services that Permal provided to the Fund, that the Permal personnel who were principally responsible for managing the Fund’s investment portfolio would continue to serve in their respective capacities following the Combination and that the terms of each New Agreement were substantially similar in material respects to the respective Prior Agreement, the Board considered information presented to them as part of the annual agreement review process at the Prior Board Meeting, as well as information about EnTrust, EnTrustPermal and the Combination received at the March Board Meeting. In connection with the March Board Meeting, the Independent Trustees requested, and Permal and EnTrust provided, materials relating to the Combination, EnTrust and EnTrustPermal in connection with the Board’s consideration of whether to approve the New Agreements. This information included a description of the Combination and its anticipated effects on EnTrust and Permal as well as information regarding EnTrust and its business activities, personnel and affiliates. The Board noted that the terms of the EnTrustPermal Management Agreement were not materially different from the terms of the Permal Management Agreement, except with respect to the names of the parties and the effective dates, and that there were no long-term or short-term plans to make changes to the management or investment policies, strategies or objectives of the Fund as a result of the Combination. Management also represented that under the EnTrustPermal Management Agreement there would be no diminution in services provided by the Manager or changes in the fees payable by the Fund as a result of the Combination. The Board also considered the substance of discussions with representatives of Permal at the Prior Board Meeting and representatives of Permal and EnTrust at the March Board Meeting. The Independent Trustees were separately represented by counsel that is independent of Permal and EnTrust in connection with their consideration of approval of the EnTrustPermal Management Agreement.
In voting to approve the Agreements, the Board considered whether the approval of the Agreements would be in the best interests of the Fund and its shareholders, an evaluation based on several factors including those discussed below.
Nature, extent and quality of the services provided to the fund under the agreements
The Board received and considered information regarding the nature, extent and quality of services provided to the Fund by the Manager and the Sub-Advisers under the Investment Management Agreement and Sub-Advisory Agreements, respectively, since the Fund commenced operations. The Independent Trustees considered information regarding the process by which the Manager selected and recommended the Sub-Advisers for Board approval and the Manager’s supervisory activities over the Sub-Advisers. In addition, the
| | |
| EnTrustPermal Alternative Select VIT Portfolio | | 45 |
Board approval of management and subadvisory agreements (unaudited) (cont’d)
Independent Trustees received and considered other information regarding the administrative and other services rendered to the Fund and its shareholders by the Manager and its affiliates. The Board noted information received at regular meetings throughout the year related to the services rendered by the Manager in its management of another fund in the Legg Mason fund complex. The Independent Trustees considered each Sub-Adviser’s specific responsibilities in all aspects of the day-to-day management of the portion of the Fund’s assets allocated to it, as well as the qualifications, experience and responsibilities of the persons who would serve as the portfolio managers for the segment of the Fund’s assets to be managed by the respective Sub-Adviser, and other key personnel at the Sub-Adviser. The Independent Trustees specifically took into account each Sub-Adviser’s investment process and capabilities, evaluating how the Sub-Adviser would complement each of the other Sub-Advisers. The Independent Trustees also discussed the acceptability of the terms of the Sub-Advisory Agreements. The Independent Trustees also considered the Manager’s favorable assessment of the nature and quality of the sub-advisory services provided or expected to be provided to the Fund by each Sub-Adviser. The Board reviewed information received from the Manager and the Fund’s Chief Compliance Officer regarding the Fund’s compliance policies and procedures established pursuant to Rule 38a-1 under the Investment Company Act of 1940, as amended, and those of each Sub-Adviser.
The Trustees then discussed with representatives of management the portfolio management strategy of the Fund’s portfolio managers. The Trustees noted that the Manager was committed to providing the resources necessary to assist the Fund’s portfolio managers in managing the Fund. The Board also considered, based on its knowledge of Legg Mason, the Manager and the Manager’s affiliates, the financial resources available to the Manager.
The Board also considered the division of responsibilities among the Manager and the Sub-Advisers and the oversight provided by the Manager and its affiliates. The Board also considered the Manager’s and Sub-Advisers’ brokerage policies and practices, the standards applied in seeking best execution, their policies and practices regarding soft dollars, and the existence of quality controls applicable to brokerage allocation procedures.
At the March Board Meeting, the Board received and considered information confirming that the nature, extent and quality of services to be provided to the Fund by EnTrustPermal under the EnTrustPermal Management Agreement would not change as a result of the Combination. The Trustees then discussed with management the portfolio management strategies of the Fund’s portfolio managers and noted that there were currently no long-term or short-term plans to make changes to the management or investment policies, strategies or objectives of the Fund as a result of the Combination. The Trustees noted that EnTrustPermal was committed to providing the resources necessary to assist the Fund’s portfolio managers in managing the Fund. At the March Board Meeting, the Board considered the fact that EnTrust does not currently provide investment advisory services to registered investment companies, but noted that the Permal personnel who have been principally responsible for managing the Fund’s investment portfolio and overseeing
| | |
| 46 | | EnTrustPermal Alternative Select VIT Portfolio |
compliance matters would continue to serve in their respective capacities following the Combination. The Board also considered, based on its knowledge of Legg Mason and EnTrust, the financial resources that will be available to EnTrustPermal.
The Board concluded that, overall, it was satisfied with the nature, extent and quality of services provided and expected to be provided under the respective Agreement by the Manager and the Sub-Advisers.
Fund performance
Because the Fund commenced operations in October 2014, it had less than one year of performance data available during the review period at the Prior Board Meeting, and, consequently, Lipper, Inc. (“Lipper”), an independent provider of investment company data, did not provide the Board with performance information for the Fund and similar mutual funds. The Board, however, reviewed performance information provided by the Manager for the six-month period ended June 30, 2015, which showed that the Fund’s performance was better than the performance of its benchmark index for the period. The Trustees discussed with representatives of the Manager the investment strategy to be employed by the Manager and the Sub-Advisers in the management of the Fund’s assets. The Trustees noted the reputation and experience of the Manager and the Sub-Advisers, the respective portfolio managers’ experience, and the Manager’s experience and reputation in selecting, evaluating, and overseeing investment managers. Based on these factors and noting the limited period of performance data available, the Board determined to approve the Prior Agreements. The Board also determined to continue to evaluate the Fund’s performance and directed the Independent Trustees’ performance committee to continue to periodically review Fund performance with the Manager and report to the full Board during periods between Board meetings.
At the March Board Meeting, the Board received and reviewed performance information for the Fund and for all alternative other funds underlying variable insurance products (the “Performance Universe”) selected by Lipper and provided by the Manager for the one-year period ended December 31, 2015. The Fund performed below the average performance of the funds in the Performance Universe for the period. Representatives of Permal and EnTrust informed the Trustees that the investment strategies to be employed by EnTrustPermal and the Sub-Advisers in the management of the Fund’s assets were expected to remain the same after the Combination. The Trustees considered the fact that the persons responsible for portfolio management of the Fund under EnTrustPermal also were anticipated to remain the same. Based on these factors and noting that the Fund had commenced operations in October 2014, the Board determined to approve the New Agreements. The Board also determined to continue to evaluate the Fund’s performance and directed the Independent Trustees’ performance committee to continue to periodically review Fund performance after the Combination and report to the full Board during periods between Board meetings.
| | |
| EnTrustPermal Alternative Select VIT Portfolio | | 47 |
Board approval of management and subadvisory agreements (unaudited) (cont’d)
Management fees and expense ratios
At the Prior Board Meeting, the Board reviewed and considered the contractual management fee (the “Contractual Management Fee”) payable by the Fund to the Manager in light of the nature, extent and quality of the management and sub-advisory services provided and expected to be provided by the Manager and the Sub-Advisers, respectively. The Board noted that the Manager, and not the Fund, pays the sub-advisory fees to the Sub-Advisers and, accordingly, that the retention of the Sub-Advisers does not increase the fees and expenses incurred by the Fund. In addition, because of the Manager’s fee waiver and/or expense reimbursement arrangement that was in effect for the Fund, which reduced the management fee paid to the Manager, the Board also reviewed and considered the actual management fee rate (after taking into account waivers and reimbursements) (the “Actual Management Fee”).
The Board also noted that the Manager and its affiliates provide the Fund with regulatory compliance and administrative services, office facilities and Fund officers (including the Fund’s chief financial, chief legal and chief compliance officers), and that the Manager coordinates and oversees the provision of services to the Fund by the Sub-Advisers. Management also discussed with the Board the Fund’s distribution arrangements, including how amounts received by the Fund’s distributor are expended, and the fees received and expenses incurred in connection with such arrangements by affiliates of the Manager.
Additionally, at the Prior Board Meeting, the Board received and considered information comparing the Fund’s Contractual Management Fee and Actual Management Fee and the Fund’s overall expense ratio for the six-month period ended June 30, 2015 with those of a group of five alternative other funds underlying variable insurance products selected by Lipper as comparable to the Fund (the “Expense Group”), and a broader group of funds selected by Lipper consisting of all alternative other funds underlying variable insurance products (the “Expense Universe”). This information showed that the Fund’s Contractual Management Fee was higher than the median of management fees paid by the funds in the Expense Group and that the Fund’s Actual Management Fee was lower than the median of management fees paid by the funds in the Expense Group and was lower than the average management fee paid by the funds in the Expense Universe. This information also showed that the Fund’s total expense ratio was higher than the median of the total expense ratios of the funds in the Expense Group and was higher than the average total expense ratio of the funds in the Expense Universe. The Trustees also noted the Manager’s fee waiver and/or expense reimbursement arrangement.
At the March Board Meeting, the Board noted that the Contractual Management Fee and the services provided to the Fund will remain the same under the EnTrustPermal Management Agreement. The Trustees also noted that EnTrustPermal had committed to continue Permal’s current fee waiver and/or expense reimbursement arrangement with the Fund, which cannot be terminated prior to December 31, 2017 without the Board’s consent, and that the terms of the current fee waiver and expense reimbursement arrangement would not change as a result of the Combination.
| | |
| 48 | | EnTrustPermal Alternative Select VIT Portfolio |
Manager profitability
At the Prior Board Meeting, the Board received and considered a profitability analysis of the Manager and its affiliates in providing services to the Fund. The Board also received profitability information with respect to the Legg Mason fund complex as a whole. In addition, the Board received information with respect to the Manager’s allocation methodologies used in preparing this profitability data as well as a report from an outside consultant that had reviewed the Manager’s methodology. The Board also noted the profitability percentage ranges determined by appropriate court cases to be reasonable given the services rendered to investment companies. The Board determined that the Manager’s profitability was not excessive in light of the nature, extent and quality of the services provided to the Fund.
At the March Board Meeting, management noted that no material impact to the Manager’s profitability with respect to the Fund is expected as a result of the Combination. Therefore, the Board determined that EnTrustPermal’s expected profitability should not be excessive in light of the nature, extent and quality of the services expected to be provided to the Fund after the Combination.
Economies of scale
At the Prior Board Meeting, the Board received and considered information regarding whether there have been economies of scale with respect to the management of the Fund as the Fund’s assets grow, whether the Fund has appropriately benefited from any economies of scale, and whether there is potential for realization of any further economies of scale. The Board considered whether economies of scale in the provision of services to the Fund were being passed along to the shareholders. The Board noted that to the extent the Fund’s assets increase over time, the Fund and its shareholders should realize economies of scale as certain expenses, such as fixed fund fees, become a smaller percentage of overall assets. The Board noted that it appeared that the benefits of any economies of scale also would be appropriately shared with shareholders through increased investment in fund management and administration resources.
Taking all of the above into consideration, the Board determined that the management fee was reasonable in light of the performance and comparative expense information and the nature, extent and quality of the services provided to the Fund under the Prior Agreements.
At the March Board Meeting, the Board determined that since the management fee and services provided to the Fund would not change as a result of the Combination, the management fee under the EnTrustPermal Management Agreement would be reasonable in light of the performance and comparative expense information and the nature, extent and quality of the services expected to be provided to the Fund under the New Agreements.
Other benefits to the manager and sub-advisers
At the Prior Board Meeting, the Board considered other benefits received by the Manager and its affiliates and the Sub-Advisers as a result of their relationship with the Fund. In light
| | |
| EnTrustPermal Alternative Select VIT Portfolio | | 49 |
Board approval of management and subadvisory agreements (unaudited) (cont’d)
of the costs of providing investment management and other services to the Fund and the Manager’s commitment to the Fund, any other ancillary benefits that the Manager and its affiliates received were considered reasonable. The Trustees noted that the Sub-Advisers may direct Fund brokerage transactions to certain brokers to obtain research and other services. However, the Trustees acknowledged that the Sub-Advisers were required to select brokers who met the Fund’s requirements for seeking best execution, and that the Fund’s administrator monitored and evaluated trade execution with respect to Fund brokerage transactions and would provide reports to the Board on these matters at least annually and more frequently as requested by the Board. The Trustees concluded that the benefits that the Sub-Advisers may receive by virtue of their relationship with the Fund also appeared to be reasonable.
Based on their discussions and considerations, including those described above, the Trustees approved the Permal Management Agreement and the Sub-Advisory Agreements to continue for another year.
No single factor reviewed by the Board at the Prior Board Meeting was identified by the Board as the principal factor in determining whether to approve the Prior Agreements.
At the March Board Meeting, the Board considered the benefits to be received by Legg Mason, Permal, EnTrust and EnTrustPermal as a result of the Combination, as well as the benefits to be received by EnTrustPermal as a result of the relationship with the Fund, and determined that any such ancillary benefits were reasonable. Based on their discussions and considerations, including those described above, the Trustees approved the New Agreements. No single factor reviewed by the Board at the March Board Meeting was identified by the Board as the principal factor in determining whether to approve the New Agreements.
| | |
| 50 | | EnTrustPermal Alternative Select VIT Portfolio |
Additional shareholder information (unaudited)
Results of a special meeting of shareholders
On May 20, 2016, a Special Meeting of Shareholders was held to approve the new management agreement between the Trust, on behalf of the Portfolio, and EnTrustPermal. The following table provides the information concerning the matter voted on at the Special Meeting of Shareholders.
| | | | | | |
% of Dollar Value
Outstanding For | | % of Dollar Value
Outstanding Against | | % of Dollar Value
Abstaining | | Broker
Non-Votes |
| 81.642% | | 7.018% | | 11.340% | | 0 |
| | |
| EnTrustPermal Alternative Select VIT Portfolio | | 51 |
EnTrustPermal
Alternative Select VIT Portfolio
Trustees
Paul R. Ades
Andrew L. Breech
Dwight B. Crane
Althea L. Duersten
Frank G. Hubbard
Howard J. Johnson Chairman
Jerome K. Miller
Ken Miller
John J. Murphy
Thomas F. Schlafly
Jane Trust
Investment manager
EnTrustPermal Management LLC
Subadvisers
Atlantic Investment Management, Inc.
BH-DG Systematic Trading LLP
Electron Capital Partners, LLC
First Quadrant, L.P.
Distributor
Legg Mason Investor Services, LLC
Custodian
State Street Bank and Trust Company
Transfer agent
BNYMellon Investment Servicing (US) Inc.
4400 Computer Drive
Westborough, MA 01581
Independent registered public accounting firm
KPMG LLP
345 Park Avenue
New York, NY 10154
EnTrustPermal Alternative Select VIT Portfolio
The Portfolio is a separate investment series of Legg Mason Partners Equity Variable Trust, a Maryland statutory trust.
EnTrustPermal Alternative Select VIT Portfolio
Legg Mason Funds
620 Eighth Avenue, 49th Floor
New York, NY 10018
The Portfolio files its complete schedule of portfolio holdings with the Securities and Exchange Commission (“SEC”) for the first and third quarters of each fiscal year on Form N-Q. The Portfolio’s Forms N-Q are available on the SEC’s website at www.sec.gov. The Portfolio’s Forms N-Q may be reviewed and copied at the SEC’s Public Reference Room in Washington, D.C., and information on the operation of the Public Reference Room may be obtained by calling 1-800-SEC-0330. To obtain information on Form N-Q, shareholders can call the Portfolio at 1-877-721-1926.
Information on how the Portfolio voted proxies relating to portfolio securities during the prior 12-month period ended June 30th of each year and a description of the policies and procedures that the Portfolio uses to determine how to vote proxies related to portfolio transactions are available (1) without charge, upon request, by calling the Portfolio at 1-877-721-1926. (2) at www.leggmason.com/variablefunds and (3) on the SEC’s website at www.sec.gov.
This report is submitted for the general information of the shareholders of EnTrustPermal Alternative Select VIT Portfolio. This report is not authorized for distribution to prospective investors in the Portfolio unless preceded or accompanied by a current prospectus.
Investors should consider the Portfolio’s investment objectives, risks, charges and expenses carefully before investing. The prospectus contains this and other important information about the Portfolio. Please read the prospectus carefully before investing.
www.leggmason.com
© 2016 Legg Mason Investor Services, LLC
Member FINRA, SIPC
Legg Mason Funds Privacy and Security Notice
Your Privacy and the Security of Your Personal Information is Very Important to the Legg Mason Funds
This Privacy and Security Notice (the “Privacy Notice”) addresses the Legg Mason Funds’ privacy and data protection practices with respect to nonpublic personal information the Funds receive. The Legg Mason Funds include any funds sold by the Funds’ distributor, Legg Mason Investor Services, LLC, as well as Legg Mason-sponsored closed-end funds and certain closed-end funds managed or sub-advised by Legg Mason or its affiliates. The provisions of this Privacy Notice apply to your information both while you are a shareholder and after you are no longer invested with the Funds.
The Type of Nonpublic Personal Information the Funds Collect About You
The Funds collect and maintain nonpublic personal information about you in connection with your shareholder account. Such information may include, but is not limited to:
| • | | Personal information included on applications or other forms; |
| • | | Account balances, transactions, and mutual fund holdings and positions; |
| • | | Online account access user IDs, passwords, security challenge question responses; and |
| • | | Information received from consumer reporting agencies regarding credit history and creditworthiness (such as the amount of an individual’s total debt, payment history, etc.). |
How the Funds Use Nonpublic Personal Information About You
The Funds do not sell or share your nonpublic personal information with third parties or with affiliates for their marketing purposes, or with other financial institutions or affiliates for joint marketing purposes, unless you have authorized the Funds to do so. The Funds do not disclose any nonpublic personal information about you except as may be required to perform transactions or services you have authorized or as permitted or required by law. The Funds may disclose information about you to:
| • | | Employees, agents, and affiliates on a “need to know” basis to enable the Funds to conduct ordinary business or comply with obligations to government regulators; |
| • | | Service providers, including the Funds’ affiliates, who assist the Funds as part of the ordinary course of business (such as printing, mailing services, or processing or servicing your account with us) or otherwise perform services on the Funds’ behalf, including companies that may perform marketing services solely for the Funds; |
| • | | The Funds’ representatives such as legal counsel, accountants and auditors; and |
| • | | Fiduciaries or representatives acting on your behalf, such as an IRA custodian or trustee of a grantor trust. |
|
| NOT PART OF THE SEMI-ANNUAL REPORT |
Legg Mason Funds Privacy and Security Notice (cont’d)
Except as otherwise permitted by applicable law, companies acting on the Funds’ behalf are contractually obligated to keep nonpublic personal information the Funds provide to them confidential and to use the information the Funds share only to provide the services the Funds ask them to perform.
The Funds may disclose nonpublic personal information about you when necessary to enforce their rights or protect against fraud, or as permitted or required by applicable law, such as in connection with a law enforcement or regulatory request, subpoena, or similar legal process. In the event of a corporate action or in the event a Fund service provider changes, the Funds may be required to disclose your nonpublic personal information to third parties. While it is the Funds’ practice to obtain protections for disclosed information in these types of transactions, the Funds cannot guarantee their privacy policy will remain unchanged.
Keeping You Informed of the Funds’ Privacy and Security Practices
The Funds will notify you annually of their privacy policy as required by federal law. While the Funds reserve the right to modify this policy at any time they will notify you promptly if this privacy policy changes.
The Funds’ Security Practices
The Funds maintain appropriate physical, electronic and procedural safeguards designed to guard your nonpublic personal information. The Funds’ internal data security policies restrict access to your nonpublic personal information to authorized employees, who may use your nonpublic personal information for Fund business purposes only.
Although the Funds strive to protect your nonpublic personal information, they cannot ensure or warrant the security of any information you provide or transmit to them, and you do so at your own risk. In the event of a breach of the confidentiality or security of your nonpublic personal information, the Funds will attempt to notify you as necessary so you can take appropriate protective steps. If you have consented to the Funds using electronic communications or electronic delivery of statements, they may notify you under such circumstances using the most current email address you have on record with them.
In order for the Funds to provide effective service to you, keeping your account information accurate is very important. If you believe that your account information is incomplete, not accurate or not current, or if you have questions about the Funds’ privacy practices, write the Funds using the contact information on your account statements, email the Funds by clicking on the Contact Us section of the Funds’ website at www.leggmason.com, or contact the Fund at 1-877-721-1926.
|
| NOT PART OF THE SEMI-ANNUAL REPORT |
www.leggmason.com
© 2016 Legg Mason Investor Services, LLC Member FINRA, SIPC
PRML179487 8/16 SR16-2841
Not applicable.
| ITEM 3. | AUDIT COMMITTEE FINANCIAL EXPERT. |
Not applicable.
| ITEM 4. | PRINCIPAL ACCOUNTANT FEES AND SERVICES. |
Not applicable.
| ITEM 5. | AUDIT COMMITTEE OF LISTED REGISTRANTS. |
Not applicable.
| ITEM 6. | SCHEDULE OF INVESTMENTS. |
Included herein under Item 1.
| ITEM 7. | DISCLOSURE OF PROXY VOTING POLICIES AND PROCEDURES FOR CLOSED-END MANAGEMENT INVESTMENT COMPANIES. |
Not applicable.
| ITEM 8. | PORTFOLIO MANAGERS OF CLOSED-END MANAGEMENT INVESTMENT COMPANIES. |
Not applicable.
| ITEM 9. | PURCHASES OF EQUITY SECURITIES BY CLOSED-END MANAGEMENT INVESTMENT COMPANY AND AFFILIATED PURCHASERS. |
Not applicable.
| ITEM 10. | SUBMISSION OF MATTERS TO A VOTE OF SECURITY HOLDERS. |
Not applicable.
| ITEM 11. | CONTROLS AND PROCEDURES. |
| | (a) | The registrant’s principal executive officer and principal financial officer have concluded that the registrant’s disclosure controls and procedures (as defined in Rule 30a- 3(c) under the Investment Company Act of 1940, as amended (the “1940 Act”)) are effective as of a date within 90 days of the filing date of this report that includes the disclosure required by this paragraph, based on their evaluation of the disclosure controls and procedures required by Rule 30a-3(b) under the 1940 Act and 15d-15(b) under the Securities Exchange Act of 1934. |
| | (b) | There were no changes in the registrant’s internal control over financial reporting (as defined in Rule 30a-3(d) under the 1940 Act) that occurred during the second fiscal quarter of the period covered by this report that have materially affected, or are likely to materially affect the registrant’s internal control over financial reporting |
(a) (1) Not applicable.
Exhibit 99.CODE ETH
(a) (2) Certifications pursuant to section 302 of the Sarbanes-Oxley Act of 2002 attached hereto.
Exhibit 99.CERT
(b) Certifications pursuant to Section 906 of the Sarbanes-Oxley Act of 2002 attached hereto.
Exhibit 99.906CERT
SIGNATURES
Pursuant to the requirements of the Securities Exchange Act of 1934 and the Investment Company Act of 1940, the registrant has duly caused this Report to be signed on its behalf by the undersigned, there unto duly authorized.
Legg Mason Partners Variable Equity Trust
| | |
| By: | | /s/ Jane Trust |
| | Jane Trust |
| | Chief Executive Officer |
| |
| Date: | | August 22, 2016 |
Pursuant to the requirements of the Securities Exchange Act of 1934 and the Investment Company Act of 1940, this report has been signed below by the following persons on behalf of the registrant and in the capacities and on the dates indicated.
| | |
| By: | | /s/ Jane Trust |
| | Jane Trust |
| | Chief Executive Officer |
| |
| Date: | | August 22, 2016 |
| |
| By: | | /s/ Richard F. Sennett |
| | Richard F. Sennett |
| | Principal Financial Officer |
| |
| Date: | | August 22, 2016 |