UNITED STATES
SECURITIES AND EXCHANGE COMMISSION
Washington, D.C. 20549
FORM N-CSR
CERTIFIED SHAREHOLDER REPORT OF REGISTERED
MANAGEMENT INVESTMENT COMPANIES
Investment Company Act file number 811-21128
Legg Mason Partners Variable Equity Trust
(Exact name of registrant as specified in charter)
620 Eighth Avenue, 49th Floor, New York, NY 10018
(Address of principal executive offices) (Zip code)
Robert I. Frenkel, Esq.
Legg Mason & Co., LLC
100 First Stamford Place
Stamford, CT 06902
(Name and address of agent for service)
Registrant’s telephone number, including area code: 1-877-721-1926
Date of fiscal year end: December 31
Date of reporting period: June 30, 2017
| ITEM 1. | REPORT TO STOCKHOLDERS. |
The Semi-Annual Report to Stockholders is filed herewith.

| | |
| Semi-Annual Report | | June 30, 2017 |
CLEARBRIDGE
VARIABLE SMALL CAP GROWTH PORTFOLIO

|
| INVESTMENT PRODUCTS: NOT FDIC INSURED • NO BANK GUARANTEE • MAY LOSE VALUE |
Portfolio objective
The Portfolio seeks long-term growth of capital.
Letter from the president

Dear Shareholder,
We are pleased to provide the semi-annual report of ClearBridge Variable Small Cap Growth Portfolio for the six-month reporting period ended June 30, 2017. Please read on for Portfolio performance information and a detailed look at prevailing economic and market conditions during the Portfolio’s reporting period.
As always, we remain committed to providing you with excellent service and a full spectrum of investment choices. We also remain committed to supplementing the support you receive from your financial advisor. One way we accomplish this is through our website, www.leggmason.com. Here you can gain immediate access to market and investment information, including:
| • | | Market insights and commentaries from our portfolio managers and |
| • | | A host of educational resources. |
We look forward to helping you meet your financial goals.
Sincerely,

Jane Trust, CFA
President and Chief Executive Officer
July 28, 2017
| | |
| II | | ClearBridge Variable Small Cap Growth Portfolio |
Investment commentary
Economic review
The pace of U.S. economic activity fluctuated during the six months ended June 30, 2017 (the “reporting period”). Looking back, the U.S. Department of Commerce reported that fourth quarter 2016 U.S. gross domestic product (“GDP”)i growth was a revised 1.8%. GDP growth then decelerated to revised 1.2% during the first quarter of 2017. Finally, the U.S. Department of Commerce’s initial estimate for second quarter 2017 GDP growth — released after the reporting period ended — was 2.6%. The acceleration in growth reflected a smaller decrease in private inventory investment, an acceleration in personal consumption expenditures and an upturn in federal government spending.
Job growth in the U.S. was solid overall and a tailwind for the economy during the reporting period. When the reporting period ended on June 30, 2017, the unemployment rate was 4.4%, as reported by the U.S. Department of Labor. The percentage of longer-term unemployed moderately declined over the period. In June 2017, 24.3% of Americans looking for a job had been out of work for more than six months, versus 24.4% when the period began.
| | |
| ClearBridge Variable Small Cap Growth Portfolio | | III |
Investment commentary (cont’d)
Market review
Q. How did the Federal Reserve Board (the “Fed”)ii respond to the economic environment?
A. Looking back, after an extended period of maintaining the federal funds rateiii at a historically low range between zero and 0.25%, the Fed increased the rate at its meeting on December 16, 2015. This marked the first rate hike since 2006. In particular, the U.S. central bank raised the federal funds rate to a range between 0.25% and 0.50%. The Fed then kept rates on hold at each meeting prior to its meeting in mid-December 2016. On December 14, 2016, the Fed raised rates to a range between 0.50% and 0.75%.
After holding rates steady at its meeting that concluded on February 1, 2017, the Fed raised rates to a range between 0.75% and 1.00% at its meeting that ended on March 15, 2017. Finally, at its meeting that concluded on June 14, 2017, the Fed raised rates to a range between 1.00% and 1.25%. The Fed also said that it planned to reduce its balance sheet, saying, “The Committee is maintaining its existing policy of reinvesting principal payments from its holdings of agency debt and agency mortgage-backed securities in agency mortgage-backed securities and of rolling over maturing Treasury securities at auction. The Committee currently expects to begin implementing a balance sheet normalization program this year, provided that the economy evolves broadly as anticipated.”
Q. What factors impacted the U.S. stock market during the reporting period?
A. While there were periods of volatility, the U.S. stock market rose sharply and posted strong results during the reporting period as a whole. The market rallied over the first two months of the period and reached several new all-time highs. This was driven by expectations for improving economic growth, an increase in fiscal spending and a rollback for certain government regulations under President Donald Trump’s administration. After largely treading water in March 2017, the market again rallied from April through June 2017, as first quarter 2017 corporate profits were generally better than expected. All told, for the six months ended June 30, 2017, the S&P 500 Indexiv gained 9.34%.
Looking at the U.S. stock market more closely, large-cap stocks, as measured by the Russell 1000 Indexv, generated the strongest returns, as they gained 9.27% over the reporting period. In contrast, small-cap stocks, as measured by the Russell 2000 Indexvi, generated the weakest results, returning 4.99%, whereas mid-cap stocks, as measured by the Russell Midcap Indexvii, returned 7.99%. From an investment style perspective, growth and value stocks, as measured by the Russell 3000 Growthviii and Russell 3000 Valueix Indices, returned 13.69% and 4.32%, respectively, during the six months ended June 30, 2017.
| | |
| IV | | ClearBridge Variable Small Cap Growth Portfolio |
Performance review
For the six months ended June 30, 2017, Class I shares of ClearBridge Variable Small Cap Growth Portfolio1 returned 11.45%. The Portfolio’s unmanaged benchmark, the Russell 2000 Growth Indexx, returned 9.97% for the same period. The Lipper Variable Small-Cap Growth Funds Category Average2 returned 11.62% over the same time frame.
| | | | |
Performance Snapshot as of June 30, 2017
(unaudited) | |
| | | 6 months | |
ClearBridge Variable Small Cap
Growth Portfolio1: | | | | |
Class I | | | 11.45 | % |
Class II | | | 11.27 | % |
| Russell 2000 Growth Index | | | 9.97 | % |
| Lipper Variable Small-Cap Growth Funds Category Average2 | | | 11.62 | % |
The performance shown represents past performance. Past performance is no guarantee of future results and current performance may be higher or lower than the performance shown above. Principal value and investment returns will fluctuate and investors’ shares, when redeemed, may be worth more or less than their original cost.
All share class returns assume the reinvestment of all distributions, including returns of capital, if any, at net asset value and the deduction of all Portfolio expenses. Performance figures for periods shorter than one year represent cumulative figures and are not annualized.
|
| Total Annual Operating Expenses (unaudited) |
As of the Portfolio’s current prospectus dated May 1, 2017, the gross total annual fund operating expense ratios for Class I and Class II shares were 0.83% and 1.08%, respectively.
Actual expenses may be higher. For example, expenses may be higher than those shown if average net assets decrease. Net assets are more likely to decrease and Portfolio expense ratios are more likely to increase when markets are volatile.
As always, thank you for your confidence in our stewardship of your assets.
Sincerely,
Jane Trust, CFA
President and Chief Executive Officer
July 28, 2017
RISKS: Equity securities are subject to price and market fluctuations. Investments in small-capitalization companies may involve a higher degree of risk and volatility than investments in larger, more established companies. Investments in foreign securities are subject to certain risks of overseas investing, including currency fluctuations and changes in social,
| 1 | The Portfolio is an underlying investment option of various variable annuity and variable life insurance products. The Portfolio’s performance returns do not reflect the deduction of expenses imposed in connection with investing in variable annuity or variable life insurance contracts, such as administrative fees, account charges and surrender charges, which, if reflected, would reduce the performance of the Portfolio. Past performance is no guarantee of future results. |
| 2 | Lipper, Inc., a wholly-owned subsidiary of Reuters, provides independent insight on global collective investments. Returns are based on the six-month period ended June 30, 2017, including the reinvestment of all distributions, including returns of capital, if any, calculated among the 90 funds in the Portfolio’s Lipper category. |
| | |
| ClearBridge Variable Small Cap Growth Portfolio | | V |
Investment commentary (cont’d)
political and economic conditions, which could result in significant market fluctuations. These risks are magnified in emerging markets. The Portfolio may use derivatives, such as options and futures, which can be illiquid, may disproportionately increase losses, and have a potentially large impact on Portfolio performance. Please see the Portfolio’s prospectus for a more complete discussion of these and other risks and the Portfolio’s investment strategies.
All investments are subject to risk including the possible loss of principal. Past performance is no guarantee of future results. All index performance reflects no deduction for fees, expenses or taxes. Please note that an investor cannot invest directly in an index.
The information provided is not intended to be a forecast of future events, a guarantee of future results or investment advice. Views expressed may differ from those of the firm as a whole.
| i | Gross domestic product (“GDP”) is the market value of all final goods and services produced within a country in a given period of time. |
| ii | The Federal Reserve Board (the “Fed”) is responsible for the formulation of U.S. policies designed to promote economic growth, full employment, stable prices and a sustainable pattern of international trade and payments. |
| iii | The federal funds rate is the rate charged by one depository institution on an overnight sale of immediately available funds (balances at the Federal Reserve) to another depository institution; the rate may vary from depository institution to depository institution and from day to day. |
| iv | The S&P 500 Index is an unmanaged index of 500 stocks and is generally representative of the performance of larger companies in the U.S. |
| v | The Russell 1000 Index measures the performance of the large-cap segment of the U.S. equity universe. It is a subset of the Russell 3000 Index and includes approximately 1,000 of the largest securities based on a combination of their market cap and current index membership. The Russell 1000 represents approximately 92% of the U.S. market. The Russell 3000 Index measures the performance of the 3,000 largest U.S. companies based on total market capitalization, which represents approximately 98% of the U.S. equity market. |
| vi | The Russell 2000 Index measures the performance of the small-cap segment of the U.S. equity universe. The Russell 2000 is a subset of the Russell 3000 Index representing approximately 10% of the total market capitalization of that index. It includes approximately 2,000 of the smallest securities based on a combination of their market cap and current index membership. |
| vii | The Russell Midcap Index measures the performance of the mid-cap segment of the U.S. equity universe. The Russell Midcap is a subset of the Russell 1000 Index. It includes approximately 800 of the smallest securities based on a combination of their market cap and current index membership. The Russell Midcap represents approximately 31% of the total market capitalization of the Russell 1000 companies. |
| viii | The Russell 3000 Growth Index measures the performance of the broad growth segment of the U.S. equity universe. It includes those Russell 3000 Index companies with higher price-to-book ratios and higher forecasted growth values. (A price-to-book ratio is the price of a stock compared to the difference between a company’s assets and liabilities.) |
| ix | The Russell 3000 Value Index measures the performance of the broad value segment of the U.S. equity value universe. It includes those Russell 3000 Index companies with lower price-to-book ratios and lower forecasted growth values. |
| x | The Russell 2000 Growth Index measures the performance of the small-cap growth segment of the U.S. equity universe. It includes those Russell 2000 Index companies with higher price-to-value ratios and higher forecasted growth values. |
| | |
| VI | | ClearBridge Variable Small Cap Growth Portfolio |
Portfolio at a glance† (unaudited)
Investment breakdown (%) as a percent of total investments
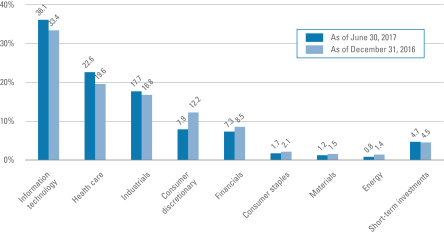
| † | The bar graph above represents the composition of the Portfolio’s investments as of June 30, 2017 and December 31, 2016 and does not include derivatives such as written options. The Portfolio is actively managed. As a result, the composition of the Portfolio’s investments is subject to change at any time. |
| | |
| ClearBridge Variable Small Cap Growth Portfolio 2017 Semi-Annual Report | | 1 |
Portfolio expenses (unaudited)
Example
As a shareholder of the Portfolio, you may incur two types of costs: (1) transaction costs and (2) ongoing costs, including management fees; service and/or distribution (12b-1) fees; and other Portfolio expenses. This example is intended to help you understand your ongoing costs (in dollars) of investing in the Portfolio and to compare these costs with the ongoing costs of investing in other mutual funds.
This example is based on an investment of $1,000 invested on January 1, 2017 and held for the six months ended June 30, 2017.
Actual expenses
The table below titled “Based on Actual Total Return” provides information about actual account values and actual expenses. You may use the information provided in this table, together with the amount you invested, to estimate the expenses that you paid over the period. To estimate the expenses you paid on your account, divide your ending account value by $1,000 (for example, an $8,600 ending account value divided by $1,000 = 8.6), then multiply the result by the number under the heading entitled “Expenses Paid During the Period”.
Hypothetical example for comparison purposes
The table below titled “Based on Hypothetical Total Return” provides information about hypothetical account values and hypothetical expenses based on the actual expense ratio and an assumed rate of return of 5.00% per year before expenses, which is not the Portfolio’s actual return. The hypothetical account values and expenses may not be used to estimate the actual ending account balance or expenses you paid for the period. You may use the information provided in this table to compare the ongoing costs of investing in the Portfolio and other funds. To do so, compare the 5.00% hypothetical example relating to the Portfolio with the 5.00% hypothetical examples that appear in the shareholder reports of the other funds.
Please note that the expenses shown in the table below are meant to highlight your ongoing costs only and do not reflect any transactional costs. Therefore, the table is useful in comparing ongoing costs only, and will not help you determine the relative total costs of owning different funds. In addition, if these transaction costs were included, your costs would have been higher.
| | | | | | | | | | | | | | | | | | | | | | | | | | | | | | | | | | | | | | | | | | | | | | |
| Based on actual total return1 | | | | | | Based on hypothetical total return1 | |
| | | Actual
Total Return2 | | | Beginning
Account
Value | | | Ending
Account
Value | | | Annualized
Expense
Ratio | | | Expenses
Paid
During
the
Period3 | | | | | | | | Hypothetical
Annualized
Total Return | | | Beginning
Account
Value | | | Ending
Account
Value | | | Annualized
Expense
Ratio | | | Expenses
Paid
During
the
Period3 | |
| Class I | | | 11.45 | % | | $ | 1,000.00 | | | $ | 1,114.50 | | | | 0.82 | % | | $ | 4.30 | | | | | | | Class I | | | 5.00 | % | | $ | 1,000.00 | | | $ | 1,020.73 | | | | 0.82 | % | | $ | 4.11 | |
| Class II | | | 11.27 | | | | 1,000.00 | | | | 1,112.70 | | | | 1.07 | | | | 5.61 | | | | | | | Class II | | | 5.00 | | | | 1,000.00 | | | | 1,019.49 | | | | 1.07 | | | | 5.36 | |
| 1 | For the six months ended June 30, 2017. |
| 2 | Assumes the reinvestment of all distributions, including returns of capital, if any, at net asset value. Total return is not annualized, as it may not be representative of the total return for the year. Total returns do not reflect expenses associated with separate accounts such as administrative fees, account charges and surrender charges, which, if reflected, would reduce the total returns. Performance figures may reflect compensating balance arrangements, fee waivers and/or expense reimbursements. In the absence of compensating balance arrangements, fee waivers and/or expense reimbursements, the total return would have been lower. Past performance is no guarantee of future results. |
| 3 | Expenses (net of compensating balance arrangements, fee waivers and/or expense reimbursements) are equal to each class’ respective annualized expense ratio multiplied by the average account value over the period, multiplied by the number of days in the most recent fiscal half-year (181), then divided by 365. |
| | |
| 2 | | ClearBridge Variable Small Cap Growth Portfolio 2017 Semi-Annual Report |
Schedule of investments (unaudited)
June 30, 2017
ClearBridge Variable Small Cap Growth Portfolio
| | | | | | | | | | | | | | | | |
| Security | | | | | | | | Shares | | | Value | |
| Common Stocks — 95.3% | | | | | | | | | | | | | | | | |
| Consumer Discretionary — 8.0% | | | | | | | | | | | | | | | | |
Auto Components — 1.2% | | | | | | | | | | | | | | | | |
Fox Factory Holding Corp. | | | | | | | | | | | 89,385 | | | $ | 3,182,106 | * |
Distributors — 1.7% | | | | | | | | | | | | | | | | |
Core-Mark Holding Co. Inc. | | | | | | | | | | | 143,899 | | | | 4,757,301 | |
Hotels, Restaurants & Leisure — 1.5% | | | | | | | | | | | | | | | | |
Buffalo Wild Wings Inc. | | | | | | | | | | | 33,618 | | | | 4,259,401 | * |
Internet & Direct Marketing Retail — 0.4% | | | | | | | | | | | | | | | | |
Liberty TripAdvisor Holdings Inc., Class A Shares | | | | | | | | | | | 85,210 | | | | 988,436 | * |
Media — 1.8% | | | | | | | | | | | | | | | | |
Lions Gate Entertainment Corp., Class A Shares | | | | | | | | | | | 89,744 | | | | 2,532,576 | |
Lions Gate Entertainment Corp., Class B Shares | | | | | | | | | | | 89,744 | | | | 2,358,472 | * |
Turn Inc. (Escrow) | | | | | | | | | | | 73,522 | | | | 71,307 | *(a)(b)(c) |
Total Media | | | | | | | | | | | | | | | 4,962,355 | |
Specialty Retail — 1.4% | | | | | | | | | | | | | | | | |
Monro Muffler Brake Inc. | | | | | | | | | | | 92,860 | | | | 3,876,905 | |
Total Consumer Discretionary | | | | | | | | | | | | | | | 22,026,504 | |
| Consumer Staples — 1.7% | | | | | | | | | | | | | | | | |
Food & Staples Retailing — 1.7% | | | | | | | | | | | | | | | | |
Casey’s General Stores Inc. | | | | | | | | | | | 44,213 | | | | 4,735,655 | |
| Energy — 0.8% | | | | | | | | | | | | | | | | |
Energy Equipment & Services — 0.8% | | | | | | | | | | | | | | | | |
Newpark Resources Inc. | | | | | | | | | | | 296,719 | | | | 2,180,885 | * |
| Financials — 7.3% | | | | | | | | | | | | | | | | |
Banks — 3.9% | | | | | | | | | | | | | | | | |
SVB Financial Group | | | | | | | | | | | 25,130 | | | | 4,417,603 | * |
Western Alliance Bancorp | | | | | | | | | | | 132,167 | | | | 6,502,616 | * |
Total Banks | | | | | | | | | | | | | | | 10,920,219 | |
Capital Markets — 2.3% | | | | | | | | | | | | | | | | |
Financial Engines Inc. | | | | | | | | | | | 105,861 | | | | 3,874,512 | |
WisdomTree Investments Inc. | | | | | | | | | | | 252,739 | | | | 2,570,356 | |
Total Capital Markets | | | | | | | | | | | | | | | 6,444,868 | |
Insurance — 1.1% | | | | | | | | | | | | | | | | |
American Equity Investment Life Holding Co. | | | | | | | | | | | 113,699 | | | | 2,988,010 | |
Total Financials | | | | | | | | | | | | | | | 20,353,097 | |
| Health Care — 22.7% | | | | | | | | | | | | | | | | |
Biotechnology — 1.5% | | | | | | | | | | | | | | | | |
Acorda Therapeutics Inc. | | | | | | | | | | | 74,700 | | | | 1,471,590 | * |
MiMedx Group Inc. | | | | | | | | | | | 176,818 | | | | 2,646,965 | * |
Total Biotechnology | | | | | | | | | | | | | | | 4,118,555 | |
See Notes to Financial Statements.
| | |
| ClearBridge Variable Small Cap Growth Portfolio 2017 Semi-Annual Report | | 3 |
Schedule of investments (unaudited) (cont’d)
June 30, 2017
ClearBridge Variable Small Cap Growth Portfolio
| | | | | | | | | | | | | | | | |
| Security | | | | | | | | Shares | | | Value | |
Health Care Equipment & Supplies — 4.8% | | | | | | | | | | | | | | | | |
Insulet Corp. | | | | | | | | | | | 96,872 | | | $ | 4,970,502 | * |
Integra LifeSciences Holdings Corp. | | | | | | | | | | | 110,935 | | | | 6,047,067 | * |
Penumbra Inc. | | | | | | | | | | | 27,161 | | | | 2,383,378 | * |
Total Health Care Equipment & Supplies | | | | | | | | | | | | | | | 13,400,947 | |
Health Care Providers & Services — 2.2% | | | | | | | | | | | | | | | | |
Diplomat Pharmacy Inc. | | | | | | | | | | | 97,254 | | | | 1,439,359 | * |
Mednax Inc. | | | | | | | | | | | 28,587 | | | | 1,725,797 | * |
Surgery Partners Inc. | | | | | | | | | | | 130,329 | | | | 2,964,985 | * |
Total Health Care Providers & Services | | | | | | | | | | | | | | | 6,130,141 | |
Health Care Technology — 6.9% | | | | | | | | | | | | | | | | |
athenahealth Inc. | | | | | | | | | | | 47,576 | | | | 6,686,807 | * |
Medidata Solutions Inc. | | | | | | | | | | | 125,513 | | | | 9,815,116 | * |
Vocera Communications Inc. | | | | | | | | | | | 92,564 | | | | 2,445,541 | * |
Total Health Care Technology | | | | | | | | | | | | | | | 18,947,464 | |
Life Sciences Tools & Services — 5.7% | | | | | | | | | | | | | | | | |
Cambrex Corp. | | | | | | | | | | | 62,349 | | | | 3,725,353 | * |
ICON PLC | | | | | | | | | | | 71,852 | | | | 7,026,407 | * |
INC Research Holdings Inc., Class A Shares | | | | | | | | | | | 84,876 | | | | 4,965,246 | * |
Total Life Sciences Tools & Services | | | | | | | | | | | | | | | 15,717,006 | |
Pharmaceuticals — 1.6% | | | | | | | | | | | | | | | | |
Pacira Pharmaceuticals Inc. | | | | | | | | | | | 93,761 | | | | 4,472,400 | * |
Total Health Care | | | | | | | | | | | | | | | 62,786,513 | |
| Industrials — 17.7% | | | | | | | | | | | | | | | | |
Aerospace & Defense — 2.2% | | | | | | | | | | | | | | | | |
Orbital ATK Inc. | | | | | | | | | | | 61,193 | | | | 6,018,943 | |
Air Freight & Logistics — 1.7% | | | | | | | | | | | | | | | | |
XPO Logistics Inc. | | | | | | | | | | | 75,106 | | | | 4,854,101 | * |
Building Products — 3.7% | | | | | | | | | | | | | | | | |
Masonite International Corp. | | | | | | | | | | | 56,474 | | | | 4,263,787 | * |
Trex Co. Inc. | | | | | | | | | | | 87,511 | | | | 5,920,994 | * |
Total Building Products | | | | | | | | | | | | | | | 10,184,781 | |
Commercial Services & Supplies — 3.9% | | | | | | | | | | | | | | | | |
Copart Inc. | | | | | | | | | | | 204,226 | | | | 6,492,345 | * |
US Ecology Inc. | | | | | | | | | | | 83,226 | | | | 4,202,913 | |
Total Commercial Services & Supplies | | | | | | | | | | | | | | | 10,695,258 | |
Machinery — 3.9% | | | | | | | | | | | | | | | | |
IDEX Corp. | | | | | | | | | | | 53,130 | | | | 6,004,221 | |
Tennant Co. | | | | | | | | | | | 65,961 | | | | 4,867,922 | |
Total Machinery | | | | | | | | | | | | | | | 10,872,143 | |
See Notes to Financial Statements.
| | |
| 4 | | ClearBridge Variable Small Cap Growth Portfolio 2017 Semi-Annual Report |
ClearBridge Variable Small Cap Growth Portfolio
| | | | | | | | | | | | | | | | |
| Security | | | | | | | | Shares | | | Value | |
Professional Services — 0.5% | | | | | | | | | | | | | | | | |
Advisory Board Co. | | | | | | | | | | | 29,310 | | | $ | 1,509,465 | * |
Trading Companies & Distributors — 1.8% | | | | | | | | | | | | | | | | |
H&E Equipment Services Inc. | | | | | | | | | | | 164,707 | | | | 3,361,670 | |
MRC Global Inc. | | | | | | | | | | | 100,260 | | | | 1,656,295 | * |
Total Trading Companies & Distributors | | | | | | | | | | | | | | | 5,017,965 | |
Total Industrials | | | | | | | | | | | | | | | 49,152,656 | |
| Information Technology — 35.9% | | | | | | | | | | | | | | | | |
Electronic Equipment, Instruments & Components — 2.2% | | | | | | | | | | | | | | | | |
MTS Systems Corp. | | | | | | | | | | | 67,228 | | | | 3,482,410 | |
OSI Systems Inc. | | | | | | | | | | | 34,504 | | | | 2,592,976 | * |
Total Electronic Equipment, Instruments & Components | | | | | | | | | | | | | | | 6,075,386 | |
Internet Software & Services — 13.7% | | | | | | | | | | | | | | | | |
comScore Inc. | | | | | | | | | | | 91,216 | | | | 2,394,420 | * |
Cornerstone OnDemand Inc. | | | | | | | | | | | 125,399 | | | | 4,483,014 | * |
Envestnet Inc. | | | | | | | | | | | 79,206 | | | | 3,136,558 | * |
GrubHub Inc. | | | | | | | | | | | 124,823 | | | | 5,442,283 | * |
MercadoLibre Inc. | | | | | | | | | | | 20,742 | | | | 5,203,753 | |
MINDBODY Inc., Class A Shares | | | | | | | | | | | 125,758 | | | | 3,420,617 | * |
Mulesoft Inc., Class A Shares | | | | | | | | | | | 8,580 | | | | 213,985 | * |
New Relic Inc. | | | | | | | | | | | 49,290 | | | | 2,119,963 | * |
Shutterstock Inc. | | | | | | | | | | | 46,260 | | | | 2,039,141 | * |
Wix.com Ltd. | | | | | | | | | | | 43,149 | | | | 3,003,170 | * |
XO Group Inc. | | | | | | | | | | | 70,090 | | | | 1,234,986 | * |
Yext Inc. | | | | | | | | | | | 29,460 | | | | 392,702 | * |
Zillow Group Inc., Class C Shares | | | | | | | | | | | 101,329 | | | | 4,966,134 | * |
Total Internet Software & Services | | | | | | | | | | | | | | | 38,050,726 | |
IT Services — 3.0% | | | | | | | | | | | | | | | | |
Cardtronics PLC, Class A Shares | | | | | | | | | | | 71,978 | | | | 2,365,197 | * |
MAXIMUS Inc. | | | | | | | | | | | 95,215 | | | | 5,963,316 | |
Total IT Services | | | | | | | | | | | | | | | 8,328,513 | |
Semiconductors & Semiconductor Equipment — 4.5% | | | | | | | | | | | | | | | | |
Inphi Corp. | | | | | | | | | | | 48,105 | | | | 1,650,001 | * |
Integrated Device Technology Inc. | | | | | | | | | | | 192,225 | | | | 4,957,483 | * |
Monolithic Power Systems Inc. | | | | | | | | | | | 60,064 | | | | 5,790,170 | |
Total Semiconductors & Semiconductor Equipment | | | | | | | | | | | | | | | 12,397,654 | |
Software — 12.5% | | | | | | | | | | | | | | | | |
Aspen Technology Inc. | | | | | | | | | | | 95,049 | | | | 5,252,408 | * |
Barracuda Networks Inc. | | | | | | | | | | | 173,793 | | | | 4,007,666 | * |
See Notes to Financial Statements.
| | |
| ClearBridge Variable Small Cap Growth Portfolio 2017 Semi-Annual Report | | 5 |
Schedule of investments (unaudited) (cont’d)
June 30, 2017
ClearBridge Variable Small Cap Growth Portfolio
| | | | | | | | | | | | | | | | |
| Security | | | | | | | | Shares | | | Value | |
Software — continued | | | | | | | | | | | | | | | | |
BroadSoft Inc. | | | | | | | | | | | 109,357 | | | $ | 4,707,819 | * |
Fortinet Inc. | | | | | | | | | | | 166,771 | | | | 6,243,906 | * |
HubSpot Inc. | | | | | | | | | | | 39,462 | | | | 2,594,626 | * |
Imperva Inc. | | | | | | | | | | | 68,962 | | | | 3,299,832 | * |
Qualys Inc. | | | | | | | | | | | 91,875 | | | | 3,748,500 | * |
Varonis Systems Inc. | | | | | | | | | | | 46,860 | | | | 1,743,192 | * |
Verint Systems Inc. | | | | | | | | | | | 71,188 | | | | 2,897,352 | * |
Total Software | | | | | | | | | | | | | | | 34,495,301 | |
Total Information Technology | | | | | | | | | | | | | | | 99,347,580 | |
| Materials — 1.2% | | | | | | | | | | | | | | | | |
Chemicals — 1.2% | | | | | | | | | | | | | | | | |
Balchem Corp. | | | | | | | | | | | 42,775 | | | | 3,324,045 | |
Total Common Stocks (Cost — $158,632,721) | | | | | | | | | | | | | | | 263,906,935 | |
| Preferred Stocks — 0.3% | | | | | | | | | | | | | | | | |
| Information Technology — 0.3% | | | | | | | | | | | | | | | | |
Software — 0.3% | | | | | | | | | | | | | | | | |
DocuSign Inc., Series F Shares | | | | | | | | | | | 44,047 | | | | 843,060 | *(a)(b)(c) |
Total Investments before Short-Term Investments (Cost — $159,473,715) | | | | 264,749,995 | |
| | | | |
| | | Rate | | | | | | | | | | |
| Short-Term Investments — 4.7% | | | | | | | | | | | | | | | | |
State Street Institutional Treasury Money Market Fund,
Premier Class (Cost — $13,159,485) | | | 0.822 | % | | | | | | | 13,159,485 | | | | 13,159,485 | |
Total Investments — 100.3% (Cost — $172,633,200#) | | | | 277,909,480 | |
Liabilities in Excess of Other Assets — (0.3)% | | | | | | | | | | | | | | | (935,220 | ) |
Total Net Assets — 100.0% | | | | | | | | | | | | | | $ | 276,974,260 | |
| * | Non-income producing security. |
| (a) | Security is valued using significant unobservable inputs (See Note 1). |
| (b) | Security is valued in good faith in accordance with procedures approved by the Board of Trustees (See Note 1). |
| (c) | Restricted security (See Note 8). |
| # | Aggregate cost for federal income tax purposes is substantially the same. |
See Notes to Financial Statements.
| | |
| 6 | | ClearBridge Variable Small Cap Growth Portfolio 2017 Semi-Annual Report |
Statement of assets and liabilities (unaudited)
June 30, 2017
| | | | |
| |
| Assets: | | | | |
Investments, at value (Cost — $172,633,200) | | $ | 277,909,480 | |
Cash | | | 2,518 | |
Receivable for Portfolio shares sold | | | 120,417 | |
Dividends and interest receivable | | | 49,589 | |
Prepaid expenses | | | 639 | |
Total Assets | | | 278,082,643 | |
| |
| Liabilities: | | | | |
Payable for securities purchased | | | 766,527 | |
Investment management fee payable | | | 170,464 | |
Payable for Portfolio shares repurchased | | | 86,023 | |
Service and/or distribution fees payable | | | 10,397 | |
Trustees’ fees payable | | | 2,292 | |
Accrued expenses | | | 72,680 | |
Total Liabilities | | | 1,108,383 | |
| Total Net Assets | | $ | 276,974,260 | |
| |
| Net Assets: | | | | |
Par value (Note 7) | | $ | 117 | |
Paid-in capital in excess of par value | | | 170,799,215 | |
Accumulated net investment loss | | | (723,818) | |
Accumulated net realized gain on investments and written options | | | 1,622,466 | |
Net unrealized appreciation on investments | | | 105,276,280 | |
| Total Net Assets | | $ | 276,974,260 | |
| |
| Net Assets: | | | | |
Class I | | | $225,001,335 | |
Class II | | | $51,972,925 | |
| |
| Shares Outstanding: | | | | |
Class I | | | 9,474,106 | |
Class II | | | 2,269,265 | |
| |
| Net Asset Value: | | | | |
Class I | | | $23.75 | |
Class II | | | $22.90 | |
See Notes to Financial Statements.
| | |
| ClearBridge Variable Small Cap Growth Portfolio 2017 Semi-Annual Report | | 7 |
Statement of operations (unaudited)
For the Six Months Ended June 30, 2017
| | | | |
| |
| Investment Income: | | | | |
Dividends | | $ | 425,801 | |
Interest | | | 30,728 | |
Total Investment Income | | | 456,529 | |
| |
| Expenses: | | | | |
Investment management fee (Note 2) | | | 972,926 | |
Service and/or distribution fees (Notes 2 and 5) | | | 50,663 | |
Shareholder reports | | | 26,580 | |
Fund accounting fees | | | 16,899 | |
Audit and tax fees | | | 16,163 | |
Legal fees | | | 16,065 | |
Trustees’ fees | | | 8,174 | |
Insurance | | | 1,868 | |
Transfer agent fees (Note 5) | | | 1,672 | |
Custody fees | | | 1,048 | |
Interest expense | | | 64 | |
Miscellaneous expenses | | | 1,946 | |
Total Expenses | | | 1,114,068 | |
| Net Investment Loss | | | (657,539) | |
| |
| Realized and Unrealized Gain on Investments and Written Options (Notes 1, 3 and 4): | | | | |
Net Realized Gain From: | | | | |
Investment transactions | | | 2,380,521 | |
Written options | | | 18,798 | |
Net Realized Gain | | | 2,399,319 | |
Change in Net Unrealized Appreciation (Depreciation) From: | | | | |
Investments | | | 26,224,049 | |
Written options | | | 2,342 | |
Change in Net Unrealized Appreciation (Depreciation) | | | 26,226,391 | |
| Net Gain on Investments and Written Options | | | 28,625,710 | |
| Increase in Net Assets From Operations | | $ | 27,968,171 | |
See Notes to Financial Statements.
| | |
| 8 | | ClearBridge Variable Small Cap Growth Portfolio 2017 Semi-Annual Report |
Statements of changes in net assets
| | | | | | | | |
For the Six Months Ended June 30, 2017 (unaudited)
and the Year Ended December 31, 2016 | | 2017 | | | 2016 | |
| | |
| Operations: | | | | | | | | |
Net investment loss | | $ | (657,539) | | | $ | (964,756) | |
Net realized gain | | | 2,399,319 | | | | 3,178,889 | |
Change in net unrealized appreciation (depreciation) | | | 26,226,391 | | | | 9,972,404 | |
Increase in Net Assets from Operations | | | 27,968,171 | | | | 12,186,537 | |
| | |
| Distributions to Shareholders From (Notes 1 and 6): | | | | | | | | |
Net realized gains | | | — | | | | (9,220,345) | |
Decrease in Net Assets From Distributions to Shareholders | | | — | | | | (9,220,345) | |
| | |
| Portfolio Share Transactions (Note 7): | | | | | | | | |
Net proceeds from sale of shares | | | 32,232,464 | | | | 37,782,642 | |
Reinvestment of distributions | | | — | | | | 9,220,345 | |
Cost of shares repurchased | | | (26,627,988) | | | | (44,254,286) | |
Increase in Net Assets From Portfolio Share Transactions | | | 5,604,476 | | | | 2,748,701 | |
Increase in Net Assets | | | 33,572,647 | | | | 5,714,893 | |
| | |
| Net Assets: | | | | | | | | |
Beginning of period | | | 243,401,613 | | | | 237,686,720 | |
End of period* | | $ | 276,974,260 | | | $ | 243,401,613 | |
*Includes accumulated net investment loss of: | | | $(723,818) | | | | $(66,279) | |
See Notes to Financial Statements.
| | |
| ClearBridge Variable Small Cap Growth Portfolio 2017 Semi-Annual Report | | 9 |
Financial highlights
| | | | | | | | | | | | | | | | | | | | | | | | |
For a share of each class of beneficial interest outstanding throughout each year ended December 31,
unless otherwise noted: | |
| Class I Shares1 | | 20172 | | | 2016 | | | 2015 | | | 2014 | | | 2013 | | | 2012 | |
| | | | | | |
| Net asset value, beginning of period | | | $21.31 | | | | $20.95 | | | | $22.40 | | | | $24.07 | | | | $17.56 | | | | $15.41 | |
| | | | | | |
| Income (loss) from operations: | | | | | | | | | | | | | | | | | | | | | | | | |
Net investment income (loss) | | | (0.05) | | | | (0.08) | | | | (0.09) | | | | (0.03) | | | | (0.08) | | | | 0.03 | |
Net realized and unrealized gain (loss) | | | 2.49 | | | | 1.27 | | | | (0.86) | | | | 0.96 | | | | 8.27 | | | | 2.94 | |
Total income (loss) from operations | | | 2.44 | | | | 1.19 | | | | (0.95) | | | | 0.93 | | | | 8.19 | | | | 2.97 | |
| | | | | | |
| Less distributions from: | | | | | | | | | | | | | | | | | | | | | | | | |
Net investment income | | | — | | | | — | | | | — | | | | — | | | | (0.01) | | | | (0.06) | |
Net realized gains | | | — | | | | (0.83) | | | | (0.50) | | | | (2.60) | | | | (1.67) | | | | (0.76) | |
Total distributions | | | — | | | | (0.83) | | | | (0.50) | | | | (2.60) | | | | (1.68) | | | | (0.82) | |
| | | | | | |
| Net asset value, end of period | | | $23.75 | | | | $21.31 | | | | $20.95 | | | | $22.40 | | | | $24.07 | | | | $17.56 | |
Total return3 | | | 11.45 | % | | | 5.80 | % | | | (4.37) | % | | | 4.08 | % | | | 47.05 | % | | | 19.43 | % |
| | | | | | |
| Net assets, end of period (000s) | | | $225,001 | | | | $212,792 | | | | $220,141 | | | | $247,729 | | | | $260,063 | | | | $160,070 | |
| | | | | | |
| Ratios to average net assets: | | | | | | | | | | | | | | | | | | | | | | | | |
Gross expenses | | | 0.82 | %4 | | | 0.83 | % | | | 0.82 | % | | | 0.82 | % | | | 0.83 | % | | | 0.86 | % |
Net expenses5 | | | 0.82 | 4 | | | 0.83 | | | | 0.82 | | | | 0.82 | | | | 0.83 | | | | 0.86 | |
Net investment income (loss) | | | (0.47) | 4 | | | (0.41) | | | | (0.40) | | | | (0.13) | | | | (0.38) | | | | 0.17 | |
| | | | | | |
| Portfolio turnover rate | | | 10 | % | | | 13 | % | | | 18 | % | | | 25 | % | | | 26 | % | | | 17 | % |
| 1 | Per share amounts have been calculated using the average shares method. |
| 2 | For the six months ended June 30, 2017 (unaudited). |
| 3 | Performance figures may reflect compensating balance arrangements, fee waivers and/or expense reimbursements. In the absence of compensating balance arrangements, fee waivers and/or expense reimbursements, the total return would have been lower. Total returns do not reflect expenses associated with separate accounts such as administrative fees, account charges and surrender charges which, if reflected, would reduce the total return for all periods shown. Past performance is no guarantee of future results. Total returns for periods of less than one year are not annualized. |
| 5 | As a result of an expense limitation arrangement, the ratio of total annual fund operating expenses, other than interest, brokerage, taxes, extraordinary expenses and acquired fund fees and expenses, to average net assets of Class I shares did not exceed 1.00%. This expense limitation arrangement cannot be terminated prior to December 31, 2018 without the Board of Trustees’ consent. |
See Notes to Financial Statements.
| | |
| 10 | | ClearBridge Variable Small Cap Growth Portfolio 2017 Semi-Annual Report |
| | | | | | | | | | | | | | | | | | | | | | | | |
For a share of each class of beneficial interest outstanding throughout each year ended December 31,
unless otherwise noted: | |
| Class II Shares1 | | 20172 | | | 2016 | | | 2015 | | | 2014 | | | 2013 | | | 2012 | |
| | | | | | |
| Net asset value, beginning of period | | | $20.58 | | | | $20.31 | | | | $21.78 | | | | $23.54 | | | | $17.25 | | | | $15.17 | |
| | | | | | |
| Income (loss) from operations: | | | | | | | | | | | | | | | | | | | | | | | | |
Net investment loss | | | (0.08) | | | | (0.13) | | | | (0.14) | | | | (0.09) | | | | (0.15) | | | | (0.00) | 3 |
Net realized and unrealized gain (loss) | | | 2.40 | | | | 1.23 | | | | (0.83) | | | | 0.93 | | | | 8.12 | | | | 2.86 | |
Total income (loss) from operations | | | 2.32 | | | | 1.10 | | | | (0.97) | | | | 0.84 | | | | 7.97 | | | | 2.86 | |
| | | | | | |
| Less distributions from: | | | | | | | | | | | | | | | | | | | | | | | | |
Net investment income | | | — | | | | — | | | | — | | | | — | | | | (0.01) | | | | (0.02) | |
Net realized gains | | | — | | | | (0.83) | | | | (0.50) | | | | (2.60) | | | | (1.67) | | | | (0.76) | |
Total distributions | | | — | | | | (0.83) | | | | (0.50) | | | | (2.60) | | | | (1.68) | | | | (0.78) | |
| | | | | | |
| Net asset value, end of period | | | $22.90 | | | | $20.58 | | | | $20.31 | | | | $21.78 | | | | $23.54 | | | | $17.25 | |
Total return4 | | | 11.27 | % | | | 5.54 | % | | | (4.59) | % | | | 3.79 | % | | | 46.62 | % | | | 18.96 | % |
| | | | | | |
| Net assets, end of period (000s) | | | $51,973 | | | | $30,610 | | | | $17,546 | | | | $19,094 | | | | $19,011 | | | | $6,132 | |
| | | | | | |
| Ratios to average net assets: | | | | | | | | | | | | | | | | | | | | | | | | |
Gross expenses | | | 1.07 | %5 | | | 1.08 | % | | | 1.07 | % | | | 1.11 | % | | | 1.13 | % | | | 1.27 | % |
Net expenses6 | | | 1.07 | 5 | | | 1.08 | | | | 1.07 | | | | 1.11 | | | | 1.13 | | | | 1.25 | 7 |
Net investment loss | | | (0.71) | 5 | | | (0.66) | | | | (0.65) | | | | (0.39) | | | | (0.68) | | | | (0.03) | |
| | | | | | |
| Portfolio turnover rate | | | 10 | % | | | 13 | % | | | 18 | % | | | 25 | % | | | 26 | % | | | 17 | % |
| 1 | Per share amounts have been calculated using the average shares method. |
| 2 | For the six months ended June 30, 2017 (unaudited). |
| 3 | Amount represents less than $0.005 per share. |
| 4 | Performance figures may reflect compensating balance arrangements, fee waivers and/or expense reimbursements. In the absence of compensating balance arrangements, fee waivers and/or expense reimbursements, the total return would have been lower. Total returns do not reflect expenses associated with separate accounts such as administrative fees, account charges and surrender charges which, if reflected, would reduce the total return for all periods shown. Past performance is no guarantee of future results. Total returns for periods of less than one year are not annualized. |
| 6 | As a result of an expense limitation arrangement, the ratio of total annual fund operating expenses, other than interest, brokerage, taxes, extraordinary expenses and acquired fund fees and expenses, to average net assets of Class II shares did not exceed 1.25%. This expense limitation arrangement cannot be terminated prior to December 31, 2018 without the Board of Trustees’ consent. |
| 7 | Reflects fee waivers and/or expense reimbursements. |
See Notes to Financial Statements.
| | |
| ClearBridge Variable Small Cap Growth Portfolio 2017 Semi-Annual Report | | 11 |
Notes to financial statements (unaudited)
1. Organization and significant accounting policies
ClearBridge Variable Small Cap Growth Portfolio (the “Portfolio”) is a separate diversified investment series of Legg Mason Partners Variable Equity Trust (the “Trust”). The Trust, a Maryland statutory trust, is registered under the Investment Company Act of 1940, as amended (the “1940 Act”), as an open-end management investment company.
Shares of the Portfolio may only be purchased or redeemed through variable annuity contracts and variable life insurance policies offered by the separate accounts of participating insurance companies or through eligible pension or other qualified plans.
The following are significant accounting policies consistently followed by the Portfolio and are in conformity with U.S. generally accepted accounting principles (“GAAP”). Estimates and assumptions are required to be made regarding assets, liabilities and changes in net assets resulting from operations when financial statements are prepared. Changes in the economic environment, financial markets and any other parameters used in determining these estimates could cause actual results to differ. Subsequent events have been evaluated through the date the financial statements were issued.
(a) Investment valuation. Equity securities for which market quotations are available are valued at the last reported sales price or official closing price on the primary market or exchange on which they trade. The valuations for fixed income securities (which may include, but are not limited to, corporate, government, municipal, mortgage-backed, collateralized mortgage obligations and asset-backed securities) and certain derivative instruments are typically the prices supplied by independent third party pricing services, which may use market prices or broker/dealer quotations or a variety of valuation techniques and methodologies. The independent third party pricing services use inputs that are observable such as issuer details, interest rates, yield curves, prepayment speeds, credit risks/spreads, default rates and quoted prices for similar securities. Short-term fixed income securities that will mature in 60 days or less are valued at amortized cost, unless it is determined that using this method would not reflect an investment’s fair value. Investments in open-end funds are valued at the closing net asset value per share of each fund on the day of valuation. When the Portfolio holds securities or other assets that are denominated in a foreign currency, the Portfolio will normally use the currency exchange rates as of 4:00 p.m. (Eastern Time). If independent third party pricing services are unable to supply prices for a portfolio investment, or if the prices supplied are deemed by the manager to be unreliable, the market price may be determined by the manager using quotations from one or more broker/dealers or at the transaction price if the security has recently been purchased and no value has yet been obtained from a pricing service or pricing broker. When reliable prices are not readily available, such as when the value of a security has been significantly affected by events after the close of the exchange or market on which the security is principally traded, but before the Portfolio calculates its net asset value, the Portfolio values these securities as determined in accordance with procedures approved by the Portfolio’s Board of Trustees.
| | |
| 12 | | ClearBridge Variable Small Cap Growth Portfolio 2017 Semi-Annual Report |
The Board of Trustees is responsible for the valuation process and has delegated the supervision of the daily valuation process to the Legg Mason North Atlantic Fund Valuation Committee (the “Valuation Committee”). The Valuation Committee, pursuant to the policies adopted by the Board of Trustees, is responsible for making fair value determinations, evaluating the effectiveness of the Portfolio’s pricing policies, and reporting to the Board of Trustees. When determining the reliability of third party pricing information for investments owned by the Portfolio, the Valuation Committee, among other things, conducts due diligence reviews of pricing vendors, monitors the daily change in prices and reviews transactions among market participants.
The Valuation Committee will consider pricing methodologies it deems relevant and appropriate when making fair value determinations. Examples of possible methodologies include, but are not limited to, multiple of earnings; discount from market of a similar freely traded security; discounted cash-flow analysis; book value or a multiple thereof; risk premium/yield analysis; yield to maturity; and/or fundamental investment analysis. The Valuation Committee will also consider factors it deems relevant and appropriate in light of the facts and circumstances. Examples of possible factors include, but are not limited to, the type of security; the issuer’s financial statements; the purchase price of the security; the discount from market value of unrestricted securities of the same class at the time of purchase; analysts’ research and observations from financial institutions; information regarding any transactions or offers with respect to the security; the existence of merger proposals or tender offers affecting the security; the price and extent of public trading in similar securities of the issuer or comparable companies; and the existence of a shelf registration for restricted securities.
For each portfolio security that has been fair valued pursuant to the policies adopted by the Board of Trustees, the fair value price is compared against the last available and next available market quotations. The Valuation Committee reviews the results of such back testing monthly and fair valuation occurrences are reported to the Board of Trustees quarterly.
The Portfolio uses valuation techniques to measure fair value that are consistent with the market approach and/or income approach, depending on the type of security and the particular circumstance. The market approach uses prices and other relevant information generated by market transactions involving identical or comparable securities. The income approach uses valuation techniques to discount estimated future cash flows to present value.
GAAP establishes a disclosure hierarchy that categorizes the inputs to valuation techniques used to value assets and liabilities at measurement date. These inputs are summarized in the three broad levels listed below:
| • | | Level 1 — quoted prices in active markets for identical investments |
| • | | Level 2 — other significant observable inputs (including quoted prices for similar investments, interest rates, prepayment speeds, credit risk, etc.) |
| • | | Level 3 — significant unobservable inputs (including the Portfolio’s own assumptions in determining the fair value of investments) |
| | |
| ClearBridge Variable Small Cap Growth Portfolio 2017 Semi-Annual Report | | 13 |
Notes to financial statements (unaudited) (cont’d)
The inputs or methodologies used to value securities are not necessarily an indication of the risk associated with investing in those securities.
The following is a summary of the inputs used in valuing the Portfolio’s assets carried at fair value:
| | | | | | | | | | | | | | | | |
| ASSETS | |
| Description | | Quoted Prices
(Level 1) | | | Other Significant
Observable Inputs
(Level 2) | | | Significant
Unobservable
Inputs
(Level 3) | | | Total | |
| Long-term investments†: | | | | | | | | | | | | | | | | |
Common stocks: | | | | | | | | | | | | | | | | |
Consumer discretionary | | $ | 21,955,197 | | | | — | | | $ | 71,307 | | | $ | 22,026,504 | |
Other common stocks | | | 241,880,431 | | | | — | | | | — | | | | 241,880,431 | |
Preferred stocks | | | — | | | | — | | | | 843,060 | | | | 843,060 | |
| Total long-term investments | | | 263,835,628 | | | | — | | | | 914,367 | | | | 264,749,995 | |
| Short-term investments† | | | 13,159,485 | | | | — | | | | — | | | | 13,159,485 | |
| Total investments | | $ | 276,995,113 | | | | — | | | $ | 914,367 | | | $ | 277,909,480 | |
| † | See Schedule of Investments for additional detailed categorizations. |
(b) Written options. When the Portfolio writes an option, an amount equal to the premium received by the Portfolio is recorded as a liability, the value of which is marked-to-market daily to reflect the current market value of the option written. If the option expires, the premium received is recorded as a realized gain. When a written call option is exercised, the difference between the premium received plus the option exercise price and the Portfolio’s basis in the underlying security (in the case of a covered written call option), or the cost to purchase the underlying security (in the case of an uncovered written call option), including brokerage commission, is recognized as a realized gain or loss. When a written put option is exercised, the amount of the premium received is subtracted from the cost of the security purchased by the Portfolio from the exercise of the written put option to form the Portfolio’s basis in the underlying security purchased. The writer or buyer of an option traded on an exchange can liquidate the position before the exercise of the option by entering into a closing transaction. The cost of a closing transaction is deducted from the original premium received resulting in a realized gain or loss to the Portfolio.
The risk in writing a covered call option is that the Portfolio may forego the opportunity of profit if the market price of the underlying security increases and the option is exercised. The risk in writing a put option is that the Portfolio may incur a loss if the market price of the underlying security decreases and the option is exercised. The risk in writing an uncovered call option is that the Portfolio is exposed to the risk of loss if the market price of the underlying security increases. In addition, there is the risk that the Portfolio may not be able to enter into a closing transaction because of an illiquid secondary market.
(c) Foreign currency translation. Investment securities and other assets and liabilities denominated in foreign currencies are translated into U.S. dollar amounts based upon
| | |
| 14 | | ClearBridge Variable Small Cap Growth Portfolio 2017 Semi-Annual Report |
prevailing exchange rates on the date of valuation. Purchases and sales of investment securities and income and expense items denominated in foreign currencies are translated into U.S. dollar amounts based upon prevailing exchange rates on the respective dates of such transactions.
The Portfolio does not isolate that portion of the results of operations resulting from fluctuations in foreign exchange rates on investments from the fluctuations arising from changes in market prices of securities held. Such fluctuations are included with the net realized and unrealized gain or loss on investments.
Net realized foreign exchange gains or losses arise from sales of foreign currencies, including gains and losses on forward foreign currency contracts, currency gains or losses realized between the trade and settlement dates on securities transactions, and the difference between the amounts of dividends, interest, and foreign withholding taxes recorded on the Portfolio’s books and the U.S. dollar equivalent of the amounts actually received or paid. Net unrealized foreign exchange gains and losses arise from changes in the values of assets and liabilities, other than investments in securities, on the date of valuation, resulting from changes in exchange rates.
Foreign security and currency transactions may involve certain considerations and risks not typically associated with those of U.S. dollar denominated transactions as a result of, among other factors, the possibility of lower levels of governmental supervision and regulation of foreign securities markets and the possibility of political or economic instability.
(d) Foreign investment risks. The Portfolio’s investments in foreign securities may involve risks not present in domestic investments. Since securities may be denominated in foreign currencies, may require settlement in foreign currencies or pay interest or dividends in foreign currencies, changes in the relationship of these foreign currencies to the U.S. dollar can significantly affect the value of the investments and earnings of the Portfolio. Foreign investments may also subject the Portfolio to foreign government exchange restrictions, expropriation, taxation or other political, social or economic developments, all of which affect the market and/or credit risk of the investments.
(e) Counterparty risk and credit-risk-related contingent features of derivative instruments. The Portfolio may invest in certain securities or engage in other transactions, where the Portfolio is exposed to counterparty credit risk in addition to broader market risks. The Portfolio may invest in securities of issuers, which may also be considered counterparties as trading partners in other transactions. This may increase the risk of loss in the event of default or bankruptcy by the counterparty or if the counterparty otherwise fails to meet its contractual obligations. The Portfolio’s subadviser attempts to mitigate counterparty risk by (i) periodically assessing the creditworthiness of its trading partners, (ii) monitoring and/or limiting the amount of its net exposure to each individual counterparty based on its assessment and (iii) requiring collateral from the counterparty for certain transactions. Market events and changes in overall economic conditions may impact the assessment of such counterparty risk by the subadviser. In addition, declines in the values of underlying collateral received may expose the Portfolio to increased risk of loss.
| | |
| ClearBridge Variable Small Cap Growth Portfolio 2017 Semi-Annual Report | | 15 |
Notes to financial statements (unaudited) (cont’d)
The Portfolio has entered into master agreements with certain of its derivative counterparties that provide for general obligations, representations, agreements, collateral, events of default or termination and credit related contingent features. The credit related contingent features include, but are not limited to, a percentage decrease in the Portfolio’s net assets or NAV over a specified period of time. If these credit related contingent features were triggered, the derivatives counterparty could terminate the positions and demand payment or require additional collateral.
Collateral requirements differ by type of derivative. Collateral or margin requirements are set by the broker or exchange clearinghouse for exchange traded derivatives while collateral terms are contract specific for over-the-counter traded derivatives. Cash collateral that has been pledged to cover obligations of the Portfolio under derivative contracts, if any, will be reported separately in the Statement of Assets and Liabilities. Securities pledged as collateral, if any, for the same purpose are noted in the Schedule of Investments.
Absent an event of default by the counterparty or a termination of the agreement, the terms of the master agreements do not result in an offset of reported amounts of financial assets and financial liabilities in the Statement of Assets and Liabilities across transactions between the Portfolio and the applicable counterparty. The enforceability of the right to offset may vary by jurisdiction.
As of June 30, 2017, the Portfolio did not have any open derivative transactions with credit related contingent features in a net liability position.
(f) Security transactions and investment income. Security transactions are accounted for on a trade date basis. Interest income, adjusted for amortization of premium and accretion of discount, is recorded on the accrual basis. Dividend income is recorded on the ex-dividend date. Foreign dividend income is recorded on the ex-dividend date or as soon as practicable after the Portfolio determines the existence of a dividend declaration after exercising reasonable due diligence. The cost of investments sold is determined by use of the specific identification method. To the extent any issuer defaults or a credit event occurs that impacts the issuer, the Portfolio may halt any additional interest income accruals and consider the realizability of interest accrued up to the date of default or credit event.
(g) Distributions to shareholders. Distributions from net investment income and distributions of net realized gains, if any, are declared at least annually. Distributions to shareholders of the Portfolio are recorded on the ex-dividend date and are determined in accordance with income tax regulations, which may differ from GAAP.
(h) Share class accounting. Investment income, common expenses and realized/unrealized gains (losses) on investments are allocated to the various classes of the Portfolio on the basis of daily net assets of each class. Fees relating to a specific class are charged directly to that share class.
(i) Compensating balance arrangements. The Portfolio has an arrangement with its custodian bank whereby a portion of the custodian’s fees is paid indirectly by credits earned on the Portfolio’s cash on deposit with the bank.
| | |
| 16 | | ClearBridge Variable Small Cap Growth Portfolio 2017 Semi-Annual Report |
(j) Federal and other taxes. It is the Portfolio’s policy to comply with the federal income and excise tax requirements of the Internal Revenue Code of 1986 (the “Code”), as amended, applicable to regulated investment companies. Accordingly, the Portfolio intends to distribute its taxable income and net realized gains, if any, to shareholders in accordance with timing requirements imposed by the Code. Therefore, no federal or state income tax provision is required in the Portfolio’s financial statements.
Management has analyzed the Portfolio’s tax positions taken on income tax returns for all open tax years and has concluded that as of December 31, 2016, no provision for income tax is required in the Portfolio’s financial statements. The Portfolio’s federal and state income and federal excise tax returns for tax years for which the applicable statutes of limitations have not expired are subject to examination by the Internal Revenue Service and state departments of revenue.
Under the applicable foreign tax laws, a withholding tax may be imposed on interest, dividends and capital gains at various rates.
(k) Reclassification. GAAP requires that certain components of net assets be reclassified to reflect permanent differences between financial and tax reporting. These reclassifications have no effect on net assets or net asset value per share.
2. Investment management agreement and other transactions with affiliates
Legg Mason Partners Fund Advisor, LLC (“LMPFA”) is the Portfolio’s investment manager and ClearBridge Investments, LLC (“ClearBridge”) is the Portfolio’s subadviser. Western Asset Management Company (“Western Asset”) manages the portion of the Portfolio’s cash and short-term instruments allocated to it. LMPFA, ClearBridge and Western Asset are wholly-owned subsidiaries of Legg Mason, Inc. (“Legg Mason”).
Under the investment management agreement, the Portfolio pays an investment management fee, calculated daily and paid monthly, at an annual rate of 0.75% of the Portfolio’s average daily net assets.
LMPFA provides administrative and certain oversight services to the Portfolio. LMPFA delegates to the subadviser the day-to-day portfolio management of the Portfolio, except for the management of the portion of the cash and short-term instruments allocated to Western Asset. For their services, LMPFA pays ClearBridge and Western Asset monthly an aggregate fee equal to 70% of the net management fee it receives from the Portfolio.
As a result of expense limitation arrangements between the Portfolio and LMPFA, the ratio of total annual fund operating expenses, other than interest, brokerage, taxes, extraordinary expenses and acquired fund fees and expenses, to average net assets of Class I and Class II shares did not exceed 1.00% and 1.25%, respectively. These expense limitation arrangements cannot be terminated prior to December 31, 2018 without the Board of Trustees’ consent.
LMPFA is permitted to recapture amounts waived and/or reimbursed to a class during the same fiscal year if the class’ total annual operating expenses have fallen to a level below
| | |
| ClearBridge Variable Small Cap Growth Portfolio 2017 Semi-Annual Report | | 17 |
Notes to financial statements (unaudited) (cont’d)
the expense limitation (“expense cap”) in effect at the time the fees were earned or the expenses incurred. In no case will LMPFA recapture any amount that would result, on any particular business day of the Portfolio, in the class’ total annual operating expenses exceeding the expense cap or any other lower limit then in effect.
Legg Mason Investor Services, LLC, a wholly-owned broker-dealer subsidiary of Legg Mason, serves as the Portfolio’s sole and exclusive distributor.
All officers and one Trustee of the Trust are employees of Legg Mason or its affiliates and do not receive compensation from the Trust.
3. Investments
During the six months ended June 30, 2017, the aggregate cost of purchases and proceeds from sales of investments (excluding short-term investments) were as follows:
| | | | |
| Purchases | | $ | 29,538,946 | |
| Sales | | | 26,025,580 | |
At June 30, 2017, the aggregate gross unrealized appreciation and depreciation of investments for federal income tax purposes were substantially as follows:
| | | | |
| Gross unrealized appreciation | | $ | 111,028,363 | |
| Gross unrealized depreciation | | | (5,752,083) | |
| Net unrealized appreciation | | $ | 105,276,280 | |
During the six months ended June 30, 2017, written option transactions for the Portfolio were as follows:
| | | | | | | | |
| | | Number of
Contracts | | | Premiums | |
| Written options, outstanding as of December 31, 2016 | | | 27 | | | $ | 8,296 | |
| Options written | | | 118 | | | | 10,502 | |
| Options closed | | | — | | | | — | |
| Options exercised | | | — | | | | — | |
| Options expired | | | (145) | | | | (18,798) | |
| Written options, outstanding as of June 30, 2017 | | | — | | | | — | |
4. Derivative instruments and hedging activities
At June 30, 2017, the Portfolio did not have any derivative instruments outstanding.
The following tables provide information about the effect of derivatives and hedging activities on the Portfolio’s Statement of Operations for the six months ended June 30, 2017. The first table provides additional detail about the amounts and sources of gains (losses) realized on derivatives during the period. The second table provides additional information about the change in unrealized appreciation (depreciation) resulting from the Portfolio’s derivatives and hedging activities during the period.
| | |
| 18 | | ClearBridge Variable Small Cap Growth Portfolio 2017 Semi-Annual Report |
| | | | |
| AMOUNT OF REALIZED GAIN (LOSS) ON DERIVATIVES RECOGNIZED | |
| | | Equity Risk | |
| Written options | | $ | 18,798 | |
| | | | |
| CHANGE IN UNREALIZED APPRECIATION (DEPRECIATION) ON DERIVATIVES RECOGNIZED | |
| | | Equity Risk | |
| Written options | | $ | 2,342 | |
During the six months ended June 30, 2017, the volume of derivative activity for the Portfolio was as follows:
| | | | |
| | | Average Market
Value | |
| Written options† | | $ | 1,520 | |
| † | At June 30, 2017, there were no open positions held in this derivative. |
5. Class specific expenses, waivers and/or expense reimbursements
The Portfolio has adopted a Rule 12b-1 shareholder services and distribution plan and under that plan the Portfolio pays service and/or distribution fees with respect to its Class II shares calculated at the annual rate of 0.25% of the average daily net assets of the class. Service and/or distribution fees are accrued daily and paid monthly.
For the six months ended June 30, 2017, class specific expenses were as follows:
| | | | | | | | |
| | | Service and/or
Distribution Fees | | | Transfer Agent
Fees | |
| Class I | | | — | | | $ | 1,169 | |
| Class II | | $ | 50,663 | | | | 503 | |
| Total | | $ | 50,663 | | | $ | 1,672 | |
6. Distributions to shareholders by class
| | | | | | | | |
| | | Six Months Ended
June 30, 2017 | | | Year Ended
December 31, 2016 | |
| Net Realized Gains: | | | | | | | | |
| Class I | | | — | | | $ | 8,307,578 | |
| Class II | | | — | | | | 912,767 | |
| Total | | | — | | | $ | 9,220,345 | |
7. Shares of beneficial interest
At June 30, 2017, the Trust had an unlimited number of shares of beneficial interest authorized with a par value of $0.00001 per share. The Portfolio has the ability to issue multiple classes of shares. Each class of shares represents an identical interest and has the same rights, except that each class bears certain direct expenses, including those specifically related to the distribution of its shares.
| | |
| ClearBridge Variable Small Cap Growth Portfolio 2017 Semi-Annual Report | | 19 |
Notes to financial statements (unaudited) (cont’d)
Transactions in shares of each class were as follows:
| | | | | | | | | | | | | | | | |
| | | Six Months Ended
June 30, 2017 | | | Year Ended
December 31, 2016 | |
| | | Shares | | | Amount | | | Shares | | | Amount | |
| Class I | | | | | | | | | | | | | | | | |
| Shares sold | | | 399,882 | | | $ | 9,058,352 | | | | 906,206 | | | $ | 17,723,987 | |
| Shares issued on reinvestment | | | — | | | | — | | | | 400,750 | | | | 8,307,578 | |
| Shares repurchased | | | (911,302) | | | | (20,659,503) | | | | (1,827,847) | | | | (35,925,825) | |
| Net decrease | | | (511,420) | | | $ | (11,601,151) | | | | (520,891) | | | $ | (9,894,260) | |
| | | | |
| Class II | | | | | | | | | | | | | | | | |
| Shares sold | | | 1,054,519 | | | $ | 23,174,112 | | | | 1,013,299 | | | $ | 20,058,655 | |
| Shares issued on reinvestment | | | — | | | | — | | | | 45,189 | | | | 912,767 | |
| Shares repurchased | | | (272,890) | | | | (5,968,485) | | | | (434,773) | | | | (8,328,461) | |
| Net increase | | | 781,629 | | | $ | 17,205,627 | | | | 623,715 | | | $ | 12,642,961 | |
8. Restricted securities
The following Portfolio investments are restricted as to resale and, in the absence of readily ascertainable market values, are valued in good faith in accordance with procedures approved by the Board of Trustees.
| | | | | | | | | | | | | | | | | | | | | | | | |
| Security | | Number of
Shares | | | Acquisition
Date | | | Cost | | | Fair Value
at 6/30/2017 | | | Value per
Share | | | Percent of
Net Assets | |
| DocuSign Inc., Series F Shares | | | 44,047 | | | | 4/15 | | | $ | 840,994 | | | $ | 843,060 | | | $ | 19.14 | | | | 0.30 | % |
| Turn Inc. (Escrow) | | | 73,522 | | | | 12/13 | | | | 108,102 | | | | 71,307 | | | | 0.97 | | | | 0.03 | |
| | | | | | | | | | | $ | 949,096 | | | $ | 914,367 | | | | | | | | 0.33 | % |
9. Deferred capital losses
As of December 31, 2016, the Portfolio had deferred capital losses of $498,537, which have no expiration date, that will be available to offset future taxable capital gains.
10. Recent accounting pronouncement
In October 2016, the U.S. Securities and Exchange Commission adopted new rules and amended existing rules (together, the “final rules”) intended to modernize the reporting and disclosure of information by registered investment companies. In part, the final rules amend Regulation S-X and require standardized, enhanced disclosure about derivatives in investment company financial statements, as well as other amendments. The compliance date for the amendments to Regulation S-X is August 1, 2017. Management is currently evaluating the impact that the adoption of the amendments to Regulation S-X will have on the Portfolio’s financial statements and related disclosures.
| | |
| 20 | | ClearBridge Variable Small Cap Growth Portfolio 2017 Semi-Annual Report |
ClearBridge
Variable Small Cap Growth Portfolio
Trustees
Paul R. Ades
Andrew L. Breech
Dwight B. Crane
Althea L. Duersten
Frank G. Hubbard
Howard J. Johnson
Chairman
Jerome H. Miller
Ken Miller
John J. Murphy
Thomas F. Schlafly
Jane Trust
Investment manager
Legg Mason Partners Fund Advisor, LLC
Subadviser
ClearBridge Investments, LLC
Distributor
Legg Mason Investor Services, LLC
Custodian
State Street Bank and Trust Company
Transfer agent
BNY Mellon Investment Servicing (US) Inc.
4400 Computer Drive
Westborough, MA 01581
Independent registered public accounting firm
KPMG LLP 345 Park Avenue
New York, NY 10154
ClearBridge Variable Small Cap Growth Portfolio
The Portfolio is a separate investment series of Legg Mason Partners Variable Equity Trust, a Maryland statutory trust.
ClearBridge Variable Small Cap Growth Portfolio
Legg Mason Funds
620 Eighth Avenue, 49th Floor
New York, NY 10018
The Portfolio files its complete schedules of portfolio holdings with the Securities and Exchange Commission (“SEC”) for the first and third quarters of each fiscal year on Form N-Q. The Portfolio’s Forms N-Q are available on the SEC’s website at www.sec.gov. The Portfolio’s Forms N-Q may be reviewed and copied at the SEC’s Public Reference Room in Washington, D.C., and information on the operation of the Public Reference Room may be obtained by calling 1-800-SEC-0330. To obtain information on Form N-Q, shareholders can call the Portfolio at 1-877-721-1926.
Information on how the Portfolio voted proxies relating to portfolio securities during the prior 12-month period ended June 30th of each year and a description of the policies and procedures that the Portfolio uses to determine how to vote proxies related to portfolio transactions are available (1) without charge, upon request, by calling the Portfolio at 1-877-721-1926, (2) at www.leggmason.com/variablefunds and (3) on the SEC’s website at www.sec.gov.
This report is submitted for general information of the shareholders of ClearBridge Variable Small Cap Growth Portfolio. This report is not authorized for distribution to prospective investors in the Portfolio unless preceded or accompanied by a current prospectus.
Investors should consider the Portfolio’s investment objectives, risks, charges and expenses before investing. The prospectus contains this and other important information about the Portfolio. Please read the prospectus carefully before investing.
www.leggmason.com
© 2017 Legg Mason Investor Services, LLC
Member FINRA, SIPC
Legg Mason Funds Privacy and Security Notice
Your Privacy and the Security of Your Personal Information is Very Important to the Legg Mason Funds
This Privacy and Security Notice (the “Privacy Notice”) addresses the Legg Mason Funds’ privacy and data protection practices with respect to nonpublic personal information the Funds receive. The Legg Mason Funds include any funds sold by the Funds’ distributor, Legg Mason Investor Services, LLC, as well as Legg Mason-sponsored closed-end funds and certain closed-end funds managed or sub-advised by Legg Mason or its affiliates. The provisions of this Privacy Notice apply to your information both while you are a shareholder and after you are no longer invested with the Funds.
The Type of Nonpublic Personal Information the Funds Collect About You
The Funds collect and maintain nonpublic personal information about you in connection with your shareholder account. Such information may include, but is not limited to:
| • | | Personal information included on applications or other forms; |
| • | | Account balances, transactions, and mutual fund holdings and positions; |
| • | | Online account access user IDs, passwords, security challenge question responses; and |
| • | | Information received from consumer reporting agencies regarding credit history and creditworthiness (such as the amount of an individual’s total debt, payment history, etc.). |
How the Funds Use Nonpublic Personal Information About You
The Funds do not sell or share your nonpublic personal information with third parties or with affiliates for their marketing purposes, or with other financial institutions or affiliates for joint marketing purposes, unless you have authorized the Funds to do so. The Funds do not disclose any nonpublic personal information about you except as may be required to perform transactions or services you have authorized or as permitted or required by law. The Funds may disclose information about you to:
| • | | Employees, agents, and affiliates on a “need to know” basis to enable the Funds to conduct ordinary business or comply with obligations to government regulators; |
| • | | Service providers, including the Funds’ affiliates, who assist the Funds as part of the ordinary course of business (such as printing, mailing services, or processing or servicing your account with us) or otherwise perform services on the Funds’ behalf, including companies that may perform marketing services solely for the Funds; |
| • | | The Funds’ representatives such as legal counsel, accountants and auditors; and |
| • | | Fiduciaries or representatives acting on your behalf, such as an IRA custodian or trustee of a grantor trust. |
|
| NOT PART OF THE SEMI-ANNUAL REPORT |
Legg Mason Funds Privacy and Security Notice (cont’d)
Except as otherwise permitted by applicable law, companies acting on the Funds’ behalf are contractually obligated to keep nonpublic personal information the Funds provide to them confidential and to use the information the Funds share only to provide the services the Funds ask them to perform.
The Funds may disclose nonpublic personal information about you when necessary to enforce their rights or protect against fraud, or as permitted or required by applicable law, such as in connection with a law enforcement or regulatory request, subpoena, or similar legal process. In the event of a corporate action or in the event a Fund service provider changes, the Funds may be required to disclose your nonpublic personal information to third parties. While it is the Funds’ practice to obtain protections for disclosed information in these types of transactions, the Funds cannot guarantee their privacy policy will remain unchanged.
Keeping You Informed of the Funds’ Privacy and Security Practices
The Funds will notify you annually of their privacy policy as required by federal law. While the Funds reserve the right to modify this policy at any time they will notify you promptly if this privacy policy changes.
The Funds’ Security Practices
The Funds maintain appropriate physical, electronic and procedural safeguards designed to guard your nonpublic personal information. The Funds’ internal data security policies restrict access to your nonpublic personal information to authorized employees, who may use your nonpublic personal information for Fund business purposes only.
Although the Funds strive to protect your nonpublic personal information, they cannot ensure or warrant the security of any information you provide or transmit to them, and you do so at your own risk. In the event of a breach of the confidentiality or security of your nonpublic personal information, the Funds will attempt to notify you as necessary so you can take appropriate protective steps. If you have consented to the Funds using electronic communications or electronic delivery of statements, they may notify you under such circumstances using the most current email address you have on record with them.
In order for the Funds to provide effective service to you, keeping your account information accurate is very important. If you believe that your account information is incomplete, not accurate or not current, or if you have questions about the Funds’ privacy practices, write the Funds using the contact information on your account statements, email the Funds by clicking on the Contact Us section of the Funds’ website at www.leggmason.com, or contact the Fund at 1-877-721-1926.
|
| NOT PART OF THE SEMI-ANNUAL REPORT |
www.leggmason.com
© 2017 Legg Mason Investor Services, LLC Member FINRA, SIPC
FDXX010092 8/17 SR17-3124
Not applicable.
| ITEM 3. | AUDIT COMMITTEE FINANCIAL EXPERT. |
Not applicable.
| ITEM 4. | PRINCIPAL ACCOUNTANT FEES AND SERVICES. |
Not applicable.
| ITEM 5. | AUDIT COMMITTEE OF LISTED REGISTRANTS. |
Not applicable.
| ITEM 6. | SCHEDULE OF INVESTMENTS. |
Included herein under Item 1.
| ITEM 7. | DISCLOSURE OF PROXY VOTING POLICIES AND PROCEDURES FOR CLOSED-END MANAGEMENT INVESTMENT COMPANIES. |
Not applicable.
| ITEM 8. | PORTFOLIO MANAGERS OF CLOSED-END MANAGEMENT INVESTMENT COMPANIES. |
Not applicable.
| ITEM 9. | PURCHASES OF SECURITIES BY CLOSED-END MANAGEMENT INVESTMENT COMPANY AND AFFILIATED PURCHASERS. |
Not applicable.
| ITEM 10. | SUBMISSION OF MATTERS TO A VOTE OF SECURITY HOLDERS. |
Not applicable.
| ITEM 11. | CONTROLS AND PROCEDURES. |
| | (a) | The registrant’s principal executive officer and principal financial officer have concluded that the registrant’s disclosure controls and procedures (as defined in Rule 30a- 3(c) under the Investment Company Act of 1940, as amended (the “1940 Act”)) are effective as of a date within 90 days of the filing date of this report that includes the disclosure required by this paragraph, based on their evaluation of the disclosure controls and procedures required by Rule 30a-3(b) under the 1940 Act and 15d-15(b) under the Securities Exchange Act of 1934. |
| | (b) | There were no changes in the registrant’s internal control over financial reporting (as defined in Rule 30a-3(d) under the 1940 Act) that occurred during the second fiscal quarter of the period covered by this report that have materially affected, or are likely to materially affect the registrant’s internal control over financial reporting. |
(a) (1) Not applicable.
Exhibit 99.CODE ETH
(a) (2) Certifications pursuant to section 302 of the Sarbanes-Oxley Act of 2002 attached hereto.
Exhibit 99.CERT
(b) Certifications pursuant to Section 906 of the Sarbanes-Oxley Act of 2002 attached hereto.
Exhibit 99.906CERT
SIGNATURES
Pursuant to the requirements of the Securities Exchange Act of 1934 and the Investment Company Act of 1940, the registrant has duly caused this Report to be signed on its behalf by the undersigned, there unto duly authorized.
Legg Mason Partners Variable Equity Trust
| | |
| By: | | /s/ Jane Trust |
| | Jane Trust |
| | Chief Executive Officer |
| |
| Date: | | August 15, 2017 |
Pursuant to the requirements of the Securities Exchange Act of 1934 and the Investment Company Act of 1940, this report has been signed below by the following persons on behalf of the registrant and in the capacities and on the dates indicated.
| | |
| By: | | /s/ Jane Trust |
| | Jane Trust |
| | Chief Executive Officer |
| |
| Date: | | August 15, 2017 |
| |
| By: | | /s/ Richard F. Sennett |
| | Richard F. Sennett |
| | Principal Financial Officer |
| |
| Date: | | August 15, 2017 |