UNITED STATES
SECURITIES AND EXCHANGE COMMISSION
Washington, D.C. 20549
FORM N-CSR
CERTIFIED SHAREHOLDER REPORT OF REGISTERED
MANAGEMENT INVESTMENT COMPANIES
Investment Company Act file number 811-21128
Legg Mason Partners Variable Equity Trust
(Exact name of registrant as specified in charter)
620 Eighth Avenue, 49th Floor, New York, NY 10018
(Address of principal executive offices) (Zip code)
Robert I. Frenkel, Esq.
Legg Mason & Co., LLC
100 First Stamford Place
Stamford, CT 06902
(Name and address of agent for service)
Registrant’s telephone number, including area code: 1-877-721-1926
Date of fiscal year end: December 31
Date of reporting period: December 31, 2016
| ITEM 1. | REPORT TO STOCKHOLDERS. |
The Annual Report to Stockholders is filed herewith.

| | |
| Annual Report | | December 31, 2016 |
CLEARBRIDGE
VARIABLE LARGE CAP
VALUE PORTFOLIO

|
| INVESTMENT PRODUCTS: NOT FDIC INSURED • NO BANK GUARANTEE • MAY LOSE VALUE |
Portfolio objectives
The primary investment objective of the Portfolio is to seek long-term growth of capital. Current income is a secondary objective.
Letter from the president

Dear Shareholder,
We are pleased to provide the annual report of ClearBridge Variable Large Cap Value Portfolio for the twelve-month reporting period ended December 31, 2016. Please read on for a detailed look at prevailing economic and market conditions during the Portfolio’s reporting period and to learn how those conditions have affected Portfolio performance.
As always, we remain committed to providing you with excellent service and a full spectrum of investment choices. We also remain committed to supplementing the support you receive from your financial advisor. One way we accomplish this is through our website, www.leggmason.com. Here you can gain immediate access to market and investment information, including:
| • | | Market insights and commentaries from our portfolio managers and |
| • | | A host of educational resources. |
We look forward to helping you meet your financial goals.
Sincerely,

Jane Trust, CFA
President and Chief Executive Officer
January 31, 2017
| | |
| II | | ClearBridge Variable Large Cap Value Portfolio |
Investment commentary
Economic review
The pace of U.S. economic activity fluctuated during the twelve months ended December 31, 2016 (the “reporting period”). Looking back, the U.S. Department of Commerce reported that first and second quarter 2016 U.S. gross domestic product (“GDP”)i growth was 0.8% and 1.4%, respectively. GDP growth for the third quarter of 2016 was 3.5%, the strongest reading in two years. The U.S. Department of Commerce’s initial reading for fourth quarter 2016 GDP growth — released after the reporting period ended — was 1.9%. The deceleration in growth reflected a downturn in exports, an acceleration in imports, a deceleration in personal consumption expenditures and a downturn in federal government spending.
While there was a pocket of weakness in May 2016, job growth in the U.S. was solid overall and a tailwind for the economy during the reporting period. When the reporting period ended on December 31, 2016, the unemployment rate was 4.7%, as reported by the U.S. Department of Labor. The percentage of longer-term unemployed also declined over the period. In December 2016, 24.2% of Americans looking for a job had been out of work for more than six months, versus 26.9% when the period began.
After an extended period of maintaining the federal funds rateii at a historically low range between zero and 0.25%, the Federal Reserve Board (the “Fed”)iii increased the rate at its meeting on December 16, 2015. This marked the first rate hike since 2006. In particular, the U.S. central bank raised the federal funds rate to a range between 0.25% and 0.50%. The Fed then kept rates on hold at each meeting prior to its meeting in mid-December 2016. On December 14, 2016, the Fed raised rates to a range between 0.50% and 0.75%. In the Fed’s statement after the December meeting it said, “The Committee expects that economic conditions will evolve in a manner that will warrant only gradual increases in the federal funds rate; the federal funds rate is likely to remain, for some time, below levels that are expected to prevail in the longer run. However, the actual path of the federal funds rate will depend on the economic outlook as informed by incoming data.”
As always, thank you for your confidence in our stewardship of your assets.
Sincerely,
Jane Trust, CFA
President and Chief Executive Officer
January 31, 2017
All investments are subject to risk including the possible loss of principal. Past performance is no guarantee of future results.
| i | Gross domestic product (“GDP”) is the market value of all final goods and services produced within a country in a given period of time. |
| ii | The federal funds rate is the rate charged by one depository institution on an overnight sale of immediately available funds (balances at the Federal Reserve) to another depository institution; the rate may vary from depository institution to depository institution and from day to day. |
| iii | The Federal Reserve Board (the “Fed”) is responsible for the formulation of U.S. policies designed to promote economic growth, full employment, stable prices and a sustainable pattern of international trade and payments. |
| | |
| ClearBridge Variable Large Cap Value Portfolio | | III |
Portfolio overview
Q. What is the Portfolio’s investment strategy?
A. The primary investment objective of the Portfolio is to seek long-term growth of capital. Current income is a secondary objective. Under normal circumstances, the Portfolio invests at least 80% of its net assets, plus borrowings for investment purposes, if any, in equity securities, or other investments with similar economic characteristics, of companies with large market capitalizations.
We emphasize individual security selection while diversifying the Portfolio’s investments across industries, which may help to reduce risk. In selecting individual companies for investment, we focus on established large capitalization companies (large capitalization companies are those companies with market capitalizations similar to companies in the Russell 1000 Indexi). We utilize an interactive fundamental research-driven approach to identify companies with favorable risk-adjusted return characteristics. We look for companies that have strong business models, sustainable competitive advantages and attractive valuations.
Q. What were the overall market conditions during the Portfolio’s reporting period?
A. The S&P 500 Indexii gained 11.96% for the twelve-month reporting period ended December 31, 2016, enduring an oil-related correction in the first two months of the year, political concerns in Europe and the United States, and uncertainty about the Federal Reserve Board’s (the “Fed”)iii pace of interest rate increases. In the U.S., improving economic reports, strong jobs data, recovering commodity prices and optimism following a contentious presidential election all buoyed markets in the latter half of the year.
The U.S. economy continued to expand in 2016, though gross domestic product (“GDP”)iv growth was tepid in the early part of the reporting period, averaging 1.1%. Third quarter 2016 GDP growth picked up substantially, however, hitting 3.5% on strong consumer spending and better-than-expected net exports. The employment situation continued to improve as well. Despite some slowing in non-farm payroll increases over the final few months of the reporting period — in addition to a lackluster May 2016, when just 24,000 new jobs were created — the overall employment picture appeared strong, with the average number of new jobs created each month during the year ended December 31, 2016, coming in at roughly 180,000. Meanwhile, the Fed’s preferred measure of inflation — core personal consumption expenditures — continued its slow march upward to the central bank’s long-term 2% target. After the Fed raised interest rates once in late 2015, mixed economic data in the summer months largely kept the Fed from raising rates until December 2016. At its bottom in July 2016, the ten-year Treasury yield hit 1.37%, the lowest level in decades. Persistently low rates contributed to a further flattening of the yield curvev in the United States and, with trillions of dollars outstanding in negative-yielding sovereign debt in Japan and Europe, investors sought potential returns in income-generating equities in the Consumer Staples, Real Estate, Telecommunication Services (“Telecom”) and Utilities sectors. This dynamic began to shift in October 2016, particularly following the U.S. presidential election.
The early part of the reporting period was marked by heightened volatility. Stocks fell in February 2016 after investors became increasingly concerned about mediocre
| | |
| ClearBridge Variable Large Cap Value Portfolio 2016 Annual Report | | 1 |
Portfolio overview (cont’d)
corporate profits and signals that the U.S. economy might be slowing down. The price of oil dropped to $26 per barrel on concerns over a supply-demand imbalance. Combined with ongoing worries about the rate of global economic growth, persistently low interest rates and political risks — highlighted in late June 2016 by “Brexit”, the U.K.’s surprise vote to leave the European Union — there were numerous potential pitfalls for the market through the first half of 2016. But by-and-large investors shook off these concerns after the market hit a low on February 11, 2016 to rise to record highs in August 2016. In October 2016, concerns about the economic implications of the outcome of the volatile U.S. presidential election campaign hurt stocks, as most major indices experienced a small drop. But expectations of a Fed rate hike began to mark the beginning of a shift toward cyclical, value-oriented stocks.
The rotation from defensive to cyclical and from bonds to equities accelerated following the U.S. election. Investors drove stock prices higher across most sectors from the election on November 8, 2016 through early December 2016, expressing optimism that president-elect Donald J. Trump and a Republican Congress would improve economic growth through a number of actions, including tax reform, regulatory relief and infrastructure spending. Overall, cyclical, value-oriented sectors like Financials, Energy and Industrials advanced most in this quarter, while defensive income-oriented sectors like Utilities, Consumer Staples and Real Estate lagged. Markets had also now embedded expectations for greater inflation and higher interest rates, pushing the yield curve meaningfully higher in the fourth quarter of 2016, as the ten-year Treasury yield closed out 2016 at 2.45%, an eighteen-month high. Perhaps anticipating a changing environment and taking into consideration employment and other economic data, the Fed agreed in December 2016 to raise rates by 25 basis pointsvi for the first time since late 2015, and signaled a faster pace of rate increases in the year to come.
Q. How did we respond to these changing market conditions?
A. We continue to focus on companies with sustainable competitive advantages and maintain our valuation discipline. During the reporting period, we identified opportunities to trim our positions in what we viewed as relatively expensive sectors, such as Consumer Staples — where we have meaningfully reduced our overweight — and added to strong companies at attractive valuations in sectors like Health Care and Energy. We opportunistically added to existing positions within the Energy sector as the price of oil declined to what we viewed as unsustainable levels. Additionally, we maintained an appropriate position in and later added to our position in the Financials sector, which are most likely to benefit from a rising yield curve. We believed over the course of the reporting period that historically low interest rates would likely normalize at some point, and as this transition began in the latter part of 2016, we saw an opportunity to add to our financials holdings with Bank of America. On the other side, we maintained our limited exposure in bond-proxy sectors like Utilities, Telecom and Real Estate.
Regardless of changing market conditions, as active value investors, we continue to look for strong business franchises at attractive valuations, regardless of geopolitical or economic uncertainties. The numerous ups and downs of the market over the last year
| | |
| 2 | | ClearBridge Variable Large Cap Value Portfolio 2016 Annual Report |
served as a strong reminder that short-term equity market returns tend to be volatile. But over the long term, we continue to believe equities are the best option for investors.
Performance review
For the twelve months ended December 31, 2016, Class I shares of ClearBridge Variable Large Cap Value Portfolio1 returned 13.00%. The Portfolio’s unmanaged benchmark, the Russell 1000 Value Indexvii, returned 17.34%, for the same period. The Lipper Variable Large-Cap Value Funds Category Average2 returned 15.59% over the same time frame.
| | | | | | | | |
Performance Snapshot as of December 31, 2016
(unaudited) | |
| | | 6 months | | | 12 months | |
ClearBridge Variable Large
Cap Value Portfolio1: | | | | | | | | |
Class I | | | 9.63 | % | | | 13.00 | % |
| Russell 1000 Value Index | | | 10.39 | % | | | 17.34 | % |
| S&P 500 Index | | | 7.82 | % | | | 11.96 | % |
Lipper Variable Large-Cap Value
Funds Category Average2 | | | 11.91 | % | | | 15.59 | % |
The performance shown represents past performance. Past performance is no guarantee of future results and current performance may be higher or lower than the performance shown above. Principal value and investment returns will fluctuate and investors’ shares, when redeemed, may be worth more or less than their original cost.
Portfolio return assumes the reinvestment of all distributions at net asset value and the deduction of all Portfolio expenses. Performance figures for periods shorter than one year represent cumulative figures and are not annualized.
|
| Total Annual Operating Expenses (unaudited) |
As of the Portfolio’s current prospectus dated May 1, 2016, the gross total annual fund operating expense ratio for Class I shares was 0.71%.
Actual expenses may be higher. For example, expenses may be higher than those shown if average net assets decrease. Net assets are more likely to decrease and Portfolio expense ratios are more likely to increase when markets are volatile.
Q. What were the leading contributors to performance?
A. On an absolute basis, the Portfolio had positive returns in eight out of the ten economic sectors it was invested in during the period (out of eleven sectors total), with the greatest contributions to returns coming from the Financials, Energy, Consumer Discretionary, Materials and Industrials sectors.
Stock selection in the Consumer Discretionary and Energy sectors contributed to relative performance for the year.
On an individual stock basis, the leading contributors to performance included positions in Time Warner Inc., Halliburton Co., JPMorgan Chase & Co., Martin Marietta Materials Inc. and Freeport-McMoRan Inc.
| 1 | The Portfolio is an underlying investment option of various variable annuity and variable life insurance products. The Portfolio’s performance returns do not reflect the deduction of expenses imposed in connection with investing in variable annuity or variable life insurance contracts, such as administrative fees, account charges and surrender charges, which, if reflected, would reduce the performance of the Portfolio. Past performance is no guarantee of future results. |
| 2 | Lipper, Inc., a wholly-owned subsidiary of Reuters, provides independent insight on global collective investments. Returns are based on the period ended December 31, 2016, including the reinvestment of all distributions, including returns of capital, if any, calculated among the 125 funds for the six-month period and among the 124 funds for the twelve-month period in the Portfolio’s Lipper category. |
| | |
| ClearBridge Variable Large Cap Value Portfolio 2016 Annual Report | | 3 |
Portfolio overview (cont’d)
Q. What were the leading detractors from performance?
A. On an absolute basis, two out of the ten economic sectors it was invested in during the period were detractors from performance for the period. The Health Care sector was the leading detractor.
Relative to the benchmark, both overall stock selection and sector allocation effects detracted from the Portfolio’s performance for the period. In particular, an overweight allocation to the Consumer Discretionary sector, as well as stock selection in the Information Technology, Consumer Staples, Health Care, Financials and Industrials sectors, detracted from relative returns. The Portfolio’s cash position also hurt relative performance somewhat.
On an individual stock basis, the detractors from Portfolio performance for the period included our holdings in Teva Pharmaceutical Industries Ltd., CVS Health Corp., Nuance Communications Inc., Xerox Corp. and Amgen Inc.
Q. Were there any significant changes to the Portfolio during the reporting period?
A. Over the course of the year we added new positions in AmerisourceBergen Corp., Bank of America Corp. and UnitedHealth Group Inc. Also during the period, our existing holdings Time Warner Cable and EMC Corp. were acquired or merged. In the second quarter of 2016, Time Warner Cable was acquired by Charter Communications Inc. in a $51 billion cash and stock transaction, in which each Time Warner share was exchanged for cash and roughly half a share of Charter stock. We maintained our position in Charter. During the third quarter of 2016, portfolio holding EMC Corp. was acquired for a combination of cash and newly issued shares of Dell Technologies (“DVMT”), a newly created security designed to track VMware stock, of which EMC owned 80%. We sold the DVMT shares in December 2016 in order to partially fund our new position in Bank of America. Also during the reporting year, we received shares of AdvanSix and Versum Materials as a result of their spinoffs from existing holdings Honeywell and Air Products and Chemicals, respectively. However, we chose not to retain our interest in the new companies and sold the shares.
Thank you for your investment in ClearBridge Variable Large Cap Value Portfolio. As always, we appreciate that you have chosen us to manage your assets and we remain focused on achieving the Portfolio’s investment goals.
Sincerely,

Robert Feitler
Portfolio Manager
ClearBridge Investments, LLC

Dmitry Khaykin
Portfolio Manager
ClearBridge Investments, LLC
January 25, 2017
RISKS: Investments in common stocks are subject to market and price fluctuations. Large capitalization companies may fall out of favor with investors based on market and economic conditions. In return for the relative stability and low volatility of large capitalization companies, the Portfolio’s value may not rise as much as the value of funds that invest in companies with smaller market capitalizations.
| | |
| 4 | | ClearBridge Variable Large Cap Value Portfolio 2016 Annual Report |
Investing in foreign securities is subject to certain risks not associated with domestic investing, such as currency fluctuations, and changes in social, political and economic condition, which could increase volatility. These risks are magnified in emerging or developing markets. Please see the Portfolio’s prospectus for a more complete discussion of these and other risks and the Portfolio’s investment strategies.
Portfolio holdings and breakdowns are as of December 31, 2016 and are subject to change and may not be representative of the portfolio managers’ current or future investments. The Portfolio’s top ten holdings (as a percentage of net assets) as of December 31, 2016 were: JPMorgan Chase & Co. (4.2%), Time Warner Inc. (3.5%), Wells Fargo & Co. (3.4%), DISH Network Corp., Class A Shares (3.0%), U.S. Bancorp (2.9%), Halliburton Co. (2.7%), CVS Health Corp. (2.7%), Honeywell International Inc. (2.6%), General Electric Co. (2.5%) and Merck & Co. Inc. (2.4%). Please refer to pages 10 through 13 for a list and percentage breakdown of the Portfolio’s holdings.
The mention of sector breakdowns is for informational purposes only and should not be construed as a recommendation to purchase or sell any securities. The information provided regarding such sectors is not a sufficient basis upon which to make an investment decision. Investors seeking financial advice regarding the appropriateness of investing in any securities or investment strategies discussed should consult their financial professional. The Portfolio’s top five sector holdings (as a percentage of net assets) as of December 31, 2016 were: Financials (26.9%), Consumer Discretionary (14.0%), Energy (12.9%), Health Care (12.1%) and Industrials (9.1%). The Portfolio’s composition is subject to change at any time.
All investments are subject to risk including the possible loss of principal. Past performance is no guarantee of future results. All index performance reflects no deduction for fees, expenses or taxes. Please note that an investor cannot invest directly in an index.
The information provided is not intended to be a forecast of future events, a guarantee of future results or investment advice. Views expressed may differ from those of the firm as a whole.
| i | The Russell 1000 Index measures the performance of the large-cap segment of the U.S. equity universe. It is a subset of the Russell 3000 Index and includes approximately 1,000 of the largest securities based on a combination of their market cap and current index membership. The Russell 1000 represents approximately 92% of the U.S. market. The Russell 3000 Index measures the performance of the 3,000 largest U.S. companies based on total market capitalization, which represents approximately 98% of the U.S. equity market. |
| ii | The S&P 500 Index is an unmanaged index of 500 stocks and is generally representative of the performance of larger companies in the U.S. |
| iii | The Federal Reserve Board (the “Fed”) is responsible for the formulation of U.S. policies designed to promote economic growth, full employment, stable prices and a sustainable pattern of international trade and payments. |
| iv | Gross domestic product (“GDP”) is the market value of all final goods and services produced within a country in a given period of time. |
| v | The yield curve is the graphical depiction of the relationship between the yield on bonds of the same credit quality but different maturities. |
| vi | A basis point is one-hundredth (1/100 or 0.01) of one percent. |
| vii | The Russell 1000 Value Index measures the performance of the large-cap value segment of the U.S. equity universe. It includes those Russell 1000 Index companies with lower price-to-book ratios and lower expected growth values. (A price-to-book ratio is the price of a stock compared to the difference between a company’s assets and liabilities.) |
| | |
| ClearBridge Variable Large Cap Value Portfolio 2016 Annual Report | | 5 |
Portfolio at a glance† (unaudited)
Investment breakdown (%) as a percent of total investments
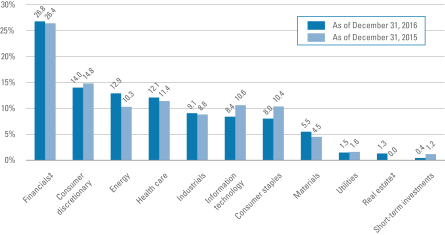
| † | The bar graph above represents the composition of the Portfolio’s investments as of December 31, 2016 and December 31, 2015. The Portfolio is actively managed. As a result, the composition of the Portfolio’s investments is subject to change at any time. |
| ‡ | Effective August 31, 2016, the Financials sector was redefined to exclude real estate and a Real Estate sector was created. |
| | |
| 6 | | ClearBridge Variable Large Cap Value Portfolio 2016 Annual Report |
Portfolio expenses (unaudited)
Example
As a shareholder of the Portfolio, you may incur two types of costs: (1) transaction costs and (2) ongoing costs, including management fees and other Portfolio expenses. This example is intended to help you understand your ongoing costs (in dollars) of investing in the Portfolio and to compare these costs with the ongoing costs of investing in other mutual funds.
This example is based on an investment of $1,000 invested on July 1, 2016 and held for the six months ended December 31, 2016.
Actual expenses
The table below titled “Based on Actual Total Return” provides information about actual account values and actual expenses. You may use the information provided in this table, together with the amount you invested, to estimate the expenses that you paid over the period. To estimate the expenses you paid on your account, divide your ending account value by $1,000 (for example, an $8,600 ending account value divided by $1,000 = 8.6), then multiply the result by the number under the heading entitled “Expenses Paid During the Period”.
Hypothetical example for comparison purposes
The table below titled “Based on Hypothetical Total Return” provides information about hypothetical account values and hypothetical expenses based on the actual expense ratio and an assumed rate of return of 5.00% per year before expenses, which is not the Portfolio’s actual return. The hypothetical account values and expenses may not be used to estimate the actual ending account balance or expenses you paid for the period. You may use the information provided in this table to compare the ongoing costs of investing in the Portfolio and other funds. To do so, compare the 5.00% hypothetical example relating to the Portfolio with the 5.00% hypothetical examples that appear in the shareholder reports of the other funds.
Please note that the expenses shown in the table below are meant to highlight your ongoing costs only and do not reflect any transactional costs. Therefore, the table is useful in comparing ongoing costs only, and will not help you determine the relative total costs of owning different funds. In addition, if these transaction costs were included, your costs would have been higher.
| | | | | | | | | | | | | | | | | | | | | | | | | | | | | | | | | | | | | | | | | | | | | | |
| Based on actual total return1 | | | | | | | | | Based on hypothetical total return1 | | | | |
| | | Actual
Total
Return2 | | | Beginning
Account
Value | | | Ending
Account
Value | | | Annualized
Expense
Ratio | | | Expenses
Paid
During
the
Period3 | | | | | | | | Hypothetical
Annualized
Total Return | | | Beginning
Account
Value | | | Ending
Account
Value | | | Annualized
Expense
Ratio | | | Expenses
Paid
During
the
Period3 | |
| Class I | | | 9.63 | % | | $ | 1,000.00 | | | $ | 1,096.30 | | | | 0.72 | % | | $ | 3.79 | | | | | | | Class I | | | 5.00 | % | | $ | 1,000.00 | | | $ | 1,021.52 | | | | 0.72 | % | | $ | 3.66 | |
| 1 | For the six months ended December 31, 2016. |
| 2 | Assumes the reinvestment of all distributions, including returns of capital, if any, at net asset value. Total return is not annualized, as it may not be representative of the total return for the year. Total returns do not reflect expenses associated with separate accounts such as administrative fees, account charges and surrender charges, which, if reflected, would reduce the total returns. Performance figures may reflect compensating balance arrangements, fee waivers and/or expense reimbursements. In the absence of compensating balance arrangements, fee waivers and/or expense reimbursements, the total return would have been lower. Past performance is no guarantee of future results. |
| 3 | Expenses (net of compensating balance arrangements, fee waivers and/or expense reimbursements) are equal to the class’ annualized expense ratio multiplied by the average account value over the period, multiplied by the number of days in the most recent fiscal half-year (184), then divided by 366. |
| | |
| ClearBridge Variable Large Cap Value Portfolio 2016 Annual Report | | 7 |
Portfolio performance (unaudited)
| | | | |
| Average annual total returns1 | | | |
| | | Class I | |
| Twelve Months Ended 12/31/16 | | | 13.00 | % |
| Five Years Ended 12/31/16 | | | 13.59 | |
| Ten Years Ended 12/31/16 | | | 6.11 | |
| | | | |
| Cumulative total returns1 | | | |
| Class I (12/31/06 through 12/31/16) | | | 80.91 | % |
All figures represent past performance and are not a guarantee of future results. Investment return and principal value of an investment will fluctuate so that an investor’s shares, when redeemed, may be worth more or less than their original cost. The returns shown do not reflect expenses associated with separate accounts such as administrative fees, account charges and surrender charges, which, if reflected, would reduce the total returns. Performance figures may reflect compensating balance arrangements, fee waivers and/or expense reimbursements. In the absence of compensating balance arrangements, fee waivers and/or expense reimbursements, the total return would have been lower.
| 1 | Assumes the reinvestment of all distributions, including returns of capital, if any, at net asset value. |
| | |
| 8 | | ClearBridge Variable Large Cap Value Portfolio 2016 Annual Report |
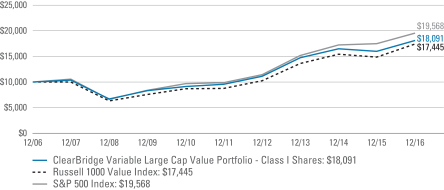
Historical performance
Value of $10,000 invested in
Class I Shares of ClearBridge Variable Large Cap Value Portfolio vs. Russell 1000 Value Index and S&P 500 Index† — December 2006 - December 2016
All figures represent past performance and are not a guarantee of future results. Investment return and principal value of an investment will fluctuate so that an investor’s shares, when redeemed, may be worth more or less than their original cost. The returns shown do not reflect expenses associated with separate accounts such as administrative fees, account charges and surrender charges, which, if reflected, would reduce the total returns. Performance figures may reflect compensating balance arrangements, fee waivers and/or expense reimbursements. In the absence of compensating balance arrangements, fee waivers and/or expense reimbursements, the total return would have been lower.
| † | Hypothetical illustration of $10,000 invested in Class I shares of ClearBridge Variable Large Cap Value Portfolio on December 31, 2006, assuming the reinvestment of all distributions, including returns of capital, if any, at net asset value through December 31, 2016. The hypothetical illustration also assumes a $10,000 investment in the Russell 1000 Value Index and S&P 500 Index. The Russell 1000 Value Index measures the performance of those Russell 1000 Index companies with lower price-to-book ratios and lower forecasted growth values. The S&P 500 Index is an unmanaged index of 500 stocks and is generally representative of the performance of larger companies in the U.S. The indices are unmanaged and are not subject to the same management and trading expenses as a fund. Please note that an investor cannot invest directly in an index. |
Prior to April 30, 2010, the Portfolio followed different investment strategies under the name “ClearBridge Variable Investors Portfolio”.
| | |
| ClearBridge Variable Large Cap Value Portfolio 2016 Annual Report | | 9 |
Schedule of investments
December 31, 2016
ClearBridge Variable Large Cap Value Portfolio
| | | | | | | | | | | | | | | | |
| Security | | | | | | | | Shares | | | Value | |
| Common Stocks — 100.0% | | | | | | | | | | | | | | | | |
| Consumer Discretionary — 14.0% | | | | | | | | | | | | | | | | |
Media — 11.6% | | | | | | | | | | | | | | | | |
Charter Communications Inc., Class A Shares | | | | | | | | | | | 20,153 | | | $ | 5,802,452 | * |
DISH Network Corp., Class A Shares | | | | | | | | | | | 153,084 | | | | 8,868,156 | * |
SES, FDR | | | | | | | | | | | 142,949 | | | | 3,147,906 | (a) |
Time Warner Inc. | | | | | | | | | | | 106,374 | | | | 10,268,282 | |
Twenty-First Century Fox Inc., Class B Shares | | | | | | | | | | | 212,528 | | | | 5,791,388 | |
Total Media | | | | | | | | | | | | | | | 33,878,184 | |
Multiline Retail — 1.0% | | | | | | | | | | | | | | | | |
Target Corp. | | | | | | | | | | | 39,877 | | | | 2,880,316 | |
Specialty Retail — 1.4% | | | | | | | | | | | | | | | | |
Home Depot Inc. | | | | | | | | | | | 31,288 | | | | 4,195,095 | |
Total Consumer Discretionary | | | | | | | | | | | | | | | 40,953,595 | |
| Consumer Staples — 8.1% | | | | | | | | | | | | | | | | |
Beverages — 0.8% | | | | | | | | | | | | | | | | |
Anheuser-Busch InBev SA/NV, ADR | | | | | | | | | | | 22,433 | | | | 2,365,335 | |
Food & Staples Retailing — 2.7% | | | | | | | | | | | | | | | | |
CVS Health Corp. | | | | | | | | | | | 98,037 | | | | 7,736,100 | |
Household Products — 1.0% | | | | | | | | | | | | | | | | |
Kimberly-Clark Corp. | | | | | | | | | | | 25,558 | | | | 2,916,679 | |
Tobacco — 3.6% | | | | | | | | | | | | | | | | |
Philip Morris International Inc. | | | | | | | | | | | 62,910 | | | | 5,755,636 | |
Reynolds American Inc. | | | | | | | | | | | 85,456 | | | | 4,788,954 | |
Total Tobacco | | | | | | | | | | | | | | | 10,544,590 | |
Total Consumer Staples | | | | | | | | | | | | | | | 23,562,704 | |
| Energy — 12.9% | | | | | | | | | | | | | | | | |
Energy Equipment & Services — 5.6% | | | | | | | | | | | | | | | | |
Halliburton Co. | | | | | | | | | | | 145,726 | | | | 7,882,319 | |
National-Oilwell Varco Inc. | | | | | | | | | | | 93,241 | | | | 3,490,943 | |
Schlumberger Ltd. | | | | | | | | | | | 60,980 | | | | 5,119,271 | |
Total Energy Equipment & Services | | | | | | | | | | | | | | | 16,492,533 | |
Oil, Gas & Consumable Fuels — 7.3% | | | | | | | | | | | | | | | | |
Chevron Corp. | | | | | | | | | | | 51,193 | | | | 6,025,416 | |
Exxon Mobil Corp. | | | | | | | | | | | 69,602 | | | | 6,282,277 | |
Royal Dutch Shell PLC, ADR, Class A Shares | | | | | | | | | | | 67,744 | | | | 3,683,919 | |
Suncor Energy Inc. | | | | | | | | | | | 160,286 | | | | 5,239,749 | |
Total Oil, Gas & Consumable Fuels | | | | | | | | | | | | | | | 21,231,361 | |
Total Energy | | | | | | | | | | | | | | | 37,723,894 | |
See Notes to Financial Statements.
| | |
| 10 | | ClearBridge Variable Large Cap Value Portfolio 2016 Annual Report |
ClearBridge Variable Large Cap Value Portfolio
| | | | | | | | | | | | | | | | |
| Security | | | | | | | | Shares | | | Value | |
| Financials — 26.9% | | | | | | | | | | | | | | | | |
Banks — 13.5% | | | | | | | | | | | | | | | | |
Bank of America Corp. | | | | | | | | | | | 172,770 | | | $ | 3,818,217 | |
Citigroup Inc. | | | | | | | | | | | 86,091 | | | | 5,116,388 | |
JPMorgan Chase & Co. | | | | | | | | | | | 141,496 | | | | 12,209,690 | |
U.S. Bancorp | | | | | | | | | | | 162,543 | | | | 8,349,834 | |
Wells Fargo & Co. | | | | | | | | | | | 179,327 | | | | 9,882,711 | |
Total Banks | | | | | | | | | | | | | | | 39,376,840 | |
Capital Markets — 3.1% | | | | | | | | | | | | | | | | |
Bank of New York Mellon Corp. | | | | | | | | | | | 78,769 | | | | 3,732,075 | |
State Street Corp. | | | | | | | | | | | 66,455 | | | | 5,164,883 | |
Total Capital Markets | | | | | | | | | | | | | | | 8,896,958 | |
Consumer Finance — 4.6% | | | | | | | | | | | | | | | | |
American Express Co. | | | | | | | | | | | 81,788 | | | | 6,058,855 | |
Capital One Financial Corp. | | | | | | | | | | | 42,774 | | | | 3,731,604 | |
Synchrony Financial | | | | | | | | | | | 101,540 | | | | 3,682,856 | |
Total Consumer Finance | | | | | | | | | | | | | | | 13,473,315 | |
Insurance — 5.7% | | | | | | | | | | | | | | | | |
Marsh & McLennan Cos. Inc. | | | | | | | | | | | 74,710 | | | | 5,049,649 | |
MetLife Inc. | | | | | | | | | | | 64,445 | | | | 3,472,941 | |
Progressive Corp. | | | | | | | | | | | 86,892 | | | | 3,084,666 | |
Travelers Cos. Inc. | | | | | | | | | | | 41,884 | | | | 5,127,439 | |
Total Insurance | | | | | | | | | | | | | | | 16,734,695 | |
Total Financials | | | | | | | | | | | | | | | 78,481,808 | |
| Health Care — 12.1% | | | | | | | | | | | | | | | | |
Biotechnology — 1.7% | | | | | | | | | | | | | | | | |
Amgen Inc. | | | | | | | | | | | 33,461 | | | | 4,892,333 | |
Health Care Providers & Services — 4.4% | | | | | | | | | | | | | | | | |
AmerisourceBergen Corp. | | | | | | | | | | | 43,240 | | | | 3,380,935 | |
Anthem Inc. | | | | | | | | | | | 41,058 | | | | 5,902,909 | |
UnitedHealth Group Inc. | | | | | | | | | | | 21,800 | | | | 3,488,872 | |
Total Health Care Providers & Services | | | | | | | | | | | | | | | 12,772,716 | |
Pharmaceuticals — 6.0% | | | | | | | | | | | | | | | | |
Johnson & Johnson | | | | | | | | | | | 45,514 | | | | 5,243,668 | |
Merck & Co. Inc. | | | | | | | | | | | 118,101 | | | | 6,952,606 | |
Novartis AG, ADR | | | | | | | | | | | 32,068 | | | | 2,335,833 | |
Teva Pharmaceutical Industries Ltd., ADR | | | | | | | | | | | 86,587 | | | | 3,138,779 | |
Total Pharmaceuticals | | | | | | | | | | | | | | | 17,670,886 | |
Total Health Care | | | | | | | | | | | | | | | 35,335,935 | |
See Notes to Financial Statements.
| | |
| ClearBridge Variable Large Cap Value Portfolio 2016 Annual Report | | 11 |
Schedule of investments (cont’d)
December 31, 2016
ClearBridge Variable Large Cap Value Portfolio
| | | | | | | | | | | | | | | | |
| Security | | | | | | | | Shares | | | Value | |
| Industrials — 9.1% | | | | | | | | | | | | | | | | |
Aerospace & Defense — 1.7% | | | | | | | | | | | | | | | | |
United Technologies Corp. | | | | | | | | | | | 43,844 | | | $ | 4,806,179 | |
Industrial Conglomerates — 5.1% | | | | | | | | | | | | | | | | |
General Electric Co. | | | | | | | | | | | 228,063 | | | | 7,206,791 | |
Honeywell International Inc. | | | | | | | | | | | 66,390 | | | | 7,691,282 | |
Total Industrial Conglomerates | | | | | | | | | | | | | | | 14,898,073 | |
Machinery — 2.3% | | | | | | | | | | | | | | | | |
Illinois Tool Works Inc. | | | | | | | | | | | 55,694 | | | | 6,820,287 | |
Total Industrials | | | | | | | | | | | | | | | 26,524,539 | |
| Information Technology — 8.5% | | | | | | | | | | | | | | | | |
Communications Equipment — 1.8% | | | | | | | | | | | | | | | | |
Motorola Solutions Inc. | | | | | | | | | | | 62,756 | | | | 5,201,845 | |
Electronic Equipment, Instruments & Components — 1.8% | | | | | | | | | | | | | | | | |
TE Connectivity Ltd. | | | | | | | | | | | 75,682 | | | | 5,243,249 | |
IT Services — 1.9% | | | | | | | | | | | | | | | | |
International Business Machines Corp. | | | | | | | | | | | 13,644 | | | | 2,264,768 | |
Xerox Corp. | | | | | | | | | | | 364,851 | | | | 3,185,149 | |
Total IT Services | | | | | | | | | | | | | | | 5,449,917 | |
Software — 3.0% | | | | | | | | | | | | | | | | |
Microsoft Corp. | | | | | | | | | | | 89,361 | | | | 5,552,892 | |
Nuance Communications Inc. | | | | | | | | | | | 218,719 | | | | 3,258,913 | * |
Total Software | | | | | | | | | | | | | | | 8,811,805 | |
Total Information Technology | | | | | | | | | | | | | | | 24,706,816 | |
| Materials — 5.5% | | | | | | | | | | | | | | | | |
Chemicals — 0.9% | | | | | | | | | | | | | | | | |
Air Products & Chemicals Inc. | | | | | | | | | | | 17,710 | | | | 2,547,052 | |
Construction Materials — 1.7% | | | | | | | | | | | | | | | | |
Martin Marietta Materials Inc. | | | | | | | | | | | 23,074 | | | | 5,111,583 | |
Containers & Packaging — 1.6% | | | | | | | | | | | | | | | | |
Crown Holdings Inc. | | | | | | | | | | | 90,483 | | | | 4,756,691 | * |
Metals & Mining — 1.3% | | | | | | | | | | | | | | | | |
Freeport-McMoRan Inc. | | | | | | | | | | | 284,068 | | | | 3,746,857 | * |
Total Materials | | | | | | | | | | | | | | | 16,162,183 | |
| Real Estate — 1.4% | | | | | | | | | | | | | | | | |
Equity Real Estate Investment Trusts (REITs) — 1.4% | | | | | | | | | | | | | | | | |
American Tower Corp. | | | | | | | | | | | 37,127 | | | | 3,923,581 | |
| Utilities — 1.5% | | | | | | | | | | | | | | | | |
Multi-Utilities — 1.5% | | | | | | | | | | | | | | | | |
Sempra Energy | | | | | | | | | | | 44,639 | | | | 4,492,470 | |
Total Investments before Short-Term Investments (Cost — $173,311,257) | | | | 291,867,525 | |
See Notes to Financial Statements.
| | |
| 12 | | ClearBridge Variable Large Cap Value Portfolio 2016 Annual Report |
ClearBridge Variable Large Cap Value Portfolio
| | | | | | | | | | | | | | | | |
| Security | | Rate | | | | | | Shares | | | Value | |
| Short-Term Investments — 0.4% | | | | | | | | | | | | | | | | |
State Street Institutional Treasury Money Market Fund, Premier Class
(Cost — $1,018,701) | | | 0.406 | % | | | | | | | 1,018,701 | | | $ | 1,018,701 | |
Total Investments — 100.4% (Cost — $174,329,958#) | | | | 292,886,226 | |
Liabilities in Excess of Other Assets — (0.4)% | | | | | | | | | | | | | | | (1,092,769 | ) |
Total Net Assets — 100.0% | | | | | | | | | | | | | | $ | 291,793,457 | |
| * | Non-income producing security. |
| (a) | Security is valued in good faith in accordance with procedures approved by the Board of Trustees (See Note 1). |
| # | Aggregate cost for federal income tax purposes is $174,751,376. |
| | |
Abbreviations used in this schedule: |
| ADR | | — American Depositary Receipts |
| FDR | | — Fiduciary Depositary Receipts |
See Notes to Financial Statements.
| | |
| ClearBridge Variable Large Cap Value Portfolio 2016 Annual Report | | 13 |
Statement of assets and liabilities
December 31, 2016
| | | | |
|
| Assets: | |
Investments, at value (Cost — $174,329,958) | | $ | 292,886,226 | |
Foreign currency, at value (Cost — $38) | | | 37 | |
Dividends and interest receivable | | | 626,206 | |
Receivable for Portfolio shares sold | | | 60,992 | |
Prepaid expenses | | | 3,172 | |
Total Assets | | | 293,576,633 | |
|
| Liabilities: | |
Payable for Portfolio shares repurchased | | | 1,537,623 | |
Investment management fee payable | | | 163,102 | |
Trustees’ fees payable | | | 3,248 | |
Distributions payable | | | 10 | |
Accrued expenses | | | 79,193 | |
Total Liabilities | | | 1,783,176 | |
| Total Net Assets | | $ | 291,793,457 | |
|
| Net Assets: | |
Par value (Note 5) | | $ | 150 | |
Paid-in capital in excess of par value | | | 172,973,712 | |
Undistributed net investment income | | | 94,089 | |
Accumulated net realized gain on investments and foreign currency transactions | | | 169,239 | |
Net unrealized appreciation on investments and foreign currencies | | | 118,556,267 | |
| Total Net Assets | | $ | 291,793,457 | |
|
| Shares Outstanding: | |
Class I | | | 14,981,018 | |
|
| Net Asset Value: | |
Class I | | | $19.48 | |
See Notes to Financial Statements.
| | |
| 14 | | ClearBridge Variable Large Cap Value Portfolio 2016 Annual Report |
Statement of operations
For the Year Ended December 31, 2016
| | | | |
|
| Investment Income: | |
Dividends | | $ | 6,469,895 | |
Interest | | | 19,307 | |
Less: Foreign taxes withheld | | | (125,667) | |
Total Investment Income | | | 6,363,535 | |
|
| Expenses: | |
Investment management fee (Note 2) | | | 1,815,199 | |
Shareholder reports | | | 57,940 | |
Legal fees | | | 37,974 | |
Audit and tax fees | | | 30,330 | |
Fund accounting fees | | | 26,897 | |
Trustees’ fees | | | 20,118 | |
Insurance | | | 4,962 | |
Custody fees | | | 2,173 | |
Transfer agent fees | | | 1,863 | |
Miscellaneous expenses | | | 4,772 | |
Total Expenses | | | 2,002,228 | |
| Net Investment Income | | | 4,361,307 | |
| |
Realized and Unrealized Gain (Loss) on Investments
and Foreign Currency Transactions (Notes 1 and 3): | | | | |
Net Realized Gain (Loss) From: | |
Investment transactions | | | 6,405,925 | |
Foreign currency transactions | | | (2,406) | |
Net Realized Gain | | | 6,403,519 | |
Change in Net Unrealized Appreciation (Depreciation) From: | |
Investments | | | 24,340,611 | |
Foreign currencies | | | (1) | |
Change in Net Unrealized Appreciation (Depreciation) | | | 24,340,610 | |
| Net Gain on Investments and Foreign Currency Transactions | | | 30,744,129 | |
| Increase in Net Assets From Operations | | $ | 35,105,436 | |
See Notes to Financial Statements.
| | |
| ClearBridge Variable Large Cap Value Portfolio 2016 Annual Report | | 15 |
Statements of changes in net assets
| | | | | | | | |
| For the Years Ended December 31, | | 2016 | | | 2015 | |
|
| Operations: | |
Net investment income | | $ | 4,361,307 | | | $ | 4,230,915 | |
Net realized gain | | | 6,403,519 | | | | 9,770,691 | |
Change in net unrealized appreciation (depreciation) | | | 24,340,610 | | | | (22,045,333) | |
Increase (Decrease) in Net Assets From Operations | | | 35,105,436 | | | | (8,043,727) | |
|
| Distributions to Shareholders From (Note 1): | |
Net investment income | | | (4,320,014) | | | | (4,240,037) | |
Net realized gains | | | (5,866,152) | | | | (11,531,853) | |
Decrease in Net Assets From Distributions to Shareholders | | | (10,186,166) | | | | (15,771,890) | |
|
| Portfolio Share Transactions (Note 5): | |
Net proceeds from sale of shares | | | 35,974,968 | | | | 58,318,403 | |
Reinvestment of distributions | | | 10,186,155 | | | | 15,771,890 | |
Cost of shares repurchased | | | (56,400,411) | | | | (78,397,376) | |
Decrease in Net Assets From Portfolio Share Transactions | | | (10,239,288) | | | | (4,307,083) | |
Increase (Decrease) in Net Assets | | | 14,679,982 | | | | (28,122,700) | |
|
| Net Assets: | |
Beginning of year | | | 277,113,475 | | | | 305,236,175 | |
End of year* | | $ | 291,793,457 | | | $ | 277,113,475 | |
*Includes undistributed net investment income of: | | | $94,089 | | | | $55,202 | |
See Notes to Financial Statements.
| | |
| 16 | | ClearBridge Variable Large Cap Value Portfolio 2016 Annual Report |
Financial highlights
| | | | | | | | | | | | | | | | | | | | |
| For a share of each class of beneficial interest outstanding throughout each year ended December 31: | |
| Class I Shares1 | | 2016 | | | 2015 | | | 2014 | | | 2013 | | | 2012 | |
| | | | | |
| Net asset value, beginning of year | | | $17.85 | | | | $19.47 | | | | $19.15 | | | | $15.41 | | | | $13.54 | |
|
| Income (loss) from operations: | |
Net investment income | | | 0.29 | | | | 0.29 | | | | 0.43 | | | | 0.30 | | | | 0.29 | |
Net realized and unrealized gain (loss) | | | 2.03 | | | | (0.84) | | | | 1.79 | | | | 4.66 | | | | 1.95 | |
Total income (loss) from operations | | | 2.32 | | | | (0.55) | | | | 2.22 | | | | 4.96 | | | | 2.24 | |
|
| Less distributions from: | |
Net investment income | | | (0.29) | | | | (0.29) | | | | (0.37) | | | | (0.31) | | | | (0.35) | |
Net realized gains | | | (0.40) | | | | (0.78) | | | | (1.53) | | | | (0.91) | | | | (0.02) | |
Total distributions | | | (0.69) | | | | (1.07) | | | | (1.90) | | | | (1.22) | | | | (0.37) | |
| | | | | |
| Net asset value, end of year | | | $19.48 | | | | $17.85 | | | | $19.47 | | | | $19.15 | | | | $15.41 | |
Total return2 | | | 13.00 | % | | | (2.87) | % | | | 11.71 | % | | | 32.37 | % | | | 16.50 | % |
| | | | | |
| Net assets, end of year (000s) | | | $291,793 | | | | $277,113 | | | | $305,236 | | | | $237,900 | | | | $205,926 | |
|
| Ratios to average net assets: | |
Gross expenses | | | 0.72 | % | | | 0.71 | % | | | 0.74 | %3 | | | 0.73 | % | | | 0.74 | % |
Net expenses4 | | | 0.72 | | | | 0.71 | | | | 0.74 | 3 | | | 0.73 | | | | 0.74 | |
Net investment income | | | 1.56 | | | | 1.49 | | | | 2.16 | | | | 1.66 | | | | 1.96 | |
| | | | | |
| Portfolio turnover rate | | | 7 | % | | | 15 | % | | | 15 | % | | | 8 | % | | | 10 | % |
| 1 | Per share amounts have been calculated using the average shares method. |
| 2 | Performance figures may reflect compensating balance arrangements, fee waivers and/or expense reimbursements. In the absence of compensating balance arrangements, fee waivers and/or expense reimbursements, the total return would have been lower. Total returns do not reflect expenses associated with separate accounts such as administrative fees, account charges and surrender charges which, if reflected, would reduce the total return for all periods shown. Past performance is no guarantee of future results. |
| 3 | Included in the expense ratios are certain non-recurring restructuring (and reorganization, if applicable) fees that were incurred by the Portfolio during the period. Without these fees, the gross and net expense ratios would both have been 0.72% for the year ended December 31, 2014. |
| 4 | As a result of an expense limitation arrangement, effective August 3, 2015, the ratio of total annual fund operating expenses, other than interest, brokerage, taxes, extraordinary expenses and acquired fund fees and expenses, to average net assets of Class I shares did not exceed 0.80%. This expense limitation arrangement cannot be terminated prior to December 31, 2018 without the Board of Trustees’ consent. Prior to August 3, 2015, the expense limitation was 1.00%. |
See Notes to Financial Statements.
| | |
| ClearBridge Variable Large Cap Value Portfolio 2016 Annual Report | | 17 |
Notes to financial statements
1. Organization and significant accounting policies
ClearBridge Variable Large Cap Value Portfolio (the “Portfolio”) is a separate diversified investment series of Legg Mason Partners Variable Equity Trust (the “Trust”). The Trust, a Maryland statutory trust, is registered under the Investment Company Act of 1940, as amended (the “1940 Act”), as an open-end management investment company.
Shares of the Portfolio may only be purchased or redeemed through variable annuity contracts and variable life insurance policies offered by the separate accounts of participating insurance companies or through eligible pension or other qualified plans.
The following are significant accounting policies consistently followed by the Portfolio and are in conformity with U.S. generally accepted accounting principles (“GAAP”). Estimates and assumptions are required to be made regarding assets, liabilities and changes in net assets resulting from operations when financial statements are prepared. Changes in the economic environment, financial markets and any other parameters used in determining these estimates could cause actual results to differ. Subsequent events have been evaluated through the date the financial statements were issued.
(a) Investment valuation. Equity securities for which market quotations are available are valued at the last reported sales price or official closing price on the primary market or exchange on which they trade. The valuations for fixed income securities (which may include, but are not limited to, corporate, government, municipal, mortgage-backed, collateralized mortgage obligations and asset-backed securities) and certain derivative instruments are typically the prices supplied by independent third party pricing services, which may use market prices or broker/dealer quotations or a variety of valuation techniques and methodologies. The independent third party pricing services use inputs that are observable such as issuer details, interest rates, yield curves, prepayment speeds, credit risks/spreads, default rates and quoted prices for similar securities. Short-term fixed income securities that will mature in 60 days or less are valued at amortized cost, unless it is determined that using this method would not reflect an investment’s fair value. Investments in open-end funds are valued at the closing net asset value per share of each fund on the day of valuation. When the Portfolio holds securities or other assets that are denominated in a foreign currency, the Portfolio will normally use the currency exchange rates as of 4:00 p.m. (Eastern Time). If independent third party pricing services are unable to supply prices for a portfolio investment, or if the prices supplied are deemed by the manager to be unreliable, the market price may be determined by the manager using quotations from one or more broker/dealers or at the transaction price if the security has recently been purchased and no value has yet been obtained from a pricing service or pricing broker. When reliable prices are not readily available, such as when the value of a security has been significantly affected by events after the close of the exchange or market on which the security is principally traded, but before the Portfolio calculates its net asset value, the Portfolio values these securities as determined in accordance with procedures approved by the Portfolio’s Board of Trustees.
| | |
| 18 | | ClearBridge Variable Large Cap Value Portfolio 2016 Annual Report |
The Board of Trustees is responsible for the valuation process and has delegated the supervision of the daily valuation process to the Legg Mason North Atlantic Fund Valuation Committee (the “Valuation Committee”). The Valuation Committee, pursuant to the policies adopted by the Board of Trustees, is responsible for making fair value determinations, evaluating the effectiveness of the Portfolio’s pricing policies, and reporting to the Board of Trustees. When determining the reliability of third party pricing information for investments owned by the Portfolio, the Valuation Committee, among other things, conducts due diligence reviews of pricing vendors, monitors the daily change in prices and reviews transactions among market participants.
The Valuation Committee will consider pricing methodologies it deems relevant and appropriate when making fair value determinations. Examples of possible methodologies include, but are not limited to, multiple of earnings; discount from market of a similar freely traded security; discounted cash-flow analysis; book value or a multiple thereof; risk premium/yield analysis; yield to maturity; and/or fundamental investment analysis. The Valuation Committee will also consider factors it deems relevant and appropriate in light of the facts and circumstances. Examples of possible factors include, but are not limited to, the type of security; the issuer’s financial statements; the purchase price of the security; the discount from market value of unrestricted securities of the same class at the time of purchase; analysts’ research and observations from financial institutions; information regarding any transactions or offers with respect to the security; the existence of merger proposals or tender offers affecting the security; the price and extent of public trading in similar securities of the issuer or comparable companies; and the existence of a shelf registration for restricted securities.
For each portfolio security that has been fair valued pursuant to the policies adopted by the Board of Trustees, the fair value price is compared against the last available and next available market quotations. The Valuation Committee reviews the results of such back testing monthly and fair valuation occurrences are reported to the Board of Trustees quarterly.
The Portfolio uses valuation techniques to measure fair value that are consistent with the market approach and/or income approach, depending on the type of security and the particular circumstance. The market approach uses prices and other relevant information generated by market transactions involving identical or comparable securities. The income approach uses valuation techniques to discount estimated future cash flows to present value.
GAAP establishes a disclosure hierarchy that categorizes the inputs to valuation techniques used to value assets and liabilities at measurement date. These inputs are summarized in the three broad levels listed below:
| • | | Level 1 — quoted prices in active markets for identical investments |
| • | | Level 2 — other significant observable inputs (including quoted prices for similar investments, interest rates, prepayment speeds, credit risk, etc.) |
| • | | Level 3 — significant unobservable inputs (including the Portfolio’s own assumptions in determining the fair value of investments) |
| | |
| ClearBridge Variable Large Cap Value Portfolio 2016 Annual Report | | 19 |
Notes to financial statements (cont’d)
The inputs or methodologies used to value securities are not necessarily an indication of the risk associated with investing in those securities.
The following is a summary of the inputs used in valuing the Portfolio’s assets carried at fair value:
| | | | | | | | | | | | | | | | |
| ASSETS | |
| Description | | Quoted Prices
(Level 1) | | | Other Significant
Observable Inputs
(Level 2) | | | Significant
Unobservable
Inputs
(Level 3) | | | Total | |
| Long-term investments†: | | | | | | | | | | | | | | | | |
Common stocks: | | | | | | | | | | | | | | | | |
Consumer discretionary | | $ | 37,805,689 | | | $ | 3,147,906 | | | | — | | | $ | 40,953,595 | |
Other common stocks | | | 250,913,930 | | | | — | | | | — | | | | 250,913,930 | |
| Total long-term investments | | $ | 288,719,619 | | | $ | 3,147,906 | | | | — | | | $ | 291,867,525 | |
| Short-term investments† | | | 1,018,701 | | | | — | | | | — | | | | 1,018,701 | |
| Total investments | | $ | 289,738,320 | | | $ | 3,147,906 | | | | — | | | $ | 292,886,226 | |
| † | See Schedule of Investments for additional detailed categorizations. |
For the year ended December 31, 2016, as a result of the fair value pricing procedures for international equities utilized by the Portfolio, certain securities have transferred in and out of Level 1 and Level 2 measurements during the period. The Portfolio’s policy is to recognize transfers between levels as of the end of the reporting period. At December 31, 2016, securities valued at $3,147,906 were classified as Level 2 within the fair value hierarchy because fair value procedures were applied when the change in value of a domestic equity security index suggested that the closing prices on foreign exchanges may no longer have represented the value of those securities at the time of closing of the NYSE.
(b) Foreign currency translation. Investment securities and other assets and liabilities denominated in foreign currencies are translated into U.S. dollar amounts based upon prevailing exchange rates on the date of valuation. Purchases and sales of investment securities and income and expense items denominated in foreign currencies are translated into U.S. dollar amounts based upon prevailing exchange rates on the respective dates of such transactions.
The Portfolio does not isolate that portion of the results of operations resulting from fluctuations in foreign exchange rates on investments from the fluctuations arising from changes in market prices of securities held. Such fluctuations are included with the net realized and unrealized gain or loss on investments.
Net realized foreign exchange gains or losses arise from sales of foreign currencies, including gains and losses on forward foreign currency contracts, currency gains or losses realized between the trade and settlement dates on securities transactions, and the difference between the amounts of dividends, interest, and foreign withholding taxes recorded on the Portfolio’s books and the U.S. dollar equivalent of the amounts actually received or paid.
| | |
| 20 | | ClearBridge Variable Large Cap Value Portfolio 2016 Annual Report |
Net unrealized foreign exchange gains and losses arise from changes in the values of assets and liabilities, other than investments in securities, on the date of valuation, resulting from changes in exchange rates.
Foreign security and currency transactions may involve certain considerations and risks not typically associated with those of U.S. dollar denominated transactions as a result of, among other factors, the possibility of lower levels of governmental supervision and regulation of foreign securities markets and the possibility of political or economic instability.
(c) Foreign investment risks. The Portfolio’s investments in foreign securities may involve risks not present in domestic investments. Since securities may be denominated in foreign currencies, may require settlement in foreign currencies or pay interest or dividends in foreign currencies, changes in the relationship of these foreign currencies to the U.S. dollar can significantly affect the value of the investments and earnings of the Portfolio. Foreign investments may also subject the Portfolio to foreign government exchange restrictions, expropriation, taxation or other political, social or economic developments, all of which affect the market and/or credit risk of the investments.
(d) Security transactions and investment income. Security transactions are accounted for on a trade date basis. Interest income, adjusted for amortization of premium and accretion of discount, is recorded on the accrual basis. Dividend income is recorded on the ex-dividend date. Foreign dividend income is recorded on the ex-dividend date or as soon as practicable after the Portfolio determines the existence of a dividend declaration after exercising reasonable due diligence. The cost of investments sold is determined by use of the specific identification method. To the extent any issuer defaults or a credit event occurs that impacts the issuer, the Portfolio may halt any additional interest income accruals and consider the realizability of interest accrued up to the date of default or credit event.
(e) REIT distributions. The character of distributions received from Real Estate Investment Trusts (‘‘REITs’’) held by the Portfolio is generally comprised of net investment income, capital gains, and return of capital. It is the policy of the Portfolio to estimate the character of distributions received from underlying REITs based on historical data provided by the REITs. After each calendar year end, REITs report the actual tax character of these distributions. Differences between the estimated and actual amounts reported by the REITs are reflected in the Portfolio’s records in the year in which they are reported by the REITs by adjusting related investment cost basis, capital gains and income, as necessary.
(f) Distributions to shareholders. Distributions from net investment income and distributions of net realized gains, if any, are declared at least annually. Distributions to shareholders of the Portfolio are recorded on the ex-dividend date and are determined in accordance with income tax regulations, which may differ from GAAP.
(g) Compensating balance arrangements. The Portfolio has an arrangement with its custodian bank whereby a portion of the custodian’s fees is paid indirectly by credits earned on the Portfolio’s cash on deposit with the bank.
| | |
| ClearBridge Variable Large Cap Value Portfolio 2016 Annual Report | | 21 |
Notes to financial statements (cont’d)
(h) Federal and other taxes. It is the Portfolio’s policy to comply with the federal income and excise tax requirements of the Internal Revenue Code of 1986 (the “Code”), as amended, applicable to regulated investment companies. Accordingly, the Portfolio intends to distribute its taxable income and net realized gains, if any, to shareholders in accordance with timing requirements imposed by the Code. Therefore, no federal or state income tax provision is required in the Portfolio’s financial statements.
Management has analyzed the Portfolio’s tax positions taken on income tax returns for all open tax years and has concluded that as of December 31, 2016, no provision for income tax is required in the Portfolio’s financial statements. The Portfolio’s federal and state income and federal excise tax returns for tax years for which the applicable statutes of limitations have not expired are subject to examination by the Internal Revenue Service and state departments of revenue.
Under the applicable foreign tax laws, a withholding tax may be imposed on interest, dividends and capital gains at various rates.
(i) Reclassification. GAAP requires that certain components of net assets be reclassified to reflect permanent differences between financial and tax reporting. These reclassifications have no effect on net assets or net asset value per share. During the current year, the following reclassifications have been made:
| | | | | | | | |
| | | Undistributed Net
Investment Income | | | Accumulated Net
Realized Gain | |
| (a) | | $ | (2,406) | | | $ | 2,406 | |
| (a) | Reclassifications are due to foreign currency transactions treated as ordinary income for tax purposes. |
2. Investment management agreement and other transactions with affiliates
Legg Mason Partners Fund Advisor, LLC (“LMPFA”) is the Portfolio’s investment manager and ClearBridge Investments, LLC (“ClearBridge”) is the Portfolio’s subadviser. Western Asset Management Company (“Western Asset”) manages the portion of the Portfolio’s cash and short-term instruments allocated to it. LMPFA, ClearBridge and Western Asset are wholly-owned subsidiaries of Legg Mason, Inc. (“Legg Mason”).
Under the investment management agreement, the Portfolio pays an investment management fee, calculated daily and paid monthly, in accordance with the following breakpoint schedule:
| | | | |
| Average Daily Net Assets | | Annual Rate | |
| First $350 million | | | 0.650 | % |
| Next $150 million | | | 0.550 | |
| Next $250 million | | | 0.525 | |
| Next $250 million | | | 0.500 | |
| Over $1 billion | | | 0.450 | |
| | |
| 22 | | ClearBridge Variable Large Cap Value Portfolio 2016 Annual Report |
LMPFA provides administrative and certain oversight services to the Portfolio. LMPFA delegates to the subadviser the day-to-day portfolio management of the Portfolio, except for the management of the portion of the cash and short-term instruments allocated to Western Asset. For their services, LMPFA pays ClearBridge and Western Asset monthly an aggregate fee equal to 70% of the net management fee it receives from the Portfolio.
As a result of an expense limitation arrangement between the Portfolio and LMPFA, the ratio of total annual fund operating expenses, other than interest, brokerage, taxes, extraordinary expenses and acquired fund fees and expenses, to average net assets of Class I shares did not exceed 0.80%. This expense limitation arrangement cannot be terminated prior to December 31, 2018 without the Board of Trustees’ consent.
LMPFA is permitted to recapture amounts waived and/or reimbursed to the Portfolio during the same fiscal year if the Portfolio’s total annual operating expenses have fallen to a level below the expense limitation (“expense cap”) in effect at the time the fees were earned or the expenses incurred. In no case will LMPFA recapture any amount that would result, on any particular business day of the Portfolio, in the Portfolio’s total annual operating expenses exceeding the expense cap or any other lower limit then in effect.
Legg Mason Investor Services, LLC, a wholly-owned broker-dealer subsidiary of Legg Mason, serves as the Portfolio’s sole and exclusive distributor.
The Portfolio had adopted an unfunded, non-qualified deferred compensation plan (the “Plan”) which allowed non-interested trustees (“Independent Trustees”) to defer the receipt of all or a portion of their fees earned until a later date specified by the Independent Trustees. The deferred balances are reported in the Statement of Assets and Liabilities under Trustees’ fees payable and are considered a general obligation of the Portfolio and any payments made pursuant to the Plan will be made from the Portfolio’s general assets. The Plan was terminated effective January 1, 2007. This change had no effect on fees previously deferred. As of December 31, 2016, the Portfolio had accrued $24 as deferred compensation payable.
All officers and one Trustee of the Trust are employees of Legg Mason or its affiliates and do not receive compensation from the Trust.
3. Investments
During the year ended December 31, 2016, the aggregate cost of purchases and proceeds from sales of investments (excluding short-term investments) were as follows:
| | | | |
| Purchases | | $ | 18,674,140 | |
| Sales | | | 30,181,590 | |
At December 31, 2016, the aggregate gross unrealized appreciation and depreciation of investments for federal income tax purposes were as follows:
| | | | |
| Gross unrealized appreciation | | $ | 124,977,928 | |
| Gross unrealized depreciation | | | (6,843,078) | |
| Net unrealized appreciation | | $ | 118,134,850 | |
| | |
| ClearBridge Variable Large Cap Value Portfolio 2016 Annual Report | | 23 |
Notes to financial statements (cont’d)
4. Derivative instruments and hedging activities
During the year ended December 31, 2016, the Portfolio did not invest in derivative instruments.
5. Shares of beneficial interest
At December 31, 2016, the Trust had an unlimited number of shares of beneficial interest authorized with a par value of $0.00001 per share. The Portfolio has the ability to issue multiple classes of shares. Each class of shares represents an identical interest and has the same rights, except that each class bears certain direct expenses, including those specifically related to the distribution of its shares.
Transactions in shares of the Portfolio were as follows:
| | | | | | | | |
| | | Year Ended
December 31, 2016 | | | Year Ended
December 31, 2015 | |
| Class I | | | | | | | | |
| Shares sold | | | 2,003,755 | | | | 3,033,715 | |
| Shares issued on reinvestment | | | 519,490 | | | | 874,040 | |
| Shares repurchased | | | (3,064,648) | | | | (4,060,966) | |
| Net decrease | | | (541,403) | | | | (153,211) | |
6. Income tax information and distributions to shareholders
The tax character of distributions paid during the fiscal years ended December 31, was as follows:
| | | | | | | | |
| | | 2016 | | | 2015 | |
| Distributions paid from: | | | | | | | | |
| Ordinary income | | $ | 4,881,005 | | | $ | 5,969,355 | |
| Net long-term capital gains | | | 5,305,161 | | | | 9,802,535 | |
| Total distributions paid | | $ | 10,186,166 | | | $ | 15,771,890 | |
As of December 31, 2016, the components of accumulated earnings (losses) on a tax basis were as follows:
| | | | |
| Undistributed ordinary income — net | | $ | 157,459 | |
| Undistributed long-term capital gains — net | | | 606,443 | |
| Total undistributed earnings | | | 763,902 | |
| Other book/tax temporary differences(a) | | | (79,156) | |
| Unrealized appreciation (depreciation)(b) | | | 118,134,849 | |
| Total accumulated earnings (losses) — net | | $ | 118,819,595 | |
| (a) | Other book/tax temporary differences are attributable to the tax deferral of losses on straddles and book/tax differences in the timing of the deductibility of various expenses. |
| (b) | The difference between book-basis and tax-basis unrealized appreciation (depreciation) is attributable to the tax deferral of losses on wash sales. |
| | |
| 24 | | ClearBridge Variable Large Cap Value Portfolio 2016 Annual Report |
7. Recent accounting pronouncement
In October 2016, the U.S. Securities and Exchange Commission adopted new rules and amended existing rules (together, the “final rules”) intended to modernize the reporting and disclosure of information by registered investment companies. In part, the final rules amend Regulation S-X and require standardized, enhanced disclosure about derivatives in investment company financial statements, as well as other amendments. The compliance date for the amendments to Regulation S-X is August 1, 2017. Management is currently evaluating the impact that the adoption of the amendments to Regulation S-X will have on the Portfolio’s financial statements and related disclosures.
| | |
| ClearBridge Variable Large Cap Value Portfolio 2016 Annual Report | | 25 |
Report of independent registered public accounting firm
The Board of Trustees and Shareholders
Legg Mason Partners Variable Equity Trust:
We have audited the accompanying statement of assets and liabilities of ClearBridge Variable Large Cap Value Portfolio (the “Portfolio”), a series of Legg Mason Partners Variable Equity Trust, including the schedule of investments, as of December 31, 2016, and the related statement of operations for the year then ended, the statements of changes in net assets for each of the years in the two-year period then ended, and the financial highlights for each of the years in the five-year period then ended. These financial statements and financial highlights are the responsibility of the Portfolio’s management. Our responsibility is to express an opinion on these financial statements and financial highlights based on our audits.
We conducted our audits in accordance with the standards of the Public Company Accounting Oversight Board (United States). Those standards require that we plan and perform the audit to obtain reasonable assurance about whether the financial statements and financial highlights are free of material misstatement. An audit includes examining, on a test basis, evidence supporting the amounts and disclosures in the financial statements. Our procedures included confirmation of securities owned as of December 31, 2016, by correspondence with the custodian and brokers or by other appropriate auditing procedures. An audit also includes assessing the accounting principles used and significant estimates made by management, as well as evaluating the overall financial statement presentation. We believe that our audits provide a reasonable basis for our opinion.
In our opinion, the financial statements and financial highlights referred to above present fairly, in all material respects, the financial position of ClearBridge Variable Large Cap Value Portfolio as of December 31, 2016, the results of its operations for the year then ended, the changes in its net assets for each of the years in the two-year period then ended, and the financial highlights for each of the years in the five-year period then ended, in conformity with U.S. generally accepted accounting principles.

New York, New York
February 16, 2017
| | |
| 26 | | ClearBridge Variable Large Cap Value Portfolio 2016 Annual Report |
Board approval of management and subadvisory agreements (unaudited)
At a meeting of the Trust’s Board of Trustees, the Board considered the re-approval for an annual period of the management agreement of ClearBridge Variable Large Cap Value Portfolio (the “Fund”), pursuant to which Legg Mason Partners Fund Advisor, LLC (the “Manager”) provides the Fund with investment advisory and administrative services, the sub-advisory agreement pursuant to which ClearBridge Investments, LLC (“ClearBridge”) provides day-to-day management of the Fund’s portfolio, and the sub-advisory agreement pursuant to which Western Asset Management Company (“Western Asset” and, together with ClearBridge, the “Sub-Advisers”) provides day-to-day management of the Fund’s cash and short-term instruments allocated to it by the Manager. (The management agreement and sub-advisory agreements are collectively referred to as the “Agreements.”) The Manager and the Sub-Advisers are wholly-owned subsidiaries of Legg Mason, Inc. The Trustees who are not “interested persons” (as defined in the Investment Company Act of 1940, as amended (the “Independent Trustees”)) of the Fund were assisted in their review by Fund counsel and independent legal counsel and met with independent legal counsel in executive sessions separate from representatives of the Manager and the Sub-Advisers. The Independent Trustees requested and received information from the Manager and the Sub-Advisers they deemed reasonably necessary for their review of the Agreements and the performance of the Manager and the Sub-Advisers. Included was information about the Manager, the Sub-Advisers and the Fund’s distributor, as well as the management, sub-advisory and distribution arrangements and services provided to the Fund and other funds overseen by the Board. This information was initially reviewed by a special committee of the Independent Trustees and then by the full Board.
In voting to approve the Agreements, the Independent Trustees considered whether the approval of the Agreements would be in the best interests of the Fund and its shareholders, an evaluation based on several factors including those discussed below.
Nature, extent and quality of the services provided to the fund under the management agreement and sub-advisory agreements
The Board received and considered information regarding the nature, extent and quality of services provided to the Fund by the Manager and the Sub-Advisers under the Management Agreement and Sub-Advisory Agreements, respectively, during the past year. The Trustees also considered the Manager’s supervisory activities over the Sub-Advisers. In addition, the Independent Trustees received and considered other information regarding the administrative and other services rendered to the Fund and its shareholders by the Manager. The Board noted information received at regular meetings throughout the year related to the services rendered by the Manager in its management of the Fund’s affairs and the Manager’s role in coordinating the activities of the Sub-Advisers and the Fund’s other service providers. The Board’s evaluation of the services provided by the Manager and the Sub-Advisers took into account the Board’s knowledge and familiarity gained as Trustees of funds in the Legg Mason fund complex, including the scope and quality of the investment management and other capabilities of the Manager and the Sub-Advisers and the quality of
| | |
| ClearBridge Variable Large Cap Value Portfolio | | 27 |
Board approval of management and subadvisory agreements (unaudited) (cont’d)
the Manager’s administrative and other services. The Board observed that the scope of services provided by the Manager had expanded over time as a result of regulatory and other developments, including maintaining and monitoring its own and the Fund’s compliance programs. The Board reviewed information received from the Manager and the Fund’s Chief Compliance Officer regarding the Fund’s compliance policies and procedures established pursuant to Rule 38a-1 under the Investment Company Act of 1940, as amended.
The Board reviewed the qualifications, backgrounds and responsibilities of the Fund’s senior personnel and the portfolio management team primarily responsible for the day-to-day portfolio management of the Fund. The Board considered the degree to which the Manager implemented organizational changes to improve investment results and the services provided to the Legg Mason fund complex and the Manager’s commitment to continue to provide effective and efficient investment management and shareholder services. The Board also considered, based on its knowledge of the Manager and the Manager’s affiliates, the financial resources available to the Manager’s parent organization, Legg Mason, Inc.
The Board also considered the division of responsibilities among the Manager and the Sub-Advisers and the oversight provided by the Manager. The Board also considered the Manager’s and ClearBridge’s brokerage policies and practices, the standards applied in seeking best execution, their policies and practices regarding soft dollars, and the existence of quality controls applicable to brokerage allocation procedures. In addition, management also reported to the Board on, among other things, its business plans, recent organizational changes, portfolio manager compensation plan and policy regarding portfolio managers’ ownership of fund shares.
The Board concluded that, overall, it was satisfied with the nature, extent and quality of services provided (and expected to be provided) under the respective Agreement by the Manager and the Sub-Advisers.
Fund performance
The Board received and reviewed performance information for the Fund and for all large-cap core funds underlying variable insurance products (the “Performance Universe”) selected by Lipper, Inc. (“Lipper”), an independent provider of investment company data. The Board was provided with a description of the methodology Lipper used to determine the similarity of the Fund with the funds included in the Performance Universe. The Trustees noted that they also had received and discussed with management at periodic intervals information on the investment performance of the Fund in comparison to similar mutual funds and benchmark performance indices. The information comparing the Fund’s performance to that of the Performance Universe was for the one-, three-, five- and ten-year periods ended June 30, 2016. The Fund performed better than the median performance of the funds in the Performance Universe for the five- and ten-year periods, but performed below the median performance of the funds in the Performance Universe for the one- and three-year periods. The Board
| | |
| 28 | | ClearBridge Variable Large Cap Value Portfolio |
reviewed performance information provided by the Manager for periods ended September 30, 2016, which showed that the Fund’s performance was below the Lipper category average during the third quarter. The Board also reviewed information prepared by Lipper comparing the Fund’s annualized total return for the three-year period ended June 30, 2016 in relation to the Fund’s standard deviation to that of the funds in the Performance Universe. The Trustees noted that the Manager and ClearBridge were committed to providing the resources necessary to assist the Fund’s portfolio managers. Based on its review, the Board generally was satisfied with the Fund’s long-term performance. The Board determined to continue to evaluate the Fund’s performance and directed the Independent Trustees’ performance committee to continue to periodically review Fund performance with the Manager and report to the full Board during periods between Board meetings.
Management fees and expense ratios
The Board reviewed and considered the contractual management fee (the “Contractual Management Fee”) payable by the Fund to the Manager in light of the nature, extent and quality of the management and sub-advisory services provided by the Manager and the Sub-Advisers, respectively. The Board noted that the Manager, and not the Fund, pays the sub-advisory fees to the Sub-Advisers and, accordingly, that the retention of the Sub-Advisers does not increase the fees and expenses incurred by the Fund.
The Board also reviewed information regarding the fees the Manager and ClearBridge charged any of their U.S. clients investing primarily in an asset class similar to that of the Fund including, where applicable, institutional separate and commingled accounts and retail managed accounts. The Manager reviewed with the Board the significant differences in the scope of services provided to the Fund and to such other clients, noting that the Fund is provided with regulatory compliance and administrative services, office facilities and Fund officers (including the Fund’s chief financial, chief legal and chief compliance officers), and that the Manager coordinates and oversees the provision of services to the Fund by other fund service providers, including the Sub-Advisers. The Board considered the fee comparisons in light of the scope of services required to manage these different types of accounts.
The Board received an analysis of complex-wide management fees provided by the Manager, which, among other things, set out a framework of fees based on asset classes. Management also discussed with the Board the Fund’s distribution arrangements, including how amounts received by the Fund’s distributor are expended, and the fees received and expenses incurred in connection with such arrangements by affiliates of the Manager.
Additionally, the Board received and considered information comparing the Fund’s Contractual Management Fee and the Fund’s overall expense ratio with those of a group of 14 large-cap core funds underlying variable insurance products selected by Lipper as comparable to the Fund (the “Expense Group”), and a broader group of funds selected by Lipper consisting of all large-cap core funds underlying variable insurance products (the “Expense
| | |
| ClearBridge Variable Large Cap Value Portfolio | | 29 |
Board approval of management and subadvisory agreements (unaudited) (cont’d)
Universe”). This information showed that the Fund’s Contractual Management Fee was at the median of management fees paid by the funds in the Expense Group and the funds in the Expense Universe, and that the Fund’s total expense ratio was slightly lower than the median of the total expense ratios of the funds in the Expense Group and the funds in the Expense Universe. The Trustees also noted the Manager’s fee waiver and/or expense reimbursement arrangement.
Manager profitability
The Board received and considered a profitability analysis of the Manager and its affiliates in providing services to the Fund. The Board also received profitability information with respect to the Legg Mason fund complex as a whole. In addition, the Board received information with respect to the Manager’s allocation methodologies used in preparing this profitability data as well as a report from an outside consultant that had reviewed the Manager’s methodology. The Board noted the profitability percentage ranges determined by appropriate court cases to be reasonable given the services rendered to investment companies. The Board determined that the Manager’s profitability was not excessive in light of the nature, extent and quality of the services provided to the Fund.
Economies of scale
The Board received and considered information regarding whether there have been economies of scale with respect to the management of the Fund as the Fund’s assets grow, whether the Fund has appropriately benefited from any economies of scale, and whether there is potential for realization of any further economies of scale. The Board considered whether economies of scale in the provision of services to the Fund were being passed along to the shareholders.
The Board noted that the Manager instituted breakpoints in the Fund’s Contractual Management Fee, reflecting the potential for reducing the Contractual Management Fee as the Fund’s assets grow. The Board noted that the Fund’s assets were below the specified asset level at which one or more breakpoints to its Contractual Management Fee are triggered. The Board noted, however, that the Contractual Management Fee increases the potential for sharing economies of scale with shareholders to the extent the Fund’s assets grow than if no breakpoints were in place. The Board also noted that to the extent the Fund’s assets increase over time, the Fund and its shareholders should realize other economies of scale as certain expenses, such as fixed fund fees, become a smaller percentage of overall assets. The Board noted that it appeared that the benefits of any economies of scale also would be appropriately shared with shareholders through increased investment in fund management and administration resources.
Taking all of the above into consideration, the Board determined that the management fee was reasonable in light of the comparative performance and expense information and the nature, extent and quality of the services provided to the Fund under the Agreements.
| | |
| 30 | | ClearBridge Variable Large Cap Value Portfolio |
Other benefits to the manager
The Board considered other benefits received by the Manager and its affiliates, including the Sub-Advisers, as a result of the Manager’s relationship with the Fund, including the opportunity to offer additional products and services to Fund shareholders.
In light of the costs of providing investment management and other services to the Fund and the Manager’s ongoing commitment to the Fund, the profits and other ancillary benefits that the Manager and its affiliates received were considered reasonable.
Based on their discussions and considerations, including those described above, the Trustees approved the Management Agreement and the Sub-Advisory Agreements to continue for another year.
No single factor reviewed by the Board was identified by the Board as the principal factor in determining whether to approve the Management Agreement and the Sub-Advisory Agreements.
| | |
| ClearBridge Variable Large Cap Value Portfolio | | 31 |
Additional information (unaudited)
Information about Trustees and Officers
The business and affairs of ClearBridge Variable Large Cap Value Portfolio (the “Portfolio”) are conducted by management under the supervision and subject to the direction of its Board of Trustees. The business address of each Trustee is c/o Jane Trust, Legg Mason, 100 International Drive, 11th Floor, Baltimore, Maryland 21202. Information pertaining to the Trustees and officers of the Portfolio is set forth below.
The Statement of Additional Information includes additional information about Trustees and is available, without charge, upon request by calling the Portfolio at 1-877-721-1926.
| | |
| Independent Trustees† |
| Paul R. Ades |
| Year of birth | | 1940 |
| Position(s) with Trust | | Trustee |
| Term of office1 and length of time served2 | | Since 1983 |
| Principal occupation(s) during past five years | | Paul R. Ades, PLLC (law firm) (since 2000) |
| Number of funds in fund complex overseen by Trustee | | 48 |
| Other board memberships held by Trustee during past five years | | None |
|
| Andrew L. Breech |
| Year of birth | | 1952 |
| Position(s) with Trust | | Trustee |
| Term of office1 and length of time served2 | | Since 1991 |
| Principal occupation(s) during past five years | | President, Dealer Operating Control Service, Inc. (automotive retail management) (since 1985) |
| Number of funds in fund complex overseen by Trustee | | 48 |
| Other board memberships held by Trustee during past five years | | None |
|
| Dwight B. Crane |
| Year of birth | | 1937 |
| Position(s) with Trust | | Trustee |
| Term of office1 and length of time served2 | | Since 1981 |
| Principal occupation(s) during past five years | | Professor Emeritus, Harvard Business School (since 2007); formerly, Professor, Harvard Business School (1969 to 2007); Independent Consultant (since 1969) |
| Number of funds in fund complex overseen by Trustee | | 48 |
| Other board memberships held by Trustee during past five years | | None |
| | |
| 32 | | ClearBridge Variable Large Cap Value Portfolio |
| | |
| Independent Trustees cont’d |
| Althea L. Duersten |
| Year of birth | | 1951 |
| Position(s) with Trust | | Trustee |
| Term of office1 and length of time served2 | | Since 2014 |
| Principal occupation(s) during past five years | | Retired (since 2011); formerly, Chief Investment Officer, North America, JPMorgan Chase (investment bank) and member of JPMorgan Executive Committee (2007 to 2011) |
| Number of funds in fund complex overseen by Trustee | | 48 |
| Other board memberships held by Trustee during past five years | | None |
|
| Frank G. Hubbard |
| Year of birth | | 1937 |
| Position(s) with Trust | | Trustee |
| Term of office1 and length of time served2 | | Since 1993 |
| Principal occupation(s) during past five years | | President, Fealds, Inc. (business development) (since 2016); formerly, President, Avatar International Inc. (business development) (1998 to 2015) |
| Number of funds in fund complex overseen by Trustee | | 48 |
| Other board memberships held by Trustee during past five years | | None |
|
| Howard J. Johnson |
| Year of birth | | 1938 |
| Position(s) with Trust | | Trustee and Chairman |
| Term of office1 and length of time served2 | | From 1981 to 1998 and since 2000 (Chairman since 2013) |
| Principal occupation(s) during past five years | | Chief Executive Officer, Genesis Imaging LLC (technology company) (since 2003) |
| Number of funds in fund complex overseen by Trustee | | 48 |
| Other board memberships held by Trustee during past five years | | None |
|
| Jerome H. Miller |
| Year of birth | | 1938 |
| Position(s) with Trust | | Trustee |
| Term of office1 and length of time served2 | | Since 1995 |
| Principal occupation(s) during past five years | | Retired |
| Number of funds in fund complex overseen by Trustee | | 48 |
| Other board memberships held by Trustee during past five years | | None |
| | |
| ClearBridge Variable Large Cap Value Portfolio | | 33 |
Additional information (unaudited) (cont’d)
Information about Trustees and Officers
| | |
| Independent Trustees cont’d |
| Ken Miller |
| Year of birth | | 1942 |
| Position(s) with Trust | | Trustee |
| Term of office1 and length of time served2 | | Since 1983 |
| Principal occupation(s) during past five years | | Retired; formerly, President, Young Stuff Apparel Group, Inc. (apparel manufacturer), division of Li & Fung (1963 to 2012) |
| Number of funds in fund complex overseen by Trustee | | 48 |
| Other board memberships held by Trustee during past five years | | None |
|
| John J. Murphy |
| Year of birth | | 1944 |
| Position(s) with Trust | | Trustee |
| Term of office1 and length of time served2 | | Since 2002 |
| Principal occupation(s) during past five years | | Founder and Senior Principal, Murphy Capital Management (investment management) (since 1983) |
| Number of funds in fund complex overseen by Trustee | | 48 |
| Other board memberships held by Trustee during past five years | | Trustee, UBS Funds (24 funds) (since 2008); Trustee, Consulting Group Capital Markets Funds (10 funds) (since 2002); Director, Fort Dearborn Income Securities, Inc. (since 2013); formerly, Director, Nicholas Applegate Institutional Funds (12 funds) (2005 to 2010) |
|
| Thomas F. Schlafly |
| Year of birth | | 1948 |
| Position(s) with Trust | | Trustee |
| Term of office1 and length of time served2 | | Since 1983 |
| Principal occupation(s) during past five years | | Chairman, The Saint Louis Brewery, LLC (brewery) (since 2012); formerly, President, The Saint Louis Brewery, Inc. (1989 to 2012); Partner, Thompson Coburn LLP (law firm) (since 2009) |
| Number of funds in fund complex overseen by Trustee | | 48 |
| Other board memberships held by Trustee during past five years | | Director, Citizens National Bank of Greater St. Louis (since 2006) |
| | |
| 34 | | ClearBridge Variable Large Cap Value Portfolio |
| | |
| Interested Trustee and Officer |
| Jane Trust3 | | |
| Year of birth | | 1962 |
| Position(s) with Trust | | Trustee, President and Chief Executive Officer |
| Term of office1 and length of time served2 | | Since 2015 |
| Principal occupation(s) during past five years | | Managing Director of Legg Mason & Co., LLC (“Legg Mason & Co.”) (since 2016); Officer and/or Trustee/Director of 156 funds associated with Legg Mason Partners Fund Advisor, LLC (“LMPFA”) or its affiliates (since 2015); President and Chief Executive Officer of LMPFA (since 2015); formerly, Senior Vice President of LMPFA (2015); Director of ClearBridge, LLC (formerly, Legg Mason Capital Management, LLC) (2007 to 2014); Managing Director of Legg Mason Investment Counsel & Trust Co. (2000 to 2007) |
| Number of funds in fund complex overseen by Trustee | | 149 |
| Other board memberships held by Trustee during past five years | | None |
| | |
| Additional Officers |
Ted P. Becker Legg Mason 620 Eighth Avenue, 49th Floor, New York, NY 10018 |
| Year of birth | | 1951 |
| Position(s) with Trust | | Chief Compliance Officer |
| Term of office1 and length of time served2 | | Since 2007 |
| Principal occupation(s) during past five years | | Director of Global Compliance at Legg Mason (since 2006); Chief Compliance Officer of LMPFA (since 2006); Managing Director of Compliance of Legg Mason & Co. (since 2005); Chief Compliance Officer of certain mutual funds associated with Legg Mason & Co. or its affiliates (since 2006) |
|
Susan Kerr Legg Mason 620 Eighth Avenue, 49th Floor, New York, NY 10018 |
| Year of birth | | 1949 |
| Position(s) with Trust | | Chief Anti-Money Laundering Compliance Officer |
| Term of office1 and length of time served2 | | Since 2013 |
| Principal occupation(s) during past five years | | Assistant Vice President of Legg Mason & Co. and Legg Mason Investor Services, LLC (“LMIS”) (since 2010); Chief Anti-Money Laundering Compliance Officer of certain mutual funds associated with Legg Mason & Co. or its affiliates (since 2013) and Anti-Money Laundering Compliance Officer of LMIS (since 2012); Senior Compliance Officer of LMIS (since 2011); formerly, AML Consultant, DTCC (2010); AML Consultant, Rabobank Netherlands, (2009); First Vice President, Director of Marketing & Advertising Compliance and Manager of Communications Review Group at Citigroup Inc. (1996 to 2008) |
| | |
| ClearBridge Variable Large Cap Value Portfolio | | 35 |
Additional information (unaudited) (cont’d)
Information about Trustees and Officers
| | |
| Additional Officers cont’d |
Jenna Bailey Legg Mason 100 First Stamford Place, 6th Floor, Stamford, CT 06902 |
| Year of birth | | 1978 |
| Position(s) with Trust | | Identity Theft Prevention Officer |
| Term of office1 and length of time served2 | | Since 2015 |
| Principal occupation(s) during past five years | | Identity Theft Prevention Officer of certain mutual funds associated with Legg Mason & Co. or its affiliates (since 2015); Compliance Officer of Legg Mason & Co. (since 2013); Assistant Vice President of Legg Mason & Co. (since 2011); formerly, Associate Compliance Officer of Legg Mason & Co. (2011 to 2013); Risk Manager of U.S. Distribution of Legg Mason & Co. (2007 to 2011) |
|
Robert I. Frenkel Legg Mason 100 First Stamford Place, 6th Floor, Stamford, CT 06902 |
| Year of birth | | 1954 |
| Position(s) with Trust | | Secretary and Chief Legal Officer |
| Term of office1 and length of time served2 | | Since 2007 |
| Principal occupation(s) during past five years | | Vice President and Deputy General Counsel of Legg Mason (since 2006); Managing Director and General Counsel — U.S. Mutual Funds for Legg Mason & Co. (since 2006) and Legg Mason & Co. predecessors (since 1994); Secretary and Chief Legal Officer of certain mutual funds associated with Legg Mason & Co. or its affiliates (since 2006) and Legg Mason & Co. predecessors (prior to 2006) |
|
Thomas C. Mandia Legg Mason 100 First Stamford Place, 6th Floor, Stamford, CT 06902 |
| Year of birth | | 1962 |
| Position(s) with Trust | | Assistant Secretary |
| Term of office1 and length of time served2 | | Since 2007 |
| Principal occupation(s) during past five years | | Managing Director and Deputy General Counsel of Legg Mason & Co. (since 2005) and Legg Mason & Co. predecessors (prior to 2005); Secretary of LMPFA (since 2006); Assistant Secretary of certain mutual funds associated with Legg Mason & Co. or its affiliates (since 2006) and Legg Mason & Co. predecessors (prior to 2006); Secretary of LM Asset Services, LLC (“LMAS”) (since 2002) and Legg Mason Fund Asset Management, Inc. (“LMFAM”) (since 2013) (formerly registered investment advisers) |
| | |
| 36 | | ClearBridge Variable Large Cap Value Portfolio |
| | |
| Additional Officers cont’d | | |
Richard F. Sennett Legg Mason 100 International Drive, 7th Floor, Baltimore, MD 21202 | | |
| Year of birth | | 1970 |
| Position(s) with Trust | | Principal Financial Officer |
| Term of office1 and length of time served2 | | Since 2011 |
| Principal occupation(s) during past five years | | Principal Financial Officer and Treasurer of certain mutual funds associated with Legg Mason & Co. or its affiliates (since 2011 and since 2013); Managing Director of Legg Mason & Co. and Senior Manager of the Treasury Policy group for Legg Mason & Co.’s Global Fiduciary Platform (since 2011); formerly, Chief Accountant within the SEC’s Division of Investment Management (2007 to 2011); Assistant Chief Accountant within the SEC’s Division of Investment Management (2002 to 2007) |
| |
Christopher Berarducci Legg Mason 620 Eighth Avenue, 49th Floor, New York, NY 10018 | | |
| Year of birth | | 1974 |
| Position(s) with Trust | | Treasurer |
| Term of office1 and length of time served2 | | Since 2014 |
| Principal occupation(s) during past five years | | Director of Legg Mason & Co. (since 2015); Treasurer of certain mutual funds associated with Legg Mason & Co. or its affiliates (since 2010); formerly, Vice President of Legg Mason & Co. (2011 to 2015); Assistant Controller of certain mutual funds associated with Legg Mason & Co. or its affiliates (prior to 2010) |
| |
Jeanne M. Kelly Legg Mason 620 Eighth Avenue, 49th Floor, New York, NY 10018 | | |
| Year of birth | | 1951 |
| Position(s) with Trust | | Senior Vice President |
| Term of office1 and length of time served2 | | Since 2007 |
| Principal occupation(s) during past five years | | Senior Vice President of certain mutual funds associated with Legg Mason & Co. or its affiliates (since 2007); Senior Vice President of LMPFA (since 2006); President and Chief Executive Officer of LMAS and LMFAM (since 2015); Managing Director of Legg Mason & Co. (since 2005) and Legg Mason & Co. predecessors (prior to 2005); formerly, Senior Vice President of LMFAM (2013 to 2015) |
| † | Trustees who are not “interested persons” of the Portfolio within the meaning of Section 2(a)(19) of the Investment Company Act of 1940, as amended (the “1940 Act”). |
| 1 | Each Trustee and officer serves until his or her respective successor has been duly elected and qualified or until his or her earlier death, resignation, retirement or removal. |
| 2 | Indicates the earliest year in which the Trustee became a board member for a fund in the Legg Mason fund complex or the officer took such office. |
| 3 | Ms. Trust is an “interested person” of the Portfolio, as defined in the 1940 Act, because of her position with LMPFA and/or certain of its affiliates. |
| | |
| ClearBridge Variable Large Cap Value Portfolio | | 37 |
Important tax information (unaudited)
The following information is provided with respect to the distributions paid during the taxable year ended December 31, 2016:
| | | | | | | | |
| Record date: | | | 6/7/2016 | | | | 12/16/2016 | |
| Payable date: | | | 6/8/2016 | | | | 12/19/2016 | |
| Ordinary income: | | | | | | | | |
Dividends qualifying for the dividends | | | | | | | | |
received deduction for corporations | | | 100.00 | % | | | 100.00 | % |
| Long-term capital gain dividend | | | $0.001350 | | | | $0.360710 | |
Please retain this information for your records.
| | |
| 38 | | ClearBridge Variable Large Cap Value Portfolio |
ClearBridge
Variable Large Cap Value Portfolio
Trustees
Paul R. Ades
Andrew L. Breech
Dwight B. Crane
Althea L. Duersten
Frank G. Hubbard
Howard J. Johnson
Chairman
Jerome H. Miller
Ken Miller
John J. Murphy
Thomas F. Schlafly
Jane Trust
Investment manager
Legg Mason Partners Fund Advisor, LLC
Subadviser
ClearBridge Investments, LLC
Distributor
Legg Mason Investor Services, LLC
Custodian
State Street Bank and Trust Company
Transfer agent
BNY Mellon Investment
Servicing (US) Inc.
4400 Computer Drive
Westborough, MA 01581
Independent registered public accounting firm
KPMG LLP
345 Park Avenue
New York, NY 10154
ClearBridge Variable Large Cap Value Portfolio
The Portfolio is a separate investment series of Legg Mason Partners Variable Equity Trust, a Maryland statutory trust.
ClearBridge Variable Large Cap Value Portfolio
Legg Mason Funds
620 Eighth Avenue, 49th Floor
New York, NY 10018
The Portfolio files its complete schedule of portfolio holdings with the Securities and Exchange Commission (“SEC”) for the first and third quarters of each fiscal year on Form N-Q. The Portfolio’s Forms N-Q are available on the SEC’s website at www.sec.gov. The Portfolio’s Forms N-Q may be reviewed and copied at the SEC’s Public Reference Room in Washington, D.C., and information on the operation of the Public Reference Room may be obtained by calling 1-800-SEC-0330. To obtain information on Form N-Q, shareholders can call the Portfolio at 1-877-721-1926.
Information on how the Portfolio voted proxies relating to portfolio securities during the prior 12-month period ended June 30th of each year and a description of the policies and procedures that the Portfolio uses to determine how to vote proxies related to portfolio transactions are available (1) without charge, upon request, by calling the Portfolio at 1-877-721-1926, (2) at www.leggmason.com/variablefunds and (3) on the SEC’s website at www.sec.gov.
This report is submitted for the general information of the shareholders of ClearBridge Variable Large Cap Value Portfolio. This report is not authorized for distribution to prospective investors in the Portfolio unless preceded or accompanied by a current prospectus.
Investors should consider the Portfolio’s investment objectives, risks, charges and expenses carefully before investing. The prospectus contains this and other information about the Portfolio. Please read the prospectus carefully before investing.
www.leggmason.com
© 2017 Legg Mason Investor Services, LLC
Member FINRA, SIPC
Legg Mason Funds Privacy and Security Notice
Your Privacy and the Security of Your Personal Information is Very Important to the Legg Mason Funds
This Privacy and Security Notice (the “Privacy Notice”) addresses the Legg Mason Funds’ privacy and data protection practices with respect to nonpublic personal information the Funds receive. The Legg Mason Funds include any funds sold by the Funds’ distributor, Legg Mason Investor Services, LLC, as well as Legg Mason-sponsored closed-end funds and certain closed-end funds managed or sub-advised by Legg Mason or its affiliates. The provisions of this Privacy Notice apply to your information both while you are a shareholder and after you are no longer invested with the Funds.
The Type of Nonpublic Personal Information the Funds Collect About You
The Funds collect and maintain nonpublic personal information about you in connection with your shareholder account. Such information may include, but is not limited to:
| • | | Personal information included on applications or other forms; |
| • | | Account balances, transactions, and mutual fund holdings and positions; |
| • | | Online account access user IDs, passwords, security challenge question responses; and |
| • | | Information received from consumer reporting agencies regarding credit history and creditworthiness (such as the amount of an individual’s total debt, payment history, etc.). |
How the Funds Use Nonpublic Personal Information About You
The Funds do not sell or share your nonpublic personal information with third parties or with affiliates for their marketing purposes, or with other financial institutions or affiliates for joint marketing purposes, unless you have authorized the Funds to do so. The Funds do not disclose any nonpublic personal information about you except as may be required to perform transactions or services you have authorized or as permitted or required by law. The Funds may disclose information about you to:
| • | | Employees, agents, and affiliates on a “need to know” basis to enable the Funds to conduct ordinary business or comply with obligations to government regulators; |
| • | | Service providers, including the Funds’ affiliates, who assist the Funds as part of the ordinary course of business (such as printing, mailing services, or processing or servicing your account with us) or otherwise perform services on the Funds’ behalf, including companies that may perform marketing services solely for the Funds; |
| • | | The Funds’ representatives such as legal counsel, accountants and auditors; and |
| • | | Fiduciaries or representatives acting on your behalf, such as an IRA custodian or trustee of a grantor trust. |
|
| NOT PART OF THE ANNUAL REPORT |
Legg Mason Funds Privacy and Security Notice (cont’d)
Except as otherwise permitted by applicable law, companies acting on the Funds’ behalf are contractually obligated to keep nonpublic personal information the Funds provide to them confidential and to use the information the Funds share only to provide the services the Funds ask them to perform.
The Funds may disclose nonpublic personal information about you when necessary to enforce their rights or protect against fraud, or as permitted or required by applicable law, such as in connection with a law enforcement or regulatory request, subpoena, or similar legal process. In the event of a corporate action or in the event a Fund service provider changes, the Funds may be required to disclose your nonpublic personal information to third parties. While it is the Funds’ practice to obtain protections for disclosed information in these types of transactions, the Funds cannot guarantee their privacy policy will remain unchanged.
Keeping You Informed of the Funds’ Privacy and Security Practices
The Funds will notify you annually of their privacy policy as required by federal law. While the Funds reserve the right to modify this policy at any time they will notify you promptly if this privacy policy changes.
The Funds’ Security Practices
The Funds maintain appropriate physical, electronic and procedural safeguards designed to guard your nonpublic personal information. The Funds’ internal data security policies restrict access to your nonpublic personal information to authorized employees, who may use your nonpublic personal information for Fund business purposes only.
Although the Funds strive to protect your nonpublic personal information, they cannot ensure or warrant the security of any information you provide or transmit to them, and you do so at your own risk. In the event of a breach of the confidentiality or security of your nonpublic personal information, the Funds will attempt to notify you as necessary so you can take appropriate protective steps. If you have consented to the Funds using electronic communications or electronic delivery of statements, they may notify you under such circumstances using the most current email address you have on record with them.
In order for the Funds to provide effective service to you, keeping your account information accurate is very important. If you believe that your account information is incomplete, not accurate or not current, or if you have questions about the Funds’ privacy practices, write the Funds using the contact information on your account statements, email the Funds by clicking on the Contact Us section of the Funds’ website at www.leggmason.com, or contact the Fund at 1-877-721-1926.
|
| NOT PART OF THE ANNUAL REPORT |
www.leggmason.com
© 2017 Legg Mason Investor Services, LLC Member FINRA, SIPC
FD04114 2/17 SR17-2982
The registrant has adopted a code of ethics that applies to the registrant’s principal executive officer, principal financial officer, principal accounting officer or controller.
| ITEM 3. | AUDIT COMMITTEE FINANCIAL EXPERT. |
The Board of Trustees of the registrant has determined that Dwight B. Crane possesses the technical attributes identified in Instruction 2(b) of Item 3 to Form N-CSR to qualify as an “audit committee financial expert,” and has designated Dwight B. Crane as the Audit Committee’s financial expert. Dwight B. Crane is an “independent” Trustee pursuant to paragraph (a)(2) of Item 3 to Form N-CSR.
| ITEM 4. | PRINCIPAL ACCOUNTANT FEES AND SERVICES. |
a) Audit Fees. The aggregate fees billed in the previous fiscal years ending December 31, 2015 and December 31, 2016 (the “Reporting Periods”) for professional services rendered by the Registrant’s principal accountant (the “Auditor”) for the audit of the Registrant’s annual financial statements, or services that are normally provided by the Auditor in connection with the statutory and regulatory filings or engagements for the Reporting Periods, were $318,825 in December 31, 2015 and $418,495 in December 31, 2016.
b) Audit-Related Fees. The aggregate fees billed in the Reporting Period for assurance and related services by the Auditor that are reasonably related to the performance of the Registrant’s financial statements were $0 in December 31, 2015 and $0 in December 31, 2016.
(c) Tax Fees. The aggregate fees billed in the Reporting Periods for professional services rendered by the Auditor for tax compliance, tax advice and tax planning (“Tax Services”) were $50,780 in December 31, 2015 and $49,560 in December 31, 2016. These services consisted of (i) review or preparation of U.S. federal, state, local and excise tax returns; (ii) U.S. federal, state and local tax planning, advice and assistance regarding statutory, regulatory or administrative developments, and (iii) tax advice regarding tax qualification matters and/or treatment of various financial instruments held or proposed to be acquired or held.
There were no fees billed for tax services by the Auditors to service affiliates during the Reporting Periods that required
pre-approval by the Audit Committee.
d) All Other Fees. There were no other fees billed in the Reporting Periods for products and services provided by the Auditor, other than the services reported in paragraphs (a) through (c) of this Item for the Legg Mason Partners Variable Equity Trust.
All Other Fees. There were no other non-audit services rendered by the Auditor to Legg Mason Partners Fund Advisors, LLC (“LMPFA”), and any entity controlling, controlled by or under common control with LMPFA that provided ongoing services to Legg Mason Partners Variable Equity Trust requiring pre-approval by the Audit Committee in the Reporting Period.
(e) Audit Committee’s pre-approval policies and procedures described in paragraph (c) (7) of Rule 2-01 of Regulation S-X.
(1) The Charter for the Audit Committee (the “Committee”) of the Board of each registered investment company (the “Fund”) advised by LMPFA or one of their affiliates (each, an “Adviser”) requires that the Committee shall approve (a) all audit and permissible non-audit services to be provided to the Fund and (b) all permissible non-audit services to be provided by the Fund’s independent auditors to the Adviser and any Covered Service Providers if the engagement relates directly to the operations and financial reporting of the Fund. The Committee may implement policies and procedures by which such services are approved other than by the full Committee.
The Committee shall not approve non-audit services that the Committee believes may impair the independence of the auditors. As of the date of the approval of this Audit Committee Charter, permissible non-audit services include any professional services (including tax services), that are not prohibited services as described below, provided to the Fund by the independent auditors, other than those provided to the Fund in connection with an audit or a review of the financial statements of the Fund. Permissible non-audit services may not include: (i) bookkeeping or other services related to the accounting records or financial statements of the Fund; (ii) financial information systems design and implementation; (iii) appraisal or valuation services, fairness opinions or contribution-in-kind reports; (iv) actuarial services; (v) internal audit outsourcing services; (vi) management functions or human resources; (vii) broker or dealer, investment adviser or investment banking services; (viii) legal services and expert services unrelated to the audit; and (ix) any other service the Public Company Accounting Oversight Board determines, by regulation, is impermissible.
Pre-approval by the Committee of any permissible non-audit services is not required so long as: (i) the aggregate amount of all such permissible non-audit services provided to the Fund, the Adviser and any service providers controlling, controlled by or under common control with the Adviser that provide ongoing services to the Fund (“Covered Service Providers”) constitutes not more than 5% of the total amount of revenues paid to the independent auditors during the fiscal year in which the permissible non-audit services are provided to (a) the Fund, (b) the Adviser and (c) any entity controlling, controlled by or under common control with the Adviser that provides ongoing services to the Fund during the fiscal year in which the services are provided that would have to be approved by the Committee; (ii) the permissible non-audit services were not recognized by the Fund at the time of the engagement to be non-audit services; and (iii) such services are promptly brought to the attention of the Committee and approved by the Committee (or its delegate(s)) prior to the completion of the audit.
(2) For the Legg Mason Partners Variable Equity Trust, the percentage of fees that were approved by the audit committee, with respect to: Audit-Related Fees were 100% and 100% for December 31, 2015 and December 31, 2016; Tax Fees were 100% and 100% for December 31, 2015 and December 31, 2016; and Other Fees were 100% and 100% for December 31, 2015 and December 31, 2016.
(f) N/A
(g) Non-audit fees billed by the Auditor for services rendered to Legg Mason Partners Variable Equity Trust, LMPFA and any entity controlling, controlled by, or under common control with LMPFA that provides ongoing services to Legg Mason Partners Variable Equity Trust during the reporting period were $0 in 2016.
(h) Yes. Legg Mason Partners Variable Equity Trust’s Audit Committee has considered whether the provision of non-audit services that were rendered to Service Affiliates, which were not pre-approved (not requiring pre-approval), is compatible with maintaining the Accountant’s independence. All services provided by the Auditor to the Legg Mason Partners Variable Equity Trust or to Service Affiliates, which were required to be pre-approved, were pre-approved as required.
| ITEM 5. | AUDIT COMMITTEE OF LISTED REGISTRANTS. |
| | a) | The independent board members are acting as the registrant’s audit committee as specified in Section 3(a)(58)(B) of the Exchange Act. The Audit Committee consists of the following Board members: |
Paul R. Ades
Andrew L. Breech
Dwight B. Crane
Althea L. Duersten
Frank G. Hubbard
Howard J. Johnson
Jerome H. Miller
Ken Miller
John J. Murphy
Thomas F. Schlafly
| ITEM 6. | SCHEDULE OF INVESTMENTS. |
Included herein under Item 1.
| ITEM 7. | DISCLOSURE OF PROXY VOTING POLICIES AND PROCEDURES FOR CLOSED-END MANAGEMENT INVESTMENT COMPANIES. |
Not applicable.
| ITEM 8. | PORTFOLIO MANAGERS OF CLOSED-END MANAGEMENT INVESTMENT COMPANIES. |
Not applicable.
| ITEM 9. | PURCHASES OF EQUITY SECURITIES BY CLOSED-END MANAGEMENT INVESTMENT COMPANY AND AFFILIATED PURCHASERS. |
Not applicable.
| ITEM 10. | SUBMISSION OF MATTERS TO A VOTE OF SECURITY HOLDERS. |
Not applicable.
| ITEM 11. | CONTROLS AND PROCEDURES. |
| | (a) | The registrant’s principal executive officer and principal financial officer have concluded that the registrant’s disclosure controls and procedures (as defined in Rule 30a- 3(c) under the Investment Company Act of 1940, as amended (the “1940 Act”)) are effective as of a date within 90 days of the filing date of this report that includes the disclosure required by this paragraph, based on their evaluation of the disclosure controls and procedures required by Rule 30a-3(b) under the 1940 Act and 15d-15(b) under the Securities Exchange Act of 1934. |
| | (b) | There were no changes in the registrant’s internal control over financial reporting (as defined in Rule 30a-3(d) under the 1940 Act) that occurred during the second fiscal quarter of the period covered by this report that have materially affected, or are likely to materially affect the registrant’s internal control over financial reporting. |
(a) (1) Code of Ethics attached hereto.
Exhibit 99.CODE ETH
(a) (2) Certifications pursuant to section 302 of the Sarbanes-Oxley Act of 2002 attached hereto.
Exhibit 99.CERT
(b) Certifications pursuant to Section 906 of the Sarbanes-Oxley Act of 2002 attached hereto.
Exhibit 99.906CERT
SIGNATURES
Pursuant to the requirements of the Securities Exchange Act of 1934 and the Investment Company Act of 1940, the registrant has duly caused this Report to be signed on its behalf by the undersigned, there unto duly authorized.
Legg Mason Partners Variable Equity Trust
| | |
| By: | | /s/ Jane Trust |
| | Jane Trust |
| | Chief Executive Officer |
| |
| Date: | | February 24, 2017 |
Pursuant to the requirements of the Securities Exchange Act of 1934 and the Investment Company Act of 1940, this report has been signed below by the following persons on behalf of the registrant and in the capacities and on the dates indicated.
| | |
| By: | | /s/ Jane Trust |
| | Jane Trust |
| | Chief Executive Officer |
| |
| Date: | | February 24, 2017 |
| |
| By: | | /s/ Richard F. Sennett |
| | Richard F. Sennett |
| | Principal Financial Officer |
| |
| Date: | | February 24, 2017 |