UNITED STATES
SECURITIES AND EXCHANGE COMMISSION
Washington, D.C. 20549
FORM N-CSR
CERTIFIED SHAREHOLDER REPORT OF REGISTERED
MANAGEMENT INVESTMENT COMPANIES
Investment Company Act file number 811-21128
Legg Mason Partners Variable Equity Trust
(Exact name of registrant as specified in charter)
620 Eighth Avenue, 49th Floor, New York, NY 10018
(Address of principal executive offices) (Zip code)
Robert I. Frenkel, Esq.
Legg Mason & Co., LLC
100 First Stamford Place
Stamford, CT 06902
(Name and address of agent for service)
Registrant’s telephone number, including area code: 1-877-721-1926
Date of fiscal year end: December 31
Date of reporting period: June 30, 2020
ITEM 1. REPORT TO STOCKHOLDERS.
The Semi-Annual Report to Stockholders is filed herewith.

| | |
| Semi-Annual Report | | June 30, 2020 |
QS
Variable Asset Allocation Series
QS Variable Growth
QS Variable Moderate Growth
QS Variable Conservative Growth
Beginning in January 2021, as permitted by regulations adopted by the Securities and Exchange Commission, your insurance company may no longer send you paper copies of the Fund’s shareholder reports like this one by mail, unless you specifically request paper copies of the reports from the insurance company or your financial intermediary. Instead, the shareholder reports will be made available on a website, and you will be notified by mail each time a report is posted and provided with a website link to access the report. Instructions for requesting paper copies will be provided by your insurance company.
If you already elected to receive shareholder reports electronically, you will not be affected by this change and you need not take any action. If your insurance company offers electronic delivery, you may elect to receive shareholder reports and other communications from them electronically by following the instructions provided by the insurance company.
You may elect to receive all future reports in paper free of charge. You can inform the insurance company that you wish to continue receiving paper copies of shareholder reports by following the instructions provided by them. Your election will apply to all Funds available under your contract with the insurance company.

|
| INVESTMENT PRODUCTS: NOT FDIC INSURED • NO BANK GUARANTEE • MAY LOSE VALUE |
QS Variable Asset Allocation Series
QS Variable Asset Allocation Series (“Variable Asset Allocation Series”) consists of separate investment Portfolios, each with its own investment objective and policies. Each Portfolio is a “fund of funds,” investing in other mutual funds and exchange-traded funds (ETFs), and is managed as an asset allocation program.
The Portfolios are separate investment series of Legg Mason Partners Variable Equity Trust, a Maryland statutory trust.
Letter from the president

Dear Shareholder,
We are pleased to provide the semi-annual report of QS Variable Asset Allocation Series for the six-month reporting period ended June 30, 2020. Please read on for each Portfolio’s performance information during the Portfolios’ reporting period.
Special shareholder notice
On July 31, 2020, Franklin Resources, Inc. (“Franklin Resources”) acquired Legg Mason, Inc. (“Legg Mason”) in an all-cash transaction. As a result of the transaction, Legg Mason Partners Fund Advisor, LLC (“LMPFA”) and the subadviser(s) became indirect, wholly-owned subsidiaries of Franklin Resources. Under the Investment Company Act of 1940, as amended, consummation of the transaction automatically terminated the management and subadvisory agreements that were in place for the Portfolios prior to the transaction. The Portfolios’ manager and subadviser(s) continue to provide uninterrupted services with respect to the Portfolios pursuant to new management and subadvisory agreements that were approved by each Portfolio’s shareholders.
Franklin Resources, whose principal executive offices are at One Franklin Parkway, San Mateo, California 94403, is a global investment management organization operating, together with its subsidiaries, as Franklin Templeton. As of June 30, 2020, after giving effect to the transaction described above, Franklin Templeton’s asset management operations had aggregate assets under management of approximately $1.4 trillion.
As always, we remain committed to providing you with excellent service and a full spectrum of investment choices. We also remain committed to supplementing the support you receive from your financial advisor. One way we accomplish this is through our website, www.leggmason.com. Here you can gain immediate access to market and investment information, including:
| • | | Market insights and commentaries from our portfolio managers and |
| • | | A host of educational resources. |
We look forward to helping you meet your financial goals.
Sincerely,

Jane Trust, CFA
President and Chief Executive Officer
July 31, 2020
| | |
| II | | QS Variable Asset Allocation Series |
Performance review
QS Variable Growth1
QS Variable Growth seeks capital appreciation. The Portfolio organizes its investments in underlying funds into two main asset classes: the equity class (equity securities of all types) and the fixed income class (fixed income securities of all types). The portfolio managers may invest across all asset classes and strategies. The portfolio managers will allocate between 70% to 100% of the Portfolio’s assets to underlying funds that invest in equity and equity-like strategies and between 0% to 30% to underlying funds that invest in fixed income strategies. The portfolio managers may, however, allocate assets to any underlying funds in varying amounts in a manner consistent with the Portfolio’s investment objective. The Portfolio’s allocation to each asset class will be measured at the time of purchase and may vary thereafter as a result of market movements.
Performance review
For the six months ended June 30, 2020, Class I shares of QS Variable Growth returned -8.25%. The Portfolio’s unmanaged benchmarks, the Bloomberg Barclays U.S. Aggregate Indexi and the Russell 3000 Indexii, and the Variable Growth Composite Benchmarkiii returned 6.14%, -3.48% and -5.54%, respectively, over the same time frame. The Lipper Variable Mixed-Asset Target Allocation Aggressive Growth Funds Category Averageiv returned -7.07% for the same period.
| | | | |
| Performance Snapshot as of June 30, 2020 (unaudited) | | | |
| | | 6 months | |
| QS Variable Growth: | | | | |
Class I | | | -8.25 | % |
| Bloomberg Barclays U.S. Aggregate Index | | | 6.14 | % |
| Russell 3000 Index | | | -3.48 | % |
| Variable Growth Composite Benchmark | | | -5.54 | % |
| Lipper Variable Mixed-Asset Target Allocation Aggressive Growth Funds Category Average | | | -7.07 | % |
The performance shown represents past performance. Past performance is no guarantee of future results and current performance may be higher or lower than the performance shown above. Principal value and investment returns will fluctuate and investors’ shares, when redeemed, may be worth more or less than their original cost.
Share class returns assume the reinvestment of all distributions, including returns of capital, if any, at net asset value and the deduction of all Portfolio expenses. Performance figures for periods shorter than one year represent cumulative figures and are not annualized.
Portfolio performance figures reflect fee waivers and/or expense reimbursements, without which the performance would have been lower.
The portfolio managers periodically adjust the allocation of the Portfolio’s assets among different Legg Mason-affiliated mutual funds and ETFs and ETFs that are managed by unaffiliated investment advisers, depending upon the portfolio managers’ outlook for the equity and bond markets in general, particular sectors of such markets and the performance outlook for the underlying funds. In assessing the equity and bond markets, the portfolio managers consider a broad range of market and economic trends and quantitative factors.
|
| Total Annual Operating Expenses† (unaudited) |
As of the Portfolio’s current prospectus dated May 1, 2020, the gross total annual fund operating expense ratio for Class I shares was 0.80%.
Actual expenses may be higher. For example, expenses may be higher than those shown if average net assets decrease. Net assets are more likely to decrease and Portfolio expense ratios are more likely to increase when markets are volatile.
As a result of expense limitation arrangements, the ratio of total annual fund operating expenses, other than interest, brokerage, taxes, extraordinary expenses and acquired fund fees and expenses (fees and expenses of underlying funds), to average net assets will not exceed 0.20% for Class I shares. This expense limitation arrangements cannot be terminated prior to December 31, 2021 without the Board of Trustees’ consent.
The manager is permitted to recapture amounts waived and/or reimbursed to a class during the same fiscal year if the Portfolio’s total annual operating expenses have fallen to a level below the expense limitation (“expense cap”) in effect at the time the fees were earned or the expenses incurred. In no case will the manager recapture any amount that would result, on any particular business day of the Portfolio, in the class’ total annual operating expenses exceeding the expense cap or any other lower limit then in effect.
| 1 | The Portfolio is an underlying investment option of various variable annuity and variable life insurance products. The Portfolio’s performance returns do not reflect the deduction of expenses imposed in connection with investing in variable annuity or variable life insurance contracts, such as administrative fees, account charges and surrender charges, which, if reflected, would reduce the performance of the Portfolio. Past performance is no guarantee of future results. |
| † | Includes expenses of the underlying funds in which the Portfolio invests. |
| | |
| QS Variable Asset Allocation Series | | III |
Performance review (cont’d)
QS Variable Moderate Growth1
QS Variable Moderate Growth seeks long-term growth of capital. The Portfolio organizes its investments in underlying funds into two main asset classes: the equity class (equity securities of all types) and the fixed income class (fixed income securities of all types). The portfolio managers may invest across all asset classes and strategies. The portfolio managers will allocate between 55% to 85% of the Portfolio’s assets to underlying funds that invest in equity and equity-like strategies and between 15% to 45% to underlying funds that invest in fixed income strategies. The portfolio managers may, however, allocate assets to any underlying funds in varying amounts in a manner consistent with the Portfolio’s investment objective. The Portfolio’s allocation to each asset class will be measured at the time of purchase and may vary thereafter as a result of market movements.
Performance review
For the six months ended June 30, 2020, Class I shares of QS Variable Moderate Growth returned -5.72%. The Portfolio’s unmanaged benchmarks, the Bloomberg Barclays U.S. Aggregate Index and the Russell 3000 Index, and the Variable Moderate Growth Composite Benchmarkv returned 6.14%, -3.48% and -3.13%, respectively, for the same period. The Lipper Variable Mixed-Asset Target Allocation Growth Funds Category Averagevi returned -3.88% over the same time frame.
| | | | |
Performance Snapshot as of June 30, 2020
(unaudited) | |
| | | 6 months | |
| QS Variable Moderate Growth: | | | | |
Class I | | | -5.72 | % |
| Bloomberg Barclays U.S. Aggregate Index | | | 6.14 | % |
| Russell 3000 Index | | | -3.48 | % |
| Variable Moderate Growth Composite Benchmark | | | -3.13 | % |
| Lipper Variable Mixed-Asset Target Allocation Growth Funds Category Average | | | -3.88 | % |
The performance shown represents past performance. Past performance is no guarantee of future results and current performance may be higher or lower than the performance shown above. Principal value and investment returns will fluctuate and investors’ shares, when redeemed, may be worth more or less than their original cost.
Share class returns assume the reinvestment of all distributions, including returns of capital, if any, at net asset value and the deduction of all Portfolio expenses. Performance figures for periods shorter than one year represent cumulative figures and are not annualized.
Portfolio performance figures reflect fee waivers and/or expense reimbursements, without which the performance would have been lower.
The portfolio managers periodically adjust the allocation of the Portfolio’s assets among different Legg Mason-affiliated mutual funds and ETFs and ETFs that are managed by unaffiliated investment advisers, depending upon the portfolio managers’ outlook for the equity and bond markets in general, particular sectors of such markets and the performance outlook for the underlying funds. In assessing the equity and bond markets, the portfolio managers consider a broad range of market and economic trends and quantitative factors.
| | | | |
| Total Annual Operating Expenses† (unaudited) |
As of the Portfolio’s current prospectus dated May 1, 2020, the gross total annual fund operating fund expense ratio for Class I shares was 0.92%.
Actual expenses may be higher. For example, expenses may be higher than those shown if average net assets decrease. Net assets are more likely to decrease and Portfolio expense ratios are more likely to increase when markets are volatile.
As a result of an expense limitation arrangement, the ratio of total annual fund operating expenses, other than interest, brokerage, taxes, extraordinary expenses and acquired fund fees and expenses (fees and expenses of underlying funds), to average net assets will not exceed 0.20% for Class I shares. This expense limitation arrangement cannot be terminated prior to December 31, 2021 without the Board of Trustees’ consent.
The manager is permitted to recapture amounts waived and/or reimbursed to a class during the same fiscal year if the class’ total annual operating expenses have fallen to a level below the expense limitation (“expense cap”) in effect at the time the fees were earned or the expenses incurred. In no case will the manager recapture any amount that would result, on any particular business day of the Portfolio, in the class’ total annual operating expenses exceeding the expense cap or any other lower limit then in effect.
| 1 | The Portfolio is an underlying investment option of various variable annuity and variable life insurance products. The Portfolio’s performance returns do not reflect the deduction of expenses imposed in connection with investing in variable annuity or variable life insurance contracts, such as administrative fees, account charges and surrender charges, which, if reflected, would reduce the performance of the Portfolio. Past performance is no guarantee of future results. |
| † | Includes expenses of the underlying funds in which the Portfolio invests. |
| | |
| IV | | QS Variable Asset Allocation Series |
QS Variable Conservative Growth1
QS Variable Conservative Growth seeks balance of growth of capital and income. The Portfolio organizes its investments in underlying funds into two main asset classes: the equity class (equity securities of all types) and the fixed income class (fixed income securities of all types). The portfolio managers may invest across all asset classes and strategies. The portfolio managers will allocate between 35% to 65% of the Portfolio’s assets to underlying funds that invest in equity and equity-like strategies and between 35% to 65% to underlying funds that invest in fixed income strategies. The portfolio managers may, however, allocate assets to any underlying funds in varying amounts in a manner consistent with the Portfolio’s investment objective. The Portfolio’s allocation to each asset class will be measured at the time of purchase and may vary thereafter as a result of market movements.
Performance review
For the six months ended June 30, 2020, Class I shares of QS Variable Conservative Growth returned -2.60%. The Portfolio’s unmanaged benchmarks, the Bloomberg Barclays U.S. Aggregate Index and the Russell 1000 Index, and the Variable Conservative Growth Composite Benchmarkvii returned 6.14%, -2.81% and -0.73%, respectively, for the same period. The Lipper Variable Mixed-Asset Target Allocation Moderate Funds Category Averageviii returned -2.39% over the same time frame.
| | | | |
Performance Snapshot as of June 30, 2020
(unaudited) | | | |
| | | 6 months | |
| QS Variable Conservative Growth: | | | | |
Class I | | | -2.60 | % |
Class II | | | -2.68 | % |
| Bloomberg Barclays U.S. Aggregate Index | | | 6.14 | % |
| Russell 1000 Index | | | -2.81 | % |
| Variable Conservative Growth Composite Benchmark | | | -0.73 | % |
| Lipper Variable Mixed-Asset Target Allocation Moderate Funds Category Average | | | -2.39 | % |
The performance shown represents past performance. Past performance is no guarantee of future results and current performance may be higher or lower than the performance shown above. Principal value and investment returns will fluctuate and investors’ shares, when redeemed, may be worth more or less than their original cost.
All share class returns assume the reinvestment of all distributions, including returns of capital, if any, at net asset value and the deduction of all Portfolio expenses. Performance figures for periods shorter than one year represent cumulative figures and are not annualized.
Portfolio performance figures reflect fee waivers and/or expense reimbursements, without which the performance would have been lower.
The portfolio managers periodically adjust the allocation of the Portfolio’s assets among different Legg Mason-affiliated mutual funds and ETFs and ETFs that are managed by unaffiliated investment advisers, depending upon the portfolio managers’ outlook for the equity and bond markets in general, particular sectors of such markets and the performance outlook for the underlying funds. In assessing the equity and bond markets, the portfolio managers consider a broad range of market and economic trends and quantitative factors.
|
| Total Annual Operating Expenses† (unaudited) |
As of the Portfolio’s current prospectus dated May 1, 2020, the gross total annual fund operating expense ratios for Class I and Class II shares were 0.69% and 0.94%, respectively.
Actual expenses may be higher. For example, expenses may be higher than those shown if average net assets decrease. Net assets are more likely to decrease and Portfolio expense ratios are more likely to increase when markets are volatile.
As a result of expense limitation arrangements, the ratio of total annual fund operating expenses, other than interest, brokerage, taxes, extraordinary expenses and acquired fund fees and expenses (fees and expenses of underlying funds), to average net assets will not exceed 0.20% for Class I shares and 0.45% for Class II shares. These expense limitation arrangements cannot be terminated prior to December 31, 2021 without the Board of Trustees’ consent.
The manager is permitted to recapture amounts waived and/or reimbursed to a class during the same fiscal year if the Portfolio’s total annual operating expenses have fallen to a level below the expense limitation (“expense cap”) in effect at the time the fees were
| 1 | The Portfolio is an underlying investment option of various variable annuity and variable life insurance products. The Portfolio’s performance returns do not reflect the deduction of expenses imposed in connection with investing in variable annuity or variable life insurance contracts, such as administrative fees, account charges and surrender charges, which, if reflected, would reduce the performance of the Portfolio. Past performance is no guarantee of future results. |
| † | Includes expenses of the underlying funds in which the Portfolio invests. |
| | |
| QS Variable Asset Allocation Series | | V |
Performance review (cont’d)
earned or the expenses incurred. In no case will the manager recapture any amount that would result, on any particular business day of the Portfolio, in the class’ total annual operating expenses exceeding the expense cap or any other lower limit then in effect.
As always, thank you for your confidence in our stewardship of your assets.
Sincerely,
Jane Trust, CFA
President and Chief Executive Officer
July 31, 2020
RISKS: Equity securities are subject to price and market fluctuations. Fixed income securities are subject to interest rate and credit risks. Foreign securities are subject to certain risks of overseas investing including currency fluctuations and political, social and economic uncertainties, which could increase volatility. These risks are magnified in emerging markets. Emerging market countries tend to have economic, political, and legal systems that are less developed and are less stable than those of more developed countries. Investments in small- and mid-capitalization companies may involve a higher degree of risk and volatility than investments in larger, more established companies. As interest rates rise, bond prices fall, reducing the value of the Portfolios’ share prices. High-yield bonds (commonly known as “junk” bonds) involve greater credit and liquidity risks than investment grade bonds.
Each Portfolio is a fund of funds – it invests primarily in other funds – and is subject to the risks of the underlying funds in which it invests. There are additional risks and other expenses associated with investing in other mutual funds and exchange-traded funds (“ETFs”), rather than directly in portfolio securities. In addition to the Portfolio’s operating expenses, you will indirectly bear the operating expenses of the underlying funds in which the Portfolio invests. The Portfolios pay brokerage commissions in connection with the purchase and sale of shares of ETFs. In addition, each Portfolio indirectly bears its pro rata share of the fees and expenses incurred by the underlying funds it invests in, including management fees and other expenses. These expenses are in addition to the expenses that each Portfolio bears directly in connection with its own operation. Certain underlying funds may use derivatives, such as options and futures, which can be illiquid, may disproportionately increase losses and have a potentially large impact on Portfolio performance. Also, the portfolio managers may invest in underlying funds that have a limited performance history. Please see the Portfolios’ prospectus for a more complete discussion of these and other risks and the Portfolios’ investment strategies.
All investments are subject to risk including the possible loss of principal. Past performance is no guarantee of future results. All index performance reflects no deduction for fees, expenses, or taxes. Please note that an investor cannot invest directly in an index.
| | |
| VI | | QS Variable Asset Allocation Series |
| i | The Bloomberg Barclays U.S. Aggregate Index is a broad-based bond index comprised of government, corporate, mortgage- and asset-backed issues, rated investment grade or higher, and having at least one year to maturity. |
| ii | The Russell 3000 Index measures the performance of the 3,000 largest U.S. companies based on total market capitalization, which represents approximately 98% of the U.S. equity market. |
| iii | The Variable Growth Composite Benchmark is a hypothetical representation of the performance of the Portfolio’s major asset classes. It consists of 45% Russell 1000 Index, 20% Russell 2000 Index, 20% MSCI EAFE Index, 10% Bloomberg Barclays U.S. Aggregate Index and 5% Bloomberg Barclays U.S. Corporate High Yield — 2% Issuer Cap Index. The Russell 1000 Index measures the performance of the large-cap segment of the U.S. equity universe. It is a subset of the Russell 3000 Index and includes approximately 1,000 of the largest securities based on a combination of their market cap and current index membership. The Russell 1000 represents approximately 90% of the U.S. market. The Russell 2000 Index measures the performance of the small-cap segment of the U.S. equity universe. The Russell 2000 is a subset of the Russell 3000 Index representing approximately 10% of the total market capitalization of that index. It includes approximately 2,000 of the smallest securities based on a combination of their market cap and current index membership. The MSCI EAFE Index is a free float adjusted market capitalization index designed to measure developed market equity performance, excluding the U.S. and Canada. The Bloomberg Barclays U.S. Corporate High Yield — 2% Issuer Cap Index is an index of the 2% Issuer Cap component of the Bloomberg Barclays U.S. Corporate High Yield Index, which covers the U.S. dollar-denominated, non-investment grade, fixed-rate, taxable corporate bond market. |
| iv | Lipper, Inc., a wholly-owned subsidiary of Reuters, provides independent insight on global collective investments. Returns are based on the six-month period ended June 30, 2020, including the reinvestment of all distributions, including returns of capital, if any, calculated among the 76 funds in the Portfolio’s Lipper category. |
| v | The Variable Moderate Growth Composite Benchmark is a hypothetical representation of the performance of the Portfolio’s major asset classes. It consists of 40% Russell 1000 Index, 15% Russell 2000 Index, 15% MSCI EAFE Index, 25% Bloomberg Barclays U.S. Aggregate Index and 5% Bloomberg Barclays U.S. Corporate High Yield — 2% Issuer Cap Index. |
| vi | Lipper, Inc., a wholly-owned subsidiary of Reuters, provides independent insight on global collective investments. Returns are based on the six-month period ended June 30, 2020, including the reinvestment of all distributions, including returns of capital, if any, calculated among the 249 funds in the Portfolio’s Lipper category. |
| vii | The Variable Conservative Growth Composite Benchmark is a hypothetical representation of the performance of the Portfolio’s major asset classes. It consists of 28% Russell 1000 Index, 12% Russell 2000 Index, 10% MSCI EAFE Index, 43% Bloomberg Barclays U.S. Aggregate Index and 7% Bloomberg Barclays U.S. Corporate High Yield — 2% Issuer Cap Index. |
| viii | Lipper, Inc., a wholly-owned subsidiary of Reuters, provides independent insight on global collective investments. Returns are based on the six-month period ended June 30, 2020, including the reinvestment of all distributions, including returns of capital, if any, calculated among the 297 funds in the Portfolio’s Lipper category. |
| | |
| QS Variable Asset Allocation Series | | VII |
Portfolios at a glance (unaudited)
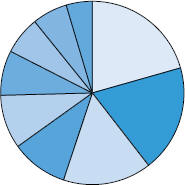
QS Variable Growth Breakdown† as of — June 30, 2020
As a Percent of Total Long-Term Investments
| | | | |
| % of Total Long-Term Investments | | Top 5 Sectors |
 | | 20.6 Legg Mason Global Asset Management Trust — BrandywineGLOBAL — Dynamic US Large Cap Value Fund, Class IS Shares | | Industrials Information Technology Consumer Discretionary Financials Health Care |
 | | 18.9 Legg Mason Global Asset Management Trust — QS International Equity Fund, Class IS Shares | | Financials Health Care Industrials Consumer Staples Consumer Discretionary |
 | | 15.6 Legg Mason Global Asset Management Trust — QS U.S. Small Capitalization Equity Fund, Class IS Shares | | Health Care Industrials Information Technology Financials Consumer Discretionary |
 | | 10.0 Western Asset Funds, Inc. — Western Asset Intermediate Bond Fund, Class IS Shares | | Corporate Bonds & Notes U.S. Government & Agency Obligations Collateralized Mortgage Obligations Mortgage-Backed Securities Asset-Backed Securities |
 | | 9.5 Legg Mason Partners Equity Trust — ClearBridge Large Cap Growth Fund, Class IS Shares | | Information Technology Consumer Discretionary Health Care Communication Services Industrials |
 | | 7.9 Legg Mason Partners Equity Trust — ClearBridge Appreciation Fund, Class IS Shares | | Information Technology Communication Services Health Care Financials Industrials |
 | | 6.7 Western Asset Funds, Inc. — Western Asset Core Bond Fund, Class IS Shares | | Corporate Bonds & Notes Mortgage-Backed Securities U.S. Government & Agency Obligations Collateralized Mortgage Obligations Asset-Backed Securities |
 | | 6.2 Legg Mason Global Asset Management Trust — BrandywineGLOBAL — Diversified US Large Cap Value Fund, Class IS Shares | | Financials Information Technology Health Care Industrials Communication Services |
 | | 4.6 Legg Mason Partners Equity Trust — ClearBridge Small Cap Growth Fund, Class IS Shares | | Information Technology Health Care Industrials Consumer Discretionary Consumer Staples |
| † | Subject to change at any time. |
| | |
| QS Variable Asset Allocation Series 2020 Semi-Annual Report | | 1 |
Portfolios at a glance (unaudited) (cont’d)
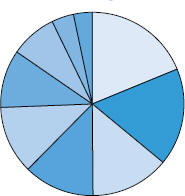
QS Variable Moderate Growth Breakdown† as of — June 30, 2020
As a Percent of Total Long-Term Investments
| | | | |
| % of Total Long-Term Investments | | Top 5 Sectors |
 | | 18.8 Western Asset Funds, Inc. — Western Asset Intermediate Bond Fund, Class IS Shares | | Corporate Bonds & Notes U.S. Government & Agency Obligations Collateralized Mortgage Obligations Mortgage-Backed Securities Asset-Backed Securities |
 | | 17.2 Legg Mason Global Asset Management Trust — BrandywineGLOBAL — Dynamic US Large Cap Value Fund, Class IS Shares | | Industrials Information Technology Consumer Discretionary Financials Health Care |
 | | 13.9 Legg Mason Global Asset Management Trust — QS International Equity Fund, Class IS Shares | | Financials Health Care Industrials Consumer Staples Consumer Discretionary |
 | | 12.5 Western Asset Funds, Inc. — Western Asset Core Bond Fund, Class IS Shares | | Corporate Bonds & Notes Mortgage-Backed Securities U.S. Government & Agency Obligations Collateralized Mortgage Obligations Asset-Backed Securities |
 | | 12.0 Legg Mason Global Asset Management Trust — QS U.S. Small Capitalization Equity Fund, Class IS Shares | | Health Care Industrials Information Technology Financials Consumer Discretionary |
 | | 10.2 Legg Mason Partners Equity Trust — ClearBridge Appreciation Fund, Class IS Shares | | Information Technology Communication Services Health Care Financials Industrials |
 | | 8.2 Legg Mason Partners Equity Trust — ClearBridge Large Cap Growth Fund, Class IS Shares | | Information Technology Consumer Discretionary Health Care Communication Services Industrials |
 | | 3.9 Legg Mason Global Asset Management Trust — BrandywineGLOBAL — Diversified US Large Cap Value Fund, Class IS Shares | | Financials Information Technology Health Care Industrials Communication Services |
 | | 3.3 Legg Mason Partners Equity Trust — ClearBridge Small Cap Growth Fund, Class IS Shares | | Information Technology Health Care Industrials Consumer Discretionary Consumer Staples |
| † | Subject to change at any time. |
| | |
| 2 | | QS Variable Asset Allocation Series 2020 Semi-Annual Report |
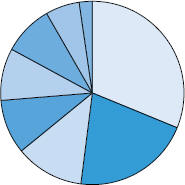
QS Variable Conservative Growth Breakdown† as of — June 30, 2020
As a Percent of Total Long-Term Investments
| | | | |
| % of Total Long-Term Investments | | Top 5 Sectors |
 | | 31.2 Western Asset Funds, Inc. — Western Asset Intermediate Bond Fund, Class IS Shares | | Corporate Bonds & Notes U.S. Government & Agency Obligations Collateralized Mortgage Obligations Mortgage-Backed Securities Asset-Backed Securities |
 | | 20.8 Western Asset Funds, Inc. — Western Asset Core Bond Fund, Class IS Shares | | Corporate Bonds & Notes Mortgage-Backed Securities U.S. Government & Agency Obligations Collateralized Mortgage Obligations Asset-Backed Securities |
 | | 12.1 Legg Mason Global Asset Management Trust — BrandywineGLOBAL — Dynamic US Large Cap Value Fund, Class IS Shares | | Industrials Information Technology Consumer Discretionary Financials Health Care |
 | | 9.6 Legg Mason Global Asset Management Trust — QS U.S. Small Capitalization Equity Fund, Class IS Shares | | Health Care Industrials Information Technology Financials Consumer Discretionary |
 | | 9.2 Legg Mason Partners Equity Trust — ClearBridge Appreciation Fund, Class IS Shares | | Information Technology Communication Services Health Care Financials Industrials |
 | | 8.8 Legg Mason Global Asset Management Trust — QS International Equity Fund, Class IS Shares | | Financials Health Care Industrials Consumer Staples Consumer Discretionary |
 | | 6.0 Legg Mason Partners Equity Trust — ClearBridge Large Cap Growth Fund, Class IS Shares | | Information Technology Consumer Discretionary Health Care Communication Services Industrials |
 | | 2.3 Legg Mason Partners Equity Trust — ClearBridge Small Cap Growth Fund, Class IS Shares | | Information Technology Health Care Industrials Consumer Discretionary Consumer Staples |
| † | Subject to change at any time. |
| | |
| QS Variable Asset Allocation Series 2020 Semi-Annual Report | | 3 |
Portfolios expenses (unaudited)
Example
As a shareholder of the Portfolio, you may incur two types of costs: (1) transaction costs and (2) ongoing costs, including other Portfolio expenses. This example is intended to help you understand your ongoing costs (in dollars) of investing in the Portfolio and to compare these costs with the ongoing costs of investing in other funds.
This example is based on an investment of $1,000 invested on January 1, 2020 and held for the six months ended June 30, 2020.
Actual expenses
The table below titled “Based on Actual Total Return” provides information about actual account values and actual expenses. You may use the information provided in this table, together with the amount you invested, to estimate the expenses that you paid over the period. To estimate the expenses you paid on your account, divide your ending account value by $1,000 (for example, an $8,600 ending account value divided by $1,000 = 8.6), then multiply the result by the number under the heading entitled “Expenses Paid During the Period”.
Hypothetical example for comparison purposes
The table below titled “Based on Hypothetical Total Return” provides information about hypothetical account values and hypothetical expenses based on the actual expense ratio and an assumed rate of return of 5.00% per year before expenses, which is not the Portfolio’s actual return. The hypothetical account values and expenses may not be used to estimate the actual ending account balance or expenses you paid for the period. You may use the information provided in this table to compare the ongoing costs of investing in the Portfolio and other portfolios. To do so, compare the 5.00% hypothetical example relating to the Portfolio with the 5.00% hypothetical examples that appear in the shareholder reports of the other funds.
Please note that the expenses shown in the table below are meant to highlight your ongoing costs only and do not reflect any transactional costs. Therefore, the table is useful in comparing ongoing costs only, and will not help you determine the relative total costs of owning different funds. In addition, if these transaction costs were included, your costs would have been higher.
| | | | | | | | | | | | | | | | | | | | | | | | | | | | | | | | | | | | | | | | | | | | | | |
| | | |
| Based on actual total return1 | | | | | | | | | Based on hypothetical total return1 | |
QS Variable
Growth | | Actual
Total Return2 | | | Beginning
Account
Value | | | Ending
Account
Value | | | Annualized
Expense
Ratio3 | | | Expenses
Paid
During
the
Period4 | | | | | | QS Variable
Growth | | Hypothetical
Annualized
Total Return | | | Beginning
Account
Value | | | Ending
Account
Value | | | Annualized
Expense
Ratio3 | | | Expenses
Paid
During
the
Period4 | |
| Class I | | | -8.25 | % | | $ | 1,000.00 | | | $ | 917.50 | | | | 0.14 | % | | $ | 0.67 | | | | | | | Class I | | | 5.00 | % | | $ | 1,000.00 | | | $ | 1,024.17 | | | | 0.14 | % | | $ | 0.70 | |
| 1 | For the six months ended June 30, 2020. |
| 2 | Assumes the reinvestment of all distributions, including returns of capital, if any, at net asset value. Total return is not annualized, as it may not be representative of the total return for the year. Total returns do not reflect expenses associated with separate accounts such as administrative fees, account charges and surrender charges, which, if reflected, would reduce the total returns. Performance figures may reflect compensating balance arrangements, fee waivers and/or expense reimbursements. In the absence of compensating balance arrangements, fee waivers and/or expense reimbursements, the total return would have been lower. Past performance is no guarantee of future results. |
| 3 | Does not include fees and expenses of the Underlying Funds in which the Portfolio invests. |
| 4 | Expenses (net of compensating balance arrangements, fee waivers and/or expense reimbursements) are equal to the class’ annualized expense ratio multiplied by the average account value over the period, multiplied by the number of days in the most recent fiscal half-year (182), then divided by 366. |
| | |
| 4 | | QS Variable Asset Allocation Series 2020 Semi-Annual Report |
Example
As a shareholder of the Portfolio, you may incur two types of costs: (1) transaction costs and (2) ongoing costs, including other Portfolio expenses. This example is intended to help you understand your ongoing costs (in dollars) of investing in the Portfolio and to compare these costs with the ongoing costs of investing in other funds.
This example is based on an investment of $1,000 invested on January 1, 2020 and held for the six months ended June 30, 2020.
Actual expenses
The table below titled “Based on Actual Total Return” provides information about actual account values and actual expenses. You may use the information provided in this table, together with the amount you invested, to estimate the expenses that you paid over the period. To estimate the expenses you paid on your account, divide your ending account value by $1,000 (for example, an $8,600 ending account value divided by $1,000 = 8.6), then multiply the result by the number under the heading entitled “Expenses Paid During the Period”.
Hypothetical example for comparison purposes
The table below titled “Based on Hypothetical Total Return” provides information about hypothetical account values and hypothetical expenses based on the actual expense ratio and an assumed rate of return of 5.00% per year before expenses, which is not the Portfolio’s actual return. The hypothetical account values and expenses may not be used to estimate the actual ending account balance or expenses you paid for the period. You may use the information provided in this table to compare the ongoing costs of investing in the Portfolio and other portfolios. To do so, compare the 5.00% hypothetical example relating to the Portfolio with the 5.00% hypothetical examples that appear in the shareholder reports of the other funds.
Please note that the expenses shown in the table below are meant to highlight your ongoing costs only and do not reflect any transactional costs. Therefore, the table is useful in comparing ongoing costs only, and will not help you determine the relative total costs of owning different funds. In addition, if these transaction costs were included, your costs would have been higher.
| | | | | | | | | | | | | | | | | | | | | | | | | | | | | | | | | | | | | | | | | | | | | | |
| | | |
| Based on actual total return1 | | | | | | | | | Based on hypothetical total return1 | |
QS Variable
Moderate
Growth | | Actual
Total Return2 | | | Beginning
Account
Value | | | Ending
Account
Value | | | Annualized
Expense
Ratio3 | | | Expenses
Paid
During
the
Period4 | | | | | | QS Variable
Moderate
Growth | | Hypothetical
Annualized
Total Return | | | Beginning
Account
Value | | | Ending
Account
Value | | | Annualized
Expense
Ratio3 | | | Expenses
Paid
During
the
Period4 | |
| Class I | | | -5.72 | % | | $ | 1,000.00 | | | $ | 942.80 | | | | 0.20 | % | | $ | 0.97 | | | | | | | Class I | | | 5.00 | % | | $ | 1,000.00 | | | $ | 1,023.87 | | | | 0.20 | % | | $ | 1.01 | |
| 1 | For the six months ended June 30, 2020. |
| 2 | Assumes the reinvestment of all distributions, including returns of capital, if any, at net asset value. Total return is not annualized, as it may not be representative of the total return for the year. Total returns do not reflect expenses associated with separate accounts such as administrative fees, account charges and surrender charges, which, if reflected, would reduce the total returns. Performance figures may reflect compensating balance arrangements, fee waivers and/or expense reimbursements. In the absence of compensating balance arrangements, fee waivers and/or expense reimbursements, the total return would have been lower. Past performance is no guarantee of future results. |
| 3 | Does not include fees and expenses of the Underlying Funds in which the Portfolio invests. |
| 4 | Expenses (net of compensating balance arrangements, fee waivers and/or expense reimbursements) are equal to the class’ annualized expense ratio multiplied by the average account value over the period, multiplied by the number of days in the most recent fiscal half-year (182), then divided by 366. |
| | |
| QS Variable Asset Allocation Series 2020 Semi-Annual Report | | 5 |
Portfolios expenses (unaudited) (cont’d)
Example
As a shareholder of the Portfolio, you may incur two types of costs: (1) transaction costs and (2) ongoing costs, including service and/or distribution (12b-1) fees; and other Portfolio expenses. This example is intended to help you understand your ongoing costs (in dollars) of investing in the Portfolio and to compare these costs with the ongoing costs of investing in other funds.
This example is based on an investment of $1,000 invested on January 1, 2020 and held for the six months ended June 30, 2020.
Actual expenses
The table below titled “Based on Actual Total Return” provides information about actual account values and actual expenses. You may use the information provided in this table, together with the amount you invested, to estimate the expenses that you paid over the period. To estimate the expenses you paid on your account, divide your ending account value by $1,000 (for example, an $8,600 ending account value divided by $1,000 = 8.6), then multiply the result by the number under the heading entitled “Expenses Paid During the Period”.
Hypothetical example for comparison purposes
The table below titled “Based on Hypothetical Total Return” provides information about hypothetical account values and hypothetical expenses based on the actual expense ratio and an assumed rate of return of 5.00% per year before expenses, which is not the Portfolio’s actual return. The hypothetical account values and expenses may not be used to estimate the actual ending account balance or expenses you paid for the period. You may use the information provided in this table to compare the ongoing costs of investing in the Portfolio and other portfolios. To do so, compare the 5.00% hypothetical example relating to the Portfolio with the 5.00% hypothetical examples that appear in the shareholder reports of the other funds.
Please note that the expenses shown in the table below are meant to highlight your ongoing costs only and do not reflect any transactional costs. Therefore, the table is useful in comparing ongoing costs only, and will not help you determine the relative total costs of owning different funds. In addition, if these transaction costs were included, your costs would have been higher.
| | | | | | | | | | | | | | | | | | | | | | | | | | | | | | | | | | | | | | | | | | | | | | |
| | | |
| Based on actual total return1 | | | | | | | | | Based on hypothetical total return1 | |
QS Variable
Conservative
Growth | | Actual
Total Return2 | | | Beginning
Account
Value | | | Ending
Account
Value | | | Annualized
Expense
Ratio3 | | | Expenses
Paid
During
the
Period4 | | | | | | QS Variable
Conservative
Growth | | Hypothetical
Annualized
Total Return | | | Beginning
Account
Value | | | Ending
Account
Value | | | Annualized
Expense
Ratio3 | | | Expenses
Paid
During
the
Period4 | |
| Class I | | | -2.60 | % | | $ | 1,000.00 | | | $ | 974.00 | | | | 0.13 | % | | $ | 0.64 | | | | | | | Class I | | | 5.00 | % | | $ | 1,000.00 | | | $ | 1,024.22 | | | | 0.13 | % | | $ | 0.65 | |
| Class II | | | -2.68 | | | | 1,000.00 | | | | 973.20 | | | | 0.38 | | | | 1.86 | | | | | | | Class II | | | 5.00 | | | | 1,000.00 | | | | 1,022.97 | | | | 0.38 | | | | 1.91 | |
| 1 | For the six months ended June 30, 2020. |
| 2 | Assumes the reinvestment of all distributions, including returns of capital, if any, at net asset value. Total return is not annualized, as it may not be representative of the total return for the year. Total returns do not reflect expenses associated with separate accounts such as administrative fees, account charges and surrender charges, which, if reflected, would reduce the total returns. Performance figures may reflect compensating balance arrangements, fee waivers and/or expense reimbursements. In the absence of compensating balance arrangements, fee waivers and/or expense reimbursements, the total return would have been lower. Past performance is no guarantee of future results. |
| 3 | Does not include fees and expenses of the Underlying Funds in which the Portfolio invests. |
| 4 | Expenses (net of compensating balance arrangements, fee waivers and/or expense reimbursements) are equal to each class’ respective annualized expense ratio multiplied by the average account value over the period, multiplied by the number of days in the most recent fiscal half-year (182), then divided by 366. |
| | |
| 6 | | QS Variable Asset Allocation Series 2020 Semi-Annual Report |
Schedules of investments (unaudited)
June 30, 2020
QS Variable Growth
| | | | | | | | | | | | | | | | |
| Description | | | | | | | | Shares | | | Value | |
| Investments in Underlying Funds(a) — 99.7% | | | | | | | | | | | | | | | | |
Legg Mason Global Asset Management Trust: | | | | | | | | | | | | | | | | |
BrandywineGLOBAL — Diversified US Large Cap Value Fund, Class IS Shares | | | | | | | | | | | 318,925 | | | $ | 5,115,561 | |
BrandywineGLOBAL — Dynamic US Large Cap Value Fund, Class IS Shares | | | | | | | | | | | 1,568,666 | | | | 17,067,084 | |
QS International Equity Fund, Class IS Shares | | | | | | | | | | | 1,114,043 | | | | 15,719,148 | |
QS U.S. Small Capitalization Equity Fund, Class IS Shares | | | | | | | | | | | 1,273,689 | | | | 12,953,421 | |
Legg Mason Partners Equity Trust: | | | | | | | | | | | | | | | | |
ClearBridge Appreciation Fund, Class IS Shares | | | | | | | | | | | 267,115 | | | | 6,589,732 | |
ClearBridge Large Cap Growth Fund, Class IS Shares | | | | | | | | | | | 134,877 | | | | 7,892,972 | |
ClearBridge Small Cap Growth Fund, Class IS Shares | | | | | | | | | | | 94,855 | | | | 3,845,436 | |
Western Asset Funds, Inc.: | | | | | | | | | | | | | | | | |
Western Asset Core Bond Fund, Class IS Shares | | | | | | | | | | | 406,877 | | | | 5,521,318 | |
Western Asset Intermediate Bond Fund, Class IS Shares | | | | | | | | | | | 720,010 | | | | 8,280,118 | |
Total Investments in Underlying Funds before Short-Term Investments (Cost — $73,094,365) | | | | | | | | | | | | | | | 82,984,790 | |
| | | | |
| | | Rate | | | | | | | | | | |
| Short-Term Investments — 0.3% | | | | | | | | | | | | | | | | |
Invesco Government & Agency Portfolio, Institutional Class
(Cost — $229,615) | | | 0.099 | % | | | | | | | 229,615 | | | | 229,615 | |
Total Investments — 100.0% (Cost — $73,323,980) | | | | | | | | | | | | | | | 83,214,405 | |
Liabilities in Excess of Other Assets — (0.0)% | | | | | | | | | | | | | | | (29,904 | ) |
Total Net Assets — 100.0% | | | | | | | | | | | | | | $ | 83,184,501 | |
| (a) | Underlying Funds are affiliated with Legg Mason, Inc. and more information about the Underlying Funds is available at www.leggmason.com/mutualfunds. |
See Notes to Financial Statements.
| | |
| QS Variable Asset Allocation Series 2020 Semi-Annual Report | | 7 |
Schedules of investments (unaudited) (cont’d)
June 30, 2020
QS Variable Moderate Growth
| | | | | | | | | | | | | | | | |
| Description | | | | | | | | Shares | | | Value | |
| Investments in Underlying Funds(a) — 99.7% | | | | | | | | | | | | | | | | |
Legg Mason Global Asset Management Trust: | | | | | | | | | | | | | | | | |
BrandywineGLOBAL — Diversified US Large Cap Value Fund, Class IS Shares | | | | | | | | | | | 72,397 | | | $ | 1,161,241 | |
BrandywineGLOBAL — Dynamic US Large Cap Value Fund, Class IS Shares | | | | | | | | | | | 465,802 | | | | 5,067,921 | |
QS International Equity Fund, Class IS Shares | | | | | | | | | | | 291,065 | | | | 4,106,929 | |
QS U.S. Small Capitalization Equity Fund, Class IS Shares | | | | | | | | | | | 347,841 | | | | 3,537,546 | |
Legg Mason Partners Equity Trust: | | | | | | | | | | | | | | | | |
ClearBridge Appreciation Fund, Class IS Shares | | | | | | | | | | | 121,734 | | | | 3,003,185 | |
ClearBridge Large Cap Growth Fund, Class IS Shares | | | | | | | | | | | 41,072 | | | | 2,403,552 | |
ClearBridge Small Cap Growth Fund, Class IS Shares | | | | | | | | | | | 23,704 | | | | 960,942 | |
Western Asset Funds, Inc.: | | | | | | | | | | | | | | | | |
Western Asset Core Bond Fund, Class IS Shares | | | | | | | | | | | 272,658 | | | | 3,699,970 | |
Western Asset Intermediate Bond Fund, Class IS Shares | | | | | | | | | | | 482,484 | | | | 5,548,570 | |
Total Investments in Underlying Funds before Short-Term Investments (Cost — $25,994,737) | | | | | | | | | | | | | | | 29,489,856 | |
| | | | |
| | | | | | Rate | | | | | | | |
| Short-Term Investments — 0.4% | | | | | | | | | | | | | | | | |
Invesco Government & Agency Portfolio, Institutional Class
(Cost — $102,352) | | | | | | | 0.099% | | | | 102,352 | | | | 102,352 | |
Total Investments — 100.1% (Cost — $26,097,089) | | | | | | | | | | | | | | | 29,592,208 | |
Liabilities in Excess of Other Assets — (0.1)% | | | | | | | | | | | | | | | (24,650 | ) |
Total Net Assets — 100.0% | | | | | | | | | | | | | | $ | 29,567,558 | |
| (a) | Underlying Funds are affiliated with Legg Mason, Inc. and more information about the Underlying Funds is available at www.leggmason.com/mutualfunds. |
See Notes to Financial Statements.
| | |
| 8 | | QS Variable Asset Allocation Series 2020 Semi-Annual Report |
QS Variable Conservative Growth
| | | | | | | | | | | | | | | | |
| Description | | | | | | | | Shares | | | Value | |
| Investments in Underlying Funds(a) — 99.8% | | | | | | | | | | | | | | | | |
Legg Mason Global Asset Management Trust: | | | | | | | | | | | | | | | | |
BrandywineGLOBAL — Dynamic US Large Cap Value Fund, Class IS Shares | | | | | | | | | | | 930,002 | | | $ | 10,118,425 | |
QS International Equity Fund, Class IS Shares | | | | | | | | | | | 524,108 | | | | 7,395,170 | |
QS U.S. Small Capitalization Equity Fund, Class IS Shares | | | | | | | | | | | 789,225 | | | | 8,026,420 | |
Legg Mason Partners Equity Trust: | | | | | | | | | | | | | | | | |
ClearBridge Appreciation Fund, Class IS Shares | | | | | | | | | | | 312,761 | | | | 7,715,807 | |
ClearBridge Large Cap Growth Fund, Class IS Shares | | | | | | | | | | | 85,131 | | | | 4,981,852 | |
ClearBridge Small Cap Growth Fund, Class IS Shares | | | | | | | | | | | 48,414 | | | | 1,962,723 | |
Western Asset Funds, Inc.: | | | | | | | | | | | | | | | | |
Western Asset Core Bond Fund, Class IS Shares | | | | | | | | | | | 1,285,618 | | | | 17,445,839 | |
Western Asset Intermediate Bond Fund, Class IS Shares | | | | | | | | | | | 2,271,249 | | | | 26,119,358 | |
Total Investments in Underlying Funds before Short-Term Investments (Cost — $74,420,873) | | | | | | | | | | | | | | | 83,765,594 | |
| | | | |
| | | | | | Rate | | | | | | | |
| Short-Term Investments — 0.2% | | | | | | | | | | | | | | | | |
Invesco Government & Agency Portfolio, Institutional Class
(Cost — $138,421) | | | | | | | 0.099% | | | | 138,421 | | | | 138,421 | |
Total Investments — 100.0% (Cost — $74,559,294) | | | | | | | | | | | | | | | 83,904,015 | |
Liabilities in Excess of Other Assets — (0.0)% | | | | | | | | | | | | | | | (9,665 | ) |
Total Net Assets — 100.0% | | | | | | | | | | | | | | $ | 83,894,350 | |
| (a) | Underlying Funds are affiliated with Legg Mason, Inc. and more information about the Underlying Funds is available at www.leggmason.com/mutualfunds. |
See Notes to Financial Statements.
| | |
| QS Variable Asset Allocation Series 2020 Semi-Annual Report | | 9 |
Statements of assets and liabilities (unaudited)
June 30, 2020
| | | | | | | | | | | | |
| | | QS Variable
Growth | | | QS Variable
Moderate
Growth | | | QS Variable
Conservative
Growth | |
| | | |
| Assets: | | | | | | | | | | | | |
Investments in affiliated Underlying Funds, at cost | | $ | 73,094,365 | | | $ | 25,994,737 | | | $ | 74,420,873 | |
Short-term investments, at cost | | | 229,615 | | | | 102,352 | | | | 138,421 | |
Investments in affiliated Underlying Funds, at value | | $ | 82,984,790 | | | $ | 29,489,856 | | | $ | 83,765,594 | |
Short-term investments, at value | | | 229,615 | | | | 102,352 | | | | 138,421 | |
Distributions receivable from affiliated Underlying Funds | | | 22,764 | | | | 15,255 | | | | 72,332 | |
Receivable for Portfolio shares sold | | | 6,705 | | | | — | | | | 63,138 | |
Interest receivable | | | 18 | | | | 8 | | | | 20 | |
Receivable from investment manager | | | — | | | | 4,209 | | | | — | |
Prepaid expenses | | | 331 | | | | 167 | | | | 320 | |
Total Assets | | | 83,244,223 | | | | 29,611,847 | | | | 84,039,825 | |
| | | |
| Liabilities: | | | | | | | | | | | | |
Payable for investments in affiliated Underlying Funds | | | 22,701 | | | | 15,213 | | | | 72,134 | |
Audit fees payable | | | 16,051 | | | | 15,915 | | | | 16,024 | |
Shareholder reports payable | | | 10,572 | | | | 3,681 | | | | 8,984 | |
Fund accounting fees payable | | | 8,023 | | | | 7,836 | | | | 7,985 | |
Payable for Portfolio shares repurchased | | | 1,086 | | | | 1,234 | | | | 37,351 | |
Trustees’ fees payable | | | 683 | | | | — | | | | 504 | |
Service and/or distribution fees payable | | | — | | | | — | | | | 2,263 | |
Accrued expenses | | | 606 | | | | 410 | | | | 230 | |
Total Liabilities | | | 59,722 | | | | 44,289 | | | | 145,475 | |
| Total Net Assets | | $ | 83,184,501 | | | $ | 29,567,558 | | | $ | 83,894,350 | |
| | | |
| Net Assets: | | | | | | | | | | | | |
Par value (Note 7) | | $ | 67 | | | $ | 23 | | | $ | 59 | |
Paid-in capital in excess of par value | | | 76,898,637 | | | | 27,269,026 | | | | 76,377,747 | |
Total distributable earnings (loss) | | | 6,285,797 | | | | 2,298,509 | | | | 7,516,544 | |
| Total Net Assets | | $ | 83,184,501 | | | $ | 29,567,558 | | | $ | 83,894,350 | |
| | | |
| Net Assets: | | | | | | | | | | | | |
Class I | | | $83,184,501 | | | | $29,567,558 | | | | $72,956,034 | |
Class II | | | — | | | | — | | | | $10,938,316 | |
| | | |
| Shares Outstanding: | | | | | | | | | | | | |
Class I | | | 6,708,718 | | | | 2,329,853 | | | | 5,122,633 | |
Class II | | | — | | | | — | | | | 771,173 | |
| | | |
| Net Asset Value: | | | | | | | | | | | | |
Class I | | | $12.40 | | | | $12.69 | | | | $14.24 | |
Class II | | | — | | | | — | | | | $14.18 | |
See Notes to Financial Statements.
| | |
| 10 | | QS Variable Asset Allocation Series 2020 Semi-Annual Report |
Statements of operations (unaudited)
For the Six Months Ended June 30, 2020
| | | | | | | | | | | | |
| | | QS Variable
Growth | | | QS Variable
Moderate
Growth | | | QS Variable
Conservative
Growth | |
| | | |
| Investment Income: | | | | | | | | | | | | |
Income distributions from affiliated Underlying Funds | | $ | 210,863 | | | $ | 122,796 | | | $ | 542,742 | |
Interest | | | 981 | | | | 531 | | | | 1,826 | |
Total Investment Income | | | 211,844 | | | | 123,327 | | | | 544,568 | |
| | | |
| Expenses: | | | | | | | | | | | | |
Fund accounting fees | | | 16,397 | | | | 16,077 | | | | 16,364 | |
Audit and tax fees | | | 16,051 | | | | 15,915 | | | | 16,025 | |
Legal fees | | | 10,591 | | | | 10,596 | | | | 10,572 | |
Shareholder reports | | | 7,705 | | | | 3,701 | | | | 6,967 | |
Trustees’ fees | | | 3,766 | | | | 1,290 | | | | 3,567 | |
Insurance | | | 972 | | | | 488 | | | | 940 | |
Custody fees | | | 706 | | | | 778 | | | | 641 | |
Transfer agent fees (Note 5) | | | 441 | | | | 378 | | | | 565 | |
Interest expense | | | 49 | | | | 63 | | | | 15 | |
Service and/or distribution fees (Notes 2 and 5) | | | — | | | | — | | | | 13,094 | |
Miscellaneous expenses | | | 773 | | | | 765 | | | | 920 | |
Total Expenses | | | 57,451 | | | | 50,051 | | | | 69,670 | |
Less: Fee waivers and/or expense reimbursements (Notes 2 and 5) | | | (547) | | | | (20,670) | | | | (567) | |
Net Expenses | | | 56,904 | | | | 29,381 | | | | 69,103 | |
| Net Investment Income | | | 154,940 | | | | 93,946 | | | | 475,465 | |
| | | |
| Realized and Unrealized Loss on Affiliated Underlying Funds (Notes 1 and 3): | | | | | | | | | | | | |
Net Realized Loss From Sale of Affiliated Underlying Funds | | | (467,557) | | | | (129,248) | | | | (756,243) | |
Change in Net Unrealized Appreciation (Depreciation) on Affiliated Underlying Funds | | | (8,072,984) | | | | (1,971,363) | | | | (2,329,425) | |
| Net Loss on Affiliated Underlying Funds | | | (8,540,541) | | | | (2,100,611) | | | | (3,085,668) | |
| Decrease in Net Assets From Operations | | $ | (8,385,601) | | | $ | (2,006,665) | | | $ | (2,610,203) | |
See Notes to Financial Statements.
| | |
| QS Variable Asset Allocation Series 2020 Semi-Annual Report | | 11 |
Statements of changes in net assets
QS Variable Growth
| | | | | | | | |
For the Six Months Ended June 30, 2020 (unaudited) and the Year Ended December 31, 2019 | | 2020 | | | 2019 | |
| | |
| Operations: | | | | | | | | |
Net investment income | | $ | 154,940 | | | $ | 1,351,777 | |
Net realized gain (loss) | | | (467,557) | | | | 2,813,912 | |
Change in net unrealized appreciation (depreciation) | | | (8,072,984) | | | | 15,775,617 | |
Increase (Decrease) in Net Assets From Operations | | | (8,385,601) | | | | 19,941,306 | |
| | |
| Distributions to Shareholders From (Notes 1 and 6): | | | | | | | | |
Total distributable earnings | | | (2,886,416) | | | | (6,438,220) | |
Decrease in Net Assets From Distributions to Shareholders | | | (2,886,416) | | | | (6,438,220) | |
| | |
| Portfolio Share Transactions (Note 7): | | | | | | | | |
Net proceeds from sale of shares | | | 239,993 | | | | 292,230 | |
Reinvestment of distributions | | | 2,886,416 | | | | 6,438,220 | |
Cost of shares repurchased | | | (6,628,552) | | | | (16,989,853) | |
Decrease in Net Assets From Portfolio Share Transactions | | | (3,502,143) | | | | (10,259,403) | |
Increase (Decrease) in Net Assets | | | (14,774,160) | | | | 3,243,683 | |
| | |
| Net Assets: | | | | | | | | |
Beginning of period | | | 97,958,661 | | | | 94,714,978 | |
End of period | | $ | 83,184,501 | | | $ | 97,958,661 | |
See Notes to Financial Statements.
| | |
| 12 | | QS Variable Asset Allocation Series 2020 Semi-Annual Report |
QS Variable Moderate Growth
| | | | | | | | |
For the Six Months Ended June 30, 2020 (unaudited) and the Year Ended December 31, 2019 | | 2020 | | | 2019 | |
| | |
| Operations: | | | | | | | | |
Net investment income | | $ | 93,946 | | | $ | 503,667 | |
Net realized gain (loss) | | | (129,248) | | | | 903,177 | |
Change in net unrealized appreciation (depreciation) | | | (1,971,363) | | | | 4,689,876 | |
Increase (Decrease) in Net Assets From Operations | | | (2,006,665) | | | | 6,096,720 | |
| | |
| Distributions to Shareholders From (Notes 1 and 6): | | | | | | | | |
Total distributable earnings | | | (873,585) | | | | (1,781,181) | |
Decrease in Net Assets From Distributions to Shareholders | | | (873,585) | | | | (1,781,181) | |
| | |
| Portfolio Share Transactions (Note 7): | | | | | | | | |
Net proceeds from sale of shares | | | 305,184 | | | | 446,023 | |
Reinvestment of distributions | | | 873,585 | | | | 1,781,181 | |
Cost of shares repurchased | | | (1,912,633) | | | | (4,828,898) | |
Decrease in Net Assets From Portfolio Share Transactions | | | (733,864) | | | | (2,601,694) | |
Increase (Decrease) in Net Assets | | | (3,614,114) | | | | 1,713,845 | |
| | |
| Net Assets: | | | | | | | | |
Beginning of period | | | 33,181,672 | | | | 31,467,827 | |
End of period | | $ | 29,567,558 | | | $ | 33,181,672 | |
See Notes to Financial Statements.
| | |
| QS Variable Asset Allocation Series 2020 Semi-Annual Report | | 13 |
Statements of changes in net assets (cont’d)
QS Variable Conservative Growth
| | | | | | | | |
For the Six Months Ended June 30, 2020 (unaudited) and the Year Ended December 31, 2019 | | 2020 | | | 2019 | |
| | |
| Operations: | | | | | | | | |
Net investment income | | $ | 475,465 | | | $ | 1,656,792 | |
Net realized gain (loss) | | | (756,243) | | | | 1,524,560 | |
Change in net unrealized appreciation (depreciation) | | | (2,329,425) | | | | 10,800,414 | |
Increase (Decrease) in Net Assets From Operations | | | (2,610,203) | | | | 13,981,766 | |
| | |
| Distributions to Shareholders From (Notes 1 and 6): | | | | | | | | |
Total distributable earnings | | | (1,485,323) | | | | (3,791,343) | |
Decrease in Net Assets From Distributions to Shareholders | | | (1,485,323) | | | | (3,791,343) | |
| | |
| Portfolio Share Transactions (Note 7): | | | | | | | | |
Net proceeds from sale of shares | | | 3,306,116 | | | | 5,925,183 | |
Reinvestment of distributions | | | 1,485,323 | | | | 3,791,343 | |
Cost of shares repurchased | | | (7,570,062) | | | | (12,559,856) | |
Decrease in Net Assets From Portfolio Share Transactions | | | (2,778,623) | | | | (2,843,330) | |
Increase (Decrease) in Net Assets | | | (6,874,149) | | | | 7,347,093 | |
| | |
| Net Assets: | | | | | | | | |
Beginning of period | | | 90,768,499 | | | | 83,421,406 | |
End of period | | $ | 83,894,350 | | | $ | 90,768,499 | |
See Notes to Financial Statements.
| | |
| 14 | | QS Variable Asset Allocation Series 2020 Semi-Annual Report |
Financial highlights
QS Variable Growth
| | | | | | | | | | | | |
For a share of each class of beneficial interest outstanding throughout each year ended December 31,
unless otherwise noted: |
| | | | | | | | | | | | | | | | | | | | | | | | |
| Class I Shares1,2 | | 20203 | | | 2019 | | | 2018 | | | 2017 | | | 2016 | | | 2015 | |
| | | | | | |
| Net asset value, beginning of period | | $ | 14.00 | | | $ | 12.20 | | | $ | 14.46 | | | $ | 14.55 | | | $ | 14.12 | | | $ | 16.45 | |
| | | | | | |
| Income (loss) from operations: | | | | | | | | | | | | | | | | | | | | | | | | |
Net investment income | | | 0.02 | | | | 0.18 | | | | 0.20 | | | | 0.22 | | | | 0.20 | | | | 0.19 | |
Net realized and unrealized gain (loss) | | | (1.18) | | | | 2.52 | | | | (1.30) | | | | 2.56 | | | | 0.98 | | | | (0.52) | |
Total income (loss) from operations | | | (1.16) | | | | 2.70 | | | | (1.10) | | | | 2.78 | | | | 1.18 | | | | (0.33) | |
| | | | | | |
| Less distributions from: | | | | | | | | | | | | | | | | | | | | | | | | |
Net investment income | | | (0.02) | | | | (0.21) | | | | (0.38) | | | | (0.29) | | | | (0.21) | | | | (0.21) | |
Net realized gains | | | (0.42) | | | | (0.69) | | | | (0.78) | | | | (2.58) | | | | (0.54) | | | | (1.79) | |
Total distributions | | | (0.44) | | | | (0.90) | | | | (1.16) | | | | (2.87) | | | | (0.75) | | | | (2.00) | |
| | | | | | |
| Net asset value, end of period | | $ | 12.40 | | | $ | 14.00 | | | $ | 12.20 | | | $ | 14.46 | | | $ | 14.55 | | | $ | 14.12 | |
Total return4 | | | (8.25) | % | | | 22.58 | % | | | (8.05) | % | | | 19.33 | % | | | 8.50 | % | | | (2.23) | % |
| | | | | | |
| Net assets, end of period (000s) | | $ | 83,185 | | | $ | 97,959 | | | $ | 94,715 | | | $ | 118,126 | | | $ | 110,803 | | | $ | 111,372 | |
| | | | | | |
| Ratios to average net assets: | | | | | | | | | | | | | | | | | | | | | | | | |
Gross expenses5 | | | 0.14 | %6 | | | 0.12 | % | | | 0.11 | % | | | 0.12 | % | | | 0.11 | % | | | 0.12 | % |
Net expenses5,7 | | | 0.14 | 6,8 | | | 0.12 | | | | 0.11 | | | | 0.12 | | | | 0.11 | | | | 0.12 | |
Net investment income | | | 0.37 | 6 | | | 1.38 | | | | 1.36 | | | | 1.40 | | | | 1.44 | | | | 1.17 | |
| | | | | | |
| Portfolio turnover rate | | | 11 | % | | | 19 | % | | | 15 | % | | | 88 | %9 | | | 20 | % | | | 54 | %9 |
| 1 | Effective May 1, 2017, the existing single class shares were renamed Class I shares. |
| 2 | Per share amounts have been calculated using the average shares method. |
| 3 | For the six months ended June 30, 2020 (unaudited). |
| 4 | Performance figures may reflect compensating balance arrangements, fee waivers and/or expense reimbursements. In the absence of compensating balance arrangements, fee waivers and/or expense reimbursements, the total return would have been lower. Total returns do not reflect expenses associated with separate accounts such as administrative fees, account charges and surrender charges which, if reflected, would reduce the total return for all periods shown. Past performance is no guarantee of future results. Total returns for periods of less than one year are not annualized. |
| 5 | Does not include fees and expenses of the Underlying Funds in which the Portfolio invests. |
| 7 | As a result of an expense limitation arrangement, the ratio of total annual fund operating expenses, other than interest, brokerage, taxes, extraordinary expenses and acquired fund fees and expenses (fees and expenses of Underlying Funds), to average net assets of Class I shares did not exceed 0.20%. This expense limitation arrangement cannot be terminated prior to December 31, 2021 without the Board of Trustees’ consent. |
| 8 | Reflects fee waivers and/or expense reimbursements. |
| 9 | Excludes the value of securities received in lieu of cash proceeds from the sale of Underlying Funds and the subsequent sale of those securities. |
See Notes to Financial Statements.
| | |
| QS Variable Asset Allocation Series 2020 Semi-Annual Report | | 15 |
Financial highlights (cont’d)
QS Variable Moderate Growth
|
For a share of each class of beneficial interest outstanding throughout each year ended December 31, unless otherwise noted: |
| | | | | | | | | | | | | | | | | | | | | | | | |
| Class I Shares1,2 | | 20203 | | | 2019 | | | 2018 | | | 2017 | | | 2016 | | | 2015 | |
| | | | | | |
| Net asset value, beginning of period | | $ | 13.87 | | | $ | 12.16 | | | $ | 13.93 | | | $ | 14.57 | | | $ | 13.95 | | | $ | 14.46 | |
| | | | | | |
| Income (loss) from operations: | | | | | | | | | | | | | | | | | | | | | | | | |
Net investment income | | | 0.04 | | | | 0.20 | | | | 0.22 | | | | 0.24 | | | | 0.24 | | | | 0.21 | |
Net realized and unrealized gain (loss) | | | (0.83) | | | | 2.25 | | | | (1.07) | | | | 2.18 | | | | 0.87 | | | | (0.46) | |
Total income (loss) from operations | | | (0.79) | | | | 2.45 | | | | (0.85) | | | | 2.42 | | | | 1.11 | | | | (0.25) | |
| | | | | | |
| Less distributions from: | | | | | | | | | | | | | | | | | | | | | | | | |
Net investment income | | | (0.01) | | | | (0.51) | | | | (0.35) | | | | (0.34) | | | | (0.30) | | | | (0.26) | |
Net realized gains | | | (0.38) | | | | (0.23) | | | | (0.57) | | | | (2.72) | | | | (0.19) | | | | — | |
Total distributions | | | (0.39) | | | | (0.74) | | | | (0.92) | | | | (3.06) | | | | (0.49) | | | | (0.26) | |
| | | | | | |
| Net asset value, end of period | | $ | 12.69 | | | $ | 13.87 | | | $ | 12.16 | | | $ | 13.93 | | | $ | 14.57 | | | $ | 13.95 | |
Total return4 | | | (5.72) | % | | | 20.43 | % | | | (6.28) | % | | | 16.73 | % | | | 7.99 | % | | | (1.79) | % |
| | | | | | |
| Net assets, end of period (000s) | | $ | 29,568 | | | $ | 33,182 | | | $ | 31,468 | | | $ | 37,446 | | | $ | 38,178 | | | $ | 39,620 | |
| | | | | | |
| Ratios to average net assets: | | | | | | | | | | | | | | | | | | | | | | | | |
Gross expenses5 | | | 0.34 | %6 | | | 0.29 | % | | | 0.30 | % | | | 0.30 | % | | | 0.23 | % | | | 0.27 | % |
Net expenses5,7,8 | | | 0.20 | 6 | | | 0.20 | | | | 0.20 | | | | 0.20 | | | | 0.20 | | | | 0.20 | |
Net investment income | | | 0.64 | 6 | | | 1.53 | | | | 1.56 | | | | 1.52 | | | | 1.70 | | | | 1.43 | |
| | | | | | |
| Portfolio turnover rate | | | 13 | % | | | 21 | % | | | 16 | % | | | 87 | %9 | | | 21 | % | | | 57 | %9 |
| 1 | Effective May 1, 2017, the existing single class shares were renamed Class I shares. |
| 2 | Per share amounts have been calculated using the average shares method. |
| 3 | For the six months ended June 30, 2020 (unaudited). |
| 4 | Performance figures may reflect compensating balance arrangements, fee waivers and/or expense reimbursements. In the absence of compensating balance arrangements, fee waivers and/or expense reimbursements, the total return would have been lower. Total returns do not reflect expenses associated with separate accounts such as administrative fees, account charges and surrender charges which, if reflected, would reduce the total return for all periods shown. Past performance is no guarantee of future results. Total returns for periods of less than one year are not annualized. |
| 5 | Does not include fees and expenses of the Underlying Funds in which the Portfolio invests. |
| 7 | Reflects fee waivers and/or expense reimbursements. |
| 8 | As a result of an expense limitation arrangement, the ratio of total annual fund operating expenses, other than interest, brokerage, taxes, extraordinary expenses and acquired fund fees and expenses (fees and expenses of Underlying Funds), to average net assets of Class I shares did not exceed 0.20%. This expense limitation arrangement cannot be terminated prior to December 31, 2021 without the Board of Trustees’ consent. |
| 9 | Excludes the value of securities received in lieu of cash proceeds from the sale of Underlying Funds and the subsequent sale of those securities. |
See Notes to Financial Statements.
| | |
| 16 | | QS Variable Asset Allocation Series 2020 Semi-Annual Report |
QS Variable Conservative Growth
| | | | | | | | | | | | |
For a share of each class of beneficial interest outstanding throughout each year ended December 31, unless otherwise noted: |
| | | | | | | | | | | | | | | | | | | | | | | | |
| Class I Shares1,2 | | 20203 | | | 2019 | | | 2018 | | | 2017 | | | 2016 | | | 2015 | |
| | | | | | |
| Net asset value, beginning of period | | | $14.88 | | | | $13.23 | | | | $14.64 | | | | $14.76 | | | | $14.07 | | | | $14.54 | |
| | | | | | |
| Income (loss) from operations: | | | | | | | | | | | | | | | | | | | | | | | | |
Net investment income | | | 0.08 | | | | 0.27 | | | | 0.28 | | | | 0.28 | | | | 0.31 | | | | 0.29 | |
Net realized and unrealized gain (loss) | | | (0.46) | | | | 2.01 | | | | (0.91) | | | | 1.73 | | | | 0.73 | | | | (0.46) | |
Total income (loss) from operations | | | (0.38) | | | | 2.28 | | | | (0.63) | | | | 2.01 | | | | 1.04 | | | | (0.17) | |
| | | | | | |
| Less distributions from: | | | | | | | | | | | | | | | | | | | | | | | | |
Net investment income | | | (0.01) | | | | (0.31) | | | | (0.38) | | | | (0.39) | | | | (0.35) | | | | (0.30) | |
Net realized gains | | | (0.25) | | | | (0.32) | | | | (0.40) | | | | (1.74) | | | | — | | | | — | |
Total distributions | | | (0.26) | | | | (0.63) | | | | (0.78) | | | | (2.13) | | | | (0.35) | | | | (0.30) | |
| | | | | | |
| Net asset value, end of period | | | $14.24 | | | | $14.88 | | | | $13.23 | | | | $14.64 | | | | $14.76 | | | | $14.07 | |
Total return4 | | | (2.60) | % | | | 17.37 | % | | | (4.40) | % | | | 13.55 | % | | | 7.43 | % | | | (1.19) | % |
| | | | | | |
| Net assets, end of period (000s) | | | $72,956 | | | | $80,945 | | | | $78,534 | | | | $94,355 | | | | $93,763 | | | | $98,024 | |
| | | | | | |
| Ratios to average net assets: | | | | | | | | | | | | | | | | | | | | | | | | |
Gross expenses5 | | | 0.13 | %6 | | | 0.12 | % | | | 0.14 | % | | | 0.14 | % | | | 0.13 | % | | | 0.14 | % |
Net expenses5,7 | | | 0.13 | 6,8 | | | 0.12 | | | | 0.14 | | | | 0.14 | | | | 0.13 | | | | 0.14 | |
Net investment income | | | 1.16 | 6 | | | 1.88 | | | | 1.90 | | | | 1.78 | | | | 2.18 | | | | 1.98 | |
| | | | | | |
| Portfolio turnover rate | | | 16 | % | | | 24 | % | | | 11 | % | | | 86 | %9 | | | 18 | % | | | 58 | %9 |
| 1 | Effective May 1, 2017, the existing single class shares were renamed Class I shares. |
| 2 | Per share amounts have been calculated using the average shares method. |
| 3 | For the six months ended June 30, 2020 (unaudited). |
| 4 | Performance figures may reflect compensating balance arrangements, fee waivers and/or expense reimbursements. In the absence of compensating balance arrangements, fee waivers and/or expense reimbursements, the total return would have been lower. Total returns do not reflect expenses associated with separate accounts such as administrative fees, account charges and surrender charges which, if reflected, would reduce the total return for all periods shown. Past performance is no guarantee of future results. Total returns for periods of less than one year are not annualized. |
| 5 | Does not include fees and expenses of the Underlying Funds in which the Portfolio invests. |
| 7 | As a result of an expense limitation arrangement, the ratio of total annual fund operating expenses, other than interest, brokerage, taxes, extraordinary expenses and acquired fund fees and expenses (fees and expenses of Underlying Funds), to average net assets of Class I shares did not exceed 0.20%. This expense limitation arrangement cannot be terminated prior to December 31, 2021 without the Board of Trustees’ consent. |
| 8 | Reflects fee waivers and/or expense reimbursements. |
| 9 | Excludes the value of securities received in lieu of cash proceeds from the sale of Underlying Funds and the subsequent sale of those securities. |
See Notes to Financial Statements.
| | |
| QS Variable Asset Allocation Series 2020 Semi-Annual Report | | 17 |
Financial highlights (cont’d)
QS Variable Conservative Growth
|
For a share of each class of beneficial interest outstanding throughout each year ended December 31, unless otherwise noted: |
| | | | | | | | | | | | | | | | |
| Class II Shares1 | | 20202 | | | 2019 | | | 2018 | | | 20173 | |
| | | | |
| Net asset value, beginning of period | | | $14.83 | | | | $13.21 | | | | $14.62 | | | | $15.72 | |
| | | | |
| Income (loss) from operations: | | | | | | | | | | | | | | | | |
Net investment income | | | 0.06 | | | | 0.25 | | | | 0.33 | | | | 0.32 | |
Net realized and unrealized gain (loss) | | | (0.45) | | | | 1.97 | | | | (0.98) | | | | 0.66 | |
Total income (loss) from operations | | | (0.39) | | | | 2.22 | | | | (0.65) | | | | 0.98 | |
| | | | |
| Less distributions from: | | | | | | | | | | | | | | | | |
Net investment income | | | (0.01) | | | | (0.28) | | | | (0.36) | | | | (0.34) | |
Net realized gains | | | (0.25) | | | | (0.32) | | | | (0.40) | | | | (1.74) | |
Total distributions | | | (0.26) | | | | (0.60) | | | | (0.76) | | | | (2.08) | |
| | | | |
| Net asset value, end of period | | | $14.18 | | | | $14.83 | | | | $13.21 | | | | $14.62 | |
Total return4 | | | (2.68) | % | | | 16.94 | % | | | (4.55) | % | | | 6.18 | % |
| | | | |
| Net assets, end of period (000s) | | | $10,938 | | | | $9,823 | | | | $4,888 | | | | $1,111 | |
| | | | |
| Ratios to average net assets: | | | | | | | | | | | | | | | | |
Gross expenses5 | | | 0.39 | %6 | | | 0.37 | % | | | 0.38 | % | | | 0.43 | %6 |
Net expenses5,7 | | | 0.38 | 6,8 | | | 0.37 | | | | 0.38 | | | | 0.43 | 6 |
Net investment income | | | 0.92 | 6 | | | 1.77 | | | | 2.32 | | | | 3.90 | 6 |
| | | | |
| Portfolio turnover rate | | | 16 | % | | | 24 | % | | | 11 | % | | | 86 | %9,10 |
| 1 | Per share amounts have been calculated using the average shares method. |
| 2 | For the six months ended June 30, 2020 (unaudited). |
| 3 | For the period June 23, 2017 (inception date) to December 31, 2017. |
| 4 | Performance figures may reflect compensating balance arrangements, fee waivers and/or expense reimbursements. In the absence of compensating balance arrangements, fee waivers and/or expense reimbursements, the total return would have been lower. Past performance is no guarantee of future results. Total returns for periods of less than one year are not annualized. |
| 5 | Does not include fees and expenses of the Underlying Funds in which the Portfolio invests. |
| 7 | As a result of an expense limitation arrangement, the ratio of total annual fund operating expenses, other than interest, brokerage, taxes, extraordinary expenses and acquired fund fees and expenses (fees and expenses of Underlying Funds), to average net assets of Class II shares did not exceed 0.45%. |
| | This expense limitation arrangement cannot be terminated prior to December 31, 2021 without the Board of Trustees’ consent. |
| 8 | Reflects fee waivers and/or expense reimbursements. |
| 9 | Excludes the value of securities received in lieu of cash proceeds from the sale of Underlying Funds and the subsequent sale of those securities. |
| 10 | For the year ended December 31, 2017. |
See Notes to Financial Statements.
| | |
| 18 | | QS Variable Asset Allocation Series 2020 Semi-Annual Report |
Notes to financial statements (unaudited)
1. Organization and significant accounting policies
QS Variable Growth (“Variable Growth”), QS Variable Moderate Growth (“Variable Moderate Growth”) and QS Variable Conservative Growth (“Variable Conservative Growth”) (the “Portfolios”) are separate non-diversified investment series of Legg Mason Partners Variable Equity Trust (the “Trust”). The Trust, a Maryland statutory trust, is registered under the Investment Company Act of 1940, as amended (the “1940 Act”), as an open-end management investment company. The Portfolios invest in other mutual funds and exchange-traded funds (“ETFs”) which are affiliated with Legg Mason, Inc. (“Legg Mason”) and ETFs managed by unaffiliated investment advisers (“Underlying Funds”). Shares of the Portfolios are offered to separate accounts sponsored by certain life insurance companies and qualified pension and retirement plans, including affiliates of the investment manager.
Shares of the Portfolio may only be purchased or redeemed through variable annuity contracts and variable life insurance policies offered by the separate accounts of participating insurance companies or through eligible pension or other qualified plans.
The following are significant accounting policies consistently followed by the Portfolios and are in conformity with U.S. generally accepted accounting principles (“GAAP”). Estimates and assumptions are required to be made regarding assets, liabilities and changes in net assets resulting from operations when financial statements are prepared. Changes in the economic environment, financial markets and any other parameters used in determining these estimates could cause actual results to differ. Subsequent events have been evaluated through the date the financial statements were issued.
(a) Investment valuation. Investments in the Underlying Funds are valued at the closing net asset value per share of each Underlying Fund on the day of valuation. Equity securities for which market quotations are available are valued at the last reported sales price or official closing price on the primary market or exchange on which they trade. The valuations for fixed income securities (which may include, but are not limited to, corporate, government, municipal, mortgage-backed, collateralized mortgage obligations and asset-backed securities) and certain derivative instruments are typically the prices supplied by independent third party pricing services, which may use market prices or broker/dealer quotations or a variety of valuation techniques and methodologies. The independent third party pricing services use inputs that are observable such as issuer details, interest rates, yield curves, prepayment speeds, credit risks/spreads, default rates and quoted prices for similar securities. Investments in open-end funds are valued at the closing net asset value per share of each fund on the day of valuation. When the Portfolios hold securities or other assets that are denominated in a foreign currency, the Portfolios will normally use the currency exchange rates as of 4:00 p.m. (Eastern Time). If independent third party pricing services are unable to supply prices for a portfolio investment, or if the prices supplied are deemed by the manager to be unreliable, the market price may be determined by the manager using quotations from one or more broker/dealers or at the transaction price if the security has recently been purchased and no value has yet been obtained from a pricing service or pricing broker. When reliable prices are not readily available, such as when the value of a security has been significantly affected by events after the close of the exchange or market on which the security is principally traded, but before each Portfolio calculates its net asset value, the Portfolios value these securities as determined in accordance with procedures approved by the Portfolios’ Board of Trustees.
The Board of Trustees is responsible for the valuation process and has delegated the supervision of the daily valuation process to the Legg Mason North Atlantic Fund Valuation Committee (the “Valuation Committee”). The Valuation Committee, pursuant to the policies adopted by the Board of Trustees, is responsible for making fair value determinations, evaluating the effectiveness of the Portfolios’ pricing policies, and reporting to the Board of Trustees. When determining the reliability of third party pricing information for investments owned by the Portfolios, the Valuation Committee, among other things, conducts due diligence reviews of pricing vendors, monitors the daily change in prices and reviews transactions among market participants.
The Valuation Committee will consider pricing methodologies it deems relevant and appropriate when making fair value determinations. Examples of possible methodologies include, but are not limited to, multiple of earnings; discount from market of a similar freely traded security; discounted cash-flow analysis; book value or a multiple thereof; risk premium/yield analysis; yield to maturity; and/or fundamental investment analysis. The Valuation Committee will also consider factors it deems relevant and appropriate in light of the facts and circumstances. Examples of possible factors include, but are not limited to, the type of security; the issuer’s financial statements; the purchase price of the security; the discount from market value of unrestricted securities of the same class at the time of purchase; analysts’ research and observations from financial institutions; information regarding any transactions or offers with respect to the security; the existence of merger proposals or tender offers affecting the security; the price and extent of public trading in similar securities of the issuer or comparable companies; and the existence of a shelf registration for restricted securities. Additionally, if the closing net
| | |
| QS Variable Asset Allocation Series 2020 Semi-Annual Report | | 19 |
Notes to financial statements (unaudited) (cont’d)
asset value per share for an Underlying Fund is not available on the day of valuation, the Valuation Committee may adjust the Underlying Fund’s last available net asset value per share to account for significant events that have occurred subsequent to the Underlying Fund’s last net asset value per share calculation but prior to the day of valuation.
For each portfolio security that has been fair valued pursuant to the policies adopted by the Board of Trustees, the fair value price is compared against the last available and next available market quotations. The Valuation Committee reviews the results of such back testing monthly and fair valuation occurrences are reported to the Board of Trustees quarterly.
The Portfolios use valuation techniques to measure fair value that are consistent with the market approach and/or income approach, depending on the type of security and the particular circumstance. The market approach uses prices and other relevant information generated by market transactions involving identical or comparable securities. The income approach uses valuation techniques to discount estimated future cash flows to present value.
GAAP establishes a disclosure hierarchy that categorizes the inputs to valuation techniques used to value assets and liabilities at measurement date. These inputs are summarized in the three broad levels listed below:
| • | | Level 1 — quoted prices in active markets for identical investments |
| • | | Level 2 — other significant observable inputs (including quoted prices for similar investments, interest rates, prepayment speeds, credit risk, etc.) |
| • | | Level 3 — significant unobservable inputs (including the Portfolios’ own assumptions in determining the fair value of investments) |
The inputs or methodologies used to value securities are not necessarily an indication of the risk associated with investing in those securities.
The following is a summary of the inputs used in valuing the Portfolios’ assets carried at fair value:
Variable Growth
| | | | | | | | | | | | | | | | |
| ASSETS | |
| Description | | Quoted Prices
(Level 1) | | | Other Significant
Observable Inputs
(Level 2) | | | Significant
Unobservable
Inputs
(Level 3) | | | Total | |
| Investments in Underlying Funds† | | $ | 82,984,790 | | | | — | | | | — | | | $ | 82,984,790 | |
| Short-Term Investments† | | | 229,615 | | | | — | | | | — | | | | 229,615 | |
| Total Investments | | $ | 83,214,405 | | | | — | | | | — | | | $ | 83,214,405 | |
| † | See Schedule of Investments for additional detailed categorizations. |
Variable Moderate Growth
| | | | | | | | | | | | | | | | |
| ASSETS | |
| Description | | Quoted Prices
(Level 1) | | | Other Significant
Observable Inputs
(Level 2) | | | Significant
Unobservable
Inputs
(Level 3) | | | Total | |
| Investments in Underlying Funds† | | $ | 29,489,856 | | | | — | | | | — | | | $ | 29,489,856 | |
| Short-Term Investments† | | | 102,352 | | | | — | | | | — | | | | 102,352 | |
| Total Investments | | $ | 29,592,208 | | | | — | | | | — | | | $ | 29,592,208 | |
| † | See Schedule of Investments for additional detailed categorizations. |
| | |
| 20 | | QS Variable Asset Allocation Series 2020 Semi-Annual Report |
Variable Conservative Growth
| | | | | | | | | | | | | | | | |
| ASSETS | |
| Description | | Quoted Prices
(Level 1) | | | Other Significant
Observable Inputs
(Level 2) | | | Significant
Unobservable
Inputs
(Level 3) | | | Total | |
| Investments in Underlying Funds† | | $ | 83,765,594 | | | | — | | | | — | | | $ | 83,765,594 | |
| Short-Term Investments† | | | 138,421 | | | | — | | | | — | | | | 138,421 | |
| Total Investments | | $ | 83,904,015 | | | | — | | | | — | | | $ | 83,904,015 | |
| † | See Schedule of Investments for additional detailed categorizations. |
(b) Fund of funds risk. The cost of investing in the Portfolios, as funds of funds, may be higher than the cost of investing in a mutual fund that only invests directly in individual securities. An Underlying Fund may change its investment objective or policies without the Portfolios’ approval, which could force the Portfolios to withdraw their investments from such Underlying Fund at a time that is unfavorable to the Portfolios. In addition, one Underlying Fund may buy the same securities that another Underlying Fund sells. Therefore, the Portfolios would indirectly bear the costs of these trades without accomplishing any investment purpose.
(c) Security transactions and investment income. Security transactions are accounted for on a trade date basis. Net investment income distributions, if any, from the Underlying Funds are recorded on the ex-dividend date as investment income. Interest income is recorded on an accrual basis. Short-term and long-term capital gain distributions, if any, from the Underlying Funds are recorded on the ex-dividend date as realized gains. The character of certain distributions received from the Underlying Funds may represent a return of capital. The Portfolios determine the components of these distributions subsequent to the ex-dividend date, based on the actual tax character reported by the Underlying Funds. These distributions are recorded by adjusting the cost basis of the related Underlying Fund. The cost of investments sold is determined by use of the specific identification method.
(d) Distributions to shareholders. Distributions from net investment income and distributions of net realized gains, if any, are declared at least annually. Distributions to shareholders of the Portfolios are recorded on the ex-dividend date and are determined in accordance with income tax regulations, which may differ from GAAP.
(e) Share class accounting. Investment income, common expenses and realized/unrealized gains (losses) on investments are allocated to the various classes of the Portfolios on the basis of daily net assets of each class. Fees relating to a specific class are charged directly to that share class.
(f) Compensating balance arrangements. The Portfolios have an arrangement with their custodian bank whereby a portion of the custodian’s fees is paid indirectly by credits earned on the Portfolios’ cash on deposit with the bank.
(g) Federal and other taxes. It is the Portfolios’ policy to comply with the federal income and excise tax requirements of the Internal Revenue Code of 1986 (the “Code”), as amended, applicable to regulated investment companies. Accordingly, the Portfolios intend to distribute their taxable income and net realized gains, if any, to shareholders in accordance with timing requirements imposed by the Code. Therefore, no federal or state income tax provision is required in the Portfolios’ financial statements.
Management has analyzed the Portfolios’ tax positions taken on income tax returns for all open tax years and has concluded that as of December 31, 2019, no provision for income tax is required in the Portfolios’ financial statements. The Portfolios’ federal and state income and federal excise tax returns for tax years for which the applicable statutes of limitations have not expired are subject to examination by the Internal Revenue Service and state departments of revenue.
(h) Reclassification. GAAP requires that certain components of net assets be reclassified to reflect permanent differences between financial and tax reporting. These reclassifications have no effect on net assets or net asset value per share.
2. Investment management agreement and other transactions with affiliates
Legg Mason Partners Fund Advisor, LLC (“LMPFA”) is each Portfolio’s investment manager and QS Investors, LLC (“QS Investors”) is each Portfolio’s subadviser. Western Asset Management Company, LLC (“Western Asset”) manages the portion of each Portfolio’s cash and short-term instruments allocated to it. LMPFA, QS Investors and Western Asset are wholly-owned subsidiaries of Legg Mason, Inc. (“Legg Mason”). As of July 31, 2020, LMPFA, QS Investors and Western Asset are indirect, wholly-owned subsidiaries of Franklin Resources, Inc. (“Franklin Resources”). Under the investment management agreements, the Portfolios do not pay a management fee.
| | |
| QS Variable Asset Allocation Series 2020 Semi-Annual Report | | 21 |
Notes to financial statements (unaudited) (cont’d)
LMPFA provides administrative and certain oversight services to the Portfolios. LMPFA delegates to the subadviser the day-to-day portfolio management of the Portfolios, except for the management of the portion of each Portfolio’s cash and short-term instruments allocated to Western Asset.
As a result of expense limitation arrangements between the Portfolios and LMPFA, the ratio of total annual fund operating expenses, other than interest, brokerage, taxes, extraordinary expenses and acquired fund fees and expenses (fees and expenses of Underlying Funds), to average net assets of Class I shares of Variable Growth, Variable Moderate Growth and Variable Conservative Growth and Class II shares of Variable Conservative Growth did not exceed 0.20% and 0.45%, respectively. These expense limitation arrangements cannot be terminated prior to December 31, 2021 without the Board of Trustees’ consent.
During the six months ended June 30, 2020, fees waived and/or reimbursed were as follows:
| | | | |
| Variable Growth | | $ | 547 | |
| Variable Moderate Growth | | | 20,670 | |
| Variable Conservative Growth | | | 567 | |
LMPFA is permitted to recapture amounts waived and/or reimbursed to a class during the same fiscal year if the class’ total annual operating expenses have fallen to a level below the expense limitation (“expense cap”) in effect at the time the fees were earned or the expenses incurred. In no case will LMPFA recapture any amount that would result, on any particular business day of the Portfolios, in the class’ total annual operating expenses exceeding the expense cap or any other lower limit then in effect.
In addition, the Portfolios indirectly pay management and/or administration fees to LMPFA and other wholly-owned subsidiaries of Legg Mason as shareholders in the Underlying Funds. These management and/or administration fees ranged from 0.40% to 0.75% of the average daily net assets of the Underlying Funds.
Legg Mason Investor Services, LLC (“LMIS”), a wholly-owned broker-dealer subsidiary of Legg Mason, serves as the Portfolios’ sole and exclusive distributor. As of July 31, 2020, LMIS is an indirect, wholly-owned broker-dealer subsidiary of Franklin Resources.
All officers and one Trustee of the Trust are employees of Legg Mason or its affiliates and do not receive compensation from the Trust.
3. Investments
During the six months ended June 30, 2020, the aggregate cost of purchases and proceeds from sales of investments (excluding short-term investments) were as follows:
| | | | | | | | |
| | | Purchases | | | Sales | |
| Variable Growth | | $ | 9,360,013 | | | $ | 15,630,000 | |
| Variable Moderate Growth | | | 3,862,130 | | | | 5,439,999 | |
| Variable Conservative Growth | | | 13,869,665 | | | | 17,545,215 | |
At June 30, 2020, the aggregate cost of investments and the aggregate gross unrealized appreciation and depreciation of investments for federal income tax purposes were substantially as follows:
| | | | | | | | | | | | | | | | |
| | | Variable Growth | |
| | | Cost | | | Gross
Unrealized
Appreciation | | | Gross
Unrealized
Depreciation | | | Net
Unrealized
Appreciation | |
| Securities | | $ | 73,323,980 | | | $ | 12,395,167 | | | $ | (2,504,742) | | | $ | 9,890,425 | |
| | | | | | | | | | | | | | | | |
| | | Variable Moderate Growth | |
| | | Cost | | | Gross
Unrealized
Appreciation | | | Gross
Unrealized
Depreciation | | | Net
Unrealized
Appreciation | |
| Securities | | $ | 26,097,089 | | | $ | 4,095,225 | | | $ | (600,106) | | | $ | 3,495,119 | |
| | |
| 22 | | QS Variable Asset Allocation Series 2020 Semi-Annual Report |
| | | | | | | | | | | | | | | | |
| | | Variable Conservative Growth | |
| | | Cost | | | Gross
Unrealized
Appreciation | | | Gross
Unrealized
Depreciation | | | Net
Unrealized
Appreciation | |
| Securities | | $ | 74,559,294 | | | $ | 10,342,755 | | | $ | (998,034) | | | $ | 9,344,721 | |
4. Derivative instruments and hedging activities
During the six months ended June 30, 2020, the Portfolios did not invest in derivative instruments.
5. Class specific expenses, waivers and/or expense reimbursements
Variable Conservative Growth has adopted a Rule 12b-1 shareholder services and distribution plan and under that plan the Portfolio pays service and/or distribution fees with respect to its Class II shares calculated at the annual rate of 0.25% of the average daily net assets of the class. Service and/or distribution fees are accrued daily and paid monthly.
For the six months ended June 30, 2020, class specific expenses were as follows:
| | | | | | | | |
| | | | | | Transfer Agent
Fees | |
| Variable Growth | | | | | | | | |
| Class I | | | | | | $ | 441 | |
| | |
| | | | | | Transfer Agent
Fees | |
| Variable Moderate Growth | | | | | | | | |
| Class I | | | | | | $ | 378 | |
| | |
| | | Service and/or
Distribution Fees | | | Transfer Agent
Fees | |
| Variable Conservative Growth | | | | | | | | |
| Class I | | | — | | | $ | 492 | |
| Class II | | $ | 13,094 | | | | 73 | |
| Total | | $ | 13,094 | | | $ | 565 | |
For the six months ended June 30, 2020, waivers and/or expense reimbursements by class were as follows:
| | | | |
| | | Waivers/Expense
Reimbursements | |
| Variable Growth | | | | |
| Class I | | $ | 547 | |
| |
| | | Waivers/Expense
Reimbursements | |
| Variable Moderate Growth | | | | |
| Class I | | $ | 20,670 | |
| |
| | | Waivers/Expense
Reimbursements | |
| Variable Conservative Growth | | | | |
| Class I | | $ | 495 | |
| Class II | | | 72 | |
| Total | | $ | 567 | |
| | |
| QS Variable Asset Allocation Series 2020 Semi-Annual Report | | 23 |
Notes to financial statements (unaudited) (cont’d)
|
| 6. Distributions to shareholders by class |
| | | | | | | | |
| | | Six Months Ended
June 30, 2020 | | | Year Ended
December 31, 2019 | |
| Variable Growth | | | | | | | | |
| Net Investment Income: | | | | | | | | |
| Class I | | $ | 125,001 | | | $ | 1,450,012 | |
| | |
| Net Realized Gains: | | | | | | | | |
| Class I | | $ | 2,761,415 | | | $ | 4,988,208 | |
| | | Six Months Ended
June 30, 2020 | | | Year Ended
December 31, 2019 | |
| Variable Moderate Growth | | | | | | | | |
| Net Investment Income: | | | | | | | | |
| Class I | | $ | 15,002 | | | $ | 540,002 | |
| | |
| Net Realized Gains: | | | | | | | | |
| Class I | | $ | 858,583 | | | $ | 1,241,179 | |
| | | Six Months Ended
June 30, 2020 | | | Year Ended
December 31, 2019 | |
| Variable Conservative Growth | | | | | | | | |
| Net Investment Income: | | | | | | | | |
| Class I | | $ | 34,747 | | | $ | 1,668,604 | |
| Class II | | | 5,255 | | | | 181,402 | |
| Total | | $ | 40,002 | | | $ | 1,850,006 | |
| | |
| Net Realized Gains: | | | | | | | | |
| Class I | | $ | 1,255,440 | | | $ | 1,778,536 | |
| Class II | | | 189,881 | | | | 162,801 | |
| Total | | $ | 1,445,321 | | | $ | 1,941,337 | |
7. Shares of beneficial interest
At June 30, 2020, the Trust had an unlimited number of shares of beneficial interest authorized with a par value of $0.00001 per share. The Portfolios have the ability to issue multiple classes of shares. Each class of shares represents an identical interest and has the same rights, except that each class bears certain direct expenses, including those specifically related to the distribution of its shares.
Transactions in shares of each class were as follows:
| | | | | | | | | | | | | | | | |
| | | Six Months Ended
June 30, 2020 | | | Year Ended
December 31, 2019 | |
| | | Shares | | | Amount | | | Shares | | | Amount | |
| Variable Growth | | | | | | | | | | | | | | | | |
| Class I | | | | | | | | | | | | | | | | |
| Shares sold | | | 19,856 | | | $ | 239,993 | | | | 22,021 | | | $ | 292,230 | |
| Shares issued on reinvestment | | | 232,963 | | | | 2,886,416 | | | | 481,350 | | | | 6,438,220 | |
| Shares repurchased | | | (541,263) | | | | (6,628,552) | | | | (1,272,013) | | | | (16,989,853) | |
| Net decrease | | | (288,444) | | | $ | (3,502,143) | | | | (768,642) | | | $ | (10,259,403) | |
| | |
| 24 | | QS Variable Asset Allocation Series 2020 Semi-Annual Report |
| | | | | | | | | | | | | | | | |
| | | Six Months Ended
June 30, 2020 | | | Year Ended
December 31, 2019 | |
| | | Shares | | | Amount | | | Shares | | | Amount | |
| Variable Moderate Growth | | | | | | | | | | | | | | | | |
| Class I | | | | | | | | | | | | | | | | |
| Shares sold | | | 24,067 | | | $ | 305,184 | | | | 33,678 | | | $ | 446,023 | |
| Shares issued on reinvestment | | | 68,895 | | | | 873,585 | | | | 132,744 | | | | 1,781,181 | |
| Shares repurchased | | | (155,299) | | | | (1,912,633) | | | | (362,320) | | | | (4,828,898) | |
| Net decrease | | | (62,337) | | | $ | (733,864) | | | | (195,898) | | | $ | (2,601,694) | |
| | |
| | | Six Months Ended
June 30, 2020 | | | Year Ended
December 31, 2019 | |
| | | Shares | | | Amount | | | Shares | | | Amount | |
| Variable Conservative Growth | | | | | | | | | | | | | | | | |
| Class I | | | | | | | | | | | | | | | | |
| Shares sold | | | 36,069 | | | $ | 501,634 | | | | 66,624 | | | $ | 960,006 | |
| Shares issued on reinvestment | | | 90,730 | | | | 1,290,187 | | | | 236,118 | | | | 3,447,140 | |
| Shares repurchased | | | (445,694) | | | | (6,139,922) | | | | (795,273) | | | | (11,435,782) | |
| Net decrease | | | (318,895) | | | $ | (4,348,101) | | | | (492,531) | | | $ | (7,028,636) | |
| Class II | | | | | | | | | | | | | | | | |
| Shares sold | | | 199,725 | | | $ | 2,804,482 | | | | 346,872 | | | $ | 4,965,177 | |
| Shares issued on reinvestment | | | 13,781 | | | | 195,136 | | | | 23,611 | | | | 344,203 | |
| Shares repurchased | | | (104,522) | | | | (1,430,140) | | | | (78,346) | | | | (1,124,074) | |
| Net increase | | | 108,984 | | | $ | 1,569,478 | | | | 292,137 | | | $ | 4,185,306 | |
8. Transactions with affiliated companies
As defined by the 1940 Act, an affiliated company is one in which the Portfolios own 5% or more of the outstanding voting securities, or a company which is under common ownership or control. Legg Mason, through subadvisory agreements with its wholly owned subsidiaries, also provides investment management services to certain of the Underlying Funds held by the Portfolios. Based on the Portfolios’ relative ownership, the following Underlying Funds were considered affiliated companies for all or some portion of the six months ended June 30, 2020. The following transactions were effected in shares of such Underlying Funds for the six months ended June 30, 2020.
| | | | | | | | | | | | | | | | | | | | | | | | | | | | | | | | | | | | |
| | | Affiliate
Value at
December 31,
2019 | | | Purchased | | | Sold | | | Realized
Gain (Loss)
from Sale
of Affiliated
Underlying
Funds | | | Income
Distributions
from
Affiliated
Underlying
Funds | | | Net Increase
(Decrease) in
Unrealized
Appreciation
(Depreciation) | | | Affiliate
Value at
June 30,
2020 | |
| Variable Growth | | Cost | | | Shares | | | Cost | | | Shares | |
| BrandywineGLOBAL — Diversified US Large Cap Value Fund, Class IS Shares | | $ | 6,328,152 | | | $ | 235,000 | | | | 14,086 | | | $ | 403,676 | | | | 22,366 | | | $ | (73,676) | | | | — | | | $ | (1,043,915) | | | $ | 5,115,561 | |
| BrandywineGLOBAL — Dynamic US Large Cap Value Fund, Class IS Shares | | | 21,812,871 | | | | 410,000 | | | | 37,305 | | | | 2,507,980 | | | | 229,161 | | | | 12,020 | | | | — | | | | (2,647,807) | | | | 17,067,084 | |
| QS International Equity Fund, Class IS Shares | | | 19,909,003 | | | | 1,345,000 | | | | 83,659 | | | | 3,117,759 | | | | 193,280 | | | | (507,759) | | | | — | | | | (2,417,096) | | | | 15,719,148 | |
| QS U.S. Small Capitalization Equity Fund, Class IS Shares | | | 16,426,125 | | | | 1,541,307 | | | | 176,649 | | | | 3,395,704 | | | | 250,468 | | | | (895,704) | | | $ | 71,307 | | | | (1,618,307) | | | | 12,953,421 | |
| ClearBridge Appreciation Fund, Class IS Shares | | | 8,200,353 | | | | — | | | | — | | | | 697,031 | | | | 46,474 | | | | 442,969 | | | | — | | | | (913,590) | | | | 6,589,732 | |
| ClearBridge Large Cap Growth Fund, Class IS Shares | | | 9,847,566 | | | | — | | | | — | | | | 1,923,599 | | | | 45,283 | | | | 501,401 | | | | — | | | | (30,995) | | | | 7,892,972 | |
| ClearBridge Small Cap Growth Fund, Class IS Shares | | | 4,580,558 | | | | 140,000 | | | | 4,509 | | | | 1,053,408 | | | | 29,753 | | | | 46,592 | | | | — | | | | 178,286 | | | | 3,845,436 | |
| Western Asset Core Bond Fund, Class IS Shares | | | 4,274,209 | | | | 2,266,755 | | | | 171,331 | | | | 1,213,736 | | | | 92,482 | | | | 6,264 | | | | 57,129 | | | | 194,090 | | | | 5,521,318 | |
| Western Asset Intermediate Bond Fund, Class IS Shares | | | 6,416,481 | | | | 3,421,951 | | | | 304,229 | | | | 1,784,664 | | | | 159,173 | | | | 336 | | | | 82,427 | | | | 226,350 | | | | 8,280,118 | |
| | | $ | 97,795,318 | | | $ | 9,360,013 | | | | | | | $ | 16,097,557 | | | | | | | $ | (467,557) | | | $ | 210,863 | | | $ | (8,072,984) | | | $ | 82,984,790 | |
| | |
| QS Variable Asset Allocation Series 2020 Semi-Annual Report | | 25 |
Notes to financial statements (unaudited) (cont’d)
| | | | | | | | | | | | | | | | | | | | | | | | | | | | | | | | | | | | |
| | | Affiliate
Value at
December 31,
2019 | | | Purchased | | | Sold | | | Realized
Gain (Loss)
from Sale
of Affiliated
Underlying
Funds | | | Income
Distributions
from
Affiliated
Underlying
Funds | | | Net Increase
(Decrease) in
Unrealized
Appreciation
(Depreciation) | | | Affiliate
Value at
June 30,
2020 | |
Variable Moderate
Growth | | Cost | | | Shares | | | Cost | | | Shares | |
| BrandywineGLOBAL — Diversified US Large Cap Value Fund, Class IS Shares | | $ | 1,434,561 | | | $ | 95,000 | | | | 5,848 | | | $ | 141,206 | | | | 7,627 | | | $ | (16,205) | | | | — | | | $ | (227,114) | | | $ | 1,161,241 | |
| BrandywineGLOBAL — Dynamic US Large Cap Value Fund, Class IS Shares | | | 6,266,202 | | | | 310,000 | | | | 29,607 | | | | 776,404 | | | | 69,552 | | | | (6,404) | | | | — | | | | (731,877) | | | | 5,067,921 | |
| QS International Equity Fund, Class IS Shares | | | 5,056,070 | | | | 615,000 | | | | 40,355 | | | | 968,905 | | | | 60,050 | | | | (183,905) | | | | — | | | | (595,236) | | | | 4,106,929 | |
| QS U.S. Small Capitalization Equity Fund, Class IS Shares | | | 4,277,656 | | | | 549,326 | | | | 61,885 | | | | 880,290 | | | | 64,959 | | | | (245,290) | | | $ | 19,326 | | | | (409,146) | | | | 3,537,546 | |
| ClearBridge Appreciation Fund, Class IS Shares | | | 3,660,355 | | | | 75,000 | | | | 2,971 | | | | 393,622 | | | | 21,212 | | | | 131,377 | | | | — | | | | (338,548) | | | | 3,003,185 | |
| ClearBridge Large Cap Growth Fund, Class IS Shares | | | 2,900,423 | | | | — | | | | — | | | | 483,620 | | | | 11,991 | | | | 166,380 | | | | — | | | | (13,251) | | | | 2,403,552 | |
| ClearBridge Small Cap Growth Fund, Class IS Shares | | | 1,103,417 | | | | 55,000 | | | | 1,767 | | | | 253,707 | | | | 6,994 | | | | 6,293 | | | | — | | | | 56,232 | | | | 960,942 | |
| Western Asset Core Bond Fund, Class IS Shares | | | 3,383,316 | | | | 862,003 | | | | 65,128 | | | | 678,830 | | | | 52,126 | | | | 11,169 | | | | 42,296 | | | | 133,481 | | | | 3,699,970 | |
| Western Asset Intermediate Bond Fund, Class IS Shares | | | 5,086,336 | | | | 1,300,801 | | | | 115,636 | | | | 992,663 | | | | 88,917 | | | | 7,337 | | | | 61,174 | | | | 154,096 | | | | 5,548,570 | |
| | | $ | 33,168,336 | | | $ | 3,862,130 | | | | | | | $ | 5,569,247 | | | | | | | $ | (129,248) | | | $ | 122,796 | | | $ | (1,971,363) | | | $ | 29,489,856 | |
| | | | | | | |
| | | Affiliate
Value at
December 31,
2019 | | | Purchased | | | Sold | | | Realized
Gain (Loss)
from Sale
of Affiliated
Underlying
Funds | | | Income
Distributions
from
Affiliated
Underlying
Funds | | | Net Increase
(Decrease) in
Unrealized
Appreciation
(Depreciation) | | | Affiliate
Value at
June 30,
2020 | |
Variable
Conservative
Growth | | Cost | | | Shares | | | Cost | | | Shares | |
| BrandywineGLOBAL — Dynamic US Large Cap Value Fund, Class IS Shares | | $ | 12,636,250 | | | $ | 1,162,175 | | | | 109,850 | | | $ | 2,216,774 | | | | 199,723 | | | $ | (16,774) | | | | — | | | $ | (1,463,226) | | | $ | 10,118,425 | |
| QS International Equity Fund, Class IS Shares | | | 9,237,419 | | | | 2,200,728 | | | | 146,830 | | | | 3,079,024 | | | | 190,480 | | | | (564,024) | | | | — | | | | (963,953) | | | | 7,395,170 | |
| QS U.S. Small Capitalization Equity Fund, Class IS Shares | | | 9,860,008 | | | | 1,796,856 | | | | 195,247 | | | | 2,909,503 | | | | 214,882 | | | | (779,503) | | | $ | 44,716 | | | | (720,941) | | | | 8,026,420 | |
| ClearBridge Appreciation Fund, Class IS Shares | | | 9,462,241 | | | | 355,000 | | | | 14,065 | | | | 1,505,338 | | | | 63,149 | | | | 74,662 | | | | — | | | | (596,096) | | | | 7,715,807 | |
| ClearBridge Large Cap Growth Fund, Class IS Shares | | | 6,121,126 | | | | 125,000 | | | | 2,313 | | | | 1,218,103 | | | | 29,167 | | | | 391,876 | | | | — | | | | (46,171) | | | | 4,981,852 | |
| ClearBridge Small Cap Growth Fund, Class IS Shares | | | 2,300,141 | | | | 180,093 | | | | 5,681 | | | | 623,590 | | | | 17,575 | | | | 46,410 | | | | — | | | | 106,079 | | | | 1,962,723 | |
| Western Asset Core Bond Fund, Class IS Shares | | | 16,350,137 | | | | 3,197,163 | | | | 241,312 | | | | 2,732,596 | | | | 210,501 | | | | 54,202 | | | | 203,576 | | | | 631,135 | | | | 17,445,839 | |
| Western Asset Intermediate Bond Fund, Class IS Shares | | | 24,559,490 | | | | 4,852,650 | | | | 430,863 | | | | 4,016,530 | | | | 360,285 | | | | 36,908 | | | | 294,450 | | | | 723,748 | | | | 26,119,358 | |
| | | $ | 90,526,812 | | | $ | 13,869,665 | | | | | | | $ | 18,301,458 | | | | | | | $ | (756,243) | | | $ | 542,742 | | | $ | (2,329,425) | | | $ | 83,765,594 | |
9. Other matters
The outbreak of the respiratory illness COVID-19 (commonly referred to as “coronavirus”) has continued to rapidly spread around the world, causing considerable uncertainty for the global economy and financial markets. The ultimate economic fallout from the pandemic, and the long-term impact on economies, markets, industries and individual issuers, are not known. The COVID-19 pandemic could adversely affect the value and liquidity of the Portfolios’ investments, impair the Portfolios’ ability to satisfy redemption requests, and negatively impact the Portfolios’ performance. In addition, the outbreak of COVID-19, and measures taken to mitigate its effects, could result in disruptions to the services provided to the Portfolio by its service providers.
| | |
| 26 | | QS Variable Asset Allocation Series 2020 Semi-Annual Report |
Board approval of new management and
new subadvisory agreements (unaudited)
Legg Mason Partners Variable Equity Trust
— QS Variable Growth
At a meeting of the Trust’s Board of Trustees held on April 7, 2020, the Board, including a majority of the Trustees who are not “interested persons” (as defined in the Investment Company Act of 1940, as amended (the “Independent Trustees”)) of the Trust, approved new management and investment advisory agreements for QS Variable Growth Portfolio (the “Fund”) to take effect, subject to shareholder approval, upon the sale of Legg Mason, Inc. to Franklin Resources, Inc., a global investment management organization operating as Franklin Templeton.1 The agreements were a new management agreement pursuant to which Legg Mason Partners Fund Advisor, LLC (the “Manager”) provides the Fund with investment advisory and administrative services, a new sub-advisory agreement pursuant to which QS Investors, LLC (“QS Investors ”) provides day-to-day management of the Fund’s portfolio, and a new sub-advisory agreement pursuant to which Western Asset Management Company, LLC (“Western Asset” and, together with QS Investors, the “Subadvisers”) provides day-to-day management of the Fund’s cash and short-term instruments allocated to it by the Manager. (The new management agreement and new sub-advisory agreements are collectively referred to as the “New Agreements.”) The current management agreement and current sub-advisory agreements are collectively referred to as the “Current Agreements.” The New Agreements are identical to the Current Agreements, except for the dates of execution, effectiveness and termination. The Board considered that the Current Agreements are the product of multiple years of review and negotiation and information received and considered by the Board in the exercise of its business judgment during those years, including as recently as at a meeting of the Trust’s Board of Trustees held in November 2019.
The sale of Legg Mason, Inc. to Franklin Resources, Inc. (referred to herein as the “Transaction”) was consummated on July 31, 2020. The Manager and the Subadvisers, each a wholly-owned subsidiary of Legg Mason, Inc., became subsidiaries of Franklin Templeton. The sale resulted in what is commonly called a “change of control” of Legg Mason and caused the Current Agreements to terminate in accordance with applicable law.
The Board also approved an interim management agreement with the Manager and interim sub-advisory agreements between the Manager and the Subadvisers that would have taken effect in the event shareholders had not approved the New Agreements before the Transaction was completed to allow the Manager and the Subadvisers to continue providing services to the Fund while shareholder approval of the New Agreements continued to be sought. (The interim management agreement and interim sub-advisory agreements are collectively referred to as the “Interim Agreements.”) The terms of the Interim Agreements are identical to those of the Current Agreements, except for the term and certain escrow provisions. At a meeting held on July 14, 2020, shareholders of the Fund approved the New Agreements.
At a telephonic meeting of the Trust’s Board of Trustees held on March 9, 2020, the Trustees discussed with Legg Mason management and certain Franklin Templeton representatives the Transaction and Franklin Templeton’s plans and intentions regarding the Legg Mason funds and Legg Mason’s asset management business, including the preservation and continued investment autonomy of the investment advisory businesses conducted by the Subadvisers and the combination of Legg Mason’s and Franklin Templeton’s distribution resources.
At the March and April meetings, the Independent Trustees considered, among other things, the anticipated impact of the Transaction on the Fund and its shareholders. To assist the Independent Trustees in their consideration of the New Agreements, Franklin Templeton provided materials and information about Franklin Templeton, including its financial condition and asset management capabilities and organization, Legg Mason provided materials and information about Legg Mason, including performance and expense comparison data and profitability information with respect to the Fund and the Legg Mason fund complex as a whole, and Franklin Templeton and Legg Mason provided materials and information about the proposed Transaction. The Independent Trustees were assisted in their review by Fund counsel and independent legal counsel and met with independent legal counsel in executive sessions separate from representatives of Franklin Templeton, Legg Mason, the Manager and the Subadvisers. The Independent Trustees requested and received information from Legg Mason and Franklin Templeton they deemed reasonably necessary for their review of the New Agreements. Included was information about the Transaction, distribution arrangements, Franklin Templeton’s business plan and other anticipated impacts of the Transaction on the Fund and its shareholders. This information was initially reviewed by a special committee
| 1 | The meeting was held telephonically in reliance on an exemptive order issued by the Securities and Exchange Commission on March 25, 2020. Reliance on the exemptive order was necessary and appropriate due to circumstances related to the effects of COVID-19. All Trustees participating in the telephonic meeting were able to hear each other simultaneously during the meeting. Reliance on the exemptive order requires Trustees, including a majority of the Independent Trustees, to ratify actions taken pursuant to the exemptive order by vote cast at the next in-person meeting. |
| | |
| QS Variable Asset Allocation Series | | 27 |
Board approval of new management and
new subadvisory agreements (unaudited) (cont’d)
of the Independent Trustees and then by the full Board. Following their review of this information, the Independent Trustees requested additional information from Franklin Templeton and Legg Mason. Franklin Templeton and Legg Mason provided further information in response to these requests, which the Board reviewed. Senior management representatives from Franklin Templeton and Legg Mason participated in portions of the meetings and addressed various questions raised by the Independent Trustees.
In voting to approve the New Agreements, the Independent Trustees considered whether the approval of the New Agreements would be in the best interests of the Fund and its shareholders. The Trustees’ evaluation of the New Agreements reflected the information provided specifically in connection with its review of the New Agreements, as well as, where relevant, information that was previously furnished to the Board in connection with the most recent renewal of the Current Agreements at in-person meetings held in November 2019 and at other prior Board meetings.
Among other things, the Trustees considered:
| (i) | the reputation, experience, financial strength and resources of Franklin Templeton and its investment advisory subsidiaries; |
| (ii) | that Franklin Templeton informed the Board that it intends to maintain the investment autonomy of the Legg Mason investment advisory subsidiaries; |
| (iii) | that Franklin Templeton and Legg Mason informed the Board that, following the Transaction, there is not expected to be any diminution in the nature, quality and extent of services provided to the Fund and its shareholders by the Manager and Subadvisers, including compliance and other non-advisory services, and represented that there are not expected to be any changes in the portfolio management personnel managing the Fund as a result of the Transaction; |
| (iv) | that Franklin Templeton and Legg Mason informed the Board regarding initial transition plans and that they are instituting long-term retention arrangements for key personnel; |
| (v) | that Franklin Templeton informed the Board that there are not expected to be any changes to the brokerage practices and standards applied by the Subadvisers in seeking best execution; |
| (vi) | that there are not expected to be any changes to the Fund’s custodian or other service providers as a result of the Transaction; |
| (vii) | that Franklin Templeton informed the Board that it has no present intention to alter currently effective expense waivers and reimbursement arrangements after their expiration, and, while it reserves the right to do so in the future, it would consult with the Board before making any changes; |
| (viii) | that Franklin Templeton does not expect to propose any changes to the investment objective of the Fund or any changes to the principal investment strategies of Fund as a result of the Transaction; |
| (ix) | the potential benefits to Fund shareholders from being part of a combined fund family with Franklin Templeton-sponsored funds and access to a broader array of investment opportunities; |
| (x) | that Franklin Templeton’s distribution capabilities, particularly with respect to retail investors, and significant network of intermediary relationships may provide additional opportunities for the Fund to grow assets and lower expenses by spreading expenses over a larger asset base; |
| (xi) | that Franklin Templeton and Legg Mason will each derive direct and ancillary benefits from the Transaction and that, as a result, they have a financial interest in the matters that were being considered; |
| (xii) | the fact that the Fund’s contractual management fee rate will remain the same and will not increase by virtue of the New Agreements; |
| (xiii) | the terms and conditions of the New Agreements, including that each New Agreement is identical to its corresponding Current Agreement except for their respective dates of execution, effectiveness and termination; |
| (xiv) | the support expressed by the current senior management team at Legg Mason for the Transaction and Legg Mason’s recommendation that the Board approve the New Agreements; |
| | |
| 28 | | QS Variable Asset Allocation Series |
| (xv) | that the Current Agreements are the product of multiple years of review and negotiation and information received and considered by the Board in the exercise of its business judgment during those years. At the November 2019 meeting, the Board conducted a full review of the investment advisory and distribution arrangements for the Fund and approved the Current Agreements in accordance with the provisions of the Investment Company Act of 1940, as amended. Without any one factor being dispositive, in approving the Current Agreements, the Board determined, in the exercise of the Trustees’ business judgment, that: (a) overall, the Board was satisfied with the nature, extent and quality of services provided (and expected to be provided) under the respective Current Agreement by the Manager and Subadvisers and their affiliates; (b) the overall performance of the Fund was satisfactory and that management was committed to providing the resources necessary to assist the Fund’s portfolio managers; (c) the Fund’s management fees and cost structure are reasonable in light of the comparative performance and expense information and in relation to the services provided; (d) in light of the costs of providing investment management and other services to the Fund and the Manager’s and Subadvisers’ ongoing commitment to the Fund, the profits that Legg Mason and its affiliates received were considered to be not excessive; (e) the benefits of any economies of scale would be appropriately shared with shareholders through increased investment in fund management and administration resources; and (f) the ancillary benefits that the Manager and Subadvisers and their affiliates received were considered reasonable; |
| (xvi) | that the Current Agreements were considered and approved as recently as November 2019; |
| (xvii) | that the Fund will not bear the costs of obtaining shareholder approval of the New Agreements, including proxy solicitation costs, legal fees and the costs of printing and mailing the proxy statement, regardless of whether the Transaction is consummated; and |
| (xviii) | that under the definitive agreement between Legg Mason and Franklin Templeton (the “Transaction Agreement”), Franklin Templeton has acknowledged that Legg Mason had entered into the Transaction Agreement in reliance upon the benefits and protections provided by Section 15(f) of the Investment Company Act of 1940, as amended, and that, in furtherance of the foregoing, Franklin Templeton agreed to use reasonable best efforts to conduct its business so that (a) for a period of not less than three years after the closing of the Transaction no more than 25% of the members of the Board shall be “interested persons” (as defined in the Investment Company Act of 1940, as amended) of any investment adviser for the Fund, and (b) for a period of not less than two years after the closing, neither Franklin Templeton nor any of its affiliates shall impose an “unfair burden” (within the meaning of the Investment Company Act of 1940, as amended, including any interpretations or no-action letters of the Securities and Exchange Commission) on any Fund as a result of the transactions contemplated by the Transaction Agreement or any express or implied terms, conditions or understandings applicable thereto. |
Certain of these considerations are discussed in more detail below.
In connection with the most recent approval or continuation of each Current Agreement, and in connection with their review of each New Agreement, the Trustees did not identify any particular factor that was all-important or controlling, and each Trustee may have attributed different weights to the various factors.
The discussion below covers both the advisory and the administrative functions rendered by the Manager for the Fund, both of which functions are encompassed by the New Management Agreement for the Fund, as well as the advisory functions rendered by the Subadvisers pursuant to the New Sub-advisory Agreements for the Fund. The Independent Trustees considered the New Management Agreement and the New Sub-advisory Agreements separately in the course of their review. In doing so, they considered the respective roles of the Manager and the Subadvisers in providing services to the Fund.
The Independent Trustees were advised by separate independent legal counsel throughout the process. Prior to voting, the Independent Trustees received a memorandum from their independent legal counsel discussing the legal standards for their consideration of the New Agreements for the Fund. The Independent Trustees discussed the Transaction and the proposed approval of the New Agreements for the Fund on multiple occasions with their independent legal counsel in private sessions at which no representatives of Franklin Templeton, Legg Mason, or the Manager or Subadvisers for the Fund were present.
| | |
| QS Variable Asset Allocation Series | | 29 |
Board approval of new management and
new subadvisory agreements (unaudited) (cont’d)
Nature, Extent and Quality of the Services to be provided to the Fund under the New Management Agreement and New Sub-Advisory Agreements
The Board received and considered information regarding the nature, extent and quality of services provided to the Fund by the Manager and the Subadvisers under the Current Agreements. In evaluating the nature, extent and quality of the services expected to be provided to the Fund by the Manager and the Subadvisers under the New Management Agreement and New Sub-advisory Agreements, respectively, the Trustees considered, among other things, the expected impact, if any, of the Transaction on the operations, facilities, organization and personnel of the Manager and the Subadvisers, and that Franklin Templeton and Legg Mason have advised the Board that, following the Transaction, there is not expected to be any diminution in the nature, extent and quality of services provided to the Fund and its shareholders by the Manager and the Subadvisers, including compliance and other non-advisory services, and that there are not expected to be any changes in portfolio management personnel as a result of the Transaction. The Board considered information Franklin Templeton and Legg Mason provided regarding initial transition plans and the institution of long-term retention arrangements for key personnel. The Board considered that Franklin Templeton informed the Boards that there are not expected to be any changes to the brokerage practices and standards applied by the Subadvisers in seeking best execution. The Board also considered the reputation, experience, financial strength and resources of Franklin Templeton and its investment advisory subsidiaries, its business and operating structure, scale of operation, distribution capabilities, and leadership, as well as the combined financial resources of Legg Mason, Inc. and Franklin Templeton and the benefits to the Fund of being part of a larger combined organization with greater financial resources following the Transaction, particularly during periods of market disruptions and volatility.
The Board’s evaluation of the services provided by the Manager and the Subadvisers took into account the Board’s knowledge and familiarity gained as Trustees of funds in the Legg Mason fund complex, including the scope and quality of the investment management and other capabilities of the Manager and the Subadvisers and the quality of the Manager’s administrative and other services rendered to the Fund and its shareholders by the Manager. The Board observed that the scope of services provided by the Manager and the Subadvisers, and the undertakings required of the Manager and Subadvisers in connection with those services, including maintaining and monitoring their own and the Fund’s compliance programs, liquidity management programs and cybersecurity programs, had expanded over time as a result of regulatory, market and other developments. The Board received and reviewed on a regular basis information from the Manager and the Subadvisers regarding the Fund’s compliance policies and procedures established pursuant to Rule 38a-1 under the Investment Company Act of 1940, as amended, and took that information into account in its evaluation of the New Agreements. The Board also considered the risks associated with the Fund borne by the Manager and its affiliates (such as entrepreneurial, operational, reputational, litigation and regulatory risk), as well as the risk management processes of the Manager and Subadvisers.
The Board reviewed the qualifications, backgrounds and responsibilities of the Fund’s senior personnel and the portfolio management team primarily responsible for the day-to-day portfolio management of the Fund. The Board also considered the policies and practices of the Manager and the Subadvisers regarding the selection of brokers and dealers and the execution of portfolio transactions for the Fund (including policies and practices regarding soft dollars and brokerage allocation), and Franklin Templeton’s representations that the brokerage practices and standards applied by the Manager and Subadvisers in seeking best execution will continue.
Fund Performance
The Board received and reviewed performance information for the Fund and for all mixed-asset target allocation aggressive growth funds (i.e., funds that maintain at least 80% of assets in equity securities, with the remainder invested in bonds, cash and cash equivalents) underlying variable insurance products (the “Performance Universe”) selected by Broadridge Financial Solutions Inc. (“Broadridge”), an independent provider of investment company data based on classifications provided by Thomson Reuters Lipper. The Board was provided with a description of the methodology Broadridge used to determine the similarity of the Fund with the funds included in the Performance Universe. It was noted that, while the Board has found the Broadridge data generally useful, the Trustees recognized the limitations of such data, including that the data may vary depending on the end date selected and that the results of the performance comparisons may vary depending on the selection of the peer group and its composition over time. The Trustees noted that they also had received and discussed with management at periodic intervals information on the investment performance of the Fund in comparison to similar mutual funds and benchmark performance indices. In addition, the Board considered the Fund’s performance in light of overall financial market conditions.
| | |
| 30 | | QS Variable Asset Allocation Series |
The information comparing the Fund’s performance to that of the Performance Universe was for the one-, three-, five- and ten-year periods ended December 31, 2019. The Fund’s Class I shares performed below the median performance of the funds in the Performance Universe for the one-year period, performed slightly below the median performance of the funds in the Performance Universe for the three-year period, performed at the median performance of the funds in the Performance Universe for the five-year period, and performed better than the median performance of the funds in the Performance Universe for the ten-year period. The Board also reviewed performance information provided by the Manager for periods ended February 29, 2020 and March 31, 2020. The Board also reviewed information prepared by Broadridge comparing the Fund’s annualized total return for the three-year period ended December 31, 2019 in relation to the Fund’s standard deviation to that of the funds in the Performance Universe.
* * * * * *
Based on their review of the materials provided and the assurances they had received from Franklin Templeton and Legg Mason, Inc., the Trustees determined that the Transaction was not expected to affect adversely the nature, extent and quality of services provided by the Manager and the Subadvisers and that the Transaction was not expected to have an adverse effect on the ability of the Manager and the Subadvisers to provide those services, and the Board concluded that, overall, the nature, extent and quality of services, including portfolio management, expected to be provided under the New Agreements for the Fund were sufficient and supported a decision to approve each New Agreement.
Management Fees and Expense Ratios
The Board considered that it had reviewed the Fund’s total expense ratio in connection with the November 2019 contract renewal meeting. The Board noted that the Fund bears indirectly its pro rata share of the expenses of the underlying funds in which it invests, including management fees payable by such underlying funds to the Manager or its affiliates. The Board noted that there is no management fee payable by the Fund to the Manager or sub-investment advisory fees payable by the Fund to the Sub-Advisers. The Board noted that the New Agreements do not impose a management fee, and that there is no present intention to alter expense waiver and reimbursement arrangements that are currently in effect.
The Board also reviewed information regarding the scope of services provided to the Fund by the Manager and its affiliates, noting that the Fund is provided with regulatory compliance and administrative services, office facilities and Fund officers (including the Fund’s chief financial, chief legal and chief compliance officers), and that the Manager coordinates and oversees the provision of services to the Fund by other fund service providers, including the Subadvisers.
The Board received an analysis of complex-wide management fees provided by the Manager, which, among other things, set out a framework of fees based on asset classes.
Additionally, the Board received and considered information comparing the Fund’s overall expense ratio with those of a group of eight mixed-asset target allocation aggressive growth affiliated funds of funds underlying variable insurance products selected by Broadridge as comparable to the Fund (the “Expense Group”), and a broader group of funds selected by Broadridge consisting of all mixed-asset target allocation aggressive growth affiliated funds of funds underlying variable insurance products (the “Expense Universe”). It was noted that while the Board found the Broadridge data generally useful they recognized its limitations, including that the data may vary depending on the selection of the peer group. This information showed that the Fund’s total expense ratio was lower than the median of the total expense ratios of the funds in the Expense Group, before and after including underlying fund expenses, and the funds in the Expense Universe, after including underlying fund expenses.
In evaluating the costs of the services to be provided by the Manager and the Subadvisers under the New Agreements, the Trustees considered, among other things, whether expenses would change as a result of the Transaction. Based on their review of the materials provided and the assurances they had received from Franklin Templeton and Legg Mason, the Trustees determined that the Transaction would not materially change the expenses borne by the Fund.
| | |
| QS Variable Asset Allocation Series | | 31 |
Board approval of new management and
new subadvisory agreements (unaudited) (cont’d)
Manager Profitability and Economies of Scale
The Board received and considered a profitability analysis of the Manager and its affiliates in providing services to the Fund. The Board also received profitability information with respect to the Legg Mason fund complex as a whole. In addition, the Board received information with respect to the Manager’s allocation methodologies used in preparing this profitability data. It was noted that the allocation methodologies had been previously reviewed by an outside consultant. The profitability of the Manager and its affiliates was considered by the Board not excessive in light of the nature, extent and quality of the services provided to the Fund.
The Board also received and considered information regarding whether there have been economies of scale with respect to the management of the Fund as the Fund’s assets grow. The Board noted that to the extent the Fund’s assets increase over time, the Fund and its shareholders should realize economies of scale or efficiencies as certain expenses, such as fixed fund fees, become a smaller percentage of overall assets. The Board noted that it appeared that the benefits of any economies of scale also would be appropriately shared with shareholders through increased investment in fund management and administration resources (e.g., enhanced cyber security oversight, enhanced risk management oversight, etc.).
The Trustees noted that Franklin Templeton and Legg Mason expected to realize cost savings from the Transaction based on synergies of operations, as well as to benefit from possible growth of the funds in the Legg Mason fund complex resulting from enhanced distribution capabilities. However, they noted that other factors could also affect profitability and potential economies of scale, and that it was not possible to predict with any degree of certainty how the Transaction would affect the profitability of the Manager and its affiliates in providing services to the Fund, nor to quantify any possible future economies of scale. The Trustees noted they will have the opportunity to periodically re-examine such profitability and any economies of scale going forward.
* * * * * *
Taking all of the above into consideration, the Board determined that the Fund’s expense ratio was reasonable in light of the comparative performance and expense information and the nature, extent and quality of the services expected to be provided to the Fund under the New Agreements after the Transaction.
Other Benefits to the Manager
The Board considered other benefits received by the Manager and its affiliates, including the Subadvisers, as a result of their relationship with the Fund, including the opportunity to offer additional products and services to Fund shareholders. In light of the costs of providing investment management and other services to the Fund and the ongoing commitment of the Manager and the Subadvisers to the Fund, the Board considered that the ancillary benefits that the Manager, the Subadvisers and their affiliates receive were reasonable. In evaluating the fall-out benefits to be received by the Manager and the Subadvisers under the New Agreements, the Trustees considered whether the Transaction would have an impact on the fall-out benefits received by virtue of the Current Agreements.
The Board also considered that Franklin Templeton may derive reputational and other benefits from its ability to use the Legg Mason investment affiliates’ names in connection with operating and marketing the Fund. The Board also considered that the Transaction, if completed, would significantly increase Franklin Templeton’s assets under management and expand Franklin Templeton’s investment capabilities. Such ancillary benefits were considered reasonable.
* * * * * *
After consideration of the factors described above as well as other factors, and in the exercise of their business judgment, the Trustees, including the Independent Trustees, concluded that entering into the New Agreements for the Fund was in the best interests of the Fund’s shareholders, and they voted to approve the New Agreements and to recommend that shareholders approve the New Agreements.
| | |
| 32 | | QS Variable Asset Allocation Series |
Legg Mason Partners Variable Equity Trust
— QS Variable Moderate Growth
At a meeting of the Trust’s Board of Trustees held on April 7, 2020, the Board, including a majority of the Trustees who are not “interested persons” (as defined in the Investment Company Act of 1940, as amended (the “Independent Trustees”)) of the Trust, approved new management and investment advisory agreements for QS Variable Moderate Growth Portfolio (the “Fund”) to take effect, subject to shareholder approval, upon the sale of Legg Mason, Inc. to Franklin Resources, Inc., a global investment management organization operating as Franklin Templeton.1 The agreements were a new management agreement pursuant to which Legg Mason Partners Fund Advisor, LLC (the “Manager”) provides the Fund with investment advisory and administrative services, a new sub-advisory agreement pursuant to which QS Investors, LLC (“QS Investors ”) provides day-to-day management of the Fund’s portfolio, and a new sub-advisory agreement pursuant to which Western Asset Management Company, LLC (“Western Asset” and, together with QS Investors, the “Subadvisers”) provides day-to-day management of the Fund’s cash and short-term instruments allocated to it by the Manager. (The new management agreement and new sub-advisory agreements are collectively referred to as the “New Agreements.”) The current management agreement and current sub-advisory agreements are collectively referred to as the “Current Agreements.” The New Agreements are identical to the Current Agreements, except for the dates of execution, effectiveness and termination. The Board considered that the Current Agreements are the product of multiple years of review and negotiation and information received and considered by the Board in the exercise of its business judgment during those years, including as recently as at a meeting of the Trust’s Board of Trustees held in November 2019.
The sale of Legg Mason, Inc. to Franklin Resources, Inc. (referred to herein as the “Transaction”) was consummated on July 31, 2020. The Manager and the Subadvisers, each a wholly-owned subsidiary of Legg Mason, Inc., became subsidiaries of Franklin Templeton. The sale resulted in what is commonly called a “change of control” of Legg Mason and caused the Current Agreements to terminate in accordance with applicable law.
The Board also approved an interim management agreement with the Manager and interim sub-advisory agreements between the Manager and the Subadvisers that would have taken effect in the event shareholders did not approve the New Agreements before the Transaction was completed to allow the Manager and the Subadvisers to continue providing services to the Fund while shareholder approval of the New Agreements continued to be sought. (The interim management agreement and interim sub-advisory agreements are collectively referred to as the “Interim Agreements.”) The terms of the Interim Agreements are identical to those of the Current Agreements, except for the term and certain escrow provisions. At a meeting held on July 14, 2020, shareholders of the Fund approved the New Agreements.
At a telephonic meeting of the Trust’s Board of Trustees held on March 9, 2020, the Trustees discussed with Legg Mason management and certain Franklin Templeton representatives the Transaction and Franklin Templeton’s plans and intentions regarding the Legg Mason funds and Legg Mason’s asset management business, including the preservation and continued investment autonomy of the investment advisory businesses conducted by the Subadvisers and the combination of Legg Mason’s and Franklin Templeton’s distribution resources.
At the March and April meetings, the Independent Trustees considered, among other things, the anticipated impact of the Transaction on the Fund and its shareholders. To assist the Independent Trustees in their consideration of the New Agreements, Franklin Templeton provided materials and information about Franklin Templeton, including its financial condition and asset management capabilities and organization, Legg Mason provided materials and information about Legg Mason, including performance and expense comparison data and profitability information with respect to the Fund and the Legg Mason fund complex as a whole, and Franklin Templeton and Legg Mason provided materials and information about the proposed Transaction. The Independent Trustees were assisted in their review by Fund counsel and independent legal counsel and met with independent legal counsel in executive sessions separate from representatives of Franklin Templeton, Legg Mason, the Manager and the Subadvisers. The Independent Trustees requested and received information from Legg Mason and Franklin Templeton they deemed reasonably necessary for their review of the New Agreements. Included was information about the Transaction, distribution arrangements, Franklin Templeton’s business plan and other anticipated impacts of the Transaction on the Fund and its shareholders. This information was initially reviewed by a special committee
| 1 | The meeting was held telephonically in reliance on an exemptive order issued by the Securities and Exchange Commission on March 25, 2020. Reliance on the exemptive order was necessary and appropriate due to circumstances related to the effects of COVID-19. All Trustees participating in the telephonic meeting were able to hear each other simultaneously during the meeting. Reliance on the exemptive order requires Trustees, including a majority of the Independent Trustees, to ratify actions taken pursuant to the exemptive order by vote cast at the next in-person meeting. |
| | |
| QS Variable Asset Allocation Series | | 33 |
Board approval of new management and
new subadvisory agreements (unaudited) (cont’d)
of the Independent Trustees and then by the full Board. Following their review of this information, the Independent Trustees requested additional information from Franklin Templeton and Legg Mason. Franklin Templeton and Legg Mason provided further information in response to these requests, which the Board reviewed. Senior management representatives from Franklin Templeton and Legg Mason participated in portions of the meetings and addressed various questions raised by the Independent Trustees.
In voting to approve the New Agreements, the Independent Trustees considered whether the approval of the New Agreements would be in the best interests of the Fund and its shareholders. The Trustees’ evaluation of the New Agreements reflected the information provided specifically in connection with its review of the New Agreements, as well as, where relevant, information that was previously furnished to the Board in connection with the most recent renewal of the Current Agreements at in-person meetings held in November 2019 and at other prior Board meetings.
Among other things, the Trustees considered:
| (i) | the reputation, experience, financial strength and resources of Franklin Templeton and its investment advisory subsidiaries; |
| (ii) | that Franklin Templeton informed the Board that it intends to maintain the investment autonomy of the Legg Mason investment advisory subsidiaries; |
| (iii) | that Franklin Templeton and Legg Mason informed the Board that, following the Transaction, there is not expected to be any diminution in the nature, quality and extent of services provided to the Fund and its shareholders by the Manager and Subadvisers, including compliance and other non-advisory services, and represented that there are not expected to be any changes in the portfolio management personnel managing the Fund as a result of the Transaction; |
| (iv) | that Franklin Templeton and Legg Mason informed the Board regarding initial transition plans and that they are instituting long-term retention arrangements for key personnel; |
| (v) | that Franklin Templeton informed the Board that there are not expected to be any changes to the brokerage practices and standards applied by the Subadvisers in seeking best execution; |
| (vi) | that there are not expected to be any changes to the Fund’s custodian or other service providers as a result of the Transaction; |
| (vii) | that Franklin Templeton informed the Board that it has no present intention to alter currently effective expense waivers and reimbursement arrangements after their expiration, and, while it reserves the right to do so in the future, it would consult with the Board before making any changes; |
| (viii) | that Franklin Templeton does not expect to propose any changes to the investment objective of the Fund or any changes to the principal investment strategies of Fund as a result of the Transaction; |
| (ix) | the potential benefits to Fund shareholders from being part of a combined fund family with Franklin Templeton-sponsored funds and access to a broader array of investment opportunities; |
| (x) | that Franklin Templeton’s distribution capabilities, particularly with respect to retail investors, and significant network of intermediary relationships may provide additional opportunities for the Fund to grow assets and lower expenses by spreading expenses over a larger asset base; |
| (xi) | that Franklin Templeton and Legg Mason will each derive direct and ancillary benefits from the Transaction and that, as a result, they have a financial interest in the matters that were being considered; |
| (xii) | the fact that the Fund’s contractual management fee rate will remain the same and will not increase by virtue of the New Agreements; |
| (xiii) | the terms and conditions of the New Agreements, including that each New Agreement is identical to its corresponding Current Agreement except for their respective dates of execution, effectiveness and termination; |
| (xiv) | the support expressed by the current senior management team at Legg Mason for the Transaction and Legg Mason’s recommendation that the Board approve the New Agreements; |
| | |
| 34 | | QS Variable Asset Allocation Series |
| (xv) | that the Current Agreements are the product of multiple years of review and negotiation and information received and considered by the Board in the exercise of its business judgment during those years. At the November 2019 meeting, the Board conducted a full review of the investment advisory and distribution arrangements for the Fund and approved the Current Agreements in accordance with the provisions of the Investment Company Act of 1940, as amended. Without any one factor being dispositive, in approving the Current Agreements, the Board determined, in the exercise of the Trustees’ business judgment, that: (a) overall, the Board was satisfied with the nature, extent and quality of services provided (and expected to be provided) under the respective Current Agreement by the Manager and Subadvisers and their affiliates; (b) the overall performance of the Fund was satisfactory and that management was committed to providing the resources necessary to assist the Fund’s portfolio managers; (c) the Fund’s management fees and cost structure are reasonable in light of the comparative performance and expense information and in relation to the services provided; (d) in light of the costs of providing investment management and other services to the Fund and the Manager’s and Subadvisers’ ongoing commitment to the Fund, the profits that Legg Mason and its affiliates received were considered to be not excessive; (e) the benefits of any economies of scale would be appropriately shared with shareholders through increased investment in fund management and administration resources; and (f) the ancillary benefits that the Manager and Subadvisers and their affiliates received were considered reasonable; |
| (xvi) | that the Current Agreements were considered and approved as recently as November 2019; |
| (xvii) | that the Fund will not bear the costs of obtaining shareholder approval of the New Agreements, including proxy solicitation costs, legal fees and the costs of printing and mailing the proxy statement, regardless of whether the Transaction is consummated; and |
| (xviii) | that under the definitive agreement between Legg Mason and Franklin Templeton (the “Transaction Agreement”), Franklin Templeton has acknowledged that Legg Mason had entered into the Transaction Agreement in reliance upon the benefits and protections provided by Section 15(f) of the Investment Company Act of 1940, as amended, and that, in furtherance of the foregoing, Franklin Templeton agreed to use reasonable best efforts to conduct its business so that (a) for a period of not less than three years after the closing of the Transaction no more than 25% of the members of the Board shall be “interested persons” (as defined in the Investment Company Act of 1940, as amended) of any investment adviser for the Fund, and (b) for a period of not less than two years after the closing, neither Franklin Templeton nor any of its affiliates shall impose an “unfair burden” (within the meaning of the Investment Company Act of 1940, as amended, including any interpretations or no-action letters of the Securities and Exchange Commission) on any Fund as a result of the transactions contemplated by the Transaction Agreement or any express or implied terms, conditions or understandings applicable thereto. |
Certain of these considerations are discussed in more detail below.
In connection with the most recent approval or continuation of each Current Agreement, and in connection with their review of each New Agreement, the Trustees did not identify any particular factor that was all-important or controlling, and each Trustee may have attributed different weights to the various factors.
The discussion below covers both the advisory and the administrative functions rendered by the Manager for the Fund, both of which functions are encompassed by the New Management Agreement for the Fund, as well as the advisory functions rendered by the Subadvisers pursuant to the New Sub-advisory Agreements for the Fund. The Independent Trustees considered the New Management Agreement and the New Sub-advisory Agreements separately in the course of their review. In doing so, they considered the respective roles of the Manager and the Subadvisers in providing services to the Fund.
The Independent Trustees were advised by separate independent legal counsel throughout the process. Prior to voting, the Independent Trustees received a memorandum from their independent legal counsel discussing the legal standards for their consideration of the New Agreements for the Fund. The Independent Trustees discussed the Transaction and the proposed approval of the New Agreements for the Fund on multiple occasions with their independent legal counsel in private sessions at which no representatives of Franklin Templeton, Legg Mason, or the Manager or Subadvisers for the Fund were present.
| | |
| QS Variable Asset Allocation Series | | 35 |
Board approval of new management and
new subadvisory agreements (unaudited) (cont’d)
Nature, Extent and Quality of the Services to be provided to the Fund under the New Management Agreement and New Sub-Advisory Agreements
The Board received and considered information regarding the nature, extent and quality of services provided to the Fund by the Manager and the Subadvisers under the Current Agreements. In evaluating the nature, extent and quality of the services expected to be provided to the Fund by the Manager and the Subadvisers under the New Management Agreement and New Sub-advisory Agreements, respectively, the Trustees considered, among other things, the expected impact, if any, of the Transaction on the operations, facilities, organization and personnel of the Manager and the Subadvisers, and that Franklin Templeton and Legg Mason have advised the Board that, following the Transaction, there is not expected to be any diminution in the nature, extent and quality of services provided to the Fund and its shareholders by the Manager and the Subadvisers, including compliance and other non-advisory services, and that there are not expected to be any changes in portfolio management personnel as a result of the Transaction. The Board considered information Franklin Templeton and Legg Mason provided regarding initial transition plans and the institution of long-term retention arrangements for key personnel. The Board considered that Franklin Templeton informed the Boards that there are not expected to be any changes to the brokerage practices and standards applied by the Subadvisers in seeking best execution. The Board also considered the reputation, experience, financial strength and resources of Franklin Templeton and its investment advisory subsidiaries, its business and operating structure, scale of operation, distribution capabilities, and leadership, as well as the combined financial resources of Legg Mason, Inc. and Franklin Templeton and the benefits to the Fund of being part of a larger combined organization with greater financial resources following the Transaction, particularly during periods of market disruptions and volatility.
The Board’s evaluation of the services provided by the Manager and the Subadvisers took into account the Board’s knowledge and familiarity gained as Trustees of funds in the Legg Mason fund complex, including the scope and quality of the investment management and other capabilities of the Manager and the Subadvisers and the quality of the Manager’s administrative and other services rendered to the Fund and its shareholders by the Manager. The Board observed that the scope of services provided by the Manager and the Subadvisers, and the undertakings required of the Manager and Subadvisers in connection with those services, including maintaining and monitoring their own and the Fund’s compliance programs, liquidity management programs and cybersecurity programs, had expanded over time as a result of regulatory, market and other developments. The Board received and reviewed on a regular basis information from the Manager and the Subadvisers regarding the Fund’s compliance policies and procedures established pursuant to Rule 38a-1 under the Investment Company Act of 1940, as amended, and took that information into account in its evaluation of the New Agreements. The Board also considered the risks associated with the Fund borne by the Manager and its affiliates (such as entrepreneurial, operational, reputational, litigation and regulatory risk), as well as the risk management processes of the Manager and Subadvisers.
The Board reviewed the qualifications, backgrounds and responsibilities of the Fund’s senior personnel and the portfolio management team primarily responsible for the day-to-day portfolio management of the Fund. The Board also considered the policies and practices of the Manager and the Subadvisers regarding the selection of brokers and dealers and the execution of portfolio transactions for the Fund (including policies and practices regarding soft dollars and brokerage allocation), and Franklin Templeton’s representations that the brokerage practices and standards applied by the Manager and Subadvisers in seeking best execution will continue.
Fund Performance
The Board received and reviewed performance information for the Fund and for all mixed-asset target allocation growth funds (i.e., funds that maintain a mix of between 60%-80% equity securities, with the remainder invested in bonds, cash and cash equivalents) underlying variable insurance products (the “Performance Universe”) selected by Broadridge Financial Solutions Inc. (“Broadridge”), an independent provider of investment company data based on classifications provided by Thomson Reuters Lipper. The Board was provided with a description of the methodology Broadridge used to determine the similarity of the Fund with the funds included in the Performance Universe. It was noted that, while the Board has found the Broadridge data generally useful, the Trustees recognized the limitations of such data, including that the data may vary depending on the end date selected and that the results of the performance comparisons may vary depending on the selection of the peer group and its composition over time. The Trustees noted that they also had received and discussed with
| | |
| 36 | | QS Variable Asset Allocation Series |
management at periodic intervals information on the investment performance of the Fund in comparison to similar mutual funds and benchmark performance indices. In addition, the Board considered the Fund’s performance in light of overall financial market conditions.
The information comparing the Fund’s performance to that of the Performance Universe was for the one-, three-, five- and ten-year periods ended December 31, 2019. The Fund’s Class I shares performed better than the median performance of the funds in the Performance Universe for each period. The Board also reviewed performance information provided by the Manager for periods ended February 29, 2020 and March 31, 2020. The Board also reviewed information prepared by Broadridge comparing the Fund’s annualized total return for the three-year period ended December 31, 2019 in relation to the Fund’s standard deviation to that of the funds in the Performance Universe.
* * * * * *
Based on their review of the materials provided and the assurances they had received from Franklin Templeton and Legg Mason, Inc., the Trustees determined that the Transaction was not expected to affect adversely the nature, extent and quality of services provided by the Manager and the Subadvisers and that the Transaction was not expected to have an adverse effect on the ability of the Manager and the Subadvisers to provide those services, and the Board concluded that, overall, the nature, extent and quality of services, including portfolio management, expected to be provided under the New Agreements for the Fund were sufficient and supported a decision to approve each New Agreement.
Management Fees and Expense Ratios
The Board considered that it had reviewed the Fund’s total expense ratio in connection with the November 2019 contract renewal meeting. The Board noted that the Fund bears indirectly its pro rata share of the expenses of the underlying funds in which it invests, including management fees payable by such underlying funds to the Manager or its affiliates. The Board noted that there is no management fee payable by the Fund to the Manager or sub-investment advisory fees payable by the Fund to the Sub-Advisers. The Board noted that the New Agreements do not impose a management fee, and that there is no present intention to alter expense waiver and reimbursement arrangements that are currently in effect.
The Board also reviewed information regarding the scope of services provided to the Fund by the Manager and its affiliates, noting that the Fund is provided with regulatory compliance and administrative services, office facilities and Fund officers (including the Fund’s chief financial, chief legal and chief compliance officers), and that the Manager coordinates and oversees the provision of services to the Fund by other fund service providers, including the Subadvisers.
The Board received an analysis of complex-wide management fees provided by the Manager, which, among other things, set out a framework of fees based on asset classes.
Additionally, the Board received and considered information comparing the Fund’s overall expense ratio with those of a group of seven mixed-asset target allocation growth affiliated funds of funds underlying variable insurance products selected by Broadridge as comparable to the Fund (the “Expense Group”), and a broader group of funds selected by Broadridge consisting of all mixed-asset target allocation growth affiliated funds of funds underlying variable insurance products (the “Expense Universe”). It was noted that while the Board found the Broadridge data generally useful they recognized its limitations, including that the data may vary depending on the selection of the peer group. This information showed that the Fund’s total expense ratio was slightly higher before including underlying fund expenses and after including underlying fund expenses than the median of the total expense ratios of the funds in the Expense Group and was slightly higher after including underlying fund expenses than the median of the total expense ratios of the funds in the Expense Universe.
In evaluating the costs of the services to be provided by the Manager and the Subadvisers under the New Agreements, the Trustees considered, among other things, whether expenses would change as a result of the Transaction. Based on their review of the materials provided and the assurances they had received from Franklin Templeton and Legg Mason, the Trustees determined that the Transaction would not materially change the expenses borne by the Fund.
Manager Profitability and Economies of Scale
The Board received and considered a profitability analysis of the Manager and its affiliates in providing services to the Fund. The Board also received profitability information with respect to the Legg Mason fund complex as a whole. In addition, the Board received information with respect to the Manager’s allocation methodologies used in preparing this profitability
| | |
| QS Variable Asset Allocation Series | | 37 |
Board approval of new management and
new subadvisory agreements (unaudited) (cont’d)
data. It was noted that the allocation methodologies had been previously reviewed by an outside consultant. The profitability of the Manager and its affiliates was considered by the Board not excessive in light of the nature, extent and quality of the services provided to the Fund.
The Board also received and considered information regarding whether there have been economies of scale with respect to the management of the Fund as the Fund’s assets grow. The Board noted that to the extent the Fund’s assets increase over time, the Fund and its shareholders should realize economies of scale or efficiencies as certain expenses, such as fixed fund fees, become a smaller percentage of overall assets. The Board noted that it appeared that the benefits of any economies of scale also would be appropriately shared with shareholders through increased investment in fund management and administration resources (e.g., enhanced cyber security oversight, enhanced risk management oversight, etc.).
The Trustees noted that Franklin Templeton and Legg Mason expected to realize cost savings from the Transaction based on synergies of operations, as well as to benefit from possible growth of the funds in the Legg Mason fund complex resulting from enhanced distribution capabilities. However, they noted that other factors could also affect profitability and potential economies of scale, and that it was not possible to predict with any degree of certainty how the Transaction would affect the profitability of the Manager and its affiliates in providing services to the Fund, nor to quantify any possible future economies of scale. The Trustees noted they will have the opportunity to periodically re-examine such profitability and any economies of scale going forward.
* * * * * *
Taking all of the above into consideration, the Board determined that the Fund’s expense ratio was reasonable in light of the comparative performance and expense information and the nature, extent and quality of the services expected to be provided to the Fund under the New Agreements after the Transaction.
Other Benefits to the Manager
The Board considered other benefits received by the Manager and its affiliates, including the Subadvisers, as a result of their relationship with the Fund, including the opportunity to offer additional products and services to Fund shareholders. In light of the costs of providing investment management and other services to the Fund and the ongoing commitment of the Manager and the Subadvisers to the Fund, the Board considered that the ancillary benefits that the Manager, the Subadvisers and their affiliates receive were reasonable. In evaluating the fall-out benefits to be received by the Manager and the Subadvisers under the New Agreements, the Trustees considered whether the Transaction would have an impact on the fall-out benefits received by virtue of the Current Agreements.
The Board also considered that Franklin Templeton may derive reputational and other benefits from its ability to use the Legg Mason investment affiliates’ names in connection with operating and marketing the Fund. The Board also considered that the Transaction, if completed, would significantly increase Franklin Templeton’s assets under management and expand Franklin Templeton’s investment capabilities. Such ancillary benefits were considered reasonable.
* * * * * *
After consideration of the factors described above as well as other factors, and in the exercise of their business judgment, the Trustees, including the Independent Trustees, concluded that entering into the New Agreements for the Fund was in the best interests of the Fund’s shareholders, and they voted to approve the New Agreements and to recommend that shareholders approve the New Agreements.
| | |
| 38 | | QS Variable Asset Allocation Series |
Legg Mason Partners Variable Equity Trust
— QS Variable Conservative Growth
At a meeting of the Trust’s Board of Trustees held on April 7, 2020, the Board, including a majority of the Trustees who are not “interested persons” (as defined in the Investment Company Act of 1940, as amended (the “Independent Trustees”)) of the Trust, approved new management and investment advisory agreements for QS Variable Conservative Growth Portfolio (the “Fund”) to take effect, subject to shareholder approval, upon the sale of Legg Mason, Inc. to Franklin Resources, Inc., a global investment management organization operating as Franklin Templeton.1 The agreements were a new management agreement pursuant to which Legg Mason Partners Fund Advisor, LLC (the “Manager”) provides the Fund with investment advisory and administrative services, a new sub-advisory agreement pursuant to which QS Investors, LLC (“QS Investors ”) provides day-to-day management of the Fund’s portfolio, and a new sub-advisory agreement pursuant to which Western Asset Management Company, LLC (“Western Asset” and, together with QS Investors, the “Subadvisers”) provides day-to-day management of the Fund’s cash and short-term instruments allocated to it by the Manager. (The new management agreement and new sub-advisory agreements are collectively referred to as the “New Agreements.”) The current management agreement and current sub-advisory agreements are collectively referred to as the “Current Agreements.” The New Agreements are identical to the Current Agreements, except for the dates of execution, effectiveness and termination. The Board considered that the Current Agreements are the product of multiple years of review and negotiation and information received and considered by the Board in the exercise of its business judgment during those years, including as recently as at a meeting of the Trust’s Board of Trustees held in November 2019.
The sale of Legg Mason, Inc. to Franklin Resources, Inc. (referred to herein as the “Transaction”) was consummated on July 31, 2020. The Manager and the Subadvisers, each a wholly-owned subsidiary of Legg Mason, Inc., became subsidiaries of Franklin Templeton. The sale resulted in what is commonly called a “change of control” of Legg Mason and caused the Current Agreements to terminate in accordance with applicable law.
The Board also approved an interim management agreement with the Manager and interim sub-advisory agreements between the Manager and the Subadvisers that would have taken effect in the event shareholders had not approved the New Agreements before the Transaction was completed to allow the Manager and the Subadvisers to continue providing services to the Fund while shareholder approval of the New Agreements continued to be sought. (The interim management agreement and interim sub-advisory agreements are collectively referred to as the “Interim Agreements.”) The terms of the Interim Agreements are identical to those of the Current Agreements, except for the term and certain escrow provisions. At a meeting held on July 14, 2020, shareholders of the Fund approved the New Agreements.
At a telephonic meeting of the Trust’s Board of Trustees held on March 9, 2020, the Trustees discussed with Legg Mason management and certain Franklin Templeton representatives the Transaction and Franklin Templeton’s plans and intentions regarding the Legg Mason funds and Legg Mason’s asset management business, including the preservation and continued investment autonomy of the investment advisory businesses conducted by the Subadvisers and the combination of Legg Mason’s and Franklin Templeton’s distribution resources.
At the March and April meetings, the Independent Trustees considered, among other things, the anticipated impact of the Transaction on the Fund and its shareholders. To assist the Independent Trustees in their consideration of the New Agreements, Franklin Templeton provided materials and information about Franklin Templeton, including its financial condition and asset management capabilities and organization, Legg Mason provided materials and information about Legg Mason, including performance and expense comparison data and profitability information with respect to the Fund and the Legg Mason fund complex as a whole, and Franklin Templeton and Legg Mason provided materials and information about the proposed Transaction. The Independent Trustees were assisted in their review by Fund counsel and independent legal counsel and met with independent legal counsel in executive sessions separate from representatives of Franklin Templeton, Legg Mason, the Manager and the Subadvisers. The Independent Trustees requested and received information from Legg Mason and Franklin Templeton they deemed reasonably necessary for their review of the New Agreements. Included was information about the Transaction, distribution arrangements, Franklin Templeton’s business plan and other anticipated impacts of the Transaction on the Fund and its shareholders. This information was initially reviewed by a special committee
| 1 | The meeting was held telephonically in reliance on an exemptive order issued by the Securities and Exchange Commission on March 25, 2020. Reliance on the exemptive order was necessary and appropriate due to circumstances related to the effects of COVID-19. All Trustees participating in the telephonic meeting were able to hear each other simultaneously during the meeting. Reliance on the exemptive order requires Trustees, including a majority of the Independent Trustees, to ratify actions taken pursuant to the exemptive order by vote cast at the next in-person meeting. |
| | |
| QS Variable Asset Allocation Series | | 39 |
Board approval of new management and
new subadvisory agreements (unaudited) (cont’d)
of the Independent Trustees and then by the full Board. Following their review of this information, the Independent Trustees requested additional information from Franklin Templeton and Legg Mason. Franklin Templeton and Legg Mason provided further information in response to these requests, which the Board reviewed. Senior management representatives from Franklin Templeton and Legg Mason participated in portions of the meetings and addressed various questions raised by the Independent Trustees.
In voting to approve the New Agreements, the Independent Trustees considered whether the approval of the New Agreements would be in the best interests of the Fund and its shareholders. The Trustees’ evaluation of the New Agreements reflected the information provided specifically in connection with its review of the New Agreements, as well as, where relevant, information that was previously furnished to the Board in connection with the most recent renewal of the Current Agreements at in-person meetings held in November 2019 and at other prior Board meetings.
Among other things, the Trustees considered:
| (i) | the reputation, experience, financial strength and resources of Franklin Templeton and its investment advisory subsidiaries; |
| (ii) | that Franklin Templeton informed the Board that it intends to maintain the investment autonomy of the Legg Mason investment advisory subsidiaries; |
| (iii) | that Franklin Templeton and Legg Mason informed the Board that, following the Transaction, there is not expected to be any diminution in the nature, quality and extent of services provided to the Fund and its shareholders by the Manager and Subadvisers, including compliance and other non-advisory services, and represented that there are not expected to be any changes in the portfolio management personnel managing the Fund as a result of the Transaction; |
| (iv) | that Franklin Templeton and Legg Mason informed the Board regarding initial transition plans and that they are instituting long-term retention arrangements for key personnel; |
| (v) | that Franklin Templeton informed the Board that there are not expected to be any changes to the brokerage practices and standards applied by the Subadvisers in seeking best execution; |
| (vi) | that there are not expected to be any changes to the Fund’s custodian or other service providers as a result of the Transaction; |
| (vii) | that Franklin Templeton informed the Board that it has no present intention to alter currently effective expense waivers and reimbursement arrangements after their expiration, and, while it reserves the right to do so in the future, it would consult with the Board before making any changes; |
| (viii) | that Franklin Templeton does not expect to propose any changes to the investment objective of the Fund or any changes to the principal investment strategies of Fund as a result of the Transaction; |
| (ix) | the potential benefits to Fund shareholders from being part of a combined fund family with Franklin Templeton-sponsored funds and access to a broader array of investment opportunities; |
| (x) | that Franklin Templeton’s distribution capabilities, particularly with respect to retail investors, and significant network of intermediary relationships may provide additional opportunities for the Fund to grow assets and lower expenses by spreading expenses over a larger asset base; |
| (xi) | that Franklin Templeton and Legg Mason will each derive direct and ancillary benefits from the Transaction and that, as a result, they have a financial interest in the matters that were being considered; |
| (xii) | the fact that the Fund’s contractual management fee rate will remain the same and will not increase by virtue of the New Agreements; |
| (xiii) | the terms and conditions of the New Agreements, including that each New Agreement is identical to its corresponding Current Agreement except for their respective dates of execution, effectiveness and termination; |
| (xiv) | the support expressed by the current senior management team at Legg Mason for the Transaction and Legg Mason’s recommendation that the Board approve the New Agreements; |
| | |
| 40 | | QS Variable Asset Allocation Series |
| (xv) | that the Current Agreements are the product of multiple years of review and negotiation and information received and considered by the Board in the exercise of its business judgment during those years. At the November 2019 meeting, the Board conducted a full review of the investment advisory and distribution arrangements for the Fund and approved the Current Agreements in accordance with the provisions of the Investment Company Act of 1940, as amended. Without any one factor being dispositive, in approving the Current Agreements, the Board determined, in the exercise of the Trustees’ business judgment, that: (a) overall, the Board was satisfied with the nature, extent and quality of services provided (and expected to be provided) under the respective Current Agreement by the Manager and Subadvisers and their affiliates; (b) the overall performance of the Fund was satisfactory and that management was committed to providing the resources necessary to assist the Fund’s portfolio managers; (c) the Fund’s management fees and cost structure are reasonable in light of the comparative performance and expense information and in relation to the services provided; (d) in light of the costs of providing investment management and other services to the Fund and the Manager’s and Subadvisers’ ongoing commitment to the Fund, the profits that Legg Mason and its affiliates received were considered to be not excessive; (e) the benefits of any economies of scale would be appropriately shared with shareholders through increased investment in fund management and administration resources; and (f) the ancillary benefits that the Manager and Subadvisers and their affiliates received were considered reasonable; |
| (xvi) | that the Current Agreements were considered and approved as recently as November 2019; |
| (xvii) | that the Fund will not bear the costs of obtaining shareholder approval of the New Agreements, including proxy solicitation costs, legal fees and the costs of printing and mailing the proxy statement, regardless of whether the Transaction is consummated; and |
| (xviii) | that under the definitive agreement between Legg Mason and Franklin Templeton (the “Transaction Agreement”), Franklin Templeton has acknowledged that Legg Mason had entered into the Transaction Agreement in reliance upon the benefits and protections provided by Section 15(f) of the Investment Company Act of 1940, as amended, and that, in furtherance of the foregoing, Franklin Templeton agreed to use reasonable best efforts to conduct its business so that (a) for a period of not less than three years after the closing of the Transaction no more than 25% of the members of the Board shall be “interested persons” (as defined in the Investment Company Act of 1940, as amended) of any investment adviser for the Fund, and (b) for a period of not less than two years after the closing, neither Franklin Templeton nor any of its affiliates shall impose an “unfair burden” (within the meaning of the Investment Company Act of 1940, as amended, including any interpretations or no-action letters of the Securities and Exchange Commission) on any Fund as a result of the transactions contemplated by the Transaction Agreement or any express or implied terms, conditions or understandings applicable thereto. |
Certain of these considerations are discussed in more detail below.
In connection with the most recent approval or continuation of each Current Agreement, and in connection with their review of each New Agreement, the Trustees did not identify any particular factor that was all-important or controlling, and each Trustee may have attributed different weights to the various factors.
The discussion below covers both the advisory and the administrative functions rendered by the Manager for the Fund, both of which functions are encompassed by the New Management Agreement for the Fund, as well as the advisory functions rendered by the Subadvisers pursuant to the New Sub-advisory Agreements for the Fund. The Independent Trustees considered the New Management Agreement and the New Sub-advisory Agreements separately in the course of their review. In doing so, they considered the respective roles of the Manager and the Subadvisers in providing services to the Fund.
The Independent Trustees were advised by separate independent legal counsel throughout the process. Prior to voting, the Independent Trustees received a memorandum from their independent legal counsel discussing the legal standards for their consideration of the New Agreements for the Fund. The Independent Trustees discussed the Transaction and the proposed approval of the New Agreements for the Fund on multiple occasions with their independent legal counsel in private sessions at which no representatives of Franklin Templeton, Legg Mason, or the Manager or Subadvisers for the Fund were present.
| | |
| QS Variable Asset Allocation Series | | 41 |
Board approval of new management and
new subadvisory agreements (unaudited) (cont’d)
Nature, Extent and Quality of the Services to be provided to the Fund under the New Management Agreement and New Sub-Advisory Agreements
The Board received and considered information regarding the nature, extent and quality of services provided to the Fund by the Manager and the Subadvisers under the Current Agreements. In evaluating the nature, extent and quality of the services expected to be provided to the Fund by the Manager and the Subadvisers under the New Management Agreement and New Sub-advisory Agreements, respectively, the Trustees considered, among other things, the expected impact, if any, of the Transaction on the operations, facilities, organization and personnel of the Manager and the Subadvisers, and that Franklin Templeton and Legg Mason have advised the Board that, following the Transaction, there is not expected to be any diminution in the nature, extent and quality of services provided to the Fund and its shareholders by the Manager and the Subadvisers, including compliance and other non-advisory services, and that there are not expected to be any changes in portfolio management personnel as a result of the Transaction. The Board considered information Franklin Templeton and Legg Mason provided regarding initial transition plans and the institution of long-term retention arrangements for key personnel. The Board considered that Franklin Templeton informed the Boards that there are not expected to be any changes to the brokerage practices and standards applied by the Subadvisers in seeking best execution. The Board also considered the reputation, experience, financial strength and resources of Franklin Templeton and its investment advisory subsidiaries, its business and operating structure, scale of operation, distribution capabilities, and leadership, as well as the combined financial resources of Legg Mason, Inc. and Franklin Templeton and the benefits to the Fund of being part of a larger combined organization with greater financial resources following the Transaction, particularly during periods of market disruptions and volatility.
The Board’s evaluation of the services provided by the Manager and the Subadvisers took into account the Board’s knowledge and familiarity gained as Trustees of funds in the Legg Mason fund complex, including the scope and quality of the investment management and other capabilities of the Manager and the Subadvisers and the quality of the Manager’s administrative and other services rendered to the Fund and its shareholders by the Manager. The Board observed that the scope of services provided by the Manager and the Subadvisers, and the undertakings required of the Manager and Subadvisers in connection with those services, including maintaining and monitoring their own and the Fund’s compliance programs, liquidity management programs and cybersecurity programs, had expanded over time as a result of regulatory, market and other developments. The Board received and reviewed on a regular basis information from the Manager and the Subadvisers regarding the Fund’s compliance policies and procedures established pursuant to Rule 38a-1 under the Investment Company Act of 1940, as amended, and took that information into account in its evaluation of the New Agreements. The Board also considered the risks associated with the Fund borne by the Manager and its affiliates (such as entrepreneurial, operational, reputational, litigation and regulatory risk), as well as the risk management processes of the Manager and Subadvisers.
The Board reviewed the qualifications, backgrounds and responsibilities of the Fund’s senior personnel and the portfolio management team primarily responsible for the day-to-day portfolio management of the Fund. The Board also considered the policies and practices of the Manager and the Subadvisers regarding the selection of brokers and dealers and the execution of portfolio transactions for the Fund (including policies and practices regarding soft dollars and brokerage allocation), and Franklin Templeton’s representations that the brokerage practices and standards applied by the Manager and Subadvisers in seeking best execution will continue.
Fund Performance
The Board received and reviewed performance information for the Fund and for all mixed-asset target allocation moderate funds (i.e., funds that maintain a mix of between 40%-60% equity securities, with the remainder invested in bonds, cash and cash equivalents) underlying variable insurance products (the “Performance Universe”) selected by Broadridge Financial Solutions Inc. (“Broadridge”), an independent provider of investment company data based on classifications provided by Thomson Reuters Lipper. The Board was provided with a description of the methodology Broadridge used to determine the similarity of the Fund with the funds included in the Performance Universe. It was noted that, while the Board has found the Broadridge data generally useful, the Trustees recognized the limitations of such data, including that the data may vary depending on the end date selected and that the results of the performance comparisons may vary depending on the selection of the peer group and its composition over time. The Trustees noted that they also had received and discussed with management at periodic intervals information on the investment performance of the Fund in comparison to similar mutual funds and benchmark performance indices. In addition, the Board considered the Fund’s performance in light of overall financial market conditions.
| | |
| 42 | | QS Variable Asset Allocation Series |
The information comparing the Fund’s performance to that of the Performance Universe was for the one-, three-, five- and ten-year periods ended December 31, 2019. The Fund’s Class I shares performed slightly below the median performance of the funds in the Performance Universe for the one-year period, and performed better than the median performance of the funds in the Performance Universe for the three-, five- and ten-year periods. The Board also reviewed performance information provided by the Manager for periods ended February 29, 2020 and March 31, 2020. The Board also reviewed information prepared by Broadridge comparing the Fund’s annualized total return for the three-year period ended December 31, 2019 in relation to the Fund’s standard deviation to that of the funds in the Performance Universe.
* * * * * *
Based on their review of the materials provided and the assurances they had received from Franklin Templeton and Legg Mason, Inc., the Trustees determined that the Transaction was not expected to affect adversely the nature, extent and quality of services provided by the Manager and the Subadvisers and that the Transaction was not expected to have an adverse effect on the ability of the Manager and the Subadvisers to provide those services, and the Board concluded that, overall, the nature, extent and quality of services, including portfolio management, expected to be provided under the New Agreements for the Fund were sufficient and supported a decision to approve each New Agreement.
Management Fees and Expense Ratios
The Board considered that it had reviewed the Fund’s total expense ratio in connection with the November 2019 contract renewal meeting. The Board noted that the Fund bears indirectly its pro rata share of the expenses of the underlying funds in which it invests, including management fees payable by such underlying funds to the Manager or its affiliates. The Board noted that there is no management fee payable by the Fund to the Manager or sub-investment advisory fees payable by the Fund to the Sub-Advisers. The Board noted that the New Agreements do not impose a management fee, and that there is no present intention to alter expense waiver and reimbursement arrangements that are currently in effect.
The Board also reviewed information regarding the scope of services provided to the Fund by the Manager and its affiliates, noting that the Fund is provided with regulatory compliance and administrative services, office facilities and Fund officers (including the Fund’s chief financial, chief legal and chief compliance officers), and that the Manager coordinates and oversees the provision of services to the Fund by other fund service providers, including the Subadvisers.
The Board received an analysis of complex-wide management fees provided by the Manager, which, among other things, set out a framework of fees based on asset classes.
Additionally, the Board received and considered information comparing the Fund’s overall expense ratio with those of a group of ten mixed-asset target allocation moderate affiliated funds of funds underlying variable insurance products selected by Broadridge as comparable to the Fund (the “Expense Group”), and a broader group of funds selected by Broadridge consisting of all mixed-asset target allocation moderate affiliated funds of funds underlying variable insurance products (the “Expense Universe”). It was noted that while the Board found the Broadridge data generally useful they recognized its limitations, including that the data may vary depending on the selection of the peer group. This information showed that the Fund’s total expense ratio was slightly higher than the median before including underlying fund expenses and was at the median after including underlying fund expenses of the total expense ratios of the funds in the Expense Group and was lower than the median after including underlying fund expenses of the total expense ratios of the funds in the Expense Universe.
In evaluating the costs of the services to be provided by the Manager and the Subadvisers under the New Agreements, the Trustees considered, among other things, whether expenses would change as a result of the Transaction. Based on their review of the materials provided and the assurances they had received from Franklin Templeton and Legg Mason, the Trustees determined that the Transaction would not materially change the expenses borne by the Fund.
Manager Profitability and Economies of Scale
The Board received and considered a profitability analysis of the Manager and its affiliates in providing services to the Fund. The Board also received profitability information with respect to the Legg Mason fund complex as a whole. In addition, the Board received information with respect to the Manager’s allocation methodologies used in preparing this profitability
| | |
QS Variable Asset Allocation Series | | 43 |
Board approval of new management and
new subadvisory agreements (unaudited) (cont’d)
data. It was noted that the allocation methodologies had been previously reviewed by an outside consultant. The profitability of the Manager and its affiliates was considered by the Board not excessive in light of the nature, extent and quality of the services provided to the Fund.
The Board also received and considered information regarding whether there have been economies of scale with respect to the management of the Fund as the Fund’s assets grow. The Board noted that to the extent the Fund’s assets increase over time, the Fund and its shareholders should realize economies of scale or efficiencies as certain expenses, such as fixed fund fees, become a smaller percentage of overall assets. The Board noted that it appeared that the benefits of any economies of scale also would be appropriately shared with shareholders through increased investment in fund management and administration resources (e.g., enhanced cyber security oversight, enhanced risk management oversight, etc.).
The Trustees noted that Franklin Templeton and Legg Mason expected to realize cost savings from the Transaction based on synergies of operations, as well as to benefit from possible growth of the funds in the Legg Mason fund complex resulting from enhanced distribution capabilities. However, they noted that other factors could also affect profitability and potential economies of scale, and that it was not possible to predict with any degree of certainty how the Transaction would affect the profitability of the Manager and its affiliates in providing services to the Fund, nor to quantify any possible future economies of scale. The Trustees noted they will have the opportunity to periodically re-examine such profitability and any economies of scale going forward.
* * * * * *
Taking all of the above into consideration, the Board determined that the Fund’s expense ratio was reasonable in light of the comparative performance and expense information and the nature, extent and quality of the services expected to be provided to the Fund under the New Agreements after the Transaction.
Other Benefits to the Manager
The Board considered other benefits received by the Manager and its affiliates, including the Subadvisers, as a result of their relationship with the Fund, including the opportunity to offer additional products and services to Fund shareholders. In light of the costs of providing investment management and other services to the Fund and the ongoing commitment of the Manager and the Subadvisers to the Fund, the Board considered that the ancillary benefits that the Manager, the Subadvisers and their affiliates receive were reasonable. In evaluating the fall-out benefits to be received by the Manager and the Subadvisers under the New Agreements, the Trustees considered whether the Transaction would have an impact on the fall-out benefits received by virtue of the Current Agreements.
The Board also considered that Franklin Templeton may derive reputational and other benefits from its ability to use the Legg Mason investment affiliates’ names in connection with operating and marketing the Fund. The Board also considered that the Transaction, if completed, would significantly increase Franklin Templeton’s assets under management and expand Franklin Templeton’s investment capabilities. Such ancillary benefits were considered reasonable.
* * * * * *
After consideration of the factors described above as well as other factors, and in the exercise of their business judgment, the Trustees, including the Independent Trustees, concluded that entering into the New Agreements for the Fund was in the best interests of the Fund’s shareholders, and they voted to approve the New Agreements and to recommend that shareholders approve the New Agreements.
| | |
| 44 | | QS Variable Asset Allocation Series |
QS
Variable Asset Allocation Series
Trustees
Paul R. Ades
Andrew L. Breech
Dwight B. Crane
Althea L. Duersten
Stephen R. Gross
Susan M. Heilbron
Frank G. Hubbard
Howard J. Johnson
Chairman
Jerome H. Miller
Ken Miller
Thomas F. Schlafly
Jane Trust
Investment manager
Legg Mason Partners Fund Advisor, LLC
Subadviser
QS Investors, LLC
Distributor
Legg Mason Investor Services, LLC
Custodian
The Bank of New York Mellon
Transfer agent
BNY Mellon Investment Servicing (US) Inc.
4400 Computer Drive
Westborough, MA 01581
Independent registered public accounting firm
PricewaterhouseCoopers LLP
Baltimore, MD
QS Variable Asset Allocation Series
QS Variable Growth
QS Variable Moderate Growth
QS Variable Conservative Growth
The Portfolios are separate investment series of Legg Mason Partners Variable Equity Trust, a Maryland statutory trust.
QS Variable Asset Allocation Series
Legg Mason Funds
620 Eighth Avenue, 49th Floor
New York, NY 10018
The Portfolios file their complete schedule of portfolio holdings with the Securities and Exchange Commission (“SEC”) for the first and third quarters of each fiscal year as an exhibit to their reports on Form N-PORT. The Portfolios’ Forms N-PORT are available on the SEC’s website at www.sec.gov. To obtain information on Form N-PORT, shareholders can call the Portfolios at 1-877-721-1926.
Information on how the Portfolios voted proxies relating to portfolio securities during the prior 12-month period ended June 30th of each year and a description of the policies and procedures that the Portfolios use to determine how to vote proxies related to portfolio transactions are available (1) without charge, upon request, by calling the Portfolios at 1-877-721-1926, (2) at www.leggmason.com/variablefunds and (3) on the SEC’s website at www.sec.gov.
This report is submitted for the general information of the shareholders of QS Variable Growth, QS Variable Moderate Growth and QS Variable Conservative Growth. This report is not authorized for distribution to prospective investors in the Portfolios unless preceded or accompanied by a current prospectus.
Investors should consider each Portfolio’s investment objectives, risks, charges and expenses carefully before investing. Each prospectus contains this and other important information about the Portfolios. Please read the prospectuses carefully before investing.
www.leggmason.com
© 2020 Legg Mason Investor Services, LLC
Member FINRA, SIPC
Legg Mason Funds Privacy and Security Notice
Your Privacy and the Security of Your Personal Information is Very Important to the Legg Mason Funds
This Privacy and Security Notice (the “Privacy Notice”) addresses the Legg Mason Funds’ privacy and data protection practices with respect to nonpublic personal information the Funds receive. The Legg Mason Funds include any funds sold by the Funds’ distributor, Legg Mason Investor Services, LLC, as well as Legg Mason-sponsored closed-end funds. The provisions of this Privacy Notice apply to your information both while you are a shareholder and after you are no longer invested with the Funds.
The Type of Nonpublic Personal Information the Funds Collect About You
The Funds collect and maintain nonpublic personal information about you in connection with your shareholder account. Such information may include, but is not limited to:
| • | | Personal information included on applications or other forms; |
| • | | Account balances, transactions, and mutual fund holdings and positions; |
| • | | Bank account information, legal documents, and identity verification documentation; |
| • | | Online account access user IDs, passwords, security challenge question responses; and |
| • | | Information received from consumer reporting agencies regarding credit history and creditworthiness (such as the amount of an individual’s total debt, payment history, etc.). |
How the Funds Use Nonpublic Personal Information About You
The Funds do not sell or share your nonpublic personal information with third parties or with affiliates for their marketing purposes, or with other financial institutions or affiliates for joint marketing purposes, unless you have authorized the Funds to do so. The Funds do not disclose any nonpublic personal information about you except as may be required to perform transactions or services you have authorized or as permitted or required by law. The Funds may disclose information about you to:
| • | | Employees, agents, and affiliates on a “need to know” basis to enable the Funds to conduct ordinary business or to comply with obligations to government regulators; |
| • | | Service providers, including the Funds’ affiliates, who assist the Funds as part of the ordinary course of business (such as printing, mailing services, or processing or servicing your account with us) or otherwise perform services on the Funds’ behalf, including companies that may perform statistical analysis, market research and marketing services solely for the Funds; |
| • | | Permit access to transfer, whether in the United States or countries outside of the United States to such Funds’ employees, agents and affiliates and service providers as required to enable the Funds to conduct ordinary business, or to comply with obligations to government regulators; |
| • | | The Funds’ representatives such as legal counsel, accountants and auditors to enable the Funds to conduct ordinary business, or to comply with obligations to government regulators; |
| • | | Fiduciaries or representatives acting on your behalf, such as an IRA custodian or trustee of a grantor trust. |
Except as otherwise permitted by applicable law, companies acting on the Funds’ behalf, including those outside the United States, are contractually obligated to keep nonpublic personal information the Funds provide to them confidential and to use the information the Funds share only to provide the services the Funds ask them to perform.
The Funds may disclose nonpublic personal information about you when necessary to enforce their rights or protect against fraud, or as permitted or required by applicable law, such as in connection with a law enforcement or regulatory request, subpoena, or similar legal process. In the event of a corporate action or in the event a Fund service provider changes, the Funds may be required to disclose your nonpublic personal information to third parties. While it is the Funds’ practice to obtain protections for disclosed information in these types of transactions, the Funds cannot guarantee their privacy policy will remain unchanged.
Keeping You Informed of the Funds’ Privacy and Security Practices
The Funds will notify you annually of their privacy policy as required by federal law. While the Funds reserve the right to modify this policy at any time they will notify you promptly if this privacy policy changes.
|
| NOT PART OF THE SEMI-ANNUAL REPORT |
Legg Mason Funds Privacy and Security Notice (cont’d)
The Funds’ Security Practices
The Funds maintain appropriate physical, electronic and procedural safeguards designed to guard your nonpublic personal information. The Funds’ internal data security policies restrict access to your nonpublic personal information to authorized employees, who may use your nonpublic personal information for Fund business purposes only.
Although the Funds strive to protect your nonpublic personal information, they cannot ensure or warrant the security of any information you provide or transmit to them, and you do so at your own risk. In the event of a breach of the confidentiality or security of your nonpublic personal information, the Funds will attempt to notify you as necessary so you can take appropriate protective steps. If you have consented to the Funds using electronic communications or electronic delivery of statements, they may notify you under such circumstances using the most current email address you have on record with them.
In order for the Funds to provide effective service to you, keeping your account information accurate is very important. If you believe that your account information is incomplete, not accurate or not current, if you have questions about the Funds’ privacy practices, or our use of your nonpublic personal information, write the Funds using the contact information on your account statements, email the Funds by clicking on the Contact Us section of the Funds’ website at www.leggmason.com, or contact the Funds at 1-877-721-1926.
Revised April 2018
|
| NOT PART OF THE SEMI-ANNUAL REPORT |
www.leggmason.com
© 2020 Legg Mason Investor Services, LLC Member FINRA, SIPC
FD01325 8/20 SR20-3940
| ITEM 3. | AUDIT COMMITTEE FINANCIAL EXPERT. |
| ITEM 4. | PRINCIPAL ACCOUNTANT FEES AND SERVICES. |
| ITEM 5. | AUDIT COMMITTEE OF LISTED REGISTRANTS. |
| ITEM 6. | SCHEDULE OF INVESTMENTS. |
| | Included herein under Item 1. |
| ITEM 7. | DISCLOSURE OF PROXY VOTING POLICIES AND PROCEDURES FOR CLOSED-END MANAGEMENT INVESTMENT COMPANIES. |
| ITEM 8. | PORTFOLIO MANAGERS OF CLOSED-END MANAGEMENT INVESTMENT COMPANIES. |
| ITEM 9. | PURCHASES OF EQUITY SECURITIES BY CLOSED-END MANAGEMENT INVESTMENT COMPANY AND AFFILIATED PURCHASERS. |
| ITEM 10. | SUBMISSION OF MATTERS TO A VOTE OF SECURITY HOLDERS. |
| ITEM 11. | CONTROLS AND PROCEDURES. |
| | (a) | The registrant’s principal executive officer and principal financial officer have concluded that the registrant’s disclosure controls and procedures (as defined in Rule 30a- 3(c) under the Investment Company Act of 1940, as amended (the “1940 Act”)) are effective as of a date within 90 days of the filing date of this report that includes the disclosure required by this paragraph, based on their evaluation of the disclosure controls and procedures required by Rule 30a-3(b) under the 1940 Act and 15d-15(b) under the Securities Exchange Act of 1934. |
| | (b) | There were no changes in the registrant’s internal control over financial reporting (as defined in Rule 30a-3(d) under the 1940 Act) that occurred during the second fiscal quarter of the period covered by this report that have materially affected, or are likely to materially affect the registrant’s internal control over financial reporting. |
| ITEM 12. | DISCLOSURE OF SECURITIES LENDING ACTIVITIES FOR CLOSED-END MANAGEMENT INVESTMENT COMPANIES. |
Not applicable
(a) (1) Not applicable.
Exhibit 99.CODE ETH
(a) (2) Certifications pursuant to section 302 of the Sarbanes-Oxley Act of 2002 attached hereto.
Exhibit 99.CERT
(b) Certifications pursuant to Section 906 of the Sarbanes-Oxley Act of 2002 attached hereto.
Exhibit 99.906CERT
SIGNATURES
Pursuant to the requirements of the Securities Exchange Act of 1934 and the Investment Company Act of 1940, the registrant has duly caused this Report to be signed on its behalf by the undersigned, there unto duly authorized.
Legg Mason Partners Variable Equity Trust
| | |
| By: | | /s/ Jane Trust |
| | Jane Trust |
| | Chief Executive Officer |
| |
| Date: | | August 24, 2020 |
Pursuant to the requirements of the Securities Exchange Act of 1934 and the Investment Company Act of 1940, this report has been signed below by the following persons on behalf of the registrant and in the capacities and on the dates indicated.
| | |
| By: | | /s/ Jane Trust |
| | Jane Trust |
| | Chief Executive Officer |
| |
| Date: | | August 24, 2020 |
| |
| By: | | /s/ Christopher Berarducci |
| | Christopher Berarducci |
| | Principal Financial Officer |
| |
| Date: | | August 24, 2020 |