Washington, D.C. 20549
Kevin J. McCarthy
Form N-CSR is to be used by management investment companies to file reports with the Commission not later than 10 days after the transmission to stockholders of any report that is required to be transmitted to stockholders under Rule 30e-1 under the Investment Company Act of 1940 (17 CFR 270.30e-1). The Commission may use the information provided on Form N-CSR in its regulatory, disclosure review, inspection, and policymaking roles.
A registrant is required to disclose the information specified by Form N-CSR, and the Commission will make this information public. A registrant is not required to respond to the collection of information contained in Form N-CSR unless the Form displays a currently valid Office of Management and Budget ("OMB") control number. Please direct comments concerning the accuracy of the information collection burden estimate and any suggestions for reducing the burden to Secretary, Securities and Exchange Commission, 450 Fifth Street, NW, Washington, DC 20549-0609. The OMB has reviewed this collection of information under the clearance requirements of 44 U.S.C. ss. 3507.
ITEM 1. REPORTS TO STOCKHOLDERS.
INVESTMENT ADVISOR NAME CHANGE
Effective January 1, 2011, Nuveen Asset Management, the Funds’ investment adviser, has changed its name to Nuveen Fund Advisors, Inc. (“Nuveen Fund Advisors”). Concurrently, Nuveen Fund Advisors has formed a wholly-owned subsidiary, Nuveen Asset Management, LLC, to house its portfolio management capabilities. Nuveen Asset Management, LLC now serves as the Funds’ sub-adviser, and the Funds’ portfolio managers have become employees of Nuveen Asset Management, LLC rather than Nuveen Fund Advisors. Nuveen Fund Advisors will compensate Nuveen Asset Management, LLC for the portfolio management services it provides to the Funds from the Funds’ management fee, which will not change as a re sult of this reorganization. Nuveen Fund Advisors and Nuveen Asset Management, LLC retain the right to reallocate investment advisory responsibilities and fees between themselves in the future.
NUVEEN INVESTMENTS COMPLETES STRATEGIC COMBINATION WITH FAF ADVISORS
On January 3, 2011, Nuveen Investments announced the completion of the strategic combination with FAF Advisors and Nuveen Asset Management LLC, the largest investment affiliate of Nuveen Investments. As part of this transaction, U.S. Bancorp–the parent of FAF Advisors—received a 9.5% stake in Nuveen Investments as well as additional cash consideration in exchange for the long term investment business of FAF Advisors, including investment-management responsibilities for the mutual funds of the First American Funds family.
The approximately $27 billion of mutual fund and institutional assets managed by FAF Advisors, along with the investment professionals managing these assets and most other key personnel, have become part of Nuveen Asset Management LLC. With these additions to Nuveen Asset Management LLC, this affiliate now manages more than $100 billion of assets across a broad range of strategies from municipal and taxable fixed income to traditional and specialized equity investments.
This combination does not affect the investment objectives or strategies of the Funds in this report. Over time, Nuveen Investments expects that the combination will provide even more ways to meet the needs of investors who work with financial advisors and consultants by enhancing the multi-boutique model of Nuveen Investments, which also includes highly respected investment teams at Hyde Park, NWQ Investment Management, Santa Barbara Asset Management, Symphony Asset Management, Tradewinds Global Investors and Winslow Capital. In total, Nuveen Investments managed approximately $195 billion of assets as of December 31, 2010.
Chairman’s
Letter to Shareholders
Dear Shareholders,
The global economy recorded another year of recovery from the financial and economic crises of 2008, but many of the factors that caused the crises still weigh on the prospects for continued recovery. In the U.S., ongoing weakness in housing values is putting pressure on homeowners and mortgage lenders. Similarly, the strong earnings recovery for corporations and banks has not been translated into increased hiring or more active lending. Globally, deleveraging by private and public borrowers is inhibiting economic growth and this process is far from complete.
Encouragingly, a variety of constructive actions are being taken by governments around the world to stimulate further recovery. In the U.S., the recent passage of a stimulatory tax bill relieves some of the pressure on the Federal Reserve System to promote economic expansion through quantitative easing and offers the promise of faster economic growth. A number of European governments are undertaking programs that could significantly reduce their budget deficits. Governments across the emerging markets are implementing various steps to deal with global capital flows without undermining international trade and investment.
The success of these government actions could have an important impact on whether 2011 brings further economic recovery and financial market progress. One risk associated with the extraordinary efforts to strengthen U.S. economic growth is that the debt of the U.S. government will continue to grow to unprecedented levels. Another risk is that over time there could be upward pressures on asset values in the U.S. and abroad, because what happens in the U.S. impacts the rest of the world economy. We must hope that the progress made on the fiscal front in 2010 will continue into 2011. In this environment, your Nuveen investment team continues to seek sustainable investment opportunities and to remain alert to potential risks in a recovery still facing many headwinds. On your b ehalf, we monitor their activities to assure they maintain their investment disciplines.
As you will note elsewhere in this report, on January 1, 2011, Nuveen Investments completed the acquisition of FAF Advisors, Inc., the manager of the First American Funds. The acquisition adds highly respected and distinct investment teams to meet the needs of investors and their advisors and is designed to benefit all fund shareholders by creating a fund organization with the potential for further economies of scale and the ability to draw from even greater talent and expertise to meet these investor needs.
As always, I encourage you to contact your financial consultant if you have any questions about your investment in a Nuveen fund. On behalf of the other members of your Fund Board, we look forward to continuing to earn your trust in the months and years ahead.
Sincerely,
Robert P. Bremner
Chairman of the Board
January 21, 2011
Nuveen Investments 1
Portfolio Manager’s Comments
Nuveen Georgia Premium Income Municipal Fund (NPG)
Nuveen Georgia Dividend Advantage Municipal Fund (NZX)
Nuveen Georgia Dividend Advantage Municipal Fund 2 (NKG)
Nuveen North Carolina Premium Income Municipal Fund (NNC)
Nuveen North Carolina Dividend Advantage Municipal Fund (NRB)
Nuveen North Carolina Dividend Advantage Municipal Fund 2 (NNO)
Nuveen North Carolina Dividend Advantage Municipal Fund 3 (NII)
Portfolio manager Daniel Close discusses key investment strategies and the six-month performance of the Nuveen Georgia and North Carolina Funds. Dan, who joined Nuveen in 2000, assumed portfolio management responsibility for these seven Funds in 2007.
What key strategies were used to manage the Georgia and North Carolina Funds during the six-month reporting period ended November 30, 2010?
During this period, the combination of strong demand and tighter supply of new tax-exempt municipal issuance continued to create favorable conditions. One reason for the decline in new tax-exempt supply was the considerable issuance of taxable municipal debt under the Build America Bond (BAB) program. Build America Bonds, first issued in April 2009, generally offer municipal issuers a federal subsidy equal to 35% of a security’s interest payments, providing issuers with an alternative to traditional tax-exempt debt. For the six months ended November 30, 2010, taxable Build America Bond issuance totaled $57.5 billion, representing 26% of new bonds in the municipal marketplace nationwide. In Georgia and North Carolina during this period, Build America Bonds accounted f or approximately 10% and 18% of municipal supply, respectively. Although these percentages were lower than the national average for BABs, the impact on tax-exempt supply was meaningful in both states, due to the fact that municipal issuance in Georgia and North Carolina was already down sharply from the same period a year earlier. Since interest payments from Build America Bonds represent taxable income, we do not view these bonds as good investment opportunities for these Funds.
Certain statements in this report are forward-looking statements. Discussions of specific investments are for illustration only and are not intended as recommendations of individual investments. The forward-looking statements and other views expressed herein are those of the portfolio manager as of the date of this report. Actual future results or occurrences may differ significantly from those anticipated in any forward-looking statements, and the views expressed herein are subject to change at any time, due to numerous market and other factors. The Funds disclaim any obligation to update publicly or revise any forward-looking statements or views expressed herein.
Any reference to credit ratings for portfolio holdings denotes the highest rating assigned by a Nationally Recognized Statistical Rating Organization (NRSRO) such as Standard & Poor’s, Moody’s or Fitch. AAA, AA, A, and BBB ratings are investment grade; BB, B, CCC, CC, C and D ratings are below investment grade. Holdings and ratings may change over time.
2 Nuveen Investments
In this environment of constrained tax-exempt municipal issuance, we continued to take a bottom-up approach in an attempt to discover undervalued sectors and individual credits with the potential to perform well over the long term. For the most part, the Funds were focused on bonds with maturities at the longer end of the yield curve. During this period, the Georgia Funds found value primarily in health care bonds. When in-state issues became especially scarce, the Georgia Funds took advantage of their ability to invest up to 20% of their net assets in out-of-state credits, buying insured Alabama electric utility bonds in order to keep the Funds as fully invested as possible. In the North Carolina Funds, our purchases included higher education credits, bonds issued for Ral eigh Durham Airport and health care bonds, including those issued for Charlotte-Mecklenburg Hospital and Novant Health.
Some of our investment activity resulted from opportunities created by the provisions of the Build America Bond program. For example, tax-exempt supply was more plentiful in the health care and higher education sectors because, as 501(c)(3) (nonprofit) organizations, hospitals and private universities generally did not qualify for the Build America Bond program and continued to issue bonds in the tax-exempt municipal market. Bonds with proceeds earmarked for refundings, working capital and private activities also were not covered by the Build America Bond program, and this resulted in attractive opportunities in various other sectors of the market.
The impact of the Build America Bond program also was evident in the area of longer-term issuance, as municipal issuers sought to take full advantage of the attractive financing terms offered by these bonds. Approximately 70% of Build America Bonds were issued with maturities of at least 30 years. This significantly reduced the availability of tax-exempt credits with longer maturities and made locating appropriate longer bonds more challenging in both of these states, although we continued to find opportunities to purchase attractive longer-term bonds for these Funds. The issuance of Build America Bonds ended on December 31, 2010.
Cash for new purchases during this period was generated primarily by the proceeds from bond calls and maturing bonds, which we worked to redeploy to keep the Funds fully invested. Although the North Carolina Funds sold a few small positions in pre-refunded bonds, active selling was relatively minimal in both states, as the bonds in our portfolios generally offered higher yields than those available in the current marketplace.
As of November 30, 2010, all seven of these Funds continued to use inverse floating rate securities.1 We employ inverse floaters as a form of leverage for a variety of reasons, including duration management, income enhancement and total return enhancement.
| 1 | An inverse floating rate security, also known as an inverse floater, is a financial instrument designed to pay long-term interest at a rate that varies inversely with a short-term interest rate index. For the Nuveen Funds, the index typically used is the Securities Industry and Financial Markets Association (SIFMA) Municipal Swap Index. Inverse floaters, including those inverse floating rate securities in which the Funds invested during this reporting period, are further defined within the Notes to Financial Statements and Glossary of Terms Used in this Report sections of this report. |
Nuveen Investments 3
How did the Funds perform?
Individual results for the Nuveen Georgia and North Carolina Funds, as well as relevant index and peer group information, are presented in the accompanying table.
Average Annual Total Returns on Common Share Net Asset Value*
For periods ended 11/30/10
| Fund | 6-Month | 1-Year | 5-Year | 10-Year |
| Georgia Funds | | | | |
| NPG | -0.02% | 4.13% | 4.09% | 5.75% |
| NZX | 0.53% | 4.67% | 4.72% | N/A |
| NKG | 0.38% | 4.81% | 4.34% | N/A |
| | | | | |
Standard & Poor’s (S&P) Georgia Municipal Bond Index2 | 1.49% | 5.11% | 4.44% | 5.21% |
Standard & Poor’s (S&P) National Municipal Bond Index3 | 1.09% | 5.06% | 4.44% | 5.27% |
Lipper Other States Municipal Debt Funds Average4 | 0.78% | 6.04% | 4.23% | 5.85% |
| | | | | |
| North Carolina Funds | | | | |
| NNC | 0.79% | 5.40% | 4.78% | 6.13% |
| NRB | 0.28% | 4.51% | 5.22% | N/A |
| NNO | 0.34% | 4.43% | 4.88% | N/A |
| NII | 0.47% | 4.57% | 5.04% | N/A |
| | | | | |
Standard & Poor’s (S&P) North Carolina Municipal Bond Index2 | 1.45% | 4.77% | 4.90% | 5.51% |
Standard & Poor’s (S&P) National Municipal Bond Index3 | 1.09% | 5.06% | 4.44% | 5.27% |
Lipper Other States Municipal Debt Funds Average4 | 0.78% | 6.04% | 4.23% | 5.85% |
For the six months ended November 30, 2010, the cumulative returns on common share net asset value (NAV) for all seven of the Nuveen Georgia and North Carolina Funds underperformed the returns for their respective state’s Standard & Poor’s (S&P) Municipal Bond Index as well as the Standard & Poor’s (S&P) National Municipal Bond Index. NNC exceeded the average return for the Lipper Other States Municipal Debt Funds Average, while the remaining six Funds underperformed the group average.
Key management factors that influenced the Funds’ returns during this period included duration and yield curve positioning, credit exposure and sector allocation. In addition, all of the Funds except NPG had holdings pre-refunded during this period, which benefited these Funds through price appreciation and enhanced credit quality. The use of financial leverage also factored into the Funds’ performance. Leverage is discussed in more detail on page five.
| * | Six-month returns are cumulative; all other returns are annualized. |
| | Past performance is not predictive of future results. Current performance may be higher or lower than the data shown. Returns do not reflect the deduction of taxes that shareholders may have to pay on Fund distributions or upon the sale of Fund shares. |
| | For additional information, see the individual Performance Overview for your Fund in this report. |
| 2 | The Standard & Poor’s (S&P) Municipal Bond Indexes for Georgia and North Carolina are unleveraged, market value-weighted indexes designed to measure the performance of the tax-exempt, investment-grade municipal bond markets in Georgia and North Carolina, respectively. These indexes do not reflect any initial or ongoing expenses and are not available for direct investment. |
| 3 | The Standard & Poor’s (S&P) National Municipal Bond Index is an unleveraged, market value-weighted index designed to measure the performance of the tax-exempt, investment-grade U.S. municipal bond market. This index does not reflect any initial or ongoing expenses and is not available for direct investment. |
| 4 | The Lipper Other States Municipal Debt Funds Average is calculated using the returns of all leveraged and unleveraged closed-end funds in this category for each period as follows: 6-month, 46 funds; 1-year, 46 funds; 5-year, 46 funds; and 10-year, 20 funds. Lipper returns account for the effects of management fees and assume reinvestment of dividends, but do not reflect any applicable sales charges. The Lipper average is not available for direct investment. Shareholders should note that the performance of the Lipper Other States Average represents the overall average of returns for funds from ten different states with a wide variety of municipal market conditions, making direct comparisons less meaningful. |
4 Nuveen Investments
During this period, municipal bonds with intermediate maturities generally outperformed other maturities, with credits at both the shortest and longest ends of the municipal yield curve posting the weakest returns. Overall, duration and yield curve positioning proved positive for the performance of the three Georgia Funds as well as NNC and NII. These Funds generally had good weightings in the outperforming intermediate-maturity sector and less exposure to the underperforming long part of the curve. NRB and NNO were not as well positioned in terms of duration and yield curve positioning, which detracted from their performance during this period.
Credit exposure also played a role in the performance of these Funds. For the period, bonds rated AA generally performed poorly on a relative basis, while those rated BBB or below and non-rated bonds posted stronger returns. In this environment, the Funds’ performance benefited from their allocations to lower quality and non-rated credits. All four of the North Carolina Funds tended to be underweighted in these lower quality credit categories, which lessened the positive impact. In addition, NPG in particular, as well as NNO, had the heaviest allocations of bonds rated AA among these Funds, which negatively impacted their relative performance for this period.
Holdings that generally made positive contributions to the Georgia Funds’ returns during this period included an underweight exposure to the underperforming transportation sector while housing was negative for all three Georgia funds. For the North Carolina Funds, the tax supported sector outperformed while our utility exposure was generally a negative.
In contrast, the education and water and sewer sectors turned in relatively weak performances and zero coupon bonds trailed the municipal market by the widest margin. The transportation sector, with the exception of the airport subsector, also failed to keep pace with the municipal market return for the six months.
IMPACT OF THE FUNDS’ LEVERAGE STRATEGIES ON PERFORMANCE
One important factor impacting the returns of most of these Funds relative to the comparative indexes was the Funds’ use of financial leverage. The Funds use leverage because their managers believe that, over time, leveraging provides opportunities for additional income and total return for common shareholders. However, use of leverage also can expose common shareholders to additional volatility. For example, as the prices of securities held by a Fund decline, the negative impact of these valuation changes on common share net asset value and common shareholder total return is magnified by the use of leverage. Conversely, leverage may enhance common share returns during periods when the prices of securities held by a Fund generally are rising. Leverage made a positive contribution to the performance of these Funds over this reporting period.
Nuveen Investments 5
RECENT DEVELOPMENTS REGARDING THE FUNDS’ LEVERAGED CAPITAL STRUCTURE
Shortly after their respective inception, each of the Funds issued auction rate preferred shares (ARPS) to create financial leverage. As noted in past shareholder reports, the ARPS issued by many closed-end funds, including these Funds, have been hampered by a lack of liquidity since February 2008. Since that time, more ARPS have been submitted for sale in each of their regularly scheduled auctions than there have been offers to buy. In fact, offers to buy have been almost completely non-existent since late February 2008. This means that these auctions have “failed to clear,” and that many, or all, of the ARPS shareholders who wanted to sell their shares in these auctions were unable to do so. This lack of liquidity in ARPS did not lower the credit quality of t hese shares, and ARPS shareholders unable to sell their shares continued to receive distributions at the “maximum rate” applicable to failed auctions, as calculated in accordance with the pre-established terms of the ARPS. In the recent market, with short-term rates at multigenerational lows, those maximum rates also have been low.
One continuing implication for common shareholders from the auction failures is that each Fund’s cost of leverage likely has been incrementally higher at times than it otherwise might have been had the auctions continued to be successful. As a result, each Fund’s common share earnings likely have been incrementally lower at times than they otherwise might have been.
As noted in past shareholder reports, the Nuveen funds’ Board of Directors/Trustees authorized several methods that can be used separately or in combination to refinance a portion of the Nuveen funds’ outstanding ARPS. Some funds have utilized tender option bonds (TOBs), also known as inverse floating rate securities, for leverage purposes. The amount of TOBs that a fund may use varies according to the composition of each fund’s portfolio. Some funds have a greater ability to use TOBs than others. Some funds have issued Variable Rate Demand Preferred (VRDP) Shares, a floating rate form of preferred stock. Some funds have issued MuniFund Term Preferred (MTP) Shares, a fixed rate form of preferred stock with a mandatory redemption period of five years.
While all these efforts have reduced the total amount of outstanding ARPS issued by the Nuveen funds, the funds cannot provide any assurance on when the remaining outstanding ARPS might be redeemed.
During 2010, and as of the time this report was prepared, 33 Nuveen leveraged closed-end funds (excluding all of the Funds included in this report) received a demand letter from a law firm on behalf of purported holders of common shares of each such fund, alleging that Nuveen and the funds’ officers and Board of Directors/ Trustees breached their fiduciary duties related to the redemption at par of the funds’ ARPS. In response, the Board established an ad hoc Demand Committee consisting of certain of its disinterested and independent Board members to investigate the claims. The Demand Committee retained independent counsel to assist it in conducting an extensive investigation. Based upon its investigation, the Demand Committee found that it was not in the
6 Nuveen Investments
best interests of each fund or its shareholders to take the actions suggested in the demand letters, and recommended that the full Board reject the demands made in the demand letters. After reviewing the findings and recommendation of the Demand Committee, the full Board of each fund unanimously adopted the Demand Committee’s recommendation.
Subsequently, 26 of the funds that received demand letters, were named as nominal defendants in a putative shareholder derivative action complaint captioned Safier and Smith v. Nuveen Asset Management, et al. that was filed in the Circuit Court of Cook County, Illinois, Chancery Division (the “Cook County Chancery Court”) on July 27, 2010. Three additional funds were named as nominal defendants in a similar complaint captioned Curbow v. Nuveen Asset Management, et al. filed in the Cook County Chancery Court on August 12, 2010, and three additional funds were named as nominal defendants in a similar complaint captioned Beidler v. Nuveen Asset Management, et al. filed in the Cook County Chancery Court on September 21, 2010 (collectively, the “Complaints”). The Complaints, filed on behalf of purported holders of each fund’s common shares, also name Nuveen Asset Management as a defendant, together with current and former Officers and interested Director/Trustees of each of the funds (together with the nominal defendants, collectively, the “Defendants”). The Complaints contain the same basic allegations contained in the demand letters. The suits seek a declaration that the Defendants have breached their fiduciary duties, an order directing the Defendants not to redeem any ARPS at their liquidation value using fund assets, indeterminate monetary damages in favor of the funds and an award of plaintiffs’ costs and disbursements in pursuing the action. Nuveen Asset Management believes that the Complaints are without merit, and intends to defend vigorously against these charges.
As of November 30, 2010, the amount of ARPS redeemed by the Funds are as shown in the accompanying table.
| | Auction Rate | % of Original |
| | Preferred Shares | Auction Rate |
| Fund | Redeemed | Preferred Shares |
| NPG | $27,800,000 | 100.0% |
| NZX | $15,000,000 | 100.0% |
| NKG | $33,000,000 | 100.0% |
| NNC | $25,250,000 | 54.0% |
| NRB | $17,000,000 | 100.0% |
| NNO | $28,000,000 | 100.0% |
| NII | $28,000,000 | 100.0% |
Nuveen Investments 7
MTP
As of November 30, 2010, the Funds have issued and outstanding MTP Shares, at liquidation value, as shown in the accompanying table.
| | MTP Shares |
| Fund | at Liquidation Value |
| NPG | $28,340,000 |
| NZX | $14,340,000 |
| NKG | $32,265,000 |
| NNC | $24,300,000 |
| NRB | $16,600,000 |
| NNO | $29,700,000 |
| NII | $28,725,000 |
Subsequent to the reporting period, NNC completed the issuance of $25.53 million of 2.60%, Series 2016 MTP. The newly issued MTP Shares trade on the NYSE under the symbol “NNC PrD.” The net proceeds from this offering were used to refinance the Fund’s remaining outstanding ARPS at par. Immediately following its MTP issuance, NNC noticed for redemption at par its remaining $21.550 million ARPS outstanding using the MTP proceeds.
(Refer to Notes to Financial Statements, Footnote 1 – General Information and Significant Accounting Policies and Footnote 4 – Fund Shares for further details on MTP Shares.)
As of November 30, 2010, all 84 of the Nuveen closed-end municipal funds that had issued ARPS have redeemed at par all or a portion of these shares. These redemptions bring the total amount of Nuveen’s municipal closed-end funds’ ARPS redemptions to approximately $5.8 billion of the approximately $11.0 billion originally outstanding.
For up-to-date information, please visit the Nuveen CEF Auction Rate Preferred Resource Center at: http://www.nuveen.com/arps.
8 Nuveen Investments
Common Share Dividend and Share Price Information
The monthly dividends of all seven Funds in this report remained stable throughout the six-month reporting period ended November 30, 2010.
All of the Funds in this report seek to pay stable dividends at rates that reflect each Fund’s past results and projected future performance. During certain periods, each Fund may pay dividends at a rate that may be more or less than the amount of net investment income actually earned by the Fund during the period. If a Fund has cumulatively earned more than it has paid in dividends, it holds the excess in reserve as undistributed net investment income (UNII) as part of the Fund’s NAV. Conversely, if a Fund has cumulatively paid dividends in excess of its earnings, the excess constitutes negative UNII that is likewise reflected in the Fund’s NAV. Each Fund will, over time, pay all of its net investment income as dividends to shareholders. As of November 3 0, 2010, all of the Funds in this report had positive UNII balances, based on our best estimates, for tax purposes and positive UNII balances for financial reporting purposes.
COMMON SHARE REPURCHASES AND SHARE PRICE INFORMATION
Since the inception of the Funds’ repurchase program, the Funds have not repurchased any of their outstanding common shares.
As of November 30, 2010, the Funds’ common share prices were trading at (+)premiums or (-)discounts to their common share NAVs as shown in the accompanying table.
| | 11/30/10 | 6-Month Average |
| Fund | (+)Premium/(-)Discount | (+)Premium/(-)Discount |
| NPG | -1.77% | -1.03% |
| NZX | +3.03% | +0.90% |
| NKG | -0.43% | -1.91% |
| NNC | +0.76% | +3.55% |
| NRB | +4.30% | +7.64% |
| NNO | +0.88% | +6.12% |
| NII | +2.22% | +5.70% |
Nuveen Investments 9
| NPG | | Nuveen Georgia |
| Performance | | Premium Income |
| | Municipal Fund |
| | | as of November 30, 2010 |
| Fund Snapshot | | | | |
| Common Share Price | | $ | 13.86 | |
| Common Share Net Asset Value (NAV) | | $ | 14.11 | |
| Premium/(Discount) to NAV | | | -1.77 | % |
| Market Yield | | | 5.11 | % |
Taxable-Equivalent Yield1 | | | 7.55 | % |
| Net Assets Applicable to Common Shares ($000) | | $ | 53,697 | |
| Average Annual Total Return | | | | | | | |
| (Inception 5/20/93) | | | | | | | |
| | | On Share Price | | On NAV | |
| 6-Month (Cumulative) | | | 1.83 | % | | -0.02 | % |
| 1-Year | | | 12.69 | % | | 4.13 | % |
| 5-Year | | | 3.75 | % | | 4.09 | % |
| 10-Year | | | 5.32 | % | | 5.75 | % |
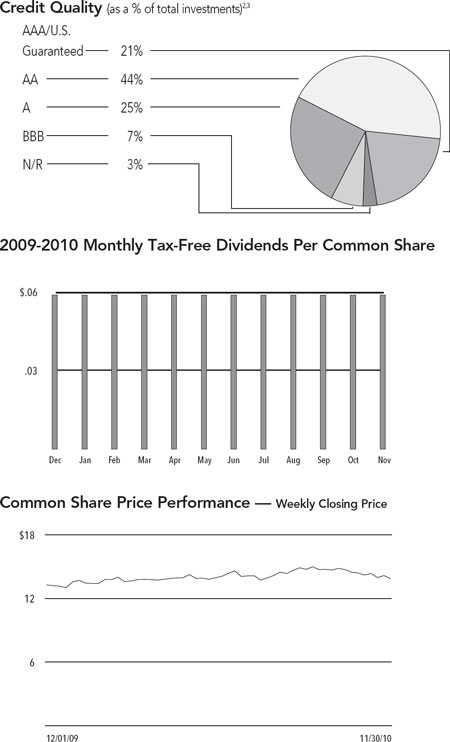
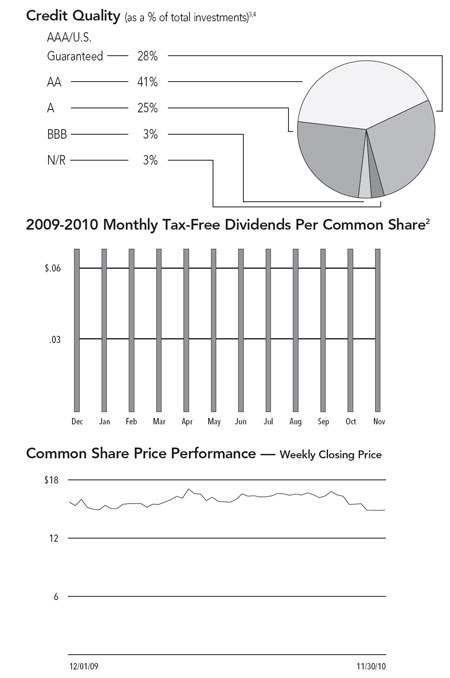
Portfolio Composition3 | | | | |
| (as a % of total investments) | | | | |
| Tax Obligation/General | | | 22.0 | % |
| Education and Civic Organizations | | | 15.7 | % |
| Water and Sewer | | | 14.5 | % |
| Tax Obligation/Limited | | | 13.6 | % |
| U.S. Guaranteed | | | 11.3 | % |
| Health Care | | | 8.2 | % |
| Utilities | | | 7.1 | % |
| Other | | | 7.6 | % |
| | Refer to the Glossary of Terms used in this Report for further definition of the terms used within this Fund’s Performance Overview page. |
| 1 | Taxable-Equivalent Yield represents the yield that must be earned on a fully taxable investment in order to equal the yield of the Fund on an after-tax basis. It is based on a combined federal and state income tax rate of 32.3%. When comparing this Fund to investments that generate qualified dividend income, the Taxable-Equivalent Yield is lower. |
| 2 | Ratings shown are the highest of Standard & Poor’s Group, Moody’s Investor Service, Inc. or Fitch, Inc. AAA includes bonds with an implied AAA rating since they are backed by U.S. Government or agency securities. AAA, AA, A and BBB ratings are investment grade; BB, B, CCC, CC, C and D ratings are below-investment grade. Holdings designated N/R are not rated by any of these national rating agencies. |
| 3 | Holdings are subject to change. |
10 Nuveen Investments
| NZX | | Nuveen Georgia |
| Performance | | Dividend Advantage |
| | Municipal Fund |
| | | as of November 30, 2010 |
| Fund Snapshot | | | | |
| Common Share Price | | $ | 14.95 | |
| Common Share Net Asset Value (NAV) | | $ | 14.51 | |
| Premium/(Discount) to NAV | | | 3.03 | % |
| Market Yield | | | 5.14 | % |
Taxable-Equivalent Yield1 | | | 7.59 | % |
| Net Assets Applicable to Common Shares ($000) | | $ | 28,619 | |
| Average Annual Total Return | | | | | | | |
| (Inception 9/25/01) | | | | | | | |
| | | On Share Price | | On NAV | |
| 6-Month (Cumulative) | | | 1.04 | % | | 0.53 | % |
| 1-Year | | | 8.45 | % | | 4.67 | % |
| 5-Year | | | 3.41 | % | | 4.72 | % |
| | | 5.45 | % | | 5.65 | % |
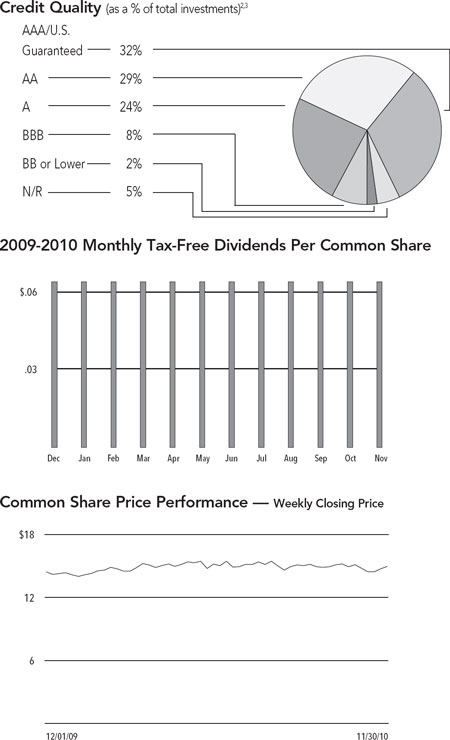
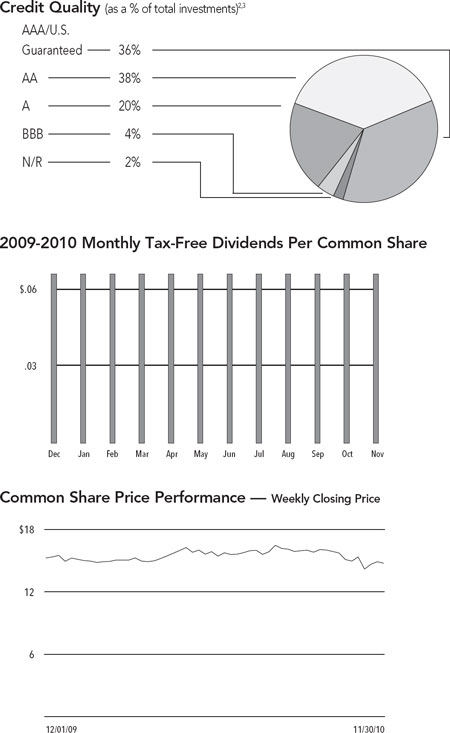
Portfolio Composition3 | | | | |
| (as a % of total investments) | | | | |
| U.S. Guaranteed | | | 16.9 | % |
| Education and Civic Organizations | | | 16.7 | % |
| Tax Obligation/General | | | 14.0 | % |
| Health Care | | | 13.6 | % |
| Water and Sewer | | | 13.3 | % |
| Housing/Single Family | | | 8.6 | % |
| Tax Obligation/Limited | | | 6.8 | % |
| Other | | | 10.1 | % |
| | Refer to the Glossary of Terms used in this Report for further definition of the terms used within this Fund’s Performance Overview page. |
| 1 | Taxable-Equivalent Yield represents the yield that must be earned on a fully taxable investment in order to equal the yield of the Fund on an after-tax basis. It is based on a combined federal and state income tax rate of 32.3%. When comparing this Fund to investments that generate qualified dividend income, the Taxable-Equivalent Yield is lower. |
| 2 | Ratings shown are the highest of Standard & Poor’s Group, Moody’s Investor Service, Inc. or Fitch, Inc. AAA includes bonds with an implied AAA rating since they are backed by U.S. Government or agency securities. AAA, AA, A and BBB ratings are investment grade; BB, B, CCC, CC, C and D ratings are below-investment grade. Holdings designated N/R are not rated by any of these national rating agencies. |
| 3 | Holdings are subject to change. |
Nuveen Investments 11
| NKG | | Nuveen Georgia |
| Performance | | Dividend Advantage |
| | Municipal Fund 2 |
| | | as of November 30, 2010 |
| Fund Snapshot | | | | |
| Common Share Price | | $ | 13.85 | |
| Common Share Net Asset Value (NAV) | | $ | 13.91 | |
| Premium/(Discount) to NAV | | | -0.43 | % |
| Market Yield | | | 5.20 | % |
Taxable-Equivalent Yield1 | | | 7.68 | % |
| Net Assets Applicable to Common Shares ($000) | | $ | 63,355 | |
| Average Annual Total Return | | | | | | | |
| (Inception 9/25/02) | | | | | | | |
| | | On Share Price | | On NAV | |
| 6-Month (Cumulative) | | | 1.47 | % | | 0.38 | % |
| 1-Year | | | 14.40 | % | | 4.81 | % |
| 5-Year | | | 6.01 | % | | 4.34 | % |
| | | 4.30 | % | | 4.71 | % |
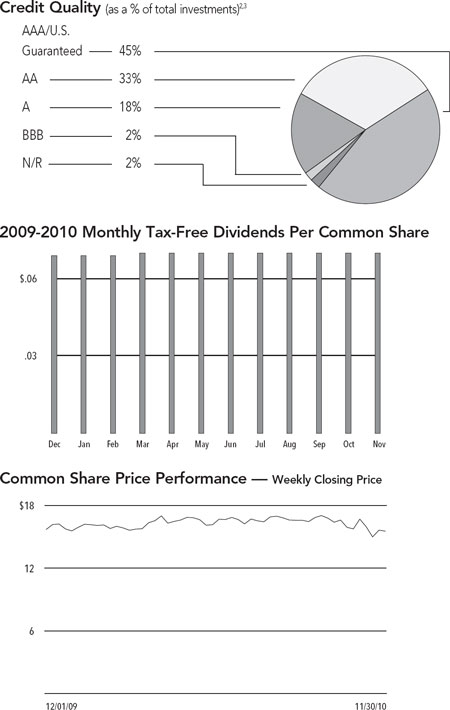
Portfolio Composition3 | | | | |
| (as a % of total investments) | | | | |
| Water and Sewer | | | 19.6 | % |
| Tax Obligation/General | | | 18.9 | % |
| Education and Civic Organizations | | | 11.7 | % |
| U.S. Guaranteed | | | 11.2 | % |
| Tax Obligation/Limited | | | 11.1 | % |
| Health Care | | | 10.5 | % |
| Utilities | | | 4.2 | % |
| Other | | | 12.8 | % |
| | Refer to the Glossary of Terms used in this Report for further definition of the terms used within this Fund’s Performance Overview page. |
| 1 | Taxable-Equivalent Yield represents the yield that must be earned on a fully taxable investment in order to equal the yield of the Fund on an after-tax basis. It is based on a combined federal and state income tax rate of 32.3%. When comparing this Fund to investments that generate qualified dividend income, the Taxable-Equivalent Yield is lower. |
| 2 | Ratings shown are the highest of Standard & Poor’s Group, Moody’s Investor Service, Inc. or Fitch, Inc. AAA includes bonds with an implied AAA rating since they are backed by U.S. Government or agency securities. AAA, AA, A and BBB ratings are investment grade; BB, B, CCC, CC, C and D ratings are below-investment grade. Holdings designated N/R are not rated by any of these national rating agencies. |
| 3 | Holdings are subject to change. |
12 Nuveen Investments
| NNC | | Nuveen North Carolina |
| Performance | | Premium Income |
| | Municipal Fund |
| | | as of November 30, 2010 |
| Fund Snapshot | | | | |
| Common Share Price | | $ | 14.58 | |
| Common Share Net Asset Value (NAV) | | $ | 14.47 | |
| Premium/(Discount) to NAV | | | 0.76 | % |
| Market Yield | | | 5.10 | % |
Taxable-Equivalent Yield1 | | | 7.69 | % |
| Net Assets Applicable to Common Shares ($000) | | $ | 92,079 | |
| Average Annual Total Return | | | | | | | |
| (Inception 5/20/93) | | | | | | | |
| | | On Share Price | | On NAV | |
| 6-Month (Cumulative) | | | -2.74 | % | | 0.79 | % |
| 1-Year | | | 1.69 | % | | 5.40 | % |
| 5-Year | | | 5.29 | % | | 4.78 | % |
| 10-Year | | | 5.96 | % | | 6.13 | % |
Portfolio Composition3 | | | | |
| (as a % of total investments) | | | | |
| Tax Obligation/Limited | | | 25.7 | % |
| Health Care | | | 15.4 | % |
| U.S. Guaranteed | | | 14.0 | % |
| Education and Civic Organizations | | | 13.1 | % |
| Transportation | | | 7.5 | % |
| Water and Sewer | | | 6.9 | % |
| Utilities | | | 5.9 | % |
| Other | | | 11.5 | % |
| | Refer to the Glossary of Terms used in this Report for further definition of the terms used within this Fund’s Performance Overview page. |
| 1 | Taxable-Equivalent Yield represents the yield that must be earned on a fully taxable investment in order to equal the yield of the Fund on an after-tax basis. It is based on a combined federal and state income tax rate of 33.7%. When comparing this Fund to investments that generate qualified dividend income, the Taxable-Equivalent Yield is lower. |
| 2 | Ratings shown are the highest of Standard & Poor’s Group, Moody’s Investor Service, Inc. or Fitch, Inc. AAA includes bonds with an implied AAA rating since they are backed by U.S. Government or agency securities. AAA, AA, A and BBB ratings are investment grade; BB, B, CCC, CC, C and D ratings are below-investment grade. Holdings designated N/R are not rated by any of these national rating agencies. |
| 3 | Holdings are subject to change. |
Nuveen Investments 13
| NRB | | Nuveen North Carolina |
| Performance | | Dividend Advantage |
| | Municipal Fund |
| | | as of November 30, 2010 |
| Fund Snapshot | | | | |
| Common Share Price | | $ | 15.53 | |
| Common Share Net Asset Value (NAV) | | $ | 14.89 | |
| Premium/(Discount) to NAV | | | 4.30 | % |
| Market Yield | | | 5.41 | % |
Taxable-Equivalent Yield1 | | | 8.16 | % |
| Net Assets Applicable to Common Shares ($000) | | $ | 33,815 | |
| Average Annual Total Return | | | | | | | |
| (Inception 1/25/01) | | | | | | | |
| | | On Share Price | | On NAV | |
| 6-Month (Cumulative) | | | -1.23 | % | | 0.28 | % |
| 1-Year | | | 2.40 | % | | 4.51 | % |
| 5-Year | | | 3.51 | % | | 5.22 | % |
| | | 5.92 | % | | 6.21 | % |
Portfolio Composition3 | | | | |
| (as a % of total investments) | | | | |
| Water and Sewer | | | 26.5 | % |
| Tax Obligation/Limited | | | 16.3 | % |
| Health Care | | | 15.2 | % |
| U.S. Guaranteed | | | 11.2 | % |
| Utilities | | | 8.0 | % |
| Tax Obligation/General | | | 6.9 | % |
| Education and Civic Organizations | | | 5.8 | % |
| Transportation | | | 5.7 | % |
| Other | | | 4.4 | % |
| | Refer to the Glossary of Terms used in this Report for further definition of the terms used within this Fund’s Performance Overview page. |
| 1 | Taxable-Equivalent Yield represents the yield that must be earned on a fully taxable investment in order to equal the yield of the Fund on an after-tax basis. It is based on a combined federal and state income tax rate of 33.7%. When comparing this Fund to investments that generate qualified dividend income, the Taxable-Equivalent Yield is lower. |
| 2 | Ratings shown are the highest of Standard & Poor’s Group, Moody’s Investor Service, Inc. or Fitch, Inc. AAA includes bonds with an implied AAA rating since they are backed by U.S. Government or agency securities. AAA, AA, A and BBB ratings are investment grade; BB, B, CCC, CC, C and D ratings are below-investment grade. Holdings designated N/R are not rated by any of these national rating agencies. |
| 3 | Holdings are subject to change. |
14 Nuveen Investments
| NNO | | Nuveen North Carolina |
| Performance | | Dividend Advantage |
| | Municipal Fund 2 |
| | | as of November 30, 2010 |
| Fund Snapshot | | | | |
| Common Share Price | | $ | 14.87 | |
Common Share Net Asset Value (NAV) | | $ | 14.74 | |
| Premium/(Discount) to NAV | | | 0.88 | % |
| Market Yield | | | 5.49 | % |
Taxable-Equivalent Yield1 | | | 8.28 | % |
| Net Assets Applicable to Common Shares ($000) | | $ | 55,312 | |
| Average Annual Total Return | | | | | | | |
| (Inception 11/15/01) | | | | | | | |
| | | On Share Price | | On NAV | |
| 6-Month (Cumulative) | | | -2.95 | % | | 0.34 | % |
| 1-Year | | | 1.37 | % | | 4.43 | % |
| 5-Year | | | 4.53 | % | | 4.88 | % |
| | | 5.47 | % | | 5.92 | % |
Portfolio Composition4 | | | | |
| (as a % of total investments) | | | | |
| Tax Obligation/Limited | | | 22.5 | % |
| Health Care | | | 18.4 | % |
| Water and Sewer | | | 15.1 | % |
| U.S. Guaranteed | | | 12.7 | % |
| Transportation | | | 8.3 | % |
| Education and Civic Organizations | | | 7.1 | % |
| Tax Obligation/General | | | 6.1 | % |
| Other | | | 9.8 | % |
| | Refer to the Glossary of Terms used in this Report for further definition of the terms used within this Fund’s Performance Overview page. |
| 1 | Taxable-Equivalent Yield represents the yield that must be earned on a fully taxable investment in order to equal the yield of the Fund on an after-tax basis. It is based on a combined federal and state income tax rate of 33.7%. When comparing this Fund to investments that generate qualified dividend income, the Taxable-Equivalent Yield is lower. |
| 2 | The Fund paid shareholders a capital gains distribution in December 2009 of $0.0023 per share. |
| 3 | Ratings shown are the highest of Standard & Poor’s Group, Moody’s Investor Service, Inc. or Fitch, Inc. AAA includes bonds with an implied AAA rating since they are backed by U.S. Government or agency securities. AAA, AA, A and BBB ratings are investment grade; BB, B, CCC, CC, C and D ratings are below-investment grade. Holdings designated N/R are not rated by any of these national rating agencies. |
| 4 | Holdings are subject to change. |
Nuveen Investments 15
| NII | | Nuveen North Carolina |
| Performance | | Dividend Advantage |
| | Municipal Fund 3 |
| | | as of November 30, 2010 |
| Fund Snapshot | | | | |
| Common Share Price | | $ | 14.75 | |
| Common Share Net Asset Value (NAV) | | $ | 14.43 | |
| Premium/(Discount) to NAV | | | 2.22 | % |
| Market Yield | | | 5.37 | % |
Taxable-Equivalent Yield1 | | | 8.10 | % |
| Net Assets Applicable to Common Shares ($000) | | $ | 56,811 | |
| Average Annual Total Return | | | | | | | |
| (Inception 9/25/02) | | | | | | | |
| | | On Share Price | | On NAV | |
| 6-Month (Cumulative) | | | -4.53 | % | | 0.47 | % |
| 1-Year | | | 0.86 | % | | 4.57 | % |
| 5-Year | | | 6.24 | % | | 5.04 | % |
| | | 4.94 | % | | 5.26 | % |
Portfolio Composition3 | | | | |
| (as a % of total investments) | | | | |
| Tax Obligation/Limited | | | 22.0 | % |
| Water and Sewer | | | 21.1 | % |
| U.S. Guaranteed | | | 20.1 | % |
| Health Care | | | 10.7 | % |
| Utilities | | | 9.1 | % |
| Transportation | | | 4.6 | % |
| Other | | | 12.4 | % |
| | Refer to the Glossary of Terms used in this Report for further definition of the terms used within this Fund’s Performance Overview page. |
| 1 | Taxable-Equivalent Yield represents the yield that must be earned on a fully taxable investment in order to equal the yield of the Fund on an after-tax basis. It is based on a combined federal and state income tax rate of 33.7%. When comparing this Fund to investments that generate qualified dividend income, the Taxable-Equivalent Yield is lower. |
| 2 | Ratings shown are the highest of Standard & Poor’s Group, Moody’s Investor Service, Inc. or Fitch, Inc. AAA includes bonds with an implied AAA rating since they are backed by U.S. Government or agency securities. AAA, AA, A and BBB ratings are investment grade; BB, B, CCC, CC, C and D ratings are below-investment grade. Holdings designated N/R are not rated by any of these national rating agencies. |
| 3 | Holdings are subject to change. |
16 Nuveen Investments
| | | Nuveen Georgia Premium Income Municipal Fund |
| NPG | | Portfolio of Investments |
| | | November 30, 2010 (Unaudited) |
| | Principal | | | Optional Call | | | | |
| | Amount (000) | | Description (1) | Provisions (2) | Ratings (3) | | Value | |
| | | | Consumer Staples – 1.7% (1.1% of Total Investments) | | | | | |
| $ | 1,000 | | Puerto Rico, The Children’s Trust Fund, Tobacco Settlement Asset-Backed Refunding Bonds, Series 2002, 5.500%, 5/15/39 | 5/12 at 100.00 | BBB | $ | 913,130 | |
| | | | Education and Civic Organizations – 23.9% (15.7% of Total Investments) | | | | | |
| | 750 | | Athens Housing Authority, Georgia, Student Housing Lease Revenue Bonds, UGAREF East Campus Housing LLC Project, Series 2009, 5.250%, 6/15/35 | 6/19 at 100.00 | Aa2 | | 775,260 | |
| | 1,000 | | Athens-Clarke County Unified Government Development Authority, Georgia, Educational Facilities Revenue Bonds, UGAREF CCRC Building LLC Project, Series 2002, 5.000%, 12/15/16 – AMBAC Insured | 12/12 at 100.00 | N/R | | 1,039,750 | |
| | 2,800 | | Atlanta Development Authority, Georgia, Educational Facilities Revenue Bonds, Science Park LLC Project, Series 2007, 5.000%, 7/01/39 | 7/17 at 100.00 | A1 | | 2,770,459 | |
| | 1,550 | | Bulloch County Development Authority, Georgia, Student Housing and Athletic Facility Lease Revenue Bonds, Georgia Southern University, Series 2004, 5.250%, 8/01/21 – SYNCORA GTY Insured | 8/14 at 100.00 | A1 | | 1,623,129 | |
| | 700 | | Carrollton Payroll Development Authority, Georgia, Student Housing Revenue Bonds, University of West Georgia, Series 2004A, 5.000%, 9/01/21 – SYNCORA GTY Insured | 9/14 at 100.00 | A1 | | 726,026 | |
| | 1,535 | | Fulton County Development Authority, Georgia, Revenue Bonds, Georgia Tech Molecular Science Building, Series 2004, 5.250%, 5/01/15 – NPFG Insured | 5/14 at 100.00 | Aa3 | | 1,717,696 | |
| | 150 | | Georgia Higher Education Facilities Authority, Revenue Bonds, USG Real Estate Foundation I LLC Project, Series 2008, 6.000%, 6/15/28 | 6/18 at 100.00 | A2 | | 164,603 | |
| | | | Private Colleges and Universities Authority, Georgia, Revenue Bonds, Emory University, Series 2009B, Trust 3404: | | | | | |
| | 270 | | 17.020%, 3/01/17 (IF) | No Opt. Call | AA | | 323,384 | |
| | 430 | | 17.048%, 3/01/17 (IF) | No Opt. Call | AA | | 492,161 | |
| | 1,180 | | Savannah Economic Development Authority, Georgia, Revenue Bonds, Armstrong Atlantic State University, Compass Point LLC Project, Series 2005, 5.000%, 7/01/25 – SYNCORA GTY Insured | 7/15 at 100.00 | A2 | | 1,214,008 | |
| | 1,490 | | Savannah Economic Development Authority, Georgia, Revenue Bonds, Armstrong Center LLC, Series 2005A, 5.000%, 12/01/34 – SYNCORA GTY Insured | 12/15 at 100.00 | A3 | | 1,491,296 | |
| | 500 | | Savannah Economic Development Authority, Georgia, Revenue Bonds, GTREP Project, Series 2002, 5.000%, 7/01/22 – NPFG Insured | 7/12 at 100.00 | Aa3 | | 508,515 | |
| | 12,355 | | Total Education and Civic Organizations | | | | 12,846,287 | |
| | | | Health Care – 12.4% (8.2% of Total Investments) | | | | | |
| | | | Coffee County Hospital Authority, Georgia, Revenue Bonds, Coffee County Regional Medical Center, Series 2004: | | | | | |
| | 100 | | 5.000%, 12/01/19 | 12/14 at 100.00 | BBB– | | 100,540 | |
| | 900 | | 5.250%, 12/01/22 | 12/14 at 100.00 | BBB– | | 898,569 | |
| | 100 | | Coweta County Development Authority, Georgia, Revenue Bonds, Piedmont Healthcare, Inc. Project, Series 2010, 5.000%, 6/15/40 | 6/20 at 100.00 | AA– | | 97,437 | |
| | | | Gainesville and Hall County Hospital Authority, Georgia, Revenue Anticipation Certificates, Northeast Georgia Health Services Inc., Series 2010B: | | | | | |
| | 300 | | 5.125%, 2/15/40 | No Opt. Call | A+ | | 290,058 | |
| | 1,700 | | 5.250%, 2/15/45 | 2/41 at 100.00 | A+ | | 1,655,086 | |
| | 900 | | Houston County Hospital Authority, Georgia, Revenue Bonds, Houston Healthcare Project, Series 2007, 5.250%, 10/01/35 | 10/17 at 100.00 | A2 | | 885,213 | |
| | 225 | | Macon-Bibb County Hospital Authority, Georgia, Revenue Anticipation Certificates, Medical Center of Central Georgia Inc., Series 2009, 5.000%, 8/01/35 | 8/19 at 100.00 | AA | | 221,227 | |
| | 770 | | Royston Hospital Authority, Georgia, Revenue Anticipation Certificates, Ty Cobb Healthcare System Inc., Series 1999, 6.700%, 7/01/16 | 1/11 at 101.00 | N/R | | 764,510 | |
| | 1,000 | | Savannah Hospital Authority, Georgia, Revenue Bonds, St. Joseph’s/Candler Health System, Series 2003, 5.250%, 7/01/23 – RAAI Insured | 1/14 at 100.00 | Baa1 | | 990,430 | |
| | 800 | | Valdosta and Lowndes County Hospital Authority, Georgia, Revenue Certificates, South Georgia Medical Center, Series 2007, 5.000%, 10/01/33 | 10/17 at 100.00 | A+ | | 761,256 | |
| | 6,795 | | Total Health Care | | | | 6,664,326 | |
Nuveen Investments 17
| | | Nuveen Georgia Premium Income Municipal Fund (continued) |
| NPG | | Portfolio of Investments November 30, 2010 (Unaudited) |
| | Principal | | | Optional Call | | | | |
| | Amount (000) | | Description (1) | Provisions (2) | Ratings (3) | | Value | |
| | | | Housing/Multifamily – 1.6% (1.1% of Total Investments) | | | | | |
| $ | 1,000 | | Cobb County Development Authority, Georgia, Student Housing Revenue Bonds, KSU Village II Real Estate Foundation LLC Project, Series 2007A, 5.250%, 7/15/38 – AMBAC Insured | 7/17 at 100.00 | Baa2 | $ | 876,850 | |
| | | | Housing/Single Family – 1.7% (1.1% of Total Investments) | | | | | |
| | 900 | | Georgia Housing and Finance Authority, Single Family Mortgage Bonds, Series 2002B-2, 5.350%, 12/01/22 (Alternative Minimum Tax) | 12/11 at 100.00 | AAA | | 907,416 | |
| | | | Materials – 1.9% (1.2% of Total Investments) | | | | | |
| | 1,000 | | Richmond County Development Authority, Georgia, Environmental Improvement Revenue Bonds, International Paper Company, Series 2001A, 6.250%, 2/01/25 (Alternative Minimum Tax) | 2/11 at 101.00 | BBB | | 1,011,180 | |
| | | | Tax Obligation/General – 33.5% (22.0% of Total Investments) | | | | | |
| | 540 | | Cherokee County Resource Recovery Development Authority, Georgia, Solid Waste Disposal Revenue Bonds, Ball Ground Recycling LLC Project, Series 2007A, 5.000%, 7/01/37 – AMBAC Insured (Alternative Minimum Tax) | 7/17 at 100.00 | AA+ | | 516,645 | |
| | 500 | | Clark County Hospital Authority, Georgia, Hospital Revenue Bonds, Athens Regional Medical Center, Series 2007, 5.000%, 1/01/27 – NPFG Insured | 1/17 at 100.00 | Aa1 | | 512,895 | |
| | 2,000 | | Clarke County Hospital Authority, Georgia, Hospital Revenue Certificates, Athens Regional Medical Center, Series 2002, 5.125%, 1/01/32 – NPFG Insured | 1/12 at 101.00 | Aa1 | | 2,009,520 | |
| | 2,215 | | Decatur, Georgia, General Obligation Bonds, Series 2007, 5.000%, 1/01/31 – AGM Insured | 1/17 at 100.00 | AA+ | | 2,329,250 | |
| | 3,000 | | Floyd County Hospital Authority, Georgia, Revenue Anticipation Certificates, Floyd Medical Center Project, Series 2002, 5.200%, 7/01/32 – NPFG Insured | 7/12 at 101.00 | Aa2 | | 3,031,109 | |
| | 1,090 | | Floyd County Hospital Authority, Georgia, Revenue Anticipation Certificates, Floyd Medical Center, Series 2003, 5.000%, 7/01/19 – NPFG Insured | 7/13 at 101.00 | Aa2 | | 1,140,304 | |
| | 905 | | Georgia Municipal Association Inc., Certificates of Participation, Riverdale Public Purpose Project, Series 2009, 5.375%, 5/01/32 – AGC Insured | 5/19 at 100.00 | AA+ | | 932,123 | |
| | 100 | | Georgia State, General Obligation Bonds, Series 2007E, 5.000%, 8/01/24 | 8/17 at 100.00 | AAA | | 109,703 | |
| | 210 | | Georgia State, General Obligation Bonds, Series 2009B, 5.000%, 1/01/26 | 1/19 at 100.00 | AAA | | 231,158 | |
| | 1,000 | | Georgia, General Obligation Bonds, Series 2005B, 5.000%, 7/01/15 | No Opt. Call | AAA | | 1,164,930 | |
| | 1,800 | | Gwinnett County School District, Georgia, General Obligation Bonds, Series 2008, 5.000%, 2/01/36 (UB) | 2/18 at 100.00 | AAA | | 1,882,008 | |
| | 1,060 | | Henry County Hospital Authority, Georgia, Revenue Certificates, Henry Medical Center, Series 2004, 5.000%, 7/01/20 – NPFG Insured | 7/14 at 101.00 | Aa1 | | 1,111,134 | |
| | 2,500 | | Paulding County School District, Georgia, General Obligation Bonds, Series 2007, 5.000%, 2/01/33 | 2/17 at 100.00 | AA+ | | 2,542,950 | |
| | 500 | | Wayne County Hospital Authority, Georgia, Hospital Revenue Bonds, Series 2006, 5.000%, 3/01/23 – SYNCORA GTY Insured | 3/16 at 100.00 | N/R | | 480,125 | |
| | 17,420 | | Total Tax Obligation/General | | | | 17,993,854 | |
| | | | Tax Obligation/Limited – 20.6% (13.6% of Total Investments) | | | | | |
| | | | Atlanta, Georgia, Tax Allocation Bonds Atlanta Station Project, Series 2007: | | | | | |
| | 70 | | 5.250%, 12/01/19 – AGC Insured | No Opt. Call | AA+ | | 74,551 | |
| | 420 | | 5.000%, 12/01/23 – AGC Insured | 12/17 at 100.00 | AA+ | | 420,441 | |
| | 225 | | Atlanta, Georgia, Tax Allocation Bonds, Eastside Project, Series 2005A, 5.625%, 1/01/16 (Alternative Minimum Tax) | No Opt. Call | A– | | 238,721 | |
| | 50 | | Atlanta, Georgia, Tax Allocation Bonds, Eastside Project, Series 2005B, 5.400%, 1/01/20 | 7/15 at 100.00 | A– | | 50,829 | |
| | 2,000 | | Cobb-Marietta Coliseum and Exhibit Hall Authority, Cobb County, Georgia, Revenue Bonds, Performing Arts Center, Series 2004, 5.000%, 1/01/22 | 1/14 at 100.00 | AAA | | 2,168,280 | |
| | 25 | | Cobb-Marietta Coliseum and Exhibit Hall Authority, Georgia, Revenue Bonds, Refunding Series 2005, 5.500%, 10/01/26 – NPFG Insured | No Opt. Call | A+ | | 28,714 | |
| | 3,890 | | Cobb-Marietta Coliseum and Exhibit Hall Authority, Georgia, Revenue Refunding Bonds, Series 1993, 5.625%, 10/01/26 – NPFG Insured | 10/19 at 100.00 | A | | 4,081,193 | |
| | 2,600 | | Macon-Bibb County Urban Development Authority, Georgia, Revenue Refunding Bonds, Public Facilities Projects, Series 2002A, 5.375%, 8/01/17 | 8/12 at 101.00 | AA | | 2,800,979 | |
| | 1,000 | | Metropolitan Atlanta Rapid Transit Authority, Georgia, Sales Tax Revenue Refunding Bonds, Series 1992P, 6.250%, 7/01/20 – AMBAC Insured | No Opt. Call | Aa2 | | 1,195,170 | |
| | 10,280 | | Total Tax Obligation/Limited | | | | 11,058,878 | |
18 Nuveen Investments
| | Principal | | | Optional Call | | | | |
| | Amount (000) | | Description (1) | Provisions (2) | Ratings (3) | | Value | |
| | | | Transportation – 4.8% (3.1% of Total Investments) | | | | | |
| $ | 215 | | Atlanta, Georgia, Airport General Revenue Bonds, Series 2000B, 5.625%, 1/01/30 – FGIC Insured (Alternative Minimum Tax) | 1/11 at 100.50 | A+ | $ | 216,460 | |
| | 2,290 | | Atlanta, Georgia, Airport General Revenue Bonds, Series 2004G, 5.000%, 1/01/26 – AGM Insured | 1/15 at 100.00 | AA+ | | 2,331,357 | |
| | 2,505 | | Total Transportation | | | | 2,547,817 | |
| | | | U.S. Guaranteed – 17.2% (11.3% of Total Investments) (4) | | | | | |
| | 735 | | Coweta County Development Authority, Georgia, Revenue Bonds, Newnan Water and Sewer, and Light Commission Project, Series 2002, 5.250%, 1/01/18 (Pre-refunded 1/01/13) – FGIC Insured | 1/13 at 100.00 | N/R (4) | | 804,377 | |
| | 2,665 | | Coweta County Water and Sewer Authority, Georgia, Revenue Bonds, Series 2001, 5.250%, 6/01/26 (Pre-refunded 6/01/11) – AMBAC Insured | 6/11 at 102.00 | AAA | | 2,783,298 | |
| | 1,750 | | Gainesville and Hall County Hospital Authority, Georgia, Revenue Anticipation Certificates, Northeast Georgia Health Services Inc., Series 2001, 5.500%, 5/15/31 (Pre-refunded 5/15/11) | 5/11 at 100.00 | N/R (4) | | 1,791,563 | |
| | 25 | | Georgia Municipal Electric Authority, Senior Lien General Power Revenue Bonds, Series 1993Z, 5.500%, 1/01/20 (Pre-refunded 1/01/17) – FGIC Insured | 1/17 at 100.00 | A+ (4) | | 28,338 | |
| | 1,000 | | Georgia, General Obligation Bonds, Series 2002D, 5.000%, 8/01/16 (Pre-refunded 8/01/12) | 8/12 at 100.00 | AAA | | 1,073,980 | |
| | 2,550 | | Gwinnett County Hospital Authority, Georgia, Revenue Anticipation Certificates, Gwinnett Hospital System Inc. Project, Series 1997B, 5.300%, 9/01/27 (Pre-refunded 2/14/12) – NPFG Insured | 2/12 at 102.00 | Aaa | | 2,738,853 | |
| | 8,725 | | Total U.S. Guaranteed | | | | 9,220,409 | |
| | | | Utilities – 10.8% (7.1% of Total Investments) | | | | | |
| | 450 | | Chatom Industrial Development Board, Alabama, Gulf Opportunity Zone Revenue Bonds, PowerSouth Energy Cooperative, Series 2010A, 5.000%, 8/01/37 – AGC Insured | 8/20 at 100.00 | AA+ | | 455,823 | |
| | 1,000 | | Georgia Municipal Electric Authority, General Power Revenue Bonds, Project 1, Series 2007A, 5.000%, 1/01/25 – NPFG Insured | 1/17 at 100.00 | A | | 1,027,930 | |
| | 975 | | Georgia Municipal Electric Authority, Senior Lien General Power Revenue Bonds, Series 1993Z, 5.500%, 1/01/20 – FGIC Insured | No Opt. Call | A+ | | 1,084,444 | |
| | 1,000 | | Municipal Electric Authority of Georgia, Combustion Turbine Revenue Bonds, Series 2003A, 5.000%, 11/01/20 – NPFG Insured | 11/13 at 100.00 | A1 | | 1,072,080 | |
| | 1,000 | | Municipal Electric Authority of Georgia, Project One Subordinated Lien Revenue Bonds, Series 2003A, 5.000%, 1/01/22 – NPFG Insured | 1/13 at 100.00 | A | | 1,024,520 | |
| | 1,200 | | Virgin Islands Water and Power Authority, Electric System Revenue Bonds, Series 2007B, 5.000%, 7/01/31 | 7/17 at 100.00 | BBB– | | 1,158,072 | |
| | 5,625 | | Total Utilities | | | | 5,822,869 | |
| | | | Water and Sewer – 22.1% (14.5% of Total Investments) | | | | | |
| | 190 | | Atlanta, Georgia, Water and Wastewater Revenue Bonds, Series 1999A, 5.000%, 11/01/38 – FGIC Insured | 5/11 at 100.00 | A1 | | 182,938 | |
| | 1,225 | | Atlanta, Georgia, Water and Wastewater Revenue Bonds, Series 2004, 5.000%, 11/01/24 – AGM Insured | 11/14 at 100.00 | AA+ | | 1,260,476 | |
| | 2,490 | | Cherokee County Water and Sewerage Authority, Georgia, Revenue Bonds, Series 2001, 5.000%, 8/01/35 – AGM Insured | 8/18 at 100.00 | AA+ | | 2,538,281 | |
| | 335 | | Coweta County Water and Sewer Authority, Georgia, Revenue Bonds, Series 2001, 5.250%, 6/01/26 – AMBAC Insured | 6/11 at 102.00 | AAA | | 347,191 | |
| | | | Coweta County Water and Sewer Authority, Georgia, Revenue Bonds, Series 2007: | | | | | |
| | 500 | | 5.000%, 6/01/32 | 6/18 at 100.00 | Aa2 | | 512,730 | |
| | 150 | | 5.000%, 6/01/37 | 6/18 at 100.00 | Aa2 | | 152,013 | |
| | 890 | | Douglasville-Douglas County Water and Sewer Authority, Georgia, Water and Sewer Revenue Bonds, Series 2007, 5.000%, 6/01/37 – NPFG Insured | 6/17 at 100.00 | Aa2 | | 904,560 | |
| | 750 | | Forsyth County Water and Sewerage Authority, Georgia, Revenue Bonds, Series 2007, 5.000%, 4/01/37 – AGM Insured | 4/17 at 100.00 | Aaa | | 758,678 | |
| | 1,950 | | Fulton County, Georgia, Water and Sewerage Revenue Bonds, Series 2004, 5.000%, 1/01/22 – FGIC Insured | 1/14 at 100.00 | Aa2 | | 2,041,260 | |
| | 1,000 | | Midgeville, Georgia, Water and Sewerage Revenue Refunding Bonds, Series 1996, 6.000%, 12/01/21 – AGM Insured | No Opt. Call | AA+ | | 1,189,880 | |
Nuveen Investments 19
| | | Nuveen Georgia Premium Income Municipal Fund (continued) |
| NPG | | Portfolio of Investments November 30, 2010 (Unaudited) |
| | Principal | | | Optional Call | | | | |
| | Amount (000) | | Description (1) | Provisions (2) | Ratings (3) | | Value | |
| | | | Water and Sewer (continued) | | | | | |
| $ | 1,000 | | Unified Government of Athens-Clarke County, Georgia, Water and Sewerage Revenue Bonds, Series 2008, 5.500%, 1/01/38 | 1/19 at 100.00 | Aa2 | $ | 1,054,980 | |
| | 890 | | Walton County Water and Sewerage Authority, Georgia, Revenue Bonds, The Oconee-Hard Creek Reservoir Project, Series 2008, 5.000%, 2/01/38 – AGM Insured | 2/18 at 100.00 | Aa2 | | 898,215 | |
| | 11,370 | | Total Water and Sewer | | | | 11,841,202 | |
| $ | 78,975 | | Total Investments (cost $79,533,637) – 152.2% | | | | 81,704,218 | |
| | | | Floating Rate Obligations – (2.2)% | | | | (1,190,000 | ) |
| | | | MuniFund Term Preferred Shares, at Liquidation Value – (52.8)% (5) | | | | (28,340,000 | ) |
| | | | Other Assets Less Liabilities – 2.8% | | | | 1,522,442 | |
| | | | Net Assets Applicable to Common Shares – 100% | | | $ | 53,696,660 | |
| (1) | | All percentages shown in the Portfolio of Investments are based on net assets applicable to Common shares unless otherwise noted. |
| (2) | | Optional Call Provisions: Dates (month and year) and prices of the earliest optional call or redemption. There may be other call provisions at varying prices at later dates. Certain mortgage-backed securities may be subject to periodic principal paydowns. |
| (3) | | Ratings: Using the highest of Standard & Poor’s Group (“Standard & Poor’s”), Moody’s Investor Service, Inc. (“Moody’s”) or Fitch, Inc. (“Fitch”) rating. Ratings below BBB by Standard & Poor’s, Baa by Moody’s or BBB by Fitch are considered to be below investment grade. Holdings designated N/R are not rated by any of these national rating agencies. |
| (4) | | Backed by an escrow or trust containing sufficient U.S. Government or U.S. Government agency securities, which ensure the timely payment of principal and interest. Such investments are normally considered to be equivalent to AAA rated securities. |
| (5) | | MuniFund Term Preferred Shares, at Liquidation Value as a percentage of Total Investments is 34.7%. |
| N/R | | Not rated. |
| (IF) | | Inverse floating rate investment. |
| (UB) | | Underlying bond of an inverse floating rate trust reflected as a financing transaction. See Notes to Financial Statements, Footnote 1 – General Information and Significant Accounting Policies, Inverse Floating Rate Securities for more information. |
See accompanying notes to financial statements.
20 Nuveen Investments
| | | Nuveen Georgia Dividend Advantage Municipal Fund |
| NZX | | Portfolio of Investments |
| | | November 30, 2010 (Unaudited) |
| | Principal | | | Optional Call | | | | |
| | Amount (000) | | Description (1) | Provisions (2) | Ratings (3) | | Value | |
| | | | Education and Civic Organizations – 25.0% (16.7% of Total Investments) | | | | | |
| $ | 500 | | Athens Housing Authority, Georgia, Student Housing Lease Revenue Bonds, UGAREF East Campus Housing LLC Project, Series 2009, 5.250%, 6/15/35 | 6/19 at 100.00 | Aa2 | $ | 516,840 | |
| | 1,200 | | Atlanta Development Authority, Georgia, Educational Facilities Revenue Bonds, Science Park LLC Project, Series 2007, 5.000%, 7/01/39 | 7/17 at 100.00 | A1 | | 1,187,340 | |
| | 1,475 | | Bulloch County Development Authority, Georgia, Student Housing and Athletic Facility Lease Revenue Bonds, Georgia Southern University, Series 2004, 5.250%, 8/01/20 – SYNCORA GTY Insured | 8/14 at 100.00 | A1 | | 1,555,284 | |
| | 1,620 | | Bulloch County Development Authority, Georgia, Student Housing Lease Revenue Bonds, Georgia Southern University, Series 2002, 5.000%, 8/01/20 – AMBAC Insured | 8/12 at 100.00 | A1 | | 1,683,650 | |
| | 1,000 | | Fulton County Development Authority, Georgia, Revenue Bonds, Georgia Tech Athletic Association, Series 2001, 5.000%, 10/01/20 – AMBAC Insured | 4/12 at 100.00 | N/R | | 1,014,330 | |
| | | | Private Colleges and Universities Authority, Georgia, Revenue Bonds, Emory University, Series 2009B, Trust 3404: | | | | | |
| | 145 | | 17.020%, 3/01/17 (IF) | No Opt. Call | AA | | 173,669 | |
| | 230 | | 17.048%, 3/01/17 (IF) | No Opt. Call | AA | | 263,249 | |
| | 750 | | Savannah Economic Development Authority, Georgia, Revenue Bonds, GTREP Project, Series 2002, 5.000%, 7/01/19 – NPFG Insured | 7/12 at 100.00 | Aa3 | | 770,348 | |
| | 6,920 | | Total Education and Civic Organizations | | | | 7,164,710 | |
| | | | Energy – 2.0% (1.4% of Total Investments) | | | | | |
| | 650 | | Virgin Islands Public Finance Authority, Revenue Bonds, Refinery Project Hovensa LLC, Series 2007, 4.700%, 7/01/22 (Alternative Minimum Tax) | 1/15 at 100.00 | Baa3 | | 583,850 | |
| | | | Health Care – 20.4% (13.6% of Total Investments) | | | | | |
| | 105 | | Baldwin County Hospital Authority, Georgia, Revenue Bonds, Oconee Regional Medical Center, Series 1997, 5.250%, 12/01/12 | 12/10 at 100.00 | BB+ | | 104,312 | |
| | 190 | | Baldwin County Hospital Authority, Georgia, Revenue Bonds, Oconee Regional Medical Center, Series 1998, 5.375%, 12/01/28 | 12/10 at 100.00 | BB+ | | 162,657 | |
| | 500 | | Coffee County Hospital Authority, Georgia, Revenue Bonds, Coffee County Regional Medical Center, Series 2004, 5.250%, 12/01/22 | 12/14 at 100.00 | BBB– | | 499,205 | |
| | 50 | | Coweta County Development Authority, Georgia, Revenue Bonds, Piedmont Healthcare, Inc. Project, Series 2010, 5.000%, 6/15/40 | 6/20 at 100.00 | AA– | | 48,719 | |
| | 600 | | Gainesville and Hall County Hospital Authority, Georgia, Revenue Anticipation Certificates, Northeast Georgia Health Services Inc., Series 2010B, 5.250%, 2/15/45 | 2/41 at 100.00 | A+ | | 584,148 | |
| | 500 | | Houston County Hospital Authority, Georgia, Revenue Bonds, Houston Healthcare Project, Series 2007, 5.250%, 10/01/35 | 10/17 at 100.00 | A2 | | 491,785 | |
| | 300 | | Macon-Bibb County Hospital Authority, Georgia, Revenue Anticipation Certificates, Medical Center of Central Georgia Inc., Series 2009, 5.000%, 8/01/35 | 8/19 at 100.00 | AA | | 294,969 | |
| | | | Royston Hospital Authority, Georgia, Revenue Anticipation Certificates, Ty Cobb Healthcare System Inc., Series 1999: | | | | | |
| | 200 | | 6.700%, 7/01/16 | 1/11 at 101.00 | BB– | | 198,574 | |
| | 250 | | 6.500%, 7/01/27 | 1/11 at 101.00 | BB– | | 224,945 | |
| | 500 | | Savannah Hospital Authority, Georgia, Revenue Bonds, St. Joseph’s/Candler Health System, Series 2003, 5.250%, 7/01/23 – RAAI Insured | 1/14 at 100.00 | Baa1 | | 495,215 | |
| | 2,000 | | Valdosta and Lowndes County Hospital Authority, Georgia, Revenue Certificates, South Georgia Medical Center, Series 2002, 5.250%, 10/01/27 – AMBAC Insured | 10/12 at 101.00 | A+ | | 2,005,060 | |
| | 750 | | Valdosta and Lowndes County Hospital Authority, Georgia, Revenue Certificates, South Georgia Medical Center, Series 2007, 5.000%, 10/01/33 | 10/17 at 100.00 | A+ | | 713,678 | |
| | 5,945 | | Total Health Care | | | | 5,823,267 | |
| | | | Housing/Multifamily – 1.1% (0.7% of Total Investments) | | | | | |
| | 350 | | Cobb County Development Authority, Georgia, Student Housing Revenue Bonds, KSU Village II Real Estate Foundation LLC Project, Series 2007A, 5.250%, 7/15/38 – AMBAC Insured | 7/17 at 100.00 | Baa2 | | 306,898 | |
| | | | Housing/Single Family – 12.9% (8.6% of Total Investments) | | | | | |
| | 650 | | Georgia Housing and Finance Authority, Single Family Mortgage Bonds, Series 2002B-2, 5.350%, 12/01/22 (Alternative Minimum Tax) | 12/11 at 100.00 | AAA | | 655,356 | |
| | 1,000 | | Georgia Housing and Finance Authority, Single Family Mortgage Bonds, Series 2006C-2, 4.500%, 12/01/27 (Alternative Minimum Tax) | 12/15 at 100.00 | AAA | | 980,200 | |
Nuveen Investments 21
| | | Nuveen Georgia Dividend Advantage Municipal Fund (continued) |
| NZX | | Portfolio of Investments November 30, 2010 (Unaudited) |
| | Principal | | | Optional Call | | | | |
| | Amount (000) | | Description (1) | Provisions (2) | Ratings (3) | | Value | |
| | | | Housing/Single Family (continued) | | | | | |
| $ | 2,000 | | Georgia Housing and Finance Authority, Single Family Mortgage Resolution 1 Bonds, Series 2002A-2, 5.450%, 12/01/22 (Alternative Minimum Tax) | 12/11 at 100.00 | AAA | $ | 2,047,677 | |
| | 3,650 | | Total Housing/Single Family | | | | 3,683,233 | |
| | | | Industrials – 3.5% (2.3% of Total Investments) | | | | | |
| | 1,000 | | Cartersville Development Authority, Georgia, Waste and Wastewater Facilities Revenue Refunding Bonds, Anheuser Busch Cos. Inc. Project, Series 2002, 5.950%, 2/01/32 (Alternative Minimum Tax) | 2/12 at 100.00 | BBB+ | | 1,007,260 | |
| | | | Long-Term Care – 0.9% (0.6% of Total Investments) | | | | | |
| | 250 | | Medical Center Hospital Authority, Georgia, Revenue Bonds, Spring Harbor at Green Island, Series 2007, 5.000%, 7/01/11 | No Opt. Call | N/R | | 250,735 | |
| | | | Materials – 2.2% (1.4% of Total Investments) | | | | | |
| | 20 | | Richmond County Development Authority, Georgia, Environmental Improvement Revenue Bonds, International Paper Company, Series 2003A, 5.750%, 11/01/27 (Alternative Minimum Tax) | 11/13 at 100.00 | BBB | | 19,796 | |
| | 600 | | Richmond County Development Authority, Georgia, Environmental Improvement Revenue Refunding Bonds, International Paper Company, Series 2002A, 6.000%, 2/01/25 (Alternative Minimum Tax) | 2/12 at 101.00 | BBB | | 603,810 | |
| | 620 | | Total Materials | | | | 623,606 | |
| | | | Tax Obligation/General – 20.9% (14.0% of Total Investments) | | | | | |
| | 360 | | Cherokee County Resource Recovery Development Authority, Georgia, Solid Waste Disposal Revenue Bonds, Ball Ground Recycling LLC Project, Series 2007A, 5.000%, 7/01/37 – AMBAC Insured (Alternative Minimum Tax) | 7/17 at 100.00 | AA+ | | 344,430 | |
| | 500 | | Clark County Hospital Authority, Georgia, Hospital Revenue Bonds, Athens Regional Medical Center, Series 2007, 5.000%, 1/01/27 – NPFG Insured | 1/17 at 100.00 | Aa1 | | 512,895 | |
| | 1,000 | | Clarke County Hospital Authority, Georgia, Hospital Revenue Certificates, Athens Regional Medical Center, Series 2002, 5.375%, 1/01/19 – NPFG Insured | 1/12 at 101.00 | Aa1 | | 1,029,300 | |
| | 200 | | Decatur, Georgia, General Obligation Bonds, Series 2007, 5.000%, 1/01/31 – AGM Insured | 1/17 at 100.00 | AA+ | | 210,316 | |
| | 250 | | Georgia Municipal Association Inc., Certificates of Participation, Riverdale Public Purpose Project, Series 2009, 5.500%, 5/01/38 – AGC Insured | 5/19 at 100.00 | AA+ | | 257,023 | |
| | 700 | | Georgia State, General Obligation Bonds, Series 2007E, 5.000%, 8/01/24 | 8/17 at 100.00 | AAA | | 767,921 | |
| | 100 | | Georgia State, General Obligation Bonds, Series 2009B, 5.000%, 1/01/26 | 1/19 at 100.00 | AAA | | 110,075 | |
| | 500 | | Georgia, General Obligation Bonds, Series 2005B, 5.000%, 7/01/15 | No Opt. Call | AAA | | 582,465 | |
| | 1,000 | | Gwinnett County School District, Georgia, General Obligation Bonds, Series 2008, 5.000%, 2/01/36 (UB) | 2/18 at 100.00 | AAA | | 1,045,560 | |
| | 500 | | Henry County Hospital Authority, Georgia, Revenue Certificates, Henry Medical Center, Series 2004, 5.000%, 7/01/20 – NPFG Insured | 7/14 at 101.00 | Aa1 | | 524,120 | |
| | 600 | | Paulding County School District, Georgia, General Obligation Bonds, Series 2007, 5.000%, 2/01/33 | 2/17 at 100.00 | AA+ | | 610,308 | |
| | 5,710 | | Total Tax Obligation/General | | | | 5,994,413 | |
| | | | Tax Obligation/Limited – 10.3% (6.8% of Total Investments) | | | | | |
| | 40 | | Atlanta, Georgia, Tax Allocation Bonds Atlanta Station Project, Series 2007, 5.000%, 12/01/23 – AGC Insured | 12/17 at 100.00 | AA+ | | 40,042 | |
| | 500 | | Atlanta, Georgia, Tax Allocation Bonds, Beltline Project Series 2008B. Remarketed, 7.375%, 1/01/31 | No Opt. Call | N/R | | 507,995 | |
| | 115 | | Atlanta, Georgia, Tax Allocation Bonds, Eastside Project, Series 2005A, 5.625%, 1/01/16 (Alternative Minimum Tax) | No Opt. Call | A– | | 122,013 | |
| | | | Atlanta, Georgia, Tax Allocation Bonds, Eastside Project, Series 2005B: | | | | | |
| | 300 | | 5.400%, 1/01/20 | 7/15 at 100.00 | A– | | 304,974 | |
| | 75 | | 5.600%, 1/01/30 | 7/15 at 100.00 | A– | | 71,696 | |
| | 215 | | Atlanta, Georgia, Tax Allocation Bonds, Princeton Lakes Project, Series 2006, 5.500%, 1/01/31 | 1/16 at 100.00 | N/R | | 186,728 | |
| | 65 | | Cobb-Marietta Coliseum and Exhibit Hall Authority, Georgia, Revenue Refunding Bonds, Series 1993, 5.625%, 10/01/26 – NPFG Insured | 10/19 at 100.00 | A | | 68,195 | |
| | 1,525 | | Macon-Bibb County Urban Development Authority, Georgia, Revenue Refunding Bonds, Public Facilities Projects, Series 2002A, 5.000%, 8/01/14 | 8/12 at 101.00 | AA | | 1,637,743 | |
| | 2,835 | | Total Tax Obligation/Limited | | | | 2,939,386 | |
| | | | Transportation – 3.5% (2.4% of Total Investments) | | | | | |
| | 1,000 | | Atlanta, Georgia, Airport General Revenue Refunding Bonds, Series 2000A, 5.400%, 1/01/15 – FGIC Insured | 1/11 at 100.50 | A+ | | 1,012,790 | |
22 Nuveen Investments
| | Principal | | | Optional Call | | | | |
| | Amount (000) | | Description (1) | Provisions (2) | Ratings (3) | | Value | |
| | | | U.S. Guaranteed – 25.3% (16.9% of Total Investments) (4) | | | | | |
| $ | 1,000 | | Athens Housing Authority, Georgia, Student Housing Lease Revenue Bonds, UGAREF East Campus Housing LLC Project, Series 2002, 5.250%, 12/01/21 (Pre-refunded 12/01/12) – AMBAC Insured | 12/12 at 100.00 | Aa2 (4) | $ | 1,082,840 | |
| | 1,500 | | Coweta County Development Authority, Georgia, Revenue Bonds, Newnan Water and Sewer, and Light Commission Project, Series 2002, 5.250%, 1/01/18 (Pre-refunded 1/01/13) – FGIC Insured | 1/13 at 100.00 | N/R (4) | | 1,641,585 | |
| | 1,250 | | Gainesville and Hall County Hospital Authority, Georgia, Revenue Anticipation Certificates, Northeast Georgia Health Services Inc., Series 2001, 5.500%, 5/15/31 (Pre-refunded 5/15/11) | 5/11 at 100.00 | N/R (4) | | 1,279,688 | |
| | 730 | | Georgia, General Obligation Bonds, Series 2002D, 5.000%, 8/01/18 (Pre-refunded 8/01/12) | 8/12 at 100.00 | AAA | | 784,005 | |
| | 1,100 | | Gwinnett County Hospital Authority, Georgia, Revenue Anticipation Certificates, Gwinnett Hospital System Inc. Project, Series 1997B, 5.300%, 9/01/27 (Pre-refunded 2/14/12) – NPFG Insured | 2/12 at 102.00 | Aaa | | 1,181,466 | |
| | 1,200 | | Private Colleges and Universities Authority, Georgia, Revenue Bonds, Mercer University, Series 2001, 5.750%, 10/01/31 (Pre-refunded 10/01/11) | 10/11 at 102.00 | Baa2 (4) | | 1,278,240 | |
| | 6,780 | | Total U.S. Guaranteed | | | | 7,247,824 | |
| | | | Utilities – 1.9% (1.3% of Total Investments) | | | | | |
| | 500 | | Municipal Electric Authority of Georgia, Combustion Turbine Revenue Bonds, Series 2003A, 5.250%, 11/01/15 – NPFG Insured | 11/13 at 100.00 | A1 | | 548,510 | |
| | | | Water and Sewer – 20.0% (13.3% of Total Investments) | | | | | |
| | 1,200 | | Atlanta, Georgia, Water and Wastewater Revenue Bonds, Series 2004, 5.000%, 11/01/24 – AGM Insured | 11/14 at 100.00 | AA+ | | 1,234,752 | |
| | 625 | | Cherokee County Water and Sewerage Authority, Georgia, Revenue Bonds, Series 2001, 5.000%, 8/01/35 – AGM Insured | 8/18 at 100.00 | AA+ | | 637,119 | |
| | 350 | | Coweta County Water and Sewer Authority, Georgia, Revenue Bonds, Series 2007, 5.000%, 6/01/37 | 6/18 at 100.00 | Aa2 | | 354,697 | |
| | 890 | | Douglasville-Douglas County Water and Sewer Authority, Georgia, Water and Sewer Revenue Bonds, Series 2007, 5.000%, 6/01/37 – NPFG Insured | 6/17 at 100.00 | Aa2 | | 904,560 | |
| | 375 | | Forsyth County Water and Sewerage Authority, Georgia, Revenue Bonds, Series 2007, 5.000%, 4/01/37 – AGM Insured | 4/17 at 100.00 | Aaa | | 379,339 | |
| | 500 | | Fulton County, Georgia, Water and Sewerage Revenue Bonds, Series 2004, 5.000%, 1/01/22 – FGIC Insured | 1/14 at 100.00 | Aa2 | | 523,400 | |
| | 1,395 | | Macon Water Authority, Georgia, Water and Sewer Revenue Bonds, Series 2001B, 5.000%, 10/01/21 | 10/11 at 101.00 | Aa1 | | 1,453,241 | |
| | 230 | | Walton County Water and Sewerage Authority, Georgia, Revenue Bonds, The Oconee-Hard Creek Reservoir Project, Series 2008, 5.000%, 2/01/38 – AGM Insured | 2/18 at 100.00 | Aa2 | | 232,123 | |
| | 5,565 | | Total Water and Sewer | | | | 5,719,231 | |
| $ | 41,775 | | Total Investments (cost $42,000,682) – 149.9% | | | | 42,905,713 | |
| | | | Floating Rate Obligations – (2.3)% | | | | (660,000 | ) |
| | | | MuniFund Term Preferred Shares, at Liquidation Value – (50.1%) (5) | | | | (14,340,000 | ) |
| | | | Other Assets Less Liabilities – 2.5% | | | | 712,945 | |
| | | | Net Assets Applicable to Common Shares – 100% | | | $ | 28,618,658 | |
| (1) | | All percentages shown in the Portfolio of Investments are based on net assets applicable to Common shares unless otherwise noted. |
| (2) | | Optional Call Provisions: Dates (month and year) and prices of the earliest optional call or redemption. There may be other call provisions at varying prices at later dates. Certain mortgage-backed securities may be subject to periodic principal paydowns. |
| (3) | | Ratings: Using the highest of Standard & Poor’s Group (“Standard & Poor’s”), Moody’s Investor Service, Inc. (“Moody’s”) or Fitch, Inc. (“Fitch”) rating. Ratings below BBB by Standard & Poor’s, Baa by Moody’s or BBB by Fitch are considered to be below investment grade. Holdings designated N/R are not rated by any of these national rating agencies. |
| (4) | | Backed by an escrow or trust containing sufficient U.S. Government or U.S. Government agency securities, which ensure the timely payment of principal and interest. Such investments are normally considered to be equivalent to AAA rated securities. |
| (5) | | MuniFund Term Preferred Shares, at Liquidation Value as a percentage of Total Investments is 33.4%. |
| N/R | | Not rated. |
| (IF) | | Inverse floating rate investment. |
| (UB) | | Underlying bond of an inverse floating rate trust reflected as a financing transaction. See Notes to Financial Statements, Footnote 1 – General Information and Significant Accounting Policies, Inverse Floating Rate Securities for more information. |
See accompanying notes to financial statements.
Nuveen Investments 23
| | | Nuveen Georgia Dividend Advantage Municipal Fund 2 |
| NKG | | Portfolio of Investments |
| | | November 30, 2010 (Unaudited) |
| | Principal | | | Optional Call | | | | |
| | Amount (000) | | Description (1) | Provisions (2) | Ratings (3) | | Value | |
| | | | Consumer Staples – 2.9% (1.9% of Total Investments) | | | | | |
| $ | 2,000 | | Puerto Rico, The Children’s Trust Fund, Tobacco Settlement Asset-Backed Refunding Bonds, Series 2002, 5.500%, 5/15/39 | 5/12 at 100.00 | BBB | $ | 1,826,260 | |
| | | | Education and Civic Organizations – 17.5% (11.7% of Total Investments) | | | | | |
| | 2,320 | | Athens Housing Authority, Georgia, Student Housing Lease Revenue Bonds, UGAREF East Campus Housing LLC Project, Series 2002, 5.000%, 12/01/33 – AMBAC Insured | 12/12 at 100.00 | Aa2 | | 2,332,064 | |
| | 500 | | Athens Housing Authority, Georgia, Student Housing Lease Revenue Bonds, UGAREF East Campus Housing LLC Project, Series 2009, 5.250%, 6/15/35 | 6/19 at 100.00 | Aa2 | | 516,840 | |
| | 1,225 | | Athens-Clarke County Unified Government Development Authority, Georgia, Educational Facilities Revenue Bonds, UGAREF CCRC Building LLC Project, Series 2002, 5.000%, 12/15/18 – AMBAC Insured | 12/12 at 100.00 | N/R | | 1,257,769 | |
| | 3,000 | | Atlanta Development Authority, Georgia, Educational Facilities Revenue Bonds, Science Park LLC Project, Series 2007, 5.000%, 7/01/39 | 7/17 at 100.00 | A1 | | 2,968,350 | |
| | 2,000 | | Fulton County Development Authority, Georgia, Revenue Bonds, Georgia Tech – Klaus Parking and Family Housing, Series 2003, 5.000%, 11/01/23 – NPFG Insured | 11/13 at 100.00 | Aa3 | | 2,021,000 | |
| | 1,050 | | Fulton County Development Authority, Georgia, Revenue Bonds, TUFF Morehouse Project, Series 2002A, 5.000%, 2/01/34 – AMBAC Insured | 2/12 at 100.00 | A2 | | 1,050,872 | |
| | | | Private Colleges and Universities Authority, Georgia, Revenue Bonds, Emory University, Series 2009B, Trust 3404: | | | | | |
| | 315 | | 17.020%, 3/01/17 (IF) | No Opt. Call | AA | | 377,282 | |
| | 490 | | 17.048%, 3/01/17 (IF) | No Opt. Call | AA | | 560,834 | |
| | 10,900 | | Total Education and Civic Organizations | | | | 11,085,011 | |
| | | | Health Care – 15.7% (10.5% of Total Investments) | | | | | |
| | 100 | | Baldwin County Hospital Authority, Georgia, Revenue Bonds, Oconee Regional Medical Center, Series 1997, 5.250%, 12/01/12 | 12/10 at 100.00 | BB+ | | 99,345 | |
| | | | Baldwin County Hospital Authority, Georgia, Revenue Bonds, Oconee Regional Medical Center, Series 1998: | | | | | |
| | 65 | | 5.250%, 12/01/22 | 12/10 at 100.00 | BB+ | | 58,880 | |
| | 550 | | 5.375%, 12/01/28 | 12/10 at 100.00 | BB+ | | 470,850 | |
| | | | Coffee County Hospital Authority, Georgia, Revenue Bonds, Coffee County Regional Medical Center, Series 2004: | | | | | |
| | 185 | | 5.000%, 12/01/19 | 12/14 at 100.00 | BBB– | | 185,999 | |
| | 1,000 | | 5.250%, 12/01/22 | 12/14 at 100.00 | BBB– | | 998,410 | |
| | 500 | | Coweta County Development Authority, Georgia, Revenue Bonds, Piedmont Healthcare, Inc. Project, Series 2010, 5.000%, 6/15/40 | 6/20 at 100.00 | AA– | | 487,185 | |
| | | | Gainesville and Hall County Hospital Authority, Georgia, Revenue Anticipation Certificates, Northeast Georgia Health Services Inc., Series 2010B: | | | | | |
| | 700 | | 5.125%, 2/15/40 | No Opt. Call | A+ | | 676,802 | |
| | 1,645 | | 5.250%, 2/15/45 | 2/41 at 100.00 | A+ | | 1,601,539 | |
| | 1,140 | | Houston County Hospital Authority, Georgia, Revenue Bonds, Houston Healthcare Project, Series 2007, 5.250%, 10/01/35 | 10/17 at 100.00 | A2 | | 1,121,270 | |
| | | | Macon-Bibb County Hospital Authority, Georgia, Revenue Anticipation Certificates, Medical Center of Central Georgia Inc., Series 2009: | | | | | |
| | 200 | | 5.000%, 8/01/32 | 8/19 at 100.00 | AA | | 200,126 | |
| | 450 | | 5.000%, 8/01/35 | 8/19 at 100.00 | AA | | 442,454 | |
| | | | Royston Hospital Authority, Georgia, Revenue Anticipation Certificates, Ty Cobb Healthcare System Inc., Series 1999: | | | | | |
| | 350 | | 6.700%, 7/01/16 | 1/11 at 101.00 | BB– | | 347,505 | |
| | 650 | | 6.500%, 7/01/27 | 1/11 at 101.00 | BB– | | 584,857 | |
| | 2,000 | | Savannah Hospital Authority, Georgia, Revenue Bonds, St. Joseph’s/Candler Health System, Series 2003, 5.250%, 7/01/23 – RAAI Insured | 1/14 at 100.00 | Baa1 | | 1,980,860 | |
| | 750 | | Valdosta and Lowndes County Hospital Authority, Georgia, Revenue Certificates, South Georgia Medical Center, Series 2007, 5.000%, 10/01/33 | 10/17 at 100.00 | A+ | | 713,678 | |
| | 10,285 | | Total Health Care | | | | 9,969,760 | |
24 Nuveen Investments
| | Principal | | | Optional Call | | | | |
| | Amount (000) | | Description (1) | Provisions (2) | Ratings (3) | | Value | |
| | | | Housing/Multifamily – 4.7% (3.1% of Total Investments) | | | | | |
| $ | 25 | | Cobb County Development Authority, Georgia, Student Housing Revenue Bonds, KSU Village II Real Estate Foundation LLC Project, Series 2007A, 5.250%, 7/15/38 – AMBAC Insured | 7/17 at 100.00 | Baa2 | $ | 21,921 | |
| | | | Savannah Economic Development Authority, Georgia, GNMA Collateralized Multifamily Housing Revenue Bonds, Snap I-II-III Apartments, Series 2002A: | | | | | |
| | 500 | | 5.150%, 11/20/22 (Alternative Minimum Tax) | 11/12 at 102.00 | AAA | | 512,150 | |
| | 980 | | 5.200%, 11/20/27 (Alternative Minimum Tax) | 11/12 at 102.00 | AAA | | 989,780 | |
| | 1,465 | | 5.250%, 11/20/32 (Alternative Minimum Tax) | 11/12 at 102.00 | AAA | | 1,470,699 | |
| | 2,970 | | Total Housing/Multifamily | | | | 2,994,550 | |
| | | | Housing/Single Family – 0.5% (0.3% of Total Investments) | | | | | |
| | 170 | | Georgia Housing and Finance Authority, Single Family Mortgage Bonds, Series 2006C-2, 4.550%, 12/01/31 (Alternative Minimum Tax) | 12/15 at 100.00 | AAA | | 157,413 | |
| | 150 | | Georgia Housing and Finance Authority, Single Family Mortgage Resolution 1 Bonds, Series 2001B-2, 5.400%, 12/01/31 (Alternative Minimum Tax) | 6/11 at 100.00 | AAA | | 154,017 | |
| | 320 | | Total Housing/Single Family | | | | 311,430 | |
| | | | Industrials – 3.2% (2.1% of Total Investments) | | | | | |
| | 2,190 | | Cobb County Development Authority, Georgia, Solid Waste Disposal Revenue Bonds, Georgia Waste Management Project, Series 2004A, 5.000%, 4/01/33 (Alternative Minimum Tax) | 4/16 at 101.00 | BBB | | 1,998,813 | |
| | | | Long-Term Care – 0.4% (0.3% of Total Investments) | | | | | |
| | 250 | | Medical Center Hospital Authority, Georgia, Revenue Bonds, Spring Harbor at Green Island, Series 2007, 5.000%, 7/01/11 | No Opt. Call | N/R | | 250,735 | |
| | | | Materials – 2.6% (1.7% of Total Investments) | | | | | |
| | 1,000 | | Richmond County Development Authority, Georgia, Environmental Improvement Revenue Bonds, International Paper Company, Series 2001A, 6.250%, 2/01/25 (Alternative Minimum Tax) | 2/11 at 101.00 | BBB | | 1,011,180 | |
| | 250 | | Richmond County Development Authority, Georgia, Environmental Improvement Revenue Refunding Bonds, International Paper Company, Series 2002A, 6.000%, 2/01/25 (Alternative Minimum Tax) | 2/12 at 101.00 | BBB | | 251,588 | |
| | 370 | | Savannah Economic Development Authority, Georgia, Pollution Control Revenue Bonds, Union Camp Corporation, Series 1995, 6.150%, 3/01/17 | No Opt. Call | Baa3 | | 396,633 | |
| | 1,620 | | Total Materials | | | | 1,659,401 | |
| | | | Tax Obligation/General – 28.3% (18.9% of Total Investments) | | | | | |
| | 600 | | Cherokee County Resource Recovery Development Authority, Georgia, Solid Waste Disposal Revenue Bonds, Ball Ground Recycling LLC Project, Series 2007A, 5.000%, 7/01/37 – AMBAC Insured (Alternative Minimum Tax) | 7/17 at 100.00 | AA+ | | 574,050 | |
| | 900 | | Decatur, Georgia, General Obligation Bonds, Series 2007, 5.000%, 1/01/31 – AGM Insured | 1/17 at 100.00 | AA+ | | 946,422 | |
| | 1,000 | | Floyd County Hospital Authority, Georgia, Revenue Anticipation Certificates, Floyd Medical Center Project, Series 2002, 5.200%, 7/01/32 – NPFG Insured | 7/12 at 101.00 | Aa2 | | 1,010,370 | |
| | 1,000 | | Forsyth County, Georgia, General Obligation Bonds, Series 2004, 5.250%, 3/01/19 | 3/14 at 101.00 | Aaa | | 1,108,520 | |
| | 915 | | Georgia Municipal Association Inc., Certificates of Participation, Riverdale Public Purpose Project, Series 2009, 5.500%, 5/01/38 – AGC Insured | 5/19 at 100.00 | AA+ | | 940,702 | |
| | 1,700 | | Georgia State, General Obligation Bonds, Series 2007E, 5.000%, 8/01/24 | 8/17 at 100.00 | AAA | | 1,864,951 | |
| | 1,645 | | Georgia State, General Obligation Bonds, Series 2009B, 5.000%, 1/01/26 | 1/19 at 100.00 | AAA | | 1,810,734 | |
| | 750 | | Georgia, General Obligation Bonds, Series 1998D, 5.250%, 10/01/15 | No Opt. Call | AAA | | 887,250 | |
| | 1,000 | | Georgia, General Obligation Bonds, Series 2005B, 5.000%, 7/01/15 | No Opt. Call | AAA | | 1,164,930 | |
| | 2,100 | | Gwinnett County School District, Georgia, General Obligation Bonds, Series 2008, 5.000%, 2/01/36 (UB) | 2/18 at 100.00 | AAA | | 2,195,676 | |
| | 250 | | La Grange-Troup County Hospital Authority, Georgia, Revenue Anticipation Certificates, Series 2008A, 5.500%, 7/01/38 | 7/18 at 100.00 | Aa2 | | 253,858 | |
| | | | Oconee County, Georgia, General Obligation Bonds, Recreation Project, Series 2003: | | | | | |
| | 1,410 | | 5.500%, 1/01/23 – AMBAC Insured | 1/13 at 101.00 | Aa2 | | 1,523,843 | |
| | 1,470 | | 5.250%, 1/01/26 – AMBAC Insured | 1/13 at 101.00 | Aa2 | | 1,538,076 | |
| | 1,200 | | Paulding County School District, Georgia, General Obligation Bonds, Series 2007, 5.000%, 2/01/33 | 2/17 at 100.00 | AA+ | | 1,220,616 | |
Nuveen Investments 25
| | | Nuveen Georgia Dividend Advantage Municipal Fund 2 (continued) |
| NKG | | Portfolio of Investments November 30, 2010 (Unaudited) |
| | Principal | | | Optional Call | | | | |
| | Amount (000) | | Description (1) | Provisions (2) | Ratings (3) | | Value | |
| | | | Tax Obligation/General (continued) | | | | | |
| $ | 950 | | Wayne County Hospital Authority, Georgia, Hospital Revenue Bonds, Series 2006, 5.000%, 3/01/23 – SYNCORA GTY Insured | 3/16 at 100.00 | N/R | $ | 912,238 | |
| | 16,890 | | Total Tax Obligation/General | | | | 17,952,236 | |
| | | | Tax Obligation/Limited – 16.6% (11.1% of Total Investments) | | | | | |
| | | | Atlanta, Georgia, Tax Allocation Bonds Atlanta Station Project, Series 2007: | | | | | |
| | 5 | | 5.250%, 12/01/21 – AGC Insured | No Opt. Call | AA+ | | 5,168 | |
| | 620 | | 5.000%, 12/01/23 – AGC Insured | 12/17 at 100.00 | AA+ | | 620,651 | |
| | 1,000 | | Atlanta, Georgia, Tax Allocation Bonds, Beltline Project Series 2008B, Remarketed, 7.375%, 1/01/31 | No Opt. Call | N/R | | 1,015,990 | |
| | 110 | | Atlanta, Georgia, Tax Allocation Bonds, Eastside Project, Series 2005A, 5.625%, 1/01/16 (Alternative Minimum Tax) | No Opt. Call | A– | | 116,708 | |
| | | | Atlanta, Georgia, Tax Allocation Bonds, Eastside Project, Series 2005B: | | | | | |
| | 450 | | 5.400%, 1/01/20 | 7/15 at 100.00 | A– | | 457,461 | |
| | 350 | | 5.600%, 1/01/30 | 7/15 at 100.00 | A– | | 334,579 | |
| | 340 | | Atlanta, Georgia, Tax Allocation Bonds, Princeton Lakes Project, Series 2006, 5.500%, 1/01/31 | 1/16 at 100.00 | N/R | | 295,290 | |
| | | | Cobb-Marietta Coliseum and Exhibit Hall Authority, Georgia, Revenue Refunding Bonds, Series 1993: | | | | | |
| | 105 | | 5.500%, 10/01/18 – NPFG Insured | No Opt. Call | A | | 115,440 | |
| | 1,755 | | 5.625%, 10/01/26 – NPFG Insured | 10/19 at 100.00 | A | | 1,841,258 | |
| | 750 | | Georgia Municipal Association Inc., Certificates of Participation, Atlanta Court Project, Series 2002, 5.125%, 12/01/21 – AMBAC Insured | 6/12 at 101.00 | N/R | | 759,863 | |
| | 2,500 | | Metropolitan Atlanta Rapid Transit Authority, Georgia, Sales Tax Revenue Refunding Bonds, Series 1992P, 6.250%, 7/01/20 – AMBAC Insured | No Opt. Call | Aa2 | | 2,987,925 | |
| | 1,945 | | Tift County Hospital Authority, Georgia, Revenue Anticipation Bonds, Tift Regional Medical Center, Series 2002, 5.250%, 12/01/19 – AMBAC Insured | 12/12 at 101.00 | Aa3 | | 1,973,008 | |
| | 9,930 | | Total Tax Obligation/Limited | | | | 10,523,341 | |
| | | | Transportation – 5.1% (3.4% of Total Investments) | | | | | |
| | 3,195 | | Atlanta, Georgia, Airport General Revenue Refunding Bonds, Series 2000A, 5.500%, 1/01/21 – FGIC Insured | 1/11 at 100.50 | A+ | | 3,236,726 | |
| | | | U.S. Guaranteed – 16.9% (11.2% of Total Investments) (4) | | | | | |
| | 180 | | Athens Housing Authority, Georgia, Student Housing Lease Revenue Bonds, UGAREF East Campus Housing LLC Project, Series 2002, 5.000%, 12/01/33 (Pre-refunded 12/01/12) – AMBAC Insured | 12/12 at 100.00 | Aa2 (4) | | 194,020 | |
| | 1,000 | | Augusta, Georgia, Water and Sewerage Revenue Bonds, Series 2002, 5.250%, 10/01/22 (Pre-refunded 10/01/12) – AGM Insured | 10/12 at 100.00 | AA+ (4) | | 1,085,260 | |
| | 1,000 | | Cherokee County School System, Georgia, General Obligation Bonds, Series 2003, 5.000%, 8/01/16 (Pre-refunded 8/01/13) – NPFG Insured | 8/13 at 100.00 | AA+ (4) | | 1,112,160 | |
| | 1,305 | | Gainesville and Hall County Hospital Authority, Georgia, Revenue Anticipation Certificates, Northeast Georgia Health Services Inc., Series 2001, 5.500%, 5/15/31 (Pre-refunded 5/15/11) | 5/11 at 100.00 | N/R (4) | | 1,335,994 | |
| | | | Newnan Hospital Authority, Georgia, Revenue Anticipation Certificates, Newnan Hospital Inc., Series 2002: | | | | | |
| | 2,260 | | 5.500%, 1/01/19 (Pre-refunded 1/01/13) – NPFG Insured | 1/13 at 100.00 | Aa3 (4) | | 2,483,514 | |
| | 3,020 | | 5.500%, 1/01/20 (Pre-refunded 1/01/13) – NPFG Insured | 1/13 at 100.00 | Aa3 (4) | | 3,318,677 | |
| | 1,100 | | Private Colleges and Universities Authority, Georgia, Revenue Bonds, Mercer University, Series 2001, 5.750%, 10/01/31 (Pre-refunded 10/01/11) | 10/11 at 102.00 | Baa2 (4) | | 1,171,720 | |
| | 9,865 | | Total U.S. Guaranteed | | | | 10,701,345 | |
| | | | Utilities – 6.3% (4.2% of Total Investments) | | | | | |
| | 900 | | Chatom Industrial Development Board, Alabama, Gulf Opportunity Zone Revenue Bonds, PowerSouth Energy Cooperative, Series 2010A, 5.000%, 8/01/37 – AGC Insured | 8/20 at 100.00 | AA+ | | 911,646 | |
| | 1,000 | | Elberton, Georgia, Combined Utility System Revenue Refunding and Improvement Bonds, Series 2001, 5.000%, 1/01/22 – AMBAC Insured | 1/12 at 100.00 | A3 | | 1,033,810 | |
| | 1,000 | | Georgia Municipal Electric Authority, General Power Revenue Bonds, Project 1, Series 2007A, 5.000%, 1/01/25 – NPFG Insured | 1/17 at 100.00 | A | | 1,027,930 | |
| | 1,000 | | Municipal Electric Authority of Georgia, Project One Subordinated Lien Revenue Bonds, Series 2003A, 5.000%, 1/01/22 – NPFG Insured | 1/13 at 100.00 | A | | 1,024,520 | |
| | 3,900 | | Total Utilities | | | | 3,997,906 | |
26 Nuveen Investments
| | | Nuveen Georgia Dividend Advantage Municipal Fund 2 (continued) |
| NKG | | Portfolio of Investments November 30, 2010 (Unaudited) |
| | Principal | | | Optional Call | | | | |
| | Amount (000) | | Description (1) | Provisions (2) | Ratings (3) | | Value | |
| | | | Water and Sewer – 29.4% (19.6% of Total Investments) | | | | | |
| | | | Atlanta, Georgia, Water and Wastewater Revenue Bonds, Series 2004: | | | | | |
| $ | 500 | | 5.250%, 11/01/15 – AGM Insured | 11/14 at 100.00 | AA+ | $ | 558,315 | |
| | 700 | | 5.000%, 11/01/37 – AGM Insured | 11/14 at 100.00 | AA+ | | 703,185 | |
| | 3,500 | | Augusta, Georgia, Water and Sewerage Revenue Bonds, Series 2002, 5.000%, 10/01/27 – AGM Insured | 10/12 at 100.00 | AA+ | | 3,552,184 | |
| | 1,990 | | Cherokee County Water and Sewerage Authority, Georgia, Revenue Bonds, Series 2001, 5.000%, 8/01/35 – AGM Insured | 8/18 at 100.00 | AA+ | | 2,028,586 | |
| | | | Coweta County Water and Sewer Authority, Georgia, Revenue Bonds, Series 2007: | | | | | |
| | 500 | | 5.000%, 6/01/32 | 6/18 at 100.00 | Aa2 | | 512,730 | |
| | 500 | | 5.000%, 6/01/37 | 6/18 at 100.00 | Aa2 | | 506,710 | |
| | 1,000 | | Douglasville-Douglas County Water and Sewer Authority, Georgia, Water and Sewer Revenue Bonds, Series 2005, 5.000%, 6/01/29 – NPFG Insured | 12/15 at 100.00 | Aa2 | | 1,035,530 | |
| | 445 | | Douglasville-Douglas County Water and Sewer Authority, Georgia, Water and Sewer Revenue Bonds, Series 2007, 5.000%, 6/01/37 – NPFG Insured | 6/17 at 100.00 | Aa2 | | 452,280 | |
| | 4,000 | | Forsyth County Water and Sewerage Authority, Georgia, Revenue Bonds, Series 2002, 5.000%, 4/01/32 | 4/13 at 100.00 | Aaa | | 4,097,759 | |
| | 375 | | Forsyth County Water and Sewerage Authority, Georgia, Revenue Bonds, Series 2007, 5.000%, 4/01/37 – AGM Insured | 4/17 at 100.00 | Aaa | | 379,339 | |
| | 950 | | Fulton County, Georgia, Water and Sewerage Revenue Bonds, Series 1998, 5.000%, 1/01/16 – FGIC Insured | 1/11 at 100.00 | Aa2 | | 953,249 | |
| | 3,100 | | Harris County, Georgia, Water System Revenue Bonds, Series 2002, 5.000%, 12/01/22 – AMBAC Insured | 12/12 at 100.00 | N/R | | 3,138,067 | |
| | 685 | | Walton County Water and Sewerage Authority, Georgia, Revenue Bonds, The Oconee-Hard Creek Reservoir Project, Series 2008, 5.000%, 2/01/38 – AGM Insured | 2/18 at 100.00 | Aa2 | | 691,323 | |
| | 18,245 | | Total Water and Sewer | | | | 18,609,257 | |
| $ | 92,560 | | Total Investments (cost $93,518,684) – 150.1% | | | | 95,116,771 | |
| | | | Floating Rate Obligations – (2.2)% | | | | (1,395,000 | ) |
| | | | MuniFund Term Preferred Shares, at Liquidation Value – (50.9)% (5) | | | | (32,265,000 | ) |
| | | | Other Assets Less Liabilities – 3.0% | | | | 1,898,660 | |
| | | | Net Assets Applicable to Common Shares – 100% | | | $ | 63,355,431 | |
| (1) | | All percentages shown in the Portfolio of Investments are based on net assets applicable to Common shares unless otherwise noted. |
| (2) | | Optional Call Provisions: Dates (month and year) and prices of the earliest optional call or redemption. There may be other call provisions at varying prices at later dates. Certain mortgage-backed securities may be subject to periodic principal paydowns. |
| (3) | | Ratings: Using the highest of Standard & Poor’s Group (“Standard & Poor’s”), Moody’s Investor Service, Inc. (“Moody’s”) or Fitch, Inc. (“Fitch”) rating. Ratings below BBB by Standard & Poor’s, Baa by Moody’s or BBB by Fitch are considered to be below investment grade. Holdings designated N/R are not rated by any of these national rating agencies. |
| (4) | | Backed by an escrow or trust containing sufficient U.S. Government or U.S. Government agency securities, which ensure the timely payment of principal and interest. Such investments are normally considered to be equivalent to AAA rated securities. |
| (5) | | MuniFund Term Preferred Shares, at Liquidation Value as a percentage of Total Investments is 33.9%. |
| N/R | | Not rated. |
| (IF) | | Inverse floating rate investment. |
| (UB) | | Underlying bond of an inverse floating rate trust reflected as a financing transaction. See Notes to Financial Statements, Footnote 1 – General Information and Significant Accounting Policies, Inverse Floating Rate Securities for more information. |
See accompanying notes to financial statements.
Nuveen Investments 27
| | | Nuveen North Carolina Premium Income Municipal Fund |
| NNC | | Portfolio of Investments |
| | | November 30, 2010 (Unaudited) |
| | Principal | | | Optional Call | | | | |
| | Amount (000) | | Description (1) | Provisions (2) | Ratings (3) | | Value | |
| | | | Education and Civic Organizations – 20.1% (13.1% of Total Investments) | | | | | |
| $ | 2,500 | | North Carolina Capital Facilities Financing Agency, Revenue Bonds, Duke University, Series 2005A, 5.000%, 10/01/41 (UB) | 10/15 at 100.00 | AA+ | $ | 2,546,550 | |
| | | | North Carolina Capital Facilities Financing Agency, Revenue Bonds, Johnson and Wales University, Series 2003A: | | | | | |
| | 970 | | 5.250%, 4/01/23 – SYNCORA GTY Insured | 4/13 at 100.00 | N/R | | 979,797 | |
| | 500 | | 5.000%, 4/01/33 – SYNCORA GTY Insured | 4/13 at 100.00 | N/R | | 464,700 | |
| | 2,285 | | North Carolina State University at Raleigh, General Revenue Bonds, Series 2003A, 5.000%, 10/01/15 | 10/13 at 100.00 | Aa1 | | 2,517,407 | |
| | 1,530 | | University of North Carolina System, Pooled Revenue Bonds, Series 2005A, 5.000%, 4/01/15 – AMBAC Insured | No Opt. Call | A+ | | 1,718,879 | |
| | 120 | | University of North Carolina System, Pooled Revenue Refunding Bonds, Series 2002A, 5.375%, 4/01/22 – AMBAC Insured | 10/12 at 100.00 | A+ | | 125,928 | |
| | | | University of North Carolina Wilmington, Certificates of Participation, Student Housing Project Revenue Bonds, Series 2006: | | | | | |
| | 1,430 | | 5.000%, 6/01/23 – FGIC Insured | 6/16 at 100.00 | A | | 1,494,836 | |
| | 1,505 | | 5.000%, 6/01/24 – FGIC Insured | 6/16 at 100.00 | A | | 1,559,496 | |
| | | | University of North Carolina, Chapel Hill, System Net Revenue Bonds, Series 2003: | | | | | |
| | 2,380 | | 5.000%, 12/01/19 | 12/13 at 100.00 | Aaa | | 2,539,698 | |
| | 2,725 | | 5.000%, 12/01/21 | 12/13 at 100.00 | Aaa | | 2,952,973 | |
| | 1,500 | | 5.000%, 12/01/23 | 12/13 at 100.00 | Aaa | | 1,615,950 | |
| | 17,445 | | Total Education and Civic Organizations | | | | 18,516,214 | |
| | | | Energy – 1.6% (1.1% of Total Investments) | | | | | |
| | 1,500 | | Virgin Islands Public Finance Authority, Revenue Bonds, Refinery Project – Hovensa LLC, Series 2003, 6.125%, 7/01/22 (Alternative Minimum Tax) | 1/14 at 100.00 | Baa3 | | 1,505,955 | |
| | | | Health Care – 23.6% (15.4% of Total Investments) | | | | | |
| | 1,145 | | Albemarle Hospital Authority, North Carolina, Health Care Facilities Revenue Bonds, Series 2007, 5.250%, 10/01/27 | 10/17 at 100.00 | N/R | | 1,022,313 | |
| | 2,300 | | Charlotte-Mecklenberg Hospital Authority, North Carolina, Carolinas HealthCare System Revenue Bonds, Series 2008A, 5.000%, 1/15/47 | 1/18 at 100.00 | AA– | | 2,269,548 | |
| | 500 | | Charlotte-Mecklenberg Hospital Authority, North Carolina, Health Care Refunding Revenue Bonds, Carolinas HealthCare System, Series 2009A, 5.250%, 1/15/39 | 1/19 at 100.00 | AA– | | 509,905 | |
| | 1,000 | | Johnston Memorial Hospital Authority, North Carolina, Mortgage Revenue Bonds, Johnston Memorial Hospital Project, Series 2008, 5.250%, 10/01/36 – AGM Insured | 4/18 at 100.00 | AA+ | | 1,018,510 | |
| | 225 | | New Hanover County, North Carolina, Hospital Revenue Bonds, New Hanover Regional Medical Center, Series 2006B, 5.125%, 10/01/31 – AGM Insured | 10/19 at 100.00 | AA+ | | 229,795 | |
| | 500 | | North Carolina Medical Care Commission Health Care Facilities Revenue Bonds Novant Health Inc., Series 2010A, 5.250%, 11/01/40 | 11/20 at 100.00 | A+ | | 499,975 | |
| | 920 | | North Carolina Medical Care Commission, Health Care Facilities Revenue Bonds, WakeMed, Series 2009A, 5.625%, | 10/14 at 100.00 | AA+ | | 942,512 | |
| | | | 10/01/38 – AGC Insured | | | | | |
| | 2,000 | | North Carolina Medical Care Commission, Healthcare Facilities Revenue Bonds, Novant Health Obligated Group, Series 2003A, 5.000%, 11/01/19 | 11/13 at 100.00 | A+ | | 2,085,340 | |
| | 2,000 | | North Carolina Medical Care Commission, Healthcare Facilities Revenue Bonds, Stanly Memorial Hospital, Series 1999, 6.375%, 10/01/29 | 4/11 at 100.00 | BBB+ | | 2,000,400 | |
| | | | North Carolina Medical Care Commission, Healthcare Facilities Revenue Bonds, Union Regional Medical Center, Series 2002A: | | | | | |
| | 1,000 | | 5.500%, 1/01/19 | 1/12 at 100.00 | A+ | | 1,014,050 | |
| | 550 | | 5.500%, 1/01/20 | 1/12 at 100.00 | A+ | | 556,793 | |
| | 1,750 | | 5.375%, 1/01/32 | 1/12 at 100.00 | A+ | | 1,748,810 | |
| | 3,000 | | North Carolina Medical Care Commission, Hospital Revenue Bonds, Southeastern Regional Medical Center, Series 2002, 5.375%, 6/01/32 | 6/12 at 101.00 | A | | 2,908,919 | |
| | 1,500 | | North Carolina Medical Care Commission, Hospital Revenue Bonds, Wilson Medical Center, Series 2007, 5.000%, 11/01/27 | 11/17 at 100.00 | A– | | 1,443,585 | |
| | 1,395 | | North Carolina Medical Care Commission, Revenue Bonds, Blue Ridge Healthcare System, Series 2005, 5.000%, 1/01/33 – FGIC Insured | 1/15 at 100.00 | A | | 1,374,759 | |
28 Nuveen Investments
| | Principal | | | Optional Call | | | | |
| | Amount (000) | | Description (1) | Provisions (2) | Ratings (3) | | Value | |
| �� | | | Health Care (continued) | | | | | |
| | | | North Carolina Medical Care Commission, Revenue Bonds, Cleveland County Healthcare System, Series 2004A: | | | | | |
| $ | 600 | | 5.250%, 7/01/20 – AMBAC Insured | 7/14 at 100.00 | A | $ | 617,730 | |
| | 500 | | 5.250%, 7/01/22 – AMBAC Insured | 7/14 at 100.00 | A | | 510,280 | |
| | 300 | | Northern Hospital District of Surry County, North Carolina, Health Care Facilities Revenue Bonds, Series 2008, 6.250%, 10/01/38 | 4/18 at 100.00 | BBB | | 303,306 | |
| | 660 | | Onslow County Hospital Authority, North Carolina, FHA Insured Mortgage Revenue Bonds, Onslow Memorial Hospital Project, Series 2006, 5.000%, 4/01/31 – NPFG Insured | 10/16 at 100.00 | A | | 667,445 | |
| | 21,845 | | Total Health Care | | | | 21,723,975 | |
| | | | Housing/Multifamily – 4.6% (3.0% of Total Investments) | | | | | |
| | 1,000 | | Asheville Housing Authority, North Carolina, GNMA-Collateralized Multifamily Housing Revenue Bonds, Woodridge Apartments, Series 1997, 5.800%, 11/20/39 (Alternative Minimum Tax) | 5/11 at 100.00 | AAA | | 1,000,350 | |
| | 2,290 | | Mecklenburg County, North Carolina, FNMA Multifamily Housing Revenue Bonds, Little Rock Apartments, Series 2003, 5.375%, 1/01/36 (Alternative Minimum Tax) | 7/13 at 105.00 | AAA | | 2,333,418 | |
| | 1,000 | | North Carolina Capital Facilities Financing Agency, Housing Revenue Bonds, Elizabeth City State University, Series 2003A, 5.000%, 6/01/28 – AMBAC Insured | 6/13 at 100.00 | N/R | | 904,110 | |
| | 4,290 | | Total Housing/Multifamily | | | | 4,237,878 | |
| | | | Housing/Single Family – 6.1% (4.0% of Total Investments) | | | | | |
| | 930 | | North Carolina Housing Finance Agency, Home Ownership Revenue Bonds, 1998 Trust Agreement, Series 10A, 5.400%, 7/01/32 – AMBAC Insured (Alternative Minimum Tax) | 1/11 at 100.00 | AA | | 930,121 | |
| | 1,875 | | North Carolina Housing Finance Agency, Home Ownership Revenue Bonds, 1998 Trust Agreement, Series 6A, 6.200%, 1/01/29 (Alternative Minimum Tax) | 1/11 at 100.00 | AA | | 1,876,594 | |
| | 1,000 | | North Carolina Housing Finance Agency, Home Ownership Revenue Bonds, Series 2007-29A, 4.800%, 7/01/33 (Alternative Minimum Tax) | 1/17 at 100.00 | AA | | 963,890 | |
| | 825 | | North Carolina Housing Finance Agency, Home Ownership Revenue Bonds, Series 25-A, 4.900%, 7/01/37 (Alternative Minimum Tax) | 7/16 at 100.00 | AA | | 801,092 | |
| | 1,085 | | North Carolina Housing Finance Agency, Single Family Revenue Bonds, Series 1996HH, 6.300%, 3/01/26 (Alternative Minimum Tax) | 3/11 at 100.00 | AA | | 1,086,161 | |
| | 5,715 | | Total Housing/Single Family | | | | 5,657,858 | |
| | | | Long-Term Care – 0.4% (0.2% of Total Investments) | | | | | |
| | 375 | | North Carolina Medical Care Commission, Revenue Bonds, Pines at Davidson, Series 2006A, 5.000%, 1/01/36 | 1/16 at 100.00 | N/R | | 335,126 | |
| | | | Materials – 0.5% (0.3% of Total Investments) | | | | | |
| | 500 | | Columbus County Industrial Facilities and Pollution Control Financing Authority, North Carolina, Environmental Improvement Revenue Bonds, International Paper Company Project, Series 2007A, 4.625%, 3/01/27 | 3/17 at 100.00 | BBB | | 437,225 | |
| | | | Tax Obligation/General – 4.5% (2.9% of Total Investments) | | | | | |
| | 1,820 | | Durham, North Carolina, General Obligation Bonds, Series 2007, 5.000%, 4/01/21 | 4/17 at 100.00 | AAA | | 2,040,256 | |
| | 2,000 | | Wake County, North Carolina, Limited Obligation Bonds, Series 2010, 5.000%, 1/01/37 | 1/20 at 100.00 | AA+ | | 2,062,540 | |
| | 3,820 | | Total Tax Obligation/General | | | | 4,102,796 | |
| | | | Tax Obligation/Limited – 39.5% (25.7% of Total Investments) | | | | | |
| | 1,330 | | Cabarrus County, North Carolina, Certificates of Participation, Series 2002, 5.250%, 2/01/17 | 2/13 at 100.00 | AA | | 1,416,743 | |
| | 1,800 | | Catawba County, North Carolina, Certificates of Participation, Series 2004, 5.250%, 6/01/21 – NPFG Insured | 6/14 at 100.00 | Aa2 | | 1,888,884 | |
| | 1,700 | | Charlotte, North Carolina, Certificates of Participation, Governmental Facilities Projects, Series 2003G, 5.375%, 6/01/26 | 6/13 at 100.00 | AA+ | | 1,764,787 | |
| | 1,400 | | Charlotte, North Carolina, Certificates of Participation, Nascar Hall of Fame, Series 2009C, 5.000%, 6/01/39 | 6/19 at 100.00 | AA+ | | 1,423,758 | |
| | 950 | | Charlotte, North Carolina, Certificates of Participation, Transit Projects Phase 2, Series 2008A, 5.000%, 6/01/33 | 6/18 at 100.00 | AA+ | | 969,352 | |
| | 1,500 | | Charlotte, North Carolina, Certificates of Participation, Transit Projects, Series 2003A, 5.000%, 6/01/33 | 6/13 at 100.00 | AA+ | | 1,520,220 | |
Nuveen Investments 29
| | | Nuveen North Carolina Premium Income Municipal Fund (continued) |
| NNC | | Portfolio of Investments November 30, 2010 (Unaudited) |
| | Principal | | | Optional Call | | | | |
| | Amount (000) | | Description (1) | Provisions (2) | Ratings (3) | | Value | |
| | | | Tax Obligation/Limited (continued) | | | | | |
| | | | Charlotte, North Carolina, Storm Water Fee Revenue Bonds, Series 2002: | | | | | |
| $ | 1,050 | | 5.250%, 6/01/20 | 6/12 at 101.00 | AAA | $ | 1,120,172 | |
| | 1,750 | | 5.000%, 6/01/25 | 6/12 at 101.00 | AAA | | 1,855,630 | |
| | 1,400 | | Craven County, North Carolina, Certificates of Participation, Series 2007, 5.000%, 6/01/27 – NPFG Insured | 6/17 at 100.00 | AA– | | 1,450,260 | |
| | 1,000 | | Davidson County, North Carolina, Certificates of Participation, Series 2004, 5.250%, 6/01/14 – AMBAC Insured | No Opt. Call | Aa3 | | 1,114,480 | |
| | 750 | | Harnett County, North Carolina, Certificates of Participation, Series 2009, 5.000%, 6/01/28 – AGC Insured | 6/19 at 100.00 | AA+ | | 778,133 | |
| | | | Lee County, North Carolina, Certificates of Participation, Public Schools and Community College, Series 2004: | | | | | |
| | 1,715 | | 5.250%, 4/01/18 – AGM Insured | 4/14 at 100.00 | AA+ | | 1,856,865 | |
| | 500 | | 5.250%, 4/01/20 – AGM Insured | 4/14 at 100.00 | AA+ | | 531,400 | |
| | 1,000 | | 5.250%, 4/01/22 – AGM Insured | 4/14 at 100.00 | AA+ | | 1,050,840 | |
| | 200 | | Mecklenburg County, North Carolina, Certificates of Participation, Series 2009A, 5.000%, 2/01/27 | No Opt. Call | AA+ | | 210,040 | |
| | 2,600 | | North Carolina Infrastructure Finance Corporation, Certificates of Participation, Capital Improvements, Series 2005A, 5.000%, 2/01/19 | 2/15 at 100.00 | AA+ | | 2,888,340 | |
| | 1,500 | | North Carolina Infrastructure Finance Corporation, Certificates of Participation, Correctional Facilities, Series 2004A, 5.000%, 2/01/23 | 2/14 at 100.00 | AA+ | | 1,602,945 | |
| | 1,500 | | North Carolina, Certificates of Participation, Repair and Renovation Project, Series 2004B, 5.000%, 6/01/20 | 6/14 at 100.00 | AA+ | | 1,592,790 | |
| | | | North Carolina, Certificates of Participation, Series 2003: | | | | | |
| | 1,130 | | 5.250%, 6/01/21 | 6/13 at 100.00 | AA+ | | 1,202,139 | |
| | 1,000 | | 5.250%, 6/01/23 | 6/13 at 100.00 | AA+ | | 1,047,460 | |
| | 2,000 | | Puerto Rico Highway and Transportation Authority, Grant Anticipation Revenue Bonds, Series 2004, 5.000%, 9/15/21 – NPFG Insured | 3/14 at 100.00 | A+ | | 2,014,320 | |
| | 3,675 | | Puerto Rico Sales Tax Financing Corporation, Sales Tax Revenue Bonds, Series 2010A, 0.000%, 8/01/35 | No Opt. Call | A+ | | 767,597 | |
| | 285 | | Raleigh, North Carolina, Certificates of Participation, Series 2007, 5.000%, 2/01/27 | 2/17 at 100.00 | AA+ | | 298,130 | |
| | 1,000 | | Randolph County, North Carolina, Certificates of Participation, Series 2004, 5.000%, 6/01/20 – AGM Insured | 6/14 at 102.00 | AA+ | | 1,071,150 | |
| | 1,000 | | Rutherford County, North Carolina, Certificates of Participation, Series 2007, 5.000%, 12/01/27 – AGM Insured | 12/17 at 100.00 | AA+ | | 1,041,630 | |
| | 1,950 | | Sampson County, North Carolina, Certificates of Participation, Series 2006, 5.000%, 6/01/34 – AGM Insured (UB) | 6/17 at 100.00 | AA+ | | 1,962,363 | |
| | 1,200 | | Wilmington, North Carolina, Certificates of Participation, Series 2008A, 5.000%, 6/01/29 | 6/18 at 100.00 | AA | | 1,249,092 | |
| | 700 | | Wilson County, North Carolina, Certificates of Participation, School Facilities Project, Series 2007, 5.000%, 4/01/25 – AMBAC Insured | 4/17 at 100.00 | Aa3 | | 721,399 | |
| | 37,585 | | Total Tax Obligation/Limited | | | | 36,410,919 | |
| | | | Transportation – 11.5% (7.5% of Total Investments) | | | | | |
| | 2,500 | | Charlotte, North Carolina, Airport Revenue Bonds, Charlotte Douglas International Refunding Series 2010A, 5.000%, 7/01/39 | 7/20 at 100.00 | A+ | | 2,496,100 | |
| | | | Charlotte, North Carolina, Airport Revenue Bonds, Series 2004A: | | | | | |
| | 600 | | 5.250%, 7/01/24 – NPFG Insured | 7/14 at 100.00 | A+ | | 629,094 | |
| | 2,710 | | 5.000%, 7/01/29 – NPFG Insured | 7/14 at 100.00 | A+ | | 2,738,211 | |
| | 1,020 | | North Carolina State Ports Authority, Port Facilities Revenue Bonds, Senior Lien Series 2010A, 5.250%, 2/01/40 | 2/20 at 100.00 | A3 | | 1,029,088 | |
| | 600 | | North Carolina Turnpike Authority, Triangle Expressway System Revenue Bonds, Series 2009A, 5.750%, 1/01/39 – AGC Insured | 1/19 at 100.00 | AA+ | | 632,250 | |
| | 4,230 | | North Carolina Turnpike Authority, Triangle Expressway System Senior Lien Revenue Bonds, Series 2009B, 0.000%, 1/01/33 – AGC Insured | No Opt. Call | AA+ | | 1,193,960 | |
| | 500 | | Piedmont Triad Airport Authority, North Carolina, Airport Revenue Bonds, Series 2005A, 5.000%, 7/01/20 – SYNCORA GTY Insured | 7/15 at 100.00 | A2 | | 529,985 | |
30 Nuveen Investments
| | Principal | | | Optional Call | | | | |
| | Amount (000) | | Description (1) | Provisions (2) | Ratings (3) | | Value | |
| | | | Transportation (continued) | | | | | |
| $ | 1,375 | | Raleigh Durham Airport Authority, North Carolina, Airport Revenue Bonds, Refunding Series 2010A, 5.000%, 5/01/36 | No Opt. Call | Aa3 | $ | 1,386,248 | |
| | 13,535 | | Total Transportation | | | | 10,634,936 | |
| | | | U.S. Guaranteed – 21.6% (14.0% of Total Investments) (4) | | | | | |
| | 1,890 | | Craven County, North Carolina, General Obligation Bonds, Series 2002, 5.000%, 5/01/21 (Pre-refunded 5/01/12) – AMBAC Insured | 5/12 at 101.00 | AA (4) | | 2,028,764 | |
| | 4,285 | | Durham County, North Carolina, General Obligation Bonds, Series 2002B, 5.000%, 4/01/16 (Pre-refunded 4/01/12) | 4/12 at 100.00 | AAA | | 4,544,113 | |
| | 1,530 | | North Carolina Medical Care Commission, Health System Revenue Bonds, Mission St. Joseph’s Health System, Series 2001, 5.250%, 10/01/31 (Pre-refunded 10/01/11) | 10/11 at 101.00 | AA (4) | | 1,604,526 | |
| | 735 | | North Carolina Medical Care Commission, Revenue Bonds, Northeast Medical Center, Series 2004, 5.000%, 11/01/24 (Pre-refunded 11/01/14) | 11/14 at 100.00 | Aa3 (4) | | 843,780 | |
| | 4,260 | | North Carolina Municipal Power Agency 1, Catawba Electric Revenue Bonds, Series 1986, 5.000%, 1/01/20 (ETM) | No Opt. Call | AAA | | 4,927,584 | |
| | 2,250 | | Raleigh Durham Airport Authority, North Carolina, Airport Revenue Bonds, Series 2001A, 5.250%, 11/01/16 (Pre-refunded 5/01/11) – FGIC Insured | 5/11 at 101.00 | Aa3 (4) | | 2,319,255 | |
| | | | University of North Carolina System, Pooled Revenue Refunding Bonds, Series 2002A: | | | | | |
| | 420 | | 5.375%, 4/01/22 (Pre-refunded 10/01/12) – AMBAC Insured | 10/12 at 100.00 | N/R (4) | | 456,767 | |
| | 460 | | 5.375%, 4/01/22 (Pre-refunded 10/01/12) – AMBAC Insured | 10/12 at 100.00 | N/R (4) | | 499,647 | |
| | 1,675 | | University of North Carolina, Wilmington, General Revenue Bonds, Series 2002A, 5.000%, 1/01/23 (Pre-refunded 1/01/12) – AMBAC Insured | 1/12 at 101.00 | A1 (4) | | 1,771,966 | |
| | 800 | | Winston-Salem, North Carolina, Water and Sewerage System Revenue Bonds, Series 2002A, 5.000%, 6/01/18 (Pre-refunded 6/01/12) | 6/12 at 100.00 | AAA | | 853,016 | |
| | 18,305 | | Total U.S. Guaranteed | | | | 19,849,418 | |
| | | | Utilities – 9.1% (5.9% of Total Investments) | | | | | |
| | 25 | | North Carolina Eastern Municipal Power Agency, Power System Revenue Bonds, Series 2003C, 5.375%, 1/01/17 | 1/13 at 100.00 | A– | | 26,795 | |
| | 3,000 | | North Carolina Eastern Municipal Power Agency, Power System Revenue Bonds, Series 2003F, 5.500%, 1/01/15 | 1/13 at 100.00 | A– | | 3,227,489 | |
| | 1,000 | | North Carolina Eastern Municipal Power Agency, Power System Revenue Bonds, Series 2005, 5.250%, 1/01/20 – AMBAC Insured | 1/16 at 100.00 | A– | | 1,098,300 | |
| | | | North Carolina Eastern Municipal Power Agency, Power System Revenue Refunding Bonds, Series 1993B: | | | | | |
| | 5 | | 5.500%, 1/01/17 – FGIC Insured | 1/11 at 100.00 | Baa1 | | 5,011 | |
| | 65 | | 5.500%, 1/01/21 | 1/11 at 100.00 | A– | | 65,085 | |
| | 165 | | 6.000%, 1/01/22 – FGIC Insured | No Opt. Call | Baa1 | | 194,472 | |
| | 575 | | North Carolina Municipal Power Agency 1, Catawba Electric Revenue Bonds, Refunding Series 2009A, 5.000%, 1/01/30 | 1/19 at 100.00 | A | | 582,222 | |
| | 2,000 | | North Carolina Municipal Power Agency 1, Catawba Electric Revenue Bonds, Series 2003A, 5.250%, 1/01/15 – AMBAC Insured | 1/13 at 100.00 | A | | 2,143,600 | |
| | 1,000 | | Wake County Industrial Facilities and Pollution Control Financing Authority, North Carolina, Revenue Refunding Bonds, Carolina Power and Light Company, Series 2002, 5.375%, 2/01/17 | 2/12 at 101.00 | A1 | | 1,055,440 | |
| | 7,835 | | Total Utilities | | | | 8,398,414 | |
| | | | Water and Sewer – 10.6% (6.9% of Total Investments) | | | | | |
| | 1,605 | | Broad River Water Authority, North Carolina, Water System Revenue Bonds, Series 2005, 5.000%, 6/01/20 – SYNCORA GTY Insured | 6/15 at 100.00 | A2 | | 1,648,239 | |
| | 500 | | Brunswick County, North Carolina, Enterprise System Revenue Bonds, Series 2008A, 5.000%, 4/01/31 – AGM Insured | 4/18 at 100.00 | AA+ | | 512,460 | |
| | 50 | | Charlotte, North Carolina, Water and Sewerage System Revenue Bonds, Series 2001, 5.125%, 6/01/26 | 6/11 at 101.00 | AAA | | 51,291 | |
| | 1,295 | | Greensboro, North Carolina, Combined Enterprise System Revenue Bonds, Series 2005A, 5.000%, 6/01/26 | 6/15 at 100.00 | AAA | | 1,365,616 | |
| | | | Oak Island, North Carolina, Enterprise System Revenue Bonds, Series 2009A: | | | | | |
| | 550 | | 6.000%, 6/01/34 – AGC Insured | 6/19 at 100.00 | AA+ | | 588,110 | |
| | 1,000 | | 6.000%, 6/01/36 – AGC Insured | 6/19 at 100.00 | AA+ | | 1,069,290 | |
Nuveen Investments 31
| | | Nuveen North Carolina Premium Income Municipal Fund (continued) |
| NNC | | Portfolio of Investments November 30, 2010 (Unaudited) |
| | Principal | | | Optional Call | | | | |
| | Amount (000) | | Description (1) | Provisions (2) | Ratings (3) | | Value | |
| | | | Water and Sewer (continued) | | | | | |
| $ | 500 | | Onslow County, North Carolina, Combined Enterprise System Revenue Bonds, Series 2004B, 5.000%, 6/01/23 – SYNCORA GTY Insured | 6/14 at 100.00 | A | $ | 521,290 | |
| | 3,865 | | Winston-Salem, North Carolina, Water and Sewer System Revenue Bonds, Series 2007A, 5.000%, 6/01/37 (UB) | 6/17 at 100.00 | AAA | | 3,978,399 | |
| | 9,365 | | Total Water and Sewer | | | | 9,734,695 | |
| $ | 142,115 | | Total Investments (cost $137,677,027) – 153.7% | | | | 141,545,409 | |
| | | | Floating Rate Obligations – (5.6)% | | | | (5,195,000 | ) |
| | | | MuniFund Term Preferred Shares, at Liquidation Value – (26.4)% (5) | | | | (24,300,000 | ) |
| | | | Other Assets Less Liabilities – 1.7% | | | | 1,578,856 | |
| | | | Auction Rate Preferred Shares, at Liquidation Value – (23.4)% (5) | | | | (21,550,000 | ) |
| | | | Net Assets Applicable to Common Shares – 100% | | | $ | 92,079,265 | |
| (1) | | All percentages shown in the Portfolio of Investments are based on net assets applicable to Common shares unless otherwise noted. |
| (2) | | Optional Call Provisions: Dates (month and year) and prices of the earliest optional call or redemption. There may be other call provisions at varying prices at later dates. Certain mortgage-backed securities may be subject to periodic principal paydowns. |
| (3) | | Ratings: Using the highest of Standard & Poor’s Group (“Standard & Poor’s”), Moody’s Investor Service, Inc. (“Moody’s”) or Fitch, Inc. (“Fitch”) rating. Ratings below BBB by Standard & Poor’s, Baa by Moody’s or BBB by Fitch are considered to be below investment grade. Holdings designated N/R are not rated by any of these national rating agencies. |
| (4) | | Backed by an escrow or trust containing sufficient U.S. Government or U.S. Government agency securities, which ensure the timely payment of principal and interest. Such investments are normally considered to be equivalent to AAA rated securities. |
| (5) | | MuniFund Term Preferred Shares and Auction Rate Preferred Shares, at Liquidation Value as a percentage of Total Investments are 17.2% and 15.2%, respectively. |
| N/R | | Not rated. |
| (ETM) | | Escrowed to maturity. |
| (UB) | | Underlying bond of an inverse floating rate trust reflected as a financing transaction. See Notes to Financial Statements, Footnote 1 – General Information and Significant Accounting Policies, Inverse Floating Rate Securities for more information. |
See accompanying notes to financial statements.
32 Nuveen Investments
| | | Nuveen North Carolina Dividend Advantage Municipal Fund |
| NRB | | Portfolio of Investments |
| | | November 30, 2010 (Unaudited) |
| | Principal | | | Optional Call | | | | |
| | Amount (000) | | Description (1) | Provisions (2) | Ratings (3) | | Value | |
| | | | Education and Civic Organizations – 9.7% (5.8% of Total Investments) | | | | | |
| $ | 380 | | North Carolina Capital Facilities Financing Agency, Revenue Bonds, Duke University, Series 2001A, 5.125%, 10/01/26 | 10/11 at 100.00 | AA+ | $ | 384,381 | |
| | 150 | | North Carolina Capital Facilities Financing Agency, Revenue Bonds, Johnson and Wales University, Series 2003A, 5.000%, 4/01/33 – SYNCORA GTY Insured | 4/13 at 100.00 | N/R | | 139,410 | |
| | 520 | | University of North Carolina System, Pooled Revenue Refunding Bonds, Series 2002A, 5.375%, 4/01/17 – AMBAC Insured | 10/12 at 100.00 | A+ | | 552,973 | |
| | 1,750 | | University of North Carolina, Chapel Hill, System Net Revenue Bonds, Series 2001A, 5.000%, 12/01/25 | 6/11 at 100.00 | Aaa | | 1,781,569 | |
| | 400 | | University of North Carolina, Chapel Hill, System Net Revenue Bonds, Series 2002B, 5.000%, 12/01/11 | No Opt. Call | Aaa | | 418,636 | |
| | 3,200 | | Total Education and Civic Organizations | | | | 3,276,969 | |
| | | | Health Care – 25.1% (15.2% of Total Investments) | | | | | |
| | 565 | | Albemarle Hospital Authority, North Carolina, Health Care Facilities Revenue Bonds, Series 2007, 5.250%, 10/01/38 | 10/17 at 100.00 | N/R | | 426,761 | |
| | 950 | | Charlotte-Mecklenberg Hospital Authority, North Carolina, Carolinas HealthCare System Revenue Bonds, Series 2008A, 5.000%, 1/15/47 | 1/18 at 100.00 | AA– | | 937,422 | |
| | 1,000 | | Charlotte-Mecklenberg Hospital Authority, North Carolina, Health Care Refunding Revenue Bonds, Carolinas HealthCare System, Series 2009A, 5.250%, 1/15/39 | 1/19 at 100.00 | AA– | | 1,019,810 | |
| | 250 | | Johnston Memorial Hospital Authority, North Carolina, Mortgage Revenue Bonds, Johnston Memorial Hospital Project, Series 2008, 5.250%, 10/01/36 – AGM Insured | 4/18 at 100.00 | AA+ | | 254,628 | |
| | 30 | | New Hanover County, North Carolina, Hospital Revenue Bonds, New Hanover Regional Medical Center, Series 2006B, 5.125%, 10/01/31 – AGM Insured | 10/19 at 100.00 | AA+ | | 30,639 | |
| | 1,000 | | North Carolina Medical Care Commission Health Care Facilities Revenue Bonds Novant Health Inc., Series 2010A, 5.250%, 11/01/40 | 11/20 at 100.00 | A+ | | 999,950 | |
| | 280 | | North Carolina Medical Care Commission, Health Care Facilities Revenue Bonds, WakeMed, Series 2009A, 5.625%, | 10/14 at 100.00 | AA+ | | 286,852 | |
| | | | 10/01/38 – AGC Insured | | | | | |
| | 1,110 | | North Carolina Medical Care Commission, Healthcare Facilities Revenue Bonds, Union Regional Medical Center, Series 2002A, 5.250%, 1/01/15 | 1/12 at 100.00 | A+ | | 1,137,306 | |
| | 980 | | North Carolina Medical Care Commission, Healthcare Revenue Bonds, Carolina Medicorp, Series 1996, 5.250%, 5/01/26 | 5/11 at 100.00 | A+ | | 980,598 | |
| | 1,500 | | North Carolina Medical Care Commission, Hospital Revenue Bonds, Southeastern Regional Medical Center, Series 2002, 5.250%, 6/01/22 | 6/12 at 101.00 | A | | 1,514,760 | |
| | 500 | | North Carolina Medical Care Commission, Hospital Revenue Bonds, Wilson Medical Center, Series 2007, 5.000%, 11/01/20 | 11/17 at 100.00 | A– | | 514,705 | |
| | 250 | | North Carolina Medical Care Commission, Revenue Bonds, Blue Ridge Healthcare System, Series 2005, 5.000%, 1/01/33 – FGIC Insured | 1/15 at 100.00 | A | | 246,373 | |
| | 150 | | Northern Hospital District of Surry County, North Carolina, Health Care Facilities Revenue Bonds, Series 2008, 6.250%, 10/01/38 | 4/18 at 100.00 | BBB | | 151,653 | |
| | 8,565 | | Total Health Care | | | | 8,501,457 | |
| | | | Housing/Single Family – 4.5% (2.7% of Total Investments) | | | | | |
| | 370 | | North Carolina Housing Finance Agency, Home Ownership Revenue Bonds, 1998 Trust Agreement, Series 10A, 5.400%, 7/01/32 – AMBAC Insured (Alternative Minimum Tax) | 1/11 at 100.00 | AA | | 370,048 | |
| | 580 | | North Carolina Housing Finance Agency, Home Ownership Revenue Bonds, 1998 Trust Agreement, Series 5A, 5.625%, 7/01/30 (Alternative Minimum Tax) | 1/11 at 100.00 | AA | | 580,203 | |
| | 250 | | North Carolina Housing Finance Agency, Home Ownership Revenue Bonds, Series 2007-29A, 4.800%, 7/01/33 (Alternative Minimum Tax) | 1/17 at 100.00 | AA | | 240,973 | |
| | 330 | | North Carolina Housing Finance Agency, Home Ownership Revenue Bonds, Series 25-A, 4.900%, 7/01/37 (Alternative Minimum Tax) | 7/16 at 100.00 | AA | | 320,437 | |
| | 1,530 | | Total Housing/Single Family | | | | 1,511,661 | |
Nuveen Investments 33
| | | Nuveen North Carolina Dividend Advantage Municipal Fund (continued) |
| NRB | | Portfolio of Investments November 30, 2010 (Unaudited) |
| | Principal | | | Optional Call | | | | |
| | Amount (000) | | Description (1) | Provisions (2) | Ratings (3) | | Value | |
| | | | Long-Term Care – 1.8% (1.1% of Total Investments) | | | | | |
| | | | North Carolina Medical Care Commission, Healthcare Facilities Revenue Bonds, Presbyterian Homes, Series 2006: | | | | | |
| $ | 200 | | 5.400%, 10/01/27 | 10/16 at 100.00 | N/R | $ | 190,426 | |
| | 300 | | 5.500%, 10/01/31 | 10/16 at 100.00 | N/R | | 275,922 | |
| | 150 | | North Carolina Medical Care Commission, Revenue Bonds, Pines at Davidson, Series 2006A, 5.000%, 1/01/36 | 1/16 at 100.00 | N/R | | 134,051 | |
| | 650 | | Total Long-Term Care | | | | 600,399 | |
| | | | Materials – 1.0% (0.6% of Total Investments) | | | | | |
| | 400 | | Columbus County Industrial Facilities and Pollution Control Financing Authority, North Carolina, Environmental Improvement Revenue Bonds, International Paper Company Project, Series 2007A, 4.625%, 3/01/27 | 3/17 at 100.00 | BBB | | 349,780 | |
| | | | Tax Obligation/General – 11.5% (6.9% of Total Investments) | | | | | |
| | 1,000 | | Durham, North Carolina, General Obligation Bonds, Series 2007, 5.000%, 4/01/21 | 4/17 at 100.00 | AAA | | 1,121,020 | |
| | | | North Carolina, General Obligation Bonds, Series 2004A: | | | | | |
| | 1,000 | | 5.000%, 3/01/18 | 3/14 at 100.00 | AAA | | 1,112,740 | |
| | 1,000 | | 5.000%, 3/01/22 | 3/14 at 100.00 | AAA | | 1,085,170 | |
| | 550 | | Wake County, North Carolina, Limited Obligation Bonds, Series 2010, 5.000%, 1/01/37 | 1/20 at 100.00 | AA+ | | 567,199 | |
| | 3,550 | | Total Tax Obligation/General | | | | 3,886,129 | |
| | | | Tax Obligation/Limited – 27.0% (16.3% of Total Investments) | | | | | |
| | 1,400 | | Charlotte, North Carolina, Certificates of Participation, Governmental Facilities Projects, Series 2003G, 5.375%, 6/01/26 (UB) | 6/13 at 100.00 | AA+ | | 1,453,354 | |
| | 200 | | Charlotte, North Carolina, Certificates of Participation, Nascar Hall of Fame, Series 2009C, 5.000%, 6/01/39 | 6/19 at 100.00 | AA+ | | 203,394 | |
| | 305 | | Charlotte, North Carolina, Certificates of Participation, Transit Projects Phase 2, Series 2008A, 5.000%, 6/01/33 | 6/18 at 100.00 | AA+ | | 311,213 | |
| | 160 | | Craven County, North Carolina, Certificates of Participation, Series 2007, 5.000%, 6/01/23 – NPFG Insured | 6/17 at 100.00 | AA– | | 169,674 | |
| | 1,870 | | Dare County, North Carolina, Certificates of Participation, Series 2002, 5.250%, 6/01/15 – AMBAC Insured | 12/12 at 100.00 | AA– | | 2,017,075 | |
| | 1,250 | | Davidson County, North Carolina, Certificates of Participation, Series 2004, 5.250%, 6/01/21 – AMBAC Insured | 6/14 at 100.00 | Aa3 | | 1,307,125 | |
| | 1,390 | | Durham, North Carolina, Certificates of Participation, Series 2005B, 5.000%, 6/01/25 | 6/15 at 100.00 | AA+ | | 1,439,693 | |
| | 50 | | Harnett County, North Carolina, Certificates of Participation, Series 2009, 5.000%, 6/01/28 – AGC Insured | 6/19 at 100.00 | AA+ | | 51,876 | |
| | 525 | | Puerto Rico Sales Tax Financing Corporation, Sales Tax Revenue Bonds, Series 2010A, 0.000%, 8/01/35 | No Opt. Call | A+ | | 109,657 | |
| | 470 | | Raleigh, North Carolina, Certificates of Participation, Downtown Improvement Project, Series 2004B, 5.000%, 6/01/20 | 6/14 at 100.00 | AA+ | | 499,074 | |
| | 170 | | Raleigh, North Carolina, Certificates of Participation, Series 2007, 5.000%, 2/01/27 | 2/17 at 100.00 | AA+ | | 177,832 | |
| | 150 | | Rutherford County, North Carolina, Certificates of Participation, Series 2007, 5.000%, 12/01/27 – AGM Insured | 12/17 at 100.00 | AA+ | | 156,245 | |
| | 700 | | Sampson County, North Carolina, Certificates of Participation, Series 2006, 5.000%, 6/01/34 – AGM Insured (UB) | 6/17 at 100.00 | AA+ | | 704,438 | |
| | 250 | | Wilmington, North Carolina, Certificates of Participation, Series 2008A, 5.000%, 6/01/29 | 6/18 at 100.00 | AA | | 260,228 | |
| | 250 | | Wilson County, North Carolina, Certificates of Participation, School Facilities Project, Series 2007, 5.000%, 4/01/25 – AMBAC Insured | 4/17 at 100.00 | Aa3 | | 257,643 | |
| | 9,140 | | Total Tax Obligation/Limited | | | | 9,118,521 | |
| | | | Transportation – 9.4% (5.7% of Total Investments) | | | | | |
| | 1,000 | | Charlotte, North Carolina, Airport Revenue Bonds, Charlotte Douglas International Refunding Series 2010A, 5.000%, 7/01/39 | 7/20 at 100.00 | A+ | | 998,440 | |
| | 360 | | North Carolina State Ports Authority, Port Facilities Revenue Bonds, Senior Lien Series 2010A, 5.250%, 2/01/40 | 2/20 at 100.00 | A3 | | 363,208 | |
34 Nuveen Investments
| | Principal | | | Optional Call | | | | |
| | Amount (000) | | Description (1) | Provisions (2) | Ratings (3) | | Value | |
| | | | Transportation (continued) | | | | | |
| | | | North Carolina Turnpike Authority, Triangle Expressway System Revenue Bonds, Series 2009A: | | | | | |
| $ | 50 | | 5.375%, 1/01/26 – AGC Insured | 1/19 at 100.00 | AA+ | $ | 53,268 | |
| | 275 | | 5.750%, 1/01/39 – AGC Insured | 1/19 at 100.00 | AA+ | | 289,781 | |
| | | | North Carolina Turnpike Authority, Triangle Expressway System Senior Lien Revenue Bonds, Series 2009B: | | | | | |
| | 2,170 | | 0.000%, 1/01/34 – AGC Insured | No Opt. Call | AA+ | | 574,529 | |
| | 175 | | 0.000%, 1/01/38 – AGC Insured | No Opt. Call | AA+ | | 35,849 | |
| | 300 | | Piedmont Triad Airport Authority, North Carolina, Airport Revenue Bonds, Series 2005A, 5.000%, 7/01/20 – SYNCORA GTY Insured | 7/15 at 100.00 | A2 | | 317,991 | |
| | 550 | | Raleigh Durham Airport Authority, North Carolina, Airport Revenue Bonds, Refunding Series 2010A, 5.000%, 5/01/36 | No Opt. Call | Aa3 | | 554,499 | |
| | 4,880 | | Total Transportation | | | | 3,187,565 | |
| | | | U.S. Guaranteed – 18.5% (11.2% of Total Investments) (4) | | | | | |
| | 100 | | Charlotte-Mecklenburg Hospital Authority, North Carolina, Healthcare System Revenue Bonds, DBA Carolinas Healthcare System, Series 2005A, 5.000%, 1/15/45 (Pre-refunded 1/15/15) | 1/15 at 100.00 | AAA | | 114,995 | |
| | 500 | | Greensboro, North Carolina, Combined Enterprise System Revenue Bonds, Series 2001A, 5.125%, 6/01/21 (Pre-refunded 6/01/11) | 6/11 at 101.00 | AAA | | 517,300 | |
| | 620 | | North Carolina Capital Facilities Financing Agency, Revenue Bonds, Duke University, Series 2001A, 5.125%, 10/01/26 (Pre-refunded 10/01/11) | 10/11 at 100.00 | AAA | | 645,358 | |
| | 125 | | North Carolina Capital Facilities Financing Agency, Revenue Bonds, High Point University, Series 2001, 5.125%, 9/01/18 (Pre-refunded 9/01/11) | 9/11 at 101.00 | N/R (4) | | 130,344 | |
| | 800 | | North Carolina Medical Care Commission, Health System Revenue Bonds, Mission St. Joseph’s Health System, Series 2001, 5.250%, 10/01/31 (Pre-refunded 10/01/11) | 10/11 at 101.00 | AA (4) | | 838,968 | |
| | 300 | | North Carolina Medical Care Commission, Revenue Bonds, Northeast Medical Center, Series 2004, 5.000%, 11/01/24 (Pre-refunded 11/01/14) | 11/14 at 100.00 | Aa3 (4) | | 344,400 | |
| | 1,530 | | Raleigh Durham Airport Authority, North Carolina, Airport Revenue Bonds, Series 2001A, 5.250%, 11/01/18 (Pre-refunded 5/01/11) – FGIC Insured | 5/11 at 101.00 | Aa3 (4) | | 1,577,093 | |
| | | | University of North Carolina System, Pooled Revenue Refunding Bonds, Series 2002A: | | | | | |
| | 1,020 | | 5.375%, 4/01/17 (Pre-refunded 10/01/12) – AMBAC Insured | 10/12 at 100.00 | N/R (4) | | 1,109,291 | |
| | 910 | | 5.375%, 4/01/17 (Pre-refunded 10/01/12) – AMBAC Insured | 10/12 at 100.00 | N/R (4) | | 988,433 | |
| | 5,905 | | Total U.S. Guaranteed | | | | 6,266,182 | |
| | | | Utilities – 13.2% (8.0% of Total Investments) | | | | | |
| | | | Greenville, North Carolina, Combined Enterprise System Revenue Bonds, Series 2001: | | | | | |
| | 1,000 | | 5.250%, 9/01/20 – AGM Insured | 9/11 at 101.00 | AA+ | | 1,039,040 | |
| | 500 | | 5.250%, 9/01/21 – AGM Insured | 9/11 at 101.00 | AA+ | | 517,975 | |
| | 500 | | North Carolina Eastern Municipal Power Agency, Power System Revenue Bonds, Series 2005, 5.250%, 1/01/20 – AMBAC Insured | 1/16 at 100.00 | A– | | 549,150 | |
| | 745 | | North Carolina Eastern Municipal Power Agency, Power System Revenue Refunding Bonds, Series 1993B, 5.500%, 1/01/17 – FGIC Insured | 1/11 at 100.00 | Baa1 | | 746,661 | |
| | 25 | | North Carolina Municipal Power Agency 1, Catawba Electric Revenue Bonds, Refunding Series 2009A, 5.000%, 1/01/30 | 1/19 at 100.00 | A | | 25,314 | |
| | 1,500 | | Wake County Industrial Facilities and Pollution Control Financing Authority, North Carolina, Revenue Refunding Bonds, Carolina Power and Light Company, Series 2002, 5.375%, 2/01/17 | 2/12 at 101.00 | A1 | | 1,583,159 | |
| | 4,270 | | Total Utilities | | | | 4,461,299 | |
| | | | Water and Sewer – 43.9% (26.5% of Total Investments) | | | | | |
| | 100 | | Brunswick County, North Carolina, Enterprise System Revenue Bonds, Series 2008A, 5.000%, 4/01/31 – AGM Insured | 4/18 at 100.00 | AA+ | | 102,492 | |
| | 505 | | Cape Fear Public Utility Authority, North Carolina, Water & Sewer System Revenue Bonds, Series 2008, 5.000%, 8/01/35 | 8/18 at 100.00 | AA | | 520,367 | |
| | 2,250 | | Charlotte, North Carolina, Water and Sewerage System Revenue Bonds, Series 2001, 5.125%, 6/01/26 | 6/11 at 101.00 | AAA | | 2,308,070 | |
| | 1,000 | | Charlotte, North Carolina, Water and Sewerage System Revenue Bonds, Series 2008, 5.000%, 7/01/38 | 7/18 at 100.00 | AAA | | 1,043,220 | |
| | 500 | | Greensboro, North Carolina, Combined Enterprise System Revenue Bonds, Series 2005A, 5.000%, 6/01/25 | 6/15 at 100.00 | AAA | | 529,390 | |
Nuveen Investments 35
| | | Nuveen North Carolina Dividend Advantage Municipal Fund (continued) |
| NRB | | Portfolio of Investments November 30, 2010 (Unaudited) |
| | Principal | | | Optional Call | | | | |
| | Amount (000) | | Description (1) | Provisions (2) | Ratings (3) | | Value | |
| | | | Water and Sewer (continued) | | | | | |
| $ | 700 | | Oak Island, North Carolina, Enterprise System Revenue Bonds, Series 2009A, 6.000%, 6/01/34 – AGC Insured | 6/19 at 100.00 | AA+ | $ | 748,503 | |
| | 400 | | Onslow County, North Carolina, Combined Enterprise System Revenue Bonds, Series 2004B, 5.000%, 6/01/23 – SYNCORA GTY Insured | 6/14 at 100.00 | A | | 417,031 | |
| | | | Raleigh, North Carolina, Combined Enterprise System Revenue Bonds, Series 2006A: | | | | | |
| | 4,440 | | 5.000%, 3/01/31 (UB) | 3/16 at 100.00 | AAA | | 4,640,732 | |
| | 3,000 | | 5.000%, 3/01/36 (UB) | 3/16 at 100.00 | AAA | | 3,101,160 | |
| | 5 | | Raleigh, North Carolina, Combined Enterprise System Revenue Bonds, Series 2006A, Residuals Series 11-R-645-2, 13.760%, 3/01/14 (IF) | No Opt. Call | AAA | | 5,506 | |
| | 1,385 | | Winston-Salem, North Carolina, Water and Sewer System Revenue Bonds, Series 2007A, 5.000%, 6/01/37 (UB) | 6/17 at 100.00 | AAA | | 1,425,636 | |
| | 14,285 | | Total Water and Sewer | | | | 14,842,107 | |
| $ | 56,375 | | Total Investments (cost $54,521,220) – 165.6% | | | | 56,002,069 | |
| | | | Floating Rate Obligations – (21.2)% | | | | (7,160,000 | ) |
| | | | MuniFund Term Preferred Shares, at Liquidation Value – (49.1)% (5) | | | | (16,600,000 | ) |
| | | | Other Assets Less Liabilities – 4.7% | | | | 1,572,634 | |
| | | | Net Assets Applicable to Common Shares – 100% | | | $ | 33,814,703 | |
| (1) | | All percentages shown in the Portfolio of Investments are based on net assets applicable to Common shares unless otherwise noted. |
| (2) | | Optional Call Provisions: Dates (month and year) and prices of the earliest optional call or redemption. There may be other call provisions at varying prices at later dates. Certain mortgage-backed securities may be subject to periodic principal paydowns. |
| (3) | | Ratings: Using the highest of Standard & Poor’s Group (“Standard & Poor’s”), Moody’s Investor Service, Inc. (“Moody’s”) or Fitch, Inc. (“Fitch”) rating. Ratings below BBB by Standard & Poor’s, Baa by Moody’s or BBB by Fitch are considered to be below investment grade. Holdings designated N/R are not rated by any of these national rating agencies. |
| (4) | | Backed by an escrow or trust containing sufficient U.S. Government or U.S. Government agency securities, which ensure the timely payment of principal and interest. Such investments are normally considered to be equivalent to AAA rated securities. |
| (5) | | MuniFund Term Preferred Shares, at Liquidation Value as a percentage of Total Investments is 29.6%. |
| N/R | | Not rated. |
| (IF) | | Inverse floating rate investment. |
| (UB) | | Underlying bond of an inverse floating rate trust reflected as a financing transaction. See Notes to Financial Statements, Footnote 1 – General Information and Significant Accounting Policies, Inverse Floating Rate Securities for more information. |
See accompanying notes to financial statements.
36 Nuveen Investments
| | | Nuveen North Carolina Dividend Advantage Municipal Fund 2 |
| NNO | | Portfolio of Investments |
| | | November 30, 2010 (Unaudited) |
| | Principal | | | Optional Call | | | | |
| | Amount (000) | | Description (1) | Provisions (2) | Ratings (3) | | Value | |
| | | | Education and Civic Organizations – 11.3% (7.1% of Total Investments) | | | | | |
| | | | Appalachian State University, North Carolina, Housing and Student Center System Revenue Refunding Bonds, Series 2002: | | | | | |
| $ | 1,040 | | 5.000%, 7/15/14 – NPFG Insured | 7/12 at 100.00 | Aa3 | $ | 1,103,066 | |
| | 1,000 | | 5.000%, 7/15/15 – NPFG Insured | 7/12 at 100.00 | Aa3 | | 1,048,170 | |
| | | | North Carolina Capital Facilities Financing Agency, Revenue Bonds, Duke University, Series 2001A: | | | | | |
| | 715 | | 5.125%, 10/01/26 | 10/11 at 100.00 | AA+ | | 723,244 | |
| | 380 | | 5.125%, 10/01/41 | 10/11 at 100.00 | AA+ | | 380,695 | |
| | 800 | | North Carolina Capital Facilities Financing Agency, Revenue Bonds, Johnson and Wales University, Series 2003A, 5.000%, 4/01/33 – SYNCORA GTY Insured | 4/13 at 100.00 | N/R | | 743,520 | |
| | 130 | | University of North Carolina System, Pooled Revenue Bonds, Series 2002B, 5.375%, 4/01/19 – AMBAC Insured | 10/12 at 100.00 | A+ | | 137,497 | |
| | 1,000 | | University of North Carolina System, Pooled Revenue Bonds, Series 2005A, 5.000%, 4/01/22 – AMBAC Insured | 4/15 at 100.00 | A+ | | 1,043,040 | |
| | 500 | | University of North Carolina Wilmington, Certificates of Participation, Student Housing Project Revenue Bonds, Series 2006, 5.000%, 6/01/21 – FGIC Insured | 6/16 at 100.00 | A | | 531,635 | |
| | 250 | | University of North Carolina, Chapel Hill, System Net Revenue Bonds, Series 2002B, 5.000%, 12/01/11 | No Opt. Call | Aaa | | 261,648 | |
| | 250 | | University of North Carolina, Charlotte, Certificates of Participation, Student Housing Project, Series 2005, 5.000%, 3/01/21 – AMBAC Insured | 3/15 at 100.00 | A | | 262,838 | |
| | 6,065 | | Total Education and Civic Organizations | | | | 6,235,353 | |
| | | | Health Care – 29.2% (18.4% of Total Investments) | | | | | |
| | 1,015 | | Albemarle Hospital Authority, North Carolina, Health Care Facilities Revenue Bonds, Series 2007, 5.250%, 10/01/38 | 10/17 at 100.00 | N/R | | 766,660 | |
| | 1,000 | | Charlotte-Mecklenberg Hospital Authority, North Carolina, Carolinas HealthCare System Revenue Bonds, Series 2008A, 5.000%, 1/15/47 | 1/18 at 100.00 | AA– | | 986,760 | |
| | 750 | | Charlotte-Mecklenberg Hospital Authority, North Carolina, Health Care Refunding Revenue Bonds, Carolinas HealthCare System, Series 2009A, 5.250%, 1/15/39 | 1/19 at 100.00 | AA– | | 764,858 | |
| | 1,640 | | Charlotte-Mecklenburg Hospital Authority, North Carolina, Healthcare System Revenue Bonds, Carolinas Healthcare System, Series 2001A, 5.000%, 1/15/31 | 1/11 at 101.00 | AA– | | 1,642,394 | |
| | 500 | | Johnston Memorial Hospital Authority, North Carolina, Mortgage Revenue Bonds, Johnston Memorial Hospital Project, Series 2008, 5.250%, 10/01/36 – AGM Insured | 4/18 at 100.00 | AA+ | | 509,255 | |
| | 120 | | New Hanover County, North Carolina, Hospital Revenue Bonds, New Hanover Regional Medical Center, Series 2006B, 5.125%, 10/01/31 – AGM Insured | 10/19 at 100.00 | AA+ | | 122,557 | |
| | 1,250 | | North Carolina Medical Care Commission Health Care Facilities Revenue Bonds Novant Health Inc., Series 2010A, 5.250%, 11/01/40, DD | 11/20 at 100.00 | A+ | | 1,249,938 | |
| | 455 | | North Carolina Medical Care Commission, Health Care Facilities Revenue Bonds, WakeMed, Series 2009A, 5.625%, | 10/14 at 100.00 | AA+ | | 466,134 | |
| | | | 10/01/38 – AGC Insured | | | | | |
| | 2,000 | | North Carolina Medical Care Commission, Healthcare Facilities Revenue Bonds, Novant Health Obligated Group, Series 2003A, 5.000%, 11/01/20 | 11/13 at 100.00 | A+ | | 2,069,580 | |
| | 1,005 | | North Carolina Medical Care Commission, Healthcare Facilities Revenue Bonds, Union Regional Medical Center, Series 2002A, 5.250%, 1/01/13 | 1/12 at 100.00 | A+ | | 1,036,386 | |
| | | | North Carolina Medical Care Commission, Hospital Revenue Bonds, Southeastern Regional Medical Center, Series 2002: | | | | | |
| | 1,000 | | 5.500%, 6/01/15 | 6/12 at 101.00 | A | | 1,042,160 | |
| | 2,100 | | 5.250%, 6/01/22 | 6/12 at 101.00 | A | | 2,120,664 | |
| | 925 | | North Carolina Medical Care Commission, Hospital Revenue Bonds, Wilson Medical Center, Series 2007, 5.000%, 11/01/27 | 11/17 at 100.00 | A– | | 890,211 | |
| | 1,250 | | North Carolina Medical Care Commission, Revenue Bonds, Blue Ridge Healthcare System, Series 2005, 5.000%, 1/01/33 – FGIC Insured | 1/15 at 100.00 | A | | 1,231,863 | |
Nuveen Investments 37
| | | Nuveen North Carolina Dividend Advantage Municipal Fund 2 (continued) |
| NNO | | Portfolio of Investments November 30, 2010 (Unaudited) |
| | Principal | | | Optional Call | | | | |
| | Amount (000) | | Description (1) | Provisions (2) | Ratings (3) | | Value | |
| | | | Health Care (continued) | | | | | |
| | | | North Carolina Medical Care Commission, Revenue Bonds, Cleveland County Healthcare System, Series 2004A: | | | | | |
| $ | 595 | | 5.250%, 7/01/20 – AMBAC Insured | 7/14 at 100.00 | A | $ | 612,582 | |
| | 500 | | 5.250%, 7/01/22 – AMBAC Insured | 7/14 at 100.00 | A | | 510,280 | |
| | 150 | | Northern Hospital District of Surry County, North Carolina, Health Care Facilities Revenue Bonds, Series 2008, 6.250%, 10/01/38 | 4/18 at 100.00 | BBB | | 151,653 | |
| | 16,255 | | Total Health Care | | | | 16,173,935 | |
| | | | Housing/Single Family – 3.6% (2.3% of Total Investments) | | | | | |
| | 320 | | North Carolina Housing Finance Agency, Home Ownership Revenue Bonds, 1998 Trust Agreement, Series 10A, 5.400%, 7/01/32 – AMBAC Insured (Alternative Minimum Tax) | 1/11 at 100.00 | AA | | 320,042 | |
| | | | North Carolina Housing Finance Agency, Home Ownership Revenue Bonds, Series 13A: | | | | | |
| | 580 | | 4.700%, 7/01/12 (Alternative Minimum Tax) | 7/11 at 100.00 | AA | | 587,842 | |
| | 585 | | 4.850%, 7/01/13 (Alternative Minimum Tax) | 7/11 at 100.00 | AA | | 591,944 | |
| | 510 | | North Carolina Housing Finance Agency, Home Ownership Revenue Bonds, Series 25-A, 4.900%, 7/01/37 (Alternative Minimum Tax) | 7/16 at 100.00 | AA | | 495,220 | |
| | 1,995 | | Total Housing/Single Family | | | | 1,995,048 | |
| | | | Long-Term Care – 1.7% (1.1% of Total Investments) | | | | | |
| | | | North Carolina Medical Care Commission, Healthcare Facilities Revenue Bonds, Presbyterian Homes, Series 2006: | | | | | |
| | 250 | | 5.400%, 10/01/27 | 10/16 at 100.00 | N/R | | 238,033 | |
| | 600 | | 5.500%, 10/01/31 | 10/16 at 100.00 | N/R | | 551,844 | |
| | 185 | | North Carolina Medical Care Commission, Revenue Bonds, Pines at Davidson, Series 2006A, 5.000%, 1/01/36 | 1/16 at 100.00 | N/R | | 165,329 | |
| | 1,035 | | Total Long-Term Care | | | | 955,206 | |
| | | | Materials – 2.5% (1.5% of Total Investments) | | | | | |
| | 300 | | Columbus County Industrial Facilities and Pollution Control Financing Authority, North Carolina, Environmental Improvement Revenue Bonds, International Paper Company Project, Series 2007A, 4.625%, 3/01/27 | 3/17 at 100.00 | BBB | | 262,335 | |
| | 1,100 | | Northampton County Industrial Facilities and Pollution Control Financing Authority, North Carolina, Environmental Improvement Revenue Bonds, International Paper Company, Series 2001A, 6.200%, 2/01/25 (Alternative Minimum Tax) | 2/11 at 101.00 | BBB | | 1,112,210 | |
| | 1,400 | | Total Materials | | | | 1,374,545 | |
| | | | Tax Obligation/General – 9.7% (6.1% of Total Investments) | | | | | |
| | 1,475 | | Durham, North Carolina, General Obligation Bonds, Series 2007, 5.000%, 4/01/22 | 4/17 at 100.00 | AAA | | 1,637,988 | |
| | 1,050 | | Forsyth County, North Carolina, General Obligation Bonds, Limited Obligation Series 2009, 5.000%, 4/01/30 | 4/20 at 100.00 | AA+ | | 1,109,693 | |
| | 500 | | North Carolina, General Obligation Bonds, Series 2004A, 5.000%, 3/01/22 | 3/14 at 100.00 | AAA | | 542,585 | |
| | 2,000 | | Wake County, North Carolina, Limited Obligation Bonds, Series 2010, 5.000%, 1/01/37 | 1/20 at 100.00 | AA+ | | 2,062,540 | |
| | 5,025 | | Total Tax Obligation/General | | | | 5,352,806 | |
| | | | Tax Obligation/Limited – 35.9% (22.5% of Total Investments) | | | | | |
| | 30 | | Cabarrus County, North Carolina, Certificates of Participation, Series 2002, 5.250%, 2/01/16 | 2/13 at 100.00 | AA | | 32,102 | |
| | 1,750 | | Charlotte, North Carolina, Certificates of Participation, Governmental Facilities Projects, Series 2003G, 5.000%, 6/01/28 | 6/13 at 100.00 | AA+ | | 1,791,493 | |
| | 400 | | Charlotte, North Carolina, Certificates of Participation, Nascar Hall of Fame, Series 2009C, 5.000%, 6/01/39 | 6/19 at 100.00 | AA+ | | 406,788 | |
| | 575 | | Charlotte, North Carolina, Certificates of Participation, Transit Projects Phase 2, Series 2008A, 5.000%, 6/01/33 | 6/18 at 100.00 | AA+ | | 586,713 | |
| | 1,850 | | Charlotte, North Carolina, Storm Water Fee Revenue Bonds, Series 2002, 5.250%, 6/01/18 | 6/12 at 101.00 | AAA | | 1,973,636 | |
| | 800 | | Craven County, North Carolina, Certificates of Participation, Series 2007, 5.000%, 6/01/27- NPFG Insured | 6/17 at 100.00 | AA– | | 828,720 | |
38 Nuveen Investments
| | Principal | | | Optional Call | | | | |
| | Amount (000) | | Description (1) | Provisions (2) | Ratings (3) | | Value | |
| | | | Tax Obligation/Limited (continued) | | | | | |
| $ | 500 | | Harnett County, North Carolina, Certificates of Participation, Series 2009, 5.000%, 6/01/29 – AGC Insured | 6/19 at 100.00 | AA+ | $ | 514,830 | |
| | | | Hartnett County, North Carolina, Certificates of Participation, Series 2002: | | | | | |
| | 1,000 | | 5.250%, 12/01/15 – AGM Insured | 12/12 at 101.00 | AA+ | | 1,085,480 | |
| | 2,025 | | 5.375%, 12/01/16 – AGM Insured | 12/12 at 101.00 | AA+ | | 2,203,078 | |
| | 715 | | Lee County, North Carolina, Certificates of Participation, Public Schools and Community College, Series 2004, 5.250%, 4/01/20 – AGM Insured | 4/14 at 100.00 | AA+ | | 759,902 | |
| | 1,380 | | Pasquotank County, North Carolina, Certificates of Participation, Series 2004, 5.000%, 6/01/25 – NPFG Insured | 6/14 at 100.00 | A | | 1,397,002 | |
| | 2,070 | | Pitt County, North Carolina, Certificates of Participation, School Facilities Project, Series 2004B, 5.000%, 4/01/29 – AMBAC Insured | 4/14 at 100.00 | AA– | | 2,085,670 | |
| | 2,625 | | Puerto Rico Sales Tax Financing Corporation, Sales Tax Revenue Bonds, Series 2010A, 0.000%, 8/01/35 | No Opt. Call | A+ | | 548,284 | |
| | | | Raleigh, North Carolina, Certificates of Participation, Downtown Improvement Project, Series 2004B: | | | | | |
| | 805 | | 5.000%, 6/01/20 | 6/14 at 100.00 | AA+ | | 854,797 | |
| | 1,310 | | 5.000%, 6/01/21 | 6/14 at 100.00 | AA+ | | 1,381,408 | |
| | 115 | | Raleigh, North Carolina, Certificates of Participation, Series 2007, 5.000%, 2/01/27 | 2/17 at 100.00 | AA+ | | 120,298 | |
| | 1,000 | | Randolph County, North Carolina, Certificates of Participation, Series 2004, 5.000%, 6/01/20 – AGM Insured | 6/14 at 102.00 | AA+ | | 1,071,150 | |
| | 100 | | Rutherford County, North Carolina, Certificates of Participation, Series 2007, 5.000%, 12/01/27 – AGM Insured | 12/17 at 100.00 | AA+ | | 104,163 | |
| | 1,150 | | Sampson County, North Carolina, Certificates of Participation, Series 2006, 5.000%, 6/01/34 – AGM Insured (UB) | 6/17 at 100.00 | AA+ | | 1,157,291 | |
| | 500 | | Wilmington, North Carolina, Certificates of Participation, Series 2008A, 5.000%, 6/01/29 | 6/18 at 100.00 | AA | | 520,455 | |
| | 400 | | Wilson County, North Carolina, Certificates of Participation, School Facilities Project, Series 2007, 5.000%, 4/01/25 – AMBAC Insured | 4/17 at 100.00 | Aa3 | | 412,228 | |
| | 21,100 | | Total Tax Obligation/Limited | | | | 19,835,488 | |
| | | | Transportation – 13.2% (8.3% of Total Investments) | | | | | |
| | 1,000 | | Charlotte, North Carolina, Airport Revenue Bonds, Charlotte Douglas International Refunding Series 2010A, 5.000%, 7/01/39 | 7/20 at 100.00 | A+ | | 998,440 | |
| | 1,935 | | Charlotte, North Carolina, Airport Revenue Bonds, Series 2004A, 5.000%, 7/01/34 – NPFG Insured | 7/14 at 100.00 | A+ | | 1,938,057 | |
| | 660 | | North Carolina State Ports Authority, Port Facilities Revenue Bonds, Senior Lien Series 2010A, 5.250%, 2/01/40 | 2/20 at 100.00 | A3 | | 665,881 | |
| | | | North Carolina Turnpike Authority, Triangle Expressway System Revenue Bonds, Series 2009A: | | | | | |
| | 90 | | 5.375%, 1/01/26 – AGC Insured | 1/19 at 100.00 | AA+ | | 95,882 | |
| | 205 | | 5.500%, 1/01/29 – AGC Insured | 1/19 at 100.00 | AA+ | | 216,554 | |
| | 430 | | 5.750%, 1/01/39 – AGC Insured | 1/19 at 100.00 | AA+ | | 453,113 | |
| | | | North Carolina Turnpike Authority, Triangle Expressway System Senior Lien Revenue Bonds, Series 2009B: | | | | | |
| | 150 | | 0.000%, 1/01/31 – AGC Insured | No Opt. Call | AA+ | | 47,850 | |
| | 100 | | 0.000%, 1/01/33 – AGC Insured | No Opt. Call | AA+ | | 28,226 | |
| | 50 | | 0.000%, 1/01/35 – AGC Insured | No Opt. Call | AA+ | | 12,440 | |
| | 5,600 | | 0.000%, 1/01/37 – AGC Insured | No Opt. Call | AA+ | | 1,222,480 | |
| | 350 | | 0.000%, 1/01/38 – AGC Insured | No Opt. Call | AA+ | | 71,698 | |
| | 435 | | Piedmont Triad Airport Authority, North Carolina, Airport Revenue Bonds, Series 2005A, 5.000%, 7/01/20 – SYNCORA GTY Insured | 7/15 at 100.00 | A2 | | 461,087 | |
| | 1,100 | | Raleigh Durham Airport Authority, North Carolina, Airport Revenue Bonds, Refunding Series 2010A, 5.000%, 5/01/36 | No Opt. Call | Aa3 | | 1,108,998 | |
| | 12,105 | | Total Transportation | | | | 7,320,706 | |
Nuveen Investments 39
| | | Nuveen North Carolina Dividend Advantage Municipal Fund 2 (continued) |
| NNO | | Portfolio of Investments November 30, 2010 (Unaudited) |
| | Principal | | | Optional Call | | | | |
| | Amount (000) | | Description (1) | Provisions (2) | Ratings (3) | | Value | |
| | | | U.S. Guaranteed – 20.2% (12.7% of Total Investments) (4) | | | | | |
| $ | 490 | | Charlotte-Mecklenburg Hospital Authority, North Carolina, Healthcare System Revenue Bonds, Carolinas Healthcare System, Series 2001A, 5.000%, 1/15/31 (Pre-refunded 1/15/11) | 1/11 at 101.00 | Aa3 (4) | $ | 497,806 | |
| | 200 | | Charlotte-Mecklenburg Hospital Authority, North Carolina, Healthcare System Revenue Bonds, DBA Carolinas Healthcare System, Series 2005A, 5.000%, 1/15/45 (Pre-refunded 1/15/15) | 1/15 at 100.00 | AAA | | 229,990 | |
| | 370 | | North Carolina Medical Care Commission, Health System Revenue Bonds, Mission St. Joseph’s Health System, Series 2001, 5.250%, 10/01/31 (Pre-refunded 10/01/11) | 10/11 at 101.00 | AA (4) | | 388,023 | |
| | 500 | | North Carolina Medical Care Commission, Revenue Bonds, Northeast Medical Center, Series 2004, 5.000%, 11/01/24 (Pre-refunded 11/01/14) | 11/14 at 100.00 | Aa3 (4) | | 574,000 | |
| | | | Raleigh Durham Airport Authority, North Carolina, Airport Revenue Bonds, Series 2001A: | | | | | |
| | 1,000 | | 5.250%, 11/01/15 (Pre-refunded 5/01/11) – FGIC Insured | 5/11 at 101.00 | Aa3 (4) | | 1,030,780 | |
| | 2,320 | | 5.250%, 11/01/16 (Pre-refunded 5/01/11) – FGIC Insured | 5/11 at 101.00 | Aa3 (4) | | 2,391,409 | |
| | 2,230 | | 5.250%, 11/01/17 (Pre-refunded 5/01/11) – FGIC Insured | 5/11 at 101.00 | Aa3 (4) | | 2,298,638 | |
| | | | Raleigh, North Carolina, Combined Enterprise System Revenue Bonds, Series 2004: | | | | | |
| | 1,000 | | 5.000%, 3/01/21 (Pre-refunded 3/01/14) | 3/14 at 100.00 | AAA | | 1,128,200 | |
| | 1,250 | | 5.000%, 3/01/22 (Pre-refunded 3/01/14) | 3/14 at 100.00 | AAA | | 1,406,825 | |
| | 505 | | University of North Carolina System, Pooled Revenue Refunding Bonds, Series 2002A, 5.375%, 4/01/19 (Pre-refunded 10/01/12) – AMBAC Insured | 10/12 at 100.00 | N/R (4) | | 548,526 | |
| | 270 | | University of North Carolina, Charlotte, Parking System Revenue Bonds, Series 2002, 5.000%, 1/01/20 (Pre-refunded 1/01/12) – NPFG Insured | 1/12 at 101.00 | A1 (4) | | 285,630 | |
| | 400 | | University of North Carolina, Greensboro, General Revenue Refunding Bonds, Series 2002B, 5.375%, 4/01/17 (Pre-refunded 4/01/11) – AGM Insured | 4/11 at 101.00 | AA+ (4) | | 410,788 | |
| | 10,535 | | Total U.S. Guaranteed | | | | 11,190,615 | |
| | | | Utilities – 7.8% (4.9% of Total Investments) | | | | | |
| | 500 | | North Carolina Eastern Municipal Power Agency, Power System Revenue Bonds, Series 2005, 5.250%, 1/01/20 – AMBAC Insured | 1/16 at 100.00 | A– | | 549,150 | |
| | | | North Carolina Eastern Municipal Power Agency, Power System Revenue Refunding Bonds, Series 1993B: | | | | | |
| | 745 | | 5.500%, 1/01/17 – FGIC Insured | 1/11 at 100.00 | Baa1 | | 746,661 | |
| | 15 | | 5.500%, 1/01/21 | 1/11 at 100.00 | A– | | 15,020 | |
| | 225 | | North Carolina Municipal Power Agency 1, Catawba Electric Revenue Bonds, Refunding Series 2009A, 5.000%, 1/01/30 | 1/19 at 100.00 | A | | 227,826 | |
| | 2,600 | | Wake County Industrial Facilities and Pollution Control Financing Authority, North Carolina, Revenue Refunding Bonds, Carolina Power and Light Company, Series 2002, 5.375%, 2/01/17 | 2/12 at 101.00 | A1 | | 2,744,143 | |
| | 4,085 | | Total Utilities | | | | 4,282,800 | |
| | | | Water and Sewer – 24.0% (15.1% of Total Investments) | | | | | |
| | 500 | | Brunswick County, North Carolina, Enterprise System Revenue Bonds, Series 2008A, 5.000%, 4/01/31 – AGM Insured | 4/18 at 100.00 | AA+ | | 512,460 | |
| | 500 | | Cape Fear Public Utility Authority, North Carolina, Water & Sewer System Revenue Bonds, Series 2008, 5.000%, 8/01/35 | 8/18 at 100.00 | AA | | 515,215 | |
| | 2,520 | | Charlotte, North Carolina, Water and Sewerage System Revenue Bonds, Series 2002A, 5.250%, 7/01/13 | No Opt. Call | AAA | | 2,805,411 | |
| | 1,000 | | Durham County, North Carolina, Enterprise System Revenue Bonds, Series 2002, 5.000%, 6/01/23 – NPFG Insured | 6/13 at 100.00 | AA | | 1,030,750 | |
| | 700 | | Oak Island, North Carolina, Enterprise System Revenue Bonds, Series 2009A, 6.000%, 6/01/34 – AGC Insured | 6/19 at 100.00 | AA+ | | 748,503 | |
| | | | Raleigh, North Carolina, Combined Enterprise System Revenue Bonds, Series 2006A: | | | | | |
| | 3,095 | | 5.000%, 3/01/31 (UB) | 3/16 at 100.00 | AAA | | 3,234,925 | |
| | 975 | | 5.000%, 3/01/36 (UB) | 3/16 at 100.00 | AAA | | 1,007,877 | |
| | 40 | | Raleigh, North Carolina, Combined Enterprise System Revenue Bonds, Series 2006A, Residuals Series 11-R-645-2, 13.453%, 3/01/14 (IF) | No Opt. Call | AAA | | 45,425 | |
40 Nuveen Investments
| | Principal | | | Optional Call | | | | |
| | Amount (000) | | Description (1) | Provisions (2) | Ratings (3) | | Value | |
| | | | Water and Sewer (continued) | | | | | |
| $ | 1,000 | | Wilmington, North Carolina, Water and Sewer Revenue Bonds, Series 2005, 5.000%, 6/01/25 – AGM Insured | 6/15 at 100.00 | AA+ | $ | 1,054,100 | |
| | 2,275 | | Winston-Salem, North Carolina, Water and Sewer System Revenue Bonds, Series 2007A, 5.000%, 6/01/37 (UB) | 6/17 at 100.00 | AAA | | 2,341,749 | |
| | 12,605 | | Total Water and Sewer | | | | 13,296,415 | |
| $ | 92,205 | | Total Investments (cost $85,837,423) – 159.1% | | | | 88,012,917 | |
| | | | Floating Rate Obligations – (8.7)% | | | | (4,805,000 | ) |
| | | | MuniFund Term Preferred Shares, at Liquidation Value – (53.7)% (5) | | | | (29,700,000 | ) |
| | | | Other Assets Less Liabilities – 3.3% | | | | 1,804,278 | |
| | | | Net Assets Applicable to Common Shares – 100% | | | $ | 55,312,195 | |
| (1) | | All percentages shown in the Portfolio of Investments are based on net assets applicable to Common shares unless otherwise noted. |
| (2) | | Optional Call Provisions: Dates (month and year) and prices of the earliest optional call or redemption. There may be other call provisions at varying prices at later dates. Certain mortgage-backed securities may be subject to periodic principal paydowns. |
| (3) | | Ratings: Using the highest of Standard & Poor’s Group (“Standard & Poor’s”), Moody’s Investor Service, Inc. (“Moody’s”) or Fitch, Inc. (“Fitch”) rating. Ratings below BBB by Standard & Poor’s, Baa by Moody’s or BBB by Fitch are considered to be below investment grade. Holdings designated N/R are not rated by any of these national rating agencies. |
| (4) | | Backed by an escrow or trust containing sufficient U.S. Government or U.S. Government agency securities, which ensure the timely payment of principal and interest. Such investments are normally considered to be equivalent to AAA rated securities. |
| (5) | | MuniFund Term Preferred Shares, at Liquidation Value as a percentage of Total Investments is 33.7%. |
| N/R | | Not rated. |
| DD | | Portion of investment purchased on a delayed delivery basis. |
| (IF) | | Inverse floating rate investment. |
| (UB) | | Underlying bond of an inverse floating rate trust reflected as a financing transaction. See Notes to Financial Statements, Footnote 1 – General Information and Significant Accounting Policies, Inverse Floating Rate Securities for more information. |
See accompanying notes to financial statements.
Nuveen Investments 41
| | | Nuveen North Carolina Dividend Advantage Municipal Fund 3 |
| NII | | Portfolio of Investments |
| | | November 30, 2010 (Unaudited) |
| | Principal | | | Optional Call | | | | |
| | Amount (000) | | Description (1) | Provisions (2) | Ratings (3) | | Value | |
| | | | Consumer Staples – 3.2% (2.0% of Total Investments) | | | | | |
| $ | 2,000 | | Puerto Rico, The Children’s Trust Fund, Tobacco Settlement Asset-Backed Refunding Bonds, Series 2002, 5.500%, 5/15/39 | 5/12 at 100.00 | BBB | $ | 1,826,260 | |
| | | | Education and Civic Organizations – 3.3% (2.0% of Total Investments) | | | | | |
| | | | North Carolina Capital Facilities Financing Agency, Revenue Bonds, Duke University, Series 2001A: | | | | | |
| | 330 | | 5.125%, 10/01/26 | 10/11 at 100.00 | AA+ | | 333,805 | |
| | 95 | | 5.125%, 10/01/41 | 10/11 at 100.00 | AA+ | | 95,174 | |
| | 200 | | North Carolina Capital Facilities Financing Agency, Revenue Bonds, Johnson and Wales University, Series 2003A, 5.000%, 4/01/33 – SYNCORA GTY Insured | 4/13 at 100.00 | N/R | | 185,880 | |
| | 705 | | University of North Carolina System, Pooled Revenue Refunding Bonds, Series 2002A, 5.000%, 4/01/27 – AMBAC Insured | 10/12 at 100.00 | A+ | | 710,978 | |
| | 500 | | University of North Carolina Wilmington, Certificates of Participation, Student Housing Project Revenue Bonds, Series 2006, 5.000%, 6/01/21 – FGIC Insured | 6/16 at 100.00 | A | | 531,635 | |
| | 1,830 | | Total Education and Civic Organizations | | | | 1,857,472 | |
| | | | Health Care – 17.2% (10.7% of Total Investments) | | | | | |
| | 695 | | Albemarle Hospital Authority, North Carolina, Health Care Facilities Revenue Bonds, Series 2007, 5.250%, 10/01/27 | 10/17 at 100.00 | N/R | | 620,531 | |
| | 1,200 | | Charlotte-Mecklenberg Hospital Authority, North Carolina, Carolinas HealthCare System Revenue Bonds, Series 2008A, 5.000%, 1/15/47 | 1/18 at 100.00 | AA– | | 1,184,112 | |
| | 500 | | Charlotte-Mecklenberg Hospital Authority, North Carolina, Health Care Refunding Revenue Bonds, Carolinas HealthCare System, Series 2009A, 5.250%, 1/15/39 | 1/19 at 100.00 | AA– | | 509,905 | |
| | 580 | | Charlotte-Mecklenburg Hospital Authority, North Carolina, Healthcare System Revenue Bonds, Carolinas Healthcare System, Series 2001A, 5.000%, 1/15/31 | 1/11 at 101.00 | AA– | | 580,847 | |
| | 520 | | Johnston Memorial Hospital Authority, North Carolina, Mortgage Revenue Bonds, Johnston Memorial Hospital Project, Series 2008, 5.250%, 10/01/36 – AGM Insured | 4/18 at 100.00 | AA+ | | 529,625 | |
| | 180 | | New Hanover County, North Carolina, Hospital Revenue Bonds, New Hanover Regional Medical Center, Series 2006B, 5.125%, 10/01/31 – AGM Insured | 10/19 at 100.00 | AA+ | | 183,836 | |
| | 2,000 | | North Carolina Medical Care Commission Health Care Facilities Revenue Bonds Novant Health Inc., Series 2010A, 5.250%, 11/01/40, DD | 11/20 at 100.00 | A+ | | 1,999,900 | |
| | 545 | | North Carolina Medical Care Commission, Health Care Facilities Revenue Bonds, WakeMed, Series 2009A, 5.625%, | 10/14 at 100.00 | AA+ | | 558,336 | |
| | | | 10/01/38 – AGC Insured | | | | | |
| | 2,000 | | North Carolina Medical Care Commission, Healthcare Facilities Revenue Bonds, Novant Health Obligated Group, Series 2003A, 5.000%, 11/01/18 | 11/13 at 100.00 | A+ | | 2,099,520 | |
| | 1,000 | | North Carolina Medical Care Commission, Hospital Revenue Bonds, Wilson Medical Center, Series 2007, 5.000%, 11/01/27 | 11/17 at 100.00 | A– | | 962,390 | |
| | 400 | | North Carolina Medical Care Commission, Revenue Bonds, Blue Ridge Healthcare System, Series 2005, 5.000%, 1/01/33 – FGIC Insured | 1/15 at 100.00 | A | | 394,196 | |
| | 150 | | Northern Hospital District of Surry County, North Carolina, Health Care Facilities Revenue Bonds, Series 2008, 6.250%, 10/01/38 | 4/18 at 100.00 | BBB | | 151,653 | |
| | 9,770 | | Total Health Care | | | | 9,774,851 | |
| | | | Housing/Multifamily – 1.8% (1.2% of Total Investments) | | | | | |
| | 1,000 | | Mecklenburg County, North Carolina, FNMA Multifamily Housing Revenue Bonds, Little Rock Apartments, Series 2003, 5.150%, 1/01/22 (Alternative Minimum Tax) | 7/13 at 105.00 | AAA | | 1,049,540 | |
| | | | Housing/Single Family – 2.7% (1.7% of Total Investments) | | | | | |
| | 580 | | North Carolina Housing Finance Agency, Home Ownership Revenue Bonds, 1998 Trust Agreement, Series 5A, 5.625%, 7/01/30 (Alternative Minimum Tax) | 1/11 at 100.00 | AA | | 580,203 | |
| | 500 | | North Carolina Housing Finance Agency, Home Ownership Revenue Bonds, Series 2007-29A, 4.800%, 7/01/33 (Alternative Minimum Tax) | 1/17 at 100.00 | AA | | 481,945 | |
42 Nuveen Investments
| | Principal | | | Optional Call | | | | |
| | Amount (000) | | Description (1) | Provisions (2) | Ratings (3) | | Value | |
| | | | Housing/Single Family (continued) | | | | | |
| $ | 505 | | North Carolina Housing Finance Agency, Home Ownership Revenue Bonds, Series 25-A, 4.900%, 7/01/37 (Alternative Minimum Tax) | 7/16 at 100.00 | AA | $ | 490,365 | |
| | 1,585 | | Total Housing/Single Family | | | | 1,552,513 | |
| | | | Long-Term Care – 1.7% (1.1% of Total Investments) | | | | | |
| | | | North Carolina Medical Care Commission, Healthcare Facilities Revenue Bonds, Presbyterian Homes, Series 2006: | | | | | |
| | 250 | | 5.400%, 10/01/27 | 10/16 at 100.00 | N/R | | 238,033 | |
| | 600 | | 5.500%, 10/01/31 | 10/16 at 100.00 | N/R | | 551,844 | |
| | 190 | | North Carolina Medical Care Commission, Revenue Bonds, Pines at Davidson, Series 2006A, 5.000%, 1/01/36 | 1/16 at 100.00 | N/R | | 169,797 | |
| | 1,040 | | Total Long-Term Care | | | | 959,674 | |
| | | | Materials – 0.3% (0.2% of Total Investments) | | | | | |
| | 200 | | Columbus County Industrial Facilities and Pollution Control Financing Authority, North Carolina, Environmental Improvement Revenue Bonds, International Paper Company Project, Series 2007A, 4.625%, 3/01/27 | 3/17 at 100.00 | BBB | | 174,890 | |
| | | | Tax Obligation/General – 6.8% (4.2% of Total Investments) | | | | | |
| | | | Lincoln County, North Carolina, General Obligation Bonds, Series 2002A: | | | | | |
| | 850 | | 5.000%, 6/01/19 – FGIC Insured | 6/12 at 101.00 | AA– | | 896,189 | |
| | 900 | | 5.000%, 6/01/20 – FGIC Insured | 6/12 at 101.00 | AA– | | 946,980 | |
| | 1,050 | | 5.000%, 6/01/21 – FGIC Insured | 6/12 at 101.00 | AA– | | 1,112,223 | |
| | 300 | | North Carolina, General Obligation Bonds, Series 2004A, 5.000%, 3/01/22 | 3/14 at 100.00 | AAA | | 325,551 | |
| | 550 | | Wake County, North Carolina, Limited Obligation Bonds, Series 2010, 5.000%, 1/01/37 | 1/20 at 100.00 | AA+ | | 567,199 | |
| | 3,650 | | Total Tax Obligation/General | | | | 3,848,142 | |
| | | | Tax Obligation/Limited – 35.3% (22.0% of Total Investments) | | | | | |
| | 1,800 | | Catawba County, North Carolina, Certificates of Participation, Series 2004, 5.250%, 6/01/22 – NPFG Insured | 6/14 at 100.00 | Aa2 | | 1,877,832 | |
| | 2,750 | | Charlotte, North Carolina, Certificates of Participation, Governmental Facilities Projects, Series 2003G, 5.000%, 6/01/33 | 6/13 at 100.00 | AA+ | | 2,787,069 | |
| | 600 | | Charlotte, North Carolina, Certificates of Participation, Nascar Hall of Fame, Series 2009C, 5.000%, 6/01/39 | 6/19 at 100.00 | AA+ | | 610,182 | |
| | 575 | | Charlotte, North Carolina, Certificates of Participation, Transit Projects Phase 2, Series 2008A, 5.000%, 6/01/33 | 6/18 at 100.00 | AA+ | | 586,713 | |
| | 800 | | Craven County, North Carolina, Certificates of Participation, Series 2007, 5.000%, 6/01/27 – NPFG Insured | 6/17 at 100.00 | AA– | | 828,720 | |
| | 3,000 | | Dare County, North Carolina, Certificates of Participation, Series 2002, 5.000%, 6/01/23 – AMBAC Insured | 12/12 at 100.00 | AA– | | 3,066,179 | |
| | 200 | | Harnett County, North Carolina, Certificates of Participation, Series 2009, 5.000%, 6/01/28 – AGC Insured | 6/19 at 100.00 | AA+ | | 207,502 | |
| | 500 | | Lee County, North Carolina, Certificates of Participation, Public Schools and Community College, Series 2004, 5.250%, 4/01/20 – AGM Insured | 4/14 at 100.00 | AA+ | | 531,400 | |
| | 200 | | Mecklenburg County, North Carolina, Certificates of Participation, Series 2009A, 5.000%, 2/01/27 | No Opt. Call | AA+ | | 210,040 | |
| | 1,000 | | North Carolina, Certificates of Participation, Repair and Renovation Project, Series 2004B, 5.000%, 6/01/20 | 6/14 at 100.00 | AA+ | | 1,061,860 | |
| | 2,625 | | Puerto Rico Sales Tax Financing Corporation, Sales Tax Revenue Bonds, Series 2010A, 0.000%, 8/01/35 | No Opt. Call | A+ | | 548,284 | |
| | 565 | | Raleigh, North Carolina, Certificates of Participation, Series 2007, 5.000%, 2/01/27 | 2/17 at 100.00 | AA+ | | 591,030 | |
| | 2,000 | | Rutherford County, North Carolina, Certificates of Participation, Series 2002, 5.000%, 9/01/21 – AMBAC Insured | 9/12 at 101.00 | A1 | | 2,038,080 | |
Nuveen Investments 43
| | | Nuveen North Carolina Dividend Advantage Municipal Fund 3 (continued) |
| NII | | Portfolio of Investments November 30, 2010 (Unaudited) |
| | Principal | | | Optional Call | | | | |
| | Amount (000) | | Description (1) | Provisions (2) | Ratings (3) | | Value | |
| | | | Tax Obligation/Limited (continued) | | | | | |
| $ | 1,000 | | Rutherford County, North Carolina, Certificates of Participation, Series 2007, 5.000%, 12/01/27 – AGM Insured | 12/17 at 100.00 | AA+ | $ | 1,041,630 | |
| | 1,200 | | Sampson County, North Carolina, Certificates of Participation, Series 2006, 5.000% | 6/17 at 100.00 | AA+ | | 1,207,608 | |
| | | | 6/01/34 – AGM Insured (UB) | | | | | |
| | 1,785 | | Union County, North Carolina, Certificates of Participation, Series 2003, 5.000%, 6/01/20 – AMBAC Insured | 6/13 at 101.00 | Aa2 | | 1,903,042 | |
| | 500 | | Wilmington, North Carolina, Certificates of Participation, Series 2008A, 5.000%, 6/01/29 | 6/18 at 100.00 | AA | | 520,455 | |
| | 400 | | Wilson County, North Carolina, Certificates of Participation, School Facilities Project, Series 2007, 5.000%, 4/01/25 – AMBAC Insured | 4/17 at 100.00 | Aa3 | | 412,228 | |
| | 21,500 | | Total Tax Obligation/Limited | | | | 20,029,854 | |
| | | | Transportation – 7.3% (4.6% of Total Investments) | | | | | |
| | 500 | | Charlotte, North Carolina, Airport Revenue Bonds, Charlotte Douglas International Refunding Series 2010A, 5.000%, 7/01/39 | 7/20 at 100.00 | A+ | | 499,220 | |
| | 660 | | North Carolina State Ports Authority, Port Facilities Revenue Bonds, Senior Lien Series 2010A, 5.250%, 2/01/40 | 2/20 at 100.00 | A3 | | 665,881 | |
| | | | North Carolina Turnpike Authority, Triangle Expressway System Revenue Bonds, Series 2009A: | | | | | |
| | 225 | | 5.500%, 1/01/29 – AGC Insured | 1/19 at 100.00 | AA+ | | 237,681 | |
| | 955 | | 5.750%, 1/01/39 – AGC Insured | 1/19 at 100.00 | AA+ | | 1,006,331 | |
| | | | North Carolina Turnpike Authority, Triangle Expressway System Senior Lien Revenue Bonds, Series 2009B: | | | | | |
| | 2,295 | | 0.000%, 1/01/35 – AGC Insured | No Opt. Call | AA+ | | 570,973 | |
| | 100 | | 0.000%, 1/01/37 – AGC Insured | No Opt. Call | AA+ | | 21,830 | |
| | 300 | | 0.000%, 1/01/38 – AGC Insured | No Opt. Call | AA+ | | 61,455 | |
| | 1,100 | | Raleigh Durham Airport Authority, North Carolina, Airport Revenue Bonds, Refunding Series 2010A, 5.000%, 5/01/36 | No Opt. Call | Aa3 | | 1,108,998 | |
| | 6,135 | | Total Transportation | | | | 4,172,369 | |
| | | | U.S. Guaranteed – 32.2% (20.1% of Total Investments) (4) | | | | | |
| | 3,900 | | Cary, North Carolina, General Obligation Water and Sewer Bonds, Series 2001, 5.000%, 3/01/20 (Pre-refunded 3/01/11) | 3/11 at 102.00 | AAA | | 4,025,111 | |
| | 170 | | Charlotte-Mecklenburg Hospital Authority, North Carolina, Healthcare System Revenue Bonds, Carolinas Healthcare System, Series 2001A, 5.000%, 1/15/31 (Pre-refunded 1/15/11) | 1/11 at 101.00 | Aa3 (4) | | 172,708 | |
| | 200 | | Charlotte-Mecklenburg Hospital Authority, North Carolina, Healthcare System Revenue Bonds, DBA Carolinas Healthcare System, Series 2005A, 5.000%, 1/15/45 (Pre-refunded 1/15/15) | 1/15 at 100.00 | AAA | | 229,990 | |
| | | | Forsyth County, North Carolina, Certificates of Participation, Public Facilities and Equipment Project, Series 2002: | | | | | |
| | 1,325 | | 5.125%, 1/01/16 (Pre-refunded 1/01/13) | 1/13 at 101.00 | AA+ (4) | | 1,454,453 | |
| | 770 | | 5.250%, 1/01/19 (Pre-refunded 1/01/13) | 1/13 at 101.00 | AA+ (4) | | 847,216 | |
| | 920 | | North Carolina Capital Facilities Financing Agency, Revenue Bonds, Duke University, Series 2001A, 5.125%, 10/01/26 (Pre-refunded 10/01/11) | 10/11 at 100.00 | AAA | | 957,628 | |
| | 1,600 | | North Carolina Capital Facilities Financing Agency, Revenue Bonds, Duke University, Series 2002A, 5.125%, 7/01/42 (Pre-refunded 10/01/12) | 10/12 at 100.00 | AAA | | 1,732,768 | |
| | 500 | | North Carolina Medical Care Commission, Health System Revenue Bonds, Mission St. Joseph’s Health System, Series 2001, 5.250%, 10/01/31 (Pre-refunded 10/01/11) | 10/11 at 101.00 | AA (4) | | 524,355 | |
| | 500 | | North Carolina Medical Care Commission, Revenue Bonds, Northeast Medical Center, Series 2004, 5.000%, 11/01/24 (Pre-refunded 11/01/14) | 11/14 at 100.00 | Aa3 (4) | | 574,000 | |
| | 1,000 | | Orange Water and Sewerage Authority, North Carolina, Water and Sewerage System Revenue Bonds, Series 2001, 5.000%, 7/01/26 (Pre-refunded 7/01/11) | 7/11 at 101.00 | AA+ (4) | | 1,037,760 | |
| | | | Raleigh Durham Airport Authority, North Carolina, Airport Revenue Bonds, Series 2001A: | | | | | |
| | 1,780 | | 5.250%, 11/01/15 (Pre-refunded 5/01/11) – FGIC Insured | 5/11 at 101.00 | Aa3 (4) | | 1,834,788 | |
| | 3,100 | | 5.000%, 11/01/20 (Pre-refunded 5/01/11) – FGIC Insured | 5/11 at 101.00 | Aa3 (4) | | 3,192,193 | |
44 Nuveen Investments
| | Principal | | | Optional Call | | | | |
| | Amount (000) | | Description (1) | Provisions (2) | Ratings (3) | | Value | |
| | | | U.S. Guaranteed (4) (continued) | | | | | |
| $ | 400 | | Raleigh, North Carolina, General Obligation Bonds, Series 2002, 5.000%, 6/01/21 (Pre-refunded 6/01/12) | 6/12 at 100.00 | AAA | $ | 426,760 | |
| | | | University of North Carolina System, Pooled Revenue Refunding Bonds, Series 2002A: | | | | | |
| | 610 | | 5.000%, 4/01/27 (Pre-refunded 10/01/12) – AMBAC Insured | 10/12 at 100.00 | N/R (4) | | 659,227 | |
| | 585 | | 5.000%, 4/01/27 (Pre-refunded 10/01/12) – AMBAC Insured | 10/12 at 100.00 | N/R (4) | | 631,420 | |
| | 17,360 | | Total U.S. Guaranteed | | | | 18,300,377 | |
| | | | Utilities – 14.6% (9.1% of Total Investments) | | | | | |
| | 150 | | North Carolina Eastern Municipal Power Agency, Power System Revenue Bonds, Series 2003F, 5.500%, 1/01/16 | 1/13 at 100.00 | A– | | 160,991 | |
| | 500 | | North Carolina Eastern Municipal Power Agency, Power System Revenue Bonds, Series 2005, 5.250%, 1/01/20 – AMBAC Insured | 1/16 at 100.00 | A– | | 549,150 | |
| | 1,400 | | North Carolina Eastern Municipal Power Agency, Power System Revenue Bonds, Series 2009B, 5.000%, 1/01/26 | 1/19 at 100.00 | A– | | 1,454,656 | |
| | 1,210 | | North Carolina Eastern Municipal Power Agency, Power System Revenue Refunding Bonds, Series 1993B, 5.500%, 1/01/17 – FGIC Insured | 1/11 at 100.00 | Baa1 | | 1,212,698 | |
| | 275 | | North Carolina Municipal Power Agency 1, Catawba Electric Revenue Bonds, Refunding Series 2009A, 5.000%, 1/01/30 | 1/19 at 100.00 | A | | 278,454 | |
| | 2,665 | | North Carolina Municipal Power Agency 1, Catawba Electric Revenue Bonds, Series 2003A, 5.250%, 1/01/15 – AMBAC Insured | 1/13 at 100.00 | A | | 2,856,346 | |
| | 250 | | North Carolina Municipal Power Agency 1, Catawba Electric Revenue Bonds, Series 2008A, 5.250%, 1/01/20 | 1/18 at 100.00 | A | | 278,733 | |
| | 1,400 | | Wake County Industrial Facilities and Pollution Control Financing Authority, North Carolina, Revenue Refunding Bonds, Carolina Power and Light Company, Series 2002, 5.375%, 2/01/17 | 2/12 at 101.00 | A1 | | 1,477,616 | |
| | 7,850 | | Total Utilities | | | | 8,268,644 | |
| | | | Water and Sewer – 33.9% (21.1% of Total Investments) | | | | | |
| | 2,000 | | Brunswick County, North Carolina, Enterprise System Revenue Bonds, Series 2008A, 5.000%, 4/01/31 – AGM Insured | 4/18 at 100.00 | AA+ | | 2,049,840 | |
| | 425 | | Cape Fear Public Utility Authority, North Carolina, Water & Sewer System Revenue Bonds, Series 2008, 5.000%, 8/01/28 | 8/18 at 100.00 | AA | | 451,223 | |
| | | | Charlotte, North Carolina, Water and Sewerage System Revenue Bonds, Series 2001: | | | | | |
| | 750 | | 5.125%, 6/01/26 | 6/11 at 101.00 | AAA | | 769,358 | |
| | 1,780 | | 5.125%, 6/01/26 – FGIC Insured | 6/11 at 101.00 | Aaa | | 1,812,538 | |
| | 300 | | Durham County, North Carolina, Enterprise System Revenue Bonds, Series 2002, 5.000%, 6/01/18 – NPFG Insured | 6/13 at 100.00 | AA | | 321,636 | |
| | 2,500 | | Kannapolis, North Carolina, Water and Sewerage System Revenue Bonds, Series 2001B, 5.250%, 2/01/26 – AGM Insured (Alternative Minimum Tax) | 2/12 at 101.00 | AA+ | | 2,504,125 | |
| | | | Oak Island, North Carolina, Enterprise System Revenue Bonds, Series 2009A: | | | | | |
| | 50 | | 6.000%, 6/01/34 – AGC Insured | 6/19 at 100.00 | AA+ | | 53,465 | |
| | 20 | | 6.000%, 6/01/36 – AGC Insured | 6/19 at 100.00 | AA+ | | 21,386 | |
| | 500 | | Onslow County, North Carolina, Combined Enterprise System Revenue Bonds, Series 2004B, 5.000%, 6/01/23 – SYNCORA GTY Insured | 6/14 at 100.00 | A | | 521,291 | |
| | | | Raleigh, North Carolina, Combined Enterprise System Revenue Bonds, Series 2006A: | | | | | |
| | 4,950 | | 5.000%, 3/01/31 (UB) | 3/16 at 100.00 | AAA | | 5,173,790 | |
| | 3,000 | | 5.000%, 3/01/36 (UB) | 3/16 at 100.00 | AAA | | 3,101,160 | |
Nuveen Investments 45
| | | Nuveen North Carolina Dividend Advantage Municipal Fund 3 (continued) |
| NII | | Portfolio of Investments November 30, 2010 (Unaudited) |
| | Principal | | | Optional Call | | | | |
| | Amount (000) | | Description (1) | Provisions (2) | Ratings (3) | | Value | |
| | | | Water and Sewer (continued) | | | | | |
| $ | 5 | | Raleigh, North Carolina, Combined Enterprise System Revenue Bonds, Series 2006A, Residuals Series 11-R-645-2, 13.760%, 3/01/14 (IF) | No Opt. Call | AAA | $ | 5,506 | |
| | 2,375 | | Winston-Salem, North Carolina, Water and Sewer System Revenue Bonds, Series 2007A, 5.000%, 6/01/37 (UB) | 6/17 at 100.00 | AAA | | 2,444,683 | |
| | 18,655 | | Total Water and Sewer | | | | 19,230,001 | |
| $ | 92,575 | | Total Investments (cost $89,374,454) – 160.3% | | | | 91,044,587 | |
| | | | Floating Rate Obligations – (13.2)% | | | | (7,480,000 | ) |
| | | | MuniFund Term Preferred Shares, at Liquidation Value – (50.6)% (5) | | | | (28,725,000 | ) |
| | | | Other Assets Less Liabilities – 3.5% | | | | 1,970,994 | |
| | | | Net Assets Applicable to Common Shares – 100% | | | $ | 56,810,581 | |
| (1) | | All percentages shown in the Portfolio of Investments are based on net assets applicable to Common shares unless otherwise noted. |
| (2) | | Optional Call Provisions: Dates (month and year) and prices of the earliest optional call or redemption. There may be other call provisions at varying prices at later dates. Certain mortgage-backed securities may be subject to periodic principal paydowns. |
| (3) | | Ratings: Using the highest of Standard & Poor’s Group (“Standard & Poor’s”), Moody’s Investor Service, Inc. (“Moody’s”) or Fitch, Inc. (“Fitch”) rating. Ratings below BBB by Standard & Poor’s, Baa by Moody’s or BBB by Fitch are considered to be below investment grade. Holdings designated N/R are not rated by any of these national rating agencies. |
| (4) | | Backed by an escrow or trust containing sufficient U.S. Government or U.S. Government agency securities, which ensure the timely payment of principal and interest. Such investments are normally considered to be equivalent to AAA rated securities. |
| (5) | | MuniFund Term Preferred Shares, at Liquidation Value as a percentage of Total Investments is 31.6%. |
| N/R | | Not rated. |
| DD | | Portion of investment purchased on a delayed delivery basis. |
| (IF) | | Inverse floating rate investment. |
| (UB) | | Underlying bond of an inverse floating rate trust reflected as a financing transaction. See Notes to Financial Statements, Footnote 1 – General Information and Significant Accounting Policies, Inverse Floating Rate Securities for more information. |
See accompanying notes to financial statements.
46 Nuveen Investments
| | | Statement of |
| | | Assets & Liabilities |
| | | November 30, 2010 (Unaudited) |
| | | | Georgia | | | Georgia | | | Georgia | |
| | | | Premium | | | Dividend | | | Dividend | |
| | | | Income | | | Advantage | | | Advantage 2 | |
| | | | (NPG | ) | | (NZX | ) | | (NKG | ) |
| Assets | | | | | | | | | | |
| Investments, at value (cost $79,533,637, $42,000,682 and $93,518,684, respectively) | | $ | 81,704,218 | | $ | 42,905,713 | | $ | 95,116,771 | |
| Cash | | | 23,733 | | | — | | | 246,398 | |
| Receivables: | | | | | | | | | | |
| Interest | | | 1,431,380 | | | 733,613 | | | 1,585,464 | |
| Investments sold | | | — | | | 45,000 | | | 50,000 | |
| Deferred offering costs | | | 554,370 | | | 355,505 | | | 615,409 | |
| Other assets | | | 9,785 | | | 10,122 | | | 12,719 | |
| Total assets | | | 83,723,486 | | | 44,049,953 | | | 97,626,761 | |
| Liabilities | | | | | | | | | | |
| Cash overdraft | | | — | | | 114,306 | | | — | |
| Floating rate obligations | | | 1,190,000 | | | 660,000 | | | 1,395,000 | |
| Payables: | | | | | | | | | | |
| Investments purchased | | | — | | | — | | | — | |
| Common share dividends | | | 208,521 | | | 119,903 | | | 266,215 | |
| Interest | | | 62,590 | | | 31,670 | | | 71,258 | |
| Offering costs | | | 169,153 | | | 144,239 | | | 199,862 | |
| MuniFund Term Preferred shares, at liquidation value | | | 28,340,000 | | | 14,340,000 | | | 32,265,000 | |
| Accrued expenses: | | | | | | | | | | |
| Management fees | | | 43,986 | | | 21,177 | | | 51,255 | |
| Other | | | 12,576 | | | — | | | 22,740 | |
| Total liabilities | | | 30,026,826 | | | 15,431,295 | | | 34,271,330 | |
| Auction Rate Preferred shares, at liquidation value | | | — | | | — | | | — | |
| Net assets applicable to Common shares | | $ | 53,696,660 | | $ | 28,618,658 | | $ | 63,355,431 | |
| Common shares outstanding | | | 3,806,285 | | | 1,971,732 | | | 4,555,299 | |
| Net asset value per Common share outstanding (net assets applicable to Common shares, divided by Common shares outstanding) | | $ | 14.11 | | $ | 14.51 | | $ | 13.91 | |
| Net assets applicable to Common shares consist of: | | | | | | | | | | |
| Common shares, $.01 par value per share | | $ | 38,063 | | $ | 19,717 | | $ | 45,553 | |
| Paid-in surplus | | | 52,351,990 | | | 27,914,866 | | | 64,230,154 | |
| Undistributed (Over-distribution of) net investment income | | | 443,256 | | | 201,128 | | | 336,826 | |
| Accumulated net realized gain (loss) | | | (1,307,230 | ) | | (422,084 | ) | | (2,855,189 | ) |
| Net unrealized appreciation (depreciation) | | | 2,170,581 | | | 905,031 | | | 1,598,087 | |
| Net assets applicable to Common shares | | $ | 53,696,660 | | $ | 28,618,658 | | $ | 63,355,431 | |
| Authorized shares: | | | | | | | | | | |
| Common | | | Unlimited | | | Unlimited | | | Unlimited | |
| Auction Rate Preferred | | | Unlimited | | | Unlimited | | | Unlimited | |
| MuniFund Term Preferred | | | Unlimited | | | Unlimited | | | Unlimited | |
See accompanying notes to financial statements.
Nuveen Investments 47
| | | Statement of |
| | | Assets & Liabilities (continued) |
| | | November 30, 2010 (Unaudited) |
| | | | North | | | North | | | North | | | North | |
| | | | Carolina | | | Carolina | | | Carolina | | | Carolina | |
| | | | Premium | | | Dividend | | | Dividend | | | Dividend | |
| | | | Income | | | Advantage | | | Advantage 2 | | | Advantage 3 | |
| | | | (NNC | ) | | (NRB | ) | | (NNO | ) | | (NII | ) |
| Assets | | | | | | | | | | | | | |
| Investments, at value (cost $137,677,027, $54,521,220, $85,837,423 and $89,374,454, respectively) | | $ | 141,545,409 | | $ | 56,002,069 | | $ | 88,012,917 | | $ | 91,044,587 | |
| Cash | | | — | | | 620,128 | | | 522,329 | | | 1,052,966 | |
| Receivables: | | | | | | | | | | | | | |
| Interest | | | 2,448,952 | | | 913,277 | | | 1,407,288 | | | 1,408,905 | |
| Investments sold | | | 174,039 | | | 15,347 | | | 76,505 | | | 10,234 | |
| Deferred offering costs | | | 555,125 | | | 436,212 | | | 614,939 | | | 588,931 | |
| Other assets | | | 24,371 | | | 8,628 | | | 9,878 | | | 9,882 | |
| Total assets | | | 144,747,896 | | | 57,995,661 | | | 90,643,856 | | | 94,115,505 | |
| Liabilities | | | | | | | | | | | | | |
| Cash overdraft | | | 859,376 | | | — | | | — | | | — | |
| Floating rate obligations | | | 5,195,000 | | | 7,160,000 | | | 4,805,000 | | | 7,480,000 | |
| Payables: | | | | | | | | | | | | | |
| Investments purchased | | | — | | | — | | | 246,958 | | | 493,917 | |
| Common share dividends | | | 364,441 | | | 154,080 | | | 250,561 | | | 255,464 | |
| Interest | | | 53,667 | | | 35,964 | | | 64,344 | | | 63,440 | |
| Offering costs | | | 231,222 | | | 197,044 | | | 207,233 | | | 221,043 | |
| MuniFund Term Preferred shares, at liquidation value | | | 24,300,000 | | | 16,600,000 | | | 29,700,000 | | | 28,725,000 | |
| Accrued expenses: | | | | | | | | | | | | | |
| Management fees | | | 72,700 | | | 24,693 | | | 37,358 | | | 44,686 | |
| Other | | | 42,225 | | | 9,177 | | | 20,207 | | | 21,374 | |
| Total liabilities | | | 31,118,631 | | | 24,180,958 | | | 35,331,661 | | | 37,304,924 | |
| Auction Rate Preferred shares, at liquidation value | | | 21,550,000 | | | — | | | — | | | — | |
| Net assets applicable to Common shares | | $ | 92,079,265 | | $ | 33,814,703 | | $ | 55,312,195 | | $ | 56,810,581 | |
| Common shares outstanding | | | 6,362,419 | | | 2,270,918 | | | 3,752,501 | | | 3,936,643 | |
| Net asset value per Common share outstanding (net assets applicable to Common shares, divided by Common shares outstanding) | | $ | 14.47 | | $ | 14.89 | | $ | 14.74 | | $ | 14.43 | |
| Net assets applicable to Common shares consist of: | | | | | | | | | | | | | |
| Common shares, $.01 par value per share | | $ | 63,624 | | $ | 22,709 | | $ | 37,525 | | $ | 39,366 | |
| Paid-in surplus | | | 87,936,269 | | | 32,192,704 | | | 53,213,680 | | | 55,508,272 | |
| Undistributed (Over-distribution of) net investment income | | | 848,135 | | | 291,755 | | | 410,436 | | | 298,025 | |
| Accumulated net realized gain (loss) | | | (637,145 | ) | | (173,314 | ) | | (524,940 | ) | | (705,215 | ) |
| Net unrealized appreciation (depreciation) | | | 3,868,382 | | | 1,480,849 | | | 2,175,494 | | | 1,670,133 | |
| Net assets applicable to Common shares | | $ | 92,079,265 | | $ | 33,814,703 | | $ | 55,312,195 | | $ | 56,810,581 | |
| Authorized shares: | | | | | | | | | | | | | |
| Common | | | Unlimited | | | Unlimited | | | Unlimited | | | Unlimited | |
| Auction Rate Preferred | | | Unlimited | | | Unlimited | | | Unlimited | | | Unlimited | |
| MuniFund Term Preferred | | | Unlimited | | | Unlimited | | | Unlimited | | | Unlimited | |
See accompanying notes to financial statements.
48 Nuveen Investments
| | | Statement of |
| | | Operations |
| | | Six Months Ended November 30, 2010 (Unaudited) |
| | | | Georgia | | | Georgia | | | Georgia | |
| | | | Premium | | | Dividend | | | Dividend | |
| | | | Income | | | Advantage | | | Advantage 2 | |
| | | | (NPG | ) | | (NZX | ) | | (NKG | ) |
| Investment Income | | $ | 2,001,872 | | $ | 1,067,712 | | $ | 2,342,253 | |
| Expenses | | | | | | | | | | |
| Management fees | | | 263,420 | | | 137,265 | | | 315,021 | |
| Auction fees | | | — | | | — | | | — | |
| Dividend disbursing agent fees | | | — | | | — | | | — | |
| Shareholders’ servicing agent fees and expenses | | | 3,308 | | | 1,574 | | | 1,611 | |
| Interest expense and amortization of offering costs | | | 444,695 | | | 234,042 | | | 505,888 | |
| Custodian’s fees and expenses | | | 9,843 | | | 6,395 | | | 11,470 | |
| Trustees’ fees and expenses | | | 1,011 | | | 525 | | | 1,174 | |
| Professional fees | | | 6,085 | | | 4,941 | | | 6,522 | |
| Shareholders’ reports – printing and mailing expenses | | | 14,175 | | | 6,010 | | | 14,555 | |
| Stock exchange listing fees | | | 264 | | | 136 | | | 11,837 | |
| Investor relations expense | | | 3,307 | | | 1,732 | | | 3,441 | |
| Other expenses | | | 1,547 | | | 2,530 | | | 5,085 | |
| Total expenses before custodian fee credit and expense reimbursement | | | 747,655 | | | 395,150 | | | 876,604 | |
| Custodian fee credit | | | (244 | ) | | (48 | ) | | (211 | ) |
| Expense reimbursement | | | — | | | (17,948 | ) | | (26,461 | ) |
| Net expenses | | | 747,411 | | | 377,154 | | | 849,932 | |
| Net investment income | | | 1,254,461 | | | 690,558 | | | 1,492,321 | |
| Realized and Unrealized Gain (Loss) | | | | | | | | | | |
| Net realized gain (loss) from investments | | | 12,122 | | | (104 | ) | | 1,446 | |
| Change in net unrealized appreciation (depreciation) of investments | | | (1,249,951 | ) | | (519,389 | ) | | (1,223,785 | ) |
| Net realized and unrealized gain (loss) | | | (1,237,829 | ) | | (519,493 | ) | | (1,222,339 | ) |
| Distributions to Auction Rate Preferred Shareholders | | | | | | | | | | |
| From net investment income | | | — | | | — | | | — | |
| Decrease in net assets applicable to Common shares from distributions to Auction Rate Preferred shareholders | | | — | | | — | | | — | |
| Net increase (decrease) in net assets applicable to Common shares from operations | | $ | 16,632 | | $ | 171,065 | | $ | 269,982 | |
See accompanying notes to financial statements.
Nuveen Investments 49
| | | Statement of |
| | | Operations (continued) |
| | | Six Months Ended November 30, 2010 (Unaudited) |
| | | | North | | | North | | | North | | | North | |
| | | | Carolina | | | Carolina | | | Carolina | | | Carolina | |
| | | | Premium | | | Dividend | | | Dividend | | | Dividend | |
| | | | Income | | | Advantage | | | Advantage 2 | | | Advantage 3 | |
| | | | (NNC | ) | | (NRB | ) | | (NNO | ) | | (NII | ) |
| Investment Income | | $ | 3,291,685 | | $ | 1,319,383 | | $ | 2,070,213 | | $ | 2,134,890 | |
| Expenses | | | | | | | | | | | | | |
| Management fees | | | 449,006 | | | 166,054 | | | 274,825 | | | 272,061 | |
| Auction fees | | | 16,206 | | | — | | | — | | | — | |
| Dividend disbursing agent fees | | | 5,014 | | | — | | | — | | | — | |
| Shareholders’ servicing agent fees and expenses | | | 4,821 | | | 1,497 | | | 1,593 | | | 1,690 | |
| Interest expense and amortization of offering costs | | | 405,586 | | | 284,229 | | | 468,506 | | | 467,921 | |
| Custodian’s fees and expenses | | | 14,968 | | | 7,574 | | | 11,145 | | | 10,729 | |
| Trustees’ fees and expenses | | | 1,687 | | | 720 | | | 1,148 | | | 1,048 | |
| Professional fees | | | 8,205 | | | 5,160 | | | 6,178 | | | 6,223 | |
| Shareholders’ reports – printing and mailing expenses | | | 20,123 | | | 6,637 | | | 10,226 | | | 13,970 | |
| Stock exchange listing fees | | | 4,560 | | | 157 | | | 260 | | | 273 | |
| Investor relations expense | | | 5,762 | | | 2,115 | | | 3,344 | | | 3,565 | |
| Other expenses | | | 7,304 | | | 11,619 | | | 3,574 | | | 4,959 | |
| Total expenses before custodian fee credit and expense reimbursement | | | 943,242 | | | 485,762 | | | 780,799 | | | 782,439 | |
| Custodian fee credit | | | (317 | ) | | (313 | ) | | (519 | ) | | (385 | ) |
| Expense reimbursement | | | — | | | (13,110 | ) | | (43,395 | ) | | (22,747 | ) |
| Net expenses | | | 942,925 | | | 472,339 | | | 736,885 | | | 759,307 | |
| Net investment income | | | 2,348,760 | | | 847,044 | | | 1,333,328 | | | 1,375,583 | |
| Realized and Unrealized Gain (Loss) | | | | | | | | | | | | | |
| Net realized gain (loss) from investments | | | 88,380 | | | 30,837 | | | 63,155 | | | 138,143 | |
| Change in net unrealized appreciation (depreciation) of investments | | | (1,588,007 | ) | | (755,827 | ) | | (1,162,450 | ) | | (1,215,705 | ) |
| Net realized and unrealized gain (loss) | | | (1,499,627 | ) | | (724,990 | ) | | (1,099,295 | ) | | (1,077,562 | ) |
| Distributions to Auction Rate Preferred Shareholders | | | | | | | | | | | | | |
| From net investment income | | | (45,085 | ) | | — | | | — | | | — | |
| Decrease in net assets applicable to Common shares from distributions to Auction Rate Preferred shareholders | | | (45,085 | ) | | — | | | — | | | — | |
| Net increase (decrease) in net assets applicable to Common shares from operations | | $ | 804,048 | | $ | 122,054 | | $ | 234,033 | | $ | 298,021 | |
See accompanying notes to financial statements.
50 Nuveen Investments
| | | Statement of |
| | | Changes in Net Assets (Unaudited) |
| | | Georgia Premium Income (NPG) | | Georgia Dividend Advantage (NZX) | | Georgia Dividend Advantage 2 (NKG) | |
| | | | Six Months | | | Year | | | Six Months | | | Year | | | Six Months | | | Year | |
| | | | Ended | | | Ended | | | Ended | | | Ended | | | Ended | | | Ended | |
| | | | 11/30/10 | | | 5/31/10 | | | 11/30/10 | | | 5/31/10 | | | 11/30/10 | | | 5/31/10 | |
| Operations | | | | | | | | | | | | | | | | | | | |
| Net investment income | | $ | 1,254,461 | | $ | 2,971,871 | | $ | 690,558 | | $ | 1,657,597 | | $ | 1,492,321 | | $ | 3,530,852 | |
| Net realized gain (loss) from investments | | | 12,122 | | | (80,448 | ) | | (104 | ) | | (247,298 | ) | | 1,446 | | | (701,883 | ) |
| Change in net unrealized appreciation (depreciation) of investments | | | (1,249,951 | ) | | 2,560,292 | | | (519,389 | ) | | 1,731,310 | | | (1,223,785 | ) | | 4,718,199 | |
Distributions to Auction Rate Preferred Shareholders: | | | | | | | | | | | | | | | | | | | |
| From net investment income | | | — | | | (86,098 | ) | | — | | | (47,292 | ) | | — | | | (93,719 | ) |
| From accumulated net realized gains | | | — | | | — | | | — | | | — | | | — | | | — | |
| Net increase (decrease) in net assets applicable to Common shares from operations | | | 16,632 | | | 5,365,617 | | | 171,065 | | | 3,094,317 | | | 269,982 | | | 7,453,449 | |
| Distributions to Common Shareholders | | | | | | | | | | | | | | | | | | | |
| From net investment income | | | (1,347,313 | ) | | (2,574,524 | ) | | (756,905 | ) | | (1,447,538 | ) | | (1,639,889 | ) | | (3,156,398 | ) |
| From accumulated net realized gains | | | — | | | — | | | — | | | — | | | — | | | — | |
| Decrease in net assets applicable to Common shares from distributions to Common shareholders | | | (1,347,313 | ) | | (2,574,524 | ) | | (756,905 | ) | | (1,447,538 | ) | | (1,639,889 | ) | | (3,156,398 | ) |
| Capital Share Transactions | | | | | | | | | | | | | | | | | | | |
| Net proceeds from Common shares issued to shareholders due to reinvestment of distributions | | | 9,387 | | | — | | | 25,314 | | | 10,096 | | | 4,430 | | | 4,625 | |
| Net increase (decrease) in net assets applicable to Common shares from capital share transactions | | | 9,387 | | | — | | | 25,314 | | | 10,096 | | | 4,430 | | | 4,625 | |
| Net increase (decrease) in net assets applicable to Common shares | | | (1,321,294 | ) | | 2,791,093 | | | (560,526 | ) | | 1,656,875 | | | (1,365,477 | ) | | 4,301,676 | |
| Net assets applicable to Common shares at the beginning of period | | | 55,017,954 | | | 52,226,861 | | | 29,179,184 | | | 27,522,309 | | | 64,720,908 | | | 60,419,232 | |
| Net assets applicable to Common shares at the end of period | | $ | 53,696,660 | | $ | 55,017,954 | | $ | 28,618,658 | | $ | 29,179,184 | | $ | 63,355,431 | | $ | 64,720,908 | |
| Undistributed (Over-distribution of) net investment income at the end of period | | $ | 443,256 | | $ | 536,108 | | $ | 201,128 | | $ | 267,475 | | $ | 336,826 | | $ | 484,394 | |
See accompanying notes to financial statements.
Nuveen Investments 51
| | | Statement of |
| | | Changes in Net Assets (Unaudited) (continued) |
| | | North Carolina Premium Income (NNC) | | North Carolina Dividend Advantage (NRB) | |
| | | | Six Months | | | Year | | | Six Months | | | Year | |
| | | | Ended | | | Ended | | | Ended | | | Ended | |
| | | | 11/30/10 | | | 5/31/10 | | | 11/30/10 | | | 5/31/10 | |
| Operations | | | | | | | | | | | | | |
| Net investment income | | $ | 2,348,760 | | $ | 5,173,597 | | $ | 847,044 | | $ | 2,123,558 | |
| Net realized gain (loss) from investments | | | 88,380 | | | 423,483 | | | 30,837 | | | 28,829 | |
| Change in net unrealized appreciation (depreciation) of investments | | | (1,588,007 | ) | | 5,030,176 | | | (755,827 | ) | | 1,416,200 | |
| Distributions to Auction Rate | | | | | | | | | | | | | |
| Preferred Shareholders: | | | | | | | | | | | | | |
| From net investment income | | | (45,085 | ) | | (162,889 | ) | | — | | | (62,338 | ) |
| From accumulated net realized gains | | | — | | | — | | | — | | | — | |
| Net increase (decrease) in net assets applicable to Common shares from operations | | | 804,048 | | | 10,464,367 | | | 122,054 | | | 3,506,249 | |
| Distributions to Common Shareholders | | | | | | | | | | | | | |
| From net investment income | | | (2,366,083 | ) | | (4,536,632 | ) | | (953,471 | ) | | (1,829,817 | ) |
| From accumulated net realized gains | | | — | | | — | | | — | | | — | |
| Decrease in net assets applicable to Common shares from distributions to Common shareholders | | | (2,366,083 | ) | | (4,536,632 | ) | | (953,471 | ) | | (1,829,817 | ) |
| Capital Share Transactions | | | | | | | | | | | | | |
| Net proceeds from Common shares issued to shareholders due to reinvestment of distributions | | | 71,415 | | | 84,012 | | | 29,163 | | | 47,006 | |
| Net increase (decrease) in net assets applicable to Common shares from capital share transactions | | | 71,415 | | | 84,012 | | | 29,163 | | | 47,006 | |
| Net increase (decrease) in net assets applicable to Common shares | | | (1,490,620 | ) | | 6,011,747 | | | (802,254 | ) | | 1,723,438 | |
| Net assets applicable to Common shares at the beginning of period | | | 93,569,885 | | | 87,558,138 | | | 34,616,957 | | | 32,893,519 | |
| Net assets applicable to Common shares at the end of period | | $ | 92,079,265 | | $ | 93,569,885 | | $ | 33,814,703 | | $ | 34,616,957 | |
| Undistributed (Over-distribution of) net investment income at the end of period | | $ | 848,135 | | $ | 910,543 | | $ | 291,755 | | $ | 398,182 | |
See accompanying notes to financial statements.
52 Nuveen Investments
| | | North Carolina Dividend Advantage 2 (NNO) | | North Carolina Dividend Advantage 3 (NII) | |
| | | | Six Months | | | Year | | | Six Months | | | Year | |
| | | | Ended | | | Ended | | | Ended | | | Ended | |
| | | | 11/30/10 | | | 5/31/10 | | | 11/30/10 | | | 5/31/10 | |
| Operations | | | | | | | | | | | | | |
| Net investment income | | $ | 1,333,328 | | $ | 3,324,701 | | $ | 1,375,583 | | $ | 3,337,128 | |
| Net realized gain (loss) from investments | | | 63,155 | | | 59,796 | | | 138,143 | | | 112,606 | |
| Change in net unrealized appreciation (depreciation) of investments | | | (1,162,450 | ) | | 2,550,370 | | | (1,215,705 | ) | | 2,553,468 | |
| Distributions to Auction Rate | | | | | | | | | | | | | |
| Preferred Shareholders: | | | | | | | | | | | | | |
| From net investment income | | | — | | | (104,048 | ) | | — | | | (91,210 | ) |
| From accumulated net realized gains | | | — | | | (2,285 | ) | | — | | | — | |
| Net increase (decrease) in net assets applicable to Common shares from operations | | | 234,033 | | | 5,828,534 | | | 298,021 | | | 5,911,992 | |
| Distributions to Common Shareholders | | | | | | | | | | | | | |
| From net investment income | | | (1,530,821 | ) | | (2,908,243 | ) | | (1,558,732 | ) | | (2,956,668 | ) |
| From accumulated net realized gains | | | — | | | (8,625 | ) | | — | | | — | |
| Decrease in net assets applicable to Common shares from distributions to Common shareholders | | | (1,530,821 | ) | | (2,916,868 | ) | | (1,558,732 | ) | | (2,956,668 | ) |
| Capital Share Transactions | | | | | | | | | | | | | |
| Net proceeds from Common shares issued to shareholders due to reinvestment of distributions | | | 19,320 | | | 24,591 | | | 16,855 | | | 34,165 | |
| Net increase (decrease) in net assets applicable to Common shares from capital share transactions | | | 19,320 | | | 24,591 | | | 16,855 | | | 34,165 | |
| Net increase (decrease) in net assets applicable to Common shares | | | (1,277,468 | ) | | 2,936,257 | | | (1,243,856 | ) | | 2,989,489 | |
| Net assets applicable to Common shares at the beginning of period | | | 56,589,663 | | | 53,653,406 | | | 58,054,437 | | | 55,064,948 | |
| Net assets applicable to Common shares at the end of period | | $ | 55,312,195 | | $ | 56,589,663 | | $ | 56,810,581 | | $ | 58,054,437 | |
| Undistributed (Over-distribution of) net investment income at the end of period | | $ | 410,436 | | $ | 607,929 | | $ | 298,025 | | $ | 481,174 | |
See accompanying notes to financial statements.
Nuveen Investments 53
| | | Statement of |
| | | Cash Flows |
| | | Six Months Ended November 30, 2010 (Unaudited) |
| | | | Georgia | | | Georgia | | | Georgia | |
| | | | Premium | | | Dividend | | | Dividend | |
| | | | Income | | | Advantage | | | Advantage 2 | |
| | | | (NPG | ) | | (NZX | ) | | (NKG | ) |
| Cash Flows from Operating Activities: | | | | | | | | | | |
| Net Increase (Decrease) in Net Assets Applicable to Common Shares from Operations | | $ | 16,632 | | $ | 171,065 | | $ | 269,982 | |
| Adjustments to reconcile the net increase (decrease) in net assets applicable to Common shares from operations to net cash provided by (used in) operating activities: | | | | | | | | | | |
| Purchases of investments | | | (912,696 | ) | | (153,406 | ) | | (1,694,963 | ) |
| Proceeds from sales and maturities of investments | | | 909,000 | | | 147,320 | | | 1,969,000 | |
| Amortization (Accretion) of premiums and discounts, net | | | 97,740 | | | 46,480 | | | 142,788 | |
| (Increase) Decrease in receivable for interest | | | 3,312 | | | 1,114 | | | 4,356 | |
| (Increase) Decrease in receivable for investments sold | | | — | | | (45,000 | ) | | (50,000 | ) |
| (Increase) Decrease in other assets | | | (547 | ) | | (5,116 | ) | | (1,817 | ) |
| Increase (Decrease) in payable for investments purchased | | | — | | | — | | | — | |
| Increase (Decrease) in payable for interest | | | 6 | | | 3 | | | 6 | |
| Increase (Decrease) in accrued management fees | | | (2,073 | ) | | 918 | | | 4,439 | |
| Increase (Decrease) in accrued other liabilities | | | (25,915 | ) | | (24,647 | ) | | (17,642 | ) |
| Net realized (gain) loss from investments | | | (12,122 | ) | | 104 | | | (1,446 | ) |
| Change in net unrealized (appreciation) depreciation of investments | | | 1,249,951 | | | 519,389 | | | 1,223,785 | |
| Taxes paid on undistributed capital gains | | | (227 | ) | | (96 | ) | | (260 | ) |
| Net cash provided by (used in) operating activities | | | 1,323,061 | | | 658,128 | | | 1,848,228 | |
| Cash Flows from Financing Activities: | | | | | | | | | | |
| (Increase) Decrease in deferred offering costs | | | 65,367 | | | 41,918 | | | 73,897 | |
| Increase (Decrease) in cash overdraft balance | | | — | | | 64,029 | | | (2,223 | ) |
| Increase (Decrease) in payable for offering costs | | | (32,500 | ) | | (32,500 | ) | | (39,913 | ) |
| Cash distributions paid to Common shareholders | | | (1,336,594 | ) | | (731,575 | ) | | (1,633,591 | ) |
| Net cash provided by (used in) financing activities | | | (1,303,727 | ) | | (658,128 | ) | | (1,601,830 | ) |
| Net Increase (Decrease) in Cash | | | 19,334 | | | — | | | 246,398 | |
| Cash at the beginning of period | | | 4,399 | | | — | | | — | |
| Cash at the End of Period | | $ | 23,733 | | $ | — | | $ | 246,398 | |
Supplemental Disclosure of Cash Flow Information
Non-cash financing activities not included herein consist of reinvestments of Common share distributions as follows:
| | | | Georgia | | | Georgia | | | Georgia | |
| | | | Premium | | | Dividend | | | Dividend | |
| | | | Income | | | Advantage | | | Advantage 2 | |
| | | | (NPG | ) | | (NZX | ) | | (NKG | ) |
| | | $ | 9,387 | | $ | 25,314 | | $ | 4,430 | |
Cash paid for interest (excluding amortization of offering costs) was as follows:
| | | | Georgia | | | Georgia | | | Georgia | |
| | | | Premium | | | Dividend | | | Dividend | |
| | | | Income | | | Advantage | | | Advantage 2 | |
| | | | (NPG | ) | | (NZX | ) | | (NKG | ) |
| | | $ | 379,321 | | $ | 192,121 | | $ | 431,985 | |
See accompanying notes to financial statements.
54 Nuveen Investments
| | | | North | | | North | | | North | | | North | |
| | | | Carolina | | | Carolina | | | Carolina | | | Carolina | |
| | | | Premium | | | Dividend | | | Dividend | | | Dividend | |
| | | | Income | | | Advantage | | | Advantage 2 | | | Advantage 3 | |
| | | | (NNC | ) | | (NRB | ) | | (NNO | ) | | (NII | ) |
| Cash Flows from Operating Activities: | | | | | | | | | | | | | |
| Net Increase (Decrease) in Net Assets Applicable to Common Shares from Operations | | $ | 804,048 | | $ | 122,054 | | $ | 234,033 | | $ | 298,021 | |
| Adjustments to reconcile the net increase (decrease) in net assets applicable to Common shares from operations to net cash provided by (used in) operating activities: | | | | | | | | | | | | | |
| Purchases of investments | | | (2,962,149 | ) | | (2,913,771 | ) | | (3,609,842 | ) | | (4,860,845 | ) |
| Proceeds from sales and maturities of investments | | | 1,927,732 | | | 2,406,768 | | | 3,165,250 | | | 4,910,263 | |
| Amortization (Accretion) of premiums and discounts, net | | | 169,271 | | | 61,324 | | | 70,214 | | | 88,423 | |
| (Increase) Decrease in receivable for interest | | | (580 | ) | | 44,679 | | | 47,988 | | | 67,881 | |
| (Increase) Decrease in receivable for investments sold | | | 5,146 | | | 1,030,464 | | | 132,587 | | | 520,352 | |
| (Increase) Decrease in other assets | | | (996 | ) | | (2,956 | ) | | (545 | ) | | (546 | ) |
| Increase (Decrease) in payable for investments purchased | | | — | | | — | | | 198,595 | | | 493,917 | |
| Increase (Decrease) in payable for interest | | | 4 | | | (3 | ) | | (6 | ) | | 6 | |
| Increase (Decrease) in accrued management fees | | | (3,115 | ) | | (1,208 | ) | | (1,841 | ) | | 3,799 | |
| Increase (Decrease) in accrued other liabilities | | | (11,141 | ) | | (18,741 | ) | | (17,937 | ) | | (17,256 | ) |
| Net realized (gain) loss from investments | | | (88,380 | ) | | (30,837 | ) | | (63,155 | ) | | (138,143 | ) |
| Change in net unrealized (appreciation) depreciation of investments | | | 1,588,007 | | | 755,827 | | | 1,162,450 | | | 1,215,705 | |
| Taxes paid on undistributed capital gains | | | (813 | ) | | — | | | — | | | (229 | ) |
| Net cash provided by (used in) operating activities | | | 1,427,034 | | | 1,453,600 | | | 1,317,791 | | | 2,581,348 | |
| Cash Flows from Financing Activities: | | | | | | | | | | | | | |
| (Increase) Decrease in deferred offering costs | | | 66,658 | | | 50,428 | | | 71,088 | | | 69,443 | |
| Increase (Decrease) in cash overdraft balance | | | 857,851 | | | — | | | — | | | (22,631 | ) |
| Increase (Decrease) in payable for offering costs | | | (58,050 | ) | | (32,356 | ) | | (32,167 | ) | | (33,725 | ) |
| Cash distributions paid to Common shareholders | | | (2,293,493 | ) | | (923,500 | ) | | (1,510,793 | ) | | (1,541,469 | ) |
| Net cash provided by (used in) financing activities | | | (1,427,034 | ) | | (905,428 | ) | | (1,471,872 | ) | | (1,528,382 | ) |
| Net Increase (Decrease) in Cash | | | — | | | 548,172 | | | (154,081 | ) | | 1,052,966 | |
| Cash at the beginning of period | | | — | | | 71,956 | | | 676,410 | | | — | |
| Cash at the End of Period | | $ | — | | $ | 620,128 | | $ | 522,329 | | $ | 1,052,966 | |
Supplemental Disclosure of Cash Flow Information
Non-cash financing activities not included herein consist of reinvestments of Common share distributions as follows:
| | | | North | | | North | | | North | | | North | |
| | | | Carolina | | | Carolina | | | Carolina | | | Carolina | |
| | | | Premium | | | Dividend | | | Dividend | | | Dividend | |
| | | | Income | | | Advantage | | | Advantage 2 | | | Advantage 3 | |
| | | | (NNC | ) | | (NRB | ) | | (NNO | ) | | (NII | ) |
| | | $ | 71,415 | | $ | 29,163 | | $ | 19,320 | | $ | 16,855 | |
Cash paid for interest (excluding amortization of offering costs) was as follows:
| | | | North | | | North | | | North | | | North | |
| | | | Carolina | | | Carolina | | | Carolina | | | Carolina | |
| | | | Premium | | | Dividend | | | Dividend | | | Dividend | |
| | | | Income | | | Advantage | | | Advantage 2 | | | Advantage 3 | |
| | | | (NNC | ) | | (NRB | ) | | (NNO | ) | | (NII | ) |
| | | $ | 338,924 | | $ | 233,804 | | $ | 397,424 | | $ | 398,472 | |
See accompanying notes to financial statements.
Nuveen Investments 55
| | | Financial |
| | | Highlights (Unaudited) |
| | | |
| | Selected data for a Common share outstanding throughout each period: |
| | | | Investment Operations | | Less Distributions | | | | | |
| | | Beginning Common Share Net Asset Value | | Net Investment Income | | Net Realized/ Unrealized Gain (Loss) | | Distributions from Net Investment Income to Auction Rate Preferred Share- holders | (a) | Distributions from Capital Gains to Auction Rate Preferred Share- holders | (a) | Total | | Net Investment Income to Common Share- holders | | Capital Gains to Common Share- holders | | Total | | Ending Common Share Net Asset Value | | Ending Market Value | |
| Georgia Premium Income (NPG) | | | | | | | | | | | | | | | | | | | | | | | | | |
| Year Ended 5/31: | | | | | | | | | | | | | | | | | | | | | | | | | | | | |
| 2011(f) | | $ | 14.46 | | $ | .33 | | $ | (.33 | ) | $ | — | | $ | — | | $ | — | | $ | (.35 | ) | $ | — | | $ | (.35 | ) | $ | 14.11 | | $ | 13.86 | |
| 2010 | | | 13.72 | | | .78 | | | .66 | | | (.02 | ) | | — | | | 1.42 | | | (.68 | ) | | — | | | (.68 | ) | | 14.46 | | | 13.95 | |
| 2009 | | | 14.19 | | | .85 | | | (.55 | ) | | (.16 | ) | | — | | | .14 | | | (.61 | ) | | — | | | (.61 | ) | | 13.72 | | | 12.10 | |
| 2008 | | | 14.55 | | | .84 | | | (.30 | ) | | (.24 | ) | | (.01 | ) | | .29 | | | (.61 | ) | | (.04 | ) | | (.65 | ) | | 14.19 | | | 13.15 | |
| 2007 | | | 14.55 | | | .86 | | | .04 | | | (.23 | ) | | — | | | .67 | | | (.67 | ) | | — | | | (.67 | ) | | 14.55 | | | 14.12 | |
| 2006 | | | 15.19 | | | .87 | | | (.48 | ) | | (.17 | ) | | (.01 | ) | | .21 | | | (.78 | ) | | (.07 | ) | | (.85 | ) | | 14.55 | | | 15.16 | |
| | | | | | | | | | | | | | | | | | | | | | | | | | | | | | | | | | | |
| Georgia Dividend Advantage (NZX) | | | | | | | | | | | | | | | | | | | | | | | | | | |
| Year Ended 5/31: | | | | | | | | | | | | | | | | | | | | | | | | | | | | |
| 2011(f) | | | 14.81 | | | .35 | | | (.27 | ) | | — | | | — | | | .08 | | | (.38 | ) | | — | | | (.38 | ) | | 14.51 | | | 14.95 | |
| 2010 | | | 13.98 | | | .84 | | | .75 | | | (.02 | ) | | — | | | 1.57 | | | (.74 | ) | | — | | | (.74 | ) | | 14.81 | | | 15.18 | |
| 2009 | | | 14.47 | | | .91 | | | (.57 | ) | | (.17 | ) | | — | | | .17 | | | (.66 | ) | | — | | | (.66 | ) | | 13.98 | | | 13.46 | |
| 2008 | | | 14.65 | | | .90 | | | (.16 | ) | | (.26 | ) | | — | | | .48 | | | (.66 | ) | | — | | | (.66 | ) | | 14.47 | | | 13.47 | |
| 2007 | | | 14.71 | | | .92 | | | .02 | | | (.25 | ) | | — | | | .69 | | | (.75 | ) | | — | | | (.75 | ) | | 14.65 | | | 16.00 | |
| 2006 | | | 15.30 | | | .94 | | | (.47 | ) | | (.19 | ) | | — | | | .28 | | | (.87 | ) | | — | | | (.87 | ) | | 14.71 | | | 15.50 | |
| | | Auction Rate Preferred Shares at End of Period | | MuniFund Term Preferred Shares at End of Period | |
| | | Aggregate Amount Outstanding (000) | | Liquidation Value Per Share | | Asset Coverage Per Share | | Aggregate Amount Outstanding (000) | | Liquidation Value Per Share | | Ending Market Value Per Share | | Average Market Value Per Share | | Asset Coverage Per Share | |
| Georgia Premium Income (NPG) | | | | | | | | | | | | | | | | | | | | | | | | | |
| Year Ended 5/31: | | | | | | | | | | | | | | | | | | | | | | | | | |
| 2011(f) | | $ | — | | $ | — | | $ | — | | $ | 28,340 | | $ | 10 | | $ | 10.08 | | $ | 10.09 | | $ | 28.95 | |
| 2010 | | | — | | | — | | | — | | | 28,340 | | | 10 | | | 9.99 | | | 9.99 | ** | | 29.41 | |
| 2009 | | | 27,800 | | | 25,000 | | | 71,967 | | | — | | | — | | | — | | | — | | | — | |
| 2008 | | | 27,800 | | | 25,000 | | | 73,571 | | | — | | | — | | | — | | | — | | | — | |
| 2007 | | | 27,800 | | | 25,000 | | | 74,784 | | | — | | | — | | | — | | | — | | | — | |
| 2006 | | | 27,800 | | | 25,000 | | | 74,747 | | | — | | | — | | | — | | | — | | | — | |
| | | | | | | | | | | | | | | | | | | | | | | | | | |
| Georgia Dividend Advantage (NZX) | | | | | | | | | | | | | | | | | | | | | | | | | |
| Year Ended 5/31: | | | | | | | | | | | | | | | | | | | | | | | | | |
| 2011(f) | | | — | | | — | | | — | | | 14,340 | | | 10 | | | 10.08 | | | 10.09 | | | 29.96 | |
| 2010 | | | — | | | — | | | — | | | 14,340 | | | 10 | | | 9.97 | | | 9.98 | ** | | 30.35 | |
| 2009 | | | 15,000 | | | 25,000 | | | 70,871 | | | — | | | — | | | — | | | — | | | — | |
| 2008 | | | 15,000 | | | 25,000 | | | 72,497 | | | — | | | — | | | — | | | — | | | — | |
| 2007 | | | 15,000 | | | 25,000 | | | 73,052 | | | — | | | — | | | — | | | — | | | — | |
| 2006 | | | 15,000 | | | 25,000 | | | 73,187 | | | — | | | — | | | — | | | — | | | — | |
56 Nuveen Investments
| | | | | Ratios/Supplemental Data |
| Total Returns | | | | Ratios to Average Net Assets Applicable to Common Shares Before Reimbursement(c) | | Ratios to Average Net Assets Applicable to Common Shares After Reimbursement(c)(d) | | | |
| Based on Market Value | (b) | Based on Common Share Net Asset Value | (b) | Ending Net Assets Applicable to Common Shares (000) | | Expenses Including Interest | (e) | Expenses Excluding Interest | | Net Investment Income | | Expenses Including Interest | (e) | Expenses Excluding Interest | | Net Investment Income | | Portfolio Turnover Rate | |
| | | | | | | | | | | | | | | | | | | | | | | | | | | | | |
| | | | | | | | | | | | | | | | | | | | | | | | | | | | | |
| 1.83 | % | | (.02 | )% | $ | 53,697 | | | 2.69 | %* | | 1.33 | %* | | 4.52 | %* | | N/A | | | N/A | | | N/A | | | 1 | % |
| 21.21 | | | 10.52 | | | 55,018 | | | 1.69 | | | 1.30 | | | 5.51 | | | N/A | | | N/A | | | N/A | | | 2 | |
| (2.86 | ) | | 1.33 | | | 52,227 | | | 1.44 | | | 1.33 | | | 6.44 | | | N/A | | | N/A | | | N/A | | | 12 | |
| (2.17 | ) | | 2.06 | | | 54,011 | | | 1.25 | | | 1.25 | | | 5.86 | | | N/A | | | N/A | | | N/A | | | 31 | |
| (2.55 | ) | | 4.62 | | | 55,359 | | | 1.25 | | | 1.25 | | | 5.84 | | | N/A | | | N/A | | | N/A | | | 4 | |
| (4.12 | ) | | 1.42 | | | 55,318 | | | 1.25 | | | 1.25 | | | 5.87 | | | N/A | | | N/A | | | N/A | | | 15 | |
| | | | | | | | | | | | | | | | | | | | | | | | | | | | | |
| | | | | | | | | | | | | | | | | | | | | | | | | | | | | |
| 1.04 | | | .53 | | | 28,619 | | | 2.69 | * | | 1.38 | * | | 4.58 | * | | 2.57 | %* | | 1.26 | %* | | 4.70 | %* | | — | *** |
| 18.75 | | | 11.41 | | | 29,179 | | | 1.76 | | | 1.37 | | | 5.62 | | | 1.58 | | | 1.19 | | | 5.81 | | | 4 | |
| 5.67 | | | 1.46 | | | 27,522 | | | 1.53 | | | 1.42 | | | 6.50 | | | 1.27 | | | 1.16 | | | 6.76 | | | 8 | |
| (11.73 | ) | | 3.33 | | | 28,498 | | | 1.32 | | | 1.32 | | | 5.86 | | | .99 | | | .99 | | | 6.19 | | | 22 | |
| 8.10 | | | 4.75 | | | 28,831 | | | 1.35 | | | 1.35 | | | 5.74 | | | .94 | | | .94 | | | 6.14 | | | 11 | |
| 2.91 | | | 1.87 | | | 28,912 | | | 1.31 | | | 1.31 | | | 5.82 | | | .86 | | | .86 | | | 6.27 | | | 5 | |
| (a) | The amounts shown are based on Common share equivalents. |
| (b) | Total Return Based on Market Value is the combination of changes in the market price per share and the effect of reinvested dividend income and reinvested capital gains distributions, if any, at the average price paid per share at the time of reinvestment. The last dividend declared in the period, which is typically paid on the first business day of the following month, is assumed to be reinvested at the ending market price. The actual reinvestment for the last dividend declared in the period may take place over several days, and in some instances may not be based on the market price, so the actual reinvestment price may be different from the price used in the calculation. Total returns are not annualized. |
| | Total Return Based on Common Share Net Asset Value is the combination of changes in Common share net asset value, reinvested dividend income at net asset value and reinvested capital gains distributions at net asset value, if any. The last dividend declared in the period, which is typically paid on the first business day of the following month, is assumed to be reinvested at the ending net asset value. The actual reinvest price for the last dividend declared in the period may often be based on the Fund’s market price (and not its net asset value), and therefore may be different from the price used in the calculation. Total returns are not annualized. |
| (c) | Ratios do not reflect the effect of dividend payments to Auction Rate Preferred shareholders; Net Investment Income ratios reflect income earned and expenses incurred on assets attributable to Auction Rate Preferred shares and/or MuniFund Term Preferred shares, where applicable. |
| (d) | After expense reimbursement from Adviser, where applicable. Ratios do not reflect the effect of custodian fee credits earned on the Fund’s net cash on deposit with the custodian bank, where applicable. |
| (e) | The expense ratios reflect, among other things, payments to MuniFund Term Preferred shareholders and/or the interest expense deemed to have been paid by the Fund on the floating rate certificates issued by the special purpose trusts for the self-deposited inverse floaters held by the Fund, where applicable, as described in Footnote 1 –General Information and Significant Accounting Policies, MuniFund Term Preferred Shares and Inverse Floating Rate Securities, respectively. |
| (f) | For the six months ended November 30, 2010. |
| N/A | Fund does not have a contractual reimbursement with the Adviser. |
| * | Annualized. |
| ** | For the period February 22, 2010 (issuance date of shares) through May 31, 2010. |
| *** | Rounds to less than 1%. |
See accompanying notes to financial statements.
Nuveen Investments 57
| | | Financial |
| | | Highlights (Unaudited) (continued) |
| | | |
| | Selected data for a Common share outstanding throughout each period: |
| | | | | | Investment Operations | | Less Distributions | | | | | | | |
| | | Beginning Common Share Net Asset Value | | Net Investment Income | | Net Realized/ Unrealized Gain (Loss) | | Distributions from Net Investment Income to Auction Rate Preferred Share-holders | (a) | Distributions from Capital Gains to Auction Rate Preferred Share- holders | (a) | Total | | Net Investment Income to Common Share- holders | | Capital Gains to Common Share- holders | | Total | | Ending Common Share Net Asset Value | | Ending Market Value | |
| Georgia Dividend Advantage 2 (NKG) |
| Year Ended 5/31: | | | | | | | | | | | | | | | | | | | | | | | | | | | | | | | |
| 2011(f) | | $ | 14.21 | | $ | .33 | | $ | (.27 | ) | $ | — | | $ | — | | $ | .06 | | $ | (.36 | ) | $ | — | | $ | (.36 | ) | $ | 13.91 | | $ | 13.85 | |
| 2010 | | | 13.27 | | | .78 | | | .87 | | | (.02 | ) | | — | | | 1.63 | | | (.69 | ) | | — | | | (.69 | ) | | 14.21 | | | 14.00 | |
| 2009 | | | 13.92 | | | .87 | | | (.73 | ) | | (.16 | ) | | — | | | (.02 | ) | | (.63 | ) | | — | | | (.63 | ) | | 13.27 | | | 11.88 | |
| 2008 | | | 14.44 | | | .88 | | | (.50 | ) | | (.26 | ) | | — | | | .12 | | | (.64 | ) | | — | | | (.64 | ) | | 13.92 | | | 13.18 | |
| 2007 | | | 14.25 | | | .89 | | | .17 | | | (.24 | ) | | — | | | .82 | | | (.63 | ) | | — | | | (.63 | ) | | 14.44 | | | 14.50 | |
| 2006 | | | 14.71 | | | .88 | | | (.45 | ) | | (.19 | ) | | — | | | .24 | | | (.70 | ) | | — | | | (.70 | ) | | 14.25 | | | 13.26 | |
| | | Auction Rate Preferred Shares at End of Period | | MuniFund Term Preferred Shares at End of Period |
| | | Aggregate Amount Outstanding (000) | | Liquidation Value Per Share | | Asset Coverage Per Share | | Aggregate Amount Outstanding (000) | | Liquidation Value Per Share | | Ending Market Value Per Share | | Average Market Value Per Share | | Asset Coverage Per Share | |
| Georgia Dividend Advantage 2 (NKG) |
| Year Ended 5/31: | | | | | | | | | | | | | | | | | | | | | | | | | |
| 2011(f) | | $ | — | | $ | — | | $ | — | | $ | 32,265 | | $ | 10 | | $ | 10.10 | | $ | 10.09 | | $ | 29.64 | |
| 2010 | | | — | | | — | | | — | | | 32,265 | | | 10 | | | 10.00 | | | 9.99 | ** | | 30.06 | |
| 2009 | | | 31,700 | | | 25,000 | | | 72,649 | | | — | | | — | | | — | | | — | | | — | |
| 2008 | | | 33,000 | | | 25,000 | | | 73,032 | | | — | | | — | | | — | | | — | | | — | |
| 2007 | | | 33,000 | | | 25,000 | | | 74,825 | | | — | | | — | | | — | | | — | | | — | |
| 2006 | | | 33,000 | | | 25,000 | | | 74,168 | | | — | | | — | | | — | | | — | | | — | |
58 Nuveen Investments
| | | | | | Ratios/Supplemental Data |
| Total Returns | | | | | Ratios to Average Net Assets Applicable to Common Shares Before Reimbursement(c) | | Ratios to Average Net Assets Applicable to Common Shares After Reimbursement(c)(d) | | | | |
| Based on Market Value | (b) | Based on Common Share Net Asset Value | (b) | Ending Net Assets Applicable to Common Shares (000) | | Expenses Including Interest | (e) | Expenses Excluding Interest | | Net Investment Income | | Expenses Including Interest | (e) | Expenses Excluding Interest | | Net Investment Income | | Portfolio Turnover Rate | |
| | | | | | | | | | | | | | | | | | | | | | | | | | | | | |
| | | | | | | | | | | | | | | | | | | | | | | | | | | | | |
| 1.47 | % | | .38 | % | $ | 63,355 | | | 2.68 | %* | | 1.36 | %* | | 4.48 | %* | | 2.60 | %* | | 1.28 | %* | | 4.57 | %* | | 2 | % |
| 24.23 | | | 12.54 | | | 64,721 | | | 1.75 | | | 1.28 | | | 5.43 | | | 1.59 | | | 1.12 | | | 5.59 | | | 3 | |
| (4.77 | ) | | .20 | | | 60,419 | | | 1.42 | | | 1.32 | | | 6.54 | | | 1.13 | | | 1.02 | | | 6.84 | | | 13 | |
| (4.64 | ) | | .89 | | | 63,402 | | | 1.23 | | | 1.23 | | | 5.82 | | | .83 | | | .83 | | | 6.22 | | | 23 | |
| 14.40 | | | 5.79 | | | 65,770 | | | 1.24 | | | 1.24 | | | 5.63 | | | .75 | | | .75 | | | 6.11 | | | 7 | |
| (1.61 | ) | | 1.68 | | | 64,901 | | | 1.24 | | | 1.24 | | | 5.63 | | | .76 | | | .76 | | | 6.11 | | | 7 | |
| (a) | The amounts shown are based on Common share equivalents. |
| (b) | Total Return Based on Market Value is the combination of changes in the market price per share and the effect of reinvested dividend income and reinvested capital gains distributions, if any, at the average price paid per share at the time of reinvestment. The last dividend declared in the period, which is typically paid on the first business day of the following month, is assumed to be reinvested at the ending market price. The actual reinvestment for the last dividend declared in the period may take place over several days, and in some instances may not be based on the market price, so the actual reinvestment price may be different from the price used in the calculation. Total returns are not annualized. |
| | Total Return Based on Common Share Net Asset Value is the combination of changes in Common share net asset value, reinvested dividend income at net asset value and reinvested capital gains distributions at net asset value, if any. The last dividend declared in the period, which is typically paid on the first business day of the following month, is assumed to be reinvested at the ending net asset value. The actual reinvest price for the last dividend declared in the period may often be based on the Fund’s market price (and not its net asset value), and therefore may be different from the price used in the calculation. Total returns are not annualized. |
| (c) | Ratios do not reflect the effect of dividend payments to Auction Rate Preferred shareholders; Net Investment Income ratios reflect income earned and expenses incurred on assets attributable to Auction Rate Preferred shares and/or MuniFund Term Preferred shares, where applicable. |
| (d) | After expense reimbursement from Adviser, where applicable. Ratios do not reflect the effect of custodian fee credits earned on the Fund’s net cash on deposit with the custodian bank, where applicable. As of September 30, 2010, the Adviser is no longer reimbursing Georgia Dividend 2 (NKG) for any fees and expenses. |
| (e) | The expense ratios reflect, among other things, payments to MuniFund Term Preferred shareholders and/or the interest expense deemed to have been paid by the Fund on the floating rate certificates issued by the special purpose trusts for the self-deposited inverse floaters held by the Fund, where applicable, as described in Footnote 1 –General Information and Significant Accounting Policies, MuniFund Term Preferred Shares and Inverse Floating Rate Securities, respectively. |
| (f) | For the six months ended November 30, 2010. |
| * | Annualized. |
| ** | For the period January 29, 2010 (issuance date of shares) through May 31, 2010. |
See accompanying notes to financial statements.
Nuveen Investments 59
| | | Financial |
| | | Highlights (Unaudited) (continued) |
| | | |
| | Selected data for a Common share outstanding throughout each period: |
| | | | | | Investment Operations | | Less Distributions | | | | | | | |
| | | Beginning Common Share Net Asset Value | | Net Investment Income | | Net Realized/ Unrealized Gain (Loss) | | Distributions from Net Investment Income to Auction Rate Preferred Share- holders | (a) | Distributions from Capital Gains to Auction Rate Preferred Share- holders | (a) | Total | | Net Investment Income to Common Share- holders | | Capital Gains to Common Share- holders | | Total | | Ending Common Share Net Asset Value | | Ending Market Value | |
| North Carolina Premium Income (NNC) |
| Year Ended 5/31: | | | | | | | | | | | | | | | | | | | | | | | | | | | | |
| 2011(f) | | $ | 14.72 | | $ | .37 | | $ | (.24 | ) | $ | (.01 | ) | $ | — | | $ | .12 | | $ | (.37 | ) | $ | — | | $ | (.37 | ) | $ | 14.47 | | $ | 14.58 | |
| 2010 | | | 13.78 | | | .81 | | | .87 | | | (.03 | ) | | — | | | 1.65 | | | (.71 | ) | | — | | | (.71 | ) | | 14.72 | | | 15.37 | |
| 2009 | | | 13.98 | | | .85 | | | (.27 | ) | | (.17 | ) | | — | | | .41 | | | (.61 | ) | | — | | | (.61 | ) | | 13.78 | | | 12.60 | |
| 2008 | | | 14.36 | | | .84 | | | (.35 | ) | | (.23 | ) | | (.01 | ) | | .25 | | | (.59 | ) | | (.04 | ) | | (.63 | ) | | 13.98 | | | 13.30 | |
| 2007 | | | 14.34 | | | .85 | | | .07 | | | (.23 | ) | | — | * | | .69 | | | (.66 | ) | | (.01 | ) | | (.67 | ) | | 14.36 | | | 14.30 | |
| 2006 | | | 15.16 | | | .88 | | | (.57 | ) | | (.16 | ) | | (.02 | ) | | .13 | | | (.79 | ) | | (.16 | ) | | (.95 | ) | | 14.34 | | | 15.09 | |
| |
| North Carolina Dividend Advantage (NRB) |
| Year Ended 5/31: | | | | | | | | | | | | | | | | | | | | | | | | | | | | |
| 2011(f) | | | 15.26 | | | .37 | | | (.32 | ) | | — | | | — | | | .05 | | | (.42 | ) | | — | | | (.42 | ) | | 14.89 | | | 15.53 | |
| 2010 | | | 14.52 | | | .94 | | | .64 | | | (.03 | ) | | — | | | 1.55 | | | (.81 | ) | | — | | | (.81 | ) | | 15.26 | | | 16.15 | |
| 2009 | | | 14.52 | | | .95 | | | (.08 | ) | | (.17 | ) | | — | | | .70 | | | (.70 | ) | | — | | | (.70 | ) | | 14.52 | | | 14.26 | |
| 2008 | | | 14.78 | | | .93 | | | (.22 | ) | | (.24 | ) | | (.01 | ) | | .46 | | | (.69 | ) | | (.03 | ) | | (.72 | ) | | 14.52 | | | 15.28 | |
| 2007 | | | 14.87 | | | .93 | | | .03 | | | (.22 | ) | | (.01 | ) | | .73 | | | (.77 | ) | | (.05 | ) | | (.82 | ) | | 14.78 | | | 16.44 | |
| 2006 | | | 15.46 | | | .94 | | | (.48 | ) | | (.17 | ) | | — | | | .29 | | | (.88 | ) | | — | | | (.88 | ) | | 14.87 | | | 17.70 | |
| | | Auction Rate Preferred Shares at End of Period | | MuniFund Term Preferred Shares at End of Period | | Auction Rate Preferred Shares and MuniFund Term Preferred Shares at End of Period | |
| | | Aggregate Amount Outstanding (000) | | Liquidation Value Per Share | | Asset Coverage Per Share | | Aggregate Amount Outstanding (000) | | Liquidation Value Per Share | | Ending Market Value Per Share | | Average Market Value Per Share | | Asset Coverage Per Share | | Asset Coverage Per $1 Liquidation Preference | |
| North Carolina Premium Income (NNC) |
| Year Ended 5/31: | | | | | | | | | | | | | | | | | | | | | | | | | |
| 2011(f) | | $ | 21,550 | | $ | 25,000 | | $ | 75,207 | | $ | 24,300 | | $ | 10 | | $ | 10.09 | | $ | 10.10 | | $ | 30.08 | | $ | 3.01 | |
| 2010 | | | 21,550 | | | 25,000 | | | 76,020 | | | 24,300 | | | 10 | | | 9.99 | | | 10.01 | *** | | 30.41 | | | 3.04 | |
| 2009 | | | 46,800 | | | 25,000 | | | 71,773 | | | — | | | — | | | — | | | — | | | — | | | — | |
| 2008 | | | 46,800 | | | 25,000 | | | 72,450 | | | — | | | — | | | — | | | — | | | — | | | — | |
| 2007 | | | 46,800 | | | 25,000 | | | 73,713 | | | — | | | — | | | — | | | — | | | — | | | — | |
| 2006 | | | 46,800 | | | 25,000 | | | 73,629 | | | — | | | — | | | — | | | — | | | — | | | — | |
| |
| North Carolina Dividend Advantage (NRB) |
| Year Ended 5/31: | | | | | | | | | | | | | | | | | | | | | | | | | |
| 2011(f) | | | — | | | — | | | — | | | 16,600 | | | 10 | | | 10.08 | | | 10.07 | | | 30.37 | | | — | |
| 2010 | | | — | | | — | | | — | | | 16,600 | | | 10 | | | 10.00 | | | 9.97 | **** | $ | 30.85 | | | — | |
| 2009 | | | 17,000 | | | 25,000 | | | 73,373 | | | — | | | — | | | — | | | — | | | — | | | — | |
| 2008 | | | 17,000 | | | 25,000 | | | 73,335 | | | — | | | — | | | — | | | — | | | — | | | — | |
| 2007 | | | 17,000 | | | 25,000 | | | 74,130 | | | — | | | — | | | — | | | — | | | — | | | — | |
| 2006 | | | 17,000 | | | 25,000 | | | 74,319 | | | — | | | — | | | — | | | — | | | — | | | — | |
60 Nuveen Investments
| | | | | | Ratios/Supplemental Data |
| Total Returns | | | | | Ratios to Average Net Assets Applicable to Common Shares Before Reimbursement(c) | | Ratios to Average Net Assets Applicable to Common Shares After Reimbursement(c)(d) | | | | |
Based on Market Value | (b) | | Based on Common Share Net Asset Value | (b) | | Ending Net Assets Applicable to Common Shares (000) | | | Expenses Including Interest | (e) | | Expenses Excluding Interest | | | Net Investment Income | | | Expenses Including Interest | (e) | | Expenses Excluding Interest | | | Net Investment Income | | | Portfolio Turnover Rate | |
| | | | | | | | | | | | | | | | | | | | | | | | | | | | | |
| | | | | | | | | | | | | | | | | | | | | | | | | | | | | |
| (2.74 | )% | | .79 | % | $ | 92,079 | | | 2.00 | %** | | 1.28 | %** | | 4.97 | %** | | N/A | | | N/A | | | N/A | | | 1 | % |
| 28.20 | | | 12.24 | | | 93,570 | | | 1.54 | | | 1.25 | | | 5.68 | | | N/A | | | N/A | | | N/A | | | 6 | |
| (.44 | ) | | 3.22 | | | 87,558 | | | 1.39 | | | 1.32 | | | 6.43 | | | N/A | | | N/A | | | N/A | | | 4 | |
| (2.52 | ) | | 1.76 | | | 88,827 | | | 1.39 | | | 1.25 | | | 5.94 | | | N/A | | | N/A | | | N/A | | | 12 | |
| (.78 | ) | | 4.84 | | | 91,191 | | | 1.27 | | | 1.24 | | | 5.82 | | | N/A | | | N/A | | | N/A | | | 13 | |
| (6.84 | ) | | .87 | | | 91,033 | | | 1.25 | | | 1.25 | | | 5.98 | | | N/A | | | N/A | | | N/A | | | 16 | |
| | | | | | | | | | | | | | | | | | | | | | | | | | | | | |
| | | | | | | | | | | | | | | | | | | | | | | | | | | | | |
| (1.23 | ) | | .28 | | | 33,815 | | | 2.79 | ** | | 1.45 | ** | | 4.78 | ** | | 2.71 | %** | | 1.37 | %** | | 4.86 | %** | | 4 | |
| 19.40 | | | 10.88 | | | 34,617 | | | 1.63 | | | 1.31 | | | 6.13 | | | 1.51 | | | 1.19 | | | 6.25 | | | 6 | |
| (1.82 | ) | | 5.17 | | | 32,894 | | | 1.71 | | | 1.37 | | | 6.63 | | | 1.51 | | | 1.16 | | | 6.83 | | | 7 | |
| (2.28 | ) | | 3.26 | | | 32,868 | | | 1.91 | | | 1.29 | | | 6.07 | | | 1.63 | | | 1.01 | | | 6.35 | | | 6 | |
| (2.26 | ) | | 4.98 | | | 33,409 | | | 1.68 | | | 1.29 | | | 5.82 | | | 1.34 | | | .95 | | | 6.17 | | | 15 | |
| 8.03 | | | 1.93 | | | 33,537 | | | 1.29 | | | 1.29 | | | 5.79 | | | .86 | | | .86 | | | 6.22 | | | 4 | |
| (a) | The amounts shown are based on Common share equivalents. |
| (b) | Total Return Based on Market Value is the combination of changes in the market price per share and the effect of reinvested dividend income and reinvested capital gains distributions, if any, at the average price paid per share at the time of reinvestment. The last dividend declared in the period, which is typically paid on the first business day of the following month, is assumed to be reinvested at the ending market price. The actual reinvestment for the last dividend declared in the period may take place over several days, and in some instances may not be based on the market price, so the actual reinvestment price may be different from the price used in the calculation. Total returns are not annualized. |
| | Total Return Based on Common Share Net Asset Value is the combination of changes in Common share net asset value, reinvested dividend income at net asset value and reinvested capital gains distributions at net asset value, if any. The last dividend declared in the period, which is typically paid on the first business day of the following month, is assumed to be reinvested at the ending net asset value. The actual reinvest price for the last dividend declared in the period may often be based on the Fund’s market price (and not its net asset value), and therefore may be different from the price used in the calculation. Total returns are not annualized. |
| (c) | Ratios do not reflect the effect of dividend payments to Auction Rate Preferred shareholders; Net Investment Income ratios reflect income earned and expenses incurred on assets attributable to Auction Rate Preferred shares and/or MuniFund Term Preferred shares, where applicable. |
| (d) | After expense reimbursement from Adviser, where applicable. Ratios do not reflect the effect of custodian fee credits earned on the Fund’s net cash on deposit with the custodian bank, where applicable. |
| (e) | The expense ratios reflect, among other things, payments to MuniFund Term Preferred shareholders and/or the interest expense deemed to have been paid by the Fund on the floating rate certificates issued by the special purpose trusts for the self-deposited inverse floaters held by the Fund, where applicable, as described in Footnote 1 –General Information and Significant Accounting Policies, MuniFund Term Preferred Shares and Inverse Floating Rate Securities, respectively. |
| (f) | For the six months ended November 30, 2010. |
| N/A | Fund does not have a contractual reimbursement with the Adviser. |
| * | Rounds to less than $.01 per share. |
| ** | Annualized. |
| *** | For the period January 21, 2010 (issuance date of shares) through May 31, 2010. |
| **** | For the period March 30, 2010 (issuance date of shares) through May 31, 2010. |
See accompanying notes to financial statements.
Nuveen Investments 61
| | | Financial |
| | | Highlights (Unaudited) (continued) |
| | | |
| | Selected data for a Common share outstanding throughout each period: |
| | | | | | Investment Operations | | Less Distributions | | | | | | | | | | |
| | | Beginning Common Share Net Asset Value | | Net Investment Income | | Net Realized/ Unrealized Gain (Loss) | | Distributions from Net Investment Income to Auction Rate Preferred Share- holders | (a) | Distributions from Capital Gains to Auction Rate Preferred Share- holders | (a) | Total | | Net Investment Income to Common Share- holders | | Capital Gains to Common Share- holders | | Total | | Ending Common Share Net Asset Value | | Ending Market Value | |
| North Carolina Dividend Advantage 2 (NNO) | | | | | | | | | | | | |
| Year Ended 5/31: | | | | | | | | | | | | | | | | | | | | | | | | | |
| 2011(f) | | $ | 15.09 | | $ | .36 | | $ | (.30 | ) | $ | — | | $ | — | | $ | .06 | | $ | (.41 | ) | $ | — | | $ | (.41 | ) | $ | 14.74 | | $ | 14.87 | |
| 2010 | | | 14.31 | | | .89 | | | .70 | | | (.03 | ) | | — | * | | 1.56 | | | (.78 | ) | | — | * | | (.78 | ) | | 15.09 | | | 15.73 | |
| 2009 | | | 14.47 | | | .92 | | | (.26 | ) | | (.17 | ) | | — | | | .49 | | | (.65 | ) | | — | | | (.65 | ) | | 14.31 | | | 13.60 | |
| 2008 | | | 14.76 | | | .91 | | | (.24 | ) | | (.25 | ) | | (.02 | ) | | .40 | | | (.63 | ) | | (.06 | ) | | (.69 | ) | | 14.47 | | | 13.66 | |
| 2007 | | | 14.75 | | | .91 | | | .10 | | | (.23 | ) | | (.01 | ) | | .77 | | | (.71 | ) | | (.05 | ) | | (.76 | ) | | 14.76 | | | 15.50 | |
| 2006 | | | 15.55 | | | .92 | | | (.60 | ) | | (.17 | ) | | (.01 | ) | | .14 | | | (.82 | ) | | (.12 | ) | | (.94 | ) | | 14.75 | | | 15.28 | |
| | | | | | | | | | | | | | | | | | | | | | | | | | | | | | | | | | | |
| North Carolina Dividend Advantage 3 (NII) | | | | | | | | | | | |
| Year Ended 5/31: | | | | | | | | | | | | | | | | | | | | | | | | | |
| 2011(f) | | | 14.75 | | | .35 | | | (.27 | ) | | — | | | — | | | .08 | | | (.40 | ) | | — | | | (.40 | ) | | 14.43 | | | 14.75 | |
| 2010 | | | 14.00 | | | .85 | | | .67 | | | (.02 | ) | | — | | | 1.50 | | | (.75 | ) | | — | | | (.75 | ) | | 14.75 | | | 15.86 | |
| 2009 | | | 14.13 | | | .90 | | | (.21 | ) | | (.16 | ) | | — | | | .53 | | | (.66 | ) | | — | | | (.66 | ) | | 14.00 | | | 13.60 | |
| 2008 | | | 14.38 | | | .88 | | | (.25 | ) | | (.23 | ) | | — | | | .40 | | | (.65 | ) | | — | | | (.65 | ) | | 14.13 | | | 14.12 | |
| 2007 | | | 14.26 | | | .89 | | | .11 | | | (.23 | ) | | — | | | .77 | | | (.65 | ) | | — | | | (.65 | ) | | 14.38 | | | 14.64 | |
| 2006 | | | 14.78 | | | .88 | | | (.50 | ) | | (.18 | ) | | — | | | .20 | | | (.72 | ) | | — | | | (.72 | ) | | 14.26 | | | 14.42 | |
| | | Auction Rate Preferred Shares at End of Period | | MuniFund Term Preferred Shares at End of Period | |
| | | Aggregate Amount Outstanding (000) | | Liquidation Value Per Share | | Asset Coverage Per Share | | Aggregate Amount Outstanding (000) | | Liquidation Value Per Share | | Ending Market Value Per Share | | Average Market Value Per Share | | Asset Coverage Per Share | |
| North Carolina Dividend Advantage 2 (NNO) | | | | | | | | | | | | | |
| Year Ended 5/31: | | | | | | | | | | | | | | | | | | | |
| 2011(f) | | $ | — | | $ | — | | $ | — | | $ | 29,700 | | $ | 10 | | $ | 10.04 | | $ | 10.08 | | $ | 28.62 | |
| 2010 | | | — | | | — | | | — | | | 29,700 | | | 10 | | | 9.97 | | | 9.97 | *** | | 29.05 | |
| 2009 | | | 28,000 | | | 25,000 | | | 72,905 | | | — | | | — | | | — | | | — | | | — | |
| 2008 | | | 28,000 | | | 25,000 | | | 73,428 | | | — | | | — | | | — | | | — | | | — | |
| 2007 | | | 28,000 | | | 25,000 | | | 74,418 | | | — | | | — | | | — | | | — | | | — | |
| 2006 | | | 28,000 | | | 25,000 | | | 74,332 | | | — | | | — | | | — | | | — | | | — | |
| | | | | | | | | | | | | | | | | | | | | | | | | | |
| North Carolina Dividend Advantage 3 (NII) | | | | | | | | | | | | | |
| Year Ended 5/31: | | | | | | | | | | | | | | | | | | | |
| 2011(f) | | | — | | | — | | | — | | | 28,725 | | | 10 | | | 10.12 | | | 10.08 | | | 29.78 | |
| 2010 | | | — | | | — | | | — | | | 28,725 | | | 10 | | | 10.00 | | | 9.99 | **** | $ | 30.21 | |
| 2009 | | | 28,000 | | | 25,000 | | | 74,165 | | | — | | | — | | | — | | | — | | | — | |
| 2008 | | | 28,000 | | | 25,000 | | | 74,602 | | | — | | | — | | | — | | | — | | | — | |
| 2007 | | | 28,000 | | | 25,000 | | | 75,457 | | | — | | | — | | | — | | | — | | | — | |
| 2006 | | | 28,000 | | | 25,000 | | | 75,044 | | | — | | | — | | | — | | | — | | | — | |
62 Nuveen Investments
| | | | | | Ratios/Supplemental Data | |
| Total Returns | | | | Ratios to Average Net Assets Applicable to Common Shares Before Reimbursement(c) | | Ratios to Average Net Assets Applicable to Common Shares After Reimbursement(c)(d) | | |
Based on Market Value | (b) | Based on Common Share Net Asset Value | (b) | Ending Net Assets Applicable to Common Shares (000) | | Expenses Including Interest | (e) | Expenses Excluding Interest | | Net Investment Income | | Expenses Including Interest | (e) | Expenses Excluding Interest | | Net Investment Income | | Portfolio Turnover Rate | |
| | | | | | | | | | | | | | | | | | | | |
| | | | | | | | | | | | | | | | | | | | |
| (2.95 | )% | | .34 | % | $ | 55,312 | | | 2.74 | %** | | 1.35 | %** | | 4.52 | %** | | 2.59 | %** | | 1.19 | %** | | 4.68 | %** | | 4 | % |
21.86 | | | 11.11 | | | 56,590 | | | 1.55 | | | 1.27 | | | 5.80 | | | 1.36 | | | 1.09 | | | 5.99 | | | 9 | |
| 4.72 | | | 3.69 | | | 53,653 | | | 1.48 | | | 1.32 | | | 6.39 | | | 1.21 | | | 1.05 | | | 6.66 | | | 4 | |
| (7.33 | ) | | 2.83 | | | 54,240 | | | 1.54 | | | 1.25 | | | 5.87 | | | 1.21 | | | .91 | | | 6.20 | | | 8 | |
| 6.64 | | | 5.24 | | | 55,349 | | | 1.39 | | | 1.24 | | | 5.68 | | | .97 | | | .83 | | | 6.09 | | | 9 | |
| (.18 | ) | | .97 | | | 55,251 | | | 1.24 | | | 1.24 | | | 5.62 | | | .79 | | | .79 | | | 6.07 | | | 9 | |
| | | | | | | | | | | | | | | | | | | | | | | | | | | | |
| | | | | | | | | | | | | | | | | | | | | | | | | | | | | |
| (4.53 | ) | | .47 | | | 56,811 | | | 2.68 | ** | | 1.31 | ** | | 4.62 | ** | | 2.60 | ** | | 1.23 | ** | | 4.70 | ** | | 5 | |
| 22.76 | | | 10.95 | | | 58,054 | | | 1.76 | | | 1.28 | | | 5.71 | | | 1.60 | | | 1.12 | | | 5.87 | | | 6 | |
| 1.43 | | | 4.11 | | | 55,065 | | | 1.55 | | | 1.31 | | | 6.39 | | | 1.26 | | | 1.02 | | | 6.68 | | | 4 | |
| 1.12 | | | 2.90 | | | 55,555 | | | 1.68 | | | 1.24 | | | 5.79 | | | 1.28 | | | .84 | | | 6.19 | | | 15 | |
| 6.23 | | | 5.48 | | | 56,511 | | | 1.49 | | | 1.23 | | | 5.62 | | | 1.02 | | | .76 | | | 6.09 | | | 12 | |
| (1.59 | ) | | 1.41 | | | 56,049 | | | 1.23 | | | 1.23 | | | 5.58 | | | .76 | | | .76 | | | 6.06 | | | 2 | |
| (a) | The amounts shown are based on Common share equivalents. |
| (b) | Total Return Based on Market Value is the combination of changes in the market price per share and the effect of reinvested dividend income and reinvested capital gains distributions, if any, at the average price paid per share at the time of reinvestment. The last dividend declared in the period, which is typically paid on the first business day of the following month, is assumed to be reinvested at the ending market price. The actual reinvestment for the last dividend declared in the period may take place over several days, and in some instances may not be based on the market price, so the actual reinvestment price may be different from the price used in the calculation. Total returns are not annualized. |
| | Total Return Based on Common Share Net Asset Value is the combination of changes in Common share net asset value, reinvested dividend income at net asset value and reinvested capital gains distributions at net asset value, if any. The last dividend declared in the period, which is typically paid on the first business day of the following month, is assumed to be reinvested at the ending net asset value. The actual reinvest price for the last dividend declared in the period may often be based on the Fund’s market price (and not its net asset value), and therefore may be different from the price used in the calculation. Total returns are not annualized. |
| (c) | Ratios do not reflect the effect of dividend payments to Auction Rate Preferred shareholders; Net Investment Income ratios reflect income earned and expenses incurred on assets attributable to Auction Rate Preferred shares and/or MuniFund Term Preferred shares, where applicable. |
| (d) | After expense reimbursement from Adviser, where applicable. Ratios do not reflect the effect of custodian fee credits earned on the Fund’s net cash on deposit with the custodian bank, where applicable. As of September 30, 2010, the Adviser is no longer reimbursing North Carolina Dividend 3 (NII) for any fees and expenses. |
| (e) | The expense ratios reflect, among other things, payments to MuniFund Term Preferred shareholders and/or the interest expense deemed to have been paid by the Fund on the floating rate certificates issued by the special purpose trusts for the self-deposited inverse floaters held by the Fund, where applicable, as described in Footnote 1 –General Information and Significant Accounting Policies, MuniFund Term Preferred Shares and Inverse Floating Rate Securities, respectively. |
| (f) | For the six months ended November 30, 2010. |
| * | Rounds to less than $.01 per share. |
| ** | Annualized. |
| *** | For the period March 30, 2010 (issuance date of shares) through May 31, 2010. |
| **** | For the period February 9, 2010 (issuance date of shares) through May 31, 2010. |
See accompanying notes to financial statements.
Nuveen Investments 63
| | | Notes to |
| | | Financial Statements (Unaudited) |
1. General Information and Significant Accounting Policies
The state funds covered in this report and their corresponding Common share stock exchange symbols are Nuveen Georgia Premium Income Municipal Fund (NPG), Nuveen Georgia Dividend Advantage Municipal Fund (NZX), Nuveen Georgia Dividend Advantage Municipal Fund 2 (NKG), Nuveen North Carolina Premium Income Municipal Fund (NNC), Nuveen North Carolina Dividend Advantage Municipal Fund (NRB), Nuveen North Carolina Dividend Advantage Municipal Fund 2 (NNO) and Nuveen North Carolina Dividend Advantage Municipal Fund 3 (NII) (collectively, the “Funds”). Common shares of Georgia Premium Income (NPG), Georgia Dividend Advantage (NZX), Georgia Dividend Advantage 2 (NKG), North Carolina Dividend Advantage (NRB), North Carolina Dividend Advantage 2 (NNO) and North Carolina Dividend Advantag e 3 (NII) are traded on the New York Stock Exchange (“NYSE”) while Common shares of North Carolina Premium Income (NNC) are traded on the NYSE Amex. The Funds are registered under the Investment Company Act of 1940, as amended, as closed-end registered investment companies.
Each Fund seeks to provide current income exempt from both regular federal and designated state income taxes by investing primarily in a portfolio of municipal obligations issued by state and local government authorities within a single state or certain U.S. territories.
The following is a summary of significant accounting policies followed by the Funds in the preparation of their financial statements in accordance with U.S. generally accepted accounting principles (“U.S. GAAP”).
Investment Valuation
Prices of municipal bonds are provided by a pricing service approved by the Funds’ Board of Trustees. These securities are generally classified as Level 2. When price quotes are not readily available (which is usually the case for municipal bonds) the pricing service establishes a security’s fair value using methods that may include consideration of the following: yields or prices of investments of comparable quality, type of issue, coupon, maturity and rating, market quotes or indications of value from security dealers, evaluations of anticipated cash flows or collateral, general market conditions and other information and analysis, including the obligor’s credit characteristics considered relevant. In pricing certain securities, particularly less liquid and lower qualit y securities, the pricing service may consider information about a security, its issuer, or market activity, provided by Nuveen Asset Management (the “Adviser”), a wholly-owned subsidiary of Nuveen Investments, Inc. (“Nuveen”). These securities are generally classified as Level 2 or Level 3 depending on the priority of the significant inputs.
Temporary investments in securities that have variable rate and demand features qualifying them as short-term investments are valued at amortized cost, which approximates market value. These securities are generally classified as Level 1 or Level 2, which is usually the case for municipal bonds.
Certain securities may not be able to be priced by the pre-established pricing methods as described above. Such securities may be valued by the Funds’ Board of Trustees or its designee at fair value. These securities generally include, but are not limited to, restricted securities (securities which may not be publicly sold without registration under the Securities Act of 1933, as amended) for which a pricing service is unable to provide a market price; securities whose trading has been formally suspended; debt securities that have gone into default and for which there is no current market quotation; a security whose market price is not available from a pre-established pricing source; a security with respect to which an event has occurred that is likely to materially affect the value of the security after the market has closed but before the calculation of a Fund’s net asset value (as may be the case in non-U.S. markets on which the security is primarily traded) or make it difficult or impossible to obtain a reliable market quotation; and a security whose price, as provided by the pricing service, is not deemed to reflect the security’s fair value. As a general principle, the fair value of a security would appear to be the amount that the owner might reasonably expect to receive for it in a current sale. A variety of factors may be considered in determining the fair value of such securities, which may include consideration of the following: yields or prices of investments of comparable quality, type of issue, coupon, maturity and rating, market quotes or indications of value from security dealers, evaluations of anticipated cash flows or collateral, general market conditions and other information and analysis, including the obligor’s credit characteristics considered re levant. These securities are generally classified as Level 2 or Level 3 depending on the priority of the significant inputs. Regardless of the method employed to value a particular security, all valuations are subject to review by the Funds’ Board of Trustees or its designee.
Refer to Footnote 2 – Fair Value Measurements for further details on the leveling of securities held by the Funds as of the end of the reporting period.
64 Nuveen Investments
Investment Transactions
Investment transactions are recorded on a trade date basis. Realized gains and losses from transactions are determined on the specific identification method. Investments purchased on a when-issued/delayed delivery basis may have extended settlement periods. Any investments so purchased are subject to market fluctuation during this period. The Funds have instructed the custodian to segregate assets with a current value at least equal to the amount of the when-issued/delayed delivery purchase commitments. At November 30, 2010, North Carolina Dividend Advantage 2 (NNO) and North Carolina Dividend Advantage 3 (NII) had outstanding delayed delivery purchase commitments of $246,958 and $493,917, respectively. There were no such outstanding purchase commitments in any of the other Funds.
Investment Income
Interest income, which reflects the amortization of premiums and accretion of discounts for financial reporting purposes, is recorded on an accrual basis. Investment income also reflects paydown gains and losses, if any.
Income Taxes
Each Fund is a separate taxpayer for federal income tax purposes. Each Fund intends to distribute substantially all of its net investment income and net capital gains to shareholders and to otherwise comply with the requirements of Subchapter M of the Internal Revenue Code applicable to regulated investment companies. Therefore, no federal income tax provision is required. Furthermore, each Fund intends to satisfy conditions that will enable interest from municipal securities, which is exempt from regular federal and designated state income taxes, to retain such tax-exempt status when distributed to shareholders of the Funds. Net realized capital gains and ordinary income distributions paid by the Funds are subject to federal taxation.
For all open tax years and all major taxing jurisdictions, management of the Funds has concluded that there are no significant uncertain tax positions that would require recognition in the financial statements. Open tax years are those that are open for examination by taxing authorities (i.e., generally the last four tax year ends and the interim tax period since then). Furthermore, management of the Funds is also not aware of any tax positions for which it is reasonably possible that the total amounts of unrecognized tax benefits will significantly change in the next twelve months.
Dividends and Distributions to Common Shareholders
Dividends from tax-exempt net investment income are declared monthly. Net realized capital gains and/or market discount from investment transactions, if any, are distributed to shareholders at least annually. Furthermore, capital gains are distributed only to the extent they exceed available capital loss carryforwards.
Distributions to Common shareholders of tax-exempt net investment income, net realized capital gains and/or market discount, if any, are recorded on the ex-dividend date. The amount and timing of distributions are determined in accordance with federal income tax regulations, which may differ from U.S. GAAP.
Auction Rate Preferred Shares
Each Fund is authorized to issue Auction Rate Preferred Shares (“ARPS”). The following Fund has issued and outstanding ARPS, $25,000 stated value per share, which approximates market value, as a means of effecting financial leverage. The Fund’s ARPS are issued in one Series. The dividend rate paid by the Fund on the Series is determined every seven days, pursuant to a dutch auction process overseen by the auction agent, and is payable at the end of each rate period. As of November 30, 2010, the number of ARPS outstanding for the Fund is as follows:
| | | | | |
| | | | North | |
| | | | Carolina | |
| | | | Premium | |
| | | | Income | |
| | | | (NNC | ) |
| Number of shares: | | | | |
| Series TH | | | 862 | |
Nuveen Investments 65
| | | Notes to |
| | | Financial Statements (Unaudited) (continued) |
Beginning in February 2008, more shares for sale were submitted in the regularly scheduled auctions for the ARPS issued by the Funds than there were offers to buy. This meant that these auctions “failed to clear,’’ and that many ARPS shareholders who wanted to sell their shares in these auctions were unable to do so. ARPS shareholders unable to sell their shares received distributions at the “maximum rate’’ applicable to failed auctions as calculated in accordance with the pre-established terms of the ARPS. As of November 30, 2010, the aggregate amount of outstanding ARPS redeemed by each Fund is as follows:
| | | | | | | | | | | | | | |
| | | | | | | Georgia | | | Georgia | | | Georgia | |
| | | | | | | Premium | | | Dividend | | | Dividend | |
| | | | | | | Income | | | Advantage | | | Advantage 2 | |
| | | | | | | (NPG | ) | | (NZX | ) | | (NKG | ) |
| ARPS redeemed, at liquidation value | | $ | 27,800,000 | | $ | 15,000,000 | | $ | 33,000,000 | |
| | | | North | | | North | | | North | | | North | |
| | | | Carolina | | | Carolina | | | Carolina | | | Carolina | |
| | | | Premium | | | Dividend | | | Dividend | | | Dividend | |
| | | | Income | | | Advantage | | | Advantage 2 | | | Advantage 3 | |
| | | | (NNC | ) | | (NRB | ) | | (NNO | ) | | (NII | ) |
| ARPS redeemed, at liquidation value | | $ | 25,250,000 | | $ | 17,000,000 | | $ | 28,000,000 | | $ | 28,000,000 | |
MuniFund Term Preferred Shares
Each Fund has issued and outstanding MuniFund Term Preferred (“MTP”) Shares, with a $10 stated value per share. Proceeds from the issuance of MTP Shares, net of offering expenses, were used to redeem all, or a portion of, each Fund’s outstanding ARPS. Each Fund’s MTP Shares are issued in one Series. Dividends, which are recognized as interest expense for financial reporting purposes, are paid monthly at a fixed annual rate, subject to adjustments in certain circumstances. The MTP Shares trade on the NYSE. As of November 30, 2010, the number of MTP Shares outstanding, fixed annual rate and the NYSE “ticker” symbol for each Fund are as follows:
| | | Georgia Premium Income (NPG) | | Georgia Dividend Advantage (NZX) | |
| | | | | | | Fixed | | | | | | | | | Fixed | | | | |
| | | | Shares | | | Annual | | | NYSE | | | Shares | | | Annual | | | NYSE | |
| | | | Outstanding | | | Rate | | | Ticker | | | Outstanding | | | Rate | | | Ticker | |
| Series 2015 | | | 2,834,000 | | | 2.65 | % | | NPG Pr C | | | 1,434,000 | | | 2.65 | % | | NZX Pr C | |
| | | Georgia Dividend Advantage 2 (NKG) | | North Carolina Premium Income (NNC) | |
| | | | | | | Fixed | | | | | | | | | Fixed | | | | |
| | | | Shares | | | Annual | | | NYSE | | | Shares | | | Annual | | | NYSE | |
| | | | Outstanding | | | Rate | | | Ticker | | | Outstanding | | | Rate | | | Ticker | |
| Series 2015 | | | 3,226,500 | | | 2.65 | % | | NKG Pr C | | | 2,430,000 | | | 2.65 | % | | NNC Pr C | |
| | | North Carolina Dividend Advantage (NRB) | | North Carolina Dividend Advantage 2 (NNO) | |
| | | | | | | Fixed | | | | | | | | | Fixed | | | | |
| | | | Shares | | | Annual | | | NYSE | | | Shares | | | Annual | | | NYSE | |
| | | | Outstanding | | | Rate | | | Ticker | | | Outstanding | | | Rate | | | Ticker | |
| Series 2015 | | | 1,660,000 | | | 2.60 | % | | NRB Pr C | | | 2,970,000 | | | 2.60 | % | | NNO Pr C | |
| | | | North Carolina Dividend Advantage 3 (NII) | |
| | | | | | | Fixed | | | | |
| | | | Shares | | | Annual | | | NYSE | |
| | | | Outstanding | | | Rate | | | Ticker | |
| Series 2015 | | | 2,872,500 | | | 2.65 | % | | NII Pr C | |
66 Nuveen Investments
Each Fund is obligated to redeem its MTP Shares by the date as specified in its offering document (“Term Redemption Date”), unless earlier redeemed or repurchased by the Fund. MTP Shares are subject to optional and mandatory redemption in certain circumstances. MTP Shares will be subject to redemption at the option of each Fund (“Optional Redemption Date”), subject to a payment of premium for one year following the Optional Redemption Date (“Premium Expiration Date”), and at par thereafter. MTP Shares also will be subject to redemption, at the option of each Fund, at par in the event of certain changes in the credit rating of the MTP Shares. Each Fund may be obligated to redeem certain of the MTP Shares if the Fund fails to maintain certain asset coverag e and leverage ratio requirements and such failures are not cured by the applicable cure date. The redemption price per share is equal to the sum of the liquidation value per share plus any accumulated but unpaid dividends. The Term Redemption Date, Optional Redemption Date and Premium Expiration Date for each Fund’s MTP Shares are as follows:
| | | | | | | | | | | |
| | | | Georgia | | | Georgia | | | Georgia | |
| | | | Premium | | | Dividend | | | Dividend | |
| | | | Income | | | Advantage | | | Advantage 2 | |
| | | | (NPG | ) | | (NZX | ) | | (NKG | ) |
| | | | Series 2015 | | | Series 2015 | | | Series 2015 | |
| Term Redemption Date | | | March 1, 2015 | | | March 1, 2015 | | | February 1, 2015 | |
| Optional Redemption Date | | | March 1, 2011 | | | March 1, 2011 | | | February 1, 2011 | |
| Premium Expiration Date | | | February 29, 2012 | | | February 29, 2012 | | | January 31, 2012 | |
| | | | North | | | North | | | North | | | North | |
| | | | Carolina | | | Carolina | | | Carolina | | | Carolina | |
| | | | Premium | | | Dividend | | | Dividend | | | Dividend | |
| | | | Income | | | Advantage | | | Advantage 2 | | | Advantage 3 | |
| | | | (NNC | ) | | (NRB | ) | | (NNO | ) | | (NII | ) |
| | | | Series 2015 | | | Series 2015 | | | Series 2015 | | | Series 2015 | |
| Term Redemption Date | | | February 1, 2015 | | | April 1, 2015 | | | April 1, 2015 | | | March 1, 2015 | |
| Optional Redemption Date | | | February 1, 2011 | | | April 1, 2011 | | | April 1, 2011 | | | March 1, 2011 | |
| Premium Expiration Date | | | January 31, 2012 | | | March 31, 2012 | | | March 31, 2012 | | | February 29, 2012 | |
The average liquidation value of MTP Shares outstanding for each Fund during the six months ended November 30, 2010, was as follows:
| | | | | | | | | | | |
| | | | Georgia | | | Georgia | | | Georgia | |
| | | | Premium | | | Dividend | | | Dividend | |
| | | | Income | | | Advantage | | | Advantage 2 | |
| | | | (NPG | ) | | (NZX | ) | | (NKG | ) |
| Average liquidation value of MTP Shares outstanding | | $ | 28,340,000 | | $ | 14,340,000 | | $ | 32,265,000 | |
| | | | North | | | North | | | North | | | North | |
| | | | Carolina | | | Carolina | | | Carolina | | | Carolina | |
| | | | Premium | | | Dividend | | | Dividend | | | Dividend | |
| | | | Income | | | Advantage | | | Advantage 2 | | | Advantage 3 | |
| | | | (NNC | ) | | (NRB | ) | | (NNO | ) | | (NII | ) |
| Average liquidation value of MTP Shares outstanding | | $ | 24,300,000 | | $ | 16,600,000 | | $ | 29,700,000 | | $ | 28,725,000 | |
For financial reporting purposes only, the liquidation value of MTP Shares is recorded as a liability on the Statement of Assets and Liabilities. Unpaid dividends on MTP Shares are recognized as a component of “Interest payable” on the Statement of Assets and Liabilities. Dividends paid on MTP Shares are recognized as a component of “Interest expense and amortization of offering costs” on the Statement of Operations.
Net amounts earned by Nuveen as underwriter of each Fund’s MTP Share offering were recorded as reductions of offering costs recognized by the Funds. For the six months ended November 30, 2010, the net amounts earned by Nuveen were as follows:
| | | | Georgia | | | Georgia | | | Georgia | |
| | | | Premium | | | Dividend | | | Dividend | |
| | | | Income | | | Advantage | | | Advantage 2 | |
| | | | (NPG | ) | | (NZX | ) | | (NKG | ) |
| Net amounts earned by Nuveen | | $ | — | | $ | — | | $ | — | |
| | | | North | | | North | | | North | | | North | |
| | | | Carolina | | | Carolina | | | Carolina | | | Carolina | |
| | | | Premium | | | Dividend | | | Dividend | | | Dividend | |
| | | | Income | | | Advantage | | | Advantage 2 | | | Advantage 3 | |
| | | | (NNC | ) | | (NRB | ) | | (NNO | ) | | (NII | ) |
| Net amounts earned by Nuveen | | $ | — | | $ | 828 | | $ | 1,524 | | $ | — | |
Nuveen Investments 67
| | | Notes to |
| | | Financial Statements (Unaudited) (continued) |
Inverse Floating Rate Securities
Each Fund is authorized to invest in inverse floating rate securities. An inverse floating rate security is created by depositing a municipal bond, typically with a fixed interest rate, into a special purpose trust created by a broker-dealer. In turn, this trust (a) issues floating rate certificates, in face amounts equal to some fraction of the deposited bond’s par amount or market value, that typically pay short-term tax-exempt interest rates to third parties, and (b) issues to a long-term investor (such as one of the Funds) an inverse floating rate certificate (sometimes referred to as an “inverse floater”) that represents all remaining or residual interest in the trust. The income received by the inverse floater holder varies inversely with the short-term rate paid to the floating rate certificates’ holders, and in most circumstances the inverse floater holder bears substantially all of the underlying bond’s downside investment risk and also benefits disproportionately from any potential appreciation of the underlying bond’s value. The price of an inverse floating rate security will be more volatile than that of the underlying bond because the interest rate is dependent on not only the fixed coupon rate of the underlying bond but also on the short-term interest paid on the floating rate certificates, and because the inverse floating rate security essentially bears the risk of loss of the greater face value of the underlying bond.
A Fund may purchase an inverse floating rate security in a secondary market transaction without first owning the underlying bond (referred to as an “externally-deposited inverse floater”), or instead by first selling a fixed-rate bond to a broker-dealer for deposit into the special purpose trust and receiving in turn the residual interest in the trust (referred to as a “self-deposited inverse floater”). The inverse floater held by a Fund gives the Fund the right (a) to cause the holders of the floating rate certificates to tender their notes at par, and (b) to have the broker transfer the fixed-rate bond held by the trust to the Fund, thereby collapsing the trust. An investment in an externally-deposited inverse floater is identified in the Portfolio of Investments as “(IF) – Inverse floating rate investment.” An investment in a self-deposited inverse floater is accounted for as a financing transaction. In such instances, a fixed-rate bond deposited into a special purpose trust is identified in the Portfolio of Investments as “(UB) – Underlying bond of an inverse floating rate trust reflected as a financing transaction,” with the Fund accounting for the short-term floating rate certificates issued by the trust as “Floating rate obligations” on the Statement of Assets and Liabilities. In addition, the Fund reflects in “Investment Income” the entire earnings of the underlying bond and recognizes the related interest paid to the holders of the short-term floating rate certificates as a component of “Interest expense and amortization of offering costs” on the Statement of Operations.
During the six months ended November 30, 2010, each Fund invested in externally-deposited inverse floaters and/or self-deposited inverse floaters.
Each Fund may also enter into shortfall and forbearance agreements (sometimes referred to as a “recourse trust” or “credit recovery swap”) (such agreements referred to herein as “Recourse Trusts”) with a broker-dealer by which a Fund agrees to reimburse the broker-dealer, in certain circumstances, for the difference between the liquidation value of the fixed-rate bond held by the trust and the liquidation value of the floating rate certificates issued by the trust plus any shortfalls in interest cash flows. Under these agreements, a Fund’s potential exposure to losses related to or on inverse floaters may increase beyond the value of a Fund’s inverse floater investments as a Fund may potentially be liable to fulfill all amounts owed to holder s of the floating rate certificates. At period end, any such shortfall is recognized as “Unrealized depreciation on Recourse Trusts” on the Statement of Assets and Liabilities.
At November 30, 2010, the Funds were not invested in externally-deposited Recourse Trusts.
| | | Georgia Premium Income (NPG | ) | | Georgia Dividend Advantage (NZX | ) | | Georgia Dividend Advantage 2 (NKG | ) | | North Carolina Premium Income (NNC | ) | | North Carolina Dividend Advantage (NRB | ) | | North Carolina Dividend Advantage 2 (NNO | ) | | North Carolina Dividend Advantage 3 (NII | ) |
| Maximum exposure to Recourse Trusts | | $ | — | | | $ | — | | | $ | — | | | $ | — | | | $ | — | | | $ | — | | | $ | — | |
The average floating rate obligations outstanding and average annual interest rate and fees related to self-deposited inverse floaters during the six months ended November 30, 2010, were as follows:
| | | Georgia Premium Income (NPG | ) | | Georgia Dividend Advantage (NZX | ) | | Georgia Dividend Advantage 2 (NKG | ) | | North Carolina Premium Income (NNC | ) | | North Carolina Dividend Advantage (NRB | ) | | North Carolina Dividend Advantage 2 (NNO | ) | | North Carolina Dividend Advantage 3 (NII | ) |
| Average floating rate obligations outstanding | | $ | 1,190,000 | | | $ | 660,000 | | | $ | 1,395,000 | | | $ | 5,195,000 | | | $ | 7,160,000 | | | $ | 4,805,000 | | | $ | 7,480,000 | |
| Average annual interest rate and fees | | | 0.64 | % | | | 0.64 | % | | | 0.64 | % | | | 0.65 | % | | | 0.50 | % | | | 0.47 | % | | | 0.48 | % |
68 Nuveen Investments
Derivative Financial Instruments
Each Fund is authorized to invest in futures, options, swaps and other derivative instruments. Although the Funds are authorized to invest in such financial instruments, and may do so in the future, they did not make any such investments during the six months ended November 30, 2010.
Zero Coupon Securities
Each Fund is authorized to invest in zero coupon securities. A zero coupon security does not pay a regular interest coupon to its holders during the life of the security. Tax-exempt income to the holder of the security comes from accretion of the difference between the original purchase price of the security at issuance and the par value of the security at maturity and is effectively paid at maturity. The market prices of zero coupon securities generally are more volatile than the market prices of securities that pay interest periodically.
Offering Costs
Costs incurred by the Funds in connection with their offerings of MTP Shares were recorded as a deferred charge, which will be amortized over the 5-year life of the shares. Each Fund’s amortized deferred charges are recognized as a component of “Interest expense and amortization of offering costs” on the Statement of Operations. Each Fund’s offering costs incurred were as follows:
| | | | | | | | | | | |
| | | | Georgia | | | Georgia | | | Georgia | |
| | | | Premium | | | Dividend | | | Dividend | |
| | | | Income | | | Advantage | | | Advantage 2 | |
| | | | (NPG | ) | | (NZX | ) | | (NKG | ) |
| MTP Shares offering costs | | $ | 653,780 | | $ | 419,600 | | $ | 737,233 | |
| | | | North | | | North | | | North | | | North | |
| | | | Carolina | | | Carolina | | | Carolina | | | Carolina | |
| | | | Premium | | | Dividend | | | Dividend | | | Dividend | |
| | | | Income | | | Advantage | | | Advantage 2 | | | Advantage 3 | |
| | | | (NNC | ) | | (NRB | ) | | (NNO | ) | | (NII | ) |
| MTP Shares offering costs | | $ | 668,198 | | $ | 504,000 | | $ | 710,500 | | $ | 699,115 | |
Custodian Fee Credit
Each Fund has an arrangement with the custodian bank whereby certain custodian fees and expenses are reduced by net credits earned on each Fund’s cash on deposit with the bank. Such deposit arrangements are an alternative to overnight investments. Credits for cash balances may be offset by charges for any days on which a Fund overdraws its account at the custodian bank.
Indemnifications
Under the Funds’ organizational documents, their officers and trustees are indemnified against certain liabilities arising out of the performance of their duties to the Funds. In addition, in the normal course of business, the Funds enter into contracts that provide general indemnifications to other parties. The Funds’ maximum exposure under these arrangements is unknown as this would involve future claims that may be made against the Funds that have not yet occurred. However, the Funds have not had prior claims or losses pursuant to these contracts and expect the risk of loss to be remote.
Use of Estimates
The preparation of financial statements in conformity with U.S. GAAP requires management to make estimates and assumptions that affect the reported amounts of assets and liabilities at the date of the financial statements and the reported amounts of increases and decreases in net assets applicable to Common shares from operations during the reporting period. Actual results may differ from those estimates.
Nuveen Investments 69
| | | Notes to |
| | | Financial Statements (Unaudited) (continued) |
2. Fair Value Measurements
In determining the fair value of each Fund’s investments, various inputs are used. These inputs are summarized in the three broad levels listed below:
| | | |
| | Level 1 - | Quoted prices in active markets for identical securities. |
| | Level 2 - | Other significant observable inputs (including quoted prices for similar securities, interest rates, prepayment speeds, credit risk, etc.). |
| | Level 3 - | Significant unobservable inputs (including management’s assumptions in determining the fair value of investments). |
The inputs or methodologies used for valuing securities are not an indication of the risk associated with investing in those securities. The following is a summary of each Fund’s fair value measurements as of November 30, 2010:
| | | | | | | | | | | | | | |
| Georgia Premium Income (NPG) | | | Level 1 | | | Level 2 | | | Level 3 | | | Total | |
| Investments: | | | | | | | | | | | | | |
| Municipal Bonds | | $ | — | | $ | 81,704,218 | | $ | — | | $ | 81,704,218 | |
| | | | | | | | | | | | | | |
| Georgia Dividend Advantage (NZX) | | | Level 1 | | | Level 2 | | | Level 3 | | | Total | |
| Investments: | | | | | | | | | | | | | |
| Municipal Bonds | | $ | — | | $ | 42,905,713 | | $ | — | | $ | 42,905,713 | |
| | | | | | | | | | | | | | |
| Georgia Dividend Advantage 2 (NKG) | | | Level 1 | | | Level 2 | | | Level 3 | | | Total | |
| Investments: | | | | | | | | | | | | | |
| Municipal Bonds | | $ | — | | $ | 95,116,771 | | $ | — | | $ | 95,116,771 | |
| | | | | | | | | | | | | | |
| North Carolina Premium Income (NNC) | | | Level 1 | | | Level 2 | | | Level 3 | | | Total | |
| Investments: | | | | | | | | | | | | | |
| Municipal Bonds | | $ | — | | $ | 141,545,409 | | $ | — | | $ | 141,545,409 | |
| | | | | | | | | | | | | | |
| North Carolina Dividend Advantage (NRB) | | | Level 1 | | | Level 2 | | | Level 3 | | | Total | |
| Investments: | | | | | | | | | | | | | |
| Municipal Bonds | | $ | — | | $ | 56,002,069 | | $ | — | | $ | 56,002,069 | |
| | | | | | | | | | | | | | |
| North Carolina Dividend Advantage 2 (NNO) | | | Level 1 | | | Level 2 | | | Level 3 | | | Total | |
| Investments: | | | | | | | | | | | | | |
| Municipal Bonds | | $ | — | | $ | 88,012,917 | | $ | — | | $ | 88,012,917 | |
| | | | | | | | | | | | | | |
| North Carolina Dividend Advantage 3 (NII) | | | Level 1 | | | Level 2 | | | Level 3 | | | Total | |
| Investments: | | | | | | | | | | | | | |
| Municipal Bonds | | $ | — | | $ | 91,044,587 | | $ | — | | $ | 91,044,587 | |
3. Derivative Instruments and Hedging Activities
The Funds record derivative instruments at fair value with changes in fair value recognized on the Statement of Operations, when applicable. Even though the Funds’ investments in derivatives may represent economic hedges, they are not considered to be hedge transactions for financial reporting purposes. The Funds did not invest in derivative instruments during the six months ended November 30, 2010.
4. Fund Shares
Common Shares
Since the inception of the Funds’ repurchase program, the Funds have not repurchased any of their outstanding Common shares.
Transactions in Common shares were as follows:
| | | Georgia | | Georgia Dividend | | Georgia Dividend | |
| | | Premium Income (NPG) | | Advantage (NZX) | | Advantage 2 (NKG) | |
| | | | | | Year Ended | | | | | | Year Ended | | | | | | Year Ended | |
| | | 11/30/10 | | | 5/31/10 | | | 11/30/10 | | | 5/31/10 | | | 11/30/10 | | | 5/31/10 | |
| Common shares issued to shareholders due to reinvestment of distributions | | 633 | | | — | | | 1,696 | | | 686 | | | 313 | | | 327 | |
70 Nuveen Investments
| | | | North Carolina Premium Income (NNC) | | | North Carolina Dividend Advantage (NRB) | |
| | | | | | | Year Ended | | | | | | Year Ended | |
| | | | 11/30/10 | | | 5/31/10 | | | 11/30/10 | | | 5/31/10 | |
| Common shares issued to shareholders due to reinvestment of distributions | | | 4,796 | | | 5,785 | | | 1,864 | | | 3,076 | |
| | | | North Carolina | | | North Carolina | |
| | | | Dividend | | | Dividend | |
| | | | Advantage 2 (NNO) | | | Advantage 3 (NII) | |
| | | | | | | Year Ended | | | | | | Year Ended | |
| | | | 11/30/10 | | | 5/31/10 | | | 11/30/10 | | | 5/31/10 | |
| Common shares issued to shareholders due to reinvestment of distributions | | | 1,239 | | | 1,620 | | | 1,113 | | | 2,340 | |
Preferred Shares
Transactions in ARPS were as follows:
| | | | | | | | | | | | | | | | | | | | | | | | | | |
| | | | Georgia Premium Income (NPG) | | | Georgia Dividend Advantage (NZX) | |
| | | | Six Months | | | | | | | | | Six Months | | | | | | | |
| | | | Ended | | | Year Ended | | | Ended | | | Year Ended | |
| | | | 11/30/10 | | | 5/31/10 | | | 11/30/10 | | | 5/31/10 | |
| | | | Shares | | | Amount | | | Shares | | | Amount | | | Shares | | | Amount | | | Shares | | | Amount | |
| ARPS redeemed and/or noticed for redemption: | | | | | | | | | | | | | | | | | | | | | | | | | |
| Series M | | | — | | $ | — | | | — | | $ | — | | | — | | $ | — | | | 600 | | $ | 15,000,000 | |
| Series TH | | | — | | | — | | | 1,112 | | | 27,800,000 | | | — | | | — | | | — | | | — | |
| Total | | | — | | $ | — | | | 1,112 | | $ | 27,800,000 | | | — | | $ | — | | | 600 | | $ | 15,000,000 | |
| | | | Georgia Dividend Advantage 2 (NKG) | | | North Carolina Premium Income (NNC) | |
| | | | Six Months | | | | | | | | | Six Months | | | | | | | |
| | | | Ended | | | Year Ended | | | Ended | | | Year Ended | |
| | | | 11/30/10 | | | 5/31/10 | | | 11/30/10 | | | 5/31/10 | |
| | | | Shares | | | Amount | | | Shares | | | Amount | | | Shares | | | Amount | | | Shares | | | Amount | |
| ARPS redeemed and/or noticed for redemption: | | | | | | | | | | | | | | | | | | | | | | | | | |
| Series TH | | | — | | $ | — | | | — | | $ | — | | | — | | $ | — | | | 944 | | $ | 23,600,000 | |
| Series F | | | — | | | — | | | 1,268 | | | 31,700,000 | | | — | | | — | | | — | | | — | |
| Total | | | — | | $ | — | | | 1,268 | | $ | 31,700,000 | | | — | | $ | — | | | 944 | | $ | 23,600,000 | |
| | | | North Carolina Dividend Advantage (NRB) | | | North Carolina Dividend Advantage 2 (NNO) | |
| | | | Six Months | | | | | | | | | Six Months | | | | | | | |
| | | | Ended | | | Year Ended | | | Ended | | | Year Ended | |
| | | | 11/30/10 | | | 5/31/10 | | | 11/30/10 | | | 5/31/10 | |
| | | | Shares | | | Amount | | | Shares | | | Amount | | | Shares | | | Amount | | | Shares | | | Amount | |
| ARPS redeemed and/or noticed for redemption: | | | | | | | | | | | | | | | | | | | | | | | | | |
| Series T | | | — | | $ | — | | | 680 | | $ | 17,000,000 | | | — | | $ | — | | | — | | $ | — | |
| Series F | | | — | | | — | | | — | | | — | | | — | | | — | | | 1,120 | | | 28,000,000 | |
| Total | | | — | | $ | — | | | 680 | | $ | 17,000,000 | | | — | | $ | — | | | 1,120 | | $ | 28,000,000 | |
Nuveen Investments 71
| | | Notes to |
| | | Financial Statements (Unaudited) (continued) |
| | | | North Carolina Dividend Advantage 3 (NII) | |
| | | | Six Months | | | | | | | |
| | | | Ended | | | Year Ended | |
| | | | 11/30/10 | | | 5/31/10 | |
| | | | Shares | | | Amount | | | Shares | | | Amount | |
| ARPS redeemed and/or noticed for redemption: | | | | | | | | | | | | | |
| Series W | | | — | | $ | — | | | 1,120 | | $ | 28,000,000 | |
Transactions in MTP Shares were as follows:
| | | | | | | | |
| | | | Georgia Premium Income (NPG) | | | Georgia Dividend Advantage (NZX) | |
| | | | Six Months | | | | | | | | | Six Months | | | | | | | |
| | | | Ended | | | Year Ended | | | Ended | | | Year Ended | |
| | | | 11/30/10 | | | 5/31/10 | | | 11/30/10 | | | 5/31/10 | |
| | | | Shares | | | Amount | | | Shares | | | Amount | | | Shares | | | Amount | | | Shares | | | Amount | |
| MTP Shares issued: | | | | | | | | | | | | | | | | | | | | | | | | | |
| Series 2015 | | | — | | $ | — | | | 2,834,000 | | $ | 28,340,000 | | | — | | $ | — | | | 1,434,000 | | $ | 14,340,000 | |
| | | | Georgia Dividend Advantage 2 (NKG) | | | North Carolina Premium Income (NNC) | |
| | �� | | Six Months | | | | | | | | | Six Months | | | | | | | |
| | | | Ended | | | Year Ended | | | Ended | | | Year Ended | |
| | | | 11/30/10 | | | 5/31/10 | | | 11/30/10 | | | 5/31/10 | |
| | | | Shares | | | Amount | | | Shares | | | Amount | | | Shares | | | Amount | | | Shares | | | Amount | |
| MTP Shares issued: | | | | | | | | | | | | | | | | | | | | | | | | | |
| Series 2015 | | | — | | $ | — | | | 3,226,500 | | $ | 32,265,000 | | | — | | $ | — | | | 2,430,000 | | $ | 24,300,000 | |
| | | | North Carolina Dividend Advantage (NRB) | | | North Carolina Dividend Advantage 2 (NNO) | |
| | | | Six Months | | | | | | | | | Six Months | | | | | | | |
| | | | Ended | | | Year Ended | | | Ended | | | Year Ended | |
| | | | 11/30/10 | | | 5/31/10 | | | 11/30/10 | | | 5/31/10 | |
| | | | Shares | | | Amount | | | Shares | | | Amount | | | Shares | | | Amount | | | Shares | | | Amount | |
| MTP Shares issued: | | | | | | | | | | | | | | | | | | | | | | | | | |
| Series 2015 | | | — | | $ | — | | | 1,660,000 | | $ | 16,600,000 | | | — | | $ | — | | | 2,970,000 | | $ | 29,700,000 | |
| | | | North Carolina Dividend Advantage 3 (NII) | |
| | | | Six Months | | | | | | | |
| | | | Ended | | | Year Ended | |
| | | | 11/30/10 | | | 5/31/10 | |
| | | | Shares | | | Amount | | | Shares | | | Amount | |
| MTP Shares issued: | | | | | | | | | | | | | |
| Series 2015 | | | — | | $ | — | | | 2,872,500 | | $ | 28,725,000 | |
72 Nuveen Investments
5. Investment Transactions
Purchases and sales (including maturities but excluding short-term investments) during the six months ended November 30, 2010, were as follows:
| | | | | | | | | | | |
| | | | Georgia | | | Georgia | | | Georgia | |
| | | | Premium | | | Dividend | | | Dividend | |
| | | | Income | | | Advantage | | | Advantage 2 | |
| | | | (NPG | ) | | (NZX | ) | | (NKG | ) |
| Purchases | | $ | 912,696 | | $ | 153,406 | | $ | 1,694,963 | |
| Sales and maturities | | | 909,000 | | | 147,320 | | | 1,969,000 | |
| | | | North | | | North | | | North | | | North | |
| | | | Carolina | | | Carolina | | | Carolina | | | Carolina | |
| | | | Premium | | | Dividend | | | Dividend | | | Dividend | |
| | | | Income | | | Advantage | | | Advantage 2 | | | Advantage 3 | |
| | | | (NNC | ) | | (NRB | ) | | (NNO | ) | | (NII | ) |
| Purchases | | $ | 2,962,149 | | $ | 2,913,771 | | $ | 3,609,842 | | $ | 4,860,845 | |
| Sales and maturities | | | 1,927,732 | | | 2,406,768 | | | 3,165,250 | | | 4,910,263 | |
6. Income Tax Information
The following information is presented on an income tax basis. Differences between amounts for financial statement and federal income tax purposes are primarily due to timing differences in recognizing taxable market discount, timing differences in recognizing certain gains and losses on investment transactions and the treatment of investments in inverse floating rate securities reflected as financing transactions, if any. To the extent that differences arise that are permanent in nature, such amounts are reclassified within the capital accounts as detailed below. Temporary differences do not require reclassification. Temporary and permanent differences do not impact the net asset values of the Funds.
At November 30, 2010, the cost and unrealized appreciation (depreciation) of investments as determined on a federal income tax basis, were as follows:
| | | | | | | | | | | |
| | | | Georgia | | | Georgia | | | Georgia | |
| | | | Premium | | | Dividend | | | Dividend | |
| | | | Income | | | Advantage | | | Advantage 2 | |
| | | | (NPG | ) | | (NZX | ) | | (NKG | ) |
| Cost of investments | | $ | 78,317,421 | | $ | 41,333,390 | | $ | 92,104,816 | |
| Gross unrealized: | | | | | | | | | | |
| Appreciation | | $ | 2,713,885 | | $ | 1,235,477 | | $ | 2,357,082 | |
| Depreciation | | | (516,837 | ) | | (322,865 | ) | | (740,734 | ) |
| Net unrealized appreciation (depreciation) of investments | | $ | 2,197,048 | | $ | 912,612 | | $ | 1,616,348 | |
| | | | North | | | North | | | North | | | North | |
| | | | Carolina | | | Carolina | | | Carolina | | | Carolina | |
| | | | Premium | | | Dividend | | | Dividend | | | Dividend | |
| | | | Income | | | Advantage | | | Advantage 2 | | | Advantage 3 | |
| | | | (NNC | ) | | (NRB | ) | | (NNO | ) | | (NII | ) |
| Cost of investments | | $ | 132,486,158 | | $ | 47,333,425 | | $ | 81,018,854 | | $ | 81,889,497 | |
| Gross unrealized: | | | | | | | | | | | | | |
| Appreciation | | $ | 4,762,426 | | $ | 1,835,328 | | $ | 2,826,786 | | $ | 2,277,729 | |
| Depreciation | | | (897,609 | ) | | (326,785 | ) | | (637,803 | ) | | (602,347 | ) |
| Net unrealized appreciation (depreciation) of investments | | $ | 3,864,817 | | $ | 1,508,543 | | $ | 2,188,983 | | $ | 1,675,382 | |
Permanent differences, primarily due to federal taxes paid, taxable market discount and distribution character reclassifications, resulted in reclassifications among the Funds’ components of common share net assets at May 31, 2010, the Funds’ last tax year end, as follows:
| | | | Georgia | | | Georgia | | | Georgia | |
| | | | Premium | | | Dividend | | | Dividend | |
| | | | Income | | | Advantage | | | Advantage 2 | |
| | | | (NPG | ) | | (NZX | ) | | (NKG | ) |
| Paid-in-surplus | | $ | (35,347 | ) | $ | (22,672 | ) | $ | (49,649 | ) |
| Undistributed (Over-distribution of) net investment income | | | 35,322 | | | 22,661 | | | 49,646 | |
| Accumulated net realized gain (loss) | | | 25 | | | 11 | | | 3 | |
Nuveen Investments 73
| | | Notes to |
| | | Financial Statements (Unaudited) (continued) |
| | | | North | | | North | | | North | | | North | |
| | | | Carolina | | | Carolina | | | Carolina | | | Carolina | |
| | | | Premium | | | Dividend | | | Dividend | | | Dividend | |
| | | | Income | | | Advantage | | | Advantage 2 | | | Advantage 3 | |
| | | | (NNC | ) | | (NRB | ) | | (NNO | ) | | (NII | ) |
| Paid-in-surplus | | $ | (47,887 | ) | $ | (17,360 | ) | $ | (24,479 | ) | $ | (42,501 | ) |
| Undistributed (Over-distribution of) net investment income | | | 47,717 | | | 17,360 | | | 24,487 | | | 42,501 | |
| Accumulated net realized gain (loss) | | | 170 | | | — | | | (8 | ) | | — | |
The tax components of undistributed net tax-exempt income, net ordinary income and net long-term capital gains at May 31, 2010, the Funds’ last tax year end, were as follows:
| | | | Georgia | | | Georgia | | | Georgia | |
| | | | Premium | | | Dividend | | | Dividend | |
| | | | Income | | | Advantage | | | Advantage 2 | |
| | | | (NPG | ) | | (NZX | ) | | (NKG | ) |
| Undistributed net tax-exempt income * | | $ | 798,730 | | $ | 419,283 | | $ | 814,267 | |
| Undistributed net ordinary income ** | | | 1,516 | | | 640 | | | 1,735 | |
| Undistributed net long-term capital gains | | | — | | | — | | | — | |
| | | | North | | | North | | | North | | | North | |
| | | | Carolina | | | Carolina | | | Carolina | | | Carolina | |
| | | | Premium | | | Dividend | | | Dividend | | | Dividend | |
| | | | Income | | | Advantage | | | Advantage 2 | | | Advantage 3 | |
| | | | (NNC | ) | | (NRB | ) | | (NNO | ) | | (NII | ) |
| Undistributed net tax-exempt income * | | $ | 1,341,801 | | $ | 583,187 | | $ | 917,261 | | $ | 799,267 | |
| Undistributed net ordinary income ** | | | 5,418 | | | — | | | — | | | 1,527 | |
| Undistributed net long-term capital gains | | | — | | | — | | | — | | | — | |
| * | Undistributed net tax-exempt income (on a tax basis) has not been reduced for the dividend declared on May 3, 2010, paid on June 1, 2010. |
| ** | Net ordinary income consists of taxable market discount income and net short-term capital gains, if any. |
The tax character of distributions paid during the Funds’ last tax year ended May 31, 2010, was designated for purposes of the dividends paid deduction as follows:
| | | | | | | | | | | |
| | | | Georgia | | | Georgia | | | Georgia | |
| | | | Premium | | | Dividend | | | Dividend | |
| | | | Income | | | Advantage | | | Advantage 2 | |
| | | | (NPG | ) | | (NZX | ) | | (NKG | ) |
| Distributions from net tax-exempt income | | $ | 2,778,948 | | $ | 1,553,295 | | $ | 3,437,916 | |
| Distributions from net ordinary income** | | | — | | | — | | | — | |
| Distributions from net long-term capital gains | | | — | | | — | | | — | |
| | | | North | | | North | | | North | | | North | |
| | | | Carolina | | | Carolina | | | Carolina | | | Carolina | |
| | | | Premium | | | Dividend | | | Dividend | | | Dividend | |
| | | | Income | | | Advantage | | | Advantage 2 | | | Advantage 3 | |
| | | | (NNC | ) | | (NRB | ) | | (NNO | ) | | (NII | ) |
| Distributions from net tax-exempt income | | $ | 4,835,850 | | $ | 1,912,327 | | $ | 3,044,632 | | $ | 3,185,473 | |
| Distributions from net ordinary income** | | | — | | | — | | | — | | | — | |
| Distributions from net long-term capital gains | | | — | | | — | | | 11,059 | | | — | |
| ** | Net ordinary income consists of taxable market discount income and net short-term capital gains, if any. |
74 Nuveen Investments
At May 31, 2010, the Funds’ last tax year end, the Funds had unused capital loss carryforwards available for federal income tax purposes to be applied against future capital gains, if any. If not applied, the carryforwards will expire as follows:
| | | | Georgia | | | Georgia | | | Georgia | | | North Carolina | | | North Carolina | | | North Carolina | | | North Carolina | |
| | | | Premium | | | Dividend | | | Dividend | | | Premium | | | Dividend | | | Dividend | | | Dividend | |
| | | | Income | | | Advantage | | | Advantage 2 | | | Income | | | Advantage | | | Advantage 2 | | | Advantage 3 | |
| | | | (NPG | ) | | (NZX | ) | | (NKG | ) | | (NNC | ) | | (NRB | ) | | (NNO | ) | | (NII | ) |
| Expiration: | | | | | | | | | | | | | | | | | | | | | | |
| May 31, 2012 | | $ | — | | $ | — | | $ | — | | $ | — | | $ | — | | $ | — | | $ | 119,458 | |
| May 31, 2013 | | | — | | | — | | | 102,004 | | | — | | | — | | | — | | | 36,008 | |
| May 31, 2014 | | | — | | | 28,170 | | | 287,093 | | | — | | | — | | | — | | | 474,910 | |
| May 31, 2015 | | | — | | | 17,587 | | | — | | | — | | | — | | | — | | | — | |
| May 31, 2016 | | | — | | | — | | | — | | | — | | | 38,847 | | | — | | | 115,010 | |
| May 31, 2017 | | | 903,290 | | | 129,031 | | | 1,087,212 | | | 356,246 | | | 3,765 | | | — | | | 42,115 | |
| May 31, 2018 | | | 393,867 | | | 247,287 | | | 1,329,548 | | | 353,181 | | | 174,232 | | | 588,094 | | | 56,088 | |
| Total | | $ | 1,297,157 | | $ | 422,075 | | $ | 2,805,857 | | $ | 709,427 | | $ | 216,844 | | $ | 588,094 | | $ | 843,589 | |
The following Funds have elected to defer net realized losses from investments incurred from November 1, 2009 through May 31, 2010, the Funds’ last tax year end, (“post-October losses”) in accordance with federal income tax regulations. Post-October losses are treated as having arisen on the first day of the current fiscal year:
| | | | Georgia | | | Georgia | | | North Carolina | |
| | | | Premium | | | Dividend | | | Dividend | |
| | | | Income | | | Advantage 2 | | | Advantage | |
| | | | (NPG | ) | | (NKG | ) | | (NRB | ) |
| Post-October capital losses | | $ | 22,422 | | $ | 51,040 | | $ | 2,300 | |
7. Management Fees and Other Transactions with Affiliates
Each Fund’s management fee is separated into two components – a fund-level fee, based only on the amount of assets within each individual Fund, and a complex-level fee, based on the aggregate amount of all fund assets managed by the Adviser. This pricing structure enables each Fund’s shareholders to benefit from growth in the assets within their respective Fund as well as from growth in the amount of complex-wide assets managed by the Adviser.
The annual fund-level fee for each Fund, payable monthly, is calculated according to the following schedule:
| | | |
| | Georgia Premium Income (NPG) |
| | North Carolina Premium Income (NNC) |
| Average Daily Managed Assets* | Fund-Level Fee Rate |
| For the first $125 million | .4500 | % |
| For the next $125 million | .4375 | |
| For the next $250 million | .4250 | |
| For the next $500 million | .4125 | |
| For the next $1 billion | .4000 | |
| For the next $3 billion | .3875 | |
| For managed assets over $5 billion | .3750 | |
Nuveen Investments 75
| | | Notes to |
| | | Financial Statements (Unaudited) (continued) |
| | Georgia Dividend Advantage (NZX) |
| | Georgia Dividend Advantage 2 (NKG) |
| | North Carolina Dividend Advantage (NRB) |
| | North Carolina Dividend Advantage 2 (NNO) |
| | North Carolina Dividend Advantage 3 (NII) |
| Average Daily Managed Assets* | Fund-Level Fee Rate |
| For the first $125 million | .4500 | % |
| For the next $125 million | .4375 | |
| For the next $250 million | .4250 | |
| For the next $500 million | .4125 | |
| For the next $1 billion | .4000 | |
| For managed assets over $2 billion | .3750 | |
The annual complex-level fee for each Fund, payable monthly, is calculated according to the following schedule:
| Complex-Level Managed Asset Breakpoint Level* | Effective Rate at Breakpoint Level |
| $55 billion | .2000 | % |
| $56 billion | .1996 | |
| $57 billion | .1989 | |
| $60 billion | .1961 | |
| $63 billion | .1931 | |
| $66 billion | .1900 | |
| $71 billion | .1851 | |
| $76 billion | .1806 | |
| $80 billion | .1773 | |
| $91 billion | .1691 | |
| $125 billion | .1599 | |
| $200 billion | .1505 | |
| $250 billion | .1469 | |
| $300 billion | .1445 | |
| * | For the fund-level and complex-level fees, managed assets include closed-end fund assets managed by the Adviser that are attributable to financial leverage. For these purposes, financial leverage includes the funds’ use of preferred stock and borrowings and certain investments in the residual interest certificates (also called inverse floating rate securities) in tender option bond TOB) trusts, including the portion of assets held by a TOB trust that has been effectively financed by the trust’s issuance of floating rate securities, subject to an agreement by the Adviser as to certain funds to limit the amount of such assets for determining managed assets in certain circumstances. The complex-level fee is calculated based upon the aggregate daily managed assets of all Nuveen funds, with such daily managed assets defined separately for each fund in its ma nagement agreement, but excluding assets attributable to investments in other Nuveen funds. As of November 30, 2010, the complex-level fee rate was .1824%. |
The management fee compensates the Adviser for overall investment advisory and administrative services and general office facilities. The Funds pay no compensation directly to those of its trustees who are affiliated with the Adviser or to its officers, all of whom receive remuneration for their services to the Funds from the Adviser or its affiliates. The Board of Trustees has adopted a deferred compensation plan for independent trustees that enables trustees to elect to defer receipt of all or a portion of the annual compensation they are entitled to receive from certain Nuveen advised funds. Under the plan, deferred amounts are treated as though equal dollar amounts had been invested in shares of select Nuveen advised funds.
For the first ten years of Georgia Dividend Advantage’s (NZX) operations, the Adviser has agreed to reimburse the Fund, as a percentage of average daily managed assets, for fees and expenses in the amounts and for the time periods set forth below:
Year Ending September 30, | | | Year Ending September 30, | | |
| 2001* | .30 | % | 2007 | .25 | % |
| 2002 | .30 | | 2008 | .20 | |
| 2003 | .30 | | 2009 | .15 | |
| 2004 | .30 | | 2010 | .10 | |
| 2005 | .30 | | 2011 | .05 | |
| 2006 | .30 | | | | |
* From the commencement of operations.
The Adviser has not agreed to reimburse Georgia Dividend Advantage (NZX) for any portion of its fees and expenses beyond September 30, 2011.
76 Nuveen Investments
For the first eight years of Georgia Dividend Advantage 2’s (NKG) and North Carolina Dividend Advantage 3’s (NII) operations, the Adviser has agreed to reimburse the Funds, as a percentage of average daily managed assets, for fees and expenses in the amounts and for the time periods set forth below:
| | | | | | |
Year Ending September 30, | | | Year Ending September 30, | | |
| 2002* | .32 | % | 2007 | .32 | % |
| 2003 | .32 | | 2008 | .24 | |
| 2004 | .32 | | 2009 | .16 | |
| 2005 | .32 | | 2010 | .08 | |
| 2006 | .32 | | | | |
* From the commencement of operations.
The Adviser has not agreed to reimburse Georgia Dividend Advantage 2 (NKG) and North Carolina Dividend Advantage 3 (NII) for any portion of their fees and expenses beyond September 30, 2010.
For the first ten years of North Carolina Dividend Advantage’s (NRB) operations, the Adviser has agreed to reimburse the Fund, as a percentage of average daily managed assets, for fees and expenses in the amounts and for the time periods set forth below:
| | | | | | |
Year Ending January 31, | | | Year Ending January 31, | | |
| 2001* | .30 | % | 2007 | .25 | % |
| 2002 | .30 | | 2008 | .20 | |
| 2003 | .30 | | 2009 | .15 | |
| 2004 | .30 | | 2010 | .10 | |
| 2005 | .30 | | 2011 | .05 | |
| 2006 | .30 | | | | |
* From the commencement of operations.
The Adviser has not agreed to reimburse North Carolina Dividend Advantage (NRB) for any portion of its fees and expenses beyond January 31, 2011.
For the first ten years of North Carolina Dividend Advantage 2’s (NNO) operations, the Adviser has agreed to reimburse the Fund, as a percentage of average daily managed assets, for fees and expenses in the amounts and for the time periods set forth below:
| | | | | | |
Year Ending November 30, | | | Year Ending November 30, | | |
| 2001* | .30 | % | 2007 | .25 | % |
| 2002 | .30 | | 2008 | .20 | |
| 2003 | .30 | | 2009 | .15 | |
| 2004 | .30 | | 2010 | .10 | |
| 2005 | .30 | | 2011 | .05 | |
| 2006 | .30 | | | | |
* From the commencement of operations.
The Adviser has not agreed to reimburse North Carolina Dividend Advantage 2 (NNO) for any portion of its fees and expenses beyond November 30, 2011.
8. New Accounting Standards
Fair Value Measurements
On January 21, 2010, the Financial Accounting Standards Board issued changes to the authoritative guidance under U.S. GAAP for fair value measurements. The objective of which is to provide guidance on how investment assets and liabilities are to be valued and disclosed. Specifically, the amendment requires reporting entities to disclose Level 3 activity for purchases, sales, issuances and settlements in the Level 3 roll-forward on a gross basis rather than as one net number. The effective date of the amendment is for interim and annual periods beginning after December 15, 2010. At this time, management is evaluating the implications of this guidance and the impact it will have to the footnote disclosures, if any.
Nuveen Investments 77
| | | Notes to |
| | | Financial Statements (Unaudited) (continued) |
9. Subsequent Events
Investment Advisory Agreements
Effective January 1, 2011, Nuveen Asset Management, the Funds’ Adviser, has changed its name to Nuveen Fund Advisors, Inc. (“Nuveen Fund Advisors”). Concurrently, Nuveen Fund Advisors has formed a wholly-owned subsidiary, Nuveen Asset Management, LLC, to house its portfolio management capabilities. Nuveen Asset Management, LLC now serves as the Funds’ sub-adviser, and the Funds’ portfolio managers have become employees of Nuveen Asset Management, LLC rather than Nuveen Fund Advisors.
This allocation of responsibilities between Nuveen Fund Advisors and Nuveen Asset Management, LLC affects each Fund within this report. Nuveen Fund Advisors (as each affected Fund’s investment adviser) will compensate Nuveen Asset Management, LLC (as each such Fund’s newly-appointed sub-adviser) for the portfolio management services it provides to the Fund from the Fund’s management fee, which will not change as a result of this restructuring. Nuveen Fund Advisors and Nuveen Asset Management, LLC retain the right to reallocate investment management and advisory responsibilities and fees between themselves in the future.
Preferred Shares
Subsequent to the reporting period, North Carolina Premium Income (NNC) successfully completed the issuance of $25.535 million of 2.60%, Series 2016 MTP. The newly issued MTP Shares trade on the NYSE under the symbol “NNC PrD.” Immediately following its MTP issuance, North Carolina Premium Income (NNC) noticed for redemption at par its remaining $21.550 million ARPS outstanding using the MTP proceeds.
78 Nuveen Investments
Board Approval of Sub-Advisory Arrangements (Unaudited)
At a meeting held on May 25-26, 2010 (the “May Meeting”), the Boards of Trustees or Directors (as the case may be) (each a “Board” and each Trustee or Director, a “Board Member”) of the Funds, including a majority of the Independent Board Members, considered and approved the advisory agreements (each an “Advisory Agreement”) between each Fund and Nuveen Asset Management (“NAM”). Since the May Meeting, Nuveen has engaged in an internal restructuring (the “Restructuring”) pursuant to which the portfolio management services provided by NAM to the Funds would be transferred to Nuveen Asset Management, LLC (“NAM LLC”), a newly-organized wholly-owned subsidiary of NAM and NAM would change its name to Nuveen Fund Advisors, Inc. (“NFA”). NAM, under its new name NFA, will continue to serve as investment adviser to the Funds and, in that capacity, will continue to provide various oversight, administrative, compliance and other services. To effectuate the foregoing, NFA will enter into a sub-advisory agreement with NAM LLC on behalf of the Funds (the “Sub-Advisory Agreement”). Under the Sub-Advisory Agreement, NAM LLC, subject to the oversight of NFA and the Board, will furnish an investment program, make investment decisions for, and place all orders for the purchase and sale of securities for the portion of each Fund’s investment portfolio allocated to it by NFA. There will be no change in the advisory fees paid by the Funds. Rather, NFA will pay a portion of the investment advisory fee it receives to NAM LLC for its sub-advisory services. The Independent Board Members reviewed the allocation of fees between NFA and NAM LLC. NFA and NAM LLC do not anticipate any reduction in the nature or level of services provided to the Funds following the Restructuring. The personnel of NFA who engaged in portfolio management activities prior to the spinoff of NAM LLC are not expected to materially change as a result of the spinoff. In light of the foregoing, at a meeting held on November 16-18, 2010, the Board Members, including a majority of the Independent Board Members, approved the Sub-Advisory Agreement on behalf of each Fund. Given that the Restructuring was not expected to reduc e the level or nature of services provided and the advisory fees paid by the Funds were the same, the factors considered and determinations made at the May Meeting in approving the Advisory Agreement were equally applicable to the approval of the Sub-Advisory Agreement. For a discussion of these considerations, please see the shareholder report of the Fund that was first issued after the May Meeting for the period including May 2010.
Nuveen Investments 79
Reinvest Automatically Easily and Conveniently
Nuveen makes reinvesting easy. A phone call is all it takes to set up your reinvestment account.
Nuveen Closed-End Funds Automatic Reinvestment Plan
Your Nuveen Closed-End Fund allows you to conveniently reinvest distributions in additional Fund shares.
By choosing to reinvest, you’ll be able to invest money regularly and automatically, and watch your investment grow through the power of compounding. Just like distributions in cash, there may be times when income or capital gains taxes may be payable on distributions that are reinvested.
It is important to note that an automatic reinvestment plan does not ensure a profit, nor does it protect you against loss in a declining market.
Easy and convenient
To make recordkeeping easy and convenient, each month you’ll receive a statement showing your total distributions, the date of investment, the shares acquired and the price per share, and the total number of shares you own.
How shares are purchased
The shares you acquire by reinvesting will either be purchased on the open market or newly issued by the Fund. If the shares are trading at or above net asset value at the time of valuation, the Fund will issue new shares at the greater of the net asset value or 95% of the then-current market price. If the shares are trading at less than net asset value, shares for your account will be purchased on the open market. If the Plan Agent begins purchasing Fund shares on the open market while shares are trading below net asset value, but the Fund’s shares subsequently trade at or above their net asset value before the Plan Agent is able to complete its purchases, the Plan Agent may cease open-market purchases and may invest the uninvested portion of the distribution in new ly-issued Fund shares at a price equal to the greater of the shares’ net asset value or 95% of the shares’ market value on the last business day immediately prior to the purchase date. Distributions received to purchase shares in the open market will normally be invested shortly after the dividend payment date. No interest will be paid on dividends and distributions awaiting reinvestment. Because the market price of the shares may increase before purchases are completed, the average purchase price per
80 Nuveen Investments
share may exceed the market price at the time of valuation, resulting in the acquisition of fewer shares than if the dividend or distribution had been paid in shares issued by the Fund. A pro rata portion of any applicable brokerage commissions on open market purchases will be paid by Plan participants. These commissions usually will be lower than those charged on individual transactions.
Flexible
You may change your distribution option or withdraw from the Plan at any time, should your needs or situation change.
You can reinvest whether your shares are registered in your name, or in the name of a brokerage firm, bank, or other nominee. Ask your investment advisor if his or her firm will participate on your behalf. Participants whose shares are registered in the name of one firm may not be able to transfer the shares to another firm and continue to participate in the Plan.
The Fund reserves the right to amend or terminate the Plan at any time. Although the Fund reserves the right to amend the Plan to include a service charge payable by the participants, there is no direct service charge to participants in the Plan at this time.
Call today to start reinvesting dividends and/or distributions
For more information on the Nuveen Automatic Reinvestment Plan or to enroll in or withdraw from the Plan, speak with your financial advisor or call us at (800) 257-8787.
Nuveen Investments 81
Glossary of Terms Used in this Report
| ■ | Auction Rate Bond: An auction rate bond is a security whose interest payments are adjusted periodically through an auction process, which process typically also serves as a means for buying and selling the bond. Auctions that fail to attract enough buyers for all the shares offered for sale are deemed to have “failed,” with current holders receiving a formula-based interest rate until the next scheduled auction. |
| | |
| ■ | Average Annual Total Return: This is a commonly used method to express an investment’s performance over a particular, usually multi-year time period. It expresses the return that would have been necessary each year to equal the investment’s actual cumulative performance (including change in NAV or market price and reinvested dividends and capital gains distributions, if any) over the time period being considered. |
| | |
| ■ | Average Effective Maturity: The market-value-weighted average of the effective maturity dates of the individual securities including cash. In the case of a bond that has been advance-refunded to a call date, the effective maturity is the date on which the bond is scheduled to be redeemed using the proceeds of an escrow account. In most other cases the effective maturity is the stated maturity date of the security. |
| | |
| ■ | Inverse Floaters: Inverse floating rate securities, also known as inverse floaters, are created by depositing a municipal bond, typically with a fixed interest rate, into a special purpose trust created by a broker-dealer. This trust, in turn, (a) issues floating rate certificates typically paying short-term tax-exempt interest rates to third parties in amounts equal to some fraction of the deposited bond’s par amount or market value, and (b) issues an inverse floating rate certificate (sometimes referred to as an “inverse floater”) to an investor (such as a Fund) interested in gaining investment exposure to a long-term municipal bond. The income received by the holder of the inverse floater varies inversely with the short-term rate paid to the floating ra te certificates’ holders, and in most circumstances the holder of the inverse floater bears substantially all of the underlying bond’s downside investment risk. The holder of the inverse floater typically also benefits disproportionately from any potential appreciation of the underlying bond’s value. Hence, an inverse floater essentially represents an investment in the underlying bond on a leveraged basis. |
82 Nuveen Investments
| ■ | Leverage-Adjusted Duration: Duration is a measure of the expected period over which a bond’s principal and interest will be paid, and consequently is a measure of the sensitivity of a bond’s or bond Fund’s value to changes when market interest rates change. Generally, the longer a bond’s or Fund’s duration, the more the price of the bond or Fund will change as interest rates change. Leverage-adjusted duration takes into account the leveraging process for a Fund and therefore is longer than the duration of the Fund’s portfolio of bonds. |
| | |
| ■ | Market Yield (also known as Dividend Yield or Current Yield): An investment’s current annualized dividend divided by its current market price. |
| | |
| ■ | Net Asset Value (NAV): A Fund’s NAV per common share is calculated by subtracting the liabilities of the Fund (including any Preferred shares issued in order to leverage the Fund) from its total assets and then dividing the remainder by the number of common shares outstanding. Fund NAVs are calculated at the end of each business day. |
| | |
| ■ | Pre-refunding: Pre-refunding, also known as advanced refundings or refinancings, is a procedure used by state and local governments to refinance municipal bonds to lower interest expenses. The issuer sells new bonds with a lower yield and uses the proceeds to buy U.S. Treasury securities, the interest from which is used to make payments on the higher-yielding bonds. Because of this collateral, pre-refunding generally raises a bond’s credit rating and thus its value. |
| | |
| ■ | Taxable-Equivalent Yield: The yield necessary from a fully taxable investment to equal, on an after-tax basis, the yield of a municipal bond investment. |
| | |
| ■ | Zero Coupon Bond: A zero coupon bond does not pay a regular interest coupon to its holders during the life of the bond. Tax-exempt income to the holder of the bond comes from accretion of the difference between the original purchase price of the bond at issuance and the par value of the bond at maturity and is effectively paid at maturity. The market prices of zero coupon bonds generally are more volatile than the market prices of bonds that pay interest periodically. |
Nuveen Investments 83
Notes
84 Nuveen Investments
Other Useful Information
Board of Trustees
John P. Amboian
Robert P. Bremner
Jack B. Evans
William C. Hunter
David J. Kundert
William J. Schneider
Judith M. Stockdale
Carole E. Stone
Terence J. Toth
Fund Manager
Nuveen Fund Advisors, Inc.
333 West Wacker Drive
Chicago, IL 60606
Sub-Adviser
Nuveen Asset
Management, LLC
333 West Wacker Drive
Chicago, IL 60606
Custodian
State Street Bank & Trust
Company
Boston, MA
Transfer Agent and Shareholder Services
State Street Bank & Trust
Company
Nuveen Funds
P.O. Box 43071
Providence, RI 02940-3071
(800) 257-8787
Legal Counsel
Chapman and Cutler LLP
Chicago, IL
Independent Registered Public Accounting Firm
Ernst & Young LLP
Chicago, IL
Quarterly Portfolio of Investments and Proxy Voting Information
You may obtain (i) each Fund’s quarterly portfolio of investments, (ii) information regarding how each Fund voted proxies relating to portfolio securities held during the most recent twelve-month period ended June 30, and (iii) a description of the policies and procedures that each Fund used to determine how to vote proxies relating to portfolio securities without charge, upon request, by calling Nuveen Investments toll-free at (800) 257-8787 or on Nuveen’s website at www.nuveen.com.
You may also obtain this and other Fund information directly from the Securities and Exchange Commission (SEC). The SEC may charge a copying fee for this information. Visit the SEC on-line at http://www.sec.gov or in person at the SEC’s Public Reference Room in Washington, D.C. Call the SEC at (202) 942-8090 for room hours and operation. You may also request Fund information by sending an e-mail request to publicinfo@sec.gov or by writing to the SEC’s Public References Section at 100 F Street NE, Washington, D.C. 20549.
CEO Certification Disclosure
Each Fund’s Chief Executive Officer has submitted to the New York Stock Exchange (NYSE) the annual CEO certification as required by Section 303A.12(a) of the NYSE Listed Company Manual.
Each Fund has filed with the SEC the certification of its Chief Executive Officer and Chief Financial Officer required by Section 302 of the Sarbanes-Oxley Act.
Common and Preferred Share Information
Each Fund intends to repurchase and/or redeem shares of its own common and/or auction rate preferred stock in the future at such times and in such amounts as is deemed advisable. During the period covered by this report, the Funds repurchased and/or redeemed shares of their common and/or auction rate preferred stock as shown in the accompanying table.
| | Common Shares | Preferred Shares |
| Fund | Repurchased | Redeemed |
| NPG | — | — |
| NZX | — | — |
| NKG | — | — |
| NNC | — | — |
| NRB | — | — |
| NNO | — | — |
| NII | — | — |
Any future repurchases and/or redemptions will be reported to shareholders in the next annual or semi-annual report.
Nuveen Investments 85
Nuveen Investments:
Serving Investors for Generations
Since 1898, financial advisors and their clients have relied on Nuveen Investments to provide dependable investment solutions through continued adherence to proven, long-term investing principles. Today, we offer a range of high quality equity and fixed-income solutions designed to be integral components of a well-diversified core portfolio.
Focused on meeting investor needs.
Nuveen Investments is a global investment management firm that seeks to help secure the long-term goals of institutions and high net worth investors as well as the consultants and financial advisors who serve them. We market our growing range of specialized investment solutions under the high-quality brands of HydePark, NWQ, Nuveen Asset Management, Santa Barbara, Symphony, Tradewinds and Winslow Capital. In total, Nuveen Investments managed approximately $195 billion of assets as of December 31, 2010.
Find out how we can help you.
To learn more about how the products and services of Nuveen Investments may be able to help you meet your financial goals, talk to your financial advisor, or call us at (800) 257-8787. Please read the information provided carefully before you invest. Investors should consider the investment objective and policies, risk considerations, charges and expenses of any investment carefully. Where applicable, be sure to obtain a prospectus, which contains this and other relevant information. To obtain a prospectus, please contact your securities representative or Nuveen Investments, 333 W. Wacker Dr., Chicago, IL 60606. Please read the prospectus carefully before you inv est or send money.
Learn more about Nuveen Funds at: www.nuveen.com/cef
| Nuveen makes things e-simple. |
| |
| It only takes a minute to sign up for e-Reports. Once enrolled, you’ll receive an e-mail as soon as your Nuveen Fund information is ready—no more waiting for delivery by regular mail. Just click on the link within the e-mail to see the report and save it on your computer if you wish. |
| |
| Free e-Reports right to your e-mail! |
| |
| www.investordelivery.com |
| If you receive your Nuveen Fund distributions and statements from your financial advisor or brokerage account. |
| |
| OR |
| |
| www.nuveen.com/accountaccess |
| If you receive your Nuveen Fund distributions and statements directly from Nuveen. |
Distributed by
Nuveen Investments, LLC
333 West Wacker Drive
Chicago, IL 60606
www.nuveen.com
ESA-C-1110D
ITEM 2. CODE OF ETHICS.
Not applicable to this filing.
ITEM 3. AUDIT COMMITTEE FINANCIAL EXPERT.
Not applicable to this filing.
ITEM 4. PRINCIPAL ACCOUNTANT FEES AND SERVICES.
Not applicable to this filing.
ITEM 5. AUDIT COMMITTEE OF LISTED REGISTRANTS.
Not applicable to this filing.
ITEM 6. SCHEDULE OF INVESTMENTS.
(a) See Portfolio of Investments in Item 1.
(b) Not applicable.
ITEM 7. DISCLOSURE OF PROXY VOTING POLICIES AND PROCEDURES FOR CLOSED-END MANAGEMENT INVESTMENT COMPANIES.
Not applicable to this filing.
ITEM 8. PORTFOLIO MANAGERS OF CLOSED-END MANAGEMENT INVESTMENT COMPANIES.
Not applicable to this filing.
ITEM 9. PURCHASES OF EQUITY SECURITIES BY CLOSED-END MANAGEMENT INVESTMENT COMPANY AND AFFILIATED PURCHASERS.
Not applicable.
ITEM 10. SUBMISSION OF MATTERS TO A VOTE OF SECURITY HOLDERS.
There have been no material changes to the procedures by which shareholders may recommend nominees to the registrant's Board of Directors or Trustees implemented after the registrant last provided disclosure in response to this Item.
ITEM 11. CONTROLS AND PROCEDURES.
ITEM 12. EXHIBITS.
File the exhibits listed below as part of this Form.
Pursuant to the requirements of the Securities Exchange Act of 1934 and the Investment Company Act of 1940, the registrant has duly caused this report to be signed on its behalf by the undersigned, thereunto duly authorized.
Kevin J. McCarthy
Pursuant to the requirements of the Securities Exchange Act of 1934 and the Investment Company Act of 1940, this report has been signed below by the following persons on behalf of the registrant and in the capacities and on the dates indicated.
Gifford R. Zimmerman
Stephen D. Foy