UNITED STATES
SECURITIES AND EXCHANGE COMMISSION
Washington, D.C. 20549
FORM N-CSR
CERTIFIED SHAREHOLDER REPORT OF REGISTERED
MANAGEMENT INVESTMENT COMPANIES
Investment Company Act file number 811-21152
Nuveen Georgia Dividend Advantage Municipal Fund 2
(Exact name of registrant as specified in charter)
Nuveen Investments
333 West Wacker Drive
Chicago, IL 60606
(Address of principal executive offices) (Zip code)
Kevin J. McCarthy
Nuveen Investments
333 West Wacker Drive
Chicago, IL 60606
(Name and address of agent for service)
Registrant's telephone number, including area code: (312) 917-7700
Date of fiscal year end: May 31
Date of reporting period: November 30, 2012
Form N-CSR is to be used by management investment companies to file reports with the Commission not later than 10 days after the transmission to stockholders of any report that is required to be transmitted to stockholders under Rule 30e-1 under the Investment Company Act of 1940 (17 CFR 270.30e-1). The Commission may use the information provided on Form N-CSR in its regulatory, disclosure review, inspection, and policymaking roles.
A registrant is required to disclose the information specified by Form N-CSR, and the Commission will make this information public. A registrant is not required to respond to the collection of information contained in Form N-CSR unless the Form displays a currently valid Office of Management and Budget ("OMB") control number. Please direct comments concerning the accuracy of the information collection burden estimate and any suggestions for reducing the burden to Secretary, Securities and Exchange Commission, 450 Fifth Street, NW, Washington, DC 20549-0609. The OMB has reviewed this collection of information under the clearance requirements of 44 U.S.C. ss. 3507.
ITEM 1. REPORTS TO STOCKHOLDERS.
LIFE IS COMPLEX.
Nuveen makes things e-simple.
It only takes a minute to sign up for e-Reports. Once enrolled, you’ll receive an e-mail as soon as your Nuveen Fund information is ready. No more waiting for delivery by regular mail. Just click on the link within the e-mail to see the report and save it on your computer if you wish.
Free e-Reports right to your e-mail!
www.investordelivery.com
If you receive your Nuveen Fund distributions and statements from your financial advisor or brokerage account.
OR
www.nuveen.com/accountaccess
If you receive your Nuveen Fund distributions and statements directly from Nuveen.
Table of Contents
| Chairman’s Letter to Shareholders | 4 |
| | |
| Portfolio Managers’ Comments | 5 |
| | |
| Fund Leverage and Other Information | 11 |
| | |
| Common Share Dividend and Price Information | 14 |
| | |
| Performance Overviews | 15 |
| | |
| Shareholder Meeting Report | 20 |
| | |
| Portfolios of Investments | 23 |
| | |
| Statement of Assets and Liabilities | 57 |
| | |
| Statement of Operations | 58 |
| | |
| Statement of Changes in Net Assets | 59 |
| | |
| Statement of Cash Flows | 61 |
| | |
| Financial Highlights | 64 |
| | |
| Notes to Financial Statements | 73 |
| | |
| Reinvest Automatically, Easily and Conveniently | 86 |
| | |
| Glossary of Terms Used in this Report | 88 |
| | |
| Additional Fund Information | 91 |
Chairman’s
Letter to Shareholders
Dear Shareholders,
Despite the global economy’s ability to muddle through the many economic headwinds of 2012, investors continue to have good reasons to remain cautious. The European Central Bank’s decisions to extend intermediate term financing to major European banks and to support sovereign debt markets have begun to show signs of a stabilized euro area financial market. The larger member states of the European Union (EU) are working diligently to strengthen the framework for a tighter financial and banking union and meaningful progress has been made by agreeing to centralize large bank regulation under the European Central Bank. However, economic conditions in the southern tier members are not improving and the pressures on their political leadership remain intense. The jury is out on whether the respective populations will support the continuing austerity measures that are needed to meet the EU fiscal targets.
In the U.S., the Fed remains committed to low interest rates into 2015 through its third program of Quantitative Easing (QE3). Inflation remains low but a growing number of economists are expressing concern about the economic distortions resulting from negative real interest rates. The highly partisan atmosphere in Congress led to a disappointingly modest solution for dealing with the end-of-year tax and spending issues. Early indications for the new Congressional term have not given much encouragement that the atmosphere for dealing with the sequestration legislation and the debt ceiling issues, let alone a more encompassing “grand bargain,” will be any better than the last Congress. Over the longer term, there are some encouraging trends for the U.S. economy: house prices are beginning to recover, banks and corporations continue to strengthen their financial positions and incentives for capital investment in the U.S. by domestic and foreign corporations are increasing due to more competitive energy and labor costs.
During 2012 U.S. investors have benefited from strong returns in the domestic equity markets and solid returns in most fixed income markets. However, many of the macroeconomic risks of 2012 remain unresolved, including negotiating through the many U.S. fiscal issues, managing the risks of another year of abnormally low U.S. interest rates, sustaining the progress being made in the euro area and reducing the potential economic impact of geopolitical issues, particularly in the Middle East. In the face of these uncertainties, the experienced investment professionals at Nuveen Investments seek out investments that are enjoying positive economic conditions. At the same time they are always on the alert for risks in markets subject to excessive optimism or for opportunities in markets experiencing undue pessimism. Monitoring this process is a critical function for the Fund Board as it oversees your Nuveen Fund on your behalf.
As always, I encourage you to communicate with your financial consultant if you have any questions about your investment in a Nuveen Fund. On behalf of the other members of your Fund Board, we look forward to continuing to earn your trust in the months and years ahead.
Sincerely,
Robert P. Bremner
Chairman of the Board
January 22, 2013
Portfolio Managers’ Comments
Nuveen Georgia Dividend Advantage Municipal Fund 2 (NKG)
Nuveen Maryland Premium Income Municipal Fund (NMY)
Nuveen Missouri Premium Income Municipal Fund (NOM)
Nuveen North Carolina Premium Income Municipal Fund (NNC)
Nuveen Virginia Premium Income Municipal Fund (NPV)
Portfolio managers Daniel Close, Chris Drahn and Tom Spalding discuss key investment strategies and the six-month performance of these five Funds. Dan assumed portfolio management responsibility for the Nuveen Georgia and North Carolina Funds in 2007. Chris took on portfolio management responsibility for the Nuveen Missouri Fund in 2011 and Tom assumed portfolio management responsibility for the Nuveen Maryland and Virginia Funds in 2011.
FUND REORGANIZATIONS
Effective before the opening of business on July 9, 2012, certain Georgia and North Carolina funds and on August 6, 2012, certain Maryland and Virginia funds (the Acquired Funds) were reorganized into four of the larger-state funds included in this report (the Acquiring Funds) as follows:
| Acquired Funds | | Symbol | | Acquiring Fund | | Symbol |
| Georgia Fund | | | | | | |
| Nuveen Georgia Premium Income | | NPG | | Nuveen Georgia Dividend Advantage | | NKG |
| Municipal Fund | | | | Municipal Fund 2 | | |
| Nuveen Georgia Dividend Advantage | | NZX | | | | |
| Municipal Fund | | | | | | |
| | | | | | | |
| Acquired Funds | | Symbol | | Acquiring Fund | | Symbol |
| Maryland Funds | | | | | | |
| Nuveen Maryland Dividend Advantage | | NFM | | Nuveen Maryland Premium Income | | NMY |
| Municipal Fund | | | | Municipal Fund | | |
| Nuveen Maryland Dividend Advantage | | NZR | | | | |
| Municipal Fund 2 | | | | | | |
| Nuveen Maryland Dividend Advantage | | NWI | | | | |
| Municipal Fund 3 | | | | | | |
Certain statements in this report are forward-looking statements. Discussions of specific investments are for illustration only and are not intended as recommendations of individual investments. The forward-looking statements and other views expressed herein are those of the portfolio managers as of the date of this report. Actual future results or occurrences may differ significantly from those anticipated in any forward-looking statements, and the views expressed herein are subject to change at any time, due to numerous market and other factors. The Funds disclaim any obligation to update publicly or revise any forward-looking statements or views expressed herein.
Ratings shown are the highest rating given by one of the following national rating agencies: Standard & Poor’s Group, Moody’s Investors Service, Inc., or Fitch, Inc. Credit ratings are subject to change. AAA, AA, A, and BBB are investment grade ratings; BB, B, CCC, CC, C and D are below investment grade ratings. Certain bonds backed by U.S. government or agency securities are regarded as having an implied rating equal to the rating of such securities. Holdings designated N/R are not rated by these national rating agencies.
| Acquired Funds | | Symbol | | Acquiring Fund | | Symbol |
| North Carolina Funds | | | | | | |
| Nuveen North Carolina Dividend | | NRB | | Nuveen North Carolina Premium Income | | NNC |
| Advantage Municipal Fund | | | | Municipal Fund | | |
| Nuveen North Carolina Dividend | | NNO | | | | |
| Advantage Municipal Fund 2 | | | | | | |
| Nuveen North Carolina Dividend | | NII | | | | |
| Advantage Municipal Fund 3 | | | | | | |
| | | | | | | |
| Acquired Funds | | Symbol | | Acquiring Fund | | Symbol |
| Virginia Funds | | | | | | |
| Nuveen Virginia Dividend | | NGB | | Nuveen Virginia Premium Income | | NPV |
| Advantage Municipal Fund | | | | Municipal Fund | | |
| Nuveen Virginia Dividend | | NNB | | | | |
| Advantage Municipal Fund 2 | | | | | | |
Upon the closing of the reorganizations, the Acquired Funds transferred their assets to the Acquiring Funds in exchange for common and preferred shares of the Acquiring Funds and the assumption by the Acquiring Funds of the liabilities of the Acquired Funds. The Acquired Funds were then liquidated, dissolved and terminated in accordance with their Declaration of Trust. Shareholders of the Acquired Funds became shareholders of the Acquiring Funds. Holders of common shares of the Acquired Funds received newly issued common shares of the Acquiring Funds, the aggregate net asset value of which was equal to the aggregate net asset value of the common shares of the Acquired Funds held immediately prior to the reorganizations (including for this purpose fractional Acquiring Funds shares to which shareholders would be entitled). Fractional shares were sold on the open market and shareholders received cash in lieu of such fractional shares. Holders of MuniFund Term Preferred (MTP) Shares of the Acquired Funds received on a one-for-one basis newly issued MTP Shares of the Acquiring Funds, in exchange for their MTP Shares of the Acquired Funds held immediately prior to the reorganizations.
What key strategies were used to manage these Funds during the six-month reporting period ended November 30, 2012?
During this reporting period, municipal bond prices generally rallied, as strong demand and tight supply combined to create favorable market conditions for municipal bonds. Although the total volume of tax-exempt supply improved over that of the same six-month period a year earlier, the issuance pattern remained light compared with long-term historical trends. This supply/demand dynamic served as a key driver of performance. Concurrent with rising prices, yields continued to decline across most maturities, especially at the longer end of the municipal yield curve, and the curve flattened. During this period, we saw an increased number of borrowers come to market seeking to take advantage of the low rate environment through refunding activity, with approximately 60% of new municipal paper issued by borrowers that were calling existing debt and refinancing at lower rates.
In this environment, we continued to take a bottom-up approach to discovering sectors that appeared undervalued as well as individual credits that had the potential to perform well over the long term. During this period, NKG, NMY, NNC and NOM found value to varying degrees in several areas of the market, including health care, higher education, electric utilities and appropriations bonds. NKG and NPV also purchased local general
obligation (GO) credits, while NNC added bonds in the transportation sector, including those issued by the North Carolina Turnpike Authority. NMY added lower rated bonds issued for Frederick Memorial Hospital and Maryland Institute College of Art. In NPV, we added to our positions in the transportation sector, including bonds issued by the Virginia Small Business Financing Authority for the Elizabeth River Crossing and credits issued for the new Chesapeake expressway. NOM added to its health care positions with purchases of continuing care retirement community (CCRC) bonds and hospital credits, including those issued by Missouri Health and Educational Facilities Authority for Mercy Health. In North Carolina, the health care sector was the predominant issuer during this time, offering attractive opportunities from a number of hospitals across the state, with credit quality of AA and A and intermediate and longer maturities. Among the health care names we purchased during this period was Wake Forest Baptist Medical Center.
Because the issuance of new municipal supply in the primary market continued to be limited, especially in Georgia, we looked to the secondary market as an additional source of attractive opportunities. During this period, the secondary market accounted for approximately 80% of NMY’s purchases and 50% in NPV. When in-state paper was scarce, NKG and NMY also purchased territorial bonds to keep the Funds as fully invested as possible, including dedicated sales tax bonds issued by the Puerto Rico Sales Tax Financing Corporation (COFINA). These territorial bonds offered higher yields, added diversification and triple exemption (i.e., exemption from federal, state and local taxes). These bonds issued by the Puerto Rico Sales Tax Financing Corporation (COFINA) were downgraded by Moody’s in July 2012. This downgrade was due mainly to the performance of Puerto Rico’s economy and its impact on the projected growth of sales tax revenues, and not to any sector or structural issues. Each of the Funds held varying amounts of the COFINA bonds purchased at different times, with those purchased prior to and early in this period performing more positively than those purchased during the latter part of this period. Therefore, the impact on performance differed from Fund to Fund. As we continue to emphasize Puerto Rico’s stronger credits, we view these bonds as long-term holdings and note that the commonwealth’s recent enforcement of sales tax collections has improved significantly.
During this period, we also took advantage of short term market opportunities created by supply/demand dynamics in the municipal market. While demand for tax-exempt paper remained consistently strong throughout the period, supply fluctuated widely. We found that periods of substantial supply provided good short term buying opportunities not only because of the increased number of issues available, but also because some investors became more hesitant in their buying as supply grew, causing spreads to widen temporarily. At times when supply was more plentiful, we focused on anticipating cash flows from bond calls and maturing bonds and closely monitored opportunities for reinvestment.
During this period, we emphasized bonds with longer maturities. The purchase of longer maturity bonds helped to extend the Funds’ durations, and enabled us to take advantage of more attractive yields at the longer end of the municipal yield curve. We also purchased lower rated bonds when we found attractive opportunities, as we believed these bonds continued to offer relative value. Our opportunities were somewhat constrained by the structure of bonds typically issued as part of refinancing deals, which tended to be characterized by shorter maturities and higher quality.
Cash for new purchases during this period was generated primarily by the proceeds from an increased number of bond calls resulting from the growth in refinancings. The elevated number of bond calls provided a meaningful source of liquidity, which drove
much of our activity during this period as we worked to redeploy these proceeds, as well as those from maturing bonds, to keep the Funds fully invested and support their income streams. Overall, selling was minimal because the bonds in our portfolios generally offered higher yields than those available in the current marketplace.
As of November 30, 2012, all of these Funds continued to use inverse floating rate securities. We employ inverse floaters for a variety of reasons, including duration management, income enhancement and total return enhancement.
How did the Funds perform during the six-month reporting period ended November 30, 2012?
Individual results for these Nuveen Funds, as well as relevant index and peer group information, are presented in the accompanying table.
| Average Annual Total Returns on Common Share Net Asset Value* | | | | |
| For periods ended 11/30/12 | | | | | | | | | | | | | |
| | | | | | | | | | | | | | |
| Fund | | | 6-Month | | 1-Year | | 5-Year | | 10-Year |
| Georgia | | | | | | | | | | | | | |
| NKG | | | 5.86 | % | | 13.45 | % | | 6.34 | % | | 6.14 | % |
| S&P Georgia Municipal Bond Index** | | | 4.21 | % | | 9.10 | % | | 5.75 | % | | 5.29 | % |
| S&P Municipal Bond Index** | | | 4.52 | % | | 10.94 | % | | 6.09 | % | | 5.57 | % |
| Lipper Other States Municipal Debt Funds | | | | | | | | | | | | | |
| Classification Average** | | | 6.85 | % | | 16.99 | % | | 7.48 | % | | 6.73 | % |
| | | | | | | | | | | | | | |
| Maryland | | | | | | | | | | | | | |
| NMY | | | 4.60 | % | | 14.01 | % | | 7.21 | % | | 6.57 | % |
| S&P Maryland Municipal Bond Index** | | | 3.22 | % | | 8.11 | % | | 5.58 | % | | 5.09 | % |
| S&P Municipal Bond Index** | | | 4.52 | % | | 10.94 | % | | 6.09 | % | | 5.57 | % |
| Lipper Other States Municipal Debt Funds | | | | | | | | | | | | | |
| Classification Average** | | | 6.85 | % | | 16.99 | % | | 7.48 | % | | 6.73 | % |
| | | | | | | | | | | | | | |
| Missouri | | | | | | | | | | | | | |
| NOM | | | 6.07 | % | | 15.94 | % | | 7.25 | % | | 6.21 | % |
| S&P Missouri Municipal Bond Index** | | | 4.16 | % | | 10.19 | % | | 6.04 | % | | 5.63 | % |
| S&P Municipal Bond Index** | | | 4.52 | % | | 10.94 | % | | 6.09 | % | | 5.57 | % |
| Lipper Other States Municipal Debt Funds | | | | | | | | | | | | | |
| Classification Average** | | | 6.85 | % | | 16.99 | % | | 7.48 | % | | 6.73 | % |
| | | | | | | | | | | | | | |
| North Carolina | | | | | | | | | | | | | |
| NNC | | | 5.56 | % | | 12.71 | % | | 7.00 | % | | 6.20 | % |
| S&P North Carolina Municipal Bond Index** | | | 3.64 | % | | 8.82 | % | | 6.01 | % | | 5.50 | % |
| S&P Municipal Bond Index** | | | 4.52 | % | | 10.94 | % | | 6.09 | % | | 5.57 | % |
| Lipper Other States Municipal Debt Funds | | | | | | | | | | | | | |
| Classification Average** | | | 6.85 | % | | 16.99 | % | | 7.48 | % | | 6.73 | % |
| | | | | | | | | | | | | | |
| Virginia | | | | | | | | | | | | | |
| NPV | | | 5.65 | % | | 14.09 | % | | 7.38 | % | | 6.53 | % |
| S&P Virginia Municipal Bond Index** | | | 4.08 | % | | 9.09 | % | | 5.52 | % | | 5.30 | % |
| S&P Municipal Bond Index** | | | 4.52 | % | | 10.94 | % | | 6.09 | % | | 5.57 | % |
| Lipper Other States Municipal Debt Funds | | | | | | | | | | | | | |
| Classification Average** | | | 6.85 | % | | 16.99 | % | | 7.48 | % | | 6.73 | % |
| | Past performance is not predictive of future results. Current performance may be higher or lower than the data shown. Returns do not reflect the deduction of taxes that shareholders may have to pay on Fund distributions or upon the sale of Fund shares. |
| | |
| | For additional information, see the Performance Overview page for your Fund in this report. |
| | |
| * | Six-month returns are cumulative; all other returns are annualized. |
| | |
| ** | For definitions, refer to Glossary of Terms Used in this Report. Indexes and Lipper averages are not available for direct investment. |
For the six months ended November 30, 2012, the cumulative returns on common share net asset value (NAV) for all these Funds exceeded the returns for their respective state’s S&P Municipal Bond Index as well as the national S&P Municipal Bond Index. For the same period, all these Funds underperformed the average return for the Lipper Other States Municipal Debt Funds Classification Average. Shareholders should note that the performance of the Lipper Other States classification represents the overall average of returns for funds from ten states with a wide variety of municipal market conditions, making direct comparisons less meaningful.
Key management factors that influenced the Funds’ returns during this period included duration and yield curve positioning, credit exposure and sector allocation. In addition, the use of regulatory leverage was an important positive factor affecting the Funds’ performance. Leverage is discussed in more detail later in this report.
In an environment of declining rates and flattening yield curve, municipal bonds with longer maturities generally outperformed those with shorter maturities during this period. Overall, credits at the longest end of the municipal yield curve posted the strongest returns, while bonds at the shortest end produced the weakest results. Duration and yield curve positioning was a net positive contributor to the performance of these Funds. These Funds benefited from being overweighted in the longer part of the yield curve that performed well. However, their performance was somewhat restrained by overweightings at the underperforming shortest end of the curve, due mostly to holdings of pre-refunded bonds. In addition, these Funds were helped by their allocations of long duration bonds, many of which had zero percent coupons, which generally outperformed the market during this period. This was especially true in NPV.
Credit exposure was another factor in the Funds’ performance during these six months, as lower quality bonds generally outperformed higher quality bonds. This outperformance was due in part to the greater demand for lower rated bonds as investors looked for investment vehicles offering higher yields. As investors became more comfortable taking on additional investment risk, municipal credit spreads or the difference in yield spreads between highly rated municipal bonds and lower rated municipal bonds. As a result of this spread compression, the Funds generally benefited from their holdings of lower rated credits, with NKG, NMY, NOM and NPV having an overweight in bonds rated BBB. NKG, NOM and NNC were also helped by being underweighted in the underperforming AAA quality sector.
During this period, revenue bonds as a whole outperformed the general municipal market. Holdings that generally made positive contributions to the Funds’ returns included health care (together with hospitals), education, water and sewer and certain transportation bonds. In particular, NKG, NMY and NPV were overweight in higher education, which was positive for performance, while NNC and NOM were positively impacted by their holdings in the water and sewer and transportation sectors. Tobacco credits backed by the 1998 master tobacco settlement agreement also performed extremely well, helped in part by their longer effective durations. During this period, NKG, NMY and NPV benefited from their holdings of tobacco credits as these bonds rallied, while NNC held a negligible amount of tobacco bonds.
In contrast, pre-refunded bonds, which are often backed by U.S. Treasury securities, were among the poorest performing market segments during this period. The underperformance of these bonds can be attributed primarily to their shorter effective maturities and higher credit quality. As of November 30, 2012, NMY and NPV had double-digit allocations of pre-refunded bonds, NNC had a heavier weighting in pre-refunded bonds than NKG, which detracted from its performance for the period. We continued to hold these pre-refunded bonds in our portfolios due to the higher yields they provided. In addition, GO bonds and housing credits lagged the performance of the general municipal market for this period.
Fund Leverage and
Other Information
IMPACT OF THE FUNDS’ LEVERAGE STRATEGIES ON PERFORMANCE
One important factor impacting the returns of all these Funds relative to the comparative indexes was the Funds’ use of leverage. The Funds use leverage because their managers believe that, over time, leveraging provides opportunities for additional income and total return for common shareholders. However, use of leverage also can expose common shareholders to additional volatility. For example, as the prices of securities held by a fund decline, the negative impact of these valuation changes on common share net asset value and common shareholder total return is magnified by the use of leverage. Conversely, leverage may enhance common share returns during periods when the prices of securities held by a fund generally are arising. Leverage made a positive contribution to the performance of these Funds over this reporting period.
THE FUNDS’ REGULATORY LEVERAGE
As of November 30, 2012, each of the Funds has issued and outstanding MTP Shares as shown in the accompanying table.
| | | | | | | Shares Issued | | | Annual | | | NYSE |
| Fund | | | Series | | | At Liquidation Value | | | Interest Rate | | | Ticker |
| Georgia | | | | | | | | | | | | |
| NKG | | | 2015 | | | 32,265,000 | | | 2.65% | | | NKG PRC |
| | | | 2015-1 | * | | 28,340,000 | | | 2.65% | | | NKG PRD |
| | | | 2015-2 | * | | 14,340,000 | | | 2.65% | | | NKG PRE |
| Maryland | | | | | | | | | | | | |
| NMY | | | 2015 | | | 38,775,000 | | | 2.65% | | | NMY PRC |
| | | | 2016 | | | 35,818,000 | | | 2.90% | | | NMY PRD |
| | | | 2015 | * | | 26,485,000 | | | 2.60% | | | NMY PRE |
| | | | 2015-1 | * | | 27,300,000 | | | 2.60% | | | NMY PRF |
| | | | 2015-1 | * | | 20,700,000 | | | 2.65% | | | NMY PRG |
| | | | 2016 | * | | 17,066,000 | | | 2.85% | | | NMY PRH |
*MTP Shares issued in connection with reorganization.
| | | | | | | Shares Issued | | | Annual | | | NYSE |
| Fund | | | Series | | | At Liquidation Value | | | Interest Rate | | | Ticker |
| Missouri | | | | | | | | | | | | |
| NOM | | | 2015 | | | 17,800,000 | | | 2.10% | | | NOM PRC |
| North Carolina | | | | | | | | | | | | |
| NNC | | | 2015 | | | 24,300,000 | | | 2.65% | | | NNC PRC |
| | | | 2016 | | | 25,535,000 | | | 2.60% | | | NNC PRD |
| | | | 2015 | * | | 16,600,000 | | | 2.60% | | | NNC PRE |
| | | | 2015-1 | * | | 29,700,000 | | | 2.60% | | | NNC PRF |
| | | | 2015-1 | * | | 28,725,000 | | | 2.65% | | | NNC PRG |
| Virginia | | | | | | | | | | | | |
| NPV | | | 2014 | | | 29,203,000 | | | 2.25% | | | NPV PRA |
| | | | 2015 | | | 32,205,000 | | | 2.65% | | | NPV PRC |
| | | | 2014 | * | | 22,800,000 | | | 2.80% | | | NPV PRD |
| | | | 2014-1 | * | | 43,200,000 | | | 2.80% | | | NPV PRE |
*MTP Shares issued in connection with reorganization.
(Refer to Notes to Financial Statements, Footnote 1 – General Information and Significant Accounting Policies and Footnote 4 – Fund Shares for further details on MTP Shares.)
RISK CONSIDERATIONS
Fund shares are not guaranteed or endorsed by any bank or other insured depository institution, and are not federally insured by the Federal Deposit Insurance Corporation. Past performance is no guarantee of future results. Fund common shares are subject to a variety of risks, including:
Investment and Market Risk. An investment in common shares is subject to investment risk, including the possible loss of the entire principal amount that you invest. Your investment in common shares represents an indirect investment in the municipal securities owned by the Fund, which generally trade in the over-the-counter markets. Your common shares at any point in time may be worth less than your original investment, even after taking into account the reinvestment of Fund dividends and distributions.
Tax Risk. The tax treatment of Fund distributions may be affected by new IRS interpretations of the Internal Revenue Code and future changes in tax laws and regulations.
Issuer Credit Risk. This is the risk that a security in a Fund’s portfolio will fail to make dividend or interest payments when due.
Interest Rate Risk. Fixed-income securities such as bonds, preferred, convertible and other debt securities will decline in value if market interest rates rise.
Reinvestment Risk. If market interest rates decline, income earned from a Fund’s portfolio may be reinvested at rates below that of the original bond that generated the income.
Call Risk or Prepayment Risk. Issuers may exercise their option to prepay principal earlier than scheduled, forcing a Fund to reinvest in lower-yielding securities.
Inverse Floater Risk. The Funds may invest in inverse floaters. Due to their leveraged nature, these investments can greatly increase a Fund’s exposure to interest rate risk and credit risk. In addition, investments in inverse floaters involve the risk that the Fund could lose more than its original principal investment.
Leverage Risk. Each Fund’s use of leverage creates the possibility of higher volatility for the Fund’s per share NAV, market price, distributions and returns. There is no assurance that a Fund’s leveraging strategy will be successful.
Common Share Dividend
and Price Information
DIVIDEND INFORMATION
During the six-month reporting period ended November 30, 2012, NKG, NMY, NNC and NPV received one monthly dividend increase, while NOM remained stable.
The Funds in this report seek to pay stable dividends at rates that reflect each Fund’s past results and projected future performance. During certain periods, each Fund may pay dividends at a rate that may be more or less than the amount of net investment income actually earned by the Fund during the period. If a Fund has cumulatively earned more than it has paid in dividends, it holds the excess in reserve as undistributed net investment income (UNII) as part of the Fund’s NAV. Conversely, if a Fund has cumulatively paid dividends in excess of its earnings, the excess constitutes negative UNII that is likewise reflected in the Fund’s NAV. Each Fund will, over time, pay all of its net investment income as dividends to shareholders. As of November 30, 2012, all of these Funds had positive UNII balances, based upon our best estimate, for tax purposes. NKG, NMY, NOM and NPV had positive UNII balances while NNC had a negative UNII balance for financial reporting purposes.
COMMON SHARE REPURCHASES AND PRICE INFORMATION
During November 2012, the Nuveen Funds Board of Directors/Trustees reauthorized the Funds’ open-market share repurchase program allowing each Fund to repurchase an aggregate of up to approximately 10% of its outstanding common shares. Since the inception of the Funds’ repurchase programs, the Funds have not repurchased any of their outstanding common shares.
As of November 30, 2012, and during the six-month reporting period, the Funds’ common share prices were trading at (+) premiums and/or (-) discounts to their common share NAVs as shown in the accompanying table.
| | 11/30/12 | Six-Month Average |
| Fund | (+)Premium/(-)Discount | (+)Premium/(-)Discount |
| NKG | (+)0.07% | (-)0.29% |
| NMY | (-)0.31% | (-)0.79% |
| NOM | (+)15.00% | (+)17.96% |
| NNC | (+)0.06% | (+)0.25% |
| NPV | (+)2.86% | (+)4.98% |
| NKG | | Nuveen Georgia |
| Performance | | Dividend Advantage |
| | Municipal Fund 2 |
| | | as of November 30, 2012 |
| Fund Snapshot | | | | |
| Common Share Price | | $ | 15.23 | |
| Common Share Net Asset Value (NAV) | | $ | 15.22 | |
| Premium/(Discount) to NAV | | | 0.07 | % |
| Market Yield | | | 4.53 | % |
Taxable-Equivalent Yield1 | | | 6.69 | % |
| Net Assets Applicable to Common Shares ($000) | | $ | 160,593 | |
| | | | | |
| Leverage | | | | |
| Regulatory Leverage | | | 31.82 | % |
| Effective Leverage | | | 34.30 | % |
| Average Annual Total Returns | | | | | | | |
| (Inception 9/25/02) | | | | | | | |
| | | | On Share Price | | On NAV |
| 6-Month (Cumulative) | | | 5.80 | % | | 5.86 | % |
| 1-Year | | | 13.23 | % | | 13.45 | % |
| 5-Year | | | 8.40 | % | | 6.34 | % |
| 10-Year | | | 5.92 | % | | 6.14 | % |
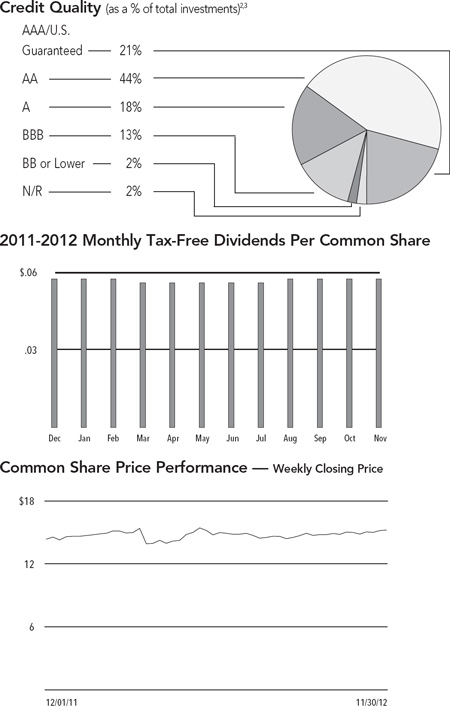
Portfolio Composition3 | | | | |
| (as a % of total investments) | | | | |
| Tax Obligation/General | | | 21.6 | % |
| Tax Obligation/Limited | | | 14.9 | % |
| Water and Sewer | | | 11.5 | % |
| Health Care | | | 11.2 | % |
| Education and Civic Organizations | | | 11.0 | % |
| U.S. Guaranteed | | | 8.5 | % |
| Utilities | | | 7.3 | % |
| Other | | | 14.0 | % |
| | Refer to the Glossary of Terms Used in this Report for further definition of the terms used within this Fund’s Performance Overview page. |
| 1 | Taxable-Equivalent Yield represents the yield that must be earned on a fully taxable investment in order to equal the yield of the Fund on an after-tax basis. It is based on a combined federal and state income tax rate of 32.3%. When comparing this Fund to investments that generate qualified dividend income, the Taxable-Equivalent Yield is lower. |
| 2 | Ratings shown are the highest rating given by one of the following national rating agencies: Standard & Poor’s Group, Moody’s Investors Service, Inc. or Fitch, Inc. Credit ratings are subject to change. AAA, AA, A and BBB are investment grade ratings; BB, B, CCC, CC, C and D are below investment grade ratings. Certain bonds backed by U.S. Government or agency securities are regarded as having an implied rating equal to the rating of such securities. Holdings designated N/R are not rated by these national rating agencies. |
| 3 | Holdings are subject to change. |
| NMY | | Nuveen Maryland |
| Performance | | Premium Income |
| | Municipal Fund |
| | | as of November 30, 2012 |
| Fund Snapshot | | | | |
| Common Share Price | | $ | 15.95 | |
| Common Share Net Asset Value (NAV) | | $ | 16.00 | |
| Premium/(Discount) to NAV | | | -0.31 | % |
| Market Yield | | | 5.08 | % |
Taxable-Equivalent Yield1 | | | 7.43 | % |
| Net Assets Applicable to Common Shares ($000) | | $ | 385,572 | |
| | | | | |
| Leverage | | | | |
| Regulatory Leverage | | | 30.11 | % |
| Effective Leverage | | | 33.57 | % |
| Average Annual Total Returns | | | | | | | |
| (Inception 3/18/93) | | | | | | | |
| | | | On Share Price | | On NAV |
| 6-Month (Cumulative) | | | 4.55 | % | | 4.60 | % |
| 1-Year | | | 17.24 | % | | 14.01 | % |
| 5-Year | | | 10.31 | % | | 7.21 | % |
| 10-Year | | | 5.64 | % | | 6.57 | % |
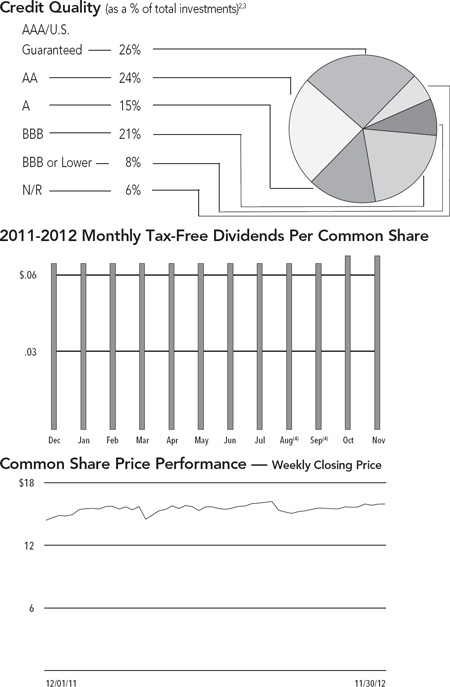
Portfolio Composition3 | | | | |
| (as a % of total investments) | | | | |
| Health Care | | | 19.2 | % |
| Tax Obligation/Limited | | | 16.9 | % |
| U.S. Guaranteed | | | 13.3 | % |
| Education and Civic Organizations | | | 8.2 | % |
| Tax Obligation/General | | | 8.0 | % |
| Housing/Single Family | | | 6.5 | % |
| Consumer Staples | | | 5.3 | % |
| Transportation | | | 3.9 | % |
| Long-Term Care | | | 3.8 | % |
| Other | | | 14.9 | % |
| | Refer to the Glossary of Terms Used in this Report for further definition of the terms used within this Fund’s Performance Overview page. |
| 1 | Taxable-Equivalent Yield represents the yield that must be earned on a fully taxable investment in order to equal the yield of the Fund on an after-tax basis. It is based on a combined federal and state income tax rate of 31.6%. When comparing this Fund to investments that generate qualified dividend income, the Taxable-Equivalent Yield is lower. |
| 2 | Ratings shown are the highest rating given by one of the following national rating agencies: Standard & Poor’s Group, Moody’s Investors Service, Inc. or Fitch, Inc. Credit ratings are subject to change. AAA, AA, A and BBB are investment grade ratings; BB, B, CCC, CC, C and D are below investment grade ratings. Certain bonds backed by U.S. Government or agency securities are regarded as having an implied rating equal to the rating of such securities. Holdings designated N/R are not rated by these national rating agencies. |
| 3 | Holdings are subject to change. |
| 4 | In connection with the Fund’s Reorganization, the Fund had dividends of $0.0207 and $0.0438 per Common share with ex-dividend dates of August 1, 2012, and August 14, 2012, respectively, both payable on October 1, 2012. These distributions were in addition to the Fund’s monthly tax-free dividend of$0.0645 with an ex-dividend date of August 1, 2012 that was payable September 4, 2012. |
| NOM | | Nuveen Missouri |
| Performance | | Premium Income |
| | Municipal Fund |
| | | as of November 30, 2012 |
| Fund Snapshot | | | | |
| Common Share Price | | $ | 17.40 | |
| Common Share Net Asset Value (NAV) | | $ | 15.13 | |
| Premium/(Discount) to NAV | | | 15.00 | % |
| Market Yield | | | 4.21 | % |
Taxable-Equivalent Yield1 | | | 6.22 | % |
| Net Assets Applicable to Common Shares ($000) | | $ | 35,182 | |
| | | | | |
| Leverage | | | | |
| Regulatory Leverage | | | 33.70 | % |
| Effective Leverage | | | 36.36 | % |
| Average Annual Total Returns | | | | | | | |
| (Inception 5/20/93) | | | | | | | |
| | | | On Share Price | | On NAV |
| 6-Month (Cumulative) | | | 5.25 | % | | 6.07 | % |
| 1-Year | | | 14.64 | % | | 15.94 | % |
| 5-Year | | | 9.76 | % | | 7.25 | % |
| 10-Year | | | 6.31 | % | | 6.21 | % |
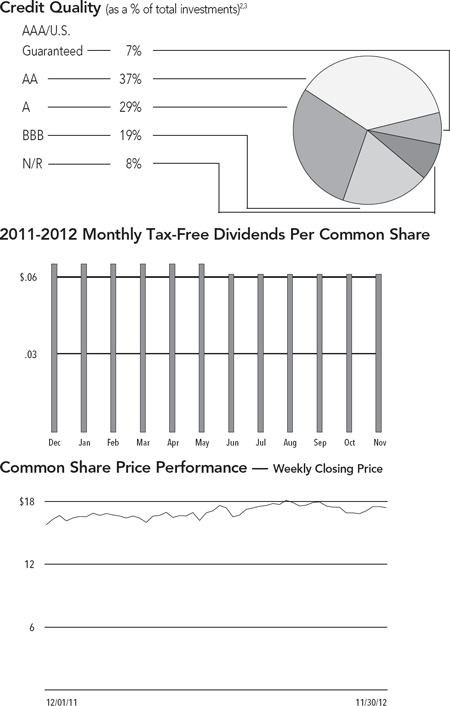
Portfolio Composition3 | | | | |
| (as a % of total investments) | | | | |
| Health Care | | | 23.7 | % |
| Tax Obligation/Limited | | | 18.8 | % |
| Tax Obligation/General | | | 11.2 | % |
| Water and Sewer | | | 9.9 | % |
| Transportation | | | 8.3 | % |
| Long-Term Care | | | 7.5 | % |
| Education and Civic Organizations | | | 5.9 | % |
| U.S. Guaranteed | | | 5.1 | % |
| Other | | | 9.6 | % |
| | Refer to the Glossary of Terms Used in this Report for further definition of the terms used within this Fund’s Performance Overview page. |
| 1 | Taxable-Equivalent Yield represents the yield that must be earned on a fully taxable investment in order to equal the yield of the Fund on an after-tax basis. It is based on a combined federal and state income tax rate of 32.3%. When comparing this Fund to investments that generate qualified dividend income, the Taxable-Equivalent Yield is lower. |
| 2 | Ratings shown are the highest rating given by one of the following national rating agencies: Standard & Poor’s Group, Moody’s Investors Service, Inc. or Fitch, Inc. Credit ratings are subject to change. AAA, AA, A and BBB are investment grade ratings; BB, B, CCC, CC, C and D are below investment grade ratings. Certain bonds backed by U.S. Government or agency securities are regarded as having an implied rating equal to the rating of such securities. Holdings designated N/R are not rated by these national rating agencies. |
| 3 | Holdings are subject to change. |
| NNC | | Nuveen North Carolina |
| Performance | | Premium Income |
| | Municipal Fund |
| | | as of November 30, 2012 |
| Fund Snapshot | | | | |
| Common Share Price | | $ | 15.80 | |
| Common Share Net Asset Value (NAV) | | $ | 15.79 | |
| Premium/(Discount) to NAV | | | 0.06 | % |
| Market Yield | | | 4.48 | % |
Taxable-Equivalent Yield1 | | | 6.75 | % |
| Net Assets Applicable to Common Shares ($000) | | $ | 261,289 | |
| | | | | |
| Leverage | | | | |
| Regulatory Leverage | | | 32.33 | % |
| Effective Leverage | | | 36.26 | % |
| Average Annual Total Returns | | | | | | | |
| (Inception 5/20/93) | | | | | | | |
| | | | On Share Price | | On NAV |
| 6-Month (Cumulative) | | | 1.21 | % | | 5.56 | % |
| 1-Year | | | 11.28 | % | | 12.71 | % |
| 5-Year | | | 9.84 | % | | 7.00 | % |
| 10-Year | | | 5.59 | % | | 6.20 | % |
Portfolio Composition3 | | | | |
| (as a % of total investments) | | | | |
| Health Care | | | 21.8 | % |
| Water and Sewer | | | 19.8 | % |
| Tax Obligation/Limited | | | 15.8 | % |
| U.S. Guaranteed | | | 12.4 | % |
| Transportation | | | 9.9 | % |
| Utilities | | | 7.7 | % |
| Other | | | 12.6 | % |
| | Refer to the Glossary of Terms Used in this Report for further definition of the terms used within this Fund’s Performance Overview page. |
| 1 | Taxable-Equivalent Yield represents the yield that must be earned on a fully taxable investment in order to equal the yield of the Fund on an after-tax basis. It is based on a combined federal and state income tax rate of 33.6%. When comparing this Fund to investments that generate qualified dividend income, the Taxable-Equivalent Yield is lower. |
| 2 | Ratings shown are the highest rating given by one of the following national rating agencies: Standard & Poor’s Group, Moody’s Investors Service, Inc. or Fitch, Inc. Credit ratings are subject to change. AAA, AA, A and BBB are investment grade ratings; BB, B, CCC, CC, C and D are below investment grade ratings. Certain bonds backed by U.S. Government or agency securities are regarded as having an implied rating equal to the rating of such securities. Holdings designated N/R are not rated by these national rating agencies. |
| 3 | Holdings are subject to change. |
| NPV | | Nuveen Virginia |
| Performance | | Premium Income |
| | Municipal Fund |
| | | as of November 30, 2012 |
| Fund Snapshot | | | | |
| Common Share Price | | $ | 16.54 | |
| Common Share Net Asset Value (NAV) | | $ | 16.08 | |
| Premium/(Discount) to NAV | | | 2.86 | % |
| Market Yield | | | 4.79 | % |
Taxable-Equivalent Yield1 | | | 7.05 | % |
| Net Assets Applicable to Common Shares ($000) | | $ | 288,109 | |
| | | | | |
| Leverage | | | | |
| Regulatory Leverage | | | 30.66 | % |
| Effective Leverage | | | 35.23 | % |
| Average Annual Total Returns | | | | | | | |
| (Inception 3/18/93) | | | | | | | |
| | | | On Share Price | | On NAV |
| 6-Month (Cumulative) | | | (0.60 | )% | | 5.65 | % |
| 1-Year | | | 13.06 | % | | 14.09 | % |
| 5-Year | | | 10.34 | % | | 7.38 | % |
| 10-Year | | | 5.80 | % | | 6.53 | % |
Portfolio Composition3 | | | | |
| (as a % of total investments) | | | | |
| Tax Obligation/Limited | | | 22.7 | % |
| Health Care | | | 15.6 | % |
| U.S. Guaranteed | | | 14.7 | % |
| Transportation | | | 13.1 | % |
| Tax Obligation/General | | | 8.7 | % |
| Long-Term Care | | | 6.1 | % |
| Education and Civic Organizations | | | 5.4 | % |
| Other | | | 13.7 | % |
| | Refer to the Glossary of Terms Used in this Report for further definition of the terms used within this Fund’s Performance Overview page. |
| 1 | Taxable-Equivalent Yield represents the yield that must be earned on a fully taxable investment in order to equal the yield of the Fund on an after-tax basis. It is based on a combined federal and state income tax rate of 32.1%. When comparing this Fund to investments that generate qualified dividend income, the Taxable-Equivalent Yield is lower. |
| 2 | Ratings shown are the highest rating given by one of the following national rating agencies: Standard & Poor’s Group, Moody’s Investors Service, Inc. or Fitch, Inc. Credit ratings are subject to change. AAA, AA, A and BBB are investment grade ratings; BB, B, CCC, CC, C and D are below investment grade ratings. Certain bonds backed by U.S. Government or agency securities are regarded as having an implied rating equal to the rating of such securities. Holdings designated N/R are not rated by these national rating agencies. |
| 3 | Holdings are subject to change. |
| 4 | The Fund paid shareholders a capital gains distribution in December 2011 of $0.0237 per share. |
| 5 | In connection with the Fund’s Reorganization, the Fund had dividends of $0.0457 and $0.0188 per Common share with ex-dividend dates of August 1, 2012, and August 14, 2012, respectively, both payable on October 1, 2012. These distributions were in addition to the Fund’s monthly tax-free dividend of$0.0645 with an ex-dividend date of August 1, 2012 that was payable September 4, 2012. |
| NKG | | Shareholder Meeting Report |
| NNC | | |
| NMY | | A special meeting of shareholders was held in the offices of Nuveen Investments on April 5, 2012; at this meeting the shareholders were asked to vote on the approval of the issuance of additional common shares and the approval of an Agreement and Plan of Reorganization. The meeting was subsequently adjourned to May 17, 2012. The meeting for NMY, NFM, NWI and NPV was subsequently adjourned to June 22, 2012. The meeting for NMY and NWI was subsequently adjourned to July 17, 2012. The meeting for NMY was additionally adjourned to July 18, 2012. The annual meeting of shareholders was held in the offices of Nuveen Investments on November 14, 2012; at this meeting the shareholders were asked to vote on the election of Board Members. |
| | | NKG | | NNC | | NMY | |
| | | Common and Preferred shares voting together as a class | | Preferred shares voting together as a class | | Common and Preferred shares voting together as a class | | Preferred shares voting together as a class | | Common and Preferred shares voting together as a class | | Preferred shares voting together as a class | |
| To approve the Agreement and Plan of Reorganization. | | | | | | | | | | | | | | | | | | | |
| For | | | — | | | — | | | — | | | — | | | 9,642,960 | | | 3,749,058 | |
| Against | | | — | | | — | | | — | | | — | | | 652,628 | | | 266,777 | |
| Abstain | | | — | | | — | | | — | | | — | | | 294,471 | | | 72,586 | |
| Total | | | — | | | — | | | — | | | — | | | 10,590,059 | | | 4,088,421 | |
| To approve the issuance of additional common shares. | | | | | | | | | | | | | | | | | | | |
| For | | | — | | | — | | | — | | | — | | | 9,587,683 | | | — | |
| Against | | | — | | | — | | | — | | | — | | | 682,349 | | | — | |
| Abstain | | | — | | | — | | | — | | | — | | | 320,027 | | | — | |
| Total | | | — | | | — | | | — | | | — | | | 10,590,059 | | | — | |
| Approval of the Board Members was reached as follows: | | | | | | | | | | | | | | | | | | | |
| Robert P. Bremner | | | | | | | | | | | | | | | | | | | |
| For | | | 3,783,285 | | | — | | | 6,090,658 | | | — | | | 7,954,657 | | | — | |
| Withhold | | | 42,902 | | | — | | | 343,848 | | | — | | | 151,355 | | | — | |
| Total | | | 3,826,187 | | | — | | | 6,434,506 | | | — | | | 8,106,012 | | | — | |
| Jack B. Evans | | | | | | | | | | | | | | | | | | | |
| For | | | 3,786,685 | | | — | | | 6,153,928 | | | — | | | 7,953,362 | | | — | |
| Withhold | | | 39,502 | | | — | | | 280,578 | | | — | | | 152,650 | | | — | |
| Total | | | 3,826,187 | | | — | | | 6,434,506 | | | — | | | 8,106,012 | | | — | |
| William C. Hunter | | | | | | | | | | | | | | | | | | | |
| For | | | — | | | 1,633,736 | | | — | | | 1,990,814 | | | — | | | 2,825,407 | |
| Withhold | | | — | | | 15,500 | | | — | | | 18,700 | | | — | | | 29,269 | |
| Total | | | — | | | 1,649,236 | | | — | | | 2,009,514 | | | — | | | 2,854,676 | |
| William J. Schneider | | | | | | | | | | | | | | | | | | | |
| For | | | — | | | 1,633,736 | | | — | | | 1,989,214 | | | — | | | 2,825,407 | |
| Withhold | | | — | | | 15,500 | | | — | | | 20,300 | | | — | | | 29,269 | |
| Total | | | — | | | 1,649,236 | | | — | | | 2,009,514 | | | — | | | 2,854,676 | |
| | | NFM | | NWI | | NOM | |
| | | Common and Preferred shares voting together as a class | | Preferred shares voting together as a class | | Common and Preferred shares voting together as a class | | Preferred shares voting together as a class | | Common and Preferred shares voting together as a class | | Preferred shares voting together as a class | |
| To approve the Agreement and Plan of Reorganization. | | | | | | | | | | | | | | | | | | | |
| For | | | 3,584,198 | | | 1,335,597 | | | 4,897,564 | | | 1,999,912 | | | — | | | — | |
| Against | | | 178,728 | | | 90,182 | | | 170,007 | | | 85,539 | | | — | | | — | |
| Abstain | | | 119,767 | | | 47,500 | | | 141,175 | | | 38,500 | | | — | | | — | |
| Total | | | 3,882,693 | | | 1,473,279 | | | 5,208,746 | | | 2,123,951 | | | — | | | — | |
| To approve the issuance of additional common shares. | | | | | | | | | | | | | | | | | | | |
| For | | | — | | | — | | | — | | | — | | | — | | | — | |
| Against | | | — | | | — | | | — | | | — | | | — | | | — | |
| Abstain | | | — | | | — | | | — | | | — | | | — | | | — | |
| Total | | | — | | | — | | | — | | | — | | | — | | | — | |
| Approval of the Board Members was reached as follows: | | | | | | | | | | | | | | | | | | | |
| Robert P. Bremner | | | | | | | | | | | | | | | | | | | |
| For | | | — | | | — | | | — | | | — | | | 1,193,080 | | | — | |
| Withhold | | | — | | | — | | | — | | | — | | | 52,317 | | | — | |
| Total | | | — | | | — | | | — | | | — | | | 1,245,397 | | | — | |
| Jack B. Evans | | | | | | | | | | | | | | | | | | | |
| For | | | — | | | — | | | — | | | — | | | 1,197,160 | | | — | |
| Withhold | | | — | | | — | | | — | | | — | | | 48,237 | | | — | |
| Total | | | — | | | — | | | — | | | — | | | 1,245,397 | | | — | |
| William C. Hunter | | | | | | | | | | | | | | | | | | | |
| For | | | — | | | — | | | — | | | — | | | — | | | 322,309 | |
| Withhold | | | — | | | — | | | — | | | — | | | — | | | 31,138 | |
| Total | | | — | | | — | | | — | | | — | | | — | | | 353,447 | |
| William J. Schneider | | | | | | | | | | | | | | | | | | | |
| For | | | — | | | — | | | — | | | — | | | — | | | 322,309 | |
| Withhold | | | — | | | — | | | — | | | — | | | — | | | 31,138 | |
| Total | | | — | | | — | | | — | | | — | | | — | | | 353,447 | |
| | | Shareholder Meeting Report (continued) |
| NPV | | |
| | | | NPV | |
| | | | Common and | | | | |
| | | | Preferred | | | Preferred | |
| | | | shares voting | | | shares voting | |
| | | | together | | | together | |
| | | | as a class | | | as a class | |
| To approve the Agreement and Plan of Reorganization. | | | | | | | |
| For | | | 8,389,368 | | | 3,104,456 | |
| Against | | | 297,102 | | | 142,889 | |
| Abstain | | | 231,692 | | | 68,900 | |
| Total | | | 8,918,162 | | | 3,316,245 | |
| To approve the issuance of additional common shares. | | | | | | | |
| For | | | 8,290,084 | | | — | |
| Against | | | 347,755 | | | — | |
| Abstain | | | 280,323 | | | — | |
| Total | | | 8,918,162 | | | — | |
| Approval of the Board Members was reached as follows: | | | | | | | |
| Robert P. Bremner | | | | | | | |
| For | | | 6,786,537 | | | — | |
| Withhold | | | 201,706 | | | — | |
| Total | | | 6,988,243 | | | — | |
| Jack B. Evans | | | | | | | |
| For | | | 6,752,842 | | | — | |
| Withhold | | | 235,401 | | | — | |
| Total | | | 6,988,243 | | | — | |
| William C. Hunter | | | | | | | |
| For | | | — | | | 2,665,735 | |
| Withhold | | | — | | | 64,500 | |
| Total | | | — | | | 2,730,235 | |
| William J. Schneider | | | | | | | |
| For | | | — | | | 2,670,735 | |
| Withhold | | | — | | | 59,500 | |
| Total | | | — | | | 2,730,235 | |
| | | Nuveen Georgia Dividend Advantage Municipal Fund 2 |
| NKG | | Portfolio of Investments |
| | | November 30, 2012 (Unaudited) |
| | Principal | | | | Optional Call | | | | | |
| | Amount (000) | | Description (1) | | Provisions (2) | Ratings (3) | | | Value | |
| | | | Consumer Staples – 4.1% (2.9% of Total Investments) | | | | | | | |
| $ | 45,000 | | Puerto Rico, The Children’s Trust Fund, Tobacco Settlement Asset-Backed Bonds, Series 2005A, 0.000%, 5/15/50 | | 5/15 at 11.19 | BB– | | $ | 3,514,500 | |
| | 3,000 | | Puerto Rico, The Children’s Trust Fund, Tobacco Settlement Asset-Backed Refunding Bonds, Series 2002, 5.500%, 5/15/39 | | 5/13 at 100.00 | BBB | | | 3,003,390 | |
| | 48,000 | | Total Consumer Staples | | | | | | 6,517,890 | |
| | | | Education and Civic Organizations – 15.4% (11.0% of Total Investments) | | | | | | | |
| | 1,750 | | Athens Housing Authority, Georgia, Student Housing Lease Revenue Bonds, UGAREF East Campus Housing LLC Project, Series 2009, 5.250%, 6/15/35 | | 6/19 at 100.00 | Aa2 | | | 1,976,188 | |
| | 5,000 | | Atlanta Development Authority, Georgia, Educational Facilities Revenue Bonds, Science Park LLC Project, Series 2007, 5.000%, 7/01/39 | | 7/17 at 100.00 | Aa3 | | | 5,651,300 | |
| | 1,550 | | Bulloch County Development Authority, Georgia, Student Housing and Athletic Facility Lease Revenue Bonds, Georgia Southern University, Series 2004, 5.250%, 8/01/21 – SYNCORA GTY Insured | | 8/14 at 100.00 | A1 | | | 1,665,599 | |
| | 700 | | Carrollton Payroll Development Authority, Georgia, Student Housing Revenue Bonds, University of West Georgia, Series 2004A, 5.000%, 9/01/21 – SYNCORA GTY Insured | | 9/14 at 100.00 | A1 | | | 751,674 | |
| | 625 | | Fulton County Development Authority Georgia Tech Foundation, 5.000%, 11/01/31 | | 5/22 at 100.00 | AA+ | | | 764,506 | |
| | 2,000 | | Fulton County Development Authority, Georgia, Revenue Bonds, Georgia Tech – Klaus Parking and Family Housing, Series 2003, 5.000%, 11/01/23 – NPFG Insured | | 11/13 at 100.00 | Aa3 | | | 2,077,600 | |
| | 1,535 | | Fulton County Development Authority, Georgia, Revenue Bonds, Georgia Tech Molecular Science Building, Series 2004, 5.250%, 5/01/15 – NPFG Insured | | 5/14 at 100.00 | Aa3 | | | 1,636,233 | |
| | 1,050 | | Fulton County Development Authority, Georgia, Revenue Bonds, TUFF Morehouse Project, Series 2002A, 5.000%, 2/01/34 – AMBAC Insured | | 2/13 at 100.00 | A2 | | | 1,053,266 | |
| | 150 | | Georgia Higher Education Facilities Authority, Revenue Bonds, USG Real Estate Foundation I LLC Project, Series 2008, 6.000%, 6/15/28 | | 6/18 at 100.00 | A2 | | | 179,280 | |
| | | | Private Colleges and Universities Authority, Georgia, Revenue Bonds, Emory University, Series 2009B, Trust 3404: | | | | | | | |
| | 730 | | 17.409%, 3/01/17 (IF) | | No Opt. Call | AA+ | | | 1,312,942 | |
| | 1,150 | | 17.438%, 3/01/17 (IF) | | No Opt. Call | AA+ | | | 2,048,288 | |
| | 1,325 | | Private Colleges and Universities Authority, Georgia, Revenue Bonds, Mercer University Project, Refunding Series 2012C, 5.250%, 10/01/30 | | 10/22 at 100.00 | Baa2 | | | 1,543,479 | |
| | 1,000 | | Private Colleges and Universities Authority, Georgia, Revenue Bonds, Mercer University, Series Series 2012A, 5.000%, 10/01/32 | | 10/21 at 100.00 | Baa2 | | | 1,125,660 | |
| | 1,180 | | Savannah Economic Development Authority, Georgia, Revenue Bonds, Armstrong Atlantic State University, Compass Point LLC Project, Series 2005, 5.000%, 7/01/25 – SYNCORA GTY Insured | | 7/15 at 100.00 | A2 | | | 1,298,283 | |
| | 1,490 | | Savannah Economic Development Authority, Georgia, Revenue Bonds, Armstrong Center LLC, Series 2005A, 5.000%, 12/01/34 – SYNCORA GTY Insured | | 12/15 at 100.00 | A3 | | | 1,628,987 | |
| | 21,235 | | Total Education and Civic Organizations | | | | | | 24,713,285 | |
| | | | Health Care – 15.7% (11.2% of Total Investments) | | | | | | | |
| | | | Baldwin County Hospital Authority, Georgia, Revenue Bonds, Oconee Regional Medical Center, Series 1998: | | | | | | | |
| | 205 | | 5.250%, 12/01/22 | | 12/12 at 100.00 | B+ | | | 196,382 | |
| | 745 | | 5.375%, 12/01/28 | | 6/13 at 100.00 | B+ | | | 687,441 | |
| | | | Coffee County Hospital Authority, Georgia, Revenue Bonds, Coffee County Regional Medical Center, Series 2004: | | | | | | | |
| | 285 | | 5.000%, 12/01/19 | | 12/12 at 100.00 | BBB– | | | 293,701 | |
| | 2,400 | | 5.250%, 12/01/22 | | 12/14 at 100.00 | BBB– | | | 2,477,256 | |
| | 255 | | 5.000%, 12/01/26 | | 12/14 at 100.00 | BBB– | | | 261,441 | |
| | 715 | | Coweta County Development Authority, Georgia, Revenue Bonds, Piedmont Healthcare, Inc. Project, Series 2010, 5.000%, 6/15/40 | | 6/20 at 100.00 | AA– | | | 793,293 | |
| | 2,500 | | Franklin County Industrial Building Authority, Georgia, Revenue Bonds, Ty Cobb Regional Medical Center Project, Series 2010, 8.000%, 12/01/40 | | 12/20 at 100.00 | N/R | | | 2,836,200 | |
| | | Nuveen Georgia Dividend Advantage Municipal Fund 2 (continued) |
| NKG | | Portfolio of Investments |
| | | November 30, 2012 (Unaudited) |
| | Principal | | | | Optional Call | | | | | |
| | Amount (000) | | Description (1) | | Provisions (2) | Ratings (3) | | | Value | |
| | | | Health Care (continued) | | | | | | | |
| | | | Gainesville and Hall County Hospital Authority, Georgia, Revenue Anticipation Certificates, Northeast Georgia Health Services Inc., Series 2010B: | | | | | | | |
| $ | 1,000 | | 5.125%, 2/15/40 | | 2/20 at 100.00 | AA– | | $ | 1,110,420 | |
| | 3,945 | | 5.250%, 2/15/45 | | 2/41 at 100.00 | AA– | | | 4,417,256 | |
| | 2,540 | | Houston County Hospital Authority, Georgia, Revenue Bonds, Houston Healthcare Project, Series 2007, 5.250%, 10/01/35 | | 10/17 at 100.00 | A+ | | | 2,785,186 | |
| | | | Macon-Bibb County Hospital Authority, Georgia, Revenue Anticipation Certificates, Medical Center of Central Georgia Inc., Series 2009: | | | | | | | |
| | 425 | | 5.000%, 8/01/32 | | 8/19 at 100.00 | AA | | | 473,705 | |
| | 975 | | 5.000%, 8/01/35 | | 8/19 at 100.00 | AA | | | 1,077,453 | |
| | 3,500 | | Savannah Hospital Authority, Georgia, Revenue Bonds, St. Joseph’s/Candler Health System, Series 2003, 5.250%, 7/01/23 – RAAI Insured | | 1/14 at 100.00 | A3 | | | 3,645,670 | |
| | 1,470 | | The Medical Center Hospital Authority, Georgia, Revenue Anticipation Certificates, Columbus Regional Healthcare System, Inc. Project, Series 2010, 5.000%, 8/01/21 – AGM Insured | | No Opt. Call | AA– | | | 1,752,681 | |
| | 2,300 | | Valdosta and Lowndes County Hospital Authority, Georgia, Revenue Certificates, South Georgia Medical Center, Series 2007, 5.000%, 10/01/33 | | 10/17 at 100.00 | A+ | | | 2,448,465 | |
| | 23,260 | | Total Health Care | | | | | | 25,256,550 | |
| | | | Housing/Multifamily – 3.9% (2.8% of Total Investments) | | | | | | | |
| | 1,600 | | Cobb County Development Authority, Georgia, Revenue Bonds, KSU University II Real Estate Foundation, LLC Project, Series 2011, 5.000%, 7/15/41 – AGM Insured | | 7/21 at 100.00 | AA– | | | 1,835,648 | |
| | 1,375 | | Cobb County Development Authority, Georgia, Student Housing Revenue Bonds, KSU Village II Real Estate Foundation LLC Project, Series 2007A, 5.250%, 7/15/38 – AMBAC Insured | | 7/17 at 100.00 | Baa2 | | | 1,440,051 | |
| | | | Savannah Economic Development Authority, Georgia, GNMA Collateralized Multifamily Housing Revenue Bonds, Snap I-II-III Apartments, Series 2002A: | | | | | | | |
| | 500 | | 5.150%, 11/20/22 (Alternative Minimum Tax) | | 11/13 at 101.00 | AA+ | | | 510,820 | |
| | 980 | | 5.200%, 11/20/27 (Alternative Minimum Tax) | | 11/13 at 101.00 | AA+ | | | 1,000,972 | |
| | 1,465 | | 5.250%, 11/20/32 (Alternative Minimum Tax) | | 11/13 at 101.00 | AA+ | | | 1,496,043 | |
| | 5,920 | | Total Housing/Multifamily | | | | | | 6,283,534 | |
| | | | Housing/Single Family – 0.7% (0.5% of Total Investments) | | | | | | | |
| | | | Georgia Housing and Finance Authority, Single Family Mortgage Bonds, Series 2006C-2: | | | | | | | |
| | 1,000 | | 4.500%, 12/01/27 (Alternative Minimum Tax) | | 12/15 at 100.00 | AAA | | | 1,035,340 | |
| | 170 | | 4.550%, 12/01/31 (Alternative Minimum Tax) | | 12/15 at 100.00 | AAA | | | 173,902 | |
| | 1,170 | | Total Housing/Single Family | | | | | | 1,209,242 | |
| | | | Industrials – 2.7% (1.9% of Total Investments) | | | | | | | |
| | 2,190 | | Cobb County Development Authority, Georgia, Solid Waste Disposal Revenue Bonds, Georgia Waste Management Project, Series 2004A, 5.000%, 4/01/33 (Alternative Minimum Tax) | | 4/16 at 101.00 | BBB | | | 2,333,051 | |
| | 2,000 | | Fulton County Development Authority, Georgia, Local District Cooling Authority Revenue Bonds, Maxon Atlantic Station LLC, Series 2005A, 5.125%, 3/01/26 (Mandatory put 3/01/15) (Alternative Minimum Tax) | | 9/15 at 100.00 | BBB | | | 2,051,220 | |
| | 4,190 | | Total Industrials | | | | | | 4,384,271 | |
| | | | Materials – 2.1% (1.5% of Total Investments) | | | | | | | |
| | 2,000 | | Richmond County Development Authority, Georgia, Environmental Improvement Revenue Bonds, International Paper Company, Series 2001A, 6.250%, 2/01/25 (Alternative Minimum Tax) | | 2/13 at 100.00 | BBB | | | 2,015,600 | |
| | 20 | | Richmond County Development Authority, Georgia, Environmental Improvement Revenue Bonds, International Paper Company, Series 2003A, 5.750%, 11/01/27 (Alternative Minimum Tax) | | 11/13 at 100.00 | BBB | | | 20,756 | |
| | 850 | | Richmond County Development Authority, Georgia, Environmental Improvement Revenue Refunding Bonds, International Paper Company, Series 2002A, 6.000%, 2/01/25 (Alternative Minimum Tax) | | 2/13 at 100.00 | BBB | | | 856,273 | |
| | 370 | | Savannah Economic Development Authority, Georgia, Pollution Control Revenue Bonds, Union Camp Corporation, Series 1995, 6.150%, 3/01/17 | | No Opt. Call | Baa3 | | | 418,559 | |
| | 3,240 | | Total Materials | | | | | | 3,311,188 | |
| | Principal | | | | Optional Call | | | | | |
| | Amount (000) | | Description (1) | | Provisions (2) | Ratings (3) | | | Value | |
| | | | Tax Obligation/General – 30.2% (21.6% of Total Investments) | | | | | | | |
| $ | 2,000 | | Chatham County Hospital Authority, Georgia, Seven Mill Tax Pledge Refunding and Improvement Revenue Bonds, Memorial Health University Medical Center Inc., Series 2012A, 5.000%, 1/01/31 | | 1/22 at 100.00 | AA | | $ | 2,356,940 | |
| | 1,500 | | Cherokee County Resource Recovery Development Authority, Georgia, Solid Waste Disposal Revenue Bonds, Ball Ground Recycling LLC Project, Series 2007A, 5.000%, 7/01/37 – AMBAC Insured (Alternative Minimum Tax) | | 7/17 at 100.00 | AA+ | | | 1,619,925 | |
| | 1,000 | | Clark County Hospital Authority, Georgia, Hospital Revenue Bonds, Athens Regional Medical Center, Series 2007, 5.000%, 1/01/27 – NPFG Insured | | 1/17 at 100.00 | Aa1 | | | 1,129,930 | |
| | 600 | | Clarke County Hospital Authority, Georgia, Hospital Revenue Certificates, Athens Regional Medical Center, Series 2012, 5.000%, 1/01/32 | | 1/22 at 100.00 | Aa1 | | | 704,448 | |
| | 3,315 | | Decatur, Georgia, General Obligation Bonds, Series 2007, 5.000%, 1/01/31 – AGM Insured | | 1/17 at 100.00 | AA+ | | | 3,749,928 | |
| | 1,090 | | Floyd County Hospital Authority, Georgia, Revenue Anticipation Certificates, Floyd Medical Center, Series 2003, 5.000%, 7/01/19 – NPFG Insured | | 7/13 at 101.00 | Aa2 | | | 1,126,635 | |
| | 1,500 | | Forsyth County Water and Sewerage Authority, Georgia, Revenue Bonds, Series 2007, 5.000%, 4/01/37 – AGM Insured | | 4/17 at 100.00 | Aaa | | | 1,712,310 | |
| | 6,400 | | Georgia Environmental Loan Acquisition Corporation, Local Government Loan Securitization Bonds, Loan Pool Series 2011, 5.125%, 3/15/31 | | 3/21 at 100.00 | Aaa | | | 7,601,532 | |
| | | | Georgia Municipal Association Inc., Certificates of Participation, Riverdale Public Purpose Project, Series 2009: | | | | | | | |
| | 905 | | 5.375%, 5/01/32 – AGC Insured | | 5/19 at 100.00 | AA– | | | 1,033,890 | |
| | 1,165 | | 5.500%, 5/01/38 – AGC Insured | | 5/19 at 100.00 | AA– | | | 1,317,545 | |
| | 2,500 | | Georgia State, General Obligation Bonds, Series 2005B, 5.000%, 7/01/15 | | No Opt. Call | AAA | | | 2,798,675 | |
| | 2,500 | | Georgia State, General Obligation Bonds, Series 2007E, 5.000%, 8/01/24 | | 8/17 at 100.00 | AAA | | | 2,933,075 | |
| | 1,955 | | Georgia State, General Obligation Bonds, Series 2009B, 5.000%, 1/01/26 | | 1/19 at 100.00 | AAA | | | 2,392,959 | |
| | 750 | | Georgia, General Obligation Bonds, Series 1998D, 5.250%, 10/01/15 | | No Opt. Call | AAA | | | 853,043 | |
| | 4,900 | | Gwinnett County School District, Georgia, General Obligation Bonds, Series 2008, 5.000%, 2/01/36 (UB) | | 2/18 at 100.00 | AAA | | | 5,679,737 | |
| | 1,560 | | Henry County Hospital Authority, Georgia, Revenue Certificates, Henry Medical Center, Series 2004, 5.000%, 7/01/20 – NPFG Insured | | 7/14 at 101.00 | Aa1 | | | 1,669,949 | |
| | 445 | | La Grange-Troup County Hospital Authority, Georgia, Revenue Anticipation Certificates, Series 2008A, 5.500%, 7/01/38 | | 7/18 at 100.00 | Aa2 | | | 498,048 | |
| | 2,475 | | Paulding County School District, Georgia, General Obligation Bonds, Series 2007, 5.000%, 2/01/33 | | 2/17 at 100.00 | AA+ | | | 2,821,748 | |
| | 2,250 | | Valdosta and Lowndes County Hospital Authority, Georgia, Revenue Certificates, South Georgia Medical Center Project, Series 2011B, 5.000%, 10/01/41 | | 10/21 at 100.00 | Aa2 | | | 2,577,195 | |
| | 1,450 | | Wayne County Hospital Authority, Georgia, Hospital Revenue Bonds, Series 2006, 5.000%, 3/01/23 – SYNCORA GTY Insured | | 3/16 at 100.00 | N/R | | | 1,490,919 | |
| | 2,000 | | Winder-Barrow Industrial Building Authority, Georgia, Revenue Bonds, City of Winder Project, Refunding Series 2012, 5.000%, 12/01/29 – AGM Insured | | 12/21 at 100.00 | Aa3 | | | 2,419,680 | |
| | 42,260 | | Total Tax Obligation/General | | | | | | 48,488,111 | |
| | | | Tax Obligation/Limited – 20.8% (14.9% of Total Investments) | | | | | | | |
| | | | Atlanta, Georgia, Tax Allocation Bonds Atlanta Station Project, Series 2007: | | | | | | | |
| | 110 | | 5.250%, 12/01/19 – AGC Insured | | 12/17 at 100.00 | AA– | | | 124,873 | |
| | 80 | | 5.250%, 12/01/21 – AGC Insured | | 12/17 at 100.00 | AA– | | | 89,718 | |
| | 1,080 | | 5.000%, 12/01/23 – AGC Insured | | 12/17 at 100.00 | AA– | | | 1,184,436 | |
| | 1,500 | | Atlanta, Georgia, Tax Allocation Bonds, Beltline Project Series 2008B. Remarketed, 7.375%, 1/01/31 | | 1/19 at 100.00 | A2 | | | 1,872,465 | |
| | 280 | | Atlanta, Georgia, Tax Allocation Bonds, Beltline Project Series 2008C. Remarketed, 7.500%, 1/01/31 | | 1/19 at 100.00 | A2 | | | 351,467 | |
| | 1,065 | | Atlanta, Georgia, Tax Allocation Bonds, Eastside Project, Series 2005A, 5.625%, 1/01/16 (Alternative Minimum Tax) | | 7/15 at 100.00 | A– | | | 1,158,432 | |
| | | | Atlanta, Georgia, Tax Allocation Bonds, Eastside Project, Series 2005B: | | | | | | | |
| | 830 | | 5.400%, 1/01/20 | | 7/15 at 100.00 | A– | | | 902,517 | |
| | 575 | | 5.600%, 1/01/30 | | 7/15 at 100.00 | A– | | | 630,189 | |
| | | Nuveen Georgia Dividend Advantage Municipal Fund 2 (continued) |
NKG | | Portfolio of Investments |
| | | November 30, 2012 (Unaudited) |
| | Principal | | | | Optional Call | | | | | |
| | Amount (000) | | Description (1) | | Provisions (2) | Ratings (3) | | | Value | |
| | | | Tax Obligation/Limited (continued) | | | | | | | |
| $ | 1,650 | | Atlanta, Georgia, Tax Allocation Bonds, Princeton Lakes Project, Series 2006, 5.500%, 1/01/31 | | 1/16 at 100.00 | BBB– | | $ | 1,687,439 | |
| | 2,000 | | Cobb-Marietta Coliseum and Exhibit Hall Authority, Cobb County, Georgia, Revenue Bonds, Performing Arts Center, Series 2004, 5.000%, 1/01/22 | | 1/14 at 100.00 | AAA | | | 2,097,240 | |
| | 125 | | Cobb-Marietta Coliseum and Exhibit Hall Authority, Georgia, Revenue Bonds, Refunding Series 2005, 5.500%, 10/01/26 – NPFG Insured | | No Opt. Call | A+ | | | 157,991 | |
| | | | Cobb-Marietta Coliseum and Exhibit Hall Authority, Georgia, Revenue Refunding Bonds, Series 1993: | | | | | | | |
| | 460 | | 5.500%, 10/01/18 – NPFG Insured | | No Opt. Call | BBB | | | 500,236 | |
| | 5,745 | | 5.625%, 10/01/26 – NPFG Insured | | 10/19 at 100.00 | BBB | | | 6,813,570 | |
| | 2,000 | | Georgia Local Governments, Certificates of Participation, Georgia Municipal Association, Series 1998A, 4.750%, 6/01/28 – NPFG Insured | | No Opt. Call | BBB | | | 2,146,880 | |
| | 750 | | Georgia Municipal Association Inc., Certificates of Participation, Atlanta Court Project, Series 2002, 5.125%, 12/01/21 – AMBAC Insured | | 6/13 at 100.00 | N/R | | | 759,038 | |
| | 405 | | Government of Guam, Business Privilege Tax Bonds, Series 2011A, 5.125%, 1/01/42 | | 1/22 at 100.00 | A | | | 463,118 | |
| | | | Macon-Bibb County Urban Development Authority, Georgia, Revenue Refunding Bonds, Public Facilities Projects, Series 2002A: | | | | | | | |
| | 1,525 | | 5.000%, 8/01/14 | | 8/13 at 100.00 | AA | | | 1,546,243 | |
| | 2,600 | | 5.375%, 8/01/17 | | 8/13 at 100.00 | AA | | | 2,636,946 | |
| | 3,500 | | Metropolitan Atlanta Rapid Transit Authority, Georgia, Sales Tax Revenue Refunding Bonds, Series 1992P, 6.250%, 7/01/20 – AMBAC Insured | | No Opt. Call | Aa2 | | | 4,112,850 | |
| | 25,000 | | Puerto Rico Sales Tax Financing Corporation, Sales Tax Revenue Bonds, Series 2007A, 0.000%, 8/01/54 – AMBAC Insured | | No Opt. Call | AA– | | | 2,246,250 | |
| | 1,945 | | Tift County Hospital Authority, Georgia, Revenue Anticipation Bonds, Tift Regional Medical Center, Series 2002, 5.250%, 12/01/19 – AMBAC Insured | | 12/13 at 100.00 | Aa3 | | | 1,968,184 | |
| | 53,225 | | Total Tax Obligation/Limited | | | | | | 33,450,082 | |
| | | | Transportation – 6.2% (4.4% of Total Investments) | | | | | | | |
| | 2,290 | | Atlanta, Georgia, Airport General Revenue Bonds, Series 2004G, 5.000%,
1/01/26 – AGM Insured | | 1/15 at 100.00 | AA– | | | 2,457,170 | |
| | 2,710 | | Atlanta, Georgia, Airport General Revenue Bonds, Series 2012C, 5.000%, 1/01/42 (Alternative Minimum Tax) | | 1/22 at 100.00 | A+ | | | 3,058,831 | |
| | 2,000 | | Atlanta, Georgia, Airport General Revenue Refunding Bonds, Series 2011B, 5.000%, 1/01/30 | | 1/21 at 100.00 | A+ | | | 2,306,200 | |
| | 1,000 | | Atlanta, Georgia, Airport Passenger Facilities Charge Revenue Bonds, Refunding Series 2004C, 5.000%, 1/01/33 – AGM Insured | | 7/14 at 100.00 | AA– | | | 1,053,830 | |
| | 1,000 | | Atlanta, Georgia, Airport Passenger Facilities Charge Revenue Bonds, Series 2004J, 5.000%, 1/01/34 – AGM Insured | | 1/15 at 100.00 | AA– | | | 1,067,870 | |
| | 9,000 | | Total Transportation | | | | | | 9,943,901 | |
| | | | U.S. Guaranteed – 12.0% (8.5% of Total Investments) (4) | | | | | | | |
| | 1,000 | | Cherokee County School System, Georgia, General Obligation Bonds, Series 2003, 5.000%, 8/01/16 (Pre-refunded 8/01/13) – NPFG Insured | | 8/13 at 100.00 | AA+ (4) | | | 1,031,900 | |
| | 2,235 | | Coweta County Development Authority, Georgia, Revenue Bonds, Newnan Water and Sewer, and Light Commission Project, Series 2002, 5.250%, 1/01/18 (Pre-refunded 1/01/13) – FGIC Insured | | 1/13 at 100.00 | N/R (4) | | | 2,244,745 | |
| | 2,000 | | Forsyth County Water and Sewerage Authority, Georgia, Revenue Bonds, Series 2002, 5.000%, 4/01/32 (Pre-refunded 4/01/13) | | 4/13 at 100.00 | Aaa | | | 2,032,060 | |
| | 1,000 | | Forsyth County, Georgia, General Obligation Bonds, Series 2004, 5.250%, 3/01/19 (Pre-refunded 3/01/14) | | 3/14 at 101.00 | Aaa | | | 1,071,830 | |
| | 2,450 | | Fulton County, Georgia, Water and Sewerage Revenue Bonds, Series 2004, 5.000%, 1/01/22 (Pre-refunded 1/01/14) – FGIC Insured | | 1/14 at 100.00 | AA– (4) | | | 2,574,068 | |
| | 25 | | Georgia Municipal Electric Authority, Senior Lien General Power Revenue Bonds, Series 1993Z, 5.500%, 1/01/20 (Pre-refunded 1/01/17) – FGIC Insured | | 1/17 at 100.00 | A+ (4) | | | 28,159 | |
| | 2,000 | | Municipal Electric Authority of Georgia, Project One Subordinated Lien Revenue Bonds, Series 2003A, 5.000%, 1/01/22 (Pre-refunded 1/01/13) – NPFG Insured | | 1/13 at 100.00 | A+ (4) | | | 2,008,040 | |
| | | | Newnan Hospital Authority, Georgia, Revenue Anticipation Certificates, Newnan Hospital Inc., Series 2002: | | | | | | | |
| | 2,260 | | 5.500%, 1/01/19 (Pre-refunded 1/01/13) – NPFG Insured | | 1/13 at 100.00 | Aa3 (4) | | | 2,270,328 | |
| | 3,020 | | 5.500%, 1/01/20 (Pre-refunded 1/01/13) – NPFG Insured | | 1/13 at 100.00 | Aa3 (4) | | | 3,033,801 | |
| | Principal | | | | Optional Call | | | | | |
| | Amount (000) | | Description (1) | | Provisions (2) | Ratings (3) | | | Value | |
| | | | U.S. Guaranteed (4) (continued) | | | | | | | |
| | | | Oconee County, Georgia, General Obligation Bonds, Recreation Project, Series 2003: | | | | | | | |
| $ | 1,410 | | 5.500%, 1/01/23 (Pre-refunded 1/01/13) – AMBAC Insured | | 1/13 at 101.00 | Aa2 (4) | | $ | 1,430,530 | |
| | 1,470 | | 5.250%, 1/01/26 (Pre-refunded 1/01/13) – AMBAC Insured | | 1/13 at 101.00 | Aa2 (4) | | | 1,491,095 | |
| | 18,870 | | Total U.S. Guaranteed | | | | | | 19,216,556 | |
| | | | Utilities – 10.1% (7.3% of Total Investments) | | | | | | | |
| | 525 | | Burke County Development Authority, Georgia, Pollution Control Revenue Bonds, Georgia Power Company – Vogtle Plant, First Series 2012, 1.750%, 12/01/49 (Mandatory put 6/01/17) | | No Opt. Call | A | | | 542,787 | |
| | 200 | | Burke County Development Authority, Georgia, Pollution Control Revenue Bonds, Ogelthrope Power Company – Vogtle Plant, Series 2008, 0.900%, 1/01/39 (Mandatory put 3/01/13) | | No Opt. Call | A | | | 200,184 | |
| | 2,000 | | Georgia Municipal Electric Authority, General Power Revenue Bonds, Project 1, Series 2007A, 5.000%, 1/01/25 – NPFG Insured | | 1/17 at 100.00 | A+ | | | 2,247,220 | |
| | 3,000 | | Georgia Municipal Electric Authority, General Power Revenue Bonds, Series 2012GG, 5.000%, 1/01/43 | | 1/23 at 100.00 | A+ | | | 3,497,460 | |
| | 975 | | Georgia Municipal Electric Authority, Senior Lien General Power Revenue Bonds, Series 1993Z, 5.500%, 1/01/20 – FGIC Insured | | No Opt. Call | A+ | | | 1,066,319 | |
| | | | Main Street Natural Gas Inc., Georgia, Gas Project Revenue Bonds, Series 2006B: | | | | | | | |
| | 1,000 | | 5.000%, 3/15/20 | | No Opt. Call | A | | | 1,164,880 | |
| | 1,300 | | 5.000%, 3/15/21 | | No Opt. Call | A | | | 1,514,084 | |
| | 1,500 | | 5.000%, 3/15/22 | | No Opt. Call | A | | | 1,759,575 | |
| | | | Main Street Natural Gas Inc., Georgia, Gas Project Revenue Bonds, Series 2007A: | | | | | | | |
| | 350 | | 5.125%, 9/15/17 | | No Opt. Call | A | | | 400,285 | |
| | 950 | | 5.000%, 3/15/18 | | No Opt. Call | A+ | | | 1,101,820 | |
| | | | Municipal Electric Authority of Georgia, Combustion Turbine Revenue Bonds, Series 2003A: | | | | | | | |
| | 500 | | 5.250%, 11/01/15 – NPFG Insured | | 11/13 at 100.00 | A1 | | | 521,395 | |
| | 1,000 | | 5.000%, 11/01/20 – NPFG Insured | | 11/13 at 100.00 | A1 | | | 1,036,910 | |
| | 1,200 | | Virgin Islands Water and Power Authority, Electric System Revenue Bonds, Series 2007B, 5.000%, 7/01/31 | | 7/17 at 100.00 | Baa3 | | | 1,252,848 | |
| | 14,500 | | Total Utilities | | | | | | 16,305,767 | |
| | | | Water and Sewer – 16.1% (11.5% of Total Investments) | | | | | | | |
| | 190 | | Atlanta, Georgia, Water and Wastewater Revenue Bonds, Series 1999A, 5.000%, 11/01/38 – FGIC Insured | | 5/13 at 100.00 | A1 | | | 190,585 | |
| | | | Atlanta, Georgia, Water and Wastewater Revenue Bonds, Series 2004: | | | | | | | |
| | 500 | | 5.250%, 11/01/15 – AGM Insured | | 11/14 at 100.00 | AA– | | | 542,475 | |
| | 2,425 | | 5.000%, 11/01/24 – AGM Insured | | 11/14 at 100.00 | AA– | | | 2,601,564 | |
| | 700 | | 5.000%, 11/01/37 – AGM Insured | | 11/14 at 100.00 | AA– | | | 743,155 | |
| | 5,105 | | Cherokee County Water and Sewerage Authority, Georgia, Revenue Bonds, Series 2001, 5.000%, 8/01/35 – AGM Insured | | 8/18 at 100.00 | AA | | | 5,953,145 | |
| | 335 | | Coweta County Water and Sewer Authority, Georgia, Revenue Bonds, Series 2001, 5.250%, 6/01/26 – AMBAC Insured | | 6/13 at 100.00 | Aa2 | | | 339,633 | |
| | | | Coweta County Water and Sewer Authority, Georgia, Revenue Bonds, Series 2007: | | | | | | | |
| | 1,000 | | 5.000%, 6/01/32 | | 6/18 at 100.00 | Aa2 | | | 1,151,930 | |
| | 1,000 | | 5.000%, 6/01/37 | | 6/18 at 100.00 | Aa2 | | | 1,134,660 | |
| | 1,250 | | DeKalb County, Georgia, Water and Sewerage Revenue Bonds, Refunding Series 2006B, 5.250%, 10/01/32 – AGM Insured | | 10/26 at 100.00 | Aa2 | | | 1,621,825 | |
| | 1,850 | | DeKalb County, Georgia, Water and Sewerage Revenue Bonds, Second Resolution Series 2011A, 5.250%, 10/01/41 | | 10/21 at 100.00 | Aa3 | | | 2,182,723 | |
| | 2,225 | | Douglasville-Douglas County Water and Sewer Authority, Georgia, Water and Sewage Revenue Bonds, Series 2007, 5.000%, 6/01/37 – NPFG Insured | | 6/17 at 100.00 | Aa2 | | | 2,554,901 | |
| | 1,000 | | Douglasville-Douglas County Water and Sewer Authority, Georgia, Water and Sewer Revenue Bonds, Series 2005, 5.000%, 6/01/29 – NPFG Insured | | 12/15 at 100.00 | Aa2 | | | 1,115,670 | |
| | 385 | | Fulton County, Georgia, Water and Sewerage Revenue Bonds, Series 2004, 5.000%, 1/01/35 – FGIC Insured | | 1/14 at 100.00 | AA- | | | 401,185 | |
| | 500 | | Georgia Environmental Loan Acquisition Corporation, Local Government Loan Securitization Bonds, Cobb County-Marietta Water Authority Loans, Series 2011, 5.250%, 2/15/36 | | 2/21 at 100.00 | Aaa | | | 590,260 | |
| | | Nuveen Georgia Dividend Advantage Municipal Fund 2 (continued) |
| NKG | | Portfolio of Investments |
| | | November 30, 2012 (Unaudited) |
| | Principal | | | | Optional Call | | | | | |
| | Amount (000) | | Description (1) | | Provisions (2) | Ratings (3) | | | Value | |
| | | | Water and Sewer (continued) | | | | | | | |
| $ | 1,000 | | Midgeville, Georgia, Water and Sewerage Revenue Refunding Bonds, Series 1996, 6.000%, 12/01/21 – AGM Insured | | No Opt. Call | AA– | | $ | 1,240,140 | |
| | 1,000 | | Unified Government of Athens-Clarke County, Georgia, Water and Sewerage Revenue Bonds, Series 2008, 5.500%, 1/01/38 | | 1/19 at 100.00 | AA+ | | | 1,205,010 | |
| | 1,975 | | Walton County Water and Sewerage Authority, Georgia, Revenue Bonds, The Oconee-Hard Creek Reservoir Project, Series 2008, 5.000%, 2/01/38 – AGM Insured | | 2/18 at 100.00 | Aa2 | | | 2,228,096 | |
| | 22,440 | | Total Water and Sewer | | | | | | 25,796,957 | |
| $ | 267,310 | | Total Investments (cost $204,334,229) – 140.0% | | | | | | 224,877,334 | |
| | | | Floating Rate Obligations – (2.0)% | | | | | | (3,245,000 | ) |
| | | | MuniFund Term Preferred Shares, at Liquidation Value – (46.7)% (5) | | | | | | (74,945,000 | ) |
| | | | Other Assets Less Liabilities – 8.7% | | | | | | 13,905,314 | |
| | | | Net Assets Applicable to Common Shares – 100% | | | | | $ | 160,592,648 | |
| (1) | | All percentages shown in the Portfolio of Investments are based on net assets applicable to Common shares unless otherwise noted. |
| (2) | | Optional Call Provisions: Dates (month and year) and prices of the earliest optional call or redemption. There may be other call provisions at varying prices at later dates. Certain mortgage-backed securities may be subject to periodic principal paydowns. |
| (3) | | Ratings: Using the highest of Standard & Poor’s Group (“Standard & Poor’s”), Moody’s Investors Service, Inc. (“Moody’s”) or Fitch, Inc. (“Fitch”) rating. Ratings below BBB by Standard & Poor’s, Baa by Moody’s or BBB by Fitch are considered to be below investment grade. Holdings designated N/R are not rated by any of these national rating agencies. |
| (4) | | Backed by an escrow or trust containing sufficient U.S. Government or U.S. Government agency securities, which ensure the timely payment of principal and interest. Certain bonds backed by U.S. Government or agency securities are regarded as having an implied rating equal to the rating of such securities. |
| (5) | | MuniFund Term Preferred Shares, at Liquidation Value as a percentage of Total Investments is 33.3% |
| N/R | | Not rated. |
| (IF) | | Inverse floating rate investment. |
| (UB) | | Underlying bond of an inverse floating rate trust reflected as a financing transaction. See Notes to Financial Statements, Footnote 1 – General Information and Significant Accounting Policies, Inverse Floating Rate Securities for more information. |
See accompanying notes to financial statements.
| | | Nuveen Maryland Premium Income Municipal Fund |
| NMY | | Portfolio of Investments |
| | | November 30, 2012 (Unaudited) |
| | Principal | | | | Optional Call | | | | | |
| | Amount (000) | | Description (1) | | Provisions (2) | Ratings (3) | | | Value | |
| | | | Consumer Discretionary – 4.3% (3.0% of Total Investments) | | | | | | | |
| | | | Baltimore, Maryland, Senior Lien Convention Center Hotel Revenue Bonds, Series 2006A: | | | | | | | |
| $ | 540 | | 5.000%, 9/01/16 – SYNCORA GTY Insured | | No Opt. Call | BB+ | | $ | 572,654 | |
| | 400 | | 5.250%, 9/01/19 – SYNCORA GTY Insured | | 9/16 at 100.00 | BB+ | | | 426,424 | |
| | 160 | | 5.250%, 9/01/25 – SYNCORA GTY Insured | | 9/16 at 100.00 | BB+ | | | 166,725 | |
| | 350 | | 5.250%, 9/01/27 – SYNCORA GTY Insured | | 9/16 at 100.00 | BB+ | | | 363,475 | |
| | 250 | | 4.600%, 9/01/30 – SYNCORA GTY Insured | | 9/16 at 100.00 | BB+ | | | 252,300 | |
| | 100 | | 5.000%, 9/01/32 – SYNCORA GTY Insured | | 9/16 at 100.00 | BB+ | | | 101,944 | |
| | 12,130 | | 5.250%, 9/01/39 – SYNCORA GTY Insured | | 9/16 at 100.00 | BB+ | | | 12,448,531 | |
| | 1,000 | | Baltimore, Maryland, Subordinate Lien Convention Center Hotel Revenue Bonds, Series 2006B, 5.875%, 9/01/39 | | 9/16 at 100.00 | Ba2 | | | 1,037,130 | |
| | 2,000 | | Maryland Economic Development Corporation, Revenue Bonds, Chesapeake Bay Hyatt Conference Center, Series 2006A, 5.000%, 12/01/31 | | 12/16 at 100.00 | N/R | | | 1,403,840 | |
| | 16,930 | | Total Consumer Discretionary | | | | | | 16,773,023 | |
| | | | Consumer Staples – 7.6% (5.3% of Total Investments) | | | | | | | |
| | | | Guam Economic Development & Commerce Authority, Tobacco Settlement Asset-Backed Bonds, Series 2007A: | | | | | | | |
| | 3,240 | | 5.250%, 6/01/32 | | 6/17 at 100.00 | B+ | | | 3,230,215 | |
| | 2,665 | | 5.625%, 6/01/47 | | 6/17 at 100.00 | B+ | | | 2,435,970 | |
| | 155,700 | | Puerto Rico, The Children’s Trust Fund, Tobacco Settlement Asset-Backed Bonds, Series 2005A, 0.000%, 5/15/50 | | 5/15 at 11.19 | BB– | | | 12,160,167 | |
| | | | Puerto Rico, The Children’s Trust Fund, Tobacco Settlement Asset-Backed Refunding Bonds, Series 2002: | | | | | | | |
| | 7,625 | | 5.375%, 5/15/33 | | 5/13 at 100.00 | BBB+ | | | 7,633,616 | |
| | 3,270 | | 5.500%, 5/15/39 | | 5/13 at 100.00 | BBB | | | 3,273,695 | |
| | 800 | | Tobacco Settlement Financing Corporation, Virgin Islands, Tobacco Settlement Asset-Backed Bonds, Series 2001, 5.000%, 5/15/31 | | 5/13 at 100.00 | A3 | | | 735,688 | |
| | 173,300 | | Total Consumer Staples | | | | | | 29,469,351 | |
| | | | Education and Civic Organizations – 12.0% (8.2% of Total Investments) | | | | | | | |
| | 2,375 | | Frederick County, Maryland, Educational Facilities Revenue Bonds, Mount Saint Mary’s College, Series 2006, 5.625%, 9/01/38 | | 9/16 at 100.00 | BB+ | | | 2,403,951 | |
| | 3,020 | | Hartford County, Maryland, Economic Development Revenue Bonds, Battelle Memorial Institute, Series 2004, 5.250%, 4/01/34 | | 4/14 at 100.00 | A+ | | | 3,157,199 | |
| | 1,750 | | Maryland Health and Higher Educational Facilities Authority, Educational Facilities Leasehold Mortgage Revenue Bonds, McLean School, Series 2001, 6.000%, 7/01/31 | | 1/13 at 100.00 | BBB– | | | 1,751,313 | |
| | 700 | | Maryland Health and Higher Educational Facilities Authority, Revenue Bonds, Goucher College, Series 2012A, 5.000%, 7/01/34 | | 7/22 at 100.00 | A– | | | 825,125 | |
| | 3,335 | | Maryland Health and Higher Educational Facilities Authority, Revenue Bonds, Johns Hopkins University, Series 2004, Trust 1003, 13.687%, 3/13/14 (IF) | | No Opt. Call | AA+ | | | 3,966,082 | |
| | 3,500 | | Maryland Health and Higher Educational Facilities Authority, Revenue Bonds, Maryland Institute College of Art, Series 2006, 5.000%, 6/01/30 | | 6/16 at 100.00 | Baa1 | | | 3,725,715 | |
| | 1,130 | | Maryland Health and Higher Educational Facilities Authority, Revenue Bonds, Maryland Institute College of Art, Series 2007, 5.000%, 6/01/36 | | 6/17 at 100.00 | Baa1 | | | 1,213,925 | |
| | 1,500 | | Maryland Health and Higher Educational Facilities Authority, Revenue Bonds, Maryland Institute College of Art, Series 2012, 5.000%, 6/01/47 | | 6/22 at 100.00 | Baa1 | | | 1,688,055 | |
| | 745 | | Maryland Health and Higher Educational Facilities Authority, Revenue Bonds, Patterson Park Public Charter School Issue, Series 2010, 6.000%, 7/01/40 | | 7/20 at 100.00 | BBB | | | 812,482 | |
| | 2,100 | | Maryland Industrial Development Financing Authority, Revenue Bonds, Our Lady of Good Counsel High School, Series 2005A, 6.000%, 5/01/35 | | 5/15 at 100.00 | N/R | | | 2,207,751 | |
| | | | Montgomery County Revenue Authority, Maryland, Lease Revenue Bonds, Montgomery College Arts Center Project, Series 2005A: | | | | | | | |
| | 1,300 | | 5.000%, 5/01/18 | | 5/15 at 100.00 | AA | | | 1,419,366 | |
| | 1,365 | | 5.000%, 5/01/19 | | 5/15 at 100.00 | AA | | | 1,487,359 | |
| | 615 | | 5.000%, 5/01/20 | | 5/15 at 100.00 | AA | | | 667,404 | |
| | | Nuveen Maryland Premium Income Municipal Fund (continued) |
| NMY | | Portfolio of Investments |
| | | November 30, 2012 (Unaudited) |
| | Principal | | | | Optional Call | | | | | |
| | Amount (000) | | Description (1) | | Provisions (2) | Ratings (3) | | | Value | |
| | | | Education and Civic Organizations (continued) | | | | | | | |
| $ | 625 | | Morgan State University, Maryland, Student Tuition and Fee Revenue Bonds, Academic Fees and Auxiliary Facilities, Series 2012, 5.000%, 7/01/29 | | 7/22 at 100.00 | Aa3 | | $ | 758,925 | |
| | 9,445 | | Morgan State University, Maryland, Student Tuition and Fee Revenue Refunding Bonds, Academic Fees and Auxiliary Facilities, Series 1993, 6.100%, 7/01/20 – NPFG Insured | | No Opt. Call | Aa3 | | | 11,643,699 | |
| | 2,000 | | University of Maryland, Auxiliary Facility and Tuition Revenue Bonds, Refunding Series 2012A, 3.000%, 4/01/13 | | No Opt. Call | AA+ | | | 2,019,220 | |
| | 265 | | University of Puerto Rico, University System Revenue Bonds, Series 2006P, 5.000%, 6/01/23 | | 6/16 at 100.00 | Baa2 | | | 276,647 | |
| | 1,145 | | University of Puerto Rico, University System Revenue Bonds, Series 2006Q, 5.000%, 6/01/19 | | 6/16 at 100.00 | Baa2 | | | 1,208,227 | |
| | | | Westminster, Maryland, Educational Facilities Revenue Bonds, McDaniel College, Series 2006: | | | | | | | |
| | 2,000 | | 5.000%, 11/01/31 | | 11/16 at 100.00 | BBB+ | | | 2,099,580 | |
| | 2,750 | | 4.500%, 11/01/36 | | 11/16 at 100.00 | BBB+ | | | 2,799,830 | |
| | 41,665 | | Total Education and Civic Organizations | | | | | | 46,131,855 | |
| | | | Health Care – 27.8% (19.2% of Total Investments) | | | | | | | |
| | 500 | | Baltimore County, Maryland, Revenue Bonds, Catholic Health Initiatives, Series 2006A, 5.000%, 9/01/36 | | 9/16 at 100.00 | AA– | | | 563,520 | |
| | 1,115 | | Maryland Health and Higher Educational Facilities Authority, Revenue Bonds Doctors Community Hospital, Refunding Series 2010, 5.750%, 7/01/38 | | 7/20 at 100.00 | Baa3 | | | 1,231,952 | |
| | | | Maryland Health and Higher Educational Facilities Authority, Revenue Bonds, Adventist Healthcare, Series 2011A: | | | | | | | |
| | 1,350 | | 6.250%, 1/01/31 | | 1/22 at 100.00 | Baa2 | | | 1,629,761 | |
| | 375 | | 6.125%, 1/01/36 | | 1/22 at 100.00 | Baa2 | | | 441,446 | |
| | 2,500 | | Maryland Health and Higher Educational Facilities Authority, Revenue Bonds, Anne Arundel Health System, Series 2010, 5.000%, 7/01/40 | | 7/19 at 100.00 | A– | | | 2,739,600 | |
| | 3,075 | | Maryland Health and Higher Educational Facilities Authority, Revenue Bonds, Calvert Memorial Hospital, Series 2004, 5.500%, 7/01/36 | | 7/14 at 100.00 | A | | | 3,176,936 | |
| | 2,550 | | Maryland Health and Higher Educational Facilities Authority, Revenue Bonds, Carroll Hospital Center, Series 2006, 5.000%, 7/01/40 | | 7/16 at 100.00 | A3 | | | 2,708,279 | |
| | | | Maryland Health and Higher Educational Facilities Authority, Revenue Bonds, Carroll Hospital Center, Series 2012A: | | | | | | | |
| | 1,000 | | 4.000%, 7/01/30 | | 7/22 at 100.00 | A3 | | | 1,066,000 | |
| | 1,275 | | 5.000%, 7/01/37 | | 7/22 at 100.00 | A3 | | | 1,441,222 | |
| | 4,755 | | Maryland Health and Higher Educational Facilities Authority, Revenue Bonds, Civista Medical Center, Series 2005, 5.000%, 7/01/37 – RAAI Insured | | 7/14 at 100.00 | N/R | | | 4,766,269 | |
| | 4,050 | | Maryland Health and Higher Educational Facilities Authority, Revenue Bonds, Doctors Community Hospital, Series 2007A, 5.000%, 7/01/29 | | 7/17 at 100.00 | Baa3 | | | 4,224,920 | |
| | 3,335 | | Maryland Health and Higher Educational Facilities Authority, Revenue Bonds, Frederick Memorial Hospital Issue, Series 2012A, 4.250%, 7/01/32 (WI/DD, Settling 12/05/12) | | 7/22 at 100.00 | BBB+ | | | 3,580,689 | |
| | | | Maryland Health and Higher Educational Facilities Authority, Revenue Bonds, Johns Hopkins Health System Obligated Group Issue, Series 2011A: | | | | | | | |
| | 500 | | 5.000%, 5/15/25 | | 5/21 at 100.00 | AA– | | | 606,865 | |
| | 500 | | 5.000%, 5/15/26 | | 5/21 at 100.00 | AA– | | | 606,695 | |
| | 4,225 | | Maryland Health and Higher Educational Facilities Authority, Revenue Bonds, Kaiser Permanente System, Series 1998A, 5.375%, 7/01/15 | | 1/13 at 100.00 | A+ | | | 4,237,295 | |
| | 6,800 | | Maryland Health and Higher Educational Facilities Authority, Revenue Bonds, Kennedy Krieger Institute, Series 2003, 5.500%, 7/01/33 | | 7/13 at 100.00 | Baa3 | | | 6,862,356 | |
| | 2,735 | | Maryland Health and Higher Educational Facilities Authority, Revenue Bonds, LifeBridge Health System, Series 2008, 5.000%, 7/01/28 – AGC Insured | | 7/17 at 100.00 | AA– | | | 3,017,608 | |
| | 1,000 | | Maryland Health and Higher Educational Facilities Authority, Revenue Bonds, LifeBridge Health System, Series 2011, 6.000%, 7/01/41 | | 7/21 at 100.00 | A | | | 1,209,980 | |
| | 1,250 | | Maryland Health and Higher Educational Facilities Authority, Revenue Bonds, Loyola University Maryland, Series 2012A, 5.000%, 10/01/39 | | 10/22 at 100.00 | A | | | 1,478,475 | |
| | | | Maryland Health and Higher Educational Facilities Authority, Revenue Bonds, MedStar Health, Series 2004: | | | | | | | |
| | 1,000 | | 5.000%, 8/15/13 | | No Opt. Call | A2 | | | 1,032,960 | |
| | 4,050 | | 5.375%, 8/15/24 | | 8/14 at 100.00 | A2 | | | 4,312,359 | |
| | Principal | | | | Optional Call | | | | | |
| | Amount (000) | | Description (1) | | Provisions (2) | Ratings (3) | | | Value | |
| | | | Health Care (continued) | | | | | | | |
| $ | 7,720 | | Maryland Health and Higher Educational Facilities Authority, Revenue Bonds, MedStar Health, Series 2007, 5.250%, 5/15/46 – BHAC Insured | | 5/16 at 100.00 | AA+ | | $ | 8,604,632 | |
| | 2,300 | | Maryland Health and Higher Educational Facilities Authority, Revenue Bonds, Mercy Medical Center, Series 2011, 5.000%, 7/01/31 | | 7/22 at 100.00 | BBB | | | 2,591,824 | |
| | | | Maryland Health and Higher Educational Facilities Authority, Revenue Bonds, Mercy Medical Center Project, Series 2007A: | | | | | | | |
| | 2,375 | | 5.000%, 7/01/37 | | 7/17 at 100.00 | BBB | | | 2,508,689 | |
| | 2,905 | | 5.500%, 7/01/42 | | 7/17 at 100.00 | BBB | | | 3,133,130 | |
| | 3,950 | | Maryland Health and Higher Educational Facilities Authority, Revenue Bonds, Peninsula Regional Medical Center, Series 2006, 5.000%, 7/01/36 | | 7/16 at 100.00 | A | | | 4,243,762 | |
| | 4,450 | | Maryland Health and Higher Educational Facilities Authority, Revenue Bonds, The Johns Hopkins Health System Obligated Group Issue, Series 2010, 5.000%, 5/15/40 | | 5/20 at 100.00 | AA– | | | 5,042,340 | |
| | | | Maryland Health and Higher Educational Facilities Authority, Revenue Bonds, Union Hospital of Cecil County, Series 2005: | | | | | | | |
| | 1,000 | | 5.000%, 7/01/35 | | 7/15 at 100.00 | A | | | 1,039,140 | |
| | 1,500 | | 5.000%, 7/01/40 | | 7/15 at 100.00 | A | | | 1,556,070 | |
| | 4,105 | | Maryland Health and Higher Educational Facilities Authority, Revenue Bonds, University of Maryland Medical System Issue, Series 2010, 5.125%, 7/01/39 | | 7/19 at 100.00 | A | | | 4,592,756 | |
| | 1,000 | | Maryland Health and Higher Educational Facilities Authority, Revenue Bonds, University of Maryland Medical System, Series 2004B, 5.000%, 7/01/24 – AMBAC Insured | | 7/13 at 100.00 | A | | | 1,018,140 | |
| | | | Maryland Health and Higher Educational Facilities Authority, Revenue Bonds, University of Maryland Medical System, Series 2006: | | | | | | | |
| | 700 | | 5.000%, 7/01/31 | | 7/16 at 100.00 | A | | | 755,783 | |
| | 1,325 | | 5.000%, 7/01/36 | | 7/16 at 100.00 | A | | | 1,423,540 | |
| | | | Maryland Health and Higher Educational Facilities Authority, Revenue Bonds, Washington County Hospital, Series 2008: | | | | | | | |
| | 6,575 | | 5.750%, 1/01/38 | | 1/18 at 100.00 | BBB | | | 7,224,807 | |
| | 1,950 | | 6.000%, 1/01/43 | | 1/18 at 100.00 | BBB | | | 2,164,227 | |
| | | | Maryland Health and Higher Educational Facilities Authority, Revenue Bonds, Western Maryland Health, Series 2006A: | | | | | | | |
| | 2,910 | | 4.500%, 1/01/22 – NPFG Insured | | 7/16 at 100.00 | BBB | | | 3,211,185 | |
| | 95 | | 5.000%, 7/01/34 – NPFG Insured | | 7/16 at 100.00 | BBB | | | 101,296 | |
| | 775 | | Maryland Health and Higher Educational Facilities Authority, Revenue Refunding Bonds, Adventist Healthcare, Series 2003A, 5.750%, 1/01/25 | | 1/13 at 101.00 | Baa2 | | | 784,106 | |
| | | | Prince George’s County, Maryland, Revenue Bonds, Dimensions Health Corporation, Series 1994: | | | | | | | |
| | 3,605 | | 5.375%, 7/01/14 | | 1/13 at 100.00 | B3 | | | 3,606,478 | |
| | 2,595 | | 5.300%, 7/01/24 | | 1/13 at 100.00 | B3 | | | 2,580,676 | |
| | 99,775 | | Total Health Care | | | | | | 107,117,768 | |
| | | | Housing/Multifamily – 5.3% (3.6% of Total Investments) | | | | | | | |
| | 2,060 | | Anne Arundel County, Maryland, FNMA Multifamily Housing Revenue Bonds, Glenview Gardens Apartments Project, Series 2009, 5.000%, 1/01/28 (Mandatory put 1/01/27) | | 1/20 at 102.00 | AA+ | | | 2,351,717 | |
| | 2,500 | | Maryland Community Development Administration, Housing Revenue Bonds, Series 1999A, 5.350%, 7/01/41 (Alternative Minimum Tax) | | 1/13 at 100.00 | Aa2 | | | 2,502,800 | |
| | 980 | | Maryland Community Development Administration, Housing Revenue Bonds, Series 2002B, 4.950%, 7/01/32 (Alternative Minimum Tax) | | 1/13 at 100.00 | Aa2 | | | 981,068 | |
| | 3,145 | | Maryland Community Development Administration, Multifamily Development Revenue Bonds, Waters Towers Senior Apartments, Series 2001F, 5.450%, 12/15/33 (Alternative Minimum Tax) | | 12/12 at 100.00 | Aaa | | | 3,149,434 | |
| | 2,110 | | Maryland Community Development Administration, Multifamily Housing Revenue Bonds, Princess Anne Apartments, Series 2001D, 5.450%, 12/15/33 (Alternative Minimum Tax) | | 12/12 at 100.00 | Aaa | | | 2,112,975 | |
| | | | Maryland Economic Development Corporation, Senior Lien Student Housing Revenue Bonds, University of Maryland – Baltimore, Series 2003A: | | | | | | | |
| | 50 | | 5.000%, 10/01/15 | | 10/13 at 100.00 | B3 | | | 48,069 | |
| | 3,460 | | 5.625%, 10/01/23 | | 10/13 at 100.00 | B3 | | | 3,146,524 | |
| | 2,615 | | Maryland Economic Development Corporation, Student Housing Revenue Refunding Bonds, University of Maryland College Park Projects, Series 2006, 5.000%, 6/01/33 – CIFG Insured | | 6/16 at 100.00 | AA– | | | 2,726,164 | |
| | | Nuveen Maryland Premium Income Municipal Fund (continued) |
| NMY | | Portfolio of Investments |
| | | November 30, 2012 (Unaudited) |
| | Principal | | | | Optional Call | | | | | |
| | Amount (000) | | Description (1) | | Provisions (2) | Ratings (3) | | | Value | |
| | | | Housing/Multifamily (continued) | | | | | | | |
| $ | 235 | | Montgomery County Housing Opportunities Commission, Maryland, GNMA/FHA-Insured Multifamily Housing Revenue Bonds, Series 1995A, 5.900%, 7/01/15 | | 1/13 at 100.00 | Aa2 | | $ | 235,891 | |
| | 405 | | Montgomery County Housing Opportunities Commission, Maryland, Multifamily Housing Development Bonds, Series 2000B, 6.200%, 7/01/30 (Alternative Minimum Tax) | | 1/13 at 100.00 | Aaa | | | 405,834 | |
| | | | Prince George’s County Housing Authority, Maryland, GNMA Collateralized Mortgage Revenue Refunding Bonds, Overlook Apartments, Series 1995A: | | | | | | | |
| | 970 | | 5.700%, 12/20/15 | | 12/12 at 100.00 | AA+ | | | 973,657 | |
| | 1,670 | | 5.750%, 12/20/19 | | 12/12 at 100.00 | AA+ | | | 1,675,294 | |
| | 20,200 | | Total Housing/Multifamily | | | | | | 20,309,427 | |
| | | | Housing/Single Family – 9.4% (6.5% of Total Investments) | | | | | | | |
| | 3,535 | | Maryland Community Development Administration Department of Housing and Community Development, Residential Revenue Bonds, Series 2008C, 5.375%, 9/01/39 | | 9/18 at 100.00 | Aa2 | | | 3,877,471 | |
| | 3,000 | | Maryland Community Development Administration Department of Housing and Community Development, Residential Revenue Bonds, Series 2009B, 4.750%, 9/01/39 | | 9/18 at 100.00 | Aa2 | | | 3,201,780 | |
| | 2,130 | | Maryland Community Development Administration Department of Housing and Community Development, Residential Revenue Bonds, Series 2010B, 5.250%, 9/01/35 | | 3/20 at 100.00 | Aa2 | | | 2,395,845 | |
| | 5,425 | | Maryland Community Development Administration, Department of Housing and Community Development, Residential Revenue Bonds, Series 2005E, 4.900%, 9/01/36 (Alternative Minimum Tax) (UB) (4) | | 9/14 at 100.00 | AA | | | 5,529,755 | |
| | | | Maryland Community Development Administration, Department of Housing and Community Development, Residential Revenue Bonds, Series 2006: | | | | | | | |
| | 1,800 | | 4.750%, 9/01/25 (Alternative Minimum Tax) (UB) (4) | | 9/15 at 100.00 | AA | | | 1,872,486 | |
| | 7,500 | | 4.875%, 9/01/26 (Alternative Minimum Tax) (UB) (4) | | 3/16 at 100.00 | AA | | | 7,864,650 | |
| | 2,345 | | 4.900%, 9/01/26 (Alternative Minimum Tax) (UB) (4) | | 9/15 at 100.00 | AA | | | 2,443,348 | |
| | 4,075 | | 4.900%, 9/01/31 (Alternative Minimum Tax) (UB) (4) | | 9/16 at 100.00 | AA | | | 4,276,425 | |
| | | | Maryland Community Development Administration, Department of Housing and Community Development, Residential Revenue Bonds, Series 2007: | | | | | | | |
| | 1,500 | | 5.000%, 9/01/27 (Alternative Minimum Tax) (UB) (4) | | 3/17 at 100.00 | AA | | | 1,600,634 | |
| | 2,820 | | 4.850%, 9/01/37 (Alternative Minimum Tax) (UB) (4) | | 3/17 at 100.00 | AA | | | 2,934,886 | |
| | | | Maryland Community Development Administration, Residential Revenue Bonds, Series 2009, Trust 3364: | | | | | | | |
| | 240 | | Puerto Rico Housing Finance Authority, Mortgage-Backed Securities Program Home Mortgage Revenue Bonds, Series 2003A, 4.875%, 6/01/34 (Alternative Minimum Tax) | | 6/13 at 100.00 | Aaa | | | 241,505 | |
| | 34,370 | | Total Housing/Single Family | | | | | | 36,238,785 | |
| | | | Industrials – 2.7% (1.9% of Total Investments) | | | | | | | |
| | 5,895 | | Maryland Economic Development Corporation, Economic Development Revenue Bonds, Transportation Facilities Project, Series 2010A, 5.750%, 6/01/35 | | 6/20 at 100.00 | Baa3 | | | 6,746,828 | |
| | 3,340 | | Maryland Economic Development Corporation, Solid Waste Disposal Revenue Bonds, Waste Management Inc., Series 2002, 4.600%, 4/01/16 (Alternative Minimum Tax) | | No Opt. Call | BBB | | | 3,623,332 | |
| | 9,235 | | Total Industrials | | | | | | 10,370,160 | |
| | | | Long-Term Care – 5.6% (3.8% of Total Investments) | | | | | | | |
| | 5,215 | | Baltimore County, Maryland, Revenue Bonds, Oak Crest Village, Series 2007A, 5.000%, 1/01/37 | | 1/17 at 100.00 | A– | | | 5,434,552 | |
| | 2,050 | | Gaithersburg, Maryland, Economic Development Revenue Bonds, Asbury Methodist Homes Inc., Series 2009B, 6.000%, 1/01/23 | | 1/20 at 100.00 | BBB– | | | 2,331,896 | |
| | | | Maryland Health and Higher Educational Facilities Authority, Revenue Bonds, Charlestown Community Issue, Series 2010: | | | | | | | |
| | 1,585 | | 6.125%, 1/01/30 | | 1/21 at 100.00 | A | | | 1,887,450 | |
| | 5,000 | | 6.250%, 1/01/45 | | 1/21 at 100.00 | A | | | 5,893,400 | |
| | 1,000 | | Maryland Health and Higher Educational Facilities Authority, Revenue Bonds, Edenwald, Series 2006A, 5.400%, 1/01/31 | | 7/16 at 100.00 | N/R | | | 1,044,260 | |
| | | | Maryland Health and Higher Educational Facilities Authority, Revenue Bonds, King Farm Presbyterian Community, Series 2007A: | | | | | | | |
| | 780 | | 5.000%, 1/01/17 | | No Opt. Call | N/R | | | 807,027 | |
| | 1,460 | | 5.250%, 1/01/27 | | 1/17 at 100.00 | N/R | | | 1,468,994 | |
| | 2,480 | | Maryland Health and Higher Educational Facilities Authority, Revenue Bonds, Mercy Ridge Retirement Community, Series 2007, 4.750%, 7/01/34 | | 7/17 at 100.00 | A– | | | 2,577,687 | |
| | 19,570 | | Total Long-Term Care | | | | | | 21,445,266 | |
| | Principal | | | | Optional Call | | | | | |
| | Amount (000) | | Description (1) | | Provisions (2) | Ratings (3) | | | Value | |
| | | | Tax Obligation/General – 11.6% (8.0% of Total Investments) | | | | | | | |
| $ | 1,310 | | Anne Arundel County, Maryland, General Obligation Bonds, Consolidated General Improvements, Series 2008, 5.000%, 4/01/13 | | No Opt. Call | AAA | | $ | 1,331,288 | |
| | | | Anne Arundel County, Maryland, General Obligation Bonds, Series 2006: | | | | | | | |
| | 2,540 | | 5.000%, 3/01/13 | | No Opt. Call | AAA | | | 2,571,064 | |
| | 1,565 | | 5.000%, 3/01/21 | | 3/16 at 100.00 | AAA | | | 1,775,727 | |
| | 685 | | Anne Arundel County, Maryland, Water and Sewer Revenue Bonds, Series 2006, 5.000%, 3/01/17 | | 3/16 at 100.00 | AAA | | | 783,661 | |
| | 1,000 | | Baltimore County, Maryland, Consolidated General Obligation Public Improvement Bonds, Series 2004, 5.000%, 8/01/13 | | No Opt. Call | AAA | | | 1,032,440 | |
| | | | Baltimore, Maryland, General Obligation Bonds, Consolidated Public Improvements, Series 2011A: | | | | | | | |
| | 1,000 | | 5.000%, 10/15/29 | | 10/21 at 100.00 | Aa2 | | | 1,226,860 | |
| | 1,200 | | 5.000%, 10/15/30 | | 10/21 at 100.00 | Aa2 | | | 1,464,660 | |
| | 1,540 | | Baltimore, Maryland, General Obligation Consolidated Public Improvement Bonds, Series 2004A, 5.000%, 10/15/22 – AMBAC Insured | | 10/14 at 100.00 | Aa2 | | | 1,667,343 | |
| | 150 | | Calvert County, Maryland, Consolidated General Obligation Public Improvement Refunding Bonds, Series 2003, 4.000%, 7/15/13 | | No Opt. Call | AAA | | | 153,609 | |
| | | | Charles County, Maryland, Consolidated General Obligation Public Improvement Bonds, Series 2006: | | | | | | | |
| | 2,145 | | 5.000%, 3/01/14 | | No Opt. Call | AA | | | 2,273,528 | |
| | 805 | | 5.000%, 3/01/16 | | No Opt. Call | Aa1 | | | 923,842 | |
| | 1,910 | | Frederick, Maryland, General Obligation Bonds, Series 2005, 5.000%, 8/01/16 – NPFG Insured | | 8/15 at 100.00 | AA | | | 2,142,772 | |
| | 4,000 | | Harford County, Maryland, General Obligation Bonds,Consolidated Public Improvement Series 2009, 5.000%, 7/01/13 | | No Opt. Call | Aaa | | | 4,114,200 | |
| | 2,305 | | Maryland National Capital Park Planning Commission, Prince George’s County, General Obligation Bonds, Park Acquisition and Development, Series 2004EE-2, 5.000%, 1/15/17 | | 1/14 at 100.00 | AAA | | | 2,424,468 | |
| | 2,330 | | Maryland, General Obligation Bonds, State and Local Facilities Loan, First Series 2003A, 5.250%, 3/01/13 | | No Opt. Call | AAA | | | 2,360,080 | |
| | 1,000 | | Maryland, General Obligation Bonds, State and Local Facilities Loan, Second Series 2010B, 5.000%, 8/01/14 | | No Opt. Call | AAA | | | 1,078,940 | |
| | 1,315 | | Montgomery County, Maryland, Consolidated General Obligation Public Improvement Bonds, Refunding Series 2010A, 5.000%, 8/01/13 | | No Opt. Call | AAA | | | 1,357,659 | |
| | 5,850 | | Montgomery County, Maryland, Consolidated General Obligation Public Improvement Bonds, Series 2005A, 5.000%, 7/01/15 | | No Opt. Call | AAA | | | 6,550,479 | |
| | 2,800 | | Montgomery County, Maryland, Consolidated General Obligation Public Improvement Bonds, Series 2006A, 5.000%, 5/01/16 | | No Opt. Call | AAA | | | 3,232,628 | |
| | 1,315 | | Prince George’s County, Maryland, General Obligation Consolidated Public Improvement Bonds, Series 2004F, 5.000%, 12/01/15 | | No Opt. Call | AAA | | | 1,438,347 | |
| | 2,270 | | Puerto Rico, General Obligation and Public Improvement Bonds, Series 2002A, 5.500%, 7/01/20 – NPFG Insured | | No Opt. Call | Baa1 | | | 2,542,831 | |
| | 2,155 | | Puerto Rico, General Obligation Bonds, Public Improvement Refunding Series 2007A, 5.500%, 7/01/20 – NPFG Insured | | No Opt. Call | Baa1 | | | 2,414,009 | |
| | 41,190 | | Total Tax Obligation/General | | | | | | 44,860,435 | |
| | | | Tax Obligation/Limited – 24.5% (16.9% of Total Investments) | | | | | | | |
| | 865 | | Anne Arundel County, Maryland, Special Obligation Bonds, National Business Park – North Project, Series 2010, 6.100%, 7/01/40 | | 7/18 at 102.00 | N/R | | | 947,045 | |
| | 385 | | Baltimore County, Maryland, Certificates of Participation, Equipment Acquisition Program, Series 2012, 4.000%, 10/01/14 | | No Opt. Call | AA+ | | | 409,486 | |
| | | | Baltimore County, Maryland, Certificates of Participation, Health and Social Services Building Project, Series 2001: | | | | | | | |
| | 1,580 | | 5.000%, 8/01/20 | | 8/13 at 100.00 | AA+ | | | 1,593,999 | |
| | 1,660 | | 5.000%, 8/01/21 | | 8/13 at 100.00 | AA+ | | | 1,674,708 | |
| | 120 | | Baltimore, Maryland, Revenue Refunding Bonds, Convention Center, Series 1998, 5.000%, 9/01/19 – NPFG Insured | | 3/13 at 100.00 | BBB | | | 120,398 | |
| | 300 | | Baltimore, Maryland, Special Obligation Bonds, North Locust Point Project, Series 2005, 5.500%, 9/01/34 | | 9/15 at 101.00 | N/R | | | 308,562 | |
| | | Nuveen Maryland Premium Income Municipal Fund (continued) |
| NMY | | Portfolio of Investments |
| | | November 30, 2012 (Unaudited) |
| | Principal | | | | Optional Call | | | | | |
| | Amount (000) | | Description (1) | | Provisions (2) | Ratings (3) | | | Value | |
| | | | Tax Obligation/Limited (continued) | | | | | | | |
| | | | Frederick County, Maryland, Lake Linganore Village Community Development Special Obligation Bonds, Series 2001A: | | | | | | | |
| $ | 119 | | 5.600%, 7/01/20 – RAAI Insured | | 1/13 at 100.00 | N/R | | $ | 119,201 | |
| | 450 | | 5.700%, 7/01/29 – RAAI Insured | | 1/13 at 100.00 | N/R | | | 450,473 | |
| | | | Fredrick County, Maryland, Special Obligation Bonds, Urbana Community Development Authority, Series 2010A: | | | | | | | |
| | 5,150 | | 5.000%, 7/01/30 | | 7/20 at 100.00 | A– | | | 5,834,744 | |
| | 2,305 | | 5.000%, 7/01/40 | | 7/20 at 100.00 | A– | | | 2,550,529 | |
| | 1,000 | | Government of Guam, Business Privilege Tax Bonds, Series 2011A, 5.250%, 1/01/36 | | 1/22 at 100.00 | A | | | 1,157,510 | |
| | 2,050 | | Hyattsville, Maryland, Special Obligation Bonds, University Town Center Project, Series 2004, 5.750%, 7/01/34 | | 7/14 at 102.00 | N/R | | | 2,102,501 | |
| | 11,750 | | Maryland Department of Transportation, Consolidated Transportation Revenue Bonds, Series 2002, 5.500%, 2/01/16 | | No Opt. Call | AAA | | | 13,611,078 | |
| | 3,180 | | Maryland Department of Transportation, Consolidated Transportation Revenue Bonds, Series 2004, 5.000%, 5/01/13 | | No Opt. Call | AAA | | | 3,245,222 | |
| | 1,000 | | Maryland Economic Development Corporation, Lease Revenue Bonds, Department of Transportation Headquarters Building, Series 2010, 4.000%, 6/01/13 | | No Opt. Call | AA+ | | | 1,019,190 | |
| | 920 | | Maryland Stadium Authority, Lease Revenue Bonds, Montgomery County Conference Center, Series 2012, 4.000%, 6/15/14 | | No Opt. Call | AA+ | | | 970,398 | |
| | 1,675 | | Montgomery County, Maryland, Special Obligation Bonds, West Germantown Development District, Senior Series 2002A, 5.500%, 7/01/27 – RAAI Insured | | 7/14 at 100.00 | A+ | | | 1,695,251 | |
| | 3,000 | | Prince George’s County, Maryland, Certificates of Participation, Equipment Acquisition Program, Series 2012, 3.000%, 10/15/14 | | No Opt. Call | AA+ | | | 3,143,940 | |
| | 740 | | Prince George’s County, Maryland, Lease Revenue Bonds, Upper Marlboro Justice Center, Series 2003A, 5.000%, 6/30/14 – NPFG Insured | | 6/13 at 100.00 | AA+ | | | 760,076 | |
| | 4,650 | | Prince George’s County, Maryland, Special Obligation Bonds, National Harbor Project, Series 2005, 5.200%, 7/01/34 | | 7/15 at 100.00 | N/R | | | 4,780,340 | |
| | 1,414 | | Prince George’s County, Maryland, Special Tax District Bonds, Victoria Falls Project, Series 2005, 5.250%, 7/01/35 | | 7/13 at 100.00 | N/R | | | 1,417,648 | |
| | 1,000 | | Puerto Rico Highway and Transportation Authority, Highway Revenue Bonds, Series 2005L, 5.250%, 7/01/35 – NPFG Insured | | No Opt. Call | Baa1 | | | 1,082,570 | |
| | | | Puerto Rico Highway and Transportation Authority, Highway Revenue Bonds, Series 2007N: | | | | | | | |
| | 1,100 | | 5.500%, 7/01/29 – AMBAC Insured | | No Opt. Call | Baa1 | | | 1,256,057 | |
| | 7,025 | | 5.250%, 7/01/31 – AMBAC Insured | | No Opt. Call | Baa1 | | | 7,753,844 | |
| | 1,850 | | 5.250%, 7/01/33 – NPFG Insured | | No Opt. Call | Baa1 | | | 2,030,967 | |
| | 1,000 | | Puerto Rico Highway and Transportation Authority, Subordinate Lien Highway Revenue Bonds, Series 2003, 5.250%, 7/01/15 – FGIC Insured | | 7/13 at 100.00 | Baa2 | | | 1,027,520 | |
| | 1,530 | | Puerto Rico Infrastructure Financing Authority, Special Tax Revenue Bonds, Series 2005A, 0.000%, 7/01/44 – AMBAC Insured | | No Opt. Call | BBB+ | | | 218,331 | |
| | 5,605 | | Puerto Rico Infrastructure Financing Authority, Special Tax Revenue Bonds, Series 2005C, 5.500%, 7/01/26 – AMBAC Insured | | No Opt. Call | BBB+ | | | 6,172,899 | |
| | 2,100 | | Puerto Rico Municipal Finance Agency, Series 2002A, 5.250%, 8/01/21 – AGM Insured | | 2/13 at 100.00 | AA– | | | 2,108,505 | |
| | 525 | | Puerto Rico Public Buildings Authority, Guaranteed Government Facilities Revenue Bonds, Series 2004I, 5.250%, 7/01/33 | | 7/14 at 100.00 | Baa1 | | | 540,472 | |
| | | | Puerto Rico Sales Tax Financing Corporation, Sales Tax Revenue Bonds, First Subordinate Series 2009A: | | | | | | | |
| | 970 | | 0.000%, 8/01/32 | | 8/26 at 100.00 | A+ | | | 1,025,436 | |
| | 1,500 | | 5.750%, 8/01/37 | | 8/19 at 100.00 | A+ | | | 1,674,090 | |
| | | | Puerto Rico Sales Tax Financing Corporation, Sales Tax Revenue Bonds, First Subordinate Series 2010A: | | | | | | | |
| | 1,425 | | 5.375%, 8/01/39 | | 2/20 at 100.00 | A+ | | | 1,547,393 | |
| | 200 | | 5.500%, 8/01/42 | | 2/20 at 100.00 | A+ | | | 217,036 | |
| | 4,310 | | Puerto Rico Sales Tax Financing Corporation, Sales Tax Revenue Bonds, First Subordinate Series 2010C, 5.250%, 8/01/41 | | 8/20 at 100.00 | A+ | | | 4,637,517 | |
| | | | Puerto Rico Sales Tax Financing Corporation, Sales Tax Revenue Bonds, Series 2007A: | | | | | | | |
| | 7,000 | | 0.000%, 8/01/40 – NPFG Insured | | No Opt. Call | AA– | | | 1,615,110 | |
| | 8,000 | | 0.000%, 8/01/41 – NPFG Insured | | No Opt. Call | AA– | | | 1,739,840 | |
| | 210 | | 0.000%, 8/01/47 – AMBAC Insured | | No Opt. Call | AA– | | | 31,105 | |
| | 12,140 | | 0.000%, 8/01/56 | | No Opt. Call | AA– | | | 969,986 | |
| | Principal | | | | Optional Call | | | | | |
| | Amount (000) | | Description (1) | | Provisions (2) | Ratings (3) | | | Value | |
| | | | Tax Obligation/Limited (continued) | | | | | | | |
| | | | Puerto Rico, Highway Revenue Bonds, Highway and Transportation Authority, Series 2003AA: | | | | | | | |
| $ | 520 | | 5.500%, 7/01/19 – NPFG Insured | | No Opt. Call | A3 | | $ | 596,518 | |
| | 2,350 | | 5.300%, 7/01/35 | | 7/20 at 100.00 | A3 | | | 2,445,857 | |
| | 820 | | Puerto Rico, Highway Revenue Bonds, Highway and Transportation Authority, Series 2005BB, 5.250%, 7/01/22 – AGM Insured | | No Opt. Call | AA– | | | 961,507 | |
| | | | Puerto Rico, Highway Revenue Bonds, Highway and Transportation Authority, Series 2007CC: | | | | | | | |
| | 765 | | 5.500%, 7/01/28 – NPFG Insured | | No Opt. Call | A3 | | | 877,401 | |
| | 1,200 | | 5.500%, 7/01/30 | | No Opt. Call | A3 | | | 1,362,780 | |
| | 2,300 | | 5.500%, 7/01/30 – AGM Insured | | No Opt. Call | AA– | | | 2,763,473 | |
| | 1,645 | | Virgin Islands Public Finance Authority, Matching Fund Loan Notes Revenue Bonds, Subordinate Lien Series 2010B, 5.250%, 10/01/29 | | 10/20 at 100.00 | Baa2 | | | 1,834,159 | |
| | 111,403 | | Total Tax Obligation/Limited | | | | | | 94,402,672 | |
| | | | Transportation – 5.6% (3.9% of Total Investments) | | | | | | | |
| | | | Baltimore, Maryland, Revenue Refunding Bonds, Parking System Facilities, Series 1998A: | | | | | | | |
| | 1,060 | | 5.250%, 7/01/17 – FGIC Insured | | No Opt. Call | A1 | | | 1,187,931 | |
| | 110 | | 5.250%, 7/01/21 – FGIC Insured | | No Opt. Call | A1 | | | 130,062 | |
| | 265 | | Guam International Airport Authority, Revenue Bonds, Series 2003A, 5.250%, 10/01/21 – NPFG Insured | | 10/13 at 100.00 | BBB | | | 272,767 | |
| | 725 | | Guam International Airport Authority, Revenue Bonds, Series 2003B, 5.250%, 10/01/19 – NPFG Insured | | 10/13 at 100.00 | BBB | | | 746,250 | |
| | | | Maryland Health and Higher Educational Facilities Authority, Parking Facilities Revenue Bonds, Johns Hopkins Hospital, Series 2001: | | | | | | | |
| | 1,300 | | 5.000%, 7/01/27 – AMBAC Insured | | 1/13 at 100.00 | N/R | | | 1,301,885 | |
| | 1,000 | | 5.000%, 7/01/34 – AMBAC Insured | | 1/13 at 100.00 | N/R | | | 1,001,050 | |
| | 750 | | Maryland Health and Higher Educational Facilities Authority, Parking Facilities Revenue Bonds, Johns Hopkins Medical Institution, Series 2004B, 5.000%, 7/01/15 – AMBAC Insured | | 1/15 at 100.00 | N/R | | | 810,233 | |
| | 460 | | Maryland Health and Higher Educational Facilities Authority, Parking Revenue Bonds, Johns Hopkins Medical Institutions Parking Facilities, Series 1996, 5.500%, 7/01/26 – AMBAC Insured | | 1/13 at 100.00 | N/R | | | 460,966 | |
| | 2,000 | | Maryland Transportation Authority, Revenue Bonds, Grant Anticipation Series 2008, 5.250%, 3/01/16 | | No Opt. Call | AAA | | | 2,314,920 | |
| | 10,110 | | Maryland Transportation Authority, Revenue Bonds, Transportation Facilities Projects, Series 2007, 5.000%, 7/01/30 – AGM Insured (UB) | | 7/17 at 100.00 | AA– | | | 11,614,368 | |
| | | | Port Authority of New York and New Jersey, Special Project Bonds, JFK International Air Terminal LLC, Sixth Series 1997: | | | | | | | |
| | 20 | | 5.750%, 12/01/22 – NPFG Insured (Alternative Minimum Tax) | | 6/13 at 100.00 | BBB | | | 20,009 | |
| | 70 | | 5.750%, 12/01/25 – NPFG Insured (Alternative Minimum Tax) | | 6/13 at 100.00 | BBB | | | 70,025 | |
| | 2,075 | | Puerto Rico Ports Authority, Special Facilities Revenue Bonds, American Airlines Inc., Series 1996A, 6.250%, 6/01/26 (Alternative Minimum Tax) (5) | | 6/13 at 100.00 | N/R | | | 1,603,021 | |
| | 19,945 | | Total Transportation | | | | | | 21,533,487 | |
| | | | U.S. Guaranteed – 19.3% (13.3% of Total Investments) (6) | | | | | | | |
| | 2,030 | | Anne Arundel County, Maryland, General Obligation Bonds, Series 2004, 5.000%, 4/01/16 (Pre-refunded 4/01/14) | | 4/14 at 100.00 | AAA | | | 2,157,971 | |
| | 1,530 | | Baltimore Board of School Commissioners, Maryland, Revenue Bonds, City Public School System, Series 2003A, 5.000%, 5/01/15 (Pre-refunded 5/01/13) | | 5/13 at 100.00 | AA+ (6) | | | 1,560,738 | |
| | 1,000 | | Baltimore, Maryland, Revenue Bonds, Wastewater Projects, Series 2003A, 5.000%, 7/01/33 (Pre-refunded 7/01/13) – FGIC Insured | | 7/13 at 100.00 | AA (6) | | | 1,028,070 | |
| | 3,015 | | Baltimore, Maryland, Revenue Refunding Bonds, Water Projects, Series 1998A, 5.000%, 7/01/28 – FGIC Insured (ETM) | | No Opt. Call | AA (6) | | | 3,801,312 | |
| | 2,000 | | Baltimore, Maryland, Revenue Refunding Bonds, Water System Projects, Series 1994A, 5.000%, 7/01/24 – FGIC Insured (ETM) | | No Opt. Call | AA (6) | | | 2,627,400 | |
| | 1,500 | | Baltimore, Maryland, Wastewater Project Revenue Bonds, Series 2006C, 5.000%, 7/01/31 (Pre-refunded 7/01/16) – AMBAC Insured | | 7/16 at 100.00 | AA (6) | | | 1,743,975 | |
| | 1,680 | | Carroll County, Maryland, Consolidated Public Improvement Bonds, Series 2005A, 5.000%, 12/01/16 (Pre-refunded 12/01/15) | | 12/15 at 100.00 | AAA | | | 1,909,354 | |
| | | | Charles County, Maryland, Consolidated General Obligation Public Improvement Bonds, Series 2006: | | | | | | | |
| | 40 | | 5.000%, 3/01/14 (ETM) | | No Opt. Call | Aa1 (6) | | | 42,353 | |
| | 15 | | 5.000%, 3/01/16 (ETM) | | No Opt. Call | Aa1 (6) | | | 17,209 | |
| | | Nuveen Maryland Premium Income Municipal Fund (continued) |
| NMY | | Portfolio of Investments |
| | | November 30, 2012 (Unaudited) |
| | Principal | | | | Optional Call | | | | | |
| | Amount (000) | | Description (1) | | Provisions (2) | Ratings (3) | | | Value | |
| | | | U.S. Guaranteed (6) (continued) | | | | | | | |
| | | | Howard County, Maryland, General Obligation Consolidated Public Improvement Bonds, Series 2004B: | | | | | | | |
| $ | 1,625 | | 5.000%, 8/15/17 (Pre-refunded 2/15/14) | | 2/14 at 100.00 | AAA | | $ | 1,716,569 | |
| | 1,180 | | 5.000%, 8/15/19 (Pre-refunded 2/15/14) | | 2/14 at 100.00 | AAA | | | 1,246,493 | |
| | 750 | | Maryland Department of Transportation, Consolidated Transportation Revenue Bonds, Series 2004, 5.000%, 5/01/15 (Pre-refunded 5/01/14) | | 5/14 at 100.00 | AAA | | | 799,688 | |
| | 2,875 | | Maryland Health and Higher Educational Facilities Authority, Revenue Bonds, Goucher College, Series 2004, 5.125%, 7/01/34 (Pre-refunded 7/01/14) | | 7/14 at 100.00 | A– (6) | | | 3,091,229 | |
| | | | Maryland Health and Higher Educational Facilities Authority, Revenue Bonds, Helix Health, Series 1997: | | | | | | | |
| | 1,545 | | 5.000%, 7/01/17 – AMBAC Insured (ETM) | | No Opt. Call | N/R (6) | | | 1,709,373 | |
| | 3,200 | | 5.000%, 7/01/27 – AMBAC Insured (ETM) | | No Opt. Call | N/R (6) | | | 4,074,432 | |
| | 3,125 | | Maryland Health and Higher Educational Facilities Authority, Revenue Bonds, Howard County General Hospital, Series 1993, 5.500%, 7/01/25 (ETM) | | 1/13 at 100.00 | N/R (6) | | | 3,595,031 | |
| | 3,875 | | Maryland Health and Higher Educational Facilities Authority, Revenue Bonds, LifeBridge Health System, Series 2004A, 5.125%, 7/01/34 (Pre-refunded 7/01/14) | | 7/14 at 100.00 | N/R (6) | | | 4,163,223 | |
| | 1,000 | | Maryland Health and Higher Educational Facilities Authority, Revenue Bonds, Mercy Ridge Retirement Community, Series 2003A, 6.000%, 4/01/35 (Pre-refunded 4/01/13) | | 4/13 at 101.00 | AA+ (6) | | | 1,029,210 | |
| | 885 | | Maryland National Capital Park Planning Commission, Prince George’s County, General Obligation Bonds, Park Acquisition and Development, Series 2004EE-2, 5.000%, 1/15/17 (Pre-refunded 1/15/14) | | 1/14 at 100.00 | Aaa | | | 930,914 | |
| | | | Maryland Stadium Authority, Lease Revenue Bonds, Montgomery County Conference Center Facilities, Series 2003: | | | | | | | |
| | 1,465 | | 5.000%, 6/15/21 (Pre-refunded 6/15/13) | | 6/13 at 100.00 | AA+ (6) | | | 1,502,636 | |
| | 1,620 | | 5.000%, 6/15/23 (Pre-refunded 6/15/13) | | 6/13 at 100.00 | AA+ (6) | | | 1,661,618 | |
| | 1,700 | | 5.000%, 6/15/24 (Pre-refunded 6/15/13) | | 6/13 at 100.00 | AA+ (6) | | | 1,743,673 | |
| | 1,555 | | Maryland Transportation Authority, Revenue Refunding Bonds, Transportation Facilities Projects, First Series 1978, 6.800%, 7/01/16 – AMBAC Insured (ETM) | | No Opt. Call | AAA | | | 1,750,370 | |
| | 1,670 | | Maryland, General Obligation Bonds, State and Local Facilities Loan, Second Series 2003, 5.000%, 8/01/15 (Pre-refunded 8/01/13) | | 8/13 at 100.00 | AAA | | | 1,723,507 | |
| | | | Morgan State University, Maryland, Student Tuition and Fee Revenue Bonds, Academic Fees and Auxiliary Facilities, Series 2003A: | | | | | | | |
| | 500 | | 5.000%, 7/01/20 (Pre-refunded 7/01/13) – FGIC Insured | | 7/13 at 100.00 | Aa3 (6) | | | 513,885 | |
| | 1,000 | | 5.000%, 7/01/32 (Pre-refunded 7/01/13) – FGIC Insured | | 7/13 at 100.00 | Aa3 (6) | | | 1,027,770 | |
| | | | Prince George’s County, Maryland, General Obligation Consolidated Public Improvement Bonds, Series 2003A: | | | | | | | |
| | 1,500 | | 5.000%, 10/01/17 (Pre-refunded 10/01/13) | | 10/13 at 100.00 | AAA | | | 1,559,925 | |
| | 5,770 | | 5.000%, 10/01/18 (Pre-refunded 10/01/13) | | 10/13 at 100.00 | AAA | | | 6,000,512 | |
| | 1,315 | | Puerto Rico Housing Finance Authority, Capital Fund Program Revenue Bonds, Series 2003, 5.000%, 12/01/19 (Pre-refunded 12/01/13) | | 12/13 at 100.00 | Aaa | | | 1,377,134 | |
| | 1,100 | | Puerto Rico Public Finance Corporation, Commonwealth Appropriation Bonds, Series 1998A, 5.125%, 6/01/24 – AMBAC Insured (ETM) | | No Opt. Call | Aaa | | | 1,383,723 | |
| | 1,000 | | Puerto Rico, Highway Revenue Bonds, Highway and Transportation Authority, Series 1996Y, 5.500%, 7/01/36 (Pre-refunded 7/01/16) | | 7/16 at 100.00 | Aaa | | | 1,179,640 | |
| | 2,380 | | Puerto Rico, Highway Revenue Bonds, Highway and Transportation Authority, Series 2003AA, 5.500%, 7/01/19 – NPFG Insured (ETM) | | No Opt. Call | BBB (6) | | | 3,094,452 | |
| | 3,135 | | University of Maryland, Auxiliary Facility and Tuition Revenue Bonds, Series 2006A, 5.000%, 10/01/22 (Pre-refunded 10/01/16) | | 10/16 at 100.00 | AA+ (6) | | | 3,661,868 | |
| | | | Washington Suburban Sanitary District, Montgomery and Prince George’s Counties, Maryland, Sewerage Disposal Bonds, Series 2005: | | | | | | | |
| | 4,500 | | 5.000%, 6/01/16 (Pre-refunded 6/01/15) | | 6/15 at 100.00 | AAA | | | 5,015,925 | |
| | 1,235 | | 5.000%, 6/01/23 (Pre-refunded 6/01/15) | | 6/15 at 100.00 | AAA | | | 1,376,593 | |
| | 1,235 | | 5.000%, 6/01/24 (Pre-refunded 6/01/15) | | 6/15 at 100.00 | AAA | | | 1,376,593 | |
| | 1,235 | | 5.000%, 6/01/25 (Pre-refunded 6/01/15) | | 6/15 at 100.00 | AAA | | | 1,376,593 | |
| | 66,785 | | Total U.S. Guaranteed | | | | | | 74,570,961 | |
| | | | Utilities – 5.5% (3.8% of Total Investments) | | | | | | | |
| | 5,750 | | Maryland Energy Financing Administration, Revenue Bonds, AES Warrior Run Project, Series 1995, 7.400%, 9/01/19 (Alternative Minimum Tax) | | 3/13 at 100.00 | N/R | | | 5,782,200 | |
| | 4,000 | | Northeast Maryland Waste Disposal Authority, Montgomery County, Resource Recovery Bonds, Series 2003, 5.500%, 4/01/15 – AMBAC Insured (Alternative Minimum Tax) | | 4/13 at 100.00 | AA | | | 4,072,480 | |
| | Principal | | | | Optional Call | | | | | |
| | Amount (000) | | Description (1) | | Provisions (2) | Ratings (3) | | | Value | |
| | | | Utilities (continued) | | | | | | | |
| $ | 550 | | Puerto Rico Electric Power Authority, Power Revenue Bonds, Series 2002LL, 5.500%, 7/01/17 – NPFG Insured | | No Opt. Call | BBB+ | | $ | 621,825 | |
| | 2,015 | | Puerto Rico Electric Power Authority, Power Revenue Bonds, Series 2004OO, 5.000%, 7/01/13 – CIFG Insured | | No Opt. Call | AA– | | | 2,062,272 | |
| | 3,600 | | Puerto Rico Electric Power Authority, Power Revenue Bonds, Series 2004PP, 5.000%, 7/01/22 – FGIC Insured | | 7/14 at 100.00 | BBB+ | | | 3,777,840 | |
| | 1,570 | | Puerto Rico Electric Power Authority, Power Revenue Bonds, Series 2005RR, 5.000%, 7/01/22 – FGIC Insured | | 7/15 at 100.00 | BBB+ | | | 1,672,757 | |
| | 1,040 | | Puerto Rico Electric Power Authority, Power Revenue Bonds, Series 2010XX, 5.250%, 7/01/40 | | 7/20 at 100.00 | BBB+ | | | 1,077,107 | |
| | 1,225 | | Puerto Rico Electric Power Authority, Power Revenue Refunding Bonds, Series 2002JJ, 5.250%, 7/01/15 – NPFG Insured | | No Opt. Call | BBB+ | | | 1,329,848 | |
| | 730 | | Virgin Islands Water and Power Authority, Electric System Revenue Bonds, Refunding Series 2007A, 5.000%, 7/01/24 | | 7/17 at 100.00 | Baa3 | | | 781,115 | |
| | 20,480 | | Total Utilities | | | | | | 21,177,444 | |
| | | | Water and Sewer – 3.8% (2.6% of Total Investments) | | | | | | | |
| | 2,690 | | Baltimore, Maryland, Revenue Refunding Bonds, Wastewater Projects, Series 2002A, 5.125%, 7/01/42 – NPFG Insured | | 1/13 at 100.00 | AA | | | 2,699,711 | |
| | 1,045 | | Baltimore, Maryland, Revenue Refunding Bonds, Water System Projects, Series 1994A, 5.000%, 7/01/24 – FGIC Insured | | No Opt. Call | AA | | | 1,262,026 | |
| | 2,570 | | Baltimore, Maryland, Wastewater Project Revenue Bonds, Series 2006C, 5.000%, 7/01/31 – AMBAC Insured | | 7/16 at 100.00 | AA | | | 2,873,311 | |
| | 3,000 | | Baltimore, Maryland, Wastewater Project Revenue Bonds, Series 2007D, 5.000%, 7/01/32 – AMBAC Insured | | 7/17 at 100.00 | AA | | | 3,446,400 | |
| | 2,000 | | Baltimore, Maryland, Wastewater Project Revenue Bonds, Series 2011A, 5.000%, 7/01/41 | | 7/21 at 100.00 | AA | | | 2,385,020 | |
| | 1,645 | | Maryland Water Quality Financing Administration, Revolving Loan Fund Revenue Bonds, Series 2005A, 5.000%, 9/01/15 | | No Opt. Call | AAA | | | 1,853,439 | |
| | 12,950 | | Total Water and Sewer | | | | | | 14,519,907 | |
| $ | 687,798 | | Total Investments (cost $513,767,502) – 145.0% | | | | | | 558,920,541 | |
| | | | Floating Rate Obligations – (5.7)% | | | | | | (21,995,000 | ) |
| | | | MuniFund Term Preferred Shares, at Liquidation Value – (43.1)% (7) | | | | | | (166,144,000 | ) |
| | | | Other Assets Less Liabilities – 3.8% | | | | | | 14,790,531 | |
| | | | Net Assets Applicable to Common Shares – 100% | | | | | $ | 385,572,072 | |
| (1) | | All percentages shown in the Portfolio of Investments are based on net assets applicable to Common shares unless otherwise noted. |
| (2) | | Optional Call Provisions: Dates (month and year) and prices of the earliest optional call or redemption. There may be other call provisions at varying prices at later dates. Certain mortgage-backed securities may be subject to periodic principal paydowns. |
| (3) | | Ratings: Using the highest of Standard & Poor’s Group (“Standard & Poor’s”), Moody’s Investors Service, Inc. (“Moody’s”) or Fitch, Inc. (“Fitch”) rating. Ratings below BBB by Standard & Poor’s, Baa by Moody’s or BBB by Fitch are considered to be below investment grade. Holdings designated N/R are not rated by any of these national rating agencies. |
| (4) | | Investment, or portion of investment, has been pledged to collateralize the net payment obligations for investments in inverse floating rate transactions. |
| (5) | | At or subsequent to the end of the reporting period, this security is non-income producing. Non-income producing security, in the case of a bond, generally denotes that the issuer has (1) defaulted on the payment of principal or interest, (2) is under the protection of the Federal Bankruptcy Court or (3) the Fund’s Adviser has concluded that the issue is not likely to meet its future interest payment obligations and has directed the Fund’s custodian to cease accruing additional income on the Fund’s records. |
| (6) | | Backed by an escrow or trust containing sufficient U.S. Government or U.S. Government agency securities, which ensure the timely payment of principal and interest. Certain bonds backed by U.S. Government or agency securities are regarded as having an implied rating equal to the rating of such securities. |
| (7) | | MuniFund Term Preferred Shares, at Liquidation Value as a percentage of Total Investments is 29.7% |
| N/R | | Not rated. |
| WI/DD | | Investment, or portion of investment, purchased on a when-issued or delayed delivery basis. |
| (ETM) | | Escrowed to maturity. |
| (IF) | | Inverse floating rate investment. |
| (UB) | | Underlying bond of an inverse floating rate trust reflected as a financing transaction. See Notes to Financial Statements, Footnote 1 – General Information and Significant Accounting Policies, Inverse Floating Rate Securities for more information. |
See accompanying notes to financial statements.
| | | Nuveen Missouri Premium Income Municipal Fund |
| NOM | | Portfolio of Investments |
| | | November 30, 2012 (Unaudited) |
| | Principal | | | | Optional Call | | | | | |
| | Amount (000) | | Description (1) | | Provisions (2) | Ratings (3) | | | Value | |
| | | | Consumer Staples – 3.7% (2.4% of Total Investments) | | | | | | | |
| $ | 1,000 | | Missouri Development Finance Board, Solid Waste Disposal Revenue Bonds, Procter and Gamble Inc., Series 1999, 5.200%, 3/15/29 (Alternative Minimum Tax) | | No Opt. Call | AA– | | $ | 1,309,890 | |
| | | | Education and Civic Organizations – 9.0% (5.9% of Total Investments) | | | | | | | |
| | 250 | | Lincoln University, Missouri, Auxillary System Revenue Bonds, Series 2007, 5.125%, 6/01/37 – AGC Insured | | 6/17 at 100.00 | AA– | | | 269,663 | |
| | 630 | | Missouri Health and Educational Facilities Authority, Revenue Bonds, A.T. Still University of Health Sciences, Series 2011, 5.250%, 10/01/41 | | 10/21 at 100.00 | A– | | | 728,066 | |
| | 700 | | Missouri Health and Educational Facilities Authority, Revenue Bonds, Rockhurst University, Series 2011A, 6.500%, 10/01/35 | | 10/18 at 103.00 | BBB | | | 809,697 | |
| | 550 | | Missouri Health and Educational Facilities Authority, Revenue Bonds, Washington University, Series 2011B, 5.000%, 11/15/37 | | 11/21 at 100.00 | AAA | | | 670,346 | |
| | 600 | | Missouri Health and Educational Facilities Authority, Revenue Bonds, Webster University, Series 2011, 5.000%, 4/01/36 | | 4/21 at 100.00 | A2 | | | 684,342 | |
| | 2,730 | | Total Education and Civic Organizations | | | | | | 3,162,114 | |
| | | | Health Care – 36.4% (23.7% of Total Investments) | | | | | | | |
| | 485 | | Cape Girardeau County Industrial Development Authority, Missouri, Health Facilities Revenue Bonds, Saint Francis Medical Center, Series 2009A, 5.750%, 6/01/39 | | 6/19 at 100.00 | AA– | | | 556,935 | |
| | 760 | | Cape Girardeau County Industrial Development Authority, Missouri, Health Facilities Revenue Bonds, Southeast Missouri Hospital Association, Series 2007, 5.000%, 6/01/27 | | 6/17 at 100.00 | BBB+ | | | 796,936 | |
| | 930 | | Cass County, Missouri, Hospital Revenue Bonds, Series 2007, 5.625%, 5/01/38 | | 11/16 at 100.00 | BBB– | | | 960,430 | |
| | 480 | | Clinton County Industrial Development Authority, Missouri, Revenue Bonds, Cameron Regional Medical Center, Series 2007, 5.000%, 12/01/37 | | 12/17 at 100.00 | N/R | | | 488,813 | |
| | 750 | | Joplin Industrial Development Authority, Missouri, Health Facilities Revenue Bonds, Freeman Health System, Series 2004, 5.500%, 2/15/29 | | 2/15 at 102.00 | BBB+ | | | 795,743 | |
| | 200 | | Joplin Industrial Development Authority, Missouri, Health Facilities Revenue Bonds, Freeman Health System, Series 2011, 5.500%, 2/15/31 | | 2/21 at 100.00 | BBB+ | | | 227,320 | |
| | 540 | | Missouri Health and Educational Facilities Authority, Health Facilities Revenue Bonds, Capital Region Medical Center, Series 2011, 5.000%, 11/01/27 | | 11/20 at 100.00 | A3 | | | 609,320 | |
| | 335 | | Missouri Health and Educational Facilities Authority, Health Facilities Revenue Bonds, Heartland Regional Medical Center, Series 2012, 5.000%, 2/15/37 | | 2/22 at 100.00 | A1 | | | 376,071 | |
| | 750 | | Missouri Health and Educational Facilities Authority, Health Facilities Revenue Bonds, Mercy Health, Series 2012, 4.000%, 11/15/42 (WI/DD, Settling 12/18/12) | | 11/22 at 100.00 | AA– | | | 780,330 | |
| | 500 | | Missouri Health and Educational Facilities Authority, Health Facilities Revenue Bonds, St. Luke’s Episcopal and Presbyterian Hospitals, Series 2011, 5.000%, 12/01/25 | | 12/21 at 100.00 | A+ | | | 582,070 | |
| | 2,000 | | Missouri Health and Educational Facilities Authority, Health Facility Revenue Bonds, St. Lukes’s Health System, Series 2010A, 5.000%, 11/15/30 | | 11/20 at 100.00 | A+ | | | 2,279,020 | |
| | | | Missouri Health and Educational Facilities Authority, Revenue Bonds, BJC Health System, Series 2003: | | | | | | | |
| | 1,500 | | 5.125%, 5/15/25 | | 5/13 at 100.00 | AA | | | 1,529,250 | |
| | 1,155 | | 5.250%, 5/15/32 | | 5/13 at 100.00 | AA | | | 1,177,626 | |
| | 500 | | Missouri Health and Educational Facilities Authority, Revenue Bonds, Lake Regional Health System, Series 2003, Reg S, 5.700%, 2/15/34 | | 2/14 at 100.00 | BBB+ | | | 514,560 | |
| | 720 | | Saline County Industrial Development Authority, Missouri, Health Facilities Revenue Bonds, John Fitzgibbon Memorial Hospital Inc., Series 2010, 5.600%, 12/01/28 | | 12/20 at 100.00 | BBB– | | | 783,317 | |
| | 350 | | St. Louis County Industrial Development Authority, Missouri, Healthcare Facilities Revenue Bonds, Ranken-Jordan Project, Refunding Series 2007, 5.000%, 11/15/27 | | 11/16 at 100.00 | N/R | | | 359,849 | |
| | 11,955 | | Total Health Care | | | | | | 12,817,590 | |
| | | | Housing/Multifamily – 0.3% (0.2% of Total Investments) | | | | | | | |
| | 105 | | Missouri Housing Development Commission, Multifamily Housing Revenue Bonds, Series 2001II, 5.250%, 12/01/16 | | 6/13 at 100.00 | AA | | | 105,320 | |
| | Principal | | | | Optional Call | | | | | |
| | Amount (000) | | Description (1) | | Provisions (2) | Ratings (3) | | | Value | |
| | | | Housing/Single Family – 2.6% (1.7% of Total Investments) | | | | | | | |
| $ | 350 | | Missouri Housing Development Commission, Single Family Mortgage Revenue Bonds, Homeownership Loan Program, Series 2007A-1, 4.700%, 9/01/27 (Alternative Minimum Tax) | | 9/16 at 100.00 | AA+ | | $ | 367,714 | |
| | 535 | | Missouri Housing Development Commission, Single Family Mortgage Revenue Bonds, Homeownership Loan Program, Series 2007C-1, 4.800%, 9/01/38 (Alternative Minimum Tax) | | 3/17 at 100.00 | AA+ | | | 548,899 | |
| | 885 | | Total Housing/Single Family | | | | | | 916,613 | |
| | | | Long-Term Care – 11.6% (7.5% of Total Investments) | | | | | | | |
| | 1,750 | | Cole County Industrial Development Authority, Missouri, Revenue Bonds, Lutheran Senior Services – Heisinger Project, Series 2004, 5.500%, 2/01/35 | | 2/14 at 100.00 | BBB+ | | | 1,783,320 | |
| | 500 | | Joplin Industrial Development Authority, Missouri, Revenue Bonds, Christian Homes Inc., Series 2007F, 5.750%, 5/15/31 | | 5/17 at 100.00 | BBB– | | | 528,495 | |
| | 475 | | Lees Summit Industrial Development Authority, Missouri, Revenue Bonds, John Knox Village Obligated Group, Series 2007A, 5.125%, 8/15/32 | | 8/17 at 100.00 | BBB– | | | 486,628 | |
| | 250 | | Missouri Health and Educational Facilities Authority, Revenue Bonds, Lutheran Senior Services Projects, Series 2011, 6.000%, 2/01/41 | | 2/21 at 100.00 | BBB+ | | | 287,638 | |
| | 425 | | St. Louis County Industrial Development Authority, Missouri, Revenue Bonds, Friendship Village of Sunset Hills, Series 2012, 5.000%, 9/01/42 | | 9/22 at 100.00 | A | | | 459,196 | |
| | 500 | | St. Louis County Industrial Development Authority, Missouri, Revenue Bonds, Friendship Village of West County, Series 2007A, 5.500%, 9/01/28 | | 9/17 at 100.00 | BBB– | | | 527,375 | |
| | 3,900 | | Total Long-Term Care | | | | | | 4,072,652 | |
| | | | Materials – 2.1% (1.4% of Total Investments) | | | | | | | |
| | 750 | | Sugar Creek, Missouri, Industrial Development Revenue Bonds, Lafarge North America Inc., Series 2003A, 5.650%, 6/01/37 (Alternative Minimum Tax) | | 6/13 at 101.00 | A | | | 755,250 | |
| | | | Tax Obligation/General – 17.2% (11.2% of Total Investments) | | | | | | | |
| | 600 | | Branson Reorganized School District R-4, Taney County, Missouri, General Obligation Bonds, School Building Series 2012, 4.375%, 3/01/32 | | 3/22 at 100.00 | A+ | | | 672,120 | |
| | 1,500 | | Camdenton Reorganized School District R3, Camden County, Missouri, General Obligation Bonds, Series 2005, 5.250%, 3/01/24 – AGM Insured | | 3/15 at 100.00 | AA– | | | 1,647,720 | |
| | 1,685 | | Independence School District, Jackson County, Missouri, General Obligation Bonds, Series 2010, 5.000%, 3/01/27 | | 3/20 at 100.00 | AA+ | | | 2,030,071 | |
| | 500 | | Missouri School Boards Association, Lease Participation Certificates, Clay County School District 53 Liberty, Series 2007, 5.250%, 3/01/27 – AGM Insured | | 3/17 at 100.00 | AA– | | | 572,625 | |
| | 1,000 | | Puerto Rico, General Obligation and Public Improvement Bonds, Series 2002A, 5.500%, 7/01/20 – NPFG Insured | | No Opt. Call | Baa1 | | | 1,120,190 | |
| | 5,285 | | Total Tax Obligation/General | | | | | | 6,042,726 | |
| | | | Tax Obligation/Limited – 28.9% (18.8% of Total Investments) | | | | | | | |
| | 600 | | Chesterfield, Missouri, Certificates of Participation, Series 2005, 5.000%,
12/01/24 – FGIC Insured | | 12/15 at 100.00 | Aa1 | | | 670,482 | |
| | 150 | | Fenton, Missouri, Tax Increment Revenue Bonds, Gravois Bluffs Redevelopment Project, Series 2006, 4.500%, 4/01/21 | | 4/14 at 100.00 | BBB+ | | | 154,083 | |
| | 315 | | Fulton, Missouri, Tax Increment Revenue Bonds, Fulton Commons Redevelopment Project, Series 2006, 5.000%, 6/01/28 | | 6/16 at 100.00 | N/R | | | 274,847 | |
| | 455 | | Government of Guam, Business Privilege Tax Bonds, Series 2012B-1, 5.000%, 1/01/42 | | 1/22 at 100.00 | A | | | 515,856 | |
| | 485 | | Jackson County, Missouri, Special Obligation Bonds, Truman Medical Center Project, Series 2011B, 4.350%, 12/01/23 | | 12/21 at 100.00 | Aa3 | | | 560,995 | |
| | 300 | | Kansas City Industrial Development Authority, Missouri, Downtown Redevelopment District Revenue Bonds, Series 2011A, 5.000%, 9/01/32 | | 9/21 at 100.00 | AA– | | | 346,248 | |
| | 475 | | Kansas City Tax Increment Financing Commission, Missouri, Tax Increment Revenue Bonds, Briarcliff West Project, Series 2006A, 5.400%, 6/01/24 | | 6/14 at 102.00 | N/R | | | 475,147 | |
| | 100 | | Kansas City Tax Increment Financing Commission, Missouri, Tax Increment Revenue Bonds, Shoal Creek Parkway Project, Series 2011, 5.000%, 6/01/21 | | 6/16 at 100.00 | N/R | | | 105,242 | |
| | 360 | | Missouri Development Finance Board, Infrastructure Facilities Revenue Bonds, Branson Landing Project, Series 2005A, 5.000%, 6/01/35 | | 6/15 at 100.00 | A | | | 373,752 | |
| | | Nuveen Missouri Premium Income Municipal Fund (continued) |
| NOM | | Portfolio of Investments |
| | | November 30, 2012 (Unaudited) |
| | Principal | | | | Optional Call | | | | | |
| | Amount (000) | | Description (1) | | Provisions (2) | Ratings (3) | | | Value | |
| | | | Tax Obligation/Limited (continued) | | | | | | | |
| $ | 415 | | Missouri Development Finance Board, Infrastructure Facilities Revenue Bonds, City of Independence, Crackerneck Creek Project, Series 2006C, 5.000%, 3/01/28 | | 3/16 at 100.00 | A– | | $ | 429,886 | |
| | 450 | | Monarch-Chesterfield Levee District, St. Louis County, Missouri, Levee District Improvement Bonds, Series 1999, 5.750%, 3/01/19 – NPFG Insured | | 3/13 at 100.00 | A | | | 451,764 | |
| | 500 | | Osage Beach, Missouri, Tax Increment Revenue Bonds, Prewitts Point Transportation Development District, Series 2006, 5.000%, 5/01/23 | | 5/13 at 101.00 | N/R | | | 448,390 | |
| | 1,750 | | Puerto Rico Sales Tax Financing Corporation, Sales Tax Revenue Bonds, First Subordinate Series 2009A, 6.000%, 8/01/42 | | 8/19 at 100.00 | A+ | | | 1,987,528 | |
| | 225 | | Puerto Rico Sales Tax Financing Corporation, Sales Tax Revenue Bonds, Senior Series 2011C, 0.000%, 8/01/41 | | No Opt. Call | AA– | | | 49,455 | |
| | 1,500 | | Puerto Rico Sales Tax Financing Corporation, Sales Tax Revenue Bonds, Series 2007A, 0.000%, 8/01/41 – NPFG Insured | | No Opt. Call | AA– | | | 326,220 | |
| | 600 | | Riverside, Missouri, L-385 Levee Redevelopment Plan Tax Increment Revenue Bonds, Series 2004, 5.250%, 5/01/20 | | 5/15 at 100.00 | A | | | 638,346 | |
| | 1,395 | | Springfield Public Building Corporation, Missouri, Lease Revenue Bonds Jordan Valley Park Projects, Series 2000A, 6.125%, 6/01/21 – AMBAC Insured | | 12/12 at 100.00 | N/R | | | 1,395,000 | |
| | | | St. Joseph Industrial Development Authority, Missouri, Tax Increment Bonds, Shoppes at North Village Project, Series 2005A: | | | | | | | |
| | 340 | | 5.375%, 11/01/24 | | 11/14 at 100.00 | N/R | | | 342,972 | |
| | 400 | | 5.500%, 11/01/27 | | 11/14 at 100.00 | N/R | | | 402,944 | |
| | 200 | | St. Joseph Industrial Development Authority, Missouri, Tax Increment Bonds, Shoppes at North Village Project, Series 2005B, 5.500%, 11/01/27 | | 11/14 at 100.00 | N/R | | | 201,472 | |
| | 11,015 | | Total Tax Obligation/Limited | | | | | | 10,150,629 | |
| | | | Transportation – 12.8% (8.3% of Total Investments) | | | | | | | |
| | 500 | | Kansas City, Missouri, Passenger Facility Charge Revenue Bonds, Kansas City International Airport, Series 2001, 5.000%, 4/01/23 – AMBAC Insured (Alternative Minimum Tax) | | 4/13 at 100.00 | A | | | 503,445 | |
| | 1,000 | | St. Louis, Missouri, Airport Revenue Bonds, Lambert-St. Louis International Airport, Series 2005, 5.500%, 7/01/18 – NPFG Insured | | No Opt. Call | A– | | | 1,176,870 | |
| | 2,500 | | St. Louis, Missouri, Airport Revenue Bonds, Lambert-St. Louis International Airport, Series 2007A, 5.000%, 7/01/21 – AGM Insured | | 7/17 at 100.00 | AA– | | | 2,820,272 | |
| | 4,000 | | Total Transportation | | | | | | 4,500,587 | |
| | | | U.S. Guaranteed – 7.8% (5.1% of Total Investments) (4) | | | | | | | |
| | 80 | | Cottleville, Missouri, Certificates of Participation, Series 2006, 5.250%, 8/01/31 (Pre-refunded 8/01/14) | | 8/14 at 100.00 | N/R (4) | | | 86,530 | |
| | 1,630 | | North Kansas City School District, Missouri, General Obligation Bonds, Series 2003A, 5.000%, 3/01/23 (Pre-refunded 3/01/13) | | 3/13 at 100.00 | AA+ (4) | | | 1,649,772 | |
| | | | St. Louis County Pattonville School District R3, Missouri, General Obligation Bonds, Series 2004: | | | | | | | |
| | 80 | | 5.250%, 3/01/20 (Pre-refunded 3/01/14) – AGM Insured | | 3/14 at 100.00 | AA (4) | | | 84,918 | |
| | 250 | | 5.250%, 3/01/20 (Pre-refunded 3/01/14) – AGM Insured | | 3/14 at 100.00 | AA– (4) | | | 265,370 | |
| | 20 | | 5.250%, 3/01/20 (Pre-refunded 3/01/14) – AGM Insured | | 3/14 at 100.00 | AA (4) | | | 21,237 | |
| | 500 | | St. Louis County, Missouri, GNMA Collateralized Mortgage Revenue Bonds, Series 1993D, 5.650%, 7/01/20 (Alternative Minimum Tax) (ETM) | | No Opt. Call | AA+ (4) | | | 640,205 | |
| | 2,560 | | Total U.S. Guaranteed | | | | | | 2,748,032 | |
| | | | Utilities – 6.0% (3.9% of Total Investments) | | | | | | | |
| | 110 | | Missouri Joint Municipal Electric Utility Commission, Iatan 2 Power Project Revenue Bonds, Series 2006A, 4.125%, 1/01/21 – AMBAC Insured | | 1/16 at 100.00 | A2 | | | 119,422 | |
| | 500 | | Missouri Joint Municipal Electric Utility Commission, Plum Point Project, Revenue Bonds, Series 2006, 5.000%, 1/01/34 – NPFG Insured | | 1/16 at 100.00 | A– | | | 526,310 | |
| | | | Missouri Joint Municipal Electric Utility Commission, Power Supply System Revenue Bonds, MoPEP Facilities, Series 2012: | | | | | | | |
| | 400 | | 5.000%, 1/01/32 | | 1/21 at 100.00 | A2 | | | 454,744 | |
| | 425 | | 5.000%, 1/01/37 | | 1/21 at 100.00 | A2 | | | 474,462 | |
| | 530 | | Puerto Rico Electric Power Authority, Power Revenue Bonds, Series 2010XX, 5.250%, 7/01/40 | | 7/20 at 100.00 | BBB+ | | | 548,910 | |
| | 1,965 | | Total Utilities | | | | | | 2,123,848 | |
| | Principal | | | | Optional Call | | | | | |
| | Amount (000) | | Description (1) | | Provisions (2) | Ratings (3) | | | Value | |
| | | | Water and Sewer – 15.3% (9.9% of Total Investments) | | | | | | | |
| $ | 600 | | Carroll County Public Water Supply District 1, Missouri, Water System Revenue Bonds, Refunding Series 2009, 6.000%, 3/01/39 | | 3/18 at 100.00 | A | | $ | 688,884 | |
| | 1,150 | | Kansas City, Missouri, Water Revenue Bonds, Series 2012A, 4.500%, 12/01/36 | | 12/21 at 100.00 | AA+ | | | 1,334,897 | |
| | 200 | | Metropolitan St. Louis Sewerage District, Missouri, Wastewater System Revenue Bonds, Series 2006C, 5.000%, 5/01/36 – NPFG Insured | | 5/17 at 100.00 | AAA | | | 228,800 | |
| | 2,965 | | Missouri Environmental Improvement and Energy Resources Authority, Water Facility Revenue Bonds, Missouri-American Water Company, Series 2006, 4.600%, 12/01/36 – AMBAC Insured (Alternative Minimum Tax) (UB) (5) | | 12/16 at 100.00 | AA+ | | | 3,122,412 | |
| | 4,915 | | Total Water and Sewer | | | | | | 5,374,993 | |
| $ | 51,065 | �� | Total Investments (cost $50,078,529) – 153.7% | | | | | | 54,080,244 | |
| | | | Floating Rate Obligations – (6.3)% | | | | | | (2,225,000 | ) |
| | | | MuniFund Term Preferred Shares, at Liquidation Value – (50.8)% (6) | | | | | | (17,880,000 | ) |
| | | | Other Assets Less Liabilities – 3.4% | | | | | | 1,206,553 | |
| | | | Net Assets Applicable to Common Shares – 100% | | | | | $ | 35,181,797 | |
| (1) | | All percentages shown in the Portfolio of Investments are based on net assets applicable to Common shares unless otherwise noted. |
| (2) | | Optional Call Provisions: Dates (month and year) and prices of the earliest optional call or redemption. There may be other call provisions at varying prices at later dates. Certain mortgage-backed securities may be subject to periodic principal paydowns. |
| (3) | | Ratings: Using the highest of Standard & Poor’s Group (“Standard & Poor’s”), Moody’s Investors Service, Inc. (“Moody’s”) or Fitch, Inc. (“Fitch”) rating. Ratings below BBB by Standard & Poor’s, Baa by Moody’s or BBB by Fitch are considered to be below investment grade. Holdings designated N/R are not rated by any of these national rating agencies. |
| (4) | | Backed by an escrow or trust containing sufficient U.S. Government or U.S. Government agency securities, which ensure the timely payment of principal and interest. Certain bonds backed by U.S. Government or agency securities are regarded as having an implied rating equal to the rating of such securities. |
| (5) | | Investment, or portion of investment, has been pledged to collateralize the net payment obligations for investments in inverse floating rate transactions. |
| (6) | | MuniFund Term Preferred Shares, at Liquidation Value as a percentage of Total Investments is 33.1% |
| N/R | | Not rated. |
| WI/DD | | Investment, or portion of investment, purchased on a when-issued or delayed delivery basis. |
| (ETM) | | Escrowed to maturity. |
| (UB) | | Underlying bond of an inverse floating rate trust reflected as a financing transaction. See Notes to Financial Statements, Footnote 1 – General Information and Significant Accounting Policies, Inverse Floating Rate Securities for more information. |
See accompanying notes to financial statements.
| | | Nuveen North Carolina Premium Income Municipal Fund |
| NNC | | Portfolio of Investments |
| | | November 30, 2012 (Unaudited) |
| | Principal | | | | Optional Call | | | | | |
| | Amount (000) | | Description (1) | | Provisions (2) | Ratings (3) | | | Value | |
| | | | Consumer Staples – 0.8% (0.5% of Total Investments) | | | | | | | |
| $ | 2,000 | | Puerto Rico, The Children’s Trust Fund, Tobacco Settlement Asset-Backed Refunding Bonds, Series 2002, 5.500%, 5/15/39 | | 5/13 at 100.00 | BBB | | $ | 2,002,260 | |
| | | | Education and Civic Organizations – 7.2% (4.6% of Total Investments) | | | | | | | |
| | 30 | | Appalachian State University, North Carolina, Revenue Bonds, Series 2005, 5.250%, 7/15/17 – NPFG Insured | | No Opt. Call | Aa2 | | | 35,682 | |
| | 1,500 | | Fayetteville State University, North Carolina, Limited Obligation Revenue Bonds, Student Housing Project, Series 2011, 5.000%, 4/01/43 – AGM Insured | | 4/21 at 100.00 | AA– | | | 1,688,520 | |
| | 2,500 | | North Carolina Capital Facilities Financing Agency, Revenue Bonds, Duke University, Series 2005A, 5.000%, 10/01/41 (UB) | | 10/15 at 100.00 | AA+ | | | 2,740,925 | |
| | | | North Carolina Capital Facilities Financing Agency, Revenue Bonds, Johnson and Wales University, Series 2003A: | | | | | | | |
| | 970 | | 5.250%, 4/01/23 – SYNCORA GTY Insured | | 4/13 at 100.00 | N/R | | | 978,022 | |
| | 1,650 | | 5.000%, 4/01/33 – SYNCORA GTY Insured | | 4/13 at 100.00 | N/R | | | 1,658,531 | |
| | 2,500 | | North Carolina Capital Facilities Finance Agency, Revenue Bonds, The Methodist University, Series 2012, 5.000%, 3/01/34 | | 3/22 at 100.00 | BBB | | | 2,780,500 | |
| | | | The University of North Carolina, System Pool Revenue Bonds, Series 2009C: | | | | | | | |
| | 1,000 | | 5.250%, 10/01/28 | | 10/19 at 100.00 | A3 | | | 1,170,760 | |
| | 1,000 | | 5.375%, 10/01/29 | | 10/19 at 100.00 | A3 | | | 1,175,130 | |
| | | | University of North Carolina System, Pooled Revenue Bonds, Series 2005A: | | | | | | | |
| | 1,530 | | 5.000%, 4/01/15 – AMBAC Insured | | No Opt. Call | A+ | | | 1,688,003 | |
| | 445 | | 5.000%, 4/01/22 – AMBAC Insured | | 4/15 at 100.00 | A+ | | | 482,789 | |
| | | | University of North Carolina Wilmington, Certificates of Participation, Student Housing Project Revenue Bonds, Series 2006: | | | | | | | |
| | 1,000 | | 5.000%, 6/01/21 – FGIC Insured | | 6/16 at 100.00 | A– | | | 1,101,680 | |
| | 1,430 | | 5.000%, 6/01/23 – FGIC Insured | | 6/16 at 100.00 | A– | | | 1,560,030 | |
| | 1,505 | | 5.000%, 6/01/24 – FGIC Insured | | 6/16 at 100.00 | A– | | | 1,635,815 | |
| | 250 | | University of North Carolina, Charlotte, Certificates of Participation, Student Housing Project, Series 2005, 5.000%, 3/01/21 – AMBAC Insured | | 3/15 at 100.00 | A | | | 272,728 | |
| | 17,310 | | Total Education and Civic Organizations | | | | | | 18,969,115 | |
| | | | Health Care – 34.1% (21.8% of Total Investments) | | | | | | | |
| | | | Albemarle Hospital Authority, North Carolina, Health Care Facilities Revenue Bonds, Series 2007: | | | | | | | |
| | 1,840 | | 5.250%, 10/01/27 | | 10/17 at 100.00 | N/R | | | 1,919,562 | |
| | 1,725 | | 5.250%, 10/01/38 | | 10/17 at 100.00 | N/R | | | 1,770,747 | |
| | 2,750 | | Charlotte-Mecklenberg Hospital Authority, North Carolina, Health Care Revenue Bonds, DBA Carolinas HealthCare System, Refunding Series 2009A, 5.250%, 1/15/39 | | 1/19 at 100.00 | AA– | | | 3,112,670 | |
| | 4,950 | | Charlotte-Mecklenberg Hospital Authority, North Carolina, Health Care Revenue Bonds, DBA Carolinas HealthCare System, Series 2008A, 5.000%, 1/15/47 | | 1/18 at 100.00 | AA– | | | 5,348,921 | |
| | 2,000 | | Charlotte-Mecklenberg Hospital Authority, North Carolina, Health Care Revenue Bonds, DBA Carolinas HealthCare System, Series 2011A, 5.250%, 1/15/42 | | 1/21 at 100.00 | AA– | | | 2,332,460 | |
| | 5,250 | | Charlotte-Mecklenburg Hospital Authority, North Carolina, Health Care Revenue Bonds, DBA Carolinas HealthCare System, Refunding Series 2012A, 5.000%, 1/15/43 | | 1/22 at 100.00 | AA– | | | 6,039,600 | |
| | 2,270 | | Johnston Memorial Hospital Authority, North Carolina, Mortgage Revenue Bonds, Johnston Memorial Hospital Project, Series 2008A, 5.250%, 10/01/36 – AGM Insured | | 4/18 at 100.00 | AA– | | | 2,539,608 | |
| | 3,860 | | Nash Health Care Systems, North Carolina, Health Care Facilities Revenue Bonds, Series 2012, 5.000%, 11/01/41 | | 5/22 at 100.00 | A | | | 4,332,618 | |
| | 555 | | New Hanover County, North Carolina, Hospital Revenue Bonds, New Hanover Regional Medical Center, Series 2006B, 5.125%, 10/01/31 – AGM Insured | | 10/19 at 100.00 | AA– | | | 629,398 | |
| | 2,000 | | North Carolina Medical Care Commission, Health Care Facilities Revenue Bonds, Duke University Health System, Series 2012A, 5.000%, 6/01/42 | | 6/22 at 100.00 | AA | | | 2,327,700 | |
| | | | North Carolina Medical Care Commission Health Care Facilities Revenue Bonds Novant Health Inc., Series 2010A: | | | | | | | |
| | 4,750 | | 5.250%, 11/01/40 | | 11/20 at 100.00 | AA– | | | 5,357,240 | |
| | 5,000 | | 5.000%, 11/01/43 | | 11/20 at 100.00 | AA– | | | 5,545,700 | |
| | Principal | | | | Optional Call | | | | | |
| | Amount (000) | | Description (1) | | Provisions (2) | Ratings (3) | | | Value | |
| | | | Health Care (continued) | | | | | | | |
| $ | 2,750 | | North Carolina Medical Care Commission, Health Care Facilities Refunding Revenue Bonds, Blue Ridge HealthCare, Series 2010A, 5.000%, 1/01/36 | | 1/20 at 100.00 | A | | $ | 2,940,025 | |
| | 2,680 | | North Carolina Medical Care Commission, Health Care Facilities Revenue Bonds, Appalachian Regional HealthCare System, Series 2011A, 6.500%, 7/01/31 | | 7/21 at 100.00 | BBB+ | | | 3,244,060 | |
| | 1,680 | | North Carolina Medical Care Commission, Health Care Facilities Revenue Bonds, Cleveland County Healthcare System, Refunding Series 2011A, 5.750%, 1/01/35 | | 1/21 at 100.00 | A | | | 1,944,802 | |
| | 2,335 | | North Carolina Medical Care Commission, Health Care Facilities Revenue Bonds, FirstHealth of the Carolinas Project, Refunding Series 2012A, 4.000%, 10/01/39 | | 10/17 at 100.00 | AA | | | 2,378,618 | |
| | 9,000 | | North Carolina Medical Care Commission, Health Care Facilities Revenue Bonds, Wake Forest Baptist Obligated Group, Series 2012A, 4.000%, 12/01/45 | | 12/22 at 100.00 | AA– | | | 9,319,318 | |
| | 2,375 | | North Carolina Medical Care Commission, Health Care Facilities Revenue Refunding Bonds, Cape Fear Valley Health System, Series 2012A, 5.000%, 10/01/27 (WI/DD, Settling 12/19/12) | | 10/22 at 100.00 | A– | | | 2,814,874 | |
| | 2,000 | | North Carolina Medical Care Commission, Health Care Facilities Revenue Refunding Bonds, WakeMed, Series 2012A, 5.000%, 10/01/27 | | 10/22 at 100.00 | AA– | | | 2,397,840 | |
| | | | North Carolina Medical Care Commission, Healthcare Facilities Revenue Bonds, Novant Health Obligated Group, Series 2003A: | | | | | | | |
| | 2,000 | | 5.000%, 11/01/18 | | 11/13 at 100.00 | AA– | | | 2,075,340 | |
| | 2,000 | | 5.000%, 11/01/19 | | 11/13 at 100.00 | AA– | | | 2,071,940 | |
| | 2,000 | | 5.000%, 11/01/20 | | 11/13 at 100.00 | AA– | | | 2,068,200 | |
| | 2,000 | | North Carolina Medical Care Commission, Healthcare Facilities Revenue Bonds, Stanly Memorial Hospital, Series 1999, 6.375%, 10/01/29 | | 4/13 at 100.00 | BBB+ | | | 2,008,680 | |
| | 1,700 | | North Carolina Medical Care Commission, Hospital Revenue Bonds, Southeastern Regional Medical Center, Refunding Series 2012, 5.000%, 6/01/32 | | 6/22 at 100.00 | A | | | 1,986,212 | |
| | | | North Carolina Medical Care Commission, Hospital Revenue Bonds, Wilson Medical Center, Series 2007: | | | | | | | |
| | 500 | | 5.000%, 11/01/20 | | 11/17 at 100.00 | A– | | | 555,095 | |
| | 3,425 | | 5.000%, 11/01/27 | | 11/17 at 100.00 | A– | | | 3,668,826 | |
| | 3,295 | | North Carolina Medical Care Commission, Revenue Bonds, Blue Ridge Healthcare System, Series 2005, 5.000%, 1/01/33 – FGIC Insured | | 1/15 at 100.00 | A | | | 3,371,806 | |
| | | | North Carolina Medical Care Commission, Revenue Bonds, Cleveland County Healthcare System, Series 2004A: | | | | | | | |
| | 1,195 | | 5.250%, 7/01/20 – AMBAC Insured | | 7/14 at 100.00 | A | | | 1,252,922 | |
| | 1,000 | | 5.250%, 7/01/22 – AMBAC Insured | | 7/14 at 100.00 | A | | | 1,042,640 | |
| | 750 | | Northern Hospital District of Surry County, North Carolina, Health Care Facilities Revenue Bonds, Series 2008, 6.250%, 10/01/38 | | 4/18 at 100.00 | BBB | | | 827,475 | |
| | 1,675 | | Onslow County Hospital Authority, North Carolina, FHA Insured Mortgage Revenue Bonds, Onslow Memorial Hospital Project, Series 2006, 5.000%, 4/01/31 – NPFG Insured | | 10/16 at 100.00 | BBB | | | 1,790,759 | |
| | 81,310 | | Total Health Care | | | | | | 89,015,656 | |
| | | | Housing/Multifamily – 1.7% (1.1% of Total Investments) | | | | | | | |
| | | | Mecklenburg County, North Carolina, FNMA Multifamily Housing Revenue Bonds, Little Rock Apartments, Series 2003: | | | | | | | |
| | 965 | | 5.150%, 1/01/22 (Alternative Minimum Tax) | | 7/13 at 105.00 | AA+ | | | 1,024,676 | |
| | 2,260 | | 5.375%, 1/01/36 (Alternative Minimum Tax) | | 7/13 at 105.00 | AA+ | | | 2,393,159 | |
| | 1,000 | | North Carolina Capital Facilities Financing Agency, Housing Revenue Bonds, Elizabeth City State University, Series 2003A, 5.000%, 6/01/28 – AMBAC Insured | | 6/13 at 100.00 | N/R | | | 1,005,990 | |
| | 4,225 | | Total Housing/Multifamily | | | | | | 4,423,825 | |
| | | | Housing/Single Family – 2.4% (1.5% of Total Investments) | | | | | | | |
| | 1,555 | | North Carolina Housing Finance Agency, Home Ownership Revenue Bonds, Series 2007-29A, 4.800%, 7/01/33 (Alternative Minimum Tax) | | 1/17 at 100.00 | AA | | | 1,624,369 | |
| | 2,200 | | North Carolina Housing Finance Agency, Home Ownership Revenue Bonds, Series 2011-1, 4.500%, 1/01/28 | | 1/21 at 100.00 | AA | | | 2,448,688 | |
| | 2,020 | | North Carolina Housing Finance Agency, Home Ownership Revenue Bonds, Series 25-A, 4.900%, 7/01/37 (Alternative Minimum Tax) | | 7/16 at 100.00 | AA | | | 2,095,831 | |
| | 5,775 | | Total Housing/Single Family | | | | | | 6,168,888 | |
| | | Nuveen North Carolina Premium Income Municipal Fund (continued) |
| NNC | | Portfolio of Investments |
| | | November 30, 2012 (Unaudited) |
| | Principal | | | | Optional Call | | | | | |
| | Amount (000) | | Description (1) | | Provisions (2) | Ratings (3) | | | Value | |
| | | | Long-Term Care – 1.2% (0.8% of Total Investments) | | | | | | | |
| | | | North Carolina Medical Care Commission, Healthcare Facilities Revenue Bonds, Presbyterian Homes, Series 2006: | | | | | | | |
| $ | 700 | | 5.400%, 10/01/27 | | 10/16 at 100.00 | N/R | | $ | 726,166 | |
| | 1,500 | | 5.500%, 10/01/31 | | 10/16 at 100.00 | N/R | | | 1,553,280 | |
| | 900 | | North Carolina Medical Care Commission, Revenue Bonds, Pines at Davidson, Series 2006A, 5.000%, 1/01/36 | | 1/16 at 100.00 | A– | | | 926,775 | |
| | 3,100 | | Total Long-Term Care | | | | | | 3,206,221 | |
| | | | Materials – 0.5% (0.4% of Total Investments) | | | | | | | |
| | 1,400 | | Columbus County Industrial Facilities and Pollution Control Financing Authority, North Carolina, Environmental Improvement Revenue Bonds, International Paper Company Project, Series 2007A, 4.625%, 3/01/27 | | 3/17 at 100.00 | BBB | | | 1,446,172 | |
| | | | Tax Obligation/General – 5.9% (3.7% of Total Investments) | | | | | | | |
| | | | Durham, North Carolina, General Obligation Bonds, Series 2007: | | | | | | | |
| | 2,820 | | 5.000%, 4/01/21 | | 4/17 at 100.00 | AAA | | | 3,283,495 | |
| | 1,475 | | 5.000%, 4/01/22 | | 4/17 at 100.00 | AAA | | | 1,729,054 | |
| | 1,050 | | Forsyth County, North Carolina, General Obligation Bonds, Limited Obligation Series 2009, 5.000%, 4/01/30 | | 4/20 at 100.00 | AA+ | | | 1,247,747 | |
| | | | North Carolina State, General Obligation Bonds, Series 2004A: | | | | | | | |
| | 1,000 | | 5.000%, 3/01/18 | | 3/14 at 100.00 | AAA | | | 1,058,510 | |
| | 1,800 | | 5.000%, 3/01/22 | | 3/14 at 100.00 | AAA | | | 1,900,170 | |
| | 5,100 | | Wake County, North Carolina, Limited Obligation Bonds, Series 2010, 5.000%, 1/01/37 | | 1/20 at 100.00 | AA+ | | | 6,107,964 | |
| | 13,245 | | Total Tax Obligation/General | | | | | | 15,326,940 | |
| | | | Tax Obligation/Limited – 24.7% (15.8% of Total Investments) | | | | | | | |
| | | | Charlotte, North Carolina, Certificates of Participation, Governmental Facilities Projects, Series 2003G: | | | | | | | |
| | 3,100 | | 5.375%, 6/01/26 | | 6/13 at 100.00 | AA+ | | | 3,171,548 | |
| | 1,750 | | 5.000%, 6/01/28 | | 6/13 at 100.00 | AA+ | | | 1,786,470 | |
| | 2,750 | | 5.000%, 6/01/33 | | 6/13 at 100.00 | AA+ | | | 2,806,320 | |
| | 2,405 | | Charlotte, North Carolina, Certificates of Participation, Transit Projects Phase 2, Series 2008A, 5.000%, 6/01/33 | | 6/18 at 100.00 | AA+ | | | 2,770,392 | |
| | 1,505 | | Charlotte, North Carolina, Certificates of Participation, Transit Projects, Series 2003A, 5.000%, 6/01/33 | | 6/13 at 100.00 | AA+ | | | 1,535,822 | |
| | | | Craven County, North Carolina, Certificates of Participation, Series 2007: | | | | | | | |
| | 160 | | 5.000%, 6/01/23 – NPFG Insured | | 6/17 at 100.00 | AA– | | | 185,726 | |
| | 3,000 | | 5.000%, 6/01/27 – NPFG Insured | | 6/17 at 100.00 | AA– | | | 3,428,100 | |
| | 2,085 | | Dare County, North Carolina, Installment Purchase Contract, Limited Obligation Series 2012B, 5.000%, 6/01/28 | | 6/22 at 100.00 | AA– | | | 2,550,122 | |
| | | | Davidson County, North Carolina, Certificates of Participation, Series 2004: | | | | | | | |
| | 1,000 | | 5.250%, 6/01/14 – AMBAC Insured | | No Opt. Call | Aa3 | | | 1,065,630 | |
| | 1,250 | | 5.250%, 6/01/21 – AMBAC Insured | | 6/14 at 100.00 | Aa3 | | | 1,334,800 | |
| | 1,390 | | Durham, North Carolina, Certificates of Participation, Series 2005B, 5.000%, 6/01/25 | | 6/15 at 100.00 | AA+ | | | 1,536,353 | |
| | 1,060 | | Government of Guam, Business Privilege Tax Bonds, Series 2011A, 5.125%, 1/01/42 | | 1/22 at 100.00 | A | | | 1,212,110 | |
| | | | Harnett County, North Carolina, Certificates of Participation, Series 2009: | | | | | | | |
| | 1,000 | | 5.000%, 6/01/28 – AGC Insured | | 6/19 at 100.00 | AA– | | | 1,144,990 | |
| | 500 | | 5.000%, 6/01/29 – AGC Insured | | 6/19 at 100.00 | AA– | | | 570,245 | |
| | | | Jacksonville Public Facilities Corporation, North Carolina, Limited Obligation Bonds, Series 2012: | | | | | | | |
| | 1,065 | | 5.000%, 4/01/29 | | 4/22 at 100.00 | A1 | | | 1,278,075 | |
| | 1,165 | | 5.000%, 4/01/30 | | 4/22 at 100.00 | A1 | | | 1,391,674 | |
| | 1,000 | | 5.000%, 4/01/31 | | 4/22 at 100.00 | A1 | | | 1,190,920 | |
| | 200 | | 5.000%, 4/01/32 | | 4/22 at 100.00 | A1 | | | 236,372 | |
| | 400 | | Mecklenburg County, North Carolina, Certificates of Participation, Series 2009A, 5.000%, 2/01/27 | | 2/19 at 100.00 | AA+ | | | 462,872 | |
| | 8,065 | | North Carolina Turnpike Authority, Monroe Connector System State Appropriation Bonds, Series 2011, 5.000%, 7/01/41 | | 7/21 at 100.00 | AA | | | 9,440,806 | |
| | 1,380 | | Pasquotank County, North Carolina, Certificates of Participation, Series 2004, 5.000%, 6/01/25 – NPFG Insured | | 6/14 at 100.00 | A | | | 1,429,390 | |
| | Principal | | | | Optional Call | | | | | |
| | Amount (000) | | Description (1) | | Provisions (2) | Ratings (3) | | | Value | |
| | | | Tax Obligation/Limited (continued) | | | | | | | |
| $ | 2,000 | | Puerto Rico Highway and Transportation Authority, Grant Anticipation Revenue Bonds, Series 2004, 5.000%, 9/15/21 – NPFG Insured | | 3/14 at 100.00 | A+ | | $ | 2,082,480 | |
| | 9,450 | | Puerto Rico Sales Tax Financing Corporation, Sales Tax Revenue Bonds, First Subordinate Series 2010A, 0.000%, 8/01/35 | | No Opt. Call | A+ | | | 2,796,539 | |
| | | | Raleigh, North Carolina, Certificates of Participation, Downtown Improvement Project, Series 2004B: | | | | | | | |
| | 1,275 | | 5.000%, 6/01/20 | | 6/14 at 100.00 | AA+ | | | 1,358,717 | |
| | 1,310 | | 5.000%, 6/01/21 | | 6/14 at 100.00 | AA+ | | | 1,396,015 | |
| | 1,135 | | Raleigh, North Carolina, Certificates of Participation, Series 2007, 5.000%, 2/01/27 | | 2/17 at 100.00 | AA+ | | | 1,285,365 | |
| | 2,000 | | Randolph County, North Carolina, Certificates of Participation, Series 2004, 5.000%, 6/01/20 – AGM Insured | | 6/14 at 102.00 | AA– | | | 2,167,800 | |
| | 2,250 | | Rutherford County, North Carolina, Certificates of Participation, Series 2007, 5.000%, 12/01/27 – AGM Insured | | 12/17 at 100.00 | AA– | | | 2,573,393 | |
| | 5,000 | | Sampson County, North Carolina, Certificates of Participation, Series 2006, 5.000%, 6/01/34 – AGM Insured (UB) | | 6/17 at 100.00 | AA– | | | 5,591,151 | |
| | 2,450 | | Wilmington, North Carolina, Certificates of Participation, Series 2008A, 5.000%, 6/01/29 | | 6/18 at 100.00 | AA | | | 2,822,229 | |
| | 1,750 | | Wilson County, North Carolina, Certificates of Participation, School Facilities Project, Series 2007, 5.000%, 4/01/25 – AMBAC Insured | | 4/17 at 100.00 | Aa3 | | | 2,018,345 | |
| | 64,850 | | Total Tax Obligation/Limited | | | | | | 64,620,771 | |
| | | | Transportation – 15.4% (9.9% of Total Investments) | | | | | | | |
| | 5,000 | | Charlotte, North Carolina, Airport Revenue Bonds, Charlotte Douglas International Refunding Series 2010A, 5.000%, 7/01/39 | | 7/20 at 100.00 | Aa3 | | | 5,774,700 | |
| | 10 | | Charlotte, North Carolina, Airport Revenue Bonds, Charlotte Douglas International Refunding Series 2010B, 5.375%, 7/01/28 (Alternative Minimum Tax) | | 7/20 at 100.00 | Aa3 | | | 11,839 | |
| | 1,400 | | Charlotte, North Carolina, Airport Revenue Bonds, Charlotte Douglas International, Series 2010B, 5.000%, 7/01/36 (Alternative Minimum Tax) | | 7/21 at 100.00 | Aa3 | | | 1,571,640 | |
| | | | Charlotte, North Carolina, Airport Revenue Bonds, Series 2004A: | | | | | | | |
| | 600 | | 5.250%, 7/01/24 – NPFG Insured | | 7/14 at 100.00 | Aa3 | | | 641,700 | |
| | 2,710 | | 5.000%, 7/01/29 – NPFG Insured | | 7/14 at 100.00 | Aa3 | | | 2,863,359 | |
| | 1,935 | | 5.000%, 7/01/34 – NPFG Insured | | 7/14 at 100.00 | Aa3 | | | 2,044,502 | |
| | 2,700 | | North Carolina State Ports Authority, Port Facilities Revenue Bonds, Senior Lien Series 2010A, 5.250%, 2/01/40 | | 2/20 at 100.00 | A3 | | | 3,116,259 | |
| | 515 | | North Carolina State Ports Authority, Port Facilities Revenue Bonds, Senior Lien Series 2010B, 5.000%, 2/01/29 | | 2/20 at 100.00 | A3 | | | 589,732 | |
| | | | North Carolina Turnpike Authority, Triangle Expressway System Revenue Bonds, Series 2009A: | | | | | | | |
| | 140 | | 5.000%, 1/01/21 – AGC Insured | | 1/19 at 100.00 | AA– | | | 167,005 | |
| | 240 | | 5.375%, 1/01/26 – AGC Insured | | 1/19 at 100.00 | AA– | | | 281,165 | |
| | 1,405 | | 5.500%, 1/01/29 – AGC Insured | | 1/19 at 100.00 | AA– | | | 1,645,466 | |
| | 7,150 | | 5.750%, 1/01/39 – AGC Insured | | 1/19 at 100.00 | AA– | | | 8,394,670 | |
| | | | North Carolina Turnpike Authority, Triangle Expressway System Senior Lien Revenue Bonds, Series 2009B: | | | | | | | |
| | 150 | | 0.000%, 1/01/31 – AGC Insured | | No Opt. Call | AA– | | | 72,701 | |
| | 4,355 | | 0.000%, 1/01/33 – AGC Insured | | No Opt. Call | AA– | | | 1,925,041 | |
| | 2,300 | | 0.000%, 1/01/34 – AGC Insured | | No Opt. Call | AA– | | | 966,345 | |
| | 2,345 | | 0.000%, 1/01/35 – AGC Insured | | No Opt. Call | AA– | | | 941,658 | |
| | 7,505 | | 0.000%, 1/01/37 – AGC Insured | | No Opt. Call | AA– | | | 2,762,365 | |
| | 1,325 | | 0.000%, 1/01/38 – AGC Insured | | No Opt. Call | AA– | | | 464,320 | |
| | 1,235 | | Piedmont Triad Airport Authority, North Carolina, Airport Revenue Bonds, Series 2005A, 5.000%, 7/01/20 – SYNCORA GTY Insured | | 7/15 at 100.00 | A– | | | 1,367,157 | |
| | 4,125 | | Raleigh Durham Airport Authority, North Carolina, Airport Revenue Bonds, Refunding Series 2010A, 5.000%, 5/01/36 | | 5/20 at 100.00 | Aa3 | | | 4,766,438 | |
| | 47,145 | | Total Transportation | | | | | | 40,368,062 | |
| | | | U.S. Guaranteed – 19.4% (12.4% of Total Investments) (4) | | | | | | | |
| | | | Cabarrus County, North Carolina, Certificates of Participation, Series 2002: | | | | | | | |
| | 30 | | 5.250%, 2/01/16 (Pre-refunded 2/01/13) | | 2/13 at 100.00 | AA (4) | | | 30,257 | |
| | 1,330 | | 5.250%, 2/01/17 (Pre-refunded 2/01/13) | | 2/13 at 100.00 | AA (4) | | | 1,341,398 | |
| | | Nuveen North Carolina Premium Income Municipal Fund (continued) |
| NNC | | Portfolio of Investments |
| | | November 30, 2012 (Unaudited) |
| | Principal | | | | Optional Call | | | | | |
| | Amount (000) | | Description (1) | | Provisions (2) | Ratings (3) | | | Value | |
| | | | U.S. Guaranteed (4) (continued) | | | | | | | |
| | | | Catawba County, North Carolina, Certificates of Participation, Series 2004: | | | | | | | |
| $ | 1,800 | | 5.250%, 6/01/21 (Pre-refunded 6/01/14) – NPFG Insured | | 6/14 at 100.00 | Aa2 (4) | | $ | 1,932,570 | |
| | 1,800 | | 5.250%, 6/01/22 (Pre-refunded 6/01/14) – NPFG Insured | | 6/14 at 100.00 | Aa2 (4) | | | 1,932,570 | |
| | 500 | | Charlotte-Mecklenburg Hospital Authority, North Carolina, Healthcare System Revenue Bonds, DBA Carolinas Healthcare System, Series 2005A, 5.000%, 1/15/45 (Pre-refunded 1/15/15) | | 1/15 at 100.00 | AA+ (4) | | | 548,765 | |
| | | | Forsyth County, North Carolina, Certificates of Participation, Public Facilities and Equipment Project, Series 2002: | | | | | | | |
| | 1,325 | | 5.125%, 1/01/16 (Pre-refunded 1/01/13) | | 1/13 at 101.00 | AA+ (4) | | | 1,343,722 | |
| | 770 | | 5.250%, 1/01/19 (Pre-refunded 1/01/13) | | 1/13 at 101.00 | AA+ (4) | | | 780,965 | |
| | | | Greensboro, North Carolina, Combined Enterprise System Revenue Bonds, Series 2005A: | | | | | | | |
| | 500 | | 5.000%, 6/01/25 (Pre-refunded 6/01/15) | | 6/15 at 100.00 | AAA | | | 557,195 | |
| | 1,295 | | 5.000%, 6/01/26 (Pre-refunded 6/01/15) | | 6/15 at 100.00 | AAA | | | 1,443,135 | |
| | | | Lee County, North Carolina, Certificates of Participation, Public Schools and Community College, Series 2004: | | | | | | | |
| | 1,715 | | 5.250%, 4/01/18 (Pre-refunded 4/01/14) – AGM Insured | | 4/14 at 100.00 | AA– (4) | | | 1,827,384 | |
| | 1,715 | | 5.250%, 4/01/20 (Pre-refunded 4/01/14) – AGM Insured | | 4/14 at 100.00 | AA– (4) | | | 1,827,384 | |
| | 1,000 | | 5.250%, 4/01/22 (Pre-refunded 4/01/14) – AGM Insured | | 4/14 at 100.00 | AA– (4) | | | 1,065,530 | |
| | 25 | | North Carolina Eastern Municipal Power Agency, Power System Revenue Bonds, Series 2003C, 5.375%, 1/01/17 (Pre-refunded 1/01/13) | | 1/13 at 100.00 | A– (4) | | | 25,110 | |
| | | | North Carolina Eastern Municipal Power Agency, Power System Revenue Bonds, Series 2003F: | | | | | | | |
| | 3,000 | | 5.500%, 1/01/15 (Pre-refunded 1/01/13) | | 1/13 at 100.00 | A– (4) | | | 3,013,650 | |
| | 150 | | 5.500%, 1/01/16 (Pre-refunded 1/01/13) | | 1/13 at 100.00 | A– (4) | | | 150,683 | |
| | 1,500 | | North Carolina Infrastructure Finance Corporation, Certificates of Participation, Correctional Facilities, Series 2004A, 5.000%, 2/01/23 (Pre-refunded 2/01/14) | | 2/14 at 100.00 | AA+ (4) | | | 1,582,290 | |
| | 2,250 | | North Carolina Medical Care Commission, Health Care Facilities Revenue Bonds, WakeMed, Series 2009A, 5.625%, 10/01/38 (Pre-refunded 10/01/14) – AGC Insured | | 10/14 at 100.00 | AA– (4) | | | 2,466,810 | |
| | 2,035 | | North Carolina Medical Care Commission, Revenue Bonds, Northeast Medical Center, Series 2004, 5.000%, 11/01/24 (Pre-refunded 11/01/14) | | 11/14 at 100.00 | N/R (4) | | | 2,211,272 | |
| | 4,260 | | North Carolina Municipal Power Agency 1, Catawba Electric Revenue Bonds, Series 1986, 5.000%, 1/01/20 (ETM) | | No Opt. Call | Aaa | | | 5,397,846 | |
| | 2,285 | | North Carolina State University at Raleigh, General Revenue Bonds, Series 2003A, 5.000%, 10/01/15 (Pre-refunded 10/01/13) | | 10/13 at 100.00 | Aa1 (4) | | | 2,376,080 | |
| | 2,500 | | North Carolina, Certificates of Participation, Repair and Renovation Project, Series 2004B, 5.000%, 6/01/20 (Pre-refunded 6/01/14) | | 6/14 at 100.00 | AA+ (4) | | | 2,674,750 | |
| | | | North Carolina, Certificates of Participation, Series 2003: | | | | | | | |
| | 1,130 | | 5.250%, 6/01/21 (Pre-refunded 6/01/13) | | 6/13 at 100.00 | AA+ (4) | | | 1,157,583 | |
| | 1,000 | | 5.250%, 6/01/23 (Pre-refunded 6/01/13) | | 6/13 at 100.00 | AA+ (4) | | | 1,024,410 | |
| | 2,070 | | Pitt County, North Carolina, Certificates of Participation, School Facilities Project, Series 2004B, 5.000%, 4/01/29 (Pre-refunded 4/01/14) – AMBAC Insured | | 4/14 at 100.00 | AA (4) | | | 2,198,754 | |
| | | | Raleigh, North Carolina, Combined Enterprise System Revenue Bonds, Series 2004: | | | | | | | |
| | 1,000 | | 5.000%, 3/01/21 (Pre-refunded 3/01/14) | | 3/14 at 100.00 | AAA | | | 1,059,010 | |
| | 1,250 | | 5.000%, 3/01/22 (Pre-refunded 3/01/14) | | 3/14 at 100.00 | AAA | | | 1,323,763 | |
| | 1,785 | | Union County, North Carolina, Certificates of Participation, Series 2003, 5.000%, 6/01/20 (Pre-refunded 6/01/13) – AMBAC Insured | | 6/13 at 101.00 | Aa2 (4) | | | 1,845,547 | |
| | 555 | | University of North Carolina System, Pooled Revenue Bonds, Series 2005A, 5.000%, 4/01/22 (Pre-refunded 4/01/15) – AMBAC Insured | | 4/15 at 100.00 | N/R (4) | | | 613,269 | |
| | | | University of North Carolina, Chapel Hill, System Net Revenue Bonds, Series 2003: | | | | | | | |
| | 2,380 | | 5.000%, 12/01/19 (Pre-refunded 12/01/13) | | 12/13 at 100.00 | Aaa | | | 2,492,717 | |
| | 2,725 | | 5.000%, 12/01/21 (Pre-refunded 12/01/13) | | 12/13 at 100.00 | Aaa | | | 2,854,056 | |
| | 1,500 | | 5.000%, 12/01/23 (Pre-refunded 12/01/13) | | 12/13 at 100.00 | Aaa | | | 1,571,040 | |
| | 47,180 | | Total U.S. Guaranteed | | | | | | 50,669,515 | |
| | | | Utilities – 12.1% (7.7% of Total Investments) | | | | | | | |
| | 2,500 | | North Carolina Eastern Municipal Power Agency, Power System Revenue Bonds, Series 2005, 5.250%, 1/01/20 – AMBAC Insured | | 1/16 at 100.00 | A– | | | 2,830,650 | |
| | 1,400 | | North Carolina Eastern Municipal Power Agency, Power System Revenue Bonds, Series 2009B, 5.000%, 1/01/26 | | 1/19 at 100.00 | A– | | | 1,625,148 | |
| | Principal | | | | Optional Call | | | | | |
| | Amount (000) | | Description (1) | | Provisions (2) | Ratings (3) | | | Value | |
| | | | Utilities (continued) | | | | | | | |
| $ | 3,500 | | North Carolina Eastern Municipal Power Agency, Power System Revenue Bonds, Series 2012A, 5.000%, 1/01/25 | | 7/22 at 100.00 | A– | | $ | 4,273,395 | |
| | | | North Carolina Eastern Municipal Power Agency, Power System Revenue Refunding Bonds, Series 1993B: | | | | | | | |
| | 95 | | 6.000%, 1/01/22 | | No Opt. Call | A– | | | 126,287 | |
| | 180 | | 6.000%, 1/01/22 – FGIC Insured | | No Opt. Call | Baa1 | | | 238,928 | |
| | 1,100 | | North Carolina Municipal Power Agency 1, Catawba Electric Revenue Bonds, Refunding Series 2009A, 5.000%, 1/01/30 | | 1/19 at 100.00 | A | | | 1,268,091 | |
| | | | North Carolina Municipal Power Agency 1, Catawba Electric Revenue Bonds, Refunding Series 2012A: | | | | | | | |
| | 4,000 | | 5.000%, 1/01/18 (WI/DD, Settling 12/11/12) | | No Opt. Call | A | | | 4,769,400 | |
| | 2,000 | | 5.000%, 1/01/19 (WI/DD, Settling 12/11/12) | | No Opt. Call | A | | | 2,438,680 | |
| | 1,000 | | 4.000%, 1/01/19 (WI/DD, Settling 12/11/12) | | No Opt. Call | A | | | 1,161,160 | |
| | 1,050 | | 4.000%, 1/01/20 (WI/DD, Settling 12/11/12) | | No Opt. Call | A | | | 1,232,784 | |
| | 4,665 | | North Carolina Municipal Power Agency 1, Catawba Electric Revenue Bonds, Series 2003A, 5.250%, 1/01/15 – AMBAC Insured | | 1/13 at 100.00 | A | | | 4,685,293 | |
| | 250 | | North Carolina Municipal Power Agency 1, Catawba Electric Revenue Bonds, Series 2008A, 5.250%, 1/01/20 | | 1/18 at 100.00 | A | | | 297,293 | |
| | 6,500 | | Wake County Industrial Facilities and Pollution Control Financing Authority, North Carolina, Revenue Refunding Bonds, Carolina Power and Light Company, Series 2002, 5.375%, 2/01/17 | | 2/13 at 100.50 | A1 | | | 6,582,353 | |
| | 28,240 | | Total Utilities | | | | | | 31,529,462 | |
| | | | Water and Sewer – 30.9% (19.8% of Total Investments) | | | | | | | |
| | 1,605 | | Broad River Water Authority, North Carolina, Water System Revenue Bonds, Series 2005, 5.000%, 6/01/20 – SYNCORA GTY Insured | | 6/15 at 100.00 | A2 | | | 1,730,672 | |
| | 3,100 | | Brunswick County, North Carolina, Enterprise System Revenue Bonds, Series 2008A, 5.000%, 4/01/31 – AGM Insured | | 4/18 at 100.00 | AA– | | | 3,586,235 | |
| | | | Cape Fear Public Utility Authority, North Carolina, Water & Sewer System Revenue Bonds, Series 2008: | | | | | | | |
| | 425 | | 5.000%, 8/01/28 | | 8/18 at 100.00 | AA | | | 507,463 | |
| | 1,005 | | 5.000%, 8/01/35 | | 8/18 at 100.00 | AA | | | 1,190,372 | |
| | 2,135 | | Cape Fear Public Utility Authority, North Carolina, Water & Sewer System Revenue Bonds, Series 2011, 5.000%, 8/01/31 | | 8/21 at 100.00 | AA | | | 2,597,847 | |
| | 1,520 | | Charlotte, North Carolina, Water and Sewerage System Revenue Bonds, Series 2002A, 5.250%, 7/01/13 | | No Opt. Call | AAA | | | 1,565,083 | |
| | 1,000 | | Charlotte, North Carolina, Water and Sewerage System Revenue Bonds, Series 2008, 5.000%, 7/01/38 | | 7/18 at 100.00 | AAA | | | 1,187,750 | |
| | | | Dare County, North Carolina, Utilities System Revenue Bonds, Series 2011: | | | | | | | |
| | 3,860 | | 5.000%, 2/01/36 | | 2/21 at 100.00 | AA | | | 4,539,321 | |
| | 1,250 | | 5.000%, 2/01/41 | | 2/21 at 100.00 | AA | | | 1,456,975 | |
| | | | Durham County, North Carolina, Enterprise System Revenue Bonds, Series 2002: | | | | | | | |
| | 300 | | 5.000%, 6/01/18 – NPFG Insured | | 6/13 at 100.00 | AA | | | 306,807 | |
| | 1,000 | | 5.000%, 6/01/23 – NPFG Insured | | 6/13 at 100.00 | AA | | | 1,022,490 | |
| | 8,600 | | Durham, North Carolina, Utility System Revenue Bonds, Refunding Series 2011, 5.000%, 6/01/41 | | 6/21 at 100.00 | AAA | | | 10,205,101 | |
| | 1,535 | | Mooresville, North Carolina, Enterprise System Revenue Bonds, Refunding Series 2012, 5.000%, 5/01/28 | | 5/22 at 100.00 | AA– | | | 1,906,946 | |
| | 1,210 | | Oak Island, North Carolina, Enterprise System Revenue Bonds, Series 2008A, 5.000%, 6/01/23 – NPFG Insured | | 6/18 at 100.00 | A2 | | | 1,437,250 | |
| | | | Oak Island, North Carolina, Enterprise System Revenue Bonds, Series 2009A: | | | | | | | |
| | 2,020 | | 6.000%, 6/01/34 – AGC Insured | | 6/19 at 100.00 | AA– | | | 2,398,548 | |
| | 1,020 | | 6.000%, 6/01/36 – AGC Insured | | 6/19 at 100.00 | AA– | | | 1,207,160 | |
| | | | Oak Island, North Carolina, Enterprise System Revenue Bonds, Series 2011: | | | | | | | |
| | 500 | | 5.625%, 6/01/30 – AGC Insured | | 6/21 at 100.00 | AA– | | | 613,645 | |
| | 2,100 | | 5.750%, 6/01/36 – AGC Insured | | 6/21 at 100.00 | AA– | | | 2,543,730 | |
| | 1,400 | | Onslow County, North Carolina, Combined Enterprise System Revenue Bonds, Series 2004B, 5.000%, 6/01/23 – SYNCORA GTY Insured | | 6/14 at 100.00 | A+ | | | 1,481,928 | |
| | 1,550 | | Puerto Rico Aqueduct and Sewerage Authority, Revenue Bonds, Senior Lien Series 2008A, 6.000%, 7/01/44 | | 7/18 at 100.00 | Baa2 | | | 1,642,070 | |
| | | Nuveen North Carolina Premium Income Municipal Fund (continued) |
| NNC | | Portfolio of Investments |
| | | November 30, 2012 (Unaudited) |
| | Principal | | | | Optional Call | | | | | |
| | Amount (000) | | Description (1) | | Provisions (2) | Ratings (3) | | | Value | |
| | | | Water and Sewer (continued) | | | | | | | |
| $ | | | Raleigh, North Carolina, Combined Enterprise System Revenue Bonds, Refunding Series 2012A: | | | | | | | |
| | 550 | | 5.000%, 3/01/30 | | 3/22 at 100.00 | AAA | | $ | 686,362 | |
| | 1,600 | | 5.000%, 3/01/31 | | 3/22 at 100.00 | AAA | | | 1,986,016 | |
| | | | Raleigh, North Carolina, Combined Enterprise System Revenue Bonds, Series 2006A: | | | | | | | |
| | 12,485 | | 5.000%, 3/01/31 (UB) | | 3/16 at 100.00 | AAA | | | 13,968,343 | |
| | 6,975 | | 5.000%, 3/01/36 (UB) | | 3/16 at 100.00 | AAA | | | 7,803,700 | |
| | 40 | | Raleigh, North Carolina, Combined Enterprise System Revenue Bonds, Series 2006A, Residuals Series II-R-645-1, 13.713%, 3/01/14 (IF) | | No Opt. Call | AAA | | | 54,254 | |
| | 10 | | Raleigh, North Carolina, Combined Enterprise System Revenue Bonds, Series 2006A, Residuals Series II-R-645-2, 14.020%, 3/01/14 (IF) | | No Opt. Call | AAA | | | 13,562 | |
| | 500 | | Raleigh, North Carolina, Combined Enterprise System Revenue Bonds, Series 2006A, 5.000%, 3/01/31 | | 3/16 at 100.00 | AAA | | | 559,405 | |
| | 1,000 | | Wilmington, North Carolina, Water and Sewer Revenue Bonds, Series 2005, 5.000%, 6/01/25 – AGM Insured | | 6/15 at 100.00 | AA | | | 1,096,640 | |
| | 9,900 | | Winston-Salem, North Carolina, Water and Sewer System Revenue Bonds, Series 2007A, 5.000%, 6/01/37 (UB) | | 6/17 at 100.00 | AAA | | | 11,367,873 | |
| | 70,195 | | Total Water and Sewer | | | | | | 80,663,548 | |
| $ | 385,975 | | Total Investments (cost $373,563,385) – 156.3% | | | | | | 408,410,435 | |
| | | | Floating Rate Obligations – (9.1)% | | | | | | (23,715,000 | ) |
| | | | MuniFund Term Preferred Shares, at Liquidation Value – (47.8)% (5) | | | | | | (124,860,000 | ) |
| | | | Other Assets Less Liabilities – 0.6% | | | | | | 1,453,269 | |
| | | | Net Assets Applicable to Common Shares – 100% | | | | | $ | 261,288,704 | |
| (1) | | All percentages shown in the Portfolio of Investments are based on net assets applicable to Common shares unless otherwise noted. |
| (2) | | Optional Call Provisions: Dates (month and year) and prices of the earliest optional call or redemption. There may be other call provisions at varying prices at later dates. Certain mortgage-backed securities may be subject to periodic principal paydowns. |
| (3) | | Ratings: Using the highest of Standard & Poor’s Group (“Standard & Poor’s”), Moody’s Investors Service, Inc. (“Moody’s”) or Fitch, Inc. (“Fitch”) rating. Ratings below BBB by Standard & Poor’s, Baa by Moody’s or BBB by Fitch are considered to be below investment grade. Holdings designated N/R are not rated by any of these national rating agencies. |
| (4) | | Backed by an escrow or trust containing sufficient U.S. Government or U.S. Government agency securities, which ensure the timely payment of principal and interest. Certain bonds backed by U.S. Government or agency securities are regarded as having an implied rating equal to the rating of such securities. |
| (5) | | MuniFund Term Preferred Shares, at Liquidation Value as a percentage of Total Investments is 30.6% |
| N/R | | Not rated. |
| WI/DD | | Investment, or portion of investment, purchased on a when-issued or delayed delivery basis. |
| (ETM) | | Escrowed to maturity. |
| (IF) | | Inverse floating rate investment. |
| (UB) | | Underlying bond of an inverse floating rate trust reflected as a financing transaction. See Notes to Financial Statements, Footnote 1 – General Information and Significant Accounting Policies, Inverse Floating Rate Securities for more information. |
See accompanying notes to financial statements.
| | | Nuveen Virginia Premium Income Municipal Fund |
| NPV | | Portfolio of Investments |
| | | November 30, 2012 (Unaudited) |
| | Principal | | | | Optional Call | | | | | |
| | Amount (000) | | Description (1) | | Provisions (2) | Ratings (3) | | | Value | |
| | | | Consumer Staples – 7.1% (4.9% of Total Investments) | | | | | | | |
| | | | Guam Economic Development & Commerce Authority, Tobacco Settlement Asset-Backed Bonds, Series 2007A: | | | | | | | |
| $ | 910 | | 5.250%, 6/01/32 | | 6/17 at 100.00 | B+ | | $ | 907,252 | |
| | 700 | | 5.625%, 6/01/47 | | 6/17 at 100.00 | B+ | | | 639,842 | |
| | 57,000 | | Puerto Rico, The Children’s Trust Fund, Tobacco Settlement Asset-Backed Bonds, Series 2005A, 0.000%, 5/15/50 | | 5/15 at 11.19 | BB– | | | 4,451,700 | |
| | | | Puerto Rico, The Children’s Trust Fund, Tobacco Settlement Asset-Backed Refunding Bonds, Series 2002: | | | | | | | |
| | 3,310 | | 5.375%, 5/15/33 | | 5/13 at 100.00 | BBB+ | | | 3,313,740 | |
| | 325 | | 5.500%, 5/15/39 | | 5/13 at 100.00 | BBB | | | 325,367 | |
| | 11,425 | | Tobacco Settlement Financing Corporation of Virginia, Tobacco Settlement Asset Backed Bonds, Series 2007B1, 5.000%, 6/01/47 | | 6/17 at 100.00 | B2 | | | 9,130,743 | |
| | 2,145 | | Tobacco Settlement Financing Corporation of Virginia, Tobacco Settlement Asset-Backed Bonds, Series 2007B2, 5.200%, 6/01/46 | | 6/17 at 100.00 | B2 | | | 1,776,339 | |
| | 75,815 | | Total Consumer Staples | | | | | | 20,544,983 | |
| | | | Education and Civic Organizations – 7.9% (5.4% of Total Investments) | | | | | | | |
| | 580 | | Amherst Industrial Development Authority, Virginia, Revenue Bonds, Sweet Briar College, Series 2006, 5.000%, 9/01/26 | | 9/16 at 100.00 | BBB | | | 615,769 | |
| | 2,000 | | District of Columbia, Revenue Bonds, National Public Radio, Series 2010A, 5.000%, 4/01/43 | | 4/15 at 100.00 | AA– | | | 2,154,560 | |
| | 1,000 | | Fairfax County Economic Development Authority, Virginia, Revenue Bonds, National Wildlife Federation, Series 1999, 5.375%, 9/01/29 – NPFG Insured | | 3/13 at 100.00 | A3 | | | 1,003,660 | |
| | 1,000 | | Lexington Industrial Development Authority, Virginia, Educational Facilities Revenue Bonds, VMI Development Board Project, Series 2006C, 5.000%, 12/01/36 | | 6/19 at 100.00 | Aa2 | | | 1,179,670 | |
| | 2,500 | | Prince William County Industrial Development Authority, Virginia, Educational Facilities Revenue Bonds, Catholic Diocese of Arlington, Series 2003, 5.500%, 10/01/33 | | 10/13 at 101.00 | A2 | | | 2,571,600 | |
| | 1,630 | | Prince William County Industrial Development Authority, Virginia, Student Housing Revenue Bonds, George Mason University Foundation Prince William Housing LLC Project, Series 2011A, 5.125%, 9/01/41 | | 9/21 at 100.00 | A | | | 1,865,796 | |
| | 1,890 | | Puerto Rico Industrial, Tourist, Educational, Medical and Environmental Control Facilities Financing Authority, Higher Education Revenue Refunding Bonds, Ana G. Mendez University System, Series 2002, 5.375%, 12/01/21 | | 12/13 at 100.00 | BBB– | | | 1,910,790 | |
| | 2,950 | | The Rector and Visitors of the University of Virginia, General Revenue Bonds, Series 2005, 5.000%, 6/01/37 | | 6/15 at 100.00 | AAA | | | 3,227,477 | |
| | 390 | | University of Puerto Rico, University System Revenue Bonds, Series 2006P, 5.000%, 6/01/14 | | No Opt. Call | Baa2 | | | 406,953 | |
| | 3,600 | | Virginia College Building Authority, Educational Facilities Revenue Bonds, Public Higher Education Financing Program, Series 2009A, 5.000%, 9/01/28 | | 9/18 at 100.00 | Aa1 | | | 4,268,988 | |
| | 750 | | Virginia College Building Authority, Educational Facilities Revenue Bonds, Public Higher Education Financing Program, Series 2010B, 5.000%, 9/01/13 | | No Opt. Call | Aa1 | | | 777,165 | |
| | 500 | | Virginia College Building Authority, Educational Facilities Revenue Refunding Bonds, Marymount University, Series 1998, 5.100%, 7/01/18 – RAAI Insured | | 1/13 at 100.00 | N/R | | | 501,140 | |
| | 1,635 | | Virginia Commonwealth University, Revenue Bonds, Series 2004A, 5.000%, 5/01/17 – AMBAC Insured | | 5/14 at 101.00 | Aa2 | | | 1,753,031 | |
| | 500 | | Virginia Small Business Finance Authority, Educational Facilities Revenue Bonds, Roanoke College, Series 2011, 5.750%, 4/01/41 | | 4/20 at 100.00 | A– | | | 579,390 | |
| | 20,925 | | Total Education and Civic Organizations | | | | | | 22,815,989 | |
| | | | Health Care – 22.7% (15.6% of Total Investments) | | | | | | | |
| | 5,000 | | Arlington County Industrial Development Authority, Virginia, Hospital Revenue Bonds, Virginia Hospital Center Arlington Health System, Refunding Series 2010, 5.000%, 7/01/31 | | 7/20 at 100.00 | A1 | | | 5,625,100 | |
| | | | Charlotte County Industrial Development Authority, Virginia, Hospital Revenue Bonds, Halifax Regional Hospital Incorporated, Series 2007: | | | | | | | |
| | 1,545 | | 5.000%, 9/01/27 | | 9/17 at 100.00 | BBB+ | | | 1,663,455 | |
| | 250 | | 5.000%, 9/01/37 | | 9/17 at 100.00 | BBB+ | | | 263,975 | |
| | | Nuveen Virginia Premium Income Municipal Fund (continued) |
| NPV | | Portfolio of Investments |
| | | November 30, 2012 (Unaudited) |
| | Principal | | | | Optional Call | | | | | |
| | Amount (000) | | Description (1) | | Provisions (2) | Ratings (3) | | | Value | |
| | | | Health Care (continued) | | | | | | | |
| | $ 2,145 | | Chesterfield County Economic Development Authority, Virginia, Revenue Bonds, Bon Secours Health, Series 2010C-2, 5.000%, 11/01/42 – AGC Insured | | 11/20 at 100.00 | AA– | | $ | 2,423,571 | |
| | 3,340 | | Fairfax County Industrial Development Authority, Virginia, Healthcare Revenue Bonds, Inova Health System, Series 2009, Trust 11733, 14.967%, 11/15/29 (IF) | | 5/19 at 100.00 | AA+ | | | 5,037,588 | |
| | 4,950 | | Fairfax County Industrial Development Authority, Virginia, Hospital Revenue Refunding Bonds, Inova Health System, Series 1993A, 5.000%, 8/15/23 | | No Opt. Call | AA+ | | | 6,285,757 | |
| | 2,500 | | Fredericksburg Economic Development Authority, Virginia, Hospital Facilities Revenue Bonds, MediCorp Health System, Series 2007, 5.250%, 6/15/23 | | No Opt. Call | Baa1 | | | 3,071,650 | |
| | 2,480 | | Fredericksburg Industrial Development Authority, Virginia, Revenue Bonds, MediCorp Health System, Series 2002B, 5.125%, 6/15/33 | | 12/12 at 100.00 | Baa1 | | | 2,483,447 | |
| | 795 | | Hanover County Industrial Development Authority, Virginia, Hospital Revenue Bonds, Memorial Regional Medical Center, Series 1995, 6.375%, 8/15/18 – NPFG Insured | | No Opt. Call | A– | | | 890,885 | |
| | 5,345 | | Harrisonburg Industrial Development Authority, Virginia, Hospital Facilities Revenue Bonds, Rockingham Memorial Hospital, Series 2006, 5.000%,
8/15/31 – AMBAC Insured | | 8/16 at 100.00 | AA | | | 5,926,536 | |
| | 2,880 | | Henrico County Economic Development Authority, Virginia, Revenue Bonds, Bon Secours Health System Inc., Series 2002A, 5.600%, 11/15/30 | | 5/13 at 100.00 | A– | | | 2,887,200 | |
| | 1,500 | | Henrico County Industrial Development Authority, Virginia, Healthcare Revenue Bonds, Bon Secours Health System, Series 1996, 6.250%, 8/15/20 – NPFG Insured | | No Opt. Call | A– | | | 1,792,035 | |
| | 3,180 | | Manassas Industrial Development Authority, Virginia, Hospital Revenue Bonds, Prince William Hospital, Series 2002, 5.250%, 4/01/33 | | 4/13 at 100.00 | A2 | | | 3,200,161 | |
| | | | Stafford County Economic Development Authority, Virginia, Hospital Facilities Revenue Bonds, MediCorp Health System, Series 2006: | | | | | | | |
| | 2,000 | | 5.250%, 6/15/25 | | 6/16 at 100.00 | Baa1 | | | 2,150,800 | |
| | 2,000 | | 5.250%, 6/15/26 | | 6/16 at 100.00 | Baa1 | | | 2,145,240 | |
| | 2,025 | | 5.250%, 6/15/31 | | 6/16 at 100.00 | Baa1 | | | 2,148,626 | |
| | 3,395 | | 5.250%, 6/15/37 | | 6/16 at 100.00 | Baa1 | | | 3,574,460 | |
| | 2,550 | | Virginia Small Business Finance Authority, Healthcare Facilities Revenue Bonds, Sentara Healthcare, Refunding Series 2010, 5.000%, 11/01/40 | | 5/20 at 100.00 | AA | | | 2,882,393 | |
| | 4,425 | | Virginia Small Business Financing Authority, Wellmont Health System Project Revenue Bonds, Series 2007A, 5.250%, 9/01/37 | | 9/17 at 100.00 | BBB+ | | | 4,678,641 | |
| | 1,620 | | Winchester Industrial Development Authority, Virginia, Hospital Revenue Bonds Valley Health System Obligated Group, Series 2009E, 5.625%, 1/01/44 | | 1/19 at 100.00 | A+ | | | 1,863,162 | |
| | 2,855 | | Winchester Industrial Development Authority, Virginia, Hospital Revenue Bonds, Winchester Medical Center, Series 2007, 5.125%, 1/01/31 | | 1/17 at 100.00 | A+ | | | 3,105,498 | |
| | 1,020 | | Wisconsin Health and Educational Facilities Authority, Revenue Bonds, Aurora Health Care, Inc., Series 2010A, 5.625%, 4/15/39 | | 4/20 at 100.00 | A | | | 1,187,494 | |
| | 57,800 | | Total Health Care | | | | | | 65,287,674 | |
| | | | Housing/Multifamily – 1.3% (0.9% of Total Investments) | | | | | | | |
| | 970 | | Arlington County Industrial Development Authority, Virginia, Multifamily Housing Mortgage Revenue Bonds, Arlington View Terrace Apartments, Series 2001, 5.150%, 11/01/31 (Mandatory put 11/01/19) (Alternative Minimum Tax) | | 12/12 at 101.00 | AA+ | | | 982,038 | |
| | 400 | | Virginia Housing Development Authority, Rental Housing Bonds, Series 2010A, 5.000%, 4/01/45 | | 10/19 at 100.00 | AA+ | | | 435,420 | |
| | 530 | | Virginia Housing Development Authority, Rental Housing Bonds, Series 2010C, 4.550%, 8/01/32 | | 2/20 at 100.00 | AA+ | | | 578,331 | |
| | 1,440 | | Waynesboro Redevelopment and Housing Authority, Virginia, Multifamily Housing Revenue Bonds, Epworth Manor, GNMA Collateralized Series 2010, 5.000%, 10/20/51 | | 4/20 at 100.00 | AA+ | | | 1,572,653 | |
| | 3,340 | | Total Housing/Multifamily | | | | | | 3,568,442 | |
| | | | Housing/Single Family – 6.1% (4.2% of Total Investments) | | | | | | | |
| | 250 | | Puerto Rico Housing Finance Authority, Mortgage-Backed Securities Program Home Mortgage Revenue Bonds, Series 2003A, 4.875%, 6/01/34 (Alternative Minimum Tax) | | 6/13 at 100.00 | Aaa | | | 251,568 | |
| | 2,600 | | Virginia Housing Development Authority, Commonwealth Mortgage Bonds, Series 2005C-2, 4.750%, 10/01/32 (Alternative Minimum Tax) | | 1/15 at 100.00 | AAA | | | 2,660,814 | |
| | 3,615 | | Virginia Housing Development Authority, Commonwealth Mortgage Bonds, Series 2006 D1, 4.900%, 1/01/33 (Alternative Minimum Tax) | | 7/15 at 100.00 | AAA | | | 3,741,272 | |
| | Principal | | | | Optional Call | | | | | |
| | Amount (000) | | Description (1) | | Provisions (2) | Ratings (3) | | | Value | |
| | | | Housing/Single Family (continued) | | | | | | | |
| $ | 2,740 | | Virginia Housing Development Authority, Commonwealth Mortgage Bonds, Series 2006, 4.800%, 7/01/29 (Alternative Minimum Tax) | | 7/15 at 100.00 | AAA | | $ | 2,842,038 | |
| | 7,900 | | Virginia Housing Development Authority, Commonwealth Mortgage Bonds, Series 2007B, 4.750%, 7/01/32 (Alternative Minimum Tax) | | 7/16 at 100.00 | AAA | | | 8,209,600 | |
| | 17,105 | | Total Housing/Single Family | | | | | | 17,705,292 | |
| | | | Long-Term Care – 8.9% (6.1% of Total Investments) | | | | | | | |
| | 2,000 | | Albemarle County Industrial Development Authority, Virginia, Residential Care Facilities Mortgage Revenue Bonds, Westminster-Cantebury of the Blue Ridge, Series 2007, 5.000%, 1/01/31 | | 1/17 at 100.00 | N/R | | | 2,063,220 | |
| | 1,000 | | Chesterfield County Health Center Commission, Virginia, Mortgage Revenue Bonds, Lucy Corr Village, Series 2005, 5.625%, 12/01/39 | | 12/15 at 100.00 | N/R | | | 1,017,780 | |
| | 5,585 | | Fairfax County Economic Development Authority, Virginia, Residential Care Facilities Mortgage Revenue Bonds, Goodwin House, Inc., Series 2007A, 5.125%, 10/01/37 | | 10/17 at 100.00 | BBB | | | 5,855,984 | |
| | | | Fairfax County Economic Development Authority, Virginia, Retirement Center Revenue Bonds, Greenspring Village, Series 2006A: | | | | | | | |
| | 1,000 | | 4.750%, 10/01/26 | | 10/16 at 100.00 | A | | | 1,059,500 | |
| | 800 | | 4.875%, 10/01/36 | | 10/16 at 100.00 | A | | | 839,280 | |
| | | | Henrico County Economic Development Authority, Virginia, Residential Care Facility Revenue Bonds, Westminster Canterbury of Richmond, Series 2006: | | | | | | | |
| | 100 | | 5.000%, 10/01/27 | | 10/17 at 100.00 | BBB | | | 102,636 | |
| | 4,740 | | 5.000%, 10/01/35 | | 10/35 at 100.00 | BBB | | | 4,863,335 | |
| | 3,590 | | Industrial Development Authority of the County of Prince William, Virginia, Residential Care Facility Revenue Bonds, Westminster at Lake, First Mortgage, Series 2006, 5.125%, 1/01/26 | | 1/17 at 100.00 | N/R | | | 2,754,535 | |
| | 2,000 | | James City County Industrial Development Authority, Virginia, Residential Care Facility First Mortgage Revenue Refunding Bonds, Williamsburg Landing Inc., Series 2003A, 6.000%, 3/01/23 | | 3/13 at 100.00 | N/R | | | 2,008,180 | |
| | 1,000 | | Roanoke Economic Development Authority, Virgina, Residential Care Facility Mortgage Revenue Refunding Bonds, Virginia Lutheran Homes Brandon Oaks Project, Series 2012, 4.625%, 12/01/27 | | 12/22 at 100.00 | N/R | | | 1,022,110 | |
| | 1,500 | | Roanoke Industrial Development Authority, Virginia, Residential Revenue Bonds, Virginia Lutheran Homes Incorporated, Series 2006, 5.000%, 12/01/39 | | 12/16 at 100.00 | N/R | | | 1,508,100 | |
| | 1,000 | | Suffolk Industrial Development Authority, Virginia, Retirement Facilities First Mortgage Revenue Bonds, Lake Prince Center, Series 2006, 5.300%, 9/01/31 | | 9/16 at 100.00 | N/R | | | 1,036,700 | |
| | 1,000 | | Virginia Beach Development Authority, Virginia, Residential Care Facility Mortgage Revenue Bonds, Westminster Canterbury on Chesapeake Bay, Series 2005, 5.000%, 11/01/22 | | 11/15 at 100.00 | N/R | | | 1,037,600 | |
| | 500 | | Winchester Industrial Development Authority, Virginia, Residential Care Facility Revenue Bonds, Westminster-Canterbury of Winchester Inc., Series 2005A, 5.200%, 1/01/27 | | 1/15 at 100.00 | BBB+ | | | 518,095 | |
| | 25,815 | | Total Long-Term Care | | | | | | 25,687,055 | |
| | | | Tax Obligation/General – 12.7% (8.7% of Total Investments) | | | | | | | |
| | 1,440 | | Bristol, Virginia, General Obligation Bonds, Refunding & Improvement Series 2010, 5.000%, 7/15/25 | | 7/20 at 100.00 | Aa3 | | | 1,791,158 | |
| | 3,560 | | Chesterfield County, Virginia, General Obligation Public Improvement Bonds, Series 2009A, 5.000%, 1/01/13 | | No Opt. Call | AAA | | | 3,574,916 | |
| | 1,000 | | Hampton, Virginia, General Obligation Bonds, Series 1998, 5.000%, 1/15/13 | | No Opt. Call | AA+ | | | 1,006,070 | |
| | 1,000 | | Loudoun County, Virginia, General Obligation Bonds, Public Improvement Series 2009A, 4.000%, 7/01/14 | | No Opt. Call | AAA | | | 1,059,080 | |
| | 1,700 | | Loudoun County, Virginia, General Obligation Bonds, Series 2006B, 5.000%, 12/01/25 | | 12/16 at 100.00 | AAA | | | 1,973,054 | |
| | 1,000 | | Newport News, Virginia, General Obligation Bonds, Series 2004B, 5.000%, 1/15/13 | | No Opt. Call | Aa1 | | | 1,006,070 | |
| | 6,050 | | Portsmouth, Virginia, General Obligation Bonds, Refunding Series 2010D, 5.000%, 7/15/34 | | 7/20 at 100.00 | AA | | | 7,137,608 | |
| | 1,280 | | Portsmouth, Virginia, General Obligation Bonds, Series 2005A, 5.000%, 4/01/15 – NPFG Insured | | No Opt. Call | AA | | | 1,415,181 | |
| | 380 | | Puerto Rico Government Development Bank, Adjustable Refunding Bonds, Variable Rate Demand Obligations, Series 1985, 4.750%, 12/01/15 – NPFG Insured | | 12/13 at 100.00 | BBB | | | 391,115 | |
| | 610 | | Puerto Rico, General Obligation and Public Improvement Bonds, Series 1998, 6.000%, 7/01/15 – NPFG Insured | | No Opt. Call | Baa1 | | | 662,423 | |
| | 740 | | Puerto Rico, General Obligation and Public Improvement Bonds, Series 2002A, 5.500%, 7/01/20 – NPFG Insured | | No Opt. Call | Baa1 | | | 828,941 | |
| | 560 | | Puerto Rico, General Obligation Bonds, Series 2004A, 5.000%, 7/01/15 – AGM Insured | | 7/14 at 100.00 | AA– | | | 592,463 | |
| | | Nuveen Virginia Premium Income Municipal Fund (continued) |
| NPV | | Portfolio of Investments |
| | | November 30, 2012 (Unaudited) |
| | Principal | | | | Optional Call | | | | |
| | Amount (000) | | Description (1) | | Provisions (2) | Ratings (3) | | Value | |
| | | | Tax Obligation/General (continued) | | | | | | |
| $ | 895 | | Richmond, Virginia, General Obligation Bonds, Refunding & Improvement Series 2012B, 2.000%, 7/15/13 | | No Opt. Call | AA+ | $ | 905,230 | |
| | 1,535 | | Suffolk, Virginia, General Obligation Bonds, Series 2005, 5.000%, 12/01/15 | | No Opt. Call | AA+ | | 1,740,122 | |
| | 2,000 | | Virginia Beach, Virginia, General Obligation Bonds, Series 2003B, 5.000%, 5/01/15 | | 5/13 at 100.00 | AAA | | 2,039,960 | |
| | | | Virginia Beach, Virginia, General Obligation Bonds, Series 2008: | | | | | | |
| | 4,500 | | 5.000%, 10/01/26 (UB) | | 10/17 at 100.00 | AAA | | 5,276,745 | |
| | 4,500 | | 5.000%, 10/01/27 (UB) | | 10/17 at 100.00 | AAA | | 5,276,745 | |
| | 32,750 | | Total Tax Obligation/General | | | | | 36,676,881 | |
| | | | Tax Obligation/Limited – 33.1% (22.7% of Total Investments) | | | | | | |
| | 200 | | Bell Creek Community Development Authority, Virginia, Special Assessment Bonds, Series 2003A, 6.750%, 3/01/22 | | 3/13 at 101.00 | N/R | | 202,664 | |
| | | | Buena Vista Public Recreational Facilities Authority, Virginia, Lease Revenue Bonds, Golf Course Project, Series 2005A: | | | | | | |
| | 665 | | 5.250%, 7/15/25 – ACA Insured | | 7/15 at 100.00 | N/R | | 624,881 | |
| | 520 | | 5.500%, 7/15/35 – ACA Insured | | 7/15 at 100.00 | N/R | | 476,767 | |
| | 1,340 | | Culpeper Industrial Development Authority, Virginia, Lease Revenue Bonds, School Facilities Project, Series 2005, 5.000%, 1/01/20 – NPFG Insured | | 1/15 at 100.00 | AA- | | 1,464,245 | |
| | 1,375 | | Cumberland County, Virginia, Certificates of Participation, Series 1997, 6.375%, 7/15/17 | | No Opt. Call | N/R | | 1,534,294 | |
| | 2,300 | | Fairfax County Economic Development Authority, Virginia, Lease Revenue Bonds, Joint Public Uses Community Project, Series 2006, 5.000%, 5/15/18 | | 5/16 at 100.00 | AA+ | | 2,606,659 | |
| | | | Government of Guam, Business Privilege Tax Bonds, Series 2011A: | | | | | | |
| | 1,020 | | 5.000%, 1/01/31 | | 1/22 at 100.00 | A | | 1,178,090 | |
| | 500 | | 5.250%, 1/01/36 | | 1/22 at 100.00 | A | | 578,755 | |
| | 5,600 | | Greater Richmond Convention Center Authority, Virginia, Hotel Tax Revenue Bonds, Series 2005, 5.000%, 6/15/30 – NPFG Insured | | 6/15 at 100.00 | A+ | | 6,061,384 | |
| | 1,270 | | James City County Economic Development Authority, Virginia, Lease Revenue Bonds, County Government Projects, Series 2005, 5.000%, 7/15/19 | | 7/15 at 100.00 | AA+ | | 1,410,310 | |
| | 890 | | Montgomery County Industrial Development Authority, Virginia, Public Facility Lease Revenue Bonds, Public Projects Series 2008, 5.000%, 2/01/29 | | 2/18 at 100.00 | AA– | | 1,000,227 | |
| | 580 | | Prince William County, Virginia, Certificates of Participation, County Facilities, Series 2005, 5.000%, 6/01/20 – AMBAC Insured | | 6/15 at 100.00 | Aa1 | | 640,303 | |
| | 2,895 | | Puerto Rico Highway and Transportation Authority, Highway Revenue Bonds, Series 2002D, 5.000%, 7/01/32 – AGM Insured | | 1/13 at 100.00 | AA– | | 2,897,113 | |
| | 680 | | Puerto Rico Highway and Transportation Authority, Highway Revenue Bonds, Series 2003G, 5.000%, 7/01/33 | | 7/13 at 100.00 | Baa1 | | 680,884 | |
| | | | Puerto Rico Highway and Transportation Authority, Highway Revenue Bonds, Series 2007N: | | | | | | |
| | 545 | | 5.500%, 7/01/29 – AMBAC Insured | | No Opt. Call | Baa1 | | 622,319 | |
| | 1,465 | | 5.250%, 7/01/30 – AMBAC Insured | | No Opt. Call | Baa1 | | 1,619,162 | |
| | 5,565 | | 5.250%, 7/01/31 – AMBAC Insured | | No Opt. Call | Baa1 | | 6,142,369 | |
| | 955 | | Puerto Rico Highway and Transportation Authority, Subordinate Lien Highway Revenue Bonds, Series 1998, 5.000%, 7/01/28 | | 1/13 at 100.00 | Baa1 | | 955,306 | |
| | | | Puerto Rico Highway and Transportation Authority, Subordinate Lien Highway Revenue Bonds, Series 2003: | | | | | | |
| | 1,000 | | 5.250%, 7/01/15 – FGIC Insured | | 7/13 at 100.00 | Baa2 | | 1,027,520 | |
| | 1,500 | | 5.250%, 7/01/17 – FGIC Insured | | 7/13 at 100.00 | Baa2 | | 1,541,280 | |
| | | | Puerto Rico Infrastructure Financing Authority, Special Tax Revenue Bonds, Series 2005A: | | | | | | |
| | 5,000 | | 0.000%, 7/01/29 – AMBAC Insured | | No Opt. Call | BBB+ | | 2,081,200 | |
| | 5,000 | | 0.000%, 7/01/43 – AMBAC Insured | | No Opt. Call | BBB+ | | 765,650 | |
| | | | Puerto Rico Infrastructure Financing Authority, Special Tax Revenue Bonds, Series 2005C: | | | | | | |
| | 2,000 | | 5.500%, 7/01/26 – AMBAC Insured | | No Opt. Call | BBB+ | | 2,202,640 | |
| | 5,875 | | 0.000%, 7/01/28 – AMBAC Insured | | No Opt. Call | BBB+ | | 2,609,616 | |
| | 2,900 | | Puerto Rico Public Buildings Authority, Guaranteed Government Facilities Revenue Bonds, Series 2007M, 6.000%, 7/01/27 – NPFG Insured | | 7/18 at 100.00 | Baa1 | | 3,168,714 | |
| | | | Puerto Rico Public Buildings Authority, Guaranteed Government Facilities Revenue Refunding Bonds, Series 2002D: | | | | | | |
| | 665 | | 5.250%, 7/01/27 | | 1/13 at 100.00 | BBB | | 666,037 | |
| | 320 | | 5.250%, 7/01/36 | | 1/13 at 100.00 | BBB | | 320,077 | |
| | Principal | | | | Optional Call | | | | |
| | Amount (000) | | Description (1) | | Provisions (2) | Ratings (3) | | Value | |
| | | | Tax Obligation/Limited (continued) | | | | | | |
| | | | Puerto Rico Sales Tax Financing Corporation, Sales Tax Revenue Bonds, First Subordinate Series 2009A: | | | | | | |
| $ | 1,190 | | 5.750%, 8/01/37 | | 8/19 at 100.00 | A+ | $ | 1,328,111 | |
| | 3,400 | | 6.000%, 8/01/42 | | 8/19 at 100.00 | A+ | | 3,861,482 | |
| | 3,705 | | Puerto Rico Sales Tax Financing Corporation, Sales Tax Revenue Bonds, First Subordinate Series 2010A, 5.500%, 8/01/42 | | 2/20 at 100.00 | A+ | | 4,020,592 | |
| | 3,195 | | Puerto Rico Sales Tax Financing Corporation, Sales Tax Revenue Bonds, First Subordinate Series 2010C, 6.000%, 8/01/39 | | 8/20 at 100.00 | A+ | | 3,685,049 | |
| | 10,000 | | Puerto Rico Sales Tax Financing Corporation, Sales Tax Revenue Bonds, Series 2007A, 0.000%, 8/01/41 – NPFG Insured | | No Opt. Call | AA– | | 2,174,800 | |
| | 1,000 | | Puerto Rico, Highway Revenue Bonds, Highway and Transportation Authority, Series 1996Y, 6.250%, 7/01/13 | | No Opt. Call | A3 | | 1,029,710 | |
| | 5 | | Puerto Rico, Highway Revenue Bonds, Highway and Transportation Authority, Series 2003AA, 5.500%, 7/01/18 – NPFG Insured | | No Opt. Call | A3 | | 5,647 | |
| | | | Puerto Rico, Highway Revenue Bonds, Highway and Transportation Authority, Series 2005BB: | | | | | | |
| | 1,080 | | 5.250%, 7/01/17 – AMBAC Insured | | No Opt. Call | A3 | | 1,189,685 | |
| | 1,290 | | 5.250%, 7/01/22 – AGM Insured | | No Opt. Call | AA– | | 1,512,615 | |
| | | | Puerto Rico, Highway Revenue Bonds, Highway and Transportation Authority, Series 2007CC: | | | | | | |
| | 760 | | 5.500%, 7/01/28 – NPFG Insured | | No Opt. Call | A3 | | 871,667 | |
| | 1,000 | | 5.500%, 7/01/30 – AGM Insured | | No Opt. Call | AA– | | 1,201,510 | |
| | 2,490 | | Stafford County and Staunton Industrial Development Authority, Virginia, Revenue Bonds, Virginia Municipal League and Virginia Association of Counties Finance Program, Series 2006A, 5.000%, 8/01/23 – NPFG Insured | | 8/16 at 100.00 | Baa2 | | 2,735,713 | |
| | 500 | | Stafford County and Staunton Industrial Development Authority, Virginia, Revenue Bonds, Virginia Municipal League and Virginia Association of Counties Finance Program, Series 2007C, 5.000%, 2/01/37 – SYNCORA GTY Insured | | 2/17 at 100.00 | BBB | | 533,740 | |
| | 5,000 | | Stafford County Economic Development Authority, Virginia, Public Project Lease Revenue Bonds, Series 2008, 5.000%, 4/01/33 – AGC Insured (UB) | | 4/18 at 100.00 | AA | | 5,728,200 | |
| | 1,000 | | Virgin Islands Public Finance Authority, Matching Fund Loan Notes Revenue Bonds, Series 2009B, 5.000%, 10/01/25 | | 10/19 at 100.00 | BBB+ | | 1,109,370 | |
| | 1,950 | | Virgin Islands Public Finance Authority, Matching Fund Loan Notes Revenue Bonds, Subordinate Lien Series 2010B, 5.250%, 10/01/29 | | 10/20 at 100.00 | Baa2 | | 2,174,231 | |
| | 1,665 | | Virginia College Building Authority, Educational Facilities Revenue Bonds, 21st Century College Program, Series 2009, Trust 09-3B, 13.345%, 2/01/27 (IF) (4) | | 2/19 at 100.00 | AA+ | | 2,740,091 | |
| | 1,665 | | Virginia College Building Authority, Educational Facilities Revenue Bonds, 21st Century College Program, Series 2009, Trust 09-4B, 13.425%, 2/01/28 (IF) (4) | | 2/19 at 100.00 | AA+ | | 2,743,387 | |
| | 2,100 | | Virginia College Building Authority, Educational Facilities Revenue Bonds, 21st Century College Program, Series 2010A, 5.000%, 2/01/13 | | No Opt. Call | AA+ | | 2,117,283 | |
| | 985 | | Virginia Gateway Community Development Authority, Prince William County, Special Assessment Bonds, Series 2003, 6.375%, 3/01/30 | | 3/13 at 102.00 | N/R | | 1,008,482 | |
| | 750 | | Virginia Public School Authority, Literary Trust Fund State Appropriation Bonds, School Technology Notes, Series 2008-VIII, 5.000%, 4/15/13 | | No Opt. Call | AA+ | | 763,680 | |
| | 1,500 | | Virginia Public School Authority, School Financing Bonds, 1997 Resolution, Series 2005B, 5.250%, 8/01/13 | | No Opt. Call | AA+ | | 1,551,030 | |
| | 2,000 | | Virginia Public School Authority, School Financing Bonds, 1997 Resolution, Series 2009C, 5.000%, 8/01/13 | | No Opt. Call | AA+ | | 2,064,840 | |
| | 95 | | Virginia Resources Authority, Infrastructure Revenue Bonds, Prerefunded-Pooled Loan Bond Program, Series 2002A, 5.000%, 5/01/19 | | 5/13 at 100.00 | AA | | 95,372 | |
| | 600 | | Virginia Transportation Board, Transportation Revenue Bonds, Capital Projects, Series 2010-A1, 5.000%, 5/15/13 | | No Opt. Call | AA+ | | 613,308 | |
| | 2,000 | | Virginia Transportation Board, Transportation Revenue Bonds, U.S. Route 58 Corridor Development Program, Series 2004B, 5.000%, 5/15/15 | | 5/14 at 100.00 | AA+ | | 2,136,960 | |
| | 1,275 | | Virginia Transportation Board, Transportation Revenue Bonds, U.S. Route 58 Corridor Development Program, Series 2007B, 5.000%, 5/15/13 | | No Opt. Call | AA+ | | 1,303,280 | |
| | 104,825 | | Total Tax Obligation/Limited | | | | | 95,378,301 | |
| | | Nuveen Virginia Premium Income Municipal Fund (continued) |
| NPV | | Portfolio of Investments |
November 30, 2012 (Unaudited)
| | Principal | | | | Optional Call | | | | |
| | Amount (000) | | Description (1) | | Provisions (2) | Ratings (3) | | Value | |
| | | | Transportation – 19.0% (13.1% of Total Investments) | | | | | | |
| $ | 1,000 | | Capital Region Airport Authority, Richmond, Virginia, Revenue Bonds, Richmond International Airport, Series 2005A, 5.000%, 7/01/18 – AGM Insured | | 7/15 at 100.00 | AA– | $ | 1,095,130 | |
| | 1,000 | | Chesapeake Bay Bridge and Tunnel Commission, Virginia, General Resolution Revenue Refunding Bonds, Series 1998, 5.500%, 7/01/25 – NPFG Insured | | No Opt. Call | A– | | 1,213,540 | |
| | 4,125 | | Chesapeake, Virginia, Transportation System Senior Toll Road Revenue Bonds, Capital Appreciation Series 2012B, 0.000%, 7/15/40 | | 7/28 at 100.00 | BBB | | 2,638,598 | |
| | | | Metropolitan Washington Airports Authority, Virginia, Dulles Toll Road Revenue Bonds, Capital Appreciation Series 2009B-2: | | | | | | |
| | 4,000 | | 0.000%, 10/01/26 – AGC Insured | | No Opt. Call | AA– | | 2,267,440 | |
| | 11,825 | | 0.000%, 10/01/34 – AGC Insured | | No Opt. Call | AA– | | 4,349,590 | |
| | 1,135 | | 0.000%, 10/01/36 – AGC Insured | | No Opt. Call | AA– | | 374,788 | |
| | 5,010 | | 0.000%, 10/01/39 – AGC Insured | | No Opt. Call | AA– | | 1,330,556 | |
| | 750 | | Metropolitan Washington D.C. Airports Authority, Airport System Revenue Bonds, Refunding Series 2010B, 5.000%, 10/01/26 (Alternative Minimum Tax) | | 10/20 at 100.00 | AA– | | 880,035 | |
| | 1,200 | | Metropolitan Washington D.C. Airports Authority, Airport System Revenue Bonds, Series 2009C, 5.000%, 10/01/28 | | 10/18 at 100.00 | AA– | | 1,404,768 | |
| | | | Metropolitan Washington D.C. Airports Authority, Airport System Revenue Bonds, Series 2010A: | | | | | | |
| | 3,000 | | 5.000%, 10/01/30 | | 10/20 at 100.00 | AA– | | 3,543,510 | |
| | 275 | | 5.000%, 10/01/35 | | 10/20 at 100.00 | AA– | | 320,554 | |
| | 2,500 | | Metropolitan Washington D.C. Airports Authority, System Revenue Bonds, Series 2007B, 5.000%, 10/01/35 – AMBAC Insured (Alternative Minimum Tax) | | 10/17 at 100.00 | AA– | | 2,694,800 | |
| | 6,700 | | Metropolitan Washington DC Airports Authority, Virginia, Dulles Toll Road Revenue Bonds, Dulles Metrorail Capital Appreciation, Series 2010B, 0.000%, 10/01/44 | | 10/28 at 100.00 | BBB+ | | 6,189,527 | |
| | 3,000 | | Norfolk, Virginia, Parking System Revenue Bonds, Series 2005A, 5.000%,
2/01/23 – NPFG Insured | | 2/15 at 100.00 | BBB | | 3,132,660 | |
| | 3,000 | | Richmond Metropolitan Authority, Virginia, Revenue Refunding Bonds, Expressway System, Series 2002, 5.250%, 7/15/22 – FGIC Insured | | No Opt. Call | A– | | 3,558,930 | |
| | 3,195 | | Virginia Port Authority, Port Facilities Revenue Refunding Bonds Series 2010, 5.000%, 7/01/40 | | 7/19 at 100.00 | Aa3 | | 3,628,370 | |
| | 3,415 | | Virginia Port Authority, Revenue Bonds, Port Authority Facilities, Series 2006, 5.000%, 7/01/36 – FGIC Insured (Alternative Minimum Tax) | | 7/13 at 100.00 | Aa3 | | 3,454,990 | |
| | | | Virginia Small Business Financing Authority, Senior Lien Revenue Bonds, Elizabeth River Crossing, Opco LLC Project, Series 2012: | | | | | | |
| | 500 | | 5.250%, 1/01/32 (Alternative Minimum Tax) | | 7/22 at 100.00 | BBB– | | 557,775 | |
| | 5,000 | | 6.000%, 1/01/37 (Alternative Minimum Tax) | | 7/22 at 100.00 | BBB– | | 5,872,300 | |
| | 5,500 | | 5.500%, 1/01/42 (Alternative Minimum Tax) | | 7/22 at 100.00 | BBB– | | 6,216,815 | |
| | 66,130 | | Total Transportation | | | | | 54,724,676 | |
| | | | U.S. Guaranteed – 21.4% (14.7% of Total Investments) (5) | | | | | | |
| | 1,750 | | Bristol, Virginia, General Obligation Utility System Revenue Bonds, Series 2002, 5.000%, 11/01/24 – AGM Insured (ETM) | | No Opt. Call | AA– (5) | | 2,205,928 | |
| | 1,000 | | Bristol, Virginia, Utility System Revenue Refunding Bonds, Series 2001, 5.000%, 7/15/21 – AGM Insured (ETM) | | No Opt. Call | AA– (5) | | 1,214,040 | |
| | | | Bristol, Virginia, Utility System Revenue Refunding Bonds, Series 2003: | | | | | | |
| | 1,705 | | 5.250%, 7/15/14 (Pre-refunded 7/15/13) – NPFG Insured | | 7/13 at 100.00 | BBB (5) | | 1,756,815 | |
| | 1,800 | | 5.250%, 7/15/15 (Pre-refunded 7/15/13) – NPFG Insured | | 7/13 at 100.00 | BBB (5) | | 1,854,702 | |
| | 2,775 | | 5.250%, 7/15/23 (Pre-refunded 7/15/13) – NPFG Insured | | 7/13 at 100.00 | BBB (5) | | 2,859,332 | |
| | 1,122 | | Broad Street Community Development Authority, Virginia, Revenue Bonds, Series 2003, 7.500%, 6/01/33 (Pre-refunded 6/01/13) | | 6/13 at 102.00 | N/R (5) | | 1,181,791 | |
| | | | Chesapeake, Virginia, General Obligation Bonds, Water and Sewerage Series 2003B: | | | | | | |
| | 1,880 | | 5.000%, 6/01/21 (Pre-refunded 6/01/13) | | 6/13 at 100.00 | AA+ (5) | | 1,925,440 | |
| | 2,060 | | 5.000%, 6/01/23 (Pre-refunded 6/01/13) | | 6/13 at 100.00 | AA+ (5) | | 2,109,790 | |
| | | | Dinwiddie County Industrial Development Authority, Virginia, Lease Revenue Bonds, Refunding Series 2004B: | | | | | | |
| | 1,000 | | 5.125%, 2/15/16 (Pre-refunded 2/15/14) – NPFG Insured | | 2/14 at 100.00 | A+ (5) | | 1,057,560 | |
| | 750 | | 5.000%, 2/15/24 (Pre-refunded 2/15/14) – NPFG Insured | | 2/14 at 100.00 | A+ (5) | | 792,510 | |
| | Principal | | | | Optional Call | | | | |
| | Amount (000) | | Description (1) | | Provisions (2) | Ratings (3) | | Value | |
| | | | U.S. Guaranteed (5) (continued) | | | | | | |
| | | | Fairfax County Economic Development Authority, Virginia, Lease Revenue Bonds, Laurel Hill Public Facilities Projects, Series 2003: | | | | | | |
| $ | 2,210 | | 5.000%, 6/01/14 (Pre-refunded 6/01/13) | | 6/13 at 101.00 | AA+ (5) | $ | 2,285,162 | |
| | 1,165 | | 5.000%, 6/01/22 (Pre-refunded 6/01/13) | | 6/13 at 101.00 | AA+ (5) | | 1,204,622 | |
| | 1,660 | | Front Royal and Warren County Industrial Development Authority, Virginia, Lease Revenue Bonds, Series 2004B, 5.000%, 4/01/18 (Pre-refunded 4/01/14) – AGM Insured | | 4/14 at 100.00 | AA– (5) | | 1,761,642 | |
| | 3,850 | | Hampton, Virginia, Revenue Bonds, Convention Center Project, Series 2002, 5.125%, 1/15/28 (Pre-refunded 1/15/13) – AMBAC Insured | | 1/13 at 100.00 | Aa3 (5) | | 3,873,639 | |
| | | | Loudoun County Industrial Development Authority, Virginia, Lease Revenue Refunding Bonds, Public Facility Project, Series 2003: | | | | | | |
| | 385 | | 5.000%, 3/01/19 (Pre-refunded 3/01/13) | | 3/13 at 100.00 | N/R (5) | | 389,662 | |
| | 1,415 | | 5.000%, 3/01/19 (Pre-refunded 3/01/13) | | 3/13 at 100.00 | AA+ (5) | | 1,432,249 | |
| | 1,000 | | Loudoun County Sanitation Authority, Virginia, Water and Sewerage System Revenue Bonds, Series 2004, 5.000%, 1/01/26 (Pre-refunded 1/01/15) | | 1/15 at 100.00 | AAA | | 1,095,790 | |
| | 500 | | Loudoun County, Virginia, General Obligation Public Improvement Bonds, Series 2005B, 5.000%, 6/01/18 (Pre-refunded 6/01/15) | | 6/15 at 100.00 | AAA | | 557,460 | |
| | 1,185 | | Lynchburg, Virginia, General Obligation Bonds, Series 2004, 5.000%, 6/01/21 (Pre-refunded 6/01/14) | | 6/14 at 100.00 | AA+ (5) | | 1,267,464 | |
| | 1,000 | | Newport News, Virginia, General Obligation Bonds, Series 2003B, 5.000%, 11/01/22 (Pre-refunded 11/01/13) | | 11/13 at 100.00 | Aa1 (5) | | 1,043,670 | |
| | 2,145 | | Newport News, Virginia, General Obligation Bonds, Series 2004C, 5.000%, 5/01/16 (Pre-refunded 5/01/14) | | 5/14 at 101.00 | Aa1 (5) | | 2,309,951 | |
| | 1,015 | | Puerto Rico Housing Finance Authority, Capital Fund Program Revenue Bonds, Series 2003, 5.000%, 12/01/18 (Pre-refunded 12/01/13) | | 12/13 at 100.00 | Aaa | | 1,062,959 | |
| | 145 | | Puerto Rico, Highway Revenue Bonds, Highway and Transportation Authority, Series 2003AA, 5.500%, 7/01/18 – NPFG Insured (ETM) | | No Opt. Call | BBB (5) | | 183,382 | |
| | 710 | | Puerto Rico, Highway Revenue Bonds, Highway and Transportation Authority, Series 2005BB, 5.250%, 7/01/22 – AGM Insured (ETM) | | No Opt. Call | AA– (5) | | 951,769 | |
| | 1,480 | | Richmond, Virginia, General Obligation Bonds, Series 2004A, 5.000%, 7/15/21 (Pre-refunded 7/15/14) – AGM Insured | | 7/14 at 100.00 | AA+ (5) | | 1,593,723 | |
| | 620 | | Richmond, Virginia, General Obligation Bonds, Series 2005A, 5.000%, 7/15/17 (Pre-refunded 7/15/15) – AGM Insured | | 7/15 at 100.00 | AA+ (5) | | 694,623 | |
| | | | Spotsylvania County Industrial Development Authority, Virginia, Lease Revenue Bonds, School Facilities, Series 2003B: | | | | | | |
| | 1,110 | | 4.375%, 8/01/20 (Pre-refunded 8/01/13) – AMBAC Insured | | 8/13 at 100.00 | N/R (5) | | 1,140,014 | |
| | 2,000 | | 5.125%, 8/01/23 (Pre-refunded 8/01/13) – AMBAC Insured | | 8/13 at 100.00 | N/R (5) | | 2,064,100 | |
| | 710 | | Stafford County and Staunton Industrial Development Authority, Virginia, Revenue Bonds, Virginia Municipal League and Virginia Association of Counties Finance Program, Series 2006A, 5.000%, 8/01/23 (Pre-refunded 8/01/16) – NPFG Insured | | 8/16 at 100.00 | Baa2 (5) | | 822,698 | |
| | 1,000 | | Staunton, Virginia, General Obligation Bonds, Series 2004, 6.250%, 2/01/25 (Pre-refunded 2/01/14) – AMBAC Insured | | 2/14 at 101.00 | Aa2 (5) | | 1,080,020 | |
| | 1,260 | | The Rector and Visitors of the University of Virginia, General Pledge Revenue Bonds, Series 2003B, 5.000%, 6/01/21 (Pre-refunded 6/01/13) | | 6/13 at 100.00 | N/R (5) | | 1,289,938 | |
| | | | Tobacco Settlement Financing Corporation of Virginia, Tobacco Settlement Asset-Backed Bonds, Series 2005: | | | | | | |
| | 6,510 | | 5.500%, 6/01/26 (Pre-refunded 6/01/15) | | 6/15 at 100.00 | Aaa | | 7,028,716 | |
| | 1,510 | | 5.625%, 6/01/37 (Pre-refunded 6/01/15) | | 6/15 at 100.00 | Aaa | | 1,702,963 | |
| | 2,295 | | Virginia Beach Development Authority, Public Facilities Revenue Bonds, Series 2005A, 5.000%, 5/01/22 (Pre-refunded 5/01/15) | | 5/15 at 100.00 | AA+ (5) | | 2,550,227 | |
| | 2,100 | | Virginia Beach, Virginia, General Obligation Bonds, Series 2005, 5.000%, 1/15/20 (Pre-refunded 1/15/16) | | 1/16 at 100.00 | AAA | | 2,395,659 | |
| | 2,540 | | Virginia Public School Authority, School Financing Bonds, 1997 Resolution, Series 2005C, 5.000%, 8/01/17 (Pre-refunded 8/01/15) | | 8/15 at 100.00 | AA+ (5) | | 2,843,428 | |
| | 57,362 | | Total U.S. Guaranteed | | | | | 61,583,438 | |
| | | Nuveen Virginia Premium Income Municipal Fund (continued) |
| NPV | | Portfolio of Investments |
November 30, 2012 (Unaudited)
| | Principal | | | | Optional Call | | | | |
| | Amount (000) | | Description (1) | | Provisions (2) | Ratings (3) | | Value | |
| | | | Utilities – 0.7% (0.5% of Total Investments) | | | | | | |
| $ | 395 | | Guam Power Authority, Revenue Bonds, Series 2012A, 5.000%, 10/01/34 | | 10/22 at 100.00 | BBB | $ | 451,315 | |
| | 635 | | Puerto Rico Electric Power Authority, Power Revenue Bonds, Series 2007UU, 5.000%, 7/01/19 – NPFG Insured | | No Opt. Call | BBB+ | | 714,610 | |
| | 730 | | Virgin Islands Water and Power Authority, Electric System Revenue Bonds, Refunding Series 2007A, 5.000%, 7/01/24 | | 7/17 at 100.00 | Baa3 | | 781,115 | |
| | 1,760 | | Total Utilities | | | | | 1,947,040 | |
| | | | Water and Sewer – 4.6% (3.2% of Total Investments) | | | | | | |
| | | | Henry County Public Service Authority, Virginia, Water and Sewerage Revenue Refunding Bonds, Series 2001: | | | | | | |
| | 1,265 | | 5.500%, 11/15/17 – AGM Insured | | No Opt. Call | AA– | | 1,495,091 | |
| | 3,000 | | 5.500%, 11/15/19 – AGM Insured | | No Opt. Call | AA– | | 3,720,660 | |
| | 3,300 | | Virginia Beach, Virginia, Water and Sewer System Revenue Bonds, Series 2005, 5.000%, 10/01/30 | | 10/15 at 100.00 | AAA | | 3,670,623 | |
| | 3,050 | | Virginia State Resources Authority, Clean Water Revenue Bonds, Series 2007, Trust 3036, 13.478%, 10/01/15 (IF) | | No Opt. Call | AAA | | 4,374,981 | |
| | 10,615 | | Total Water and Sewer | | | | | 13,261,355 | |
| $ | 474,242 | | Total Investments (cost $385,187,332) – 145.5% | | | | | 419,181,126 | |
| | | | Floating Rate Obligations – (3.2)% | | | | | (9,250,000 | ) |
| | | | MuniFund Term Preferred Shares, at Liquidation Value – (44.2)% (6) | | | | | (127,408,000 | ) |
| | | | Other Assets Less Liabilities – 1.9% | | | | | 5,586,076 | |
| | | | Net Assets Applicable to Common Shares – 100% | | | | $ | 288,109,202 | |
| (1) | | All percentages shown in the Portfolio of Investments are based on net assets applicable to Common shares unless otherwise noted. |
| (2) | | Optional Call Provisions: Dates (month and year) and prices of the earliest optional call or redemption. There may be other call provisions at varying prices at later dates. Certain mortgage-backed securities may be subject to periodic principal paydowns. |
| (3) | | Ratings: Using the highest of Standard & Poor’s Group (“Standard & Poor’s”), Moody’s Investors Service, Inc. (“Moody’s”) or Fitch, Inc. (“Fitch”) rating. Ratings below BBB by Standard & Poor’s, Baa by Moody’s or BBB by Fitch are considered to be below investment grade. Holdings designated N/R are not rated by any of these national rating agencies. |
| (4) | | Investment, or portion of investment, has been pledged to collateralize the net payment obligations for investments in inverse floating rate transactions. |
| (5) | | Backed by an escrow or trust containing sufficient U.S. Government or U.S. Government agency securities, which ensure the timely payment of principal and interest. Certain bonds backed by U.S. Government or agency securities are regarded as having an implied rating equal to the rating of such securities. |
| (6) | | MuniFund Term Preferred Shares, at Liquidation Value as a percentage of Total Investments is 30.4% |
| N/R | | Not rated. |
| (ETM) | | Escrowed to maturity. |
| (IF) | | Inverse floating rate investment. |
| (UB) | | Underlying bond of an inverse floating rate trust reflected as a financing transaction. See Notes to Financial Statements, Footnote 1 – General Information and Significant Accounting Policies, Inverse Floating Rate Securities for more information. |
See accompanying notes to financial statements.
| | | Statement of |
| | | Assets & Liabilities |
November 30, 2012 (Unaudited)
| | | | | | | | | | | | | North | | | | |
| | | | Georgia | | | Maryland | | | Missouri | | | Carolina | | | Virginia | |
| | | | Dividend | | | Premium | | | Premium | | | Premium | | | Premium | |
| | | | Advantage 2 | | | Income | | | Income | | | Income | | | Income | |
| | | | (NKG | ) | | (NMY | ) | | (NOM | ) | | (NNC | ) | | (NPV | ) |
| Assets | | | | | | | | | | | | | | | | |
| Investments, at value (cost $204,334,229, $513,767,502, $50,078,529, $373,563,385 and $385,187,332, respectively) | | $ | 224,877,334 | | $ | 558,920,541 | | $ | 54,080,244 | | $ | 408,410,435 | | $ | 419,181,126 | |
| Cash | | | 2,665,313 | | | 2,194,677 | | | 1,157,243 | | | 2,020,826 | | | — | |
| Receivables: | | | | | | | | | | | | | | | | |
| Interest | | | 3,585,693 | | | 8,858,267 | | | 755,723 | | | 6,036,807 | | | 6,285,561 | |
| Investments sold | | | 11,122,056 | | | 9,296,046 | | | 10,000 | | | 6,538,253 | | | 980,212 | |
| Deferred offering costs | | | 848,165 | | | 2,170,993 | | | 354,584 | | | 1,595,582 | | | 1,251,904 | |
| Other assets | | | 3,996 | | | 9,061 | | | 2,028 | | | 7,901 | | | 7,716 | |
| Total assets | | | 243,102,557 | | | 581,449,585 | | | 56,359,822 | | | 424,609,804 | | | 427,706,519 | |
| Liabilities | | | | | | | | | | | | | | | | |
| Cash overdraft | | | — | | | — | | | — | | | — | | | 675,904 | |
| Floating rate obligations | | | 3,245,000 | | | 21,995,000 | | | 2,225,000 | | | 23,715,000 | | | 9,250,000 | |
| Payables: | | | | | | | | | | | | | | | | |
| Common share dividends | | | 588,770 | | | 1,567,384 | | | 133,330 | | | 946,717 | | | 1,103,869 | |
| Investments purchased | | | 2,906,589 | | | 4,570,071 | | | 768,495 | | | 12,416,898 | | | 39,123 | |
| Interest | | | 165,513 | | | 374,966 | | | 31,290 | | | 272,738 | | | 279,882 | |
| Offering costs | | | — | | | 276,836 | | | 70,439 | | | 236,204 | | | 84,870 | |
| MuniFund Term Preferred (MTP) Shares, at liquidation value | | | 74,945,000 | | | 166,144,000 | | | 17,880,000 | | | 124,860,000 | | | 127,408,000 | |
| Accrued expenses: | | | | | | | | | | | | | | | | |
| Management fees | | | 120,541 | | | 279,366 | | | 26,776 | | | 192,092 | | | 211,524 | |
| Trustees fees | | | 850 | | | 2,946 | | | 192 | | | 2,124 | | | 2,210 | |
| Reorganization | | | 457,941 | | | 423,994 | | | — | | | 555,890 | | | 361,561 | |
| Other | | | 79,705 | | | 242,950 | | | 42,503 | | | 123,437 | | | 180,374 | |
| Total liabilities | | | 82,509,909 | | | 195,877,513 | | | 21,178,025 | | | 163,321,100 | | | 139,597,317 | |
| Net assets applicable to Common shares | | $ | 160,592,648 | | $ | 385,572,072 | | $ | 35,181,797 | | $ | 261,288,704 | | $ | 288,109,202 | |
| Common shares outstanding | | | 10,548,246 | | | 24,104,666 | | | 2,325,827 | | | 16,548,509 | | | 17,922,209 | |
| Net asset value per Common share outstanding (net assets applicable to Common shares, divided by Common shares outstanding) | | $ | 15.22 | | $ | 16.00 | | $ | 15.13 | | $ | 15.79 | | $ | 16.08 | |
| Net assets applicable to Common shares consist of: | | | | | | | | | | | | | | | | |
| Common shares, $.01 par value per share | | $ | 105,482 | | $ | 241,047 | | $ | 23,258 | | $ | 165,485 | | $ | 179,222 | |
| Paid-in surplus | | | 142,408,155 | | | 338,844,434 | | | 31,017,899 | | | 226,672,890 | | | 252,105,107 | |
| Undistributed (Over-distribution of) net investment income | | | 128,564 | | | 2,560,296 | | | 316,785 | | | (260,348 | ) | | 1,182,113 | |
| Accumulated net realized gain (loss) | | | (2,592,658 | ) | | (1,226,744 | ) | | (177,860 | ) | | (136,373 | ) | | 648,966 | |
| Net unrealized appreciation (depreciation) | | | 20,543,105 | | | 45,153,039 | | | 4,001,715 | | | 34,847,050 | | | 33,993,794 | |
| Net assets applicable to Common shares | | $ | 160,592,648 | | $ | 385,572,072 | | $ | 35,181,797 | | $ | 261,288,704 | | $ | 288,109,202 | |
| Authorized shares: | | | | | | | | | | | | | | | | |
| Common | | | Unlimited | | | Unlimited | | | Unlimited | | | Unlimited | | | Unlimited | |
| Preferred | | | Unlimited | | | Unlimited | | | Unlimited | | | Unlimited | | | Unlimited | |
See accompanying notes to financial statements.
| | Six Months Ended November 30, 2012 (Unaudited) |
| | | | | | | | | | | | | North | | | | |
| | | | Georgia | | | Maryland | | | Missouri | | | Carolina | | | Virginia | |
| | | | Dividend | | | Premium | | | Premium | | | Premium | | | Premium | |
| | | | Advantage 2 | | | Income | | | Income | | | Income | | | Income | |
| | | | (NKG | ) | | (NMY | ) | | (NOM | ) | | (NNC | ) | | (NPV | ) |
| Investment Income | | $ | 4,767,147 | | $ | 10,502,805 | | $ | 1,255,777 | | $ | 7,491,348 | | $ | 7,841,460 | |
| Expenses | | | | | | | | | | | | | | | | |
| Management fees | | | 644,783 | | | 1,364,125 | | | 162,244 | | | 1,020,127 | | | 1,053,662 | |
| Shareholder servicing agent fees and expenses | | | 23,112 | | | 35,413 | | | 9,557 | | | 33,528 | | | 27,108 | |
| Interest expense and amortization of offering costs | | | 1,034,375 | | | 2,209,689 | | | 247,757 | | | 1,785,125 | | | 1,638,504 | |
| Custodian fees and expenses | | | 15,811 | | | 20,584 | | | 6,486 | | | 25,698 | | | 20,661 | |
| Trustees fees and expenses | | | 2,948 | | | 6,164 | | | 758 | | | 4,800 | | | 4,758 | |
| Professional fees | | | 17,688 | | | 14,806 | | | 12,245 | | | 22,560 | | | 12,424 | |
| Shareholder reporting expenses | | | 71,347 | | | 52,259 | | | 12,931 | | | 110,665 | | | 34,156 | |
| Stock exchange listing fees | | | 7,794 | | | 9,248 | | | 7,649 | | | 19,235 | | | 9,834 | |
| Investor relations expense | | | 11,124 | | | 13,604 | | | 2,906 | | | 18,195 | | | 8,322 | |
| Reorganization expenses | | | 14,627 | | | — | | | — | | | 6,211 | | | — | |
| Other expenses | | | 22,584 | | | 10,687 | | | 12,079 | | | 24,993 | | | 10,860 | |
| Total expenses before custodian fee credit | | | 1,866,193 | | | 3,736,579 | | | 474,612 | | | 3,071,137 | | | 2,820,289 | |
| Custodian fee credit | | | (1,026 | ) | | (771 | ) | | (146 | ) | | (1,608 | ) | | (855 | ) |
| Net expenses | | | 1,865,167 | | | 3,735,808 | | | 474,466 | | | 3,069,529 | | | 2,819,434 | |
| Net investment income (loss) | | | 2,901,980 | | | 6,766,997 | | | 781,311 | | | 4,421,819 | | | 5,022,026 | |
| Realized and Unrealized Gain (Loss) | | | | | | | | | | | | | | | | |
| Net realized gain (loss) from investments | | | 56,392 | | | 216,464 | | | 6,355 | | | 243,255 | | | 266,647 | |
| Change in net unrealized appreciation (depreciation) of investments | | | 5,843,955 | | | 6,092,466 | | | 1,236,037 | | | 8,793,633 | | | 7,235,607 | |
| Net realized and unrealized gain (loss) | | | 5,900,347 | | | 6,308,930 | | | 1,242,392 | | | 9,036,888 | | | 7,502,254 | |
| Net increase (decrease) in net assets applicable to Common shares from operations | | $ | 8,802,327 | | $ | 13,075,927 | | $ | 2,023,703 | | $ | 13,458,707 | | $ | 12,524,280 | |
See accompanying notes to financial statements.
| | | Statement of |
| | | Changes in Net Assets (Unaudited) |
| | | Georgia Dividend Advantage 2 (NKG) | | Maryland Premium Income (NMY) | | Missouri Premium Income (NOM) | |
| | | Six Months | | Year | | Six Months | | Year | | Six Months | | Year | |
| | | Ended | | Ended | | Ended | | Ended | | Ended | | Ended | |
| | | 11/30/12 | | 5/31/12 | | 11/30/12 | | 5/31/12 | | 11/30/12 | | 5/31/12 | |
| Operations | | | | | | | | | | | | | | | | | | | |
| Net investment income (loss) | | $ | 2,901,980 | | $ | 2,794,038 | | $ | 6,766,997 | | $ | 7,296,589 | | $ | 781,311 | | $ | 1,601,799 | |
| Net realized gain (loss) from investments | | | 56,392 | | | 242,277 | | | 216,464 | | | 98,201 | | | 6,355 | | | 29,398 | |
| Change in net unrealized appreciation (depreciation) of investments | | | 5,843,955 | | | 4,370,828 | | | 6,092,466 | | | 14,845,670 | | | 1,236,037 | | | 3,488,918 | |
| Net increase (decrease) in net assets applicable to Common shares from operations | | | 8,802,327 | | | 7,407,143 | | | 13,075,927 | | | 22,240,460 | | | 2,023,703 | | | 5,120,115 | |
| Distributions to Common Shareholders | | | | | | | | | | | | | | | | | | | |
| From net investment income | | | (2,982,972 | ) | | (3,157,205 | ) | | (6,594,027 | ) | | (8,215,471 | ) | | (850,984 | ) | | (1,810,947 | ) |
| From accumulated net realized gains | | | — | | | — | | | — | | | — | | | — | | | — | |
| Decrease in net assets applicable to Common shares from distributions to Common shareholders | | | (2,982,972 | ) | | (3,157,205 | ) | | (6,594,027 | ) | | (8,215,471 | ) | | (850,984 | ) | | (1,810,947 | ) |
| Capital Share Transactions | | | | | | | | | | | | | | | | | | | |
| Common shares: | | | | | | | | | | | | | | | | | | | |
Issued in the Reorganizations(1) | | | 87,714,734 | | | — | | | 211,807,271 | | | — | | | — | | | — | |
| Net proceeds issued to shareholders due to reinvestment of distributions | | | 19,647 | | | 12,432 | | | 75,351 | | | 100,957 | | | 30,111 | | | 74,892 | |
| Net increase (decrease) in net assets applicable to Common shares from capital share transactions | | | 87,734,381 | | | 12,432 | | | 211,882,622 | | | 100,957 | | | 30,111 | | | 74,892 | |
| Net increase (decrease) in net assets applicable to Common shares | | | 93,553,736 | | | 4,262,370 | | | 218,364,522 | | | 14,125,946 | | | 1,202,830 | | | 3,384,060 | |
| Net assets applicable to Common shares at the beginning of period | | | 67,038,912 | | | 62,776,542 | | | 167,207,550 | | | 153,081,604 | | | 33,978,967 | | | 30,594,907 | |
| Net assets applicable to Common shares at the end of period | | $ | 160,592,648 | | $ | 67,038,912 | | $ | 385,572,072 | | $ | 167,207,550 | | $ | 35,181,797 | | $ | 33,978,967 | |
| Undistributed (Over-distribution of) net investment income at the end of period | | $ | 128,564 | | $ | 209,556 | | $ | 2,560,296 | | $ | 2,387,326 | | $ | 316,785 | | $ | 386,458 | |
(1) Refer to Footnote 1 – General Information and Significant Accounting Policies, Fund Reorganizations for further details.
See accompanying notes to financial statements.
| | | Statement of |
| | | Changes in Net Assets (continued) |
| | | North Carolina Premium Income (NNC) | | Virginia Premium Income (NPV) | |
| | | Six Months | | Year | | Six Months | | Year | |
| | | Ended | | Ended | | Ended | | Ended | |
| | | 11/30/12 | | 5/31/12 | | 11/30/12 | | 5/31/12 | |
| Operations | | | | | | | | | | | | | |
| Net investment income (loss) | | $ | 4,421,819 | | $ | 3,645,610 | | $ | 5,022,026 | | $ | 6,106,911 | |
| Net realized gain (loss) from investments | | | 243,255 | | | 158,661 | | | 266,647 | | | 336,954 | |
| Change in net unrealized appreciation (depreciation) of investments | | | 8,793,633 | | | 6,853,662 | | | 7,235,607 | | | 11,664,825 | |
| Net increase (decrease) in net assets applicable to Common shares from operations | | | 13,458,707 | | | 10,657,933 | | | 12,524,280 | | | 18,108,690 | |
| Distributions to Common Shareholders | | | | | | | | | | | | | |
| From net investment income | | | (5,120,761 | ) | | (4,508,294 | ) | | (4,866,379 | ) | | (7,259,759 | ) |
| From accumulated net realized gains | | | — | | | — | | | — | | | (214,014 | ) |
| Decrease in net assets applicable to Common shares from distributions to Common shareholders | | | (5,120,761 | ) | | (4,508,294 | ) | | (4,866,379 | ) | | (7,473,773 | ) |
| Capital Share Transactions | | | | | | | | | | | | | |
| Common shares: | | | | | | | | | | | | | |
Issued in the Reorganizations(1) | | | 155,423,952 | | | — | | | 139,077,537 | | | — | |
| Net proceeds issued to shareholders due to reinvestment of distributions | | | 29,851 | | | 91,188 | | | 274,869 | | | 432,067 | |
| Net increase (decrease) in net assets applicable to Common shares from capital share transactions | | | 155,453,803 | | | 91,188 | | | 139,352,406 | | | 432,067 | |
| Net increase (decrease) in net assets applicable to Common shares | | | 163,791,749 | | | 6,240,827 | | | 147,010,307 | | | 11,066,984 | |
| Net assets applicable to Common shares at the beginning of period | | | 97,496,955 | | | 91,256,128 | | | 141,098,895 | | | 130,031,911 | |
| Net assets applicable to Common shares at the end of period | | $ | 261,288,704 | | $ | 97,496,955 | | $ | 288,109,202 | | $ | 141,098,895 | |
| Undistributed (Over-distribution of) net investment income at the end of period | | $ | (260,348 | ) | $ | 438,594 | | $ | 1,182,113 | | $ | 1,026,466 | |
(1) Refer to Footnote 1 – General Information and Significant Accounting Policies, Fund Reorganizations for further details.
See accompanying notes to financial statements.
| | Six Months Ended November 30, 2012 (Unaudited) |
| | | | Georgia | | | Maryland | | | Missouri | |
| | | | Dividend | | | Premium | | | Premium | |
| | | | Advantage 2 | | | Income | | | Income | |
| | | | (NKG | ) | | (NMY | ) | | (NOM | ) |
| Cash Flows from Operating Activities: | | | | | | | | | | |
| Net Increase (Decrease) in Net Assets Applicable to Common Shares from Operations | | $ | 8,802,327 | | $ | 13,075,927 | | $ | 2,023,703 | |
| Adjustments to reconcile the net increase (decrease) in net assets applicable to Common shares from operations to net cash provided by (used in) operating activities: | | | | | | | | | | |
| Purchases of investments | | | (14,203,764 | ) | | (48,593,115 | ) | | (1,580,078 | ) |
| Proceeds from sales and maturities of investments | | | 18,605,000 | | | 49,971,475 | | | 1,830,000 | |
| Assets and (Liabilities) acquired in the Reorganization, net | | | (35,001,647 | ) | | (82,738,631 | ) | | — | |
| Amortization (Accretion) of premiums and discounts, net | | | 119,418 | | | 247,840 | | | 39,002 | |
| (Increase) Decrease in: | | | | | | | | | | |
| Receivable for interest | | | (2,028,898 | ) | | (4,658,743 | ) | | (25,873 | ) |
| Receivable for investments sold | | | (11,122,056 | ) | | (6,106,671 | ) | | 5,000 | |
| Other assets | | | 7,606 | | | 19,335 | | | 8,162 | |
| Increase (Decrease) in: | | | | | | | | | | |
| Payable for interest | | | 87,127 | | | 185,558 | | | (3,129 | ) |
| Payable for investments purchased | | | 2,906,589 | | | 4,152,000 | | | 284,703 | |
| Accrued management fees | | | 66,925 | | | 149,178 | | | (545 | ) |
| Accrued Trustees fees | | | 460 | | | 2,001 | | | (11 | ) |
| Accrued other expenses | | | (83,609 | ) | | (180,848 | ) | | 2,731 | |
| Net realized (gain) loss from investments | | | (56,392 | ) | | (216,464 | ) | | (6,355 | ) |
| Change in net unrealized (appreciation) depreciation of investments | | | (5,843,955 | ) | | (6,092,466 | ) | | (1,236,037 | ) |
| Taxes paid on undistributed capital gains | | | (1,471 | ) | | (14,666 | ) | | — | |
| Net cash provided by (used in) operating activities | | | (37,746,340 | ) | | (80,798,290 | ) | | 1,341,273 | |
| Cash Flows from Financing Activities: | | | | | | | | | | |
| (Increase) Decrease in deferred offering costs | | | (454,044 | ) | | (1,054,438 | ) | | 59,205 | |
| Increase (Decrease) in: | | | | | | | | | | |
| Cash overdraft balance | | | — | | | (2,439,861 | ) | | — | |
| Payable for offering costs | | | (16,250 | ) | | 107,398 | | | 1,882 | |
| Accrued reorganization expense | | | 457,941 | | | 423,994 | | | — | |
| MTP Shares, at liquidation value | | | 42,680,000 | | | 91,551,000 | | | — | |
| Cash distributions paid to Common shareholders | | | (2,624,137 | ) | | (5,595,126 | ) | | (828,678 | ) |
| Net cash provided by (used in) financing activities | | | 40,043,510 | | | 82,992,967 | | | (767,591 | ) |
| Net Increase (Decrease) in Cash | | | 2,297,170 | | | 2,194,677 | | | 573,682 | |
| Cash at the beginning of period | | | 368,143 | | | — | | | 583,561 | |
| Cash at the End of Period | | $ | 2,665,313 | | $ | 2,194,677 | | $ | 1,157,243 | |
Supplemental Disclosure of Cash Flow Information
Non-cash financing activities not included herein consist of reinvestments of Common share distributions as follows:
| | | | Georgia | | | Maryland | | | Missouri | |
| | | | Dividend | | | Premium | | | Premium | |
| | | | Advantage 2 | | | Income | | | Income | |
| | | | (NKG | ) | | (NMY | ) | | (NOM | ) |
| | | $ | 19,647 | | $ | 75,351 | | $ | 30,111 | |
Cash paid for interest (excluding amortization of offering costs) was as follows:
| | | | Georgia | | | Maryland | | | Missouri | |
| | | | Dividend | | | Premium | | | Premium | |
| | | | Advantage 2 | | | Income | �� | | Income | |
| | | | (NKG | ) | | (NMY | ) | | (NOM | ) |
| | | $ | 788,078 | | $ | 1,698,777 | | $ | 191,682 | |
See accompanying notes to financial statements.
| | | Statement of |
| | | Cash Flows (Unaudited) (continued) |
| | | | North | | | | |
| | | | Carolina | | | Virginia | |
| | | | Premium | | | Premium | |
| | | | Income | | | Income | |
| | | | (NNC | ) | | (NPV | ) |
| Cash Flows from Operating Activities: | | | | | | | |
| Net Increase (Decrease) in Net Assets Applicable to Common Shares from Operations | | $ | 13,458,707 | | $ | 12,524,280 | |
| Adjustments to reconcile the net increase (decrease) in net assets applicable to Common shares from operations to net cash provided by (used in) operating activities: | | | | | | | |
| Purchases of investments | | | (41,460,121 | ) | | (38,770,334 | ) |
| Proceeds from sales and maturities of investments | | | 29,090,450 | | | 36,889,500 | |
| Assets and (Liabilities) acquired in Reorganization, net | | | (63,243,549 | ) | | (62,237,994 | ) |
| Amortization (Accretion) of premiums and discounts, net | | | 445,884 | | | 145,478 | |
| (Increase) Decrease in: | | | | | | | |
| Receivable for interest | | | (3,597,245 | ) | | (3,249,725 | ) |
| Receivable for investments sold | | | (2,256,255 | ) | | 1,095,898 | |
| Other assets | | | 18,116 | | | 20,263 | |
| Increase (Decrease) in: | | | | | | | |
| Payable for interest | | | 152,852 | | | 141,408 | |
| Payable for investments purchased | | | 11,062,590 | | | (589,820 | ) |
| Accrued management fees | | | 113,802 | | | 101,995 | |
| Accrued Trustees fees | | | 1,546 | | | 1,417 | |
| Accrued other expenses | | | (272,371 | ) | | (214,983 | ) |
| Net realized (gain) loss from investments | | | (243,255 | ) | | (266,647 | ) |
| Change in net unrealized (appreciation) depreciation of investments | | | (8,793,633 | ) | | (7,235,607 | ) |
| Taxes paid on undistributed capital gains | | | (3,235 | ) | | (30,202 | ) |
| Net cash provided by (used in) operating activities | | | (65,525,717 | ) | | (61,675,073 | ) |
| Cash Flows from Financing Activities: | | | | | | | |
| (Increase) Decrease in deferred offering costs | | | (740,898 | ) | | (441,608 | ) |
| Increase (Decrease) in: | | | | | | | |
| Cash overdraft balance | | | (2,841,072 | ) | | (93,029 | ) |
| Payable for offering costs | | | 32,122 | | | (117,700 | ) |
| Accrued reorganization expense | | | 555,890 | | | 361,561 | |
| MTP Shares, at liquidation value | | | 75,025,000 | | | 66,000,000 | |
| Cash distributions paid to Common shareholders | | | (4,484,499 | ) | | (4,034,151 | ) |
| Net cash provided by (used in) financing activities | | | 67,546,543 | | | 61,675,073 | |
| Net Increase (Decrease) in Cash | | | 2,020,826 | | | — | |
| Cash at the beginning of period | | | — | | | — | |
| Cash at the End of Period | | $ | 2,020,826 | | $ | — | |
Supplemental Disclosure of Cash Flow Information
Non-cash financing activities not included herein consist of reinvestments of Common share distributions as follows:
| | | | North | | | | |
| | | | Carolina | | | Virginia | |
| | | | Premium | | | Premium | |
| | | | Income | | | Income | |
| | | | (NNC | ) | | (NPV | ) |
| | | $ | 29,851 | | $ | 274,869 | |
Cash paid for interest (excluding amortization of offering costs) was as follows:
| | | | North | | | | |
| | | | Carolina | | | Virginia | |
| | | | Premium | | | Premium | |
| | | | Income | | | Income | |
| | | | (NNC | ) | | (NPV | ) |
| | | $ | 1,344,573 | | $ | 1,213,142 | |
See accompanying notes to financial statements.
THIS PAGE INTENTIONALLY LEFT BLANK
| | | Financial |
| | | Highlights (Unaudited) |
| | | |
| | Selected data for a Common share outstanding throughout each period: |
| | | | | Investment Operations | | Less Distributions | | | | | |
| | | Beginning Common Share Net Asset Value | | Net Investment Income (Loss) | | Net Realized/ Unrealized Gain (Loss) | | Distributions from Net Investment Income to Auction Rate Preferred Share- holders | (a) | Distributions from Capital Gains to Auction Rate Preferred Share- holders | (a) | Total | | Net Investment Income to Common Share- holders | | Capital Gains to Common Share- holders | | Total | | Ending Common Share Net Asset Value | | Ending Market Value | |
| Georgia Dividend Advantage 2 (NKG) | | | | | | | | | | | | | | | | | | | | | | | | | | | | |
| Year Ended 5/31: | | | | | | | | | | | | | | | | | | | | | | | | | | | | | | | |
| 2013(g) | | $ | 14.71 | | $ | .31 | | $ | .54 | | $ | — | | $ | — | | $ | .85 | | $ | (.34 | ) | $ | — | | $ | (.34 | ) | $ | 15.22 | | $ | 15.23 | |
| 2012 | | | 13.78 | | | .61 | | | 1.01 | | | — | | | — | | | 1.62 | | | (.69 | ) | | — | | | (.69 | ) | | 14.71 | | | 14.73 | |
| 2011 | | | 14.21 | | | .65 | | | (.36 | ) | | — | | | — | | | .29 | | | (.72 | ) | | — | | | (.72 | ) | | 13.78 | | | 13.92 | |
| 2010 | | | 13.27 | | | .78 | | | .87 | | | (.02 | ) | | — | | | 1.63 | | | (.69 | ) | | — | | | (.69 | ) | | 14.21 | | | 14.00 | |
| 2009 | | | 13.92 | | | .87 | | | (.73 | ) | | (.16 | ) | | — | | | (.02 | ) | | (.63 | ) | | — | | | (.63 | ) | | 13.27 | | | 11.88 | |
| 2008 | | | 14.44 | | | .88 | | | (.50 | ) | | (.26 | ) | | — | | | .12 | | | (.64 | ) | | — | | | (.64 | ) | | 13.92 | | | 13.18 | |
| | | | | | | | | | | | | | | | | | | | | | | | | | | | | | | | | | | |
| Maryland Premium Income (NMY) | | | | | | | | | | | | | | | | | | | | | | | | | | | | |
| Year Ended 5/31: | | | | | | | | | | | | | | | | | | | | | | | | | | | | | | | |
| 2013(g) | | | 15.68 | | | .28 | | | .43 | | | — | | | — | | | .71 | | | (.39 | ) | | — | | | (.39 | ) | | 16.00 | | | 15.95 | |
| 2012 | | | 14.37 | | | .68 | | | 1.40 | | | — | | | — | | | 2.08 | | | (.77 | ) | | — | | | (.77 | ) | | 15.68 | | | 15.64 | |
| 2011 | | | 14.77 | | | .80 | | | (.43 | ) | | (.01 | ) | | — | | | .36 | | | (.76 | ) | | — | | | (.76 | ) | | 14.37 | | | 14.00 | |
| 2010 | | | 13.58 | | | .84 | | | 1.10 | | | (.02 | ) | | — | | | 1.92 | | | (.73 | ) | | — | | | (.73 | ) | | 14.77 | | | 14.43 | |
| 2009 | | | 14.19 | | | .89 | | | (.67 | ) | | (.16 | ) | | (.01 | ) | | .05 | | | (.63 | ) | | (.03 | ) | | (.66 | ) | | 13.58 | | | 12.68 | |
| 2008 | | | 14.57 | | | .88 | | | (.41 | ) | | (.24 | ) | | — | | | .23 | | | (.61 | ) | | — | | | (.61 | ) | | 14.19 | | | 13.10 | |
| (a) | The amounts shown are based on Common share equivalents. |
| (b) | Total Return Based on Market Value is the combination of changes in the market price per share and the effect of reinvested dividend income and reinvested capital gains distributions, if any, at the average price paid per share at the time of reinvestment. The last dividend declared in the period, which is typically paid on the first business day of the following month, is assumed to be reinvested at the ending market price. The actual reinvestment for the last dividend declared in the period may take place over several days, and in some instances may not be based on the market price, so the actual reinvestment price may be different from the price used in the calculation. Total returns are not annualized. |
| | Total Return Based on Common Share Net Asset Value is the combination of changes in Common share net asset value, reinvested dividend income at net asset value and reinvested capital gains distributions at net asset value, if any. The last dividend declared in the period, which is typically paid on the first business day of the following month, is assumed to be reinvested at the ending net asset value. The actual reinvest price for the last dividend declared in the period may often be based on the Fund’s market price (and not its net asset value), and therefore may be different from the price used in the calculation. Total returns are not annualized. |
| | | | Ratios/Supplemental Data |
| | Total Returns | | | | Ratios to Average Net Assets Applicable to Common Shares Before Reimbursement(c)(d) | | Ratios to Average Net Assets Applicable to Common Shares After Reimbursement(c)(d)(e) | | | |
| | | | | | | | | | | | | | | | | |
| | Based on Market Value | (b) | Based on Common Share Net Asset Value | (b) | Ending Net Assets Applicable to Common Shares (000) | | Expenses | (f) | Net Investment Income (Loss) | | Expenses | (f) | Net Investment Income (Loss) | | Portfolio Turnover Rate | |
| | | | | | | | | | | | | | | | | | | | | | | | | |
| | | | | | | | | | | | | | | | | | | | | | | | | |
| | | 5.80 | % | | 5.86 | % | $ | 160,593 | | | 2.69 | %* | | 4.18 | %* | | N/A | | | N/A | | | 7 | % |
| | | 11.12 | | | 12.04 | | | 67,039 | | | 2.95 | | | 4.30 | | | N/A | | | N/A | | | 11 | |
| | | 4.84 | | | 2.13 | | | 62,777 | | | 2.79 | | | 4.64 | | | 2.75 | % | | 4.68 | % | | 4 | |
| | | 24.23 | | | 12.54 | | | 64,721 | | | 1.75 | | | 5.43 | | | 1.59 | | | 5.59 | | | 3 | |
| | | (4.77 | ) | | .20 | | | 60,419 | | | 1.42 | | | 6.54 | | | 1.13 | | | 6.84 | | | 13 | |
| | | (4.64 | ) | | .89 | | | 63,402 | | | 1.23 | | | 5.82 | | | .83 | | | 6.22 | | | 23 | |
| | | | | | | | | | | | | | | | | | | | | | | | | |
| | | | | | | | | | | | | | | | | | | | | | | | | |
| | | 4.55 | | | 4.60 | | | 385,572 | | | 2.45 | * | | 4.44 | * | | N/A | | | N/A | | | 11 | |
| | | 17.69 | | | 14.82 | | | 167,208 | | | 2.91 | | | 4.54 | | | N/A | | | N/A | | | 7 | |
| | | 2.32 | | | 2.53 | | | 153,082 | | | 2.10 | | | 5.48 | | | N/A | | | N/A | | | 6 | |
| | | 19.89 | | | 14.44 | | | 157,243 | | | 1.49 | | | 5.88 | | | N/A | | | N/A | | | 2 | |
| | | 2.57 | | | .66 | | | 144,504 | | | 1.35 | | | 6.80 | | | N/A | | | N/A | | | 5 | |
| | | (7.55 | ) | | 1.63 | | | 150,994 | | | 1.25 | | | 6.13 | | | N/A | | | N/A | | | 14 | |
| (c) | | Ratios do not reflect the effect of dividend payments to Auction Rate Preferred shareholders, where applicable; Net Investment Income (Loss) ratios reflect income earned and expenses incurred on assets attributable to Auction Rate Preferred Shares (“ARPS”) and/or MTP Shares, where applicable. |
| (d) | | Ratios do not reflect the effect of custodian fee credits earned on the Fund’s net cash on deposit with the custodian bank, where applicable. |
| (e) | | After expense reimbursement from the Adviser, where applicable. As of September 30, 2010, the Adviser is no longer reimbursing Georgia Dividend Advantage 2 (NKG) for any fees and expenses. |
| (f) | | The expense ratios reflect, among other things, all interest expense and other costs related to MTP Shares and/or the interest expense deemed to have been paid by the Fund on the floating rate certificates issued by the special purpose trusts for the self-deposited inverse floaters held by the Fund, where applicable, both as described in Footnote 1 – General Information and Significant Accounting Policies, MuniFund Term Preferred Shares and Inverse Floating Rate Securities, respectively, as follows: |
| Georgia Dividend Advantage 2 (NKG) | | | | |
| Year Ended 5/31: | | | | |
| 2013(g) | | | 1.49 | %* |
| 2012 | | | 1.56 | |
| 2011 | | | 1.60 | |
| 2010 | | | .55 | |
| 2009 | | | .10 | |
| 2008 | | | — | |
| Maryland Premium Income (NMY) | | | | |
| Year Ended 5/31: | | | | |
| 2013(g) | | | 1.45 | %* |
| 2012 | | | 1.56 | |
| 2011 | | | 1.00 | |
| 2010 | | | .32 | |
| 2009 | | | .05 | |
| 2008 | | | .01 | |
| (g) | | For the six months ended November 30, 2012. |
| N/A | | Fund does not have, or no longer has, a contractual reimbursement agreement with the Adviser. |
| * | | Annualized. |
See accompanying notes to financial statements.
| | | Financial |
| | | Highlights (Unaudited) (continued) |
| | | |
| | Selected data for a Common share outstanding throughout each period: |
| | | | | Investment Operations | | Less Distributions | | | | | |
| | | Beginning Common Share Net Asset Value | | Net Investment Income (Loss) | | Net Realized/ Unrealized Gain (Loss) | | Distributions from Net Investment Income to Auction Rate Preferred Share- holders | (a) | Distributions from Capital Gains to Auction Rate Preferred Share- holders | (a) | Total | | Net Investment Income to Common Share- holders | | Capital Gains to Common Share- holders | | Total | | Ending Common Share Net Asset Value | | Ending Market Value | |
| Missouri Premium Income (NOM) | | | | | | | | | | | | | | | | | | | | | | | | | | | | |
| Year Ended 5/31: | | | | | | | | | | | | | | | | | | | | | | | | | | | | | | | |
| 2013(f) | | $ | 14.62 | | $ | .34 | | $ | .54 | | $ | — | | $ | — | | $ | .88 | | $ | (.37 | ) | $ | — | | $ | (.37 | ) | $ | 15.13 | | $ | 17.40 | |
| 2012 | | | 13.19 | | | .69 | | | 1.52 | | | — | | | — | | | 2.21 | | | (.78 | ) | | — | | | (.78 | ) | | 14.62 | | | 16.90 | |
| 2011 | | | 13.55 | | | .78 | | | (.35 | ) | | (.01 | ) | | — | | | .42 | | | (.78 | ) | | — | | | (.78 | ) | | 13.19 | | | 13.88 | |
| 2010 | | | 12.44 | | | .83 | | | .99 | | | (.03 | ) | | — | | | 1.79 | | | (.68 | ) | | — | | | (.68 | ) | | 13.55 | | | 16.50 | |
| 2009 | | | 13.52 | | | .85 | | | (1.12 | ) | | (.16 | ) | | — | | | (.43 | ) | | (.65 | ) | | — | | | (.65 | ) | | 12.44 | | | 12.90 | |
| 2008 | | | 14.27 | | | .89 | | | (.62 | ) | | (.20 | ) | | (.04 | ) | | .03 | | | (.65 | ) | | (.13 | ) | | (.78 | ) | | 13.52 | | | 14.76 | |
| | | | | | | | | | | | | | | | | | | | | | | | | | | | | | | | | | | |
| North Carolina Premium Income (NNC) | | | | | | | | | | | | | | | | | | | | | | | | | | | | |
| Year Ended 5/31: | | | | | | | | | | | | | | | | | | | | | | | | | | | | | | | |
| 2013(f) | | | 15.30 | | | .27 | | | .57 | | | — | | | — | | | .84 | | | (.35 | ) | | — | | | (.35 | ) | | 15.79 | | | 15.80 | |
| 2012 | | | 14.34 | | | .57 | | | 1.10 | | | — | | | — | | | 1.67 | | | (.71 | ) | | — | | | (.71 | ) | | 15.30 | | | 15.97 | |
| 2011 | | | 14.72 | | | .69 | | | (.32 | ) | | (.01 | ) | | — | | | .36 | | | (.74 | ) | | — | | | (.74 | ) | | 14.34 | | | 14.41 | |
| 2010 | | | 13.78 | | | .81 | | | .87 | | | (.03 | ) | | — | | | 1.65 | | | (.71 | ) | | — | | | (.71 | ) | | 14.72 | | | 15.37 | |
| 2009 | | | 13.98 | | | .85 | | | (.27 | ) | | (.17 | ) | | — | | | .41 | | | (.61 | ) | | — | | | (.61 | ) | | 13.78 | | | 12.60 | |
| 2008 | | | 14.36 | | | .84 | | | (.35 | ) | | (.23 | ) | | (.01 | ) | | .25 | | | (.59 | ) | | (.04 | ) | | (.63 | ) | | 13.98 | | | 13.30 | |
| (a) | The amounts shown are based on Common share equivalents. |
| (b) | Total Return Based on Market Value is the combination of changes in the market price per share and the effect of reinvested dividend income and reinvested capital gains distributions, if any, at the average price paid per share at the time of reinvestment. The last dividend declared in the period, which is typically paid on the first business day of the following month, is assumed to be reinvested at the ending market price. The actual reinvestment for the last dividend declared in the period may take place over several days, and in some instances may not be based on the market price, so the actual reinvestment price may be different from the price used in the calculation. Total returns are not annualized. |
| | Total Return Based on Common Share Net Asset Value is the combination of changes in Common share net asset value, reinvested dividend income at net asset value and reinvested capital gains distributions at net asset value, if any. The last dividend declared in the period, which is typically paid on the first business day of the following month, is assumed to be reinvested at the ending net asset value. The actual reinvest price for the last dividend declared in the period may often be based on the Fund’s market price (and not its net asset value), and therefore may be different from the price used in the calculation. Total returns are not annualized. |
| | | | Ratios/Supplemental Data |
| | Total Returns | | | | Ratios to Average Net Assets Applicable to Common Shares(c)(d) | | | |
| | | | | | | | | | | | | |
| | Based on Market Value | (b) | Based on Common Share Net Asset Value | (b) | Ending Net Assets Applicable to Common Shares (000) | | Expenses | (e) | Net Investment Income (Loss) | | Portfolio Turnover Rate | |
| | | | | | | | | | | | | | | | | | | |
| | | | | | | | | | | | | | | | | | | |
| | | 5.25 | % | | 6.07 | % | $ | 35,182 | | | 2.76 | %* | | 4.54 | %* | | 3 | % |
| | | 28.21 | | | 17.16 | | | 33,979 | | | 2.95 | | | 4.93 | | | 13 | |
| | | (11.29 | ) | | 3.22 | | | 30,595 | | | 2.30 | | | 5.90 | | | 11 | |
| | | 34.31 | | | 14.69 | | | 31,348 | | | 1.37 | | | 6.37 | | | 7 | |
| | | (7.83 | ) | | (2.92 | ) | | 28,734 | | | 1.55 | | | 6.96 | | | 2 | |
| | | (5.74 | ) | | .26 | | | 31,170 | | | 1.52 | | | 6.43 | | | 5 | |
| | | | | | | | | | | | | | | | | | | |
| | | | | | | | | | | | | | | | | | | |
| | | 1.21 | | | 5.56 | | | 261,289 | | | 2.75 | * | | 3.95 | * | | 9 | |
| | | 16.23 | | | 11.88 | | | 97,497 | | | 3.28 | | | 3.85 | | | 18 | |
| | | (1.27 | ) | | 2.57 | | | 91,256 | | | 2.49 | | | 4.77 | | | 10 | |
| | | 28.20 | | | 12.24 | | | 93,570 | | | 1.54 | | | 5.68 | | | 6 | |
| | | (.44 | ) | | 3.22 | | | 87,558 | | | 1.39 | | | 6.43 | | | 7 | |
| | | (2.52 | ) | | 1.76 | | | 88,827 | | | 1.39 | | | 5.94 | | | 6 | |
| (c) | | Ratios do not reflect the effect of dividend payments to Auction Rate Preferred shareholders, where applicable; Net Investment Income (Loss) ratios reflect income earned and expenses incurred on assets attributable to ARPS and/or MTP Shares, where applicable. |
| (d) | | Ratios do not reflect the effect of custodian fee credits earned on the Fund’s net cash on deposit with the custodian bank, where applicable. |
| (e) | | The expense ratios reflect, among other things, all interest expense and other costs related to MTP Shares and/or the interest expense deemed to have been paid by the Fund on the floating rate certificates issued by the special purpose trusts for the self-deposited inverse floaters held by the Fund, where applicable, both as described in Footnote 1 – General Information and Significant Accounting Policies, MuniFund Term Preferred Shares and Inverse Floating Rate Securities, respectively, as follows: |
| Missouri Premium Income (NOM) | | | | |
| Year Ended 5/31: | | | | |
| 2013(f) | | | 1.44 | %* |
| 2012 | | | 1.55 | |
| 2011 | | | .93 | |
| 2010 | | | .03 | |
| 2009 | | | 13 | |
| 2008 | | | .21 | |
| North Carolina Premium Income (NNC) | | | | |
| Year Ended 5/31: | | | | |
| 2013(f) | | | 1.60 | %* |
| 2012 | | | 1.71 | |
| 2011 | | | 1.29 | |
| 2010 | | | .34 | |
| 2009 | | | .07 | |
| 2008 | | | .14 | |
| (f) | | For the six months ended November 30, 2012. |
| * | | Annualized. |
See accompanying notes to financial statements.
| | | Financial |
| | | Highlights (Unaudited) (continued) |
| | | |
| | Selected data for a Common share outstanding throughout each period: |
| | | | | Investment Operations | | Less Distributions | | | | | |
| | | Beginning Common Share Net Asset Value | | Net Investment Income (Loss) | | Net Realized/ Unrealized Gain (Loss) | | Distributions from Net Investment Income to Auction Rate Preferred Share- holders | (a) | Distributions from Capital Gains to Auction Rate Preferred Share- holders | (a) | Total | | Net Investment Income to Common Share- holders | | Capital Gains to Common Share- holders | | Total | | Ending Common Share Net Asset Value | | Ending Market Value | |
| Virginia Premium Income (NPV) | | | | | | | | | | | | | | | | | | | | | | | | | | | | |
| Year Ended 5/31: | | | | | | | | | | | | | | | | | | | | | | | | | | | | | | | |
| 2013(f) | | $ | 15.60 | | $ | .34 | | $ | .53 | | $ | — | | $ | — | | $ | .87 | | $ | (.39 | ) | $ | — | | $ | (.39 | ) | $ | 16.08 | | $ | 16.54 | |
| 2012 | | | 14.42 | | | .68 | | | 1.32 | | | — | | | — | | | 2.00 | | | (.80 | ) | | (.02 | ) | | (.82 | ) | | 15.60 | | | 17.05 | |
| 2011 | | | 14.73 | | | .77 | | | (.27 | ) | | (.01 | ) | | — | | | .49 | | | (.80 | ) | | — | | | (.80 | ) | | 14.42 | | | 14.92 | |
| 2010 | | | 13.76 | | | .88 | | | .93 | | | (.03 | ) | | — | | | 1.78 | | | (.81 | ) | | — | | | (.81 | ) | | 14.73 | | | 15.85 | |
| 2009 | | | 14.39 | | | .90 | | | (.66 | ) | | (.15 | ) | | (.02 | ) | | .07 | | | (.65 | ) | | (.05 | ) | | (.70 | ) | | 13.76 | | | 14.36 | |
| 2008 | | | 14.89 | | | .88 | | | (.40 | ) | | (.22 | ) | | (.03 | ) | | .23 | | | (.64 | ) | | (.09 | ) | | (.73 | ) | | 14.39 | | | 14.04 | |
| (a) | The amounts shown are based on Common share equivalents. |
| (b) | Total Return Based on Market Value is the combination of changes in the market price per share and the effect of reinvested dividend income and reinvested capital gains distributions, if any, at the average price paid per share at the time of reinvestment. The last dividend declared in the period, which is typically paid on the first business day of the following month, is assumed to be reinvested at the ending market price. The actual reinvestment for the last dividend declared in the period may take place over several days, and in some instances may not be based on the market price, so the actual reinvestment price may be different from the price used in the calculation. Total returns are not annualized. |
| | Total Return Based on Common Share Net Asset Value is the combination of changes in Common share net asset value, reinvested dividend income at net asset value and reinvested capital gains distributions at net asset value, if any. The last dividend declared in the period, which is typically paid on the first business day of the following month, is assumed to be reinvested at the ending net asset value. The actual reinvest price for the last dividend declared in the period may often be based on the Fund’s market price (and not its net asset value), and therefore may be different from the price used in the calculation. Total returns are not annualized. |
| | | | Ratios/Supplemental Data |
| | Total Returns | | | | Ratios to Average Net Assets Applicable to Common Shares(c)(d) | | | |
| | | | | | | | | | | | | |
| | Based on Market Value | (b) | Based on Common Share Net Asset Value | (b) | Ending Net Assets Applicable to Common Shares (000) | | Expenses | (e) | Net Investment Income (Loss) | | Portfolio Turnover Rate | |
| | | | | | | | | | | | | | | | | | | |
| | | | | | | | | | | | | | | | | | | |
| | | (.60 | )% | | 5.65 | % | $ | 288,109 | | | 2.43 | %* | | 4.33 | %* | | 11 | % |
| | | 20.61 | | | 14.26 | | | 141,099 | | | 2.78 | | | 4.49 | | | 12 | |
| | | (.58 | ) | | 3.48 | | | 130,032 | | | 2.11 | | | 5.36 | | | 12 | |
| | | 16.60 | | | 13.19 | | | 132,302 | | | 1.45 | | | 6.14 | | | 3 | |
| | | 8.05 | | | .88 | | | 123,119 | | | 1.36 | | | 6.82 | | | 6 | |
| | | (2.94 | ) | | 1.56 | | | 128,512 | | | 1.25 | | | 6.02 | | | 14 | |
| (c) | | Ratios do not reflect the effect of dividend payments to Auction Rate Preferred shareholders, where applicable; Net Investment Income (Loss) ratios reflect income earned and expenses incurred on assets attributable to ARPS and/or MTP Shares, where applicable. |
| (d) | | Ratios do not reflect the effect of custodian fee credits earned on the Fund’s net cash on deposit with the custodian bank, where applicable. |
| (e) | | The expense ratios reflect, among other things, all interest expense and other costs related to MTP Shares and/or the interest expense deemed to have been paid by the Fund on the floating rate certificates issued by the special purpose trusts for the self-deposited inverse floaters held by the Fund, where applicable, both as described in Footnote 1 – General Information and Significant Accounting Policies, MuniFund Term Preferred Shares and Inverse Floating Rate Securities, respectively, as follows: |
| Virginia Premium Income (NPV) | | | | |
| Year Ended 5/31: | | | | |
| 2013(f) | | | 1.41 | %* |
| 2012 | | | 1.41 | |
| 2011 | | | .93 | |
| 2010 | | | .29 | |
| 2009 | | | .08 | |
| 2008 | | | .02 | |
| (f) | | For the six months ended November 30, 2012. |
| * | | Annualized. |
See accompanying notes to financial statements.
| | | Financial |
| | | Highlights (Unaudited) (continued) |
| | | ARPS at the End of Period | | MTP Shares at the End of Period(a) | | ARPS and MTP Shares at the End of Period | |
| | | Aggregate Amount Outstanding (000 | ) | Asset Coverage Per $25,000 Share | | Aggregate Amount Outstanding (000 | ) | Asset Coverage Per $10 Share | | Asset Coverage Per $1 Liquidation Preference | |
| Georgia Dividend Advantage 2 (NKG) | | | | | | | | | | | | | |
| Year Ended 5/31: | | | | | | | | | | | | | | | | |
| 2013(b) | | $ | — | | $ | — | | $ | 74,945 | | $ | 31.43 | | $ | — | |
| 2012 | | | — | | | — | | | 32,265 | | | 30.78 | | | — | |
| 2011 | | | — | | | — | | | 32,265 | | | 29.46 | | | — | |
| 2010 | | | — | | | — | | | 32,265 | | | 30.06 | | | — | |
| 2009 | | | 31,700 | | | 72,649 | | | — | | | — | | | — | |
| 2008 | | | 33,000 | | | 73,032 | | | — | | | — | | | — | |
| | | | | | | | | | | | | | | | | |
| Maryland Premium Income (NMY) | | | | | | | | | | | | | |
| Year Ended 5/31: | | | | | | | | | | | | | | | | |
| 2013(b) | | | — | | | — | | | 166,144 | | | 33.21 | | | — | |
| 2012 | | | — | | | — | | | 74,593 | | | 32.42 | | | — | |
| 2011 | | | — | | | — | | | 74,593 | | | 30.52 | | | — | |
| 2010 | | | 32,975 | | | 79,788 | | | 38,775 | | | 31.92 | | | 3.19 | |
| 2009 | | | 70,875 | | | 75,972 | | | — | | | — | | | — | |
| 2008 | | | 79,100 | | | 72,722 | | | — | | | — | | | — | |
(a) The Ending and Average Market Value Per Share for each Series of the Fund’s MTP Shares were as follows:
| | | | 2013 | (b) | | 2012 | | | 2011 | | | 2010 | (d) |
| Georgia Dividend Advantage 2 (NKG) | | | | | | | | | | | | | |
| Series 2015 (NKG PRC) | | | | | | | | | | | | | |
| Ending Market Value per Share | | $ | 10.08 | | $ | 10.10 | | $ | 10.06 | | $ | 9.99 | |
| Average Market Value per Share | | | 10.08 | | | 10.07 | | | 10.02 | | | 9.99 | ^ |
| Series 2015-1 (NKG PRD) (c) | | | | | | �� | | | | | | | |
| Ending Market Value per Share | | | 10.05 | | | — | | | — | | | — | |
| Average Market Value per Share | | | 10.07 | Ω | | — | | | — | | | — | |
| Series 2015-2 (NKG PRE) (c) | | | | | | | | | | | | | |
| Ending Market Value per Share | | | 10.07 | | | — | | | — | | | — | |
| Average Market Value per Share | | | 10.07 | Ω | | — | | | — | | | — | |
| | | | | | | | | | | | | | |
| Maryland Premium Income (NMY) | | | | | | | | | | | | | |
| Series 2015 (NMY PRC) | | | | | | | | | | | | | |
| Ending Market Value per Share | | | 10.05 | | | 10.06 | | | 10.09 | | | 10.00 | |
| Average Market Value per Share | | | 10.10 | | | 10.10 | | | 10.04 | | | 10.01 | ^ |
| Series 2016 (NMY PRD) | | | | | | | | | | | | | |
| Ending Market Value per Share | | | 10.16 | | | 10.11 | | | 10.10 | | | — | |
| Average Market Value per Share | | | 10.17 | | | 10.14 | | | 10.04 | ^^ | | — | |
| Series 2015 (NMY PRE) (c) | | | | | | | | | | | | | |
| Ending Market Value per Share | | | 10.07 | | | — | | | — | | | — | |
| Average Market Value per Share | | | 10.08 | ΩΩ | | — | | | — | | | — | |
| Series 2015-1(NMY PRF) (c) | | | | | | | | | | | | | |
| Ending Market Value per Share | | | 10.06 | | | — | | | — | | | — | |
| Average Market Value per Share | | | 10.08 | ΩΩ | | — | | | — | | | — | |
| Series 2015-1(NMY PRG) (c) | | | | | | | | | | | | | |
| Ending Market Value per Share | | | 10.08 | | | — | | | — | | | — | |
| Average Market Value per Share | | | 10.09 | ΩΩ | | — | | | — | | | — | |
| Series 2016 (NMY PRH) (c) | | | | | | | | | | | | | |
| Ending Market Value per Share | | | 10.10 | | | — | | | — | | | — | |
| Average Market Value per Share | | | 10.13 | ΩΩ | | — | | | — | | | — | |
| (b) | For the six months ended November 30, 2012. |
| (c) | MTP Shares issued in connection with the Reorganizations as further described in Footnote 1, General Information and Significant Accounting Policies, Fund Reorganizations and MuniFund Term Preferred Shares. |
| (d) | The Fund did not issue MTP Shares prior to the fiscal year ended May 31, 2010. |
| ^ | For the period January 29, 2010 (first issuance date of shares) through May 31, 2010. |
| ^^ | For the period March 15, 2011 (first issuance date of shares) through May 31, 2011. |
| Ω | For the period July 9, 2012 (effective date of the Reorganizations) through November 30, 2012. |
| ΩΩ | For the period August 6, 2012 (effective date of the Reorganizations) through November 30, 2012. |
| | | ARPS at the End of Period | | MTP Shares at the End of Period(a) | | ARPS and MTP Shares at the End of Period | |
| | | Aggregate Amount | | Asset | | Aggregate Amount | | Asset | | Asset Coverage | |
| | | Outstanding | | Coverage | | Outstanding | | Coverage | | Per $1 Liquidation | |
| | | (000 | ) | Per $25,000 Share | | (000 | ) | Per $10 Share | | Preference | |
| Missouri Premium Income (NOM) | | | | | | | | | | | | | |
| Year Ended 5/31: | | | | | | | | | | | | | | | | |
| 2013(b) | | $ | — | | $ | — | | $ | 17,880 | | $ | 29.68 | | $ | — | |
| 2012 | | | — | | | — | | | 17,880 | | | 29.00 | | | — | |
| 2011 | | | — | | | — | | | 17,880 | | | 27.11 | | | — | |
| 2010 | | | 16,000 | | | 73,981 | | | — | | | — | | | — | |
| 2009 | | | 16,000 | | | 69,897 | | | — | | | — | | | — | |
| 2008 | | | 16,000 | | | 73,703 | | | — | | | — | | | — | |
| | | | | | | | | | | | | | | | | |
| North Carolina Premium Income (NNC) | | | | | | | | | | | | | |
| Year Ended 5/31: | | | | | | | | | | | | | | | | |
| 2013(b) | | | — | | | — | | | 124,860 | | | 30.93 | | | — | |
| 2012 | | | — | | | — | | | 49,835 | | | 29.56 | | | — | |
| 2011 | | | — | | | — | | | 49,835 | | | 28.31 | | | — | |
| 2010 | | | 21,550 | | | 76,020 | | | 24,300 | | | 30.41 | | | 3.04 | |
| 2009 | | | 46,800 | | | 71,773 | | | — | | | — | | | — | |
| 2008 | | | 46,800 | | | 72,450 | | | — | | | — | | | — | |
(a) The Ending and Average Market Value Per Share for each Series of the Fund’s MTP Shares were as follows:
| | | | 2013 | (b) | | 2012 | | | 2011 | | | 2010 | (d) |
| Missouri Premium Income (NOM) | | | | | | | | | | | | | |
| Series 2015 (NOM PRC) | | | | | | | | | | | | | |
| Ending Market Value per Share | | $ | 10.04 | | $ | 10.40 | | $ | 13.88 | | $ | — | |
| Average Market Value per Share | | | 10.09 | | | 9.98 | | | 15.41 | Δ | | — | |
| | | | | | | | | | | | | | |
| North Carolina Premium Income (NNC) | | | | | | | | | | | | | |
| Series 2015 (NNC PRC) | | | | | | | | | | | | | |
| Ending Market Value per Share | | | 10.06 | | | 10.11 | | | 10.04 | | | 9.99 | |
| Average Market Value per Share | | | 10.12 | | | 10.09 | | | 10.04 | | | 10.01 | ΔΔ |
| Series 2016 (NNC PRD) | | | | | | | | | | | | | |
| Ending Market Value per Share | | | 10.12 | | | 10.10 | | | 10.00 | | | — | |
| Average Market Value per Share | | | 10.10 | | | 10.07 | | | 9.94 | ΔΔΔ | | — | |
| Series 2015 (NNC PRE) (c) | | | | | | | | | | | | | |
| Ending Market Value per Share | | | 10.06 | | | — | | | — | | | — | |
| Average Market Value per Share | | | 10.07 | Ω | | — | | | — | | | — | |
| Series 2015-1 (NNC PRF) (c) | | | | | | | | | | | | | |
| Ending Market Value per Share | | | 10.04 | | | — | | | — | | | — | |
| Average Market Value per Share | | | 10.06 | Ω | | — | | | — | | | — | |
| Series 2015-1 (NNC PRG) (c) | | | | | | | | | | | | | |
| Ending Market Value per Share | | | 10.08 | | | — | | | — | | | — | |
| Average Market Value per Share | | | 10.07 | Ω | | — | | | — | | | — | |
| (b) | For the six months ended November 30, 2012. |
| (c) | MTP Shares issued in connection with the Reorganizations as further described in Footnote 1, General Information and Significant Accounting Policies, Fund Reorganizations and MuniFund Term Preferred Shares. |
| (d) | Missouri Premium Income (NOM) and North Carolina Premium Income (NNC) did not issue MTP Shares prior to the fiscal year ended May 31, 2011 and May 31, 2010, respectively. |
| Δ | For the period November 9, 2010 (first issuance date of shares) through May 31, 2011. |
| ΔΔ | For the period January 21, 2010 (first issuance date of shares) through May 31, 2010. |
| ΔΔΔ | For the period December 14, 2010 (first issuance date of shares) through May 31, 2011. |
| Ω | For the period July 9, 2012 (effective date of the Reorganizations) through November 30, 2012. |
| ΩΩ | For the period August 6, 2012 (effective date of the Reorganizations) through November 30, 2012. |
See accompanying notes to financial statements.
| | | Financial |
| | | Highlights (Unaudited) (continued) |
| | | | | | | | | | | | | | | ARPS and | |
| | | | | | | | | | | | | | | MTP Shares | |
| | | | | | | | | | | | | | | at the | |
| | | | ARPS at the End of Period | | MTP Shares at the End of Period(a) | | End of Period | |
| | | Aggregate Amount | | Asset | | Aggregate Amount | | Asset | | Asset Coverage | |
| | | Outstanding | | Coverage | | Outstanding | | Coverage | | Per $1 Liquidation | |
| | | (000 | ) | Per $25,000 Share | | (000 | ) | Per $10 Share | | Preference | |
| Virginia Premium Income (NPV) | | | | | | | | | | | | | | | | |
| Year Ended 5/31: | | | | | | | | | | | | | | | | |
| 2013(b) | | $ | — | | $ | — | | $ | 127,408 | | $ | 32.61 | | $ | — | |
| 2012 | | | — | | | — | | | 61,408 | | | 32.98 | | | — | |
| 2011 | | | — | | | — | | | 61,408 | | | 31.18 | | | — | |
| 2010 | | | 25,550 | | | 82,269 | | | 32,205 | | | 32.91 | | | 3.29 | |
| 2009 | | | 63,800 | | | 73,244 | | | — | | | — | | | — | |
| 2008 | | | 63,800 | | | 75,357 | | | — | | | — | | | — | |
| (a) | The Ending and Average Market Value Per Share for each Series of the Fund’s MTP Shares were as follows: |
| | | | 2013 | (b) | | 2012 | | | 2011 | | | 2010 | (d) |
| Virginia Premium Income (NPV) | | | | | | | | | | | | | |
| Series 2014 (NPV PRA) | | | | | | | | | | | | | |
| Ending Market Value per Share | | $ | 10.04 | | $ | 10.12 | | $ | 10.03 | | $ | — | |
| Average Market Value per Share | | | 10.09 | | | 10.10 | | | 10.02 | * | | — | |
| Series 2015 (NPV PRC) | | | | | | | | | | | | | |
| Ending Market Value per Share | | | 10.08 | | | 10.13 | | | 10.01 | | | 10.00 | |
| Average Market Value per Share | | | 10.09 | | | 10.09 | | | 10.07 | | | 10.00 | ** |
| Series 2014 (NPV PRD) (c) | | | | | | | | | | | | | |
| Ending Market Value per Share | | | 10.10 | | | — | | | — | | | — | |
| Average Market Value per Share | | | 10.09 | ΩΩ | | — | | | — | | | — | |
| Series 2014-1 (NPV PRE) (c) | | | | | | | | | | | | | |
| Ending Market Value per Share | | | 10.13 | | | — | | | — | | | — | |
| Average Market Value per Share | | | 10.09 | ΩΩ | | — | | | — | | | — | |
| (b) | For the six months ended November 30, 2012. |
| (c) | MTP Shares issued in connection with the Reorganizations as further described in Footnote 1, General Information and Significant Accounting Policies, Fund Reorganizations and MuniFund Term Preferred Shares. |
| (d) | The Fund did not issue MTP Shares prior to the fiscal year ended May 31, 2010. |
| * | For the period March 14, 2011 (first issuance date of shares) through May 31, 2011. |
| ** | For the period January 26, 2010 (first issuance date of shares) through May 31, 2010. |
| ΩΩ | For the period August 6, 2012 (effective date of the Reorganizations) through November 30, 2012. |
| | | Notes to |
| | | Financial Statements (Unaudited) |
1. General Information and Significant Accounting Policies
General Information
The state funds covered in this report and their corresponding Common share stock exchange symbols are Nuveen Georgia Dividend Advantage Municipal Fund 2 (NKG), Nuveen Maryland Premium Income Municipal Fund (NMY), Nuveen Missouri Premium Income Municipal Fund (NOM), Nuveen North Carolina Premium Income Municipal Fund (NNC) and Nuveen Virginia Premium Income Municipal Fund (NPV) (each a “Fund” and collectively, the “Funds”). Common shares of Maryland Premium Income (NMY) and Virginia Premium Income (NPV) are traded on the New York Stock Exchange (“NYSE”) while common shares of Georgia Dividend Advantage 2 (NKG), North Carolina Premium Income (NNC) and Missouri Premium Income (NOM) are traded on the NYSE MKT. The Funds are registered under the Investment Company Act of 1940, as amended, as diversified, closed-end registered investment companies.
On December 31, 2012, the Funds’ investment adviser converted from a Delaware corporation to a Delaware limited liability company. As a result, Nuveen Fund Advisers, Inc., a wholly-owned subsidiary of Nuveen Investments, Inc. (“Nuveen”), changed its name to Nuveen Fund Advisers, LLC (the “Adviser”). There were no changes to the identities or roles of any personnel as a result of the change.
Each Fund seeks to provide current income exempt from both regular federal and designated state income taxes by investing primarily in a portfolio of municipal obligations issued by state and local government authorities within a single state or certain U.S. territories.
Fund Reorganizations
Effective before the opening of business on July 9, 2012, certain Georgia and North Carolina funds and effective before the opening of business on August 6, 2012, certain Maryland and Virginia funds (the “Acquired Funds”) were reorganized in four of the larger-state funds included in this report (the “Acquiring Funds”) as follows:
| Acquired Funds | | Acquiring Funds |
| Georgia Funds | | |
| Nuveen Georgia Premium Income Municipal Fund (NPG) (“Georgia Premium Income (NPG)”) | | Georgia Dividend Advantage 2 (NKG) |
| Nuveen Georgia Dividend Advantage Municipal Fund (NZX) (“Georgia Dividend Advantage (NZX)”) | | |
| | | |
| Maryland Funds | | |
| Nuveen Maryland Dividend Advantage Municipal Fund (NFM) (“Maryland Dividend Advantage (NFM)”) | | Maryland Premium Income (NMY) |
| Nuveen Maryland Dividend Advantage Municipal Fund 2 (NZR) (“Maryland Dividend Advantage 2 (NZR)”) | | |
| Nuveen Maryland Dividend Advantage Municipal Fund 3 (NWI) (“Maryland Dividend Advantage 3 (NWI)”) | | |
| | | |
| North Carolina Funds | | |
| Nuveen North Carolina Dividend Advantage Municipal Fund (NRB) (“North Carolina Dividend Advantage (NRB)”) | | North Carolina Premium Income (NNC) |
| Nuveen North Carolina Dividend Advantage Municipal Fund 2 (NNO) (“North Carolina Dividend Advantage 2 (NNO)”) | | |
| Nuveen North Carolina Dividend Advantage Municipal Fund 3 (NII) (“North Carolina Dividend Advantage 3 (NII)”) | | |
| | | |
| Virginia Funds | | |
| Nuveen Virginia Dividend Advantage Municipal Fund (NGB) (“Virginia Dividend Advantage (NGB)”) | | Virginia Premium Income (NPV) |
| Nuveen Virginia Dividend Advantage Municipal Fund 2 (NNB) (“Virginia Dividend Advantage 2 (NNB)”) | | |
The reorganizations of the Georgia, Maryland, North Carolina and Virginia Funds were approved by the shareholders of the Acquired Funds at a special meeting on May 15, 2012, July 18, 2012, May 14, 2012 and June 22, 2012, respectively.
Upon the closing of each Fund’s reorganization (each a “Reorganization” and collectively, the “Reorganizations”), the Acquired Funds transferred their assets to the Acquiring Funds in exchange for common and preferred shares of the Acquiring Funds and the assumption by the Acquiring Funds of the liabilities of the Acquired Funds. The Acquired Funds were then liquidated, dissolved and terminated in accordance with their Declaration of Trust. Shareholders of the Acquired Funds became shareholders of the Acquiring Funds. Holders of common shares of the Acquired Funds received newly issued common shares of the Acquiring Funds, the aggregate net asset value of which was equal to the aggregate net asset value of the common shares of the Acquired Funds held immediately prior to the Reorganizations (including for this purpose fractional Acquiring Funds shares to which shareholders would be entitled). Fractional shares were sold on the open market and shareholders received cash in lieu of such fractional shares. Holders of MuniFund Term Preferred (“MTP”) Shares of the Acquired Funds received on a one-for-one basis newly issued MTP Shares of the Acquiring Funds, in exchange for their MTP Shares of the Acquired Funds held immediately prior to the Reorganizations. Details of each state’s Reorganizations are further described in the MuniFund Term Preferred Shares section of this footnote and Footnote 8 – Fund Reorganizations.
| | | Notes to |
| | | Financial Statements (Unaudited) (continued) |
Significant Accounting Policies
The following is a summary of significant accounting policies followed by the Funds in the preparation of their financial statements in accordance with U.S. generally accepted accounting principles (“U.S. GAAP”).
Investment Valuation
Prices of municipal bonds are provided by a pricing service approved by the Funds’ Board of Trustees. These securities are generally classified as Level 2 for fair value measurement purposes. The pricing service establishes a security’s fair value using methods that may include consideration of the following: yields or prices of investments of comparable quality, type of issue, coupon, maturity and rating, market quotes or indications of value from security dealers, evaluations of anticipated cash flows or collateral, general market conditions and other information and analysis, including the obligor’s credit characteristics considered relevant. In pricing certain securities, particularly less liquid and lower quality securities, the pricing service may consider information about a security, its issuer, or market activity, provided by the Advisor. These securities are generally classified as Level 2 or Level 3 depending on the priority of the significant inputs.
Certain securities may not be able to be priced by the pre-established pricing methods as described above. Such securities may be valued by the Funds’ Board of Trustees or its designee at fair value. These securities generally include, but are not limited to, restricted securities (securities which may not be publicly sold without registration under the Securities Act of 1933, as amended) for which a pricing service is unable to provide a market price; securities whose trading has been formally suspended; debt securities that have gone into default and for which there is no current market quotation; a security whose market price is not available from a pre-established pricing source; a security with respect to which an event has occurred that is likely to materially affect the value of the security after the market has closed but before the calculation of a Fund’s net asset value (as may be the case in non-U.S. markets on which the security is primarily traded) or make it difficult or impossible to obtain a reliable market quotation; and a security whose price, as provided by the pricing service, is not deemed to reflect the security’s fair value. As a general principle, the fair value of a security would appear to be the amount that the owner might reasonably expect to receive for it in a current sale. A variety of factors may be considered in determining the fair value of these securities, which may include consideration of the following: yields or prices of investments of comparable quality, type of issue, coupon, maturity and rating, market quotes or indications of value from security dealers, evaluations of anticipated cash flows or collateral, general market conditions and other information and analysis, including the obligor’s credit characteristics considered relevant. These securities are generally classified as Level 2 or Level 3 depending on the priority of the significant inputs. Regardless of the method employed to value a particular security, all valuations are subject to review by the Funds’ Board of Trustees or its designee.
Refer to Footnote 2 – Fair Value Measurements for further details on the leveling of securities held by the Funds as of the end of the reporting period.
Investment Transactions
Investment transactions are recorded on a trade date basis. Realized gains and losses from transactions are determined on the specific identification method, which is the same basis used for federal income tax purposes. Investments purchased on a when-issued/delayed delivery basis may have extended settlement periods. Any investments so purchased are subject to market fluctuation during this period. The Funds have instructed the custodian to earmark securities in the Funds’ portfolios with a current value at least equal to the amount of the when-issued/delayed delivery purchase commitments. At November 30, 2012, Maryland Premium Income (NMY), Missouri Premium Income (NOM) and North Carolina Premium Income (NNC) had outstanding delayed delivery purchase commitments of $3,522,961, $768,495 and $12,416,898, respectively. There were no such outstanding purchase commitments in any of the other Funds.
Investment Income
Investment income, which reflects the amortization of premiums and includes accretion of discounts for financial reporting purposes, is recorded on an accrual basis. Investment income also reflects paydown gains and losses, if any.
Professional Fees
Professional fees presented on the Statement of Operations consist of legal fees incurred in the normal course of operations, audit fees, tax consulting fees and, in some cases, workout expenditures. Workout expenditures are incurred in an attempt to protect or enhance an investment, or to pursue other claims or legal actions on behalf of Fund shareholders. Legal fee refund presented on the Statement of Operations reflects a refund of workout expenditures paid in a prior reporting period, when applicable.
Income Taxes
Each Fund is a separate taxpayer for federal income tax purposes. Each Fund intends to distribute substantially all of its net investment income and net capital gains to shareholders and to otherwise comply with the requirements of Subchapter M of the Internal Revenue Code applicable to regulated investment companies. Therefore, no federal income tax provision is required. Furthermore, each Fund intends to satisfy conditions that will enable interest from municipal securities, which is exempt from regular federal and designated state income taxes, to retain such tax-exempt status when distributed to shareholders of the Funds. Net realized capital gains and ordinary income distributions paid by the Funds are subject to federal taxation.
For all open tax years and all major taxing jurisdictions, management of the Funds has concluded that there are no significant uncertain tax positions that would require recognition in the financial statements. Open tax years are those that are open for examination by taxing authorities (i.e., generally
the last four tax year ends and the interim tax period since then). Furthermore, management of the Funds is also not aware of any tax positions for which it is reasonably possible that the total amounts of unrecognized tax benefits will significantly change in the next twelve months.
Dividends and Distributions to Common Shareholders
Dividends from net investment income are declared monthly. Net realized capital gains and/or market discount from investment transactions, if any, are distributed to shareholders at least annually. Furthermore, capital gains are distributed only to the extent they exceed available capital loss carryforwards.
Distributions to Common shareholders of net investment income, net realized capital gains and/or market discount, if any, are recorded on the ex-dividend date. The amount and timing of distributions are determined in accordance with federal income tax regulations, which may differ from U.S. GAAP.
Auction Rate Preferred Shares
Each Fund is authorized to issue Auction Rate Preferred Shares (“ARPS”). As of May 31, 2011, the Funds redeemed all of their outstanding ARPS at liquidation value.
MuniFund Term Preferred Shares
The Funds have issued and outstanding MTP Shares, with a $10 stated (“par”) value per share. Proceeds from the issuance of MTP Shares, net of offering expenses, were used to redeem all, or a portion of, the remainder of each Fund’s outstanding ARPS in previous fiscal periods. Each Fund’s MTP Shares may be issued in one or more Series and trade on the NYSE. Dividends on MTP Shares, which are recognized as interest expense for financial reporting purposes, are paid monthly at a fixed annual rate, subject to adjustments in certain circumstances.
In connection with Georgia Dividend Advantage 2’s (NKG), Maryland Premium Income’s (NMY), North Carolina Premium Income’s (NNC) and Virginia Premium Income’s (NPV) Reorganizations, holders of MTP Shares of the Acquired Funds received on a one-for-one basis newly issued MTP Shares of the Acquiring Funds, in exchange for MTP Shares of the Acquired Funds held immediately prior to the Reorganizations.
Prior to the closing of the Reorganizations, the Acquired Funds’ outstanding MTP Shares and annual interest rate by NYSE “ticker” symbol were as follows:
| | | | | | | | | | | | | Shares | | | | |
| | | | | | | | | | | | | Outstanding | | | Annual | |
| | | | | | | NYSE | | | Shares | | | at $10 Per Share | | | Interest | |
| | | | Series | | | Ticker | | | Outstanding | | | Liquidation Value | | | Rate | |
| Georgia Premium Income (NPG) | | | | | | | | | | | | | | | | |
| | | | 2015 | | | NPG PRC | | | 2,834,000 | | $ | 28,340,000 | | | 2.65 | % |
| Georgia Dividend Advantage (NZX) | | | | | | | | | | | | | | | | |
| | | | 2015 | | | NZX PRC | | | 1,434,000 | | $ | 14,340,000 | | | 2.65 | % |
| Maryland Dividend Advantage (NFM) | | | | | | | | | | | | | | | | |
| | | | 2015 | | | NFM PRC | | | 2,648,500 | | $ | 26,485,000 | | | 2.60 | % |
| Maryland Dividend Advantage 2 (NZR) | | | | | | | | | | | | | | | | |
| | | | 2015 | | | NZR PRC | | | 2,730,000 | | $ | 27,300,000 | | | 2.60 | % |
| Maryland Dividend Advantage 3 (NWI) | | | | | | | | | | | | | | | | |
| | | | 2015 | | | NWI PRC | | | 2,070,000 | | $ | 20,700,000 | | | 2.65 | % |
| | | | 2016 | | | NWI PRD | | | 1,706,600 | | | 17,066,000 | | | 2.85 | |
| North Carolina Dividend Advantage (NRB) | | | | | | | | | | | | | | | | |
| | | | 2015 | | | NRB PRC | | | 1,660,000 | | $ | 16,600,000 | | | 2.60 | % |
| North Carolina Dividend Advantage 2 (NNO) | | | | | | | | | | | | | | | | |
| | | | 2015 | | | NNO PRC | | | 2,970,000 | | $ | 29,700,000 | | | 2.60 | % |
| North Carolina Dividend Advantage 3 (NII) | | | | | | | | | | | | | | | | |
| | | | 2015 | | | NII PRC | | | 2,872,500 | | $ | 28,725,000 | | | 2.65 | % |
| Virginia Dividend Advantage (NGB) | | | | | | | | | | | | | | | | |
| | | | 2014 | | | NGB PRC | | | 2,280,000 | | $ | 22,800,000 | | | 2.80 | % |
| Virginia Dividend Advantage 2 (NNB) | | | | | | | | | | | | | | | | |
| | | | 2014 | | | NNB PRC | | | 4,320,000 | | $ | 43,200,000 | | | 2.80 | % |
| | | Notes to |
| | | Financial Statements (Unaudited) (continued) |
As of November 30, 2012, the Funds’ outstanding MTP Shares and annual interest rate by NYSE ticker symbol are as follows:
| | | | | | | | | | | | | Shares | | | | |
| | | | | | | | | | | | | Outstanding | | | Annual | |
| | | | | | | NYSE | | | Shares | | | at $10 Per Share | | | Interest | |
| | | | Series | | | Ticker | | | Outstanding | | | Liquidation Value | | | Rate | |
| Georgia Dividend Advantage 2 (NKG) | | | | | | | | | | | | | | | | |
| | | | 2015 | | | NKG PRC | | | 3,226,500 | | $ | 32,265,000 | | | 2.65 | % |
| | | | 2015-1 * | | | NKG PRD | | | 2,834,000 | | | 28,340,000 | | | 2.65 | |
| | | | 2015-2 * | | | NKG PRE | | | 1,434,000 | | | 14,340,000 | | | 2.65 | |
| Maryland Premium Income (NMY) | | | | | | | | | | | | | | | | |
| | | | 2015 | | | NMY PRC | | | 3,877,500 | | | 38,775,000 | | | 2.65 | % |
| | | | 2016 | | | NMY PRD | | | 3,581,800 | | | 35,818,000 | | | 2.90 | |
| | | | 2015 * | | | NMY PRE | | | 2,648,500 | | | 26,485,000 | | | 2.60 | |
| | | | 2015-1 * | | | NMY PRF | | | 2,730,000 | | | 27,300,000 | | | 2.60 | |
| | | | 2015-1 * | | | NMY PRG | | | 2,070,000 | | | 20,700,000 | | | 2.65 | |
| | | | 2016 * | | | NMY PRH | | | 1,706,600 | | | 17,066,000 | | | 2.85 | |
| Missouri Premium Income (NOM) | | | | | | | | | | | | | | | | |
| | | | 2015 | | | NOM PRC | | | 1,780,000 | | | 17,800,000 | | | 2.10 | % |
| North Carolina Premium Income (NNC) | | | | | | | | | | | | | | | | |
| | | | 2015 | | | NNC PRC | | | 2,430,000 | | | 24,300,000 | | | 2.65 | % |
| | | | 2016 | | | NNC PRD | | | 2,553,500 | | | 25,535,000 | | | 2.60 | |
| | | | 2015 * | | | NNC PRE | | | 1,660,000 | | | 16,600,000 | | | 2.60 | |
| | | | 2015-1 * | | | NNC PRF | | | 2,970,000 | | | 29,700,000 | | | 2.60 | |
| | | | 2015-1 * | | | NNC PRG | | | 2,872,500 | | | 28,725,000 | | | 2.65 | |
| Virginia Premium Income (NPV) | | | | | | | | | | | | | | | | |
| | | | 2014 | | | NPV PRA | | | 2,920,300 | | | 29,203,000 | | | 2.25 | % |
| | | | 2015 | | | NPV PRC | | | 3,220,500 | | | 32,205,000 | | | 2.65 | |
| | | | 2014 * | | | NPV PRD | | | 2,280,000 | | | 22,800,000 | | | 2.80 | |
| | | | 2014-1 * | | | NPV PRE | | | 4,320,000 | | | 43,200,000 | | | 2.80 | |
* MTP Shares issued in connection with the Reorganizations.
Each Fund is obligated to redeem its MTP Shares by the date as specified in its offering document (“Term Redemption Date”), unless earlier redeemed or repurchased by the Fund. MTP Shares are subject to optional and mandatory redemption in certain circumstances. MTP Shares will be subject to redemption at the option of each Fund (“Optional Redemption Date”), subject to a payment of premium for one year following the Optional Redemption Date (“Premium Expiration Date”), and at par thereafter. MTP Shares also will be subject to redemption, at the option of each Fund, at par in the event of certain changes in the credit rating of the MTP Shares. Each Fund may be obligated to redeem certain of the MTP Shares if the Fund fails to maintain certain asset coverage and leverage ratio requirements and such failures are not cured by the applicable cure date. The redemption price per share is equal to the sum of the liquidation value per share plus any accumulated but unpaid dividends. The Term Redemption Date, Optional Redemption Date and Premium Expiration Date for each Fund’s series of MTP Shares by NYSE ticker symbol are as follows:
| | | | | | | Term | | Optional | | Premium |
| | | | | NYSE | | Redemption | | Redemption | | Expiration |
| | | Series | | Ticker | | Date | | Date | | Date |
| Georgia Dividend Advantage 2 (NKG) | | | | | | | | | | |
| | | 2015 | | NKG PRC | | February 1, 2015 | | February 1, 2011 | | January 31, 2012 |
| | | 2015-1 * | | NKG PRD | | March 1, 2015 | | March 1, 2012 | | February 28, 2013 |
| | | 2015-2 * | | NKG PRE | | March 1, 2015 | | March 1, 2012 | | February 28, 2013 |
| Maryland Premium Income (NMY) | | | | | | | | | | |
| | | 2015 | | NMY PRC | | February 1, 2015 | | February 1, 2011 | | January 31, 2012 |
| | | 2016 | | NMY PRD | | April 1, 2016 | | April 1, 2012 | | March 31, 2013 |
| | | 2015 * | | NMY PRE | | May 1, 2015 | | May 1, 2012 | | April 30, 2013 |
| | | 2015-1 * | | NMY PRF | | May 1, 2015 | | May 1, 2012 | | April 30, 2013 |
| | | 2015-1 * | | NMY PRG | | March 1, 2015 | | March 1, 2012 | | February 28, 2013 |
| | | 2016 * | | NMY PRH | | February 1, 2016 | | February 1, 2013 | | January 31, 2014 |
* MTP Shares issued in connection with Reorganization.
| | | | | | | Term | | Optional | | Premium |
| | | | | NYSE | | Redemption | | Redemption | | Expiration |
| | | Series | | Ticker | | Date | | Date | | Date |
| Missouri Premium Income (NOM) | | | | | | | | | | |
| | | 2015 | | NOM PRC | | December 1, 2015 | | December 1, 2011 | | November 30, 2012 |
| North Carolina Premium Income (NNC) | | | | | | | | | | |
| | | 2015 | | NNC PRC | | February 1, 2015 | | February 1, 2011 | | January 31, 2012 |
| | | 2016 | | NNC PRD | | January 1, 2016 | | January 1, 2012 | | December 31, 2012 |
| | | 2015 * | | NNC PRE | | April 1, 2015 | | April 1, 2012 | | March 31, 2013 |
| | | 2015-1 * | | NNC PRF | | April 1, 2015 | | April 1, 2012 | | March 31, 2013 |
| | | 2015-1 * | | NNC PRG | | March 1, 2015 | | March 1, 2012 | | February 28, 2013 |
| Virginia Premium Income (NPV) | | | | | | | | | | |
| | | 2014 | | NPV PRA | | April 1, 2014 | | April 1, 2012 | | March 31, 2013 |
| | | 2015 | | NPV PRC | | February 1, 2015 | | February 1, 2011 | | January 31, 2012 |
| | | 2014 * | | NPV PRD | | December 1, 2014 | | December 1, 2011 | | November 30, 2012 |
| | | 2014-1 * | | NPV PRE | | December 1, 2014 | | December 1, 2011 | | November 30, 2012 |
* MTP Shares issued in connection with the Reorganizations.
The aggregate average liquidation value for all series of each Fund’s MTP Shares outstanding during the six months ended November 30, 2012, was as follows:
| | | | | | | | | | | | | North | | | | |
| | | | Georgia | | | Maryland | | | Missouri | | | Carolina | | | Virginia | |
| | | | Dividend | | | Premium | | | Premium | | | Premium | | | Premium | |
| | | | Advantage 2 | | | Income | | | Income | | | Income | | | Income | |
| | | | (NKG | ) | | (NMY | ) | | (NOM | ) | | (NNC | ) | | (NPV | ) |
| Average liquidation value of MTP Shares outstanding | | $ | 66,082,486 | | $ | 133,125,607 | | $ | 17,880,000 | | $ | 109,281,038 | | $ | 103,604,721 | |
For financial reporting purposes only, the liquidation value of MTP Shares is recorded as a liability and recognized as “MuniFund Term Preferred (MTP) Shares, at liquidation value” on the Statement of Assets and Liabilities. Unpaid dividends on MTP Shares are recognized as a component of “Interest payable” on the Statement of Assets and Liabilities. Costs incurred by the Funds in connection with their offerings of MTP Shares were recorded as a deferred charge, which are amortized over the life of the shares and are recognized as a component of “Deferred offering costs” on the Statement of Assets and Liabilities. Dividends paid on MTP Shares and each Fund’s amortized deferred charges are recognized as a component of “Interest expense and amortization of offering costs” on the Statement of Operations.
Inverse Floating Rate Securities
Each Fund is authorized to invest in inverse floating rate securities. An inverse floating rate security is created by depositing a municipal bond, typically with a fixed interest rate, into a special purpose trust created by a broker-dealer. In turn, this trust (a) issues floating rate certificates, in face amounts equal to some fraction of the deposited bond’s par amount or market value, that typically pay short-term tax-exempt interest rates to third parties, and (b) issues to a long-term investor (such as one of the Funds) an inverse floating rate certificate (sometimes referred to as an “inverse floater”) that represents all remaining or residual interest in the trust. The income received by the inverse floater holder varies inversely with the short-term rate paid to the floating rate certificates’ holders, and in most circumstances the inverse floater holder bears substantially all of the underlying bond’s downside investment risk and also benefits disproportionately from any potential appreciation of the underlying bond’s value. The price of an inverse floating rate security will be more volatile than that of the underlying bond because the interest rate is dependent on not only the fixed coupon rate of the underlying bond but also on the short-term interest paid on the floating rate certificates, and because the inverse floating rate security essentially bears the risk of loss of the greater face value of the underlying bond.
A Fund may purchase an inverse floating rate security in a secondary market transaction without first owning the underlying bond (referred to as an “externally-deposited inverse floater”), or instead by first selling a fixed-rate bond to a broker-dealer for deposit into the special purpose trust and receiving in turn the residual interest in the trust (referred to as a “self-deposited inverse floater”). The inverse floater held by a Fund gives the Fund the right (a) to cause the holders of the floating rate certificates to tender their notes at par, and (b) to have the broker transfer the fixed-rate bond held by the trust to the Fund, thereby collapsing the trust. An investment in an externally-deposited inverse floater is identified in the Portfolio of Investments as “(IF) – Inverse floating rate investment.” An investment in a self-deposited inverse floater is accounted for as a financing transaction. In such instances, a fixed-rate bond deposited into a special purpose trust is identified in the Portfolio of Investments as “(UB) – Underlying bond of an inverse floating rate trust reflected as a financing transaction,” with the Fund accounting for the short-term floating rate certificates issued by the trust as “Floating rate obligations” on the Statement of Assets and Liabilities. In addition, the Fund reflects in “Investment Income” the entire earnings of the underlying bond and recognizes the related interest paid to the holders of the short-term floating rate certificates as a component of “Interest expense and amortization of offering costs” on the Statement of Operations.
During the six months ended November 30, 2012, each Fund invested in externally-deposited inverse floaters and/or self-deposited inverse floaters.
| | | Notes to |
| | | Financial Statements (Unaudited) (continued) |
Each Fund may also enter into shortfall and forbearance agreements (sometimes referred to as a “recourse trust” or “credit recovery swap”) (such agreements referred to herein as “Recourse Trusts”) with a broker-dealer by which a Fund agrees to reimburse the broker-dealer, in certain circumstances, for the difference between the liquidation value of the fixed-rate bond held by the trust and the liquidation value of the floating rate certificates issued by the trust plus any shortfalls in interest cash flows. Under these agreements, a Fund’s potential exposure to losses related to or on inverse floaters may increase beyond the value of a Fund’s inverse floater investments as a Fund may potentially be liable to fulfill all amounts owed to holders of the floating rate certificates. At period end, any such shortfall is recognized as “Unrealized depreciation on Recourse Trusts” on the Statement of Assets and Liabilities.
As of November 30, 2012, Virginia Premium Income (NPV) was invested in externally-deposited Recourse Trusts. The Fund’s maximum exposure to the floating rate obligations issued by externally-deposited recourse trusts was $13,330,000. As of November 30, 2012, none of the other Funds were invested in externally-deposited Recourse Trusts.
The average floating rate obligations outstanding and average annual interest rate and fees related to self-deposited inverse floaters during the six months ended November 30, 2012, were as follows:
| | | | | | | | | | | | | North | | | | |
| | | | Georgia | | | Maryland | | | Missouri | | | Carolina | | | Virginia | |
| | | | Dividend | | | Premium | | | Premium | | | Premium | | | Premium | |
| | | | Advantage 2 | | | Income | | | Income | | | Income | | | Income | |
| | | | (NKG | ) | | (NMY | ) | | (NOM | ) | | (NNC | ) | | (NPV | ) |
| Average floating rate obligations outstanding | | $ | 3,245,000 | | $ | 21,995,000 | | $ | 2,225,000 | | $ | 23,715,000 | | $ | 9,250,000 | |
| Average annual interest rate and fees | | | 0.54 | % | | 0.82 | % | | 0.35 | % | | 0.67 | % | | 0.45 | % |
Derivative Financial Instruments
Each Fund is authorized to invest in certain derivative instruments, including foreign currency forwards, futures, options and swap contracts. Although the Funds are authorized to invest in such financial instruments, and may do so in the future, they did not make any such investments during the six months ended November 30, 2012.
Market and Counterparty Credit Risk
In the normal course of business each Fund may invest in financial instruments and enter into financial transactions where risk of potential loss exists due to changes in the market (market risk) or failure of the other party to the transaction to perform (counterparty credit risk). The potential loss could exceed the value of the financial assets recorded on the financial statements. Financial assets, which potentially expose each Fund to counterparty credit risk, consist principally of cash due from counterparties on forward, option and swap transactions, when applicable. The extent of each Fund’s exposure to counterparty credit risk in respect to these financial assets approximates their carrying value as recorded on the Statement of Assets and Liabilities. Futures contracts, when applicable, expose a Fund to minimal counterparty credit risk as they are exchange traded and the exchange’s clearinghouse, which is counterparty to all exchange traded futures, guarantees the futures contracts against default.
Each Fund helps manage counterparty credit risk by entering into agreements only with counterparties the Adviser believes have the financial resources to honor their obligations and by having the Adviser monitor the financial stability of the counterparties. Additionally, counterparties may be required to pledge collateral daily (based on the daily valuation of the financial asset) on behalf of each Fund with a value approximately equal to the amount of any unrealized gain above a pre-determined threshold. Reciprocally, when each Fund has an unrealized loss, the Funds have instructed the custodian to pledge assets of the Funds as collateral with a value approximately equal to the amount of the unrealized loss above a pre-determined threshold. Collateral pledges are monitored and subsequently adjusted if and when the valuations fluctuate, either up or down, by at least the pre-determined threshold amount.
Zero Coupon Securities
Each Fund is authorized to invest in zero coupon securities. A zero coupon security does not pay a regular interest coupon to its holders during the life of the security. Income to the holder of the security comes from accretion of the difference between the original purchase price of the security at issuance and the par value of the security at maturity and is effectively paid at maturity. The market prices of zero coupon securities generally are more volatile than the market prices of securities that pay interest periodically.
Custodian Fee Credit
Each Fund has an arrangement with the custodian bank whereby certain custodian fees and expenses are reduced by net credits earned on each Fund’s cash on deposit with the bank. Such deposit arrangements are an alternative to overnight investments. Credits for cash balances may be offset by charges for any days on which a Fund overdraws its account at the custodian bank.
Indemnifications
Under the Funds’ organizational documents, their officers and trustees are indemnified against certain liabilities arising out of the performance of their duties to the Funds. In addition, in the normal course of business, the Funds enter into contracts that provide general indemnifications to other parties. The Funds’ maximum exposure under these arrangements is unknown as this would involve future claims that may be made against the Funds that have not yet occurred. However, the Funds have not had prior claims or losses pursuant to these contracts and expect the risk of loss to be remote.
Use of Estimates
The preparation of financial statements in conformity with U.S. GAAP requires management to make estimates and assumptions that affect the reported amounts of assets and liabilities at the date of the financial statements and the reported amounts of increases and decreases in net assets applicable to Common shares from operations during the reporting period. Actual results may differ from those estimates.
2. Fair Value Measurements
Fair value is defined as the price that the Funds would receive upon selling an investment or transferring a liability in an orderly transaction to an independent buyer in the principal or most advantageous market for the investment. A three-tier hierarchy is used to maximize the use of observable market data and minimize the use of unobservable inputs and to establish classification of fair value measurements for disclosure purposes. Observable inputs reflect the assumptions market participants would use in pricing the asset or liability. Observable inputs are based on market data obtained from sources independent of the reporting entity. Unobservable inputs reflect the reporting entity’s own assumptions about the assumptions market participants would use in pricing the asset or liability. Unobservable inputs are based on the best information available in the circumstances. The following is a summary of the three-tiered hierarchy of valuation input levels.
| Level 1 – | Inputs are unadjusted and prices are determined using quoted prices in active markets for identical securities. |
| Level 2 – | Prices are determined using other significant observable inputs (including quoted prices for similar securities, interest rates, prepayment speeds, credit risk, etc.). |
| Level 3 – | Prices are determined using significant unobservable inputs (including management’s assumptions in determining the fair value of investments). |
The inputs or methodologies used for valuing securities are not an indication of the risks associated with investing in those securities. The following is a summary of each Fund’s fair value measurements as of the end of the reporting period:
| Georgia Dividend Advantage 2 (NKG) | | | Level 1 | | | Level 2 | | | Level 3 | | | Total | |
| Long-Term Investments*: | | | | | | | | | | | | | |
| Municipal Bonds | | $ | — | | $ | 224,877,334 | | $ | — | | $ | 224,877,334 | |
| | | | | | | | | | | | | | |
| Maryland Premium Income (NMY) | | | Level 1 | | | Level 2 | | | Level 3 | | | Total | |
| Long-Term Investments*: | | | | | | | | | | | | | |
| Municipal Bonds | | $ | — | | $ | 528,920,541 | | $ | — | | $ | 528,920,541 | |
| | | | | | | | | | | | | | |
| Missouri Premium Income (NOM) | | | Level 1 | | | Level 2 | | | Level 3 | | | Total | |
| Long-Term Investments*: | | | | | | | | | | | | | |
| Municipal Bonds | | $ | — | | $ | 54,080,244 | | $ | — | | $ | 54,080,244 | |
| | | | | | | | | | | | | | |
| North Carolina Premium Income (NNC) | | | Level 1 | | | Level 2 | | | Level 3 | | | Total | |
| Long-Term Investments*: | | | | | | | | | | | | | |
| Municipal Bonds | | $ | — | | $ | 408,410,435 | | $ | — | | $ | 408,410,435 | |
| | | | | | | | | | | | | | |
| Virginia Premium Income (NPV) | | | Level 1 | | | Level 2 | | | Level 3 | | | Total | |
| Long-Term Investments*: | | | | | | | | | | | | | |
| Municipal Bonds | | $ | — | | $ | 419,181,126 | | $ | — | | $ | 419,181,126 | |
* Refer to the Fund’s Portfolio of Investments for industry classifications.
The Nuveen funds’ Board of Directors/Trustees is responsible for the valuation process and has delegated the oversight of the daily valuation process to the Adviser’s Valuation Committee. The Valuation Committee, pursuant to the valuation policies and procedures adopted by the Board of Directors/Trustees, is responsible for making fair value determinations, evaluating the effectiveness of the funds’ pricing policies, and reporting to the Board of Directors/Trustees. The Valuation Committee is aided in its efforts by the Adviser’s dedicated Securities Valuation Team, which is responsible for administering the daily valuation process and applying fair value methodologies as approved by the Valuation Committee. When determining the reliability of independent pricing services for investments owned by the funds, the Valuation Committee, among other things, conducts due diligence reviews of the pricing services and monitors the quality of security prices received through various testing reports conducted by the Securities Valuation Team.
The Valuation Committee will consider pricing methodologies it deems relevant and appropriate when making fair value determinations. Examples of possible methodologies include, but are not limited to, multiple of earnings; discount from market of a similar freely traded security; discounted cash-flow analysis; book value or a multiple thereof; risk premium/yield analysis; yield to maturity; and/or fundamental investment analysis. The Valuation Committee will also consider factors it deems relevant and appropriate in light of the facts and circumstances. Examples of possible factors include, but are not limited to, the type of security; the issuer’s financial statements; the purchase price of the security; the discount from market value of unrestricted securities of the same class at the time of purchase; analysts’ research and observations from financial institutions; information regarding any transactions or offers with respect to the security; the existence of merger proposals or tender offers affecting the security; the price and extent of public trading in similar securities of the issuer or comparable companies; and the existence of a shelf registration for restricted securities.
| | | Notes to |
| | | Financial Statements (Unaudited) (continued) |
For each portfolio security that has been fair valued pursuant to the policies adopted by the Board of Directors/Trustees, the fair value price is compared against the last available and next available market quotations. The Valuation Committee reviews the results of such testing and fair valuation occurrences are reported to the Board of Directors/Trustees.
3. Derivative Instruments and Hedging Activities
The Funds record derivative instruments at fair value, with changes in fair value recognized on the Statement of Operations, when applicable. Even though the Funds’ investments in derivatives may represent economic hedges, they are not considered to be hedge transactions for financial reporting purposes. The Funds did not invest in derivative instruments during the six months ended November 30, 2012.
4. Fund Shares
Common Shares
Since the inception of the Funds’ repurchase program, the Funds have not repurchased any of their outstanding Common shares.
Transactions in Common shares were as follows:
| | | Georgia Dividend | | Maryland Premium | | Missouri Premium | |
| | | Advantage 2 (NKG) | | Income (NMY) | | Income (NOM) | |
| | | | Six Months | | | | | | Six Months | | | | | | Six Months | | | | |
| | | | Ended | | | Year Ended | | | Ended | | | Year Ended | | | Ended | | | Year Ended | |
| | | | 11/30/12 | | | 5/31/12 | | | 11/30/12 | | | 5/31/12 | | | 11/30/12 | | | 5/31/12 | |
| Common shares: | | | | | | | | | | | | | | | | | | | |
Issued in the Reorganizations (1) | | | 5,990,755 | | | — | | | 13,439,122 | | | — | | | — | | | — | |
| Issued to shareholders due to reinvestment of distributions | | | 1,315 | | | 877 | | | 4,796 | | | 6,501 | | | 1,831 | | | 5,049 | |
| | | North Carolina | | Virginia Premium | |
| | | Premium Income (NNC) | | Income (NPV) | |
| | | | Six Months | | | | | | Six Months | | | | |
| | | | Ended | | | Year Ended | | | Ended | | | Year Ended | |
| | | | 11/30/12 | | | 5/31/12 | | | 11/30/12 | | | 5/31/12 | |
| Common shares: | | | | | | | | | | | | | |
Issued in the Reorganizations (1) | | | 10,175,659 | | | — | | | 8,861,589 | | | — | |
| Issued to shareholders due to reinvestment of distributions | | | 1,941 | | | 6,117 | | | 17,342 | | | 28,499 | |
| (1) | Refer to Footnote 8–Fund Reorganizations for further details. |
Preferred Shares
Missouri Premium Income (NOM) did not have any transactions in MTP Shares during the six months ended November 30, 2012. Transactions in MTP Shares for the other Funds were as follows:
| | | Six Months ended November 30, 2012 | |
| | | | | | NYSE | | | | | | | |
| | | | Series | | Ticker | | | Shares | | | Amount | |
| Georgia Dividend Advantage 2 (NKG) | | | | | | | | | | | | |
| | | | 2015-1 * | | NKG PRD | | | 2,834,000 | | $ | 28,340,000 | |
| | | | 2015-2 * | | NKG PRE | | | 1,434,000 | | | 14,340,000 | |
| | | | | | | | | 4,268,000 | | $ | 42,680,000 | |
| Maryland Premium Income (NMY) | | | | | | | | | | | | |
| | | | 2015 * | | NMY PRE | | | 2,648,500 | | $ | 26,485,000 | |
| | | | 2015-1 * | | NMY PRF | | | 2,730,000 | | | 27,300,000 | |
| | | | 2015-1 * | | NMY PRG | | | 2,070,000 | | | 20,700,000 | |
| | | | 2016 * | | NMY PRH | | | 1,706,600 | | | 17,066,000 | |
| | | | | | | | | 9,155,100 | | $ | 91,551,000 | |
| North Carolina Premium Income (NNC) | | | | | | | | | | | | |
| | | | 2015 * | | NNC PRE | | | 1,660,000 | | $ | 16,600,000 | |
| | | | 2015-1 * | | NNC PRF | | | 2,970,000 | | | 29,700,000 | |
| | | | 2015-1 * | | NNC PRG | | | 2,872,500 | | | 28,725,000 | |
| | | | | | | | | 7,502,500 | | $ | 75,025,000 | |
| * | MTP Shares issued in connection with the Reorganizations. |
| | | Six Months ended November 30, 2012 | |
| | | | | | NYSE | | | | | | | |
| | | | Series | | Ticker | | | Shares | | | Amount | |
| Virginia Premium Income (NPV) | | | | | | | | | | | | |
| | | | 2014 * | | NPV PRD | | | 2,280,000 | | $ | 22,800,000 | |
| | | | 2014-1 * | | NPV PRE | | | 4,320,000 | | | 43,200,000 | |
| | | | | | | | | 6,600,000 | | $ | 66,000,000 | |
| * | MTP Shares issued in connection with the Reorganizations. |
5. Investment Transactions
Purchases and sales (including maturities but excluding short-term investments, where applicable) during the six months ended November 30, 2012, were as follows:
| | | | | | | | | | | | | North | | | | |
| | | | Georgia | | | Maryland | | | Missouri | | | Carolina | | | Virginia | |
| | | | Dividend | | | Premium | | | Premium | | | Premium | | | Premium | |
| | | | Advantage 2 | | | Income | | | Income | | | Income | | | Income | |
| | | | (NKG | ) | | (NMY | ) | | (NOM | ) | | (NNC | ) | | (NPV | ) |
| Purchases | | $ | 14,203,764 | | $ | 48,593,115 | | $ | 1,580,078 | | $ | 41,460,121 | | $ | 38,770,334 | |
| Sales and maturities | | | 18,605,000 | | | 49,971,475 | | | 1,830,000 | | | 29,090,450 | | | 36,889,500 | |
6. Income Tax Information
The following information is presented on an income tax basis. Differences between amounts for financial statement and federal income tax purposes are primarily due to timing differences in recognizing taxable market discount, timing differences in recognizing certain gains and losses on investment transactions and the treatment of investments in inverse floating rate securities reflected as financing transactions, if any. To the extent that differences arise that are permanent in nature, such amounts are reclassified within the capital accounts as detailed below. Temporary differences do not require reclassification. Temporary and permanent differences do not impact the net asset values of the Funds.
At November 30, 2012, the cost and unrealized appreciation (depreciation) of investments, as determined on a federal income tax basis, were as follows:
| | | | | | | | | | | | | North | | | | |
| | | | Georgia | | | Maryland | | | Missouri | | | Carolina | | | Virginia | |
| | | | Dividend | | | Premium | | | Premium | | | Premium | | | Premium | |
| | | | Advantage 2 | | | Income | | | Income | | | Income | | | Income | |
| | | | (NKG | ) | | (NMY | ) | | (NOM | ) | | (NNC | ) | | (NPV | ) |
| Cost of investments | | $ | 201,022,998 | | $ | 492,325,665 | | $ | 47,808,723 | | $ | 349,767,656 | | $ | 375,687,711 | |
| Gross unrealized: | | | | | | | | | | | | | | | | |
| Appreciation | | $ | 20,628,958 | | $ | 47,243,009 | | $ | 4,133,955 | | $ | 34,943,138 | | $ | 38,107,175 | |
| Depreciation | | | (19,043 | ) | | (2,642,983 | ) | | (87,751 | ) | | (16,913 | ) | | (3,863,760 | ) |
| Net unrealized appreciation (depreciation) of investments | | $ | 20,609,915 | | $ | 44,600,026 | | $ | 4,046,204 | | $ | 34,926,225 | | $ | 34,243,415 | |
Permanent differences, primarily due to federal taxes paid, taxable market discount, nondeductible offering costs and nondeductible reorganization costs, resulted in reclassifications among the Funds’ components of Common share net assets at May 31, 2012, the Funds’ last tax year end, as follows:
| | | | | | | | | | | | | North | | | | |
| | | | Georgia | | | Maryland | | | Missouri | | | Carolina | | | Virginia | |
| | | | Dividend | | | Premium | | | Premium | | | Premium | | | Premium | |
| | | | Advantage 2 | | | Income | | | Income | | | Income | | | Income | |
| | | | (NKG | ) | | (NMY | ) | | (NOM | ) | | (NNC | ) | | (NPV | ) |
| Paid-in-surplus | | $ | (266,952 | ) | $ | (692,796 | ) | $ | (118,412 | ) | $ | (619,856 | ) | $ | (681,182 | ) |
| Undistributed (Over-distribution of) net investment income | | | 266,920 | | | 691,581 | | | 117,952 | | | 618,660 | | | 705,251 | |
| Accumulated net realized gain (loss) | | | 32 | | | 1,215 | | | 460 | | | 1,196 | | | (24,069 | ) |
| | | Notes to |
| | | Financial Statements (Unaudited) (continued) |
The tax components of undistributed net tax-exempt income, net ordinary income and net long-term capital gains at May 31, 2012, the Funds’ last tax year end, were as follows:
| | | | | | | | | | | | | North | | | | |
| | | | Georgia | | | Maryland | | | Missouri | | | Carolina | | | Virginia | |
| | | | Dividend | | | Premium | | | Premium | | | Premium | | | Premium | |
| | | | Advantage 2 | | | Income | | | Income | | | Income | | | Income | |
| | | | (NKG | ) | | (NMY | ) | | (NOM | ) | | (NNC | ) | | (NPV | ) |
| Undistributed net tax-exempt income* | | $ | 507,992 | | $ | 2,899,381 | | $ | 533,311 | | $ | 892,451 | | $ | 1,605,268 | |
| Undistributed net ordinary income ** | | | 6,397 | | | 42,483 | | | — | | | — | | | 59,977 | |
| Undistributed net long-term capital gains | | | — | | | — | | | — | | | — | | | 317,648 | |
The tax character of distributions paid during the Funds’ last tax year ended May 31, 2012, was designated for purposes of the dividends paid deduction as follows:
| | | | | | | | | | | | | North | | | | |
| | | | Georgia | | | Maryland | | | Missouri | | | Carolina | | | Virginia | |
| | | | Dividend | | | Premium | | | Premium | | | Premium | | | Premium | |
| | | | Advantage 2 | | | Income | | | Income | | | Income | | | Income | |
| | | | (NKG | ) | | (NMY | ) | | (NOM | ) | | (NNC | ) | | (NPV | ) |
| Distributions from net tax-exempt income | | $ | 4,030,387 | | $ | 10,273,550 | | $ | 2,186,098 | | $ | 5,847,630 | | $ | 8,769,902 | |
| Distributions from net ordinary income** | | | — | | | — | | | — | | | — | | | — | |
| Distributions from net long-term capital gains | | | — | | | — | | | — | | | — | | | 214,014 | |
| * | Undistributed net tax-exempt income (on a tax basis) has not been reduced for the dividend declared on May 1, 2012, paid on June 1, 2012. |
| ** | Net ordinary income consists of taxable market discount income and net short-term capital gains, if any. |
At May 31, 2012, the Funds’ last tax year end, the following Funds had unused capital loss carryforwards available for federal income tax purposes to be applied against future capital gains, if any. If not applied, the carryforwards will expire as follows:
| | | | | | | | | | | | | North | |
| | | | Georgia | | | Maryland | | | Missouri | | | Carolina | |
| | | | Dividend | | | Premium | | | Premium | | | Premium | |
| | | | Advantage 2 | | | Income | | | Income | | | Income | |
| | | | (NKG | ) | | (NMY | ) | | (NOM | ) | | (NNC | ) |
| Expiration: | | | | | | | | | | | | | |
| May 31, 2014 | | $ | 182,725 | | $ | — | | $ | — | | $ | — | |
| May 31, 2017 | | | 1,087,212 | | | 297,132 | | | 92,675 | | | 12,771 | |
| May 31, 2018 | | | 1,329,548 | | | — | | | 91,539 | | | 353,181 | |
| May 31, 2019 | | | 48,370 | | | — | | | — | | | — | |
| Total | | $ | 2,647,855 | | $ | 297,132 | | $ | 184,214 | | $ | 365,952 | |
During the Funds’ last tax year ended May 31, 2012, the Funds utilized capital loss carryforwards as follows:
| | | | | | | | | | | | | North | |
| | | | Georgia | | | Maryland | | | Missouri | | | Carolina | |
| | | | Dividend | | | Premium | | | Premium | | | Premium | |
| | | | Advantage 2 | | | Income | | | Income | | | Income | |
| | | | (NKG | ) | | (NMY | ) | | (NOM | ) | | (NNC | ) |
| Utilized capital loss carryforwards | | $ | 206,372 | | $ | 99,416 | | $ | 29,858 | | $ | 159,857 | |
Under the Regulated Investment Company Modernization Act of 2010, capital losses incurred by the Fund after December 31, 2010, will not be subject to expiration. During the Funds’ last tax year ended May 31, 2012, there were no post-enactment capital losses generated by any of the Funds.
The Funds have elected to defer losses incurred from November 1, 2011 through May 31, 2012, the Funds’ last tax year end, in accordance with federal income tax rules. These losses are treated as having arisen on the first day of the current fiscal year. The following Fund has elected to defer losses as follows:
| | | | Georgia | |
| | | | Dividend | |
| | | | Advantage 2 | |
| | | | (NKG | ) |
| Post-October capital losses | | $ | 2,668 | |
| Late-year ordinary losses | | | — | |
7. Management Fees and Other Transactions with Affiliates
Each Fund’s management fee consists of two components – a fund-level fee, based only on the amount of assets within the Fund, and a complex-level fee, based on the aggregate amount of all eligible fund assets managed by the Adviser. This pricing structure enables Fund shareholders to benefit from growth in the assets within their respective Fund as well as from growth in the amount of complex-wide assets managed by the Adviser.
The annual fund-level fee for each Fund, payable monthly, is calculated according to the following schedules:
| | Georgia Dividend Advantage 2 (NKG) |
| Average Daily Managed Assets* | Fund-Level Fee Rate |
| For the first $125 million | .4500 | % |
| For the next $125 million | .4375 | |
| For the next $250 million | .4250 | |
| For the next $500 million | .4125 | |
| For the next $1 billion | .4000 | |
| For managed assets over $2 billion | .3750 | |
| | North Carolina Premium Income (NNC) |
| | Maryland Premium Income (NMY) |
| | Missouri Premium Income (NOM) |
| | Virginia Premium Income (NPV) |
| Average Daily Managed Assets* | Fund-Level Fee Rate |
| For the first $125 million | .4500 | % |
| For the next $125 million | .4375 | |
| For the next $250 million | .4250 | |
| For the next $500 million | .4125 | |
| For the next $1 billion | .4000 | |
| For the next $3 billion | .3875 | |
| For managed assets over $5 billion | .3750 | |
The annual complex-level fee for each Fund, payable monthly, is calculated according to the following schedule:
| Complex-Level Managed Asset Breakpoint Level* | Effective Rate at Breakpoint Level |
| $55 billion | .2000 | % |
| $56 billion | .1996 | |
| $57 billion | .1989 | |
| $60 billion | .1961 | |
| $63 billion | .1931 | |
| $66 billion | .1900 | |
| $71 billion | .1851 | |
| $76 billion | .1806 | |
| $80 billion | .1773 | |
| $91 billion | .1691 | |
| $125 billion | .1599 | |
| $200 billion | .1505 | |
| $250 billion | .1469 | |
| $300 billion | .1445 | |
| * | For the fund-level and complex-level fees, managed assets include closed-end fund assets managed by the Adviser that are attributable to financial leverage. For these purposes, financial leverage includes the funds’ use of preferred stock and borrowings and certain investments in the residual interest certificates (also called inverse floating rate securities) in tender option bond (TOB) trusts, including the portion of assets held by a TOB trust that has been effectively financed by the trust’s issuance of floating rate securities, subject to an agreement by the Adviser as to certain funds to limit the amount of such assets for determining managed assets in certain circumstances. The complex-level fee is calculated based upon the aggregate daily managed assets of all Nuveen Funds that constitute “eligible assets.” Eligible assets do not include assets attributable to investments in other Nuveen Funds or assets in excess of $2 billion added to the Nuveen Fund complex in connection with the Adviser’s assumption of the management of the former First American Funds effective January 1, 2011. As of November 30, 2012, the complex level fee rate for each of these Funds was .1684%. |
The management fee compensates the Adviser for overall investment advisory and administrative services and general office facilities. The Adviser is responsible of each Fund’s overall strategy and asset allocation decisions. The Adviser has entered into sub-advisory agreements with Nuveen Asset Management, LLC, (the”Sub-Adviser”), a wholly-owned subsidiary of the Adviser, under which the Sub-Adviser manages the investment portfolios of the Funds. The Sub-Adviser is compensated for its services to the Funds from the management fees paid to the Adviser.
| | | Notes to |
| | | Financial Statements (Unaudited) (continued) |
The Funds pay no compensation directly to those of its trustees who are affiliated with the Adviser or to its officers, all of whom receive remuneration for their services to the Funds from the Adviser or its affiliates. The Board of Trustees has adopted a deferred compensation plan for independent trustees that enables trustees to elect to defer receipt of all or a portion of the annual compensation they are entitled to receive from certain Nuveen-advised funds. Under the plan, deferred amounts are treated as though equal dollar amounts had been invested in shares of select Nuveen-advised funds.
8. Fund Reorganizations
The Reorganizations were structured to qualify as tax-free reorganizations under the Internal Revenue Code for federal income tax purposes, and the Acquired Funds’ shareholders will recognize no gain or loss for federal income tax purposes as a result of the Reorganizations. Prior to the closing of each of the Reorganizations, the Acquired Funds distributed all of their net investment income and capital gains, if any. Such a distribution may be taxable to the Acquired Funds’ shareholders for federal income tax purposes.
The cost, fair value and net unrealized appreciation (depreciation) of the investments of the Acquired Funds as of the date of their respective Reorganization, were as follows:
| | | | Georgia | | | Georgia | | | Maryland | | | Maryland | | | Maryland | |
| | | | Premium | | | Dividend | | | Dividend | | | Dividend | | | Dividend | |
| | | | Income | | | Advantage | | | Advantage | | | Advantage 2 | | | Advantage 3 | |
| | | | (NPG | ) | | (NZX | ) | | (NFM | ) | | (NZR | ) | | (NWI | ) |
| Cost of investments | | $ | 74,023,324 | | $ | 39,598,253 | | $ | 82,829,435 | | $ | 82,417,114 | | $ | 109,258,185 | |
| Fair value of investments | | | 80,083,798 | | | 42,632,583 | | | 88,564,164 | | | 88,714,979 | | | 117,266,759 | |
| Net unrealized appreciation (depreciation) of investments | | | 6,060,474 | | | 3,034,330 | | | 5,734,729 | | | 6,297,865 | | | 8,008,574 | |
| | | | North | | | North | | | North | | | | | | | |
| | | | Carolina | | | Carolina | | | Carolina | | | Virginia | | | Virginia | |
| | | | Dividend | | | Dividend | | | Dividend | | | Dividend | | | Dividend | |
| | | | Advantage | | | Advantage 2 | | | Advantage 3 | | | Advantage | | | Advantage 2 | |
| | | | (NRB | ) | | (NNO | ) | | (NII | ) | | (NGB | ) | | (NNB | ) |
| Cost of investments | | $ | 44,956,748 | | $ | 77,258,450 | | $ | 80,525,486 | | $ | 65,656,871 | | $ | 122,078,841 | |
| Fair value of investments | | | 48,849,544 | | | 83,400,020 | | | 86,417,939 | | | 70,027,790 | | | 131,287,742 | |
| Net unrealized appreciation (depreciation) of investments | | | 3,892,796 | | | 6,141,570 | | | 5,892,453 | | | 4,370,919 | | | 9,208,901 | |
For financial reporting purposes, assets received and shares issued by the Acquiring Funds were recorded at fair value; however, the cost basis of the investments received from the Acquired Funds were carried forward to align ongoing reporting of the Acquiring Funds’ realized and unrealized gains and losses with amounts distributable to shareholders for tax purposes.
For accounting and performance reporting purposes, the Acquiring Funds are the survivors. The shares outstanding, net assets and net asset value (“NAV”) per Common share immediately before and after the Reorganizations are as follows:
| | | | Georgia | | | Georgia | | | Maryland | | | Maryland | | | Maryland | |
| | | | Premium | | | Dividend | | | Dividend | | | Dividend | | | Dividend | |
| | | | Income | | | Advantage | | | Advantage | | | Advantage 2 | | | Advantage 3 | |
| Acquired Funds – Prior to Reorganizations | | (NPG | ) | | (NZX | ) | | (NFM | ) | | (NZR | ) | | (NWI | ) |
| Common shares outstanding | | | 3,810,299 | | | 1,975,018 | | | 4,197,999 | | | 4,204,113 | | | 5,366,559 | |
| Net assets applicable to Common shares | | $ | 57,081,247 | | $ | 30,633,487 | | $ | 64,327,256 | | $ | 65,104,341 | | $ | 82,375,675 | |
| NAV per Common share outstanding | | $ | 14.98 | | $ | 15.51 | | $ | 15.32 | | $ | 15.49 | | $ | 15.35 | |
| | | | North | | | North | | | North | | | | | | | |
| | | | Carolina | | | Carolina | | | Carolina | | | Virginia | | | Virginia | |
| | | | Dividend | | | Dividend | | | Dividend | | | Dividend | | | Dividend | |
| | | | Advantage | | | Advantage 2 | | | Advantage 3 | | | Advantage | | | Advantage 2 | |
| Acquired Funds – Prior to Reorganizations | | (NRB | ) | | (NNO | ) | | (NII | ) | | (NGB | ) | | (NNB | ) |
| Common shares outstanding | | | 2,275,204 | | | 3,755,555 | | | 3,939,410 | | | 3,148,929 | | | 5,770,011 | |
| Net assets applicable to Common shares | | $ | 35,996,337 | | $ | 58,882,419 | | $ | 60,545,196 | | $ | 48,481,366 | | $ | 90,596,172 | |
| NAV per Common share outstanding | | $ | 15.82 | | $ | 15.68 | | $ | 15.37 | | $ | 15.40 | | $ | 15.70 | |
| | | | | | | | | | North | | | | |
| | | | Georgia | | | Maryland | | | Carolina | | | Virginia | |
| | | | Dividend | | | Premium | | | Premium | | | Premium | |
| | | | Advantage 2 | | | Income | | | Income | | | Income | |
| Acquiring Funds – Prior to Reorganizations | | | (NKG | ) | | (NMY | ) | | (NNC | ) | | (NPV | ) |
| Common shares outstanding | | | 4,556,373 | | | 10,663,947 | | | 6,372,067 | | | 9,048,006 | |
| Net assets applicable to Common shares | | $ | 66,712,868 | | $ | 168,069,475 | | $ | 97,327,475 | | $ | 142,002,913 | |
| NAV per Common share outstanding | | $ | 14.64 | | $ | 15.76 | | $ | 15.27 | | $ | 15.69 | |
| | | | | | | | | | North | | | | |
| | | | Georgia | | | Maryland | | | Carolina | | | Virginia | |
| | | | Dividend | | | Premium | | | Premium | | | Premium | |
| | | | Advantage 2 | | | Income | | | Income | | | Income | |
| Acquiring Funds – Post Reorganizations | | | (NKG | ) | | (NMY | ) | | (NNC | ) | | (NPV | ) |
| Common shares outstanding | | | 10,547,129 | | | 24,103,070 | | | 16,547,726 | | | 17,909,595 | |
| Net assets applicable to Common shares | | $ | 154,427,602 | | $ | 379,876,747 | | $ | 252,751,427 | | $ | 281,080,451 | |
| NAV per Common share outstanding | | $ | 14.64 | | $ | 15.76 | | $ | 15.27 | | $ | 15.69 | |
The beginning of the Acquired Funds’ current fiscal period was June 1, 2012.
Assuming the Reorganizations had been completed on June 1, 2012, the beginning of the Acquiring Funds’ current fiscal period, the pro forma results of operations for the six months ended November 30, 2012, are as follows:
| | | | | | | | | | North | | | | |
| | | | Georgia | | | Maryland | | | Carolina | | | Virginia | |
| | | | Dividend | | | Premium | | | Premium | | | Premium | |
| | | | Advantage 2 | | | Income | | | Income | | | Income | |
| | | | (NKG | ) | | (NMY | ) | | (NNC | ) | | (NPV | ) |
| Net investment income (loss) | | $ | 3,266,363 | | $ | 8,605,390 | | $ | 5,096,869 | | $ | 6,168,369 | |
| Net realized and unrealized gains (losses) | | | 5,722,490 | | | 8,624,434 | | | 8,763,932 | | | 9,628,805 | |
| Change in net assets resulting from operations | | | 8,988,853 | | | 17,229,824 | | | 13,860,801 | | | 15,797,174 | |
Because the combined investment portfolios for each Reorganization have been managed as a single integrated portfolio since each Reorganization was completed, it is not practicable to separate the amounts of revenue and earnings of the Acquired Funds that have been included in the Statement of Operations since the Reorganizations were consummated.
In connection with the Reorganizations, the Acquiring Funds have accrued for certain associated costs and expenses. Such amounts are included as components of “Accrued reorganization expenses” on the Statement of Assets and Liabilities and “Reorganization expenses” on the Statement of Operations.
9. New Accounting Pronouncements
Financial Accounting Standards Board (“FASB”) Balance Sheet (Topic 210): Disclosures about Offsetting Assets and Liabilities
In December 2011, the FASB issued Accounting Standards Update (“ASU”) No. 2011-11 (“ASU No. 2011-11”) to enhance disclosures about financial instruments and derivative instruments that are subject to offsetting (“netting”) on the Statement of Assets and Liabilities. This information will enable users of the entity’s financial statements to evaluate the effect or potential effect of netting arrangements on the entity’s financial position. ASU No. 2011-11 is effective prospectively during interim or annual periods beginning on or after January 1, 2013. At this time, management is evaluating the implications of this guidance and the impact it will have to the financial statements amounts and footnote disclosures, if any.
Reinvest Automatically,
Easily and Conveniently
Nuveen makes reinvesting easy. A phone call is all it takes to set up your reinvestment account.
Nuveen Closed-End Funds Automatic Reinvestment Plan
Your Nuveen Closed-End Fund allows you to conveniently reinvest distributions in additional Fund shares.
By choosing to reinvest, you’ll be able to invest money regularly and automatically, and watch your investment grow through the power of compounding. Just like distributions in cash, there may be times when income or capital gains taxes may be payable on distributions that are reinvested.
It is important to note that an automatic reinvestment plan does not ensure a profit, nor does it protect you against loss in a declining market.
Easy and convenient
To make recordkeeping easy and convenient, each month you’ll receive a statement showing your total distributions, the date of investment, the shares acquired and the price per share, and the total number of shares you own.
How shares are purchased
The shares you acquire by reinvesting will either be purchased on the open market or newly issued by the Fund. If the shares are trading at or above net asset value at the time of valuation, the Fund will issue new shares at the greater of the net asset value or 95% of the then-current market price. If the shares are trading at less than net asset value, shares for your account will be purchased on the open market. If the Plan Agent begins purchasing Fund shares on the open market while shares are trading below net asset value, but the Fund’s shares subsequently trade at or above their net asset value before the Plan Agent is able to complete its purchases, the Plan Agent may cease open-market purchases and may invest the uninvested portion of the distribution in newly-issued Fund shares at a price equal to the greater of the shares’ net asset value or 95% of the shares’ market value on the last business day immediately prior to the purchase date. Distributions received to purchase shares in the open market will normally be invested shortly after the distribution payment date. No interest will be paid on distributions awaiting reinvestment. Because the market price of the shares may increase before purchases are completed, the average purchase price per share may
exceed the market price at the time of valuation, resulting in the acquisition of fewer shares than if the distribution had been paid in shares issued by the Fund. A pro rata portion of any applicable brokerage commissions on open market purchases will be paid by Plan participants. These commissions usually will be lower than those charged on individual transactions.
Flexible
You may change your distribution option or withdraw from the Plan at any time, should your needs or situation change.
You can reinvest whether your shares are registered in your name, or in the name of a brokerage firm, bank, or other nominee. Ask your investment advisor if his or her firm will participate on your behalf. Participants whose shares are registered in the name of one firm may not be able to transfer the shares to another firm and continue to participate in the Plan.
The Fund reserves the right to amend or terminate the Plan at any time. Although the Fund reserves the right to amend the Plan to include a service charge payable by the participants, there is no direct service charge to participants in the Plan at this time.
Call today to start reinvesting distributions
For more information on the Nuveen Automatic Reinvestment Plan or to enroll in or withdraw from the Plan, speak with your financial advisor or call us at (800) 257-8787.
Glossary of Terms
Used in this Report
| ■ | Auction Rate Bond: An auction rate bond is a security whose interest payments are adjusted periodically through an auction process, which process typically also serves as a means for buying and selling the bond. Auctions that fail to attract enough buyers for all the shares offered for sale are deemed to have “failed,” with current holders receiving a formula-based interest rate until the next scheduled auction. |
| | |
| ■ | Average Annual Total Return: This is a commonly used method to express an investment’s performance over a particular, usually multi-year time period. It expresses the return that would have been necessary each year to equal the investment’s actual cumulative performance (including change in NAV or market price and reinvested dividends and capital gains distributions, if any) over the time period being considered. |
| | |
| ■ | Average Maturity: For a bond fund or defined portfolio, the average of the stated maturity dates of the fixed-income securities held. In general, the longer the average maturity, the greater the fund’s or defined portfolio’s sensitivity to interest-rate changes, which means greater price fluctuation. A shorter average maturity usually means a less sensitive, and consequently, less volatile, portfolio. |
| | |
| ■ | Duration: A measure of the price sensitivity of a fixed-income security or portfolio to changes in interest rates. Duration is stated in years. For example, if a bond has a duration of four years, the price of the bond is expected to change by approximately 4% for every one percentage point change in interest rates. The shorter the duration the less price variability expected in the security’s price due to changes in interest rates. |
| | |
| ■ | Effective Leverage: Effective leverage is a Fund’s effective economic leverage, and includes both regulatory leverage and the leverage effects of certain derivative investments in the Fund’s portfolio. Currently, the leverage effects of Tender Option Bond (TOB) inverse floater holdings are included in effective leverage values, in addition to any regulatory leverage. |
| | |
| ■ | Gross Domestic Product (GDP): The total market value of all final goods and services produced in a country/region in a given year, equal to total consumer, investment and government spending, plus the value of exports, minus the value of imports. |
| | |
| ■ | Inverse Floating Rate Securities: Inverse floating rate securities, also known as inverse floaters or tender option bonds (TOBs), are created by depositing a municipal bond, typically with a fixed interest rate, into a special purpose trust created by a broker dealer. This trust, in turn, (a) issues floating rate certificates typically paying short-term tax-exempt interest rates to third parties in amounts equal to some fraction of the deposited bond’s par amount or market value, and (b) issues an inverse floating rate certificate (sometimes referred to as an “inverse floater”) to an investor (such as a Fund) interested in gaining investment exposure to a long-term municipal bond. The income received by the holder of the inverse floater varies inversely with the short term rate paid to the |
| | floating rate certificates’ holders, and in most circumstances the holder of the inverse floater bears substantially all of the underlying bond’s downside investment risk. The holder of the inverse floater typically also benefits disproportionately from any potential appreciation of the underlying bond’s value. Hence, an inverse floater essentially represents an investment in the underlying bond on a leveraged basis. |
| | |
| ■ | Leverage: Using borrowed money to invest in securities or other assets, seeking to increase the return of an investment or portfolio. |
| | |
| ■ | Lipper Other States Municipal Debt Funds Classification Average: Calculated using the returns of all closed-end funds in this category. Lipper returns account for the effects of management fees and assume reinvestment of distributions, but do not reflect any applicable sales charges. |
| | |
| ■ | Market Yield (also known as Dividend Yield or Current Yield): An investment’s current annualized dividend divided by its current market price. |
| | |
| ■ | Net Asset Value (NAV): The net market value of all securities held in a portfolio. |
| | |
| ■ | Net Asset Value (NAV) Per Share: The market value of one share of a mutual fund or closed-end fund. For a Fund, the NAV is calculated daily by taking the Fund’s total assets (securities, cash, and accrued earnings), subtracting the Fund’s liabilities, and dividing by the number of shares outstanding. |
| | |
| ■ | Pre-Refunding: Pre-Refunding, also known as advanced refundings or refinancings, is a procedure used by state and local governments to refinance municipal bonds to lower interest expenses. The issuer sells new bonds with a lower yield and uses the proceeds to buy U.S. Treasury securities, the interest from which is used to make payments on the higher-yielding bonds. Because of this collateral, pre-refunding generally raises a bond’s credit rating and thus its value. |
| | |
| ■ | Regulatory Leverage: Regulatory Leverage consists of preferred shares or debt issued by the Fund. Both of these are part of a Fund’s capital structure. Regulatory leverage is sometimes referred to as “‘40 Act Leverage” and is subject to asset coverage limits set in the Investment Company Act of 1940. |
| | |
| ■ | S&P Georgia Municipal Bond Index: An unleveraged, market value-weighted index designed to measure the performance of the tax-exempt, investment-grade Georgia municipal bond market. Index returns assume reinvestment of distributions, but do not reflect any applicable sales charges or management fees. |
| | |
| ■ | S&P Maryland Municipal Bond Index: An unleveraged, market value-weighted index designed to measure the performance of the tax-exempt, investment-grade Maryland municipal bond market. Index returns assume reinvestment of distributions, but do not reflect any applicable sales charges or management fees. |
| | |
| ■ | S&P Municipal Bond Index: An unleveraged, market value-weighted index designed to measure the performance of the tax-exempt, investment-grade U.S. municipal bond market. Index returns assume reinvestment of distributions, but do not reflect any applicable sales charges or management fees. |
Glossary of Terms
Used in this Report (continued)
| ■ | S&P Missouri Municipal Bond Index: An unleveraged, market value-weighted index designed to measure the performance of the tax-exempt, investment-grade Missouri municipal bond market. Index returns assume reinvestment of distributions, but do not reflect any applicable sales charges or management fees. |
| | |
| ■ | S&P North Carolina Municipal Bond Index: An unleveraged, market value-weighted index designed to measure the performance of the tax-exempt, investment-grade North Carolina municipal bond market. Index returns assume reinvestment of distributions, but do not reflect any applicable sales charges or management fees. |
| | |
| ■ | S&P Virginia Municipal Bond Index: An unleveraged, market value-weighted index designed to measure the performance of the tax-exempt, investment-grade Virginia municipal bond market. Index returns assume reinvestment of distributions, but do not reflect any applicable sales charges or management fees. |
| | |
| ■ | Taxable-Equivalent Yield: The yield necessary from a fully taxable investment to equal, on an after-tax basis, the yield of a municipal bond investment. |
| | |
| ■ | Zero Coupon Bond: A zero coupon bond does not pay a regular interest coupon to its holders during the life of the bond. Tax-exempt income to the holder of the bond comes from accretion of the difference between the original purchase price of the bond at issuance and the par value of the bond at maturity and is effectively paid at maturity. The market prices of zero coupon bonds generally are more volatile than the market prices of bonds that pays interest periodically. |
Additional Fund Information
Board of Trustees
John P. Amboian
Robert P. Bremner
Jack B. Evans
William C. Hunter
David J. Kundert
William J. Schneider
Judith M. Stockdale
Carole E. Stone
Virginia L. Stringer
Terence J. Toth
Fund Manager
Nuveen Fund Advisors, LLC
333 West Wacker Drive
Chicago, IL 60606
Custodian
State Street Bank
& Trust Company
Boston, MA
Transfer Agent and
Shareholder Services
State Street Bank & Trust
Company
Nuveen Funds
P.O. Box 43071
Providence, RI 02940-3071
(800) 257-8787
Legal Counsel
Chapman and Cutler LLP
Chicago, IL
Independent Registered
Public Accounting Firm
Ernst & Young LLP
Chicago, IL
Quarterly Portfolio of Investments and Proxy Voting Information
You may obtain (i) each Fund’s quarterly portfolio of investments, (ii) information regarding how each Fund voted proxies relating to portfolio securities held during the most recent twelve-month period ended June 30, and (iii) a description of the policies and procedures that each Fund used to determine how to vote proxies relating to portfolio securities without charge, upon request, by calling Nuveen Investments toll-free at (800) 257-8787 or on Nuveen’s website at www.nuveen.com.
You may also obtain this and other Fund information directly from the Securities and Exchange Commission (SEC). The SEC may charge a copying fee for this information. Visit the SEC on-line at http://www.sec.gov or in person at the SEC’s Public Reference Room in Washington, D.C. Call the SEC at (202) 942-8090 for room hours and operation. You may also request Fund information by sending an e-mail request to publicinfo@sec.gov or by writing to the SEC’s Public References Section at 100 F Street NE, Washington, D.C. 20549.
CEO Certification Disclosure
Each Fund’s Chief Executive Officer (CEO) has submitted to the New York Stock Exchange (NYSE) the annual CEO certification as required by Section 303A.12(a) of the NYSE Listed Company Manual.
Each Fund has filed with the SEC the certification of its Chief Executive Officer and Chief Financial Officer required by Section 302 of the Sarbanes-Oxley Act.
Common and Preferred Share Information
Each Fund intends to repurchase shares of its own common stock in the future at such times and in such amounts as is deemed advisable. During the period covered by this report, the Funds repurchased shares of their common stock as shown in the accompanying table.
| | | | Common Shares |
| Fund | | | Repurchased |
| NKG | | | — |
| NMY | | | — |
| NOM | | | — |
| NNC | | | — |
| NPV | | | — |
Any future repurchases will be reported to shareholders in the next annual or semiannual report.
Nuveen Investments:
Serving Investors for Generations
Since 1898, financial advisors and their clients have relied on Nuveen Investments to provide dependable investment solutions through continued adherence to proven, long-term investing principles. Today, we offer a range of high quality equity and fixed-income solutions designed to be integral components of a well-diversified core portfolio.
Focused on meeting investor needs.
Nuveen Investments provides high-quality investment services designed to help secure the long-term goals of institutional and individual investors as well as the consultants and financial advisors who serve them. Nuveen Investments markets a wide range of specialized investment solutions which provide investors access to capabilities of its high-quality boutique investment affiliates—Nuveen Asset Management, Symphony Asset Management, NWQ Investment Management Company, Santa Barbara Asset Management, Tradewinds Global Investors, Winslow Capital Management and Gresham Investment Management. In total, Nuveen Investments managed $220 billion as of September 30, 2012.
Find out how we can help you.
To learn more about how the products and services of Nuveen Investments may be able to help you meet your financial goals, talk to your financial advisor, or call us at (800) 257-8787. Please read the information provided carefully before you invest. Investors should consider the investment objective and policies, risk considerations, charges and expenses of any investment carefully. Where applicable, be sure to obtain a prospectus, which contains this and other relevant information. To obtain a prospectus, please contact your securities representative or Nuveen Investments, 333 W. Wacker Dr., Chicago, IL 60606. Please read the prospectus carefully before you invest or send money.
Learn more about Nuveen Funds at: www.nuveen.com/cef
Distributed by
Nuveen Securities, LLC
333 West Wacker Drive
Chicago, IL 60606
www.nuveen.com
ESA-A-1112D
ITEM 2. CODE OF ETHICS.
Not applicable to this filing.
ITEM 3. AUDIT COMMITTEE FINANCIAL EXPERT.
Not applicable to this filing.
ITEM 4. PRINCIPAL ACCOUNTANT FEES AND SERVICES.
Not applicable to this filing.
ITEM 5. AUDIT COMMITTEE OF LISTED REGISTRANTS.
Not applicable to this filing.
ITEM 6. SCHEDULE OF INVESTMENTS.
(a) See Portfolio of Investments in Item 1.
(b) Not applicable.
ITEM 7. DISCLOSURE OF PROXY VOTING POLICIES AND PROCEDURES FOR CLOSED-END MANAGEMENT INVESTMENT COMPANIES.
Not applicable to this filing.
ITEM 8. PORTFOLIO MANAGERS OF CLOSED-END MANAGEMENT INVESTMENT COMPANIES.
Not applicable to this filing.
ITEM 9. PURCHASES OF EQUITY SECURITIES BY CLOSED-END MANAGEMENT INVESTMENT COMPANY AND AFFILIATED PURCHASERS.
Not applicable.
ITEM 10. SUBMISSION OF MATTERS TO A VOTE OF SECURITY HOLDERS.
There have been no material changes to the procedures by which shareholders may recommend nominees to the registrant's Board implemented after the registrant last provided disclosure in response to this Item.
ITEM 11. CONTROLS AND PROCEDURES.
| (a) | The registrant's principal executive and principal financial officers, or persons performing similar functions, have concluded that the registrant's disclosure controls and procedures (as defined in Rule 30a-3(c) under the Investment Company Act of 1940, as amended (the "1940 Act") (17 CFR 270.30a-3(c))) are effective, as of a date within 90 days of the filing date of this report that includes the disclosure required by this paragraph, based on their evaluation of the controls and procedures required by Rule 30a-3(b) under the 1940 Act (17 CFR 270.30a-3(b)) and Rules 13a-15(b) or 15d-15(b) under the Securities Exchange Act of 1934, as amended (the "Exchange Act")(17 CFR 240.13a-15(b) or 240.15d-15(b)). |
| (b) | There were no changes in the registrant's internal control over financial reporting (as defined in Rule 30a-3(d) under the 1940 Act (17 CFR 270.30a-3(d)) that occurred during the second fiscal quarter of the period covered by this report that has materially affected, or is reasonably likely to materially affect, the registrant's internal control over financial reporting. |
ITEM 12. EXHIBITS.
File the exhibits listed below as part of this Form.
| (a)(1) | Any code of ethics, or amendment thereto, that is the subject of the disclosure required by Item 2, to the extent that the registrant intends to satisfy the Item 2 requirements through filing of an exhibit: Not applicable to this filing. |
| (a)(2) | A separate certification for each principal executive officer and principal financial officer of the registrant as required by Rule 30a-2(a) under the 1940 Act (17 CFR 270.30a-2(a)) in the exact form set forth below: See Ex-99.CERT attached hereto. |
| (a)(3) | Any written solicitation to purchase securities under Rule 23c-1 under the 1940 Act (17 CFR 270.23c-1) sent or given during the period covered by the report by or on behalf of the registrant to 10 or more persons: Not applicable. |
| (b) | If the report is filed under Section 13(a) or 15(d) of the Exchange Act, provide the certifications required by Rule 30a-2(b) under the 1940 Act (17 CFR 270.30a-2(b)); Rule 13a-14(b) or Rule 15d-14(b) under the Exchange Act (17 CFR 240.13a-14(b) or 240.15d-14(b)), and Section 1350 of Chapter 63 of Title 18 of the United States Code (18 U.S.C. 1350) as an exhibit. A certification furnished pursuant to this paragraph will not be deemed "filed" for purposes of Section 18 of the Exchange Act (15 U.S.C. 78r), or otherwise subject to the liability of that section. Such certification will not be deemed to be incorporated by reference into any filing under the Securities Act of 1933 or the Exchange Act, except to the extent that the registrant specifically incorporates it by reference: See Ex-99.906 CERT attached hereto. |
SIGNATURES
Pursuant to the requirements of the Securities Exchange Act of 1934 and the Investment Company Act of 1940, the registrant has duly caused this report to be signed on its behalf by the undersigned, thereunto duly authorized.
(Registrant) Nuveen Georgia Dividend Advantage Municipal Fund 2
By (Signature and Title) /s/ Kevin J. McCarthy
Kevin J. McCarthy
Vice President and Secretary
Pursuant to the requirements of the Securities Exchange Act of 1934 and the Investment Company Act of 1940, this report has been signed below by the following persons on behalf of the registrant and in the capacities and on the dates indicated.
By (Signature and Title) /s/ Gifford R. Zimmerman
Gifford R. Zimmerman
Chief Administrative Officer
(principal executive officer)
By (Signature and Title) /s/ Stephen D. Foy
Stephen D. Foy
Vice President and Controller
(principal financial officer)