
| | | | | Neuberger Berman
Municipal Closed-End Funds |
| | | | | |
| | | | | Neuberger Berman California
Municipal Fund Inc. |
| | | | | Neuberger Berman Municipal
Fund Inc. |
| | | | | Neuberger Berman New York
Municipal Fund Inc. |
| | | | | Annual Report |
| | | | | October 31, 2021 |
As permitted by regulations adopted by the U.S. Securities and Exchange Commission, paper copies of the Fund’s annual and semi-annual shareholder reports will no longer be sent by mail, unless you specifically request paper copies of the reports. Instead, the reports will be made available on the Fund’s website www.nb.com/CEFliterature, and you will be notified by mail each time a report is posted and provided with a website link to access the report. If you already elected to receive shareholder reports electronically, you will not be affected by this change and you need not take any action. You may elect to receive shareholder reports and other communications from the Fund electronically anytime by contacting your financial intermediary (such as a broker-dealer or bank) or, if you are a direct investor, by calling 800.877.9700 or by sending an e-mail request to fundinfo@nb.com. You may elect to receive all future reports in paper free of charge. If you invest through a financial intermediary, you can contact your financial intermediary to request that you continue to receive paper copies of your shareholder reports. If you invest directly with the Fund, you can call 800.877.9700 or send an email request to fundinfo@nb.com to inform the Fund that you wish to continue receiving paper copies of your shareholder reports. Your election to receive reports in paper will apply to all funds held in your account if you invest through your financial intermediary or all funds held with the fund complex if you invest directly with the Fund. |
| | | | | |
| | | | | |
| | | | | Contents |
| | | | | | | |
| | | | | PRESIDENT’S LETTER | | 1 |
| | | | | | | |
| | | | | PORTFOLIO COMMENTARIES | | 2 |
| | | | | | | |
| | | | | SCHEDULES OF INVESTMENTS | | |
| | | | | California Municipal Fund Inc. | | 9 |
| | | | | Municipal Fund Inc. | | 14 |
| | | | | New York Municipal Fund Inc. | | 25 |
| | | | | | | |
| | | | | FINANCIAL STATEMENTS | | 31 |
| | | | | | | |
| | | | | FINANCIAL HIGHLIGHTS | | |
| | | | | California Municipal Fund Inc. | | 42 |
| | | | | Municipal Fund Inc. | | 43 |
| | | | | New York Municipal Fund Inc. | | 44 |
| | | | | | | |
| | | | | Report of Independent Registered Public Accounting Firm | | 46 |
| | | | | | | |
| | | | | Fund Investment Objectives, Policies and Risks | | |
| | | | | California Municipal Fund Inc. | | 47 |
| | | | | Municipal Fund Inc. | | 48 |
| | | | | New York Municipal Fund Inc. | | 49 |
| | | | | | | |
| | | | | Distribution Reinvestment Plan for each Fund | | 55 |
| | | | | Directory | | 58 |
| | | | | Directors and Officers | | 59 |
| | | | | Proxy Voting Policies and Procedures | | 67 |
| | | | | Quarterly Portfolio Schedule | | 67 |
| | | | | Notice to Stockholders | | 68 |
| | | | | Report of Votes of Stockholders | | 69 |
| | | | | Board Consideration of the Management Agreements | | 70 |
The “Neuberger Berman” name and logo and “Neuberger Berman Investment Advisers LLC” name are registered service marks of Neuberger Berman Group LLC. The individual Fund names in this piece are either service marks or registered service marks of Neuberger Berman Investment Advisers LLC. ©2021 Neuberger Berman Investment Advisers LLC. All rights reserved.
President’s Letter
Dear Stockholder,
I am pleased to present this annual report for Neuberger Berman California Municipal Fund Inc. (NBW), Neuberger Berman Municipal Fund Inc. (NBH) and Neuberger Berman New York Municipal Fund Inc. (NBO and, together with NBW and NBH, the Funds) for the 12 months ended October 31, 2021 (the reporting period). The report includes for each Fund a portfolio commentary, a listing of the Fund’s investments and its audited financial statements for the reporting period.
Each Fund’s investment objective is to provide a high level of current income exempt from federal income tax and, for the state-specific Funds, NBW seeks to provide income that is also exempt from California’s personal income taxes and NBO seeks to provide income that is also exempt from New York State and New York City personal income tax. The Funds may invest in securities the interest on which is subject to the federal alternative minimum tax.
We maintain a conservative investment philosophy and disciplined investment process in an effort to provide you with tax-exempt current income over the long term with less volatility and risk.
Thank you for your confidence in the Funds. We will continue to do our best to retain your trust in the years to come.
Sincerely,

Joseph V. Amato
President and CEO
Neuberger Berman California Municipal Fund Inc.
Neuberger Berman Municipal Fund Inc.
Neuberger Berman New York Municipal Fund Inc.
1
Neuberger Berman Municipal Closed-End Funds
Portfolio Commentaries (Unaudited)
For the 12 months ended October 31, 2021 (the reporting period), on a net asset value (NAV) basis, all three of the Neuberger Berman Municipal Closed-End Funds outperformed their benchmark, the Bloomberg 10-Year Municipal Bond Index (the Index). Neuberger Berman California Municipal Fund Inc. (NBW), Neuberger Berman Municipal Fund Inc. (NBH) and Neuberger Berman New York Municipal Fund Inc. (NBO and, together with NBW and NBH, the Funds) posted 4.97%, 5.91% and 5.32% total returns, respectively, whereas the Index generated a 2.12% total return for the same period. (Fund performance on a market price basis is provided in the table immediately following this commentary.) The use of leverage (typically a performance enhancer in up markets and a detractor during market retreats) contributed to performance given the positive price return for the municipal bond market during the reporting period.
The investment-grade municipal bond market generated a positive total return and outperformed the taxable investment-grade bond market during the reporting period. All told, the Bloomberg Municipal Bond Index gained 2.64% for the reporting period, whereas the overall taxable investment-grade bond market, as measured by the Bloomberg U.S. Aggregate Bond Index, returned -0.48%. U.S. Treasury yields moved sharply higher across the curve, as the economy continued to expand, inflation reached multi-year highs and the U.S. Federal Reserve Board (Fed) indicated that it would begin removing some of its monetary policy accommodation. That said, economic growth moderated late in the reporting period as the COVID-19 Delta variant and supply chain issues tempered consumer spending.
The Funds continued to have a lower credit quality bias relative to that of the Index, as we looked to generate additional yield. In particular, an overweight to securities rated BBB and below versus the Index was positive for results. They outperformed higher quality bonds given continued monetary and fiscal stimulus and robust investor demand. In terms of security selection, our selection of longer-term tobacco bonds was rewarded in all three Funds. For NBH, an allocation to Illinois general obligation bonds was beneficial, as they were purchased at attractive valuations and they rallied over the reporting period. Elsewhere, yield curve positioning was additive for the Funds’ performance given their overweight to the longer end of the curve. On the downside, small exposures to certain project-oriented securities that were behind schedule due to issues related to the pandemic were a drag on performance.
Among the changes made to the Funds during the reporting period, we replaced maturing securities by largely emphasizing below investment-grade issues for their yield advantage.
We continue to believe that the Fed’s transition to slightly tighter monetary policy may lead to more volatility. In addition, U.S. municipal bonds entered the fourth quarter of 2021 with tighter valuations relative to U.S. Treasuries when compared to historical relationships between the two asset classes. As a result, we have a guarded view as it relates to interest rate risk. With uncertainty out of Washington, D.C. relating to infrastructure policy, the debt limit, and who will lead the Fed, as of the end of the reporting period, we believe the conditions are in place for more volatility in the municipal bond market. Against this backdrop, we are hopeful that opportunities to add value through security selection will increase. We have always believed that the best and most consistent way to add value in the municipal bond market is through security selection. We think our investment style, which is centered on a spirited relative value debate as we consider investments, is very well suited to the type of environment which may lie ahead.
Sincerely,
James L. Iselin and S. Blake Miller
Portfolio Co-Managers
The portfolio composition, industries and holdings of each Fund are subject to change without notice.
The opinions expressed are those of the Funds’ portfolio managers. The opinions are as of the date of this report and are subject to change without notice.
The value of securities owned by a Fund, as well as the market value of shares of the Fund’s common stock, may decline in response to certain events, including those directly involving the issuers whose securities are owned by the Fund; conditions affecting the general economy; overall market changes; local, regional, national or global political, social or economic instability; regulatory or legislative developments; price and interest rate fluctuations, including those resulting from changes in central bank policies; and changes in investor sentiment.
The bond rating(s) noted above represent segments of the Bloomberg 10-Year Municipal Bond Index, which are determined based on the average ratings issued by S&P Global, Moody’s and Fitch.
2
Municipal Closed-End Funds (Unaudited)
| TICKER SYMBOLS | | |
| California Municipal Fund Inc. | | NBW |
| Municipal Fund Inc. | | NBH |
| New York Municipal Fund Inc. | | NBO |
| CALIFORNIA MUNICIPAL FUND INC. PORTFOLIO BY STATE AND TERRITORY | | | | |
| (as a % of Total Investments*) | | | | |
| American Samoa | | | 0.5 | % |
| California | | | 88.2 | |
| Guam | | | 1.3 | |
| Illinois | | | 0.8 | |
| Kansas | | | 0.5 | |
| Louisiana | | | 0.4 | |
| New Jersey | | | 0.3 | |
| New York | | | 0.5 | |
| North Carolina | | | 0.2 | |
| Ohio | | | 3.4 | |
| Puerto Rico | | | 3.0 | |
| South Carolina | | | 0.5 | |
| Texas | | | 0.2 | |
| Wisconsin | | | 0.2 | |
| Total | | | 100.0 | % |
| | |
| * | Does not include the impact of the Fund’s open positions in derivatives, if any. |
| | |
| NEW YORK MUNICIPAL FUND INC. PORTFOLIO BY STATE AND TERRITORY | | | |
| (as a % of Total Investments*) | | | | |
| American Samoa | | | 0.5 | % |
| California | | | 3.0 | |
| Guam | | | 1.3 | |
| Illinois | | | 0.9 | |
| Kansas | | | 0.7 | |
| Louisiana | | | 0.4 | |
| New York | | | 86.0 | |
| Ohio | | | 0.2 | |
| Puerto Rico | | | 4.9 | |
| South Carolina | | | 0.3 | |
| Texas | | | 0.2 | |
| Wisconsin | | | 1.0 | |
| Other | | | 0.6 | |
| Total | | | 100.0 | % |
| | |
| * | Does not include the impact of the Fund’s open positions in derivatives, if any. |
| | | Inception
Date | | Average Annual Total Return
Ended 10/31/2021 |
| At NAV2 | | | 1 Year | | 5 Years | | 10 Years | | Life of Fund |
| California Municipal Fund Inc. | | 9/24/2002 | | 4.97 | % | | 3.83 | % | | 5.02 | % | | 5.52 | % |
| Municipal Fund Inc. | | 9/24/2002 | | | 5.91 | % | | | 3.81 | % | | | 5.60 | % | | | 5.81 | % |
| New York Municipal Fund Inc. | | 9/24/2002 | | | 5.32 | % | | | 3.14 | % | | | 4.28 | % | | | 4.94 | % |
| At Market Price3 | | | | | | | | | | | | | | | | | | |
| California Municipal Fund Inc. | | 9/24/2002 | | | 12.36 | % | | | 1.92 | % | | | 4.27 | % | | | 4.72 | % |
| Municipal Fund Inc. | | 9/24/2002 | | | 12.92 | % | | | 5.24 | % | | | 5.92 | % | | | 5.68 | % |
| New York Municipal Fund Inc. | | 9/24/2002 | | | 11.75 | % | | | 2.62 | % | | | 3.73 | % | | | 4.11 | % |
| Index | | | | | | | | | | | | | | | | | | |
Bloomberg 10-Year
Municipal Bond Index**, 4 | | | | | 2.12 | % | | | 3.42 | % | | | 3.97 | % | | | 4.40 | % |
| | |
| ** | Effective August 24, 2021, the Bloomberg Barclays 10-Year Municipal Bond Index changed its name to Bloomberg 10-Year Municipal Bond Index. |
Listed closed-end funds, unlike open-end funds, are not continually offered. Generally, there is an initial public offering and, once issued, shares of common stock of closed-end funds are sold in the secondary market on a stock exchange.
The performance data quoted represent past performance and do not indicate future results. Current performance may be lower or higher than the performance data quoted. For current performance data, please visit www.nb.com/cef-performance.
The results shown in the table reflect the reinvestment of income dividends and other distributions, if any. The results do not reflect the effect of taxes a stockholder would pay on Fund distributions or on the sale of shares of a Fund’s common stock.
The investment return and market price will fluctuate and shares of a Fund’s common stock may trade at prices above or below NAV. Shares of a Fund’s common stock, when sold, may be worth more or less than their original cost.
Returns would have been lower if Neuberger Berman Investment Advisers LLC (“NBIA” or “Management”) had not waived a portion of its investment management fees during certain of the periods shown. The waived fees are from prior years that are no longer disclosed in the Financial Highlights.
| MUNICIPAL FUND INC. PORTFOLIO BY STATE AND TERRITORY |
| (as a % of Total Investments*) | | | | | | | | |
| Alabama | | | 0.7 | % | | New Jersey | | | 6.6 | |
| American Samoa | | | 0.4 | | | New Mexico | | | 0.3 | |
| Arizona | | | 1.4 | | | New York | | | 11.1 | |
| California | | | 19.6 | | | North Carolina | | | 1.9 | |
| Colorado | | | 3.7 | | | Ohio | | | 3.7 | |
| Connecticut | | | 0.2 | | | Oklahoma | | | 0.7 | |
| District of Columbia | | | 0.7 | | | Oregon | | | 0.0 | |
| Florida | | | 5.1 | | | Pennsylvania | | | 3.5 | |
| Georgia | | | 0.4 | | | Puerto Rico | | | 4.1 | |
| Hawaii | | | 1.7 | | | Rhode Island | | | 0.7 | |
| Illinois | | | 12.9 | | | South Carolina | | | 0.9 | |
| Indiana | | | 0.8 | | | Tennessee | | | 0.5 | |
| Iowa | | | 0.5 | | | Texas | | | 3.4 | |
| Kentucky | | | 0.3 | | | Utah | | | 1.8 | |
| Louisiana | | | 1.3 | | | Vermont | | | 1.0 | |
| Massachusetts | | | 1.1 | | | Virginia | | | 0.1 | |
| Michigan | | | 3.9 | | | Washington | | | 2.4 | |
| Minnesota | | | 0.1 | | | Wisconsin | | | 1.0 | |
| Mississippi | | | 0.5 | | | Wyoming | | | 0.4 | |
| Nevada | | | 0.4 | | | Total | | | 100.0 | % |
| New Hampshire | | | 0.2 | | | | | | | |
| | |
| * | Does not include the impact of the Fund’s open positions in derivatives, if any. |
3
Municipal Closed-End Funds (Unaudited)
California Municipal Fund Inc.
| COMPARISON OF A $10,000 INVESTMENT |
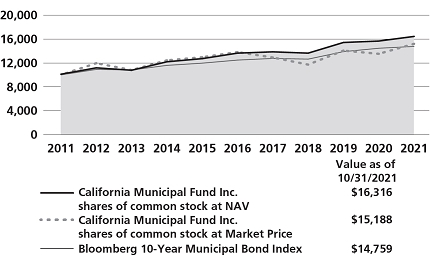 |
This graph shows the change in value of a hypothetical $10,000 investment in the Fund over the past 10 fiscal years. The graph is based on the Fund’s shares of common stock both at net asset value (NAV) and at market price. The Fund’s common stock may trade at market prices above or below NAV per share (see Performance Highlights chart). The result is compared with a broad-based market index. The market index has not been reduced to reflect any of the fees and costs of investing. The results shown in the graph reflect the reinvestment of income dividends and other distributions, if any, at prices obtained under the Fund’s Distribution Reinvestment Plan. The results do not reflect the effect of taxes a stockholder would pay on Fund distributions or on the sale of Fund shares. Results represent past performance and do not indicate future results.
Impact of the Fund’s Distribution Policy
The Fund has a practice of seeking to maintain a relatively stable level of distributions to common stockholders. In general, this practice does not affect the Fund’s investment strategy and may reduce the Fund’s NAV. Management believes the practice helps maintain the Fund’s competitiveness and may benefit the Fund’s market price and premium/discount to the Fund’s NAV per share. During the 12-month period ended October 31, 2021, the Fund made distributions to common stockholders totaling $0.54 per share, of which $0.00 will be treated as a return of capital for tax purposes.
4
Municipal Closed-End Funds (Unaudited)
Municipal Fund Inc.
| COMPARISON OF A $10,000 INVESTMENT |
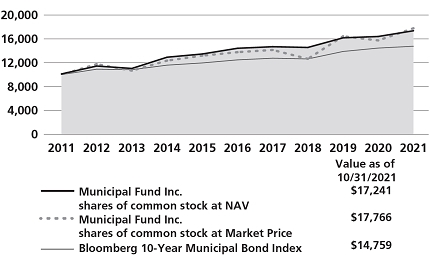 |
This graph shows the change in value of a hypothetical $10,000 investment in the Fund over the past 10 fiscal years. The graph is based on the Fund’s shares of common stock both at net asset value (NAV) and at market price. The Fund’s common stock may trade at market prices above or below NAV per share (see Performance Highlights chart). The result is compared with a broad-based market index. The market index has not been reduced to reflect any of the fees and costs of investing. The results shown in the graph reflect the reinvestment of income dividends and other distributions, if any, at prices obtained under the Fund’s Distribution Reinvestment Plan. The results do not reflect the effect of taxes a stockholder would pay on Fund distributions or on the sale of Fund shares. Results represent past performance and do not indicate future results.
Impact of the Fund’s Distribution Policy
The Fund has a practice of seeking to maintain a relatively stable level of distributions to common stockholders. In general, this practice does not affect the Fund’s investment strategy and may reduce the Fund’s NAV. Management believes the practice helps maintain the Fund’s competitiveness and may benefit the Fund’s market price and premium/discount to the Fund’s NAV per share. During the 12-month period ended October 31, 2021, the Fund made distributions to common stockholders totaling $0.75 per share, of which $0.00 will be treated as a return of capital for tax purposes.
5
Municipal Closed-End Funds (Unaudited)
New York Municipal Fund Inc.
| COMPARISON OF A $10,000 INVESTMENT |
 |
This graph shows the change in value of a hypothetical $10,000 investment in the Fund over the past 10 fiscal years. The graph is based on the Fund’s shares of common stock both at net asset value (NAV) and at market price. The Fund’s common stock may trade at market prices above or below NAV per share (see Performance Highlights chart). The result is compared with a broad-based market index. The market index has not been reduced to reflect any of the fees and costs of investing. The results shown in the graph reflect the reinvestment of income dividends and other distributions, if any, at prices obtained under the Fund’s Distribution Reinvestment Plan. The results do not reflect the effect of taxes a stockholder would pay on Fund distributions or on the sale of Fund shares. Results represent past performance and do not indicate future results.
Impact of the Fund’s Distribution Policy
The Fund has a practice of seeking to maintain a relatively stable level of distributions to common stockholders. In general, this practice does not affect the Fund’s investment strategy and may reduce the Fund’s NAV. Management believes the practice helps maintain the Fund’s competitiveness and may benefit the Fund’s market price and premium/discount to the Fund’s NAV per share. During the 12-month period ended October 31, 2021, the Fund made distributions to common stockholders totaling $0.47 per share, of which $0.00 will be treated as a return of capital for tax purposes.
6
Endnotes (Unaudited)
| 1 | A portion of each Fund’s income may be a tax preference item for purposes of the federal alternative minimum tax for certain stockholders. |
| | |
| 2 | Returns based on the NAV of each Fund. |
| | |
| 3 | Returns based on the market price of shares of each Fund’s common stock on the NYSE American. |
| | |
| 4 | Please see “Description of Index” on page 8 for a description of the index. |
For more complete information on any of the Neuberger Berman Municipal Closed-End Funds, call Neuberger Berman Investment Advisers LLC at (877) 461-1899, or visit our website at www.nb.com.
7
Description of Index (Unaudited)
Bloomberg 10-Year Municipal
Bond Index: | | The index is the 10-year (8-12 years to maturity) component of the Bloomberg Municipal Bond Index. The Bloomberg Municipal Bond Index measures the investment grade, U.S. dollar-denominated, long-term, tax-exempt bond market and has four main sectors: state and local general obligation bonds, revenue bonds, insured bonds and prerefunded bonds. Effective August 24, 2021 all Bloomberg Barclays fixed income indices were rebranded as “Bloomberg indices”. |
Please note that the index does not take into account any fees and expenses or any tax consequences of investing in the individual securities that it tracks and that individuals cannot invest directly in any index. Data about the performance of this index are prepared or obtained by NBIA and include reinvestment of all income dividends and other distributions, if any. Each Fund may invest in securities not included in the above described index and generally does not invest in all securities included in the index.
8
Schedule of Investments California Municipal Fund Inc.^
October 31, 2021
| PRINCIPAL AMOUNT | | VALUE | |
| | | | | | | | | |
| Municipal Notes 162.4% | | | | |
| | | | | | | | | |
| American Samoa 0.8% | | | | |
| $ | 600,000 | | | American Samoa Econ. Dev. Au. Gen. Rev. Ref., Ser. 2015-A, 6.25%, due 9/1/2029 | | $ | 695,480 | |
| | | | | | | | | |
| California 143.2% | | | | |
| | 1,000,000 | | | Bay Area Toll Au. Toll Bridge Rev., Ser. 2013-S-4, 5.00%, due 4/1/2027 Pre-Refunded 4/1/2023 | | | 1,067,855 | |
| | 1,875,000 | | | California Comm. Choice Fin. Clean Energy Proj. Au. Rev. Green Bond, Ser. 2021-B-1, (LOC: Morgan Stanley), 4.00%, due 2/1/2052 Putable 8/1/2031 California Ed. Facs. Au. Ref. Rev. (Univ. of Redlands) | | | 2,251,920 | |
| | 250,000 | | | Ser. 2016-A, 5.00%, due 10/1/2028 | | | 290,477 | |
| | 260,000 | | | Ser. 2016-A, 3.00%, due 10/1/2029 | | | 275,664 | |
| | 400,000 | | | Ser. 2016-A, 3.00%, due 10/1/2030 | | | 420,624 | |
| | 1,000,000 | | | California Ed. Facs. Au. Rev. (Green Bond- Loyola Marymount Univ.), Ser. 2018-B, 5.00%, due 10/1/2048 | | | 1,196,548 | |
| | 1,263,232 | | | California HFA Muni. Cert., Ser. 2019-2, Class A, 4.00%, due 3/20/2033 | | | 1,479,041 | |
| | 1,000,000 | | | California Hlth. Facs. Fin. Au. Rev. (Children’s Hosp. Los Angeles), Ser. 2012-A, 5.00%, due 11/15/2026 | | | 1,044,700 | |
| | 991,683 | | | California Hsg. Fin. Agcy. Muni. Cert., Ser. 2021-1, Class A, 3.50%, due 11/20/2035 | | | 1,142,874 | |
| | 500,000 | | | California Infrastructure & Econ. Dev. Bank Rev. (Wonderful Foundations Charter Sch. Portfolio Proj.), Ser. 2020-A-1, 5.00%, due 1/1/2055 | | | 550,117 | (a) |
| | 770,000 | | | California Infrastructure & Econ. Dev. Bank St. Sch. Fund Lease Rev. (King City Joint Union High Sch. Dist. Fin.), Ser. 2010, 5.13%, due 8/15/2024 | | | 771,294 | |
| | 1,000,000 | | | California Muni. Fin. Au. Charter Sch. Lease Rev. (Sycamore Academy Proj.), Ser. 2014, 5.63%, due 7/1/2044 | | | 1,075,992 | (a) |
| | 500,000 | | | California Muni. Fin. Au. Charter Sch. Lease Rev. (Vista Charter Middle Sch. Proj.), Ser. 2014, 5.13%, due 7/1/2029 California Muni. Fin. Au. Charter Sch. Rev. (John Adams Academics Proj.) | | | 544,132 | |
| | 210,000 | | | Ser. 2015-A, 4.50%, due 10/1/2025 | | | 219,818 | |
| | 1,115,000 | | | Ser. 2019-A, 5.00%, due 10/1/2049 | | | 1,194,383 | (a) |
| | 1,000,000 | | | California Muni. Fin. Au. Charter Sch. Rev. (Palmdale Aerospace Academy Proj.), Ser. 2016, 5.00%, due 7/1/2031 | | | 1,132,929 | (a) |
| | 500,000 | | | California Muni. Fin. Au. Rev. (Baptist Univ.), Ser. 2015-A, 5.00%, due 11/1/2030 California Muni. Fin. Au. Rev. (Biola Univ.) | | | 570,574 | (a) |
| | 375,000 | | | Ser. 2013, 4.00%, due 10/1/2025 | | | 397,824 | |
| | 410,000 | | | Ser. 2013, 4.00%, due 10/1/2026 | | | 433,694 | |
| | 455,000 | | | Ser. 2013, 4.00%, due 10/1/2027 | | | 479,891 | |
| | 600,000 | | | California Muni. Fin. Au. Rev. (Southwestern Law Sch.), Ser. 2011, 6.00%, due 11/1/2026 California Muni. Fin. Au. Rev. (Touro College & Univ. Sys. Obligated Group) | | | 602,187 | |
| | 605,000 | | | Ser. 2014-A, 4.00%, due 1/1/2027 | | | 647,790 | |
| | 630,000 | | | Ser. 2014-A, 4.00%, due 1/1/2028 | | | 671,821 | |
| | 330,000 | | | Ser. 2014-A, 4.00%, due 1/1/2029 | | | 350,746 | |
| | 2,000,000 | | | California Muni. Fin. Au. Std. Hsg. Rev. (CHF-Davis I, LLC-West Village Std. Hsg. Proj.), Ser. 2018, (BAM Insured), 4.00%, due 5/15/2048 California Pub. Fin. Au. Ref. (Henry Mayo Newhall Hosp.) | | | 2,257,465 | |
| | 400,000 | | | Ser. 2021-A, 4.00%, due 10/15/2027 | | | 462,678 | |
| | 360,000 | | | Ser. 2021-A, 4.00%, due 10/15/2028 | | | 422,446 | |
| | 400,000 | | | California Sch. Fac. Fin. Au. Rev. (Alliance College - Ready Pub. Sch. Proj.), Ser. 2015-A, 5.00%, due 7/1/2030 | | | 450,090 | (a) |
| | 1,500,000 | | | California Sch. Fac. Fin. Au. Rev. (Green Dot Pub. Sch. Proj.), Ser. 2018-A, 5.00%, due 8/1/2048 California Sch. Fac. Fin. Au. Rev. (KIPP LA Proj.) | | | 1,736,749 | (a) |
| | 400,000 | | | Ser. 2017-A, 4.00%, due 7/1/2023 | | | 422,273 | (a) |
| | 250,000 | | | Ser. 2014-A, 4.13%, due 7/1/2024 | | | 263,793 | |
| | 375,000 | | | Ser. 2017-A, 5.00%, due 7/1/2025 | | | 427,537 | (a) |
| | 130,000 | | | Ser. 2017-A, 5.00%, due 7/1/2027 | | | 155,527 | (a) |
| | 2,195,000 | | | California St. Dept. of Veterans Affairs Home Purchase Ref. Rev., Ser. 2016-A, 3.00%, due 6/1/2029 | | | 2,321,121 | |
| | | | | | | | | |
| See Notes to Financial Statements | 9 | |
Schedule of Investments California Municipal Fund Inc.^
(cont’d)
| PRINCIPAL AMOUNT | | VALUE | |
| | | | | | | | | |
| | | | | California St. Dept. of Wtr. Res. Ctr. Valley Proj. Rev. (Wtr. Sys.) | | | | |
| $ | 15,000 | | | Ser. 2012-AN, 5.00%, due 12/1/2021 | | $ | 15,058 | |
| | 540,000 | | | Ser. 2012-AN, 5.00%, due 12/1/2021 | | | 542,130 | |
| | | | | California St. G.O. | | | | |
| | 1,500,000 | | | Ser. 2012, 5.00%, due 2/1/2027 | | | 1,518,021 | |
| | 2,000,000 | | | Ser. 2020, 3.00%, due 11/1/2050 | | | 2,117,992 | |
| | 1,390,000 | | | California St. Hlth. Fac. Fin. Au. Rev. (Commonspirit Hlth. Oblig.), Ser. 2020-A, 4.00%, due 4/1/2049 | | | 1,581,137 | |
| | 2,000,000 | | | California St. Poll. Ctrl. Fin. Au. Rev. (San Jose Wtr. Co. Proj.), Ser. 2016, 4.75%, due 11/1/2046 | | | 2,249,800 | |
| | 710,000 | | | California St. Poll. Ctrl. Fin. Au. Solid Waste Disp. Rev. (Aemerage Redak Svcs. So. California LLC Proj.), Ser. 2016, 7.00%, due 12/1/2027 | | | 319,500 | (a)(b) |
| | 600,000 | | | California St. Poll. Ctrl. Fin. Au. Solid Waste Disp. Rev. (Calplant I Green Bond Proj.), Ser. 2019, 7.50%, due 12/1/2039 | | | 15,000 | (a)(b) |
| | 550,000 | | | California St. Poll. Ctrl. Fin. Au. Solid Waste Disp. Rev. (Green Bond-Rialto Bioenergy Fac. LLC, Proj.), Ser. 2019, 7.50%, due 12/1/2040 | | | 450,547 | (a) |
| | 1,770,000 | | | California St. Poll. Ctrl. Fin. Au. Wtr. Furnishing Rev., Ser. 2012, 5.00%, due 7/1/2027 | | | 1,895,296 | (a) |
| | 415,000 | | | California St. Sch. Fin. Au. Charter Sch. Rev. (Downtown College Prep-Oblig. Group), Ser. 2016, 4.50%, due 6/1/2031 | | | 449,022 | (a) |
| | 400,000 | | | California St. Sch. Fin. Au. Charter Sch. Rev. (Rocketship Ed.), Ser. 2016-A, 5.00%, due 6/1/2031 | | | 437,775 | (a) |
| | 1,060,000 | | | California St. Sch. Fin. Au. Ed. Facs. Rev. (New Designs Charter Sch. Administration Campus Proj.), Ser. 2019-A, 5.00%, due 6/1/2050 | | | 1,168,737 | (a) |
| | 280,000 | | | California St. Sch. Fin. Au. Ed. Facs. Rev. (Partnerships Uplifts Comm. Valley Proj.), Ser. 2014-A, 5.35%, due 8/1/2024 | | | 297,004 | (a) |
| | 1,000,000 | | | California Statewide CDA College Hsg. Rev. (NCCD-Hooper Street LLC-College of the Arts Proj.), Ser. 2019, 5.25%, due 7/1/2052 | | | 1,069,491 | (a) |
| | 1,325,000 | | | California Statewide CDA Hosp. Rev. (Methodist Hosp. of Southern Proj.), Ser. 2018, 4.25%, due 1/1/2043 | | | 1,479,683 | |
| | 100,000 | | | California Statewide CDA Multi-Family Hsg. Rev. (Irvine Apt. Comm. LP), Ser. 2001-W-1, (LOC: Wells Fargo Bank N.A.), 0.03%, due 8/1/2034 | | | 100,000 | (c) |
| | 720,000 | | | California Statewide CDA Rev. (Henry Mayo Newhall Mem. Hosp.), Ser. 2014-A, (AGM Insured), 5.00%, due 10/1/2026 Pre-Refunded 10/1/2024 | | | 812,617 | |
| | 500,000 | | | California Statewide CDA Rev. (Loma Linda Univ. Med. Ctr.), Ser. 2018-A, 5.50%, due 12/1/2058 | | | 606,642 | (a) |
| | 700,000 | | | California Statewide CDA Rev. (Redwoods Proj.), Ser. 2013, 5.00%, due 11/15/2028 | | | 755,918 | |
| | 600,000 | | | California Statewide CDA Rev. Ref. (Lancer Ed. Std. Hsg. Proj.), Ser. 2016-A, 5.00%, due 6/1/2036 | | | 683,480 | (a) |
| | 1,500,000 | | | California Statewide CDA Rev. Ref. (Loma Linda Univ. Med. Ctr.), Ser. 2014-A, 5.25%, due 12/1/2029 | | | 1,697,339 | |
| | 1,500,000 | | | California Statewide CDA Rev. Ref. (Redlands Comm. Hosp.), Ser. 2016, 4.00%, due 10/1/2041 | | | 1,652,992 | |
| | 705,000 | | | California Statewide CDA Spec. Tax Rev. Ref. (Comm. Facs. Dist. Number 2007-01 Orinda Wilder Proj.), Ser. 2015, 4.50%, due 9/1/2025 | | | 790,831 | |
| | 2,055,000 | | | California Statewide CDA Std. Hsg. Rev. (Univ. of Irvin Campus Apts. Phase IV), Ser. 2017-A, 5.00%, due 5/15/2032 | | | 2,458,655 | |
| | 500,000 | | | California Statewide CDA Std. Hsg. Rev. Ref. (Baptist University), Ser. 2017-A, 5.00%, due 11/1/2032 | | | 592,133 | (a) |
| | 2,000,000 | | | Contra Costa Co. Redev. Agcy. Successor Agcy. Tax Allocation Ref., Ser. 2017-A, (BAM Insured), 5.00%, due 8/1/2031 Corona Norco Unified Sch. Dist. Pub. Fin. Au. Sr. Lien Rev. | | | 2,416,147 | |
| | 350,000 | | | Ser. 2013-A, 5.00%, due 9/1/2026 Pre-Refunded 9/1/2023 | | | 380,314 | |
| | 560,000 | | | Ser. 2013-A, 5.00%, due 9/1/2027 Pre-Refunded 9/1/2023 | | | 608,502 | |
| | 700,000 | | | Daly City Hsg. Dev. Fin. Agcy. Rev. Ref. (Franciscan Mobile Home Park), Ser. 2007-A, 5.00%, due 12/15/2021 | | | 701,072 | |
| | 2,000,000 | | | Davis Joint Unified Sch. Dist. Cert. of Participation (Yolo Co.), Ser. 2014, (BAM Insured), 4.00%, due 8/1/2024 | | | 2,189,227 | |
| | 1,250,000 | | | Emeryville Redev. Agcy. Successor Agcy. Tax Allocation Ref. Rev., Ser. 2014-A, (AGM Insured), 5.00%, due 9/1/2025 | | | 1,402,410 | |
| | 1,500,000 | | | Foothill-Eastern Trans. Corridor Agcy. Toll Road Rev. Ref., Subser. 2014-B2, 3.50%, due 1/15/2053 | | | 1,638,347 | |
| | | | | | | | | |
| See Notes to Financial Statements | 10 | |
Schedule of Investments California Municipal Fund Inc.^
(cont’d)
| PRINCIPAL AMOUNT | | VALUE | |
| | | | | | | | | |
| | | | | Golden St. Tobacco Securitization Corp. Tobacco Settlement Rev. Ref. | | | | |
| $ | 2,000,000 | | | Ser. 2018-A-1, 5.00%, due 6/1/2047 | | $ | 2,047,907 | |
| | 5,000,000 | | | Ser. 2018-A-2, 5.00%, due 6/1/2047 | | | 5,119,761 | |
| | 1,000,000 | | | Imperial Comm. College Dist. G.O. Cap. Appreciation (Election 2010), Ser. 2011-A, (AGM Insured), 6.75%, due 8/1/2040 Pre-Refunded 8/1/2025 | | | 1,227,610 | |
| | 1,000,000 | | | Inglewood Unified Sch. Dist. Facs. Fin. Au. Rev., Ser. 2007, (AGM Insured), 5.25%, due 10/15/2026 Irvine Spec. Tax (Comm. Facs. Dist. Number 2005-2) | | | 1,148,232 | |
| | 150,000 | | | Ser. 2013, 4.00%, due 9/1/2023 | | | 160,174 | |
| | 300,000 | | | Ser. 2013, 4.00%, due 9/1/2024 | | | 320,052 | |
| | 450,000 | | | Ser. 2013, 4.00%, due 9/1/2025 | | | 479,125 | |
| | 645,000 | | | Ser. 2013, 3.50%, due 9/1/2026 | | | 678,218 | |
| | 690,000 | | | Ser. 2013, 3.63%, due 9/1/2027 | | | 724,961 | |
| | 680,000 | | | Jurupa Pub. Fin. Auth. Spec. Tax Rev., Ser. 2014-A, 5.00%, due 9/1/2024 La Verne Cert. of Participation (Brethren Hillcrest Homes) | | | 762,328 | |
| | 315,000 | | | Ser. 2014, 5.00%, due 5/15/2026 Pre-Refunded 5/15/2022 | | | 326,190 | |
| | 500,000 | | | Ser. 2014, 5.00%, due 5/15/2029 Pre-Refunded 5/15/2022 | | | 517,761 | |
| | 1,105,000 | | | Lodi Pub. Fin. Au. Lease Rev., Ser. 2012, 5.25%, due 10/1/2026 | | | 1,126,597 | |
| | 1,500,000 | | | Los Angeles City Dept. of Arpts. Arpt. Rev., Ser. 2020-C, 4.00%, due 5/15/2050 | | | 1,697,683 | |
| | 3,150,000 | | | Los Angeles Co. Metro. Trans. Au. Rev. (Green Bond), Ser. 2020-A, 5.00%, due 6/1/2031 | | | 4,147,550 | |
| | 2,000,000 | | | Los Angeles Muni. Imp. Corp. Lease Ref. Rev. (Real Property), Ser. 2012-C, 5.00%, due 3/1/2027 Pre-Refunded 3/1/2022 | | | 2,032,099 | |
| | 1,385,000 | | | Ohlone Comm. College Dist. G.O. (Election 2010), Ser. 2014-B, 0.00%, due 8/1/2029 Pre-Refunded 8/1/2024 | | | 1,104,941 | |
| | 1,305,000 | | | Oxnard Harbor Dist. Rev., Ser. 2011-B, 4.50%, due 8/1/2024 | | | 1,401,317 | |
| | 1,250,000 | | | Palomar Hlth. Ref. Rev., Ser. 2016, 4.00%, due 11/1/2039 | | | 1,368,312 | |
| | 1,000,000 | | | Rancho Cucamonga Redev. Agcy. Successor Agcy. Tax Allocation Rev. (Rancho Redev. Proj.), Ser. 2014, (AGM Insured), 5.00%, due 9/1/2027 | | | 1,118,206 | |
| | 600,000 | | | Riverside Co. Comm. Facs. Dist. Spec. Tax Rev. (Scott Road), Ser. 2013, 5.00%, due 9/1/2025 | | | 621,243 | |
| | 500,000 | | | Riverside Co. Trans. Commission Toll Rev. Ref. Sr. Lien (RCTC Number 91 Express Lanes), Ser. 2021-B-1, 4.00%, due 6/1/2046 Riverside Co. Trans. Commission Toll Rev. Sr. Lien (Cap. Appreciation) | | | 574,384 | |
| | 1,320,000 | | | Ser. 2013-B, 0.00%, due 6/1/2022 | | | 1,317,057 | |
| | 1,500,000 | | | Ser. 2013-B, 0.00%, due 6/1/2023 | | | 1,489,050 | |
| | | | | Romoland Sch. Dist. Spec. Tax Ref. (Comm. Facs. Dist. Number 2006-1) | | | | |
| | 100,000 | | | Ser. 2017, 4.00%, due 9/1/2029 | | | 112,116 | |
| | 200,000 | | | Ser. 2017, 4.00%, due 9/1/2030 | | | 223,285 | |
| | 525,000 | | | Ser. 2017, 3.25%, due 9/1/2031 | | | 557,302 | |
| | 1,700,000 | | | Sacramento Area Flood Ctrl. Agcy. Ref. (Consol Cap. Assessment Dist. Number 2), Ser. 2016-A, 5.00%, due 10/1/2047 Sacramento City Fin. Au. Ref. Rev. (Master Lease Prog. Facs.) | | | 1,995,308 | |
| | 1,000,000 | | | Ser. 2006-E, (AMBAC Insured), 5.25%, due 12/1/2024 | | | 1,148,538 | |
| | 400,000 | | | Ser. 2006-E, (AMBAC Insured), 5.25%, due 12/1/2026 | | | 490,454 | |
| | 1,950,000 | | | Sacramento Co. Arpt. Sys. Rev. Ref., Ser. 2018-C, 5.00%, due 7/1/2033 | | | 2,370,971 | |
| | 500,000 | | | Sacramento Spec. Tax (Natomas Meadows Comm. Facs. Dist. Number 2007-01), Ser. 2017, 5.00%, due 9/1/2047 | | | 552,186 | (a) |
| | 175,000 | | | San Jose Multi-Family Hsg. Rev. (Fallen Leaves Apts. Proj.), Ser. 2002-J1, (AMBAC Insured), 4.95%, due 12/1/2022 | | | 175,344 | |
| | 685,000 | | | San Mateo Foster City Sch. Dist. G.O. (Election 2015), Ser. 2016-A, 4.00%, due 8/1/2029 Pre-Refunded 8/1/2025 | | | 776,400 | |
| | 1,390,000 | | | San Rafael Redev. Agcy. Tax Allocation Ref. (Central San Rafael Redev. Proj.), Ser. 2009, (Assured Guaranty Insured), 5.00%, due 12/1/2021 Santa Maria Bonita Sch. Dist. Cert. of Participation (New Sch. Construction Proj.) | | | 1,395,073 | |
| | 310,000 | | | Ser. 2013, (BAM Insured), 3.25%, due 6/1/2025 | | | 322,427 | |
| | 575,000 | | | Ser. 2013, (BAM Insured), 3.50%, due 6/1/2026 | | | 598,954 | |
| | 325,000 | | | Ser. 2013, (BAM Insured), 3.50%, due 6/1/2027 | | | 337,551 | |
| | 270,000 | | | Ser. 2013, (BAM Insured), 3.50%, due 6/1/2028 | | | 279,680 | |
| | 1,000,000 | | | Santa Monica-Malibu Unified Sch. Dist. Ref. G.O., Ser. 2013, 3.00%, due 8/1/2027 Pre-Refunded 8/1/2023 | | | 1,047,978 | |
| | 1,000,000 | | | Successor Agcy. to the Monrovia Redev. Agcy. Tax Allocation Rev. (Cent. Redev. Proj.), Ser. 2013, 5.00%, due 8/1/2026 | | | 1,032,491 | |
| | | | | | | | | |
| See Notes to Financial Statements | 11 | |
Schedule of Investments California Municipal Fund Inc.^
(cont’d)
| PRINCIPAL AMOUNT | | VALUE | |
| | | | | | | | | |
| | | | | Sulphur Springs Union Sch. Dist. Cert. of Participation Conv. Cap. Appreciation Bonds | | | | |
| $ | 125,000 | | | Ser. 2010, (AGM Insured), 6.50%, due 12/1/2037 | | $ | 135,296 | |
| | 525,000 | | | Ser. 2010, (AGM Insured), 6.50%, due 12/1/2037 Pre-Refunded 12/1/2025 | | | 647,740 | |
| | 620,000 | | | Ser. 2010, (AGM Insured), 6.50%, due 12/1/2037 | | | 757,016 | |
| | 2,000,000 | | | Sweetwater Union High Sch. Dist. Pub. Fin. Au. Rev., Ser. 2013, (BAM Insured), 5.00%, due 9/1/2025 | | | 2,156,679 | |
| | 500,000 | | | Tobacco Securitization Au. Southern California Tobacco Settlement Rev. Ref. (San Diego Co. Asset Securitization Corp.), Ser. 2019-A, Class 1, 5.00%, due 6/1/2048 | | | 608,901 | |
| | 3,000,000 | | | Victor Valley Comm. College Dist. G.O. Cap. Appreciation (Election 2008), Ser. 2009-C, 6.88%, due 8/1/2037 | | | 4,164,541 | |
| | 3,500,000 | | | William S. Hart Union High Sch. Dist. G.O. Cap. Appreciation (Election 2001), Ser. 2005-B, (AGM Insured), 0.00%, due 9/1/2026 | | | 3,326,641 | |
| | 2,250,000 | | | Wiseburn Sch. Dist. G.O. Cap. Appreciation (Election 2010), Ser. 2011-B, (AGM Insured), 0.00%, due 8/1/2036 | | | 2,541,643 | (d) |
| | | | | | | | 122,090,666 | |
| | | | | | | | | |
| Guam 2.1% | | | | |
| | 500,000 | | | Guam Gov’t Bus. Privilege Tax Rev. Ref., Ser. 2021-F, 4.00%, due 1/1/2042 | | | 556,469 | |
| | 1,000,000 | | | Guam Gov’t Hotel Occupancy Tax Rev. Ref., Ser. 2021-A, 5.00%, due 11/1/2040 | | | 1,233,326 | |
| | | | | | | | 1,789,795 | |
| | | | | | | | | |
| Illinois 1.2% | | | | |
| | 1,000,000 | | | Chicago Ref. G.O., Ser. 2003-B, 5.00%, due 1/1/2023 | | | 1,051,670 | |
| | | | | | | | | |
| Kansas 0.8% | | | | |
| | | | | Goddard Kansas Sales Tax Spec. Oblig. Rev. Ref. (Olympic Park Star Bond Proj.) | | | | |
| | 350,000 | | | Ser. 2019, 3.60%, due 6/1/2030 | | | 352,433 | |
| | 300,000 | | | Ser. 2021, 3.50%, due 6/1/2034 | | | 292,453 | |
| | | | | | | | 644,886 | |
| | | | | | | | | |
| Louisiana 0.6% | | | | |
| | 500,000 | | | Louisiana Pub. Facs. Au. Rev. (Southwest Louisiana Charter Academy Foundation Proj.), Ser. 2013-A, 7.63%, due 12/15/2028 | | | 531,175 | |
| | | | | | | | | |
| New Jersey 0.5% | | | | |
| | 400,000 | | | New Jersey St. Econ. Dev. Au. Rev. (Continental Airlines, Inc., Proj.), Ser. 1999, 5.13%, due 9/15/2023 | | | 415,994 | |
| | | | | | | | | |
| New York 0.8% | | | | |
| | 650,000 | | | Build NYC Res. Corp. Rev., Ser. 2014, 5.25%, due 11/1/2034 | | | 712,154 | |
| | | | | | | | | |
| North Carolina 0.4% | | | | |
| | 345,000 | | | North Carolina Med. Care Commission Hlth. Care Fac. First Mtge. Rev. (Lutheran Svcs. for Aging, Inc.), Ser. 2012-A, 4.25%, due 3/1/2024 | | | 349,427 | |
| | | | | | | | | |
| Ohio 5.5% | | | | |
| | 3,885,000 | | | Buckeye Tobacco Settlement Fin. Au. Asset-Backed Sr. Ref. Rev., Ser. 2020-B-2, Class 2, 5.00%, due 6/1/2055 | | | 4,359,511 | |
| | 280,000 | | | So. Ohio Port Exempt Fac. Au. Rev., (PureCycle Ohio LLC), Ser. 2020-A, 7.00%, due 12/1/2042 | | | 319,876 | (a) |
| | | | | | | | 4,679,387 | |
| | | | | | | | | |
| Puerto Rico 4.9% | | | | |
| | 3,662,000 | | | Puerto Rico Sales Tax Fin. Corp. Sales Tax Rev., Ser. 2018-A-1, 5.00%, due 7/1/2058 | | | 4,134,206 | |
| | | | | | | | | |
| See Notes to Financial Statements | 12 | |
Schedule of Investments California Municipal Fund Inc.^
(cont’d)
| PRINCIPAL AMOUNT | | VALUE | |
| | | | | | | | | |
| South Carolina 0.8% | | | | |
| $ | 250,000 | | | South Carolina Jobs Econ. Dev. Au. Solid Waste Disp. Rev. (Green Bond-Last Step Recycling LLC Proj.), Ser. 2021-A, 6.50%, due 6/1/2051 | | $ | 256,429 | (a) |
| | 395,000 | | | South Carolina St. Jobs Econ. Dev. Au. Econ. Dev. Rev. (River Park Sr. Living Proj.), Ser. 2017-A, 7.75%, due 10/1/2057 | | | 395,915 | |
| | | | | | | | 652,344 | |
| | | | | | | | | |
| Texas 0.4% | | | | |
| | 294,782 | | | Mission Econ. Dev. Corp. Wtr. Supply Rev. (Green Bond-Env. Wtr. Minerals Proj.), Ser. 2015, 7.75%, due 1/1/2045 | | | 23,582 | (a)(b) |
| | 450,000 | | | New Hope Cultural Ed. Facs. Fin. Corp. Sr. Living Rev. (Bridgemoor Plano Proj.), Ser. 2018-A, 7.25%, due 12/1/2053 | | | 312,402 | (b) |
| | | | | | | | 335,984 | |
| | | | | | | | | |
| Wisconsin 0.4% | | | | |
| | 300,000 | | | Pub. Fin. Au. Retirement Fac. Rev. Ref. (Friends Homes), Ser. 2019, 5.00%, due 9/1/2054 | | | 337,337 | (a) |
| | | | | Total Investments 162.4% (Cost $128,378,082) | | | 138,420,505 | |
| | | | | Other Assets Less Liabilities 2.1% | | | 1,819,669 | |
| | | | | Liquidation Preference of Variable Rate Municipal Term Preferred Shares (net of unamortized deferred offering costs of $5,966) (64.5)% | | | (54,994,034 | ) |
| | | | | Net Assets Applicable to Common Stockholders 100.0% | | $ | 85,246,140 | |
| | | | | | | | | |
| (a) | Securities were purchased under Rule 144A of the Securities Act of 1933, as amended, or are otherwise restricted and, unless registered under the Securities Act of 1933 or exempted from registration, may only be sold to qualified institutional investors or may have other restrictions on resale. At October 31, 2021, these securities amounted to $17,190,208, which represents 20.2% of net assets applicable to common stockholders of the Fund. |
| | |
| (b) | Defaulted security. |
| | |
| (c) | Variable rate demand obligation where the stated interest rate is not based on a published reference rate and spread. Rather, the interest rate generally resets daily or weekly and is determined by the remarketing agent. The rate shown represents the rate in effect at October 31, 2021. |
| | |
| (d) | Currently a zero coupon security; will convert to 7.30% on August 1, 2026. |
| | |
The following is a summary, categorized by Level (see Note A of Notes to Financial Statements), of inputs used to value the Fund’s investments as of October 31, 2021:
| Asset Valuation Inputs | | Level 1 | | | Level 2 | | | Level 3 | | | Total | |
| Investments: | | | | | | | | | | | | | | | | |
| Municipal Notes(a) | | | $— | | | $ | 138,420,505 | | | | $— | | | $ | 138,420,505 | |
| Total Investments | | | $— | | | $ | 138,420,505 | | | | $— | | | $ | 138,420,505 | |
| | | | | | | | | | | | | | | | | |
| (a) | The Schedule of Investments provides a categorization by state/territory. |
| | |
| ^ | A balance indicated with a “—”, reflects either a zero balance or an amount that rounds to less than 1. |
| | |
| See Notes to Financial Statements | 13 | |
Schedule of Investments Municipal Fund Inc.^
October 31, 2021
| PRINCIPAL AMOUNT | | VALUE | |
| | | | | | | | | |
| Municipal Notes 159.2% | | | | |
| | | | | | | | | |
| Alabama 1.2% | | | | |
| $ | 1,300,000 | | | Alabama Hsg. Fin. Au. Multi-Family Hsg. Rev. (Alison Pt. Apts. Proj.), Ser. 2007-B, (LOC: U.S. Bank N.A.), 0.11%, due 4/1/2037 | | $ | 1,300,000 | (a) |
| | 1,900,000 | | | Selma IDB Rev. (Int’l Paper Co. Proj.), Ser. 2011-A, 5.38%, due 12/1/2035 | | | 1,906,808 | |
| | | | | | | | 3,206,808 | |
| | | | | | | | | |
| American Samoa 0.7% | | | | |
| | 1,700,000 | | | American Samoa Econ. Dev. Au. Gen. Rev. Ref., Ser. 2015-A, 6.25%, due 9/1/2029 | | | 1,970,526 | |
| | | | | | | | | |
| Arizona 2.3% | | | | |
| | 500,000 | | | Maricopa Co. Ind. Dev. Au. Ed. Ref. Rev. (Paradise Sch. Proj. Paragon Management, Inc.), Ser. 2016, 5.00%, due 7/1/2036 | | | 557,957 | (b) |
| | 1,205,000 | | | Maricopa Co. Ind. Dev. Au. Sr. Living Facs. Rev. (Christian Care Surprise, Inc. Proj.), Ser. 2016, 5.00%, due 1/1/2026 | | | 1,201,786 | (b) |
| | 2,250,000 | | | Navajo Nation Ref. Rev., Ser. 2015-A, 5.00%, due 12/1/2025 | | | 2,451,328 | (b) |
| | 1,385,000 | | | Phoenix Ind. Dev. Au. Ed. Rev. (Great Hearts Academies Proj.), Ser. 2014, 3.75%, due 7/1/2024 | | | 1,445,557 | |
| | 395,000 | | | Phoenix Ind. Dev. Au. Rev. (Deer Valley Veterans Assisted Living Proj.), Ser. 2016-A, 5.13%, due 7/1/2036 | | | 393,964 | |
| | 400,000 | | | Phoenix-Mesa Gateway Arpt. Au. Spec. Fac. Rev. (Mesa Proj.), Ser. 2012, 5.00%, due 7/1/2024 | | | 412,272 | |
| | | | | | | | 6,462,864 | |
| | | | | | | | | |
| California 31.2% | | | | |
| | 1,000,000 | | | California Hlth. Facs. Fin. Au. Rev. (Children’s Hosp. Los Angeles), Ser. 2012-A, 5.00%, due 11/15/2026 | | | 1,044,699 | |
| | 1,325,000 | | | California Infrastructure & Econ. Dev. Bank St. Sch. Fund Rev. (King City Joint Union High Sch.), Ser. 2010, 5.13%, due 8/15/2024 California Muni. Fin. Au. Charter Sch. Lease Rev. (Sycamore Academy Proj.) | | | 1,327,227 | |
| | 465,000 | | | Ser. 2014, 5.00%, due 7/1/2024 | | | 491,840 | (b) |
| | 630,000 | | | Ser. 2014, 5.13%, due 7/1/2029 | | | 680,467 | (b) |
| | | | | California Muni. Fin. Au. Charter Sch. Lease Rev. (Vista Charter Middle Sch. Proj.) | | | | |
| | 455,000 | | | Ser. 2014, 5.00%, due 7/1/2024 | | | 484,272 | |
| | 430,000 | | | Ser. 2014, 5.13%, due 7/1/2029 | | | 467,954 | |
| | 500,000 | | | California Muni. Fin. Au. Charter Sch. Rev. (Palmdale Aerospace Academy Proj.), Ser. 2016, 5.00%, due 7/1/2031 | | | 566,464 | (b) |
| | 570,000 | | | California Muni. Fin. Au. Rev. (Baptist Univ.), Ser. 2015-A, 5.00%, due 11/1/2030 | | | 650,454 | (b) |
| | 585,000 | | | California Muni. Fin. Au. Rev. (Touro College & Univ. Sys. Obligated Group), Ser. 2014-A, 4.00%, due 1/1/2026 | | | 628,130 | |
| | 2,000,000 | | | California Muni. Fin. Au. Std. Hsg. Rev. (CHF-Davis I, LLC-West Village Std. Hsg. Proj.), Ser. 2018, 5.00%, due 5/15/2051 | | | 2,380,404 | |
| | 1,000,000 | | | California Muni. Fin. Au. Std. Hsg. Rev. (CHF-Davis II, LLC, Green Bond-Orchard Park Std. Hsg. Proj.), Ser. 2021, (BAM Insured), 3.00%, due 5/15/2054 | | | 1,024,064 | |
| | 1,300,000 | | | California Sch. Fac. Fin. Au. Rev. (Alliance College - Ready Pub. Sch. Proj.), Ser. 2015-A, 5.00%, due 7/1/2030 California St. Dept. of Veterans Affairs Home Purchase Ref. Rev. | | | 1,462,792 | (b) |
| | 2,155,000 | | | Ser. 2016-A, 2.90%, due 6/1/2028 | | | 2,280,918 | |
| | 2,450,000 | | | Ser. 2016-A, 2.95%, due 12/1/2028 | | | 2,592,124 | |
| | 470,000 | | | California St. Poll. Ctrl. Fin. Au. Solid Waste Disp. Rev. (Aemerage Redak Svcs. So. California LLC Proj.), Ser. 2016, 7.00%, due 12/1/2027 | | | 211,500 | (b)(c) |
| | 2,000,000 | | | California St. Poll. Ctrl. Fin. Au. Solid Waste Disp. Rev. (Calplant I Green Bond Proj.), Ser. 2019, 7.50%, due 12/1/2039 | | | 50,000 | (b)(c) |
| | | | | | | | | |
| See Notes to Financial Statements | 14 | |
Schedule of Investments Municipal Fund Inc.^
(cont’d)
| PRINCIPAL AMOUNT | | VALUE | |
| | | | | | | | | |
| $ | 1,855,000 | | | California St. Poll. Ctrl. Fin. Au. Solid Waste Disp. Rev. (Green Bond-Rialto Bioenergy Fac. LLC, Proj.), Ser. 2019, 7.50%, due 12/1/2040 | | $ | 1,519,571 | (b) |
| | 4,430,000 | | | California St. Poll. Ctrl. Fin. Au. Wtr. Furnishing Rev., Ser. 2012, 5.00%, due 7/1/2027 | | | 4,743,593 | (b) |
| | 2,500,000 | | | CMFA Spec. Fin. Agcy. VIII Essential Hsg. Rev. (Sr. Elan Huntington Beach), Ser. 2021-A-1, 3.00%, due 8/1/2056 | | | 2,296,939 | (b) |
| | 1,000,000 | | | Golden St. Tobacco Securitization Corp. Tobacco Settlement Rev. Ref., Ser. 2018-A-2, 5.00%, due 6/1/2047 | | | 1,023,952 | |
| | 2,000,000 | | | Imperial Comm. College Dist. G.O. Cap. Appreciation (Election 2010), Ser. 2011-A, (AGM Insured), 6.75%, due 8/1/2040 Pre-Refunded 8/1/2025 | | | 2,455,220 | |
| | 590,000 | | | La Verne Cert. of Participation Ref. (Brethren Hillcrest Homes), Ser. 2014, 5.00%, due 5/15/2029 Pre-Refunded 5/15/2022 | | | 610,959 | |
| | 2,250,000 | | | Los Angeles Reg. Arpt. Imp. Corp. Lease Rev. Ref. (Laxfuel Corp.), Ser. 2012, 4.50%, due 1/1/2027 | | | 2,264,356 | |
| | 3,620,000 | | | Norwalk-La Mirada Unified Sch. Dist. G.O. Cap. Appreciation, Ser. 2005-B, (AGM Insured), 0.00%, due 8/1/2024 | | | 3,561,268 | |
| | 5,750,000 | | | Norwalk-La Mirada Unified Sch. Dist. G.O. Cap. Appreciation (Election 2002), Ser. 2009-E, (Assured Guaranty Insured), 5.50%, due 8/1/2029 | | | 7,287,972 | |
| | 5,000,000 | | | Redondo Beach Unified Sch. Dist. G.O., Ser. 2009, 6.38%, due 8/1/2034 | | | 6,276,397 | |
| | 4,000,000 | | | Sacramento City Fin. Au. Ref. Rev. (Master Lease Prog. Facs.), Ser. 2006-E, (AMBAC Insured), 5.25%, due 12/1/2026 | | | 4,904,538 | |
| | 2,000,000 | | | San Bernardino Comm. College Dist. G.O. Cap. Appreciation (Election), Ser. 2009-B, 6.38%, due 8/1/2034 Pre-Refunded 8/1/2024 | | | 2,325,778 | |
| | 6,000,000 | | | San Mateo Foster City Sch. Dist. G.O. Cap. Appreciation (Election 2008), Ser. 2010-A, 0.00%, due 8/1/2032 | | | 7,143,872 | (d) |
| | 1,540,000 | | | Successor Agcy. to the Monrovia Redev. Agcy. Tax Allocation Rev. (Cent. Redev. Proj.), Ser. 2013, 5.00%, due 8/1/2026 | | | 1,590,037 | |
| | 2,040,000 | | | Sweetwater Union High Sch. Dist. Pub. Fin. Au. Rev., Ser. 2013, (BAM Insured), 5.00%, due 9/1/2025 | | | 2,199,813 | |
| | 150,000 | | | Tender Option Bond Trust Receipts/Certificates, Ser. 2020, (LOC: Mizuho Cap. Markets LLC), 0.21%, due 7/1/2032 | | | 150,000 | (a)(b) |
| | 9,070,000 | | | Victor Valley Comm. College Dist. G.O. Cap. Appreciation (Election 2008), Ser. 2009-C, 6.88%, due 8/1/2037 | | | 12,590,794 | |
| | 5,095,000 | | | Victor Valley Joint Union High Sch. Dist. G.O. Cap. Appreciation Bonds, Ser. 2009, (Assured Guaranty Insured), 0.00%, due 8/1/2026 | | | 4,854,028 | |
| | 3,000,000 | | | Wiseburn Sch. Dist. G.O. Cap. Appreciation (Election 2010), Ser. 2011-B, (AGM Insured), 0.00%, due 8/1/2036 | | | 3,388,858 | (e) |
| | | | | | | | 87,531,254 | |
| | | | | | | | | |
| Colorado 5.8% | | | | |
| | 2,500,000 | | | Aerotropolis Reg. Trans. Au. Spec. Rev., Ser. 2021, 4.38%, due 12/1/2052 Colorado Ed. & Cultural Facs. Au. Rev. (Charter Sch.- Atlas Preparatory Sch. Proj.) | | | 2,466,439 | |
| | 1,050,000 | | | Ser. 2015, 4.50%, due 4/1/2025 | | | 1,081,631 | (b) |
| | 1,000,000 | | | Ser. 2015, 5.13%, due 4/1/2035 | | | 1,042,667 | (b) |
| | 1,350,000 | | | Ser. 2015, 5.25%, due 4/1/2045 | | | 1,396,766 | (b) |
| | 750,000 | | | Colorado Ed. & Cultural Facs. Au. Rev. Ref., Ser. 2014, 4.50%, due 11/1/2029 | | | 804,029 | |
| | 5,000,000 | | | Denver City & Co. Arpt. Sys. Rev., Ser. 2011-B, 5.00%, due 11/15/2024 Pre-Refunded 11/15/2021 | | | 5,008,472 | |
| | 2,550,000 | | | Plaza Metro. Dist. Number 1 Tax Allocation Rev., Ser. 2013, 4.00%, due 12/1/2023 | | | 2,607,802 | (b) |
| | 5,866,666 | | | Villages at Castle Rock Co. Metro. Dist. Number 6 (Cabs - Cobblestone Ranch Proj.), Ser. 2007-2, 0.00%, due 12/1/2037 | | | 1,911,892 | |
| | | | | | | | 16,319,698 | |
| | | | | | | | | |
| Connecticut 0.3% | | | | |
| | 750,000 | | | Hamden G.O., Ser. 2013, (AGM Insured), 3.13%, due 8/15/2025 | | | 783,197 | |
| | | | | | | | | |
| See Notes to Financial Statements | 15 | |
Schedule of Investments Municipal Fund Inc.^
(cont’d)
| PRINCIPAL AMOUNT | | VALUE | |
| | | | | | | | | |
| District of Columbia 1.1% | | | | |
| $ | 1,615,000 | | | Dist. of Columbia HFA Rev. (Capitol Hill Towers Proj.), Ser. 2011, (Fannie Mae Insured), 4.10%, due 12/1/2026 | | $ | 1,619,140 | |
| | 650,000 | | | Dist. of Columbia Rev. (Friendship Pub. Charter Sch.), Ser. 2012, 3.55%, due 6/1/2022 | | | 662,309 | |
| | 650,000 | | | Dist. of Columbia Std. Dorm. Rev. (Provident Group-Howard Prop.), Ser. 2013, 5.00%, due 10/1/2045 | | | 670,202 | |
| | | | | | | | 2,951,651 | |
| | | | | | | | | |
| Florida 8.2% | | | | |
| | 800,000 | | | Cap. Trust Agcy. Sr. Living Rev. (H-Bay Ministries, Inc. Superior Residences-Third Tier), Ser. 2018-C, 7.50%, due 7/1/2053 | | | 160,000 | (b)(c) |
| | 1,000,000 | | | Cityplace Comm. Dev. Dist. Spec. Assessment Rev. Ref., Ser. 2012, 5.00%, due 5/1/2026 Florida Dev. Fin. Corp. Ed. Facs. Rev. (Renaissance Charter Sch., Inc.) | | | 1,117,083 | |
| | 225,000 | | | Ser. 2012-A, 5.50%, due 6/15/2022 | | | 227,578 | (b) |
| | 3,120,000 | | | Ser. 2013-A, 6.75%, due 12/15/2027 Pre-Refunded 6/15/2023 | | | 3,438,713 | |
| | 1,750,000 | | | Ser. 2014-A, 5.75%, due 6/15/2029 | | | 1,890,047 | |
| | 1,075,000 | | | Florida Dev. Fin. Corp. Ed. Facs. Rev. Ref. (Pepin Academies, Inc.), Ser. 2016-A, 5.00%, due 7/1/2036 | | | 1,115,172 | |
| | 1,200,000 | | | Florida Dev. Fin. Corp. Sr. Living Rev. (Tuscan Isle Champions Gate Proj.), Ser. 2016-A, 6.38%, due 6/1/2046 | | | 840,000 | (b)(c) |
| | 100,000 | | | Greater Orlando Aviation Au. Arpt. Facs. Ref. Rev. (JetBlue Airways Corp. Proj.), Ser. 2013, 5.00%, due 11/15/2036 | | | 104,484 | |
| | 9,000,000 | | | Hillsborough Co. Ind. Dev. Au. Hosp. Rev. (Tampa General Hosp. Proj.), Ser. 2020-A, 3.50%, due 8/1/2055 | | | 9,538,627 | |
| | 1,135,000 | | | Lakeland Ed. Facs. Rev. Ref. (Florida So. College Proj.), Ser. 2012-A, 5.00%, due 9/1/2027 | | | 1,172,829 | |
| | 1,400,000 | | | St. Lucie Co. PCR Rev. Ref. (Florida Pwr. & Lt. Co. Proj.), Ser. 2000, 0.05%, due 9/1/2028 | | | 1,400,000 | (a) |
| | 870,000 | | | Village Comm. Dev. Dist. Number 11 Spec. Assessment Rev., Ser. 2014, 4.13%, due 5/1/2029 | | | 896,875 | |
| | 980,000 | | | Village Comm. Dev. Dist. Number 13 Spec. Assessment Rev., Ser. 2019, 3.70%, due 5/1/2050 | | | 1,029,427 | |
| | | | | | | | 22,930,835 | |
| | | | | | | | | |
| Georgia 0.6% | | | | |
| | 2,000,000 | | | DeKalb Co. Hsg. Au. Sr. Living Rev. Ref. (Baptist Retirement Comm. of Georgia Proj.), Ser. 2019-A, 5.13%, due 1/1/2049 | | | 1,675,600 | (b) |
| | | | | | | | | |
| Hawaii 2.7% | | | | |
| | 5,200,000 | | | Hawaii St. Arpt. Sys. Ref. Rev., Ser. 2011, 4.13%, due 7/1/2024 | | | 5,215,529 | |
| | 2,250,000 | | | Hawaii St. Dept. of Budget & Fin. Spec. Purp. Rev. (Hawaiian Elec. Co., Inc. - Subsidiary), Ser. 2019, 3.50%, due 10/1/2049 | | | 2,332,052 | |
| | | | | | | | 7,547,581 | |
| | | | | | | | | |
| See Notes to Financial Statements | 16 | |
Schedule of Investments Municipal Fund Inc.^
(cont’d)
| PRINCIPAL AMOUNT | | VALUE | |
| | | | | | | | | |
| Illinois 20.6% | | | | |
| $ | 5,705,000 | | | Berwyn G.O., Ser. 2013-A, 5.00%, due 12/1/2027 Chicago G.O. | | $ | 6,037,001 | |
| | 250,000 | | | Ser. 2002-2002B, 5.13%, due 1/1/2027 | | | 281,573 | |
| | 2,000,000 | | | Ser. 2002-B, 5.00%, due 1/1/2025 | | | 2,258,668 | |
| | 1,000,000 | | | Ser. 2019-A, 5.00%, due 1/1/2044 | | | 1,170,140 | |
| | 3,500,000 | | | Chicago Midway Arpt. Rev. (Second Lien), Ser. 2014-C, (LOC: Barclays Bank PLC), 0.09%, due 1/1/2044 Chicago Ref. G.O. | | | 3,500,000 | (a) |
| | 1,000,000 | | | Ser. 2005-D, 5.50%, due 1/1/2040 | | | 1,117,226 | |
| | 2,500,000 | | | Ser. 2012-C, 5.00%, due 1/1/2024 | | | 2,517,432 | |
| | 700,000 | | | Ser. 2014-A, 5.00%, due 1/1/2027 | | | 760,506 | |
| | 3,000,000 | | | Ser. 2017-A, 6.00%, due 1/1/2038 | | | 3,640,307 | |
| | | | | Cook Co. Sch. Dist. Number 83 G.O. (Mannheim) | | | | |
| | 1,350,000 | | | Ser. 2013-C, 5.45%, due 12/1/2030 | | | 1,492,815 | |
| | 1,960,000 | | | Ser. 2013-C, 5.50%, due 12/1/2031 | | | 2,169,377 | |
| | 1,560,000 | | | Illinois Fin. Au. Ref. Rev. (Presence Hlth. Network Obligated Group), Ser. 2016-C, 5.00%, due 2/15/2031 | | | 1,873,043 | |
| | 2,000,000 | | | Illinois Fin. Au. Rev. Ref. (Northwestern Mem. Hlth. Care Obligated Group), Ser. 2017-A, 4.00%, due 7/15/2047 | | | 2,273,745 | |
| | 1,905,000 | | | Illinois Sports Facs. Au. Cap. Appreciation Rev. (St. Tax Supported), Ser. 2001, (AMBAC Insured), 0.00%, due 6/15/2026 Illinois St. G.O. | | | 1,795,432 | |
| | 3,900,000 | | | Ser. 2012, 4.00%, due 8/1/2025 | | | 3,996,990 | |
| | 1,000,000 | | | Ser. 2013, 5.00%, due 7/1/2023 | | | 1,074,524 | |
| | 5,200,000 | | | Ser. 2017-D, 5.00%, due 11/1/2028 | | | 6,199,384 | |
| | 4,250,000 | | | Illinois St. G.O. Ref., Ser. 2016, 5.00%, due 2/1/2024 So. Illinois Univ. Cert. of Participation (Cap. Imp. Proj.) | | | 4,665,125 | |
| | 945,000 | | | Ser. 2014-A-1, (BAM Insured), 5.00%, due 2/15/2027 | | | 1,033,530 | |
| | 1,375,000 | | | Ser. 2014-A-1, (BAM Insured), 5.00%, due 2/15/2028 | | | 1,502,172 | |
| | 715,000 | | | Ser. 2014-A-1, (BAM Insured), 5.00%, due 2/15/2029 | | | 780,277 | |
| | | | | Univ. of Illinois (Hlth. Svc. Facs. Sys.) | | | | |
| | 2,725,000 | | | Ser. 2013, 5.00%, due 10/1/2027 | | | 2,922,300 | |
| | 2,875,000 | | | Ser. 2013, 5.75%, due 10/1/2028 | | | 3,124,563 | |
| | 1,500,000 | | | Upper Illinois River Valley Dev. Au. Rev. Ref. (Cambridge Lakes Learning Ctr.), Ser. 2017-A, 5.25%, due 12/1/2047 | | | 1,595,881 | (b) |
| | | | | | | | 57,782,011 | |
| | | | | | | | | |
| Indiana 1.2% | | | | |
| | 3,055,000 | | | Indiana Trans. Fin. Au. Hwy. Ref. Rev., Ser. 2004-B, (National Public Finance Guarantee Corp. Insured), 5.75%, due 12/1/2021 | | | 3,068,820 | |
| | 365,000 | | | Valparaiso Exempt Facs. Rev. (Pratt Paper LLC Proj.), Ser. 2013, 5.88%, due 1/1/2024 | | | 387,923 | |
| | | | | | | | 3,456,743 | |
| | | | | | | | | |
| Iowa 0.8% | | | | |
| | | | | Iowa St. Higher Ed. Loan Au. Rev. (Des Moines Univ. Proj.) | | | | |
| | 1,105,000 | | | Ser. 2020, 5.00%, due 10/1/2028 | | | 1,352,333 | |
| | 775,000 | | | Ser. 2020, 4.00%, due 10/1/2045 | | | 865,620 | |
| | | | | | | | 2,217,953 | |
| | | | | | | | | |
| Kentucky 0.5% | | | | |
| | 1,350,000 | | | Ashland City, Kentucky Med. Ctr. Ref. Rev. (Ashland Hosp. Corp. DBA Kings Daughter Med. Ctr.), Ser. 2019, (AGM Insured), 3.00%, due 2/1/2040 | | | 1,399,303 | |
| | | | | | | | | |
| See Notes to Financial Statements | 17 | |
Schedule of Investments Municipal Fund Inc.^
(cont’d)
| PRINCIPAL AMOUNT | | VALUE | |
| | | | | | | | | |
| Louisiana 2.1% | | | | |
| $ | 1,715,000 | | | Louisiana Local Gov’t Env. Facs. & Comm. Dev. Au. Rev. Ref. (Westside Habilitation Ctr. Proj.), Ser. 2017-A, 5.75%, due 2/1/2032 | | $ | 1,864,974 | (b) |
| | 775,000 | | | Louisiana Pub. Facs. Au. Rev. (Southwest Louisiana Charter Academy Foundation Proj.), Ser. 2013-A, 7.63%, due 12/15/2028 | | | 823,321 | |
| | 700,000 | | | Louisiana St. Local Gov’t Env. Facs. & Comm. Dev. Au. Rev. (Lafourche Parish Gomesa Proj.), Ser. 2019, 3.95%, due 11/1/2043 | | | 750,059 | (b) |
| | 1,655,000 | | | St. Charles Parish Gulf Zone Opportunity Rev. (Valero Energy Corp.), Ser. 2010, 4.00%, due 12/1/2040 Putable 6/1/2022 | | | 1,689,170 | |
| | 800,000 | | | St. John the Baptist Parish LA Rev. Ref. (Marathon Oil Corp. Proj.), Subser. 2017-A-1, 2.00%, due 6/1/2037 Putable 4/1/2023 | | | 813,581 | |
| | | | | | | | 5,941,105 | |
| | | | | | | | | |
| Massachusetts 1.7% | | | | |
| | | | | Massachusetts St. Dev. Fin. Agcy. Rev. (Milford Reg. Med. Ctr.) | | | | |
| | 200,000 | | | Ser. 2014-F, 5.00%, due 7/15/2024 | | | 214,416 | |
| | 415,000 | | | Ser. 2014-F, 5.00%, due 7/15/2025 | | | 443,864 | |
| | 200,000 | | | Ser. 2014-F, 5.00%, due 7/15/2026 | | | 213,409 | |
| | 190,000 | | | Ser. 2014-F, 5.00%, due 7/15/2027 | | | 202,231 | |
| | 150,000 | | | Ser. 2014-F, 5.00%, due 7/15/2028 | | | 159,322 | |
| | | | | Massachusetts St. Ed. Fin. Au. Rev. | | | | |
| | 860,000 | | | Ser. 2011-J, 5.00%, due 7/1/2023 | | | 860,810 | |
| | 1,200,000 | | | Ser. 2012-J, 4.70%, due 7/1/2026 | | | 1,202,223 | |
| | 1,490,000 | | | Ser. 2013-K, 4.50%, due 7/1/2024 | | | 1,528,251 | |
| | | | | | | | 4,824,526 | |
| | | | | | | | | |
| Michigan 6.2% | | | | |
| | | | | City of Detroit MI G.O. | | | | |
| | 3,000,000 | | | Ser. 2021-A, 5.00%, due 4/1/2046 | | | 3,618,930 | |
| | 3,850,000 | | | Ser. 2021-A, 5.00%, due 4/1/2050 | | | 4,627,314 | |
| | 1,500,000 | | | Detroit Downtown Dev. Au. Tax Increment Rev. Ref. (Catalyst Dev. Proj.), Ser. 2018-A, (AGM Insured), 5.00%, due 7/1/2048 Michigan St. Hsg. Dev. Au. Rev. | | | 1,653,625 | |
| | 1,935,000 | | | Ser. 2016-C, 2.05%, due 12/1/2022 | | | 1,961,019 | |
| | 1,835,000 | | | Ser. 2016-C, 2.15%, due 6/1/2023 | | | 1,871,374 | |
| | 2,500,000 | | | Michigan St. Strategic Fund Ltd. Oblig. Rev. (Green Bond-Recycled Board Machine Proj.), Ser. 2021, 4.00%, due 10/1/2061 Putable 10/1/2026 | | | 2,776,151 | |
| | 750,000 | | | Michigan St. Strategic Fund Ltd. Oblig. Rev. (Improvement Proj.), Ser. 2018, 5.00%, due 6/30/2048 | | | 884,245 | |
| | 100,000 | | | Summit Academy Pub. Sch. Academy Ref. Rev., Ser. 2005, 6.38%, due 11/1/2035 | | | 100,123 | |
| | | | | | | | 17,492,781 | |
| | | | | | | | | |
| Minnesota 0.2% | | | | |
| | 400,000 | | | St. Paul Hsg. & Redev. Au. Charter Sch. Lease Rev. (Metro Deaf Sch. Proj.), Ser. 2018-A, 5.00%, due 6/15/2038 | | | 429,650 | (b) |
| | | | | | | | | |
| Mississippi 0.8% | | | | |
| | 1,700,000 | | | Mississippi Dev. Bank Spec. Oblig. (Jackson Co. Gomesa Proj.), Ser. 2021, 3.63%, due 11/1/2036 | | | 1,664,321 | (b) |
| | 565,000 | | | Mississippi St. Bus. Fin. Corp. Rev. Ref. (Sys. Energy Res., Inc. Proj.), Ser. 2019, 2.50%, due 4/1/2022 | | | 567,472 | |
| | | | | | | | 2,231,793 | |
| | | | | | | | | |
| See Notes to Financial Statements | 18 | |
Schedule of Investments Municipal Fund Inc.^
(cont’d)
| PRINCIPAL AMOUNT | | VALUE | |
| | | | | | | | | |
| Nevada 0.6% | | | | |
| | | | | Director of the St. of Nevada Dept. of Bus. & Ind. Rev. (Somerset Academy) | | | | |
| $ | 1,100,000 | | | Ser. 2015-A, 4.00%, due 12/15/2025 | | $ | 1,149,033 | (b) |
| | 500,000 | | | Ser. 2015-A, 5.13%, due 12/15/2045 | | | 544,917 | (b) |
| | | | | | | | 1,693,950 | |
| | | | | | | | | |
| New Hampshire 0.3% | | | | |
| | 750,000 | | | Nat’l Fin. Au. Rev. (Green Bond), Ser. 2020-B, 3.75%, due 7/1/2045 Putable 7/2/2040 | | | 787,176 | (b) |
| | | | | | | | | |
| New Jersey 10.5% | | | | |
| | 1,325,000 | | | New Jersey Econ. Dev. Au. Rev. (Continental Airlines, Inc., Proj.), Ser. 1999, 5.13%, due 9/15/2023 | | | 1,377,980 | |
| | 1,230,000 | | | New Jersey Econ. Dev. Au. Rev. (Sch. Facs. Construction), Ser. 2019-LLL, 5.00%, due 6/15/2028 New Jersey Econ. Dev. Au. Rev. (The Goethals Bridge Replacement Proj.) | | | 1,521,442 | |
| | 500,000 | | | Ser. 2013, 5.25%, due 1/1/2025 | | | 552,343 | |
| | 500,000 | | | Ser. 2013, 5.50%, due 1/1/2026 | | | 554,518 | |
| | | | | New Jersey Econ. Dev. Au. Rev. (United Methodist Homes of New Jersey Obligated Group) | | | | |
| | 1,420,000 | | | Ser. 2013, 3.50%, due 7/1/2024 | | | 1,462,445 | |
| | 1,470,000 | | | Ser. 2013, 3.63%, due 7/1/2025 | | | 1,514,246 | |
| | 1,520,000 | | | Ser. 2013, 3.75%, due 7/1/2026 | | | 1,564,549 | |
| | 765,000 | | | Ser. 2013, 4.00%, due 7/1/2027 | | | 788,882 | |
| | 1,565,000 | | | New Jersey Higher Ed. Assist. Au. Rev. (Std. Loan Rev.), Ser. 2012-1A, 4.38%, due 12/1/2026 New Jersey St. Econ. Dev. Au. Sch. Rev. (Beloved Comm. Charter, Sch., Inc. Proj.) | | | 1,618,560 | |
| | 1,105,000 | | | Ser. 2019-A, 5.00%, due 6/15/2049 | | | 1,187,951 | (b) |
| | 725,000 | | | Ser. 2019-A, 5.00%, due 6/15/2054 | | | 777,381 | (b) |
| | 8,250,000 | | | New Jersey St. Trans. Trust Fund Au., Ser. 2019-BB, 4.00%, due 6/15/2050 New Jersey St. Trans. Trust Fund Au. Trans. Sys. Rev. Ref. | | | 9,129,751 | |
| | 1,250,000 | | | Ser. 2018-A, 5.00%, due 12/15/2036 | | | 1,520,349 | |
| | 4,000,000 | | | Ser. 2018-A, 4.25%, due 12/15/2038 | | | 4,567,567 | |
| | 1,000,000 | | | Ser. 2018-A, (BAM Insured), 4.00%, due 12/15/2037 | | | 1,147,951 | |
| | | | | | | | 29,285,915 | |
| | | | | | | | | |
| New Mexico 0.5% | | | | |
| | | | | Winrock Town Ctr. Tax Increment Dev. Dist. Number 1 Tax Allocation Sr. Lien Rev. (Gross Receipts Tax Increment Bond) | | | | |
| | 443,000 | | | Ser. 2015, 5.25%, due 5/1/2025 | | | 450,647 | (b) |
| | 1,000,000 | | | Ser. 2015, 5.75%, due 5/1/2030 | | | 1,017,179 | (b) |
| | | | | | | | 1,467,826 | |
| | | | | | | | | |
| New York 17.6% | | | | |
| | 225,000 | | | Buffalo & Erie Co. Ind. Land Dev. Corp. Rev. Ref. (Charter Sch. for Applied Technologies Proj.), Ser. 2017-A, 5.00%, due 6/1/2035 | | | 248,707 | |
| | 625,000 | | | Buffalo & Erie Co. Ind. Land Dev. Corp. Rev. Ref. (Orchard Park), Ser. 2015, 5.00%, due 11/15/2029 | | | 706,948 | |
| | 1,345,000 | | | Build NYC Res. Corp. Ref. Rev. (New York Law Sch. Proj.), Ser. 2016, 4.00%, due 7/1/2045 Build NYC Res. Corp. Rev. | | | 1,453,803 | |
| | 1,100,000 | | | Ser. 2014, 5.00%, due 11/1/2024 | | | 1,220,977 | |
| | 835,000 | | | Ser. 2014, 5.25%, due 11/1/2029 | | | 922,553 | |
| | 975,000 | | | Ser. 2014, 5.50%, due 11/1/2044 | | | 1,065,753 | |
| | 250,000 | | | Build NYC Res. Corp. Rev. (Metro. Lighthouse Charter Sch. Proj.), Ser. 2017-A, 5.00%, due 6/1/2047 | | | 275,394 | (b) |
| | 825,000 | | | Build NYC Res. Corp. Rev. (New Dawn Charter Sch. Proj.), Ser. 2019, 5.75%, due 2/1/2049 Build NYC Res. Corp. Rev. (South Bronx Charter Sch. for Int’l Cultures and the Arts) | | | 889,847 | (b) |
| | 205,000 | | | Ser. 2013-A, 3.88%, due 4/15/2023 | | | 209,866 | |
| | 1,450,000 | | | Ser. 2013-A, 5.00%, due 4/15/2043 | | | 1,498,017 | |
| | | | | | | | | |
| See Notes to Financial Statements | 19 | |
Schedule of Investments Municipal Fund Inc.^
(cont’d)
| PRINCIPAL AMOUNT | | VALUE | |
| | | | | | | |
| $ | 720,000 | | | Build NYC Res. Corp. Solid Waste Disp. Ref. Rev. (Pratt Paper, Inc. Proj.), Ser. 2014, 4.50%, due 1/1/2025 | | $ | 767,138 | (b) |
| | | | | Hempstead Town Local Dev. Corp. Rev. (Molloy College Proj.) | | | | |
| | 700,000 | | | Ser. 2014, 5.00%, due 7/1/2023 | | | 750,545 | |
| | 735,000 | | | Ser. 2014, 5.00%, due 7/1/2024 | | | 813,349 | |
| | 390,000 | | | Ser. 2018, 5.00%, due 7/1/2030 | | | 470,048 | |
| | 1,400,000 | | | Jefferson Co. IDA Solid Waste Disp. Rev. (Green Bond-Reenergy Black River LLC Proj.), Ser. 2014, 5.25%, due 1/1/2024 | | | 1,363,151 | (b) |
| | | | | Metro. Trans. Au. Rev. (Green Bond) | | | | |
| | 8,500,000 | | | Ser. 2020-D-3, 4.00%, due 11/15/2049 | | | 9,407,449 | |
| | 3,000,000 | | | Ser. 2020-D-3, 4.00%, due 11/15/2050 | | | 3,317,787 | |
| | 5,000,000 | | | New York City IDA Rev. (Yankee Stadium Proj.), Ser. 2020, 3.00%, due 3/1/2049 | | | 5,101,012 | |
| | 500,000 | | | New York Liberty Dev. Corp. Ref. Rev. (3 World Trade Ctr. Proj.), Ser. 2014-2, 5.38%, due 11/15/2040 | | | 554,459 | (b) |
| | 3,200,000 | | | New York St. Dorm. Au. Rev. Non St. Supported Debt (Univ. Facs.), Ser. 2013-A, 5.00%, due 7/1/2028 Pre-Refunded 7/1/2023 | | | 3,453,325 | |
| | 2,300,000 | | | New York St. Dorm. Au. Rev. Ref. Non St. Supported Debt (Montefiore Oblig. Group), Ser. 2018-A, 5.00%, due 8/1/2035 | | | 2,771,057 | |
| | 2,000,000 | | | New York St. Mtge. Agcy. Homeowner Mtge. Ref. Rev., Ser. 2014-189, 3.45%, due 4/1/2027 | | | 2,072,777 | |
| | 1,000,000 | | | New York St. Trans. Dev. Corp. Fac. Rev. (Empire St. Thruway Svc. Areas Proj.), Ser. 2021, 4.00%, due 4/30/2053 | | | 1,118,643 | |
| | 2,000,000 | | | New York St. Trans. Dev. Corp. Spec. Fac. Rev. (Delta Airlines, Inc.-LaGuardia Arpt. Term. C&D Redev.), Ser. 2018, 5.00%, due 1/1/2033 | | | 2,377,639 | |
| | 550,000 | | | Newburgh G.O. (Deficit Liquidation), Ser. 2012-B, 5.00%, due 6/15/2022 | | | 563,940 | |
| | 1,435,000 | | | Niagara Area Dev. Corp. Rev. (Niagara Univ. Proj.), Ser. 2012-A, 5.00%, due 5/1/2023 Pre- Refunded 5/1/2022 | | | 1,468,915 | |
| | 1,155,000 | | | Suffolk Co. Judicial Facs. Agcy. Lease Rev. (H. Lee Dennison Bldg.), Ser. 2013, 4.25%, due 11/1/2026 | | | 1,222,974 | |
| | 2,000,000 | | | Utility Debt Securitization Au. Rev., Ser. 2013-TE, 5.00%, due 12/15/2028 | | | 2,195,012 | |
| | 500,000 | | | Westchester Co. Local Dev. Corp. Rev. (Purchase Sr. Learning Comm., Inc. Proj.), Ser. 2021-A, 5.00%, due 7/1/2056 | | | 519,354 | (b)(f) |
| | 600,000 | | | Westchester Co. Local Dev. Corp. Rev. Ref. (Wartburg Sr. Hsg. Proj.), Ser. 2015-A, 5.00%, due 6/1/2030 | | | 602,901 | (b)(g) |
| | | | | | | | 49,403,340 | |
| | | | | | | | | |
| North Carolina 3.0% | | | | |
| | 3,860,000 | | | North Carolina HFA Homeownership Ref. Rev., Ser. 2020-45, (GNMA/FNMA/FHLMC Insured), 2.20%, due 7/1/2040 | | | 3,820,915 | |
| | 855,000 | | | North Carolina Med. Care Commission Hlth. Care Facs. Rev. (Lutheran Svc. For Aging, Inc.), Ser. 2012-A, 4.25%, due 3/1/2024 | | | 865,970 | |
| | | | | North Carolina Med. Care Commission Retirement Facs. Rev. | | | | |
| | 735,000 | | | Ser. 2013, 5.13%, due 7/1/2023 | | | 774,911 | |
| | 2,000,000 | | | Ser. 2020-A, 4.00%, due 9/1/2050 | | | 2,140,453 | |
| | 700,000 | | | North Carolina Med. Care Commission Retirement Facs. Rev. (Twin Lakes Comm.), Ser. 2019- A, 5.00%, due 1/1/2049 | | | 782,058 | |
| | | | | | | | 8,384,307 | |
| | | | | | | | | |
| Ohio 5.8% | | | | |
| | 7,190,000 | | | Buckeye Tobacco Settlement Fin. Au. Asset-Backed Sr. Ref. Rev., Ser. 2020-B-2, 5.00%, due 6/1/2055 | | | 8,068,181 | |
| | 2,060,000 | | | Cleveland Arpt. Sys. Rev. Ref., Ser. 2012-A, 5.00%, due 1/1/2027 Pre-Refunded 1/1/2022 | | | 2,076,434 | |
| | 1,000,000 | | | Jefferson Co. Port Econ. Dev. Au. Rev. (JSW Steel USA, Ohio, Inc. Proj.), Ser. 2021, 3.50%, due 12/1/2051 | | | 1,009,307 | (b) |
| | 500,000 | | | Ohio St. Air Quality Dev. Au. Exempt Facs. Rev. (AMG Vanadium LLC), Ser. 2019, 5.00%, due 7/1/2049 | | | 570,566 | (b) |
| | |
| See Notes to Financial Statements | 20 | |
Schedule of Investments Municipal Fund Inc.^
(cont’d)
| PRINCIPAL AMOUNT | | VALUE | |
| | | | | | | |
| $ | 1,000,000 | | | Ohio St. Air Quality Dev. Au. Rev. (Ohio Valley Elec. Corp. Proj.), Ser. 2014-B, 2.60%, due 6/1/2041 Putable 10/1/2029 |
| $ | 1,048,177 | |
| | 3,500,000 | | | Port Au. of Greater Cincinnati Dev. Rev. (Convention Ctr. Hotel Acquisition and Demolition Proj.), Ser. 2020-A, 3.00%, due 5/1/2023 | | | 3,516,917 | |
| | | | | | | | 16,289,582 | |
| | | | | | | | | |
| Oklahoma 1.1% | | | | |
| | 2,000,000 | | | Oklahoma St. Dev. Fin. Au. Hlth. Sys. Rev. (OU Medicine Proj.), Ser. 2018-B, 5.00%, due 8/15/2033 | | | 2,421,607 | |
| | | | | Tulsa Arpt. Imp. Trust Ref. Rev. | | | | |
| | 250,000 | | | Ser. 2015-A, (BAM Insured), 5.00%, due 6/1/2024 | | | 278,327 | |
| | 400,000 | | | Ser. 2015-A, (BAM Insured), 5.00%, due 6/1/2025 Pre-Refunded 6/1/2024 | | | 445,869 | |
| | | | | | | | 3,145,803 | |
| | | | | | | | | |
| Oregon 0.0%(h) | | | | |
| | 30,000 | | | Oregon St. Hsg. & Comm. Svc. Dept. Multi-Family Rev., Ser. 2012-B, (FHA/GNMA/FNMA/ FHLMC Insured), 3.50%, due 7/1/2027 | | | 30,109 | |
| | | | | | | | | |
| Pennsylvania 5.6% | | | | |
| | | | | Indiana Co. Ind. Dev. Au. Rev. (Std. Cooperative Assoc., Inc.) | | | | |
| | 500,000 | | | Ser. 2012, 3.50%, due 5/1/2025 | | | 506,757 | |
| | 350,000 | | | Ser. 2012, 3.60%, due 5/1/2026 | | | 354,783 | |
| | 2,830,000 | | | Lancaster Co. Hosp. Au. Ref. Rev. (Hlth. Centre-Landis Homes Retirement Comm. Proj.), Ser. 2015-A, 4.25%, due 7/1/2030 | | | 3,035,142 | |
| | 1,250,000 | | | Lancaster Ind. Dev. Au. Rev. (Garden Spot Village Proj.), Ser. 2013, 5.38%, due 5/1/2028 Pre-Refunded 5/1/2023 | | | 1,345,128 | |
| | 3,430,000 | | | Norristown Area Sch. Dist. Cert. of Participation (Installment Purchase), Ser. 2012, 4.50%, due 4/1/2027 Pre-Refunded 4/1/2022 | | | 3,487,141 | |
| | 2,625,000 | | | Pennsylvania Econ. Dev. Fin. Au. Exempt Facs. Rev. Ref. (Amtrak Proj.), Ser. 2012-A, 5.00%, due 11/1/2024 | | | 2,740,704 | |
| | 2,350,000 | | | Pennsylvania Econ. Dev. Fin. Au. Rev. Ref. (Tapestry Moon Sr. Hsg. Proj.), Ser. 2018-A, 6.75%, due 12/1/2053 | | | 940,000 | (b)(c) |
| | 3,000,000 | | | Pennsylvania St. Turnpike Commission Turnpike Rev., Subser. 2019-A, 4.00%, due 12/1/2049 | | | 3,359,848 | |
| | | | | | | | 15,769,503 | |
| | | | | | | | | |
| Puerto Rico 6.6% | | | | |
| | 16,373,000 | | | Puerto Rico Sales Tax Fin. Corp. Sales Tax Rev., Ser. 2018-A-1, 5.00%, due 7/1/2058 | | | 18,484,259 | |
| | | | | | | | | |
| Rhode Island 1.1% | | | | |
| | 3,045,000 | | | Rhode Island St. Hsg. & Mtge. Fin. Corp. Rev. (Homeownership Opportunity), Ser. 2020-73- A, 2.30%, due 10/1/2040 | | | 3,037,197 | |
| | | | | | | | | |
| South Carolina 1.4% | | | | |
| | 1,480,000 | | | South Carolina Jobs Econ. Dev. Au. Econ. Dev. Rev. (River Park Sr. Living Proj.), Ser. 2017-A, 7.75%, due 10/1/2057 | | | 1,483,427 | |
| | 2,325,000 | | | South Carolina Jobs Econ. Dev. Au. Solid Waste Disp. Rev. (Green Bond-Jasper Pellets LLC, Proj.), Ser. 2018-A, 7.00%, due 11/1/2038 | | | 2,030,991 | (b) |
| | 750,000 | | | South Carolina Jobs Econ. Dev. Au. Solid Waste Disp. Rev. (Repower South Berkeley LLC Proj.), Ser. 2017, 6.25%, due 2/1/2045 | | | 300,000 | (b)(c) |
| | | | | | | | 3,814,418 | |
| | |
| See Notes to Financial Statements | 21 | |
Schedule of Investments Municipal Fund Inc.^
(cont’d)
| PRINCIPAL AMOUNT | | VALUE | |
| | | | | | | |
| Tennessee 0.8% | | | | |
| $ | 2,000,000 | | | Tennessee St. Energy Acquisition Corp. Gas Rev. (Goldman Sachs Group, Inc.), Ser. 2006-A, 5.25%, due 9/1/2023 | | $ | 2,173,172 | |
| | | | | | | | | |
| Texas 5.4% | | | | |
| | 250,000 | | | Anson Ed. Facs. Corp. Ed. Rev. (Arlington Classics Academy), Ser. 2016-A, 5.00%, due 8/15/2045 | | | 272,400 | |
| | | | | Arlington Higher Ed. Fin. Corp. Rev. (Universal Academy) | | | | |
| | 340,000 | | | Ser. 2014-A, 5.88%, due 3/1/2024 | | | 357,240 | |
| | 1,000,000 | | | Ser. 2014-A, 6.63%, due 3/1/2029 | | | 1,090,877 | |
| | 730,000 | | | Austin Comm. College Dist. Pub. Fac. Corp. Lease Rev., Ser. 2018-C, 4.00%, due 8/1/2042 | | | 813,234 | |
| | 750,000 | | | Central Texas Reg. Mobility Au. Sr. Lien Ref. Rev., Ser. 2020-E, 5.00%, due 1/1/2045 | | | 911,966 | |
| | 320,000 | | | Clifton Higher Ed. Fin. Corp. Rev. (Uplift Ed.), Ser. 2013-A, 3.10%, due 12/1/2022 | | | 324,148 | |
| | 250,000 | | | Dallas Co. Flood Ctrl. Dist. Number 1 Ref. G.O., Ser. 2015, 5.00%, due 4/1/2028 | | | 256,887 | (b) |
| | 2,000,000 | | | Fort Bend Co. Ind. Dev. Corp. Rev. (NRG Energy, Inc.), Ser. 2012-B, 4.75%, due 11/1/2042 | | | 2,071,262 | |
| | 1,000,000 | | | Harris Co. Cultural Ed. Facs. Fin. Corp. Rev. (Brazos Presbyterian Homes, Inc. Proj.), Ser. 2013-B, 5.75%, due 1/1/2028 | | | 1,049,904 | |
| | | | | Houston Higher Ed. Fin. Corp. Rev. (Cosmos Foundation) | | | | |
| | 85,000 | | | Ser. 2012-A, 4.00%, due 2/15/2022 | | | 85,921 | |
| | 1,000,000 | | | Ser. 2012-A, 5.00%, due 2/15/2032 | | | 1,013,699 | |
| | 300,000 | | | Houston Utils. Sys. Rev. Ref. (First Lien), Ser. 2018-C, (LOC: Barclays Bank PLC), 0.06%, due 5/15/2034 | | | 300,000 | (a) |
| | | | | New Hope Cultural Ed. Facs. Fin. Corp. Rev. (Beta Academy) | | | | |
| | 545,000 | | | Ser. 2019, 5.00%, due 8/15/2039 | | | 570,183 | (b) |
| | 520,000 | | | Ser. 2019, 5.00%, due 8/15/2049 | | | 540,484 | (b) |
| | 1,225,000 | | | New Hope Cultural Ed. Facs. Fin. Corp. Sr. Living Rev. (Bridgemoor Plano Proj.), Ser. 2018-A, 7.25%, due 12/1/2053 | | | 850,427 | (c) |
| | 500,000 | | | New Hope Cultural Ed. Facs. Fin. Corp. Sr. Living Rev. (Cardinal Bay, Inc. Village On The Park Carriage), Ser. 2016-C, 5.50%, due 7/1/2046 | | | 377,917 | |
| | 1,250,000 | | | Texas Private Activity Bond Surface Trans. Corp. Sr. Lien Rev. Ref. (North Tarrant Express Managed Lanes Proj.), Ser. 2019-A, 4.00%, due 12/31/2039 | | | 1,424,257 | |
| | 1,500,000 | | | Texas Pub. Fin. Au. Rev. (So. Univ. Fin. Sys.), Ser. 2013, (BAM Insured), 5.00%, due 11/1/2021 | | | 1,500,000 | |
| | 1,000,000 | | | Texas St. Private Activity Bond Surface Trans. Corp. Rev. (Segment 3C Proj.), Ser. 2019, 5.00%, due 6/30/2058 | | | 1,187,857 | |
| | | | | | | | 14,998,663 | |
| | | | | | | | | |
| Utah 2.9% | | | | |
| | | | | Salt Lake City Arpt. Rev. | | | | |
| | 1,000,000 | | | Ser. 2017-A, 5.00%, due 7/1/2042 | | | 1,185,990 | |
| | 2,000,000 | | | Ser. 2017-A, 5.00%, due 7/1/2047 | | | 2,369,414 | |
| | 1,000,000 | | | Ser. 2018-A, 5.00%, due 7/1/2043 | | | 1,199,175 | |
| | 3,000,000 | | | Salt Lake Co. Hosp. Rev. (IHC Hlth. Svc., Inc.), Ser. 2001, (AMBAC Insured), 5.40%, due 2/15/2028 | | | 3,424,422 | |
| | 35,000 | | | Utah Hsg. Corp. Single Family Mtge. Rev., Ser. 2011-A2, Class I, 5.45%, due 7/1/2022 | | | 35,072 | |
| | | | | | | | 8,214,073 | |
| | | | | | | | | |
| Vermont 1.5% | | | | |
| | | | | Vermont Std. Assist. Corp. Ed. Loan Rev. | | | | |
| | 155,000 | | | Ser. 2013-A, 4.25%, due 6/15/2024 | | | 157,513 | |
| | 365,000 | | | Ser. 2013-A, 4.35%, due 6/15/2025 | | | 370,778 | |
| | 545,000 | | | Ser. 2013-A, 4.45%, due 6/15/2026 | | | 553,418 | |
| | 175,000 | | | Ser. 2013-A, 4.55%, due 6/15/2027 | | | 177,636 | |
| | 1,800,000 | | | Ser. 2014-A, 5.00%, due 6/15/2024 | | | 1,990,396 | |
| | 980,000 | | | Ser. 2015-A, 4.13%, due 6/15/2027 | | | 1,042,739 | |
| | | | | | | | 4,292,480 | |
| | |
| See Notes to Financial Statements | 22 | |
Schedule of Investments Municipal Fund Inc.^
(cont’d)
| PRINCIPAL AMOUNT | | VALUE | |
| | | | | | | |
| Virginia 0.1% | | | | |
| $ | 360,000 | | | Fairfax Co. Econ. Dev. Au. Residential Care Fac. Rev. (Vinson Hall LLC), Ser. 2013-A, 4.00%, due 12/1/2022 | | $ | 367,400 | |
| | | | | | | | | |
| Washington 3.9% | | | | |
| | 6,700,000 | | | Vancouver Downtown Redev. Au. Rev. (Conference Ctr. Proj.), Ser. 2013, 4.00%, due 1/1/2028 | | | 7,050,733 | |
| | 1,000,000 | | | Washington St. Econ. Dev. Fin. Au. Env. Facs. Rev. (Green Bond), Ser. 2020-A, 5.63%, due 12/1/2040 | | | 1,178,539 | (b) |
| | 790,000 | | | Washington St. Hlth. Care Fac. Au. Rev. Ref. (Virginia Mason Med. Ctr.), Ser. 2017, 5.00%, due 8/15/2026 | | | 924,047 | |
| | 1,491,266 | | | Washington St. Hsg. Fin. Commission, Ser. 2021-A-1, 3.50%, due 12/20/2035 | | | 1,710,182 | |
| | | | | | | | 10,863,501 | |
| | | | | | | | | |
| Wisconsin 1.6% | | | | |
| | 870,000 | | | Pub. Fin. Au. Ed. Rev. (Pine Lake Preparatory, Inc.), Ser. 2015, 4.95%, due 3/1/2030 | | | 956,303 | (b) |
| | 200,000 | | | Pub. Fin. Au. Ed. Rev. (Resh Triangle High Sch. Proj.), Ser. 2015-A, 5.38%, due 7/1/2035 | | | 214,774 | (b) |
| | 1,115,000 | | | Pub. Fin. Au. Rev. Ref. (Roseman Univ. Hlth. Sciences Proj.), Ser. 2015, 5.00%, due 4/1/2025 | | | 1,195,407 | |
| | 2,000,000 | | | Pub. Fin. Au. Sr. Rev. (Wonderful Foundations Charter Sch. Portfolio Proj.), Ser. 2020-A-1, 5.00%, due 1/1/2055 | | | 2,184,919 | (b) |
| | | | | | | | 4,551,403 | |
| | | | | | | | | |
| Wyoming 0.7% | | | | |
| | 2,000,000 | | | Lincoln Co. PCR (PacifiCorp.), Ser. 1994, 0.10%, due 11/1/2024 | | | 2,000,000 | (a) |
| | | | | | | | | |
| | | | | Total Investments 159.2% (Cost $410,453,524) | | | 446,209,956 | |
| | | | | | | | | |
| | | | | Other Assets Less Liabilities 1.6% | | | 4,416,596 | |
| | | | | | | | | |
| | | | | Liquidation Preference of Variable Rate Municipal Term Preferred Shares (net of unamortized deferred offering costs of $5,962) (60.8)% | | | (170,394,038 | ) |
| | | | | | | | | |
| | | | | Net Assets Applicable to Common Stockholders 100.0% | | $ | 280,232,514 | |
| | | |
| (a) | | Variable rate demand obligation where the stated interest rate is not based on a published reference rate and spread. Rather, the interest rate generally resets daily or weekly and is determined by the remarketing agent. The rate shown represents the rate in effect at October 31, 2021. |
| | | |
| (b) | | Securities were purchased under Rule 144A of the Securities Act of 1933, as amended, or are otherwise restricted and, unless registered under the Securities Act of 1933 or exempted from registration, may only be sold to qualified institutional investors or may have other restrictions on resale. At October 31, 2021, these securities amounted to $54,011,101, which represents 19.3% of net assets applicable to common stockholders of the Fund. |
| | | |
| (c) | | Defaulted security. |
| | | |
| (d) | | Currently a zero coupon security; will convert to 6.13% on August 1, 2023. |
| | | |
| (e) | | Currently a zero coupon security; will convert to 7.30% on August 1, 2026. |
| | | |
| (f) | | When-issued security. Total value of all such securities at October 31, 2021 amounted to $519,354, which represents 0.2% of net assets applicable to common stockholders of the Fund. |
| | | |
| (g) | | All or a portion of this security is segregated in connection with obligations for when-issued securities with a total value of $602,901. |
| | | |
| (h) | | Represents less than 0.05% of net assets applicable to common stockholders of the Fund. |
| | | |
| See Notes to Financial Statements | 23 | |
Schedule of Investments Municipal Fund Inc.^
(cont’d)
The following is a summary, categorized by Level (see Note A of Notes to Financial Statements), of inputs used to value the Fund’s investments as of October 31, 2021:
| Asset Valuation Inputs | | Level 1 | | | Level 2 | | | Level 3 | | | Total | |
| Investments: | | | | | | | | | | | | |
| Municipal Notes(a) | |
| $— | | |
| $446,209,956 | | |
| $— | | |
| $446,209,956 | |
| Total Investments | |
| $— | | |
| $446,209,956 | | |
| $— | | |
| $446,209,956 | |
| | | |
| (a) | | The Schedule of Investments provides a categorization by state/territory. |
| | | |
| ^ | | A balance indicated with a “—”, reflects either a zero balance or an amount that rounds to less than 1. |
| | | |
| See Notes to Financial Statements | 24 | |
Schedule of Investments New York Municipal Fund Inc.^
October 31, 2021
| PRINCIPAL AMOUNT | | VALUE | |
| | | | | | | |
| Municipal Notes 163.3% | | | | |
| | | | | | | | | |
| American Samoa 0.8% | | | | |
| $ | 500,000 | | | American Samoa Econ. Dev. Au. Gen. Rev. Ref., Ser. 2015-A, 6.25%, due 9/1/2029 | | $ | 579,567 | |
| | | | | | | | | |
| California 4.9% | | | | |
| | 250,000 | | | California St. Poll. Ctrl. Fin. Au. Solid Waste Disp. Rev. (Aemerge Redak Svcs. So. California LLC Proj.), Ser. 2016, 7.00%, due 12/1/2027 | | | 112,500 | (a)(b) |
| | 345,000 | | | California St. Poll. Ctrl. Fin. Au. Solid Waste Disp. Rev. (Green Bond-Rialto Bioenergy Fac. LLC, Proj.), Ser. 2019, 7.50%, due 12/1/2040 | | | 282,616 | (b) |
| | 3,115,000 | | | Corona-Norca Unified Sch. Dist. G.O. Cap. Appreciation (Election 2006), Ser. 2009-C, (AGM Insured), 0.00%, due 8/1/2024 | | | 3,060,268 | |
| | | | | | | | 3,455,384 | |
| | | | | | | | | |
| Guam 2.1% | | | | |
| | 500,000 | | | Guam Gov’t Bus. Privilege Tax Rev. Ref., Ser. 2021-F, 4.00%, due 1/1/2042 | | | 556,469 | |
| | 750,000 | | | Guam Gov’t Hotel Occupancy Tax Rev., Ser. 2021-A, 5.00%, due 11/1/2035 | | | 939,989 | |
| | | | | | | | 1,496,458 | |
| | | | | | | | | |
| Illinois 1.5% | | | | |
| | 1,000,000 | | | Chicago G.O. Ref., Ser. 2003-B, 5.00%, due 1/1/2023 | | | 1,051,670 | |
| | | | | | | | | |
| Kansas 1.1% | | | | |
| | | | | Goddard Kansas Sales Tax Spec. Oblig. Rev. (Olympic Park Star Bond Proj.) | | | | |
| | 355,000 | | | Ser. 2019, 3.60%, due 6/1/2030 | | | 357,468 | |
| | 420,000 | | | Ser. 2021, 3.50%, due 6/1/2034 | | | 409,434 | |
| | | | | | | | 766,902 | |
| | | | | | | | | |
| Louisiana 0.7% | | | | |
| | 500,000 | | | Louisiana St. Pub. Facs. Au. Rev. (Southwest Louisiana Charter Academy Foundation Proj.), Ser. 2013-A, 7.63%, due 12/15/2028 | | | 531,175 | |
| | | | | | | | | |
| New York 141.4% | | | | |
| | | | | Albany Cap. Res. Corp. Ref. Rev. (Albany College of Pharmacy & Hlth. Sciences) | | | | |
| | 380,000 | | | Ser. 2014-A, 5.00%, due 12/1/2027 | | | 423,837 | |
| | 375,000 | | | Ser. 2014-A, 5.00%, due 12/1/2028 | | | 416,757 | |
| | 270,000 | | | Ser. 2014-A, 5.00%, due 12/1/2029 | | | 298,864 | |
| | 1,645,000 | | | Broome Co. Local Dev. Corp. Rev. (United Hlth. Svc.), Ser. 2020, (AGM Insured), 3.00%, due 4/1/2045 | | | 1,711,290 | |
| | 500,000 | | | Buffalo & Erie Co. Ind. Land Dev. Corp. Rev. (Tapestry Charter Sch. Proj.), Ser. 2017-A, 5.00%, due 8/1/2047 | | | 558,563 | |
| | 1,325,000 | | | Buffalo & Erie Co. Ind. Land Dev. Corp. Rev. Ref. (Charter Sch. for Applied Technologies Proj.), Ser. 2017-A, 5.00%, due 6/1/2035 | | | 1,464,610 | |
| | | | | Buffalo & Erie Co. Ind. Land Dev. Corp. Rev. Ref. (Orchard Park) | | | | |
| | 500,000 | | | Ser. 2015, 5.00%, due 11/15/2027 | | | 569,760 | |
| | 500,000 | | | Ser. 2015, 5.00%, due 11/15/2028 | | | 567,444 | |
| | | | | Build NYC Res. Corp. Ref. Rev. (City Univ. - Queens College) | | | | |
| | 270,000 | | | Ser. 2014-A, 5.00%, due 6/1/2026 | | | 302,147 | |
| | 225,000 | | | Ser. 2014-A, 5.00%, due 6/1/2029 | | | 250,187 | |
| | | | | Build NYC Res. Corp. Ref. Rev. (Methodist Hosp. Proj.) | | | | |
| | 250,000 | | | Ser. 2014, 5.00%, due 7/1/2022 | | | 257,885 | |
| | 500,000 | | | Ser. 2014, 5.00%, due 7/1/2029 | | | 560,620 | |
| | 1,250,000 | | | Build NYC Res. Corp. Ref. Rev. (New York Law Sch. Proj.), Ser. 2016, 4.00%, due 7/1/2045 | | | 1,351,118 | |
| | | | | Build NYC Res. Corp. Ref. Rev. (Packer Collegiate Institute Proj.) | | | | |
| | 155,000 | | | Ser. 2015, 5.00%, due 6/1/2026 | | | 174,911 | |
| | 125,000 | | | Ser. 2015, 5.00%, due 6/1/2027 | | | 140,637 | |
| | 195,000 | | | Ser. 2015, 5.00%, due 6/1/2028 | | | 218,594 | |
| | 220,000 | | | Ser. 2015, 5.00%, due 6/1/2029 | | | 245,640 | |
| | 325,000 | | | Ser. 2015, 5.00%, due 6/1/2030 | | | 361,798 | |
| | |
| See Notes to Financial Statements | 25 | |
Schedule of Investments New York Municipal Fund Inc.^
(cont’d)
| PRINCIPAL AMOUNT | | VALUE | |
| | | | | | | |
| $ | 565,000 | | | Build NYC Res. Corp. Rev., Ser. 2014, 5.00%, due 11/1/2024 | | $ | 627,138 | |
| | 750,000 | | | Build NYC Res. Corp. Rev. (Metro. Lighthouse Charter Sch. Proj.), Ser. 2017-A, 5.00%, due 6/1/2047 | | | 826,182 | (b) |
| | 575,000 | | | Build NYC Res. Corp. Rev. (New Dawn Charter Sch. Proj.), Ser. 2019, 5.75%, due 2/1/2049 | | | 620,196 | (b) |
| | 450,000 | | | Build NYC Res. Corp. Rev. (New World Preparatory Charter Sch. Proj.), Ser. 2021-A, 4.00%, due 6/15/2056 | | | 475,769 | |
| | 750,000 | | | Build NYC Res. Corp. Rev. (Shefa Sch. Proj.), Ser. 2021-A, 5.00%, due 6/15/2051 | | | 884,112 | (b) |
| | 205,000 | | | Build NYC Res. Corp. Rev. (South Bronx Charter Sch. Int’l Cultures), Ser. 2013-A, 3.88%, due 4/15/2023 | | | 209,866 | |
| | 140,000 | | | Build NYC Res. Corp. Solid Waste Disp. Ref. Rev. (Pratt Paper, Inc. Proj.), Ser. 2014, 4.50%, due 1/1/2025 | | | 149,166 | (b) |
| | | | | Dutchess Co. Local Dev. Corp. Rev. (Culinary Institute of America Proj.) | | | | |
| | 200,000 | | | Ser. 2016-A-1, 5.00%, due 7/1/2041 | | | 224,118 | |
| | 275,000 | | | Ser. 2016-A-1, 5.00%, due 7/1/2046 | | | 306,313 | |
| | | | | Hempstead Town Local Dev. Corp. Rev. (Molloy College Proj.) | | | | |
| | 405,000 | | | Ser. 2018, 5.00%, due 7/1/2031 | | | 485,939 | |
| | 425,000 | | | Ser. 2018, 5.00%, due 7/1/2032 | | | 508,708 | |
| | 450,000 | | | Ser. 2018, 5.00%, due 7/1/2033 | | | 537,092 | |
| | | | | Metro. Trans. Au. Rev. (Green Bond) | | | | |
| | 1,500,000 | | | Ser. 2020-C-1, 5.00%, due 11/15/2050 | | | 1,782,501 | |
| | 2,000,000 | | | Ser. 2020-D-3, 4.00%, due 11/15/2049 | | | 2,213,517 | |
| | 300,000 | | | Monroe Co. Ind. Dev. Corp. Rev. (Monroe Comm. College), Ser. 2014, (AGM Insured), 5.00%, due 1/15/2029 | | | 325,695 | |
| | | | | Monroe Co. Ind. Dev. Corp. Rev. (Nazareth College of Rochester Proj.) | | | | |
| | 500,000 | | | Ser. 2013-A, 5.00%, due 10/1/2024 | | | 542,479 | |
| | 500,000 | | | Ser. 2013-A, 5.00%, due 10/1/2025 | | | 540,908 | |
| | 250,000 | | | Ser. 2013-A, 4.00%, due 10/1/2026 | | | 264,693 | |
| | | | | Monroe Co. Ind. Dev. Corp. Rev. (St. John Fisher College) | | | | |
| | 1,120,000 | | | Ser. 2012-A, 5.00%, due 6/1/2023 | | | 1,148,352 | |
| | 210,000 | | | Ser. 2012-A, 5.00%, due 6/1/2025 | | | 215,029 | |
| | 1,265,000 | | | Montgomery Co. Cap. Res. Corp. Lease Ref. Rev. (HFM Boces Proj.), Ser. 2014, (AGM Insured), 5.00%, due 9/1/2027 | | | 1,415,121 | |
| | 2,000,000 | | | Nassau Co. G.O. (Gen. Imp. Bonds), Ser. 2013-B, 5.00%, due 4/1/2028 Pre-Refunded 4/1/2023 | | | 2,135,120 | |
| | | | | Nassau Co. Local Econ. Assist. Corp. Rev. (Catholic Hlth. Svcs. of Long Island Obligated Group Proj.) | | | | |
| | 500,000 | | | Ser. 2014, 5.00%, due 7/1/2023 | | | 538,274 | |
| | 1,000,000 | | | Ser. 2014, 5.00%, due 7/1/2027 | | | 1,113,889 | |
| | 4,175,000 | | | Nassau Co. Tobacco Settlement Corp. Asset Backed, Ser. 2006-A-3, 5.13%, due 6/1/2046 | | | 4,240,924 | |
| | 1,500,000 | | | New York City IDA Rev. (Queens Ballpark Co. LLC), Ser. 2021-A, (AGM Insured), 3.00%, due 1/1/2046 | | | 1,561,829 | |
| | 3,000,000 | | | New York City IDA Rev. (Yankee Stadium Proj.), Ser. 2020, (AGM Insured), 3.00%, due 3/1/2049 | | | 3,105,940 | |
| | 750,000 | | | New York City Trust for Cultural Res. Ref. Rev. (Lincoln Ctr. for the Performing Arts, Inc.), Ser. 2020-A, 4.00%, due 12/1/2035 | | | 889,463 | |
| | 500,000 | | | New York Liberty Dev. Corp. Ref. Rev. (3 World Trade Ctr. Proj.), Ser. 2014, 5.38%, due 11/15/2040 | | | 554,459 | (b) |
| | 2,000,000 | | | New York Liberty Dev. Corp. Rev. (Goldman Sachs Headquarters), Ser. 2005, 5.25%, due 10/1/2035 | | | 2,780,329 | |
| | 750,000 | | | New York Liberty Dev. Corp. Rev. Ref. (Bank of America Tower at One Bryant Park Proj.), Ser. 2019, Class 3, 2.80%, due 9/15/2069 | | | 761,036 | |
| | 1,815,000 | | | New York St. Dorm. Au. Ref. Rev. Non St. Supported Debt (Pratt Institute), Ser. 2015-A, 3.00%, due 7/1/2027 Pre-Refunded 7/1/2024 | | | 1,937,494 | |
| | 780,000 | | | New York St. Dorm. Au. Rev. Non St. Supported Debt (Culinary Institute of America), Ser. 2013, 4.63%, due 7/1/2025 | | | 828,958 | |
| | 750,000 | | | New York St. Dorm. Au. Rev. Non St. Supported Debt (Fordham Univ.), Ser. 2020, 4.00%, due 7/1/2046 | | | 858,150 | |
| | 1,375,000 | | | New York St. Dorm. Au. Rev. Non St. Supported Debt (Rochester Institute of Technology), Ser. 2012, 4.00%, due 7/1/2028 Pre-Refunded 7/1/2022 | | | 1,409,719 | |
| | 2,540,000 | | | New York St. Dorm. Au. Rev. Non St. Supported Debt (St. Univ. Dorm. Fac.), Ser. 2018-A, 5.00%, due 7/1/2048 | | | 3,061,046 | |
| | |
| See Notes to Financial Statements | 26 | |
Schedule of Investments New York Municipal Fund Inc.^
(cont’d)
| PRINCIPAL AMOUNT | | VALUE | |
| | | | | | | | | |
| | | | | New York St. Dorm. Au. Rev. Non St. Supported Debt (Touro College & Univ. Sys. Obligated Group) | | | | |
| $ | 460,000 | | | Ser. 2014-A, 4.00%, due 1/1/2026 | | $ | 493,914 | |
| | 470,000 | | | Ser. 2014-A, 4.00%, due 1/1/2027 | | | 503,242 | |
| | 200,000 | | | Ser. 2014-A, 4.00%, due 1/1/2028 | | | 213,276 | |
| | 275,000 | | | Ser. 2014-A, 4.13%, due 1/1/2029 | | | 293,182 | |
| | 1,350,000 | | | New York St. Dorm. Au. Rev. Non St. Supported Debt (Univ. Facs.), Ser. 2013-A, 5.00%, due 7/1/2028 Pre-Refunded 7/1/2023 | | | 1,456,871 | |
| | 750,000 | | | New York St. Dorm. Au. Rev. Non St. Supported Debt (Vaughn College of Aeronautics & Technology), Ser. 2016, 5.00%, due 12/1/2026 | | | 802,296 | (b) |
| | 1,500,000 | | | New York St. Dorm. Au. Rev. Ref. Non St. Supported Debt (Montefiore Oblig. Group), Ser. 2018-A, 5.00%, due 8/1/2035 | | | 1,807,211 | |
| | | | | New York St. Dorm. Au. Rev. Ref. Non St. Supported Debt (Orange Reg. Med. Ctr.) | | | | |
| | 400,000 | | | Ser. 2017, 5.00%, due 12/1/2035 | | | 474,823 | (b) |
| | 200,000 | | | Ser. 2017, 5.00%, due 12/1/2036 | | | 237,054 | (b) |
| | 400,000 | | | Ser. 2017, 5.00%, due 12/1/2037 | | | 473,265 | (b) |
| | 2,000,000 | | | New York St. Dorm. Au. Rev. St. Personal Income Tax Rev., Ser. 2012-A, 5.00%, due 12/15/2026 | | | 2,105,885 | |
| | | | | New York St. Env. Facs. Corp. Solid Waste Disp. Rev. (Casella Waste Sys. Inc. Proj.) | | | | |
| | 500,000 | | | Ser. 2014, 2.88%, due 12/1/2044 Putable 12/3/2029 | | | 524,871 | (b) |
| | 500,000 | | | Ser. 2020-R-1, 2.75%, due 9/1/2050 Putable 9/2/2025 | | | 517,315 | |
| | 1,000,000 | | | New York St. HFA Rev., Ser. 2020-H, 2.45%, due 11/1/2044 | | | 992,560 | |
| | 960,000 | | | New York St. HFA Rev. (Affordable Hsg.), Ser. 2012-F, (SONYMA Insured), 3.05%, due 11/1/2027 | | | 970,235 | |
| | 1,045,000 | | | New York St. Mtge. Agcy. Homeowner Mtge. Ref. Rev., Ser. 2014-189, 3.45%, due 4/1/2027 | | | 1,083,026 | (c) |
| | 2,000,000 | | | New York St. Trans. Dev. Corp. Fac. Rev. (Empire St. Thruway Svc. Areas Proj.), Ser. 2021, 4.00%, due 4/30/2053 | | | 2,237,287 | |
| | 1,500,000 | | | New York St. Trans. Dev. Corp. Spec. Fac. Ref. Rev. (American Airlines, Inc.-John F Kennedy Int’l Arpt. Proj.), Ser. 2016, 5.00%, due 8/1/2031 | | | 1,502,905 | |
| | 2,000,000 | | | New York St. Trans. Dev. Corp. Spec. Fac. Rev. (Delta Airlines, Inc.-LaGuardia Arpt. Term. C&D Redev.), Ser. 2018, 5.00%, due 1/1/2033 | | | 2,377,639 | |
| | 1,545,000 | | | New York St. Trans. Dev. Corp. Spec. Fac. Rev. (LaGuardia Arpt. Term. B Redev. Proj.), Ser. 2016-A, 4.00%, due 7/1/2041 | | | 1,657,624 | |
| | | | | New York St. Trans. Dev. Corp. Spec. Fac. Rev. Ref. (JFK Int’l Arpt. Term. 4 Proj.) | | | | |
| | 250,000 | | | Ser. 2020-A, 5.00%, due 12/1/2023 | | | 271,552 | |
| | 100,000 | | | Ser. 2020-A, 4.00%, due 12/1/2042 | | | 111,204 | |
| | 1,500,000 | | | Ser. 2020-C, 4.00%, due 12/1/2042 | | | 1,673,196 | |
| | 785,000 | | | Newburgh, G.O., Ser. 2012-A, 5.00%, due 6/15/2022 | | | 804,896 | |
| | | | | Niagara Area Dev. Corp. Rev. (Niagara Univ. Proj.) | | | | |
| | 640,000 | | | Ser. 2012-A, 5.00%, due 5/1/2025 Pre-Refunded 5/1/2022 | | | 655,126 | |
| | 300,000 | | | Ser. 2012-A, 5.00%, due 5/1/2026 Pre-Refunded 5/1/2022 | | | 307,090 | |
| | 1,000,000 | | | Niagara Area Dev. Corp. Solid Waste Disp. Fac. Rev. Ref. (Covanta Proj.), Ser. 2018-A, 4.75%, due 11/1/2042 | | | 1,039,741 | (b) |
| | 1,100,000 | | | Niagara Falls City Sch. Dist. Ref. Cert. of Participation (High Sch. Fac.), Ser. 2015, (AGM Insured), 4.00%, due 6/15/2026 | | | 1,191,163 | |
| | | | | Niagara Frontier Trans. Au. Rev. Ref. (Buffalo Niagara Int’l Arpt.) | | | | |
| | 375,000 | | | Ser. 2019-A, 5.00%, due 4/1/2037 | | | 457,062 | |
| | 350,000 | | | Ser. 2019-A, 5.00%, due 4/1/2038 | | | 425,802 | |
| | 350,000 | | | Ser. 2019-A, 5.00%, due 4/1/2039 | | | 424,959 | |
| | | | | Oneida Co. Local Dev. Corp. Rev. Ref. (Mohawk Valley Hlth. Sys. Proj.) | | | | |
| | 1,250,000 | | | Ser. 2019-A, (AGM Insured), 3.00%, due 12/1/2044 | | | 1,299,857 | |
| | 2,000,000 | | | Ser. 2019-A, (AGM Insured), 4.00%, due 12/1/2049 | | | 2,235,217 | |
| | 500,000 | | | Port Au. New York & New Jersey Cons. Bonds Rev. Ref. (Two Hundred), Ser. 2017, 5.00%, due 4/15/2057 | | | 589,518 | |
| | 1,410,000 | | | St. Lawrence Co. IDA Civic Dev. Corp. Rev. (St. Lawrence Univ. Proj.), Ser. 2012, 5.00%, due 7/1/2028 | | | 1,475,550 | |
| | 1,980,000 | | | Suffolk Co. Judicial Facs. Agcy. Lease Rev. (H. Lee Dennison Bldg.), Ser. 2013, 5.00%, due 11/1/2025 | | | 2,129,574 | |
| | 1,750,000 | | | Suffolk Tobacco Asset Securitization Corp. Ref. (Tobacco Settle Asset Backed Sub. Bonds), Ser. 2021-B-1, 4.00%, due 6/1/2050 | | | 1,952,316 | |
| | 105,000 | | | Triborough Bridge & Tunnel Au. Spec. Oblig., Ser. 1998-A, (National Public Finance Guarantee Corp. Insured), 4.75%, due 1/1/2024 | | | 108,807 | |
| | |
| See Notes to Financial Statements | 27 | |
Schedule of Investments New York Municipal Fund Inc.^
(cont’d)
| PRINCIPAL AMOUNT | | VALUE | |
| | | | |
| | | | | TSASC Inc. Rev. Ref. | | | | |
| $ | 580,000 | | | Ser. 2017-A, 5.00%, due 6/1/2028 | | $ | 699,107 | |
| | 3,000,000 | | | Ser. 2017-A, 5.00%, due 6/1/2041 | | | 3,450,718 | |
| | 3,000,000 | | | Utility Debt Securitization Au. Rev., Ser. 2013-TE, 5.00%, due 12/15/2028 | | | 3,292,518 | |
| | 1,000,000 | | | Westchester Co. Local Dev. Corp. Ref. Rev. (Wartburg Sr. Hsg. Proj.), Ser. 2015-A, 5.00%, due 6/1/2030 | | | 1,004,836 | (b) |
| | | | | Westchester Co. Local Dev. Corp. Ref. Rev. (Westchester Med. Ctr.) | | | | |
| | 825,000 | | | Ser. 2016, 5.00%, due 11/1/2030 | | | 945,682 | |
| | 1,000,000 | | | Ser. 2016, 3.75%, due 11/1/2037 | | | 1,043,783 | |
| | 1,000,000 | | | Westchester Co. Local Dev. Corp. Rev. (Purchase Sr. Learning Comm., Inc. Proj.), Ser. 2021-A, 5.00%, due 7/1/2056 | | | 1,038,708 | (b)(d) |
| | 665,000 | | | Yonkers Econ. Dev. Corp. Ed. Rev. (Charter Sch. of Ed. Excellence Proj.), Ser. 2019-A, 5.00%, due 10/15/2049 | | | 757,462 | |
| | | | | | | | 100,064,111 | |
| | | | | | | | | |
| Ohio 0.4% | | | | |
| | 230,000 | | | So. Ohio Port Exempt Fac. Au. Rev., Ser. 2020-A, 7.00%, due 12/1/2042 | | | 262,755 | (b) |
| | | | | | | | | |
| Puerto Rico 8.0% | | | | |
| | 5,017,000 | | | Puerto Rico Sales Tax Fin. Corp. Sales Tax Rev., Ser. 2018-A-1, 5.00%, due 7/1/2058 | | | 5,663,930 | |
| | | | | | | | | |
| South Carolina 0.4% | | | | |
| | 300,000 | | | South Carolina Jobs-Econ. Dev. Au. Solid Waste Disp. Rev. (AMT-Green Bond-Last Step Recycling LLC Proj.), Ser. 2021-A, 6.50%, due 6/1/2051 | | | 307,715 | (b) |
| | | | | | | | | |
| Texas 0.4% | | | | |
| | 393,043 | | | Mission Econ. Dev. Corp. Wtr. Supply Rev. (Green Bond-Env. Wtr. Minerals Proj.), Ser. 2015, 7.75%, due 1/1/2045 | | | 31,443 | (a)(b) |
| | 325,000 | | | New Hope Cultural Ed. Facs. Fin. Corp. Sr. Living Rev. (Bridgemoor Plano Proj.), Ser. 2018-A, 7.25%, due 12/1/2053 | | | 225,624 | (a) |
| | | | | | | | 257,067 | |
| | | | | | | | | |
| Wisconsin 1.6% | | | | |
| | 300,000 | | | Pub. Fin. Au. Retirement Fac. Rev. Ref. (Friends Homes), Ser. 2019, 5.00%, due 9/1/2054 | | | 337,337 | (b) |
| | 800,000 | | | St. Croix Chippewa Indians of Wisconsin Ref., Ser. 2021, 5.00%, due 9/30/2041 | | | 770,660 | (b) |
| | | | | | | | 1,107,997 | |
| | | | | Total Municipal Notes (Cost $109,327,982) | | | 115,544,731 | |
| | | | | | | | | |
| UNITS | | | | |
| | | | | | | | | |
| Liquidating Trust - Real Estate 1.1% | | | | |
| | 600 | | | CMS Liquidating Trust (Cost $3,105,388) | | | 750,000 | *(e)(f) |
| | | | | Total Investments 164.4% (Cost $112,433,370) | | | 116,294,731 | |
| | | | | Other Assets Less Liabilities 1.1% | | | 751,814 | |
| | | | | Liquidation Preference of Variable Rate Municipal Term Preferred Shares (net of unamortized deferred offering costs of $5,966) (65.5)% | | | (46,294,034 | ) |
| | | | | Net Assets Applicable to Common Stockholders 100.0% | | $ | 70,752,511 | |
| | |
| See Notes to Financial Statements | 28 | |
Schedule of Investments New York Municipal Fund Inc.^
(cont’d)
| * | | Non-income producing security. |
| | | |
| (a) | | Defaulted security. |
| | | |
| (b) | | Securities were purchased under Rule 144A of the Securities Act of 1933, as amended, or are otherwise restricted and, unless registered under the Securities Act of 1933 or exempted from registration, may only be sold to qualified institutional investors or may have other restrictions on resale. At October 31, 2021, these securities amounted to $10,734,735, which represents 15.2% of net assets applicable to common stockholders of the Fund. |
| | | |
| (c) | | All or a portion of this security is segregated in connection with obligations for when-issued securities with a total value of $1,083,026. |
| | | |
| (d) | | When-issued security. Total value of all such securities at October 31, 2021 amounted to $1,038,708, which represents 1.5% of net assets applicable to common stockholders of the Fund. |
| | | |
| (e) | | Value determined using significant unobservable inputs. |
| | | |
| (f) | | This security has been deemed by the investment manager to be illiquid, and is subject to restrictions on resale. |
| | | |
At October 31, 2021, this security amounted to $750,000, which represents 1.1% of net assets applicable to common stockholders of the Fund.
| Restricted Security | | Acquisition
Date | | | Acquisition
Cost | | | Acquisition
Cost
Percentage
of Net Assets
Applicable
to Common
Stockholders
as of
Acquisition
Date | | | Value as of
10/31/2021 | | | Fair Value
Percentage
of Net Assets
Applicable
to Common
Stockholders
as of
10/31/2021 | |
| CMS Liquidating Trust | | | 11/21/2012 | | |
| $3,105,388 | | | | 4.1% |
| |
| $750,000 | | | | 1.1% |
|
The following is a summary, categorized by Level (see Note A of Notes to Financial Statements), of inputs used to value the Fund’s investments as of October 31, 2021:
| Asset Valuation Inputs | | Level 1 | | | Level 2 | | | Level 3(b) | | | Total | |
| Investments: | | | | | | | | | | | | |
| Municipal Notes(a) | | $ | — | | | $ | 115,544,731 | | | $ | — | | | $ | 115,544,731 | |
| Liquidating Trust - Real Estate | | | — | | | | — | | | | 750,000 | | | | 750,000 | |
| Total Investments | | $ | — | | | $ | 115,544,731 | | | $ | 750,000 | | | $ | 116,294,731 | |
| | | |
| (a) | | The Schedule of Investments provides a categorization by state/territory. |
| | | |
| See Notes to Financial Statements | 29 | |
Schedule of Investments New York Municipal Fund Inc.^
(cont’d)
| (b) | The following is a reconciliation between the beginning and ending balances of investments in which unobservable inputs (Level 3) were used in determining value: |
| | | Beginning
balance,
as of
11/1/2020 | | | Accrued
discounts/
(premiums) | | | Realized
gain/(loss) | | | Change in
unrealized
appreciation/
(depreciation) | | | Purchases | | | Sales | | | Transfers
into Level 3 | | | Transfers
out of Level 3 | | | Balance,
as of
10/31/2021 | | | Net change
in unrealized
appreciation/
(depreciation)
from
investments
still held as of
10/31/2021 | |
| (000’s omitted) | | | | | | | | | | | | | | | | | | | | | | | | |
Investments in
Securities: | | | | | | | | | | | | | | | | | | | | | | | | | | | | | | | | | | | | | | | | |
| Units | | | | | | | | | | | | | | | | | | | | | | | | | | | | | | | | | | | | | | | | |
| Liquidating | | | | | | | | | | | | | | | | | | | | | | | | | | | | | | | | | | | | | | | | |
| Trust— | | | | | | | | | | | | | | | | | | | | | | | | | | | | | | | | | | | | | | | | |
| Real Estate(c) | | $ | 1,620 | | | $ | — | | | $ | — | | | $ | (870 | ) | | $ | — | | | $ | — | | | $ | — | | | $ | — | | | $ | 750 | | | $ | (870 | ) |
| Total | | $ | 1,620 | | | $ | — | | | $ | — | | | $ | (870 | ) | | $ | — | | | $ | — | | | $ | — | | | $ | — | | | $ | 750 | | | $ | (870 | ) |
| | | |
| (c) | | Quantitative Information about Level 3 Fair Value Measurements: |
| | | |
Investment
type | | Fair Value at
10/31/2021 | | Valuation
approach | | Unobservable
input(s) | | Input value/
range | | Weighted
average(d) | | Impact to valuation
from Increase in Input(e) |
| Units | |
| $750,000 | | Income Approach | | Discount Rate | | | 10.00% | | | 10.00% | | Increase |
| | | | | | Market Approach | | Transaction Price | |
| $20.00 | |
| $20.00 | | Increase |
| | | |
| (d) | | The weighted averages disclosed in the table above were weighted by relative fair value. |
| | | |
| (e) | | Represents the expected directional change in the fair value of the Level 3 investments that would result from an increase or decrease in the corresponding input. Significant changes in these inputs could result in significantly higher or lower fair value measurements. |
| | | |
| ^ | | A balance indicated with a “—”, reflects either a zero balance or an amount that rounds to less than 1. |
| | | |
| See Notes to Financial Statements | 30 | |
Statements of Assets and Liabilities
Neuberger Berman
| | | CALIFORNIA
MUNICIPAL
FUND INC. | | MUNICIPAL
FUND INC. | | NEW YORK
MUNICIPAL
FUND INC. |
| | | October 31, 2021 | | October 31, 2021 | | October 31, 2021 |
| Assets | | | | | | |
| Investments in securities, at value* (Note A)—see Schedule of Investments: | | | | | | |
| Unaffiliated issuers(a) | | $138,420,505 | | $446,209,956 | | $116,294,731 |
| Cash | | 344,061 | | 122,329 | | 633,715 |
| Interest receivable | | 1,669,713 | | 5,739,474 | | 1,551,645 |
| Receivable for securities sold | | 269,010 | | 723,502 | | — |
| Prepaid expenses and other assets | | 16,059 | | 21,817 | | 15,635 |
| Total Assets | | 140,719,348 | | 452,817,078 | | 118,495,726 |
| Liabilities | | | | | | |
| Variable Rate Municipal Term Preferred Shares, Series A ($100,000 liquidation preference per share; 550, 1,704 and 463 shares outstanding for California Fund, Municipal Fund and New York Fund, respectively) † (Note A) | | 54,994,034 | | 170,394,038 | | 46,294,034 |
| Distributions payable—preferred shares | | 44,377 | | 137,487 | | 37,357 |
| Distributions payable—common stock | | 248,687 | | 1,176,057 | | 199,695 |
| Payable to investment manager (Note B) | | 29,861 | | 96,084 | | 24,897 |
| Payable for securities purchased | | — | | 519,350 | | 1,038,700 |
| Payable to administrator (Note B) | | 35,833 | | 115,300 | | 29,876 |
| Payable to directors | | 13,889 | | 13,889 | | 13,889 |
| Other accrued expenses and payables | | 106,527 | | 132,359 | | 104,767 |
| Total Liabilities | | 55,473,208 | | 172,584,564 | | 47,743,215 |
| Net Assets applicable to Common Stockholders | | $85,246,140 | | $280,232,514 | | $70,752,511 |
| Net Assets applicable to Common Stockholders consist of: | | | | | | |
| Paid-in capital—common stock | | $77,388,677 | | $258,366,046 | | $70,235,667 |
| Total distributable earnings/(losses) | | 7,857,463 | | 21,866,468 | | 516,844 |
| Net Assets applicable to Common Stockholders | | $85,246,140 | | $280,232,514 | | $70,752,511 |
| Shares of Common Stock Outstanding ($0.0001 par value; 999,996,410, 999,990,206 and 999,996,517 shares authorized for California Fund, Municipal Fund and New York Fund, respectively) | | 5,551,044 | | 18,834,989 | | 5,077,417 |
| Net Asset Value Per Share of Common Stock Outstanding | | $15.36 | | $14.88 | | $13.93 |
| * Cost of Investments: | | | | | | |
| (a) Unaffiliated Issuers | | $128,378,082 | | $410,453,524 | | $112,433,370 |
| † Net of unamortized deferred offering costs of: | | $5,966 | | $5,962 | | $5,966 |
| | |
| See Notes to Financial Statements | 31 | |
Statements of Operations
Neuberger Berman
| | | CALIFORNIA
MUNICIPAL
FUND INC. | | MUNICIPAL
FUND INC. | | NEW YORK
MUNICIPAL
FUND INC. |
| | | For the Fiscal
Year Ended
October 31, 2021 | | For the Fiscal
Year Ended
October 31, 2021 | | For the Fiscal
Year Ended
October 31, 2021 |
| Investment Income: | | | | | | |
| Income (Note A): | | | | | | |
| Interest and other income-unaffiliated issuers | | $5,155,910 | | $18,239,072 | | $4,064,778 |
| Expenses: | | | | | | |
| Investment management fees (Note B) | | 354,476 | | 1,144,297 | | 296,327 |
| Administration fees (Note B) | | 425,371 | | 1,373,157 | | 355,592 |
| Audit fees | | 49,211 | | 50,261 | | 49,211 |
| Basic maintenance (Note A) | | 12,500 | | 12,500 | | 12,500 |
| Custodian and accounting fees | | 75,637 | | 100,010 | | 73,317 |
| Insurance | | 4,444 | | 14,366 | | 3,719 |
| Legal fees | | 41,555 | | 73,929 | | 49,633 |
| Stockholder reports | | 6,973 | | 23,966 | | 6,652 |
| Stock exchange listing fees | | 4,357 | | 14,084 | | 3,650 |
| Stock transfer agent fees | | 25,755 | | 25,798 | | 25,742 |
| Distributions to Variable Rate Municipal Term Preferred Shareholders and amortization of offering costs (Note A) | | 537,239 | | 1,634,013 | | 454,553 |
| Directors’ fees and expenses | | 43,394 | | 43,407 | | 43,393 |
| Interest | | 1,240 | | 1,900 | | 846 |
| Miscellaneous | | 29,225 | | 33,520 | | 28,900 |
| Total expenses | | 1,611,377 | | 4,545,208 | | 1,404,035 |
| Net investment income/(loss) | | $3,544,533 | | $13,693,864 | | $2,660,743 |
| Realized and Unrealized Gain/(Loss) on Investments (Note A): | | | | | | |
| Net realized gain/(loss) on: | | | | | | |
| Transactions in investment securities of unaffiliated issuers | | 386,863 | | (644,299) | | 388,882 |
| Change in net unrealized appreciation/(depreciation) in value of: | | | | | | |
| Investment securities of unaffiliated issuers | | (67,176) | | 3,473,886 | | 433,463 |
| Net gain/(loss) on investments | | 319,687 | | 2,829,587 | | 822,345 |
| Net increase/(decrease) in net assets applicable to Common Stockholders resulting from operations | | $3,864,220 | | $16,523,451 | | $3,483,088 |
| | |
| See Notes to Financial Statements | 32 | |
Statements of Changes in Net Assets
Neuberger Berman
| | | CALIFORNIA MUNICIPAL FUND INC. | | MUNICIPAL FUND INC. |
| | | Fiscal Year Ended
October 31, 2021 | | Fiscal Year Ended
October 31, 2020 | | Fiscal Year Ended
October 31, 2021 | | Fiscal Year Ended
October 31, 2020 |
| Increase/(Decrease) in Net Assets Applicable to Common Stockholders: | | | | | | | | |
| From Operations (Note A): | | | | | | | | |
| Net investment income/(loss) | | $3,544,533 | | $3,423,489 | | $13,693,864 | | $12,724,561 |
| Net realized gain/(loss) on investments | | 386,863 | | 160,540 | | (644,299) | | (607,097) |
| Change in net unrealized appreciation/ (depreciation) of investments | | (67,176) | | (2,738,602) | | 3,473,886 | | (8,887,682) |
| Net increase/(decrease) in net assets applicable to Common Stockholders resulting from operations | | 3,864,220 | | 845,427 | | 16,523,451 | | 3,229,782 |
| Distributions to Common Stockholders From (Note A): | | | | | | | | |
| Distributable earnings | | (2,984,241) | | (2,984,241) | | (14,105,250) | | (14,096,302) |
| From Capital Share Transactions (Note D): | | | | | | | | |
| Proceeds from reinvestment of dividends and distributions | | — | | — | | 260,779 | | 187,009 |
| Net Increase/(Decrease) in Net Assets Applicable to Common Stockholders | | 879,979 | | (2,138,814) | | 2,678,980 | | (10,679,511) |
| Net Assets Applicable to Common Stockholders: | | | | | | | | |
| Beginning of year | | 84,366,161 | | 86,504,975 | | 277,553,534 | | 288,233,045 |
| End of year | | $85,246,140 | | $84,366,161 | | $280,232,514 | | $277,553,534 |
| | |
| See Notes to Financial Statements | 33 | |
| NEW YORK MUNICIPAL FUND INC. |
Fiscal Year Ended
October 31, 2021 | | Fiscal Year Ended
October 31, 2020 |
| | | |
| | | |
| $2,660,743 | | $2,485,485 |
| 388,882 | | (245,279) |
| | | |
| 433,463 | | (1,556,889) |
| | | |
| 3,483,088 | | 683,317 |
| | | |
| (2,396,338) | | (2,396,338) |
| | | |
| — | | — |
| | | |
| 1,086,750 | | (1,713,021) |
| | | |
| 69,665,761 | | 71,378,782 |
| $70,752,511 | | $69,665,761 |
| See Notes to Financial Statements | 34 | |
Notes to Financial Statements Municipal Closed-End Funds
Note A—Summary of Significant Accounting Policies:
| 1 | General: Neuberger Berman California Municipal Fund Inc. (“California Fund”), Neuberger Berman Municipal Fund Inc. (“Municipal Fund”) and Neuberger Berman New York Municipal Fund Inc. (“New York Fund”), (each individually a “Fund”, and collectively, the “Funds”) were organized as Maryland corporations on July 29, 2002. California Fund and New York Fund registered as non-diversified, closed-end management investment companies and Municipal Fund registered as a diversified, closed-end management investment company under the Investment Company Act of 1940, as amended (the “1940 Act”). Under the 1940 Act, the status of a Fund that was registered as non-diversified may, under certain circumstances, change to that of a diversified fund. Each Fund is currently a diversified fund. Each Fund’s Board of Directors (“Board”) may classify or re-classify any unissued shares of capital stock into one or more classes of preferred stock without the approval of stockholders. |
| | |
| | A balance indicated with a “—”, reflects either a zero balance or a balance that rounds to less than 1. |
| | |
| | The assets of each Fund belong only to that Fund, and the liabilities of each Fund are borne solely by that Fund and no other. |
| | |
| | Each Fund is an investment company and accordingly follows the investment company accounting and reporting guidance of the Financial Accounting Standards Board Accounting Standards Codification (“ASC”) Topic 946 “Financial Services—Investment Companies.” |
| | |
| | The preparation of financial statements in accordance with U.S. generally accepted accounting principles (“GAAP”) requires Neuberger Berman Investment Advisers LLC (“Management” or “NBIA”) to make estimates and assumptions at the date of the financial statements. Actual results could differ from those estimates. |
| | |
| 2 | Portfolio valuation: In accordance with ASC 820 “Fair Value Measurement” (“ASC 820”), all investments held by each of the Funds are carried at the value that Management believes a Fund would receive upon selling an investment in an orderly transaction to an independent buyer in the principal or most advantageous market for the investment under current market conditions. Various inputs, including the volume and level of activity for the asset or liability in the market, are considered in valuing the Funds’ investments, some of which are discussed below. Significant Management judgment may be necessary to value investments in accordance with ASC 820. |
| | |
| | ASC 820 established a three-tier hierarchy of inputs to create a classification of value measurements for disclosure purposes. The three-tier hierarchy of inputs is summarized in the three broad Levels listed below. |
| | | |
| | ● | Level 1 – unadjusted quoted prices in active markets for identical investments |
| | ● | Level 2 – other observable inputs (including quoted prices for similar investments, interest rates, prepayment speeds, credit risk, amortized cost, etc.) |
| | ● | Level 3 – unobservable inputs (including a Fund’s own assumptions in determining the fair value of investments) |
| | |
| | The inputs or methodology used for valuing an investment are not necessarily an indication of the risk associated with investing in those securities. |
| | |
| | The value of the Funds’ investments in municipal notes and liquidating trust - real estate is determined by Management primarily by obtaining valuations from independent pricing services based on readily available bid quotations, or if quotations are not available, by methods which include various considerations such as yields or prices of securities of comparable quality, coupon, maturity and type; indications as to values from dealers; and general market conditions (generally Level 2 inputs). Other Level 2 and 3 inputs used by independent pricing services to value municipal notes and liquidating trust - real estate include current trades, bid-wanted lists (which inform the market that a holder is interested in selling a position and that offers will be considered), offerings, general information on market movement, direction, trends, appraisals, bid offers and specific data on specialty issues. |
35
Management has developed a process to periodically review information provided by independent pricing services for all types of securities.
If a valuation is not available from an independent pricing service, or if Management has reason to believe that the valuation received does not represent the amount a Fund might reasonably expect to receive on a current sale in an orderly transaction, Management seeks to obtain quotations from brokers or dealers (generally considered Level 2 or Level 3 inputs depending on the number of quotes available). If such quotations are not readily available, the security is valued using methods the Board has approved in the good-faith belief that the resulting valuation will reflect the fair value of the security. Inputs and assumptions considered in determining the fair value of a security based on Level 2 or Level 3 inputs may include, but are not limited to, the type of the security; the initial cost of the security; the existence of any contractual restrictions on the security’s disposition; the price and extent of public trading in similar securities of the issuer or of comparable companies; quotations or evaluated prices from broker-dealers and/or pricing services; information obtained from the issuer and/or analysts; an analysis of the company’s or issuer’s financial statements; an evaluation of the inputs that influence the issuer and the market(s) in which the security is purchased and sold.
Fair value prices are necessarily estimates, and there is no assurance that such a price will be at or close to the price at which the security is next quoted or next trades.
In December 2020, the Securities and Exchange Commission (“SEC”) adopted Rule 2a-5 under the 1940 Act, which establishes requirements for determining fair value in good faith for purposes of the 1940 Act, including related oversight and reporting requirements. The rule also defines when market quotations are “readily available” for purposes of the 1940 Act, which is the threshold for determining whether a fund must fair value a security. The rule became effective on March 8, 2021, however, the SEC adopted an eighteen-month transition period beginning from the effective date. Management is currently evaluating this guidance.
| 3 | Securities transactions and investment income: Securities transactions are recorded on trade date for financial reporting purposes. Interest income, including accretion of discount (adjusted for original issue discount, where applicable) and amortization of premium, where applicable, is recorded on the accrual basis. Realized gains and losses from securities transactions are recorded on the basis of identified cost and stated separately in the Statements of Operations. |
| | |
| 4 | Income tax information: Each Fund is treated as a separate entity for U.S. federal income tax purposes. It is the policy of each Fund to continue to qualify for treatment as a regulated investment company (“RIC”) by complying with the requirements of the U.S. Internal Revenue Code applicable to RICs and to distribute substantially all of its net investment income and net realized capital gains to its stockholders. To the extent a Fund distributes substantially all of its net investment income and net realized capital gains to stockholders, no federal income or excise tax provision is required. |
The Funds have adopted the provisions of ASC 740 “Income Taxes” (“ASC 740”). ASC 740 sets forth a minimum threshold for financial statement recognition of a tax position taken, or expected to be taken, in a tax return. The Funds recognize interest and penalties, if any, related to unrecognized tax positions as an income tax expense in the Statements of Operations. The Funds are subject to examination by U.S. federal and state tax authorities for returns filed for the tax years for which the applicable statutes of limitations have not yet expired. As of October 31, 2021, the Funds did not have any unrecognized tax positions.
For federal income tax purposes, the estimated cost and unrealized appreciation/(depreciation) in value of investments held at October 31, 2021 were as follows:
| | | Cost | | Gross
Unrealized
Appreciation | | Gross
Unrealized
Depreciation | | Net Unrealized
Appreciation/
(Depreciation) |
| California Fund | | $ | 128,502,603 | | | $ | 11,647,192 | | | $ | 1,729,290 | | | $ | 9,917,902 | |
| Municipal Fund | | | 410,724,474 | | | | 42,468,382 | | | | 6,982,900 | | | | 35,485,482 | |
| New York Fund | | | 112,649,599 | | | | 7,028,382 | | | | 3,383,250 | | | | 3,645,132 | |
36
Income distributions and capital gain distributions are determined in accordance with income tax regulations, which may differ from GAAP. These differences, if any, are primarily due to differing treatments of income and gains on various investment securities held by each Fund and net operating losses written off.
Any permanent differences resulting from different book and tax treatment are reclassified at year-end and have no impact on net income, net asset value (“NAV”) or NAV per share of common stock of the Funds. For the year ended October 31, 2021, the Funds recorded permanent reclassifications primarily related to one or more of the following: non-deductible stock issuance costs, adjustments to the prior period accumulated balances and net operating losses written off. For the year ended October 31, 2021, the Funds recorded the following permanent reclassifications:
| | | Paid-in Capital | | Distributable
Earnings/(Losses) |
| California Fund | | $ | (14,512 | ) | | $ | 14,512 | |
| Municipal Fund | | | (14,512 | ) | | | 14,512 | |
| New York Fund | | �� | (54,463 | ) | | | 54,463 | |
The tax character of distributions paid during the years ended October 31, 2021, and October 31, 2020, was as follows:
| | | Distributions Paid From: |
| | | Tax-Exempt
Income | | | Ordinary
Income | | | Long-Term
Capital Gain | | | Return of
Capital | | | Total | |
| | | 2021 | | | 2020 | | | 2021 | | | 2020 | | | 2021 | | | 2020 | | | 2021 | | | 2020 | | | 2021 | | | 2020 | |
| California Fund | | $ | 3,505,199 | | | $ | 3,871,277 | | | $ | 1,768 | | | $ | 15,220 | | | | $— | | | | $— | | | | $— | | | | $— | | | $ | 3,506,967 | | | $ | 3,886,497 | |
| Municipal Fund | | | 15,511,565 | | | | 16,662,963 | | | | 213,186 | | | | 228,692 | | | | — | | | | — | | | | — | | | | — | | | | 15,724,751 | | | | 16,891,655 | |
| New York Fund | | | 2,836,378 | | | | 3,155,873 | | | | — | | | | — | | | | — | | | | — | | | | — | | | | — | | | | 2,836,378 | | | | 3,155,873 | |
As of October 31, 2021, the components of distributable earnings (accumulated losses) on a U.S. federal income tax basis were as follows:
| | | Undistributed
Ordinary
Income | | Undistributed
Tax-Exempt
Income | | Undistributed
Long-Term
Capital Gain | | Unrealized
Appreciation/
(Depreciation) | | Loss
Carryforwards
and Deferrals | | Other
Temporary
Differences | | Total |
| California Fund | | | $— | | | $ | 1,041,609 | | | | $— | | | $ | 9,917,902 | | | $ | (2,808,983 | ) | | $ | (293,065 | ) | | $ | 7,857,463 | |
| Municipal Fund | | | — | | | | 1,472,260 | | | | — | | | | 35,485,482 | | | | (13,777,729 | ) | | | (1,313,545 | ) | | | 21,866,468 | |
| New York Fund | | | — | | | | 361,191 | | | | — | | | | 3,645,132 | | | | (3,252,427 | ) | | | (237,052 | ) | | | 516,844 | |
The temporary differences between book basis and tax basis distributable earnings are primarily due to: defaulted bond adjustments, timing differences of fund level distributions and tax adjustments related to partnerships and other investments.
To the extent each Fund’s net realized capital gains, if any, can be offset by capital loss carryforwards, it is the policy of each Fund not to distribute such gains. Capital loss carryforward rules allow for RICs to carry forward capital losses indefinitely and to retain the character of capital loss carryforwards as short-term or long-term. As determined at October 31, 2021, the Funds had unused capital loss carryforwards available for federal income tax purposes to offset future net realized capital gains, if any, as follows:
| | | Post-Enactment (No Expiration Date) |
| | | Long-Term | | Short-Term |
| California Fund | | $ | 2,122,096 | | | $ | 686,887 | |
| Municipal Fund | | | 12,493,833 | | | | 1,283,896 | |
| New York Fund | | | 2,508,184 | | | | 744,243 | |
During the year ended October 31, 2021, California Fund and New York Fund utilized capital loss carryforwards of $385,915 and $387,618, respectively.
37
| 5 | Distributions to common stockholders: Each Fund earns income, net of expenses, daily on its investments. It is the policy of each Fund to declare and pay monthly distributions to common stockholders. Distributions from net realized capital gains, if any, are normally distributed in December. Distributions to common stockholders are recorded on the ex-date. Distributions to preferred stockholders are accrued and determined as described in Note A-7. |
On November 15, 2021, each Fund declared a monthly distribution to common stockholders payable December 15, 2021, to stockholders of record on November 30, 2021, with an ex-date of November 29, 2021 as follows:
| | | Distribution per share |
| California Fund | | $ | 0.04480 | |
| Municipal Fund | | | 0.06244 | |
| New York Fund | | | 0.03933 | |
On December 15, 2021, each Fund declared a monthly distribution to common stockholders payable January 18, 2022, to stockholders of record on December 31, 2021, with an ex-date of December 30, 2021 as follows:
| | | Distribution per share |
| California Fund | | $ | 0.04480 | |
| Municipal Fund | | | 0.06244 | |
| New York Fund | | | 0.03933 | |
| | |
| 6 | Expense allocation: Certain expenses are applicable to multiple funds within the complex of related investment companies. Expenses directly attributable to a fund are charged to that fund. Expenses borne by the complex of related investment companies, which includes open-end and closed-end investment companies for which NBIA serves as investment manager, that are not directly attributable to a particular investment company (e.g., a Fund) are allocated among the Funds and the other investment companies or series thereof in the complex on the basis of relative net assets, except where a more appropriate allocation of expenses to each of the investment companies or series thereof in the complex can otherwise be made fairly. |
| | |
| 7 | Financial leverage: California Fund, Municipal Fund and New York Fund issued Variable Rate Municipal Term Preferred Shares (“VMTPS”) on June 30, 2014, July 1, 2014 and July 2, 2014, respectively, as follows: |
| | |
| | | Shares |
| California Fund | | | 590 | |
| Municipal Fund | | | 1,794 | |
| New York Fund | | | 483 | |
On April 1, 2019, the Funds extended the maturity and completed a partial redemption of VMTPS. After such partial redemptions, the Funds had VMTPS outstanding as follows:
| | | Shares
Redeemed | | Shares
Outstanding |
| California Fund | | | 40 | | | | 550 | |
| Municipal Fund | | | 90 | | | | 1,704 | |
| New York Fund | | | 20 | | | | 463 | |
Each Fund’s VMTPS have a liquidation preference of $100,000 per share plus any accumulated unpaid distributions, whether or not earned or declared by the Fund, but excluding interest thereon (“VMTPS Liquidation Value”). Distributions on the VMTPS are accrued daily and paid monthly at a floating rate. For financial reporting purposes only, the liquidation preference of the VMTPS is recognized as a liability in each Fund’s Statement of Assets and Liabilities.
38
The distribution rate for each Fund’s VMTPS is calculated based on the applicable SIFMA (“Securities Industry and Financial Markets Association”) Municipal Swap Index plus a spread. The table below sets forth key terms of each Fund’s VMTPS.
| Fund | | Series | | Term
Redemption
Date | | Shares Outstanding | | Aggregate Liquidation Preference |
| California Fund | | Series A | | 3/31/2022 | | | 550 | | | $ | 55,000,000 | |
| Municipal Fund | | Series A | | 3/31/2022 | | | 1,704 | | | $ | 170,400,000 | |
| New York Fund | | Series A | | 3/31/2022 | | | 463 | | | $ | 46,300,000 | |
The Funds have paid up front expenses in connection with offering the VMTPS, which are being amortized over the life of the VMTPS. The expenses are included in the “Distributions to Variable Rate Municipal Term Preferred Shareholders and amortization of offering costs (Note A)” line item that is reflected in the Statements of Operations.
Each Fund may redeem its VMTPS, in whole or in part, at its option after giving notice to the relevant holders of its VMTPS. Each Fund is also subject to certain restrictions relating to the VMTPS. Failure to comply with these restrictions could preclude a Fund from declaring any distributions to common stockholders or repurchasing common stock and/or could trigger the mandatory redemption of its VMTPS at the VMTPS Liquidation Value. The holders of the VMTPS are entitled to one vote per share and will vote with holders of common stock as a single class, except that the holders of the VMTPS will vote separately as a class on certain matters, as required by law or the Fund’s organizational documents. The holders of the VMTPS, voting as a separate class, are entitled at all times to elect two Directors of the Fund, and to elect a majority of the Directors of the Fund if the Fund fails to pay distributions on its VMTPS for two consecutive years.
During the year ended October 31, 2021, the average aggregate liquidation preference outstanding and average annualized distribution rate of the VMTPS were $55,000,000 and 0.95%, $170,400,000 and 0.95%, and $46,300,000 and 0.95%, for California Fund, Municipal Fund and New York Fund, respectively.
Subsequent to October 31, 2021, on December 16, 2021, each Fund extended the term of its VMTPS to December 15, 2024.
| 8 | Securities lending: Each Fund, using State Street Bank and Trust Company (“State Street”) as its lending agent, may loan securities to qualified brokers and dealers in exchange for negotiated lender’s fees. These fees, if any, would be disclosed within the Statements of Operations under the caption “Income from securities loaned-net” and are net of expenses retained by State Street as compensation for its services as lending agent. |
The initial cash collateral received by a Fund at the beginning of each transaction shall have a value equal to at least 102% of the prior day’s market value of the loaned securities (105% in the case of international securities). Thereafter, the value of the cash collateral is monitored on a daily basis, and cash collateral is moved daily between a counterparty and a Fund until the close of the transaction. A Fund may only receive collateral in the form of cash (U.S. dollars). Cash collateral is generally invested in a money market fund registered under the 1940 Act that is managed by an affiliate of State Street. The risks associated with lending portfolio securities include, but are not limited to, possible delays in receiving additional collateral or in the recovery of the loaned securities. Any increase or decrease in the fair value of the securities loaned and any interest earned or dividends paid or owed on those securities during the term of the loan would accrue to the Fund.
During the year ended October 31, 2021, the Funds did not participate in securities lending.
| 9 | Concentration of risk: The ability of the issuers of the debt securities held by the Funds to meet their obligations may be affected by economic developments, including those particular to a specific industry or region. California Fund and New York Fund normally invest a substantial portion of their assets in municipal bonds of issuers located in the state of California and the state of New York, respectively. The value of each of these Funds’ securities are more susceptible to adverse economic, political, regulatory or other factors affecting the issuers of such municipal bonds than a fund that does not limit its investments to such issuers. |
39
| 10 | Indemnifications: Like many other companies, the Funds’ organizational documents provide that their officers (“Officers”) and directors (“Directors”) are indemnified against certain liabilities arising out of the performance of their duties to the Funds. In addition, both in some of their principal service contracts and in the normal course of their business, the Funds enter into contracts that provide indemnifications to other parties for certain types of losses or liabilities. Each Fund’s maximum exposure under these arrangements is unknown as this could involve future claims against each Fund. |
| | |
| 11 | Arrangements with certain non-affiliated service providers: In order to satisfy rating agency requirements, each Fund is required to provide the rating agency that rates its VMTPS a report on a monthly basis verifying that each Fund is maintaining eligible assets having a discounted value equal to or greater than the Preferred Shares Basic Maintenance Amount, which is a minimum level set by the rating agency as one of the conditions to maintain its rating on the VMTPS. “Discounted value” refers to the fact that the rating agency requires each Fund, in performing this calculation, to discount portfolio securities below their face value, at rates determined by the rating agency. Each Fund pays a fee to State Street for the preparation of this report which is reflected in the Statements of Operations under the caption “Basic maintenance (Note A).” |
| | |
| 12 | Other matters—Coronavirus: The outbreak of the novel coronavirus in many countries has, among other things, disrupted global travel and supply chains, and adversely impacted global commercial activity, the transportation industry and commodity prices in the energy sector. The impact of this virus has negatively affected and may continue to affect the economies of many nations, individual companies and the global securities and commodities markets, including liquidity and volatility. The development and fluidity of this situation precludes any prediction as to its ultimate impact, which may have a continued adverse effect on global economic and market conditions. Such conditions (which may be across industries, sectors or geographies) have impacted and may continue to impact the issuers of the securities held by the Funds. |
Note B—Investment Management Fees, Administration Fees, and Other Transactions with Affiliates:
Each Fund retains NBIA as its investment manager under a Management Agreement. For such investment management services, each Fund pays NBIA an investment management fee at an annual rate of 0.25% of the Fund’s average daily Managed Assets. Managed Assets equal the total assets of the Fund, less liabilities other than the aggregate indebtedness entered into for purposes of leverage. For purposes of calculating Managed Assets, any VMTPS liquidation preference is not considered a liability.
Each Fund retains NBIA as its administrator under an Administration Agreement. Each Fund pays NBIA an administration fee at an annual rate of 0.30% of its average daily Managed Assets under this agreement. Additionally, NBIA retains State Street as its sub-administrator under a Sub-Administration Agreement. NBIA pays State Street a fee for all services received under the Sub-Administration Agreement.
Note C—Securities Transactions:
During the year ended October 31, 2021, there were purchase and sale transactions of long-term securities as follows:
| | | Purchases | | Sales |
| California Fund | | $ | 13,760,194 | | | $ | 13,371,921 | |
| Municipal Fund | | | 58,058,547 | | | | 57,707,086 | |
| New York Fund | | | 18,622,016 | | | | 17,690,547 | |
40
Note D—Capital:
Transactions in shares of common stock for the years ended October 31, 2021 and October 31, 2020 were as follows:
| | | For the Year Ended October 31, 2021 | | For the Year Ended October 31, 2020 |
| | | Stock Issued on
Reinvestment of Dividends
and Distributions | | Net Increase/(Decrease)
In Common Stock
Outstanding | | Stock Issued on
Reinvestment of Dividends
and Distributions | | Net Increase/(Decrease)
In Common Stock
Outstanding |
| California Fund | | | — | | | | — | | | | — | | | | — | |
| Municipal Fund | | | 16,893 | | | | 16,893 | | | | 12,293 | | | | 12,293 | |
| New York Fund | | | — | | | | — | | | | — | | | | — | |
41
Financial Highlights
California Municipal Fund Inc.
The following table includes selected data for a share of common stock outstanding throughout each year and other performance information derived from the Financial Statements. Amounts that do not round to $0.01 or $(0.01) per share are presented as $0.00 or $(0.00), respectively. Ratios that do not round to 0.01% or (0.01)% are presented as 0.00% or (0.00)%, respectively. A “-” indicates that the line item was not applicable in the corresponding period.
| | | Year Ended October 31, | |
| | | 2021 | | | 2020 | | | 2019 | | | 2018 | | | 2017 | |
| Common Stock Net Asset Value, Beginning of Year | | $ | 15.20 | | | $ | 15.58 | | | $ | 14.33 | | | $ | 15.22 | | | $ | 15.67 | |
| | | | | | | | | | | | | | | | | | | | | |
| Income From Investment Operations Applicable to Common Stockholders: | | | | | | | | | | | | | | | | | | | | |
| Net Investment Income/(Loss)@ | | | 0.64 | | | | 0.62 | | | | 0.54 | | | | 0.51 | | | | 0.61 | |
| Net Gains or (Losses) on Securities (both realized and unrealized) | | | 0.06 | | | | (0.46 | ) | | | 1.25 | | | | (0.83 | ) | | | (0.41 | ) |
| Total From Investment Operations Applicable to Common Stockholders | | | 0.70 | | | | 0.16 | | | | 1.79 | | | | (0.32 | ) | | | 0.20 | |
| | | | | | | | | | | | | | | | | | | | | |
| Less Distributions to Common Stockholders From: | | | | | | | | | | | | | | | | | | | | |
| Net Investment Income | | | (0.54 | ) | | | (0.54 | ) | | | (0.52 | ) | | | (0.54 | ) | | | (0.65 | ) |
| Tax Return of Capital | | | — | | | | — | | | | (0.02 | ) | | | (0.03 | ) | | | — | |
| Total Distributions to Common Stockholders | | | (0.54 | ) | | | (0.54 | ) | | | (0.54 | ) | | | (0.57 | ) | | | (0.65 | ) |
| Common Stock Net Asset Value, End of Year | | $ | 15.36 | | | $ | 15.20 | | | $ | 15.58 | | | $ | 14.33 | | | $ | 15.22 | |
| Common Stock Market Value, End of Year | | $ | 13.91 | | | $ | 12.86 | | | $ | 13.92 | | | $ | 12.08 | | | $ | 13.91 | |
| Total Return, Common Stock Net Asset Value† | | | 4.97 | % | | | 1.57 | % | | | 13.19 | % | | | (1.59 | )% | | | 1.60 | %a |
| Total Return, Common Stock Market Value† | | | 12.36 | % | | | (3.82 | )% | | | 19.96 | % | | | (9.23 | )% | | | (6.55 | )%a |
| | | | | | | | | | | | | | | | | | | | | |
| Supplemental Data/Ratios | | | | | | | | | | | | | | | | | | | | |
| Net Assets Applicable to Common Stockholders, End of Year (in millions) | | $ | 85.2 | | | $ | 84.4 | | | $ | 86.5 | | | $ | 79.6 | | | $ | 84.5 | |
| Preferred Stock Outstanding, End of Year (in millions) | | $ | 55.0 | ØØ | | $ | 55.0 | ØØ | | $ | 55.0 | ØØ | | $ | 59.0 | ØØ | | $ | 59.0 | ØØ |
| Preferred Stock Liquidation Preference Per Share | | $ | 100,000 | | | $ | 100,000 | | | $ | 100,000 | | | $ | 100,000 | | | $ | 100,000 | |
| Ratios are Calculated Using Average Net Assets Applicable to Common Stockholders | | | | | | | | | | | | | | | | | | | | |
| Ratio of Gross ExpensesØ | | | 1.86 | % | | | 2.35 | % | | | 3.05 | % | | | 3.17 | % | | | 2.76 | % |
| Ratio of Net ExpensesØ | | | 1.86 | % | | | 2.35 | % | | | 3.05 | % | | | 3.17 | % | | | 2.70 | %b |
| Ratio of Net Investment Income/(Loss) | | | 4.08 | % | | | 4.06 | % | | | 3.59 | % | | | 3.41 | % | | | 4.04 | %b |
| Portfolio Turnover Rate | | | 10 | % | | | 27 | % | | | 25 | % | | | 30 | % | | | 36 | % |
| Asset Coverage Per Share of Preferred Stock, End of Year¢ | | $ | 255,063 | | | $ | 253,442 | | | $ | 257,409 | | | $ | 235,042 | | | $ | 243,283 | |
| | | |
| See Notes to Financial Highlights | 42 | |
Financial Highlights
Municipal Fund Inc.
The following table includes selected data for a share of common stock outstanding throughout each year and other performance information derived from the Financial Statements. Amounts that do not round to $0.01 or $(0.01) per share are presented as $0.00 or $(0.00), respectively. Ratios that do not round to 0.01% or (0.01)% are presented as 0.00% or (0.00)%, respectively. A “-” indicates that the line item was not applicable in the corresponding period.
| | | Year Ended October 31, | |
| | | 2021 | | | 2020 | | | 2019 | | | 2018 | | | 2017 | |
| Common Stock Net Asset Value, Beginning of Year | | $ | 14.75 | | | $ | 15.33 | | | $ | 14.52 | | | $ | 15.49 | | | $ | 16.06 | |
| | | | | | | | | | | | | | | | | | | | | |
| Income From Investment Operations Applicable to Common Stockholders: | | | | | | | | | | | | | | | | | | | | |
| Net Investment Income/(Loss)@ | | | 0.73 | | | | 0.68 | | | | 0.66 | | | | 0.69 | | | | 0.74 | |
| Net Gains or (Losses) on Securities (both realized and unrealized) | | | 0.15 | | | | (0.51 | ) | | | 0.90 | | | | (0.89 | ) | | | (0.48 | ) |
| Total From Investment Operations Applicable to Common Stockholders | | | 0.88 | | | | 0.17 | | | | 1.56 | | | | (0.20 | ) | | | 0.26 | |
| | | | | | | | | | | | | | | | | | | | | |
| Less Distributions to Common Stockholders From: | | | | | | | | | | | | | | | | | | | | |
| Net Investment Income | | | (0.75 | ) | | | (0.75 | ) | | | (0.75 | ) | | | (0.77 | ) | | | (0.83 | ) |
| Common Stock Net Asset Value, End of Year | | $ | 14.88 | | | $ | 14.75 | | | $ | 15.33 | | | $ | 14.52 | | | $ | 15.49 | |
| Common Stock Market Value, End of Year | | $ | 15.22 | | | $ | 14.15 | | | $ | 15.57 | | | $ | 12.62 | | | $ | 14.92 | |
| Total Return, Common Stock Net Asset Value† | | | 5.91 | % | | | 1.40 | % | | | 11.18 | % | | | (0.85 | )% | | | 1.83 | %a |
| Total Return, Common Stock Market Value† | | | 12.92 | % | | | (4.23 | )% | | | 29.92 | % | | | (10.54 | )% | | | 2.68 | %a |
| | | | | | | | | | | | | | | | | | | | | |
| Supplemental Data/Ratios | | | | | | | | | | | | | | | | | | | | |
| Net Assets Applicable to Common Stockholders, End of Year (in millions) | | $ | 280.2 | | | $ | 277.6 | | | $ | 288.2 | | | $ | 273.0 | | | $ | 291.3 | |
| Preferred Stock Outstanding, End of Year (in millions) | | $ | 170.4 | ØØ | | $ | 170.4 | ØØ | | $ | 170.4 | ØØ | | $ | 179.4 | ØØ | | $ | 179.3 | ØØ |
| Preferred Stock Liquidation Preference Per Share | | $ | 100,000 | | | $ | 100,000 | | | $ | 100,000 | | | $ | 100,000 | | | $ | 100,000 | |
| Ratios are Calculated Using Average Net Assets Applicable to Common Stockholders | | | | | | | | | | | | | | | | | | | | |
| Ratio of Gross ExpensesØ | | | 1.58 | % | | | 2.03 | % | | | 2.66 | % | | | 2.69 | % | | | 2.31 | % |
| Ratio of Net ExpensesØ | | | 1.58 | % | | | 2.03 | % | | | 2.66 | % | | | 2.69 | % | | | 2.29 | %b |
| Ratio of Net Investment Income/(Loss) | | | 4.77 | % | | | 4.54 | % | | | 4.39 | % | | | 4.54 | % | | | 4.78 | %b |
| Portfolio Turnover Rate | | | 13 | % | | | 39 | % | | | 44 | % | | | 24 | % | | | 20 | % |
| Asset Coverage Per Share of Preferred Stock, End of Year¢ | | $ | 264,533 | | | $ | 262,958 | | | $ | 269,321 | | | $ | 252,390 | | | $ | 262,497 | |
| | | |
| See Notes to Financial Highlights | 43 | |
Financial Highlights
New York Municipal Fund Inc.
The following table includes selected data for a share of common stock outstanding throughout each year and other performance information derived from the Financial Statements. Amounts that do not round to $0.01 or $(0.01) per share are presented as $0.00 or $(0.00), respectively. Ratios that do not round to 0.01% or (0.01)% are presented as 0.00% or (0.00)%, respectively. A “-” indicates that the line item was not applicable in the corresponding period.
| | | Year Ended October 31, | |
| | | 2021 | | | 2020 | | | 2019 | | | 2018 | | | 2017 | |
| Common Stock Net Asset Value, Beginning of Year | | $ | 13.72 | | | $ | 14.06 | | | $ | 13.29 | | | $ | 14.10 | | | $ | 14.56 | |
| | | | | | | | | | | | | | | | | | | | | |
| Income From Investment Operations Applicable to Common Stockholders: | | | | | | | | | | | | | | | | | | | | |
| Net Investment Income/(Loss)@ | | | 0.52 | | | | 0.49 | | | | 0.48 | | | | 0.50 | | | | 0.55 | |
| Net Gains or (Losses) on Securities (both realized and unrealized) | | | 0.16 | | | | (0.36 | ) | | | 0.76 | | | | (0.82 | ) | | | (0.47 | ) |
| Total From Investment Operations Applicable to Common Stockholders | | | 0.68 | | | | 0.13 | | | | 1.24 | | | | (0.32 | ) | | | 0.08 | |
| | | | | | | | | | | | | | | | | | | | | |
| Less Distributions to Common Stockholders From: | | | | | | | | | | | | | | | | | | | | |
| Net Investment Income | | | (0.47 | ) | | | (0.47 | ) | | | (0.45 | ) | | | (0.49 | ) | | | (0.54 | ) |
| Tax Return of Capital | | | — | | | | — | | | | (0.02 | ) | | | — | | | | — | |
| Total Distributions to Common Stockholders | | | (0.47 | ) | | | (0.47 | ) | | | (0.47 | ) | | | (0.49 | ) | | | (0.54 | ) |
| Common Stock Net Asset Value, End of Year | | $ | 13.93 | | | $ | 13.72 | | | $ | 14.06 | | | $ | 13.29 | | | $ | 14.10 | |
| Common Stock Market Value, End of Year | | $ | 12.54 | | | $ | 11.64 | | | $ | 12.39 | | | $ | 11.13 | | | $ | 12.44 | |
| Total Return, Common Stock Net Asset Value† | | | 5.32 | % | | | 1.45 | % | | | 9.96 | % | | | (1.69 | )% | | | 1.04 | %a |
| Total Return, Common Stock Market Value† | | | 11.75 | % | | | (2.33 | )% | | | 15.71 | % | | | (6.68 | )% | | | (3.43) | %a |
| | | | | | | | | | | | | | | | | | | | | |
| Supplemental Data/Ratios | | | | | | | | | | | | | | | | | | | | |
| Net Assets Applicable to Common Stockholders, End of Year (in millions) | | $ | 70.8 | | | $ | 69.7 | | | $ | 71.4 | | | $ | 67.5 | | | $ | 71.6 | |
| Preferred Stock Outstanding, End of Year (in millions) | | $ | 46.3 | ØØ | | $ | 46.3 | ØØ | | $ | 46.3 | ØØ | | $ | 48.3 | ØØ | | $ | 48.3 | ØØ |
| Preferred Stock Liquidation Preference Per Share | | $ | 100,000 | | | $ | 100,000 | | | $ | 100,000 | | | $ | 100,000 | | | $ | 100,000 | |
| Ratios are Calculated Using Average Net Assets Applicable to Common Stockholders | | | | | | | | | | | | | | | | | | | | |
| Ratio of Gross ExpensesØ | | | 1.94 | % | | | 2.44 | % | | | 3.10 | % | | | 3.16 | % | | | 2.75 | % |
| Ratio of Net ExpensesØ | | | 1.94 | % | | | 2.44 | % | | | 3.10 | % | | | 3.16 | % | | | 2.69 | %b |
| Ratio of Net Investment Income/(Loss) | | | 3.68 | % | | | 3.56 | % | | | 3.45 | % | | | 3.65 | % | | | 3.92 | %b |
| Portfolio Turnover Rate | | | 15 | % | | | 29 | % | | | 29 | % | | | 19 | % | | | 25 | % |
| Asset Coverage Per Share of Preferred Stock, End of Year¢ | | $ | 252,881 | | | $ | 250,508 | | | $ | 254,281 | | | $ | 239,886 | | | $ | 248,341 | |
| | | |
| See Notes to Financial Highlights | 44 | |
Notes to Financial Highlights Municipal Closed-End Funds
| @ | Calculated based on the average number of shares of common stock outstanding during each fiscal period. |
| | |
| † | Total return based on per share NAV reflects the effects of changes in NAV on the performance of each Fund during each fiscal period. Total return based on per share market value assumes the purchase of shares of common stock at the market price on the first day and sale of common stock at the market price on the last day of the period indicated. Dividends and distributions, if any, are assumed to be reinvested at prices obtained under each Fund’s distribution reinvestment plan. Results represent past performance and do not indicate future results. Current returns may be lower or higher than the performance data quoted. Investment returns will fluctuate and shares of common stock when sold may be worth more or less than original cost. |
| | |
| Ø | Distributions on VMTPS are included in expense ratios. The annualized ratios of distributions on VMTPS to average net assets applicable to common stockholders were: |
| | | | | | | | | | | | |
| | | | Year Ended October 31, |
| | | | 2021 | | 2020 | | 2019 | | 2018 | | 2017 |
| | California Fund | | 0.60% | | 1.07% | | 1.75% | | 1.83% | | 1.41% |
| | Municipal Fund | | 0.56% | | 1.00% | | 1.59% | | 1.62% | | 1.24% |
| | New York Fund | | 0.61% | | 1.09% | | 1.74% | | 1.78% | | 1.36% |
| | |
| ØØ | Net of unamortized deferred issuance costs. The unamortized deferred issuance costs were: |
| | | | | | | | | | | | |
| | | | Year Ended October 31, |
| | | | 2021 | | 2020 | | 2019 | | 2018 | | 2017 |
| | California Fund | | $5,966 | | $20,479 | | $35,031 | | $19,412 | | $48,977 |
| | Municipal Fund | | 5,962 | | 20,475 | | 35,027 | | 37,703 | | 94,807 |
| | New York Fund | | 5,966 | | 20,479 | | 35,031 | | 18,355 | | 46,048 |
| | |
| ¢ | Calculated by subtracting the Fund’s total liabilities (excluding the liquidation preference of VMTPS and accumulated unpaid distributions on VMTPS) from the Fund’s total assets and dividing by the number of VMTPS outstanding. |
| | |
| a | In May 2016, the Funds’ custodian, State Street, announced that it had identified inconsistencies in the way in which the Funds were invoiced for categories of expenses, particularly those deemed “out-of-pocket” costs, from 1998 through November 2015, and refunded to the Funds certain expenses, plus interest, determined to be payable to the Funds for the period. These amounts had no impact on the Funds’ total returns for the year ended October 31, 2017. |
| | |
| b | The custodian expenses refund noted in (a) above is non-recurring and is included in these ratios. Had the Funds not received the refund, the annualized ratio of net expenses to average net assets applicable to common stockholders and the annualized ratio of net investment income/(loss) to average net assets applicable to common stockholders would have been: |
| | | | | |
| | | Ratio of Net Expenses
to Average Net Assets
Applicable to Common
Stockholders
Year Ended
October 31, 2017 | | Ratio of Net Investment Income/
(Loss) to Average Net Assets
Applicable to Common
Stockholders
Year Ended
October 31, 2017 |
| | California Fund | 2.76% | | 3.98% |
| | Municipal Fund | 2.31% | | 4.75% |
| | New York Fund | 2.75% | | 3.86% |
45
Report of Independent Registered Public Accounting Firm
To the Stockholders and Boards of Directors of:
Neuberger Berman California Municipal Fund Inc.
Neuberger Berman Municipal Fund Inc.
Neuberger Berman New York Municipal Fund Inc.
Opinion on the Financial Statements
We have audited the accompanying statements of assets and liabilities of Neuberger Berman California Municipal Fund Inc., Neuberger Berman Municipal Fund Inc., and Neuberger Berman New York Municipal Fund Inc. (collectively referred to as the “Funds”), including the schedules of investments, as of October 31, 2021 and the related statements of operations for the year then ended, the statements of changes in net assets for each of the two years in the period then ended, the financial highlights for each of the five years in the period then ended and the related notes (collectively referred to as the “financial statements”). In our opinion, the financial statements present fairly, in all material respects, the financial position of the Funds at October 31, 2021, the results of their operations for the year ended, the changes in net assets for each of the two years in the period then ended and their financial highlights for each of the five years in the period then ended, in conformity with U.S. generally accepted accounting principles.
Basis for Opinion
These financial statements are the responsibility of the Funds’ management. Our responsibility is to express an opinion on each of the Funds’ financial statements based on our audits. We are a public accounting firm registered with the Public Company Accounting Oversight Board (United States) (“PCAOB”) and are required to be independent with respect to the Funds in accordance with the U.S. federal securities laws and the applicable rules and regulations of the Securities and Exchange Commission and the PCAOB.
We conducted our audits in accordance with the standards of the PCAOB. Those standards require that we plan and perform the audit to obtain reasonable assurance about whether the financial statements are free of material misstatement, whether due to error or fraud. The Funds are not required to have, nor were we engaged to perform, an audit of the Funds’ internal control over financial reporting. As part of our audits, we are required to obtain an understanding of internal control over financial reporting, but not for the purpose of expressing an opinion on the effectiveness of the Funds’ internal control over financial reporting. Accordingly, we express no such opinion.
Our audits included performing procedures to assess the risks of material misstatement of the financial statements, whether due to error or fraud, and performing procedures that respond to those risks. Such procedures included examining, on a test basis, evidence regarding the amounts and disclosures in the financial statements. Our procedures included confirmation of securities owned as of October 31, 2021, by correspondence with the custodian and brokers or by other appropriate auditing procedures where replies from brokers were not received. Our audits also included evaluating the accounting principles used and significant estimates made by management, as well as evaluating the overall presentation of the financial statements. We believe that our audits provide a reasonable basis for our opinion.

We have served as the auditor of one or more Neuberger Berman investment companies since 1954.
Boston, Massachusetts
December 21, 2021
46
Fund Investment Objectives, Policies and Risks
Investment Objectives and Policies
Neuberger Berman California Municipal Fund Inc. (NBW)
The Fund’s investment objective is to provide a high level of current income exempt from federal income tax and California personal income tax. There is no assurance that the Fund will achieve its investment objective.
The Fund seeks to achieve its investment objective by normally investing at least 80% of its total assets (including proceeds from the issuance of any preferred stock and the proceeds of any borrowings for investment purposes) in securities of municipal issuers that provide interest income that is exempt from federal income tax and California personal income tax; however, the Fund may invest without limit in municipal securities the interest on which may be an item of tax preference for purposes of the federal alternative minimum tax (“Tax Preference Item”). The Fund’s distributions are generally exempt from federal income tax and California personal income tax, although stockholders may have to pay an alternative minimum tax on income deemed to be a Tax Preference Item.
Municipal securities that provide interest income that is exempt from federal income tax and California personal income tax include securities issued by the State of California, any of its political subdivisions, agencies, or instrumentalities, or by U.S. territories and possessions, such as Guam, the U.S. Virgin Islands, and Puerto Rico, and their political subdivisions and public corporations.
The Fund’s investment objective is not fundamental and may be changed by the Fund’s Board of Directors without stockholder approval, however, stockholders would be provided at least 60 days’ notice of any changes. The Fund’s policy of investing at least 80% of its total assets (including proceeds from the issuance of any preferred stock and the proceeds of any borrowings for investment purposes) in municipal securities that provide interest income that is exempt from federal income tax and California personal income tax is a fundamental policy that may not be changed without the approval of the holders of a majority of the outstanding voting securities of the Fund (as defined in the Investment Company Act of 1940, as amended (the “1940 Act”)).
The Fund may invest in municipal obligations of any maturity or duration and does not have a target maturity or duration. Under normal market conditions, the Fund will invest at least 70% of its total assets in municipal securities that, at the time of investment, are rated within the four highest rating categories by at least one independent credit rating agency or, if unrated, are determined by the Fund’s portfolio managers to be of comparable quality. The Fund may invest up to 30% of its total assets in municipal securities that at the time of investment are rated Ba/BB or B by Moody’s, S&P or Fitch or that are unrated but judged to be of comparable quality by the Fund’s portfolio managers. The Fund will not invest more than 25% of its total assets in any industry. The Fund may invest more than 25% of its assets in industrial development bonds. The Fund may invest up to 20% of its total assets in securities the interest income on which is subject to federal income tax and/or California personal income tax. All percentage and ratings limitations on securities in which the Fund may invest apply at the time of making an investment and shall not be considered violated as a result of subsequent market movements or if an investment rating is subsequently downgraded to a rating that would have precluded the Fund’s initial investment in such security.
The Fund uses leverage to pursue its investment objective and has issued Variable Rate Municipal Term Preferred Shares (the “Preferred Shares”). Under the 1940 Act, the Fund is permitted to issue debt up to 33 1/3% of its total managed assets or equity securities (e.g., Preferred Shares) up to 50% of its total managed assets. The Fund may voluntarily elect to limit its leverage to less than the maximum amount permitted under the 1940 Act. In addition, the Fund may also be subject to certain asset coverage, leverage or portfolio composition requirements imposed by the Preferred Shares’ governing instruments or by agencies rating the Preferred Shares, which may be more stringent than those imposed by the 1940 Act.
47
The Fund may invest in all types of municipal bonds, including general obligation bonds, revenue bonds and pre-refunded bonds. The Fund may invest in zero coupon bonds, which are issued at substantial discounts from their value at maturity and pay no cash income to their holders until they mature.
The Fund may purchase municipal bonds that are additionally secured by insurance, bank credit agreements, or escrow accounts. The credit quality of companies that provide such credit enhancements will affect the value of those securities. Although the insurance feature reduces certain financial risks, the premiums for insurance and the higher market price paid for insured obligations may reduce the Fund’s income. The insurance feature does not guarantee the market value of the insured obligations or the net asset value of the Fund’s shares of common stock.
Neuberger Berman Municipal Fund Inc. (NBH)
The Fund’s investment objective is to provide a high level of current income exempt from federal income tax. There is no assurance that the Fund will achieve its investment objective.
The Fund seeks to achieve its investment objective by normally investing at least 80% of its total assets (including proceeds from the issuance of any preferred stock and the proceeds of any borrowings for investment purposes) in securities of municipal issuers that provide interest income that is exempt from federal income tax; however, the Fund may invest without limit in municipal securities the interest on which may be an item of tax preference for purposes of the federal alternative minimum tax (“Tax Preference Item”). The Fund’s distributions are generally exempt from federal income tax, although stockholders may have to pay an alternative minimum tax on income deemed to be a Tax Preference Item. A portion of the distributions you receive may also be exempt from state and local income taxes, depending on where you live.
Municipal securities that provide interest income that is exempt from federal income tax include securities issued by state and local governments, including U.S. territories and possessions, political subdivisions, agencies and public authorities.
The Fund’s investment objective is not fundamental and may be changed by the Fund’s Board of Directors without stockholder approval, however, stockholders would be provided at least 60 days’ notice of any changes. The Fund’s policy of investing at least 80% of its total assets (including proceeds from the issuance of any preferred stock and the proceeds of any borrowings for investment purposes) in municipal securities that provide interest income that is exempt from federal income tax is a fundamental policy that may not be changed without the approval of the holders of a majority of the outstanding voting securities of the Fund (as defined in the Investment Company Act of 1940, as amended (the “1940 Act”)).
The Fund may invest in municipal obligations of any maturity or duration and does not have a target maturity or duration. Under normal market conditions, the Fund will invest at least 70% of its total assets in municipal securities that, at the time of investment, are rated within the four highest rating categories by at least one independent credit rating agency or, if unrated, are determined by the Fund’s portfolio managers to be of comparable quality. The Fund may invest up to 30% of its total assets in municipal securities that, at the time of investment, are rated Ba/BB or B by Moody’s, S&P or Fitch or that are unrated but judged to be of comparable quality by the Fund’s portfolio managers. The Fund will not invest more than 25% of its total assets in any industry and the Fund normally will not invest more than 5% of its total assets in the securities of any single issuer. The Fund may invest more than 25% of its total assets in industrial development bonds or in issuers located in the same state. The Fund may invest up to 20% of its total assets in securities the interest income on which is subject to federal income tax. All percentage and ratings limitations on securities in which the Fund may invest apply at the time of making an investment and shall not be considered violated as a result of subsequent market movements or if an investment rating is subsequently downgraded to a rating that would have precluded the Fund’s initial investment in such security.
The Fund uses leverage to pursue its investment objective and has issued Variable Rate Municipal Term Preferred Shares (the “Preferred Shares”). Under the 1940 Act, the Fund is permitted to issue debt up to 33 1/3% of its total managed assets or equity securities (e.g., Preferred Shares) up to 50% of its total managed assets. The Fund may voluntarily elect to limit its leverage to less than the maximum amount permitted under the 1940 Act. In addition, the Fund may also be subject
48
to certain asset coverage, leverage or portfolio composition requirements imposed by the Preferred Shares’ governing instruments or by agencies rating the Preferred Shares, which may be more stringent than those imposed by the 1940 Act.
The Fund may invest in all types of municipal bonds, including general obligation bonds, revenue bonds and pre-refunded bonds. The Fund may invest in zero coupon bonds, which are issued at substantial discounts from their value at maturity and pay no cash income to their holders until they mature.
The Fund may purchase municipal bonds that are additionally secured by insurance, bank credit agreements, or escrow accounts. The credit quality of companies that provide such credit enhancements will affect the value of those securities. Although the insurance feature reduces certain financial risks, the premiums for insurance and the higher market price paid for insured obligations may reduce the Fund’s income. The insurance feature does not guarantee the market value of the insured obligations or the net asset value of the Fund’s shares of common stock.
Neuberger Berman New York Municipal Fund Inc. (NBO)
The Fund’s investment objective is to provide a high level of current income exempt from federal income tax and New York State and New York City personal income taxes. There is no assurance that the Fund will achieve its investment objective.
The Fund seeks to achieve its investment objective by normally investing at least 80% of its total assets (including proceeds from the issuance of any preferred stock and the proceeds of any borrowings for investment purposes) in securities of municipal issuers that provide interest income that is exempt from federal income tax and New York State and New York City personal income taxes; however, the Fund may invest without limit in municipal securities the interest on which may be an item of tax preference for purposes of the federal alternative minimum tax (“Tax Preference Item”). The Fund’s distributions are generally exempt from federal income tax and New York State and New York City personal income taxes, although stockholders may have to pay an alternative minimum tax on income deemed to be a Tax Preference Item.
Municipal securities that provide interest income that is exempt from federal income tax and New York State and New York City personal income taxes include securities issued by the State of New York, any of its political subdivisions, agencies, or instrumentalities, or by U.S. territories and possessions, such as Guam, the U.S. Virgin Islands, and Puerto Rico, and their political subdivisions and public corporations.
The Fund’s investment objective is not fundamental and may be changed by the Fund’s Board of Directors without stockholder approval, however, stockholders would be provided at least 60 days’ notice of any changes. The Fund’s policy of investing at least 80% of its total assets (including proceeds from the issuance of any preferred stock and the proceeds of any borrowings for investment purposes) in municipal securities that provide interest income that is exempt from federal income tax and New York State and New York City personal income taxes are fundamental policies that may not be changed without the approval of a majority of the outstanding voting securities of the Fund (as defined in the Investment Company Act of 1940, as amended (the “1940 Act”)).
The Fund may invest in municipal obligations of any maturity or duration and does not have a target maturity or duration. Under normal market conditions, the Fund will invest at least 70% of its total assets in municipal securities that, at the time of investment, are rated within the four highest rating categories by at least one independent credit rating agency or, if unrated, are determined by the Fund’s portfolio managers to be of comparable quality. The Fund may invest up to 30% of its total assets in municipal securities that at the time of investment are rated Ba/BB or B by Moody’s, S&P or Fitch or that are unrated but judged to be of comparable quality by the Fund’s portfolio managers. The Fund will not invest more than 25% of its total assets in any industry. The Fund may invest more than 25% of its assets in industrial development bonds. The Fund may invest up to 20% of its total assets in securities the interest income on which is subject to federal income tax and/or New York State and/or New York City personal income taxes. All percentage and ratings limitations on securities in which the Fund may invest apply at the time of making an investment and shall not be considered violated as a result of subsequent market movements or if an investment rating is subsequently downgraded to a rating that would have precluded the Fund’s initial investment in such security.
49
The Fund uses leverage to pursue its investment objective and has issued Variable Rate Municipal Term Preferred Shares (the “Preferred Shares”). Under the 1940 Act, the Fund is permitted to issue debt up to 33 1/3% of its total managed assets or equity securities (e.g., Preferred Shares) up to 50% of its total managed assets. The Fund may voluntarily elect to limit its leverage to less than the maximum amount permitted under the 1940 Act. In addition, the Fund may also be subject to certain asset coverage, leverage or portfolio composition requirements imposed by the Preferred Shares’ governing instruments or by agencies rating the Preferred Shares, which may be more stringent than those imposed by the 1940 Act.
The Fund may invest in all types of municipal bonds, including general obligation bonds, revenue bonds and pre-refunded bonds. The Fund may invest in zero coupon bonds, which are issued at substantial discounts from their value at maturity and pay no cash income to their holders until they mature.
The Fund may purchase municipal bonds that are additionally secured by insurance, bank credit agreements, or escrow accounts. The credit quality of companies that provide such credit enhancements will affect the value of those securities. Although the insurance feature reduces certain financial risks, the premiums for insurance and the higher market price paid for insured obligations may reduce the Fund’s income. The insurance feature does not guarantee the market value of the insured obligations or the net asset value of the Fund’s shares of common stock.
Risk Factors for the Funds
This section contains a discussion of principal risks of investing in each Fund. The net asset value per share (“NAV”) and market price of, and distributions paid on, each Fund’s shares of common stock will fluctuate with and be affected by, among other things, the risks more fully described below. As with any fund, there can be no guarantee that a Fund will meet its investment objective or that the Fund’s performance will be positive for any period of time. Each of the following risks, which are described in alphabetical order and not in order of importance, can significantly affect a Fund’s performance. The relative importance of, or potential exposure as a result of, each of these risks will vary based on market and other investment-specific considerations. Each Fund may be subject to other risks in addition to those identified below. Each risk noted below is applicable to each Fund unless the specific Fund or Funds are noted in a parenthetical.
Anti-Takeover and Other Provisions in the Articles of Incorporation and Bylaws. The Fund’s Articles of Incorporation and Bylaws include provisions that could limit the ability of other entities or persons to acquire control of the Fund, to cause it to engage in certain transactions or to modify its structure. Such provisions may limit the ability of common stockholders to sell their shares at a premium over the then-current market prices and may have the effect of inhibiting structural changes to the Fund, such as a conversion to an open-end investment company.
Call Risk. Upon the issuer’s desire to call a security, or under other circumstances where a security is called, including when interest rates are low and issuers opt to repay the obligation underlying a “callable security” early, the Fund may have to reinvest the proceeds in an investment offering a lower yield and may not benefit from any increase in value that might otherwise result from declining interest rates. In addition, the Fund may realize a taxable gain or loss on such securities.
California State Specific Risk (NBW Only). Because the Fund invests primarily in municipal securities of California issuers, it is more vulnerable to unfavorable economic, political and regulatory developments in California than are funds that invest in municipal securities of many states.
Credit Risk. Credit risk is the risk that issuers, guarantors, or insurers may fail, or become less able or unwilling, to pay interest and/or principal when due. Changes in the actual or perceived creditworthiness of an issuer, or a downgrade or default affecting any of the Fund’s securities could affect the Fund’s performance. Generally, the longer the maturity and the lower the credit quality of a security, the more sensitive it is to credit risk.
Distressed Securities Risk. Distressed securities may present a substantial risk of default, including the loss of the entire investment, or may be in default. The Fund may not receive interest payments on the distressed securities and may incur costs to protect its investment. The prices of such securities may be subject to periods of abrupt and erratic market movements and above-average price volatility and it may be difficult to value such securities. In certain periods, there may be little or no liquidity in the markets for distressed securities meaning that the Fund may be unable to exit its position.
50
Interest Rate Risk. The Fund’s distribution rate and NAV will fluctuate in response to changes in interest rates. In general, the value of investments with interest rate risk, such as debt securities, will move in the direction opposite to movements in interest rates. If interest rates rise, the value of such securities may decline. Typically, the longer the maturity or duration of a debt security, the greater the effect a change in interest rates could have on the security’s price. Thus, the sensitivity of the Fund’s debt securities to interest rate risk will increase with any increase in the duration of those securities.
Issuer-Specific Risk. An individual security may be more volatile, and may perform differently, than the market as a whole.
Leverage Risk. The Fund’s use of leverage may cause higher volatility for the Fund’s NAV, market price, and distribution rate. Leverage typically magnifies the total return of the Fund’s portfolio, whether that return is positive or negative. Leverage is intended to increase common stock net income, but there is no assurance that the Fund’s leveraging strategy will be successful or that the use of leverage will result in a higher yield on the Fund’s shares of common stock. Leverage may also increase the Fund’s liquidity risk, as the Fund may need to sell securities at inopportune times to stay within Fund, contractual or regulatory limits. The Fund’s use of leverage may increase operating costs, which may reduce total return. The Fund’s use of leverage may increase or decrease from time to time in its discretion and the Fund may, in the future, determine not to use leverage.
Liquidity Risk. From time to time, the trading market for a particular investment in which the Fund invests, or a particular type of instrument in which the Fund is invested, may become less liquid or even illiquid. Illiquid investments frequently can be more difficult to purchase or sell at an advantageous price or time, and there is a greater risk that the investments may not be sold for the price at which the Fund is carrying them. Certain investments that were liquid when the Fund purchased them may become illiquid, sometimes abruptly. Additionally, market closures due to holidays or other factors may render a security or group of securities (e.g., securities tied to a particular country or geographic region) illiquid for a period of time. An inability to sell a portfolio position can adversely affect the Fund’s value or prevent the Fund from being able to take advantage of other investment opportunities. Market prices for such securities or other investments may be volatile. During periods of substantial market volatility, an investment or even an entire market segment may become illiquid, sometimes abruptly, which can adversely affect the Fund’s ability to limit losses.
Lower-Rated Debt Securities Risk. Lower-rated debt securities (commonly known as “junk bonds”) and unrated debt securities determined to be of comparable quality involve greater risks than investment grade debt securities. Such securities may fluctuate more widely in price and yield and may fall in price during times when the economy is weak or is expected to become weak. These securities also may require a greater degree of judgment to establish a price and may be difficult to sell at the time and price the Fund desires. Lower-rated debt securities are considered by the major rating agencies to be predominantly speculative with respect to the issuer’s continuing ability to pay principal and interest and carry a greater risk that the issuer of such securities will default in the timely payment of principal and interest. Issuers of securities that are in default or have defaulted may fail to resume principal or interest payments, in which case the Fund may lose its entire investment. The creditworthiness of issuers of these securities may be more complex to analyze than that of issuers of investment grade debt securities, and the overreliance on credit ratings may present additional risks.
Market Premium/Discount Risk. The market price of the Fund’s shares of common stock will generally fluctuate in accordance with changes in the Fund’s NAV as well as the relative supply of and demand for shares on the secondary market. The Fund’s investment advisor cannot predict whether shares will trade below, at or above their NAV because the shares trade on the secondary market at market prices and not at NAV. Because the market price of the shares of common stock will be determined by factors such as relative supply of and demand for the common shares in the market, general market and economic circumstances, and other factors beyond the control of the Fund, the Fund cannot predict whether the common shares will trade at, below or above NAV. This characteristic is a risk separate and distinct from the risk that the Fund’s NAV could decrease as a result of investment activities. Common stockholders bear a risk of loss to the extent that the price at which they sell their shares is lower in relation to the Fund’s NAV than at the time of purchase.
51
Municipal Securities Risk. The municipal securities market could be significantly affected by adverse political and legislative changes, as well as uncertainties related to taxation or the rights of municipal security holders. Changes in the financial health of a municipality or other issuer, or an insurer of municipal securities, may make it difficult for it to pay interest and principal when due and may affect the overall municipal securities market. To the extent that the Fund invests a significant portion of its assets in the municipal securities of a particular state or U.S. territory or possession, there is greater risk that political, regulatory, economic or other developments within that jurisdiction may have a significant impact on the Fund’s investment performance. Declines in real estate prices and general business activity may reduce the tax revenues of state and local governments. Municipal issuers have on occasion defaulted on obligations, been downgraded, or commenced insolvency proceedings.
Because many municipal securities are issued to finance similar types of projects, especially those related to education, health care, housing, transportation, and utilities, conditions in those sectors can affect the overall municipal securities market. Interest on municipal securities paid out of current or anticipated revenues from a specific project or specific asset (so-called “private activity bonds”) may be adversely impacted by declines in revenue from the project or asset. Declines in general business activity could affect the economic viability of facilities that are the sole source of revenue to support private activity bonds. To the extent that the Fund earns interest income on private activity bonds, a part of its dividends will be a Tax Preference Item.
Municipal bonds may be bought or sold at a market discount (i.e., a price less than the bond’s principal amount or, in the case of a bond issued with original issue discount (“OID”), a price less than the amount of the issue price plus accrued OID). If the market discount is more than a de minimis amount, and if the bond has a maturity date of more than one year from the date it was issued, then any market discount that accrues annually, or any gains earned on the disposition of the bond, generally will be subject to federal income taxation as ordinary (taxable) income rather than as capital gains. Some municipal securities, including those in the high yield market, may include transfer restrictions similar to restricted securities (e.g., may only be transferred to qualified institutional buyers and purchasers meeting other qualification requirements set by the issuer). As such, it may be difficult to sell municipal securities at a time when it may otherwise be desirable to do so or the Fund may be able to sell them only at prices that are less than what the Fund regards as their fair market value.
New York State Specific Risk (NBO Only). Because the Fund invests primarily in municipal securities of New York issuers, it is more vulnerable to unfavorable economic, political and regulatory developments in New York than are funds that invest in municipal securities of many states. The economic and financial condition of New York State, New York City and other municipalities of New York are closely related, and any financial difficulty in these jurisdictions may have an adverse effect on New York municipal securities held by the Fund. Certain issuers of New York municipal securities have experienced serious financial difficulties in the past and reoccurrence of these difficulties may impair the ability of certain New York issuers to pay principal or interest on their obligations.
Operational and Cybersecurity Risk. The Fund and its service providers, and your ability to transact with the Fund, may be negatively impacted due to operational matters arising from, among other problems, human errors, systems and technology disruptions or failures, or cybersecurity incidents. Cybersecurity incidents may allow an unauthorized party to gain access to fund assets, customer data, or proprietary information, or cause the Fund or its service providers, as well as the securities trading venues and their service providers, to suffer data corruption or lose operational functionality. Cybersecurity incidents can result from deliberate attacks or unintentional events. It is not possible for the Manager or the other Fund service providers to identify all of the cybersecurity or other operational risks that may affect the Fund or to develop processes and controls to completely eliminate or mitigate their occurrence or effects. Most issuers in which the Fund invests are heavily dependent on computers for data storage and operations, and require ready access to the internet to conduct their business. Thus, cybersecurity incidents could also affect issuers of securities in which the Fund invests, leading to significant loss of value.
52
Recent Market Conditions. National economies are substantially interconnected, as are global financial markets, which creates the possibility that conditions in one country or region might adversely impact issuers in a different country or region. Some countries, including the U.S., have in recent years adopted more protectionist trade policies. The rise in protectionist trade policies, changes to some major international trade agreements and the potential for changes to others, could affect the economies of many nations in ways that cannot necessarily be foreseen at the present time. Equity markets in the U.S. and China have been very sensitive to the outlook for resolving the U.S.-China “trade war,” a trend that may continue in the future.
High public debt in the U.S. and other countries creates ongoing systemic and market risks and policymaking uncertainty, and there may be a further increase in public debt due to the economic effects of the COVID-19 pandemic and ensuing economic relief and public health measures. Governments and central banks have moved to limit the potential negative economic effects of the COVID-19 pandemic with interventions that are unprecedented in size and scope and may continue to do so, but the ultimate impact of these efforts is uncertain. Governments’ efforts to limit potential negative economic effects of the pandemic may be altered, delayed, or eliminated at inopportune times for political, policy or other reasons. Interest rates have been unusually low in recent years in the U.S. and abroad, and central banks have reduced rates further in an effort to combat the economic effects of the COVID-19 pandemic. Because there is little precedent for this situation, it is difficult to predict the impact on various markets of a significant rate increase or other significant policy changes, perhaps in response to indications of increasing inflation. Over the longer term, rising interest rates may present a greater risk than has historically been the case due to the current period of relatively low rates and the effect of government fiscal and monetary policy initiatives and potential market reaction to those initiatives or their alteration or cessation.
The impact of the pandemic has negatively affected and may continue to affect the economies of many nations, individual companies and the global securities and commodities markets, including their liquidity, in ways that cannot necessarily be foreseen at the present time. The pandemic has accelerated trends toward working remotely and shopping on-line, which may negatively affect the value of office and commercial real estate and companies that have been slow to transition to an on-line business model, and has disrupted the supply chains that many businesses depend on. The travel, hospitality and public transit industries may suffer long-term negative effects from the pandemic and resulting changes to public behavior.
Funds and their advisers, as well as many of the companies in which they invest, are subject to regulation by the federal government. Over the past several years, the U.S. has moved away from tighter industry regulation, a trend that appears to be changing. Increased regulation may impose added costs on the Fund and its service providers for monitoring and compliance, and affect the businesses of various portfolio companies, in ways that cannot necessarily be foreseen at the present time.
Climate Change. There is widespread concern about the potential effects of global climate change on property and security values. A rise in sea levels, an increase in powerful windstorms and/or a climate-driven increase in flooding could cause coastal properties to lose value or become unmarketable altogether. Unlike previous declines in the real estate market, properties in affected coastal zones may not ever recover their value. Large wildfires driven by high winds and prolonged drought may devastate businesses and entire communities and may be very costly to any business found to be responsible for the fire. The U.S. administration appears concerned about the climate change problem and is focusing regulatory and public works projects around those concerns. Regulatory changes tied to concerns about climate change could adversely affect the value of certain land and the viability of certain industries.
Losses related to climate change could adversely affect corporate issuers and mortgage lenders, the value of mortgage-backed securities, the bonds of municipalities that depend on tax or other revenues and tourist dollars generated by affected properties, and insurers of the property and/or of corporate, municipal or mortgage-backed securities. Since property and security values are driven largely by buyers’ perceptions, it is difficult to know the time period over which these market effects might unfold.
53
LIBOR Transition. Trillions of dollars’ worth of financial contracts around the world specify rates that are based on the London Interbank Offered Rate (LIBOR). LIBOR is produced daily by averaging the rates for inter-bank lending reported by a number of banks. Current plans call for certain LIBOR-based tenors to be phased out by the end of 2021. There are risks that the financial services industry will not have a suitable substitute in place by that time and that there will not be time to perform the substantial work necessary to revise the many existing contracts that rely on LIBOR. The transition process, or a failure of the industry to transition properly, might lead to increased volatility and illiquidity in markets that currently rely on LIBOR. It also could lead to a reduction in the value of some LIBOR-based investments and reduce the effectiveness of new hedges placed against existing LIBOR-based instruments. Some experts have called for legislation to ease the transition from LIBOR, but there is no assurance whether or when such legislation will be forthcoming.
Risk Management. Risk is an essential part of investing. No risk management program can eliminate the Fund’s exposure to adverse events; at best, it may only reduce the possibility that the Fund will be affected by such events, and especially those risks that are not intrinsic to the Fund’s investment program. The Fund could experience losses if judgments about risk prove to be incorrect.
Sector Risk. From time to time, based on market or economic conditions, the Fund may have significant positions in one or more sectors of the market. To the extent the Fund invests more heavily in particular sectors, its performance will be especially sensitive to developments that significantly affect those sectors. Individual sectors may be more volatile, and may perform differently, than the broader market. The industries that constitute a sector may all react in the same way to economic, political or regulatory events.
Shareholder Activism Risk. Shareholder activism can take many forms, including making public demands that the Fund consider certain alternatives, engaging in public campaigns to attempt to influence the Fund’s governance and/or management, commencing proxy contests in an effort to elect the activists’ representatives or others to the Fund’s Board of Directors or to seek other actions such as a tender offer or Fund liquidation, and commencing litigation. Shareholder activism arises in a variety of situations, and has been increasing in the closed-end fund space recently. While the Fund is currently not subject to any shareholder activism, due to the potential volatility of the Fund’s common stock market price and for a variety of other reasons, the Fund may in the future become the target of shareholder activism. Shareholder activism could result in substantial costs and divert Management’s and the Fund’s Board’s attention and resources from its business. Also, the Fund may be required to incur significant legal and other expenses related to any activist shareholder matters. Further, the Fund’s stock price could be subject to significant fluctuation or otherwise be adversely affected by the events, risks and uncertainties of any shareholder activism. Shareholder activists seek short-term actions that can increase Fund costs per share and be detrimental to long-term stockholders.
Valuation Risk. The Fund may not be able to sell an investment at the price at which the Fund has valued the investment. Such differences could be significant, particularly for illiquid securities and securities that trade in relatively thin markets and/or markets that experience extreme volatility. If market or other conditions make it difficult to value some investments, SEC rules and applicable accounting protocols may require the Fund to value these investments using more subjective methods, known as fair value methodologies. Using fair value methodologies to price investments may result in a value that is different from an investment’s most recent price and from the prices used by other funds to calculate their NAVs. The Fund’s ability to value its investments in an accurate and timely manner may be impacted by technological issues and/or errors by third party service providers, such as pricing services or accounting agents.
54
Distribution Reinvestment Plan for each Fund
American Stock Transfer & Trust Company, LLC (the “Plan Agent”) will act as Plan Agent for stockholders who have not elected in writing to receive dividends and distributions in cash (each a “Participant”), will open an account for each Participant under the Distribution Reinvestment Plan (“Plan”) in the same name as their then-current shares of the Fund’s common stock (“Shares”) are registered, and will put the Plan into effect for each Participant as of the first record date for a dividend or capital gains distribution.
Whenever the Fund declares a dividend or distribution with respect to the Shares, each Participant will receive such dividends and distributions in additional Shares, including fractional Shares acquired by the Plan Agent and credited to each Participant’s account. If on the payment date for a cash dividend or distribution, the net asset value is equal to or less than the market price per Share plus estimated brokerage commissions, the Plan Agent shall automatically receive such Shares, including fractions, for each Participant’s account. Except in the circumstances described in the next paragraph, the number of additional Shares to be credited to each Participant’s account shall be determined by dividing the dollar amount of the dividend or distribution payable on their Shares by the greater of the net asset value per Share determined as of the date of purchase or 95% of the then-current market price per Share on the payment date.
Should the net asset value per Share exceed the market price per Share plus estimated brokerage commissions on the payment date for a cash dividend or distribution, the Plan Agent or a broker-dealer selected by the Plan Agent shall endeavor, for a purchase period lasting until the last business day before the next date on which the Shares trade on an “ex-dividend” basis, but in no event, except as provided below, more than 30 days after the payment date, to apply the amount of such dividend or distribution on each Participant’s Shares (less their pro rata share of brokerage commissions incurred with respect to the Plan Agent’s open-market purchases in connection with the reinvestment of such dividend or distribution) to purchase Shares on the open market for each Participant’s account. No such purchases may be made more than 30 days after the payment date for such dividend or distribution except where temporary curtailment or suspension of purchase is necessary to comply with applicable provisions of federal securities laws. If, at the close of business on any day during the purchase period the net asset value per Share equals or is less than the market price per Share plus estimated brokerage commissions, the Plan Agent will not make any further open-market purchases in connection with the reinvestment of such dividend or distribution. If the Plan Agent is unable to invest the full dividend or distribution amount through open-market purchases during the purchase period, the Plan Agent shall request that, with respect to the uninvested portion of such dividend or distribution amount, the Fund issue new Shares at the close of business on the earlier of the last day of the purchase period or the first day during the purchase period on which the net asset value per Share equals or is less than the market price per Share, plus estimated brokerage commissions, such Shares to be issued in accordance with the terms specified in the third paragraph hereof. These newly issued Shares will be valued at the then-current market price per Share at the time such Shares are to be issued.
For purposes of making the reinvestment purchase comparison under the Plan, (a) the market price of the Shares on a particular date shall be the last sales price on the New York Stock Exchange (or if the Shares are not listed on the New York Stock Exchange, such other exchange on which the Shares are principally traded) on that date, or, if there is no sale on such Exchange (or if not so listed, in the over-the-counter market) on that date, then the mean between the closing bid and asked quotations for such Shares on such Exchange on such date and (b) the net asset value per Share on a particular date shall be the net asset value per Share most recently calculated by or on behalf of the Fund. All dividends, distributions and other payments (whether made in cash or Shares) shall be made net of any applicable withholding tax.
Open-market purchases provided for above may be made on any securities exchange where the Fund’s Shares are traded, in the over-the-counter market or in negotiated transactions and may be on such terms as to price, delivery and otherwise as the Plan Agent shall determine. Each Participant’s uninvested funds held by the Plan Agent will not bear interest, and it is understood that, in any event, the Plan Agent shall have no liability in connection with any inability to purchase Shares within 30 days after the initial date of such purchase as herein provided, or with the timing of any purchases effected. The Plan Agent shall have no responsibility as to the value of the Shares acquired for each
55
Participant’s account. For the purpose of cash investments, the Plan Agent may commingle each Participant’s funds with those of other stockholders of the Fund for whom the Plan Agent similarly acts as agent, and the average price (including brokerage commissions) of all Shares purchased by the Plan Agent as Plan Agent shall be the price per Share allocable to each Participant in connection therewith.
The Plan Agent may hold each Participant’s Shares acquired pursuant to the Plan together with the Shares of other stockholders of the Fund acquired pursuant to the Plan in noncertificated form in the Plan Agent’s name or that of the Plan Agent’s nominee. The Plan Agent will forward to each Participant any proxy solicitation material and will vote any Shares so held for each Participant only in accordance with the instructions set forth on proxies returned by the Participant to the Fund.
The Plan Agent will confirm to each Participant each acquisition made for their account as soon as practicable but not later than 60 days after the date thereof. Although each Participant may from time to time have an undivided fractional interest (computed to three decimal places) in a Share, no certificates for a fractional Share will be issued. However, dividends and distributions on fractional Shares will be credited to each Participant’s account. In the event of termination of a Participant’s account under the Plan, the Plan Agent will adjust for any such undivided fractional interest in cash at the market value of the Shares at the time of termination, less the pro rata expense of any sale required to make such an adjustment.
Any Share dividends or split Shares distributed by the Fund on Shares held by the Plan Agent for Participants will be credited to their accounts. In the event that the Fund makes available to its stockholders rights to purchase additional Shares or other securities, the Shares held for each Participant under the Plan will be added to other Shares held by the Participant in calculating the number of rights to be issued to each Participant.
The Plan Agent’s service fee for handling capital gains and other distributions or income dividends will be paid by the Fund. Participants will be charged their pro rata share of brokerage commissions on all open-market purchases.
Each Participant may terminate their account under the Plan by notifying the Plan Agent in writing. Such termination will be effective immediately if the Participant’s notice is received by the Plan Agent not less than ten days prior to any dividend or distribution record date, otherwise such termination will be effective the first trading day after the payment date for such dividend or distribution with respect to any subsequent dividend or distribution. The Plan may be terminated by the Plan Agent or the Fund upon notice in writing mailed to each Participant at least 30 days prior to any record date for the payment of any dividend or distribution by the Fund.
These terms and conditions may be amended or supplemented by the Plan Agent or the Fund at any time or times but, except when necessary or appropriate to comply with applicable law or the rules or policies of the Securities and Exchange Commission or any other regulatory authority, only by mailing to each Participant appropriate written notice at least 30 days prior to the effective date thereof. The amendment or supplement shall be deemed to be accepted by each Participant unless, prior to the effective date thereof, the Plan Agent receives written notice of the termination of their account under the Plan. Any such amendment may include an appointment by the Plan Agent in its place and stead of a successor Plan Agent under these terms and conditions, with full power and authority to perform all or any of the acts to be performed by the Plan Agent under these terms and conditions. Upon any such appointment of any Plan Agent for the purpose of receiving dividends and distributions, the Fund will be authorized to pay to such successor Plan Agent, for each Participant’s account, all dividends and distributions payable on Shares held in their name or under the Plan for retention or application by such successor Plan Agent as provided in these terms and conditions.
The Plan Agent shall at all times act in good faith and agrees to use its best efforts within reasonable limits to ensure the accuracy of all services performed under this Agreement and to comply with applicable law, but assumes no responsibility and shall not be liable for loss or damage due to errors unless such error is caused by the Plan Agent’s negligence, bad faith, or willful misconduct or that of its employees. These terms and conditions are governed by the laws of the State of Maryland.
56
Reinvested dividends and distributions are taxed in the same manner as cash dividends and distributions — i.e., reinvestment in additional Shares does not relieve stockholders of, or defer the need to pay, any income tax that may be payable (or that is required to be withheld) on Fund dividends and distributions. Participants should contact their tax professionals for information on how the Plan impacts their personal tax situation. For additional information about the Plan, please contact the Plan Agent by telephone at 1-866-227-2136 or by mail at 6201 15th Avenue, Brooklyn, NY, 11219 or online at www.astfinancial.com.
57
Directory
Investment Manager and Administrator Neuberger Berman Investment Advisers LLC
1290 Avenue of the Americas
New York, NY 10104-0002
877.461.1899 | | Plan Agent American Stock Transfer & Trust Company, LLC
Plan Administration Department
P.O. Box 922
Wall Street Station
New York, NY 10269-0560 |
| | | |
Custodian State Street Bank and Trust Company
One Lincoln Street
Boston, MA 02111 | | Overnight correspondence should be sent to:
American Stock Transfer & Trust Company, LLC
6201 15th Avenue
Brooklyn, NY 11219 |
| | | |
Transfer Agent American Stock Transfer & Trust Company, LLC
6201 15th Avenue
Brooklyn, NY 11219
Shareholder Services 866.227.2136 | | Legal Counsel K&L Gates LLP
1601 K Street, NW
Washington, DC 20006-1600 |
| | | |
| | | Independent Registered Public Accounting Firm Ernst & Young LLP
200 Clarendon Street
Boston, MA 02116 |
58
Directors and Officers
The following tables set forth information concerning the Directors and Officers of each of the Funds. All persons named as Directors and Officers also serve in similar capacities for other funds administered or managed by NBIA. Each Fund’s Statement of Additional Information includes additional information about the Directors as of the time of the Fund’s most recent public offering and is available upon request, without charge, by calling (877) 461-1899.
Information about the Board of Directors
Name, (Year of Birth), and
Address(1) | | Position(s)
and Length
of Time
Served(2) | | Principal Occupation(s)(3) | | Number
of Funds
in Fund
Complex
Overseen
by Director | | Other Directorships Held
Outside Fund Complex by
Director(3) |
| | | | | | | | | |
| | | | | CLASS I | | | | |
| | | | | | | | | |
| Independent Directors | | | | |
| | | | | | | | | |
| Marc Gary (1952) | | Director since 2015 | | Executive Vice Chancellor and Chief Operating Officer, Jewish Theological Seminary, since 2012; formerly, Executive Vice President and General Counsel, Fidelity Investments, 2007 to 2012; formerly, Executive Vice President and General Counsel, BellSouth Corporation, 2004 to 2007; formerly, Vice President and Associate General Counsel, BellSouth Corporation, 2000 to 2004; formerly, Associate, Partner, and National Litigation Practice Co-Chair, Mayer, Brown LLP, 1981 to 2000; formerly, Associate Independent Counsel, Office of Independent Counsel, 1990 to 1992. | | 47 | | Director, UJA Federation of Greater New York, since 2019; Trustee, Jewish Theological Seminary, since 2015; Director, Legility, Inc. (privately held for-profit company), since 2012; Director, Lawyers Committee for Civil Rights Under Law (not-for-profit), since 2005; formerly, Director, Equal Justice Works (not-for-profit), 2005 to 2014; formerly, Director, Corporate Counsel Institute, Georgetown University Law Center, 2007 to 2012; formerly, Director, Greater Boston Legal Services (not-for-profit), 2007 to 2012. |
| | | | | | | | | |
| Michael M. Knetter (1960) | | Director since 2007 | | President and Chief Executive Officer, University of Wisconsin Foundation, since 2010; formerly, Dean, School of Business, University of Wisconsin - Madison; formerly, Professor of International Economics and Associate Dean, Amos Tuck School of Business - Dartmouth College, 1998 to 2002. | | 47 | | Director, 1 William Street Credit Income Fund, since 2018; Board Member, American Family Insurance (a mutual company, not publicly traded), since March 2009; formerly, Trustee, Northwestern Mutual Series Fund, Inc., 2007 to 2011; formerly, Director, Wausau Paper, 2005 to 2011; formerly, Director, Great Wolf Resorts, 2004 to 2009. |
59
Name, (Year of Birth), and
Address(1) | | Position(s)
and Length
of Time
Served(2) | | Principal Occupation(s)(3) | | Number
of Funds
in Fund
Complex
Overseen
by Director | | Other Directorships Held
Outside Fund Complex by
Director(3) |
| | | | | | | | | |
| Tom D. Seip (1950) | | Director since 2002; Chairman of the Board since 2008; formerly Lead Independent Director from 2006 to 2008 | | Formerly, Managing Member, Ridgefield Farm LLC (a private investment vehicle), 2004 to 2016; formerly, President and CEO, Westaff, Inc. (temporary staffing), May 2001 to January 2002; formerly, Senior Executive, The Charles Schwab Corporation, 1983 to 1998, including Chief Executive Officer, Charles Schwab Investment Management, Inc.; Trustee, Schwab Family of Funds and Schwab Investments, 1997 to 1998; and Executive Vice President-Retail Brokerage, Charles Schwab & Co., Inc., 1994 to 1997. | | 47 | | Formerly, Director, H&R Block, Inc. (tax services company), 2001 to 2018; formerly, Director, Talbot Hospice Inc., 2013 to 2016; formerly, Chairman, Governance and Nominating Committee, H&R Block, Inc., 2011 to 2015; formerly, Chairman, Compensation Committee, H&R Block, Inc., 2006 to 2010; formerly, Director, Forward Management, Inc. (asset management company), 1999 to 2006. |
| | | | | | | | | |
| Peter P. Trapp (1944) | | Director since 2002 | | Retired; formerly, Regional Manager for Mid-Southern Region, Ford Motor Credit Company, September 1997 to 2007; formerly, President, Ford Life Insurance Company, April 1995 to August 1997. | | 47 | | None. |
60
Name, (Year of Birth), and
Address(1) | | Position(s)
and Length
of Time
Served(2) | | Principal Occupation(s)(3) | | Number
of Funds
in Fund
Complex
Overseen
by Director | | Other Directorships Held
Outside Fund Complex by
Director(3) |
| | | | | | | | | |
| | | | | CLASS II | | | | |
| | | | | | | | | |
| Independent Directors | | | | |
| | | | | | | | | |
| Michael J. Cosgrove (1949) | | Director since 2015 | | President, Carragh Consulting USA, since 2014; formerly, Executive, General Electric Company, 1970 to 2014, including President, Mutual Funds and Global Investment Programs, GE Asset Management, 2011 to 2014, President and Chief Executive Officer, Mutual Funds and Intermediary Business, GE Asset Management, 2007 to 2011, President, Institutional Sales and Marketing, GE Asset Management, 1998 to 2007, and Chief Financial Officer, GE Asset Management, and Deputy Treasurer, GE Company, 1988 to 1993. | | 47 | | Director, America Press, Inc. (not-for-profit Jesuit publisher), since 2015; formerly, Director, Fordham University, 2001 to 2018; formerly, Director, The Gabelli Go Anywhere Trust, June 2015 to June 2016; formerly, Director, Skin Cancer Foundation (not-for-profit), 2006 to 2015; formerly, Director, GE Investments Funds, Inc., 1997 to 2014; formerly, Trustee, GE Institutional Funds, 1997 to 2014; formerly, Director, GE Asset Management, 1988 to 2014; formerly, Director, Elfun Trusts, 1988 to 2014; formerly, Trustee, GE Pension & Benefit Plans, 1988 to 2014; formerly, Member of Board of Governors, Investment Company Institute. |
| | | | | | | | | |
| Deborah C. McLean (1954) | | Director since 2015 | | Member, Circle Financial Group (private wealth management membership practice), since 2011; Managing Director, Golden Seeds LLC (an angel investing group), since 2009; Adjunct Professor, Columbia University School of International and Public Affairs, since 2008; formerly, Visiting Assistant Professor, Fairfield University, Dolan School of Business, Fall 2007; formerly, Adjunct Associate Professor of Finance, Richmond, The American International University in London, 1999 to 2007. | | 47 | | Board member, Norwalk Community College Foundation, since 2014; Dean’s Advisory Council, Radcliffe Institute for Advanced Study, since 2014; formerly, Director and Treasurer, At Home in Darien (not-for-profit), 2012 to 2014; formerly, Director, National Executive Service Corps (not-for-profit), 2012 to 2013; formerly, Trustee, Richmond, The American International University in London, 1999 to 2013. |
61
Name, (Year of Birth), and
Address(1) | | Position(s)
and Length
of Time
Served(2) | | Principal Occupation(s)(3) | | Number
of Funds
in Fund
Complex
Overseen
by Director | | Other Directorships Held
Outside Fund Complex by
Director(3) |
| | | | | | | | | |
| George W. Morriss (1947) | | Director since 2007 | | Adjunct Professor, Columbia University School of International and Public Affairs, since 2012; formerly, Executive Vice President and Chief Financial Officer, People’s United Bank, Connecticut (a financial services company), 1991 to 2001. | | 47 | | Director, 1 William Street Credit Income Fund, since 2018; Director and Chair, Thrivent Church Loan and Income Fund, since 2018; formerly, Trustee, Steben Alternative Investment Funds, Steben Select Multi-Strategy Fund, and Steben Select Multi-Strategy Master Fund, 2013 to 2017; formerly, Treasurer, National Association of Corporate Directors, Connecticut Chapter, 2011 to 2015; formerly, Manager, Larch Lane Multi-Strategy Fund complex (which consisted of three funds), 2006 to 2011; formerly, Member, NASDAQ Issuers’ Affairs Committee, 1995 to 2003. |
62
Name, (Year of Birth), and
Address(1) | | Position(s)
and Length
of Time
Served(2) | | Principal Occupation(s)(3) | | Number
of Funds
in Fund
Complex
Overseen
by Director | | Other Directorships Held
Outside Fund Complex by
Director(3) |
| | | | | | | | | |
| | | | | CLASS III | | | | |
| | | | | | | | | |
| Independent Directors | | | | |
| | | | | | | | | |
| Martha C. Goss (1949) | | Director since 2007 | | President, Woodhill Enterprises Inc./Chase Hollow Associates LLC (personal investment vehicle), since 2006; formerly, Consultant, Resources Global Professionals (temporary staffing), 2002 to 2006; formerly, Chief Financial Officer, Booz-Allen & Hamilton, Inc., 1995 to 1999; formerly, Enterprise Risk Officer, Prudential Insurance, 1994 to 1995; formerly, President, Prudential Asset Management Company, 1992 to 1994; formerly, President, Prudential Power Funding (investments in electric and gas utilities and alternative energy projects), 1989 to 1992; formerly, Treasurer, Prudential Insurance Company, 1983 to 1989. | | 47 | | Director, American Water (water utility), since 2003; Director, Allianz Life of New York (insurance), since 2005; Director, Berger Group Holdings, Inc. (engineering consulting firm), since 2013; Director, Financial Women’s Association of New York (not-for-profit association), since 2003; Trustee Emerita, Brown University, since 1998; Director, Museum of American Finance (not-for-profit), since 2013; formerly, Non- Executive Chair and Director, Channel Reinsurance (financial guaranty reinsurance), 2006 to 2010; formerly, Director, Ocwen Financial Corporation (mortgage servicing), 2005 to 2010; formerly, Director, Claire’s Stores, Inc. (retailer), 2005 to 2007; formerly, Director, Parsons Brinckerhoff Inc. (engineering consulting firm), 2007 to 2010; formerly, Director, Bank Leumi (commercial bank), 2005 to 2007; formerly, Advisory Board Member, Attensity (software developer), 2005 to 2007. |
| | | | | | | | | |
| James G. Stavridis (1955) | | Director since 2015 | | Operating Executive, The Carlyle Group, since 2018; Commentator, NBC News, since 2015; formerly, Dean, Fletcher School of Law and Diplomacy, Tufts University, 2013 to 2018; formerly, Admiral, United States Navy, 1976 to 2013, including Supreme Allied Commander, NATO and Commander, European Command, 2009 to 2013, and Commander, United States Southern Command, 2006 to 2009. | | 47 | | Director, American Water (water utility), since 2018; Director, NFP Corp. (insurance broker and consultant), since 2017; Director, U.S. Naval Institute, since 2014; Director, Onassis Foundation, since 2014; Director, BMC Software Federal, LLC, since 2014; Director, Vertical Knowledge, LLC, since 2013; formerly, Director, Navy Federal Credit Union, 2000-2002. |
63
Name, (Year of Birth), and
Address(1) | | Position(s)
and Length
of Time
Served(2) | | Principal Occupation(s)(3) | | Number
of Funds
in Fund
Complex
Overseen
by Director | | Other Directorships Held
Outside Fund Complex by
Director(3) |
| | | | | | | | | |
| Director who is an “Interested Person” | | |
| | | |
| Joseph V. Amato* (1962) | | Chief Executive Officer and President since 2018 and Director since 2009 | | President and Director, Neuberger Berman Group LLC, since 2009; President and Chief Executive Officer, Neuberger Berman BD LLC and Neuberger Berman Holdings LLC (including its predecessor, Neuberger Berman Inc.), since 2007; Chief Investment Officer (Equities) and President (Equities), NBIA (formerly, Neuberger Berman Fixed Income LLC and including predecessor entities), since 2007, and Board Member of NBIA since 2006; formerly, Global Head of Asset Management of Lehman Brothers Holdings Inc.’s (“LBHI”) Investment Management Division, 2006 to 2009; formerly, member of LBHI’s Investment Management Division’s Executive Management Committee, 2006 to 2009; formerly, Managing Director, Lehman Brothers Inc. (“LBI”), 2006 to 2008; formerly, Chief Recruiting and Development Officer, LBI, 2005 to 2006; formerly, Global Head of LBI’s Equity Sales and a Member of its Equities Division Executive Committee, 2003 to 2005; President and Chief Executive Officer, eleven registered investment companies for which NBIA acts as investment manager and/ or administrator. | | 47 | | Member of Board of Advisors, McDonough School of Business, Georgetown University, since 2001; Member of New York City Board of Advisors, Teach for America, since 2005; Trustee, Montclair Kimberley Academy (private school), since 2007; Member of Board of Regents, Georgetown University, since 2013. |
| (1) | The business address of each listed person is 1290 Avenue of the Americas New York, NY 10104. |
| | |
| (2) | The Board shall at all times be divided as equally as possible into three classes of Directors designated Class I, Class II and Class III. The Class I, Class II and Class III Directors shall serve until the Annual Meeting of Stockholders held in 2024, 2022 and 2023, respectively, and each third Annual Meeting of Stockholders thereafter, or until their successors have been duly elected and qualified. |
| | |
| (3) | Except as otherwise indicated, each individual has held the positions shown during at least the last five years. |
| | |
| * | Indicates a Director who is an “interested person” within the meaning of the 1940 Act. Mr. Amato is an interested person of each Fund by virtue of the fact that he is an officer of NBIA and/or its affiliates. |
64
Information about the Officers of each Fund
Name, (Year of Birth), and
Address(1) |
| Position(s) and
Length of Time
Served(2) | | Principal Occupation(s)(3) |
| | | | | |
| Claudia A. Brandon (1956) | | Executive Vice President since 2008 and Secretary since 2002 | | Senior Vice President, Neuberger Berman, since 2007 and Employee since 1999; Senior Vice President, NBIA, since 2008 and Assistant Secretary since 2004; formerly, Vice President, Neuberger Berman, 2002 to 2006; formerly, Vice President — Mutual Fund Board Relations, NBIA, 2000 to 2008; formerly, Vice President, NBIA, 1986 to 1999 and Employee, 1984 to 1999; Executive Vice President and Secretary, thirty registered investment companies for which NBIA acts as investment manager and/or administrator. |
| | | | | |
| Agnes Diaz (1971) | | Vice President since 2013 | | Senior Vice President, Neuberger Berman, since 2012; Senior Vice President, NBIA, since 2012 and Employee since 1996; formerly, Vice President, Neuberger Berman, 2007 to 2012; Vice President, eleven registered investment companies for which NBIA acts as investment manager and/or administrator. |
| | | | | |
| Anthony DiBernardo (1979) | | Assistant Treasurer since 2011 | | Senior Vice President, Neuberger Berman, since 2014; Senior Vice President, NBIA, since 2014, and Employee since 2003; formerly, Vice President, Neuberger Berman, 2009 to 2014; Assistant Treasurer, eleven registered investment companies for which NBIA acts as investment manager and/or administrator. |
| | | | | |
| Savonne Ferguson (1973) | | Chief Compliance Officer since 2018 | | Senior Vice President, Chief Compliance Officer (Mutual Funds) and Associate General Counsel, NBIA, since November 2018; formerly, Vice President T. Rowe Price Group, Inc. (2018), Vice President and Senior Legal Counsel, T. Rowe Price Associates, Inc. (2014-2018), Vice President and Director of Regulatory Fund Administration, PNC Capital Advisors, LLC (2009-2014), Secretary, PNC Funds and PNC Advantage Funds (2010-2014); Chief Compliance Officer, thirty registered investment companies for which NBIA acts as investment manager and/or administrator. |
| | | | | |
| Corey A. Issing (1978) | | Chief Legal Officer since 2016 (only for purposes of sections 307 and 406 of the Sarbanes-Oxley Act of 2002) | | General Counsel — Mutual Funds since 2016 and Managing Director, NBIA, since 2017; formerly, Associate General Counsel (2015 to 2016), Counsel (2007 to 2015), Senior Vice President (2013-2016), Vice President (2009 — 2013); Chief Legal Officer (only for purposes of sections 307 and 406 of the Sarbanes-Oxley Act of 2002), thirty registered investment companies for which NBIA acts as investment manager and/or administrator. |
| | | | | |
| Sheila R. James (1965) | | Assistant Secretary since 2002 | | Vice President, Neuberger Berman, since 2008 and Employee since 1999; Vice President, NBIA, since 2008; formerly, Assistant Vice President, Neuberger Berman, 2007; Employee, NBIA, 1991 to 1999; Assistant Secretary, thirty registered investment companies for which NBIA acts as investment manager and/or administrator. |
65
Name, (Year of Birth), and
Address(1) | | Position(s) and
Length of Time
Served(2) | | Principal Occupation(s)(3) |
| | | | | |
| Brian Kerrane (1969) | | Chief Operating Officer since 2015 and Vice President since 2008 | | Managing Director, Neuberger Berman, since 2013; Chief Operating Officer — Mutual Funds and Managing Director, NBIA, since 2015; formerly, Senior Vice President, Neuberger Berman, 2006 to 2014; Vice President, NBIA, 2008 to 2015 and Employee since 1991; Chief Operating Officer, eleven registered investment companies for which NBIA acts as investment manager and/or administrator; Vice President, thirty registered investment companies for which NBIA acts as investment manager and/or administrator. |
| | | | | |
| Anthony Maltese (1959) | | Vice President since 2015 | | Senior Vice President, Neuberger Berman, since 2014 and Employee since 2000; Senior Vice President, NBIA, since 2014; Vice President, eleven registered investment companies for which NBIA acts as investment manager and/or administrator. |
| | | | | |
| Josephine Marone (1963) | | Assistant Secretary since 2017 | | Senior Paralegal, Neuberger Berman, since 2007 and Employee since 2007; Assistant Secretary, thirty registered investment companies for which NBIA acts as investment manager and/or administrator. |
| | | | | |
| Owen F. McEntee, Jr. (1961) | | Vice President since 2008 | | Vice President, Neuberger Berman, since 2006; Vice President, NBIA, since 2006 and Employee since 1992; Vice President, eleven registered investment companies for which NBIA acts as investment manager and/or administrator. |
| | | | | |
| John M. McGovern (1970) | | Treasurer and Principal Financial and Accounting Officer since 2005 | | Senior Vice President, Neuberger Berman, since 2007; Senior Vice President, NBIA, since 2007 and Employee since 1993; formerly, Vice President, Neuberger Berman, 2004 to 2006; formerly, Assistant Treasurer, 2002 to 2005; Treasurer and Principal Financial and Accounting Officer, eleven registered investment companies for which NBIA acts as investment manager and/or administrator. |
| | | | | |
| Frank Rosato (1971) | | Assistant Treasurer since 2005 | | Vice President, Neuberger Berman, since 2006; Vice President, NBIA, since 2006 and Employee since 1995; Assistant Treasurer, eleven registered investment companies for which NBIA acts as investment manager and/or administrator. |
| (1) | The business address of each listed person is 1290 Avenue of the Americas New York, NY 10104. |
| | |
| (2) | Pursuant to the Bylaws of each Fund, each officer elected by the Directors shall hold office until his or her successor shall have been elected and qualified or until his or her earlier death, inability to serve, or resignation. Officers serve at the pleasure of the Directors and may be removed at any time with or without cause. |
| | |
| (3) | Except as otherwise indicated, each individual has held the positions shown during at least the last five years. |
66
Proxy Voting Policies and Procedures
A description of the policies and procedures that the Funds use to determine how to vote proxies relating to portfolio securities is available, without charge, by calling 800-877-9700 (toll-free) and on the SEC’s website at www.sec.gov. Information regarding how the Funds voted proxies relating to portfolio securities during the most recent 12-month period ended June 30 is also available, upon request, without charge, by calling 800-877-9700 (toll-free), on the SEC’s website at www.sec.gov, and on Neuberger Berman’s website at www.nb.com.
Quarterly Portfolio Schedule
Each Fund files a complete schedule of portfolio holdings with the SEC for the first and third quarters of each fiscal year as an exhibit to its report on Form N-PORT. Each Fund’s Forms N-PORT are available on the SEC’s website at www.sec.gov. The portfolio holdings information on Forms N-PORT is available upon request, without charge, by calling 800-877-9700 (toll-free).
67
Notice to Stockholders
In early 2022 you will receive information to be used in filing your 2021 tax returns, which will include a notice of the exact tax status of all distributions paid to you by each Fund during calendar year 2021. Please consult your own tax advisor for details as to how this information should be reflected on your tax returns.
For the fiscal year ended October 31, 2021, the percentages representing the portion of distributions from net investment income, which are exempt from federal income tax, other than alternative minimum tax are as follows:
| Neuberger Berman | | |
| | | |
| California Municipal Fund Inc. | | 99.95% |
| | | |
| Municipal Fund Inc. | | 98.64% |
| | | |
| New York Municipal Fund Inc. | | 100.00% |
68
Report of Votes of Stockholders
The Annual Meeting of Stockholders was held on September 29, 2021. Stockholders voted to elect four Class I Directors to serve until the Annual Meeting of Stockholders in 2024, or until their successors are elected and qualified. The Class II Directors (which include Michael J. Cosgrove, Deborah C. McLean and George W. Morriss (preferred stock only)) and the Class III Directors (which include Joseph V. Amato, Martha C. Goss and James G. Stavridis) continue to hold office until the Annual Meeting of Stockholders in 2022 and 2023, respectively, or until their successors are elected and qualified.
To elect four Class I Directors to serve until the Annual Meeting of Stockholders in 2024 or until their successors are elected and qualified.
| CALIFORNIA | | | | | | | | |
| Shares of Common and Preferred Stock | | Votes For | | Votes
Withheld | | Abstentions | | Broker
Non-Votes |
| Marc Gary | | 4,366,637 | | 180,600 | | — | | — |
| Michael M. Knetter | | 4,342,023 | | 205,214 | | — | | — |
| Tom D. Seip | | 4,343,810 | | 203,427 | | — | | — |
| | | | | | | | | |
| Shares of Preferred Stock | | Votes For | | Votes
Withheld | | Abstentions | | Broker
Non-Votes |
| Peter P. Trapp | | 550 | | — | | — | | — |
| |
| MUNICIPAL | | | | | | | | |
| Shares of Common and Preferred Stock | | Votes For | | Votes
Withheld | | Abstentions | | Broker
Non-Votes |
| Marc Gary | | 15,967,364 | | 223,936 | | — | | — |
| Michael M. Knetter | | 15,846,072 | | 345,228 | | — | | — |
| Tom D. Seip | | 15,814,675 | | 376,625 | | — | | — |
| | | | | | | | | |
| Shares of Preferred Stock | | Votes For | | Votes
Withheld | | Abstentions | | Broker
Non-Votes |
| Peter P. Trapp | | 1,704 | | — | | — | | — |
| |
| NEW YORK | | | | | | | | |
| Shares of Common and Preferred Stock | | Votes For | | Votes
Withheld | | Abstentions | | Broker
Non-Votes |
| Marc Gary | | 3,798,417 | | 778,770 | | — | | — |
| Michael M. Knetter | | 3,800,078 | | 777,109 | | — | | — |
| Tom D. Seip | | 3,800,078 | | 777,109 | | — | | — |
| | | | | | | | | |
| Shares of Preferred Stock | | Votes For | | Votes
Withheld | | Abstentions | | Broker
Non-Votes |
| Peter P. Trapp | | 463 | | — | | — | | — |
69
Board Consideration of the Management Agreements
On an annual basis, the Boards of Directors (each, a “Board” and, collectively, the “Boards”) of Neuberger Berman California Municipal Fund Inc., Neuberger Berman Municipal Fund Inc., and Neuberger Berman New York Municipal Fund Inc. (each, a “Fund” and, collectively, the “Funds”), including the Directors who are not “interested persons” of the Funds or of Neuberger Berman Investment Advisers LLC (“Management”) (including its affiliates), as such term is defined under the Investment Company Act of 1940, as amended (“1940 Act”), (“Independent Fund Directors”), consider whether to continue each Fund’s management agreement with Management (the “Agreements” and, with respect to each Fund, the “Agreement”). Throughout the process, the Independent Fund Directors are advised by counsel that is experienced in 1940 Act matters and that is independent of Management (“Independent Counsel”). At a meeting held on October 21, 2021, each Board, including the Independent Fund Directors, approved the continuation of the Agreement for each Fund.
In evaluating the Agreements, the Boards, including the Independent Fund Directors, reviewed extensive materials provided by Management in response to questions submitted by the Independent Fund Directors and Independent Counsel, and met with senior representatives of Management regarding its personnel, operations, and profitability as they relate to the Funds. The annual contract review extends over at least two regular meetings of the Boards to ensure that Management has time to respond to any questions the Independent Fund Directors may have on their initial review of the materials and that the Independent Fund Directors have time to consider those responses. Additionally, the Boards considered the impact of significant market volatility that occurred during and after the period for which information was requested in conducting its evaluation of Management.
In connection with its deliberations, each Board also considered the broad range of information relevant to the annual contract review that is provided to each Board (including its various standing committees) at meetings throughout the year, including reports on investment performance based on net asset value and common stock market prices, portfolio risk, use of leverage, information regarding share price premiums and/or discounts, and other portfolio information for its Fund, as well as periodic reports on, among other matters, pricing and valuation; quality and cost of portfolio trade execution; compliance; and stockholder and other services provided by Management and its affiliates. A Contract Review Committee, which is comprised of Independent Fund Directors, was established by each Board to assist in its evaluation and analysis of materials for the annual contract review. The Boards have also established other committees that focus throughout the year on specific areas relevant to the annual contract review, such as Fund performance or compliance matters, and that are charged with specific responsibilities regarding the annual contract review. Those committees provide reports to the full Boards, including the members of the Contract Review Committees, which considers that information as part of the annual contract review process. Each Board’s Contract Review Committee annually considers and updates the questions it asks of Management in light of legal advice furnished to it by Independent Counsel; its own business judgment; and developments in the industry, in the markets, in fund regulation and litigation, and in Management’s business model.
The Independent Fund Directors received from Independent Counsel a memorandum discussing the legal standards for their consideration of the proposed continuation of the Agreements. During the course of the year and during their deliberations regarding the annual contract review, the Contract Review Committees and the Independent Fund Directors met with Independent Counsel separately from representatives of Management.
Provided below is a description of the Boards’ contract approval process and material factors that the Boards considered at their meetings regarding renewals of the Agreements and the compensation to be paid thereunder. In connection with its approval of the continuation of its Fund’s Agreement, each Board evaluated the terms of the Agreement, the overall fairness of the Agreement to its Fund, and whether the Agreement was in the best interests of the Fund and Fund stockholders. Each Board’s determination to approve the continuation of its Fund’s Agreement was based on a comprehensive consideration of all information provided to each Board throughout the year and specifically in connection with the annual contract review. Each Board considered its Fund’s Agreement separately from those of the other Funds.
70
This description is not intended to include all of the factors considered by the Boards. The Board members did not identify any particular information or factor that was all-important or controlling, and each Director may have attributed different weights to the various factors. Each Board focused on the costs and benefits of its Fund’s Agreement to the Fund and, through the Fund, Fund stockholders.
Nature, Extent, and Quality of Services
With respect to the nature, extent, and quality of the services provided, each Board considered the investment philosophy and decision-making processes of, and the qualifications, experience, and capabilities of, and the resources available to, the portfolio management personnel of Management who perform services for its Fund. The Boards also considered Management’s long history and experience in managing and operating closed-end funds, such as the Funds, including experience monitoring and assessing discounts and premiums and complying with securities exchange requirements. The Boards noted that Management also provides certain administrative services, including fund accounting and compliance services. The Boards also considered Management’s policies and practices regarding trade execution, trading costs, and allocation of portfolio transactions and reviewed the quality of the execution services that Management had provided. The Boards also reviewed Management’s use of brokers to execute Fund transactions that provide research services to Management. Moreover, the Boards considered Management’s approach to potential conflicts of interest both generally and between the Funds’ investments and those of other funds or accounts managed by Management. The Boards also noted that Management had increased its capabilities with respect to environmental, social, and corporate governance matters and considered how those factors may relate to investment performance.
The Boards recognized the extensive range of services that Management provides to the Funds beyond the investment management services. The Boards noted that Management is also responsible for monitoring compliance with the Funds’ investment objectives, policies, and restrictions, as well as compliance with applicable law, including implementing rulemaking initiatives of the U.S. Securities and Exchange Commission. In addition, the Boards considered that Management has developed a leverage structure for the Funds tailored to each Fund’s investment strategy and needs, has monitored each Fund’s ongoing compliance with legal and other restrictions associated with its leverage, and has recommended changes in and/or amendments to the amount or structure of its leverage over time. The Boards also considered that Management assumes significant ongoing entrepreneurial and business risks as the investment adviser and sponsor to each Fund, for which it is entitled to reasonable compensation. The Directors also considered that Management’s responsibilities include continual management of investment, operational, enterprise, legal, regulatory, and compliance risks as they relate to the Funds, and the Boards consider on a regular basis information regarding Management’s processes for monitoring and managing risk. In addition, the Boards noted that when Management launches a new fund, it assumes entrepreneurial risk with respect to that fund, and that some funds have been liquidated without ever having been profitable to Management.
The Boards also reviewed and evaluated Management’s activities under its contractual obligation to oversee the Funds’ various outside service providers, including its evaluation of service providers’ infrastructure, cybersecurity programs, compliance programs, and business continuity programs, among other matters. The Boards also considered Management’s ongoing development of its own infrastructure and information technology to support the Funds through, among other things, cybersecurity, business continuity planning, and risk management. The Boards noted Management’s largely seamless implementation of its business continuity plan in response to the COVID-19 pandemic and its success in continuously providing services to the Funds not withstanding the disruptions caused by the pandemic. In addition, the Boards noted the positive compliance history of Management, as no significant compliance problems were reported to the Boards with respect to Management. The Boards also considered the general structure of the portfolio managers’ compensation and whether this structure provides appropriate incentives to act in the best interests of the Funds. The Boards also considered the ability of Management to attract and retain qualified personnel to service the Funds.
As in past years, the Boards also considered the manner in which Management addressed various matters that arose during the year, some of them a result of developments in the broader fund industry or the regulations governing it. In addition, the Boards considered actions taken by Management in response to recent market conditions, such as changes
71
in fixed-income market liquidity, the economic dislocation and rise in volatility that accompanied shutdowns related to the efforts to stem the spread of COVID-19, and considered the overall performance of Management in this context. The Boards also noted that Management actively monitors any discount from net asset value per share at which the Funds’ common stock trades and evaluates potential ways to mitigate the discount and potential impacts on the discount, including the level of distributions that the Funds pay. The Boards likewise took into account that Management monitors, to the extent information is publicly available, events that may disrupt each Fund’s long-term investment program.
Fund Performance
The Boards requested a report from an outside consulting firm that specializes in the analysis of fund industry data that compared each Fund’s performance, along with its fees and other expenses, to a group of industry peers (“Expense Group”) and to a broader universe of funds pursuing generally similar strategies with the same investment classification and/or objective (“Performance Universe”). Each Board considered its Fund’s performance and fees in light of the limitations inherent in the methodology for constructing such comparative groups and determining which investment companies should be included in the comparative groups, noting differences as compared to certain fund industry ranking and rating systems. The Boards also considered the impact and inherent limitation on the comparisons due to the small number of funds included in the Expense Groups and Performance Universes noting, among other things, that the peer groups for California Municipal Fund Inc. and New York Municipal Fund Inc. included national funds and state specific funds that were not focused on California and New York, respectively. In this regard, the Boards recognized that the number of leveraged closed-end funds pursuing similar strategies with the same investment classification and/ or objective as the Funds has decreased over time. The Boards also recognized the limitations inherent in comparing the Funds’ performance to a benchmark index due to the Funds’ use of leverage and pursuit of investment strategies that is not tied directly to an index. The Boards also recognized the inherent limitations in comparing performance of peer funds utilizing leverage in light of, among other things, the impacts due to the level and type of leverage utilized and when peer funds entered into their leverage arrangements (which can impact pricing and, therefore, cost and performance). The Boards also considered the premium/discount levels at which peer funds traded along with the distribution rates and yields of those funds.
With respect to investment performance, each Board considered information regarding its Fund’s short-, intermediate-and long-term performance, net of its Fund’s fees and expenses, on an absolute basis, relative to a benchmark index that does not deduct the fees or expenses of investing, and compared to the performance of its Expense Group and Performance Universe, each constructed by the consulting firm.
The Performance Universes referenced in this section were identified by the consulting firm, as discussed above. In the case of underperformance for any of the periods reported, the Boards considered the magnitude and duration of that underperformance relative to the Performance Universe and/or the benchmark (e.g., the amount by which the Fund underperformed, including, for example, whether the Fund slightly underperformed or significantly underperformed its benchmark). With respect to performance quintile rankings for a Fund compared to its Performance Universe, the first quintile represents the highest (best) performance and the fifth quintile represents the lowest performance.
For California Municipal Fund Inc., the Board considered that, based on performance data for the periods ended December 31, 2020: (1) as compared to its benchmark, the Fund’s performance was lower for the 1- and 3-year periods and higher for the 5- and 10-year periods; and (2) as compared to its Performance Universe, the Fund’s performance was in the fifth quintile for the 1-, 3-, 5-, and 10-year periods. The Board noted that the benchmark is a nationwide index of municipal securities and that the Fund’s relative performance may have been affected by the way in which the market for California municipal securities performed versus the nationwide average. The Board noted the Fund’s outperformance versus its benchmark during the 7-month period ending July 31, 2021. The Board also noted the Fund’s ranking was in the first quintile of its Morningstar peer category and in the second quintile of its Lipper peer category for the 7-month period ending July 31, 2021. In addition, the Board met with the portfolio management team in March 2021 to discuss the Fund’s performance and further noted Management’s comments regarding the small size of the Fund and the limited options for improving the Fund’s competitiveness relative to peers.
72
For Municipal Fund Inc., the Board considered that, based on performance data for the periods ended December 31, 2020: (1) as compared to its benchmark, the Fund’s performance was lower for the 1- and 3-year periods and higher for the 5- and 10-year periods; and (2) as compared to its Performance Universe, the Fund’s performance was in the fifth quintile for the 1-, 3-, 5-, and 10-year periods. The Board noted the Fund’s outperformance versus its benchmark during the 7-month period ending July 31, 2021. The Board also noted the Fund’s ranking was in the second quintile of its Morningstar peer category for the 7-month period ending July 31, 2021. In addition, the Board met with the portfolio management team in March 2021 to discuss the Fund’s performance.
For New York Municipal Fund Inc., the Board considered that, based on performance data for the periods ended December 31, 2020: (1) as compared to its benchmark, the Fund’s performance was lower for the 1-, 3-, 5-, and 10-year periods; and (2) as compared to its Performance Universe, the Fund’s performance was in the second quintile for the 1-year period and the fifth quintile for the 3-, 5-, and 10-year periods. The Board also noted that the benchmark is a nationwide index of municipal securities and that the Fund’s relative performance may have been affected by the way in which the market for New York municipal securities performed versus the nationwide average. The Board noted the Fund’s outperformance versus its benchmark during the 7-month period ending July 31, 2021. The Board also noted the Fund’s ranking was in the first quintile of its Morningstar peer category and in the second quintile of its Lipper peer category for the 7-month period ending July 31, 2021. In addition, the Board met with the portfolio management team in March 2021 to discuss the Fund’s performance and further noted Management’s comments regarding the small size of the Fund and the limited options for improving the Fund’s competitiveness relative to peers.
The Boards identified the Funds as having underperformed in certain of these comparisons to an extent, and/or over a period of time, that the Boards felt warranted additional inquiry, and discussed with Management the Funds’ performance, potential reasons for the relative performance, and steps that Management had taken, or intended to take, to improve performance. The Boards noted that the type, amount and term of the leverage are consistent with the portfolio managers’ preferences for the Funds’ investment strategies. The Boards also took into account the positive impact the Funds’ leverage arrangements had on performance. Each Board also considered Management’s responsiveness with respect to the relative performance. The Boards recognized that the performance data reflects a snapshot of a period as of a particular date and that selecting a different performance period could produce significantly different results. The Boards further acknowledged that long-term performance could be impacted by even one period of significant outperformance or underperformance, and that a single investment theme could disproportionately affect performance. In this regard, each Board noted that performance, especially short-term performance, is only one of the factors that it deems relevant to its consideration of its Fund’s Agreement and that, after considering all relevant factors, it determined to approve the continuation of the Agreement notwithstanding its Fund’s relative performance.
Fee Rates, Profitability, and Fall-out Benefits
With respect to the overall fairness of each Agreement, the Boards considered the fee structure for the Funds under the Agreements as compared to the Expense Group provided by the consulting firm, as discussed above. Each Board reviewed a comparison of its Fund’s management fee to its Expense Group. The Boards noted that the comparative management fee analysis includes, in the Funds’ management fee, the separate administrative fees paid to Management. However, the Boards noted that some funds in the Expense Group pay directly from fund assets for certain services that Management covers out of the administration fees for the Funds. Accordingly, the Boards also considered the Funds’ total expense ratio as compared with their Expense Group as a way of taking account of these differences. The Boards considered that only leveraged closed-end funds were considered for inclusion in the Expense Groups presented for comparison with the Funds but also noted the challenges associated with making comparisons regarding expenses for leveraged closed-end funds. The Boards took into account Management’s representations that relevant expenses would be difficult for the consulting firm to fully and accurately identify due to, among other things, differences in the type of leverage used and the way such leverage costs are reported. The Boards also considered Management’s representations regarding the potential impact on expenses due to the time at which the funds in the Expense Groups entered into their leverage arrangements and the funds’ fiscal year-ends (which determine the time period for which leverage costs are reported). With this understanding, the Boards also considered the impact of investment-related expenses and taxes on the total
73
expenses of the Funds and the funds in the Expense Groups that the consulting firm was able to identify. The Boards also considered Management’s representations that there were certain characteristics of leverage that increased leverage expenses but provided benefits and value to stockholders that were not reflected in the Funds’ expense ratios. The Boards also considered that, in comparison to certain other products managed by Management, including open-end funds, there are additional portfolio management challenges in managing closed-end funds such as the Funds, including those associated with less liquid holdings and the use of leverage.
Each Board considered its Fund’s contractual management fee on managed assets (generally consisting of net assets plus leverage proceeds), as well as the actual management fee on managed assets as a percentage of assets attributable to common stockholders as compared to its Fund’s Expense Group. The Boards were aware of the additional expenses borne by common stockholders as a result of the Funds’ leveraged structure. The Boards took into account that Management has a financial incentive for the Funds to continue to use leverage, which may create a conflict of interest. They also considered Management’s representation that it continues to believe the use of leverage is in the best interests of each Fund’s stockholders regardless of the level of compensation Management receives. With respect to the quintile rankings for fees and total expenses (net of waivers or other adjustments, if any) on managed assets for a Fund compared to its Expense Group, the first quintile, or lowest number in ranking, represents the lowest fees and/or total expenses and the fifth quintile, or highest number in ranking, represents the highest fees and/or total expenses.
For California Municipal Fund Inc., the Board considered that, as compared to its Expense Group, the Fund’s contractual management fee and the actual management fee were each ranked second out of five funds, total expenses ranked fourth out of five funds, and total expenses excluding the investment-related expenses and taxes identified by the consulting firm ranked fifth out of five funds. For Municipal Fund Inc., the Board considered that, as compared to its Expense Group, the Fund’s contractual management fee ranked in the second quintile and the actual management fee, total expenses, and total expenses excluding the investment-related expenses and taxes identified by the consulting firm each ranked in the third quintile. For New York Municipal Fund Inc., the Board considered that, as compared to its Expense Group, the Fund’s contractual management fee and actual management fee each ranked first out of five funds, and total expenses and total expenses excluding the investment-related expenses and taxes identified by the consulting firm each ranked fourth out of five funds.
In determining to renew the Agreement, the Boards took into account Management’s representations regarding the effect that the cost of leverage had on each Fund’s total expenses relative to its peers with different types and levels of leverage and noted Management’s efforts to ensure the Fund’s leverage arrangements were among the best available for a fund of its size and investment strategy and with its preferences regarding types and levels of leverage at the time the Fund entered into its leverage arrangements. In addition, each Board considered its Closed-End Fund Committee’s ongoing evaluation of its Fund, including the use of leverage and the specific leverage arrangements.
In concluding that the benefits accruing to Management and its affiliates by virtue of their relationship with each Fund were reasonable in light of the costs of providing the investment advisory and other services and the benefits accruing to that Fund, the Boards reviewed specific data as to Management’s estimated profit on each Fund for a recent period on a pre-tax basis without regard to distribution expenses, but including year-over-year changes in each of Management’s reported expense categories. (The Boards also reviewed data on Management’s estimated profit on each Fund after distribution/servicing expenses and taxes were factored in, as indicators of the health of the business and the extent to which Management is directing its profits into the growth of the business.) The Boards considered the cost allocation methodology that Management used in developing its estimated profitability figures. In recent years, each Board engaged an independent forensic accountant to review the profitability methodology utilized by Management when preparing this information and discussed with the consultant its conclusion that Management’s process for calculating and reporting its estimated profit was not unreasonable.
Recognizing that there is no uniform methodology regarding the allocation of firm-wide or complex-wide expenses within the asset management industry for determining profitability for this purpose and that the use of different reasonable methodologies can give rise to different profit and loss results, the Boards, in recent years, requested from Management examples of profitability calculated by different methods and noted that the estimated profitability levels were still reasonable when calculated by these other methods. The Boards further noted Management’s representation
74
that its estimate of profitability is derived using methodology that is consistent with the methodology used to assess and/or report measures of profitability elsewhere at the firm. In addition, the Boards recognized that Management’s calculations regarding its costs may not reflect all risks, including regulatory, legal, operational, reputational, and, where appropriate, entrepreneurial risks, associated with offering and managing a closed-end fund in the current regulatory and market environment. The Boards also considered any fall-out (i.e., indirect) benefits likely to accrue to Management or its affiliates from their relationship with each Fund. Each Board recognized that Management and its affiliates should be entitled to earn a reasonable level of profits for services they provide to each Fund and, based on review, concluded that Management’s reported level of estimated profitability on each Fund was reasonable.
Information Regarding Services to Other Clients
The Boards also considered whether there were other funds or separate accounts that were advised or sub-advised by Management or its affiliates with investment objectives, policies, and strategies that were similar to those of any of the Funds. The Boards compared the fees charged to the Funds to the fees charged to such comparable funds, noting Management’s representation that there were no such separate accounts. The Boards considered the appropriateness and reasonableness of any differences between the fees charged to each Fund and such comparable funds, and determined that differences in fees and fee structures were consistent with the differences in the management and other services provided. The Boards explored with Management its assertion that although, generally, the rates of fees paid by such funds, except other Neuberger Berman mutual funds, were lower than the fee rates paid by the corresponding Funds, the differences reflected Management’s greater level of responsibilities and significantly broader scope of services regarding the Funds, the more extensive regulatory obligations and risks associated with managing the Funds, and other financial considerations with respect to creation and sponsorship of the Funds.
Economies of Scale
The Boards also evaluated apparent or anticipated economies of scale in relation to the services Management provides to the Funds and noted that there is little expectation that closed-end funds will show significant economies of scale. The Boards considered that, as closed-end investment companies, the Funds do not continually offer new shares to raise additional assets (as does a typical open-end investment company), but may experience asset growth through investment performance and/or the increased use of leverage. The Boards also considered that Management has provided, at no added cost to the Funds, certain additional services, including but not limited to, services required by new regulations or regulatory interpretations, services impelled by changes in the securities markets or the business landscape, and/or services requested by the Boards. The Boards considered that this is a way of sharing economies of scale with each Fund and its stockholders.
Conclusions
In approving the continuation of its Fund’s Agreement, each Board concluded that, in its business judgment, the terms of its Fund’s Agreement are fair and reasonable to its Fund and that approval of the continuation of the Agreement is in the best interests of its Fund and Fund stockholders. In reaching this determination, each Board considered that Management could be expected to continue to provide a high level of service to its Fund; that the Board retained confidence in Management’s capabilities to manage the Fund; that its Fund’s fee structure appeared to the Board to be reasonable given the nature, extent, and quality of services provided; and that the benefits accruing to Management and Management’s affiliates by virtue of their relationship with its Fund were reasonable in light of the costs of providing the investment advisory and other services and the benefits accruing to its Fund. The Boards’ conclusions may be based in part on their consideration of materials prepared in connection with the approval or continuance of the Agreements in prior years and on the Boards’ ongoing regular review of Fund performance and operations throughout the year, in addition to material prepared specifically for the most recent annual review of the Agreements.
75
| | | | |  |
| | | | | |
| | | | | Neuberger Berman Investment Advisers LLC 1290 Avenue of the Americas
New York, NY 10104-0002
Internal Sales & Services
877.461.1899
www.nb.com Statistics and projections in this report are derived from sources deemed to be reliable but cannot be regarded as a representation of future results of the Funds. This report is prepared for the general information of stockholders and is not an offer for shares of the Funds. |
| | | | | |
| | | | |  | H0649 12/21 |
| | | | | |
| | | | | |
| | | | |
|