
Exhibit 99.1
Endurance Specialty Holdings Ltd.
Merrill Lynch Insurance Investor
Conference
February 14, 2006

Forward Looking Statements
Statements contained in this presentation that are not based on
current or historical fact are forward-looking in nature. Such forward-
looking statements are based on current plans, estimates and
expectations and are made pursuant to the Private Securities
Litigation Reform Act of 1995. Forward-looking statements are based
on known and unknown risks, assumptions, uncertainties and other
factors. The Company's actual results, performance, or achievements
may differ materially from any future results, performance, or
achievements expressed or implied by such forward-looking
statements. The Company undertakes no obligation to publicly update
or revise any forward-looking statement.
2

Overview
3

Founded on best practices of enterprise risk management, with leading edge:
Underwriting expertise
Data
Technology
Underwriting, financial and accounting controls
Corporate governance
Strong management team that thinks and acts like shareholders
Committed to building long-term shareholder value
Focused on execution excellence
Executive compensation aligned with shareholders’ interests
Shareholder-friendly culture
Commitment to openness, transparency and industry leading disclosure practices
Endurance was named a finalist in Institutional Investor magazine’s ranking of America’s
most shareholder-friendly companies in 2005
Endurance Differentiation
4
What We Have Achieved
Established one of the leading insurance/reinsurance markets in the industry
Global reinsurance
Bermuda based insurance products
U.K./European property insurance
U.S. based specialty insurance
Developed technical underwriting culture focused on achieving superior returns on equity
Goal is to generate 15%+ return on equity throughout the P&C cycle
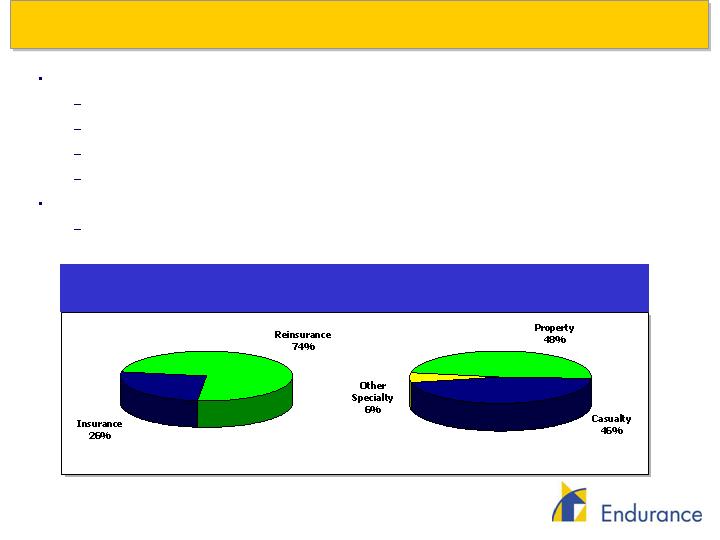
Our Business At A Glance
2005 Gross Premiums Written = $1.8B [a]
[a] Prior to deposit accounting adjustments
5
Strong Executive Management Team
22
Chief Operating Officer, Endurance Specialty Insurance Ltd.
Susan Patschak
21
President, Endurance Services Limited
John O’Connor
31
President, Endurance U.S. Insurance Operations
Michael Fujii
25
CEO of Endurance Worldwide Insurance Limited (U.K.)
Mark Boucher
25
President, Endurance Reinsurance Corporation of America
William Jewett
33
President, Endurance Specialty Insurance Ltd. (Bermuda)
Daniel Izard
21
Chief Actuary and Chief Risk Officer
Michael Angelina
15
Chief Underwriting Officer
David Cash
27
Chief Operating Officer, Chairman of the Underwriting
Committee, Chairman of Endurance Services Ltd.
Steven Carlsen
12
Chief Financial Officer
Michael McGuire
27
Chairman, President & Chief Executive Officer
Kenneth LeStrange
Years of
Experience
Position
Name
Executive Team has proven its ability to execute challenging strategies
Built a culture of meritocracy and ownership
5% of equity interests owned by management at 12/31/05
6

Underwriting & Strategy
7
Strategy
Identify business segments with sufficient opportunities to apply expertise
Only underwrite risks that are susceptible to underwriting and actuarial analysis
Reallocate capital as different businesses become relatively less attractive
Net line underwriting with limited use of reinsurance
Culture
Understand the risk correlations within each segment and across portfolio to determine required
margins
Identify risks within each segment that meet return thresholds
Apply technical resources at the front end to evaluate and select business
Control
Focus on target returns, not premiums
Monitor underwriting decisions on a live basis
Monitor emergence of results to corroborate assumptions
Underwriting Philosophy
Philosophy that is disciplined, consistent
and embraced by underwriting teams
8
Inception-to-date Underwriting Results are Profitable
Generated an inception-to-date underwriting profit and a combined ratio of 99%, despite experiencing 7
of the 10 costliest hurricanes in history during our first four years of operation
Our non-wind exposed businesses performed well in 2005, significantly mitigating the financial loss for
the year
10.0
Wilma
2005
3.4
Georges
1998
3.7
Jeanne
2004
4.6
Frances
2004
4.7
Rita
2005
6.4
Hugo
1989
7.1
Ivan
2004
7.5
Charley
2004
20.8
Andrew
1992
34.4
Katrina
2005
Insured Loss ($, Billion)
Event
Year
Top 10 Hurricanes and Estimated Insured Loss
(Events that occurred prior to 2004 are adjusted to 2004 $)
9
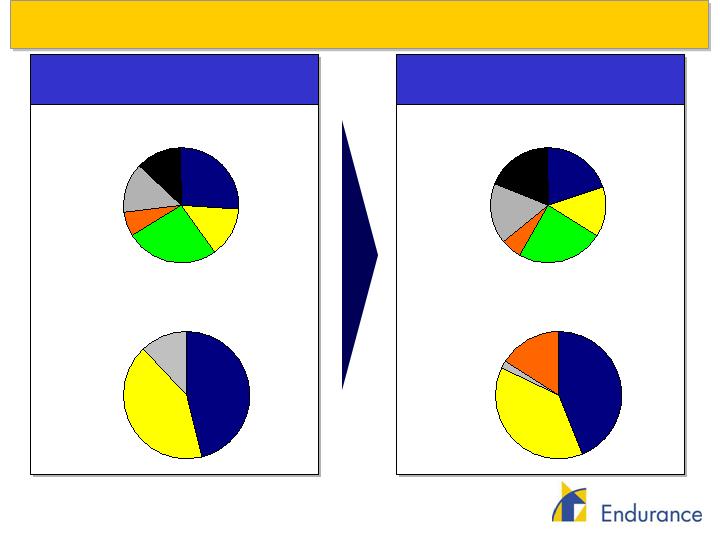
Risk Exposures Adjusted to Changing Market Conditions
2005 Gross Premiums Written =
$1.8B [a]
(a)
Prior to deposit accounting adjustments
2004 Gross Premiums Written =
$1.7B
U.S.
Reinsurance
42%
Bermuda
46%
U.K.
12%
Casualty Treaty
26%
Property
Cat
14%
Property
Per Risk
26%
Aerospace &
Other Specialty
13%
Casualty
Individual Risk
14%
Property
Individual Risk
7%
Casualty
Treaty
24%
Property
Cat
14%
Property
Per Risk
20%
Aerospace &
Other Specialty
19%
Casualty
Individual Risk
17%
Property
Individual Risk
6%
U.S.
Reinsurance
38%
Bermuda
44%
U.K.
16%
U.S.
Insurance
2%
10
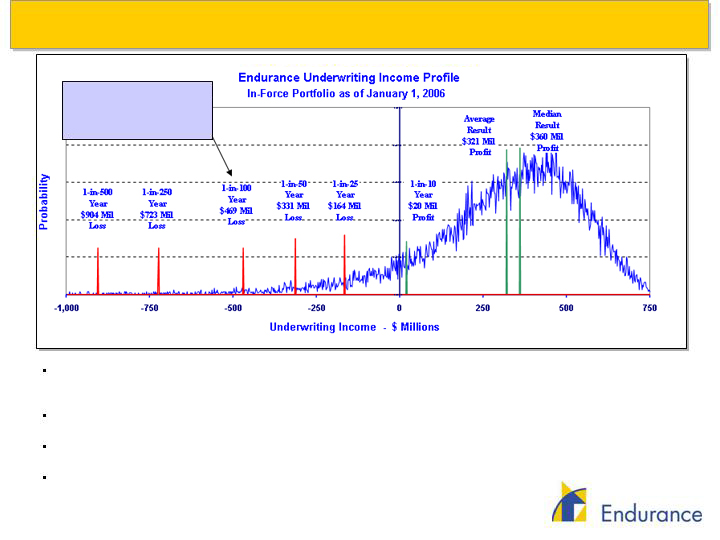
Risk Review – Portfolio Expected Risk Curve
This chart represents a cumulative simulation analysis of our in-force underwriting portfolio. Portions to the right of the
y-axis represent simulated underwriting profit and those to the left underwriting losses. Underwriting income
represents annual premiums earned less losses, acquisition expenses, G&A expenses and investment income.
Based on our business at January 1, 2006, there is approximately an 85% chance of a profitable underwriting result
and a mean expected result of a $321 million underwriting profit.
We base our budget and forecasts off of the mean result, although the nature of the curve places the median result
further to the right (i.e., more profitable).
We manage the tail of our exposures to limit our loss in a 1-in-100 year to 25% of our capital or less for a year.
Stated objective is to
limit our loss in a 1-in-
100 year to 25% of our
capital or less
11

Observations Based on Review of 2005 Hurricanes
Diversification matters
Despite the enormity of the 2005 hurricanes:
All segments inception-to-date combined ratio = 99%
Property cat inception-to-date combined ratio = 80%
All segments excluding property cat inception-to-date combined ratio = 102%
Our corporate philosophy of allowing each type of business to be written in only one location
(“Bright Lines”) served us well in identifying and limiting our loss, as well as communicating
our ongoing posture in the market
Catastrophe simulation model performance varied by line of business
We suffered a disproportionate loss on our Property Individual Risk business written out of
Bermuda
Limited use of reinsurance means our prospective risk profile needs adjustment, but not
drastic reductions
12

Actions Based on These Observations
We have shifted toward a lower, more certain catastrophic risk profile
We have adjusted the frequency and severity assumptions in the catastrophe models to reflect
current climate conditions
We have increased our underwriting margin requirements to reflect new insights in the
amounts of capital required for backing many of our business segments
We have developed new risk management tools to fill gaps in existing catastrophe models
(including flood exposure and location-by-location aggregation tools)
Key opportunities for Endurance
U.S. on-shore Property Individual Risk insurance
Property Catastrophe reinsurance
Property Per Risk Treaty reinsurance
13

Financial Review
14
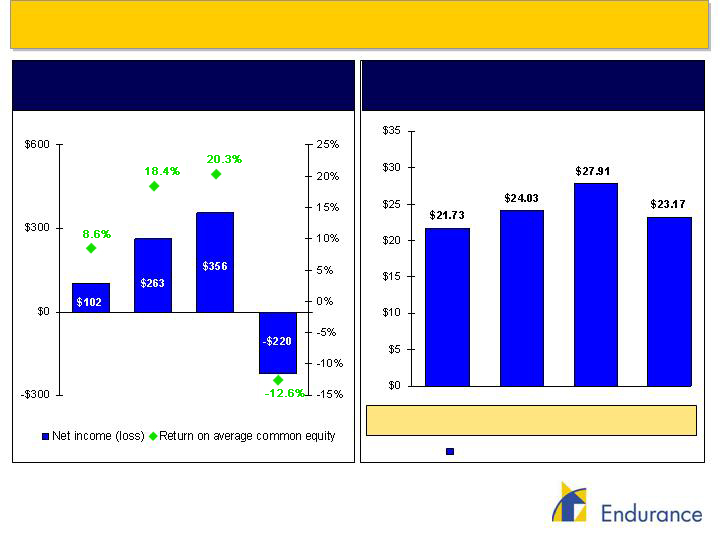
Strong Financial Performance in Volatile Segments
Net Income (Loss) ($M) and
Return on Average Common Equity
Diluted Book Value Per Common Share
2002
2003
2004
2005
2002
2003
2004
2005
Diluted Book Value Per Common Share
Dividends
per share
$0.32
$0.81
$1.00
-
15
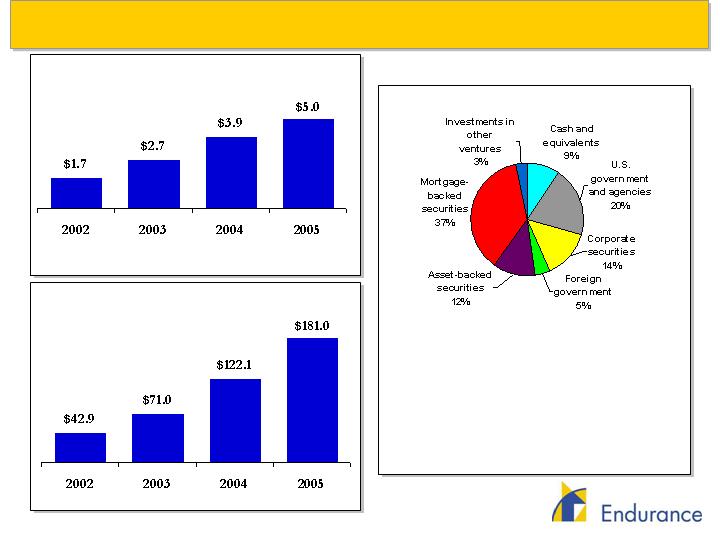
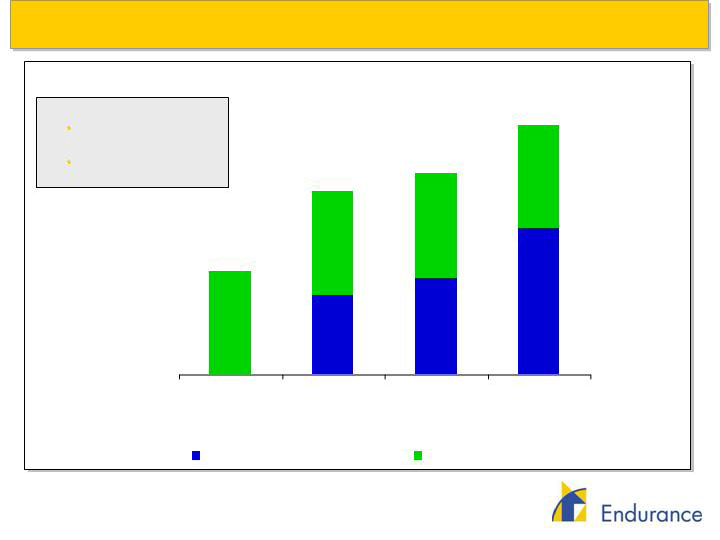
Investments Becoming A Larger Contributor to Income
Cash and Invested Assets ($, billions)
Investment Income ($, millions)
A Conservative Investment Portfolio
Fair Value at Dec. 31, 2005 = $5.0 B
Investment Ratings
AAA/U.S. Govt. & Agencies 85%
AA/Aa 4%
A/A 8%
BBB and below 0%
Not rated/Other ventures 3%
16
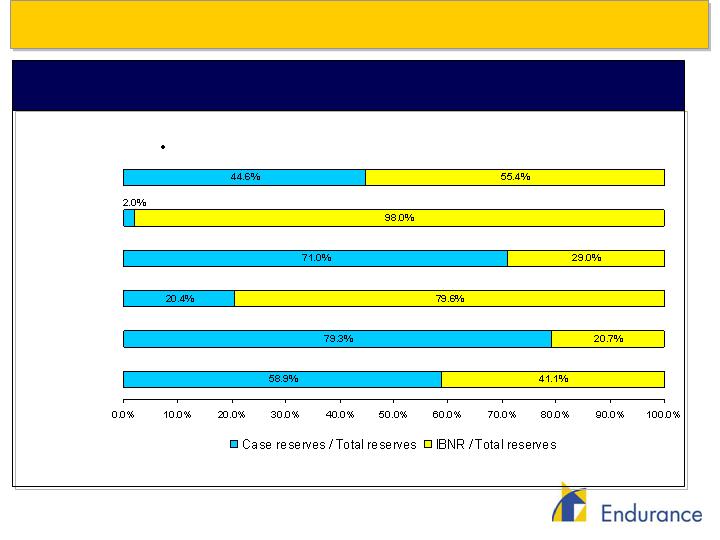
Prudent Loss Reserves
Ratio of IBNR to Total Reserves by Segment as of December 31, 2005
Aerospace &
Other Specialty
Casualty
Individual Risk
Property
Individual Risk
Casualty Treaty
Reinsurance
Property CAT
Property Per
Risk
Total Company: Case Reserves = 38.9%; IBNR = 61.1%
48% of case reserves related to 2005 hurricanes [a]
[a] % of case reserves related to 2005 hurricanes by segment: Aerospace & Other Specialty = 53%; Casualty Individual Risk = 0%; Property
Individual Risk = 59%; Casualty Treaty Reinsurance = 0%; Property CAT = 82%; Property Per Risk = 42%.
17
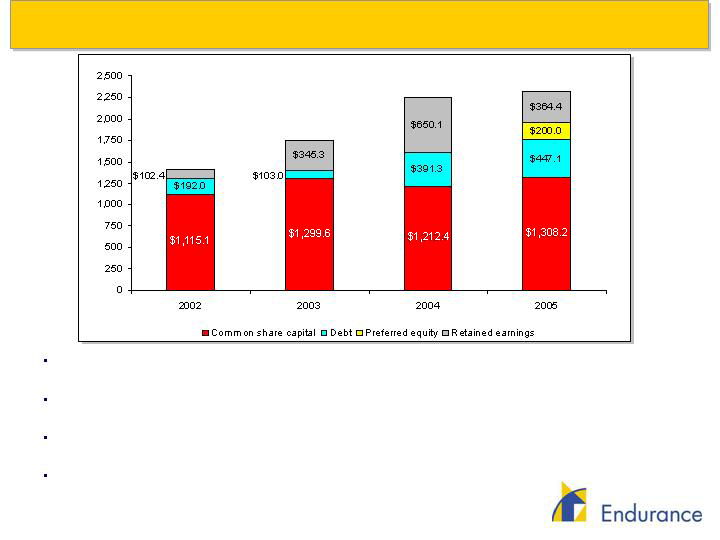
Strong and Flexible Capital Structure
Capital structure is driven by our goal to achieve a return on equity of 15% or higher throughout
the cycle
Cyclicality of industry and rating agency capital requirements necessitate a flexible capital
structure and strong relationships with capital markets
We optimize the cost, mix and access to various forms of capital, as well as the form in which
capital is returned to shareholders
2005 capital raising achieved with minimal dilution to existing shareholders
$, Millions
$1,410
$1,748
$2,254
$2,320
18
Achieving Our Targets
Return On Equity Sensitivity Analysis*
* The Projected 2006 ROE Component Build-Up is purely illustrative and should not be construed as guidance
for 2006 performance.
Operating Assumptions
2.4:1.0 Investment
Leverage at 4.0% yield
0.9:1.0 Operating
Leverage
ROE = 9.6%
ROE = 18.6%
ROE = 23.1%
---
7.4%
9.0%
9.6%
9.6%
9.6%
9.6%
13.5%
100%
Combined
Ratio
91.8%
Combined
Ratio
90%
Combined
Ratio
85%
Combined
Ratio
ROE from Underwriting Activity
ROE from Investing Activity
ROE = 17.0%
19

Capital Management Strategy
Understanding capital utilization
Catastrophe exposure
Loss reserves
Rating agency
Reducing Cost of Capital
$925 million multi-year debt facility
$250 million 30-year notes, 7% coupon
$200 million 10-year notes, 6.15% coupon
$200 million of perpetual preferred shares, 7.75% dividend
Efficient access to capital markets
Strong issuing capacity and relationships
Significant increase in public float (secondary, block trades)
Raised $600 million in new capital in response to 2005 hurricanes
Three separate capital markets transactions completed in ten days
Optimized mix of capital to minimize dilution
Returning excess capital
$264 million in stock repurchased as of 12/31/2005
1.8 million share repurchase authorization
$133 million in dividends paid to common shareholders as of 12/31/2005
Trade off between share buybacks and dividends understood
20

Conclusion
21

Conclusion
Built strong, technical, underwriting based culture that is focused on profit, not
revenue
Created robust controls, systems, and infrastructure
World class management team that thinks like shareholders
Value enhancement through capital management
Goal is to generate 15%+ return on equity throughout the cycle
Demonstrated ability to create shareholder value with significant future upside, in
spite of extreme frequency and severity of recent natural catastrophes
Well positioned with strong capitalization, balance sheet quality and diversified
strategy to take advantage of market opportunities
22

Appendix
23
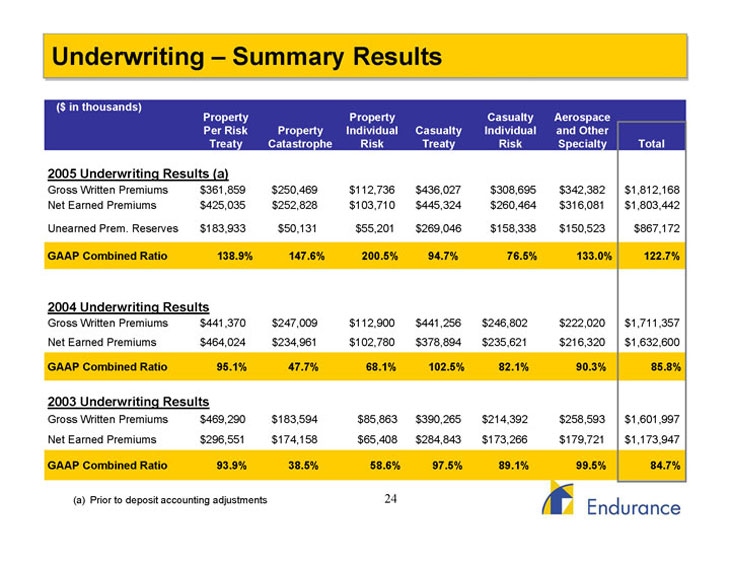
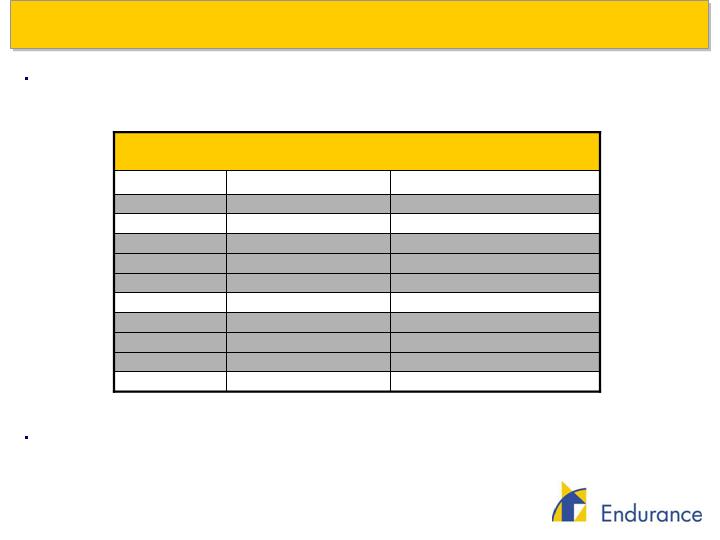
Underwriting Summary Results ($ in thousands) Property Property Casualty Aerospace Per Risk Property Individual Casualty Individual and Other Treaty Catastrophe Risk Treaty Risk Specialty Total 2005 Underwriting Results (a) Gross Written Premiums $ 361,859 $ 250,469 $ 112,736 $ 436,027 $ 308,695 $ 342,382 $1,812,168 Net Earned Premiums $ 425,035 $ 252,828 $ 103,710 $ 445,324 $ 260,464 $ 316,081 $1,803,442 Unearned Prem. Reserves $ 183,933 $ 50,131 $ 55,201 $ 269,046 $ 158,338 $ 150,523 $ 867,172 GAAP Combined Ratio 138.9% 147.6% 200.5% 94.7% 76.5% 133.0% 122.7% 2004 Underwriting Results Gross Written Premiums $ 441,370 $ 247,009 $ 112,900 $ 441,256 $ 246,802 $ 222,020 $1,711,357 Net Earned Premiums $ 464,024 $ 234,961 $ 102,780 $ 378,894 $ 235,621 $ 216,320 $1,632,600 GAAP Combined Ratio 95.1% 47.7% 68.1% 102.5% 82.1% 90.3% 85.8% 2003 Underwriting Results Gross Written Premiums $ 469,290 $ 183,594 $ 85,863 $ 390,265 $ 214,392 $ 258,593 $1,601,997 Net Earned Premiums $ 296,551 $ 174,158 $ 65,408 $ 284,843 $ 173,266 $ 179,721 $1,173,947 GAAP Combined Ratio 93.9% 38.5% 58.6% 97.5% 89.1% 99.5% 84.7% (a) Prior to deposit accounting adjustments 24
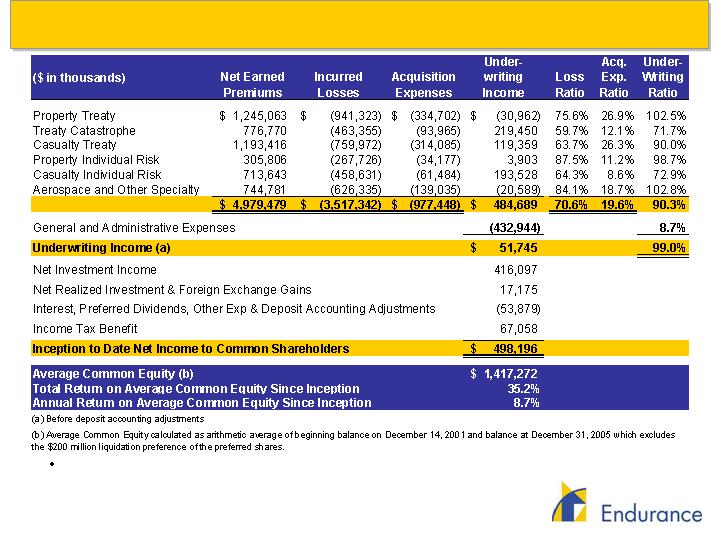
Inception to Date Results Through 12/31/05 Are Profitable
These results for just over 3 ½ years include the impact of Hurricanes
Katrina, Rita, Wilma, Charley, Ivan, Frances and Jeanne, 7 of the 10
costliest hurricanes in recorded history.
25

Summary Financial Performance ($ in thousands) Year Ended Year Ended Year Ended Year Ended Dec. 31, Dec. 31, Dec. 31, Dec. 31, Income Statement 2002 2003 2004 2005 Gross Written Premiums $798,760 $ 1,601,997 $ 1,711,357 $ 1,812,168(a) Net Earned Premiums 369,489 1,173,947 1,632,600 1,803,442(a) Operating Income (Loss) 93,024 247,938 348,443 (208,321) Combined Ratio 86.2% 84.7% 85.8% 122.7% (a) Operating ROE 7.8% 17.3% 19.9% (11.9)% Balance Sheet Total Investments & Cash $1,663,249 $2,674,232 $ 3,940,353 $ 4,953,237 Reserve for Losses & Loss Exp. 200,840 833,158 1,549,661 2,603,590 Reserve for Unearned Prem. 403,305 824,685 897,605 867,172(a) Total Shareholders' Equity 1,217,500 1,644,815 1,862,455 1,872,543 Debt / Total Capitalization 13.6% 5.9% 17.4% 19.3% (a) Prior to deposit accounting adjustments 26