Exhibit 99.2
2015a
Investor day
February 12, 2015 / new York, new York
Cautionary Statement
Safe Harbor Statement under the Private Securities Litigation Reform Act of 1995: This slide presentation
and our accompanying oral remarks contain numerous “forward-looking statements” regarding, without
limitation: our future business plans; the expected start dates of our Medicare-Medicaid Plan (MMP)
implementations; our expansion plans in Florida; our expansion plans and expected operational start date in
Puerto Rico; our Marketplace plans’ growth and operations; the Affordable Care Act annual health industry fee
and its expected reimbursement by states, including any tax impact; and various other matters. All of our
forward-looking statements are subject to numerous risks, uncertainties, and other factors that could cause our
actual results to differ materially. Anyone viewing or listening to this presentation is urged to read the risk factors
and cautionary statements found under Item 1A in our annual report on Form 10-K, as well as the risk factors and
cautionary statements in our quarterly reports and in our other reports and filings with the Securities and
Exchange Commission and available for viewing on its website at www.sec.gov. Except to the extent otherwise
required by federal securities laws, we do not undertake to address or update forward-looking statements in
future filings or communications regarding our business or operating results.
2
©
2015
MOLINA
HEALTHCARE,
INC.
Investor day 2015A
Agenda
Approx. Time Topic Speaker
12:30pm-12:35pm Opening Remarks Juan José Orellana, SVP Investor Relations
J. Mario Molina, MD, Chief Executive Officer;
12:35pm-1:20pm Business Overview Terry Bayer, Chief Operating Officer
1:20pm-1:35pm Q&A
1:35pm-1:40pm Break
John Molina, Chief Financial Officer;
1:40pm-2:25pm 2015 Outlook Joseph White, Chief Accounting Officer
John Molina, Chief Financial Officer;
2:25pm-3:10pm Long Term Financial Overview Joseph White, Chief Accounting Officer
3:10pm-3:30pm Q&A
3:30pm End of Program
3
©
2015
MOLINA
HEALTHCARE,
INC.
2015a
Investor day
Business overview
j. Mario Molina, president & chief executive officer
February 12, 2015 / new York, new York
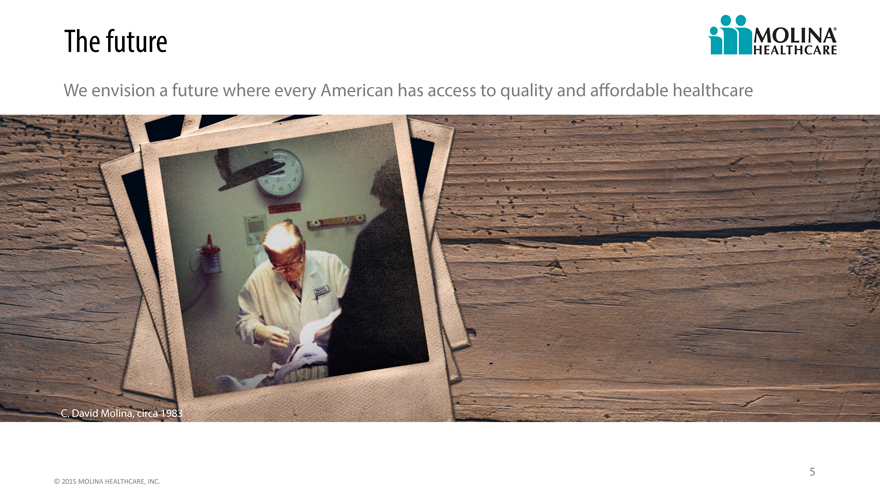
The future
We envision a future where every American has access to quality and affordable healthcare
C. David Molina, circa 1983
5
©
2015
MOLINA
HEALTHCARE,
INC.
Our mission
To provide quality health care to people receiving government assistance
6
©
2015
MOLINA
HEALTHCARE,
INC.
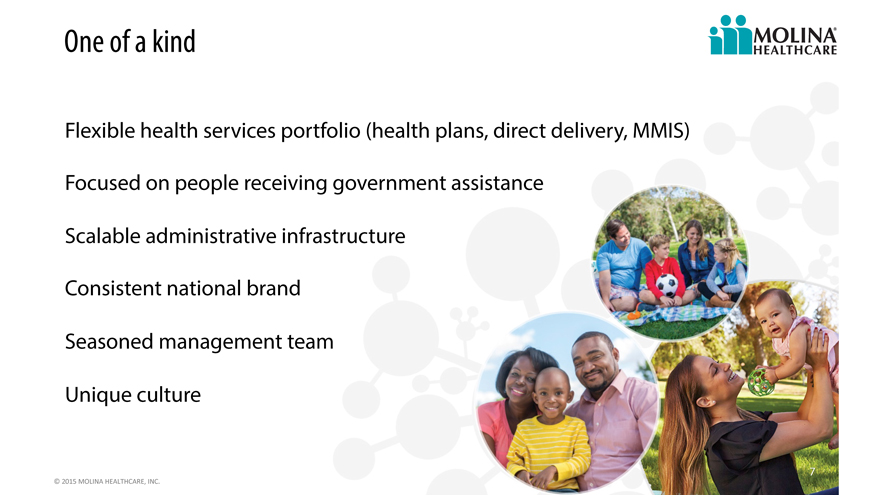
One of a kind
Flexible health services portfolio (health plans, direct delivery, MMIS)
Focused on people receiving government assistance
Scalable administrative infrastructure
Consistent national brand
Seasoned management team
Unique culture
7
©
2015
MOLINA
HEALTHCARE,
INC.
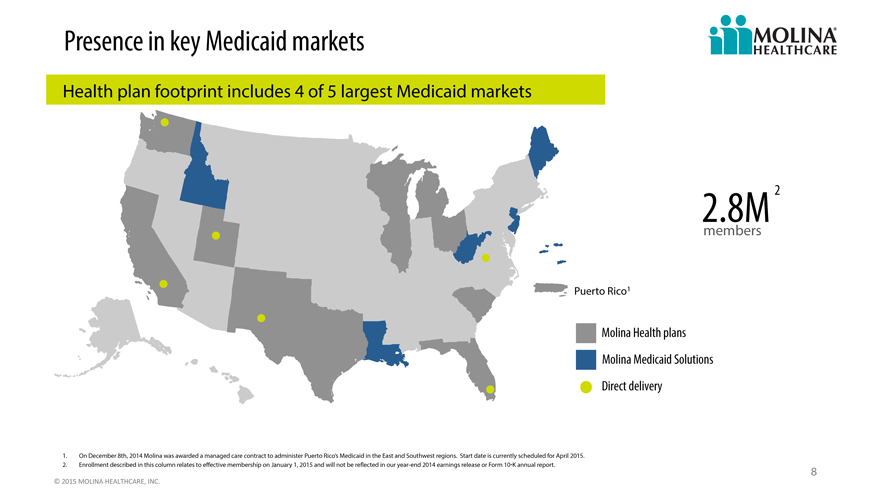
Presence in key Medicaid markets
Health plan footprint includes 4 of 5 largest Medicaid markets
2.8M 2
members
Puerto Rico1
Molina Health plans
Molina Medicaid Solutions
Direct delivery
1. On December 8th, 2014 Molina was awarded a managed care contract to administer Puerto Rico’s Medicaid in the East and Southwest regions. Start date is currently scheduled for April 2015.
2. Enrollment described in this column relates to effective membership on January 1, 2015 and will not be reflected in our year-end 2014 earnings release or Form 10-K annual report.
8
©
2015
MOLINA
HEALTHCARE,
INC.
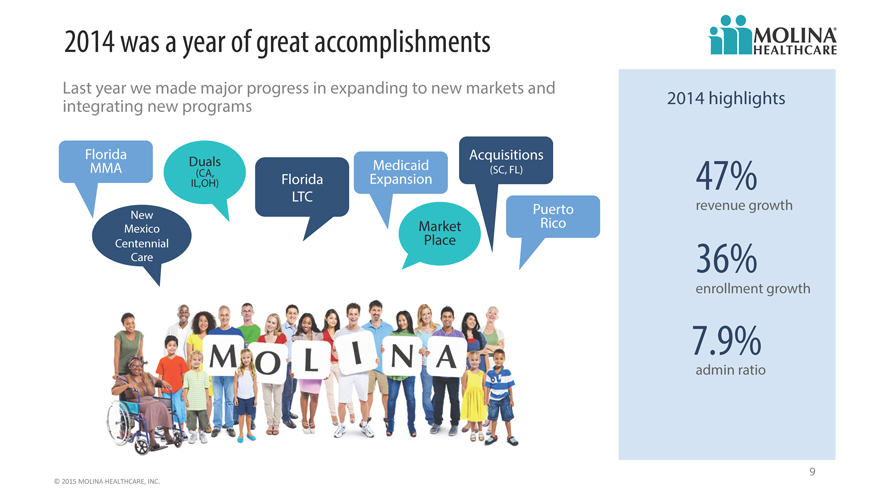
2014 was a year of great accomplishments
Last year we made major progress in expanding to new markets and
integrating new programs 2014 highlights
Florida Acquisitions
MMA Duals (CA, Medicaid (SC, FL)
IL,OH) Florida Expansion 47%
LTC
New Puerto revenue growth
Mexico Market Rico
Centennial Place
Care 36%
enrollment growth
7.9%
admin ratio
9
©
2015
MOLINA
HEALTHCARE,
INC.
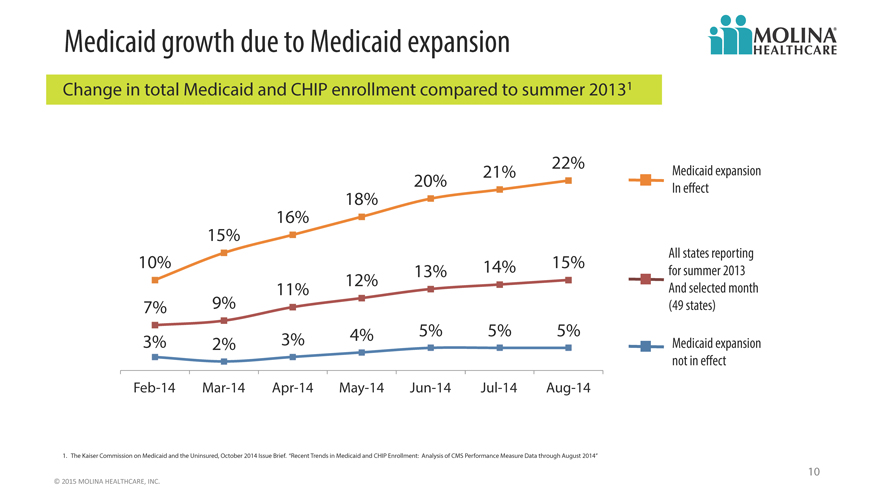
Medicaid growth due to Medicaid expansion
Change in total Medicaid and CHIP enrollment compared to summer 20131
22%
20% 21% Medicaid expansion
18% In effect
16%
15%
10% 13% 14% 15% for All states summer reporting 2013
12%
11% And selected month
7% 9% (49 states)
3% 2% 3% 4% 5% 5% 5% Medicaid expansion
not in effect
Feb-14 Mar-14 Apr-14 May-14 Jun-14 Jul-14 Aug-14
1. The Kaiser Commission on Medicaid and the Uninsured, October 2014 Issue Brief. “Recent Trends in Medicaid and CHIP Enrollment: Analysis of CMS Performance Measure Data through August 2014”
10
©
2015
MOLINA
HEALTHCARE,
INC.
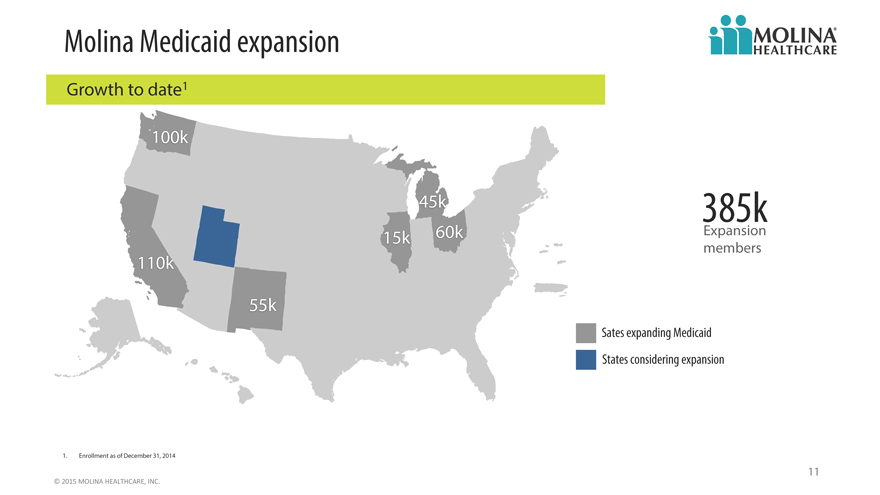
Molina Medicaid expansion
Growth to date1
100k
45k 385k
15k 60k Expansion
members
110k
55k
Sates expanding Medicaid
States considering expansion
1. Enrollment as of December 31, 2014
11
©
2015
MOLINA
HEALTHCARE,
INC.
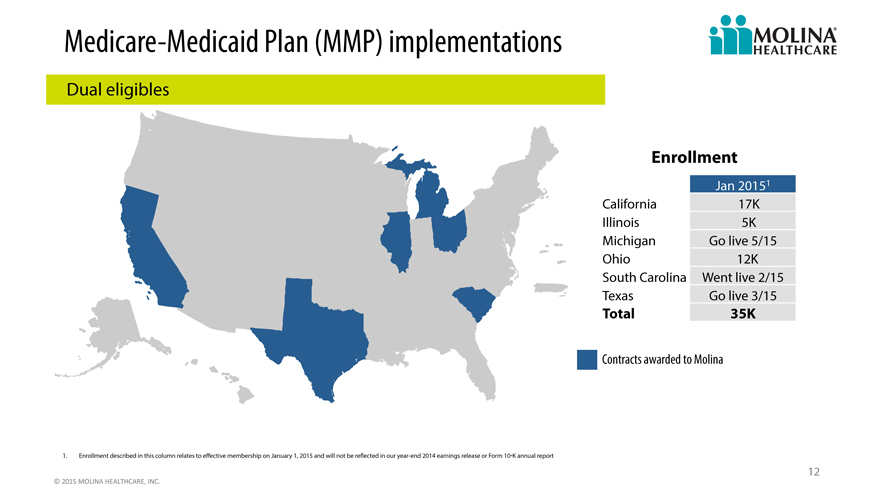
Medicare -Medicaid Plan (MMP) implementations
Dual eligibles
Enrollment
Jan 20151
California 17K
Illinois 5K
Michigan Go live 5/15
Ohio 12K
South Carolina Went live 2/15
Texas Go live 3/15
Total 35K
Contracts awarded to Molina
1. Enrollment described in this column relates to effective membership on January 1, 2015 and will not be reflected in our year-end 2014 earnings release or Form 10-K annual report
12
©
2015
MOLINA
HEALTHCARE,
INC.
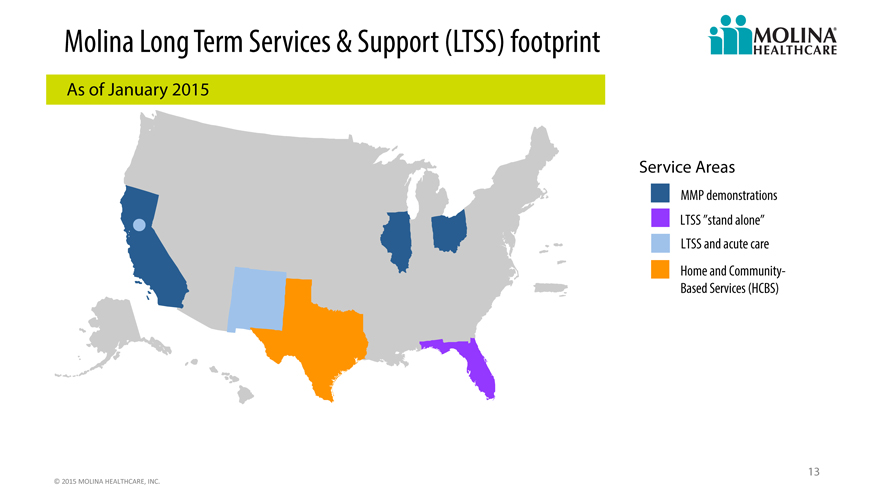
Molina Long Term Services & Support (LTSS) footprint
As of January 2015
Service Areas
MMP demonstrations
LTSS “stand alone”
LTSS and acute care
Home and Community-
Based Services (HCBS)
13
©
2015
MOLINA
HEALTHCARE,
INC.
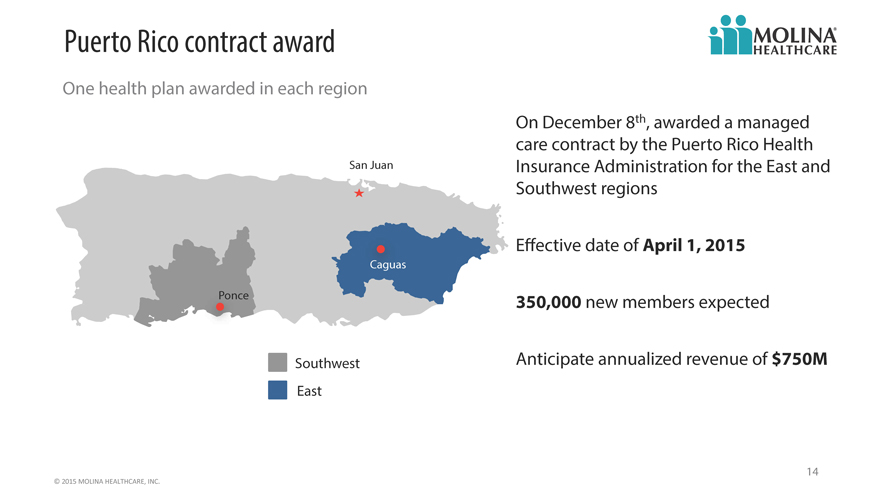
Puerto Rico contract award
One health plan awarded in each region
On December 8th, awarded a managed
care contract by the Puerto Rico Health
San Juan Insurance Administration for the East and
Southwest regions
Effective date of April 1, 2015
Ponce 350,000 new members expected
Southwest Anticipate annualized revenue of $750M
East
14
©
2015
MOLINA
HEALTHCARE,
INC.
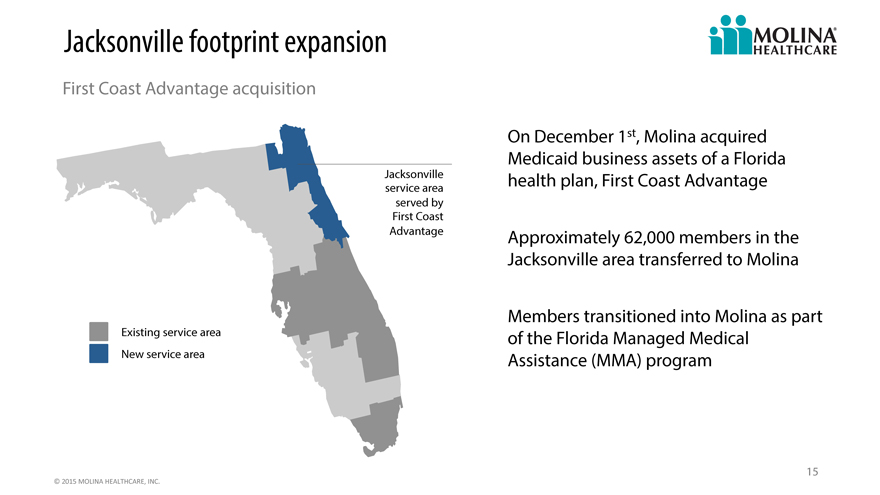
Jacksonville footprint expansion
First Coast Advantage acquisition
On December 1st, Molina acquired
Medicaid business assets of a Florida
Jacksonville health plan, First Coast Advantage
service area
served by
First Coast
Advantage Approximately 62,000 members in the
Jacksonville area transferred to Molina
Members transitioned into Molina as part
Existing service area of the Florida Managed Medical
New service area Assistance (MMA) program
15
©
2015
MOLINA
HEALTHCARE,
INC.
Marketplace year two
2014 pricing assumed higher medical costs
and utilization compared to existing
membership
2015 focused on competitive pricing in
existing markets
Significant sign up activity during 2015 open
enrollment
16
©
2015
MOLINA
HEALTHCARE,
INC.
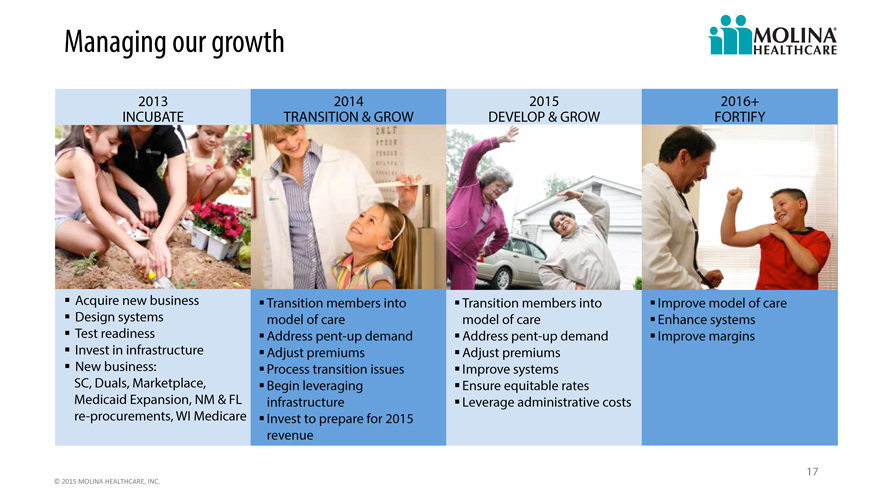
Managing our growth
2013 2014 2015 2016+
INCUBATE TRANSITION & GROW DEVELOP & GROW FORTIFY
Acquire new business Transition members into Transition members into Improve model of care
Design systems model of care model of care Enhance systems
Test readiness Address pent-up demand Address pent-up demand Improve margins
Invest in infrastructure Adjust premiums Adjust premiums
New business: Process transition issues Improve systems
SC, Duals, Marketplace, Begin leveraging Ensure equitable rates
Medicaid Expansion, NM & FL infrastructure Leverage administrative costs
re-procurements, WI Medicare Invest to prepare for 2015
revenue
17
©
2015
MOLINA
HEALTHCARE,
INC.
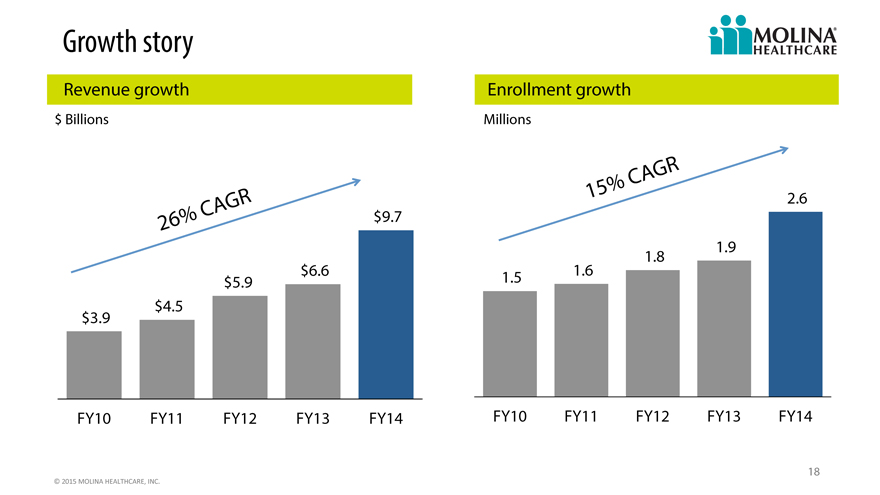
Growth story
Revenue growth Enrollment growth
$ Billions Millions
CAGR
GR 15% 2.6
CA $9.7
26%
1.8 1.9
$5.9 $6.6 1.5 1.6
$3.9 $4.5
FY10 FY11 FY12 FY13 FY14 FY10 FY11 FY12 FY13 FY14
18
©
2015
MOLINA
HEALTHCARE,
INC.
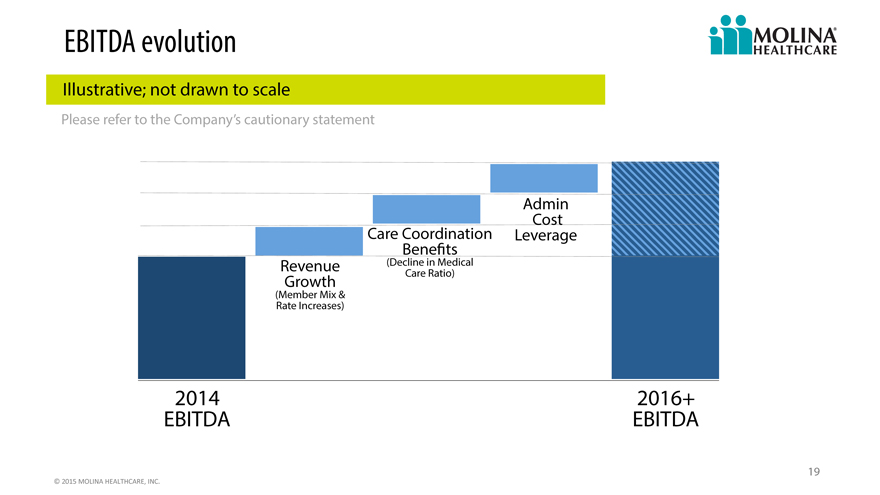
EBITDA evolution
Illustrative; not drawn to scale
Please refer to the Company’s cautionary statement
Admin
Cost
Care Coordination Leverage
Benefits
Revenue (Decline in Medical
Growth Care Ratio)
(Member Mix &
Rate Increases)
2014 2016+
EBITDA EBITDA
19
©
2015
MOLINA
HEALTHCARE,
INC.
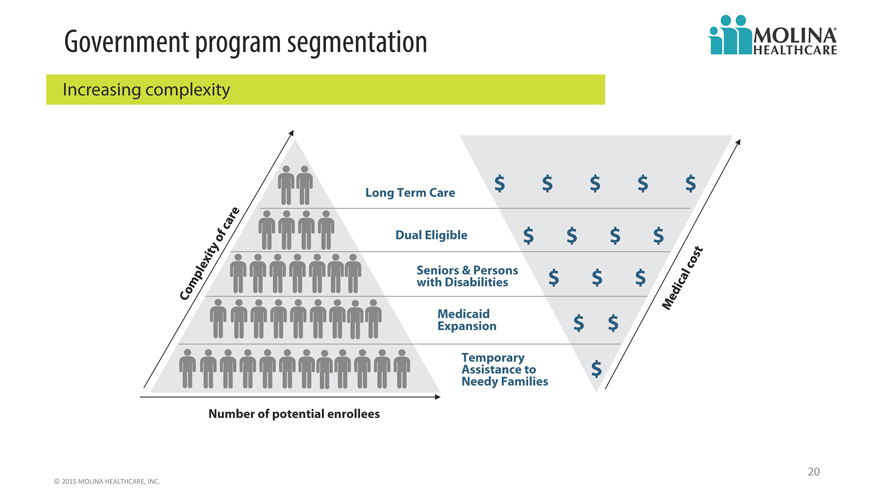
Government program segmentation
Increasing complexity
Long Term Care $ $ $ $ $
Dual Eligible $ $ $ $
Seniors & Persons $ $ $
with Disabilities
Medicaid
Expansion $ $
Assistance Temporary to $
Needy Families
Number of potential enrollees
20
©
2015
MOLINA
HEALTHCARE,
INC.
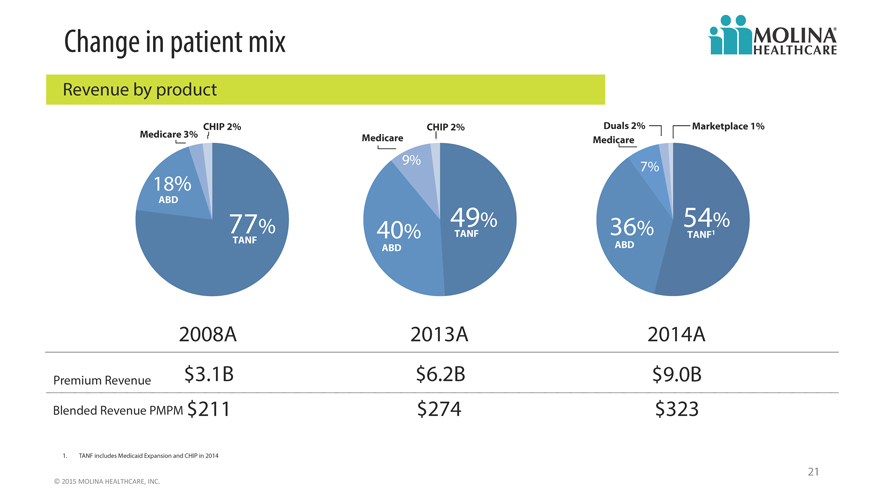
Change in patient mix
Revenue by product
CHIP 2% CHIP 2% Duals 2% Marketplace 1%
Medicare 3% Medicare Medicare
9% 7%
18%
ABD
77% 40% 49% TANF 36% 54% TANF1
TANF ABD ABD
2008A 2013A 2014A
Premium Revenue $3.1B $6.2B $9.0B
Blended Revenue PMPM $211 $274 $323
1. TANF includes Medicaid Expansion and CHIP in 2014
21
©
2015
MOLINA
HEALTHCARE,
INC.
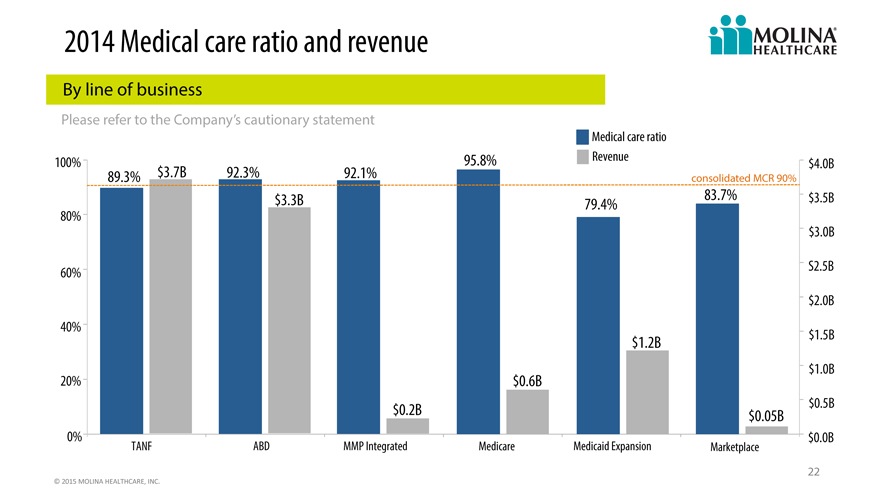
2014 Medical care ratio and revenue
By line of business
Please refer to the Company’s cautionary statement
Medical care ratio
100% 95.8% Revenue $4.0B
89.3% $3.7B 92.3% 92.1% consolidated MCR 90%
$3.3B 79.4% 83.7% $3.5B
80%
$3.0B
60% S2.5B
$2.0B
40%
$1.2B $1.5B
$1.0B
20% $0.6B
$0.5B
$0.2B $0.05B
0% $0.0B
TANF ABD MMP Integrated Medicare Medicaid Expansion Marketplace
22
©
2015
MOLINA
HEALTHCARE,
INC.
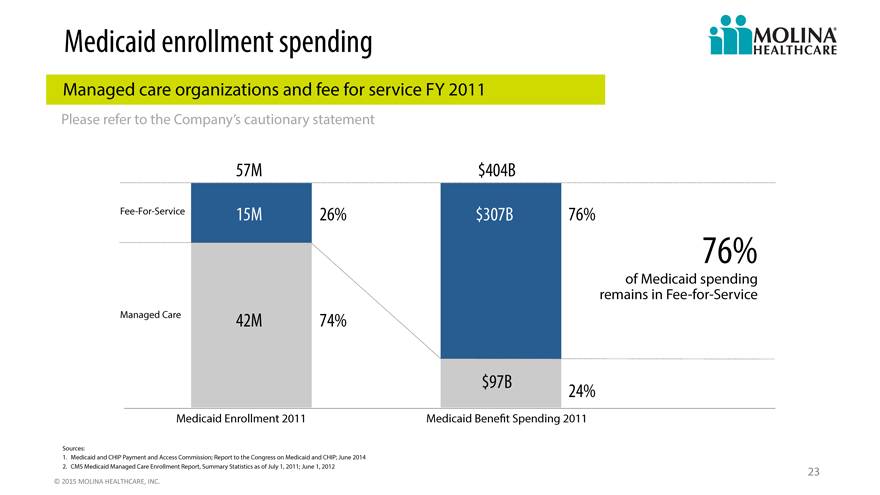
Medicaid enrollment spending
Managed care organizations and fee for service FY 2011
Please refer to the Company’s cautionary statement
57M $404B
Fee-For-Service 15M 26% $307B 76%
76%
of Medicaid spending
remains in Fee-for-Service
Managed Care 42M 74%
$97B 24%
Medicaid Enrollment 2011 Medicaid Benefit Spending 2011
Sources:
1. Medicaid and CHIP Payment and Access Commission; Report to the Congress on Medicaid and CHIP; June 2014
2. CMS Medicaid Managed Care Enrollment Report, Summary Statistics as of July 1, 2011; June 1, 2012 23
©
2015
MOLINA
HEALTHCARE,
INC.
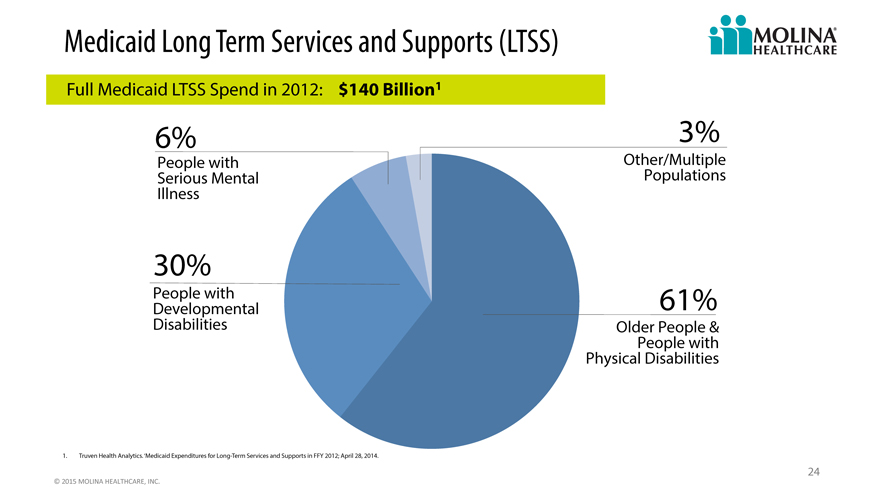
Medicaid Long Term Services and Supports (LTSS)
Full Medicaid LTSS Spend in 2012: $140 Billion1
6% 3%
People with Other/Multiple
Serious Mental Populations
Illness
30%
Developmental People with 61%
Disabilities Older People &
People with
Physical Disabilities
1. Truven Health Analytics. ‘Medicaid Expenditures for Long-Term Services and Supports in FFY 2012; April 28, 2014.
24
©
2015
MOLINA
HEALTHCARE,
INC.
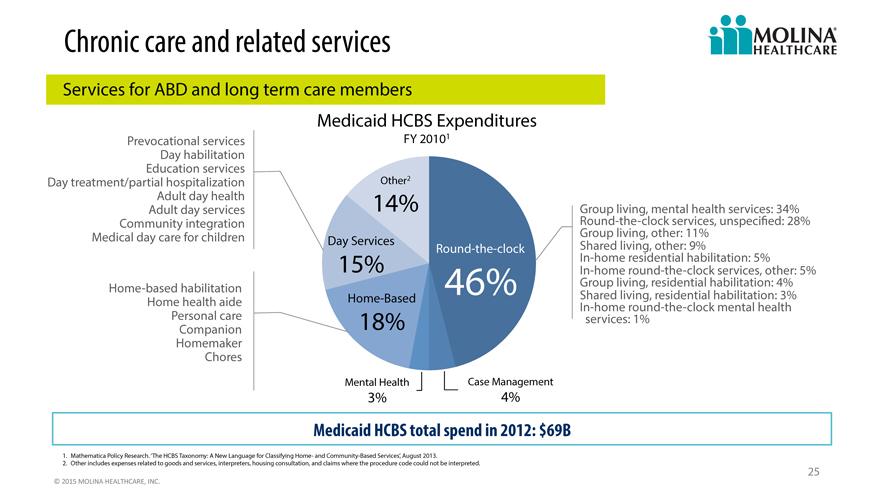
Chronic care and related services
Services for ABD and long term care members
Medicaid HCBS Expenditures
Prevocational services FY 20101
Day habilitation
Education services
Day treatment/partial hospitalization Other2
Adult day health 14% Group
Adult day services living, mental health services: 34%
Community integration Round-the-clock services, unspecified: 28%
Medical day care for children Day Services Group living, other: 11%
Round-the-clock Shared living, other: 9%
In-home residential habilitation: 5%
In-home round-the-clock services, other: 5%
Home-based habilitation 15% 46% Group living, residential habilitation: 4%
Home health aide Home-Based In-home Shared living, round-the-clock residential habilitation: mental health 3%
Personal Companion care 18% services: 1%
Homemaker
Chores
Mental Health Case Management
3% 4%
Medicaid HCBS total spend in 2012: $69B
1. Mathematica Policy Research. ‘The HCBS Taxonomy: A New Language for Classifying Home- and Community-Based Services’, August 2013.
2. Other includes expenses related to goods and services, interpreters, housing consultation, and claims where the procedure code could not be interpreted.
25
©
2015
MOLINA
HEALTHCARE,
INC.
The landscape
Post ACA
26
©
2015
MOLINA
HEALTHCARE,
INC.
Regulation
27
©
2015
MOLINA
HEALTHCARE,
INC.
Technology
28
©
2015
MOLINA
HEALTHCARE,
INC.
Drug spending
29
©
2015
MOLINA
HEALTHCARE,
INC.
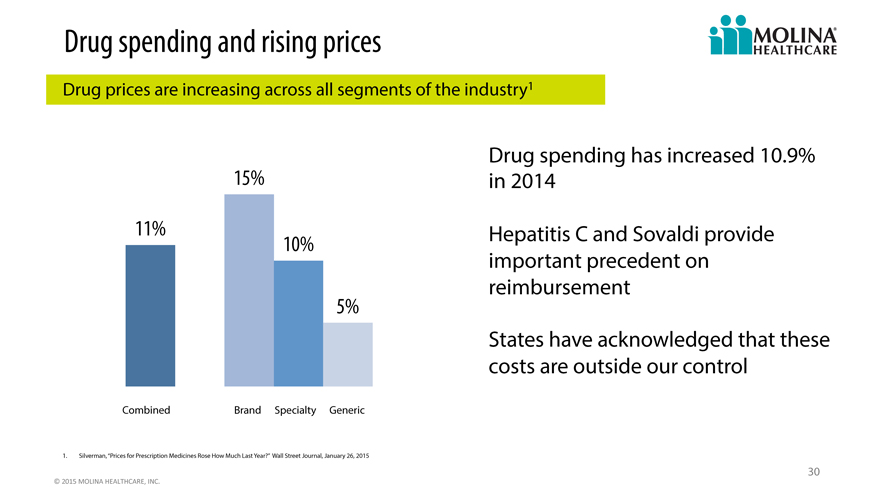
Drug spending and rising prices
Drug prices are increasing across all segments of the industry1
Drug spending has increased 10.9%
15% in 2014
11% 10% Hepatitis C and Sovaldi provide
important precedent on
reimbursement
5%
States have acknowledged that these
costs are outside our control
Combined Brand Specialty Generic
1. Silverman, “Prices for Prescription Medicines Rose How Much Last Year?” Wall Street Journal, January 26, 2015
30
©
2015
MOLINA
HEALTHCARE,
INC.
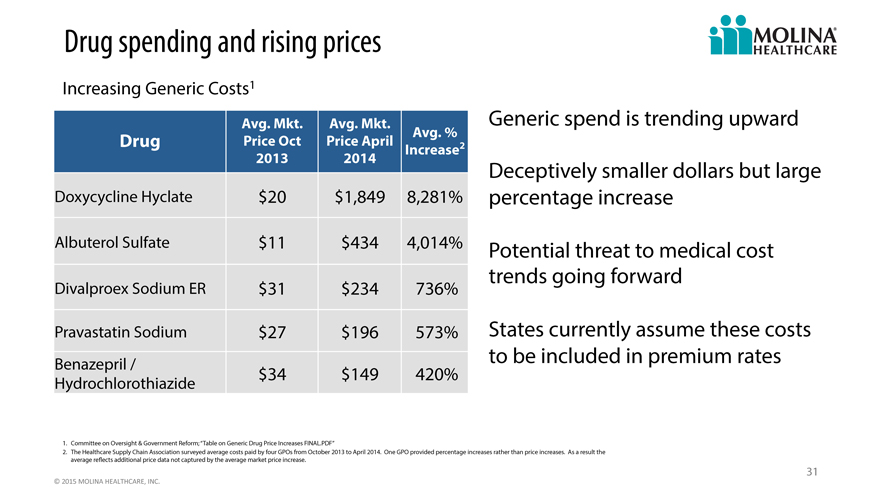
Drug spending and rising prices
Increasing Generic Costs1
Avg. Mkt. Avg. Mkt. Generic spend is trending upward
Drug Price Oct Price April Avg. % 2
Increase
2013 2014 Deceptively smaller dollars but large
Doxycycline Hyclate $ 20 $1,849 8,281% percentage increase
Albuterol Sulfate $ 11 $434 4,014% Potential threat to medical cost
Divalproex Sodium ER $ 31 $234 736% trends going forward
Pravastatin Sodium $ 27 $196 573% States currently assume these costs
Benazepril / to be included in premium rates
Hydrochlorothiazide $ 34 $149 420%
1. Committee on Oversight & Government Reform; “Table on Generic Drug Price Increases FINAL.PDF”
2. The Healthcare Supply Chain Association surveyed average costs paid by four GPOs from October 2013 to April 2014. One GPO provided percentage increases rather than price increases. As a result the
average reflects additional price data not captured by the average market price increase.
31
©
2015
MOLINA
HEALTHCARE,
INC.
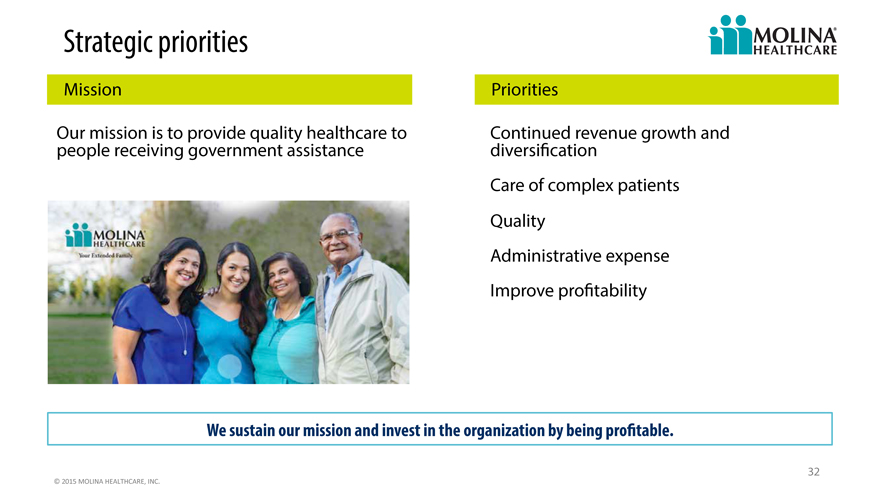
Strategic priorities
Mission Priorities
Our mission is to provide quality healthcare to Continued revenue growth and
people receiving government assistance diversification
Care of complex patients
Quality
Administrative expense
Improve profitability
We sustain our mission and invest in the organization by being profitable.
32
©
2015
MOLINA
HEALTHCARE,
INC.
The year ahead
Headwinds Tailwinds
Delay in state program Medicaid expansion
implementations
Footprint includes 4 of 5 largest
ACA reimbursement Medicaid markets
Medical cost pressure associated Uniquely positioned to capture Dual
with new contracts/populations Eligible enrollment
Flu season Marketplace open enrollment
33
©
2015
MOLINA
HEALTHCARE,
INC.
Q&A
34
2015a
Investor day
2015 outlook
John c. Molina, chief financial officer
February 12, 2015 / new York, new York
Cautionary Statement
Safe Harbor Statement under the Private Securities Litigation Reform Act of 1995: This slide presentation and our accompanying oral remarks contain numerous “forward-looking statements” regarding, without limitation: our new health plan in Puerto Rico; our Marketplace plans’ growth and operations; our overall growth, consolidation, and profitability improvement measures and strategy; drug pricing trends; and our 2015 financial guidance and outlook, including among other things expected rates, medical cost ratios, and ACA fee reimbursement and revenue recognition; and various other matters. All of our forward-looking statements are subject to numerous risks, uncertainties, and other factors that could cause our actual results to differ materially. Anyone viewing or listening to this presentation is urged to read the risk factors and cautionary statements found under Item 1A in our annual report on Form 10-K, as well as the risk factors and cautionary statements in our quarterly reports and in our other reports and filings with the Securities and Exchange Commission and available for viewing on its website at www.sec.gov. Except to the extent otherwise required by federal securities laws, we do not undertake to address or update forward-looking statements in future filings or communications regarding our business or operating results.
36
©
2015
MOLINA
HEALTHCARE,
INC.
2015 and beyond
2013 2014 2015 2016+
INCUBATE TRANSITION & GROW DEVELOP & GROW FORTIFY
Acquire new business Transition members into Transition members into Improve model of care
Design systems model of care model of care Enhance systems
Test readiness Address pent-up demand Address pent-up demand Improve margins
Invest in infrastructure Adjust premiums Adjust premiums
New business: Process transition issues Improve systems
SC, Duals, Marketplace, Begin leveraging Ensure equitable rates
Medicaid Expansion, NM & FL infrastructure Leverage administrative costs
re-procurements, WI Medicare Invest to prepare for 2015
revenue
37
©
2015
MOLINA
HEALTHCARE,
INC.
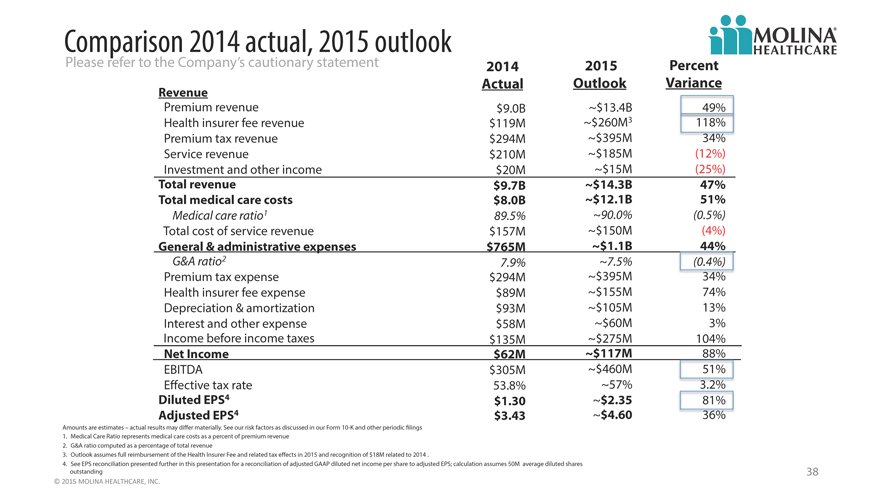
Comparison 2014 actual, 2015 outlook
Please refer to the Company’s cautionary statement 2014 2015 Percent
Revenue Actual Outlook Variance
Premium revenue $9.0B ~$13.4B 49%
Health insurer fee revenue $119M ~$260M3 118%
Premium tax revenue $294M ~$395M 34%
Service revenue $210M ~$185M (12%)
Investment and other income $20M ~$15M (25%)
Total revenue $9.7B ~$14.3B 47%
Total medical care costs $8.0B ~$12.1B 51%
Medical care ratio1 89.5% ~90.0% (0.5%)
Total cost of service revenue $157M ~$150M (4%)
General & administrative expenses $765M ~$1.1B 44%
G&A ratio2 7.9% ~7.5% (0.4%)
Premium tax expense $294M ~$395M 34%
Health insurer fee expense $89M ~$155M 74%
Depreciation & amortization $93M ~$105M 13%
Interest and other expense $58M ~$60M 3%
Income before income taxes $135M ~$275M 104%
Net Income $62M ~$117M 88%
EBITDA $305M ~$460M 51%
Effective tax rate 53.8% ~57% 3.2%
Diluted EPS4 $1.30 ~$2.35 81%
Adjusted EPS4 $3.43 ~$4.60 396%
Amounts are estimates – actual results may differ materially. See our risk factors as discussed in our Form 10-K and other periodic filings
1. Medical Care Ratio represents medical care costs as a percent of premium revenue
2. G&A ratio computed as a percentage of total revenue
3. Outlook assumes full reimbursement of the Health Insurer Fee and related tax effects in 2015 and recognition of $18M related to 2014 .
4. See EPS reconciliation presented further in this presentation for a reconciliation of adjusted GAAP diluted net income per share to adjusted EPS; calculation assumes 50M average diluted shares
outstanding
©
2015
MOLINA
HEALTHCARE,
INC.
38
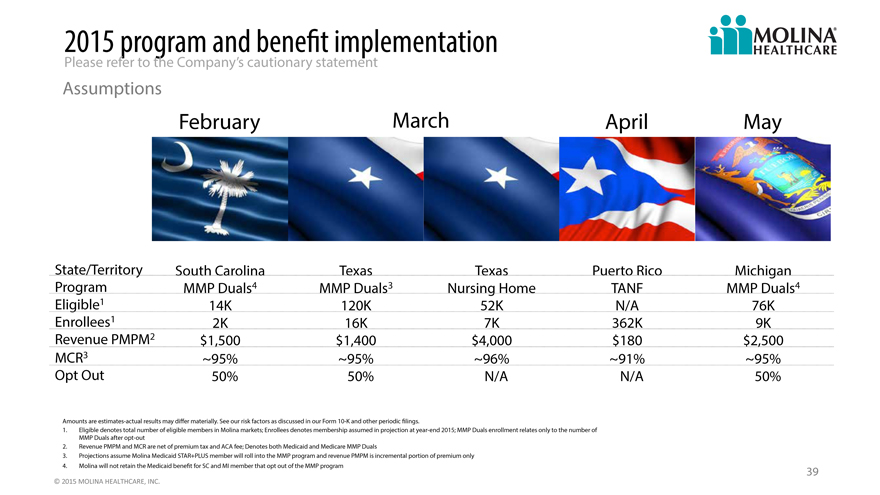
2015 program and benefit implementation
Please refer to the Company’s cautionary statement
Assumptions
February March April May
State/Territory South Carolina Texas Texas Puerto Rico Michigan
Program MMP Duals4 MMP Duals3 Nursing Home TANF MMP Duals4
Eligible1 14K 120K 52K N/A 76K
Enrollees1 2K 16K 7K 362K 9K
Revenue PMPM2 $1,500 $1,400 $4,000 $180 $2,500
MCR3 ~95% ~95% ~96% ~91% ~95%
Opt Out 50% 50% N/A N/A 50%
Amounts are estimates-actual results may differ materially. See our risk factors as discussed in our Form 10-K and other periodic filings.
1. Eligible denotes total number of eligible members in Molina markets; Enrollees denotes membership assumed in projection at year-end 2015; MMP Duals enrollment relates only to the number of
MMP Duals after opt-out
2. Revenue PMPM and MCR are net of premium tax and ACA fee; Denotes both Medicaid and Medicare MMP Duals
3. Projections assume Molina Medicaid STAR+PLUS member will roll into the MMP program and revenue PMPM is incremental portion of premium only
4. Molina will not retain the Medicaid benefit for SC and MI member that opt out of the MMP program 39
©
2015
MOLINA
HEALTHCARE,
INC.
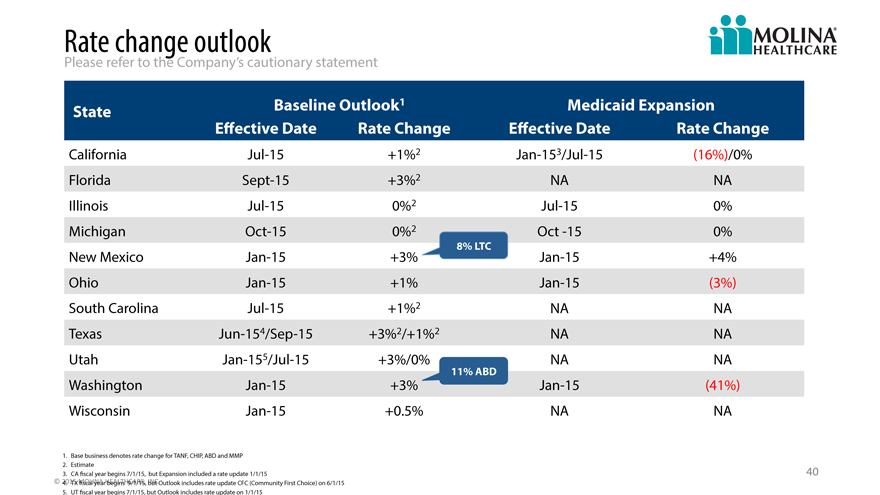
Rate change outlook
Please refer to the Company’s cautionary statement
State Baseline Outlook1 Medicaid Expansion
effective Date Rate Change effective Date Rate Change
California Jul-15 +1%2 Jan-153/Jul-15 (16%)/0%
Florida Sept-15 +3%2 NA NA
Illinois Jul-15 0%2 Jul-15 0%
Michigan Oct-15 0%2 Oct -15 0%
8% LTC
New Mexico Jan-15 +3% Jan-15 +4%
Ohio Jan-15 +1% Jan-15 (3%)
South Carolina Jul-15 +1%2 NA NA
Texas Jun-154/Sep-15 +3%2/+1%2 NA NA
Utah Jan-155/Jul-15 +3%/0% NA NA
11% ABD
Washington Jan-15 +3% Jan-15 (41%)
Wisconsin Jan-15 +0.5% NA NA
1. Base business denotes rate change for TANF, CHIP, ABD and MMP
2. Estimate
3. CA fiscal year begins 7/1/15, but Expansion included a rate update 1/1/15 40
©
2015
MOLINA
HEALTHCARE,4. TX fiscal year begins 9/1/15,
INC.but Outlook
includes rate update CFC (Community First Choice) on 6/1/15
5. UT fiscal year begins 7/1/15, but Outlook includes rate update on 1/1/15
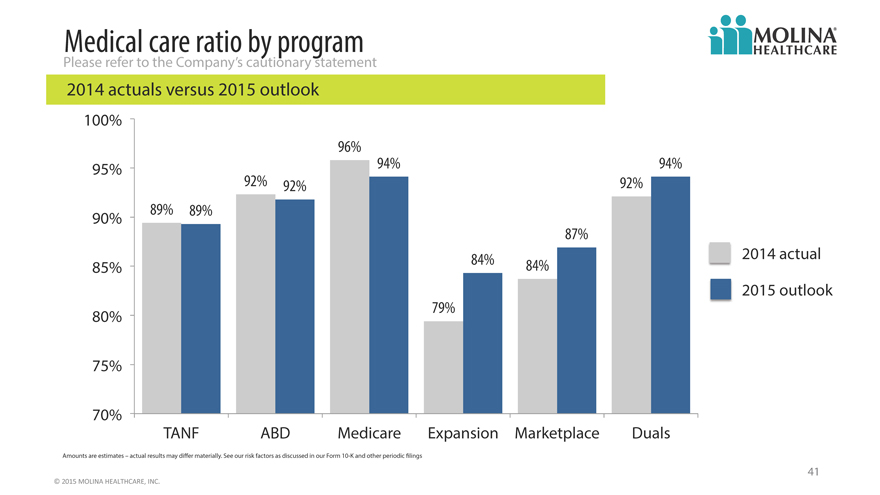
Medical care ratio by program
Please refer to the Company’s cautionary statement
2014 actuals versus 2015 outlook
100%
96%
95% 94% 94%
92% 92% 92%
90% 89% 89%
87%
84% 2014 actual
85% 84%
2015 outlook
80% 79%
75%
70%
TANF ABD Medicare Expansion Marketplace Duals
Amounts are estimates – actual results may differ materially. See our risk factors as discussed in our Form 10-K and other periodic filings
41
©
2015
MOLINA
HEALTHCARE,
INC.
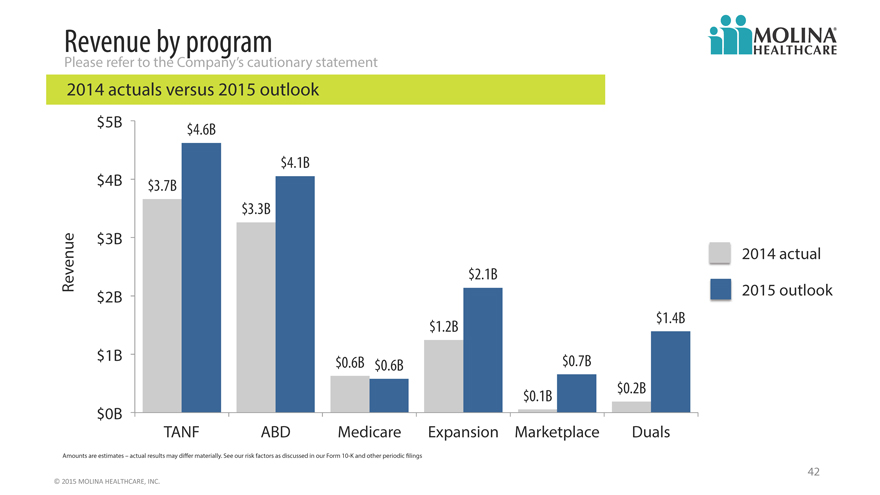
Revenue by program
Please refer to the Company’s cautionary statement
2014 actuals versus 2015 outlook
$ 5B $ 4.6B
$ 4.1B
$ 4B $3.7B
$ 3.3B
$ 3B
2014 actual
Revenue $ 2.1B
$ 2B 2015 outlook
$1.2B $ 1.4B
$ 1B $0.6B $ 0.6B $ 0.7B
$ 0.1B $0.2B
$ 0B
TANF ABD Medicare Expansion Marketplace Duals
Amounts are estimates – actual results may differ materially. See our risk factors as discussed in our Form 10-K and other periodic filings
42
©
2015
MOLINA
HEALTHCARE,
INC.
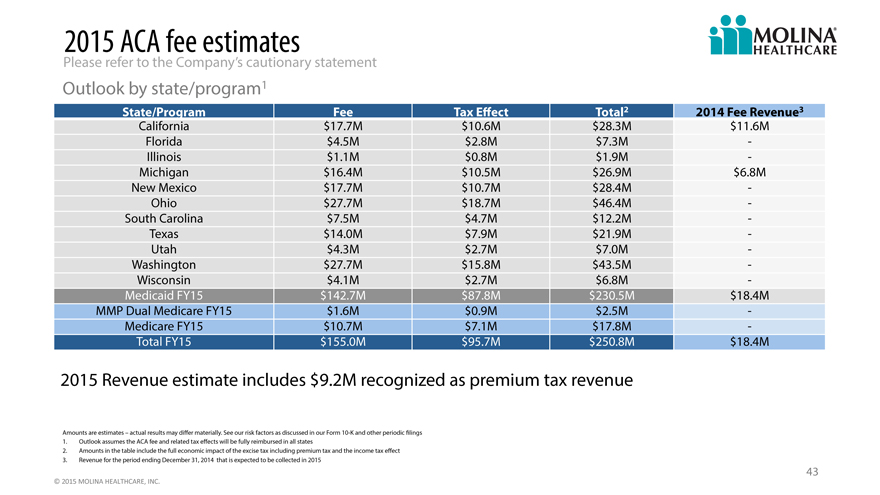
2015 ACA fee estimates
Please refer to the Company’s cautionary statement
Outlook by state/program1
State/Program Fee Tax Effect Total 2 2014 Fee Revenue3
California $17.7M $10.6M $28.3M $11.6M
Florida $4.5M $2.8M $7.3M —
Illinois $1.1M $0.8M $1.9M —
Michigan $16.4M $10.5M $26.9M $6.8M
New Mexico $17.7M $10.7M $28.4M —
Ohio $27.7M $18.7M $46.4M —
South Carolina $7.5M $4.7M $12.2M —
Texas $14.0M $7.9M $21.9M —
Utah $4.3M $2.7M $7.0M —
Washington $27.7M $15.8M $43.5M —
Wisconsin $4.1M $2.7M $6.8M —
Medicaid FY15 $142.7M $87.8M $230.5M $18.4M
MMP Dual Medicare FY15 $1.6M $0.9M $2.5M —
Medicare FY15 $10.7M $7.1M $17.8M —
Total FY15 $155.0M $95.7M $250.8M $18.4M
2015 Revenue estimate includes $9.2M recognized as premium tax revenue
Amounts are estimates – actual results may differ materially. See our risk factors as discussed in our Form 10-K and other periodic filings
1. Outlook assumes the ACA fee and related tax effects will be fully reimbursed in all states
2. Amounts in the table include the full economic impact of the excise tax including premium tax and the income tax effect
3. Revenue for the period ending December 31, 2014 that is expected to be collected in 2015
43
©
2015
MOLINA
HEALTHCARE,
INC.
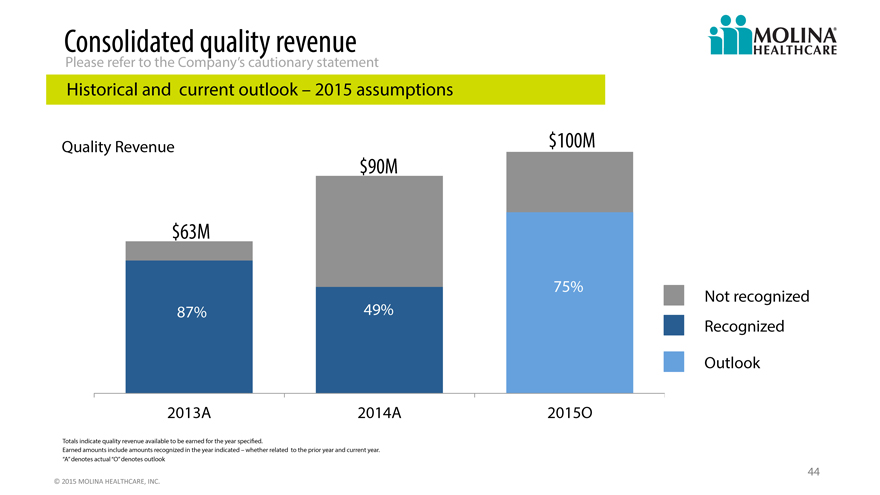
Consolidated quality revenue
Please refer to the Company’s cautionary statement
Historical and current outlook – 2015 assumptions
Quality Revenue $100M
$90M
$63M
75% Not recognized
87% 49%
Recognized
Outlook
2013A 2014A 2015O
Totals indicate quality revenue available to be earned for the year specified.
Earned amounts include amounts recognized in the year indicated – whether related to the prior year and current year.
“A” denotes actual “O” denotes outlook
44
©
2015
MOLINA
HEALTHCARE,
INC.
General and administrative cost leverage
Please refer to the Company’s cautionary statement
Revenue growth maximizes G&A investment
11%
10.1%
10% G&A Ratio
9% 8.8%
7.9%
8% 7.5%
7%
6%
5%
2012A 2013A 2014A 2015O
45
©
2015
MOLINA
HEALTHCARE,
INC.
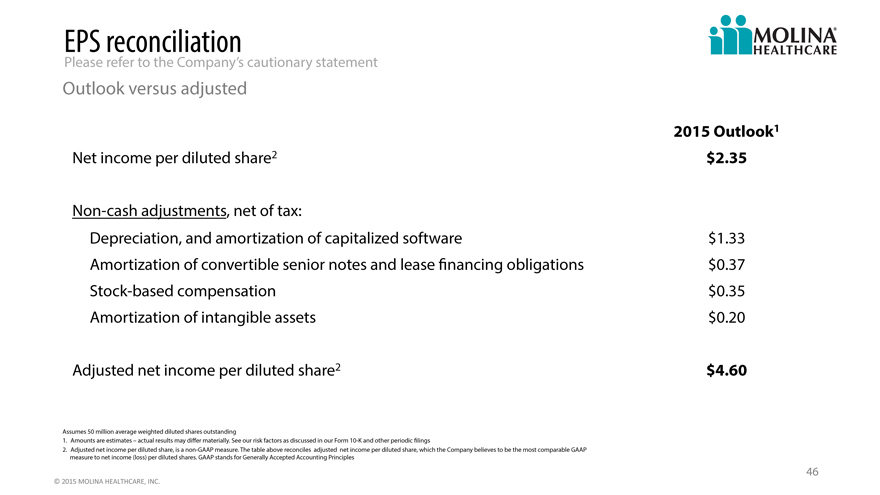
EPS reconciliation
Please refer to the Company’s cautionary statement
Outlook versus adjusted
2015 Outlook1
Net income per diluted share2 $2.35
Non-cash adjustments, net of tax:
Depreciation, and amortization of capitalized software $1.33
Amortization of convertible senior notes and lease financing obligations $0.37
Stock-based compensation $0.35
Amortization of intangible assets $0.20
Adjusted net income per diluted share2 $4.60
Assumes 50 million average weighted diluted shares outstanding
1. Amounts are estimates – actual results may differ materially. See our risk factors as discussed in our Form 10-K and other periodic filings
2. Adjusted net income per diluted share, is a non-GAAP measure. The table above reconciles adjusted net income per diluted share, which the Company believes to be the most comparable GAAP
measure to net income (loss) per diluted shares. GAAP stands for Generally Accepted Accounting Principles
46
©
2015
MOLINA
HEALTHCARE,
INC.
2015a
Investor day
Long term financial improvement
John c. Molina, chief financial officer
February 12, 2015 / new York, new York
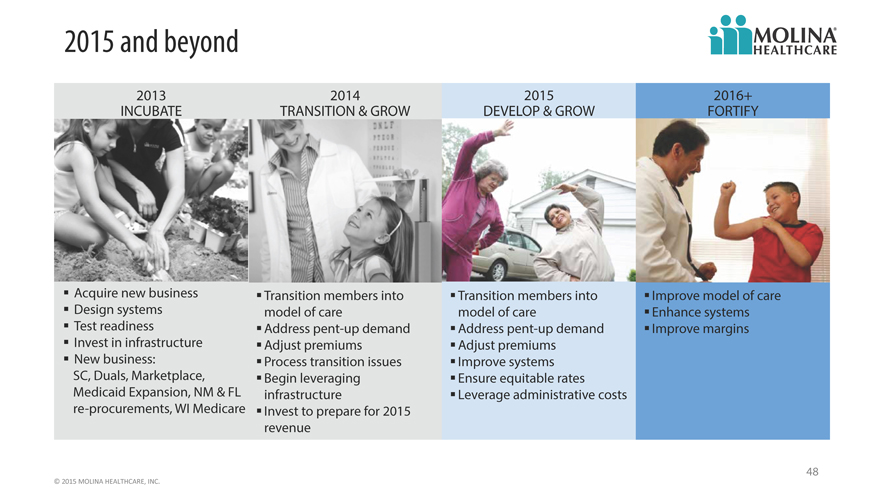
2015 and beyond
2013 2014 2015 2016+
INCUBATE TRANSITION & GROW DEVELOP & GROW FORTIFY
Acquire new business Transition members into Transition members into Improve model of care
Design systems model of care model of care Enhance systems
Test readiness Address pent-up demand Address pent-up demand Improve margins
Invest in infrastructure Adjust premiums Adjust premiums
New business: Process transition issues Improve systems
SC, Duals, Marketplace, Begin leveraging Ensure equitable rates
Medicaid Expansion, NM & FL infrastructure Leverage administrative costs
re-procurements, WI Medicare Invest to prepare for 2015
revenue
48
©
2015
MOLINA
HEALTHCARE,
INC.
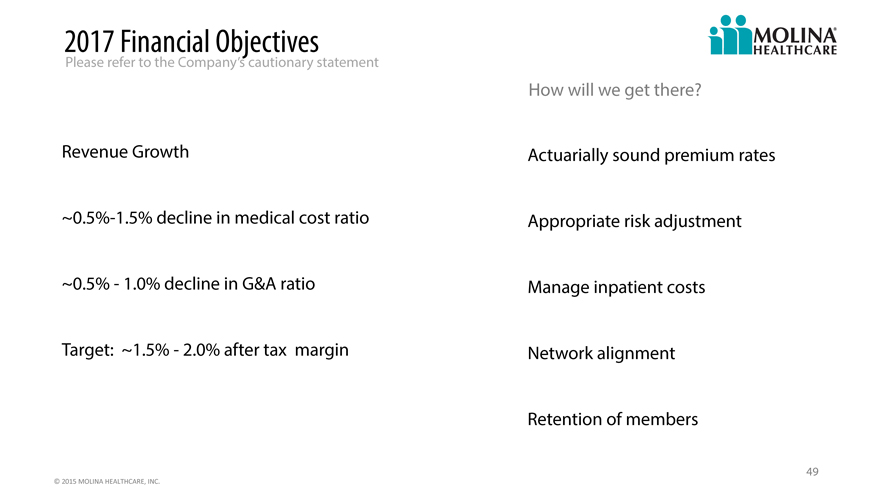
2017 Financial Objectives
Please refer to the Company’s cautionary statement
How will we get there?
Revenue Growth Actuarially sound premium rates
~0.5%-1.5% decline in medical cost ratio Appropriate risk adjustment
~0.5%—1.0% decline in G&A ratio Manage inpatient costs
Target: ~1.5%—2.0% after tax margin Network alignment
Retention of members
49
©
2015
MOLINA
HEALTHCARE,
INC.
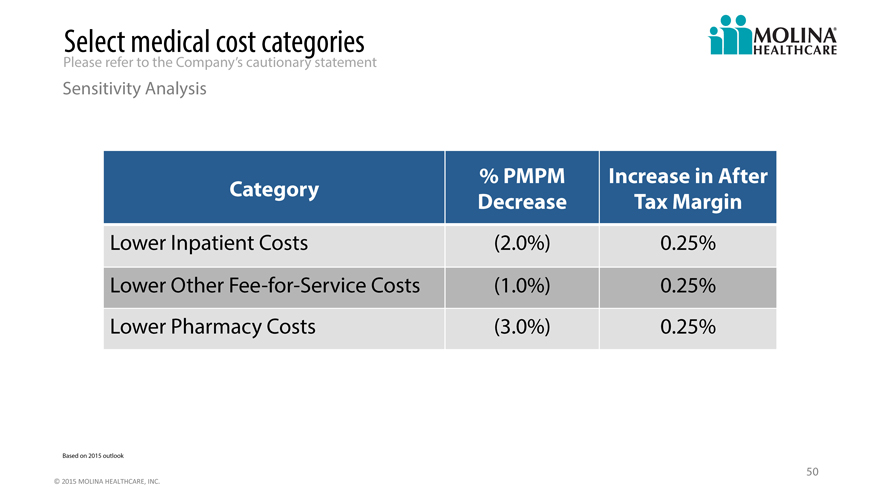
Select medical cost categories
Please refer to the Company’s cautionary statement
Sensitivity Analysis
% PMPM Increase in After
Category Decrease Tax Margin
Lower Inpatient Costs (2.0%) 0.25%
Lower Other Fee -for-Service Costs (1.0%) 0.25%
Lower Pharmacy Costs (3.0%) 0.25%
Based on 2015 outlook
50
©
2015
MOLINA
HEALTHCARE,
INC.
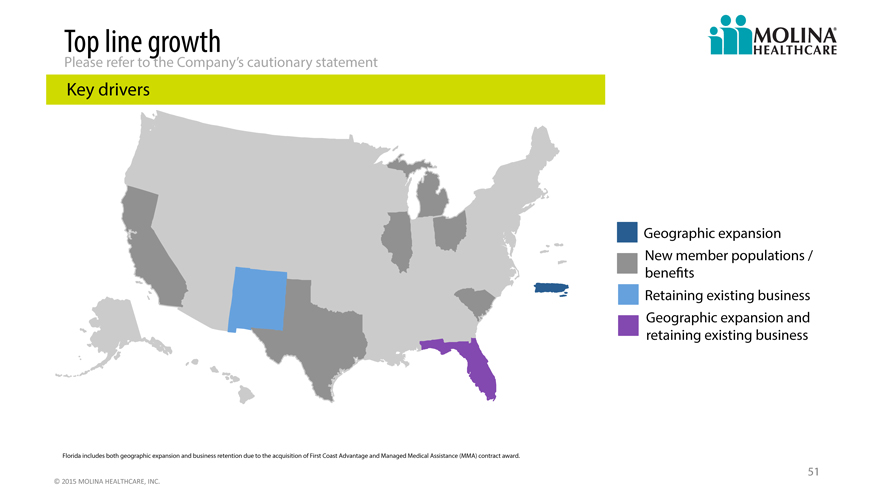
Top line growth
Please refer to the Company’s cautionary statement
Key drivers
Geographic expansion
New member populations /
benefits
Retaining existing business
Geographic expansion and
retaining existing business
Florida includes both geographic expansion and business retention due to the acquisition of First Coast Advantage and Managed Medical Assistance (MMA) contract award.
51
©
2015
MOLINA
HEALTHCARE,
INC.
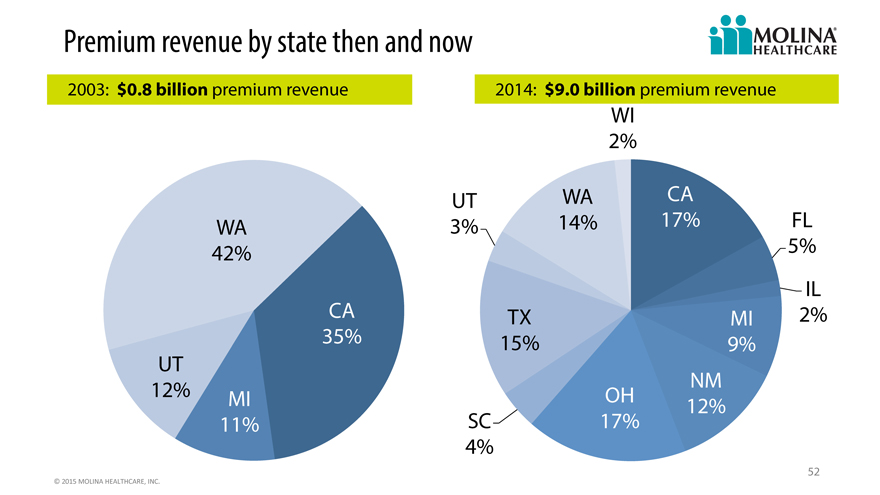
Premium revenue by state then and now
2003: $0.8 billion premium revenue 2014: $9.0 billion premium revenue
WI
2%
UT WA CA
WA 3% 14% 17% FL
42% 5%
IL
CA TX MI 2%
35% 15% 9%
UT
12% OH NM
MI 12%
11% SC 17%
4%
52
©
2015
MOLINA
HEALTHCARE,
INC.
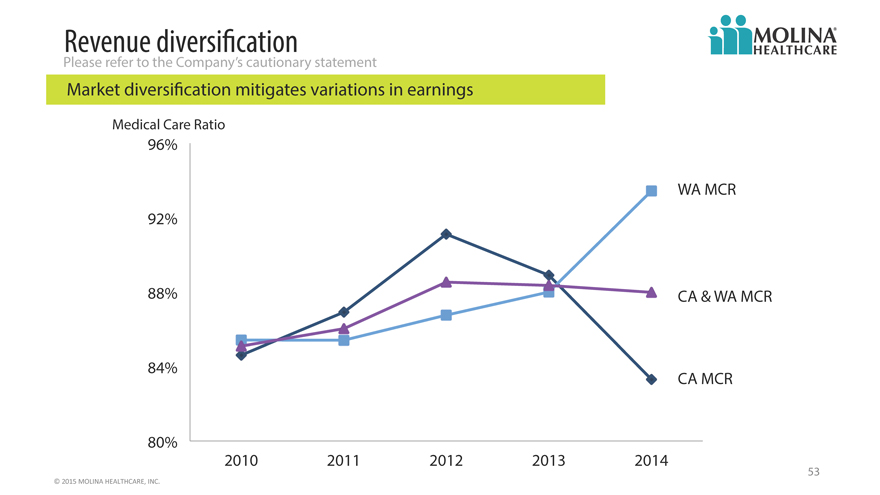
Revenue diversification
Please refer to the Company’s cautionary statement
Market diversification mitigates variations in earnings
Medical Care Ratio
96%
WA MCR
92%
88% CA & WA MCR
84% CA MCR
80%
2010 2011 2012 2013 2014
53
©
2015
MOLINA
HEALTHCARE,
INC.
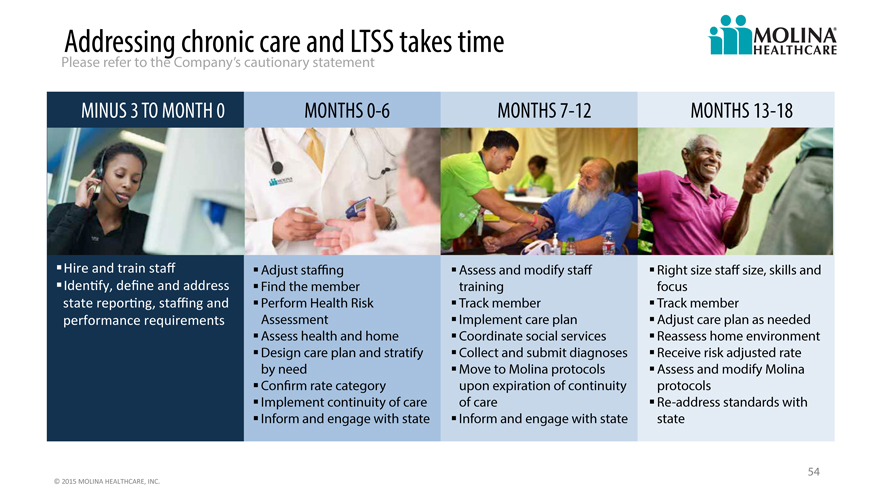
Addressing chronic care and LTSS takes time
Please refer to the Company’s cautionary statement
MINUS 3 TO MONTH 0 MONTHS 0-6 MONTHS 7-12 MONTHS 13-18
Hire
and
train
staff
Adjust staffing Assess and modify staff Right size staff size, skills and
Identify,
define
and
address
Find the member training focus
state
reporting,
staffing
and
Perform Health Risk Track member Track member
performance
requirements
Assessment Implement care plan Adjust care plan as needed
Assess health and home Coordinate social services Reassess home environment
Design care plan and stratify Collect and submit diagnoses Receive risk adjusted rate
by need Move to Molina protocols Assess and modify Molina
Confirm rate category upon expiration of continuity protocols
Implement continuity of care of care Re-address standards with
Inform and engage with state Inform and engage with state state
54
©
2015
MOLINA
HEALTHCARE,
INC.
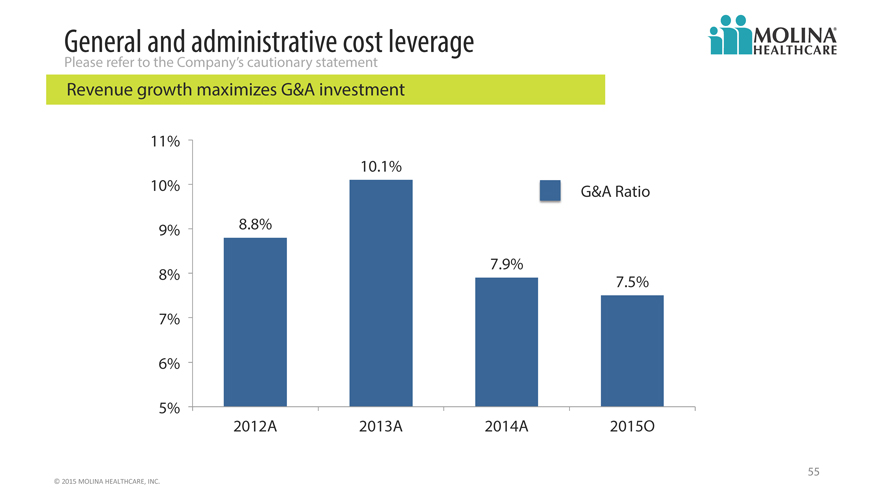
General and administrative cost leverage
Please refer to the Company’s cautionary statement
Revenue growth maximizes G&A investment
11%
10.1%
10% G&A Ratio
9% 8.8%
7.9%
8% 7.5%
7%
6%
5%
2012A 2013A 2014A 2015O
55
©
2015
MOLINA
HEALTHCARE,
INC.
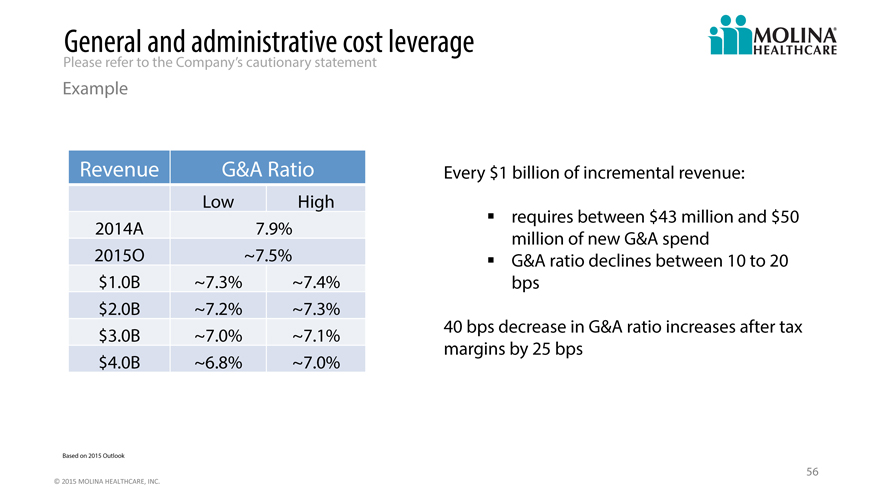
General and administrative cost leverage
Please refer to the Company’s cautionary statement
Example
Revenue G&A Ratio Every $1 billion of incremental revenue:
Low High
requires between $43 million and $50
2014A 7.9% million of new G&A spend
2015O ~7.5% G&A ratio declines between 10 to 20
$ 1.0B ~7.3% ~7.4% bps
$ 2.0B ~7.2% ~7.3%
$ 3.0B ~7.0% ~7.1% 40 bps decrease in G&A ratio increases after tax
margins by 25 bps
$ 4.0B ~6.8% ~7.0%
Based on 2015 Outlook
56
©
2015
MOLINA
HEALTHCARE,
INC.
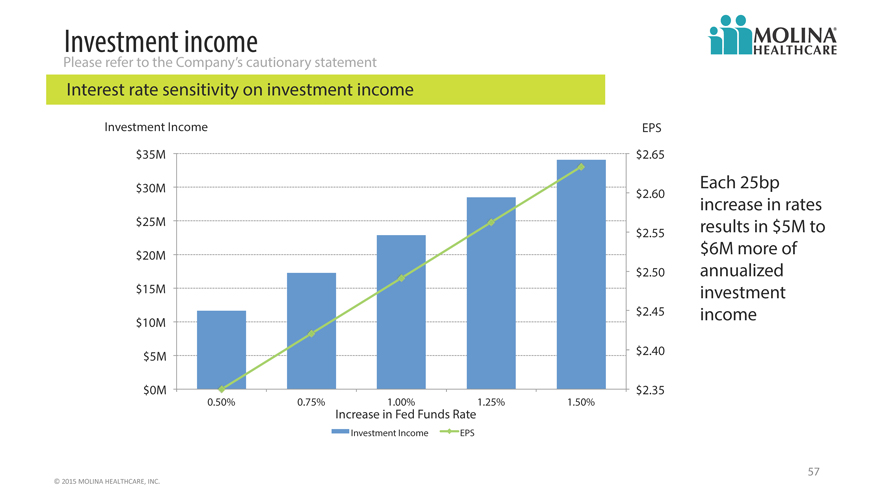
Investment income
Please refer to the Company’s cautionary statement
Interest rate sensitivity on investment income
Investment Income EPS
$35M $ 2.65
$30M $ 2.60 Each 25bp
increase in rates
$25M $ 2.55 results in $5M to
$20M $6M more of
$ 2.50 annualized
$15M investment
$10M $ 2.45 income
$5M $ 2.40
$0M $ 2.35
0.50% 0.75% 1.00% 1.25% 1.50%
Increase in Fed Funds Rate
Investment Income EPS
57
©
2015
MOLINA
HEALTHCARE,
INC.
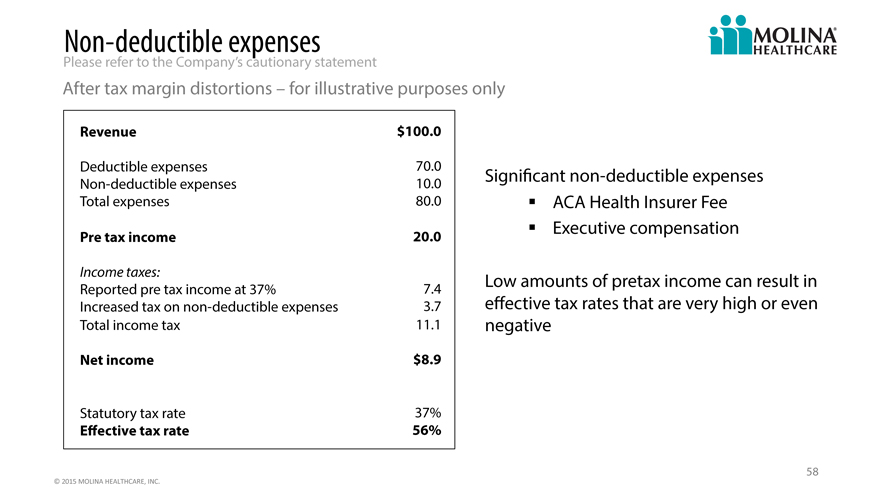
Non- deductible expenses
Please refer to the Company’s cautionary statement
After tax margin distortions – for illustrative purposes only
Revenue $100.0
Deductible expenses 70.0
Non-deductible expenses 10.0 Significant non-deductible expenses
Total expenses 80.0 ACA Health Insurer Fee
Pre tax income 20.0 Executive compensation
Income taxes:
Reported pre tax income at 37% 7.4 Low amounts of pretax income can result in
Increased tax on non-deductible expenses 3.7 effective tax rates that are very high or even
Total income tax 11.1 negative
Net income $8.9
Statutory tax rate 37%
Effective tax rate 56%
58
©
2015
MOLINA
HEALTHCARE,
INC.
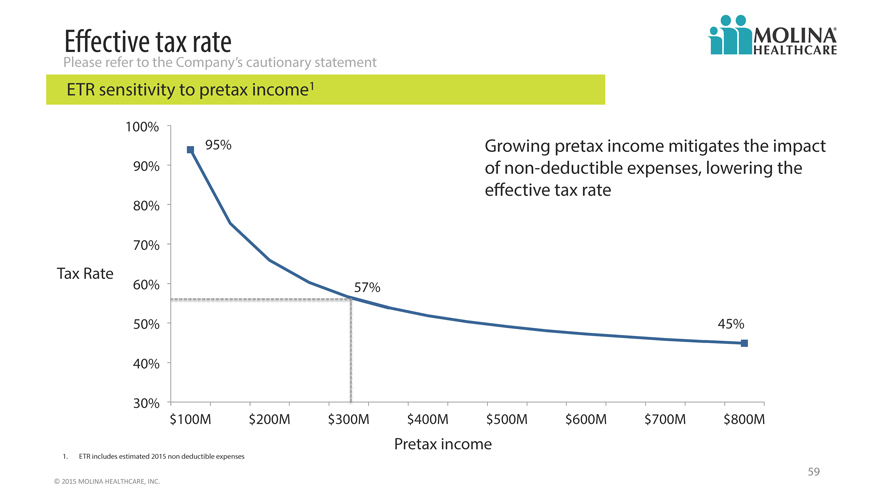
Effective tax rate
Please refer to the Company’s cautionary statement
ETR sensitivity to pretax income1
100%
95% Growing pretax income mitigates the impact
90% of non-deductible expenses, lowering the
effective tax rate
80%
70%
Tax Rate
60% 57%
50% 45%
40%
30%
$100M $200M $300M $400M $500M $600M $700M $800M
Pretax income
1. ETR includes estimated 2015 non deductible expenses
59
©
2015
MOLINA
HEALTHCARE,
INC.
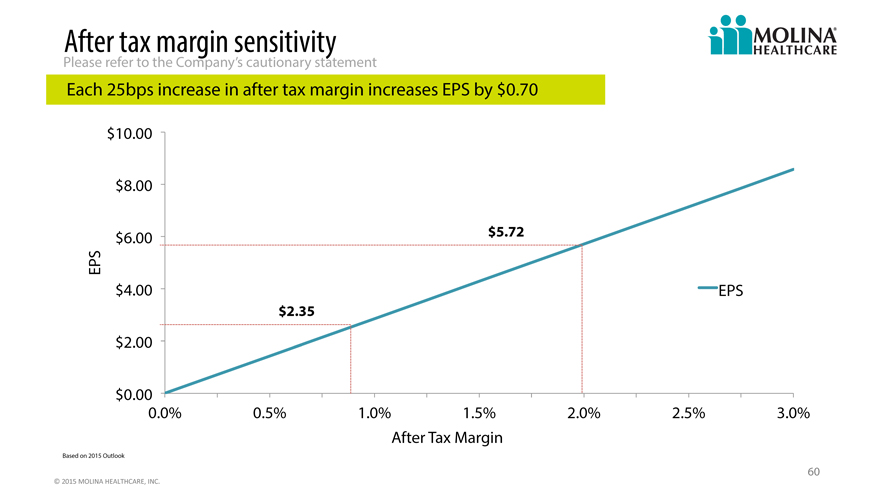
After tax margin sensitivity
Please refer to the Company’s cautionary statement
Each 25bps increase in after tax margin increases EPS by $0.70
$10.00
$8.00
$6.00 $5.72
EPS
$4.00 EPS
$2.35
$2.00
$0.00
0.0% 0.5% 1.0% 1.5% 2.0% 2.5% 3.0%
After Tax Margin
Based on 2015 Outlook
60
©
2015
MOLINA
HEALTHCARE,
INC.
Q&A
61