Growth History 2002-2004
2002
December, completed IPO market cap of ~ $125 million
December 31st, total assets of $849.5 million
2003
December 31st, total assets of $1.7 billion, market cap ~ $481.1 million
Ended ’03 as 3rd largest lender of multifamily loans in California
2004
June, acquired Hawthorne Financial
$2.5 billion dollar thrift
15 banking offices
June, opened 20th bank office, Malibu, CA
December 31st, total assets of $5.0 billion, market cap ~ $1.26 billion
6

Growth History 2005
7
2005
February, acquired TIMCOR Exchange Corporation ~
$400 million exchange balances
May, acquired North American Exchange Company ~ $175
million of exchange balances
November, announced signing of agreement to acquire
Calnet Business Bank with $176.6 million of total assets,
$152.9 million deposits
December 31st, total assets of $5.5 billion

Experienced Executive Team
The Company has built its management team with
seasoned executives that have significant expertise in the
company’s areas of focus. This expertise includes tenure
with a variety of organizations in significant roles.
Large banking institutions
Fortune 1,000 companies
Regulatory experience
Real estate development
Investment banking
8

Experienced Executive Team
29
<1
EVP General Counsel
Don Royer
25
1
EVP Commercial Banking
James Daley
28
1
EVP Retail Banking
Richard Grout
27
4
EVP Relationship Banking
Chris Walsh
20
7
EVP Asset Quality
Rob Noble
16
4
Chief Administrative Officer
Richard Sanchez
30
8
Chief Lending Officer
Robert Williams
25
<1
Chief Financial Officer
Jim Leonetti
21
8
President/Chief Operating Officer*
David DePillo
22
8
Chief Executive Officer*
Stephen Gordon
Total Years
Experience
Years at
CCBI
Title
Name
* Founder
9
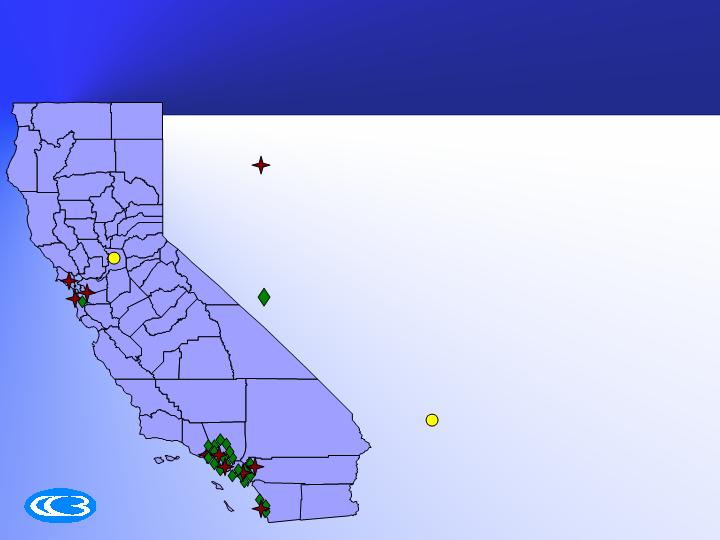
Statewide Banking Presence
10
Headquartered in Irvine, California
10 Loan Offices
Alameda County
Contra Costa County
Los Angeles County
Marin County
Orange County
San Diego County
San Mateo County
Chicago, Illinois
23 Banking Offices
Los Angeles County
Orange County
Riverside County
San Diego County
San Mateo County
Ventura County
#24 Valencia opens in Spring 2006
#25 Pasadena opens in Summer 2006
Sacramento - Pending acquisition of Calnet
Business Bank
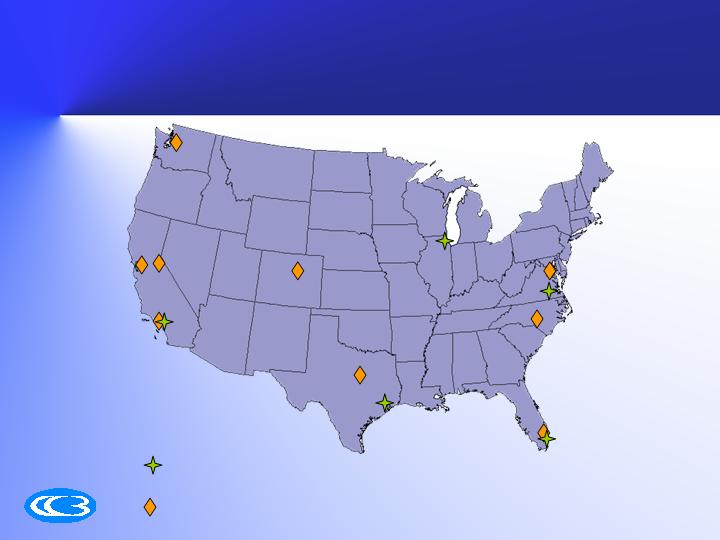
Nationwide 1031 Exchange
Accommodator Presence
TIMCOR Exchange Corporation
North American Exchange Company
11

CCB is a leading income property lender, and the
third largest originator of multifamily loans in
California
Predominately adjustable rate portfolio lender
Fixed rate programs through Fannie Mae and conduit
Permanent and bridge
Additional loan products
Construction
Single-family residential
Business lines
Income Property Focus
12

Lending Focus
The focus on retail loan production, with strict
credit underwriting has created valuable
origination franchise that is a key component
of the company’s strategy.
95.7% of loan fundings are core
Greater control over credit quality
Greater opportunity to build relationships with the customer
Avoid competition with lower margin, more highly competitive
single-family lenders
13
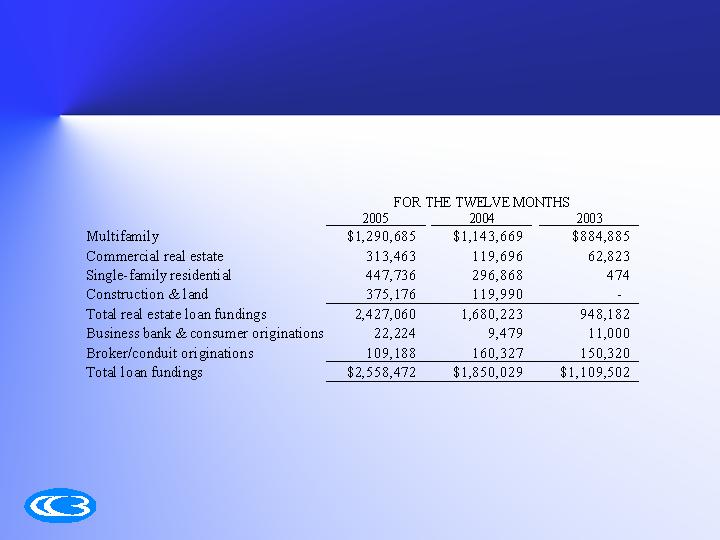
Loan Funding Composition
($ in thousands)
14
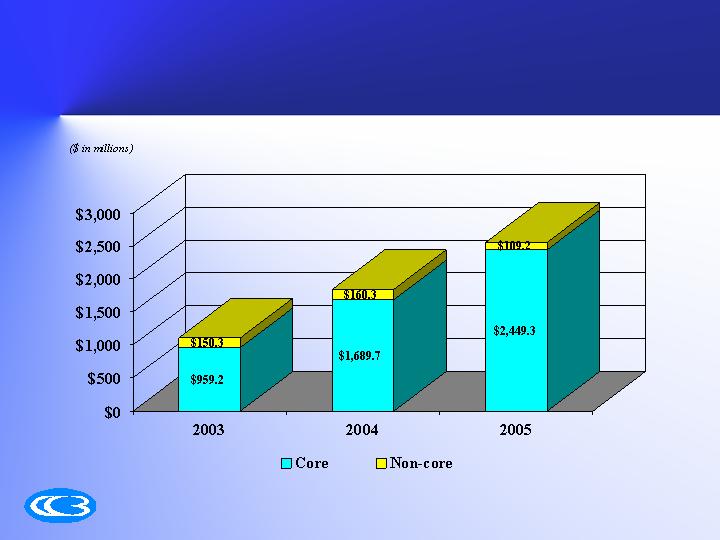
Strong Loan Fundings
15

Adjustable Rate Lender
2005
2004
2003
Fixed
73,344
$
18,897
$
11,335
$
12 MAT
1,339,048
1,084,701
715,188
6 mo CMT
189,241
159,370
73,433
Prime
370,982
146,228
13,656
COFI
250,653
165,068
4,500
LIBOR
191,164
115,438
141,070
Other
34,852
-
-
Core Loan Fundings
2,449,284
$
1,689,702
$
959,182
$
($ in thousands)
16

Income Property Loan Funding Data
17
2005
2004
2003
Multifamily
Average LTV
65.9%
68.0%
67.6%
Average DCR
1.22
1.27
1.29
Ratio of ARMS
97.8%
99.0%
98.9%
Ratio of Refinancings
45.8%
51.7%
66.4%
Commercial
Average LTV
61.5%
64.6%
62.9%
Average DCR
1.47
1.45
1.41
Ratio of ARMS
91.3%
98.9%
96.9%
Ratio of Refinancings
69.1%
62.9%
54.8%
Construction & Land
Average LTV
67.0%
61.9%
-
Average DCR
N/A
N/A
-
Ratio of ARMS
96.1%
97.7%
-
Ratio of Refinancings
N/A
N/A
-
Loan Portfolio Mix
December 2005
Multifamily
70%
Commercial Real Estate
14%
Single-
family
9%
Const & Land
7%
$395
$277
$3,051
Multifamily Commercial RE Single-family Construction & Land
$602
18

Diversified Funding Strategy
Retail banking provides stable funds and builds
banking relationships
1031 exchange accommodation strategy provides
low cost funding source which is linked to primary
lending business
Commercial banking provides cash management
and treasury services to corporate clients
Wholesale borrowing enables the Bank to have
flexibility
Relationship banking provides banking and deposit
services to franchise borrowers
19
Funding Sources
20

Retail & Relationship Banking
23 retail banking offices led by
Relationship Managers
Products and services to meet the needs of the
high net worth clients, including income
property investors
Deposit products and services
Loan products
Active and committed to the community
21
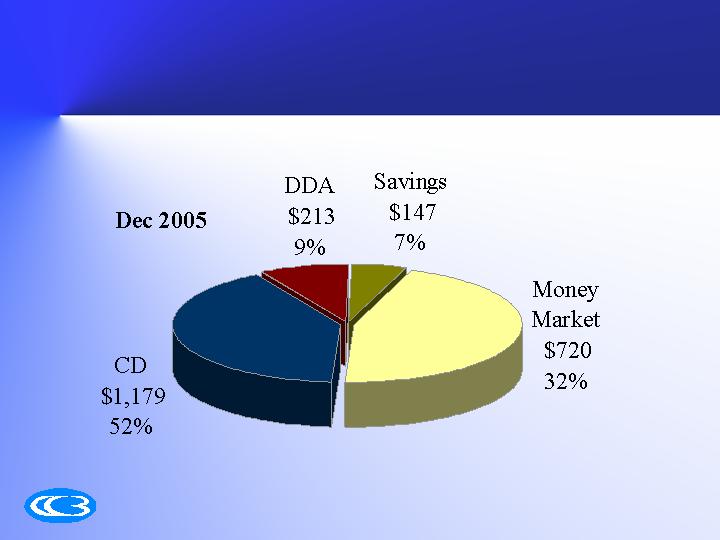
Bank Deposit Composition
22
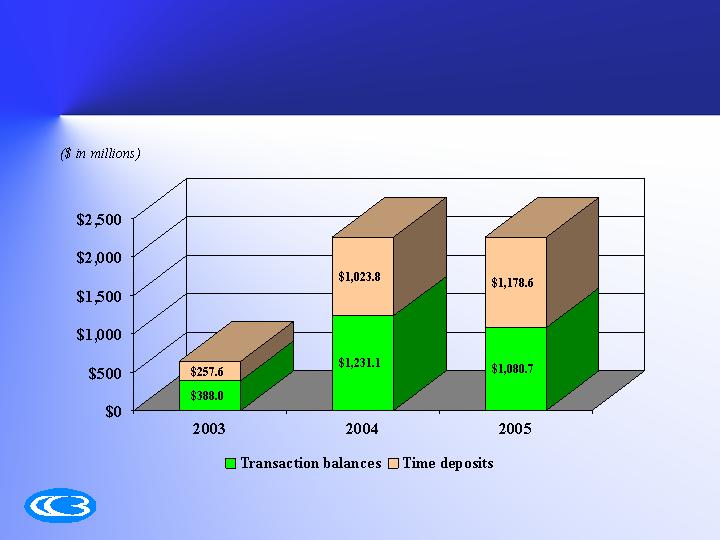
Deposit Mix
23

Commercial Banking
Provides treasury and cash management services to:
Title and escrow companies
1031 exchange accommodators
Property management companies
Fiduciary and corporate financial services
companies
24

1031 Exchange Accommodators
1031 Exchange Accommodators provide services for real
estate investors, who are selling real estate and seek to defer
taxes and reinvest the proceeds in a replacement property. If
the transaction complies with IRS requirements, the investor
may defer the tax on the sale.
Real estate investors are required to have a qualified
intermediary hold the funds from the sale of a real estate asset
while they seek to acquire a replacement property.
1031 Exchange Accommodators fill the role of holding the
proceeds from the sale of the asset for the real estate investor,
while they search for a replacement asset.
25

1031 Exchange Accommodators
1.
Low cost source of funds (0.86% for 2005)
2.
Provides fee income from accommodation services
3.
Builds relationships with real estate investors for loan,
deposit and other banking services
Building a 1031 Exchange
Accommodation business
provides the company with a
number of strategic advantages:
26
1031 Exchange Services
North American Exchange Company
Acquired May 2005
NAEC is Headquartered in Walnut Creek, CA and facilitates
1031 exchange transactions nationwide:
Long Beach, CA Seattle, WA
Sacramento, CA Denver, CO
Miami, FL Washington DC
Dallas, TX Charlotte, NC
TIMCOR Exchange Corporation
Acquired February 2005
TIMCOR is headquartered in Los Angeles, and
facilitates 1031 exchange transactions nationwide:
Houston Chicago Miami Richmond
Total combined exchange balances of $623.3 million as of Dec. 31, 2005
27
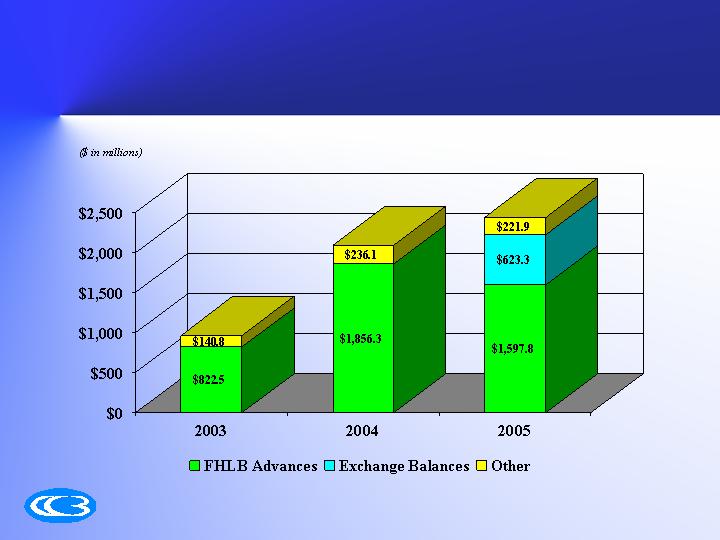
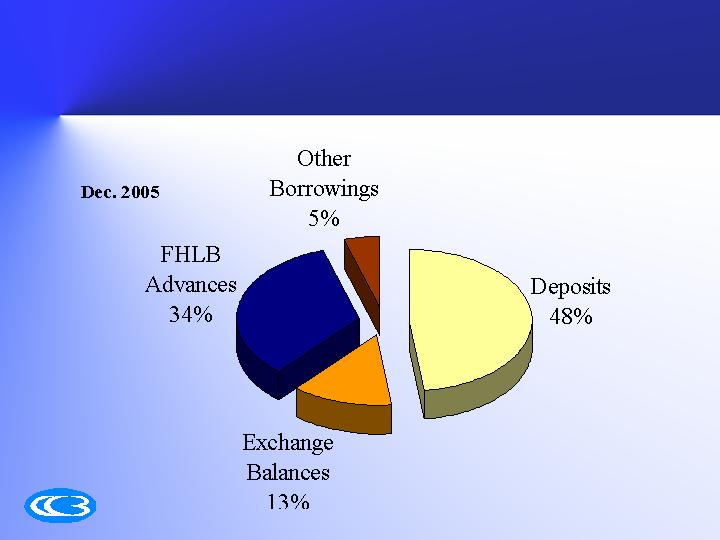
Borrowing Mix
28

Growth Strategy
Organic
De Novo:
Crystal Cove, January 2006
Valencia, Spring 2006
Pasadena, Summer 2006
Acquisition:
Calnet Business Bank $152 million of deposits
Lawyers Asset Management $100 million of
exchange balances
29

Acquisition Strategy
The Company will evaluate potential acquisitions that:
Immediately will be accretive to earnings
Continues to build the exchange business
More fully adds financial service capabilities to serve the
banking needs of the commercial real estate investor
(title, escrow, etc)
Strengthens or expands the depository franchise
Diversifies the dependency on wholesale funding and
lending sources
Allows for greater efficiencies and cost saving opportunities
30

Operating Performance
31
($ in thousands, except per share data)
2005
2004
2003
Net interest income
152,927
$
113,022
$
41,234
$
Recapture of losses
8,109
-
-
Noninterest income
24,147
15,087
9,169
Noninterest expenses
(68,971)
(37,652)
(15,446)
Net income before taxes
116,212
90,457
34,957
Income tax expense
(41,863)
(34,195)
(13,242)
Net income
74,349
$
56,262
$
21,715
$
Diluted earnings per share
1.29
$
1.21
$
0.66
$

Performance Indicators
32
2005
2004
2003
Net interest margin
3.27%
3.40%
3.30%
Operating efficiency ratio
38.6%
29.1%
28.1%
G&A to average assets
1.31%
0.99%
1.09%
Effective income tax rate
36.0%
37.8%
39.3%
Dividend payout ratio
21.7%
7.4%
-
Return on average assets
1.42%
1.55%
1.57%
Return on average equity
11.1%
14.3%
22.7%
Return on average tangible equity
26.6%
31.1%
26.5%

Interest Yields and Costs
33
2005
2004
2003
Interest Earning Assets
Loans
5.76%
5.42%
5.84%
Securities
4.37%
4.29%
4.53%
FHLB stock
4.41%
3.98%
4.36%
Cash and cash equivalents
2.90%
1.44%
1.02%
Total yield on interest earning assets
5.60%
5.20%
5.30%
Interest bearing liabilities
Transaction accounts
2.04%
1.69%
2.17%
Certificates of deposit
2.84%
1.62%
1.93%
FHLB advances
2.66%
1.98%
2.01%
Exchange balances
0.86%
N/A
N/A
Junior subordinated debentures
6.36%
4.89%
5.02%
Other borrowings
3.23%
1.50%
1.63%
Cost of interest bearing liabilities
2.49%
1.91%
2.09%
Net spread
3.11%
3.29%
3.21%
Net interest margin
3.27%
3.40%
3.30%

Financial Indicators
34
($ in thousands, except per share data)
2005
2004
2003
Loans receivable
4,335,538
$
3,914,780
$
1,062,525
$
Investment securities
384,144
491,265
560,729
Total assets
5,463,549
5,023,924
1,723,139
Deposits
2,260,082
2,256,781
645,596
FHLB advances
1,597,806
1,856,349
822,519
Exchange balances
623,284
-
-
Shareholders' equity
698,117
625,216
102,042
Book value per share
12.36
11.47
3.41
Tangible book value per share
5.23
4.80
2.97
Tangible equity to assets ratio
5.84%
5.62%
5.20%

Regulatory Capital Ratios
35
Well
Capitalized
2005
2004
2003
Core capital
5.00%
8.75%
8.01%
7.97%
Tier I risk based capital
6.00%
11.72%
11.11%
13.47%
Risk based capital
10.00%
12.48%
12.21%
13.87%
Bank Actual

INVESTOR PRESENTATION
NASDAQ: CCBI
February 2006