Table of Contents
FORM 6-K
SECURITIES AND EXCHANGE COMMISSION
Washington, D.C. 20549
Report of Foreign Private Issuer
Pursuant to Rule 13a-16 or 15d-16 of
the Securities Exchange Act of 1934
For the month of May 2013
Commission File Number: 1-31452
KONAMI CORPORATION
(Translation of registrant’s name into English)
7-2, Akasaka 9-chome
Minato-ku, Tokyo 107-8323
Japan
(Address of principal executive offices)
Indicate by check mark whether the registrant files or will file annual reports under cover of Form 20-F or Form 40-F:
Form 20-F x Form 40-F ¨
Indicate by check mark if the registrant is submitting the Form 6-K in paper as permitted by Regulation S-T Rule 101(b)(1): ¨
Indicate by check mark if the registrant is submitting the Form 6-K in paper as permitted by Regulation S-T Rule 101(b)(7): ¨
Table of Contents
Information furnished in this form:
| 1. | Consolidated Financial Results for the Year Ended March 31, 2013 which was filed with the Tokyo Stock Exchange on May 9, 2013. |
Table of Contents
SIGNATURES
Pursuant to the requirements of the Securities Exchange Act of 1934, the registrant has duly caused this report to be signed on its behalf by the undersigned, thereunto duly authorized.
| KONAMI CORPORATION | ||||
| Date: May 9, 2013 | By: | /s/ Takuya Kozuki | ||
| Name: | Takuya Kozuki | |||
| Title: | Representative Director, President | |||
Table of Contents
Consolidated Financial Results
for the Year Ended March 31, 2013
(Prepared in Accordance with U.S. GAAP)
May 9, 2013
| KONAMI CORPORATION | ||||||
| Address: | 7-2, Akasaka 9-chome, Minato-ku, Tokyo, Japan | |||||
| Stock code number, TSE: | 9766 | |||||
| Ticker symbol, NYSE: | KNM | |||||
| URL: | http://www.konami.co.jp/en | |||||
| Shares listed: | Tokyo Stock Exchange, New York Stock Exchange, and London Stock Exchange | |||||
| Representative: | Takuya Kozuki, Representative Director, President | |||||
| Contact: | Yasuyuki Yamaji, Corporate Officer, General Manager, Corporate Planning (Phone: +81-3-5771-0222) | |||||
| Date of General Shareholders Meeting: | June 27, 2013 | |||||
| Date of dividend payment: | June 6, 2013 | |||||
| Adoption of U.S. GAAP: | Yes | |||||
(Amounts are rounded to the nearest million)
1. Consolidated Financial Results for the Year Ended March 31, 2013
(1) Consolidated Results of Operations
| (Millions of Yen, except percentages and per share amounts) | ||||||||||||||||
| Net revenues | Operating income | Income before income taxes and equity in net income of affiliated company | Net income attributable to KONAMI CORPORATION | |||||||||||||
Year ended March 31, 2013 | 225,995 | 21,875 | 21,915 | 13,174 | ||||||||||||
% change from previous year | (15.0 | )% | (46.6 | )% | (45.2 | )% | (42.8 | )% | ||||||||
Year ended March 31, 2012 | 265,758 | 40,950 | 40,026 | 23,012 | ||||||||||||
% change from previous year | 3.0 | % | 97.0 | % | 109.8 | % | 77.9 | % | ||||||||
| Note: | Comprehensive income |
Year ended March 31, 2013: ¥16,902 million a year-on-year decrease of 26.0%
Year ended March 31, 2012: ¥22,840 million a year-on-year increase of 116.2%
| Basic net income attributable to KONAMI CORPORATION per share (yen) | Diluted net income attributable to KONAMI CORPORATION per share (yen) | Return on stockholders’ equity attributable to KONAMI CORPORATION | Ratio of income before income taxes to total assets | Ratio of operating income to net revenues | ||||||||||||||||
Year ended March 31, 2013 | 95.04 | 95.04 | 6.0 | % | 6.7 | % | 9.7 | % | ||||||||||||
Year ended March 31, 2012 | 166.23 | 166.23 | 11.2 | % | 12.5 | % | 15.4 | % | ||||||||||||
| Reference: | Equity in net income of affiliated company |
Year ended March 31, 2013: ¥44 million
Year ended March 31, 2012: ¥52 million
1
Table of Contents
(2) Consolidated Financial Position
| (Millions of Yen, except percentages and per share amounts) | ||||||||||||||||||||
| Total assets | Total equity | KONAMI CORPORATION stockholders’ equity | KONAMI CORPORATION stockholders’ equity ratio | KONAMI CORPORATION stockholders’ equity per share (yen) | ||||||||||||||||
March 31, 2013 | 322,948 | 225,999 | 225,425 | 69.8 | % | 1,626.23 | ||||||||||||||
March 31, 2012 | 328,006 | 215,720 | 215,458 | 65.7 | % | 1,554.31 | ||||||||||||||
(3) Consolidated Cash Flows
| (Millions of Yen) | ||||||||||||||||
| Net cash provided by (used in) | Cash and cash equivalents at end of year | |||||||||||||||
| Operating activities | Investing activities | Financing activities | ||||||||||||||
Year ended March 31, 2013 | 10,236 | (11,575 | ) | (12,377 | ) | 63,669 | ||||||||||
Year ended March 31, 2012 | 37,915 | (7,646 | ) | (13,254 | ) | 76,451 | ||||||||||
2. Cash Dividends
Record Date | Cash dividends per share (yen) | Total cash dividends (annual) | Payout ratio (consolidated) | Cash dividend rate for stockholders’ equity (consolidated) | ||||||||||||||||||||||||||||
| First quarter end | Second quarter end | Third quarter end | Year end | Annual | ||||||||||||||||||||||||||||
Year ended March 31, 2012 | — | 25.00 | — | 25.00 | 50.00 | ¥ | 6,932 million | 30.1 | % | 3.4 | % | |||||||||||||||||||||
Year ended March 31, 2013 | — | 25.00 | — | 25.00 | 50.00 | ¥ | 6,930 million | 52.6 | % | 3.1 | % | |||||||||||||||||||||
Year ending March 31, 2014 -Forecast- | — | 17.00 | — | 17.00 | 34.00 | 30.4 | % | |||||||||||||||||||||||||
3. Consolidated Earnings Forecast for the Year Ending March 31, 2014
| (Millions of Yen, except percentages and per share data) | ||||||||||||||||||||
| Net revenues | Operating income | Net income before income taxes | Net income attributable to KONAMI CORPORATION | Net income attributable to KONAMI CORPORATION per share (yen) | ||||||||||||||||
Year ending March 31, 2014 | 232,000 | 27,000 | 26,000 | 15,500 | 111.82 | |||||||||||||||
% change from previous year | 2.7 | % | 23.4 | % | 18.6 | % | 17.7 | % | ||||||||||||
4. Other
| (1) | Changes in significant consolidated subsidiaries during the period (status changes of subsidiaries due to changes in the scope of consolidation) :None |
| (2) | Changes in accounting principles, procedures and reporting policies for consolidated financial statements |
| 1. | Changes accompanying amendment of accounting standard: Yes |
| 2. | Other: None |
Please refer to page 28 for further information regarding amendment of accounting standard.
2
Table of Contents
| (3) | Number of shares issued (Common Stock) |
| 1. | Number of shares issued: (Treasury stock included) |
Year ended March 31, 2013 | 143,500,000 shares | |||
Year ended March 31, 2012 | 143,500,000 shares |
| 2. | Number of Treasury Stock: |
Year ended March 31, 2013 | 4,881,940 shares | |||
Year ended March 31, 2012 | 4,879,848 shares |
| 3. | Average number of shares outstanding: |
Year ended March 31, 2013 | 138,619,128 shares | |||
Year ended March 31, 2012 | 138,433,751 shares |
(Reference) Summary of Non-consolidated Financial Results
1. Results for the Year Ended March 31, 2013
(1) Non-consolidated Results of Operations
| (Millions of Yen, except percentages and per share data) | ||||||||||||||||
| Operating revenues | Operating income | Ordinary income | Net income | |||||||||||||
Year ended March 31, 2013 | 28,469 | 22,471 | 23,959 | 23,900 | ||||||||||||
% change from previous year | 55.2 | % | 64.9 | % | 72.7 | % | 77.2 | % | ||||||||
Year ended March 31, 2012 | 18,348 | 13,623 | 13,869 | 13,488 | ||||||||||||
% change from previous year | 11.7 | % | 13.4 | % | 16.1 | % | 8.6 | % | ||||||||
| Basic net income per share (yen) | Diluted net income per share (yen) | |||||||
Year ended March 31, 2013 | 172.42 | — | ||||||
Year ended March 31, 2012 | 97.44 | — | ||||||
(2) Non-consolidated Financial Position
| (Millions of Yen, except percentages and per share data) | ||||||||||||||||
| Total assets | Total net assets | Equity ratio | Net assets per share | |||||||||||||
March 31, 2013 | 218,170 | 192,906 | 88.4 | % | 1,391.64 | |||||||||||
March 31, 2012 | 220,601 | 175,870 | 79.7 | % | 1,268.72 | |||||||||||
| Reference: | Total Stockholders’ equity |
Year ended March 31, 2013: ¥192,906 million
Year ended March 31, 2012: ¥175,870 million
3
Table of Contents
Information Regarding the Audit Review Procedures:
This report is outside the scope of the procedures for audit of consolidated financial statements as required under the Financial Instruments and Exchange Act of Japan. The aforementioned procedures have not been completed as of the time of disclosure of this document.
Cautionary Statement with Respect to Forward-Looking Statements and Other Matters:
Statements made in this document with respect to our current plans, estimates, strategies and beliefs, including the above forecasts, are forward-looking statements about our future performance. These statements are based on management’s assumptions and beliefs in light of information currently available to it and, therefore, you should not place undue reliance on them. A number of important factors could cause actual results to be materially different from and worse than those discussed in forward-looking statements. Such factors include, but are not limited to: (i) changes in economic conditions affecting our operations; (ii) fluctuations in currency exchange rates, particularly with respect to the value of the Japanese yen, the U.S. dollar and the Euro; (iii) our ability to continue to win acceptance of our products, which are offered in highly competitive markets characterized by the continuous introduction of new products, rapid developments in technology and subjective and changing consumer preferences; (iv) the timing of the release of new game titles and products, especially game titles and products that are part of historically popular series; (v) our ability to successfully expand internationally with a focus on our Digital Entertainment business and Gaming & Systems business; (vi) our ability to successfully expand the scope of our business and broaden our customer base through our Health & Fitness business; (vii) regulatory developments and changes and our ability to respond and adapt to those changes; (viii) our expectations with regard to further acquisitions and the integration of any companies we may acquire; and (ix) the outcome of existing contingencies.
Please refer to pages 9, 10 and 11 for further information regarding our business forecasts.
The Company disclosed the supplemental data for the consolidated financial statements via the Company’s website on May 9, 2013.
4
Table of Contents
| 1. | Business Performance |
1. Analysis of Business Performance
(1) Business Overview
Though the world economy remains uncertain, the business environment surrounding the Konami Group show signs of a rebound in personal consumption due to continuing yen depreciation and rise in stock prices resulting from anticipation stimulated by economy-boosting measures since the end of the last year.
In the entertainment market, with improving performance in mobile devices due to the rapid spread of smartphones and tablet PCs and development of information and telecommunications infrastructure, game platforms continue to diversify more, and business opportunities for the game industry are increasing. In the overseas markets, with the global spread of casino market related to developing tourism resources, growth of the gaming business is expected.
In the health and fitness industry, with growing health consciousness throughout the entire society, especially a large proportion of senior citizens and women tend to focus their leisure activities on improving health and physical strength year by year. We continue to see growing health-consciousness, sports preference and interest in preventing the need for nursing care in old age.
Against this backdrop, in the Digital Entertainment segment of Konami Group, the number of registered users for content for social networks includingDRAGON COLLECTION continued to grow. Meanwhile, as for computer and video games, the latest titles in theWinning Eleven (known in the U.S. and Europe asPro Evolution Soccer) series and theMETAL GEAR series were also released and sold steadily.
In our Health & Fitness segment, a new counseling system,MY Fit Planner, was introduced in Konami Sports Clubs nationwide, in addition to supporting activities to improve the health and physical condition of our users according to each customer’s need. These efforts are performing favorably in the market.
In our Gaming & Systems segment, sales of products such as thePodium video slot machine and theAdvantage mechanical slot machine series continued to be favorable mainly in the U.S. market.
In the Pachinko and Pachinko Slot Machines segment, we released the pachinko slot machine SENGOKU COLLECTION, which leverages our popular content for social networks into pachinko slot machines andSKYGIRLS - Yoroshiku! Zero, which utilizes original content from the Konami Group. Those received favorable reviews.
In terms of the consolidated results for the year ended March 31, 2013, net revenues amounted to ¥225,995 million (a year-on-year decrease of 15.0%), operating income was ¥21,875 million (a year-on-year decrease of 46.6%), income before income taxes and equity in net income of affiliated company was ¥21,915 million (a year-on-year decrease of 45.2%), and net income attributable to KONAMI CORPORATION was ¥13,174 million (a year-on-year decrease of 42.8%).
5
Table of Contents
(2) Performance by Business Segment
Summary of net revenues by business segment:
| Millions of Yen except percentages | ||||||||||||
| Year ended March 31, 2012 | Year ended March 31, 2013 | % change | ||||||||||
Digital Entertainment | ¥ | 140,400 | ¥ | 116,366 | (17.1 | ) | ||||||
Health & Fitness | 82,555 | 79,896 | (3.2 | ) | ||||||||
Gaming & Systems | 25,212 | 24,984 | (0.9 | ) | ||||||||
Pachinko & Pachinko Slot Machines | 18,430 | 5,398 | (70.7 | ) | ||||||||
Eliminations | (839 | ) | (649 | ) | (22.6 | ) | ||||||
|
|
|
|
|
| |||||||
Consolidated net revenues | ¥ | 265,758 | ¥ | 225,995 | (15.0 | ) | ||||||
|
|
|
|
|
| |||||||
Digital Entertainment
As for content for social networks,DRAGON COLLECTION was awarded Hall of Fame Special Award (Best Game by a GREE Partner) andCROWS X WORST - Saikyou Densetsu - was awarded the Hall of Fame Award at the GREE Platform Award 2012, hosted by GREE, Inc. In addition, the total number of registered users across all content for social networks has surpassed 35 million. This genre received acclaim from a lot of consumers and contributed to our stable revenue. We also began to distributeDRAGON COLLECTION as a native application for iOS devices, which resulted in providing more users with its high-quality services. The main content includingSENGOKU COLLECTION, theCROWS X WORSTseries and Professional Baseball Dream Ninehave enjoyed steady sales.
In regard to new titles,METAL GEAR SOLID SOCIAL OPS, the first content for social networks ever in theMETAL GEARseries, which marked its 25th anniversary last year. In addition, distribution began ofDRACOLLE & POKERandTokimeki Restaurant¶¶¶ for iOS and Android markets, which are drawing more attention due to the increased prevalence of smartphones, and have received favorable reviews.
As for computer and video games,WORLD SOCCER Winning Eleven 2013 (known in the U.S. and Europe asPro Evolution Soccer 2013), the latest title in theWinning Eleven series, andMETAL GEAR RISING REVENGEANCE, the latest title of theMETAL GEARseries, were released. We also releasedPROFESSIONAL BASEBALL SPIRITS 2013, the latest title in thePROFESSIONAL BASEBALL SPIRITSseries, which received favorable reviews and contributed to our revenue.
As for amusement arcade video games,beatmaniaseries strengthened the expansion of our e-AMUSEMENT Participation system titles as well as the large-scale mass-medal arcade game FORTUNE TRINITY 2andGI-GranDesire, with stable popularity, continued enjoying sustained sales.Monster Retsuden ORECA BATTLE, a card game machine title, which was launched in the previous fiscal year, continued to enjoy favorable sales mainly due to gaining lots of popularity primarily among elementary school-age boys because of its groundbreaking features including the ability for users to obtain their own original cards and connectivity with smartphone applications.DRAGON COLLECTION - The Ambition of The Pepper Gang, also launched and continued strong, which is a companion product toDRAGON COLLECTION, our extremely popular content for social networks. Meanwhile, we heldKONAMI Arcade Championship 2012, which determined each champion in 14 titles of our arcade games, to maximize our content-value, andQUIZ MAGIC ACADEMY Kenja no Tobirawas awarded a Guinness World Records™ certificate for the most questions in a trivia game. These efforts resulted in a boost to the market presence of our titles.
6
Table of Contents
As for card games, theYu-Gi-Oh! TRADING CARD GAME series continued to perform strongly in the global market. In addition, the Yu-Gi-Oh! Championship Series held in California, the U.S., has been officially recognized by Guinness World Records™ as the world’s largest trading card game tournament.
Furthermore, at the exciting KONAMI Nippon Series 2012 and 2013 WORLD BASEBALL CLASSIC™, which we sponsored, we held in-game events for baseball fans linked in real time to the baseball game and events utilizing our baseball-themed content for social networks includingProfessional Baseball Dream Nine, computer and video games and amusement arcade video games.
In terms of financial performance, consolidated net revenues for the year ended March 31, 2013 in this segment amounted to ¥116,366 million (a year-on-year decrease of 17.1%).
Health & Fitness
In our fitness club business, with growing health consciousness among consumers and stronger interest in preventing the need for nursing care in old age, we introduced a new concept, “Total Health Partner”, with the aim of establishing ourselves as a leading provider of new health-themed services, not only providing places for exercise but also becoming the most reliable provider of a wide range of health and body services for all of our customers, from children to senior citizens.
We also launched a new brand,OyZ, which mainly targets senior citizens over sixty years old. For the first step of the brand, we started two body building classes at ten facilities including Konami Sports club Funabashi (Funabashi City, Chiba Prefecture). One of the two classes isBuilding Trunk Strength Class, which helps to make physical activity easier. The other isStrengthening Leg Muscles Class, which promotes endurance mainly by helping to prevent leg muscles from becoming strained. These services have received favorable reviews from new customers. In addition, we introduced a new counseling system,MY Fit Planner, in Konami Sports Clubs nationwide. The new counseling enables us to offer the most suitable training method and a continuous fitness life plan for each customer. This service merges our database, which we have developed over years of providing guidance to our customers, our unique counseling practice and our detailed one-on-one training. This enables us to choose and offer the most suitable training menu for customers from approximately 285 options, and is aimed for helping customers maintain and promote their health in order to let them exercise continuously.
We also introducedGRIT™SERIES, which is a new program ofLES MILLSfor which Konami Sports & Life Co., Ltd. is authorized as its exclusive agency in Japan.GRIT™SERIES is a program, which has been gaining worldwide attention, that accelerates fat burning by high-intensity interval training in a short time and regulates health conditions. Due to its team training system with small classes, we develop the program at small facilities where we had not been able to launch the existingLES MILLS programs. In March 2013, we renewedBIOMETRICS, which is a popular program and offers the most suitable plan for body making.
7
Table of Contents
The program enables customers to use their time effectively and achieve their desired outcomes, and is aimed at customers who, in the past, had not been regularly going to sports clubs due to a lack of free time because of their work and housekeeping responsibilities, and allows us to meet the needs of customers who would like to feel results in short time because of their diverse lifestyles and preferences.
Konami Group recognizes disuse syndrome as an important social problem. Sufferers of this syndrome display symptoms including a decrease in physical activity in daily life, which can be caused by old age or in relation to conditions experienced by disaster refugees. We donated 100STEPWELL 2 to Motoyoshicho, Kesennuma City in Miyagi prefecture as part of the support activities after the Great East Japan Earthquake, with the aim of preventing disuse syndrome by providing a slowstep method of exercise that can be performed easily indoors. In addition, we held seminars for the development of physical strength and trial sessions for slowstep exercises. This is one of our efforts to offer physical activity opportunities to every regional participant and improve their health.
In terms of financial performance, consolidated net revenues for the year ended March 31, 2013 in this segment amounted to ¥79,896 million (a year-on-year decrease of 3.2%).
Gaming & Systems
In the North American market, thePodium video slot machine, which has become a staple item, and theAdvantagemechanical slot machine series continued to enjoy favorable sales. We expanded our lineup of premium products which has been met with high expectations from players by introducing products such asPodium Goliath, which increased the size ofPodium, to participation agreements (in which profits are shared with casino operators). We also launchedSYNKROS, which was a new-generationKonami Casino Management System, enhanced with various new functions.
In the Oceania market, we continue to distributePodium, and full-scale marketing is in progress in Asia, Europe and Central and South America with building a distributor network including established a branch office in Singapore.
In terms of financial performance, consolidated net revenues for the year ended March 31, 2013 in this segment amounted to ¥24,984 million (a year-on-year decrease of 0.9%).
Pachinko & Pachinko Slot Machines
We released theSENGOKU COLLECTION, which leverage for the first time our popular content for social networks into pachinko slot machines. We also launchedSKYGIRLS - Yoroshiku! Zero, the first device ofMEBIUSTAR which was a new cabinet entirely illuminated in full-color crystal LED, continues to perform steady and has received favorably in the market.
In terms of financial performance, consolidated net revenues for the year ended March 31, 2013 in this segment amounted to ¥5,398 million (a year-on-year decrease of 70.7%).
8
Table of Contents
(3) Outlook for the Fiscal Year Ending March 31, 2014
Digital Entertainment
With the spread of smartphones and tablet PCs worldwide, the available means of providing game software continue to diversify, and opportunities to reach an even greater audience for game software are increasing. Against such a backdrop, our belief is that we can increase the number of “outlets” for the Konami Group’s game content by taking advantage of opportunities presented by the emergence of new devices and developing our business around game content. We intend to develop ways of playing games that match the characteristics of each device.
As for content for social networks, the total number of registered users for the Konami Group’s content for social networks is increasing steadily. We are further focusing our managerial resources on the development of content that we believe will become major hits in order to produce more hit content. Looking ahead, we will continue to expand our lineup, utilizing previously established production and operational expertise and rich content resources. We also intend to develop more for new global platforms not only in the U.S. and Europe markets but also in the Asia markets and enhance new releases with attractive content by creating synergies with established content.
As for computer and video games, we will focus efforts on continued global development utilizing the production know-how of the Konami Group, while also continuing the production of content for selected existing AAA titles, and continue to strive towards producing hit titles by leveraging existing content. On the production side, as quickly as possible, we intend to develop local production systems in order to develop localized content tailored to the needs of our overseas game users. We also intend to promoteMETAL GEARseries, our leading products, including effectively utilizing E3 2013 which will be held at Los Angeles, in the U.S. in June 2013. In addition, forWinning Elevenseries, our original and next-generation game engine, basic programming of games, using solely for soccer is currently under development in order to provide enjoyment of more real soccer game.
As for amusement arcade equipment, Konami Group intends to work to revitalize the amusement arcade industry by providing entertainment that can be enjoyed only at an amusement facility through “interpersonal communication” using the e-AMUSEMENT system. We intend to propose innovative services that will lead the industry. This will involve promoting the continual development of equipment compatible with the eAMUSEMENT community site services, the PASELI e-money service and e-AMUSEMENT Participation, which are currently in operation, as well as enhancements to and the expansion of services. Such enhancements include the intended launch of new products and services with our strong content forMonster Retsuden ORECA BATTLE andDRAGON COLLECTION - The Ambition of The Pepper Gang with the aim of further improving content-value. These are expected to be well received in the market.
As for card games, we will continue the global development of theYu-Gi-Oh! TRADING CARD GAME series. Additionally, we plan to sequentially release new product lineups, including theDigital Game Card series.
9
Table of Contents
Health & Fitness
In our Health and Fitness business, we will continually aim to accurately grasp the needs of our increasingly diverse customer base and offer a new lifestyle with the aim of creating value-added Konami Sports Clubs. Against the backdrop of an aging society and government measures taken in response to lifestyle diseases, with a heightened social awareness of health and fitness, we believe that we will be able to continue to operate fitness clubs and develop and market health and fitness equipment, while also continuing to promote good health in future to various range in ages and types of expected customers.
Konami Sports Clubs are promoting the new concept of “Total Health Partner” with the aim of establishing themselves as a reliable concierge in daily life for all of their customers, from children to senior citizens, in every aspect of health, not only exercise but also diet, sleep and mental health. We also intend to promote our health and fitness business, whether in or outside our facilities, by leveraging our strengths in the operation of more than 300 of Japan’s large-scale sports clubs, by expanding our products and services and by focusing on the enrichment of the programs offered at our facilities, the computerization of health management and the upgrading and expansion of our product lineup, as well as other efforts.
Amidst the growing need for good health, we intend to expand the new counseling system,MY Fit Planner which we introduced in the fiscal year ended March 2013, by offering more suitable plans for each customer needs, and support continuous fitness life.
Gaming & Systems
In regard to slot machine sales, we will promote the strengthening of sales together with product expansion focusing onPodiumvideo slot machines, which has received positive reviews, andKP3, a software-controlled next generation platform capable of real-time, high-resolution 3D graphics. In mechanical slot machines, we will continue to aggressively promote sales of the five-reel mechanical slot machine series,Advantage 5, which has received much acclaim. Furthermore, we intend to stabilize our operational results by increasing periodical income through expansion of participation agreements (profit sharing) with operators whose sales style adequately meets the market as well as making enhancements to address the needs of casino operators, by expanding its coverage products. In the Asian, European and Central and South American markets, we continue to develop sales by adopting to local needs.
Furthermore,SYNKROS, which is a brand-new and new-generationKonami Casino Management Systemenhanced with various new functions, has received positive reviews by major operators since it was first showcased at the Global Gaming Expo 2012, the world’s largest gaming equipment trade show, in Las Vegas. Looking ahead, we intend to actively pursue sales in other markets and make efforts to enhance product strength while developing new product features.
10
Table of Contents
Pachinko & Pachinko Slot Machines
In the Pachinko and Pachinko Slot Machines business, we continue to improve production lines which enable us to increase production based on market demand by upgrading manufacturing bases. With the aim of strengthening our sales structure, KPE-TAKASAGO Sales Co., Ltd. Started to operate and we intend to develop more stabilized sales bases and maximize our sales numbers. On the production side, we intend to focus efforts to boost our market presence by providing our pachinko and pachinko slot machines, which are loved by all and fun for all, utilizing the know-how developed in our Digital Entertainment business and creating value-added as well as introducing renewed core titles to seek a larger running of our products.
The Konami Group began operation of its Ichinomiya Office (Ichinomiya City, Aichi Prefecture), acquired for the purpose of extending its production and logistic system in Japan and reducing risk by de-centralizing its plant locations. We intend to expand the production system in response to changes in the business environment in the future, and we will strive towards the realization of a timely and stable product supply.
Projected consolidated results for the fiscal year ending March 31, 2014 are as follows: net revenue of ¥232,000 million; operating income of ¥27,000 million; income before income taxes and equity in net income of affiliated company of ¥26,000 million; and net income attributable to KONAMI CORPORATION of ¥15,500 million.
KONAMI, as a business affected by “hit” products, requires flexibility in how its products are released and is subject to fluctuations in sales throughout the course of the fiscal year. For this reason, projected consolidated results for the half year are not disclosed.
We will to continue to elaborate on the disclosure for the quarterly financial results.
2. Consolidated Financial Position
(1) Total Assets, Total Liabilities and Total KONAMI CORPORATION Stockholders’ Equity
Total Assets:
Total assets amounted to ¥322,948 million as of March 31, 2013, decreasing by ¥5,058 million compared with March 31, 2012. This decrease mainly resulted from a decrease in cash and cash equivalents.
Total Liabilities:
Total liabilities amounted to ¥96,949 million as of March 31, 2013, decreasing by ¥15,337 million compared with March 31, 2012. This decrease primarily resulted from a decrease in accrued income taxes due to payments for income taxes and redemption of bonds.
Total KONAMI CORPORATION Stockholders’ Equity:
Total KONAMI CORPORATION stockholders’ equity amounted to ¥225,425 million as of March 31, 2013, increasing by ¥9,967 million compared with March 31, 2012. This mainly resulted from the recognition of net income and an increase in accumulated other comprehensive income (loss) including foreign currency translation adjustments.
KONAMI CORPORATION stockholders’ equity ratio was 69.8%, increasing by 4.1 % compared with March 31, 2012.
11
Table of Contents
(2) Cash Flows
| Millions of Yen | ||||||||||||
| Year ended March 31, 2012 | Year ended March 31, 2013 | Change | ||||||||||
Net cash provided by operating activities | ¥ | 37,915 | ¥ | 10,236 | ¥ | (27,679 | ) | |||||
Net cash used in investing activities | (7,646 | ) | (11,575 | ) | (3,929 | ) | ||||||
Net cash used in financing activities | (13,254 | ) | (12,377 | ) | 877 | |||||||
Effect of exchange rate changes on cash and cash equivalents | (105 | ) | 934 | 1,039 | ||||||||
Net increase (decrease) in cash and cash equivalents | 16,910 | (12,782 | ) | (29,692 | ) | |||||||
|
|
|
|
|
| |||||||
Cash and cash equivalents, end of year | ¥ | 76,451 | ¥ | 63,669 | ¥ | (12,782 | ) | |||||
|
|
|
|
|
| |||||||
Cash and cash equivalents (hereafter, referred to as “Net cash”), for the year ended March 31, 2013, amounted to ¥63,669 million, a decrease of ¥12,782 million compared to the year ended March 31, 2012, and a year-on-year decrease of 16.7 %.
Cash flow summary for each activity for the year ended March 31, 2013 is as follows:
Cash flows from operating activities:
Net cash provided by operating activities amounted to ¥10,236 million for the year ended March 31, 2013, a year-on-year decrease of 73.0%. This primarily resulted from a decrease in net income and an increase in the amount of income tax paid, while proceeds from sales receivables and trade notes have increased compared to that for the year ended March 31, 2012.
Cash flows from investing activities:
Net cash used in investing activities amounted to ¥11,575 million for the year ended March 31, 2013, a year-on-year increase of 51.4%. This mainly resulted from an increase in term deposits and expenditures for acquisition of business.
Cash flows from financing activities:
Net cash used in financing activities amounted to ¥12,377 million for the year ended March 31, 2013, a year-on-year decrease of 6.6%. This primarily resulted from cash inflows from borrowings, while the amount of dividends paid has increased and there has been no proceed from sale-leaseback transactions which had been during the year ended March 31, 2012.
12
Table of Contents
The trends of cash flow index are as follows:
| Year ended March 31, 2012 | Year ended March 31, 2013 | |||||||
Equity-assets ratio (%) | 65.7 | 69.8 | ||||||
Equity-assets ratio at fair value (%) | 99.1 | 81.3 | ||||||
Liabilities to cash flow ratio (years) | 1.0 | 3.4 | ||||||
Interest coverage ratio (times) | 26.6 | 7.9 | ||||||
|
|
|
| |||||
Equity-assets ratio: Total stockholders’ equity / Total assets | ||||||||
Equity-assets ratio at fair value: Total stockholders’ equity at fair value / Total assets | ||||||||
Liabilities to cash flow ratio: Interest-bearing liabilities / Cash flows from operating activities | ||||||||
Interest coverage ratio: Cash flows from operating activities / Interest expense | ||||||||
Notes:
| 1. | Each index is calculated from figures prepared in accordance with U.S. generally accepted accounting principles (U.S. GAAP). |
| 2. | Cash flows from operating activities derive from our consolidated cash flow statement. |
| 3. | Interest-bearing debt covers all liabilities with interest in our consolidated balance sheet. |
(3) Basic Policy on the Distribution of Profits
Konami Group believes that the provision of dividends and the enhancement of corporate value are important ways to return profits to our shareholders. It is our policy to emphasize payment of dividends as a target of a consolidated payout ratio of more than 30% and to use retained earnings for investments focused on business fields with good future prospects in order to continually reinforce KONAMI’s growth potential and competitiveness.
As for term-end dividends for the consolidated year ended March 31, 2013, 25 yen per share dividend was approved at the Board Meeting held on May 9, 2013. As a result, the dividends on an annual basis will be 50 yen per share, including a distributed interim dividend of 25 yen per share.
KONAMI CORPORATION plans to distribute dividends of 34 yen per share for the fiscal year ending March 31, 2014.
Special Note:
This document contains “forward-looking statements,” or statements related to future events that are based on management’s assumptions and beliefs in light of information currently available. These statements are subject to various risks and uncertainties.
When relying on forward-looking statements to make investments, you should not place undue reliance on such forward-looking statements. Actual results may be affected by a number of important factors and may be materially different from those discussed in forward-looking statements. Such factors include, but are not limited to, changes in economic conditions affecting our operations, market trends and fluctuations in currency exchange rates, particularly with respect to the value of the Japanese yen, the U.S. dollar and the Euro.
13
Table of Contents
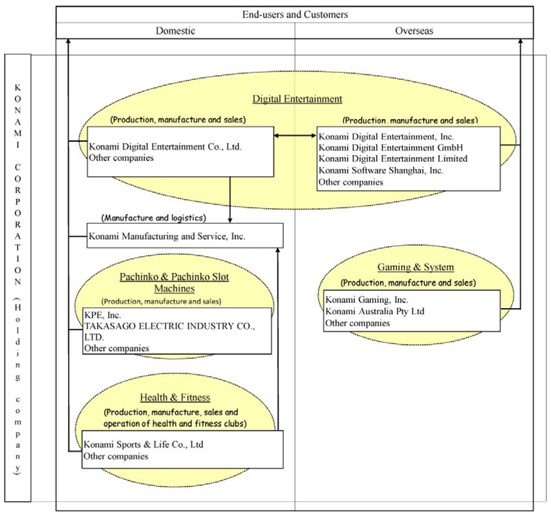
2. Organizational Structure of the Konami Group
The Konami Group is a corporate group engaged in the entertainment and health fitness industries providing customers with “High Quality Life.” The Konami Group is comprised of KONAMI CORPORATION (“the Company”) and its 25 consolidated subsidiaries and one equity-method affiliate.
The summary overview of the Company, the consolidated subsidiaries and the equity-method affiliate and the business segment in which they operate are as follows.
The four business segments shown below are based on the same categorization as described below in “6. Segment Information” under “4. Consolidated Financial Statements”.
Business Segments | Major Companies | |||
| Digital Entertainment | Domestic | Konami Digital Entertainment Co., Ltd. | ||
| Konami Manufacturing & Service, Inc. | ||||
Other companies
| ||||
| Overseas | Konami Digital Entertainment, Inc. | |||
| Konami Digital Entertainment GmbH | ||||
| Konami Digital Entertainment Limited | ||||
| Konami Software Shanghai, Inc. | ||||
Other companies (Note 2-2)
| ||||
| Health & Fitness | Domestic | Konami Sports & Life Co., Ltd. (Note 2-1) | ||
| Konami Manufacturing & Service, Inc. | ||||
| Resort Solution Co., Ltd. (Note 3) | ||||
Other companies
| ||||
| Gaming & Systems | Overseas | Konami Gaming, Inc. | ||
| Konami Australia Pty Ltd. | ||||
Other companies
| ||||
| Pachinko & Pachinko Slot Machines | Domestic | KPE, Inc. | ||
| Takasago Electric Industry Co., Ltd. | ||||
| Other companies | ||||
Notes:
| 1. | Major companies that have operations in more than one business segment are included in each segment in which they operate. |
| 2. | During the year ended March 31, 2013, primary changes in companies are as follows: |
| 1) | Konami Sports & Life Co., Ltd. merged with COMBI WELLNESS Corporation in June 2012. |
| 2) | Konami Digital Entertainment Co., Ltd. established Konami Digital Entertainment Pte. Ltd. in August, 2012. |
| 3. | Resort Solution Co., Ltd. is an equity-method affiliate. |
14
Table of Contents
Business Organization
15
Table of Contents
3. Management Policy
1. Management Policy
We, the Konami Group, are aiming to be a business group that is always highly regarded by all people, by creating and providing them with “Valuable Time”. Furthermore, our basic management policy is to “value shareholders” and to “maintain sound relationships with all stakeholders, including our shareholders, and contribute to society as a good corporate citizen.” We aim for the optimum use of the group’s managerial resources with the following as specific guiding principles for management: to “follow global standards,” “engage in fair competition” and “pursue high profits.”
To “value shareholders,” our basic policy is to emphasize payment of dividends as a target for more than 30% in the consolidated payout ratio and enhance our corporate value to return profits to our shareholders. It is also our policy to focus the investment of retained earnings after dividends in highly promising fields so that we may increase corporate value and enlarge resources for the payment of dividends in the future.
To “maintain sound relationships with all stakeholders, including our shareholders, and contribute to society as a good corporate citizen,” we focus on maintaining sound relationships with shareholders, investors, customers, business partners, employees and society as a whole, as well as carrying out support activities in a wide range of fields including education, sports and culture. In accordance with such basic policies, Konami Group will continue to seek to deliver dreams and excitement to people around the world by creating and providing “Valuable Time.”
2. Profit Appropriation Policy
Konami Group aims to continually enhance profitability through the improvement of operational efficiency. Emphasis is placed on three managerial indexes: the ratio of operating income to net sales, the ratio of net income to net sales and return on equity.
3. Medium- to Long-term Corporate Strategies and Objectives
Build a powerful organization that can respond to rapid changes in the global economy
While the global economy remains slow resulting from factors including the European sovereign-debt crisis, there were signs of a gradual recovery. There is also concerns regarding the business environment surrounding our businesses - Digital Entertainment, Health & Fitness, Gaming & Systems and Pachinko & Pachinko Slot Machines - due to the impact of economic uncertainty. On the other hand, in our business environment, progress has been made in developing a network environment. In the process, users have begun sharing a variety of information, and communities are starting to emerge, each with distinct tastes.
Konami Group has shifted to a holding company structure so that it may respond appropriately to a rapidly changing market environment and evolve into a flexible and sustainable entity. As such, there is now a clear separation between the management of the Konami Group and the execution of duties for each business segment. This is to enable on-target response to the needs of each market and changes of users as well as promote the agile development of each business. We also intend to promote the competitiveness and the sustainable growth of each group company. We believe that this will allow the Konami Group as a whole to make a leap forward.
16
Table of Contents
Enhance profitability and channel managerial resources to growth areas
In the Digital Entertainment segment, the popularization of games for social networking services (SNS) and the development of a globally connected online environment have led to an increase in users who seek new modes of play that emphasize network connectivity. The needs of such users are expected to become increasingly diverse. With such diversity and globalization sought by users, Konami Group intends to channel appropriate managerial resources in selective and focused manners.
In the Health & Fitness segment, against the backdrop of higher health consciousness and an increase in people with more leisure time due to the retirement of baby boomers, it is anticipated that health consciousness will become even higher in the future while preferences and lifestyles will diversify. In order to achieve further growth, we will take proactive steps to create value-added Konami Sports Clubs that meet the diversifying consumer needs and offer a new lifestyle. We are promoting a new concept, “Total Health Partner”, with the aim of establishing ourselves as a leading provider of new health-themed services, not only providing places for exercise but also becoming the most reliable provider of a wide range of health and body services for all of our customers, from children to senior citizens.
In the Gaming & Systems segment, as for the casino market where Konami Group operates, the legalization of gambling is progressing in various countries and regions around the world, and the number of casinos is increasing each year. Business opportunities are continuously increasing for Konami Group, which manufactures and markets slot machines and offers participation agreements and theKonami Casino Management System that secure stable revenues for Konami Group. We will endeavor to expand our business in the future with strategic alliances with other companies.
In the Pachinko & Pachinko Slot Machines segment, Konami Group will strive to increase its market share by providing products leveraging the Group’s extensive entertainment expertise in step with market developments such as changes in how games are played and user preferences.
Konami Group plans to allocate appropriate managerial resources not only to the existing Digital Entertainment, Health & Fitness, Gaming & Systems, and Pachinko & Pachinko Slot Machines but also to new business fields where growth is anticipated in the medium to longterm.
17
Table of Contents
4. Consolidated Financial Statements
| 1. | Consolidated Balance Sheets (Unaudited) |
| Millions of Yen | Thousands of U.S. Dollars | |||||||||||||||||||
| March 31, 2012 | March 31, 2013 | March 31, 2013 | ||||||||||||||||||
| % | % | |||||||||||||||||||
ASSETS | ||||||||||||||||||||
CURRENT ASSETS: | ||||||||||||||||||||
Cash and cash equivalents | ¥ | 76,451 | ¥ | 63,669 | $ | 676,970 | ||||||||||||||
Trade notes and accounts receivable, net of allowance for doubtful accounts of ¥380 million at March 31, 2012 and ¥683 million ($7,262 thousand) at March 31, 2013 | 33,647 | 33,066 | 351,579 | |||||||||||||||||
Inventories | 22,121 | 26,349 | 280,159 | |||||||||||||||||
Deferred income taxes, net | 20,503 | 20,749 | 220,617 | |||||||||||||||||
Prepaid expenses and other current assets | 9,243 | 9,650 | 102,605 | |||||||||||||||||
|
|
|
|
|
|
|
|
|
| |||||||||||
Total current assets | 161,965 | 49.4 | 153,483 | 47.5 | 1,631,930 | |||||||||||||||
PROPERTY AND EQUIPMENT, net | 62,251 | 19.0 | 62,651 | 19.4 | 666,146 | |||||||||||||||
INVESTMENTS AND OTHER ASSETS: | ||||||||||||||||||||
Investments in marketable securities | 429 | 440 | 4,678 | |||||||||||||||||
Investments in affiliate | 2,184 | 2,247 | 23,892 | |||||||||||||||||
Identifiable intangible assets | 41,283 | 42,225 | 448,963 | |||||||||||||||||
Goodwill | 21,875 | 21,934 | 233,216 | |||||||||||||||||
Lease deposits | 26,827 | 26,625 | 283,094 | |||||||||||||||||
Deferred income taxes, net | 976 | 1,875 | 19,936 | |||||||||||||||||
Other assets | 10,216 | 11,468 | 121,936 | |||||||||||||||||
|
|
|
|
|
|
|
|
|
| |||||||||||
Total investments and other assets | 103,790 | 31.6 | 106,814 | 33.1 | 1,135,715 | |||||||||||||||
|
|
|
|
|
|
|
|
|
| |||||||||||
TOTAL ASSETS | ¥ | 328,006 | 100.0 | ¥ | 322,948 | 100.0 | $ | 3,433,791 | ||||||||||||
|
|
|
|
|
|
|
|
|
| |||||||||||
18
Table of Contents
| Millions of Yen | Thousands of U.S. Dollars | |||||||||||||||||||
| March 31, 2012 | March 31, 2013 | March 31, 2013 | ||||||||||||||||||
| % | % | |||||||||||||||||||
LIABILITIES | ||||||||||||||||||||
CURRENT LIABILITIES: | ||||||||||||||||||||
Short-term borrowings | ¥ | 2,300 | ¥ | 4,681 | $ | 49,772 | ||||||||||||||
Current portion of long-term debt | 5,000 | 5,000 | 53,163 | |||||||||||||||||
Current portion of capital lease and financing obligations | 2,458 | 2,166 | 23,030 | |||||||||||||||||
Trade notes and accounts payable | 16,290 | 14,443 | 153,567 | |||||||||||||||||
Accrued income taxes | 10,449 | 4,104 | 43,636 | |||||||||||||||||
Accrued expenses | 19,993 | 19,971 | 212,345 | |||||||||||||||||
Deferred revenue | 5,595 | 5,464 | 58,097 | |||||||||||||||||
Other current liabilities | 5,805 | 3,683 | 39,160 | |||||||||||||||||
|
|
|
|
|
|
|
|
|
| |||||||||||
Total current liabilities | 67,890 | 20.7 | 59,512 | 18.4 | 632,770 | |||||||||||||||
LONG-TERM LIABILITIES: | ||||||||||||||||||||
Long-term debt, less current portion | 5,000 | — | — | |||||||||||||||||
Capital lease and financing obligations, less current portion | 24,803 | 22,588 | 240,170 | |||||||||||||||||
Accrued pension and severance costs | 1,641 | 1,531 | 16,278 | |||||||||||||||||
Deferred income taxes, net | 4,024 | 4,424 | 47,039 | |||||||||||||||||
Other long-term liabilities | 8,928 | 8,894 | 94,567 | |||||||||||||||||
|
|
|
|
|
|
|
|
|
| |||||||||||
Total long-term liabilities | 44,396 | 13.5 | 37,437 | 11.6 | 398,054 | |||||||||||||||
|
|
|
|
|
|
|
|
|
| |||||||||||
TOTAL LIABILITIES | 112,286 | 34.2 | 96,949 | 30.0 | 1,030,824 | |||||||||||||||
COMMITMENTS AND CONTINGENCIES | ||||||||||||||||||||
EQUITY: | ||||||||||||||||||||
KONAMI CORPORATION stockholders’ equity: | ||||||||||||||||||||
Common stock, no par value- Authorized 450,000,000 shares; issued 143,500,000 shares at March 31, 2012 and March 31, 2013 | 47,399 | 14.4 | 47,399 | 14.7 | 503,977 | |||||||||||||||
Additional paid-in capital | 74,175 | 22.6 | 74,175 | 23.0 | 788,676 | |||||||||||||||
Legal reserve | 284 | 0.1 | 284 | 0.1 | 3,020 | |||||||||||||||
Retained earnings | 107,565 | 32.8 | 113,808 | 35.2 | 1,210,080 | |||||||||||||||
Accumulated other comprehensive income (loss) | (2,719 | ) | (0.8 | ) | 1,009 | 0.3 | 10,728 | |||||||||||||
Treasury stock, at cost- 4,879,848 shares at March 31, 2012 and 4,881,940 shares at March 31, 2013 | (11,246 | ) | (3.4 | ) | (11,250 | ) | (3.5 | ) | (119,617 | ) | ||||||||||
|
|
|
|
|
|
|
|
|
| |||||||||||
Total KONAMI CORPORATION stockholders’ equity | 215,458 | 65.7 | 225,425 | 69.8 | 2,396,864 | |||||||||||||||
|
|
|
|
|
|
|
|
|
| |||||||||||
Noncontrolling interest | 262 | 0.1 | 574 | 0.2 | 6,103 | |||||||||||||||
|
|
|
|
|
|
|
|
|
| |||||||||||
TOTAL EQUITY | 215,720 | 65.8 | 225,999 | 70.0 | 2,402,967 | |||||||||||||||
|
|
|
|
|
|
|
|
|
| |||||||||||
TOTAL LIABILITIES AND EQUITY | ¥ | 328,006 | 100.0 | ¥ | 322,948 | 100.0 | $ | 3,433,791 | ||||||||||||
|
|
|
|
|
|
|
|
|
| |||||||||||
19
Table of Contents
| 2. | Consolidated Statements of Income and Consolidated Statements of Comprehensive Income (Unaudited) |
Consolidated Statements of Income
| Millions of Yen | Thousands of U.S. Dollars | |||||||||||||||||||
| Year ended March 31, 2012 | Year ended March 31, 2013 | Year ended March 31, 2013 | ||||||||||||||||||
| % | % | |||||||||||||||||||
NET REVENUES: | ||||||||||||||||||||
Product sales revenue | ¥ | 140,159 | ¥ | 103,928 | $ | 1,105,029 | ||||||||||||||
Service and other revenue | 125,599 | 122,067 | 1,297,895 | |||||||||||||||||
|
|
|
|
|
|
|
|
|
| |||||||||||
Total net revenues | 265,758 | 100.0 | 225,995 | 100.0 | 2,402,924 | |||||||||||||||
|
|
|
|
|
|
|
|
|
| |||||||||||
COSTS AND EXPENSES: | ||||||||||||||||||||
Costs of products sold | 89,924 | 64,152 | 682,105 | |||||||||||||||||
Costs of services rendered and others | 84,491 | 88,661 | 942,701 | |||||||||||||||||
Selling, general and administrative | 50,051 | 51,307 | 545,529 | |||||||||||||||||
Earthquake related expenses | 342 | — | — | |||||||||||||||||
|
|
|
|
|
|
|
|
|
| |||||||||||
Total costs and expenses | 224,808 | 84.6 | 204,120 | 90.3 | 2,170,335 | |||||||||||||||
|
|
|
|
|
|
|
|
|
| |||||||||||
Operating income | 40,950 | 15.4 | 21,875 | 9.7 | 232,589 | |||||||||||||||
|
|
|
|
|
|
|
|
|
| |||||||||||
OTHER INCOME (EXPENSES): | ||||||||||||||||||||
Interest income | 215 | 182 | 1,935 | |||||||||||||||||
Interest expense | (1,427 | ) | (1,300 | ) | (13,823 | ) | ||||||||||||||
Foreign currency exchange gain (loss), net | 331 | 1,285 | 13,663 | |||||||||||||||||
Other, net | (43 | ) | (127 | ) | (1,350 | ) | ||||||||||||||
|
|
|
|
|
|
|
|
|
| |||||||||||
Other income (expenses), net | (924 | ) | (0.3 | ) | 40 | 0.0 | 425 | |||||||||||||
|
|
|
|
|
|
|
|
|
| |||||||||||
INCOME BEFORE INCOME TAXES AND EQUITY IN NET INCOME OF AFFILIATED COMPANY | 40,026 | 15.1 | 21,915 | 9.7 | 233,014 | |||||||||||||||
INCOME TAXES | 16,941 | 6.4 | 8,473 | 3.8 | 90,090 | |||||||||||||||
EQUITY IN NET INCOME OF AFFILIATED COMPANY | 52 | 0.0 | 44 | 0.0 | 468 | |||||||||||||||
|
|
|
|
|
|
|
|
|
| |||||||||||
NET INCOME | 23,137 | 8.7 | 13,486 | 5.9 | 143,392 | |||||||||||||||
NET INCOME ATTRIBUTABLE TO THE NONCONTROLLING INTEREST | 125 | 0.0 | 312 | 0.1 | 3,318 | |||||||||||||||
|
|
|
|
|
|
|
|
|
| |||||||||||
NET INCOME ATTRIBUTABLE TO KONAMI CORPORATION | ¥ | 23,012 | 8.7 | ¥ | 13,174 | 5.8 | $ | 140,074 | ||||||||||||
|
|
|
|
|
|
|
|
|
| |||||||||||
20
Table of Contents
Consolidated Statements of Comprehensive Income
| Millions of Yen | Thousands of U.S. Dollars | |||||||||||
| Year ended March 31, 2012 | Year ended March 31, 2013 | Year ended March 31, 2013 | ||||||||||
Net income | ¥ | 23,137 | ¥ | 13,486 | $ | 143,392 | ||||||
|
|
|
|
|
| |||||||
Other comprehensive income (loss), net of tax: | ||||||||||||
Foreign currency translation adjustments | (455 | ) | 3,646 | 38,766 | ||||||||
Net unrealized gains (losses) on available-for-sale securities | (0 | ) | 79 | 840 | ||||||||
Pension liability adjustment | 283 | 3 | 32 | |||||||||
|
|
|
|
|
| |||||||
Other comprehensive income (loss) | (172 | ) | 3,728 | 39,638 | ||||||||
|
|
|
|
|
| |||||||
Comprehensive income (loss) | 22,965 | 17,214 | 183,030 | |||||||||
|
|
|
|
|
| |||||||
Comprehensive income (loss) attributable to the non controlling interest | 125 | 312 | 3,318 | |||||||||
|
|
|
|
|
| |||||||
Comprehensive income (loss) attributable to KONAMI CORPORATION | ¥ | 22,840 | ¥ | 16,902 | $ | 179,712 | ||||||
|
|
|
|
|
| |||||||
PER SHARE DATA
| Yen | U.S. Dollar | |||||||||||
| Year ended March 31, 2012 | Year ended March 31, 2013 | Year ended March 31, 2013 | ||||||||||
Basic net income attributable to KONAMI CORPORATION per share | ¥ | 166.23 | ¥ | 95.04 | $ | 1.01 | ||||||
Diluted net income attributable to KONAMI CORPORATION per share | 166.23 | 95.04 | 1.01 | |||||||||
|
|
|
|
|
| |||||||
Weighted-average common share outstanding | 138,433,751 | 138,619,128 | ||||||||||
Diluted weighted-average common shares outstanding | 138,433,751 | 138,619,128 | ||||||||||
21
Table of Contents
| 3. | Consolidated Statements of Stockholders’ Equity (Unaudited) |
| Millions of Yen | ||||||||||||||||||||||||||||||||||||
| Stockholders’ Equity | Total KONAMI CORPORATION stockholders’ equity | Non controlling Interest | Total Equity | |||||||||||||||||||||||||||||||||
| Common Stock | Additional Paid-in Capital | Legal Reserve | Retained Earnings | Accumulated Other Comprehensive Income (Loss) | Treasury Stock, at Cost | |||||||||||||||||||||||||||||||
Balance at March 31, 2011 | ¥ | 47,399 | ¥ | 75,490 | ¥ | 284 | ¥ | 90,250 | ¥ | (2,547 | ) | ¥ | (16,962 | ) | ¥ | 193,914 | ¥ | 4,493 | ¥ | 198,407 | ||||||||||||||||
|
|
|
|
|
|
|
|
|
|
|
|
|
|
|
|
|
| |||||||||||||||||||
Cash dividends attributable to KONAMI CORPORATION | (5,697 | ) | (5,697 | ) | (5,697 | ) | ||||||||||||||||||||||||||||||
Purchase of treasury stock | (29 | ) | (29 | ) | (29 | ) | ||||||||||||||||||||||||||||||
Reissuance of treasury stock | (0 | ) | 5,745 | 5,745 | 5,745 | |||||||||||||||||||||||||||||||
Equity transaction with noncontrolling interests and others | (1,315 | ) | (1,315 | ) | (4,356 | ) | (5,671 | ) | ||||||||||||||||||||||||||||
Comprehensive income | ||||||||||||||||||||||||||||||||||||
Net income | 23,012 | 23,012 | 125 | 23,137 | ||||||||||||||||||||||||||||||||
Foreign currency translation adjustments | (455 | ) | (455 | ) | (455 | ) | ||||||||||||||||||||||||||||||
Net unrealized gains (losses) on available-for-sale securities | (0 | ) | (0 | ) | (0 | ) | ||||||||||||||||||||||||||||||
Pension liability adjustment | 283 | 283 | 283 | |||||||||||||||||||||||||||||||||
|
|
|
|
|
| |||||||||||||||||||||||||||||||
Total comprehensive income for the year | 22,840 | 125 | 22,965 | |||||||||||||||||||||||||||||||||
|
|
|
|
|
|
|
|
|
|
|
|
|
|
|
|
|
| |||||||||||||||||||
Balance at March 31, 2012 | ¥ | 47,399 | ¥ | 74,175 | ¥ | 284 | ¥ | 107,565 | ¥ | (2,719 | ) | ¥ | (11,246 | ) | ¥ | 215,458 | ¥ | 262 | ¥ | 215,720 | ||||||||||||||||
|
|
|
|
|
|
|
|
|
|
|
|
|
|
|
|
|
| |||||||||||||||||||
Cash dividends attributable to KONAMI CORPORATION | (6,931 | ) | (6,931 | ) | (6,931 | ) | ||||||||||||||||||||||||||||||
Purchase of treasury stock | (6 | ) | (6 | ) | (6 | ) | ||||||||||||||||||||||||||||||
Reissuance of treasury stock | (0 | ) | 2 | 2 | 2 | |||||||||||||||||||||||||||||||
Comprehensive income | ||||||||||||||||||||||||||||||||||||
Net income | 13,174 | 13,174 | 312 | 13,486 | ||||||||||||||||||||||||||||||||
Foreign currency translation adjustments | 3,646 | 3,646 | 3,646 | |||||||||||||||||||||||||||||||||
Net unrealized gains (losses) on available-for-sale securities | 79 | 79 | 79 | |||||||||||||||||||||||||||||||||
Pension liability adjustment | 3 | 3 | 3 | |||||||||||||||||||||||||||||||||
|
|
|
|
|
| |||||||||||||||||||||||||||||||
Total comprehensive income for the year | 16,902 | 312 | 17,214 | |||||||||||||||||||||||||||||||||
|
|
|
|
|
|
|
|
|
|
|
|
|
|
|
|
|
| |||||||||||||||||||
Balance at March 31, 2013 | ¥ | 47,399 | ¥ | 74,175 | ¥ | 284 | ¥ | 113,808 | ¥ | 1,009 | ¥ | (11,250 | ) | ¥ | 225,425 | ¥ | 574 | ¥ | 225,999 | |||||||||||||||||
|
|
|
|
|
|
|
|
|
|
|
|
|
|
|
|
|
| |||||||||||||||||||
22
Table of Contents
| Thousands of U.S. Dollars | ||||||||||||||||||||||||||||||||||||
| Stockholders’ Equity | Total KONAMI CORPORATION stockholders’ equity | Non controlling Interest | Total Equity | |||||||||||||||||||||||||||||||||
| Common Stock | Additional Paid-in Capital | Legal Reserve | Retained Earnings | Accumulated Other Comprehensive Income (Loss) | Treasury Stock, at Cost | |||||||||||||||||||||||||||||||
Balance at March 31, 2012 | $ | 503,977 | $ | 788,676 | $ | 3,020 | $ | 1,143,700 | $ | (28,910 | ) | $ | (119,575 | ) | $ | 2,290,888 | $ | 2,785 | $ | 2,293,673 | ||||||||||||||||
|
|
|
|
|
|
|
|
|
|
|
|
|
|
|
|
|
| |||||||||||||||||||
Cash dividends attributable to KONAMI CORPORATION | (73,694 | ) | (73,694 | ) | (73,694 | ) | ||||||||||||||||||||||||||||||
Purchase of treasury stock | (64 | ) | (64 | ) | (64 | ) | ||||||||||||||||||||||||||||||
Reissuance of treasury stock | (0 | ) | 22 | 22 | 22 | |||||||||||||||||||||||||||||||
Comprehensive income | ||||||||||||||||||||||||||||||||||||
Net income | 140,074 | 140,074 | 3,318 | 143,392 | ||||||||||||||||||||||||||||||||
Foreign currency translation adjustments | 38,766 | 38,766 | 38,766 | |||||||||||||||||||||||||||||||||
Net unrealized gains (losses) on available-for-sale securities | 840 | 840 | 840 | |||||||||||||||||||||||||||||||||
Pension liability adjustment | 32 | 32 | 32 | |||||||||||||||||||||||||||||||||
|
|
|
|
|
| |||||||||||||||||||||||||||||||
Total comprehensive income for the year | 179,712 | 3,318 | 183,030 | |||||||||||||||||||||||||||||||||
|
|
|
|
|
|
|
|
|
|
|
|
|
|
|
|
|
| |||||||||||||||||||
Balance at March 31, 2013 | $ | 503,977 | $ | 788,676 | $ | 3,020 | $ | 1,210,080 | $ | 10,728 | $ | (119,617 | ) | $ | 2,396,864 | $ | 6,103 | $ | 2,402,967 | |||||||||||||||||
|
|
|
|
|
|
|
|
|
|
|
|
|
|
|
|
|
| |||||||||||||||||||
23
Table of Contents
| 4. | Consolidated Statements of Cash Flows (Unaudited) |
| Millions of Yen | Thousands of U.S. Dollars | |||||||||||
| Year ended March 31, 2012 | Year ended March 31, 2013 | Year ended March 31, 2013 | ||||||||||
Cash flows from operating activities: | ||||||||||||
Net income | ¥ | 23,137 | ¥ | 13,486 | $ | 143,392 | ||||||
Adjustments to reconcile net income to net cash provided by operating activities: | ||||||||||||
Depreciation and amortization | 9,798 | 10,513 | 111,781 | |||||||||
Provision for doubtful receivables | 44 | 266 | 2,828 | |||||||||
Gain or loss on sale or disposal of property and equipment, net | 311 | 176 | 1,871 | |||||||||
Equity in net loss (income) of affiliated company | (52 | ) | (44 | ) | (468 | ) | ||||||
Deferred income taxes | 2,824 | (626 | ) | (6,656 | ) | |||||||
Change in assets and liabilities, net of business acquired: | ||||||||||||
Decrease (increase) in trade notes and accounts receivable | (5,406 | ) | 2,427 | 25,806 | ||||||||
Decrease (increase) in inventories | 2,201 | (5,484 | ) | (58,309 | ) | |||||||
Decrease (increase) in prepaid expenses | 790 | 623 | 6,624 | |||||||||
Increase (decrease) in trade notes and accounts payable | (2,458 | ) | (3,066 | ) | (32,600 | ) | ||||||
Increase (decrease) in accrued income taxes, net of tax refunds | 4,396 | (6,343 | ) | (67,443 | ) | |||||||
Increase (decrease) in accrued expenses | 1,947 | 70 | 744 | |||||||||
Increase (decrease) in deferred revenue | 830 | (386 | ) | (4,104 | ) | |||||||
Increase (decrease) in advance received | (256 | ) | (847 | ) | (9,006 | ) | ||||||
Other, net | (191 | ) | (529 | ) | (5,624 | ) | ||||||
|
|
|
|
|
| |||||||
Net cash provided by operating activities | 37,915 | 10,236 | 108,836 | |||||||||
24
Table of Contents
| Millions of Yen | Thousands of U.S. Dollars | |||||||||||
| Year ended March 31, 2012 | Year ended March 31, 2013 | Year ended March 31, 2013 | ||||||||||
Cash flows from investing activities: | ||||||||||||
Capital expenditures | (9,260 | ) | (9,927 | ) | (105,550 | ) | ||||||
Proceeds from sales of property and equipment | 11 | 79 | 840 | |||||||||
Decrease (increase) in lease deposits, net | 466 | 189 | 2,010 | |||||||||
Decrease (increase) in term deposits, net | 1,412 | (569 | ) | (6,050 | ) | |||||||
Acquisition of business | — | (1,245 | ) | (13,238 | ) | |||||||
Other, net | (275 | ) | (102 | ) | (1,085 | ) | ||||||
|
|
|
|
|
| |||||||
Net cash used in investing activities | (7,646 | ) | (11,575 | ) | (123,073 | ) | ||||||
Cash flows from financing activities: | ||||||||||||
Increase (decrease) in short-term borrowings, net | (1,700 | ) | 2,124 | 22,584 | ||||||||
Redemption of bonds | (5,000 | ) | (5,000 | ) | (53,163 | ) | ||||||
Principal payments under capital lease and financing obligations | (2,385 | ) | (2,578 | ) | (27,411 | ) | ||||||
Dividends paid | (5,689 | ) | (6,919 | ) | (73,567 | ) | ||||||
Purchases of treasury stock by parent company | (29 | ) | (6 | ) | (64 | ) | ||||||
Proceeds from sale-leaseback transaction | 1,547 | — | — | |||||||||
Other, net | 2 | 2 | 21 | |||||||||
|
|
|
|
|
| |||||||
Net cash used in financing activities | (13,254 | ) | (12,377 | ) | (131,600 | ) | ||||||
Effect of exchange rate changes on cash and cash equivalents | (105 | ) | 934 | 9,930 | ||||||||
|
|
|
|
|
| |||||||
Net increase (decrease) in cash and cash equivalents | 16,910 | (12,782 | ) | (135,907 | ) | |||||||
|
|
|
|
|
| |||||||
Cash and cash equivalents, beginning of year | 59,541 | 76,451 | 812,877 | |||||||||
|
|
|
|
|
| |||||||
Cash and cash equivalents, end of year | ¥ | 76,451 | ¥ | 63,669 | $ | 676,970 | ||||||
|
|
|
|
|
| |||||||
| 5. | Going concern assumption: |
None
25
Table of Contents
| 6. | Segment Information (Unaudited) |
| (1) | Segment information |
Year ended March 31, 2012 | Digital Entertainment | Health & Fitness | Gaming & Systems | Pachinko & Pachinko Slot Machines | Corporate and Eliminations | Consolidated | ||||||||||||||||||
| (Millions of Yen) | ||||||||||||||||||||||||
Net revenue: | ||||||||||||||||||||||||
Customers | ¥ | 139,710 | ¥ | 82,429 | ¥ | 25,212 | ¥ | 18,407 | — | ¥ | 265,758 | |||||||||||||
Intersegment | 690 | 126 | — | 23 | ¥ | (839 | ) | — | ||||||||||||||||
|
|
|
|
|
|
|
|
|
|
|
| |||||||||||||
Total | 140,400 | 82,555 | 25,212 | 18,430 | (839 | ) | 265,758 | |||||||||||||||||
Operating expenses | 107,379 | 79,726 | 18,556 | 14,251 | 4,896 | 224,808 | ||||||||||||||||||
|
|
|
|
|
|
|
|
|
|
|
| |||||||||||||
Operating income (loss) | ¥ | 33,021 | ¥ | 2,829 | ¥ | 6,656 | ¥ | 4,179 | ¥ | (5,735 | ) | ¥ | 40,950 | |||||||||||
|
|
|
|
|
|
|
|
|
|
|
| |||||||||||||
Year ended March 31, 2013 | Digital Entertainment | Health & Fitness | Gaming & Systems | Pachinko & Pachinko Slot Machines | Corporate and Eliminations | Consolidated | ||||||||||||||||||
| (Millions of Yen) | ||||||||||||||||||||||||
Net revenue: | ||||||||||||||||||||||||
Customers | ¥ | 115,750 | ¥ | 79,866 | ¥ | 24,984 | ¥ | 5,395 | — | ¥ | 225,995 | |||||||||||||
Intersegment | 616 | 30 | — | 3 | ¥ | (649 | ) | — | ||||||||||||||||
|
|
|
|
|
|
|
|
|
|
|
| |||||||||||||
Total | 116,366 | 79,896 | 24,984 | 5,398 | (649 | ) | 225,995 | |||||||||||||||||
Operating expenses | 95,203 | 76,882 | 19,378 | 6,564 | 6,093 | 204,120 | ||||||||||||||||||
|
|
|
|
|
|
|
|
|
|
|
| |||||||||||||
Operating income (loss) | ¥ | 21,163 | ¥ | 3,014 | ¥ | 5,606 | ¥ | (1,166 | ) | ¥ | (6,742 | ) | ¥ | 21,875 | ||||||||||
|
|
|
|
|
|
|
|
|
|
|
| |||||||||||||
Year ended March 31, 2013 | Digital Entertainment | Health & Fitness | Gaming & Systems | Pachinko & Pachinko Slot Machines | Corporate and Eliminations | Consolidated | ||||||||||||||||||
| (Thousands of U.S. Dollars) | ||||||||||||||||||||||||
Net revenue: | ||||||||||||||||||||||||
Customers | $ | 1,230,728 | $ | 849,187 | $ | 265,646 | $ | 57,363 | — | $ | 2,402,924 | |||||||||||||
Intersegment | 6,550 | 319 | — | 32 | $ | (6,901 | ) | — | ||||||||||||||||
|
|
|
|
|
|
|
|
|
|
|
| |||||||||||||
Total | 1,237,278 | 849,506 | 265,646 | 57,395 | (6,901 | ) | 2,402,924 | |||||||||||||||||
Operating expenses | 1,012,259 | 817,459 | 206,039 | 69,793 | 64,785 | 2,170,335 | ||||||||||||||||||
|
|
|
|
|
|
|
|
|
|
|
| |||||||||||||
Operating income (loss) | $ | 225,019 | $ | 32,047 | $ | 59,607 | $ | (12,398 | ) | $ | (71,686 | ) | $ | 232,589 | ||||||||||
|
|
|
|
|
|
|
|
|
|
|
| |||||||||||||
| Notes: | 1. | Primary businesses of each segment are as follows: | ||||
| Digital Entertainment Segment: | Production, manufacture and sale of digital content and related products including Content for social networks, Online games, Computer & Video Games, Amusement and Card Games. | |||||
| Health & Fitness Segment: | Operation of health and fitness clubs, and production, manufacture and sale of health and fitness related goods. | |||||
| Gaming & Systems Segment: | Development, manufacture, sale and service of gaming machines and the Casino Management System for overseas markets. | |||||
| Pachinko & Pachinko Slot Machines Segment: | Production, manufacture and sale of pachinko slot machines and LCDs units for pachinko machines. | |||||
| 2. | “Corporate” primarily consists of administrative expenses of the Company. | |||||
| 3. | “Eliminations” primarily consists of eliminations of intercompany sales and of intercompany profits on inventories. | |||||
26
Table of Contents
| (2) | Geographic information |
Year ended March 31, 2012 | Japan | United States | Europe | Asia/ Oceania | Total | Eliminations | Consolidated | |||||||||||||||||||||
| (Millions of Yen) | ||||||||||||||||||||||||||||
Net revenue: | ||||||||||||||||||||||||||||
Customers | ¥ | 208,641 | ¥ | 35,955 | ¥ | 14,561 | ¥ | 6,601 | ¥ | 265,758 | — | ¥ | 265,758 | |||||||||||||||
Intersegment | 12,557 | 3,706 | 512 | 234 | 17,009 | ¥ | (17,009 | ) | — | |||||||||||||||||||
|
|
|
|
|
|
|
|
|
|
|
|
|
| |||||||||||||||
Total | 221,198 | 39,661 | 15,073 | 6,835 | 282,767 | (17,009 | ) | 265,758 | ||||||||||||||||||||
Operating expenses | 189,256 | 32,277 | 14,149 | 6,234 | 241,916 | (17,108 | ) | 224,808 | ||||||||||||||||||||
|
|
|
|
|
|
|
|
|
|
|
|
|
| |||||||||||||||
Operating income (loss) | ¥ | 31,942 | ¥ | 7,384 | ¥ | 924 | ¥ | 601 | ¥ | 40,851 | ¥ | 99 | ¥ | 40,950 | ||||||||||||||
|
|
|
|
|
|
|
|
|
|
|
|
|
| |||||||||||||||
Year ended March 31, 2013 | Japan | United States | Europe | Asia/ Oceania | Total | Eliminations | Consolidated | |||||||||||||||||||||
| (Millions of Yen) | ||||||||||||||||||||||||||||
Net revenue: | ||||||||||||||||||||||||||||
Customers | ¥ | 171,057 | ¥ | 36,631 | ¥ | 12,703 | ¥ | 5,604 | ¥ | 225,995 | — | ¥ | 225,995 | |||||||||||||||
Intersegment | 12,713 | 3,097 | 608 | 607 | 17,025 | ¥ | (17,025 | ) | — | |||||||||||||||||||
|
|
|
|
|
|
|
|
|
|
|
|
|
| |||||||||||||||
Total | 183,770 | 39,728 | 13,311 | 6,211 | 243,020 | (17,025 | ) | 225,995 | ||||||||||||||||||||
Operating expenses | 165,640 | 35,650 | 14,057 | 5,952 | 221,299 | (17,179 | ) | 204,120 | ||||||||||||||||||||
|
|
|
|
|
|
|
|
|
|
|
|
|
| |||||||||||||||
Operating income (loss) | ¥ | 18,130 | ¥ | 4,078 | ¥ | (746 | ) | ¥ | 259 | ¥ | 21,721 | ¥ | 154 | ¥ | 21,875 | |||||||||||||
|
|
|
|
|
|
|
|
|
|
|
|
|
| |||||||||||||||
Year ended March 31, 2013 | Japan | United States | Europe | Asia/ Oceania | Total | Eliminations | Consolidated | |||||||||||||||||||||
| (Thousands of U.S. Dollars) | ||||||||||||||||||||||||||||
Net revenue: | ||||||||||||||||||||||||||||
Customers | $ | 1,818,788 | $ | 389,485 | $ | 135,066 | $ | 59,585 | $ | 2,402,924 | — | $ | 2,402,924 | |||||||||||||||
Intersegment | 135,173 | 32,929 | 6,465 | 6,454 | 181,021 | $ | (181,021 | ) | — | |||||||||||||||||||
|
|
|
|
|
|
|
|
|
|
|
|
|
| |||||||||||||||
Total | 1,953,961 | 422,414 | 141,531 | 66,039 | 2,583,945 | (181,021 | ) | 2,402,924 | ||||||||||||||||||||
Operating expenses | 1,761,191 | 379,054 | 149,463 | 63,285 | 2,352,993 | (182,658 | ) | 2,170,335 | ||||||||||||||||||||
|
|
|
|
|
|
|
|
|
|
|
|
|
| |||||||||||||||
Operating income (loss) | $ | 192,770 | $ | 43,360 | $ | (7,932 | ) | $ | 2,754 | $ | 230,952 | $ | 1,637 | $ | 232,589 | |||||||||||||
|
|
|
|
|
|
|
|
|
|
|
|
|
| |||||||||||||||
For the purpose of presenting its operations in geographic areas above, KONAMI CORPORATION and its subsidiaries attribute revenues from external customers to individual countries in each area based on where we sold products or rendered services, and attributes assets based on where assets are located.
Notes: (Unaudited)
| • | The consolidated financial statements presented herein were prepared in accordance with U.S. generally accepted accounting principles (U.S. GAAP). |
| • | Certain reclassifications have been made to the prior year’s consolidated financial statements to conform to the presentation used for the year ended March 31, 2013. |
27
Table of Contents
| • | New Accounting Pronouncements Adopted |
Effective April 1, 2012, KONAMI has adopted Accounting Standards Update (“ASU”) 2011-05 “Comprehensive Income (Topic 220): Presentation of Comprehensive Income”, which was subsequently amended by ASU2011-12 “Comprehensive Income (Topic 220): Deferral of the Effective Date for Amendments to the Presentation of Reclassifications of Items Out of Accumulated Other Comprehensive Income in ASU2011-05”. ASU2011-05 requires the presentation of net income and other comprehensive income in a single continuous statement or in two separate but consecutive statements and eliminates the current option to report comprehensive income in the statement of equity. ASU2011-12 would defer the requirement to separately present within net income reclassification adjustments of items out of accumulated other comprehensive income, a part of which is required in ASU2011-05. The adoption of ASU2011-05 and ASU2011-12 did not have a material impact on KONAMI’s financial position and results.
| • | Subsequent Events |
None
28